Embed Size (px)
Citation preview

Author's personal copy
Review Paper
Grid computing technology for hydrological applications
G. Lecca a,!, M. Petitdidier b, L. Hluchy c, M. Ivanovic d, N. Kussul e, N. Ray f,g, V. Thieron h
aCenter for Advanced Studies, Research and Development in Sardinia (CRS4), Edificio 1, Parco Tecnologico ‘‘Polaris’’, 09010 Pula (Cagliari), ItalybUniversité Versailles St-Quentin, CNRS/INSU, LATMOS-IPSL, 10-12 Avenue de l’Europe, 78140 Velizy, Francec Institute of Informatics of the Slovak Akademia of Science (IISAS), Bratislava, Slovakiad Faculty of Science of the University of Kragujevac, Radoja Domanovica 12, 34000 Kragujevac, Serbiae Space Research Institute of the National Academy of Sciences of Ukraine and National Space Agency of Ukraine (NASU-NSAU), Glushkov Prospekt 40, Build. 4/1, Kyiv 03680, Ukrainef EnviroSPACE Laboratory, Climate Change and Climate Impacts, Institute for Environmental Sciences, University of Geneva, Battelle - Building D, 7 route de Drize, CH-1227 Carouge,SwitzerlandgGlobal Resource Information Database – Europe, Division of Early Warning and Assessment, United Nations Environment Programme, International Environment House, 11Chemin des Anémones, CH-1219 Châtelaine, Switzerlandh Ecole des Mines d’Alès (LGEI) – 6, Avenue de Clavières, 30319 Alès Cedex, France
a r t i c l e i n f o
Article history:Received 17 February 2010Received in revised form 5 February 2011Accepted 3 April 2011Available online 17 April 2011This manuscript was handled by P. Baveye,Editor-in-Chief
Keywords:Computational hydrologyEnvironmental dataGrid computinge-InfrastructureWater resources management
s u m m a r y
Advances in e-Infrastructure promise to revolutionize sensing systems and the way in which data are col-lected and assimilated, and complex water systems are simulated and visualized. According to the EUInfrastructure 2010 work-programme, data and compute infrastructures and their underlying technolo-gies, either oriented to tackle scientific challenges or complex problem solving in engineering, areexpected to converge together into the so-called knowledge infrastructures, leading to a more effectiveresearch, education and innovation in the next decade and beyond. Grid technology is recognized as afundamental component of e-Infrastructures. Nevertheless, this emerging paradigm highlights severaltopics, including data management, algorithm optimization, security, performance (speed, throughput,bandwidth, etc.), and scientific cooperation and collaboration issues that require further examinationto fully exploit it and to better inform future research policies. The paper illustrates the results of six dif-ferent surface and subsurface hydrology applications that have been deployed on the Grid. All the appli-cations aim to answer to strong requirements from the Civil Society at large, relatively to natural andanthropogenic risks. Grid technology has been successfully tested to improve flood prediction, ground-water resources management and Black Sea hydrological survey, by providing large computing resources.It is also shown that Grid technology facilitates e-cooperation among partners by means of services forauthentication and authorization, seamless access to distributed data sources, data protection and accessright, and standardization.
! 2011 Elsevier B.V. All rights reserved.
Contents
1. Introduction . . . . . . . . . . . . . . . . . . . . . . . . . . . . . . . . . . . . . . . . . . . . . . . . . . . . . . . . . . . . . . . . . . . . . . . . . . . . . . . . . . . . . . . . . . . . . . . . . . . . . . . . . 1872. What is the Grid?. . . . . . . . . . . . . . . . . . . . . . . . . . . . . . . . . . . . . . . . . . . . . . . . . . . . . . . . . . . . . . . . . . . . . . . . . . . . . . . . . . . . . . . . . . . . . . . . . . . . . 187
2.1. The Grid middleware . . . . . . . . . . . . . . . . . . . . . . . . . . . . . . . . . . . . . . . . . . . . . . . . . . . . . . . . . . . . . . . . . . . . . . . . . . . . . . . . . . . . . . . . . . . . 1882.2. Geospatial data components and Grid . . . . . . . . . . . . . . . . . . . . . . . . . . . . . . . . . . . . . . . . . . . . . . . . . . . . . . . . . . . . . . . . . . . . . . . . . . . . . . . 188
3. Grid-enabled hydrological applications . . . . . . . . . . . . . . . . . . . . . . . . . . . . . . . . . . . . . . . . . . . . . . . . . . . . . . . . . . . . . . . . . . . . . . . . . . . . . . . . . . . 1883.1. Multi-model multi-scale flood workflow. . . . . . . . . . . . . . . . . . . . . . . . . . . . . . . . . . . . . . . . . . . . . . . . . . . . . . . . . . . . . . . . . . . . . . . . . . . . . 1893.2. Flood mapping from satellite Earth Observation data . . . . . . . . . . . . . . . . . . . . . . . . . . . . . . . . . . . . . . . . . . . . . . . . . . . . . . . . . . . . . . . . . . 1903.3. Flash flood and crisis management on a OGC platform . . . . . . . . . . . . . . . . . . . . . . . . . . . . . . . . . . . . . . . . . . . . . . . . . . . . . . . . . . . . . . . . . 1913.4. Computational services for optimal decision making in groundwater protection (AQUAGRID). . . . . . . . . . . . . . . . . . . . . . . . . . . . . . . . . . 193
0022-1694/$ - see front matter ! 2011 Elsevier B.V. All rights reserved.doi:10.1016/j.jhydrol.2011.04.003
! Corresponding author. Tel.: +39 070 9250 272; fax: +39 070 9250 216.E-mail addresses: [email protected] (G. Lecca), monique.petitdidier@latmo-
s.ipsl.fr (M. Petitdidier), [email protected] (L. Hluchy), [email protected](M. Ivanovic), [email protected] (N. Kussul), [email protected] (N. Ray),[email protected] (V. Thieron).
Journal of Hydrology 403 (2011) 186–199
Contents lists available at ScienceDirect
Journal of Hydrology
journal homepage: www.elsevier .com/locate / jhydrol

Author's personal copy
3.5. Lizza PAKP Grid-enabled groundwater flow simulation . . . . . . . . . . . . . . . . . . . . . . . . . . . . . . . . . . . . . . . . . . . . . . . . . . . . . . . . . . . . . . . . . 1953.6. EnviroGRIDS: building capacity for a Black Sea Catchment observation and assessment system . . . . . . . . . . . . . . . . . . . . . . . . . . . . . . . . 195
4. Concluding remarks and future developments. . . . . . . . . . . . . . . . . . . . . . . . . . . . . . . . . . . . . . . . . . . . . . . . . . . . . . . . . . . . . . . . . . . . . . . . . . . . . . 197Acknowledgments . . . . . . . . . . . . . . . . . . . . . . . . . . . . . . . . . . . . . . . . . . . . . . . . . . . . . . . . . . . . . . . . . . . . . . . . . . . . . . . . . . . . . . . . . . . . . . . . . . . . 197
Appendix A . . . . . . . . . . . . . . . . . . . . . . . . . . . . . . . . . . . . . . . . . . . . . . . . . . . . . . . . . . . . . . . . . . . . . . . . . . . . . . . . . . . . . . . . . . . . . . . . . . . . . . . . . . . 197References . . . . . . . . . . . . . . . . . . . . . . . . . . . . . . . . . . . . . . . . . . . . . . . . . . . . . . . . . . . . . . . . . . . . . . . . . . . . . . . . . . . . . . . . . . . . . . . . . . . . . . . . . . 197
1. Introduction
Water is critical to well-being of humans, but its environment ischanging at unprecedented rates. Growing populations, increasingurbanization, and climate change are shifting the balance betweenwater supply and demand, and impacting the quality of water re-sources. Appropriated characterization, prediction and response tothreats to water resources is limited by our understanding of thedynamics and spatial variability of environmental processes; andhow perturbations alter these processes over time scales of dec-ades or longer, and spatial scales that range from local to global.
Surface water and groundwater interaction, field scale behaviorof spatially variable processes, multi-scale processes for river floodprediction, interplay between geological, hydrological and bio-chemical processes, optimal solutions to management of highlycomplex systems and socio-economic implications of human inter-ventions – just to cite few examples – are challenging researchobjectives governed by complex mathematical models based onhighly-demanding simulation and data analysis tools.
Hydrology science is largely based on the systematic integrationof data originating from several disciplines: weather and oceanobservations, soils, geomorphology and geology, social and demo-graphic datasets, etc. In addition, water data are often stored inwidely dispersed databases, managed by regional and national-government agencies in charge of water protection and manage-ment. The data, originating from a large variety of ground-basedas well as satellite sensors, are sometimes neither quality assured,analyzed, or interpreted adequately, nor available in a sufficientlytimely manner to inform management actions.
The amount of data to exploit and the modeling requirementsneed more and more computing resources (in terms of CPUs andstorage). But despite their rapid growth over the last two decades,a gap still exists and limits the ability of researchers, professionalsand decision makers to identify, assemble and analyze all relevantdata for a region or problem of interest (Cossu et al., 2010).
In many Earth Science (ES) fields, integrated networks ofobserving systems and facilities to store, retrieve and analyze theresulting data, are today foreseen as the key building block to pro-vide the foundation on which the understanding of environmentalprocesses can go forward and critical decisions to be made. Inhydrology, initiatives are taken in Europe such as the DistributedResearch Infrastructure for Hydro-Meteorology Study1 (DRIHMS)and in the USA such as the WATERS network.2 Many ES data centershave developed service tools based on Web services for basic re-search activities like searching, discovering, browsing and down-loading of datasets. However applications need a direct access notonly to various heterogeneous and geographically-distributed datasets, but also to the required computing resources.
Grid technology as defined by Foster and Kesselman (1999) andFoster (2002) meets these requirements as a distributed resourcessystem allowing (1) the integration and coordination of resourcesand users living within different control domains and (2) the scal-ing up of computing power and storage capacity in a way that isimpossible for a single institution to do. Grid could be also consid-
ered as an e-collaboration platform allowing scientific cooperationwithin a virtual team, i.e. sharing information, knowledge, applica-tions, data and resources via (dedicated) Web gateways (Bourraset al., 2009).
This paper aims at describing, from the application perspective,various aspects of this emerging paradigm in science and engineer-ing through the description of six different Grid-enabled hydrolog-ical applications, ported independently on the Grid.
The body of the paper is organized into four sections. After thisintroduction, Section 2 addresses the description of the Grid con-cept along with other interconnected technological frameworks,relevant to Earth and Environmental Sciences, such as the spatialdata infrastructures (SDIs) and the Web developments that are atthe very core of the research e-Infrastructures. Section 3 illustratesthe Grid-enabled hydrological applications related to flood predic-tion and monitoring, groundwater resources management andcomprehensive hydrological and environmental survey of thecatchment area of the Black Sea. For each of them we illustratethe hydrological environment, difficulties and limitations of previ-ous relevant studies, model mechanisms, value added solutions bymeans of data management and software implementation issues,and future improvements. Section 4 draws some conclusions fromthe lessons learned, anticipates future developments and high-lights research policy issues.
2. What is the Grid?
In this section, an overview of the main Grid technology charac-teristics is presented without discussing detailed implementationsand solutions. For such details the reader is referred to Foster andKesselman (1999) and Wang et al. (2009). The term Grid computingoriginated in the 1990s as a vision for making computer power aseasy to access as electric power (Foster and Kesselman, 1999). AGrid can be defined as a layer on top of network services that typ-ically allows users single sign-on access to distributed collection ofresources not centrally controlled. These resources can among oth-ers be in the form of computational capabilities, data repositories,software services and applications. According to the resourcesshared and domain involved the term Grid is used for a wide vari-ety of different objectives. A commonly used way is to divide theminto Computational or Data Grids according to their focus on pro-vision of computing cycles or data solutions and, into Science Grids(e.g. HealthGrid3) or Business Grids according to the category ofusers and applications.
Basic concepts lying behind the word ‘‘Grid’’ are: medium-termand dynamic collaboration, user and provider communities andsecurity. Associated to the Grid, there are always users belongingto different administrative organizations but to the same commu-nity or project, called Virtual Organization (VO), and resources fromdifferent organizations that constitute the Grid infrastructure. Thisuser community wants to share geographically distributed re-sources in a secure way. Users as well as resources must be authen-ticated by a certification authority before acceptance in the VO forusers or in the Grid infrastructure for resources. A valid certificate
1 http://www.drihms.org.2 http://www.watersnet.org. 3 http://www.healthgrid.org/.
G. Lecca et al. / Journal of Hydrology 403 (2011) 186–199 187

Author's personal copy
authorize users to access the resources based on the policies of theVO. Security and confidentiality are of great importance. In hydrol-ogy, as well as in other ES fields, complex data policies govern theaccess to data. As an example, local or regional data concerning thewater management may be very sensitive. Therefore, in their cur-rent form, most Grids use encryption and advanced authenticationmechanisms, such as public key certificates and different user rolesin the VO, to protect data confidentiality.
2.1. The Grid middleware
As a Grid often spans multiple administrative domains, hard-ware and software installations vary greatly. The Grid middlewareis responsible for the operation of the Grid and allows a uniformaccess to the often highly heterogeneous resources. The Grid mid-dleware usually hides this disparity from the user perspective, sothe Grid is seen as a seamless information processing system. Untiltoday, several, often architecturally different, Grid-middlewarehave been developed or are still being actively developed. Com-monly used middleware in Europe are for example gLite,4 UNiformInterface to COmputing REsources5 (UNICORE), Globus Toolkit,6 andAdvanced Resource Connector7 (ARC). The most spread all over theworld is the Globus toolkit that has the largest range of higher levelservices and allows users to easily build their own services, in partic-ular interfaced with Web services. It is used currently by thousandsof sites in business and academia but mostly not inter-connected.gLite is the middleware of the largest Grid deployment today, En-abling Grids for E-Science8 (EGEE), that is designed for the analysisof the petabytes (i.e. 1015 bytes) of data produced by the EuropeanOrganization for Nuclear Research’s (CERN) Large Hadron Collider(LHC) experiment in Geneva. However, access to EGEE is not re-stricted to high energy physics and is currently used by otherscientific communities mainly in public research including bioinfor-matics, astronomy and earth sciences (Renard et al., 2009). In Octo-ber 2009, EGEE was deployed at around 260 sites, providing around150,000 CPUs, more than 20 petabytes of storage, and running up to330,000 jobs/day. A new era has started in May 2010 with the Euro-pean Grid Infrastructure9 (EGI) to support the transition from a pro-ject-based system such as EGEE to a sustainable pan-European e-Infrastructure to enable access to computing resources for Europeanresearchers from all fields of science.
The interoperability of different Grid middleware and the defi-nition of standard components are discussed within the Open GridForum10 (OGF). The Global Grid Forum (GGF) published the OpenGrid Services Architecture (OGSA) that represents an evolution to-wards a Grid system architecture based on Web services technology,assuring interoperability on heterogeneous systems.
2.2. Geospatial data components and Grid
In the last years many European and international projects andinitiatives (e.g. INSPIRE,11 GEOSS,12 GMES13) aimed to define anarchitectural framework for the realization of the so-called SpatialData Infrastructure (SDI). The Open Geospatial Consortium14 (OGC)Inc.", a non-profit, international, voluntary consensus standardsorganization, is leading the development of standards for geospatialand location based services. It has defined specifications for manydifferent geospatial Web-based services: the Open Geospatial WebServices (OWS). As an example, a Web Processing Service (WPS) isa computer code to publish and perform geospatial processes (e.g.a simple geometric calculation or a complex simulation model) overthe Web with a standardized and open interface.
Linking Grid computing to OGC Web services is well suited toaccomplish high processing performance and storage capacityalong with improved service availability and usability. In thehydrology domain, a specific Spatial Data Infrastructure built uponthe EGEE platform has been designed and implemented for theflash flood application presented in Section 3.3 (Mazzetti et al.,2009). Sensor Web services have also been implemented on theGrid in the application of flood monitoring using satellite data,in situ sensors and simulations (Kussul et al., 2009), presented inSection 3.2. OGC components are also implemented with Globus(Lanig and Zipf, 2009).
3. Grid-enabled hydrological applications
The section describes six Grid-enabled applications addressinghydrological problems related to surface and subsurface waters.They are characterized by different computational and technolog-ical solutions, summarized in Table 1. Three applications concern
Table 1Main characteristics of the six Grid-enabled hydrology applications.
Ref. Domain Model Data Parallel system GIS/OGC Webinterface
Goal
3.1 Flood Multi-modelsystem
Local and Global(meteorological data)
Distributed Job (MPI) – Grid portal Demonstration
3.2 Flood – Global (Satellite data) Distributed Job (OpenMP) GIS andOCG
Portal + Web-GIS
Real time
3.3 Flash flood ALTHAIR Local and Global(meteorological data)
Independent Jobs (scenarioanalysis)
OGC Portal + Web-GIS
Real time
3.4 Subsurfacehydrology
CODESA-3D Local Independent Jobs (MonteCarlo)
GIS Portal + Web-GIS
Water Resources Management
3.5 Subsurfacehydrology
Lizza-PAKP Local Distributed Job(MPI) + parametric analysis
– – Water Resources Management
3.6 HydrologyCatchment
SWAT Local and Global Independent Jobs (MonteCarlo)
GIS Portal Survey and Water ResourcesManagement
4 http://glite.web.cern.ch/.5 http://www.unicore.eu/.6 http://www.globus.org/.7 http://www.nordugrid.org/arc/.8 http://www.eu-egee.org/.9 http://www.egi.eu/.
10 http://www.ogf.org/.11 http://www.inspire-geoportal.eu – Infrastructure for Spatial Information in theEuropean Community.12 http://www.earthobservations.org – The Global Earth Observation System ofSystems.13 http://gmes.info – Global Monitoring for Environment and Security.14 http://www.opengeospatial.org/.
188 G. Lecca et al. / Journal of Hydrology 403 (2011) 186–199

Author's personal copy
river floods (3.1–3.3). The first multi-model multi-scale application(3.1) has started to be developed in the framework of the EU FP6CROSSGRID15 project (2002–2005) and demonstrates the capabilityto implement on the Grid complex workflows using a cascade ofnested models operating at different spatial and temporal scales.The second application (3.2) is based on the information extractedfrom satellite data and is part of the United Nations EnvironmentProgramme (UNEP) on flood prediction. The third application (3.3)concerns a prototypal system for flash flood prediction developedin close cooperation with the forecasting service in France. Twoapplications are related to groundwater resources management(3.4 and 3.5). The first one (3.4) is a suite of modeling services andalready deployed case-studies in the Mediterranean area, targetedfor contamination problems including seawater intrusion in coastalaquifers and geochemical data analysis; the other (3.5) is a generalmodel for groundwater flow. The last application (3.6) is devotedto a survey of the hydrology and biodiversity of the catchment areaof the Black Sea.
3.1. Multi-model multi-scale flood workflow
Flood is a common problem in Slovakia due to the Danube Riverand its tributaries. Therefore, building a system for flood predic-tion, warning and prevention is topical. However, the problem isquite difficult and implies multi-disciplinary cooperation of manyorganizations, with a request for a huge amount of compute andstorage resources. Flood prediction is a complex multi-model mul-ti-scale application that is suitable to evaluate the capacity of Gridto implement a complex workflow. Flood forecasting requiresquantitative precipitation forecasts based on meteorological simu-lations of different resolutions from meso- to storm-scale. From
these quantitative precipitation forecasts, hydrological modelsare used to determine the discharge from the affected area. In turn,hydraulic models, based on this information, simulate flowthrough various river structures to predict the impact of the flood.Fig. 1 illustrates this cascade of models.
The meteorological models, data and expertise are provided bythe Slovak Hydro-Meteorological Institute (SHMI). One of themeteorological models is ALADIN/SLOVAKIA model, which is cur-rently operated by SHMI in daily operation. ALADIN16 is a modelwith primeval equations, based on spectrum technique includinghydrostatic, eulerian or semi lagranean options, digital filter initiat-ing, optimum interpolation analysis and lately variational assimila-tion of 3D data. ALADIN is license-restricted so another mesoscalemeteorological model, MM5,17 is used. The PSU/NCAR mesoscalemodel (known as MM5) is a limited-area, nonhydrostatic, terrain-following sigma-coordinate model designed to simulate or predictmesoscale atmospheric circulation. Conversion of input data forMM5 from ALADIN/LACE is provided by SHMI. The WRF18 (WeatherResearch and Forecasting) model, a next-generation mesoscalenumerical weather prediction system designed to serve both opera-tional forecasting and atmospheric research needs, is also under test.
Hydrological and hydraulic models, data and expertise are pro-vided by the Water Research Institute (WRI) and the Slovak WaterEnterprise, which manages all river authorities in Slovakia. Theorganizations have rich historical hydrological data from the net-work of water stations distributed over all important localities inSlovakia. However, the quality of terrain maps is very unequal.For some locations, high-resolution digital maps (1 ! 1 m) havebeen obtained using LIDAR (Light Detection and Ranging) technol-ogy; for some other places, the maps even are completely missing.
Fig. 1. Workflow of the cascade of simulations for flood forecasting.
15 http://www.eu-crossgrid.org – Development of Grid Environment for InteractiveApplications.
16 http://www.cnrm.meteo.fr/aladin.17 http://www.mmm.ucar.edu/mm5/mm5-home.html.18 http://www.wrf-model.org/index.php.
G. Lecca et al. / Journal of Hydrology 403 (2011) 186–199 189

Author's personal copy
Therefore, different hydrological models are applied for differentriver tributaries in Slovakia. When accurate data are available,physical models based on terrain maps like HEC-119 and HSPF20
are applied. These models simulate the surface-runoff response ofa river basin to precipitation by representing the basin as an inter-connected system of hydrologic and hydraulic components. Modelsuse continuous rainfall and other meteorologic records and the re-sult of the modeling process is the computation of streamflowhydrographs and pollutographs at desired locations in the river ba-sin. In the other cases, ERM (Empirical – Regressive Model) a purelyempirical model based on historical hydrological data is used. Simi-larly, several hydraulic models to simulate surface-water flows areused, including FESWMS-2DH21 and DaveF (Hluchy et al., 2002).Although both models have nearly identical input data (terrainmaps, inflows, coverage) and produce similar output (water levelsand velocities at flooded areas), FESWMS-2DH is based on the finiteelement method and is suitable for steady-state and semi-steady-state flow (plain flood), while DaveF is based on the finite volumemethod and is suitable for critical flow (flash flood). Both modelsare supported by a graphical user interface that can be used forpre- and post-processing.
The workflow (Habala et al., 2007) of the flood simulation isshown in Fig. 1. Each of the three simulation modules is consideredas a composite block that can be further decomposed into severalsub-blocks. Each simulation takes the input data set from the stor-age, preprocesses the data and starts the computational task. Thenthe post-processing of the output dataset is performed. Pre- andpost-processing filter blocks (dashed boxes in the same figure) ex-tract the data of interest from the dataset and format them into astructure suitable for the following processing or storage. The filterblocks may or may not appear in the actual simulation blockdepending on specific data structure requirements of individualcomponents. Output filtering before storing the resulting datasetsmay be important in case of large datasets (like meteorologicaloutput) where only a subset is of interest. Simulation results areimported into GIS (Geographic Information System) software, suchas ArcView22 and GRASS,23 to integrate them into maps for impactassessment.
Most of the models mentioned above, especially meteorologicaland hydraulic models, require a lot of computing resources. Theuse of Grid technology to provide enough computing power willbe vital for an operational use of this workflow for flood prediction.Another point in favor of the use of Grid technologies is that it pro-vides solutions for cooperation among the different organizations,e.g. authentication and authorization, distributed data sources,data protection and access right, and mainly the automatic execu-tion of complex workflows with many components.
The workflow has been tested on a pilot site in Slovakia pro-vided with topological LIDAR data. Before doing service composi-tion, the meteorological data of the pilot area have to beextracted from global data and the hydrological and hydraulicmodels have to be calibrated for actual terrain conditions. The Riv-er Vah Authority was the customer of this computational service tosimulate flood conditions for a small airport. Currently in Slovakiamodels for all the rivers are not calibrated, mainly due to missingtopological data. Therefore, the workflow cannot be widely used inSlovakia but is planned to be used in other countries.
There are still some obstacles in running the application in fullyoperational mode on generic Grid infrastructures like EGEE. In
operational mode, the application should be executed in real-time,assimilating data and boundary conditions from larger scale mod-els and displaying the current state of the flood to forecasters. Thisimplies the availability of the required computing resources whenneeded; since in EGEE the reservation of resources is not currentlypossible, there is no guarantee to have all the resources at the giventime. However the Grid infrastructure is able to provide enoughcomputation power and tools for cooperation and research investi-gation after the critical event.
3.2. Flood mapping from satellite Earth Observation data
Efficient monitoring and prediction of floods and risk manage-ment for large river is quasi-impossible without the use of EarthObservation (EO) data from space. As a matter of fact one of themost important problems associated with flood monitoring is thedifficulty to determine the extent of the flood area as even adense network of observations cannot provide such information.The flood extent information is used for damage assessmentand risk management, and benefits to rescuers during flooding;it is also very important for calibration and validation of hydrau-lic models to reconstruct what happened during the flood anddetermine what caused the water to go where it did (Horritt,2006).
The EO domain, in general, is characterized by large volumes ofdata that should be processed, catalogued, and archived (Fuscoet al., 2007; Shelestov et al., 2006). The processing of satellite datacan be viewed as a complex workflow that is composed of manytasks (Kussul et al., 2008). For flood mapping from satellite data,the workflow consists of the following stages: (1) data transferupon user request, through the SAR (Synthetic-Aperture Radar)portal, from the ESA (European Space Agency) rolling archives tothe local or Grid resources; local storage of the concerned SARmetadata in a catalog in order to enable efficient retrieval ofSAR images; (2) geometric (ortho-rectification) and radiometriccorrection of the SAR image using digital elevation model(DEM); regions with shadows and layover are identified at thisstage as well; (3) processing of SAR image using a neural networkclassifier. The neural network assigns to each pixel of the outputimage a binary value corresponding to one of two classes(‘‘Water’’ and ‘‘No water’’) taking as input a moving window ofimage pixel intensities; (4) removal of those regions that were de-tected as shadow/layover at the stage No. 2, since the pixel valuesin these regions are not related to physical conditions of the envi-ronment; (5) geocoding, i.e. transformation to geographical pro-jection using ground-control points (GCPs) incorporated in theSAR image; (6) visualization of the results using ESRI shape files,KML (Keyhole Markup Language) files, and OGC WMS. In orderto provide a more comprehensive analysis of a flood situation,other data are used when available: optical satellite data (e.g.Landsat-5), land cover/land use maps (Corine Land Cover, ESAGLOBCOVER), and vector data (assets, cities/villages/settlements,population density/quantity, road networks). The produced floodmaps are delivered to civil protection and emergency agenciesto calibrate and validate hydrological models and to analyze dif-ferent scenarios of disaster.
Dealing with EO data, we have also to consider the security is-sues regarding satellite data policy with the need of near-real-timeprocessing in order to provide a fast response within internationalprograms and initiatives, in particular the International Charter‘‘Space and Major Disasters’’ and the International Federation ofRed Cross. A considerable need therefore exists for an appropriateinfrastructure that will enable the integrated and operational useof multi-source data for different application domains. From atechnological point of view, Grids can provide solutions to theabove-mentioned problems (Foster, 2002; Fusco et al., 2007; She-
19 http://www.ground-water-models.com/products/wms_hec-1/wms_hec-1.html.20 http://www.epa.gov/ceampubl/swater/hspf.21 http://water.usgs.gov/software/FESWMS-2DH – Finite Element Surface-WaterModeling System.22 http://www.esri.com/software/arcview/index.html.23 http://grass.itc.it.
190 G. Lecca et al. / Journal of Hydrology 403 (2011) 186–199

Author's personal copy
lestov et al., 2006). In this case, a Grid environment can be consid-ered not only for providing high-performance computations, butalso to facilitate interactions between different actors by providinga standard infrastructure and a collaborative framework to sharedata, algorithms, storage resources, and processing capabilities(Fusco et al., 2007).
To benefit from Grid computing capabilities, a parallel versionof the application of flood mapping from SAR imagery was devel-oped on the Grid infrastructure. Parallelization of the image pro-cessing is performed by splitting the SAR image into uniformparts that are processed on different nodes using the OpenMP24
Application Program Interface. The use of the Grid reduced thetime required to process a single SAR image from more than10 min on a single workstation to less than 1 min on the Grid infra-structure. Currently, the Grid infrastructure integrates resources ofseveral geographically distributed organizations:– Space Research Institute NASU-NSAU (Ukraine) with deployedcomputational and storage nodes based on Globus Toolkit 4,NorduGrid25 and gLite 3 middleware, access to geospatial dataand a Grid portal.
– Institute of Cybernetics of NASU (Ukraine) with deployed com-putational and storage nodes (SCIT-1/2/3 clusters) based onGlobus Toolkit 4 middleware and access to computing resources(approximately 500 processors).
– The Center for Earth Observation and Digital Earth of ChineseAcademy Science-CEODE-CAS (China) with deployed computa-tional nodes based on gLite 3 middleware and access to geospa-tial data (approximately 16 processors).
Other Grid resources may be accessible if needed.In all cases, the Grid Resource Allocation and Management
(GRAM) service is used to execute jobs on the Grid resources (Felleret al., 2007). Access to the resources of the Grid environment is or-ganized via a high-level Grid portal that has been deployed usingGridSphere framework.26 Through the portal, users can accessthe required satellite data and submit jobs to the computing re-sources of the Grid in order to process satellite imagery. The work-flow of the data processing steps (transformation, calibration,orthorectification, classification, etc.) in the Grid is controlled bya Karajan engine.27 The open-source OpenLayers framework28
and UMN Mapserver v529 are used to visualize the results of dataprocessing in the Grid environment. Having created WMS servicesfor the EO derived products, we use them in the OpenLayers frame-work and in Google Earth by generating corresponding KML files.
The approach to determine flood extent from SAR imageries ac-quired by different satellite instruments (ERS-2/SAR, ENVISAT/ASAR, RADARSAT-1/2) has been applied to a number of case-studyareas: Ukraine and Hungary (2001), China (2007), Mozambique(2008), Zambia (2009), Australia (2009, Fig. 2). Classification ratesfor independent testing data sets were 85.40%, 98.52%, 95.99% forERS-2, ENVISAT and RADARSAT-1 satellite imagery, respectively.In case of emergency in any region, the UN-SPIDER30 knowledgeportal provides flood maps based on satellite data along with contin-uous monitoring of areas prone to seasonal floods. These areas in-clude Ukraine (Carpathian region), Namibia (Caprivi region) andAustralia (Norman River). The derived flood maps in conjunctionwith rainfall estimates, water level and water flow data can be usedby statistical models to predict the flood extent.
In conclusion, the use of Grids allows us to reduce the overallcomputing time required for satellite image processing, to effec-tively manage complex workflows, and to make also possible thefast response within international programs and initiatives con-cerned with emergencies.
3.3. Flash flood and crisis management on a OGC platform
In South-East France, flash flood phenomena represent the mostimportant natural threat for population and infrastructures. Dur-ing the flash flood that occurred on September 2002 in the Gardregion, 22 persons died and the economic damages were estimatedat 1.2 billion euro (Delrieu et al., 2005; Sauvagnargues-Lesage andAyral, 2007). After such dramatic floods, the proposed actions con-cerned the enhancement of the existing operational functioningand of the flash flood hydrological modeling (Anquetin et al.,2010; Braud et al., 2010; Estupina-Borell et al., 2004; Gaumeet al., 2004).
In France, Grand Delta flood forecasting service (SPC-GD) han-dles the monitoring and the forecasting of flash floods, based onthe real-time analysis of rain gauges and water level stations. Addi-tionally, the forecasters use the ALHTAÏR model to simulate runofffrom all the supervised watersheds with the rainfall intensity de-duced from data of the ground-based radar system that covers this
Fig. 2. SAR image acquired from RADARSAT-2 satellite (14.02.2009) during the flooding on the river Norman, Australia (left) and derived flood extent map! CSA 2009 (right).
24 http://www.openmp.org.25 http://www.nordugrid.org.26 http://www.gridsphere.org.27 http://www.gridworkflow.org/snips/gridworkflow/space/Karajan.28 http://www.openlayers.org.
29 http://www.mapserver.org.30 http://www.un-spider.org/ – United Nations Platform for Space-based Informa-tion for Disaster Management and Emergency Response.
G. Lecca et al. / Journal of Hydrology 403 (2011) 186–199 191

Author's personal copy
region. This operational model has already enabled realistic hydro-logical monitoring; however the lack of a high-end computinginfrastructure limits its use for short-term operational forecasting.The main scope of this research has been to design a prototype ofthe hydrological modeling platform G-ALHTAÏR able to operateALHTAÏR model both in real-time and after the event, under differ-ent scenarios (Duband, 2000; Doswell et al., 1996).
The ALHTAÏR is a distributed rainfall-runoff model derived fromthe Horton principle (Ayral et al., 2007; Horton, 1933). Based on anevent-driven functioning, it includes two independent modules:
– The ‘‘production module’’ is dedicated to convert raw rainfallprovided by the radars in effective rainfall over the given water-sheds. For each cell of the watershed, the local surface runoff iscalculated according to the infiltration capacity. New hydrolog-ical conditions are simulated and then used as input of the nexttime step.
– The ‘‘propagation module’’ propagates the surface runoff of eachwatershed’s cell to its outlet (i.e. geo-morphological transferfunction).
– The main output of ALHTAÏR is a real-time hydrograph with aforecast horizon equal to the time of concentration of thewatershed.
Although from the ground-based radar system one-hour rainfallforecast is provided, the modeled runoff is not always in goodagreement with observed values due to uncertainties on rainfalls.In order to take into account the rainfall uncertainties, the simula-
tions are carried out with different rainfall scenarios at differentforecast horizons (i.e. time period at which the forecast is deliv-ered). Within an operational lead time (i.e. expected duration toget the simulation output), the forecasters should execute simula-tions with different hydro-meteorological conditions on eachsupervised watershed (bunch of hydrographs) and select the mostprobable upcoming runoffs. The needed compute and storage re-sources are not available locally at SPC-GD but on the EuropeanGrid infrastructure. Hence, G-ALHTAÏR is dedicated to handle thesenew hydrometeorological capabilities, exploiting the resourcesprovided by the EGI.
Within the framework of the EU FP6 Cyber Infrastructure forCivil protection Operative ProcedureS-CYCLOPS31 project (2006–2008) such a platform has been developed taking advantage of Gridtechnology capabilities combined with OGC Web services (Mazzettiet al., 2009). The flash flood application demonstrates the capabilityof the platform to handle low level Grid tasks for hydrological pro-cessing by inexperienced end-users, through simple HTTP/XML re-quest. The prototype required (1) to adapt input/output data(radar, hydrological conditions, watersheds, and hydrographs) tocomply with Web services requirements and (2) to re-code ALHTAÏRalgorithms to enable their independent execution on the Grid mid-dleware (gLite). A new geospatial Web services layer has been de-signed on top of the Grid infrastructure in order to exchange datawith the existing SPC-GD information system (Mazzetti et al., 2009).
Fig. 3. G-ALTHAIR platform is based on three layers: existing client–server SPC-GD local system, OWS services implemented on the User Interface server and the GridInfrastructure providing computational and storage resources.
31 http://www.cyclops-project.eu/.
192 G. Lecca et al. / Journal of Hydrology 403 (2011) 186–199

Author's personal copy
Fig. 3 shows the G-ALTHAIR platform that is a simplified versionof the platform developed in the framework of CYCLOPS. Numberson the figure are used to describe the different tasks of the work-flow. The two Web services, implemented on the User Interfaceserver, are the Web Coverage Service (WCS) to transform initialdata to model input data (re-sampling and sub-setting) [1] andto make them accessible to other grid services [2], and the WebProcessing Service (WPS) to wrap the ALHTAÏR production [3]and propagation [4] modules. WPS provides an easy customizableprocessing on the Grid. Existing ALTHAÏR model holds up effi-ciently real-time hydrological monitoring on the SPC-GD local sys-tem [5], while G-ALHTAÏR is mainly dedicated to support on-demand forecasting scenarios on the Grid Infrastructure [6]. WPSautomatically manages: WCS for local data retrieving (last hydro-logical conditions and most recent forecasting rainfall and chosenwatershed) [1], production and transfer module execution onworker nodes [6], and output transfer on local system [7]. The out-put corresponds to a bunch of hydrographs representing every var-iation of the rainfall intensity required by the forecaster [8].Forecaster can also provide additional customized meteorologicalscenarios to G-ALHTAÏR platform.
Through G-ALTHAIR end-users easily submit hydrological simu-lations in a more intensive way than usual, given the large compu-tational capabilities of the Grid infrastructure. In-progress realistictests show that SPC-GD, in adopting such system, can potentiallybenefit from the results of more hydrological modeling instances(Thierion et al., 2011). Taking into account that each forecastingscenario requires two sequences of four elementary grids jobs(three WCS instances and one WPS instance), the tests pointedout that G-ALTHAÏR can potentially perform approx. three hydro-logical forecasting scenarios for each of the 30 supervised water-sheds of SPC-GD, i.e. around 300 elementary grid jobs in theoperational lead time (Thierion et al., 2011). However, the EGEEGrid is generally characterized by shared access without any re-source reservation. Therefore during the critical period resultsmay not be provided on time due to some Grid-component outagesor algorithm software compatibility issues on some sites.
The experimental platform G-ALTHAÏR will easily allow to addother hydrological modules such as kinematic waves transfer func-tion, SCS production function (Gaume et al., 2004), real-time runoffassimilation (Beven, 2001; Collier, 2007; Estupina-Borell et al.,2006; Rabuffetti, 2006). Hence, in a operational situation, forecast-ers could have, at their disposal, a suite of hydrological modules torapidly build different processing workflows adapted to the vari-ability of hydrometeorological processes occurring in mountainouswatersheds (Beven, 2003; Doswell et al., 1996; Rabuffetti andBarbero, 2005).
Further research is planned to develop in the G-ALHTAÏR plat-form a discharge assimilation process and hydraulic models forflood area forecast in crisis context. G-ALHTAÏR will be tested un-der operational service at SPC-GD during the autumn of 2011.
3.4. Computational services for optimal decision making ingroundwater protection (AQUAGRID)
Groundwater models are becoming increasingly important inthe decision making process as they provide systematic and consis-tent information on water availability, impacts of climate and landuse changes, and analyses of non-point source pollution. The mainenvironmental problem addressed by AQUAGRID is the seawaterintrusion in regional coastal aquifers, under explicit considerationof uncertainty. The uncertainty assessment, performed bymeans ofMonte Carlo analysis on the scenario outputs, considers as poten-tial uncertainty sources either hydraulic parameters (Lecca andCau, 2009) or model stresses (e.g. pumping rates, Kerrou et al.,2010). Running such complex and regional seawater intrusion
models on a single PC for a sufficient number of stochastic realiza-tions is often just not feasible. That difficulty can be overcome byusing a cluster of computers on which each stochastic realizationis executed independently. This is a common technology today,but it still remains rather expensive and not all laboratories haveaccess to such an infrastructure, particularly where hydrogeolo-gists are located in countries with low incomes. This is an issue be-cause also these countries frequently face the problem of seawaterintrusion with the most dramatic consequences for their economy.Therefore, a Grid computing infrastructure could be used to runcomplex and large simulations remotely, and possibly directlyfrom the countries where the problems occur (Kerrou et al., 2010).
Groundwater simulation is at the heart of complex data work-flows, composed by nested and linked models of varying degreesof complexity, applied to the same region or problem. The compu-tational engine is the CODESA-3D hydro-geological model (Gam-bolati et al., 1999) to simulate complex and large coupleddensity-dependent and variably-saturated 3D groundwater flowand salt transport problems. CODESA-3D is a three-dimensional fi-nite element simulator for groundwater flow and solute transportin variably-saturated porous media on unstructured domains. Theflow and solute transport processes are coupled through the vari-able density of the filtrating mixture made of water and dissolvedmatter (salt, pollutants). The flow module simulates the watermovement in the porous medium, taking into account differentforcing inputs: infiltration/evaporation, recharge/discharge, with-drawal/injection, etc., while the transport module computes themigration of the salty plume due to advection and diffusion pro-cesses. Model parameters and system excitations are assumed var-iable in space and/or time. Among the open source third-partysoftware integrated into AQUAGRID workflows are: HYDRO_GEN32
a spatially distributed random field generator for correlated hydro-geological fields to be used in Monte Carlo analysis, PHREEQC33 toperform speciation, batch-reaction, one-dimensional transport, andinverse geochemical calculations, PHAST34 to simulate groundwaterflow, solute transport, and multi-component geochemical reactions,PEST35 to calibrate models by nonlinear optimization of parametersagainst field measurements, and the Fortran Genetic Algorithm Dri-ver36 to perform water resources management optimization using asearch technique based on natural selection.
AQUAGRID is the subsurface hydrology service of the GRIDA337
computing platform, centered on groundwater modeling and geo-chemical data analysis. It makes available to users a Web frameworkintegrating data sets, modeling, analysis and visualization tools (Lec-ca et al., 2009). The underlying computing infrastructure, located atCRS4, provides a number of environmental science and engineeringsoftware applications on data collections shared among project part-ners (Murgia et al., 2009). Remote users access and control comput-ing resources via the EnginFrame Grid portal framework38 anddistributed data and metadata via the iRODS middleware.39 Theprincipal goal achieved using a data-Grid in conjunction with ahigh-end computing platform is to federate and share know-how,data and computational services across a community of multi-disci-plinary experts, via a dedicated Web gateway. Major applicationfields of AQUAGRID entail the scientific and technical support tothe planning and management of optimal aquifer developmentschemes and monitoring networks, and the selection of the most
32 http://www.ing.unitn.it/~bellin/frames/hydrogen.php.33 http://wwwbrr.cr.usgs.gov/projects/GWC_coupled/phreeqc/.34 http://wwwbrr.cr.usgs.gov/projects/GWC_coupled/phast/.35 http://www.parameter-estimation.com/.36 http://www.cuaerospace.com/carroll/ga.html.37 http://grida3.crs4.it.38 http://www.enginframe.com.39 https://www.irods.org/.
G. Lecca et al. / Journal of Hydrology 403 (2011) 186–199 193
Author's personal copy
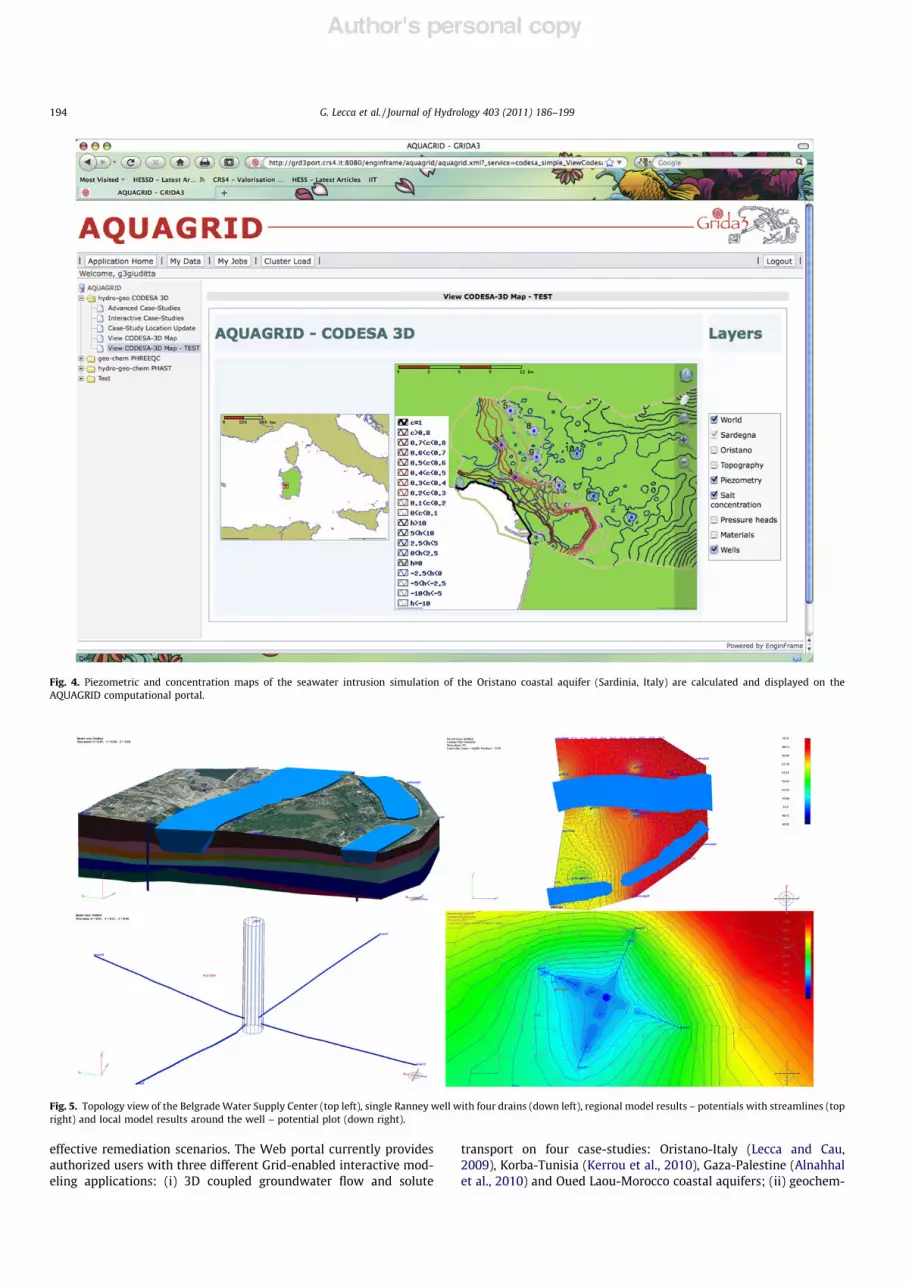
effective remediation scenarios. The Web portal currently providesauthorized users with three different Grid-enabled interactive mod-eling applications: (i) 3D coupled groundwater flow and solute
transport on four case-studies: Oristano-Italy (Lecca and Cau,2009), Korba-Tunisia (Kerrou et al., 2010), Gaza-Palestine (Alnahhalet al., 2010) and Oued Laou-Morocco coastal aquifers; (ii) geochem-
Fig. 4. Piezometric and concentration maps of the seawater intrusion simulation of the Oristano coastal aquifer (Sardinia, Italy) are calculated and displayed on theAQUAGRID computational portal.
Fig. 5. Topology view of the BelgradeWater Supply Center (top left), single Ranney well with four drains (down left), regional model results – potentials with streamlines (topright) and local model results around the well – potential plot (down right).
194 G. Lecca et al. / Journal of Hydrology 403 (2011) 186–199

Author's personal copy
ical speciation of aqueous solutions on 900 samples grouped into 20online Sardinian mine-districts campaigns (Biddau et al., 2008); and(iii) 3D multi-component reactive transport simulations to designand assess the performance of remediation systems as open lime-stone channels and permeable reactive barriers.
As an example, we consider the 127 km2 aquifer system of theOristano coastal plain (Sardinia, Italy) consisting of two main pro-ductive units interbedded by a thin, possibly vanishing, clayeyaquitard. Using a Monte Carlo technique, a range of aquifer systemconfigurations has been explicitly simulated to study the effect ofaquitard spatial discontinuities on the seawater intrusionmechanism (Lecca and Cau, 2009). Fig. 4 shows the groundwaterhead and salt concentration maps resulting from one of the 100stochastic transient simulations (all submitted as independentjobs), displayed directly on the infrastructure via the UMNMapserver40 Web-GIS interface.
AQUAGRID is an application shared by a small but growingcommunity. The CODESA-3D modeling service has been alsodeployed in the framework of the EU FP6 Sustainable Water Man-agement in Mediterranean Coastal Aquifers-SWIMED project(2003–2006, Benavente et al., 2004) and of the large European Gridprojects (2006–2008) EGEE and EUMedGRID.41
3.5. Lizza PAKP Grid-enabled groundwater flow simulation
Groundwater flow dynamic parameters are of the highestimportance in the business field of drinking water supply, manage-ment and planning. Lizza–PAKP is a groundwater flow simulationsystem that integrates a solver (PAKP) based on finite element(FE) method and a user interface (Lizza). PAKP module includes asolver based on Darcy’s law which describes the flow of a fluidthrough a porous medium (Wang and Anderson, 1982). It also pro-vides fully 3D modeling capabilities, stationary and non-stationaryanalysis, water saturated and non-saturated regime calculations, aswell as mass and heat transport handling. The application wasdeveloped in cooperation between Institute for Water Resources‘‘Jaroslav Cerni’’, Belgrade and the University of Kragujevac, Serbia.
Lizza–PAKP introduces innovative solutions to model Ranneywells (Kojic et al., 2007), compared to similar software, includingregional and local models together with user-friendliness. A Ran-ney well is a kind of well that has a center caisson with horizontalperforated pipes extending radially into an aquifer (Fig. 5, downleft). It is particularly applicable to the development of thin aqui-fers at shallow depths. The coupling of 1D elements correspondingto radial pipes of Ranney well and 3D elements corresponding tothe surrounding ground material is one of the most importantapplication achievements.
Using the desktop environment Lizza, one forms arbitraryshaped 3D model by specifying data in the usual way in hydrolog-ical practice, i.e., terrain contours, bottom surface contours andlayer material and river-bed characteristics. Boundary conditionsare prescribed as specified levels, flow rates and type of wells (tubeand Ranney). Input data is specified in the CSV (Comma SeparatedValues) format, while background maps and textures are allowedto be provided in a number of standard image formats.
While all pre-processing tasks are chosen to be desktop-ori-ented, the FE analysis and output storage have been moved intothe Grid environment. As soon as the Grid-enabled FE analysis fin-ishes, PAKP module transfers the huge output files in the UniversalFile Format to the Grid storage elements. Despite the wide outputportability, Lizza itself seems to be the most appropriate post-pro-cessing and visualization tool according to user preferences. Since
this requires the transfer of large output files from remote Gridstorage nodes to the local desktop, different solutions are understudy to address the issue.
When Grid porting began, Lizza–PAKP was already a matureapplication with two years of active development behind. At thattime, the application was capable to perform heavy computationsemploying a parallel multi-frontal solver using the MPI (MessagePassing Interface) library on a local cluster. The main objectivesof the Grid porting were: (1) to speed-up application using addi-tional processing resources, (2) to provide support to simulatemuch more large and complex models thanks to Grid processing/memory resources, (3) to considerably improve parametric analy-sis by means of parametric and collection jobs that allow to launcha bulk of jobs using a single submission and to retrieve all the out-put at once, (4) to employ Grid storage resources in order to storeand archive large output files, and (5) to simplify end-userexperience.
In order to achieve the above objectives, the Grid porting em-ployed various Grid services provided by the EGEE middleware,gLite, most notably WMS (Workload Management System) andLFC (Logical File Catalog). The application also provides aWork Bin-der interface,42 one of the EU FP6 SEE-GRID43 application services,which helps in hiding the Grid complexity from the end-user view-point and allows a easier handling of various parametric analyses. Itsmain purpose is to quickly allocate new jobs for Grid users, togetherwith presenting a more interactive behavior to them (Marovic et al.,2009). It makes also possible to follow calculation progress, then totransfer, present and analyze partial results, without waiting for theGrid job to finish.
The application was employed to successfully model a systemof Ranney wells near the Sava River (Belgrade Water Supply Cen-ter). The global model includes porous medium on both sides ofSava River, with dimensions approximately 2100 m ! 2100 m inthe horizontal plane and a depth of 40 m. The total number of finiteelement nodes in the model discretization was about one million.Boundary conditions consist of impermeable bottom plane, imper-meable vertical surface bounding the model, and river modeled byprescribed potential at the river–soil boundary. Fig. 5 shows atopology view of the Belgrade Water Supply Center (top left panel)and a sketch of a single Ranney well with four drains (down left pa-nel), along with regional and local model results (potentials withstreamlines, top and down right panels).
Without Grid resource support, it would not be possible to ana-lyze such a huge model and a few dozens of its variants. Singlemodel variant is still suitable to be analysed in a cluster environ-ment, but Grid is a key term in an attempt to analyze multiplemodel variants concurrently.
3.6. EnviroGRIDS: building capacity for a Black Sea Catchmentobservation and assessment system
The EU FP7 EnviroGRIDS44 project (2009–2013) aims at buildingcapacities in the Black Sea region on new international standards togather, store, distribute, analyze, visualize and disseminate crucialinformation on past, present and future states of this region in orderto assess its sustainability and vulnerability (Lehmann et al., 2009).The project is essentially focused on the Black Sea hydrologicalCatchment (BSC), whose surface amounts to about 2 M km2 with apopulation of 160 M inhabitants over 24 countries. This catchmentis subject to numerous environmental pressures and threats thatgenerate several direct consequences such as pollution of surface/
40 http://mapserver.org/.41 http://www.eumedgrid.org.
42 http://wiki.egee-see.org/index.php/Work_Binder_Application_Service.43 http://www.see-grid.org/.44 http://www.envirogrids.net/.
G. Lecca et al. / Journal of Hydrology 403 (2011) 186–199 195
Author's personal copy
groundwater, eutrophication, degradation of biodiversity, and accel-erated runoff/erosion (PCU, 1999; Tavitian et al., 2008).
One of the main scientific objectives of EnviroGRIDS is to assesshow the sustainability of water usage in this catchment mayevolve in the future under different scenarios of change for climatechanges, land use, agriculture and demography. To achieve thisobjective, the Soil and Water Assessment Tool (SWAT; Arnoldet al., 1998) model will be used. SWAT is a widely used basin-scale,continuous-time model that is designed to predict the impact ofmanagement on water, sediment, and agricultural chemical yieldsin ungauged watersheds (Gassman et al. 2007). SWAT was alreadyused to simulate the hydrology of large-scale body masses such asthe African continent (Schuol et al., 2008), the entire U.S. with riverdischarges data at around 6000 gauging stations (Arnold et al.,1999), and of twelve large river catchments in India (Gosainet al., 2006). In the EnviroGRIDS project, SWAT will be used to ap-ply a high-resolution (sub-catchment spatial and daily temporalresolution) water balance model to the entire BSC. The key datasets needed as inputs are Digital Elevation Models, soil and landcover maps. The BSC model will be calibrated and validated usinglong-time series of daily river discharge data, river water qualitydata, and crop yield data (Abbaspour et al., 2007). Some of this datacomes from remotely sensed datasets including soil moisture andmeteorological data (rainfall, wind speed, evapo-transpiration,humidity). The transnational nature of the Black Sea catchmentmakes it very difficult to get the same quantity and quality of datain all areas of the catchment. Raw environmental monitoring dataare often limited to distribution because of their commercial valueat the national level. In the first phase of the project (ended in mid-2010), the available data from the Consortium were gathered toconstruct and calibrate a coarse-resolution SWATmodel for the fullcatchment. Recent results obtained with this model (Abbaspour,pers. comm.) include long-term averages of river discharge, precip-itation, actual and potential evapo-transpiration, soil moisture and
aquifer recharge over the entire catchment. In the ongoing secondphase of the project, data policies or agreements are being soughtwith a maximum of regional institutions in order to accessadditional high-resolution temporal and spatial data sets.
The Grid infrastructure will be the keystone in computing ahigh-resolution water balance of the BSC under various environ-mental scenarios. The first step has been to Grid-enable (gridifica-tion) the SWAT toolset in order to run it on the EGEE infrastructure.The main challenge of this task is to be able to spatially partitionthe input data by independent hydrological sub-catchments, pro-cess them as independent jobs on the Grid, and merge the resultsto reconstruct the complete hydrological network. Using this tech-nique, recent results from our consortium have confirmed the sub-stantial gain in computation time when running large SWATmodels. Classical Monte Carlo simulations for SWAT sensitivityanalysis will also greatly benefit from the Grid, with associatedcomputational time requirements potentially scaled down by anorder of magnitude.
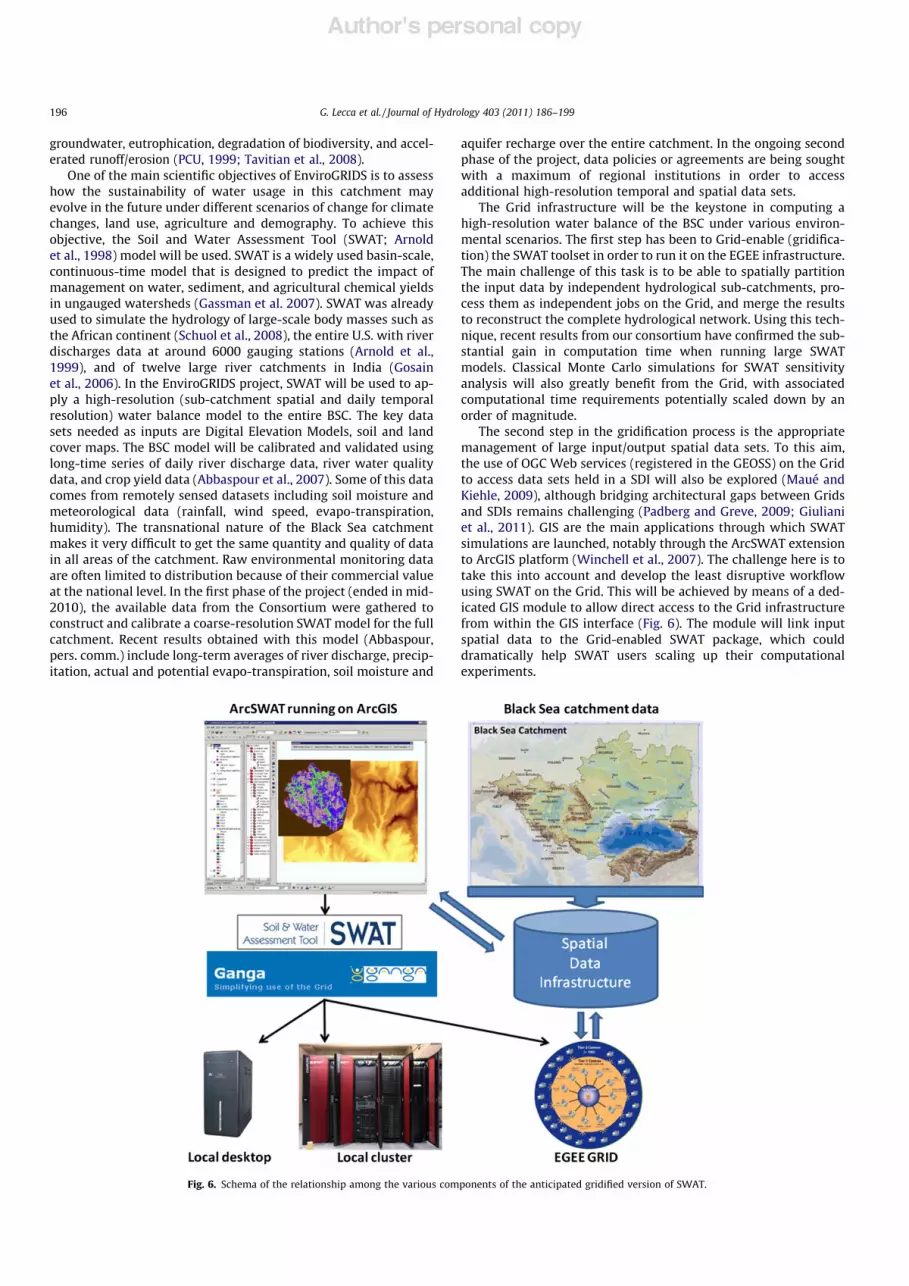
The second step in the gridification process is the appropriatemanagement of large input/output spatial data sets. To this aim,the use of OGC Web services (registered in the GEOSS) on the Gridto access data sets held in a SDI will also be explored (Maué andKiehle, 2009), although bridging architectural gaps between Gridsand SDIs remains challenging (Padberg and Greve, 2009; Giulianiet al., 2011). GIS are the main applications through which SWATsimulations are launched, notably through the ArcSWAT extensionto ArcGIS platform (Winchell et al., 2007). The challenge here is totake this into account and develop the least disruptive workflowusing SWAT on the Grid. This will be achieved by means of a ded-icated GIS module to allow direct access to the Grid infrastructurefrom within the GIS interface (Fig. 6). The module will link inputspatial data to the Grid-enabled SWAT package, which coulddramatically help SWAT users scaling up their computationalexperiments.
Fig. 6. Schema of the relationship among the various components of the anticipated gridified version of SWAT.
196 G. Lecca et al. / Journal of Hydrology 403 (2011) 186–199

Author's personal copy
In conclusion, Grid technology is essential for the assessment ofthe future trends in water balance in the BSC using high-resolutionspatial data. In addition to a substantial gain in total simulationtime, the use of a Grid infrastructure will certainly be a drivingforce in the standardization processes of many data sets currentlyfound in various formats in different countries of the region. More-over, regional organizations, such as the Commission on the Pro-tection of the Black Sea against Pollution and the InternationalCommission for the Protection of the Danube River will be ableto take advantage of EnviroGRIDS to analyze large trans-boundaryenvironmental datasets in a harmonized way in order to supportthe conceptualization and implementation of environmental andrelevant sustainable development policies.
4. Concluding remarks and future developments
The paper illustrates a sample of the enormous potential of Gridcomputing technology in hydrology science and water resourcesengineering, by means of six Grid-enabled numerical applications.The history and goals of each application are quite different. How-ever their principal motivation is to use the Grid to significantlyimprove flood prediction, groundwater resources managementand comprehensive hydrological survey, all grand challenges forthe Civil Society at large.
Results pointed out that the scaling up of computing resourcesallows to get results on a shorter time interval, to increase the spa-tial and time resolution of the models and to assess their robust-ness against uncertainty, that are important issues for decisionmakers in realistic applications. However, real-time applicationsstill pose some difficulties on the European Grid Infrastructure be-cause a high number of computational nodes is not guaranteed tobe available at any given time, without a proper resources reserva-tion mechanism.
In terms of processing capacity, the Grid usually performs con-siderably better than a local cluster due to the availability of manyclusters in the distributed infrastructure instead of a local one.However for the Grid-enabled applications, critical points concernthe post-processing and visualization of the results, usually madeon a desktop, because of the transfer of large output files storedon remote Grid storage nodes. Different solutions are under studyto address these problems.
In addition, as it was shown in most of the applications, Gridtechnology promotes the use of applications modules by severalteams, an efficient cooperation among them, and economies ofscale to assemble a critical mass of people and investments. Asan example, the use of a Grid infrastructure has been a drivingforce in the standardization processes of many data sets currentlyfound in various formats in different countries of the Black SeaCatchment area. This standardization process will enable regionalorganizations to take advantage of EnviroGRIDS to analyze largetrans-boundary environmental datasets in a harmonized way tosupport the conceptualization and implementation of environmen-tal and relevant sustainable development policies.
User-friendly interfaces to the Grid are Web gateways that inte-grate a community-developed set of tools, applications, and datacustomized to meet the needs of the targeted community. Someof these science gateways greatly facilitate the use of Gridhigh-end compute, data, and visualization resources throughcommunity-designed interfaces. TeraGrid45 has developed gate-ways in various fields, AQUAGRID is an example to a lesser extent,and the EnviroGRIDS and flash flood applications are planning toprovide ones open to various communities.
The capacity of Grid technology to federate on a world-widescale not only computing resources but also experts, is an impor-tant issue for research. In Europe several virtual scientific Gridcommunities have been developed around the Grid. TheEuropean-wide Earth Science virtual community is spread overmany countries and scientific and technical domains (Cossuet al., 2010). The community building, carried out in the last years,has enabled flow of information, knowledge exchange and com-mon proposals and actions. The next step will be to set-up a collab-oration framework in order to define a common strategy and tocoordinate new developments.
Acknowledgments
The authors wish to acknowledge colleagues P.A. Ayral (EMA)and V. Tran (IISAS) who participated to the porting of the applica-tions and contributed to the paper with fruitful discussions. TheAQUAGRID application is supported by the GRIDA3 project (MIURFAR D.Lvo 297/99No. 1433/2006) and Sardinian Regional Authori-ties. The multi-model multi-scale flood workflow application issupported by projects ADMIRE FP7-215024, APVV DO7RP-0006-08, DMM VMSP-P-0048-09, EGEE-III FP7-222667 and VEGA 2/0184/10. The Lizza–PAKP application is supported by the EU FP7SEE-GRID-SCI initiative (Contract No. 211338). Nicholas Ray is sup-ported by the EU FP7 EnviroGRIDS project (Grant Agreement No.227640).
Appendix A
See Table 2.
Table 2List of acronyms.
ARC Advanced Resource ConnectorASAR Advanced Synthetic-Aperture RadarBSC Black Sea hydrological CatchmentCERN European Organisation for Nuclear ResearchCEODE-
CASCenter for Earth Observation and Digital Earth of ChineseAcademy Science
CSV Comma Separated ValuesCYCLOPS Cyber Infrastructure for Civil protection Operative ProcedureSDEM Digital Elevation ModelDRIHMS Distributed Research Infrastructure for hydro-meteorology StudyEGEE Enabling Grids for E-ScienceEGI European Grid InfrastructureENVISAT Earth Observation SatelliteEO Earth ObservationERM Empirical Regressive ModelERS European Remote Sensing Satellite systemES Earth ScienceESA European Space AgencyESR Earth Science Research – Virtual OrganisationEU European UnionFE Finite ElementFESWMS Finite Element Surface Water Modeling SystemFP6/FP7 Framework Programme 6 or 7GEOSS Global Earth Observation System of SystemsGGF Global Grid ForumGIS Geographical Information SystemGMES Global Monitoring for Environment and SecurityGRAM Grid Resource Allocation and ManagementGRASS Geographic Resources Analysis Support SystemHSPF Hydrologic Simulation Program FortranINSPIRE Infrastructure for Spatial Information in the European
CommunityKML Keyhole Markup LanguageLFC Logical File CatalogLHC Large Hadron Collider
(continued on next page)45 http://www.teragrid.org.
G. Lecca et al. / Journal of Hydrology 403 (2011) 186–199 197

Author's personal copy
References
Abbaspour, K.C., Yang, J., Maximov, I., Siber, R., Bogner, K., Mieleitner, J., Zobrist, J.,Srinivasan, R., 2007. Spatially-distributed modelling of hydrology and waterquality in the pre-alpine/alpine Thur watershed using SWAT. J. Hydrol. 333,413–430.
Alnahhal, S., Afifi, S., Qahman, K., Dentoni, M., Lecca, G., 2010. A Simulation/Optimization approach to manage groundwater resources in the Gaza aquifer(Palestine). In: J. Carrera (Ed.), Proceedings of the XVIII International Conferenceon Water Resources CMWR 2010. CIMNE, Barcelona. <http://congress.cimne.com/cmwr2010/Proceedings/docs/p35.pdf>.
Anquetin, S., Braud, I., Vannier, O., Viallet, P., Boudevillain, B., Creutin, J.-D., Manus,C., 2010. Sensitivity of the hydrological response to the variability of rainfallfields and soils for the Gard 2002 flash-flood next term event. J. Hydrol. 394,134–147.
Arnold, J.G., Srinivasan, R., Muttiah, R.S., Williams, J.R., 1998. Large area hydrologicmodeling and assessment. Part I: Model development. J. Am. Water ResourcesAssoc. 34, 73–89.
Arnold, J.G., Srinivasan, R., Muttiah, R.S., Allen, P.M., 1999. Continental scalesimulation of the hydrologic balance. J. Am. Water Resources Assoc. 35, 1037–1051.
Ayral, P.-A., Sauvagnargues-Lesage, S., Bressand, F., Gay, S., 2007. Forecasting flashfloods with an operational model: application in the South-East of France(Gard). In: Begum S., Stive M.J.F., Hall J.W. (Eds.), Adv. in Natural and Technol.Hazards Res. Flood risk management in Europe: Innovation in Policy andPractice, vol. 25, pp. 335–352.
Benavente, J., Larabi, A., El Mabrouki, K. (Eds.), 2004. Monitoring, Modeling andManagement of Coastal Aquifers. Water Research Institute, University ofGranada. ISBN:84-699-7903-5.
Beven, K.J., 2001. Rainfall–Runoff Modelling: The Primer. Wiley.Beven, K.J., 2003. On environmental models of everywhere on the GRID. Hydrol.
Process. 17, 171–174.Biddau, R., Lecca, G., Fanfani, L., Murgia, F., 2008. AQUAGRID: a grid services for
advanced modeling and geochemical data analysis in groundwater resourcesmanagement. Rendiconti Online Soc. Geol. Ital. 3 (1), 112–113.
Bourras, C., Giannaka, E., Tsiatos, E., 2009. e-Collaboration concepts, systems andapplications. In: N. Kock, N. (Ed.), Information Science Reference, E-Collaboration: Concepts, Methodologies, Tools, and Applications, vol. 1(Section I, Chapter 1.2).
Braud, I., Roux, H., Anquetin, S., Maubourguet, M.M., Manus, C., Viallet, P., Dartus, D.,2010. The use of distributed hydrological models for the Gard 2002 flash floodnext term event: Analysis of associated hydrological processes. J. Hydrol. 394,162–181.
Collier, C.G., 2007. Flash flood forecasting: what are the limits of predictability?Quart. J. Roy. Meteorol. Soc. 133, 3–23.
Cossu, R., Petitdidier, M., Linford, J., Badoux, V., Fusco, L., Gotab, B., Hluchy, L., Lecca,G., Murgia, F., Plevier, C., Renard, P., Schwichtenberg, H., Som de Cerff, W., Tran,V., Vetois, G., 2010. A roadmap for a dedicated Earth Science Grid platform.Earth Sci. Informatics 3 (3), 135–148. doi:10.1007/s12145-010-0045-4.
Delrieu, G., Ducrocq, V., Gaume, E., Nicol, J., Payrastre, O., Yates, E., Kirstetter, P.,Andrieu, H., Ayral, P., Bouvier, C., Creutin, J.-D., Livet, M., Anquetin, S., Lang, M.,Neppel, L., Obled, C., Parent-du-Châtelet, J., Saulnier, G.-M., Walpersdorf, A.,
Wobrock, 2005. The catastrophic flash-flood event of 8–9 September 2002 inthe Gard region, France. A first case study for the Cévennes-VivaraisMediterranean Hydrometeorological Observatory. J. Hydrometeorol. 6, 34–52.
Doswell, C.A., Brooks, H., Maddox, R., 1996. Flash flood forecasting: an ingredients-based methodology. Weather Forecast. 11, 560–581.
Duband, D., 2000. Thinking over hydrometeorological forecasting. Houille Blanche1, 42–50.
Estupina-Borell, V., Llovel, C., Maubourguet, M. M., Chorda, J., Dartus, D., Ababou, R.,Alquier, M., 2004. Flash flood modeling for prediction, warning and riskassessment. In: ‘‘Trends der Wasserwirtschaft: reagieren oder agieren’’/33.IWASA, Internationales Wasserbau-Symposium, Aachen 2003. Shaker Verlag,pp. 175–223. ISBN:3 8322-3083-1.
Estupina-Borell, V., Dartus, D., Ababou, R., 2006. Flash flood modelling with theMARINE hydrological distributed model. Hydrol. Earth Syst. Sci. Discuss. 3,3397–3438.
Feller, M., Foster, I., Martin, S., 2007. GT4 GRAM: a functionality and performancestudy. In: TERAGRID 2007 Conference, Madison, Wisconsin, USA.
Foster, I., 2002. The grid: a new infrastructure for 21st century science. PhysicsToday 55 (2), 42–47.
Foster, I., Kesselman, C., 1999. The Grid: Blueprint for a New ComputingInfrastructure. Morgan Kaufmann.
Fusco, L., Cossu, R., Retscher, C., 2007. Open grid services for Envisat and earthobservation applications. In: Plaza, A.J., Chang, C.-I. (Eds.), High PerformanceComputing in Remote Sensing, first ed. Taylor & Francis Group, New York, pp.237–280.
Gambolati, G., Putti, M., Paniconi, C. 1999. Three-dimensional dimensional modelof coupled density-dependent flow and miscible salt transport. In: Bear, J.,et al. (Eds.), Seawater Intrusion in Coastal Aquifers – Concepts Methods andPractices. Kluwer Academic, Dordrecht, The Netherlands, pp. 315–362(Chapter 10).
Gassman, P.W., Reyes, M.R., Green, C.H., Arnold, J.G., 2007. The soil and waterassessment tool: historical development, applications, and future researchdirections. Trans. ASAE 50 (4), 1211–1250.
Gaume, E., Livet, M., Desbordes, M., Villeneuve, J., 2004. Hydrological analysis of theriver Aude, France, flash flood on 12 and 13 November 1999. J. Hydrol. 286,135–154.
Giuliani, G., Ray, N., Lehmann, A., 2011. Grid-enabled spatial data infrastructure forenvironmental sciences: challenges and promises. Fut. Generat. Comput. Syst.27 (3), 292–303.
Gosain, A.K., Rao, S., Basuray, D., 2006. Climate change impact assessment onhydrology of Indian River basins. Curr. Sci. 90, 346–353.
Habala, O., Mamiska, M., Hluchy, L., 2007. Service-based flood forecastingsimulation cascade in K-Wf grid. In: Steffen, Unger (Eds.), K-WfGrid – TheKnowledge-based Workflow System for Grid Applications, Proceedings ofCGW’06, vol. II. Marian Bubak, pp. 138–145. ISBN:978-83-915141-8-4.
Hluchy, L., Nguyen, G.T., Halada, L., Tran, V.D., 2002. Parallel flood modelling. In:D’Hollander, E.H., et al. (Eds.), Parallel Computing – Advances and CurrentIssues. Proceedings of the International Conference ParCo 2001. ImperialCollege Press, pp. 157–164. ISBN:1-86094-315-2.
Horritt, M.S., 2006. A methodology for the validation of uncertain flood inundationmodels. J. Hydrol. 326, 153–165.
Horton, R.E., 1933. The role of infiltration in the hydrological cycle. Trans. Am.Geophys. Union 14, 446–460.
Kerrou, J., Renard, P., Lecca, G., Tarhouni, J., 2010. Grid-enabled Monte Carlo analysisof the impacts of uncertain discharge rates on seawater intrusion in the Korbaaquifer (Tunisia). Hydrol. Sci. J. 55 (8), 1325–1336.
Kojic, M., Filipovic, N., Stojanovic, B., Rankovic, V., Krstic, M., Ota!evic, L., Ivanovic,M., Nedeljkovic, M., Dimkic, M., Trickovic, M., Pu!ic, M., Boreli-Zdravkovic, D.,"uric, D., 2007. Finite element modeling of underground water flow withRanney wells. Water Sci. Technol.: Water Supply 7, 41–50.
Kussul, N., Shelestov, A., Skakun, S., 2008. Grid system for flood extent extractionfrom satellite images. Earth Sci. Informatics 1 (3–4), 105–117, doi:10.1007/s12145-008-0014-3.
Kussul, N., Shelestov, A., Skakun, S., 2009. Grid and sensor Web technologies forenvironmental monitoring. Earth Sci. Informatics 2 (1–2), 37–51. doi:10.1007/s12145-009-0024-9.
Lanig, S., Zipf, A., 2009. Interoperable processing of digital elevation models in gridinfrastructures. Earth Sci. Informatics 2 (1–2), 107–116. doi:10.1007/s12145-009-0030-y.
Lecca, G., Cau, P., 2009. Using a Monte Carlo approach to evaluate seawaterintrusion in the Oristano coastal aquifer: a case study from the AQUAGRIDcollaborative computing platform. Phys. Chem. Earth 34, 654–661. doi:10.1016/j.pce.2009.03.002.
Lecca, G., Lai, C., Murgia, F., Biddau, R., Fanfani, L., Maggi, P., 2009. AQUAGRID: anextensible platform for collaborative problem solving in groundwaterprotection. Earth Sci. Informatics 2 (1–2), 83–95. doi:10.1007/s12145-009-0019-6.
Lehmann, A., Giuliani, G., Ray, N., Allenbach, K., Charvat, K., Gorgan, D., Gvilava, M.,Bakuradze, T., Sözen, S., Goksel, C., the EnviroGRIDS Consortium, 2009. TheBlack Sea Catchment observation system built on a grid-enabled spatial datainfrastructure. In: Charvat, K., Alberts, M., Horajova, S. (Eds.), INSPIRE, GMES andGEOSS Activities, Methods and Tools Towards a Single Information Space inEurope for the Environment. Wirelessinfo Tehnologiju Attistibas Forums, Riga,pp. 42–58.
Marovic, B., Potocnik, M., Ivanovic, M., 2009. Work binder application service. In:4th EGEE User Forum/OGF 25 and OGF Europe’s 2nd International Event, 2–6
LIDAR Light Detection and RangingMPI Message Passing InterfaceNASU National Academy of Sciences of UkraineNCAR National Center for Atmospheric Research (USA)NSAU National Space Agency of UkraineOGC Open Geospatial ConsortiumOGF Open Grid ForumOGSA Open Grid Service ArchitectureOWS Open Geospatial Web ServicesPSU Penn State University (USA)SAR Synthetic-Aperture RadarSCS Soil Conservation ServiceSDI Spatial Data InfrastructureSEE-GRID South-Eastern European Grid-enabled e-Infrastructure
DevelopmentSHMI Slovak Hydro- Meteorological InstituteSWAT Soil and Water Assessment ToolSWS Sensor Web ServiceUNICORE Uniform Interface to Computing ResourcesUNEP United Nations Environment ProgrammeUMN University of Minnesota (USA)VO Virtual OrganisationWCS Web Coverage ServiceWMS Web Mapping Service (3.3)WMS Workload Management System (3.6)WPS Web Processing ServiceWRF Weather Research and Forecasting modelWRI Water Research Institute
198 G. Lecca et al. / Journal of Hydrology 403 (2011) 186–199

Author's personal copy
March 2009, Catania, Italy <http://www.bioirc.ac.rs/media/WB-AS-EGEE%20-UF4-2009.ppt>.
Maué, P., Kiehle, C. 2009. Grid technologies for geospatial applications; an overview.Special issue of GIS. Science on Grid Computing. GIS. Science 3, 65–67.ISSN:1430-3663. <http://ww.gis-biz.de>.
Mazzetti, P., Nativi, S., Angelini, V., Verlato, M., Fiorucci, P., 2009. A Grid platform forthe European Civil Protection e-Infrastructure: the forest fires use scenario.Earth Sci. Informatics 2 (1–2), 53–62. doi:10.1007/s12145-009-0025-8.
Murgia, F., Biddau, R., Concas, A., Demontis, R., Fanfani, L., Heilmann, Z., Lai, C., Lecca,G., Lorrai, E., Marrocu, M., Marrone, V., Muscas, L., Peneva, E., Piras, A., Pisu, M.,Pusceddu, G., Satta, G., Theis, D., Vacca, A., Valera, P., Vallenilla, Ferrara, A.M.,Bonomi, E., 2009. GRIDA3—a shared resources manager for environmental dataanalysis and applications. Earth Sci. Informatics 2 (1–2), 5–21. doi:10.1007/s12145-009-0020-0.
Padberg, A., Greve, K., 2009. Gridification of OGC web services: challenges andpotential. Special issue of GIS.Science on Grid Computing. GIS Science 3, 77–81.ISSN:1430-3663. <http://ww.gis-biz.de>.
PCU (Programme Co-ordination Unit), 1999. Strategic Action Plan for the DanubeRiver Basin 1995–2005 – Revision 1999. Danube Pollution ReductionProgramme. <http://www.ceit.sk/wwwisis/sap1.htm>.
Rabuffetti, D., 2006. Discharge assimilation in a distributed flood forecasting model.Adv. Geosci. 7, 355–360.
Rabuffetti, D., Barbero, D., 2005. Operational hydro-meteorological warning andreal-time flood forecasting; the Piemonte region case study. Hydrol. Earth Syst.Sci. 9, 457–466.
Renard, P., Badoux, V., Petitdidier, M., Cossu, R., 2009. Grid computing for earthscience. EOS, Trans. Am. Geophys. Union 90 (14), 117–119.
Sauvagnargues-Lesage, S., Ayral, P.A., 2007. Using GIS for emergency management:a case study during the 2002 and 2003 flooding in south-east France. Int. J.Emergency Manage. 4, 682–703. doi:10.1504/IJEM.2007.015738.
Schuol, J., Abbaspour, K.C., Yang, H., Srinivasan, R., Zehnder, A.J.B., 2008. Modellingblue and green water availability in Africa. Water Resources Res. 44 (W07406),18.
Shelestov, A., Kussul, N., Skakun S., 2006. Grid technologies in monitoring systemsbased on satellite data. J. Autom. Inform. Sci. 38, 69–80. doi:10.1615/J.Automat.Inf.Scien.v38.i3.50.
Tavitian, N., Anderson, J., Chiavari, J., Rubel, O., Renshaw, N., Wittich, A., Maas, A.,Carius, A., Dupont, C. 2008. Greening the Black Sea synergy. WWF –World WideFund for Nature and Heinrich Böll Foundation, Brussels. <http://assets.panda.org/downloads/black_sea_full_report.pdf>.
Thierion, V., Ayral, P.-A., Giesel, J., Sauvagnargues-Lesage, S., Payrastre, O., 2011.Grid technology reliability for flash flood forecasting: end-user assessment. J.Grid Computing, in press, doi:10.1007/s10723-010-9173-9.
Wang, H.F., Anderson, M.P., 1982. Introduction to Groundwater Modeling: FiniteDifference and Finite Element Methods. Academic Press. ISBN:012734585X.
Wang, L., Jie, W., Chen, J., 2009. Grid Computing: Infrastructure, Service, andApplications. CRC Press. ISBN:9781420067668.
Winchell, M., Srinivasan, R., DiLuzio, M., Arnold, J. 2007. ArcSWAT Interface forSWAT User’s Guide. Blackland Research Center, Temple, Texas. pp. 431.
G. Lecca et al. / Journal of Hydrology 403 (2011) 186–199 199


