Embed Size (px)
Citation preview
Environ Monit Assess (2011) 173:371–385DOI 10.1007/s10661-010-1393-8
Groundwater arsenic contamination in Brahmaputrariver basin: a water quality assessment in Golaghat(Assam), India
Mridul Chetia · Soumya Chatterjee ·Saumen Banerjee · Manash J. Nath ·Lokendra Singh · Ravi B. Srivastava ·Hari P. Sarma
Received: 30 July 2009 / Accepted: 11 February 2010 / Published online: 12 March 2010© Springer Science+Business Media B.V. 2010
Abstract Distribution of arsenic (As) and its com-pound and related toxicology are serious concernsnowadays. Millions of individuals worldwide aresuffering from arsenic toxic effect due to drink-ing of As-contaminated groundwater. The Bengaldelta plain, which is formed by the Ganga–Padma–Meghna–Brahmaputra river basin, cover-ing several districts of West Bengal, India, andBangladesh is considered as the worst As-affectedalluvial basin. The present study was carried out toexamine As contamination in the state of Assam,an adjoining region of the West Bengal and
M. Chetia (B) · S. Chatterjee (B) · S. Banerjee ·M. J. Nath · L. SinghDefence Research Laboratory, DRDO,Post Bag No. 02, Tezpur 784001, Assam, Indiae-mail: [email protected]: [email protected]
R. B. SrivastavaDirectorate of Life Sciences, Defence R&DOrganization, DRDO Bhawan,New Delhi 110011, India
H. P. SarmaDepartment of Environmental Science,Gauhati University, Guwahati 781014,Assam, India
Bangladesh borders. Two hundred twenty-twogroundwater samples were collected from shallowand deep tubewells of six blocks of Golaghat dis-trict (Assam). Along with total As, examinationof concentration levels of other key parameters,viz., Fe, Mn, Ca, Na, K, and Mg with pH, totalhardness, and SO2−
4 , was also carried out. In re-spect to the permissible limit formulated by theWorld Health Organization (WHO; As 0.01 ppm,Fe 1.0 ppm, and Mn 0.3 ppm for potable water),the present study showed that out of the 222groundwater samples, 67%, 76.4%, and 28.5%were found contaminated with higher metal con-tents (for total As, Fe, and Mn, respectively).The most badly affected area was the Gamariguriblock, where 100% of the samples had As andFe concentrations above the WHO drinking waterguideline values. In this block, the highest Asand Fe concentrations were recorded 0.128 and5.9 ppm, respectively. Tubewell water of depth180 ± 10 ft found to be more contaminated by Asand Fe with 78% and 83% of the samples weretainted with higher concentration of such toxicmetals, respectively. A strong significant correla-tion was observed between As and Fe (0.697 atp < 0.01), suggesting a possible reductive dissolu-tion of As–Fe-bearing minerals for the mobiliza-tion of As in the groundwater of the region.
Keywords Arsenic · Groundwater · Alluvium ·Brahmaputra river basin
372 Environ Monit Assess (2011) 173:371–385
Introduction
Natural potable water resource is becoming ex-ceedingly a limited reserve for the human racethroughout the world. Furthermore, presence ofvaried numbers of pollutants including heavymetals in the water through natural and/oranthropogenic interventions imparts toxic andharmful effects to the environment and the indi-vidual (Chatterjee et al. 2008; Vaclavikova et al.2008). Among the pollutants, arsenic is considereda high-priority toxic metal because it acts as a hu-man carcinogen (Jie and Waalkes 2008; Das et al.2009; Henke 2009). The introduction of a redox-sensitive element like arsenic (standard reductionpotential E◦ = 0.56 V and standard oxidation po-tential E◦ =−0.67 V) in the environment may takeplace through several ways. Eroded sedimentsand varied inputs of human activities like min-ing, pesticides, pharmaceuticals, etc. are thoughtto be the common sources of arsenic (Bunnellet al. 2007). Chronic arsenic exposure is detri-mental to human health being associated withcancer of the skin, lung, liver, urinary bladder,and kidney (Tchounwou et al. 2003; Bunnell et al.2007; Jie and Waalkes 2008) and other diseases,including cardiovascular and peripheral vascu-lar diseases, diabetes, peripheral neuropathies,portal fibrosis, and adverse birth outcomes (Xiaet al. 2009). The arsenic contamination of drink-ing water is among the most awesome environ-mental health challenges nowadays, threateningthe well-being and livelihood of more than ahundred million people worldwide (Bhattacharyaet al. 2007). The presence of arsenic in ground-water has been reported extensively in recentyears from different parts of the world, includingcountries in North America and Latin America(viz., USA, Canada, Mexico, Argentina, Bolivia,Brazil, and Nicaragua), Australia, and SoutheastAsia (viz., Bangladesh, China, Nepal, Vietnam,Cambodia, and India; Smedley and Kinniburgh2002; Bhattacharya et al. 2006; Mukherjee et al.2006; Acharyya and Shah 2007; Das et al.2009). However, the environmental problem ofarsenic toxicity in groundwater of the entireBengal delta of the Ganga–Padma–Meghna–Brahmaputra (GPMB) river plain, covering sev-eral districts of West Bengal and Bangladesh, cre-
ates apprehension toward the scientific commu-nity and considered as the worst arsenic-affectedalluvial basin (Smith et al. 2000; Das et al. 2009).The magnitude of the severity in respect witharsenic toxicity in the region, where subsurfacewater is primarily used as a source of drinkingwater, is very high. In Bangladesh, 28–77 millionpeople drink arsenic-contaminated water withouthaving alternative resources. Chronic consump-tion of such toxic water, in the future, may leadto, according to the estimate of the World HealthOrganization (WHO), 1 in every 10 adult deathscaused by arsenic-related cancer (Ahmad et al.2003; Halem et al. 2009, SOS-Arsenic, down-loaded from http://www.sos-arsenic.net on 28 Feb2010). Again, the permissible limit for As in drink-ing water, according to the WHO, is 0.01 ppm,which is similar to the specification laid down bythe Bureau of Indian Standards (BIS; BIS 1991;WHO 1993; Nickson et al. 2007); however, inIndia, according to the BIS (1991), the maximumpermissible limit in the absence of an alternatesource is 0.05 ppm.
The Bengal delta plain is formed by the Ganga–Brahmaputra river system, the 13th largest mod-ern delta in the world. The average annual sedi-ment transport by the Ganga-Brahmaputra riversystem is about 1,800 tons/km2 and a suspendedload around 540–1,157 million tons per year (withdissolved particulates 173 million tons and sus-pended solids 1,060 million tons approximately),along with several trace elements channeling to-ward the Bay of Bengal (Singh 2006; Stephane andCharlet 2007). Arsenic in groundwater is often as-sociated with geologic sources, but in some cases,anthropogenic inputs can be extremely important(Dey et al. 2005; Bhattacharya et al. 2007). How-ever, a specific source of arsenic is yet to be iden-tified in the region, but researchers envisaged fewpotential minor sources of arsenic, which are lo-cated in the Ganges catchment areas including theHimalayas and peninsular India (Acharyya andShah 2007). The arsenic problem in groundwaterin West Bengal, India, was first recognized in theearly 1980s (Garai et al. 1984), and the healtheffects are now reasonably well documented. Infact, more than 50 million people are undoubt-edly at risk in the Bengal delta plain (Sharmaet al. 2006; Das et al. 2009). More recently, the
Environ Monit Assess (2011) 173:371–385 373
scale of the problem in other states adjoiningthe West Bengal with a similar hydrogeologicpattern like Assam, Tripura, Manipur, ArunachalPradesh, Nagaland, Bihar, Jharkhand, and UttarPradesh has also been reported (Mukherjee et al.2006; Nickson et al. 2007). In northeastern India,the presence of arsenic has been identified in 21districts out of 24 districts of Assam and in threedistricts in Tripura, six in Arunachal Pradesh, onein Manipur, and two in Nagaland (Singh 2004;Mukherjee et al. 2006; Das et al. 2009). However,the problem of arsenic in groundwater and relatedhealth hazards in Assam is yet to get enoughsystematic attention due to its recent emergencehaving few review reports (Singh 2004; SOES2004; Mukherjee et al. 2006; Nickson et al. 2007;Chetia et al. 2008).
Along with arsenic, the problem of iron in wa-ter is another major issue in the region (Singh2004; Ground Water Information Booklet 2008).Chronic and excess iron consumption is toxicfor the health, which might cause genetic disor-ders like hemochromatosis. This redox flexibleelement produces oxygen free radicals that aretoxic to the cells. Moreover, iron hydroxides inwater are supposed to help in the generation ofarsenic species (Bhattacharjee et al. 2005). Re-cently, the problem of manganese has also comeup in some parts of Assam (unpublished obser-vation). Numerous pathologic conditions couldoccur as a consequence of excess persistent intakeof manganese including behavioral changes andother nervous system disorders (Elster et al. 1988;ATSDR 2008).
Nowadays in Assam, family- and/orcommunity-based groundwater tubewells havebecome more popular as a source of potablewater instead of surface water for householdutilization to do away with the difficulty of waterscarcity in the dry period and waterlogging andinundation problems in the rainy season so as toavoid diarrhea and other waterborne diseases.The objective of the present detailed survey-based study was to determine the contaminationof heavy metals like arsenic, iron, and manganeseand their depth-wise distribution in the tubewellwater of Golaghat district (26.0◦ N to 27.1◦ Nand 93.0◦ E to 94.18◦ E) located in the state ofAssam. Moreover, the concentrations of other key
water quality parameters, namely, sodium (Na),potassium (K), calcium (Ca), magnesium (Mg),pH, total hardness (TH), and sulfate (SO2−
4 ) werealso been examined. Thus, the current articlewould help to fling light on the water qualityespecially relating to toxic metals in one of themost important areas of northeast India.
Experimental
Study site
Samples were collected from different regionsof Golaghat district of Assam, India. The totalgeographical area of the district is 3,502 km2,having tropical, hot, and humid climates with anaverage annual rainfall of around 2,012 mm/year.Physiographically, the district has a general el-evation of around 100 m above mean sea levelwith a rise at the southern part, where it mergeswith the hills of the Nagaland as well as Karbi-Anglong district of Assam. Predominant geo-logic formations include Quaternary Formation(comprises younger and older alluvial depositsconsisting of different grades of sand, pebbles,cobbles, gravel, and clay in the area) followed byArchaean Age deposit with rock types like gran-ite, granite gneiss, and quartzite (Ground Wa-ter Information Booklet 2008). Older alluvialdeposits occur mainly toward southern parts. Thehard crystalline of the Archaean Age covers theextreme southern boundary of the district merg-ing with Karbi-Anglong district (Ground WaterInformation Booklet 2008). Two prominent soiltypes (light gray to dark gray and deep reddish)are seen in the district with low nitrogen, lowphosphate, and medium to high potash contents.Acidic characters of the soil are representativeof the soil cover found in the hills. In the plainareas, the other type of the soil covers is foundto be feebly alkaline. About 40% of the totaldistrict area is covered by forest, 18% by un-cultivable land, 2% by fallow land, and 40%by total cropped area with paddy, the princi-pal crop grown in the district (Ground WaterInformation Booklet 2008). The district is hav-ing a unique water regimen with rivers Dhansiri
374 Environ Monit Assess (2011) 173:371–385
and Kakodonga traversing along the regionfrom south to north direction. The mighty riverBrahmaputra flows along the north part of thedistrict. River Kakodonga marks the eastern bor-der of Golaghat and adjoining district Jorhat.Dhansiri, originating from “Laisang peak” of theadjoining state Nagaland, flows northward alongthe midwestern side of the Golaghat district fora distance of 352 km before joining the Brahma-putra and has a catchment area of 1,220 km2.Doyang, Nambor, Doigrung, and Kalioni are thefour rivulets of Dhansiri. Doyang originates from“Maw” of Nagaland and joins with Dhansiri atthe south of Golaghat town, the district head-quarters. The other rivulets originate from theadjacent district Karbi-Anglong and flow in a
west-to-northeast direction. Hydrogeologically,the district is proved to be very potential, har-boring approximately 3–9 prolific aquifer systems.Depth-to-water level measurements in majorparts of the district varies from 2 to 7 m. Ground-water occurs under water table to confined con-ditions as aquifers that tend to increase towardthe north and in the southeastern parts (GroundWater Information Booklet 2008).
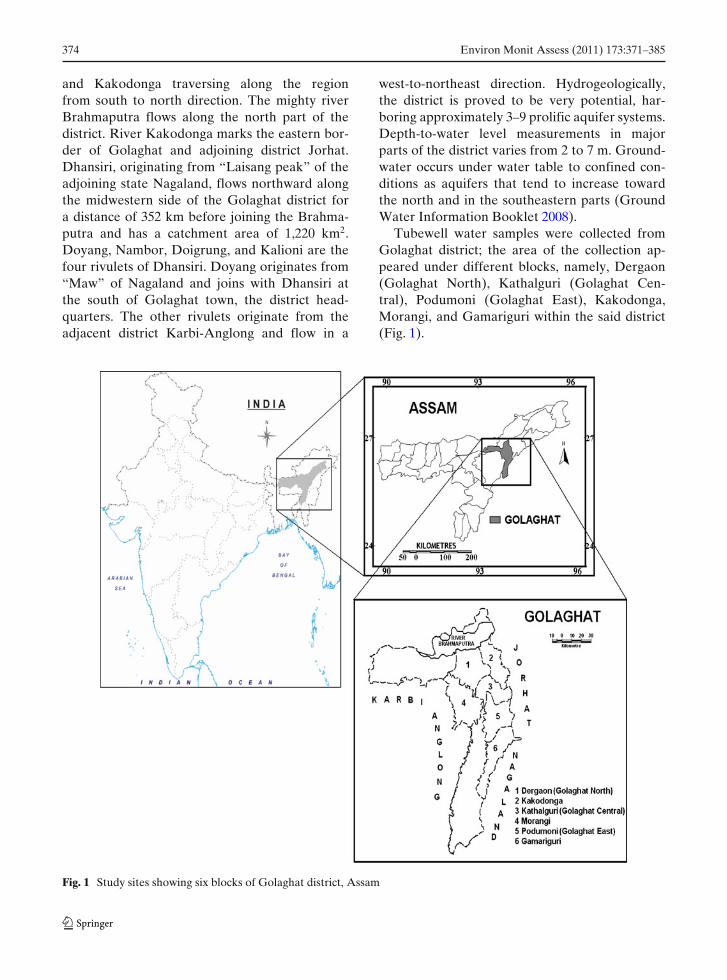
Tubewell water samples were collected fromGolaghat district; the area of the collection ap-peared under different blocks, namely, Dergaon(Golaghat North), Kathalguri (Golaghat Cen-tral), Podumoni (Golaghat East), Kakodonga,Morangi, and Gamariguri within the said district(Fig. 1).
Fig. 1 Study sites showing six blocks of Golaghat district, Assam
Environ Monit Assess (2011) 173:371–385 375
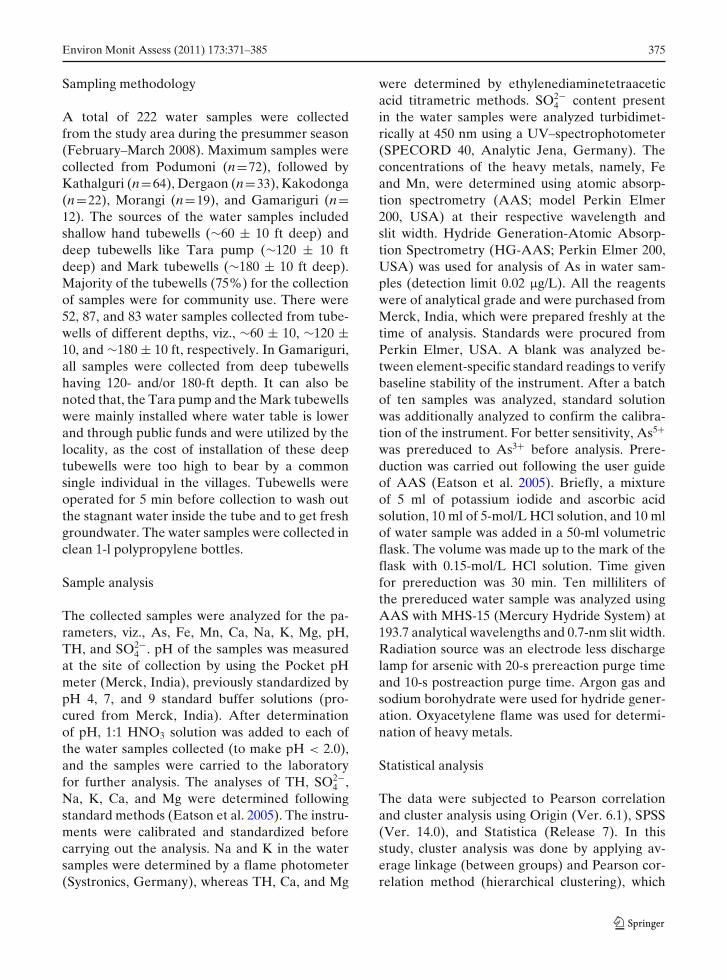
Sampling methodology
A total of 222 water samples were collectedfrom the study area during the presummer season(February–March 2008). Maximum samples werecollected from Podumoni (n=72), followed byKathalguri (n=64), Dergaon (n=33), Kakodonga(n=22), Morangi (n=19), and Gamariguri (n=12). The sources of the water samples includedshallow hand tubewells (∼60 ± 10 ft deep) anddeep tubewells like Tara pump (∼120 ± 10 ftdeep) and Mark tubewells (∼180 ± 10 ft deep).Majority of the tubewells (75%) for the collectionof samples were for community use. There were52, 87, and 83 water samples collected from tube-wells of different depths, viz., ∼60 ± 10, ∼120 ±10, and ∼180 ± 10 ft, respectively. In Gamariguri,all samples were collected from deep tubewellshaving 120- and/or 180-ft depth. It can also benoted that, the Tara pump and the Mark tubewellswere mainly installed where water table is lowerand through public funds and were utilized by thelocality, as the cost of installation of these deeptubewells were too high to bear by a commonsingle individual in the villages. Tubewells wereoperated for 5 min before collection to wash outthe stagnant water inside the tube and to get freshgroundwater. The water samples were collected inclean 1-l polypropylene bottles.
Sample analysis
The collected samples were analyzed for the pa-rameters, viz., As, Fe, Mn, Ca, Na, K, Mg, pH,TH, and SO2−
4 . pH of the samples was measuredat the site of collection by using the Pocket pHmeter (Merck, India), previously standardized bypH 4, 7, and 9 standard buffer solutions (pro-cured from Merck, India). After determinationof pH, 1:1 HNO3 solution was added to each ofthe water samples collected (to make pH < 2.0),and the samples were carried to the laboratoryfor further analysis. The analyses of TH, SO2−
4 ,Na, K, Ca, and Mg were determined followingstandard methods (Eatson et al. 2005). The instru-ments were calibrated and standardized beforecarrying out the analysis. Na and K in the watersamples were determined by a flame photometer(Systronics, Germany), whereas TH, Ca, and Mg
were determined by ethylenediaminetetraaceticacid titrametric methods. SO2−
4 content presentin the water samples were analyzed turbidimet-rically at 450 nm using a UV–spectrophotometer(SPECORD 40, Analytic Jena, Germany). Theconcentrations of the heavy metals, namely, Feand Mn, were determined using atomic absorp-tion spectrometry (AAS; model Perkin Elmer200, USA) at their respective wavelength andslit width. Hydride Generation-Atomic Absorp-tion Spectrometry (HG-AAS; Perkin Elmer 200,USA) was used for analysis of As in water sam-ples (detection limit 0.02 μg/L). All the reagentswere of analytical grade and were purchased fromMerck, India, which were prepared freshly at thetime of analysis. Standards were procured fromPerkin Elmer, USA. A blank was analyzed be-tween element-specific standard readings to verifybaseline stability of the instrument. After a batchof ten samples was analyzed, standard solutionwas additionally analyzed to confirm the calibra-tion of the instrument. For better sensitivity, As5+was prereduced to As3+ before analysis. Prere-duction was carried out following the user guideof AAS (Eatson et al. 2005). Briefly, a mixtureof 5 ml of potassium iodide and ascorbic acidsolution, 10 ml of 5-mol/L HCl solution, and 10 mlof water sample was added in a 50-ml volumetricflask. The volume was made up to the mark of theflask with 0.15-mol/L HCl solution. Time givenfor prereduction was 30 min. Ten milliliters ofthe prereduced water sample was analyzed usingAAS with MHS-15 (Mercury Hydride System) at193.7 analytical wavelengths and 0.7-nm slit width.Radiation source was an electrode less dischargelamp for arsenic with 20-s prereaction purge timeand 10-s postreaction purge time. Argon gas andsodium borohydrate were used for hydride gener-ation. Oxyacetylene flame was used for determi-nation of heavy metals.
Statistical analysis
The data were subjected to Pearson correlationand cluster analysis using Origin (Ver. 6.1), SPSS(Ver. 14.0), and Statistica (Release 7). In thisstudy, cluster analysis was done by applying av-erage linkage (between groups) and Pearson cor-relation method (hierarchical clustering), which
376 Environ Monit Assess (2011) 173:371–385
was used as the measure of similarity. Beforeanalyzing for clusters, the data were subjectedto Pearson correlation between different waterquality parameters of the study site.
Results
The present paper deals with the study of tube-well water samples that were collected fromsix different blocks of Golaghat district, As-sam (Fig. 1). The details of the study site andthe determination of water quality parameterswere presented in “Experimental” of this paper.Table 1 represented the concentration of different
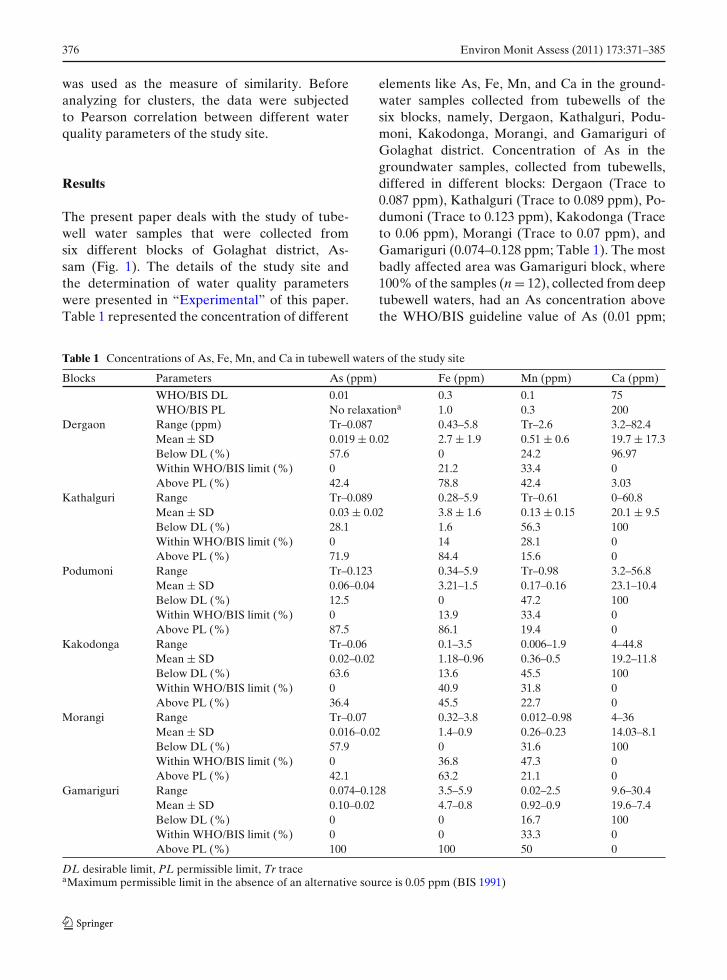
elements like As, Fe, Mn, and Ca in the ground-water samples collected from tubewells of thesix blocks, namely, Dergaon, Kathalguri, Podu-moni, Kakodonga, Morangi, and Gamariguri ofGolaghat district. Concentration of As in thegroundwater samples, collected from tubewells,differed in different blocks: Dergaon (Trace to0.087 ppm), Kathalguri (Trace to 0.089 ppm), Po-dumoni (Trace to 0.123 ppm), Kakodonga (Traceto 0.06 ppm), Morangi (Trace to 0.07 ppm), andGamariguri (0.074–0.128 ppm; Table 1). The mostbadly affected area was Gamariguri block, where100% of the samples (n = 12), collected from deeptubewell waters, had an As concentration abovethe WHO/BIS guideline value of As (0.01 ppm;
Table 1 Concentrations of As, Fe, Mn, and Ca in tubewell waters of the study site
Blocks Parameters As (ppm) Fe (ppm) Mn (ppm) Ca (ppm)
WHO/BIS DL 0.01 0.3 0.1 75WHO/BIS PL No relaxationa 1.0 0.3 200
Dergaon Range (ppm) Tr–0.087 0.43–5.8 Tr–2.6 3.2–82.4Mean ± SD 0.019 ± 0.02 2.7 ± 1.9 0.51 ± 0.6 19.7 ± 17.3Below DL (%) 57.6 0 24.2 96.97Within WHO/BIS limit (%) 0 21.2 33.4 0Above PL (%) 42.4 78.8 42.4 3.03
Kathalguri Range Tr–0.089 0.28–5.9 Tr–0.61 0–60.8Mean ± SD 0.03 ± 0.02 3.8 ± 1.6 0.13 ± 0.15 20.1 ± 9.5Below DL (%) 28.1 1.6 56.3 100Within WHO/BIS limit (%) 0 14 28.1 0Above PL (%) 71.9 84.4 15.6 0
Podumoni Range Tr–0.123 0.34–5.9 Tr–0.98 3.2–56.8Mean ± SD 0.06–0.04 3.21–1.5 0.17–0.16 23.1–10.4Below DL (%) 12.5 0 47.2 100Within WHO/BIS limit (%) 0 13.9 33.4 0Above PL (%) 87.5 86.1 19.4 0
Kakodonga Range Tr–0.06 0.1–3.5 0.006–1.9 4–44.8Mean ± SD 0.02–0.02 1.18–0.96 0.36–0.5 19.2–11.8Below DL (%) 63.6 13.6 45.5 100Within WHO/BIS limit (%) 0 40.9 31.8 0Above PL (%) 36.4 45.5 22.7 0
Morangi Range Tr–0.07 0.32–3.8 0.012–0.98 4–36Mean ± SD 0.016–0.02 1.4–0.9 0.26–0.23 14.03–8.1Below DL (%) 57.9 0 31.6 100Within WHO/BIS limit (%) 0 36.8 47.3 0Above PL (%) 42.1 63.2 21.1 0
Gamariguri Range 0.074–0.128 3.5–5.9 0.02–2.5 9.6–30.4Mean ± SD 0.10–0.02 4.7–0.8 0.92–0.9 19.6–7.4Below DL (%) 0 0 16.7 100Within WHO/BIS limit (%) 0 0 33.3 0Above PL (%) 100 100 50 0
DL desirable limit, PL permissible limit, Tr traceaMaximum permissible limit in the absence of an alternative source is 0.05 ppm (BIS 1991)
Environ Monit Assess (2011) 173:371–385 377
WHO 1993; BIS 1991) followed by Podumoni(87.5%), Kathalguri (71.9%), Dergaon (42.4%),Morangi (42.1%), and Kakodonga (36.4%). Max-imum As content recorded was 0.128 ppm in awater sample collected from Gamariguri block.It was also noted that all samples collected fromthe Gamariguri block were from deep tube-wells. Again, the analysis showed that 76.4%of the groundwater samples of the study areahad Fe content higher than the permissible limit(1.0 ppm) provided by the WHO/BIS (WHO1993; BIS 1991); Gamariguri (100%), Podumoni,(86.1%), Kathalguri (84.4%), Dergaon (78.8%),Morangi (63.2%), and Kakodonga (45.5%) wereworse affected. The wide variation of Fe con-
tent in the collected samples was represented inTable 1 with lowest concentration observed ina sample collected from Kakodonga (0.1 ppm)and the highest, 5.9 ppm, in three samples ofKathalguri, Podumoni, and Gamariguri (one ineach block). The study also revealed that 28.5%of total groundwater samples collected fromdifferent tubewells had Mn concentration abovethe permissible limit (0.3 ppm) of the WHO/BIS(WHO 1993; BIS 1991) standards. The highlycontaminated area was the Gamariguri block,where 50% groundwater samples had Mn contentabove the permissible limit, followed by Dergaon(42.4%), Kakodonga (22.7%), Morangi (21.1%),Podumoni (19.4%), and Kathalguri (15.6%). The
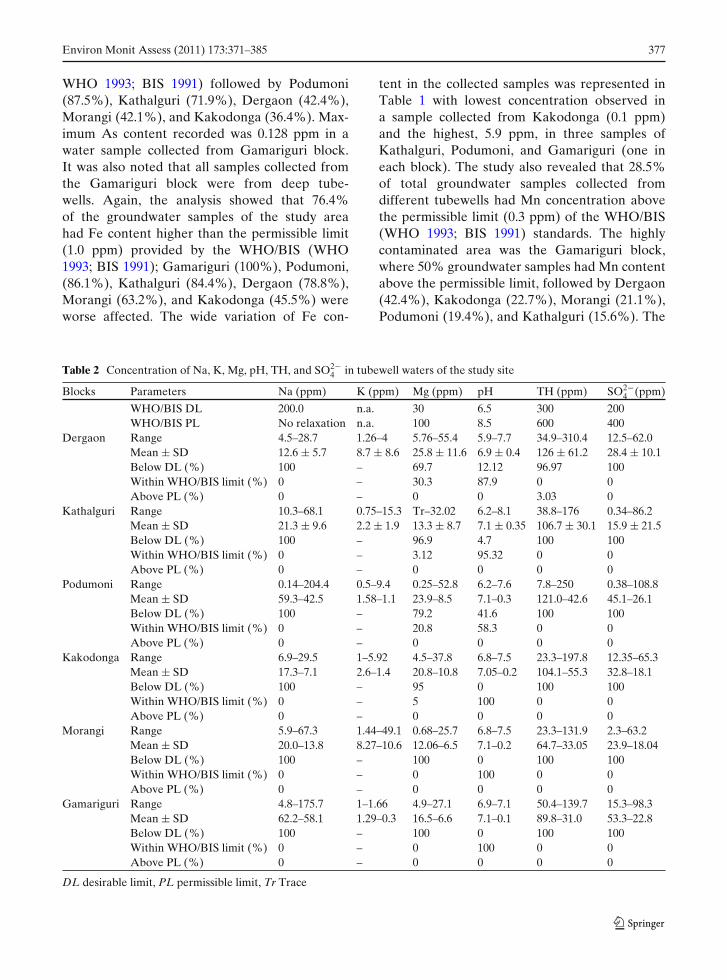
Table 2 Concentration of Na, K, Mg, pH, TH, and SO2−4 in tubewell waters of the study site
Blocks Parameters Na (ppm) K (ppm) Mg (ppm) pH TH (ppm) SO2−4 (ppm)
WHO/BIS DL 200.0 n.a. 30 6.5 300 200WHO/BIS PL No relaxation n.a. 100 8.5 600 400
Dergaon Range 4.5–28.7 1.26–4 5.76–55.4 5.9–7.7 34.9–310.4 12.5–62.0Mean ± SD 12.6 ± 5.7 8.7 ± 8.6 25.8 ± 11.6 6.9 ± 0.4 126 ± 61.2 28.4 ± 10.1Below DL (%) 100 – 69.7 12.12 96.97 100Within WHO/BIS limit (%) 0 – 30.3 87.9 0 0Above PL (%) 0 – 0 0 3.03 0
Kathalguri Range 10.3–68.1 0.75–15.3 Tr–32.02 6.2–8.1 38.8–176 0.34–86.2Mean ± SD 21.3 ± 9.6 2.2 ± 1.9 13.3 ± 8.7 7.1 ± 0.35 106.7 ± 30.1 15.9 ± 21.5Below DL (%) 100 – 96.9 4.7 100 100Within WHO/BIS limit (%) 0 – 3.12 95.32 0 0Above PL (%) 0 – 0 0 0 0
Podumoni Range 0.14–204.4 0.5–9.4 0.25–52.8 6.2–7.6 7.8–250 0.38–108.8Mean ± SD 59.3–42.5 1.58–1.1 23.9–8.5 7.1–0.3 121.0–42.6 45.1–26.1Below DL (%) 100 – 79.2 41.6 100 100Within WHO/BIS limit (%) 0 – 20.8 58.3 0 0Above PL (%) 0 – 0 0 0 0
Kakodonga Range 6.9–29.5 1–5.92 4.5–37.8 6.8–7.5 23.3–197.8 12.35–65.3Mean ± SD 17.3–7.1 2.6–1.4 20.8–10.8 7.05–0.2 104.1–55.3 32.8–18.1Below DL (%) 100 – 95 0 100 100Within WHO/BIS limit (%) 0 – 5 100 0 0Above PL (%) 0 – 0 0 0 0
Morangi Range 5.9–67.3 1.44–49.1 0.68–25.7 6.8–7.5 23.3–131.9 2.3–63.2Mean ± SD 20.0–13.8 8.27–10.6 12.06–6.5 7.1–0.2 64.7–33.05 23.9–18.04Below DL (%) 100 – 100 0 100 100Within WHO/BIS limit (%) 0 – 0 100 0 0Above PL (%) 0 – 0 0 0 0
Gamariguri Range 4.8–175.7 1–1.66 4.9–27.1 6.9–7.1 50.4–139.7 15.3–98.3Mean ± SD 62.2–58.1 1.29–0.3 16.5–6.6 7.1–0.1 89.8–31.0 53.3–22.8Below DL (%) 100 – 100 0 100 100Within WHO/BIS limit (%) 0 – 0 100 0 0Above PL (%) 0 – 0 0 0 0
DL desirable limit, PL permissible limit, Tr Trace
378 Environ Monit Assess (2011) 173:371–385
highest recorded value of Mn was 2.6 ppm in asample from the Dergaon block. The Mn contentin Dergaon, Kathalguri, Podumoni, Kakodonga,Morangi, and Gamariguri blocks varied fromTrace to 2.6 ppm, Trace to 0.61 ppm, Trace to0.98 ppm, 0.006 to 1.9 ppm, 0.012 to 0.98 ppm,and 0.02 to 2.5 ppm, respectively (Table 1). Itwas observed from the experiment that the pH ofthe water samples collected in the Dergaon (5.9to 7.7), Kathalguri (6.2 to 8.1), Podumoni (6.2 to7.6), Kakodonga (6.8 to 7.5), Morangi (6.8 to 7.5),and Gamariguri (6.9 to 7.1) blocks were variedconsiderably (Table 2). The concentrations of the
other parameters, viz., Ca, Na, K, Mg, TH, andSO2−
4 (Tables 1, 2) in all the samples collectedfrom the study area were within the safe limit pro-vided by the WHO/BIS (WHO 1993; BIS 1991).However, the pH of 90.3% of the samples wasfound within the drinking water standard (6.5–8.5) of the WHO/BIS. The maximum value ofthe pH was recorded as 8.1 in a sample from theKathalguri block.
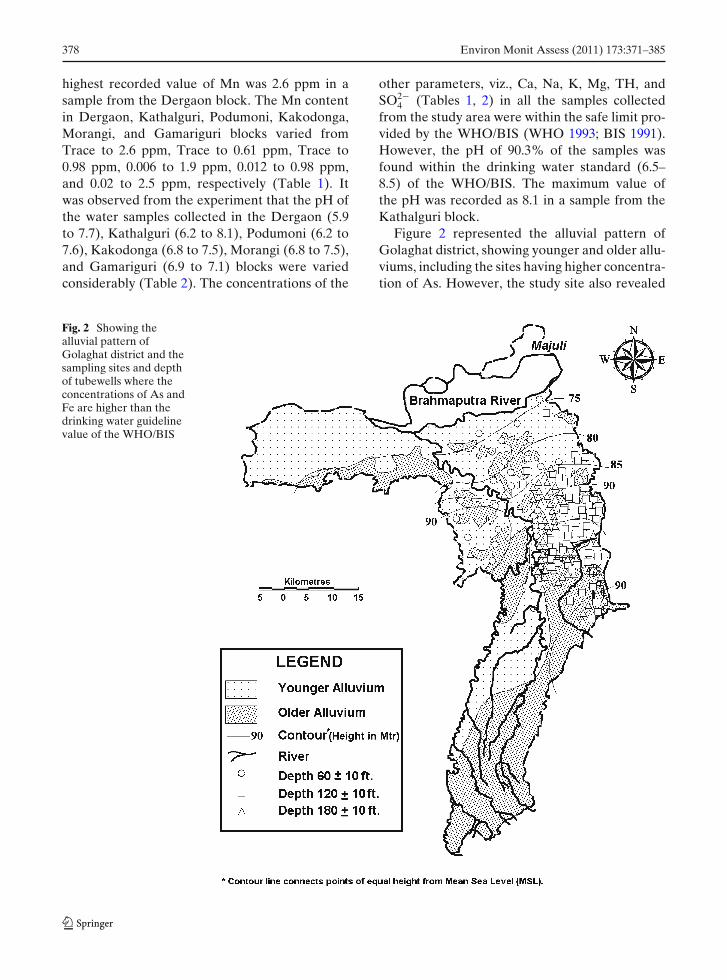
Figure 2 represented the alluvial pattern ofGolaghat district, showing younger and older allu-viums, including the sites having higher concentra-tion of As. However, the study site also revealed
Fig. 2 Showing thealluvial pattern ofGolaghat district and thesampling sites and depthof tubewells where theconcentrations of As andFe are higher than thedrinking water guidelinevalue of the WHO/BIS
Environ Monit Assess (2011) 173:371–385 379
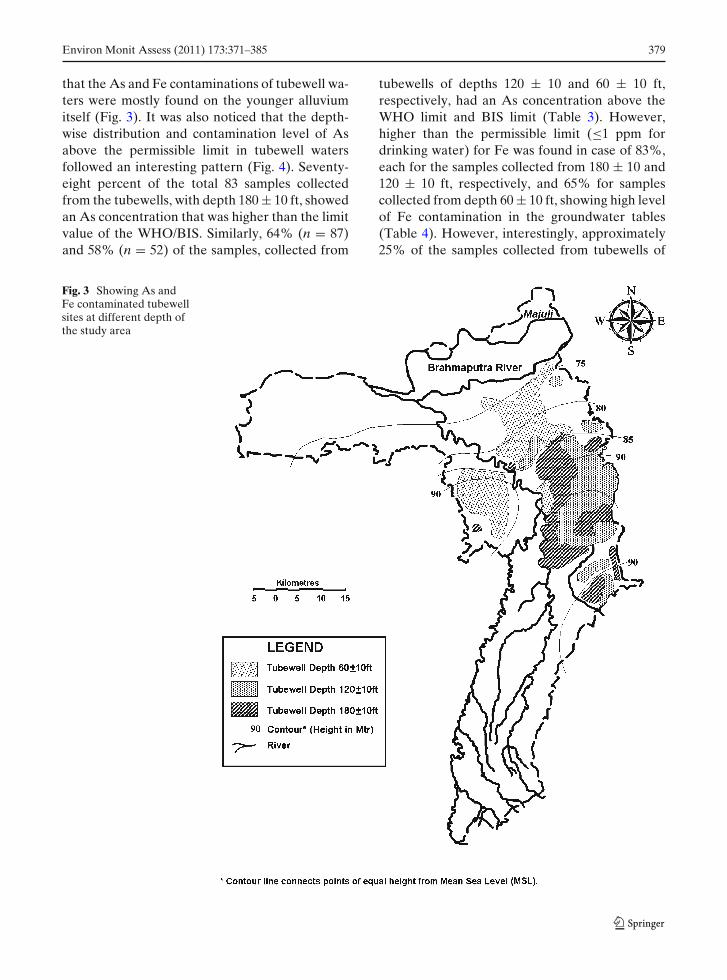
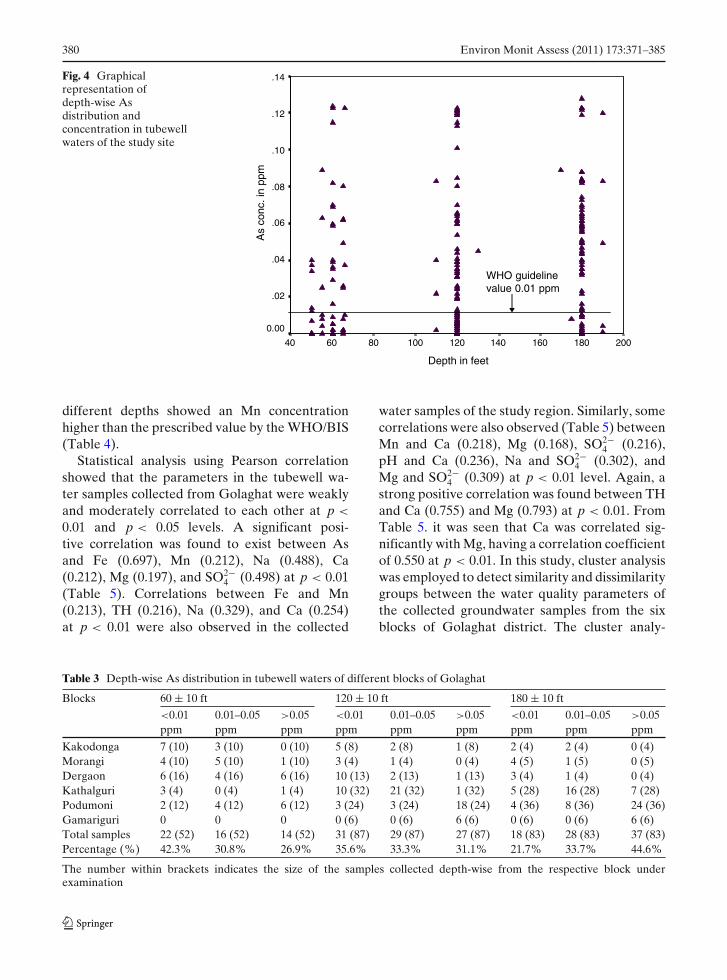
that the As and Fe contaminations of tubewell wa-ters were mostly found on the younger alluviumitself (Fig. 3). It was also noticed that the depth-wise distribution and contamination level of Asabove the permissible limit in tubewell watersfollowed an interesting pattern (Fig. 4). Seventy-eight percent of the total 83 samples collectedfrom the tubewells, with depth 180 ± 10 ft, showedan As concentration that was higher than the limitvalue of the WHO/BIS. Similarly, 64% (n = 87)and 58% (n = 52) of the samples, collected from
tubewells of depths 120 ± 10 and 60 ± 10 ft,respectively, had an As concentration above theWHO limit and BIS limit (Table 3). However,higher than the permissible limit (≤1 ppm fordrinking water) for Fe was found in case of 83%,each for the samples collected from 180 ± 10 and120 ± 10 ft, respectively, and 65% for samplescollected from depth 60 ± 10 ft, showing high levelof Fe contamination in the groundwater tables(Table 4). However, interestingly, approximately25% of the samples collected from tubewells of
Fig. 3 Showing As andFe contaminated tubewellsites at different depth ofthe study area
380 Environ Monit Assess (2011) 173:371–385
Fig. 4 Graphicalrepresentation ofdepth-wise Asdistribution andconcentration in tubewellwaters of the study site
Depth in feet
200180160140120100806040
As
conc
. in
ppm
.14
.12
.10
.08
.06
.04
.02
0.00
WHO guideline value 0.01 ppm
different depths showed an Mn concentrationhigher than the prescribed value by the WHO/BIS(Table 4).
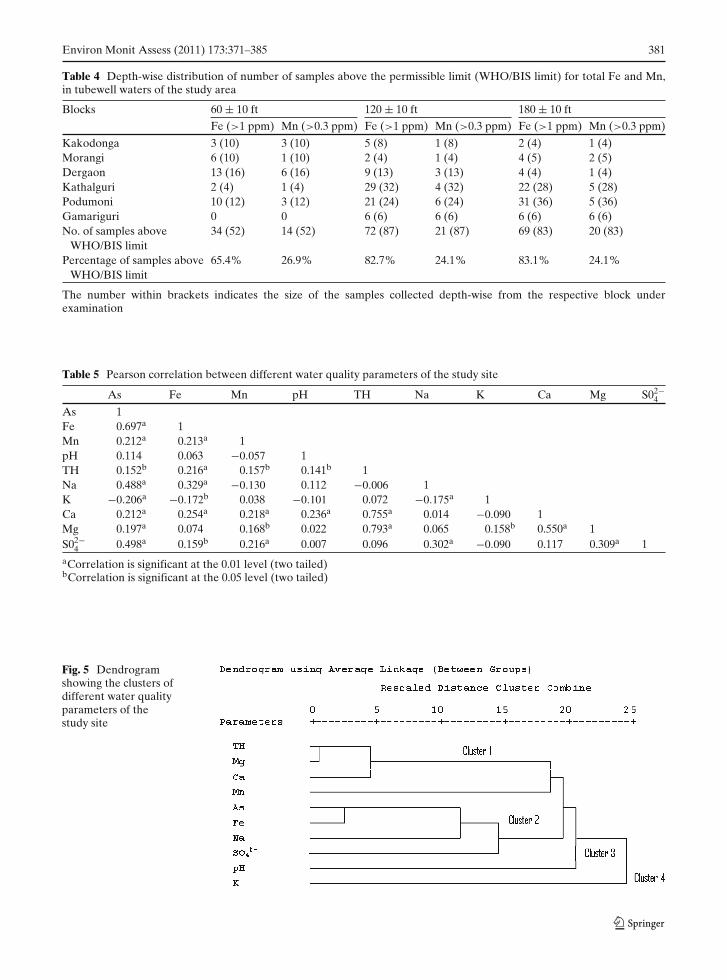
Statistical analysis using Pearson correlationshowed that the parameters in the tubewell wa-ter samples collected from Golaghat were weaklyand moderately correlated to each other at p <
0.01 and p < 0.05 levels. A significant posi-tive correlation was found to exist between Asand Fe (0.697), Mn (0.212), Na (0.488), Ca(0.212), Mg (0.197), and SO2−
4 (0.498) at p < 0.01(Table 5). Correlations between Fe and Mn(0.213), TH (0.216), Na (0.329), and Ca (0.254)at p < 0.01 were also observed in the collected
water samples of the study region. Similarly, somecorrelations were also observed (Table 5) betweenMn and Ca (0.218), Mg (0.168), SO2−
4 (0.216),pH and Ca (0.236), Na and SO2−
4 (0.302), andMg and SO2−
4 (0.309) at p < 0.01 level. Again, astrong positive correlation was found between THand Ca (0.755) and Mg (0.793) at p < 0.01. FromTable 5. it was seen that Ca was correlated sig-nificantly with Mg, having a correlation coefficientof 0.550 at p < 0.01. In this study, cluster analysiswas employed to detect similarity and dissimilaritygroups between the water quality parameters ofthe collected groundwater samples from the sixblocks of Golaghat district. The cluster analy-
Table 3 Depth-wise As distribution in tubewell waters of different blocks of Golaghat
Blocks 60 ± 10 ft 120 ± 10 ft 180 ± 10 ft
<0.01 0.01–0.05 >0.05 <0.01 0.01–0.05 >0.05 <0.01 0.01–0.05 >0.05ppm ppm ppm ppm ppm ppm ppm ppm ppm
Kakodonga 7 (10) 3 (10) 0 (10) 5 (8) 2 (8) 1 (8) 2 (4) 2 (4) 0 (4)Morangi 4 (10) 5 (10) 1 (10) 3 (4) 1 (4) 0 (4) 4 (5) 1 (5) 0 (5)Dergaon 6 (16) 4 (16) 6 (16) 10 (13) 2 (13) 1 (13) 3 (4) 1 (4) 0 (4)Kathalguri 3 (4) 0 (4) 1 (4) 10 (32) 21 (32) 1 (32) 5 (28) 16 (28) 7 (28)Podumoni 2 (12) 4 (12) 6 (12) 3 (24) 3 (24) 18 (24) 4 (36) 8 (36) 24 (36)Gamariguri 0 0 0 0 (6) 0 (6) 6 (6) 0 (6) 0 (6) 6 (6)Total samples 22 (52) 16 (52) 14 (52) 31 (87) 29 (87) 27 (87) 18 (83) 28 (83) 37 (83)Percentage (%) 42.3% 30.8% 26.9% 35.6% 33.3% 31.1% 21.7% 33.7% 44.6%
The number within brackets indicates the size of the samples collected depth-wise from the respective block underexamination
Environ Monit Assess (2011) 173:371–385 381
Table 4 Depth-wise distribution of number of samples above the permissible limit (WHO/BIS limit) for total Fe and Mn,in tubewell waters of the study area
Blocks 60 ± 10 ft 120 ± 10 ft 180 ± 10 ft
Fe (>1 ppm) Mn (>0.3 ppm) Fe (>1 ppm) Mn (>0.3 ppm) Fe (>1 ppm) Mn (>0.3 ppm)
Kakodonga 3 (10) 3 (10) 5 (8) 1 (8) 2 (4) 1 (4)Morangi 6 (10) 1 (10) 2 (4) 1 (4) 4 (5) 2 (5)Dergaon 13 (16) 6 (16) 9 (13) 3 (13) 4 (4) 1 (4)Kathalguri 2 (4) 1 (4) 29 (32) 4 (32) 22 (28) 5 (28)Podumoni 10 (12) 3 (12) 21 (24) 6 (24) 31 (36) 5 (36)Gamariguri 0 0 6 (6) 6 (6) 6 (6) 6 (6)No. of samples above 34 (52) 14 (52) 72 (87) 21 (87) 69 (83) 20 (83)
WHO/BIS limitPercentage of samples above 65.4% 26.9% 82.7% 24.1% 83.1% 24.1%
WHO/BIS limit
The number within brackets indicates the size of the samples collected depth-wise from the respective block underexamination
Table 5 Pearson correlation between different water quality parameters of the study site
As Fe Mn pH TH Na K Ca Mg S02−4
As 1Fe 0.697a 1Mn 0.212a 0.213a 1pH 0.114 0.063 −0.057 1TH 0.152b 0.216a 0.157b 0.141b 1Na 0.488a 0.329a −0.130 0.112 −0.006 1K −0.206a −0.172b 0.038 −0.101 0.072 −0.175a 1Ca 0.212a 0.254a 0.218a 0.236a 0.755a 0.014 −0.090 1Mg 0.197a 0.074 0.168b 0.022 0.793a 0.065 0.158b 0.550a 1S02−
4 0.498a 0.159b 0.216a 0.007 0.096 0.302a −0.090 0.117 0.309a 1aCorrelation is significant at the 0.01 level (two tailed)bCorrelation is significant at the 0.05 level (two tailed)
Fig. 5 Dendrogramshowing the clusters ofdifferent water qualityparameters of thestudy site
382 Environ Monit Assess (2011) 173:371–385
sis was done by using average linkage (betweengroups) and Pearson correlation methods. Thedendrogram in Fig. 5 showed four distinct clustersof water quality parameters of the study area.Cluster 1 includes the water quality parametersTH, Mg, Ca, and Mn. Cluster 2 included As, Fe,Na, and SO2−
4 . These two clusters (clusters 1 and2) were connected with cluster 3 comprising pH,which is again connected with cluster 4 havingonly one parameter, K.
Discussion
The present study indicated the distributionof different water quality parameters includingheavy metals like As, Fe, and Mn of the tubewellsin the six blocks of Golaghat district of Assam,India. It was revealed that the residents of thearea had been chronically exposed to high levels(above the permissible limit of the WHO/BIS)of As (67% of the total 222 samples collected)and Fe (77% of the total 222 samples col-lected), in comparison with the highly As-exposedpopulations of the adjoining regions like WestBengal, India (Mukherjee et al. 2006; Nicksonet al. 2007) and Bangladesh (Bhattacharya et al.2007; Halem et al. 2009). Again, the study alsorevealed that around 35.1% of the water sourcesof tubewells have an As contamination of morethan the 0.05 ppm, which is higher (11.2%) thanthe previous report by Nickson et al. (2007). It wasapparent from the study for As in the region thatgroundwater adjacent to the foothills (Gamariguriblock) is highly As-contaminated as mentioned byanother author (Singh 2004). This area is mainlywithin the quaternary alluvial basin (Ground Wa-ter Information Booklet 2008) bounded by theHimalayan Mountains. However, the Kakodongablock, bordering the river Kakodonga, was lesscontaminated with As with 63.6% and Fe with45.5% of the water samples, within the safe limitfor drinking purposes (Table 1). The probablereason for As contamination might be heavydeposition of sediments through leaching fromsurrounding mountains (Singh 2004). In addi-tion, the present study revealed that the qua-ternary alluvium deposits especially the youngerregions were more As-contaminated, in compar-
ison to the older one (Figs. 2, 3). Our findingsalso corresponded the findings of earlier workers(McArthur et al. 2004; Mukherjee et al. 2006) whohad reported that the As-contaminated zones inthe GPMB river basin are mostly lying within ayounger alluvium plain.
Mobilization of As in tubewell waters inthe Gangetic delta of West Bangal, India andBangladesh had already been proposed by severalworkers (Smedley and Kinniburgh 2002; Rmalliet al. 2005; McArthur et al. 2004; Bhattacharyaet al. 2006). Regarding sedimentology, the north-eastern part of India, especially Assam region, isrelated to that of the Bangladesh plains (Enmarkand Nordborg 2007). Therefore, the adjoining dis-trict Golaghat, the site of our interest, might be ex-pected to follow the comparable way in respect tothe mobilization of As in groundwater. Workerslike Smedley and Kinniburgh (2002), McArthuret al. (2004), and Bhattacharya et al. (2006) pro-posed the importance of reductive dissolution ofmetal (iron) oxide/hydroxide and subsequent re-lease of the adsorbed As, in the process of itsmobilization. The degradation of organic matterpresent in the aquifers might also be involved inthe reductive dissolution of the iron hydroxide,causing desorption of any adsorbed As (Parkhurst1995). Moreover, Fe hydroxides, carrying a sur-face charge, could adsorb the electrically chargedAs ions that appeared to be a pH-dependentprocess and related to the net charge of the ad-sorbing surface (Parkhurst 1995). Generation ofAs oxyanionic species through oxidative dissolu-tion of the As-bearing pyrite minerals (FeAsS +3.5O2 + 4H2O → Fe (OH)3 + H3AsO4 + 2H++ SO2−
4 ) could be the another basis of conta-mination of the groundwater tables (Acharyyaet al. 1999; Nickson et al. 2000). In this study,higher concentrations of As and Fe (Table 1) inthe tubewell waters of Golaghat district showed asignificant correlation between the two elements(0.697 at p < 0.01; Table 5). The phenomenon ofthe mobilization of As might be due to the reduc-tive dissolution of As–Fe-bearing minerals in thesediments reduced by oxygen-deficient groundwa-ter (Singh 2004). Overwithdrawal of groundwa-ter in the study region for agriculture practicesand household uses might be another strong rea-son for the As mobilization (Bhattacharjee et al.
Environ Monit Assess (2011) 173:371–385 383
2005) in aquifers in Golaghat district. However,the presence of SO2−
4 in tubewell waters in theregion having a significant correlation (0.498 atp < 0.01; Table 4) with As could also be one ofthe probable sources of As mobilization throughwhich As might possibly come to the water en-vironment by the oxidation of the sulfide ores ofAs (Acharyya et al. 1999). Again, unhygienic soapuse in tubewells area facilitated microorganisms torelease arsenic-involving bioelectrochemical reac-tions (Dey et al. 2005). A significant correlationbetween As with Fe and Mn (Table 5) indicatedthat the tubewell water of the study area mighthave some common natural sources of pollutionthrough which mobilization of As, Fe, and Mn wastaking place.
The region has the potential resources of waterin so far as groundwater is concerned (1,056.26million cubic meters for the district as mentionedin Ground Water Information Booklet 2008), thearea belonging to northern part of the district likethe Dergaon, Kakodonga, and Morangi blocks.The groundwater level in these three blocks wasfound to be closer as mainly shallow tubewellswere found during the collection of the samples.Moreover, availability and utilization of surfacewater for household purposes might be the basisof the fewer number of tubewells in the region.
The incidence of As contamination(>0.01 ppm) was noted greater in the southernparts of the districts compared to the northernpart. Again, 78% of the water collected fromthe tubewells having a depth of 180 ± 10 ft wasfound to be contaminated by As, followed by65% of the water from 120 ± 10 ft. Potentialaquifers pertained to the Quaternary Formationhave unique subsurface geology. The cumulativethickness of the aquifer zones of the district hasthe tendency to increase toward the north andin the southeastern parts; however, the thicknessof the upper bedrock reverses considerably withthicker midzones. The movement of groundwateris from south to north, and the trend of the waterlevel shows a gradual rising toward the north.According to the hydrogeologic information ofthe Central Ground Water Board, India, thereare possibly 3–9 prolific aquifer systems thatexist in the district (Ground Water InformationBooklet 2008), and these aquifers might be the
sources of As contamination of the tubewells inthe study region. The layers of aquifers possiblyarranged in a horizontal pattern in relation to theslope of the district usually get recharged fromdistant sources. Little mixing occurs across theseflow-paths, and therefore, solute concentrationswithin an aquifer were also layered, with eachdeeper layer representing the biogeochemicaloutcome of water inputs from more remotesources (Harvey 2008). It had been elaboratedin a recent study (Polizzotto et al. 2008) thatpond sediments were also an important sourceof As mobilization in groundwater. The steadysettling and decomposition of organic matter atthe bottom of the tropical ponds, like the areaof interest, in an anaerobic condition ensuingmicrobe mediated Fe (III) and As (V) reductions(McArthur et al. 2004; Polizzotto et al. 2005,2008). Furthermore, water passing through pondsediments could also contain organic carbonthat, on decomposition, might help to liberatearsenic from deeper sediments, adding more tothe contamination (Harvey 2008).
Conclusion
For almost two decades, research on As hasgained a considerable momentum as a responseto the detrimental health effects of the ele-ment. The recognition of the scale of As enrich-ments in groundwater in West Bengal, India andBangladesh and elsewhere has opened up a seri-ous concern in the scientific community. Billionsof people use to drink waters from aquifers daily;however, new reports are coming from differentareas regarding As contamination. Several factorsare involved in the ever expanding impure wa-ter tables throughout the world, involving newaquifers that are yet to be recognized. This paperrepresented the detailed groundwater quality inthe different blocks of Golaghat district. Around35% of the water sources of the tubewells werefound having an As contamination of more thanthe 0.05 ppm and 67% above 0.01 ppm. Again,a high percentage of Fe contamination (77%) inthe tubewell waters of the region indicates theseverity of the heavy metal pollution in the region.
384 Environ Monit Assess (2011) 173:371–385
Therefore, the primary concern to counter theproblem of groundwater contamination especiallywith a high-priority toxic substance like As in anewly reported region is an early survey-baseddetection of the pollution and identification ofthe affected sources to remediate the crisis. Themitigation strategy for the problem in the areamight be specific to the location, taking intoconsiderations the geomorphological variationsand socioeconomic conditions. Understanding thegroundwater movements requires in-depth char-acterization and routine verification of physicalhydrogeology. Moreover, community participa-tion to make the villagers of the affected re-gions of the district studied understand the signsand symptoms of the chronic As toxic effects isof utmost necessary. Again, cost-effective, user-friendly technologies providing pure water arerequired to counter the serious health hazards dueto consumption of As- and/or Fe-contaminatedwater. A wholistic approach involving medicalpractitioners, scientists, and social workers willneed to work coherently to find out a solution thatcan lessen sufferings of the humanity and makinga provision for safe drinking water.
Acknowledgements The authors gratefully acknowledgeMr. P. K. Mudoi and Mr. P. K. Sarma Tamuli, Junior En-gineer, PHED, Golaghat, Government of Assam and Mr.N. Bora, Project Manager, Arunodoy, Golaghat (NGO)for their kind help and support during sample collection.Two anonymous reviewers are thanked for their excellentcomments on the draft manuscript that greatly improvedthe final version.
References
Acharyya, S. K., & Shah, B. A. (2007). Arsenic-contaminated groundwater from parts of Damodarfan-delta and west of Bhagirathi River, West Bengal,India: Influence of fluvial geomorphology and Quater-nary morphostratigraphy. Environmental Geology, 52,489–501.
Acharyya, S. K., Chakraborty, P., Lahiri, S., Raymahashay,B. C., Guha, S., & Bhowmik, A. (1999). Arsenic poi-soning in the Ganges Delta. Nature, 401, 545.
Ahmad, J., Goldar, B. N., Misra, S., & Jakariya, M. (2003).Willingness to pay for arsenic-free, safe drinking wa-ter in Bangladesh. World Bank Water and SanitationProgram—South Asia.
ATSDR (2008). US Department of Health and HumanServices. http://www.atsdr.cdc.gov. Accessed 28 Feb2010.
Bhattacharjee, S., Chakravarty, S., Maity, S., Dureja, V.,& Gupta, K. K. (2005). Metal content in groundwaterof Sahebgunj district, Jharkhand, India, with specialreference to arsenic. Chemospere, 58, 1203–1217.
Bhattacharya, P., Ahmed, K. M., Broms, S., Fogelström, J.,Jacks, G., Sracek, O., et al. (2006). Mobility of arsenicin groundwater in a part of Brahmanbaria district,NE Bangladesh. In: R. Naidu, E. Smith, G. Owens,P. Bhattacharya, & P. Nadebaum (Eds.), Managingarsenic in the environment: From soil to human health(pp. 95–115). Melbourne: CSIRO Publishing.
Bhattacharya, P., Welch, A. H., Stollenwerk, K. G.,McLaughlin, M. J., Bundschuh, J., & Panaullah, G.(2007). Arsenic in the environment: Biology andchemistry. Science of the Total Environment, 379, 109–120.
Bureau of Indian Standards (BIS) (1991). 10500:1991,Second Revision ICS No. 13.060.20. http://www.bis.org.in/sf/fad/FAD25(2047)C.pdf. Accessed 6 Jan 2010.
Bunnell, J. E., Finkelman, R. B., Centeno, J. A., &Selinus, O. (2007). Medical geology: A globally emerg-ing discipline. Geologica Acta, 5(3), 273–281.
Chatterjee, S., Chattopadhyay, B., & Mukhopadhyay, S.K. (2008). Elemental profile of abiotic componentsof the East Calcutta Wetlands, a Ramsar site in In-dia. Land Contamination & Reclamation, 16(4), 365–379.
Chetia, M., Singh, S. K., Bora, K., Kalita, H., Saikia, L. B.,Goawami, D. C., et al. (2008). Groundwater arseniccontamination in three blocks of Golaghat district ofAssam. Journal of Indian Water Works Association,40(2), 150–154.
Das, B., Rahman, M. M., Nayak, B., Pal, A., Chowdhury,U. K., Mukherjee, S. C., et al. (2009). Groundwaterarsenic contamination, its health effects and approachfor mitigation in West Bengal, India and Bangladesh.Water Quality Exposure Health, 1, 5–21.
Dey, S., Chatterjee, S., & Sarkar, S. (2005). Direct andindirect arsenic release from soaps by unhygienic usein Tubewells. Current Science, 89(11), 1913–1917.
Eatson, A. D., Clesceri, L. S., Rice, E. W., & Greenberg,A. E. (2005). Standard methods for the examination ofwater and wastewater (21st ed., pp. 4–138). CentennialEdition, USA.
Elster, E. F., Wagner, G. A., & Schutz, W. (1988).Activated oxygen in green plants in relation to stresssituation. Current Topics in Plant Biochemistry &Physiology, 7, 159–187.
Enmark, G., & Nordborg, D. (2007). Arsenic in the ground-water of the Brahmaputra floodplains, Assam, India –Source, distribution and release mechanisms (35 p.).Minor Field Study 131, Committee of Tropical Ecol-ogy, Uppsala University, Uppsala, Sweden, ISSN1653-5634.
Garai, R., Chakraborti, A. K., Dey, S. B., & Saha, K.C. (1984). Chronic arsenic poisoning from tubewellwater. Journal of Indian Medical Association, 82,34–35.
Environ Monit Assess (2011) 173:371–385 385
Ground Water Information Booklet (2008). Golaghat Dis-trict, Assam, Ministry of Water Resources, Guwahati.http://cgwb.gov.in/District_Profile/Assam/.pdf. Accessed28 Feb 2010.
Halem, D. V., Bakker, S. A., Amy, G. L., & Van Dijk, J. C.(2009). Arsenic in drinking water: Not just a problemfor Bangladesh. Drinking Water Engineering and Sci-ence Discussion, 2, 51–64.
Harvey, C. F. (2008). Poisoned waters traced to sources.Nature, 454, 415–416.
Henke, K. R. (2009). Arsenic: Environmental chemistry,health threats and waste management. West Sussex:John Wiley and Sons.
Jie, L., & Waalkes, M. P. (2008). Liver is a target of ar-senic carcinogenesis. Toxicological Sciences, 105(1),24–32.
McArthur, J. M., Banerjee, D. M., Hudson-Edwards, K. A.,Mishra, R., Purohit, R., Ravenscroft, P., et al. (2004).Natural organic matter in sedimentary basins and itsrelation to arsenic in anoxic groundwater: The exam-ple of West Bengal and its worldwide implications.Applied Geochemistry, 19, 1255–1293.
Mukherjee, A., Sengupta, M. K., Hossain, M. A., Ahmed,S., Das, B., Nayak, B., et al. (2006). Arsenic conta-mination in groundwater: A global perspective withemphasis on the Asian scenario. Journal of HealthPopulation and Nutrition, 24(2), 142–163.
Nickson, R. T., McArthur, J. M., Ravenscroft, P., Burgess,W. G., & Ahmed, K. M. (2000). Mechanism ofarsenic release to groundwater, Bangladesh and WestBengal. Journal of Applied Geochemistry, 15(4), 403–413.
Nickson, R., Sengupta, C., Mitra, P., Dave, S. N., Banerjee,A. K., Bhattacharya, A., et al. (2007). Current knowl-edge on the distribution of arsenic in groundwater infive states of India. Journal of Environmental Scienceand Health Part A, 42, 1707–1718.
Parkhurst, D. L. (1995). User’s guide to PHREEQC—acomputer program for speciation, reaction path, ad-vective transport and inverse geochemical calculations(pp. 143). Washington: US Geological Service, WaterResources Investigations, 95-4227.
Polizzotto, M. L., Harvey, C. F., Sutton, S. R., & Fendorf, S.(2005). Processes conducive to the release and trans-port of arsenic into aquifers of Bangladesh. Proceed-ings National Academy of Sciences of the United Statesof America, 102, 18819–18823.
Polizzotto, M. L., Kocar, B. D., Benner, S. G., Sampson,M., & Fendorf, S. (2008). Near-surface wetland sedi-ments as a source of arsenic release to groundwater inAsia. Nature, 454, 505–508.
Rmalli, S. W. A., Harrington, C. F., Ayub, M., & Haris,P. I. (2005). A biomaterial based approach for ar-senic release to groundwater, Bangladesh & WestBengal. Journal of Environmental Monitoring, 7, 279–282.
Sharma, A. K., Tjell, J. C., & Mosbæk, H. (2006). Healtheffects from arsenic in groundwater of the Bengaldelta: Effects of iron and water storage practices. Jour-nal of Environmental Geosciences, 13(1), 17–29.
Singh, A. K. (2004). Arsenic contamination in groundwaterof Northeastern India. In Proceedings of 11th nationalsymposium on hydrology with focal theme on waterquality (pp. 255–262). Roorkee: National Institute ofHydrology.
Singh, A. K. (2006). Review article-Chemistry of arsenicin groundwater of Gangas–Brahmaputra river basin.Current Science, 91, 599–605.
Smedley, P. L., & Kinniburgh, D. G. (2002). A reviewof the source, behavior and distribution of arsenicin natural waters. Applied Geochemistry, 17(5), 517–568.
Smith, A. H., Lingas, E. O., & Rahman, M. (2000). Conta-mination of drinking water by arsenic in Bangladesh:A public health emergency. Bulletin of the WorldHealth Organization, 78, 1093–1103.
SOES (2004). Groundwater arsenic contamination inNorth Eastern states, India. The School of Environ-mental Studies, Jadavpur University. http://www.soesju.org/arsenic/north_east.htm. Accessed 28 Feb 2010.
Stephane, G., & Charlet, L. (2007). Bengal arsenic, anarchive of Himalaya orogeny and paleohydrology.Journal of Environmental Science and Health, Part AToxic/Hazardous Substances and Environmental En-gineering, 42(12), 1785–1794.
Tchounwou, P. B., Patlolla, A. K., & Centeno, J. A. (2003).Carcinogenic and systemic health effects associatedwith arsenic exposure- a critical review. ToxicologyPathology, 31(6), 575–588.
Vaclavikova, M., Gallios, G. P., Hredzak, S., & Jakabsky,S. (2008). Removal of arsenic from water stream: Anoverview of available techniques. Clean Technologiesand Environmental Policy, 10(1), 89–95.
WHO (1993). Guidelines for drinking water quality.Geneva: World Health Organization http://www.lenntech.com/WHO’s-drinking-water-standards.htm.Accessed 28 Feb 2010.
Xia, Y., Wade, T. J., Wu, K., Li, Y., Ning, Z., Le, X. C., et al.(2009). Well water arsenic exposure, arsenic inducedskin-lesions and self-reported morbidity in innerMongolia. International Journal of Environment Re-source Public Health, 6, 1010–1025.


