Embed Size (px)
Citation preview

Growth trends of Horticulture Crops in India
Tawheed Nabi
Dr. S.T.Bagalkoti
Abstract
The growth of horticulture crops has become one of the driving forces for overall development
of agricultural sector in India. With the emergence of urbanization and modernization, changes
in cropping pattern from traditional to high value cash crops, especially the horticultural crops
has been initiated in Indian agriculture. Horticulture is perhaps the most profitable venture of all
farming activities as it provides ample employment opportunities and scope to raise the income
of the farming community. It also has tremendous potential to push the overall agriculture
growth to more than the targeted 4 per cent. It is the fastest growing sector within agriculture. It
contributes in poverty alleviation, nutritional security and have ample scope for farmers to
increase their income and helpful in sustaining large number of agro-based industries which
generate huge employment opportunities. Keeping these understandings in mind, the present
study estimates growth rates and value of output of the major agricultural crops, including the
horticultural crops. The study reveals that the growth of area, production and yield of horticulture
crops in the country was found to be statistically significant. Within the greater horticulture
sector, the value of output for fruits and vegetables was found to be at the highest, accounted for
26 per cent of the total agricultural value of output. However, despite impressive output growth,
the yield growth rate of fruit crop was found to be statistically insignificant.’
Keywords: Horticulture, Trend of Horticulture Produce, NHM, Growth, India
Introduction
Agriculture plays a vital role in the Indian economy. Over 70 per cent of the rural households
depend on agriculture as their principal means of livelihood. The total Share of Agriculture and
allied Sectors in terms of percentage of GDP is 13.9 percent during 2013-14 at 2004-05 prices.
(Estimates released by Central Statistics Office). Horticulture is a part of agriculture, which is
concerned with the cultivation of “garden crops” and can be defined as the branch of agriculture
concerned with intensively cultured plants directly used by peoples for food, for medicinal
purpose or for aesthetic gratification (Singh 2012). Horticulture includes cultivation of fruits,

nuts, vegetables, medicinal and aromatic plants, flowers, etc. Importance of horticulture lies in
the fact that it generates much income per hectare of land as compared to other agricultural crops
facilitates employment, food and nutritional security and industrialization too. The growth in the
production of fruits and vegetables assumes critical importance nowadays due to the increase in
the demand generated by the rapid increase in population and has been accelerated by the rise in
the levels of income of the people and the consequent changes in the pattern of consumption.
Fruits play a unique role in developing countries like India both in economic and social sphere
for improving income and nutritional status particularly of rural masses.
India is the second largest producer of vegetables and fruits after China and is popularly known
as Fruits and Vegetable Basket of the world (Gandhi & Nambordiri, 2002). India has started
putting greater thrust on the development of horticultural sector after sixties in order to exploit
the country’s vast potential and to generate the much needed value addition. In 2010-11
horticultural crops put together covered approximately 11.35% of the total cropped area with an
annual production of about 114 million tons accounting for more than 18% of agricultural output
of India (Das, Gogoi and Borah, 2013). The importance of horticulture in improving the
productivity of the land, generating employment, improving economic conditions of the farmers
and entrepreneurs, enhancing exports and above all, providing nutritional security to the desert
dwellers, can hardly be overemphasized (Bhandari et.al 2014).
Objectives
1) To analyse the growth trends of area, production and productivity of horticultural crops.
2) To identify the effects through which the production of horticulture crops has increased
in the recent past, in India.
3) To analyse the role of horticulture in the development of Agriculture.
Methodology
The data has been obtained from official websites and official records & documents; such as
National Horticulture Board (NHB), Agricultural and Processed Food Products Export
Development Authority (APEDA), Handbook of Horticulture, Statistical Year Book and others.
Different Books, Reports, and Research Papers have been consulted to generate the idea and of

literature available. Statistical techniques and tools like trend analysis, Percentages, Growth rates
have been applied in drawing results and analysis of data.
Results and Analysis
Figure1. shows the trends of total area and production of horticultural crops. Total area under
horticultural crops has increased from 16,592 thousand hectares of 2001-02 to 24,198 thousand
hectares in the year 2013-14. Similarly, total horticultural production increased to 2,77352
thousand metric tons in 2013-14 from 1,45785 thousand metric tons of 2001-02. But in the year
2002-03 total horticultural area decreased from 16,592 thousand hectares of the year 2001-02 to
16,270 thousand hectares. Total area under horticultural crops, which was 19,208 thousand
hectares in 2003-04 decreased to 18,445 thousand hectares in the year 2004-05, while overall
production decreased only once in the year 2002-03 from 1,44380 thousand metric tons of the
year 2001-02 to 14,578 thousand metric tons (2002-03), which is a slight downfall of the
production of horticulture production.
Fruits, vegetables and plantation crops are the major component of horticultural crops.
Besides these, flowers and nuts are also important. Analysis (of Table 1. and Table 2.) shows
that vegetables ranks first in terms of both area and production among all horticultural crops
from the year 2001-02 to 2013-14; while the fruits are positioned on the second. Plantation
crops ranks third in area and production terms. Area of fruits was 4,010 (2001-02) thousand
hectares which increased to 7,216 thousand hectares in the year 2013-14. Vegetables show a
prominent growth in a real terms and the area under vegetables increased to 9,396 thousand
hectares in 2013-14 from 6,156 thousand hectares in 2001-02. Area of flowers has been
doubled during the study period from 106 thousand hectares (2001-02) to 255 thousand
hectares in 2013-14. Area of aromatic and medicinal crops rose heavily from 131 thousand
hectares in 2004-05 to 557 thousand hectares in 2012-13, but in 2013-14 it fell down to 493
thousand hectares. Whereas nuts, have shown limited growth in terms of area during the study
period, and has been included in fruits from the year 2010-11onwards. Area under spices
decreased during the study period as it was 3,220 thousand hectares in 2001-02 and
decreased to 3,163 thousand hectares in 2013-14. ( T a b l e 1 . )
There is a tremendous growth in the production statistics of horticulture crops in India from
2001-02 production of fruits has increased from 43,001 thousand metric tons to 88,977 thousand

metric tons in 2013-14 which is a double increase. Similarly production of vegetables has
followed the same trend. Production of vegetables has increased from 88,622 thousand metric
tons to 1,62,897 thousand metric tons in the study period from 2001-02 to 2013-14. Flower
production rose 4.2 times, as it was only 535 thousand metric tons in 2001- 02 and become 2,297
thousand metric tons in 2013-14. Production of plantation crops increased from 9,697 thousand
metric tons to 16,301 thousand metric tons in the study period. Spices showed a growth of 1.5
times in production between the years 2001-02 to 2013- 14 in spite of decreased area. (Table2)
Table3. shows that growth in the horticultural area was highest in the year 2003-04 which is about
18.1 per cent; while production growth was highest in 2007-08 about 10.1 per cent. Highest
productivity was in the year 2009-10 which was 10.7 metric tons/ha while the lowest is 8.0 metric
tons/ha in 2003-04.
Table 5. shows the share of output of horticulture crops with percentage share in agriculture. The
share of fruits and vegetable is very high, and is increasing. In the year 2008-09 the share of fruits
and vegetables was 24.5 percent in total horticulture and share of horticulture in overall
agriculture sector was 31.1 percent. In the year 2009-10 the share of horticulture was 31.7, but in
the year 2010-11 the contribution of horticulture has declined little and was recorded as 29.5
percent. Horticulture sector is contributing about 30 percent to overall agriculture output,
especially fruits and vegetables which are the backbone of horticulture. So there is a vast scope
for this sector.
Table6. shows the crop wise area, production and productivity of horticulture crops in India from
last three year. Production of Banana in fruits for all the three years is very high. In 2013-14
production of Banana was 29725 Thousand MT and area of the Banana was 803 Thousand
Hectares. Productivity of banana was 37 Thousand MT per hectare for the year 2013-14 which is
high as compared to other crops. In vegetables the share of potatoes is 41555 Thousand MT and
area of potatoes was 1973 Thousand Hectares in the year 2013-14. Highest productivity for any
horticulture crop in India is Papaya with 42.3 Thousand MT per hectare followed by Tapico (35
Thousand Hectares), Banana(37 Thousand Hectares), Cabbage (226 Thousand Hectares) and
Apple (21.8 Thousand Hectares). Total production of all horticulture crops was 268847
Thousand MT in the year 2012-13 and total area in the same year was 2369 Thousand Hectares
which increased to 277352 Thousand MT and 2419 Thousand Hectares in the year 2013-14.

Table7. shows the percentage share of horticulture crops in total horticulture for last three years.
The main contributors to horticulture sector are fruits and vegetables contributing 90.8 percent of
total horticulture production, among fruits and vegetables 58.73 percent share comes from
vegetables in the year 2013-14. Share of fruits was 32.08 percent to total horticulture production
of India for the year 2013-14. Share of plantation crops was 5.88 percent in the year 2013-14.
Similarly share of spices was 2.13 percent and share of flowers (including cut flowers and loose
flowers) and aromatics was 1.15 percent in the year 2013-14. Among all crops the share fruits is
increasing year after year and share of vegetables is declining.
Table8. shows the production of horticulture with respect to food grains. As data clearly shows
that, total horticultural production has surpassed the foodgrain production in India. In the year
2013-14 total foodgrain production of India was 266.57 MT and total horticulture production in
the same year was 280.79 MT which is quite higher than that of food grains. From the year 2011-
12 horticulture production has overtaken the foodgrain production in India, which is a positive
sign for horticulture sector. From 2011-12 to 2013-14 production of horticulture is dominating
the foodgrain production in India.
Table9. shows the total value of India’s horticultural exports in 2014-'15 was Rs 13,82281lakh
(nearly $2.8 billion). Despite being the world’s second-largest producer of fruits and vegetables,
India accounted for just 0.36% and 1.03% of exports, respectively, in terms of value, in 2012.
Overall horticultural exports from India to rest of the world is increasing year by year. Processed
fruits and vegetables, accounts 256991.89 lakh in the year 2014-15. The percentage share of
onions in the year 2014-15 is 1.75 percent followed by cucumber (0.92 percent) and grapes
(0.83 percent) in the year 2014-15 respectively. Total exports of all horticulture commodities
have increased from 1059403 lakh INR in the year 2012-13 to 1,436488 lakh INR in the year
2013-14.
The government of India has launched several schemes for the development of horticulture
sector in the country. The main step taken by the government was the introduction of National
Horticulture Mission
National Horticulture Mission (NHM)
National horticulture mission was launched during the year 2005-06 to provide a thrust to the
development of horticulture in the country. It is a centrally sponsored scheme in which
government of India contributes 85% and 15% is met by the state governments. For its

successful implementation mission is divided into three levels: 1) National level 2) State level
and 3) District level.
NHM Objectives
The main objectives of the Mission are:
1) To provide holistic growth of the horticulture sector through an area based regionally
differentiated strategies which include research, technology promotion, extension,
postharvest management, processing and marketing, in consonance with comparative
advantage of each State/region and its diverse agro-climatic feature;
2) To enhance horticulture production , improve nutritional security and income support to
farm households;
3) To establish convergence and synergy among multiple on-going and planned programs
for horticulture development;
4) To promote, develop and disseminate technologies, through a seamless blend of
traditional wisdom and modern scientific knowledge;
5) To create opportunities for employment generation for skilled and unskilled persons,
especially unemployed youth;
Conclusion and Suggestions
The horticulture sector has become one of the driving forces for overall development of
agriculture sector. Its products have more demand in local, national and international markets. It
occupies an important position in terms of providing livelihood options, meeting the required
amount of demand for food and nutritional security. The study reveals that there is positive
relationship between area and production of horticulture crops in India and there is also a
positive, significant and high relationship between horticultural production and horticulture
exports in the country compared to other combinations of variables. In order to reduce the
imports from abroad, to boost the area under the cultivation of horticulture crops and
productivity through adopting modern technology is a pre-condition in Indian horticulture sector,
to overcome this phenomenon. Despite significant growth in production, the yield growth rate of

fruit was not very impressive. Therefore, it calls for technological innovation in the sector. On
the policy side, as the issues of environmental degradation, sinking of arable land and
urbanization have been at the forefront of national debate now, more emphasis should be given
to enhance the yield level with the help of innovations and technology. Secondly, to enhance
production and meet ever increasing demand of horticulture crops, cultivable waste lands of the
bigger States could be brought under horticulture cultivation. Thirdly, the problem of storage
should be solved by setting up more and more warehouses and cold storages facilities in all
districts and sub districts in the country.
Figure1. Trends of Total Area and Production of Horticultural Crops; (2001-02 to
2013-14)
Source: NHB Database, 2014
Table1. Area Under Various Horticultural Crops (in ’000 ha); (2001-02 to 2013-14)
Year Fruits Vegetables Flowers
Nuts
(Almond
&
Walnut)
Aromatic
&
Medicinal
Plantation
crops Spices
Grand
total
2001-02 4010 6156 106 117 NA 2984 3220 16592
2002-03 3788 6092 70 117 NA 2984 3220 16270
2003-04 4661 6082 101 106 NA 3102 5155 19208
2004-05 5049 6744 118 106 131 3147 3150 18445
2005-06 5324 7213 129 130 262 3283 2366 18707
2006-07 5554 7581 144 132 324 3207 2448 19389
1659
2
1627
0
19
20
8
1844
5
1870
7
1938
9
2020
7
2066
2
2087
6
2182
5
2324
2
2369
4
24
19
8
1457
85
1443
80
1533
02
1669
39
1828
16
1918
13
21
12
35
2147
16
2230
89
2405
31
2572
77
2688
47
2773
52
0
50000
100000
150000
200000
250000
300000
2001
-02
2002
-03
2003
-04
2004
-05
2005
-06
2006
-07
2007
-08
2008
-09
2009
-10
2010
-11
2011
-12
2012
-13
2013
-14
AR
EA
('0
00 h
a)/
PR
OD
UC
TIO
N (
'000m
etri
c
ton
ne)
Year
Trends of Area and Production
Area
Production

2007-08 5857 7848 166 132 397 3190 2617 20207
2008-09 6101 7981 167 136 430 3217 2629 20662
2009-10 6329 7985 183 142 509 3265 2464 20876
2010-11 6383 8495 191 I F* 510 3306 2940 21825
2011-12 6705 8989 254 I F* 506 3577 3212 23242
2012-13 6982 9205 233 I F* 557 3641 3076 23694
2013-14 7216 9396 255 I F* 493 3675 3163 24198
Source: NHB Database, 2014
*Included in fruits
Table2. Production of Various Horticultural Crops (in ’000 metric tons); (2001-02 to 2012-
13)
Year Fruits Vegetables Flowers
Nuts
(Almond
&
Walnut)
Aromatic
&
Medicinal
Plantation
crops spices Mushroom Honey
Grand
Total
2001-
02 43001
88622 535 114 NA 9697 3765
40 10
145785
2002-
03 45203
84815 735 114 NA 9697 3765
40 10
144380
2003-
04 45942
88334 580 121 NA 13161 5113
40 10
153302
2004-
05 50867
101246 659 121 159 9835 4001
40 10
166939
2005-
06 55356
111399 654 149 202 11263 3705
35 52
182816
2006-
07 59563
114993 880 150 178 12007 3953
37 51
191813
2007-
08 65587
128449 868 177 396 11300 4357
37 65
211235
2008-
09 68466
129077 987 173 430 11336 4145
37 65
214716
2009-
10 71516
133738 1021 193 573 11928 4016
41 65
223089
2010-
11 74878
146554 1031 In fruits 605 12007 5350
41 65
240531
2011-
12 76424
156325 1652 In fruits 566 16359 5951
NA NA
257277
2012-
13 81285
162187 1729 In fruits 918 16985 5744
NA NA
268847
2013-
14 88977
162897 2297 In fruits 895 16301 5908 NA 76 277352
Source: NHB Database, 2014 Table3. Annual Area, Production and Productivity Growth Trends of Total Horticultural
Crops); (2001-02 to 2013-14)

Year Area Production
%Growth
in Area
%Growth
in
Production
Productivity
(metric
tons/ha)
%Growth
in
Productivity
2001-02 16592 145785 8.8
2002-03 16270 144380 -1.9 -1.0 8.9 1.0
2003-04 19208 153302 18.1 6.2 8.0 -10.1
2004-05 18445 166939 -4.0 8.9 9.1 13.4
2005-06 18707 182816 1.4 9.5 9.8 8.0
2006-07 19389 191813 3.6 4.9 9.9 1.2
2007-08 20207 211235 4.2 10.1 10.5 5.7
2008-09 20662 214716 2.3 1.6 10.4 -0.6
2009-10 20876 223089 1.0 3.9 10.7 2.8
2010-11 21825 240531 4.5 7.8 11.0 3.1
2011-12 23242 257277 6.5 7.0 11.1 0.4
2012-13 23694 268847 1.9 4.5 11.3 2.5
2013-14 24198 277352 2.1 3.2 11.5 1.0 Source: NHB Database 2014, Calculated by Author
Table4. Trend Growth Rate in Area, Production and Productivity of Horticulture Crops of
India
(In Percent)
1991-92
to
1995-96
1996-97
to
2001-02
2001-02
to
2005-06
2006-07
to
2010-11
2011-12
to
2013-14
Area 1.37 1.74 2.41 2.36 1.42
Production 5.37 3.48 4.63 4.63 2.54
Productivity 4.17 1.74 2.18 2.13 1.19
Source: www.IndiaAgristat.com, Calculated by Author
Table5. Value of Output of Horticulture Crops with Percentage Share in Agriculture (At
constant prices)
(Rs ‘00 Crore)
Value of Output (Rs. '00 Crore)
% Share in Total Agriculture
2008-09 2009-10 2010-11 2008-09 2009-10 2010-11
All Agricultural Crops 5250 5241 5761
Total Fruits and Vegetables 1288.62 1286.18 1292.02 24.5 24.5 22.4
Total Condiments 155 170 185 2.9 3.2 3.2

&Spices
Total Floriculture 70 75 80 1.3 1.4 1.4
(i) Coconut 76 82 88 1.4 1.6 1.5
(ii) Cashew nut 17 20 14 0.3 0.4 0.2
(iii) Cocoa 0.2 0.19 0.2 0 0 0
(iv) Arecanut 28.5 29.07 37.6 0.5 0.6 0.7
Total Plantation Crops
(i)+(ii)+(iii)+(iv) 122 131 140 2.3 2.5 2.4
Total Horticulture 1635 1662 1697 31.1 31.7 29.5
Source: State wise estimates of output from Agriculture & Allied Activities, CSO, M/o Statistics &
Programme Implementation
Table 6. Area and Production of Horticulture Crops for the years (2011-12, 2012-13 and
2013-14)
(A: Area in '000 Ha; P: Production in '000 MT)
Crops 2011-12 2012-13 2013-14
Area Productio
n
PdY*
.
Area Productio
n
PdY*
.
Area Productio
n
PdY*
. Fruits
Banana 797 28455 35.7 776 26509 34.2 803 29725 37
Mango 2378 16196 6.8 2500 18002 7.2 2516 18431 7.3
citrus 915 7922 8.7 1042 10090 9.7 1078 11147 10.3
Papaya 117 4457 38.1 132 5382 40.7 133 5639 42.3
guava 220 2510 11.4 236 3198 13.6 268 3668 13.7
Apple 322 2203 6.8 312 1915 6.1 119 2585 21.8
Pineapple 102 1500 14.7 105 1571 14.9 313 2498 8
Sapota 163 1426 8.7 164 1495 9.1 177 1744 9.9
grapes 116 2221 19.1 118 2483 21.1 110 1737 15.8
Pomegranate 112 772 6.9 113 745 6.6 131 1346 10.3
litchi 80 538 6.7 83 580 7 84 585 7
Others 1383 8224 5.9 1402 9315 6.6 1484 9872 6.7
Fruits-total 6705 76424 11.4 6982 81285 11.6 7216 88977 12.3
Vegetables
Potato 1907 41483 21.8 1992 45344 22.8 1973 41555 21.1
tomato 907 18653 20.6 880 18227 20.7 1204 19402 16.1
Onion 1087 17511 16.1 1052 16813 16 882 18736 21.2
Brinjal 692 12634 18.3 722 13444 18.6 711 13558 19.1
tapioca 227 8747 38.5 207 7237 35 228 8139 35.7
cabbage 390 8412 21.6 372 8534 22.9 400 9039 22.6
Caulilower 391 7349 18.8 402 7887 19.6 434 8573 19.8
Okra 518 6259 12.1 231 6350 27.5 533 6346 11.9
Peas 408 3745 9.2 421 4006 9.5 434 3869 8.9
Sweet Potato 110 1073 9.8 112 1132 10.1 106 1088 10.3
Others 2352 30459 13 2815 33213 11.8 2492 32591 13.1
Veg.-total 8989 156325 17.4 9205 162187 17.6 9396 162897 17.3

Aromatic 506 566 1.1 557 918 1.6 493 895 1.8
Flowers Loose 254 1652 6.5 233 1729 7.4 255 1754 6.9
Flowers Cut* 75066 76732 543
Plantation
crops
3577 16359 4.6 3641 16985 4.7 3675 16301 4.4
Spices 3212 5951 1.9 3076 5744 1.9 3163 5908 1.9
Honey 76
Grand Total 2324
3
257277 11.1 2369
5
268847 11.3 2419
8
277352 11.5
Source: http://www.indiastat.com/ and www.IndiaAgristat.com, Data net India Pvt. Ltd.
PdY* Productivity (000 MT)
Table7. Percentage Share of Production of various Horticulture Crops in Total Horticulture
For last three years
Crops % Share in Total Horticulture
2009-10 2010-11 2011-12 2012-13 2013-14
Fruits 32.2 31.1 29.7 30.2 32.08
Vegetables 60 61 60.8 60.3 58.73
Flowers &Aromatics 0.7 0.7 0.9 1 1.15
Plantation Crops 5.3 5 6.4 6.3 5.88
Spices 1.8 2.2 2.3 2.1 2.13
Total Horticulture 100 100 100 100 100 Source: NHB Database 2014, Calculated by Author
Table 8. Production of Horticulture vis-à-vis Food grains
Year Production (In Million Tons)
Total Horticulture Total Foodgrain
2001-02 145.79 212.85
2002-03 144.38 174.77
2003-04 153.30 213.19
2004-05 166.94 198.36
2005-06 182.82 208.60
2006-07 191.81 217.28
2007-08 211.24 230.78
2008-09 214.72 234.47
2009-10 223.09 218.11
2010-11 240.53 244.49
2011-12 257.28 259.29
2012-13 268.85 257.13
2013-14 280.79 266.57
Source: Hand Book on Horticulture Statistics 2014, Ministry of Agriculture, Department of Agriculture and Cooperation, GOI

Fig2. Production of Horticulture vs. Production of food grains in India, from 2001-02 to
2013-14
Table9. Export of Horticulture Produce from India
2012-13 2013-14 2014-15
%age
share
PRODUCT Qty Rs. Lacs Qty Rs. Lacs Qty Rs. Lacs
in
2014-
15
Floriculture 27121.86 42344.6 22485.21 45590.62 22947.27 46077.23 0.35
Fruits & Vegetables Seeds 17168 34772.39 17816.7 41053.76 12499.31 42703.8 0.33
Fresh Onions 1666873 196662.7 1482499 316961.3 1238103 230054.14 1.75
Other Fresh Vegetables 768627.2 151633.6 953731.2 229332.3 835501.2 240223.6 1.83
Walnuts 5295.47 19983.57 6726.36 32453.5 2665.85 13645.24 0.1
Fresh Mangoes 55584.99 26471.78 41279.97 28542.85 42998.33 30253.66 0.23
Fresh Grapes 172744.4 125942.8 192616.9 166647.5 107257.8 108648.99 0.83
Other Fresh Fruits 263970.3 77975.78 240552.5 102159.2 274436.1 124588.02 0.95
Cucumber and Gherkins( Prepd. & Presvd) 238624.9 85659.18 218749.8 95520.18 251183 120242.24 0.92
Dried & Preserved Vegetables 68520.25 63795.76 56158.38 74271.74 63701.77 84713.55 0.65
Mango Pulp 147815.7 60855.73 174860.3 77294.76 154820.7 84138.54 0.64
Other Processed Fruits & Vegetables 269217.3 173305.5 287384.6 226660.3 316059.4 256991.89 1.96
Total 3701563 1059403 3694861 1436488 3322173 1382281 10.54
Source: APEDA, Ministry of Commerce and Industries GOI
145.8 144.4 153.3 166.9
182.8 191.8 211.2 214.7 223.1
240.5 257.3
268.9 280.8
212.9
174.8
213.2 198.4
208.6 217.3 230.8 234.5
218.1
244.5 259.3 257.1 266.6
0.0
50.0
100.0
150.0
200.0
250.0
300.0
Pro
du
ctio
n (m
illio
n t
on
ne
)
Year
Horticulture vs. foodgrain Production in India
Horticulture Production
Foodgrain Production
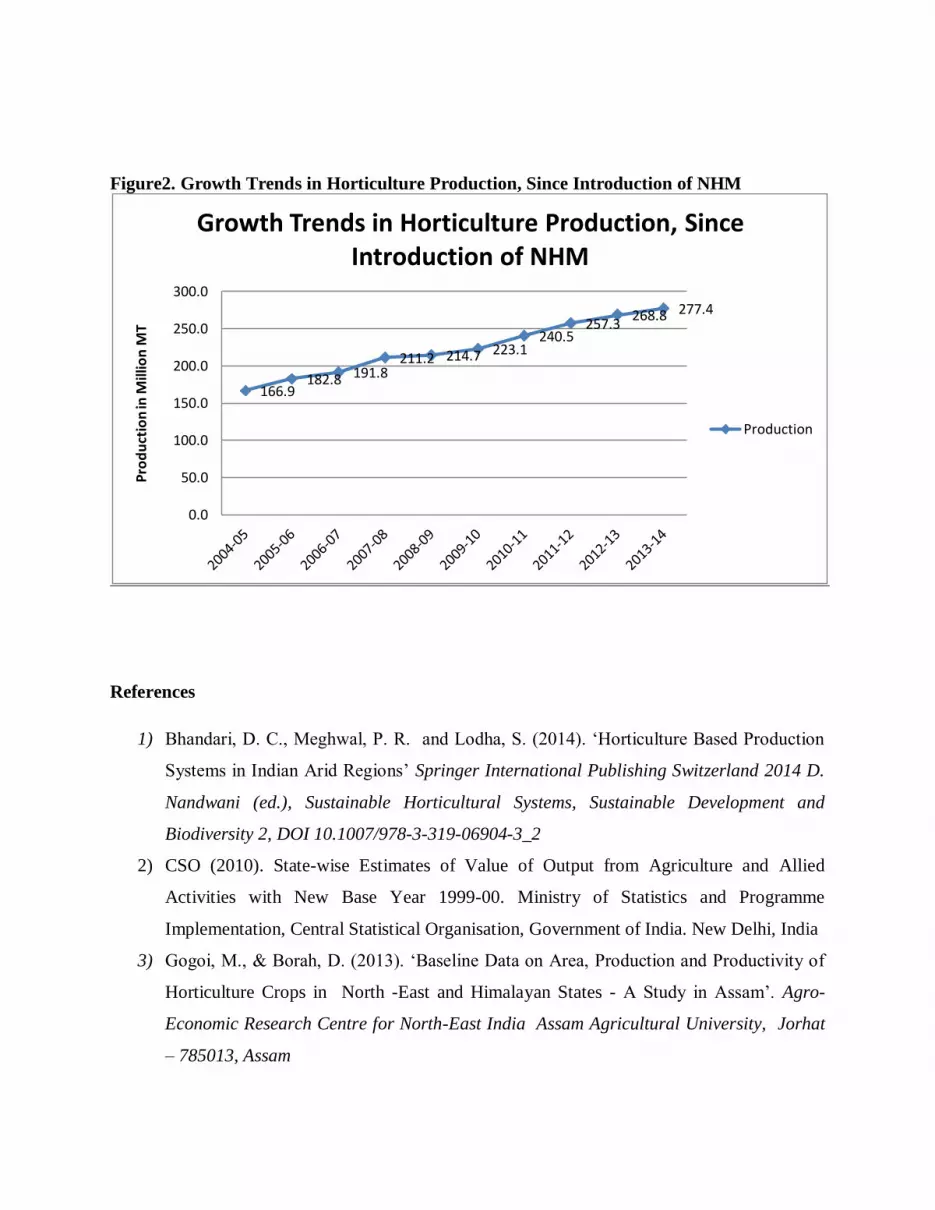
Figure2. Growth Trends in Horticulture Production, Since Introduction of NHM
References
1) Bhandari, D. C., Meghwal, P. R. and Lodha, S. (2014). ‘Horticulture Based Production
Systems in Indian Arid Regions’ Springer International Publishing Switzerland 2014 D.
Nandwani (ed.), Sustainable Horticultural Systems, Sustainable Development and
Biodiversity 2, DOI 10.1007/978-3-319-06904-3_2
2) CSO (2010). State-wise Estimates of Value of Output from Agriculture and Allied
Activities with New Base Year 1999-00. Ministry of Statistics and Programme
Implementation, Central Statistical Organisation, Government of India. New Delhi, India
3) Gogoi, M., & Borah, D. (2013). ‘Baseline Data on Area, Production and Productivity of
Horticulture Crops in North -East and Himalayan States - A Study in Assam’. Agro-
Economic Research Centre for North-East India Assam Agricultural University, Jorhat
– 785013, Assam
166.9 182.8 191.8
211.2 214.7 223.1 240.5
257.3 268.8 277.4
0.0
50.0
100.0
150.0
200.0
250.0
300.0
Pro
du
ctio
n in
Mill
ion
MT
Growth Trends in Horticulture Production, Since Introduction of NHM
Production

4) Kondal, K. (2014). Trends in Area and Production of Horticulture Sector in India.
ANVESAK, Vol. 44, No. 2.
5) Kumar Choudhary (2013) ‘Contribution Of National Horticulture Mission In Agricultural
Development’ International Journal of Advanced Research in Management and Social
Sciences ISSN: 2278-6236
6) Mittal, S. (2007). Can Horticulture be a Success Story for India? Working Paper No. 197,
Indian Council for Research on International Economic Relations, New Delhi, India
7) Nanda, N, Goswami, A. and Choudary, S. (2008) “Export Potentials of Indian
Horticultural Products in the US and EU” Energy and Research Institute New Delhi
8) NHB (2012). Indian Horticulture Database 2010. National Horticulture Board, Ministry
of Agriculture, Government of India, Gurgaon, India
9) NHB (2013). Indian Horticulture Database 2011. National Horticulture Board, Ministry
of Agriculture, Government of India, Gurgaon, India.
10) NHB (2014). Indian Horticulture Database 2010. National Horticulture Board, Ministry
of Agriculture, Government of India, Gurgaon, India
11) Singh, J. (2012). Basic Horticulture, Kalyani Publishers, New Delhi.
12) www.nhb.gov.in
13) www.nhm.nic.in
14) www.agricoop.nic.in
15) www.actahort.org
16) www.planningcommission.nic.in


