Embed Size (px)
Citation preview

Continental Shelf Research 59 (2013) 65–83
Contents lists available at SciVerse ScienceDirect
Continental Shelf Research
0278-43http://d
n CorrTrinas 4
E-m
journal homepage: www.elsevier.com/locate/csr
Research papers
Late winter coccolithophore bloom off central Portugal in response toriver discharge and upwelling
Catarina Guerreiro a,b,c,n, Anabela Oliveira a, Henko De Stigter c, Mário Cachão b,d,Carolina Sá e, Carlos Borges a, Lluϊsa Cros f, Ana Santos a, José-Manuel Fortuño f,Aurora Rodrigues a
a Portuguese Hydrographic Institute (IH), Rua das Trinas 49, 1249-093 Lisboa, Portugalb Geology Centre of the University of Lisbon, 1749-016 Lisboa, Portugalc Royal Netherlands Institute for Sea Research (NIOZ), Marine Geology Department, Texel, The Netherlandsd Department of Geology, Faculty Sciences, University of Lisbon, 1749-016 Lisboa, Portugale Oceanography Centre, Faculty of Sciences of University of Lisbon, 1749-016 Lisboa, Portugalf Institut de Ciencies del Mar (CSIC), Passeig Marítim de la Barceloneta, 37-49. E-08003 Barcelona, Spain
a r t i c l e i n f o
Article history:Received 11 October 2012Received in revised form4 February 2013Accepted 3 April 2013Available online 17 April 2013
Keywords:Coccolithophore ecologyRiver runoffEkman circulationHaline-stratificationPortuguese margin
43/$ - see front matter & 2013 Elsevier Ltd. Ax.doi.org/10.1016/j.csr.2013.04.016
esponding author at: Portuguese Hydrogra9, 1249-093 Lisboa, Portugal. Fax: +351 21750ail address: [email protected] (C. Guer
a b s t r a c t
Coccolithophore communities collected during late winter (9–19 March of 2010) over the centralPortuguese margin showed a major change in species abundance and composition within a few days'time, closely related to the highly transient meteorological and oceanographic conditions.
Particularly favourable conditions for coccolithophore growth resulted from late winter continentalrunoff combined with northerly winds prevailing over the shelf, under clear sky conditions. A nutrient-rich Buoyant Plume (BP) resulting from intense river water runoff prior to and during the start of thecruise, was observed to spread out over the denser winter mixed layer water beneath, and extendequatorwards and offshore under influence of Ekman superficial dynamics. Stabilization of buoyancy,settling of suspended sediment from the BP and the prevailing clear sky conditions in the transition tothe 2nd leg of the cruise resulted in optimum conditions for coccolithophores to develop, at the expenseof nutrient availability in the superficial sunlit layer. Within a few days, coccolithophore cell densitiesand associated phytoplankton biomass more than tripled, reaching maximum values of 145,000 cells/land �13 mg/l Chl-a, respectively.
Often considered as a uniform functional group of calcifying phytoplankton thriving in low-turbulence,low-nutrients and high-light environments, results presented in this study clearly show that coccolithophorelife strategies are much more diverse than expected. The increase of cell densities was mainly due to the bloomof Emiliania huxleyi and Gephyrocapsa oceanica in the coastal region west off Cape Carvoeiro, together withother opportunistic phytoplankton genera (Chaetoceros s.l., Thalassiosira s.l and Skeletonema s.l.). This confirmstheir role as early succession r-selected taxa, capable of rapid growth within nutrient-rich environments. Onthe contrary, Syracosphaera spp. and Ophiaster spp. displayed the characteristics of K-selected species, beingconsistently more abundant in more oceanic and less eutrophic waters, away from the influence of the BP,during both low- and high-productive periods.
A general description of coccolithophore communities as well as the environmental conditions during thisperiod is presented in this study (i.e. hydrography and nutrient availability). Multivariate analysis was used toinvestigate the impact of short-term environmental changes on the productivity and ecology of this group. Inview of the observed dominance of coccolithophores off Portugal during winter, this transitional periodappears particularly favourable for coccolithophores to develop. The results highlight the importance of takingshort-term hydrographic and meteorological variability into account when interpreting the ecologicalpreferences of coccolithophores from coastal-neritic-oceanic transitional settings.
& 2013 Elsevier Ltd. All rights reserved.
ll rights reserved.
phic Institute (IH), Rua das0119.reiro).
1. Introduction
Coccolithophores are a major group of unicellular marinephytoplankton, representing the main component of extant calcar-eous nannoplankton. Their ability to produce delicate calcite

C. Guerreiro et al. / Continental Shelf Research 59 (2013) 65–8366
platelets, the coccoliths, combined with their ocean-wide distri-bution, makes them the most productive calcifying organisms onEarth, with remarkable potential as paleoenvironmental markers(e.g. Winter et al., 1994; Ziveri et al., 2004; Silva et al., 2008). Inaddition to their unique role in the marine carbon cycle, formingpart of both the biological and carbonate pumps (Rost andRiebesell, 2004), they are likely to produce additional feedbackto climate due to their physical (albedo increase resulting from thehighly reflective masses of detached coccoliths) and biochemical(production of dimethylsulphonium propionate—DMSP) charac-teristics (Westbroek et al., 1993; Malin and Steinke, 2004).
The general biogeography and habitat characteristics ofcoccolithophores are known from plankton and bottom sedimentsurveys (McIntyre and Bé, 1967; Brand, 1994; Roth, 1994; Winteret al., 1994; Young, 1994; Ziveri et al., 2004). The group is usuallyassociated with oligotrophic conditions in warm and stratifiedwaters from low and middle latitude regions (e.g. McIntyre andBé, 1967; Winter et al., 1994; Ziveri et al., 2004). However, localphenomena such as coastal currents, gyres, eddies, upwelling,river runoff, are known to regionally affect their productivity(Cachão and Moita, 2000; Ziveri et al., 2004). Studies of moderncoccolithophores suggest that their ecology is mostly controlledby light and nutrient availability rather than by temperature andwater stratification alone. This is indicated by their occurrence inblooms (e.g. Knappertsbusch and Brummer, 1995; Souza et al.,2011) in the context of subtropical oligotrophic gyres or withinturbulent coastal and mature upwelled waters (e.g. Ziveri et al.,1995; Baumann et al., 1999; 2000; Cachão and Moita, 2000;Moita, 2001; Moita et al., 2010; Silva et al., 2008). More regionalstudies on living coccolithophores are required to calibrate theirspecific local ecological tolerances and to assess their potentialfor local paleoceanographic reconstructions (e.g. Andruleit et al.,2003).
Fig. 1. (a) Schematic map of the central Portuguese margin, showing topographic featusampling area. Arrows represent the main currents: river runoff (thick brown) and offshlines), summer equatorward shelf current (continuous blue), IPC (continuous black), Por(long dashed); (b) enlargement of the sampling area. Black squares and triangles refer toto stations where samples were collected for HPLC. Squares with a black contour refer tolabel indicate the locations where coccolithophore sampling was performed. Red and bluand west of Cape Carvoeiro, during the 1st and 2nd legs of the cruise, respectively, as shoreader is referred to the web version of this article.).
The central Portuguese margin (Fig. 1) is part of the NorthAtlantic Upwelling Region (see Relvas et al., 2007), and located onthe boundary between the transitional and the subtropical cocco-lithophore biogeographical zones (McIntyre and Bé, 1967). In anumber of important studies on the coccolithophore assemblagesliving off Portugal, the group generally appears to be dominantover diatoms during winter, when warmer and nutrient-depletedsubtropical waters flow onto the Portuguese shelf (Abrantes andMoita, 1999; Cachão and Moita, 2000; Cachão et al., 2000; Cachãoand Oliveira, 2000; Silva et al., 2008, 2009; Moita et al., 2010).The entrainment of subtropical water masses, originating fromsouth of the Azores Front into the Iberian Poleward Current duringwinter, is reflected in coccolithophore assemblages by the occur-rence of subtropical species like Algirosphaera quadricornu,Alveosphaera bimurata, Cyclolithus annulus, Florisphaera profunda,Michaelsarsia elegans, Syracosphaeara lamina and Turrilithus later-icioides, along with temperate species like Gephyrocapsa muellerae,Gephyrocapsa ericsonii and Emiliania huxleyi (Cachão et al., 2000).
More recently, during a four years weekly survey, Silva et al.(2008) performed the first systematic investigation of the cocco-litophore assemblages from offshore Portugal. This study con-firmed the preference of the group for non-upwelling conditions,although certain species appeared capable of withstanding coastalturbulence and well-adapted to the nutrient-rich coastal environ-ment (i.e. E. huxleyi, Gephyrocapsa oceanica). Later, Moita et al.(2010) identified the assemblage composed by Helicosphaeracarteri, Syracosphaera pulchra and Coronosphaera mediterranea asa summer tracer of subtropical waters upwelled along the south-western and southern coast of Portugal.
Here we report on coccolithophore assemblages collectedduring a two-leg hydrographic and plankton survey west offPortugal, during a late winter period (9–19 March 2010) at theend of an exceptionally negative phase of the North Atlantic
res and surface and deep currents mentioned in the text. Rectangle indicates theore and equatorward expansion of the buoyant river plume (curved brown dashedtugal Current (thick light grey), ENACWsp and ENACWst (short dashed), and MOWCTD casts from the 1st and 2nd legs (March, 2010), respectively. Green squares referstations where samples were collected for nutrient analysis. Stations with numbere lines represent the location of the density profiles along the upper-middle NC axiswn in Fig. 3 (For interpretation of the references to colour in this figure legend, the

C. Guerreiro et al. / Continental Shelf Research 59 (2013) 65–83 67
Oscillation. A detailed characterization of the living assemblages ispresented, as well as a general description of the meteorologicaland oceanographic conditions during the cruise (i.e. wind, hydro-graphy, chlorophyll-a and nutrient availability). Our aim is toinvestigate the impact of the transient environmental settings onthe ecology and productivity of this group in the central Portu-guese margin.
2. Regional setting
The central Portuguese margin has a relatively narrow shelf(20–50 km wide and a gradient of �11), which at 100–200 mdepth passes into a steep irregular slope (61–71). The shelf iscomposed of thick (41000 m) Cenozoic sediments covering aMesozoic substrate (Jouanneau et al., 1998) and dissected by anumber of long submarine canyons, namely the Nazaré, Cascaisand Setúbal–Lisbon canyons (e.g. Vanney and Mougenot, 1981;Alves et al., 2003; Lastras et al., 2009).
Surface water circulation along the Portuguese margin isdirectly dependent on two major current systems that transportsurface water masses from west to east across the Atlantic: theNorth Atlantic Current extending to the north of the IberianPeninsula, and the Azores Current south of Iberia (Saunders,1982; Pollard and Pu, 1985; Barton, 2001; Peliz et al., 2005). Asthe Azores Current flows eastwards, branches of thiscurrent smoothly loop northward into the Portugal Current andsouthward into the Canary Current (Saunders, 1982; Barton, 2001)(Fig. 1a).
The upper 500 m of water column off Portugal, including thesurface mixed layer and the first thermocline, are constituted byEastern North Atlantic Central Water (ENACW) which is the mainsource of the nutrient-rich upwelled waters along the Portuguesecoast. The ENACW has two main components of different origin,converging to this region: a lighter, relatively warm and saltysubtropical branch (ENACWst) formed along the Azores Front,which gradually loses its characteristics as it travels furthernorthwards along the Iberian margin; a less saline colder watermass of subpolar origin (ENACWsp), related to the Subpolar ModeWater formed in the eastern North Atlantic by winter cooling anddeep convection (Fiúza et al., 1998), slowly flowing southwardsbelow the poleward subtropical branch (Fig. 1a).
Beneath the near-surface equatorward flow of the Portugal andCanary currents, the Iberian Poleward Current (IPC) can berecognized travelling poleward, counter to the general circulationand closely bound to the continental slope, its core extendingabout 300–400 m vertically (Fig. 1a). This current is mostlyrestricted to the subsurface layers along most of the easternsubtropical gyre, but it surfaces whenever the Trade Windsweaken or turn northward (Barton, 2001).
Circulation over the Portuguese shelf and upper slope displaysa marked seasonal variation associated with seasonal shifts in theposition of the Azores high and Iceland low pressure systems(e.g. Haynes et al., 1993; Barton, 2001; Relvas et al., 2007). Duringsummer, the Azores high migrates towards the central Atlantic,typically inducing Trade Winds to become northerly, inducing anequatorward circulation over the upper 150–200 m of the watercolumn off Portugal. A surface layer of about 30 m thick ofrelatively warmer and lighter water is swept offshore by Ekmantransport, allowing colder, less salty and nutrient enriched subsur-face water to rise to the surface along the coast (e.g. Fiúza, 1983;Haynes et al., 1993; Barton, 2001; Relvas et al., 2007; Alvarez et al.,2011). During winter, when the Azores high is located furthersouth and the Iceland low intensifies, the dominant wind regimebecomes southerly along the western Portuguese margin. Thisinduces the IPC to rise over the upper slope and shelf, where the
poleward flow produces an onshore Ekman transport, in turnresulting in downwelling conditions over the shelf (Fiúza, 1983;Vitorino et al., 2002).
Discharge of fresh water from rivers and streams, leading to theformation of coastal low salinity water lenses, is another impor-tant feature of the winter circulation over the western Portuguesemargin. The Buoyant Plumes (BP's) that are thus formed eitherdevelop into inshore currents (Relvas et al., 2007; Otero et al.,2008) or spread further offshore, depending on the wind forcingconditions over the shelf (Otero et al., 2008). Under typical winterconditions, the onshore Ekman transport driven by prevailingsoutherly winds induces the saline front to move toward thecoast, thus forcing the BP to develop into a narrow coastal currentwith strong poleward velocities (e.g. Marta-Almeida et al., 2002;Oliveira et al., 2002; Relvas et al., 2007). When the southerly windsweaken or turn northerly, offshore spreading of the plume occurs,even when wind variation is of short (1–3 h) duration (Otero et al.,2008) (Fig. 1a). The Western Iberian Buoyant Plume is mostly fedby outflow from the northern Portuguese rivers (Mondego, Douro,Minho, Lima, Vouga), and is characterized by low salinities(o35.8) and lower temperature than the ambient shelf waters(Peliz et al., 2005).
The seasonally variable circulation on the Portuguese shelf andslope is also subject to interannual variation associated with theNorth Atlantic Oscillation (NAO), the latter resulting from fluctuationsin the difference of atmospheric pressure between the Azores highand the Iceland low. Under NAO high index conditions, Trade Windsincrease and bring moist air to Europe, leading to cool summers andmild and wet winters in central Europe and its Atlantic facade. Onthe contrary, NAO low index conditions are characterized by atmo-spheric temperature extremes with heat-waves and cold spells, andan increase of storm activity and rainfall in southern Europe andNorth Africa. Several studies indicate that in more recent yearsupwelling events off Portugal have decreased in intensity butincreased in frequency, occurring even during the winter period(e.g. Barton, 2001; Vitorino et al., 2002; Santos et al., 2004; Ribeiroet al., 2005; Silva et al., 2008; Alvarez et al., 2009), apparently linkedwith the trend toward the “high index” polarity of the NAO observedover the last decades, (Barton, 2001; Wallace, 2002).
3. Material and methods
3.1. Sample collection
Sampling was conducted between 9 and 19 of March 2010, onboard of NRP “Almirante Gago Coutinho” during the 2nd HERMIONE(Hotspot Ecosystem Research and Man's Impact on European Seas)scientific cruise. Coccolithophore communities were investigated in127 water column samples collected and analyzed from 39 CTD(conductivity, temperature, depth) casts from the Nazaré Canyonregion (Fig. 1b, Table 1). Samples were collected at discrete waterdepth levels between 5 and 110 m depth to assess the distribution ofcoccolithophores along the shelf and oceanic water column inrelation with hydrographic and biological characteristics.
During the 1st leg (9–12 March) CTD profiling and watersampling was conducted along a transect in the upper and middlepart of Nazaré Canyon following the canyon axis, as well as alongtransects across the upper canyon and surrounding shelf. Duringthe 2nd leg (15–19 March) profiling and sampling was conductedalong a transect crossing the Nazaré Canyon near the upper-middle canyon transition (stations 174, 176 and 258), and twotransects across the adjacent shelf and slope, one along thenorthern valley, a minor incision of the shelf break north of NazaréCanyon (stations 146, 142 and 251), and the other west off CapeCarvoeiro, south of the canyon.

Table 1List of stations fromwhich water column samples were collected for coccolithophore and nutrient analysis, with sampling date, latitude, longitude, general location, bottomdepth, depth intervals for water sampling and analysis carried out. The bottom nepheloid layer (BNL) was sampled in all stations with bottom depth ≤110 m.
Station Date Lat degN Long degW Location Bottomdepth (m)
Depth (m) Chl-a Nutrients
1st Leg: 09–12 March 201079 3/9/2010 39.617 −9.284 Upper NC axis 721.6 40, 50, 100 x x80 3/9/2010 39.629 −9.236 Upper NC axis 673.9 16.4, 25 x x81 3/9/2010 39.612 −9.221 Upper NC axis 588.2 5, 25, 5085 3/9/2010 39.590 −9.141 Upper NC axis 306.1 5, 25, 50, 100 x89 3/10/2010 39.577 −9.117 S of NC head 39.7 5, 25, BNL x x90 3/10/2010 39.589 −9.114 NC head 130.9 5, 25, 5093 3/10/2010 39.608 −9.112 N of NC head 33 5, 15, BNL x x94 3/10/2010 39.663 −9.114 N of NC head 36.6 5, 15, BNL x95 3/10/2010 39.629 −9.131 N of NC head 41.9 5, 15, BNL96 3/10/2010 39.607 −9.149 Upper NC 55.8 5, 25, BNL x98 3/10/2010 39.579 −9.159 Upper NC 361.4 5, 25, 50, 100 x x100 3/10/2010 39.551 −9.182 Upper NC 61.5 5, 25, 50, BNL x101 3/10/2010 39.531 −9.190 S of upper NC 50.6 5, 25, BNL x x102 3/10/2010 39.577 −9.224 S of upper NC 71.6 5, 25, 50, BNL x x103 3/10/2010 39.589 −9.216 S of upper NC 108.9 5, 25, 50 BNL105 3/10/2010 39.609 −9.203 Upper NC 250.8 5, 25, 50, 100109 3/10/2010 39.655 −9.174 N of upper NC 71 5, 25, 50, BNL x110 3/10/2010 39.676 −9.162 N of Upper NC 64.7 5, 15, 50, BNL x111 3/10/2010 39.697 −9.150 N of upper NC 61.6 5, 15, 25, BNL x x112 3/10/2010 39.713 −9.186 Vitoria Tributary 91 5, 25, 50, BNL x x113 3/10/2010 39.697 −9.201 Vitoria Tributary 128.6 5, 25, 50 x115 3/10/2010 39.672 −9.225 Vitoria Tributary 224.2 5, 25, 50 x122 3/11/2010 39.546 −9.452 Upper NC axis 1311 25, 50, 100 x131 3/12/2010 39.530 −9.805 Middle NC axis 3096.7 25, 50, 100 x132 3/12/2010 39.505 −9.903 Middle NC axis 3477.5 5, 25, 50
2nd Leg: 15−19 March 2010146 3/15/2010 39.623 −9.498 Northern valley 170.9 5, 7, 25, 50, 100 x x230 3/15/2010 39.342 −9.758 Cape Carvoeiro 165.1 25, 50 x x233 3/15/2010 39.342 −9.678 Cape Carvoeiro 46.1 5, 25, BNL x x234 3/15/2010 39.342 −9.651 Cape Carvoeiro 86.4 5, BNL235 3/15/2010 39.342 −9.608 Cape Carvoeiro 102.7 5, BNL x236 3/15/2010 39.342 −9.575 Cape Carvoeiro 99.8 5, 25, 50, BNL x x238 3/15/2010 39.342 −9.515 Cape Carvoeiro 53.5 5, 15, 25, BNL x238a 3/15/2010 39.342 −9.470 Cape Carvoeiro 37.7 5, 15, BNL x x142 3/16/2010 39.623 −9.609 Northern valley 752.3 10, 22 x x174 3/16/2010 39.517 −9.609 Upper-middle NC axis 1150.7 5176 3/16/2010 39.492 −9.609 Upper-middle NC axis 2024.1 5, 25, 50 x x258 3/18/2010 39.459 −9.800 NC southern slope 2279.7 5, 25, 50, 100 x x261 3/18/2010 39.384 −9.800 Slope W of Cape Carvoeiro 353.2 5, 25, 50, 100 x x251 3/19/2010 39.621 −9.800 Open slope 1589 5, 25, 50, 100 x x
C. Guerreiro et al. / Continental Shelf Research 59 (2013) 65–8368
Physical oceanographic, biological and chemical data (i.e. tem-perature, salinity, turbidity, fluorometry and nutrients) andwater column samples were collected using a combined NeilBrown MKIIIC CTD profiler equipped with an Aquatrackanephelometer, a Seapoint fluorometer and a rosette sampler (12Niskin bottles of 8 l). Around 192 samples of suspendedmatter were collected from surface, intermediate and bottomnepheloid layers in order to define the particulate matterconcentration and to calibrate the nephelometer response (tur-bidity). Calibration of turbidity was carried out following themanufacturer's recommendations. The used nephelometer has apulsed Xenon flash light source with high ultra violet content(440 nm), and measures light scattered back from suspendedparticles using a solar-blind photodiode detector. It has a veryhigh sensitivity to low values of turbidity, and to small particles(o4 mm), with a precision of 4% of the measured value. Measure-ments are not affected by Chl-a (680 nm). The particulate matterconcentration (PCM, g/m3) was compared to a laboratory calibra-tion of the instrument with a standard formazine solution (FTU).The turbidity calibration for March 2010, was FTU¼0.112� PMCwith r¼0.88.
CTD data are represented as contour plots constructed with theinverse distance to power gridding method of Surfer Version 8.
3.2. Meteorological and hydrographic data
Wind data were collected with an Aanderaa AWS 2700 coastalweather station located at Ferrel and maintained by the Portu-guese Hydrographic Institute (IH) (position: 391 23.3′N; 091 17.5′W, WGS84). Sea wave conditions were obtained from the MON-ICAN multiparametric buoy (IH) located offshore in the NazaréCanyon axis (position: 391 28′N; −91 40′W) (http://monican.hidrografico.pt/). Average daily river discharge data (m3/s) of the DouroRiver, measured at the hydrometric station at Crestuma (EDP)(position: 41104′N; 8129′W) were obtained from the SistemaNacional de Informação de Recursos Hídricos, SNIRH, from Insti-tuto da Água (http://snirh.pt). Photosynthetically Active Radiation(PAR) and monthly averaged chlorophyll-a data (Chl-a) for the areaand time interval involved in this study were downloaded fromthe Ocean Colour Website (http://oceandata.sci.gsfc.nasa.gov).These data were acquired by the Moderate-resolution imagingspectroradiometer (MODIS) on NASA′s Aqua satellite and pro-cessed by the Ocean Biology Processing Group (OBPG). Dailyimages covering the region of interest were averaged for PAR.Cloud coverage was also estimated from MODIS data, as thepercentage of pixels in the image flagged with “probable cloudor ice contamination”.

C. Guerreiro et al. / Continental Shelf Research 59 (2013) 65–83 69
3.3. Laboratory and microscope analysis
3.3.1. Phytoplankton pigments and nutrientsChlorophyll-a (Chl-a) concentrations were used as an indicator
for phytoplankton biomass. Water samples of 2 l were filtered overWhatman GF/F filters (0.7 μm pore size, 25 mm diameter), and thefilters were immediately deep-frozen and stored at −80 1C. Phyto-plankton pigments were extracted with 2–3 ml of 95% cold-buffered methanol (2% ammonium acetate) and analyzed withhigh-performance liquid chromatography (HPLC). Chromato-graphic separation was carried out following Zapata et al.(2000). Chl-a concentrations obtained from 38 HPLC samples werethen used to calibrate fluorometry measurements obtained fromCTD casts (r2¼0.7 and r2¼0.6, with po0.01, for the 1st and 2ndleg, respectively). Further details on the HPLC method used can befound in Mendes et al. (2007).
Water samples for nutrient analysis were filtered on board shipby vacuum with polycarbonate filters of 0.45 mm pore size and keptfrozen below −20 1C until analysis. Nutrient concentrations (NOx:nitrate/nitrite, ammonium, PO4: phosphate, and SiO2: dissolvedsilica) were determined using a Skalar SAN plus Segmented FlowAuto Analyzer specially designed for the analysis of saline waters.N–NOx and N–NO2 were determined according to Strickland andParsons (1972), with N–NO3 being estimated by the differencebetween the previous two; N–NH4 and Si–SiO2 were determinedaccording to Koroleff (1976); P–PO4 was determined according toMurphy and Riley (1962). All methods were adapted to themethodology of segmented flow analysis and uncertainties weredetermined following Mendes et al. (2011). Limits of quantificationand detection (¼1/3 LQ) were, respectively, the following: 0.50 and0.17 for nitrate+nitrite, 0.1 and 0.033 for nitrite, 1.0 and 0.33 forammonia, 0.2 and 0.067 for phosphate, and 0.3 and 0.1 for silica.
3.3.2. CoccolithophoresFor the study of coccolithophores, seawater samples of around
2 l were filtered over cellulose acetate filters (0.45 μm pore size,47 mm diameter) using a low pressure vacuum system. The filterswere then rinsed with tap water to remove salt and oven-dried at40 1C for 24 h. A randomly chosen section (approx. 301–451) ofeach filter (radius of �24 mm) was cut and permanently mountedon a glass slide. Coccospheres (cells) were identified and countedunder polarized light microscope (PLM) (Olympus BX-40) at1250� magnification. The examined area per filter variedbetween 3.0�105 and 3.4�106 mm2, depending on the generalcell density. The number of cells per liter (cells/l) was estimatedfrom the number of counted coccospheres in the examined areamultiplied with the ratio of total filter area to examined area anddivided by the volume of filtered water (Cros, 2001).
Taxonomy of coccolithophores was performed according toJordan et al. (2004). To refine the taxonomic differentiation ofSyracosphaera spp., Gephyrocapsa spp., Algirosphaera robusta andOphiaster spp., 18 samples were investigated using the ScanningElectron Microscope (SEM Hitachi S-3500N, at 5 kV). Sampleswere selected for containing relatively higher cell densities andspecies diversity. A randomly chosen section of the selectedfilters was fixed with colloidal Ag on a SEM stub and sputteredwith an Au–Pd coating of maximum 20 nm thick. A minimum of100 vision fields (VF) were then examined and coccospherescounted using magnifications between 1000� (observation areaof each VF: 1.2�104 μm2) and 2000� (observation area of eachVF: 3.0�104 mm).
3.4. Statistical analysis
In order to investigate the relationship between coccolitho-phore taxa and environmental conditions during the cruise, a
statistical multivariate analysis (r-mode Factor Analysis, by Statis-tica 10) was performed upon data matrices with coccolithophorecell densities, nutrient concentrations (NOx, PO4 and SiO2), Chl-aand physical parameters (temperature, salinity and turbidity) ascolumns (variables). In view of the very different conditionsencountered during the 1st and 2nd leg (see Section 4.1) the twolegs of the cruise were analyzed separately from two distinctdata matrices. Only the more abundant coccolithophore specieswere considered (42000 cells/l). Results from the original datamatrices were optimized through Varimax Raw rotation.
4. Results
4.1. Environmental conditions during the cruise
Hydrographic profiling and plankton sampling took place at theend of what for southwest European standards was an unusuallycold winter (2009–2010), associated with an exceptionally nega-tive phase of the North Atlantic Oscillation (NAO) (Cattiaux et al.,2010; Troupin and Machín, 2012), as indicated by data from theNOAA-AVHRR data centre (http://www.knmi.nl/datacentrum/satellite_earth_observations/NOAA/2010). Whereas the winter mixedlayer still comprised the upper 150–200 m of the water columnover the shelf and upper slope, the period of sample collection wasmarked by transient meteorological and hydrographic conditions.During the 1st leg of the cruise, the general circulation on the shelfwas under the influence of intense river runoff, and intensified on-shore oceanic convergence induced by the southerly wind regimeprevailing prior to the cruise (Fig. 2). Hydrometric stations alongthe Douro River measured a peak discharge two weeks prior to thecruise.
A shift to northerly winds occurred on the 9th of March 2010,coinciding with the start of the cruise. Initially alternating innortherly and southeasterly direction during most of the 1st leg,the wind increased in strength (max. �15 m/s) and becamepersistently northerly in the interval between the two legs, turn-ing back to southerlies on the 15th of March at the start of the 2ndleg (Fig. 2). Sea wave conditions were mostly moderate, dominatedby significant wave heights (Hs) between 1.4 and 2.3 m, mainlycoming from W to NW. Ocean colour satellite images indicate acloud coverage 450% during most of the cruise except at the endof the 1st leg and the two following days when skies weregenerally clear. The clear skies resulted in a relative increase ofPhotosynthetically Active Radiation (PAR) in this short period(Fig. 2).
During both legs of the cruise a well-established surface layerof less dense water was observed, with markedly lower tempera-ture and salinity than that of the underlying winter mixed layer.The layer, interpreted as a buoyant plume (BP) resulting from therecent high river discharge, extended from near the coast to morethan 50 km offshore (see water density profiles in Fig. 3a and b).During the 1st leg, while there was still important river dischargeto the shelf, T and S values in the BP were conspicuously low (min.14.2 1C and 33.8, respectively), slightly increasing during the 2ndleg (min. 14.4 1C and 34.8, respectively), following three days ofpersistent northerly wind.
Significant variability in thickness of the BP and in the steep-ness of the TS gradient at its base was noticed during both legs ofthe cruise. During the 1st leg, closer to the coast, the BP was40–50 m thick and gradually increasing in TS from the surfacedown to the winter mixed layer below, suggesting significantvertical mixing between the two water masses; further offshore,the BP decreased to 15–20 m thick with a relatively steep TSgradient at its base. During the 2nd leg, the BP appeared to haveincreased in thickness relative to what was observed during the

Fig. 2. Time series of relevant meteorological parameters and Douro River discharge measured in March 2010. Mean Photosynthetically Active Radiation (PAR, Einstein/m2/day)and cloud cover (%) determined from satellite imagery. Douro River daily average discharge (m3/s) from the Crestuma (EDP) hydrometric station.Wind intensity (m/s) and directionfrom the coastal meteorological station at Ferrel. Northerly winds dominated from 9 to 15 of March, later changing to southerlies from 16 to 19 of March of 2010. Grey shaded areasmark the periods of the two legs of the cruise.
C. Guerreiro et al. / Continental Shelf Research 59 (2013) 65–8370
1st leg, with the TS gradient at its lower boundary extending insome cases to more than 100 m depth, closer to the shelf-break.The BP decreased in thickness and at the same time became moresharply defined in offshore direction, with the thinnest BP occur-ring at the more distal stations off Cape Carvoeiro.
The warmer and saltier winter mixed layer underneath the BPwas present in the entire investigated region, at depths generallybetween 15 and 20 m and 200 m. Higher TS values close to theshelf-break, at the upper-middle Nazaré Canyon transition, andfurther offshore along the southern flank of the Nazaré Canyon,trace out the core of the IPC along the upper slope. Further northalong the slope around �39.51N, lower TS values indicate mixingof the IPC with colder water masses from north.
The boundary with the colder and less saline superficial layerwas particularly well-defined during the 1st leg, when the core ofthe IPC was centred less than 10 km off the coast. The TS gradientmarking the boundary between the BP and the winter mixedlayer water appeared less acute in CTD profiles measured duringthe 2nd leg, suggesting mixing of the two water masses hadtaken place.
Whereas turbidity was generally low during the cruise, somenear-shore stations monitored during the 1st leg showed higherturbidity at the surface. Enhanced turbidity was clearly associatedwith the BP, as the highest FTU values corresponded to the lowestsalinity. High turbidity values recorded around 200–300 m waterdepth in the upper canyon, however, appear to reflect bottomsediment resuspension caused by the canyon's internal tide.
4.2. Nutrients
During the 1st leg, highest nutrient concentrations wererecorded in the relatively cool and low-saline surface water ofthe BP, decreasing to lower concentrations in the winter mixedwater layer below the surface (Fig. 4). The decrease with depthwas particularly noticeable in the case of SiO2. During the 2nd leg,nutrient concentrations in the superficial water layer appeared tohave significantly decreased, becoming lower than in the under-lying water mass. In the deeper water layer nutrients had alsodecreased but much less than near the surface. The rapid depletion
of nutrients from the superficial water layer, and slower decreasein nutrient concentrations below the surface is likely reflectinghigher rates of nutrient consumptions by phytoplankton at thesurface during this time of the cruise. This is particularly apparentfor NOx, but to a lesser degree for PO4 and SiO2.
Median+/− standard deviation of NOx/PO4 ratio in superficialwater layer was 16.1+/−2.1 and 3.8+/−3.8 during the 1st and 2ndleg, respectively, close to the 16:1 Redfield Ratio typical for marinewaters (Redfield et al., 1963). Lower ratio's occurring in samplesfrom the 2nd leg suggest that NOx was becoming the limitingnutrient for phytoplankton growth at that time.
4.3. Phytoplankton biomass (Chl-a) and coccolithophore celldensities
Phytoplankton biomass (Chl-a) and coccolithophore celldensities (cells/l) drastically increased from the 1st leg (max.o1 mg/l and 4.2�104 cells/l) to the 2nd leg (max. �13 mg/l and15�104 cells/l). Both were generally higher at the upper part ofthe water column, associated with the relatively cool and low-saline superficial layer, and gradually decreasing with depth(Fig. 5). The highest Chl-a concentrations and cell densities werefound off Cape Carvoeiro and further NW, where the northernvalley cuts the shelf-break north of the Nazaré Canyon. Whereascoccolithophore cell densities displayed only a weak positivecorrelation with phytoplankton biomass and no correlation withnutrients during the 1st leg (Fig. 6), a strong positive correlationwith phytoplankton biomass and a negative correlation with NOx
and PO4 was observed during the 2nd leg, reflecting the growth ofcoccolithophores at the expense of nutrients in the surface waterlayer (Fig. 7).
Additional pigment data (C. Sá personal communication, datanot presented in this study) revealed that coccolithophores anddiatoms, constituting the two dominant phytoplankton groups,contributed equally to total Chl-a concentration during the 1st leg,with diatoms being generally more abundant at the surface andcoccolithophores in deeper subsurface waters. During the 2nd leg,diatoms were clearly the dominant phytoplankton group and themain contributor to Chl-a production, except further offshore

Fig. 3. Representative density sections based on CTD casts along two coast-to-ocean transects: (a) WSW—ENE transect along the axis of the upper to middle part of NazaréCanyon (NC) covered during the 1st leg, and (b) W—E transect off Cape Carvoeiro covered during the 2nd leg. Location of the transects is indicated on Fig. 1. CTD stationpositions are indicated by tick marks along the top of the graph. Number labels refer to CTD stations where coccolithophore samples were collected.
C. Guerreiro et al. / Continental Shelf Research 59 (2013) 65–83 71
where other groups recorded an increase of their relative abun-dances (station 251).
4.4. Coccolithophore species diversity and ecological preferences
A total of 35 distinct taxa of coccolithophores (coccospheres)were recognized. 19 species and four genera were identified usingPLM whereas an additional Scanning Electron Microscope analysisrevealed 14 species belonging to the genera Syracosphaera, Ophia-ster, Alisphaera and Acanthoica, and one species of holococcolitho-phore (for the complete list of taxa, see Appendix A). Of the 35identified coccolithophore taxa, only 10 reached cell densities ofmore than 2000 cells/l which we considered as significant forsubsequent analysis. Mean and maximum abundances of differenttaxa during the two legs, as determined from PLM observations,are indicated in Table 2. The 10 more significant taxa were(in order of maximum abundance): E. huxleyi, G. ericsonii, G.oceanica, G. muellerae, Syracosphaera spp. (dominated by S. margin-oporata), C. mediterranea, Ophiaster spp. (dominated by O. hydro-ideus), Helicosphaera carteri, Syracolithus dalmaticus and A. robusta.Other plankton groups observed on filters collected during the 2ndleg include diatoms (Chaetoceros sp., Rhizosolenia sp., Skeletonemacostatum, Thalassionema sp, Thalassiosira sp.), silicoflagellates(Dictyocha fibula), siliceous Chromista as Meringosphaera sp. andPrymnesium neolepis; and dinoflagellates (Ceratium sp., Protoper-idinium sp.), calcareous dinoflagellates (Thoracosphaera s.l.), radi-olarians (Sticholonche zanclea), choanoflagellates, tintinnids andforaminifera.
The strong increase in coccolithophore abundance observedduring the 2nd leg of the cruise was mostly due to a strongincrease of E. huxleyi, and to a lesser extent of G. oceanica andC. mediterranea (Fig. 8). All three species can be characterized assurface dwellers, being consistently more abundant at the surfaceand gradually decreasing with depth.
G. ericsonii and S. dalmaticus had also increased during the 2ndleg, although less strongly in comparison to the previous threespecies. G. ericsonii revealed a broad vertical distribution duringboth legs, whereas S. dalmaticus was preferably more abundant atthe uppermost 5–25 m (Fig. 8).
G. muellerae, Ophiaster spp. and Syracosphaera spp. kept similarcell densities during both periods, although slightly decreasingtheir maxima during the 2nd leg. Whereas all three revealed abroad vertical distribution, the latter two can be characterized asdistinct subsurface dwellers. H. carteri and A. robusta were gen-erally low abundant during the cruise without a specific waterdepth preference, although maxima of both were observed in thesurface water layer.
During both legs, coccolithophore assemblages from the bot-tom nepheloid layer (BNL) generally appeared to reflect those fromthe surface water layer, dominated by the more productivesurface-dwelling species (E. huxleyi, G. ericsonii, G. oceanica andC. mediterranea) and, to a lesser extend from the subsurface-dwelling taxa Syracosphaera spp. and Ophiaster spp. The maximumabundance of H. carteri during the cruise was observed in the BNLof station 93, collected during the 1st leg.
During the 1st leg, higher turbidity at the surface appeared tobe caused by suspended sediment load supplied by runoff,

Fig. 4. Salinity (PSS-78) and nutrient concentrations (mmol/l) measured in the upper 100 m of the water column during the 1st and 2nd leg of the cruise (light and darksymbols, respectively).
Fig. 5. Coccolithophore cell densities (cells/l) and phytoplankton biomass (Chl-a mg/l) in the upper 110 m of the water column, measured during the 1st leg (a) and 2nd leg(b) of the cruise.
C. Guerreiro et al. / Continental Shelf Research 59 (2013) 65–8372
whereas during the 2nd leg, turbidity showed a good correlationwith Chl-a, suggesting it was then related to enhanced phyto-plankton productivity (see Fig. S1 in Appendix B).
Coccolithophore assemblages showed considerable variation inabundance and taxonomic composition, not only in time (1st and2nd leg) and water depth (surface and subsurface layer), but alsolaterally (near-shore and offshore). As illustrated by Fig. 9, thelarge increase in coccolithophore abundance from the 1st to the2nd leg (from less than 4.3�104 cells/l to more than 14�104
cells/l, respectively) was mostly accounted for by surface-dwellingtaxa like E. huxleyi, particularly in stations on the shelf and upperslope where the BP was well developed. The boundary betweenthe BP and the underlying winter mixed layer was marked by adistinct step in T and S, clearly visible in all the CTD profiles, exceptthose from the most offshore stations, where the plume is absentand the winter mixed layer occupies the entire water column up tothe surface (stations 132 and 251).
Highest cell densities of E. huxleyi occurred west of CapeCarvoeiro, where it appeared closely associated with the highestChl-a concentrations and maxima of small-chain diatom speciesconsidered to be 1st stage taxa in phytoplankton succession(Margalef, 1978) (e.g. Thalassiosira spp., Chaetoceros spp., Skeleto-nema spp.). The significant increase of G. oceanica and C. mediter-ranea during the 2nd leg appeared also closely related with thesuperficial BP. Maxima of G. oceanica occurred close to the coastwest off Cape Carvoeiro (station 238), whereas the maximum of
C. mediterraneawas reached further offshore at the northern valley(station 146). In the latter area, modest increases in some otherspecies such as Syracosphaera spp. and Ophiaster spp., wereobserved, as well as a broader vertical distribution of coccolitho-phores and stronger correlation between coccolithophore cells andphytoplankton biomass (Chl-a). This makes the northern valleyappear different from the area off Cape Carvoeiro.
A similar increase in abundance was not noticed in the mostoceanward stations where the BP was absent and the wintermixed layer occupied the entire water column up to the surface(stations 132 and 251, respectively Fig. 9c and f). In those stations,E. huxleyi was subordinate to less prolific surface dwellers like G.ericsonii and subsurface dwellers like Ophiaster spp. and Syraco-sphaera spp. even during the 2nd leg. The latter genera wereobserved displaying a broad vertical distribution along the entire100 m at these distal locations.
4.5. Multivariate analysis
In order to explore and statistically demonstrate the rapidresponse of coccolithophore taxa (and phytoplankton s.l.) to theshort-term environmental variations that occurred during thecruise, factor analysis was performed using the cell densities ofthe dominant coccolithophore taxa and the physical–biologicalproxies as variables in one single data matrix. In view of the verydifferent environmental conditions and ecological responses

Fig. 6. Scatter plots of phytoplankton biomass (Chl-a, mg/l) and nutrient concentration (NOx, PO4, SiO2, mmol/l) versus coccolithophore cell density (cell/l) measured duringthe 1st leg of the cruise, showing a weak positive correlation between coccolithophore cell density and phytoplankton biomass, and no correlation between coccolithophorecell density and nutrients.
C. Guerreiro et al. / Continental Shelf Research 59 (2013) 65–83 73
encountered during the two legs of the cruise, factor analysis wasperformed on data from each of the two legs of the cruiseseparately. Only the samples for which nutrient data were avail-able were considered as cases in the factor analysis. Since thelateral coast-to-ocean and vertical water column gradients appearas the most significant ecological gradients, factor scores wereplotted against distance to coast and water depth (Figs. 10–12).
Four factors explained 55% and 73% of the total variance in thedata from, respectively, the 1st and 2nd leg, of which Factor 1 (F1)and Factor 2 (F2) were considered the most statistically relevantfor subsequent environmental analysis (Table 3).
For the 1st leg, F1 (28%) is mostly represented by nutrients(positive loadings) in opposition to salinity, temperature andSyracosphaera spp. (negative loadings), whereas F2 (13%) is repre-sented by Chl-a, Ophiaster spp. and Gephyrocapsa ericsonii (positiveloadings).
Samples influenced by the factor assemblage NOx, PO4 and SiO2
(F1 positive scores) are better represented at the surface waterlevel close to the coast (Fig. 10a). The lack of nutrient data at thesurface of the more distal stations (i.e. 122 and 131) limits ourperception about its latitudinal distribution at surface level. Belowthe surface this assemblage is practically inexistent or weaklyrepresented. Samples influenced by the factor assemblage salinity,temperature and Syracosphaera spp. (F1 negative scores) aremostly found at deeper levels below the surface and furtheroffshore along the entire uppermost 100 m. Samples influencedby the factor assemblage Chl-a, Ophiaster spp. and G. ericsonii(F2 positive scores) are preferentially distributed further offshore,revealing a rather broad vertical distribution (Fig. 10b).
For the 2nd leg, F1 (38%) is represented by temperature andsalinity (positive loadings) in opposition to E. huxleyi, turbidity,
Chl-a, G. oceanica, C. mediterranea, S. dalmaticus and H. carteri(negative loadings), whereas F2 (16%) is represented by G. muel-lerae, Syracosphaera spp. and G. ericsonii (positive loadings) inopposition to temperature (negative loadings).
Samples influenced by the factor assemblage E. huxleyi, turbid-ity, Chl-a, G. oceanica, C. mediterranea, S. dalmaticus and H. carteri(F1 negative scores) are better represented at the surface waterlevel in more neritic-coastal regions, i.e. off Cape Carvoeiro(Fig. 11a) and at the northern valley (Fig. 12a). Underneath thesurface and further offshore along the entire water column, thisassemblage appears nearly absent. Samples influenced by tem-perature and salinity (F1 positive scores) are mostly related to afurther offshore location (station 251), broadly distributed alongthe uppermost 50 m depth (Fig. 12a). Samples influenced by thefactor assemblage G. muellerae, Syracosphaera spp. and G. ericsonii(F2 positive scores) are mostly distributed further offshore, withthe strongest signal recorded at the NW limit of the study areabroadly distributed along the uppermost 50 m (station 251) andmore weakly represented at the surface water layer of station 146,at the northern valley (station 146). Temperature (F2 negativescores) is weakly opposed to the former assemblage and generallybetter represented west of Cape Carvoeiro (Fig. 11b).
Results from factor analysis were generally statistically signifi-cant, particularly during the 2nd leg, when a clear response ofphytoplankton in general, and coccolithophores in particular, tonutrient availability at the surface, was observed. The contrastbetween the two legs and the quick change of hydrographicconditions and related phytoplankton response is well representedby the lower versus higher statistical significance obtained for the1st and 2nd legs, respectively. Lower percentage of explainedvariance obtained for the 1st leg reflects the more steady-state and

Fig. 7. Scatter plots of phytoplankton biomass (Chl-a, mg/l) and nutrient concentration (NOx, PO4, SiO2, mmol/l) versus coccolithophore cell density (cell/l) measured duringthe 2nd leg of the cruise, showing a strong positive correlation between coccolithophore cell density and phytoplankton biomass, and negative correlation with nutrients(particularly PO4 and NOx).
Table 2Mean and maximum cell densities of the more important coccolithophore species (42000 cells/l, observed under PLM), for each sampling period, with water column depth,station and bottom depth for which maximum density was observed. (BNL¼bottom nepheloid layer ≤110 m). Minimum and maximum values of cell densities, temperature,salinity, turbidity, fluorometry, Chl-a measured by HPLC, phytoplankton biomass and nutrients (NOx, PO4 and SiO2) for the same set of samples are indicated below.
Taxa 1st leg: 9–12 March 2nd leg: 15–19 March
Cells/l Depth (m) Station Bottom depth (m) Cells/l Depth (m) Station Bottom depth (m)
Mean Max. Mean Max.Algirosphaera robusta 299 2049 5 101 51 290 1418 25 238 54Coronosphaera mediterranea 707 4536 BNL 94 37 1875 7728 5 146 171Emiliania huxleyi 9520 26353 5 89 40 37317 132900 5 236 100Gephyrocapsa ericsonii 2774 7115 BNL 111 62 5197 12096 25 146 171Gephyrocapsa muellerae 1644 9466 50 98 361 1306 3746 25 251 1589Gephyrocapsa oceanica 534 3893 15 111 62 2402 11841 15 238 54Helicosphaera carteri 140 5184 BNL 93 33 174 854 5 238a 38Ophiaster spp. 1510 5544 25 132 3478 1049 5197 25 238 54Syracolithus dalmaticus 113 3209 25 115 224 494 2722 5 236 100Syracosphaera spp. 2447 8951 5 132 3478 2426 8307 100 251 1589
Min. Max. Min. Max.
Cells/l 3629 42077 7818 144693Temperature (ºC) 13.9 15.04 14.3 15.1Salinity (PSS-78) 34.3 36.2 35 36.2Turbidity (FTU) 0.02 0.19 0.02 0.08Fluorometry (lm/l) 0.11 1.02 0.1 5HPLC Chl-a (lm/l) 0.06 0.69 0.67 12.3Phyto. biomass (Chl-a lm/l) 0.15 0.63 0 12.6NOx (lmol/l) 2.3 9.7 0.4 6.7PO4 (lmol/l) 0.1 0.6 0.1 0.3SiO2 (lmol/l) 1.7 10.7 0.3 2.5
C. Guerreiro et al. / Continental Shelf Research 59 (2013) 65–8374
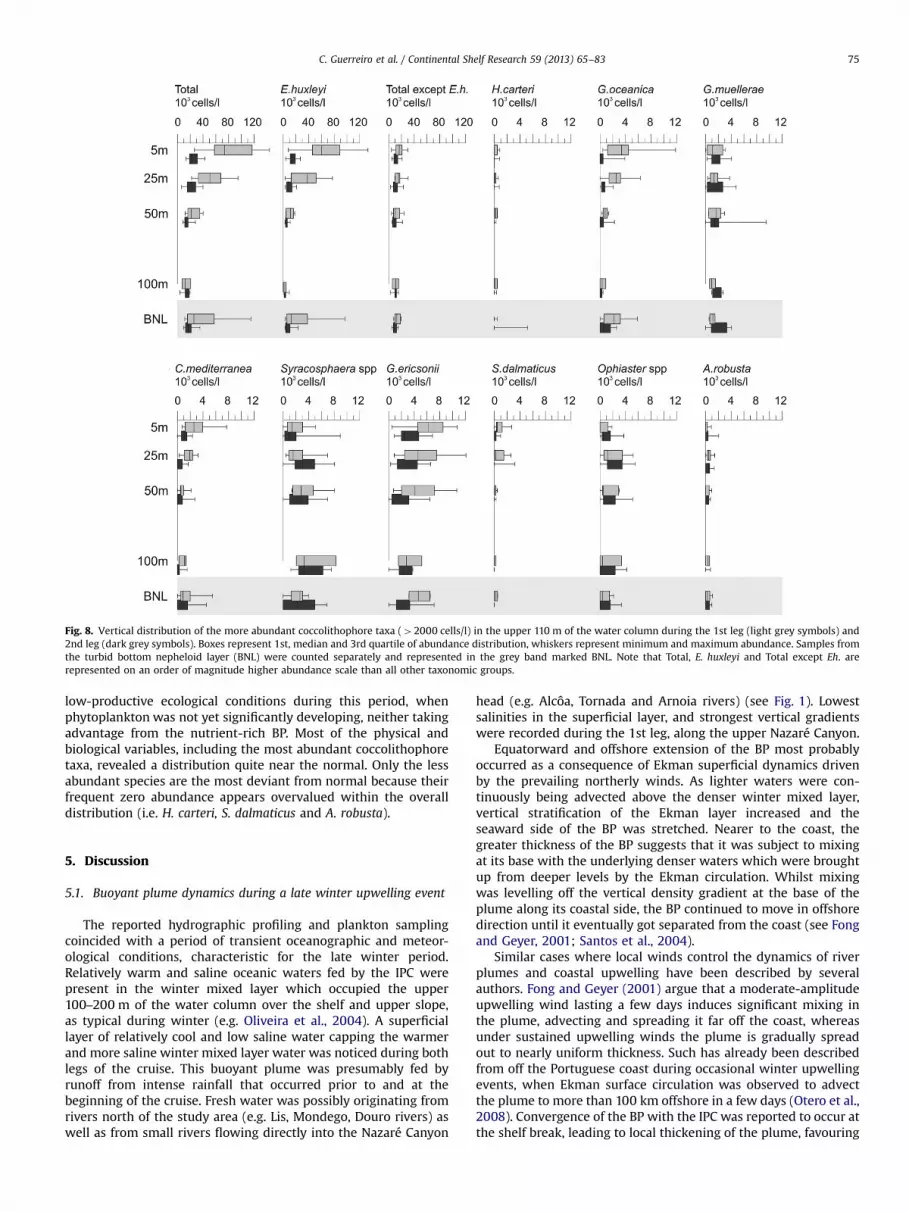
Fig. 8. Vertical distribution of the more abundant coccolithophore taxa (42000 cells/l) in the upper 110 m of the water column during the 1st leg (light grey symbols) and2nd leg (dark grey symbols). Boxes represent 1st, median and 3rd quartile of abundance distribution, whiskers represent minimum and maximum abundance. Samples fromthe turbid bottom nepheloid layer (BNL) were counted separately and represented in the grey band marked BNL. Note that Total, E. huxleyi and Total except Eh. arerepresented on an order of magnitude higher abundance scale than all other taxonomic groups.
C. Guerreiro et al. / Continental Shelf Research 59 (2013) 65–83 75
low-productive ecological conditions during this period, whenphytoplankton was not yet significantly developing, neither takingadvantage from the nutrient-rich BP. Most of the physical andbiological variables, including the most abundant coccolithophoretaxa, revealed a distribution quite near the normal. Only the lessabundant species are the most deviant from normal because theirfrequent zero abundance appears overvalued within the overalldistribution (i.e. H. carteri, S. dalmaticus and A. robusta).
5. Discussion
5.1. Buoyant plume dynamics during a late winter upwelling event
The reported hydrographic profiling and plankton samplingcoincided with a period of transient oceanographic and meteor-ological conditions, characteristic for the late winter period.Relatively warm and saline oceanic waters fed by the IPC werepresent in the winter mixed layer which occupied the upper100–200 m of the water column over the shelf and upper slope,as typical during winter (e.g. Oliveira et al., 2004). A superficiallayer of relatively cool and low saline water capping the warmerand more saline winter mixed layer water was noticed during bothlegs of the cruise. This buoyant plume was presumably fed byrunoff from intense rainfall that occurred prior to and at thebeginning of the cruise. Fresh water was possibly originating fromrivers north of the study area (e.g. Lis, Mondego, Douro rivers) aswell as from small rivers flowing directly into the Nazaré Canyon
head (e.g. Alcôa, Tornada and Arnoia rivers) (see Fig. 1). Lowestsalinities in the superficial layer, and strongest vertical gradientswere recorded during the 1st leg, along the upper Nazaré Canyon.
Equatorward and offshore extension of the BP most probablyoccurred as a consequence of Ekman superficial dynamics drivenby the prevailing northerly winds. As lighter waters were con-tinuously being advected above the denser winter mixed layer,vertical stratification of the Ekman layer increased and theseaward side of the BP was stretched. Nearer to the coast, thegreater thickness of the BP suggests that it was subject to mixingat its base with the underlying denser waters which were broughtup from deeper levels by the Ekman circulation. Whilst mixingwas levelling off the vertical density gradient at the base of theplume along its coastal side, the BP continued to move in offshoredirection until it eventually got separated from the coast (see Fongand Geyer, 2001; Santos et al., 2004).
Similar cases where local winds control the dynamics of riverplumes and coastal upwelling have been described by severalauthors. Fong and Geyer (2001) argue that a moderate-amplitudeupwelling wind lasting a few days induces significant mixing inthe plume, advecting and spreading it far off the coast, whereasunder sustained upwelling winds the plume is gradually spreadout to nearly uniform thickness. Such has already been describedfrom off the Portuguese coast during occasional winter upwellingevents, when Ekman surface circulation was observed to advectthe plume to more than 100 km offshore in a few days (Otero et al.,2008). Convergence of the BP with the IPC was reported to occur atthe shelf break, leading to local thickening of the plume, favouring

Fig. 9. Water column profiles of phytoplankton biomass (mg/l), temperature (1C), salinity (PSS-78), suspended particulate matter (FTU) and coccolithophore assemblagesfrom three representative stations of the 1st leg of the cruise: Station 85 (306 m), Station 122 (1311 m) and Station 132 (3478 m), and three stations of the 2nd leg of thecruise: Station 236 (100 m), Station 146 (171 m) and Station 251 (1589 m).
C. Guerreiro et al. / Continental Shelf Research 59 (2013) 65–8376
the retention of biological material in this area (Peliz and Fiúza,1999; Santos et al., 2004; Ribeiro et al., 2005).
Such a scenario appears to apply also to our cruise: whereasriver runoff decreased, the northerly wind-driven Ekman circula-tion persisted, causing the BP to spread further offshore andbecome detached from the coast. Nevertheless, contrary to sum-mer upwelling episodes, during which northerly winds are moreintense and persistent over the Portuguese coast (e.g. Peliz et al.,2002; Alvarez-Salgado et al., 2003), the observed northerly windevent was probably not persistent enough to bring nutrients frombelow the deep (�150 m) seasonal pycnocline (e.g. Ribeiro et al.,2005). Moreover, vertical profiles along the uppermost 1000 m ofstations from the 1st leg (data not shown) revealed that nutrientconcentrations significantly decreased from the surface down to250 m depth and thus, no significant input would be expectedfrom the levels immediately below the pycnocline. Therefore, theobserved upwelling event should be viewed in terms of itscapacity to spread a thin nutrient-rich BP from the coast towardsoffshore, rather than as a mechanism of nutrient replenishment
from subsurface waters. That highest nutrient concentrations weremeasured within the BP indicates that nutrients were beingsourced mainly by runoff discharged by rivers prior to and at thebeginning of the cruise.
In comparison to some other areas of the world's oceans,nutrient concentrations during the cruise can be considered asgenerally low (Levitus et al., 1993), but enough to support thephytoplankton communities thriving in this area (see Section 4.2).N:P ratios falling below the typical 16:1 Redfield ratio in surfacewaters during the 2nd leg point at nitrogen as the main limitingnutrient for phytoplankton growth, in good agreement withseveral studies within coastal waters (Redfield, 1958; Redfieldet al., 1963; Ryther and Dunstan, 1971; Fisher et al., 1992; Labryet al., 2002; Mendes et al., 2011).
5.2. Productivity variations on a weekly basis
Results presented in this study strikingly illustrate the rapidresponse of phytoplankton to favourable environmental

Fig. 10. Water column density section (kg/m3) for a transect along the axis of the upper and middle part of NC, with spatial distribution of scores from Factor 1 (a) and Factor2 (b) obtained from the coccolithophore data from the 2nd leg. For taxonomical references, see Table 3.
Fig. 11. Water column density section (kg/m3) for a transect off Cape Carvoeiro, with spatial distribution of scores from Factor 1 (a) and Factor 2 (b) obtained from thecoccolithophore data from the 2nd leg. For taxonomical references, see Table 3.
C. Guerreiro et al. / Continental Shelf Research 59 (2013) 65–83 77
conditions. A brief period of northerly winds was enough topromote spreading of the nutrient-rich BP, favouring a massiveincrease in phytoplankton biomass and coccolithophore cell den-sities from the 1st to the 2nd leg of the cruise.
Vertical stratification associated with the BP appears to haveacted as a mechanism retaining both nutrients and cells within the
sunlit surface layer, leading to a remarkable phytoplankton bloomin the otherwise relatively nutrient-poor oceanic conditions thatprevail during winter on the central Portuguese margin (seeSantos et al., 2004; Ribeiro et al., 2005). Cells and nutrients wereclearly associated with the salinity minima of the BP and wereprobably advected along with it. This would explain why the

Fig. 12. Water column density section (kg/m3) for a transect along the northern valley cutting the shelf-break north of Nazaré Canyon, with spatial distribution of scores fromFactor 1 (a) and Factor 2 (b) obtained from the coccolithophore data from the 2nd leg. For taxonomical references, see Table 3.
Table 3Factor loadings (varimax raw), eigenvalues and percentage of the explainedvariance extracted from the data matrices referring the two legs of the cruise(r-mode Factor Analysis by Statistica 10; marked loadings are 40.6). Hc—Helico-sphaera carteri, Go—Gephyrocapsa oceanica, Gm—Gephyrocapsa muellerae,Cm—Coronosphaera mediterranea, Syraco—Syracosphaera spp., Eh—Emiliania hux-leyi, Ge—Gephyrocapsa erocsonii, Sdalm—Syracolithus dalmaticus, Ophi—Ophiasterspp., Arob—Algirosphaera robusta, T—Temperature, S—Salinity, Turb—Turbidityand Chl-a—phytoplankton biomass.
1st leg 2nd leg
F1 F2 F1 F2
Hc 0.0 0.0 −0.6 −0.1Go −0.2 −0.2 −0.7 0.0Gm 0.0 −0.4 0.3 0.8Cm 0.2 0.5 −0.6 0.0Syraco −0.6 0.2 0.3 0.8Eh 0.4 0.0 −0.9 −0.2Ge −0.2 0.6 −0.2 0.8Sdalm 0.5 −0.1 −0.6 −0.3Ophi −0.4 0.6 0.2 0.5Arob −0.2 0.2 0.1 0.1T −0.9 0.1 0.7 −0.6S −1.0 −0.1 0.7 0.1Turb 0.3 −0.3 −0.9 0.0Chl-a 0.3 0.8 −0.7 −0.1NOx 0.9 0.0 0.4 0.0PO4 0.7 0.0 0.5 0.1SiO2 0.6 0.0 −0.1 0.1Eigenvalues 4.7 2.1 6.5 2.8Total variance (%) 28 13 38 16
C. Guerreiro et al. / Continental Shelf Research 59 (2013) 65–8378
highest concentrations of Chl-a and coccolithophore cells occurredpreferentially at the surface of the more distal part of the transectwest off Cape Carvoeiro, where the BP was thinner andmore sharply defined at the surface. A map of Chl-a averageconcentration for March 2010 obtained from satellite data (see Fig.S2 in Appendix B) illustrates the broad spreading of this Chl-aenrichment, extending from the coast to the middle shelf region,and apparently originating from the north.
Although nutrients were already available at the time of the 1stleg of the cruise, and probably were still being replenished byrunoff from land, a clear response in phytoplankton productivitywas only observed during the 2nd leg. Such delay may beexplained partly by the higher advective mixing between the BPand shelf's ambient waters and significant cloud coverage duringthe 1st leg (see Fig. 2). When river runoff had decreased at the endof the 1st leg, the intensity of mixing between the BP and thedenser water layer below probably weakened, leading to stabiliza-tion of the vertical stratification (see Ribeiro et al., 2005). Theretention of cells within the BP promoted exposure of phytoplank-ton to sunlight and allowed cell division to remain constant aslong as the cells remained inside the BP (e.g. Smetacek andPassow, 1990; Ribeiro et al., 2005). With nutrient availabilityensured within the BP, light seems logically the ultimate factorneeded to set off the phytoplankton bloom. Clear skies and slightincrease of PAR (see Fig. 2) occurring in the interval between thetwo legs of the cruise may have provided the required favourablelight conditions.
Another factor that possibly contributed to the establishment offavourable conditions for phytoplankton to bloom within thesurface layer was the relatively low suspended sediment load inthe BP, therefore not significantly reducing light availability. Riverfloods occurring in autumn and early winter, when river basins arestill loaded with accumulated fine sediments, tend to dischargemuch more turbid waters onto the shelf, thereby inhibitingphytoplankton growth. Waters discharged as a result of the latewinter flood prior to our cruise were probably relatively clear. Themoderate sea wave conditions also contributed to the generallylow turbidity values during the cruise, and to the persistence ofthe water stratification, long enough to allow the development of aphytoplankton bloom at the surface. Even so, settling of suspendedsediment from the BP as it spread out in offshore direction mayhave played a role in improving light conditions near the surfaceas well as in deeper water. Change from a suspension-relatedturbidity during the 1st leg, to phytoplankton-related turbidity

C. Guerreiro et al. / Continental Shelf Research 59 (2013) 65–83 79
during the 2nd leg supports this hypothesis (see Fig. S1 inAppendix B).
Wind-driven turbulence, water stratification and mixed-layerdepth were already demonstrated to be important factorscontrolling phytoplankton access to its basic requirements forgrowth: light and nutrients (Doyon et al., 2000; Kudela et al.,2005). The importance of river runoff in providing nutrients tophytoplankton communities, and stratification of the upper watercolumn as a key-factor in the occurrence of phytoplankton bloomsduring winter and spring on the Portuguese continental shelf, havealso been confirmed by several authors (Peliz and Fiúza, 1999;Moita, 2001; Varela et al., 2001; Ribeiro et al., 2005; De Castroet al., 2006).
Moita (2001) found that Chl-a peaks during winter wereassociated with runoff-driven haline-stratification, particularlynorth of Cape Carvoeiro, and that phytoplankton growth duringspring occurred at the expense of nutrients replenished duringwinter when thermal stratification was still weakly developed.During this transient period the relatively well-mixed watercolumn showed a certain degree of stability at the uppermostwater levels, where blooms occurred very close to the surfacefollowing calm and relatively warm days and in the presence ofsome haline-stratification. Peliz and Fiúza (1999), analyzingCoastal Zone Colour Scanner images obtained between 1979 and1985, concluded that the highest Chl-a concentrations occurred inwinter over the shelf and slope, extending to large distances offthe coast. They appeared associated with the offshore spreading ofriver plumes, eventually occupying the whole shelf and slope zonein about one week (e.g. Peliz and Fiúza, 1999; Santos et al., 2004).The role of Cape Carvoeiro in rapidly redirecting the nutrient-richBP further offshore, following similar dynamics as associated withthe generation of chlorophyll-rich upwelling filaments extendingto the ocean during summer, should not be discarded (e.g. Fiúza,1983; Haynes et al., 1993; Peliz et al., 2002).
The late winter bloom here described occurred at the expenseof nutrients within the BP, as indicated by the significantdecrease of NOx, PO4 and SiO2 at the surface. A lesser decreasein nutrient concentrations at deeper levels is indicative of lowerconsumption rates below the surface (Fig. 4). Chl-a concentra-tions reported in this study revealed to be much higher than sofar reported from the Portuguese margin, with a maximum Chl-aof 13 mg/l off Cape Carvoeiro, compared to 4.3 mg/l in the Nazarécanyon region in June of 2006 (Mendes et al., 2011), max. 46 mg/loff CapeS. Vicente and along the coastal region north of Cape Carvoeiro,during summer, and max. 6.3 mg/l off Faro, during spring (Moita,2001), max. �3.5 mg/l in the NW region of the Portuguese shelf,February of 2000 (Ribeiro et al., 2005), and max. 5.3 mg/l in LisbonBay, February 2005 (Silva et al., 2009). The winter–spring transi-tion may thus lead to a stronger ecological response thanoccurring during the summer-upwelling season, when windand sunlight conditions are usually more persistently favourable.
Pigment data from this period indicate that diatoms were thedominant phytoplankton group and the main contributor for Chl-aproduction, particularly at the uppermost water layer (data notshown). The conspicuous depletion of SiO2 at the surface, observedespecially off Cape Carvoeiro therefore likely reflects the bloom ofsmall-chain diatoms (see Margalef, 1978). Rapid exhaustion ofsilica by diatoms apparently led coccolithophores to profit fromNOx and PO4 still available at the surface, contributing to theirunexpectedly rapid and significant bloom near the coast.
5.3. Coccolithophore ecological preferences
Often considered as a uniform functional group of calcifyingphytoplankton thriving in low-turbulence, low-nutrients and
high-light environments, results presented in this study clearlyshow that coccolithophore life strategies are much more diversethan expected. The most striking ecological variations occurredalong the coastal-oceanic lateral gradient and vertically along theupper photic layer. It is clear that some taxa were favoured by theoffshore spread of the BP, taking profit from nutrient and lightavailability at the surface, whereas others preferably developedbelow the surface and further offshore, away from the influence ofriver runoff (see Figs. 9–12). Results from factor analysis clearlyconfirmed such short-term ecological changes.
Factor analysis for the 1st leg clearly illustrates the strongestcontrast between the coastal-neritic region affected by nutrient-rich runoff waters in the BP and the oceanic mixed water massfurther offshore observed in this period. Only few coccolithophorespecies displayed some direct relation with such lateral gradient:subsurface dweller Syracosphaera spp. preferably associated tomore oceanic and oligotrophic water conditions below the surfaceand along the entire uppermost 100 m further offshore (F1,Fig. 10a), whereas Ophiaster spp., G. ericsonii and, to a lesser extent,C. mediterranea, were more associated to (low) phytoplanktonproductivity (Biom Chl-a) occurring at the surface closer to thecoast (F2, Fig. 10b).
The observed coccolithophore bloom at the expense of nutri-ents within the BP is clearly showed by factor analysis performedfor the 2nd leg. E. huxleyi, G. oceanica and C. mediterranea were themore productive and contributor species for the remarkableincrease of Chl-a observed in this period (F1, Figs. 11 and 12a),whereas G. muellerae, Syracosphaera spp., G. ericsonii and Ophiasterspp. were more independent from the nutrient-rich BP andpreferentially developing offshore, outside the influence of runoff(F2, Fig. 12b).
The observed dominance of E. huxleyi during both low- andhigh productivity periods during the cruise is in good agreementwith its presumed cosmopolitan and opportunistic behaviour(Winter et al., 1994; Baumann et al., 2000; Andruleit, 2007;Boeckel and Baumann, 2008). The remarkable occurrence ofE. huxleyi together with small-chain diatoms and significantlycontributing to phytoplankton biomass during the high-productive period, supports earlier observations identifying it asan early succession r-selected species, capable of rapid growthwithin nutrient-rich, turbulent environments (e.g. Giraudeau andBayley, 1995; Andruleit and Rogalla, 2002; Sprengel et al., 2002;Andruleit, 2007; Silva et al., 2008) and constituting the mainbloom-forming coccolithophore (e.g. Okada and Honjo, 1973;Knappertsbusch and Brummer, 1995; Garcia et al., 2011; Souzaet al. 2011).
G. oceanica was apparently “dormant” during the low-productiveperiod (1st leg) but rapidly developed as soon as nutrient-light-stratification conditions became favourable during the 2nd leg. Itmanifests itself as one of the species better adapted to thrive withinnutrient-rich, competitive conditions near the coast, although notreaching cell densities as high as those of E. huxleyi. Results agreewith several authors referring to it as a typical coastal coccolitho-phore, well adapted to the nutrient-rich and productive environ-ment off Portugal (Silva et al., 2008), and as maximum upwellingindicator, based on its quick response to nutrient input(Winter et al., 1994; Giraudeau and Bayley, 1995; Broerse et al.,2000; Andruleit and Rogalla, 2002; Sprengel et al., 2002; Andruleitet al., 2003).
C. mediterranea was also able to profit from nutrient favourableconditions during the cruise and flourished in the 2nd leg,although less prominently than the two latter, and more displacedtowards the shelf-break region, at the northern valley. Silva et al.(2008) and Moita et al. (2010) also reported the presence of highcell densities of C. mediterranea off the Nazaré region duringwinter, referring to it as a good tracer for the convergence of

FigprorivinflanshesouG.
C. Guerreiro et al. / Continental Shelf Research 59 (2013) 65–8380
subtropical waters (ENACWst) onto the Portuguese shelf duringthe upwelling-downwelling transition.
Despite the generally low abundance of S. dalmaticus, correla-tion of this species with E. huxleyi, G. oceanica and C. mediterranea,closer to the coast off Cape Carvoeiro, suggest that it hassome capacity to profit from nutrient availability, in the contextof moderate-to-low turbulence within coastal regions. This contra-dicts previous studies which associate holococcolithophores withmore oligotrophic and oceanic environments (i.e. MediterraneanSea, NE Atlantic, Red Sea and Gulf of Aden, Kleijne, 1991).
Observations on Syracosphaera spp. are consistent with Andruleit(2007) in terms of its broad depth range but contradict severalstudies reporting this genus as having affinity for nutrient availabilityin coastal regions (e.g. Andruleit and Rogalla, 2002; Andruleit, 2007).In addition, little is known about S. marginoporata, the dominantspecies within this group (max. 1.4�104 cells/l counted with SEM).The same applies to Ophiaster spp. which, similarly to Syracosphaeraspp., includes a variety of species which cannot be distinguished withPLM but which are expected to have distinct ecological preferences(Young, 1994). Lack of taxonomical differentiation and of a systematicquantification of typical nutrient levels in the above-mentionedstudies may partially explain discrepancies with the present study.
G. ericsonii was the second most abundant species during thecruise, next to E. huxleyi, confirming its preference for nutrient-enriched coastal/neritic regions inferred by several authors (e.g.California Current System, Winter et al., 1979; south of Benguelaupwelling system, Giraudeau and Bayley, 1995; Lisbon Bay, Silva et al.,
. 13. Schematic representation of the environmental conditions that contributed to theductive pre-bloom period: wind regime shifting from southerlies to northerlies, and strer discharge; (b) period between legs: predominantly clear sky conditions, decreasinguence of northerly winds, all contribute to trigger the phytoplankton and coccolithophod diatom bloom at the surface, at the expense of nutrients available within the BP; E. huxllf and upper slope waters affected by the BP. During this time, the BP became more mtherlies and an increase of cloud coverage was noticed. Abbreviation of taxonomic naoceanica—Go; Ophiaster spp.—Ophi; Syraco. dalmaticus—Sdalm; S. marginoporata—SM.
2008). Yet, its highest cell densities further offshore during the high-productivity period, away from the influence of the BP and coastalturbulence, suggest that it is better adapted to compete with E. huxleyiin oceanic conditions than in coastal waters. Although with muchlower abundances, G. muellerae displayed an ecological performancesimilar to G. ericsonii: higher abundances and coastal-neritic distribu-tion during the 1st leg and better performance in more oceanicregions during the high-productive period, suggesting it has a moreoligotrophic behaviour on the central Portuguese margin, in compar-ison to other placolith-bearing species (i.e. G. oceanica and E. huxleyi).The two species are apparently able to thrive and dominate thecoccolithophore community under steady-state low-productive con-ditions over the shelf, but not when shelf and coastal waters becomefavourable for r-selected species like E. huxleyi and G. oceanica.
The observed higher diversity of coccolithophore species,broader vertical distribution and stronger correlation betweencells and phytoplankton biomass (Chl-a) at the shelf-break region(northern valley), possibly reflect the dominance of this groupwithin more distal regions.
6. Conclusions
Coccolithophores off central Portugal showed a rapid responseto regional meteorological and hydrographic variations occurringin late winter between 9 and 19 March 2010, either taking profit ofnutrient availability in coastal-neritic areas and competing with
late winter coccolithophore bloom observed during the cruise: (a) 1st leg, low-ong vertical gradient between BP and winter mixed layer due to still significantrunoff driven turbidity, and spreading of the BP by Ekman circulation underre bloom in the BP; (c) 2nd leg, high-productive bloom period: coccolithophoreeyi, G. oceanica and C. mediterranea show a remarkable increase of abundance inixed with the underlying winter mixed layer, the wind regime changed back tomes: C. mediterranea—Cm; E. huxleyi—Eh; G. ericsonii—Ge; G. muellerae—Gm;

C. Guerreiro et al. / Continental Shelf Research 59 (2013) 65–83 81
other r-selected phytoplankton groups (e.g. small-chain diatoms),or preferentially developing in more oceanic-oligotrophic regions,where competition with r-selected taxa is expectedly lower.
Over the relatively warm and saline winter mixed layer wateroccupying the upper 100–200 m of the water column over theshelf and upper slope, a superficial nutrient-rich Buoyant Plume(BP) of relatively cool and low-saline water, presumably fed byrunoff from intense rainfall that occurred prior to and at thebeginning of the cruise, was spread out equatorwards and off-shore, most probably as a consequence of Ekman superficialdynamics generated by the prevailing northerly winds. Whereasriver runoff decreased, the Ekman circulation driven by the north-erly wind made the BP to spread further offshore and becomedetached from the coast. Despite relatively high nutrient avail-ability within the BP, cloud cover and initial relatively highturbidity within the BP resulted in sub-optimal light conditionsunfavourable for the growth of phytoplankton (Fig. 13a).
In the transition towards the 2nd leg, stable density stratification,decreasing turbidity at the surface and prevailing clear skies finallyallowed phytoplankton to take advantage of the nutrients retained inthe BP. In the shelf and upper slope area covered by the BP, E. huxleyiand G. oceanica were the coccolithophore species that benefited themost from favourable nutrient conditions within the sunlit layer. C.mediterranea and S. dalmaticus also responded to the favourableconditions, although less notably than the first two species (Fig. 13b).
Syracosphaera spp. and Ophiaster spp. were the most consis-tently oligotrophic taxa, constituting an important component inoffshore assemblages and displaying a broad vertical distributionextending well below the nutrient-rich surface layer in the morecoastal-neritic regions. G. ericsonii and G. muellerae decreased inabundance in shelf and upper slope waters, but increased in themost offshore waters where E. huxleyi was not significantlydeveloping (Fig. 13a).
The observed rapid response of coccolithophores to short-termmeteorological and hydrographic variability presents a challenge tothe application of coccoliths in paleoclimatic and paleoceanographicreconstructions, and demonstrates the need for improved knowledgeof the ecological and characteristics of this group.
Acknowledgements
This research was supported by the HERMIONE project (ECcontract 226354) funded by the European Commission and the CdTox-CoN project (FCT-PTDC/MAR/102800/2008) funded by thePortuguese Science Foundation FCT. The first author benefits froman FCT PhD grant (FRH/BD/41330/2007). The authors are grateful tothe crew of the NRP Almirante Gago Coutinho and several research-ers participating in the 2nd HERMIONE cruise conducted by IH fortheir valuable help during the collection of samples. All the sampleswere prepared and analyzed in NANOLAB, Geology Centre of LisbonUniversity (CEGUL). SEM observations were made at the Institut deCiències del Mar (ICM—CSIC, Barcelona, Spain). We also thank JoãoVitorino and Inês Martins (IH, Oceanography Dep.) for compilingCTD data, Manuela Valença (IH, Chemistry and Pollution Dep.) foranalyzing and compiling nutrient data and Francisco Silva and SaraAlmeida (IH Oceanography Dep.) for providing wave and wind data.Constructive criticism and helpful suggestions from two anon-ymous reviewers are most gratefully acknowledged by the authors.
Appendix A. Taxonomic appendix
For taxonomic references, see Jordan et al. (2004) and Monniotand Buge (1971).Kingdom Chromista Cavalier-Smith 1986
Division Haptophyta Hibberd 1972Class Prymnesiophyceae Hibbert 1976 emend. Cavalier-Smithet al. 1996
1. Order Coccolithales Schwartz 1932 emend. Edvardsenet al. 2000
Family Calcidiscaceae Young and Bown 1997Genus Calcidiscus Kamptner 1950
Calcidiscus leptoporus (Murray andBlackman 1898) Loeblich and Tappan 1978
Genus Umbilicosphaera Lohmann 1902Umbilicosphaera hulburtiana Gaarder
1970Umbilicosphaera sibogae (Weber-van
Bosse 1901) Gaarder 1970Family Coccolithaceae Poche 1913 emend. Young and Bown1997
Genus Coccolithus Schwartz 1894Coccolithus pelagicus subsp. braarudii
(Gaarder 1962) Geisen et al. 2002
2. Order Isochrysidales Pascher, 1910 emend. Edvardsen andEikrem in Edvardsen et al. 2000
Family Noelaerhabdaceae Jerkovic 1970 emend. Young andBown 1997
Genus Emiliania Hay and Mohler in Hay et al. 1967Emiliania huxleyi (Lohmann 1902) Hay and
Mohler 1967Genus Gephyrocapsa Kamptner 1943
Gephyrocapsa ericsonii McIntyre and Bé, 1967Gephyrocapsa muellerae Bréhéret 1978Gephyrocapsa oceanica Kamptner 1943
3. Order Syracosphaerales Hay 1977 emend. Young et al.2003
Family Rhabdosphaeraceae Haeckel 1894Genus Acanthoica Lohmann 1903; emend. Schiller 1913,
Kleijne 1992Acanthoica quattrospina Lohmann 1903
Genus Algirosphaera Schlauder 1945; emend. Norris 1984Algirosphaera robusta (Lohmann 1902) Norris
1984Genus Discosphaera Haeckel 1894
Discosphaera tubifera (Murray and Blackman1898) Ostenfeld 1900
Genus Palusphaera Lecal 1966a; emend. Norris 1984Palusphaera vandelii Lecal 1966a; emend.
Norris 1984Genus Rhabdosphaera Haeckel 1894
Rhabdosphaera clavigera Murray andBlackman 1898
Family Syracosphaeraceae (Lohmann 1902) Lemmermann 1903Genus Michaelsarsia Gran 1912; emend. Manton et al.
1984Michaelsarsia elegans Gran 1912; emend.
Manton et al. 1984Genus Ophiaster Gran 1912; emend. Manton and Oates
1983b

C. Guerreiro et al. / Continental Shelf Research 59 (2013) 65–8382
Ophiaster formosus Gran 1912 sensu Gaarder1967; emend. Manton and Oates 1983b var. formosus
Ophiaster hydroideus (Lohmann 1903)Lohmann 1913b; emend. Manton and Oates 1983b
Ophiaster reductus Manton and Oates 1983bGenus Syracosphaera Lohmann, 1902
Syracosphaera anthos (Lohmann 1912) Janin1987
Syracosphaera bannockii (Borsetti and Cati1976) Cros et al. 2000
Syracosphaera marginoporata Knappertsbusch1993
Syracosphaera molicshii Schiller 1925Syracosphaera nodosa Kamptner 1941Syracosphaera ossa (Lecal 1966b) Loeblich Jr.
and Tappan 1968Syracosphaera pulchra Lohmann 1902
4. Genera incertae sedis
Families with possible affinities to the SyracosphaeralesFamily Alisphaeraceae Young, Kleijne and Cros in Young et al.2003
Genus Alisphaera Heimdal 1973; emend. Jordan andChamberlain 1993a; Kleijne et al. 2002
Alisphaera extenta Kleijne et al. 2002Alisphaera ordinata (Kamptner 1941) Heimdal
1973Alisphaera pinnigera Kleijne et al. 2002
Genera with possible affinities with theSyracosphaerales
Genus Coronosphaera Gaarder in Gaarder and Heimdal1977 (71)
Coronosphaera mediterranea (Lohmann 1902)Gaarder in Gaarder and Heimdal 1977 (72)
5. Order Zygodiscales Young and Bown 1997
Family Helicosphaeraceae Black 1971 emend. Jafar and Martini1975
Genus Helicosphaera Kamptner 1954Helicosphaera carteri var. carteri (Wallich
1877) Kamptner 1954Family Pontosphaeraceae Lemmermann 1908
Genus Scyphosphaera Lohmann 1902Scyphosphaera apsteinii Lohmann 1902
6. Holococcolith-bearing taxa
Family Calyptrosphaeraceae Boudreaux and Hay 1969Genus Syracolithus (Kamptner 1941) Deflandre 1952
Syracolithus dalmaticus (Kamptner 1927)Loeblich Jr. and Tappan 1966Nannolith-Bearing families
Family Braarudosphaeraceae Deflandre 1947Genus Braarudosphaera Deflandre 1947
Braarudosphaera bigelowii (Gran and Braarud1935) Deflandre 1947
Appendix B. Supplementary information
Supplementary data associated with this article can be found inthe online version at http://dx.doi.org/10.1016/j.csr.2013.04.016.
References
Alves, T.M., Gawthorpe, R.L., Hunt, D.W., Monteiro, J.H., 2003. Cenozoic tectonose-dimentary evolution of the western Iberian Margin. Marine Geology 195,75–108.
Abrantes, F., Moita, T., 1999. Water column and recent sediment data on diatomsand coccolithophorids, off Portugal, confirm sediment record of upwellingevents. Oceanologica Acta 22 (3), 319–336.
Alvarez, I., Gomez-Gesteira, M., de Castro, M., Lorenzo, M.N., Crespo, A.J.C.,Dias, J.M., 2011. Comparative analysis of upwelling influence between thewestern and northern coast of the Iberian. Continental Shelf Research 31 (5),388–399.
Alvarez, I., Ospina-Alvarez, N., Pazos, Y., de Castro, M., Bernardez, P., Campos, M.J.,Gomez-Gesteira, G.L., Alvarez-Ossorio, M.T., Varela, M., Gomez-Gesteira, M.,Prego, R., 2009. A winter upwelling event in the Northern Galician Rias:Frequency and oceanographic implications. Estuarine, Coastal and Shelf Science82 (4), 573–582.
Alvarez-Salgado, X.A.A., Figueiras, F.G., Pereza, F.F., Groom, S., Nogueira, E., Borges, A.V.,Chou, L., Castro, C.G., Moncoiffe, G., Rios, A.F., Miller, A.E.J., Frankignoulle, M.,Savidge, G., Wollast, R., 2003. The Portugal coastal counter current off NW Spain:new insights on its biogeochemical variability. Progress in Oceanography 56,281–321.
Andruleit, H., 2007. Status of the Java upwelling area (Indian Ocean) during theoligotrophic northern hemisphere winter monsoon season as revealed bycoccolithophores. Marine Micropaleontology 64, 36–51.
Andruleit, H., Rogalla, U., 2002. Coccolithophores in surface sediments of theArabian Sea in relation to environmental gradients in surface waters. MarineGeology 186, 505–526.
Andruleit, H., Stager, S., Rogalla, U., Cepek, P., 2003. Living coccolithophores in thenorthern Arabian Sea: ecological tolerances and environmental control. MarineMicropaleontology 49, 157–181.
Barton, E., 2001. Canary and Portugal currents. In: Steele, J., Turekian, K., Thorpe, S.(Eds.), Encyclopedia of Ocean Sciences, vol. 1. Academic Press, pp. 380–389.
Baumann, K.-H., Andruleit, H.A., Samtleben, C., 2000. Coccolithophores in theNordic Seas: comparison of living communities with surface sediment assem-blages. Deep-Sea Research II 47, 1743–1772.
Boeckel, B., Baumann, K.-H., 2008. Vertical and lateral variations in coccolithophorecommunity structure across the subtropical frontal zone in the South AtlanticOcean. Marine Micropaleontology 76, 255–273.
Brand, L., 1994. Physiological ecology of marine coccolithophores. In: Winter, A.,Siesser, W. (Eds.), Coccolithophores. Cambridge University Press, Cambridge,pp. 39–149.
Broerse, A.T.C., Ziveri, P., van Hinte, J.E., Honjo, S., 2000. Coccolithophore exportproduction, species composition and coccolith-CaCo3 fluxes in the NE Atlantic(341N 211W and 481N 211W). Deep-Sea Research II 47, 1877–1906.
Cachão, M., Oliveira, A., 2000. (Cocco)liths versus (Cocco)spheres: approaching theecological performance of coccolithophores. Journal of NannoplanktonResearch 22 (1), 29–34.
Cachão, M., Moita, T., 2000. Coccolithus pelagicus, a productivity proxy related tomoderate fronts off Western Iberia. Marine Micropaleontology 39 (1/4),131–155.
Cachão, M., Oliveira, A., Vitorino, J., 2000. Subtropical winter guests, offshorePortugal. Journal of Nannoplankton Research 22 (1), 19–26.
Cattiaux, J., Vautard, R., Cassou, C., Yiou, P., Masson-Delmotte, V., Codron, F., 2010.Winter 2010 in Europe: A cold extreme in a warming climate. Geophys. Res.Lett. 37, L20704, http://dx.doi.org/10.1029/2010GL044613.
Cros, L., 2001. Planktonic Coccolithophores of the NW Mediterranean. University ofBarcelona, Barcelona. (Ph.D. thesis, unpublished).
De Castro, M., Alvarez, I., Varela, M., Prego, R., Gómez-Gesteira, M., 2006. Miño Riverdams discharge on neighbour Galician Rias Baixas (NW Iberian Peninsula):hydrographic, chemical and biological changes in water column. Estuarine,Coastal and Shelf Science 70 (1–2), 52–62.
Doyon, P., Klein, B., Ingram, R.G., Legendre, L., Tremblay, J.-ED., Therriault, J.-C.,2000. Influence of wind mixing and upper-layer stratification on phytoplanktonbiomass in the Gulf of St. Lawrence. Deep-Sea Research II 47, 415–433.
Fisher, T.R., Peele, E.R., Ammerman, J.W., Harding, L., 1992. Nutrient limitation ofphytoplankton in Cheasapeake Bay. Marine Ecology Progress 82, 51–63.
Fiúza, A.F.G., Hamann, M., Ambar, I., Del R, G., González, N., Cabanas, J., 1998. Watermasses and their circulation off western Iberia during May 1993. Deep Sea

C. Guerreiro et al. / Continental Shelf Research 59 (2013) 65–83 83
Research Part I: Oceanographic Research Papers 45 (7)1127–1160.Fiúza, A., 1983. Upwelling patterns off Portugal. In: Suess, E., Thie, J. (Eds.), Coastal
Upwelling: Its sediment Record. Plenum, New York, pp. 85–98.Fong, D.A., Geyer, W.R., 2001. Response of a river plume during an upwelling
favourable wind event. Journal of Geophysical Research 106 (C1), 1067–1084.Garcia, C.A.E., Garcia, V.M.T., Dogliotti, A.I., Ferreira, A., Romero, S.I., Mannino, A.,
Souza, M.S., Mata, M.M., 2011. Environmental conditions and bio-opticalsignature of a coccolithophore bloom in the Patagonian shelf. J. Geophys. Res.116, C03025, http://dx.doi.org/10.1029/2010JC006595.
Giraudeau, J., Bayley, G.W., 1995. Spatial dynamics of coccolithophore communitiesduring an upwelling event in the Southern Benguela system. Continental ShelfResearch 15, 1825–1852.
Haynes, R., Barton, E.D., Pilling, I., 1993. Development, persistence and variability ofupwelling filaments off the Atlantic coast of the Iberian Peninsula. Journal ofGeophysical Research 98, 22681–22692.
Jordan, R., Cros, L., Young, J., 2004. A revised classification scheme for livinghaptophytes. Micropaleontology 50 (1), 55–79.
Jouanneau, J.M., Garcia, C., Oliveira, A., Rodrigues, A., Dias, J.A., Weber, O., 1998.Dispersal and deposition of suspended sediment on the shelf off the Tagus andSado estuaries. S.W. Portugal. Progress in Oceanography 42, 233–257.
Kleijne, A., 1991. Holococcolithophorids from the Indian Ocean, Red Sea, Mediter-ranean Sea and North Atlantic Ocean. Marine Micropaleontology 17, 1–76.
Knappertsbusch, M., Brummer, G.-J.A., 1995. A sediment trap investigation ofsinking coccolithophores in the North Atlantic. Deep-Sea Research Part I 42(7), 1083–1109.
Koroleff, F., 1976. Determination of ammonia. In: Grasshoff, K. (Ed.), Methods ofSeawater Analysis. Verlag Chemie, New York, pp. 126–158.
Kudela, R., Pitcher, G., Probyn, T., Figueiras, F., Moita, T., Trainer, V., 2005. Harmfulalgal blooms in coastal upwelling systems. Oceanography 18, 184–197.
Labry, C., Herbland, A., Delmas, D., 2002. The role of phosphorus on planktonicproduction of the Gironde plume waters in the Bay of Biscay. Journal ofPlankton Research 24 (2), 97–117.
Lastras, G., Arzola, R.G., Masson, D.G., Wynn, R.B., Huvenne, V.A.I., Hühnerbach, V.,Canals, M., 2009. Geomorphology and sedimentary features in the CentralPortuguese submarine canyons, Western Iberian margin. Geomorphology 103(3), 310–329.
Levitus, S., Conkright, M.E., Reid, J.L., Najjar, R.G., Mantyla, A., 1993. Distribution ofnitrate, phosphate and silicate in the world oceans. Progress in Oceanography31, 245–273.
Malin, G., Steinke, M., 2004. Dimethyl sulphide production: what is the contribu-tion of cocolithophores?. In: Thierstein, HR, Young, JR (Eds.), Coccolithophores—From Molecular Processes to Global Impact. Springer-Verlag, Berlin,pp. 127–164.
Margalef, R., 1978. Life-forms of phytoplankton as survival alternatives in anunstable environment. Oceanologica Acta1 4, 493–509.
Marta-Almeida, M., Dubert, J., Peliz, A., 2002. Simulations of extreme shelf currentalong the North-Western Iberian Shelf forced by wind and river runoff. In:Proceedings of the 3rd Iberian Meeting on Geophysics and Geodesy, Valencia,February 4–8, 2002, pp. 1555–1559.
McIntyre, A., Bé, A., 1967. Modern coccolithophoridae of the atlantic ocean—I.Placoliths and cyrtolyths. Deep-Sea Research 14, 561–597.
Mendes, C.R., Cartaxana, P., Brotas, V., 2007. HPLC determination of phytoplanktonand microphytobenthos pigments: comparing resolution and sensitivity of aC18 and a C8 method. Limnology and Oceanography: Methods 5, 363–370.
Mendes, R., Sá, C., Vitorino, J., Borges, C., Garcia, V., Brotas, V., 2011. Distribution ofphytoplankton assemblages in the Nazaré submarine canyon region (Portugal):HPLC-CHEMTAX approach. Journal of Marine Systems 87, 90–101.
Moita, M.T., 2001. Estrutura, Variabilidade e Dinâmica do Fitoplâncton na Costa dePortugal Continental. University of Lisbon, Lisbon. (Ph.D. thesis, unpublished).
Moita, M.T., Silva, A., Palma, S., Vilarinho, M.G., 2010. The coccolithophore summer–autumn assemblage in the upwelling waters of Portugal: Patterns of mesoscaledistribution (1985–2005). Estuarine, Coastal and Shelf Science 87, 411–419.
Murphy, J., Riley, J.P., 1962. A modified single solution method for the determina-tion of phosphate in natural waters. Analytica Chimica Acta 27, 31–36.
Okada, H., Honjo, S., 1973. The distribution of oceanic coccolithophorids in thePacific. Deep-Sea Research 20, 355–374.
Oliveira, A., Vitorino, J., Rodrigues, A., Jouanneau, J.M., Dias, J., Weber, O., 2002.Nepheloid layer dynamics in the northern Portuguese shelf. Progress inOceanography 52, 195–213.
Oliveira, P.B., Peliz, A., Dubert, J., Rosa, R.T., Santos, A.M.P., 2004. Winter geostrophiccurrents and eddies in the western Iberia coastal transition zone. Deep-SeaResearch I 51, 367–381.
Otero, P., Ruiz-Villarreal, M., Peliz, A., 2008. Variability of river plumes off North-west Iberia in response to wind events. Journal of Marine Systems 72, 238–255.
Peliz, A.J., Fiúza, A.F.G., 1999. Temporal and spatial variability of CZCS-derivedphytoplankton pigment concentrations off the western Iberian Peninsula.International Journal of Remote Sensing 20 (7), 1363–1403.
Peliz, A., Rosa, T., Santos, A.M.P., Pissarra, J., 2002. Fronts, jets, and counter-flows inthe Western Iberia Upwelling System. Journal of Marine Systems 35, 61–77.
Peliz, A., Dubert, J., Santos, A.M.P., Oliveira, P.B., Le Cann, B., 2005. Winter upperocean circulation in the Western Iberian Basin—Fronts, Eddies and PolewardFlows: an overview. Deep-Sea Research I 52, 621–646.
Pollard, R., Pu, S., 1985. Structure and circulation of the upper Atlantic Oceannortheast of the Azores. Progress in Oceanography 14, 443–462.
Redfield, A.C., 1958. The biological control of chemical factors in the environment.American Scientist 46, 205–221.
Redfield, A., Ketchum, B., Richards, F., 1963. The influence of organisms on thecomposition of sea-water. In: Hill, M.N. (Ed.), The Sea vol. 2: The composition ofseawater comparative and descriptive oceanography. Interscience Publishers,London, 554 pp.
Relvas, P., Barton, E.D., Dubert, J., Oliveira, P.B., Peliz, A., da Silva, J.C.B., Santos, A.M.P.,2007. Physical oceanography of the western Iberia ecosystem: latest views andchallenges. Progress in Oceanography 74, 149–173.
Ribeiro, A., Peliz, A., Santos, M.P., 2005. A study of the response of chlorophyll-abiomass to a winter upwelling event off Western Iberia using SeaWiFS andin situ data. Journal of Marine Systems 53, 87–107.
Rost, B., Riebesell, U., 2004. Coccolithophores and the biological pump: responses toenvironmental changes. In: Thierstein, Hans R., Young, Jeremy R. (Eds.),Coccolithophores: From Molecular Processes to Global Impact. Springer, Berlin,pp. 99–125.
Roth, P.H., 1994. Distribution of coccoliths in oceanic sediments. In: Winter, A.,Siesser, W.G. (Eds.), Coccolithophores. Cambridge University Press, Cambridge,pp. 199–218.
Ryther, J.H., Dunstan, W.M., 1971. Nitrogen, phosphorus and eutrophication in thecoastal marine environment. Science 171, 1198–1203.
Santos, A.M.P., Peliz, A., Dubert, J., Oliveira, P.B., Angélico, M.M., Ré, P., 2004. Impactof a winter upwelling event on the distribution and transport of sardine(Sardina pilchardus) eggs and larvae off western Iberia: a retention mechanism.Continental Shelf Research 24, 149–165.
Saunders, P., 1982. Circulation in the eastern North Atlantic. Journal of MarineResearch 40, 641–657.
Silva, A., Palma, S., Moita, M.T., 2008. Coccolithophores in the upwelling waters ofPortugal: Four years of weekly distribution in Lisbon bay. Continental ShelfResearch 28, 2601–2613.
Silva, A., Palma, S., Oliveira, P.B., Moita, M.T., 2009. Composition and interannualvariability of phytoplankton in a coastal upwelling region (Lisbon Bay, Portugal).Journal of Sea Research 62, 238–249.
Smetacek, V., Passow, U., 1990. Spring bloom initiation and Sverdrup’s critical-depth model. Limnology and Oceanography 35, 228–234.
Souza, M.S., Mendes, C.R.B., Garcia, V.M., Pollery, R., Brotas, V., 2011. Phytoplanktoncommunity during a coccolithophorid bloom in the Patagonian shelf: micro-scopic and high-performance liquid chromatography pigment analyses. Journalof the Marine Biological Association of the United Kingdom, 1–15.
Sprengel, C., Baumann, K.-H., Henderiks, J., Henrich, R., Neuer, S., 2002. Moderncoccolithophore and carbonate sedimentation along a productivity gradient inthe Canary Islands region: seasonal export production and surface accumula-tion rates. Deep-Sea Research II 49, 3577–3598.
Strickland, J.D.H., Parsons, T.R., 1972. A Practical Handbook of Seawater Analysis.Fisheries Research Board of Canada, Ottawa.
Troupin, C., Machín, F., 2012. Negative Wind Anomalies Generated a Diminution ofProductivity in the North Atlantic in 2010. EGU General Assembly, Vienna⟨http://hdl.handle.net/2268/123991⟩.
Vanney, J.R., Mougenot, D., 1981. La plate-forme continentale du Portugal et lesprovinces adjacentes: analyse géomorphologique. Memórias dos ServiçosGeológicos Portugal 28, 145.
Varela, M., Prego, R., Belzunce, M.J., Salas, F.M., 2001. Inshore–offshore differencesin seasonal variations of phytoplankton assemblages: the case of a Galician RiaAlta (Ria de A Coruña) and its adjacent shelf (NW of Spain). Continental ShelfResearch 21 (16–17), 1815–1838.
Vitorino, J., Oliveira, A., Jouanneau, J.M., Drago, T., 2002. Winter dynamics on thenorthern Portuguese shelf Part 1: physical processes. Progress in Oceanography52, 129–153.
Wallace, J.M., 2002. Two Faces of the North Atlantic Oscillation (NAO). Luso-American Foundation, Lisbon, Portugal.
Westbroek, P., Brown, C.W., van Bleijswijk, J., Brownlee, C., Brummer, G.J., Conte, M.,Egge, J., Fernández, E., Jordan, R., Knappertsbusch, M., Stefels, J., Veldhuis, M.,van der Wal, P., Young, J., 1993. A model system approach to biological climateforcing. The example of Emiliania huxleyi. Global and Planetary Change 8 (1–2),27–46.
Winter, A., Jordan, R., Roth, P., 1994. Biogeography of living coccolithophores inocean waters. In: Winter, A., Siesser, W. (Eds.), Coccolithophores. CambridgeUniversity Press, pp. 161–177.
Winter, A., Reiss, Z., Luz, B., 1979. Distribution of living coccolithophore assem-blages in the Gulf of Elat (Aqaba). Marine Micropaleontology 4, 197–223.
Young, J., 1994. Functions of coccoliths. In: Winter, A., Siesser, W. (Eds.), Cocco-lithophores. Cambridge University Press, Cambridge, pp. 63–82.
Zapata, M., Rodriguez, F., Garrido, J.L., 2000. Separation of chlorophylls andcarotenoids from 1 marine phytoplankton: a new HPLC method using areversed phase C8 column and pyridine-2 containing mobile phases. MarineEcology Progress 195, 29–45.
Ziveri, P., Thunell, R., Rio, D., 1995. Export production of coccolithophores in anupwelling region: results from San Pedro Basin, Southern California Border-lands. Marine Micropaleontology 24, 335–358.
Ziveri, P., Baumann, K.-H., Boeckel, B., Bollmann, J., Young, J.R., 2004. Biogeographyof selected holocene coccoliths in the Atlantic Ocean. In: Thierstein, H.R., Young,J.R. (Eds.), Coccolithophores—From Molecular Processes to Global Impact.Springer-Verlag, pp. 403–428.