Embed Size (px)
Citation preview
AeENCY _jdiOaCdVe72 I)7ViXOfl
GUIDEBOOK to Field Trips in VERMONT
and Adjacent Regions
of
NEW HAMPSHIRE and
NEW YORK
GUIDEBOOK
to Field Trips in
VERMONT
and Adjacent Regions of
NEW HAMPSHIRE and NEW YORK
Edited by STEPHEN F. WRIGHT
Department of Geology University of Vermont
Burlington, Vermont 05405
Hosted by UNIVERSITY OF VERMONT
NEW ENGLAND INTERCOLLEGIATE GEOLOGICAL CONFERENCE 91st Annual Meeting
October 1, 2, and 3, 1999 Burlington, Vermont
1
Copies of this guidebook may be purchased from:
Department of Geology University of Vermont
Burlington, Vermont 05405
Price: $18.00 plus $3 postage
Cover:
Cross-section of Big Falls Synform, North Troy, Vermont
From Stanley, R.S., 1997, Digital bedrock map of part of the Serpentine Belt, Lowell and North Troy quadrangles, Vermont: Vermont Geological Survey Open-File
Report VG97-04A, 2 plates.
Copyright ©1999 by Department of Geology, University of Vermont, all rights reserved.
No part of this publication may be reproduced, stored in a retrieval system, or transmitted in any form by any means, electronic, mechanical, photocopy or otherwise, without
permission of the copyright holder.
Printed by University of Vermont Graphics and Printing
11
TABLE OF CONTENTS
Acknowledgements v Dedications vi Meetings of the New England Intercollegiate Geological Conference viii Field Trip Leaders ix
Al Surficial Geology of the Eastern Half of the StJohnsbury 7.5 X 15 Minute Quadrangle, Northeastern Vermont. 1 George Springston and George M. Haselton
A2 Slope Stability and Late Pleistocene!Holocene History, Northwestern Vermont 17 Paul Bierman, Stephen Wright, and Kyle Nichols
A3 Lithotectonic Packages and Tectonic Boundaries Across the Lamoille River Transect in Northern Vermont 51 Peter Thompson, Thelma Thompson, and Barry Doolan
A4 Mineralogy, Petrology, and Health Issues at the IJitrarnafic Complex, Belvidere Mt., Vermont, USA 95 Mark Van Baalen, Carl A Francis, and Brooke T. Mossman
AS Nature of the Albee-Animonoosuc Contact, Moore Reservoir Area, N.H.-V.T.: The Piermont-Frontenac Allochthon—Embattled but Thriving! 113 Robert H. Moench
A6 Faults and Fluids in the Vermont Foreland and Hinterland in Western Vermont 135 Rolfe Stanley ,.Tracy Rushmer, Caleb Holyoke, and Andrea Lini
A7 Geologic Field Trip Sites for Teachers in Northwestern Vermont 159
Christine Massey and Shelley Snyder
Bi Deglaciation History of the Stevens Branch Valley: Williamstown to Barre, Vermont 179 Stephen Wright
B2 The Origin and Fate of the Sandstone Pavement Pine Barrens in Northeastern New York 201 David A. Franzi and Kenneth B. Adams
B3 Lamoille River Valley Bedrock Transect #2
213 Jonathan Kim, Marjorie Gale, Jo Laird, and Rolfe Stanley
B4 Evidence for Movement of the Monroe Fault During Intrusion of the Victory Pluton, Northeastern Vermont 251 Kimberly Hannula
B5 A Field Discussion of the Pinnacle Formation, a Late Precambrian Rift Valley Fill, and the Development of the lapetus Basin 273 Lars Cherichetti and Alexis Richardson
Cl Glacial History of the Montpelier, Vermont, 7.5 Minute Quadrangle 286 Frederick D. Larsen
111
C2 Pine Street Canal Superfund Site: Hydrogeology and its Effects Upon the Extent of Manufactured Coal Gas Contamination 301 Don Maynard
C3 Lithotectonic Packages and Tectonic Boundaries Across the Lamoille River Transect in Northern Vermont. Repeat of A3 51 Barry Doolan, Peter Thompson, and Thelma Thompson
C4 The New England - Québec Igneous Province in Western Vermont 341 J. Gregory McHone and Nancy W. McHone
C5 The Champlain Thrust Fault at Lone Rock Point 359 Rolfe Stanley
Abstracts from the NEIGC Symposium on Surficial Mapping 365 Sponsored by the United states and Vermont Geological Surveys
lv
L
ACKNOWLEDGMENTS
The editor of this guidebook offers his sincere thanks to the many individuals who have worked so hard to make this guidebook and this year's meeting come to fruition. It has been 27 years since UVM has hosted the NEIGC. All of us in Vermont's geological community hope that you, the participant or the reader, now or in the future, can glean the results of some of our activities during the last quarter century through this guidebook and the field trips they describe. The year 2000 marks the retirement of two of the cornerstones of geology in Vermont: Rolfe Stanley and Fred Larsen. While focusing their research efforts in very different fields, they share a love of field work and a love of teaching that has made them such good mentors to many of us who have had the pleasure of working with them. Anyone pursuing Vermont geological work in the future will find themselves working in a geological framework partially unraveled by their careful work.
I have listed below the individuals whose efforts have made this meeting possible:
• As always, the greatest efforts were expended by the many authors of the field trip guides who are listed on page ix. Their willingness to compile their ongoing research into a field trip guide(s) deserves great thanks.
• Simon Rupard, a recent UVM geology graduate, did a tremendous job formatting and reformatting and reformatting and ... many parts of this guidebook. More so, he also critically read many of the manuscripts, finding and correcting many errors, small and large.
• Barry Doolan did most of the onerous organizational work, setting dates, setting deadlines, finding a meeting place, finding motels, and answering many, many phone calls and electronic messages. Barry's indefatigable good nature through all the planning stages of this conference are sincerely appreciated. The editor would also like to note the wisdom gained by senior faculty in 27 years by not undertaking the role of editor a second time.
• Jack Drake adroitly handled the Conference's monetary logistics, keeping careful records of all of you who attended the meeting.
• Sarah Fuller and Seth Jones, both students at UVM, handled registration for the conference, keeping track of who wanted to be where, when.
• I would also like to collectively thank the many landowners throughout the state who have graciously allowed us to both work on their land and to lead large groups of our colleaguesthere as well.
I apologize to anyone I've overlooked, but know that your efforts too are much appreciated.
Stephen Wright Editor
V
DEDICATIONS on the
Occasions of their Retirement
Rolfe Stanley and Frederick Larsen
Rolfe Stanley Professor of Geology
University of Vermont
A
This dedication is made, on the eve of his retirement from UVM in January 2000, to gratefully acknowledge on behalf of the entire NIEIGC community, the many con-tributions he has made to New England geology. This dedication also publicly acknowledges the deep appreciation of UVM Geology faculty and students, past and present, for his leadership, mentoring and teaching he has selflessly provided during the past 36 years.
vi
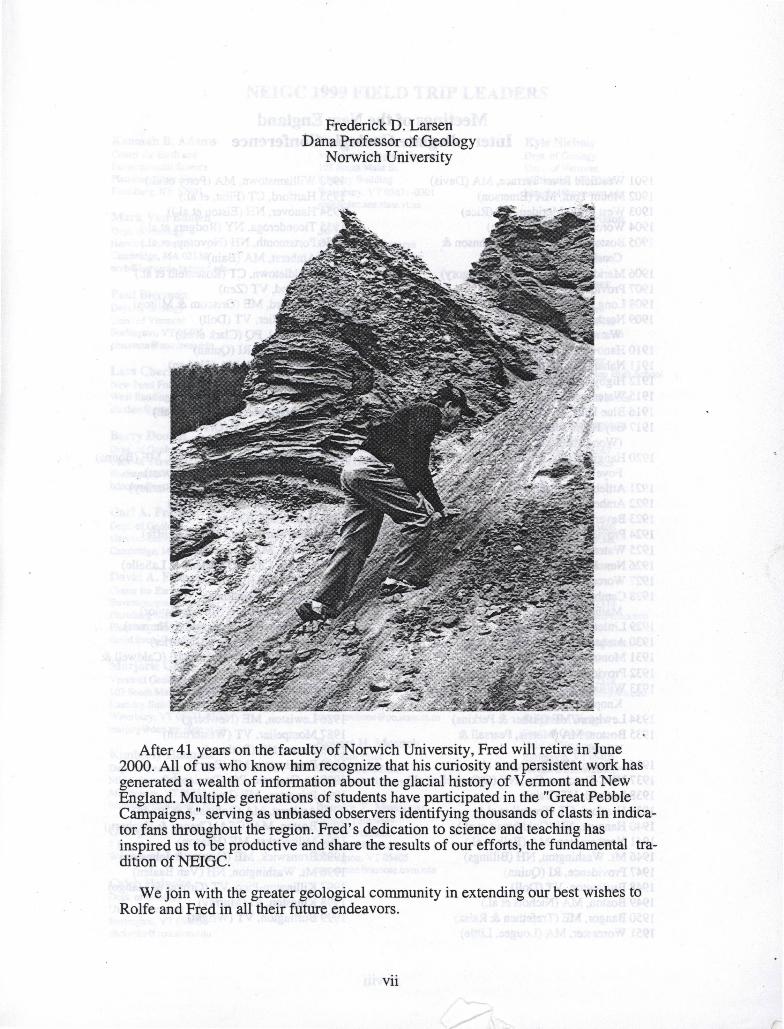
Frederick D. Larsen Dana Professor of Geology
Norwich University
.1
-S ...,
After 41 years on the faculty of Norwich University, Fred will retire in June 2000. All of us who know him recognize that his curiosity and persistent work has generated a wealth of information about the glacial history of Vermont and New England. Multiple generations of students have participated in the "Great Pebble Campaigns," serving as unbiased observers identifying thousands of clasts in indica-tor fans throughout the region. Fred's dedication to science and teaching has inspired us to be productive and share the results of our efforts, the fundamental tra-dition of NEIGC.
We join with the greater geological community in extending our best wishes to Rolfe and Fred in all their future endeavors.
vii
Meetings of the New England Intercollegiate Geologic Conference
1901 Westfield River Terrace, MA (Davis) 1902 Mount Tom, MA (Emerson) 1903 West Peak, Meriden, CT (Rice) 1904 Worcester, MA (Emerson) 1905 Boston-Nantasket, MA (Johnson &
Crosby) 1906 Meriden-East Berlin, CT (Gregory) 1907 Providence, RI (Brown) 1908 Long Island, NY (Barrel) 1909 Northern Berkshires, MA (Crosby &
Warren) 1910 Hanover, NH (Goldthwait) 1911 Nahant-Medford, MA (Lane & Johnson) 1912 Higby-Lamentation Blocks, CT (Rice) 1915 Waterbury-Winsted, CT (Barrell) 1916 Blue Hills, MA (Crosby & Warren) 1917 Gay Head, Martha's Vineyard, MA
(Woodworth & Wigglesworth) 1920 Hanging Hills, Meriden, CT (Rice &
Foye) 1921 Attleboro, MA (Woodworth) 1922 Amherst, MA (Antevs) 1923 Beverly, MA (Lane) 1924 Providence, RI (Brown) 1925 Waterville, ME (Perkins) 1926 New Haven, CT (Longwell) 1927 Worcester, MA (Perry, Little & Gordon) 1928 Cambridge, MA (Billings, Bryan &
Mather) 1929 Littleton, NH (Crosby) 1930 Amherst, MA (Loomis, Grodon) 1931 Montreal, PQ (O'Neill et al.) 1932 Providence-Newport, RI (Brown) 1933 Williamstown, MA (Cleland, Perry &
Knopf) 1934 Lewiston, ME (Fisher & Perkins) 1935 Boston, MA (Morris, Pearsall &
Whitehead) 1936 Littleton, NH (Billings et al.) 1937 NYC-Dutchess Co., NY (O'Connell et aL) 1938 Rutland, VT (Bain) 1939 Hartford, CT (Troxell et al.) 1940 Hanover, NH (Goldthwait et al.) 1941 Northampton, MA (Balk et al.) 1946 Mt. Washington, NH (Billings) 1947 Providence, RI (Quinn) 1948 Burlington, VT (Doll) 1949 Boston, MA (Nichols et al.) 1950 Bangor, ME (Trefethen & Raisz) 1951 Worcester, MA (Lougee, Little)
1952 Williamstown, MA (Perry et al.) 1953 Hartford, CT (Flint, et al.) 1954 Hanover, NH (Elston et al.)) 1955 Ticonderoga, NY (Rodgers et al.) 1956 Portsmouth, NH (Novotny, et al.) 1957 Amherst, MA (Bain) 1958 Middletown, CT (Rosenfeld et al.) 1959 Rutland, VT (Zen) 1960 Rumford, ME (Griscom & Milton) 1961 Montpelier, VT (Doll) 1962 Montreal, PQ (Clark et al.) 1963 Providence, RI (Quinn) 1964 Chestnut Hill, MA (Skehan) 1965 Brunswick, ME (Hussey) 1966 Katahdin, ME (Caldwell) 1967 Amherst, MA (Robinson et aL) 1968 New Haven, CT (Orville) 1969 Albany, NY (Bird) 1970 Rangeley Lakes-Dead River, ME (Boone) 1971 Concord, NH (Lyons & Stewart) 1972 Burlington, VT (Doolan & Stanley) 1973 Fredericton, NB (Rast et al.) 1974 Orono, ME (Osberg) 1975 Great Barrington, MA (Ratcliffe) 1976 Boston, MA (Cameron) 1977 Quebec City, PQ (Beland & LaSalle) 1978 Calais, ME (Ludman) 1979 Troy, NY (Friedman) 1980 Presque Isle, ME (Roy & Naylor) 1981 Kingston, RI (Boothroyd & Hermes) 1982 Storrs, CT (Joesten & Quarrier) 1983 Greenville-Millinocket, ME (Caldwell &
Hanson) 1984 Danvers, MA (Hanson) 1985 New Haven, CT (Tracy) 1986 Lewiston, ME (Newberg) 1987 Montpelier, VT (Westerman) 1988 Keene, NH (Bothner) 1989 Farmington, ME (Berry) 1990 La Gaspesie, PQ (Trzcienski) 1991 Princeton, ME (Ludman) 1992 Amherst, MA (Robinson & Brady) 1993 Boston, MA (GSA: Cheney & Hepburn) 1994 Millinocket, ME (Hanson) 1995 Brunswick, ME (Hussey & Johnston) 1996 Mt. Washington, NH (Van Baalen) 1997 Killington-Pico, VT (Grover & Mango) 1998 Kingston, RI (Murray) 1999 Burlington, VT (Wright)
viii
hk
NEIGC 1999 FIELD TRIP LEADERS
Kenneth B. Adams Center for Earth and Environmental Science Plattsburg State Univ. Plattsburg, NY 12901
Mark Van Baalen Dept. of Geology Harvard University Cambridge, MA 02138 [email protected]
Paul Bierman Dept of Geology Univ. of Vermont Burlington, VT 05405 [email protected]
Lars Cherichetti New Pond Foundation West Redding, CT 06896 [email protected]
Barry Doolan Dept. of Geology Univ. of Vermont Burlington, VT 05405 [email protected]
Carl A. Francis Dept. of Geology Harvard University Cambridge, MA 02138
David A. Franzi Center for Earth and Environmental Science Plattsburg State Univ. Plattsburg, NY 12901 [email protected]
Marjorie Gale Vermont Geological Survey 103 South Main St Laundry Building Waterbury, VT 05671-0301 [email protected]
Kimberly Hannula Dept. of Geology Middlebusy College Middlebury, VT 05753 [email protected]
George M. Haselton 7Esty Rd. Westmoreland, NH 03467
Jonathan Kim Vennont Geological Survey 103 South Main St. Laundry Building Waterbury, VT 05671-0301 [email protected]
Jo Laird Dept. of Earth Sciences Univ. of New Hampshire Durham, NH 03824 [email protected]
Frederick D. Larsen Dept. of Geology Norwich University Northfield, VT 05663
Andrea Lini Dept. of Geology Univ. of Vermont Burlington, VT 05405 [email protected]
Christine Massey Dept. of Geology Univ. of Vermont Burlington, VT 05405 [email protected]
Don Maynard The Johnson Company Montpelier, VT [email protected]
J. Gregory McHone G.L.S. Program Wesleyan University Middletown, CT 06459 [email protected]
Nancy W. McHone Ci Geological and Natural History Survey Hartford, CT 06106 [email protected]
Robert H. Moench 902 Grant Place Boulder, CO 80302 [email protected]
Brooke T. Mossman Dept. of Pathology Univ. of Vermont College of Medicine Burlington, VT 05405 [email protected]
Kyle Nichols Dept. of Geology Univ. of Vermont Burlington, VT 05405 [email protected]
Alexis Richardson Town of Wilton Wilton, CT 06897 alexlarsgateway.net
Tracy Rushmer Dept. of Geology Univ. of Vermont Burlington, VT 05405 [email protected]
Shelley Snyder Mt Abraham Union High School Bristol, VT 05443 [email protected]
George Springston 81 E. Hill Rd. Plainfield, VT 05667 [email protected]
Rolfe Stanley Dept of Geology Univ. of Vermont Burlington, VT 05405 [email protected]
Peter Thompson Dept of Geology Cornell College Mt Vernon, IA 52314 [email protected]
Thelma Thompson Dept. of Geology Cornell College Mt Vernon, IA 52314 [email protected]
Stephen Wright Dept of Geology Univ. of Vermont Burlington, VT 05405 [email protected]
Caleb Holyoke
of OMIT

SURFICIAL GEOLOGY OF THE EASTERN HALF OF THE SAINT JOHNSBURY 7.5 x 15 MINUTE QUADRANGLE
by George E. Springston, 81 East Hill Road, Plainfield, VT 05667
George M. Haselton, 7 Esty Road, Westmorelarid. NH 03467-4506
"At St Johnsbury, half a mile south of the plain, is a bank where a narrow stratum of clay rests on sand. Above the clay is a deposit of gravel, several feet thick." Charles Adams, 1846
INTRODUCTION
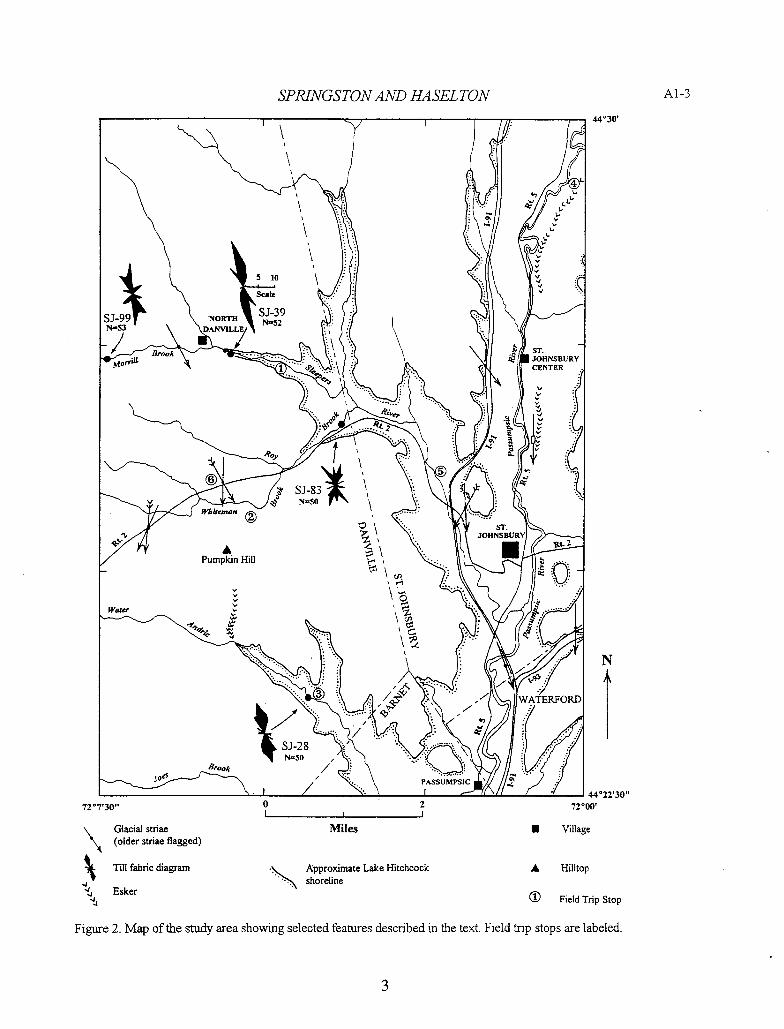
On this field trip through the Saint Johnsbury area we will examine exposures of glacial till, a probable deltaic deposit, an extensive esker and outwash system, varved lacustrine deposits, and glacial striations, all of which contain important clues for unraveling the glacial and post-glacial history. The study area is located in Caledoma County in northeastern Vermont (Figure 1), and is part of the Vermont Piedmont physiographic province (Stewart and MacClintock, 1969). Relief is moderate; the high point is approximately 480 meters (1,575 feet) above sea level and the low point is approximately 156 meters (512 feet). All of the streams in the study area drain into the Passumpsic River, which in turn drains southward into the Connecticut River at East Barnet, approximately four miles south of the study area. Figure 2 shows the general drainage pattern, selected cultural features, glacial striae, till fabric diagrams, the approximate shoreline of glacial Lake Hitchcock, and the field trip stops.
Most of the area is underlain by the calcareous granulite, calcareous schist, and amphibolite of the Waits River Formation, with the phyllite, slate, and micaceous quartzite of the Gile Mountain Formation underlying the easternmost section. These units are of probable Devonian age (Hall, 1959; Hatch, 1988). A small, poorly exposed body of granite (also of probable Devonian age) is exposed in the southwestern portion of the study area to the west of Morses Mills (Hall, 1959).
There is a long tradition of geologic research involving the surficial deposits in this area, starting with the work of Charles Adams (1846), who gave the general description quoted above. Edward Hitchcock and his co-workers produced a general map of "terraces" of the Passumpsic Valley (Hitchcock and others, 1861). Ernst Antevs (1928) conducted studies of varve stratigraphy at four sites in the quadrangle. He also included some intriguing observations about a supposed moraine at St. Johnsbuzy and its possible correlation with the Littleton—Bethiehem Moraine (see section on Moraines below). The first overall study of the surf cial deposits of the area was done in the 1950's or 1960's by David Stewart as part of his study of the St. Johnsbury 15 minute quadrangle (Stewart, no date). This work was incorporated into the Surficial Geologic Map of Vermont (Doll, 1970) and is described in general terms by Stewart and MacClintock (1969). Subsequent surficial geologic work in the study area includes Wayne Newell's study of the surficial deposits in the Passump sic River Valley (Newell, 1970) and limited test borings and depth to bedrock measurements in the Sleepers River Research Watershed (Thor Smith. U.S.G.S., Montpelier, personal communication, 1999).
SURFICL4L DEPOSiTS
The oldest surficial deposits encountered in the study area consist of firm, silt-rich basal till and friable to loose, sandy ablation till. Ice-contact deposits of sand and gravel in the form of kames and kame terraces occur at several locations in and near the area. Several relatively thin and somewhat discontinuous sand and gravel deposits in the Whiteman Brook Valley appear to have formed in a deltaic environment of a high-level proglacial lake. A system of esker deposits of ice-contact gravels and sands is spectacularly well-developed in the Passumpsic River Valley. This esker system is flanked by extensive outwash deposits of gravel, sand, and silt. In the valleys, the esker and outwash deposits are overlain by fine-grained lacustrine deposits of varved silt and clay associated with glacial Lake Hitchcock. All of the preceding materials are of Pleistocene age. Holocene alluvial deposits consisting of silt, sand, gravel, andlor boulders are common in the valleys. A few small Holocene talus deposits occur, and both landslide and mudflow deposits are common where steep slopes in basal till are currently being eroded by streams.
Springston, G., and Haselton, G. M., 1999, Surficial geology of the eastern half of the StJohnsbury 7.5 X 15 minute quadrangle, northeastern Vermont.; in Wright, S.F. ed., New England Intercollegiate Geologic Conference Guidebook Number 91, p. 1-16.
Al -2 SPRJNGSTON AND HASEL TON
Figure 1. Outhne map of Vermont. The study area is indicated by diagonal ruling. The St. Johnsbury 15 minute quadrangle is indicated by the larger rectangle. The northern half of the 15 minute quadrangle comprises the St. Johnsbury 7.5 x 15 minute quadrangle.
Following Newell (1970), two principal types of till are recognized: firm, fine-grained basal or lodgement till and looser, sandy to loamy ablation till. An important complication is that some exposures show till with physical characteristics intermediate between these two types of till. As described below, we have interpreted this intermediate material as a weathering product of the basal till.
Throughout the study area the streams occasionally expose a finn, unweathered, dark gray (Munsell color N4/) till containing predominantly unweathered, striated and faceted pebbles, cobbles and boulders of calcareous granulite, quartzite, schist, amphibolite, and granitic rock. This material has a subtle bluish cast to it despite the Munsell designation cited above and is sometimes locally referred to as "blue clay" or "blue till". Its firmness leads to yet another local designation as "hardpan". In some localities this material has a marked fissility. Although this matenal underlies the stream valleys throughout the area, the full extent of this material is unknown. It is not encountered in the upland interfiuves between the streams. This is either because it was I) not deposited in these areas, 2) eroded away from these areas, or 3) the till in the interfiuves is a weathered version of the till exposed in the stream valleys in which the clay has
2
SPRINGSTON AND I-IA SEL TON
Al-3
44°30'
H
A 510
Scale
SJ 99 NORTH SJ-39
N=53 DANVILLE / N.52
/ ... .\ Brook
R
©
Whiteman ©
\ A
Pumpn Hill
\'
Water
3
SJ28
Brook /
'1 .1
1 JOHNSBURY CENTER
I
ST.
oH
PASSUMPSIC
I - 4422'3O'
727'30" 0 2 7200' I I
\ Glacial stnae Miles U Village (older striae flagged)
Till fabric diagram . Approximate Lake Hitchcock A Hilltop shoreline
' Esker 1 Field Trip Stop
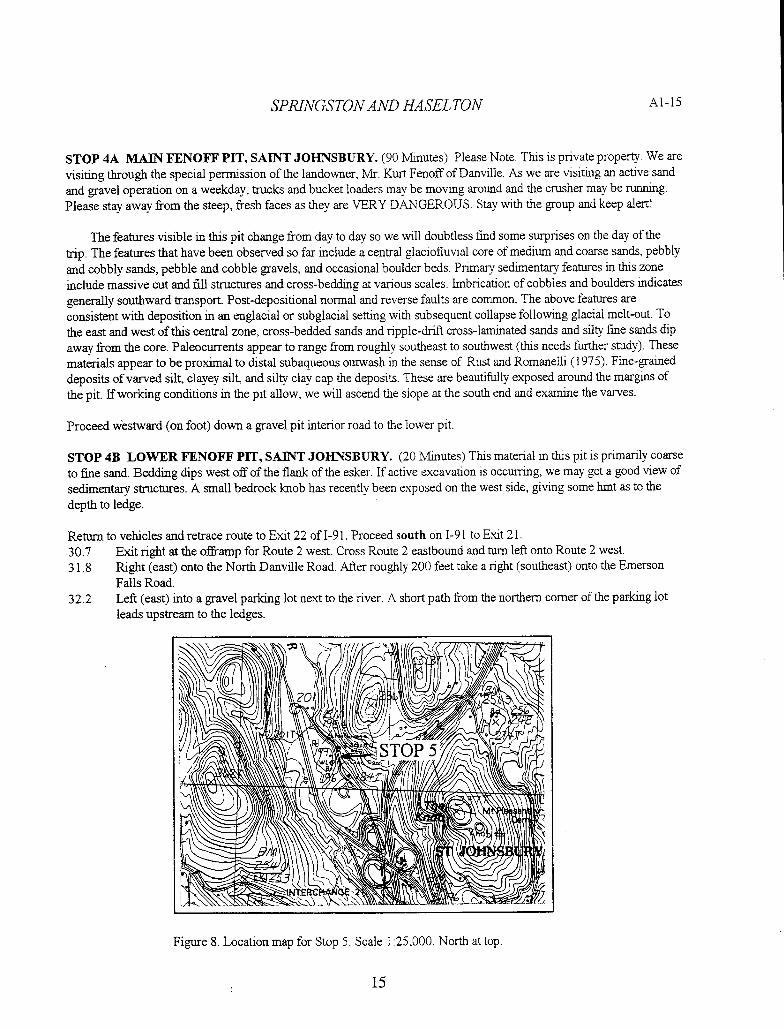
Figure 2. Map of the study area showing selected features described in the text. Field trip stops are labeled.
3
Al -4 SPRINGSTONAKD HASEL TON
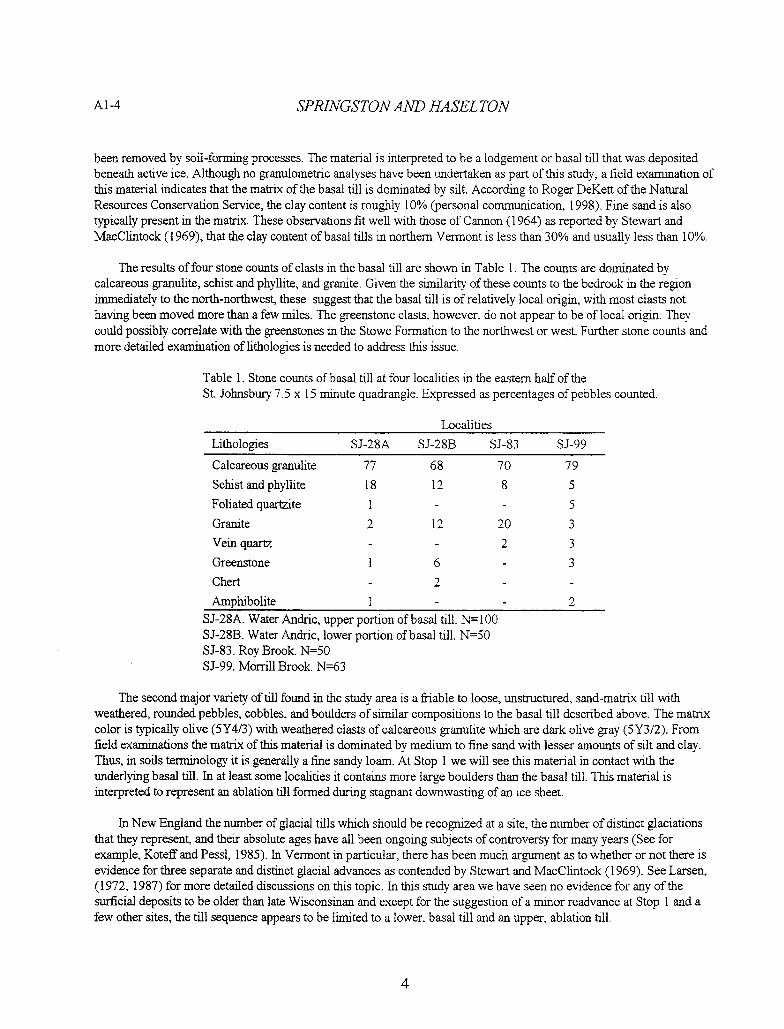
been removed by soil-forming processes. The matenal is interpreted to be a lodgement or basal till that was deposited beneath active ice. Although no granulometric analyses have been undertaken as part of this study, a field examination of this material indicates that the matrix of the basal till is dominated by silt. According to Roger DeKett of the Natural Resources Conservation Service, the clay content is roughly 10% (personal communication, 1998). Fine sand is also typically present in the matrix. These observations fit well with those of Cannon (1964) as reported by Stewart and MacClintock (1969), that the clay content of basal tills in northern Vermont is less than 30% and usually less than 10%.
The results of four stone counts of clasts in the basal till are shown in Table 1. The counts are dominated by calcareous granulite, schist and phyllite, and granite. Given the similarity of these counts to the bedrock in the region immediately to the north-northwest, these suggest that the basal till is of relatively local origin, with most clasts not havmg been moved more than a few miles. The greenstone clasts, however, do not appear to be of local origin. They could possibly correlate with the greenstones in the Stowe Formation to the northwest or west. Further stone counts and more detailed examination of lithologies is needed to address this issue.
Table 1. Stone counts of basal till at four localities in the eastern half of the St. Johnsbury 7.5 x 15 minute quadrangle. Expressed as percentages of pebbles counted.
Localities Lithologies SJ-28A SJ-28B SJ-83 SJ-99
Calcareous granulite 77 68 70 79 Schist and phyllite 18 12 8 5 Foliated quartzite 1 - - 5
Granite 2 12 20 3 Veinquartz - - 2 3 Greenstone 1 6 - 3 Chert - 2 - -
Amphibolite I - - 2 SJ-28A. Water Andric, upper portion of basal till. Nl 00 SJ-28B. Water Andric, lower portion of basal till. N50 SJ-83. Roy Brook. N='50 SJ-99. Morrill Brook. N"63
The second major variety of till found in the study area is a friable to loose, unstructured, sand-matrix till with weathered, rounded pebbles, cobbles, and boulders of similar compositions to the basal till described above. The matrix color is typically olive (5Y413) with weathered clasts of calcareous granulite which are dark olive gray (5Y3/2). From field examinations the matrix of this material is dominated by medium to fine sand with lesser amounts of silt and clay. Thus, in soils terminology it is generally a fine sandy loam. At Stop 1 we will see this material in contact with the underlying basal till. In at least some localities it contains more large boulders than the basal till. This material is interpreted to represent an ablation till formed during stagnant downwasting of an ice sheet.
In New England the number of glacial tills which should be recognized at a site, the number of distinct glaciations that they represent, and their absolute ages have all been ongoing subjects of controversy for many years (See for example, Koteff and Pessi, 1985). In Vermont in particular, there has been much argument as to whether or not there is evidence for three separate and distinct glacial advances as contended by Stewart and MacClintock (1969). See Larsen, (1972, 1987) for more detailed discussions on this topic. In this study area we have seen no evidence for any of the surficial deposits to be older than late Wisconsinan and except for the suggestion of a minor readvance at Stop 1 and a few other sites, the till sequence appears to be limited to a lower, basal till and an upper, ablation till.
ru
SPRINGSTON AND HASEL TON Al -5
The remnants of what was apparently an areally extensive but relatively thin deposit of sand and gravel occur in the Whiteman Brook Valley approximately 0.5 mile north of Pumpkin Hill. This deposit has been heavily exploited for highway fill material. From conversations with excavators and town officials, it does not appear that the material removed was of very high quality. We will visit a small pit in this deposit at Stop 2. Although Stewart (no date) and Doll (1970) show this feature as a kame terrace, the current exposures seem more in accord with a deltaic deposit into a high-level pro-glacial lake.
By far the largest ice-contact deposit in the study area is a portion of the Passump sic Valley Esker System. This is one of the longest and finest in Vermont, if not New England. It extends from St. Johnsbury northward past Lyndonville, where it splits into two branches, one extending up the valley of the Sutton River to West Burke, and the other extending up the Passumpsic River Valley to East Haven. In the study area this feature is a composite of a true esker and vast flanking deposits of subaqueous outwash sands and gravels, all overlain by lacustrine deposits. The deposit exceeds 100 feet in thickness in numerous locations in the study area. The many sand and gravel pits excavated in the deposit reveal a complex variety of features. In the core of the esker the material includes medium and coarse sands, pebbly and cobbly sands, pebble and cobble gravels, and occasional boulder beds. Primary sedimentary features include massive cut and fill structures and cross-bedding at various scales. Post-depositional normal and reverse faults are common. These features are consistent with deposition in an englacial or subglacial setting with subsequent collapse following glacial melt-out. Cross-bedded sands, ripple-drift cross-laminated sands, and silty fine sands make up the bulk of the flanking outwash deposits, most of which appear to have been deposited as proximal to distal subaqueous outwash after the models of Rust and Romanelli (1975) and Larsen (1987).
A second, smaller, esker system in Danville extends from 0.4 to 1.1 miles due south of Pumpkin Hill. This esker system has several branches which are flanked by fields of kame and kettle topography. The crests are mainly on the order of 10 to 20 feet higher than the surrounding land, however in some places the esker crests rise more than 30 feet above their surroundings. On the south end of the westernmost esker, the western flank appears to be approximately 100 feet high. The material encountered in several auger holes and shovel pits was generally medium to fine sand or medium to fine sandy loam, although in a few spots we encountered pebbly or cobbly sand. We will not be visiting this deposit.
Fine-grained lacustrine deposits of varved silt, clayey silt, silty clay, and occasionally fine sand are common in the valleys of the study area, especially in the Passumpsic and Sleepers River Valleys. In the Passumpsic River Valley these deposits range in thickness from a few feet to as much as 100 feet, the thickest deposits being encountered in the valley bottom with only a few feet of material covering the crest of the esker. Although areally extensive deposits of fine-grained lacustrine material were not encountered above an elevation of 270 meters, several small deposits of varved silty clay were seen in tributaries of the Sleepers River at elevations up to approximately 300 meters.
We interpret these fine-gramed lacustrine deposits to represent annual deposits in glacial Lake Hitchcock (Antevs, 1928; Koteff and Larsen, 1989; Ridge and others, 1996, 1999). The approximate Lake Hitchcock shoreline shown on Figure 2 is a modification of the projected lake level data of Koteff and Larsen (1989). Based on the correlations and dating work reported in Ridge and others (1999), the lowermost lake deposits at the southern end of the study area (Passumpsic Village) would have formed in the lake at approximately 12.0 4C ka. Following the Littleton-Bethiehem Readvance at approximately 11.9-11.8 14 C ka, the ice margin again retreated and the lake may have persisted in the upper Connecticut Valley until at least as late as 10.4 ' 4C ka (Ridge and others, 1999).
Holocene alluvial deposits of silt, sand, gravel, and boulders are quite common in the valleys of the study area. These typically take the form of coarse-grained point bar deposits and finer grained overbank deposits.
ICE MOVEMENT DIRECTIONS
Only a few examples of glacial siriations were encountered during our work in the field area (Figure 2), apparently because of the high carbonate content in much of the bedrock, which means that most striated surfaces exposed to the weather would likely have been destroyed due to chemical weathering. In support of this idea, the sites where we
Al-6 SPRINGSTONAND HASEL TON
observed striations were all places where the bedrock had been recently exposed either because of road-building or recent erosion of overlying surficial material. See the discussion of the cross-cutting striae at Stop 6 In the road log.
A conspicuous feature in the basal till is a strong preferred orientation of the clasts. Four sets of reconnaissance till fabric measurements made during our study are shown on Figure 2. Newell (1970, Figure 3-1) shows till fabric diagrams for two sites in the study area: the Roy Brook area and the South Danville—Morses Mills area in the vicinity of Joes Brook. The Roy Brook diagram shows a maximum at approximately N45 °E (by far the most easterly till fabric reported or observed) while the South Danville-Morses Mills site shows a maximum at approximately N5 °W, in good agreement with the basal till measurements at Stations SJ-39 and SJ-99. All of the above-mentioned till fabnc data, with the exception of Newell's for the Roy Brook area, and ours for the Roy Brook site, correspond reasonably well with vector means for "subsurface till" (presumably basal till) at four localities studied by Stewart and MacClintock (1969, p. 192, Fabrics 19-22). Given that the stones in the Roy Brook Valley had the weakest preferred onentation of any of the sites studied, further work is needed to determine if the maxima indicated for that site are statistically significant.
In general, both the predominant striation directions and the till fabric maxima indicate a generally north-northwest to south-southeast direction of ice movement. The variations in striation directions are probably due to a combination of control of ice-flow direction by underlying topography and a presumably lobate pattern of ice flow during the late Wisconsinan. See Ackerly and Larsen (1986) for a more detailed discussion of regional striation patterns and their relationships to patterns of glacial movement.
MORAINES
We have so far been unable to find two "moraines" reported by earlier workers. The first is supposed to have been located in the lower Sleepers River Valley west of St. Johnsbury. The second is supposed to occur in the uplands in the southwestern portion of the study area.
Moraine at St. Johnsbury In 1928 Ernst Antevs published the second of his superb memoirs on ice retreat at the close of the last glaciation in
New England (Antevs, 1928). In reference to a locality "at the junction of the railroads at the southern edge of the city, kettle in the southern end of the large gravel deposit." he states that, "The formation of the alternating clay and gravel beds at locality 171... seems to prove that the ice edge stood in the vicinity for at least 200 years. Moramal deposits at St. Johnsbuiy also indicate halt and readvance." (pp. 119-120). In reference to this moraine Crosby (1934, pp. 411-412) states, "Antevs believed, from his studies of varved clay and other features, that there was a re-advance of the ice with the formation of a moraine at St. Johnsbury, and he suggested that this moraine might correspond with the Bethlehem-Littleton moraine 15 miles to the east.' Crosby's Figure 1 indicates a section of moraine just west of St. Johnsbuiy in the lower Sleepers River Valley. However, this is a rough, small scale map and it is impossible to be sure exactly where this feature was located. In articles dealing with surface water runoff production, Dunne and Black (1 970a and b) describe a stratigraphic section on the west side of the Sleepers River Valley. The section was apparently destroyed by highway construction soon thereafter. Their section includes 22 feet of sand overlying 38 feet of varved silt and sand, which in turn overlies basal till. From the description, it appears likely that the sand was probably a shallow lacustrine deposit Even though it is possible that Antevs was describing something other than an active-ice feature (which present use of the term moraine would be limited to), it would have been quite inconsistent with his other descnptions for Antevs to have described a sand deposit lacking in till as a moraine. As there are still a few corners of the valley to check, there is still a chance that the missing moraine may turn up.
A search of the later maps and materials relating to the St. Johnsbury area has so far failed to find further evidence of such a moraine, and in our field work we could discover no evidence of such a feature. Given the extensive earth-moving which occurred in this valley during the construction of 1-91, it is possible that the feature has been destroyed. Although no moraine has been found, a 45-foot high bank on the west side of the solid waste transfer station (marked as "Sanitary Landfill" on the topographic map) does provide a hint that a re-advance may have taken place. At that locality, the sequence from bottom to top is approximately 40 feet of silty fine sand and fine sand, a lens of approximately one
SFRJNGSTONAND HA SEL TON A1-7
foot of sandy till, one to two feet of sand, and three feet or more of sandy till. Although the exposures are quite lunited, the till could be interpreted as evidence of a readvance.
Danville Moraine The manuscript surficial map of the St. Johnsbuiy 15 minute quadrangle by David P. Stewart (at Vermont
Geological Survey, no date) shows, in the southwestern part of this study area, an area that is mapped as "moraine". This is part of the feature designated as the Danville Moraine by Stewart and MacClintock (1969) and shown on the Surficial Geologic Map of Vermont (Doll, 1970). These authors show this feature extending from Bradford to Glover, a distance of approximately 50 miles.
We believe that the portion of the "Danville Moraine" in the study area is actually an area of very thin till overlying bedrock and is in no way distinguished from other upland parts of the study area. Numerous auger holes, examination of aerial photographs, water well drillers' logs, and inspection of the excavations for a municipal water line constructed during the fall of 1998 in the center of Danville, all indicate that bedrock in this portion of the map area is within 3-10 feet of the surface. In other parts of New England where moraines have been mapped, one sees a blanket of thick drift including a great concentration of boulders, together with distinct ridge forms that can be traced as features across the countryside. Our investigations showed no such forms in the study area, although based on an examination of aerial photos the distinct possibility remains that such features exist to the west of the study area. Further detailed mapping is needed to determine whether, in fact, a moraine does exist to the west.
GLACIAL AND POSTGLACIAL HISTORY
The oldest surficial deposits in the study area consist of the basal glacial till. From regional correlations it appears that this material is unlikely to be older than early Wisconsinan (Koteff and Pessl. 1985) and it is more probably of late Wisconsinan age.
Using the deglaciation chronology of Ridge and others (1999, Figure 15), the St. Johnsbury area was free of ice for the first time at approximately 12.0 ' 4 C ka bp (their date for the first deposits associated with glacial Lake Hitchcock) and then, following the Littleton—Bethlehem Readvance at approximately 11.9-11.8 ' 4C ka the area was finally ice-free by approximately 11.8 ' 4C ka. The intriguing two-till section at Stop 3 may well represent this readvance.
If the Littleton—Bethiehem Readvance is a reality, then the Passumpsic Valley Esker System was likely formed after the readvance (otherwise it would have been destroyed or at the very least greatly disrupted by the overriding ice) and is thus a feature of very latest Wisconsinan age. The extensive deposits certainly indicate that the valley served as one of the major regional drainage channels during deglaciation. It is unclear whether or not parts of the Passumpsic Valley outwash deposits are parts of morphosequences in the sense of Koteff and Pessl (1981). Although they do not approach the maximum elevation of Lake Hitchcock, which had a shoreline elevation in the vicinity of 300 meters no deltaic facies have been observed in these deposits which could indicate the maximum level to which they were graded. In the absence of such evidence we can only say that these deposits represent a series of glaciofluvial to glaciolacustrine deposits at the boundary between the retreating ice sheet and Lake Hitchcock.
If the chronology of Ridge and others (1999) is correct, final ice recession was complete to the Canadian border by approximately 11.5 'C ka and Lake Hitchcock would have persisted until at least 10.4 C ka.
In the immediate post-glacial time, the climate may have warmed sufficiently rapidly that no significant permafrost features such as pingo scars or patterned ground were produced. No evidence of such features was encountered during this study.
7
Al -8 SPRJNGSTON AND HASEL TON
Analysis of nearby peat deposits containing pollen and plant fragments indicates that tundra vegetation had spread through the area soon after the retreat of the glaciers and that mixed woodlands of poplar, spruce, fir, and other species followed soon after (Davis and Jacobson, 1985 McDowell and others, 1971).
During the Holocene Epoch, the vegetation has continued to change in response to a combination of northward range extensions, soil profile development, and a changing climate. In the meantime, stream erosion has continued to modify the landscape, with much of the energy of the streams being devoted to the reworking of the deposits of the last glaciation.
ACKNOWLEDGEMENTS
Field work was funded by the Vermont Geological Survey with support from the Statemap Program of the U.S. Geological Survey. We would like to express our sincere appreciation to Laurence Becker, Vermont State Geologist, and Maijorie Gale, Geologist with the Survey.
We extend our thanks to the U.S. Geological Survey for allowing us to stay at their "Town Line Cabin" in the Sleepers River Research Watershed. G. Scot Applegate compiled a massive spreadsheet of water well drilling logs and other borings. Mike Williams of the University of Massachusetts at Amherst kindly loaned us the manuscript bedrock geologic map for the area produced by the late Leo M. Hall, Roger DeKett of the Natural Resources Conservation Service Office in St. Johnsbury helped us in many ways, including spending time with us in the field. Thanks also to Sm Clark, Jarnié Shan.ley, and Thor Smith of the U.S. Geological Survey and to Stephen Parker, Administrative Assistant to the Danville Selectboard. Thanks to Stephen Wright. Josh Gaister, Rachel House, Karen Jennings, and Anders Noren, all of the University of Vermont, for helping to excavate the Water Andric site. Special thanks to Fred Larsen of Norwich University and Stephen Wright of the University of Vermont for many helpful discussions. Rose Paul reviewed the manuscript and made many helpful suggestions.
Finally, we would like to thank the landowners of the study area. Every person we spoke with was helpful and cooperative, with many people going out of their way to help us with our explorations. Their friendliness made this study possible.
REFERENCES CITED
Ackerly, S.C., and Larsen, F.P., 1987, Southwest-trending striations in the Green Mountains, central Vermont: in Westerman, D.S., ed., Guidebook for New England Intercollegiate Geological Conference 79th meeting, p. 369-382.
Adams, C.B., 1846, Second annual report on the geology of Vermont: Burlington, 265p. Antevs, E., 1928, The last glaciation with special reference to the ice retreat in Northeastern North America: American
Geographical Society Research Series, No. 17, 292p. Bouchard, M., and Pavich, M.J., 1989, Characteristics and significance of pre-Wisconsinan saprolites in the northern
Appalachians: Zeitschift fur Geomorphologie, N.F.: Suppl.,-Bd.72, p.1 25-137. Cannon, W.F., 1964, The petrology of tills in northern Vermont: M.S. Thesis, Miami University, Oxford, Ohio. Crosby, I.B., 1934, Extension of the Bethlehem, New Hampshire, Moraine: Journal of Geology, v. 42, p.4 11-421. Davis, R.B., and Jacobson, G.L., Jr., 1985, Late glacial and early Holocene landscapes in northern New England and
adjacent areas of Canada: Quaternary Research, v. 23, p. 341-368 . Doll, C.G., 1970, Surficial geologic map of Vermont: Vermont Geological Survey, 1:250,000. Dunne, T., and Black, R.D., 1 970a, An experimental investigation of runoff production in permeable soils: Water
Resources Research, v.6, p.478-490. ______ 1 970b, Partial area contributions to storm runoff in a small New England watershed: Water Resources Research,
v.6, p.1296-131 1. Hall, L.M., 1959, The geology of the St. Johnsbuxy quadrangle, Vermont and New Hampshire: Vermont Geological
Survey Bulletin 13, lOSp.
[] [sJ
SPRINGSTON AND HASEL TON Al -9
Hatch, N.L., Jr., 1988, Some revisions to the stratigraphy and structure of the Connecticut Valley trough, eastern Vermont: American Journal of Science, v. 288, p.1041-1059.
Hitchcock, E., and others, 1861, Report on the geology of Vermont: descriptive, theoretical, economical, and stratigraphical: Claremont, New Hampshire, 2 vols.
Koteff, C., and Larsen, F.D., 1989, Postglacial uplift in western New England: Geologic evidence for delayed rebound: in Gregersen, S., and Basham, P., eds.. Proceedings of a NATO symposium on causes and effects of earthquakes along the passive margins on both sides of the Atlantic in areas of postglacial uplift. Vordingborg, Denmark.
Koteff, C., and Pessi, F., 1981, Systematic ice retreat in New England: U.S. Geological Survey Professional Paper 1179, 2Op.
1985, Till siratigraphy in New Hampshire: Correlations with adjacent New England and Quebec: in Borns, H.W., LaSalle, P., and Thompson, W.B., eds., Late Pleistocene history of northeastern New England and adjacent Quebec: Geological Society of America Special Paper 197, p.1- 12.
Larsen, F.D., 1972, Glacial history of Central Vermont: in Doolan, B.L. and Stanley, R.S.. eds.. Guidebook for New England Intercollegiate Geological Conference 64th meeting, p.297-3 16.
Larsen, F.D., 1987, Glacial Lake Hitchcock in the valleys of the White and Ottauquechee Rivers, east-central Vermont: in Westerman, D.S., ed., Guidebook for New England Intercollegiate Geological Conference 79th meeting, p.29-52.
LaSalle, P., De Kimpe, C.R., and Laverdiere, M.R., 1985, Sub-till saprolites in southeastern Quebec and adjacent New England: Erosional, stratigraphic, and climatic significance: in Borns, H.W.. LaSalle, P.. and Thompson, W.B., eds., Late Pleistocene history of northeastern New England and adjacent Quebec: Geological Society of America Special Paper 197, p.13-20.
McDowell, L.L., Dole, R.M., Jr.,Montague, H., Jr., and Farnngton, R.A., 1971, Palynology and radiocarbon chronology of Bugbee Wildflower Sanctuary and Natural Area, Caledonia County, Vermont: Pollen et Spores, v.13, p. 73-91 .
Newell, W.L., 1970, Surficial geology of the Passumpsic Valley, northeastern Vermont: Ph.D. Dissertation, Johns Hopkins University, Baltimore, I04p.
Ridge, J.C., Thompson, W.B., Brochu, M., Brown, S., and Fowler, B., 1996, Glacial geology of the Upper Connecticut Valley in the vicinity of the Lower Ammonoosuc and Passumpsic Valleys of New Hampshire and Vermont: in Van Baalen, M.R., ed., 1996, New England Intercollegiate Geologic Conference, 88th Annual Meeting Guidebook, p.309-339.
Ridge, J.C., Besonen, M.R., Brochu, M., Brown, S.L., Callahan, J.W., Cook, G.J., Nicholson, R.S., and Toll, N.T., 1999, Varve, paleomagnetic, and 14 C chronologies for Late Pleistocene events in New Hampshire and Vermont, U.S.A.: Géographie physique et Quatemaire, v. 53, p. 79-107 .
Rust, B.R., and Romanelli. R., 1975, Late Quaternary subaqueous outwash deposits near Ottawa. Canada: in Jopling, A.V., and McDonald, B.C., eds., Glaciofluvial and glaciolacustnne sedimentation: Society of Economic Paleontologists and Mineralogists Special Publication No. 23, p. 177-192 .
Stewart, D.P., no date, Manuscript surficial geologic map of the St. Johnsbury 15 minute quadrangle, on file at the Vermont Geological Survey, Waterbury.
Stewart, D.P., and MacClintock, P., 1969, The surficial geology and Pleistocene history of Vermont: Vermont Geological Survey, Bulletin 31, Montpelier, 251 p.
ROAD LOG
Assemble at the town green on the south side of U.S. Route 2 in Danville. The field trip vehicles will assemble on the street bounding the east side of the green. Please consolidate vehicles as much as possible. Note that if your vehicle has exceptionally low ground clearance you should ride with someone else. A section of the road between Stops 2 and 3 is narrow and rutted (however, four wheel drive is not needed). The last stop will be on Route 2 approximately 2.8 miles to the east of the assembly point so there's no good reason not to carpool. You can park on the streets surrounding the town green as long as no driveways or hydrants are blocked.
Please bring your LUNCH with you. There is a general store across the street from the assembly point and there are also stores located east and west of town on Route 2.
Al-lU SPRJNGSTONAND HA SEL TON
As the basal till exposed at Stops 1 and 3 is rather clayey, you may want to wear old boots (or even a pair of rubber "barn boots" if the day is wet).
The entire route is on the Saint Johnsbuiy 7.5 x 15 minute, 1:25,000 quadrangle (USGS, 1983). You may also find the Delormes' Vermont Atlas and Gazetteer (1996) useful for following the route.
Departure time is 9:00 a.m.
Mileage
0.0 Cross U.S. Route 2 and head north on the North Danville Road (paved, with centerline).
3.5 Cross bndge over Morrill Brook, contmuing on North Danville Road. A till fabnc measurement made just south of this bridge shows a strong north-northwest orientation (Figure 2).
5.0 North Danville. Continue around a sharp right-hand turn and stay on the North Danville Road. For the next couple of miles you will be descending alongside the Sleepers River.
5.2 Fresh ledge exposure on the left.
5.5 Looking of to the right past a small, unpainted woodframe building you may catch a glimpse of a spectacular 70 foot section of till. No time to stop for this one. As you continue down the valley, note the outcroppings of blue-gray clay-silt matrix basal till on the roadsides, in the river bed, and in cut-banks on the outside bends of the river. Slumping of this material is quite common, as evidenced by the "drunken" cedars on the slopes above the river.
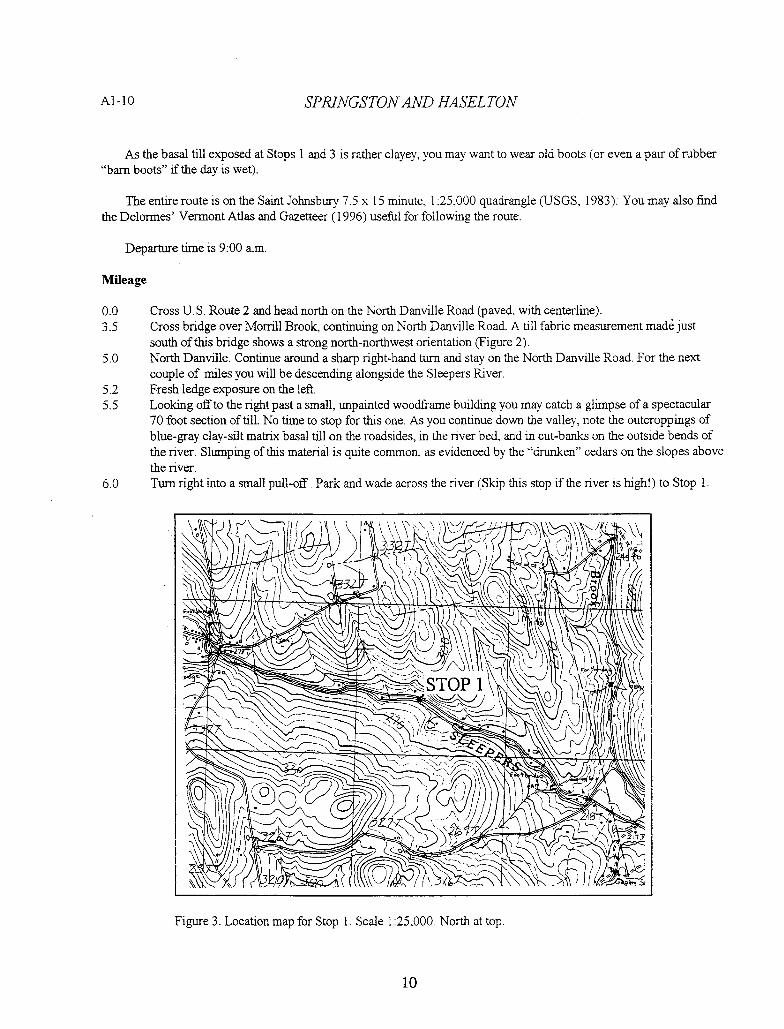
6.0 Turn right into a small pull-off. Park and wade across the river (Skip this stop if the river is high!) to Stop I.
Figure 3. Location map for Stop 1. Scale 1:25.000. North at top.
10
SPRINGSTON AND HASEL TON Al-Il
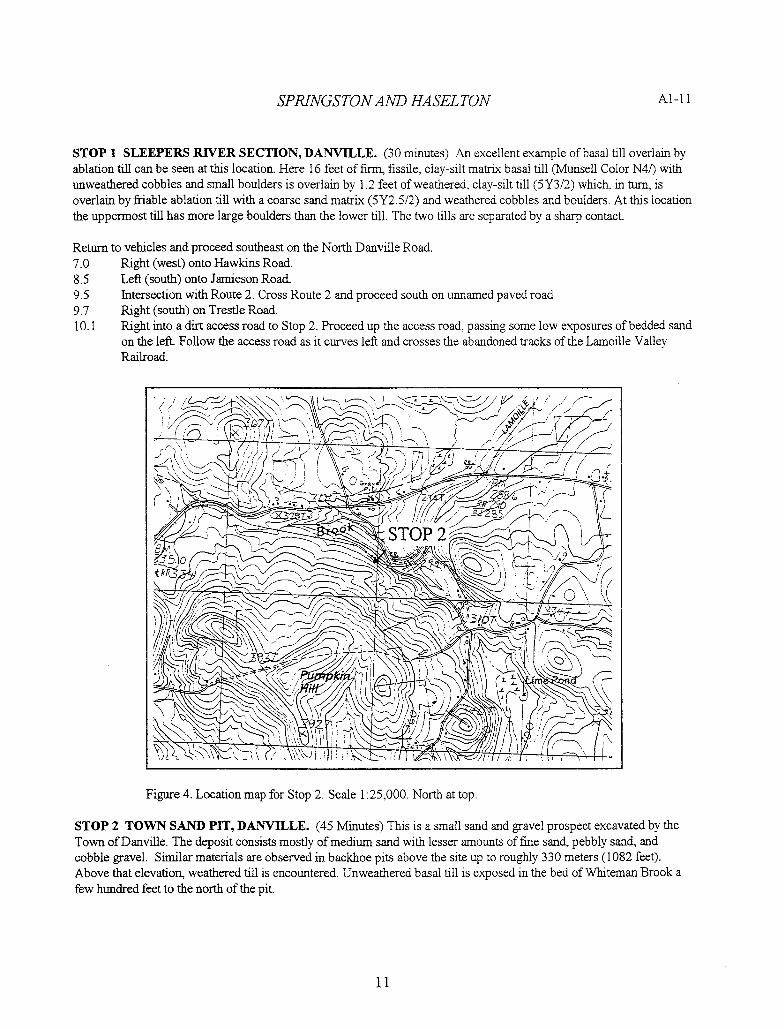
STOP 1 SLEEPERS RiVER SECTION, DANVILLE. (30 minutes) An excellent example of basal till overlain by ablation till can be seen at this location. Here 16 feet of firm, fissile, clay-silt matrix basal till (Munsell Color N41) with unweathered cobbles and small boulders is overlain by 1.2 feet of weathered, clay-silt till (5Y3/2) which, in turn, is overlain by friable ablation till with a coarse sand matrix (5Y2.512) and weathered cobbles and boulders. At this location the uppermost till has more large boulders than the lower till. The two tills are separated by a sharp contact.
Return to vehicles and proceed southeast on the North Danville Road. 7.0 Right (west) onto Hawkins Road. 8.5 Left (south) onto Jamieson Road. 9.5 Intersection with Route 2. Cross Route 2 and proceed south on unnamed paved road 9.7 Right (south) on Trestle Road. 10.1 Right into a dirt access road to Stop 2. Proceed up the access road, passing some low exposures of bedded sand
on the left. Follow the access road as it curves left and crosses the abandoned tracks of the Lamoille Valley Railroad.
Figure 4. Location map for Stop 2. Scale 1:25,000. North at top.
STOP 2 TOWN SAND PIT, DANVILLE. (45 Minutes) This is a small sand and gravel prospect excavated by the Town of Danville. The deposit consists mostly of medium sand with lesser amounts of fme sand, pebbly sand, and cobble gravel. Similar materials are observed in backhoe pits above the site up to roughly 330 meters (1082 feet). Above that elevation, weathered till is encountered. Unweathered basal till is exposed in the bed of Whiteman Brook a few hundred feet to the north of the pit.
11
A1-12 SPRINGSTON AND HA SEL TON
The overall bedding in the pit dips roughly north-northeast. The lack of faulting suggests that this is not an ice-contact deposit. On the south side of the pit the sands are overlain by an irregular cover of a sandy diamict which is ftiIl of weathered cobbles and boulders. Since these sand and gravel deposits extend well above the level reached by Lake Hitchcock (roughly 262 meters or 860 feet) in this part of the quadrangle, it appears that the deposit formed as a delta in a high-level proglacial lake which preceded Lake Hitchcock. This would probably have formed while ice still blocked the Passumpsic River Valley to the east It is not clear what the origin of the overlying sandy diamict is. Field trip participants are invited to help us explain this stop more satisfactorily.
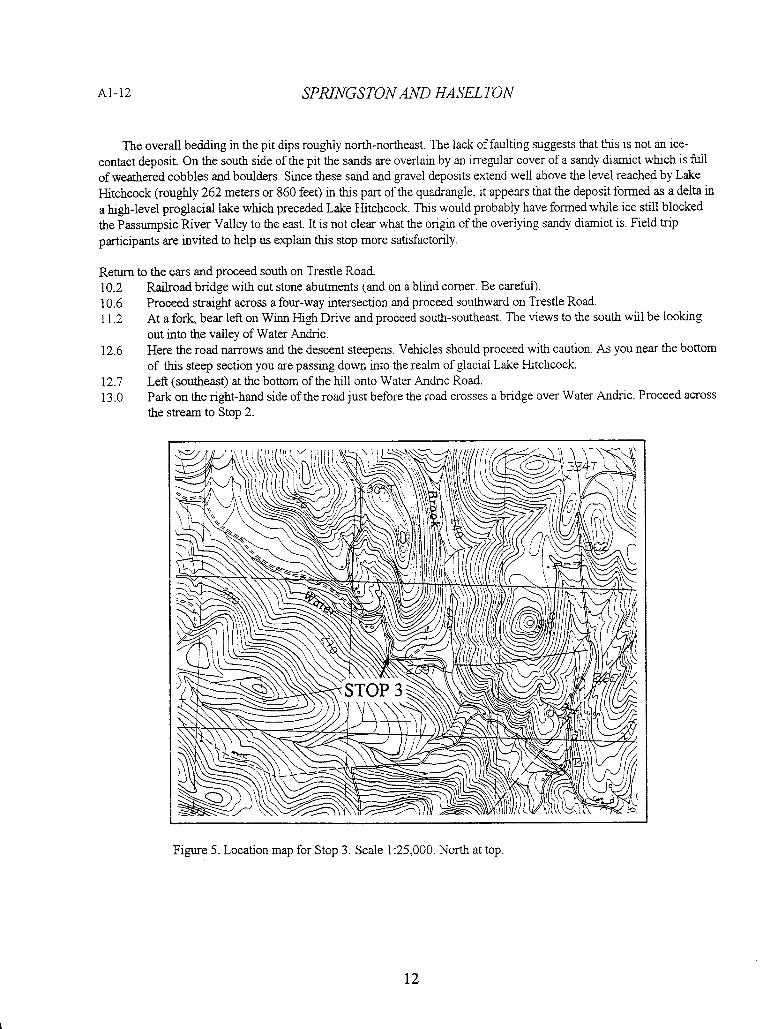
Return to the cars and proceed south on Trestle Road. 10.2 Railroad bridge with cut stone abutments (and on a blind corner. Be careflul). 10.6 Proceed straight across a four-way intersection and proceed southward on Trestle Road. 11.2 At a fork, bear left on Winn High Drive and proceed south-southeast. The views to the south will be looking
out into the valley of Water Andric. 116 Here the road narrows and the descent steepens. Vehicles should proceed with caution. As you near the bottom
of this steep section you are passing down into the realm of glacial Lake Hitchcock. 12.7 Left (southeast) at the bottom of the hill onto Water Andric Road. 13.0 Park on the right-hand side of the road just before the road crosses a bridge over Water Andric. Proceed across
the stream to Stop 2.
Figure 5. Location map for Stop 3. Scale 1:25,000. North at top.
12
SPRINGSTON AND HASEL TON Al -13
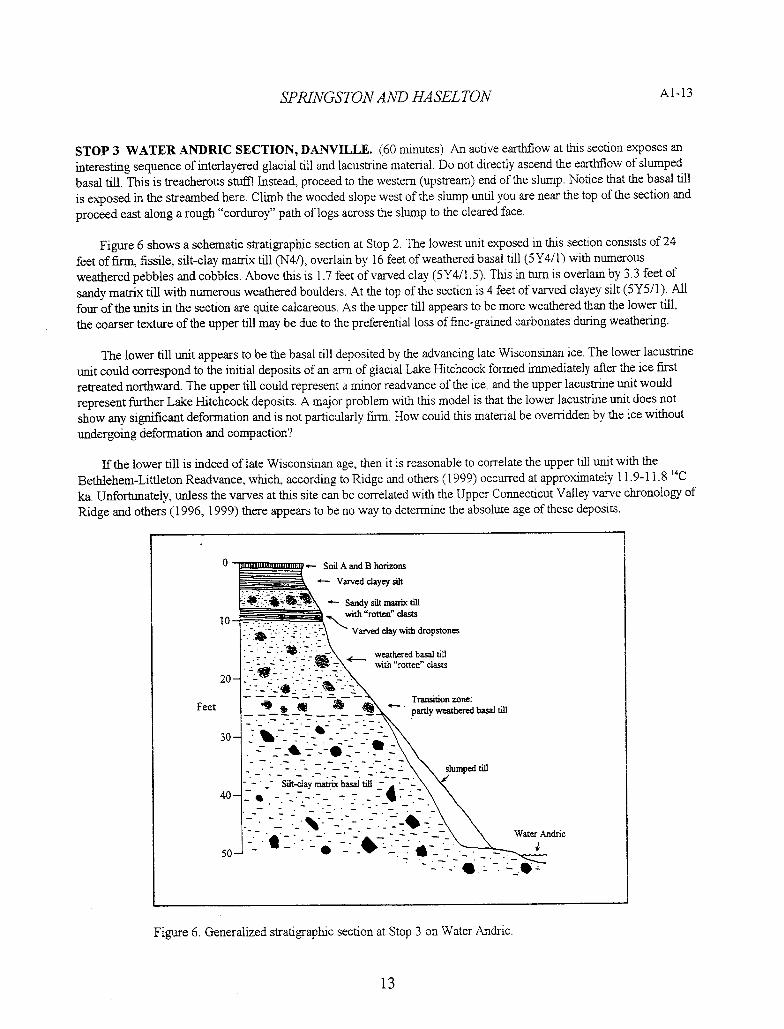
STOP 3 WATER ALNDRIC SECTION, DANVILLE. (60 minutes) An active earthflow at this section exposes an interesting sequence of interlayered glacial till and lacustnne material. Do not directly ascend the earthflow of slumped basal till. This is treacherous stufli Instead, proceed to the western (upstream) end of the siump. Notice that the basal till is exposed in the streambed here. Climb the wooded slope west of the slump until you are near the top of the section and proceed east along a rough "corduroy" path of logs across the slump to the cleared face.
Figure 6 shows a schematic stratigraphic section at Stop 2. The lowest unit exposed in this section consists of 24 feet of finn, flssile, silt-clay matrix till (N41), overlain by 16 feet of weathered basal till (5Y4/1) with numerous weathered pebbles and cobbles. Above this is 1.7 feet of varved clay (5Y411.5). This in turn is overlain by 3.3 feet of sandy matrix till with numerous weathered boulders. At the top of the section is 4 feet of varved clayey silt (5Y5/1). All four of the units in the section are quite calcareous. As the upper till appears to be more weathered than the lower till, the coarser texture of the upper till may be due to the preferential loss of fine-gramed carbonates during weathering.
The lower till unit appears to be the basal till deposited by the advancing late Wisconsinan ice. The lower lacustrine unit could correspond to the initial deposits of an arm of glacial Lake Hitchcock formed immediately after the ice first retreated northward. The upper till could represent a minor readvance of the ice, and the upper lacustrine unit would represent further Lake Hitchcock deposits. A major problem with this model is that the lower lacustrine unit does not show any significant deformation and is not particularly firm. How could this material be overridden by the ice without undergoing deformation and compaction?
If the lower till is indeed of late Wisconsinan age, then it is reasonable to correlate the upper till umt with the Bethlehem-Littleton Readvance, which, according to Ridge and others (1999) occurred at approximately 11.9-11.8 14C ka. Unfortunately, unless the varves at this site can be correlated with the Upper Connecticut Valley varve chronology of Ridge and others (1996, 1999) there appears to be no way to determine the absolute age of these deposits.
0 Soil A and B horizons
Varved ctayey silt
- - Sandy silt matrix till with "rotten" clasts
Ved clay with dropones
weathered basal till with "rotten" clasts
20-
Transitionzone: Feet - - 4 partly weathered basal till
30- -
s1mp
40-%_._. - -
-= -- L- WerAndnc
50-
Figure 6. Generalized stratigraphic section at Stop 3 on Water Andric.
13
Al -14 SPRINGSTON AND HASEL TON
This will be our lunch site. After examining the outcrop across the stream, get your lunches and (weather permitting) we'll eat down at the water's edge. Return to the cars and continue southeast.
13.9 At a four-way intersection turn left (north) on Keyser Hill Road. 15.4 Bear right as a road comes in from the left and almost immediately bear left onto Lawrence Hill Road
(unmarked). After crossing over the southeast end of Crow Hill, the views will be northward into the Sleepers River Valley.
16.7 Crow Hill Road comes in from the left. Bear right (east). 16.9 Stop at bottom of hill, turn left (north). 17.0 Left (west) onto Route 2. 17.6 Right onto entrance ramp for 1-91 northbound (Exit 21). 19.5 Right onto offiamp at Exit 22. 19.7 Right (east) from offiamp onto Hospital Road. 20.6 Left onto U.S. Rt. 5 north. As you drive northward, notice the frequent exposures of sand on the steep slopes on
the right-hand side of the road. These deposits are part of the Passumpsic Valley Esker System, which is a composite of a glaciofluvial esker deposit and vast flanking deposits of subaqueous outwash sands and gravels, all overlain by lacustrine deposits.
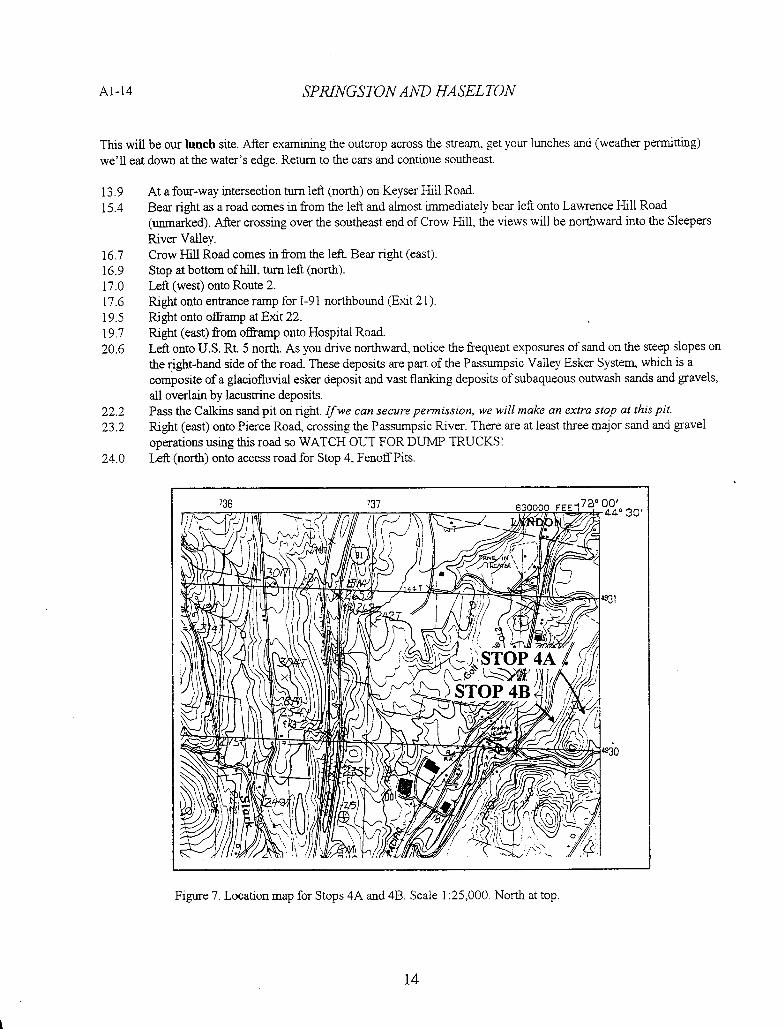
22.2 Pass the Calkins sand pit on right. If we can secure permission, we will make an extra stop at this pit.
23.2 Right (east) onto Pierce Road, crossing the Passumpsic River. There are at least three major sand and gravel operations using this road so WATCH OUT FOR DUMP TRUCKS!
24.0 Left (north) onto access road for Stop 4, Fenoff Pits.
SI
S ' :
Figure 7. Location map for Stops 4A and 4B. Scale 1:25,000. North at top.
14
SPRJNGSTONAND HA SEL TON A1-15
STOP 4A MAIN FIENOFF PIT, SAINT JOHNSBURY. (90 Minutes) Please Note. This is private property. We are visiting through the special permission of the landowner, Mr. Kurt Fenoff of Danville. As we are visiting an active sand and gravel operation on a weekday, trucks and bucket loaders may be movmg around and the crusher may be runmng. Please stay away from the steep, fresh faces as they are VERY DANGEROUS. Stay with the group and keep alert!
The features visible in this pit change from day to day so we will doubtless find some surprises on the day of the trip. The features that have been observed so far include a central glaciofluvial core of medium and coarse sands, pebbly and cobbly sands, pebble and cobble gravels, and occasional boulder beds. Primaiy sedimentary features in this zone include massive cut and fill structures and cross-bedding at various scales. Imbncation of cobbles and boulders indicates generally southward transport. Post-depositional normal and reverse faults are common. The above features are consistent with deposition in an englacial or subglacial setting with subsequent collapse following glacial melt-out. To the east and west of this central zone, cross-bedded sands and ripple-drift cross-laminated sands and silty fine sands dip away from the core. Paleocurrents appear to range from roughly southeast to southwest (this needs further study). These materials appear to be proximal to distal subaqueous outwash in the sense of Rust and Romanelli (1975). Fine-gramed deposits of varved silt, clayey silt, and silty clay cap the deposits. These are beautifully exposed around the margms of the pit. If working conditions in the pit allow, we will ascend the slope at the south end and examine the varves.
Proceed westward (on foot) down a gravel pit interior road to the lower pit
STOP 4B LOWER FENOFF PiT, SAll'T JOIINSBURY. (20 Minutes) This material in this pit is primarily coarse to fine sand. Bedding dips west off of the flank of the esker. If active excavation is occurring, we may get a good view of sedimentary structures. A small bedrock knob has recently been exposed on the west side, giving some hint as to the depth to ledge.
Return to vehicles and retrace route to Exit 22 of 1-91. Proceed south on 1-91 to Exit 21.
30.7 Exit right at the offi-amp for Route 2 west. Cross Route 2 eastbound and turn left onto Route 2 west.
31.8 Right (east) onto the North Danville Road. After roughly 200 feet take a right (southeast) onto the Emerson Falls Road.
32.2 Left (east) into a gravel parking lot next to the river. A short path from the northern corner of the parking lot leads upstream to the ledges.
Figure 8. Location map for Stop 5. Scale 1:25,000. North at top.
15
Al-16 SPRINGS TON AND HA SEL TON
STOP 5 EMERSON FALLS, SAINT JOHNSBURY. (20 minutes) Here the Sleepers River cascades over ledges of calcareous granulite and rusty-weathering phyllite. Just above the top of the cascade is a small hydroelectric facility and a stream gaging station. Small potholes ranging from a few inches to two feet in diameter are common. Across the road and approximately 200 feet southwest of the gaging station, a U.S.G. S. boring penetrated 5 feet of loamy soil, 6 feet of fine to very fine sand and silt, 25 feet of silty gray clay, and 13 feet of silty clay with a little very fine sand before encountering till at 49 feet. The well bottomed in till at 51 feet. In combination with a water well to the north which penetrated 40 feet of surflcial materials, this indicates that there is a buned river channel located to the west of the present course of the river. The till reported at the bottom indicates that the channel predates the last glaciation.
Return to Route 2. Turn right (west). 35.7 At a set of prominent ledges, pull off to the right and park as far off the shoulder as possible. Stay off the
highway! Route 2 is quite busy, especially during foliage season. Cars near the rear of the caravan should put on their emergency flashers.
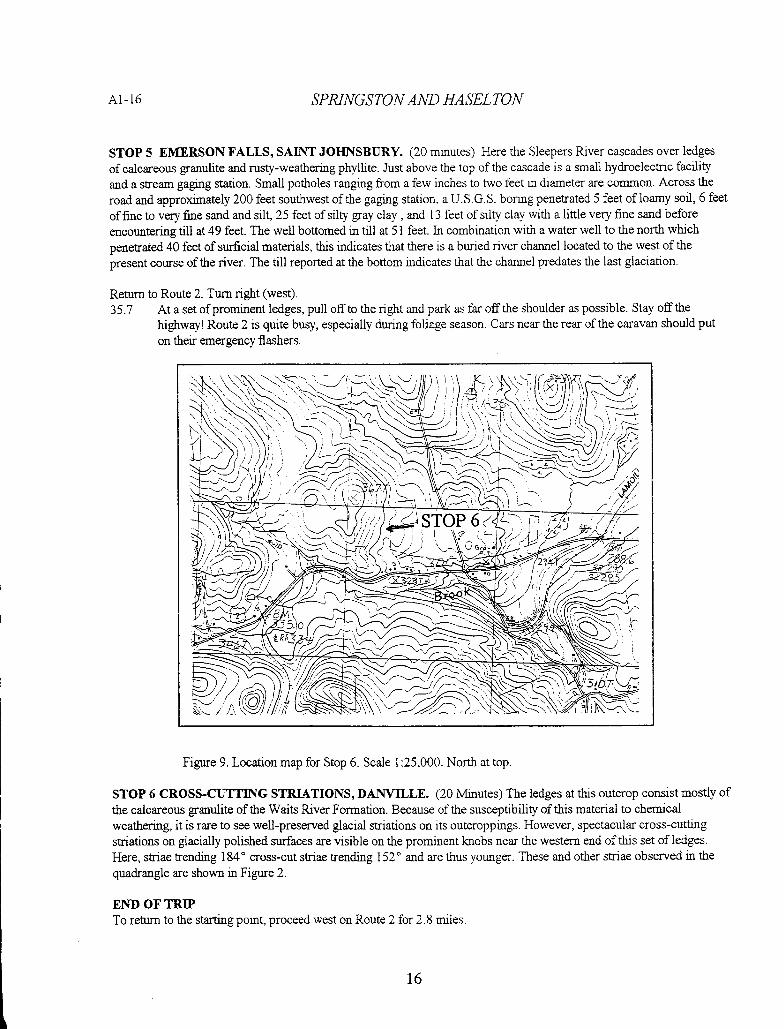
Figure 9. Location map for Stop 6. Scale 1:25,000. North at top.
STOP 6 CROSS-CUTTING STRIATIONS, DANVILLE. (20 Minutes) The ledges at this outcrop consist mostly of the calcareous granulite of the Waits River Formation. Because of the susceptibility of this material to chemical weathering, it is rare to see well-preserved glacial striations on its outcroppings. However, spectacular cross-cutting striations on glacially polished surfaces are visible on the prominent knobs near the western end of this set of ledges. Here, striae trending 1840 cross-cut striae trending 1520 and are thus younger. These and other striae observed in the quadrangle are shown in Figure 2.
END OF TRIP To return to the starting point, proceed west on Route 2 for 2.8 miles.
10
A2-1
TRIP A-2: SLOPE STABILITY AND LATE PLEISTOCENE/HOLOCENE HISTORY,
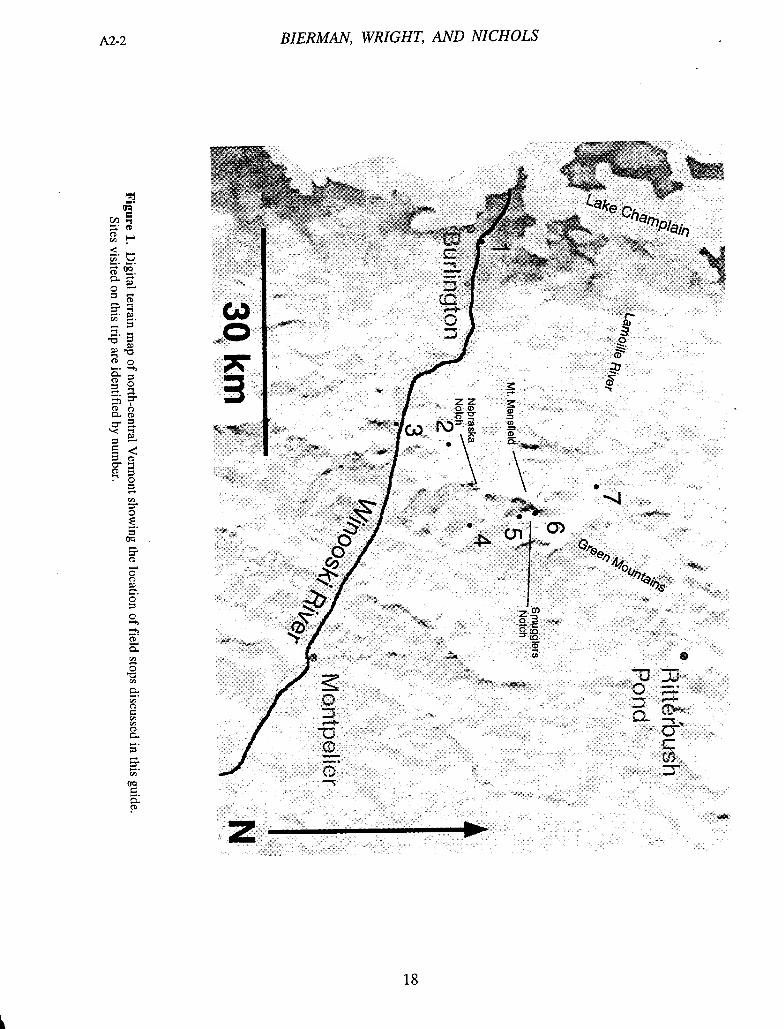
NORTHWESTERN VERMONT
Paul R. Bierman, Stephen F. Wright, and Kyle Nichols, Department of Geology, University of Vermont, Burlington, VT 05405
INTRODUCTION
The landscape of northwestern Vermont is one of dramatic contrasts. To the west are the Champlain Lowland and Lake Champlain, draining north to the Gulf of Saint Lawrence over a bedrock-controlled spiliway in the Richelieu River (Figure 1). To the east are the Green Mountains, oriented north-south following the strike of the dominant foliation, the structural grain of the schists and phyllites that dominate the range. Farther east, the Connecticut River flows south to the Atlantic Ocean. The Champlain Lowland, underlain predominately by sedimentary rocks, is mantled in many places by sorted glacial sediments, deposited directly off ice or in glacial lakes bordering the ice margin. The uplands of the Green Mountains are covered primarily with varying thickness of till. Where bedrock does crop out, it is primarily metamorphic. In the uplands, sorted glacial and post-glacial sediments are rarely present outside river valleys, with the exception of isolated ice-marginal deposits (Stewart and MacClintock, 1969).
Presumably, northern Vermont was repeatedly overrun by advancing ice sheets throughout the Quaternary. The latest advance probably overran the state sometime before 27,000 14C y BP (Fullerton, 1986), at its maximum burying northern Vermont under several kilometers of ice. Deglaciation appears to have occurred by thinning, separation over the mountains, step-wise stagnation zone retreat, and eventual larger-scale stagnation and melting near the ice margin as a calving bay advanced up the St. Lawrence River Valley (Chauvin et al., 1985). The only direct age limit we have for the onset of deglaciation (>12.7 14C y BP) in northern Vermont comes from a 14( age of bulk organic material at the base of a core from Sterling Pond, 900 m elevation on the flank of Mt. Mansfield (Li, 1996). Basal 14C ages of cores collected from Ritterbush Pond near Eden, Vermont, 600 m lower in elevation and 40 km to the northeast, are 800 14C years younger (Li, 1996), consistent with a thinning ice sheet.
Although New England is often referred to as a landscape shaped by ice, it is hard to know exactly the actual impact of glaciers. Without question, ice sheets accentuated the pre-existing landscape, by removing most of the weathered rock, steepening slopes, and reshaping the rock outcroppings. The depth of material removed from northern Vermont by glacial action is unknown, but in some places, surprisingly little material was scoured. For example, in the Champlain Lowland, Miocene lignites and kaolinite outcroppings were not completely removed by the overriding ice. The Winooski River, draining 2900 km 2 of northern Vermont, cuts a narrow valley more than 1000 m deep, directly across the grain of the Green Mountains. This drainage, and the large-scale topography we see today, almost certainly existed prior to glaciation.
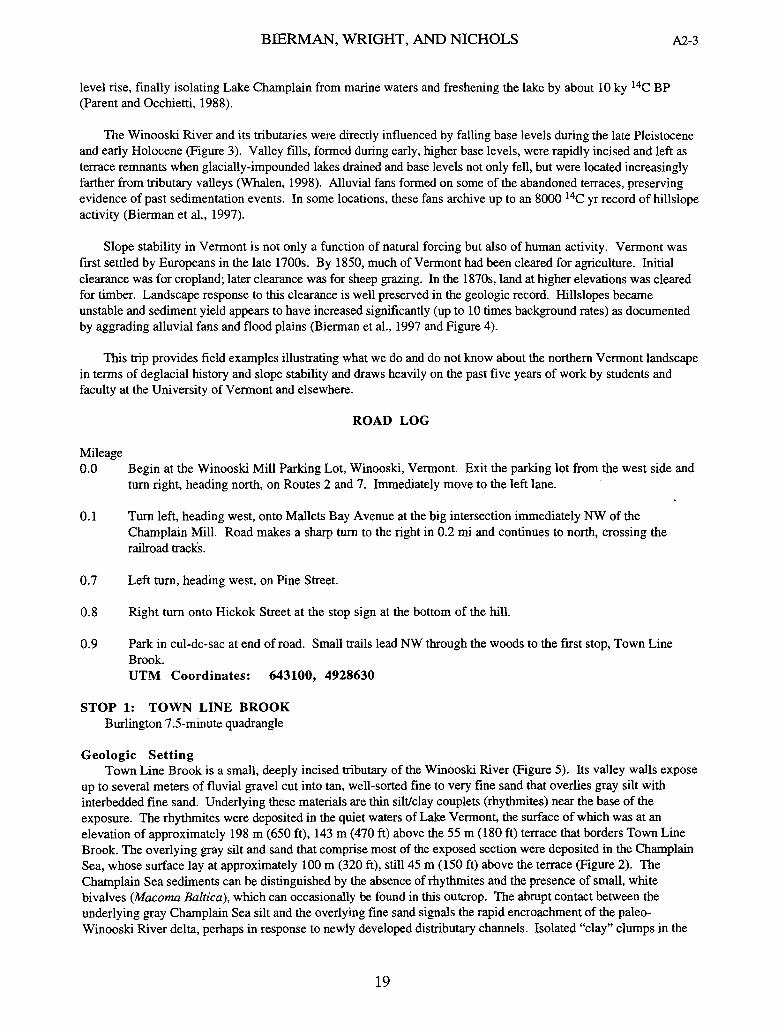
Drainage in most of northwestern Vermont is generally toward the Champlain Lowland, and from there to the Saint Lawrence River. When ice filled all or part of the Champlain Lowland (both during glacial advance and retreat), north-flowing drainage was blocked and glacial lakes formed in the lowland and in tributary drainage basins. Water in the Champlain lowland flowed south to the Hudson River. Water ponded to the east by ice in the Champlain lowland flowed to the Connecticut River (Figure 2).
As ice melted and the ice margin retreated, what began as isolated ice-marginal lakes coalesced into glacial Lake Vermont, which drained into the Hudson River Valley through a spillway near the southern end of Lake Champlain (Chapman, 1937). Lake Vermont at its lowest stage held approximately 240 km 3 of water, about ten times the volume of present-day Lake Champlain (Desilets and Cassidy, 1993; Figure 2B). Lake Vermont ended when ice-margin retreat allowed the ponded lake water to escape into the Gulf of St. Lawrence. Marine waters entered the isostatically depressed Champlain Lowland (Figure 2C) forming the Champlain Sea. Over the next 1000 to 1500 years, isostatic rebound increased the elevation of the Richelieu River sill at a rate greater than eustatic sea-
Bierman, P., Wright, S., and Nichols, K., 1999, Slope stability and late PleistocenefHolocene history, northwestern Vermont; in Wright, S.F. ed., New England Intercollegiate Geologic Conference Guidebook Number 91, p. 17-50.
A2-2
C 0- CD
BIERMAN, WRIGHT, AND NICHOLS
/ L. ke0
C) I zz
ND CL
-LG
z C
4/
4
- _
- _ -
z
Oil
CD CD
tl 9.
0 -
1
CD0 -.-0- CD 0
CD C) M. CD
cr CD
CD
C
aq CD
0 C)
0
0
CD
0
0
0
C)
CD 0
In
BIERMAN, WRIGHT, AND NICHOLS A2-3
level rise, finally isolating Lake Champlain from marine waters and freshening the lake by about 10 ky 14C BP (Parent and Occhietti, 1988).
The Winooski River and its tributaries were directly influenced by falling base levels during the late Pleistocene and early Holocene (Figure 3). Valley fills, formed during early, higher base levels, were rapidly incised and left as terrace remnants when glacially-impounded lakes drained and base levels not only fell, but were located increasingly farther from tributary valleys (Whalen, 1998). Alluvial fans formed on some of the abandoned terraces, preserving evidence of past sedimentation events. In some locations, these fans archive up to an 8000 14C yr record of hillslope activity (Bierman et al., 1997).
Slope stability in Vermont is not only a function of natural forcing but also of human activity. Vermont was first settled by Europeans in the late 1700s. By 1850, much of Vermont had been cleared for agriculture. Initial clearance was for cropland; later clearance was for sheep grazing. In the 1870s, land at higher elevations was cleared for timber. Landscape response to this clearance is well preserved in the geologic record. Hillslopes became unstable and sediment yield appears to have increased significantly (up to 10 times background rates) as documented by aggrading alluvial fans and flood plains (Bierman et al., 1997 and Figure 4).
This trip provides field examples illustrating what we do and do not know about the northern Vermont landscape in terms of deglacial history and slope stability and draws heavily on the past five years of work by students and faculty at the University of Vermont and elsewhere.
ROAD LOG
Mileage
0.0 Begin at the Winooski Mill Parking Lot, Winooski, Vermont. Exit the parking lot from the west side and turn right, heading north, on Routes 2 and 7. Immediately move to the left lane.
0.1 Turn left, heading west, onto Mallets Bay Avenue at the big intersection immediately NW of the Champlain Mill. Road makes a sharp turn to the right in 0.2 mi and continues to north, crossing the railroad tracks.
0.7 Left turn, heading west, on Pine Street.
0.8 Right turn onto Hickok Street at the stop sign at the bottom of the hill.
0.9 Park in cul-de-sac at end of road. Small trails lead NW through the woods to the first stop, Town Line Brook. UTM Coordinates: 643100, 4928630
STOP 1: TOWN LINE BROOK Burlington 7.5-minute quadrangle
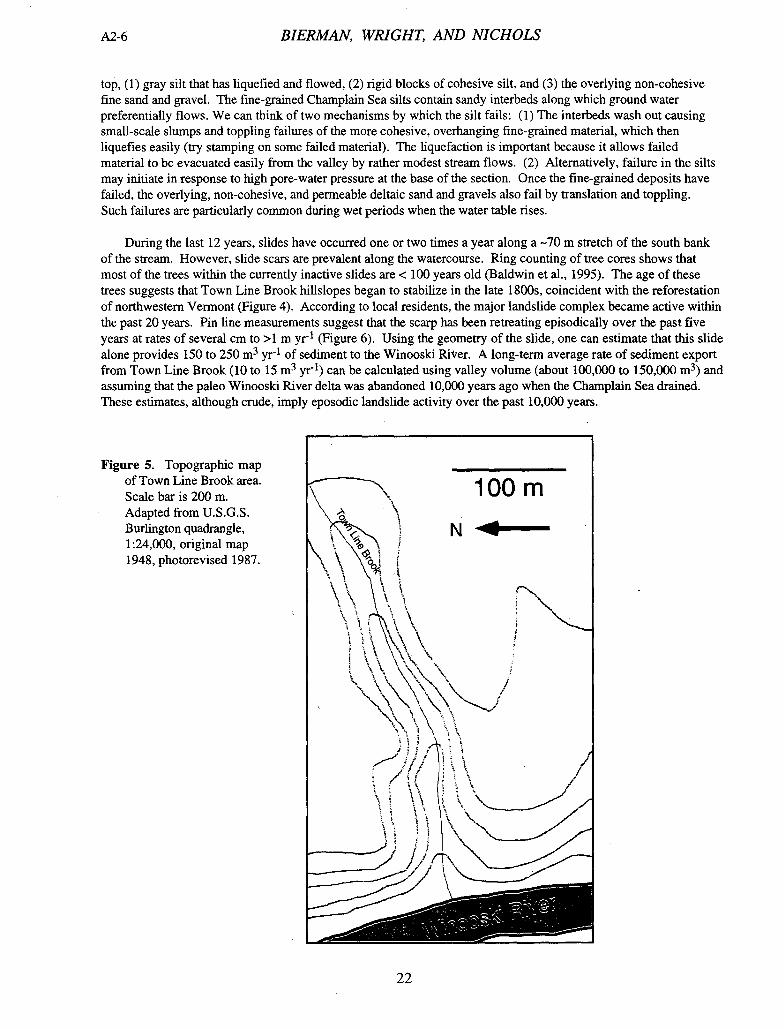
Geologic Setting Town Line Brook is a small, deeply incised tributary of the Winooski River (Figure 5). Its valley walls expose
up to several meters of fluvial gravel cut into tan, well-sorted fine to very fine sand that overlies gray silt with interbedded fine sand. Underlying these materials are thin silt/clay couplets (rhythmites) near the base of the exposure. The rhythmites were deposited in the quiet waters of Lake Vermont, the surface of which was at an elevation of approximately 198 m (650 ft), 143 in (470 ft) above the 55 m (180 ft) terrace that borders Town Line Brook. The overlying gray silt and sand that comprise most of the exposed section were deposited in the Champlain Sea, whose surface lay at approximately 100 in (320 ft), still 45 in (150 ft) above the terrace (Figure 2). The Champlain Sea sediments can be distinguished by the absence of rhythmites and the presence of small, white bivalves (Macoma Baltica), which can occasionally be found in this outcrop. The abrupt contact between the underlying gray Champlain Sea silt and the overlying fine sand signals the rapid encroachment of the paleo-Winooski River delta, perhaps in response to newly developed distributary channels. Isolated "clay" clumps in the
19
A2-4 BIERMAN, WRIGHT, AND NICHOLS
LAKE QUAKER
QUEBEC
SPRINGS
/ /
NEWYORK_—'
I BurIington
,
JI 0 25
Brandon\ kilometers
T c - -J
VERMONT
Troy
MASSACHUSETTS
A CONNECTICUT
LAKE COVEVILLE
QUEBEC Ab NEW YORK_. --J
t-Burfington-1 ~j
Waterbu C ,.j
/
(/ 0 25 r kilometers Brandofl\
(roy
VERMONT
MASSACHUSETTS
B( C ONNECTICUT
CHAMPLAIN SEA
-/
I /
C
Burlington-\ •-J
C
/ 0 25 C
,> • k Brandon\ ilometers
-Jc c
VERMONT
(Lroy
(I MASSACHUSETTS
CONNECTICUT
Figure 2. Extent of glacial lakes occupying the Champlain Lowland in comparison with present-day Lake Champlain. A. Lake Quaker Springs, ice margin (heavy dashed line), and isolated ice-marginal lakes in Winooski River Valley. Present-day lake Champlain shown in dark gray. B. Coveville stage of Lake Vermont; ice margin (heavy dashed line) is north of Winooski River Valley and isolated lakes have coalesced into Lake Vermont. C. Extent of Champlain Sea. Diagrams from Whalen (1998; Figures 2.8, 2.9, 2.12).
fine sand indicate that clay deposited in Lake Vermont was being eroded by the river and carried, perhaps in blocks of ice, over the delta before thawing. Coarse sand and well-rounded pebble gravel unconformably overlie the fine sands. Both shallow and deep channels cut into the sand indicate that base level was somewhat lower than the terrace bordering Town Line Brook (55m, 180 ft) at the time the gravel was deposited, indicating that the Champlain Sea had drained and Lake Champlain was no more than 24 in (80 ft) above its current elevation. The north side of the stream (in Colchester) is an old dump sited, as so many are, on the town line!
A perched water table aquifer exists in the fine sand. Groundwater usually seeps from the contact with the underlying gray silt year round. The lower groundwater table intersects the stream and presumably extends up into the silt away from the stream. Storm water drains, located in the development where the cars are parked, may provide a significant additional source of recharge to one or both of the groundwater systems.
I1
BIERMAN, WRIGHT, AND NICHOLS
A2-5
Explanation - Fan deposit
River terrace deposit
Glaciolacustine silt and sand
Glaciolacustnne day and silt
[] Glacial till
12.6 to 8.0 ka terraces
Early Fluvial Stage Incision of glaciolacustrifle sediments due to baselevel changes and glacio-
isostatic forcings.
>13.5 ka
ICE
Late Glacial Stage Retreating Laurentide ice sheet deposits
till and ice contact stratified drift.
8.0 to 0.2 ka
terraces fan rieposit
lt=w Fluvial Stage
Fan development and river incision due to climate-driven changes.
13.5 tol2.6 ka
Lft-
Ix Proglacial Lake Stage LU Glaciolacustrine sediments
fill valley as lake shoals.
0.2 ka to Today
Post-sefflement Stage t.0 Further fan development and river
incision due to land use.
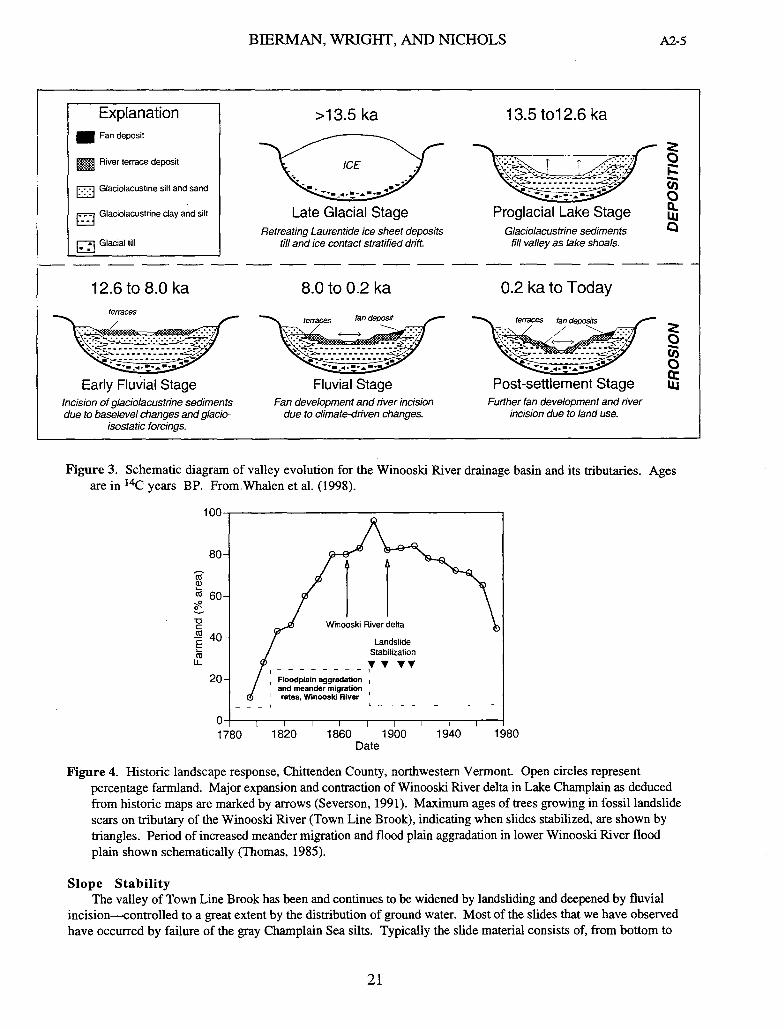
Figure 3. Schematic diagram of valley evolution for the Winooski River drainage basin and its tributaries. Ages are in 14C years BP. From.Whalen et al. (1998).
60 0
0 River delta C
/Floodplaininiski
I 4ç
Landslide Stabilization
U-
radation20migration ki River
0 I I I
1780 1820 1860 1900 1940 1980 Date
Figure 4. Historic landscape response, Chittenden County, northwestern Vermont. Open circles represent percentage farmland. Major expansion and contraction of Winooski River delta in Lake Champlain as deduced from historic maps are marked by arrows (Severson, 1991). Maximum ages of trees growing in fossil landslide scars on tributary of the Winooski River (Town Line Brook), indicating when slides stabilized, are shown by triangles. Period of increased meander migration and flood plain aggradation in lower Winooski River flood plain shown schematically (Thomas, 1985).
Slope Stability The valley of Town Line Brook has been and continues to be widened by landsliding and deepened by fluvial
incision—conirolled to a great extent by the distribution of ground water. Most of the slides that we have observed have occurred by failure of the gray Champlain Sea silts. Typically the slide material consists of, from bottom to
21
A2-6 BIERMAN, WRIGHT, AND NICHOLS
top, (1) gray silt that has liquefied and flowed, (2) rigid blocks of cohesive silt, and (3) the overlying non-cohesive fine sand and gravel. The fine-grained Champlain Sea silts contain sandy interbeds along which ground water preferentially flows. We can think of two mechanisms by which the silt fails: (1) The interbeds wash out causing small-scale slumps and toppling failures of the more cohesive, overhanging fine-grained material, which then liquefies easily (try stamping on some failed material). The liquefaction is important because it allows failed material to be evacuated easily from the valley by rather modest stream flows. (2) Alternatively, failure in the silts may initiate in response to high pore-water pressure at the base of the section. Once the fine-grained deposits have failed, the overlying, non-cohesive, and permeable deltaic sand and gravels also fail by translation and toppling. Such failures are particularly common during wet periods when the water table rises.
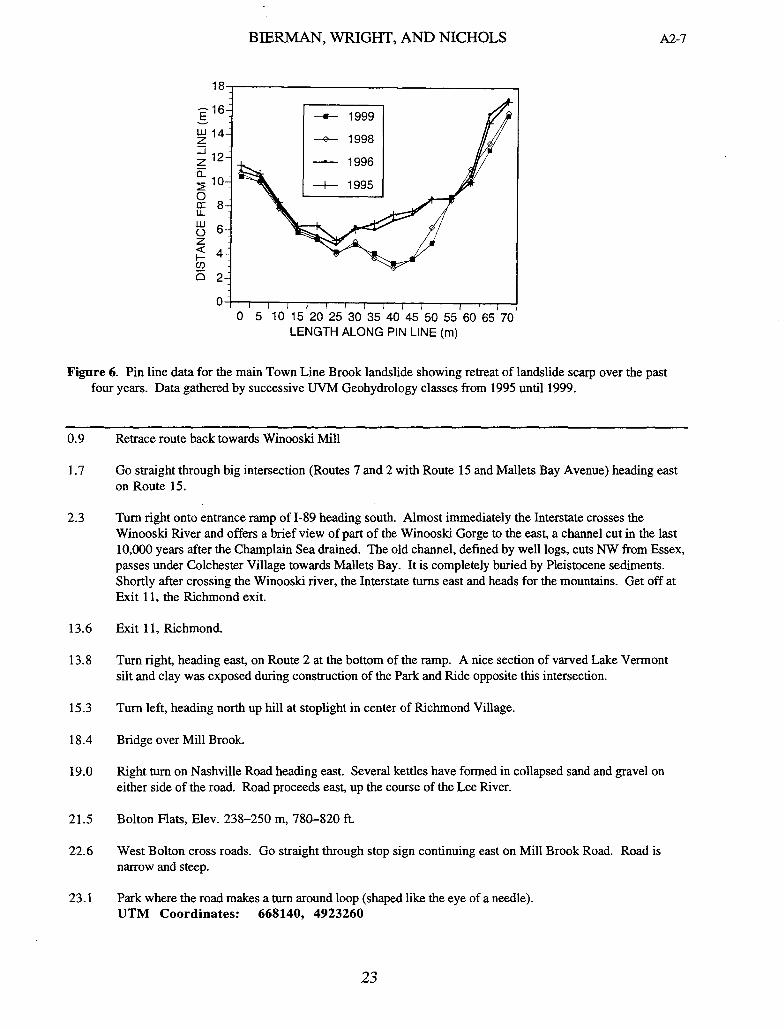
During the last 12 years, slides have occurred one or two times a year along a —70 in stretch of the south bank of the stream. However, slide scars are prevalent along the watercourse. Ring counting of tree cores shows that most of the trees within the currently inactive slides are < 100 years old (Baldwin et al., 1995). The age of these trees suggests that Town Line Brook hillslopes began to stabilize in the late 1800s, coincident with the reforestation of northwestern Vermont (Figure 4). According to local residents, the major landslide complex became active within the past 20 years. Pin line measurements suggest that the scarp has been retreating episodically over the past five years at rates of several cm to >1 in yr 1 (Figure 6). Using the geometry of the slide, one can estimate that this slide alone provides 150 to 250 m 3 yr 1 of sediment to the Winooski Riirer. A long-term average rate of sediment export from Town Line Brook (10 to 15 m3 yr 1 ) can be calculated using valley volume (about 100,000 to 150,000 m 3) and assuming that the paleo Winooski River delta was abandoned 10,000 years ago when the Champlain Sea drained. These estimates, although crude, imply eposodic landslide activity over the past 10,000 years.
Figure 5. Topographic map of Town Line Brook area. Scale bar is 200 m. Adapted from U.S.G.S. Burlington quadrangle, 1:24,000, original map 1948, photorevised 1987.
lOOm
I
\\ j
22
BIERMAN, WRIGHT, AND NICHOLS
—a— 1999
-G- 1998
- 1996
—+-- 1995 0 Cr U- W 0 z cC I- C!) a
o 5 10 15 20 25 30 35 40 45 50 55 60 65 70 LENGTH ALONG PIN LINE (m)
Figure 6. Pin line data for the main Town Line Brook landslide showing retreat of landslide scarp over the past four years. Data gathered by successive UVM Geohydrology classes from 1995 until 1999.
0.9 Retrace route back towards Winooski Mill
1.7 Go straight through big intersection (Routes 7 and 2 with Route 15 and Mallets Bay Avenue) heading east on Route 15.
2.3 Turn right onto entrance ramp of 1-89 heading south. Almost immediately the Interstate crosses the Winooski River and offers a brief view of part of the Winooski Gorge to the east, a channel cut in the last 10,000 years after the Champlain Sea drained. The old channel, defined by well logs, cuts NW from Essex, passes under Coichester Village towards Mallets Bay. It is completely buried by Pleistocene sediments. Shortly after crossing the Winooski river, the Interstate turns east and heads for the mountains. Get off at Exit 11, the Richmond exit.
13.6 Exit 11, Richmond.
13.8 Turn right, heading east, on Route 2 at the bottom of the ramp. A nice section of varved Lake Vermont silt and clay was exposed during construction of the Park and Ride opposite this intersection.
15.3 Turn left, heading north up hill at stoplight in center of Richmond Village.
18.4 Bridge over Mill Brook.
19.0 Right turn on Nashville Road heading east. Several kettles have formed in collapsed sand and gravel on either side of the road. Road proceeds east, up the course of the Lee River.
21.5 Bolton Flats, Elev. 238-250 m, 780-820 ft.
22.6 West Bolton cross roads. Go straight through stop sign continuing east on Mill Brook Road. Road is narrow and steep.
23.1 Park where the road makes a turn around ioop (shaped like the eye of a needle). UTM Coordinates: 668140, 4923260
Wi z -j
z C-
23
A2-8 BIERMAN, WRIGHT, AND NICHOLS
Continue up the road on foot staying left where the road Y's. Right side of Y is gated and posted. Note old mill foundation between road and stream. Continue until reaching a point where the road abruptly ends at stream crossing (Mill Brook).
STOP 2: MILL BROOK Richmond 7.5-minute quadrangle
Introduction Rivers and streams draining the Green Mountains have played extensive roles in Vermonts development
providing both water supplies and power, particularly during the 19th century. At this stop we will try to understand the history of one such stream, Mill Brook, that drains westward through West Bolton. Mill Brook, as the name implies, was dammed in several places to supply water to mills (Figure 7). We will be inspecting the site of one such dam.
Geologic Setting The western flank of the Green Mountains at this latitude is underlain by metasedimentary rocks (dominantly
muscovite, chlorite, albite, quartz schists, quartzites, and rare greenstones) belonging to the Underhill formation. The strong foliation and compositional layering in these rocks strike N—S. Streams draining to the west cut across alternately strong and weak rocks. Stream channels are characteristically narrow and contain waterfalls where they cut across the stronger lithologies. The dam site here is one such site. Aside from alluvium, most of the surficial material at this elevation is till although sandy terraces at approximately 408 m (1,340 ft) on either side of the stream suggest that a small ice-bounded lake or stream may have existed here during the retreat of the ice sheet. Landslides initiated by the flash floods of 1990 (described below) yield excellent exposures of gray, clay-rich till. Within this till, blocks of varved silt/clay occur. Given their weakness, it seems likely that the source of these lacustrine sediments was a preglacial lake that may have been trapped between the athrancing ice sheet in the Champlain Valley and the mountain side.
Mill Brook Flash Flood, July 1990 Along Mill Brook in West Bolton we will observe the effects of a flash flood that affected many of the drainage
basins around Mount Mansfield on July 4, 1990. The weather station on the top of Mount Mansfield recorded 2.10 inches of rain at 4 PM on July 4 and 2.14 inches of rain at 4 PM on July 5th. These readings result from one storm that dumped half its rain before and half its rain after 4 PM in the afternoon when rain collected in the rain gauge is recorded. This is, of course, only an estimate of the rainfall that actually fell in the Mill Brook drainage basin, 9 km SSW of the recording station. This and another flash flood on July 23rd (3.25 inches of rain recorded at 4 PM on the 23rd of July at the top of Mount Mansfield) washed out many roads in the area and significantly altered the course of Mill Brook and many other streams. The drainage basin of Mill Brook above the dam is a bowl covering 6.5 km2 extending from the main range of the Green Mountains (Bolton Mountain, elev. 1,128 m, 3,700 ft) to the dam (elev. 378 rn 1,240 ft). Using the 4.24 inch (0.108 m) total recorded at the weather station and assuming that this total fell over the entire drainage basin, 700,000 m 3 of water fell on the drainage basin and, given the intensity of the storm and the steep gradients and low permeability soils in the drainage basin (clay-rich till), it is safe to assume that a large percentage of that volume flowed past the Mill site over an unknown period of time, i.e., peak discharges are unknown.
The old (pre-flood) channel of Mill Brook is still clearly visible where it flowed across sand and gravel that filled the former mill pond. It is now possible to determine the sequence of channel jumping events that occurred as Mill Brook repeatedly dammed itself with woody debris (much of this derived from landslides) and cobbles. That sequence will be mapped on the field trip. The final channel-jumping event occurred approximately 300 m upstream from the dam. The newly routed stream presently flows along the south side of the valley. Approaching the dam (now broken and several meters lower than its once functioning height), the stream has eroded its channel through all of the sand and gravel that accumulated behind the mill dam. An old soil horizon is now exposed that contains leaves and other soil detritus, and stumps of trees with clear indications that they have been cut with tools and not chewed by beaver. As a result of the flood, the stream channel has re-exposed the forest floor that existed in the early 19th century when the land was first cleared and the dam first constructed.
24
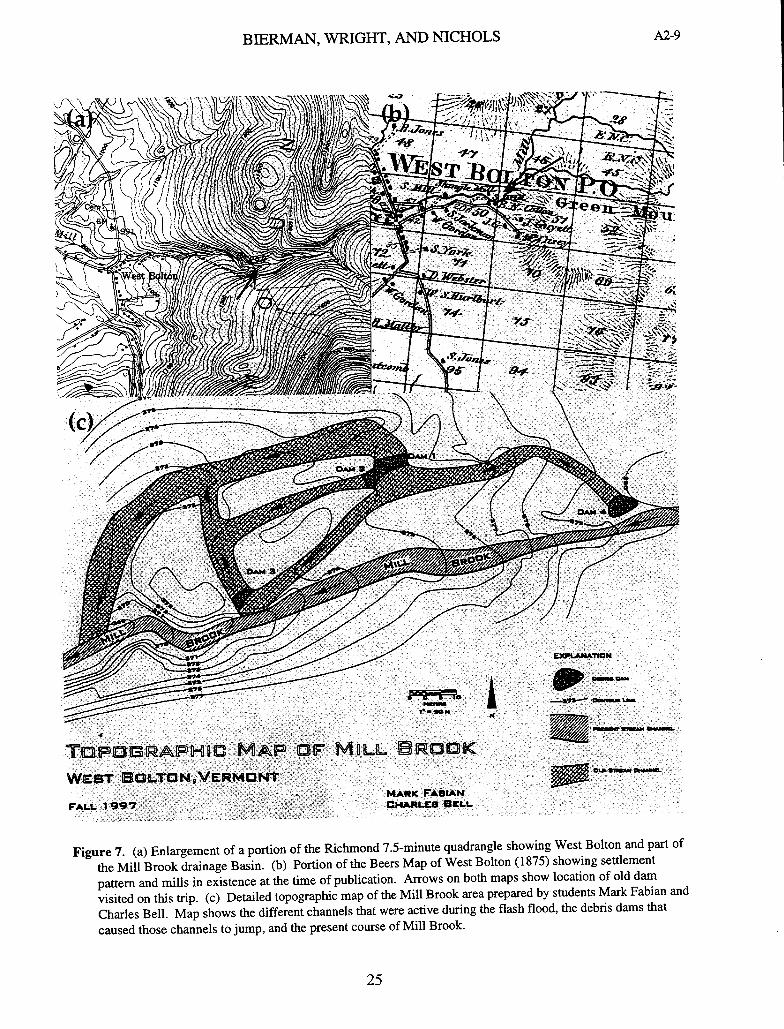
BIERMAN, WRIGHT, AND NICHOLS A2-9
.r *.
MAF OF MALL BROOK
WBT 1EOLTDN,VRMDNT CD5JItMO
MARK FABIAN
FALL 1997 CIARLEB BELL
Figure 7. (a) Enlargement of a portion of the Richmond 7.5-minute quadrangle showing West Bolton and part of the Mill Brook drainage Basin. (b) Portion of the Beers Map of West Bolton (1875) showing settlement pattern and mills in existence at the time of publication. Arrows on both maps show location of old dam visited on this trip. (c) Detailed topographic map of the Mill Brook area prepared by students Mark Fabian and Charles Bell. Map shows the different channels that were active during the flash flood, the debris dams that caused those channels to jump, and the present course of Mill Brook.
25
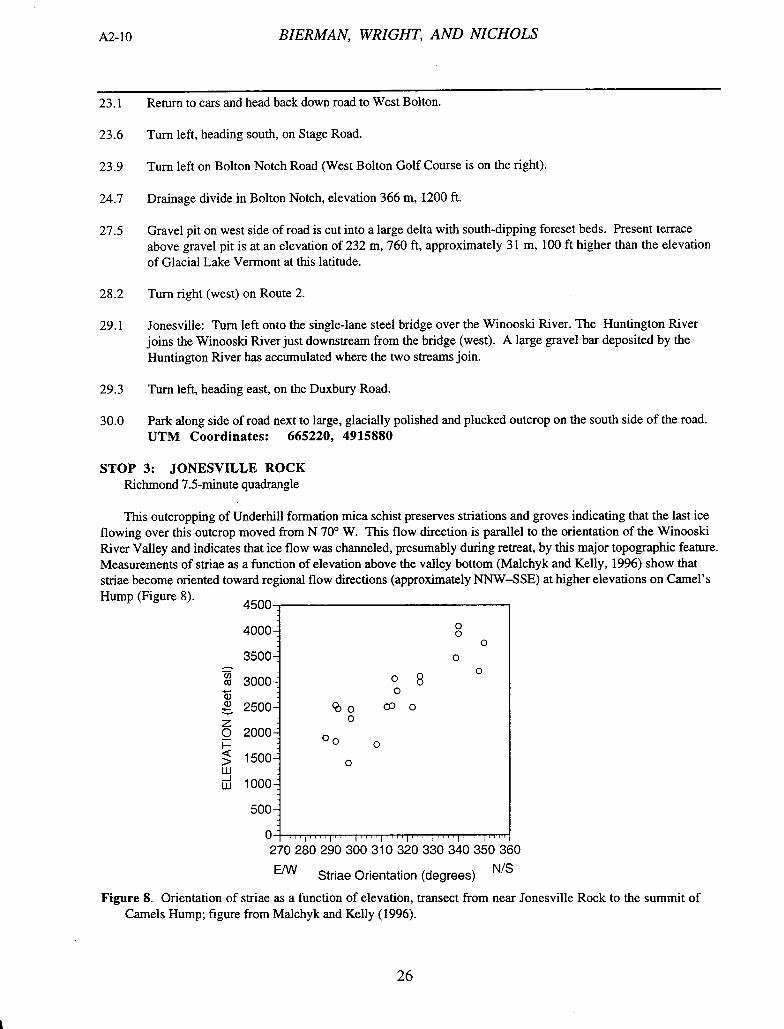
-io BIER MAN, WRIGHT, AND NICHOLS
23.1 Return to cars and head back down road to West Bolton.
23.6 Turn left, heading south, on Stage Road.
23.9 Turn left on Bolton Notch Road (West Bolton Golf Course is on the right).
24.7 Drainage divide in Bolton Notch, elevation 366 m, 1200 ft.
27.5 Gravel pit on west side of road is cut into a large delta with south-dipping foreset beds. Present terrace above gravel pit is at an elevation of 232 m, 760 ft. approximately 31 m, 100 ft higher than the elevation of Glacial Lake Vermont at this latitude.
28.2 Turn right (west) on Route 2.
29.1 Jonesville: Turn left onto the single-lane steel bridge over the Winooski River. The Huntington River joins the Winooski River just downstream from the bridge (west). A large gravel bar deposited by the Huntington River has accumulated where the two streams join.
29.3 Turn left, heading east, on the Duxbury Road.
30.0 Park along side of road next to large, glacially polished and plucked outcrop on the south side of the road. UTM Coordinates: 665220, 4915880
STOP 3: JONESVILLE ROCK Richmond 7.5-minute quadrangle
This outcropping of Underhill formation mica schist preserves striations and groves indicating that the last ice flowing over this outcrop moved from N 70° W. This flow direction is parallel to the orientation of the Winooski River Valley and indicates that ice flow was channeled, presumably during retreat, by this major topographic feature. Measurements of striae as a function of elevation above the valley bottom (Malchyk and Kelly, 1996) show that striae become oriented toward regional flow directions (approximately NNW—SSE) at higher elevations on Camel's Hump (Figure 8).
4000 0 0
35001 0
0
cd
0 in
3000-i ° 8 0
2500-1 %o coo z I 0
0 2000-1 O 1
1500-1 w 1 iii i000
5001
01 I 270 280 290 300 310 320 330 340 350 360
E/W Striae Orientation (degrees) N/S
Figure 8. Orientation of striae as a function of elevation, transect from near Jonesville Rock to the summit of Camels Hump; figure from Malchyk and Kelly (1996).
26
BIERMAN, WRIGHT, AND NICHOLS p2- 11
Sundue (1997) measured lichen size as a function of underlying tombstone age in the Richmond, Vermont cemetery. He established that lichen growth rates over the past century are linear and on the order of 1 mm yr 1 .
This rate is similar to that determined for lichens on tombstones less than 50 years old in the Champlain Lowland (Royce and Young, 1994). Using the Richmond calibration (Figure 9), lichen diameters on bare, striated bedrock outcrops similar to and near the Jonesville Rock, suggest exposure within the last century or two. Such recent exposure is consistent with the excellent preservation of striae on this relatively easily weathered rock. Exposure of the bare rock surface was most likely the result of land clearance for farming and grazing during the 1800's.
E 0
ci) ci) E (ci a ci) -c 0
—J
3-I
I 1/ e
,1> I /
0 10 20 30 40 50 60 70
Lichen Age (years)
Figure 9. Calibration of lichen (probably Xanthoparmelia plittii) maximum diameter for the Richmond, Vermont area (Sundae, 1997).
OPTIONAL SIDE TRIP TO HUNTINGTON GORGE (Road log not included)
Huntington Gorge is cut through schist of the Underhill Formation and displays well-developed pot holes and plunge pools. The gorge appears to exploit joint sets trending N82° E, N75° W, and N5 low (Christman and Secor, 1961). Until recently, it was not known when the gorge formed although the common speculations include incision immediately after deglaciation when poorly vegetated slopes generated large amounts of sediment-charged runoff or catastrophic draining of a glacial lake. However, recent work by Whalen (1998), who surveyed longitudinal profiles of the Huntington River terraces, 14C-dated terrace sediments, and correlated terraces to changing base-levels, constrains the age of the present Huntington Gorge.
Whalen's T6 terrace passes over the gorge with no apparent increase in gradient indicating that during T6 time, the gorge was not exposed (Figure 10). The T6 terrace was graded to the Fort Ann stage of Lake Vermont, which ended 11,700 14C y BP with the initiation of the Champlain Sea. Thus, 11,700 14C y BP, is the upper limit for the age of the gorge. The gorge may have been exposed as late as 8500 14C y BP, the oldest age for charcoal pulled from the overbank sediments of terrace T5, the first terrace showing a gradient increase in the area of the gorge (Figure 10). These dates lead to an important conclusion; the gorge was not formed by fluvial erosion related to the latest deglaciation nor was it formed by the catastrophic draining of the last glacial lake to occupy the Huntington Valley. Either the gorge was formed by erosion through the Holocene or the Huntington River excavated and reoccupied a gorge that was cut previous to the last glaciation.
27
- H CD -
o
H -1 H CD
pp.
-I -1 (y 0)
-1 H C) > >
o
-I H N) > >
CD
tiul I -4.
0
G) 0 - CD
\ \\
*
A2-12 BIERMAN, WRIGHT, AND NICHOLS
oil
CD C
T1 -.
U C/) '-I-
H CD CD
-4-.
1. 3
CD
CD
CD
cD - CD
Elevation (m) - - N) N) N) N) 01 01 01 01
tCD
CD CD
CA) 0) N) 01 01
BIERMAN, WRIGHT, AND NICHOLS A2-13
30.0 Retrace route back over bridge to Route 2.
30.9 Turn right, heading east, on Route 2. Follow this, through Bolton, to Waterbury.
39.8 Intersection with Route 100. Turn left, heading north, crossing over the Interstate and continuing to Waterbury Center.
42.2 Well developed terrace (bedrock core!) in pasture on west side of road is at an elevation of 204 m, 670 ft—coincident with the elevation of Glacial Lake Vermont.
43.5 Cider Mill, Waterbury Center: Lunch Stop. Continue north on Route 100.
47.5 Turn left, heading west, onto the Moscow Road. Sign also indicates that this is an alternate route to the Mount Mansfield Ski Area. Continue through the village of Moscow.
49.0 Barrows Road intersection. Continue straight (west).
49.6 Bridge over Miller Brook. Follow road around to right, now called the Nebraska Valley Road.
50.0 Look for white house (former barn) on left side of road and continue another 100 in and park in meadow on left side of road adjacent to an active alluvial fan. UTM Coordinates: 679300, 4923650
STOP 4: MILLER BROOK ALLUVIAL FAN AND GULLY Stowe 7.5-minute quadrangle
Introduction West of Moscow, Vermont, is the most frequently active alluvial fan that we have identified so far in
northwestern Vermont. The fan has a low gradient at the apex (4°) and the toe merges imperceptibly and irregularly with the underlying fluvial terrace. The fan is active several times a year following heavy rain or snow-melt events and sediment deposition on the fan appears to be solely by stream flow. We have repeatedly observed shallow (<10 cm) fan-head trenching. The fan is composed of reworked, fine-grained glacial-lacustrine sediments eroded from the terrace above. An adjacent gully indicates that till extends under the fine-grained sediments.
Geologic Setting Almost 6 in of lacustrine sediments are exposed on the near-vertical walls of the gully above the fan, extending
from the top down to the contact with the underlying till. These sediments were deposited in Glacial Lake Winooski, a lake dammed by ice in the Winooski River valley whose outlet lay approximately 4 km south of Williamstown (see further descriptions of this lake in both Wright, 1999 and Larsen, 1999, this volume). At this point, the lake surface was at approximately 337 m, 1,100 ft (134 m, 440 ft above the gully). This section, deposited directly on till, records the early sedimentation history in this part of the lake when the ice front was probably quite close by. Most of the sediments accumulating in this part of the lake were derived from the mouth of an esker tunnel that lay at the base of the ice sheet and extended at least as far up valley as Lake Mansfield (Wright et al., 1997).
The bottom of the section consists of a thin (0.1-0.2 m) layer of coarse sand and pebble gravel deposited on top of the steeply dipping till surface. Above this (from 3.1 down to -5.5 m; datum is top surface of the gully) is a highly disturbed (slumped) section of lacustrine fine to very fine sand, silt, and clay. Bedding, where visible, is folded and pockets of sand are completely surrounded by clay. The slumped sediments below are overlain by a 1 in thick section (from 2.1 down to 3.1 m) of horizontally layered, medium to fine sand/silt and clay couplets (couplets are 10-15 cm thick). The sand in many of these layers has been severely disrupted by soft sediment deformation occasioned either by loading or by seismic activity. Above this lies 1.3 in (from 0.8 in to 2.1 m down) of finely laminated lacustrine silt and clay with minor very fine sand. The top 0.8 in of the section consists of pebbles
29
A2-14 BIERMAN, WRIGHT, AND NICHOLS
suspended in a structureless matrix of veiy fine sand and silt. It is unclear whether this material is (1) a debris flow deposit, (2) a particularly dense accumulation of dropstones, or (3) fill, perhaps added at some point in the past when the gully first started to form.
Fan Dynamics A long (-.50 m) narrow (-6 m) gully supplies sediment to the fan (Figure 11). Within the uncertainty of our
calculations, the gully and the fan volume are similar (830 m 3 vs. 1100 m3, respectively). There is no surface drainage in the gully. Sediment leaves the gully through a natural piping network below the gully bottom; the pipe daylights about half way down the terrace riser. The pipe(s) are eroded from the fine lacustrine sand and follow the steeply dipping contact between the relatively impermeable till below and the very permeable sand and gravel horizon. Dye tracing of pipe flow conducted during an extended dry period suggests unconstricted flow through the pipe. On the south side of the active gully is a relict gully, now apparently stable as indicated by the presence of mature trees.
This site illustrates the interdependence of groundwater flow and slope stability. Failure of the gully walls by toppling and rotation appears to occur when the water table and thus pore pressures along the gully walls are high. Nested piezometers indicate that both the active and now-stabilized gullies act as groundwater drains lowering the water table. The relatively low hydraulic conductivity of the glacial-lacustrine sediments (< 1.5 x 10 cm s1)
results in large pore pressure gradients near the gully walls. The south side of the gully, where the water table is lowered by the proximity of a stabilized gully 25 in away, maintains a shallower face than the northern wall of the gully, where the water table is higher. Mass wasting on the south side occurs primarily by slumping, freeze thaw, and soil creep. The north side erodes primarily by a combination of toppling and rotational failure.
The fan and the gully appear to be quite young. A soil pit dug near the fan apex revealed an old road surface more than a meter below the current land surface. The road was relocated in the late 1960s or early 1970s, suggesting that most if not all deposition on the fan occurred within approximately the last 30 years. Just above the road surface, buried by fan sediments, was an automobile part confirming that the recent period of fan activity has lasted no longer than the last 20 to 30 years.
Figure 11. Map of gully and terrace immediately above active Stowe alluvial fan. Map produced using Pentax Total station and Trimble GPS 4400 RTK system by University of Vermont, 1998 Geohydrology class.
30
BIERMAN, WRIGHT, AND NICHOLS A2-15
We have only recently identified the process that most likely led to the formation of this gully. Neighbors believed that the gully formed in response to clearcutting and the construction of logging roads. However, analysis of aerial photographs from 1943 onward shows that the slopes above the gully were clear for many years before erosion began (Flemer, 1998). Furthermore, examination of the town records show that this area was first cleared for farming before 1856 (Flemer, 1998). Further erosion of the pipe in the wet summer of 1998 prompted the roof of the pipe to collapse. This collapse revealed that the pipe was formed in a lens of sand and gravel within the fine sand and silt. The high hydraulic conductivity of the sand and gravel compared to the lower hydraulic conductivity of the fine-grained lacustrine sediment focused water flow and promoted erosion. If this hypothesis is correct, the natural piping system eroded the gully from the bottom up rather than the more-familiar top-down erosion of surface drainage networks.
Comparing the size of the currently active gully with that of the adjacent gullies, and considering the average rate of erosion and sediment deposition on the fan over the past 20 years, we suggest that it will take the better part of a century for the gully to reach the depth and size of its neighbors.
50.0 Retrace route back to Barrows Road Intersection
51.0 Turn left, heading north, on B arrows Road.
52.7 Turn right on Luce Hill Road. Road to left goes to the Trapp Family Lodge.
53.3 Turn left, heading northwest, at intersection with Route 108.
56.8 Road pitches upward steeply as it climbs the front of a sand and gravel deposit that is probably a delta. Terrace opposite Mount Mansfield Cross-country ski center is at an elevation of 357 m, 1,170 ft. This falls on the projected water surface plane of Glacial Lake Winooski (see discussions elsewhere in this volume by Wright, 1999 and Larsen, 1999).
58.7 Ski slope entrance on left.
60.1 Pull over along wide margin opposite toe of debris flow, now partially covered with young vegetation. UTM Coordinates: 675340, 4934560
STOP 5: SMUGGLERS NOTCH DEBRIS FLOW Mount Mansfield 7.5-minute quadrangle
The debris flow deposit visible along Rt. 108 near the Cambridge/Stowe town line is one of several that occurred during the night of May 22, 1986 and are described by Lee et al. (1994). This particular flow, approximately 250,000 m 3 of material, originated in the gully extending up the east side of the valley below Spruce Peak and incorporated colluvium as well as trees and soil (Lee et al., 1994). An intense rainfall apparently initiated this and other debris flows that evening, loosening colluvium and organic debris that had accumulated in the chute. At present, this debris flow chute is almost barren of colluvium and will take some time to accumulate sufficient debris so as to again present a hazard.
60.1 Continue northwest up to top of Smugglers Notch.
60.4 Big Spring on right.
61.1 Parking Lot at top of Smugglers Notch. UTM Coordinates: 675100, 4935800
31
A2-16 BIERMAN, WRIGHT, AND NICHOLS
STOP 6: SMUGGLERS NOTCH AND MOUNT MANSFIELD Mount Mansfield 7.5-minute quadrangle
Introduction Smugglers Notch is a deep cleft that cuts across the main range of the Green Mountains just north of Mt.
Mansfield. The extreme topographic relief, recent landslide scars, and large truck-sized blocks of rock that have fallen from the cliffs high overhead make this a much-visited site. Slope stability history and hazards in Smugglers Notch are discussed in Lee et al. (1994) and the 1983 slope failure is described in some detail by Baskerville et al. (1988).
Geologic Setting The rocks exposed in the cliffs above Smugglers Notch are all schists belonging to both the Underhill and
Hazen's Notch Formations. The foliation is defined largely by both muscovite and chlorite and, along the main range of the Green Mountains, has been folded to form the Green Mountain Anticlinorium. In Smuggler's Notch, the layering in the cliffs high overhead is almost horizontal and the Underhill Formation structurally overlies the Hazen's Notch Formation.
Smuggler's Notch does not make a straight knife-like cut across the Green Mountains, but instead is segmented into three relatively straight sections that are probably controlled by joints. Although the valley fill hides the bedrock along the floor of the notch and the structures contained therein, joint sets in the adjacent cliffs that are parallel to the valley segments are visible on aerial photographs and were measured by Lee et al. (1994).
Rock Falls and Debris Flows Rock falls and debris flows are relatively frequent events in Smugglers Notch, many of which have been
documented in the last 150 years (Lee et al., 1994). No bedrock is exposed anywhere along the floor of the notch. Most of the larger material transported to the bottom of the notch remains there and consequently the floor of the notch is gaining elevation as the sides widen. Structural controls that determine the dimensions ofthe cliff-loosened blocks include the horizontal foliation, the position of the relatively stronger Underhill Formation rocks above the weaker Hazen's Notch Formation rocks, and the joint sets.
We will observe the debris slide that occurred on July 13, 1983 and is described by Baskerville et al. (1988). The landslide began at about 7 a.m. when a large block of rock ( —10.4 x 10⁶ kg) that cantilevered over the valley broke loose and fell onto the talus slope at the base of the cliff. The fall initiated a debris slide along the talus slope and material moved as far as the road (Baskerville et al., 1988). The rock fall occurred on a clear, sunny, midsummer morning and no rain had fallen for several days. Baskerville et al. (1988) suggest that the rock failure was most likely due to thermal expansion of the rock along a crack that had previously been extended by frost wedging.
Mount Mansfield Mt. Mansfield, at 1340 in (4393') is the highest point in Vermont. It is one of only five peaks in Vermont that
exceed 1220 m (4000') in elevation, the others being Killington Peak at 1293 in (4,241'), Camels Hump at 1248 m (4,093'), Mt. Ellen at 1245 in (4,083'), and Mt. Abraham at 1221 in (4,006'). Mt. Mansfield's rocky summit exposes multiply deformed schist of the Underhill Formation (Christman and Secor, 1961) covered in places by a thin mantle of till. Although the rock has been eroded into streamlined forms, >12,000 years of post glacial weathering and erosion have removed striations except in areas recently exposed by human activity. Glacial grooves, striations, the orientation of streamlined features, and erratics derived from the Champlain Lowland can be used to show that ice flowed approximately NNW to SSE over the summit (Figure 8).
Mt. Mansfield has a weather station at the summit where precipitation and temperature have been measured since 1955. In general, annual precipitation is well-correlated to the Burlington station and about twice as abundant (1880 mm/74 inches vs. 890 mml 35 inches) due to orographic lifting. Lapse rates vary seasonally based on Burlington observations made at 101 in asl (Figure 12). Winter inversions reduce effective average lapse rates from about 0.6° C/100 in in late spring and summer to <0.4° C/100 m in January (Lipke and Pickard, 1993).
The relatively harsh climate on the top of Mt. Mansfield affects the vegetation. The summit area is dominated by a boreal assemblage of trees and tundra species typically found hundreds of kilometers farther north. Stunted
32
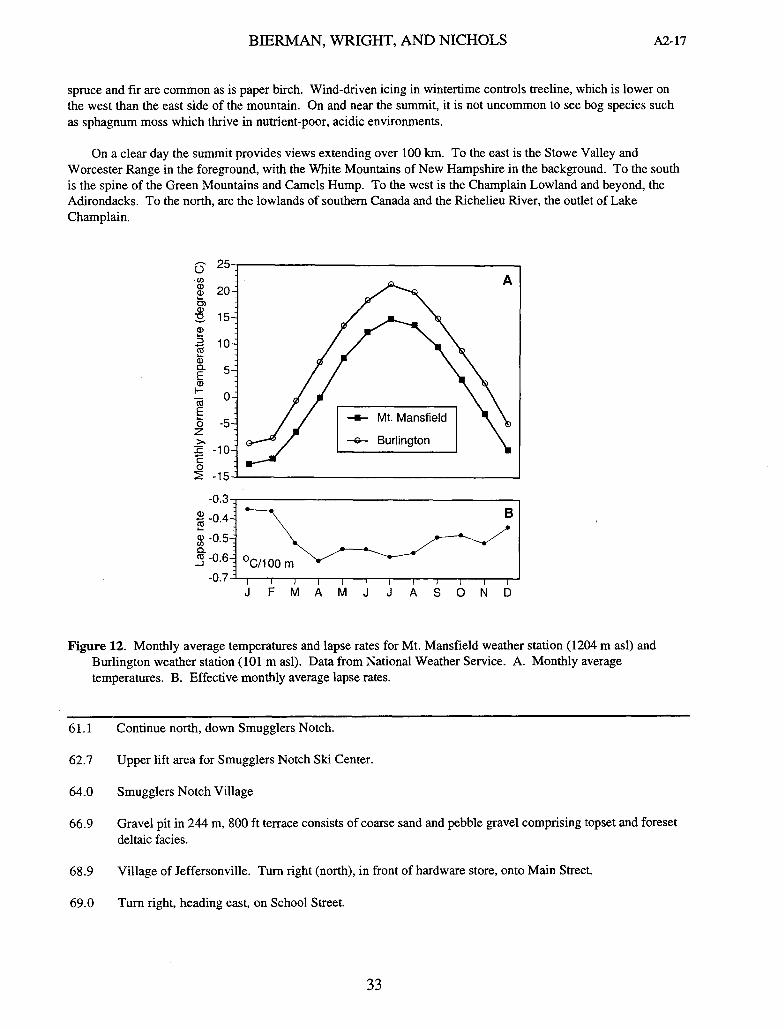
BIERMAN, WRIGHT, AND NICHOLS A2-17
spruce and fir are common as is paper birch. Wind-driven icing in wintertime controls treeline, which is lower on the west than the east side of the mountain. On and near the summit, it is not uncommon to see bog species such as sphagnum moss which thrive in nutrient-poor, acidic environments.
On a clear day the summit provides views extending over 100 km. To the east is the Stowe Valley and Worcester Range in the foreground, with the White Mountains of New Hampshire in the background. To the south is the spine of the Green Mountains and Camels Hump. To the west is the Champlain Lowland and beyond, the Adirondacks. To the north, are the lowlands of southern Canada and the Richelieu River, the outlet of Lake Champlain.
0 (I) a) a) 0) a) 0
a)
a) 0 E
co
a) F-
E 0 z > -c C 0
-1
-1
-0.3
1 a) : .5
. o
_0.71i I I
J FMAMJ J ASOND
Figure 12. Monthly average temperatures and lapse rates for Mt. Mansfield weather station (1204 m asl) and Burlington weather station (101 m asi). Data from National Weather Service. A. Monthly average temperatures. B. Effective monthly average lapse rates.
61.1 Continue north, down Smugglers Notch.
62.7 Upper lift area for Smugglers Notch Ski Center.
64.0 Smugglers Notch Village
66.9 Gravel pit in 244 m, 800 ft terrace consists of coarse sand and pebble gravel comprising topset and foreset deltaic facies.
68.9 Village of Jeffersonville. Turn right (north), in front of hardware store, onto Main Street.
69.0 Turn right, heading east, on School Street.
33
A2-18 BIERMAN, WRIGHT, AND NICHOLS
69.2 Park in the lot behind the Cambridge Elementary School. UTM Coordinates: 672380, 4945560
STOP 7: JEFFERSONVILLE CLAY BANK: 1999 LANDSLIDES Jeffersonville 7.5-minute quadrangle
Introduction The Jeffersonville slides of 1999 are a series of three mass movements that have generated a dramatic scarp and
attracted significant local media attention. The slides have undermined the foundation of one house and currently threaten several others nearby (Figure 13). The three slides disrupted a 50-rn high stack of glaciolacustrine material, carrying more than 27,000 m 3 of silt and sand over a convex, cut bank of the Brewster River and onto the point bar and low terraces on the other side.
The debris was unusually mobile, moving more than 150 in laterally on what geologic evidence suggests was a rapidly deforming, fluidized bed. The landslide probably owes its long run out distance to high basal pore pressure, the best evidence for which is a series of fluid escape structures, mud volcanoes. Excess pore pressures, in the remobilized fine-grain material, allowed some of the slide material to flow as a non-Newtonian fluid forming distinct debris-flow like snouts at the margin of the run out zone.
Geologic Setting The village of Jeffersonville is built on a large alluvial fan deposited by the Brewster River as flow became
unconfined and as its gradient abruptly lessens where it meets the Lamoille River floodplain. The Brewster River channel is currently incised into the east side of the fan and has remained in that position for at least the last 122 years, (Beers Atlas map of Jeffersonville, 1877). A large rooted tree stump was exposed at river level by minor flooding approximately 5 years ago. While we did not date the stump, it nevertheless indicates that the fan has aggraded during the Holocene, similar to other alluvial fans in northern Vermont (Bierman, et al., 1997).
The Jeffersonville slides originated from a steep bank (the "Jeff Clay Bank") of unconsolidated glacial and immediately post-glacial sediments. The bank is the western margin of a North-South oriented ridge defined by the Brewster River to the West and an unnamed stream to the East (Figure 13). The top of the ridge is flat, most likely a fluvial terrace of the ancestral Brewster River as it began eroding the thick section of glaciolacustrine material exposed in the landslide scarp.
A detailed stratigraphic section was measured by one of us (SFW) during the summer/fall of 1991 at the site of the current slide (Figure 14a). The measured section begins approximately 2 in above water level and extends to within 15 in of the top of the bank. The entire measured section (29 m) consists of 143 couplets (rhythmites) consisting of varved silt/clay that grade into fine sand/clay couplets higher in the section. The silt layers in the lower part of the section range in thickness from 6.7 to 51.6 cm and the clay interbeds range from 0.4 to 2.9 cm. The clay layers are usually graded, becoming progressively finer grained from bottom to top. These are relatively deep water lacustrine sediments deposited in one of the lakes that occupied the Lamoille River valley once the ice sheet had retreated NW of this point (Glacial Lakes Mansfield and Vermont; Connally, 1972). An unknown thickness of surficial materials (most likely lacustrine clay and till) lies below the exposed section. A similar section was measured by Antevs (1922, his section number 170) approximately 50 in to the north, although he only measured the silt/clay couplets comprising the lower half of the section.
The clay layers are systematically jointed into orthogonal sets (Figure 14b). Typically the clay layers break into rectangular pieces along these joints. At present it is unclear whether the joints have formed in response to a regional stress system in the last 13,000 years or whether the stress system is local, perhaps resulting from gravitational stresses along the steep bank. The joint surfaces are frequently stained red or orange with iron oxide minerals suggesting that groundwater flow, at least near the surface, is controlled by this secondary porosity in the clay layers.
Two massive slumps (underwater landslides) in the bottom part of the section transported considerable thicknesses (0.81 and -.5.5 in respectively) of lacustrine clay and sand to this part of the lake bottom (Figure 14).
34
BIERMAN, WRIGHT, AND NICHOLS A2-19
The upper slump contains an impressive array of deformation structures including abundant folds and imbricate thrust faults. Both slumps are conformably overlain by quiet water silt/clay couplets indicating that normal sedimentation resumed after the slumps. It is presently unclear whether these slumps were initiated by seismic activity, storms, oversteepened slopes, or some combination of the above.
Higher in the section fine to very fine sand becomes increasingly abundant and completely replaces the silt component of the couplets (Figure 14a and 15). These are most likely bottomset beds of a delta built into the glacial lake by the Brewster River, perhaps 1.5 - 2.5 km south of the clay bank. An unconformity separates the fine lacustrine sand and clay couplets from fluvial gravels that comprise the upper —2-5 m of the section (not measured in Figure 14a). These were probably deposited by the Brewster River after the glacial lake drained and represent an early part of the history of erosion of the lacustrine materials that continues to the present day.
The entire section of lacustrine material visible at the Jeffersonville clay bank was probably deposited in a relatively short period of time. In addition to the 143 couplets measured in the section, the bottom 2 m of covered section probably contains another 15 varves (extrapolating the average varve thickness down section). In addition, the top, unmeasured —15 m, part of the section may contain another 10-15 sand/clay couplets below the unconformity with the overlying gravels. If one interprets each couplet to represent a year's sedimentation cycle in the lake, then the measured section was deposited in 143 years and the entire exposed section in —170 years. This rapid deposition was no doubt influenced by the close proximity to the Brewster River delta noted above.
Slide history The Jeffersonville slide appears to be one of the largest mass movements in the collective memory of living
Vermonters. On April 11, 1999, the first of three landslides occurred at this site. A week later, (April 18), the largest of the three slides released. On July 4, 1999, a third slide occurred at the same location. The slides garnered significant media attention because they progressively endangered a house at the scarp margin and because two houses in the run-out zone were affected by the second failure (mud splash only). Residents were concerned about the possibility of future slides because the debris could dam the Brewster River, a potentially hazardous situation for village residents, all of whom live on the alluvial fan created by the Brewster River.
The Jeffersonville clay bank has been the locus of landslide activity for quite some time. Antevs (1922) measured a section of varves 50 m downstream of the present slide suggesting that exposure was good then, probably from a recent slide. Our own observations over the last 12 years indicate that much of the clay bank has been exposed by small-scale slumps during all of that time. Reconnaissance mapping up- and down-stream of the slide, as well as interviews with local residents, suggests that similar failures have happened here before. As one faces the scarp and looks across the river, there is a well-vegetated slide scar just upstream of the current scarp, probably the result of a similar but smaller slide that occurred in the 1950s. This slide also crossed the Brewster River. Local accounts suggest that the fine grain material from the 1950s slide was used to create the clay tennis courts that were largely buried by the 1999 slides.
Immediately after the second slide, there was public insistence that some type of remediation be conducted to prevent future slides and lessen the possibility of a future slide damming the river. The state of Vermont, employing a local contractor, spent $40,000 "cleaning the channel" below the slide for a distance of 175 m during which time small caliber (< 1 m to 1.3 m) rip-rap was installed 2 m high on the slide-proximal bank of the river. The third slide ran over the rip rap, burying some blocks and carrying other blocks over the river and up the debris apron on the distal side. After the third slide, bulldozers were again used to clean the channel but no further rip rap was applied. The State of Vermont is currently studying remediation alternatives and the Vermont Agency of Natural Resources has concluded that the preferred option for addressing issues created by the slide is removal of all slide material from the 100-year flood plain (virtually the entire debris apron) and extension of the rip-rap another 70 m down stream to prevent oversteepening of the bank by lateral migration of the Brewster River.
Slide Morphology The slides originated from a 50-rn high bluff, the steepness of which is maintained by the Brewster River, which
currently erodes the toe of the slope. Observations, made prior to the 1999 slides, indicate that the slope was bare and free of vegetation from the stream up to the top of the slope (Figure 1 3b). The old nonvegetated slide scarp was
35
A2-20 BIERMAN, WRIGHT, AND NICHOLS
relatively narrow (-20 in across) on the upper part of the slope (>15 in above river level), but widened at the base (from river level up to —15 m) to least 100 m. The exposed area was much smaller than the present scalp, but evidence of small-scale, recurring landslides was abundant. The break in slope, marking the top of the lower slide, occurs at the top of the massive 5.5 in thick slump that is interbedded with the varved silt and clay (Figure 14). Areas both north and south of the upper part of the preexisting scarp were tree covered, but were undercut by the active slides on the lower slope.
The current slide scar is arcuate in plan view and is about 150 in long. A steep upper section extends down from the upper terrace to a distinct bench in the lower section. The bench occurs at the level of the massive slump (Figure 14) and has a steep margin on the side of the Brewster River. Approximately half way down the slope is a cluster of back tilted trees transported down slope from the terrace top. To the north of the active slide, the silt is exposed at and near the river level in a steep bank. To the south of the current slide area, there is an older, well-vegetated arcuate slide scar separated from the current failure by a short ridge. Farther south (upstream), the lacustrine silt appears to be underlain by till (L. Becker, personal communication), an observation supported by the frequency and size of boulders in the Brewster River Channel.
The run out zone was littered with downed trees. Mapping done just after the second slide indicated that most of the trees were concentrated at the perimeter of the slide (Figure 16). The orientation of the trees in the run out zone with respect to the nearest debris margin was bimodal, parallel and perpendicular to the direction of run out. Perpendicular orientations are consistent with trees pushed in front of the moving debris. Trees oriented parallel to the transport direction presumably moved on the debris.
On the basis of a detailed GPS survey (>3000 points) conducted within days of the second slide, we estimate that the volume of the run out material on the west side of the Brewster River was about 23,000 m 3 of silt, sand and gravel (Figure 17A). This volume estimate is somewhat sensitive to assumptions regarding initial topography and could be 20 to 30% larger if the flood plain elevation were significantly lower than the elevation of the flat areas just distal to the run out margins. The volume of material crossing the Brewster River during the smaller third slide (4200 m3 not including additional material removed by bulldozers in the stream channel) was estimated using a second GPS survey in early July (Figure 17B).
Hydrologic Effects on Slope Stability The drainage basin above the slide is small and narrow. Beyond the ridge visible from the slide debris, the slope
quickly falls off on the other side toward an unnamed brook (Figure 13). Nevertheless, during wetter times of the year, seeps emanate from the top of the silt just below the region where the material becomes sandier. Similar stratigraphic control on groundwater flow is well demonstrated at other sites such as Town Line Brook.
Several lines of evidence suggest that the varved silt and clay at the base of the section was saturated when it failed. The silt and clay adjacent to the river channel is usually saturated and regularly slumps or flows into the river channel. The material flowed immediately after failing in the slide. t)ewatering of the slide material took days to weeks. Saturation of the fine-grain material prior to failure would have lowered resisting forces (decreased normal force on the failure plane) and increased driving forces (increased slide mass).
Curiously, the fall of 1998 was much drier than normal; the winter of 1998-1999 was somewhat drier than normal and the spring and summer of 1999 were much drier than normal (Figure 18). In fact, the summer of 1999 was the fifth driest on record. However, 1998 was the wettest year on record in Burlington, Vermont with annual precipitation 50.42', 152% of the average amount. The summer of 1998 was particularly wet. Burlington received 24.77' of precipitation in June, July and August, surpassing the previous record by more than 2 inches.
Although it is not possible to link the slide directly to moist antecedent conditions, it is possible that the wet summer and fall of 1998 may have helped induce the failure. Higher than average summer flow in the Brewster River undoubtedly occurred in response to unusually heavy summer rains in 1998; these flows likely undercut the bank directly below the slide, the outside bend of a meander. It is also possible that the low permeability of the silt retarded drainage of water infiltrated during the previous summer, maintaining high pore pressures in the silt as a result of the heavy rains of 1998.
36
BIERMAN, WRIGHT, AND NICHOLS A2-21
Larry Becker, Vermont State Geologist, has proposed another means by which to increase pore pressure in the underlying silt. The bed of the unnamed stream to the east of the active slide is 10 to 12 meters above the Brewster River (Figure 15). Movement of groundwater exfiltrated from the stream toward the Brewster River could substantially raise pore pressure in the silt, reducing resisting forces.
Slide Dynamics Observations made just after the second failure, some of which can still be made today, five months after the
event, clarify slide dynamics. In particular, field observations allow us to constrain the type of failure and the mode of debris transport.
It appears from the stratigraphy preserved in the debris apron that the failure was, at least in part, translational. Closest to the river and to the slide scarp, most material exposed at the surface of the slide apron is sand. Moving away from the river, the distal debris apron is increasingly dominated by silt and fine sand. This spatial pattern suggests that the failure initiated in lower part of the scarp (the glacial-lacustrine silt) which rotated toward and then over or through the river. The sand, which is stratigraphically higher on the scarp, then followed in translation. The overall stratigraphy preserved in the run out zone, silt farther from and sand closer to the slide scarp, is consistent with such a translational mechanism as opposed to the toppling failures frequently observed at Town Line Brook (Stop 1).
The style of failure and the mobility of the material have important public policy and management implications. The mobility of the failed material allowed significant run-out putting residences over 150 m away from the slide in harm's way. However, the same mobility allowed the slide to translate away from its source leaving mostly fine sand (easily erodable material) in the channel of the Brewster River. Observations of mudlines made just after the second slide indicated that river stage up stream of the slide remained below bankfull, mandating that the river very quickly cut down through whatever slide material (mostly sand) remained in the channel. After the third slide, mudlines just reached the bank full stage suggesting that it may have taken the river slightly longer to clear its channel. It does not appear that the slide material dammed the river sufficiently that the course of the channel was diverted or the floodplain inundated.
Once failed, the slide material became extremely mobile and flowed. Several lines of field evidence suggest strongly that at least some of the fine-grained material behaved as a non-Newtonian fluid, moving until the driving force no longer exceeded its shear strength and then freezing into lobes with steep snouts reminiscent of debris flows (Figure 19). Rafts of stacked logs were pushed along by the flows and came to rest intact many meters from where they were originally stacked (Figure 20). The run out from the third slide had no debris-flow-like snouts and travelled a much shorter distance.
Additional field evidence suggests that at least some of the material in the debris apron must have been saturated when it was deposited and by analogy when it failed. Immediately after the second slide, there was spectacular evidence that dewatering had and was continuing to occur in the slide apron. Over the surface of the slide, we found dozens of fluid escape structures. These took the form of mud volcanoes with small central vents (2 to 20 cm) and large low gradient aprons (50 to 200 cm) made up primarily of fine sand (Figure 21). The vent areas of these volcanoes were easily liquifiable with agitation for over a week after the slide occurred suggesting that dewatering happened only slowly through the fine-grain material. It is possible that some Brewster River water was incorporated by the slide as it ran over the channel. The best evidence for such incorporation were splash marks we observed on the trees and a house on the upstream edge of the debris apron.
The mobility of material in the slide apron has significant implications for hazard management. The fluidization and debris-flow-like character of the debris apron allowed slide materials to move much father away from the source than we would have expected based on our experiences with other landslides in Vermont. This mobility, while it may endanger residences several hundred meters from the scarp, allowed the failed material to move away from the Brewster River channel. Less mobile slide debris might have plugged the channel, diverting the Brewster River and possibly inundating parts of Jeffersonville including the school which would likely have been moistened by waters rising behind a landslide dam.
37
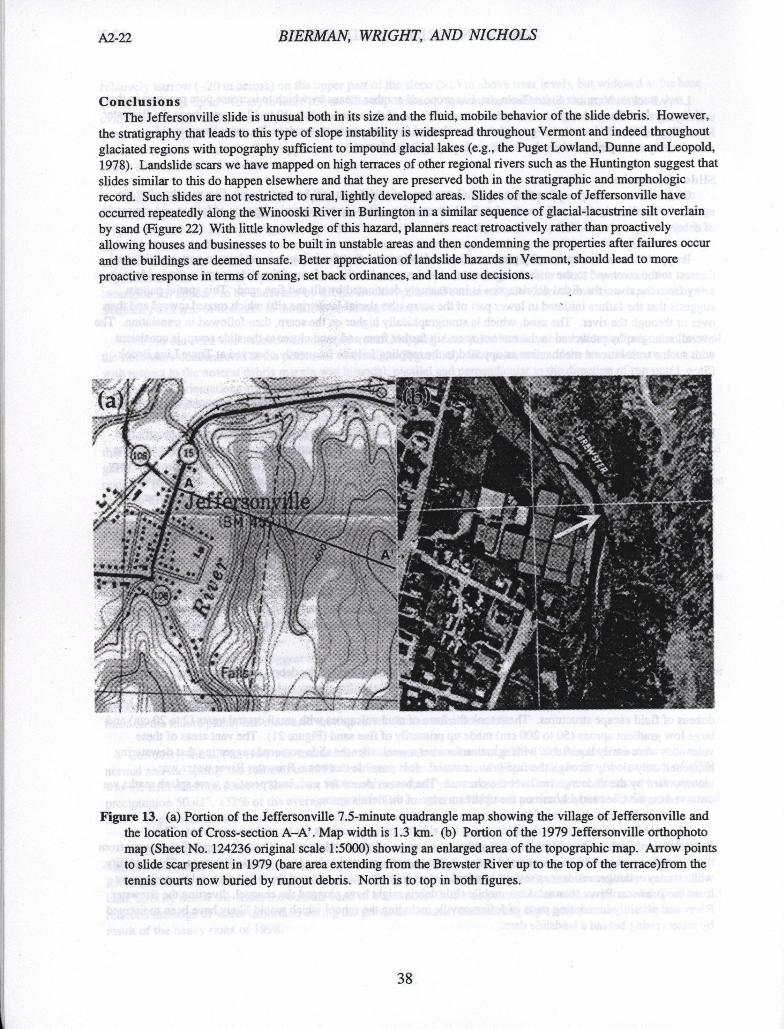
A2-22 BIERMAN, WRIGHT, AND NICHOLS
Conclusions The Jeffersonville slide is unusual both in its size and the fluid, mobile behavior of the slide debris. However,
the stratigraphy that leads to this type of slope instability is widespread throughout Vermont and indeed throughout glaciated regions with topography sufficient to impound glacial lakes (e.g., the Puget Lowland, Dunne and Leopold, 1978). Landslide scars we have mapped on high terraces of other regional rivers such as the Huntington suggest that slides similar to this do happen elsewhere and that they are preserved both in the stratigraphic and morphologic record. Such slides are not restricted to rural, lightly developed areas. Slides of the scale of Jeffersonville have occurred repeatedly along the Winooski River in Burlington in a similar sequence of glacial-lacustrine silt overlain by sand (Figure 22) With little knowledge of this hazard, planners react retroactively rather than proactively allowing houses and businesses to be built in unstable areas and then condemning the properties after failures occur and the buildings are deemed unsafe. Better appreciation of landslide hazards in Vermont, should lead to more proactive response in terms of zoning, set back ordinances, and land use decisions.
Figure 13. (a) Portion of the Jeffersonville 7.5-minute quadrangle map showing the village of Jeffersonville and the location of Cross-section A—A'. Map width is 1.3 km. (b) Portion of the 1979 Jeffersonville orthophoto map (Sheet No. 124236 original scale 1:5000) showing an enlarged area of the topographic map. Arrow points to slide scar present in 1979 (bare area extending from the Brewster River up to the top of the terrace)from the tennis courts now buried by runout debris. North is to top in both figures.
W.
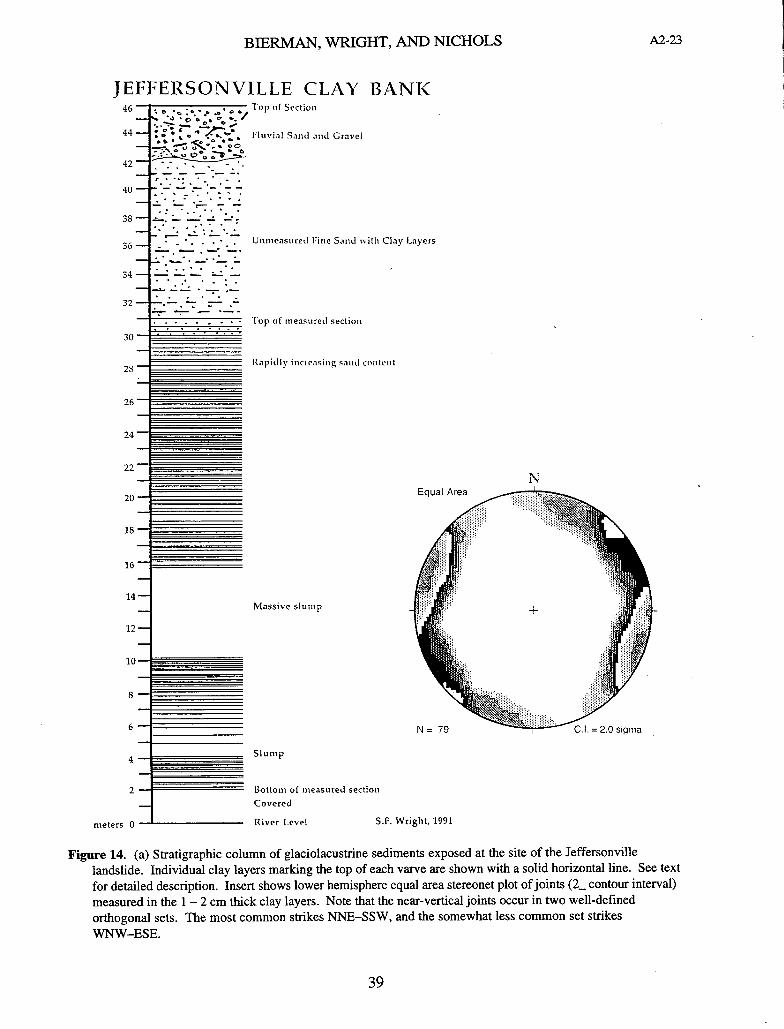
BIERMAN, WRIGHT, AND NICHOLS A2-23
JEFFERSONVILLE CLAY BANK 46 o :. • lop Of Section
44 Fluvial Sand and Gravel -
35 -.-
36 .T Unmeasured Fine Sand with Clay Layers
34 -
32- - lop of measured section .. . . .. . .
30
28 I Rapid I y i net eac i ng saId coit it te I
26
24
22
20
18
16
14
12
10
8
6
N
Massive slump
4 I Slump
2 Bottom of measured section Covered
meters 0 River Level S.F. Wright, 1991
Figure 14. (a) Stratigraphic column of glaciolacustrine sediments exposed at the site of the Jeffersonville landslide. Individual clay layers marking the top of each varve are shown with a solid horizontal line. See text for detailed description. Insert shows lower hemisphere equal area stereonet plot ofjoints (2_ contour interval) measured in the 1 - 2 cm thick clay layers. Note that the near-vertical joints occur in two well-defined orthogonal sets. The most common strikes NNE—SSW, and the somewhat less common set strikes WNW—ESE.
I,J
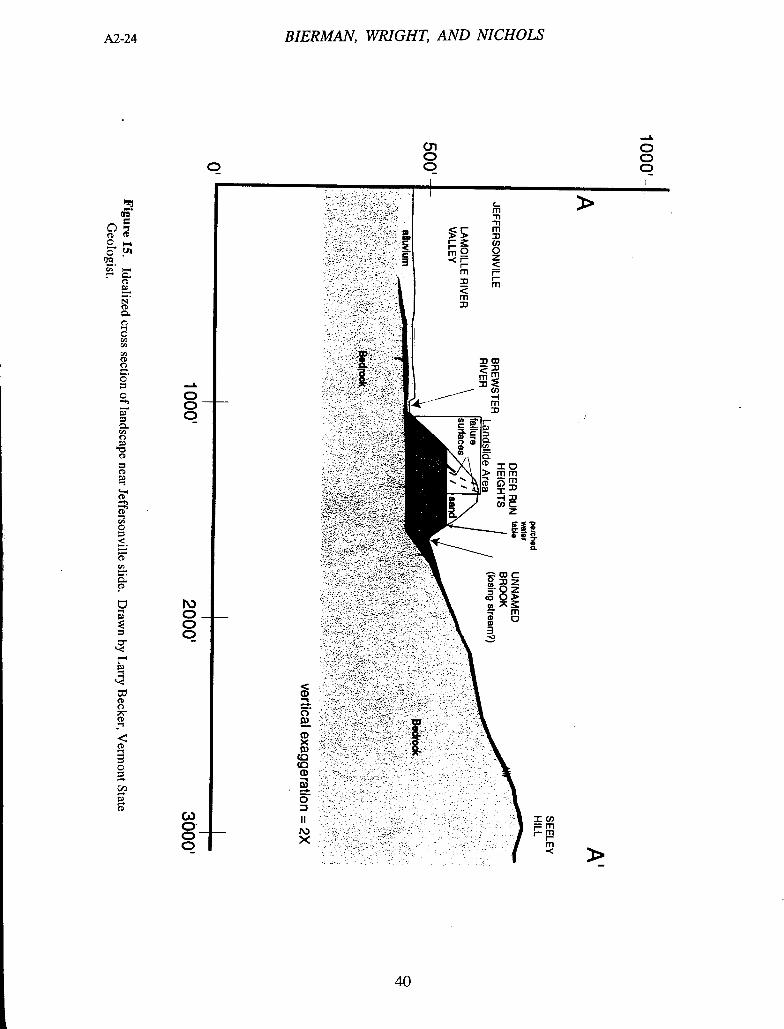
10
CD'
CL
CDeD 0 -
co
CD
CD 1
0
CD CD
0
0
CD
•0 CD
CD
CD
CD
-t
A2-24
BIERMAN, WRIGHT, AND NICHOLS
(71
0 0
0 0
0
C- m m
<r ni >> r 0)
2 0 -(I— Z
I- m 1=
m
mm
cn
4 —1
a I0 > mm •
- .-
Coc a
CL
Co C g
0 z 0>
a, m
3
cD
C)
CD x
CD
0
C) 0 0 0
-
0 0 0
0 0 0
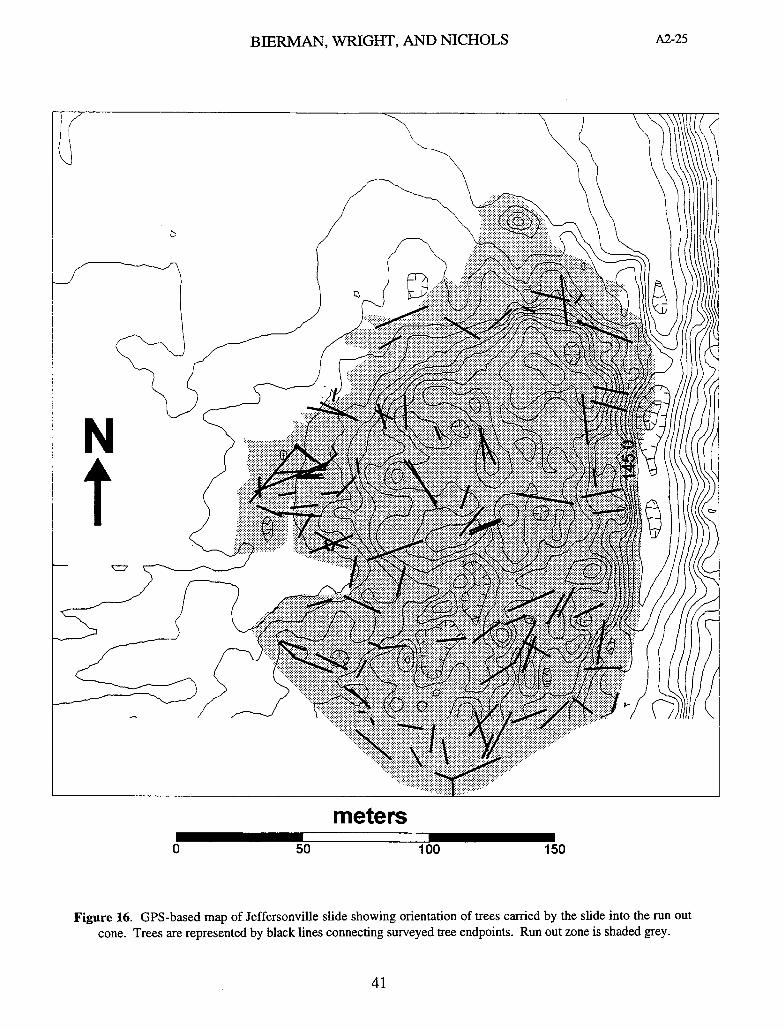
BIERMAN, WRIGHT, AND MCHOLS A2-25
meters 0 50 100 150
Figure 16. GPS-based map of Jeffersonville slide showing orientation of trees carried by the slide into the run out cone. Trees are represented by black lines connecting surveyed tree endpoints. Run out zone is shaded grey.
41
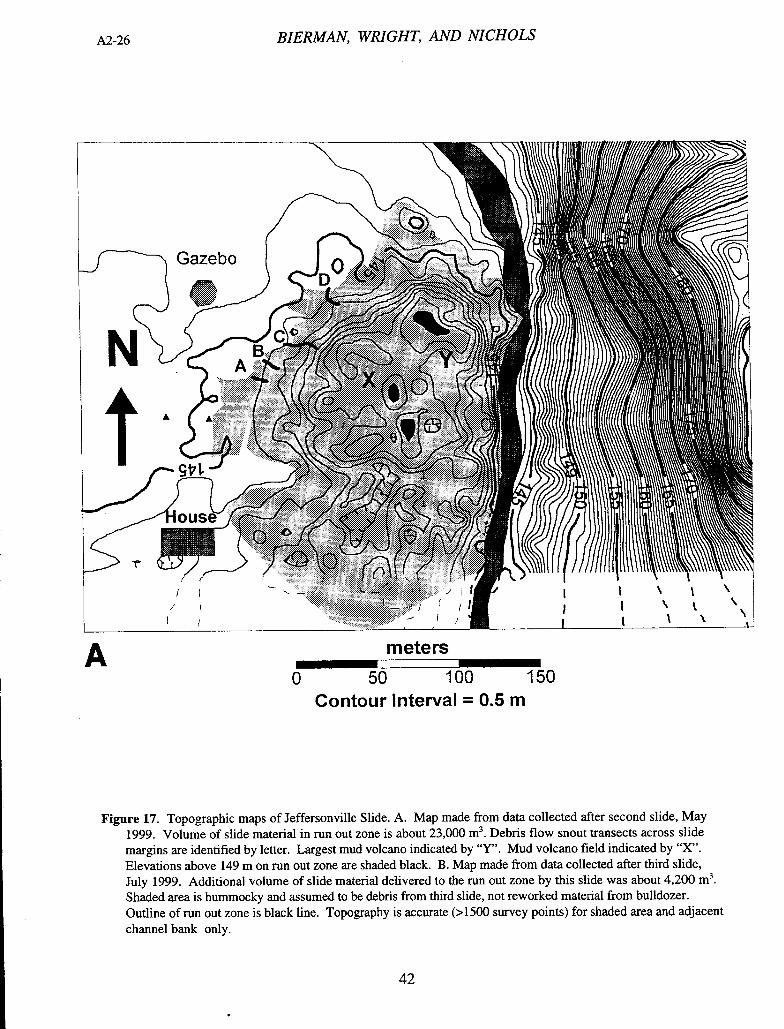
A2-26 BIERMAN, WRIGHT, AND NICHOLS
A meters
0 50 100 150 Contour Interval = 0.5 m
Figure 17. Topographic maps of Jeffersonville Slide. A. Map made from data collected after second slide, May 1999. Volume of slide material in run out zone is about 23,000 m 3. Debris flow snout transects across slide margins are identified by letter. Largest mud volcano indicated by "Y". Mud volcano field indicated by "X". Elevations above 149 in on run out zone are shaded black. B. Map made from data collected after third slide, July 1999. Additional volume of slide material delivered to the run out zone by this slide was about 4,200 m 3 .
Shaded area is hummocky and assumed to be debris from third slide, not reworked material from bulldozer. Outline of run out zone is black line. Topography is accurate (>1500 survey points) for shaded area and adjacent channel bank only.
42
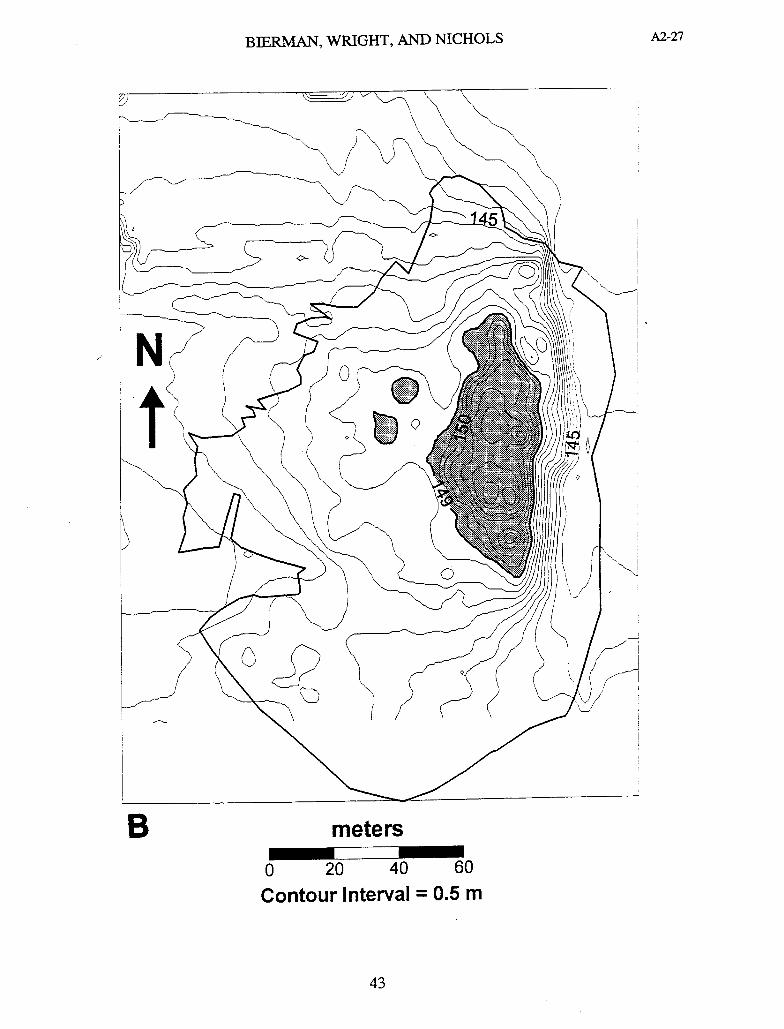
BIERMAN, WRIGHT, AND NICHOLS A2-27
B meters
0 20 40 60
Contour Interval = 0.5 m
43
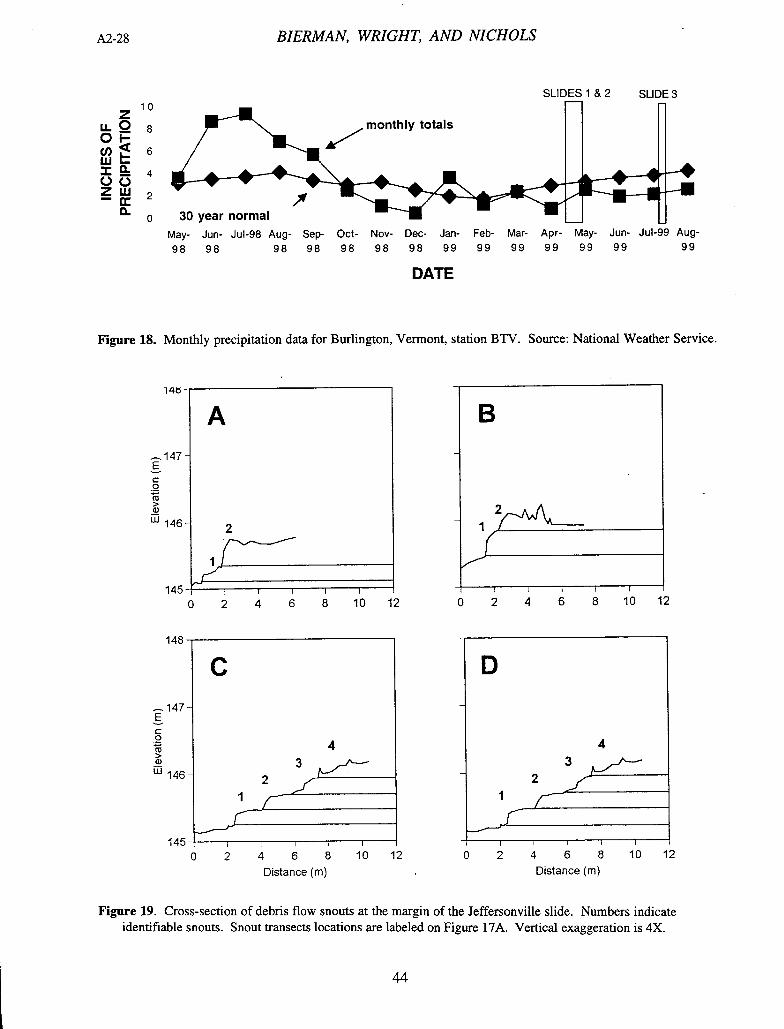
A2-28
BIERMAN, WRIGHT, AND NICHOLS
SLIDES 1 & 2 SLIDE 3
z 10
(fl<6 Uji 4 normai, rnonthii tota * 44 4
w o5 z 2-
IL 0
May- Jun- Jul-98 Aug- Sep- Oct- Nov- Dec- Jan- Feb- Mar- Apr- May- Jun- Jul-99 Aug-
98 98 98 98 98 98 98 99 99 99 99 99 99 99
DATE
Figure 18. Monthly precipitation data for Burlington, Vermont, station BTV. Source: National Weather Service.
1 4
A 147
E
0
>
LU146 2
145 1 i I I I
0 2 4 6 8 10 12
2
11
0 2 4 6 8 10 12
145
147 E C 0
CD > 0)
146
145
4
0 2 4 6 8 10 12 0 2 4 6 8 10 12
Distance (m) Distance (m)
Figure 19. Cross-section of debris flow snouts at the margin of the Jeffersonville slide. Numbers indicate identifiable snouts. Snout transects locations are labeled on Figure 17A. Vertica' exaggeration is 4X.
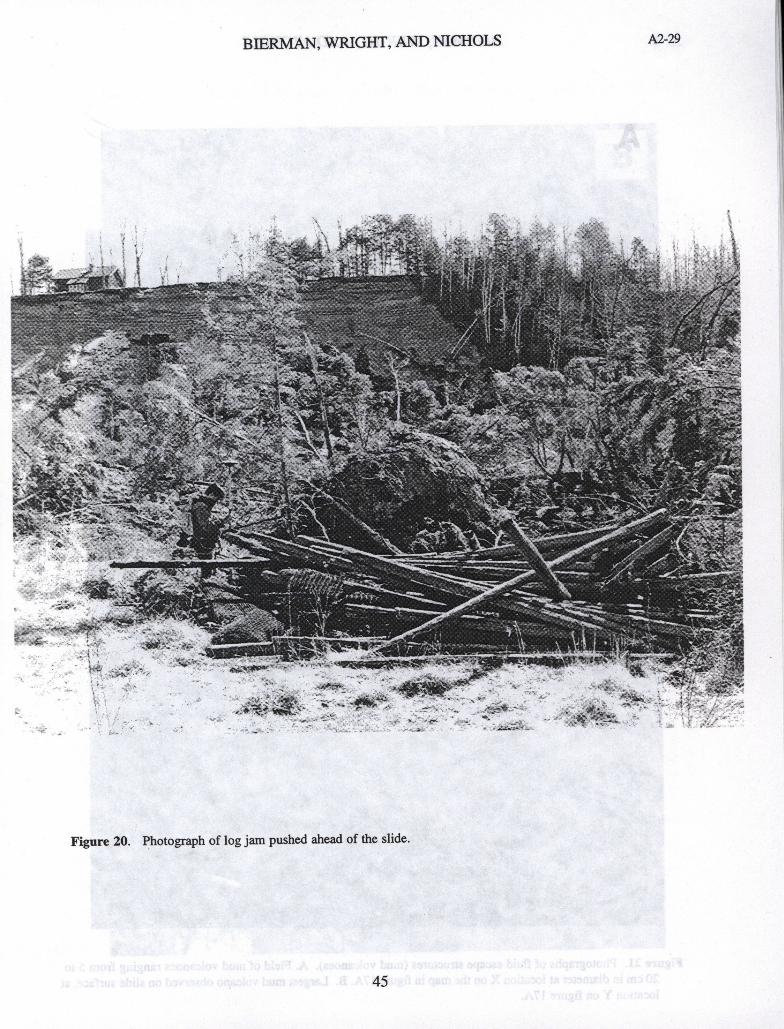
BIERMAN, WRIGHT, AND NICHOLS A2-29
4
at
- I
rA lie
ki
Figure 20. Photograph of log jam pushed ahead of the slide.
45
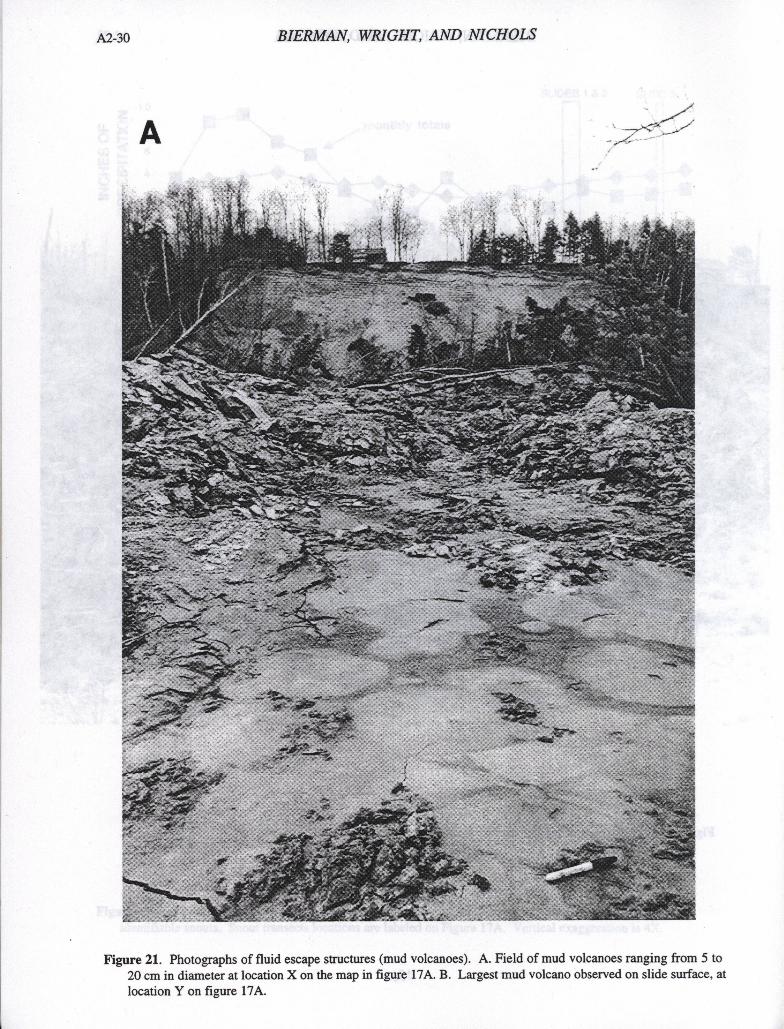
A2-30
BIERMAN, WRIGHT, AND NICHOLS
A
I
r - ' ..t -
'- -
-
- - -
-
4
- -
V.
Figure 21. Photographs of fluid escape structures (mud volcanoes). A. Field of mud volcanoes ranging from 5 to 20 cm in diameter at location X on the map in figure 17A. B. Largest mud volcano observed on slide surface, at location Y on figure 17A.
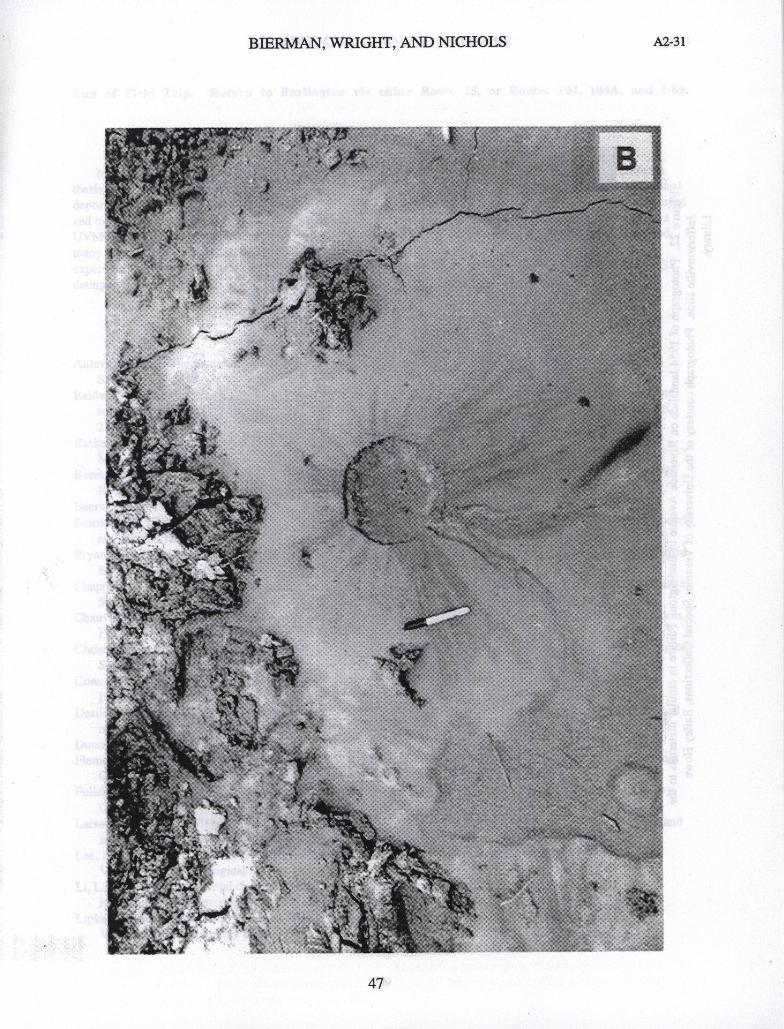
47
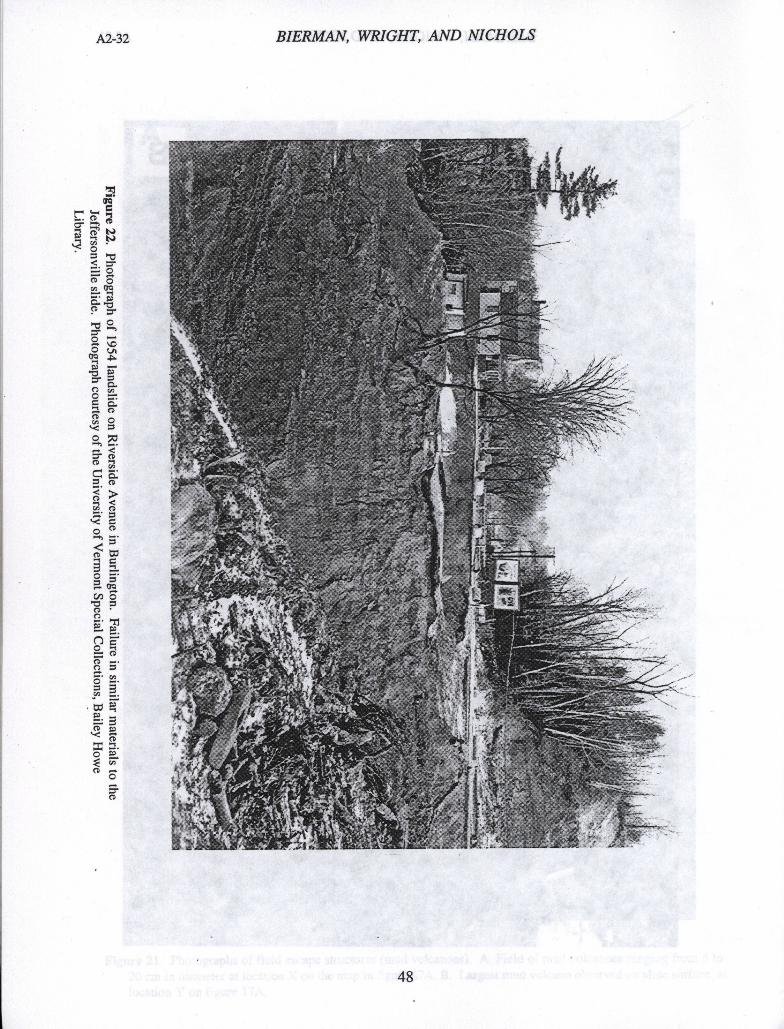
A2-32 BIERMAN, WRIGHT, AND NICHOLS
.0 < - =0
-.
0
0 u
0- CA
0 = 0-
CA
2'. (D
CD
CD
o
& 0 CD
CD
- .
-
CD
CD
CD
CD
BIERMAN, WRIGHT, AND NICHOLS A2-33
End of Field Trip. Return to Burlington via either Route 15, or Routes 104, 104A, and 1-89.
ACKNOWLEDGMENTS
Much of the work reported in this guide was done by students at the University of Vermont. Undergraduate thesis students Paul Zehfuss (UVM BS 1996) and Kristine Bryan (UVM BS 1995) mapped alluvial fans and glacial deposits, respectively. Tim Whalen (UVM Geology MS 1998) and Chris Valin (UVM Geology BS 1997) surveyed and trenched terraces along three main tributaries of the Winooski River. Undergraduates and graduate students in UVM Geomorphology and Geohydrology classes, named in the text where appropriate, found and first interpreted many of the sites referred to in this guidebook. Tom Davis (Bentley College) provided field and laboratory experience with pond sediment cores and John Southon (Livermore National Laboratory) is responsible for AMS dating.
REFERENCES
Antevs, E., 1922, The recession of the last ice sheet in New England; American Geographical Society Research Series no. 11, 120p.
Baldwin, L., Bierman, P., Schwartz, A., Church, A. and Larsen, P., 1995, The effects of colonial disturbance and subsequent reforestation on the Vermont landscape: Geological Society of America Abstracts with Programs, 27(1), A28.
Baskerville, C.A., Ratte, C.A., and Lee, F.T., 1988, A rock fall and debris slide at Smugglers Notch, Mount Mansfield, Cambridge, Vermont: Vermont Geological Survey, Studies in Vermont Geology, no. 4, lOp.
Beers, F.W., 1875, Atlas of Chittenden County, Vermont; from actual surveys by and under the direction of F.W. Beers, assisted by Geo. P. Sanford and others; Reprinted 1971, C.E. Tuttle Co.
Beers, F.W., 1878, Atlas of the counties of Lamoille and Orleans, Vermont; F.W. Beers and Co. Bierman, P., Lini, A., Davis, P.T., Southon, J., Baldwin, L., Church, A. and Zehfuss, P., 1997, Post-glacial ponds
and alluvial fans: recorders of Holocene landscape history: GSA Today v. 7, no. 10, p. 1-8. Bryan, K., 1995, Deglaciation of southern Chittenden County and northern Addison County, Vermont: unpublished
BS thesis, University of Vermont, 97 p. Chapman, D. H., 1937, Late-glacial and post glacial history of the Champlain valley: American Journal of Science,
5th series, v. 34, p. 89-124. Chauvin, L., Marineau, G., and LaSalle, P., 1985, Deglaciation of the lower St. Lawrence Region, Quebec: Boms,
H.W., LaSalle, P., and Thompson, W.B., eds., GSA special Paper 197, p. 111-123. Christman, R. A. and Secor, D. T., 1961, Geology of the Camels Hump quadrangle, Vermont: Vermont Geological
Survey, Bulletin 15, 70 p. Connally, G.G., 1972, Proglacial lakes in the Lamoille Valley, Vermont; in Doolan, B.D., ed., New England
Intercollegiate Geological Conference Guidebook, p. 343-358. Desilets, D. and Cassidy, R., 1993, An assessment of the volume of Lake Vermont, Fort Ann Stage: unpublished
report for University of Vermont Geomorphology class, 25 p. Dunne, T. and Leopold, L., 1978, Water and Environmental Planning, Freeman, 812 p. Flemer, S., 1998, Historical past of the Stowe alluvial fan: unpublished poster session for University of Vermont
Geohydrology class, 12p. Fullerton, D.S., 1986, Stratigraphy and correlation of glacial deposits from Indiana to New York and New Jersey:
Quaternary Science Reviews, v. 5, p. 23-37. Larsen, F.D., 1999b, Glacial history of the Montpelier 7.5-minute Quadrangle: in Wright, S.F., ed. New England
Intercollegiate Geological Conference Guidebook No. 91, Cl-i - 14, (this volume). Lee, F.T., Odum, J.K., and Lee, J.D., 1994, Rock falls and debris avalanches in the Smugglers Notch area,
Vermont: U.S.: Geological Survey Bulletin 2075, 33 p. Li, Lin, 1996, Environmental changes inferred from pollen analysis and 14C ages of pond sediments, Green
Mountains, Vermont: unpublished Masters Thesis, University of Vermont, 125 p. Lipke, D. and Pickard, S., 1993, Lapse rates in northern New England: unpublished report for University of
Vermont Geomorphology class, 17 p.
A2-34 BIERMAN, WRIGHT, AND NICHOLS
Malczyk, J. and Kelly, B., 1996, Glacial Striations of the Bamforth Ridge, Camels Hump, Vermont: unpublished report for University of Vermont Geomorphology class, 15 p.
Parent, M. and Occhietti, S., 1988, Late Wisconsin deglaciation and Champlain Sea invasion in the St. Lawrence Valley, Quebec: Geographie physique et Quarternaire, v. 42, 215-246.
Royce, T. and Young, J., 1994, Lichen growth rate curve: unpublished report for University of Vermont Geomorphology class, 26 p.
Severson, J. P., 1991, Patterns and causes of 19th and 20th century shoreline changes of the Winooski Delta: University of Vermont, Field Naturalist Program, MS thesis.
Stewart, D.P. and MacClintock, P., 1969, The surficial geology and Pleistocene history of Vermont: Vermont Geological Survey Bulletin 31, 251 p.
Sundue, M., 1997, Lichenometric dating of exposed bedrock surfaces: unpublished report for University of Vermont Geomorphology class, 12 p.
Thomas, P. A., 1985, Archeological and geomorphological evaluation; M5000 (3) northern connector material supply/disposal area, Howe Farm flood plain. Burlington, Vermont: University of Vermont, Department of Anthropology, no. 54, p. 41.
Whalen, T., 1998, Interpretation of post-glacial fluvial terrace remnants in the Winooski River Basin, Vermont: unpublished Masters Thesis, University of Vermont, 186 p.
Wright, S.F., 1999, Deglaciation of the Stevens Branch Valley, Williamstown to Barre, Vermont, in Wright, S.F., ed. . New England Intercollegiate Geological Conference Guidebook No. 91, B 1-1 - ??, (this volume).
Wright, S.F., Whalen, T.N., Zehfuss, P.H., and Bierman, P.R., 1997, Late Pleistocene-Holocene history: Huntington River and Miller Brook valleys, northern Vermont: in Grover, T.W., Mango, H.N., and Hasenohr, E.J., eds., New England Intercolligiate Geological Conference Guidebook , No. 89, p. C4- 1 - C4-30.
Zehfuss, P. H., 1996, Alluvial fans in Vermont as recorders of changes in sedimentation rates due to deforestation: unpublished BS thesis, University of Vermont, 70 p.
50
LITHOTECTONIC PACKAGES AND TECTONIC BOUNDARIES ACROSS THE LAMOILLE RiVER TRANSECT IN NORTHERN VERMONT
by Peter J. Thompson, Department of Geology, Cornell College, Mt. Vernon, IA 52314
Thelma B. Thompson, Department of Geology, Cornell College, Mt. Vernon, IA 52314 Bany L. Doolan, Department of Geology, University of Vermont, Burlington, VI' 05405
INFRODUCHON
The Lamoille River, unlike the Winooski, cuts across the Green Mountains by taking advantage of a place where more easily eroded rock units cross the Green Mountain anticlinorium. The Winooski follows a strong N70W lineament formed by closely spaced joints and Mesozoic dikes. The Lamoille valley has apparently been eroded along an infold of less resistant rocks, where the Ottauquechee Formation nearly bridges the Green Mountain anticlinorium on the upper plate of the Prospect Rock thrust We propose this fault as analogous to the Whitcomb Summit thrust of Massachusetts (Stanley and Ratciffe, 1985). Broadly speaking, we accept the model of Doll and others (1961) whereby rock units in the Camels Hump Group of northern Vermont were deposited as facies of one another. However, detailed mapping has revealed a much more complex map pattern than shown on the 1961 map (a portion of which is reproduced as Figure 1). The new map pattern reflects a complicated histoiy of folding and faulting (Figure 2).
Trip stops are indicated on Figure 3. The geology of the area covered by this trip is shown in Figure 4. The purposes of this trip are twofold: (1) to demonstrate evidence for lithotectonic packages separated by major faults (as shown in Figures 2 and 3) and (2) to explore the facies relations between units of the Camels Hump Group, Ottauquechee Formation, and Stowe Formation. The reader is referred to Doolan and others (1987) for extensive discussion of facies relationships and structure along the Larnoile transect west of Jeffersonville. Stops on this trip will provide opportunities to compare silver-green rock units (Undethill, Fayston, and Jay Peak) and black, sullidic units (Sweetsburg, Hazens Notch, and Ottauquechee). The black rocks are generally less resistant to weathering than the silver-green and on this trip we will see several examples of the effects of underlying bedrock on topography. Trip B3 (Kim and others, this volume) continues the Lamoille transect east to the Moretown Formation, providing more opportunities to compare black units and green units.
PREVIOUS WORK
The area of the field trip is located within the Jeffersonville and Johnson 7.5-minute topographic quadrangles. Bedrock geology along the Lamoille valley was originally mapped by Albee (1957, Hyde Park 15-minute quadrangle), and Christman (1961, modified by Christrnan and Secor, 1961, Mount Mansfield 15-minute quadrangle). Their work was incorporated into the Centennial Geological Map of Vermont (Doll and others, 1961), although with significant differences of interpretation, especially in the area of Foot Brook. Rocks that Albee had mapped as a syncline of Stowe and Ottauquechee Formations were respectively reassigned to the Foot Brook Member of the Underhill and to the Hazens Notch Formation (see Figure 1). Portions of the Jay Peak 15-minute quadrangle were mapped by Cady and others (1963) and Dennis (1964). An unpublished manuscript map by Cady, dated 1956 and on file at the Vermont Geological Survey, shows the Jay Peak Member of the Camels Hump Group on the west side of the anticlinorium extending south beyond the Lamoille River, much like in our new interpretation (Figure 2). Thompson (1975) mapped the Peaked Mountain Greenstone in the northeast part of the Jeffersonville quadrangle, showing that it continues south to the Lamoille River.
'This field trip description accompanies Trip A3 (repeated as Trip C3) of the New England Intercollegiate Geological Conference, held in Burlington, Vermont, October 1-3, 1999, and organized by the Department of Geology at the University of Vermont with guidebook edited by Stephen F. Wright.
Thompson, P., Thompson, T., and Doolari, B.D. 1999, Lithotectonic packages and tectonic boundaries across the Lamoille River transect in northern Vermont.; in Wright, S.F. ed., New England Intercollegiate Geologic Conference Guidebook Number 91, p. 5 1-94.
A3-2 THOMPSON. THOMPSONAND DOOLAN
-- __
I4—uf
1 /u
0 Aj Peak
ur
uj
of Om
V 'I Ept
/ 7
tWere ' 1
ii • Vo AS
, .c)
oEdeir
/a
a )/
3e..*Sot LU
/1
CLL HIcte ?cL%.k
Li
f ai
_
KOM" Co
ri/ A A
Elmore t
M. /
2.60000
Figire 1. Bedrock geology of north-central Vermont, after Doll and others (1961).
THOMPSON, THOMPSONAND DOOLAN
A3-3
450
440 4I
44o30.
Quadrangle names for Figure 1.
I
Enos- Richford Jay Peak NorTh
I
Newport burg Troy Center Falls I
Bakers- Cold Hazens Lowell Irasburg field Hollow Notch I
Mtns.
Jeffer- Johnson Eden Albany Crafts- sonville bury
Mouit Sterling Morris- Wolcott Caspian Mans- Mtn. ville Lake field
72.°45' 12°3d 72"15'
53
Figure 2. Legend. (See next page.)
MAJOR FAULTS: (From west to east) BT: Brome Thrust HHF: Honey Hollow Fault PRF: Prospect Rock Fault BMF: Belvidere Mountain Fault BBF: Burgess Branch Fault ENF: Eden Notch Fault
LITHOLOGY:
Solid black = ultramafics.
Other rock units in alphabetical order \%'ithin each age designation:
Silurian and Devonian: Dg: Granite DS: Undifferentiated
Ordovician: Ocr: Cram Hill Om: Missisquoi Formation 0mm: Moretown Member
Cambrian: -Co: Ottauquechee Formation -Cs: Sweetsburg Formation
Late Proterozoic-Cambrian: €Zf: Fayston Formation €Zfp: Fairfield Pond Formation €Zhn: Hazens Notch Formation €Zj: Jay Peak Formation €Zp: Pinnacle Formation €Zs: Stowe Formation €Zth: Tibbit Hill Volcanics €Zu: Underhill Formation
Figure 1.
Figure 1. Legend.
Solid black = ultrarnafics.
OTHER ROCK UNITS , with formations arranged roughly from youngest to oldest, according to Doll and others, 1961:
DS: Undifferentiated Silurian and Devonian Om: Missisquoi Formation
0mm: Moretown Member Ornu: Umbrella Hill Member
OCs: Stowe Formation -€s: Sweetsburg Formation €0: Ottauquechee Formation €h: Hazens Notch Formation
-€hb: Belvidere Mtn. Amphibolite €hg: Greenstone €hm: Magnetite schist
-Cu: Underhill Formation -€uc: Carbonaceous schist -CuTh: Foot Brook Member €ufp: Fairfield Pond Member Lug: Greenstone Luj: Jay Peak Member €up: Peaked Mountain Greenstone
€p: Pinnacle Formation €pt: Tibbit Hill Volcanics
0
7Z03dW 44°3d
A3-4 THOMPSON, THOMPSON AND DOOLAN
Figure 2. Bedrock geology of north-central Vermont, as reinterpreted in this paper.
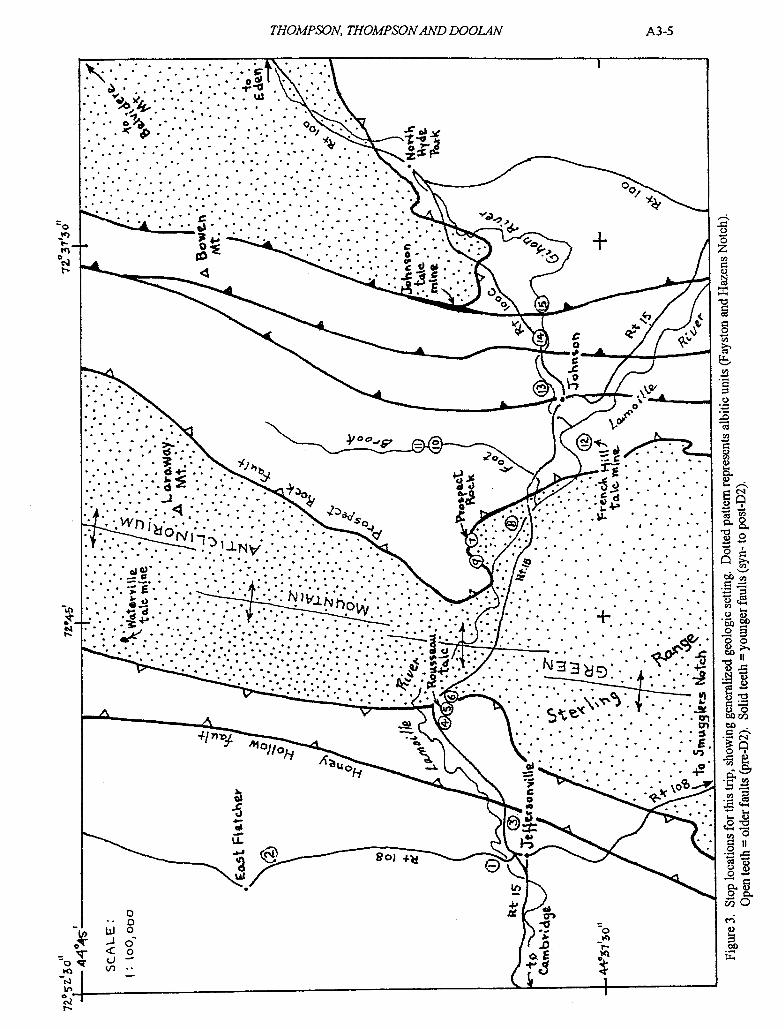
C.)
0
C)
C.)
.0
C) Cl)
C) Cl)
I-. OC)
00
C)
C) '
-
Cl)°
ii
II C)
00
L.
— o Jo
THOMPSON, THOMPSONAND DOOLAN
•... •.... ..\ I
••I \\
..•:. +
A3-5
2
ar - IE
~
vl
\:..-'.-..:." ....
sc
0
1'-
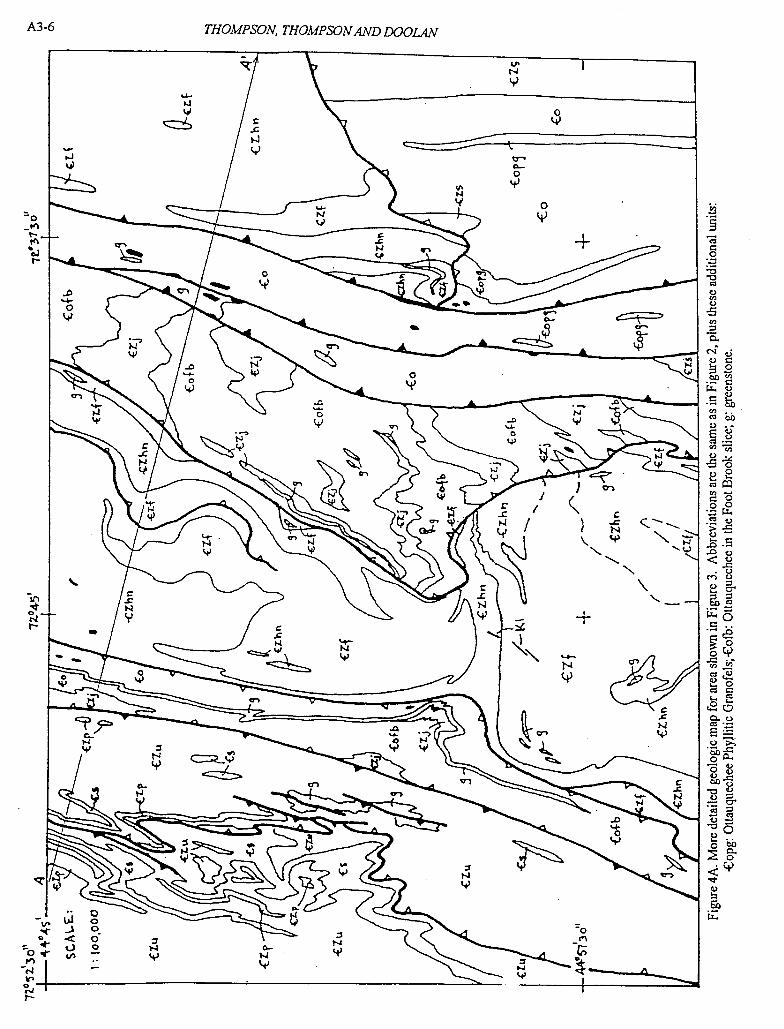
A3-6 THOMPSON, THOMPSONAND DOOLAN
'4
'4 C- 0
0 N 4) -o
-I- - -
0
'-4- —
a- -
a- - 44
- H
o 4) (4)
91 44 '-i- 0 4)
'4 — H
- V a- -
H N 4)
N .0 0
¼ \ £ N - N 44 +
N
— H 4 co
(/fl - 4)
0.0 N
'4- --
0 '-4 c N"4)
to
Ld
H -
C _r
N 0) N 9)
4)
00
0 0
7-
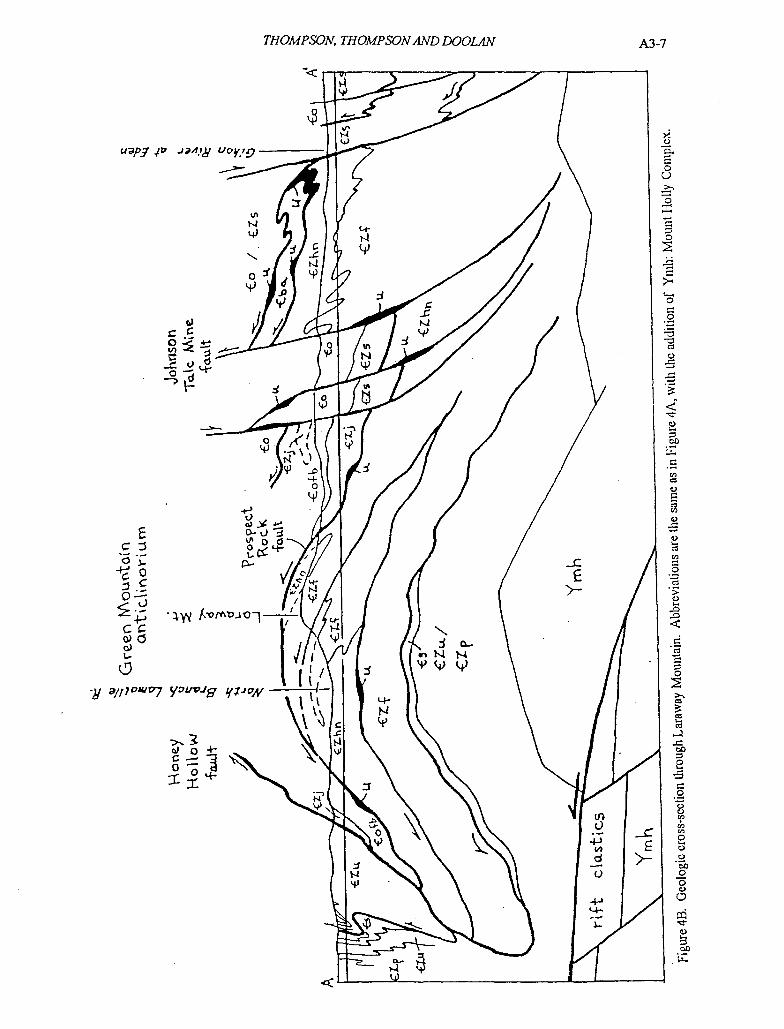
THOMPSON, THOMPSONAND DOOL4N A3-7
p7 /D JM'
CC
v < -:
o
E ci 4o
j . o -
cc & I-
y a/170WE77 yi/vd
D )
0
0
C)
C)
C)
C)
C)
U)
0
> C)
0 Cl
co
CC
0
CC
CC
CC
0
0 C.) C.) U,
U,
C) C)
0 0 C.)
0
C)
A3-8 THOMPSON, THOMPSONAND DOOLAN
Albee (1972), in the text for his NEIGC trip along the Lamoille River, summarized the main problems of stratigraphic correlation, which the present trip will also address as we revisit several outcrops featured on Albee's trip. What was viewed in 1961 and 1972 as a homoclinal sequence on the east side of the Green Mountain anticlinorium, progressively younger toward the east, is now known to be cut by regionally important pre-peak metamorphic thrust faults (for example, Stanley and others, 1984; Stanley and others, 1987a and 1987b; and Thompson and Thompson, 1992). At the Rousseau talc prospect, mapped at 1:1200 by Chidester and others (1952), and at Prospect Rock on the west side of Albee's "Foot Brook syncline", we will present evidence for pre-metamorphic faults. The map in Figure 2 shows truncation of units along contacts that we interpret as early faults. Much of Figure 2 is based on recent mapping at 1:24,000 and compilations by various workers, including (from west to east and north to south, as shown on the quadrangle index map of quadrangles on Figure 1): Richford (Rosencrantz and others, 1998), Jay Peak (Schoonmaker, 1 998b; Doolan, 1999), North Troy (Stanley and others, 1984; Stanley, 1997), Newport Center (Gale, 1980; Hoar, 1981), Bakersfield (Mock, 1989; Rose, 1987), Cold Hollow Mountains (Doolan and others, 1999), Hazens Notch (Bothner and Laird, 1987; Schoonmaker, 1998a; Gale and Kim, 1999), Lowell (Kim, 1997; Stanley, 1997), lrasburg (Kim, 1997), Jeffersonville (Thompson and Thompson, 1 997a), Johnson (Thompson and Thompson, 1999), Eden (Kim, Springston and Gale, 1998), Mount Mansfield (Thompson and Thompson, I 997b), Sterling Mountain (Spririgston, 1997), Monisville (Springston and others, 1998). Rose (1987) analyzed twelve greenstone samples from the Underhill Formation east of Fletcher. All but one were titanium-rich, continental-rift metabasalts. Van Horn and others (1999) studied the en echelon pattern of Mesozoic lamprophyre dikes in a brook south of the Lamoille, near the anticlinorial axial trace, and concluded that the dikes were not emplaced along preexisting fractures.
STRATIGRAPHY
Two stratigraphic problems confront the geologist who maps in the northern Green Mountains: no fossil control exists, and the differences between mappable units are subtle. Many formations contain lenses and layers nearly identical to other formations, some of which are shown schematically on Figure 5A. We have separated such layers out where they are thick enough to map at 1:24,000. The criteria we have followed in assigning outcrops to formations are summarized below, grouped according to whether they are dominantly green or black in color. In the next section we explain how the formations are grouped into lithotectomc packages (Figure 5B). Units that appear on Figure 2, but not encountered on this trip, such as Pinnacle Formation and Belvidere Amphibolite, are not described here. We have included a description of the Stowe Formation for comparison with the rocks that we have mapped as Jay Peak.
Silver-Green Units (all contain chlorite, muscovite and quartz, in varying proportions):
Underhill (€zu): Silver-green to tan-weathering schist and phyllite, +1- magnetite, dolomite, albite; local white to gray quartzite, metawacke, and greenstone with continental rift geochemistry.
Fayston (€Zf): Silver-green to gray schist with white to gray albite, +1- magnetite, garnet; local white quartzite, and greenstone with transitional geochemistry.
Jay Peak (€Zj): Pearly silver-green to blue-black, aluminous phyllite and schist, +1- magnetite, chiontoid, garnet, rare albite; quartzose phyllite and schist; local white quartzite, and greenstone.
Phyllitic Granofels Member of Ottauquechee (€opg): Tan to gray-green phyllitic metawacke, +1-magnetite, +1- quartz clasts; local conglomerate.
Stowe (€Zs): Silvery grayish-green quartzose phyllite with floating isoclinal hinge lines of vein quartz, +1-magnetite. Greenstones locally abundant.
Rustv-weathern black units (all contain muscovite, quartz, graphite, and pyrite):
Sweetsburg (Cs): Black phyllite with tan-weathering layers of gray dolomite and black to gray quartzite.
I1I
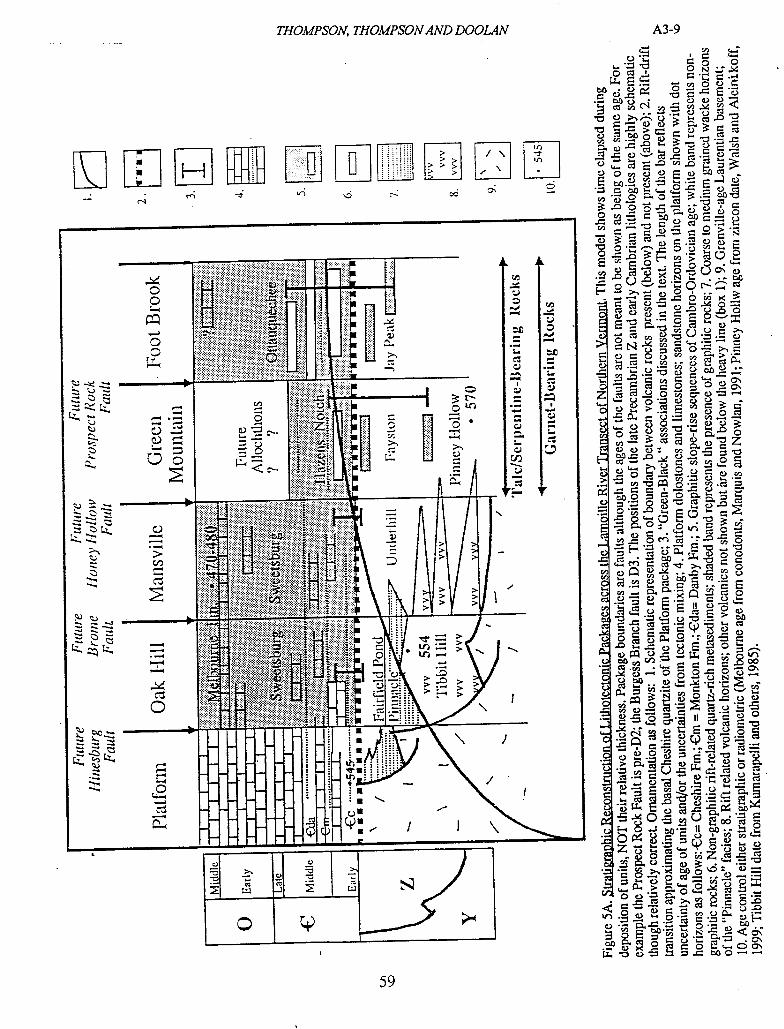
THOMPSON, THOMPSONAND DOOLAN
_ TI [R RE ElLIJL 4 tri 06
0 o
— iI •••• • :
.-e I .
— —
0 •.iE. E 0 - —
AA/ : L I
\
W -z; V
ti HdhftI1 1
ftftj±J 41 0 HIIIIHIHI
Lt.
- C"s
It-1t-1t1IMI : .
—
Tc .2 I
A3-9
o 0
I C)
2 2
c C) '-.- 2 .0
C) C)
E n •
0.) 9 . 0) 0
0.0.
•- —
C
;:;.. 0) 0o c.
10. 0 . z o
• 1-. 0
0 . 0) 0 0 C);
c1 01
00 OS 0.5
9 0
—
aJI!IP 0 • —
.:
01>.00. 0 0 •-.0- 0 0 b
2 --
0
512 0
0) 0 00
. fl 00
.5 • 00 01 ca
z
C) ,•-. 0 0) .
-
C) C) •= . o
59
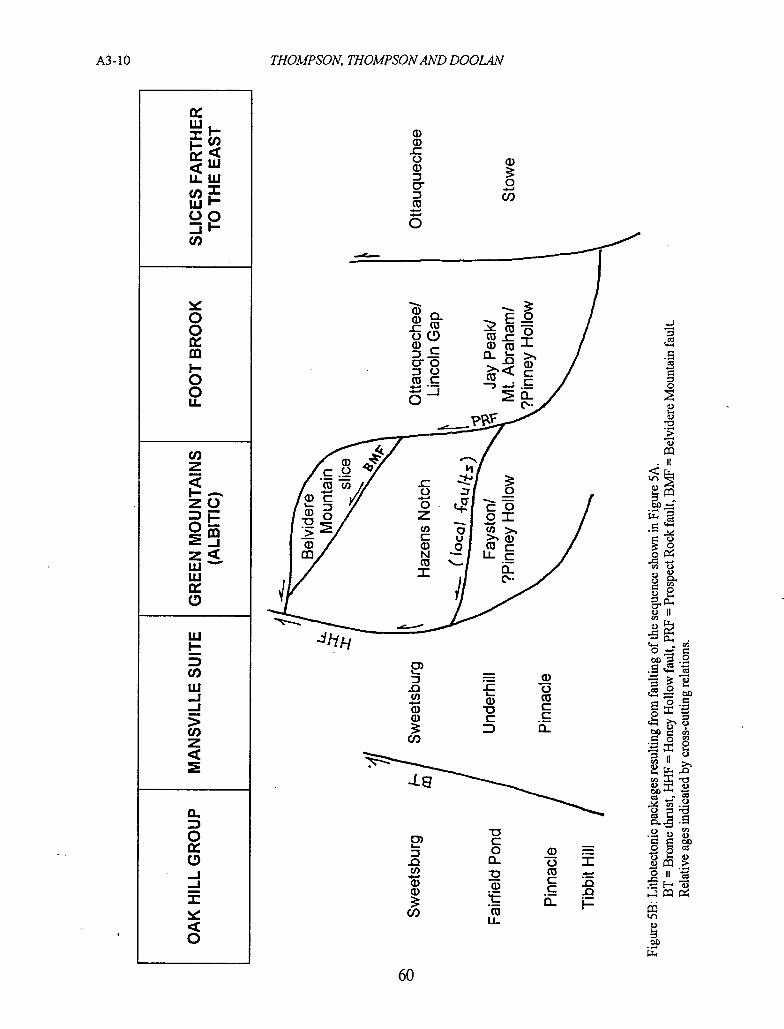
A3- 10
THOMPSON, THOMPSONAND DOOL4N
Ui
ck< <LU U-LU c/) WI- 00 — ii-
(I)
0 0 ix Im I-0 0 L1
Cl) z
ZC)
—J
LU LU
0
LU I- -
U) LU -j -J > U) z
CL
0
0 —J —J =
0
a) a) r o a)
.2 Co
Cl)
0
CU
co Coc5J
ca _)._.. C a.
0
P9 5:
C s r 0
- Cl) C
Q l)> >.a) a) a)
N
u 0 -
CU LLC 0
C', ••.-. •-
U o II
- -c ci
0) -o Co
0) C . (I)
U
0
o
C 0 0)
.0 C- - 3 I cn - II
0 a) 15 •1z
C/) CU Lj_
60
THOMPSON, THOMPSON AND DOOLAN A3- 11
Hazens Notch (.CZhn): Rusty, gray or black to patchy graphitic schist with black albite, +1- chlorite; local black, gray, and white quartzite; local greenstone with transitional geochemistiy.
Ottauquechee (Co) of the Foot Brook slice: Rusty, gray or black to patchy graphitic, quartzose phyllite and schist with local layers and lenses of Jay Peak lithologies; local thin black, gray, and white quartzite; local greenstone (no geochemical data available).
Ottauquechee (Co): Black to rusty gray quartzose phyllite and schist with abundant graphite and variable amounts of chlorite; black, gray, white, and tan quartzite; local pale green actinolitic greenstone (no geochemical data available from our part of the transect).
DISCUSSION OF STRATIGRAPHY
IJuderhill-Fayston Relationship
We have recognized faults largely on the basis of map-scale truncations of units. Certain formations, such as Fayston and Hazens Notch, generally occur together within a fault-bounded package. However, the distinction between units is in part based on their association. For example, we use the name "Underhill" for silver-green schists associated with Pinnacle and Sweetsburg lithologies, but "Fayston" for similar silver-green schists associated with Hazens Notch. The Underhill tends to be fmer-grained, and the Fayston commonly contains albite porphyroblasts, but identical rocks could be assigned to either formation, depending on their location relative to the Honey Hollow fault. Underhill and Fayston were almost certainly depositional facies equivalents. Greenstones in the Underhill have continental rift geochemistiy, whereas those in the Fayston and Hazens Notch were apparently erupted through thinner crust (Coish, 1985; Rose, 1987).
Thus, the Underhill Formation of Doll and others (1961) has been divided into the Underhill and Fayston Formations. Walsh (1992) proposed the name "Fayston Formation" for muscovite-quartz-albite-chlorite schists, regardless of whether Doll and others (1961) included them in Undethill or Hazens Notch. Consequently, most rocks formerly mapped as white albitic schists within the Hazens Notch are now included in the Fayston. Some contacts between Hazens Notch and Fayston seem to be depositional, whereas others are faults. The transition from Fayston to Hazens Notch was likely diachronous.
Foot Brook Area
The depositional model presented in Figure 5 raises questions about the relationships between Jay Peak Formation and Stowe Formation that we are not prepared to answer definitively. Are Jay Peak and Stowe Formations essentially the same rock, reappearing in two different lithotectonic packages, both in association with Ottauquechee? Are they facies of one another, with discemable, mappable differences that can be explained by somewhat different depositional environments? Are they vely similar rocks from different stratigraphic positions, which, due to lack of fossil control, are incorrectly correlated?
Albee (1957) recognized that rocks along Foot Brook in Johnson greatly resemble Ottauquechee and Stowe Formations. When he originally interpreted them as the Foot Brook syncline, he envisioned Stowe surrounded by Ottauquechee within the syncline, and in turn the whole syncline surrounded by Camels Hump Group rocks (later designated as Hazens Notch by Doll and others, 1961) (Figure 1). The pattern of silver-green and black rocks, however, is not that of a simple syncline, but rather one of interlayering or interfolding (see Figure 2). The western margin of Albee's "syncline" is a regionally important early fault, the Prospect Rock fault, discussed in later sections. The eastern margin is apparently a younger fault contact, and the rocks east of the "syncline" are not Hazens Notch Formation, but Ottauquechee. The resulting package is continuous to the north with the "Jay Peak syncline" shown by Doll and others (1961) as Ottauquechee Formation and Jay Peak Member of the Undethill. The silver-green rocks are distinctive enough to retain the name Jay Peak, elevating it to formational status. We use the name "Jay Peak" for the silver-green rocks because they are physically isolated from the lithologically similar Pinney Hollow and Stowe Formations. We propose that the Foot Brook slice may occupy the same structural position as the silver-green Mount Abraham Formation and
61
A3- 12 THOMPSON, THOMPSONAND DOOLAN
the black Lincoln Gap Member of the Ottauquechee. The Jay Peak, Mount Abraham, and Pirmey Hollow were originally depositionally transitional between Fayston and Stowe Formations (see Figure 5).
Ottauquechee-Hazens Notch-Sweetsburg Relationships
Albee (1957) reported that coarse-grained, albitic, graphitic portions of the Camels Hump Group (Hazens Notch of Doll and others, 1961) were found west of the Foot Brook area, and in the northeastern part of the Hyde Park quadrangle. However, he found that on the east side of the Foot Brook syncline it was difficult to distinguish fme-grained Hazens Notch from Ottauquechee. We have defmed the Hazens Notch formation more narrowly, based mainly on the presence of albite porphyroblasts. Both units commonly contain quartzite beds, but the Ottauquechee is more likely to contain abundant thin quartz laminae. Grain size is generally coarser in the Hazens Notch, and we have remapped most of Albee's fme-grained graphitic Camels Hump Group as Ottauquechee.
All three graphitic units contain quartzite beds. Carbonates, however, vary in abundance among the units. Dolomite and marble beds and pods are veiy common in the Sweetsburg, but veiy rare in Hazens Notch and Ottauquechee. These observations suggest facies relationships, with the Sweetsburg closest to the carbonate shelf (Figure 5A). More evidence for correlations between Sweetsburg and Ottauquechee is presented in the next section.
L1THOTECTONIC PACKAGES
The lithotectonic packages described below and shown in Figure 5B are separated by regionally extensive thrust faults. Where faults juxtapose similar rock units, their locations become uncertain and we have relied on truncation of marker beds such as greenstones and quartzites, or location of talc bodies, which tend to "decorate" faults of all ages.
Stanley and others (1987a) presented a depositional, pre-deformational model in which carbonaceous (graphitic) units (Hazens Notch and Ottauquechee) originally lay on top of a continuous sheet of non-graphitic, silver-green units (Underhill, Pinney Hollow, Mount Abraham and Stowe). In northern Vermont the silver-green units are Underhill, Fayston, Jay Peak and Stowe, with the Jay roughly correlative with Pinney Hollow and Mount Abraham. This approach may be too simplistic, as black to gray slates alternate with green and red slates in the Tacomc allochthons, where there is excellent fossil control on ages. Furthermore, it is clear from recent mapping in northern Vermont that here graphitic and non-graphitic rocks are intimately associated with each other in each of the lithotectonic packages east of the platform sequence and west of the Moretown slice (see for example, Figure 4). However, if we adopt Stanley and others' model, each lithotectonic package contains a pair of black and silver-green units, from west to east as follows:
Oak Hill Group: SweetsburgfFairfield Pond "Mansville Suite": SweetsburgfUnderhill Green Mountain (albitic) slice: Hazens Notch! Fayston Belvidere Mountain slice: (dominated by amphibolites) Foot Brook slice: Ottauquechee/Jay Peak.
In the autochthonous sequence above the Lincoln massif, a shift from dominantly green, magnetite-bearing rocks to dominantly black, pynte- and graphite-bearing rocks is recorded in the transition from Fairfield Pond to Lower Cheshire Formations (Tauvers, 1982). This transition may correlate roughly with the transition from active rifting to a passive continental margin, as observed further north in the Oak Hill slice where Sweetsburg overlies Fairfield Pond-like rocks of the Frelighsburg-Lower Gilman sequence (Charbonneau, 1980). The Cheshire contains Cambrian fossils, as do Sweetsburg correlatives in Quebec. Accepting the correlations of Osberg (1965) and Marquis and Nowlan (1991) between Sweetsburg and Ottauquechee, the Ottauquechee is probably in part Cambrian as well. Deposition rates may have been extremely slow on the continental slope and rise, and some of the black rocks may be as young as the Middle Ordovician Melbourne Formation of Quebec, which directly overlies the Sweetsburg (Marquis and Nowlan, 1991), or the conodont-bearing dolomites at West Bridgewater, Vermont (Ratcliffe and others, 1997).
62
THOMPSON, THOMPSON AND DOOLAN A3- 13
Oak Hill Group The Hinesburg thrust carried rocks of the parautochthonous Oak Hill Group (Tibbit Hill, Pinnacle,
Fairfield Pond, and Sweetsburg) west onto rocks of the carbonate shell (Cheshire Quartzite and Cambro-Ordovician carbonates). The Oak Hill Group consists of metamorphosed volcanics and elastics deposited during Late Proterozoic iifting of the Grenville crust, covered by carbonate-bearing drift deposits (Sweetsburg). Upright F2 folds dominate the area between the Hinesburg and Brome thrusts. Structures corresponding to Dl and D3 in other packages are rare or absent.
"Mansvile Suite" East of the Brome Thrust (West Fletcher fault of Doolan and others, 1987; Underhill thrust of Tauvers,
1982) structures are more complicated in what has been called the Fletcher or Enosburg Falls anticline (Chiistman, 1959; Dennis, 1964). In Canada the corresponding rocks have been referred to as the Mansville phase of the Oak Hill Group. Rocks in the Mansville are eastern correlatives of the Oak Hill Group, characterized by fewer volcanics and more intense deformation (Colpron, 1989), and in Vermont include Sweetsburg Formation, and Pinnacle and Underhill Formations with interbedded volcanics. These rocks are folded by west-verging isoclinal F I folds, cut by pre-Sn faults, and refolded by F2 folds related to a broad Sn cleavage fan. East-directed faults with relatively small displacement accompanied the back-folding. All are folded by upright F3 folds.
Farther east, closer to the Honey Hollow fault, east-dipping Sn (S2) steepens through the vertical and dips west on the west flank of the Green Mountain anticlinorium. Here, in the "Richford-Cambridge syncline" (Dennis, 1964; Doolan and others, 1987), Sweetsburg Formation is preserved in the center of a refolded pre-Sn synclinal isocline. The eastern contact of the Sweetsburg is, locally at least, a refolded early fault that brought Underhill Formation on top of Sweetsburg.
Green Mountain (albitic) slice The next lithotectomc packages to the east were also deposited along the Laurentian margin, but in a
more distal position, in a widening and possibly deepening basin. Structural style within these packages reflects higher strain during Taconian deformation: piirnaiy structures are rarely preserved, layering in the schists is transposed, and marker beds are commonly discontinuous along strike. Details on structures within these packages can be found in the Structure section.
The Hazens Notch/Fayston package is dominated by albitic rocks, and was thrust westward over the Sweetsburgftinderhill package along the Honey Hollow fault, which dips west at the latitude of the Lamoille River due to backfolding. The fault is nearly vertical south of the Winooski River in Honey Hollow itself, and still farther south it dips east. Within the package, Hazens Notch and Fayston are deformed by numerous early folds and faults. At the latitudes of the present report, the package is exposed in two large areas: in the core of the anticlinorium below the Prospect Rock fault, and in the area extending north and south from Hazens Notch itself, north of the Gihon River.
The Prospect Rock fault and the fault along the Gihon River both place Ottauquechee Formation onto the Hazens Notch/Fayston package. We interpret these two faults as formerly the same surface, now cut by younger faults. The Prospect Rock fault is deformed by folds associated with the dominant foliation and peak Taconian metamorphism (see sections below). This fault is analogous to the Whitcomb Summit thrust (Stanley and Ratcliffe, 1985) in that both earned Ottauquechee/Stowe correlatives westward onto the Laurentian margin. However, in southern Vermont the oveniding plate rests directly on autochthonous Hoosac Formation (roughly correlative with Pinnacle), whereas in northern Vermont a wide expanse of intervening rocks is preserved. Stanley and Ratcliffe (1985) showed the northern extension of the Whitcomb Summit thrust following the Belvidere Mountain thrust across northern Vermont, with a "Hazens Notch slice" structurally below it. The western boundaiy of the Hazens Notch slice was the Underhill-Hazens Notch contact taken from Doll and others (1961). Our map differs in several respects. Albitic Hazens Notch is now in a package with Fayston Formation (formerly part of the Underhill), and non-albitic Hazens Notch is now mapped as Ottauquechee, moving the Whitcomb Summit thrust farther west, even across the crest of the anticlinoiium.
63
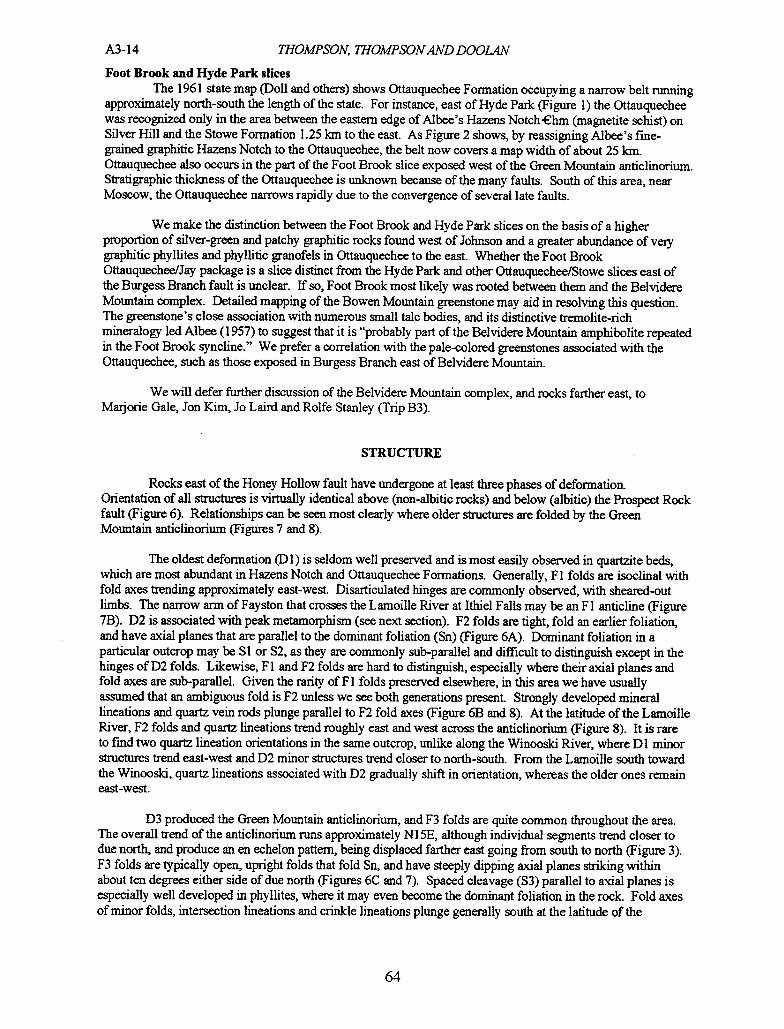
A3-1 4 THOMPSON, THOMPSONAND DOOLAN
Foot Brook and Hyde Park slices The 1961 state map (Doll and others) shows Ottauquechee Formation occupying a narrow belt running
approximately north-south the length of the state. For instance, east of Hyde Park (Figure 1) the Ottauquechee was recognized only in the area between the eastern edge of Albee's Hazens Notch €hm (magnetite schist) on Silver Hill and the Stowe Formation 1.25 km to the east. As Figure 2 shows, by reassigning Albee's fme-grained graphitic Hazens Notch to the Ottauquechee, the belt now covers a map width of about 25 km. Ottauquechee also occurs in the part of the Foot Brook slice exposed west of the Green Mountain anticlinorium. Stratigraphic thickness of the Ottauquechee is unknown because of the many faults. South of this area, near Moscow, the Ottauquechee narrows rapidly due to the convergence of several late faults.
We make the distinction between the Foot Brook and Hyde Park slices on the basis of a higher proportion of silver-green and patchy graphitic rocks found west of Johnson and a greater abundance of vely graphitic phyllites and phyllitic granofels in Ottauquechee to the east. Whether the Foot Brook Ottauquechee/Jay package is a slice distinct from the Hyde Park and other Ottauquechee/Stowe slices east of the Burgess Branch fault is unclear. If so, Foot Brook most likely was rooted between them and the Belvidere Mountain complex. Detailed mapping of the Bowen Mountain greenstone may aid in resolving this question. The greenstone's close association with numerous small talc bodies, and its distinctive tremolite-nch mineralogy led Albee (1957) to suggest that it is "probably part of the Belvidere Mountain amphibolite repeated in the Foot Brook syncline." We prefer a correlation with the pale-colored greenstones associated with the Ottauquechee, such as those exposed in Burgess Branch east of Belvidere Mountain.
We will defer further discussion of the Belvidere Mountain complex, and rocks farther east, to Marjorie Gale, Jon Kim, Jo Laud and Rolfe Stanley (Trip B3).
STRUCTURE
Rocks east of the Honey Hollow fault have undergone at least three phases of deformation. Orientation of all structures is virtually identical above (non-albitic rocks) and below (albitic) the Prospect Rock fault (Figure 6). Relationships can be seen most clearly where older structures are folded by the Green Mountain anticlinorium (Figures 7 and 8).
The oldest deformation (Dl) is seldom well preserved and is most easily observed in quartzite beds, which are most abundant in Hazens Notch and Ottauquechee Formations. Generally, F I folds are isoclinal with fold axes trending approximately east-west. Disarticulated hinges are commonly observed, with sheared-out limbs. The narrow ann of Fayston that crosses the Lamoille River at Ithiel Falls may be an Fl anticline (Figure 7B). D2 is associated with peak metamorphism (see next section). F2 folds are tight, fold an earlier foliation, and have axial planes that are parallel to the dominant foliation (Sn) (Figure 6A). Dominant foliation in a particular outcrop may be Sl or S2, as they are commonly sub-parallel and difficult to distinguish except in the hinges of D2 folds. Likewise, Fl and F2 folds are hard to distinguish, especially where their axial planes and fold axes are sub-parallel. Given the rarity of F I folds preserved elsewhere, in this area we have usually assumed that an ambiguous fold is F2 unless we see both generations present. Strongly developed mineral lineations and quartz vein rods plunge parallel to F2 fold axes (Figure 6B and 8). At the latitude of the Lamoille River, F2 folds and quartz lineations trend roughly east and west across the anticlinorium (Figure 8). It is rare to fmd two quartz lineation orientations in the same outcrop, unlike along the Winooski River, where Dl minor structures trend east-west and D2 minor structures trend closer to north-south. From the Lainoille south toward the Winooski, quartz lineations associated with D2 gradually shift in orientation, whereas the older ones remain east-west.
D3 produced the Green Mountain anticlinorium, and F3 folds are quite common throughout the area. The overall trend of the anticlinorium runs approximately NI 5E, although individual segments trend closer to due north, and produce an en echelon pattern, being displaced farther east going from south to north (Figure 3). F3 folds are typically open, upright folds that fold Sn, and have steeply dipping axial planes striking within about ten degrees either side of due north (Figures 6C and 7). Spaced cleavage (S3) parallel to axial planes is especially well developed in phyllites, where it may even become the dominant foliation in the rock. Fold axes of minor folds, intersection lineations and crinkle lineations plunge generally south at the latitude of the
RE
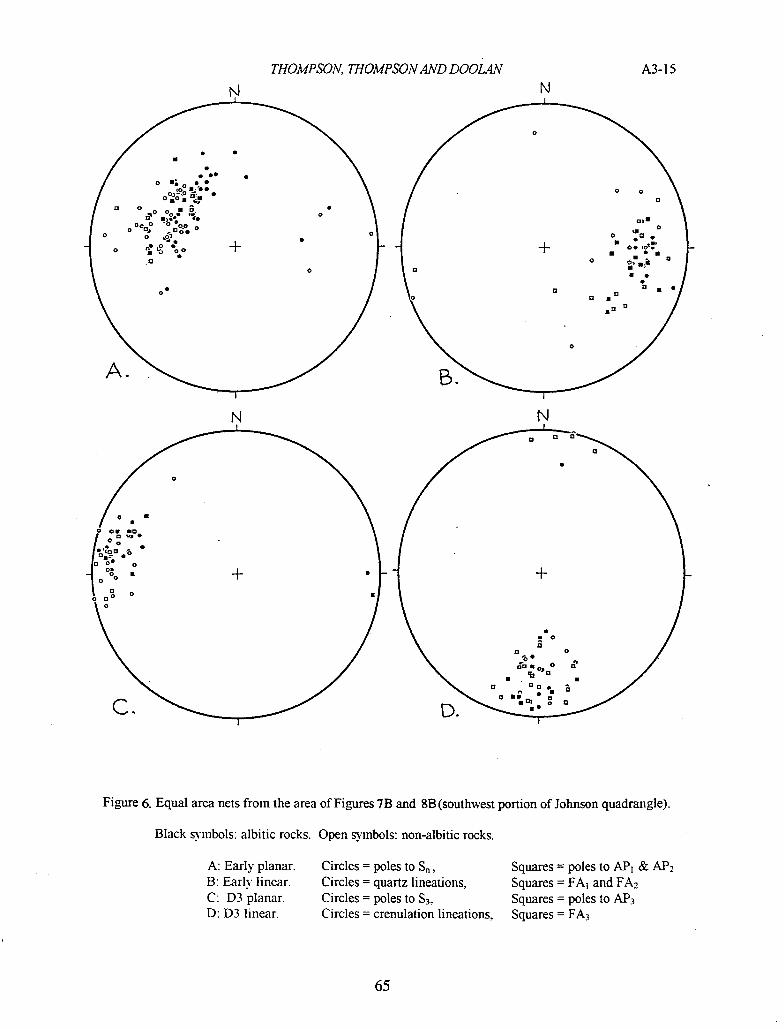
THOMPSON, THOMPSONAND DOOLAN
A3- 15
N
N
N
Figure 6. Equal area nets from the area of Figures lB and SB (southwest portion of Johnson quadrangle).
Black symbols: albitic rocks. Open symbols: non-albitic rocks.
A: Early planar. Circles = poles to Sn ,
Squares = poles to AP 1 & AP2 B: Early linear. Circles = quartz lineations, Squares = FA 1 and FA 2 C: D3 planar. Circles = poles to S 3 ,
Squares = poles to AP 3 D: D3 linear. Circles = crenulation lineations, Squares = FA3
65
A3-1 6 THOMPSON, THOMPSONAND DOOL4N
44°4d
/
LI 1Ho+b
o /2o- -
3071 .
- - b
C
Is - 6 .cz
00 ••••
C
51
.....) 0
IXII
..-
Z9 Z h n -
..... 18
-'c--- - 44 j ....
7....
38A[84 £o.Fb
/ 2. 31'
7a\.c, ' PRF
35
Sz
SCALE: 1L1,000 77°2'
Figure 7. Geology and planar structures in the core of the Green Mountains at the Lamoille transect.
7A: Southeast portion of Jeffersonville quadrangle.
Circled numbers = field trip stops. Lithologic symbols are the same as Figure 2, with the addition of g = greenstone, tc = talc. Contacts and faults dashed where poorly exposed PRF (Prospect Rock Fault) open teeth on upper plate Dotted line = F2 trace with overturned symbol. Other structural s'vnibols:
dominant foliation 3 spaced cleavage f vertical spaced cleavage
THOMPSON, THOMPSON AND DOOLAN
A3-17
>'
CZIin Zhn [73 /Th
£ofb / /
8 ,9\ eZj
/ ? /
/43 / 1
90
/3'
p68 / /31 X49 11.78 /24 / K4 zq "
38 : 74 45 .cZf
:
[ '.~ , q 39
I&6t
\ 48/48 /34 3 6 p4; 1k CZh
82. IL 5B
..7'433
F
•..
I '-
48 - 38
Ft s 24 34 £Zhn ,/ £lf a8
3S 42 ,Lço
- - / 70
(8o
I / "Uf l / /
/ 86
£Z sz kn
" ~ ~a4-2 rf—
/
C / 31
83
-CZf Z5
1204cl SCALE. : t.Z4000
7B: Southwest portion of Johnson quadrangle.
Symbols same as Figure lA, except as noted below.
Other structural symbols:
F bedding overturned bedding ,1 dominant foliation [spaced cleavage
04d
rIYA
A3- 18 THOMPSON, THOMPSON AND DOOL4N
44e4d
4 44
I Is. t
tO 31
33
s a ---
4 A
I /
4,
Zo
2/ 23 4-
34*
Grccn Mouncin ctc.Yt'rora\
S
I 20
35
•-*- 12.
ZA-ALE'. 1Z4 000
Figure 8. Linear structures in the core of the Green Mountains at the Lamoille transect.
8 A: Southeast portion of Jeffersonville quadrangle.
Circled numbers = field trip stops. Faults dashed where poorly exposed PRF (Prospect Rock Fault) open teeth on upper plate Dotted line = F2 trace with overturned symbol. Other structural symbols:
- FAR, showing rotation sense where known --- quartz lineation or rod
72Y4'
THOMPSON. THOMPSONAND DOOLAN A3-
•
_-4--4pg3
• 2 2o
48 • -39
so
/ 3o
26 ••-4.39 —2-
-
_.8o I , 36 3o
28
—Z-• 3 2:7 •__'..4.. 3' -
-,-4-
I -
72 045
SB: Southwest portion of Johnson quadrangle.
Symbols same as Figure 8A.
69
A3-20 THOMPSON, THOMPSONAND DOOL4N
Lamoille River (Figure 61)). Along the length of the anticlinorium plunge varies from gently north to gently south. South of the area in Figure 7 the plunge switches to north. The axis reaches a culmination in the Sterling Range, and then plunges south again at Smugglers Notch and Mount Mansfield. F3 folds can plunge quite steeply, if the surface being folded had a steep dip prior to being folded. This is especially true east of the Prospect Rock fault, where bedding and Si foliations dip moderately to steeply south, almost at right angles to 1)3 folds and faults.
We occasionally see a vely slight warping of limbs of S3 folds indicating some later deformation. There are also a few locations where there appears to be a foliation intermediate between Sn and S3. It is impossible to determine whether or not Dl structures correlate from one lithotectonic package to the next. However, the packages were apparently in juxtaposition during 1)2 deformation, as D2 structures cross faults such as the Prospect Rock and Belvidere Mountain faults.
Faulting
As noted earlier, most major faults, especially older faults, are recognized most easily by map-scale truncations, either of major lithologies or of marker beds, such as greenstones. Smaller-scale layers may be truncated in outcrops, but it can be hard to determine if they represent more than local events. Zones with veiy fissile, papeiy foliation that cuts across Sn, are assumed to be post-metamorphic faults (although these younger faults may be utilizing older fault surfaces). Older faults, which have undergone simultaneous or subsequent metamorphism, such as the Prospect Rock fault, do not have a papely shear fabric. In some places these older faults have fmely laminated pinstriping, although in other places no recognizable fault fabric is preserved. Within lithotectonic packages still older faults may be present, for example within and between Fayston and Hazens Notch Formations.
Honey Hollow fault. Thompson and Thompson (1992) first recognized the Honey Hollow fault as a contact west of Camels Hump along which map units were truncated. Rocks west of the fault are less severely deformed, with primaiy features such as graded beds preserved. The graphitic rocks commonly contain carbonates. Albite porphyroblasts, if present, tend to be smaller west of the fault, and garnet is absent. The Honey Hollow fault is envisioned as a pre- to syn-metamorphic, west-directed fault, later rotated back toward the east and probably experiencing some post-metamorphic back-thrusting during D2. In one place near the Winooski River it is folded by F3. The fault surface itself is not exposed at the latitude of the Lamoille River. More field work is needed to confirm its location toward Quebec, especially where Sweetsburg and Ottauquechee are juxtaposed.
Prospect Rock fault. The Prospect Rock fault is a pre-metamorphic fault, folded during D2 and D3. In the western part of the Johnson quadrangle, the fault is deformed by a large, map-scale, F2 fold overturned toward the north (Figure 6B). At Prospect Rock itself, the fault is upright, with Ottauquechee Formation above Fayston. To the west this surface is overturned, and farther west upright again. The orientation of S2 is consistent throughout, dipping southeast on the east limb of the D3 anticlinorium. In the overturned limb the fault surface is a sharp contact, without any apparent fault fabric. At one site on the western upright limb, however, the fault is a zone two meters thick, with alternating albitic schist, graphitic phyllite, and sheared-up greenstone along the contact. The large F2 fold which deforms the Prospect Rock fault is draped across the anticlinoriurn, so that the same structure reappears in the area south of the Rousseau talc deposit (Figure 6A), although outcrop control is not as good there.
Johnson Talc Mine fault. The eastern margin of what Albee (1957) mapped as the Foot Brook syncline is a steep, late fault, certainly post-D2 and possibly post-D3. This fault branches such that three nearly parallel faults, spaced one to two kilometers apart, follow the western margin of the Hazens Notch/Fayston area northeast of the Johnson Talc Mine (Figure 3). Talc is common along these faults and also occurs as sheared-out lenses in the rocks between the faults. Southeast of the talc mine the albitic rocks plunge south beneath the pre-metamorphic fault along the Gihon River, which we believe to be a continuation of the Prospect Rock fault.
The mine itself followed a narrow zone of talc almost vertically downward about 300 m, and extended at least 1000 in along strike. The deposit consists of anastomosing, pinching and swelling bodies, separated by septa of schist (Chidester and others, 1951). According to the same authors, NNE faults dipping 30° to 60 ° am
70
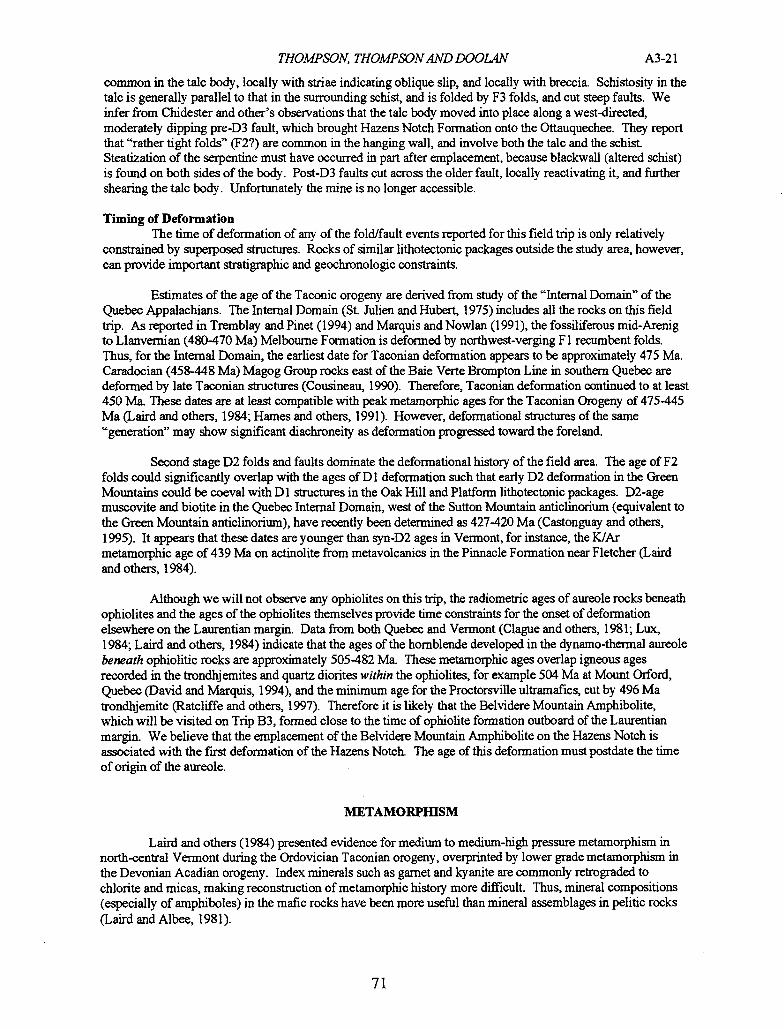
THOMPSON, THOMPSONAND DOOLAN A3-2 I
common in the talc body, locally with striae indicating oblique slip, and locally with breccia Schistosity in the talc is generally parallel to that in the surrounding schist, and is folded by P3 folds, and cut steep faults. We infer from Chidester and other's observations that the talc body moved into place along a west-directed, moderately dipping pre-D3 fault, which brought Hazens Notch Formation onto the Ottauquechee. They report that "rather tight folds" (P2?) are common in the hanging wall, and involve both the talc and the schist. Steatization of the serpentine must have occurred in part after emplacement, because blackwall (altered schist) is found on both sides of the body. Post-D3 faults cut across the older fault, locally reactivating it, and further shearing the talc body. Unfortunately the mine is no longer accessible.
Timing of Deformation The time of deformation of any of the fold/fault events reported for this field trip is only relatively
constrained by superposed structures. Rocks of similar lithotectonic packages outside the study area, however, can provide important stratigraphic and geochronologic constraints.
Estimates of the age of the Taconic orogeny are derived from study of the "Internal Domain" of the Quebec Appalachians. The Internal Domain (St. Julien and Hubert, 1975) includes all the rocks on this field trip. As reported in Tremblay and Pinet (1994) and Marquis and Nowlan (1991), the fossiliferous mid-Arcing to Lianvernian (480-470 Ma) Melbourne Formation is deformed by northwest-verging Fl recumbent folds. Thus, for the Internal Domain, the earliest date for Taconian deformation appears to be approximately 475 Ma. Caradocian (458-448 Ma) Magog Group rocks east of the Bale Verte Brompton Line in southern Quebec are deformed by late Tacoman structures (Cousineau, 1990). Therefore, Taconian deformation continued to at least 450 Ma. These dates are at least compatible with peak metamorphic ages for the Taconian Orogeny of 475-445 Ma (Laird and others, 1984; Hames and others, 1991). However, deformational structures of the same "generation" may show significant diachroneity as deformation progressed toward the foreland.
Second stage D2 folds and faults dominate the deformational history of the field area. The age of F2 folds could significantly overlap with the ages of Dl deformation such that early D2 deformation in the Green Mountains could be coeval with Dl structures in the Oak Hill and Platform lithotectonic packages. 132-age muscovite and biotite in the Quebec Internal Domain, west of the Sutton Mountain anticlinorium (equivalent to the Green Mountain anticlinorium), have recently been determined as 427420 Ma (Castonguay and others, 1995). It appears that these dates are younger than syn-D2 ages in Vermont, for instance, the K/Ar metamorphic age of 439 Ma on actinolite from metavolcanics in the Pinnacle Formation near Fletcher (Laird and others, 1984).
Although we will not observe any ophiolites on this trip, the radiometric ages of aureole rocks beneath ophiolites and the ages of the ophiolites themselves provide time constraints for the onset of deformation elsewhere on the Laurentian margin. Data from both Quebec and Vennont (Clague and others, 1981; Lux, 1984; Laird and others, 1984) indicate that the ages of the homblende developed in the dynamo-thermal aureole beneath ophiolitic rocks are approximately 505-482 Ma. These metamorphic ages overlap igneous ages recorded in the trondhjemites and quartz diorites within the ophiolites, for example 504 Ma at Mount Orford, Quebec (David and Marquis, 1994), and the minimum age for the Proctorsville ultramafics, cut by 496 Ma trondhjemite (Ratcliffe and others, 1997). Therefore it is likely that the Belvidere Mountain Amphibolite, which will be visited on Trip B3, formed close to the time of ophiolite formation outboard of the Laurentian margin. We believe that the emplacement of the Belvidere Mountain Amphibolite on the Hazens Notch is associated with the first deformation of the Hazens Notch The age of this deformation must postdate the time of origin of the aureole.
METAMORPHISM
Laird and others (1984) presented evidence for medium to medium-high pressure metamorphism in north-central Vermont during the Ordovician Taconian orogeny, overprinted by lower grade metamorphism in the Devonian Acadian orogeny. Index minerals such as garnet and kyanite are commonly retrograded to chlorite and micas, making reconstruction of metamorphic history more difficult. Thus, mineral compositions (especially of amphiboles) in the mafic rocks have been more useful than mineral assemblages in politic rocks (Laird and Albee, 1981).
71
A3-22 THOMPSON, THOMPSONAND DOOLAN
Different lithotectonic packages in northern Vermont experienced somewhat different conditions prior to emplacement along pre- and syn-metamorphic thrust faults. West of the Brome thrust, greenstones do not contain amphibole, and pelitic rocks have metamorphic chlorite, but not biotite. Between the Brome thrust and Honey Hollow fault, greenstones are in the epidote-amphibolite facies and biotite is present in wackes and schists of appropriate bulk composition. A sample of Tibbet Hill Volcanics near Fletcher shows medium-high pressure facies series metamorphism at 439 Ma (Laird and others, 1984).
East of the Honey Hollow fault garnet and chloritoid occur in the more aluminous rocks, although in most thin sections garnets have ragged outlines embayed by iron-chlorite. Clumps of chlorite are presumed to be completely replaced gamets. Albee (1957) reported garnet inclusions in albite in rocks where no garnet remains in the mairix. Other samples from the same area contain euhedral garnets that appear to have grown across the dominant foliation. One of us (Peter Thompson) studied euhedral gamets in a sample from Mount Mansfield with the electron microprobe, and found a pattern of prograde iron enrichment (at the expense of manganese) from core to rim. More study is warranted to determine if some rocks along the crest of the Green Mountain anticlinorium may have experienced two stages of garnet growth.
East of the Honey Hollow fault magnetite porphyroblasts in metasedimentaiy rocks are commonly flattened in the plane of Sn, whereas to the west they are more apt to be euhedral. Whether this difference is due to different timing or different intensity during D2 is unclear. Magnetites are euhedral in mafic schists throughout both areas. In the Fayston fme-grained magnesium-rich chlorite and muscovite are chiefly responsible for producing the dominant foliation. Quartz, magnetite, and dark green chlorite streaks (pseudomorphs after garnet?) form lineations on foliation planes. Albite grows across both Sn and S3, although inclusion trails seen in thin section indicate that the cores started to grow prior to Sn. Some albites have dark cores and white rims, suggesting that as the feldspar grew porphyroblasts eventually incorporated all the carbon from the matrix.
If the Prospect Rock fault predates peak metamorphism as we propose, then the contrast in presence of albite above and below that surface is a result of bulk composition rather than metamorphic grade. However, the rocks above the fault are overall finer-grained schists or even phyllites. These textural differences may represent a higher strain (less recovery?) distributed throughout rocks in the upper plate. Shearing out of fold limbs and transposed bedding become more and more common eastward through Ottauquechee rocks.
Our trip will conclude west of the areas of high and medium-high pressure metamorphic rocks at Tillotson Peak and Elmore Mountain, which will be discussed on Trip B3.
SUMMARY
In brief outline form, the history of the rocks found in this part of the Lamoille transect is as follows: 1. Late Proterozoic to Cambrian: rifting of Grenville crust; deposition of clastics and volcanics. 2. Cambrian: drifting; deposition of carbonate shelf, lower Sweetsburg and starved sequence on slope and rise
(Ottauquechee, upper Hazens Notch). 3. Early to Middle Ordovician: deposition of Sweetsburg, Melbourne Formation, possibly upper
Ottauquechee; subduction zone outboard of continental margin; Dl in aecretionaly wedge, incorporation of ophiolites, blueschist.
4. Middle Ordovician: collision of accretionaiy wedge with Laurentian margin (Taconian Orogeny): a. Dl in rift elastics, Sn-I foliation. Not necessarily coeval from package to package. b. Prospect Rock fault and early movement on Honey Hollow fault toward west; emplacement of
allochthons. c. F2 folds, Sn foliation, peak Taconian metamorphism; backfolding and syn-D2 faults; movement on
Honey Hollow fault toward east 5. Devonian: Acadian Orogeny:
a. Green Mountain anticlinorium; F3 folds, spaced cleavage, retrograde metamorphism. b. Steep faults such as Johnson Talc Mine fault
6. Mesozoic: extension and lamprophyre dikes.
72
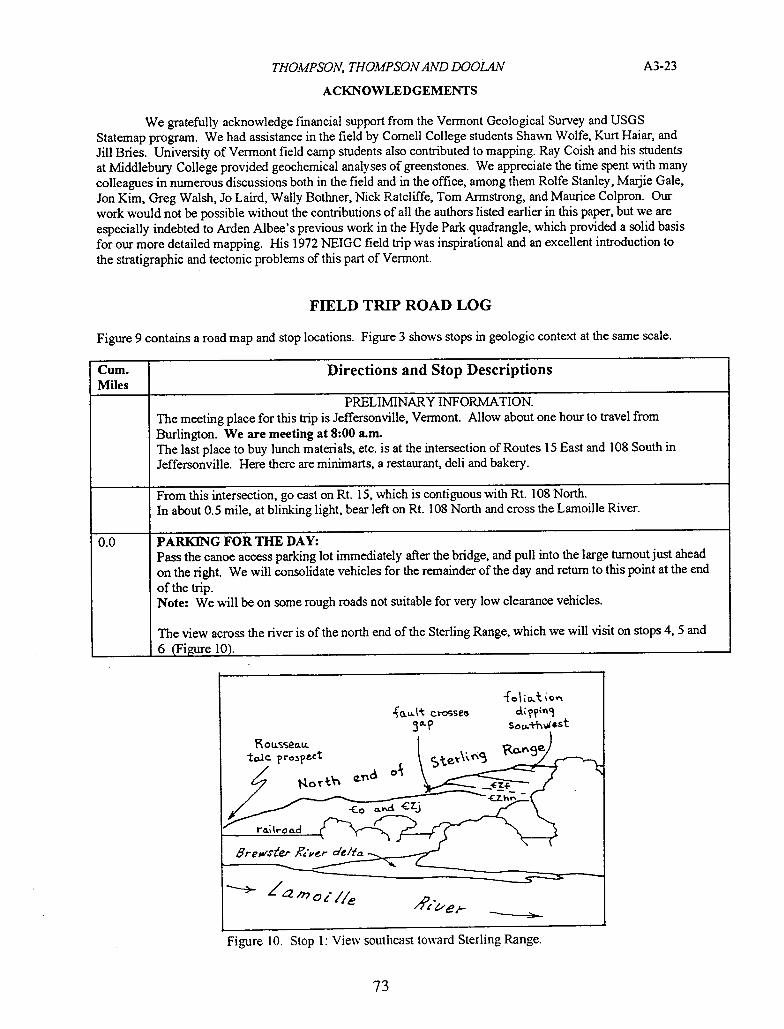
THOMPSON, THOMPSON AND DOOLAN A3-23
ACKNOWLEDGEMENTS
We gratefully acknowledge fmancial support from the Vermont Geological Survey and USGS Statemap program. We had assistance in the field by Cornell College students Shawn Wolfe, Kurt Haiar, and Jill Bries. University of Vermont field camp students also contributed to mapping. Ray Coish and his students at Middlebury College provided geochemical analyses of greenstones. We appreciate the time spent with many colleagues in numerous discussions both in the field and in the office, among them Rolfe Stanley, Marjie Gale, Jon Kim, Greg Walsh, Jo Laird, Wally Bothner, Nick Ratcliffe, Tom Armstrong, and Maurice Coipron. Our work would not be possible without the contributions of all the authors listed earlier in this paper, but we are especially indebted to Arden Albee's previous work in the Hyde Park quadrangle, which provided a solid basis for our more detailed mapping. His 1972 NEIGC field trip was inspirational and an excellent introduction to the stratigraphic and tectonic problems of this part of Vermont.
FIELD TRIP ROAD LOG
Figure 9 contains a road map and stop locations. Figure 3 shows stops in geologic context at the same scale.
Cum. Directions and Stop Descriptions Miles
PRELIMINARY INFORMATION. The meeting place for this trip is Jeffersonville, Vermont. Allow about one hour to travel from Burlington. We are meeting at 8:00 a.m. The last place to buy lunch materials, etc. is at the intersection of Routes 15 East and 108 South in Jeffersonville. Here there are minimarts, a restaurant, deli and bakery.
From this intersection, go east on Rt. 15, which is contiguous with Rt. 108 North. In about 0.5 mile, at blinking light, bear left on Rt. 108 North and cross the Lamoille River.
0.0 PARKING FOR THE DAY: Pass the canoe access parking lot immediately after the bridge, and pull into the large turnout just ahead on the right. We will consolidate vehicles for the remainder of the day and return to this point at the end of the trip. Note: We will be on some rough roads not suitable for very low clearance vehicles.
The view across the river is of the north end of the Sterling Range, which we will visit on stops 4, 5 and 6 (Figure 10).
ct-o5Se
ou.seo.u. tolc pr03?tct
Zf-
SreWSfr_r .'er a'e/i
c
Figure 10. Stop 1: View southeast toward Sterling Range.
73
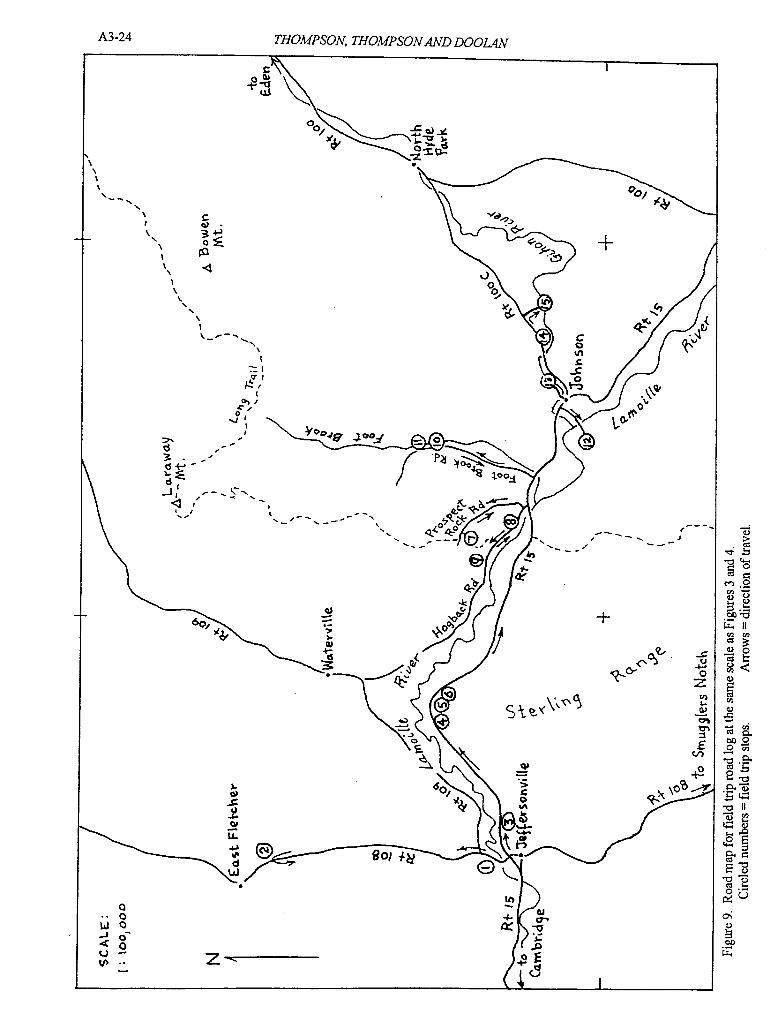
3-24 THOMPSON, THOMPSON ARD DOOL4N
- 0)
+I"
in
-C
- -
0
3. - -
---- in
+
' - -J U
2:
3. 4S0 /
0
JJ 8o Ui.
0
wo
It)
.- rr - <0
z-. . -
THOMPSON, THOMPSONAND DOOLAN A 3-25
P-0Cross Rt. 108 and walk up Blackberry Hill Drive (private driveway) towards left-hand house overlookinc the river. These are the pasture outcrops of Albee's Stop B2 (1972).
STOP 1: UNDERHILL FORMATION (€Zu) OF THE MANSV1LLE LITHOTECTONIC PACKAGE, AND GENERAL FIELD TRIP ORIENTATION. Short walk. Time: 40 mm.
No hammers, please. Ifvisitingat a later date, secure permission from landowners.
The silver-green schists and phyllites of the Underhill Formation are the dominant lithologies of the Mansville lithotectonic package. The formation was named by Christman and Secor (1961) for the fine- grained sedimentary rocks overlying the Pinnacle formation. The type locality is somewhat vaguely defined as "Underhill township in the northern part of the Camels Hump quadrangle and in the southern part of the Mount Mansfield [15] quadrangle" (Christman and Secor, 1961, p. 18). Although the area described includes carbonaceous rocks, in general usage "Underhill Formation" has been restricted to non-carbonaceous silver-green rocks. We have further restricted its usage to west of the Honey Hollow fault. The Underhill has been correlated with the West Sutton Slate of the Oak Hill Group of Quebec (Clark, 1936) and with the Bonsecours Formation of southern Quebec by Osberg (1965).
The Underhill Formation is very heterogeneous with variable amounts of quartz, white mica, albite, chlorite, and magnetite. The Underhill is primarily schist but contains phyllitic horizons as well as metawacke beds. Numerous quartz veins are typical. At this stop we will see various lithologies of the Underhill, and also observe several generations of fold and cleavage development.
The dominant foliation (S2) strikes about N30E and dips steeply to the west. F2 fold axes plunge steeply to moderately to the southwest. A later spaced cleavage (S3) is not abundant here (see Stop 3), but where found dips steeply eastward with similar strike as S2 (Figure 1 IA and B). F3 folds plunge gently north and south (Figure 11).
N la
++ +
Figure 11. Representative structural data for the Underhill Formation at Stops 1 and 3. A. Poles to S2 foliations (solid dots) and F2 fold axes and lineations (open squares) B. Poles to F3 foliations (stars) and F3 fold axes and 0/12 lineations (plus).
75
A3-26 THOMPSON, THOMPSONAND DOOLAN
Continue north on Rt. 108. 0.15 Routes 108 and 109 split. Bear left, continuing north on Rt. 108. 3.9 At Fletcher town line, almost immediately cross road to pull off into a turnout on the left. Park so as to
turn around and head back south after Stop 2.
Cross the field on east side of road to an unnamed brook slightly north of turnout, starting at base of steep section.
STOP 2: BROOK TRAVERSE - SWEETSBURG FORMATION (Cs). Short walk to brook then steep scramble up wet ledges in brook. Time: 35 mui.
This stop examines the lower part of a nearly continuous 500m section of Sweetsburg Formation exposed after a major flood in 1983. The section contains three members of the Sweetsburg Formation as described by Mock (1989): (1) carbonate-bearing phyllite consisting of blue-gray dolomite beds interbedded with thin black carbonaceous limestone and black carbonaceous phyllite; (2) a Quartzite Member--cyclically bedded dark gray quartzites ranging in thickness from 6 to 10 cm interbedded with graphitic phyllite; (3) a Black Phyllite Member—graphitic phyllite with thin silty dolomitic laminae and rare quartzite beds (Figure 12).
Beginning in the streambed at the base of the exposures, note the occurrence of both black limestone and tan-weathering dolomite beds interbedded with graphitic phyllite. Drill holes are sample sites for a comparison of carbon isotope ratios in the Sweetsburg, Ottauquechee and Hazens Notch Formations (Hengstenberg, 1998). Hengstenberg concluded that the carbonaceous material had an organic source in all these units. The dolomite beds, which range from 8-20 cm thick, become more abundant toward the contact with the overlying Quartzite Member. The change from dolomite to quartzite is veiy sharp with the exception of a single dolomite bed of blue-gray dolomite within the massive quartzite unit. The quartzite can also be seen above the first waterfall in the stream.
Both steeply plunging F2 and shallowly plunging F3 folds are visible in these outcrops, as are minor faults sub-parallel to the dominant S2 foliation.
The Sweetsburg Formation stratigraphically overlies the Underhill Formation. Infolds of Sweetsburg rocks can be seen in similar positions west of the Honey Hollow fault from Quebec southward to at least central Vermont. This stop exposes one of the most complete sections of Sweetsburg known in Vermont. In Quebec the Sweetsburg Formation grades upward into calcareous black phyllites of the Melbourne Formation, which has been dated by conodonts as lower Middle Ordovician (Marquis and Nowlan, 1991).
Turn around and retrace route south on Rt. 108.
On your left, the south end of Fletcher Mountain is where Rose (1987) sampled rift volcanics from the Underhill Formation.
Going_south there_are_good views_of Mount Mansfield_straight ahead. 6.8 Views of the Sterling Range and Smuggler's Notch. 7.4 At intersection with Fisher Rd. the view of the Sterling Range shows steep north-facing slopes and
gently dipping slopes to the south. This topography is the result of the southerly plunge of the Green Mountain anticlinorium and the southwestern dip of the dominant foliation.
7.8 Pass Stop 1 and continue south to intersection with Rt. 15. 8.05 Turn left (northeast) on Rt. 15. Straight ahead is the scarp of a series of landslides that began in April
1999, and which, if it continues, threatens to dam the Brewster River and flood the village of Jeffersonville.
8.15 As you cross the bridge over Brewster River, you can get a quick view of the toe of the landslide. 8.6 Pull well off road on shoulder near roadcut just past the Deer Run Motel.
76
THOMPSON, THOMPSONAND DOOL4N A3-27
SWEETSBURG FORMATION
Black Phyl].ite Member
Graphitic phyllite with thin dolomitic silty laninae. Quartzite beds are rare and become less abundant toward the too of the section.
Quartzjte Member
Cyclically bedde dark gray artzite beds 6-10cm thick
inter-bedded with grathizic hyllite.
Light gray to white massive qiartzite.
Carbomate-bearing Phyllite Member
Blue-gray dolomite beds 10 cm thick interbedded with thin black limestone and black phyllite.
1o 1 m
0 —
Figure 12 (from Mock, 1989). Measured stratigraphic section of the Sweetsburg Formation at Stop 2. The lower contact with the Underhill Formation is not exposed at this location. Graphitic phyllite beds are shown in black. Graded bedding in the quartzites indicate topping direction.
77
A3-28 THOMPSON, THOMPSON AND DOOL4N
STOP 3: IJNDEEHILL FORMATION (CZu) NEAR ITS EASTERNMOST EXPOSURE. Optional Stop
This roadcut is near the eastern edge of the Mansville lithotectonic package. The rock is a quartz-muscovite-chlorite-albite-magnetite schist similar to that of Stop 1. Structural data collected here are also similar to those from Stop 1 (Figure 11). This stop offers advantages of viewing a vertical face, which displays the dominant S2 foliation and S3 spaced cleavage. F2 folds here verge towards the west, whereas F3 verges east.
Continue east on Rt. 15. 8.75 Cross the Honey Hollow fault, which strikes about N20E (not exposed here). 9.6 View soon after passing Sunny Acres Road on right: To the north nearer ledges are Pinnacle and
Undethill Formations; far hills to northeast are Laraway Mountain (with visible ledges of Fayston Formation) and the Cold Hollow Mountains (mostly Hazens Notch Formation). Throughout the northern Green Mountains, large expanses of bare ledges are likely to be Fayston Formation.
9.7 The greenstone exposed in small obscure brook is evidence that the Peaked Mountain Greenstone continues to the south along the west side of the Green Mountain anticlinorium.
10.7 Park in driveway of house that sits uphill on right near power line. Keep turn around area clear.
STOP 4: JAY PEAK FORMATION (€Zj) AID PEAKED MOUNTAIN GREENST ONE. Outcrops in yard and adjacent woods. Time: 15 mm.
Please do not hammer on outcrops in yard or in woods near owner's trails. If visiting at a later date, secure owner's permission.
We have now crossed the Honey Hollow fault, but we are still on the west side of the Green Mountain anticlinorium and still west of the western exposure of the Prospect Rock fault (Figure 3).
The outcrop exposed near the garage at Stop 4 is typical of the less quartzose portions of the Jay Formation within the Foot Brook slice. It is firie-grained, vely lustrous (pearly), and silver-blue to silver-green in color. It often weathers to produce a vely pale tan color on foliation surfaces. Chloritoid is locally abundant. Crinide lineations and small-scale F3 folds are commonly very well developed in these fine-grained rocks. To the south on the ridges that form the northern extension of the Sterling Range similar rocks are typically interlayered with fme-grained rusty and graphitic rocks at a scale impossible to map at 1:24,000, and thus are included within the Ottauquechee Formation. This belt of rocks pinches out 11 km to the southwest, where the Prospect Rock fault is cut out by the Honey Hollow fault. The belt extends 30 km to the northeast, where it crosses the Green Mountain anticlinorium toward Jay Peak (Figure 2).
In the woods south of the house are many outcrops of greenstone, which we believe to be the Peaked Mountain Greenstone. The greenstone here contains varying proportions of chlorite, amphibole, albite, epidote, pinkish dolomite, and magnetite. Its texture varies from schistose to massive. It is at least 10 m thick at this location and its eastern exposure is in contact with rusty and graphitic schist (Foot Brook slice of Ottauquechee). To the south on the ridgeline, it is thicker due to early folds and possibly faults as well (Figure 6). On the ridge top we observe the same relations, with Jay on the west and Foot Brook on the east.
The Peaked Mountain Greenstone as shown on the Centennial Geologic Map (Doll and others, 196 1) is a remarkably persistent body (although there are gaps in outcrop exposure in some localities). It extends from the Jeffersonville quadrangle north to near the Canadian border, and possibly correlates with another greenstone body in Quebec.
One of us (Peter Thompson, 1975) showed that, from the Lamoille River north to its type locality, the Peaked Mountain Greenstone occurs entirely within graphitic rocks, rather than along the contact between Underhill and the Jay Peak Member of the Undethill as mapped by Dennis (1964) (compare our Figures 1 and 2). Thompson assigned those graphitic rocks to the Hazens Notch Formation; we now interpret them as
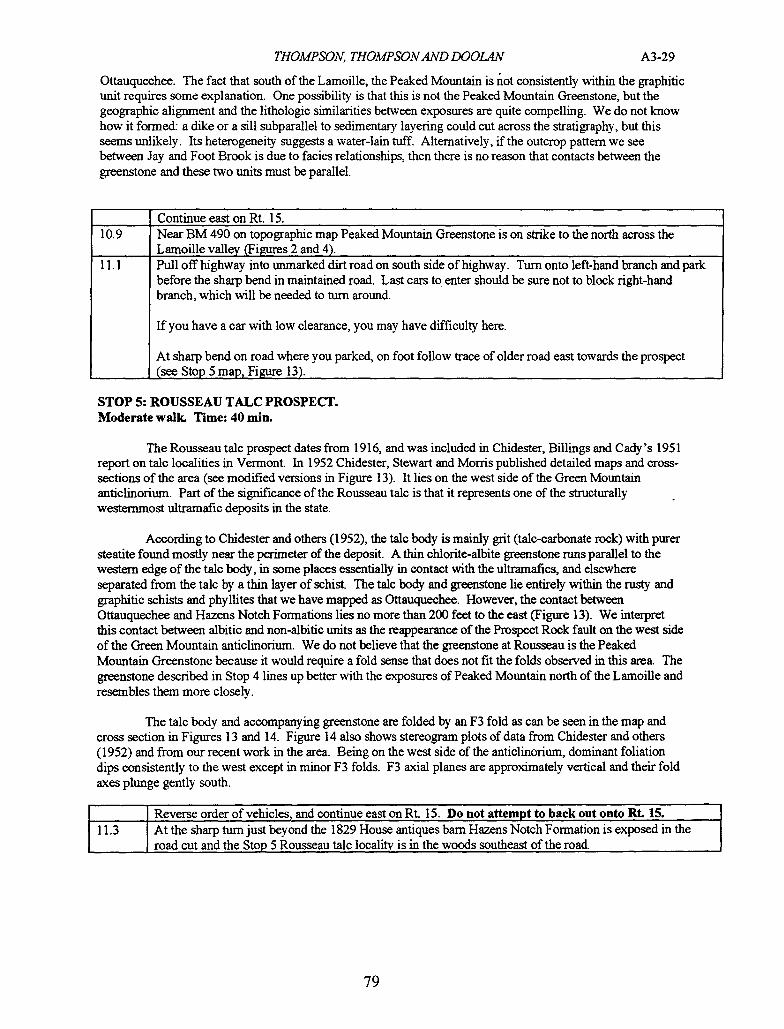
THOMPSON, THOMPSONAND DOOL4N A3-29
Ottauquechee. The fact that south of the Lamoille, the Peaked Mountain is not consistently within the graphitic unit requires some explanation. One possibility is that this is not the Peaked Mountain Greenstone, but the geographic alignment and the lithologic similarities between exposures are quite compelling. We do not know how it formed: a dike or a sill subparallel to sedimentaiy layering could cut across the stratigraphy, but this seems unlikely. Its heterogeneity suggests a water-lain tuff. Alternatively, if the outcrop pattern we see between Jay and Foot Brook is due to facies relationships, then there is no reason that contacts between the greenstone and these two units must be parallel.
Continue east on Rt. 15. 10.9 Near BM 490 on topographic map Peaked Mountain Greenstone is on strike to the north across the
Lamoille valley (Figures 2 and 4). 11.1 Pull off highway into unmarked dirt road on south side of highway. Turn onto left-hand branch and park
before the sharp bend in maintained road. Last cars to enter should be sure not to block right-hand branch, which will be needed to turn around.
If you have a car with low clearance, you may have difficulty here.
At sharp bend on road where you parked, on foot follow trace of older road east towards the prospect (see Stop 5 map, Figure 13).
STOP 5: ROUSSEAU TALC PROSPECT. Moderate walk. Time: 40 mm.
The Rousseau talc prospect dates from 1916, and was included in Chidester, Billings and Cady 's 1951 report on talc localities in Vermont. In 1952 Chidester, Stewart and Moms published detailed maps and cross-sections of the area (see modified versions in Figure 13). It lies on the west side of the Green Mountain anticlinorium. Part of the significance of the Rousseau talc is that it represents one of the structurally westernmost ultramafic deposits in the state.
According to Chidester and others (1952), the talc body is mainly grit (talc-carbonate rock) with purer steatite found mostly near the perimeter of the deposit A thin chlorite-albite greenstone runs parallel to the western edge of the talc body, in some places essentially in contact with the ultrarnafics, and elsewhere separated from the talc by a thin layer of schist The talc body and greenstone lie entirely within the rusty and graphitic schists and phyllites that we have mapped as Ottauquechee. However, the contact between Ottauquechee and Hazens Notch Formations lies no more than 200 feet to the east (Figure 13). We interpret this contact between albitic and non-albitic units as the reappearance of the Prospect Rock fault on the west side of the Green Mountain anticlinorium. We do not believe that the greenstone at Rousseau is the Peaked Mountain Greenstone because it would require a fold sense that does not fit the folds observed in this area. The greenstone described in Stop 4 lines up better with the exposures of Peaked Mountain north of the Lamoille and resembles them more closely.
The talc body and accompanying greenstone are folded by an F3 fold as can be seen in the map and cross section in Figures 13 and 14. Figure 14 also shows stereogram plots of data from Chidester and others (1952) and from our recent work in the area. Being on the west side of the anticlinorium, dominant foliation dips consistently to the west except in minor F3 folds. F3 axial planes are approximately vertical and their fold axes plunge gently south.
Reverse order of vehicles, and continue east on Rt 15. Do not attempt to back out onto Rt. 15. 11.3 At the sharp turn just beyond the 1829 House antiques barn Hazens Notch Formation is exposed in the
road cut and the Stop 5 Rousseau talc locality is in the woods southeast of the road.
79
A3-30
THOMPSON, THOMPSON AND DOOL4N
z
ulg
- II ...••
I'-)! /1 tr'
I I
I—I MI-,
.JLt¼/
..... t;
bI...i .<V(
I / <t'.":- •: .. •
I I
/ I
- I
I / I
I I I
'I ,......•__v- 4
0
0
4) ji
ii ••••r— In
t.-
I IA
Yb
'o/o ,
N
• 0
1p
IL
THOMPSON, THOMPSON AND DOOLAN A3-3 I
A3-32 THOMPSON, THOMPSONAND DOOL4N
11.55 Turn left off highway into parking lot of A.O.T. maintenance building. Do not block buildings or roadway east of the facility. From this roadway look northwest for views of Kings Hill Mountain (Underhill Formation) and Shattuck Ridge (Jay Peak Formation). Peaked Mountain (Ireenstone is well exposed east of Shattuck Ridge.
Cross Rt 15. Good outcrops are immediately opposite the A.O.T. flagpole. Use care as there is a lot of traffic.
STOP 6: DISCUSSION OF ALBITIC ROCKS —FAYSTON (€Z 1) AND HAZENS NOTCH (€Zhn) FORMATIONS - RELATNE TO ROUSSEAU ROCKS (€o). Short steep walk. Time: 35 mm.
Starting with outcrops at the highway directly opposite the flagpole at the A.O.T. building and climbing uphill to the south, one can see three rock units in succession: Fayston, Hazens Notch and Foot Brook slice Ottauquechee. The Fayston is similar to both the Undeinill and Jay in that it is a silver-green quartz-chlorite-muscovite schist. However, these outcrops display features that distinguish them from the other silver-green units: they are coarser-grained and contain abundant white albite. In the Fayston magnetite is usually readily detected using a magnet, although at this stop veiy little is actually visible to the eye.
Higher up the slope (and also structurally higher, given the southwest-dipping foliation) we see other rocks that contain albite. However, these rocks are rusty with patchy graphite and most of the albites, which can reach to nearly 1 cm. in size, are black. The dark color of the albites is due to inclusions of graphite. These rocks are typical of the Hazens Notch and similar outcrops continue steeply upslope until a break in slope where outcrops of non-albitic rocks are encountered. The Prospect Rock fault is located at the break in slope.
We probably will not have time to visit the rocks above the fault. They are still rusty and graphitic, but are much finer-grained and lack visible albite. Thus, we have mapped them as Ottauquechee, and they can be followed northwest back to the Rousseau talc prospect.
Continue east on Route 15. 11.8 Fayston Formation in blasted cuts on new logging road on right An excellent exposure of the transition
from Fayston to Hazens Notch can be seen along the road and in outcrops just uphill from the end of the road. This seems to be a depositional contact.
12.6 Road cuts of Fayston Formation, which crosses the valley here near the crest of the south-plunging Green Mountain anticlinonum.
13.3 Leaving Jeffersonville quadrangle; entering Johnson quadrangle.
View northeast across the valley towards Prospect Rock (visible ledges are Fayston Formation). 14.5 Cemetery on the right contains typical "anthrupogenic erratics" of granite, marble, etc. Nearer ledges
on the left show a folded contact between Hazens Notch and Fayston. 15.4 Cross the Lamoille River. As you cross the bridge, note the extensive sand and gravel pits on the south
side of Rt 15. The Lamoille Valley has interesting glacial features that will not be explored on today's trip.
15.5 Immediately after the bridge, turn sharp left on to Hog Back Road. A second sign says "Waterville". 15.6 Turn right (north) off of Hog Back Road and onto Prospect Rock Road. 15.7 Outcrops near the road are graphitic Hazens Notch Formation. 16.3 Use care as road narrows and becomes rougher. 16.6 Ledges on right mark the western limit of Albee's Foot Brook syncline. At this point the ledges do
indeed contain Ottauquechee graphitic phyllite as shown on Albee's map (1957). 16.85 Pass parking lot for Long Trail South. There is only room for a few vehicles here. Leave these spaces
for hikers. 17.0 Proceed to larger parking area just beyond where the Long Trail leaves the road and heads north. This is
a newly seeded former log yard, some parts of which may be quite soft. Part here or in other pull offs just ahead. Do not block either driveway.
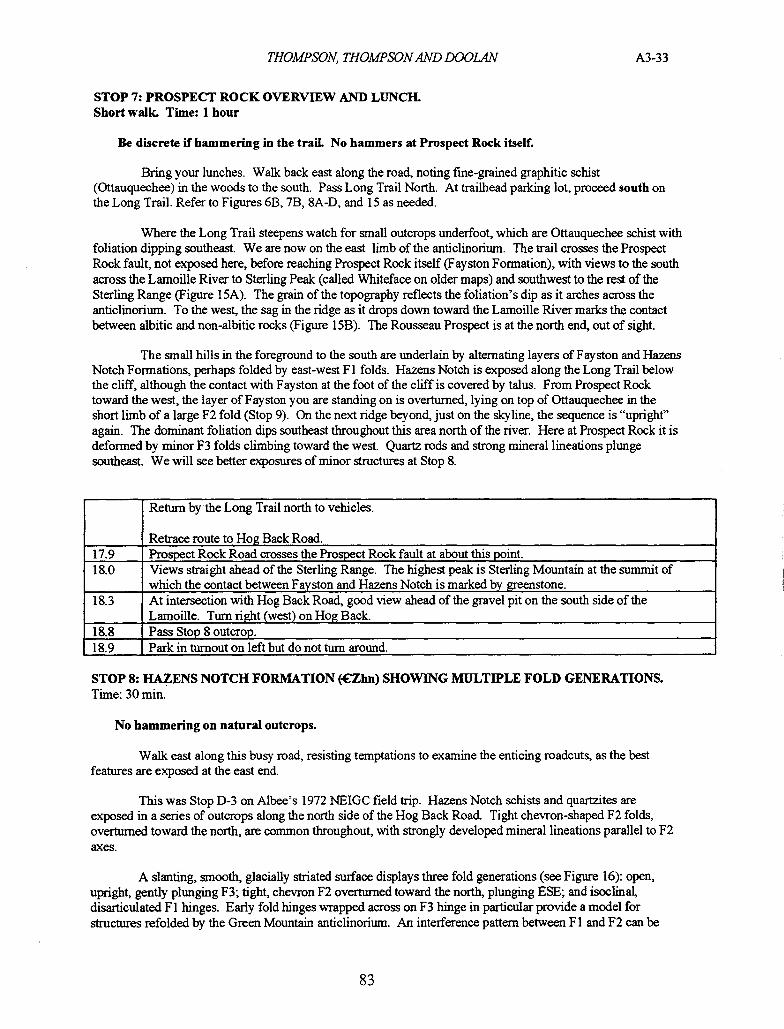
THOMPSON, THOMPSONAND DOOLAN A3-33
STOP 7: PROSPECT ROCK OVERVIEW AND LIJNCIL Short walk. Time: 1 hour
Be discrete if hammering in the trail. No hammers at Prospect Rock itself.
Bring your lunches. Walk back east along the road, noting fine-grained graphitic schist (Ottauquechee) in the woods to the south. Pass Long Trail North. At trailhead parking lot, proceed south on the Long Trail. Refer to Figures 6B, 7B, 8A-D, and 15 as needed.
Where the Long Trail steepens watch for small outcrops underfoot, which are Ottauquechee schist with foliation dipping southeast. We are now on the east limb of the anticlinorium. The trail crosses the Prospect Rock fault, not exposed here, before reaching Prospect Rock itself (Pay ston Formation), with views to the south across the Lamoille River to Sterling Peak (called Whiteface on older maps) and southwest to the rest of the Sterling Range (Figure 1 5A). The grain of the topography reflects the foliation's dip as it arches across the anticlinorium. To the west, the sag in the ridge as it drops down toward the Lamoille River marks the contact between albitic and non-albitic rocks (Figure 1 SB). The Rousseau Prospect is at the north end, out of sight.
The small hills in the foreground to the south are underlain by alternating layers of Fayston and Hazens Notch Formations, perhaps folded by east-west Fl folds. Hazens Notch is exposed along the Long Trail below the cliff, although the contact with Fayston at the foot of the cliff is covered by talus. From Prospect Rock toward the west, the layer of Fayston you are standing on is overturned, lying on top of Ottauquechee in the short limb of a large F2 fold (Stop 9). On the next ridge beyond, just on the skyline, the sequence is "upright" again. The dominant foliation dips southeast throughout this area north of the river. Here at Prospect Rock it is deformed by minor F3 folds climbing toward the west. Quartz rods and strong mineral lineations plunge southeast. We will see better exposures of minor structures at Stop 8.
Return by the Long Trail north to vehicles.
Retrace route to Hog Back Road. 17.9 Prospect Rock Road crosses the Prospect Rock fault at about this point. 18.0 Views straight ahead of the Sterling Range. The highest peak is Sterling Mountain at the summit of
which the contact between Fayston and Hazens Notch is marked by greenstone. 18.3 At intersection with Hog Back Road, good view ahead of the gravel pit on the south side of the
Lamoille. Turn right (west) on Hog Back. 18.8 Pass Stop 8 outcrop. 18.9 Park in turnout on left but do not turn around.
STOP 8: HAZENS NOTCH FORMATION (€Zhn) SHOWING MULTIPLE FOLD GENERATIONS. Time: 30 mm.
No hammering on natural outcrops.
Walk east along this busy road, resisting temptations to examine the enticing roadcuts, as the best features are exposed at the east end.
This was Stop D-3 on Albee's 1972 NEIGC field trip. Hazens Notch schists and quartzites are exposed in a series of outcrops along the north side of the Hog Back Road. Tight chevron-shaped P2 folds, overturned toward the north, are common throughout, with strongly developed mineral lineations parallel to F2 axes.
A slanting, smooth, glacially striated surface displays three fold generations (see Figure 16): open, upright, gently plunging F3, tight, chevron F2 overturned toward the north, plunging ESE; and isoclinal, disarticulated F I hinges. Early fold hinges wrapped across on F3 hinge in particular provide a model for structures refolded by the Green Mountain anticlinorium. An interference pattern between Fl and F2 can be
M.
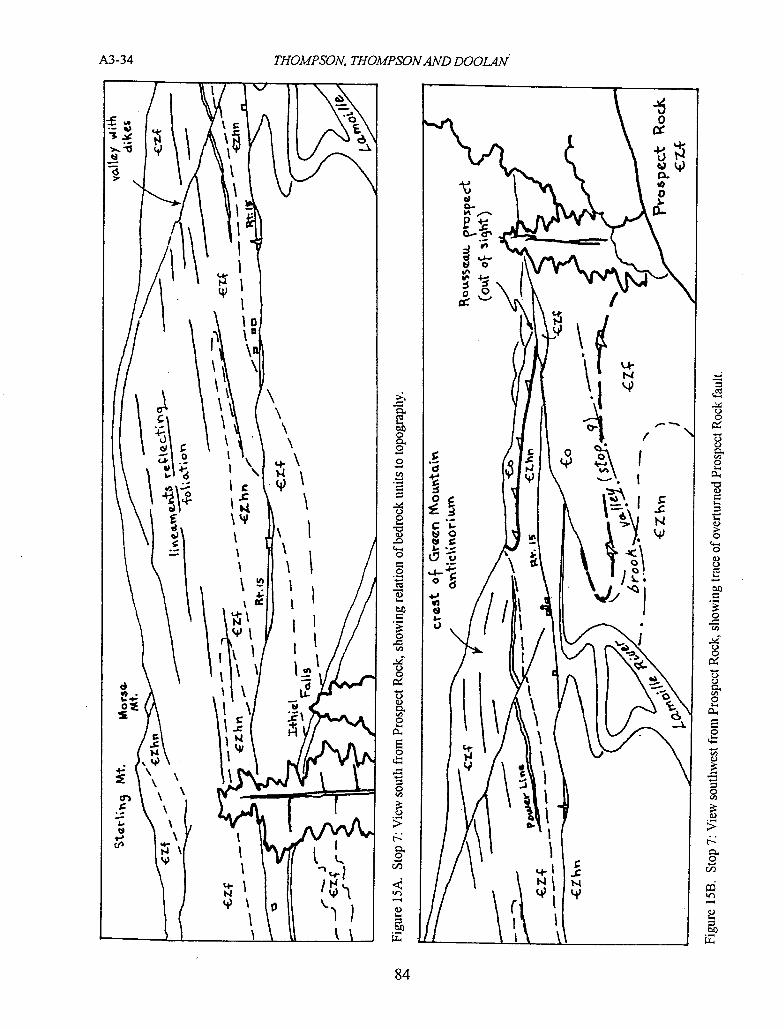
0 fx
0 tO 0
13-
U-.
I'
C 0
tl)t4) I
°E C
' g 01
It.. I I I lit
(, I
y
\\ 0.
I
kn
C) 6. 2
0 0 0, 0 0,
0) 0 0
0) 0
C,- 0 0) 0 0 0
0 Cl)
C) 0, U, 0 0,
0
U) C) 0 0 C')
C) >
S 0, 0
A3-34
THOMPSON, THOMPSONAND DOOLAN
1\ \\\ '
W i
\
\
\ \v \ 9 \ \
\ —' 0
I\ o
Ic •9)
4-
\ H —
1
4;
o
to
\/ 1 Lc
'9)
a \ -
'1 'V
w
1
RE
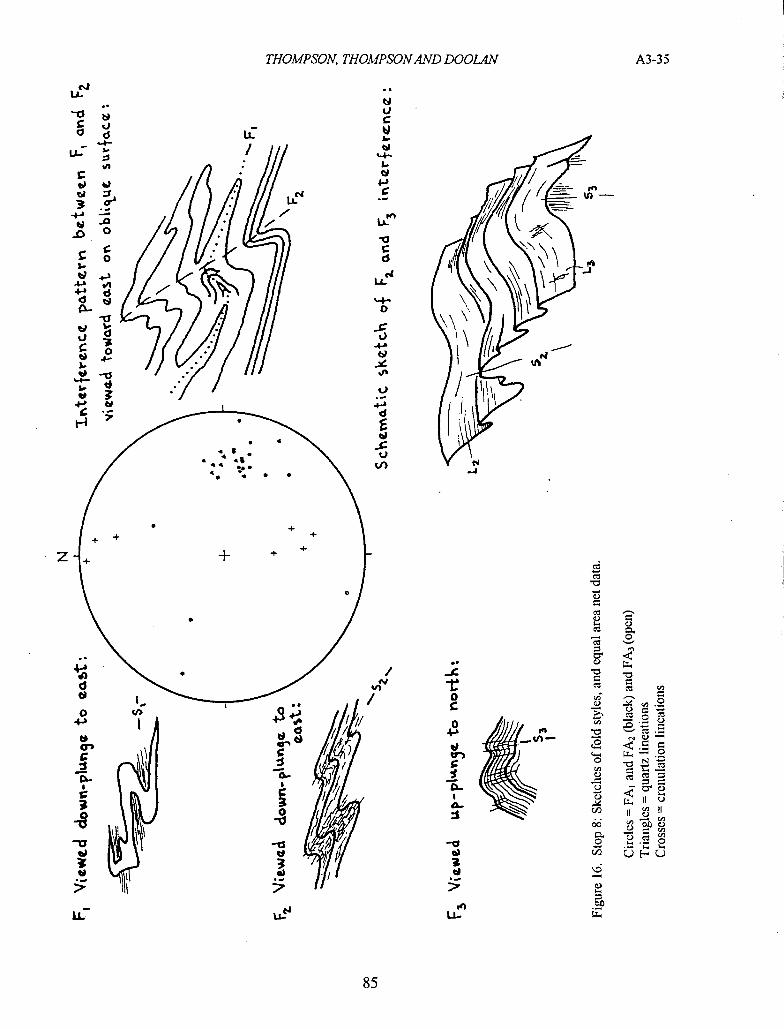
THOMPSON, THOMPSON AND DOOLAN
a) I) C
I(LZ4
a) '4-I-a)
C
,
C 4
I \\\
Li.
/
cj U-
-0 C
d
0
C Co I- b1 .4.3
vl
4 I
U C o
4- a) -0 I- U
VA
+3 cl to I) a' II c r
C III1YI 3 (I I
- • (cIif111 a) ; I
a) 3
a) a) •1111
[C
A3-35
(
V)
.1 U's
(- ) CO 0
. C)
. CO
o C • C-) og o 4.3
(1)
a) C 0 zn
I-
IZ 9 cz
. 3
C-ID "II 00
a) 3 a)
U.
.../ 7/
0 -c L U
a)
(p
'I
4
E a)
U 'I)
-J
A3-36 THOMPSON, THOMPSONAND DOOLAN
observed in the same outcrop, higher and to the east behind a poplatree. Unfortunately, the plunge ofF 1 folds is difficult to determine here. On the riverbank nearby, Fl and F2 are nearly coaxial, plunging -35°, S75E.
Return to vehicles. If there is time we can look at the intervening roadcuts as we walk back.
The Lamoille River is just over the steep bank on your left. You can look down at the upper falls, which are a narrows formed where numerous and massive layers of more resistant quartzite within the Flazens Notch cross the river.
This turnout is on a blind stretch of mad; post a spotter at the top of the hilL Pull across traffic and continue west on Hog Back Road.
19.1 Ithiel Falls proper is located here at Ithiel Falls Camp Meeting. 1999 was the 100th year of this event. The falls are formed where a thin band of Fayston crosses the Lamoille. Fayston is also exposed on the north side of Hog Back Road at the side road followed by the Long Trail, for instance, in the outcrop with the "Do not block drive" sign. Just to the east, the contact between Fayston and Hazens Notch is exposed.
19.3- These outcrops of Hazens Notch are between the Fayston at Ithiel Falls and the Fayston on Prospect 19.5 Rock, and display early folds similar to those at Stop 8, but F2 folds here are south-verging. Participants
who do not wish to go on the Stop 9 traverse could explore these outcrops. 19.55 Pass the east end of a large turnout on the south side of the road. Using the west entrance, pull across the
road so as to park facing east. Watch out for the low shoulder on the north side of road.
Walk across the road to the smaller turnout The brook valley is narrow, steep and slippery, and the exposures can only be seen by a few people at a time. An old road parallels the brook and we will place ribbons at points along the road for people who want to see key outcrops but not walk the entire brook A trip leader will be posted at each of the key outcrops to describe the features seen there. Figure 17 shows both routes.
A third alternative involves no hiking: some participants may prefer to observe the same rock units in roadcuts west along Hog Back Road. However, the fault contact is not seen in the madcuts.
STOP 9: BROOK TRAVERSE OBSERVING PROSPECT ROCK FAULT. Brook route: strenuous wallc. Logging road route: moderate walk. Time: 1 hour.
Hazens Notch schist with southeast-dipping foliation is exposed in an outcrop overhanging the brook just upstream from Hog Back Road. Follow the brook, or take the logging road and bear left at the three road forks back to the brook, to where the brook steepens sharply. Steep open rocks in the brook expose the Hazens Notch lying on top of Fayston to the northwest (upstream).
From here it is a steep scramble up over continuous Fayston outcrops to the Prospect Rock fault. You may prefer to follow the flagged route to the logging road and thence up to the fault by a longer but easier route (Figure 17).
Just upstream from where the upper trail reaches the brook, nearly vertical quartz veins lie parallel to F3 axial planes. The Fayston lies in sharp contact with underlying Ottauquechee, interpreted as the overturned Prospect Rock fault. Farther upstream, quartzite beds in the graphitic phyllites preserve F3 and south-verging F2 folds.
Return to Hog Back Road along the trail, past a large open ledge of Fayston. In contrast to the Hazens Notch, Fayston typically forms open ledges, apparently because it is more resistant to weathering.
Return to vehicles and proceed back to the east on Hog Back Road. 19.8 Good view looking upstream to Ithiel Falls and the Fayston layer crossing the river. 20.85 Intersection of Hog Back Road and Rt. 15. Turn left (east) on Rt. 15.
M.
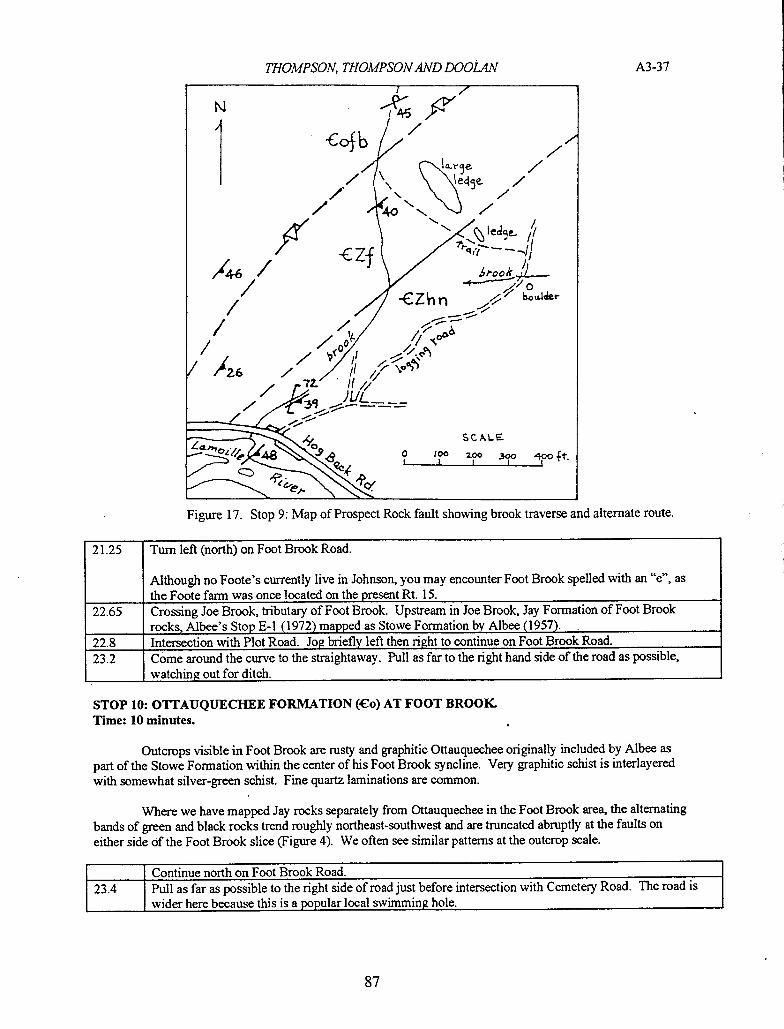
THOMPSON, THOMPSON AND DOOLAN A3-37
/ I
ofb /
- -4/q,7 /
£Zhn / boulder -----:7
/
/26 / ! /
SCALE.
0 too ZOO 300__400 ft. t I I
Figure 17. Stop 9: Map of Prospect Rock fault showing brook traverse and alternate route.
21.25 Turn left (north) on Foot Brook Road.
Although no Foote's currently live in Johnson, you may encounter Foot Brook spelled with an "e", as the Foote farm was once located on the present Rt. 15.
22.65 Crossing Joe Brook, tributaiy of Foot Brook. Upstream in Joe Brook, Jay Formation of Foot Brook rocks, Albee's Stop E-1 (1972) mapped as Stowe Formation by Albee (1957).
22.8 Intersection with Plot Road. Jog briefly left then right to continue on Foot Brook Road. 23.2 Come around the curve to the straightaway. Pull as far to the right hand side of the road as possible,
watching out for ditch.
STOP 10: OTFAUQUECIIEE FORMATION (€o) AT FOOT BROOK Time: 10 minutes.
Outcrops visible in Foot Brook are rusty and graphitic Ottauquechee originally included by Albee as part of the Stowe Formation within the center of his Foot Brook syncline. Very graphitic schist is interlayered with somewhat silver-green schist. Fine quartz laminations are common.
Where we have mapped Jay rocks separately from Ottauquechee in the Foot Brook area, the alternating bands of green and black rocks trend roughly northeast-southwest and are truncated abruptly at the faults on either side of the Foot Brook slice (Figure 4). We often see similar patterns at the outcrop scale.
Continue north on Foot Brook Road. 23.4 Pull as far as possible to the right side of road just before intersection with Cemetery Road. The road is
wider here because this is a popular local swimming hole.
EM
A3-38 THOMPSON, THOMPSONAND DOOLAN
STOP 11: SILVER-GREEN JAY PEAK FORMATION (€Zj) AND CREENSTONE AT FOOT BROOK Time: 15 minutes.
Discrete hammering only.
Stop 11 Jay Formation differs from that seen at Stop 4 in that it is coarser and contains more disarticulated quartz veins. It also lacks chloritoid and may contain veiy small albites. Both types of Jay are present in the Foot Brook area. Upstream closer to the culvert there are well developed F3 folds and S3 spaced cleavage.
The greenstone at this stop is rich in magnetite and epidote, and contains both Fn and F3 folds. It is interesting to speculate why this relatively small brook should have such a deep hole at the contact between the Jay and the greenstone.
23.45 Turn around at intersection of Cemetery and Foot Brook Roads. 24.1 Continue south on Foot Brook Road, crossing Plot Road. 24.4 View southeast to far ridgeline: Worcester Range with Elmore Mountain at the north end (final stop on
Trip B3). 25.65 Intersection with Rt. 15. Turn left (east) on Rt. 15. 26.4 At sign for town of Johnson, fine-grained rusty and graphitic schist in roadcuts. 26.75 Across from the Johnson Firehouse, these rusty and graphitic rocks were included in Albee's 1972 trip
stop F-I as fme-grained Hazens Notch. They do not contain visible albite. 26.9 Near the center of Johnson, turn right (south) on Railroad St 27.2 Cross the Lamoille River and stay on Railroad St. 27.4 At T-intersection with Upper French Hill Rd. continue straight. 27.6 Continue through the gate and park where you will not interfere with town vehicles. These buildings,
now owned by the town of Johnson, are the site of the former Johnson talc mill of Eastern Magnesia Talc Co.
The Johnson Village (French Hill) Talc Mine site is a short walk south from the buildings. Talc was first mined in this area in 1903 in North Waterville (Figure 3). The first talc mill at the Stop 12 site opened in 1904. The French Hill Mine operated from 1906-1913 (Smalley and others, 1961). The main Johnson Talc Mine (located in East Johnson) was worked from the closing of the French Hill mine until the 1980's.
STOP 12: OTrAUQIJIECUEE FORMATION (Co): GRAPH1TIC AND NON-GRAPHJTIC QIJARTZOSE PHYLUTE, QIJARTZJTE. Time: 15 minutes.
This stop examines more lithologies and structures of the Ottauquechee Formation within the Foot Brook slice. We are on the east side of the Green Mountain anticlinoriurn. These rocks were originally included in the Hazens Notch Formation of Doll and others (1961). Several distinctive Ottauquechee lithologies are present here. Massive quartzites within graphitic, laminated black phyllites are well exposed on the east side of the garage. The notable thickness of the quartzite, while not unusual, is likely the result of tectonic thickening by internal folding and imbrication during Dl and D2 deformation. A second layer. of quartzite interbedded with graphitic slatey phyllite is seen in the recently excavated drainage ditch at the corner of the garage.
Behind the garage (to the west), dominant S2 foliation planes dip steeply east, with L2 smear lineations. Continuing west, the large exposure facing the parking lot contains silver-green, highly laminated quartz-rich granofels (possibly part of the Jay Peak Formation) displaying F2 early folds. Also present is a centimeter-scale spaced cleavage (S2.5) with slightly more northeasterly strike relative to S2 (Figure 18A). S2.5 cleavage is similar in style to S3, but S3 has a steeper dip (Figure 18B). Several faults are present here. The dominant one appears to be syn- to late-D2 and strikes north-south (Figure I 8A).
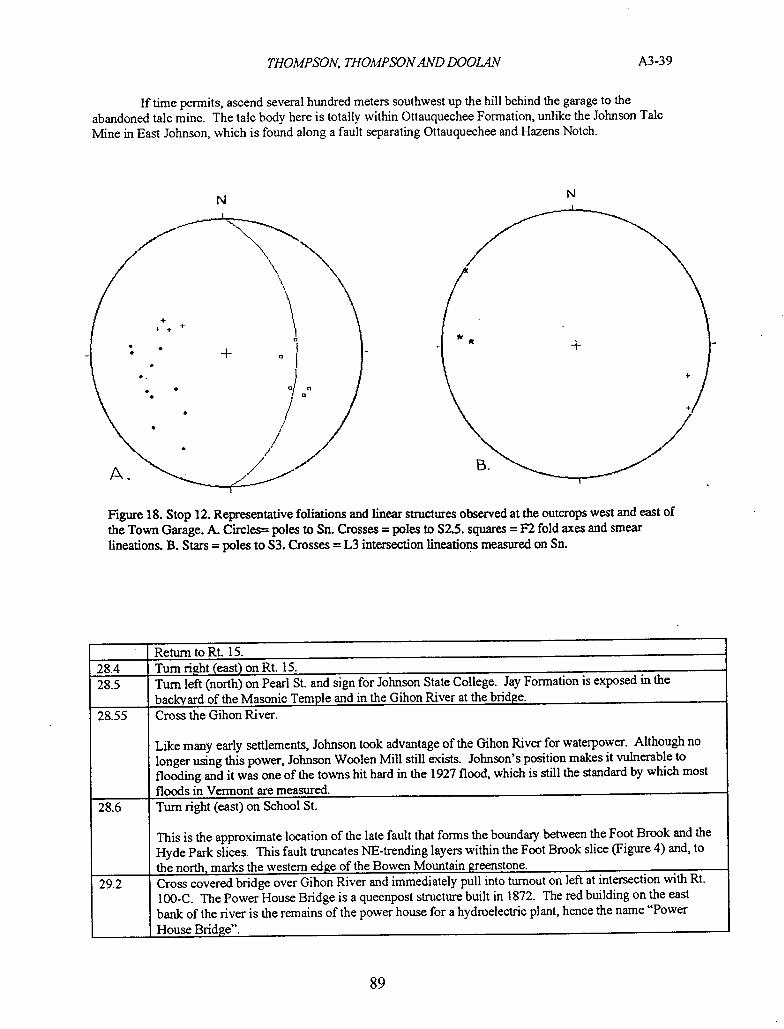
N
THOMPSON, THOMPSONAND DOOL4N A3-39
If time permits, ascend several hundred meters southwest up the hill behind the garage to the abandoned talc mine. The talc body here is totally within Ottauquechee Formation, unlike the Johnson Talc Mine in East Johnson, which is found along a fault separating Ottauquechee and Hazens Notch.
Figure 18. Stop 12. Representative foliations and linear structures observed at the outcrops west and east of the Town Garage. A. Circles= poles to Sn. Crosses = poles to S2.5. squares = F2 fold axes and smear lineations. B. Stars = poles to S3. Crosses = L3 intersection lineations measured on Sn.
Return toRt. 15. 28.4 Turn right (east) on Rt. 15. 28.5 Turn left (north) on Pearl St. and sign for Johnson State College. Jay Formation is exposed in the
backyard_of the Masonic_Temple and_in_the Gihon River at_the bridge. 28.55 Cross the Gihon River.
Like many early settlements, Johnson took advantage of the Gihon River for waterpower. Although no longer using this power, Johnson Woolen Mill still exists. Johnson's position makes it vulnerable to flooding and it was one of the towns hit hard in the 1927 flood, which is still the standard by which most floods in Vermont are measured.
28.6 Turn right (east) on School St.
This is the approximate location of the late fault that forms the boundaiy between the Foot Brook and the Hyde Park slices. This fault truncates NE-trending layers within the Foot Brook slice (Figure 4) and, to the north,_marks_the_westernthe_Bowen_Mountain_greenstone. _edge_of
29.2 Cross covered bridge over Gihon River and immediately pull into turnout on left at intersection with Rt. 100-C. The Power House Bridge is a queenpost structure built in 1872. The red building on the east bank of the river is the remains of the power house for a hydroelectric plant, hence the name "Power 1-louse Bridge".
M.
A3-40 THOMPSON, THOMPSON AND DOOLAN
Walk back across the bridge and descend to the river on the upstream side.
STOP 13: POWER HOUSE BRIDGE, OTTAUQUECHEE FORMATION (Co): RUSTY QUARTZOSE AND GRAPHITIC PHYLLITE AND QUARTZ1TE WITHIN THE HYDE PARK SLICE. Short walk. Time: 20 minutes.
Albee called the rocks exposed in the river fine-grained Hazens Notch, which we have reinterpreted as Ottauquechee. They are rusty and graphitic, and some of the more quartzose layers are pitted due to the weathering out of carbonates. There are also several sizable gray quartzite layers. Quartzites are typically discontinuous due to shearing, but preserve folds of at least two generations.
These rocks look vely similar to the Ottauquechee exposed within the Foot Brook slice. Differences between the two slices are not generally apparent in individual outcrops, but rather are a matter of overall proportions of various lithologies in numerous adjacent outcrops. See the text for a discussion of stratigraphic and lithotectonic correlations between these two slices and relations to Ottauquechee east of this area.
Return to vehicles._Cross traffic with careto proceed northon Rt._100-C. 29.6 Cross first of two bridges over Gihon River. The house on the island on the right is a former mill.
Cross the second bridge. Upstream on the left bank of the river there is a veiy small exposure of talc carbonate within Ottauquechee Formation. Schists near the talc contain bright green (? chrome) mica.
29.75 Pass two driveways to the right after the second bridge. The third and fourth drives leave from almost the same point. Turn right (south) into the long driveway that leads up to a house on the ridge. At the curve in the drive, where a ledge is exposed, pull to the right side of the drive. Do not block the driveway.
STOP 14: OflAUQUECHEE FORMATION: PHYLLITIC GRANOFELS (Copg). Time: 10 minutes.
Although veiy graphitic schist or phyllite with fine quartz laminations is the "classic" Ottauquechee lithology, there are several other vely distinctive lithologies included within the Ottauquechee. Stop 13 displays a distinctive rock type known variously as "Phyllitic Granofels" (Kim and others, 1998) or "Quartzose Schist" (Walsh, pers. comm., 1999). Here it contains mainly quartz, with muscovite +1- chlorite in the phyllitic partings, and ranges from white to somewhat rusty. This unit often contains pebbles, including blue quartz, and it might represent a metamorphosed quartz-rich wacke deposited in a submarine fan. At this outcrop, pebbles are crushed and hard to distinguish. A more schistose layer at the south end of the outcrop defmes an F2 fold. Early foliation is at a high angle to Sn. This fabric mimics the larger scale truncation of early structures within the linear bands of phyllitic granofels shown on Figure 4.
Go to top of drive to turn around. At bottom of drive, turn right to continue northeast on Rt. 100-C. 30.4 Turn right (southeast) on Rocky Road.
At the house on this corner, cuttings from a newly drilled well contain abundant talc. According to drillers at H. A. Manosh Corp., talc is common in wells in the East Johnson area. Here we are about 2 km SSW of the talc mine, and the unexposed southern extension of the Talc Mine fault crosses between here and the next stop.
30.7 Pull to right side of road just before the covered bridge. Walk through the bridge and follow a path on the right down the bank to outcrops in the river.
Scribner Bridge is another queenpost covered bridge, of uncertain age. Barna (1996) states that it was probably not originally covered and the present roof was added about 1919.
THOMPSON, THOMPSONAND DOOLAN A3-41
STOP 15: SCRIBNER BRIDGE: DOLOMITIC OTFAUQUECHEE FORMATION. Short walk. Time: 15 minutes.
Directly under the bridge you will see rocks that by now should look to you like typical vely graphitic Ottauquechee phyllite. However, the ledges slightly farther downstream have layers and pods of brown-weathering dolomite +1- calcite. Pods range up to about 15 cm thick and about 0.5 m in length. Quartz layers are also brown-speckled due to the carbonates. The surrounding phyllite is somewhat greener than typical Ottauquechee and graphite is very patchy. This resembles another distinctive lithology found within the Ottauquechee in only a few locations. In Waitsfield, Walsh (1992) described this type of Ottauquechee as "Gray carbonate schist", and he has also mapped it in the Plymouth area (Walsh, pers. comm., 1999).
Finding carbonates in the Ottauquechee reinforces its correlation with the Sweetsburg. We picture the Ottauquechee as a unit deposited slowly over a long period of time. If so, these dolomitic rocks at Scribner Bridge may represent the youngest part of the Ottauquechee.
31.1 Retrace route to Rt. 100-C. Turn left (southwest). 32.5 To return to Burlington: At intersection with Rt. 15 in Johnson, turn right (west).
To get to 1-89 south: At intersection with Rt. 15 in Johnson, turn left (east). Rt 15 is contiguous with Rt. 100 between Hyde Park and Mon-isville. In Morrisville, continue south on Rt. 100 to pass through Morrisville and Stowe to the Waterbury interchange.
OPTIONAL STOPS; MAY BE SUBSTITUTED FOR SOME OF THE STOPS DESCRIBED ABOVE.
0.0 Starting point Johnson, junction Routes 15 and 100-C. Turn left (east) on Rt. 15.
1.2 Ottauquechee on north side of road. 2.5 STOP A: PHYLLITIC GRANOFELS OF THE OTTAUQUECHEE (Sterling Mountain quadrangle).
Beautiful, glacially striated outcrop east of barn containing quartz granules and pebbles. 3.1 Ottauquechee on north side of road. 3.3 Ottauquechee on north side of road. 4.45 Route 100 joins Route 15, continue straight ahead. More Ottauguechee on both sides of road. 4.65 Roadcut northeast of intersection with Fitch Hill Road, Ottauquechee. 4.8 Turn left (north) on Centerville Road. 5.3 Bear right (not sharp right onto private road) onto Noyes Farm Road. 5.9 At intersection with Silver Hill Road, bear left and park on right side of road.
STOP B: SILVER HILL PHYLLITIC GRANOFELS (Momsville quadrangle). (Albee's 1972 NEIGC Stop G-1)
Silver Hill is a very narrow north-south ridge formed from resistant silver-green quartzose schist containing magnetite. Albee equated this unit with the Pinney Hollow, and thus he reasoned that only the graphitic rocks to the east of Silver Hill were Ottauquechee. We believe that Ottauquechee is found on both sides of the unit. Compositional layering and Sn- 1 lie transverse to the Silver Hill belt, suggesting that it is bounded by faults. Extensive linear ridges with similar lithologies are found elsewhere in the Hyde Park slice. Continue east from the intersection.
6.2 Bear left (north) on Brook Road (gravel). 7.9 In the center of Centerville, turn left (west) on Centerville Road. 8.0 Keep straight, continuing on this road as it curves sharply to angle its way south up onto Silver Hill. 8.5 STOP C: OTTAUQ(JECHEE FORMATION (Albee's 1972 NEIGC Stop G-2)
Here on the east side of Silver Hill, we are looking at rocks that Albee mapped as Ottauquechee. 8.9 Cross Silver Hill Phyllitic Granofels at height of land. 9.7 Keep south on Centerville Road at intersection with Noyes Farm Road. 10.2 Return to Route 15/100.
91
A3-42 THOMPSON, THOMPSONAND DOOLAN
REFERENCES
Albee, A.L., 1957, Bedrock geology of the Hyde Park quadrangle, Vermont: U.S. Geological Survey Quadrangle Map GQ-102, scale 1:62,500.
Albee, A.L., 1972, Stratigraphic and structural relationships across the Green Mountain anticlinorium in north- central Vermont, Trip B-8, in Doolan, B.L. and Stanley, R.S., eds., Guidebook for field trips in Vermont: New England Intercollegiate Geological Conference, 60 Annual Meeting, Burlington, Vermont, p. 179-194.
Bama, E., 1996, Covered bridges of Vermont: The Countryman Press, 215 p. Bothner, W.A. and Laird, J., 1987, Structure and metamorphism at Tillotson Peak, north-central Vermont, Trip
C-2: in Westennan, D.S., ed., Guidebook for Field Trips in Vermont Volume 2, New England Intercollegiate Geological Conference, 79th Annual Meeting, Montpelier, Vermont, p.383-395.
Cady, W.M., Albee, A.L., and Chidester, A.H., 1963, Bedrock geology and asbestos deposits of the upper Missisquoi Valley and Vicinity, Vermont: U. S. Geological Survey Bulletin 1122-B, Contributions to Economic Geology, 78p.
Castonguay, S., Tremblay, A., Ruffet, G., Seraud, G., and Sosson, M., 1995, 40ArPAr cooling ages of Taconic deformation and metamorphism along the Laurentian margin of the Quebec Appalachians, Canada: Middle Ordovician and Silurian: Geological Society of America Abstracts with Programs, v. 27, n. 6, p. 225.
Charbonneau, J.-M., 1980, Region de Sutton (W): Ministere de l'Energie et des Ressources du Quebec, DPV-681, 89p.
Chidester, A.H., Billings, M.P., and Cady, W.M., 1951, Talc investigations in Vermont, preliminaiy report: U.S. Geological Survey Circular 95, 33 p.
Chidester, A.H., Stewart, G.W., and Morris, D., 1952, Geologic map of the Rousseau talc prospect, Cambridge, Vermont: U.S. Geological Survey Mineral Investigations, Field Studies Map MF8.
Christman, R.A., 1959, Bedrock geology of the Mount Mansfield quadrangle, Vermont: Vermont Geological Survey Bulletin No. 12, 75 p.
Chrisiman, R.A. and Secor, D.T., Jr., 1961, Geology of the Camels Hump quadrangle, Vermont: Vermont Geological Survey Bulletin No. 15,70 p.
Clague, E., Rubin, J., and Brackett, R., 1981, The age and origin of the garnet amphibolite underlying the Thetford Mines ophiolite, Quebec: Canadian Journal of Earth Sciences, v. 18, p. 1257-1261.
Clark, T.H., 1936, A Lower Cambrian Series from southern Quebec: Transactions of the Royal Canadian Institute, no. 45, v. 21,partl,p. 135-151.
Coish, R.A., 1985, Regional geochemical variations in greenstones from the central Vermont Appalachians in Westerman, D.S., ed., Guidebook for Field Trips in Vermont Volume 2, New England Intercollegiate Geological Conference, 79th Annual Meeting, Montpelier, Vermont, p. 345-350.
Coipron, M., 1990, Rift and collisional tectonics of the Eastern Townships Humber Zone, Brome Lake area, Quebec: Master of Science thesis, University of Vermont, Burlington, Vermont, 278 p.
Cousineau, P.A., 1990, Le Groupe de Caidwell et le domaine oceanique entre St-Joseph-de-Beauce et Ste-Sabine: Quebec, Ministere de l'Energie et des Ressources, MM87-02, 165 p.
David, J. and Marquis, R., 1994, Geochronologie U-Pb dans les Apalaches du Quebec: Application aux roches de la zone de Dunnage: La Revue Geologique, v. 1, p. 16-20.
Dennis, J.G., 1964, The geology of the Enosburg area, Vermont: Vermont Geological Survey Bulletin No. 23, 56 p.
Doll, C.G., Cady, W.M., Thompson, J.B., Jr., and Billings, M.P., 1961, Centennial geologic map of Vermont: Vermont Geological Survey, scale 1:250,000.
Doolan, B., 1999, Compilation bedrock geologic map of the Jay Peak quadrangle, Vermont: Vermont Geological Survey Open-File Report VG99-1, 1 plate, scale 1:24,000.
Doolan, B.L., Brooks, K., Rosencrantz, E., Holt, J., Schoonmaker, A., Copans, B., Sonenburg, D., and Talcott, J., 1999, Bedrock geology of the Cold Hollow Mountains Quadrangle, Vermont: Vermont Geological Survey Open-File Report VG99-3, 6 plates, scale 1:24,000.
Doolan, B.L, Mock, T., and McBean, A., 1987, Stratigraphy and structure of the Camels Hump Group along the Lamoille River transect, northern Vermont, Trip B-2, in Westemian, D.S., ed., Guidebook for Field Trips in Vermont Volume 2, New England Intercollegiate Geological Conference, 79th Annual Meeting, Montpelier, Vermont, p. 152-191.
92
THOMPSON, THOMPSONAND DOOL4N A3-43
Gale, M.H. and Kim, J., 1999, Compilation bedrock geologic map of the Hazens Notch Quadrangle, Vennont: Vermont Geological Survey Open-File Report 99-2, 2 plates. scale 1:24,000.
Gale, P.N., 1980, Geology of the Newport Center area, north-central Vermont: Master of Science thesis, University of Vermont, Burlington, Vermont, 126 p.
Hames, W.E., Tracy, R.J., Ratcliffe, N.M., and Sutter, J.F., 1991, Petrologic, structural and geochronologic characteristics of the Acadian metamorphic overprint on the Taconide zone in part of southwestern New England: American Journal of Science, v. 291, p. 887-913.
Hengstenberg, C, 1998, unpublished research project, University of Vermont, Burlington, Vermont. Hoar, R.S., 1981, The bedrock geology of the Coventiy area, Vermont: Master of Science thesis, University of
Vermont, Burlington, Vermont, 139 p. Karabinos, P., Samson, S.D., Hepburn, J.C., and Stoll, H.M., 1998, Taconian orogeny in New England
Appalachians: Collision between Laurentia and the Shelburne Falls Arc: Geology, v. 26, no. 3, p. 215-218. Kim, J., 1997, Bedrock geologic map of parts of the Eden, Lowell, Hazens Notch and Irasburg quadrangles:
Vermont Geological Survey Open-File Report VG97-5, 6p., 2 plates, scale 1:24,000. Kim, J., Springston, G., and Gale, M., 1998, Digital bedrock geologic map of the Eden quadrangle, Vermont:
Vermont Geological Survey Open-File Report VG98-3A, 2 plates, scale 1:24,000. Kumarapelli, P.S., Dunning, G.R., Pintson, H., and Shaver, J., 1989, Geochemistiy and U-Pb zircon age of
comenditic metafelsites of the Tibbit Hill Formation, Quebec Appalachians: Canadian Journal of Earth Sciences, v. 26, p. 1374-1383.
Laird, J. and Albee, Al., 1 981b, Pressure, temperature, and time indicators in mafic schist: Their application to reconstructing the polymetamorphic history of Vermont: American Journal of Science, v. 281, p. 127-175.
Laird, J., Lanphere, M.A., and Albee, A.L., 1984, Distribution of Ordovician and Devonian metamorphism in mafic and pelitic schists from northern Vermont: American Journal of Science, v. 284, p. 376-413.
Lux, D.R., 1984, A maximum age estimate for the emplacement of the Thetford Mines ophiolite [abstract]: Geological Society of America, Northeastern Section, Abstracts with Programs, v. 16, p. 48.
Marquis, R. and Nowlan, G.S., 1991, Stratigraphic position and conodonts of early Middle Ordovician Melbourne Formation, Quebec: Canadian Journal of Earth Science, v. 28, no. 5, p. 816-821.
Mock, T.D., 1989, Bedrock geology of the East Fletcher-Bakersfield area, northern Vermont : Vennont Geological Survey Special Bulletin No. 10, 28 p.
Osberg, P.H., 1965, Structural geology of the Knowlton-Richmond area, Quebec: Geological Society of America Bulletin, v. 76, p. 223-250.
Ratcliffe, N.M., Walsh, G., and Aleinikoff, J.N., 1997, Basement metasedimentaiy and tectonic cover of the Green Mountain massif and western flank of the Chester Dome, Trip C6, in Grover, T.W., Mango, H.N., and Hasenohr, E.J., eds., Guidebook to field trips in Vermont and adjacent New Hampshire and New York: New England Inteinollegiate Geological Conference, 89 th Annual Meeting, Castleton, Vermont, p. C6- 1 to C6-54.
Rose, H.R., 1987, Stratigraphy, structure and metamorphism, Fletcher Mountain area, Jeffersonville, Vermont: Undergraduate Thesis, University of Vermont, Burlington, Vermont, 148 p.
Rosencrantz, E., Schoonmaker, A., Copans, B., Holt, J., Ryan, J., Talcott, J., and Sonenberg, D., 1998, Bedrock geology of the Richford quadrangle, Franklin County, Vermont: Vermont Geological Survey Open-File Report VG98-4, 45 p.,6 plates, scale 1:24,000.
Schoonmaker, A., 1 998a, Geology of the western 1/3 of the Hazens Notch 7.5 minute quadrangle, northern Vermont: Vermont Geological Survey Open-File Report VG98-6, 2 plates, scale 1:24,000.
Schoonmaker, A., 1 998b, Geology of the western 1/3 of the Jay Peak 7.5 minute quadrangle, northern Vermont: Vermont Geological Survey Open-File Report VG98-5, 2 plates, scale 1:24,000.
Smalley, MIT., Hill, E.S., May, H., Rexford, Z., and Chitwood, F., 1961, Histoiy of Johnson, Vermont: Essex Publishing Co., 125p.
Springston, G., 1997, Bedrock geology of the Stowe-Waterbuiy area, north-central Vermont: Vermont Geological Survey Open-File Report VG97-4, 23 p.,4 plates, scale 1:24,000.
Springston, G., Kim, J., and Applegate, G.S., 1998, Digital bedrock geologic map of the Monisville quadrangle, Vermont: Vermont Geological Survey Open-File Report VG98-IA, 2 plates, scale 1:24,000.
St. Julien, P. and Hubert, C., 1975, Evolution of the Taconian orogen in the Quebec Appalachians: American Journal of Science, v. 275A, p. 337-362.
Stanley, R.S., 1997, Digital bedrock geologic map of part of the Serpentine Belt, Lowell and North Troy quadrangles, Vermont: Vermont Geological Survey Open-File Report VG97-04A, 2 plates, scale 1:24,000.
Stanley, R.S., and Ratcliffe, N.M., 1985, Tectonic synthesis of the Taconian orogeny in western New England: Geological Society of America Bulletin, v. 96, p. 1227-1250.
93
A3-44 THOMPSON, THOMPSONAND DOOL4N
Stanley, R.S., DelloRusso, V., O'Loughlin, S., Lapp, E., Armstrong, T., Prewitt, J., Kraus, J. and Walsh, G., 1 987a, A transect through the pre-Silurian rocks of central Vermont, Trip B-8, in Westerman, D.S., ed., Guidebook for Field Trips in Vermont Volume 2, New England Intercollegiate Geological Conference, 79th Annual Meeting, Montpelier, Vermont, p. 272-313.
Stanley, R.S., Armstrong, T., Kraus, J., Walsh, G., Prewitt, J., Kimball, C., and Cua, A., 1987b, The Pre-Silurian Hinterland along the valleys of the White and Mad Rivers, central Vermont, TripC-6, in Westerman, D.S., ed., Guidebook for Field Trips in Vermont Volume 2, New England Intercollegiate Geological Conference, 79th Annual Meeting, Montpelier, Vermont, p. 314-338.
Stanley, R.S., Roy, D.L., Hatch, N.L. Jr., and Knapp, D.A., 1984, Evidence for the tectonic emplacement of the ultramafic and associated rocks in the pre-Silurian eugeosynclinal belt of western new England-vestiges of an ancient accretionary wedge: American Journal of Science, v.284, p 559-595.
Tauvers, P.R., 1982, Bedrock geology of the Lincoln area, Vermont: Vermont Geological Survey Special Bulletin No. 2, 8 p.
Thompson, P. J., 1975, Stratigraphy and structure of Shattuck Ridge, Bakersfield and Waterville, Vermont: Master of Science thesis, University of Vermont, Burlington, Vermont, 68p.
Thompson, P.J. and Thompson, LB., 1992, Bedrock geology of the Camels Hump-Bolton Mountain area, north- central Vermont: Vermont Geological Survey Special Bulletin No. 12, 32 p.
Thompson, P.J. and Thompson, T.B., I 997a, Bedrock geology of the Mount Mansfield, Jeffersonville, and Bolton Mountain Quadrangles, Vermont: Unpublished report to the Vermont Geological Survey.
Thompson, P.J. and Thompson, T.B., I 997b, Digital bedrock geologic map of the Mount Mansfield quadrangle, Vermont: Vermont Geological Survey Open-File Report VG97-05A, 2 plates, scale 1:24,000.
Thompson, P.J. and Thompson, T.B., 1999, Digital bedrock geologic map of the Johnson quadrangle, Vermont: Vennont Geological Survey Open-File Report VG98-2A, 2 plates, scale 1:24,000.
Tremblay, A., and Pinet, N., 1994, Distribution and characteristics of Taconian and Acadian deformation, southern Quebec Appalachians: Geological Society of America Bulletin, v. 106, p. 1172-1131.
Van Horn, S.R., Jones, A., Stansfield, W., and Markey, Z., 1999, Emplacement mechanism of small lamprophync dikes in north-central Vermont: Implications for their use as paleostress indicators:Geological Society of America Abstracts with Programs, Northeastern Section, v. 31, no. 2, p. 75.
Walsh, G.J., 1992, Bedrock geology of the Fayston-Buels Gore area, central Vermont: Vermont Geological Survey Special Bulletin No. 13, 74 p.
Walsh, G.J. and Aleinikoff, J.N., 1999, U-Pb zircon age of metafelsite from the Pinney Hollow Formation: Implications for the development of the Vermont Appalachians: American Journal of Science, v. 299, p. 157-170.
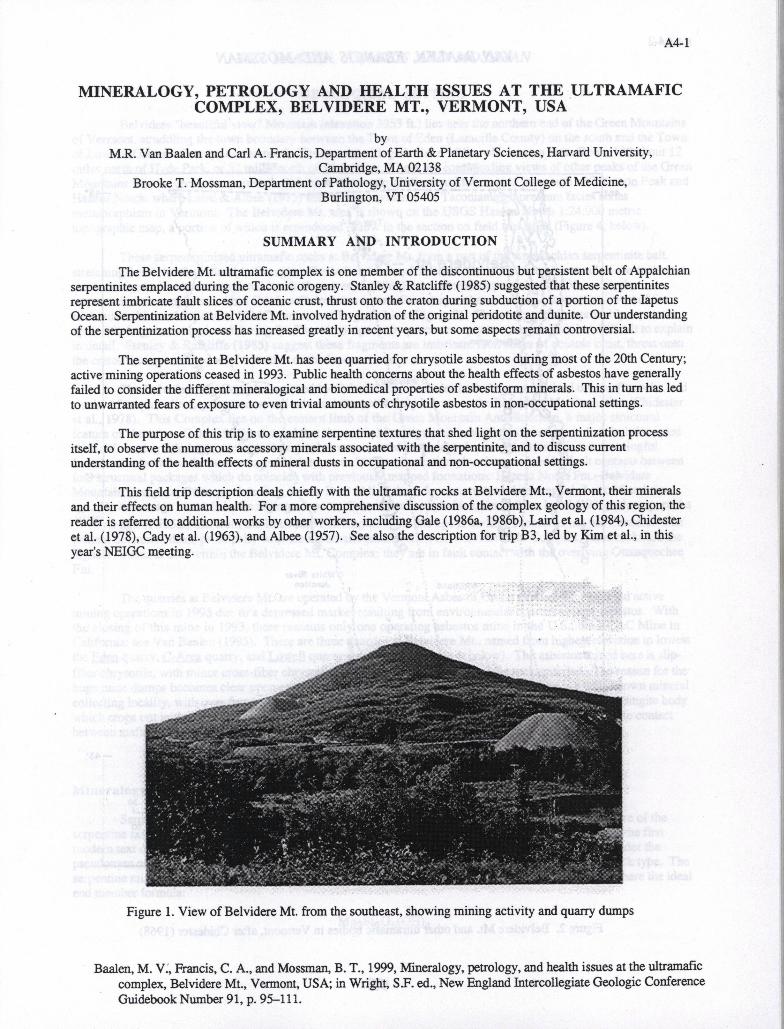
A4-1
MINERALOGY, PETROLOGY AND HEALTH ISSUES AT THE ULTRAMAFIC COMPLEX, BELVIDERE MT., VERMONT, USA
by M.R. Van Baalen and Carl A. Francis, Department of Earth & Planetary Sciences, Harvard University,
Cambridge, MA 02138 Brooke T. Mossman, Department of Pathology, University of Vermont College of Medicine,
Burlington, VT 05405
SUMMARY AND INTRODUCTION
The Belvidere Mt. ultramafic complex is one member of the discontinuous but persistent belt of Appalchian serpentinites emplaced during the Taconic orogeny. Stanley & Ratcliffe (1985) suggested that these serpentinites represent imbricate fault slices of oceanic crust, thrust onto the craton during subduction of a portion of the lapetus Ocean. Serpentimzation at Belvidere Mt. involved hydration of the original peridotite and dunite. Our understanding of the serpentinization process has increased greatly in recent years, but some aspects remain controversial.
The serpentinite at Belvidere Mt. has been quarried for chrysotile asbestos during most of the 20th Century; active mining operations ceased in 1993. Public health concerns about the health effects of asbestos have generally failed to consider the different mineralogical and biomedical properties of asbestiform minerals. This in turn has led to unwarranted fears of exposure to even trivial amounts of chrysotile asbestos in non-occupational settings.
The purpose of this trip is to examine serpentine textures that shed light on the serpentinization process itself, to observe the numerous accessory minerals associated with the serpentinite, and to discuss current understanding of the health effects of mineral dusts in occupational and non-occupational settings.
This field trip description deals chiefly with the ultramafic rocks at Belvidere Mt., Vermont, their minerals and their effects on human health. For a more comprehensive discussion of the complex geology of this region, the reader is referred to additional works by other workers, including Gale (1986a, 1986b), Laird et al. (1984), Chidester et al. (1978), Cady et al. (1963), and Albee (1957). See also the description for trip B3, led by Kim et al., in this years NEIGC meeting.
Figure 1. View of Belvidere Mt. from the southeast, showing mining activity and quarry dumps
Baalen, M. V, Francis, C. A., and Mossman, B. T., 1999, Mineralogy, petrology, and health issues at the ultramafic complex, Belvidere Mt., Vermont, USA; in Wright, S.F. ed., New England Intercollegiate Geologic Conference Guidebook Number 91, p. 95-111.
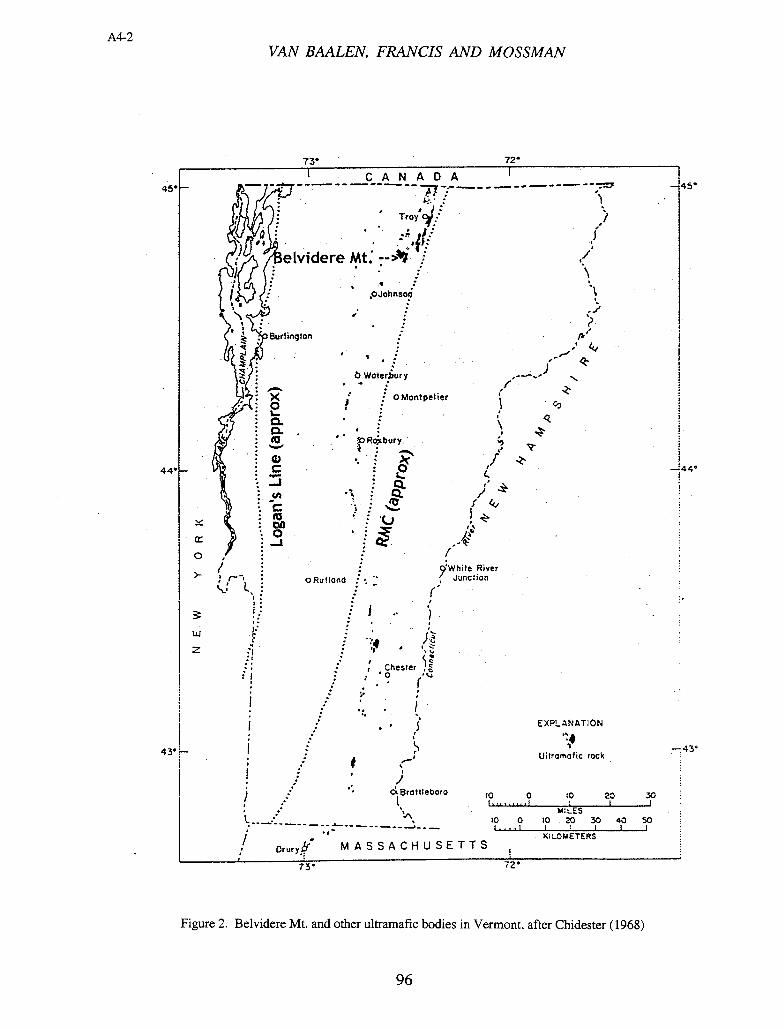
45.
430
VAN BAALEN, FRANCIS AND MOSSMAN
73• - 72
'CANADA
.•/ L(1A a
Troy
elvidere Mt: >i
(4 ,OJohnso \
• : Burlington I
'.1 bWaterury
OMontpelter
1c
CL CL
• to Rbury.
• . .z
6
I k. I
• to •.
cr (3
9White River
L. ORuflond ' Junction
(
/
•; :
Chesier
I / •
:
I • EXPLN8TION
/I
,....' Ijitromafic rock
I j dirottteooro 1 0
20 ...? 3°
/ too
M:LES to
/ Drury MASSAC HUSETTS
XILOMETERS
A4-2
Figure 2. Belvidere Mt. and other ultramafic bodies in Vermont, after Chidester (1968)
ali
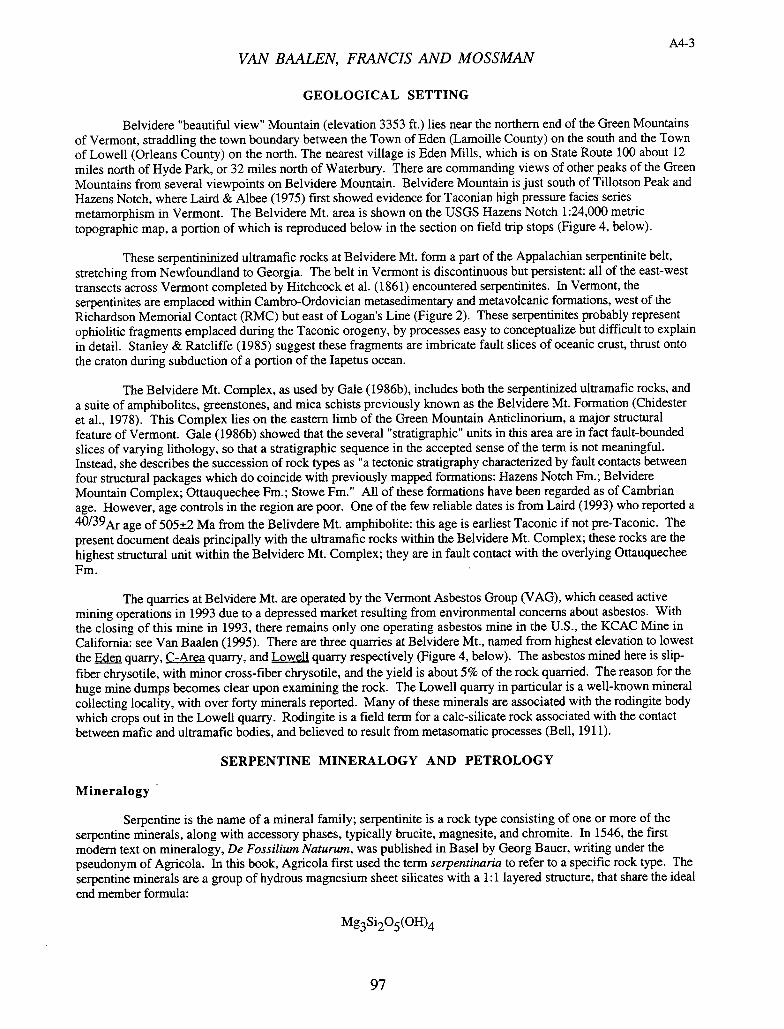
A4-3 VAN BAALEN, FRANCIS AND MOSSMAN
GEOLOGICAL SETTING
Belvidere 'beautiful view" Mountain (elevation 3353 ft.) lies near the northern end of the Green Mountains of Vermont, straddling the town boundary between the Town of Eden (Lamoille County) on the south and the Town of Lowell (Orleans County) on the north. The nearest village is Eden Mills, which is on State Route 100 about 12 miles north of Hyde Park, or 32 miles north of Waterbury. There are commanding views of other peaks of the Green Mountains from several viewpoints on Belvidere Mountain. Belvidere Mountain is just south of Tillotson Peak and Hazens Notch, where Laird & Albee (1975) first showed evidence for Taconian high pressure facies series metamorphism in Vermont. The Belvidere Mt. area is shown on the USGS Hazens Notch 1:24,000 metric topographic map, a portion of which is reproduced below in the section on field trip stops (Figure 4, below).
These serpentininized ultramafic rocks at Belvidere Mt. form a part of the Appalachian serpentinite belt, stretching from Newfoundland to Georgia. The belt in Vermont is discontinuous but persistent: all of the east-west transects across Vermont completed by Hitchcock et al. (1861) encountered serpentinites. In Vermont, the serpentinites are emplaced within Cambro-Ordovician metasedimentary and metavolcanic formations, west of the Richardson Memorial Contact (RMC) but east of Logan's Line (Figure 2). These serpentinites probably represent ophiolitic fragments emplaced during the Taconic orogeny, by processes easy to conceptualize but difficult to explain in detail. Stanley & Ratcliffe (1985) suggest these fragments are imbricate fault slices of oceanic crust, thrust onto the craton during subduction of a portion of the Japetus ocean.
The Belvidere Mt. Complex, as used by Gale (1986b), includes both the serpentinized ultramafic rocks, and a suite of amphibolites, greenstones, and mica schists previously known as the Belvidere Mt. Formation (Chidester et al., 1978). This Complex lies on the eastern limb of the Green Mountain Anticlinorium, a major structural feature of Vermont. Gale (1986b) showed that the several "stratigraphic" units in this area are in fact fault-bounded slices of varying lithology, so that a stratigraphic sequence in the accepted sense of the term is not meaningful. Instead, she describes the succession of rock types as "a tectonic stratigraphy characterized by fault contacts between four structural packages which do coincide with previously mapped formations: Hazens Notch Fm.; Belvidere Mountain Complex; Ottauquechee Fm.; Stowe Fm." All of these formations have been regarded as of Cambrian age. However, age controls in the region are poor. One of the few reliable dates is from Laird (1993) who reported a
age of 505±2 Ma from the Belivdere Mt. amphibolite: this age is earliest Taconic if not pre-Taconic. The present document deals principally with the ultramafic rocks within the Belvidere Mt. Complex; these rocks are the highest structural unit within the Belvidere Mt. Complex; they are in fault contact with the overlying Ottauquechee Fm.
The quarries at Belvidere Mt. are operated by the Vermont Asbestos Group (VAG), which ceased active mining operations in 1993 due to a depressed market resulting from environmental concerns about asbestos. With the closing of this mine in 1993, there remains only one operating asbestos mine in the U.S., the KCAC Mine in California: see Van Baalen (1995). There are three quarries at Belvidere Mt., named from highest elevation to lowest the En quarry, C-Area quarry, and Lowell quarry respectively (Figure 4, below). The asbestos mined here is slip-fiber chrysotile, with minor cross-fiber chrysotile, and the yield is about 5% of the rock quarried. The reason for the huge mine dumps becomes clear upon examining the rock. The Lowell quarry in particular is a well-known mineral collecting locality, with over forty minerals reported. Many of these minerals are associated with the rodingite body which crops out in the Lowell quarry. Rodingite is a field term for a calc-silicate rock associated with the contact between mafic and ultramafic bodies, and believed to result from metasomatic processes (Bell, 1911).
SERPENTINE MINERALOGY AND PETROLOGY
Mineralogy
Serpentine is the name of a mineral family; serpentinite is a rock type consisting of one or more of the serpentine minerals, along with accessory phases, typically brucite, magnesite, and chromite. In 1546, the first modern text on mineralogy, De Fossilium Naturum, was published in Basel by Georg Bauer, writing under the pseudonym of Agricola. In this book, Agricola first used the term serpentinaria to refer to a specific rock type. The serpentine minerals are a group of hydrous magnesium sheet silicates with a 1:1 layered structure, that share the ideal end member formula:
Mg3Si2O5(OH)4
ZM
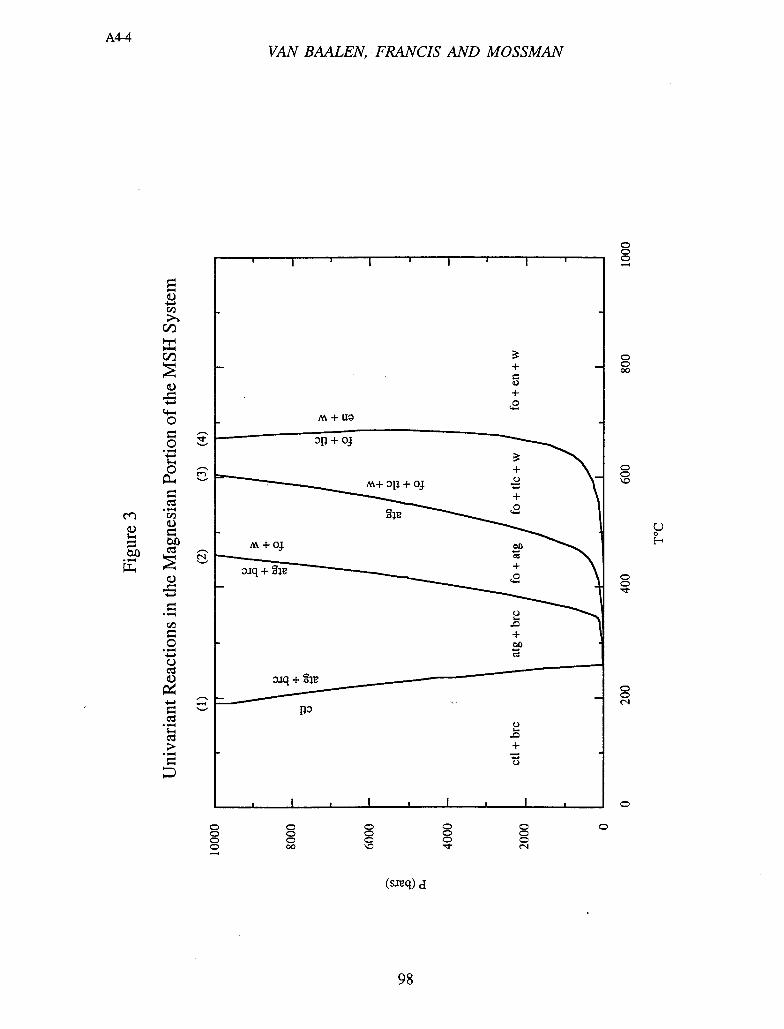
I I
+
+
M+D+oJ
M+OJ
CD C C C C 0 0 0 0 C 0 0 0 0 0 o 00 '0
C C 0
C 0
L
0 0 H
C C
C 0
0
C
L)
Ia-)
4- C
o
o
rA
cz
C
0 '1.)
I .
• —
VAN BAALEN, FRANCIS AND MOSSMAN A
(s.iq) d
VAN BAALEN, FRANCIS AND MOSSMAN
These minerals share common structural features and overlap substantially in composition space. The most common members of the group worldwide are lizardite, antigonte and chrysotile, in decreasing order of abundance (Wicks & OHanley, 1988). At Belvidere Mt., however, antigorite is most abundant. These three principal serpentine minerals were at one time considered polymorphs, but current research suggests this is not necessarily true. A necessary condition for the serpentine minerals to be true polymorphs is that they be chemically identical: it is now clear that lizardite, antigorite and chrysotile are not chemically identical. Each occupies a compositional range, and these ranges partially overlap (OHariley, 1996).
Phase Relations
Phase relations among serpentine minerals are difficult to show schematically and are not completely understood. In general, lizardite and chrysotile are the low temperature phases; antigorite is the high temperature phase (see Van Baalen, 1995, for a discussion of some complications). The stability field of lizardite probably extends to higher temperatures than that of chrysotile, due to ionic substitutions of Al and Fe (OHanley et al., 1989). The presence of lizardite and antigorite in blueschist facies serpentinites suggests these two phases are the stable high pressure phases. Reversed experiments showing the above relationships remain to be done; no reliable thermochemical data for lizardite have been published. The stability field of antigorite extends to higher temperatures than that of the other serpentine minerals - in this sense it is the high T 'polymorph. Antigorite does not commonly form as a retrograde alteration product of olivine; rather it generally forms as a prograde metamorphic product, together with brucite, after pre-existing lizardite and chrysotile, according to the endothermic reaction:
17Mg3Si2O5 (OH)4 = M948Si34085(OH)62 + 3Mg(OH)2 (1)
chrysotile antigorite brucite
One of the unexpected phenomena associated with serpentinites is that during hydration of peridotite at low temperatures, antigorite rarely forms; instead one sees lizardite or chrysotile. On the other hand, dehydration of a serpentinite by progressive metamorphism produces antigorite, which eventually dehydrates with rising temperature to form olivine. Why does hydration of olivine not produce antigorite? One possible explanation has to do with the relationship between H2O and Ptota.j. Sanford (1981) proposed that the lower limit of the antigorite stability field
may be bypassed during serpentinization when PH20 <pt0ti typical of infiltration of water along cracks at shallow
depths, while antigorite is stabilized during prograde metamorphism of serpentinites when PH20 = 1ntaI Sanfords
model did not, however, consider the formation of lizardite versus chrysotile.
Styles of Serpentinization
Our understanding of the serpentimzation process has increased greatly in recent years, but some aspects remain controversial. Labotka & Albee (1979), in a study at Belvidere Mt., found evidence for introduction of silica from the country rock during hydration, but no migration of magnesia into the country rock. O'Hanley (1992) in a general discussion of kernel textures, argued for volume increases but against metasomatism of silica and magnesia during typical serpentinization events. Nearly all workers agree that fluid flow along veins and fractures is the chief method of introducing the fluids needed for the hydration reactions. Dunite and harzburgite tend to fracture differently; thus the style of serpentinization of these ultramafic rocks differs. Serpentine formed after dunite often has a knobby outcrop texture formed by intersecting serpentine/brucite veins that isolate rounded kernels of unserpentinized dunite. Development of the intersecting veining is aided by the relatively isotropic fracture behavior of dunite - there is no preferred direction for vein development. Serpentine formed after harzburgite often has a slabby texture, and the serpentinized rock fractures, leaving sharp edges rather than the rounded kernels of serpentinized dumte. Two aspects of harzburgite are responsible for this difference - mineralogy and fabric. Harzburgite differs from dunite in having significant amounts of orthopyroxene, which is frequently found in parallel layers that give the rock a banded appearance. These layers may be a primary igneous feature or may have been prduced by deformation of the harzburgite prior to serpentinization. Fractures along which serpentinizing fluids flow tend to form preferentially parallel to the layers. Examples of both styles of serpentinization exist at Belvidere Mt.
Progressive Serpentinization
Serpentine minerals most often form by hydration of minerals in ultramafic rocks, chiefly olivine and pyroxene. It is important to view the formation of serpentinites as a multi-stage process, in which early minerals
A4-6 VAN BAALEN, FRANCIS AND MOSSMAN
may recrystallize or be replaced more than once along their path from ultramafic protolith to geologists sample bag. The term progressive serpentinization is used here to describe this multi-stage process. Due to the importance of Fe and Al, discussion of serpentine phase relations in M90-Si02-H20 (MSH) alone is probably unproductive; MgO- A1203-Si02-H20 (MASH) is the simplest realistic system (OHanley, D.S., personal communication 1993). The MSH system, however, can be used as a first-order approximation for formulating phase relations between serpentine minerals and other minerals found in serpentinites. The thermal stabilities of common phase assemblages in serpentinites are limited by the univariant reactions shown in Figure 3. This figure is calculated using the TWQ2S (Berman, 1991) program with the database of Berman (1988) for the MSH system, and includes only the stable reactions for the portion of MSH in which chrysotile + brucite are the low temperature assemblage. The calculated positions of the univariant equilibria agree well with experimental evidence (Bowen & Tuttle, 1949), and field evidence (Evans et aL, 1976). The univariant reactions in MSH with a fluid phase of pure H 20 are, in addition to reaction (1):
M948Si34085(OH)62 + 20Mg(OH)2 = 34M92SiO4 + 51H20 (2) antigorite brucite forsterite
M948Si34085(OH)62 = 4Mg3Si40 10(OH)2 + 18M92SiO4 + 27H20 (3) antigorite talc forsterite
2M92SiO4 + 2Mg3Si40 10(OH)2 = lOMgSiO3 + 2H20 (4) forsterite talc enstatite
Note that the upper stability limit of chrysotile is less than 300°C at 1 bar; the univariant line has a negative slope.
At Belvidere Mt. numerous examples of progressive serpentinization are displayed. It is likely that the dominant antigorite here has formed by recrystallization under prograde conditions of earlier serpentine generation(s) dominated by lizardite; the ore-grade chrysotile has formed by recrystallization of earlier generations of serpentine under retrograde conditions and shearing stress. So in a general way we may view the antigorite as at least "second generation" and the chrysotile as at least "third or fourth generation" serpentine, relative to the anhydrous protoliths. Complicating this simple picture are the antigorite mylonites displayed at the Eden Quarry (see description of Eden Quarry below).
Implications for Regional Metamorphism
What, then, are the serpentinized rocks at Belivdere Mt. telling us about regional metamorphism? Is their story consistent with conclusions reached by Laird and coworkers about the polymetarnorphic history of Northern Vermont? The answer is that the serpentinites do speak, but softly. The record of progressive serpentinization at Belvidere Mt. is consistent with other evidence of polymetamorphism on a regional scale, but unfortunately the serpentinites do not provide any much-needed age controls on this history. Broadly speaking, we see evidence of at least four stages of serpentinization at Belivdere Mt., starting with the original hydration of an ultramafic protolith, that probably produced abundant lizardite, which is now rare at this locality. This first event may have occurred under either greenschist or blueschist facies conditions. Next came a prograde replacement of lizardite by antigorite, which now dominates the locality. This replacement occurred under somewhat higher temperature conditions, possibly upper greenschist facies. Next came an episode of shearing and recrystallization of the antigorite at relatively high temperatures, as evidenced by the healed antigorite mylonites first recognized by David O'Hanley at the Eden Quarry on a 1993 field trip. This event may or may not have coincided with the isolated production of prograde olivine with talc, caused by crossing the univariant antigorite-out reaction boundary (3) as shown in Figure 3. This prograde olivine was found in thin section (O'Hanley, personal communication, 1999) and exhibited a elongated morphology also seen in prograde olivine at New Idria, California (Van Baalen, 1995). The final stage of serpentinization occurred under retrograde, subgreenschist conditions, and resulted in the production of the economic deposits of chrysotile by replacement of antigorite. It is interesting to speculate on this timing of this last event, which was also accompanied by deformation - could it have been Acadian?
A4-7 VAN BAALEN, FRANCIS AND MOSSMAN
MINERALOGY AND MINERAL COLLECTING
Introduction
There are three asbestos quarries on Belvidere Mountain. The mine office and mill are located in the Town of Lowell at the eastern foot of Belvidere Mountain on North Road 3.7 miles north of the village of Eden Mills. The Eden quarry is located on the southeast side of the mountain at an elevation of 2300 feet in the Town of Eden. The Lowell quarry is in the Town of Lowell just northwest of the office and mill. The C-Area quarry is mostly in the Town of Eden southwest of the office and south of the Lowell quarry. The Belvidere Mountain site has been referred to as 'Eden Mills" in the literature because Eden Mills on Route 100 is the last village one passes on the way to the mine. If the specific source of a specimen is unknown, our preference for labeling is: "Belvidere Mountain quarries, Lowell, Orleans Co., Vermont".
The Belvidere Mountain quarries rate as Vermont's premier mineral locality. Although more than forty species occur as rock-forming and vein-forming minerals in the ultramafic lithologies and their contact rocks, this reputation rests firmly on the fine specimens of grossular and vesuvianite found in rodingite, a contact metasomatic rock exposed in the Lowell and C-Area quarries. Frondel (1946) first brought the Lowell quarry to the attention of mineralogists with his description of grossular and vesuvianite crystals as well as the rare species pyroaurite (second US occurrence) and artinite (third US occurrence). Grant (1968) briefly described the locality and listed 32 minerals occurring there. Chidester et al. (1978) summarized the results of a U. S. Geological Survey project on the geology of Belvidere Mountain that began in 1951. This important study includes a detailed petrographic and chemical study of 56 handsamples that was largely finished before the electron microprobe became a standard laboratory tool. Nevertheless, it is the firm foundation upon which our present and evolving understanding of mineralogy and petrology of Belvidere Mountain is built.
For many years Vermont Asbestos Group, Inc. distributed to visitors printed fact sheets that describe the history and properties of asbestos and the geology and history of mining and milling operations at Belvidere Mountain. These notes include a page comparing Grant's list of minerals reported with that of Clement Mason, quarry superintendent and guide for visiting groups. It was not uncommon for vanloads of college students to be invited to Mason's Hyde Park home to view his collection after a tour of the mine. A portion of Mason's collection acquired by the Harvard Mineralogical Museum in 1985 included many unidentified specimens. Study of these has already added aragonite, feno-axinite and xonolite to the list of species from Belvidere Mountain. The most recent description of Belvidere Mountain minerals is by Hadden (1996).
The following discussion is limited to the mineralogy of the ultramafic and contact rocks. It draws heavily on Chidester et al. (1978) [henceforth CHC], and on the Harvard collection for the minerals from the rodingites.
The primary igneous rocks preserved in the cores of the serpentinite lenses are dunite and peridotite. Dunite is almost entirely forsterite (partly serpentinized) with —2% chromite. The peridotites, which do not form mappable units, contain 5 to 10% pyroxene and thus are only marginally peridotites. The pyroxene is almost completely altered to pseudomorphs of anthophyllite, antigorite, brucite and magnetite. Primary accessories in dunite and peridotite include chromite, magnetite, and minor sulfides. Chromitite layers are not common but reach 30 cm thick in one instance. CHC noted opaques, which are yellow and white in reflected light. The former they referred to pyrite and possibly pyrrhotite and the later to sulfarsenides, probably gersdorfite, NiAsS, and possibly arsenopyrite, FeAsS. Labotka and Albee (1979) reported heazelwoodite, which has implications in terms of J02 andfS. The opaque minerals need modem study.
Picrolite is fairly widespread at Belvidere Mt. Picrolite is a field term for an apple green, columnar form of serpentine found in broad veins and fractures. Formerly, picrolite was thought to consist exclusively of the mineral antigorite, but according to O'Hanley (1996) all the serpentine minerals can assume the picrolite habit.
Along the margins of the serpentinite bodies contact metasomatic rocks formed by replacement of the adjacent amphibolite and schists. Contact rock associations include steatite, talc-carbonate rock and blackwall chlorite; rodingite and serpentine-chlorite rock; and tremolite rock with chlorite rock.
Albite NaAlSi308 pophyroblasts occur in the outer margins of blackwall in contact with albite-containing schist.
101
A4-8 VAN BAALEN, FRANCiS AND MOSSMAN
Anthophyllite (Mg,Fe)7Si8O22(OH)2 was tentative identified optically by CAC as pseudomorphs after pyroxene (augite) in peridotite.
Antigorite M93Si2O5(OH)4 is volumetrically the most important serpentine group mineral in the deposit. We'll visit an antigorite "dike" in the C-Area quarry. It forms 55— 98% of the metasomatic serpentinite reaction zone adjacent to the cross-fiber chrysotile veins studied by Lobatka and Albee (1979). The formula is also written as M948Si34085(OH)62 when it is desired to show the distinct chemistry of antigorite relative to chrysotile.
Aragonite CaCO3 occurs as late-formed crystals in cavities in veins.
Artinite M92(CO3)(OH)2.3H20 is one of many hydrous Mg carbonates that occur in fractures in serpentinites worldwide. It was identified from the Lowell quarry as white radially fibrous botryoidal crusts on slip planes in serpentine (Frondel 1946).
Augite Ca(Mg,Fe)Si206 is inferred to be the primary pyroxene in peridotite. It is mostly altered to anthophyllite?, antigorite, brucite and magnetite (CAC p. 35).
Bornite Cu5FeS4 occurs as small masses in rodingite.
Brucite Mg(OH)2 is a minor but persistent accessory. It occurs as veinlets in the selvedge of cross-fibre ore, as soft, green spindle shaped masses 5 cm long in slip-fiber asbestos, and as crystals lining pockets in serpentine.
Calcite CaCO3 is common as a late stage vein mineral in serpentinite, where its coexistence with serpentine is however metastable. Minor chrysotile may give it a columnar or coarsely fibrous structure. It is very common as late forming crystals or completely filling cavities in coarse rodingite. Specimens of grossular etc may have had enclosing calcite etched away.
Chalcocite Cu2S occurs as small black masses and crystals in rodingite.
Chalcopyrite CuFeS2 occurs as brassy masses in rodingite.
Chromite FeCr204 is a common accessory in dunite and peridotite. It may form chromitite layers to 30 cm thick. Crystals usually have a metamorphic overgrowth of low Cr magnetite. See CAC and especially Hoffman and Walker (1978).
Chrysotile M93Si2O5(OH)4 is the economic serpentine mineral in the deposit. The specific polytype(s) have not been established. Presumably most is cinochrysotile. It occurs in several forms the most obvious being as cross-fiber asbestos veins in dunite with metasomatic antigorite reaction zones between the asbestos vein and the dunite (Labotka and Albee, 1979). Unlike the spectacularly thick chrysotile veins from Quebec, cross-fibre veins at Belvidere Mountain are typically only one to two cm wide. Slip-fibre chrysotile occurs particularly in sheared serpentinite. Fibrous chrysotile also occurs in calcite veins and massive chrysotile occurs in the serpentinite.
Clinochiore (chlorite) (Mg,Fe)6(Si,Al)4010(OH)8 is the primary constituent of blackwall and serpentine-chlorite contact rocks. Very fine euhedral crystals of dark green to almost colorless clinochlore occur in chlorite-calcite-magnetite veins and in cavities in rodingite. Frondel (1946) used the now obsolete name "leuchtenbergite" in reference to iron-free clinochlore.
Clinozoisite Ca2(AI,Fe)3(SiO4)3(OH) Both clinozoisite and epidote occur as fine crystals enclosed in calcite in rodingite, particularly in the C-Area quarry.
Copper Cu is a rare member of the copper sulfide assemblage in rodingite.
Diopside CaMgSi206 is an abundant constituent of rodingite with fine colorless to pale green crystals in cavities.
102
A4-9 VAN BAALEN, FRANCIS AND MOSSMAN
Enstatite (Mg,Fe)SiO3 is an orthopyroxene found as relict crystals in the cores of serpentinized bastite grains. Bastite, in turn, is a field term for pseudomorphic replacement of pyroxene by serpentine.
Epidote Ca2(Fe,Al)3(SiO4)3(OH) Both clinozoisite and epidote occur as fine bladed to prismatic crystals in cavities, particularly in the C-Area quarry.
Ferro-axinite Ca2FeAl2(BO30H)(SiO4)3 was identified by XRD (Pitman, Francis & Lange, 1996) on a single specimen associated with epidote and chrysotile.
Fluorapatite Ca5(PO4)3F was recently collected from the C-Area quarry as colorless transparent hexagonal tablets.
Forsterite (olivine) (Mg,Fe)2SiO4 is the most abundant constituent of dunite and peridotite. Generally fine- grained but CAC noted a 3x2 cm crystal! Optical data by CAC indicate a very low iron content. Microprobe analyses by Labotka and Albee (1979) yield a composition of Fo93
Graphite C is a fine-grained rock-forming mineral. We'll examine a graphitic serpentinite in the C-Area quarry.
Grossular Ca3AI2(SiO4)3 Reddish brown gemmy dodecahedrons ("essonite" or " hessonite") to 2 cm in diameter from rodingite are famous. They have been studied by Azikuki (1984) who misreported the occurrence as "Eden Hill." An analysis by Allen and Buseck(1988) show only slight amounts of iron and hydroxyl. Unlike the calcium garnets from some other rodingites, these are not hydrogrossular. Garnets colored deep green have been labeled uvarovite but by analogy to those from Quebec analyzed by Dunn (1978) are likely chromian grossulars.
Heazlewoodite Ni3S2 containing minor Co, Fe and Mg is a primary mineral in dunite (Labotka and Albee, 1979).
Ilmenite FeTiO3 Present in the chlorite-serpentine and blackwall contact rocks. It is replace successively by rutile and titanite.
Kaolinite Al2Si2O5(OH)4 A massive clay mineral sometimes fills cavities in rodingite. Identification requires verification.
Lizardite M93Si2O5(OH)4 is the least common of the serpentine minerals at Belvidere Mountain.
Magnesite MgCO3 Pophyroblasts to 3 cm in talc-carbonate rock.
Magnetite FeFe204 is a ubiquitous accessory in the ultramafic rocks as mantles on chromite, dispersed throughout serpentinite and pure masses in chlonte-calcite-magnetite veins. It is sufficiently abundant in cross-fiber chrysotile veins that they are magnetic!
Malachite Cu2CO3(OH)2 Green alteration of copper sulfides in rodingite. Identification requires verification.
Prehnite Ca2Al2Si3O 10(OH)2 was recognized by Frondel (1946) as white (i.e. iron-free) crystal aggregates in cavities in rodingite.
Pyrite FeS2 is rare. Cubes to 3mm occur on one specimen in rodingite.
Pyroaurite M96Fe2CO3(OH) 16 41120 was identified from the Lowell quarry by Frondel (1946) as brown fibrous patches in slip-fiber chrysotile. Probably much more common than presently realized.
Rutile Ti02 Minor rock-forming mineral in blackwall and other contact rocks.
Silver Ag A minor member of the copper sulfide assemblage in rodingite.
103
A4-10 VAN BAALEN, FRANCIS AND MOSSMAN
Talc M93Si4O10(OH)2 Fine-grained essential constituent of steatite and talc-carbonate rock.
Titanite (sphene) CaTiSi05 is a minor rock-forming mineral in blackwall and other contact rocks.
Tremolite Ca2Mg5Si8O2(OH)2 is a rock-forming mineral in tremolite contact rock between steatite and blackwall.
Vesuvianite (idocrase) Ca10M92Al4(SiO4)5(Si07)2(OH)4 occurs as a massive green constituent of rodingite and as fine lustrous crystals to several cm. Occasionally, it is brown due to titanium. A lovely crystal in the Harvard micromount collection is brown with green tips at each end!
Xonolite Ca6Si6O7(OH)2 occurs as white fibers on massive gray fine-grained rodingite.
HISTORY
This history was compiled primarily from various Reports of the State Geologist of the Mineral Industries and Geology of Certain Areas of Vermont. Anecdotal histories (e.g. Dann, 1988; Hadden, 1996) credit the discovery of asbestos at Belvidere Mountain to unidentified French Canadian loggers in 1892. Judge Melvin E. Tucker of Hyde Park who had extensive lumber interests in the region undertook serious prospecting and discovered an asbestos deposit on the east side of Belvidere Mountain on November 9, 1899. Operating as the Tucker Asbestos Company, he opened prospects in 1900 that eventually became the Lowell quarry. That same year B. B. Black discovered the asbestos deposit on the southeast side of Belvidere Mountain which was opened by the New England Mining and Milling Company of Fall River, Massachusetts. This became known as the Eden quarry. The United States Asbestos Company, the National Mining and Development Company, and the Lamoille Asbestos Company explored the properties to the east. All of the prospects or quarries were open cuts on steep outcrops of serpentimte showing asbestos. Cross-fiber asbestos was only abundant in the Tucker property in Lowell. Slip-fiber asbestos dominated in the New England Mining and Milling Company and the National Mining and Development Company prospects in Eden. Only the New England Mining and Milling Company, which leased 90 acres for 198 years, really made a substantial investment ($90,000) in mining. A three story mill was built in 1901 and mining commenced in May 1902 only to cease that October. By 1904 the State Geologist reported that all asbestos mining on Belvidere Mountain had stopped.
Mining resumed by 1908. The Tucker prospects on Belvidere Mountain were acquired by the Lowell Lumber and Asbestos Company, later referred to as The Chrysotile Asbestos Corporation, was managed by William G. Gallagher. A small village called Chrysotile grew up around the mill; this mill is described as being 158 x 36 feet and several stories high with a capacity for crushing fifty tons of rock per day that yielded ten tons of fiber. About 2,000 tons of all six grades of asbestos were produced in 1909. By 1920 the Gallagher mine was idle.
The New England Mining and Milling Company's quarry in Eden was in litigation until 1919 when the Asbestos Corporation of America, capitalized at $1,500,000, was formed to take over this and adjacent properties. An enthusiastic description of the effort to reopen the Eden quarry appears in the State Geologist's Report for 19 19-1920. However, this attempt to mine asbestos also failed and the property again fell into litigation. In 1929 the Vermont Asbestos Corporation was formed and produced 1,170 short tons of asbestos from the Eden quarry. Finally, asbestos mining on Belvidere Mountain, which had been an intermittent activity since the beginning of the century, became profitable and continuous.
On February 5, 1936 the Vermont Asbestos Corporation sold its property, plant and equipment to a subsidiary of the Ruberoid Company, which retained the name Vermont Asbestos Corporation and expanded by purchasing the Gallagher property. All of the asbestos properties were now under a single effective management. Following an extensive exploration program the Lowell quarry was opened in April 1944 which obliterated the old Gallagher quarry. Initially ore from the Lowell quarry was carried up to the processing plant at the Eden quarry via an aerial tramway. A new mill was later constructed adjacent to the new quarry. Operations at the Eden quarry had entirely ceased by 1949. The C-Area quarry was developed south of the Lowell quarry in 1953.
Ruberoid Company merged with General Analine Film Corporation in 1967 and shortened its name to GAP Corporation. During this period public awareness of the association between exposure to asbestos and lung cancer grew and became very controversial. In 1974 GAP Corporation announced its intention to close the mining and
104
A4-11 VAN BAALEN, FRANCIS AND MOSSMAN
milling operations rather than come into compliance with new Environmental Protection Agency regulations. In response, mine employees formed Vermont Asbestos Group, Inc. and on March 12, 1975 purchased the mine from GAF Corporation thereby becoming the nation's largest employee-owned business. Although VAG closed the mine in June 1993, the quarries remain accessible and scientific understanding of this deposit continues to grow!
CHRYSOTILE ASBESTOS AND HEALTH
The asbestos minerals (chrysotile and asbestiform amphiboles) are infamous in the the causation of lung cancer, asbestosis (a nonmalignant disease where scarring of the lung occurs leading to lung stiffening, impaired gas exchange and death in some workers), and mesothelioma (a tumor arising in the cells lining the chest wall) in occupational settings. Asbestos fibers in ores are not respirable until they are released and become airborne during mining, milling and processing. They then are inhaled and may accumulate in the lung over time if they are of respirable dimensions, i.e. generally 10 microns or less in aerodynamic diameter. Since many studies suggest that chrysotile is less potent in disease causation vs. certain members of the amphibole class, i.e. crocidolite and amosite, several theories have emerged to explain the different biologic potential of chrysotile fibers (Mossman et al., 1990; Guthrie and Mossman, 1993; Alleman and Mossman, 1997). One theory is that the curly fibrillâr bundles of chrysotile asbestos, as opposed to the straight, rod-like amphibole fibers, are intercepted in regions of airway branching, are more effectively cleared from the respiratory tract, and are less apt to enter the deep lung. Other studies show that the biopersistence of chrysotile asbestos fibers is less in the lung or in simulated lung environments than the more durable amphibole fibers because chrysotile fibers tend to dissolve or be leached over time. In addition, iron-containing amphiboles may serve as catalysts for the formation of active oxygen species (AOS) which damage lung cells, cause inflammation, and promote lung disease.
There are no published data in the medical literature on the epidemiology of the miners at Belvidere Mt., and apparently no law suits have been filed on behalf of any miners who might have acquired asbestos-associated diseases. However, the lack of reports brings up the controversial question, "does exposure to pure chrysotile cause mesothelioma or lung cancer?" The latter issue is difficult to address since a confounding factor in lung cancer is smoking, and the vast majority of miners and asbestos workers were smokers, regardless of the cohort. Studies in general, regardless of asbestos type, suggest that smoking is a far more potent risk factor than asbestos when these factors are considered individually, but asbestos workers who smoke have a multiplicative or additive risk in comparison to risk from smoking alone. Whether chrysotile uncontaminated with amphiboles gives rise to mesothelioma is also a subject of controversy, primarily based upon study of the Quebec chrysotile miners (McDonald and McDonald, 1996, McDonald et al., 1997). Of this cohort of approximately 11,000 men, an estimated 38 have died of mesothelioma i.e. very low numbers proportionately in comparison to amphibole-exposed cohorts. These cases were restricted to areas in which chrysotile was contaminated with tremolite asbestos or crocidolite was also processed in the mills. The presence of amphibole fibers in the lungs of these patients confirms that they were exposed to multiple types of asbestos. The lack of reported mesotheliomas in the Vermont miners may be important in validating the hypothesis that exposures to "pure" chrysotile may not result in the development of mesothelioma.
A proposed EPA ban on all types of asbestos was lifted in 1991, but the public perception of asbestos, which is often guided by sensationalism rather than science, is unlikely to result in increased use of asbestos fibers in the future. The occupational and environmental regulation of asbestos by U.S. governmental agencies, which regulate the asbestos group as a whole rather than by individual types, stands in contrast to policies in most countries. Whether or not nonoccupational exposure to asbestos, especially chrysotile, which constitutes the majority of fibers in buildings and schools, causes increased risks of lung diseases, is a controversial topic. However, current levels of airborne asbestos fibers, even in buildings with friable asbestos contamination, are miniscule compared to the levels associated with disease causation in past occupational settings. Moreover, the predicted rates of future deaths associated with indoor and outdoor exposures to asbestos are low, comparable to many everyday health risks, and extremely small in comparison to risks associated with smoking and alcohol abuse (Health Effects Institute, 1991). A critical question now being addressed is whether synthetic substitutes for asbestos fibers can fulfill many of the attributes of asbestos in industrial applications while providing less of a risk to human health.
105
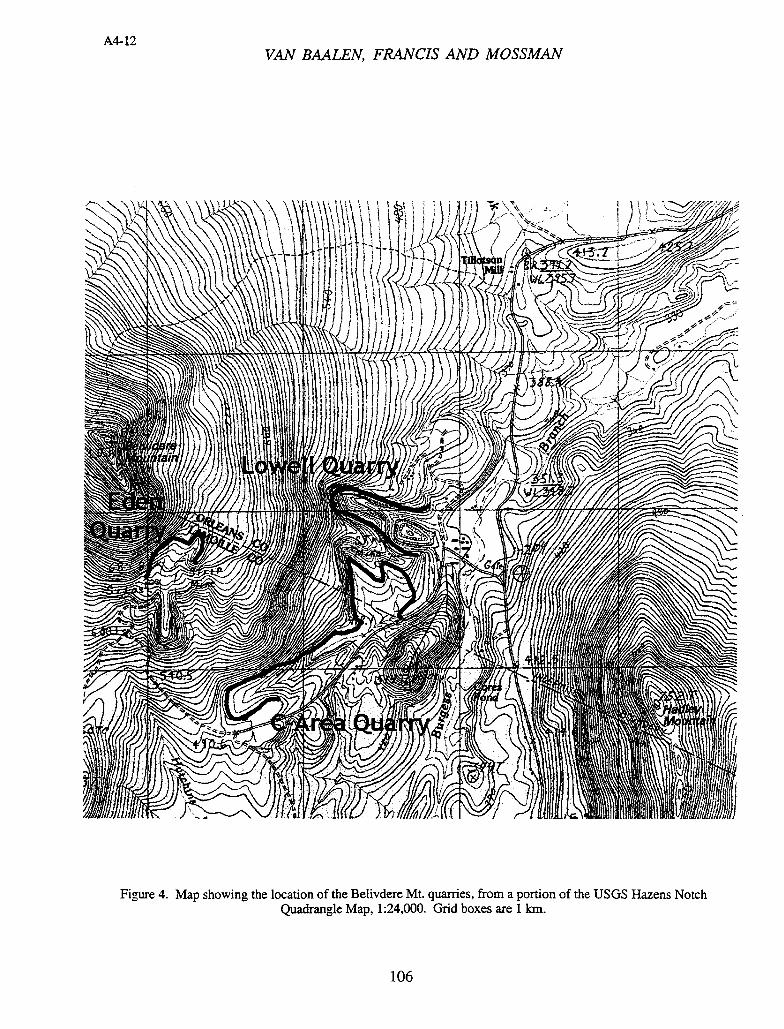
A4-12 VAN BAALEN, FRANCIS AND MOSSMAN
Figure 4. Map showing the location of the Belivdere Mt. quarries, from a portion of the USGS Hazens Notch Quadrangle Map, 1:24,000. Grid boxes are 1 km.
106
A4- 13 VAN BAALEN, FRANCIS AND MOSSMAN
FIELD TRIP STOPS
NEIGC 1999 Meeting
Meeting Time and Place for NEIGC field trip A4, October 1, 1999:
Uncle Bills Diner, Eden, VT, at 8:30 a.m. The diner is on State Route 100, just 2 miles south of its intersection with Route 118 in Eden. From here, drive north 2 miles on Route 100 to Eden Mills, with its General Store on the left.
Starting from the parking lot of the general store in Eden Mills, Vermont, bear left and proceed north on North Rd. about 3.7 miles to the gate for the VAG mine. There are views of the mountain (3353 ft.) and the mine dumps along this road. The gate is locked and a key is necessary. As of this writing, Mr. Elvern Jones of North Road, Eden Mills, is the one to ask about access (802-635-2508). Once inside the VAG property, a large mine dump is visible to the right (north). An even larger dump, with conveyer belt, is visible to the left (south). Straight ahead (west) the headwall of the Lowell quarry can be seen.
Eden Quarry
At a T junction next to the mill building, a good quality gravel mine road goes left, uphill towards the C-Area and Eden quarries. There are several turnoffs on the right along this road which lead to various levels of the C-Area quarry. There is a chain across the road which may require a second key to pass, and the road continues uphill, taking a right fork towards the Eden quarry. As of this writing, the road is passable with a high clearance vehicle as far as the dumps for the Eden quarry, just below two concrete silos. Total distance to this point from the T junction at the mill below, is about 2 miles. Uphill from here the road is in bad shape, but a five minute hike reaches the floor of the Eden quarry, with its spectacular view to the south along the spine of the Green Mountains.
The Eden quarry has not been worked for many years, and so is the most stable of the quarries to be visited. Even so, there is the possibility of falling rock and caution is advised. An small inselberg at the quarry entrance has convenient exposures of slip fiber asbestos. The west wall of the quarry, perhaps 100 ft. high, shows different styles of serpentinization on a grand scale. Dunite-rich areas tend to form spheroidal masses in which cores of dumte are isolated by numerous intersecting fractures. Harzburgite-rich areas tend to form slabby masses in which fracture planes are sub-parallel. Picrolite is found in these fractures. On the east wall of the quarry, small pods or layers of chromite are visible. Mylonites with lemon-sized clasts are displayed. As noted previously, David O'Hanley first recognized the significance of these mylonites during a 1993 field trip to Belvidere Mt. (see previous section on regional metamorphism) The serpentinization process at Belvidere Mt. has resulted in a range of alteration of the ultramafic protolith: Chidester et al. use 'dunite" as a field term for a partially serpentinized rock retaining its igneous texture, in which at least one-third of the olivine and pyroxene remain. "Serpentinite" includes rocks more than two-thirds serpentinized. The serpentinites in turn may be massive or sheared.
At the western margin of the quarry is a contact with the Belvidere Mt. arnphibolite, as shown on Chidester et al.'s map. Taking the trail from the east side of the quarry around to the north, one finds increasingly sheared and mylonitized serpentinite as the contact nears. Boulders of amphibolite, which have tumbled down from the cliffs above, are also in evidence. The actual contact is approximately at the tree line here, not easy to find. According to the map, scaling the cliff at the very southern end of the quarry might lead to a place where the contact is exposed. However, a recent attempt to find this contact led to struggles in dense undergrowth.
C-Area quarry
Returning downhill from the Eden Quarry, going back through the chain mentioned above, one comes to the large C-Area quarry, the site of the most recent mining operations at Belvidere Mt. Turn off the road at telephone pole #45, which has a power transformer, and drive west onto the quarry floor. **Caution** There is much loose rock in this quarry. Look up to see what is over your head before approaching any quarry faces.
On the north wall of the quarry, here perhaps 100 ft. high, is a vertical structure which resembles a dike. It is about 25 ft. wide and brown weathering; the rock in places rings like phonolite when struck with a hammer. It is massive antigorite, having in thin section an interpenetrating texture. To the left of this dike" is variably foliated, green serpentinite with abundant slip fiber asbestos. Immediately to the right of this "dike" is a vertical fault, to the right
107
A4-14 VAN BAALEN, FRANCIS AND MOSSMAN
of which is a dark green, strongly sheared, graphitic serpentinite. It is worth considering the source of the graphite here: at least one of us (MVB) believes the graphite has been precipitated in fluids moving up along a fault zone from a carbonaceous source in the underlying Hazens Notch or overlying Ottaquechee Formation. The sheared graphitic serpentinite grades to the right into massive serpentinite, lacking in cross or slip fiber asbestos. Clearly mining in this quarry results in variable yields of the desired asbestos.
Turning around and facing the lower south wall of the quarry, it is clear that some of the structural features on the north wall project across the quarry, while others do not. Graphitic serpentinite is not abundant on the south wall. The orientation of the foliation also rotates to the southwest and the dip flattens out, suggesting an open fold pattern. In general, however, much of the apparent structural variation within the serpentinite is inconsistent and chaotic, as semi-rigid blocks rotate against each other during the progress of serpentinization under tectonic stresses.
Lowell Quarry
Proceeding down the mine road from the C-Area quarry, one returns to the vicinity of the mill and the T intersection encountered upon entry to the mine property. Continuing a short distance straight ahead (north) from the T, the building on the left is the jaw crusher, with the Lowell quarry visible to the west. Turn in by the crusher and park within sight of the quarry pond. Continue on foot along a bench to the north of the pond, with cliffs to the right exposing Hazens Notch Formation, here consisting of non-graphitic mafic schist and albite gneiss. The contact between this schist and the serpentinite is opposite the west end of the quarry pond. This contact is also strongly sheared on the serpentinite side. Scramble up the talus slope to the quarry floor, using caution. Here too there is loose rock, especially near the small waterfall, so Heads Up!
The quarry floor of the Lowell quarry is a large flat area with several levels of benches above continuing up about 200-300 ft. This quarry has not been worked in recent years. As in the Eden quarry, a variety of styles of serpentimzation are exposed in the quarry walls. At the west end of the quarry a vertical amphibolite dike is exposed, with a rodingite zone to the left of the dike. In the quarry floor two shallow pits have been excavated by back hoe, exposing more of the rodingite zone.
Rodingites are named for exposures along the Roding River in New Zealand (Bell et al., 1911). As originally described the term referred to a metasomatized contact between mafic gabbro dikes and ultramafic host rock. The characteristic rodingite minerals are grossular garnet and diopside. Here at the Lowell quarry the same two characteristic minerals are seen in the two shallow pits, along with green vesuvianite and white prehnite. One of the pits exposes vesuvianite-rich rock of a green color, while the other exposes garnet-rich rock which is red. It is difficult to see the context of these zones because all of the contacts are buried. Continuing to the west wall of the quarry, and scrambling over the talus slope, one comes to the amphibolite dike with rodingite zone to the left. Here the rodingite zone is massive, cream colored diopside-garnet rock, fractured horizontally and occasionally compositionally zoned with vertical bands. The classical concept of rodingites involves calcium metasomatism, with calcium released from clinopyroxene during the process of serpentinization.
To the left of the rodingite zone the dark green serpentinite is strongly sheared, grading into somewhat more massive serpentinite further from the contact. At the rodingite-serpentinite contact is a dark grey granular rock consisting of garnet, diopside, and chlorite. The sheared serpentinite contains an undulating foliation marked by stringers of magnetite and graphite, plus ribbons of chlorite. The more massive serpentinite farther to the left has lizardite and chrysotile in a pseudomorphic texture after harzburgite, with relict Opx crystals preserved in the cores of bastites. This observation, and similar observations in the other quarries, suggest that peridotite may be more abundant at Belvidere Mt. than previously supposed. Here too are stringers of magnetite and graphite (?). The amphibolite to the right of the rodingite zone consists of hornblende, epidote, plag, garnet, clinopyroxene, abundant sphene frequently rimming cores of ilmenite, and possibly zircon as high relief inclusions in the homblende. This coarse grained amphibolite is distinct from a fine grained version at the contact with the serpentinite. The mineralogy of the fine grained member is similar, but with the addition of crosscutting quartz veins.
Finally, in the talus at the base of a small face 50 ft. to the left of the rodingite body, are found rectangular blocks of white, fibrous calcite. The blocks are a few inches long and have a greasy feel.
As mentioned in the introduction, active mining operations at the VAG mine ceased in 1993, and this locality has an uncertain future as a field trip destination.
A4- 15 VAN BAALEN, FRANCiS AND MOSSMAN
ACKNOWLEDGEMENTS
The authors are appreciative of the efforts of Barry Doolan and his coworkers for organizing this year's NEIGC meeting. Additionally, we thank Wally Bothner, Jo Laird, Marjorie Gale, Dave O'Hanley, Mac Ross and Walt Trzcienski for encouragement and helpful discussions over the years that have helped to develop the ideas expressed here.
REFERENCES
Akizuki, M., 1984, Origin of optical variations in grossular-andradite garnet: American Mineralogist, 69, 328-338.
Albee, A.L., 1957, Bedrock Geology of the Hyde Park Quadrangle. USGS Quadrangle Map GQ 0102.
Allen, F. M., and Buseck, P. R., 1988, XRD, FTIR, and TEM studies of optically anisotropic grossular garnets: American Mineralogist, 73, 568-584.
Alleman, J.E. & Mossman, B.T. 1997, Asbestos revisited. Scientific American 277, No. 1 pp. 54-57.
Bell, J.M. et al., 1911, The geology of the Dun Mountain subdivision, Nelson. N.Z. Geological Survey Bull. 12, pp. 29-40.
Berman, R.G., 1988, Internally-consistent thermodynamic data for minerals in the system Na 2O-K20-CaO-MgO-FeO-Fe203-A1203-Si02-Ti02-H20-0O2. Jour. Pet., 29, pp. 445-522.
Berman, R.G., 1991, Thermobarometry using multiequilibrium calculations: a new technique with petrologic applications. Can. Mm., 29, pp. 833-855.
Bowen, N.L. & Tuttle, O.F., 1949, The system MgO-Si0 2-H20. Geo. Soc. Am. Bull., 80, pp. 1947-1960.
Bothner, W.A., & Laird, J., 1991, lapetan crustal edges and the preservation of high-pressure metamorphism in Vermont: Geological Society of America, Abstracts with Programs, 23, p. 10 .
Cady, W.M., Albee, A.L. & Chidester, A.H., 1963, Bedrock geology and asbestos deposits of the upper Mississquoi Valley and vicinity. USGS Bulletin. 1122-B, 78 pp.
Chidester, A.H., Albee, A.L. & Cady, W.M., 1978, Petrology, structure, and genesis of the asbestos-bearing ultramafic rocks of the Belvidere Mt. area in Vermont. USGS Prof. Paper 1016, 95 pp.
Chidester, A.H., 1968, Evolution of the Ultramafic Complexes of Northwestern New England. in Zen, E.A., Hadley, J.B., White, R.S. and Thompson, J.B., Jr., eds., Studies of Appalachian Geology, northern and maritime. Interscience Publishers, New York.
Chidester, A.H., 1961, Economic geology of the Belvidere Mountain asbestos area. New England Intercollegiate Geological Congress 1961 Field Trip Guide, trip B-i. 3 pp. with map.
Dann, K.T., 1988, Traces on the Appalachians. Rutgers Univ. Press., 159 pp.
Doll, C.G., Cady, W.M., Thompson, J.B., Jr. and Billings, M.P., 1961, Centennial geologic map of Vermont. Montpelier, Vermont Geol. Survey, 1:250,000.
Dunn, P. J., 1978, On the composition of some Canadian garnets: Canadian Mineralogist, 16, 205-206.
Evans, B.W., Johannes, W., Oterdoom, H. & Trommsdorff, V., 1976, Stability of chrysotile and antigonte in the serpentinite multisystem. Schweiz. Mm. Pet. Mitt., 56, pp. 79-93.
FEI
A4-16 VAN BAALEN, FRANCIS AND MOSSMAN
Frondel, C., 1946, Minerals from a Vermont asbestos quarry. Rocks and Minerals, 21, no. 8, (whole no. 181), p. 490.
Gale, M.H., 1980, Geology of the Belvidere Mt. complex, Eden and Lowell, Vt. USGS Open File Rept. 80-978, 169 pp. (microfiche)
Gale, M.H., 1986a, Geologic map of the Belivdere Mt. area, Eden and Lowell, Vermont. USGS Misc. Investigation. Series, 1-1560, 1:24,000.
Gale, M.H., 1986b, Geology of the Belvidere Mountain Complex, Eden and Lowell, Vermont. M.S. Thesis, University of Vermont, Burlington, VT., 169 pp.
Grant, R. W., 1968, Mineral collecting in Vermont: Vermont Geological Survey Special Publication 2, 49p.
Guthrie, G.D. & Mossman, B.T., eds., 1993, Health Effects of Mineral Dusts. Mineralogical Society of America, Reviews In Mineralogy, 28, 584 pp.
Hadden, S. H., 1996, Minerals of the quarries of Lowell-Eden, Vermont: Rocks & Minerals, 71, 236-244.
Hitchcock, E., et al., 1861, Report on the Geology of Vermont - descriptive, theoretical, economical, and scenographical. Claremont, N.H., Claremont Mfg. Co. 2 volumes.
Hoffman, M. A., and Walker, D., 1978, Textural and chemical variation of olivine and chrome spinel in the East Dover ultramafic bodies, south-central Vermont: Geological Society of America Bulletin, 89, 699-710.
Labotka, T.C. & Albee, A.L., 1979, Serpentinization of the Belvidere Mountain ultramafic body, Vermont: mass balance and reaction at the metasomatic front. Canadian. Mineralogist., 17, pp. 831-845.
Laird, J., 1993, 40Ar/39Ar age spectra constraints on polymetamorphism in Vermont. GSA Abstracts with Programs, 25, p. A102.
Laird, J. et al., 1984, Distribution of Ordovician and Devonian metamorphism in mafic and pelitic schists from Northern Vermont. American. Journal of Science, 284, pp. 376-413.
Laird, J., and Albee, A.L., 1975, Polymetamorphism and the first occurrence of glaucophane and omphacite in Northern Vermont. GSA Abstracts with Programs, 7, p.1159.
McDonald, J.C. and McDonald, A.B.,1996, The epidemiology of mesothelioma in historical context. European. Resp. J., 20, pp. 1932-1942 .
McDonald, A.D., Case, B.W., Churg, A., Dufresne, A., Gibbs, G.W., Sebastien, P. and McDonald, J.C., 1997. Mesothelioma in Quebec chrysotile miners and millers: epidemiology and aetiology. Annals Occup. Hyg., 41, pp. 707-7 19.
Mossman, B.T. et al., 1990, Asbestos: scientific developments and implications for public policy. Science, 247, pp. 294-300.
O'Hanley, D.S., 1996, Serpentinites: Records of Tectonic and Petrological History. Oxford University Press, New York, 277 pp.
OHanley, D.S., 1992, A solution to the volume problem in serpentinization. Geology, 20, pp. 705-708.
OHanley, D.S., et al., 1989, The stability of lizardite and chyrsotile. Canadian Mineralogist, 27, pp. 483-493.
Pitman, L. C., Francis, C. A., and Lange, D. E., 1995, Two New England occurrences of ferroaxinite: Rocks & Minerals, 71, 199.
110
A4- 17 VAN BAALEN, FRANCIS AND MOSSMAN
Sanford, R.F., 1982, Growth of ultramafic reaction zones in greenschist to amphibolite facies metamorphism., Am. Jour. Sci., 282, PP. 543-616.
Sanford, R.F., 1981, Mineralogical and chemical effects of hydration reactions and applications to serpentinization. American Mineralogist, 66, pp. 290-297.
Sanford, R.F., 1978, Regional metamorphism of ultramafic bodies and their contact zones, western New England. Harvard University. Ph.D. thesis, 377 pp.
Stanley, R.S. & Ratcliffe, N.M., 1985, Tectonic synthesis of the Taconian orogeny in western New England. GSA Bull., 96, pp. 1227-1250.
Van Baalen, M.R., 1995, The New Idria Serpentinite. Ph.D. Thesis, Harvard University, Cambridge, MA. 482 pp.
Wicks, F.J. and O'Hanley, D.S. 1988, Serpentine minerals: structure and petrology, in Bailey, S.W., ed., Hydrous Phyllosilicates (exclusive of micas). Mineralogical Society of America Reviews in Mineralogy, 19, pp. 91- 168.
111

112
MOENCH
A5-1
NATURE OF THE ALBEE-AMMONOOSUC CONTACT IN THE MOORE RESERVOIR AREA, NEW HAMPSHIRE AND VERMONT: PIERMONT-FRONTENAC ALLOCHTHON,
EMBATTLED BUT THRIVING!
By Robert H. Moench, 902 Grant Place, Boulder, CO. 80302 (e-mail: [email protected])
INTRODUCTION
A newly published U-Pb zircon age of 441 Ma (Rankin and Tucker, 1999) for the Morse Mountain granite sheet, about 6 km northwest of Groveton, N.H. (fig. 1), clearly indicates that my mapping on both sides of the Connecticut River near the sheet is incorrect (see Moench and others, 1995). However, Rankin and Tucker's conclusion that their data rule out the existence of the Piermont-Frontenac allochthon north of 44017.5' N lat., near the south edge of the area of this trip (see figs. 1, 2), vastly overstates the impact of what is otherwise a very welcome contribution. Their number did, however, sharply focus my fieldwork in May, 1999, which resulted in a new alignment of the Foster Hill sole fault of the allochthon in NE Vermont. The core question is whether the original Albee Formation of Billings (1935) and his colleagues defines an entirely autochthonous sequence below the Ordovician Ammonoosuc Volcanics (Rankin's view), or (my view) divides into (1) autochthonous Ordovician turbidites (Dead River Formation) below the Ammonoosuc, and (2) allochthonous, mainly Silurian turbidites and shelf deposits (Piermont sequence), originally 1-2 km stratigraphically above the Animonoosuc.
This trip is focused on Foster Hill and nearby, about 6 miles west of Littleton, N.H., which is the type area of the Foster Hill detachment fault (FHF), marking the sole of the Piermont-Frontenac allochthon (figs. 1-3). This is a small but critical area that lies about 1/3rd the distance between the southern tip of the allocthon about 10 km southwest of Sunday Mountain, N.H., and its northernmost extent, near Woburn, Quebec, a distance of slightly more than 200 km (fig. 1). Near Woburn and farther southwest, Silurian rocks of the allochthon, shown as the Piermont sequence on figure 1, are stratigraphically linked to bimodal volcanics, tuffaceous phyllite, and calciferous graywacke of the Silurian Frontenac Formation (fig. 1, Frontenac sequence), which is one of the fundamental units of the Connecticut Valley trough (Marvinney and others, 1992, 1999; Moench and others, 1992, 1999a).
At Foster Hill, Billings (1935, 1992) and Rankin (1994, 1996) mapped an inferred depositional contact between the Albee Formation and the overlying Ammonoosuc Volcanics, both Ordovician, forming the lower units of the classic New Hampshire sequence. In contrast, ever since my earliest work in the area, about 1983, I have interpreted Billings' Albee-Ammonoosuc contact (see fig. 3 for Rankin's slightly different definition) as a major premetamorphic fault, based partly on inferred opposed stratigraphic facing directions (see Moench and others, 1984, 1987; Moench, 1989, fig. 4, 1990, 1992, 1996, fig. 4; Moench and others, 1995, 1999b). As my work progressed through 1985 and later, I became convinced that the Albee Formation and some other units of the Connecticut Valley region can be divided and sorted among several units that strongly resemble the mainly Silurian Rangeley sequence, on the opposite side of the Bronson Hill-Boundary Mountains anticlinorium (figs. 1, 4). This recognition, if true, further supported the fault hypothesii at Foster Hill. However, only in 1997, when I mapped the hill at 1:6,000 (fig. 3), did I gain what I consider to be a thorough understanding of stratigraphic and structural relationships on both sides of that contact, and in outcrops of the contact itself (fig. 6A).
The first 3 stops are along Under the Mountain Road (figs. 2, 5, UTM Rd.), on the lower east side of Gardner Mountain, which is the type area of the Albee Formation of Billings (1935). I have divided all the stratified rocks of Gardner Mountain into the lithologically and sequentially distinctive Silurian Rangeley, Perry Mountain, Smalls Falls, and Madrid Formations, and the Littleton-like Lower Devonian Ironbound Mountain Formation. The rocks at Stops 1-3 represent the two uppermost Formations (Madrid and Ironbound Mountain), along the inferred trailing edge of the allochthon. Stop 4 (Rankin's Stop A5; his Scarritt Hill Formation) displays typical Rangeley Formation and its transition to the overlying Perry Mountain Formation. Exposed at Stop 5 are typical rocks of the Ordovician Ammonoosuc Volcanics and small intrusions that I correlate to the Ordovician Joslin Turn pluton, both of the autochthonous Bronson Hill sequence. Stop 6 (Rankin's Stop AlO) is Foster Hill, discussed in the next section. At Stop 7 (Rankin' s Stop A4) we see Rankin' s "discovery" outcrop of alleged Ordovician Joslin Turn tonalite intrusive into my alleged Silurian Perry Mountain Formation. The question here is whether these intrusions resemble Joslin Turn or, instead, rocks of the predominantly mafic regional dike swarm; R.D. Tucker (in Rankin, 1996; written commun., 1996) dated a diorite member at 419.8±2.6 Ma.
Moench, R. H., 1999, Nature of the Albee-Ammonoosuc contact, Moore Reservoir Area, N.H.-V.T.: The Piermont-Frontenac Allochthon—Embattled but thriving!; in Wright, S.F. ed., New England Intercollegiate Geologic Conference Guidebook Number 91, p. 113-133.
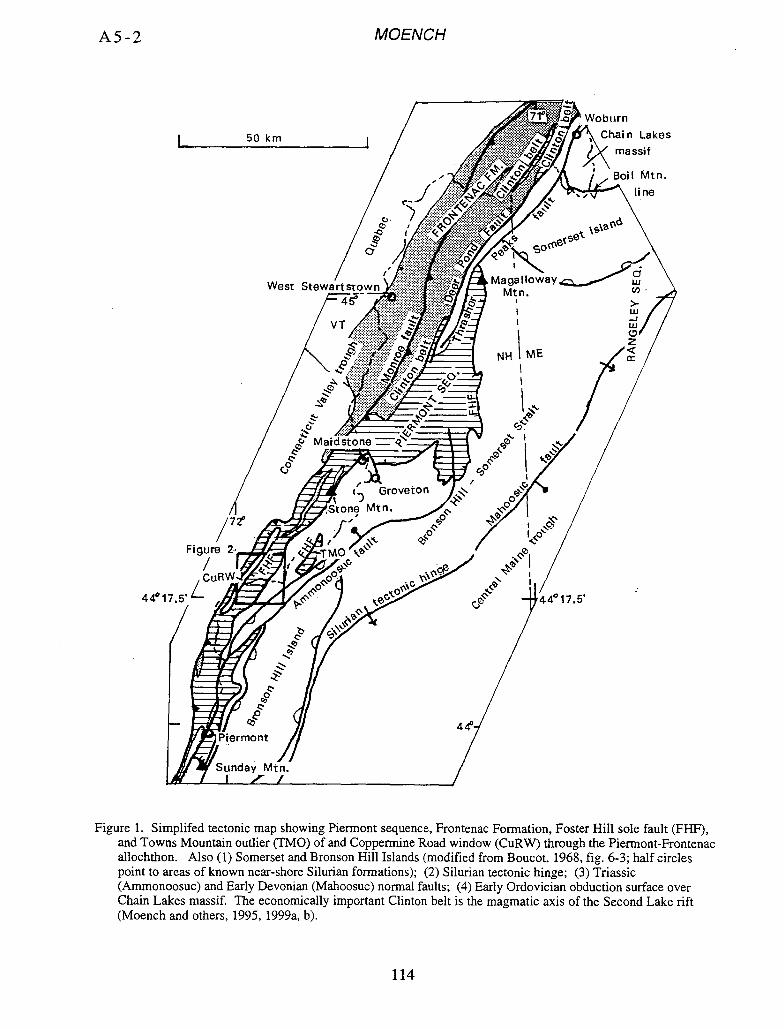
440 1
A5-2
MOENCH
Figure 1. Simplifed tectonic map showing Piermont sequence, Frontenac Formation, Foster Hill sole fault (FHF), and Towns Mountain outlier (TMO) of and Coppermine Road window (CuRW) through the Piermont-Frontenac allochthon. Also (1) Somerset and Bronson Hill Islands (modified from Boucot, 1968, fig. 6-3; half circles point to areas of known near-shore Silurian formations); (2) Silurian tectonic hinge; (3) Triassic (Ammonoosuc) and Early Devonian (Mahoosuc) normal faults; (4) Early Ordovician obduction surface over Chain Lakes massif. The economically important Clinton belt is the magmatic axis of the Second Lake rift (Moench and others, 1995, 1999a, b).
114
MOENCH
A5-3
Stops 8 to 10 compare and contrast the Silurian Peny Mountain Formation and the lower Middle and Lower Ordovician Dead River Formation' of my mapping, versus Rankin's inclusion of both lithologies in his Albee Formation. The Perry Mountain and Dead River come together at Stop 11.
The Dead River Formation, long considered Ordovician and Cambrian(?) in age, is now assigned an early Middle and Early Ordovician age on the basis of a recently determined Early Ordovician zircon age of 483±5 Ma (SHRIMP) for fragmental keratophyre of the Jim Pond Formation in NW Maine (J.N. Aleinikoff, writ. comm., May, 1999), sampled in 1984 by Moench, Aleinikoff, and E.L. Boudette (see Moench and others, 1995 site M-4). Complete data and implications are given in Moench and Aleinikoff (in press).
STRATIGRAPHY AND STRUCTURE OF FOSTER HILL
The essentials of the controversy can be seen on figure 3 by comparing my linework with Rankin's (from Rankin, 1996, fig. 5). Briefly, according to Rankin, the rocks of Foster Hill define a southeast-topping, mainly homoclinal sequence, exposed in layers 1-5, in stratigraphic order, all intruded by igneous rocks of Unit 6:
Layer 1--Ordovician Albee Formation (Oal), consisting mainly of sharply interbedded quartzite and greenish-gray slate; outcrop belt —500 in wide. This unit is conformably underlain by rusty-weathering interbedded gray-black slate and feldspathic quartzite of Rankin's (1996, fig.2) Scarritt Hill Formation, which is seen at Stop 4 of this paper.
Layer 2--Sedimentary member of Ordovician Animonoosuc Volcanics (Oas), consisting of black slate interlayered with minor metasandstone and metasiltstone; belt as wide as 100 m.
Layer 3--Rhyolitic metatuff of Ammonoosuc (Oar); belt —200 m wide. The basal Oar contact is Rankin's Foster Hill line and approximately my Foster Hill fault.
Layer 4--Pinstriped gray metasiltstone of Ammonoosuc (Oam); belt —200 in wide.
Layer 5--Rhyolitic Ammonoosuc (Oar); belt —1 km wide; includes two Oas lenses that are exposed —2km southeast of Foster Hill, west of Partridge Lake (fig. 2).
Unit 6--Tonalitic intrusions related to the Ordovician Joslin Turn pluton (fig. 2, Oj), dated at 469±13 Ma (Moench and others, 1995, site 0-13). According to Rankin (1996), these intrusions are commonly distinguished by granophyric texture. Because they intrude units 1-5 at Foster Hill and elsewhere, the entire Piermont sequence (Rangeley to Ironbound Mountain) must be no younger than —469 Ma.
According to my mapping (figs. 2, 3), Rankin's Layers 1 and 2, west of the Foster Hill detachment, contains largely east-topping homoclinal rocks of the Perry Mountain, Smalls Falls, Madrid and Ironbound Mountain Formations. His Layers 3-5, to the east, contain isoclinally folded rocks of the Dead River Formation and Animonoosuc Volcanics; only these rocks are intruded by probable offshoots of the Joslin Turn pluton. My mapping shows:
Layer 1--Rankin's Albee Formation (Oal) is the Perry Mountain Formation (Sp), composed mainly of interbedded green slate and feldspathic quartzite; I correlate it to the type Perry Mountain of the Rangeley sequence (fig. 4). Similarly, Rankin's underlying Scarntt Hill Formation, exposed west of the area of figure 3, is my Rangeley Formation (Sr), composed mainly of sharply interbedded, rusty-weathering gray to black slate and thin to thick beds of feldspathic quartzite. In addition to characteristic Perry Mountain slate and quartzite, uppermost Perry Mountain at Foster Hill contains an irregular lens of white-weathering, thickly stratified felsic crystal metatuff (Spy); an attempt to date was unsuccessful, owing to an absence of zircon. Rankin included these volcanics in his sedimentary member of the Ammonoosuc (Oas). Regionally, the Rangeley and Perry Mountain of the allochthon are much thinner and more shelf-like in sedimentary style than their turbidite basin equivalents south of Rangeley, Maine (fig. 4; —500 m vs. 3 km for Sr, and —300 m vs. 650 in for Sp). We will see the Rangeley and its transition to the overlying Perry Mountain at Stop 4. The Perry Mountain will also be seen at Stops 6, 7, and 9-11.
115
A5-4 MOENCH
EXPLANATION FOR FIGURES 2, 3, and 5 See text and Moench and others (1995) for sources of age data
PLUTONIC ROCKS Dga Moulton gabbro.diorite (DEVONIAN) DSd Marc and bimodal dikes and sheeted dike bodies of Second Lake rift (Early
Devonian? and Silurian)--419±2.6 Ma, 418±4 Ma DSi Undated calcitic felsic intrusions (Devonian? or Silurian?) Oh Highlandcroft Pluton--Type body of Highlandcroft Plutonic Suite; 450±5 Ma Oj Joslin Turn pluton and offshoots (lower Middle Ordovician)--469±1 .3 Ma
STRATIFIED METAMORPHIC ROCKS Bronson Hill and cover sequences (Lower Devonian to Lower Ordovician)
Dl Littleton Formation (Lower Devonian, Pragian and Emsian) Dlv Mixed volcanic and volcaniclastic member DSg Gile Mountain Formation, undivided (Lower Devonian and Silurian) Sf Fitch Formation (Pridolian and Ludlovian) Oqv Bimodal volcanic member of Quimby Formation (Lower Silurian? and Upper
Ordovician)--Locally contains polymictic debris-flow conglomerate at lower contact; 443±4 Ma Op Partridge Formation (lower Upper and Middle Ordovician) On Ammonoosuc Volcanics, undivided (Middle Ordovician)--Lower contact >469 Ma;
upper part -461 Ma Oal Fine-grained distal facies 01 Dead River Formation (lower Middle and Lower Ordovician)--Upper contact >469 Ma Odi Laminite facies
Piermont Sequence (Lower Devonian to Upper Ordovician) DSp Upper formations, undivided (Lower Devonian and Upper Silurian Dsi Ironbound Mountain Formation (Lower Devonian) Dsiw "Whitewacke" and slate at basal contact Sm Madrid Formation (Silurian, Pridolian?) Smq Quartzite lentil Ssf Smalls Falls Formation (Silurian, Ludlovian?)
Middle formations (Silurian) Sp Perry Mountain Formation (Silurian, Wenlockian?) Spy Volcanic-bearing member Sr Rangeley Formation (Silurian, Llandoverian) Sni Quartz conglomerate of member C
Lower Formations (Silurian and Upper Ordovician)--Greenvale Cove and Quimby, exposed only near Piermont
GEOLOGIC STRUCTURES Contact--Arrow indicates stratigraphic facing based on primary features
Contact mapped by Rankin (1996, fig. 5)--See fig. 3 and text
Foster Hill detachment fault and branch--Ticks on side of younger rocks; solid dot indicates outcrop
Attitudes of bedding--Dot on symbol indicates top of upright and overturned beds
Attitudes of vertical and inclined main (spaced) cleavage
Bearing and plunge of asymmetric minor fold
Anticline and syncline
116
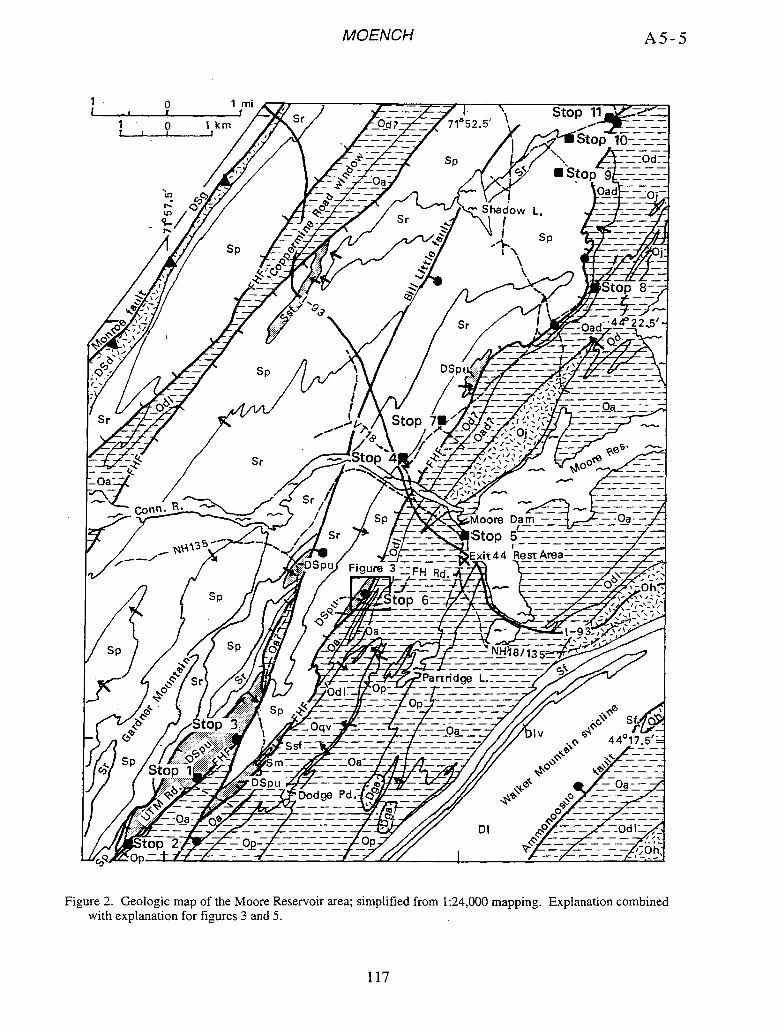
MOENCH
A5-5
1 0 1 mi
-__r L..f.i I -_--/---1 Stop 11
1 0 1 km Sr _Od? - 7152.5'
stop
Oa
77 0Sr7
I Sp Sp
/
/(fI j Sr ad
Sp ,J ,./\\/ / DSpI¼1_
YSr Stop
Sr -- - Stop Sp
/ ' ------ xit RestArea---- DSpu Figii
/ 1//SP ) / Sp O
/r - ParTridge L.__J-
f% 0d Op-
Sp
- ----- op --
(/>StoP 3 \ 4475.
Sp
DSpuir/'A Figure 2. Geologic map of the Moore Reservoir area; simplified from 1:24,000 mapping. Explanation combined
with explanation for figures 3 and 5.
117

A5-6 MOENCH
Units of Rankin (1996, fig. 5) See text for discussion of layers and unit 6
Layer 1 Oar " / - - Layer 5
175 Oal Layer 2 efi ,/ Layer 3 / Layer 4 I Unit 6
/ Oas ./OJ/ Oar / Oam Oj
I 1
WILLE:RES
Odl
A /
/ ----- - _-_ Layer 5
' -- o1-t--t -Oar
- _-:--- -:----f - _ I — iI —I —ii-E--I—ii-i / DSiY E EIE _--E-7--:HI—:— I—I-ii--I-E-
DSi // Sp - !_—_— T — —2L - 11--IITE
DSdA-.. Sp " ss Sm : - _---:--
ET- 70 DS I::i:- N Spv
so - _:=i:i= - = - - - 0st0r O8
Ssf __--!-- - -
_-- 500 0 1000 Ft. Sm - - =i=====_ii====—
A Allochthon AutochthOfl A
Sm -- Oa 08 Oa Feet
Spv
Figure 3. Geologic map and section of the Foster Hill area compared to layering mapped by Rankin (1996, fig. 5), here labeled Layers 1-5 and Unit 6. See figure 6A and 6B for outcrop maps at Sites E and H.
Layer 2--In ascending order I divide Rankin's Oas of this layer into: 1) A small remnant of Perry Mountain Formation (Sp) juxtaposed against the Foster Hill detachment fault.
2) The Smalls Falls Formation (Ssf), composed of rusty-weathering, black, pyrrhotitic slate with sparse to abundant laminations and thin beds of feldspathic quartzite. As drawn on figure 3 (section), the Smalls Falls is
118
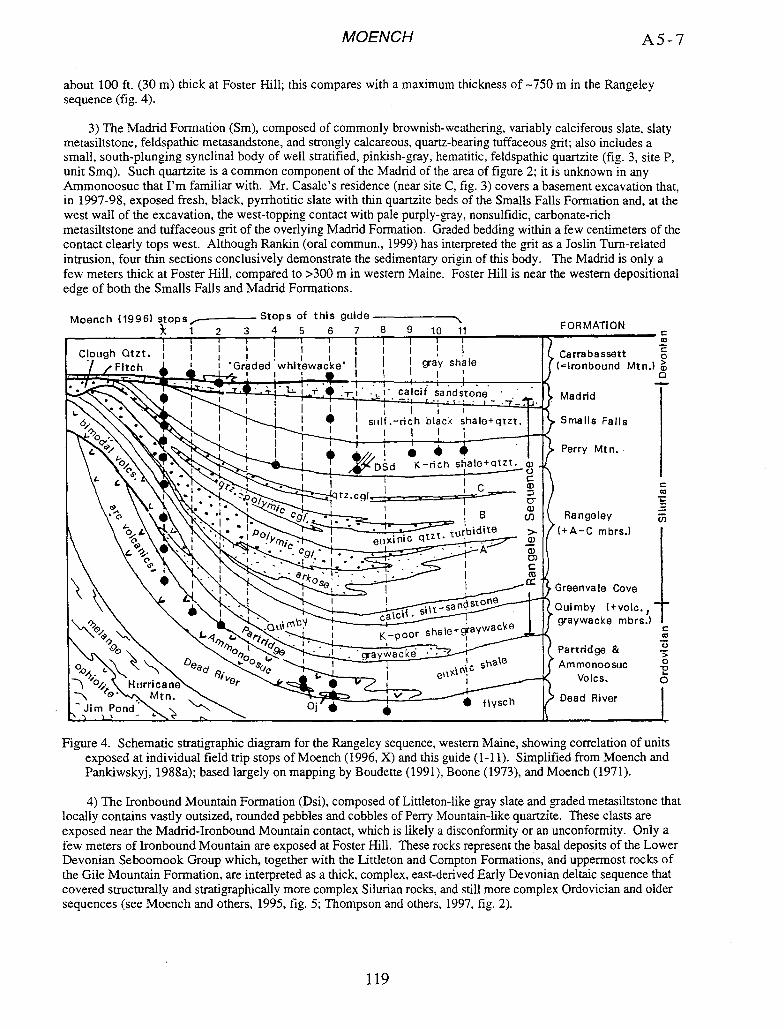
F OR MAT) ON
Carrabassett o (=lronbound Mtn.) >
Madrid
Smalls Falls
Perry Mtn.
C co
Rangeley (+A-C mbrs.)
Greenvale Cove Quimby (+volc. 1 -
graywacke mbrs.)
Partndge &
Ammonoosuc .
Volcs.
Dead River
MOENCH
A5-7
about 100 ft. (30 m) thick at Foster Hill; this compares with a maximum thickness of —750 in in the Rangeley sequence (fig. 4).
3) The Madrid Formation (Sm), composed of commonly brownish-weathering, variably calciferous slate, slaty metasiltstone, feldspathic metasandstone, and strongly calcareous, quartz-bearing tuffaceous grit; also includes a small, south-plunging synclinal body of well stratified, pinkish-gray, hematitic, feldspathic quartzite (fig. 3, site F, unit Smq). Such quartzite is a common component of the Madrid of the area of figure 2; it is unknown in any Ammonoosuc that I'm familiar with. Mr. Casale's residence (near site C, fig. 3) covers a basement excavation that, in 1997-98, exposed fresh, black, pyrrhotitic slate with thin quartzite beds of the Smalls Falls Formation and, at the west wall of the excavation, the west-topping contact with pale purply-gray, nonsulfidic, carbonate-rich metasiltstone and tuffaceous grit of the overlying Madrid Formation. Graded bedding within a few centimeters of the contact clearly tops west. Although Rankin (oral commun., 1999) has interpreted the grit as a Joslin Turn-related intrusion, four thin sections conclusively demonstrate the sedimentary origin of this body. The Madrid is only a few meters thick at Foster Hill, compared to >300 m in western Maine. Foster Hill is near the western depositional edge of both the Smalls Falls and Madrid Formations.
Moench (1996) Stops of this guide 1 2 3 4 5 6 7891011
I • I 1 — I
dough Qtzt. I t I I
,, J Ft4_ I Graded whit1ewace I ay shale ___ I 4b I
cajcifsandsto 7
sitlf .-rich black shalo+qtzt
I 0 DSd K-rich shale+atZT. ,
C)
I C cr
A
cc
stone
gtO'0
• ttysch Jim Pond
4.
N,
Figure 4. Schematic stratigraphic diagram for the Rangeley sequence, western Maine, showing correlation of units exposed at individual field trip stops of Moench (1996, X) and this guide (1-11). Simplified from Moench and Pankiwskyj, 1988a); based largely on mapping by Boudette (1991), Boone (1973), and Moench (1971).
4) The Ironbound Mountain Formation (Dsi), composed of Littleton-like gray slate and graded metasiltstone that locally contains vastly outsized, rounded pebbles and cobbles of Perry Mountain-like quartzite. These clasts are exposed near the Madrid-Ironbound Mountain contact, which is likely a disconformity or an unconformity. Only a few meters of Ironbound Mountain are exposed at Foster Hill. These rocks represent the basal deposits of the Lower Devonian Seboomook Group which, together with the Littleton and Compton Formations, and uppermost rocks of the Gile Mountain Formation, are interpreted as a thick, complex, east-derived Early Devonian deltaic sequence that covered structurally and stratigraphically more complex Silurian rocks, and still more complex Ordovician and older sequences (see Moench and others, 1995, fig. 5; Thompson and others, 1997, fig. 2).
119
A5-8 MOENCH
Layers 3 to 5--These layers, containing three members of Rankin's Ammonoosuc (sedimentary, Oas; rhyolitic, Oar; metasiltstone, Oam), are more complexly mapped on figure 3 (section) as isoclinally infolded Ammonoosuc Volcanics (Oa) and underlying flysch-Iike rocks; the latter are mapped as a laminite facies (Odi), and a graded wacke and slate facies (Od) of the Dead River Formation.
Typical Ammonoosuc of the Littleton-Moore Reservoir area is massively bedded and compositionally mixed.. At Foster Hill (fig. 3) it varies from mafic to felsic (dacitic?) metatuff, but no recognized flow rocks; lapilli-sized felsic clasts occur locally in the tuff, and hematitic iron-formation was found at one place (fig. 6B). Most of the underlying Dead River Formation is composed of sharply alternating laminations of dark greenish-gray pelitic slate and lighter colored metasiltstone, fine-grained tuffaceous metasandstone, and sparse lenses of felsic metatuff; pink manganiferous lenses and nodules occur locally. The laminations are planar and 1 mm to 1 cm thick; some are graded. Secondary cleavage-parallel silty laminations occur locally. Thinly interbedded (2-5 cm), well graded wacke and slate that typifies Dead River occurs in one outcrop; it is thought to lie stratigraphically below the laminite (fig. 3, section). The Dead River-Ammonoosuc contact is either abrupt or gradational by interbedding within about 1 meter; where topping evidence is visible, Ammonoosuc consistently overlies Dead River laminite. In my experience, from Moore Reservoir, N.H. to Oquossoc, Maine, the abruptness of the Dead River-Ammonoosuc contact is characteristic.
Figure 10 of Rankin shows two lenses of rock that he mapped as sedimentary Ammonoosuc (Oas) within his Layer 5. These lenses are 1-2 km southeast of the area of fig. 3 and west of Partridge Lake (fig. 2); both are composed mainly of poorly bedded, jet-black slate that is identical to the type Partridge, just to the southeast at Partridge Lake (fig. 2). These rocks are quite unlike the rocks of Rankin's Layer 2. Their only similarity is to the rustiness and blackness of the Smalls Falls; lacking are the quartzites of the Smalls Falls Formation, the calciferous deposits of the Madrid Formation, and the Littleton-like gray slate of the Ironbound Mountain Formation.
Billings (1935) inferred that the type Partridge at Partridge Lake (fig. 2) is a synclinal body that is conformably underlain by the type Ammonoosuc Volcanics; as shown on figure 2, I have confirmed Billings' interpretation on the basis of topping evidence at two localities along the type Ainmonoosuc-Partridge contact. The synclinal structure of the type Partridge is further confirmed by consistently west-topping grades observed in very thickly stratified pyroclastic flow deposits that are exposed through a width of >2,000 ft. in the immediate southeast limb of the syncline. The deposits are well exposed in 1-93 roadcuts, which I mapped during construction of the highway in 1983.
The two Partridge lenses in question that lie to the west of Partridge Lake similarly overlie the Ammonoosuc. As shown on figure 2, however, the westernmost lens tops entirely west. Its western contact is an unconformity marked, where shown by the arrow, by debris-flow conglomerate at the base of a distinctly younger, strongly bimodal, mainly pyroclastic sequence that I map as the Upper Ordovician and Silurian(?) Quimby Formation. Here the basal Quimby debris flow contains abundant, blocky to wispy rip-ups of black slate derived from the underlying Partridge. Other basal or near-basal debris-flow conglomerates contain rounded tonalite cobbles that are probably derived from the Joslin Turn pluton or related bodies. At Bath, N.H., felsic metatuff of the Quimby yielded an age of 443±4 Ma (Moench and others, 1995, site M-10). As shown on figure 2, the unconformity channels across the Partridge Formation and the underlying Ainmonoosuc Volcanics, and into the Dead River Formation. The basal Quimby unconformity is described elsewhere (Moench and Aleinikoff, in press) and is not addressed by this trip.
Unit 6 and the Joslin Turn controversy--Rankin (1996, and other publications) has repeatedly emphasized the crucial importance of the tonalitic Ordovician Joslin Turn pluton and what he believes to be its many correlatives that intrude stratified rocks of layers 1-5, on both sides of his Foster Hill line (—my FHF). The only body that has been dated so far is the Joslin Turn pluton itself. In my experience, Rankin's correlatives to the Joslin Turn include at least four unrelated rock types of diverse field habit and petrographic composition: 1) Several small probable Joslin Turn offshoots that intrude Dead River and Ammonoosuc, seen at Stops 5 and 6. 2) Likely Late Silurian to Early Devonianmetadiabase dikes, some sheeted as at Stop 7. 3) Metarhyolite sills and tuffisites, such as the dated bodies that occur in the Perry Mountain Formation on Gardner Mountain (Moench and others, 1995, site M-7; 414±4 Ma, 412±2 Ma). 4) Strongly calcareous tuffaceous grit, locally abundantly exposed in the Madrid Formation, and similar but less calcareous felsic bodies mapped locally in the Perry Mountain Formation.
Where least altered, the main Joslin Turn body is holocrystalline one-feldspar biotite tonalite; the texture is strongly seriate, and characterized by interpenetrating plagioclase laths. Rankin (1996, figs. 3A, 3C) has noted graphic quartz-plagioclase intergrowths, or granophyre, within the main body and in one of several small offshoots
120
MOENCH A5-9
that I accept as Joslin Turn (his fig. 3B, my fig. 3). Alteration products in the main body and in the acceptable offshoot described by him are chlorite, epidote, and sparse sericite; carbonate is uncommon. In my experience, the many other small dikes and lenses of Rankin's Joslin Turn correlatives are thoroughly and consistently altered to variable proportions of albite, carbonate (.- 15% to >50%), chlorite, ±muscovite, ±quartz. Primary minerals have not survived the ambient greenschist facies conditions of the region.
It was Rankin's recognition (1996, p. 30, Stop A4; my Stop 7) of granophyre-like texture in an altered dike that led him "to the hypothesis that the plagioclase, carbonate-rich, white mica-bearing rocks in the Albee Formation and Ammonoosuc Volcanics are dikes and sills correlative with the Joslin Turn pluton, here about 1 km across strike to the southeast." None of these bodies have been dated.
Two essential questions are: First, is granophyric texture, or any other texture, a viable sole basis for correlation even within a small area? Second, has Rankin conclusively identified granophyric texture in his presumed Joslin Turn correlatives?
The answer to the first question is self-evident and manifestly no, for the following reasons. First, within the tectonic belt that contains the Piermont-Frontenac allochthon, the Joslin Turn pluton is not the only one with granophyric texture. Others known to me are: 1) The Silurian East Inlet pluton (Eisenberg, 1982, p. 166; Lyons and others, 1986, p. 492), dated by Lyons and others at 430±4 Ma, and its offshoots (Green, 1968, p.1626). 2) The several Early Devonian microgranites and rhyolite domes that occur within the Ironbound Mountain Formation to the east of the East Inlet pluton (Green, 1968, p. 1626; Eisenberg, 1982, p. 167), one dated by Eisenberg at —414 Ma (concordant U-Pb zircon). 3) Probable granophyre in the central portion of the rhyolite sill on Gardner Mountain that was dated at 4 14±4 Ma.
Second, although texture combined with some degree of mineralogic uniformity and field habit might be a tentative basis of correlation over small distances, the two bodies described by him that occur northwest of my Foster Hill fault are very unlike one another and are not comparable to the Joslin Turn pluton itself. As shown at Stop 7 (see fig. 7), Rankin's (1996, stop A4) "discovery" outcrop of Joslin Turn is, instead, a set of at least three metadiabasic intrusions that discordantly cut the Perry Mountain Formation. The largest dike (DSd1) is chilled against the Perry Mountain; its northwestern chill border is truncated by dike DSd2, which is chilled against DSdl and Perry Mountain. DSdl is further intruded by the cm-thin DSd3, composed of entirely chilled greenstone, and DSd2 is intruded by a similarly thin pair of lighter-colored, more felsic dikes, DSd4.
Thin sections of DSd 1 and DSd2 indicate a mineral assemblage that is consistent with the ambient greenschist facies condition of the region--chlorite, albite, carbonate, an opaque mineral, and sparse muscovite and quartz. Dike DSdl is the body reported by Rankin (1996, p. 30) to contain granophyre. My thin section indicates that it contains scattered lenses of well crystallized strained quartz that locally enclose lath-shaped crystals of twinned, unzoned albite that are embayed by the quartz. The quartz is secondary; it has replaced albite that, given the abundant carbonate in the rock (-15% reported by Rankin is a minimum), must have been altered from primary andesine or labradorite. Sparse, fine-grained, mottled (but nongraphic) quartz-albite intergrowths that are comparable to Rankin's "granophyre" (1996, fig. 3E) do occur, but nowhere as conclusive granophyre. One such patch deeply embays an albite crystal; I interpret this as a low-temperature alteration texture. Metamorphic muscovite (<1%) occurs as small tabs that locally show evidence of growth across the chioritic foliation. A thin section of dike DSd2 indicates a more mafic composition, with more carbonate, chlorite and opaque mineral, less albite, sparse muscovite and only a trace of quartz. The muscovite occurs as a few poikiloblastic porphyroblasts. In conclusion, the mineralogy and textures of all these rocks are of nonprimary, metamorphic origin. All of the intrusives at Stop 7 are reasonably interpreted to belong to the Silurian to Early Devonian(?) extensional swarm that extends the full length and most of the width of the allochthon, and beyond; they are a major component of the Second Lake rift.
Another of Rankin's (1996, p. 16, fig. 3D) "Joslin Turn granophyre" bodies is, instead, a small synclinal lens of Madrid Formation (Sm) that is flanked by underlying black slate and quartzite of the Smalls Falls Formation (Ssf). These rocks are exposed 2,700 ft., azimuth S80E of Stop 3. Rankin correctly described the location. According to him, the "granophyric sill" is about 30 feet thick. My mapping indicates, however, that this same body is composed of about 20 feet of pale reddish-gray, hematitic metasandstone and 10 feet of richly calcareous tuffaceous grit. I think the grit is what Rankin confused with Joslin Turn tonalite. As seen in two thin sections, the metasandstone is composed of closely packed, poorly sorted quartz and feldspar, abundant "dusty" hematite, and sparse intergranular sericite. One of three thin sections from the grit shows subequal amounts of calcite, albite, and chlorite, a small amount of fine-grained quartz, and sparse small tabs of muscovite grown randomly across the
121
A5-10 MOENCH
chloritic foliation; grit fragments include equant 2 mm clasts of albitic porphyry, and larger irregular lenses of pure to impure chlorite probably derived from basalt. A second thin section shows a similar texture, but more carbonate (...50%) and muscovite (- 1%). A third thin section, collected near the center of the body, is chloritic metamudstone containing much more abundant chlorite and muscovite, and showing conclusive evidence of folded bedding, approximately normal to foliation. The only feature I saw that might be confused with granophyre is likely strain lamellea at the margins of some albite grains of the porphyry clasts; when nicols are uncrossed, the lamellea disappear. However, my observations do not preclude the existence of granophyre which, if real, likely occurs within the clasts.
It is finally noteworthy that figures 2 and 5 of Rankin (1996) show the Joslin Turn pluton as a single massive body that extends continuously southwestward from the northwest side of Moore Reservoir, across the eastern end of Foster Hill, where he gives it a width of about 350 ft.; 4,000 ft. farther southwest he mapped a width of about 1,000 ft. According to my mapping (fig. 3), his portion of the pluton at the east end of Foster Hill and farther southwest is underlain by Ammonoosuc metatuff that is intruded by several small bodies of acceptable Joslin Turn, each no wider than about 30 ft, but most much smaller. The small ones occur as irregular stringers, patches and lenses, much as exposed at Stop 5. Their features suggest that they represent offshoots of Joslin Turn magma that intruded unconsolidated Ammonoosuc tuff. According to my model, Joslin Turn magma was emplaced as semiconcordant bodies along or near the Dead River-Ammonoosuc contact; their wide distribution across strike was produced by folding. They intruded poorly consolidated material, perhaps as feeders to early Ammonoosuc eruptions at —470 Ma.
THE PERRY MOUNTAIN-DEAD RIVER-ALBEE CONTROVERSY
Ever since I recognized the existence of the Rangeley sequence along the Connecticut Valley near Piermont, N.H., and Fairlee, Vermont, I have attempted to sort the pre-Ainmonoosuc flysch sequence mapped as Dead River Formation, from not altogether unlike post-Ammonoosuc rocks mapped as the Perry Mountain Formation. This was an effort in continuing education that started particularly in 1994 in the Moore Reservoir area, when I found a thick sequence of somewhat rusty-weathering, well graded, planar bedded quartzwacke and metashale that conclusively underlies the Ammonoosuc Volcanics (fig. 2; arrow on contact). This recognition--too late for the publication of Moench and others (1995), and only partly in time for Lyons and others (1997) and Moench and others (1999b)--meant that I had previously misidentified large tracts of stratified bedrock along the Connecticut Valley northeast and northwest of Moore Reservoir, as acknowledged in the Introduction. My revision of early (1983-94) reconnaissance had not progressed as far north as Groveton until May, 1999, just after Rankin kindly informed me of the new data that he and Tucker (1999) presented at the Spring AGU meeting.
On the basis of my May, 1999, fieldwork, I now recognize that the dated (441 Ma) Morse Mountain sheet, northwest of Groveton, N.H., intrudes certain Dead River Formation and overlying synclinal bodies of Partridge Formation; intervening distal volcanics of the Anirnonoosuc are uncharacteristically thin (<50 m) or absent.
Additionally, I mapped a new alignment the Foster Hill detachment (fig. 1) extending from just north of Maidstone, southwest to the east side of Stone Mountain, the north ridge of Baldwin Hill (not shown), and Mink Brook (Stop 11). Northwest of that alignment, I now recognize sequences of more widespread Rangeley Formation in the allochthon, and less abundant Perry Mountain and Smalls Falls Formations. The synclinal body of Frontenac Formation (calciferous metagraywacke) shown west of Stone Mountain (fig. 1) and other units of the allochthon remain approximately as shown by Moench and others (1995). The long Coppermine Road window (CuRW) occurs to the west of the main alignment of the FHF, and the large Towns Mountain outlier (TMO), possibly a separate slide body, occurs to the east; there may be other outliers. The FHF is exposed at the northeastern foot of Stone Mountain; there it is marked by several tens of meters of fragmented Perry Mountain that sharply contacts less disrupted Dead River laminite to the east, and gray slate of the Ironbound Mountain Formation to the west.
How, then, do I now distinguish Dead River from Perry Mountain? Their essential characteristics follow:
Perry Mountain Formation--Typically sharply interbedded quartzite or feldspathic quartzite and pale green or greenish-gray slate (or muscovite-rich schist at high grade). If you see dark-gray or black slate you are looking at underlying Rangeley Formation or overlying Smalls Falls Formation. Perry Mountain may be "clean" and nonrusty or rusty-weathering. Quartzite beds are both planar and lenticular, may be "slow-graded," more commonly "fast-graded" to sharp both sides; local Bouma turbidite sequences, and local small- to medium-scale cross bedding throughout a bed, suggesting reworking by traction currents; rip-ups occur near base of some thick quartzite beds. Petrographically, the quartzites are mostly matrix-poor, closely packed, moderately to well sorted. Chemical
122
MOENCH
A5-1 1
data for metashales indicate high K2OINa20 ratios and high A1203 contents. In outcrops, quartzite beds are typically ribby and resistant; do not weather rapidly. Perry Mountain of the Piermont sequence is interpreted as a partly resedimented shelf facies that differs somewhat from the more uniformly turbiditic basin facies represented by the Perry Mountain of the Rangeley sequence (fig. 4). Bedding styles are unlike those of the Moretown Formation of Vermont.
Dead River Formation--Typically less sharply interbedded quartzwacke and greenish-gray to olive-green slate. Quartzwacke beds are mainly planar; very common "slow to medium fast-graded;" local convolutions in upper part of beds (Bouma C); almost every bed is good for a top determination. Petrographically, quartzwacke beds are more matrix-rich and less well sorted than most Perry Mountain quartzite beds. Chemical data from West Milan area and from Boone (1973) indicate that the metashales have lower K20/Na20 ratios and lower A1203 contents relative to Perry Mountain, and significantly higher FeO+MgO contents, suggesting a partial mafic igneous provenance. In outcrops, quartzwacke beds are less ribby than Perry Mountain quartzite beds, and tend to weather and stain more rapidly. Interpreted as a deep water turbidite sequence; very similar to Moretown Formation in bedding styles.
A word of caution: There is some overlap of Perry Mountain vs. Dead River sedimentary styles, and I remain quite capable of mistaking these units; Perry Mountain-like, ribby, resistant quartzite locally occurs with well graded Dead River lithologies. Additionally, bedding-parallel "pinstriping," long cited as the hallmark of pre-Ammonoosuc Albee, may be found in both units, as well as in several other metasedimentary formations as young as Devonian in the region. Accordingly, an independant method of distinguishing Perry Mountain from Dead River would be welcome.
REGIONAL STRUCTURE
From Sunday Mountain to Magalloway Mountain (fig. 1), the east side and south end of the allochthon is marked by the extremely sinuous Foster Hill premetamorphic fault (FHF), interpreted as an originally gently west-dipping detachment at the sole of the allochthon. Farther north it is marked by the Thrasher Peaks- fault (TPF), an east-vergent Acadian thrust fault where it strikes NNE near Magalloway Mountain, and a dextral strike-slip fault in northern Maine (Marvinney, 1989), where it strikes ENE; the change from thrust to strike-slip may be a function of this strike change. As shown and cited by Moench and others (1995, map and site D-2C), the TPF and its companion Deer Pond fault (DPF) cut Lower Devonian and underlying strata, but they are cut by the granitic Spider Lake pluton, dated at 367.7±1.3 Ma. Both faults, however, probably have major Silurian ancestry--the TPF as a west-dipping, basin-margin normal fault, and the DPF as an east-dipping normal fault, antithetic to the TPF. On the seizmic profile of Stewart and others (1993), the TPF dips about 500 NW and extends in depth to at least 10 km (possibly to 20 km) where it cuts Chain Lakes and Grenville basements. The DPF has a steeper NW dip and joins the TPF at a depth of about 5 km. On the northwest side of the Connecticut Valley-Gaspé trough is La Guadeloupe fault, the Quebec equivalent of the RMC of Vermont. As shown by the seismic profiles of Stewart and others (1993), La Guadeloupe fault is an almost mirror image of the Thrasher Peaks fault. Although it shows good evidence of Acadian thrusting (Cousineau and Tremblay, 1993), La Guadeloupe fault, like the Thrasher Peaks, may have had ancestry as a major Silunan normal fault. Both faults may have acted as basin-margin normal faults during orogen-normal Silurian extension (Moench and others, 1999b, Moench and Aleinikoff, in press).
The west side of the allochthon is truncated by the Monroe fault (MNF), considered a west-vergent Acadian thrust fault (Jahrling, 1983). Almost traditionally, the MNF is said to separate the Silurian and Devonian "Vermont sequence" from the mainly Ordovician "New Hampshire sequence." In my view, this concept is both arcane and misleading, giving the impression that the MNF separates unrelated geologic terranes. Instead, mapping by Moench and others (1999a) and Marvinney and others (1999) and their colleagues indicates that the MNF lies almost entirely within the Frontenac Formation from northwestern Maine, across southern Quebec, and south to the approximate latitude of North Stratford, N.H. From there south to the latitude of Sunday Mountain it separates undivided strata of the Gile Mountain Formation of the "Vermont sequence" from the mainly Silurian Piermont sequence and Frontenac Formation (fig. 1). Interpretation of the MNF as a west-vergent thrust fault implies that the Waits River and Gile Mountain Formations west of the fault are underlain by unexposed facies of the Piermont sequence. Viability of this concept, however, depends upon the outcome of the Piermont controversy.
INTERPRETATION OF THE ALLOCHTHON AS A COHERENT SUBMARINE LANDSLIDE MARGINAL TO THE CONNECTICUT VALLEY RIFT BASIN
I have already emphasized (Moench, 1993) that my initial model for the allochthon (Moench, 1990, and
123
A5-12 MOENCH
references therein) as an east-derived Acadian thrust sheet rooted along the western margin of the Central Maine trough (CMT) is invalid, mainly because of the stratigraphic linkage that has been mapped between the Piermont sequence of the allochthon and the autochthonous Frontenac Formation of the Connecticut Valley trough (CVT; Marvinney and others, 1992, 1999; Moench and others, 1992, 1999a). Specifically: 1) Dated Silurian, VMS-bearing, bimodal volcanics of the Frontenac Formation (fig. 1, Clinton belt) are overlain by the Smalls Falls Formation west of Woburn, Quebec, and are underlain father south by the Perry Mountain and Rangeley Formations (Cousineau, 1995; Moench and others, 1995, 1999a, b). 2) West of the depositional edges of the Madrid and Smalls Falls Formations, between Maidstone and Wells River, Vermont, synclinal bodies of dated Silurian calciferous metagraywacke and finer-grained deposits of the Frontenac rest directly on the Perry Mountain Formation (fig. 1; Moench and others, 1999a). The conspicuous absence of much hard-rock cataclasis along the Foster Hill sole fault further argues against the thrust model.
The stratigraphic relationships described above indicate that the Piermont sequence accumulated either along the eastern margin of the Connecticut Valley trough (CVT), or in a strait that connected the CVT and CMT basins. Such a strait is permitted by the >100 km gap between groups of outcrops of rather thin, near-shore Silurian units (Clough Quartzite, Fitch Formation, and equivalents) that rest unconformably on Ordovician and older rocks along the Bronson Hill anticline in the south, and around the Boundary Mountains anticlinorium in the north. These groups tentatively define the Bronson Hill and Somerset Islands, respectively (fig. 1), and show that the whole Bronson Hill-Boundary Mountains anticlinonum was not necessarily the continuous Silurian sedimentary barrier that I and others previously thought it was. My current model is based on the assumption that the thick, continuously deposited Rangeley sequence was spread from the CMT, across the Bronson Hill-Somerset strait, and into at least the east side of the CVT, where it comprises the Piermont sequence. If so, the present location of the Piermont sequence is probably only several (or a few tens of) kilometers west of its site of deposition. Accordingly, the term parautochthon might be more appropriate than allochthon.
In surmnary, according to my current view the Piermont sequence accumulated across the Bronson Hill-Somerset strait, was dislodged along a gently west-dipping detachment (the FHF), and slid westward as a largely coherent sheet into the CVT. Transport probably occurred while the CVT rift basin widened and deepened (Moench and others, 1999b; Moench and Aleinikoff, in press). The sheet was at least 200 km long, probably several tens of kilometers wide, and, to judge from the total thickness of the Piermont sequence, about 0.5-1.5 km thick. Sliding occurred before and during Late(?) Silurian Frontenac sedimentation and rift volcanism. It also occurred during Early Devoman sedimentation of the Ironbound Mountain Formation, but ended before sedimentation of higher units of the Lower Devonian cover sequence (Moench and others, 1995; Thompson and others, 1997). The slide came to rest before emplacement of the Early Devonian Fairlee stitching pluton (near Piermont, west of the Ammonoosuc fault), dated by J.N. Aleinikoff at 410±5 Ma (Moench, 1990, p. J2). The cover sequence is represented by dark-gray, largely pelitic deposits and graded wackes of the Seboomook Group (with Ironbound Mountain Formation at its base), the Littleton and Compton Formations, and only the upper part of the Gile Mountain Formation. West of the Monroe thrust fault (fig. 1), Silurian(?) calciferous metagraywacke in the lower part of the Gile Mountain probably covers equivalents of the Piermont sequence, much as identical rocks of the Frontenac Formation occur in synclinal bodies above the Perry Mountain Formation east of the fault.
Enormous submarine landslides are known to occur on sloping areas of the seafloor (Hampton and Lee, 1993, and references therein). Assuming a length of —200 km, an average thickness of —1 km, and a convenient average original width of —25 km, the calculated —5,000 km3 volume of the Piermont slide was well within the size range of known marine slides, as are the several mapped detachments of somewhat different character of the Central Maine trough (Moench, 1970; Moench and Pankiwskyj, 1988a, b). Given that Paleozoic or older sequences of ancient mountain belts, such as the Appalachians, contain abundant marine geoclinal deposits that accumulated in very active tectonic settings, it is surprising that ancient submarine landslides of comparable dimensions are not more widely reported.
Hoffman and Harte (1999) have recently described an enormous ancient submarine landslide in Namibia, in a desert region of almost total exposure. They described the sole of the slide, the Ombonde detachment, as "a primary low-angle normal fault, which developed in an undeformed Neoproterozoic carbonate-dominated shelf succession as it entered a west-dipping Pan-African subduction zone." The dimensions of the displaced body are only somewhat smaller than those of the Piermont sequence, and the typically knife-sharp, noncataclastic character of the Ombonde detachment itself is identical to that of the Foster Hill detachment. Many differences in stratigraphy, structure, and tectonic setting can be cited. For example, whereas the displaced sheet above the Ombonde detachment is largely undeformed, except for back rotation, the Piermont sequence above the Foster Hill detachment shows (1) strong
124
MOENCH
A5-13
evidence of complex, pre-cleavage (pre-Acadian), nonsystematic probable slump folding (see Stop 2 and discussion); (2) internal thrusting near the south end of the allochthon (Moench, 1990, figs. 2 and 3); and (3) locally extensive total disruption of stratification in the northern 1/2 of the allochthon (Moench and others, 1995; premetamorphic breccia), as at Stone Mountain (fig. 1). Although described as breccia by Moench and others (1995), no single term is adequate; these rocks contain some angular quartzite clasts, but subrounded lenticular clasts are more common, as well as rounded outsized quartzite cobbles and boulders set in a matrix of pelitic schist. The "breccia" probably formed by disorganized, downslope mass movement and olistostromal deposition that accompanied the formation of the allochthon. Back rotation is indicated by the common occurence of the uppermost units of the Piermont sequence (Smalls Falls, Madrid, Ironbound Mountain) along the eastern, inferred trailing edge of the allochthon.
The Ombonde and Foster Hill detachments also differ in tectonic setting. Whereas the Ombonde is positioned on a pre-collisional passive continental margin (Hoffman and Harte, 1999), the Foster Hill occurs on the margin of a rift that was superimposed on the newly accreted Ordovician (Taconian) margin of Laurentia (Moench and others, 1999b; Moench and Aleinikoff, in press). The west-directed Foster Hill detachment along the eastern side of the Connecticut Valley trough, and several east-directed giant slump detachments mapped along the west side of the Central Maine trough (e.g. Blueberry Mountain, Barnjum, Plumbago Mountain and Winter Brook) formed during mainly Silurian orogen-normal extension that intervened between the Taconian and Acadian collisions.
ROAD LOG
This trip starts at the Interstate 93 rest area at Exit 44 (Moore Dam), about 7 miles west of Littleton, N.H. (fig. 2) Follow signs at exit ramps to the rest area, which is on NB 18/135 just south of 1-93. Meeting time is 8:30 a.m., Friday, October 1. We will leave leave at 8:45, after a brief introduction by yours truly. It will be easy for late corners to catch up.
Mileage
0.00 From rest area, turn right (north) onto NH 18/135. The road passes under 1-93.
1.30 Fork left onto NH 135. Rte. 18 crosses the Connecticut River into Vermont.
3.90 Sharp left (south) onto North Skinneyridge Road. This is a nearly blind intersection, so watch out for fast oncoming traffic on NH 135.
6.20 Fork right onto Under The Mountain Road (graded), for brevity hereafter called the UTM Road. This road follows the lower east side of Gardner Mountain.
7.50 Stop 1--20 minutes; Ironbound Mountain Formation and Ammonoosuc Volcanics. Stops 1-3 are shown on figure 2A. Park on right and follow old logging trail about 170 ft. to outcrops of gray slate with graded laniinations and thin beds of metasiltstone and fine-grained metasandstone. Then clamber over the main outcrop, which stands about 30 ft. above the trail. These rocks typify the Ironbound Mountain Formation and parts of other Lower Devonian units of northern New England and Quebec. As shown on figure 2A, the Ironbound Mountain at this locality is underlain to the west by sporadically exposed calciferous rocks of the Madrid Formation and black sulfidic slate and quartzite of the Smalls Falls Formation. Rubble and outcrops of greenstone of the Ammonoosuc Volcanics occur between UTM Road and about 170 ft. to the southeast
7.70 Intersection with Bobbie Mill Road on the left; continue south on UTM Road.
9.00 Stop 2--25 minutes; basal Ironbound Mountain Formation, Madrid Formation, Partridge Formation, and Ammonoosuc Volcanics. Park on west side of UTM Road, at intersection with logging road that leads up east side of Gardner Mountain. Several small outcrops, on a low ridge immediately east of UTM Road, expose (1) interbedded dark-gray slate and "slow-graded" "whitewacke" (so named because it typically weathers white, owing to high feldspar content) at the base of the Ironbound Mountain Formation, and, to the south and east, (2) strongly calciferous, pale reddish-gray to dark purply gray, quartz-feldspar metasandstone, greenish-gray to brownish-gray slate, and deeply brown-weathering, strongly calcareous felsic metatuff of the underlying Madrid Formation.
As shown by the enlargement of Stop 2 outcrops on figure 5, the graded "whitewacke" and slate beds of Ironbound Mountain illustrate the great complexity of pre-cleavage folding that typifies the internal structure of the Piermont sequence throughout the Gardner Mountain area. Whereas the main cleavage maintains a fairly uniform attitude, extreme nonsystematic variations are shown by the attitudes of the
125
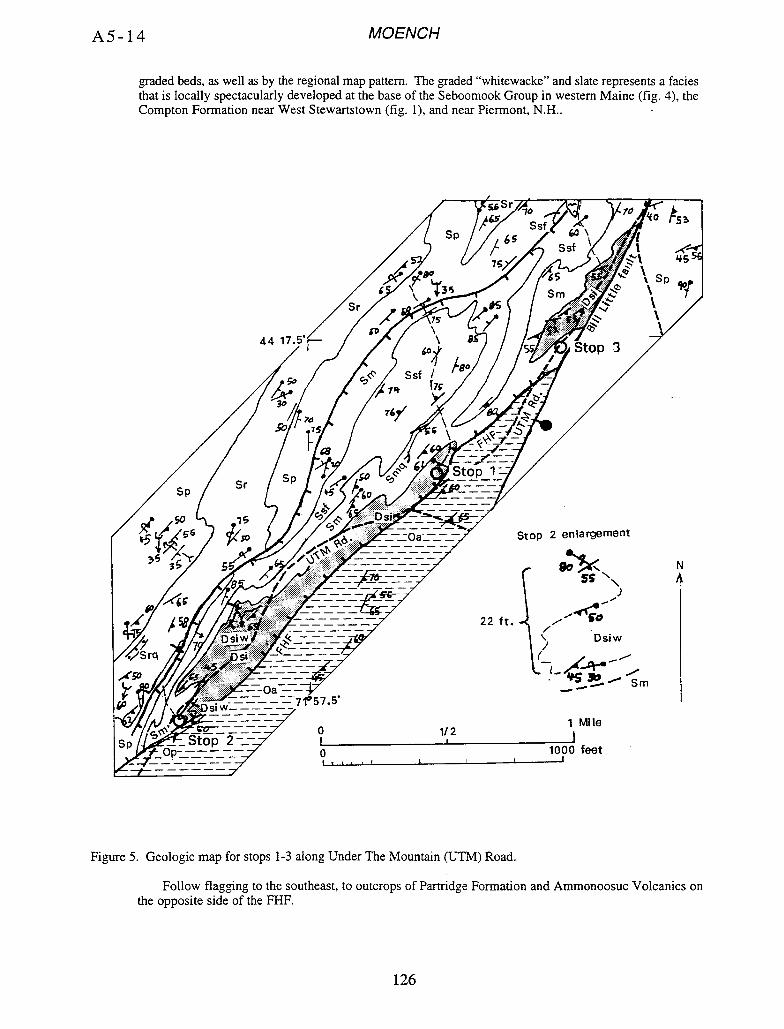
A5-14
MOENCH
graded beds, as well as by the regional map pattern. The graded "whitewacke" and slate represents a facies that is locally spectacularly developed at the base of the Seboomook Group in western Maine (fig. 4), the Compton Formation near West Stewartstown (fig. 1), and near Piermont, N.H..
. , , S5"
2
ft.- ,- Dsiw
1/ \ >
Sm
1 o 1/2 I I
0 1090
Figure 5. Geologic map for stops 1-3 along Under The Mountain (UTM) Road.
Follow flagging to the southeast, to outcrops of Partridge Formation and Ammonoosuc Volcanics on the opposite side of the FHF.
126
MOENCH A5-15
Return to vehicles, reverse direction and drive north on UTM Road.
11.20 Stop 3--5 minutes; Madrid Formation. Park on right (east side) just beyond roadcut, which exposes strongly crenulated, brown-weathering, calciferous phyllite and minor wacke mapped as Madrid Formation. The crenulation was probably produced by the east-dipping, Triassic(?) Bill Little fault--a normal fault that is antithetic to the larger, west-dipping Ammonoosuc normal fault. The Madrid here occurs on the east limb of a tight, north-plunging, faulted syncline. Dark-gray, noncalciferous slate of the overlying Ironbound Mountain Formation is well exposed as flatirons near the top of the steep hillside to the west, some 140-180 ft. above the road level; a wide belt of Madrid, forming the west limb of the syncline, occurs in deeply weathered outcrops on the terrace to the west of the Ironbound flatirons.
14.10 Sharp right (east) onto NH 135. 16.70 Sharp left onto rte. 18 and cross the Connecticut River into Vermont
17.30 Stop 4--25 minutes; Rangeley and Perry Mountain Formations. Reverse direction and park on shoulder of VT 18, under or near the 1-93 overpass. Walk northeast past the east abutment of 1-93, and uphill about 100 yards to a terrace whose edge is marked by several wooden guardrail posts. The outcrops are a few tens of feet to the east. This is Rankin's (1996, Stop A5; Turbidites of Scarritt Hill). The large pavement, cleared by Rankin before his 1996 trip, is now strongly stained and >50% covered by moss. Nonetheless, characteristic features of the Rangeley Formation are quite visible, especially in smaller pavements for a distance of about 150 ft. along and near an old farm trail that leads south to southeast from the south end of the large pavement.
The rusty-weathering Rangeley Formation exposed here contains subequal amounts of sharply interbedded resistant feldspathic quartzite interbedded with less resistant gray-black pelitic slate. Bedding is subvertical and strikes N30E; abrupt grading at the upper contacts of quartzite beds indicates southeast tops. The quartzite beds are 2-10 cm thick, and stand as much as 2 cm above the intervening slate beds. In the Rangeley quadrangle (Moench, 1971), identical thinly bedded rocks are about 1,000 ft. (300 m) thick in Rangeley member C (fig. 4), immediately below the transition to the overlying Perry Mountain Formation.
The Perry Mountain Formation at Stop 4, is exposed at the southeast end of the sequence of outcrops, about 150 ft. southeast of the main pavement. A covered interval of about 25 ft. separates exposures of uppermost Rangeley from the Perry Mountain, which is a bench about 7 ft. wide, across bedding, 40 ft. long, and as much as 5 ft. high. This is a quartzite-dominated sequence of Perry Mountain, containing sharp thin (5 cm) to thick (25-40 cm) planar beds of slightly rusty-weathering, strongly resistant quartzite with thin interbeds of interlaminated green slate and quartzite. The green color of the slate and the more resistant character of the quartzite distinguish these rocks from the underlying Rangeley Formation.
Return to vehicles and drive south, back to New Hampshire. 17.90 Turn left onto NH 135/18.
18.70 Stop 5--20 minutes; Ammonoosuc Volcanics and small offshoots of probable Joslin Turn tonalite (-469 Ma). Turn left into a picnic area on the shore of Moore Reservoir, opposite 1-93, northbound exit 44 ramp. Lunch after outcrop scrutiny.
Rather typical Ammonoosuc lithologies are exposed in almost 200 ft. of shoreline outcrops, including, from west to east, thickly stratified ash- and lapilli-metatuff with thin interlayers of chloritic schist, pyritic chlorite schist, pyritic chiorite-sericite schist, and rusty-weathering felsic metatuff associated with mafic metasedimentaiy deposits. At the east edge of the outcrop sequence the latter is intruded by "little squirts" of possible Joslin Turn tonalite.
The chief purpose of this stop is to see what I consider to be acceptable Joslin Turn offshoots, at the southeastern corner of the exit ramp, where the ramp intersects NH 135/18. The striated pavement shows a complex mixture of white-weathering, rather coarsely crystallized, seriate, feldspathic tonalite, as extremely irregular stringers and patches that intrude gray, fine-grained felsic to intermediate metatuff. Unlike the dikes exposed at Stop 7, there is no evidence of chilling at the tonalite-tuff contacts, suggesting that the tonalite was intruded as a crystal mush. The outcrop characteristics suggest that the mush intruded unconsolidated tuff. Where exposures are good enough, these same features are what I have seen in Joslin
127
A5-16 MOENCH
Turn offshoots that are acceptable to me.
After lunch (30 minutes, or less), turn left onto NH 135/1 8, under 1-93. 19.20 1-93 rest area. 19.25 Right (south) onto Partridge Lake/Foster Hill Road. 19.30 Right (west) onto Foster Hill Road. 19.60 Large roadcut in Ammonoosuc Volcanics (Stop A9 of Rankin, 1966).
21.00 Stop 6----3 hours; Foster Hill detachment, Dead River Formation, Ammonoosuc Volcanics, and Perry Mountain to Ironbound Mountain sequence. On the north side of Foster Hill Road is the driveway to the Wilbur Willey residence. Visible to the southwest, across the road, is the new Richard Casale residence. The line of traverse is intended to be followed from Sites A to Q.
From the Willey driveway, walk -.1,000 ft. west along Foster Hill Road to Site A. Exposed on the south side of Foster Hill Road is a ribline of very distinctive, southeast-topping Perry Mountain quartzite, in beds of medium thickness (several cm) with thinner interbeds of green slate. Some of the quartzite beds are well graded, some are sharp both sides, and some display spectacular trough crossbedding. Near the base of the outcrop, these rocks are intruded by metadiabase that locally contains quartzite inclusions. Rankin (1996, p. 34) claimed to have found a calcite-rich, Joslin Turn tonalite sill just across the road; it and others, are labeled DSi on fig. 3.
This sequence of quartzites and slates is bordered to the southwest by a thick sequence of white-weathering, very thickly bedded, felsic crystal metatuff, mapped along the Perry Mountain-Smalls Falls contact (fig. 3). Rankin (1996, p. 34) described the tuff as a sill. An attempt to date the tuff was unsuccessful, owing to the absence of zircon. The sharp contact between the tuff and overlying black slate of the Small Falls is exposed at Site B and at one other location.
Exposed at Site C, arcing northwest to northeast of the Casale residence, is a southeast-topping sequence of (1) black, pyrrhotitic slate, metasiltstone and metasandstone of the Smalls Falls Formation, (2) about 4 meters of brownish-weathering, thinly bedded, calciferous slate and metasiltstone of the Madrid Formation, and (3) poorly bedded gray slate and metasiltstone of the Ironbound Mountain Formation, only a few meters of which are exposed. Strongly outsized, rounded, slate-supported pebbles and cobbles of grainy, Perry Mountain-like quartzite locally occur near the lower contact of the Ironbound Mountain. These clasts, and other regional relationships, give evidence of a basal Ironbound Mountain disconformity or unconformity along the Connecticut Valley.
Relationships already described (under Layer 2, Madrid Formation) indicate the presence of a west-topping sequence of the Smalls Falls and Madrid Formation in the now covered basement excavation for the Casale residence.
At Site D is the southeast-plunging folded, knife-sharp contact between foliated calcitic greenstone of the Ammonoosuc Volcanics and thinly bedded calciferous deposits of the Madrid Formation. The folds show that the Madrid structurally overlies the Ammonoosuc. This is one of two known outcrops of the Foster Hill detachment on Foster Hill. An oriented thin section of the calcitic greenstone shows evidence of intense cataclasis. Although the cataclasis did not necessarily form during detachment, there is no evidence here, contrary to Rankin's claim (1996, p. 34), that the contact is "surely depositional."
At Site E (fig. 6A), thinly interbedded grainy quartzite and green, sericitic to chioritic phyllite mapped as Perry Mountain Formation is separated from calcitic greenstone of the Ammonoosuc Volcanics by several centimeters of gritty, phyllitic metamudstone that I interpret to mark the Foster Hill detachment. The metamudstone contains isolated sand grains and sandstone lenses; adjacent Perry Mountain quartzites are complexly folded, truncated, and strongly dismembered. I interpret the Perry Mountain here as a faulted remnant of the southeast limb of a hangingwall syncline that formed by back rotation at the trailing edge of the detachment. The greenstone to the southeast shows a little evidence of cataclasis, as at Site D. The greenstone body is at least 75 ft. thick; near its southeast side it contain scattered quartz grains and greenstone-supported felsic lapilli.
128
0
1" ê
GradeS?
1 IllCo
I
it J t(1f1
Jo
B--Site H
to
le
-' 0
r1
75
SP
b
• 0
/ .-
.1
MOENCH
A5-17
Oa 0 15 Feet
A--Site E
Figure 6. Outcrop maps of Sites E and H, Foster Hill (fig. 3).
Rocks at Site F are mapped as a laminite facies of the Dead River Formation, stratigraphically below the Ammonoosuc, althou gh the contact is not exposed here. Seen here is interlaminated dark greenish-gray slate, metasiltstone or fine-grained metasandstone, felsic metatuff, and scattered pink, probably manganiferous nodules. Grading in some of the laminations suggest tops to the northwest.
At Site G; PeITy Mountain green slate and metasandstone (of the same Perry Mountain belt seen at Site E) is in contact with black slate of the Smalls Falls. Graded bedding suggests tops to the west.
At Site H (fig. 6B), Dead River laminite is in contact with a probably west-topping sequence of metamorphosed Ammonoosuc basalt, iron-formation, and dacitic(?) tuff. Although conclusive topping evidence is difficult to find, I infer that the Ammonoosuc overlies the laminite, and defines the west-topping east limb of a tight syncline that is truncated farther west by the Foster Hill detachment. If these relationships are correct, the Foster Hill fault is partly defined by opposed stratigraphic facing directions, much as I originally proposed (Moench and others, 1984, 1987), in principle but with many subsequent changes.
From Site H, the line of traverse crosses several alternating belts of isoclinally folded laminite and massively bedded Ammonoosuc (Sites L to N); an outcrop of rather standard Dead River Formation (Site L); and a 30-ft-thick offshoot of probable Joslin Turn tonalite (Site M). Readers are referred to the last paragraph under "Unit 6 and Joslin Turn controversy" for a discussion of the Joslin Turn at Site M. As near as I can determine, wherever topping evidence is visible, Dead River laminite is abruptly overlain by Arnmonoosuc. The standard Dead River outcrop (Site L) contains west-topping, thinly interbedded graded wacke and dark-greenish-gray slate, deformed by south-plunging folds. Although quite unweathered and "photoscenic" only two years ago, these rocks are now strongly stained and weathered.
Retrace much of the way to Site 0, at the north end of another probable Joslin Turn offshoot (recently covered by logging slash), then across the FHF to Site P. Exposed here is a set of thin beds of pinkish- gray hematitic quartzite that is deformed by a south-plunging syncline (Smq). Although not found elsewhere in the Madrid of Foster Hill, similar hematitic quartzite is a common component of the Madrid farther southwest in the area of figure 2. The quartzite body at P is interpreted as a synclinal remnant of basal Madrid, lying stratigraphically above surrounding rocks of the Smalls Falls Formation.
129
A5-18
MOENCH
At Site Q, near the Willey farmhouse, is an east-topping sequence of feldspathic quartzite and subordinate green slate within the Perry Mountain Formation.
Return to vehicles and retrace route to Moore Dam and beyond. 24.10 Fork right (north) onto rte. 18, to Vermont. 24.50 Right (northeast) onto unnamed paved road. 24.90 Pavement ends. 25.70 Crossroad, farmhouse on right, barn on left.
25. 85 Stop 7--15 minutes; Perry Mountain Formation intruded by sheeted metadiabase dikes. Park on right and walk west about 200 ft. to pavement outcrop in pasture. This is Rankin's (1996) Stop A4. The main features of the outcrop are shown on figure 7. As shown, dike DSd1 is chilled against and discordant to bedding in the Perry Mountain Formation. Dike DSd2 is chilled against and discordant to dike DSdI and its chill border. Dike DSd3 is a 1-cm-thin dikelet of chilled mafic material that cuts DSd1; dikes DSd4 are similarly thin dikelets of more felsic composition. The unnumbered dike may be related to any of dikes DS 1-3, or it may represent still another generation. As already discussed (Unit 6 and the Joslin Turn controversy) the "granophyric texture" described by Rankin (1996, p. 30) is not igneous granophyre; in my view it formed by greenschist-facies or lower temperature replacement. The dikes do not resemble the Joslin Turn pluton or its acceptable offshoots, such as those at Stop 5. I correlate the dikes to the Silurian and Early Devonian(?) mafic to locally felsic dike swarm of the Second Lake rift.
28.10 Sharp right onto road down valley of Halls Brook.
Chill
Figure 7. Outcrop map at Stop 7 showing Perry Mountain Formation intruded by probable Early Devonian or Silurian dikes; this is Stop 4 of Rankin (1996). For detailed descriptions see "Unit 6 and the Joslin Turn controversy."
28.50 Sharp left across logging bridge over Halls Brook; continue uphill to the northeast. Interbedded quartzite and green slate of the Perry Mountain Formation is exposed along the brook upstream from the bridge and
130
MOENCH A5-19
for about 80 ft. downstream, where strongly disrupted Perry Mountain quartzite beds abut against pyritic quartz-sencite schist that locally contains sparse pinpoints of chalcopyrite. I interpret the pyritic schist as an altered and weakly copper-mineralized facies of the Arnrnonoosuc Volcanics. Massive, fine-grained felsic Ammonoosuc metatuff is exposed farther downstream. I map the Perry Mountain-Ammonoosuc contact as the Foster Hill detachment. These rocks are best seen by wading in low water-fair weather conditions.
29.20 Stop 8--15 minutes; Dead River Formation. Large pavements at crest of hill; an elevation gain of about 300 ft. from Halls Brook. This is a predominantly pelitic facies of Dead River, composed of interlaminated greenish-gray pelitic slate and metasiltstone. The metasiltstone is commonly pinstriped parallel to bedding, and is locally seen as "slow-graded" beds as thick as 4 cm. Folds defined by graded bedding plunge southwest. Thinly interbedded graded wacke and slate of Dead River is exposed about 700 ft. farther northeast along the road. On the steep slope above Moore Reservoir, about 3,500 ft., S80E of Stop 8, are superb outcrops of more thickly bedded graded wacke and subordinate slate.
Reverse direction, return to the Halls Brook valley road, and drive north. 31.10 At intersection of three roads, bear right (north) onto Shadow Lake Road. 31.80 Continue north on Long Hill Road; Shadow Lake Road branches left. 32.25 Right (east) onto Leonard Hill Road. 32.80 Right (southeast) onto Johnson Road.
33.20 Stop 9--20 minutes; Perry Mountain Formation. Park on right, opposite Graves Cemetary, and walk S60W about 375 ft. along an old logging trail through an open area, then S75W another 250 ft.; a short distance beyond that point the main trail bends to about S45W, and an overgrown side trail branches steeply uphill to the south, about 100 ft. to large pavement at an elevation of 1570 ft. on the ridgeline. This location is about 800 ft., S60W from Graves Cemetary. The rocks here represent a typical, quartzite-rich sequence in the Perry Mountain Formation. The subvertical beds strike about N30E and top southeast.
Return to Johnson Road and continue east on Leonard Hill Road.
34.00 Stop 10--5 minutes; Perry Mountain Formation. Park on right at open area with bold outcrops of Perry Mountain Formation, similar to rocks at Stop 9. See text for a general description of the Perry Mountain.
34.70 Stop 11..-30 minutes; juxtaposition of Perry Mountain and Dead River Formations. Park either side, just south of the bridge over Mink Brook. This stop is reasonable only in low water-fair weather conditions; it illustrates the trials and tribulations of the Perry Mountain-Dead River separation where they actually come together. For easiest access to the brook exposures, follow a well maintained trail that leads south from near the Leonard Hill-Royalston Road intersection (north of the bridge), past a cabin, and down to an old sign "J.D. Smithers Memorial Bridge" (there is no bridge) at Mink Brook; then walk upstream (northwest) to the first solid outcrop about 300 ft. above the sign.
From northwest to southeast the outcrop sequence includes: 1) A large pavement, at a logging trail just north of the road and 150 ft. west of Mink brook bridge, exposing strongly folded dark greenish-gray phyllite and pinstripe-laminated quartzite, tentatively mapped as Dead River (although it might be pelitic Perry Mountain). 2) A ribby, quartzite-rich sequence of Perry Mountain exposed along Mink Brook, between about 50 ft. downstream from the bridge to about 250 ft. farther downstream. There, 3), at about 12 ft. upstream from the lower end of a long cascade, is a 50-cm-wide band of white, serniconcordant quartz veins; these veins are interpreted to occur along the the Foster Hill detachment (such veins also occur at some other FHF locations). The quartz vein band separates Perry Mountain rocks from, 4), a less arenaceous sequence mapped as Dead River Formation, composed of olive-green phyllite with thin beds of wacke. When I first mapped this Dead River sequence about 2 years ago, "slow-graded" wacke beds, now stained, were plainly visible. Dead River-like rocks occur in other cascades for a distance of more than 500 ft. downstream from the inferred FHF outcrop,
End of trip. Return to "civilization" to the north, then west on Royalston Rd. (intersection with Leonard Hill Rd. just ahead to the east) to US 2 at Concord, Vt., about 3.5 miles. Long Hill Rd., 1.5 ml. to the west, also leads to Concord in about the same distance. For travel south, retrace route to 1-93 at Moore Dam; or east, follow Leonard Hill Rd. to East Concord and Gilman, Vt.
131
A5-20 MOENCH
ACKNOWLEDGEMENTS
Mr. Wilbur Willey has generously tolerated my wanderings and hammerings on his farmland ever since my first trip to Foster Hill in the early 1980s. If a good geologist never has to return for agonizing reappraisal, only Mr. Willey knows how many times I proved myself a lousy one. I thank Mr. Willey and his new neighbor across the road, Mr. Richard Casale, for permission to lead several raucous (but hopefully not too unruly) geologists across their lands. This paper is totally unrefereed, and so I apologize for the mistakes contained herein.
REFERENCES CITED
Billings, M.P., 1935, Geology of the Littleton and Moosilauke quadrangles, New Hampshire: Concord, New Hamphire Planning and Development Commission, 51 p., scale 1:62,500.
______ 1992, The "Piermont allochthon" in the Littleton-Moosilauke area of west-central New Hampshire--An alternative interpretation: Geological Society of America Bulletin, v. 103, p. 1539-154 1.
Boone, G.M., 1973, Metamorphic stratigraphy, petrology, and structural geology of the Little Bigelow Mountain map area, western Maine: Maine Geological Survey Bulletin 24, 136 p.
Boucot, A.J, 1968, Silurian and Devonian of the Northern Appalachians, in Zen, E-an, and others, eds., Studies of Appalachian Geology--Northern and maritime: New York, Interscience Publishers, p. 83-94.
Boudette, E.L., 1991, Geologic map of the Kennebago Lake quadrangle, Franidin County, Maine: U.S. Geological Survey Miscellaneous Investigations Series Map 1-2058), scale 1:62,500; pamphlet, 12 p.
Cousineau, P.A., 1995, Le mélange de Chesham: Québec, Ministère des Ressources naturelles, Secteur des mines, MB 95-43.
Cousineau, P.A., and Tremblay, Alain, 1993, Acadian deformations in the southwestern Quebec Appalachians, in Roy, D.C., and Skehan, J.W., The Acadian orogeny: Recent studies in New England, Maritime Canada, and the autochthonous foreland: Geological Society of America Special Paper 275, p. 8 3-99.
Eisenberg, R.A., 1982, Chronostratigraphy and lithogeochemistry of Lower Paleozoic rocks from the Boundary Mountains, west-central Maine: Berkeley, Calif., University of California Ph.D. dissertation, 180 p.
Green, J.C., 1968, Geology of the Connecticut Lakes-Parmachenee area, New Hampshire and Maine: Geological Society of America Bulletin, v. 79, p. 1601-1638.
Hampton, M.A., and Lee, H.J., 1996, Submarine landslides: Reviews of Geophysics, v.34, p. 33-59. Hoffman, P.F., and Harte, E.H., 1999, Large, coherent, submarine landslide associated with Pan-African foreland
flexure: Geology, v. 27, no. 8, p. 687-690. Jahrling, C.E., II, 1983, Geophysical, structural, and stratigrphic relations across the Monroe line and related
contacts in the Indian Stream area, northern New Hampshire: Durham, N.H., University of New Hampshire, M.S. thesis, 106 p.
Lyons, J.B., Aleinikoff, J.N., and Zartman, R.E., 1986, Uranium-thorium-lead ages of the Highlandcroft Plutonic Suite, northern New England: American Journal of Science, v. 286, no. 6, p. 489-509.
Lyons, J.B., Bothner, W.A., Moench, R.H., and Thompson, J.B., Jr., 1997, Bedrock geologic map of New Hampshire: U.S. Geological Survey; scale 1:250,000.
Marvinney, R.G., 1989, Thrust and strike-slip faults near Jackman, Maine, in Tucker, R.D., and Marvinney, R.G., eds., Studies in Maine geology, Volume 2: Augusta, Maine, Maine Geological Survey, p. 173-185.
Marvinney, R.G., Bothner, W.A., and Pollock, S.G., 1992, Silurian stratigraphic succession of northern NH and western ME: Geological Society of America Abstracts with Programs, v. 24, no. 3, p. 61.
Marvinney, R.G., Moench, R.H., Marquis, R., Cousineau, P., and Bothner, W.A., 1999, Resolved Silurian-Devoman correlation across the Quebec-Maine-NH borders and its bearing on Silurian extension: Geological Society of America Abstract with Programs, v. 31, no. 2 p. A-32.
Moench, R.H.,1970, Premetamorphic down-to-basin faulting, folding, and tectonic dewatering, Rangeley area, western Maine: Geological Society of America Bulletin, v. 81, p. 1463-1469.
______ 1971, Geologic map of the Rangeley and Phillips quadrangles, Franklin and Oxford Counties, Maine: U.S. Geological Survey Miscellaneous Geologic Investigations Map 1-605, scale 1/62.500.
______ 1989, Metamorphic stratigraphy and structure of the Connecticut valley area, Littleton to Piermont, New Hampshire, in Lyons, J.B. and Bothner, W.A., eds., A transect through the New England Appalachians, 28th International Geological Congress: Washington, D.C., American Geophysical Union, Field Trip Guidebook T162, Day 4, p. 45-53.
______ 1990, The Piermont allochthon, northern Connecticut valley area, New England--Preliminary description and resource implications, in Slack, J.S., ed., Summary results of the Glens Falls CUSMAP project, New York, Vermont, and New Hampshire: U.S. Geological Survey Bulletin 1887, p. J1423.
132
MOENCH A5-21
1992, The "Piermont allochthon" in the Littleton-Moosilauke area of west central New Hampshire--Reply: Geological Society of America Bulletin, v. 103, P. 1541-1545.
1993, Highlights of metamorphic stratigraphy and tectonics in western Maine to northeastern Vermont, in Cheney, J.T., and Hepbume, D.C., eds., Field trip guidebook for the northeastern United States; Geological Society of America, Annual Meeting, Boston, Mass., 1993: University of Massachusetts, Department of Geology and Geography, Contribution no. 67, v. 2, p. DD-1 to DD-32.
1996, Stratigraphic basis for the Piermont-Frontenac allochthon, Bath to Piermont, New Hampshire, and Bradford, Vermont, in van Baalen, M.R., ed., Guidebook to Field Trips in northern New Hampshire and adjacent regions of Maine and Vermont: Cambridge, Massachusetts, Harvard University, New England Intercollegiate Geological Conference, 88th Annual Meeting, p. 133-153.
ed., 1984, Geologic map of the Sherbrooke-Lewiston area, Maine, New Hampshire, and Vermont: U.S. Geological Survey Open-File Report 84-0650, scale 1:250,000.
Moench R.H., and Aleinikoff, in press, Stratigraphy, geochronology, and accretionary terrane settings of Bronson Hill arc and off-arc sequences, northern New England, in Jacobi, R.D., and Mitchell, C.E., eds., Taconic convergence--Orogen, foredeep, and craton Interactions: Geological Society of America Special paper
Moench, R.H., and Pankiwskyj, K.A., 1988a Geologic map of western interior Maine, with contributions by G.M. Boone, E.L. Boudette, Allan Ludman, W.R. Newell, and T.I., Vehrs: U.S. Geoogical Survey Miscellaneous Investigations Series Map 1-1692, scale 1:250,000 (includes pamphlet, 51.p.).
1988b, Definition, problem, and reinterpretation of early premetamorphic faults in western Maine and northeastern New Hampshire in Tucker, R.D., and Marvinney, R.G., Studies in Maine Geology, V.1: Augusta, Maine Geological Survey, p. 35-50.
Moench, R.H., Hamner-Douglass, Katrin, Jahrling, C.E., II, and Pyke, A.R., 1987, Metamorphic stratigraphy of the classic Littleton area, New Hampshire: Geological Society of America Centennial Field Guide, Northeastern Section, p. 247-256.
Moench, R.H., Bothner, W.A., Marvinney, R.G., and Pollock, S.G., 1992, The Second Lake rift, northern New England: Possible resolution of the Piermont allochthon-Frontenac Formation problem: Geologicial Society of America Abstracts with Programs, v. 24, no. 2, p. 63-64.
Moench, R.H., Boone, G.M., Bothner, W.A., Boudette, E.L., Hatch, N.L., Jr., Hussey, A.M. II, and Marvinney, R.G., 1995, Geologic map of the Sherbrooke-Lewiston area, Maine, New Hampshire, Vermont, United States, and Quebec, Canada, with contributions to geochronology by J.N. Aleinikoff: U.S. Geological Survey Miscellaneous Series Investigsations Map I-i 898-D; scale 1:250,000, 56 p. pamphlet.
Moench, R.H., Bothner, W.A., and Cousineau, P.A., 1999a, Silurian stratigraphy from Woburn, Quebec, to Fairlee, Vermont: Geological Society of America Abstracts with Programs, v. 31, no. 2, p. A-58.
Moench, R.H., Boudette, E.L., and Bothner, W.A., 1999b, Tectonic lithofacies, geophysical, and mineral-resource-appraisal maps of the Sherbrooke-Lewiston area, Maine, New Hampshire, and Vermont, United States, and Canada: U.S. Geological Survey Miscellaneous Investigation Series Maps I-i 898-E, Maps A-D, scale 1:250,000, 107p. pamphlet (in press).
Rankin, D.W., 1994, Preliminary bedrock geoogic map of parts of the Lower Waterford, Concord, Littleton, and Miles Pond 7 1/2-minute quadrangles, Vermont and New Hampshire: United States Geological Survey Open-File Report 94-4 10.
Rankin, D.W., 1996, Bedrock geology of the Littleton, Vermont-New Hampshire 15-minute quadrangle northwest of the Ammonoosuc fault, with a section on the analytical methods and isotopic age investigation of pegmatitic metadiorite of the intrusive suite of Commerford dam by R.D. Tucker, in van Baalen, M.R., Guidebook to field trips in northern New Hampshire and adjacent regions of Maine and Vermont: Cambridge, Massachusetts, Harvard University, New England Intercollegiate Geological Conference, 88th Annual Meeting, p. 5-37.
Rankin, D.W., and Tucker, R.D., 1999, Age and contact relations of the Lost Nation pluton, upper Connecticut valley--Implications for the Piermont-Frontenac allochthon: EOS, Transactions, American Geophysical Union, 1999 Spring Meeting Supplement, v. 80, no. 17, p.S358.
Stewart, D.B., Wright, B.E., Unger, J.D., Phillips, J.D., and Hutchinson, D.R., 1993, Global geoscience traverse 8--Quebec-Maine-Gulf of Maine transect, southeastern Canada, northeastern United States of America,with contributions by J.H. Luetgert, W.A. Bothner, K.D. Klitgord, L.M. Liberty, and Carl Spencer: U.S. Geological Survey Miscellaneous Investigations Series Map 1-2329, 17 p. scale 1:1,000,000.
Thompson, J.B., Jr., Rosenfeld, J.L., Hepburne, J.C., and Trzcienski, W.E., 1997, How does New Hamphire connect to Vermont?, in Grover, T.W., Mango, H.N., and Hasenohr, E.J., eds., Guidebook to Field Trips in Vermont and adjacent New Hampshire and New York: Castleton, Vermont, Castleton State College, 89th Annual Meeting, New England Intercollegiate Geological Conference, p. Cl, 1-17.
133

134
A6- 1
STANLEY, RUSHMER, HOLYOKE, LINI
Trip A6: FAULTS AND FLUIDS, THE VERMONT FORELAND AND WESTERN HINTERLAND
Leaders: Rolfe Stanley, Tracy Rushmer, Caleb Holyoke Ill, and Andrea Lini, University of Vermont
INTRODUCTION
The focus of this trip will be on the characteristics and evolution of four fault zones that represent behavior at three progressively deeper levels in the earth's crust. We begin in the Vermont foreland (Lessor's Quarry and the Beam, Fig. 1) where the rocks are cleaved but unmetamorphosed. Deformation occurred under confining pressures in the order of 0.5 kilobars (-.1.5 km) and temperatures of about 65 0 C (Stanley, 1990, p.238) assuming a normal geothermal gradient, double the siratigraphic section (1065m) due to tectonic stacking, and a deformation age of Middle Ordovician (Taconic Orogeny). Fluid composition is dominantly calcite-bearing, interstitial water, although dehydration of clays can not be totally ruled out in the pressure solution development of the cleavage. After studying this outcrop, we will then travel eastward to the Hinesburg thrust fault where Late Proterozoic to Lower Cambrian rocks of the Fairfield Pond Phyllite and lower part of the Cheshire Quartzite (rift-drift transition) were displaced westward over the Lower Ordovician Bascom Formation (carbonate-siliciclastic platform) (Fig 1). Based on ductile deformation fabrics in quartz, brittle deformation fabrics in feldspar, chlorite-sericite assemblages, and dolomite-quartz veins, confining pressures and temperatures are estimated to be a minimum of 3.5 Kbars (-.11 km) and 3750
C (Fig.2). Fluids in the argillaceous quartzite of the upper plate were saturated in silica as evidenced by numerous generations of quartz veins. These veins record a rich history of deformation. The fluids were enriched in sulphides in the ultramylonites of the fault surface. Quartz-dolomite veins are found in the carbonate slivers of the lower plate. Understanding the origin of the fluids and the history of the veins is critically important in understanding the evolution of the fault zone. We will give you our best interpretation! Our last stops will be along the boundary of the Lincoln massif where Middle Proterozoic rocks are involved with major, biotite-grade, ductile thrust zones (Cobb Hill thrust and the Underhill thrust zone at South Lincoln, Fig 1, Fig.3). Here biotite-quartz-feldspar gneiss of the Mount Holly Group has reacted to form muscovite-quartz mylonites with varying amounts of flattened clasts of feldspar, and gneiss. Where quartz lenses, pods, and veins are present, the mylonites are rich in muscovite or become schistose. Biotite-chlorite schist occurs in the fault zone near amphibolite of the Mount Holly. Based on these relations the confining pressure and temperatures are estimated to be 5 kbars (17 km) and 4500 C to 4750 C (Fig.2)
Clearly, the traverse has gone from near-surface conditions where meteoric fluid (interstitial water) is important in pressure solution and brittle deformation (abnormal pore pressure) to deeper zones where metamorphic reactions play a critical role in strain softening processes and fault-zone fabrics. The Hinesburg thrust fault is, in many respects, the most complicated since it represents conditions transitional between the other two.
FLUIDS AND THE GEOLOGY OF VERMONT
After spending some time in the field in Vermont, as you will today, you will sense that fluid plays an active role in many of the features observed in the rock; everything from veining to development of hydrous metamorphic assemblages. Fluid flow has been a "hot" topic in Vermont geology for sometime and has attracted attention world wide as an area in which pervasive, instead of channelized, fluid flow is the rule rather than the exception. This has mainly been studied from a metamorphic point of view. Fluid interaction during deformation, however, has also been documented as these outcrops show beautifully. At these different crustal levels, fluids have clearly been present during deformation. This is significant in that the presence of fluid can create abnormal pore pressures which enables brittle deformation even under pressure and temperature conditions where deformation is macroscopically ductile. In addition, dehydration of sediments can produce mica phases which can localize ductile deformation.
Stanley, R., Rushmer, T., Holyoke, C., and Lim, A., 1999,Faults and fluids in the Vermont foreland and hinterland in western Vermont; in Wright, S.F. ed., New England Intercollegiate Geologic Conference Guidebook Number 91,p. 135-158.
A6-2
STANLEY, RUSHMER, HOLYOKE, LINI
At the "beam" outcrop, the shallowest of our outcrops today and where fluid is trapped interstitially, abnormal pore pressures generated during cleavage development focuses deformation along fluid-lined fractures. As we go deeper into the crust, dehydration of hydrous phases begins to play a role. The origin of the silica-saturated fluid at the Hinesburg Thrust may be derived from the phyllite layers. Quartz veins are evidence of brittle behavior induced when pore pressure increased and stress exceeded what could be accommodated by the ductile deformation mechanisms (mainly accommodated by mylonization focused in the muscovite-rich phyllite layers). Interestingly, this shift to brittle behavior occurred more than once suggesting a cyclic process of fluid build-up and release by fracturing during the development of the fault zone. Finally at the deepest fault zone we see evidence of muscovite growth and free silica produced from a potassium feldspar reaction with water. The water source is likely derived from the dehydration of sediments during burial. The muscovite-rich assemblage is then weaker than surrounding feldspar-rich rocks and can accommodate strain during subsequent deformation.
GEOLOGIC SETTING
Central Vermont provides an excellent field laboratory for studying the tectonic transition between the foreland and the pre-Silurian hinterland of western New England because many of the major lithotectonic units are exposed in a 40 km wide belt (Fig. 1) and the underlying Middle Proterozoic granitic basement of the Green Mountains is present in the Lincoln massif (Fig. 3)
The rocks of the foreland consist of a basal rift-clastic sequence overlain by carbonate and siliciclastic rocks of the platform whereas the rocks of the hinterland consist of metamorphosed pelitic, psammitic, and mafic volcanic rocks of the slope-rise and outer rise sequence (Fig. 1 and Fig. 3). Major west-directed thrust faults (Champlain, Hinesburg, Cobb Hill, Underhill at South Lincoln, for example) cut the section and become more numerous to the east in the hinterland. Some of these faults have brought Middle Proterozoic rocks to the surface (Cobb Hill, Underhill at South Lincoln) whereas others like the Champlain thrust fault can be traced by seismic studies into the Middle Proterozoic basement beneath the Green Mountains. The metamorphic grade ranges from essentially unmetamorphosed, although well lithified and cleaved, sedimentary platform rocks of the foreland to kyanite-chloritoid grade in the hinterland along the Green
FIGURE 1 (opposite page) Interpretative Geologic Map of Vermont and eastern New York modified from Stanley and Ratcliffe (1985, p1. 1, Fig. 2A). The following symbols are generally listed from west to east. Y, Middle Proterozoic of the Adirondack massif; g, Middle Proterozoic of the Green Mountain massif; YL, Middle Proterozoic of the Lincoln massif; 1, Middle Proterozoic between the Green Mountain massif (XgL and the Taconic allochthons (medium grey); QC, Cambrian and Ordovician rocks of the carbonate-siliciclastic platform (DRIFT STAGE); rift-clastic sequence of the Pinnacle (CZp') and Fairfield Pond Formations 1Zfl and their equivalents on the east side of the Lincoln and Green Mountain massifs. CZu, Underhill Formation; QZuJay Peak Member of the Underhill Formation (RIFT STAGE IN HINTERLAND); Qr, include RIFF STAGE rocks of the Pinney Hollow and Stowe Formations; FOREARC SEQUENCE (Missisquoi Group) include Qrn, Moretown Formation and Qh includes Harlow Bridge and Cram Hill Formations in Vermont and Hawley Formation in Massachusetts. Silurian-Devonian sequence include Shaw Mountain, Northfield and Waits River Formations in the area labelled "Silurian-Devonian Formations". Symbol I in A6 is the glaucophane locality at Tilliston Peak. Short line with X's (Worcester Mountains and Mt Elmore) and line with rhombs (Mount Grant) in C6 and D5 mark the Ordovician kyanite-chioritoid zones of Albee (1968). Widely-spaced diagonal lines in north central Vermont outline the region that contains medium-high pressure amphiboles described by Laird and Albee (1981). Irregular black marks are ultramafic bodies (Lfl. LQ & BEAM IT, Lessor's Quarry and the "Beam", phI, Philipsburg thrust; Highgate Springs thrust; El, Pinnacle thrust; OT, Orwell thrust; HI. Hinesburg thrust; HTFM, the Hinesburg thrust fault at Mechanicsville; COBB HILL, Cobb Hill thrust fault at Lincoln; 1I, Underhill thrust; UTSL, Underhill thrust fault at South Lincoln; JS, Jerusalem slice; U, Underhill slice; ENS. Hazens North slice; MVFZ, Missisquoi Valley fault zone;
Pinney Hollow slice; BMT, Belvidere Mountain thrust; CHT, Coburn Hill thrust; Qa, Ascot-Weedon sequence (?) in grid location 7A.
136
L ialrJ/,., rx:
•
-
5
-- '
-
4' <
/'- -, 5--
/
1
• I, ff/f///
I/1/f/If
•S/ 4 NORTHERN
2ROOT ZONE - fOR ERODED PART
,OF TACONIC SLICES
5;S -
/
/
/ • f/_i. /
•(// /7/7/,
/
-
p '5k//'/ /'•
/
L'U/////
4 1-1
B
4°30
43*30'
A6-3 STANLEY, RUSHMER, HOLYOKE, UNI
73'30 73°00
2
ii. +,* *
: : :. : 11
7
5°OO
.,...'...cl...l,, A
- . . . . / , • -
-'- - - OCp
BEAM
'
o P B
P. :
• • . _:-.:-:-:-:-: N
c :T Tj1;
- --: - - -' -' HTFM '
- 1 -,
o -
u TT T .' \
. 1r L -
- -'.. --- • -
/ •
HN E JIISScS f £Zp -
-( •- •5 c: i--: - _11
:
.
FIGURE 1 137
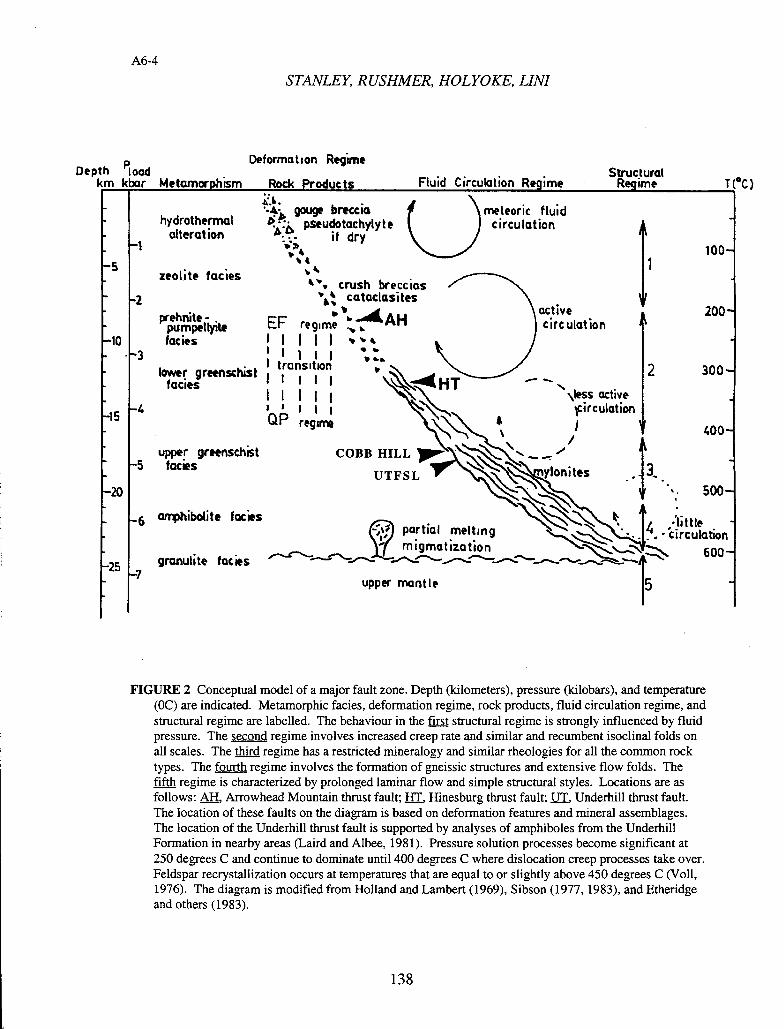
A6-4
STANLEY, RUSHMER, HOLYOKE, LINI
Deforma I ion Regime Depth ood Structural
km kbar Metamorphism Rock Products Fluid Circulation Regime Regime T(C)
..4 gouge breccici \ meteoric fluid
r - hydrothermal : pseudotachytyte ) circulation alteration it dry v /
-F
zeolite fades 4.
V crush breccias IV cataclasites
-
prehnite I. EF ' _4AH pumpett yte regime . facies t I I I I
lower greenschist facues
i tronstiofl i
' SIj QP regirr
upper greenschist COBB HILL' facies
UTFSL
'II
active 200 circulation
2 300
\lesS active yirculation
400- * I
z czIonites 500-
t tie irculotion
600
6 anhibotite fades partial melting migmotization
granutite facies
upper mantle
FIGURE 2 Conceptual model of a major fault zone. Depth (kilometers), pressure (kilobars), and temperature (OC) are indicated. Metamorphic facies, deformation regime, rock products, fluid circulation regime, and structural regime are labelled. The behaviour in the fli structural regime is strongly influenced by fluid pressure. The second regime involves increased creep rate and similar and recumbent isoclinal folds on all scales. The third regime has a restricted mineralogy and similar rheologies for all the common rock types. The fourth regime involves the formation of gneissic structures and extensive flow folds. The fifth regime is characterized by prolonged laminar flow and simple structural styles. Locations are as follows: AH, Arrowhead Mountain thrust fault; El. Hinesburg thrust fault; UI Underhill thrust fault. The location of these faults on the diagram is based on deformation features and mineral assemblages. The location of the Underhill thrust fault is supported by analyses of amphiboles from the Underhill Formation in nearby areas (Laird and Albee, 1981). Pressure solution processes become significant at 250 degrees C and continue to dominate until 400 degrees C where dislocation creep processes take over. Feldspar recrystallization occurs at temperatures that are equal to or slightly above 450 degrees C (Voll, 1976). The diagram is modified from Holland and Lambert (1969), Sibson (1977, 1983), and Etheridge and others (1983).
138
A6-5
STANLEY, RUSHMER, HOLYOKE, LINI
Mountain anticlinorium. Based on regional considerations (Stanley and Ratcliffe, 1985) and available isotopic-age analysis (Sutter and Ratcliffe, 1985, Ratcliffe and others, 1998 and references therein), deformation and metamorphism throughout the western (foreland) and central (accretionary complex) part of the belt largely occurred during the Taconian orogeny (Middle Ordovician). Younger Acadian deformation (Middle Devonian) has severely deformed the Ordovician Moretown and Cram Hill Formations (fore-arc sequence) as well as the Silurian and Devonian section. The Acadian deformation decreases in intensity westward into the Taconian accretionary complex where its influence is thought to be minimal. Future isotopic work must clarify the extent and relative importance of these two orogenic events. During the Early Cretaceous alkalic dikes and normal faults cut the existing geology and represent abortive rifting during the opening of the North Atlantic (McHone, 1987 and this field conference; Stanley, 1980).
Stop 1 LESSOR'S QUARRY (Directly south off of Sunset View Road) - This quarry is located in the fossiliferous Glens Falls Limestone of Middle Ordovician age (Fig.4 and Fig.5). The Glens Falls contains excellent examples of graded beds of fossil fragments interlayered with laminated micrite. Bryozoan mounds are scattered through both rock types. The graded beds represent distinct pulses of carbonate sedimentation possibly caused by storms. Study the stratigraphy of the larger blocks.
The quarry contains a number of imbricate bedding plane thrusts which can be studied by mapping all the walls. The most conspicuous thrust, called the Lessor's Quarry thrust, is well exposed on the north wall. Conspicuous slickenlines, east-dipping fault-zone cleavage, and bent Si cleavage indicate that the upper plate moved to the west-northwest over the lower plate. The amount of displacement is unknown. A conspicuous syncline forms the lower plate on the east side of the north wall. This syncline deforms an older bedding-plane thrust (synclinal fault, Fig. 5) which dies out in small faults and pressure solution features on the western limb of the syncline. It is a blind thrust. Multiple cleavages along the blind thrust indicate that it moved westward before it was folded by the syncline. The syncline and its eastern anticline can be traced by careful mapping to the south wall where it forms a fault-bend fold (Stanley fault-bend fold, Fig. 5) that developed over a ramp that must exist just east of the eastern wall of the quarry. You will note that the Lessor's Quarry thrust is not folded by the syncline or its eastern anticline, but instead truncates the synclinal fault (Fig. 5). Thus the Lessor's Quarry thrust is an excellent example of an out-of-sequence thrust in the foreland.
The Si cleavage is a superb example of pressure solution. You will note that it is discontinuous, filled with foliated, black clay-like material. Si off sets bedding where the bedding-cleavage angle is less than 90 degrees. Furthermore, fossils are truncated by the cleavage. The calcite from the pressure solution was largely deposited in fractures and along fault surfaces.
Discussions will focus on the geometry of the faults and folds and their structural history.
Stop 2 "THE BEAM" (Fig. 6) (Outcrops on Rt. 2, one mile east of Lessor's Quarry). This is a superb outcrop that serves as a field laboratory for research and teaching of foreland deformation. Please study it. Use cameras but not hammers. This exposure has been thoroughly discussed in the following paper: Stanley, R.S., 1990, The evolution of mesoscopic imbricate thrust faults - an example from the Vermont foreland: Journal of Structural Geology, v. 12, p. 227-242.
The outcrop is located in the Cumberland Head Formation (Middle Ordovician) 5 miles west of the exposed front of the Champlain thrust fault or approximately 4600 feet (1400 meters) below the restored westward projection of the thrust surface (Fig.4). The major questions that will be discussed are: 1. How do ramp faults form?, 2. Are there criteria to determine if imbricate thrust faults develop toward the foreland (west) or the hinterland (east)?, 3. What is the relation between faulting and cleavage development?, 4. What processes are involved in the formation of the fault zones?, 5. Are there criteria that indicate the relative importance and duration of motion along the fault zone?, 6. Is there evidence to suggest that abnormal pore pressure existed during faulting?, and finally 7. What is the structural evolution of the imbricate faults and cleavage formation? The first six questions will largely be addressed by evidence at the outcrop. The
139
STANLEY, RUSHMER, HOLYOKE, LINI
FIGURE 3 (opposite page) Geological cross section through the pre-Silurian foreland and hinterland along a latitude of 440 N. The section represents the Taconian Accretionary Wedge. It is based on mapping by Cady (1945), Washington (1987), and Harding and Hartz (1987) in the foreland, by Tauvers (1982) and DelloRusso and Stanley (1986) in the Lincoln massif, and by Lapp and Stanley (1986), Prewitt (1986), Stanley (1986, 1987), Kraus (1987), Haydock (1988), Walsh (1989), Kimball-Falta (1991), and Armstrong (1993) in the Taconian part of the hinterland. North American Middle Proterozoic (Y) crust is shown by the random dash pattern. The overlying foreland rocks consist of Late Proterozoic (Z) rift clastic rocks (stippled pattern) and Cambrian and Ordovician platform rocks (carbonate and siliciclastic rocks overlain by shales) shown by the stacked rectangles. Symbols for the deformed and metamorphosed slope-rise and outer rise sequence correspond to those in Figure 1. The sequence designations are those used in Stanley and Ratcliffe (1985) and Figure 1 The black lenses in the hinterland sequence represent serpentinites. Zones 1 through 4 are based on mafic rock geochemistry (Coish, 1987, 1988). Temperatures of coexisting mineral assemblages are given as (i.e.290 0c) and are based on carbon and oxygen isotope analyses by Sheppard and Schwarcz (1970) for the foreland, oxygen isotope analyses by Garlick and Epstein (1967) and calcite-dolomite and amphibole-plagioclase temperatures (Laird and others, 1984) for the western part of the hinterland. The 471 Ma ages are based on 40Ar/39Ar analyses of hornblende by Laird and others (1984). The 376-389 Ma ages are based on 40Ar/39Ar total fusion ages of muscovite and biotite (Laird and others, 1984; Lamphere and others, 1983). The symbol a refers to amphibole, b refers to biotite, and m refers to muscovite. The metamorphic series assignment is based on amphibole analyses by Laird (1987). The solid squares represent hornblendes from the high-pressure metamorphic series and the open circles represent hornblendes from the medium-pressure metamorphic series. Based on stratigraphic and sedimentologic information, Stanley and others (1989) suggested that the root zone for the northern extension of the Taconic allochthons is located along a complex zone of pre- to late metamorphic faults that forms the western boundary of the albite-rich and aluminous rocks of the Hazens Notch, eastern Underhill and Mt. Abraham formations. This location is supported by the fact that the metabasalts in the Taconic allochthons are chemically more similar to the mafic rocks of the western Underhill and Pinnacle formations (Zone 2) than they are to the mafic rocks to the east in Zones 3 and 4. The exposed Middle Proterozoic rocks of the Lincoln massif consist of two major anticlines in which the eastern one has been severely flattened by numerous thrust faults which contain Paleozoic mylonites with east-over-west fabrics. A third anticline is buried beneath the platform sequence to the west of the East Middlebury thrust (Harding and Hartz, 1987). The breakthrough faults (East Middlebury thrust) and geometry of the western anticline suggests that the three anticlines of Middle Proterozoic rocks began their development as fault-propagation folds (Suppe, 1985). The eastern antcline was then flattened by the development of axial-surface cleavage and extensive high-angle faults. The available PT information suggests that this deformation in the massif occurred over temperatures that ranged from 290 0C to the west to 4350 C along the eastern border of the massif. These temperatures would correspond to pressures in the range of 3 kbars (10 km) to the west and 4.5 to 5.0 kbars (16 to 18 km) to the east assuming a standard geothermal gradient of 20 0C to 300C per kilometer (Strehle and Stanley, 1986, Fig. 5). This information again suggests that there was a significant tectonic load over the Lincoln massif when these structures formed. The minor imbricate faults of the Middlebury synclinorium are based on work by Washington (1987). The slice of North American crust floored by the Vergennes thrust is an interpretation based on some unpublished seismic reflection work. Shortening across this section is estimated to be between 400-500 km. of which approximately 70 km involved the folding and faulting of North American crust.
140
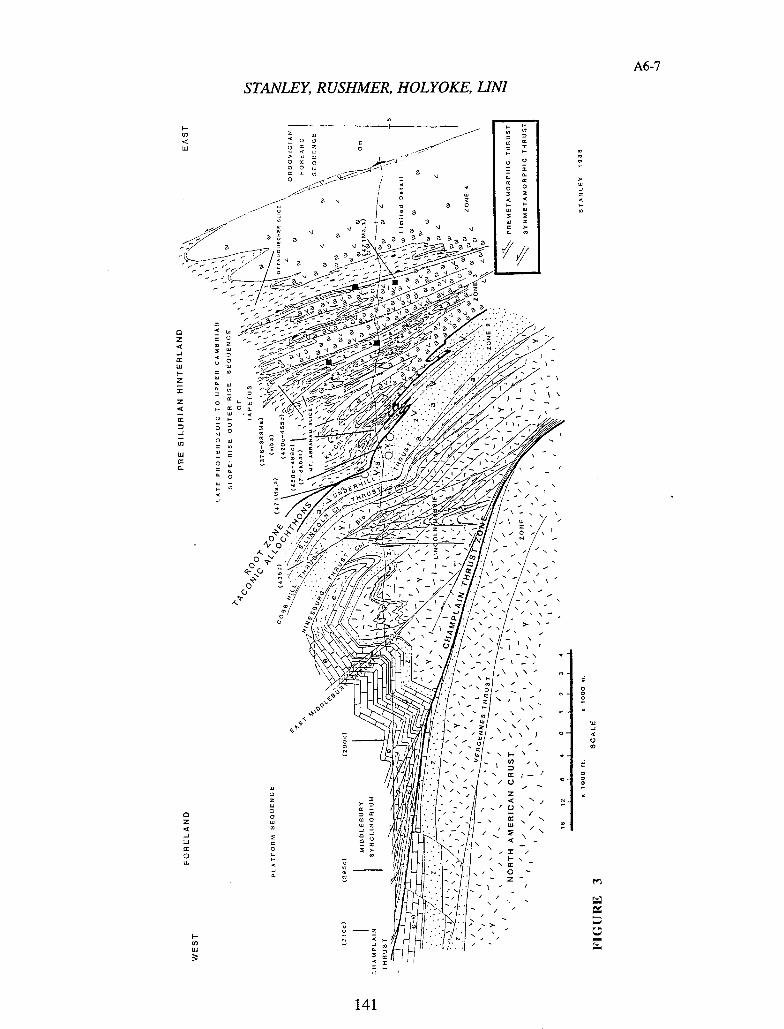
A6-7
STANLEY, RUSHMER, HOLYOKE, LINI
rn
-
uj
!
- \\
k CL
•/-: a:-: ! :
I
cc z -
cc
LU
141
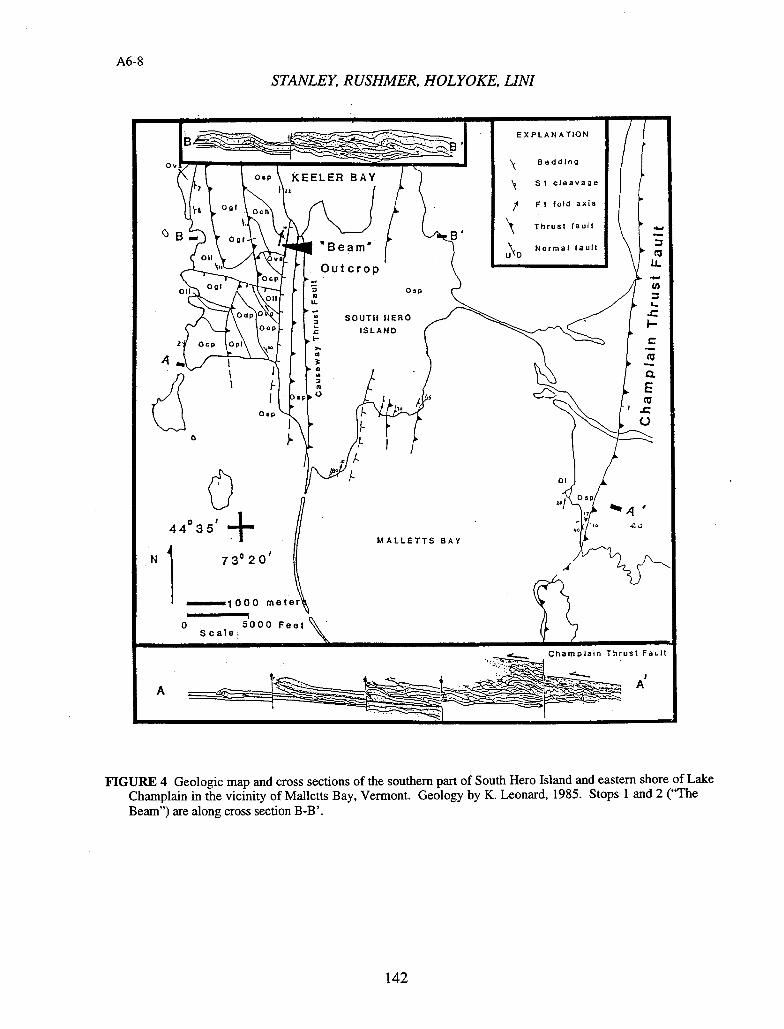
F EXPLANATION
Bedding
SI cleavage
El told axis
Thrust fault
U D Normal fault j
\Ju..
/1 w
I.s:
Ic
c.
(.)
STANLEY, RUSHMER, HOLYOKE, LINI A6-8
Ov
O'p KEELER BAY
1.
Outcrop
Oil
Oup Ogi
Osp Oil
U.
Odp SOUTH HERO Oup ISLAND
l-. Z Ocp Opi
A
Oip
II 440351 1/ MALLETTS BAY
N 73 ° 20 '
1000 meter
O Scale5000
Feet
Cl I
a p/4
A
Champlain Thrust Eauit
A A'
FIGURE 4 Geologic map and cross sections of the southern part of South Hero Island and eastern shore of Lake Champlain in the vicinity of Malletts Bay, Vermont. Geology by K. Leonard, 1985. Stops 1 and 2 ("The Beam") are along cross section B-B'.
142
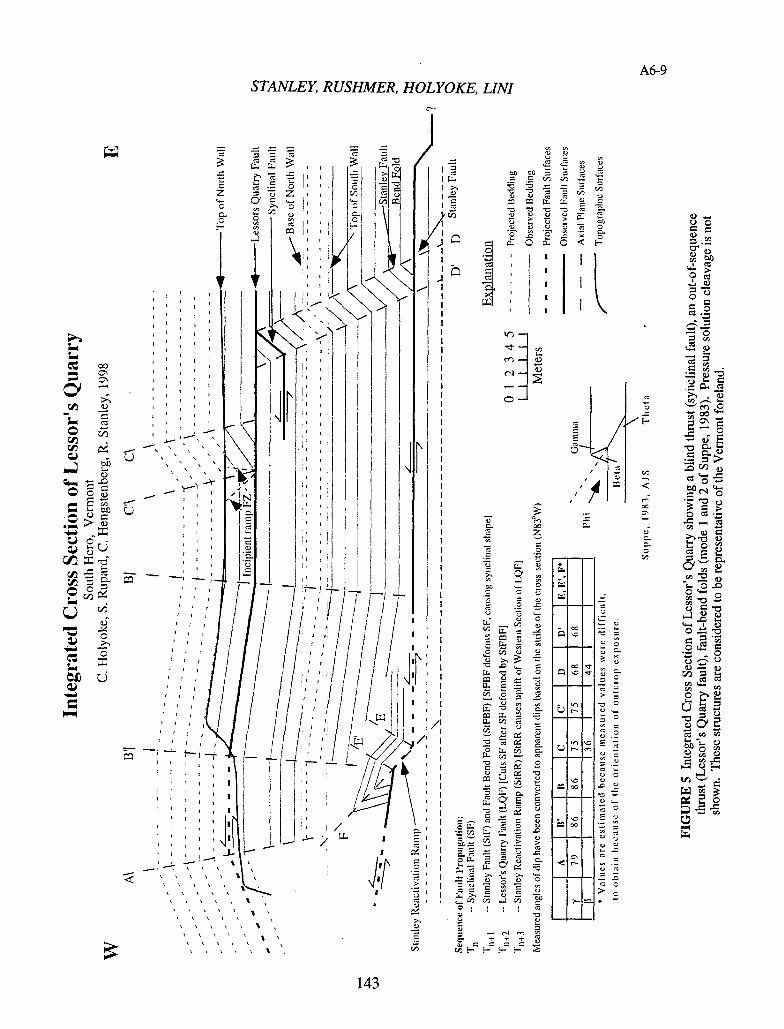
0
5 C, U
LM
Ihil \h
o o o a II
00 I
E 0 cn U
En
to
• • U
0.
E-
cz
I I
:
C
0
i _,• /i
TH
a U
— LI. =
H C) , 0 0
U a
—
a
0
U 0
C- - 0
C) -
U C U -
coo
U 0-
= a 0
0.0
0. CY - 0
0
I \I
A I I 0 I
0 tz
I'! •:
o U . • U -I
C_& Q _.0.'
— >. U
C) U
0
- 10.0 >0
STANLEY, RUSHMER, HOLYOKE, LINI Cl.
A6-9
0 z 0
- 00
- - I
_l-•
L)
—
—
L)
- II
I
U
cC
—c
) _ oI-0
CO
00
0) 0 C)
(I)
• 0 0) o cO--
CY 2 0.0)
0.0 o 4
0)
CO
0) C#D
cl
UI
cs2
•0 0)0 CIS
tn
C.. 0)
143
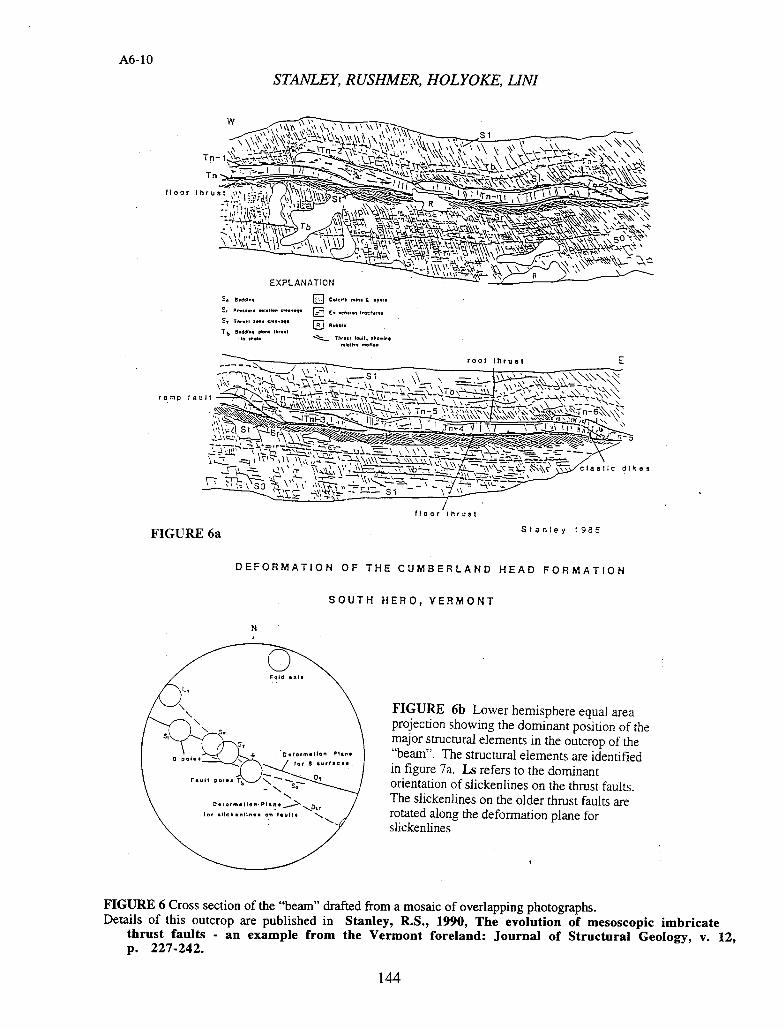
A6- 10
STANLEY, RUSHMER, HOLYOKE, LINI
Tn-1
Tn
floor 1hrust 1,'
--
- I
EXPLANATION
S, El CeICIlOI.. & 17!
S. ....................... Co •C0iO
J A.W.
Tb 9•ddIq
ranp fault,,
-4
'—v
roof thruet E
claotic dikes
floor thrust
FIGURE 6a
Stanley 1985
DEFORMATION OF THE CUMBERLAND HEAD FORMATION
SOUTH HERO, VERMONT
Fold .01.
L.
Op
S.
D.la,.,..IIoo.Plon.
FIGURE 6b Lower hemisphere equal area projection showing the dominant position of the major structural elements in the outcrop of the "beam". The structurai elements are identified in figure 7a. Ls refers to the dominant orientation of slickenlines on the thrust faults. The slickenljnes on the older thrust faults are rotated along the deformation plane for slickenlines
FIGURE 6 Cross section of the "beam" drafted from a mosaic of overlapping photographs. Details of this outcrop are published in Stanley, R.S., 1990, The evolution of mesoscopic imbricate
thrust faults - an example from the Vermont foreland: Journal of Structural Geology, v. 12, p. 227-242.
A6- 11
STANLEY, RUSHMER, HOLYOKE, LJNI
seventh question will be answered by palinspastically restoring the imbricated and cleaved sequence to its undeformed state.
ISOTOPE ANALYSIS, SYSTEMS DYNAMICS AND THE "BEAM" - AN INTERLUDE (Stanley, Abbott, Whalen, and Lini, 1996, Geol. Soc. Am. Abs for Annual Meeting, Denver, Co.p.A244)
In order to determine if the calcite in the veins was derived locally from the surrounding shales, samples of the micrite and host-rock (shale) microlithons, cleaved shale, and of sparry calcite from the younger veins and floor and ramp thrusts were analyzed for stable isotopic composition. The mean carbon and oxygen isotopic composition of the younger calcite veins is similar to that of the host rock (1.3 +1- 0.02 %o and -7.2 +1- 0.1 %, respectively) which suggests local dissolution of local matrix carbonate and precipitation as vein calcite under fairly constant temperatures. Calcite veins related to different faulting events also show similar carbon and oxygen isotopic composition, suggesting that deformation occurred at each fault under similar conditions. However, fault veins were found to be enriched in 13C relative to host rock by approximately 0.2 %o, still indicating dominant matrix control on isotopic composition. This difference is not considered to be significant at this scale, although it may indicate a temperature difference of a degree or two between carbonate dissolution and precipitation
Proposed System Dynamics Model (Fig. 7)
The foregoing geological and isotopic evidence indicates a cycling between imbricate faulting in the micrite and pressure solution in the shale during westward progression of Taconian compression. What factors controlled deformation as dominant shortening alternated between the micrite and the shale? Evidence was presented by Stanley (1990, p. 238) for intermittent development of abnormal pore pressure. During this process the transport of calcite - rich fluids from the shale was likely controlled by hydraulic conductivity of the rocks and the dissolution rate of calcite from the shale during cleavage formation. These two parameters may well have controlled the rate and duration of faulting across the outcrop. To represent this dynamic system with the feed back between the "beam" and the shale, we used a modeling code called STELLA (ITHINK) developed by High Performance Systems Inc. (1990, 1992, 1994). The basic code is embedded in four basic icons that represent the fundamental parts of any system. The rectangular icons are stocks which represent integrals or accumulations of quantities over time (for example, fault zone fluid, uncleaved rock, or displacement). The arrows with values are flows which represent quantities per unit time or differentials (for example, movement rate, fluid oufflow, or pressure solution). The circular icons or converters represent specific values, mathematical relations or graphs that feed data into the flows or record mathematical relations during the simulation (for example, dissolution fraction, hydraulic conductivity, or a decay constant). Most of the icons are connected by arrows that represent x to y (arrow head) dependency. These are the 4 basic tools of system thinking as originally described by Jay Forester of MIT and subsequently amplified and popularized by Barry Richmond and associates at High Performance Systems Inc. (1990, 1992). The equations that describe the relations of the model are listed in Appendix 1. Short descriptions with many of the equations document the reasoning behind specific values and describe their uncertainly. Values such as hydraulic conductivity are taken from standard references (Hardcastle et al., 1989; Anderson and Woessner, 1992; Saihotra and Nichols, 1993; Manning and Ingebritsen, 1999). We suspect that the hydraulic properties of the shale become more anisotropic with cleavage. However, since hydraulic conductivities were not measured directly for the Cumberland Head Formation, an estimate of anisotropy was used in the model. Other such values as dissolution fractions are best guesses since the pressure solution reaction rates are not well constrained. Thus the model presented here is a simplified and as yet unverifiable representation of the geological system.
Two graphs are presented that illustrate the results of two separate simulation runs for the model (Figures 7b and 7c). Figure 7b represents a simulation run over 8,000 years where the hydraulic conductivity changes from 10 -9 cm/sec to 10 -11 cm/sec during the simulation. We intended this change to represent a decrease in conductivity as more cleavage is formed in the originally uncleaved rock. Figure 7c is a similar run where the hydraulic conductivity changes from 10 -11 cm/sec to 10-9 cm/sec during the simulation time of 16,000
145
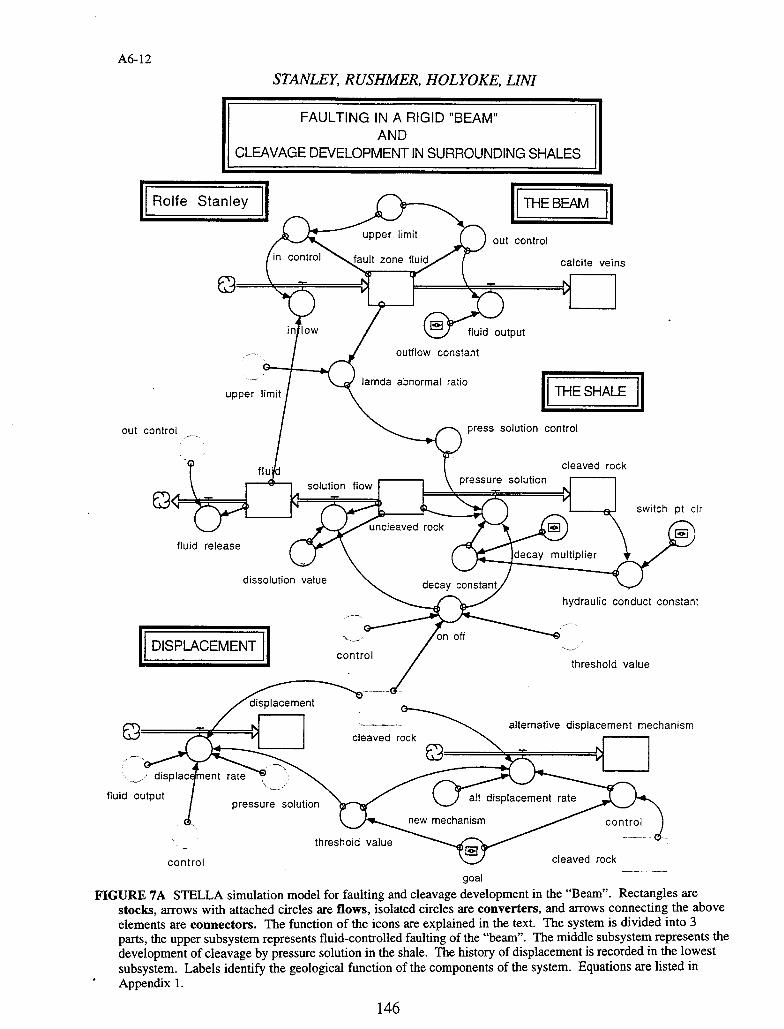
A6-12
STANLEY, RUSHMER, HOLYOKE, LINI
I FAULTING IN A RIGID "BEAM" AND
CLEAVAGE DELOPMENT IN SURROUNDING SHALES1
Rolfe Stanley
' 1mi Cu
THE BEAM 1 control
in control " ...J,!ault zone fluid calcite veins
in low (.,..Yfluid output
outflow constant
Iamda abnormal ratio upper limit THE SHALE
out control press solution control
cleaved rock flud
solution flow
pressure solution
switch Pt dr
uncleaved rock
fluid release decay multiplier
dissolution value decay constant
hydraulic conduct constant
I DISPCEMENT 1 corol
on
threshold value
displacement
alternative displacement mechanism cleaved rock
splac e;
fluid output j pressure solution
threshold value
control
alt displacement rate
new control
goal
FIGURE 7A STELLA simulation model for faulting and cleavage development in the "Beam". Rectangles are stocks, arrows with attached circles are flows, isolated circles are converters, and arrows connecting the above elements are connectors. The function of the icons are explained in the text. The system is divided into 3 parts, the upper subsystem represents fluid-controlled faulting of the "beam". The middle subsystem represents the development of cleavage by pressure solution in the shale. The history of displacement is recorded in the lowest subsystem. Labels identify the geological function of the components of the system. Equations are listed in Appendix 1.
146
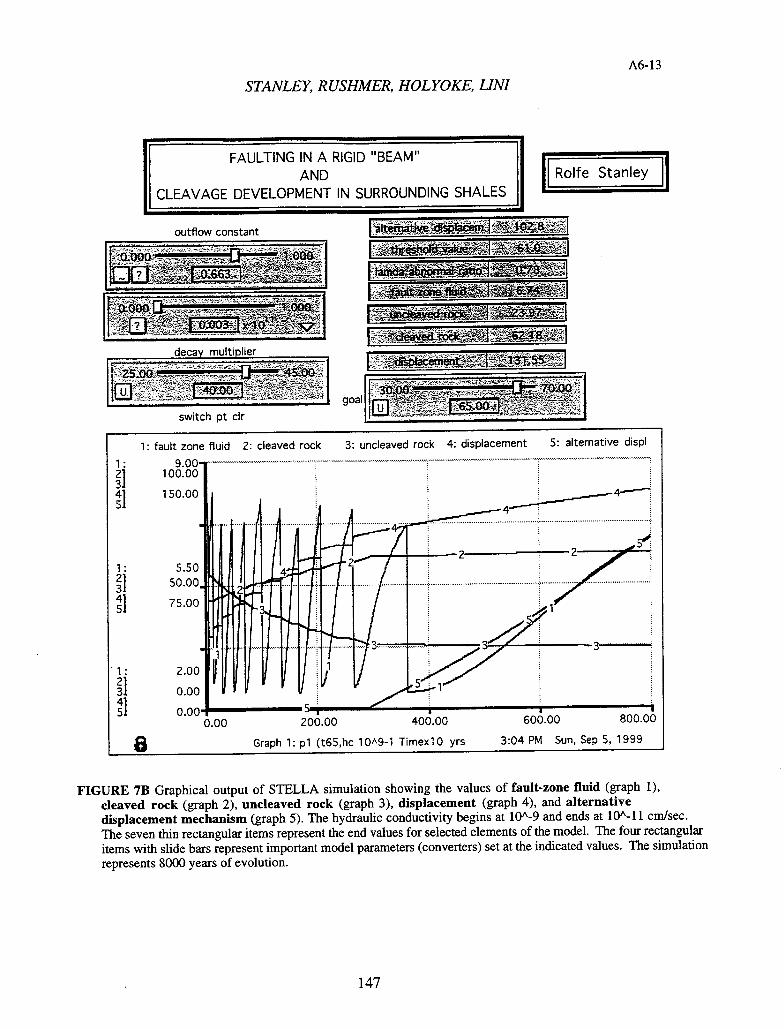
A6- 13
STANLEY, RUSHMER, HOLYOKE, LINI
FT FAULTING IN A RIGID "BEAM" AND Rolfe Stanley
CLEAVAGE DEVELOPMENT IN SURROUNDING SHALES
outflow constant
decay multiplier
[I' 25.00
goal I I oo
switch Pt dr
1: fault zone fluid 2: cleaved rock 3: uricleaved rock 4: displacement 5: alternative dispi
1: 9.00 ---------------................. ....
21 100.00
150.00 4
4; H 4 7 __-.-.
0.00 200.00 400.00 600.00 800.00
8 Graph 1: p1 (t65,hc 10A91 TirnexlO yrs 3:04 PM Sun, Sep 5, 1999
FIGURE 7B Graphical output of STELLA simulation showing the values of fault-zone fluid (graph 1), cleaved rock (graph 2), uncleaved rock (graph 3), displacement (graph 4), and alternative displacement mechanism (graph 5). The hydraulic conductivity begins at 1O'-9 and ends at l0'-1 1 cm/sec. The seven thin rectangular items represent the end values for selected elements of the model. The four rectangular items with slide bars represent important model parameters (converters) set at the indicated values. The simulation represents 8000 years of evolution.
147
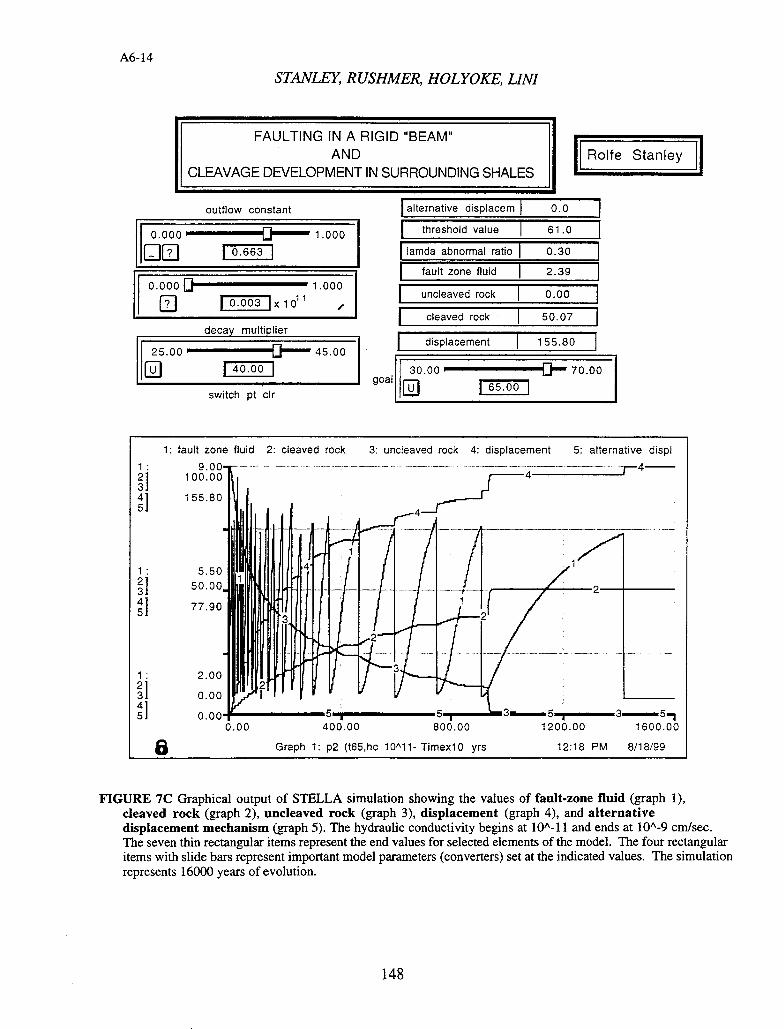
STANLEY, RUSHMER, HOLYOKE, LINI
FAULTING IN A RIGID BEAM AND Rolfe Stanley
CLEAVAGE DEVELOPMENT IN SURROUNDING SHALES
A6-14
alternative displacem J 0.0
threshold value 1 61.0
lamda abnormal ratio 0.30
fault zone fluid 2.39
[
uncleaved rock f 0.00
cleaved rock 50.07
displacement 155.80
30.00 . 70.00 goal
I 65.00 I
outflow constant
I
0.000 . 1.000
FT-1 0.663
0.000 U 1.000
III 10.003 Ix loll
decay multiplier
25.00 . U- 45.00
140001
switch pt dr
FIGURE 7C Graphical output of STELLA simulation showing the values of fault-zone fluid (graph 1), cleaved rock (graph 2), uncleaved rock (graph 3), displacement (graph 4), and alternative displacement mechanism (graph 5). The hydraulic conductivity begins at 10A1 1 and ends at 10'-9 cm/sec. The seven thin rectangular items represent the end values for selected elements of the model. The four rectangular items with slide bars represent important model parameters (converters) set at the indicated values. The simulation represents 16000 years of evolution.
A6-15
STANLEY, RUSHMER, HOLYOKE, LINI
years. We intend this conductivity change to represent an increase in conductivity as more cleavage surfaces are formed during deformation. Note that the hydraulic conductivity multiplier is used to change the value of the hydraulic conductivity from cm/sec to cmIlO years. The contrast between the two graphs is striking. In the first simulation the alternative deformation mechanism (Fig.7a) begins at around 3,750 years (Fig. 7b). In the second simulation run over 16,000 years the alternative deformation mechanism part of the model (Fig. 7a) never is activated. Thus the model states that shortening continues to be accumulated by imbricate faulting and cleavage development at the "beam location" during at least 16,000 years. In both graphs, the time between faulting events, represented by the" sawtooth" curves, increases as the simulation progresses in time. This behavior represents the progressive strain hardening of the shale as more of the undeformed shale is cleaved. As the cleavage process slows down the rate of pore pressure increase also slows down thus lengthening the time between faulting events. Eventually faulting ceases since most of the uncleaved rock (98%) has been converted into cleaved rock. Thus the rock is essentially dewatered and fluid is no longer an aid in faulting. In short, the outcrop has strain hardened and further deformation has to be in the form of one or more alternative deformation mechanism(s) (cleavage-controlled faulting, or the development of a new cleavage, for example). Note how the graph of displacement changes during the simulation. During each faulting event the curve steepens dramatically, recording "rapid" displacement (significant faulting distance within a 10 year time step). During the intervals between fault events, the curves are gradual and represent the slow shortening by pressure solution. As time progresses during the simulation, these curved segments are more horizontal, reflecting the decreasing rate of cleavage formation as less and less undeformed shale is available. The time step used in this particular simulation represents 10 years. This value was selected so that the behavior of the subsystems for fluid-controlled faulting and pressure solution could be demonstrated within a reasonable length of computational time. Although this time step is arbitrary, we believe it may be representative of the time span of deformation since hydraulic conductivity is a very important factor in controlling fault evolution in these rocks. As a further caution, the vertical displacement on the graph that represents a "single fault
FIGURE 7A STELLA simulation model for faulting and cleavage development in the "Beam". Rectangles are stocks, arrows with attached circles are flows, isolated circles are converters, and arrows connecting the above elements are connectors. The function of the icons are explained in the text. The system is divided into 3 parts, the upper subsystem represents fluid-controlled faulting of the "beam". The middle subsystem represents the development of cleavage by pressure solution in the shale. The history of displacement is recorded in the lowest subsystem. Labels identify the geological function of the components of the system. Equations are listed in Appendix 1.
FIGURE 713 Graphical output of STELLA simulation showing the values of fault-zone fluid (graph 1), cleaved rock (graph 2), uncleaved rock (graph 3), displacement (graph 4), and alternative displacement mechanism (graph 5). The hydraulic conductivity begins at l0'-9 and ends at 10'-1 1 cm/sec. The seven thin rectangular items represent the end values for selected elements of the model. The four rectangular items with slide bars represent important model parameters (converters) set at the indicated values. The simulation represents 8000 years of evolution.
FIGURE 7C Graphical output of STELLA simulation showing the values of fault-zone fluid (graph 1), cleaved rock (graph 2), uncleaved rock (graph 3), displacement (graph 4), and alternative displacement mechanism (graph 5). The hydraulic conductivity begins at 10"-1 1 and ends at 10"-9 cm/sec. The seven thin rectangular items represent the end values for selected elements of the model. The four rectangular items with slide bars represent important model parameters (converters) set at the indicated values. The simulation represents 16000 years of evolution.
149
A6-16 STANLEY, RUSHMER, HOLYOKE, LINI
Quartz vein
1 Metasandston
Quartz vein muscovite-quartz schist
20 ft -
Metasandstone Quart z veins
muscovite-quartz schist
Quartz io,t
vir Metasandsione
Quartz veins Fine grained muscovite-quartz schist
L= ft]
Th rust p Surface
No vertical exaggeration
Viewed looking to the north northeast
FIGURE 8 Schematic cross section of the Hinesburg thrust fault showing the distribution of superposed quartz veins in the upper plate. Adapted from the exposure at Mechanicsville just north of the village of Hinesburg, Vermont.
-
- ID
N
N
150
A6-17 STANLEY, RUSHMER, HOLYOKE, LINI
event" in the graphs is far too simple and must represent a whole series of small displacements or microfaulting events that result from the continual alternation between pressure solution and fault displacement. Thus the dynamic simulation is only a gross simplification of what was probably occurring during the shortening at the "beam". However, this model provides an instructive graphical representation of the long term deformation process at this outcrop.
Stop 3 HINESBURG THRUST FAULT (Fig. 8). This is the type locality of the Hinesburg thrust fault which, for central and north Vermont, is the major structural boundary between the carbonate-siliciclastic platforms of the foreland to the west and the highly deformed, and metamorphosed rift - drift sequence of the Taconian hinterland to the east. Westward displacement is in the order of 4 miles (6.4 km). Although the Lower Ordovician carbonate rocks of the lower plate are poorly exposed here, the upper plate of argillaceous quartzite of the Lower Cambrian Cheshire Formation and stratigraphic lower Fairfield Pond Phyllite form the cliffs along the western front of the hill. These rocks contain many such fault-related structures as deformed extension fractures, isoclinal folds, shear bands, mylonitic textures, slickenlines, and pressure fringes around pyrite. Many of these have been analyzed by Stanley and his students (Gillespie and others, 1972; Strehle, 1985; and Strehle and Stanley, 1986). Stanley, Martin and Smith (1993) studied the "z" shaped extension fractures. The results of this and earlier work will be discussed. We will concentrate on the following features:
1. Is the conspicuous layering in the basal part of the upper plate, bedding or foliation? 2. The presence of asymmethc fault-related folds and their relation to the Hinesburg recumbent fold. 3. The prominent mineral lineation consisting of elongate quartz and clusters of quartz grains 4. "Z" shaped quartz veins, their correlation and history throughout the upper plate. 5. Rare, east-dipping shear bands.
Return to the junction of Rt. 116 and Champlain Valley High School Road and turn south. Travel through the village of Hinesburg 16 miles (26 1cm) to the junction of the New Haven River and Rt. 116 just north of the village of Bristol. Turn east onto the Lincoln Gap Road. Continue east onto the Lincoln Gap Road and travel 3 miles (4.8 1cm) to the village of Lincoln. Continue east through Lincoln to the second bridge over the New Haven River. Park on the east side of the bridge.
Stop 4- WESTERN CONTACT OF THE EASTERN LINCOLN MASSIF (Fig. 9) This outcrop shows the western contact between the Middle Proterozoic rocks of the Eastern Lincoln massif and the overlying basal conglomerate of the Pinnacle Formation. Along most of this western boundary this contact is an erosional unconformity which dips steeply west or is slightly overturned with gentle north-plunging parasitic folds (DelloRusso and Stanley, 1986), Here, however, the contact is offset across a west-directed thrust fault (Cobb Hill thrust fault). The associated folds in the cover have been rotated toward the transport direction. The Grenvillian foliation of the Middle Proterozoic rocks is progressively overprinted by the Taconian muscovite-bearing schistosity (K/Ar age of 410 Ma on biotite, Cady 1969) of the cover as the contact is approached from the basement. The basal conglomerate of the Pinnacle is generally a quartz cobble conglomerate with minor pebbles and cobbles of granitic rocks. Here, however, large granitic cobbles and boulders form lensoidal deposits separated by quartz-feldspar metawacke. The origin of this deposit is controversial, but Stanley, following Tauvers (1982), will argue that they represent ancient channels that have been subsequently deformed into nearly reclined folds.
Continue south to where the road changes to dirt paving. Keep to the left at the junction and travel several mile south to South Lincoln where 3 roads join near several houses. The bridge to the east is the Bridge at South Lincoln where our next stop is located.
Stop 5- EASTERN CONTACT OF THE LINCOLN MASSIF (Fig. 10) - The South Lincoln thrust fault at the bridge at South Lincoln. This outcrop along the New Haven River contains a mylonitic sliver of Middle
151
CD. -
CD. CD-
CD. CD-
CD.
CD
CD
CD CD CD-
co CD CD
CD c/DCDg
CD CD -
CD CD CD CD Cl) Cl) C)
CD Cl)
CD CD + CD + ,- .CD -
a CDtIlX
Ew CD
CD C- CD
CD a a
CD C- CD
CD
C CD.
o =
C)
( C
C)
CD CD
C)
CD CD
- CD CD
.
CD
r
.
CD
C)
on CD CD CD
. Cl)
-
a CD C') CD
CD
N
CD
CD C.) C)
C)
CD
N
-r- -V- -r--
F1 K M
!! CD CD CD CD , $ gaEl ) ID Cl) • -4 c,- -
CD CD CD
C) CD
qQ CD
CD CD CD
CD CD CD
CD CD aQ
CD
CD CD
.I1 CD ,
CD
CD
> 'C 'C C
CD C) - CD C) C)
rm
CD
C) CD, CD, CD
A6- 18
STANLEY, RUSHMER, HOLYOKE, LFNI
'ZE - CD-'< CD
CD = CD
CDCDO) D CD
:r CD a2CDCD o
CD
C- CD CD CD - CDCD
—._ CM
D CD_ o H CD CD '. CD CD C) CD C- CD CD . CD CD ' C-
CD < CD C)
CDC)—t HCD6CD= ro
-iCD N
CD
• CD
•ifl • -- I go
CD' : '
CD CD C)
CD CD 'C CD CD CD CD CD -
a
'<0CD CDCD - CD CD
CD CD - C- - 2. CD
CD CD CD- CD 'CD CD CD<
CN CD CD
CD Cl) CDCD
CD
CD CD
-
CD
CDcl) CD CD
=r CD C) HCD
CD CD—' CD -, CD CD - CD CD
a- &o 0.
-t •iCD CD n CD = 6' CD CD < —'CD
CD CD = CD CD CD
0 CD CD CD CD 4CI CD " CD =
CD 0 CD
CD — CDCD ,
CD CD CD CD
u II CD — CD- • CD' CD CD CD
CDa CD CD
o CD , C CD
CD
CD
CD
:E Cl)
- -
' CD < CD CD = CD CD — CD CD - -
CDCD'CDCD - CD
' CD- N
C-9,N cr CD CD — CD CD 1 = CD
CD CD = ' CD CD CD - CD o
__ •-
152
A6-19 STANLEY, RUSHMER, HOL YOKE, LINI
I.Jwui I III 14I _
CZhbs - Chlorite Biotite Quartz Albite Schist F Strike and Dip of Fault
[] CZhbc - Matrix Supported Meta-Conglomerate Mean Strike and Dip of S.
Yrnhg - Muscovite Plagioclase Quartz Gneiss Strike and Dip of 5n+0 5
with Mylonitic Fabric of Ordovician Age Mean Strike and Dip of 5n+1 Contact Between Gneiss and Meta-Conglomerate Mean Trend and Plunge of L Fault Surface 60
45 MeanTrendandPlungeofFn+1 7
Figure 10. Geological Map of South Lincoln, Vermont. Base map taken from Tauvers (1982), but subsequently modi-fied by DelloRusso and Stanley (1985) and Stehie and Stanley, (1986). Areas of outcrops are shaded by unit. No out-crop in blank areas. Strike and Dip measurements are means of data. A profile section looking down-plunge, per-pendicular to the F +1 fold axes (along section line A - A') is shown in Figure 6.
153
A6-20
STANLEY, RUSHMER, HOLYOKE, LINI
Proterozoic gneiss in thrust contact with biotite-chiorite schist of the Hoosac (Tyson) Formation. A thick conglomerate containing quartzite and granitic gneiss pebbles, cobbles, and boulders in a matrix of biotite-chlorite schist and metawacke overlies the gneiss. The clasts are identical to the Middle Proterozoic rocks in the Lincoln Massif. Late northeast-plunging folds deform the fault zone. These folds are in turn overprinted by late biotite that is randomly oriented across the dominant schistosity. Based on the fact that the feldspar in the mylonitic gneiss has been dynamically recrystallized and the surrounding rocks have been metamorphosed to the garnet grade the temperature is estimated to have been in the order of 4350 C to 4500
C or slightly higher (Fig. 2). These temperatures would correspond to pressures in the order of 5 to 6 kbars (17 to 20 km) (Strehle and Stanley, 1986). This synmetamorphic fault zone with a sliver of basement is typical of the eastern margin of the Lincoln massif. In fact, about 10 km. to the south fault zones like this become so numerous that they essentially make up the eastern half of the Lincoln massif as it is shown on the Geological Map of Vermont (Doll and others, 1961).
Return on the dirt road directly west of the New Haven River to the junction of the .Lincoln Gap Road. Stop by the bridge that leads back to Lincoln. Do not go up the Lincoln Gap Road.
SELECTED REFERENCES
Anderson, M.P., and Woessner, W.W. 1992. Applied Groundwater Modeling: Simulation of Advective Flow and Transport: San Diego, California, Academic Press, Inc., 381 p.
DelloRusso, Vincent and Stanley, R. S., 1986, Geology of the northern part of the Lincoln massif, central Vermont: Vermont Geological Survey Special Bulletin No. 8, 35p. and 4 plates.
Doll, C.G., Cady, W.M., Thompson, J.B., and Billings, M.P., 1961, Centennial Geologic Map of Vermont: Montpelier, Vermont. Vermont Geological Survey, scale 1:250,000.
Dorsey, R.J., P.C. Agnew, C.M. Carter, E.J. Rosencrantz, and R.S. Stanley. 1893. Bedrock geology of the Milton quadrangle, Northwestern Vermont. Vermont Geological Survey Special Bulletin No. 3. 14 p.4 p1.
Hardcastle, K.C., Wise, D.U., and Lively, G. 1989 Interim report on the relationships between lineaments, bedrock fracture fabric and well yields in the Colchester Quadrangle, Vt., University of Massachusetts.
Manning, C. E, and Ingebritsen, S. E., 1999, Permeability of the continental crust: Implications of geothermal and metamorphic systems: Review of Geophysics, v. 37, Nr. 1, American Geophysical Union, p.127-150.
McHone, J. G., 1987, Cretaceous intrusions and rift features in the Champlain Valley of Vermont: in Westerman, D. S., ed., Guidebook to field trips in Vermont, volume 2, New England Intercollegiate Geological Conference 79th Annual Meeting, p. 237-253.
Ratcliffe, N. M., Hames W. E. , and Stanley, R. 5., 1998, Interpretation of ages of arc magnetism, metamorphism, and collisional tectonics in the Taconian orogen of Western New England: Am. Jour. Sci. v.298, p. 791-797.
Salhotra, A., and Nichols, E. 1993. Modeling Subsurface Contaminant Transport, Modeling Subsurface Contaminant Transport: Portland, Maine, Environmental Education Enterprises, p. 571.
154
A6-21
STANLEY, RUSHMER, HOLYOKE, LINI
Sheppard, S. M. F. and Schwarcz, H. P., 1970, Fractionation of carbon and oxygen isotopes and magnesium between coexisting metamorphic calcite and dolomite: Contributions to Mineralogy and Petrology, v. 26, p. 161-198.
Stanley, R.S., 1980, Mesozoic faults and their environmental significance in western Vermont: Vermont Geology, v. 1, p. 22-32.
, 1987, The Champlain thrust fault, Lone Rock Point, Burlington, Vermont: in Roy, D. C., ed., Centennial Field Guide No. 5, Geological Society of America, p. 225-228.
Stanley, R. S. and Ratcliffe, N.M., 1985, Tectonic Synthesis of the Taconian orogeny in western New England: Geological Society of America, v. 96. p. 1227-1250.
Stanley, R. S., DelloRusso, V., Otoughlin, S. B., Lapp, E. T., Armstrong, T. R., Prewitt, J. P., Kraus, J. F, and Walsh, G. J., 1987, A transect through the pre-Silurian rocks of central Vermont: in Westerman, D. S., ed., Guidebook to field trips in Vermont, volume 2, Montpelier, Vermont, p. 272-313.
Strehle, B. A., and Stanley, R. S., 1986, A comparison of fault zone fabrics in northwestern Vermont: Vermont Geological Survey, Studies in Vermont Geology No. 3, 36 p. and 4 plates.
155
A6-22
STANLEY, RUSHMER, HOLYOKE, LINI
alternative_displacement_mechanism(t) = alternative_displacement_mechanism(t - dt) + (alt_displacement_rate) * dt INIT alternative_displacement_mechanism = 0 IN FLOWS:
alt_displacement_rate = if (cleaved_rock>=threshold_value) then ( new_mec han i sm*1/control) else (0) DOCUMENT: The "if , then" statements are used to turn on the flow for 'alt displacement" which represents the development of alternative deformation mechanisms for the beam outcrop. These involve faulting controlled by the orientation of the cleavage which continues to benefit from cleavage formation by pressure solution although at a greatly reduced rate. As the beam outcrop strain hardens deformation most likely transgressive westward where the shales are essentially uncleaved. The "control" function results in the gradual, nonlinear development of these alternative mechanisms.
J calcite_veins(t) = calcite_veins(t - dt) + (fluid_output) * cit INIT calcite_veins = 0 INFLOWS:
fluid_output = ou t_cont rol*outflow_constant DOCUMENT: The units are fluid quantity! time. Fluid amount should be converted into equivalent distance (cm), so that distance/time flows into displacement.
cleaved_rock(t) = cleaved_rock(t - dt) + (pressure_solution) * dt INIT cleaved_rock = 0
DOCUMENT: cm/sec. common values for shale are 1Q A 7 to 10"-11 cm/sec. There are 3600 sec/hr; 86,400
secs/day; 31,536,000 sec / yr or 3.1536*10A7 sec/yr. or 3.1536"10'8sec /10 yrs or 3 . 2*10A9 sec/lOG yrs. Because of these relations I run the time step at 1 representing a 10 year interval. If I ran the simulation at 0.5 then the time step would be a five year interval.
INFLOWS:
pressure_solution = unc l eaved_roc k*decay_constan t*p ress_solution_control*on_off
DOCUMENT: Distance/time. Here cm/time. See comment for the outflow called 'fluid output'.
J displacement(t) = displacement(t - dt) + (displacement_rate) * dt NIT displacement = 0
DOCUMENT: Measured in cm for the beam.
INFLOWS:
displacement_rate = if (cleaved_rock<=threshold_value) then (pressure_solution+fluid_output) else (control) DOCUMENT: distance/time or cm/time for the "beam". Need a value that converts both "fluid outflow" and "pressure solution" to a distance/time. The "if, then" statements and the "control" represent strain hardening of the shale due to dewatering and the resulting development of alternative mechanisms of deformation. The "control" allows the transition to be gradual.
EJ fault_zone_fluid(t) = fault_zone_fluid(t - dt) + (inflow - fluid_output) * dt INIT fault_zone_fluid = 4.5
DOCUMENT: This value can be considered to be the normal hydrostatic value that is present along a water saturated fault zone. The upper limit would the be the condition where pore pressure is equal to the load pressure. Thus the Hubbert and Rubey (1959) ratio would be 1. The initial value for this stock is 4.5 or 1/2 of the upper limit. If this stock goes below the initial value then that condition represents pore pressures below hydrostatic.
INFLOWS:
inflow = fl u id*i n_con t rol DOCUMENT: represents fluid flowing into the fault zone
STANLEY, RUSHMER, HOL YOKE LINI
APPENDIX 1 D. i
156
A6-23 STANLEY, RUSHMER, HOLYOKE, LINI
OLifFLOWS:
fluid_output = out_controloutflow_constant DOCUMENT: The units are fluid quantity! time. Fluid amount should be converted into equivalent distance (cm), so that distance/time flows into displacement.
El fluid(t) = fluid(t - dt) + (solution_flow - fluid_release) * dt NIT fluid = 0 INFLOWS:
solution_flow = ( unc leaved_ rock*di sso l u ti on_va l ue )*on_off
OUTFLOWS:
fluid_release = fl u id*out_contro l
DOCUMENT: This outflow must be activated when faulting occurs so that fluids flow into veins near the fault zone.
El uncleaved_rock(t) = uncleaved_rock(t - dt) + (- pressure_solution - solution_flow) * dt NIT uncleaved_rock = 100
DOCUMENT: Cubic cm or cm if a constant area is divided into all volume quantities. The stock represents the quantity of uncleaved rock which is a finite resource for the outcrop of the 'beam".
OUTFLOWS:
pressure_solution = u nc leaved_ rock*decay_constan t*pr es s_so l ution_cont ro l*on_off
DOCUMENT: Distance/time. Here cm/time. See comment for the outflow called "fluid output'.
solution_flow = ( u ncleaved_rock*di ssol utio n_va lue)*on_off
Q control = 1-(cleaved_rock)/goal
Q decay_constant = hydraulic_conduct_constantdecay_multiplier
O decay_multiplier = 3.1536E8 DOCUMENT: Hydraulic conductivity given as cm/sec. Common values for shale are 10"-7 to 10A11 cm/sec. There are 3600 sec/hr; 86,400 secs/day; 31,536,000 sec / yr or 3.1536*101\7 sec/yr. or 3.1536*10A8sec
/10 yrs or 3.2*10A9 sec/lOU yrs. This simulation is run at a value of 10A8 for the decay multiplier so that the hydraulic conductivity is given as a value of cm/lU years. Each time step is worth 10 years. A graph run for 500 time units would represent geological phenomena over 5000 years.
0 goal=65
0 hydraulic_conduct_constant = if (cleaved_rock) <= switch_pt_dr then (10'-11) else (1OA9) DOCUMENT: These values are the reported values for shales in cm/sec. See note under decay multiplier. The different values are intended to represent the supposed decrease in hydraulic conductivity as more of the shale is cleaved. The initial values in the if..then* statement are l0A9 to J0AJJ which represent ranges given in the literature (see text). Sensitivity runs with different values of hydraulic conductivity" show different behavior over time of such state properties as " fault zone fluid", "cleaved rock* , "uncleaved rock", "displacement', and "alternative displacement mechanism" (compare graphs in Graph Pad 1). In general, with lower values of hydraulic conductivity (>10-9, for example), deformation by fluid-aided faulting and pressure solution is slower and the intervals between faulting events is much longer compared to higher values of hydraulic conductivity (<10A9, for example). Thus the duration of deformation for the 'beam" outcrop depends on the value of hydraulic conductivity. I also run a simulation at hydraulic conductivities that start at 10-11 and end at 10-9 simulation the possibility that the rate of fluid transport may actual increase with the development of cleavage (Manning and Ingebritsen, 1999, Reviews of Geophysics)
APPENDIX 1 P. ii
157
A6-24
STANLEY, RUSHMER, HOLYOKE, LINI
Q in_control = 1 -fault_zone_fluid/upper_limit DOCUMENT: This ratio acts as a valve that is gradually closes as the amount of fluid in the stock "fault zone fluid" increases. When the value of the stock fault zone fluid' reaches the upper limit the inflow into the stock is zero. The upper limit represents highest value of pore pressure that can exist in the fault zone prior to actual fault motion.
0 lamda_abnormal_ratio = fault_zone_fluid/upper_limit
Q new_mechanism = .01 DOCUMENT: This number is arbitary and represents the increment in centimeters of displacement resulting from faulting along the cleavage, or movement of the deformation front westward beyond the beam' outcrop where the rocks are essentially uncleaved. It represents any deformation processes other than fluid-added faulting of the beam or continued development of the Si or St cleavage.
0 on_off = if (cleaved_rock<=threshold_value) then (1) else (control) DOCUMENT: This statement causes faulting in the "beam and pressure solution in the shale to stop essentjally and for alternative mechanisms of displacement to begin. This is represented by the stock labeled "alternative displacment mechanisms' and the flow labeled "alt displacement rate'. The threshold value is arbitary.
("3 outflow_constant = Random(0.5,0.7,1) DOCUMENT: Try this at 0.6, then try a graph over time, then a random function (0.5,0.7,1). What does it mean if the fault zone (stock) does not empty each time? What does the outflow constant represent in terms of the phenomena that are taking place in the fault zone ? (fracture porosity, fracture permeability)? (Read Sibson, 1975 on seismic pumping)
out_control = if fault_zone_fluid ~ (upper_limit) then fault_zone_fluid else 0 DOCUMENT: the out control is set so that the fault actual moves at about a Iamda value of .95.. thus quite high. I might actually try to set the upper limit at a random value of between 7-9. When the value of the pore pressure in the fault zone is equal to the upper limit, then lamda value approaches 1 and the resistence to movement on the fault is substantially reduced. As a result the fault moves. The system is designed to duplicate the outpouring of fluids during and just after movement on a fault.
0 switch_pt_dr = 35
O threshold_value = goal-4 DOCUMENT: This sets the threshold value at 4 units less than the goal. The number 4 is arbitary. The threshold is the point at which the alternative deformation mechanisms begin.
o upper_limit = RANDOM(7,9,1) DOCUMENT: Random(7.0,9,1) is one selection (Taiwan value). If this is set to 10 then the volume of the fault never reaches the upper limit since the upper limit also acts as a control to the inflow. Therefore this must be set to less than 10 say 9. This relation must be placed in the outflow control (for example, upper limit-i). Because a stock can not be programmed for such "built in functions" as the randon function, I have programmed the upper limit with this random function to produce the elevated pore pressure affect.
0 dissolution_value = G RAPH(uncleaved_rock) (20.0, 0.0001), (25.0, 0.0001), (30.0, 0.0005), (35.0, 0.0009), (40.0, 0.00115), (45.0, 0.0016), (50.0, 0.002), (55.0, 0.0029), (60.0, 0.0042), (65.0, 0.0053), (70.0, 0.00605), (75.0, 0.007), (80.0, 0.0075), (85.0, 0.0088), (90.0, 0.0088), (95.0, 0.0088), (100, 0.0088) DOCUMENT: This graph represents the supposed reduction in the value of the "reaction constant" between the calcite and the adjacent clay grains. The numbers are arbitary and based on imaginary data.
0 press_solution_control = GRAPH(lamda_abnormal_ratio) (0.5, 0.94), (0.533, 0.885), (0.567, 0.725), (0.6, 0.585), (0.633, 0.47), (0.667, 0.325), (0.7, 0.195), (0.733, 0.12), (0.767, 0.085), (0.8, 0.05), (0.833, 0.02), (0.867, 0.005), (0.9, 0.00) DOCUMENT: This converter is basically a switch that activates the pressure solution process during intervals of zero fault movement.
APPENDIX 1 p iii
158
GEOLOGIC FIELD TRIP SITES FOR TEACHERS IN NORTHWESTERN VERMONT
by Christine A. Massey, Perkins Museum, Department of Geology, Perkins Hall, Burlington, VT 05405-0122,
(802) 656-1344, [email protected]
Shelley F. Snyder, Science Department, Mount Abraham Union High School, Bristol, VT 05443, (802) 453-2333, [email protected]
INTRODUCTION
The areas around Northwestern Vermont (Figure 1) provide a wealth of accessible geologic information for interpretation by school teachers and students. On this trip, teachers will learn about the geological history of Vermont through visits and hands-on exploration of four local sites. All of the sites are accessible to the general public (with prior permission) and are suitable for visits by groups of students. We will share our techniques for exploring these sites with young earth scientists.
Our trip begins at Redstone Quarry Natural Area (Burlington) in an ancient shoreline environment which we now view as the Monkton Quartzite. We will visit the famous Champlain Thrust Fault at Lone Rock Point (Burlington) and examine marine off-shore environments of the Iberville Shale and Dunham Dolostone Formations. The islands of South Hero and Isle La Motte provide two quarries for viewing some of the life forms preserved in the limestones of the ancient lapetus Ocean. The Glens Falls Limestone at Lessor's Quarry (South Hero) shows bryozoa, brachiopods and other fossils, while the Crown Point Limestone at the Fisk Quarry Preserve (Isle La Motte) preserves an ancient reef ecosystem which contains such fossils as stromatoporoids, bryozoa, algae, gastropods, cephalopods, and others.
GEOLOGIC FORMATION OF VERMONT
Geologic timeline in Northwestern Vermont
The geologic history of Vermont is a story of ancient shoreline processes, oceanic sedimentation, plate collisions, mountain building, and subsequent weathering and erosion. Figure 2 summarizes the timing of major geologic events in the formation of Vermont. Although the geologic timeline depicted on the left in Figure 2 is to scale, the events in Vermont's history are represented only schematically along the right.
In summary, most of the rocks in Northwestern Vermont are approximately 550 to 420 million years old (Cambrian to Ordovician in age) and were originally sedimentary units deposited in the ancient lapetus Ocean. North America was nearer to the equator at this time, and the sedimentary rocks are typical of warm, tropical oceans. Two major mountain building events called the Taconic and Acadian Orogenies created the Green Mountains in Vermont and other parts of the Appalachian Chain when continental land masses collided 450 million years ago (mya) and 360 mya, respectively. During the collisions, Vermont's sedimentary rocks were metamorphosed to varying degrees, with increasing metamorphism towards the spine of the Green Mountains. Long-term weathering and recent glaciations (the last 2 million years) have eroded and polished the rocks of Vermont, but have only served to accentuate the preexisting north-south topography created by the massive collisions.
Massey, C., and Snyder, S., 1999, Geologic field trip sites for teachers in northwestern Vermont; in Wright, S.F. ed., New England Intercollegiate Geologic Conference Guidebook Number 91, p. 159-177.
I
MASSEY AND SNYDER A7-2
0 10Km
Figure 1. Location map for Redstone Quarry (1), Lone Rock Point (2), Lessor's Quarry (3), and Fisk Quarry Preserve (4) (after Van Diver, 1995).
160
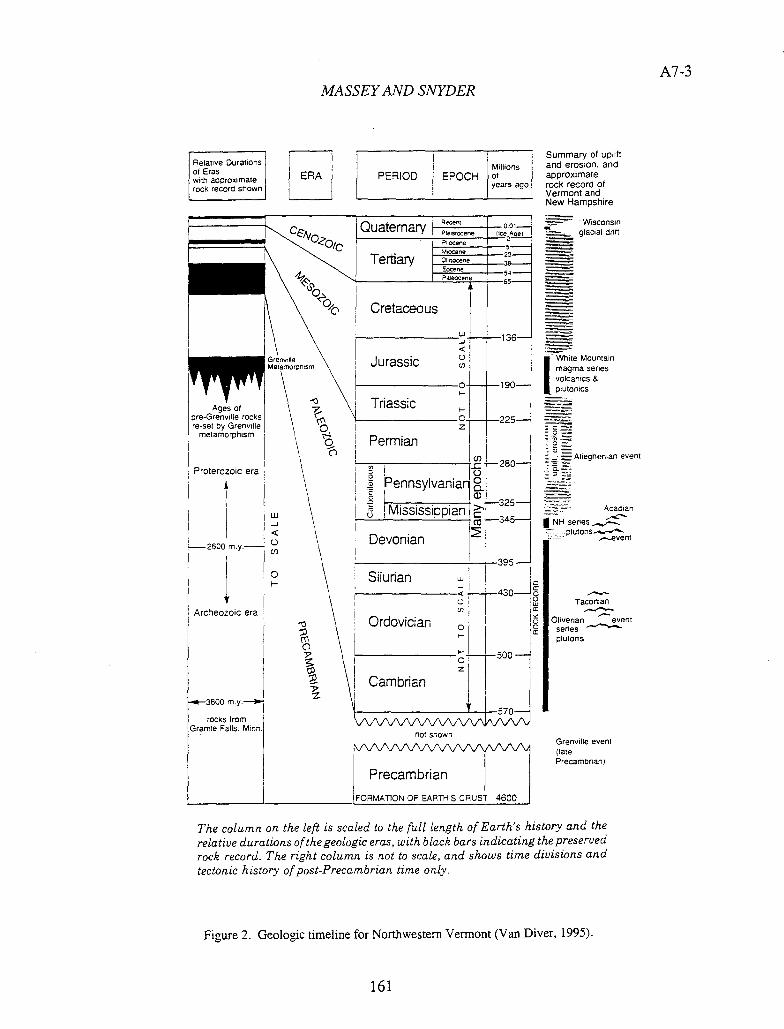
MASSEY AND SNYDER A7-3
Relative Durations
I of Eras with approximate EER
Lrock record shown
Miflions
PEOD EPOCH of years ago
P!eistocene fine 5Sf PiOCefle
LuaCene Teia I Ohxocene
—23—
Excene Ssieocene
—54--- - —65-
Ve Cretaceous
<I Grenv,lle 01 Jurassic Metamorpnism Cn
—190
Ages of Triassc pre-Greriville rocks re-set by Grenville 0 Z
metamorphism Permian - T
Proterozoic era
o) - —280—
A PennsyIvania .n_______ C)
325w
I Mississippian uJ li345_ -J
—2600 rn.y.— 0 Devonian
o Silurian -
<--430--b
Archeozoic era
- Ordovician ar
0
I-
_________________ 500
—3800 rn.y.-
rocks from Granite Falls. Minn.
not shown
Precambrian
FORMATION OF EARTHS CRUST 4600
The column on the left is scaled to the full length of Earth's history and the
relative durations of the geologic eras, with black bars indicating the preserved rock record. The right column is not to scale, and shows time divisions and tectonic history of post-Precambrian time only.
Figure 2. Geologic timeline for Northwestern Vermont (Van Diver, 1995).
161
Summary of uplift
and erosion, and approximate rock record of Vermont and New Hampshire
Wsconain glacial drift
IWhiteMountain
magma series
volcanica & plutonics
C C 0
- 0
Alieghenian event
= 0
Acadian
• NH aeries plutons-n-'-'
event
Taconiani
Oliverian event senes plutorns
Grenivilfe event (fate Precambrian)
A7-4 MASSEY AND SNYDER
Tectonic History of Vermont
The continental landmass we call Vermont is part of the North American tectonic plate. In general, tectonic, or lithospheric, plates are buoyed up and float on top of the dense, partially molten material in the Earth's asthenosphere. The convection currents within the asthenosphere carry tectonic plates across the surface of the Earth—rifting plates apart, drifting them farther from each other, and also colliding them with each other in long-term cycles called Wilson Cycles. Figure 3 shows one such cycle in the geologic formation of Vermont.
An ancient continental landmass called the Grenville Supercontinent (also called Rodinia) began splitting apart during a plate tectonic rifting event approximately 700 mya. The rift occurred roughly along what is now the Vermont-New Hampshire border at a time when Rodinia was located nearer to the equator. When the continental crust thinned sufficiently, oceanic crust was formed by cooling lava emerging from the rift zone. The dense oceanic basaltic crust supported the lapetus Ocean (proto-Atlantic) in the location we call Vermont today. Sediments on the shore and off the shore of the lapetus Ocean were deposited during the drifting stage (widening of the lapetus ocean). Sandstones formed near the shore while dolostones and limestones formed within the shallow, tropical ocean.
Around 500 mya, the plates of the Earth shifted and began a collision course centered in the Vermont region. Subduction occurred in the middle of the lapetus Ocean due to the shortening, and caused volcanism. Continued subduction caused a deepening of the ocean near the proto-North American shoreline and dolostones and limestones covered the beach deposits. By approximately 420 mya, deep-water shales were deposited in the trench environment of the subduction zone near the proto-North American shoreline. A small chain of volcanoes collided with proto-North America during the Taconic Orogeny. Metamorphism of some of Vermont's ocean sediments occurred.
Around 360 mya, proto-Europe/Africa collided with proto-North America during the Acadian Orogeny and closed the final Japetus gap. The new supercontinent formed from this collision is called Pangaea and marked the completion of a Wilson Cycle. Continued metamorphism occurred in the rocks of Vermont during the Acadian Orogeny, but spared the western-most sedimentary units from massive deformation. These "slightly" metamorphosed rocks, or meta-sediments, are most of what is exposed in Northwestern Vermont.
Stratigraphy of Northwestern Vermont
The meta-sediments of Northwestern Vermont record the deepening of the ancient lapetus Ocean from a shoreline to a trench environment. Figure 4 shows the continuous sequence of sedimentary units.
The Dunham Dolostone is a gradual contact with an older quartz sandstone. We will see the Dunham Dolostone at Lone Rock Point (Stop #2), where it is in contact with the much younger Iberville Shale. The Dunham Dolostone exhibits characteristics typical of a stable continental shelf area similar to that found in todays Bahamas platform—a modern carbonate platform. The carbonate sediments are disturbed by burrowing life forms and have been transported from shallow to deeper waters. This disturbance is consistent with subtidal sediments. The Dunham Dolostone has shallowing-up cycles that indicate changes in the balance of sediment supply and change in sea level due to subsidence. The Dunham Dolostone outcrop at Lone Rock Point is some of the youngest dolostone in the unit.
We will see the Monkton Quartzite Formation at Redstone Quarry (Stop #1). The Monkton Quartzite represents a near-shore, intertidal zone with rippled sandstone, evidence of bioturbation, and desiccation marks. The quarry has one dolomite layer about 12 inches thick. Dolostone grains could have been washed up from deeper water along the continental shelf (Merhtens, 1985). The silica rich materials (quartz and feldspars) which make up the bulk of the pinkish quartzite are of terrigenous origin. The carbonate material (calcite and dolomite) originate off shore. The Monkton Quartzite, like the Dunham Dolostone, records deposition on a stable continental margin.
162
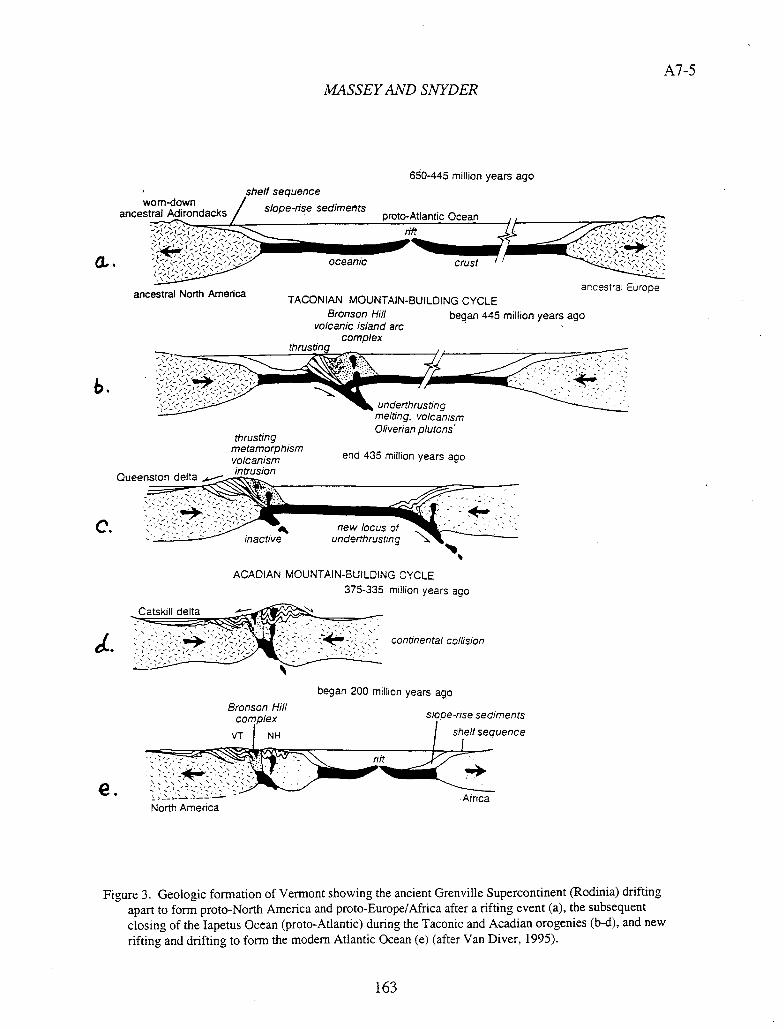
MASSEY AND SNYDER
650-445 miuion years ago
A7-5
worn-down ancest. LAdiroas
ancestral North America
ft sequence
slope-rise sediments proto-Atlantic Ocean
crust
ancestral Europe TACONIAN MOUNTAIN-BUILDING CYCLE
Bronson Hill began 445 million years ago volcanic island arc
complex
oceanic
C.
melting, Volcanism
thrusting 0/i yen an plutons
metamorphism volcanism end 435 million years ago
Queenstori delta intrusion
"7 <'~ ACADIAN MOUNTAIN-BUILDING CYCLE
375-335 million years ago
Catskill delta -
continental collision
began 200 million years ago
Bronson Hill complex slope-rise sediments
VT NH / shelf sequence
nft - 7' Africa
North Amenca
Figure 3. Geologic formation of Vermont showing the ancient Grenville Supercontinent (Rodinia) drifting apart to form proto-North America and proto-Europe/Africa after a rifting event (a), the subsequent closing of the Japetus Ocean (proto-Atlantic) during the Taconic and Acadian orogenies (b-d), and new rifting and drifting to form the modern Atlantic Ocean (e) (after Van Diver, 1995).
163
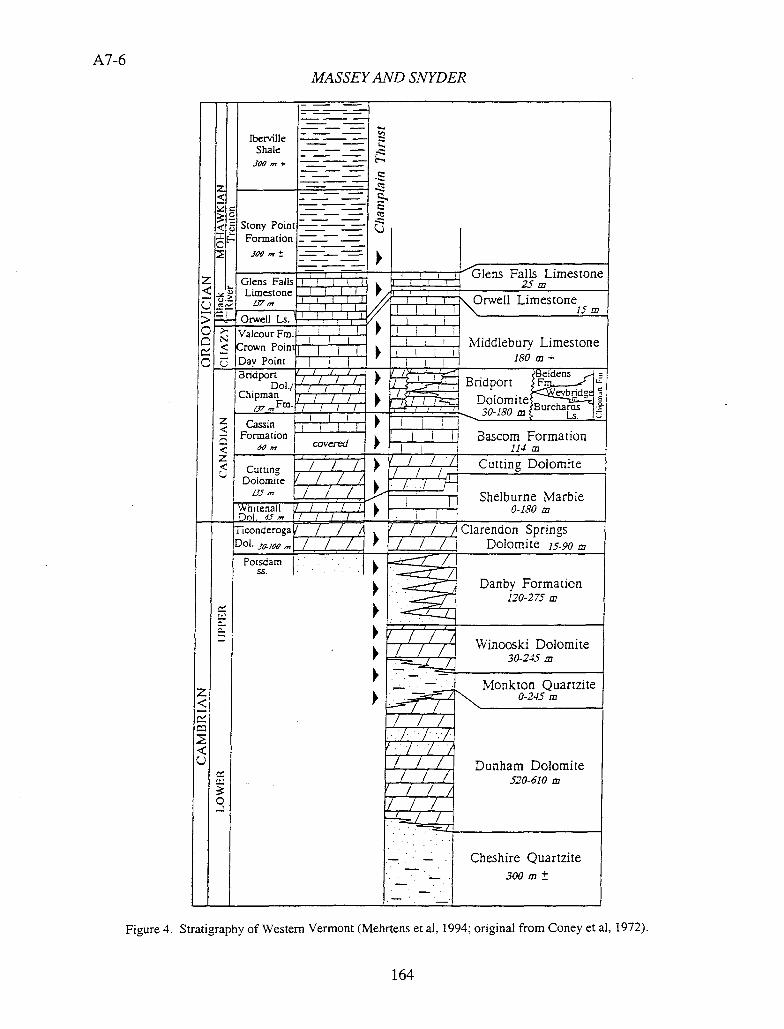
MASSEY AND SNYDER
Z
O
o
z
< EE
Iberville Shale
-----
-
I [ins Falls Limestone m
------
-
--
Stony Point Formation 3Omt
-=-
-_
Glens Falls Limestone
I I I 1 1 I
irN Orwell Limestone "-
>4_OrwellLs.''H/"IpI
Middlebury Limestone 180 +
< VajcourFm. rown Poin
Day Point I I I
H Be'dens Dolomite BurcharcLs
Ba.scom Formation F ion ormat Cassin__________________________
covererj II
— -
Cutting Dolomite
w -
/7 LrLf Cutting Dolomite /
Shelburne Marble 0-180 al
/ I I
W hitehall / / / //
(
Dol. JAM
Ticonderoga P
Clarendon Springs 1 Dolomite jn / / / / / /
Potsdam $5.
• Danby Formation 120-275
Winooski Dolomite
— -. 1 Monkton Quartzite 0-245 m
Dunham Dolomite I/ f / f
•
Cheshire Quartzite 300
Figure 4. Stratigraphy of Western Vermont (Mehrtens et a!, 1994; original from Coney et a!, 1972).
A7-6
I[I
A7-7 MASSEY AND SNYDER
The Crown Point Limestone found in the Fisk Quarry (Stop #4) is an excellent exposure of Ordovician reef deposits. The reef is composed of carbonate mounds and a fine-grained, muddy carbonate matrix with local concentrations of dolomite and quartz sands. On vertical quarry surfaces stromatoporoids (mounds of laminated carbonate formed by coral-like animals) are visible. Bedding surfaces often contain fragments of fossils (fossil hash) and/or the outline of large gastropods and cephalopods—organisms which lived on the reef. The Crown Point Limestone was deposited just below sea level on a stable continental margin. Other limestones (Day Point and Valcour) found on Isle La Motte show both shallower and deeper water reef deposits, respectively, as indicated by their fossil assemblages.
The Glens Falls Formation seen in Lessor's Quarry (Stop #3) is perhaps the most fossiliferous of the Ordovician rocks in the Champlain Valley. The limestone is shaly to silty in composition. The formation breaks in nearly orthogonal blocks. Silicified fossils (fossils replaced by quartz) are common on weathered surfaces and can be extracted in a mild muriatic acid bath. The disarticulated nature of the fossil layers suggest that fossil-laden sediments were deposited as they washed off the reef to deeper water below wave base. The deepening of the lapetus Ocean is recorded in the Glens Falls Limestone.
The Therville Shale contains only a few fossils (such as graptolites) which drifted into a deeper water environment. Graptolites are pelagic colonial organisms, which did not live in deep water. The Iberville Shale is fine-grained, black, platy and cleaves in thin sheets. This is typical of shale which have been metamorphosed. The Iberville Shale is in contact with the Dunham Dolostone at Lone Rock Point (Stop #2) only because of the Champlain Thrust Fault.
Invertebrate life in Northwestern Vermont
Life in the Cambrian and Ordovician seas in Northwestern Vermont was very different than it is today. At the end of the Pre-Cámbrian, soft bodied life forms took an amazing divergence from what was common at that time. The advent of exoskeletons defines the beginning of the Cambrian Period from 570 million years ago. The Cambrian seas were teeming with invertebrate life. All of the major invertebrate phyla were present in the Cambrian. Primitive algae and variety of seaweed were grazed on by worms, trilobites, and gastropods which were in turn predated upon by carnivorous trilobites, cephalopods (nautaloids), and gastropods (snails). Passage into the Cambrian saw an increase in biodiversity and in numbers of individuals. This became a "self-feeding" cycle of increasing biomass in the oceans. The marine environment was supporting an increasingly diverse biomass but there was no land based life (Ward, 1992). The Ordovician era saw a continued expansion on the diversity of life on earth. The invertebrates responded to predation pressures by developing increasingly complex exoskeletons. The lancelet, a chordate, foretold the coming of the jawless fishes in the Ordovician (Parker, 1990).
Fossil evidence of Cambrian life can be seen in Redstone Quarry. There is evidence of algal matts and worm borrows. Later in the Ordovician sequence, in the Crown Point Limestone, there are reef dwelling organisms including stromatoporoids, crinoids, brachiopods, corals and sponges and a variety of larger organisms such as cephalopods and gastropods. The increase in diversity of fossils is evident in the rocks. Some of the typical Ordovician fossils present at Lessor's Quarry are shown in Figure 5. Fossils from the Fisk Quarry Preserve are shown in Figure 6. The presence of fossils allows us to interpret the paleoecology of the rock units.
165
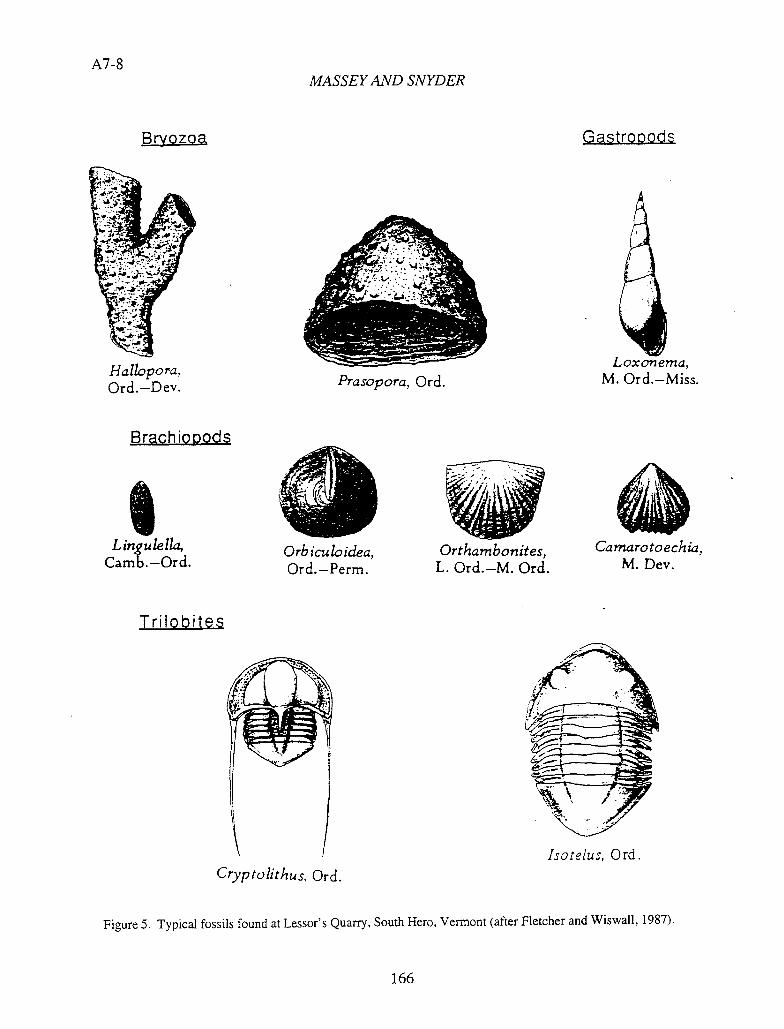
Isotelus, Ord.
A7-8 MASSEY AND SNYDER
L'14i1!
Loxonema, M. Ord.—Miss. Halk'po ra,
Ord.—Dev. Prasopora, Ord.
Lingulelk ''S
•1E
Trifo bites
Cryptolithus, Ord.
Figure 5. Typical fossils found at Lessor's Quarry, South Hero, Vermont (after Fletcher and Wiswall, 1987).
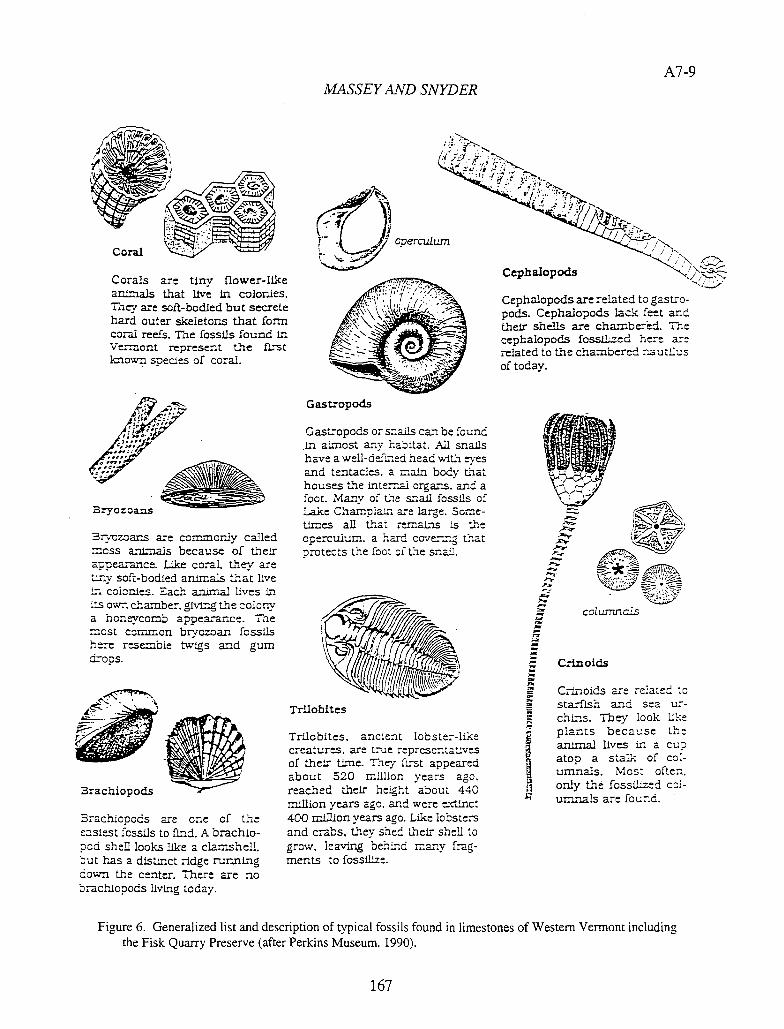
Gastropods
MASSEY AND SNYDER A7-9
Corals are tiny flower-like animals that live in colonies. They are soft-bodied but secrete hard outer skeletons that form coral reefs. The fossils found in Vermont represent the first Imown species of coral.
3rvczoans are commonly called rncss animals because of their appearance. Like coral. they are tiflv soft-bodied animals that live in coionjes. Each aatrnal lives 111 ts own chamber. gMng the colony a honeycomb appearance. The most common bryozoan fossils here resemble twigs and gum drops.
rachiopods are one of the easiest fcssils to find. A brachio-pod shell looks like a clamshell, but has a distinct ridge running down the center. There are no brachiopods living today.
Gasopods or snails can be found in almost any habitat. All snails have a well-defined head with eves and tentacles, a main body that houses the internal organs. and a foot. Many of the snail fossils of Lake Champlain are large. Some-times all that remains is the operculum. a hard cover-.r.g that protects the !'Oct of the snaiL
Trilobites
Trilobites, ancIent lobster-like creatures. are true representatives of their time. They first appeared about 520 million years ago, reached their height about 440 million years ago, and were extinct 400 mIllion years ago. Like lobsters and crabs, they shed their shell to grow, leaving behind many frag-ments to fossilize.
a coLnnais
Crinoids S. a
Crinoids are related to staxfls'n and sea ur-chins. They look like plants because the animal lives in a cup atop a stalk of col-umnals. Most often. only the fossilized cci-umnals are found.
Figure 6. Generalized list and description of typical fossils found in limestones of Western Vermont including the Fisk Quarry Preserve (after Perkins Museum, 1990).
167
A7-1O MASSEY AND SNYDER
Recent Geologic Change—Glaciations in Vermont
Within approximately the last 2 million years, during the Quaternary Period, over 40 glaciations occurred in North America, many covering the area of Vermont. We are still in the middle of the Quaternary Ice Age! Although we are currently in an "interglaciation," evidence of the most recent glaciation surrounds us in Vermont today.
The Most Recent Glacial Advance. During the last glacial event, ice advanced over New England as far south as Long Island and Nantucket Island, reaching the maximum extent approximately 21,000 years ago. Vermont was deeply buried in several kilometers of ice. The advancing ice entrained loose sediment and soil from the landscape and redeposited the sediment in hollows further to the south in the form of glacial till (unsorted material). In Vermont, we find glacial till whose origins are north and west, from New York and Canada. Sediment trapped in the ice acted like sandpaper on the local rock ledges and gouged out many glacial striations along the glacial flow paths. Most striations in Vermont trend NNW-SSE except in local valleys where existing topography controlled ice flow. Flowing ice followed the existing north-south contours of the New England landscape, flowing first through the valleys and then covering all of the mountain tops.
The weight of the ice caused isostatic depression of the landscape in New England. The asthenosphere below North America was able to "flow" out of the way as the "solid" rock of the North American lithosphere was pushed downward from the weight of the ice. Areas to the north experienced greater isostatic depression because the ice was thicker towards the center of the ice sheet in Canada.
Glacial Retreat. When the climate started warming 21,000 years ago, the toe, or terminus, of the continental glacier began retreating northward. Ice within the ice sheet still flowed south until the supply of new of ice material diminished in the north, however. By approximately 15,000 years ago, the southern parts of Vermont and the highest mountains were ice-free. As the ice melted, additional unsorted till deposits were laid down in Vermont along with individual glacial erratic boulders. In addition, melt-water streams emerging from the retreating glacier lobes reworked some of the till and sorted the sediment into outwash deposits. Meitwater ponded in front of the retreating glacier lobes in the form of pro-glacial lakes. Small pro-glacial lakes existed in the high mountainous regions of Vermont and environs, first in the south, and then later in the north as the ice retreated. Fine-grained lake sediments are found along with sandy deltaic deposits at elevations as high as 1,200 feet, recording the presence of these past glacial lakes in the upper reaches of the Winooski, Lamoille, and Missisquoi drainage networks, for example.
Lake Vermont. Although accurate dating is absent, limiting ages suggest that by approximately 13,000 years ago only the lowlands of the Champlain Valley and Connecticut Valley remained ice-covered. During continued ice retreat, large pro-glacial lakes formed in these valleys and were called, respectively, Lake Vermont and Lake Hitchcock. Both lakes drained to the south. In the Champlain Valley, icy Lake Vermont filled the lowland to an elevation of approximately 650 feet above modern sea level—or 550 feet above the modern Lake Champlain. Rivers from the surrounding ice-free mountains carried fine-grained silts and clays to Lake Vermont where slow settling occurred. Along the shore, sandy deltaic deposits formed at the mouths of entering streams. Now high and dry today, these deltas provide sand and gravel in the Champlain lowland.
Champlain Sea. Further northward retreat of the ice exposed the Champlain Lowland to the salt waters of the St. Lawrence Seaway. Marine water entered the Champlain Lowland because isostatic depression had lowered the land below sea level. The Champlain Sea was approximately 300 feet above sea level, or 200 feet above the modern Lake Champlain. Based on the dating of fossils found within the glacial marine clays and silts from the sea, the Champlain Sea existed in the lowland from approximately 12,500 to 10,000 years ago. Beluga whales also inhabited the Champlain Sea. The most famous beluga fossil remains are now the Vermont State Fossil—dubbed The Charlotte Whale—and are on display at the University of Vermont's Perkins Museum. The Champlain Sea was short-lived, and ended when isostatic rebound buoyed the land back up again. The ancient shorelines of both the Champlain Sea and Lake Vermont are now tilted on the modern landscape because the northern part of the basin has rebounded more. Deltaic sediments of the Champlain Sea
I.r.]
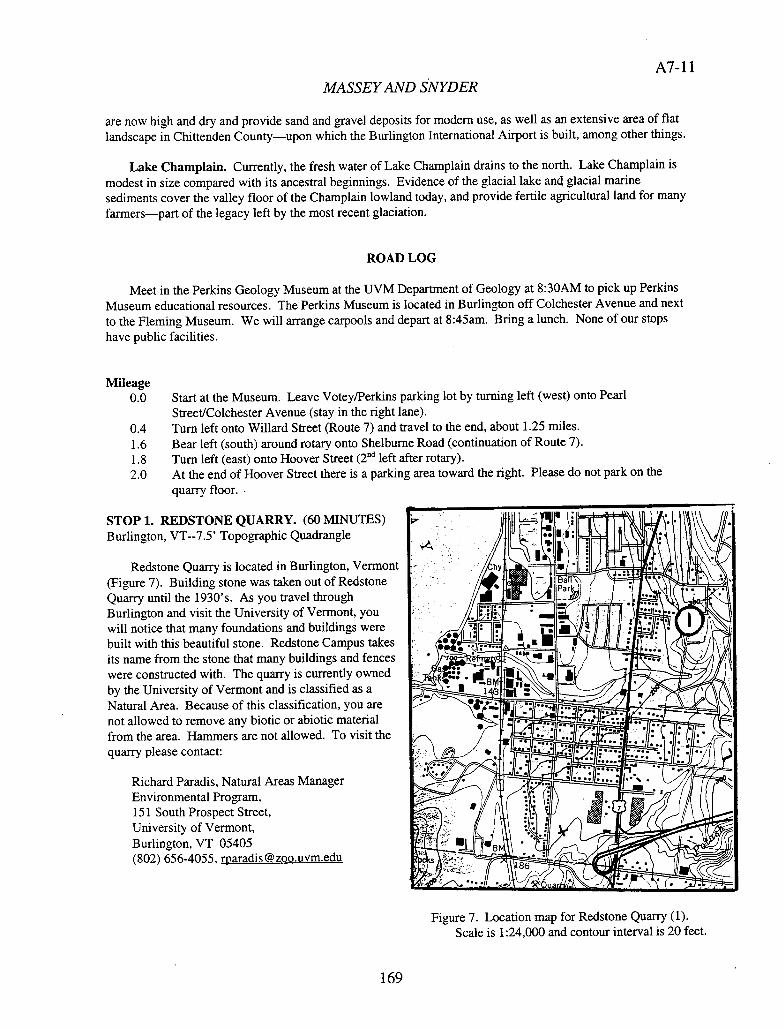
A7-11 MASSEY AND SNYDER
are now high and dry and provide sand and gravel deposits for modern use, as well as an extensive area of flat landscape in Chittenden County—upon which the Burlington International Airport is built, among other things.
Lake Champlain. Currently, the fresh water of Lake Champlain drains to the north. Lake Champlain is modest in size compared with its ancestral beginnings. Evidence of the glacial lake and glacial marine sediments cover the valley floor of the Champlain lowland today, and provide fertile agricultural land for many farmers—part of the legacy left by the most recent glaciation.
ROAD LOG
Meet in the Perkins Geology Museum at the UVM Department of Geology at 8:30AM to pick up Perkins Museum educational resources. The Perkins Museum is located in Burlington off Colchester Avenue and next to the Fleming Museum. We will arrange carpools and depart at 8:45am. Bring a lunch. None of our stops have public facilities.
Mileage
0.0 Start at the Museum. Leave Votey/Perkins parking lot by turning left (west) onto Pearl StreetlColchester Avenue (stay in the right lane).
0.4 Turn left onto Willard Street (Route 7) and travel to the end, about 1.25 miles.
1.6 Bear left (south) around rotary onto Shelburne Road (continuation of Route 7).
1.8 Turn left (east) onto Hoover Street (2 d left after rotary).
2.0 At the end of Hoover Street there is a parking area toward the right. Please do not park on the quarry floor.
tol
Figure 7. Location map for Redstone Quarry (1). Scale is 1:24,000 and contour interval is 20 feet.
STOP 1. REDSTONE QUARRY. (60 MINUTES) Burlington, VT--7.5' Topographic Quadrangle
Redstone Quarry is located in Burlington, Vermont (Figure 7). Building stone was taken out of Redstone Quarry until the 1930's. As you travel through Burlington and visit the University of Vermont, you will notice that many foundations and buildings were built with this beautiful stone. Redstone Campus takes its name from the stone that many buildings and fences were constructed with. The quarry is currently owned by the University of Vermont and is classified as a Natural Area. Because of this classification, you are not allowed to remove any biotic or abiotic material from the area. Hammers are not allowed. To visit the quarry please contact:
Richard Paradis, Natural Areas Manager Environmental Program, 151 South Prospect Street, University of Vermont, Burlington, VT 05405 (802) 656-4055, [email protected]
169
A7-12 MASSEY AND SNYDER
Rock Type and Composition
The Monkton Quartzite Formation is a slightly metamorphosed sandstone and consists of two distinctive units. The lower, older unit is white quartzite inter-bedded with layers of dolostone and is found from Vergennes to Shelburne Bay. This rock unit may have been deposited below low tide to the intertidal zone. The rock that we see exposed at Redstone Quarry is the upper part of the Monkton Quartzite. The upper, younger unit is composed of quartz sand that ranges from pink to purple. Most of the sand is made of quartz and feldspar with small amounts of calcite (CaCO 3). The red color is due to iron oxides (mostly hematite) in clay coatings around the grains. The material is mostly coarse to medium grained sand with some silt and/or thin layers of clay. The quartz and feldspar sediments at Redstone Quarry are very mature, well rounded and of fairly uniform size. The sand is "clean" with little clay in it. This part of the Monkton Quartzite has many very thin layers of clay material draped on top of the quartz layers. This suggests that the red Monkton was formed in the intertidal zone.
Depositional Environment
Sedimentary features present include rippled sands, burrows, and scour channels. The sediments that form the Monkton Quartzite were deposited early in the Cambrian Period between 600 and 500 million years ago. The source rock was the Ancient Adirondack Mountains which were much higher during the Cambrian period. Rivers washed sediments from the flanks of the mountains to the shore of the shallow lapetus Ocean to the east. At the time of deposition, the area which eventually became what is now Redstone Quarry was approximately 60-80 km (35-50 miles) to the east of its present location (Stanley, 1987).
The Monkton Quartzite rocks reflect a near-shore, stable continental shelf environment. Many invertebrate phyla were present in this shelf environment in the Cambrian Period. All of these organisms were aquatic, and lived in and on oceanic sediments. Geologists find evidence of trilobites, algal matts, and a variety of worms in the Monkton Quartzite.
Structure
The Cambrian rocks in western Vermont follow a north-south trending belt. The quarry is located on the west flank of a south plunging synclinal (concave) fold. This fold is the result of continental collision. Since the quarry is on the west flank of this fold, the beds (layers) all tilt to the east. There are many fractures visible on the quarry floor. They appear to be in four orientations. These fractures probably formed in one or both of two collision events, the Taconic (450 mya) and Acadian (360 mya) orogenies. There are basalt dikes associated with several orientations of fractures suggesting age differentiation of the fractures.
There is one large basalt dike that crosses the quarry floor. Outcrop of the dike can be found on the east wall and the western edge of the quarry. This dike is no longer clearly visible on the quarry floor but can be traced via the "no chive zone. This area is preferentially weathered and an area where chives do not grow.
The second type of fracture found in the quarry is radial in nature. These are artifacts of blasting associated with mining operations. They can be seen on the quarry floor as a radial fracture pattern or on the quarry walls at the bottom of bore holes.
Mileage
2.1 At the bottom of Hoover Street, turn right (north) onto Shelburne Road (Route 7). Stay in the left lane.
2.3 At the rotary, proceed left towards downtown Burlington on the main road.
3.1 Turn left (west) onto Maple Street at stop sign.
3.3 Turn right (north) onto Battery Street (last street before lakefront buildings). Follow Battery Street up the hill to Battery Park in Burlington.
170
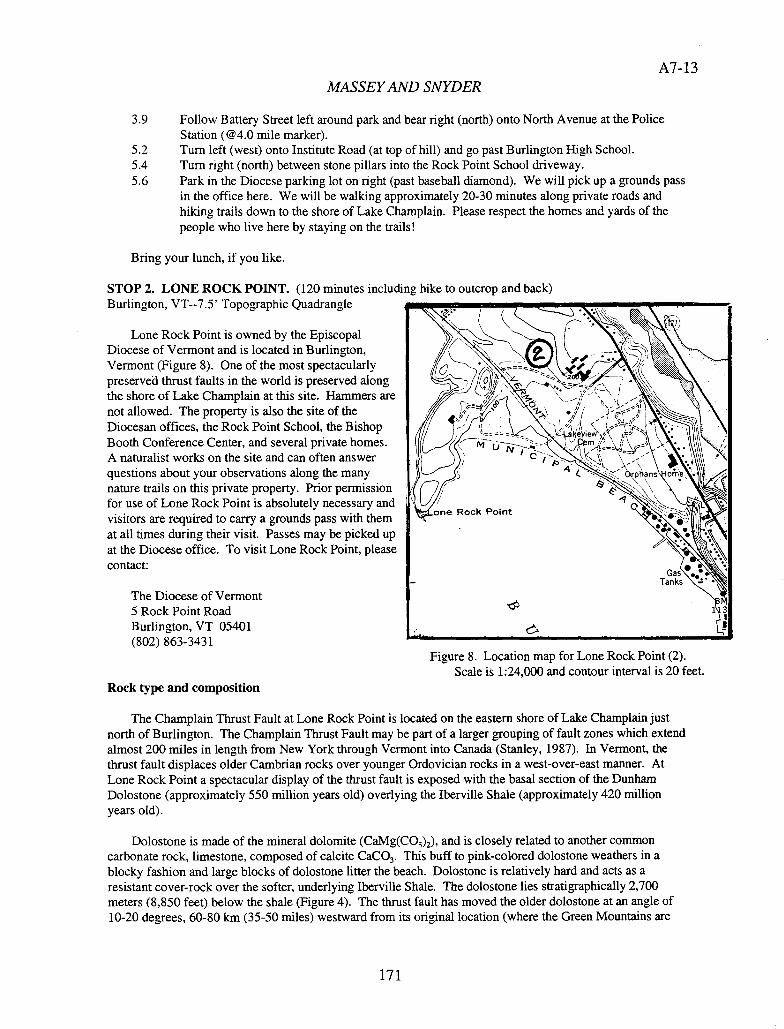
A7- 13 MASSEY AND SNYDER
3.9 Follow Battery Street left around park and bear right (north) onto North Avenue at the Police Station (@4.0 mile marker).
5.2 Turn left (west) onto Institute Road (at top of hill) and go past Burlington High School.
5.4 Turn right (north) between stone pillars into the Rock Point School driveway.
5.6 Park in the Diocese parking lot on right (past baseball diamond). We will pick up a grounds pass in the office here. We will be walking approximately 20-30 minutes along private roads and hiking trails down to the shore of Lake Champlain. Please respect the homes and yards of the people who live here by staying on the trails!
Bring your lunch, if you like.
STOP 2. LONE ROCK POINT. (120 minutes including hike to outcrop and back) Burlington, VT--7.5' Topographic Quadrangle ..
Lone Rock Point is owned by the Episcopal Diocese of Vermont and is located in Burlington, Vermont (Figure 8). One of the most spectacularly preserved thrust faults in the world is preserved along the shore of Lake Champlain at this site. Hammers are not allowed. The property is also the site of the Diocesan offices, the Rock Point School, the Bishop Booth Conference Center, and several private homes. A naturalist works on the site and can often answer questions about your observations along the many nature trails on this private property. Prior permission for use of Lone Rock Point is absolutely necessary and visitors are required to carry a grounds pass with them at all times during their visit. Passes may be picked up at the Diocese office. To visit Lone Rock Point, please contact:
The Diocese of Vermont 5 Rock Point Road Burlington, VT 05401 (802) 863-3431
Rock type and composition
VoneRock Point
Gas '.• Tanks .
Figure 8. Location map for Lone Rock Point (2). Scale is 1:24,000 and contour interval is 20 feet.
The Champlain Thrust Fault at Lone Rock Point is located on the eastern shore of Lake Champlain just north of Burlington. The Champlain Thrust Fault may be part of a larger grouping of fault zones which extend almost 200 miles in length from New York through Vermont into Canada (Stanley, 1987). In Vermont, the thrust fault displaces older Cambrian rocks over younger Ordovician rocks in a west-over-east manner. At Lone Rock Point a spectacular display of the thrust fault is exposed with the basal section of the Dunham Dolostone (approximately 550 million years old) overlying the Iberville Shale (approximately 420 million years old).
Dolostone is made of the mineral dolomite (CalvIg(CO 3)2), and is closely related to another common carbonate rock, limestone, composed of calcite CaCO 3 . This buff to pink-colored dolostone weathers in a blocky fashion and large blocks of dolostone litter the beach. Dolostone is relatively hard and acts as a resistant cover-rock over the softer, underlying Iberville Shale. The dolostone lies stratigraphically 2,700 meters (8,850 feet) below the shale (Figure 4). The thrust fault has moved the older dolostone at an angle of 10-20 degrees, 60-80 km (35-50 miles) westward from its original location (where the Green Mountains are
171
A7-14 MASSEY AND SNYDER
now) up and over the younger shale (Stanley, 1987). The sedimentary units above the Dunham Dolostone (including perhaps the Iberville Shale) likely moved with it and have long been eroded away.
Shale is composed of fine-grained silt and clay particles cemented together. The charcoal to black-colored Iberville Shale breaks apart easily along planes of weakness called cleavage, and weathers typically into small planar stones. The shale was metamorphosed and contorted (small folds are visible) during the actual thrusting process. Deformation along the thrust fault was primarily taken up within the more pliable shale rather than the more competent dolostone. The cleavage patterns in the shale suggest that motion along the Champlain Thrust occurred both during the Taconic collision event (450 mya) and the Acadian collision event (360 mya). The fault has not been active since. Abundant white calcite veins (soft and react with dilute hydrochloric acid) are found within the shale and likely stem from dissolution and re-precipitation of calcite from other sources.
Depositional Environment
Some dolostones are formed in shallow marine waters by direct precipitation of (CaMg(CO 3)2). Most dolostones were originally limestones and are products of alteration of CaCO 3 whereby some of the calcium is replaced by magnesium from circulating ground waters. By contrast, shales are fine-grained, clastic, sediments that settle slowly into deep-water basins. The fine-grained sediments may be cemented with carbonate or other binding agents. The Iberville Shale does not contain carbonate cement. However, secondary deposition of carbonate can be found in fractures. The Ordovician Iberville Shale, which lies stratigraphically above the Cambrian Dunham Dolostone by almost 130 million years, highlights the deepening of the lapetus Ocean as a trench formed.
Mileage 5.9 At Rock Point entrance turn left (east) onto Institute Road. 6.1 Turn left (north) on North Avenue. 6.5 Turn right onto Route 127 (entrance ramp) and take Rte. 127 North towards Mallet's Bay. Stay
on Rte. 127 (turns into Prim Road @ 10.5 mile marker). 11.5 Turn right onto West Lakeshore Drive at the Harborview Plaza (still Rte. 127). Follow Rte. 127
North (becomes Blakely Road) over freeway to its end at Route 2 and Route 7 junction. 15.3 Turn left (north) on Route 2 West (Rte. 7 N) towards Milton. 19.8 Turn left (west) on Route 2 West towards the Champlain Islands. Go over causeway onto South
Hero Island. Watch for pedestrian traffic on South Hero! Continue on Rte 2 W past Apple Farm Market @ 28.4 mile marker.
29.5 Turn left (southwest) onto Sunset View Road (dirt road). 30.1 Turn left on private dirt driveway (mailbox #65, Grimes residence) at power lines. 30.3 Turn left into quarry. Do not block private driveway!
STOP 3. LESSOR'S QUARRY (60 MINUTES) South Hero, VT--7.5' Topographic Quadrangle
Lessor's Quarry is located in South Hero, Vermont (Figure 9). The quarry is currently owned by the University of Vermont and is maintained by the Geology Department for educational purposes. Please make a reservation for class use so as not to conflict with TJVM Geology course use. You are not allowed to remove any fossil material from the area without prior permission. Hammers are not allowed. Please stay on the quarry floor and work safely at all times. Parking is permitted only inside the quarry and not on the access road, which is a private driveway. Because of potential driveway damage, visits to Lessor's Quarry are not allowed during the winter and spring mud season. To visit Lessor's Quarry at other times, please contact:
The Perkins Museum Geology Department, University of Vermont Burlington, VT 05405-0122 (802) 656-8694
172
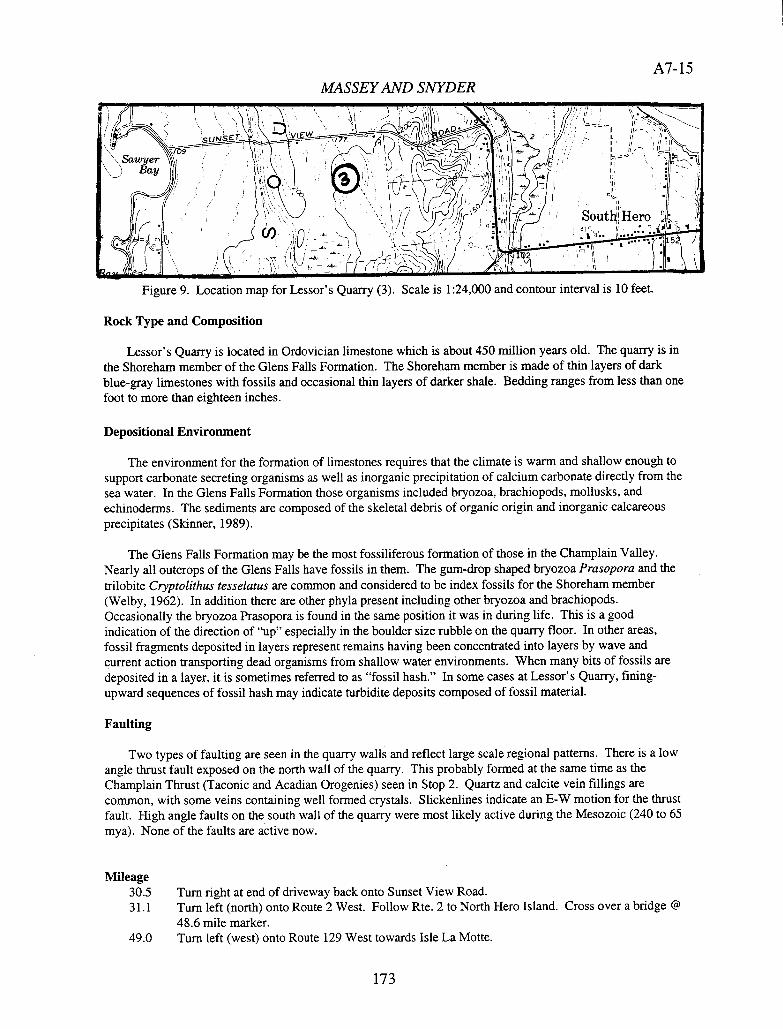
A7-15 MASSEY AND SNYDER
/ J 'SUNE VIEW 2 /
awyer Bay
Figure 9. Location map for Lessor's Quarry (3). Scale is 1:24,000 and contour interval is 10 feet.
Rock Type and Composition
Lessor's Quarry is located in Ordovician limestone which is about 450 million years old. The quarry is in the Shoreham member of the Glens Falls Formation. The Shoreham member is made of thin layers of dark blue-gray limestones with fossils and occasional thin layers of darker shale. Bedding ranges from less than one foot to more than eighteen inches.
Depositional Environment
The environment for the formation of limestones requires that the climate is warm and shallow enough to support carbonate secreting organisms as well as inorganic precipitation of calcium carbonate directly from the sea water. In the Glens Falls Formation those organisms included bryozoa, brachiopods, mollusks, and echinoderms. The sediments are composed of the skeletal debris of organic origin and inorganic calcareous precipitates (Skinner, 1989).
The Glens Falls Formation may be the most fossiliferous formation of those in the Champlain Valley. Nearly all outcrops of the Glens Falls have fossils in them. The gum-drop shaped bryozoa Prasopora and the trilobite Cryptolithus tesselatus are common and considered to be index fossils for the Shoreham member (Welby, 1962). In addition there are other phyla present including other bryozoa and brachiopods. Occasionally the bryozoa Prasopora is found in the same position it was in during life. This is a good indication of the direction of "up" especially in the boulder size rubble on the quarry floor. In other areas, fossil fragments deposited in layers represent remains having been concentrated into layers by wave and current action transporting dead organisms from shallow water environments. When many bits of fossils are deposited in a layer, it is sometimes referred to as "fossil hash." In some cases at Lessor's Quarry, fining-upward sequences of fossil hash may indicate turbidite deposits composed of fossil material.
Faulting
Two types of faulting are seen in the quarry walls and reflect large scale regional patterns. There is a low angle thrust fault exposed on the north wall of the quarry. This probably formed at the same time as the Champlain Thrust (Taconic and Acadian Orogenies) seen in Stop 2. Quartz and calcite vein fillings are common, with some veins containing well formed crystals. Slickenlines indicate an E-W motion for the thrust fault. High angle faults on the south wall of the quarry were most likely active during the Mesozoic (240 to 65 mya). None of the faults are active now.
Mileage
30.5 Turn right at end of driveway back onto Sunset View Road.
31.1 Turn left (north) onto Route 2 West. Follow Rte. 2 to North Hero Island. Cross over a bridge @ 48.6 mile marker.
49.0 Turn left (west) Onto Route 129 West towards Isle La Motte.
173
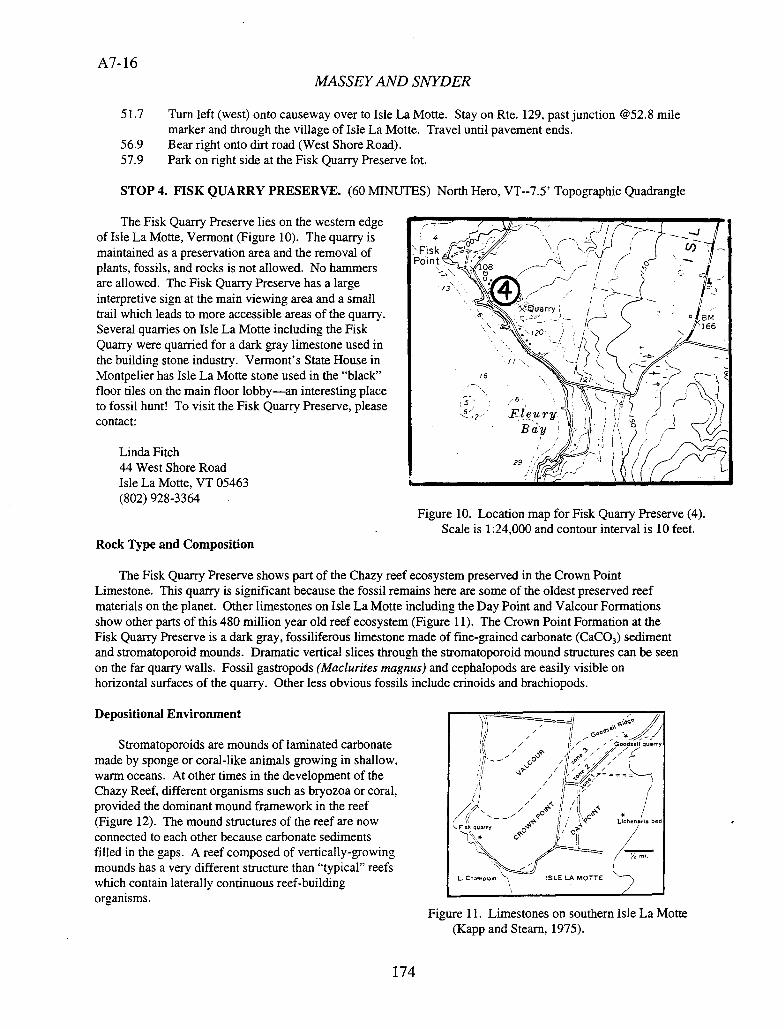
A7-16 MASSEY AND SNYDER
51.7 Turn left (west) onto causeway over to Isle La Motte. Stay on Rte. 129, past junction @52.8 mile marker and through the village of Isle La Motte. Travel until pavement ends.
56.9 Bear right onto dirt road (West Shore Road).
57.9 Park on right side at the Fisk Quarry Preserve lot.
STOP 4. FISK QUARRY PRESERVE. (60 MINUTES) North Hero, VT--7.5' Topographic Quadrangle
The Fisk Quarry Preserve lies on the western edge of Isle La Motte, Vermont (Figure 10). The quarry is maintained as a preservation area and the removal of plants, fossils, and rocks is not allowed. No hammers are allowed. The Fisk Quarry Preserve has a large interpretive sign at the main viewing area and a small trail which leads to more accessible areas of the quarry. Several quarries on Isle La Motte including the Fisk Quarry were quarried for a dark gray limestone used in the building stone industry. Vermont's State House in Montpelier has Isle La Motte stone used in the "black" floor tiles on the main floor lobby—an interesting place to fossil hunt! To visit the Fisk Quarry Preserve, please contact:
Linda Fitch 44 West Shore Road Isle La Motte, VT 05463 (802) 928-3364
_J 1I( 7 j Point
08 /7
:/\ _i'-•'-' I
/
rry / BM - /
•j30 _/ / 166
/
/6
6
j2 / - c Bay /
/
29 ; f
Figure 10. Location map for Fisk Quarry Preserve (4). Scale is 1:24,000 and contour interval is 10 feet.
Rock Type and Composition
The Fisk Quarry Preserve shows part of the Chazy reef ecosystem preserved in the Crown Point Limestone. This quarry is significant because the fossil remains here are some of the oldest preserved reef materials on the planet. Other limestones on Isle La Motte including the Day Point and Valcour Formations show other parts of this 480 million year old reef ecosystem (Figure 11). The Crown Point Formation at the Fisk Quarry Preserve is a dark gray, fossiliferous limestone made of fine-grained carbonate (CaCO 3) sediment and stromatoporoid mounds. Dramatic vertical slices through the stromatoporoid mound structures can be seen on the far quarry walls. Fossil gastropods (Maclurites magnus) and cephalopods are easily visible on horizontal surfaces of the quarry. Other less obvious fossils include cnnoids and brachiopods.
Depositional Environment
Stromatoporoids are mounds of laminated carbonate made by sponge or coral-like animals growing in shallow, warm oceans. At other times in the development of the Chazy Reef, different organisms such as bryozoa or coral, provided the dominant mound framework in the reef (Figure 12). The mound structures of the reef are now connected to each other because carbonate sediments filled in the gaps. A reef composed of vertically-growing mounds has a very different structure than "typical" reefs which contain laterally continuous reef-building organisms.
OO 6 %
— / Lh,,L bcd ' o
/
L. Ch.n',g//, "7 ISLE LA MOTTE
Figure 11. Limestones on southern Isle La Motte (Kapp and Steam, 1975).
174
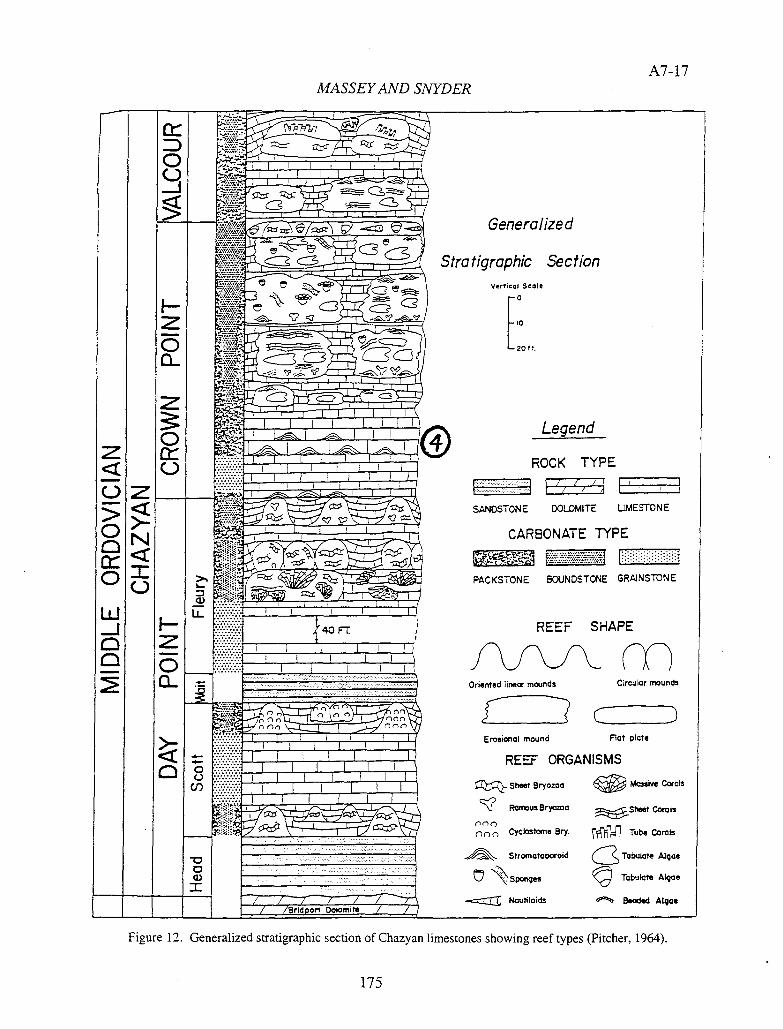
A7-17 MASSEY AND SNYDER
!r' • ___ I -
-- --
-' h- -
•1 • * -- _1. • • _____
• •
• _______________________________ a •
• _______ ____ iq •1i'l1 -
&MJLØIJI • —. r*tsj'i 1I'J-1Pi
.. __
2 • ____
fl 1 .1r1rr1(iir.
I. - - • rTr TTiT -------
I wag
Figure 12. Generalized stratigraphic section of Chazyan limestones showing reef types (Pitcher, 1964).
175
A7- 18 MASSEY AND SNYDER
TEACHER RESOURCES AND FURTHER READING
Baldwin, B., 1982, Geology of Vermont: Earth Science Magazine, American Geological Institute, v. 35, n. 3, p 10-14.
Deike, R., 1998, Stone Wall Secrets Teacher's Guide—Exploring Geology in the Classroom: Tilbury House Publishers, Gardiner, Maine, 90 pp.
Demarest, A. B., 1997, This Lake Alive!: Shelburne Farms, Burlington, Vermont, 502 pp.
Doolan, B. L., 1988, When continents collide: A history of bedrock geology in the Champlain Basin: Lake Champlain Committee special publication, Burlington, Vermont, 10 pp.
Doolan, B. L., 1996, The geology of Vermont: Rocks & Minerals, v. 71, n.4, p. 218-225.
Johnson, C. W., 1998, The nature of Vermont: Introduction and guide to a New England environment (2 Edition): University Press of New England, Hanover, New Hampshire, 354pp.
National Science Foundation (NSF) Teacher Enhancement in Constructivist Physical Science Project, 1996, Vermont Constructivist Science Handbook: University of Vermont Education Department, Burlington, Vermont.
Raymo, C. and Raymo, M., 1982, Written in Stone: Pequot Press, p. 1-79.
Schuele, E. M., 1996, Vermont's geologic history: As told by its fossils: Rocks & Minerals, v. 71, n. 4, p. 226-230.
Thorson, K. and Thorson, R., 1998, Stone Wall Secrets: Tilbury House Publishers, Gardiner, Maine, 38 pp.
REFERENCES CITED
Coney, P. J., Powell, R. E., Tennyson, M. E., and Baldwin, B., 1972, The Champlain Thrust Fault and related features near Middlebury, Vermont: in Doolan, B. J. and Stanley, R. S. (eds.), 1972, New England Intercollegiate Guidebook for Field Trips in Vermont, 64 th Annual Meeting, Burlington, Vermont, p. 97-116.
Fletcher, C. and Wiswall, C. G., 1987, Concepts in geology: An activities approach to problem solving in the laboratory: Kendall Hunt Publishing, Dubuque, Iowa.
Kapp, U., S. and Steam, C. W., 1975, Stromatoporoids of the Chazy Group (Middle Ordovician), Lake Champlain, Vermont and New York: Journal of Paleontology, v. 49, n. 1, p. 163-186.
Mehrtens, C., 1985, The Cambrian platform in northwestern Vermont: Vermont Geology, Vermont Geological Society Guidebook, v. 4, p. E1-E21.
Mehrtens, C., Doolan, B., and Bechtel, S., 1994, A laboratory manual for introductory geology—University of Vermont Geology Department: McGraw-Hill, Inc. Custom College Series, New York, New York, p. 8-2.
Parker, S. and Bernor, R. L., (Eds.), 1990, The Practical Paleontologist: Simon & Schuster Inc., 159 pp.
176
A7-19 MASSEY AND SNYDER
Perkins Museum, 1990, Fossils of the Lake Champlain region: Perkins Museum, University of Vermont, Burlington, Vermont.
Pitcher, M., 1964, Evolution of Chazyan (Ordovician) of Eastern United States and Canada: Bull. Can. Petrol. Geol., v. 12, P. 632-682.
Skinner, B. J. and Porter, S. C., 1989, The Dynamic Earth: John Wiley & Sons, 540 pp.
Stanley, R. S., 1987, The Champlain thrust fault, Lone Rock Point, Burlington, Vermont, in Geological Society of America Centennial Field Guide—Northeastern Section, 1987, p. 225-227.
Van Diver, B. B., 1995, Roadside Geology of Vermont and New Hampshire: Mountain Press Publishing Co., Missoula, Montana, 230 Pp.
Ward, P. D., 1992, On Methuselah's Trail: W. H. Freeman and Company, 212 pp.
Welby, C. W., 1962, Paleontology of the Champlain Basin in Vermont: Special Publication No. 1., Vermont Geological Survey, 88 pp.
177

178
B1-1
DEGLACIATION HISTORY OF THE STEVENS BRANCH VALLEY, WILLIAMSTOWN TO BARRE, VERMONT
Stephen F. Wright; Department of Geology; University of Vermont Burlington, VT 05405; [email protected]
INTRODUCTION
This field trip visits exposures that help elucidate the deglaciation history of the Stevens Branch valley from its headwaters to its confluence with the Winooski River. Work that forms the basis of this field thp was completed while mapping the Barre West 7.5-minute quadrangle during the summer and fall of 1998, work supported by the Vermont Geological Survey as part of the STATEMAP program. This work occurred concurrently with Fred Larsen's mapping in the adjacent Montpelier 7.5-minute quadrangle to the north (Larsen, 1999, this volume). The purpose of this field trip is to describe several critical exposures that provide good evidence of processes transpiring during the retreat of the Laurentide ice sheet through this part of central Vermont. Specifically this thp focuses on the development of the Stevens Branch esker and the different glacial lakes that occupied the valley during both the advance and retreat of the Laurentide ice sheet.
The bedrock geology of the area consists of low to moderate grade metasedimentary rocks belonging to the Devonian Waits River Formation (Doll et al., 1961). This formation largely consists of dark gray to dark brown metasiltstones and slates interlayered with calcareous sandstone and sandy limestone; turbidites deposited in the lapetus Ocean after the Taconic orogeny and before the Acadian orogeny. Veins of quartz are common. Low to moderate grade metasedimentary and metavolcamc rocks outcrop west and northwest of the area and contribute erratics to the area (Doll et al., 1961; Cady, 1956; Westerman, 1987). The Barre granite quarries are located just 2 km east of the Stevens Branch valley and similar, although smaller, granite intrusions to the north and east (Adamant and Woodbury, Vermont) contribute erratics to the glacial materials of the area (Doll et al., 1961; Cady, 1956; Murthy, 1957). The granites of eastern Vermont were intruded in association with the Acadian orogeny are syn- to post-metamorphic (Hannula, 1999, this volume). Structural trends (strike of bedding and the dominant metamorphic cleavage, S) are NNE—SSW and control the alignment of the mountains and the tributary drainages.
The surficial materials in the region are dominantly of glacial origin and were deposited in the late Pleistocene (Wisconsinan) (1) immediately prior to the advance of the Laurentide ice sheet, (2) while the area was covered by the ice sheet, and (3) during and shortly after the retreat of that ice. Holocene alluvial fans, river systems, and slope movements have significantly redistributed these sediments in restricted areas. Typical of most of New England, the upland areas are covered by till that varies considerably in thickness, composition, and texture. Local erratics are common, but include those having traveled from the Green Mountains, the Champlain and St. Lawrence Valleys, and the Laurentian Mountains in Québec. Most of the till contains carbonate minerals also derived from the Waits River Formation. In limited areas till overlies unweathered lake sediments that were overridden by the ice sheet. Till is commonly overlain by a variety of ice-contact sediments deposited during ice retreat. These in turn are overlain by lacustrine sediments deposited in lakes formed as the retreating ice front dammed the WNW-flowing Winooski River (Larsen, 1987a). The modern valley bottoms are also the locus of Holocene alluvial fan deposition, fluvial activity, and the accumulation areas for colluvium.
PREVIOUS WORK
Early Work Merwin (1908) was the first geologist to propose a model for ice sheet retreat in central Vermont that envisioned
the existence of proglacial lakes bordered by an ice margin retreating to the northwest (see Larsen, 1987a for a thorough review of Merwin's work). Merwin's (1908) ideas were based on reconnaissance mapping over a wide area. Subsequent mapping of the Barre-Montpelier region by Richardson (1916) emphasized bedrock mapping, but he also compiled enough striation data to determine ice flow directions though the area. As part of a larger effort to map surficial materials in the state, the Stevens Branch valley was mapped by D.P Stewart in the late 1950's and early
Wright, S.F., 1999, Deglaciation of the Stevens Branch valley, Williamstown to Barre, Vermont, in Wright, S.F. ed., New England Intercollegiate Geologic Conference Guidebook Number 91, p. 179-199.
179
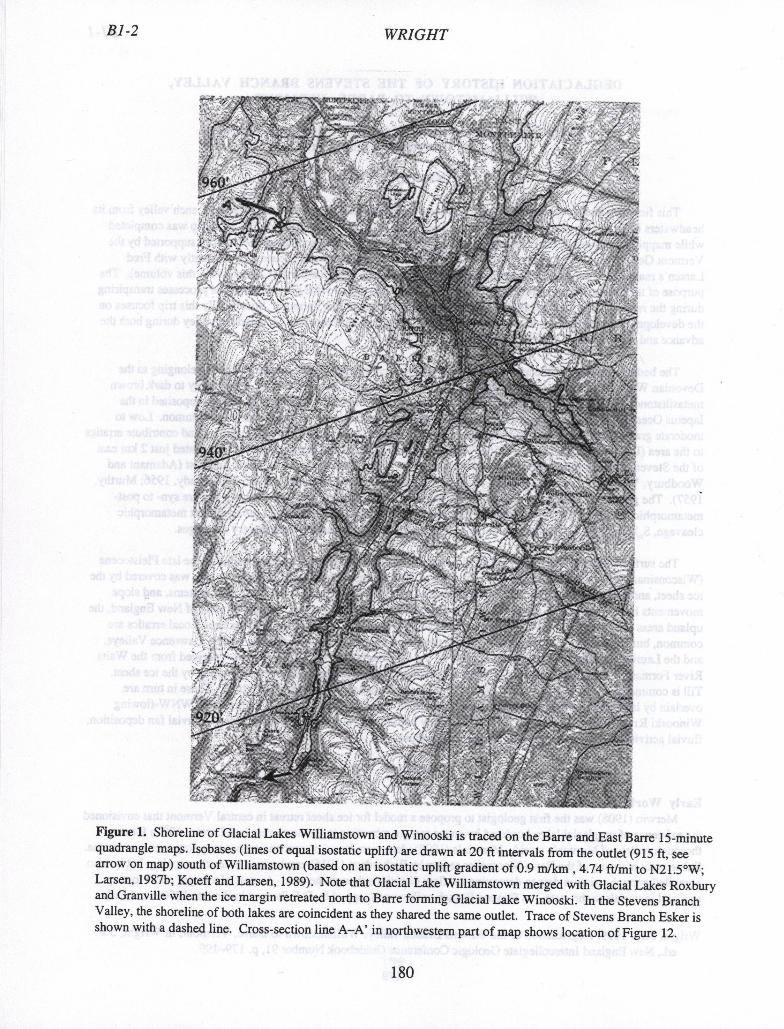
B1-2
WRIGHT
Figure 1. Shoreline of Glacial Lakes Williamstown and Winooski is traced on the Barre and East Barre 15-minute quadrangle maps. Isobases (lines of equal isostatic uplift) are drawn at 20 ft intervals from the outlet (915 ft, see arrow on map) south of Williamstown (based on an isostatic uplift gradient of 0.9 rn/km , 4.74 ft/mi to N2 1.5 °W; Larsen, 1987b; Koteff and Larsen, 1989). Note that Glacial Lake Willianistown merged with Glacial Lakes Roxbury and Granville when the ice margin retreated north to Barre forming Glacial Lake Winooski. In the Stevens Branch Valley, the shoreline of both lakes are coincident as they shared the same outlet. Trace of Stevens Branch Esker is shown with a dashed line. Cross-section line A—A' in northwestern part of map shows location of Figure 12.
WRIGHT B1-3
Water well data was gathered by Hodges and Butterfield (1967) and used to evaluate groundwater resources in the region. During their work they identified two large buried valleys: (1) The old channel of the Winooski river extending from Barre north to East Montpelier and (2) a valley extending north from Berlin Pond to the Winooski River. Both will be visited on this field trip. Stewart (1971) summarized the reconnaissance mapping completed for the state surficial map (Stewart and MacClintock, 1970) in a guide to environmental planning. As part of that work, seismic surveys were conducted across several of the river valleys, known buried valleys, and prominent terraces within the area (e.g. Stevens Branch, Winooski River, Berlin Corners Terrace) and published as seismic cross-sections (Stewart, 1971). Water well logs were also used extensively in the present study to constrain the subsurface geology depicted in cross-sections (Wright, 1999).
Preglacial Lake History The first field stop on Larsen's 1972 NEIGC field trip was to a section along the Jail Branch of the Winooski
River (-6 kin east of Barre City center). In this section Larsen (1972) describes a lucustrine section that is overlain by till. Recent mapping by both Larsen (1999a) and Wright (1999) has documented many exposures with a similar stratigraphy—deformed lacustrine sediments overlain by till. Larsen's (1999b) field guide in this volume (C-i) fully describes these exposures and formerly names the lake in which they were deposited Glacial Lake Merwin. Glacial Lake Merwin was a lake similar in form to Glacial Lake Winooski, except that it formed as the Laurentide ice sheet advance up the Winooski River valley. As with Glacial Lake Winooski the advancing ice blocked drainage to the west, forcing the ponded water to drain through the outlet at the headwaters of the Stevens Branch River.
Post Glacial Lake History Larsen (1972) provided the first coherent description of the deglaciation history of central Vermont, considerably
expanding on the general framework established by Merwin. Based on detailed mapping of the Northfield 7.5-minute quadrangle (Larsen, 1984) and surrounding areas Larsen (1987a) further clarified the glacial lake history in the region. The Stevens Branch valley is a key part of that history because the drainage divide separating the north-flowing Stevens Branch from the south-flowing Second Branch of the White river (located approximately 4 km south of Williamstown village, Stop 1) is the lowest divide in the Winooski River drainage basin east of Jonesville. As a consequence, the divide (279 m, 915 ft ASL) was the outlet of a glacial lake (Glacial Lake Williamstown; Merwin, 1908) as soon as the ice sheet margin retreated north of this point. West of the Stevens Branch, two parallel north-flowing river valleys also contained glacial lakes that were probably coeval with Glacial Lake Williamstown (Larsen, 1987b). Larsen (1972) has named these Glacial Lake Roxbury (elev. 308 m, 1,010 ft in the Dog River valley) and Glacial Lake Granville (elev. 430 m, 1,410 ft in the Mad River valley). Both lakes drained over higher drainage divides into tributaries to the White River.
With continued retreat of the ice sheet margin to the northwest, these three small lakes merged into a much larger lake named Glacial Lake Winooski (Larsen 1972,1987a) that utilized the lowest outlet; the drainage divide at the headwaters of the Stevens Branch valley south of Williamstown (Fig. 1, see also maps in Larsen, 1987a). Glacial Lake Winooski continued to grow as the ice sheet retreated to the northwest. Few deltas have been mapped in the Stevens Branch Valley and they are small; a consequence of the small drainage basins of the streams flowing into the glacial lakes or poor preservation. The Williamstown outlet was not abandoned until the lower outlet through Gillet Pond and Hollow Brook (229 m, 750 ft) in Richmond and Huntington, respectively, allowed the ponded water to flow into Glacial Lake Vermont at South Hinesburg, producing an enormous delta (Larsen, 1987a).
When the lower outlet was uncovered, Glacial Lake Winooski quickly drained from the Stevens Branch valley and the Stevens Branch river began eroding the recently deposited lacustrine sediments. The Winooski River never found its old bedrock valley between East Montpelier and Barre and instead began flowing west and cut a new or reoccupied a still older valley. Fluvial terraces were formed and later abandoned as the streams downcut to lower levels. Holocene alluvium therefore, lies unconformably on any of the older glacial deposits.
STEVENS BRANCH ESKER
Stewart and McClintock (1970) mapped most of the Stevens Branch valley as a kame terrace; the exceptions being an area mapped as a delta to the south and an area covered by lacustrine sediments to the north. My own mapping (Wright, 1999) shows a different distribution of surficial materials in the valley consisting of two principal
181
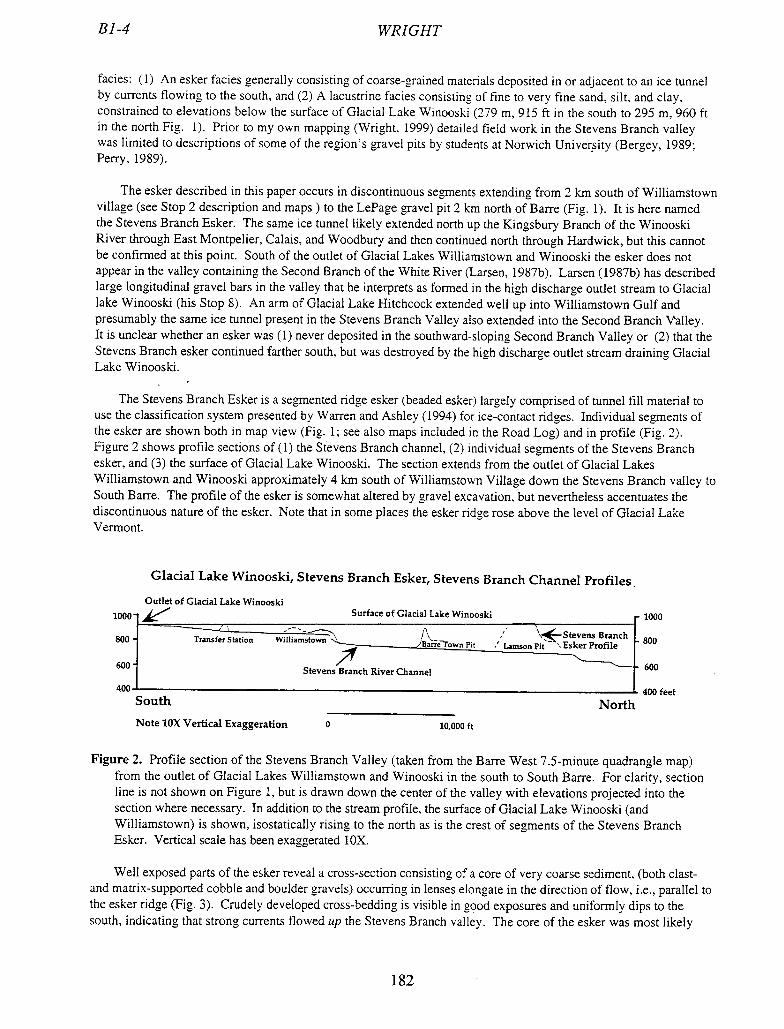
B1-4 WRIGHT
facies: (1) An esker facies generally consisting of coarse-grained materials deposited in or adjacent to an ice tunnel by currents flowing to the south, and (2) A lacustrine facies consisting of fine to very fine sand, silt, and clay, constrained to elevations below the surface of Glacial Lake Winooski (279 m, 915 ft in the south to 295 m, 960 ft in the north Fig. 1). Prior to my own mapping (Wright, 1999) detailed field work in the Stevens Branch valley was limited to descriptions of some of the region's gravel pits by students at Norwich University (Bergey, 1989; Perry, 1989).
The esker described in this paper occurs in discontinuous segments extending from 2 km south of Williamstown village (see Stop 2 description and maps) to the LePage gravel pit 2 km north of Bane (Fig. 1). It is here named the Stevens Branch Esker. The same ice tunnel likely extended north up the Kingsbury Branch of the Winooski River through East Montpelier, Calais, and Woodbury and then continued north through Hardwick, but this cannot be confirmed at this point. South of the outlet of Glacial Lakes Williamstown and Winooski the esker does not appear in the valley containing the Second Branch of the White River (Larsen, 1987b). Larsen (1987b) has described large longitudinal gravel bars in the valley that he interprets as formed in the high discharge outlet stream to Glacial lake Winooski (his Stop 8). An arm of Glacial Lake Hitchcock extended well up into Williamstown Gulf and presumably the same ice tunnel present in the Stevens Branch Valley also extended into the Second Branch Valley. It is unclear whether an esker was (1) never deposited in the southward-sloping Second Branch Valley or (2) that the Stevens Branch esker continued farther south, but was destroyed by the high discharge outlet stream draining Glacial Lake Winooski.
The Stevens Branch Esker is a segmented ridge esker (beaded esker) largely comprised of tunnel fill material to use the classification system presented by Warren and Ashley (1994) for ice-contact ridges. Individual segments of the esker are shown both in map view (Fig. 1; see also maps included in the Road Log) and in profile (Fig. 2). Figure 2 shows profile sections of (1) the Stevens Branch channel, (2) individual segments of the Stevens Branch esker, and (3) the surface of Glacial Lake Winooski. The section extends from the outlet of Glacial Lakes Williamstown and Winooski approximately 4 km south of Williamstown Village down the Stevens Branch valley to South Bane. The profile of the esker is somewhat altered by gravel excavation, but nevertheless accentuates the discontinuous nature of the esker. Note that in some places the esker ridge rose above the level of Glacial Lake Vermont.
Glacial Lake Winooski, Stevens Branch Esker, Stevens Branch Channel Profiles
Outlet of Glacial Lake Winooskj 10001 Surface of Glacial Lake Winooskj r 1000
\.—Stevens Branch J. 800 800 -j Pit Lamson Pit . Esker Profile
Transfer Station Willianistown
600 1 Stevens, Branch River Channel -J- 600
400 400 feet South North Note lOX Vertical Exaggeration 0 10,000 ft
Figure 2. Profile section of the Stevens Branch Valley (taken from the Bane West 7.5-minute quadrangle map) from the outlet of Glacial Lakes Williamstown and Winooski in the south to South Bane. For clarity, section line is not shown on Figure 1, but is drawn down the center of the valley with elevations projected into the section where necessary. In addition to the stream profile, the surface of Glacial Lake Winooski (and Williamstown) is shown, isostatically rising to the north as is the crest of segments of the Stevens Branch Esker. Vertical scale has been exaggerated i Ox.
Well exposed parts of the esker reveal a cross-section consisting of a core of very coarse sediment, (both clast-and matri x- supported cobble and boulder gravels) occurring in lenses elongate in the direction of flow, i.e., parallel to the esker ridge (Fig. 3). Crudely developed cross-bedding is visible in good exposures and uniformly dips to the south, indicating that strong currents flowed up the Stevens Branch valley. The core of the esker was most likely
182
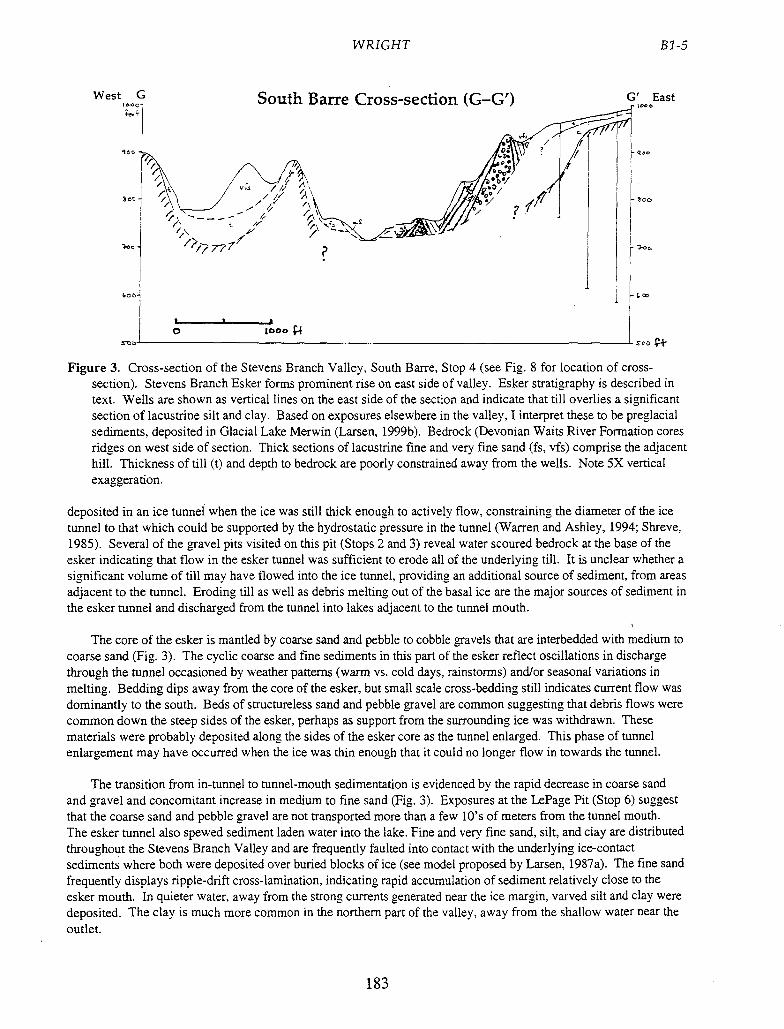
WRIGHT
West G Smith Rarrp Crnsc-ceeHmi ((—("
B 1-5
G'East
q'
c'o
Figure 3. Cross-section of the Stevens Branch Valley, South Barre, Stop 4 (see Fig. 8 for location of cross-section). Stevens Branch Esker forms prominent rise on east side of valley. Esker stratigraphy is described in text. Wells are shown as vertical lines on the east side of the section and indicate that till overlies a significant section of lacustrine silt and clay. Based on exposures elsewhere in the valley, I interpret these to be preglacial sediments, deposited in Glacial Lake Merwin (Larsen, 1999b). Bedrock (Devonian Waits River Formation cores ridges on west side of section. Thick sections of lacustrine fine and very fine sand (fs, vfs) comprise the adjacent hill. Thickness of till (t) and depth to bedrock are poorly constrained away from the wells. Note 5X vertical exaggeration.
deposited in an ice tunnel when the ice was still thick enough to actively flow, constraining the diameter of the ice tunnel to that which could be supported by the hydrostatic pressure in the tunnel (Warren and Ashley, 1994; Shreve, 1985). Several of the gravel pits visited on this pit (Stops 2 and 3) reveal water scoured bedrock at the base of the esker indicating that flow in the esker tunnel was sufficient to erode all of the underlying till. It is unclear whether a significant volume of till may have flowed into the ice tunnel, providing an additional source of sediment, from areas adjacent to the tunnel. Eroding till as well as debris melting Out of the basal ice are the major sources of sediment in the esker tunnel and discharged from the tunnel into lakes adjacent to the tunnel mouth.
The core of the esker is mantled by coarse sand and pebble to cobble gravels that are interbedded with medium to coarse sand (Fig. 3). The cyclic coarse and fine sediments in this part of the esker reflect oscillations in discharge through the tunnel occasioned by weather patterns (warm vs. cold days, rainstorms) and/or seasonal variations in melting. Bedding dips away from the core of the esker, but small scale cross-bedding still indicates current flow was dominantly to the south. Beds of structureless sand and pebble gravel are common suggesting that debris flows were common down the steep sides of the esker, perhaps as support from the surrounding ice was withdrawn. These materials were probably deposited along the sides of the esker core as the tunnel enlarged. This phase of tunnel enlargement may have occurred when the ice was thin enough that it could no longer flow in towards the tunnel.
The transition from in-tunnel to tunnel-mouth sedimentation is evidenced by the rapid decrease in coarse sand and gravel and concomitant increase in medium to fine sand (Fig. 3). Exposures at the LePage Pit (Stop 6) suggest that the coarse sand and pebble gravel are not transported more than a few 10's of meters from the tunnel mouth. The esker tunnel also spewed sediment laden water into the lake. Fine and very fine sand, silt, and clay are distributed throughout the Stevens Branch Valley and are frequently faulted into contact with the underlying ice-contact sediments where both were deposited over buried blocks of ice (see model proposed by Larsen, 1987a). The fine sand frequently displays ripple-drift cross-lamination, indicating rapid accumulation of sediment relatively close to the esker mouth. In quieter water, away from the strong currents generated near the ice margin, varved silt and clay were deposited. The clay is much more common in the northern part of the valley, away from the shallow water near the outlet.
183
B1-6 WRIGHT
Summary The hydraulic gradient in the Laurentide ice sheet generally mimicked the slope of the ice sheet surface (to the
SSE) driving water currents in subglacial tunnels in that direction (Shreve, 1985). The Stevens Branch Esker is probably just one segment of a much longer tunnel system that extended to the north. If the tunnel system extended south of Williamstown, material was either not deposited in it, or thoroughly redeposited as fluvial gravels in the river draining Glacial Lake Winooski. Erosion at the base of the tunnel and infall of debris from melting ice provided sediment to the subglacial drainage system. Abundant cross-bedding in the esker gravels indicates that water currents were flowing southward, up the Stevens Branch valley. The core of the esker, consisting of very coarse, angular cobble an bolder gravel was deposited rapidly. Cyclic high and low discharge flow is recorded by alternating layers of relatively coarse and fine sediments, although it is likely that only a few of the many cycles experienced in the tunnel are recorded in the sediment record. Detailed descriptions of the esker stratigraphy are given in the Road Log that follows.
ACKNOWLEDGMENTS
This work was supported by STATEMAP funds administered through the Vermont Geological Survey. I want to extend my thanks to the staff of the Survey, Larry Becker, Marjorie Gale, and Jonathan Kim for their ongoing logistical support. Jonathan Kim supplied the enlarged photos that were used for mapping the gravel pits. The owners and operators of the gravel pits visited on this field trip were particularly gracious in allowing access to the working pits. I also want to thank the many landowners who not only allowed me access to their properties, but provided much needed encouragement and many stimulating questions. Robert Danckert, an undergraduate student at UVM, located many of the water wells in the area, work that eventually allowed the well logs to be used for cross-section construction. Finally, I cannot thank Fred Larsen enough for his continued support, many discussions, and frequent site visits throughout this project. His careful and thorough work throughout central Vermont provided the working framework for this study. Fred, George Springston, Rose Paul, Rachel Howse, Karen Jennings, Anders Noren, Josh Galster, and Adam Spangler all provided help cleaning up some of the sections visited on this field trip.
ROAD LOG
This field trip begins at the Berlin Exit "Park & Ride" (Exit 7 on 1-89) approximately 4 miles south of Montpelier (Fig. 4). We will start the trip by traveling south on the Interstate to Exit 5, following Route 64 east to Williamstown, and then continuing south on Route 14 to the first stop. Subsequent stops will be along Route 14 and Route 302. We will return to the Berlin Exit "Park & Ride" via Route 62. All field stops are located on the Brookfield and Barre West 7.5-minute Quadrangles. Distances from the starting point are given in miles. Field stops are also located with UTM coordinates. Access to the gravel pits has been graciously given by the owners at the time of this field trip. Geologists wishing to visit these pits in the future should request permission.
0.0 Begin at the Berlin Exit Park & Ride (Exit 7, 1-89). Travel south on the Interstate to the Northfield/Williamstown Exit (Route 64, Exit 5).
1.3 Outlet to Berlin Pond. Outcrops along the interstate are all in the Waites River Formation.
7.9 Exit 5: Leave Interstate at Exit 5 and turn left (EAST) on Route 64. Follow Rt. 64 down into the valley where it ends at Williamstown village.
11.6 Intersection with Route 14: Turn south on Route 14.
14.0 Cutter Pond cross roads
14.8 Intersection with "old main road:" Single track dirt road enters from the right (WEST). Carefully turn onto this and head back north to Cutter Pond cross roads (Fig. 5).
15.7 Cutter Pond cross road, STOP 1: Dirt road provides good parking adjacent to, but off Route 14. UTM Coordinates: 695920, 4884440
WEI
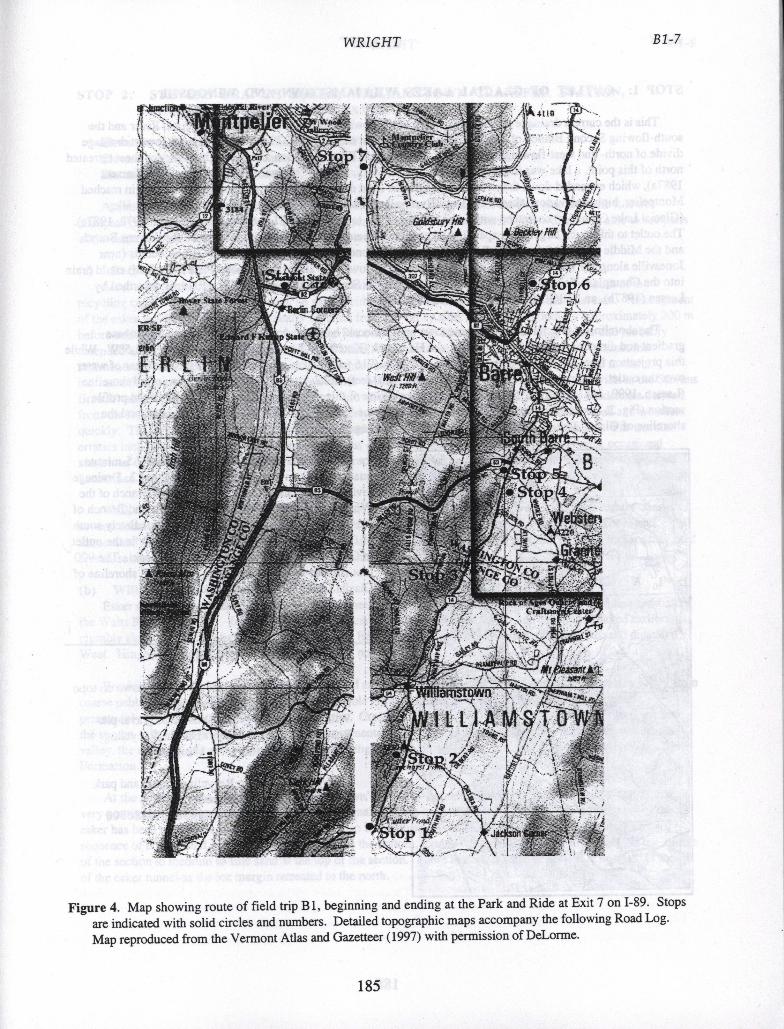
WRIGHT
B1-7
Figure 4. Map showing route of field trip B 1, beginning and ending at the Park and Ride at Exit 7 on 1-89. Stops are indicated with solid circles and numbers. Detailed topographic maps accompany the following Road Log. Map reproduced from the Vermont Atlas and Gazetteer (1997) with permission of DeLorme.
185
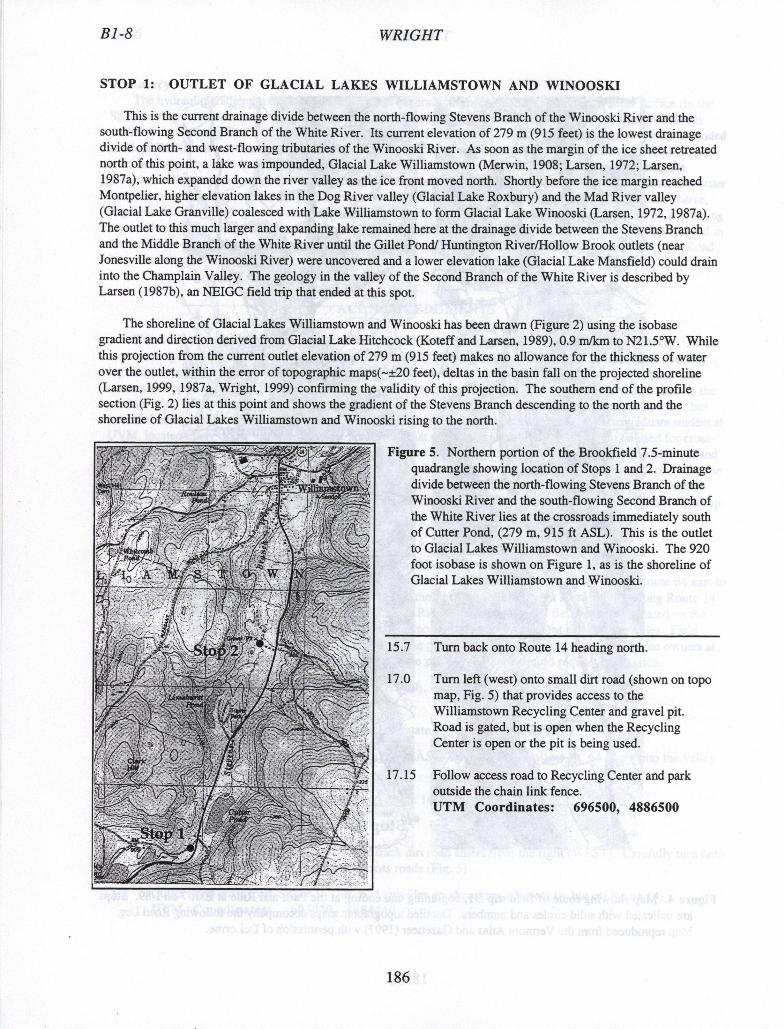
WRIGHT
STOP 1: OUTLET OF GLACIAL LAKES WILLIAMSTOWN AND WINOOSKI
This is the current drainage divide between the north-flowing Stevens Branch of the Winooski River and the south-flowing Second Branch of the White River. Its current elevation of 279 m (915 feet) is the lowest drainage divide of north- and west-flowing tributaries of the Winooski River. As soon as the margin of the ice sheet retreated north of this point, a lake was impounded, Glacial Lake Williamstown (Merwin, 1908; Larsen, 1972; Larsen, 1987a), which expanded down the river valley as the ice front moved north. Shortly before the ice margin reached Montpelier, higher elevation lakes in the Dog River valley (Glacial Lake Roxbury) and the Mad River valley (Glacial Lake Granville) coalesced with Lake Williamstown to form Glacial Lake Winooski (Larsen, 1972, 1987a). The outlet to this much larger and expanding lake remained here at the drainage divide between the Stevens Branch and the Middle Branch of the White River until the Gillet Pond/ Huntington River/Hollow Brook outlets (near Jonesville along the Winooski River) were uncovered and a lower elevation lake (Glacial Lake Mansfield) could drain into the Champlain Valley. The geology in the valley of the Second Branch of the White River is described by Larsen (1987b), an NEIGC field trip that ended at this spot.
The shoreline of Glacial Lakes Williamstown and Winooski has been drawn (Figure 2) using the isobase gradient and direction derived from Glacial Lake Hitchcock (Koteff and Larsen, 1989), 0.9 rn/kin to N21.5°W. While this projection from the current outlet elevation of 279 m (915 feet) makes no allowance for the thickness of water over the outlet, within the error of topographic maps(—±20 feet), deltas in the basin fall on the projected shoreline (Larsen, 1999, 1987a, Wright, 1999) confirming the validity of this projection. The southern end of the profile section (Fig. 2) lies at this point and shows the gradient of the Stevens Branch descending to the north and the shoreline of Glacial Lakes Williamstown and Winooski rising to the north.
ill nn
- 2. fr:
f
K K kJ 0 J
Figure 5. Northern portion of the Brookfield 7.5-minute quadrangle showing location of Stops 1 and 2. Drainage divide between the north-flowing Stevens Branch of the Winooski River and the south-flowing Second Branch of the White River lies at the crossroads immediately south of Cutter Pond, (279 m, 915 ft ASL). This is the outlet to Glacial Lakes Williamstown and Winooski. The 920 foot isobase is shown on Figure 1, as is the shoreline of Glacial Lakes Williamstown and Winooski.
15.7 Turn back onto Route 14 heading north.
17.0 Turn left (west) onto small dirt road (shown on topo map, Fig. 5) that provides access to the Williamstown Recycling Center and gravel pit. Road is gated, but is open when the Recycling Center is open or the pit is being used.
17.15 Follow access road to Recycling Center and park outside the chain link fence. UTM Coordinates: 696500, 4886500
IRV
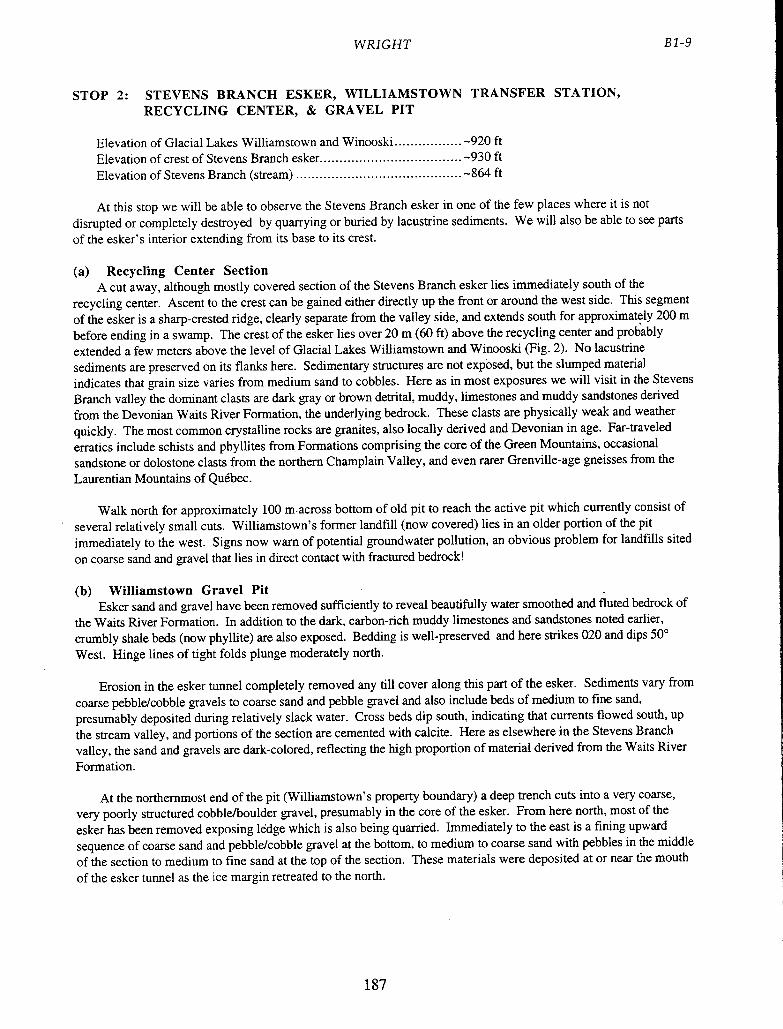
WRIGHT B1-9
STOP 2: STEVENS BRANCH ESKER, WILLIAMSTOWN TRANSFER STATION, RECYCLING CENTER, & GRAVEL PIT
Elevation of Glacial Lakes Williamstown and Winooski.................-920 ft Elevation of crest of Stevens Branch esker....................................-930 ft Elevation of Stevens Branch (stream) ..........................................-864 ft
At this stop we will be able to observe the Stevens Branch esker in one of the few places where it is not disrupted or completely destroyed by quarrying or buried by lacustrine sediments. We will also be able to see parts of the esker' s interior extending from its base to its crest.
(a) Recycling Center Section A cut away, although mostly covered section of the Stevens Branch esker lies immediately south of the
recycling center. Ascent to the crest can be gained either directly up the front or around the west side. This segment of the esker is a sharp-crested ridge, clearly separate from the valley side, and extends south for approximately 200 m before ending in a swamp. The crest of the esker lies over 20 m (60 ft) above the recycling center and probably extended a few meters above the level of Glacial Lakes Williamstown and Winooski (Fig. 2). No lacustrine sediments are preserved on its flanks here. Sedimentary structures are not exposed, but the slumped material indicates that grain size varies from medium sand to cobbles. Here as in most exposures we will visit in the Stevens Branch valley the dominant clasts are dark gray or brown detrital, muddy, limestones and muddy sandstones derived from the Devonian Waits River Formation, the underlying bedrock. These clasts are physically weak and weather quickly. The most common crystalline rocks are granites, also locally derived and Devonian in age. Far-traveled erratics include schists and phyllites from Formations comprising the core of the Green Mountains, occasional sandstone or dolostone clasts from the northern Champlain Valley, and even rarer (3renville-age gneisses from the Laurentian Mountains of Québec.
Walk north for approximately 100 m.across bottom of old pit to reach the active pit which currently consist of several relatively small cuts. Williamstown's former landfill (now covered) lies in an older portion of the pit immediately to the west. Signs now warn of potential groundwater pollution, an obvious problem for landfills sited on coarse sand and gravel that lies in direct contact with fractured bedrock!
(b) Williamstown Gravel Pit Esker sand and gravel have been removed sufficiently to reveal beautifully water smoothed and fluted bedrock of
the Waits River Formation. In addition to the dark, carbon-rich muddy limestones and sandstones noted earlier, crumbly shale beds (now phyllite) are also exposed. Bedding is well-preserved and here strikes 020 and clips 50° West. Hinge lines of tight folds plunge moderately north.
Erosion in the esker tunnel completely removed any till cover along this part of the esker. Sediments vary from coarse pebble/cobble gravels to coarse sand and pebble gravel and also include beds of medium to fine sand, presumably deposited during relatively slack water. Cross beds dip south, indicating that currents flowed south, up the stream valley, and portions of the section are cemented with calcite. Here as elsewhere in the Stevens Branch valley, the sand and gravels are dark-colored, reflecting the high proportion of material derived from the Waits River Formation.
At the northernmost end of the pit (Williamstown's property boundary) a deep trench cuts into a very coarse, very poorly structured cobble/boulder gravel, presumably in the core of the esker. From here north, most of the esker has been removed exposing ledge which is also being quarried. Immediately to the east is a fining upward sequence of coarse sand and pebble/cobble gravel at the bottom, to medium to coarse sand with pebbles in the middle of the section to medium to fine sand at the top of the section. These materials were deposited at or near the mouth of the esker tunnel as the ice margin retreated to the north.
187
Bi-lO
WRIGHT
17.15 Return to main road.
17.3 Intersection with Route 14: Turn left heading north towards Williamstown village.
18.4 Intersection with Route 64 in Williamstown: Continue north. The Stevens Branch esker lies along the eastern edge of the village. The conspicuous north-south trending ridge on the east side of Route 14, just north of the cemetery, is cored by bedrock and mantled by till. A former pit (now largely reclaimed) in the village along the eastern side of the valley is described by Larsen (1972, his Stop 7, Fig. 5) as part of a "discontinuous esker" containing faulted beds with south-dipping cross lamination. The village sewage treatment plant is located in a former pit that is also part of the Stevens Branch esker as is the still active pit above and east of the sewage treatment plant.
Continue north through the village until reaching the entrance to the Barre Town and Williamstown gravel pit located on the east side of Route 14 immediately south of the boundary between Bane Town and Williamstown and labeled on the topographic map as a "Sandpit" (Fig. 6). Park in the pulloff outside the gate. Barre Town owns the north end of the pit and Williamstown the south end.
20.5 UTM Coordinates: 698170, 4891250
Figure 6. Portion of the Barre West 7.5-minute quadrangle along Route 14 showing location of Stop 3, the Barre and Williamstown Town Pit(s). Shoreline of Glacial Lakes Williamstown and Winooski is outlined with heavy line (930 ft). Orthogonal lines delineate 1 km squares.
STOP 3: BARRE TOWN & WILLIAMSTOWN GRAVEL PIT
Elevation of Glacial Lakes Williamstown and Winooski.................-930 ft Elevation of crest of Stevens Branch esker............................-900-940' ft Elevation of Stevens Branch (stream) ..........................................-755 ft
This gravel pit is being excavated from materials deposited in the Stevens Branch esker. While much of the esker has already been removed, the many active cuts reveal both erosion processes and different sediment facies active both within the esker tunnel and near the tunnel mouth. Two general characteristics of the sediments to note: (1) Very coarse grained units (coarse sand to cobble, boulder gravels) are interbedded with much finer grained units (medium to coarse sand) indicating fluctuations in discharge through the esker tunnel and (2) many beds have no sedimentary structures suggesting either extremely rapid deposition or slumping (e.g. grain flows) after deposition. Both small- and large-scale normal faults are particularly common in the pit. To facilitate discussion, field stops within the pit are located on an enlarged aerial photograph (Fig. 7).
(a) West Wall of Pit The west wall of the pit (between the pit and Route 14) lies parallel to the esker and currently offers a
longitudinal profile of the esker close to its base. Poorly sorted beds of cobble gravel are interlayered with less
1 The 940 foot elevation comes from the 1957 Barre 15-minute quadrangle map, whereas the 900 foot elevation is from the 7.5-minute Barre West quadrangle (1978).
188
WRIGHT Bi-Til
floutel4
4
Figure 7. Enlarged orthophotograph of the Barre Town and Williamstown pit (1989). Parking area outside the gate is designated with a "P." Field stops within the pit are designated with small case letters (a, b, c, ...) and the approximate location of pit faces are shown with a solid or dashed line. Note that pit faces have changed in the 10 years since the photo was taken.
189
B1-12 WRIGHT
abundant coarse sand in 2-3 in thick beds with poorly developed, south-dipping cross-beds. The top of the section, at the northwest corner of pit, consists of a poorly sorted, structureless cobble gravel set in a muddy matrix.
(b) South Wall of Pit (Western end) A small, water-worn, fluted knob of bedrock (Waits River Fm.) lies at the bottom of this section indicating that
fluvial erosion in the esker tunnel was sufficient to remove any underlying till. Bedrock exposures 100 in to the west, adjacent to the Stevens Branch, are still mantled by till. Sediments in this section range from coarse sand and pebble gravel to cobble and boulder gravels. The coarse units occur both as clast supported and muddy matrix supported lenses. Bedding in this section generally dips to the west, away from the bedrock knob, but is highly disrupted by high-angle faults, many with at least several meters of displacement.
(c) South Wall of Pit (Eastern end) On the eastern end of the south face is a large, downfaulted, structureless block of silt, clay, and fine sand. This
material was all originally deposited on top of the esker when the ice margin was some distance to the north and was subsequently down-dropped to its present position when a block of buried ice melted. These very cohesive sediments form a near vertical face. A high-angle fault separates these massive lacusthne sediments on the west from a structureless pebble, cobble, boulder gravel to the east. Sedimentary structures in both the fine-grained lucustrine and the coarse-grained esker sediments have been destroyed by slumping.
(d), (e), and (1) Eastern Wall of Pit The northern end of this cut (d) consists of a massive, matrix supported, cobble gravel at least 3 in thick. This
bed dips to the east and may have slumped off the east side of the esker. This unit is overlain by well bedded medium sand that is in turn overlain by a bedded cobble gravel. Section (e) farther to the south reveals a similar section of alternating coarse and relatively fine beds. These are overlain by several meters of stuctureless lacustrine silt, clay, and fine sand downdropped from higher in the section, similar to (c). The Barre 15-minute quadrangle map (1957) shows a closed depression here and no indication of gravel removal suggesting that these exposures reveal the inner structure of a kettle. The lowest and southernmost part of this cut (f) exposes a very poorly sorted cobble, boulder gravel that includes several clasts in excess of 2 in in diameter.
(g) and (h) Williamstown Pit Williamstown owns and operates the southern end of the pit, the highest parts of which are still close to the pre-
excavation elevation of the landform which is here taken as the crest of the esker. As noted in the table at the beginning of this section, the crest of the esker rose close to the surface of Glacial Lake Winooski. No lacustrine sediments are found preserved on these highest parts of the esker. Exposures in these high pits reveal alternating layers of pebble, cobble gravel and coarse sand. South-dipping cross lamination at the crest of the esker indicates currents flowing to the south, up the Stevens Branch valley. A fine view to the south from the top of the hill (under the power line cut) provides views of another much smaller gravel pit to the south that is also cut into the esker.
Turn right back on to Route 14 heading north.
21.9 Entrance to Lamson Gravel Pit on right, just after self storage sheds (Fig. 8). Park outside gate and off access road. UTM Coordinates: 699080, 4893440
IV1€
WRIGHT
B 1-13
4\1' /
7 / 7
) I F eo/
.
Figure 8. Enlarged topographic map (Barre West 7.5-minute quadrangle) showing the locations of Stops 4 and 5. Shoreline of Glacial Lakes Williamstown and Winooski is shown with heavy line (935 ft). Location of Cross-section G—G' (Fig. 3) is shown.
STOP 4: LAMSON GRAVEL PIT, SOUTH BARRE
Elevation of Glacial Lakes Williamstown and Winooski.................-935 ft Elevation of crest of Stevens Branch esker....................................-940 ft Elevation of Stevens Branch (stream) ..............................- .......... —710 ft
The Lamson pit offers excellent exposures of the next segment of the Stevens Branch esker including a cumulative vertical section of over 60 m (200 feet). The crest of the esker lies along the easternmost and highest part of the pit. Most of the pit is excavated along parts of the western flank of the esker. In the northern end of the pit lacustrine sand overlies the esker gravels. The stop descriptions below begin at the crest of the esker and work down the western side of the esker to the base of the pit. As in Stop 3, stops are shown on an enlarged orthophotograph of the pit (Fig. 9).
(a) Crest of esker Recent excavations at the top the pit expose an excellent cross-section of the esker, schematically shown in
Figure 3. The core of the esker consists of very poorly sorted/bedded, matrix supported, cobble, boulder gravel. Many of the boulders are still very angular suggesting that they were quickly buried soon after they dropped into the tunnel from the melting ice. Sediments flanking the core Consist of pebble gravels with some cobbles and lenses of coarse sand and granules that alternate with fine sand layers. Beds dip to the east on the east side of the esker and to
191
WRIGHT
'1 r S-
I "
e
d
i S
S
5 •-,'
S
Figure 9. Enlarged orthophotograph of the Lamson pit (1989). Parking area outside the gate is designated with a "P." Field stops within the pit are designated with small case letters (a, b, c,
...). Note that pit faces have
changed in the 10 years since the nhoto was taken.
192
WRIGHT
B 1-15
the west on the west side of the esker. Smaller scale cross lamination dip generally south. Small-scale faults are common along the west side of the esker.
The crest of the esker lies at or above the elevation of Glacial Lakes Williamstown and Winooski and thus is not covered by lacustrine sediments (Fig. 2). However, a thin cover of fine sand lies over esker gravels immediately to the east. The fine sand and esker gravels are in contact with till to the east following the 950 foot contour. Recent foundation excavations —120 m ESE of here exposed lenses of coarse gravel overlying the till that likely originated from mouth of the nearby esker tunnel. A water well drilled at the same location during the summer of 1998 penetrated a thick section of varved clay beneath the overlying till (Fig. 3). These are probably lacustrine sediments deposited in Glacial Lake Merwin (Larsen, 1999b, this volume).
(b) and (c) West Flank of Esker, Middle Level This long north-south face of the esker reveals two distinct sedimentary facies (Fig. 9). At the southern end of
the cut (b) very coarse, poorly sorted cobble, boulder gravel is crudely interlayered with pebbly coarse sand. Bedding dips moderately to the west and northwest, parallel to the side of the esker. The uppermost 1-2 m of the section consists of structureless fine sand which in turn is overlain by a mixture of coarse sand, pebbles, and cobbles.
At the north end of the cut (c) the section consists of layers of coarse sand and granule gravel alternating with medium to fine sand. The combined thickness of the couplets is about 1 m. Trough cross-bedding is common. Large scale bedding dips to the west and contains abundant small-scale cross-bedding that also dips to the west. These pulses of alternately coarse and fine sediment reflect changing discharge either within or immediately in front of the esker tunnel. Small-scale faults are common, most sthking N—S and having down-to-the-west displacement.
(d) North End of Pit, Middle Level This section lies to the north of (b) and (c) described above (Fig. 9) and consists entirely of lacustrine sediments
that accumulated close to the mouth of the esker. Most of the section consists of thinly bedded fine sand interbedded with very fine sand and silt and lenses of granule gravel. Some beds display load structures and many are partially cemented with calcite. All beds are inclined to the south (Fig. E) which may reflect the structure of a small subaqueous delta that developed in front of the esker tunnel. Faults are common throughout the section.
(e) North End of Pit , Lower Level The north face of the pit, immediately east of the pit entrance is composed of a core of boulder gravel overlain
by poorly bedded pebble and cobble gravel that arches over the boulder gravel core. I interpret this to be a small esker parallel to the much larger esker to the east. The esker gravels are covered by lacusthne sediments that are draped over the underlying gravel knob. These consist of alternating cm-scale layers of silt and coarse sand with occasional lenses of pebble gravel, that were probably deposited relatively close to the mouth of the esker tunnel.
(f) East Face, Lower Level This long north-south face is cut along the western flank of the large esker described in (a). Large-scale bedding
dips to the west, away from the core of the esker, although small-scale cross lamination typically dips to the south. At the south end of the cut the unit consists of beds of coarse sand and pebble gravel that alternate with beds of medium sand, the same cyclic pattern of high and low energy flow that characterizes much of the pit. Small faults are common, typically with down-to-north movement and displacements of less than 30 cm.
(g) West and North Face of Lowest Level This is the deepest part of the pit. The west face is a longitudinal view of lenses of clast-supported cobble
gravel (1-2 m thick and 6-10 m long) surrounded by pebbly coarse sand and well-bedded medium sand. The north face contains the same coarse facies at its base, with the cobble gravel lenses now viewed in cross-section. Here the gravels are overlain by a unit of extensively slumped and deformed fine sand, silt, and clay that is, in turn, is overlain by another gravel horizon. This pit probably contains material deposited in the small esker noted in (e) above in alternating high and low flow regimes.
193
B1-16
WRIGHT
Turn right on Route 14 heading north.
22.1 Turn left at the Bond Auto Parts store and drive to the back of the building along its north side (Fig. 8). Park between the two ball fields and walk along the outfield fence of the southern field until reaching a cut bank extending down to river level. UTM Coordinates: 699040, 4893780
STOP 5: STEVENS BRANCH SECTION, BALL FIELD CUTBANK A small landslide along the east bank of the Stevens Branch river offers excellent exposure extending from the
ball field terrace almost 10 m down to near river level. The bottom of the section (beginning 8 m down from the top of the bank) consists of fine and very fine lacustrine sand with numerous faults. The section generally fines upwards to more distal lacustrine facies characterized by varved gray silt and clay layers intermixed with fine sand and one medium to coarse sand unit. An unconformity (3.4 m down from the top of the bank) separates the glaciolacustrine sediments below from fluvial sediments above. The unconformity and fluvial sediments were produced by the Stevens Branch river subsequent to the drainage of Glacial Lake Winooski. The age of the ball field terrace is unknown, but the terrace likely formed when local base level (the waterfall approximately 1 km to the north) was stable at an elevation approximately 10 in higher than at present.
Turn left on Route 14 heading north
22.2 Stoplight at intersection with Route 63. Continue north through intersection on Route 14. Road to right leads to the granite quarries and the Rock of Ages Visitors Center.
23.3 Cross the Jail Branch, a tributary of the Stevens Branch that enters from the east. An extensive terrace exists at the confluence of the two streams at an elevation of 940 feet (Fig. 1), which is also the projected elevation of Glacial Lake Winooski at this point (UTM Coordinates: 700800, 4894940, East Barre 7.5-minute quadrangle). A gravel pit is cut into the terrace sediments, but is abandoned and extensive slumping precludes observation of bedding. This is probably a delta deposited by the Jail Branch into Glacial Lake Winooski. In the time since Glacial Lake Winooski drained, the Jail Branch has cut through 61 m (200 ft) of section.
Continue into Barre. Follow signs and stay on Route 14 north.
23.8 City Center. Turn left on Routes 302 West and 14 North. Road continues NW through downtown Barre. Much of the floodplain that underlies the city has been covered with fill, largely derived from the granite quarries.
24.2 Big intersection with Route 62 (left). Turn right following Route 14 north. Steep, largely overgrown bank parallel to and east of Route 14 consists of coarse sand and gravel.
24.6 Turn left on Brook Street.
24.6 Turn right (north) on Farwell Street. Road follows small Brook. Hope Cemetery lies on terrace above and east of brook. Coarse sand and gravel comprise most of the slope from the stream up towards the cemetery. The top of the hill, hosting the cemetery, is covered with medium to fine sand. Continue north passing old landfill (now covered) and ball fields on right.
25.2 Dirt road on right is entrance to lower level of the LePage gravel pit. We have permission to drive down the access road. Park away from truck traffic. UTM Coordinates: 699620, 4898750
194
WRIGHT
B 1-17
fill 41 -
Vir
- --
/
STOP 6: LEPAGE GRAVEL PIT, NORTH BARRE
Figure 10. Enlarged topographic map (Barre West and Barre East 7.5-minute quadrangles) showing the location of Stop 6. North of here lies a buried bedrock valley, the former channel of the Winooski River. The Stevens Branch Esker continues north from here, but is buried by lacustrine sediments. Shoreline of Glacial Lake Winooski is shown with a heavy line (950 ft). Line extending ENE from the Maplewood Cemetery is the site of a seismic survey conducted by Stewart (1971).
Elevation of Glacial Lake Winooski............................................ -950 ft Elevation of crest of Stevens Branch esker....................................-880 ft
The area extending north from Barre City to East Montpelier is underlain by a buried bedrock valley. This was identified by Hodges and Butterfield (1967) while compiling well logs in the upper Winooski River Basin. The buried valley is also depicted in a seismic section across the valley published by Stewart (1971, his Fig. 9). (Section extends ENE from Maplewood Cemetery; location is shown on Fig. 10, —0.6 km north of Stop 6.) Stewart shows surficial materials extending from the surface (elevation 820 ft) down 200 ft to 620 ft. only 40 ft higher than the present elevation of the Stevens Branch in Barre, approximately 2 km to the south. This valley is probably the former course of the Winooski River that funneled drainage from north to south before turning back to the northwest in Barre. Being the deepest north-south surface depression, it also hosted a major tunnel in the ice sheet, the same ice tunnel that extended south, up the Stevens Branch valley.
Lepage Pit, Lower Level The LePage pit offers superb cross-sectional exposures of the Stevens Branch esker at two different levels. Most
parts of the pit contain two distinct facies: (1) Coarse-grained sediments deposited in the ice tunnel and (2) Lacustrine sediments deposited relatively near to the mouth of the esker tunnel. The lower pit has two active parts, separated by a broad, mined-out area. The southernmost part of the pit is cut into a now-isolated hill that exposes the core of the esker overlain by lacustrine sand. The esker is composed of lenses of clast-supported cobble, boulder gravel that alternate with medium to coarse sand layers. A north-south section exposed on the east side of the hill reveals poorly developed south-dipnin cross-beds in one of the 2-4 in thick cobble gravels. Beds of medium to
195
B1-18 WRIGHT
coarse sand with occasional pebble gravel lenses mantle the west side of the esker and dip gently west. The gravel content drops off sharply to the west, away from the crest of the esker and the section fines upwards to alternating layers of medium sand and fine sand/silt. Small-scale cross-beds in the lacustrine sands dip from west to south. The lenses of pebble gravel and coarse sand suggest that the mouth of the esker tunnel was relatively close at the time most of these lacustrine sediments were deposited. Relatively few, small displacement faults occur in this section.
The north end of the lower level contains both N—S and E—W sections. The E—W face cuts across the core of the esker and is a mirror image of the face described in the preceding paragraph. One to two meter thick cobble gravel lenses alternate with coarse sand layers. The face cuts across troughs, perpendicular to current flow. Large (2-4 in diameter), angular Waits River boulders lie scattered on the pit floor. Medium to fine sand and silt fill the space between west side of the esker and the bedrock that outlines the west side of the valley.
The N—S section at the north end of the lower pit exposes a longitudinal profile of the east flank of the esker. The lower, coarse-grained (esker) portion of the section contains many faults and beds that have slumped in response to that faulting. Many of the cobble gravels are matrix-supported and contain no bedding. The upper lacustrine part of the section consists of layers of fine sand and silt that alternate with lenses of coarse sand and pebble gravel. Slumping is also common in this part of the section.
Return to Farwell Street.
25.6 Turn right (north) on Farwell Street. Note the bedrock exposures along Farwell Street, indicating the steep slope of the bedrock valley.
25.8 Entrance to upper level of LePage Pit. Drive in and park by old busses.
LePage Pit, Upper Level This E—W cut offers a cross-sectional view of the esker close to the esker crest. Once again, very coarse-grained
sediments, pebble/cobble gravels alternating with coarse sand and pebble gravel, comprise the esker facies. Several very large (2-6 in diameter), angular boulders of Waits River Formation have been pulled from the upper level of the esker. These blocks apparently melted out from the ice surrounding the tunnel and were quickly buried by coarse sand and gravel. The coarse-grained esker facies is overlain by a lacustrine facies that consists of interbedded medium to fine sand and silt that alternates with medium to coarse sand. Many of the beds are structureless, indicating that they slumped soon after they were deposited on the steep slope of the underlying esker.
From here north to the Winooski River and East Montpelier the esker is buried by lacustrmne sediments consisting of fine sand and varved silt and clay. While not appearing on the Surficial Geologic Map of Vermont (Stewart and MacClintock, 1970)1 think that the tunnel bearing the Stevens Branch esker likely continued north up the Route 14 valley through East Montpelier, Calais, Woodbury, and Hardwick where a mapped esker continues north towards Craftsbury.
Return to Farwell Street.
26.0 Turn right on Farwell Street heading north.
26.3 Stop sign at crossroads, Maplewood Cemetery on NW corner of intersection. Site of Stewart's (1971) seismic line across the valley (Fig. 10). Esker here is completely buried by lacustrine sand and clay. Travel north through intersection. Road follows former Winooski River valley (now buried).
27.5 Central Vermont landfill (now closed lies to the left.
27.8 Junction with Route 2. Turn left and head west down Route 2, parallel to the Winooski river. Note that the river gradient is steep and frequently cut by bedrock.
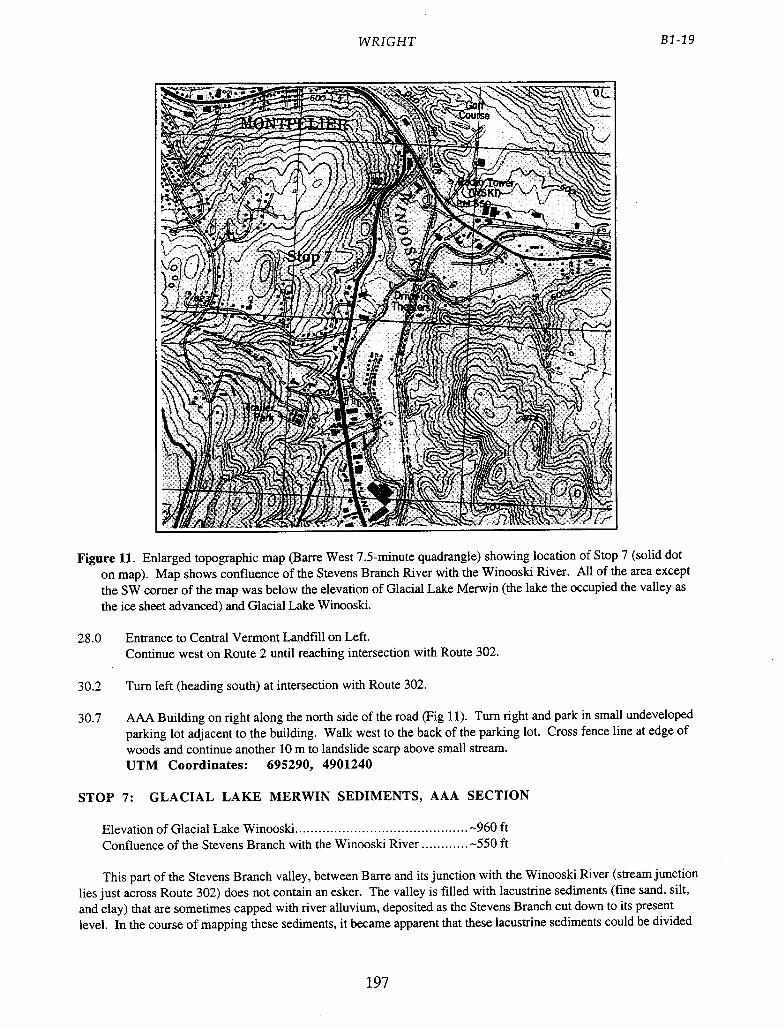
WRIGHT
B 1-19
Figure 11. Enlarged topographic map (Barre West 7.5-minute quadrangle) showing location of Stop 7 (solid dot on map). Map shows confluence of the Stevens Branch River with the Winooski River. All of the area except the SW corner of the map was below the elevation of Glacial Lake Merwin (the lake the occupied the valley as the ice sheet advanced) and Glacial Lake Winooski.
28.0 Entrance to Central Vermont Landfill on Left. Continue west on Route 2 until reaching intersection with Route 302.
30.2 Turn left (heading south) at intersection with Route 302.
30.7 AAA Building on right along the north side of the road (Fig 11). Turn right and park in small undeveloped parking lot adjacent to the building. Walk west to the back of the parking lot. Cross fence line at edge of woods and continue another 10 in to landslide scarp above small stream. UTM Coordinates: 695290, 4901240
STOP 7: GLACIAL LAKE MERWIN SEDIMENTS, AAA SECTION
Elevation of Glacial Lake Winooski............................................-960 ft Confluence of the Stevens Branch with the Winooski River ............-550 ft
This part of the Stevens Branch valley, between Barre and its junction with the Winooski River (stream junction lies just across Route 302) does not contain an esker. The valley is filled with lacustrine sediments (fine sand, silt, and clay) that are sometimes capped with river alluvium, deposited as the Stevens Branch cut down to its present level. In the course of mapping these sediments, it became apparent that these lacustrine sediments could be divided
197
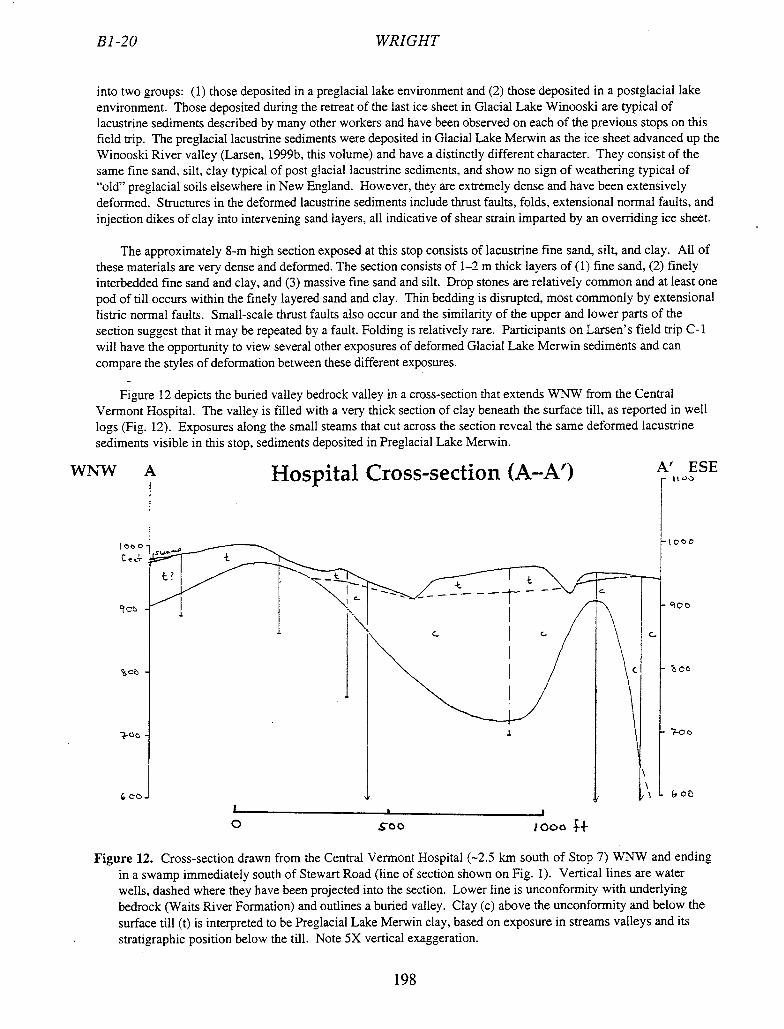
0 soo 1000
WNW A J-Jncr41 Crnc.c-prHnt, (A—A"
o C
A' ESE I1Q'
OCo
ROO
C
(,on
B1-20 WRIGHT
into two groups: (1) those deposited in a preglacial lake environment and (2) those deposited in a postglacial lake environment. Those deposited during the retreat of the last ice sheet in Glacial Lake Winooski are typical of lacustrine sediments described by many other workers and have been observed on each of the previous stops on this field trip. The preglacial lacustrine sediments were deposited in Glacial Lake Merwin as the ice sheet advanced up the Wiriooski River valley (Larsen, 1999b, this volume) and have a distinctly different character. They consist of the same fine sand, silt, clay typical of post glacial lacustrine sediments, and show no sign of weathering typical of "old" preglacial soils elsewhere in New England. However, they are extremely dense and have been extensively deformed. Structures in the deformed lacustrine sediments include thrust faults, folds, extensional normal faults, and injection dikes of clay into intervening sand layers, all indicative of shear Strain imparted by an overriding ice sheet.
The approximately 8-rn high section exposed at this stop consists of lacustrine fine sand, silt, and clay. All of these materials are very dense and deformed. The section consists of 1-2 in thick layers of (1) fine sand, (2) finely interbedded fine sand and clay, and (3) massive fine sand and silt. Drop stones are relatively common and at least one pod of till occurs within the finely layered sand and clay. Thin bedding is disrupted, most commonly by extensional listric normal faults. Small-scale thrust faults also occur and the similarity of the upper and lower parts of the section suggest that it may be repeated by a fault. Folding is relatively rare. Participants on Larsen's field trip C-i will have the opportunity to view several other exposures of deformed Glacial Lake Merwin sediments and can compare the styles of deformation between these different exposures.
Figure 12 depicts the buried valley bedrock valley in a cross-section that extends WNW from the Central Vermont Hospital. The valley is filled with a very thick section of clay beneath the surface till, as reported in well logs (Fig. 12). Exposures along the small steams that cut across the section reveal the same deformed lacustrine sediments visible in this stop, sediments deposited in Preglacial Lake Merwin.
Figure 12. Cross-section drawn from the Central Vermont Hospital (-2.5 km south of Stop 7) V/NW and ending in a swamp immediately south of Stewart Road (line of section shown on Fig. 1). Vertical lines are water wells, dashed where they have been projected into the section. Lower line is unconformity with underlying bedrock (Waits River Formation) and outlines a buried valley. Clay (c) above the unconformity and below the surface till (t) is interpreted to be Preglacial Lake Merwin clay, based on exposure in streams valleys and its stratigraphic position below the till. Note 5X vertical exaggeration.
WRIGHT
B 1-21
Turn right and continue south on Route 302 until reaching intersection with Route 62.
31.2 Turn right on Route 62 and head SE up steep hill.
32.2 Continue straight through intersection with stoplight.
33.1 Return to Berlin Corner Park and Ride.
REFERENCES
Bergey, L.E., 1989, Surficial geology of the Barre Town Pit, Steven's Branch Valley, Williamstown, Vermont, Unpublished student report prepared for F.D. Larsen, Norwich University, 14p.
Bierman, P., Lini, A., Zehfuss, P., Church, A., Davis, P.T., Southon, J., and Baldwin, L., 1997, Postglacial ponds and alluvial fans: Recorders of Holocene landscape history: GSA Today, Vol. 7., p. 1-8.
Cady, W.M., 1956, Bedrock Geology of the Montpelier Quadrangle, Vermont: U.S. Geological Survey, Geological Quadrangle Map GQ-79.
Doll, C.G., Cady, W.M., Thompson, J.B., Jr., Billings, M.P., 1961, Centennial Geologic Map of Vermont: Vermont Geological Survey, 1:250,000.
Hodges, A.L. and Butterfield, D., 1967, Groundwater favorability map of the Winooski River Basin: Vermont Department of Water Resources.
Koteff, C., and Larsen, F.D., 1989, Postglacial uplift in western New England: Geologic evidence for delayed rebound: in Gregersen, S., and Basham, P.W., eds., Earthquakes at North Atlantic passive margins: Neotectonics and postglacial rebound, Kluwer Academic Publishers, p. 105-123.
Larsen, F.D., 1972, Glacial History of central Vermont: in Doolan, B.D., ed., New England Intercollegiate Geological Conference, Guidebook for field trips in Vermont, Vol. 1, p. 297-316.
Larsen, F.D., 1984, Preliminary Surficial Geologic Map of the Northfield, Vermont 7.5-minute Quadrangle: Unpublished Vermont Geologic Survey Map.
Larsen, F.D., 1987a, History of glacial lakes in the Dog River Valley, Central Vermont: in Westerman, D.S., ed., New England Intercollegiate Geological Conference, Guidebook for Field Trips in Vermont, Vol. 2., p. 213-237.
Larsen, F.D., 1987b, Glacial Lake Hitchcock in the Valleys of the White and Ottauqueche Rivers, East-Central Vermont: in Westerman, D.S., ed., New England Intercollegiate Geological Conference, Guidebook for Field Trips in Vermont, Vol. 2., p. 29-52.
Larsen, F.D., 1999a Surficial Geologic Map and Cross-sections of the Montpelier 7.5-minute quadrangle; in press, Vermont Geological Survey.
Larsen, F.D., 1999b, Glacial history of the Montpelier 7.5-minute Quadrangle: in Wright, S.F., ed. New England Intercollegiate Geological Conference Guidebook No. 91, Field Trip Cl, (this volume).
Merwin, H.E., 1908, Some late Wisconsin and post-Wisconsin shorelines of north-western Vermont: Vermont State Geologist 6th Report, p. 113-138.
Murthy, V.R. 1957, Bedrock geology of the East Barre Quadrangle, Vermont: Vermont Geologic Survey Bulletin 12, 121 p.
Perry, 3., 1989, Surficial geology of the Farnham Pit, Williamstown, Vermont, Unpublished student report prepared for F.D. Larsen, Norwich University, 11 p.
Richardson, C.H., 1916, the geology of Calais, East Montpelier, Montpelier, and Berlin, Vermont: in Perkins, G.M., Report of the State Geologist on the Mineral Industries and Geology of Vermont 1915-1916, p. 111-149.
Shreve, R.L., 1985, Esker characteristics in terms of glacier physics, Katahdin esker system, Maine; Geol. Soc. Amer. Bull., v. 96, p. 639-646.
Stewart, D.P., 1971, Geology for environmental planning in the Barre—Montpelier region, Vermont: Vermont Geological Survey Environmental Geology No. 1., 32 p.
Stewart, D.P. and MacClintock, P., 1970, Surficial geologic map of Vermont: Vermont Geological Survey. Warren, W.P. and Ashley, G.M., 1994, Origins of the ice-contact stratified ridges (eskers) of Ireland; Jour.
Sedimentary Research, vol. A64, p. 433-449. Westerman, D.S., 1987, Structures in the Dog River Fault Zone between Northfield and Montpelier, Vermont:
in Westerman, D.S. ed., New England Intercollegiate Geological Conference, Guidebook for field trips in Vermont, Vol. 2, p. 109-132.
Wright, S.F., 1999, Surficial geologic map and cross-sections of the Barre West 7.5-minute quadrangle, in press, Vermont Geological Survey.
199

200
ORIGIN AND FATE OF THE SANDSTONE PAVEMENT PINE BARRENS IN NORTHEASTERN NEW YORK
by
David A. Franzi and Kenneth B. Adams, Center for Earth and Environmental Science, Plattsburgh State University, Plattsburgh, New York 12901
INTRODUCTION
The sandstone pavement pine barrens of northeastern New York are island ecosystems amidst the larger matrix of northern hardwood and mixed hardwood-conifer forests in the Champlain Lowland. Reschke (1990) describes sandstone pavement barrens as open-canopy woodlands on very shallow soils over nearly level sandstone bedrock. The sandstone pavements in Clinton County, New York, known locally as "Flat Rocks", were created by catastrophic floods from the drainage of glacial Lake Iroquois and younger post-Iroquois proglacial lakes in the St. Lawrence Lowland (Woodworth, 1905a, 1905b; Chapman, 1937; Coleman, 1937; Denny, 1974; Clark and Karrow, 1984; Muller and Prest, 1985; Pair et aL, 1988; Pair and Rodrigues, 1993). The boreal jack pine dominates many of these pavements because of its adaptations to fire and ability to survive in a droughty, nutrient-deficient, high-stress environment: Jack pine requires periodic crown fires for successful regeneration to occur (Ahlgren and Ahlgren, 1960; Cayford, 1971; Rowe and Scotter, 1973; Cayford and McRae, 1983; Rouse, 1986). Wildfires release seeds from serotinous cones stored in the jack pine canopy, prepare a nutrient-rich ash seedbed, and reduce competition for the young seedlings.
The sandstone pavement jack pine barrens in northeastern New York are marginal communities in delicate equilibrium with existing hydrogeological and climatological conditions. The New York Natural Heritage Program (Reschke, 1990) ranks these sandstone pavement barrens as globally rare and considers them imperiled or vulnerable to extinction. The extensive ice storm that affected much of northern New York and New England in January 1998 severely impacted large portions of the pine barrens, leaving the future of this fragile ecosystem uncertain (Adams and Franzi, 1998). In 1998, Miner Institute contracted a logging company to complete a restoration cutting on approximately 60 ha of pine barrens heavily damaged by the ice storm. The objectives were to reduce the hazardous fuel loadings (reduce the risk of uncontrollable wildfires) and tiy to initiate regeneration of jack pine without fire. Restoration cutting on an additional 160 ha is presently occurring.
On this field trip we examine the deglacial events leading to the formation of the sandstone pavements by following the path of glacial meltwater from the Gulf at Covey Hill, P.Q. to Altona Flat Rock (Figure 1). We will also examine the linkages between hydrogeology and ecosystem-level processes in the pine barrens and discuss the disturbance impact of the 1998 ice stonn. An important question to be addressed is whether or not the pine barrens community can regenerate here without fire given the harsh physical environment of the pavements. The trip will feature several sites in the southeastern portion of Altona Flat Rock where Plattsburgh State University and the W.H. Miner Institute jointly sponsor an Ecosystem Studies Field Laboratory for undergraduate education and research. The text of this trip is an updated and expanded version of previous field guides (Franzi and Adams, 1993; Franzi, et al., 1993) that was concerned with the geology and ecology of Altona Flat Rock.
GEOLOGY AND PHYSIOGRAPHY
The northeastern New York sandstone pavements (Figure 1), are entirely underlain by nearly flat-lying Potsdam Sandstone (Cambrian) (Fisher, 1968; Lewis, 1971). The lithology of the Potsdam ranges from cross-laminated, orange-pink to pale red, very coarse to medium-grained arkose with quartzitic green shale and conglomeratic interbeds to pinkish gray to very pale orange, well sorted, fme to medium-grained quartz sandstone (Fisher, 1968). The pavement surfaces generally slope north and east from an elevation of more than 300 meters as.!. (above sea level) to below 200 meters a.s.l. where they pass beneath surficial deposits in the Champlain Lowland (Denny, 1974). The sloping surfaces are broken into a series of stair-like bedrock treads separated by risers that range from a few decimeters to tens of meters in height. The tread surfaces have little local relief except near stream channels and risers. The eroded edges of truncated trough cross-beds, ripple marks, and solution pits are
Franzi, D. A., and Adams, K. B., 1999, The origin and fate of the sandstone pavement pine barrens in northeastern New York; in Wright, S.F. ed., New England Intercollegiate Geologic Conference Guidebook Number 91, p. 201-212.
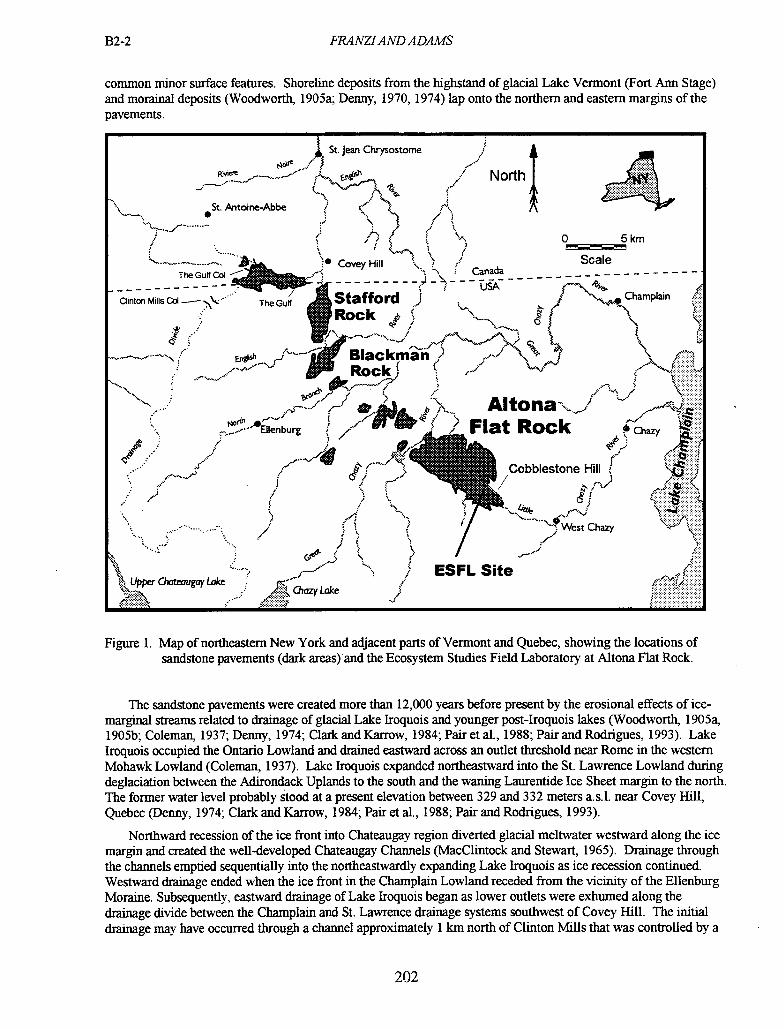
132-2 FRANZIAND ADAMS
common minor surface features. Shoreline deposits from the highstand of glacial Lake Vermont (Fort Ann Stage) and morainal deposits (Woodworth, 1 905a; Denny, 1970, 1974) lap onto the northern and eastern margins of the pavements.
I St. Jean Chrysostome / 4oI /1
------ / North ( J ...........f -
St.Aritoine-Abbe / ç
0 5km
\ /
-.---...--... . Covey Hill Scale TheGuif Cal - Canada --
fltOflMfflSC The Gulf A Stafford USA
Champlain
' X Blackmi4l~ ROCk
. AltonaJ EOenburg 1 Flat Rock
/ Hill
West Chazy
GJ ( ___i 4.
\upper Chateaugay Lake ... ._'' ) ESFL Site
. ...-...:.
Figure 1. Map of northeastern New York and adjacent parts of Vermont and Quebec, showing the locations of sandstone pavements (dark areas)and the Ecosystem Studies Field Laboratory at Altona Flat Rock.
The sandstone pavements were created more than 12,000 years before present by the erosional effects of ice-marginal streams related to drainage of glacial Lake Iroquois and younger post-Iroquois lakes (Woodworth, 1 905a, 1905b; Coleman, 1937; Denny, 1974; Clark and Karrow, 1984; Pair Ct al., 1988; Pair and Rodrigues, 1993). Lake Iroquois occupied the Ontario Lowland and drained eastward across an outlet threshold near Rome in the western Mohawk Lowland (Coleman, 1937). Lake Iroquois expanded northeastward into the St. Lawrence Lowland during deglaciation between the Adirondack Uplands to the south and the waning Laurentide Ice Sheet margin to the north. The former water level probably stood at a present elevation between 329 and 332 meters a.s.l. near Covey Hill, Quebec (Denny, 1974; Clark and Karrow, 1984; Pair et al., 1988; Pair and Rodrigues, 1993).
Northward recession of the ice front into Chateaugay region diverted glacial meltwater westward along the ice margin and created the well-developed Chateaugay Channels (MacClintock and Stewart, 1965). Drainage through the channels emptied sequentially into the northeastwardly expanding Lake Iroquois as ice recession continued. Westward drainage ended when the ice front in the Champlain Lowland receded from the vicinity of the Ellenburg Moraine. Subsequently, eastward drainage of Lake Iroquois began as lower outlets were exhumed along the drainage divide between the Champlain and St. Lawrence drainage systems southwest of Covey Hill. The initial drainage may have occurred through a channel approximately 1 km north of Clinton Mills that was controlled by a
202
FRANZIAND ADAMS B2-3
threshold between 329 and 332 meters as.l. (Clark and Karrow, 1984). The falling levels of proglacial lakes in the St. Lawrence and Ontario lowlands temporarily stabilized at the glacial Lake Frontenac level (Clark and Karrow, 1984; Pair et al., 1988; Pair and Rodrigues, 1993) as the ice margin receded northward and the col at The Gulf (308-311 meters a.s.l.) was uncovered. Outflow from these lakes was directed southeastward along the ice margin where it crossed the English, North Branch and Great Chazy watersheds before eventually emptying into Lake Fort Ann which occupied the Champlain Lowland at an elevation between 225 and 228 meters a.s.l. (Denny, 1974). The oufflow streams stripped large areas of their surficial cover and cut deep bedrock channels and plunge pools (e.g. The Gulf (MacClintock and Terasme, 1960) and the Dead Sea (Woodworth, 1905a; Denny, 1974)) into the Potsdam Sandstone. The most intense scour (e.g. Stafford Rock, Blackman Rock, and Altona Flat Rock) generally occurred on major watershed divides. The scour of the areas southeast of the St. Lawrence-Champlain divide continued as ice recession caused the drainage of Lake Frontenac around the northern flank of Covey Hill. Denny (1974) suggested that the ice margin may have oscillated in the area around Covey Hill causing the lakes in the eastern St. Lawrence Lowland to refill and empty several times. The lake-drainage episodes ended when the ice front receded from the northern flank of Covey Hill for the last time and the proglacial lake in the St. Lawrence merged with Lake Fort Ann in the Champlain Lowland Lowland (Pair, et. al., 1988; Pair and Rodrigues, 1993). The nature and timing of the outflow floods and their role in the creation of the sandstone pavements has been an issue of considerable debate (e.g. MacClintock and Terasme, 1960; MacClintock and Stewart, 1965; Denny, 1974; Muller and Prest, 1985; Coles, 1990) but it is likely that the erosion occurred in stages, as suggested by Denny (1974) and Coles (1990), rather than as a single massive flood event.
THE PINE BARRENS ECOSYSTEM
The large areas of sandstone pavement provide habitat for some of the largest jack pine (Pinus banksiana) barrens in the eastern United States (Woehr, 1980; Reschke, 1990). Jack pine is a relatively short-lived (<150 years), shade-intolerant, boreal species that maintains communities on the sandstone pavements because of its adaptations to fire and ability to survive in an area with thin (or absent), nutrient-poor soils. These pine barrens are near the southern limit of the present natural range of jack pine (Bums and Honkala, 1990; Harlow, et al., 1991). A large proportion of the pine barrens in northeastern New York are owned by a few public and private sector organizations. The William H. Miner Agricultural Research Institute is the largest landowner of pine barrens with almost 1000 ha (hectares) ofjack and pitch pine barrens on Altona Flat Rock. New York State owns an additional 600 ha of the Altona Flat Rock barrens, approximately 100 ha of the Gadway barrens and 200 ha of pine barrens at The Gulf near Covey Hill. The Adirondack Nature Conservancy owns 222 ha of the Gadway jack pine barrens at Blackman Rock. The Nature Conservancy of Canada, with support from the Adirondack Nature Conservancy owns 105 ha of the white pine barrens on the Canadian side of The Gulf. This joint venture is hopefully the first of many cross-border projects between these conservancy partners.
The relatively low species diversity in the barrens reflects low seasonal water availability and the thin, nutrient-poor soils on Flat Rock. Most of the barrens is dominated by a single tree species, jack pine, with virtually no subcanopy and few understory trees. The understory shrubs are predominantly late low blueberry (Vaccinium angustifolium), black huckleberry (Gaylussacia baccata), black chokebeny (Pyrus melanocarpa), sweetfern (Comptonia pçgrina), and sheep laurel (Kalmia an.gustifb/ia). Three species of lichen comprise most of the ground cover (Cladonia uncialis, Cladina ran.ziferina, and Cladina Other ground cover plants include haircap moss (Polytrichum commune), bracken fern (Pteridium aguilinum), and Sphagnum syp. (Stergas and Adams, 1989). Jack pine requires periodic crown fires for successflul regeneration to occur (Ahlgren and Ahlgren, 1960; Cayford, 1971; Rowe and Scotter, 1973; Cayford and McRae, 1983; Rouse, 1986). Fire releases seeds from serotinous cones stored in the jack pine canopy, prepares a nutrient-rich ash seedbed, and reduces competition for the young seedlings. Since this barrens is a fire-dependent ecosystem, fire exclusion will ultimately cause the local extinction ofjack pine and the deterioration of the major heath plants, bluebeny and huckleberry (Adams and Franzi, 1994).
The physical environment of the sandstone pavements strongly influences vegetation distribution and ecosystem processes, such as surface water runoff, organic matter decomposition and nutrient cycling, and ecological disturbances such as wildfires and ice storms. Mean annual precipitation from meteorological records for a 27-year period between July, 1963 to August, 1992 at the Miner Institute in Chazy, New York is approximately 80 cm. Mean monthly air temperature ranges from -11 °C in January to 20° C in July (Stergas and Adams, 1989). Summer air temperature in bare rock areas, however, may be as much as 16 °C higher than in the surrounding areas, and
203
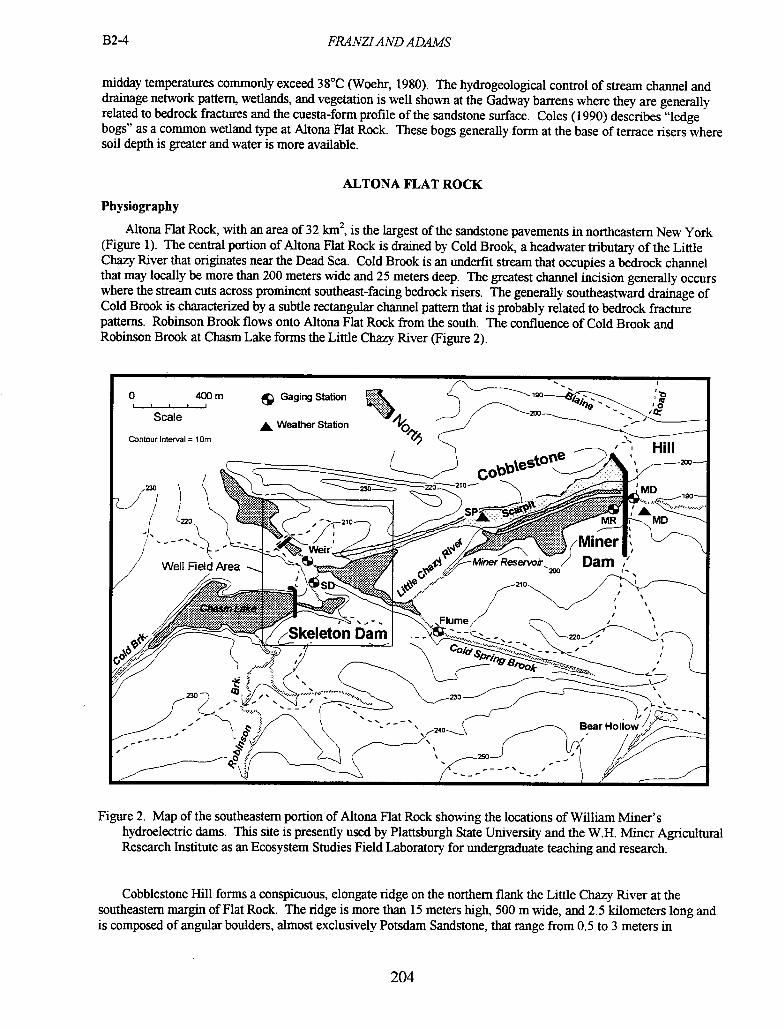
B24
FRANZIANDAJJAMS
midday temperatures commonly exceed 38 °C (Woehr, 1980). The hydrogeological control of stream channel and drainage network pattern, wetlands, and vegetation is well shown at the Gadway barrens where they are generally related to bedrock fractures and the cuesta-form profile of the sandstone surface. Coles (1990) describes "ledge bogs" as a common wetland type at Altona Flat Rock. These bogs generally form at the base of terrace risers where soil depth is greater and water is more available.
ALTONA FLAT ROCK
Physiography
Altona Flat Rock, with an area of 32 km 2, is the largest of the sandstone pavements in northeastern New York (Figure 1). The central portion of Altona Flat Rock is drained by Cold Brook, a headwater tributary of the Little Chazy River that originates near the Dead Sea. Cold Brook is an underfit stream that occupies a bedrock channel that may locally be more than 200 meters wide and 25 meters deep. The greatest channel incision generally occurs where the stream cuts across prominent southeast-facing bedrock risers. The generally southeastward drainage of Cold Brook is characterized by a subtle rectangular channel pattern that is probably related to bedrock fracture patterns. Robinson Brook flows onto Altona Flat Rock from the south. The confluence of Cold Brook and Robinson Brook at Chasm Lake forms the Little Chazy River (Figure 2).
m ç Gaging Station
Scale
j Weather Station
Contour Interval = 1Cm
I
: Hill
J. L
Well Field Area A —M,nerReservo/ Dam
AL"f7 = 1fSS I ; \
SD
"981u0k
Figure 2. Map of the southeastern portion of Altona Flat Rock showing the locations of William Miner's hydroelectric dams. This site is presently used by Plattsburgh State University and the W.H. Miner Agricultural Research Institute as an Ecosystem Studies Field Laboratory for undergraduate teaching and research.
Cobblestone Hill forms a conspicuous, elongate ridge on the northern flank the Little Chazy River at the southeastern margin of Flat Rock. The ridge is more than 15 meters high, 500 m wide, and 2.5 kilometers long and is composed of angular boulders, almost exclusively Potsdam Sandstone, that range from 0.5 to 3 meters in
204
FRANZIAND ADAMS
B2-5
diameter. The average size of surface boulders decreases to the southeast. Boulder and gravel terraces on the northeast flank of Cobblestone Hill represent beach ridges formed in Lake Vermont (Woodworth, 1 905a; Chapman, 1937; Denny, 1974).
Disturbance Impacts on the Pine Barrens Ecosystem
The combined effects of high summer air temperature, low seasonal water availability, and flammable foliage create a high-stress environment that is sensitive to natural disturbances, such as wildflres and ice storms. There have been four stand-replacing wildflres at Altona Flat Rock during this century (1919, 1940, 1957 and 1965). The oldest jack pine stand at Flat Rock (ca. 80 years) was beginning to show signs of decline well before the 1998 ice storm. Hawver (1992) reported that nearly 40 percent of the trees in the 1919 burn area were dead resulting in an increase in dead tree biomass and the probability of another fire in this stand.
The ice storm of January, 1998 was a major disturbance in the Altona Flat Rock pine barrens but caused minimal damage at the Gadway Preserve. Initial sampling at Altona Flat Rock showed that nearly 50 percent of the jack pine trees snapped off under the ice load in their crowns and another 30 percent were either uprooted or had serious crown damage. The tangle of dead and dying trees presented a major wildfire hazard and there was concern that the jack pine "seed bank" contained in the broken crowns could be lost, thereby puthng the future of this rare plant community at risk In an attempt to avert these situations, restoration cuttings were made on 60 ha with the dual objectives of reducing fuel loadings and mechanically regenerating a new jack pine stand. Preliminary results of post-icestorm vegetation sampling indicate that both of these objectives may be met. Similar treatments are currently being made elsewhere in the barrens.
The Altona Flat Rock Hydroelectric Project
In the summer of 1910, William Miner began construction of a hydroelectric dam and generating station on southeastern margin of Altona Flat Rock. By the time of its completion in March, 1913, the concrete dam, known locally as the "Million-Dollar Dam" (Gooley, 1980), had a maximum height of over 10 meters and stretched more than 700 meters across the Cold Brook valley. The design capacity of the reservoir was more than 3.5 million cubic meters. A second dam, the Skeleton Dam (Gooley, 1980), was constructed upstream to provide supplemental flow to the main impoundment.
The dam and generating station were completed in 1913 but it took almost two years to fill the reservoir to near capacity. The inadequate flow of Cold Brook and ground water seepage through Cobblestone Hill, which formed the eastern flank of the reservoir, proved to be major design flaws. At one point, seepage beneath the dam was so great that it caused severe damage at the LaPierre residence, approximately 600 meters east of the dam (Gooley, 1980). A 10 to 15 cm layer of concrete grout was spread over more than 100,000 m 2 along the southwestern flank of Cobblestone Hill to mitigate the seepage. A deep trench was excavated at the base of Cobblestone Hill behind the dam for the purpose of pouring a grout curtain to the underlying sandstone and thereby, presumably, sealing the northeastern flank of the reservoir. The grouting effort was partially successful and the power generating plant began operation on January 21, 1915, more than four years from the beginning of the project (Gooley, 1980). The power plant produced electricity intermittently for seven years before mechanical problems forced the abandonment of the project.
The Ecosystem Studies Field Laboratory Plattsburgh State University and the W.H. Miner Agricultural Research Institute (Miner Institute) in Chazy,
New York have collaborated in undergraduate research and educational initiatives for more than 25 years. The centerpiece of this collaboration is the Applied Environmental Science Program (AESP), a semester-long residential program for Plattsburgh State University's Center for Earth and Environmental Science (CEES) students that emphasizes hands-on field and laboratory instruction in the environmental sciences. An important outgrowth of the close relationship between Plattsburgh State University and the Miner Institute is the Ecosystem Studies Field Laboratory, an instrumented portion of the upper Little Chazy River in the Altona Flat Rock jack pine barrens. The site was created in 1992 to enhance instruction and provide research opportunities for undergraduate students in geology and environmental science. The field site offers an excellent geological, hydrological and ecological setting for illustrating the interdependence of natural processes and the effects of human activities on natural ecosystems. Instrumentation at the field site presently includes 2 digital-recording weather stations, 5 stream and lake gages equipped with Stevens GS-93 dataloggers, and 9 ground-water observation wells (Figure 2).
B2-6 FR14NZIAND ADAMS
ACKNOWLEDGEMENTS
The authors would like to acknowledge the Center for Earth and Enviromnental Science and the Applied Environmental Science Program at STJNY Plattsburgh and the W.H. Miner Agricultural Research Institute for their unwavering support of our research and instructional efforts at Altona Flat Rock. Jaime Shanley, Jon Denner (U.S. Geological Survey, Montpelier, Vermont) and Marc Halt (MacAlester College, St. Paul, Minnesota) provided valuable technical assistance for the installation of the monitoring well network and the meteorological and stream-gaging stations. Special thanks are also extended to Michael Parsons of Michael Parsons Well Drilling Company, who generously donated drilling services for well installation. The meteorological and surface-water monitoring at the Ecosystem Studies Field Laboratory site was purchased through grants from the National Science Foundation (NSF 4955 1126) and the New York State Education Department (Summer Institutes for Math and Science). Our students Neil Gifford, Kortney Brewster, Alycia Keefe, Chris Lassell, and Paul Pavone enthusiastically helped with equipment installation and monitoring during the early stages of the ESFL project. Finally, we would like to thank the more than 30 undergraduate and 6 graduate students whose independent research projects have contributed to the growing body of knowledge of the sandstone pavement pine ban -ens ecosystems.
REFERENCES CITED
Adams, K.B. and Franzi, D.A., 1994, The Clinton County (New York) pine barrens: Glacial catastrophe, historical wildfires, and modem uniquity: Wildflower, V.10, No.4, pp.30-33.
-, 1998, Fire and Ice: Restoration or requiem for an ecological preserve: Adirondack Research Consortium, Fifth Annual Conference on the Adirondacks.
Ahlgren, I.F., and Ahigren, C.E., 1960, Ecological effects of forest fires: Bot. Rev., V.26, p.483-533.
Burns, R.M., and Honkala, B.H., 1990, Silvics of North America I. Conifers: U.S. Dept. Agric. For. Serv., Agric. Hndbk. 654, 675p.
Cayford, J.H., 1971, The role of fire in the ecology and silviculture ofjack pine: Proc. Tall Timbers Fire Ecol. Conf. 10, p.221-224.
Cayford, J.H. and McRae, D.J., 1983, The ecological role of fire in jack pine forests: in Wein, R.W. and MacLean, D.A. (eds.), The role of fire in northern circumpolar ecosystems: John Wiley and Sons, New York, p.183-199.
Chapman, D.H., 1937, Late-glacial and postglacial history of the Champlain Valley: Amer. Jour. of Sci., V.34, 5th Ser., No.200, p.89-124.
Clark, P.U. and Karrow, P.F., 1984, Late Pleistocene water bodies in the St. Lawrence Lowland, New York, and regional correlations: Geol. Soc. of Amer. Bull., V.95, p.805-8 13.
Coleman, A.P., 1937, Lake Iroquois: Ontario Dept. Mines 45 0' Ann. Report, 1936, V. 45, Part 7, p.1-36.
Coles, J.J., 1990, By fire and by ice: The evolution of an unusual landscape: unpublished M. S. thesis, Department of Botany, University of Vermont, 49p.
Denny, CS., 1970, Surficial geologic map of the Mooers quadrangle and part of the Rouses Point quadrangle, Clinton County, New York: U.S. Geol. Surv. Misc. Geol. mv. Map 1-630.
--------, 1974, Pleistocene geology of the northeastern Adirondack region, New York: United States Geological Survey, Professional Paper 786, SOp.
Fisher, D.W., 1968, Geology of the Plattsburgh and Rouses Point, New York-Vermont quadrangles: New York State Mus. and Sci. Serv., Map and Chart Ser. No. 10, 51p.
Franzi, D.A., and Adams, K.B., 1993, The Altona Flat Rock jack pine barrens: A legacy of fire and ice: Vermont Geology, V.7, p.43-61.
Franzi, D.A., and Adams, K.B., and Pair, D.L., 1993, The late glacial origin of the Clinton County Flat Rocks: New York State Geol. Assoc. Field Trip Guidebook, 65th Annual Meeting, p.
206
FRANZJ AND ADAMS
B2-7
Gooley, L., 1980, A history of Altona Flat Rock, located in Clinton County, New York State: Denton Publications, Inc., Elizabethtown, New York, 103p.
Harlow, W.M., Harrar, J.W., Hardin, E.S., and White, F.M., 1991, Textbook of Dendrology, 7th Edition: McGraw-Hill, Inc., New York, 501p.
Hawver, C.A., 1992, Stand structure in ajack pine forest chronosequence: Unpublished manuscript. 50p.
Lewis, D.W., 1971, Quantitative petrographic interpretation of Potsdam Sandstone (Cambrian), southwestern Quebec: Canadian Journal of Earth Sciences, V.8, No.8, p.853-882.
MacClintock, P. and Stewart, D.P., 1965, Pleistocene geology of the St. Lawrence Lowlands: N.Y. State Mus. Bull. 394, l52p.
MacClintock, P. and Terasme, J., 1960, Glacial history of Covey Hill: Jour. Geol., V.68, No.2, p.232-241.
Muller, E.H. and Prest, V.K., 1985, Glacial lakes in the Ontario Basin: in Karrow, P.F. and Calldn, P.E., Quatemary Evolution of the Great Lakes, Geological Association of Canada Special Paper 30, p.213 -229.
Pair, D., Karrow, P.F., and Clark, P.U., 1988, History of the Champlain Sea mthe central St. Lawrence Lowland, New York, and its relationship to water levels in the Lake Ontario basin: in Gadd, N. .R. (ed.), The Late Quatemary development of the Champlain Sea basin: Geological Association of Canada, Special Paper 35, p.107-123.
Pair, D.L., and Rodrigues, C.G., 1993, Late Quaternary deglaciation of the southwestern St. Lawrence Lowland, New York and Ontario: Geol. Soc. Amer. Bull., v.105, p.1151-1164.
Reschke, C., 1990, Ecological communities of New York State: New York State Heritage Program, Latham, New York, 96p.
Rouse, C., 1986, Fire effects in the northeastern forests: jack pine: United States Dept Ag. Forest Serv. Gen. Tech. Rept. NC-106.
Rowe, J.S. and Scotter, G.W., 1973, Fire in the boreal forest: Quat. Res., V.3, p. 444-464 . Stergas, R.L. and Adams, K.B., 1989, Jack pine barrens in northeastern New York: postfire macronutrient
concentrations, heat content, and understory biomass: Canadian Journal of Forest Research, V.19, No.7, p.904-910.
Woehr, J.R., 1980, The Flat Rock jack pine barrens: Management Planning for a unique ecosystem: in Dawson, J.C. (ed.), Proc. 1980, Seventh Ann. Lake Champlain Basin Envir. ConI., p.52-57.
Woodworth, J.B., 1905a, Pleistocene geology of the Mooers Quadrangle: New York State Mus. Bull. 83, 67p.
1905b, Ancient water levels of the Champlain and Hudson valleys: New York State Mus. Bull. 84, 265p.
207
B2-8 FRANZIAND ADAMS
ROAD LOG
The road log begins at the Lake Champlain Feny dock on Cumberland Head, Plattsburgh, New York. Road log distances were measured from U.S. Geological Survey 7.5-minute topographic maps so actual mileage may be greater. Road log distances are presented in English units but all other measurements are in SI units.
Persons using this log in the future should be aware that the field trip stops are located on private property that is owned and patrolled by the William H. Miner Agricultural Institute. A permit must be obtained from the Miner Institute to access this property.
Miles Between Points Description
0.0 Assemble in the Lake Champlain Feny parking lot at Cumberland Head, Plattsburgh, New York. Proceed west on NY Route 314 toward Plattsburgh.
0.8 Route 314 bears sharply right (to northwest)
3.2 Intersection of NY Route 314 and US Route 9. Proceed straight ahead through the intersection to the northbound entrance ramp of Interstate 87 (Adirondack Northway).
0.1 Northbound entrance ramp. Turn right (north) and proceed to Interchange 40 (Speilman Road) in Beekmantown.
3.8 Exit ramp at Interchange 40. Exit right and proceed to Spellman Road.
0.1 Intersection of Northway exit ramp and Speilnian Road. Turn left and proceed west to Beekmantown Corners.
2.7 Intersection of Spellman Road and US Route 22. Turn right and proceed north on US Route 22. Continue northbound for 13.9 miles to the junction of US Routes 22 and 11 in Mooers.
13.9 Intersection of US Routes 22 and 11 in Mooers. Turn left and proceed west to Ellenburg Depot.
12.0 Intersection of US Route 11 and Plank Road in Ellenburg Depot. Turn left and proceed south. The ridge to the right is the crest of the Ellenburg Moraine. Continue southbound for 1.0 mile to the entrance of a gravel pit adjacent to a white house.
1.0 STOP 1. ELLENBURG MORAINE. Gravel pit entrance.
The gravel pit at this stop is excavated into the eastern (ice-proximal) side of the moraine. The pit contains approximately 10 to 12 meters of interbedded sand, gravel and diamicton that overlies Potsdam Sandstone. Bed thickness generally ranges from about a decimeter to just over a meter but a prominent dianucton layer at the northern end of the exposure exceeds 2 meters in thickness. The maximum elevation of the upper surface of the moraine at this location ranges between 290 and 297 meters a.s.l.
An exposure on the west (ice-distal) side of the moraine near the outlet of Lake Roxanne, previously described by Franzi, et al. (1993), is no longer well exposed and will not be visited. The Lake Roxanne exposure contains approximately 10 to 12 meters of interbedded fine to medium sand with minor gravel and silt interbeds. Bedsets range from a centimeter to a few decimeters thick and are commonly horizontally laminated or ripple-cross laminated. Thin silt or silty fine sand deposits occur locally as draped laininae. Ripple azimuths and the gentle dip of the strata indicate a westerly paleocurrent The Ellenburg Moraine deposits were probably deposited in a proglacial lake west of the moraine in the upper North Branch valley. A small sandplain at an elevation of about 290 meters as.l. at Ellenburg may represent a delta that was built by the North Branch into the western end of the proglacial lake.
FRANZIAND ADAMS
B2-9
Miles Between Points Description
Return to vehicles and proceed north on Plank Road to Ellenburg Depot.
1.0 Intersection of Plank Road and US Route 11. Turn right and proceed east on US Route 11.
1.5 Intersection of US Route 11 and Cannon Corners Road. Turn left and proceed north on Cannon Corners Road.
2.5 STOP 2. GADWAY PRESERVE. Turn left onto the gravel access road to the (ladway Preserve. Proceed west and southwest on this road for approximately 1.5 miles to a cul-de-sac created by the Adirondack Nature Conservancy.
The Gadway Preserve is a 222 ha sandstone pavement jack pine barrens owned by the Adirondack Nature Conservancy. The pavement at this location represents the surface of the Keeseville Member of the Potsdam Sandstone, a nearly pure white quartz arenite (Fisher, 1968). The jack pine trees here were not as damaged by the ice storm as the barrens at other locations and thus represents, as best as possible, the pre-ice-storm condition of a typical jack pine barrens. The reasons why this barrens was spared severe ice damage are not yet well understood, but stand density and the stunted nature of the pines may have been contributing factors.
Miles Between Points Description
Return to vehicles and proceed northeast and east to Cannon Corners Road. Turn right onto Cannon Corners Road and proceed south to US Route 11.
2.5 Intersection of Cannon Corners Road and US Route 11. Turn left and proceed east on US Route 11.
1.6 Intersection of US Route 11 and Irona Road. Turn right and proceed south on Irona Road.
1.2 Intersection of Irona Road, Alder Bend Road and Irona Forest Road at the village of Irona. Turn left at this intersection, continuing on the Irona Road, and proceed east to Altona.
2.6 Intersection of Irons Road and Devils Den Road in Altona. Turn right and proceed south on Devils Den Road.
1.3 Devils Den Road bears right at its intersection with Rock Road. Continue straight ahead onto Rock Road and proceed south. Rock Road passes over the western edge of Altona Flat Rock. Note the extensive ice storm damage to the jack pine community here.
2.6 Intersection of Rock Road and Military Turnpike. Turn left onto Old Military Turnpike (Route 190) and proceed southeast.
3.0 Intersection of Military Turnpike and Atwood Road. Turn left onto Atwood Road (gravel surface) and proceed east. The road is paved after the intersection with Harvey Road at approximately 1.5 miles.
3.0 Intersection of Atwood Road and Recore Rad. Continue straight ahead (east) onto Recore Road for about 0.1 mile to the interesection with Barnaby Road.
0.1 Intersection of Recore Road and Barnaby Road. Turn left onto Barnaby Road and proceed north.
1.0 Barnaby Road changes to Blaine Road (gravel surface) at the farm just north of Slosson Road intersection.
1.0 STOP 3. LAKE VERMONT (FORT ANN STAGE) BEACH RIDGES. Park at the gate at the entrance of the Miner Institute property and continue northward on foot along Blaine Road approximately 100 meters (320 ft). Turn left into woods and proceed west (150 to 200 meters
209
B2-10 FRANZIAND ADAMS
(500-750 ft)) up the eastern flank of Cobblestone Hill. The beach ridges occur at elevations between 175 and 205 meters (580 and 670 ft) above sea level (Denny, 1974).
The beach ridges on Cobblestone Hill were described by Woodworth (1905a) and Denny (1974). The beaches consist predominantly of moderately rounded to well rounded, pebble to cobble gravel that is deposited in multiple, elongate, low-relief ridges that extend along the northern and eastern flanks of Cobblestone Hill between 175 and 205 meters a.s.l.. Individual deposits are typically 1 to 2 meters high and 5 to 20 meters wide, and may extend laterally for more than 400 meters (Denny, 1974). The gravel is almost exclusively composed of Potsdam Sandstone that was presumably derived from the alluvial cobble to boulder gravel that composes Cobblestone Hill.
Miles Between Points Description
Return to the vechicles and proceed through the entrance gate. Low roadside excavations approximately 75 meters (250 ft) west of the gate expose the cobble gravel that comprises the Lake Fort Ann beach ridges. Near the crest of the ridge the angular, 0.3 to 1.2 meter (ito 4 ft) diameter boulders that comprise the core of Cobblestone Hill can be observed at the surface.
0.3 STOP 4. MINER DAM AND THE ECOSYSTEM STUDIES FIELD LABORATORY. The remains of the William Miner's "Million-Dollar Dam" are best seen at the bridge over the Little Chazy River.
Miner Dam and its and hydroelectric generation plant were completed on 11 March, 1913 and operated intermittently from 21 January, 1915 until its closure in 1922 (Gooley, 1980). A large hole was blasted in the dam shortly after William Miner's death in 1930 to permit the Little Chazy River to drain freely through the former reservior. The Altona Flat Rock sandstone pavement is exposed on the southwest side of the river. The change from mixed deciduous, primarily oak, forest on Cobblestone Hill to jack pine barrens on Altona Flat Rock is characteristically sharp at this location.
The gaging station at this location was constructed in the fall of 1992 to continuously monitor surface-water discharge in the upper Little Chazy River watershed (basin area =29 1cm 2). The gaging station is part of the Ecosystem Studies Field Laboratory, a joint initiative by the Center for Earth and Environmental Science at Plattsburgh State University and the W.H. Miner Agricultural Research Institute to study ecosystem-level processes in the Altona Flat Rock jack pine barrens.
Miles Between Points Description
Return to the vechicles and continue southwest across the Little Chazy River following the trend of Miner Dam.
0.2 STOP 5. THE 1998 RESTORATION CUT. Return to the vehicles following the discussions at this site and proceed northeast toward Cobblestone Hill.
0.4 Turn left onto a small road near the crest of the hill that leads northwestward along the flank of the former reservoir.
0.2 STOP 6. THE SCARPIT. The road crosses the top of the Miner Dam. From this point the and the 1998 and 1999 "restoration cuts" can be seen. Return to the vehicles and proceed northwest on the concrete road.
The Scarpit is the local name given to the desolate landscape created by efforts to grout the porous boulder gravel slope of Cobblestone Hill (Gooley, 1980). The surface consists of a thin (1.2 to 2.5 cm) layer of cement that was poured and raked between large boulders composed predominantly of Potsdam Sandstone. The trench that was dug for the grout curtain (Figure 5) can be observed approximately 100 meters west of the concrete road that parallels the former shoreline of the reservoir.
210
FRANZIAND ADAMS
B2-1l
Miles Between Points Description
Return to the vehicles and continue northwest on the concrete road.
0.5 The first of nine observation wells drilled in May 1992 can be observed to the left near the treeline at the edge of the grout surface. The wooded area beyond the well is the tread surface of a minor southeast-facing bedrock terrace. The slope of Cobblestone Hill steepens and the boulder size increases to the northwest.
0.5 The concrete road ends and the access road bears sharply northeast and continues on the bedrock surface through the jack pine barrens.
0.1 The road crosses a surface-water supported wetland. The road bed is deeply rutted where it crosses a wetland that contains 0.2 to 1.0 meters of organic soil. Observation wells located approximately 50 meters northeast and 70 meters southwest of the wetland indicate downward component exists to the hydraulic gradient beneath this wetland.
0.2 The road crosses a fault-line valley that contains a large wetland. A concrete wall on the left (south) side of the road was constructed to prevent water impounded behind Miner Dam to escape northward through this channel..
The access road forks immediately west of the channel. The right fork leads to an abandoned fire tower on the top of Pine Ridge. Bear left and proceed southward.
0.2 STOP 7. THE SKELETON DAM AND CHASM LAKE. The road ends at a cul-de-sac at the Skeleton Dam.
The partially completed Skeleton Dam was designed to augment flow to the reservoir impounded behind the Miner Dam. The dam impounds Chasm Lake (Gooley, 1980), presumably named for the deep gorge cut into a prominent sandstone riser at its northwestern edge.
The water level of Chasm Lake dropped more than 2 meters below the spillway of the Skeleton Dam during the sununers of 1991 and 1992. What little surface flow reached the basin during the summer months was lost by evaporation and ground-water seepage. Water level measurements from nearby observation wells since late July, 1992 indicate that steep, eastwardly directed hydraulic gradients exist at the southeastern flank of Chasm Lake, providing additional evidence that water is being lost from the reservoir by groundwater seepage.
Miles Between Points Description
Return to the vehicles and return to the gate at the entrance to the Miner Institute property on Blaine Road.
1.6 Gate at Blaine Road. Continue east (straight ahead) and south to Barnaby Road and then to Recore Road.
2.0 Intersection of Barnaby Road and Recore Road. Turn left and proceed east on Recore Road.
0.8 Intersection of Recore Road and O'Neil Road. Turn right on O'Neil Road and proceed south to Beekmantown.
4.1 Intersection of O'Neil Road and US Route 22. Turn left and proceed north on US Route 22 to Spellman Road.
0.3 Intersection of US Route 22 and Spellman Road. Turn right onto Spellman Road and proceed east to the Northway (1-87).
211
B2-12
FRANZIAND ADAMS
Miles Between
Points Description
2.7 Intersection of Speilman Road and 1-87. Turn right onto the southbound entrance ramp and proceed to Exit 39.
3.8 Exit 1-87 and follow road signs to Route 314 and the Cumberland Head Ferry to Vermont.
5.1 Cumberland Head ferry dock.
End of Road Log
212
B3-1 TRIP B3: LAMOILLE RIVER VALLEY BEDROCK TRANSECT #2
Jonathan Kim, Vermont Geological Survey, Waterbury, Vt 05671 ionk(iidec.anr.state.vt.us Marjorie Gale, Vermont Geological Survey, Waterbury, Vt 05671 marIieg(ãdec.anr.state.vt.us
Jo Laird, Dept. of Earth Sciences, University of New Hampshire, Durham, N.H., 03824 il(christa.unh.edu
TRIP SUMMARY
The purpose of this field irip is to integrate the geologic mapping that has been done in the eastern Hazens Notch (including Belvidere Mountain Complex), Ottauquechee, Stowe, and Moretown formations in northern Vermont as part of the new Vermont State Bedrock Geologic Map with structural geology, petrology, and geochemistiy to arrive at a "Big Picture" story. When combined with Trip A3, the B3 the participant will be exposed to a significant portion of the northern Vermont Pre-Silunan orogen. This trip will begin in the Green Mountain Slice west of Belvidere Mountain and will proceed to examine representative lithologic, structural, petrological, and geochemical elements of each of the lithotectonic packages present in this Hazens Notch, Ottauquechee, Stowe, Moretown belt and fmish at Mt. Elinore at the northern end of the Worcester Mountains. This trip focuses on the bedrock geology of the Mt. Mansfield one-degree sheet as compiled by Doolan, Thompson, Gale, and Kim for the Bedrock Geologic Map of Vermont (in progress).
INTRODUCTION
A close examination of the study area for this field trip on the Centennial Bedrock Geologic Map of Vermont by Doll et al. (1961) reveals a complicated map pattern in the Pre-Silurian rocks in which there are: 1) continuous belts of Ottauquechee, Stowe, and Moretown formation lithologies, some of which continue northward toward Canada and others that continue southward toward central Vermont, 2) isolated areas such as Belvidere Mountain/Tillotson Peak and Mount Elmore with anomalous structural andlor metamorphic patterns, and 3) all stratigraphic contacts between lithologic units. The previous larger scale (1:62,500) mapping by Albee (1957), Cady, Albee, and Chidester (1963), and Konig and Dennis (1964) originally defmed the complex geology that was the critical base for later detailed studies.
The general pre-plate tectonic concept that the northern Vermont Pre-Silurian rocks represent an east-facing stratigraphically continuous sequence was challenged by field mapping-based studies by M.H.Gale (1980, 1986), P.N. Gale (1980), Hoar (1981), Doolan et al. (1982), Roy (1982), and Stanley et al.(1984) in various parts of or adjacent to the study area. These studies demonstrated that the aforementioned complex map pattern was due to the juxtaposition of lithologic units along thrust faults of various ages. In northern Vermont, the work by Doolan et al. (1982) and Stanley et al. (1984) introduced the concept of the Lithotectonic Package (LP) which is a fault-bounded assemblage of genetically-related rocks with internally recognizable stratigraphy. Some lithologies may be common to multiple lithotectonic packages.
Petrological studies conducted by Laird and Albee (1981) and Laird, Lanphere, and Albee (1984) on mafic metaigneous and metapelitic rocks independent from the above mapping confirmed the necessity of tectonic contacts between lithologic units and demonstrated the distribution of Tacoman and Acadian metamorphism in northern and central Vermont. The diverse geochemical signatures obtained from meta-igneous rocks in the Ottauquechee-Stowe belt both south and north of our study area by Coish (1986) and his students Evans (1989) and Pugin (1989) were important additions to the field mapping and petrology lines of evidence for tectonic contacts.
Recent 1:24,000 scale mapping by Kim (1997), Kim, Springston, and Gale (1998), Schoonrnaker (1998), Stanley (1997), Springston, Kim, and Applegate (1998), Doolan and others (1999) Thompson and Thompson (1997,1999) and Bothner and Laird (in progress) has filled in the gaps that existed between and adjacent to the field areas described above. Now that 1:24,000 scale mapping is complete across this portion of the Hazens Notch, Ottauquechee, Stowe, Moretown belt in northern Vermont (Figure 1-compiled at 1:100,000 scale), we have defmed lithotectomc packages across this belt. In addition, the criteria used to defme the lithotectonic packages have been improved through the integration of new structural, petrological, and geochemical data.
Kim. .1., Gale. M, Laird, J., and Stanley, R., 1999, Lamoille River \'alley bedrock transect #2; in Wright, S.F. ed., New Eiigland Intercollegiate Geologic Conference Guidebook Number 91, p. 213-250.
B3-2 KIM, GALE, AND LAIR])
NORTHERN VERMONT LITHOTECTONIC PACKAGES
The map pattern in the study area (Figure 1) is a composite result of deformation during the Taconian and Acadian orogenies. The map in Figure 1 and the accompanying cross-section (Figure 2) will be used as a reference throughout the trip. Although the map pattern in the field area reflects severe dissection by steeply-dipping Acadian faults , we believe we can "see through" the Acadian effects using lithologic, structural, petrologic, and geochemical criteria to identify regionally traceable Lithotectomc Packages (Figures 2, 3, and 4) that were assembled prior to and during the Taconian Orogeny.
Descriptions (see Figures 1, 2, 3, 4, and Table 1 for this section)
Green Mountain Slice (GMS).
The Green Mountain Slice (Trip A3, Thompson and others, this volume) lies structurally below both the Belvidere Mountain Slice and the Prospect Rock Fault (PRFZ). Please refer to Trip A3 for a complete discussion of the Prospect Rock Fault which places black and green phyllites and schists of the Ottauquechee and Jay Peak Formations, respectively, on top of predominantly albitic schists of the Hazens Notch and Fayston Formations. The Green Mountain Slice appears along the axis of the Green Mountains and to the east extends north from the Gihon River. To the east, along the Burgess Branch Fault Zone, the multiple fault history results in severe deformation and dissection of these early lithotectonic packages.
The Hazens Notch Formation was mapped as part of the Camels Hump Group in the upper Missisquoi Valley and assigned a lower Cambrian age based on its position west of and below the Ottauquechee Formation (Doll et.al . 1961; Cady et.al ., 1963). We consider the Hazens Notch Formation to include medium grained graphitic albitic schists, quartzites and green and rusty albitic schists as suggested by Thompson and others (this volume). Walsh (1992) mapped muscovite-quartz-chlorite-albite schist as the Fayston Formation and Thompson and Thompson (1997, 1999) included the silver-green and white albitic schists in the Hazens Notch Formation to the north as Fayston Formation. Stanley (1997) mapped white albitic schist as part of the Hazens Notch Formation in the Lowell-North Troy area and has reassigned the unit to the Fayston Formation (1999, pers. comm.). The Fayston Formation thus appears to be geographically widespread and in association with the Hazens Notch Formation within the Green Mountain Slice.
Recognition of black and rusty, carbonaceous albitic schists and silver-green albitic schists just west of the Worcester Mountain Range near Stowe suggests that the Green Mountain Slice extends to the east at depth (Kim and Gale, in progress) in a similar structural position as shown in the cross-section (Figure 2).
Belvidere Mountain Slice (BMS).
The Belvidere Mountain Slice is a complex tectonic assemblage of ultramafics, amphibolites, greenstones, metasediments, and mafic clast-bearing schists that preserves the earliest known structure (syn-Dl; Gale, 1986) and metamorphism (505 Ma; Laird et al, 1993) in the field area. The lower contact of the BMS is an early-Taconian fault surface (Belvidere MountainFault Zone (BMFZ)) that juxtaposes the BMS with the GMS. The BMS is bounded to the east by the Burgess Branch Fault Zone (BBFZ)- a composite fault zone that experienced several episodes of motion from Taconian through Acadian times.
Gale (1980) mapped, from top to base, serpentinized ultramafic, coarse-grained amphibolite and garnet amphibolite, fme- grained amphibolite, greenstone, and muscovite schist (fault breccia) as part of the Belvidere Mountain Complex. The mafic rocks defmed a tectonic stratigraphy underplated at the base of the serpentinite and emplaced onto the albite gneiss of the Hazens Notch Formation. Lithotectonic packages were defmed based on a series of identified early (pre- to syn- F 1) fault contacts between the units. Doolan and others (1982) considered the mafic rocks to be a dynamically metamorphosed basal aureole complex associated with imbricated serpentirnte.
214
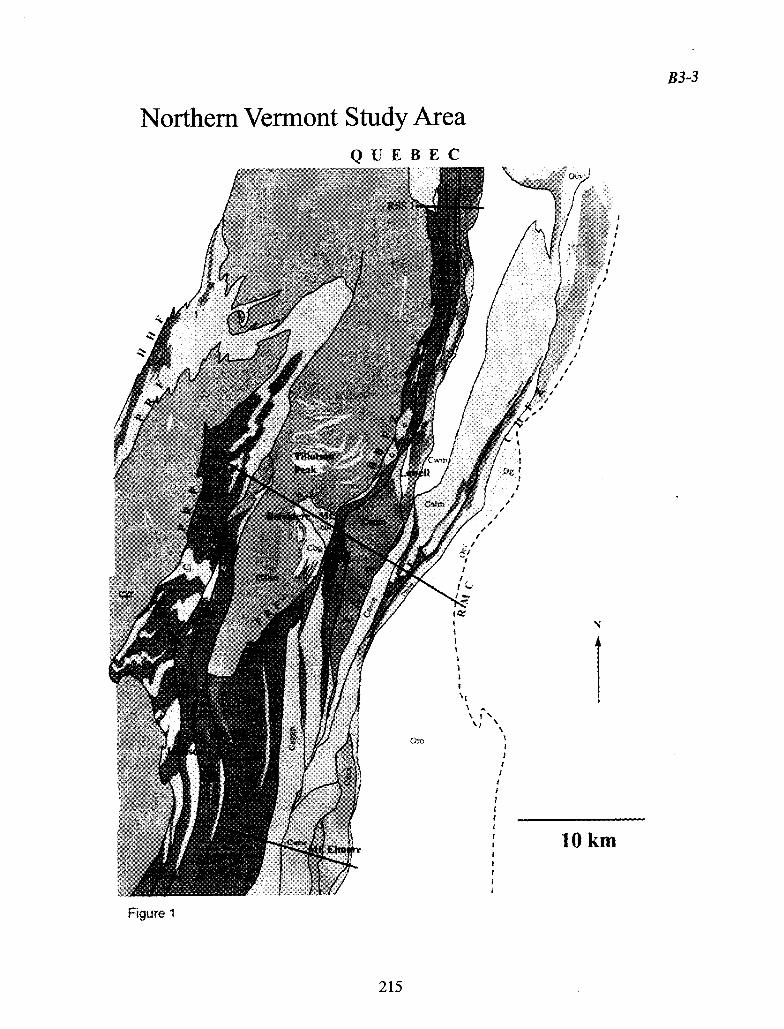
Northern Vermont Study Area QL E REC
B3-3
Ture 1
215
1 /
1 I
I I
I I
10km
B3-4
0 E
cu
cm
co
Cb cn
3vg /
a)
CD
N U-
\ U
/ I
N
ca co
I
x 0 0 a)
U-
216
B3-5
-J -j
I
0
Rs il ww o
ZZ? L1L!WL1Cl) Li..
a:
UJWW
- o 1J0)
cz CL
.2 w WW 0 Oa:9
LL 0 U) — coIa-
C.) (I)
(I) F-;Tfl — a:
0 0
1-:
w 1--5-- wo
i wF- N
LI
ME IE Ifl U-
a-
w 0 -J
W F 1
-C
CO _C Z
0 -0 oW
LL
a)
CIS
-a a a) LL ( _C
a
LL
°a CO
Ull-
cao a) — C) 0 aa) co 0.
C LL o0 to-
OC -c -
C75 0 U.. -
a) a) = -- - C)
> =
Om..o
C).1 .CIS
a) a) - C
.ãM c C —
a) C)
U..
217
B3-6
Figure 4- Map showing lithotectonic packages and fault zones.
218
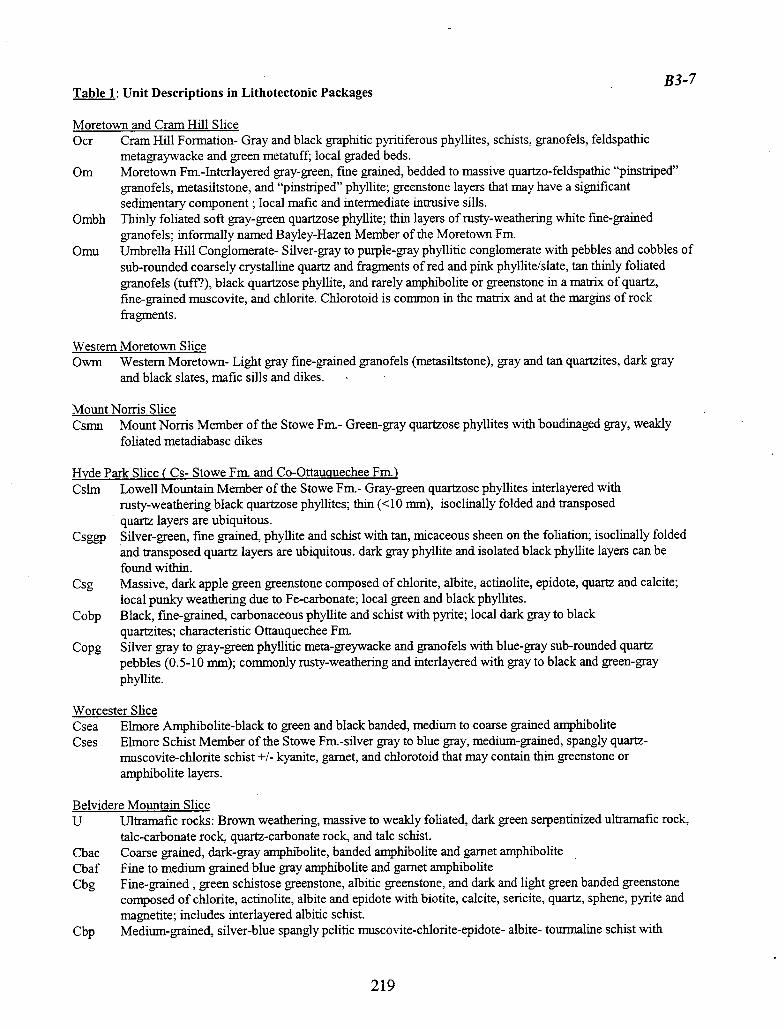
B3-7 Table 1: Unit Descriptions in Lithotectonic Packages
Moretown and Cram Hill Slice Ocr Cram Hill Formation- Gray and black graphitic pyritiferous phyllites, schists, granofels, feldspathic
metagraywacke and green metatuff; local graded beds. Om Moretown Fm.-lnterlayered gray-green, fme grained, bedded to massive quartzo-feldspathic "pinstriped"
granofels, metasiltstone, and "pinstriped" phyllite; greenstone layers that may have a significant sedimentary component; local mafic and intermediate intrusive sills.
Ombh Thinly foliated soft gray-green quartzose phyllite; thin layers of rusty-weathering white fme-gramed granofels; informally named Bayley-Hazen Member of the Moretown Fm.
Omu Umbrella Hill Conglomerate- Silver-gray to purple-gray phyllitic conglomerate with pebbles and cobbles of sub-rounded coarsely crystalline quartz and fragments of red and pink phyllite/slate, tan thinly foliated granofels (tuft?), black quartzose phyllite, and rarely amphibolite or greenstone in a matrix of quartz, fme-grained muscovite, and chlorite. Chlorotoid is common in the matrix and at the margins of rock fragments.
Western Moretown Slice Owm Western Moretown- Light gray fine-grained granofels (metasiltstone), gray and tan quartzites, dark gray
and black slates, mafic sills and dikes.
Mount Norris Slice Csmn Mount Norris Member of the Stowe Fm.- Green-gray quartzose phyllites with boudinaged gray, weakly
foliated metadiabase dikes
Hyde Park Slice ( Cs- Stowe Fm. and Co-OttauQuechee Fm.) Cslm Lowell Mountain Member of the Stowe Fm.- Gray-green quartzose phyllites interlayered with
rusty-weathering black quartzose phyllites; thin (<10 mm), isoclinally folded and transposed quartz layers are ubiquitous.
Csggp Silver-green, fme grained, phyllite and schist with tan, micaceous sheen on the foliation; isoclinally folded and transposed quartz layers are ubiquitous. dark gray phyllite and isolated black phyllite layers can be found within.
Csg Massive, dark apple green greenstone composed of chlorite, albite, actinolite, epidote, quartz and calcite; local punky weathering due to Fe-carbonate; local green and black phyllites.
Cobp Black, fme-grained, carbonaceous phyllite and schist with pyrite; local dark gray to black quartzites; characteristic Ottauquechee Fm.
Copg Silver gray to gray-green phyllitic meta-greywacke and granofels with blue-gray sub-rounded quartz pebbles (0.5-10 mm); commonly rusty-weathering and interlayered with gray to black and green-gray phyllite.
Worcester Slice Csea Elmore Amphibolite-black to green and black banded, medium to coarse grained amphibolite Cses Ehnore Schist Member of the Stowe Fm.-silver gray to blue gray, medium-grained, spangly quartz-
muscovite-chlorite schist +1- kyanite, garnet, and chlorotoid that may contain thin greenstone or amphibolite layers.
Belvidere Mountain Slice U Ultraniafic rocks: Brown weathering, massive to weakly foliated, dark green serpentinized ultraniafic rock,
talc-carbonate rock, quartz-carbonate rock, and talc schist. Cbac Coarse grained, dark-gray amphibolite, banded amphibolite and garnet amphibolite Cbaf Fine to medium grained blue gray aniphibolite and garnet amphibolite Cbg Fine-grained , green schistose greenstone, albitic greenstone, and dark and light green banded greenstone
composed of chlorite, actinolite, albite and epidote with biotite, calcite, sericite, quartz, sphene, pyrite and magnetite; includes interlayered albitic schist.
Cbp Mediuni-grained, silver-blue spangly pelitic muscovite-chlorite-epidote- albite- tourmaline schist with
219
B3-8 lenses, discontinuous layers and rounded blocks (3mm-20cm) of coarse-grained amphibolite, greenstone, and fme-grained amphibolite.
Cbagn Medium grained, massive, light gray, dark gray and green banded quartz-albite-muscovite gneiss with minor epidote, chlorite, sphene and magnetite.
Green Mountain Slice (refer to Trip A3) CZ1m Hazens Notch Formation- Black and rusty, slightly graphitic, albite porphyroblast schist, green albitic
schist, and fme-grained silver gray sencite schist with magnetite. CZf Fayston Formation-silver green to gray quartz-muscovite-chlorite-albite porphyroblast schist+/- magnetite,
garnet; local white quartzite.
220
B3-9 KiM, GALE, AND LAIRD
The Belvidere Mountain Amphibolite was originally named by Keith and Barn (1932) for the amphibolite on Belvidere Mountain. Albee (1957) mapped the greenstone south of the mountain as part of the Belvidere Mountain Amphibolite at the top of the Camels Hump Group, below and west of the Ottauquechee Formation. Doll et al. (1961) and Cady et al. (1963) treated the Belvidere Mountain Amphibolite as the upper member of the Hazens Notch Formation. Chidester et al (1978) elevated Belvidere Mountain Amphibolite to the Belvidere Mountain Formation and mapped coarse amphibolite, fme amphibolite, greenstone and muscovite schist as members of the formation.
Several mappers (Doolan, Stanley, Thompson, 1999, pers. comm.) in the northern Vermont group have suggested a metamorphosed mylonite or tectonite as a parent for the albite gneiss and we here include those rocks as part of the upper plate associated with transport and emplacement of the ultramafic and mafic rocks rather than assigning the gneiss to the Hazens Notch Fm. in the Green Mountain Slice.
The correlation of units between Belvidere Mountain and Tillotson Peak is currently being discussed. Recent mapping in the Tillotson Peak area (Laird and Bothner, in progress), geochemical analyses of mafic rocks from south of Belvidere Mountain north to Hazens Notch, and integration of past work with mapping in the surrounding quadrangles should help solve remaining problems in the quadrangle. A variety of mafic rocks may have been included in the unit mapped as Belvidere Mountain Amphibolite. The ultramafic, mafic and some of the metasedimentary rocks are a fault -constructed lithotectonic package in which ainphibolites were (imbricated) underplated at the base of the ultramafic rock and subsequently thrust on top of greenstones (+1- interbedded sediments), tectonic melange (muscovite schist with small to large rounded blocks of amphibolites and greenstones), and, to the north, the Tillotsori Peak terrain mapped by Laird and Bothner (in progress).
Worcester Slice.
The Worcester Slice is an assemblage of amphibolites and "spangly" quartz-muscovite-chlorite schists that may/may not have garnet and kyanite. The garnet and kyanite in these schists have been retrograded to chlorite and white mica, respectively. Albee (1957) originally mapped the schists and amphibolites as part of the Stowe Formation and accounted for their higher metamorphic grade by inserting garnet and kyanite isograds that close near the north end of Mt. Elmore and extend southward through the remainder of the Worcester Mountains. In Albee's cross-section the Mt. Elmore amphibolites and schists overlie the main belt of Stowe rocks. In northern Vermont, amphibolites are only found in the Worcester Mountains and in the Belvidere Mountain and Tillotson Peak areas.
The Worcester Slice "closes" approximately one mile north of Mt. Elmore where the eastern and western contacts of the chioritized garnet-bearing muscovite schist rapidly converge and gray-green phyllites and greenstones of the Hyde Park Slice are then continuous to the north. To the west, the massive Elmore amphibolite yields to gray-green phyllites along a fault contact that is likely continuous with the Eden Notch Fault Zone. The eastern boundary of the Worcesters at the latitude of Mt. Elmore juxtaposes massive amphibolite with presumed F 1 and F2 infolds of Worcester Schist against gray-green phyllites of Stowe affinity. Moretown gray-green "pinstriped" phyllites and granofels are also found a short distance farther to the east.
Hyde Park Slice (lIPS).
The Hyde Park Slice (HPS) consists primarily of black, gray, and green phyllites, phyllitic metagraywackes (with bluish-gray quartz pebbles), and greenstones. In general, the black and gray phyllites and phyllitic metagraywacke were assigned to the Ottauquechee Formation (Perry, 1929) whereas green phyllites were assigned to the Stowe Formation (Cady, 1956); greenstones can be found in either, but are more abundant in the Stowe Formation. Black phyllites and green phyllites commonly occur as separate and discrete belts on the map, but also can be found interlayered with one another (i.e. Lowell Mountains).
221
B3-1O KIM, GALE, AND LAIRD
The HPS is bounded on the west by an eastern extension of the east-dipping Prospect Rock Fault (PRF) that juxtaposes Ottauquechee black and gray phyllites and phyllitic metagraywackes to the east with Hazens Notch Formation and Fayston Formation black albitic schists and green albitic schists, respectively, to the west. The PRF was defmed by Thompson and Thompson (1997; 1999; this volume) in the Foot Brook area as the Pre-D2 (Taconian) fault surface that separates Ottauquechee and Jay Peak formation rocks from underlying Hazens Notch and Fayston Formation rocks. Albee (1957) also recognized the similarity of the Ottauquechee/Stowe rocks seen in the Foot Brook area west of the main Ottauquechee belt; he mapped them as the Stowe and Ottauquechee formation in the Foot Brook Syncline (Fig. 1, Trip A3). To the east the HPS is bounded by the Umbrella Hill Conglomerate (Omu) whose western contact is interpreted to be tectonic.
If overall lithologic similarity is used alone, the rocks of the Hyde Park Slice and Foot Brook Slice (FBS) of Thompson and Thompson (1997; 1999; this volume) are thought to be correlative and would suggest a Ottauquechee/Stowe slice of significant across-strike extent. Subtle differences such as the presence of more abundant phyllitic metagraywacke in the Hyde Park Slice may suggest that it is a separate slice from the Foot Brook Slice. The Lowell Mt. portion of the Hyde Park Slice has an abundance of interlayered black and greeen phyllites that are similar to those found in the Foot Brook Slice. Progressively younger faults, some with composite histories, transect the Hyde Park Slice and shuffle the units in this lithotectonic package, and making absolute slice correlations difficult.
Mount Norris Slice (MNS).
The Mount Noms Slice is composed of gray-green phyllites that have been intruded by gray, massive, rounded, granular, weai.dy-foliated metadiabases with distinct buff-colored weathering rinds (+1- plagioclase phenocrysts). The intrusive origin is based on the presence of chilled margins and rare xenoliths of metasedimentaiy lithologies. Contacts of the metadiabases with the surrounding metasedimentary units are always very sharp and are either coplanar with or cut the dominant foliation at a low angle. The metadiabases are frequently boudinaged within the dominant foliation and individual dikes/sills cannot be traced over large distances. Although highly altered, the metadiabases display original igneous textures. Based on field relationships, the intrusion of the dikes/sills is, at least, pre-S3 (earliest Acadian structural fabric) and therefore are pre- or syn- S2 (Taconian). The metadiabases do not intrude across faults of any age and are confmed to discrete lithotectomc packages which in addition to the Mt. Norris Slice also include the Western Moretown and Moretown slices. Stanley et al. (1984) mapped lithotectonic packages containing metadiabasic dikes in this belt in the North Troy and Jay areas of Vermont.
The Mt. Norris Slice is bounded to the west by an S2 fault that places the metadiabase-bearing gray-green phyllites on top of phyllitic metagraywackes and black phyllites of the Hyde Park Slice. The syn-S3Eden Notch Fault Zone truncates the Mt. Norris slice to the east and places it against the Lowell Mt. portion of the Hyde Park Slice.
Western Moretown Slice (WMS).
In northern Vermont there are two distinct belts of Moretown Formation present on the Centennial Geologic Map of Vermont (Doll et al. (1961. The western belt of Moretown which terminates just south of the Town of Lowell and extends northward toward Quebec is composed primarily of gray metasiltstones, black phyllites, and metadiabases. The senior author of this article in concurrence with Stanley (1998, pers. comm.) believes that the western belt of Moretown is separable lithologically from the main belt of Moretown to the east.
The Western Moretown Slice truncates abruptly against the Acadian Eden Notch Fault Zone to the west where it is placed against ultramafics and the Mt. Norris Slice. To the east the Western Moretown Slice is juxtaposed against the Lowell Mt. portion of the Hyde Park Slice along a pre-D3 fault of presumed D2 age.
222
B3-11 KIM, GALE, AND LAIRD
Moretown/Cram Hill Slice.
This slice is the eastern belt of Moretown and Cram Hill formations on the east side of the study area overlying the Umbrella Hill Conglomerate that are continuous southward into Massachusetts. Certain members of the Moretown Formation contain metadiabasic intrusives, however, the westernmost members, the Umbrella Hill Conglomerate and informal Bayley-Hazen member do not; some metadiabases are found in the black phyllites, black phyllitic granofels, and quartzites of the Cram Hill Formation. The informal Wild Branch member of the Moretown Formation is composed of gray-green "pinstriped" phyllites and quartzo-feldspathic granofels, metadiabases, and "greenstones" that range in composition from true volcanic greenstones to volcanic sediments. These slices are bounded by the discontinuous Umbrella Hill Conglomerate, the western margin of which is interpreted to be a fault zone (Umbrella Hill Fault Zone (tJHFZ)) to the west and by the Richardson Memorial Contact (RMC) to the east (Pre-SilurianlSiluro-Devonian boundary.
Structural Geology of Lithotectonic Packages
Foliation Domains.
The field area for this trip can be divided into three basic structural domains which are: Domain 1 A northeast-trending shallow to moderately east-dipping Taconian SI and S2 composite fabric is dominant. It has been gently folded by north-northeast trending, asymmetric, close to tight, gently north or south-plunging Acadian F3 "Green Mountain" folds with an associated axial planar steeply west-dipping crenulation cleavage (Figure 5).
F2 folds are usually reclined isoclinal folds that often have quartz rods or other mineral lineations that are colinear with their fold axes. The F2 fold axes and colinear quartz rods are a result of the rotation of the fold axes into the transport direction (e.g. Ratcliffe et al., 1992; Stanley, 1998, pers. comm.). Fl folds are cryptic, but where visible are isoclinal folds with transposed limbs and a variable plunge. While Si and S2 are virtually coplanar, the fold axes for Fl and F2 folds are not coaxial. Rare occurrences of bedding (So) have usually been thoroughly transposed by later foliations. The F3 folds are known to be Acadian in age because they and their associated fabric can be traced eastward into Siluro-Devonian rocks of the Shaw Mountain, Northfield, and Waits River formations where S3 is the earliest structural fabric. The vergence of F3 folds may be consistent coming down the east side of the Green Mountain Anticlinorium. West of the Burgess Branch Fault Zone (BBFZ) there is considerable variation in the strike of S3 that may related to the pre-Acadian geometry of the BBFZ (Doolan et al., 1982; Laird et al.,1993). An open fold set (F4) with nearly east-west trending axial surfaces gently warps all earlier structures. The Green Mountain and Belvidere Mountain slices are in Domain l(Figure 5).
Domain 2 In this domain there is significant overlap between the S2 and S3 fabrics. The dominant foliation is a composite Tacoman S2 and Acadian S3 fabric in which S2 has been reoriented into the attitude of S3 and has been overprinted by a strongly developed S3 spaced cleavage. S3 intensifies as one moves to the east in Domain 2 as well as in proxirmty to 53-coeval fault zones. F3 folds have inconsistent vergence in Domain 2. F3 crenulate fold axes frequently form intersection lineations on the S2 surface that overprint the quartz rod lineations. This domain is also folded by the open F4 folds described above. The Mt. Norris, Western Moretown, and Worcester slices are in Domain 2 (Figure 6). Parts of the Hyde Park slice are in Domain 2.
Domain 3 From the Umbrella Hill Conglomerate to the east, the dominant schistosity is the Acadian S3 spaced cleavage. S2 forms a steeply-plunging intersection lineation on S3 and steeply-plunging quartz lineations may be seen in S2. S3 has consistently shallower westward dips and more northerly strike than S2. Moderately south-plunging crenulation lineations may be seen on S2 that overprint the quartz lineations (Figure 6).
Near the RMC a locally-developed fold generation that is intennediate in relative age between F3 and F4 (F 3.5) is characterized by asymmetric tight to isoclinal folds with north-northeast trending axial surfaces and axes with moderate plunges either north or south; S 3.5 consistently has a slightly shallower westward dip than S3
223
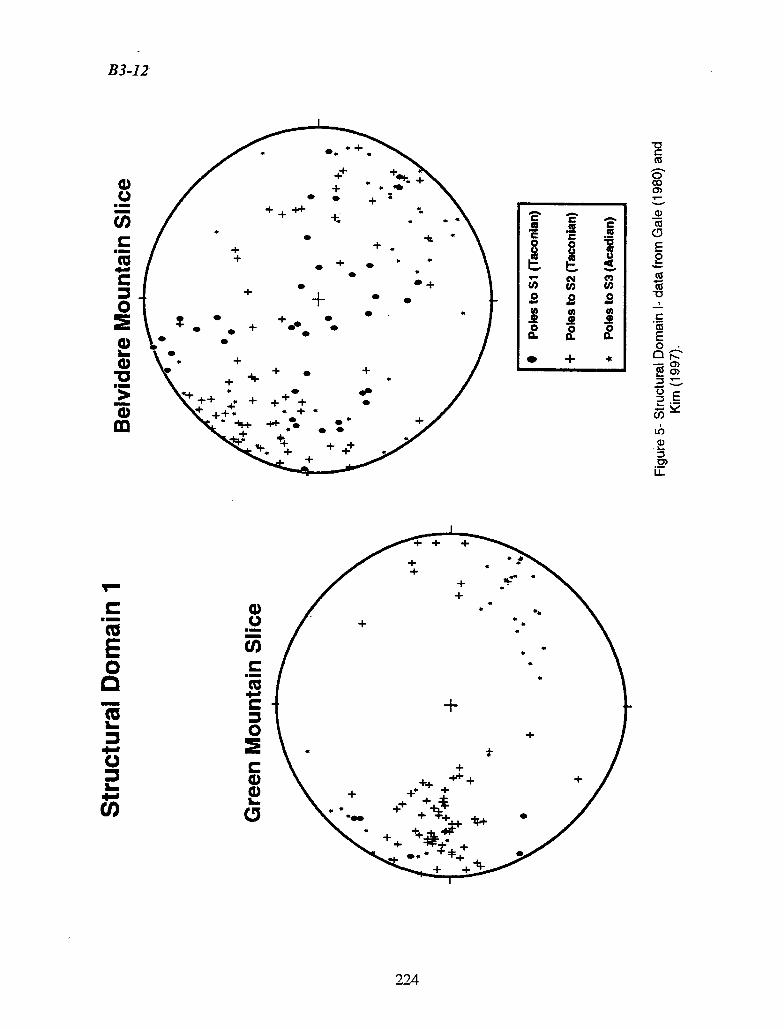
- C
. C
-
C
C
C
0
C)
a) (a
C!, E 2 (a (U
C (U E 0 0R —C)
0
L
a) 0)
U-
B3-12
(I)
C
C
0
w a)
I;
C)
• + 'b%
• + • • • z
- ; •
• • - * • + •
+
+ + +
U U • U
• + + • •
• + +
+
• • U • • •• •
• •
I
• +
+ + +• U
+ • -I+ • • U U
+ +f
• *
1
E 0
LEM
mba
•E I-
0
Cl)
C) (I)
C
C
0
C C) a) I-
224
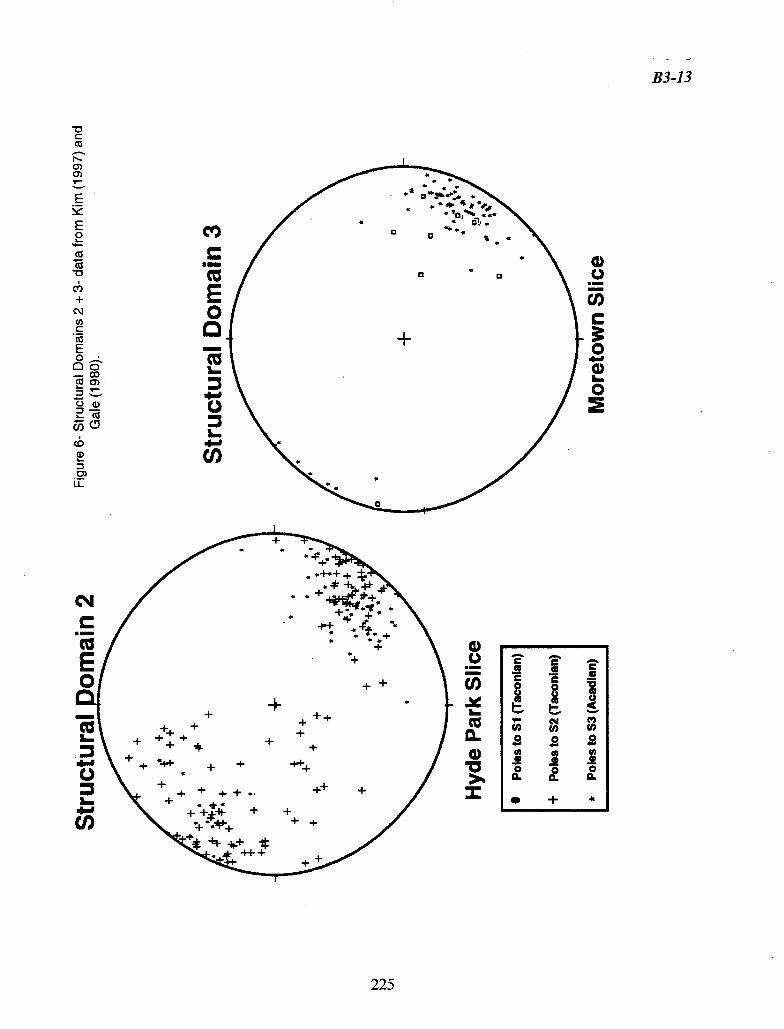
-o C cu N- 0) 0)
E
E 0 a-
-o C')
CIS
+
C
E 0 Oc
co
cn
-
0)
OG)
th a- - 0)
LL
C
E 0
LM
C.)
L.
(1)
a) Cu)
C
0 a) 0
B3-13
+
+ ~.,
44F 4, +4
I
+ + + ++
+ + +++ +
+ + 4 + +
++*.4* + +
++
++ + ++ ++ +
+
f4+ -
.! .!
o o 0
• +
C
E
CI)
HE
*
a) C.)
L.
IL a) >1 I
225
B3-14 KIM, GALE, AND LAIRD
(Figure 6). Crenulation lineations of S3 on S4 and vice versa can be seen locally. In the absence of either of the two fabrics, they can difficult to distinguish.. The large map-scale open fold generation (F4) with east-west trending axial surfaces deforms S3 and S 3.5; locally F4 has a weakly-developed crenulation cleavage. The fact that the S2/S3 composite relationships and orientations are similar to those of the S3/S 3.5 makes relative fabric correlations difficult in parts Domain 3 in the vicinity of the RMC.
Major Faults
There are a number of major north-northeast trending fault zones of differing relative ages that divide the study area into lithotectonic packages or slices which are the Belvidere Mt., Prospect Rock, Burgess Branch, Eden Notch, and Umbrella Hill fault zones (see Figures 2, 3, and 4). These fault zones may be defmed by the following criteria: 1) upper and lower plate truncations of map units, 2) abrupt truncation of map units, 3)abrupt reorientation of map units into the fault zone, 4) the superposition of a fault cleavage, and 5) fault zone fabrics. The relative ages of these fault zones has been determined by tracking reference foliation surfaces of known relative ages across the map area (see Figures 1, 2, 3, and 4 for this section).
Belvidere Mountain Fault Zone (BMFZ).
Gale (1980;1986) and Doolan et al. (1982), made the BMFZ the Dl fault surface associated with the emplacement of ultramaflc rocks. The BMFZ was also defined by Stanley et al. (1984) in northern Vennont as the fault that separates rocks of the Ottauquechee and Stowe formations from Hazens Notch formation rocks. After consulting with Stanley (1999, pers. comm.), we are redefining the BMFZ to be the base of the albite gneiss that separates all overlying mafic, ultramafic, and metasedimentary rocks of the Belvidere Mt. Slice from the underlying Green Mt. Slice; this fault is a pre-syn D2 surface. There are numerous fault surfaces internal to the Belvidere Mt. Slice that predate the BMFZ and thus the Belvidere Mt. Slice records the earliest known deformation in the study area.
Prospect Rock Fault (PRF).
The PRF was originally defmed by Thompson and Thompson (1997; 1999; this volume) west of Johnson, Vermont as the fault that separates Ottauquechee and Jay Peak formation rocks of the Foot Brook Slice from underlying Hazens Notch and Fayston formation albitic rocks. We have used the lithotectomc context of Thompson and Thompson (1999) and extended the PRF farther to the east whereby Ottauquechee and Stowe rocks to the south and east overlie Hazens Notch and Fayston rocks to the north and west The Green Mt. Slice and overlying Belvidere Mt. Slice represent an anticlinorial window over which the Foot Brook/Hyde Park Slice once extended. In this scenario the upper plate of the PRF is correlative with, at least, the western part of the Hyde Park slice. The PRF is folded by F2.
Burgess Branch Fault Zone (BBFZ).
The BBFZ in northern Vermont is a continuation of the Baie Verte-Brompton Line (e.g. Pinet and Tremblay, 1994) of Quebec and is a composite fault zone with multiple ages of movement. The Belvidere Mountain Slice and Foot Brook/Hyde Park Slice root at depth east of the BBFZ. The BBFZ currently dips steeply which is the result of Late Taconian? and Acadian structural events; this is consistent with the attitude of the Baie Verte-Brompton Line in Quebec. The BBFZ is thought to have moved both prior to and coevally with D3 because fault surfaces in the lower plate (Hazens Notch Formation Rocks) are transected by a cleavage interpreted to be S3 whereas the upper plate (Ottauquechee Formation rocks) exhibits lithologic contacts parallel to S3. Late kinematics on the BBFZ suggest that motion associated with S3 had a component of right lateral oblique slip motion based on C-S structures in upper plate black phyllites; earlier motion is constrained wealdy by steeply southwest-plunging lineations, some of which may be related to stretching on surfaces interpreted to be S2.
226
B3-15 KIM, GALE, AND LAIRD
Eden Notch Fault Zone (ENFZ).
The ENFZ was determined to be syn-S3 in age because: 1) S2 foliations are truncated abruptly, 2) the S3 cleavage intensifies as on approaches the ENFZ, 3) there are "crushed" zone or fault zone fabrics at the contacts between map units in the ENFZ, 4) lithologic contacts are coplanar with S3 and 5) the ENFZ is only folded by what is interpreted to be the east-west trending open F4 folds. The ENFZ extends from the west side of the Big Falls Synform (Stanley et al., 1984) in northernmost Vermont to the west side of the Worcester Mountains where it is currently being traced farther to the south. The latest motion on the ENFZ is thought to be down to the west normal motion based on kinematics observed in the "crushed" zones and the rotation sense of folds as one approaches the ENFZ.
Umbrella Hill Fault Zone (UHFZ).
The presence of the UHFZ is suggested by: 1) truncation of 10 map units along the length of the Umbrella Hill Conglomerate (UHC); truncations occur in the upper and lower plates (including complete loss of the Moretown Formation), 2) increases in strain as one approaches the UHFZ, 3) truncation of earlier structures by the UHFZ, 4) the presence of metadiabasic intrusives in map units on either side of the UHC, but not in the UHC, 5) the presence of numerous discontinuous slivers of diverse lithologies between the major bodies of UHC, and 6) the UHFZ is the structural break between domains 2 and 3. The UHFZ is thought to have a composite structural history with its latest motion coeval with the development of S3. Badger (1979) observed locations in which he interpreted the contacts between the Stowe-like rocks west of the UHC and the UHC to be conformable because of interlayering of the two units; the only way to accomodate both hypotheses is to suggest that the major episodes of faulting along the UFIFZ postdate the aforementioned interlayering.
Geothermobarometry and Geochronology of Lithotectonic Packages
Laird et al. (1984) and Laird et al. (1993) have geothennobarometric and geochronologic data from each of the Lithotectonic Packages in the field area. The geothermobarometric data for mafic rocks are presented in Figure 7 which is modified from Laird, Trzcienski, and Bothner (1993). On the X axis, an increase in the (AP" + Fe3 +2 Ti + Cr) substitution in amphibole (TK vector) is proxy for an increase in the temperature of metamorphism, whereas on the Y-axis, an increase of Na in the M4 site in amphibole is proxy for an increase in the pressure of metamorphism (see Laird et al., 1984).
Tillotson Peak Slice. Metamorphosed mafic rocks from Tillotson Peak contain glaucophane, omphacite, and garnet and
experienced the highest pressure of metamorphism in the field area (High-P Facies Series). Glaucophane-bearing samples are excluded from Figure 7. Our structural interpretation places the Tillotson Peak slice underneath the Belvidere Mountain Slice, but above the Green Mountain Slice. Thermobarometry of oniphacite inclusions and adjacent garnet compositions by Laird, Trzcienski, and Bothner (1993) yield temperatures and pressures that range from 360 - 470 C and 9.4 - 11.2 kb, respectively; whereas garnet rim and omphacite pairs give temperatures ranging from 520 - 620 C and pressures from 12.2 - 14.1 kbar. A 468 +1- 6 Ma °Ar/19Ar total fusion age on glaucophane was reported by Laird et al. (1984).
Belvidere Mountain Slice.
Amphibolite samples from the Belvidere Mountain Slice have barroisitic cores and barroisitic rims; the cores, however, have more edenite component than the rims. The BMS amphibolites fall in the Medium-High P Facies Series on Figure 7. Garnet -homblende geothennometry on a garnet aniphibolite from Belvidere Mt. indicated metamorphic temperatures of 550-650 C (Laird et al., 1993). A total fusion °ArP'Ar age on barroisite from the top of Belvidere Mountain yielded a 490 +/ 8 Ma (Laird et al. (1984); further analysis of the same sample gave a 505 +1-2 Ma 40Ar/39Ar plateau age.
227
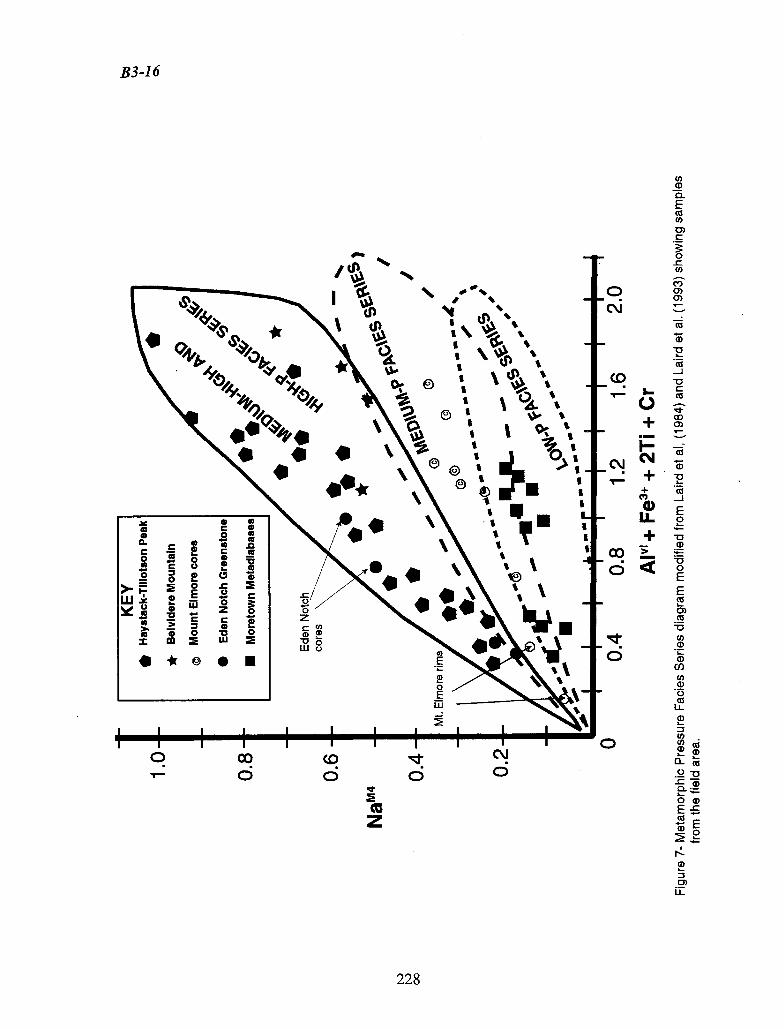
%Th\
\A \%
a) a, a, 0
a) a,
2 c a)
g a)
a, a,
0 .0 a,
a, E -
2 0 z
c a, . C
0 C
• 0 iLl
CV)
V o w c.,
a) a, 0
E a) a) 0) C
0
C) 0) 0)
a)
(D
V
a)
Nr CD
-J 0 C a)
0)
a)
a, V
a) -J
E 0
V (D
V 0 E E a) 0) Its V
CO) a, a,
Cl) a) a, C) a)
U- a,
a)
.2 V
oa, E
a,
0) IL
B3-16
I S
*
I C.)
a + I I- I
I
a.* •1 -.
I.-
a. I.
I.
U-
I' +
I
.aa t I
• .. j. 0) d
E 0
'Ii
0 0 cx CD
dd ci
228
B3-17 KIM, GALE, AND LAIRD
Worcester Slice.
The cores and rims of amphiboles from the Elmore Amphibolite have magnesio-homblende and actinolite compositions, respectively; the amphibole cores fall in the Medium-P Facies Series (Figure 7). These amphiboles give an 40Ar/' 9Ar plateau age of 470 +/-12.6 Ma, an isochron age for high temperature steps of 460 +1- 6.1 Ma, and apparent ages of 3 76-400 Ma for low temperature steps. Coarse-grained muscovite from the Worcester Mountains gave an °Ar/39Ar plateau age of 445 +1- 9 Ma whereas muscovite pseudomorphing kyanite from the same area yielded an °Ar/39Ar plateau age of 363 +/- 4 Ma (Lanphere and Albee, 1974). The kyanite grade metamorphism in the Worcester Mountains is Tacoman while the retrogression is Acadian.
Hyde Park Slice.
The Eden Notch Greenstone is considered to be part of the Hyde Park Slice. Amphiboles in the Eden Notch Greenstone have winchite cores and actinolite rims; winchite cores place these amphiboles in the Medium-High P Fades Series (Figure 7). No metamorphic age is available for the Eden Notch Greenstone.
Mount Norris, Western Moretown, and Moretown Slices.
Metadiabasic intrusives are found in all of these slices. Relict hypidiomorphic igneous textures and pyroxene and twinned plagioclase pseudomorphs can be seen in thin sections of many of these metadiabases. The diabases have experienced a severe greenschist metamorphic overprint, but there is no evidence of any earlier metamorphism. Metadiabases from the Moretown Formation east of the Worcester Mountains were analyzed by Laird et al. (1984) and found to fall in the Low-P Facies Series (Figure 7); we have assigned our metadiabases to the this series.
Igneous Geochronology
Ages of Mafic Units.
No igneous crystallization ages exist for any of the mafic units in the study area so it is necessary to extrapolate along-strike for age control. The minimum age for the Moretown Formation in central Vermont is established by a U/Pb age on a trondhjemitic Barnard Gneiss sample by Ratcliffe, Walsh, and Aleinikoff (1997) of 496 +1- 8 Ma; this trondhjemite also intrudes the Proctorsville ultramafic belt and possibly also the Cram Hill Formation. Additional ages for the Cram Hill Formation in southern Vermont include U/Pb ages of 462 +1- 6 Ma (South Newfane- North River Intrusive Suite trondhjemite) and 484 +1- 4 Ma (Springfield- Cram Hill felsic volcanic) (Ratcliffe, Walsh, and Aleinikoff, 1997).
There are no known crystallization ages from igneous units in the Stowe and Ottauquechee formations in Vermont; however, there is a recent U/Pb age of 571 +1-5 Ma on a metafelsite from the Pinney Hollow Formation (Walsh and Aleinikoff, 1999), the western unit of the Pinney Hollow, Ottauquechee, Stowe lithotectonic sequence (from west to east). East of the Pre-Cambrian basement massifs in central Vermont the Pinney Hollow conformably overlies the informally-named Fayston Formation to the west and is in fault contact (Taconian and Acadian-aged) with the Ottauquechee Formation to the east. Because of the tectonic contact that the Pinney Hollow Formation has with the Ottauquechee Formation, the 571 Ma age weakly constrains the ages of the Ottauquechee and Stowe formations.
Rare Earth Element (REE) and Trace Element Geochemistry of Mafic Rocks
Mount Norris, Western Moretown, and Moretown Slices.
Chondrite-normalized REE patterns of metadiabasic intrusives found associated with the Mt. Norris, Western Moretown, and Moretown slices are Light Rare Earth Element (LREE) enriched, have flat Heavy Rare
229
B3-18 KIM, GALE, AND LAIRD
Earth Elements (HREE), and slight negative Eu anomalies (Figures 8A and 8C); overall LREE abundances are between 20-40X chondrite whereas HREE range from 1 O-20X chondrite. MORB-normalized multi-element spider diagrams show irregular LILE abundances, distinctive Th, Ta, Nb, Ce signatures, and generally flat patterns near unity of P to Cr (Figures 8B and 813).
Mafic rocks with LREE-enriched REE patterns like the northern Vermont metadiabases can be found in a number of different tectonic settings such as: Back Arc Basins (BAB), transitional rifts, and enriched (transitional) MORB environments. The Th, Ta, Nb, Ce signatures are not consistent with transitional rift or MORB environments because elements in the Th to Ce interval should be enriched above MORB abundances and vary more smoothly and not show strong anomalies (e.g. Pearce, 1982). Negative Nb anomalies are suggestive of a suprasubduction zone source. Backarc basin basalts (BABB) from the Yaxnato Basin in the Sea of Japan (Allan and Gorton, 1992) have similar absolute and relative abundances of Th, Ta, Nb, and Ce as the northern Vermont metadiabases; the Yamato BABBs are hypothesized to result from the mixing of several mantle sources.
Hyde Park Slice.
Chondrite-normalized REE patterns of the Eden Notch Greenstone as well as one greenstone from the Burgess Branch Fault Zone are Light Rare Earth Element (LREE) depleted to flat with slight negative Eu anomalies; overall REE abundances are between 1 0-20X chondrite (Figure 8E). In the interval between immobile elements Ce and Cr, Mid Ocean Ridge Basalt (MORE) -normalized trace element spider diagrams (Pearce, 1982) exhibit basically flat patterns near unity with a slight upward slope toward Cr and slightly negative abundances of Zr and Hf relative to MORB (Figure 817). Slight to significant departure from MORB abundances occurs for the elements from Th to Nb with Th, Ta, and Nb elevated 2-4X, 1 .5-5X, and up to 2.5X, respectively. Small negative Nb anomalies relative to MORB are found in samples 7-2-96-1 and 7-4-96-1. Mobile Large Ion Lithophile Elements (LILE) elements from Sr-Ba exhibit irregular behavior that is suggestive of metasomatic alteration.
LREE depleted chondrite-normalized REE patterns and generally flat MOR.B-normalized immobile element spider patterns at MORB abundances are consistent with an origin of the Eden Notch and Burgess Branch Fault Zone greenstones in a MORB tectonic environment or possibly a back arc basin in advanced stages of evolution. The presence of elevated abundances of Th. Ta, and occasionally Nb may indicate the involvement of a weakly alkalic MORE-source; the R.EE and spider patterns are not consistent with within plate and continental rift signatures. However, since the behavior of Ta and Nb is usually strongly coupled in igneous rocks from most tectonic environments (e.g. Pearce, 1982), the presence of elevated Ta with slight negative Nb anomalies in some samples (7-2-96-1 and 7-4-96-1) could be due to the contribution of an island arc source (e.g. Pearce, 1982; Wilson, 1989). The Stowe and Ottauquechee formation mafic rocks from northern Vermont are very similar to the Mad River greenstones analyzed by Coish et al. (1986) that were interpreted as MOREs related to the opening of the lapetus Ocean in Proterozoic to Cambrian time.
At first glance, although having different REE patterns, one might consider the trace element spider diagrams for the greenstones to be similar to those of the metadiabases. The metadiabases, however, have consistently more Th and Ce and generally less Ta and Nb than the greenstones. In fact, if one is to normalize the metadiabases to average Eden Notch Greenstone, the normalization makes the Ta and Nb anomalies look more like classic negative Ta-Nb anomalies seen in suprasubduction zone (SSZ)- related mafic rocks.
Belvidere Mountain Slice.
The geochemistry of the Belvidere Mountain area was originally reported by Gale (1980) and was summarized by Doolan et al. (1982); both studies suggested that mafic rocks had MOR.B affinity. Abbreviated MORE-normalized spider diagrams of Belvidere Mt. mafic rocks using the data of Gale (1980) are shown in Figures 9A and 9B. The Route 118 greenstones which were sampled from the Bgs lithologic unit show near MORE abundances of the plotted elements from P to Y and elevated Nb relative to MORE; small negative anomalies can be seen in Zr and Ti . Analysis of amphibolites and greenstones from near the summit of Belvidere Mt. show
230
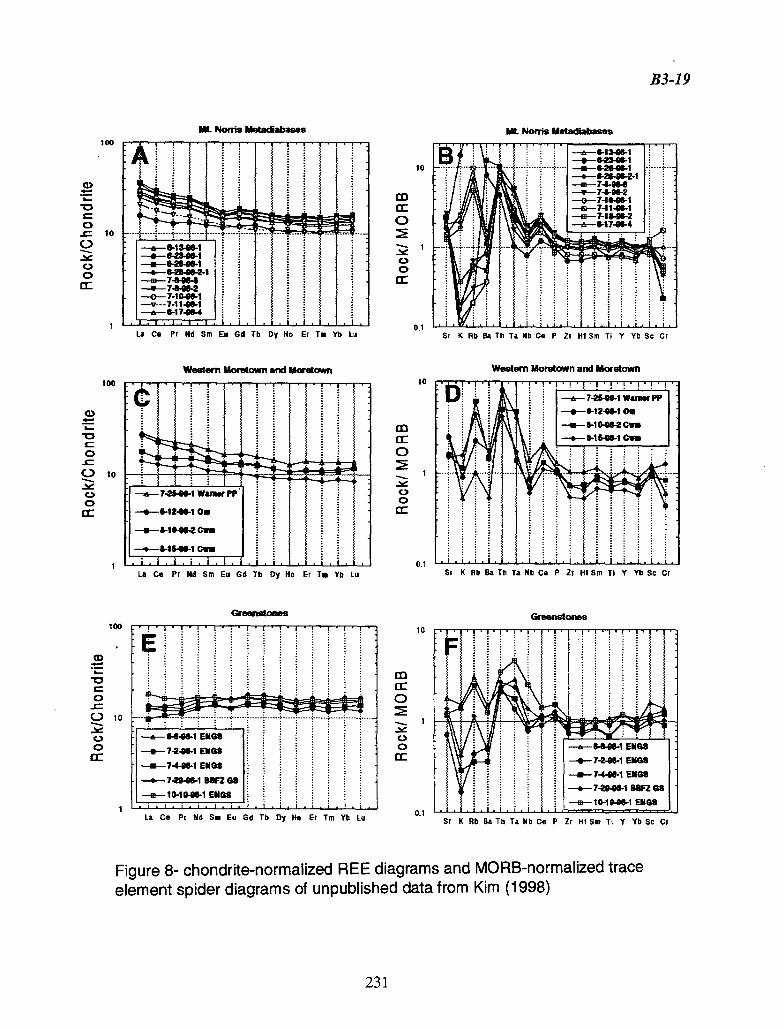
-o
o 10
()
0
010
a 0
1W
C)
em
La Ce Pr Nd Sm Eu Gd Tb Dy Ho Er Tm Yb Lu
Western Moretown and Moretown 100
C)
IHiIiII — -----
1uuIm II! I1tLmnTi1
CD cc 0
-
a 0 cc
0.1
to
CD II 0
a 0 cc
10
—8--- 7-2-00-1 ENGS
.-•-- 7-4-Il-i ENGS
-.-- 7-20-Il-i B$FZ Ge
—s—ID-i 0-00-i ENGS
100
0
Oio -
C.) 0
cc
nfl__n__n
10
CD cc 0
-1
a 0 cc
B3-19
ML Norris Metacabases Mt. Norris Metadiabases
—a.-- wamw P ---- t-1 2-00-1 On
•—— 04 048-2 Cs. 0-16-al-I Ova
0.1 Ce Pr Nd Sm Eu Gd Tb Dy Ho Er Tm Yb
K Rb Ba Tb Ta Nb Ce P Zi Ill Sm Ti V Yb Sc
eenstones Greenstones
Si K Rb Ba Tb Ta Nb Ce P Zi Ill Sm Ti Y Yb Sc Cr
Western Moretown and Moretown
La Ce Pi Nd Sm Eu Gd Tb Dy Ito Ei Tm Yb Lu Sr K Rb Ba Th Ta Nb Ce P Zr HI Sm Ti V Yb Sc
Figure 8- chondrite-normalized REE diagrams and MORB-normalized trace element spider diagrams of unpublished data from Kim (1998)
231
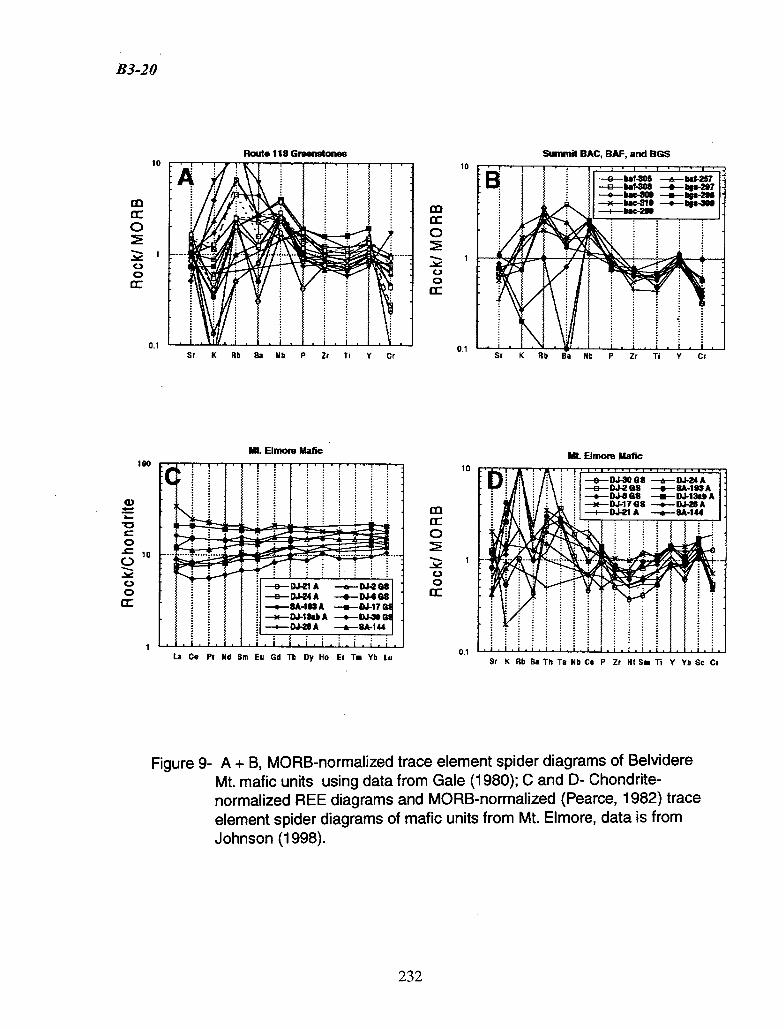
---a- 10 10
0.1 - Sr K Rb Ba Nb P Zr Ti V Cr
cc 0
a 0 cc
a) cc 0
-
a 0 cc
0-I
LIH r K Rb Ba Nb P Zr Ti V C
100
G)
0 - 10 ()
a 0 ii
10
'XI ci: 0
-..
a 0
cc
B3-20
Route 118 Greanstones
Summit BAC, BAF, and BGS
Ml. Eimoro BaSic
•1 •I41IJL!i! La C. Pr Nd Sm Eu Gd Tb Dy Ho Er To Yb Lu
III. Eimom Malic
—e--DJ-208 —1--SA-ISSA —.--DJ-588
• —M—DJ-1708 —.--DJ-A • . __________
0.1 K Rb Ba T, Ta Nb Ca P Zr Nt Sm Ti V Yb Sc Cr
Figure 9- A + B, MORB-normalized trace element spider diagrams of Belvidere Mt. mafic units using data from Gale (1980); C and D- Chondrite-normalized REE diagrams and MORB-normalized (Pearce, 1982) trace element spider diagrams of mafic units from Mt. Elmore, data is from Johnson (1998).
232
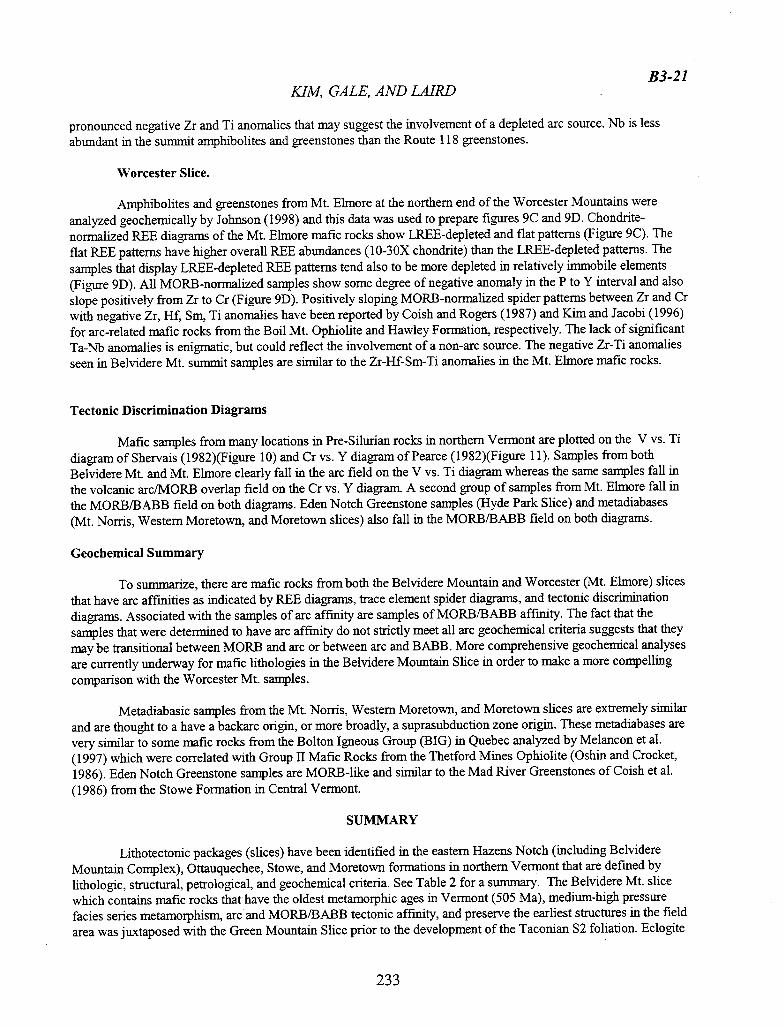
B3-21 KIM, GALE, AND LAIRD
pronounced negative Zr and Ti anomalies that may suggest the involvement of a depleted arc source. Nb is less abundant in the summit amphibolites and greenstones than the Route 118 greenstones.
Worcester Slice.
Amphibolites and greenstones from Mt. Elmore at the northern end of the Worcester Mountains were analyzed geochemically by Johnson (1998) and this data was used to prepare figures 9C and 9D. Chondrite-normalized REE diagrams of the Mt. Elmore mafic rocks show LREE-depleted and flat patterns (Figure 9C). The flat REE patterns have higher overall REE abundances (10-30X chondrite) than the LREE-depleted patterns. The samples that display LREE-depleted REE patterns tend also to be more depleted in relatively immobile elements (Figure 9D). All MORB-normalized samples show some degree of negative anomaly in the P to Y interval and also slope positively from Zr to Cr (Figure 9D). Positively sloping MORB-normali.zed spider patterns between Zr and Cr with negative Zr, Hf, Sm, Ti anomalies have been reported by Coish and Rogers (1987) and Kim and Jacobi (1996) for arc-related mafic rocks from the Boil Mt. Ophiolite and Hawley Formation, respectively. The lack of significant Ta-Nb anomalies is enigmatic, but could reflect the involvement of a non-arc source. The negative Zr-Ti anomalies seen in Belvidere Mt summit samples are similar to the Zr-Hf-Sm-Ti anomalies in the Mt. Elmore mafic rocks.
Tectonic Discrimination Diagrams
Mafic samples from many locations in Pre-Silurian rocks in northern Vermont are plotted on the V vs. Ti diagram of Shervais (1982)(Figure 10) and Cr vs. Y diagram of Pearce (1 982)(Figure 11). Samples from both Belvidere Mt. and Mt. Elmore clearly fall in the arc field on the V vs. Ti diagram whereas the same samples fall in the volcanic arc/MORB overlap field on the Cr vs. Y diagram. A second group of samples from Mt. Ehnore fall in the MORB/BABB field on both diagrams. Eden Notch Greenstone samples (Hyde Park Slice) and metadiabases (Mt. Norris, Western Moretown, and Moretown slices) also fall in the MORB/BABB field on both diagrams.
Geochemical Summary
To summarize, there are mafic rocks from both the Belvidere Mountain and Worcester (Mt. Elmore) slices that have arc affinities as indicated by REE diagrams, trace element spider diagrams, and tectonic discrimination diagrams. Associated with the samples of arc affmity are samples of MORB/BABB affmity. The fact that the samples that were determined to have arc affmity do not strictly meet all arc geochemical criteria suggests that they may be transitional between MORB and arc or between arc and BABB. More comprehensive geochemical analyses are currently underway for mafic lithologies in the Belvidere Mountain Slice in order to make a more compelling comparison with the Worcester Mt. samples.
Metadiabasic samples from the Mt. Norris, Western Moretown, and Moretown slices are extremely similar and are thought to a have a backarc origin, or more broadly, a suprasubduction zone origin. These metadiabases are very similar to some mafic rocks from the Bolton Igneous Group (BIG) in Quebec analyzed by Melancon et al. (1997) which were correlated with Group II Mafic Rocks from the Thetford Mines Ophiolite (Oshin and Crocket, 1986). Eden Notch Greenstone samples are MORB-like and similar to the Mad River Greenstones of Coish et al. (1986) from the Stowe Formation in Central Vermont.
SUMMARY
Lithotectonic packages (slices) have been identified in the eastern Hazens Notch (including Belvidere Mountain Complex), Ottauquechee, Stowe, and Moretown formations in northern Vermont that are defined by lithologic, structural, petrological, and geochemical criteria. See Table 2 for a summary. The Belvidere Mt. slice which contains mafic rocks that have the oldest metamorphic ages in Vermont (505 Ma), medium-high pressure facies series metamorphism, arc and MORB/BABB tectonic affinity, and preserve the earliest structures in the field area was juxtaposed with the Green Mountain Slice prior to the development of the Taconian S2 foliation. Eclogite
233
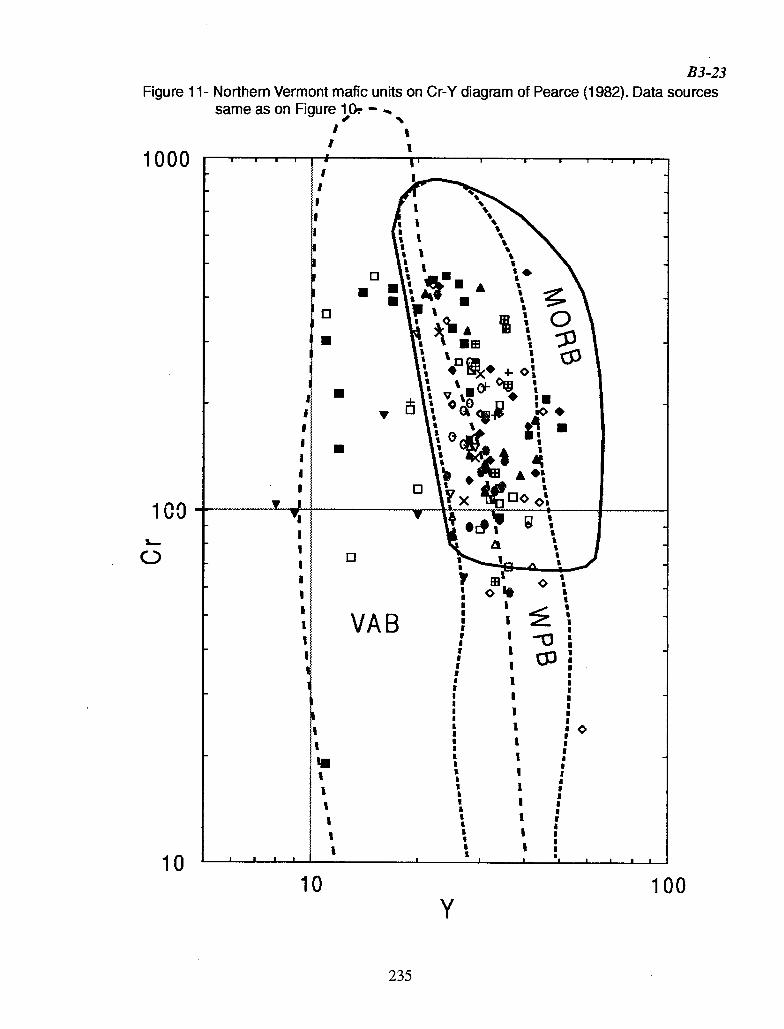
B3-23 Figure 11- Northern Vermont mafic units on Cr-Y diagram of Pearce (1982). Data sources
same as on Figure 1 Or - I S
1 I
1uuu 1
I St 5
I S $ I
S ' I S I
S It
0
0 $ * -F- • '\;•
cP $
4-0 I .oI-o I I
• I.
• S $ I
V
At I I .
I
xo 0 I
y 4' I 7 4,1
A Li V Bt '0
I I I
VAB I
I I -
I
I I I
I I I
I 1 I I
I i •0 I I I
I. I I
I 1
I I 1
I ,I
II I
1 ,
10 100
Y
100
C-)
10
235
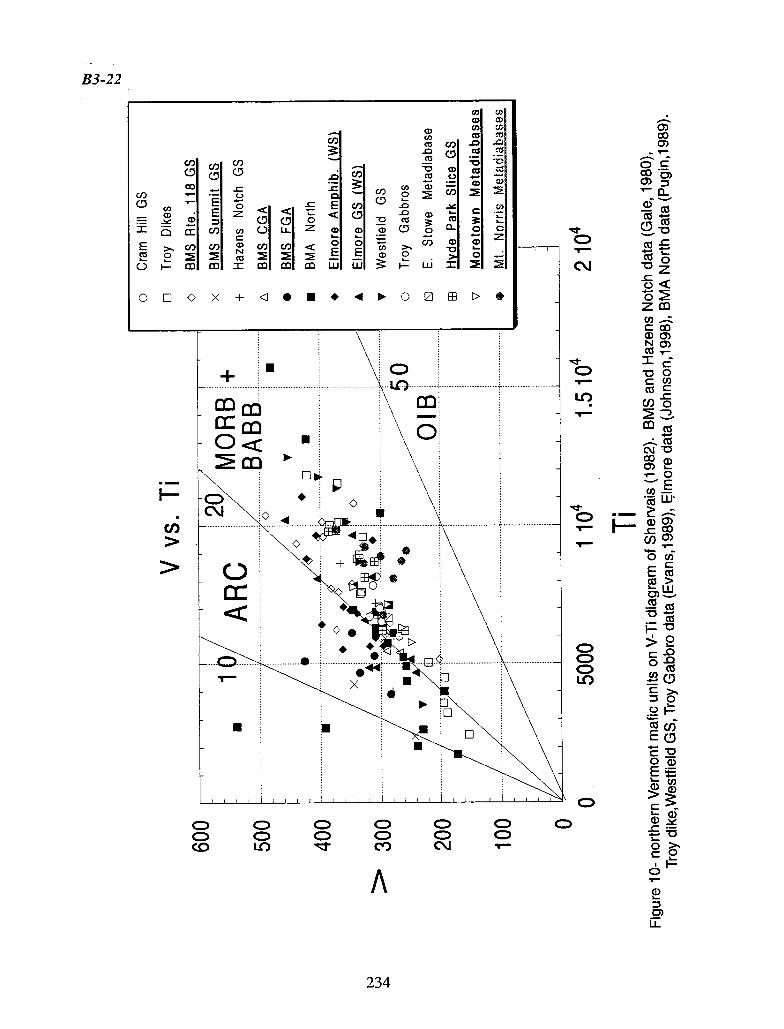
B3-22
a) (,
j> a>
Ca ci .0.0 0) 1
Cl) Cl) — -- Sc
Cl)
= Cl) a, C.) LL 0 2 2 a> C) E > Cl) Cl) Cl) Cl) < o 0
a> 2 Cl) G)
> ° — co = m m m W W I— W =1 21 C'-.J
x + <.•. 40 >• z
cO
.--------- -------------------- .............. rr \
\(Th —
cts Or
cn CJ D CO
Lul
- Cl)
C\j .. ......... 4-44% .. .
- --
I- CO
>. N\<>• ., EEP
—
> 0 rr LLI
cts as co •.
............ .. •!:K
...
A
234
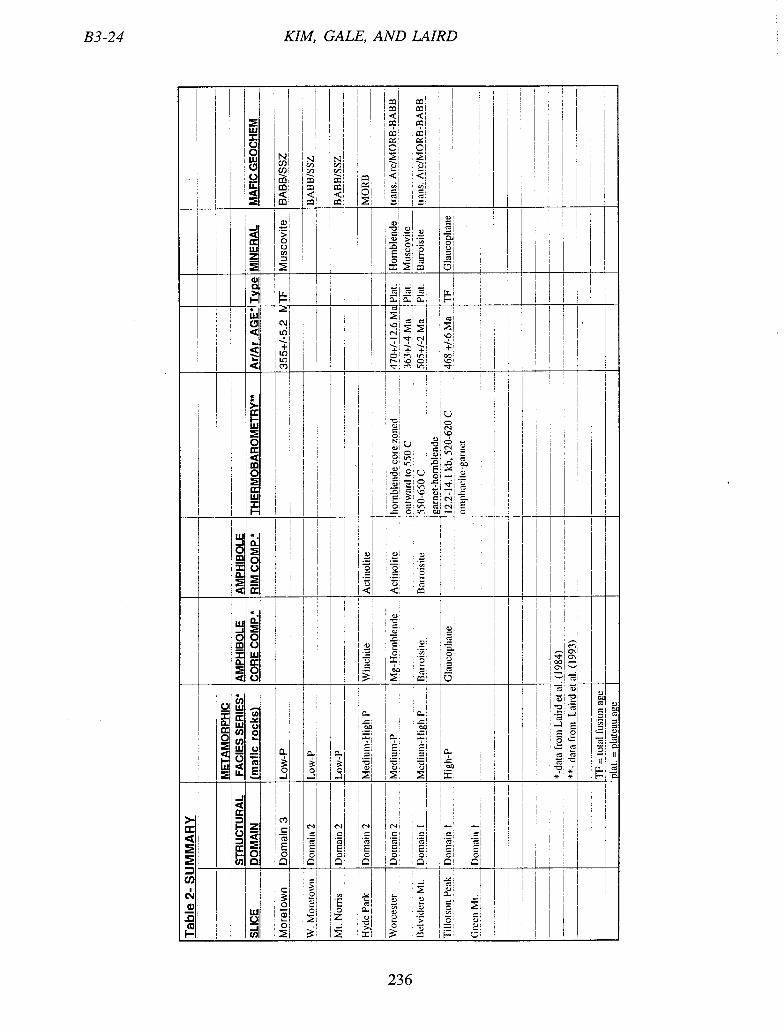
B3-24 KIM, GALE, AND LAIRD
H H ! l H
ul I< <
I H I th
8 LU N N N IIH H 0
Ci) I v Ci)
< <! H I
< <1< <
ii LU cn I
I °I
oI
[L:
-- 1 -- __ - -
'9 < H <C
tO 0 '01
>- L)
LU H 0
ii,' Vo CI I OI2L)
E'- I 0
uj
H . :
. 2
I oc I I E
:
H IL 0 o_t
LL
H >- co
o =1 (0 E
• • 5
• 5
. I . i 5 51 •. •
cfl 0 i 0 0 0 0
cn T -
. , z. •
cn _ 0
236
B3-25 KIM, GALE, AND LAIRD
and glaucophane-bearing mafic rocks from Tillotson Peak record the highest pressures of metamorphism, record 468 Ma Taconian metamorphism, and are thought to structurally underlie the Belvidere Slice.
The Hyde Park Slice, which can be generally correlated with the Foot Brook Slice (FBS) of Thompson and Thompson (1999), has greenstones of MORB affmity that recorded medium-high pressure facies series metamorphism; the HPS was thrust westward over the Belvidere and Green Mt. slices along the pre-D2 Prospect Rock Fault (PRF). Alternatively, it is possible that the HPS represents a second thrust slice that overlies the Foot Brook Slice. In this case the FBS and HPS are not directly correlative.
Worcester Slice amphibolites and garnet and kyanite-bearing metasedimentary rocks are thought to structurally underlie the Hyde Park Slice and are exposed in the core of a D3 (Acadian) anticlinorial arch (anticlinonal window) represented by the Worcester Mountains. Worcester slice mafic rocks have arc and MORB/BABB geochemical affinities and fall in the medium-pressure fades series. The Worcester Slice probably overlies the Belvidere and Green Mt. slices at depth.
Suprasubduction zone basin-signature hypabyssal metadiabasic rocks in the Mt. Norris, Western Moretown, and Moretown slices fall in the low pressure facies series and do not appear to have undergone any metamorphism prior to a greenschist (Acadian?) event; we believe that these slices were emplaced on top of the Hyde Park/Lowell Mt. slice in D2 time along a precursor to the Umbrella Hill Fault Zone which postdated the pre-D2 Prospect Rock Fault.
Acadian high angle faulting has severely dissected these Taconian lithotectonic packages and has significantly altered the map pattern. The Burgess Branch Fault Zone is correlative with the Baie Verte-Brompton Line from the Canadian border to Belvidere Mt., but appears to diverge southward into a number of fault zones of various ages. The regionally extensive syn-D3 Eden Notch Fault Zone extends from northernmost Vermont and has been traced southward to the west side of the Worcester Mountains.
ACKNOWLEDGMENTS Many geologists have contributed to the 1:100000 compilation map (Figure 1) and are included in the list of references. We appreciate the landowners who have allowed us access to their property. We would like to thank Peter and Thelma Thompson for many hours of discussion, e-mails, field time and enthusiasm in preparation for this field trip. We benefitted greatly from discussions and field time spent with Rolfe Stanley, Wally Bothner, and Barry Doolan. We also wish to express our gratitude to Larry Becker, State Geologist, for his commitment to the mapping project. Funding for mapping in the area was provided by the Vermont Geological Survey, Agency of Natural Resources and by the USGS STATEMAP Program.
REFERENCES
Albee, A.L., 1957, Bedrock geology of the Hyde Park quadrangle, Vermont: U.S. Geological Survey Quadrangle Map GQ-102, scale 1:62,500.
Allan, J.F. and Gorton, M.P., 1992, Geochemistry of igneous rocks from legs 127 and 128, Sea of Japan: in Tarriaki, K., Suyehiro, K., Allan, J., McWilliams, M., and al., e., eds., Proceedings of the Ocean Drilling program-Scientific Results, p. 905-929.
Badger, R., 1977, Stratigraphy and origin of the Umbrella Hill Conglomerate: Master of Science thesis, University of Vermont, Burlington, Vermont, 106 p.
Badger, R., 1979, Origin of the Umbrella Hill Conglomerate, north-central Vermont: American Journal of Science, v. 279, p. 692-702.
Bothner, W.A. and Laird, J., 1987, Structure and metamorphism at Tillotson Peak, north-central Vermont: in Westerman, D.S., ed., New England Intercollegiate Geological Conference: Guidebook for Field Trips in Vermont, v. 2, 79th Annual Meeting, Montpelier, Vermont, p.383-395.
Cady, W.M., 1956, Bedrock geology of the Montpelier quadrangle, Vermont: U.S. Geological Survey Geologic Quadrangle Map GQ -79, scale 1:62,500.
237
B3-26 KIM, GALE, AND LAIRD
Cady, W.M., Albee, A.L., and Chidester, A.H., 1963, Bedrock geology and asbestos deposits of the upper Missisquoi Valley and Vicinity, Vermont: U. S. Geological Survey Bulletin 1122-B, Contributions to Economic Geology, 78 p.
Chidester, A.H., Albee, A.L., and Cady, W.M., 1978, Petrology, structure and genesis of the asbestos-bearing ultraniafic rocks of the Belvidere Mountain area in Vermont: U.S. Geologic Survey Professional Paper 1016, 95 p.
Coish, R.A., Perry, D.A., Anderson, C.D., and Bailey, D, 1986, metavolcanic rocks from the Stowe Fonnation, Vermont: Remnants of ridge and intraplate volcanism in the lapetus ocean: American Journal of Science, v. 286, P. 1-28.
Coish, R.A., and Rogers, N.W., 1987, Geochemistry of the Boil Mountain ophiolitic complex, northwest Maine, and tectonic implications: Contributions to Mineralogy and Petrology, v. 97, p. 51-65.
Doll, C.G., Cady, W.M., Thompson, J.B., Jr., and Billings, M.P., 1961, Centennial geologic map of Vermont: Vermont Geological Survey, scale 1:250,000.
Doolan, B.L., Gale, M.H., Gale, P.N., and Hoar, R.S., 1982, Geology of the Quebec re-entrant: Possible constraints from early rifts and the Vermont-Quebec serpentine belt: in St. Julien, P. and Beland, J., eds., Major structural zones and faults of the northern Appalachians: Geol. Assoc. of Canada Spec. Paper 34, p. 87-115.
Doolan, B.D., Brooks, K., Copans, B., Hengstenburg, C., and Sonenburg, D., 1999, Bedrock geology of the Cold Hollow Mtns. Quadrangle, Vermont: Vermont Geological Survey Open File report VG99-3, scale 1:24,000.
Doolan, B., 1999,Compilation bedrock geologic map of the Jay Peak quadrangle, Vermont: Vermont Geological Survey Open-File Report VG99-1, scale 1:24,000.
Dooley, T. and McClay, K., 1997, Analog modeling of pull-apart basins: AAPG Bulletin, v. 81, no. 11, p. 1804-1826.
Evans, M.J., 1994, Geochemistry of metadiabasic dikes and metavolcanic rocks from north-central Vermont: Senior thesis, Middlebury College, Middlebury, VT.
Gale, M.H., 1980, Geology of the Belvidere Mountain Complex, Eden and Lowell, Vermont: Master of Science thesis, University of Vermont, Burlington, Vermont, 169 p.
Gale, M.H., 1986, Geologic Map of the Belvidere Mountain Area, Eden and Lowell, Vermont: U.S. Geological Survey Misc. Investigations Series map 1-1560.
Gale, M.H. and Kim, J.,1999, Compilation bedrock geologic map of the Hazens Notch Quadrangle, Vermont: Vermont Geological Survey Open-File Report VG99-2, scale 1:24,000.
Gale, P.N., 1980, Geology of the Newport Center area, north-central Vermont: Master of Science thesis, University of Vermont, Burlington, Vermont, 126 p.
Hadden, S.H., 1996, Minerals of the quarries of Lowell-Eden, Vermont: Rocks and Minerals Magazine, vol. 71, no. 4, p. 236-246.
Hoar, R.S., 1981, The bedrock geology of the Coventry area, Vermont: Master of Science thesis, University of Vermont, Burlington, Vermont, 139 p.
Johnson, D.L., 1998, A geochemical analysis of Stowe metavolcanics in the Mt. Elmore region of Vermont: Senior thesis, Middlebuiy College, Middlebuiy, VT.
Kim, Jonathan, 1997, Bedrock geologic map of parts of the Eden, Lowell, Hazens Notch and Irasburg quadrangles: Vermont Geological Survey Open-File Report 97-5, scale 1:24,000.
Kim, J., and Jacobi, R.D., 1996, Geochemistry and tectonic implications of Hawley Formation meta-igneous units: northwestern Massachusetts: American Journal of Science, v. 296, p. 1126-1174.
Kim, J., Spnngston, G., and Gale, M., 1998, Digital bedrock geologic map of the Eden quadrangle, Vermont: Vermont Geological Survey Open-File Report VG98-3A, 2 plates, scale 1:24,000.
Konig, R.H. and Dennis, J.G., 1964, The geology of the Hardwick area, Vermont: Vermont Geological Survey Bulletin 24, 57 p.
Laird, J., 1977, Phase equilibria in mafic schist and polymetamorphic history of Vermont: Ph.D. thesis, California Inst. Tech., Pasedena, California.
Laird, J. and Albee, A.L., 1981, Pressure, temperature, and time indicators in mafic schist: their application to reconstructing the polymetamorphic history of Vermont: American Journal of Science, v. 281, p. 127-175.
238
B3-27 KIM, GALE, AND LAIRD
Laird, J., Lanphere, M.A. and Albee, A.L., 1984, Distribution of Ordovician and Devonian metamorphism in mafic and pelitic schists from northern Vermont: American Journal of Science, v. 284, P. 367-413.
Laird, J., Trzcienski, W.E. and Bothner, W.A., 1993, High-pressure, Taconian and subsequent polyrnetamorphism of southern Quebec and northern Vermont: in Field Trip Guidebook for the Northeastern United States: 1993 Boston GSA, v. 2, p 1-32, 1993 Geological Society of America Annual Meeting and 85th Annual New England Intercollegiate Geological Conference Meeting, Boston, MA.
Lanphere,M.A. and Albee, A.L., 1974, 40Ar/39Ar age measurements in the Worcester Mountains: Evidence of Ordovician and Devonian metamorphic events in northern Vermont: American Journal of Science, v. 274, p. 545-555.
Marsters, V.F., 1905, Petrography of the amphibolite, serpentine, and associated asbestos deposits of Belvidere Mountain, Vermont: Geol. Soc. America Bull., v. 16, p. 419-446.
Melancon, B., Hebert, R., Laurent, R. and Dostal, J., 1997, Petrological and geochemical characteristics of the Bolton Igneous Group, southern Quebec Appalachians: American Journal of Science, v. 297, p. 527-549.
Oshlin, 1.0. and Crocket, J.H., 1986, The geochemistry and petrogenesis of ophiolitic volcanic rocks from Lac de l'Est, Thetford Mines Complex, Quebec, Canada: Canadien Journal of Earth Science, v. 23, p. 202-2 13.
Pearce, J.A., 1982, Trace element characteristics of lavas from destructive plate boundaries, in Thorpe, R.S., ed., Andesites: New York, John Wiley and Sons, p. 525-548.
Perry, E.L., 1929, The geology of the Bridgewater and Plymouth Townships, Vermont: Vermont State Geologist 161h Report, 1927-1928, p. 1-64.
Pinet, N. and Tremblay, A., 1995, Tectonic evolution of the Quebec-Maine Appalachians: from oceanic spreading to obduction and collision in the northern Appalachians: American Journal of Science, v.295, p. 173-200.
Pugin, P.A., 1989, Geochemistry of the Belvidere Mountain Amphibolite, Troy, Vermont: Senior thesis, Middlebuiy College, Middlebury, VT.
Ratcliffe, N., Walsh, G. and Aleinokoff, J., 1997, Basement, metasedimentary and tectonic cover of the Green Mountain massif and western flank of the Chester dome; in Grover, T.W., Mango, H.N. and Hasenohr, E.J., eds., New England Intercollegiate Geological Conference: Guidebook for Field Trips in Vermont and Adjacent New Hampshire and New York, 89th Annual Meeting, Castleton, Vermont
Roy, D.L., 1982, The structure and stratigraphy of the ultramafic belt, Troy, Vermont, and its significance in northern New England: Master of Science thesis, University of Vermont, Burlington, Vermont.
Schooninaker, A., 1998, Geology of the western 1/3 of the Hazens Notch 7.5 minute quadrangle, northern Vermont Vermont Geological Survey Open-File Report 9 8-6, 2 plates, scale 1:24,000.
Schoonrnaker, A., 1998, Geology of the western 1/3 of the Jay Peak 7.5 minute quadrangle, northern Vermont: Vermont Geological Survey Open-File Report 2 plates, scale 1:24,000.
Shervais, J.W., 1982, Ti-V plots and the petrogenesis of modern ophiolitic lavas: Earth Planet. Sci. Lett., v. 59, p 101-118.
Springston, G., 1997, Bedrock geology of the Stowe-Waterbury area, north-central Vermont: Unpublished report to the Vermont Geological Survey.
Springston, G., Kim, J., and Applegate, G.S., 1998, Digital bedrock geologic map of the Morrisville quadrangle, Vermont: Vermont Geological Survey Open-File Report VG98-1A, 2 plates, scale 1:24,000.
Stanley, R.S., Roy, D.L., Hatch, N.L. Jr., and Knapp, D.A., 1984, Evidence for the tectonic emplacement of the ultramafic and associated rocks in the pre-Silurian eugeosyndlinal belt of western new England-vestiges of an ancient accretionary wedge: American Journal of Science, v.284, p 559-595.
Stanley, R.S. and Ratcliffe, N.M., 1985, Tectonic synthesis of the Taconic orogeny in western New England: Geological Society of America, v. 96, p. 1227-1250.
Stanley, R.S., 1997, Digital bedrock geologic map of part of the Serpentine Belt, Lowell and North Troy quadrangles, Vermont: Vermont Geological Survey Open-File Report VG97-04A, 2 plates, scale 1:24,000.
Thompson, P.J. and Thompson, T.B., 1997, Bedrock geology of the Mt. Mansfield, Jeffersonville, and Bolton Mtn. Quadrangles, Vermont: Unpublished report to the Vermont Geological Survey.
Thompson, P.J. and Thompson, T.B., 1999, Digital bedrock geologic map of the Mt. Mansfield quadrangle, Vermont: Vermont Geological Survey Open File Report VG99-2A.
239
B3-28 KIM, GALE, AND LAIRD
Thompson, P.J. and Thompson, T.B., 1999, Digital bedrock geologic map of the Johnson quadrangle, Vermont: Vermont Geological Survey Open File Report VG98-2A, scale 1:24,000.
Tremblay, A., 1992, Tectonic and accretionary history of Tacoman oceanic rocks of the Quebec Appalachians: American Journal of Science, v. 292, no. 4, p. 229-252.
Walsh, G.J., 1992, Bedrock geology of the Fayston-Buels Gore area, central Vermont: Vermont Geological Survey Special Bulletin No. 13, 74 p.
Walsh, G. and Aleinokoff, J., 1999, U-Pb zircon age of metafelsite from the Pinney Hollow Formation: implications for the development of the Vermont Appalachians: American Journal of Science, v. 299, p157-170.
Williams, H. and St. Julien, P., 1982, The Baie Verte-Brompton line: Early Paleozoic continent-ocean interface in the Canadian Appalachians: in St. Julien, P. and Beland, J. eds., Major structural zones and faults of the northern Appalachians: Geol. Assoc. of Canada Spec. Paper 34, p. 177-207.
Wilson, M., 1989, Igneous Petrogenesis: London, Unwin-Hyman, 466 p.
240
R3-29
Figure 12- Road Map showing stop locations for Trip B3
241
B3-30 KIM, GALE, AND LAIRD
FIELD TRIP ROAD LOG
Meet at McDonald's (M) on Route 15 and Route 100 on the north side of Momsville.
0 Exit the west end of the parking lot and turn right onto Route 100 north. 0.2 Traffic light. Turn left at light onto Rtes. 15 and 100. 2.2 Turn right onto Route 100 going north. 7.8 Go through the town of North Hyde Park. Continue on Route 100. 11.9 Turn left onto Route 118. 14.2 Turn left onto Knowles Flat Road. 14.45 Turn right into dirt driveway. Park along the sides of the driveway. The outcrops which we are visiting are
in the front yard and there are flower beds as well. Please do not use hammers.
Stopi Green Mountain Slice- Fayston Fm.
This 'stop provides an opportunity to view domain 1 structures in rocks of the Green Mountain slice. As outlined in the introduction, the dominant foliation in domain 1 is an S l/S2 composite foliation that is gently folded by an upright asymmetric F3 (Acadian) fold set. We will see a large exposure of albitic schist of the Fayston Formation and discuss evidence for at least three fold generations. Carbonaceous albitic schist of the Hazens Notch Formation is exposed just down the hill to the west.
There are, at least, 3 generations of folds observable in these outcrops. The youngest generation (F3=Acadian) are open folds which climb gently to the west. The associated slip cleavage (S3) is rather constant in orientation, striking generally to the north and dipping steeply to the west. Hinge lines of the F3 folds are basically horizontal or plunging a few degrees to the south. Gently southward- plunging F3 crenulation lineations are found on most S2 surfaces. Please try to keep track of the orientation and character of F3 folds and the associated S3 as we move to the east for further stops.
The next youngest fold generation (F2=Taconian) are tight to isoclinal folds with an axial surface schistosity that ranges from penetrative to closely-spaced; F2 is oriented at a shallow angles from the horizontal. Hinges for F2 folds vary in orientation but generally trend between northwest and northeast. These folds deform an older composition layering that consists of quartz and feldspar-rich layers and mica-rich layers. A mineral lineation/stretching lineation is oriented to the east-northeast and is not colinear with the F2 fold axes. The folds are of at least two orders of scale with small parasitic folds on still larger folds. The dominant sense of rotation for the larger scale F2 folds is clockwise as one looks to the north.
The oldest generation of folds (Fl) is hardest to see. The presence of Fl folds is inferred by the fact that compositional layering is folded by F2 and F3 folds. The compositional layering described above is thought to be the axial surface schistosity of Fl .We do see distinct layers of quartz-feldspar granofels within this dominantly schistose rock; these layers probably represent bedding or transposed bedding. It is very difficult to identify the hinges of these F 1 folds, however, in the hinge region of F2 folds, one can fmd thin layers of quartz-feldspar granofels that outline small closures or hooks which are folded by F2. Furthermore, Ranisay Type 2 (?) interference patterns can be seen on the large outcrop just east of the pond. The stretching lineation described above may be parallel to or nearly parallel to the hinges ofFl folds.
There are a number of fracture sets of differing relative ages that are visible as one walks down the outcrop near the house: 1) planar unfilled fractures, 2) planar fractures filled with quartz, and 3) folded quartz-filled fractures.
14.45 Exit driveway and return to Route 118. 14.7 Turn right on Route 118.
242
B3-31 KIM, GALE, AND LAIRD
15.3 Pass by an outcrop on the left of the Belvidere Mountain greenstone in contact with schists of the Hazens Notch Formation. The fine grained, schistose, dark and light banded greenstone with quartz veins is composed of chlorite, actinolite, albite, epidote, calcite, sphene, magnetite and biotite. The lighter green bands are composed primarily of epidote and albite. F2 isoclinal folds deform both the compositional bands and the contact with schists of the Hazens Notch Formation. The contact is exposed at the back of the outcrop.
17.0 Turn left onto Route 100.
18.3 Eden Mills. Veer left just after the general store onto Mines Road.
22.1 Belvidere Mountain. Enter mine on the left and go through the gate. We will drive up behind the waste piles to the south and past the "C" quarry.
Stop 2 Belvidere Mountain
We will drive through the asbestos quarry and up the road past waste piles to the south. From here we will be able to view the field area, and review maps and cross-sections. We will then proceed to take a short 3/4 mile hike along the old mine road above the silos to see the Belvidere Mountain coarse-grained amphibolite and greenstone. For anyone not wishing to hike, we suggest you return to the C-area quarry for a brief look at the serpentinized ultramafic rock. Abundant pieces of amphibolite can be found on the quarry floor.
Belvidere Mountain drew attention in 1899 when Judge M.E. Tucker found asbestos in the area (Marsters, 1905). In the 1960's, an average of 3500 tons of ore were mined daily (Hadden, 1981) with chrysotile asbestos used in brake linings, roofmg, shingles and pipe lining. Asbestos related health issues and stringent environmental laws depressed the asbestos market and the mine closed in 1993. The mountain continues to draw the attention of mineral collectors, hikers who cross the summit on the Long Trail, botanists and ecologists searching for unique plant communities related to the high magnesium, iron and calcium-rich rocks, scientists investigating ways to store or "dispose" of excess CO2, and others interested in the magnesium rich rocks. Our interest in the area stems from the location of the uliramafic rocks within the ophiolite belt of the northern Appalachians, its association with a variety of metamophosed mafic rocks, and the structural history reflected in the map pattern.
Detailed geology of the ultraniafic rocks and the quarry mapping was done by Chidester, Albee and Cady in 1978. They mapped dunite, peridotite, and massive serpentinite surrounded by schistose serpentinite in the quarry. Asbestos is present as slip fiber and cross fiber. Layering is prevalent in the massive rock. Talc-carbonate and quartz-carbonate rock was also mapped. Gale (1980) mapped the area south of the summit, focusing on the metamorphosed mafic rocks and defmed several fault surfaces. Laird and Albee (1981) documented high-pressure facies series metamorphism in rocks mapped as the Belvidere Mountain Aniphibolite (Doll et. aL, 1961) to the north at Tillotson Peak. Doolan and others (1982) and Stanley and others (1984) consider the ultramafic rocks to be ophiolite fragments or fault slivers. As interpreted here, the ultramafic rocks are fault-emplaced on top of the Belvidere Mountain Amphibolite, greenstone and meta-sedimentary rocks, exotic mafic-clast-bearing schists, and the high-pressure mafic and metasedimentary rocks at Tillotson Peak. The base of this tectonic sequence which defmes the Belvidere Mountain slice is the albite gneiss.
The coarse grained amphibolite, exposed above the silos on the east flank of the mountain, is a dark gray, banded massive rock composed of amphibole (barroisite cores, barroisite rims, Laird, 1977 ), epidote and garnet with lesser amounts of albite, chlorite, sphene, sencite, biotite and calcite. Calcite is present as aggregates giving some outcrops a speckled appearance. Garnet occurs as pale red or green porphyroblasts, depending on the amount of alteration to chlorite. The parallelism of amphibole laths defmes the dominant Si lineation. Textures in the amphibolite show a five stage development: amphibole cores; alignment of amphibole and amphibole rims; shearing; alteration of barroisitic homblende and recrystallization of chlorite, epidote and actinolite parallel to S2; and crenulate folds. The maximum thickness of the amphibolite, assuming 100% repetition by folding, is 60 meters.
The metamorphic assemblage associated with Dl is zoned hornblende (barroisitic-hornblende cores with barroisite rims, Laird, 1977), twinned albite, zoned epidote and garnet. The assemblage is in the medium to high
243
B3-32 KIM, GALE, AND LAIRD
pressure facies series. The mineral assemblage associated with D2 is chlorite, epidote, albite +1- actinolite, biotite, quartz, sphene and opague. In the coarse grained aniphibolite, the metamorphism associated with D2 deformation results in only partial retrogradation of the earlier mineralogy. Homblende is partially altered to chlorite and biotite, resulting in a fibrous texture which defmes S2. Garnet exhibits partial to complete alteration to chlorite , albite and epidote. Large epidote grains (syn-S 1) are fractured, and some have recrystallized as finer aggregates and as discrete grains parallel to S2. Quartz veins cross-cut the dominant Li amphibole lineation.
The striking features about this location are the obvious structurally flat-lying structures and the massive nature of the outcrop. Compositional layers strike generally ENE with a variable gentle dip to the southeast and northwest. A crenulate schistosity is also visible, superposed on the earlier structures.
The Belvidere Mountain greenstone is exposed along the road and in the woods just to the west. The rock is a fme-grained, blue-green greenstone with albite porphyroblasts in relief on the weathered surface. A modal analysis based on 1000 points per thin section is: amphibole (44%), epidote (39%), quartz (7%), chlorite (5 °)'o),
albite (2%), biotite (1%), sphene (2%) and opagues including pyrite and magnetite (1%). Some chlorite occurs as a pseudomorph of garnet. The unit, as mapped, includes this albitic greenstone, a schistose greenstone, and a light and dark green banded greenstone (exposed on Route 118). The textural variations in the rock do not defme separable map units and occur together within single outcrops.
The contact of the greenstone with the coarse grained and fine grained amphibolites, the serpentinite, and the pelitic schistlmuscovite schist are fault contacts marked by fault slivers and thin talc zones. The foliation in the greenstone becomes more prevalent, pervasive and closely spaced at the contacts with the serpentinite. The contact of the greenstone with the albite gneiss and with schists of the Hazens Notch Formation is interpreted as a fault contact based on map scale truncation of units.
0 RESET THE ODOMETER TO 0. Exit the mine and turn left on Mines Road. 2.7 Cheney Road. Turn right on Cheney Road. Cross a bridge. 3.0 Turn left on Valley Road. 4.2 Turn left into driveway. Please park on the grass to the right or left of the driveway, avoiding the flower
gardens. Do not park in the driveway or blocking the driveway.
Stop 3 Burgess Branch Fault Zone (BBFZ), Valley Road, Lowell
The BBFZ in northern Vermont is a southern continuation of part of the Baie-Verte Brompton Line that runs from Newfoundland through Quebec. At this location, the BBFZ is a composite fault zone along which the Taconian Belvidere Mountain and Prospect Rock faults rooted; later late-Taconian and Acadian movement also occurred along this surface. To the south, the BBFZ diverges to the east from the Prospect Rock Fault. The BBFZ defines the western side of the Vermont Ultramafic Belt. Numerous discontinuous lithologies are juxtaposed along this fault zone over short distances.
The first part of this stop will examine a diverse assemblage of rocks that have Hazens Notch Formation affinities such as: 1) calcareous greenstones, 2) silvery gray-green albite porphyroblast phyllites, 3) volcaniclastic metasediments that have a composition intermediate between the greenstones and phyllites (elevated quartz), and 4) pyritiferous granofels.
The dominant foliation (Taconian S2) in the pyritiferous granofels is folded by a north-northeast trending moderately south-plunging tight fold set that have lineations that are colinear with their fold axes. As one moves northward along Burgess Branch Brook and into the fault zone, the dominant foliation steepens to nearly vertical and becomes phyllonitic. Two lineations are apparent on the steeply dipping foliation surfaces. A moderate to steep south-plunging lineation is overprinted by a shallowly north-plunging crenulation lineation. The earlier and steeper lineation in the fault zone is colinear with the fold axes seen in the pyritiferous granofels and we believe that they are related. However, an argument could be made that these lineations are the Taconian L2 lineations. The margins
44
B3-33 KIM, GALE, AND LAIRD
of large ultramafic on the east bank of the brook against which the Hazens's Notch lithologies are juxtaposed are composed of talc-carbonate and have a strong foliation coplanar with the BBFZ.
The dominant foliation in the greenstones and volcaniclastic metasediments in the brook (please be very careful- these rocks are extremely slippery- we have taken some hard spectacular falls here) is transected by a late north-south trending and steeply west-dipping crenulation cleavage that may be the Acadian S3. If the late crenulation cleavage is S3 then the latest significant movement along the BBFZ is post-Taconian S2; however, if the late transecting cleavage is post-S3, then the BBFZ had a syn-S3 history. Although the sense of shear along the BBFZ is not clear, local C-S fabrics suggest right lateral oblique slip motion and the general map pattern along the BBFZ is consistent with map patterns in the vicinity of strike-slip faults (e.g. Dooley and McClay, 1997). Doolan et al. (1982) proposed left-lateral strike-slip motion in this belt in northern Vermont.
After walking back across the pasture, we will walk a short distance to the north on Valley Road to look at highly deformed outcrops of an Ottauquechee Formation lithology on the east side of the BBFZ. This lithology is a rusty-weathering silver gray to gray-green pyritiferous phyllite that contains patches of graphite. The dominant schistosity in these phyllonitic papery rocks is a north-northeast trending steeply west-dipping fabric that is the BBFZ fabric whereas the folded fabric is interpreted to be the Taconian S2. This lithology is juxtaposed against an ultramafic (same body as seen in Burgess Branch Brook) and against greenstones, and is abruptly truncated to the north and south.
Trace and rare-earth element geochemical analysis of one of the greenstones in the Hazens Notch - lithologies indicates a MORB origin. REE patterns are LREE-depleted and trace element spider patterns show MORB abundances of immobile elements (See Figure 8E and 8F). The geochemical signature of this BBFZ greenstone in the Hazens Notch rocks is nearly identical to those of the Eden Notch Greenstone that will be seen in Stop 6.
4.2 Exit driveway and continue north on Valley Road.
5.0 Turn right onto Route 58.
5.4 Turn right onto Lower Village Road.
5.6 Warner Power Plant is on the left just across from the intersection with Bousquet Road. Park along the road.
Stop 4 Lunch stop and the Warner Power Plant, Lowell
This stop shows some of the lithologies that are present in a series of slivers that are pinned against a re-entrant in the Lowell ultramafic body. The lithologies present in this outcrop are blue-gray metasiltstone, rusty weathering black phyllites, and metadiabase; other lithologies present in this sliver include green and gray phyllites and gray quartzites. This unit truncates abruptly against the southern end of the Lowell ultramafic.
Three distinct superposed fold generations can be observed in this outcrop: 1) a northeast-trending isoclinal fold set with steeply-plunging axes that folds early compositional layering, 2) a northeast- trending gently plunging fold set, and 3) an east-west trending steeply-plunging tight fold set. We believe that the first fold generation is correlative with the Taconian S2, the second fold generation is probably F3 (with odd character and orientation relative to F3 folds elsewhere), and that the third fold generation is F4 which results in a gentle post-F3 warping of all units in the field area.
Steeply-plunging lineations colinear with the F2 isoclinal folds are folded by the later two folds sets. A gently plunging lineation that is colinear with the axes of second fold set is folded by the F4 folds. There is no known lineation associated with the F4 folds.
Just below the dam, the contact between the metadiabase and the blue-gray metasiltstone is exposed and the early isoclinal folds are clearly cut at a high angle by the metadiabase. Well-developed chilled margins can be
245
B3-34 KIM, GALE, AND LAIRD
seen in a few locations. However, across the dam the eastern diabase contact has a different appearance that looks somewhat gradational based on the presence of isoclinal infolds of metadiabase and metasiltstone. The metadiabase contact is folded by the second and third fold sets.
The rare-earth and trace element geochemistry of this metadiabase is similar to that of the Mt. Norris metadiabases and is interpreted to have a suprasubduction zone basin origin (Figures 8A-8D). Metadiabases such as these can be directly compared with metadiabases found in the Moretown Formation southeast of this study area that were analyzed by Laird, Trzcienski, and Bothner (1993) and fall in the Low Pressure Facies Series (see Figure 7).
5.6 Return to cars and continue east on Lower Village Road. 5.9 Turn right onto Route 100. Continue south on Route 100. 8.4 Turn left onto Meek Road. Bear left and park along the roadside.
Stop 5 Mt. Norris Member (informal) of the Stowe Formation
Thisstop in the farmer's field shows the Mt. Norris member (Kim, 1997) of the Stowe Formation which is characterized by silvery gray-green quartzose phyllites that contain metadiabasic intrusives. Stanley et al. (1984) mapped a unit identical to this in the North Troy and Jay areas of northern Vermont. Metadiabases are also found in the Western Moretown, Moretown, and Cram Hill formations. The Mt. Norris member of the Stowe Formation is found to the west of the D3 (Acadian) Eden Notch Fault Zone (ENFZ) and is juxtaposed with the greenstones and black phyllites in this fault zone (see Stop 6).
The dominant foliation in the gray-green phyllites at this outcrop is interpreted to be S2 (Tacoman) and contains floating hingelines of vein quartz that have been transposed into this foliation; steeply plunging lineations are found on S2 surfaces that may be related to stretching. The contacts of the metadiabasic bodies are coplanar with the donimant S2 foliation in the phyllites and are therefore pre or syn S2 in age. Tight asymmetric north-plunging F3 (Acadian) folds deform the S2 fabric and have an axial planar crenulation cleavage (S3). Both S2 and S3 are northeast-trending and steeply west-dipping.
This metadiabase is a gray, massive, rounded, granular, and weakly-foliated rock with hypidiomorphic texture. The intrusive origin for this and other diabases is based on the presence of chilled margins and rare xenoliths of metasedimentary lithologies. This metadiabase cannot be traced any further than the end of the outcrop as these metadiabases are commonly boudinaged.
The rare-earth element geochemistry of this metadiabase is similar to that of all other Mt. Norris metadiabases (Figure 8A and 8B) and is interpreted to have a suprasubduction zone basin origin (see geochemistry section). Metadiabases such as these can be directly compared with metadiabases found in the Moretown Formation southeast of this study area that were analyzed by Laird, Trziencski, and Bothner (1993) and fall in the Low Pressure Facies Series (see Figure 7).
0 Return to Route 100 South and RESET THE ODOMETER TOO. Drive past the Eden Notch Barn. 1.9 Turn right into dirt driveway and park along the side of the drive.
Stop 6 Eden Notch Fault Zone
This stop focuses on the lithologies and structural fabrics associated with a segment of the syn-F3 (Acadian) Eden Notch Fault Zone (ENFZ). We will begin by looking at a sliver of black phyllite that has been sandwiched between the regionally extensive Eden Notch greenstone (informal) and a much smaller greenstone; the Mt. Norris member of the Stowe that contains metadiabasic intrusives is exposed at the top of the hill to the east (seen in Stop 5), but will not be observed here.
246
B3-35 KIM, GALE, AND LAIRD
The sliver of rusty-weathering graphitic and pyntiferous black phyllite at the small waterfall that is believed to have Ottauquechee Formation affmities has two foliations that are interpreted to be the Taconian S2 (shallower dip) and superposed Acadian S3 (steeper dip). The S3 fabric intensifies as we approach the contact of the black phyllite with the Eden Notch greenstone (contact not exposed here). As we walk uphill through the small stream valley the black phyllite will be beneath our feet with the Eden Notch greenstone to the east. Near the western boundary of the black phyllite sliver, S3 will again intensify and we will reach the thin greenstone sliver that has a a "crushed" zone at its base. The zone is essentially a papery schist with phacoidal cleavage and abundant calcite. Kinematics along this fault are equivocal but fold asymmetry entering the "crushed" zone is suggestive of the ENFZ being a down to the west normal fault.
The ENFZ juxtaposes metadiabase-bearing gray-green phyllites of the Mt. Norris member of the Stowe Formation with the Eden Notch greenstone and Ottauquechee Formation black phyllites. The metadiabases not only have a different geochemical signature than the Eden Notch greenstone, but also have a different metamorphic history. The Eden Notch Greenstone has a MORB signature (Figures 8E and 8F) whereas the metadiabases have a SSZ basin signature. Petrologically, the Eden Notch Greenstone has polyrnetamorphic amphiboles with winchite cores that fall into the Medium-High Pressure Facies Series (Laird et al., 1984)(Figure 7) and actinolite rims, but the metadiabases exhibit Low Pressure Facies Series metamorphism and maintain relict igneous textures and plagioclase and pyroxene pseudomorphs.
1.9 Return to Route 100 and go south. Pass the boat launch and Lake Eden Campground. 5.3 Turn sharply left onto East Hill Road and climb the hill. Bear right. 6.8 Road cut. Park just beyond the road cut.
Stop 7 Stowe Formation, East Hill Road, Eden Mills
This stop in the Mt. Norris member (informal) of the Stowe Formation is directly west of the Eden Notch Fault Zone. The fault contact with the Eden Notch greenstone is on the east side of the small valley that one sees just ahead along East Hill Road (looking eastward). Metadiabases are not found within this outcrop, but are abundant in the outcrops farther up the hill. The lithology here is a silvery gray-green phyllite with a greasy feel (talc?) and abundant floating isoclinal hingelmes of vein quartz that mark earlier schistosities. A boudinaged layer of gray granofels is visible at one location in the outcrop. The dominant schistosity is a composite S2/S3 fabric in which there is little difference in attitude between the folded S2 and the superposed S3. The intensity of the S3 fabric is interpreted to be related to the close proximity to the syn-S3 Eden Notch Fault Zone.
The three schistosities visible at this outcrop are (in order of decreasing relative age): 1) Taconian S2 which is marked by transposed isoclinally folded quartz veins that have been folded by the superposed asymmetric fold set (F3); S2 foliation surfaces commonly have steeply southeast-plunging quartz lineations which may be stretching lineations, 2) a northeast-trending steeply west-dipping spaced cleavage that is axial planar to the tight asymmetric shallowly south-plunging F3 folds; a crenulation intersection lineation (L3) can be found on S2 foliation surfaces that is colinear with F3 fold axes, and 3) a northeast-trending moderately to steeply west-dipping post S3 and post-metamorphic schistosity that is localized around the small late fault surfaces that are internal to this outcrop; reclined isoclinal folds and a fault-related crenulation lineation of different orientation than the L3 can also be seen locally. The late faulting at this outcrop is thought to postdate the ENFZ, because in other locations S2 is truncated by an S3 fault cleavage.
6.8 Continue east on East Hill Road. 8.2 Road cut Park beyond the Umbrella Hill Conglomerate road cut Park well off the road and watch for
traffic.
247
B3-36 KIM, GALE, AND LAIRD
Stop 8 Umbrella Hill Conglomerate (UHC) and Ottauquechee Black Phyllites, East Hill Road, Eden
The lithology at this location is a silvery gray phyllitic conglomerate in which the most abundant clasts are rounded to sub rounded pebbles and cobbles of coarsely crystalline quartz with subordinate occurrences of red-pinkish slate/phyllite, tan and whitish granofels, and black phyllite clasts. Other clasts identified by Badger (1979) include gray phyllite and greenstone. Chiorotoid is particularly abundant at the margins of the clasts of red slate/phyllite and tan granofels and is also found in the matrix of silvery-gray phyllite; Laird (1999, personal communication) has reported kyanite in the UHC. Metadiabasic intrusives are found in units on either side of the UHC; however, none are found in the UHC.
There are two northeast-trending foliations present in this outcrop which are: 1) a dominant later cleavage that truncates the earlier spaced cleavage (Acadian S3?) 2) an earlier spaced cleavage that strikes slightly more to the east and dips more steeply to the west than the later cleavage (Taconian S2?). The earlier foliation contains a steeply northwest-plunging lineation which maybe a Taconian stretching lineation and also a southwest-plunging intersection imeation of S3 crenulate fold axes on S2.
The contact of the UHC with the Moretown Formation is conformable whereby conglomeratic layers are interlayered with grayish-green pinstriped phyllites near the eastern UHC contact (Badger, 1979; Kim, 1997). The western contact of the UHC with Lowell Mountain lithologies (Stowe and Ottauquechee) is enigmatic because the contact has both conformable (Badger, 1979) and tectonic/unconformable (Kim, 1997) characteristics. The truncation of numerous Stowe and Ottauquechee map units along-strike coupled with truncation of earlier structures is suggestive of, at least, an angular unconformity. North of this study area Badger, (1977; 1979) not only noted interlayering of Umbrella Hill conglomeratic layers and Stowe Formation grayish-green phyllites, but also found very abrupt contacts of black phyllites against the UHC.
After exaniining and discussing the UHC we may walk to the west to briefly look at the rusty-weathering black graphitic Ottauquechee phyllite that is exposed in the back yard of a nearby home. The presence of this lithology at the contact with the UHC demonstrates that these black phyllites can be found in the eastern lithotectonic packages as well as those to the west in the field area. Structures in the black phyllites show an earlier foliation that is marked by floating isoclinal hingelines of vein quartz (Taconian S2); these fold hingelines have been folded by a set of asymmetric tight crenulate folds with an axial planar crenulation cleavage (Acadian S3). The F3 folds moderately to the north whereas the earlier F2 fold axes plunge steeply north or south.
8.2 Continue east on East Hill Road. 10.0 Pass outcrops of the Moretown Formation on the left. 12.9 Turn right onto Wild Branch Road just past the Craftsbury General Store. 21.3 Route 15. Turn right. 25.3 Turn left onto Route I 5A and enter Morrisville. 27.05 Turn left onto Route 12 South. Enter the town of Elmore. 31.3 Turn right into Elmore State Park and follow the park road uphill to the parking lot and gate at the
trailhead.
Stop 9 Mt. Elmore State Park, Worcester Schist and Amphibolite members (informal) of the Stowe Formation
The purpose of this fmal stop is to give you a "broad brush" introduction to the Elmore Amphibolite and garnet and kyanite-bearing Elmore Schist ("spangly schist"); these are representative of lithologies found in the core of the Worcester Mountains. The aniphibolites and schists were previously mapped continuously with the Stowe Formation, but were isolated by elliptical isograds that follow the core of the Worcester Mountains (Albee, 1957). For example, the Eden Notch Greenstone (Stop 6) and Stowe Formation grayish-green phyllites (Stop 7) to the north were mapped as along-strike correlatives of the Elmore Amphibolite and Schists.
B3-3 7 KIM, GALE, AND LAIRD
We believe that the core of the Worcester Mountains represents a slice that is structurally lower than the Hyde Park Slice in which Taconian garnet and kyanite-grade metamorphism is preserved; there is no evidence of garnet and kyanite-grade metamorphism in surrounding Ottauquechee, Stowe, and Moretown formation lithologies (with the exception of Kyanite reported by Laird (1998, pers. comm.) in the Umbrella Hill Conglomerate that is related to an anomalously aluminous bulk composition). The Worcester Mountains (with emphasis on Mt. Elmore) are thought to be a D3 arch or anticlinorium cored by the Worcester Schist and Amphibolite for the following reasons: 1) the elliptical nearly concentric isograds can be explained by the erosional removal of overlying rocks to expose the core of an anticlinorial window, 2) the isograds terminate abruptly to the north, 3) pre-S3 lithological contacts and foliations wrap around Mt Elmore on both sides to the north, 4) earlier D2 and possibly Dl structures are preserved on the east side of Mt. Elmore and not in surrounding rocks, 5) the earlier structures are preserved in a structural domain where F3 becomes dominant in the surrounding rocks, 6) as one moves up into the core of the Worcesters (schist) F3 folding and the accompanying axial planar crenulation cleavage intensify, and 7) the aspect ratio of the polygons that defme the isograds are similar to the aspect ratio of isograds surrounding other Acadian domes or arches in Vermont. Albee (1957) labeled the Worcester Mountains as the Worcester Anticline. Ongoing geologic mapping in the Worcester Mts. by Kim and Gale will help resolve which fold generations are responsible for the "arching" in hope of defming a variation on a Ramsey-Type II Fold Interference Patterns.
Our cross-section shows that the Worcester slice is interpreted to lie above the Belvidere Mt. and Green Mt. slices and below the Hyde Park and Western Moretown slices (Figure 2). If we are to interpret the thermobarometric data of Laird et al. (1984; 1993) strictly we must acknowledge that the Worcester Slice could lie at a higher structural level in the cross section above the Foot Brook Slice, but below the Hyde Park Slice; in this case the Foot Brook and Hyde Park slices would be related but separate. Existing geochemical data suggest that some Elmore Amphibolite samples have an arc-affmity as do samples of the Belvidere Mt. Amphibolite (Figures 9A, 9B,9C, 9D, 10, and 11) If future detailed geochemical work on the Belvidere Mt. Arnphibolite bolsters this connection, then we have mafic rocks of the same or similar chemistiy that underwent significantly different Pressure-Temperature histories.
This is a Vermont State Park and thus hammers are not perm itted
We will walk approximately one mile up the trail during this stop. The trail first follows a park service road and then splits off and becomes a hiking trail. The first stop (9A) will begin at the ainphibolite to the east of the trailhead gate which is part of the major amphibolite body mapped on the east side of Mt. Elmore. There are at least two fold generations preserved at this outcrop which are the isoclinally-folded floating hingelines of earlier compositional layering and vein quartz (S2) and tight asymmetric F3 folds. The contact between this amphibolite and the Elinore Schist is between this outcrop and the next outcrop to the south.
Stop 9B will be the large exposure of schist on the left side of the trail which is a gray-green quartz-muscovite-chlorite schist with magnetite and rare retrograded (chloriti.zed) garnets. The garnets look blackish-green and are dodecahedral. Try to keep track of what the S2 and F3/S3 are doing as we walk up the trail.
We will walk "freeform" up around the major bend and look at the outcrops (Stop 9C) on the left side of the trail in which one can see, if the light is right, white mica pseudomorphs after kyanite. You should also see some "retro" garnets. The F3 folding has made the S2 considerably steeper and one should be able to see the S3 overprinting the S2. Proceed further up the trail on your way to the picnic table that is at the end of the service road portion of the trail. Outcrops on the right are more muscovitic ("spangly") and have abundant completely retrograded garnets and rare mildly retrograded garnets in which one can see the original garnet (Stop 9D).
We will now begin walking up the hiking trail and will stop at the amphibolite that is —1/4 mile up the trail on the right; the sharp eastern contact of this amphibolite is exposed here and this ainphibolite body is —1 00 min map width (Stop 9E). This amphibolite has abundant epidote-albite compositional layering and magnetite. If one walks around this outcrop to the right and up the hill —10 yards, one can see an outcrop face in which multiple fold
249
B3-38 KIM, GALE, AND LAIRD
generations are visible (we believe we can see three). The first two fold sets are isoclinal and are overprinted by a strong asymmetric F3 fold generation.
The last stop at this location will be to look at some kyanite-bearing schists a short distance up the trail and then up to a small ridge on the left side. One will see blades of kyanite replaced by white mica, retrograded gamets, and a strongly developed S3 cleavage.
0 Exit the park to the left onto Route 12. RESET THE ODOMETER TO 0. 4.4 Town of Morrisville. 4.5 Turn right on Route 100 North. 4.65 Turn left by the Texaco Station, staying on Route 100 North to Route 15. 4.8 Go right on Brookline Street (Rte. lOON to Rte. 15). 6.7 Turn right into Ames Plaza and McDonald's. Hope to see you at the banquet.
250
B4-1
EVIDENCE FOR MOVEMENT OF THE MONROE FAULT DURING INTRUSION OF THE VICTORY PLUTON, NORTHEASTERN VERMONT
by Kimberly A. Hannula, Geology Department, Middlebury College, Middlebury, VT 05753
INTRODUCTION
The granites of northeastern Vermont represent some of the westernmost magmatism associated with the Acadian Orogeny. They provide important pieces of information needed to understand Acadian tectonics in New England: I) The geochemistry of the plutons may provide information about the magma source and about the tectonic setting in which it was generated; 2) The relative timing of pluton intrusion and deformation, combined with the absolute age of intrusion, can constrain the age of tectonic-related deformation, which is otherwise difficult to determine; 3) Plutons and their aureoles record a crustal depth at a particular time, allowing P-T and T-time histories to be linked at a different part of the P-T history than is possible from combining P-T studies with cooling ages.
The plutons of northeastern Vermont appear to cut all Acadian structures, and have therefore been used to place a minimum age bracket on local Acadian deformation. In the aureole of the Victory Pluton, however, there is significant evidence that deformation along the Monroe Fault occurred during or after contact metamorphism. The purpose of this field trip is to present the metamorphic and microstructural evidence for syn-faulting pluton intrusion, and to discuss the implications of new 40Ar/39Ar cooling ages from the Victory Pluton and its aureole.
BACKGROUND
REGIONAL GEOLOGY
The Victory Pluton is one of a group of Devonian plutons that straddle the boundary between two major subdivisions of the New England Appalachians: the Connecticut Valley trough and the Bronson Hill belt (Fig. 1). The Connecticut Valley trough (Hatch, 1987) is underlain by two major Silurian-Devonian stratigraphic units (Doll and others, 1961; Hatch, 1987). The mixed pelitic and quartzose Gile Mountain Formation is late Early Devonian in age (Hueber and others, 1990), whereas the underlying calcareous Waits River Formation is Silurian in age (Aleinikoff & Karabinos, 1990; Annstrong and others, 1997) (Fig. 1). Connecticut Valley trough rocks lie above and east of rocks representing rift and post-rift sediments east of the passive margin of Laurentia (Fig. 1). The margin of Laurentia was partially subducted and, along with accretionary wedge sediments, imbricated along numerous thrust faults (Stanley & Ratcliffe, 1985) and metamorphosed to high pressure greenschist or epidote-amphibolite facies conditions (Laird & Albee, 1981) during the Ordovician Taconian orogeny.
To the east of the Connecticut Valley trough lie the rocks of the Bronson Hill belt, which include the Ordovician Oliverian gneisses, Albee Formation, Ammonoosuc Volcanics, and Partridge Formation, the Silurian Clough Quartzite, the Silurian-Devonian Fitch Formation, and the Devonian Littleton Formation (Thompson and others, 1968; Rankin, 1996) (Fig. 1). The rocks of the Bronson Hill belt are separated from the rocks of the Connecticut Valley trough by the Monroe Line (Hatch, 1988).
MONROE FAULT
The nature of the contact between Connecticut Valley trough and Bronson Hill belt rocks is controversial. Along the length of the belt, some workers have argued that it is a fault (e.g. Johansson, 1963; Hatch, 1987; Hatch, 1988; Rankin, 1996; Armstrong and others, 1997), while others consider it an unconformity (e.g. Doll and others, 1961; Thompson and others, 1997). Discussion of the nature, significance, and precise location of the contact is complicated by disagreements about the stratigraphy on both sides of the contact. In southern and central Vermont, Thompson and others (1997) argue that rocks of the Connecticut Valley trough lie unconformably on pre-Silurian rocks of the Bronson Hill belt, and Thompson and others (1993) argue that the Devonian Littleton Formation lies unconformably above the Gile Mountain Formation. Armstrong and others (1997), on the other hand, argue that some rocks mapped as the Littleton Formation in eastern Vermont belong to the Waits River Formation of the Connecticut Valley trough, and that the contact between Connecticut Valley and Bronson Hill rocks is controlled by two thrust faults: the pre-peak metamorphic Skitchewaug Mountain fault and the post-peak metamorphic Westminster West fault.
Hannula, K., 1999, Evidence for movement of the Monroe Fault during intrusion of the Victory Pluton, Northeastern Vermont; in Wright, S.F. ed., New England Intercollegiate Geologic Conference Guidebook Number 91, p. 251-272.
43° N
B4-2
HANNULA
73°W 72°W
v
440 N
1 ? / /
7l°W
Cretaceous White Mountain plutonic series
Devonian New Hampshire plutonic series
P metasedimentary Ordovician-Devonian
and metaigneous rocks, BHB and CMB
Rocks of the Merrimack trough
Devonian Gile Mountain pelitic and quartzose schists
Silurian (?) Waits River limestones and calcareous schists
Pre-Silurian metasedimentary rocks, western Vermont
Laurentian Precambrian basement
Figure 1. Simplified geologic map of Vermont and New Hampshire (from Doll, 1961 and Billings, 1955). The box labeled 2" indicates the area of Fig. 2. The Northeast Kingdom batholith of Ayuso & Arth (1992) is indicated by darker borders around New Hampshire series plutons. Inset: simplified map of Acadian tectonic zones (after Bradley, 1983, and Rast & Skehan, 1993). CVT = Connecticut Valley trough; BHB = Bronson Hill belt; CMB = Central Maine belt. The location of the Connecticut Valley trough and Avalonia is from Bradley (1983). The Bronson Hill belt includes the Piscataquis Volcanic Arc of Bradley (1983); the Central Maine belt includes the Merrimack trough and the Kearsarge-Central Maine belt of Rast & Skehan (1993).
252
HANNULA 134-3
In northern Vermont, there is general agreement that the contact is a thrust fault, the Monroe Fault (Hatch, 1987; Hatch, 1988; Moench and others, 1995; Rankin, 1996), but disagreements about stratigraphic relationships on both sides of the fault make any estimate of total displacement along the fault difficult. The origin and age of the rocks immediately east of the fault are particularly controversial. Billings (1955) and Rankin (1996) interpreted them to lie stratigraphically beneath the Ordovician Ammonoosuc Volcanics, and mapped them as the Ordovician Albee Formation. Moench (1992, 1996), however, argued that they are correlative with Upper Ordovician to Lower Devonian rocks found in western Maine, and were emplaced west of the Bronson Hill belt along a gravity slide as the Frontenac-Piermont allochthon. One possible stratigraphic tie has been made across the Monroe Fault in northern New Hampshire: the Devonian Ironbound Mountain Formation of the Connecticut Valley trough has been mapped in depositional contact with the controversial Albee Formation (Rankin, personal communication) or the Silurian Smalls Falls Formation of the western Maine sequence (Moench and others, 1995).
There is evidence for both brittle, probably Mesozoic, faulting and ductile, probably Acadian, faulting along and near the Monroe Line in northeastern Vermont (Hatch, 1988; Rankin, 1996). Evidence for ductile faulting includes deformed porphyroblasts, sheared-off limbs of isoclinal folds, concentrations of quartz veins (Hatch, 1988), and development of a high-strain fabric in metamorphosed gabbro to tonalite dikes (Rankin, 1996). Placement of the pre-Devonian Albee Formation on the Devonian Gile Mountain Formation along a steeply east-dipping fabric suggests a thrust sense of movement (Rankin, 1996).
NORTHEAST KINGDOM PLUTONS
The New Hampshire series plutons of northeastern Vermont are also known as the Northeast Kingdom batholith (Ayuso & Arth, 1992; Arth & Ayuso, 1997) (Fig. 1). The plutons range in composition from quartz diorite to muscovite-bearing granite and originated from a variety of mantle- and crustal-derived melts that underwent varying amounts of fractional crystallization (Arth & Ayuso, 1997). Rb-Sr whole-rock isochron ages for plutons of the Northeast Kingdom batholith range from 370 ± 17 Ma (Derby Pluton) to 390 ± 14 Ma (Nulhegan Pluton) (Arth & Ayuso, 1997). Although the plutons appear mostly undeformed and cut both foliations (Doll, 1951; Dennis, 1956; Woodland, 1965), a few granitic dikes and sills are boudinaged (Doll, 1951; Dennis, 1956) or folded (Doll, 1951), suggesting that the plutons did not postdate all Acadian deformation. Xenoliths of country rock are abundant near the contacts of the plutons (Ayuso & Arth, 1992), and a zone of mixed granite and country rock containing numerous xenoliths and granitic dikes (the "granite-hornfels complex' of Woodland, 1965) up to two miles wide can be found along the western contact and to the southeast of the Victory Pluton (Fig. 2).
The Victory Pluton itself is very poorly exposed (Fig. 2). Although the "granite-hornfels complex" underlies many peaks in the area, including Kirby Mountain, Burke Mountain, and Umpire Mountain, most of the pluton proper is found beneath the Victory Bog. The mapped contact (Woodland, 1965; Johansson, 1963) between the pluton and its country rock follows the break in slope at the base of hills surrounding the bog in many places. The eastern lobe of the pluton, which is mapped as cutting across the Monroe Fault, is particularly poorly exposed. Although the presence of sillimanite-grade country rock exposed above the break in slope suggests the pluton or the "granite-hornfels complex" is nearby, the exact shapes of the Victory Pluton and its surrounding "granite-hornfels complex" are poorly known.
GEOCHEMISTRY OF VICTORY PLUTON
The Victory Pluton is broadly similar to rocks of the Northeast Kingdom Batholith (Ayuso & Arth, 1992; Arth & Ayuso, 1997). The Victory Pluton consists of granite, granodiorite, and tonalite with calc-alkaline affinities (Applegate, 1996). The rocks are metaluminous to weakly peraluminous, with A1 203/(CaO + Na2O + K20) ranging from 0.9 to 1.3 and normative corundum varying from zero to three percent. Some of the more mafic parts of the pluton contain hornblende, while other parts contain up to 15% muscovite. Portions of the pluton, particularly within the border zone on Burke Mountain, contain a foliation defined by aligned plagioclase and biotite phenocrysts (Applegate, 1996).
Geochemically, the Victory Pluton is similar to arc-type plutonic rocks (Applegate, 1996). Chondrite-normalized rare earth element plots show an enrichment in light rare earth elements (Fig. 3A). Trace elements normalized to a chondritic mantle (Thompson and others, 1984) show an enrichment in low field strength elements, with depletions in Nb, Ta, and Ti (Fig. 3B). On tectonic discriminant diagrams, the Victory Pluton samples plot in volcanic arc fields with some overlap to syn-collisional or late- and post-collisional fields (Fig. 3C, Fig. 3D).
253
B4-4 HANNULA
Umpire 3urke Mtn '1tr £
Kirby r'7 Mtn
Mile tn
7200' 71 050 71 045 I / •SD N
standsil . -- -- zones DLe A
J •S/ .'.• •,.•.' , .----_ • •Le •S I Legend
- _IY Devonian New Hampshire series
------ : /T . •S2 plutons - - - --- k
• . • +
- rt zone mixture of plutonic rocks and country
t zone :. St and sit .. rocks
• S2 .
- 11 Meetinghouse
i - . . 1 ,"gone Silurian-Devonian
Gile Mountain 440 30 - grt zone
• 0 - Formation •
sili- kfs____ zone
51 , • SD : '
2 Os3 Silurian-Devonian
• '2 v • SD L / / Waits River '3l
z.. Le •
S.
e • / / Formation
-. • ?c' ' E Ordovician (?) Albee Formation
• %•••
2 3 4 5 Miles Mountain ., migmatite complex
Figure 2. Simplified geologic map of the Victory Pluton and its aureole showing stereonet data (modified from Woodland, 1965, Eric & Dennis, 1958, and Johansson, 1963). SD = dominant foliation; Le = mineral elongation lineation. Inset: extent of cover in the vicinity of the Victory Pluton. The gray pattern indicates areas of Quaternary sedimentary cover (after Woodland, 1965).
254
HANNULA
B4-5
100 -.--V7036 -.- V7056 000 -.- V7036 -.- V7056
V7050 -- V7059 -e—V7054
-
C
C_) 10
E Ce
Cn
ii I I I I I I I I I
La Ce Pr Nd PmSm Eu Gd Th Dy Ho Er TmYb Lu Rare Earth Elements
Figure 3 A. Variation of the rare earth elements for five samples from the Victory pluton. Note the enrichment in light rare-earth elements with a small; negative europium anomaly.
I Trace Elements
Figure 3 B. Trace element values normalized to a chondritic mantle (Thompson et al., 1984). Victory pluton samples are enriched in low-field strength elements,with notable depletions in Nb, Ta, and Ti. The element patterns, especially Nb and Ta depletions, are typical of calc-alkaline granites in volcanic arcs and continental collision zones.
Rb/30
volcanic arc - within-plate OLG - syn-collisional LG - late id post-
collisional A
.1 1 10 Yb (ppm)
Figure 3 D. Variation of Ta with Yb in Victory pluton granitic samples. Tectonic discrimnant fields are syn-collisional (syn-COLG), volcanic arc (VAG), ocean ridge granite (ORG), and within-plate granite (WPG). Samples from the Victory pluton fall into the volcanic arc to syn-collisional fields.
WPG
Hf after Harris et al. (1986) Ta*3
Figure 3 C. Variation of Rb-Hf-Ta in Victory pluton samples, which plot in the volcanic arc and late to post-collisional fields.
100 -
WPG
syn-COL
ORG
after Pearce et al. (1984) n1 . I -
100
255
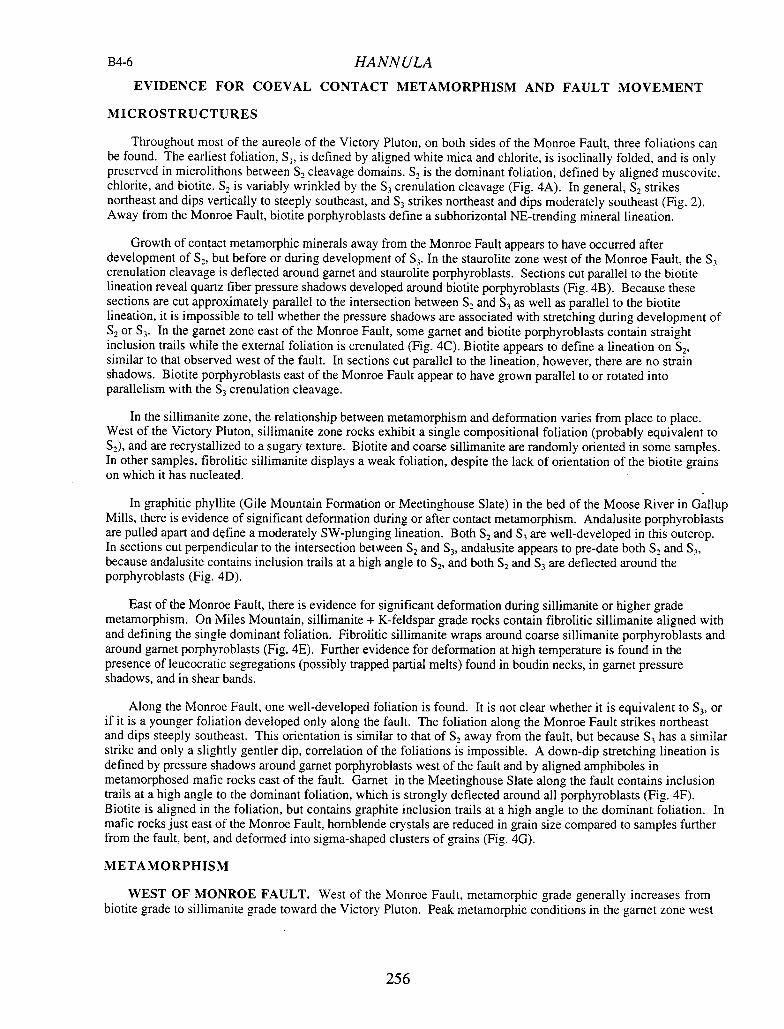
B4-6 HANNULA
EVIDENCE FOR COEVAL CONTACT METAMORPHISM AND FAULT MOVEMENT
MICROSTRUCTURES
Throughout most of the aureole of the Victory Pluton, on both sides of the Monroe Fault, three foliations can be found. The earliest foliation, S I , is defined by aligned white mica and chlorite, is isoclinally folded, and is only preserved in microlithons between S1 cleavage domains. 2 is the dominant foliation, defined by aligned muscovite, chlorite, and biotite. S2 is variably wrinkled by the S 3 crenulation cleavage (Fig. 4A). In general, S 2 strikes northeast and dips vertically to steeply southeast, and S 3 strikes northeast and dips moderately southeast (Fig. 2). Away from the Monroe Fault, biotite porphyroblasts define a subhorizontal NE-trending mineral lineation.
Growth of contact metamorphic minerals away from the Monroe Fault appears to have occurred after development of S 2, but before or during development of S 3 . In the staurolite zone west of the Monroe Fault, the S 3 crenulation cleavage is deflected around garnet and staurolite porphyroblasts. Sections cut parallel to the biotite lineation reveal quartz fiber pressure shadows developed around biotite porphyroblasts (Fig. 4B). Because these sections are cut approximately parallel to the intersection between S 2 and S 3 as well as parallel to the biotite lineation, it is impossible to tell whether the pressure shadows are associated with stretching during development of
or S 3 . In the garnet zone east of the Monroe Fault, some garnet and biotite porphyroblasts contain straight inclusion trails while the external foliation is crenulated (Fig. 4C). Biotite appears to define a lineation on S 2 ,
similar to that observed west of the fault. In sections cut parallel to the lineation, however, there are no strain shadows. Biotite porphyroblasts east of the Monroe Fault appear to have grown parallel to or rotated into parallelism with the S 3 crenulation cleavage.
In the sillimanite zone, the relationship between metamorphism and deformation varies from place to place. West of the Victory Pluton, sillimanite zone rocks exhibit a single compositional foliation (probably equivalent to S2), and are recrystallized to a sugary texture. Biotite and coarse sillimanite are randomly oriented in some samples. In other samples, fibrolitic sillimanite displays a weak foliation, despite the lack of orientation of the biotite grains on which it has nucleated.
In graphitic phyllite (Gile Mountain Formation or Meetinghouse Slate) in the bed of the Moose River in Gallup Mills, there is evidence of significant deformation during or after contact metamorphism. Andalusite porphyroblasts are pulled apart and define a moderately SW-plunging lineation. Both S 2 and S 3 are well-developed in this outcrop. In sections cut perpendicular to the intersection between S 2 and S3 , andalusite appears to pre-date both S 2 and S 3 ,
because andalusite contains inclusion trails at a high angle to S 2, and both S 2 and S 3 are deflected around the porphyroblasts (Fig. 413).
East of the Monroe Fault, there is evidence for significant deformation during sillimanite or higher grade metamorphism. On Miles Mountain, sillimanite + K-feldspar grade rocks contain fibrolitic sillimanite aligned with and defining the single dominant foliation. Fibrolitic sillimanite wraps around coarse sillimanite porphyroblasts and around garnet porphyroblasts (Fig. 4E). Further evidence for deformation at high temperature is found in the presence of leucocratic segregations (possibly trapped partial melts) found in boudin necks, in garnet pressure shadows, and in shear bands.
Along the Monroe Fault, one well-developed foliation is found. It is not clear whether it is equivalent to S 3, or if it is a younger foliation developed only along the fault. The foliation along the Monroe Fault strikes northeast and dips steeply southeast. This orientation is similar to that of S 2 away from the fault, but because S 3 has a similar strike and only a slightly gentler dip, correlation of the foliations is impossible. A down-dip stretching lineation is defined by pressure shadows around garnet porphyroblasts west of the fault and by aligned amphiboles in metamorphosed mafic rocks east of the fault. Garnet in the Meetinghouse Slate along the fault contains inclusion trails at a high angle to the dominant foliation, which is strongly deflected around all porphyroblasts (Fig. 4F). Biotite is aligned in the foliation, but contains graphite inclusion trails at a high angle to the dominant foliation. In mafic rocks just east of the Monroe Fault, hornblende crystals are reduced in grain size compared to samples further from the fault, bent, and deformed into sigma-shaped clusters of grains (Fig. 4G).
METAMORPHISM
WEST OF MONROE FAULT. West of the Monroe Fault, metamorphic grade generally increases from biotite grade to sillimanite grade toward the Victory Pluton. Peak metamorphic conditions in the garnet zone west
256
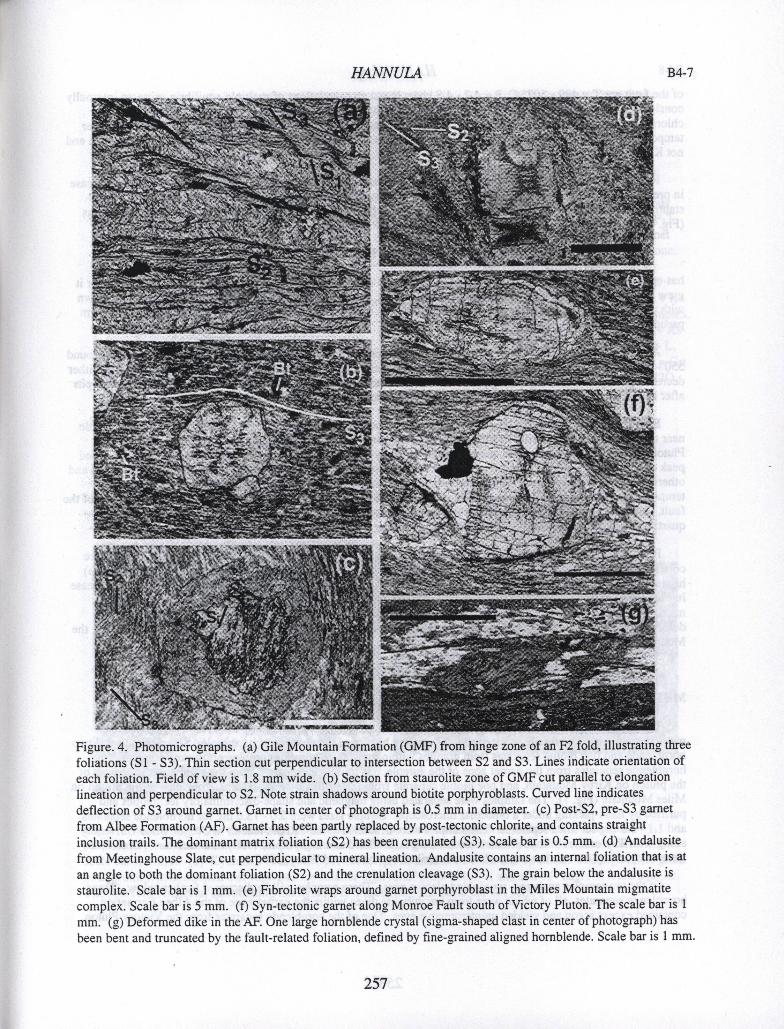
HANNULA
B4-7
Figure. 4. Photomicrographs. (a) Gile Mountain Formation (GMF) from hinge zone of an F2 fold, illustrating three foliations (Si - S3). Thin section cut perpendicular to intersection between S2 and S3. Lines indicate orientation of each foliation. Field of view is 1.8 mm wide. (b) Section from stauroiite zone of GMF cut parallel to elongation lineation and perpendicular to S2. Note strain shadows around biotite porphyroblasts. Curved line indicates deflection of S3 around garnet. Garnet in center of photograph is 0.5 mm in diameter. (c) Post-S2, pre-S3 garnet from Albee Formation (AF). Garnet has been partly replaced by post-tectonic chlorite, and contains straight inclusion trails. The dominant matrix foliation (S2) has been crenulated (S3). Scale bar is 0.5 mm. (d) Andalusite from Meetinghouse Slate, cut perpendicular to mineral lineation. Andalusite contains an internal foliation that is at an angle to both the dominant foliation (S2) and the crenulation cleavage (S3). The grain below the andalusite is staurolite. Scale bar is 1 mm. (e) Fibrolite wraps around garnet porphyroblast in the Miles Mountain migmatite complex. Scale bar is 5 mm. (f) Syn-tectonic garnet along Monroe Fault south of Victory Pluton. The scale bar is 1 mm. (g) Deformed dike in the AF. One large hornblende crystal (sigma-shaped clast in center of photograph) has been bent and truncated by the fault-related foliation, defined by fine-grained aligned hornblende. Scale bar is 1 mm.
257
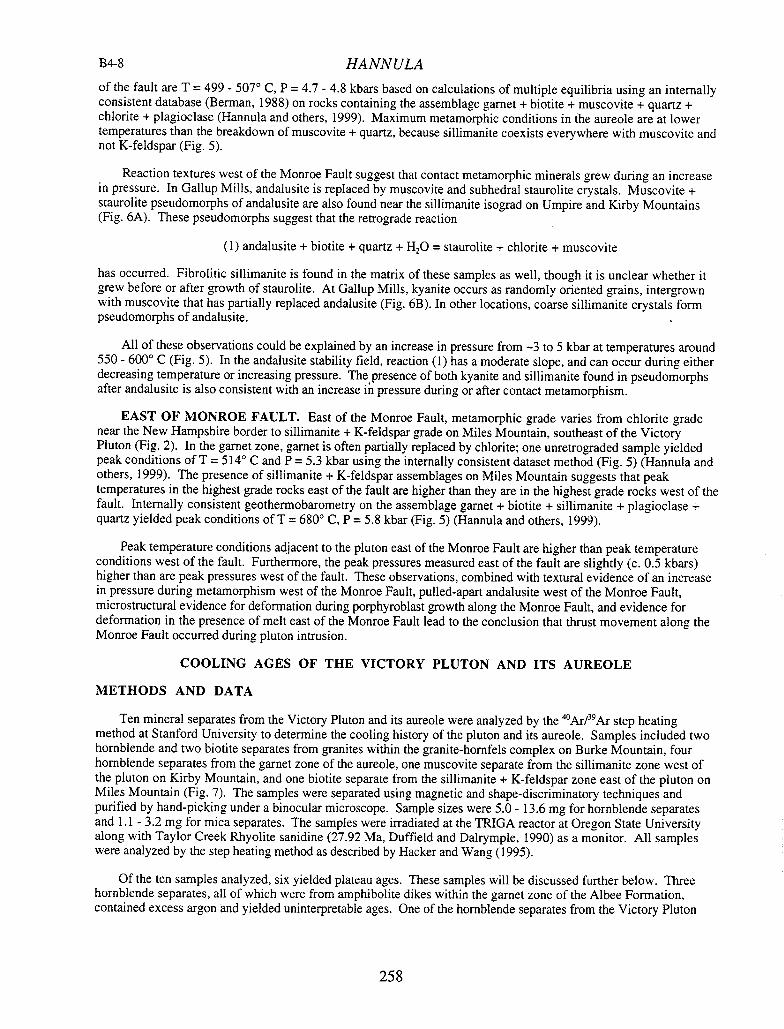
B4-8 HANNULA
of the fault are T = 499 - 507° C, P = 4.7 - 4.8 kbars based on calculations of multiple equilibria using an internally consistent database (Berman, 1988) on rocks containing the assemblage garnet + biotite + muscovite + quartz + chlorite + plagioclase (1-lannula and others, 1999). Maximum metamorphic conditions in the aureole are at lower temperatures than the breakdown of muscovite + quartz, because sillimanite coexists everywhere with muscovite and not K-feldspar (Fig. 5).
Reaction textures west of the Monroe Fault suggest that contact metamorphic minerals grew during an increase in pressure. In Gallup Mills, andalusite is replaced by muscovite and subhedral staurolite crystals. Muscovite + staurolite pseudomorphs of andalusite are also found near the sillimanite isograd on Umpire and Kirby Mountains (Fig. 6A). These pseudomorphs suggest that the retrograde reaction
(1) andalusite + biotite + quartz + H 20 = staurolite + chlorite + muscovite
has occurred. Fibrolitic sillimanite is found in the matrix of these samples as well, though it is unclear whether it grew before or after growth of staurolite. At Gallup Mills, kyanite occurs as randomly oriented grains, intergrown with muscovite that has partially replaced andalusite (Fig. 6B). In other locations, coarse sillimanite crystals form pseudomorphs of andalusite.
All of these observations could be explained by an increase in pressure from —3 to 5 kbar at temperatures around 550 - 600° C (Fig. 5). In the andalusite stability field, reaction (1) has a moderate slope, and can occur during either decreasing temperature or increasing pressure. The presence of both kyanite and sillimanite found in pseudomorphs after andalusite is also consistent with an increase in pressure during or after contact metamorphism.
EAST OF MONROE FAULT. East of the Monroe Fault, metamorphic grade varies from chlorite grade near the New Hampshire border to sillimanite + K-feldspar grade on Miles Mountain, southeast of the Victory Pluton (Fig. 2). In the garnet zone, garnet is often partially replaced by chlorite; one unretrograded sample yielded peak conditions of T = 514° C and P = 5.3 kbar using the internally consistent dataset method (Fig. 5) (Hannula and others, 1999). The presence of sillimanite + K-feldspar assemblages on Miles Mountain suggests that peak temperatures in the highest grade rocks east of the fault are higher than they are in the highest grade rocks west of the fault. Internally consistent geothermobarometry on the assemblage garnet + biotite + sillimanite + plagioclase + quartz yielded peak conditions of T = 680° C, P = 5.8 kbar (Fig. 5) (Hannula and others, 1999).
Peak temperature conditions adjacent to the pluton east of the Monroe Fault are higher than peak temperature conditions west of the fault. Furthermore, the peak pressures measured east of the fault are slightly (c. 0.5 kbars) higher than are peak pressures west of the fault. These observations, combined with textural evidence of an increase in pressure during metamorphism west of the Monroe Fault, pulled-apart andalusite west of the Monroe Fault, microstructural evidence for deformation during porphyroblast growth along the Monroe Fault, and evidence for deformation in the presence of melt east of the Monroe Fault lead to the conclusion that thrust movement along the Monroe Fault occurred during pluton intrusion.
COOLING AGES OF THE VICTORY PLUTON AND ITS AUREOLE
METHODS AND DATA
Ten mineral separates from the Victory Pluton and its aureole were analyzed by the 40Ar/39Ar step heating method at Stanford University to determine the cooling history of the pluton and its aureole. Samples included two hornblende and two biotite separates from granites within the granite-hornfels complex on Burke Mountain, four hornblende separates from the garnet zone of the aureole, one muscovite separate from the sillimanite zone west of the pluton on Kirby Mountain, and one biotite separate from the sillimanite + K-feldspar zone east of the pluton on Miles Mountain (Fig. 7). The samples were separated using magnetic and shape-discriminatory techniques and purified by hand-picking under a binocular microscope. Sample sizes were 5.0 - 13.6 mg for hornblende separates and 1.1 - 3.2 mg for mica separates. The samples were irradiated at the TRIGA reactor at Oregon State University along with Taylor Creek Rhyolite sanidine (27.92 Ma, Duffield and Dalrymple, 1990) as a monitor. All samples were analyzed by the step heating method as described by Hacker and Wang (1995).
Of the ten samples analyzed, six yielded plateau ages. These samples will be discussed further below. Three hornblende separates, all of which were from amphibolite dikes within the garnet zone of the Albee Formation, contained excess argon and yielded uninterpretable ages. One of the hornblende separates from the Victory Pluton
258
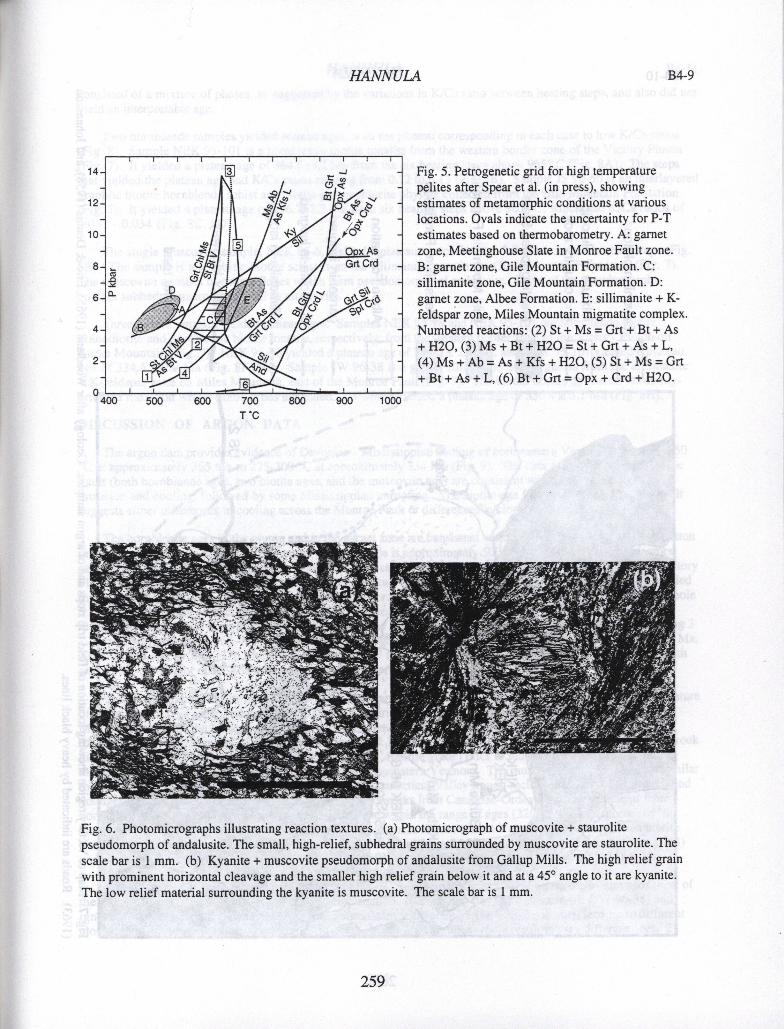
HANNUL14
WM
• n I' A .O
lilt i-
• sIj;:LI iv Vos • A GrtCrd
CU
-
D
• (B
400 500 600 700 800 900 1000
T C
14
12
10
8
6
4
2
n
Fig. 5. Petrogenetic grid for high temperature pelites after Spear et al. (in press), showing estimates of metamorphic conditions at various locations. Ovals indicate the uncertainty for P-T estimates based on thermobarometry. A: garnet zone, Meetinghouse Slate in Monroe Fault zone. B: garnet zone, Gile Mountain Formation. C: sillimanite zone, Gile Mountain Formation. D: garnet zone, Albee Formation. E: sillimanite + K-feldspar zone, Miles Mountain migmatite complex. Numbered reactions: (2) St + Ms = Grt + Bt + As + H20, (3) Ms + Bt + H20 = St + Grt + As + L, (4) Ms + Ab = As + Kfs + H20, (5) St + Ms = Grt + Bt + As + L, (6) Bt + Grt = Opx + Crd + H20.
Fig. 6. Photomicrographs illustrating reaction textures. (a) Photomicrograph of muscovite + staurolite pseudomorph of andalusite. The small, high-relief, subhedral grains surrounded by muscovite are staurolite. The scale bar is 1 mm. (b) Kyanite + muscovite pseudomorph of andalusite from Gallup Mills. The high relief grain with prominent horizontal cleavage and the smaller high relief grain below it and at a 45° angle to it are kyanite. The low relief material surrounding the kyanite is muscovite. The scale bar is 1 mm.
259
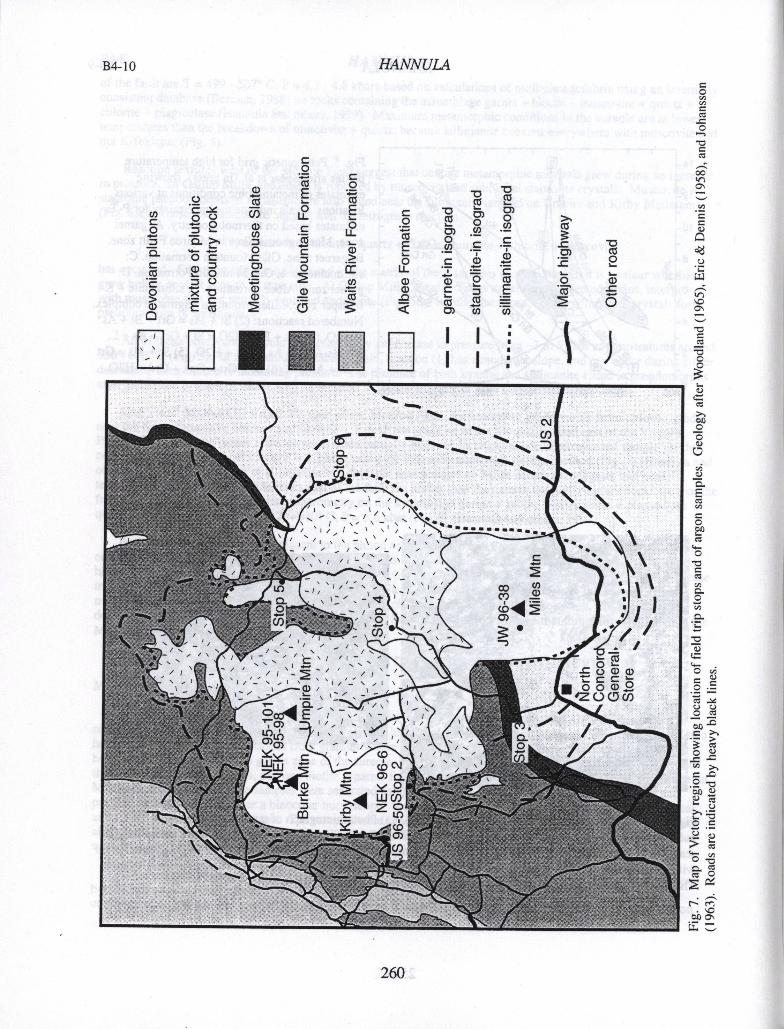
I cJ
- /
/ •:'"
4 -
- - -' I- co 'a CL S , - 0 4 4 - --
C) a I ,. - a
'',
'S / 'S_ C ' •
cu o a) a)
-/ I,__l '- • 00a).
-'
dZ 0 (D(l)
1E "T a - , LO '
Cos 0
E
= C
C
C
I- •0 0
g 0
00 Cc = >5.
C 0 >5. = .
.2 - 0 0
' 0 '-S
B4-10 HANNULA
C 0
0 .2 - .2 -
>
CL — 0 c0 cz 0 0
C Cl) 0) 0 rr IL -- — -
_0 C E O (/) 0 CtS 0 (D o x - Cl) a) c =3 E > C C - =
Ec
LJI!LLHH Si
260
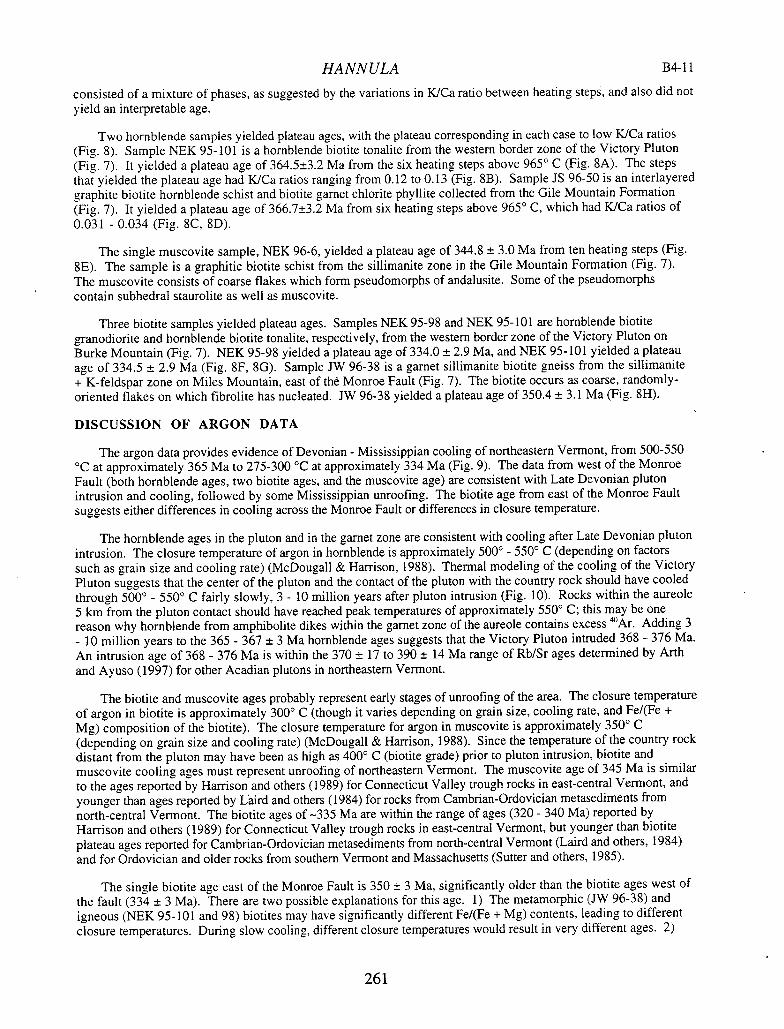
HANNULA 134-11
consisted of a mixture of phases, as suggested by the variations in K/Ca ratio between heating steps, and also did not yield an interpretable age.
Two hornblende samples yielded plateau ages, with the plateau corresponding in each case to low K/Ca ratios (Fig. 8). Sample NEK 95-101 is a hornblende biotite tonalite from the western border zone of the Victory Pluton (Fig . 7). It yielded a plateau age of 364.5±3.2 Ma from the six heating steps above 965° C (Fig. 8A). The steps that yielded the plateau age had K/Ca ratios ranging from 0.12 to 0.13 (Fig. 8B). Sample JS 96-50 is an interlayered graphite biotite hornblende schist and biotite garnet chlorite phyllite collected from the Gile Mountain Formation (Fig. 7). It yielded a plateau age of 366.7±3.2 Ma from six heating steps above 965° C, which had K/Ca ratios of 0.031 - 0.034 (Fig. 8C, 8D).
The single muscovite sample, NEK 96-6, yielded a plateau age of 344.8 ± 3.0 Ma from ten heating steps (Fig. 8E). The sample is a graphitic biotite schist from the sillimanite zone in the Gile Mountain Formation (Fig. 7). The muscovite consists of coarse flakes which form pseudomorphs of andalusite. Some of the pseudomorphs contain subhedral staurolite as well as muscovite.
Thiee biotite samples yielded plateau ages. Samples NEK 95-98 and NEK 95-101 are hornblende biotite granodiorite and hornblende biotite tonalite, respectively, from the western border zone of the Victory Pluton on Burke Mountain (Fig. 7). NEK 95-98 yielded a plateau age of 334.0 ± 2.9 Ma, and NEK 95-101 yielded a plateau age of 334.5 ± 2.9 Ma (Fig. 8F, 8G). Sample JW 96-38 is a garnet sillimanite biotite gneiss from the sillimanite + K-feldspar zone on Miles Mountain, east of thd Monroe Fault (Fig. 7). The biotite occurs as coarse, randomly-oriented flakes on which fibrolite has nucleated. JW 96-38 yielded a plateau age of 350.4 ± 3.1 Ma (Fig. 8H).
DISCUSSION OF ARGON DATA
The argon data provides evidence of Devonian - Mississippian cooling of northeastern Vermont, from 500-550 °C at approximately 365 Ma to 275-300 °C at approximately 334 Ma (Fig. 9). The data from west of the Monroe Fault (both hornblende ages, two biotite ages, and the muscovite age) are consistent with Late Devonian pluton intrusion and cooling, followed by some Mississippian unroofing. The biotite age from east of the Monroe Fault suggests either differences in cooling across the Monroe Fault or differences in closure temperature.
The hornblende ages in the pluton and in the garnet zone are consistent with cooling after Late Devonian pluton intrusion. The closure temperature of argon in hornblende is approximately 500° - 550° C (depending on factors such as grain size and cooling rate) (McDougall & Harrison, 1988). Thermal modeling of the cooling of the Victory Pluton suggests that the center of the pluton and the contact of the pluton with the country rock should have cooled through 500° - 550° C fairly slowly, 3 - 10 million years after pluton intrusion (Fig. 10). Rocks within the aureole 5 kin from the pluton contact should have reached peak temperatures of approximately 550° C; this may be one reason why hornblende from amphibolite dikes within the garnet zone of the aureole contains excess 40Ar. Adding 3 - 10 million years to the 365 - 367 ± 3 Ma hornblende ages suggests that the Victory Pluton intruded 368 - 376 Ma. An intrusion age of 368 - 376 Ma is within the 370 ± 17 to 390 ± 14 Ma range of Rb/Sr ages determined by Arth and Ayuso (1997) for other Acadian plutons in northeastern Vermont.
The biotite and muscovite ages probably represent early stages of unroofing of the area. The closure temperature of argon in biotite is approximately 300° C (though it varies depending on grain size, cooling rate, and Fe/(Fe + Mg) composition of the biotite). The closure temperature for argon in muscovite is approximately 350° C (depending on grain size and cooling rate) (McDougall & Harrison, 1988). Since the temperature of the country rock distant from the pluton may have been as high as 400° C (biotite grade) prior to pluton intrusion, biotite and muscovite cooling ages must represent unroofing of northeastern Vermont. The muscovite age of 345 Ma is similar to the ages reported by Harrison and others (1989) for Connecticut Valley trough rocks in east-central Vermont, and younger than ages reported by Laird and others (1984) for rocks from Cambrian-Ordovician metasediments from north-central Vermont. The biotite ages of —335 Ma are within the range of ages (320 - 340 Ma) reported by Harrison and others (1989) for Connecticut Valley trough rocks in east-central Vermont, but younger than biotite plateau ages reported for Cambrian-Ordovician metasediments from north-central Vermont (Laird and others, 1984) and for Ordovician and older rocks from southern Vermont and Massachusetts (Sutter and others, 1985).
The single biotite age east of the Monroe Fault is 350 ± 3 Ma, significantly older than the biotite ages west of the fault (334 ± 3 Ma). There are two possible explanations for this age. 1) The metamorphic (JW 96-38) and igneous (NEK 95-101 and 98) biotites may have significantly different Fe/(Fe + Mg) contents, leading to different closure temperatures. During slow cooling, different closure temperatures would result in very different ages. 2)
261
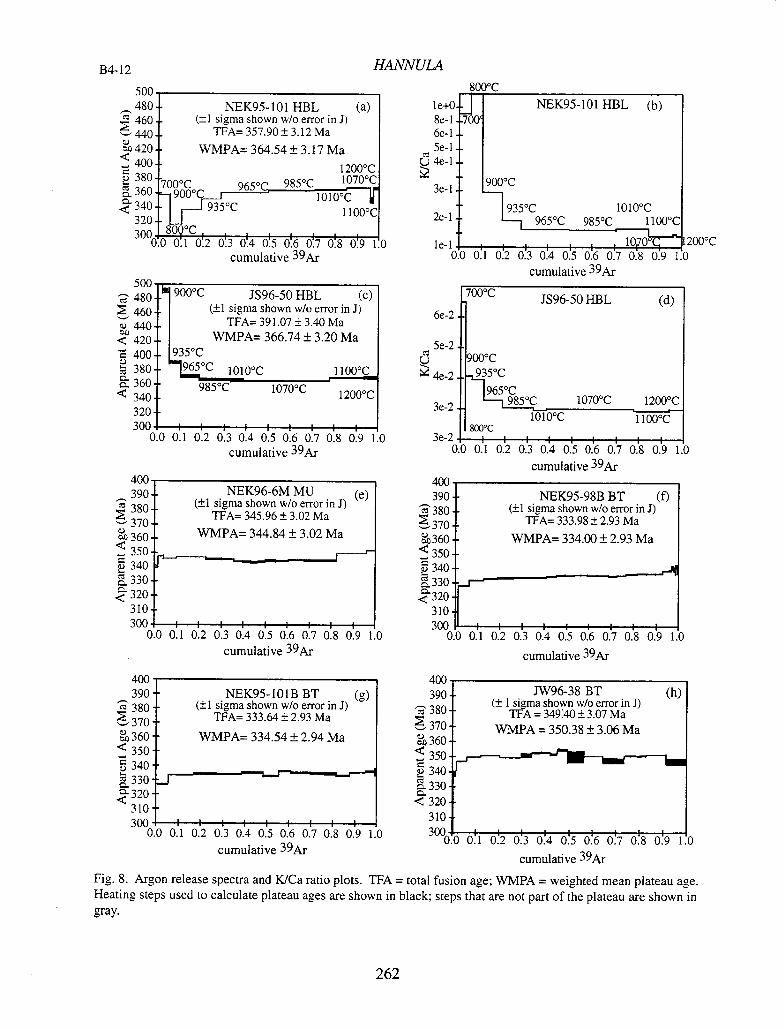
NEK95-101 HBL (b)
900°C
935°C 1010°C L__1 965°C 985°C 11
200°C )0 0.1 0:2 0:3 0:4 0.5 0:6 0:7 0:8 0:9 1.(
cumulative 39Ar
le+C 8e-1 6e-1 Se-I
t4e-1
3e-1
2e- 1
le- 1
700°C JS96-50 HBL (d)
900°C
12 50C 1070°C 1200°C 1010°C 1100°C
800°C
0 0.1 0.2 0.3 0.4 0.5 0.6 0.7 0.8 0.9 cumulative 39Ar
NEK95-98B BT (f) (±1 sigma shown w/o error in J)
TFA= 333.98 ± 2.93 Ma WMPA= 334.00 ± 2.93 Ma
6e-2
Cz Se-2
U 4e-2
3e-2
3e-2 0
40C 39( 38(
35(
.< 32( 31( 30C
0.0 0.1 0.2 0.3 0.4 0.5 0.6 0.7 0.8 0.9 1.0
cumulative 39Ar
'RA)
390 '380 370
a 360 350
2340 . 330
<320 310
B4-12 HANNULA
500 480 460 440
01 aa 420 400
320
NEK95-101 HBL (a) (±1 sigma shown w/o error in J)
TFA= 357.90± 3.12 Ma WMPA= 364.54 ± 3.17 Ma
1200°C
985 °c 1070°C
935°C IIOOOC
1 02 03 04 0:5 06 07 08 09 1 cumulative 39Ar
500
480 900°C JS96-50 HBL (c)
. 460 I (±1 sigma shown w/o error in J)
440 TFA= 391.07 ± 3.40 Ma
< 420 I WMPA= 366.74 ± 3.20 Ma 400 1935°C
380 96C 1010°C 1100°C
Cl- 360 985°C 1070°C
< 340 1200°C 320
300 I I I I 0.0 0.1 0.2 0.3 0.4 0.5 0.6 0.7 0.8 0.9 1.0
cumulative 39Ar
400
390 NEK96-6M MU (e)
380 (±1 sigma shown w/o error in J)
370 TFA= 345.96 ± 3.02 Ma
360 WMPA= 344.84±3.02 Ma 350 340
310
300 I I I I I 0.0 0.1 012 0.3 0.4 0.5 0.6 0.7 0.8 0.9 1.0
cumulative 39Ar
'+uu 390 380 370
0101
)
350 340
Cm 330 .-320
310 300
0.0 0.1 0.2 0.3 0.4 0.5 0.6 0.7 0.8 0.9 1.0 300 cumulative 39Ar
cumulative -Ar
Fig. 8. Argon release spectra and K/Ca ratio plots. TFA = total fusion age; WMPA = weighted mean plateau age. Heating steps used to calculate plateau ages are shown in black; steps that are not part of the plateau are shown in gray.
0
262
HANNULA
B4-13
900
800
700
600
500
400
300
200
100
0
hornblende
muscovite
tite east of Monroe Fault
biotite west of Monroe Fault
Fig. 9. Temperature-time path for the Victory Pluton and its aureole based on 40Ar/39Ar data.
380 375 370 365 360 355 350 345 340 335 330 Age (millions of years)
Ills
ModeLing parameters
center of pluton hornblende
pluton-country rock contact closure temperature
country rock 5 km from contact
I I I I I I I I
Half-width of pluton = 5 km Country rock temperature = 400° C (16 km
depth x 25° C/kin) Intrusion temperature = 900° C T interval of crystallization = 1000 C Heat of crystallization = 1 x 10⁵ J/kg Thermal conductivity = 2.75 W/m °K Heat capacity = 1000 Jfkg °K
800 0
600 I-
400
200
2.0 490 690 8.0 10.0 Time after intrusion (million years)
Fig. 10. Temperature-time plot illustrating a thermal model of a cooling pluton. The light gray line represents the cooling of the center of the pluton, the medium gray line represents cooling of the pluton-country rock contact, and the black line represents heating and cooling of rock 5 km from the pluton contact (a similar location to the garnet zone of the Victory Pluton). The light gray bar represents the closure temperature of argon in hornblende. The rate of cooling through hornblende argon closure temperatures depends strongly on the assumed country rock temperature. Peak metamorphic pressures west of the fault (4.7-4.8 kbar) imply a depth of approximately 16 km, which suggests a country rock temperature of 400° C at a typical continental gradient of 25° C/km. Initial country rock temperatures would have been colder west of the fault if 1-4 km of reverse offset occurred on the Monroe Fault during pluton intrusion, and hotter east of the fault. Erosion and exhumation during cooling are also possible; simultaneous exhumation and cooling were not incorporated into the model.
A 900° C intrusion temperature is consistent with peak contact metamorphic temperatures of approximately 650° C.
WN
134-14 HANNULA
The east side of the Monroe Fault may have cooled at an earlier time than the west side. Because the biotite cooling ages probably represent unroofing, they suggest that the east side of the Monroe Fault was at a shallower crustal level than the west side of the Monroe Fault at 350 - 334 Ma, and the two sides have since been juxtaposed by fault movement. The movement on such a fault would have the opposite sense of motion (east side down) from that suggested for the Acadian Monroe Fault (east side up). Brittle Mesozoic normal faulting has been described along the Monroe Line (Hatch, 1988), and could account for this juxtaposition. We have not seen field evidence for such faulting, but neither have we seen evidence that it did not occur. The ages of muscovite west of the fault (345 ± 3 Ma) and biotite east of the fault (350 ± 3 Ma) are within error of one another. It is therefore possible to speculate about the maximum post-Mississippian throw on such a fault. The closure temperatures of biotite and muscovite can be as much as 75 °C different. At a normal continental geothermal gradient of 25 °C/km, 75 °C corresponds to a 3 km difference in depth. A higher geothermal gradient or a smaller difference in closure temperatures would imply less movement.
SUMMARY AND CONCLUSIONS
Contact metamorphism due to intrusion of the Victory Pluton occurred during movement along the Monroe Fault. Microstructures along the fault indicate that deformation took place after metamorphic mineral growth, P-T differences across the fault are consistent with 1-4 km of fault movement after mineral growth, and reaction textures suggest that an increase in pressure occurred during contact metamorphism west of the fault. Away from the fault, a crenulation cleavage developed during and after growth of contact metamorphic minerals; the cleavage may represent either regional deformation or local deformation accommodating pluton emplacement.
Argon-argon cooling ages on hornblende, muscovite, and biotite are consistent with previously determined ages on similar rocks elsewhere in Vermont. Hornblende cooling ages of c. 365 Ma are consistent with pluton intrusion around 368-372 Ma, consistent with the Rb/Sr ages of other plutons in the Northeast Kingdom Batholith. Muscovite and biotite cooling ages are similar to those reported from Connecticut Valley trough rocks in east-central Vermont, although they are younger than those reported for Ordovician rocks further to the west. This suggests that, although the depths at which peak metamorphism occurred in southeastern and east-central Vermont were greater than those in northeastern Vermont, unroofing of the areas occurred at similar times. Biotite ages fall into two groups, and may represent the effect of Mesozoic normal faulting along the Monroe Fault.
The Victory Pluton intruded late in the history of the Acadian Orogeny, after deformation and pluton intrusion had occurred to the east in Maine. Locally, it intruded during the last thrust movement along the Monroe Fault, as evidenced by the weakly- to undeformed nature of the granite and by the very small differences in metamorphic pressures across the fault. The age and relationship to deformation of the Victory Pluton are consistent with the model of a westward-progressing deformational and plutonic front proposed by Bradley and others (1998).
ACKNOWLEDGMENTS
This research would have been impossible without the hard work of a large number of Middlebury undergraduates. In particular, the initial work on most of the samples discussed during this field trip was done as senior theses by Middlebury undergraduates: Gordon McGrath '95, Elizabeth Mattox '96, Jade Star Lackey '97, Emily Onasch '97, Jill Wertheim '97, G. Scot Applegate '98, Myrth Anderson '99, and Elizabeth Goeke '99. Nate West '01 and Andy Wall '99 assisted in mapping and sample collection during 1998, and Josh Cole '00 and Justin Klein '00 during 1999. Ray Coish has worked on the geochemistry of the Victory Pluton.
Doug Rankin introduced me to the Monroe Fault, and has passed along the location of numerous interesting outcrops he has come across during his mapping.
This research has been supported by VT-EPSCoR and the Howard Hughes Medical Institute.
ROAD LOG
Meet at the North Concord General Store. Directions from Burlington: take 1-89 south to Montpelier (Exit 8). At the exit, take US Rt. 2 east toward St. Johnsbury (approximately 37 miles). Just before reaching St. Johnsbury, US 2 intersects 1-91. Take 1-91 south to Exit 19 (the 2nd exit after entering 1-91, approximately 2.5 miles). Exit onto 1-93 south. Follow 1-93 to Exit 1 (approximately 3.5 miles) and exit to VT 18. Turn left at the end of the exit ramp. Follow VT 18 to US 2 (0.3 miles). Turn right (east) on US 2. Follow US 2 for 8.5 miles to the North Concord General Store (formerly known as Copp's Store), which is a red building on the right at a crossroads.
264
HANNULA 134-15
Bring a lunch, or buy one at the North Concord General Store before starting the trip.
Mileage
0.0 - North Concord General Store. Drive west on US 2 to junction with VT 18. 8.5 (8.5) Turn left onto VT 18. 8.9 (0.3) Junction VT 18 and 1-93.
STOP 1: 1-93 NORTHBOUND EXIT RAMP: GILE MOUNTAIN FORMATION OUTSIDE AUREOLE.
The purpose of this stop is to observe the structures and metamorphism in the Gile Mountain Formation outside the aureole of the Victory Pluton. The roadcut at this stop is also described at Stop C15 of Rankin (1996).
The Gile Mountain Formation here is a dark gray graphitic phyllite composed of graded beds of light gray quartz-rich ("sandy") layers to dark gray mica-rich ("shaly") layers. The northwestern portion of the roadcut contains spectacular evidence for two generations of folds. The earlier generation (identified as F 2 by Rankin (1996)'s regional mapping) are tight and moderately to gently inclined. The axial planar cleavage to S1 is folded by the upright chevron F 3 folds, which are the most obvious structure on the outcrop from a distance. The axial planar cleavage to F3 folds is a spaced crenulation cleavage which strikes approximately north and dips 60° E. A differently-oriented (and younger?) cleavage is found in the northwesternmost portion of the roadcut. Lithologic layering is more difficult to recognize here, and numerous quartz veins deformed into rootless isoclinal folds suggest this may be an area of higher strain than the rest of the outcrop.
This stop lies six miles from the contact with the Victory Pluton, and is outside the aureole mapped by Eric and Dennis (1958), Johansson (1963), and Woodland (1965). Biotite porphyroblasts which are not aligned in either S 2 or S3 are the most prominent indicators of metamorphic grade. Rankin (1996) describes garnet in the eastern portion of the outcrop. The presence of regional garnet in the Gile Mountain Formation is an important point to consider for the interpretation of microstructures in the Meetinghouse Slate in the garnet zone of the Victory Pluton along the Monroe Fault (Stop 3).
Return to US 2 via VT 18. 9.2 (0.3) Turn right (east) on US 2. 12.8 (3.6) Turn left on Kirby Mountain Road, a dirt road with a sign pointing towards Kirby. 13.1 (0.3) Bear to right, remaining on Kirby Mountain Road 15.1 (2.0) Intersection with Ranney Hill Road 18.9 (3.8) Junction with Victory Road (dirt) at a sharp left turn. Turn right on Victory Road. 19.7 (0.8) Turn left into dirt parking area used for logging.
STOP 2: CONTACT RELATIONS BETWEEN VICTORY PLUTON AND GILE MOUNTAIN FORMATION.
There are a number of interesting outcrops near this parking area.
Outcrop 2A: Staurolite pseudomorphs, graded bedding, and two foliations in pavement outcrop beside road.
Walk back to Victory Road from parking area. Walk uphill approximately 0.1 mile to a pavement outcrop on the right side of the road.
The outcrop consists of dark gray garnet staurolite biotite phyllite of the Gile Mountain Formation. Graded bedding shows that the local up direction is toward the SE. The dominant foliation (probably S 2) cuts lithologic layering at an angle of approximately 10°. The sharp contacts between the mica-rich and quartz-rich layers are deformed into tight to isoclinal centimeter-wavelength disharmonic folds, with S 2 forming an axial planar cleavage. A spaced crenulation cleavage cuts lithologic layering at an angle of approximately 45°.
The darkest mica-rich layers contain abundant mm-sized garnet and staurolite. The more quartz-rich layers contain staurolite replaced partially by muscovite + chlorite (visible in thin section, and less obvious though recognizable in outcrop). The S 3 crenulation wraps weakly around the staurolite pseudomorphs, suggesting that D 3 deformation took place during or after staurolite growth, but before retrogression.
265
B4-16 HANNULA
Return to logging parking area.
Outcrop 2B: Outcrop at entrance to parking area.
This outcrop consists of Gile Mountain Formation that has been multiply folded. At least one fold hinge of an early (F2 ?) isoclinal fold is visible, and the axial planar foliation to the isoclinal folds is the dominant foliation in the outcrop. The dominant foliation and the axial surface of the isoclinal fold are folded around moderately inclined open folds (F 3). Axial planar cleavage to the F 3 folds is variably developed.
Porphyroblasts are more abundant in the dark-colored layers than in the lighter layers. Staurolite is the most abundant porphyroblast, followed by biotite and tiny garnets. There are also rare pseudomorphs of andalusite present, recognizable by the square cross-section and the remnant chiastolite cross. Muscovite has completely replaced andalusite here.
Outcrop 2C: Northwest corner of parking area.
This outcrop also consists of fine-grained schist of the Gile Mountain Formation. At least two generations of folding are apparent: an older tight to isoclinal fold, and younger open folds. Both sets of folds have steeply-plunging hinges. The dominant foliation in the lighter gray quartzose layers (S 2?) consists of thin biotite-rich bands that are axial planar to the isoclinal folds. Axial planar foliation to the younger open folds (S 3) is weakly developed, and strikes due east and dips 55 N. This orientation is very different from that of S 3 east and west of the Victory Pluton, where S 3 typically strikes NE (Fig. 2).
Metamorphic porphyroblasts found in this outcrop include garnet (predominantly in the light gray layers), staurolite, and up to two cm long andalusite pseudomorphs (found in both light and dark gray layers). The andalusite is replaced by muscovite + tiny brown staurolite crystals, which can be recognized in outcrop as well as in thin section. The andalusite pseudomorphs suggest the reaction
andalusite + biotite + quartz + H 20 = staurolite + chlorite + muscovite
has occurred. This reaction can occur during either an increase in pressure or a decrease in temperature (Fig. 5).
The light gray layers throughout the outcrop contain K-feldspar + quartz + muscovite filled veins. Most of the veins are approximately 0.5 cm wide by 5 cm long, and are oriented approximately perpendicular to S 2 . S2 bends toward the middle of the veins, as if it has been slightly boudinaged, and the veins fill the boudin necks. Some of the veins are found in right-stepping en echelon arrays. One pegmatitic muscovite + quartz + K-feldspar vein is present at the top of the outcrop. Its orientation is similar to that of the smaller veins.
Outcrop 2D: Granite-Gile Mountain Formation contacts
Several outcrops on the hillside above the parking area expose contacts between the granite and its country rock. The contact is discordant to the dominant foliation in the country rock at map scale, but at outcrop scale it consists of numerous sills intruding the country rock parallel to the dominant foliation. Angular xenoliths containing at least one pre-intrusion foliation are common near the pluton contact. In some outcrops the granite is unfoliated, and in others it contains a weak foliation defined by aligned plagioclase and biotite parallel to the granite-country rock contact.
Follow the skidder road that leaves the NNE corner of the parking lot and follow it —N25E uphill approximately 700 feet. One good example of the plutonlcountry rock contact can be found approximately 100 feet southeast of the trail.
The outcrop contains the contact between biotite granite of the Victory Pluton and fine-grained, sugary-textured, contact-metamorphosed Gile Mountain Formation. The contact in this outcrop is irregular and sharp, and cuts across the compositional layering in the country rock (which is the dominant foliation here). Dark layers in the Gile Mountain Formation contain 5 mm long andalusite pseudomorphs, which now consist of muscovite + staurolite. The staurolite grains are small, but can be seen in outcrop.
Muscovite from andalusite pseudomorphs from one of the outcrops on this hillside yielded a 40Ar/39Ar plateau age of 344.8 ± 3.0 Ma.
266
HANNULA
B4-17
Return to vehicles and drive back down Victory Road. 20.5 (0.8) Intersection of Victory Road and Kirby Mountain Road. Turn left on Kirby Mountain
Road. 24.2 (3.7) Turn left on Ranney Hill Road. 24.3 (0.1) Intersection of Ranney Hill Road and Wood Lane. Continue straight on Ranney Hill
Road. 24.5 (0.2) Farmhouse at end of road. Park.
STOP 3: MONROE FAULT EXPOSED ALONG RANNEY BROOK (1.4 MILE WALK)
Walk approximately 0.5 miles down the farm road that bears right behind the farmhouse. The road crosses Ranney Brook at the downstream end of a series of waterfalls within which the Monroe Fault zone is exposed.
Follow Ranney Brook upstream. Outcrop is semi-continuous for approximately 0.4 miles, and deformed amphibolite similar to dikes found in the Albee Formation and graphitic phyllite similar to the Meetinghouse Slate are found in varying proportions along the stream.
The first outcrops exposed in the streambed, 300 feet upstream of the road crossing, are of deformed amphibolite. The rock appears to have been originally a coarse-grained amphibolite, but now contains a foliation defined by elongate clots of hornblende. Fine hornblende crystals are not aligned. Float on the east side of the stream has a strong stretching lineation, but we have been unable to measure its orientation in outcrop.
Continue upstream approximately 200 feet. Most of the rock along this set of falls, for the next 150 feet, is Meetinghouse Slate. Near the top of this set of falls, mm-sized garnets have pressure shadows parallel to the crenulation.
Enter an area of poor outcrop. Continue upstream approximately 700 feet to another series of small waterfalls.
Near the top of the first waterfall, a fine-grained biotite granite dike crosses the stream parallel to foliation. The dike contains a strong foliation defined by aligned biotite phenocrysts. In thin section, plagioclase porphyroclasts are surrounded by a matrix of extremely fine-grained, equigranular quartz and feldspar with the 120° grain boundary angles typical of annealed intracrystalline deformation. This texture may represent an annealed core-and-mantle structure.
Most outcrop for the next 300 feet is Meetinghouse Slate. A second rock which resembles the deformed dike crosses the stream at 215 feet. Its igneous origin is less obvious than the first, larger dike.
At approximately 300 feet, outcrops in the stream bed include both a small outcrop of highly deformed amphibolite and a larger outcrop of garnet-bearing Meetinghouse Slate. The Meetinghouse Slate contains a down dip stretching lineation defined by pressure shadows around 2-3 mm garnet porphyroblasts. Biotite porphyroblasts are also aligned, at a slight angle to the pressure shadow lineation.
In thin section cut parallel to the stretching lineation, garnet porphyroblasts from this area contain inclusion trails at a high angle to the single dominant foliation, implying that garnet growth preceded deformation (Fig. 4F).
The last outcrop (185 feet upstream) lies below a bridge made of large boulders, through which the stream runs. The outcrop appears to lie in the hinge zone of a fold of unknown generation, based on the high angle between lithologic layering and the dominant cleavage. The dominant foliation strikes NNE and dips SE. It is cut by two crenulation cleavages: an east-striking, steeply south-dipping crenulation cleavage which forms a down-dip crenulation lineation on SD surfaces, and a moderately SE-dipping crenulation cleavage with a similar strike to SD. Garnet porphyroblasts less than 1 mm in diameter are found in some layers.
Leave the streambed on the left (west) bank of the boulder bridge and walk across the field to a dirt farm road. Follow the farm road uphill (west) to the farmhouse and cars, approximately 0.4 miles.
Turn vehicles around and head back west on Ranney Hill Road.
24.7 (0.2) Intersection of Ranney Hill Road and Wood Lane. Turn left on Wood Lane. Wood Lane becomes Brook Road at Concord town line.
27.0 (2.3) Intersection with US 2. Turn left (east) on US 2.
267
B4-18 HANNULA
29.1 (2.1) North Concord General Store and intersection with Victory Road. Rest room and food stop. Turn left (north) on Victory Road (dirt), which becomes River Road in the town of Victory.
34.5 (5.4) Park in dirt pull-out on left.
STOP 4: VICTORY BOG. VIEWS OF BURKE MOUNTAIN, UMPIRE MOUNTAIN, AND HOBART RIDGE.
This stop lies within the extremely poorly-exposed eastern lobe of the Victory Pluton. Much of the Victory Pluton lies within the Victory Bog. However, the margins of the pluton and portions of the western margin of the pluton underlie the hills to the north and west of this stop. From the parking area, the peaks visible from west to east are Burke Mountain (with a fire tower and several antennas visible at the peak), Umpire Mountain, and, closer to the parking area, Hobart Ridge. Burke Mountain lies within the "granite-hornfels complex" of Woodland (1965). The complex on Burke Mountain consists primarily of granite and granodiorite containing numerous xenoliths of metasedimentary rock, and is accessible by a road to the top and by downhill ski trails from the town of East Burke. Umpire Mountain also exposes "granite-hornfels complex" at its peak, but exposes the Victory Pluton proper on its lower slopes. The complex on the northern end of Umpire Mountain consists primarily of staurolite to sillimanite grade Gile Mountain Formation, intruded by numerous granitic dikes. Metamorphic rocks on Umpire Mountain contain similar textures to those found on Kirby Mountain. Hobart Ridge is underlain mostly by the Victory Pluton.
Continue north on River Road.
38.7 (4.2) Victory town garage on left. Park and walk down river bank behind sand pile to Moose River.
STOP 5: PULLED-APART ANDALUSITE IN MEETINGHOUSE SLATE, MOOSE RIVER.
Follow the Moose River downstream to outcrops in the streambed.
The streambed outcrop consists of graphitic phyllite of the Meetinghouse Slate or the Gile Mountain Formation. The lithologic layering is isoclinally folded, with the dominant foliation (striking ENE and dipping moderately SE) axial planar to the folds. At low water, you can see granitic dikes that form the outlet channels to the swimming holes. The dikes are strongly foliated along their margins, which strike NE and dip moderately SE.
Andalusite, staurolite, and garnet form porphyroblasts in this outcrop. The andalusite forms porphyroblasts up to 2 cm long that are aligned and pulled apart. The dominant foliation is deflected around andalusiteporphyroblasts. The andalusite is partially to completely replaced, and fine brown staurolite can be seen in andalusite pseudomorphs even in outcrop.
In thin sections cut perpendicular to the intersection lineation between the dominant foliation and a crenulation cleavage, the order of deformation and mineral growth can be determined. The thin sections reveal evidence for three foliations, the earliest defined by aligned biotite and muscovite. Andalusite porphyroblasts contain chiastolite crosses made of aligned minerals oriented at a high angle to S 2 (the dominant foliation throughout most of the section), which is deflected around the andalusite. Staurolite porphyroblasts also contain inclusion trails. The staurolite inclusion trails are parallel to S 2, but are straight whereas the external S 2 has been crenulated. Garnet contains broadly curved inclusion trails parallel to S 3 crenulations. The order of deformation and mineral growth is therefore andalusite growth, then development of S 2, then growth of staurolite, then development of S 3 and growth of garnet. It is not clear whether the fabrics in this outcrop correlate with foliations observed elsewhere in the aureole of the Victory Pluton. Andalusite pseudomorphs generally do not pre-date the dominant foliation elsewhere in the aureole; therefore the crenulations identified as "S 2" and "S 3" may be similar in age to "S 3" elsewhere in the aureole.
Metamorphic textures visible in thin sections from this outcrop suggest a pressure increase or a temperature decrease following contact metamorphism. The andalusite is partially to completely replaced by muscovite. Much of the muscovite replacement is along the edges of the grains, but some muscovite replacement occurs preferentially in the center of the grains, where inclusions are concentrated. Subhedral staurolite occurs within clots of muscovite replacing andalusite. In some cases, the staurolite is near the edge of the andalusite; however, in others, the staurolite is found in clumps of muscovite in the core of the andalusite. The staurolite is always accompanied by muscovite, and it appears as though both the staurolite and muscovite replace inclusion-rich portions of the andalusite, rather than the staurolite occurring as inclusions in the andalusite. Less commonly, grains of kyanite
HANNULA
B4-19
occur within the decussate muscovite replacing andalusite. In one section, kyanite + muscovite clearly define the square shape of andalusite viewed down its c axis, suggesting that kyanite has replaced andalusite rather than andalusite replacing kyanite.
Garnet appears to be a late-forming mineral, based on its relation to the foliations. It is not involved in the reaction textures with andalusite, but its presence as a late, retrograde phase may be related to andalusite breakdown. The cores of the andalusite are pink and pleochroic, and presumably manganese-rich (though they have not been probed). The late garnet, stabilized by the addition of Mn previously trapped in andalusite cores, may have grown instead of chlorite during andalusite breakdown:
(AFM) andalusite + biotite + H 20 -> staurolite + chlorite + muscovite + quartz (observed) andalusite + biotite + H2O -> staurolite + garnet + muscovite + quartz
Continue north on River Road 100 yards to stop sign and intersection with Granby Road. Turn right (east) on Granby Road.
40.1 (1.4) Downtown Granby. 40.5 (0.4) Turn right on Shures Hill Road. 41.0 (0.5) Cross Granby Brook. 41.5 (0.5) Turn right on one lane road to Rogers Brook. 42.0 (0.5) Follow dirt road to log cabin. Park and walk 0.3 miles down road to Rogers Brook.
STOP 6: CORDIERITE TEXTURES IN ROGERS BROOK (0.6 MILE WALK).
Follow Rogers Brook downstream. There are several outcrops in the stream.
The outcrop just downstream from the road is a garnet biotite sillimanite muscovite schist containing deformed muscovite-K-feldspar-quartz pegmatite veins. In thin section, muscovite, biotite, and sillimanite define the dominant foliation in the rock, and biotite is folded.
There is good outcrop along the stream for approximately 0.1 mile before the stream gradient decreases at the edge of the Victory Bog. The last outcrop before the stream's gradient decreases is a waterfall. At the top of the waterfall, the rock consists of coarse sillimanite biotite schist with thin layers of garnet-bearing pegmatite. The sillimanite defines a gently north-plunging lineation.
At the bottom of the waterfall, the outcrop includes staurolite garnet cordierite sillimanite biotite schist. The rock has a weak north-plunging lineation.
In thin section, this last rock exposed before the Victory Bog contains intriguing reaction textures. The sample contains cordierite + sillimanite + garnet + biotite + staurolite + chlorite + plagioclase + quartz. Cordierite forms small, anhedral grains with yellow pleochroic halos. It is typically found, along with quartz and plagioclase, in lozenge-shaped clusters of grains surrounded by foliated fibrolitic sillimanite. Garnet is found as subhedral to anhedral porphyroblasts that have been partly resorbed. Nearly adjacent cordierite and garnet grains are separated by fringes of fibrolitic sillimanite. Sillimanite includes both rare coarse sillimanite and fibrolitic sillimanite. The fibrolite is found fringing garnet and cordierite, is intergrown with biotite, and defines an anastomosing foliation that wraps around most other minerals, including cordierite, biotite, garnet, quartz, and plagioclase. Staurolite occurs as small, subhedral to euhedral grains. Some staurolite grains are found adjacent to resorbed garnets and in contact with biotite and sillimanite; others occur as tiny euhedral grains within biotite + sillimanite patches in cordierite-rich layers. Biotite is weakly foliated to unoriented, and served as a nucleation site for fibrolite. Chlorite appears to be a retrograde alteration of biotite.
The order of AFM diagram mineral growth in this sample is therefore:
garnet + cordierite -> fibrolitic sillimanite -> staurolite -> chlorite
This order of mineral growth suggests that reactions similar to the following have occurred:
garnet + cordierite (+ K-feldspar and/or melt) = biotite + sillimanite + quartz
garnet + biotite + sillimanite + H20 = staurolite (+ muscovite)
FM
134-20 HANNULA
Neither muscovite nor K-feldspar is found in this rock, so no reactions involving biotite can be balanced using only phases found in the sample. Texturally, however, it appears that biotite is involved in the reactions, and it is possible that a K*bearing fluid phase was involved in the reactions. Both of these reactions have moderate slopes in the sillimanite stability field (Spear & Cheney, 1989), and could have occurred during an increase in pressure or a decrease in temperature. An increasing pressure P-T path is similar to that observed west of the Monroe Fault. This site, however, is in the upper plate of the Monroe Fault, and an increase in pressure can not be explained by movement along the Monroe Fault. It may be the result of magma loading above the current erosional surface; alternatively, it may be the result of synchronous movement along yet another thrust fault further to the east.
Return to North Concord General Store.
END OF TRIP
REFERENCES CITED
Aleinikoff, J. N., and Karabinos, P., 1990, Zircon U-Pb data for the Moretown and Barnard Volcanic Members of the Missisquoi Formation and a dike cutting the Standing Pond Volcanics, southeastern Vermont, in Summary results of the Glens Falls CUSMAP project, New York, Vermont, and New Hampshire: U. S. Geological Survey Bulletin, v. 1887, p. D1-D10.
Applegate, G. S, 1996, The geochemistry and petrography of the Victory Pluton, Northeast Kingdom, Vermont [senior thesis]: Middlebury College, 61 p.
Armstrong, T. R., Walsh, G. J., and Spear, F. S., 1997, A transect across the Connecticut Valley sequence in east-central Vermont, in Grover, T. W., Mango, H. N., and Hasehohr, E. J. eds, Guidebook to Field Trips in Vermont and Adjacent New Hampshire and New York: New England Intercollegiate Geological Conference, v. 89, p. A6-1-A6-56.
Arth, J. G., and Ayuso, R. A., 1997, The Northeast Kingdom batholith, Vermont: geochronology and Nd, 0, Pb, and Sr isotopic constraints on the origin of Acadian granitic rocks. in Sinha, A. K., Whalen, J. B., and Hogan, J. P., eds., The nature of magmatism in the Appalachian orogen: Geological Society of America Memoir, v. 191, p. 1-18.
Ayuso, R. A., and Arth, J. G., 1992, The Northeast Kingdom batholith, Vermont: magmatic evolution and geochemical constraints on the origin of Acadian granitic rocks: Contributions to Mineralogy and Petrology, v. lll,p. 1-23.
Berman, R. G., 1988, Internally-consistent thermodynamic data for minerals in the system Na0-K0-Ca0-MgO-FeO-Fe203-A1203-Si02-Ti02-H20-0O2: Journal of Petrology, v. 29, p. 445-522.
Billings, M. P. (compiler), 1955, Geologic map of New Hampshire: New Hampshire State Planning and Development Commission, scale 1:250,000.
Bradley, D. C., 1983, Tectonics of the Acadian orogeny in New England and adjacent Canada: Journal of Geology, v. 91, p. 381-400.
Bradley, D.C., Tucker, R.D., Lux, D., Harris, A.G., and McGregor, D.C., 1998, Migration of the Acadian orogen and foreland basin across the Northern Appalachians: U.S. Geological Survey Open-File Report 98-770, 79 p.
Dennis, J. G., 1956, The geology of the Lyndonville area, Vermont: Vermont Geological Survey Bulletin, v. 8, 98p.
Doll, C. 0., 1951, Geology of the Memphremagog quadrangle and the southeastern portion of the Irasburg quadrangle, Vermont: Vermont Geological Survey Bulletin, v. 3, 113 P.
Doll, C. G., Cady, W. M., Thompson, J. B., and Billings, M. P., Jr. (compilers), 1961, Centennial geologic map of Vermont: Vermont Geological Survey, scale 1:250,000.
270
HANNULA B4-21
Duffield, W. A., and Dalrymple, G. B., 1990, The Taylor Creek Rhyolite of New Mexico: a rapidly emplaced field of lava domes and flows: Bulletin of Volcanology, v. 52, p. 475-487.
Eric, J. H., and Dennis, J. G., 1958, Geology of the Concord-Waterford area, Vermont: Vermont Geological Survey Bulletin, v. 11, 66 p.
Hacker, B.R., and Wang Qingchen, 1995, Ar/Ar geochronology of ultrahigh-pressure metamorphic rocks in central China: Tectonics, v. 14, p. 994-1006.
Hannula, K. A., Lackey, J. S., Mattox, E., McGrath, G., Onasch, E., and Wertheim, J., 1999, Syn-tectonic pluton intrusion during contractional deformation: microstructural and metamorphic evidence from the aureole of the Acadian Victory Pluton, northeastern Vermont, USA: Journal of Metamorphic Geology, v. 17, p. 271-286.
Harrison, T. M., Spear, F. S., and Heizler, M. T., 1989, Geochronologic studies in central New England II: Post-Acadian hinged and differential uplift: Geology, v. 17, p. 185-189.
Hatch, N. L., 1987, Lithofacies, stratigraphy, and structure in the rocks of the Connecticut Valley Trough, eastern Vermont, in Westerman, D. S., ed., Guidebook for Field Trips in Vermont: New England Intercollegiate Geological Conference, v. 2, p. 192-2 12.
Hatch, N. L., 1988, New evidence for faulting along the "Monroe Line', eastern Vermont and westernmost New Hampshire: American Journal of Science, v. 288, p. 1-18.
Hueber, F. M., Bothner, W. A., Hatch, N. L., and Aleinikoff, J., 1990, Devonian plants from southern Quebec and northern New Hampshire and the age of the Connecticut Valley Trough: American Journal of Science, v. 290, p. 360-395.
Johansson, W. I., 1963, Geology of the Lunenburg-Brunswick-Guildhall area, Vermont: Vermont Geological Survey Bulletin, v. 22, 86 p.
Laird, J. & Albee, A. L., 1981, High-pressure metamorphism in mafic schist from northern Vermont: American Journal of Science, v. 281, p. 97-126.
Laird, J., Lanphere, M., and Albee, A., 1984, Distribution of Ordovician and Devonian metamorphism in mafic and pelitic schists from northern Vermont: American Journal of Science, v. 284, p. 376-4 13.
McDougall, I., and Harrison, T. M., 1988, Geochronology and thermochronology by the 40Ar/39Ar method: New York, Oxford University Press, 212 p.
Moench, R. H., 1992, The "Piermont allochthon" in the Littleton-Moosilauke area of west central New Hampshire - -Reply: Geological Society of America Bulletin, v. 103, p. 1541-1545.
Moench, R. H., 1996, Stratigraphic basis for the Piermont-Frontenac allochthon, Bath to Piermont, New Hampshire, and Bradford, Vermont, in van Baalen, M. R., ed., Guidebook to field trips in northern New Hampshire and adjacent regions of Maine and Vermont: New England Intercollegiate Geological Conference, v. 88, p. 133-153.
Moench, R. H., Boone, G. M., Bothner, W. A., Boudette, E. L., Hatch, N. L. Jr., Hussey, A. M. II, and Marvinney, R. G., 1995, Geologic map of the Sherbrooke-Lewiston area, Maine, New Hampshire, and Vermont, United States, and Quebec, Canada: U. S. Geological Survey Miscellaneous Investigations Map, I-l898-D, scale 1:250,000.
Rankin, D. W., 1996, Bedrock geology of the Littleton, Vermont - New Hampshire 15-minute quadrangle northwest of the Ammonoosuc Fault, in van Baalen, M. R., ed., Guidebook to field trips in northern New Hampshire and adjacent regions of Maine and Vermont: New England Intercollegiate Geological Conference, v. 88, p. 5-37.
Rast, N., and Skehan, J. W., 1993, Mid-Paleozoic orogenesis in the North Atlantic: the Acadian orogeny, in Roy, D. C. & Skehan, J. W., eds., The Acadian orogeny: recent studies in New England, maritime Canada, and the autochthonous foreland: Geological Society of America Special Paper, v. 275, p. 1-25.
271
B4-22 HANNULA
Spear, F. S., and Cheney, J. T., 1989, A petrogenetic grid for pelitic schists in the system Si0 2 - A1 203 - FeO - MgO - K20 - H2 0: Contributions to Mineralogy and Petrology, v. 101, p. 149-164.
Stanley, R. S., and Ratcliffe, N. M., 1985, Tectonic synthesis of the Taconian orogeny in western New England: Geological Society of America Bulletin, v. 96, p. 1227-1250.
Sutter, J. F., Ratcliffe, N. M., and Mukasa, S. B., 1985, 40Ar/39Ar and K-Ar data bearing on the metamorphic and tectonic history of western New England: Geological Society of America Bulletin, v. 96, p. 123-136.
Thompson, R. N., Morrison, M. A., Hendry, G. L., and Parry, S. J., 1984, An assessment of the relative roles of crust and mantle in magma genesis; an elemental approach, in Moorbath, S., Thompson, R. N., and Oxburgh, E. R., eds., The relative contributions of mantle, oceanic crust and continental crust to magma genesis: Philosophical Transactions of the Royal Society of London, Series A: Mathematical and Physical Sciences, v. 310, p. 549-590
Thompson, J. B., Robinson, P., Clifford, T. N., and Trask, N. J. J., 1968, Nappes and gneiss domes in west-central New England, in Zen, E., White, W. S., Hadley, J. B., and Thompson, J. B., eds., Studies in Appalachian geology: Northern and maritime: New York, Interscience Publishers, p. 203-2 18.
Thompson, J. B., Rosenfeld., J. L., and Chamberlain, C. P., 1993, Sequence and correlation of tectonic and metamorphic events in southeastern Vermont, in Cheney, J., and Hepburn, J. C., eds., Field trip guidebook for the northeastern United States: 1993 Boston GSA: University of Massachusetts Department of Geology and Geography Contributions, v. 67, p. B-1 - B-26.
Thompson, J. B., Rosenfeld, J. L., Hepburn, J. C., and Trzcienski, W. E., 1997, How does New Hampshire connect to Vermont? in Grover, T. W., Mango, H. N., and Hasehohr, E. J., eds., Guidebook to Field Trips in Vermont and Adjacent New Hampshire and New York: New England Intercollegiate Geological Conference, v. 89, p. Cl-1-C1-17.
Woodland, B. G., 1965, The geology of the Burke quadrangle, Vermont: Vermont Geological Survey Bulletin, v. 28, 151 p.
272
A FIELD DISCUSSION OF THE PINNACLE FORMATION, A LATE PRECAMBRIAN RIFT VALLEY FILL, AND THE DEVELOPMENT OF THE IAPETUS BASIN
by Lars Cherichetti, Department of Geology, University of Vermont, Burlington, VT 05401
and Alexis Richardson, Department of Geology, University of Vermont, Burlington, VT 05401 2
INTRODUCTION
The stratigraphy of the ancient margin of North America includes rift-related volcanic rocks and early clastic sediments (Tibbit Hill and Pinnacle Formations), which predate the fuliy developed Cambro-Ordovician passive margin platform sequence bordering the ancient lapetus Ocean. Thickness, lithofacies, and lateral associations support an alluvial fan, braided stream, or braidplain delta sedimentary environmental interpretation for the Pinnacle Formation in northwestern Vermont examined in this field trip.
Northwestern Vermont lies within th axis of the Quebec reentrant, a I st order structure that preserves original deposition features and the ability to correlate stratigraphic units along strike without major truncations by faulting, (Thomas, 1977; Williams and Doolan, 1979) making it ideal for reconstructing the margin. The Pinnacle Formation lies entirely within the internal domain of the Appalachian Orogen (St. Julien and Hubert, 1975). All but Stop 1 of this trip lies within the bounds of the Hinesburg Thrust to the west and the West Fletcher Fault (correlated to Brome Thrust of Quebec) to the east (Figure 1). This field trip will discuss the contact relations of the Pinnacle Formation as well as the facies characteristics within the unit in northwestern Vermont. We will observe lithofacies of the Pinnacle Formation, interpret depositional features, and discuss the depositional environment and basin morphology during initial subsidence of the active margin.
The Pinnacle Formation in northwestern Vermont is divided into three members: a massive metawacke member, an upper metawacke member, and a quartz—pebble conglomerate member (Cherichetti etal., 1998). The estimated thickness of the Pinnacle Formation in northwestern Vermont exceeds 3250 m (Cherichetti, 1996). Previous descriptions of the Pinnacle Formation in Quebec (Marquis and Kumarapeli, 1993; Dowling, 1988; Colpron, 1990) estimate thickness of the Pinnacle on the order of 100-130 meters. In Quebec Pinnacle Formation is lithically better sorted and finer grained than in northwestern Vermont (Cherichetti, 1996; Tauvers, 1982; DiPietro, 1983; Warren, 1990). Changes in the thickness and lithology of the Pinnacle Formation along strike can be used to develop an understanding of the morphology of the ancient rift basin.
The depositional features of the Pinnacle Formation can be established by several field-based data: (1) isolated angular intraformational silt clasts in a sand matrix; (2) massive, thick sand beds; (3) well-bedded coarse to granule sand grain size metawacke; (4) intraformational rip-up shale clast conglomerates in a sandstone matrix; (5) matrix-supported polymictic conglomerates with well rounded pebble to cobble clasts; (6) clast-supported polymictic conglomerates with rounded clasts, which appear to be laterally discontinuous; (7) graded beds, and (8) a gradational contact with the overlying fine-grained Fairfield Pond Formation. Data suggest a regime of sedimentation that was characterized by 1) fluctuating flow velocities, 2) periodic high velocities, 3) episodic erosional events, 4) variable detritus grain size, 5) high rates of sedimentation, and 6) a lower energy, laterally contiguous environment. Cherichetti (1996) has proposed all of these characteristics can be derived from alluvial fan, fan delta and braid plain delta environments.
Present address: 'New Pond Foundation, West Redding, CT 06896 2 Town of Wilton, Wilton, CT 06897
Cherichetti, L., and Richardson, A., 1999, A field discussion of the Pinnacle Formation, a Late Precambrian rift valley fill, and the development of the lapetus Basin; in Wright, S.F. ed., New England Intercollegiate Geologic Conference Guidebook Number 91, p. 273-285.
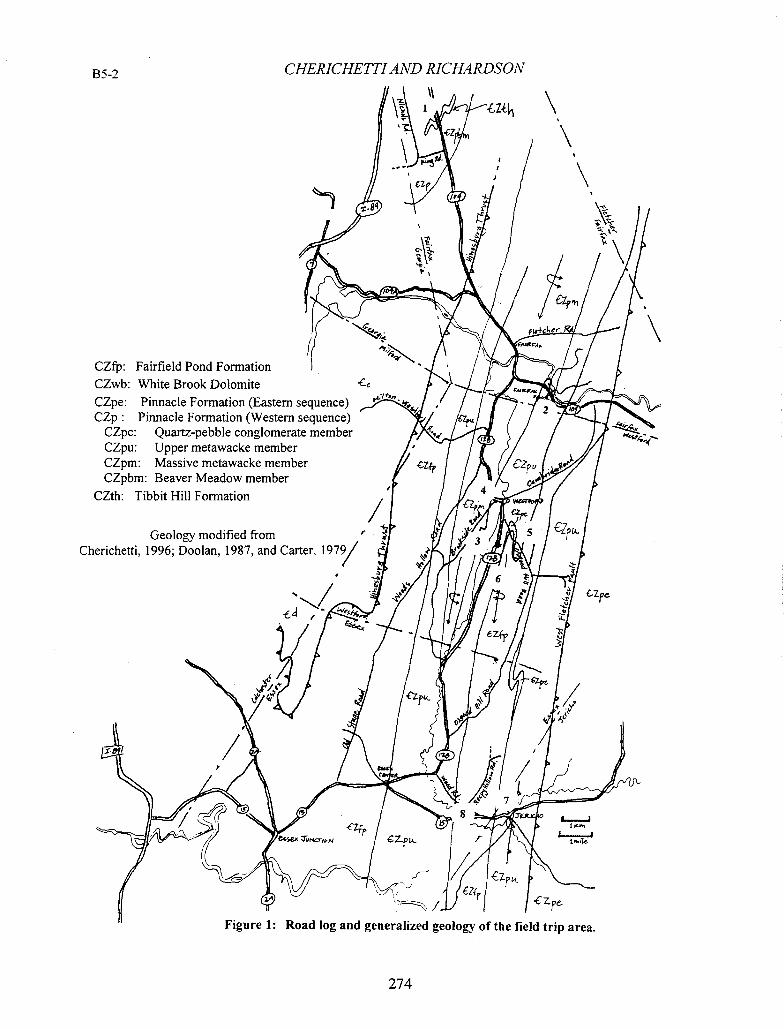
B5-2 CHERICHETTI AND RICHARDSON
\-,
\ ._\ F
- P t
/ CZf: Fairfield Pond Formation CZwb: White Brook Dolomite CZpe: Pinnacle Formation (Eastern sequence) -
• 2.' CZp: Pinnacle Formation (Western sequence)
4. CZpc: Quartz-pebble conglomerate member CZpu: Upper metawacke member CZpm: Massive metawacke member CZpbm: Beaver Meadow member
1 4 CZth: Tibbit Hill Formation
/
Geology modified from 3
Cherichetti, 1996; Doolan, 1987, and Carter, 1979/ - 4'
V. I 6
•• -?
. a Zpe 4
/ -
(4
74i Z!,
I f I
1
8 TeX
I I N
/ \- ,(
Cz
Figure 1: Road log and generalized geology of the field trip area.
274
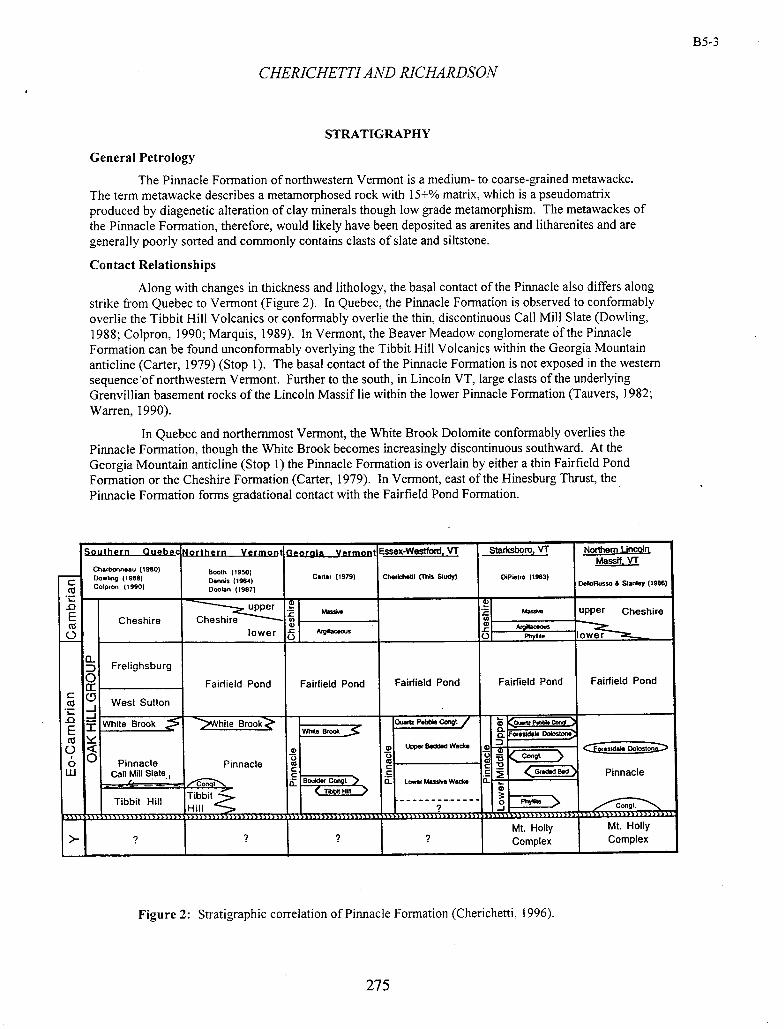
CHERICHETTI AND RICHARDSON
STRATIGRAPHY
General Petrology
The Pinnacle Formation of northwestern Vermont is a medium- to coarse-grained metawacke. The term metawacke describes a metamorphosed rock with 1 5+% matrix, which is a pseudomatrix produced by diagenetic alteration of clay minerals though low grade metamorphism. The metawackes of the Pinnacle Formation, therefore, would likely have been deposited as arenites and litharenites and are generally poorly sorted and commonly contains clasts of slate and siltstone.
Contact Relationships
Along with changes in thickness and lithology, the basal contact of the Pinnacle also differs along strike from Quebec to Vermont (Figure 2). In Quebec, the Pinnacle Formation is observed to conformably overlie the Tibbit Hill Volcanics or conformably overlie the thin, discontinuous Call Mill Slate (Dowling, 1988; Colpron, 1990; Marquis, 1989). In Vermont, the Beaver Meadow conglomerate of the Pinnacle Formation can be found unconformably overlying the Tibbit Hill Volcanics within the Georgia Mountain anticline (Carter, 1979) (Stop 1). The basal contact of the Pinnacle Formation is not exposed in the western sequence 'of northwestern Vermont. Further to the south, in Lincoln VT, large clasts of the underlying Grenvillian basement rocks of the Lincoln Massif lie within the lower Pinnacle Formation (Tauvers, 1982; Warren, 1990).
In Quebec and northernmost Vermont, the White Brook Dolomite conformably overlies the Pinnacle Formation, though the White Brook becomes increasingly discontinuous southward. At the Georgia Mountain anticline (Stop 1) the Pinnacle Formation is overlain by either a thin Fairfield Pond Formation or the Cheshire Formation (Carter, 1979). In Vermont, east of the Hinesburg Thrust, the Pinnacle Formation forms gradational contact with the Fairfield Pond Formation.
Southern QuebeclNprthern Vermont Georgia yermont'ESSeXWeStfOfd, VT Starlcsboro, VT MaI
Charbonneac (1980) D0WIW9 (1988)
Booth (1950) Dennis (1964)
Cads, (1979) CherIcheill (This Study) DiPieI,o (1983) - Colpron (1990) 000lan (1987)
ley DSIOROSSO I Sta (1988)
E upper
I Cheshire
.aI upper Cheshire
co o lower
0 Frelighsburg
0 _____________ Fairfield Pond Fairfield Pond Fairfield Pond Fairfield Pond Fairfield Pond
West Sutton
T Whi(e Brook' _______ While
- Otiadz Pebble Ctgl. 0.
cc.side1. Doiostonà CU
a u Wache
.
Pinnaci e Pinnacle - o c.t congl) to
W Call Will Slate (Stacied B. Pinnacle ii: Boulder c,ngl. > i: Lower Ma3sise Wed,. CL
Tibbit CTCHa ) - a
Tibbit Hill Hill
Mt. Holly Mt. Holly
>- ? ? ? Complex Complex
B5-3
Figure 2: Stratigraphic correlation of Pinnacle Formation (Cherichetti, 1996).
275
CHERICHETTI AND RICHARDSON
Designation of Members and Lithofacies
Three lithologically distinct members of the Pinnacle Formation, in northwestern Vermont, have been designated by Cherichetti (1996). Lithofacies for each member are recognized in the field. The Pinnacle Formation generally coarsens upwards from a medium- to coarse-grained sand to an uppermost pebble conglomerate (Figure 3).
Massive metawacke member. The lowest member of the Pinnacle Formation exposed east of the Hinesburg Thrust is the massive metawacke member (CZpm). This blue-gray massive metawacke has been divided into an extremely poorly sorted, coarse-grained, quartz-rich metawacke lithofacies and a poorly sorted fine-grained to medium-grained metawacke lithofacies. As we will observe at Stop 2, the massive metawacke member lacks black shale interbeds, though isolated light siltstone clasts are common.
The occurrence of massive, thick sand beds suggests that sedimentation occurred at high rates during relatively uniform velocities. High rates of unconfined deposition may be obtained by sediment gravity flows. Sediment gravity flow deposits are known to produce poorly sorted, coarse-grained, unconfined deposits, isolated angular clasts, and massive structureless beds (Blair and McPherson, 1994).
Upper metawacke member. The upper metawacke member of the Pinnacle Formation (Czpu) is characterized by a bedded metawacke, in which interbeds of black shale and associated rip-up clasts are common. Three lithofacies have been identified within the upper rnetawacke member. I) The slate-c last conglomerate lithofacies is a matrix-supported conglomerate that is dominated by angular black slate clasts (Stop 6). 2) The metawacke with slate interbeds lithofacies is a quartzo-feldspathic metawacke, interbedded with black, rusty-weathering slate beds (Stops 3&4). The tops of some of these slate interbeds are ripped up and incorporated into the lower overlying metawacke bed as isolated, angular clasts. 3) The third lithofacies of the upper metawacke member consists of 0.25 to 1 m thick beds of sand-size grains that alternate with thinner beds of silt-size grains (Stop 7).
The three lithofacies of the upper metawacke member suggest deposition by catastrophic overbank sheetflood. Sheetflood deposits, the result of widening flow and decreasing water depth and velocity, are well sorted and bedded (Bull, 1972). Deposition, erosion and scour of fine-grained beds are indicative of variable confmed flows within migrating channels. The deposition of sand/silt couplets is attributed to an episodic deceleration of currents, such as during out-of-channel flow on a flood plain. In an alluvial system, these lithofacies would have been deposited on a more distal alluvial fan braidplain delta as sheet flood deposits and flood plain deposits.
Ouartz-pebble conglomerate member. The quart-pebble conglomerate member (CZpc) of the Pinnacle Formation is discontinuous and in gradational contact with the underlying upper metawacke member. The quartz-pebble conglomerate member is the most lithically diverse member and is distinguishable by the presence of large (0.5 to 1 cm) blue-quartz pebbles. Two different conglomerate lithofacies and two meta-sandstone lithofacies are recognized in this member. The quartz-arenite pebble to cobble conglomerate lithofacies is clast-supported and distinguished by the meta-arenite, blue quartz, and white vein quartz clasts. The polymictic conglomerate lithofacies is matrix supported and contains five dominant types of well-rounded clasts: black slate, light colored siltstone, meta-arenite, blue quartz and white vein quartz. These conglomeritic lithofacies are interbedded with the quartz arenite metawacke lithofacies, a quartz and plagioclase rich muscovite metawacke. The quartz meta-arenite lithofacies is a nearly monomineralic coarse-grained blue and vein quartz meta-arenite lithofacies.
The well-rounded clasts of the quartz-pebble conglomerate member suggest of high energy and high velocity deposition that is proximal to a recycled source. These sedimentary features can all be associated with bedload transport. Cherichetti (1996) interprets these laterally discontinuous units as evidence of bedload transport within a braided stream system of an alluvial braidplain delta.
Fairfield Pond Formation. The Fairfield Pond Formation is a siliceous phyllite that contains, particularly at its base, interbeds of quartz-arenite. The contact with the underlying Pinnacle Formation is gradational and marked by the change in ratio of arenite to phyllite beds. The depositional environment of
B5-4
276
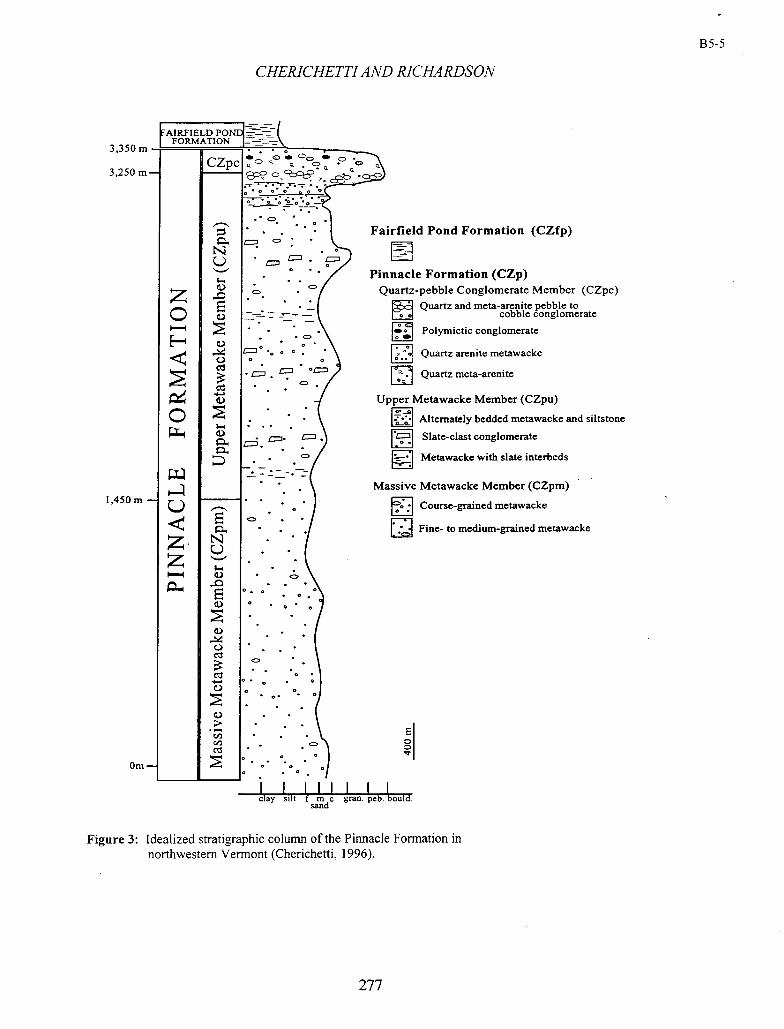
CHERICHETTI AND RICHARDSON
AIRFIELD PONLi FORMATION l—\
3,350 m
CZpc 3,250m
• Fairfield Pond Formation (CZfp)
L) - Pinnacle Formation (CZp)
z . Quartz-pebble Conglomerate Member (CZpc)
0 E Quartz and meta-arenite pebble to cobble conglomerate - 0 0
• . Polymictic conglomerate
0 0 • [] Quartz arenite metawacke
Ce 0 Quartz meta-arenite
Cd
Upper Metawacke Member (CZpu)
0 [} . • Alternately bedded metawacke and siltstone
. . Slate-clast conglomerate
] Metawacke with slate interbeds
Massive Metawacke Member (CZpm) 1,450m - • . Course-grained metawacke
: Fine- to medium-grained metawacke
ZN C-) .—•l
E , . 0. 0
tI) 0
C.) Ce 0'
0
E CID ce
• •
0
Om— 0 0
I III I I I clay silt f m c gran. peb. bould.
sand
Figure 3: Idealized stratigraphic column of the Pinnacle Formation in northwestern Vermont (Cherichetti, 1996).
B5-5
277
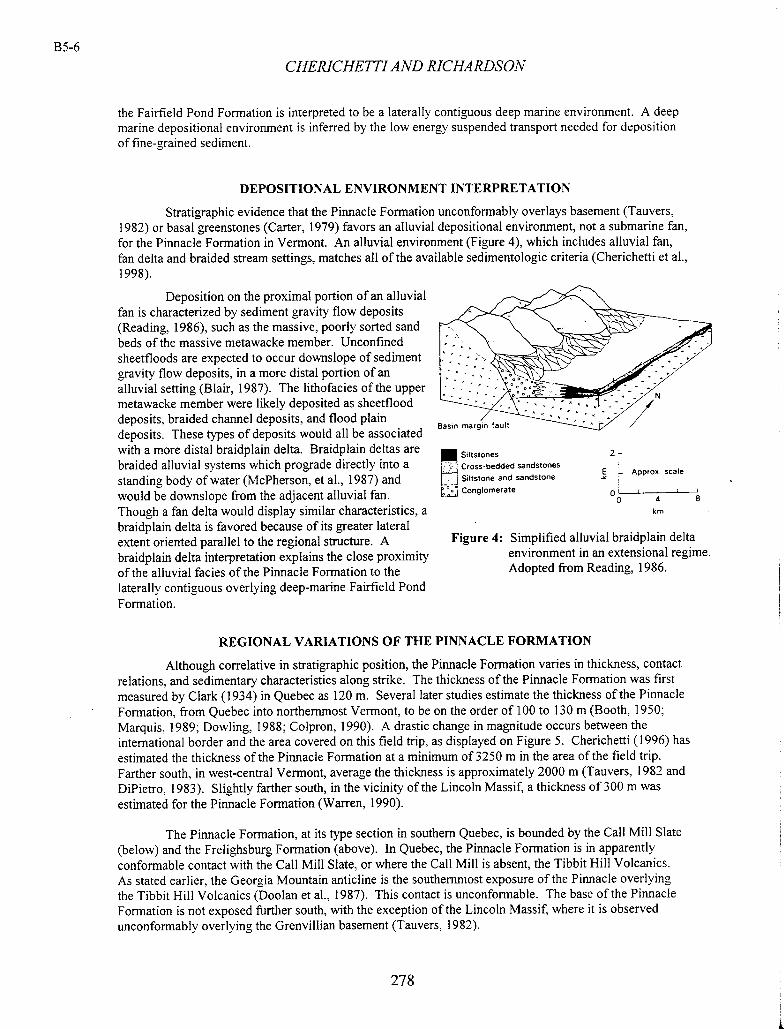
Sdtstones
Cross-bedded sandstones
j Siltstone and sandstone
Conglomerate
2-
Approx. scale
0 4 8
km
Figure 4: Simplified alluvial braidplain delta environment in an extensional regime. Adopted from Reading, 1986.
CHERICHETTI AND RICHARDSON
the Fairfield Pond Formation is interpreted to be a laterally contiguous deep marine environment. A deep marine depositional environment is inferred by the low energy suspended transport needed for deposition of fine-grained sediment.
DEPOSITIONAL ENVIRONMENT INTERPRETATION
Stratigraphic evidence that the Pinnacle Formation unconformably overlays basement (Tauvers, 1982) or basal greenstones (Carter, 1979) favors an alluvial depositional environment, not a submarine fan, for the Pinnacle Formation in Vermont. An alluvial environment (Figure 4), which includes alluvial fan, fan delta and braided stream settings, matches all of the available sedimentologic criteria (Cherichetti et al., 1998).
MW
Deposition on the proximal portion of an alluvial fan is characterized by sediment gravity flow deposits (Reading, 1986), such as the massive, poorly sorted sand beds of the massive metawacke member. Unconfined sheetfloods are expected to occur downslope of sediment gravity flow deposits, in a more distal portion of an alluvial setting (Blair, 1987). The lithofacies of the upper metawacke member were likely deposited as sheetflood deposits, braided channel deposits, and flood plain deposits. These types of deposits would all be associated with a more distal braidplain delta. Braidplain deltas are braided alluvial systems which prograde directly into a standing body of water (McPherson, et al., 1987) and would be downslope from the adjacent alluvial fan. Though a fan delta would display similar characteristics, a braidp lain delta is favored because of its greater lateral extent oriented parallel to the regional structure. A braidplain delta interpretation explains the close proximity of the alluvial facies of the Pinnacle Formation to the laterally contiguous overlying deep-marine Fairfield Pond Formation.
II -' - .
A
REGIONAL VARIATIONS OF THE PINNACLE FORMATION
Although correlative in stratigraphic position, the Pinnacle Formation varies in thickness, contact relations, and sedimentary characteristics along strike. The thickness of the Pinnacle Formation was first measured by Clark (1934) in Quebec as 120 m. Several later studies estimate the thickness of the Pinnacle Formation, from Quebec into northernmost Vermont, to be on the order of 100 to 130 in (Booth, 1950; Marquis, 1989; Dowling, 1988; Colpron, 1990). A drastic change in magnitude occurs between the international border and the area covered on this field trip, as displayed on Figure 5. Cherichetti (1996) has estimated the thickness of the Pinnacle Formation at a minimum of 3250 in in the area of the field trip. Farther south, in west-central Vermont, average the thickness is approximately 2000 in (Tauvers, 1982 and DiPietro, 1983). Slightly farther south, in the vicinity of the Lincoln Massif, a thickness of 300 in was estimated for the Pinnacle Formation (Warren, 1990).
The Pinnacle Formation, at its type section in southern Quebec, is bounded by the Call Mill Slate (below) and the Frelighsburg Formation (above). In Quebec, the Pinnacle Formation is in apparently conformable contact with the Call Mill Slate, or where the Call Mill is absent, the Tibbit Hill Volcanics. As stated earlier, the Georgia Mountain anticline is the southernmost exposure of the Pinnacle overlying the Tibbit Hill Volcanics (Doolan et al., 1987). This contact is unconformable. The base of the Pinnacle Formation is not exposed further south, with the exception of the Lincoln Massif, where it is observed unconformably overlying the Grenvillian basement (Tauvers, 1982).
278
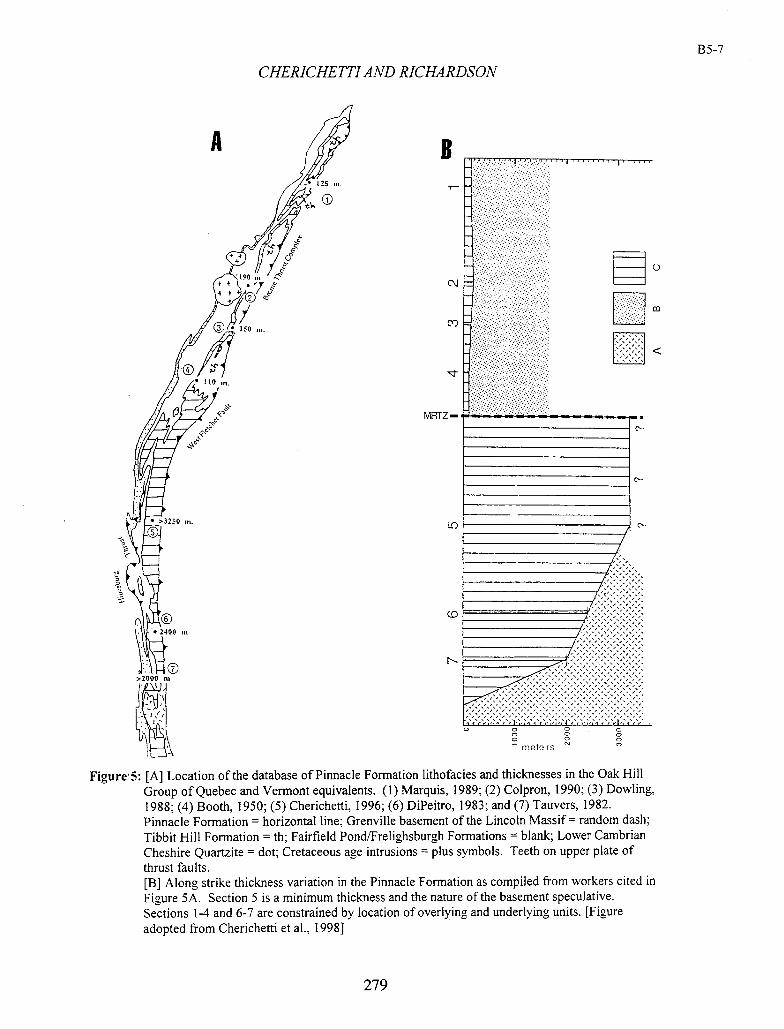
c"j
Co
MRVZ-
LC)
Am -----------
- I
0
- meters
CHERICHETTI AND RICHARDSON
B5-7
IWAIP• rv•
I
1k
Figure5: [A] Location of the database of Pinnacle Formation lithofacies and thicknesses in the Oak Hill Group of Quebec and Vermont equivalents. (1) Marquis, 1989; (2) Coipron, 1990; (3) Dowling, 1988; (4) Booth, 1950; (5) Cherichetti, 1996; (6) DiPeitro, 1983; and (7) Tauvers, 1982. Pinnacle Formation = horizontal line; Grenville basement of the Lincoln Massif = random dash; Tibbit Hill Formation = th; Fairfield Pond!Frelighsburgh Formations = blank; Lower Cambrian Cheshire Quartzite = dot; Cretaceous age intrusions = plus symbols. Teeth on upper plate of thrust faults. [B] Along strike thickness variation in the Pinnacle Formation as compiled from workers cited in Figure 5A. Section 5 is a minimum thickness and the nature of the basement speculative. Sections 1-4 and 6-7 are constrained by location of overlying and underlying units. [Figure adopted from Cherichetti et al., 1998]
279
135-8 CHERICHETTI AND RICHARDSON
Overlying the Pinnacle Formation in Quebec is the White Brook Dolomite (Colpron, 1990). Nearer the international border, the White Brook Dolomite becomes more discontinuous and the upper contact of the Pinnacle Formation grades into the Fairfield Pond Formation. In the area of this study, as well as to the south, the Pinnacle Formation is overlain by the Fairfield Pond Formation (DiPietro, 1983; Tauvers, 1982; Warren, 1990; Doolan, 1989; and Cherichetti, 1996).
Lithologically, the Pinnacle Formation in southern Quebec is finer-grained and more well-sorted than that of northwestern Vermont. The Pinnacle Formation in Quebec has been described by Dowling (1988) as containing a magnetite sandstone member, a slate breccia member, a quartz-chlorite wacke member, and a fine-grained muscovite-rich wacke. A progressive increase in grain size and abundance of conglomeratic horizons from Quebec to Vermont has long been noted (Dowling, 1988; Tauvers, 1982; and Cady, 1960, Booth, 1950). Depositional environments have been interpreted as a delta-plain and a delta-front in Richmond, Quebec (Marquis and Kumarapeli, 1993) and shallow marine in Sutton, Quebec (Dowling, 1988). In contrast, interpretations for southern Vermont include a submarine fan, as the proposed depositional environment by Tauvers (1982).
RIFT GEOMETRY
The Pinnacle Formation of the Quebec reentrant, based on thickness and paleo-environmental data, was deposited on two different types of rift margins. The analysis by Cherichetti et al. (1998) and discussed here supports the Pinnacle Formation of Vermont being deposited on the lower plate of an asymmetric rift, whereas the Pinnacle Formation of Quebec was deposited on the upper plate of an asymmetric rift. A major stratigraphic transition is therefore required between these two basin-s. The transition is a structural transfer zone between the two basins with oppositely-dipping lithospheric-scale extensional faults and is named the Missisquoi River Transfer Zone for its position in northern most Vermont.
ACKNOWLEDGEMENTS
The authors would like to thank Barry Doolan for his encouragement, Char Mehrtens for sharing her knowledge of sedimentology and stratigraphy, and Kerry Canfield for her logistical help.
ROAD LOG
00.0 Leave UVM Perkins Geology Hall. Proceed north (right) onto Colchester Ave. and into Winooski.
00.25 Continue straight at the light and continue through Winooski, following Rt. 7 North.
01.3 Left turn onto 1-89 North.
17.0 Continue on 1-89 North to Exit 18 (Rt. 1 04A east and Rt. 7 South). Turn right at the end of off- ramp and follow signs "To Rt. 104A".
17.3 Left turn onto Rt. 104A east. Continue to the end of Rt. 104A.
21.9 At the junction of Rt. 104A and Rt. 104. Turn north (left) onto Rt. 104 north. The Hinesburg Thrust fault, which juxtaposes the Cambrian Dunham and Cheshire with the Fairfield Pond Formation of the Western sequence, crosses the road just north of the Rt. 104A/Rt.104 intersection.
25.6 At the intersection of King Road to the left, continue straight.
WE
CHERICHETTI AND RICHARDSON
25.7 Turn left just north of the barn. Park in the grassy patch north of the barn and driveway. Do not block any part of the driveway in case the grain or milk truck comes.
STOP 1: Tibbit Hill Volcanics and Beaver Meadow conglomerate. (60 minutes) At this stop, we will examine the Tibbit Hill Formation and the Beaver Meadow conglomerate of the Pinnacle Formation. This outcrop exposure lies below the Hinesburg Thrust fault and displays one of the southern most exposures of the Tibbit Hill Formation volcanics/volcaniclastics.
We will begin with the outcrops closest to the road and walk westward. Exposed are beds of quartz-feldspar metawacke interbedded with horizons of clast-supported, polymictic cobble conglomerate. Notice the large (2-40 cm), well-rounded clasts and the variety of clast materials (granitic gneiss, slate, arkosic sandstone, perthite, etc.). The poor sorting, rounded clasts, and laterally discontinuous nature of the unit imply that this unit was deposited by bedload transport.
Moving west, there is an increase in abundance of slate and greenstone clasts as we approach the contact with the greenstones of the Tibbit Hill Formation. These slate fragments are similar the Call Mill Formation which stratigraphically overlies the Tibbit Hill in Quebec (Doolan, 1988).
This conglomerate has been designated the Beaver Meadow conglomerate unit of the Pinnacle Formation by Doolan (1987). This unit has not been found in the Western sequence, though may be correlative with conglomeritic lithofacies in the upper Pinnacle Formation.
25.7.1 Turn around and head back on Rt. 104 South. Continue south on Rt. 104 though Fairfax and across the Lamoille River.
31.9 Junction with Rt. 128. Bear left and stay on Rt. 104 South.
33.0 Parking is on the northeast (left) side of road just above the dam. Pull off to the side of the road and await parking instructions.
STOP 2: Massive Metawacke member. (40 minutes) Exposures along the Lamoille River and on both sides of the road display the Massive Metawacke member of the lower Pinnacle Formation. Today, we will examine only the road cuts. Examples of topping direction can be found on the southern road cut (opposite from the dam). The rocks of the road cut are massive beds of quartz and feldspar detritus.
The dominant foliation (S 2) trends N20E and dips steeply to the east and cross cuts an earlier S 1 bedding parallel cleavage. S 3 kink bands are subhorizontal and cross cut all other cleavages. There is a steeply dipping fault exposed in the road cut. It is most likely a normal fault of Mesozoic age, correlative with other Champlain Valley normal faults and dikes. Bedding-cleavage relationships suggest that the exposure is near the axis of the Fairfax Falls anticline.
33.0 Turn around and head back on Rt. 140 North.
33.9 Bear left Onto McNall Road (follow signs for Rt. 128).
34.0 Take first left onto Rt. 128 South.
35.4 Road intersection with Westford-Milton Road at right; continue south on Rt.128.
37.2 Intersection with Brookside Road at Westford town center. Turn south (right) onto Brookside Road.
37.9 Turn left into the Westford School entrance. Continue to the parking lot behind the building. Walk up the grass path (to the right of the swing set) to the Nature Trail entrance.
STOP 3: Upper Metawacke member. (45 minutes) There are many accessible outcrops of the Pinnacle Formation in this area, which is criss-crossed by a series of hiking trails. We will visit two outcrops at this stop to get a taste of the gradational contact between the Massive Metawacke member and the Upper Metawacke member. The first outcrop that we will study today is just off the main trail to the
I.
281
B5- 10 CHERICHETTI AND RICHARDSON
left of the first trail junction. The outcrop exposes a bedded quartzo-feldspathic metawacke with continuous, darker slate horizons. The tops of the slate beds are sharply overlain by coarse-grained metawacke beds. Bedding strikes N10 E and dips steeply to the east. Walking down section (west) thick, monotonous outcrops of the Massive Metawacke member are exposed. These observations suggest high sedimentation rates (massive sand beds) and fluctuating velocities (graded beds).
The dominant schistosity strikes NNE 70E. These outcrops are on the west limb of parasitic syncline on the east limb of the Browns River anticline.
37.9 Turn north (right) back onto Brookside Road and return to center of town.
38.5 Turn right at the intersection with Common Road. Park on the left side of the road adjacent to the Town Common. This is our lunch stop (30 minutes); enjoy your bag lunch on the Town Common or buy lunch at the Westford Store. Walk west over Brookside Road. Outcrops are along the yoad and up on the Church lawn.
STOP 4: Upper Metawacke member. (20 minutes) A fresh exposure along the road shows depositional features of interest. Like Stop 3, this outcrop displays the lowest portions of the Upper Metawacke member. The metawacke beds at this outcrop range from sand-size to silt-size beds. The thick metawacke beds are interbedded with thin slate beds. Two thin beds of black and rusty weathering slate can be traced in the southern tip of the outcrop. The ditch directly next to the road is parallel to bedding and is inferred to be another weathered interbed of slate.
38.5 Go east for a short distance on Common Road to the intersection of Rt. 128.
38.8 Turn south (right) onto Rt. 128 South.
39.4 Turn left Onto Osgood Hill Road. This gravel road has scattered outcrops along it length
40.3 Pull over to the right side of the road. There is a small outcrop next to the road just north of a road drainage culvert. Be sure to put your parking brake on.
STOP 5: Quartz-pebble conglomerate member. (15 minutes) This unit has been mapped as the uppermost Pinnacle Formation in the Western Sequence (Cherichetti, 1996). The member is laterally discontinuous and ranges in thickness from 0 to 100 m. This member of the Pinnacle is the most litho logically diverse and the four lithofacies identified by Cherichetti (1996) will be discussed at this stop. The small roadside outcrop exposes a clast-bearing coarse-grained feldspathic quartz arenite. This conglomeratic member is distinguishable from the slate-clast conglomerate lithofacies of the underlying member by the occurrence of large (0.5 - 1 cm) rounded blue-quartz pebble clasts.
40.3 Return to cars and continue south on Osgood Hill Road.
40.9 Intersection with Stony Ridge Road. Use intersection to turn around and head north on Osgood Hill Road.
43.0 Turn south (left) at the intersection of Rt. 128. Continue to travel south on Rt. 128.
44.8 Pull entirely off of road onto the western (right) shoulder just before crest of hill. Pull off of shoulder onto level grassy area. We will walk along the western shoulder to crest of the hill and then carefully cross to the east side of the road.
STOP 6: Slate-clast conglomerate lithofacies of the Upper Metawacke member. (20 minutes) At this stop we will discuss the lithofacies of the Upper Metawacke member as designated by Cherichetti (1996). The large road cut displays beds of typical quartzo-feldspathic metawacke that have horizons of the slate-clast conglomerate lithofacies. The slate clast conglomerate is supported by a matrix of quartz-feldspar metawacke. Angular clasts of up to 75 cm long and 3 cm thick can be found at this outcrop. These angular
282
CHERICHETTIAND RICHARDSON
clasts are concentrated at the base of metawacke beds and can be used to determine topping direction. The sedimentation regime for this lithofacies is interpreted to have been characterized by fluctuating velocities with episodic high velocities and erosion events.
44.8 Return to cars and continue south on Rt. 128.
45.7 Large outcrop to the right at the intersection of Brookside Road is Massive Metawacke Pinnacle.
47.5 Pass the southern intersection of Osgood Hill Road at left; continue south on Rt. 128.
48.3 As Rt.128 bears sharply to the right, turn left onto Weed Road.
49.4 Intersection with Sleepy Hollow Road to left; continue on Weed Road.
49.8 Turn east (left) onto Rt. 15 East.
50.5 Take the first left after the bridge over the Browns River onto Rotunda Lane (see sign "Additional Parking for Joe's Snack Bar"). This lane ends in a wide gravel parking area, which is where we will park. From the parking area, walk west across the meadow to the river.
STOP 7: Alternately bedded metawacke and siltstone lithofacies of the Upper Metawacke member. (30 minutes) This outcrop is across the river from the Old Mill, where the Browns River has been historically dammed for the mill. The ravine has an outstanding fresh exposure of the alternately bedded metawacke and siltstone lithofacies. The typical blue-gray color of the Pinnacle Formation is beautifully exhibited here. As we walk down the exposure to the river, we will examine couplets of sand beds overlain by siltstone beds. Bedding strikes N-S and dips steeply to the east. Topping direction can be determined here by the scoured tops of the siltstone beds. Some of the overlying metawacke beds have incorporated intraformational clasts of the eroded siltstone beds. The sand beds range in thickness from 0.5 to I in thick. The repeating sequences of couplets tend to increase in bed thickness up section.
The graded and well-bedded metawacke is evidence for unconfined deposition of suspended load with episodic deceleration of current velocities.
50.5 Turn around in the parking area and turn right onto Rt. 15 West.
51.2 Turn right, back onto Weed Road.
51.6 Turn right onto Sleepy Hollow Road. Pull over to the right side of the road and park. We will walk back across Weed Road to the whaleback outcrops in the pasture. Take care to step over the downed barbed wire lying on the ground, then step over the electric fence. This is home to two large Percherons who may come find us.
STOP 8: Fairfield Pond Formation. (20 minutes) Exposed are both the siliceous chloritic phyllite and quartz meta-arenite lithofacies of the Fairfield Pond. Unlike the Pinnacle, the Fairfield Pond shows more intense deformation, including tight folding and intense cleavage development. This outcrop is dominated by blue-gray phyllite, though less-weathered quartz meta-arenite layers are clearly represented as well.
This is the last stop of the trip. Directions to return to Perkins Geology Hall follow.
51.6 Turn around again and turn right onto Weed Road.
52.7 Intersection with Rt. 128. Turn south (left) onto Rt. 128 South.
54.0 Essex Center School and signs for the junction of Rt. 128 and Rt. 15. Continue on Rt. 15 West.
55.6 Turn right at the light onto Rt. 289 West (the Circ. Highway). The magnificent road cuts along the highway expose Pinnacle Formation.
57.5 At the end of Rt. 289, turn left onto Rt. 2A towards Essex Junction.
B5-12 CHERICHETTI AND RICHARDSON
57.7 At the light, turn right onto Susie Wilson Road. Follow signs "To Rt. 15 West."
59.0 Turn right, at the end of Susie Wilson Road, onto Rt. 15 West and continue on Rt. 15 West into Winooski.
61.1 Drive under 1-89 underpass. Move into left lane of Rt. 15.
61.7 Turn left onto Rt. 7 South.
61.9 At the bridge over the Winooski River, stay in left lane and continue straight up the hill on Colchester Ave.
62.7 Return to Perkins Geology Hall. Turn left into parking lot.
REFERENCES CITED
Blair, T. C., 1987, Sedimentary processes, vertical stratification sequences, and geomorphology of the Roaring River alluvial fan, Rocky Mountain National Park, Colorado: Journal of Sedimentary petrology, v. 57, no. 1, p. 1-18.
Bull, W. B., 1972, Recognition of alluvial-fan deposits in the stratigraphic record: Society of Economic Paleontologists and Mineralogists Special Publication no. 16, p. 63-83.
Booth, V. H., 1950, Stratigraphy and structure of the Oak Hill section in Vermont: Geological Society of America Bulletin, v. 61, p. 1131-1168.
Carter, C. M., 1979, Interpretation of the Hinesburg Trust North of the Lamoille River, Northwestern Vermont: University of Vermont, Master Thesis, 84 p.
Cherichetti, L., 1996, Lithostratigraphy, deposition, and rift model analysis of the Pinnacle Formation between the Lamoille and Winooski Rivers in northwestern Vermont: University of Vermont, Master Thesis, 122p.
Cherichetti, L., Doolan, B., and Mehrtens, C., 1998, The Pinnacle Formation: A late Precambrian rift valley fill with implications for lapetus rift basin evolution: Northeastern Geology and Environmental Sciences, v. 20, no. 3, p. 175-185.
Clark, T. H., 1934, Structure and stratigraphy of Quebec: Geological Society of America Bulletin, v. 45, p. 1-20.
Coipron, M., 1990, Rift and Collisional Tectonics of the Eastern Townships Humber Zone, Brome Lake Area, Quebec: University of Vermont, Master Thesis. 278 p.
DiPietro, J.A., 1983, Geology of the Starksboro area, Vermont: Vermont Geological Survey Special Bulletin No.4, 14p.
Doolan, B. L., 1989, A Transect across the Taconian Hinterland of Northern Vermont, in A Transect Through the New England Appalachians: I.G.C. Field Trip Guidebook T162, p. 30-38.
Doolan, B., Mock, T., and McBean, A., 1987, Stratigraphy and structure of the Camel's Hump Group along the Lamoille River Transect, Northern Vermont, in Westerman, D. S., ed., NEIGC 1987, Guidebook for Filed Trips in Vermont. Northfield, VT, Norwich University, v. B2, p. 152-191.
Dowling, W. M., 1988, Depositional Environment of the Oak Hill Group, Southern Quebec: Implications for the Late Precambrian Break-up of North America in the Quebec Reentrant: University of Vermont, Master Thesis, 1 86p.
McPherson, J., Shanmugam, G., and Moila, R., 1987, Fan-deltas and braid deltas: Varieties of coarse-grained deltas: Geological Society of America Bulletin, v. 99, p. 33 1-140.
Marquis, R., 1989, L'Anticlinorium des Monts Sutton, Richmond, Quebec: University of Montreal: Doctoral Thesis.
Marquis, R. and P. S. Kumarapeli, 1993, An Early Cambrian deltaic-fluvial model an Iapetan rift-arm drainage system, southeastern Quebec: Canadian Journal of Earth Science, v. 30, p. 1254-1261.
Reading, H.G., 1986, Sedimentary Environments and Facies. Blackwell Scientific PubI., Oxford, 615 p. St. Julien, P. and C. Hubert, 1975, Evolution of the Taconian Orogeny in western New England: Geological
Society of America Bulletin, v. 275-A, p. 33 7-362.
CHERICHETTI AND RICHARDSON
Tauvers, P. R., 1982, Basement-cover Relationships in the Lincoln Area, Vermont: University of Vermont, Master Thesis. 177 p.
Thomas, W.A., 1977, Evolution of Appalachian-Ouachita salients and recesses from reentrants and promontories in the continental margin: American Journal of Science, v. 277, p. 1233-1278.
Warren, M. J., 1990, Rift history and subsequent collisional behavior of the North American lapetus margin, Lincoln massif, central Vermont: an open and shut case: University of Vermont, Masters Thesis, 235p.
Williams, H., and Doolan, B.L., 1979, Vestiges and margins of lapetus in the Appalachian orogen: Geological Society of America and Geological Association of Canada Joint Meeting, Toronto, Abstracts with Programs, v. 10, no. 7, p. 517.
B5- 13
RMI
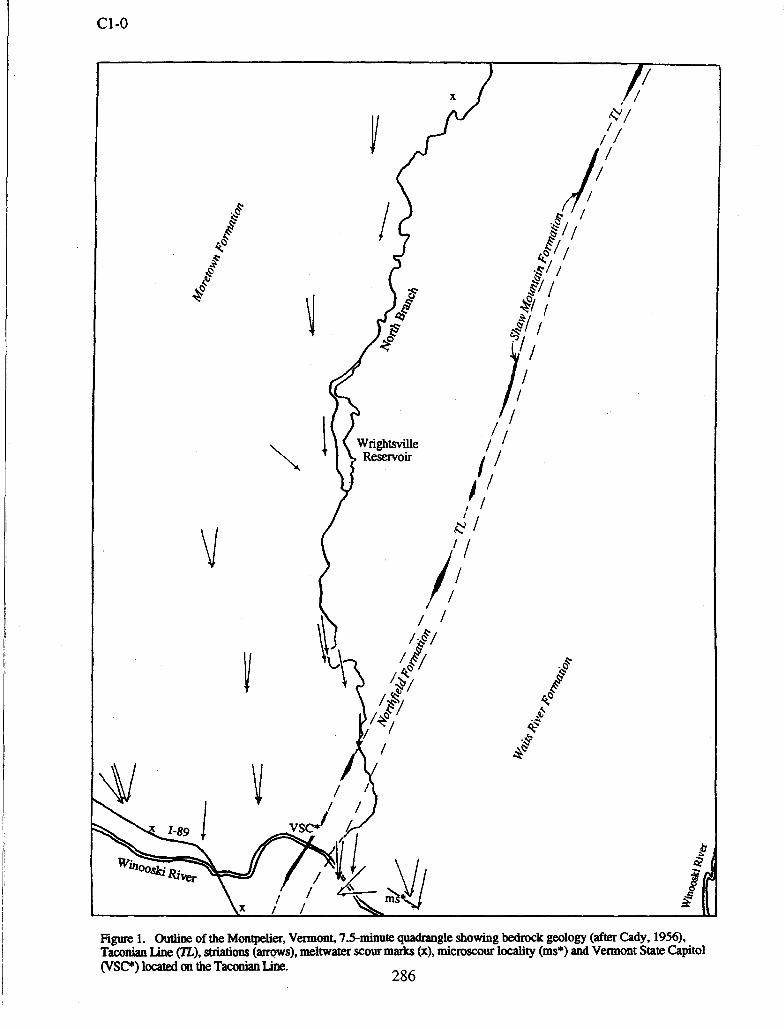
LOU
1' x 7/
1/
/
I I
'I I
II! /
N Wgh1e
Reservoir
V /I /1 /
ii
\ /
1 /
vsc'
/ / 1-89
/
WiflOoski River /
x vJ , / /
Figure 1. Outline of the Montpelier, Vermont, 7.5-minute quadrangle showing bedrock geology (after Cady, 1956), Taconian Line (Th), striations (airows), meitwater scour marks (x), microscour locality (ms*) and Vermont State Capitol (VSC*) located on the Taconian Lim.
286
GLACIAL HISTORY OF THE MONTPELJER, VERMONT, 7.5-MINUTE QUADRANGLE
Frederick D. Larsen, DeparUnent of Geology, Norwich University, Northfield, VT 05663
INTRODUCTION
The Montpelier quadrangle lies on an important geologic contact in the bedrock known variously as the Taconian Line (Hatch, 1982), the Richardson Memorial Contact (informal designation) or the Dog River Fault Zone (Westerman, 1987). The line passes under the Vermont State Capitol and extends N23°E to Robinson Hill at the north edge of the map and separates two distinctive groups of bedrock (Fig. 1). The bedrock lying north and west of the Taconian Line was mapped by Cady (1956) as the Moretown Formation, which consists of greenish-gray quartzite and phyuite, and dark green greenstone. Southeast of the Taconian Line are the Waits River Formation with interbedded light to dark gray calcareous quartzite and phyllite and the Northfield Formation with light to dark gray phyllite and slate. Extending in narrow lenses along the Taconian Line is the Shaw Mpuntain Formation which has "schist, quartz-pebble conglomerate and minor limestone" (Cady, 1956). Cady also mapped sheet-like bodies of fine- to medium-grained light gray granite in the vicinity of Adamant in the east-central part of the map area
The topography developed on the more resistant Moretown Formation northwest of the Taconian Line is more rugged with steeper slopes than to the southeast where the terrain developed on the less resistant Waits River and Northfield Formations consists of smooth, rounded hills. Total relief is slightly greater than 1500 ft. The highest elevation is just above 2000 ft ASL on Long Meadow Hill and the lowest is just below 500 ft ASL where the Winooski River leaves the quadrangle near the southwest corner.
The quadrangle lies entirely within the Winooski River drainage basin. The Winooski River enters the map area at the southeast corner, turns south and enters the Barre West Quadrangle. It turns to the west-northwest, reenters the Montpeier Quadrangle and flows through the City of Montpelier and eventually through the Green Mountains and into Lake Champlain. A major tributary, the North Branch, flows south in the middle of the quadrangle and cuts obliquely across north-northeast-trending bedrock and joins the Winooski in the City of Montpelier (Fig. 1). Many of the short tributaries are straight and oriented northwest-southeast which indicates control by a well developed spaced-joint pattern in the underlying bedrock. Overall the stream drainage pattern is crudely rectangular.
During the Wisconsinan glaciation (90,000 to 12,000 B.P.), the land was depressed by the weight of the ice sheet. When the weight of the ice sheet was removed during deglaciation, the land rebounded to its present position. The amount and direction of uplift was measured by Koteff and Larsen (1989) to be 0.9 in/km (4.74 ft/mi) to N20.5°W-N21°W using deltaic deposits of glacial Lake Hitchcock in the Connecticut Valley. Assuming that any smaller glacial lake in western New England experienced the same rebound, a projection for a glacial lake in the Winooski River drainage basin was drawn starting at the 279-meter (915-ft) threshold south of Wiliamstown and extended into the Winooski basin (Fig. 2)(Larsen, 1987). The projection falls at the break-in-slope (approximate topset/foreset contact) of 6 deltas in the Dog River valley and 5 in the Mad River valley. With recent detailed mapping in the North Branch valley the projection was found to coincide with the break-in-slope of 3 deltas and 2 possible deltas.
Glacial lakes filled the Winooski River basin during both the advance and retreat of the last (Laurentide) ice sheet. Recent detailed mapping in both the Montpelier and Barre West 7.5-minute quadrangles has revealed several locations with till overlying lake-bottom sediments. Lacking other evidence for a local readvance by active ice, these till-over-varve sections are interpreted to be related to the Late Wisconsinan ice advance. The threshold for both preglacial Lake Merwin (named later in this paper) and postglacial Lake Winooski (Merwin, 1908; Larsen, 1987) was the same, 4.0 km south of Wiliiamstown. In each case the Winooski River had to be dammed by ice between Bolton and Middlesex village preventing the Winooski from draining to Lake Champlain (Fig. 2). The focus of this trip concerns the preglacial and postglacial sediments in the Montpelier area. The recent discovery of a possible two-till site and a site with 2.6 in of compact, deformed varves between two tills adds a new dimension to the glacial history of central Vermont.
Larsen, F. D., 1999, Glacial history of the Montpelier, Vermont, 7.5 Minute Quadrangle; in Wright, S.F. ed., New England Intercollegiate Geologic Conference Guidebook Number 91, p. 286-300.
Cl-i
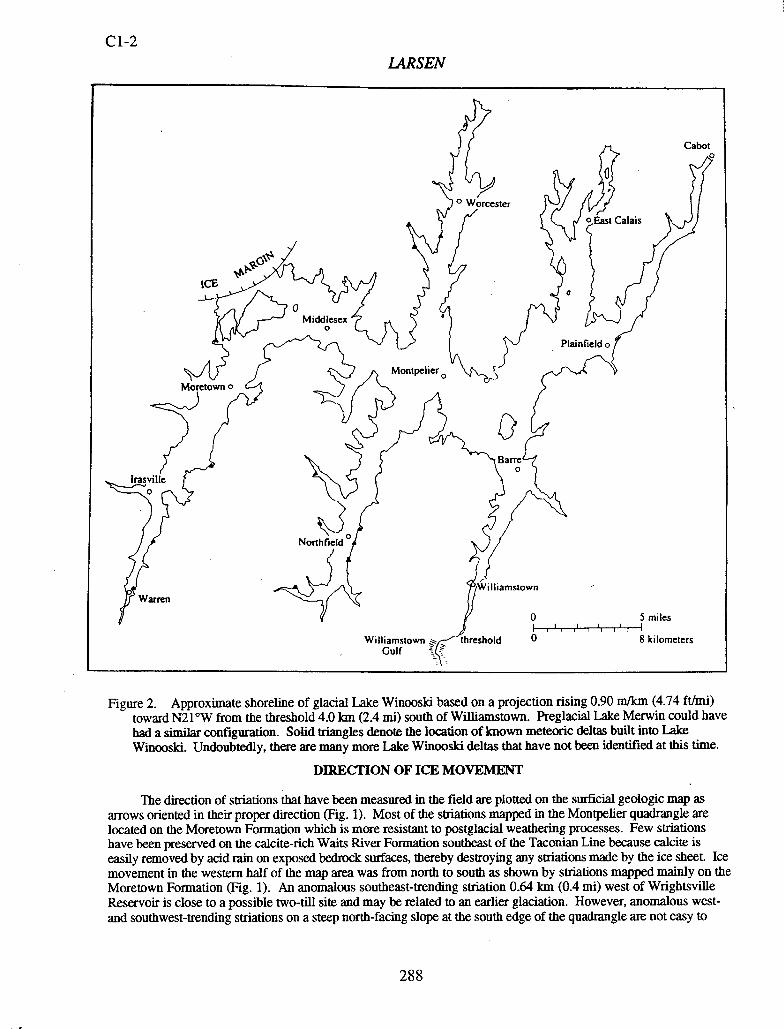
C1-2
L4RSEN
Cabot 0
0 Worcester
1
CE 0
°Eas Calais
0 Middlesex
ontpeI'er
0
Plainfieldo
Moretown
0 Bare
Irasville 0
I Northfield
Wjlliamstown Warren
0 5 miles I I
Will iamStOwn threshold 0 8 kilometers Gulf
Figure 2. Approximate shoreline of glacial Lake Winooski based on a projection rising 0.90 rn/km (4.74 ft/mi) toward N21°W from the threshold 4.0 km (2.4 mi) south of Williamstown. Preglacial Lake Merwin could have had a similar configuration. Solid triangles denote the location of known meteoric deltas built into Lake Winooski. Undoubtedly, there are many more Lake Winooski deltas that have not been identified at this time.
DIRECTION OF ICE MOVEMENT
The direction of striations that have been measured in the field are plotted on the surficial geologic map as arrows oriented in their proper direction (Fig. 1). Most of the striations mapped in the Montpeier quadrangle are located on the Moretown Formation which is more resistant to postglacial weathering processes. Few striations have been preserved on the calcite-rich Waits River Formation southeast of the Taconian Line because calcite is easily removed by acid rain on exposed bedrock surfaces, thereby destroying any striations made by the ice sheet. Ice movement in the western half of the map area was from north to south as shown by striations mapped mainly on the Moretown Formation (Fig. 1). An anomalous southeast-trending striation 0.64 km (0.4 mi) west of Wrightsville Reservoir is close to a possible two-till site and may be related to an earlier glaciation. However, anomalous west-and southwest-trending striations on a steep north-facing slope at the south edge of the quadrangle are not easy to
px.I,J
C1-3
L4RSEN
explain, but probably formed late during deglaciation. In a regional view striations mapped on Mount Hunger less than 3 km (1.8 mi) from the northwest corner of the quadrangle trend S35 °E. Striations all along the crest of the Worcester Range trend between S30 0E and S400E (Stewart F. Clark, pers. commun., 1987). Striations along the Winooski River west of the map area trend S70 0E parallel to the Winooski valley as it cuts through the mountains in the vicinity of Bolton. Overall, the direction of ice movement in central Vermont was south-southeast.
A second type of marking on bedrock is caused by abrasive particles suspended in glacial meitwater as it flows under the ice sheet. The abrasive particles are derived from material gouged from bedrock during the formation of striations and by the breakdown of glacial tools used in the process. The suspended particles are driven against the bedrock by fast-moving meltwater and form depressions known as meitwater scour marks that range in size from small microscours less than 1.0 cm (0.4 in) in length to large potholes. Meltwater scour marks are often found on the downglacier side of roches moutonnees. No potholes with closed depressions were found in the Montpelier quadrangle during this study, but well-developed meltwater scour marks have been mapped at three locations (Fig. 1).
SURFICIAL DEPOSITS
Preglacial Deposits
Two-till site (?). A possible two-till site (STOP SB) is located on the south bank of Culver Brook 0.55 km (0.34 mi) N50°W of the west end of Wrightsville dam. As used here the term "two-till site" is a locality where tills of two separate glaciations can be found, and does not refer to an ablation till/lodgment till couplet formed during a single glaciation. Two-till sites are common in southern New England but are uncommon in central Vermont. In southern New England the lower till is clayey and compact to very compact and the upper till is sandy and loose to compact. According to Koteff and Pessl (1985) the upper till is late Wisconsinan in age and the lower till is either early Wisconsinan or Illinoian in age. The lower till at Culver Brook is very compact and has a dark greenish-gray to bluish-gray color when moist, similar to rocks in the Moretown Formation. The upper 1.0 m (3.3 ft) of the lower till appears to have been weathered because it is light to dark yellowish brown in cOlor and contains "phantoms", pockets of loose, small grains formed by the weathering of what were once solid pebbles transported by the ice sheet. The upper till is gravelly, loose to compact, brown to gray, overlies a sharp contact on the lower till, and contains a slab of the lower till and a 2-meter (6.5 ft) slab of (preglacial?) lacustrine sediment. Because the lower till is very compact, appears to be weathered to a depth of 1.0 meter, and lies only 45 m (150 ft) from an anomalous S53°E-striation locality in an area where most other striations trend close to due south, it is interpreted to be early Wisconsinan in age or older, and the upper till is late Wisconsinan. My interpretation is that the lower till, being weathered, is older and was formed by ice that moved southeast and much later the upper till was formed by ice moving due south.
Preglacial lake deposits. Several exposures with till overlying deformed and undeformed lacustrine sediments occur in the Montpelier, Northfield and Bane West 7.5-minute quadrangles. A notable and accessible exposure is on Culver Hill Road 0.68 km (0.42 mi), N53.5°W of the west end of Wrightsville dam. At this site (STOP 5A) 1.2 m (4.0 ft) of till and colluvium rest upon 25 cm (12 in) of varved lake-bottom deposits indicating that the last ice sheet overrode its own proglacial lake deposits during its southward advance. The boring log for a well located 1.80 km (1.12 mi), S74.5°E of the Vermont State Capitol records "70 ft (21.3 m) of hardpan yellow over 30 ft (9.1 m) of blue clay soft over 150 ft (45.7 m) of bedrock" (Vermont Geological Survey, 1998). In addition, till at lower elevations near the Winooski River and its major tributaries, the North Branch, Dog River and Stevens Branch, commonly is clay rich and often contains slabs of deformed and undeformed lacustrine sediments such as varved silt and clay. The evidence indicates that an extensive lake occupied the Winooski River basin prior to the advance of the last ice sheet, and was similar to glacial Lake Winooski, a proglacial lake that occupied the Winooski River basin during deglaciation (Larsen, 1987). This early lake is named here "preglacial Lake Merwin" after Herbert E. Merwin (1908), who was the first to describe the sequence of down-dropping proglacial lakes associated with the retreat of the late Wisconsinan ice margin.
The best stratigraphic section of Lake Merwin sediments is on the north side of Martins Brook 0.39 km (0.24 mi), N46.5°E of bench mark 1099 at Middlesex Rumney School (STOP 4B). The exposure is 12.2 m (40 ft) wide measured east-west and 4.5 m (15 ft) high. The sediments are compact and consist of fine to very fine sand, silt and clay in varves 2.5 to 10 cm (1.0 to 4.0 in) thick. The clay layers are thin, 0.3 to 0.6 cm (0.12 to 0.24 in), indicating a low supply of clay-size sediment during winter months. The silt and very fine sand are laminated and the fine sand occurs in lenses or starved ripples that display cross-bedding up to 3.8 cm (1.5 in) in height. The mean
C1-4
LARSEN
of eight dip-direction measurements of ripple cross-bedding is S28.4°E, which is down-valley and parallel to Patterson Brook valley. Based on the projected shoreline of glacial Lake Wmooski as an approximation for preglacial Lake Merwin, the starved ripples were deposited in 24 to 27 in (80 to 90 ft) of water by turbidity currents flowing parallel to the present valley bottom. Some time after they were deposited, the varves were offset by thrust faults that strike north and north-northwest and dip to the east. The thrust faults are believed to be the result of deformation caused by overriding ice. Because the Martins Brook varves are unlike softer postglacial varves, are compact, have been structurally deformed and occur just 104 in (340 ft) south of, and below, a section of till overlying lacustrine sediments, they are interpreted to be preglacial ("pre-last" advance of ice).
Glacial Deposits
Till. Till is the most common glacial deposit in the Montpelier quadrangle. It covers most upland areas with a blanket of poorly sorted rock debris that was deposited directly from the base of the ice sheet. The color and composition of unweathered till closely resemble those same characteristics in local bedrock, because most of the particles in a till have been transported only a short distance from their bedrock source. In the Montpelier quadrangle the ice sheet had three main sources of material to incorporate into its base and recycle into deposits of till. They are: (1) the area of Moretown Formation lying northwest of the Taconian Line (Fig. 1), (2) the area of Waits River and Northfield Formations located southeast of the Taconian Line, and (3) unconsolidated silt and clay, which are the bottom deposits of preglacial Lake Merwin. In the Montpelier quadrangle three fades of surface till are recognized on the basis of color and texture. They are greenish-gray sandy to silty till northwest of the Taconian Line, gray sandy to silty till southeast of the Taconian Line and gray clayey till in and near the valley bottoms. The Taconian Line extends southwest through the Northfield quadrangle where a similar distribution of the same three facies of till occurs (Larsen, 1984). The colors mentioned here relate to fresh unweathered till and not to the upper 0.6 in (2 ft) of a till section which is the approximate thickness altered by postglacial weathering. Roadside exposures of till are common at elevations above 275 to 305 in (900 to 1000 ft) where town roads have been widened, but these exposures usually only show the weathered zone and the soil developed on it.
Till derived from the greenish-gray quartzites and phyllites of the Moretown Formation are sandy to silty in texture and light to dark greenish-gray in color when fresh. When weathered, the till is yellowish brown to dark orangish brown because of magnetite and greenstone that are easily altered to dark iron oxides by acid rain percolating down through the upper soil zone. The maximum thickness of till observed in the quadrangle is 9.1 in (30 ft) of "Moretown-type" till at a borrow pit on Culver Hill Road 0.3 km (0.2 mi), N30°W of Wrightsville Dam.
A typical till derived from the Waits River Formation was observed in a temporary excavation for a house 6.2 km (3.85 mi) N86°E of the Vermont State Capitol. There, 1.9 in (6.3 ft) of brownish-gray, sandy to silty, compact till are overlain by 0.6 in (2 ft) of light yellowish-brown very fine lake-bottom sand. Larger brown erratics in the till are calcareous quartzite from which soluble calcite and ankerite have been removed by ground water, leaving an iron-oxide stained rock. Sometimes when all of the soluble minerals have been removed, only pockets of loose brown sand are left behind as phantoms.
An example of till derived from preglacial lake deposits and the Moretown Formation is located on private property 1.4 km (0.85 mi), N38°E of the Vermont State Capitol. The till is a mixture of two distinct sediments, gray thinly bedded varves of silt and clay and yellowish-brown gritty Moretown-type till with numerous pebbles and cobbles, some of which are phantoms derived from greenstone. Slabs of deformed varves and irregular masses of till have been placed adjacent to each other by shoving at the base of the ice sheet. At other localities in the southeast corner of the quadrangle the till is very clay rich with a few pebbles mixed in.
The largest erratic noted in this study measures 5.2 x 4.3 x 2.7 in (17 x 14 x 9 ii) and is located in a borrow pit 0.3 km (0.2 ml) N30°W of the west end of Wrightsville Dam. Numerous erratics of greenstone, amphibolite and quartz-mica schist with garnet phenocrysts (crystals) up to 8 mm (0.3 in) in diameter are common in the Mootpelier quadrangle. The provenance or source area for these three distinctive metamorphic rocks is a narrow zone of the Stowe Formation located along the crest of the Worcester Range as mapped by Cady (1956). Their common occurrence in the Montpelier quadrangle indicates that glacial movement was southeast from the Worcester Range into the Montpelier area. In addition, a few far-traveled erratics of pink granitic gneiss and augen gneiss have been carried to the map area from the Precambrian Canadian shield north of Montreal, a minimum distance of 200 km (125 mi).
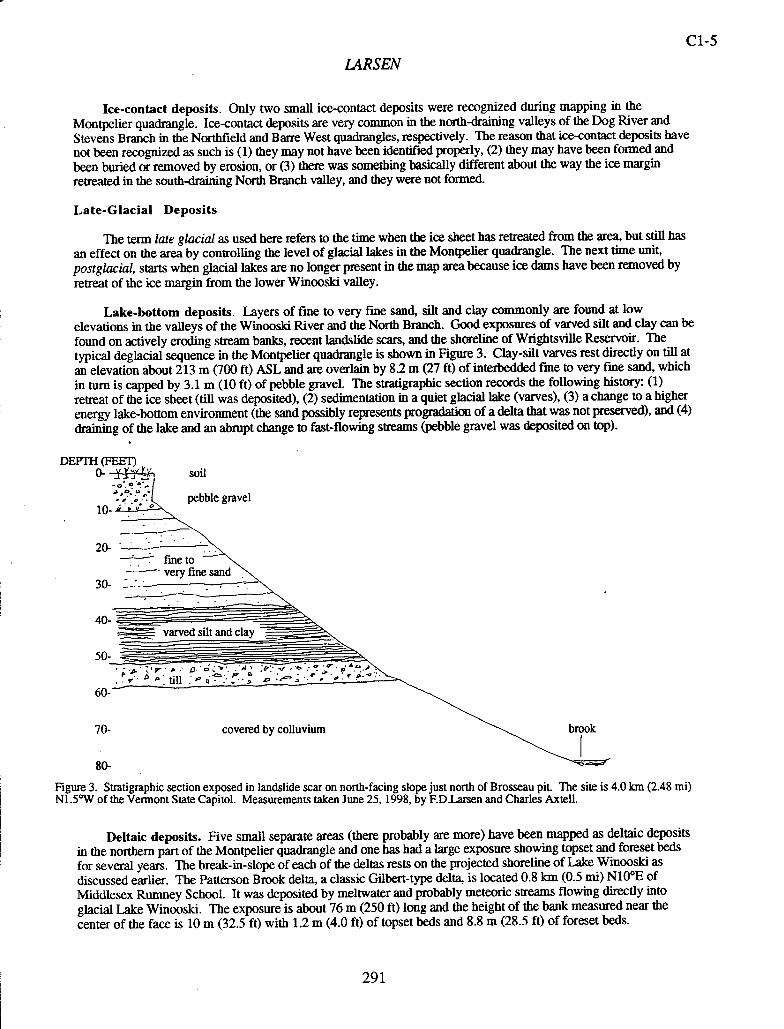
C1-5
L4RSEN
Ice-contact deposits. Only two small ice-contact deposits were recognized during mapping in the Montpelier quadrangle. Ice-contact deposits are very common in the north-draining valleys of the Dog River and Stevens Branch in the Northfield and Barre West quadrangles, respectively. The reason that ice-contact deposits have not been recognized as such is (1) they may not have been identified properly, (2) they may have been fonned and been buried or removed by erosion, or (3) there was something basically different about the way the ice margin retreated in the south-draining North Branch valley, and they were not formed.
Late-Glacial Deposits
The term late glacial as used here refers to the time when the ice sheet has retreated from the area, but still has an effect on the area by controlling the level of glacial lakes in the Montpelier quadrangle. The next time unit, postglacial, starts when glacial lakes are no longer present in the map area because ice dams have been removed by retreat of the ice margin from the lower Winooski valley.
Lake-bottom deposits. Layers of fine to very fine sand, silt and clay commonly are found at low elevations in the valleys of the Winooski River and the North Branch. Good exposures of varved silt and clay can be found on actively eroding stream banks, recent landslide scars, and the shoreline of Wrightsville Reservoir. The typical deglacial sequence in the Montpelier quadrangle is shown in Figure 3. Clay-silt varves rest directly on till at an elevation about 213 m (700 ft) ASL and are overlain by 8.2 m (27 ft) of interbedded fme to very fme sand, which in turn is capped by 3.1 m (10 ft) of pebble gravel. The stratigraphic section records the following history: (1) retreat of the ice sheet (till was deposited), (2) sedimentation in a quiet glacial lake (varves), (3) a change to a higher energy lake-bottom environment (the sand possibly represents progradation of a delta that was not preserved), and (4) draining of the lake and an abrupt change to fast-flowing streams (pebble gravel was deposited on top).
DEPTH (FEET) 0- -jX.4 soil
Efinesand
20-
30-
varved silt and cla
50- ::-' .•
•v•. till • • F' -.'.
60-
70- covered by colluvium
Figure 3. Stratigraphic section exposed in landslide scar on north-facing slope just north of Brosseau pit. The site is 4.0 km (2.48 mi) N1.5°W of the Vermont State Capitol. Measurements taken June 25, 1998, by F.D.Larsen and Charles Axtell.
Deltaic deposits. Five small separate areas (there probably are more) have been mapped as deltaic deposits in the northern part of the Montpelier quadrangle and one has had a large exposure showing topset and foreset beds for several years. The break-in-slope of each of the deltas rests on the projected shoreline of Lake Winooski as discussed earlier. The Patterson Brook delta, a classic Gilbert-type delta, is located 0.8 km (0.5 mi) N10°E of Middlesex Rumney School. It was deposited by meltwater and probably meteoric streams flowing directly into glacial Lake Winooski. The exposure is about 76 m (250 ft) long and the height of the bank measured near the center of the face is 10 m (32.5 ft) with 1.2 m (4.0 ft) of topset beds and 8.8 m (28.5 ft) of foreset beds.
291
C1-6 LARSEN
Postglacial Deposits
Terrace/fan deposits. Flat to gently dipping layers of pebbly medium to coarse sand, pebble gravel and pebble gravel with cobbles are found lying directly on flat lake-bottom deposits of Lake Winooski. The topographic expression where terrace/fan deposits are found consists of flat stream terraces and gently sloping alluvial fan surfaces that grade laterally into each other, and are elevated above the modern stream system. These landforms are remnants of a once-large fluvial deposit that was laterally continuous and has been eroded into many separate segments by the stream system that formed it. Undoubtedly, it extended into adjacent quadrangles along the Winooski River and its tributaries. The deposits were formed by streams flowing out onto the exposed bottom of Lake Winooski shortly after it drained. Draining of the lake was caused by northwest retreat of the ice margin when it was located near Bolton and Jonesville. This resulted in the uncovering shortly in succession of two thresholds for lower glacial lakes in the Winooski Valley, Lake Mansfield I and Lake Mansfield H (Larsen, 1987). The threshold for Lake Mansfield I, if it existed, was at an elevation of 229 in (750 ft) southwest of Gillett Pond and the threshold for Lake Mansfield H was at 204 in (670 ft) 3.0 km (1.8 mi) southwest of Huntington. Projected shorelines for these two lakes were extended southeast into the Winooski basin based on the regional rebound measurement of 0.90 rn/km (4.74 ft/mi) to N21°W made by Koteff and Larsen (1989). It appears that the Lake Mansfield I shoreline, although it extends into the Montpelier quadrangle, had no significant effect on postglacial sedimentation. The Lake Mansfield II projected shoreline did not extend into the quadrangle, but that lake probably was the base level that controlled the fluvial grade on which the terrace/fan deposits were formed.
An important example is the flat surface underlying College Street and Vermont College, 1.3 km (0.8 mi), S500E of the Vermont State Capitol. The surface is underlain by pebble gravel and pebbly sand of fluvial origin resting on flat lake-bottom beds of fine sand. Flat lake-bottom fine to very fine sand, silt and clay can be observed on the west side of Bingham Street just north of the Vermont College campus. The College Street terrace rises to the northeast from 203 to 210 in (665 to 690 ft) where 1.0 in (3.3 ft) of pebble-cobble gravel rests on pebbly fine sand. These deposits represent proximal alluvial fan deposits by an early Blanchard Brook located to the east. The College Street surface lies 91.5 in (300 ft) below the projected shoreline of Lake Winooski and 6.7 in (22 ft) below the projection for Lake Mansfield I.
Stream-terrace deposits. Beds of fine to very fine sand overlying pebble gravel and pebbly sand occur on terraces above modem flood plains. An auger hole located 3.06 km (1.90 mi), N880W of the Vermont State Capitol had 1.4 m (4.7 ft) of fine sand over 1.0 in (3.3 ft) of pebble gravel. The occurrence of fining-upward sequences is typical of deposits formed by meandering streams. The coarser pebble gravel represents high-energy deposition on a point bar on the inside of a meander and the finer sand is formed as overbank deposition on the flood plain when flooding occurs. As the stream channel migrates laterally point-bar deposits are covered by overbank deposits. When downdutting occurs, the former flood plain is left elevated as a terrace 2 to 3 meters (6 to 10 ft) or more above the modern flood plains of the Winooski River and North Branch.
Alluvium. Layers of fine to very fine sand, silt and clay overlying pebble gravel and pebbly sand are common in flood plains adjacent to modern streams. Alluvium occurs as fining-upward sequences formed by meandering streams as described above in the section on stream-terrace deposits. The coarse sediment deposited in the channel and point bar are left behind and covered with fine overbank sediment as the stream channel migrates laterally. Both the Winooski River and the North Branch have meandering reaches adjacent to flood plains. An excellent place to observe the modem flood plain and the effects of an active meander is on the Dog River just west of the Montpelier sewer plant 1.77 km (1.1 mi), S630W of the Vermont State Capitol.
Artificial fill. Unconsolidated materials have been derived from all types of surficial deposits and bedrock and have been placed by man as embankments in dams and under roads, railroads and building sites. The flood plain of the Winooski River and North Branch in the urban portion of Montpelier and the area of the high school has been covered with artificial fill upto 4.3 m (14 ft) thick. In the railroad yard at Montpelier Junction 0.5 to 1.5 in (1.6 to 5.0 ft) of artificial fill was placed directly on pebble gravel that was formed as a stream-terrace deposit. The largest body of artificial fill is at Wrightsville dam built in 1933 to 1935 as a flood-control dam. An old till pit located on Culver Hill Road 0.3 km (0.2 mi), N30°W of the west end of the dam probably supplied some material for the dam.
292
C1-7 LARSEN
GLACIAL HISTORY
The Montpelier quadrangle apparently has experienced two separate glaciations. This statement is based on the possible two tills at STOP 5B and particularly on the till-varves-till site at STOP SC. At this latter site on Culver Brook it seems most probable that an early Wisconsinan, or older, till was covered by varves deposited in Lake Merwin, a proglacial lake that occupied the Winooski River basin and was controlled by a threshold south of Williamstown. During the late Wisconsinan glaciation, Lake Merwin varves were overridden by the ice sheet, were highly deformed and covered with till.
During late-glacial time in central Vermont, glacial Lake Winooski formed when the Winooski River was dammed up and prevented from flowing to the west by the retreating ice sheet (Larsen, 1987). Lake Winooski filled with meitwater and meteoric precipitation in front of the ice margin and drained south over a 279-rn (915-ft) threshold located 4.0 km (2.4 mi) south of Williamstown (Fig. 2). As the ice margin retreated from Montpelier to Bolton, Lake Winooski expanded west-northwest in the present Winooski River valley. Classic clay-silt varves resting on till record the presence of Lake Winooski following glacial retreat (Fig. 3). When the ice margin retreated west from Bolton, a lower outlet was uncovered at Gilleu Pond and Lake Winooski dropped about 86.3 in (283 ft) to the level of glacial Lake Mansfield I (Larsen, 1987). Shortly thereafter, Lake Mansfield I dropped about 20.4 in (67 ft) to the level of Lake Mansfield II, which was controlled by a 204-meter (670-ft) threshold, the so-called Hollow Brook threshold 3.0 km (1.86 mi) southwest of Huntington.
When the major terraces of the Mad River valley are projected onto a vertical plane trending N21°W-S21 0E they fall on a concave-up profile parallel to and 15 in (50 ii) above the projected profile of the present-day Mad River (Larsen, 1987). At the north end of the profile the elevation of the terraces rises onto the projected level of Lake Mansfield I. In 1987, this led me to conclude that Lake Mansfield I was the base level control for the Mad River terraces, and that I would fmd deltas on the projected level of Lake Mansfield I elsewhere in the Winooki River basin. When the Lake Mansfield I projection is extended into the North Branch valley, it intersects only one small deposit with truncated deltaic foreset beds about 1.0 in (3.3 ft) high in the middle of the quadrangle. Elsewhere in the North Branch valley terrace/fan deposits with flat fluvial beds rest directly on flat lake-bottom deposits. At Worcester in the north terrace/fan deposits only 1.0 in (3.3 ft) thick lie 12 in (40 ft) above the projection, and at Vermont College in the south terrace/fan deposits are 6.7 in (22 ft) below the projection. That is, the projected profile of the terrace/fan deposits has a steeper gradient than the projected profile for Lake Mansfield I. I conclude that there was no great system of deltas graded to Lake Mansfield I, and if that lake existed it was short lived. Instead, we are left with a major set of terraces in the valleys of the North Branch and the Mad River and that set of terraces probably was fonned on a fluvial grade to Lake Mansfield H or a lower lake in the Winooski valley.
Retreat of the ice margin from the lower Winooski valley resulted in the draining of Lake Mansfield II and abandonment of the Hollow Brook threshold southwest of Huntington. Downcutting and subsequent lateral cutting by the Winooski River and its tributaries through nonresistant lake deposits and till has eroded much unconsolidated sediment from the area. Interestingly, less than a dozen small stream terraces have been recognized below the terrace/fan deposits in the Montpelier quadrangle. The landscape today is undergoing rapid change caused by floods and small landslides that result from sudden storms and hurricanes.
ACKNOWLEDGMENTS
The following Norwich University students wrote papers on the Montpelier quadrangle in 1988: Joe Fiacco, Andrew Linehan, Bill Lukaskiewicz, and Mike Senus; and in 1998: Chuck Axtell, Brian Barney, Nick Malczyk, Stephanie Ogarek, Rockey Preston, Aaron Stoddard, and Heather Streetman. The following University of Vermont field naturalists completed small mapping projects in 1989: Mike Batcher, Eric Lile, Polly Harris and Mike Shephard. The following Norwich students prepared the exposures for this trip: Chuck Axtell, Brian Bennett, Dan Corindia, Jim Crook, Nathan Donahue, Tim Merlino, Jon Moll, and Dagan Murray. Professor Stephen Wright and George Springston visited several stops and gave counsel. Maureen Larsen proofread the paper. Professor David Westerman helped with computer problems. Professor John Stevens measured the topset/foreset contact at the Leslie Pit. Norwich University supplied logistical support. To all of the above I extend a hearty thank you. "Research supported by the Vermont Geological Survey, Dept. of Environmental Conservation and the U. S. Geological Survey, National Cooperative Mapping Program, under assistance Award No. 98HQAG2068. The views and conclusions contained in this document are those of the author and should not be interpreted as necessarily representing the official policies, either expressed or implied of the U. S. Government."
293
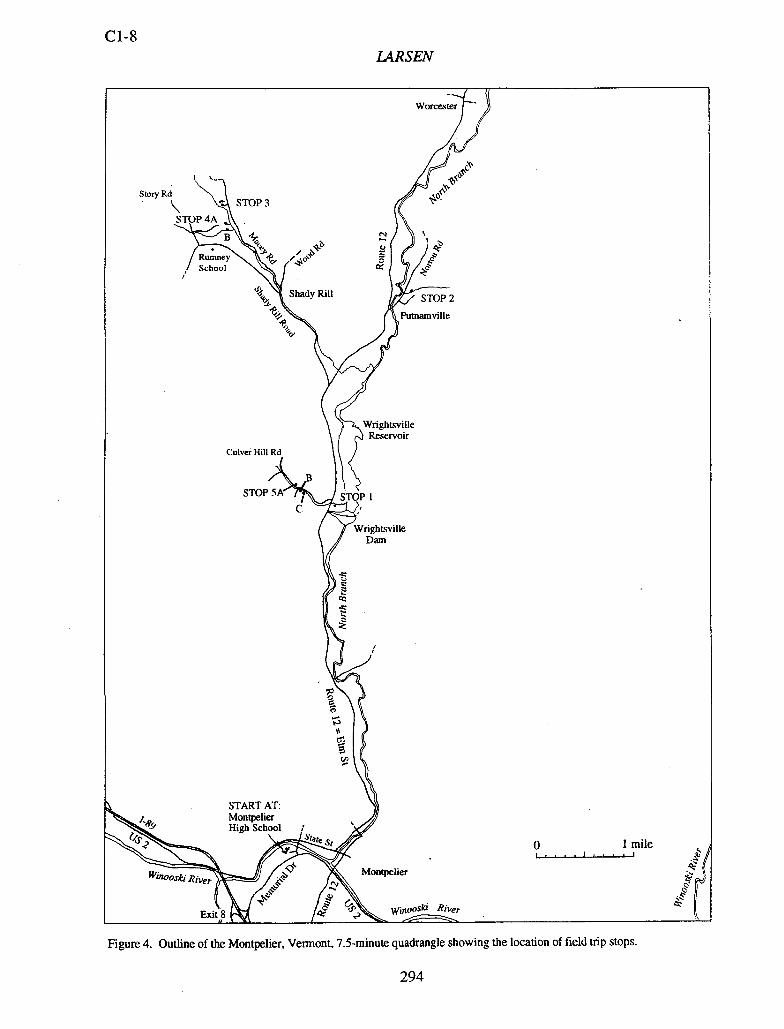
C1-8 LARSEN
Worcester -
I Story Rd
STOP 3
STOP4A
B 4- \/b
Rumney •ç, '4cP School
, Shady Rill STOP 2
Putnamville
Wrightsville Reservoir
Culver Hill Rd
STOP 5A i C
Wrightsville Dam
/
START AT:
1.q Montpelier High School
te Sj 0 1 mile
Winooski River Montpeier
.51
wiiw0 1 River Exit,8 -'>
Figure 4. Outline of the Montpelier, Vermont, 7.5-minute quadrangle showing the location of field trip stops.
294
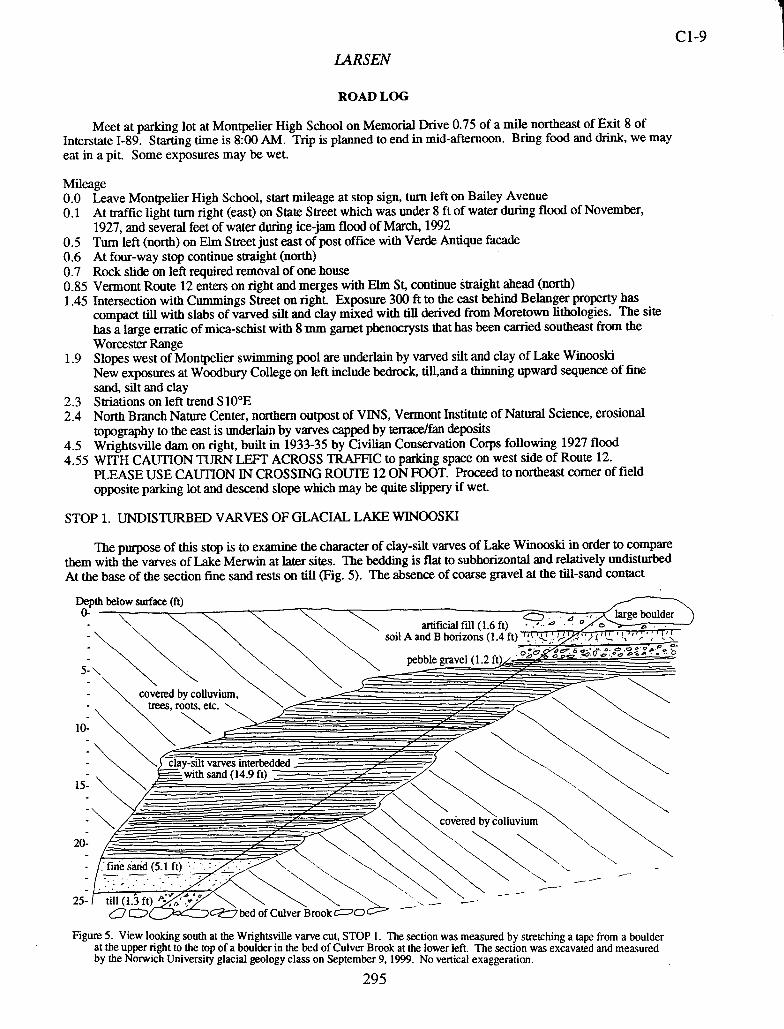
- /:finesind(5.lft)
2'
25- /till (1. ft)A 7 cc LL L
- '. clay-silt varves mu
15:
:\
20-/
C1-9 LARSEN
ROAD LOG
Meet at parking lot at Montpelier High School on Memorial Drive 0.75 of a mile northeast of Exit 8 of Interstate 1-89. Starting time is 8:00 AM. Trip is planned to end in mid-afternoon. Bring food and drink, we may eat in a pit. Some exposures may be wet.
Mileage 0.0 Leave Montpelier High School, start mileage at stop sign, turn left on Bailey Avenue 0.1 At traffic light turn right (east) on State Street which was under 8 ft of water during flood of November,
1927, and several feet of water during ice-jam flood of March, 1992 0.5 Turn left (north) on Elm Street just east of post office with Verde Antique facade 0.6 At four-way stop continue straight (north) 0.7 Rock slide on left required removal of one house 0.85 Vermont Route 12 enters on right and merges with Elm St, continue straight ahead (north) 1.45 Intersection with Cummings Street on right. Exposure 300 ft to the east behind Belanger property has
compact till with slabs of varved silt and clay mixed with till derived from Moretown lithologies. The site has a large erratic of mica-schist with 8mm garnet phenocrysts that has been carried southeast from the Worcester Range
1.9 Slopes west of Montpelier swimming pool are underlain by varved silt and clay of Lake Winooski New exposures at Woodbury College on left include bedrock, till,and a thinning upward sequence of fine sand, silt and clay
2.3 Striations on left trend S 10 0E 2.4 North Branch Nature Center, northern outpost of VINS, Vermont Institute of Natural Science, erosional
topography to the east is underlain by varves capped by terrace/fan deposits 4.5 Wrightsville dam on right, built in 1933-35 by Civilian Conservation Corps following 1927 flood 4.55 WITH CAUTION TURN LEFT ACROSS TRAFFIC to parking space on west side of Route 12.
PLEASE USE CAUTION IN CROSSING ROUTE 12 ON FOOT. Proceed to northeast corner of field opposite parking lot and descend slope which may be quite slippery if wet.
STOP 1. UNDISTURBED VARVES OF GLACIAL LAKE WINOOSKI
The purpose of this stop is to examine the character of clay-silt varves of Lake Winooski in order to compare them with the varves of Lake Merwin at later sites. The bedding is flat to subhorizontal and relatively undisturbed At the base of the section fine sand rests on till (Fig. 5). The absence of coarse gravel at the till-sand contact
Depth below surface (ft) 0- - z--'--- -
artificial fill (1.6 ft) soil A and B horizons (1.4 ft)
pebble gravel (1.2
large
c7 -
- covered by colluvium, trees, roots, etc.
FigureS. View looking south at the Wrightsville varve cut, STOP 1. The section was measured by stretching a tape from a boulder at the upper right to the top of a boulder in the bed of Culver Brook at the lower lefL The section was excavated and measured by the Norwich University glacial geology class on September 9, 1999. No vertical exaggeration.
295
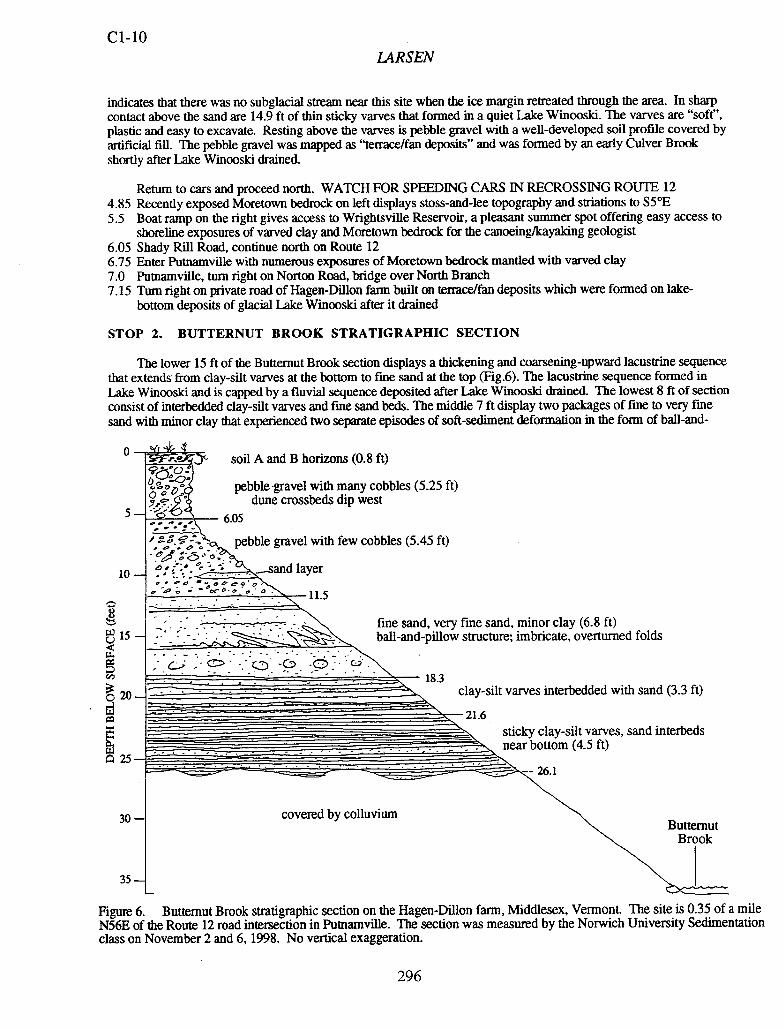
cl-b L4RSEN
indicates that there was no subglacial stream near this site when the ice margin retreated through the area. In sharp contact above the sand are 14.9 ft of thin sticky varves that formed in a quiet Lake Winooski. The varves are "soft", plastic and easy to excavate. Resting above the varves is pebble gravel with a well-developed soil profile covered by artificial fill. The pebble gravel was mapped as "terrace/fan deposits" and was formed by an early Culver Brook shortly after Lake Winooski drained.
Return to cars and proceed north. WATCH FOR SPEEDING CARS IN RECROSSING ROUTE 12 4.85 Recently exposed Moretown bedrock on left displays stoss-and-lee topography and striations to WE 5.5 Boat ramp on the right gives access to Wrightsville Reservoir, a pleasant summer spot offering easy access to
shoreline exposures of varved clay and Moretown bedrock for the canoeing/kayaking geologist 6.05 Shady Rill Road, continue north on Route 12 6.75 Enter Putnamville with numerous exposures of Moretown bedrock mantled with varved clay 7.0 Pumamvile, turn right on Norton Road, bridge over North Branch 7.15 Turn right on private road of Hagen-Dillon farm built on terrace/fan deposits which were formed on lake-
bottom deposits of glacial Lake Winooski after it drained
STOP 2. BUTTERNUT BROOK STRATIGRAPHIC SECTION
The lower 15 ft of the Butternut Brook section displays a thickening and coarsening-upward lacustrine sequence that extends from clay-silt varves at the bottom to fme sand at the top (Fig.6). The lacustrine sequence formed in Lake Winooski and is capped by a fluvial sequence deposited after Lake Winooski drained. The lowest 8 ft of section consist of interbedded clay-silt varves and fme sand beds. The middle 7 ft display two packages of fine to very fme sand with minor clay that experienced two separate episodes of soft-sediment deformation in the form of ball-and-
soil A and B horizons (0.8 ft) ôj
pebble gravel with many cobbles (5.25 ft) dune crossbeds dip west
- 6.05
pebble gravel with few cobbles (5.45 ft)
10— • .._sand layer
11.5
fine sand, very fine sand, minor clay (6.8 ft)
15 - - -- . ball-and-pillow structure; imbricate, overturned folds
20 - clay-silt varves interbedded with sand (3.3 ft)
- 21.6 sticky clay-silt varves, sand interbeds near bottom (4.5 ft)
25— -. .. - . •-----------
-. - 26.1
30— covered by colluvium Butternut
Brook
35
Figure 6. Butternut Brook stratigraphic section on the Hagen-Dilon farm, Middlesex, VermonL The site is 0.35 of a mile N56E of the Route 12 road intersection in Puinamville. The section was measured by the Norwich University Sedimentation class on November 2 and 6, 1998. No vertical exaggeration.
296
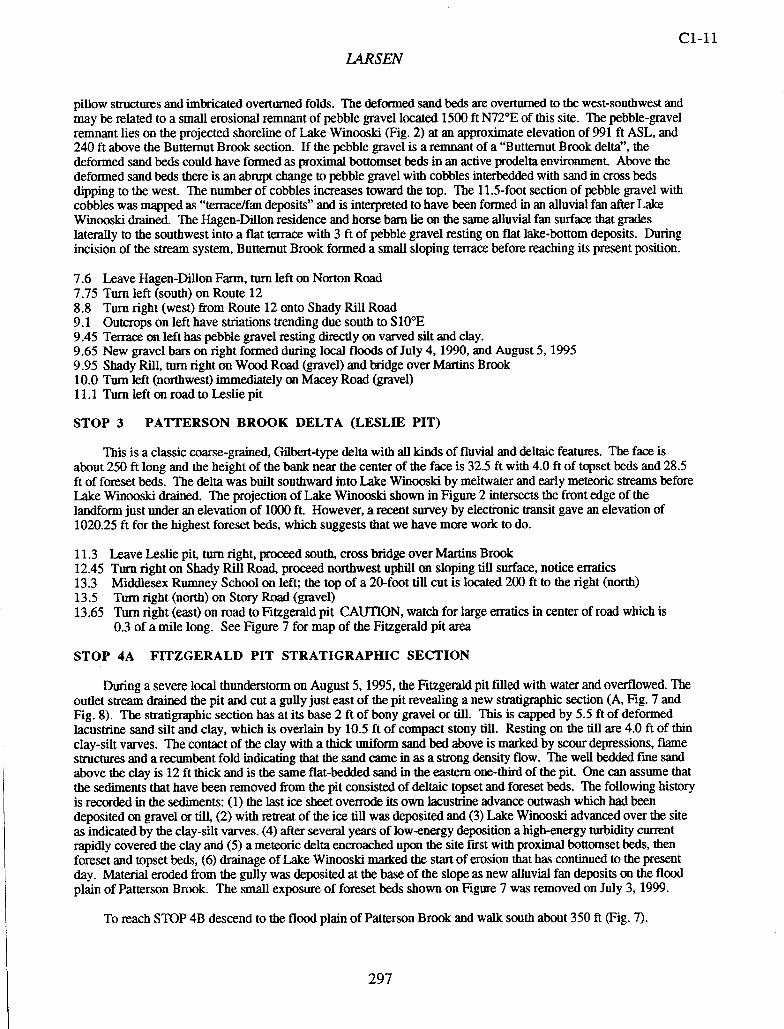
cl-il
LARSEN
pillow structures and imbricated overturned folds. The deformed sand beds are overturned to the west-southwest and may be related to a small erosional remnant of pebble gravel located 1500 ft N72°E of this site. The pebble-gravel remnant lies on the projected shoreline of Lake Winooski (Fig. 2) at an approximate elevation of 991 ft ASL, and 240 ft above the Butternut Brook section. If the pebble gravel is a remnant of a "Butternut Brook delta", the deformed sand beds could have formed as proximal bottomset beds in an active prodelta enviroiunent. Above the deformed sand beds there is an abrupt change to pebble gravel with cobbles interbedded with sand in cross beds dipping to the west. The number of cobbles increases toward the top. The 11.5-foot section of pebble gravel with cobbles was mapped as "terrace/fan deposits" and is interpreted to have been formed in an alluvial fan after Lake Winooski drained. The Hagen-Dilon residence and horse barn he on the same alluvial fan surface that grades laterally to the southwest into a flat terrace with 3 ft of pebble gravel resting on flat lake-bottom deposits. During incision of the stream system, Butternut Brook formed a small sloping terrace before reaching its present position.
7.6 Leave Hagen-Dillon Farm, turn left on Norton Road 7.75 Turn left (south) on Route 12 8.8 Turn right (west) from Route 12 onto Shady Rill Road 9.1 Outcrops on left have striations trending due south to S10°E 9.45 Terrace on left has pebble gravel resting directly on varved silt and clay. 9.65 New gravel bars on right formed during local floods of July 4, 1990, and August 5, 1995 9.95 Shady Rill, turn right on Wood Road (gravel) and bridge over Martins Brook 10.0 Turn left (northwest) immediately on Macey Road (gravel) 11.1 Turn left on road to Leslie pit
STOP 3 PATTERSON BROOK DELTA (LESLIE PIT)
This is a classic coarse-grained, Gilbert-type delta with all kinds of fluvial and deltaic features. The face is about 250 ft long and the height of the bank near the center of the face is 32.5 ft with 4.0 ft of topset beds and 28.5 ft of foreset beds. The delta was built southward into Lake Winooski by meltwater and early meteoric streams before Lake Winooski drained. The projection of Lake Winooski shown in Figure 2 intersects the front edge of the landform just under an elevation of 1000 ft. However, a recent survey by electronic transit gave an elevation of 1020.25 ft for the highest foreset beds, which suggests that we have more work to do.
11.3 Leave Leslie pit, turn right, proceed south, cross bridge over Martins Brook 12.45 Turn right on Shady Rill Road, proceed northwest uphill on sloping till surface, notice erratics 13.3 Middlesex Rumney School on left; the top of a 20-foot till cut is located 200 ft to the right (north) 13.5 Turn right (north) on Story Road (gravel) 13.65 Turn right (east) on road to Fitzgerald pit CAUTION, watch for large erratics in center of road which is
0.3 of a mile long. See Figure 7 for map of the Fitzgerald pit area
STOP 4A FITZGERALD PIT STRATIGRAPHIC SECTION
During a severe local thunderstorm on August 5, 1995, the Fitzgerald pit tilled with water and overflowed. The outlet stream drained the pit and cut a gully just east of the pit revealing a new stratigraphic section (A, Fig. 7 and Fig. 8). The stratigraphic section has at its base 2 ft of bony gravel or till. This is capped by 5.5 ft of deformed lacustrine sand silt and clay, which is overlain by 10.5 ft of compact stony till. Resting on the till are 4.0 ft of thin clay-silt varves. The contact of the clay with a thick uniform sand bed above is marked by scour depressions, flame structures and a recumbent fold indicating that the sand came in as a strong density flow. The well bedded fme sand above the clay is 12 ft thick and is the same flat-bedded sand in the eastern one-third of the pit. One can assume that the sediments that have been removed from the pit consisted of deltaic topset and foreset beds. The following history is recorded in the sediments: (1) the last ice sheet overrode its own lacustrine advance outwash which had been deposited on gravel or till, (2) with retreat of the ice till was deposited and (3) Lake Winooski advanced over the site as indicated by the clay-silt varves. (4) after several years of low-energy deposition a high-energy turbidity current rapidly covered the clay and (5) a meteoric delta encroached upon the site first with proximal bottomset beds, then foreset and topset beds, (6) drainage of Lake Winooski marked the start of erosion that has continued to the present day. Material eroded from the gully was deposited at the base of the slope as new alluvial fan deposits on the flood plain of Patterson Brook. The small exposure of foreset beds shown on Figure 7 was removed on July 3, 1999.
To reach STOP 4B descend to the flood plain of Patterson Brook and walk south about 350 ft (Fig. 7).
297
C1-12 LARSEN
0 lOOft
200
(removed 7/3/99)
oheast-dipping foresets
ewalluvial
/
1 '+ compact II
deposi Or
bestrou
ts fine sand
te
f
2'
wooded steep
wooded steep slope slope (down) -+
down
' k B
roOk
Figure 7 Pace-and-compass map of the Fitzgerald pit showing the location of (A) the stratigraphic section and (B) the location of preglacial Lake Merwin varves.
WEST .--- to Fitzgerald pit EAST
Depth below surface (ft)
bediled
- - fine sand (12 ft)
10- flame structures and overturned fold
- clay-silt varves4.0ft
20- - compact stony till (10.5 ft) : - o'o'• • 1" - ..o O - . - deformed lacustrine sand, ___.-..------"
covered
Figure 8. Generalized stratigraphic section at STOP 5A measured by hand leveling at the east side of the Fitzgerald pit.
C1-13
LARSEN
STOP 4B PREGLACIAL LAKE MERWIN VARVES (B)
This description of preglacial Lake Merwin varves is repeated from page C1-3. The exposure is 12.2 m (40 ft) wide measured east-west and 4.5 m (15 ft) high. The sediments are compact and consist of fine to very fine sand, silt and clay in varves 2.5 to 10 cm (1.0 to 4.0 in) thick. The clay layers are thin, 0.3 to 0.6 cm (0.12 to 0.24 in), indicating a low supply of clay-size sediment during winter months. The silt and very fine sand are laminated and the fine sand occurs in lenses or starved ripples that display cross-bedding up to 3.8 cm (1.5 in) in height. The mean of eight dip-direction measurements of ripple cross-bedding is S28.4°E, which is down-valley and parallel to Patterson Brook valley. Based on the projected shoreline of glacial Lake Winooski as an approximation for preglacial Lake Merwin, the starved ripples were deposited in 24 to 27 m (80 to 90 ft) of water by turbidity currents flowing parallel to the present valley bottom. Some time after they were deposited, the varves were offset by thrust faults that strike north and north-northwest and dip to the east. The thrust faults are believed to be the result of deformation caused by overriding ice. Because the Martins Brook varves are unlike softer postglacial varves, are compact, have been structurally deformed and occur just 104 m (340 ft) south of, and below, a section of till overlying lacustrine sediments, they are interpreted to be preglacial ("pre-last" advance of ice).
14.25 Leave Fitzgerald pit, turn left (south) on Story Road 14.4 Turn left (southeast) on Shady Rill Road 16.8 Turn right (south) on Route 12 18.05 Turn 'right (west) on Culver Hill Road 18.25 Borrow pit on has 30 ft of compact till and a large erratic of quartz-mica schist 18.3 Turn left (south) on Warren Road and park so not to block road entirely. WATCH FOR TRAFFIC.
From Warren Road walk west about 300 ft to STOP 5A on the north side of Culver Hill Road
STOP SA CULVER HILL ROAD TILL OVER VARVED CLAY
STOP 5A is not a safe spot for a large group blocking the road. Four feet of till and colluvium rest on 1 ft of varved clay. To reach STOP 5B, walk south on Warren Road about 220 ft, turn left and drop down, follow trail at base of slope on new alluvial fan deposits to exposure on south bank of Culver Brook.
STOP SB CULVER BROOK SECTION 1
The lower till at Culver Brook is very compact and has a dark greenish-gray to bluish-gray color when moist, similar to rocks in the Moretown Formation . The upper 3.3 ft of the lower till appears to have been weathered because it is light to dark yellowish brown in color and contains "phantoms", pockets of loose, small grains formed by the weathering of what were once solid pebbles transported by the ice sheet. The upper till is gravelly, loose to compact, brown to gray, overlies a sharp contact on the lower till, and appears to contain slabs or clasts of both the lower till and lacustrine sediments. Because the lower till is very compact, appears to be weathered to a depth of 3.3 ft, and lies only 150 ft from an anomalous S53°E-striation locality in an area where most other striations trend close to due south, it is interpreted to be early Wisconsinan in age or older. To reach STOP 5C, climb up slope at west end of STOP 5B and follow trail east-southeast on the contour about 200 ft to landslide scar.
STOP SC CULVER BROOK SECTION 2
Exposed in the landslide scar is a package of blue-gray, very compact and highly deformed clay-silt varves 8.5 to 10 ft thick resting on yellowish-brown, compact, sandy till that is similar to the lower till of STOP SB (Fig. 9). Between the deformed varves and the till is a 4 in layer of light yellowish-brown, fine to very fine sand and silt, which appears to be a shear zone on which the overlying package of varves moved. Three shallow pits were dug on the slope above the landslide scar and yellowish-brown, compact till was exposed in each. It appears that this site has two tills separated by deformed lake sediments. If that is true, then the upper till represents the late Wisconsinan ice advance, the deformed clays were deposited during interglacial time in pre-last glacial Lake Merwin, and the lower till is early Wisconsinan, or older, in age.
End of trip. Proceed east on Culver Hill Road. Turn right on Route 12 for points south, east and west, turn left for points north
299
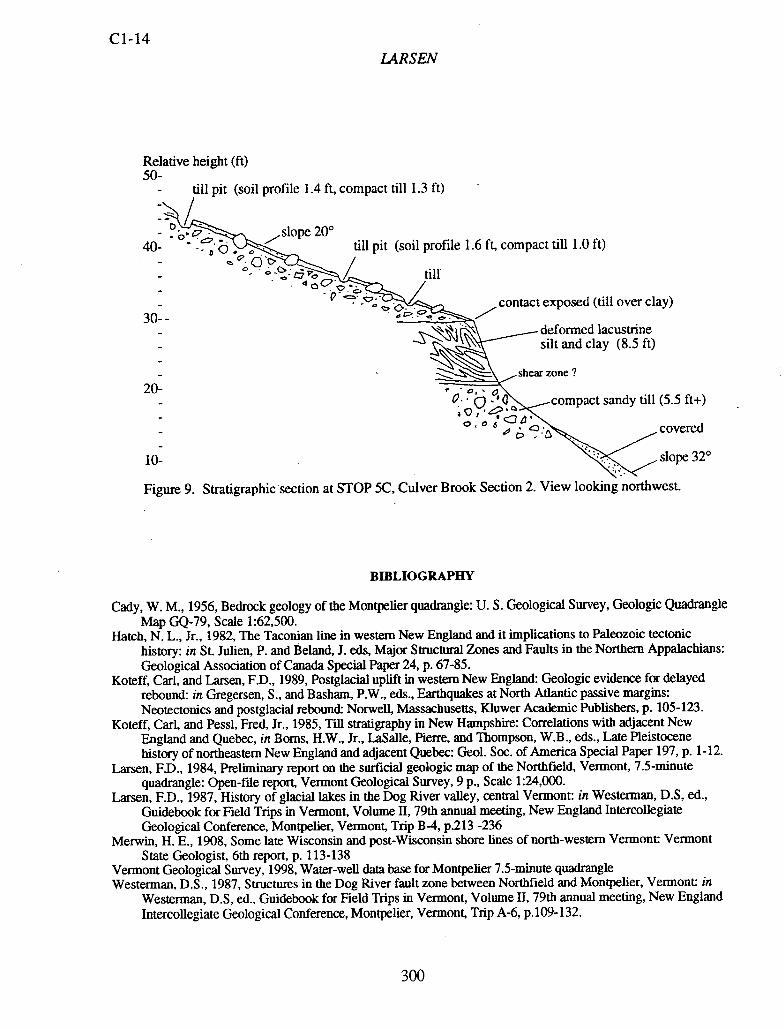
C1-14 LARSEN
Relative height (ft) 50-
- till pit (soil profile 1.4 ft, compact till 1.3 ft)
- - slope 20°
40- -. . till pit (soil profile 1.6 ft, compact till 1.0 ft) -
- / till
- contact exposed (till over clay) -
30--
- deformed lacustnne silt and clay (8.5 ft)
- shear zone? 20-
- O b - 1 0 compact sandy till (5.5 ft+) - - ) covered
10- slope 32°
Figure 9. Stratigraphic section at STOP 5C, Culver Brook Section 2. View looking northwest.
BIBLIOGRAPHY
Cady, W. M., 1956, Bedrock geology of the Montpelier quadrangle: U. S. Geological Survey, Geologic Quadrangle Map GQ-79, Scale 1:62,500.
Hatch, N. L., Jr., 1982, The Taconian line in western New England and it implications to Paleozoic tectonic history: in St. Julien, P. and Beland, J. eds, Major Structural Zones and Faults in the Northern Appalachians: Geological Association of Canada Special Paper 24, p. 67-85.
Koteff, Carl, and Larsen, F.D., 1989, Postglacial uplift in western New England: Geologic evidence for delayed rebound: in Gregersen, S., and Basham, P.W., eds., Earthquakes at North Atlantic passive margins: Neotectonics and postglacial rebound: Norwell, Massachusetts, Kluwer Academic Publishers, p. 105-123.
Koteff, Carl, and Pessl, Fred, Jr., 1985, Till stratigraphy in New Hampshire: Correlations with adjacent New England and Quebec, in Borns, H.W., Jr., LaSalle, Pierre, and Thompson, W.B., eds., Late Pleistocene history of northeastern New England and adjacent Quebec: Geol. Soc. of America Special Paper 197, p. 1-12.
Larsen, F.D., 1984, Preliminary report on the surficial geologic map of the Northfield, Vermont, 7.5-minute quadrangle: Open-file report, Vermont Geological Survey, 9p., Scale 1:24,000.
Larsen, F.D., 1987, History of glacial lakes in the Dog River valley, central Vermont: in Westerman, D.S, ed., Guidebook for Field Trips in Vermont, Volume II, 79th annual meeting, New England Intercollegiate Geological Conference, Montpelier, Vermont, Trip B-4, p.213 -236
Merwin, H. E., 1908, Some late Wisconsin and post-Wisconsin shore lines of north-western Vermont Vermont State Geologist, 6th report, p. 113-138
Vermont Geological Survey, 1998, Water-well data base for Montpelier 7.5-minute quadrangle Westennan, D.S., 1987, Structures in the Dog River fault zone between Northfield and Montpelier, Vermont in
Westerman, D.S, ed., Guidebook for Field Trips in Vermont, Volume II, 79th annual meeting, New England Intercollegiate Geological Conference, Montpelier, Vermont, Trip A-6, p.109-1132.
300
PINE STREET CANAL SUPERFUND SITE: HYDROGEOLOGY AND ITS EFFECTS UPON THE EXTENT OF
MANUFACTURED COAL GAS CONTAMINATION
by Donald M. Maynard
The Johnson Company, Inc. 100 State Street, Suite 600
Montpelier; Vermont 05602
INTRODUCTION
The Pine Street Canal Superfund Site (the Site) occupies approximately 70 acres of land lying between Lake Champlain (the Lake) and Pine Street approximately V2 mile south of downtown Burlington, Vermont This area was historically a wetland environment which experienced industrial development since the mid 1 800s. A manufactured gas plant (MGP) operated on the Site from around the turn of the century until 1966. This operation generated a variety of waste materials, the most notable of which is coal tar, which came to be located in the wetland and Canal to the west of the MGP and seeped into a peat layer in the subsurface where the bulk of the contamination appears to currently reside. In addition to the MGP, other types of industrial and urban sources may have contributed to a variety of types of contamination now found at the Site.
The Site was placed on the CERCLA National Priority List (NPL) in 1981 and has been the subject of numerous environmental investigations. Fifteen hydrogeologic investigations were completed on various portions of the Site between 1978 and 1994. In 1994 the Potentially Responsible Parties (PRPs) performed an Additional Remedial Investigation (ARI). This document discusses the results of subsurface contaminant distribution and transport evaluations performed during the ART. While this report utilizes the data, as appropriate, from all the previous investigations, only brief summaries of the previous investigations are presented in this report. Therefore, the reader is encouraged to refer to the actual source documents for detailed information regarding the actual procedures, results, conclusions and the tabular data from the investigations.
One result of the ARI was a demonstration that the naturally occurring stratigraphy and hydrogeology of the Site have served to protect Lake Champlain and the bedrock aquifer from the subsurface migration of contamination from on-site source areas.
The current geologic interpretation is based upon more than 600 geological boring logs. Six separate hydrogeologic flow systems were characterized at the Site. Some of these units are not lateraliy continuous, and therefore may not be present in certain areas of the Site. From top to bottom the units are: Fill, Peat, Silty Sand, Silt-Clay, Silty Gravel and Bedrock.
More than one hundred wells and piezometers have been installed at the Site and were used during the API for water level measurements. Depths to water in these wells and piezometers were measured on a monthly basis from October, 1994 to September, 1995.
Conclusions regarding subsurface contaminant transport based upon available data include the following: A permanent groundwater divide exists between the Canal and Lake in the southern portion of the Site. The divide is ephemeral in the northern portion of the Site. Solute transport calculations suggest dissolved contamination is likely in a state of dynamic equilibrium and contaminants are not reaching the Lake in concentrations to cause concern. Downward contaminant transport to bedrock is not likely to occur to any significant degree due to upward hydraulic gradients and to the low hydraulic conductivity of the silt-clay.
Maynard, D., 1999, Pine Street Canal Superfund Site: Hydrogeology and its effects upon the extent of manufactured coal gas contamination; in Wright, S.F. ed., New England Intercollegiate Geologic Conference Guidebook Number 91, p. 301-340.
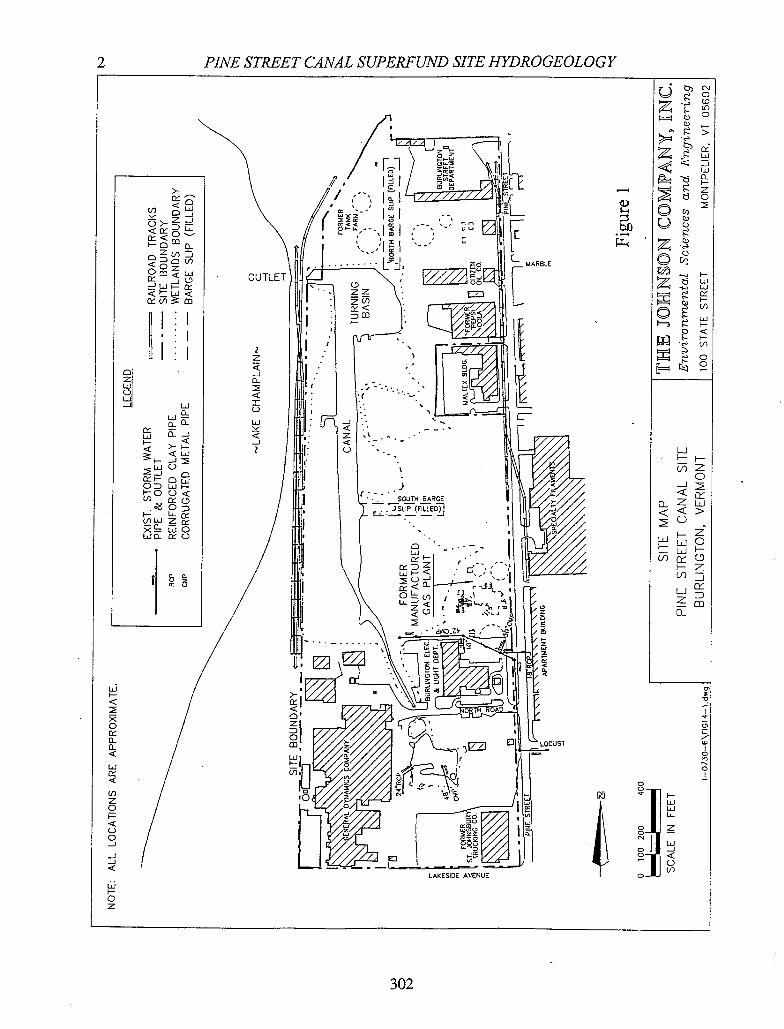
2 PINE STREET CANAL SUPERFUND SITE HYDROGEOLOGY
_ Ln
0
Fal — hI11
\\ /7 --ii
Cl
OUTLE MARBLE
• .1 I. I
Li Lj Lo
• i •j I F/o/i
• j L/Y/J II
;
Li I Ld
ODuj - J • 0
OO< / I
/ 1 • ) BARGE r I'/////
_
SOUT
L / • • • JSLIP (FILLED3J <
z 1
LJ
/
w O
/
•
/ <3L&. j LLJ
LL ::) Q`)
/ -
Li
/ • '••
/ •. '.••• . 'p
/ • Lt
LLJ
LLJ
LAKESIDE AVtNUE 0
I- 0 z
302
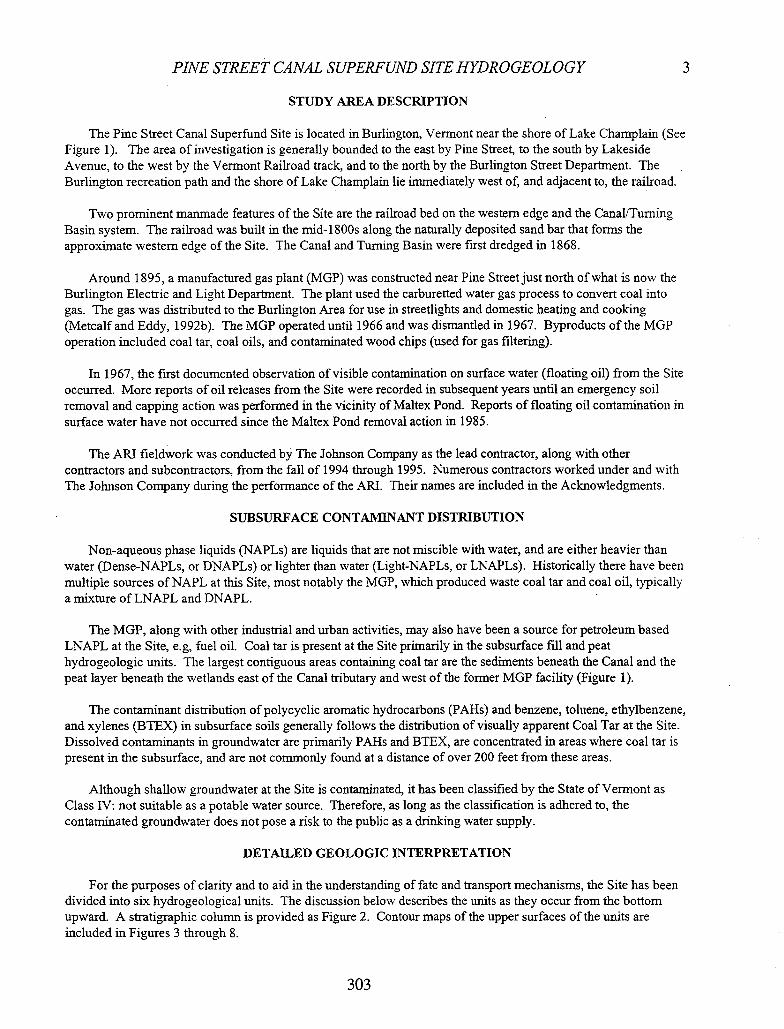
PINE STREET CANAL SUPERFUND SITE HYDROGEOLOGY
STUDY AREA DESCRIPTION
The Pine Street Canal Superfund Site is located in Burlington, Vermont near the shore of Lake Champlain (See Figure 1). The area of investigation is generally bounded to the east by Pine Street, to the south by Lakeside Avenue, to the west by the Vermont Railroad track, and to the north by the Burlington Street Department. The Burlington recreation path and the shore of Lake Champlain lie immediately west of, and adjacent to, the railroad.
Two prominent manmade features of the Site are the railroad bed on the westem edge and the Canal/Turning Basin system. The railroad was built in the mid- 1 800s along the naturally deposited sand bar that forms the approximate western edge of the Site. The Canal and Turning Basin were first dredged in 1868.
Around 1895, a manufactured gas plant (MGP) was constructed near Pine Street just north of what is now the Burlington Electric and Light Department. The plant used the carburetted water gas process to convert coal into gas. The gas was distributed to the Burlington Area for use in streetlights and domestic heating and cooking (Metcalf and Eddy, 1992b). The MGP operated until 1966 and was dismantled in 1967. Byproducts of the MGP operation included coal tar, coal oils, and contaminated wood chips (used for gas filtering).
In 1967, the first documented observation of visible contamination on surface water (floating oil) from the Site occurred. More reports of oil releases from the Site were recorded in subsequent years until an emergency soil removal and capping action was performed in the vicinity of Maltex Pond. Reports of floating oil contamination in surface water have not occurred since the Maltex Pond removal action in 1985.
The ART fieldwork was conducted by The Johnson Company as the lead contractor, along with other contractors and subcontractors, from the fall of 1994 through 1995. Numerous contractors worked under and with The Johnson Company during the performance of the ART. Their names are included in the Acknowledgments.
SUBSURFACE CONTAMINANT DISTRIBUTION
Non-aqueous phase liquids (NAPLs) are liquids that are not miscible with water, and are either heavier than water (Dense-NAPLs, or DNAPLs) or lighter than water (Light-NAPLs, or LNAPLs). Historically there have been multiple sources of NAPL at this Site, most notably the MGP, which produced waste coal tar and coal oil, typically a mixture of LNAPL and DNAPL.
The MGP, along with other industrial and urban activities, may also have been a source for petroleum based LNAPL at the Site, e.g, fuel oil. Coal tar is present at the Site primarily in the subsurface fill and peat hydrogeologic units. The largest contiguous areas containing coal tar are the sediments beneath the Canal and the peat layer beneath the wetlands east of the Canal tributary and west of the former MGP facility (Figure 1).
The contaminant distribution of polycyclic aromatic hydrocarbons (PAH5) and benzene, toluene, ethylbenzene, and xylenes (BTEX) in subsurface soils generally follows the distribution of visually apparent Coal Tar at the Site. Dissolved contaminants in groundwater are primarily PAHs and BTEX, are concentrated in areas where coal tar is present in the subsurface, and are not commonly found at a distance of over 200 feet from these areas.
Although shallow groundwater at the Site is contaminated, it has been classified by the State of Vermont as Class TV: not suitable as a potable water source. Therefore, as long as the classification is adhered to, the contaminated groundwater does not pose a risk to the public as a drinking water supply.
DETAILED GEOLOGIC INTERPRETATION
For the purposes of clarity and to aid in the understanding of fate and transport mechanisms, the Site has been divided into six hydrogeological units. The discussion below describes the units as they occur from the bottom upward. A stratigraphic column is provided as Figure 2. Contour maps of the upper surfaces of the units are included in Figures 3 through 8.
303
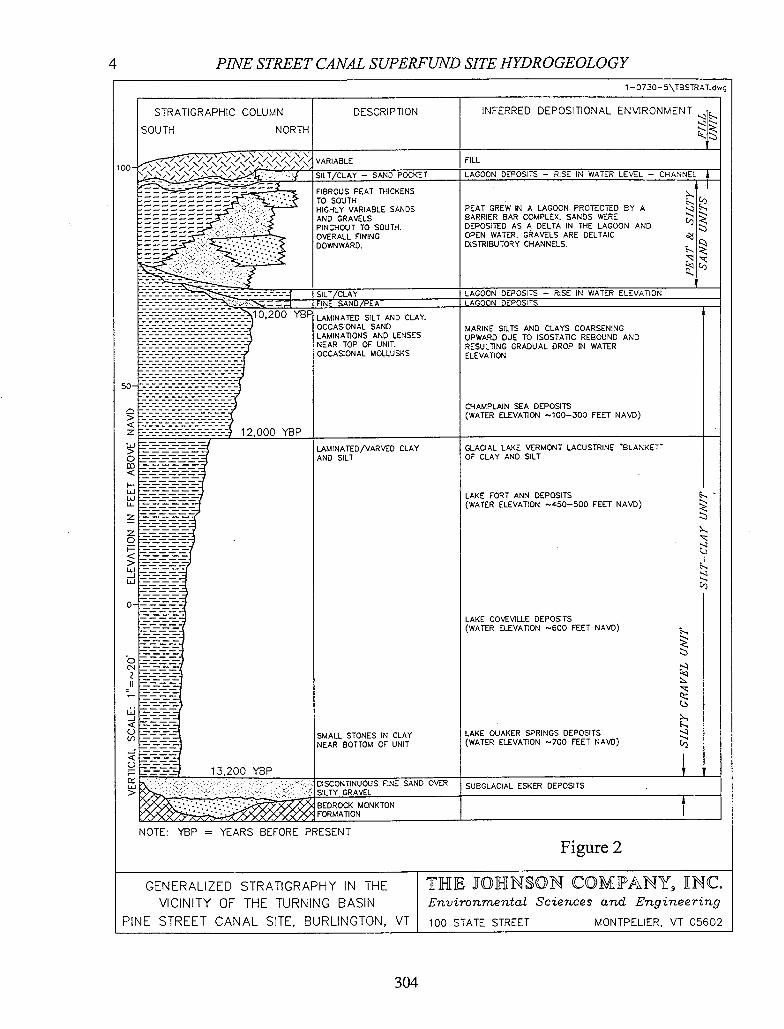
4 PINE STREET CANAL SUPERFUND SITE HYDROGEOLOGY 1 -0730-5\TBSTRAT.dwg
100 •
50-
>
w > 0
H- Id Id
z
z 0 H-
> LU -J LU
0-
0
Id -J
0 (I,
-J
0
Id >
NOTE: YBP = YEARS BEFORE PRESENT
Figure 2
GENERALIZED STRATIGRAPHY IN THE THE JO1H[NON COMPANY, INC. VICINITY OF THE TURNING BASIN Environmental Sciences and Engineering
PINE STREET CANAL SITE, BURLINGTON, VT 100 STATE STREET MONTPELIER, VT 05602
STRATIGRAPHIC COLUMN DESCRIPTION INFERRED DEPOSITIONAL ENVIRONMENT
SOUTH NORTH
VARIABLE FILL
SILT/CLAY - SAND POCKET LAGOON DEPOSITS - RISE IN WATER LEVEL - CHANNEL A
FIBROUS PEAT THICKENS 1
- HIGHLY VARIABLE SANDS PEAT GREW IN A LAGOON PROTECTED BY A -. - - - AND GRAVELS BARRIER BAR COMPLEX. SANDS WERE
PINCHOUT TO SOUTH. DEPOSITED AS A DELTA IN THE LAGOON AND OVERALL FINING OPEN WATER. GRAVELS ARE DELTAIC DOWNWARD DISTRIBUTORY CHANNELS
-::-D=:::-------------1 SILT/CLAY LAGOON DEPOSITS - RISE IN WATER ELEVATION FINE SAND/PEAT LAGOON DEPOSITS - LAMINATED SILT AND CLAY. 10,200 YB OCCASIONAL SAND MARINE SILTS AND CLAYS COARSENING LAMINA11ONS AND LENSES UPWARD DUE TO ISOSTA11C REBOUND AND
:-:-:-:-:-:-:-:-:-:-:-:-:-:-:-:- NEAR TOP OF UNIT. RESUL11NG GRADUAL DROP IN WATER OCCASIONAL MOLLUSKS ELEVA11ON
CHAMPLAIN SEA DEPOSITS (WATER ELEVA11ON -100-300 FEET NAVD)
12 000 YBP z ___________________
-
LAMINATED/VARVED CLAY GLACIAL LAKE VE RMONT LACUSTRINE "BLANKET AND SILT OF CLAY AND SILT
LAKE FORT ANN DEPOSITS (WATER ELEVATION -450-500 FEET NAVD)
LAKE COVEVILLE DEPOSITS (WATER ELEVATiON -600 FEET NAVD)
(.5
5,
SMALL STONES IN CLAY LAKE QUAKER SPRINGS DEPOSITS
NEAR BOTTOM OF UNIT (WATER ELEVATiON -700 FEET NAVO)
13.200 ThP DISCONTINUOUS FINE SAND OVER SUBGLACIAL ESKER DEPOSITS
BEDROCK MDNKTON
304
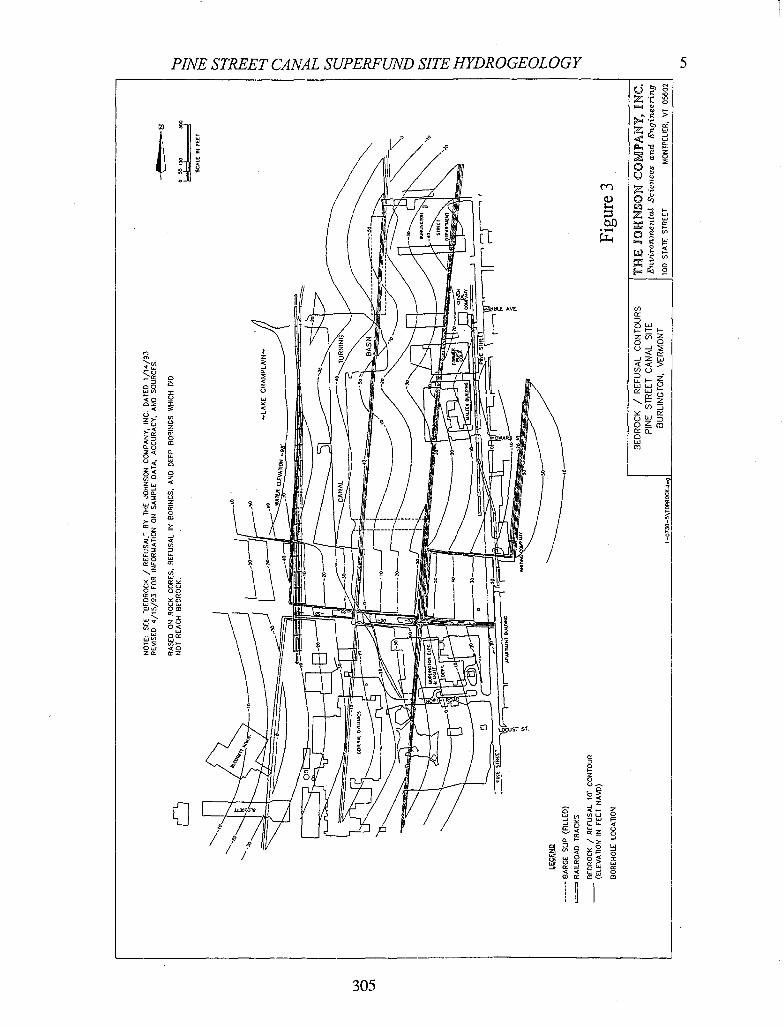
PINE STREET CANAL SUPERFUND SITE HYDROGEOLOGY
z
ri
/ !Fi nii I
\ \ \I2 I
\ \ II r
tz
h
- Ii w jjH
H J7;! ED
I 0 LOJST ST
I F
/
111
305
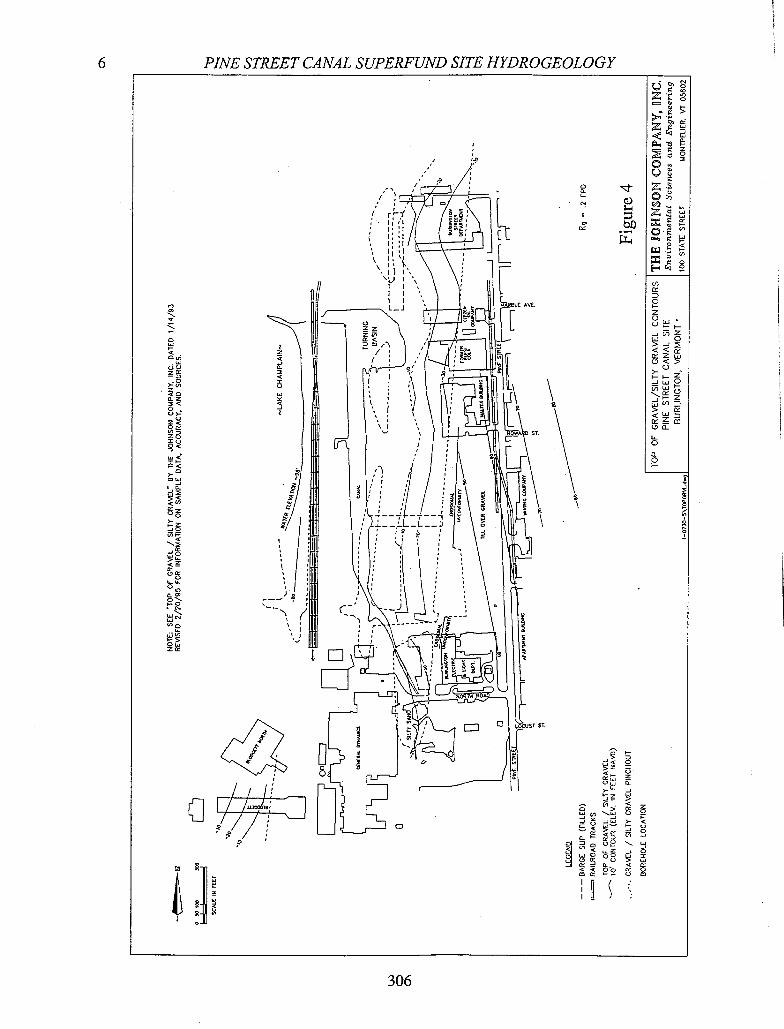
0
0i
C))- C)
"S
oz z
PINE STREET CANAL SUPERFUND SITE HYDROGEOLOGY
/
/ (
II I
'\ IH' i)
"S eLC At
[ , (Y <
Egg
5 -
\
rl I
I rn5 -
J5T ST. .5—
0
< 5_C
eta o -J
. < cC >
5-
- 0
8 < 'CC 00
I I I
306
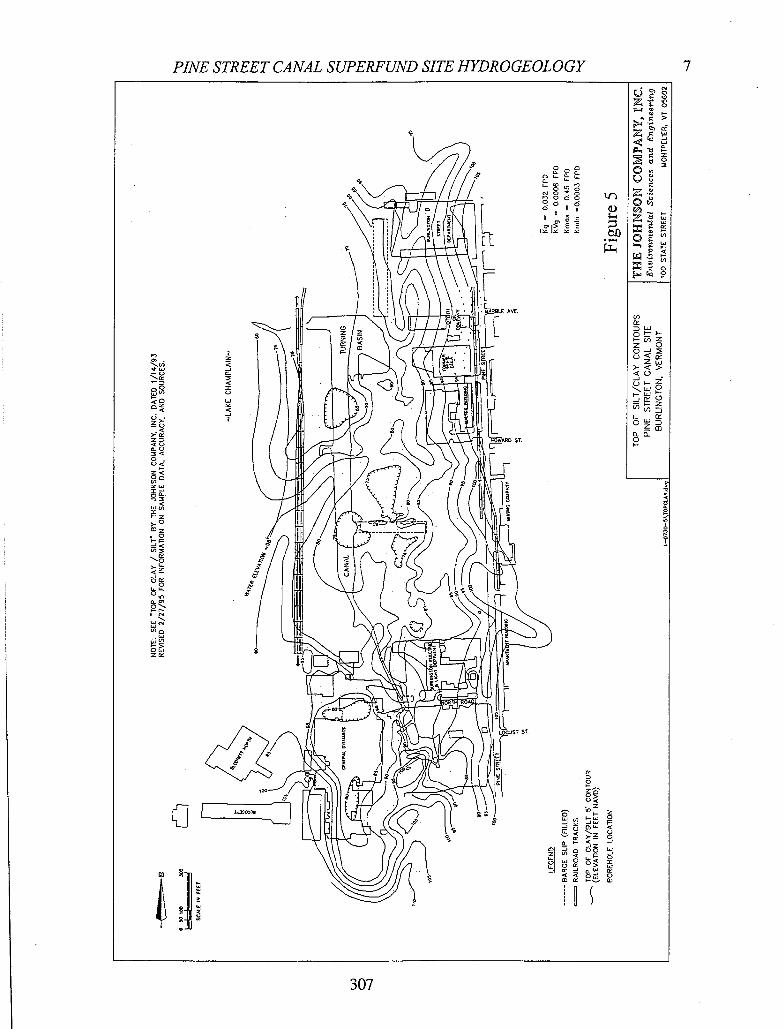
PINE STREET CANAL SUPERFUND SITE HYDROGEOLOGY 7
z • -
Z• 1LLL_L .
o
\
o \ II \ \ \
LZ
\\
.9tEA't
Lj
o
10
' I I ) /
-'
1 D$T
a I L H
3
-J 0 00
307
8 PINE STREET CANAL SUPERFUND SITE HYDROGEOLOGY
z t
-
!H I !
'z
V)
i )tt/ f7/fl rW It < X -•i 1\
(3 L wo
ol
osT.
/V /
1' .1
• .• •
0 •'• -
zrx
:. tOSTST.
J -
lz 0 z
PINE STREET CANAL SUPERFUND SITE HYDROGEOLOGY 9
c5
) L
LJ/ GL L LJ
n o
Z Z
Lu
CL
/ L
------------
1) 1
zo
JL R
G ""II1
§ -N•____)
309
10 PINE STREET CANAL SUPERFUND SITE HYDROGEOLOGY
z •
00
1il ...
AVE _71
L J IF5T f
It / I
,-
I
I Il /1 ii U1
'.
it IL I
I
ZO
1
Q .:.i. jrTsr
hi D
Z 0 _
II § USc
310
PINE STREET CANAL SUPERFUND SITE HYDROGEOLOGY 11
Bedrock. Bedrock beneath the Site consists primarily of red quartzite and dolomite of the Monkton Formation. Depth to
bedrock from the ground surface is between about 60-150 feet at the Site (VT. AOT, 1977 and 1982; Perkins/Jordan, 1983; Metcalf and Eddy, 1 992b). The bedrock below the Site is dolomite, according to the limited available core descriptions from the Metcalf and Eddy Feasibility Study (FS) (Metcalf and Eddy, 1 992g). However, the Monkton Formation contains beds of both dolomite and quartzite, and both likely exist below the Site.
An interpretation that the bedrock surface dips 1 0 toward the west-northwest could be made based on straight-line correlations between wells, but this interpretation but does not account for the complexity of bedrock surfaces in Vermont. The bedrock in nearby outcrops exhibits three planes of structural weakness: 1) near vertical normal faults, joints, and dikes striking approximately east-west; 2) near vertical joints striking approximately north-south and; 3) the bedding of the rock, which dips (slopes) approximately 10-20° toward the east (Hitchcock, 1861; Perkins, 1908; Maynard, 1993; personal observations of nearby outcrops).
The bedrock surface is best characterized as 'step-like" consisting of relatively flat benches truncated by near vertical walls that form steps. The Bedrock Unit surface topography is due to the natural planes of weakness in the rock. The "benches" are formed by the rock breaking along bedding planes, and the "steps" by breaks along the joints, fractures, and faults. Steps up to 60 feet high dropping downward toward the Lake have been identified below the Site (See Figure 3).
The "benches" slope gradually (10-20°) toward the east, away from the Lake. Figure 3 is based on limited test boring data (28 locations), and on typical bedrock surface geometry observed in nearby outcrops at Queen City Park, ± 1.5 miles south of the Site. Reported refusal in test borings was presumed to indicate the bedrock surface when rock coring data were not available.
Subglacial Sands and Silty Gravels (Silty Gravel). Vermont was completely covered by ice during the Wisconsin Glacial Stage, which ended roughly 13,200 years
ago (Hunt, 1980; Connally and Sirkin, 1971; Stewart and MacClintock, 1969; Chapman, 1937). It is likely that the Site area was scoured clean to the rock by the glacier. Immediately overlaying the Bedrock Unit at the Site is about 10 feet of coarse silty gravel and/or fine sand. These deposits were probably deposited by meitwater beneath the glacier. The gravels do not extend across the entire Site, but are confined to areas where the sub-glacial water was flowing swiftly enough to transport stones, primarily in bedrock troughs. Some laterally discontinuous glacial tills, deposited directly by the glacial ice, may be present below Pine Street.
All these ice-contact deposits are collectively referred to as the Silty Gravel Unit for the purposes of this report. A contour map of the upper surface of these ice-contact deposits is included in Figure 4. This map was based on limited data (30 locations), including drillers' logs of water supply wells. Many of the boring logs indicated no ice-contact deposits. These logs were used in combination with the conceptual depositional model described above to delineate the margins of the ice contact deposits. One drill log was not used in the construction of this map. This log was collected by "mud-logging" during rotary drilling of a bedrock monitoring well (PEER, 1990). The description of a very thick sand and gravel unit in this log was refuted during the ART coring PSP-3.
Post-Glacial Lacustrine and Marine Silts and Clays (Silt-Clay). A thick sequence of laminated silts and clays lies on top of the silty gravel and/or bedrock. This unit is referred
to as the Silt-Clay Unit for the purposes of this paper. The Silt-Clay horizon varies between about 45-110 feet thick. These deposits are horizontally continuous across the entire Site. The Silt-Clay Unit was deposited in deep, relatively still water by settling of fine particles and is essentially a blanket deposit over the underlying materials. The upper surface of the Silt-Clay generally mimics the Bedrock and Silty Gravel topography below, and forms a "basin" shape below the Site (see contour map in Figure 5 and geologic profiles shown on Figures 9 through 13).
The Silt-Clay Unit was initially deposited in a series of fresh water, post-glacial lakes which filled the Champlain Valley between about 11,800 and 13,200 years ago. The post-glacial history of the Lake Champlain has been described in detail by a number of authors.
311
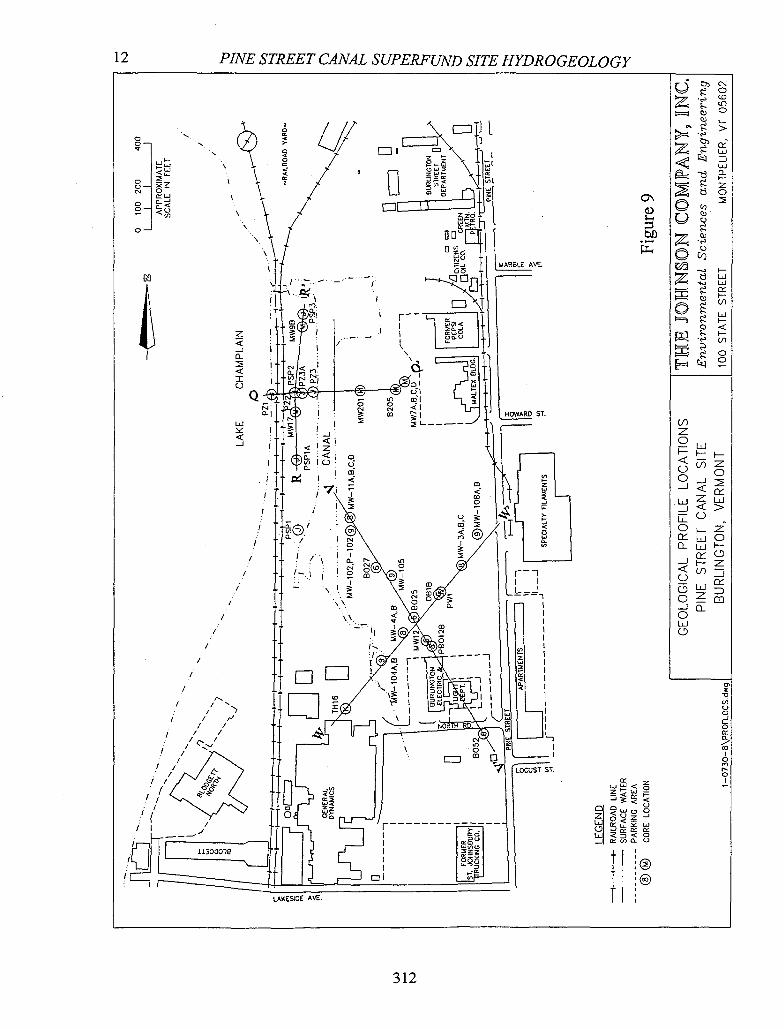
12 PINE STREET CANAL SUPERFUND SITE HYDROGEOLOGY
(7) \ 1 / /1 \ Ti : •
LU \ If '\ •F ZO
/ n o d \ki
/ " k / ;-
go . z•
LVE. I- co -
1- zLJ
I I I r
Ic o_l qi
Llj oi I HOWARD ST.
LU L.__— (1) I z S o —J LiJ <I
I 'lC) 5 I 3- - 0
71 I I J __] LJJZLJJ
i I I
I 0 O.LjJH -
- I / 7
I \\• 0 3- In _J0_. 2
HI o 0 III hID1
I I,
h --.- En
CL 0 I
LOCUST
I. a )-.
V) 3. C) £1303018 zz I
:J
LAKESIDE AVE. I
312
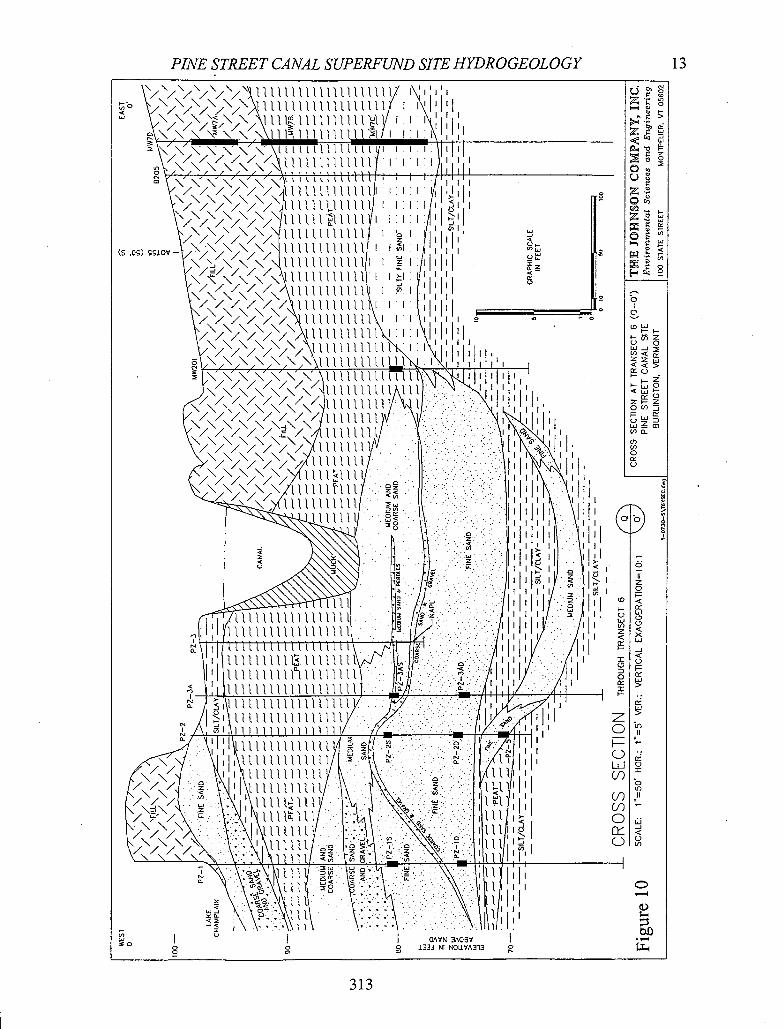
PINE STREET CANAL SUPERFUND SITE HYDROGEOLOGY
13
-o
1 l iii 111111 'l / I I
:
\LttLlIllillllt I I I Ii
I iii i 1111111 I
ilUllllllUl I / / llllllllllllI I I I >i z•
/ / / ///JllilulUllll I I I I I I
//////'IIt111LI1I1L I I \ \ \ \ \ \I ll)l <
(s,o)ccjov— /////1 111111 III
'lliilllillllI I 2
\' \\\ I Il I' I I
I I / / llliilllill 1 95 1
I I I I
I I I LO
11111111111 LLJ
1111111111 ill N
11. •.!::li; I I I
11111111 •.\II\ 11111111
1111111 0
I I
tililiflhl lz HI II
0 •0 •
\i I II I)I o
IIiIyI z I 'if Ji 2
till hllhlhilhilhhhihl
/lHlt • Hi Of
Il'lilihlhlhhlhhhhlhh ./III / lhlllihhhiilhhiihi hhlhlilihlhhhhlhhl I I if / I
II lhihlillhlhlhhillh tHu Al H illihliilhhlhihilil A Y I'
llUhlllhhihhlhlU -. li
J iuiiuiiiiiuii 0 / ft II z 051 111111111111 nii - (i I I 0 ?
-/ \:Illuluuhllhu i /iT Of
I 11111111111 0 1/ / /1 I 11111111111
\ hhlllll
11-1 I I hl ill 0
1/ / /A • '1111111 hlll'l • I 111111 :6 71 • 11111
: 1111 •• ii
0 CAVN3'IOBv 1333 NI NOLLYA31 •.
313
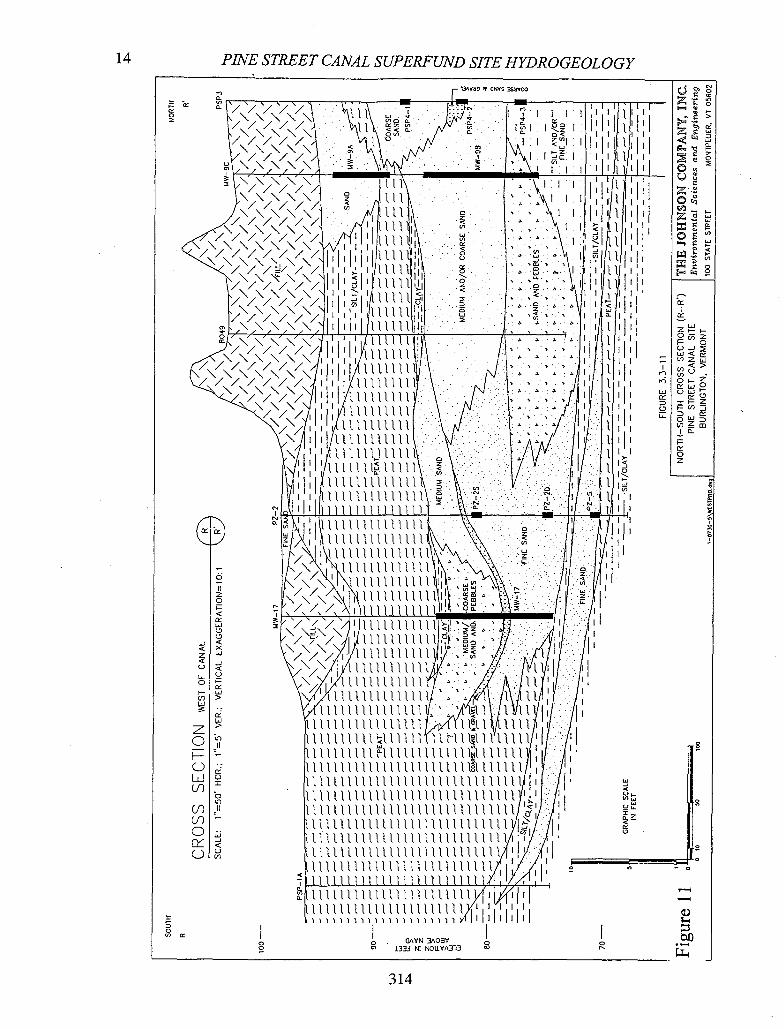
14 PINE STREET CANAL SUPERFUND SITE HYDROGEOLOGY
0 z
'IAYMO U UWU) 3SWU03
0
U \ PH I II I 1
ill S S
lll '111tH I j S I I
I 1
Y I
oz
<: llllU1i1. tt 1 II
I ill
/////I'l'lYlllllll1l hit lllllhlll
llllllllll I 1
\Al1l/1111lhl111l - I' lilt I 'llhlllhllll 0 ii
/llllllllllll 0 S 0
AiIillullllllIllll U) ,
It
I t
I I1l1ll1111lIl111 0
lhllll1lllllll '
llllllllllllll Ill / Ill11l1lU1lUl5 iI 1 \ 1 llllll1l1llU II I
It \\\\lllllllll 1 l I: I 11:1 I
\/\/\/\I\1l1ll1flhu) I, - I /t
'/''/Julllll1llllI1 /11
r / ' / I All1lllll1llI° '1/
••
Or
OEV
zI—-- oz 0 Li< ('Zj
- - - QfZ Li OLJ
i (fl:, -V)j
cif I-
0 z
C I- C Li (-I
C- c' C
C-
0 0 U)
Ckf uj
Vv(11I111111111111Y' 11111111111111111 : tf::/ llulllllhll1ll1 llll1llllllll/ h l/.7 h I lllhllllllllll1llllll1hlllllli1 A' llllhllllllllllllllllll1hllllll/ ...i 1 : 1111 111111111111111 1111111 lull I / lhllhllllllhlllllllllllllllllh1IIi:..p lhllhllllllhllllllllllllllllllJ''J;J 11111111111111111111111111111 V! il lu1hllllllll1llullllllllllllAJ lllllhllhllllllulllllulllllAlyA'i lllllhllllhlIllulllllullll/ '/ lllhllllhl1lluu1lllllliY
____________
lllhllllllllllull1lllll1/fIj)III hllhl1ll1llllllll1lll" I I I
11111
0 0 OWN 3A08Y 0 133j Ni NOILW\313 r-
314
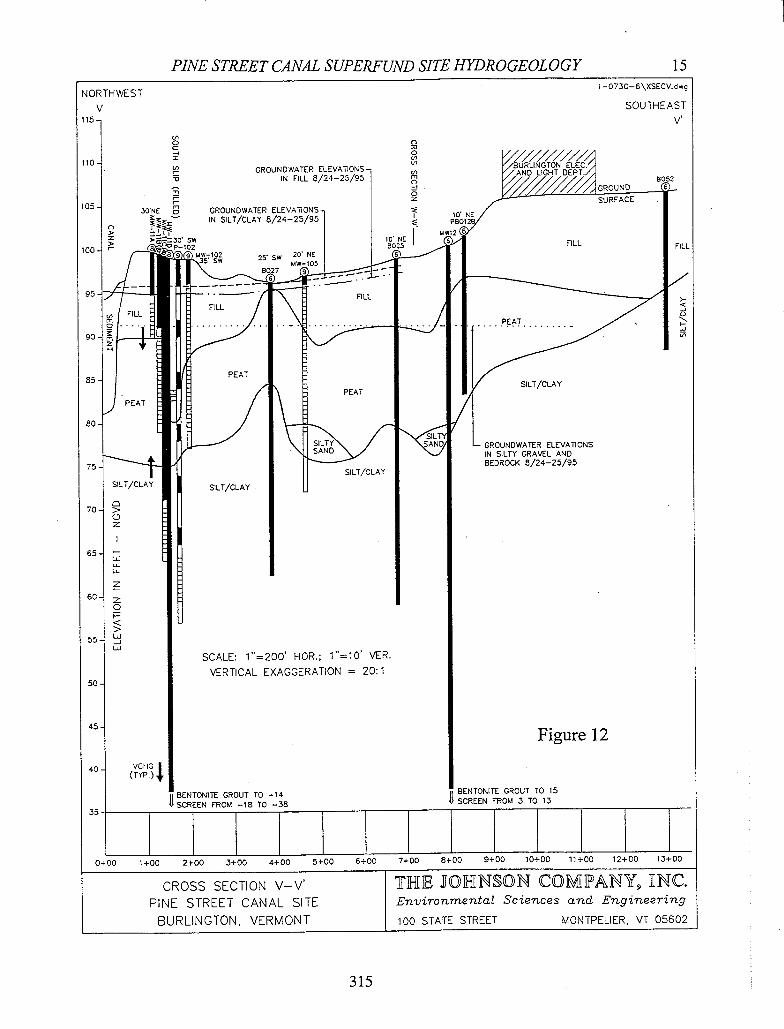
PINE STREET CANAL SUPERFUND SITE HYDROGEOLOGY 15 1 -073O-6 \XSECV.dwg
NORTHWEST
V SOUTHEAST 115 V.
In 0 C
0
110 GROUNDWATER ELEVATIONS
(/ BIJRLINGTON ELEC.A In 9 DET 'A ,L9jT,
IN FILL 6/24-25/95 r) 8032 GROUND -
0 z SURFACE 105
30NE M 0 GROUNDWATER ELEVA11ONS
IN SILT/CLAY 8/24-25/951 P80128
> NW128
> >30 SW P-102
10 NE 8025 FILL FILL 100
(1 MW- 5'102 25' SW 20 NE 3 SW
6
MW-lOS - 8027 9
I FILL FILL 1LT. PEA T....
go ZI
85 PEAT
SILT
JPEAT
PEAT
/ 80
SIL SILTY SAND - GROUNDWATER ELEVA11ONS SAND IN SILTY GRAVEL AND
75 -.-----'----.t- BEDROCK 8/24-25/95 SILT/CLAY
SILT/CLAY SILT/CLAY
7° (7 z
65
w
60 z 0
> 55
Uj
SCALE: 1"=200' HOR.; 1"=10' VER.
VERTICAL EXAGGERATION = 20: 1 5°
45
Figure 12
40. VCHG i (TYP.)
ii BENTONITE GROUT TO -14 BENTONITE GROUT TO 15
SCREEN FROM -18 TO -38 v SCREEN FROM 3 TO 13
35-
HHH ___
0+00 1+00 2+00 3+00 4+00 5+00 6+00 7+00 8+00 9+00 10+00 11+00 12+00 13+00
CROSS SECTION V—V' THE JOHNSON COMPANY, PINE STREET CANAL SITE Environmental Sciences and Engineering
BURLINGTON, VERMONT 100 STATE STREET MONTPELIER, VT 05602
315
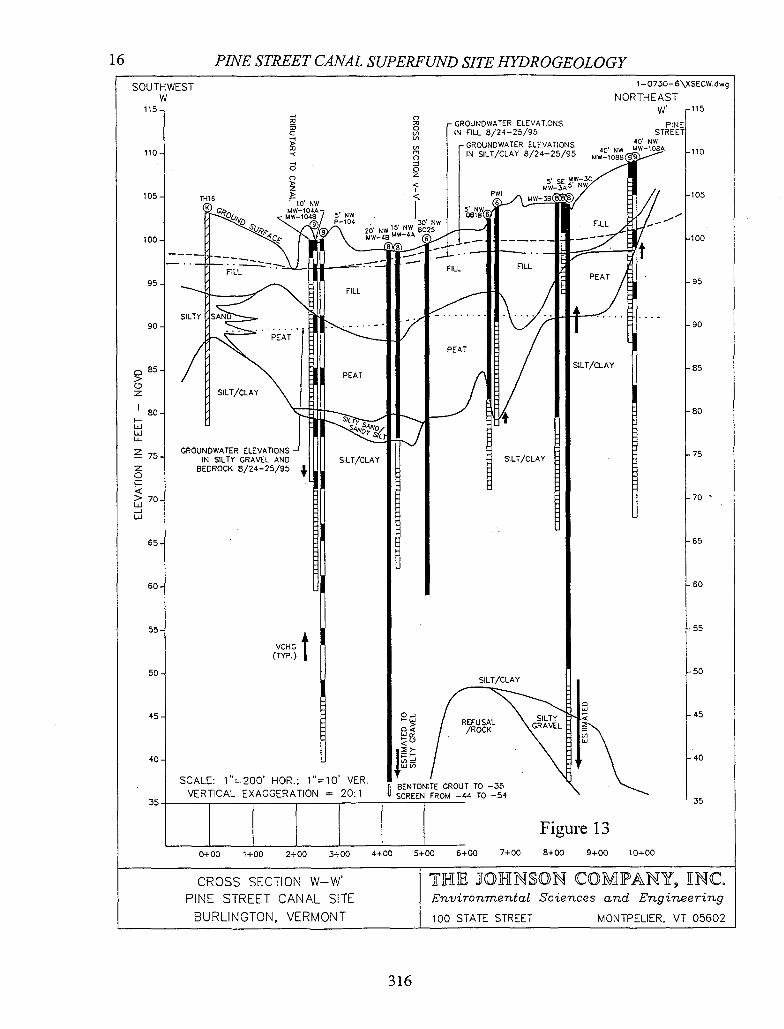
16 PINE STREET CANAL SUPERFUND SITE HYDROGEOLOGY 1-0730- 6\XSECW.dwg
NORTHEAST .115
PINE STREET
40 NW NW MW-1084
SOUTHWEST W
115-
110.
105.
100
95.
SILTY 90•
-4
C -4 >
-I 0 C-) > z >
C,
r CROLINDWATER ELEVATIONS CA IN FILL 5/24-25/95
GROUNDWATER ELEVATIC [IN SILT/CLAY 6/24-25
0 II z 5SE
85
80
75
70
65
60
55
50
45
40
35
/ H > o Z H SILT/CLAY
I o. I— w El LLI I4
GROUNDWATER ELEVATIONS IN SILTY GRAVEL AND
Z BEDROCK 8/24-25/95 + 0
> 70. U
U
65
60
55.
(TYP.) VCHG
50 SILT/Cl
01 FREFU
< C, Ll
1 - 40 CO -4
SCALE: 1"=200' HOR.; 1=10 VER. BENTONITE GROUT TO -35
VERTICAL EXAGGERATION = 20:1 SCREEN FROM -44 TO -54 35
Figure 13 0+00 1+00 2+00 3+00 4+00 5+00 6+00 7+00 8+00 9+00 10+00
CROSS SECTION W—W' THE JOHNSON COMPANY9 INC. PINE STREET CANAL SITE Environmental Sciences and Engineering
BURLINGTON, VERMONT 100 STATE STREET MONTPELIER, VT 05602
316
PINE STREET CANAL SUPERFUND SITE HYDROGEOLOGY 17
Portions of the following discussion are based upon the descriptions (Des Simone and LaFleur, 1986; Connally, 1982; Hunt, 1980; Stewart and MacClintock, 1969; Chapman, 1937). The water surface in these lakes was over 400 feet above present day sea level as referenced to the national geodetic vertical datum (NGVD) of 1988. The last and lowest of these fresh water glacial lakes was Lake Vermont. The glaciers eventually receded northward beyond the Saint Lawrence Valley.
Two major forces which controlled the level of post-glacial ponded water in the Champlain Valley were the global sea level and isostatic rebound of the earth's crust. Other influencing factors included bedrock and possibly ice control of the outlets to the north and south.
Available evidence suggests the global sea level began to increase approximately 12-14,000 years before present (bp) (Bloch, 1976; Williams, 1984; Parizek, 1988). The increase in global sea level near the end of the Wisconsin Glacial Stage is generally attributed to the influx of water from the melting continental glaciers. Evidence of isostatic rebound in the Hudson and Champlain Valleys suggests it was occurring as early as 14,700 years bp and continued through 10,200 years bp (De Simone and La Fleur, 1985; Pair, et al., 1987). Isostatic rebound is a response to the compression of the earth's crust during the, continental glaciation. When the glaciers retreated, the earth's crust decompressed or rebounded. This rebound was fastest immediately after the retreat of the glaciers. Rebound rates of 2.6-2.7 feet'mile are cited for Lake Albany (circa 14,700-13,700 years bp), while rebound rates of 1 foot per mile are estimated for Lake Fort Ann (circa 11,800 years bp). Lake Fort Ann was the last glacial lake to drain southward through the Hudson Valley. The elevation of the fmal stage of Lake Fort Ann at Burlington was approximately 450-500 feet above present day sea level (Chapman, 1937; De Simone and La Fleur, 1985). The elevation of the southern outlet of this lake was 140 feet at Fort Edward (the difference in elevations between the outlet and Burlington is due to differential isostatic rebound) (De Simone and La Fleur, 1985).
Eventually seawater filled the Champlain Valley to an elevation of about 300 feet above present day sea level (at Burlington). This estuarine body of water lasted from about 10,200 to 11,800 years ago and is referred to as the Champlain Sea (Hunt, 1980; Cronin, 1976, Stewart and MacClintock, 1969). The water elevation of the Champlain Sea at Burlington decreased over time from 300 to about 100 feet above present day sea level due to gradual isostatic rebound, as well as to eustatic changes in sea level (De Simone and LaFleur, 1986; Connally, 1982; Hunt, 1980; Stewart and MacClintock, 1969; Chapman, 1937). Marine bivalves have been observed in the Silt-Clay at one location on the Site (PEER, 1990). This boring was drilled with a rotary drill rig; therefore, the depth at which the bivalves occurred is indeterminate.
Stewart and MacClintock state that atmospheric exposure of the glacial lake sediments occurred down to the current elevation of Lake Champlain between the retreat of the ice from the Champlain Valley and a subsequent influx of sea water from the Atlantic Ocean. Because atmospheric exposure of the fme grained glacial lake deposits would possibly allow formation of vertical macropores, which would facilitate contaminant migration to bedrock, this interpretation is reviewed in detail below.
Macropores or fractures in the Silt-Clay Unit would only have developed if the sediments had historically been exposed to freezing or desiccation. These fracture forming processes would be likely to occur if the sediments were exposed to air, thus allowing freezing and drying to occur. Therefore, it is important to consider whether exposure of the sediments may have occurred.
A comparison of the global sea level with the elevation of the Champlain Sea beaches and deltas shows the minimum sea level for the last 13,500 years was not below the elevation of the top of the Silt-Clay Unit in areas containing DNAPL or dissolved contamination at the Site. The rationale behind this statement is provided in the paragraphs below.
The marine nature of the Champlain Sea has been documented by many geologists since the late 1800's, when whale bones were first discovered in the Champlain Valley of Vermont (Hitchcock, 1910). One implicit assumption in the following evaluation is that the water level of the Champlain Sea was equal to the global sea level. This is reasonable, based on the overwhelming evidence of a marine environment. In order to defmitively determine if
317
18 PINE STREET CANAL SUPERFUND SITE HYDROGEOLOGY
atmospheric exposure of Lake Fort Ann and Lake Vermont sediments at the Site occurred, it is necessary to determine the timing and elevation of global sea levels, and compare them with the timing and magnitude of the isostatic depression of the earth's crust.
Prehistoric global sea levels for various dates have been inferred from a number of sources world-wide. Dating of paleo-sea levels typically use Carbon 14 dating techniques, and sea level elevations are typically identified by paleo-shoreline features such as beaches and deltas. The quality of documentation for each sea level and date varies considerably. The data show generally increasing global sea levels from 14,000 years bp to present (Bloch, 1965, 1976). Most of the data indicate global sea levels rose in a series of rapid increases, each followed by a decrease of lesser magnitude, as shown in Figure 14.
The Champlain Sea lasted from approximately 12,000-10,300 ybp (Cronin, 1976; Stewart and MacClintock, 1967; Hunt, 1980; Pair et al., 1987). The maximum elevation (in reference to current sea level by the National Geodetic Vertical Datum, NGVD) of the Champlain Sea at Burlington was approximately 300 feet (Chapman, 1937). This elevation occurred between approximately 11,500-12,000 ybp based on several radiocarbon dates (Cronin, 1976). The maximum global sea level during the time of the Champlain Sea was approximately -65 feet NGVD as shown on Figure 15 (Bloch, 1965, 1976). The difference in elevation between the global sea level and the observed elevation of the Champlain Sea is therefore approximately 365 feet [300 - (-65) = 365]. Therefore, during the maximum extent of the Champlain Sea, the earth's surface at Burlington was depressed at least 365 feet from its present elevation.
The highest elevation of the Silt-Clay Unit top at the Site is approximately 100 feet NGVD in the area containing subsurface DNAPL or dissolved contamination. Adjusting this elevation, using the 365 feet of depression in the earth's crust 11,500-12,000 years ago, provides a critical elevation of -265 feet NGVD. As shown on Figure 14, the minimum probable elevation of the global sea level between 10,000-12,500 years ago was about - 130 feet NGVD. Therefore, a minimum of 135 feet of water covered the Silt-Clay Unit at the time of the change from Glacial Lake Fort Ann silt and clay deposition to the influx of the Champlain Sea.
An alternative method of evaluating the likelihood of atmospheric exposure of the Silt-Clay Unit was also evaluated. This evaluation is based upon the presence or absence of erosional features in Lake Fort Ann sediments in the Champlain Valley. No such erosional features were observed in over 400 logs of on-site cores reviewed during the Additional Remedial Investigation. Several scientific papers relating to this issue and baSed on data in the Northeast provide additional evidence that erosion did not occur at the Site after Lake Fort Ann and prior to the Champlain Sea (Denny, 1972; Diemer, 1987; Pair etal., 1987).
The prime locality containing evidence of erosion of the Lake Fort Ann and Lake Vermont sediments is in Sheldon Springs in the Missisquoi Valley approximately 30 miles north of Burlington (Cannon, 1 964a). The lowest elevation in Sheldon Springs at which erosion of the glacial lake sediments can be observed is approximately 335 feet NGVD (Stewart and MacClintock, Surficial Geological Map of Vermont, 1969). Using a one foot/mile differential rebound rate, the lowest documented erosional elevation prior to the Champlain Sea is 305 feet NGVD at Burlington, above the 100 foot NGVD elevation of the top of the Silt-Clay Unit at the Site.
The contact between the marine and fresh water deposits has not been defmitely determined at the Site. Based on reported grain sizes and biota in soil cores, a possible contact elevation of approximately 40 feet NGVD was assumed for the generalized stratigraphic column in Figure 2. The maximum observed thickness of marine sediments in the Champlain Valley is about 50 feet (Hunt, 1980). The maximum known thickness of the Lake Vermont sediments is 330 feet, but Hunt suggests that their thickness may exceed 660 feet in some locations.
Since the retreat of the glaciers, the elevation of Lake Champlain and its predecessors has probably never been below its current level. During the period when glacial lakes were present, the Lake stage was controlled by a series of outlets in the Hudson Valley to the South (De Simone, 1986). The elevations of the Champlain Sea and of Lake Champlain were controlled by the relative elevation of the Saint Lawrence River. The minimum elevation of Lake Champlain over 89 years of records is 92.1 feet NGVD during 1908 (USGS, 1972, 1995).
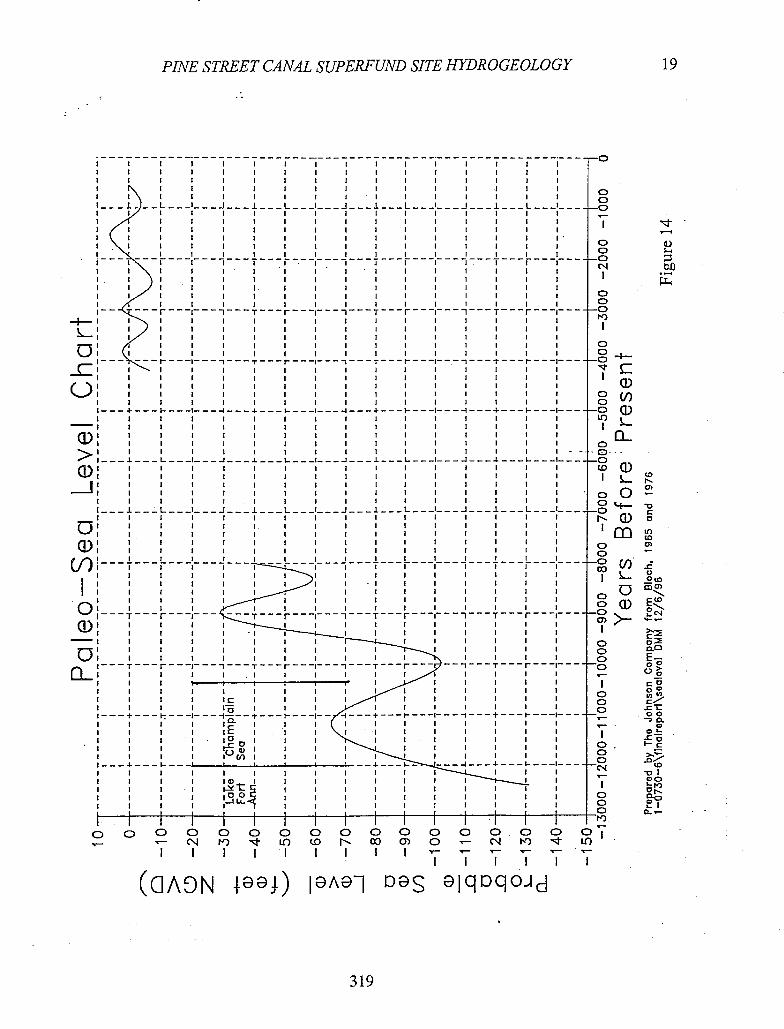
(b
0)
-U C 0
U, ID 0)
-c I, o10
0)
C (0
I-. ('I
om
o l
CO 00
.ct: 00
CL
0 0- .0 o I- c
o1 00
I-!
19 PINE STREET CANAL SUPERFUND SITE HYDROGEOLOGY
L)
CD
I I 3 I I I I I I I I I I
I 3 I I I I I I I I I I I I I I I I I
0 l .....J. __L -------J___J..__.L-------J___J.__... IL -------JI __i___L ------- -0
I I I I I I I I I I
I I I I I I I I I I
I I I I I I I I I I I I I I I I I I I I I I
I I I 0
I I I I I I I I I I I I CD
I I I I• I I .3 I I I. I I I
I I I I I I I I I I I I
I I I 3 I I I I I I I I I
I I I I I I I I 0
I I I I I I I I I I I ---- - ------ ---- - --- - --- - --- ---- - --- - ---- - - - --- - -- - ---- - ---- ------0
I I I I I I I I I I I I I I
I I I I I I I I I I I I I I I I I I I I I I I I I I 0
Di i i I I I I i I I
— --- ---- ----- - ----- - ----- ---------- 0 I I I I I I I
I I I I I I I I I I I I I I I I
I I I I I I I I I I I I I I I 0
I I I I I I I I I I I I I 0 I---+---I- --------I---.+---3- -
-------I ---+---I- --------I---+---I- -------- ci)
I I I I I I I I I I I I I I Lt)
I I I I I I I I I I I I I I cI) I I I I I I I I I I I I I I I I I I I I I I I I I I
> 1 I I I I I I I I I I I I I __i__ ---------J._.._L___L --------J__4.__.L -------- 0 co _1J
I I I I I I I I I I I I I
I I I I I I I I I I I I oO
I I I I I I I I I I I I I ----------J --- J._..L --- ----J --- 1 --- L -------J....._i___L --------0
I I I I I I I I I I I I
D II I I I I I I I I I I I
I 3 3 I I I I I I I I I I
U) I I I I I I I I I I I I I I 0 I I I 1 I I I I I I I I I I I 0
I P -------------------- -1 I 1 --- --- ---- - --- - --- - --- -----0
LJi I I I I I —I I I I I 3 I I
I l I I I I 1 I I I I I I
I I I 1 I I 1 I I 1 I 1 I I 0
I I I I I I 1 I I I I
I I I I I I I I Co
I ................................... I I I I I I I I I
O I I I I I I I I I I I I I 0
I I I I I I I I I I 0 ------------------- --- ------------- --- ---- --- - --- --------
Q I
I I 1•- I I I I I I
I I I I I I I I I I I I I
I I I I I I I I I I
I I I I I I I I I I I I 0
I+I --------11---I-"-1 -I---t---I- --------i----t----i- --------
I I I I I I I I I I I I I
I I I 10 I I I I I I I I I I I rCI
I I I I (/)I I I I I I I I I I
I I I I I I I I I I I I I I
I I I 30 3 I I I I I I I I
I I I I 1.tc I I I I I I I
I I I 1ooc 3 I 3 3 0
I I I I I I I 3 3 0
Ii 1111111 III I - © 0 0 0 0 0 0 (D 0 00 0 0 00 0 O
(N Po) t It) (0 N 00 0) 0 - C' t) ct L()
II
(GAON ooj.) IOAO1 DOS elqiDqojd
I-
319
20 PINE STREET CANAL SUPERFUND SITE HYDROGEOLOGY
Due to the ductility of the Silt-Clay Unit, unless it were dry or frozen, it would not fracture under conditions of isostatic rebound, earthquakes, etc. Typical silt-clay liquid limits are 28-58% and plastic limits are 20-38% (VT. AOT, 1977, test borings Ul-U5). All evidence discussed above indicates that the silt-clay horizon below approximately 92 feet NGVD has not been exposed to drying, freezing, or other forces which would render it brittle, or create preferential vertical pathways.
It is possible that marine organisms formed burrows in the marine silt-clay which may create preferential vertical migration pathways. Theoretically these burrows could be vertically interconnected through numerous generations throughout the marine silt-clay deposits. These bivalve burrows would be expected to fill in with material surrounding the hole (e.g. sand and silt). Burrowing would not be present in the freshwater Lake Vermont. No freshwater burrowing organisms have been documented in Lake Vermont deposits (Hunt, 1980). In one on-site rotary mud log, bivalves were observed while drilling through the upper 40 feet of Silt-Clay (from about 92-5 2 ft NGVD). This should be considered a maximum thickness for the marine unit, due to sampling errors inherent in recycling of the drilling mud and to caving. Based on nearby borings, the Silt-Clay Unit extends down to about -25 ft NGVD (AOT 1976 and 1982), leaving a minimum of about 77 feet of Lake Vermont silt-clay below the marine deposits at that location.
Roots of plants may also form vertical preferential migration pathways. Roots have been described up to 11 feet below ground surface (minimum elevation 98 ft. NGVD) in seven of the 400+ locations of the silt-clay samples collected on-site (Aquatec, 1 988a,; WH&N, 1 993b). Roots of terrestrial plants do not typically extend significantly below the seasonal low groundwater table, which has always been above the minimum Lake elevation of 92 feet NGVD as described above.
Beach and Deltaic Sands, Barrier Bars (Silty Sand), and Peat Bogs (Peat). The water level of the Champlain Sea eventually dropped to a level of about 110 ft NGVD due to isostatic
rebound. During this time, and later in the history of the Site, numerous laterally discontinuous units of sands and silty-sands were deposited. Collectively, these relatively coarse grained shallow water deposits are called the Silty Sand Unit in this report. A large laterally continuous layer of sphagnum moss and other peat forming plants grew across much of the Site at about the same time and after the deposition of the Silty Sand Unit. This organic layer is called the Peat Unit for the purposes of this report, and its description is included in this section because its growth was intimately linked to the deposition of the Silty Sand Unit.
While the water was at about 110 ft NGVD, a sandy beach was deposited along Pine Street and further east. In addition, a barrier bar consisting of sand was formed beneath the current location of the railroad tracks. With the water level at 110 feet above sea level, most of the Site was under about 10-30 feet of water. The beach and bar are shown on Figures 6 and 7, but are not differentiated from later shallow water deposits.
As isostatic rebound continued, andlor the Lake Champlain outlet eroded, the water level dropped to about 98 feet above sea level. This exposed the barrier bar and allowed the formation of a new sandy beach under the present location of the railroad tracks. The beach formation progressed from the south toward the north due to prevailing Lake current patterns. The beach also migrated from west to east during its formation based on the stratigraphy of cores collected by The Johnson Company. This beach ridge formed a protected lagoon in which peat and sand were deposited. Sand was deposited as a distributary delta in the lagoon in the vicinity of the Turning Basin, and extending south to about 6_MW- 17 (See Figure 11, Profile R-R'). Peat bog deposits formed in the lagoon next to, and above, the sands. The presence of the beach ridge during this period is confirmed by the deposition of peat, which requires acidic conditions and does not form in open-water environments such as Lake Champlain.
One source of sediment into the lagoon was a small stream northeast of the Site which emptied into what is now the Turning Basin. This stream was still present during the early stages of settlement of the City of Burlington. A second sediment source was a stream south and southeast of the Site, which emptied into the lagoon in the vicinity of General Dynamics.
The upper sediments in the vicinity of the Turning Basin are dominated by sands deposited in a deltaic
320
PINE STREET CANAL SUPERFUND SITE HYDROGEOLOGY 21
distributary environment. These sands are highly variable in grain size, both laterally and vertically, due to the presence of coarse grained distributary channels, fine grained channel fill sediments, and deltaic depositional lobes. Most of the sand was deposited in the protected lagoon formed by the beach/barrier bar described above. Three distributary channels of the delta have been identified as cutting across the beach ridge toward Lake Champlain. Two of these channels are located in the vicinity of MW-9 and PSP-4. The third is located at MW-17 (Figure 11).
The majority of the Silty-Sand Unit is north of Maltex Pond and is replaced by peat toward the south, although sand stringers extend southward along Lake Champlain and below the center of the Site. There is also a lobe of silty-sand near and under the General Dynamics property which is probably a second deltaic deposit with a source to the southeast.
As described above, a thick peat deposit overlies the Silty Sand Unit over most of the Site. The peat bog deposits are between zero and 20 feet thick, and are filled with wood, decomposed moss, and other rotted organic matter. The peat is typically fibrous in nature. The top of the peat bog deposit is equal to, or less than, the Lake level at the time of its growth, i.e. approximately 98 feet above sea level. The peat interfmgers with and overlies portions of the sands described above. A contour map of the extent and elevation of the top of Peat Unit is shown on Figure 8. The peat is extremely porous, and therefore is very susceptible to compaction. The current elevation of the Peat Unit (Figure 8) is extremely variable due to compaction from post-depositional filL
Fill. During the mid 1800's the lagoon was dredged to form the Canal and Turning Basin. The remainder of the Site
was filled for lumber and coal storage and other industrial uses (Sanbom, 1885). The Fill Unit thickness ranges up to about 15 feet. The Fill Unit has not been differentiated on the geologic profiles in terms of age or composition. However, both the age of the fill, and its composition, vary dramatically over the Site.
The earliest filling at the Site was probably circa 1850-1860 during construction of the railroad and later, the Canal and the General Dynamics facility building (then used as a cotton mill). Sporadic filling of portions of the Site continued through the 1970's (Sanborn, 1906, 1912, 1919, 1926, 1942, 1965; and Aerial Photographs, 1937, 1942, 1962, 1966, 1974, 1975, 1978, 1979, 1980).
HYDROGEOLOGY
As described above, there are six hydrogeologic units at the Site defmed by their grain size, depositional environment, elevation, and other hydrogeologic factors. The unit with the highest geometric mean of in-situ tests is the Silty Sand (2.04 ft/day), followed by the Fill (1.05 ft/day), followed by the Silty Gravel (0.2 ft/day), followed by thePeat (0.093 ft/day), followed by the Silt-Clay (0.032 ft/day). The Bedrock at General Dynamics well #3 has a transmissivity of about 1,777 square feet/day (WH&N, 1993a).
Water levels were measured in 108 wells between October, 1994 and September, 1995. Maps of the hydraulic head in the silty sand and fill units are presented as Figures 15 and 16. Where more than one unit was intersected by the screened interval of a given well, the water level data from that well were attributed to the unit with the highest permeability for the purposes of contour mapping. The maps of hydraulic head do not account for variations in the screen elevation and vertical component of the hydraulic gradient.
Hydrographs for some typical wells are presented as Figures 17 through 19. Included on the hydrographs are precipitation data and stage elevations for the Canal and Lake Champlain. The Canal stage and precipitation was measured by automated datalogger. The Lake Champlain stage elevations at the King Street Ferry Dock were provided by the USGS (USGS, 1995).
A prominent groundwater divide exists near the railroad tracks and is documented for the period of record since 1990 (Figures 15 an 16). The location of the divide corresponds with a north-south trending ridge in the upper surface of the Silt-Clay (Figure 5). The continued presence of this divide demonstrates that dissolved groundwater contamination cannot migrate through the Silty Sand from the southern half of the Site to the Lake.
321
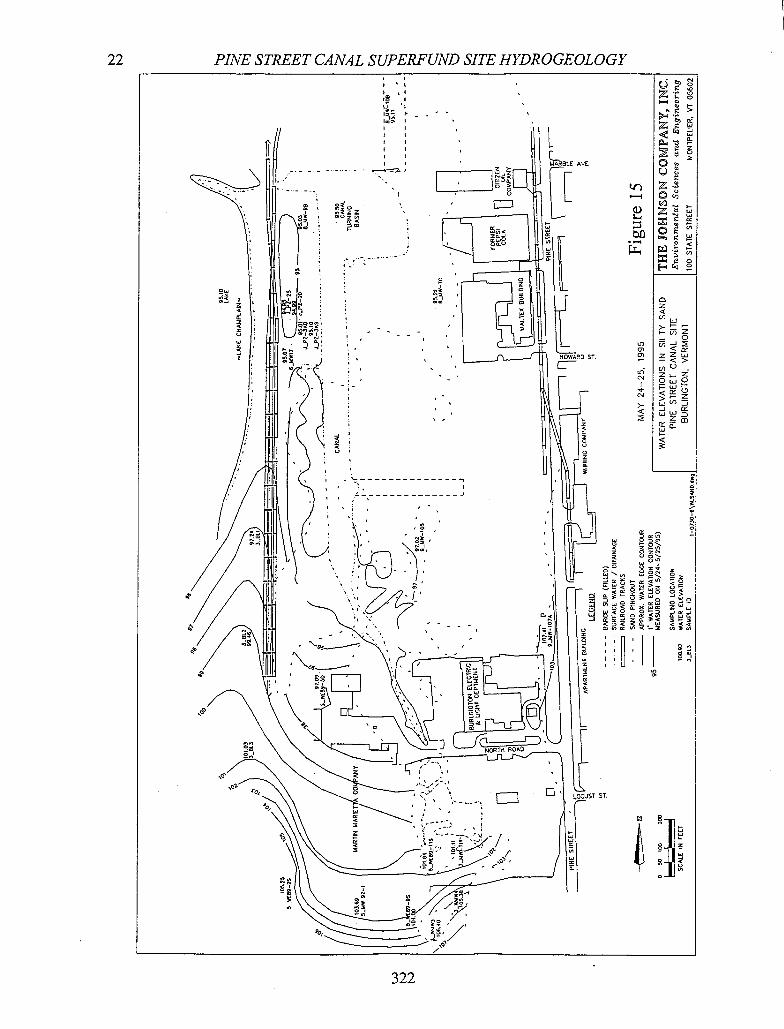
22 PINE STREET CANAL SUPERFUND SITE HYDROGEOLOGY
ill
1p
1
S S
(
:1 S
r3
S -
L L MARBLE AVE.
ci)
HOWARD ST.
C-
4-
0
o
fl ! 2
2
Ilp
105051 ST.
ijy
322
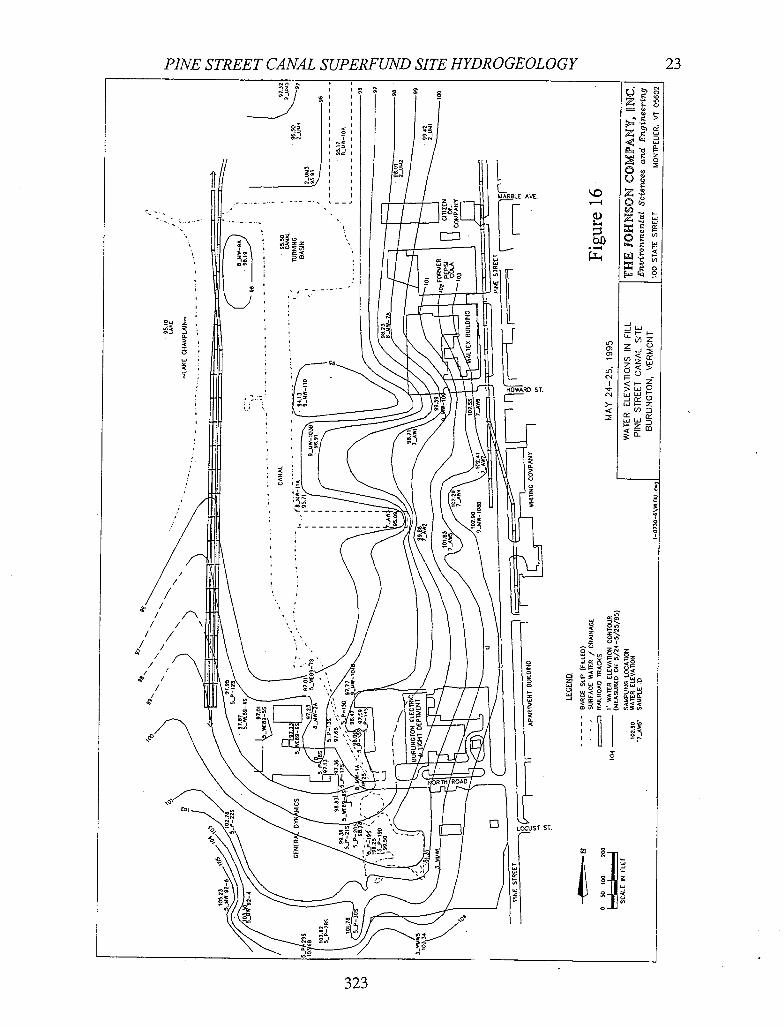
PINE STREET CANAL SUPERFUND SITE HYDROGEOLOGY
23
H
lb
H L L MARBLE AVL "C Z •
= 1L [L J_l
z
II rr- (rZ
II II H
ZZUJ
L OWARDST.
H
Lr
=8
I - — ol
•,\ ±L:K I—I \- LOCUST ST.
JJ
323
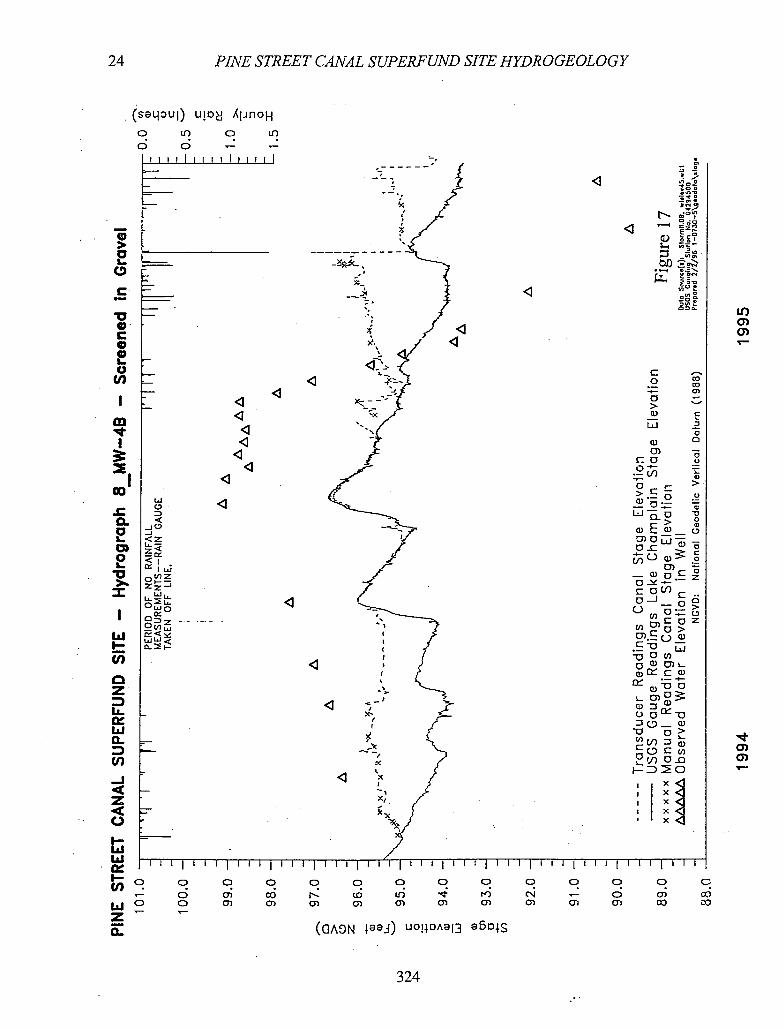
24 PINE STREET CANAL SUPERFUND SITE HYDROGEOLOGY
(seqou) U!OJ XIJnOH o u C) U)
o o
/ j.
< o
a - -----;- -- - - - -' C., 7
co
LLJ
co
L <Z U- 0
o I.. .0
0) = _a)o.E > z'i
I O
DZ ---------
U / w
(n ( 0W0) L.
CD
-- —:
LL. 00
/
U) Enoo
!;
I I j I I Ij I I I I I I I I I I
c, — 0 N U)
W 2 2 O)
(GAON uo!4DA913 96o
U) C) a)
C) C)
324
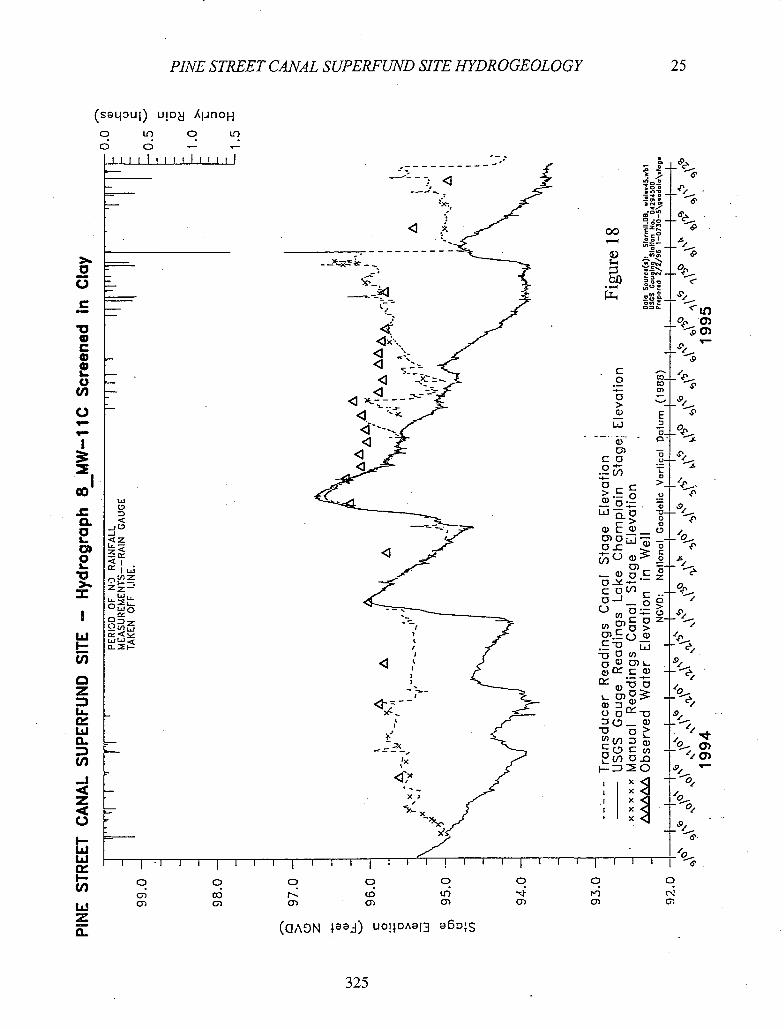
0c
6'
14
C
• -
qo)
''9,
'9,
0
4,
4..,
/
.9
/ /
/ .9,
-
- "a)
.9
I
0
•9,
0
0
(-"I C) .
0
0)
o
> - E w
C
ci) 0) -
CO
>
w.2 LLJ -a • •
> 0 wEw c 0)0 LLJ= 0C WE
0) = o - - C OW)
o —2> . U) 0) C 0 Z
-
0 v) 0 C) wo C ci)
---4- 0
0) 0
o D0_ ci 0 >
V) ) 0Cc,,
L 0_a
x I X
.1 X I X • x
0_O n q
00 ,-
(L) ..
• A.
PINE STREET CANAL SUPEKF'UND SITE HYDROGEOLOGY
PA
(sei 3 uI) U! 0 XIJflOH
0 L C ir o 0 —
Go
'I
I L.
o ;9 Of 1w
Li
Lii LJLJ< a-
z
La -
Lii /
C/') IX
cLx -
z x_J
La cr-
LLS
0• —
C) C) 0) C) 0)
(GAON eej) UO!IOAaI as
325
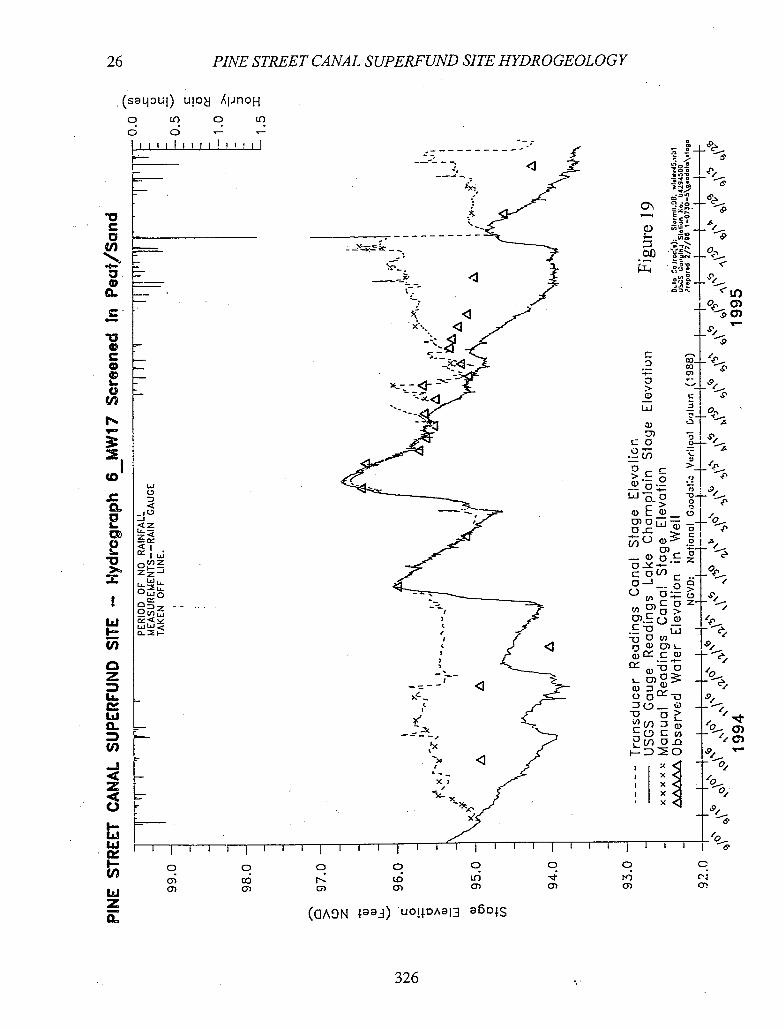
— ..
:x
2 x,
C
th
£1-
C .
0 C 0
U)
Li
(0
2 2
I- Cf)
0 z
U.
Lii 0
U,
—J
z
Uj
C,
I- U)
Lii z
C,
- IC, -j
<I
z-J Uj
LJQ
LjL.J<
26 PINE STREET CANAL SUPERFUND SITE HYDROGEOLOGY
(saquj) u!o AIJflOH 00 0 I!)
ci o
o o a 0 0 0
N (O Lri 0) 0) 0) 0) 0) 0)
(QAON jaoj) uo!DA9I3 °°4S
-, —1 —
.r,
o\ E c o
.9 A
.? iP
o-
OC) —:- O)
OD
-.. I
.2 - o 3 .;.9 > I
.9 uJ
,
LO
.ct) c
--2-i-- , .9 •0'
tj) r>
o,o— _-L'O o:
(1) .2 A
z _j_ OP
o_j
Z12
. -o i: +- t)OU)
0)S_ •,
.--4-- I I Of
kO) c_
'9 JO_G) 0 0> '1
10 —O) ev) 0O "C) E—JO .9,
L
0• C
0) 0)
326
PINE STREET CANAL SUPERFUND SITE HYDROGEOLOGY 27
Three pairs of nested piezometers and two monitoring wells installed during the ART were used to define the hydraulic head distribution in the northern portion of the peninsula west of the Canal. During 1994 and 1995, the groundwater flow direction in the Silty Sand was generally from the Canal toward the Lake. Transient groundwater ridges and troughs were observed in the Silty Sand Unit on the peninsula. These ridges and troughs acted as temporary groundwater divides between the Canal and Lake Champlain (Figures 15 an 19). Potential contaminant transport through the Silty Sand to Lake Champlain is therefore intermittent, if it occurs at all.
The Vertical Component of the Hydraulic Gradient. The vertical component of the hydraulic gradient (VCHG) was evaluated using measurements in 21 monitoring
well and piezometer nest/clusters. Graphs of the vertical component of hydraulic gradient for some well nest/clusters are included as Figures 20 through 24. The VCHG in the upper hydrogeologic units was not exhaustively examined, as it has little bearing upon the migration of contamination into the Silty Gravel or Bedrock aquifers.
There are two nests which measure the vertical component within the Silt-Clay Unit. A plot of the vertical component of the hydraulic gradient within the Silt-Clay showing consistently upward gradients is included as Figure 21.
During some portions of the year, a downward component of the hydraulic gradient between the Silt-Clay and the underlying aquifers was measured (Figure 20). It is unlikely the magnitude of this component is constant throughout the Silt-Clay Unit. As demonstrated by the VCHG graph in Figure 21, the VCHG is neutral or upwards in the center of the Silt-Clay aquifer. The most likely scenario is that the VCHG remains neutral throughout most of the Silt-Clay Unit, and becomes increasingly downward with proximity to the Silty Gravel.
Groundwater Velocities. Table 1 presents data concerning average hydraulic conductivity and hydraulic gradients which produce an
average linear velocity. The velocities are presented along three major axes: horizontal, vertical and along the principal direction of the hydraulic gradient. The highest velocities were found in the Silty Sand and the Fill (0.02 and 0.03 feet per day, respectively). Velocities in the Peat and Silt Clay were roughly two orders of magnitude lower.
CONTAMINANT DISTRIBUTION AND MIGRATION
Migration to Bedrock. The Silt-Clay Unit is relatively thick and is laterally continuous across the Site. Dissolved contaminant
migration downwards through the Silt-Clay Unit is unlikely to occur due to the continuous upward hydraulic gradient within that unit. Even if dissolved contaminants were to migrate downwards, the travel time would be on the order of thousands of years due to the absence of macropores and relatively low hydraulic conductivity in the Silt-Clay Unit.
Migration to Lake Champlain. The results of the sampling and analysis of groundwater west of the Canal indicate the only water quality
degradation above maximum contaminant levels (MCLs) is at monitoring well MW-17. The groundwater at this location exceeded the MCL for benzene but not for any of the other organic analytes. Only the more mobile of the organic compounds found at the Site were found at MW- 17. This, coupled with the observation that no measurable contamination was found at the other sampling points west of the Canal, indicates the potential for mass transport at the Site is extremely limited, presumably due to sorption and biodegradation. The contamination at MW- 17 is bounded by non-detect results at PSP2, approximately 90 feet to the north and by a pinch-out of the Silty Sand Unit at PSP 1A approximately 220 feet to the south.
Table 2 presents the data generated for BTEX over the sampling history of monitoring well MW-17, a period of approximately four years. The concentrations of these compounds have remained stable for the period of record. These data indicate that the groundwater in this location is in a state of dynamic equilibrium.
327
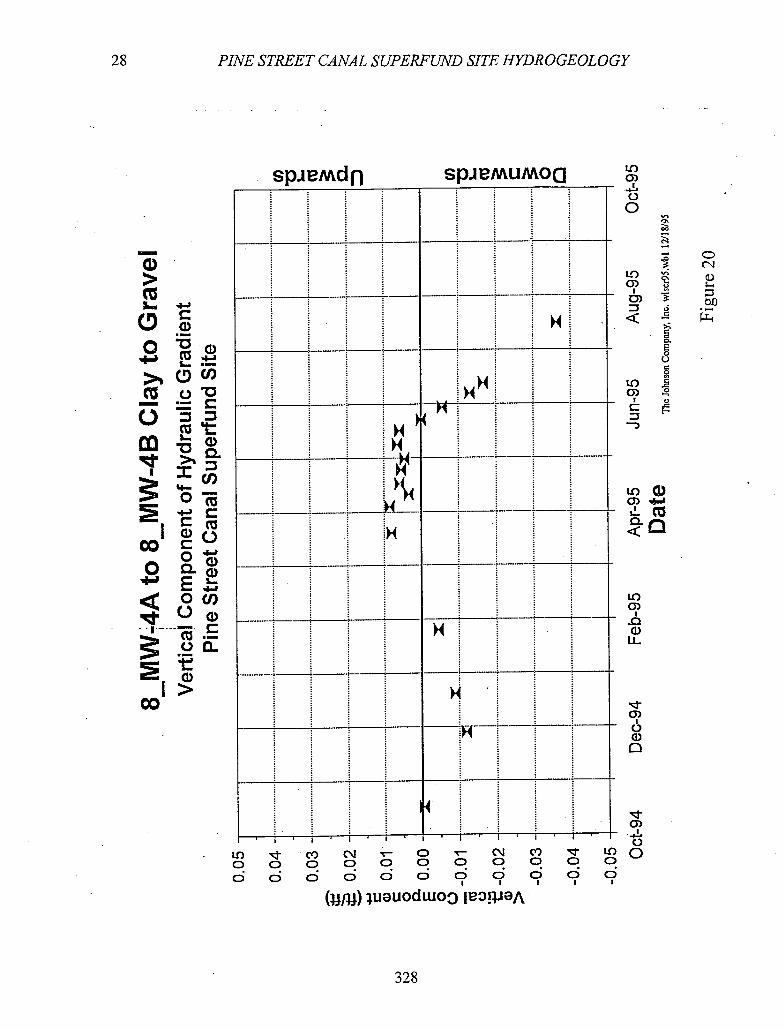
28 PINE STREET CANAL SUPERFUND SITE HYDROGEOLOGY
LO 0)
0 0 !
LID 0)
0) • -
LO
.I
F" sd 0)
o.
c .= C C) (t uJ
CI) ;i o.
00 1w
C
ca 0 o
E- 0)
w I>
00
SpJeMdfl SPJMUMOO
N
N -.---
-1—
Hi iH
• N
N
N -----------
4
Lo(1) LC
CL <IZ
U) 0)
a) LL
Nt 0)
- ö riI-
----- —r r -•---•---- -1---- 0)
I -
L() - c) (J - C) - (' 1 c) - 00 0 0 C) P p P C) 0 CD 0
CD CD ci 00000000
(4gJ)ueuodwo3Ie31peA I I I
328
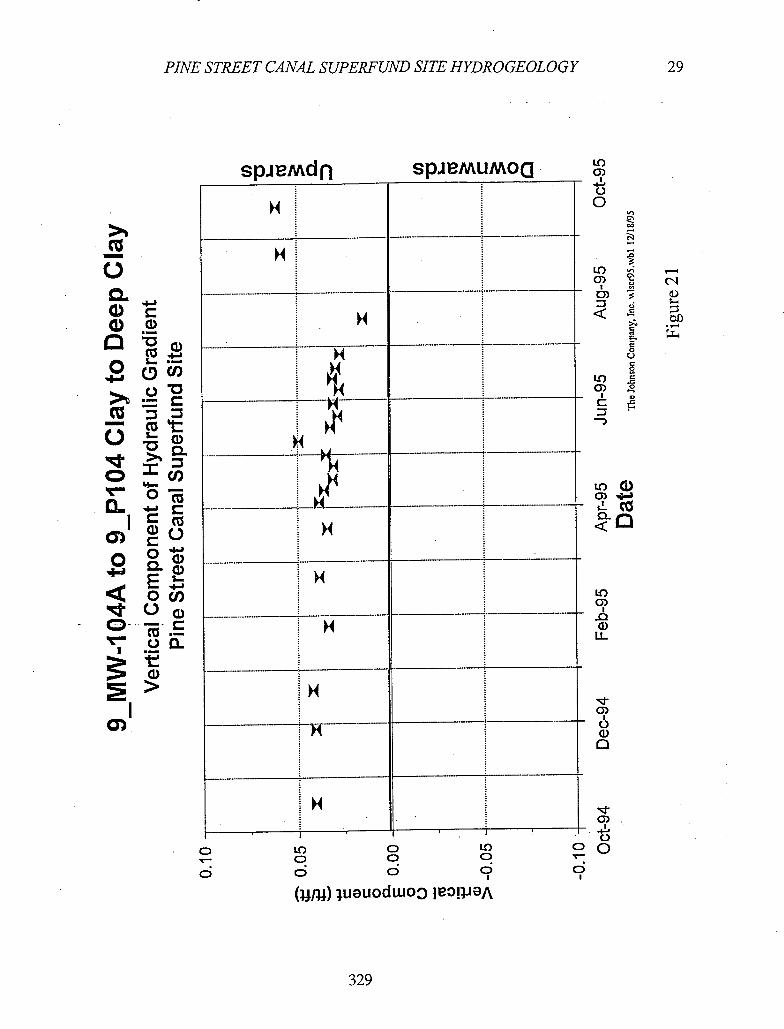
IC) 0)
0
IC)
c,)
IC) 0)
C'
-o t4
0 C
I a)
I
0)
- ó ci
PINE STREET CANAL SUPERFUND SITE HYDROGEOLOGY
911
0 0
tj ØU)
CL
CL
u >:s
I.
<0(l)
0)
SDJMdfl SPJ8MUMOO
H
H
H
N
0 10 CD IC) 0 0 CD
ci C) C) C?
(iiiii) luauodwoo Ie3!POA
LOW
cc
IC) 0)
£ 0) LL
0).
0 L.A
ci
329
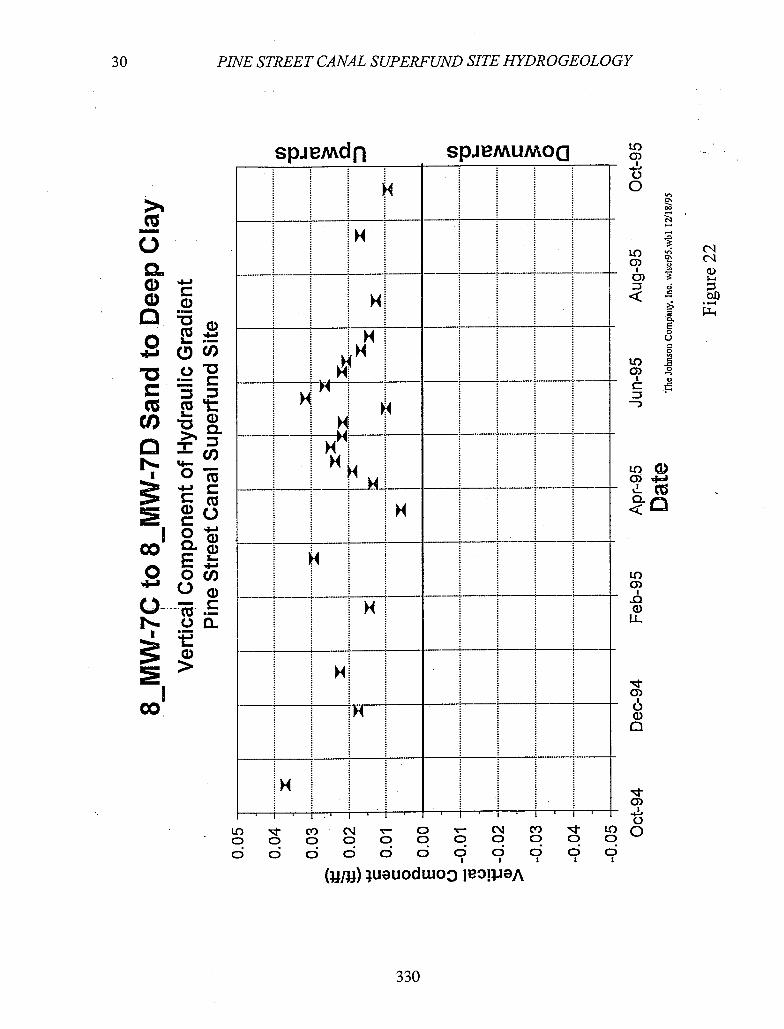
30 PINE STREET CANAL SUPERFUND SITE HYDROGEOLOGY
0 CL
ca Cl)
D
Cct COvW
cu
CL
I
a, C
co l CD
Ooc
tE ci)
Co
SpieMdfl SPJMUMO
H
H
H H
tO CQ (14 - 0 - (N o o CD 0 0 q c odd d do 00
(jjt) ;uauodwo I 3!PA
to C)
LO
LO
- 0
cq
-I
toW O)4
0
to 0)
ci) IL
0)
a)
It • 0)
• r " 0
C) lqt tO0 o o Q o 0 CD
I I I
330
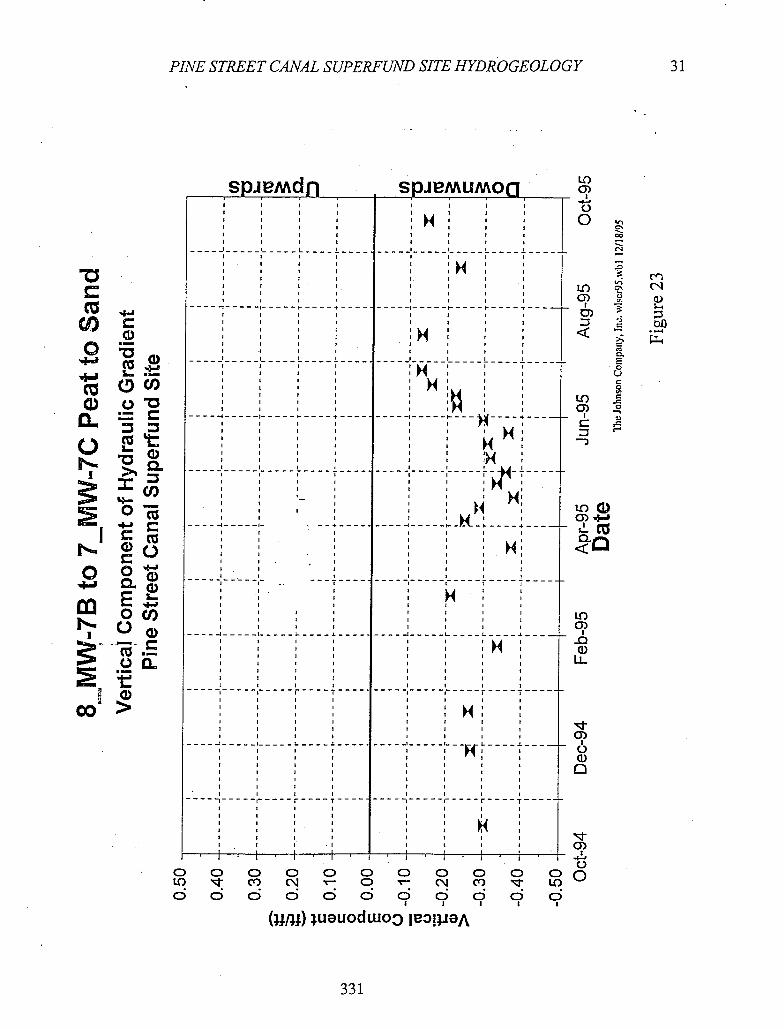
SpJIMdfl SPJMUMO LO
H
LO
-----4 - ---- -------- -
I I I I I
Lo
IL
CLO
LO
LL
zTii: cl
cl)
G) OD 1%
O t c2-
o c IC c
CD '.J -c1) NI
00)
- oQ.
N
to
PINE STREET CANAL SUPERFUND SITE HYDROGEOLOGY
31
L) 0 0 0 0 0 0 0 0 0 0 00 m N C) - N CO t (0 O 0 0 0 0 0 0 0 0 0 0
ueuodwo3Ie3!peA
331
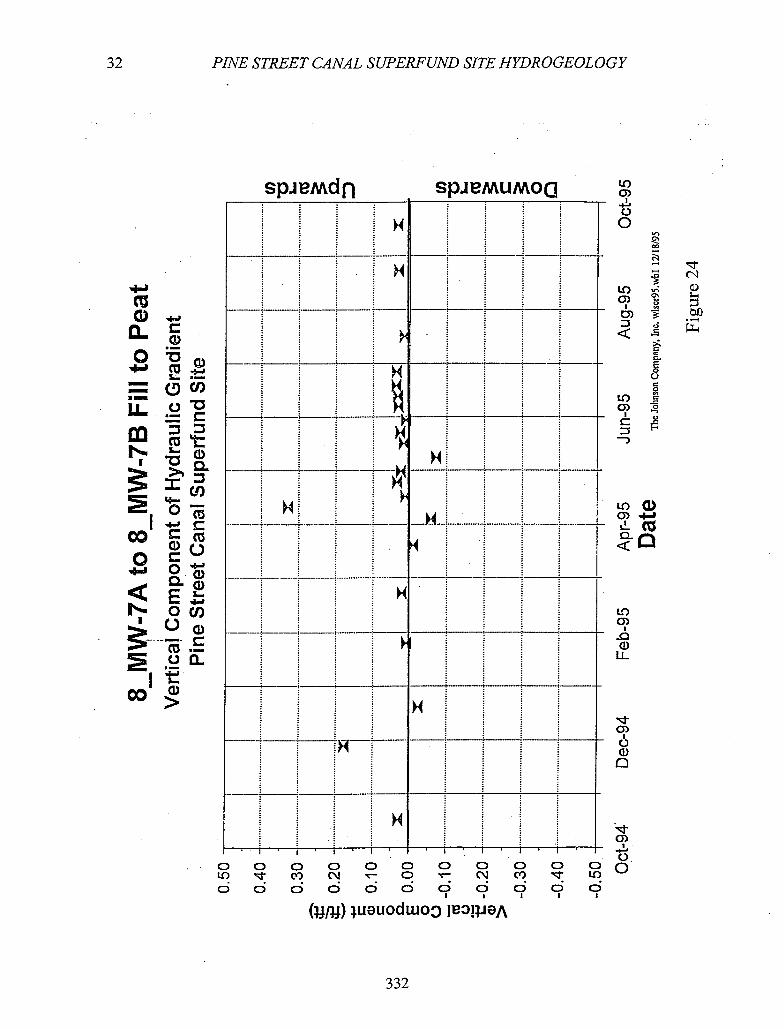
C) a (D
32 PINE STREET CANAL SUPERFUND SITE HYDROGEOLOGY
4-a
0+.'
0v 0
co
0(l)
Ib
I co 4- o c
, w
og +.1
CL
N. 0(1) I
- .E
'a)
sweMdn SUMUMOfl
H
H
----Th. --- - H
H
'4
-- -----:----
H r -I-- -•1--- -1--- r
o o o 0 0 0 C) 0 0 C) U) c) C'.J - 0 C C) -
OOOO do 9000
U) C)
0 0
C'
LI)
0
C.
0 U C 0
LO
U)(1) 0)4-I
0
U) 0) £ 0 IL
C)
0 C) LI) d
(jj.j) ueuodwo I 3!PeA
332
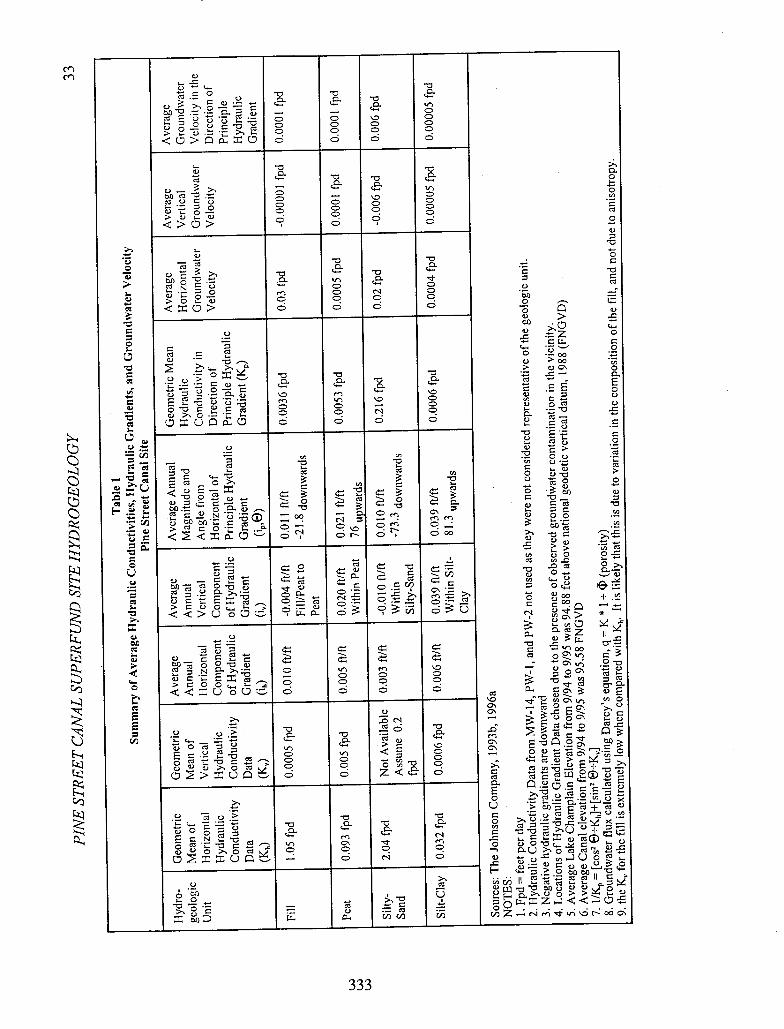
C) C-.
'loin d
- In
COC)C.) C
CD
6
C- C)
- 0
cz
0- - - - C9- 6
0 . CO
C ca
> C C) 00
CN C CO.. •Co
- -
- a -
-
•
-.. - .22 C) C)
C - 6 C- - - C) o C)
•9 o - as 0) >S C . C..
d C> 6 0 0)
C) '- .2
COcO CO CO C,) -
C-
.9 - co 0 C.. -Q C/)
- 0 C) 0
<0 C C
0to r, -
"
0Q) 03 0.
- . CO C .9 N - 00 C\ enen
C- C 2.2 00
0? C)0bC'
. CO -- ri - .
en ar-
J; .
o = - CO - CO
to rfl.D
C 00
a. o
—.9 CO _
N C. >. Ct) ._ 'C) If) cqj
CO ON
CO 'ef2 0 -COC) >
6 c
r.0 a
CO4Q CO
- CO C.-. _• 'C 0 CO
0 CO C...
' 2 .< 2 - .2 c. 01)
— - C L 6 C 0 0 CO - C .
"
0 - — C)
,_. C CO C C CO 9 >. C) C) C) >. Q CO Z<
- 9Q5.9
o
- E- a C C)COC->'-'C)',) CIS
9 C N - .. o.-. C 0 co
C C) CO () o •Q CO . C) C) C >. 0 CO -
c 0 0
- o d
= 5cico
C5
333
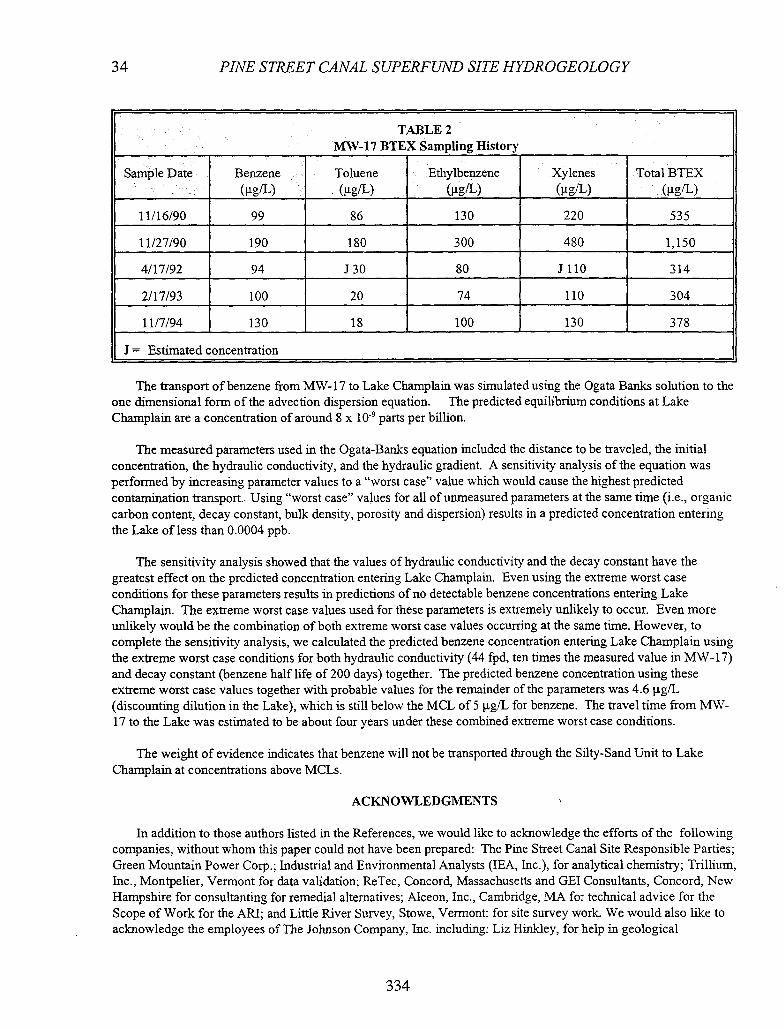
34 PINE STREET CANAL SUPERFUND SITE HYDROGEOLOGY
TABLE 2 MW-17 BTEX Sampling History
Sample Date Benzene (gtL)
Toluene (jtgIL)
Ethylbenzene (ig/L)
Xylenes (.ig/L)
Total BTEX (ig/L)
11/16/90 99 86 130 220 535
11/27/90 190 180 300 480 1,150
4/17/92 94 J30 80 JilO 314
2/17/93 100 20 74 110 304
11/7/94 130 18 100 130 378
J = Estimated concentration
The transport of benzene from MW- 17 to Lake Champlain was simulated using the Ogata Banks solution to the one dimensional form of the advection dispersion equation. The predicted equilibrium conditions at Lake Champlain are a concentration of around 8 x 1 Ø9 parts per billion.
The measured parameters used in the Ogata-Banks equation included the distance to be traveled, the initial concentration, the hydraulic conductivity, and the hydraulic gradient. A sensitivity analysis of the equation was performed by increasing parameter values to a "worst case" value which would cause the highest predicted contamination transport. Using "worst case" values for all of unmeasured parameters at the same time (i.e., organic carbon content, decay constant, bulk density, porosity and dispersion) results in a predicted concentration entering the Lake of less than 0.0004 ppb.
The sensitivity analysis showed that the values of hydraulic conductivity and the decay constant have the greatest effect on the predicted concentration entering Lake Champlain. Even using the extreme worst case conditions for these parameters results in predictions of no detectable benzene concentrations entering Lake Champlain. The extreme worst case values used for these parameters is extremely unlikely to occur. Even more unlikely would be the combination of both extreme worst case values occurring at the same time. However, to complete the sensitivity analysis, we calculated the predicted benzene concentration entering Lake Champlain using the extreme worst case conditions for both hydraulic conductivity (44 fpd, ten times the measured value in MW- 17) and decay constant (benzene half life of 200 days) together. The predicted benzene concentration using these extreme worst case values together with probable values for the remainder of the parameters was 4.6 g/L (discounting dilution in the Lake), which is still below the MCL of 5 .tgfL for benzene. The travel time from MW-17 to the Lake was estimated to be about four years under these combined extreme worst case conditions.
The weight of evidence indicates that benzene will not be transported through the Silty-Sand Unit to Lake Champlain at concentrations above MCLs.
ACKNOWLEDGMENTS
In addition to those authors listed in the References, we would like to acknowledge the efforts of the following companies, without whom this paper could not have been prepared: The Pine Street Canal Site Responsible Parties; Green Mountain Power Corp.; Industrial and Environmental Analysts (TEA, Inc.), for analytical chemistry; Trillium, Inc., Montpelier, Vermont for data validation; ReTec, Concord, Massachusetts and GEl Consultants, Concord, New Hampshire for consultanting for remedial alternatives; Alceon, Inc., Cambridge, MA for technical advice for the Scope of Work for the ART; and Little River Survey, Stowe, Vermont: for site survey work. We would also like to acknowledge the employees of The Johnson Company, Inc. including: Liz Hinkley, for help in geological
334
PINE STREET CANAL SUPERFUND SITE HYDROGEOLOGY 35
interpretation; Seth Pitkin, for help in contaminant transport interpretation; Paul Daly and Warren Davey for help in sampling; Chris Crandell and Greg Johnson, for review; Jim Bowes, for surface water stage automated monitoring; and Tim Killian, for drafting.
REFERENCES
Aquatec, 1985, GC/MS results from water samples, March 12, 1985.
Aquatec, 1988a, Southern Connector Subsurface Contamination Search, June 1988.
Aquatec, 1988b, VAT Barge Canal II Field Boring Log, October 1988.
Aquatec, 1989a, Weissner Property and St. Johnsbury Trucking Sites Subsurface Contamination Delineation, February 1989.
Aquatec, 1989b, Subsurface Investigation, Blodgett Oven Company, Inc., July 1989.
Bloch, M. R., 1976. A hypothesis for the change of ocean levels depending on the albedo of the polar ice caps. In Interdisciplinary Science Reviews, vol. 1 No. 4, 1976.
Bloch, M. R., 1965. Palaeogeography, , palaeoclimatology, paleoecology, Elsevier Publishing Company, Amsterdam-Printed in The Netherlands
Cannon, W.F., 1964a. Report of Progress: 1964 The Pleistocene Geology of the Enosburg Falls Quadrangle, Vermont, Open File Report #1964-1 to the Vermont State Geologist
Cannon, W.F., 1 964b. Pleistocene Geology of the Northern Champlain Islands and Alburg Peninsula, Vermont, Open File Report #1964-2 to the Vermont State Geologist
Chapman, D.H., 1937. Late Glacial and Post-glacial History of Lake Champlain: American Journal of Science, 5th Series, 34: 89-124.
Connally, G. Gordan and Sirkin, L.A., 1971. Lluzern Readvance Near Glens Falls, New York: Geological Society of American Bulletin, 82: 989-1008.
Connally, G. Gordan, 1982. Deglacial History of Western Vermont.
Cronin, C.M, 1976. Late-Wisconsin Marine Environments of the Champlain Valley (New York, Quebec). Quatemary Research 7: 238-253.
Denny, C. 5., 1972. The Ingraham eskar, Cha.zy, New York, USGS Prof. Paper 800-B, pp B35-41.
De Simone, David J. and La Fleur, Robert G., 1986. Glaciolacustrine Phases in the Northern Hudson Lowland and Correlatives in Western Vermont. Northeastern Geology, 8 (4): 218-229.
Diemer, J.A., 1987, Subaqueous outwash deposits in the Ingraham ridge, Cha.zy, New York, Can. J. Earth Science 25: 1384-1396.
Ecology and Environment, 1982a. Preliminary Site Assessment and Site Inspection for Pine Street Barge Canal, Burlington, VT, Final report for USEPA under Field Investigation Team (FIT) Contract, June 1982.
Ecology & Environment Inc, 1982b. Monitoring Well Installation, April 1982. Ecology & Environment, 1 982c. Field Investigations of Uncontrolled Hazardous Waste Sites, FIT PROJECT, June
23, 1982.
Ecology & Environment, 1 982d. FIT Report - Preliminary Site Assessment and Inspection for Pine Street Canal, June 1982.
335
36 PINE STREET CANAL SUPERFUND SITE HYDROGEOLOGY
EMHART Corp, 1981. Boring Logs, Pine Street Property of Christine Farrell, October 5 and 14, 1981.
ERM Northeast, 1986, Environmental Site Assessment, Ultramar Petroleum Inc. Burlmgton, VT. Terminal, November 2, 1986.
ERT, J. Malter, 1981. Boring Logs Former Property of EB and AC Whiting Co, August 8, 1981.
Feenstra, Cherry, 1990. Groundwater Contamination by Creosote, November, 6-7, 1990.
GEl, 1995. Post Screening Field Investigation Work Plan Rev. 1., Pine Street Canal Site, Burlington, Vermont, Oct. 27, 1995.
General Electric, 1991. Draft RCRA Facility Investigation Work Plan, Volume III, General Electric Company, Lakeside Avenue Facility, Burlington, Vermont, April 1991.
General Electric, 1992. Oversight Report for EPA Activities on the GE Site on 4/16 and 4/20/92, April 30, 1992.
Gil, 1990. Evaluation of the Treatability Study Work Plan. December 7, 1990.
GTI, 1991 a. Evaluation of the Treatability Study Work Plan - Pine Street Canal Site, January 11, 1991.
GTI, April 24, 199.1b, Final Evaluation of the EPA Treatability Study Work Plan: Groundwater Portion
GTI, 1991 c. Supplemental RIPS Analytical Data Summary, December 31, 1991.
GTI, 1991 d. Analysis of Split Samples During The Supplement RI, December 31, 1991.
Hitchcock, Edward, et al., 1861. Report on the Geology of Vermont, Descriptive, Theoretical, Economical and Scenographical, Claremont Manufacturing Co., Claremont, New Hampshire.
Hitchcock, Edward, 1910. Surficial geology of the Champlain basin: Vermont State Geologist, 7th Report, pp1 99-212
Hunt, Allen S., 1976. Sedimentation Rates and Sediment Thickness in Lake Champlain: 1975 - 1976; U.S. Department of the Interior Project No. A-027-VT.
Hunt, A.S., 1980. The stratigraphy of unconsolidated sediments of Lake Champlain in Vermont Geology, Volume 1, October 1980.
Johnson Company, The, 1995. Additional Remediation Investigation Report - Pine Street Canal Superfund Site, Burlington, Vermont
Kjelleren, 1996. Telephone Conversation with Gary Kjelleren on April 10, 1996.
Koemer, Fred, 1959. Boring Log: G. S. Blodgett Co., Inc. Proposed Office Building Burlington, VT, April 1959.
Koemer, Fred, 1961. Boring Logs General Electric Plant Lakeside Avenue Burlington, Vermont, January 3, 1961.
Malter, John, January 31, 1977, Affidavit - John Malter
Metcalf & Eddy, 1 990a. Technical Memorandum No. 2, Pine Street Canal - Treatability Study, Pumping Test Plan, August 15, 1990.
Metcalf & Eddy, 1 990b. Technical Memorandum No. 5, Pine Street Canal Treatability Study, Trial Pumping Test Results, September 13, 1990.
Metcalf & Eddy, 1991. Technical Memorandum No. 7, Pine Street Canal Treatability Study Task 7, January 4, 1991.
336
PINE STREET CANAL SUPERFUND SITE HYDROGEOLOGY 37
Metcalf & Eddy, 1 992a. Treatability Study Final Report -- Volumes I-Ill, February 1992.
Metcalf & Eddy, March 1 992b Supplemental Remedial Investigation Final Report - Volume I - III, March 1992.
Metcalf& Eddy, 1992c. Baseline Risk Assessment Final Report Pine Street Canal Superfund Site, Burlington, Vermont, May 1992. EPA Contract No. 68-W9-0036.
Metcalf& Eddy, 1992d. M.L. Zirbell, Letter, June 16, 1992.
Metcalf& Eddy, 1992e. Tech. Memo. # 14 Supp. RI/FS Task 3, June 16, 1992.
Metcalf & Eddy, 1992f. Resubmittal of Technical Memo No. 14 describing field sampling and analysis conducted in April, 1992, November 23, 1992.
Metcalf & Eddy, 1 992g, Feasibility Study Final Report
Metcalf& Eddy, 1993a, Technical Memo No. 17 - update of Document No. 266, February 1993.
Metcalf & Eddy, 1993b. Technical Memorandum #17, PSBC-SRI-FS Analysis and Toxicity Results for Sample Collection in February 1993, April 13, 1993.
Metcalf & Eddy, Unknown a. Technical Memorandum Pine Street Canal Treatability Study.
Metcalf & Eddy, Unknown b. Technical Memorandum No. 3, Pine Street Canal Treatability Study.
Pair, D., Karrow, P.F., and Clark, P.U., 1987. History of the Champlain Sea in the Central St. Lawrence Lowland, New York, and its Relationship to Water Levels in the Lake Ontario Basin in Gadd, N.R., ed., The Late Quaternary Development of the Champlain Sea Basin: Geological Association of Canada, Special Paper 35.
Pari.zek, R.R., 1988. Concepts of Hydrology as illustrated by Case Histories, presented at University of Vermont, March 24-25, 1988.
PEER, 1989. Field Operations Plan for Pine Street Canal Site RI/FS for EPA, March 1989.
PEER, 1990. Draft Remedial Investigation Report -- Volumes I-Ill, May 1990.
Perkins, George H., 1908. Report of the State Geologist on the Mineral Industries and Geology of Certain Areas of Vermont, Rumford Printing Co. Concord, New Hampshire.
Perkins/Jordan, 1982. Burlington Southern Connector Remedial Action and Highway Construction Assessment, August 1982.
Perkins/Jordan, 1983. Burlington Southern Connector Remedial Action and Highway Construction Assessment, February 1983.
Perkins/Jordan, 1984. Burlington Southern Connector Pine St. Canal Site VT AEC, Permit Application, January 1984.
SANBORN, Various. SANBORN Insurance Maps, Sanborn Map Company, 1885, 1894, 1900, 1906, 1912, 1919, 1926, 1942, 1965.
Stewart, David P., and MacClintock, Paul, 1969. The Surficial Geology of Pleistocene History of Vermont, Bulletin No. 31, Department of Water Resources, Montpelier, Vermont.
U.S. Coast Guard, 1977. Release Report Letters, July 9, 1977 and November 23, 1977.
U.S. Environmental Protection Agency, 1982, Photographic Analysis of Shoreline Disposal Area, Burlington, Vermont, November 1982.
337
38 PINE STREET CANAL SUPERFUND SITE HYDROGEOLOGY
U.S. Environmental Protection Agency, 1985. Maltex Pond Remedial Action Progress Report, December 6, 1985.
U.S. Environmental Protection Agency, 1988. Revised Draft Report Pine Street Barge Canal, January 1, 1988.
U.S. Environmental Protection Agency, 1 992d, Analytical results from 4/17/92 testing
U.S. Geological Survey, 1972, 1995. Lake Stage Records, Station #04294500, Burlington, Vermont
VT Agency of Environmental Conservation, 1977. Lake Champlain Water Levels - Observations at Rouses Point, NY, August 1977.
VT Agency of Natural Resources, 1985, Fact Sheet - Maltex Pond Removal Action, Oct. 7, 1985.
VT Agency of Natural Resources, 1993a. Pine Street Barge Canal Class IV Groundwater Area Reclassification, MayS, 1993.
VT Agency of Transportation, 1976-1983 Drilling and Boring Logs
VT Agency of Transportation, 1984. Draft Supplemental Environmental Impact Statement for Connector, December 6, 1984.
Versar, 1989. Final RFA Sampling Visit Report - General Electric Facility - Burlington VT, June 29, 1989.
Wagner Heindel and Noyes, 1983. Review of Computer Modeling Techniques for Burlington Southern Connector Pine St, December 3, 1983.
Wagner Heindel and Noyes, 1984. Review of Pump Tests, Pine Street Southern Connector AEC, February 21, 1984.
Wagner Heindel and Noyes, 1993a. Draft Well No. 3 Pump Test and Capacity Analysis Report, April 1993.
Wagner Heindel and Noyes, 1 993b. Limited Hydrogeologic Analysis Former General Electric Site, June 15, 1993.
Wehran, 1989. Summary of Environmental Sampling at the GE Company Lakeside Plant Volumes I, II, October, 1989.
Wehran, 1990. Report on Oversight for the CERCLA field activities conducted at the GE Lakeside, February 1, 1990.
Wehran, 1991. Draft RCRA Work Plan Volumes I-Ill for the GE Company Lakeside Plant, April, 1991
Williams, D.F., 1984. A brief overview of oxygen isotope stratigraphy: A new approach for absolute age dating and stratigraphic correlations for Pleistocene offshore sections from the Gulf of Mexico and other marine basins, in Geologic Evolution and Hydrocarbon Potential of the Louisiana Slope, A New Orleans Geological Society Short Course, Nov. 27, 1984.
338
PINE STREET CANAL SUPERFUND SITE HYDROGEOLOGY 39
ROAD LOG
START AT THE GATE ON THE WEST SIDE OF PINE STREET BETWEEN THE BURLINGTON ELECTRIC AND LIGHT DEPARTMENT AND THE MALTEX BUILDING (ACROSS THE STREET FROM THE LARGE BLUE SPECIALTY FILAMENTS (FORMERLY WHITING COMPANY) BUILDING. THIS LOCATION IS SOUTH OF THE INTERSECTION OF PINE STREET WITH HOWARD STREET, AND NORTH OF THE INTERSECTION WITH LAKESIDE AVENUE.
NOTE THAT ALL THE PROPERTY ON THE PINE STREET SITE IS PRIVATELY OWNED, AND ALTHOUGH PERMISSION WAS AUAINED FOR THIS FIELD TRIP, IT MUST BE REQUESTED SEPARATELY BY INDIVIDUALS WHO WISH TO VISIT THE SITE.
THE SITE WALKOVER IS EXPECTED TO TAKE ONE TO TWO HOURS. SEVERAL AREAS ARE EMERGENT WETLANDS, AND HEAVILY OVERGROWN, SO WATER RESISTENT BOOTS AND LONG PANTS ARE SUGGESTED.
While facing the Site, turn left and walk southwards towards the Burlington Electric and Light facility. Turn right onto North Road, and continue to the gates of General Dynamics.
Stop 1. (15 MINUTES) To the South of North Road is the wetlands and sedimentation basin for the City of Burlington Storm Sewer, the major source of surface water which enters the Site. The surface sediments in the basin are contaminated above acceptable ecological risk levels, and are scheduled to be capped circa 2001. The basin acts as a discharge point for groundwater in the southern portion of the Site. Prior to development of the Site, this area served as one of two major tributaries to the lagoon which was present before construction of the canal.
To the West is the General Dynamics facility, the original structure is one of the oldest existing buildings on-site, constructed in the mid 1 9th century. It is built upon a silty sand delta. The North Road elevation at this point is approximately 100 feet NGVD, and has flooded on several occasions during the last decade.
To the north is the tributary which feeds the Pine Street Canal. The surrounding areas have been built up by filling over the history of the Site.
Return to Pine Street, turn left, and walk northwards approximately 400 feet to the north end of the Burlington Electric Department parking lot. Turn west, following the edge of the parking lot approximately 300 feet, and then turn right and follow a narrow path through the trees. A large mound of soil will be in front of you. This was placed on-site during the early 1970's as a pre-loading test for a proposed industrial building. Climb the mound of dirt to attain an overview of the Site.
Stop 2. (15 MINUTES) To the east is the former location of the manufactured gas plant. Beneath the mound of dirt you are standing on is approximately five feet of fill over 15-20 feet of peat saturated with coal tar and coal oils. The mound settled more than five feet during the first year after its construction, including the catastrophic failure of one side due to differential compaction of the peat.
To the West the emergent wetlands surrounding the canal are visible. Some of the wetlands are vegetated with cattails, bu the majority are covered with Phragmites, a non-native, invasive, bamboo like weed. The cattail areas are probably similar to later stages of the development of the natural lagoon, which filled in overtime. Earlier stages of the lagoon development would have exhibited sphagnum moss and numerous distributary channels extending to the outlet in the North.
Climb back down the mound, and return to where the vehicles are parked on Pine Street. Enter the Site at the gates, and follow the dirt road northwest for approximately 400 feet. Turn left and follow a faint path south on the
339
40 PINE STREET CANAL SUPERFUND SITE HYDROGEOLOGY
western side of a clearing. Continue on the path as it turns westward, past a former homeless persons' shelter. The path ends at the intersection of the South Slip with the Canal. The South Slip, and the area you just walked over, was filled in the 1970's in preparation for construction of industrial facilities.
Stop 3. (15 MiNUTES) Note that the canal depth is very shallow to the South, and deeper towards the North. Cores of the southern portion show that it has filled in with fine sand and silty sediments, probably due to inflow from the storm water sewer system and its predecessor, the natural tributary to the Canal. Core data suggest that more than five feet of sediments have been deposited since the last time the Canal was dredged sometime in the early 20' century.
The worst of the dense non-aqueous phase liquid coal tar contamination in the canal begins at the South Slip, and extends northwards. Coal tar mixed with extremely soft (less than 20 psf shear strength) organic muck has been observed up to five feet thick on the bottom of the canal. The canal was historically dredged to approximately 80-85 feet NGVD, which means it was cut into the peat horizon in this area.
Return to the vehicle parking area, and walk northwards on Pine Street to the Maltex Building. Follow the parking lot around the back of the building to its southwest corner. Follow the faint path westwards approximately 200 feet
Stop 4. (15 MINUTES) To your left is the Maltex Pond. This is the area which was remediated during an emergency action in the 1980's. The remediation consisted of removal of coal tar contaminated sediments and peat, and placement of a synthetic liner covered by two feet of clean soil. The area is now heavily vegetated with cattails. No further NAPL releases to surface waters have been reported after the Maltex Pond remedial action.
Return to the Maltex parking lot, and follow it northwards to the southeast corner of the Turning Basin.
Stop 5. (10 MINUTES) The outlet to Lake Champlain is visible across the Turning Basin. The former North Slip location is in the northeast corner of the Basin. A storm sewer (now abandoned) also has its outfall in that corner. The second natural tributary to the Site entered this area from the Northeast. Historical maps of Burlington indicate that this stream was confined to a manmade channel early during the City's development. The delta formed by the stream extended from Maltex Pond northwards to the Burlington Street Department, and from where you are standing out into Lake Champlain.
If the water is low, you may see remnants of a sunken coal barge exposed in the Basin. There are five such barges, and two subaqueous railways for a dry dock, located in the Turning Basin. The barges are typically eight feet wide and 100 feet long, and were probably modified Erie Canal barges.
An optional stroll along the Burlington Bike Path is the next portion of the Field Trip. Although the Site itself is barely visible from the path, the current Lake Champlain sedimentation processes can be observed easily. Walk south on Pine Street to Lakeside Avenue and turn right. Follow Lakeside Avenue beneath the railroad overpass. Climb up to the bike path on the path at the north end of the overpass. Traveling northwards on the bike path you will observe wave forms and ripple marks in the beach deposits, and preferential sedimentation on the south side of jetties and obstructions. The outlet from the Canal is visible at the northern end of the Site, where it is crossed by a bridge.
340
McFIONE ALVD IvIci -IONE C4-1
THE NEW ENGLAND - QUEBEC IGNEOUS PROVINCE IN WESTERN VERMONT
J. Gregoiy McHone, G.L.S. Program, Wesleyan University, Middletown, CT 06459 Nancy W. McHone, Ct. Geological and Natural History Survey, Hartford, CT 06106
INTRODUCTION
Early Cretaceous ailcalic intrusive rocks are common across northern New England, northeastern New York, and southern Quebec southeast of Montreal. The name of "New England - Quebec" or NEQ province was used by McHone and Butler (1984) to indicate a closely related origin for igneous rocks of the Monteregian Hills petrographic province in Quebec and northwestern Vermont, and the "younger" White Mountain magma series in the rest of northern New England Many examples of NEQ intrusive rocks are well displayed around Burlington. Vermont, and these rocks were formerly considered to be outliers of the main Monteregian Hills (Philpotts, 1974).
The seven stops of this field excursion include outcrops of the major igneous rock types - monchiquite and camptonite (varieties of volatile-rich alkali basalt), bostomte (h)rpabyssal trachyte) and alkali syemte - a bimodal mafic/felsic association characteristic of many regions of continental rift volcanism. The timing of high-angle faulting within the Champlain Valley may be constrained by associations with the Early Cretaceous (115-135 Ma) magmas (McHone, 1987). Xenoliths are fairly frequent and occasionally abundant, and they provide samples of the underlying Paleozoic shelf sequence and Proterozoic (Grenville) metamorphic basement. The intrusive rocks provide intriguing petrological clues to mantle events and the origins of the alkalic basalt/trachyte association. All of these topics can be addressed during this short field excursion.
REGIONAL SETTING
The Lake Champlain Valley between Vermont and New York is from 20 to 50 km wide and 140 km long between the northern Taconic Mountains and the Canadian border. Topographically, the Tacomc klippe interrupts the southern Champlain Valley, but structurally the same valley terrane widens to connect with the northern Hudson Valley southeast of the Adirondack Mountains. The surface of the lake is only 29 in above sea level while the deepest part of the lake, near the western side, approaches 120 m below sea level. Many peaks of the Adirondacks to the west and the Green Mountains to the east rise above 1000 in, providing considerable relief to the Valley margins.
Excellent exposures are common along lake shores, river and stream banks, highway cuts, and quarries. Our field sites include all of these types of exposures. The glacial soils on many hillsides are thin enough to reveal bedrock rubble (including dike float), but much of the area is also covered by thick, glacial lake and marine sediments that make good farmland but effectively hide the bedrock and structures. On the other hand, the glaciers produced polished surfaces of NEQ intrusions with fine details that would be obscured at more weathered outcrops.
Distribution of NEQ Rocks
Figure 1 (modified from McHone and Corneille, 1980) shows locations for many of the igneous intrusions of the central Lake Champlain Valley. As shown by other regional maps (McHone and McHone, 1993), dikes become scarcer southward from Vergennes, but then are fairly common across the northern Tacomcs and Green Mountains to the west and southeast of Rutland, Vermont. The northern Champlain Valley is curiously devoid of dikes from North Hero well up into Quebec, but similar dikes are abundant in the Monteregian Hills province ESE of Montreal. Lamprophyre dikes occur with lesser frequency westward as far as the east-central Adirondack Mountains, and are scattered but continuously present eastward across Vermont, New Hampshire, and the southern half of Maine (McHone, 1984).
Special studies of Champlain Valley igneous rocks start with early publications by Thompson (1860) and Hitchcock (1860), followed by petrographical and theoretical work by Kemp and Marsters (1893), Shinier (1903), Ailing (1928), Hudson and Cushing (1931), Laurent and Pierson (1973), and Mdllone and Corneille (1980). Other
McHone, J. G., and McHone, N. W., 1999, The New England - Québec igneous province in Western Vermont; in Wright, S.F. ed., New England Intercollegiate Geologic Conference Guidebook Number 91, p. 341-358.
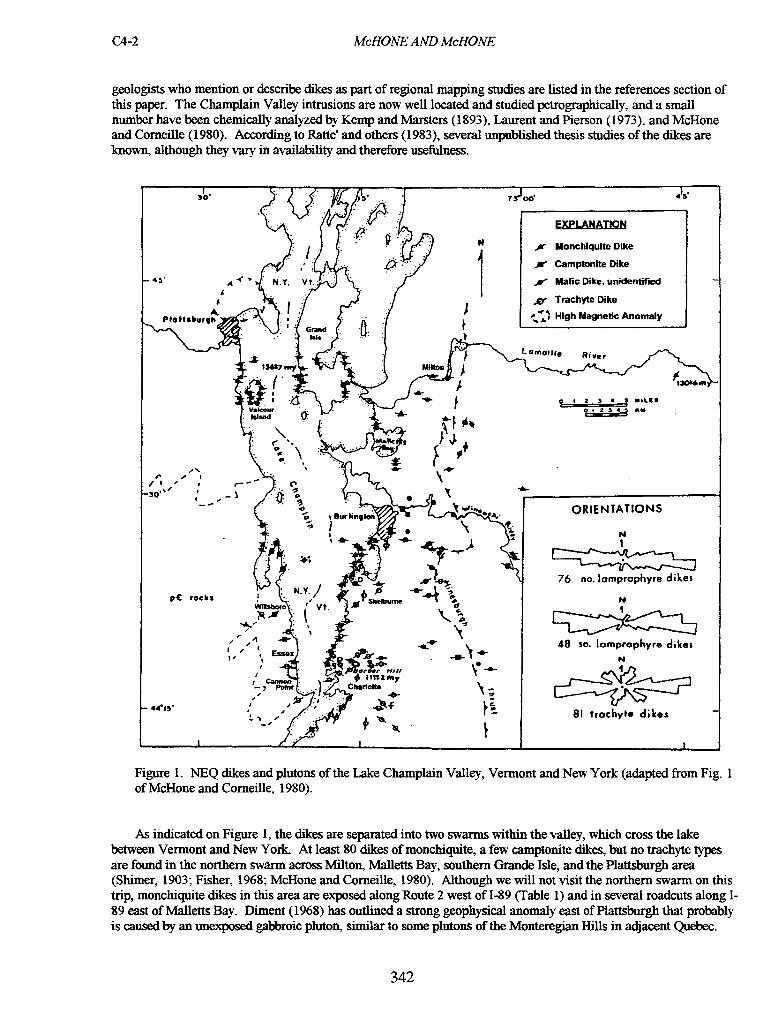
C4-2
McHOWE AND McHONE
geologists who mention or describe dikes as part of regional mapping studies are listed in the references section of this paper. The Champlain Valley intrusions are now well located and studied petrographically, and a small number have been chemically analyzed by Kemp and Marsters (1893), Laurent and Pierson (1973), and Mdflone and Corneille (1980). According to Ratte' and others (1983), several unpublished thesis studies of the dikes are known, although they vary in availability and therefore usefulness.
• V •.
: EXPLANATION
/ • . N a Monchiqulte Dike
. Camptonite Dike
- 45 N.Y. Vt w Mafic Dike, unidentified
Ar Trachyte Dike
PioisPergh .. . High Magnetic Anomaly • Grand .
• .: - Milton
Ar 0 • 2 3 4 a
Vaicaur
or H c •t 0•• (
I' / I
- -. •o• /_ " -C-____________________________
— - - •. C
''P''• ORIENTATIONS
-'\-1::7
. ;
Burlinqon I 4 I • 3; P1
dikes 76 no. lomprophyre NY)
p-C rocks 4 glShburn. P4
Essex . . 48 so. lomprophyre dkei
-_ .- N
81 trochyle dikes
I_ — •A tk _____
Figure 1. NEQ dikes and plutons of the Lake Champlain Valley, Vermont and New York (adapted from Fig. 1 of McHone and Corneille, 1980).
As indicated on Figure 1, the dikes are separated into two swarms within the valley, which cross the lake between Vermont and New York. At least 80 dikes of monchiquite, a few caniptonite dikes, but no trachyte types are found in the northern swarm across Milton, Malletts Bay, southern Grande Isle, and the Plattsburgh area (Shimer, 1903; Fisher, 1968; McHone and Corneille, 1980). Although we will not visit the northern swarm on this trip, monchiquite dikes in this area are exposed along Route 2 west of 1-89 (Table 1) and in several roadcuts along I-89 east of Malletts Bay. Diment (1968) has outhned a strong geophysical anomaly east of Plattsburgh that probably is caused by an unexposed gabbroic pluton, similar to some plutons of the Monteregian Hills in adjacent Quebec.
342
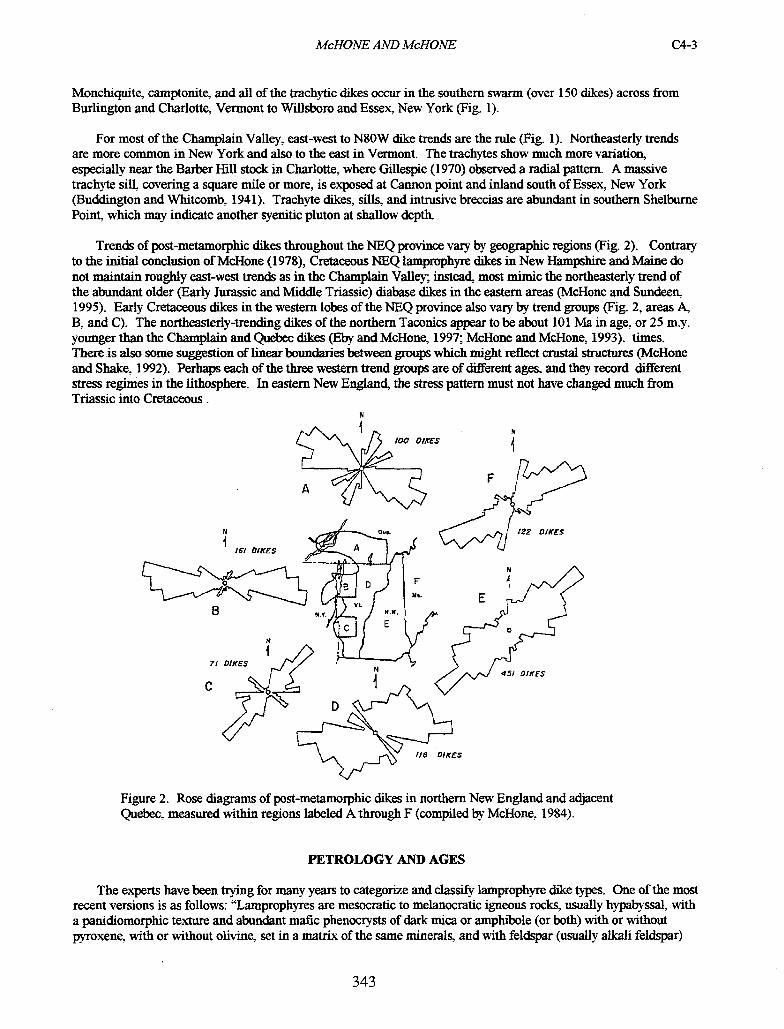
DIKES<~A
McHONE AND McHONE
C4-3
Monchiquite, caniptonite, and all of the trachytic dikes occur in the southern swarm (over 150 dikes) across from Burlington and Charlotte. Vermont to Willsboro and Essex, New York (Fig. 1).
For most of the Champlain Valley, east-west to N80W dike trends are the rule (Fig. 1). Northeasterly trends are more common in New Yoit and also to the east in Vermont. The trachytes show much more variation, especially near the Barber Hill stock in Charlotte, where Gillespie (1970) observed a radial pattern. A massive trachyte sill, covering a square mile or more, is exposed at Cannon point and inland south of Essex, New York (Buddington and Whitcomb, 1941). Trachyte dikes, sills, and intrusive breccias are abundant in southern Shelburne Point, which may indicate another syenitic pluton at shallow depth.
Trends of post-metamorphic dikes throughout the NEQ province vary by geographic regions (Fig. 2). Contrary to the initial conclusion of McI-lone (1978), Cretaceous NEQ lamprophyre dikes in New Hampshire and Maine do not maintain roughly east-west trends as in the Champlain Valley, instead, most mimic the northeasterly trend of the abundant older (Early Jurassic and Middle Triassic) diabase dikes in the eastern areas (McHone and Sundeen, 1995). Early Cretaceous dikes in the western lobes of the NEQ province also vaiy by trend groups (Fig. 2, areas A B. and C). The northeasterly-trending dikes of the northern Taconics appear to be about 101 Ma in age, or 25 m.y. younger than the Champlain and Quebec dikes (Eby and McHone, 1997; McHone and McHone, 1993). times. There is also some suggestion of linear boundaries between groups which might reflect crustal structures (McHone and Shake, 1992). Perhaps each of the three western trend groups are of different ages, and they record different stress regimes in the lithosphere. In eastern New England, the stress pattern must not have changed much from Triassic into Cretaceous.
N fl IOOE
L F N
A
FI-212DUCES
ii DIKES
Figure 2. Rose diagrams of post-metamorphic dikes in northern New England and adjacent Quebec, measured within regions labeled A through F (compiled by McHone. 1984).
PETROLOGY AND AGES
The experts have been trying for many years to categorize and classil' lamprophyre dike types. One of the most recent versions is as follows: "Lamprophyres are mesocratic to melanocratic igneous rocks, usually hypabyssal, with a panidiomorphic texture and abundant mafic phenoczysts of dark mica or amphibole (or both) with or without pyroxene, with or without olivine. set in a matrix of the same minerals, and with feldspar (usually alkali feldspar)
343
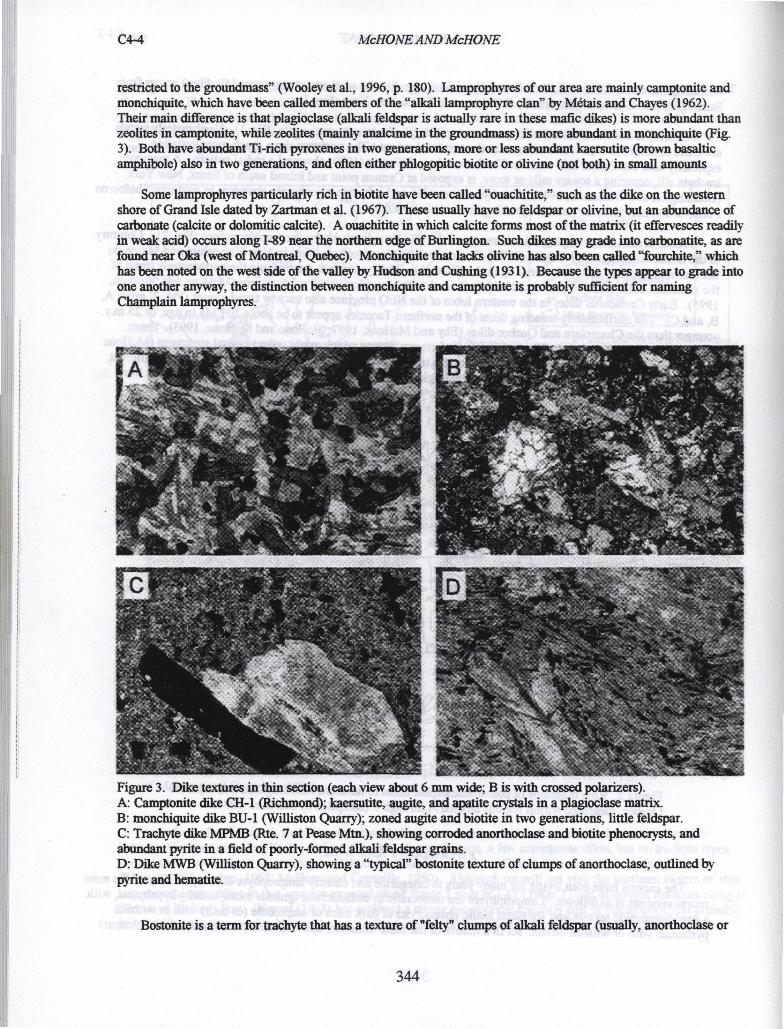
C44 McHONEAND McHONE
restricted to the groundmass" (Wooley et al., 1996, p. 180). Lamprophyres of our area are mainly camptomte and monchiquite, which have been called members of the "alkali laniprophyre clan" by Métais and Chayes (1962). Their main difference is that plagioclase (alkali feldspar is actually rare in these mafic dikes) is more abundant than zeolites in camptonite, while zeolites (mainly analcime in the groundmass) is more abundant in monchiquite (Fig. 3). Both have abundant Ti-rich pyroxenes in two generations, more or less abundant kaersutite (brown basaltic amphibole) also in two generations, and often either phlogopitic biotite or olivine (not both) in small amounts
Some lamprophyres particularly rich in biotite have been called "ouachitite," such as the dike on the western shore of Grand Isle dated by Zartman et al. (1967). These usually have no feldspar or olivine, but an abundance of carbonate (calcite or dolomitic calcite). A ouachititc in which calcite forms most of the matrix (it effervesces readily in weak acid) occurs along 1-89 near the northern edge of Burlington. Such dikes may grade into carbonalite, as are found near Oka (west of Montreal, Quebec). Monchiquite that lacks olivine has also been called "fourchite," which has been noted on the west side of the valley by Hudson and Cushing (1931). Because the types appear to grade Into one another anyway, the distinction between monchiquite and caniptonite is probably sufficient for naming Champlain laniprophyres.
Figure 3. Dike textures in thin section (each view about 6 mm wide; B is with crossed polarizers). A: Camptonite dike CH-1 (Richmond); kaersutite, augite, and apatite crystals in a plagioclase matrix. B: monchiquite dike BU-1 (Wilhiston Quarry); zoned augite and biotite in two generations, little feldspar. C: Trachyte dike MPMB (Rte. 7 at Pease Mtn.), showing corroded anorthoclase and biotite phenocrysts, and abundant pyrite in a field of poorly-formed alkali feldspar grains. D: Dike MWB (Williston Quarry), showing a "typical" bostonite texture of clumps of anorthoclase, outlined by pyrite and hematite.
Bostonite is a term for trachyte that has a texture of "felty" clumps of alkali feldspar (usually, anorthoclase or
Im
McHONE AND McHONE C4-5
albite) apparent only in thin section (Fig. 3). Although 'tbostonite" is a legitimate term that is widely applied to felsic dikes of this region. not all of the dikes display this texture, so the volcanic term of trachyte may be preferred. Although typically dominated by fine-grained anorthoclase, the trachyte dikes often display euhedral phenocrysts of beta-quartz, corroded biotite, and orthoclase.
In many caniptonites and several monchiquites, small pink globular segregations up to a few cm across are scattered though the rock The segregations are called oceili (eye-like), which are not xenoliths but rather display co-liquid boundaries with the lamprophyre matrix. The ocelli usually contain abundant sodic or potassic feldspar, analcime and calcite, as well as hydrous minerals such as kaersutite, which may be observed across the boundary between the liquids.
Intrusion ages
The few radiometric dates for Champlain Valley igneous rocks compare well with Early Cretaceous dates of the Monteregian Hills of adjacent Quebec, and for other intrusions of the New England-Quebec igneous province of McHone and Butler (1984). Mdllone (1984) summarized radiometric ages of northern New England dikes, including two for local lainprophyre dikes. Zartman and others (1967) found a Rb-Sr age of 136 +1-7 Ma, using phiogopite from a dike of lamprophyre (ouachitite or monchiquite) on the western shore of Grande Isle. Using kaersutite separated from a monchiquite dike located about 35 km to the east (in the Green Mountains). Mchione (1975) obtained a K-Ar age of 130+/-6 Ma. To the south, in the northern Taconics west of Rutland, Vermont, caniptonite dikes have dates of 105 +1-4 Ma and 110+/-4 Ma (McHone, 1984). In the eastern Adirondacks, Isachsen and Seiderman (1985) reported K-Ar dates of 113, 123, and 127 Ma on caniptonite dikes, and 137 and 146 Ma on dikes that apparently are monchiquite.
Armstrong and Stump (1971) reported a K-Ar date of 111 +/-2 Ma for the syenitic Barber Hill stock at Charlotte, using a biotite separate. The Barber Hill stock is considered to be cogenetic with the bostonite (trachyte) dikes of the area. Seven trachyte dike samples from the Burlington area analyzed by McHone define a whole-rock Rb-Sr isochron of 125+/-5 Ma (McHone and Corneille, 1980). Partial Rb-Sr data collected by Fisher (1968) for the Cannon Point trachyte sill, across the lake at Essex, New York, indicated an age of "less than 140" Ma, but which also fits the 125 Ma isochron. Isachsen and Seiderman (1985) reported a whole-rock K-Ar age of 120 Ma for a trachyte dike in Willsboro, New York
Two monchiquite dikes are crosscut by a bostonite dike and a bostonite sill along the shoreline SW of Shelburne Point (Kemp, 1893; Welby, 1961). Welby (1961, p. 188) reported that a caniptomte dike crosscuts the Barber Hill syenite "near the crest of the hill at its northwest corner," but we did not find it in June of 1999. Our group will pass near that area in Stop 4, and perhaps someone will relocate this feature. In combination with the radiometnc data, these crosscutting relationships are consistent with ages generally about 135 Ma for monchiquite, 125 Ma for trachytelbostonite, and 115 Ma for camptonite, plus or minus perhaps 5 Ma for each type. Older dates that are recalculated to new radiometric constants become 3 or 4 Ma older, but do not change the age relationships.
After all of the earlier considerations, we still need modern 40Ar/39Ar dates, because in other areas of the NEQ provnce. Kenneth Foland and his students have good evidence for much more confined timing of magmatism. Their dates in the Monteregian Hills (Foland et al.. 1986) cluster near 124 Ma, while several other NEQ plutons in New Hampshire are close to 122 Ma (Hubacher and Foland, 1991). Based on those results, we might suspect that all Champlain Valley magmatism occurred at about the same time, perhaps near 124 Ma.
Xenoliths and Intrusive Breccias
Xenoliths of sedimentary and metamorphic rocks have always been noted in Champlain dikes, but the most careful catalog was made by Corneille (1975). He observed a wide variety of xenoliths in 35 dikes, about evenly divided between lamprophyres and bostomtes. The largest xenoliths occur in bostonite dikes wider than about 1.2 meters, some of which are actually "intrusive breccias" that are mostly xenoliths by volume. Inclusions of anorthosite in dikes at Shelburne Point demonstrate the eastward extension of Adirondack inassif anorthosite under
345
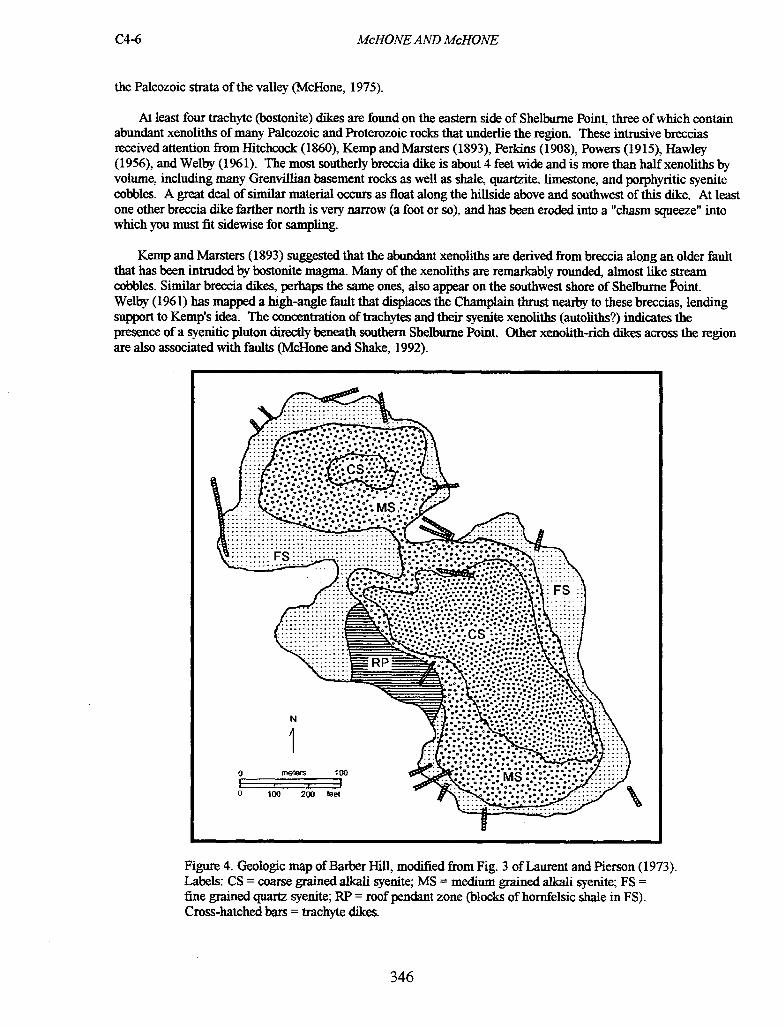
C4-6
McHONE AND McHONE
the Paleozoic strata of the valley (McHone, 1975).
At least four trachyte (bostonite) dikes are found on the eastern side of Shelburne Point, three of which contain abundant xenoliths of many Paleozoic and Proterozoic rocks that underlie the region. These intrusive breccias received attention from Hitchcock (1860), Kemp and Marsters (1893), Perkins (1908). Powers (1915), Hawley (1956), and Welby (1961). The most southerly breccia dike is about 4 feet wide and is more than half xenoliths by volume, including many (3renvillian basement rocks as well as shale, quartzite, limestone, and porphyritic syenite cobbles. A great deal of similar material occurs as float along the hillside above and southwest of this dike. At least one other breccia dike farther north is very narrow (a foot or so), and has been eroded into a "chasm squeeze" into which you must fit sidewise for sampling.
Kemp and Marsters (1893) suggested that the abundant xenoliths are derived from breccia along an older fault that has been intruded by bostonite magma. Many of the xenoliths are remarkably rounded, almost like stream cobbles. Similar breccia dikes, perhaps the same ones, also appear on the southwest shore of Shelburne t'oint. Welby (1961) has mapped a high-angle fault that displaces the Champlain thrust nearby to these breccias, lending support to Kemp's idea. The concentration of trachytes and their syemte xenoliths (autoliths?) indicates the presence of a syexutic pluton directly beneath southern Shelburne Point. Other xenolith-rich dikes across the region are also associated with faults (Mdllone and Shake, 1992).
Ms
FS
0 meters 100
100 200 feet -
Figure 4. Geologic map of Barber Hill, modified from Fig. 3 of Laurent and Pierson (1973). Labels: CS = coarse grained alkali syenite; MS = medium grained alkali syemte; FS = fine grained quartz syenite; RP = roof pendant zone (blocks of homfelsic shale in FS). Cross-hatched bars = trachyte dikes.
346
McHONE AND McHONE
C4-7
Barber Bill
Barber Hill was originally described as a laccolith (Welby, 1961; Dimon, 1962), which indicates a sill-like form inflated into an upward bulge. Probably this description was influenced by the large trachyte sill at Cannon Point, across the lake in Essex, New York, which crops out along the shoreline with the upper horizontal contact exposed. Barber Hill was re-mapped by Roger Laurent in the early 1970's as the double-dome top of a small stock of syenite, with coarser zones toward the interior. As also shown by Laurent and Pierson (1973; Fig. 4 below), there are numerous bostonite or trachyte dikes in the immediate area and crosscutting the stock. These have more random orientations than the regional dikes, and Gillespie (1970) described the surrounding bostonite dikes as having a radial pattern around Barber Hill. Welby (1961) mentions a camptonite dike cutting the syenite near its top, an important crosscutting observation, but we have not found that locality. A small prospect for molybdenite occurs in a hornfelsic portion of the roof zone.
Using a sample of "slightly altered biotite" collected by Richard Gillespie from the coarse-grained syenite, Armstrong and Stump (1971) derived a K-Ar age of 111 +1-2 Ma (114 +1-2 Ma with newer standards) for Barber Hill. Ar can easily escape from altered mica, which could cause the K/Ar date to be too young. Because we regard the trachyte dikes as co-genetic with the syemte, 125 Ma is a better cooling date, as indicated by the RbISr isochron of Mdllone and Corneile (1980) and by Ar/Ar dates for the Monteregian Hills (Foland et al., 1986).
Geochemical relationships
NEQ dike analyses have been reported by Woodland (1962), Hodgson (1969), Laurent and Pierson (1973), McHone (1975, 1978), Hale and Freiberg (1995), and others. Average compositions for camptonite, monchiquite, and bostonite from Vermont are comparable to worldwide averages for basanite, nephelinite, and alkali trachyte, except that lamprophyres are richer in water and carbon dioxide than theIr volcanic equivalents (Table 1). As also expected, the calculated density of trachyte magma is lower than lainprophyre magma, but trachyte viscosity at 1 kb is up to a power of 6 (in poise) greater than laniprophyre magma. For trachyte magma to flow, dike fractures should be generally wider and depths of origin perhaps shallower than the lamprophyric mantle melts. High volatile contents may also be necessary.
TABLE 1k AVERAGE COMPOSITIONS OF VERMONT NEQ DIKE TYPES
Group la lb 2a 2b 3a 3b
SiO2 38.60 40.60 43.07 44.30 65.31 61.95 TiQ 2.73 2.66 2.80 2.51 0.17 0.73 A1203 12.30 14.33 13.89 14.70 17.75 18.03 Fe203 4.85 5.48 3.62 3.94 2.54(t) 2.33 FeO 6.41 6.17 7.55 7.50 - 1.51 MnO 0.22 0.26 0.25 0.16 0.18 0.13 MgO 7.91 6.39 7.08 8.54 0.37 0.63 CaO 13.78 11.89 9.79 10.19 1.60 1.89 Na20 3.24 4.79 3.02 3.55 5.95 6.55 K20 1.91 3.46 1.93 1.96 4.39 5.53 P20 1.35 1.07 0.74 0.74 0.07 0.18 1120+ 2.46 1.65 2.36 1.20 0.53 0.54 CO2 3.48 0.60 2.97 0.18 0.18 -
Mg# 73.0 58.9 65.0 74.2 25.5 25.6 Viscosity 5.94e1 6.93e1 1.39e1 2.73e1 2.35e5 4.05e6 Density 2.42 2.56 2.42 2.55 2.37 2.38
347
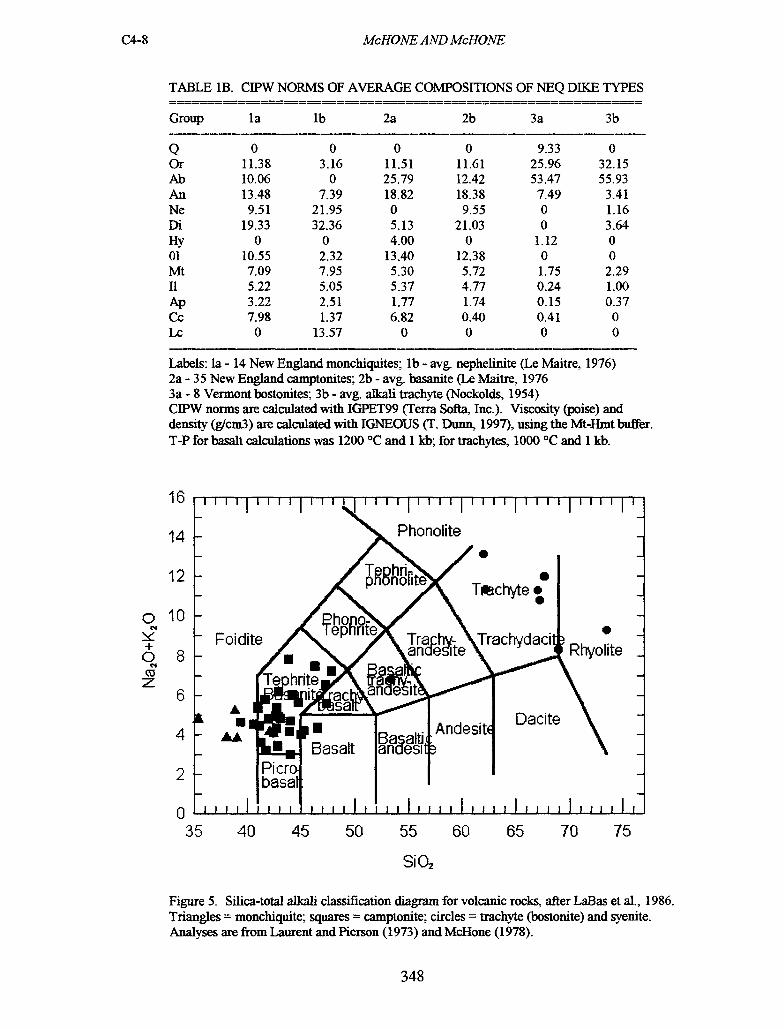
C4-8 McHONE AND McHONE
TABLE lB. CIPW NORMS OF AVERAGE COMPOSITIONS OF NEQ DIKE TYPES
Group la lb 2a 2b 3a 3b
Q 0 0 0 0 9.33 0 Or 11.38 3.16 11.51 11.61 25.96 32.15 Ab 10.06 0 25.79 12.42 53.47 55.93 An 13.48 7.39 18.82 18.38 7.49 3.41 Ne 9.51 21.95 0 9.55 0 1.16 Di 19.33 32.36 5.13 21.03 0 3.64 Hy 0 0 4.00 0 1.12 0 01 10.55 2.32 13.40 12.38 0 0 Mt 7.09 7.95 5.30 5.72 1.75 2.29 Ii 5.22 5.05 5.37 4.77 0.24 1.00 Ap 3.22 2.51 1.77 1.74 0.15 0.37 Cc 7.98 1.37 6.82 0.40 0.41 0 Lc 0 13.57 0 0 0 0
Labels: la - 14 New England monchiquites; lb - avg. nephelinite (Le Maitre, 1976) 2a - 35 New England camptonites; 2b - avg. basanite (Le Maitre, 1976 3a -8 Vermont bostonites; 3b - avg. alkali trachyte (Nockolds, 1954) CIPW norms are calculated with IGPET99 (Terra Softa, Inc.). Viscosity (poise) and density (g1cm3) are calculated with IGNEOUS (T. Dunn, 1997), using the Mt-Hint buffer. T-P for basalt calculations was 1200 °C and 1 kb; for trachytes, 1000 °C and I kb.
16
14
12
10
Co
+
4
2
Ii
III I 1 1111 1 1 11 1 1111 1 111 11111 I 11111111111
Phonolite
pBnoIite Tchyte.
Thon o- - Foidite rite
Traj Trachydacil - I
an Rhyolite - . Ba
an e it -
hrite traa S - I ac A sa
Dacite Ba alti Andesit'
- AL 6!.. Basalt anesi Picro
- basa
_III1I III 111111 IIIJ,IIIIIllJIIll1IIIiIl
35 40 45 50 55 60 65 70 75
SiO2
Figure 5. Silica-total alkali classification diagram for volcanic rocks, after LaBas et al., 1986. Triangles = monchiquite; squares = camptonite; circles = trachyte (bostomte) and syenite. Analyses are from Laurent and Pierson (1973) and McHone (1978).
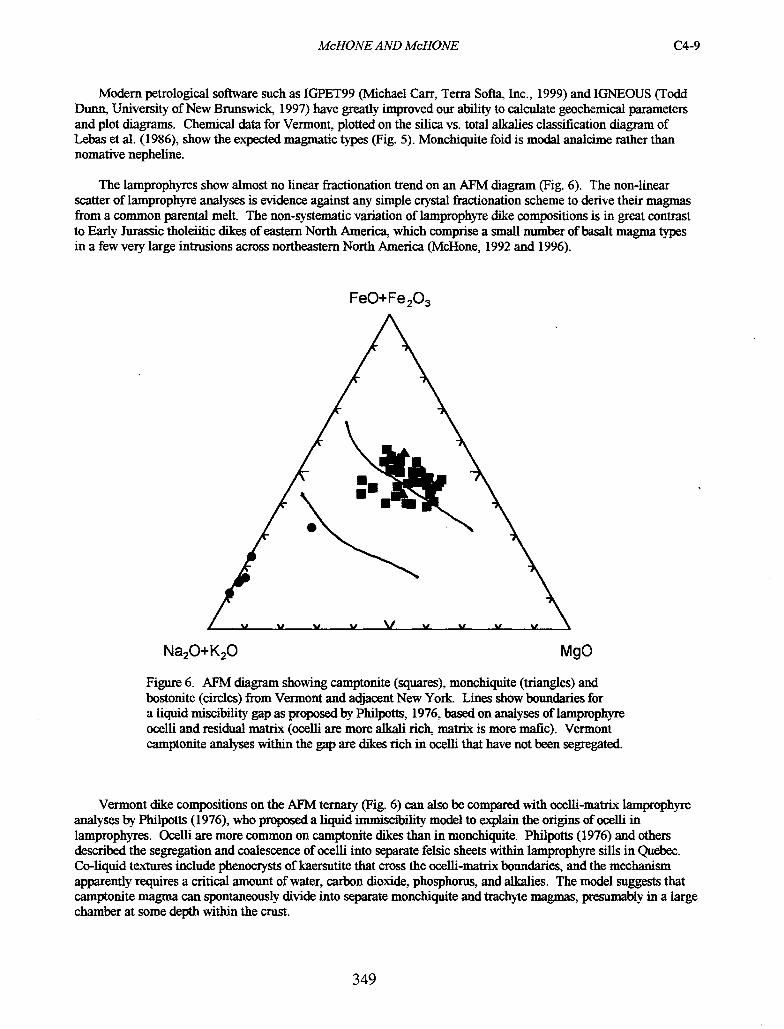
McHONE AND McHONE
C4-9
Modern petrological software such as IGPET99 (Michael Carr, Terra Sofia, Inc., 1999) and IGNEOUS (Todd Dunn, University of New Brunswick, 1997) have greatly improved our ability to calculate geochemical parameters and plot diagrams. Chemical data for Vermont, plotted on the silica vs. total alkalies classification diagram of Lebas et al. (1986), show the expected magmatic types (Fig. 5). Monchiquite foid is modal analcime rather than nomative nepheline.
The lamprophyres show almost no linear fractionation trend on an AFM diagram (Fig. 6). The non-linear scatter of lamprophyre analyses is evidence against any simple crystal fractionation scheme to derive their magmas from a common parental melt. The non-systematic variation of lamprophyre dike compositions is in great contrast to Early Jurassic tholeiitic dikes of eastern North America, which comprise a small number of basalt magma types in a few very large intrusions across northeastern North America (McHone, 1992 and 1996).
FeO+Fe 203
Na20+K20
MOP Figure 6. AFM diagram showing camptonite (squares), monchiquite (triangles) and bostonite (circles) from Vermont and adjacent New York Lines show boundaries for a liquid miscibility gap as proposed by Philpotts, 1976, based on analyses of lamprophyre ocelli and residual matrix (ocelli are more alkali rich, matrix is more mafic). Vermont caniptonite analyses within the gap are dikes rich in ocelli that have not been segregated.
Vermont dike compositions on the AFM ternary (Fig. 6) can also be compared with ocelli-matrix laniprophyre analyses by Phulpotts (1976), who proposed a liquid immiscibility model to explain the origins of oceffi in lamprophyres. Ocelli are more common on camptonite dikes than in monchiquite. Philpotts (1976) and others described the segregation and coalescence of ocelli into separate felsic sheets within lamprophyre sills in Quebec. Co-liquid textures include phenocrysts of kaersutite that cross the ocelli-matrix boundaries, and the mechanism apparently requires a critical amount of water, carbon dioxide, phosphorus, and alkalies. The model suggests that camptonite magma can spontaneously divide into separate monchiquite and trachyte magmas, presumably in a large chamber at some depth within the crust.
349
C4-10 McfIONE AND McHONE
There is support for the model in the distribution of dikes: camptonite is widespread across the entire region, while monchiquite and bostonite (trachyte) are found in local dike clusters associated with plutonic complexes (McHone, 1984). Presumably, magma chambers that split into separate liquids also represent sources for larger plutomc stocks such as Barber Hill, and for the monchiquite dikes in the same regions. NEQ dikes and the Barber Hill stock in the Champlain Valley could provide excellent material for further tests of this model.
ROAD LOG
Refer to Figure 7 for map iocations of stops 1 - 6. Traffic is commonly heavy and fast along Route 7, so please take your time and drive carefully (you can always catch up later). At stops 1, 2, and 4, parking with access through private property is by special permission. Food can be purchased at our lunch stop at the Old Brick Store in Charlotte Corner.
The stops are within the Burlington and Mt. Philo 7 1/2' USGS quadrangles, and are along or near to local roads and highways. The Vermont Atlas and Gazetteer (DeLonne and Co.), available in local stores, has a convenient format and useful detail. The local geology was mapped by Cady (1945). Welby (1961), and in summary by Doll and others (1961). Other areas of the Champlain Valley that contain dikes were mapped by White (1894), Buddington and Whitcomb (1941), Stone and Dennis (1964), and Fisher (1968). New geologic maps have also been prepared for the upcoming bedrock map of Vermont, which will include Mesozoic dikes and plutons throughout the state (thanks to Nick Ratcliffe and Greg Walsh, among others).
Assemble at the northern end of the boat storage yard of Shelburne Shipyard and Marina. Directions: From Burlington, head south on Rte. 7, turning right onto Bay Road at the light just south of the former Hideaway Restaurant (a much-missed landmark). Go past the southern end of Shelburne Bay, and after 1.7 miles turn right onto Harbor Road (intersection at Shelburne Fanns), and then head north for another 3 miles. Enter the marina, bear left and park near the far northern end of the boat yard. Drive carefully near the stored yachts!
Mileage
Total by Point
0 0 Start of trip at the northern end of Shelburne Shipyard and Marina.
STOP 1. SHELBURNE SHIPYARD MONCIHQUITE DIKE.
Here a monchiquite dike forms a northern wall (overgro'vii by brush) that bounds the Shelburne Shipyard boat storage area. This is Kemp and Marster's (1893) dike no. 12, Corneille's (1975) no. 36, and McHone's (1978) BU-14. It is about 2 m wide, AZ 98, dip 85 S, color medium dark gray. In thin section it is a fairly typical monchiquite, with much porphyritic zoned augite (salite), a small amount of phlogopite, and little feldspar. Many augite phenociysts show cores of green Na-rich pyroxene, pale gray-green intermediate sections, and rims of reddish Ti-rich pyroxene. These zones were described as separate pyroxene types by Mdllone (1986), each of which can be related to P-T-X stages of the magma between its origin in the mantle and its final shallow emplacement. Additional analysis of these interesting mineral varieties was made by Bédard et al. (1988).
The dike probably crosses the point, and Corneille (1975) mapped several monchiquites on the western shore. Corneille (1975) noted that some monchiquite dikes in this area contain small xenoliths of limestone, shale, quartzite, and pink felsite, which perhaps could be found with better searching in this example.
Head back south along Harbor Road.
3.0 3.0 Turn right (west) into Shelburne Farms. Proceed past the toll booth after identifying yourselves as members of the field trip.
5.2 2.2 Go past the driveway to the Inn and park in the lot off the left side of the road. Walk back to the lakeside wall north of the Inn, and climb down to the shoreline.
350
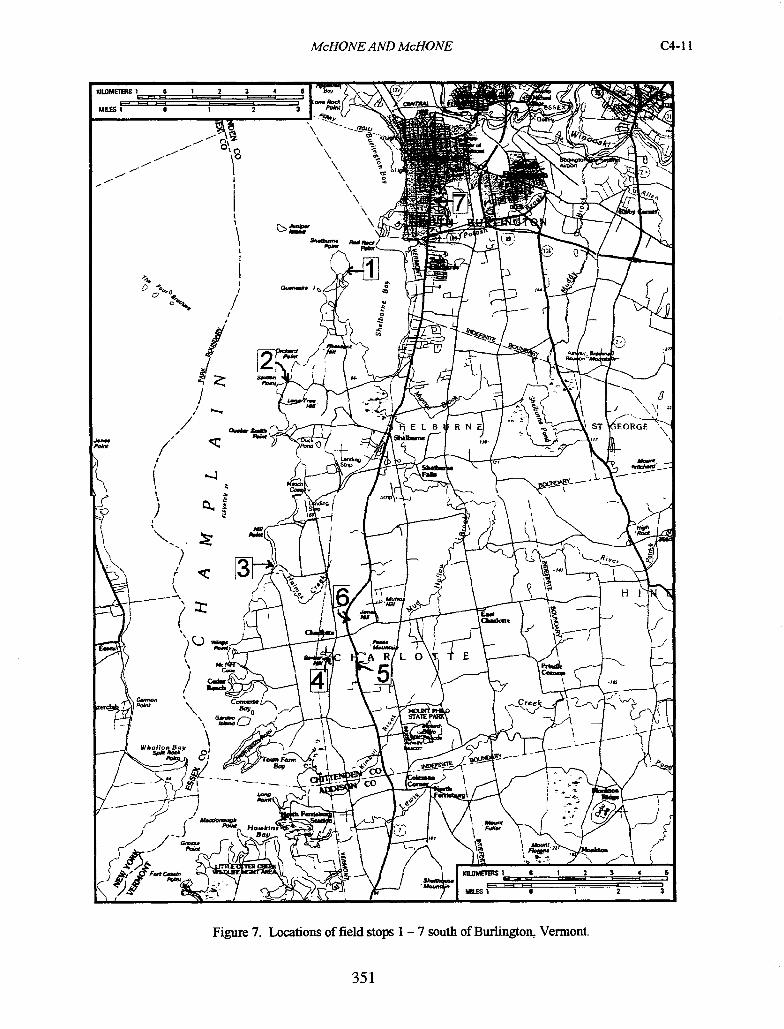
McHONE AND McHONE C4-1 1
Figure 7. Locations of field stops 1 —7 south of Burlington, Vermont
351
C4-12
McHONE AND McHONE
STOP 2. SHELBURNE FARMS TRACHYTE DIKE
This wonderful estate was the home of Dr. Seward Webb and his wife, Lila Vanderbilt Webb. Having been born and raised at her father's fabulous Biltmore Estate near Asheville. North Carolina, Mrs. Webb recreated some of the grandeur of her youth here in pastoral Vermont. Their manor house on the high bluff of Saxton Point is now Shelburne Farms Inn. You should consider returning to visit the gift shop and tour Shelburne Farms, which is a non-profit, education-oriented organization. The Inn is also a grand place to spend a few days.
This is dike 113 of Kemp and Marsters (1893) and dike 7 of Comeille (1975). The dike intrudes Odovician Iberville shale, which easily shows deformation from the many local and regional faults of the Champlain Valley. Low angles of intrusion are more common for trachyte dikes than for the mafic types; this example is virtually a sill, with a trend near N-S. dip 47E, and thickness about 3.5 m.. It weathers to a reddish tan color but fresh pieces are more light gray. The coarse texture with large alkali feldspar phenociysts qualifies it as a good trachyte, but it is also not too different from the Barber Hill syemte that we will see at the next stop.
Return on the same estate road to the entrance.
7.4 2.2 Turn right (south) onto Harbor Road. 9.0 1.6, In Shelburne Village, turn right (south) onto Rte. 7 9.8 0.8 Turn right (southwest) onto Boswick Road. 11.7 1.9 Turn right (west) onto Orchard Road. 13.0 1.3 Turn left into the parking lot for the town beach (Hills Bay on older topo maps).
Park and walk to the shore.
STOP 3. CHARLOTTE TOWN BEACH BOSTONITE DIKE.
This is dike 58 of Corneille (1975), actually a series of branching dikes intruding Stony Point shale. It is not clear if Kemp and Marsters (1893) visited this locality, although it is well exposed near a very old road. The dikes of this cluster are extraordinarily thin for bostomte, which is generally viscous enough to require fairly wide fracture openings. There are at least seven dikes that together total about 2 in in thickness here, with glossy dark contact surfaces, and pale tan, sandy-textured fresh broken surfaces. The rock is fine grained and not especially porphyritic, unusual features for bostomte. Overall, they trend about E-W with a steep dip.
Continue south on Whaley Road, through the Holmes Creek Covered Bridge.
14.8 1.8 Turn left (east) onto Ferry Road. 15.8 1.0 Charlotte Corners. Turn right (south) onto Greenbush Road. 16.3 0.5 Turn right into the driveway and parking area on the southern side of Old Lantern
Campground. Park near the far end below the hill.
STOP 4. BARBER HILL SYEN1TE STOCK.
We will walk up the field to the top of Barber Hill, a small syenite stock which is probably closely related to the trachyte dikes of this region. From the top, there is a fine view of the "Red Sandrock Range" of hills capped by the Champlain thrust, especially Pease Mountain nearby to the east. Pease Mountain is an excellent site for field mapping practice, and it has numerous mafic and felsic dikes also mapped by many of Rolfe Stanley's field geology students.
The upper west side of Barber Hill has good outcrops of coarse alkali syenite as well as a few felsic dikes. Please stay together as we traverse a short distance through the woods. In the 1970's, molybdemte was visible in hand samples from a small prospect farther south, but we do not have permission to traverse that way. Instead, we hope participants will keep their eyes open for any mafic dikes that may crosscut the syenite.
Return north on Greenbush Road.
352
McHONE AND McHONE C4-13
16.8 0.5 Charlotte Corners. Food and drinks may be obtained at the Old Brick Store. Parking is rather limited near the store; so please watch for traffic and do not block the road. After lunch, head east on Ferry Road toward Rte. 7.
17.1 0.3 Turn right (south) at the light onto Rte. 7.
17.4 0.3 Turn left into the highway garage access road opposite Vermont Wildflower Farm. Watch traffic! Park along the road to the left and walk back to the highway cut.
STOP 5. PEASE MOUNTAIN RTE. 7 BOSTONITE DIKES.
A dozen or more trachyte and lainprophyre dikes are exposed in the Pease Mountain hillside above this roadcut, and many of the trachyte dikes trend toward Barber Hill. McHone's (1978) dike BU-21 and (1975) dike MPMB (now BU-22) are located along the cut south of the highway garage road. Each are ito 2 in wide, oriented about AZ 100 and vertical. They are both good trachyte porphyries, with large orthoclase phenociysts set in a buff-colored matrix. The surrounding Iberville shale was highly deformed before the intrusions, and the trachyte magmas followed some uneven fractures as shown by contact structures. Nevertheless, the dikes incorporated only a few small shale xenoliths.
Return to Rte. 7 and turn right (north)
18.1 0.7 Pull off the pavement onto the shoulder, adjacent to the camptonite dike
STOP 6. JONES HILL RTE. 7 CAMPTOMTE DIKE.
This dike was exposed by highway construction in the late 1960's (dike BU-8 of McHone, 1978). The Champlain thrust fault caps this hill (also called "Mutton Hill" or "Church Hill" on various maps) with durable Cambrian Monkton quartzite, as well as Pease Mountain, Mt. Philo, Buck Mountain, Snake Mountain, and others of the "Red Sandrock Range." According to Welby (1961), younger cross faults cut the Champlain thrust, which localized the erosion that separated these hills from one another. As at the Pease Mountain roadcut farther south, the Ibeiville shale is highly contorted and folded.
There is an offset visible halfway up in the dike, with a surlhce oriented about AZ30, 69, and siibparallel to shale cleavage. Apparent offset is 106 cm of this 148 cm dike. The dike partly follows shaley cleavage, but it is clear that the magma crosscuts most of the deformation. Although generally covered by rubble, the southern end of the offset is a sharp break, indicating a post-intrusion fault However, the dike along the offset is fine-grained like the chill margin, so it may a syn-magmatic feature. As listed in Table 2, the petrography of this dike shows it to be a normal cainptonite, with modal variations that might be attributed to cooling rates. Chemical analyses of two of the five cross samples are typical for basanite, except for the high volatile content. This dike may be one Studied in detail by Shearer (1974).
Continue north on Rte. 7, through Shelburne toward Burlington.
22.6 4.5 Shelburne Village center, traffic light
23.2 0.6 "S9" roadcut, where a major fault is exposed along with a few dikes. Not safe for a large group to visit, but this site is described elsewhere (Stanley and Sarkesian, 1972; McHone, 1987).
24.3 1.7 Past Bay Road. Stay on Rte. 7, which is Shelburne Road.
28.1 3.8 Turn right (east) onto Hoover Street. Travel 0.2 mile up the hill, and park in the quarty, not in the neighbors' yards.
353
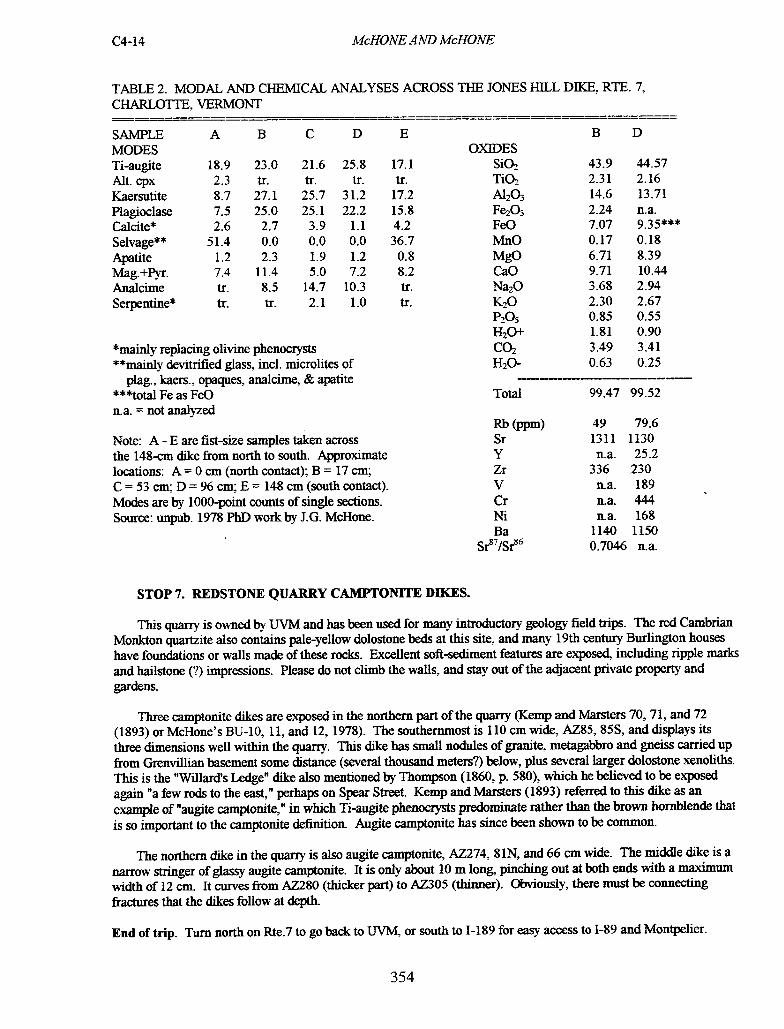
C4-14
McHONE AND McHONE
TABLE 2. MODAL AND CHEMICAL ANALYSES ACROSS THE JONES HILL DIKE, RTE. 7, CHARLOTTE, VERMONT
SAMPLE A B C D E B D MODES OXIDES Ti-augite 18.9 23.0 21.6 25.8 17.1 SiO2 43.9 44.57 Alt. cpx 2.3 tr. tr. tr. tr. TiO2 2.31 2.16 K.aersutite 8.7 27.1 25.7 31.2 17.2 A1203 14.6 13.71 Plagioclase 7.5 25.0 25.1 22.2 15.8 Fe2O3 2.24 n.a. Calcite* 2.6 2.7 3.9 1.1 4.2 FeO 7.07 9•35***
Selvage** 51.4 0.0 0.0 0.0 36.7 MnO 0.17 0.18 Apatite 1.2 2.3 1.9 1.2 0.8 MgO 6.71 8.39 Mag.+Pyr. 7.4 11.4 5.0 7.2 8.2 CaO 9.71 10.44 Analcime tr. 8.5 14.7 10.3 tr. Na2O 3.68 2.94 Serpentine* tr. tr. 2.1 1.0 tr. K2O 2.30 2.67
P205 0.85 0.55 1120+ 1.81 0.90
*,naipjy replacing olivine phenocrysts CO2 3.49 3.41 **inajpjy devitrifled glass, mc!. microlites of 1120- 0.63 0.25
plag., kaers., opaques, analcime, & apatite ***total Fe as FeO Total 99.47 99.52 n.a. = not analyzed
Rb(ppm) 49 79.6 Note: A - E are fist-size samples taken across Sr 1311 1130 the 148-cm dike from north to south. Approximate Y n.a. 25.2 locations: A = 0 cm (north contact); B = 17 cm; Zr 336 230 C = 53 cm; D = 96 cm; E = 148 cm (south contact). V n.a. 189 Modes are by 1000-point counts of single sections. Cr na. 444 Source: unpub. 1978 PhD work by J.G. McHone. Ni n.a. 168
Ba 1140 1150 Sr87/Sr86 0.7046 n.a.
STOP 7. REDSTONE QUARRY CAMPTON1TE DIKES.
This quarry is owned by UVM and has been used for many introductory geology field trips. The red Cambrian Monkton quartzite also contains pale-yellow dolostone beds at this site, and many 19th century Burlington houses have foundations or walls made of these rocks. Excellent soft-sediment features are exposed, including ripple marks and hailstone (?) impressions. Please do not climb the walls, and stay out of the adjacent private property and gardens.
Three camptonite dikes are exposed in the northern part of the quarry (Kemp and Marsters 70,71, and 72 (1893) or McHone's BU-lO, 11, and 12, 1978). The southernmost is 110 cm wide, AZ85, 85S, and displays its three dimensions well within the quarry. This dike has small nodules of granite, metagabbro and gneiss carried up from Grenvilhian basement some distance (several thousand meters?) below, plus several larger dolostone xenoliths. This is the "Willard's LedgeTM dike also mentioned by Thompson (1860, p. 580), which he believed to be exposed again "a few rods to the east," perhaps on Spear Street. Kemp and Marsters (1893) referred to this dike as an example of "augite camptonite," in which Ti-augite phenocrysts predominate rather than the brown hornblende that is so important to the camptonite definition. Augite camptonite has since been shown to be common.
The northern dike in the quarry is also augite camptonite, AZ274, 81N, and 66 cm wide. The middle dike is a narrow stringer of glassy augite cainptonite. It is only about 10 in long, pinching out at both ends with a maximum width of 12 cm. It curves from AZ280 (thicker part) to AZ305 (thinner). Obviously, there must be connecting fractures that the dikes follow at depth.
End of trip. Turn north on Rte.7 to go back to UVM, or south to 1-189 for easy access to 1-89 and Montpelier.
354
McHONE AND McHONE C4-15
REFERENCES AND ADDITIONAL BIBLIOGRAPHY
Ailing, H.L., 1928, A porphyritic monzomtic bostonite: Vermont State Geologist, 16th Annual Report, p. 290-29 1.
Armstrong, R.L. and Stump, E., 1971, Additional K-Ar dates, White Mountain magma series, New England: American Journal of Science, v. 270, P. 331-333.
Bédard, J.H., Francis, D.M., and Ludden, J., 1988, Petrology and jrroxene chemistry of Monteregian dykes: the origin of concentric zoning and green cores in clinopyroxenes from alkali basalts and laniprophyres: Canadian Journal of Earth Sciences, v. 25, p. 204 1-2058.
Buddington, A.F. and Whitcomb, L., 1941, Geology of the Wilisboro quadrangle, New York: New York State Museum Bulletin 325,137 p.
Cady, W.M., 1945. Stratigraphy and structure of west-central Vermont: Geological Society of America Bulletin, v. 56, p. 5 15-558.
Corneille, E. S., 1975, Bostonite and lamprohyre dikes from the Champlain Valley, Vermont [M.Sc. thesis]: Burlington, University of Vermont, 129 p.
Crough. S.T., 1981, Mesozoic hotspot epeirogeny in eastern North America: Geology, v. 9, p. 2-6.
Diment, W.R, 1968, Gravity anomalies in northwestern New England, in E-an Zen and others, eds., Studies of Appalachian geology: Northern and Maritime: New York; Wiley Interscience, p. 399-413.
Dimon, J.R, 1962, Petrology of the laccolith at Baiber Hill, Vermont [M. Sc thesis]: Burlington, University of Vermont, 62 p.
Doll, C.G., Cady, W.M., Thompson, J.B., Jr., and Billings, IvLP., compilers and editors, 1961, Centennial geologic map of Vermont: Vermont Geological Survey, scale 1:250,000.
Eby, G.N., 1984, Geochronology of the Monteregian Hills alkaline igneous province, Quebec: Geology, v. 12, p. 468-470.
Eby. G.N. and McHone, J.G., 1997, Plutonic and hypabyssal intrusions of the Early Cretaceous Cuttingsville complex, Vermont, in Mango, H., ed., Field Guide for the New England Intercollegiate Geological Conference: Rutland, Vermont, Trip B-2, 19p.
Fisher, D.W., 1968, Geology of the Plattsburgh and Rouses Point, New York - Vermont quadrangles: Vermont Geological Survey, Special Bulletin 1, 51 p.
Foland, K.A., Gilbert, L.A., Sebring, C.A., and Chen, J.-F., 1986, 40Ar/39Ar ages for plutons of the Monteregian Hills, Quebec: Evidence for a single episode of Cretaceous magmatism: Geological Society of Amenca Bulletin, v. 97. p. 966-974.
Gillespie, R.P., 1970, An investigation of the alkalic dikes of Charlotte, Vermont [senior thesis]: Burlington, University of Vermont, 31 p.
Hale. J.R.. and Friberg, L.V.M., 1995, Petrogenesis of Mesozoic mafic dikes from Hilisborough, Merrimack, and Rockingham Counties, New Hampshire: Northeastern Geology,
Hawley, David, 1956, Boulder-filled dikes near Burlington, Vermont [abstract]: Geological Society of America Bulletin, v. 67, p. 1815.
355
C4-16
McHONE AND McHONE
Hitchcock, E., 1860, On certain conglomerated and brecciated trachytic dikes in Vermont: Proceedings of the American Association for the Advancement of Science, v. 14, p. 156-158.
Hodgson, C.J., 1968, Monteregian dike rocks [Ph.D. thesis]: Montreal, McGill University, 168 p.
Hubacher, F.A. and Foland, K.A., 1991, 40Ar/39Ar ages for Cretaceous intrusions of the White Mountain magma series, northern New England, and their tectonic implications: Geological Society of America, Abstracts with Programs, v. 23, p. 47.
Hudson, G.H., 1931, The fault systems of the northern Champlain Valley, New York: New York State Museum Bulletin 286, p. 5-80.
Hudson, G.H. and Cushing, H.P., 1931, The dike invasions of the Champlain Valley, New York: New York State Museum Bulletin 286, p. 81-112.
Isachsen, Y.W. and Fisher, D.W., 1971, Geologic map of New York, Adirondack sheet: New York State Museum and Science Service, Map and Chart Seriesl5, scale 1:250,000.
Isachsen, Y.W. and Seidennan, D., 1985, Dike orientations in basement rocks of the Adirondack dome, New York, and regional paleostrain history as deduced using their K/Ar ages: Toronto, International Conference on Mafic Dike Swarms Abstracts, p. 94.
Jaffe, H.W., 1953, Amygdular camptomte dikes from Mt. Jo, Mt. Marcy quadrangle, Essex County, New York: American Mineralogist, v. 38, p. 1065-1077.
Kemp, J.F. and Marsters, V.F., 1893, The trap dikes of the Lake Champlain region: U.S. Geological Survey Bull. 107, 62 p.
Kumarapei, P.S. and Saull, V.A., 1966, The St. Lawrence Valley system: A North American equivalent of the East African rift valley system: Canadian Journal of Earth Science, v.3, p. 639-658.
Laurent, R. and Pierson, T.C., 1973, Petrology of alkaline rocks from Cuttmgsville and the Shelburne Peninsula, Vermont: Canadian Journal of Earth Sciences, v. 10, p. 1244-1256.
LeBas, M.J., LeMaitre, RW., Streckeisen, A., and Zanettin B., 1986, A chemical classification of volcanic rocks based on the total alkali silica diagram. Journal of Putrology, v. 27, p. 745-750.
Manning, A. H. and de Beer, J. Z., 1989, Deformation of Mesozoic dikes in New England: Geology, v. 17, p. 1016-1019.
McHone, J.G., 1975, Petrochemistiy and genesis of Champlain Valley dike rocks [M.Sc. thesis]: Burlington, University of Vermont, 73p.
McHone, J.G., 1978. Lamprophyre dikes of New England [Ph.D. thesis]: Chapel Hill, University of North Carolina, 189 P.
McHone, J.G., 1978, Distribution, orientations, and ages of mafic dikes in central New England: Geological Society of America Bulletin, v. 89, p. 1645-1655.
McHone, J.G., 1984, Mesozoic igneous rocks of northern New England and adjacent Quebec: Geological Society of America, Map and Chart Series MC-49, map with 5p. text.
McHone, J.G., 1985, Zoned clinopyroxenes and the crystallization of lamprophyres: Geological Society of America, Abstracts with Programs, v. 17, p. 54.
Wi
McHONE AND McHONE
C4-17
McHone, J. G., 1987, Cretaceous intrusions and rift features in the Champlain Valley of Vermont, in Westerman, D., ed.. Guidebook for Field Trips in Vermont, Volume 2: New England Intercollegiate Geological Conference. Montpeier, p. 237-253.
McHone, J.G., 1992, Mafic dike suites within Mesozoic igneous provinces of New England and Atlantic Canada, in Puffer. J.H. and Ragland, P.C., eds., Eastern North American Mesozoic Magmatism: Geological Society of America Special Paper 268, P. 1-11.
McHone, J.G. 1996, Constraints on the mantle plume model for Mesozoic alkaline intrusions in northeastern North America: Canadian Mineralogist, v. 34, p. 325-3 34.
McHone, J.G., 1996, Broad-terrane Jurassic flood basalts across northeastern North America: Geology, v. 24, p. 319-322
McHone. J.G. and Corneille, E.S., 1980, Alkalic dikes of the Lake Champlain Valley: Vermont Geology, v. 1, p. 16-2 1.
McHone, J.G. and Butler, J.R., 1984, Mesozoic igneous provinces of New England and the opening of the North Atlantic Ocean: Geological Society of America Bulletin. v. 95, p. 757-765.
McHone, J.G., Ross, M.E., and Greenough, J.D., 1987, Mesozoic dyke swarms of eastern North America, in Halls, H.C. and Fahrig, W.H., eds., Mafic dyke swarms: Geological Association of Canada Special Paper 34, p. 102-111.
McHone, J.G. and Shake, S.N., 1992, Structural control of Mesozoic magmatism in New England, in Mason, it, ed., Basement Tectonics 7: Boston, Kiuwer, p. 399-407.
McHone, J.G. and McHone, N.W., 1993, Field guide to Cretaceous intrusions in the northern Taconic Mountains region, Vermont: Vermont Geology, v. 7, p. 1-27.
McHone, J.G. and Sundeen, D.A., 1995, Mesozoic intrusions in southeastern New Hampshire, in Hussey, A.M. IL ed., Field Guide for the New England Intercollegiate Geological Conference: Brunswick, Maine, Trip C-2, 20p.
McHone, N.W., 1986, Geochemistry of peridotite xenoliths from lamprophyre dikes in Vermont and Quebec: Geological Society of America Abstracts with Programs, v. 18, p. 53.
Métais, D. and Chayes, F., 1962, Varieties of lamprophyres: Annual Report of the Geophysical Laboratory, Carnegie Institute Yearbook 62, p. 156-157.
Migliori, J.J., 1959, Petrography of some Champlain Valley dikes [M.Sc. thesis]: Burlington, University of Vermont, 68 p.
Perkins, G.H., 1908, Report on the geology of Chittenden County: Vermont State Geologist, 6th Report, p.221-264.
Perkins, G.H., 1911, Geology and petrography of the Burlington Quadrangle, Vermont: Vermont State Geologist, 7th Report, p. 249-257.
Philpotts, Alt, 1974, The Monteregian province, in Sorensen, H. (ad.), The Alkaline Rocks: New York, Wiley and Sons, p. 293-3 10.
Philpotts, A. it, 1976, Silicate liquid immiscibility: Its probable extent and petrogenetic significance: American Journal of Science, v. 276, p. 1147-1177.
Powers, Sidney, 1915, The origin of the inclusions in dikes. Part H: Journal of Geology. v. 23, p. 166-182.
Quinn, A.W., 1933, Normal faults of the Lake Champlain region: Journal of Geology, v. 41, P. 113-143.
357
C4-18 McHONE AND McHONE
Ratte', C.A., Vanacek, D.M., and Dunn, A.L., 1983, A bibliography of Vermont geology: Montpelier, Vermont Geological Survey, 154 p.
Shearer. C., 1974, Compositional variations in the mafic dikes of the Champlain Valley [abstract]: Vermont Geological Society Annual Meetin& p.1.
Shimer, H.W., 1903, Petrographic description of the dikes of Grand Isle, Vermont: Vermont State Geologist, 3rd Report, p. 174-183.
Sleep, N.H., 1990, Monteregian hotspot track: A long-lived mantle plume: Journal of Geophysical Research, v. 95, p. 21,983-21,990
Stanley, R.S., 1974, Environment of deformation, Monkton Quartzite, Shelburne Bay, western Vermont: Geological Society of America Bulletin, v. 85. p. 233-246.
Stanley, RS., 1980, Mesozoic faults and their environmental significance in western Vermont: Vermont Geology, v. 1, p. 22-32.
Stanley, R.S. and Sarkesian, A.C., 1972, Analysis and chronology of structures along the Champlain thrust west of the Hinesburgh syndlinoriuin, in Doolan, B.L. and Stanley, RS., eds., New England Intercollegiate Geological Conference, 64th Annual Meeting: Burlington, Vermont, p. 117-149.
Stone, S.W. and Dennis, J.G., 1964, The geology of the Milton quadrangle, Vermont: Vermont Geological Survey, Bulletin no. 26, 79p.
Thompson, Z., 1861, Dikes of Chittenden County: Report on the Geology of Vermont, v. 2, p. 579-588.
Wada, Y., On the relationship between dike width and magma viscosity: Journal of Geophysical Research, v. 99, p. 17,743-17,755.
Welby, C.W., 1961, Bedrock geology of the central Champlain Valley of Vermont: Vermont Geological Survey Bulletin no.4, 296 p.
White. T.G., 1894, The geology of Essex and Willsboro Townships, Essex County, New York: Transactions of the New York Academy of Science, v. 13, p. 2 14-233.
Williams. N. A and McHone, J. G., 1984, Mantle and crustal xenoliths from the North Hartland dike, Vermont: Geological Society of America Abstracts with Programs, v.16, p.71.
Woolley. AR, Bergman, S.C., Edgar, AD., LeBas, M.J., Mitchell, RH., Rock, N.M.S., and Scott Smith, B.H., 1996, Classification of lamprophyres, lamproites, kimberlites, and the kalsilitic, melilitic, and leucitic rocks: Canadian Mineralogist, v. 34, p. 175-186.
Zartinan, R.E., Brock, M.R, Heyl, A.V., and Thomas, H.H., 1967, K-Ar and Rb-Sr ages of some alkalic intrusive rocks from central and eastern United States: American Journal of Science, v. 265, p. 848-870.
C5-1 STANLEY
THE CHAMPLAIN THRUST FAULT LONE ROCK POINT
Rolfe Stanley Guide
WESTERN VERMONT
The structure of the Vermont foreland is dominated by major, north-trending folds and imbricate thrust faults (Doll and others, 1961 and the western part of Figure 3 in Stanley et al., 1999. The largest of these, the Champlain thrust, extends from southern Quebec to Albany, New York and places the older platform sequence over the younger foreland basin. Estimates of westward displacement range from 15 km to 100 km (Stanley, 1987). Seismic traverses across western Vermont show that the Champlain thrust dips eastward at about 15 degrees beneath the hinterland of the Green Mountains where a ramp may exist beneath the longitude of Mount Mansfield. Furthermore, many of the major folds of western Vermont are probably fault-bend folds, duplexes, and related structures on the Champlain and other thrust faults in the Vermont foreland. Along the Green Mountain front several of the larger anticlines appear to be fault propagation folds (Suppe, 1985; Fig. 3, in Stanley et al., 1999). Seismic information suggests that some of the high angled-faults in the western foreland are older than the Champlain thrust whereas others are younger. The increase in deformation towards the Champlain thrust is well illustrated in selected outcrops (Lessor's Quarry and the "Beam") in the Ordovician rocks of the lower plate exposed on the Champlain Islands (Figs. 1 and 2 ,trip A6, this guidebook)
An eastern, but smaller Hinesburg thrust (Figs. 1 and 2), places transitional and rift clastic rocks over the platform sequence and, as such, forms the boundary between the foreland rocks of western Vermont and the hinterland. Dorsey and others (1983) have demonstrated that the Hinesburg thrust developed as a breakthrough thrust on the overturned limb of the Hinesburg nappe and therefore is quite different from the geometry of the Champlain thrust. Westward displacement is estimated to be 6 km.
LONE ROCK POINT
Turn left onto Colchester Avenue from the parking lot at Perkins Geology Hall, University of Vermont and travel west until you reach North Avenue just above Lake Champlain. Travel north several miles past the cemetery to Burlington High School. Turn left onto the road at the light and proceed to the Episcopal Diocese of Vermont. You must secure permission at the small, one story building just opposite the parking lot. Furthermore, all vehicles must be parked in this lot. You must walk about a mile to the exposure of the fault on the lake shore.
This is by far the best exposure of the Champlain thrust fault in the northern Appalachians. Furthermore, it is one of the best exposures of a foreland thrust fault in the United States. Wave erosion of the weaker shale of the lower plate has exposed the fault zone for a distance of over 1 mile (1.6 krn). A few copies of the paper listed below will be available. Refer to Figures 1-3 in Stanley et al., 1999.
Read Stanley, R. S., 1987, The Champlain thrust, Lone Rock Point, Burlington, Vermont: Geological Society of America, Centennial Field Guide for the Northeast Section, p. 67-72 for further instructions and a discussion of the outcrop.
TECTONIC IMPORTANCE OF THE CHAMPLAIN THRUST
The tectonic evolution of western Vermont can best be seen in a series of retrodeformed cross sections constructed for central Vermont (Figures ito 4) which show the failure of the eastern margin of sialic crust of ancient North America. These sections begin with the present cross section for the western part of central Vermont (Figure 3 in Stanley et al., 1999). This section displays the structural detail, critical isotopic ages, and the temperature and pressure information inferred from mineral compositions or isotopic ratios. We begin with this section and retrodeform the sequence using sedimentological relations, structural sequence,
Stanley, R., 1999, The Champlain Thrust Fault at Lone Rock Point; in Wright, S.F. ed., New England Intercollegiate Geologic Conference Guidebook Number 91, p. 359-364.
C5-2
STANLEY
and metamorphic isotopic information (Figures 1 through 4 for this trip). By its very nature, any palinspastic analysis for rocks as highly deformed as those in western New England is largely qualitative since key markers and critical age information needed to measure displacement are lacking. The westward displacement of 70 km on the Middle Proterozoic slices, however, can be calculated from their relationship in cross section. The important relations shown in each section are discussed in the captions for Figures 1 through 4. As shown in these sections the Champlain thrust zone forms a regional decollement for collapse of the North American sialic crust.
SELECTED REFERENCES CITED
Stanley, R. S, 1987, The Champlain thrust fault, Lone Rock Point, Burlington, Vermont: in Roy, D. C., ed., Centennial Field Guide No. 5, Geological Society of America, p. 225-228.
Stanley, R. S. and Ratcliffe, N.M., 1985, Tectonic Synthesis of the Taconian orogeny in western New England: Geological Society of America, v. 96. p. 1227-1250.
Stanley, R., Rushmer, T., Holyoke, C., and Lini, A., Faults and Fluids in the Vermont Foreland and Hinterland in Western Vermont, in Wright, S.F. ed., New England Intercollegiate Geologic Conference Guidebook Number 91, C5: 1-24.
360
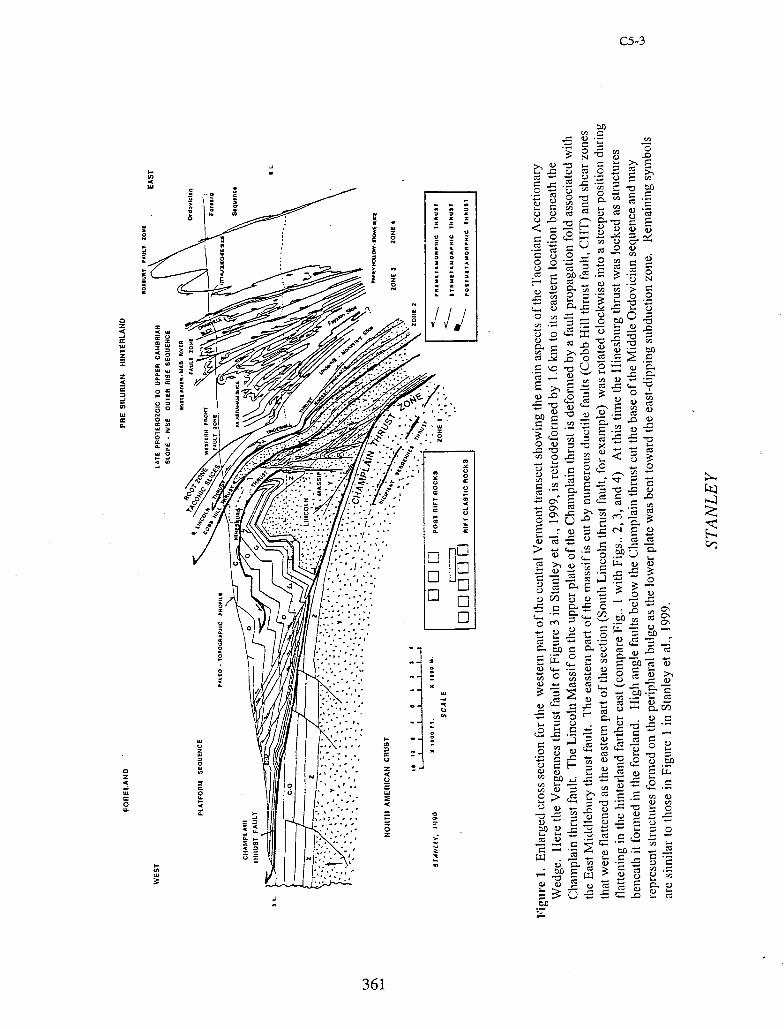
C5-3
U,
0 z —J
w I- z
z
Ui
0.
0 z -a Us
0
V
2
— C
- -
— - o o • — 2 C.) CC.
to
cc
C).
- -' 0 .
cz
,
C) s.... Cc
CZ
cz
ca
a-.
0 O
- E 0-_C)
CC.
—)
CC.
C. CC.g
to -..
C.C) C)
cc
+- 0 0.a-- • C)0 a-.-..Q
tz . • C) —. -
C)tC 9
to C.
to C) C) CC. C)
•-'-- a,) a--. C)
•..-. a-. C) - C)--C). C)
- -
361
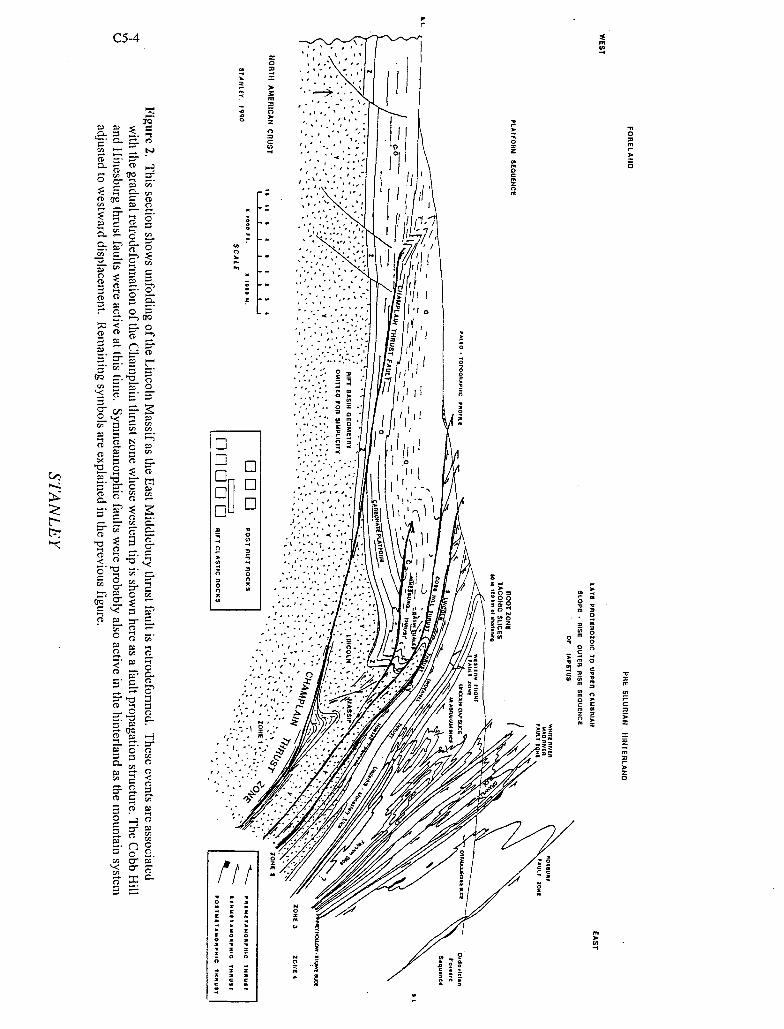
Con
N
C -
'ii 'IfI\
1 - .- '.....
1 111(1 ! Ej - •..'..;.:,..':
—. C • ,. . .
. ..
d' 'II
Er CD
-
H II I''
CC/D- ..:.. = o• ! 1
Cl. Cl. .. .•. o
'I D •::...
E 0
CD
CD CD
CD C- .,.,...-... .
•1
0 . II-
. k
C o -
¶
.. .-.,...
/
• ..•. • . --•.•....-....
•
C Cl. -+
..•- ...••.....•,..... -: - 0
••'•.•.- 'r• o
C- .•.,.,.•...•,. • ... .
---
CD • .
. .::-:•-.. . I,, , !-- C / 0 ....•.,,. •.••
. A
I /
/ CD 2.:
• . C C- .,. ,.. •\ 1Ti ..
CD H ',-. .• . y1 / • •.. • .
-, ..'.•. .. . / •;-
C- P,
CD
CD F
CCD
/ C9. ..
(ft
• C C
- C 0 0 IA -,
0 rn
a
0
C
> z
z m
z a
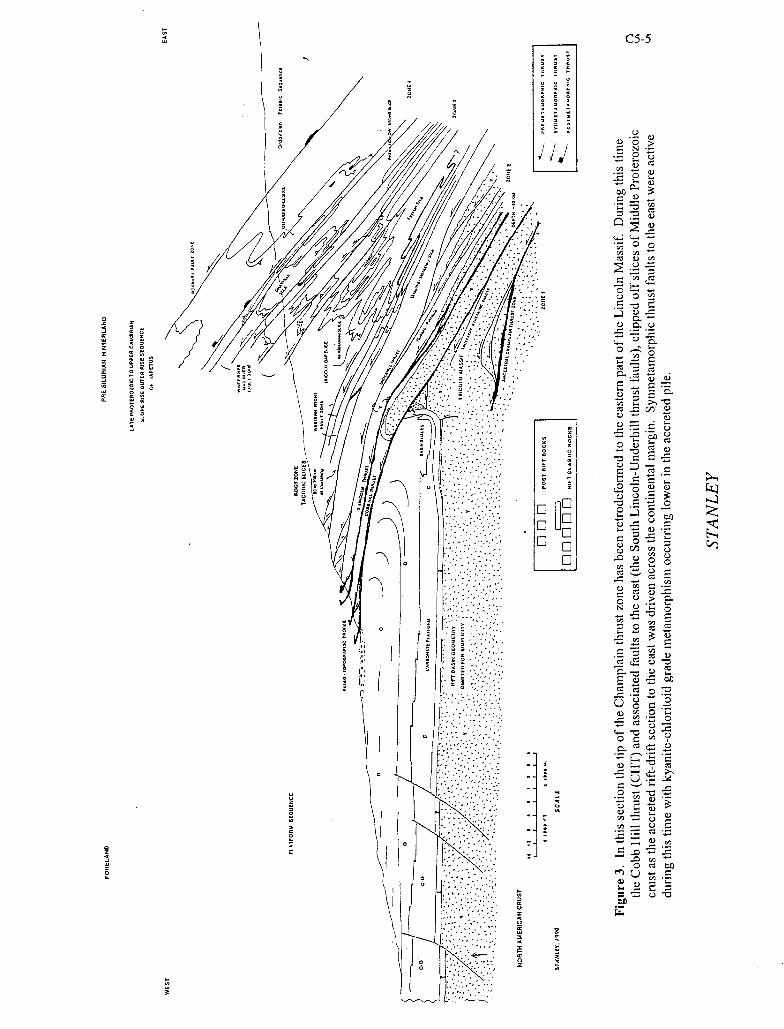
z
z 5
-
a z 4
0
I
H
C5-5
) C N- Ct
— — 1)
C C
CO ) cl
C
t C.
U CO
0 00 -C C)
- .
C
UI CI) ci
C- CO )
— CO CI a..-
C CO C) - C . N C)
— CCO
C)
C C)
C)
. o
C) Cl) C C-
•:
C — - o - - -
C
..0 c —
• C CO bS U —
C)
-
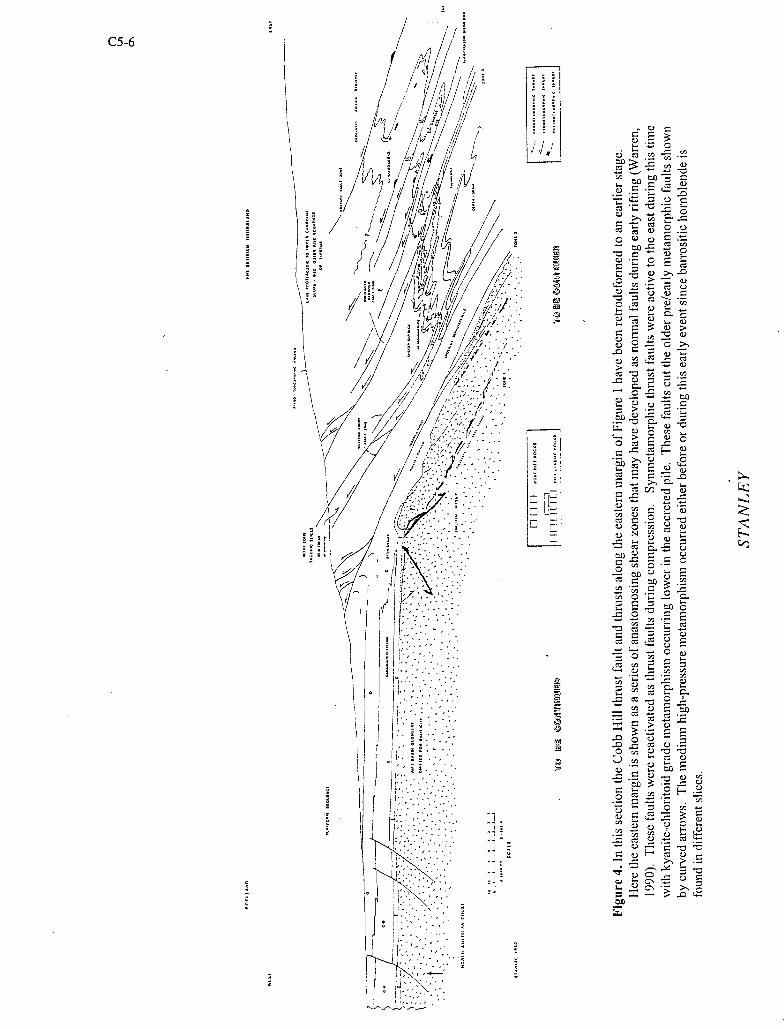
ED
-. - o_
C
- C)
C C) C C)
- _ C
C) C) C) C) C o C C) -
cc cc
- C) C) C)
C C) o - C -
-C
— C) -
•-
o c C) o C : -
C C = - > C.
C)-
-C
Co - O C
E E DC - - CC C':
CC/C C-
C/C
0 - - - C': C) -
cr
C -
- ':•-.0
• (HO C/C
. , H
C5-6
/
I (1 II
:
c-I
s-i
NEIGC SYMPOSIUM ON SURFICIAL MAPPING Sponsored by the United States and Vermont Geological Surveys
Thursday September 30, 1999 Burlington, Vermont
ABSTRACTS
VERMONT GEOLOGICAL SURVEY - NEW SURFICIAL MAPPING PROGRAM BECKER, Laurence R.; Vermont Geological Survey; 103 South Main Street; Waterbury, Vermont 05671-0301; [email protected]
The Vermont Geological Survey is developing a new surficial geologic mapping program. Six quadrangles are in progress with three in digital open file format by September 30, 1999. Locating existing borings including water wells is a first step to provide information in the third dimension. Field visits to locate water wells is the standard practice. A protocol to locate water wells linking owner name and E91 1 parcel locations that are already geospacially referenced is in development. Isopach maps of overburden thickness are first stage products of the mapping derived from existing borings, bedrock outcrop locations, and surficial geologic information. In late fall, the intention is to advance the capability of the Vermont Survey by performing seismic refraction, backhoe work and drilling in the Vermont portion of the Newbury quadrangle to support surficial mapping investigations with an eye toward aquifer identification. Placing information in a GIS data base is a byproduct of any new mapping and will have great utility for end users. Those with specific needs will be able to query data to find depth to bedrock and the nature of materials in the subsurface for their specific applied purpose. For the first time in Vermont, 1:24,000 surficial map and three dimensional data will be digitized in an integrated fashion.
Vermont known for its strong environmental programs has a real need for information on the geology of unconsolidated materials. Understanding the surficial geology of Vermont in the third dimension has immediate relevance for short-term development, as the geological function of locating water supplies, arranging for waste disposal and understanding the effects of unplanned releases to the ground, shape land use. Analysis of growth centers and smart growth issues is facilitated. The extraction of mineral resources for expanding infrastructure and the location of sand and gravel is necessary for Vermont's economic well being. General land planning requires these data for: larger infrastructure projects: project reviews for Vermont's Land Use and Development Law - Act 250, management of state lands, determining landslide hazard, archeology at federally funded projects and morphology as geoindicator for long-term studies of global change.
Seismic waves can be amplified in the unconsolidated overburden and knowing the nature of that material supports interpretations of potential risk. Geological research helps locate earth materials and water resources upon which ecosystems are rooted supporting forest and agricultural production.
THREE-DIMENSIONAL GEOLOGIC MAPPING OF GLACIAL SEDIMENTS: ILLINOIS AND THE CENTRAL GREAT LAKES GEOLOGIC MAPPING COALITION BERG, Richard C., and SHILTS, William W.; Illinois State Geological Survey; Champaign, IL 61820
In 1996, the illinois State Geological Survey (ISGS) initiated a series of pilot projects in which glacial sediments were mapped in 3-dimensions at a scale of 1:24,000. Teams of geologists and support staff presently are mapping several pilot 1 :24,000-scale quadrangles in the state. Surficial and bedrock geologic maps and derivative maps of the Villa Grove Quadrangle in east-central illinois serve as examples of the types of user-friendly maps that can be produced by the ISGS (Hansel, Berg, and Abert, 1999 and Berg, Abert, and Hansel, 1999). At current funding levels, however, it will take several hundred years to complete the mapping. Obtaining data is very expensive, particularly in areas where several hundred feet of glacial sediments from multiple glacial episodes overlie bedrock. In addition, there is a lack of trained staff to conduct the mapping. To overcome these deficiencies, the ISGS has joined with the state geological surveys from Indiana, Ohio, and Michigan and the USGS to form the Central Great Lakes Geologic Mapping Coalition (Berg et al, 1999). In this Coalition, the lack of resources of individual partners can be overcome by sharing equipment and personnel and by cooperatively working to increase funding levels to deliver needed 3-dimensional geologic information into the hands of users in a timely fashion at an appropriate scale.
NEIGC Symposium on Surficial Mapping; in Wright, S.F. ed., New England Intercollegiate Geologic Conference Guidebook Number 91, p. 365-377.
S-2 SYMPOSIUM ON SURFICIAL MAPPING
The Coalition program will focus on high-priority mapping areas in the four states (mainly urban/suburban areas) and is scheduled to last 17 years. Investigations in pilot mapping areas in northeastern flhinois, southwestern Michigan, near Fort Wayne, Indiana, and near Sandusky, Ohio will commence this Fall. Principal issues that will be addressed by the Coalition's mapping effort are groundwater resource identification and resource protection, identification of areas that are prone to hazards from earthquakes, floods, erosion, and subsidence, and development of aggregate resources. All of these issues are related to sustainable development/smart growth initiatives at both the federal and state levels.
References: Berg, R. C. and C. C. Abert. 1999. General aquifer sensitivity map, Villa Grove Quadrangle, Douglas County,
Illinois, Illinois State Geological Survey Illinois Geologic Quadrangle map: IGQ Villa Grove-AS, Scale 1:24,000.
Berg, R. C., N. K. Bleuer, B. E. Jones, K. A. Kincare, R. R. Pavey, and B. D. Stone. 1999. Mapping the glacial geology of the central Great Lakes region three-dimensions: A model for state-federal cooperation: USGS Open File Report 99-349.
Hansel, A. K., R. C. Berg, and C. C. Abert. 1999. Surficial geology map, Villa Grove Quadrangle, Douglas County, Illinois: Illinois State Geological Survey Illinois Geologic Quadrangle map: IGQ Villa Grove-SG, Scale 1:24,000.
THE HOLOCENE RECORD OF HILLSLOPE EROSION IN VERMONT: FIVE YEARS OF CHASING PALEO-STORMS AND THE EFFECTS OF CLEAR CUTTING BIERMAN, Paul, R., JENNINGS, K.L., and NOREN, A.J., Department of Geology, University of Vermont, Burlington , Vermont 05405
For the past five years, my students and I have been trenching alluvial fans and coring frozen ponds to learn more about the post-glacial behavior of hillslopes in the mountainous terrain of New England. From these deposits, we infer the timing and magnitude of historic and pre-historic (Holocene) hillslope erosion.
Six well-dated, overlapping gyttja-rich sediment cores from the center and sides of Ritterbush Pond in the Green Mountains include 52 layers of sand and silt. On the basis of texture and stable carbon isotopic measurements, we interpret these inorganic layers as terrestrially-derived, episodic sedimentation events triggered by hillslope erosion in the steeply sloping, 2.2 km 2 watershed. The thickness of these layers suggests hydrologic events at least equal in size to, and probably much larger than, any storm or flood recorded during nearly 300 years of written regional history.
Layer thickness and frequency, and by inference storm size and recurrence, change through the Holocene. The largest events occurred 2620, 6840, and 9440 calibrated 14C years before present (cal 14C yBP). The most frequent hydrologic events occurred in three periods: 1750 to 2620, 6330 to 6840, and >8600 cal 14C yBP. The recurrence interval of layer deposition during stormy periods averages 130±100 years, whereas the recurrence interval during less stormy periods is longer, 270±170 years. The Ritterbush Pond event record illustrates the potential of inorganic lacustrine sediment to serve as detailed proxy record for estimating paleoflood frequency and deciphering climate change.
Trenching of five small (<2500 m2) alluvial fans demonstrates that these landforms preserve a detailed and datable record of deposition from which we have estimated aggradation rates and inferred changes in hilislope denudation over the past 8,000 4C years. In every fan, a well-preserved paleosol is buried by 0.5 to 4 in of historic sediment indicating that colonial land clearance and agricultural practices increased hillslope erosion by up to an order of magnitude over background rates; such a dramatic increase in sedimentation during historic time is not present in the Ritterbush Pond sediment cores.
Within the resolution of our 24 AMS ' 4C ages, periods of increased inorganic sediment deposition in the pond are coincident with periods of sediment deposition on the alluvial fans. Both archives appear to reflect climatic forcing of hillslope erosion during both the early (>6000 14C y BP) and late (<2500 ' 4C y BP) Holocene. The middle Holocene appears to be a time of greater hillslope stability and lower sediment yield with less terrestrial sediment delivered to the pond and reduced rates of fan sedimentation.
366
SYMPOSIUM ON SURFICIAL MAPPING S-3
SURFICIAL GEOLOGIC MAPPING IN RHODE ISLAND BOOTHROYD, Jon; Rhode Island Geological Survey, University of Rhode Island, Department of Geology Kingston, RI 02881, [email protected]
The RI Geological Survey is working toward a Quaternary Geologic Map of RI, in digital format, to be published at ascale of 1:100,000. This map will complement, but probably not replace, the digital coverage available from the RI Geographic Information System (RIGIS). The RIGIS coverage, called glacial geology but more properly named glacial materials, was compiled form 1950-60s era water-resources materials maps. We intend to use published and open file USGS surficial quadrangles, together with new field mapping, to generate a Quaternary map.
The State can be divided into 3 general glacial provinces: 1) thick stratified deposits (south and central), including Narragansett Bay, 2) granitic till upland (northwest), and 3) compact till upland (east). A fourth province, Block Island, is a complex of till and stratified material. Each province presents a different set of problems for interpreting processes and mapping morphosequences. The thick stratified deposits are of particular importance because of numerous high-yield wells for municipal water supply and turf irrigation, and because of hazardous materials buried in old landfills or disposed of directly on or into stratified material.
Quadrangles are being compiled at 1:24,000, again in digital format; morphosequences will be simplified for presentation at 1:100,000. Extra effort will be taken with details of the thick stratified deposits. Along with the geologic map, new derivative materials and hydrogeology maps are planned.
SEISMIC HAZARD ASSESSMENT, ONONDAGA COUNTY, NEW YORK CADWELL, Donald H.; New York State Geological Survey; 3140 CEC; Albany, NY 12230
Seismic shear-wave data collection is expanding the database for the statewide projection of seismic hazards and is obtaining detailed information about the varied surficial materials across New York State. Onondaga County was selected for study because of the types of surficial materials deposited within the County during retreat of the Wisconsinan Ice Sheet, 13,000! 10,000 years ago, and because of the large urban population in the greater Syracuse region. Lacustrine sands, silts, and clays were deposited in Glacial Lake Oneida, a 1036 square-kilometer lake that developed at the edge of the glacier front, during the waning stages of Woodfordian deglaciation. The glacier retreated from the southern part of Onondaga County, near Tully and the Otisco Uplands, and this retreat continued past Syracuse and Green Lakes State Park into the Mohawk Lowlands to the north. Glacial Lake Oneida included most of the lowland and swamp regions within 15-30 kilometers of the present 650 square kilometer Oneida Lake. Forty site locations for interpretation of seismic data were chosen based on the type of surficial material and the projected susceptibility to liquefaction, landslide, and seismic shear-wave attenuation. Measured primary- and shear-wave velocities, together with subsurface boring and water well data, were used to interpret depth to water table and depth to bedrock. The Federal Emergency Management Agency (FEMA) HAZUS methodology was used to determine derivative information including liquefaction susceptibility, landslide susceptibility, and ground shaking amplification.
USE OF THE KOTEFF AND LARSEN (1989) REBOUND MEASUREMENT IN THE CONNECTICUT VALLEY AS A PREDICTOR OF GLACIAL LAKE SHORELINES IN NORTH-DRAINING VALLEYS IN CENTRAL VERMONT LARSEN, Frederick D., Department of Geology, Norwich University, Northfield, VT 05663
In 1989, Koteff and Larsen published elevation data of the topset-foreset contact for 60 deltas built into glacial Lake Hitchcock in the Connecticut River valley. Thirty seven deltas were too collapsed or had been trimmed by meteoric streams and were not used in the analysis. The remaining 23 deltas were formed in contact with the retreating ice sheet by meitwater flowing directly into Lake Hitchcock and were used in trend surface analysis to determine the orientation of the Lake Hitchcock shoreline following rebound due to removal of the weight of the ice sheet.. The slope of the tilted water plane was determined to rise 0.9 rn/km (4.74 ft/mi) to N20.5W to N21W. The fact that the profile of the water plane was linear over a long distance indicates that rebound did not commence until after the Connecticut River valley had been deglaciated about 14,000 B.P.
367
S-4 SYMPOSIUM ON SURFICIAL MAPPING
In 1987, I used these data to predict a shoreline for glacial Lake Winooski, which formed when the Winooski River was dammed up and prevented from flowing west-northwest by the retreating margin of the last ice sheet. The outlet for Lake Winooski was at an elevation of 279 m (915 ft) ASL and located 3.9 km (2.4 mi) south of Williamstown, Vermont. The projection of the Lake Winooski shoreline from the 279-meter threshold into the drainage basin fell at the break-in-slope (approximate topsetl foreset contact) of 6 deltas in the Dog River and 4 in the Mad River valley. This confinned the existence and position of Lake Winooski and lent credence to the rebound measurements of Koteff and Larsen. At that time, I placed an ice lobe in the valley of the North Branch north of Montpelier, but more recently while mapping the surficial geology of the Montpelier 7.5-minute quadrangle I extended the projection into that valley and discovered 5 more deltaic deposits, one with a spectacular topsetlforeset contact, resting directly on the projection.
The demise of Lake Winooski came with retreat of the ice margin in the lower Winooski valley and the uncovering of a 229-m (750-ft) threshold at Gillett Pond controlling Lake Mansfield I and subsequently with further retreat a 204-rn (670-ft) threshold southwest of Huntington controlling Lake Mansfield II. When the level of Lake Mansfield II is projected east-southeast to the Montpelier quadrangle, it is clear that lake-bottom deposits of Lake Winooski stand higher than the projection so Lake Mansfield II did not extend into the quadrangle. However, the projection of the Lake Mansfield I shoreline extends along the Winooski valley to Montpelier and north in the North Branch valley nearly to Worcester. In the middle of the quadrangle the projection falls right on deposits that I have mapped as "terrace/fan deposits" which are flat-bedded fluvial sand and gravel that directly overlie flat-bedded lacustrine deposits of Lake Winooski. In one instance only are short, truncated foreset beds found between the terrace/fan deposits and the flat lake-bottom deposits. Interestingly, the projection falls above these deposits in the south at Vermont College by 5.2 m (17 ft) and below in the north at Worcester by more than 12 in (40 ft). The inference I make is that when Lake Winooski drained, streams flowing out of tributary valleys quickly deposited fluvial and alluvial-fan deposits directly on lake-bottom sediments of Lake Winooski. The projection of the Lake Mansfield I shoreline into the Montpelier quadrangle coupled with detailed mapping of surficial deposits indicates that there was no great system of deltas graded to Lake Mansfield I as there was for Lake Winooski. This indicates that the Gillett Pond outlet and Lake Mansfield I were short lived, if they existed at all. We are left with the probability that there was one Lake Mansfield controlled by the 204-meter threshold southwest of Huntington, and terrace/fan deposits mapped in the Montpelier quadrangle were on a fluvial grade to that lake.
References Koteff, Carl, and Larsen, F.D., 1989, Postglacial uplift in western New England: Geologic evidence for delayed
rebound: in Gregersen, S., and Basham, P.W., eds., Earthquakes at North Atlantic passive margins: Neotectonics and postglacial rebound: Norwell, Massachusetts, Kiuwer Academic Publishers, p. 105-123.
Larsen, F.D., 1987, History of glacial lakes in the Dog River valley, central Vermont: in Westerman, D.S, ed., Guidebook for Field Trips in Vermont, Volume II, 79th annual meeting, New England Intercollegiate Geological Conference, 79th annual meeting, Montpelier, Vermont, Trip B-4, p. 213 -236.
STRATIFIED-DRIFT AQUIFERS IN NEW HAMPSHIRE MACK, Thomas J. and Moore, Richard B., U.S. Geological Survey; 361 Commerce Way; Pembroke, NH 03275; [email protected] ; [email protected]
Increases in population and development in New Hampshire have increased water-supply demands. Towns and commumties are interested in developing additional groundwater supplies and in protecting existing water resources for the future. In 1984, the New Hampshire Department of Environmental Services, Water Division, entered into a long-term cooperative program with the U.S. Geological Survey (USGS) to assess the State=s ground-water resources. Under this program, the USGS has identified and described the State's principal sand and gravel aquifers. General information about stratified-drift aquifers statewide is summarized below:
1. About 14 percent, or 1,299 of the 9,282 mi 2 of New Hampshire, is underlain by stratified-drift aquifers. 2. The largest stratified-drift aquifer is in the Ossipee River Basin in the towns of Tamworth, Madison,
Ossipee, Freedom, and Effingham. 3. Saturated thicknesses range from 0 to more than 500 ft, the thickest being along the Connecticut River in
Orford and Haverhill. 4. Transmissivity values range from 0 to 26,000 ft 2/d or greater.
SYMPOSIUM ON SURFICIAL MAPPING S-5
SYSTEMS APPROACH TO HOLOCENE SEDIMENT AND NUTRIENT CYCLING IN CHESAPEAKE ESTUARIES NEWELL, Wayne L., BRICKER, Owen P., WEIMER, Lisa M., and WILLARD, Debra A., Mail Stop 926A, U.S. Geological Survey, Reston, VA 20192
Surficial geologic maps of small, meso-tidal estuaries and their watersheds can be interpreted as scale independent analogs to understand the function of larger estuarine systems. Popes Creek, a minor tributary to the Virginia side of the Potomac River estuary, is an effective trap for sediment and nutrients derived from a variety of forested and farmed watersheds that drain broad, low relief terraces and dissected upland slopes. Situated in Westmoreland County, the watershed of the Popes Creek estuary includes drainage from the George Washington Birthplace National Monument; continuous records of land use document events that have entrained, transported, and moved sediment from the inception of colonial agriculture to present times. This estuary is a particularly effective trap for terrestrially derived sediment because its mouth is plugged by a flood-tide delta resulting from rising sea level and long-shore movement of Potomac River sediment stripped from nearby eroding bluffs and beaches.
The surficial geologic map of the Popes Creek watershed documents a system of weathering, erosion, slope deposition, and fluvial to estuarine terrace deposition that has been moving, storing, weathering, and reworking sediments since the end of the Pliocene. Geomorphic processes, at present, are generating most new sediment from sheet wash on cultivated fields, spring sapping and headward erosion of gullies, and sheet wash on forested, steep slopes. Much of the sediment is stored in ravines and on flood plains of the larger tributaries; we have observed as much as 2 meters of agriculturally derived ravine fill covering logs and stumps that date from the middle of the 17th century. On broad, low gradient flood plains, modem sediment is being transported in a random but peristaltic cadence of storage and erosion; braided channel, alluviated surfaces alternate with deeply gullied reaches. Aliquots of sediment are added from slope deposits and alluvial fans along the valley margins. Entire flood plains are marked by a series of breached and current beaver dams and ponds. Several old miliponds also interrupt the flow of modem sediment. Minimal sediment is presently reaching the distal ends of tributary deltas, which are now accumulating freshwater peat. Much of the modem terrestrially derived sediment appears to be stored in the fluvial part of the system.
Anecdotal lore suggests that Popes Creek estuary was navigable by deep draft vessels a century ago; today the estuary is, for the most part, 1 meter or less deep and has a tide range of 0.3 to 0.4 meter. Initial coring in the flood-tide delta has penetrated almost 15 meters of Crassostrea- and Rangia- bearing sediments overlying fresh water peat and fluvial sand. These deposits are thought to be less than 5,000 years old. The Popes Creek estuary is shoaling as rising sea level drives the products of coastal erosion a kilometer or more inland. As additional data are gathered, the Popes Creek estuary will provide a baseline for comparing other more intensively used Coastal Plain watersheds.
A REGIONAL RECORD OF HOLOCENE HILLSLOPE EROSION FROM LAKE AND ALLUVIAL FAN SEDIMENT, VERMONT NOREN, Anders J., JENNINGS, Karen L, BIERMAN, Paul R., GALSTER, Joshua C., LINI, Andrea, FREDRJKSEN, Guinevere, Department of Geology, University of Vermont, Burlington, VT 05405; JANUKAJTIS, Forrest A., Department of Geology, Bates College, Lewiston, ME 04240.
Little is 1uown about spatial and temporal patterns of Holocene hillslope erosion in New England. However, lakes and postglacial alluvial fans in this hilly terrain preserve sedimentary archives that may reveal such patterns. We have created detailed visual logs of the stratigraphy in deep (1 to 2 m), long (10 to 15 m) trenches in four small (-500 m2), postglacial alluvial fans. We have also retrieved thirteen 6-meter sediment cores from seven small (0.03 to 2 km2), deep (13 to 30 m) Vermont lakes with steep drainage basins. Analyses including visual logging, magnetic susceptibility, X-radiography, and loss-on-ignition document stratigraphic variability in core sediment character.
Alluvial fan interiors reveal a distinct horizontal stratification, often alternating between coarser and finer grain sizes. Thin, organic-rich soil horizons in the fan stratigraphy represent former fan surfaces where paleosol A-horizons were buried rapidly by further fan deposition. These buried paleosols indicate that fan surfaces were stable for long periods of time, allowing an organic-rich forest soil to develop. Soil development was halted when erosion of the
369
S-6 SYMPOSIUM ON SURFICIAL MAPPII'4G
adjacent hillslopes caused additional deposition. In each alluvial fan, over 0.5 meter of historic (<250 years BP) sediment buries the most recent paleosol. Three of the four fans overlie river terrace sediments, while the fourth overlies glacial, ice-contact gravels.
In each lake core, several layers of coarse-grained, mineral-rich sediment with abundant macrofossils of terrestrial plants punctuate the otherwise fine-grained, organic-rich gyttja matrix. The character of these coarse layers leads us to believe that they originated as terrestrial sediment eroded from the uplands during severe storm events. If this hypothesis is valid, the ages of these terrigenous layers correspond to the timing of large storms that passed over the lakes' drainage basins.
Numerous radiocarbon dates provide age control for deposition of upland sediment on the fans and in the lakes. Whereas the most recent sedimentation events (<250 years BP) recorded by both the lakes and alluvial fans probably represents deposition due to deforestation and other land-use changes since European settlement began in the area, the earlier depositional episodes were probably caused by periods of increased storminess. The dates of terrigenous layer deposition in cores from different lakes and periods of increased alluvial fan sedimentation will reveal spatial and temporal patterns of hillslope erosion in this region during the Holocene.
DEPOSITIONAL AND EROSIONAL STRATIGRAPHY IN THE APPALACHIANS OF QUÉBEC AND NEW ENGLAND - 50 YEARS OF EVOLUTION SHILTS, W W., Illinois State Geological Survey; Champaign, IL 61820
The foundations for modern understanding of the glacial stratigraphy of the Appalachian Mountains of Québec and New England were laid in areas peripheral to them in the 1950's by N. R. Gadd and P. F. Karrow in Québec and by Paul MacClintock and D. P. Stewart in the St. Lawrence Seaway region of New York and Canada. Gadd and Karrow identified tills of two glacial events separated by nonglacial organic beds which they named the St. Pierre Beds. In numerous Seaway excavations, MacClintock and Stewart identified two glacial events that now appear to be members of the uppermost till described by Gadd and Karrow in the Montréal-Trois Rivières sector of the St. Lawrence Valley. In the 1960's Stewart and MacClintock, building on their "Seaway" model, described a three-till stratigraphy in Vermont in which tills were correlated from section to section on the basis of their fabrics. The model of the three- till stratigraphy of northern Vermont was imported into Southern Québec by B. C. McDonald in 1964. It has stood until present, more or less as it was described in a 1971 paper by McDonald and the present author. Essentially, the depositional stratigraphy of southern Québec and northern New England comprises a lower, pre-Wisconsinan till (Johnville Till), deposited by an ancestral Laurentide Ice Sheet over a preglacial regolith, separated from two Wisconsinan tills by nonglacial sediments with organic remains older than 54,000 years B .P. (Massawippi Formation). The lowermost upper till (Chaudiere Till) was deposited by ice flowing from an Appalachian ice cap centered in Maine and/or New Brunswick; the uppermost till (Lennoxville Till) was deposited by the Laurentide Ice Sheet that traversed all of New England during the latter part of the Wisconsinan. Thirty-five years of testing the validity of the three-till model of MacClintock and Stewart has not altered the concept, though it is doubtful that it applies in southern Vermont and southern New England as they originally suggested. The model is supported by extensive till fabric and striation data, by depositional models for associated waterlain sediment, by till mineralogy, and, above all, by drift geochemistry. Systematic mapping of the region has led to the discovery of many natural and man-made stratigraphic exposures which have been supplemented with more than 50 deep, continuously cored bore holes to bedrock.
In 1971, Robert Lamarche rediscovered a prominent set of northward striations that clearly postdate the widespread, southeastward-trending striations related to the glacial event during which the Lennoxville Till was deposited. The northward flow phenomenon had first been described by Chalmers in the 1890's, but had been largely overlooked until McDonald's research in the mid-60's. Work subsequent to that of Lamarche and McDonald revealed an intricate series of striations reflecting regional flow events related to a relict Appalachian ice mass that was created by the formation of a late-glacial marine calving bay in the lower St. Lawrence estuary. The final ice flow event along the Appalachian Front was a readvance of Laurentide ice up major valleys to the so-called Highland Front moraine position. Although as many as seven distinct ice flow events have been inferred from the erosional stratigraphy, they are represented depositionally by only one or two recognizable till units.
As mapping proceeds in northern New England and Québec, it is important to keep the strengths and weaknesses of this prior work in perspective so that our further development of the regional glacial history is built on the substantial existing foundation.
370
SYMPOSIUM ON SURFICIAL MAPPING S-7
INCREASING THE EFFICIENCY OF SURFICIAL GEOLOGIC MAPPING THROUGH THE USE OF AERIAL PHOTOGRAPHS AND ORTHOPHOTOS SPRINGSTON, George; 81 E. Hill Road; Plainfield, VT 05667; [email protected]
Aerial photo interpretation (API) should be a component of all surficial geologic investigations. Aerial photos are useful both in the planning stages before field work commences and as day-to-day field tools. Given that it is never possible to walk over every acre of ground in a large study area, careful stereoscopic API can reveal features of potential interest which are not visible from the ground during a roadside reconnaissance and limited cross-country traversing. Also, API can provide a useful look into areas where the researcher cannot obtain permission to enter.
In order to undertake successful API, the researcher needs to understand how to choose the appropriate type and date of photography and must understand how to interpret aerial photo signatures. The most useful film emulsions are black and white panchromatic (BW) and color infrared (CIR). CIR photography is especially sensitive to the photosynthetic state of vegetation and to soil moisture. Photos should be taken during leaves-off conditions without snow-cover (spring or fall). The most useful scales are 1:40,000 to 1:12,000. Smaller scales show too little detail and larger scales require handling too many photos.
In New England, there are usually several dates of photos available for a given quadrangle, with the oldest BW photos often going back to the late 1930's or early 1940's. The oldest CIR coverage usually dates from the late 1970's or early 1980's. Given the general pattern of farm abandonment and the increase in forest cover which has occurred in the region, the older photos often provide a much clearer view of landforms than more recent photography.
Signature elements to be considered include size, shape, pattern, association, shadows, texture, and tone or color (Avery and Berlin, 1992). No one element will allow for reliable identification of features. For example, it is a mistake to focus on tone or color to the exclusion of the other elements.
A standard aerial photo is not a map. Because of radial distortion and relief displacement, features plotted on an aerial photo need to be transferred point-by-point onto a base map. If nearby landscape features are visible on both the base map and the aerial photograph, limited transferring can be successfully done by estimation. For more extensive areas, a zoom transfer scope may be appropriate. Orthophotos are fully rectified images produced from aerial photos. Although they can make excellent base maps, they cannot be viewed stereoscopically, which severely limits their use for detection of subtle landforms.
Since no one set of photos will show all landscape features clearly, an effective strategy is to use at least one of the older BW sets and a recent CIR set. The older BW photos will probably show more open land, thus penrntting identification of more bedrock areas and subtle landforms in areas which are wooded today, while the newer CIR photos will show new roads, houses, sand and gravel pits, beaver dams, and logged-over areas. In combination with the other signature elements, the variations in color on CIR photos can be correlated with variations in the plant communities, which in turn may reflect differences in soils and landforms.
Reference: Avery, T.E., and Berlin, G.L., 1992, Fundamentals of remote sensing and airphoto interpretation: Macmillan
Publishing Co., New York, 472p.
ILLINOIS 3.D SURFICIAL MAPPING PROJECT, AND ITS SUCCESSOR, A PUBLIC/PRIVATE CONSORTIUM TO MODEL AND MANAGE THE BURIED SURFICIAL AQUIFER SOLLER, David R., U.S. Geological Survey, 908 National Center, Reston, VA 20192, [email protected] ; and BERG, Richard C., Illinois State Geological Survey, 615 E. Peabody St., Champaign, IL 61820
A cooperative geologic mapping project was conducted by the illinois State Geological Survey (ISGS) and the United States Geological Survey (USGS) to map the Quaternary deposits in east central Illinois. This area provides an excellent geologic setting to develop and test new techniques for mapping Quaternary deposits in three dimensions (i.e., mapping the thickness and distribution of geologic materials both at land surface and in the subsurface), because it has diverse Quatemary geology and thick, regional sand and gravel aquifers within a buried bedrock valley system (the Mahomet Bedrock Valley). The Mahomet Sand, which fills the deepest portions of the bedrock valley, is the thickest and most widespread glacial aquifer in this system. In addition, overlying the Mahomet Sand are sand
371
S-8 SYMPOSIUM ON SURFICIAL MAPPiNG
and gravel aquifers intercalated with fine-grained deposits. These aquifers are important sources of water for rural farmsteads, communities, and industries.
Because computer-based mapping of deposits in three dimensions is not yet a common, well established practice, GIS-based methods to integrate point (key stratigraphic control data) and areal (geologic mapping) data had to be developed. Each principal glacigenic unit and the bedrock surface were mapped, comprising a set of 8 surfaces that are internally consistent. These maps were produced using digital methods because: 1) the surfaces were too complex to map easily by hand, and 2) counties, planning agencies, and other entities increasingly are using GIS to support decisionmaking and planning. The maps are being published as USGS Map 1-2669 (Soller and others, in press). The GIS based methods are briefly described in Soller and others (1998).
This three-dimensional geologic map database was in part created to support regional groundwater management. To realize this goal, in the past year the ISGS and USGS have helped form the "Mahomet Aquifer Consortium.' This group of local, state, and Federal organizations, both private and public, intends to build a better scientific and public understanding of the regional groundwater resource and, among the various stakeholders in the region, develop a plan to manage it. The Consortium will begin by building a regional groundwater management model based on the 3-D geologic map database produced by this project.
References: Soller, D.R., Price, S.D., Kempton, J.P., and Berg, R.C., in press, Three-dimensional geologic maps of Quaternary
sediments in east-central illinois: U.S. Geological Survey Geologic Investigations Series Map 1-2669. Soller, D.R., Price, S.D., Berg, R.C., and Kempton, J.P., 1998, A Method for Three-Dimensional Mapping, in
D.R. Soller, ed., Digital Mapping Techniques '98 -- Workshop Proceedings: U.S. Geological Survey Open-File Report 98-487, p. 79-84, <http:Ilpubs.usgs.gov/openfile/of98-487/soller4.htmb..
COMBINING 3-D LITHOSTRATIGRAPHY, MATERIALS UNITS, AND GEOLOGIC HISTORY IN REGIONAL SURFICIAL GEOLOGIC MAP FOLIOS STONE, Byron D., U.S. Geological Survey, 354 Mansfield Rd. U-45, Storrs, CT 06269: NEWELL, Wayne L., and KOTEFF, Carl, U.S. Geological Survey, National Center, MS 926-A, Reston, VA 20192
Regional surficial geologic maps show the distribution of unconsolidated (nonlithified) materials on a topographic base map at scales <1:100,000. Limitations of scale severely impact the scope of these maps. One map cannot depict all elements of the geology; a folio of maps (digital and-or paper) is required. Glacial maps traditionally emphasize age in order to differentiate deposits of multiple glacial advances (Chamberlain, 1883; National Research Council (U.S.), 1959; Pavey and others, 1999). The USGS Quaternary Atlas map series (for example, Lineback and others, 1983; Borns and others, 1987) added the correlation of map units diagram to these maps, thus showing the time-transgressive boundaries of till sheets and the diachronous nature of the glacial record. Within a single glacial episode, traditional maps use map units based on morphogenetic classifications, such as moraines, outwash plains, lake plains, and flood plains, to describe geologic materials (Goldthwait and others, 1951; Stewart and MacClintock, 1970; Thompson and Borns, 1985; Cadwell, 1990). Glacial-lake shoreline symbols tied the national map (National Research Council (U.S.), 1959) to the complex late Wisconsin history of ice-lobe advances and lake levels. The lithostratigraphic method emerged in illinois (Lineback, 1979) where extensive, multiple glacial and eolian units generally are stacked in a predictable sequence. In this approach, all materials bear lithostratigraphic names, such that even recent alluvium is known by its name, the Cahokia Formation.
Regional maps of Connecticut (J.R. Stone and others, 1998) and northern New Jersey (B.D. Stone and others, in press) for the first time include map units showing the distribution of sediments related to geographically distinct meltwater streams and lakes, and moraines that formed during the last deglaciation. These informal, allostratigraphic units commonly contain several morphosequences (Koteff and Pessl, 1981, mappable at 1:24,000 scale) that were deposited in the same glacial lake or outwash valley. Ice-margin retreat lines show correlation of regional meltwater and moraine units on the map. The units are grouped by relative ages in the correlation diagram. Overprint patterns on cross-sections show the vertical distribution of sedimentary facies (closely related to materials units). The Connecticut map extends this approach into Long Island Sound. The New Jersey map proposes formation-rank units that contain the regional meltwater units.
372
SYMPOSIUM ON SURFICIAL MAPPING S-9
Engineering and hydrogeologic applications require mapping of surficial materials units, such as gravel, sand, silt and clay, and till (diamicton). Regional maps use standard geologic classifications to show the surface distribution of materials (J.R. Stone and others, 1979), based on detailed maps showing materials as overprint patterns (Langer, 1979). Maps showing the three-dimensional distribution of surficial units, known as "stack maps" in Illinois (Kempton, 1981; J.R. Stone and others, 1992), followed from similar detailed studies. A regional map (Soller, 1993) showing intricate units of sediment character (chiefly grain size) and total thickness of surficial deposits cannot also depict geologic history. Other necessary components of regional maps include areas of bedrock outcrops, contours on the top of the bedrock surface, descriptive and geophysical logs from test wells, and geotechnical characteristics of materials. Thus, a folio of maps showing basic geologic information and derivative applications is required to convey sound geologic analyses to today's decisionmakers.
References: Borns, H.W., Jr., Gadd, N.R., LaSalle, Pierre, Martineay, Ghismond, Chauvin, Luc, Fullerton, D.S., Fulton, R.J.,
Chapman, W.F., Wagner, W.P., and Grant, D.R., 1987, Quaternary geologic map of the Quebec 4 0 x6° quadrangle, United States and Canada (Quaternary Geologic Atlas of the United States): U.S. Geological Survey Miscellaneous Investigations Map 1-1420 (NL- 19), scale 1:1,000,000.
Cadwell, D.H., 1990, Surficial Geologic Map of New York: Finger Lakes, Hudson-Mohawk, Niagara, Lower Hudson and Adirondack sheets: New York State Museum, New York State Geological Survey, scale 1:250,000.
Chamberlain, T.C., 1883, Preliminary paper on the terminal moraine of the second glacial epoch: U.S. Geological Survey 3rd Annual Report, 188 1-82, p. 29 1-402.
Goldthwait, J.W., Goldthwait, Lawrence, and Goldthwait, R.P., 1951, The Geology of New Hampshire: Part 1- Surficial Geology: New Hampshire Planning and Development Commission, 81 p, map, scale 1:250,000
Kempton, J.P., 1981, Three-dimensional geologic mapping for environmental studies in Illinois: Illinois State Geological Survey Environmental Geology Notes 100, 43 p.
Koteff, Carl, and Pessl, Fred, Jr., 1981, Systematic ice reireat in New England: U.S. Geological Survey Professional Paper 1179, 20 p.
Langer, W.H., 1979, Surficial Geology of the Glastonbury Quadrangle, Hartford and Middlesex Counties, Connecticut: U.S. Geological Survey Geologic Quadrangle Map GQ- 1354, scale 1:24,000.
Lineback, J.A., 1979, Quaternary deposits of illinois: Illinois State Geological Survey map, scale 1:500,000. Lineback, J.A., Bleuer, N.K., Mickelson, D.M., Ferrand, W.R., and Goldthwait, R.P., 1983, Quaternary Geologic
Map of the Chicago 1 o x 2o quadrangle, United States (Quaternary Geologic Atlas of the United States): U.S. Geological Survey Miscellaneous Investigations Series Map 1-14 (NO- 16), scale 1:1,000,000.
National Research Council (U.S.), 1959, Glacial map of the United States east of the Rocky Mountains: (compiled by R.F. Flint and others), National Research Council (U.S.), Division of Earth Sciences, scale 1:1,175,000.
Pavey, R.R., Goldthwait, R.P., Brockman, C.S., Hull, D.N., Swinford, E.M., Van Horn, R.G., 1999, Quaternary geology of Ohio: Ohio Division of Geological Survey, Map No. 2, scale 1:500,000.
Soller, D.S., 1993, Map showing the thickness and character of Quaternary sediments in the glaciated United States east of the Rocky Mountains - Northeastern states, the Great Lakes, and parts of southern Ontario and the Atlantic offshore area (east of 80°31' West longitude): U.S. Geological Survey Miscellaneous Investigations Map 1-1970-A, scale 1:1,000,000.
Stewart, D.P., and MacClintock, Paul, 1970, Surficial geologic map of Vermont: Vermont Geological Survey, scale 1:250,000.
Stone, B.D., Stanford, S.D., and Witte, R.W., in press, Surficial geologic map of northern New Jersey: U.S. Geological Survey Miscellaneous Investigations Map I-2540D, scale 1:100,000.
Stone, J.R., London, E.H, and Langer, W.H., 1979, Map showing textures of unconsolidated materials, Connecticut Valley Urban Area, central New England: U.S. Geological Survey Miscellaneous Investigations Map 1-1074-B, scale 1:125,000.
Stone, J.R., Schafer, J.P., London, E.H., and Thompson, W.B., 1992, Surficial Materials Map of Connecticut: U.S. Geological Survey Special Map, scale 1:125,000.
Stone, J.R., Schafer, J.P., London, E.H., DiGiacomo-Cohen, M.L., Lewis, R.S., and Thompson, W.B., 1998, Quaternary geologic map of Connecticut and Long Island Sound Basin: U.S. Geological Survey Open-file Report 98-371, 68 p. scale 1:125,000.
Thompson, W.B., and Boms, H.W., Jr., 1985, Surficial geologic map of Maine: Maine Geological Survey, scale 1:500,000.
373
S-10 SYMPOSIUM ON SURFICIAL MAPPING
THE SURFICIAL GEOLOGIC MAPS OF CONNECTICUT STONE, Janet Radway, U.S. Geological Survey, East Hartford, CT 06108, DIGIACOMO-COHEN, Mary L., and LEWIS, Ralph S., Connecticut Geological and Natural History Survey, Hartford, CT 06106
The Quatemary Geologic Map of Connecticut and Long Island Sound Basin by J.R. Stone, J.P. Schafer, E.H. London, M.L. DiGiacomo-Cohen, R.S. Lewis and W.B. Thompson is completed and available as a USGS open-file map and text (Stone and others, 1998), and anticipated to be published at a scale of 1:125,000 with accompanying text, figures and cross-sections in the near future. This map will be a companion to the already published Surficial Materials Map of Connecticut (Stone and others, 1992). Both maps are the culmination of more than 40 years of quadrangle mapping by many different geologists in a cooperative effort between the USGS and the State of Connecticut.
The Surficial Materials Map emphasizes the surface and subsurface distribution of textural variations within the glacial and postglacial deposits. The Quaternary Geologic Map describes these deposits on the basis of depositional environments, and along with accompanying cross-sections, text, and figures, depicts the Quaternary geologic history of the region. This map is a compilation of basic surficial geologic information from earlier quadrangle maps presented using a consistent, interpretive rationale based on the modem concepts of stagnation-zone retreat and morphosequence deposition. The extension of onland geology offshore beneath Long Island Sound is a unique aspect of the new Quaternary Geologic Map. Application of terrestrial geologic concepts and techniques to the interpretation of basin-wide marine seismic-reflection profile data resulted in a 'seamless" product; this synergistic approach has resulted in an enhanced understanding of the major glacial lakes of the region and postglacial events including isostatic rebound and sea-level rise.
References Stone, J.R., Schafer, J.P., London, E.H., and Thompson, W.B., 1992, Surficial Materials Map of Connecticut:
U.S. Geological Survey Special Map, scale 1:125,000, 2 sheets. Stone, J.R., Schafer, J.P., London, E.H., , DiGiacomo-Cohen, M.L., Lewis, R.S., and Thompson, W.B., 1998,
Quatemary Geologic Map of Connecticut and Long Island Sound Basin: U.S. Geological Survey Open-File Report 98-371, scale 1:175,000 with text, 68 p.
USE OF GLACIAL MORPHOSEQUENCE MODELS TO PRODUCE 3-D SURFICIAL GEOLOGIC MAPS: EXAMPLES FROM CONNECTICUT, RHODE ISLAND, MASSACHUSETTS AND MAINE STONE, Janet Radway, U.S. Geological Survey, 101 Pitkin Street, East Hartford, CT 06108 [email protected]
Systematic mapping of glacial deposits in southern New England during the past 50 years has enhanced the understanding of glacial, glaciolacustrine/marine, and glaciofluvial processes and produced detailed depositional models. The conceptual models can be used to map and predict the three-dimensional distribution of coarse- and fine-grained materials within glacial meitwater deposits, given primary data about grain size at specific points. These deposits are the major ground-water aquifers of the area and are also major sources of construction aggregate. Surficial materials maps that show the areal and vertical distribution of textures in glacial meltwater deposits have been produced for the State of Connecticut at 1:24,000 scale (Stone and others, 1992), and at larger scales in other areas of southern New England for water-resource investigations and characterization of Superfund sites (Melvin and others, 1995a; 1995b; Nielsen and others, 1995; Stone and others, 1996; Dickerman and others, 1997; Lyford and others, 1998; Mullaney and others, 1999). Use of a defined internal geometry of "stratified-drift" aquifers in constructing numerical ground-water flow models can greatly enhance the model's capability to accurately predict flow paths, contributing areas to wells, connectivity of aquifer zones, and to find optimal locations for high-yielding wells.
The glacial meltwater deposits of southern New England resulted mainly from the interaction of three factors: 1) the form of the landscape across which the ice was retreating, 2) the form of the margin of the retreating ice, and 3) the locations of the principal meltwater streams emerging from the ice. These factors are not independent of one another— the form of the landscape influenced the other two to a considerable extent. The character of these deposits supports their interpretation through two closely related concepts: morphosequence deposition and stagnation-zone retreat (Currier, 1941; Jahns, 1941; Koteff, 1974; Koteff and Pessl, 1981). These concepts have roots more than a century old, were articulated in present form more than five decades ago, and have since been exemplified in many
374
SYMPOSIUM ON SURFICIAL MAPPING S-il
quadrangle studies. Morphosequences are the basic mappable geographic-chronologic units of glacial meitwater deposits. They are the bodies of sediment formed in particular valleys during specific short periods of time as meitwater streams aggraded their beds, filled proglacial ponds and lakes, and built up to maximum levels that were controlled by spiliways over divides or older deposits downstream. Within a morphoseqeunce, grain size decreases and sorting improves from the ice-marginal (proximal) end of the deposit downstream to the distal end. Coarse-gained sediments are associated with the proximal parts of morphosequences and fine-gained deposits are present in distal parts. In glaciolacustrine morphosequences, coarse-gained deposits overlie fine-gained deposits in many places. Morphosequences commonly occur in a shingled arrangement in valleys so that collapsed, proximal parts of earlier morphosequences are overlain by distal parts of successively younger (more northerly) morphosequences; in these places, fine-grained deposits overlie coarse-gained deposits.
Seven types of morphosequences are recognized in southern New England, and are defined by the particular distribution of glaciofluvial, glaciodeltaic, and glacial lake-bottom sedimentary facies, and by whether or not their heads were deposited in contact with the ice margin. Mapping of these deposits for regional framework studies, water-resources investigations, and analysis of contaminated ground-water sites supports the classification principles of the morphosequence concept (Koteff and Pessl, 1981). New subsurface data from many sites further defines sedimentary facies that compose individual morphosequences. In Connecticut, glacial meltwâter deposits have been characterized at intermediate scale, based in part on included types of morphosequences and lake-bottom sediments (Stone and others, 1998).
References Currier, L.W., 1941, Disappearance of the last ice sheet in Massachusetts by stagnation zone retreat (abs.):
Geological Society of America Bulletin, v. 52, no. 2, pt. 2, p. 1895. Dickerman, D. C., Kliever, J.D., and Stone., J.R., 1997, Hydrogeology, water quality, and simulation of ground-
water development alternatives in the Usequepaug-Queen ground-water reservoir, southern Rhode Island: U.S. Geological Survey Water-Resources Investigations Report 97-4126, 48 P.
Jahns, R.H., 1941, Outwash chronology in northeastern Massachusetts (abs): Geological Society of America Bulletin, v. 52, no. 12, Pt. 2, p. 1910.
Koteff, Carl, 1974, The morphologic sequence concept and deglaciation of southern New England, in Coates, D.R., ed., Glacial geomorphology: Binghamton, N.Y., State University of New York, Publications in Geomorphology, p. 121-144.
Koteff, Carl and Pessi, Fred, Jr., 1981, Systematic ice retreat in New England: U.S. Geological Survey Professional Paper 1179, 20 p.
Lyford, F.P., Stone, J.R., Nielsen, J.P., and Hansen, B.P., 1998, Geohydrology and ground-water quality, Eastern Surplus Superfund site, Meddybemps, Maine: U.S. Geological Survey Water-Resources Investigations Report 98- 4174, 68 P.
Melvin, R.L., Stone, J.R., Craft, P.A., and Lane, J.W., 1995, Geohydrology of the Gallup's Quarry area, Plainfield, Connecticut: U.S. Geological Survey Water-Resources Investigations Report 93-4138, 52p.
Melvin, R.L., Stone, J.R., and Craft, P.A., Lane, J.W., and Davies, B.S., 1995, Geohydrology and water quality of the Durham Center Area, Durham, Connecticut: U.S. Geological Survey Water-Resources Investigations Report 94- 4237, 97 p.
Mullaney, J.R., Mondazzi, R.A., and Stone, J.R., 1999, Hydrogeology and water quality of the Nutmeg Valley area, Wolcott and Waterbury, Connecticut: U.S. Geological Survey Water Resources Investigations Report 99-408 1, 90 P.
Nielsen, M.G., Stone, J.R., Hansen, B.P., and Nielsen, J.P., 1995, Geohydrology, water quality, and conceptual model of the hydrologic system, Saco Landfill area, Saco, Maine: U.S. Geological Survey Water-Resources Investigations Report 95-4027, 94 p.
Stone, J.R., Schafer, J.P., London, E.H., and Thompson, W.B., 1992, Surficial materials map of Connecticut: Reston Va., U.S. Geological Survey Special Map, scale 1:125,000.
Stone, J.R., Barlow, P.M., and Starn, J.J., 1996, Geohydrology and conceptual model of a ground-water-flow system near a Superfund site in Cheshire, Connecticut: U.S. Geological Survey Open-File Report 96-162, 88 p.
Stone, J.R., Schafer, J.P., London, E.H., DiGiacomo-Cohen, M., Lewis, R.S., and Thompson, W.B., 1998, Quaternary geologic map of Connecticut and Long Island Sound Basin: U.S. Geological Survey Open-file Report 98-371, scale 1:175,000, with text, 69 p.
375
S-12 SYMPOSIUM ON SURFICIAL MAPPING
SURFICIAL GEOLOGIC MAPPING IN SOUTHWESTERN MAINE THOMPSON, Woodrow B.; Maine Geological Survey; 22 State House Station; Augusta, ME 04333-0022; [email protected]
Since 1986, the Maine Geological Survey (MGS) has participated in surficial mapping cooperatives withthe U. S. Geological Survey under the COGEOMAP and STATEMAP programs. These programs have funded detailed mapping of 7.5-minute quadrangles, with initial emphasis on the densely settled and rapidly developing southwestern part of Maine.
Fifty-two quadrangles have been mapped during this period, including the entire Maine portions of the Portland and Kittery 1:100:000 map sheets. The STATEMAP products for each quad include two maps and an accompanying report. The geologic map shows the Quaternary stratigraphic units, while the materials map shows field data such as gravel pits, well logs, and seismic lines.
During the last few years, MGS has used its geographic information system (GIS) to radically improve the production, appearance, and utility of surficial quadrangle maps. The maps are now printed in color and on-demand. A set of three interrelated GIS maps is prepared for each quadrangle, showing geology, materials, and sand-and-gravel aquifers. The geologic map explanation includes a series of color photos illustrating Quatemary deposits found in the quadrangle. Examples of sediment textures are shown on the companion materials map, which brings together site-specific information used to compile both the geologic and aquifer maps.
Field mapping has likewise evolved greatly since the beginning of the MGS reconnaissance program in the early 1970's. Work by many individuals has improved our understanding of the Quaternary stratigraphy and histoiy of southwestern Maine, and surficial quadrangle mapping provides an essential foundation for academic and applied studies. The most important practical application of the surficial maps is for delineating sand and gravel resources and aquifers, while other uses include landslide hazard assessment (particularly in marine clays) and general land-use planning.
Two geologic terrains with very different assemblages of glacial deposits exist in this part of the state: the lowland areas that experienced marine submergence in late-glacial time, and the uplands extending from the White Mountain foothills north through the higher mountains of western Maine to the Canadian border. Twenty-five years of mapping in the coastal lowland has elucidated glaciomarine sedimentary environments (e.g. Retelle and Bither, 1989; Smith and Hunter, 1989); the role of marine deltas in recording former sea level and isostatic crustal uplift (Thompson et al., 1989; Koteff et al., 1993); and the widespread occurrence of reworked sediments deposited during marine regression (Weddle and Retelle, in prep.). Above the marine limit, detailed mapping is revealing moraines and other evidence of systematic retreat of locally active ice in areas formerly believed to have been deglaciated solely by glacial stagnation and downwastage (Thompson, in prep.). Morphosequence mapping is possible where successions of glacial-lake deposits record the recession of the late Wisconsinan ice margin. Other evidence used to reconstruct the glacial history includes striations and meitwater channels.
Radiocarbon ages of marine fossils and basal organics in lake sediment cores are the basis for establishing a deglaciation chronology. The few available limiting ages indicate ice-margin recession from the southern tip of Maine to the Frontier Moraine on the Québec border between about 15 and 11.5 ka BP (radiocarbon years). However, additional data and resolution of discrepancies between marine and terrestrial ages in Maine and neighboring states and provinces are needed to refine this chronology.
References Koteff, C., Robinson, G. R., Goldsmith, R., and Thompson, W. B., 1993, Delayed postglacial uplift and synglacial
sea levels in coastal central New England: Quaternary Research, v. 40, p. 46-54. Retelle, M. J., and Bither, K. M.,. 1989, Late Wisconsinan glacial and glaciomarine sedimentary facies in the lower
Androscoggin Valley, Topsham, Maine, in Tucker, R. D., and Marvinney, R. G., eds., Studies in Maine geology - Volume 6: Quaternary geology: Augusta, Maine Geological Survey, p. 33-51.
Retelle, M. J., and Weddle, T. K., in prep., Deglaciation and relative sea-level chronology, Casco Bay Lowland and lower Androscoggin River Valley, Maine, in Weddle, T. K., and Retelle, M. J., eds., Deglacial history and relative sea-level changes, northern New England and adjacent Canada: Geological Society of America, Special Paper.
Smith, G. W., and Hunter, L. E., 1989, Late Wisconsinan deglaciation of coastal Maine, in Tucker, R. D., and Marvinney, R. G., eds., Studies in Maine geology - Volume 6: Quaternary geology: Augusta, Maine Geological Survey, p. 13-32.
376
SYMPOSIUM ON SURFICIAL MAPPING S-i 3
Thompson, W. B., Crossen, K. J., Borns, H. W., Jr., and Andersen, B. G., 1989, Glaciomarine deltas of Maine and their relation to late Pleistocene - Holocene crustal movements, in Anderson, W. A., and Borns, H. W., Jr., eds., Neotectonics of Maine: Augusta, Maine Geological Survey, Bulletin 40, p. 43-67.
Thompson, W. B., in prep., Deglaciation of western Maine, in Weddle, T. K., and Retelle, M. J., eds., Deglacial history and relative sea-level changes, northern New England and adjacent Canada: Geological Society of America, Special Paper.
SURFICIAL DEPOSITS AND AQUIFER MAPPING IN MAINE WEDDLE, Thomas K., and MARVINNEY, Robert G., Maine Geological Survey; 22 State House Station, Augusta, ME 04333
Sand and gravel aquifer mapping in Maine provides maps which show the distribution of aquifers with yields greater than 10 gallons per minute, locations of gravel-pack wells, test-boring locations and stratigraphy, gravel pit locations and stratigraphy, and potential threats to ground water. The maps, partially derived from surficial geologic maps, are compiled from the above information, as well as detailed field and seismic data, and the Maine Geological Survey bedrock water well inventory (for depth to bedrock and overburden thickness). Commonly, the maps are utilized as the basis for permitting certain development activities within the aquifer boundaries and have been used by communities as a basis for zoning. The maps represent best available data and have been well-received by the public and municipalities because of their quality and clarity, and because they are readily available to the public at low cost. Produced in GIS format, these maps are easily updated as new geological information becomes available.
377
jo;IpH >IooqapinD
1UM j uaildaqS
FA
- >IooqapinD @DuaiajuoDPTH I JTOTOD PuPl QuEl MBN
6661 0144 Ui paqstqnd spx 'jooqprn ai; jo Au npoidx 04 uoissiuid AAJnS 172DT190TOaD 4Uomj\q1 Jo iquxain Xur SOAIS i;;j sTq
'AA1ns lu:)TSolo@DIUOUIJA aq; Jo siqwj
1U0UI1A IXinqi@4uM XaAlfl5 T!oIoaD U0ULIA
6661 '9 iaqwa
S1700 -99 (o) XVd 96CC - 999 (o8)
ZO-SOSO ±NOA NOiONI1fl8
' T1VH A90100 SNI>83d
AE010D dO IN1HVdQ
)1TUJ.T3 JO AlliS TlT)A1U1 '-II