Embed Size (px)
Citation preview
GUIDELINES FOR
GEOPHYSICAL INVESTIGATIONS
OF MINES UNDER HIGHWAYS
MINE RESEARCH PROJECT - GUE 70 - 14.10
PID No. 18459
Report to
OHIO DEPARTMENT OF TRANSPORTATION
Prepared by
BBC&M ENGINEERING, INC.
and
SOFTEARTH ASSOCIATES, INC.
DUBLIN, OHIO
Prepared in cooperation with the Ohio Department of Transportation and the U.S.
Department of Transportation, Federal Highway Administration
June 2003

Disclaimer Statement
The contents of this report reflect the views of the authors who are responsible for the facts and
the accuracy of the data presented herein. The contents do not necessarily reflect the official
views or policies of the Ohio Department of Transportation or the Federal Highway
Administration. This report does not constitute a standard, specification, or regulation.
TABLE OF CONTENTS
SECTION 1 - SCOPE AND OVERVIEW . . . . . . . . . . . . . . . . . . . . . . . . . . . . . . . . . . . . . . . . 1
1.1 Purpose of Document . . . . . . . . . . . . . . . . . . . . . . . . . . . . . . . . . . . . . . . . . . . . . . . . . . . . . 1
1.2 Motivation for the Study . . . . . . . . . . . . . . . . . . . . . . . . . . . . . . . . . . . . . . . . . . . . . . . . . . 1
1.3 Geophysical Methods . . . . . . . . . . . . . . . . . . . . . . . . . . . . . . . . . . . . . . . . . . . . . . . . . . . . 2
1.3.1 Surface Ground Penetrating Radar (GPR) . . . . . . . . . . . . . . . . . . . . . . . . . . . . . . . 2
1.3.2 Surface Seismic Reflection . . . . . . . . . . . . . . . . . . . . . . . . . . . . . . . . . . . . . . . . . . 3
1.3.3 Spectral Analysis of Surface Waves (SASW) . . . . . . . . . . . . . . . . . . . . . . . . . . . . 5
1.3.4 Side Looking Underground Radar (SLUR) . . . . . . . . . . . . . . . . . . . . . . . . . . . . . . 6
1.3.5 Resistivity . . . . . . . . . . . . . . . . . . . . . . . . . . . . . . . . . . . . . . . . . . . . . . . . . . . . . . . 7
1.3.6 Cross-hole Ground Penetrating Radar . . . . . . . . . . . . . . . . . . . . . . . . . . . . . . . . . . 8
1.3.7 Cross-hole Seismic Methods . . . . . . . . . . . . . . . . . . . . . . . . . . . . . . . . . . . . . . . . . 9
1.3.8 Down-hole Geophysical Borehole Logging . . . . . . . . . . . . . . . . . . . . . . . . . . . . 10
SECTION 2 - EVALUATION OF TECHNIQUES . . . . . . . . . . . . . . . . . . . . . . . . . . . . . . . 11
2.1 Evaluation Summary . . . . . . . . . . . . . . . . . . . . . . . . . . . . . . . . . . . . . . . . . . . . . . . . . . . . 11
2.2 Summary of the Phase II Geophysical Studies . . . . . . . . . . . . . . . . . . . . . . . . . . . . . . . . 13
SECTION 3 - RECOMMENDED PROCEDURES FOR
APPLICATION OF GEOPHYSICAL METHODS . . . . . . . . . . . . . . . . . . . . . . . . . 15
SECTION 4 - PITFALLS OF APPLYING GEOPHYSICAL METHODS . . . . . . . . . . . . 18
SECTION 5 - REFERENCES . . . . . . . . . . . . . . . . . . . . . . . . . . . . . . . . . . . . . . . . . . . . . . . . 19
List of Photographs
Photograph 1 Surface GPR Data Acquisition Equipment . . . . . . . . . . . . . . . . . . . . . . . . . . . . . . 3
Photograph 2 Seismic Geophones on 1-foot Spacings . . . . . . . . . . . . . . . . . . . . . . . . . . . . . . . . . 4
Photograph 3 Field Operations for SASW . . . . . . . . . . . . . . . . . . . . . . . . . . . . . . . . . . . . . . . . . . 5
Photograph 4 SLUR Data Acquisition with Antennas in Co-pole Orthogonal Configuration . . 6
Photograph 5 Sting Resistivity System . . . . . . . . . . . . . . . . . . . . . . . . . . . . . . . . . . . . . . . . . . . . 7
Photograph 6 GPR Transmitter and Receiver being Lowered into Boreholes . . . . . . . . . . . . . . 8
Photograph 7 Set-up for Cross-hole Seismic Shear Wave Measurements . . . . . . . . . . . . . . . . . . 9
List of Tables
Table 1 - Summary of Geophysical Methods Evaluated . . . . . . . . . . . . . . . . . . . . . . . . . . . . . . . 12
List of Figures
Figure 1 - Composite of Interpreted Data . . . . . . . . . . . . . . . . . . . . . . . . . . . . . . . . . . . . . . . . . . 14
SECTION 1 - SCOPE AND OVERVIEW
1.1 Purpose of Document
This document discusses the results of geophysical investigation methods conducted along
Interstate Route 70 (IR-70) under a contract with the Ohio Department of Transportation
(ODOT). The specific site conditions, as determined by the investigations that were conducted,
are not presented in this document. Those findings were reported in the document entitled “Site
Investigation Report - Mine Research Project GUE 70 - 14.10". However, a brief description of
the scope of the IR-70 field project is included to establish the overall scope and focus of the
project.
1.2 Motivation for the Study
The Study Area is a 2,100-foot long section of IR-70 (between Stations 467+00 and 488+00)
located between Cambridge and Old Washington in Guernsey County, Ohio. In the Study Area,
IR-70 crosses over underground mine workings that are part of the abandoned Murray Hill No. 2
mine complex. During March of 1994, a mine-related collapse pit was recognized by ODOT in
the median just east of Station 478+00 and two additional subsidence pits were identified
adjacent to the shoulder of the westbound lanes. Drilling conducted at this time encountered
voids beneath the roadway and debris in the mined zone, indicating that collapse of the mine roof
had occurred at several locations. A collapse of the eastbound lanes of IR-70 occurred during
March of 1995 between Stations 483+00 and 484+00; the collapse resulted in a pit roughly 10
feet in diameter.
Immediately subsequent to the recognition of collapse areas along the roadway during 1994, an
aggregate material was used to fill depression features, and the areas were then patched with
asphalt. Following the 1995 collapse, the roadway was closed for 4 months, during which time a
mine remediation project was constructed. This work consisted of drilling and grouting within
the Project Area to fill mine voids and rock fractures, and to construct land bridges (composed of
reinforced concrete) along the westbound lanes. After the roadway reopened, grout settlements
at borehole locations developed during the spring of 1996, at which time exploratory drilling
revealed voids in several locations where grouting had been previously performed. A second
2
phase of grouting was then conducted from May through September of 1997. During the two
phases of grouting, approximately 1,800 grout injection boreholes were drilled along the roadway
in a grid pattern.
Shortly after the completion of the mine remediation work at the site, ODOT decided that the
entire Project Area should be studied to determine if the post-construction subsurface conditions
were remaining in a stable condition. ODOT recognized that geophysical investigative methods
that were found to be effective in studying the Project Area might also be effective for use at
other similar roadway locations. A research team comprised of individuals from academia and
industry were chosen to test several different investigative methods at the Project Area.
The methods were tested in two phases. The first phase of the testing (Phase I) consisted of
testing most of the conventional geophysical methods over a limited area (200 linear feet of the
eastbound lanes). The methods consisted of techniques that have been utilized in mining and
engineering applications over the past few decades. The second phase of the study (Phase II)
consisted of applying the most promising techniques, as determined by Phase I testing, over the
entire 2,100-foot length of highway.
1.3 Geophysical Methods
The methods discussed below were evaluated during the project.
1.3.1 Surface Ground Penetrating Radar (GPR)
Surface GPR is a technique that utilizes the fact that high frequency electromagnetic waves
propagate in the subsurface at a velocity that is directly related to the electrical dielectric constant
of the material. If the wave encounters a change in dielectric constant as it propagates into the
subsurface, then some of the energy is refracted into the lower medium, while the remainder of
the energy is reflected back to the surface. The energy that is reflected (or diffracted in the case
of sharp boundaries) returns to the surface where its arrival time and energy distribution are
mapped. These measurements of the energy that is reflected back to the surface become
3
“records”, or maps of the distribution of boundaries between materials of different velocities.
Since the velocities are related to the dielectric constant, and the dielectric constant is related to
the density, GPR records can be interpreted as two dimensional cross sections of the density
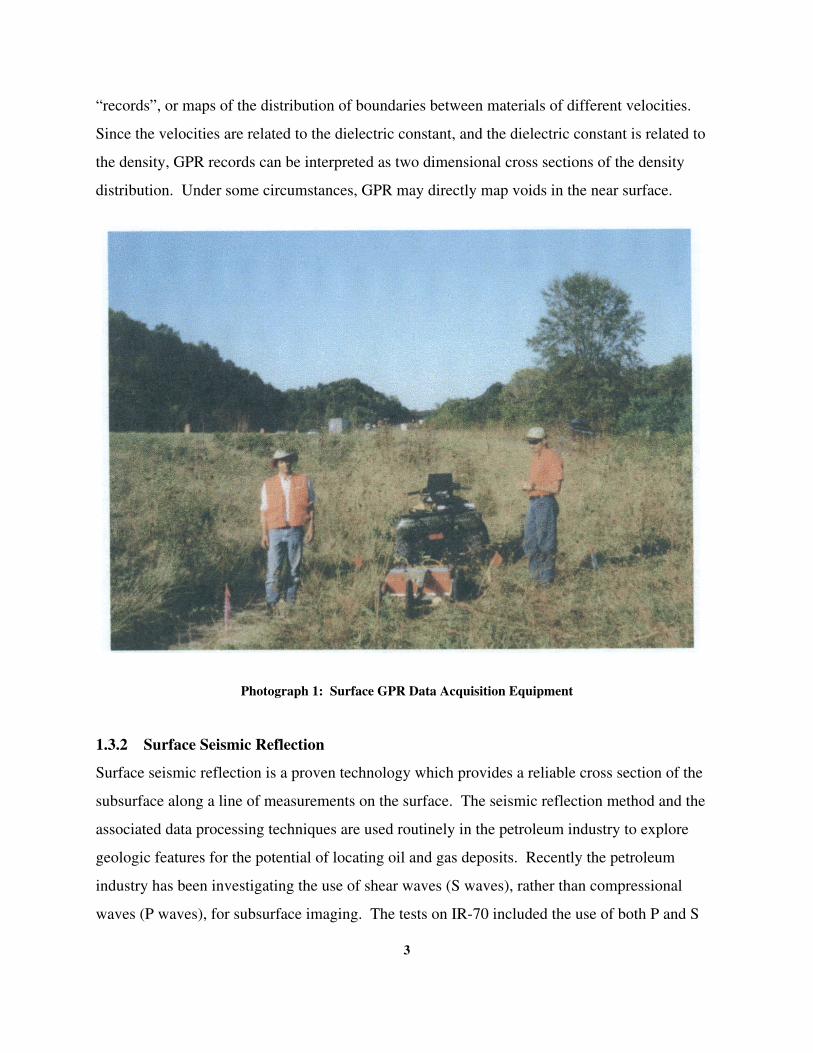
distribution. Under some circumstances, GPR may directly map voids in the near surface.
Photograph 1: Surface GPR Data Acquisition Equipment
1.3.2 Surface Seismic Reflection
Surface seismic reflection is a proven technology which provides a reliable cross section of the
subsurface along a line of measurements on the surface. The seismic reflection method and the
associated data processing techniques are used routinely in the petroleum industry to explore
geologic features for the potential of locating oil and gas deposits. Recently the petroleum
industry has been investigating the use of shear waves (S waves), rather than compressional
waves (P waves), for subsurface imaging. The tests on IR-70 included the use of both P and S
4
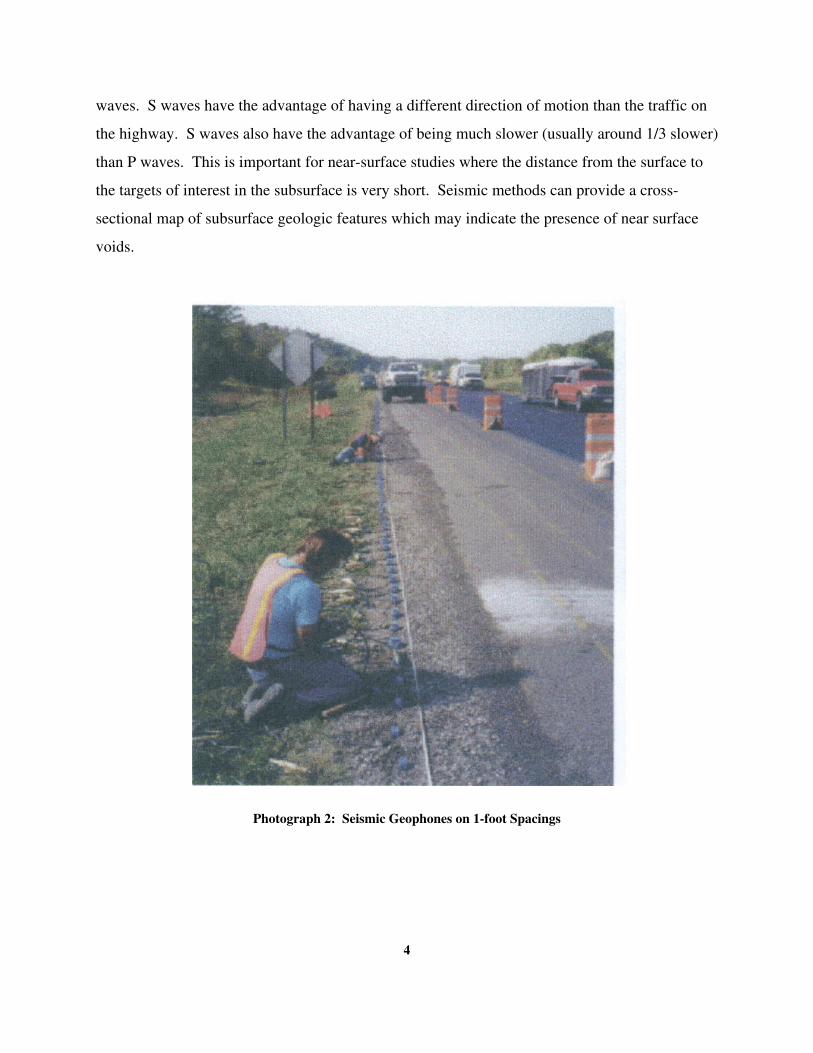
waves. S waves have the advantage of having a different direction of motion than the traffic on
the highway. S waves also have the advantage of being much slower (usually around 1/3 slower)
than P waves. This is important for near-surface studies where the distance from the surface to
the targets of interest in the subsurface is very short. Seismic methods can provide a cross-
sectional map of subsurface geologic features which may indicate the presence of near surface
voids.
Photograph 2: Seismic Geophones on 1-foot Spacings
5
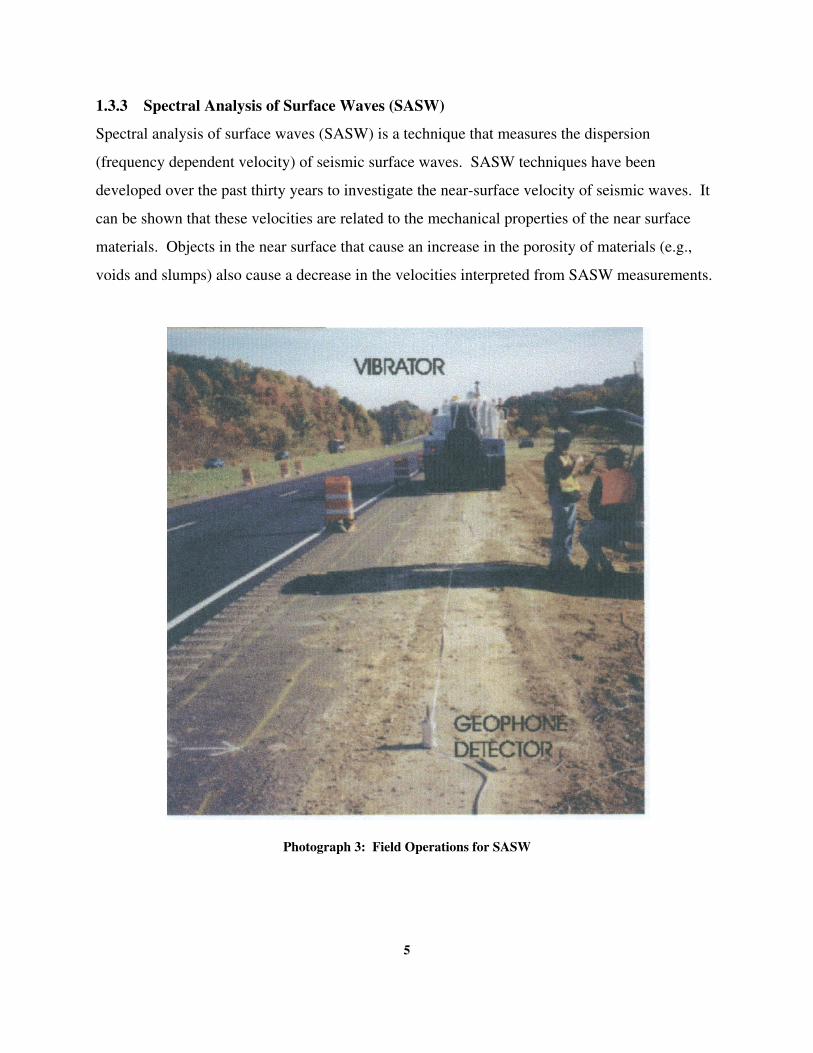
1.3.3 Spectral Analysis of Surface Waves (SASW)
Spectral analysis of surface waves (SASW) is a technique that measures the dispersion
(frequency dependent velocity) of seismic surface waves. SASW techniques have been
developed over the past thirty years to investigate the near-surface velocity of seismic waves. It
can be shown that these velocities are related to the mechanical properties of the near surface
materials. Objects in the near surface that cause an increase in the porosity of materials (e.g.,
voids and slumps) also cause a decrease in the velocities interpreted from SASW measurements.
Photograph 3: Field Operations for SASW
6
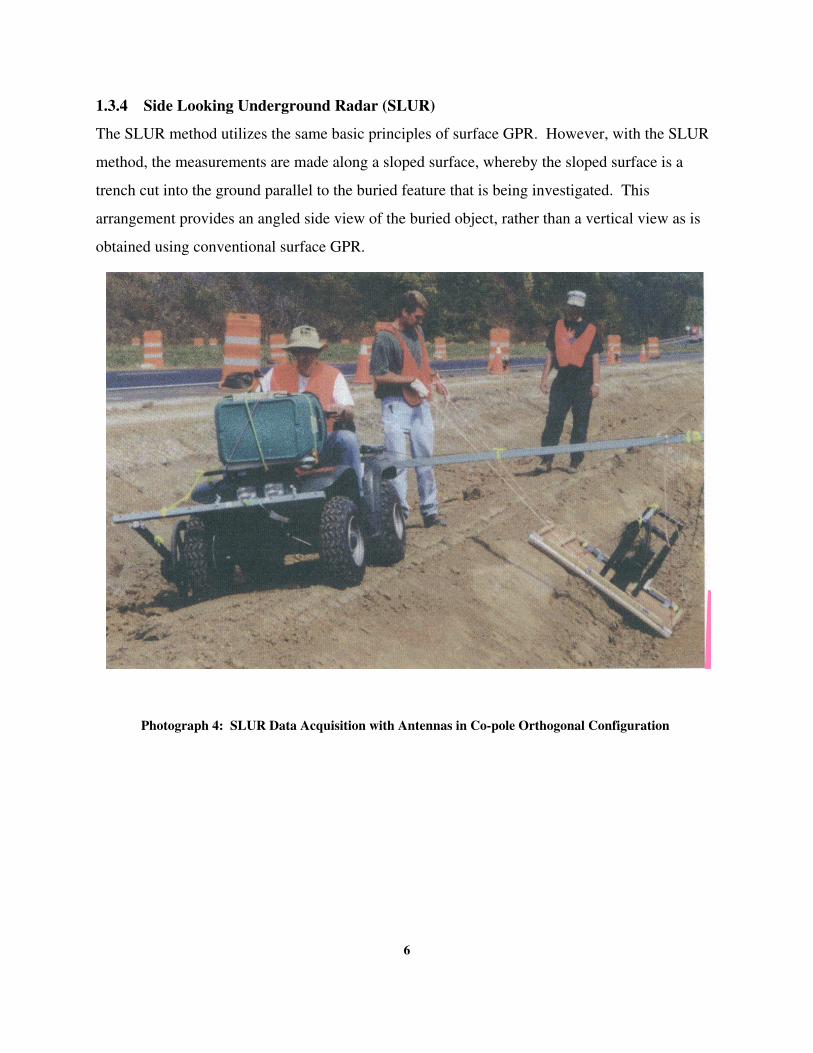
1.3.4 Side Looking Underground Radar (SLUR)
The SLUR method utilizes the same basic principles of surface GPR. However, with the SLUR
method, the measurements are made along a sloped surface, whereby the sloped surface is a
trench cut into the ground parallel to the buried feature that is being investigated. This
arrangement provides an angled side view of the buried object, rather than a vertical view as is
obtained using conventional surface GPR.
Photograph 4: SLUR Data Acquisition with Antennas in Co-pole Orthogonal Configuration
7
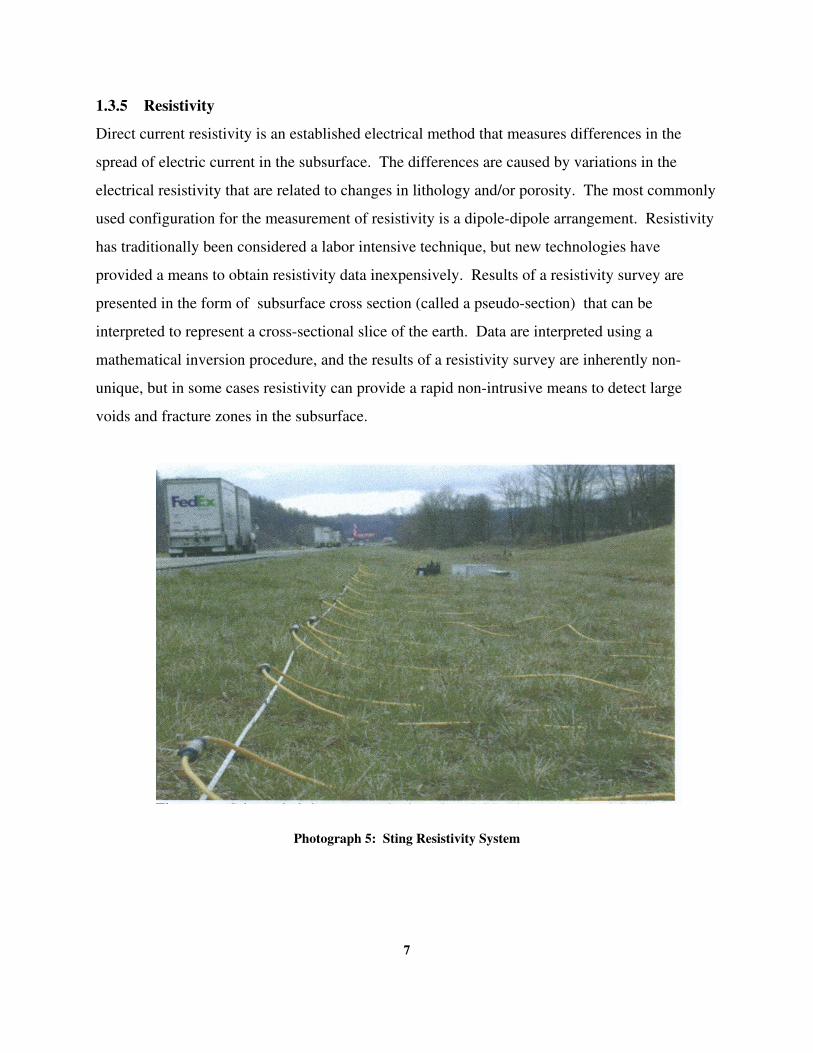
1.3.5 Resistivity
Direct current resistivity is an established electrical method that measures differences in the
spread of electric current in the subsurface. The differences are caused by variations in the
electrical resistivity that are related to changes in lithology and/or porosity. The most commonly
used configuration for the measurement of resistivity is a dipole-dipole arrangement. Resistivity
has traditionally been considered a labor intensive technique, but new technologies have
provided a means to obtain resistivity data inexpensively. Results of a resistivity survey are
presented in the form of subsurface cross section (called a pseudo-section) that can be
interpreted to represent a cross-sectional slice of the earth. Data are interpreted using a
mathematical inversion procedure, and the results of a resistivity survey are inherently non-
unique, but in some cases resistivity can provide a rapid non-intrusive means to detect large
voids and fracture zones in the subsurface.
Photograph 5: Sting Resistivity System
8
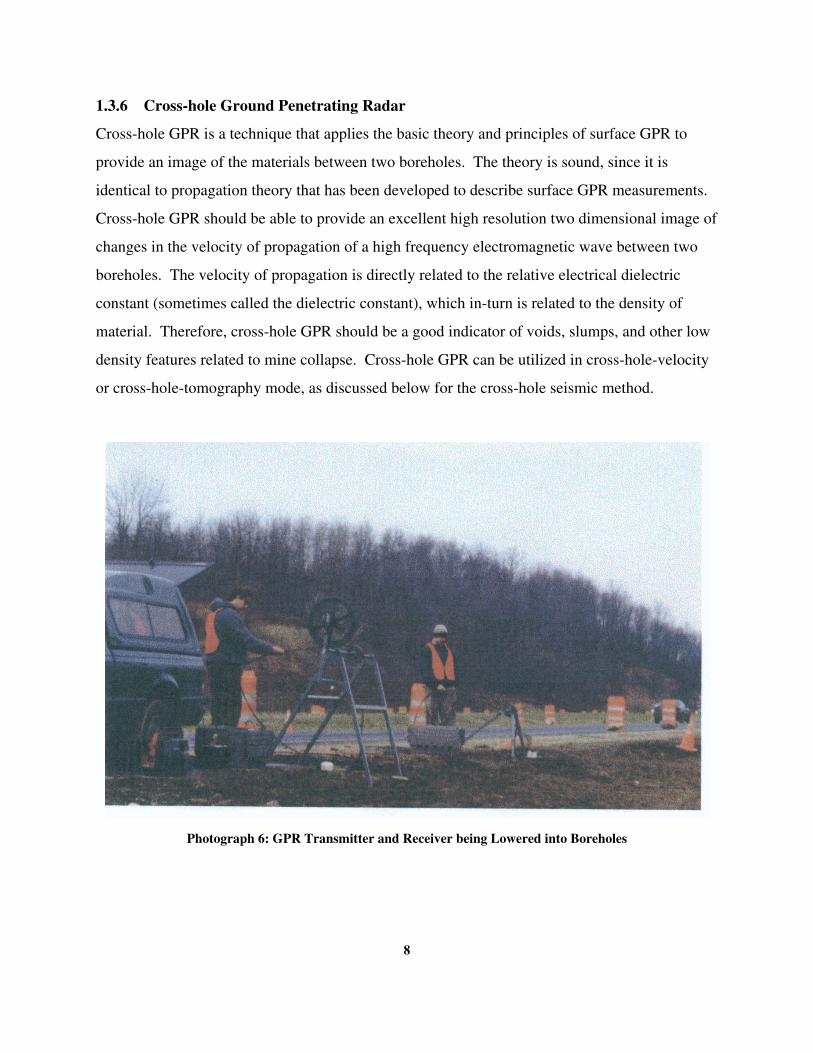
1.3.6 Cross-hole Ground Penetrating Radar
Cross-hole GPR is a technique that applies the basic theory and principles of surface GPR to
provide an image of the materials between two boreholes. The theory is sound, since it is
identical to propagation theory that has been developed to describe surface GPR measurements.
Cross-hole GPR should be able to provide an excellent high resolution two dimensional image of
changes in the velocity of propagation of a high frequency electromagnetic wave between two
boreholes. The velocity of propagation is directly related to the relative electrical dielectric
constant (sometimes called the dielectric constant), which in-turn is related to the density of
material. Therefore, cross-hole GPR should be a good indicator of voids, slumps, and other low
density features related to mine collapse. Cross-hole GPR can be utilized in cross-hole-velocity
or cross-hole-tomography mode, as discussed below for the cross-hole seismic method.
Photograph 6: GPR Transmitter and Receiver being Lowered into Boreholes
9
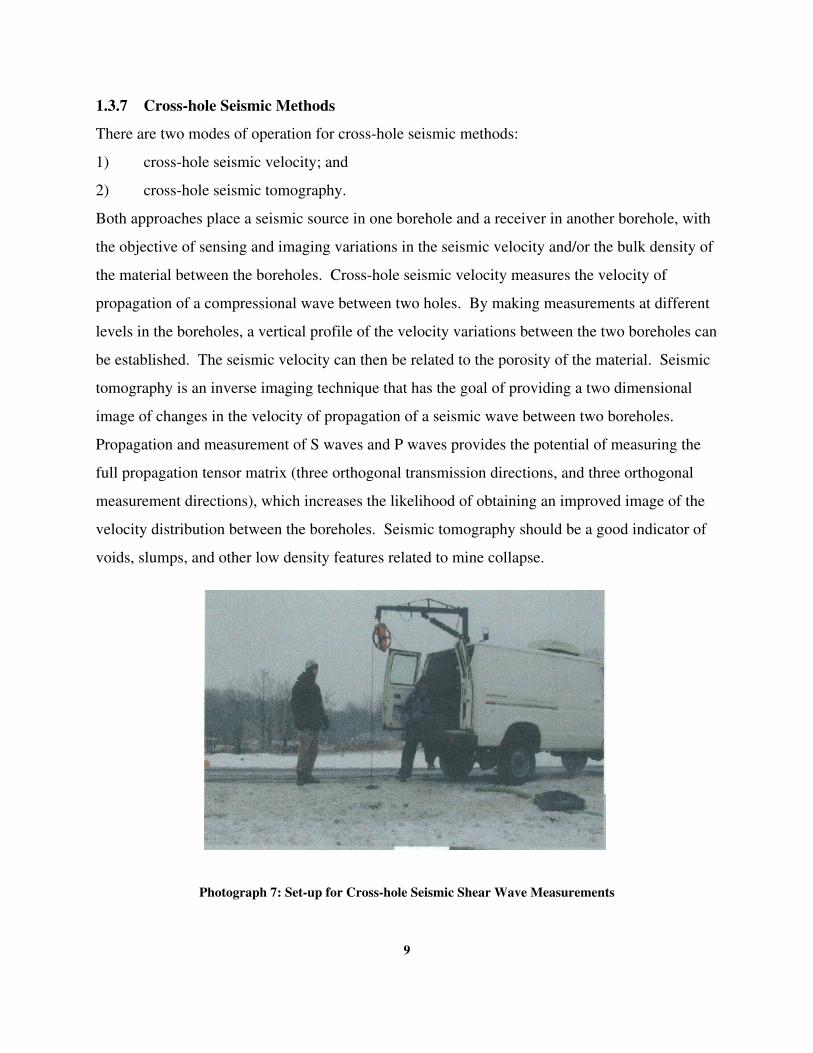
1.3.7 Cross-hole Seismic Methods
There are two modes of operation for cross-hole seismic methods:
1) cross-hole seismic velocity; and
2) cross-hole seismic tomography.
Both approaches place a seismic source in one borehole and a receiver in another borehole, with
the objective of sensing and imaging variations in the seismic velocity and/or the bulk density of
the material between the boreholes. Cross-hole seismic velocity measures the velocity of
propagation of a compressional wave between two holes. By making measurements at different
levels in the boreholes, a vertical profile of the velocity variations between the two boreholes can
be established. The seismic velocity can then be related to the porosity of the material. Seismic
tomography is an inverse imaging technique that has the goal of providing a two dimensional
image of changes in the velocity of propagation of a seismic wave between two boreholes.
Propagation and measurement of S waves and P waves provides the potential of measuring the
full propagation tensor matrix (three orthogonal transmission directions, and three orthogonal
measurement directions), which increases the likelihood of obtaining an improved image of the
velocity distribution between the boreholes. Seismic tomography should be a good indicator of
voids, slumps, and other low density features related to mine collapse.
Photograph 7: Set-up for Cross-hole Seismic Shear Wave Measurements
10
1.3.8 Down-hole Geophysical Borehole Logging
Geophysical borehole logs provide a detailed analysis of the physical properties within the
immediate vicinity of the borehole wall. The logs provide a continuous record of the physical
properties and indicate the details of the physical property changes. The geophysical borehole
logging evaluated for this project included a natural gamma ray and a conductivity (inverse
resistivity) logging. Borehole geophysical measurements can in some cases replace many of the
standard testing methods that have been traditionally utilized for the analysis of physical and
geologic properties in boreholes.
11
SECTION 2 - EVALUATION OF TECHNIQUES
2.1 Evaluation Summary
Geophysical methods were tested extensively in Phase I over a limited Test Area, with the most
promising methods being applied to the entire IR-70 Study Area. The results are summarized in
this section. Based on the analysis of the Phase I results, it was recommended that
• surface GPR should be used to try to detect any features that might be located directly
beneath the roadbed;
• seismic reflection should be used to detect fracturing in the bedrock above the mine;
• cross-hole methods should be utilized to help image specific features identified by the
surface work; and,
• borehole geophysical logging measurements should be used to help define the geologic
features in individual boreholes.
A summary of the techniques tested at the IR-70 site are presented in Table 1 on the following
page.

12
Tab
le1
:S
um
mar
yo
fG
eop
hy
sica
lM
eth
od
sE
val
uat
edD
uri
ng
the
Pro
ject
������
���
��� �������������������������
�����
����������������� �����������
�������������
� ������ �����
������
�����������
������� �������� �� ������������
��������� �������� ��������� ����
��������� �� ������ ������� �� ����� ������� �� ����
�� ������� ���� ����� ���
�������
����� �������� �� �� �����
������! "�� � ������� ������ ������� ����� �����
������������ �� #����
����$
%������������ ������������ ����� �� "� ��� ����������
���� ��
������� ������ �� ���
� �� ��
&��� ������ ������ �� ����������
&��� ��������� ��� ����������� ���������� �� ������
����������
��������� �� ���� �� ���� �����
"��� ��� "�������
"������ ��������� ���������� �� ����� �� ����������
���'��$
�� ����� ()��������
���� ��
������� ������ �� ���
� �� ��
%�� ��� ������� � ���� �� �������
&��� ��� ������� ���� ���� �������� *������� "�
����������
��������� �� ���� ��
� ����� ����� �����
������ ������ ()��������
�+�'��$
�� ��������� �����
�*�'
������� ������ �� ��� �������
�%�� ��� ������� ���� ����������
��������� �� ������ ��������� ���������� *������� "�
������� �� ������ �����
�������! ���� ������ �������
������ �����! �� ��� ������������� �������� ����
��������
������ ���������
&+�
������� ������ �� ��� ����������
� �� ��
%������� �� ���� ��� ����� "�
��������� �� ������ ������� �� ����� ������� �
�������� ,���� �� ���� ������
�������� ���� ��� � ��������
������� �������-% � ��� %���� �� ���������� �� "�
��� ���� ��������
�� � �� ���� �������� ��
������ ���������� �� �� � ���� �� .�/ ����� ������� �� ����
��� �� �� ������
��������� ���� ���� �����������
& ��
00������� ������� ��������� ��� ��
� �� ��
&��� ��������
&��� ������ ��� ����� ��� �� "� ���� �� ���� ��
����� ��� �����������
� ����� ��� ������ ����� ������ �� �����������
1�����������2
00������� ������� ��������� ��� ��
� �� ��
&��� ��������
&��� ������ ��� ����� ��� �� "� ���� �� ���� ��
�����������
����� ��� ���������� ��2�� ������
������� � ����� ��� ������ ����� ������ ��
����������� &��� ��� ������������� �� ����� �� ���������
3�� � ���� � � �� ��� �����������
1��������� ���
45����#�� ���������� �� ������ &+� ��
� �� ��
&��� ��������
����� ���� �� �� � ����� ��� �� ������� �������
���������� �"6���� "������
����� "���������
"���������
1���������
45����#�� ���������� �� ���� �� ���
�+������� �� ��� ����� ��� �������
����� �� �������� ��� ��� ������� ��� ������� ��
���� ��
��������� �� ���������� �"6����
�� ����� 1������ ����� ��� �� ���
������ �� ������� ����"�� �� ���������� ������� ��
�� ������
"������ "���������
�������
��������� �� ������ �� ��� ������
1���������
45����#�� ���������� �� ���� �� ���
� �� ��
������� ���� ��������� �� �������
���� �� ���� �� ���������� ���� �� �� �������$
���� ��
��������� �� ���������� �"6����
,�������
"������ "���������
���� 7������
�5����#�� ���������� �� ������ &+� ��
�%�������� �� ������ ��
+������� ���� ������� ����� ���� ������ �����������
5����������
���������� �"6���� ��� ��� ������
� ��� ���� ������ �����! "�� ���
��������� ��� ���������� ����� �� ���� �� ����� ��������
��� ��75�$
� � �����
������� ��� ������� �����
������������ �� �������� ���� ��� ����� �� "�����#���
����������
*L
egen
d:
Type
S:
Surf
ace
Mea
sure
men
ts
Type
B:
Bore
hole
Mea
sure
men
ts
Type
X:
Cro
ss-h
ole
Mea
sure
men
ts
13
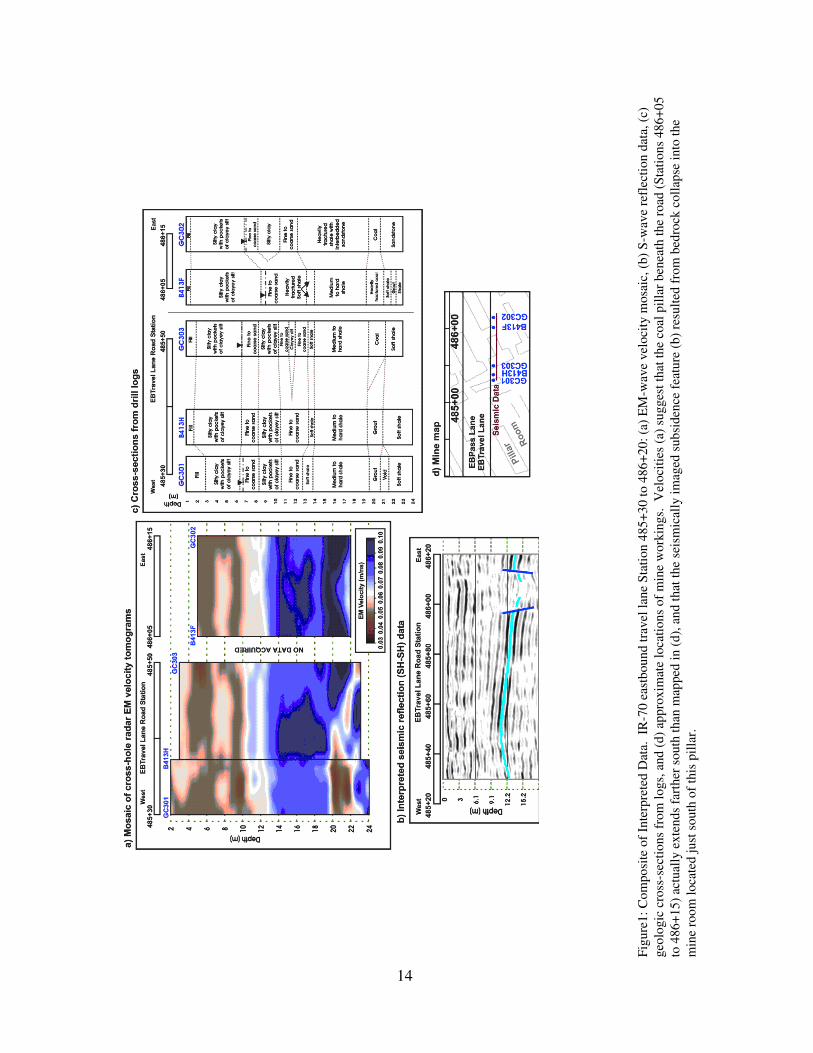
2.2 Summary of the Phase II Geophysical Studies
The Phase II studies established the usefulness of an integrated geophysical testing approach that
makes use of GPR for very-shallow investigations, seismic shear wave reflection surveys for
determining fracturing and voids in the bedrock above the mined interval and establishing the
continuity of the subsurface geology, and cross-hole GPR for determining the presence of void
space and other low density features between boreholes. In a few cases, the seismic shear wave
reflection surveys can be used to map block failures in the bedrock. The GPR, seismic shear
wave measurements, and cross-hole GPR measurements should be interpreted in a composite
form (see Figure 1 on the next page), and in all cases the interpretation of the composite
geophysical data should be conducted in connection with existing geologic and hydrogeologic
information.
14
Fig
ure
1:
Com
posi
teof
Inte
rpre
ted
Dat
a.IR
-70
east
bound
trav
ella
ne
Sta
tion
485+
30
to486+
20:
(a)
EM
-wav
evel
oci
tym
osa
ic,(b
)S
-wav
ere
flec
tion
dat
a,(c
)
geo
logic
cross
-sec
tions
from
logs,
and
(d)
appro
xim
ate
loca
tions
of
min
ew
ork
ings.
Vel
oci
ties
(a)
sugges
tth
atth
eco
alpil
lar
ben
eath
the
road
(Sta
tions
486+
05
to486+
15)
actu
ally
exte
nds
fart
her
south
than
map
ped
in(d
),an
dth
atth
ese
ism
ical
lyim
aged
subsi
den
cefe
ature
(b)
resu
lted
from
bed
rock
coll
apse
into
the
min
ero
om
loca
ted
just
south
of
this
pil
lar.
15
SECTION 3 - RECOMMENDED PROCEDURES FOR
APPLICATION OF GEOPHYSICAL METHODS
The selection and sequential application of geophysical methods is important. The following
general recommendations are made concerning the integration of geophysical methods into
investigations of potential mine subsidence under highways:
1) All sources of site information, including ODOT construction and maintenance records,
mine maps, existing boring and well logs, geologic and water resource maps, existing
mine permits and maps, and any other available information should be reviewed during
the earliest stages of an investigation (see ODOT Abandoned Underground Mine
Inventory and Risk Assessment Manual (AUMIRA) Section 3.1, 3.2, and Appendices C
& D).
2) A detailed site reconnaissance should be performed by personnel with experience in
evaluating and remediating mine subsidence (see AUMIRA Section 3.3).
3) Surface GPR measurements should be conducted on the driving lanes and shoulders to
detect voids or slumping that might be present in the immediate vicinity of the surface.
GPR can be used to identify suspect areas that have little or no apparent disturbance at the
surface. In general 2D GPR should be attempted initially because it is quicker and the
lower frequencies used may provide greater depth of penetration (compared to 3D GPR).
3D GPR should be attempted to delineate the horizontal and vertical extent of anomalies
at suspect locations identified by the 2D GPR. The use of 3D GPR requires close line
spacings and higher frequencies, which may limit the depth of penetration. An antenna
range of 0.2 to 1 meter (0.7 to 3.2 feet) with a centerband frequency range of 500 HHz to
12 GHz can be expected to be most affective in paved areas for shallow investigations. In
non-paved areas the most affective antenna frequency will vary depending upon the soil
type, 0.5 to 10 meters (1.6 to 33 feet) at 50 MHz to 500 MHz for sandy soils and 0.1 to
0.5 meters (0.3 to 1.6 feet) for sandy/clayey soils. Generally speaking lower frequencies
provide deeper depths of penetration. In all cases, a range of antennas should be tested at
16
the site to determine the optimum antenna arrangement.
4) A drilling program should be planned and implemented which investigates any anomalies
detected by the GPR and includes the general characterization of the site. The drilling
should include standard penetration testing at regular intervals, the collection of
undisturbed samples (if appropriate), and recovery of bedrock samples via coring
methods. Estimates of the vertical drops of the drilling tools should be recorded to
estimate the extent of voids. It is noted that voids can occur within the soil, overburden
bedrock, or at the mined zone (see ODOT Specifications for Subsurface Investigations
Manual).
5) For cases where mine dewatering is believed to have been a contributing factor to the
subsidence, a hydrogeologic investigation should be performed. The investigation should
include the installation of groundwater monitoring wells or piezometers, in-situ and/or
laboratory permeability testing, and estimates of lateral and vertical groundwater
movement. The lowering of the groundwater level in abandoned mines can significantly
increase the effective loading on the mine roof, and result in subsidence. At a minimum,
at least three monitoring wells should be installed in each significant water-bearing
formation encountered, including the abandoned mine.
6) Resistivity may be useful in the early stages of an investigation to help define the
boundaries of the larger slump regions and regions of fracturing in the near surface. The
work completed for this Project used capacitively coupled and direct coupled dipole-
dipole arrays.
7) Where there is a high probability of the presence of collapse features at the soil - bedrock
interface, a seismic reflection survey using shear waves is recommended. The best
component combination identified by this research is an SH-SH configuration in which
the source and detector orientation is orthogonal to the line direction.
17
8) Confirmation drilling and sampling of the soil and bedrock should be conducted in areas
where anomalous data has been gathered and in areas of suspected abandoned
underground mines. Conventional borehole geophysical log measurements should be
made in each borehole. These measurements serve as a continuous record of the
lithology; can be used to verify the presence of voids; and, can be correlated to determine
the continuity of near-horizontal geologic features.
9) Seismic cross-hole velocity and tomography measurements proved to be difficult to
implement above the water table. However, these investigations showed the usefulness
of cross-hole GPR measurements. These measurements proved to be a high-resolution
compliment to surface seismic and surface GPR measurements. Cross-hole GPR was a
successful tool to determine the vertical location and extent of fractured zones that may
be present between boreholes.
Interpretation of data is an iterative process between the drilling program and the geophysical
data. The drilling data will improve the interpretation of the geophysical data, and the improved
data interpretation should be applied to re-direct the drilling to a conclusive result. All
geophysical methods are interpretive, and the interpretation improves as more subsurface
information becomes available.
18
SECTION 4 - PITFALLS OF APPLYING GEOPHYSICAL METHODS
In terms of subsurface physical properties, some sites have significant variability that makes it
difficult to conduct geophysical surveys in a normal manner. The geologic variability
(heterogeneity of the physical properties) can lead to ambiguity in the interpretation of the
geophysical measurements. This situation may be improved in the future with sophisticated
models that help to account for the spatial variability of the subsurface materials. At present, the
effect of the geologic variability on the geophysical measurements can only be determined by
performing confirmatory drilling and sampling at the locations of the anomalies to assist in the
interpretation of the results.
Other major factors that affect the geophysical measurements along highways are the effect of
passing traffic on the measurements, as well as traffic control, and above and below ground
utility effects and constraints. In addition to the obvious factor of workers safety, the subsurface
vibrations induced by the flow of traffic can significantly affect the geophysical measurements.
Because of these affects, the data must be interpreted by personnel with the knowledge and
experience to differentiate between the “noise” and genuine subsurface features. It should be
noted that the IR-70 Study did prove that high resolution surface seismic reflection can be used
effectively along a busy highway by measuring shear waves rather than the compressional waves.
A major hindrance at the present time to the general acceptance of geophysical techniques is the
level of technical competence needed for routine application. There are no instruments which are
currently available that can be used by the field engineer or geologist without specialized training
and/or consultation with geophysicists. Additionally, economically-viable, rapid acquisition
systems such as GPR may not be used frequently enough by a highway department to warrant the
equipment costs and training needed for the reliable collection and interpretation of data. These
problems are difficult to overcome and are compounded by the unknown variability of the
subsurface conditions of sites with limited available information. On this basis, collection of
data and interpretation of the data by trained geophysicists is recommended.
19
SECTION 5 - REFERENCES
ASTM Standards
D 420 Guide to Site Characterization for Engineering, Design, and Construction Purposes
D 653 Terminology Relating to Soil, Rock, and Contained Fluids
D 4428/D 4428M Test Methods for Cross-hole Seismic Testing
D 5753 Guide for Planning and Conducting Borehole Geophysical Logging
G 57 Test Method for Field Measurement of Soil Resistivity Using the Wenner dipole-dipole
Method
D 6429 Standard Guide for Selecting Surface Geophysical Methods
ODOT Manuals
Manual for Abandoned Underground Mine Inventory and Risk Assessment
Specifications for Subsurface Investigations
ODOT Report
PID No. 18459 Site Investigation Report: Mine Research Project - GUE 70 – 14.10
Books (author, title)
Parasnis, Principles of Applied Geophysics
Reynolds, An Introduction to Applied and Environmental Geophysics
Robinson and Coruh, Basic Exploration Geophysics
General (source or author, title)
EEGS, Proceedings of the Symposium on the Application of Geophysics to Environmental and
Engineering Problems.
EEGS, Journal of Environmental and Engineering Geophysics. Daniels, et al., Geophysical
Methods Applied to Soil Science.
20
Sheriff, Encyclopedic Dictionary of Applied Geophysics. Sheriff, R.E., Geophysical Methods:
Prentice Hall.
Soc. Exploration Geophysicists, Geophysics
Soc. Exploration Geophysicists, The Leading Edge of Exploration
Daniels, J.J., B. Allred, M. Collins, and J. Doolittle, 2003, Geophysics in Soil Science: in Ency.
Soil Science, Update 4, Marcel Dekker, NY, p. 1-5.
EEGS, 1988-2003, Proceedings of the Symposium on the Application of Geophysics to
Environmental and Engineering Problems: Environmental and Engineering Geophysical
Society (EEGS), Denver.
Parasnis, 1975, Principles of Applied Geophysics: Chapman and Hall, London, 214 p.
Reynolds, 1998, An Introduction to Applied and Environmental Geophysics: Wiley, NY, 796 p.
Robinson, E.S., and C. Coruh, 1988, Basic Exploration Geophysics: Wiley, NY, 562 p.
Sheriff, 2002, Encyclopedic Dictionary of Applied Geophysics: Soc. Expl. Geoph., Tulsa, 429 p.


