Embed Size (px)
Citation preview

arX
iv:a
stro
-ph/
0103
046v
1 2
Mar
200
1Mon. Not. R. Astron. Soc.000, 000–000 (0000) Printed 7 January 2014 (MN LATEX style file v1.4)
H0 from an orientation-unbiased sample of SZ and X-ray clusters
Michael E. Jones,1 Alastair C. Edge,2 Keith Grainge,1 William F. Grainger,1
Rudiger Kneissl,1 G.G. Pooley,1 Richard Saunders,1 Shigeru J. Miyoshi,3
Taisuke Tsuruta,3 Koujun Yamashita,4 Yuzuru Tawara,4 Akihiro Furuzawa,4
Akihiro Harada,4 Isamu Hatsukade51Astrophysics Group, Cavendish Laboratory, Madingley Road, Cambridge CB3 0HE2Department of Physics, South Road, Durham DH1 3LE3Department of Physics, Kyoto Sangyo University, Kamigamo-Motoyama, Kita-ku, Kyoto 603-8555, Japan4Department of Astrophysics, Faculty of Science, Nagoya University, Chikusa-ku, Nagoya 464-0814, Japan5Faculty of Engineering, Miyazaki University, 1-1 Gakuen-kibanadai-nishi, Miyazaki 889-2192, Japan
7 January 2014
ABSTRACT
We have observed the Sunyaev–Zel’dovich effect in a sample of five moderate-redshiftclusters with the Ryle Telescope, and used them in conjunction with X-ray imaging and spec-tral data fromROSATandASCA to measure the Hubble constant. This sample was chosenwith a strict X-ray flux limit using both the BCS and NORAS cluster catalogues to be wellabove the surface-brightness limit of theROSATAll-Sky Survey, and hence to be unbiasedwith respect to the orientation of the cluster. This controls the major potential systematic ef-fect in the SZ/X-ray method of measureingH0. Taking the weighted geometric mean of theresults and including the main sources of random error, namely the noise in the SZ measure-ment, the uncertainty in the X-ray temperatures and the unknown ellipticity of the clusters, wefind H0 = 59+8
−7kms−1Mpc−1 assuming a standard CDM model withΩM = 1.0,ΩΛ = 0.0, orH0 = 65+8
−7kms−1Mpc−1 if ΩM = 0.3,ΩΛ = 0.7.
Key words:cosmic microwave background – cosmology:observations – X-rays – distance scale – galax-ies:clusters:individual (A697, A773, A1413, A1914, A2218)
1 INTRODUCTION
It has long been recognised that the Sunyaev–Zel’dovich (SZ) ef-fect (Sunyaev & Zel’dovich 1972) in clusters of galaxies, alongwith X-ray measurements, can provide a method of measuring dis-tances on cosmological scales (Gunn 1978; Silk & White 1978;Cavaliere et al. 1979; Birkinshaw 1979). The method takes advan-tage of the differing dependences on the cluster electron density
ne and temperatureTe of the X-ray bremsstrahlung (∝ n2eT1/2
e ) andSZ effect (∝ neTe) to measure the physical size of the cluster, andhence its angular-diameter distance. The dependence of thederivedvalue ofH0 on the important quantities is
H0 ∝(
Te
∆TSZ
)2
θSXℓ⊥ℓ‖
,
where∆TSZ is the SZ brightness decrement,SX is the X-ray surfacebrightness,θ is the apparent angular size of the cluster, andℓ⊥
ℓ‖is
the ratio of the linear sizes of the cluster perpendicular and parallelto the line of sight.
The systematic effects in this method of measuringH0 are
quite different from those in other methods, either in the traditionaldistance ladder or in other direct physical methods such as gravita-tional lensing, and are mostly due to the difficulty of modelling thecluster gas that causes both the SZ effect and the X-ray emission.Recent work has shown that the small-scale features in the gas dis-tribution such as cooling flows or clumping contribute smaller bi-ases than might have been thought, since the effects on the observedquantities enteringH0 tend to cancel each other even for a singlecluster (eg, Grainger (2001), Maggi et al.). However, the large-scaledistribution of the gas poses a problem, since the line-of-sight depththrough the cluster cannot be measured directly, and has to be as-sumed to be the same as the size of the cluster in the plane of thesky. This asumption will be violated if clusters are chosen prefer-entially because of high surface brightness, since this will favourclusters that are extended along the line of sight. This willbias lowthe derived value ofH0. We therefore need a cluster sample that isselected on total flux rather than surface brightness, well above thesurface brightness limit of the survey. Although several individualH0 estimates from the SZ/X-ray method have been published (eg(Hughes & Birkinshaw 1998; Holzapfel et al. 1997; Reese et al.
c© 0000 RAS

2 M.E. Jones et al.
2000)), properly selected cluster samples are only recently begin-ning to emerge (Mason, Myers & Readhead 2001). In this paper wederive a sample of moderate-redshift X-ray-selected clusters that iscarefully controlled to be free of any orientation bias, anduse it tocalculateH0 using the SZ data from the Ryle Telescope (RT).
Unless stated otherwise, we assume a standard cold dark mat-ter cosmology (SCDM,ΩM = 1.0, ΩΛ = 0.0). We also give ourresults assuming aΛCDM cosmology (ΩM = 0.3, ΩΛ = 0.7).
2 X-RAY CLUSTER SELECTION
The most complete X-ray cluster samples suitable for our purposeare selected from theROSAT All-Sky Survey (RASS). We usetwo such samples, the Bright Cluster Sample (BCS) (Ebeling et al.1998), and Northern Rosat All-Sky Survey (NORAS) (Bohringer etal. 2000). We began selection of our SZ sample from BCS while itwas being compiled; we use NORAS as a consistency check. Bothsurveys are based on cluster candidates found in the first processing(SASS) of the RASS data, with further tests to check they are in-deed clusters. A problem, particularly for clusters at highredshift,is the risk of incompleteness for compact clusters that may not ap-pear extended enough to be recognised as such. BCS attempts toovercome this problem by adding known Abell and Zwicky clustersto the sample. However, comparing the BCS and NORAS samplesafter applying our RT selection criteria, it turns out that our sam-ple is not affected by differences between the BCS and NORASsecondary selections.
The flux limit of NORAS is 3×10⁻¹² erg s−1 cm−2 at 90%completeness; that of BCS is 4.4×10⁻¹² erg s−1 cm−2 to the samecompleteness. But we limit our sample to even higher fluxes, ofgreater than 5×10⁻¹² erg s−1 cm−2 (see Figure 1). Both this anda restriction to redshiftsz < 0.3 help reduce the risk of missingcompact clusters. In accordance with the requirements for the RyleTelescope we restrict our sample to the northern sky at declina-tions δ > 20, to a redshift range ofz> 0.14, and luminosities ofLx > 8×1044 erg s−1. Table 1 lists the clusters from BCS and fromNORAS that meet these criteria, and also indicates those whichhave radio sources that would make SZ measurement difficult orimpossible. Where the surveys disagree on whether a clustershouldbe included on grounds of flux, we cautiously select only thoseclusters that meet our criteria in both surveys: this excludes threeclusters above our flux limits in BCS and not in NORAS, and onein NORAS but not in BCS. This is consistent with the errors in theflux estimates in each survey. Two BCS-selected clusters arenot inNORAS, consistent with the inclusion of optically selectedclustersin BCS that are not in NORAS due to lack of extent. Of the elevenclusters satisfying our X-ray criteria, six have radio sources in thecluster or within the field of view of the RT that are too brightat15 GHz to allow SZ observation with the RT. We have observedthe remaining five, A697, A773, A1413, A1914 and A2218 withthe RT and obtained detections for all of them; the results are dis-cussed below. Since the presence of radio sources cannot be cor-related with cluster orientation, this subsample is effectively ran-domly chosen, and therefore retains the orientation-independenceof the whole sample. Indeed, we have checked that the our subsam-ple is not correlated to X-ray properties such as flux, extentlike-lihood and measured extent. It therefore appears unlikely that anysignificant bias, larger than the random error, is present inour aver-agedH0 result. Clearly a larger sample would improve matters: thesmall size of our sample highlights the difficulty of selecting rig-
orously at moderately high redshift, even using the best large-areaX-ray surveys available.
3 SZ OBSERVATIONS AND H0 CALCULATION
Details of our observational and modelling methods are given inGrainge et al. (2001a), Grainge et al. (2001b) and Grainger et al.(2001). We briefly summarise them here.
In each case we fit theROSATPSPC or HRI image using anellipsoidalβ-model, withβ, the core radii in the plane of the sky,θ1andθ2, the position angle of the major axis, the position on the sky,and the central electron densityn0 all as free parameters. The coreradius in the line of sight is set to the geometric mean of the othertwo. A downhill simplex method is used to maximise the likelihoodof the data given the model, using Poisson statistics. For the PSPCimages we use the hard band (0.5–2 keV) in order to minimise theeffect of Galactic absorption.
We remove contaminating radio sources by a maximum like-lihood fit to the visibility data, simultaneously fitting theSZ decre-ment (using the X-ray-determined model, with a variable ampli-tude) and the sources. We include trial sources at all positions sug-gested either from the long baseline RT data or from other obser-vations such as NVSS (Condon et al. 1998), and allow their po-sitions and fluxes to vary in the fit. This allows us to remove theeffects of sources whose existence is known from lower-frequencyobservations but whose brightness would not warrant a significantdetection from the RT data alone.
Finally we take the source-subtracted data and compare themwith mock SZ data derived from the X-ray model, taking into ac-count the full response of the RT. We vary the normalisation ofthe mock data (equivalent to varyingH0) and find the likelihood ofthe data, and then multiply by a prior that is uniform in log space(sinceH0 is a scale parameter) to find the peak and extent of theposterior probability distribution. We then apply corrections for themore exact relativistic form of the Comptony parameter (Challi-nor & Lasenby 1998), and small time-dependant variations fromthe nominal RT flux calibration scale (determined from VLA mon-itoring of our primary flux calibrators, 3C48 and 3C286), as wellas adding in (in quadrature) estimates of the other main sources oferror.
We now give details of the procedure for each of the five clus-ters. Two have been published more fully elsewhere (A773, Saun-ders et al. (2001) and A1413, Grainge et al. (2001b)) and are brieflysummarised here; one (A2218) is a re-analysis of previouslypub-lished data (Jones 1995); the other two (A697 and A1914) are new.
3.1 A697
A697 was observed with theROSAT HRI on 1995 November 6with a live time of 28.1 ks. We also observed it using ASCA dur-ing 1996 April in order to determine its temperature. Analysingboth the GIS and SIS data using standard XSPEC tools, we finda temperature of 8.0+0.6
−0.4 keV (68% confidence), with a metallicityof 0.24± 0.07 solar. Fitting to theROSAT HRI data, we find theparameters given in Table 2. The HRI image, model and residualsare shown in Figure 2.
We observed A697 with the RT on 42 occasions between1994 August 6 and 1996 April 27. The map of all the data isshown in Figure 4. The bright source to the NW is extended, butcan be successfully modelled as three point sources. Fitting si-multaneously to the sources and SZ decrement gives a good fit
c© 0000 RAS, MNRAS000, 000–000
H0 from an orientation-unbiased sample 3
with the source parameters listed in Table 3. Fitting the source-subtracted data to the model derived from the X-ray data (Fig-ure 3), and applying the relativistic and flux-scale corrections, wefind H0 = 52+8
−6 kms−1 Mpc−1 (errors from SZ fitting only). Includ-
ing the other errors, dominated by the X-ray temperature (+14−10%)
and ellipticity (±14%), we findH0 = 52+13−11kms−1 Mpc−1. For a
ΛCDM cosmology withΩM = 0.3 andΩΛ = 0.7, this becomesH0 = 59+15
−12kms−1 Mpc−1.
3.2 A773
Details of the determination ofH0 from A773 are given in Saun-ders et al. (2001). We used aROSAT HRI image and a tem-perature measurement from ASCA in conjunction with our RTdata to estimate a value ofH0 = 77+19
−17kms−1 Mpc−1 for SCDM,
H0 = 85+20−19kms−1 Mpc−1 for ΛCDM.
3.3 A1413
Details for A1413 are given by Grainge et al. (2001b), who alsodiscuss the contributions to theH0 error budget in general. Us-ing aROSATPSPC image and ASCA temperature, we findH0 =57+23
−16kms−1 Mpc−1 for SCDM, H0 = 61+25−17kms−1 Mpc−1 for
ΛCDM.
3.4 A1914
A1914 was observed with theROSAT PSPC for 8.6 ks in 1992July. There are several pieces of evidence to suggest that A1914is undergoing a merger. TheROSAT image (see Figure 5) showssignificant substructure in the core of the cluster, but no evidenceof a cooling flow. The temperature, measured from an ASCA ob-servation, is rather high at 8.56±0.39 keV. The POSS optical im-age shows two distinct groups of galaxies with no single dominantgalaxy, and finally there is a diffuse steep-spectrum radio source tothe NE of the cluster centre that is detected in the WENSS (300MHz) (Rengelink et al. 1996) and NVSS (1.4 GHz) surveys. Thisraises the question of whether A1914 should be included in oursample, since it is possible that the cluster gas might be farfromhydrostatic equilibrium and difficult to model. We choose toin-clude it in our sample since simulations (Grainger 2001) show thateven including clusters with large internal kinetic energies in theirgas does not bias the sample averageH0 However, such clusters canhave a large scatter about the mean value – this does appear tobethe case with A1914 and also with A2218.
We fitted aβ model to theROSATPSPC image with the pa-rameters given in Table 2. The residuals (see Figure 2) were no-ticeably poorer than those from the fits to other clusters such asA1413; a Monte Carlo analysis shows that the hypothesis thatthetrue structure is aβ model and that the features seen result fromPoisson noise can be rejected at the 4-σ level. A1914 was observedwith the RT on 19 occasions between 1996 March 6 and April16; the full resolution radio image is shown in Figure 5. Thereare clearly several radio sources near the cluster centre, some ofwhich are also detected in a VLA image (Figure 5). We used theVLA source positions and positions from a long-baseline RT im-age to estimate the fluxes of nine sources; the fluxes found andsub-tracted are shown in Table 3. Fitting the source-subtractedshort-baseline data to the X-ray-based model (Figure 3) results ina valueof H0 = 119+42
−31kms−1 Mpc−1 with errors just from the SZ fitting,
andH0 = 119+46−38kms−1 Mpc−1 including the other sources of er-
ror. ForΛCDM this becomesH0 = 129+51−42kms−1 Mpc−1.
3.5 A2218
A2218 was the first cluster to be observed in the RT SZ pro-gramme (Jones et al. 1993), and has also been extensively observedin many wavebands, with SZ detections in the radio (eg Birkinshaw& Hughes (1994)) as well as strong and weak lensing observations(eg Kneib et al. (1995) and Squires et al. (1996)) and X-ray stud-ies (eg Markevitch (1997)). We have previously reported a mea-surement ofH0 from this cluster (Jones 1995); we re-analyse ourdata here because we have improved our source-subtraction andmodelling techniques, and because a new temperature measure-ment from ASCA is available that supersedes the previous GINGAmeasurement.
Figure 6 shows the image made by combining 30 days’ RTdata taken in two array configurations between 1992 December4and 1993 March 23. This map has simply been CLEANed with nosource subtraction; nevertheless, even at this high resolution the SZdecrement is clearly visible, and an approximate calculation of theobserved temperature decrement, using the CLEAN restoringbeamsize of 40′′×36′′, gives a maximum decrement of−760±150µK.This agrees well with the fittedβ-model central temperature of−797µK.
We used theROSATPSPC observation made on 1991 May 25,which has a live time of 42.47 ks. The X-ray model fitting parame-ters are shown in Table 2. As with A1914, the X-ray image containssubstructure that is significantly different from a smooth ellipsoidalβ model (see Figure 2). Preliminary source subtraction in themapplane had shown that, of the three bright sources evident in Fig-ure 6, the central one was point-like but the eastern and westernsources had some additional extended flux. We therefore fitted a to-tal of six trial sources, modelling the western source as three pointsand the eastern source as two. This gave a good fit to the data withthe source parameters listed in Table 3. Subtracting these sourcesand fitting to the X-ray model (using an ASCA-derived temper-ature of 7.20± 0.36 keV (Mushotzky & Loewenstein 1997)), wefind a best fit value ofH0 = 31+8
−6 kms−1 Mpc−1, where these errorsonly include the SZ fitting. Including the other dominant sourcesof error (±10% from the temperature measurement and±14%from the likely ellipticity), we findH0 = 31+10
−8 kms−1 Mpc−1, or
H0 = 35+11−9 kms−1 Mpc−1 for ΛCDM.
3.6 Combined result
The values ofH0 derived from each cluster are summarised in in Ta-ble 4. Since the main sources of error in each value are in the formof a multiplicative factor, we calculate the sample mean by taking aweighted average of logH0. The result isH0 = 59+8
−7 kms−1 Mpc−1
for SCDM orH0 = 65+8−7 kms−1 Mpc−1 for ΛCDM. Looking at the
scatter in our individual values, we see that A697, A773 and A1413all agree with the mean within 1-σ. A1914 is 1.6σ above the meanand A2218 is 2.8σ below it. These are the two clusters for whichthere is independent evidence, from the lack of a good fit of theX-ray model and from the optical galaxy distribution, of signifi-cant dynamical activity. Since our error estimate does not includea component to take account of this effect (for lack of a meansofquantifiying it), it is not suprising that the scatter appears anoma-lously large. Nevertheless we feel justified in keeping these twoclusters in the sample based on the evidence from simulations that
c© 0000 RAS, MNRAS000, 000–000

4 M.E. Jones et al.
dynamically active clusters do not bias the value ofH0 – indeed,removing them does not significantly change the best estimate ofH0.
4 CONCLUSIONS
We have usedROSATand ASCA X-ray data and Ryle TelescopeSZ observations to measure the Hubble constantH0 from a sam-ple of five clusters, selected using the BCS and NORAS clustercatalogues to be free of orientation bias. The weighted geometricmean value ofH0 from this sample isH0 = 59+8
−7 kms−1 Mpc−1
assuming a standard CDM model withΩM = 1.0,ΩΛ = 0.0, orH0 = 65+8
−7 kms−1 Mpc−1 if ΩM = 0.3,ΩΛ = 0.7.
5 ACKNOWLEDGEMENTS
We thank the staff of the Cavendish Astrophysics group who ensurethe operation of the Ryle Telescope, which is funded by PPARC.AE acknowledges support from the Royal Society; RK acknowl-edges support from an EU Marie Curie Fellowship; WFG acknowl-edges support from a PPARC studentship. We have made use ofthe ROSAT Data Archive of the Max-Planck-Institut fur extrater-restrische Physik (MPE) at Garching, Germany. We thank HansBohringer for helpful discussions.
c© 0000 RAS, MNRAS000, 000–000

H0 from an orientation-unbiased sample 5
REFERENCES
Birkinshaw M., 1979, MNRAS, 187, 487Birkinshaw M., Hughes J. P., ApJ, 1994, 420, 33.Bohringer H., Voges W., Huchra J.P., McLean B., Giacconi R.,Rosati P.,
Burg R., Mader J., Schuecker P., Simic D., Komossa S., Reiprich T.H.,Retzlaff J., Trumper J., 2000, ApJS, 129, 435.
Cavaliere A., Danese L., DeZotti G., 1979, A&A, 75, 322.Challinor A., Lasenby A. N., ApJ, 1998, 499, 1.Condon J.J., Cotton W.D., Greisen E.W., Yin Q.F., Perley R.A., Taylor G.B.,
Broderick J.J.,1998, AJ, 115, 1693.Ebeling H., Edge A.C., Bohringer H., Allen S.W., Crawford C.S., Fabian
A.C., Voges W., Huchra J.P., 1998, MNRAS, 301, 881.Grainge K., Grainger W. F., Jones M. E., Kneissl R., Pooley G.G., Saunders
R., 2001a, submitted to MNRAS.Grainge K., Jones M. E., Saunders R., Pooley G. G., Edge A., Kneissl R.,
2001b, submitted to MNRAS.Grainger W. F., 2001, PhD. thesis, University of Cambridge.Grainger W. F., Das R., Grainge K., Jones M. E., Kneissl R., Pooley G. G.,
Saunders R., 2001, submitted to MNRAS.Gunn J.E., 1978, in: Observational Cosmology, ed. A. Maeder, L. Martinet
and G. Tammann (Geneva: Geneva Observatory)Holzapfel W. L., Arnaud M., Ade P. A. R., Church S. E., FischerM. L.,
Mauskopf P. D., Rephaeli Y., Wilbanks T. M., Lange A. E., 1997ApJ,480, 449.
Hughes J. P., Birkinshaw M., 1998, ApJ, 501, 1.Jones M. E., Saunders R., Alexander P., Birkinshaw M., Dillon N., Grainge
K., Lasenby A., Lefebvre D., Pooley G. G., Scott P., Titterington D.,Wilson D., 1993, Nat, 365, 320.
Jones, M. E., 1995, Astro. Lett. and Communications, 1995, 32, 347.Kim K.T., Tribble P. C., Kronberg P. P., 1991, ApJ, 379, 80.Kneib J. P., Mellier Y., Pello R., Miralda-Escude J., Le Borgne J.-F.,
Boehringer H., Picat J.-P., 1995, A&A, 303, 27.aggi A., et al., in prepMarkevitch M., 1997, ApJL, 483, L17.Markevitch, M., Forman, W. R., Sarazin, C.L., Vikhlinin, A., ApJ, 1998,
503, 77Mason, B.S., Myers, S. T., Readhead, A. C. S., 2001, ApJL in press (astro-
ph/0101169). 485, 1.Mushotzky R.F., Loewenstein M., 1997, ApJ, 481, L63.Myers, S. T., Baker, J. E., Readhead, A. C. S., Leitch, E. M., Herbig, T.,
1997, ApJ, 485, 1.Reese E. D. , Mohr J. J., Carlstrom J. E., Joy M. , Grego L., Holder G. P.,
Holzapfel W. L., Hughes J. P., Patel S. K., Donahue M., 2000, ApJ 53338.
Rengelink R.B, Tang Y., de Bruyn A.G., Miley G.K., Bremer M.N.,Rottgering H.J.A., Bremer M.A.R., 1996, A&AS, 124, 259-28
Saunders R., Kneissl R. , Grainger W. F., Grainge K., Jones M.E., MaggiA., Das R. Edge A. C., Lasenby A. N., Pooley G. G., Miyoshi S. J., Tsu-ruta T., Yamashita K., Tawara Y., Furuzawa A., Harada A., HatsukadeI., 2001, submitted to MNRAS.
Silk J., White S.D.M., 1978, ApJL, 226, L103Squires G., Kaiser N., Babul A., Fahlman G., Woods D., Neumann D. M.,
Boehringer H., 1996, ApJ, 461, 572.Sunyaev R. A., Zel’dovich Ya B., 1972, Comm. Astrophys. Sp. Phys., 4,
173.
c© 0000 RAS, MNRAS000, 000–000

6 M.E. Jones et al.
Cluster Flux density (µJy) RA offset (arcsec) dec offset (arcsec)
A697 462 −468 193154 −442 156215 −483 226624 28 −236
A1914 153 −262 −195379 −169 −99155 −141 31173 −108 201103 −118 −52278 −96 −82234 49 66123 −56 210186 13 158
A2218 1438 −189 361227 −40 1171541 126 94522 132 105543 −196 23240 −207 41
Table 3. Sources subtracted from the radio data. The flux densities givenare apparent, ie not corrected for the RT primary beam. Offsets arefrom the radio pointing centres: A697 08h42m57s.7+ 36.721′45′′; A191414h26m02s.0+ 3749′29′′; A2218 14h26m02s.0+ 3749′29′′(J2000). Theerrors on the source fluxes are±30,±45 and±35µJy respectively.
Cluster H0 (SCDM) H0 (ΛCDM) ∆T0 (µK)
A697 52+13−11 59+15
−12 1047A773 77+19
−17 85+20−19 737
A1413 57+23−16 61+25
−17 863A1914 119+46
−38 129+51−42 864
A2218 31+10−8 35+11
−9 797
Sample 59+8−7 65+8
−7
Table 4. H0 values for the five clusters in the sample, for both SCDM andΛCDM cosmologies. Also given are the central temperature decrements us-ing the best normalisation of the fittedβ model to the SZ data.
c© 0000 RAS, MNRAS000, 000–000

H0 from an orientation-unbiased sample 7
Cluster R.A. (J2000) Dec z fBCSX LBCS
X f NORASX LNORAS
X B? N? R?
A586 113.091 31.629 0.1710 9.1 11.12 7.94 9.84 * *A665 127.739 65.854 0.1818 11.8 16.33 11.23 15.69 * *A697 130.741 36.365 0.2820 5.0 16.30 5.77 19.15 * * *A773 139.475 51.716 0.2170 6.7 13.08 5.71 12.11 * * *Z2701 148.198 51.891 0.2140 5.6 10.68 – – *A963 154.255 39.029 0.2060 5.9 10.41 – – *
A1413 178.826 23.408 0.1427 15.5 13.28 12.69 10.91 * * *A1423 179.342 33.632 0.2130 5.3 10.03 3.73 7.23 * *A1682 196.739 46.545 0.2260 5.3 11.26 4.07 8.79 *A1758 203.179 50.550 0.2799 3.6 11.68 5.60 18.29 * *A1763 203.818 40.996 0.2279 6.9 14.93 6.35 13.85 * *A1914 216.509 37.835 0.1712 15.0 18.39 12.90 15.91 * * *A2111 234.924 34.417 0.2290 5.0 10.94 3.91 8.68 *A2218 248.970 66.214 0.1710 7.5 9.30 7.16 8.16 * * *A2219 250.094 46.706 0.2281 9.5 20.40 11.18 24.33 * *
RXJ1720 260.037 26.635 0.1640 14.3 16.12 10.84 12.34 * *A2261 260.615 32.127 0.2240 8.7 18.18 9.83 20.61 * *
Table 1. The selection of the cluster sample from the BCS and NORAS surveys. Clusters are required to haveLX > 8× 1044ergs−1 and fX > 5×10⁻¹²ergs−1 cm−2 in both samples, and to be free of contaminating radio sources. The final three columns indicate which clusters are selected from BCS,NORAS, and radio data respectively. Eleven clusters meet the X-ray selection criteria, and five of these (shown in bold) are sufficiently free of radio sourcesto have their SZ effects measured. Units of luminosityLX are 1044ergs−1 and of flux fX are 10−12ergs−1 cm−2.
Cluster z β θ1 (′′) θ2 (′′) PA n0 h−1/250 cm−3 Temperature (keV)
A697 0.282 0.67 46 34 101 7.9×10⁻³ 8.0+0.55−0.42
A773 0.217 0.64 61 44 16 6.8×10⁻³ 8.7+0.42−0.42
A1413 0.143 0.58 56 38 1 9.6×10⁻³ 8.5+0.79−0.48
A1914 0.1712 0.69 51 46 10 13.6×10⁻³ 8.6+0.36−0.39
A2218 0.171 0.65 69 53 −8 6.0×10⁻³ 7.20+0.36−0.36
Table 2. X-ray parameters for the five clusters used in the combinedH0 measurement.
c© 0000 RAS, MNRAS000, 000–000

8 M.E. Jones et al.
Figure 1. The full NORAS X-ray cluster sample and the region (white) ofour SZ subsample. The lines correspond to flux limits of 1, 3 and 5×10⁻¹²
erg s−1 cm−2, which are the approximate lower detection limit, the 90%completeness limit, and the limit of the SZ sample respectively.
c© 0000 RAS, MNRAS000, 000–000
H0 from an orientation-unbiased sample 9
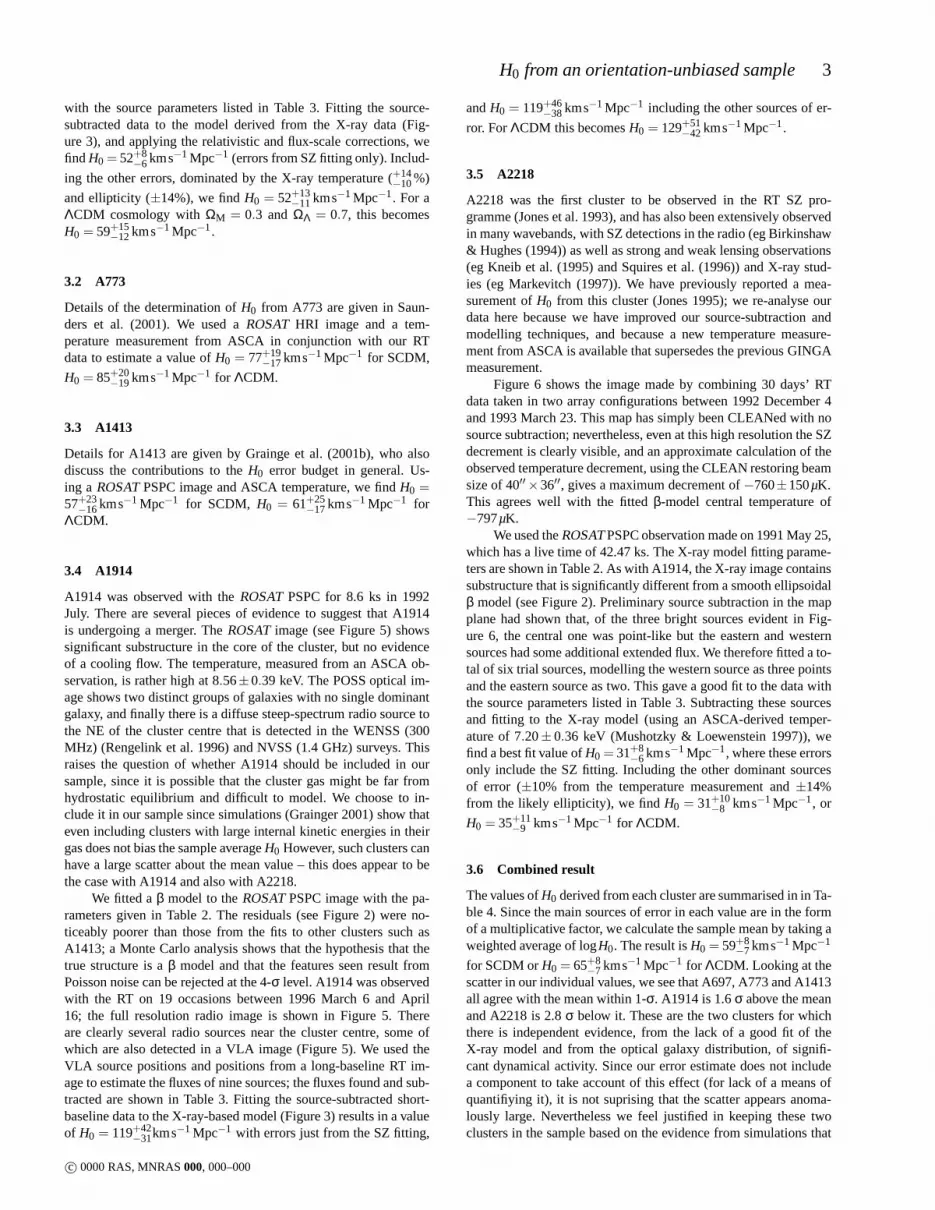
Figure 2. X-ray image, best-fitting model, and residuals for (top) A697, (centre) A1914 and (bottom) A2218. The contour intervalsare respectively 1 countper 4 arcsec pixel, 2 counts per 8 arcsec pixel and 2 counts per8 arcsec pixel.
Figure 3. Source-subtracted visibilities (real part only) for (left) A697, (centre) A1914 and (right) A2218 (filled points with error bars), binned azimuthally,compared with the best-fitting model in each case (open points joined by lines). The lack of smoothness in the models is dueto the inclusion of points fromdifferent baselines with different model values (due to ellipticity) in the same bin.
c© 0000 RAS, MNRAS000, 000–000

10 M.E. Jones et al.
10 20 30
DE
CL
INA
TIO
N (
J200
0)
RIGHT ASCENSION (J2000)08 43 30 15 00 42 45 30 15
36 30
28
26
24
22
20
18
16
14
10 20 30
DE
CL
INA
TIO
N (
J200
0)
RIGHT ASCENSION (J2000)08 43 15 00 42 45
36 26
25
24
23
22
21
20
19
18
17
Figure 4. (Left)CLEANed map of all the radio data on A697 (contours) superposed on theROSAT HRI image (greyscale). The contour interval is60µJybeam−1; dashed contours are negative. The CLEAN restoring beam of 101′′ × 61′′ is shown (inset). (Right)CLEANed map of the source-subtractedradio data on A697, with a gaussian taper of width 2000λ applied (contours) superposed on theROSAT HRI image (greyscale). The contour interval is60µJybeam−1; dashed contours are negative. The CLEAN restoring beam of 76′′×39′′ is shown (inset).
0.0 0.5 1.0
DECLINATION (J2000)
RIGHT ASCENSION (J2000)14 26 45 30 15 00 25 45 30
37 58
56
54
52
50
48
46
44
42
0 50 100
DECLINATION (J2000)
RIGHT ASCENSION (J2000)14 26 45 30 15 00 25 45 30
37 58
56
54
52
50
48
46
44
42
Figure 5. (left) Full-resolution radio image of A1914 (contours) overlaid on a VLA 1.4 GHz image (greyscale). The contours are at−3,−2,2,3,4,5,6,7,8×35µJybeam−1,; the beamsize of 69× 33 arcsec, PA 5 is shown (inset). The steep-spectrum halo source can be seenin the VLA image just to the east ofthe cluster centre – no emission is apparent in the RT image however, where the SZ decrement can also be seen. (right) Source-subtracted CLEANed low-resolution radio image of A1914 showing the SZ decrement, overlaid on theROSATPSPC image (greyscale). The contour interval is 80µJybeam−1, dashedcontours are negative. The beam (inset) is 175′′×108′′, PA 4.
c© 0000 RAS, MNRAS000, 000–000

H0 from an orientation-unbiased sample 11
0 2 4 6 8
DECLINATION (J2000)
RIGHT ASCENSION (J2000)16 36 45 30 15 00 35 45 30 15
66 18
17
16
15
14
13
12
11
10
09
08
0 100 200
DECLINATION (J2000)
RIGHT ASCENSION (J2000)16 36 45 30 15 00 35 45 30 15
66 18
17
16
15
14
13
12
11
10
09
08
Figure 6. (left) Full-resolution radio image of A2218 (contours) overlaid on the NVSS 1.4 GHz image (greyscale). The contours areat−4,−3,−2,2,4,8,16,32× 35µJybeam−1; the beamsize of 41× 36 arcsec, PA−9 is shown (inset). The SZ decrement can be clearly seen even inthishigh-resolution image. (right) Source-subtracted CLEANed low-resolution radio image of A2218 showing the SZ decrement, overlaid on theROSATPSPCimage (greyscale). The contours interval is 80µJybeam−1, dashed contours are negative. The beam (inset) is 130′′×120′′, PA−5.
c© 0000 RAS, MNRAS000, 000–000


![VELOCITY-RESOLVED [Ne III] FROM X-RAY IRRADIATED Sz 102 MICROJETS](https://img.pdfslide.net/doc/110x75/634f4bea2630aed5000861c6/velocity-resolved-ne-iii-from-x-ray-irradiated-sz-102-microjets.jpg)


