Embed Size (px)
Citation preview

Public
2022Half Year Results12 MAY 2022
Sanjeev Gandhi | Managing Director & CEO
Christopher Davis | Chief Financial Officer

22022 HALF YEAR RESULTS
This presentation is in summary form and is not necessarily complete. It should be read together with Orica’s Half Year Report and other announcements lodged with the Australian Securities Exchange, which are available at www.asx.com.au
This announcement contains information that is based on projected and/or estimated expectations, assumptions or outcomes. Forward-looking statements are subject to a range of risk factors. Orica cautions against reliance on any forward-looking statements, particularly in light of commodity price volatility, input cost volatility, geopolitical and social issues, foreign currency exchange fluctuations and COVID-19 related issues.
While Orica has prepared this information based on its current knowledge and understanding and in good faith, there are risks and uncertainties involved which could cause results to differ from projections. Orica will not be liable for the correctness and/or accuracy of the information, nor any differences between the information provided and actual outcomes and reserves the right to change its projections from time to time. Orica undertakes no obligation to update any forward-looking statement to reflect events or circumstances after the date of this announcement, subject to disclosure obligations under the applicable law and ASX listing rules.
OtherNon-International Financial Reporting Standards (Non-IFRS) information
This announcement makes reference to certain non-IFRS financial information. This information is used by management to measure the operating performance of the business and has been presented as this may be useful for investors. This information has not been reviewed by the Group’s auditor. The 2022 Half Year Results presentation includes non-IFRS reconciliations. Refer to slide 41 for a reconciliation of IFRS compliant statutory net profit/(loss) after tax to EBITDA. Forecast information has been estimated on the same measurement basis as actual results.
Note: numbers in this document are subject to rounding and stated in Australian dollars unless otherwise noted.
Disclaimer

Public
2022 Half Year ResultsAGENDA
32022 HALF YEAR RESULTS
First half in review
Financial performance
Strategy in action
Outlook
Slide 4
Slide 10
Slide 20
Slide 25

Public
First half in reviewSANJEEV GANDHI, MANAGING DIRECTOR & CEO
42022 HALF YEAR RESULTS

Public
Safety and sustainability are at the heart of our purpose
SAFETY AND SUSTAINABILITY
52022 HALF YEAR RESULTS
• Maintained zero fatality workplace
• Continued focus on improving our safety performance
• Ongoing response to COVID-19 by keeping our people and operations safe and supporting their wellbeing
• Engagement and inclusion survey demonstrated engaged, energised and enabled workforce
– Safety culture particularly strong, consistently above global benchmarks
– Inclusion index above global manufacturing and mining norms
• A decision has been made to exit from our operations in Russia in the second half. Exit to be carried out in a responsible manner with a focus on keeping our people safe
• Zero serious environmental incidents
• Loss of containment and potable water intensity on target
• Orica Impact Fund investing in local community development, COVID-19 response and recovery
• Executed our human rights, modern slavery and First Nations Peoples’ actions to plan
Safety and our people Caring for the community and environment

Public
Accelerating decarbonisation and moving towards a low-carbon future
SAFETY AND SUSTAINABILITY
62022 HALF YEAR RESULTS
Climate change
Accelerating decarbonisation
Smarter, sustainable solutions
Partnering for progress
Executed our decarbonisation milestones to plan
• Tertiary catalyst abatement technology operational at Carseland with performance above expectation• Kooragang Island Decarbonisation Project approved and supported by government funding, implementation to begin in
October 2022• Advanced Yarwun Decarbonisation Project pre-feasibility study underway• Global AN market fluctuations altering greenhouse gas emissions profile, with scope 1 & 2 replacing scope 3 emissions
Increased our exposure towards key decarbonising technologies
• Signed green hydrogen MoU with Origin for Kooragang Island plant, green hydrogen and ammonia MoU with H2U Group for Yarwun plant
• High Purity Alumina (HPA) Project in Australia awarded $45 million Federal Government grant with 10% flowing to Orica• Increasing customer productivity and sustainability (reduced energy use, emissions avoidance) through Design for
Outcome digital solution, currently implemented at Roy Hill, Australia
Collaborated and partnered for action on climate
• AN supplier and mining customer value chain engagement • Progressed Mineral Carbonation International carbon capture and utilisation demonstration plant at Kooragang Island • A- CDP Climate Change Leadership recognition• Proactive engagement with industry bodies

Public
72022 HALF YEAR RESULTS
Improved result driven by better market conditions & refreshed strategy
HALF YEAR RESULTS
Underlying EBIT1,2
$245mUP 58% vs pcp
AN volume
2.04mtUP 5% vs pcp
Underlying NPAT1,3
$129mUP 71% vs pcp
Sales revenue1
$3.3bUP 25% vs pcp
Gearing4
38.3%WITHIN target range
Interim dividend
13.0 cps41% payoutratio 5
• Improved performance driven by strong global commodity markets
– Strengthened volume growth, particularly in Australia, Indonesia and Latin America
– Price improvements in new contracts and contract renewals broadly offset impact from input cost increases
– Improved product mix as customers shift to premium products, particularly in Australia, Latin America, Nordics and Africa
• Ongoing uncertainty from geopolitical issues, most notably the Russia-Ukraine conflict
• Non-core asset sales continue, including Minova, Nitro Consult AB and land at Nowra
• Carseland, Yarwun and Burrup turnarounds completed
• Interim unfranked dividend of 13.0 cents per ordinary share, representing a payout ratio of 41%
1. Includes contribution from discontinued operation (Minova) 2. Equivalent to profit/(loss) before financing costs and income tax as disclosed in Note 2(b) within the Appendix 4D – Half Year Report,
before individually significant items3. Equivalent to profit after income tax expense before individually significant items attributable to shareholders of Orica Limited as
disclosed in Note 2(b) within Appendix 4D – Half Year Report. Statutory net loss after tax was $85 million4. Excludes the impact of leases which, under AASB 16 Leases, are treated as debt with effect from 1 October 20195. Dividend amount / Underlying NPAT before individually significant items

Public
• Strengthened volume growth
• Good pricing discipline in contract renewals and new contracts
• All continuous plants producing in line with demand; planned Yarwunand Burrup turnarounds completed
• Improved fixed cost recovery from better loaded AN manufacturing plants and cost reduction efficiencies
• Lag in passing through rising input costs
Improved performance across all segmentsFIRST HALF BUSINESS PERFORMANCE
82022 HALF YEAR RESULTS
Australia Pacific & Asia
• Increased volume from higher commodity demand
• Improved pricing on new and renewed contracts
• Efficiency and cost reduction initiatives mitigated impact of inflation and increased freight costs
• Increased 3rd party AN purchases during Carseland plant turnaround
• Carseland plant turnaround completed in October 2021, including installation of tertiary abatement technology
North America
• Strengthened AN and EBS volume growth, driven by improved customer demand
• Increased focus by customers on premium products
• Improved pricing discipline including shortening of rise and fall reset periods
• Higher freight costs, partially recovered via rise and fall
• Alternate AN sourcing arrangements implemented to provide security of supply for customers
• EXSA a considerable contributor to performance
Latin America

Public
Russia-Ukraine conflict drives lower AN volumes in EMEAFIRST HALF BUSINESS PERFORMANCE
92022 HALF YEAR RESULTS
• Lower AN volumes due to disrupted mining activity as a result of Russia-Ukraine conflict and slower contract ramp ups
• Improved initiating systems product mix
• Higher AN and logistics costs, passed through to customers
• Supply chain cost reduction benefits and lower overhead costs
• Alternate AN sourcing arrangements implemented to provide security of supply for customers
Europe, Middle East & Africa
• Strengthened radar sales and growth in recurring contracts
• Improved pricing
• Shipping delays and increased freight costs
• Second assembly line being planned outside of Australia to increase production, reduce cost and improve speed to global markets
• New office opened in Brazil to provide support services
• Growth expected from broadening and integration of sensors and software suite with Orica Digital Solutions end-to-end digital workflows
Orica Monitor
Russia operations
• A decision has been made to exit from our operations in Russia
• The expected exit in the second half, to be carried out in a safe and responsible way to ensure the safety of Orica people and the community
– No earnings contribution expected in second half

Public
Financial PerformanceCHRISTOPHER DAVIS, CHIEF FINANCIAL OFFICER
102022 HALF YEAR RESULTS
Public
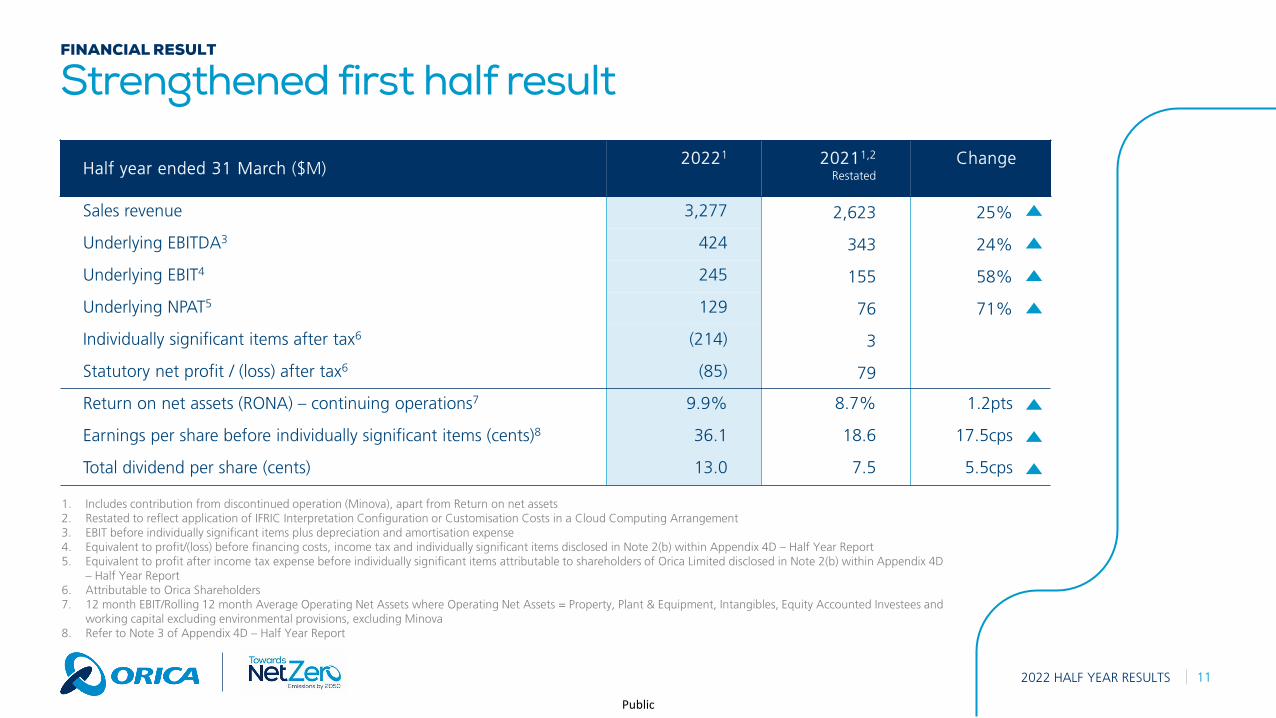
Strengthened first half resultFINANCIAL RESULT
Half year ended 31 March ($M)20221 20211,2
RestatedChange
Sales revenue 3,277 2,623 25%
Underlying EBITDA3 424 343 24%
Underlying EBIT4 245 155 58%
Underlying NPAT5 129 76 71%
Individually significant items after tax6 (214) 3
Statutory net profit / (loss) after tax6 (85) 79
Return on net assets (RONA) – continuing operations7 9.9% 8.7% 1.2pts
Earnings per share before individually significant items (cents)8 36.1 18.6 17.5cps
Total dividend per share (cents) 13.0 7.5 5.5cps
112022 HALF YEAR RESULTS
1. Includes contribution from discontinued operation (Minova), apart from Return on net assets2. Restated to reflect application of IFRIC Interpretation Configuration or Customisation Costs in a Cloud Computing Arrangement3. EBIT before individually significant items plus depreciation and amortisation expense4. Equivalent to profit/(loss) before financing costs, income tax and individually significant items disclosed in Note 2(b) within Appendix 4D – Half Year Report5. Equivalent to profit after income tax expense before individually significant items attributable to shareholders of Orica Limited disclosed in Note 2(b) within Appendix 4D
– Half Year Report6. Attributable to Orica Shareholders 7. 12 month EBIT/Rolling 12 month Average Operating Net Assets where Operating Net Assets = Property, Plant & Equipment, Intangibles, Equity Accounted Investees and
working capital excluding environmental provisions, excluding Minova8. Refer to Note 3 of Appendix 4D – Half Year Report

Public
One-off items driven by asset sales and impact of Russia
INDIVIDUALLY SIGNIFICANT ITEMS
122022 HALF YEAR RESULTS
Half year ended 31 March 2022 ($M)Gross
(before tax)
Tax Net(after tax)
Gain on sale of Minova and Nitro Consult businesses 30 (2) 28
Release of foreign currency translation reserve from sale of Minova and Nitro Consult businesses
(95) (7) (102)
Impairment of EMEA1,2 assets (156) (2) (158)
Non-controlling interests in individually significant items 18 - 18
Individually significant items attributable to shareholders of Orica (203) (11) (214)
1. Refer to Note 11 of Appendix 4D – Half Year Report2. The FCTR balance relating to Russia will release to the income statement upon executing the exit in the second half
Included within the $203 million above, is $14 million of positive cash inflow and the remaining adverse impact of $217 million is non-cash in nature

Public
EBIT BRIDGE
132022 HALF YEAR RESULTS
Orica Group EBIT 1H21 to 1H22 ($M)
Improved result driven by better market conditions & refreshed strategy
1. Restated to reflect application of IFRIC Interpretation Configuration or Customisation Costs in a Cloud Computing Arrangement2. Change in underlying EBIT contribution from Discontinued operations
1
155
245
2814
21 8 217 8
Mix & margin
Foreignexchange
UnderlyingEBIT
1H21
ManufacturingVolume Miningchemicals
Orica Monitor Other Discontinuedoperations2
UnderlyingEBIT
1H22
(8)
Public
FY22 expectation: $340m -$360m
192
85
101
52
15
15
15
323
152
FY21 1H22
SAP project Sustainability capital
Growth capital Sustenance capital
142022 HALF YEAR RESULTS
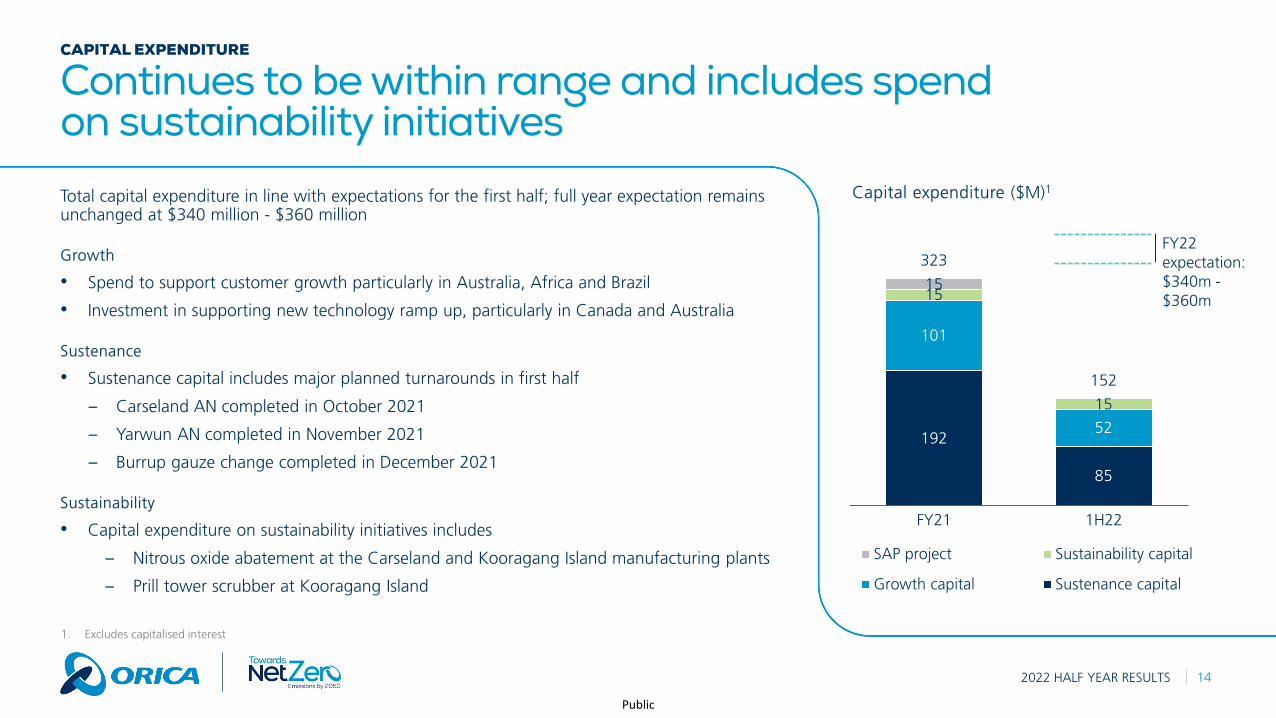
CAPITAL EXPENDITURE
Continues to be within range and includes spend on sustainability initiatives
Total capital expenditure in line with expectations for the first half; full year expectation remains unchanged at $340 million - $360 million
Growth
• Spend to support customer growth particularly in Australia, Africa and Brazil
• Investment in supporting new technology ramp up, particularly in Canada and Australia
Sustenance
• Sustenance capital includes major planned turnarounds in first half
– Carseland AN completed in October 2021
– Yarwun AN completed in November 2021
– Burrup gauze change completed in December 2021
Sustainability
• Capital expenditure on sustainability initiatives includes
– Nitrous oxide abatement at the Carseland and Kooragang Island manufacturing plants
– Prill tower scrubber at Kooragang Island
1. Excludes capitalised interest
Capital expenditure ($M)1

Public
152022 HALF YEAR RESULTS
CASH FLOW
Lower cash as a result of an increase in working capital
Cash conversion2 (%)
H1 H2
1. Restated to reflect application of IFRIC Interpretation Configuration or Customisation Costs in a Cloud Computing Arrangement
2. (Underlying EBITDA add / less movement in trade working capital, adjusted for acquisitions and disposals) / Underlying EBITDA
3. Includes Minova4. Based on continuing operations excluding Minova
Net operating cash flow1 ($M)
62.9
138.6
66.1
1H20 1H21 1H22
41139
(157)
104
480
145
619
FY20 FY21 1H22 3 3 4

Public
162022 HALF YEAR RESULTS
RISING INPUT COST
Input cost increases driving inventory and trade receivables valueFar East CFR ammonia index 1
($USD/t)
0200400600800
1,0001,200
4… 18… 1… 15…
29…
13…
27…
10…
24…
8 Ju
l…22
… 5… 19…
14…
28…
11…
25… 9… 23… 6… 20… 3…
+ 67%
0
500
1,000
1,500
2,000
4… 18… 1… 15…
29…
13…
27…
10…
24…
8 Ju
l…22
… 5… 19…
14…
28…
11…
25… 9… 23… 6… 20… 3… 17…
Tampa CFR ammonia index 1
($USD/t) + 144%
30 Sep 2021
31 Mar 2022
636
809
30 Sep2021
31 Mar2022
+27%
678 706
30 Sep2021
31 Mar2022
+4%
Inventory ($M)
Trade receivables ($M)
1. Source: Fertecon Ammonia Market Report
1 Mar 2021

Public
172022 HALF YEAR RESULTS
TRADE WORKING CAPITAL
Trade working capital days improving
69 64 64
31 Mar2021
30 Sep2021
31 Mar2022
62 61 56
30 Sep2021
31 Mar2021
31 Mar2022
66 63 59
31 Mar2021
30 Sep2021
31 Mar2022
569438
576
31 Mar2021
30 Sep2021
31 Mar2022
Trade working capital ($M) Days inventory held1
Days sales outstanding1 Days payables outstanding1
Trade working capital ($M)
438
576173
28
Trade payables
31 Mar2022
30 Sep2021
Trade receivables
Inventory
(63)
1. Calculated on a 12-month rolling basis

Public
182022 HALF YEAR RESULTS
NET DEBT
Net debt and gearing remain within target range
Net debt1 & gearing ($M, %) Movement in net debt1,2 ($M)
1. Excludes the impact of leases on net debt2. Net debt includes Minova
1,821
1,479
1,645
38.2%
34.6%
38.3%
FY20 FY21 1H22
Net debt Gearing
1,4791,645
53
225
FY21net debt
Dividendspaid
Netcash
outflow
1H22net debt
Foreignexchangetranslation
(112)
166
(excl lease liability)
(excl lease liability)
22

Public
192022 HALF YEAR RESULTS
FINANCIAL POSITION
Balance sheet and liquidity profile
1. Orica’s debt covenants exclude the impact of AASB 16 (Leases)2. For debt maturity profile, refer slide 38
• Cash and undrawn committed facilities provide liquidity of $1.7 billion
• Significant headroom to gearing and interest cover debt covenants
• Well distributed debt maturity profile2, with limited near term refinancing requirements
• Average drawn debt tenor of 4.7 years
• Continued focus on balance sheet and cash preservation, including:
– trade working capital performance
– disciplined capital allocation
– management of operational costs and discretionary spend
– monetisation of non-core asset and land holdings
494
1,167
1,661
31 March 2022
Undrawn committed facilities
Cash and cash equivalents
Available liquidity ($M)
1
Gearing (%)
Interest cover (times)
Debt covenants1
38.3%
57.5%
5.4x
2.0x
Orica Covenant
31 March 2022
31 March 2022

Public
Strategy in actionSANJEEV GANDHI, MANAGING DIRECTOR & CEO
202022 HALF YEAR RESULTS

Public
Positioning Orica to deliver shareholder valueSTRATEGY
212022 HALF YEAR RESULTS

Public
222022 HALF YEAR RESULTS
Our approach focuses on four business verticals
WHERE WE WILL WIN – FOUR BUSINESS VERTICALS
Mining Quarry and construction
Mining chemicals Digital solutions
• Blasting in mining at the core of our business
• Future-facing commodities growing ahead of GDP
• Building momentum from our industry-leading suite of blasting technology and solutions
• Unlocking value across the manufacturing network
• Leading player in the growing quarry and construction sector
• Well positioned to capture opportunities in both mature and developing Q&C markets
• Growing in mining chemicals, building on our world-class manufacturing facilities
• Rapid acceleration of value-add offerings beyond blasting, moving towards design for outcome

Public
232022 HALF YEAR RESULTS
MINING VERTICAL
Accelerated roll-out of technology, unlocking value in manufacturing network
Focusing on growing commodity markets
Accelerating penetration from both core and new flagship technology
Unlocking value in the manufacturing network
• Continued to grow in future facing commodities, with new contracts secured in nickel, copper & lithium
• Considerable proportion of Australia Pacific and Latin America mining pipeline is focussed on future facing commodities
• Development application for 30KT ammonia tank at Kooragang Island submitted, potentially enhances our network advantage on the East Coast of Australia
• Investigating opportunities to debottleneck continuous manufacturing plants• Design of a regionalised EBS assembly model has commenced, to improve assembly capacity to
meet demand, improve security of supply and reduce network costs• Upgrades to Lurin and Gomia cap manufacturing underway, enabling additional sourcing capacity• Commenced implementation of Packaged Explosives network improvements to reduce costs and
improve security of supply for customers
• Increased sales of premium IS products (EBS and WebGenTM) • The rollout of 4DTM has begun in Australia on 2 sites, additional sites globally in second half • First AvatelTM commercial trial announced at Newcrest’s Cadia underground mine, to commence in
second half

Public
242022 HALF YEAR RESULTS
DIGITAL SOLUTIONS VERTICAL
Orica Digital Solutions well positioned to enable Orica to become industry’s first end-to-end solutions provider
FY19 FY20 FY21 1H22 FY22F
Actual FY22 Expectation
Orica Digital Solutions (Sites implemented)
OREBODYINTELLIGENCE
BLASTDESIGNANDEXECUTION
DOWNSTREAM MEASUREMENT &
OPTIMISATION
In-situ orebody knowledge enabling real-time mine
planning
Automated Blasting enabled with Orebody
variability
Geotechnical monitoring enabling continuous improvement loop
MINE TO MILL
End-to-end integrated workflows across the value chain focusing on Safety, Productivity, and ESG
1
1. Forecast provided in November 2021

Public
252022 HALF YEAR RESULTS
OutlookSANJEEV GANDHI, MANAGING DIRECTOR & CEO

Public
Full year outlook remains unchangedOUTLOOK
262022 HALF YEAR RESULTS
• Momentum in EBIT from the ongoing businesses is expected to continue in the second half. There will be no further contribution from Russia operations or Nitro Consult AB.
• Previous expectations of drivers of margin improvement on the pcp remain:
‒ Volume growth, in line with global GDP growth.
‒ Increased adoption of advanced technology offerings, particularly digital and monitoring solutions.
‒ Key strategic initiatives driving supply chain efficiencies.
‒ Sustainable overhead cost reductions, net of inflation.
‒ Pricing discipline expected to broadly mitigate rising input costs and pass-through lag.
• Capital expenditure expected to be within $340 million to $360 million range.
• Continuing focus on balance sheet and cash flow optimisation, with gearing expected at higher end of stated range of 30 – 40%.

Public
A clear pathway towards profitable growth and value creation for our stakeholders
STRATEGIC PLAN
272022 HALF YEAR RESULTS
Supported by SAP system capabilities, ongoing pricing discipline and cost reduction focus
1. Covers global Scope 1 & Scope 2 emissions under Orica’s direct control, and material Scope 3 emission sources. Material means the GHG emissions embodied in purchased ammonia and ammonium nitrate included in the Scope 3 reporting category of purchased goods and services.
0-3 years Status
Pursue organic growth from the core
Accelerate adoption of innovative blasting technologies and digital solutions, both upstream and downstream
Optimise manufacturing and supply chains
Grow presence in future-facing commodities
Diversify portfolio by increasing presence in quarry and construction markets, particularly in high growth economies
Expand in high-growth mining chemicals markets
Financial targets Status
3-year average RONA 10% to 12%
Gearing between 30% and 40%
Dividend payout ratio between 40% and 70%
Annual capital expenditure between $340 and $360 million
Safety and sustainability outcomes Status
Target of zero fatalities (ongoing)
Target of Serious Injury Case Rate <0.14 (ongoing)
Target of ≥40% reduction in scope 1 & 2 greenhouse gas emissions by 2030
Ambition to achieve net zero scope 1, 2 and material scope 3 emissions1 by 2050
Legend
Met target On track Tracking below target

Public
Supplementary information
282022 HALF YEAR RESULTS

Public
Explosives volumesSUPPLEMENTARY INFORMATION
292022 HALF YEAR RESULTS
1. Ammonium Nitrate includes prill and solution2. Emulsion products include bulk emulsion and packaged solution
Half year ended 31 March 2022 volumes vs pcp
‘000 tonnesAN 1 Emulsion
products 2 Total AN 1 Emulsion products 2 Total
Australia Pacific & Asia 355 492 847 29% (4%) 8%
North America 260 265 525 1% 6% 4%
Latin America 128 348 476 11% 6% 7%
Europe, Middle East & Asia 9 183 192 (50%) - (5%)
Total 752 1,288 2,040 13% 1% 5%

Public
SUPPLEMENTARY INFORMATION
302022 HALF YEAR RESULTS
Half year ended 31 March 2022 2021 Variance
$M External revenue EBIT External revenue EBIT (restated) 1
External revenue EBIT
Australia Pacific & Asia 1,194 155 943 110 27% 41%
North America 707 55 576 48 23% 15%
Latin America 668 24 431 13 55% 85%
Europe, Middle East & Asia 420 11 402 5 4% 120%
Orica Monitor 57 15 52 13 10% 15%
Global Support - (30) - (41) - 27%
Continuing operations 3,046 230 2,404 148 27% 55%
Minova (discontinued operation) 231 15 219 7 5% 114%
Total 3,277 245 2,623 155 25% 58%
1. Restated to reflect application of IFRIC Interpretation Configuration or Customisation Costs in a Cloud Computing Arrangement
Segment analysis

Public
Diversified global businessSUPPLEMENTARY INFORMATION
312022 HALF YEAR RESULTS
39%
23%
22%
14%
2%
Australia Pacific & Asia North America
Latin America EMEA
Orica Monitor
20%
35%6%
16%
6%
14%
3%
AN/ANFO Bulk EmulsionPackaged Products Initiating SystemsMining Chemicals Onsite ServicesOther
Revenue by region 1 Revenue by commodity 1 Revenue by product/service type 1
2
1. Based on external sales, excluding Minova2. Includes Orica Monitor
16%
6%
9%
14%
21%
23%
11%
Thermal Coal Metallurgical CoalIron Ore Q&CGold CopperOther

Public
322022 HALF YEAR RESULTS
SUPPLEMENTARY INFORMATION
Australia Pacific & Asia
Market conditions
• High commodity prices and strong mining activity
• Growth in metals sector, particularly iron ore, gold and copper
• Growth in coal demand from Indonesia
• Heavy rainfall and floods on east coast of Australia causing a temporary halt / reduction of mining activity
Segment performance
• Strengthened volume growth
• Good pricing discipline in contract renewals and new contracts
• All continuous plants producing in line with demand; planned Yarwunand Burrup turnarounds completed
• Improved fixed cost recovery from better loaded AN manufacturing plants and cost reduction efficiencies
• Lag in passing through rising input costs
32%
12%13%
6%
16%
14%
7%
Thermal Coal Metallurgical CoalIron Ore Q&CGold CopperOther
815 787 847
949 958
1,764 1,745
2020 2021 2022
AN volume (KT)
985 9431,194
1,066 1,163
2,051 2,106
2020 2021 2022
External revenue ($M)
171
110155
202
170
373
280
2020 2021 2022
EBIT ($M)
External revenue by commodity
H1 H2

Public
12%5%
10%
25%26%
11%
11%
Thermal Coal Metallurgical CoalIron Ore Q&CGold CopperOther
332022 HALF YEAR RESULTS
SUPPLEMENTARY INFORMATION
North America
Market conditions
• Strong commodity demand, particularly Q&C and thermal coal
• Mining activity continuing to recover towards pre COVID-19 levels
• Supply chain challenges across all sectors including higher freight costs
• High energy prices
Segment performance
• Increased volume from higher commodity demand
• Improved pricing on new and renewed contracts
• Efficiency and cost reduction initiatives mitigated impact of inflation and increased freight costs
• Increased 3rd party AN purchases during Carseland plant turnaround
• Carseland plant turnaround completed in October 2021 including installation of tertiary abatement technology
559 506 525
464 507
1,023 1,013
2020 2021 2022
AN volume (KT)
679576
707
581 654
1,260 1,230
2020 2021 2022
External revenue ($M)
96
48 55
69
60
165
108
2020 2021 2022
EBIT ($M)
External revenue by commodity
H1 H2
Public
2% 4%3%
24%
60%
7%
Thermal Coal Metallurgical CoalIron Ore Q&CGold CopperOther
342022 HALF YEAR RESULTS
SUPPLEMENTARY INFORMATION
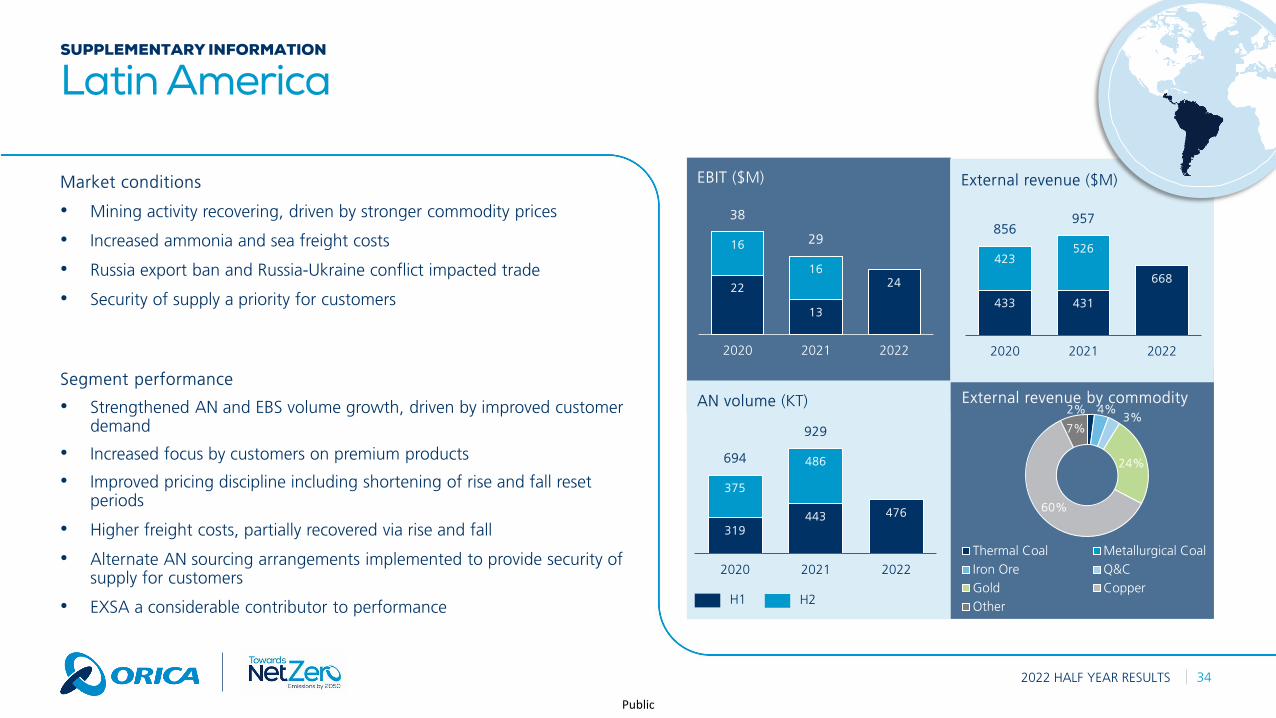
Latin America
Market conditions
• Mining activity recovering, driven by stronger commodity prices
• Increased ammonia and sea freight costs
• Russia export ban and Russia-Ukraine conflict impacted trade
• Security of supply a priority for customers
Segment performance
• Strengthened AN and EBS volume growth, driven by improved customer demand
• Increased focus by customers on premium products
• Improved pricing discipline including shortening of rise and fall reset periods
• Higher freight costs, partially recovered via rise and fall
• Alternate AN sourcing arrangements implemented to provide security of supply for customers
• EXSA a considerable contributor to performance
319443 476
375
486694
929
2020 2021 2022
AN volume (KT)
433 431
668
423526
856957
2020 2021 2022
External revenue ($M)
22
13
24
16
16
38
29
2020 2021 2022
EBIT ($M)
External revenue by commodity
H1 H2

Public
1%0% 3%
35%
29%
13%
19%
Thermal Coal Metallurgical CoalIron Ore Q&CGold CopperOther
352022 HALF YEAR RESULTS
SUPPLEMENTARY INFORMATION
Europe, Middle East & Africa
Market conditions
• Russia export ban and Russia-Ukraine conflict significantly disrupting AN and energy trade
• Strong copper and gold mining activity in Africa
• Improvements in quarry and construction in Nordics and Western Europe as move into post-COVID recovery
• High gas prices leading to closure of several ammonia plants in Europe
Segment performance
• Lower AN volumes due to disrupted mining activity as a result of Russia-Ukraine conflict and slower contract ramp ups
• Improved initiating systems product mix
• Higher AN and logistics costs, passed through to customers
• Supply chain cost reduction benefits and lower overhead costs
• Alternate AN sourcing arrangements implemented to provide security of supply for customers
258202 192
192204
450406
2020 2021 2022
AN volume (KT)
471402 420
412399
883801
2020 2021 2022
External revenue ($M)
33
511
31
20
64
25
2020 2021 2022
EBIT ($M)
External revenue by commodity
H1 H2
Public
362022 HALF YEAR RESULTS
SUPPLEMENTARY INFORMATION
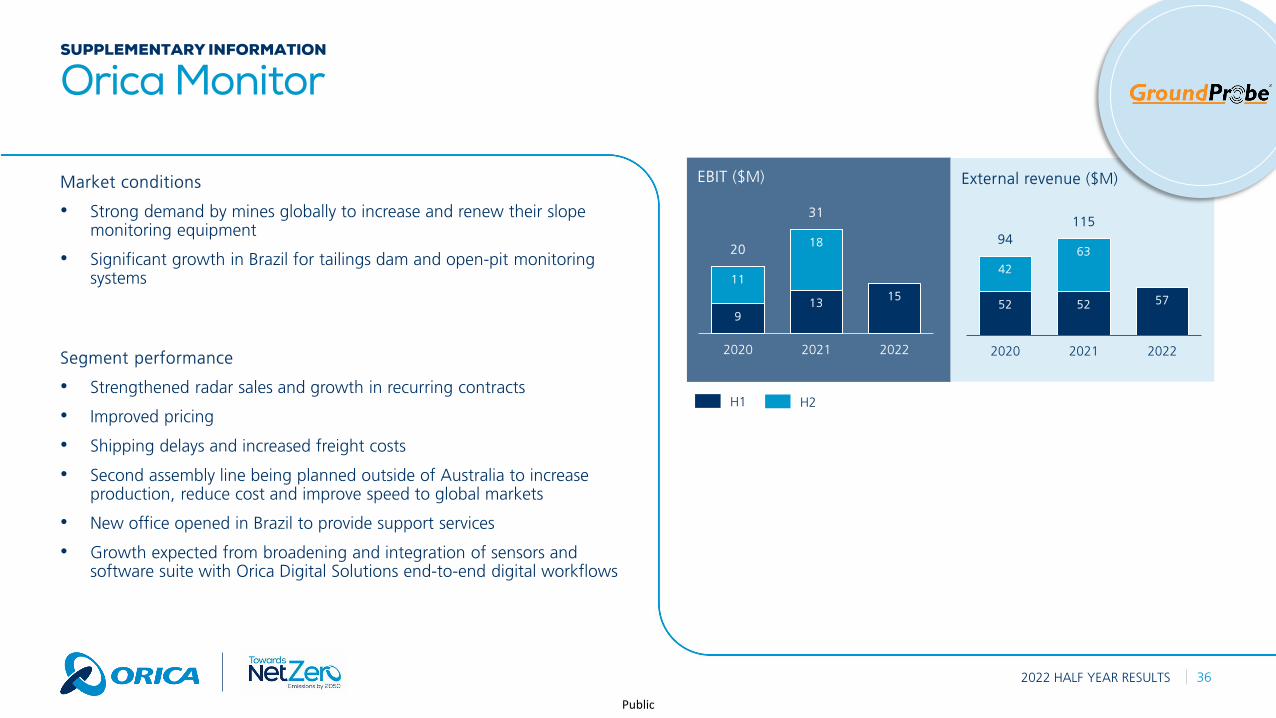
Orica Monitor
52 52 57
42
6394
115
2020 2021 2022
External revenue ($M)
913 15
11
1820
31
2020 2021 2022
EBIT ($M)
H1 H2
Market conditions
• Strong demand by mines globally to increase and renew their slope monitoring equipment
• Significant growth in Brazil for tailings dam and open-pit monitoring systems
Segment performance
• Strengthened radar sales and growth in recurring contracts
• Improved pricing
• Shipping delays and increased freight costs
• Second assembly line being planned outside of Australia to increase production, reduce cost and improve speed to global markets
• New office opened in Brazil to provide support services
• Growth expected from broadening and integration of sensors and software suite with Orica Digital Solutions end-to-end digital workflows

Public
Foreign exchange translationSUPPLEMENTARY INFORMATION
Key currency movements 1H22 1H21 Var 31 Mar 2022 31 Mar 2021 Var
Currency Average rates Spot rates
CAD – Canadian Dollar 0.9173 0.9657 (5%) 0.9375 0.9592 (2%)
USD – US Dollar 0.7261 0.7520 (3%) 0.7512 0.7598 (1%)
MXN – Mexican Peso 14.98 15.36 (2%) 14.93 15.64 (5%)
PEN – Peruvian Sol 2.8457 2.7308 4% 2.7904 2.8659 (3%)
RUB – Russian Rouble 58.25 56.59 3% 62.66 57.65 9%
KZT – Kazakhstani Tenge 322.54 317.88 1% 348.06 322.86 8%
372022 HALF YEAR RESULTS
(4)(0)
3 3
(10)
Global Support APA North America Latin America EMEA
1. Excludes Orica Monitor and discontinued operations
Total ($8m)
Basket of 41 currencies translated to Australian Dollar (AUD) earnings
FX translation vs pcp by region ($M) 1

Public
382022 HALF YEAR RESULTS
SUPPLEMENTARY INFORMATION
Debt profile
1. Clean Energy Finance Corporation2. Includes overdraft and other borrowings
1
Average tenor at March 2022 – 3.8 years (drawn debt: 4.7 years)
Drawn debt maturity profile ($M)
0100200300400500600700800900
1,000
FY22 FY23 FY24 FY25 FY26 FY27 FY29 FY31
Committed bank facilities US private placement CEFC Other2
• Shortly after 31 March 2022, Orica completed a $299 million refinancing of committed bank facilities on 5 April 2022
• The refinancing included a $40 million 4 year tranche and a $259 million 5 year tranche
• All FY22 maturities were extended as part of the refinancing
• As a result of the refinancing, the average committed debt facility maturity increased to 4.2 years from 3.8 years

Public
392022 HALF YEAR RESULTS
SUPPLEMENTARY INFORMATION
Environmental and decommissioning provisions
As at 31 March ($M) 2022 20211
Botany groundwater remediation 196 212
Botany hexachlorabenzene (HCB) waste 25 29
Burrup decommissioning 38 44
Initiating systems network optimisation 24 27
Deer Park remediation 8 12
Yarraville remediation 14 16
Other provisions 41 44
Total 346 384
1. As at 30 Sep 2021

Public
402022 HALF YEAR RESULTS
SUPPLEMENTARY INFORMATION
Significant items
Half year ended 31 March 2022 ($M)Gross
(before tax)Net
(after tax)
Impairment expense (156) (158)
• Impairment of assets of the Russia business (78) (80)
• Impairment of assets of the Turkey business (33) (33)
• Impairment of Goodwill in EMEA segment (45) (45)
Cash gain on sale of Nitro Consult business before foreign currency translation reserve (FCTR) release 19 19
FCTR release on sale of Nitro Consult 1 1
Significant items from continuing operations (136) (138)
Less non-controlling interests share of Turkey impairment 18 18
Significant items from continuing operations attributable to shareholders of Orica (118) (120)
Cash gain on sale of Minova before FCTR release 11 9
FCTR release on sale of Minova (96) (103)
Significant items from discontinued operations (85) (94)
Total Significant items attributable to shareholders of Orica (203) (214)

Public
412022 HALF YEAR RESULTS
SUPPLEMENTARY INFORMATION
Non-IFRS reconciliations
Half year ended 31 March ($M) 2022 2021Restated
Variance
Statutory net profit / (loss) after tax1
(85) 79
Add back: Individually significant items after tax1 214 (3)
Underlying profit after tax1 129 76 71%
Adjust for the following:
Net financing costs 43 42 (2%)
Net interest expense excluding unwinding of discount on provision and lease interest 47 48
Unwinding of discount on provisions (10) (12)
Lease interest 6 6
Income tax expense 2
66 35 (89%)
Non-controlling interests 2
7 2
EBIT 245 155 58%
Depreciation and amortisation (179) (188) 5%
EBITDA 424 343 24%
1. Attributable to Orica Shareholders2. Excludes individually significant items
Public
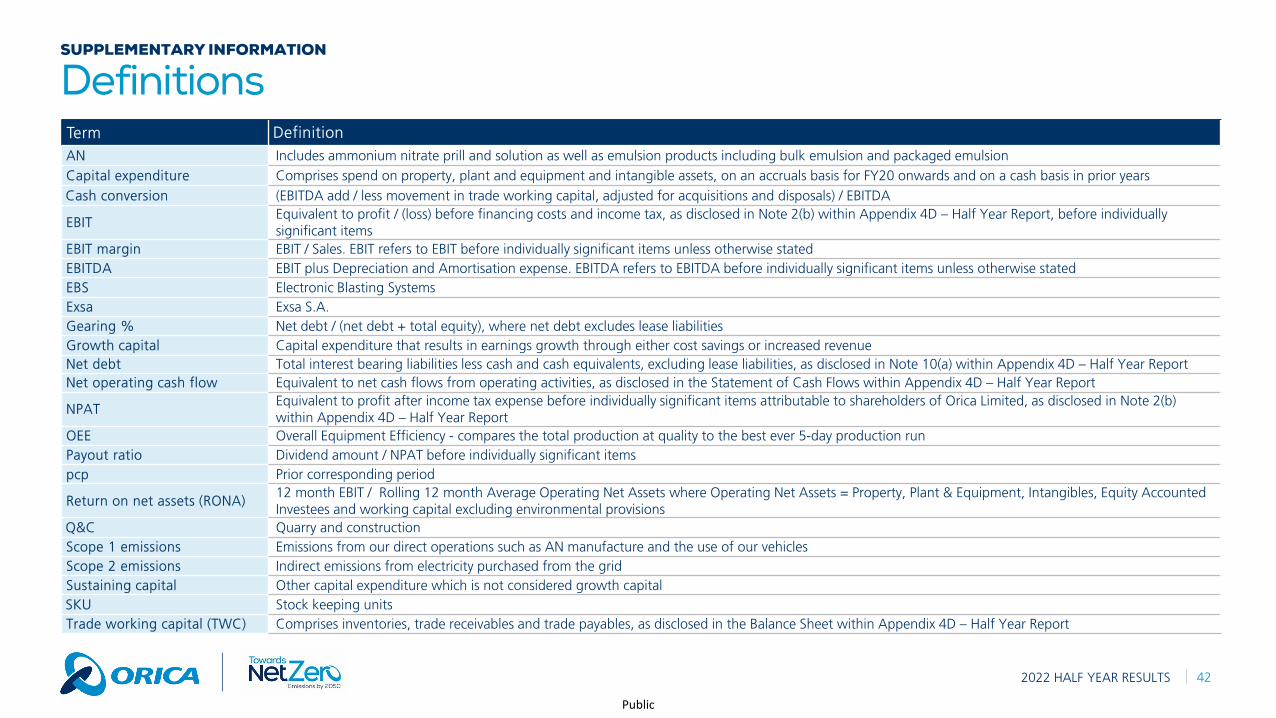
DefinitionsSUPPLEMENTARY INFORMATION
Term Definition AN Includes ammonium nitrate prill and solution as well as emulsion products including bulk emulsion and packaged emulsionCapital expenditure Comprises spend on property, plant and equipment and intangible assets, on an accruals basis for FY20 onwards and on a cash basis in prior yearsCash conversion (EBITDA add / less movement in trade working capital, adjusted for acquisitions and disposals) / EBITDA
EBIT Equivalent to profit / (loss) before financing costs and income tax, as disclosed in Note 2(b) within Appendix 4D – Half Year Report, before individually significant items
EBIT margin EBIT / Sales. EBIT refers to EBIT before individually significant items unless otherwise statedEBITDA EBIT plus Depreciation and Amortisation expense. EBITDA refers to EBITDA before individually significant items unless otherwise statedEBS Electronic Blasting SystemsExsa Exsa S.A.Gearing % Net debt / (net debt + total equity), where net debt excludes lease liabilitiesGrowth capital Capital expenditure that results in earnings growth through either cost savings or increased revenueNet debt Total interest bearing liabilities less cash and cash equivalents, excluding lease liabilities, as disclosed in Note 10(a) within Appendix 4D – Half Year ReportNet operating cash flow Equivalent to net cash flows from operating activities, as disclosed in the Statement of Cash Flows within Appendix 4D – Half Year Report
NPATEquivalent to profit after income tax expense before individually significant items attributable to shareholders of Orica Limited, as disclosed in Note 2(b) within Appendix 4D – Half Year Report
OEE Overall Equipment Efficiency - compares the total production at quality to the best ever 5-day production runPayout ratio Dividend amount / NPAT before individually significant itemspcp Prior corresponding period
Return on net assets (RONA)12 month EBIT / Rolling 12 month Average Operating Net Assets where Operating Net Assets = Property, Plant & Equipment, Intangibles, Equity Accounted Investees and working capital excluding environmental provisions
Q&C Quarry and constructionScope 1 emissions Emissions from our direct operations such as AN manufacture and the use of our vehiclesScope 2 emissions Indirect emissions from electricity purchased from the gridSustaining capital Other capital expenditure which is not considered growth capitalSKU Stock keeping unitsTrade working capital (TWC) Comprises inventories, trade receivables and trade payables, as disclosed in the Balance Sheet within Appendix 4D – Half Year Report
2022 HALF YEAR RESULTS 42


