Embed Size (px)
Citation preview
HANDBOOKSEPTEMBER 2015


Sept. 2015
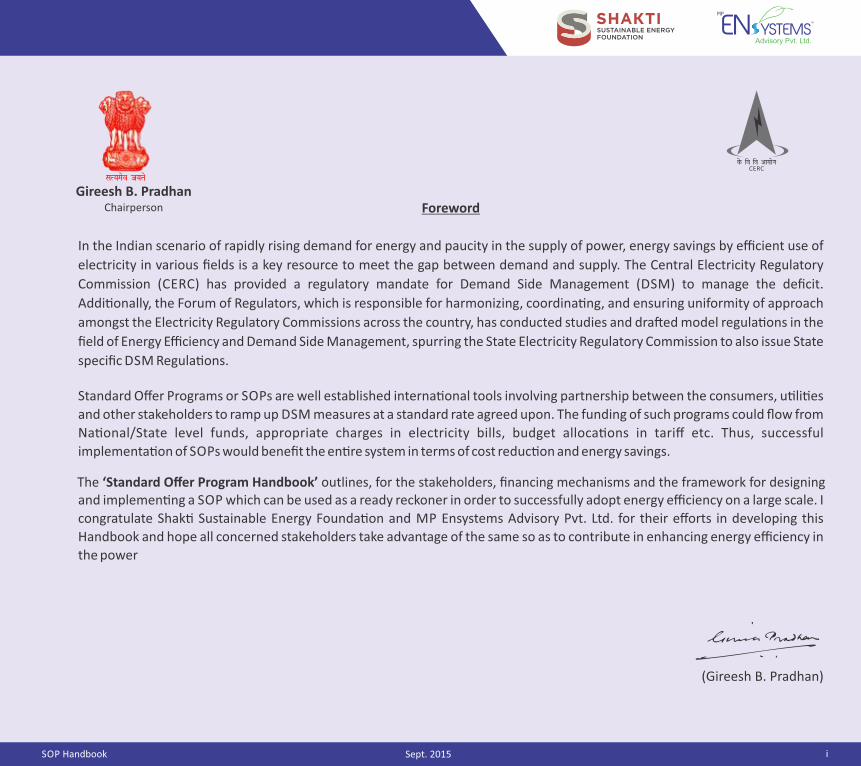
The ‘Standard Offer Program Handbook’ outlines, for the stakeholders, financing mechanisms and the framework for designing
Sept. 2015

Sept. 2015
Sept. 2015
About the SOP Handbook
The Standard Offer Program (SOP) Handbook is an
important and comprehensive how‐to guide for regulators
and policy makers, Central and State Government en��es,
electricity distribu�on u�li�es and project implementers.
This Handbook has been developed with the objec�ve of
guiding these stakeholders through the process of
conceptualiza�on and roll‐out of the SOP. The Handbook
discusses in detail all the aspects involved in design,
approval and implementa�on of an SOP and provides
necessary guidance on all stages right from conceptualizing
and designing the SOP and seeking the necessary approvals
to determining the savings achieved from the program and
incen�vizing consumers.
Acknowledgements
The MP Ensystems Advisory Private Limited team would like
to extend our sincere gra�tude to the Shak� Sustainable
Energy Founda�on (SSEF) for entrus�ng us with this
assignment and suppor�ng us throughout the process of
developing this Handbook. SOP works to strengthen the
energy security of the country by aiding the design and
implementa�on of policies that encourage energy efficiency
as well as renewable energy. Our special thanks to Mr.
Gireesh Pradhan, Chairman, Central Electricity Regulatory
Commission, Dr. Ajay Mathur, Director General & Ms.
Pravatanalini Samal, Assistant Energy Economist, Bureau of
Energy Efficiency, Mr. Saurabh Kumar, Managing Director,
Energy Efficiency Services Limited, Mr. U. N. Panjiar,
Chairman, Bihar Electricity Regulatory Commission, experts
at the Haryana and U�ar Pradesh Electricity Regulatory
Commission, Mr. V. L. Sonavane, ex‐Member, Maharashtra
Electricity Regulatory Commission, Dr. Ni�n Pandit,
Managing Director World Resources Ins�tute – India and
Prof. Suryanarayana Doolla, Indian Ins�tute of Technology –
Bombay for their cri�cal review and valuable and �mely
inputs to enrich this document. We are indebted to the team
at SSEF, especially Mr. Deepak Gupta, Ms. Natasha Bhan and
Ms. Vrinda Sarda, for their ac�ve involvement and support in
this project. Our sincere thanks to Mr. Chinmaya Acharya,
Chief of Programs at the SSEF for being available to our
larger team to discuss key aspects covered under this
program. We also thank Convener, DSM Consulta�on
Commi�ee at MERC and DSM cell members of BEST, Tata
Power, and Reliance Infra for their inputs. The project team
has also benefited from the interac�ons with several
colleagues from the State Electricity Regulatory
Commissions, Distribu�on Licensees, Forum of Regulators,
Energy Sector Consultants and Equipment/Appliance
Suppliers for sharing data wherever possible. We thank all of
them for their inputs & insights while preparing this
document, and hope that the Handbook will prove to be of
immense use to them in their DSM endeavors.
Project Team
The Project team that put together this SOP Handbook
comprises Deepak Gupta, Natasha Bhan and Vrinda Sarda of
the SSEF, Mahesh Patankar, Sonia Shukla, Parag Kulkarni,
Rahul Yenumula, Sudhanshu Mishra, Harman Singh, Ishan
Paliwal and Priya Bhargava, of MP Ensystems Advisory
Private Limited, Arijit Maitra, Legal Expert and Professor
Suryanarayana Doolla of IIT Bombay. Other team members,
Archana Patankar, Ira Prem and Sravanthi Rallabandi,
provided support towards finaliza�on of this Handbook.
v SOP Handbook
TABLE OF CONTENTS
Sept. 2015
EXECUTIVE SUMMARY
�. Introduc�on: Brief descrip�on of a Standard Offer Pro�ram and its Benefits
�. SOP Implementa�on Framework �.� The Re�ulatory backin� for a Standard Offer Pro�ram �.� The Key Stakeholders �.� Implementa�on Op�ons �.� Fundin� Sources �.� Determina�on of SOP Price �.� Poten�al End‐uses and Technolo�ies �.� Measurement and Verifica�on (M&V)
�. Implementa�on Process �.� Pre‐implementa�on Phase �.� Implementa�on Phase �.� Post‐implementa�on Phase
�. SOP Desi�n Process �.� Guidelines to select which SOP to offer �.� Guidelines to perform Benefit‐Cost Analysis
�.�.� Elements of Benefits and Costs �.�.� Approach for performin� the benefit‐cost analysis �.�.� Illustra�ve pro�rams
�.� Guidelines on determinin� the SOP price �.� Guidelines on payment of incen�ves (SOP Price)
�. Measurement and Verifica�on for an SOP �.� The Importance of M&V for an SOP �.� Possible M&V Approaches �.� The Measurement & Verifica�on Process �.� Standardized M&V �.� Comprehensive M&V
1
3
10
111214
1518
18
20202325
26
262626293046
49
505050515152
10
vi SOP Handbook
TABLE OF CONTENTS
Sept. 2015
�. Roles and Responsibili�es of Various Stakeholders �.� Pro�ram Owner �.� A��re�ator and/or Ener�y Service Provider (ESP) �.� M&V A�ency �.� Par�cipa�n� Consumers
Annexures Annex I: Abbrevia�ons Annex II: Glossary Annex III: Interna�onal Examples of successful SOP s Annex IV: Methodology and Typical Terms of Reference (ToR) for Load Research Ac�vi�es Annex V: Sample Ques�ons for Consumer Survey ‐ Residen�al and Commercial Category Annex VI: Sample Ques�ons for Vendor Survey Annex VII: Representa�ve Load Curves Annex VIII: Template for Regulatory Filing (Program Design Document (PDD)) ‐ with Aggregator Annex IX: Template for Regulatory filing (Program Design Document (PDD)) ‐ without Aggregator Annex X : Types of meters, available makes, M&V applicability, indica�ve costs Annex XI: Brief Descrip�on of Energy Efficient Technologies Annex XII: Details of Energy Efficient Technologies Annex XIII: Annual Energy Savings from Energy Efficient Technologies Annex XIV: Average Power Purchase Cost (APPC) and Highest Marginal Cost (HMC) of Indian u�li�es Annex XV: Capital Recovery Factor (CRF) Annex XVI: Table of Contents of Program Roll‐out Manual Annex XVII: Agreements and contractual documents ‐ Summary of provisions Annex XVIII: Consumer Outreach Material Annex XIX: Communica�on and Marke�ng approaches Annex XX: DSM ini�a�ves undertaken by u�li�es in India
5353535454
565760667278818394105106109116
122
123124127133135136
vii SOP Handbook
LIST OF FIGURES
Sept. 2015
Figure 1: DSM Load Shape Objec�ves Figure 2: Typical Residen�al Load Curve (e.g. during summer in Delhi) Figure 3: Status of DSM Regula�ons in India Figure 4: Key Stakeholders in Implementa�on of SOP Figure 5: Computa�on of SOP Price Figure 6: Pre‐Roll‐Out Phase Figure 7: Roll‐out Phase Figure 8: Post Roll‐out Phase Figure 9: Flow‐Chart for Benefit‐Cost Analysis Figure 10: Typical APPC and HMC in rela�on to Consumer Tariffs Figure 11: Determina�on of SOP Price Figure 12: Indica�ve SOP Price Range for Various Technologies Figure 13: Incen�ves Offered by Various U�li�es in Interna�onal SOPs Figure 14: Representa�ve Load Curves Figure 15: Annual Energy Savings in Ligh�ng Figure 16: Annual Energy Savings in Air Condi�oning Figure 17: Annual Savings in Chillers Figure 18: Annual Savings for Refrigerators Figure 19: Annual Savings in Water Hea�ng Figure 20: Annual Savings in Water Pumping Figure 21: APPC and HMC of Indian U�li�es Figure 22: Sample Program Announcement Flyer Figure 23: Sample Consumer Registra�on Form
4
6
10
11
15
202325
304748
496381
116
117118
119120
121
122133134
viii SOP Handbook
LIST OF TABLES
Sept. 2015
Table 1: SOP Benefits Table 2: Descrip�on of Sec�ons Table 3: Descrip�on of Annexes Table 4: Proposed Op�ons for Implementa�on of SOP Table 5: Possible Funding Op�ons Table 6: Proposed Schedule of Payment for various End‐uses Table 7: Proposed Technologies for Interven�on under various End‐uses Table 8: Possible M&V Methodologies Table 9: Pre‐Roll‐Out phase Table 10: Roll‐Out Phase Table 11: Post Roll‐Out Phase Table 12: Benefits‐Cost In the three tests Table 13: Illustra�ve Programs ‐ Details Table 14: Assump�ons for Benefit‐Cost Analysis for Illustra�ve Program 1 (1.5 ton unitary ACs) Table 15: Projected Power Purchase Price (Rs/kWh) Table 16: Savings (Rs) from the Program Table 17: NPV of Benefits (Rs) Table 18: First Cost of the Program (Rs) / Consumer Table 19: Recurring Cost of the Program (Rs) Table 20: First Cost of the Program (Rs) Table 21: Recurring Cost of the Program (Rs) Table 22: Assump�ons for Benefit‐Cost Analysis for Illustra�ve Program 2 Table 23: Other assump�ons for Benefit‐Cost Analysis for Illustra�ve Program 2 Table 24: Projected Power Purchase Price (Rs/kWh) Table 25: Savings (Rs) from the Program Table 26: NPV of Savings (Rs) Table 27: First Cost of the Program (Rs) Table 28: Recurring Cost of the program (Rs) Table 29: First Cost of the Program (Rs) Table 30: Recurring Cost of the program (Rs) Table 31: M&V approach Table 32: Comprehensive M&V ‐ Technologies and Parameters to be Measured
5781214171819212426283131343536373738394041434344444545465153
iv SOP Handbook July 2015 ix
LIST OF TABLES
SOP Handbook Sept. 2015
Table 33: Glossary of Terms Table 34: Brief Snapshot of Interna�onal SOPs Implemented Table 35: Technologies Targeted in Interna�onal SOP Table 36: Step‐by‐step approach for undertaking consumer surveys Table 37: Load Research Ac�vi�es, Objec�ves and Analysis Table 38: Types of Meters, Available Makes, M&V Applicability, Indica�ve Costs Table 39: Details of Energy Efficient Technologies Table 40: Capital Recovery Factor for Various Years and Discount Rates Table 41: Table of Contents for Program Roll‐out Manual Table 42: Summary of Provisions in Agreements and Contractual Documents Table 43: DSM Ini�a�ves Undertaken by U�li�es in India
5760626770105109123124127136
1
EXECUTIVE SUMMARY
SOP Handbook Sept. 2015
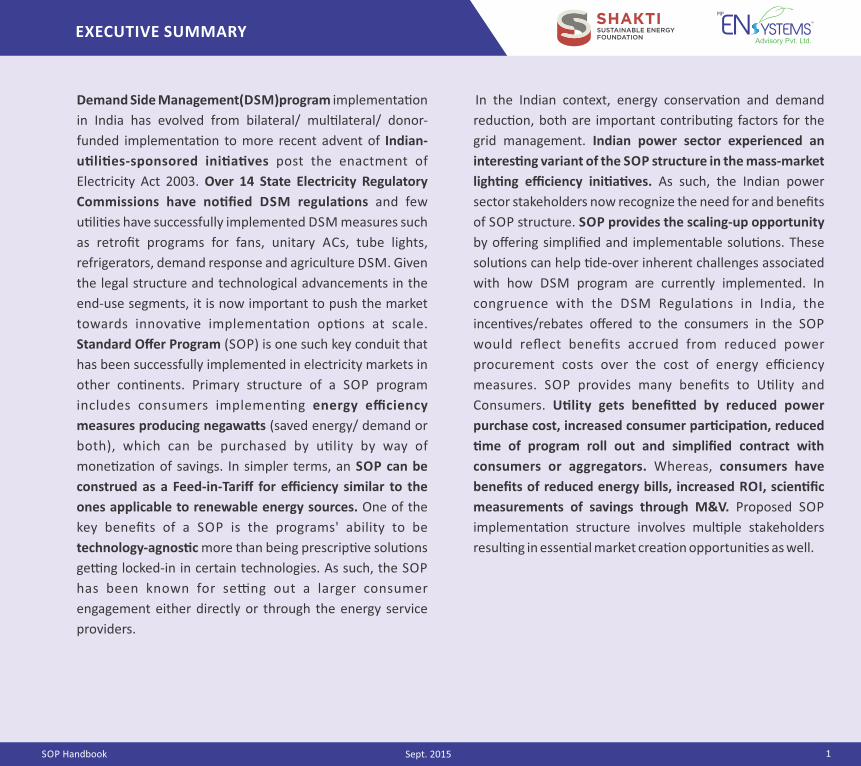
Demand Side Management(DSM)program implementa�on
in India has evolved from bilateral/ mul�lateral/ donor‐
funded implementa�on to more recent advent of Indian‐
u�li�es‐sponsored ini�a�ves post the enactment of
Electricity Act 2003. Over 14 State Electricity Regulatory
Commissions have no�fied DSM regula�ons and few
u�li�es have successfully implemented DSM measures such
as retrofit programs for fans, unitary ACs, tube lights,
refrigerators, demand response and agriculture DSM. Given
the legal structure and technological advancements in the
end‐use segments, it is now important to push the market
towards innova�ve implementa�on op�ons at scale.
Standard Offer Program (SOP) is one such key conduit that
has been successfully implemented in electricity markets in
other con�nents. Primary structure of a SOP program
includes consumers implemen�ng energy efficiency
measures producing negawa�s (saved energy/ demand or
both), which can be purchased by u�lity by way of
mone�za�on of savings. In simpler terms, an SOP can be
construed as a Feed‐in‐Tariff for efficiency similar to the
ones applicable to renewable energy sources. One of the
key benefits of a SOP is the programs' ability to be
technology‐agnos�c more than being prescrip�ve solu�ons
ge�ng locked‐in in certain technologies. As such, the SOP
has been known for se�ng out a larger consumer
engagement either directly or through the energy service
providers.
In the Indian context, energy conserva�on and demand
reduc�on, both are important contribu�ng factors for the
grid management. Indian power sector experienced an
interes�ng variant of the SOP structure in the mass‐market
ligh�ng efficiency ini�a�ves. As such, the Indian power
sector stakeholders now recognize the need for and benefits
of SOP structure. SOP provides the scaling‐up opportunity
by offering simplified and implementable solu�ons. These
solu�ons can help �de‐over inherent challenges associated
with how DSM program are currently implemented. In
congruence with the DSM Regula�ons in India, the
incen�ves/rebates offered to the consumers in the SOP
would reflect benefits accrued from reduced power
procurement costs over the cost of energy efficiency
measures. SOP provides many benefits to U�lity and
Consumers. U�lity gets benefi�ed by reduced power
purchase cost, increased consumer par�cipa�on, reduced
�me of program roll out and simplified contract with
consumers or aggregators. Whereas, consumers have
benefits of reduced energy bills, increased ROI, scien�fic
measurements of savings through M&V. Proposed SOP
implementa�on structure involves mul�ple stakeholders
resul�ng in essen�al market crea�on opportuni�es as well.
2
EXECUTIVE SUMMARY
SOP Handbook Sept. 2015
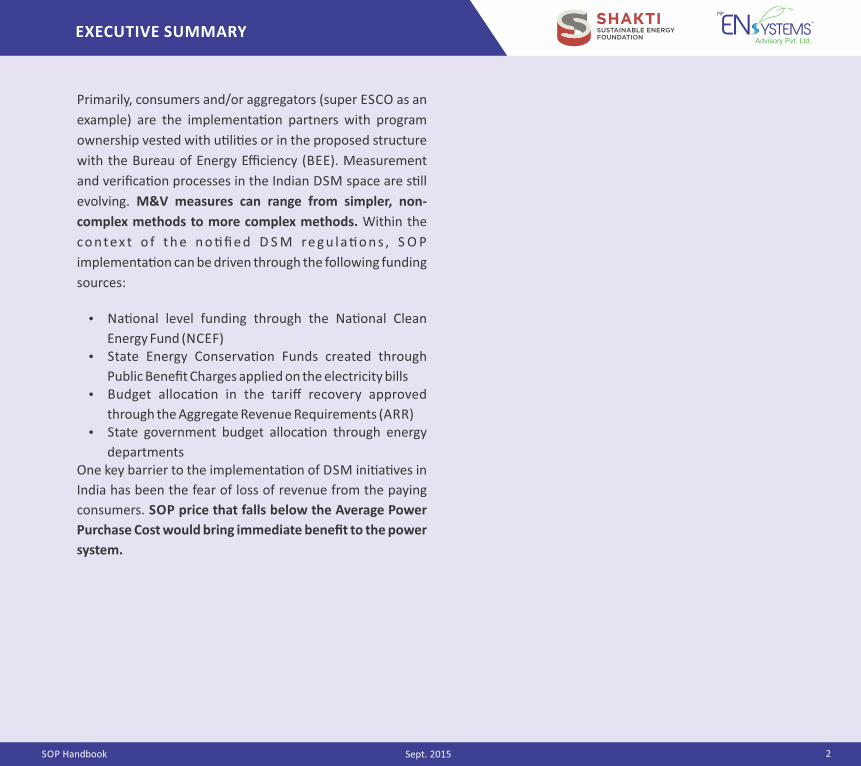
Primarily, consumers and/or aggregators (super ESCO as an
example) are the implementa�on partners with program
ownership vested with u�li�es or in the proposed structure
with the Bureau of Energy Efficiency (BEE). Measurement
and verifica�on processes in the Indian DSM space are s�ll
evolving. M&V measures can range from simpler, non‐
complex methods to more complex methods. Within the
co ntex t o f t h e n o � fi e d D S M re g u l a� o n s , S O P
implementa�on can be driven through the following funding
sources:
Na�onal level funding through the Na�onal Clean
Energy Fund (NCEF) State Energy Conserva�on Funds created through
Public Benefit Charges applied on the electricity bills Budget alloca�on in the tariff recovery approved
through the Aggregate Revenue Requirements (ARR) State government budget alloca�on through energy
departmentsOne key barrier to the implementa�on of DSM ini�a�ves in
India has been the fear of loss of revenue from the paying
consumers. SOP price that falls below the Average Power
Purchase Cost would bring immediate benefit to the power
system.

3
1. INTRODUCTION: BRIEF DESCRIPTION OF A STANDARD OFFER PROGRAM AND ITS BENEFITS
SOP Handbook Sept. 2015
Savings from efficient use of electricity are a key resource for
any electricity system, especially in a country like India,
which faces electricity shortage and access issues. The
Indian regulatory framework supports design and
implementa�on of Demand Side Management (DSM)
measures by u�li�es, for their consumers. The preamble to
The Electricity Act, 2003 sets out in broader terms what the
Act is expected to achieve. The Preamble men�ons
"promo�on of efficient and environmentally benign
policies" as an important objec�ve. Further, Sec�on 23 of
the Electricity Act, 2003 empowers the Electricity
Regulatory Commissions to take steps and measures for
inter alia maintaining the efficient supply of electricity�.
Several State Electricity Regulatory Commissions (SERCs) in
India have issued Regula�ons to this effect�. A small number
of u�li�es have successfully implemented DSM measures,
such as, retrofit programs for fans, unitary air‐condi�oners,
tube lights, refrigerators and proven their benefits. Given
these successful examples, it is now opportune to scale up
implementa�on of DSM measures.
Distribu�on u�li�es in India have tried out specific DSM
measures that include on‐bill financing, rebates, incen�ves
and limited design assistance. A Standard Offer Program
(SOP) is a construct where the consumers are encouraged to
ac�vely par�cipate in the u�lity DSM programs. Consumer
par�cipa�on has been proven to be effec�ve when the
spectrum of the technologies deployed has been
broadened. Reduced tariffs and reduced first‐costs of the
technologies deployed have also made the necessary impact
over the u�lity systems. Essen�ally, the consumers ac�ng as
the producers of negawa�s that benefit them as well as the
u�li�es have been at the epicenter of successful DSM
ini�a�ves. Most importantly, the consumers by adop�on of
efficient technologies become an integral part of resource
acquisi�on, in reduc�on of overall cost structure and
measurement of savings.
A SOP provides opportuni�es for scaling‐up by offering
simplified and implementable solu�ons. These solu�ons can
help �de‐over inherent challenges associated with the way
DSM program are currently implemented. SOP can even be
termed as an acquisi�on at par with the feed‐in tariff
provision applicable for renewable energy sources.
Classical defini�on of SOP: SOP is the purchase of energy and/or demand savings by a distribu�on company from consumers for energy and/or demand savings from key end-uses, at a standard rate (Rs/kW and/or Rs/kWh) agreed upon at the start of the program.
1
3
Sec�on 23 of The Electricity Act, 2003 states "Direc�ons to licensees. - If the Appropriate Commission is of the opinion that it is necessary or expedient so to do for maintaining the efficient supply, securing the equitable distribu�on of electricity and promo�ng compe��on, it may, by order, provide for regula�ng supply, distribu�on, consump�on or use thereof." As on 28th February, 2015, 16 final no�fied and 2 dra� DSM Regula�ons have been issued by various ERCs. Addi�onally, some more States have included specific direc�ves in the u�lity tariff orders, direc�ng the u�li�es to undertake ac�vi�es such as load research and iden�fica�on of DSM poten�al.
1
2
4 SOP Handbook
1. INTRODUCTION: BRIEF DESCRIPTION OF A STANDARD OFFER PROGRAM AND ITS BENEFITS
Sept. 2015
SOP has proven to be a simple tool for distribu�on u�li�es across the world (e.g. United States of America, South Africa and Portugal)�, and more recently in India where Energy Efficiency Services Limited (EESL) launched a successful ligh�ng SOP ini�a�ve in Puducherry to intervene on the consumer side of the meter and facilitate efficient opera�ons at a large scale. One of the Mumbai based u�li�es, Tata Power, has launched an SOP for their commercial and industrial (C&I) consumers recently.
The SOP program of Tata Power, Mumbai supports energy efficiency ini�a�ves undertaken by commercial and industrial consumers on their own. Eligible interven�ons under this program are any EE/EC measures such as HVAC, Ligh�ng, mo�ve power, control systems, etc. The savings from these interven�ons should be measurable through the M&V procedure laid down by Tata Power. M&V is carried out by a third party appointed by Tata Power. SOP price finalized for the program is Rs 1 / kWh for verified savings between
8am and 8pm excluding Sundays and holidays. The program is under implementa�on and results are awaited.
An SOP meets two objec�ves from the u�li�es' perspec�ve: (a) Load Management(b) Strategic Conserva�on
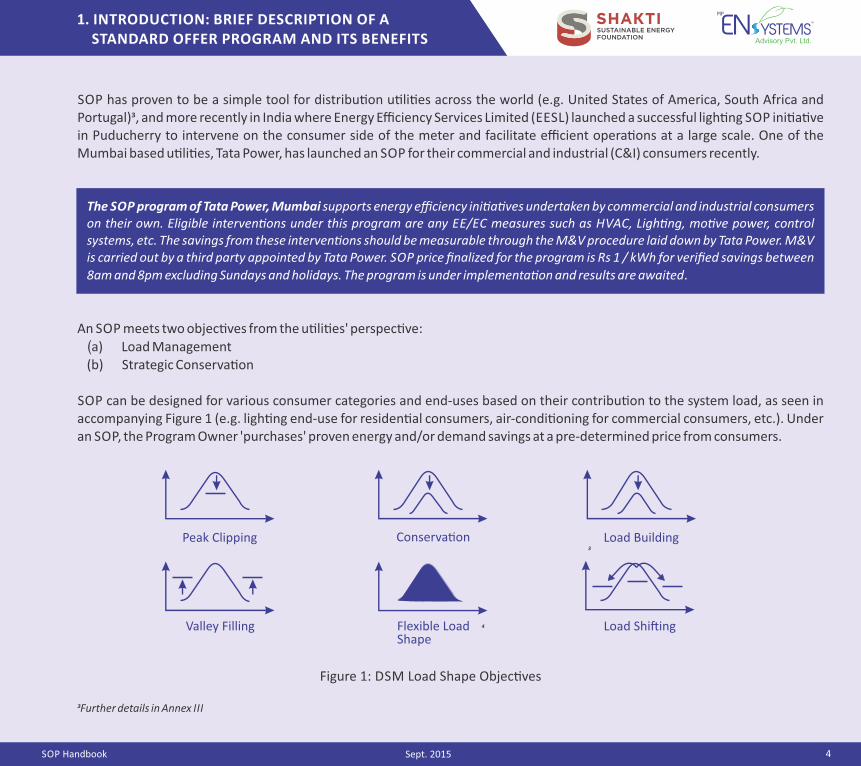
SOP can be designed for various consumer categories and end‐uses based on their contribu�on to the system load, as seen in accompanying Figure 1 (e.g. ligh�ng end‐use for residen�al consumers, air‐condi�oning for commercial consumers, etc.). Under an SOP, the Program Owner 'purchases' proven energy and/or demand savings at a pre‐determined price from consumers.
3
Load Building
Load Shi�ing4
Conserva�on
Flexible Load Shape
Peak Clipping
Valley Filling
Figure 1: DSM Load Shape Objec�ves
�Further details in Annex III
5 SOP Handbook
1. INTRODUCTION: BRIEF DESCRIPTION OF A STANDARD OFFER PROGRAM AND ITS BENEFITS
Sept. 2015
�The discounted payments to be made by the consumers may collected from the consumers in the following manner: (i) upfront, at the �me of technology installa�on, or, (ii) through on-bill financing, in which the u�lity may charge the consumer equated monthly instalments in their electricity bills (corresponding to their share of the efficient technology cost), over a period of 6 months to one year.
�This is the en�ty implemen�ng the SOP on behalf of mul�ple consumers and aggrega�ng the savings achieved. The Aggregator will coordinate with
consumers in the implementa�on of the SOP.�Proven savings is verified savings based on agreed M&V protocol.
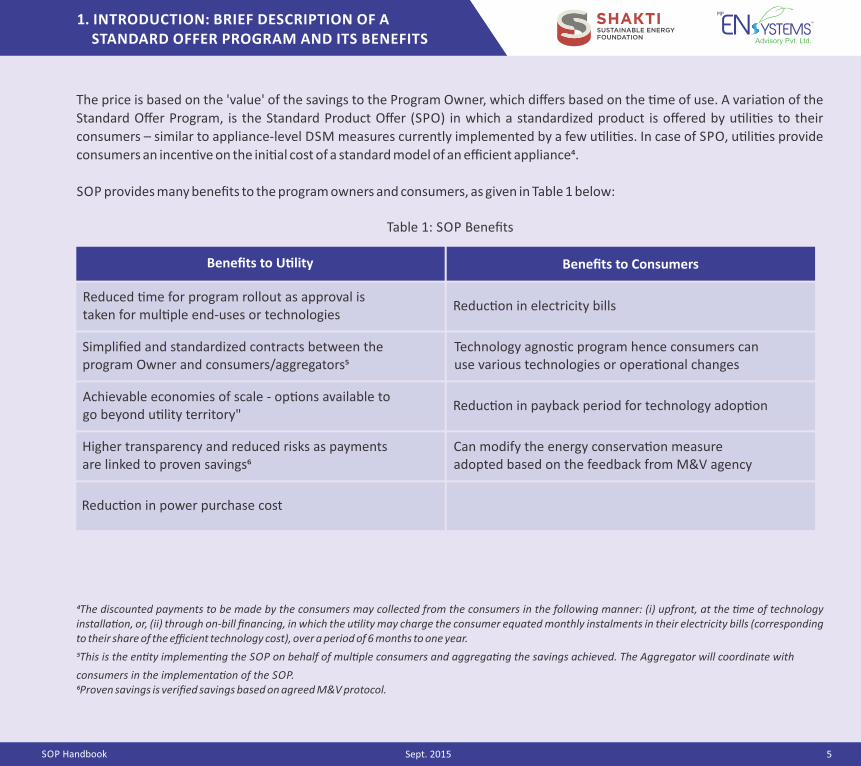
Reduced �me for program rollout as approval is taken for mul�ple end‐uses or technologies
Simplified and standardized contracts between the program Owner and consumers/aggregators�
Achievable economies of scale ‐ op�ons available to go beyond u�lity territory "
Higher transparency and reduced risks as payments are linked to proven savings�
Reduc�on in power purchase cost
Reduc�on in electricity bills
Reduc�on in payback period for technology adop�on
Technology agnos�c program hence consumers can use various technologies or opera�onal changes
Can modify the energy conserva�on measure adopted based on the feedback from M&V agency
Benefits to U�lity
Table 1: SOP Benefits
The price is based on the 'value' of the savings to the Program Owner, which differs based on the �me of use. A varia�on of the
Standard Offer Program, is the Standard Product Offer (SPO) in which a standardized product is offered by u�li�es to their
consumers – similar to appliance‐level DSM measures currently implemented by a few u�li�es. In case of SPO, u�li�es provide
consumers an incen�ve on the ini�al cost of a standard model of an efficient appliance�.
SOP provides many benefits to the program owners and consumers, as given in Table 1 below:
Benefits to Consumers
6 SOP Handbook
1. INTRODUCTION: BRIEF DESCRIPTION OF A STANDARD OFFER PROGRAM AND ITS BENEFITS
Sept. 2015
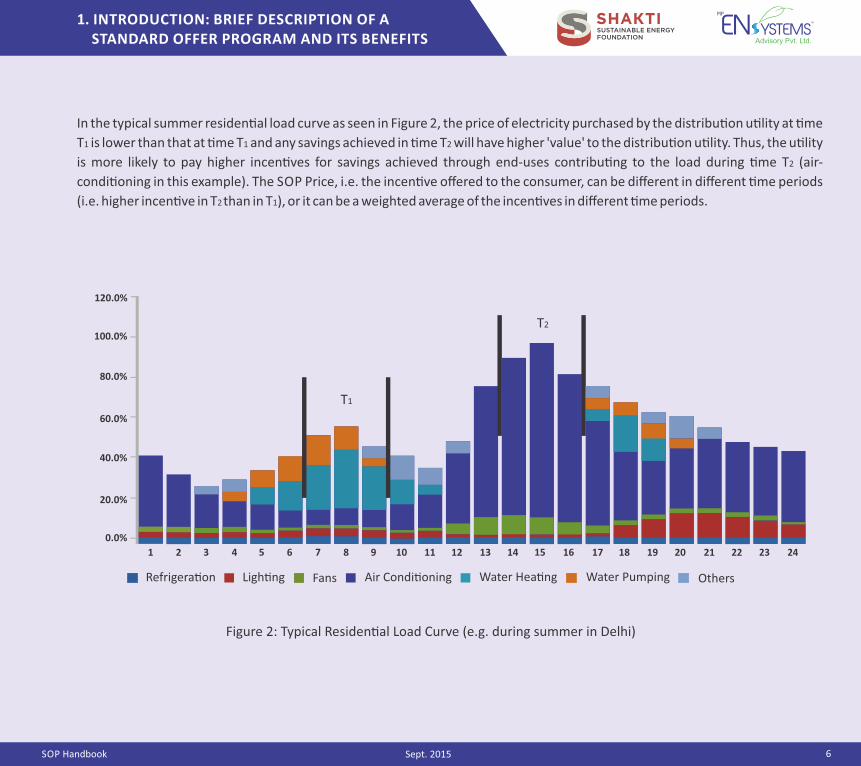
In the typical summer residen�al load curve as seen in Figure 2, the price of electricity purchased by the distribu�on u�lity at �me
T1 is lower than that at �me T1 and any savings achieved in �me T2 will have higher 'value' to the distribu�on u�lity. Thus, the u�lity
is more likely to pay higher incen�ves for savings achieved through end‐uses contribu�ng to the load during �me T2 (air‐
condi�oning in this example). The SOP Price, i.e. the incen�ve offered to the consumer, can be different in different �me periods
(i.e. higher incen�ve in T2 than in T1), or it can be a weighted average of the incen�ves in different �me periods.
1 2 3 4 5 6 7 8 9 10 11 12 13 14 15 16 17 18 19 20 21 22 23 24
0.0%
20.0%
40.0%
60.0%
80.0%
100.0%
120.0%
Refrigera�on Ligh�ng Fans Air Condi�oning Water Hea�ng Water Pumping Others
Figure 2: Typical Residen�al Load Curve (e.g. during summer in Delhi)
T1
T2
7 SOP Handbook
1. INTRODUCTION: BRIEF DESCRIPTION OF A STANDARD OFFER PROGRAM AND ITS BENEFITS
Sept. 2015
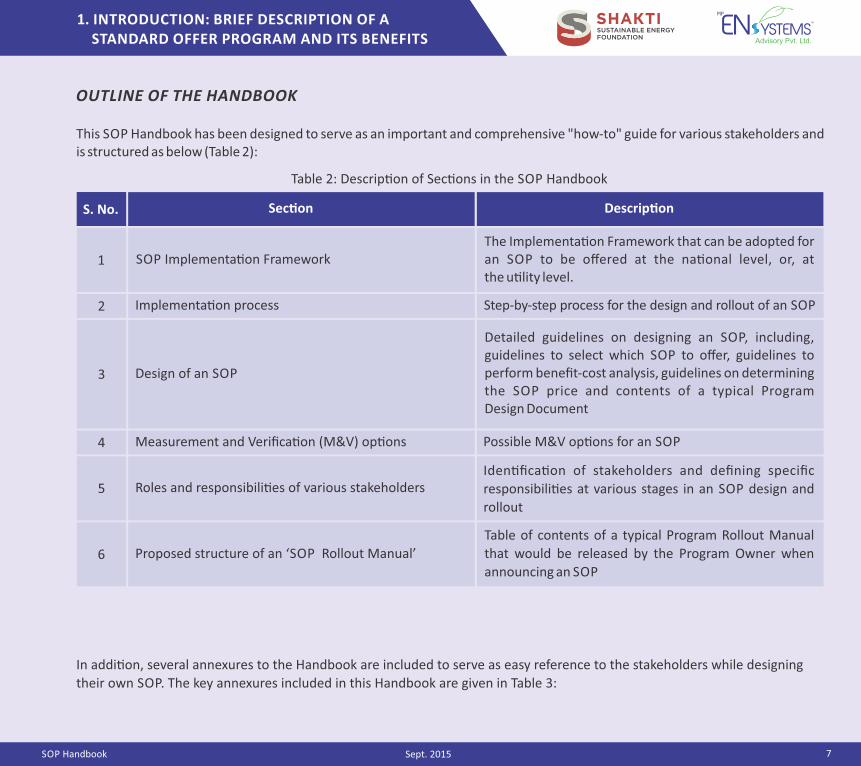
This SOP Handbook has been designed to serve as an important and comprehensive "how‐to" guide for various stakeholders and is structured as below (Table 2):
Descrip�on
SOP Implementa�on Framework The Implementa�on Framework that can be adopted for an SOP to be offered at the na�onal level, or, at the u�lity level.
1
Implementa�on process 2 Step‐by‐step process for the design and rollout of an SOP
Design of an SOP 3
Possible M&V op�ons for an SOP
Iden�fica�on of stakeholders and defining specific
responsibili�es at various stages in an SOP design and
rollout
Table of contents of a typical Program Rollout Manual
that would be released by the Program Owner when
announcing an SOP
In addi�on, several annexures to the Handbook are included to serve as easy reference to the stakeholders while designing
their own SOP. The key annexures included in this Handbook are given in Table 3:
Table 2: Descrip�on of Sec�ons in the SOP Handbook
S. No. Sec�on
OUTLINE OF THE HANDBOOK
Detailed guidelines on designing an SOP, including, guidelines to select which SOP to offer, guidelines to perform benefit‐cost analysis, guidelines on determiningthe SOP price and contents of a typical Program Design Document
Roles and responsibili�es of various stakeholders5
6 Proposed structure of an ‘SOP Rollout Manual’
Measurement and Verifica�on (M&V) op�ons 4
8 SOP Handbook
1. INTRODUCTION: BRIEF DESCRIPTION OF A STANDARD OFFER PROGRAM AND ITS BENEFITS
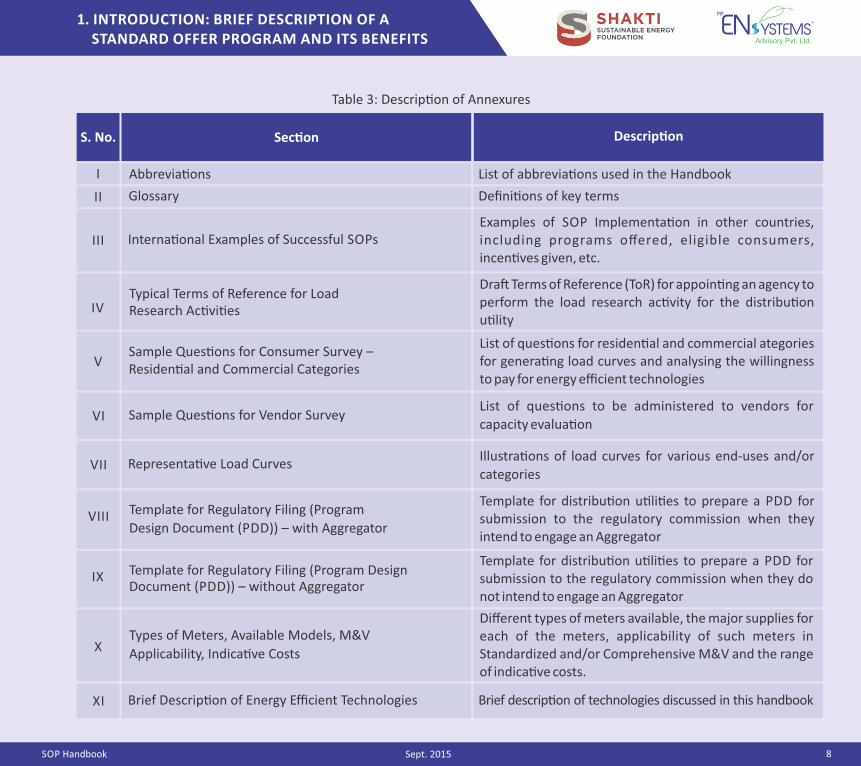
Table 3: Descrip�on of Annexures
IX
X
Template for Regulatory Filing (Program
Design Document (PDD)) – with Aggregator
Template for distribu�on u�li�es to prepare a PDD for submission to the regulatory commission when they intend to engage an Aggregator
Template for Regulatory Filing (Program Design Document (PDD)) – without Aggregator
Template for distribu�on u�li�es to prepare a PDD for submission to the regulatory commission when they do not intend to engage an Aggregator
Types of Meters, Available Models, M&V
Applicability, Indica�ve Costs
XI Brief Descrip�on of Energy Efficient Technologies Brief descrip�on of technologies discussed in this handbook
Different types of meters available, the major supplies for each of the meters, applicability of such meters in Standardized and/or Comprehensive M&V and the range of indica�ve costs.
List of abbrevia�ons used in the Handbook
S. No.
III
IV
V
Interna�onal Examples of Successful SOPsExamples of SOP Implementa�on in other countries, including programs offered, eligible consumers, incen�ves given, etc.
Typical Terms of Reference for Load Research Ac�vi�es
Dra� Terms of Reference (ToR) for appoin�ng an agency to perform the load research ac�vity for the distribu�on u�lity
Sample Ques�ons for Consumer Survey – Residen�al and Commercial Categories
List of ques�ons for residen�al and commercial ategories for genera�ng load curves and analysing the willingness to pay for energy efficient technologies
VI
VII
VIII
Sample Ques�ons for Vendor SurveyList of ques�ons to be administered to vendors for
capacity evalua�on
Representa�ve Load CurvesIllustra�ons of load curves for various end‐uses and/or
categories
I Abbrevia�ons
II Glossary Defini�ons of key terms
Descrip�on Sec�on
Sept. 2015
9 SOP Handbook
1. INTRODUCTION: BRIEF DESCRIPTION OF A STANDARD OFFER PROGRAM AND ITS BENEFITS
Sept. 2015
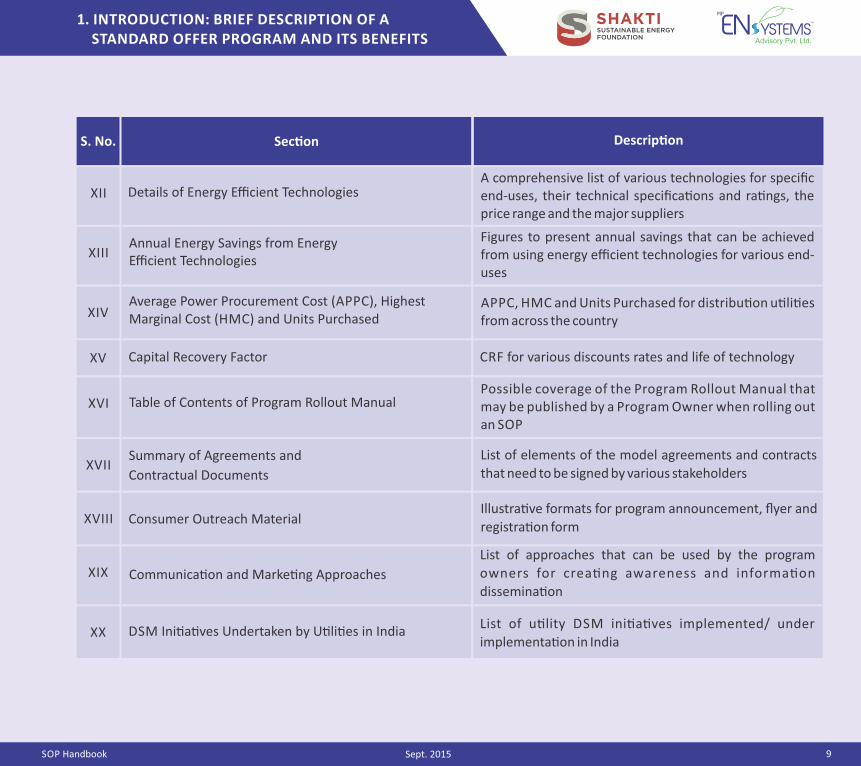
APPC, HMC and Units Purchased for distribu�on u�li�esfrom across the country
CRF for various discounts rates and life of technology
Figures to present annual savings that can be achieved from using energy efficient technologies for various end‐uses
S. No. Descrip�on Sec�on
XII
XIV
XV
XX
XIII
Average Power Procurement Cost (APPC), Highest Marginal Cost (HMC) and Units Purchased
Capital Recovery Factor
DSM Ini�a�ves Undertaken by U�li�es in India
Details of Energy Efficient Technologies
Annual Energy Savings from Energy Efficient Technologies
A comprehensive list of various technologies for specific end‐uses, their technical specifica�ons and ra�ngs, the price range and the major suppliers
XVI Table of Contents of Program Rollout ManualPossible coverage of the Program Rollout Manual that may be published by a Program Owner when rolling out an SOP
XVIISummary of Agreements and
Contractual Documents
List of elements of the model agreements and contracts
that need to be signed by various stakeholders
List of u�lity DSM ini�a�ves implemented/ under
implementa�on in India
XIX Communica�on and Marke�ng Approaches
XVIII Consumer Outreach Material Illustra�ve formats for program announcement, flyer and
registra�on form
List of approaches that can be used by the program
owners for crea�ng awareness and informa�on
dissemina�on
10
2. SOP IMPLEMENTATION FRAMEWORK
SOP Handbook Sept. 2015
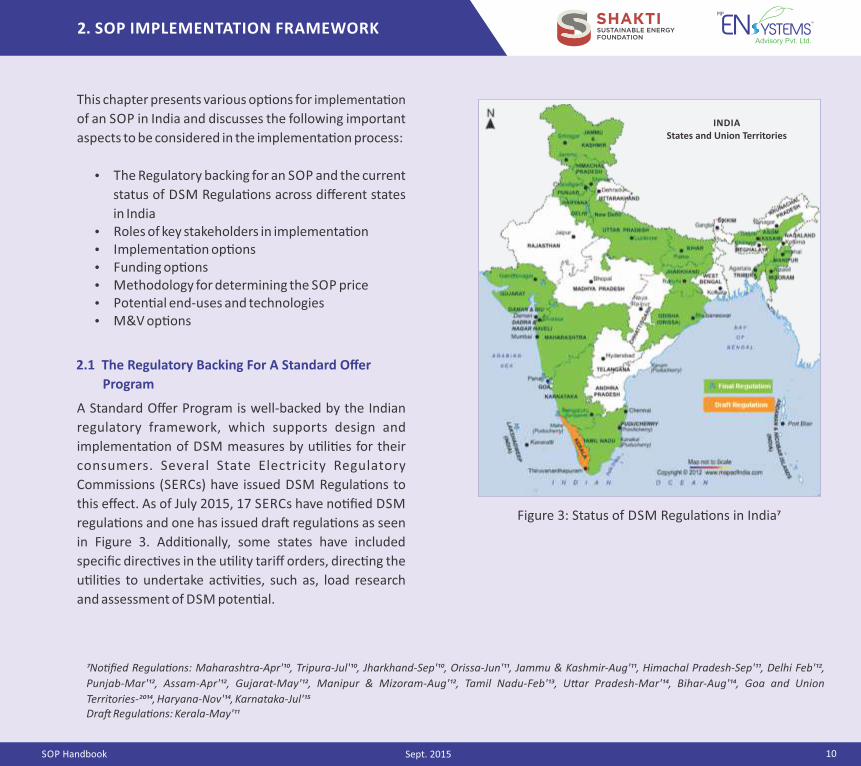
�No�fied Regula�ons: Maharashtra-Apr'��, Tripura-Jul'��, Jharkhand-Sep'��, Orissa-Jun'��, Jammu & Kashmir-Aug'��, Himachal Pradesh-Sep'��, Delhi Feb'��,
Punjab-Mar'��, Assam-Apr'��, Gujarat-May'��, Manipur & Mizoram-Aug'��, Tamil Nadu-Feb'��, U�ar Pradesh-Mar'��, Bihar-Aug'��, Goa and Union
Territories-����, Haryana-Nov'��, Karnataka-Jul'��Dra� Regula�ons: Kerala-May'��
Figure 3: Status of DSM Regula�ons in India�
The Regulatory backing for an SOP and the current
status of DSM Regula�ons across different states
in India Roles of key stakeholders in implementa�on Implementa�on op�ons Funding op�ons Methodology for determining the SOP price Poten�al end‐uses and technologies M&V op�ons
This chapter presents various op�ons for implementa�on
of an SOP in India and discusses the following important
aspects to be considered in the implementa�on process:
A Standard Offer Program is well‐backed by the Indian
regulatory framework, which supports design and
implementa�on of DSM measures by u�li�es for their
consumers. Several State Electricity Regulatory
Commissions (SERCs) have issued DSM Regula�ons to
this effect. As of July 2015, 17 SERCs have no�fied DSM
regula�ons and one has issued dra� regula�ons as seen
in Figure 3. Addi�onally, some states have included
specific direc�ves in the u�lity tariff orders, direc�ng the
u�li�es to undertake ac�vi�es, such as, load research
and assessment of DSM poten�al.
2.1 The Regulatory Backing For A Standard Offer
Program
INDIAStates and Union Territories
11
2. SOP IMPLEMENTATION FRAMEWORK
SOP Handbook Sept. 2015
Important provisions in the current DSM Regula�ons are:
DSM programs are to be driven by distribu�on u�li�es for their consumers DSM programs and plans are to be prepared by u�li�es and approved by the respec�ve commissions Incen�ves can be offered by u�li�es to their consumers Program investments to be "cost‐effec�ve" to both the licensee and the consumers DSM expenses may be passed through in the tariff, while simultaneously aiming for reduc�on in the overall tariff M&V to be undertaken for ascertaining demand and energy savings
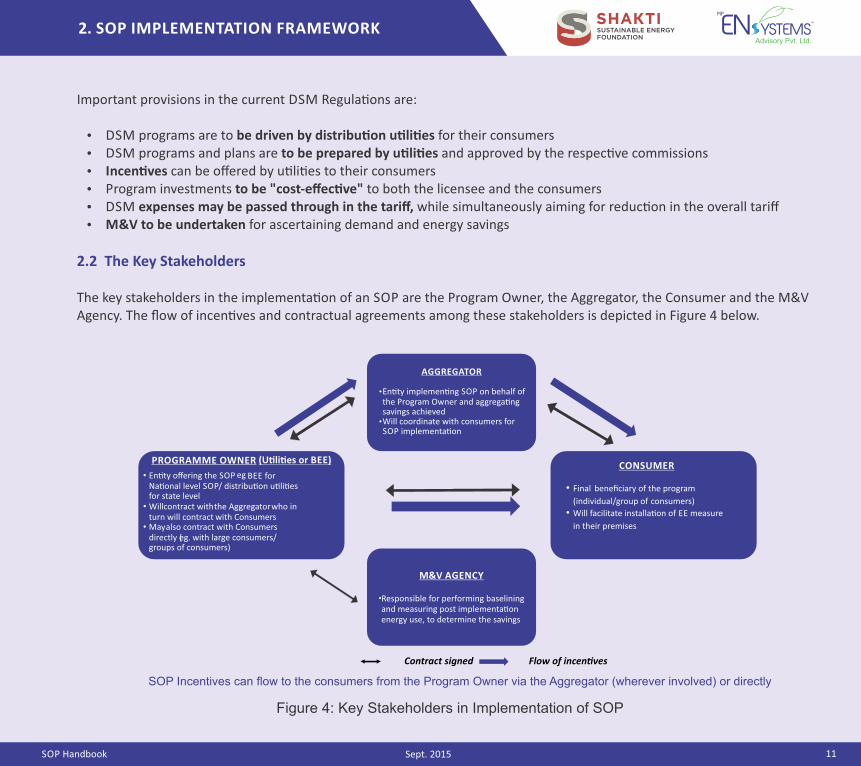
2.2 The Key Stakeholders
The key stakeholders in the implementa�on of an SOP are the Program Owner, the Aggregator, the Consumer and the M&V Agency. The flow of incen�ves and contractual agreements among these stakeholders is depicted in Figure 4 below.
Contract signed Flow of incen�ves
AGGREGATOR
CONSUMER
beneficiary of the program
(individual/group of consumers)
Will facilitate installa�on of EE measure
their premises
M&V AGENCY
Figure 4: Key Stakeholders in Implementation of SOP
SOP Incentives can flow to the consumers from the Program Owner via the Aggregator (wherever involved) or directly
• Final
•in
En�ty implemen�ng SOP on behalf of the Program Owner and aggrega�ng savings achievedWill coordinate with consumers for SOP implementa�on
•
•
Responsible for performing baselining and measuring post implementa�on energy use, to determine the savings
•
PROGRAMME OWNER (U�li�es or BEE)
• En�ty offering the SOP eg BEE for Na�onal level SOP/ distribu�on u�li�es for state level
• Will contract with the Aggregator who in turn will contract with Consumers
• May also contract with Consumers directly (eg. with large consumers/ groups of consumers)
12 SOP Handbook
2. SOP IMPLEMENTATION FRAMEWORK
Sept. 2015
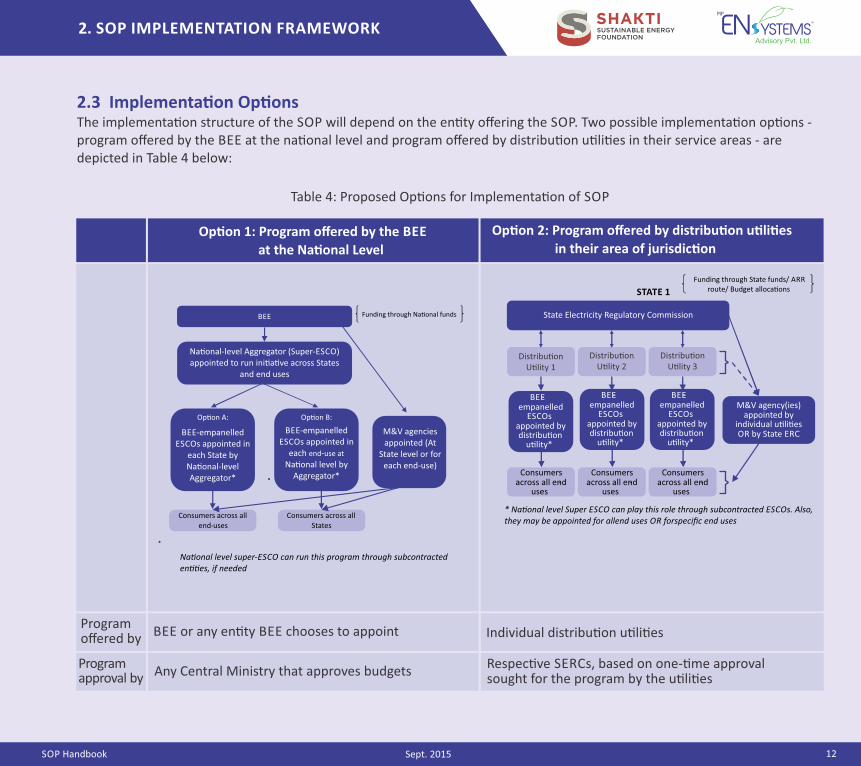
2.3 Implementa�on Op�onsThe implementa�on structure of the SOP will depend on the en�ty offering the SOP. Two possible implementa�on op�ons ‐ program offered by the BEE at the na�onal level and program offered by distribu�on u�li�es in their service areas ‐ are depicted in Table 4 below:
Table 4: Proposed Op�ons for Implementa�on of SOP
Op�on 1: Program offered by the BEE
at the Na�onal Level
Op�on 2: Program offered by distribu�on u�li�es
in their area of jurisdic�on
*
Na�onal level super-ESCO can run this program through subcontracted en��es, if needed
Distribu�on U�lity 1
BEE‐empanelled
ESCOs appointed by distribu�on
u�lity*
M&V agency(ies)appointed by
individual u�li�es OR by State ERC
Consumers across all end‐
uses
* Na�onal level Super ESCO can play this role through subcontracted ESCOs. Also, they may be appointed for allend uses OR forspecific end uses
Funding through State funds/ ARR route/ Budget alloca�ons
Distribu�on U�lity 2
BEE‐empanelled
ESCOs appointed by distribu�on
u�lity*
Consumers across all end‐
uses
Distribu�on U�lity 3
BEE‐empanelled
ESCOs appointed by distribu�on
u�lity*
Consumers across all end‐
uses
State Electricity Regulatory Commission
STATE 1
BEE
Consumers across all States
M&V agencies appointed (At
State level or for each end‐use)
Consumers across all end‐uses
Funding through Na�onal funds
Na�onal‐level Aggregator (Super‐ESCO) appointed to run ini�a�ve across States
and end uses
Op�on A:
BEE‐empanelled ESCOs appointed in
each State by Na�onal‐level Aggregator*
Op�on B:
BEE‐empanelled ESCOs appointed in
each end‐use at Na�onal level by
Aggregator*
BEE or any en�ty BEE chooses to appointProgram offered by Individual distribu�on u�li�es
Program approval by Any Central Ministry that approves budgets
Respec�ve SERCs, based on one‐�me approval sought for the program by the u�li�es
13 SOP Handbook
2. SOP IMPLEMENTATION FRAMEWORK
Sept. 2015
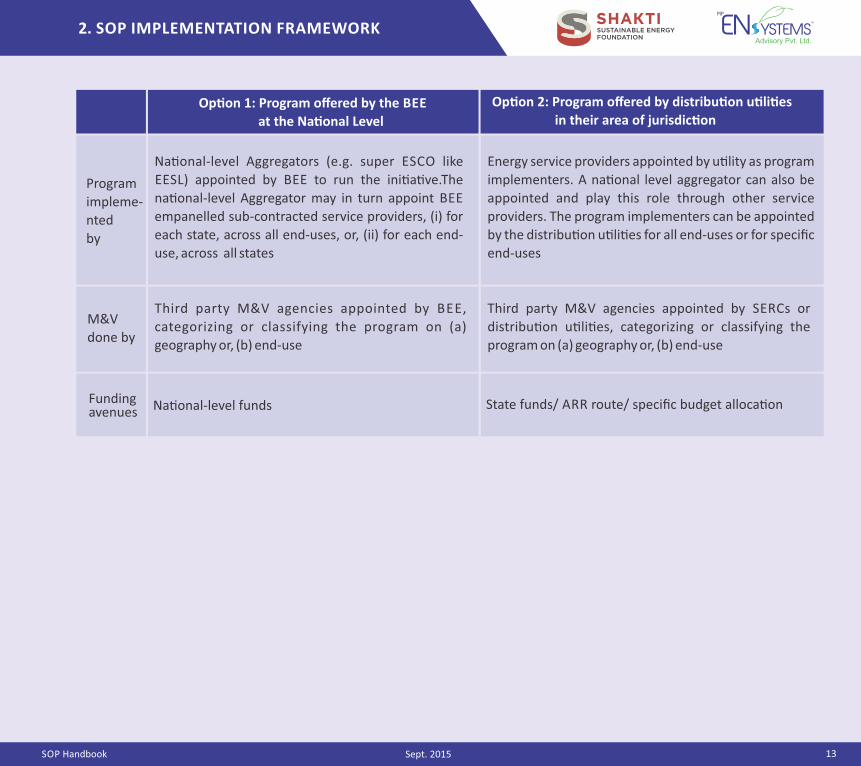
Na�onal‐level Aggregators (e.g. super ESCO like
EESL) appointed by BEE to run the ini�a�ve.The
na�onal‐level Aggregator may in turn appoint BEE
empanelled sub‐contracted service providers, (i) for
each state, across all end‐uses, or, (ii) for each end‐
use, across all states
Energy service providers appointed by u�lity as program
implementers. A na�onal level aggregator can also be
appointed and play this role through other service
providers. The program implementers can be appointed
by the distribu�on u�li�es for all end‐uses or for specific
end‐uses
M&V
done by
Third party M&V agencies appointed by BEE,
categorizing or classifying the program on (a)
geography or, (b) end‐use
Third party M&V agencies appointed by SERCs or
distribu�on u�li�es, categorizing or classifying the
program on (a) geography or, (b) end‐use
Funding avenues Na�onal‐level funds State funds/ ARR route/ specific budget alloca�on
Program
impleme‐
nted
by
Op�on 1: Program offered by the BEE
at the Na�onal Level
Op�on 2: Program offered by distribu�on u�li�es
in their area of jurisdic�on
14 SOP Handbook
2. SOP IMPLEMENTATION FRAMEWORK
Sept. 2015
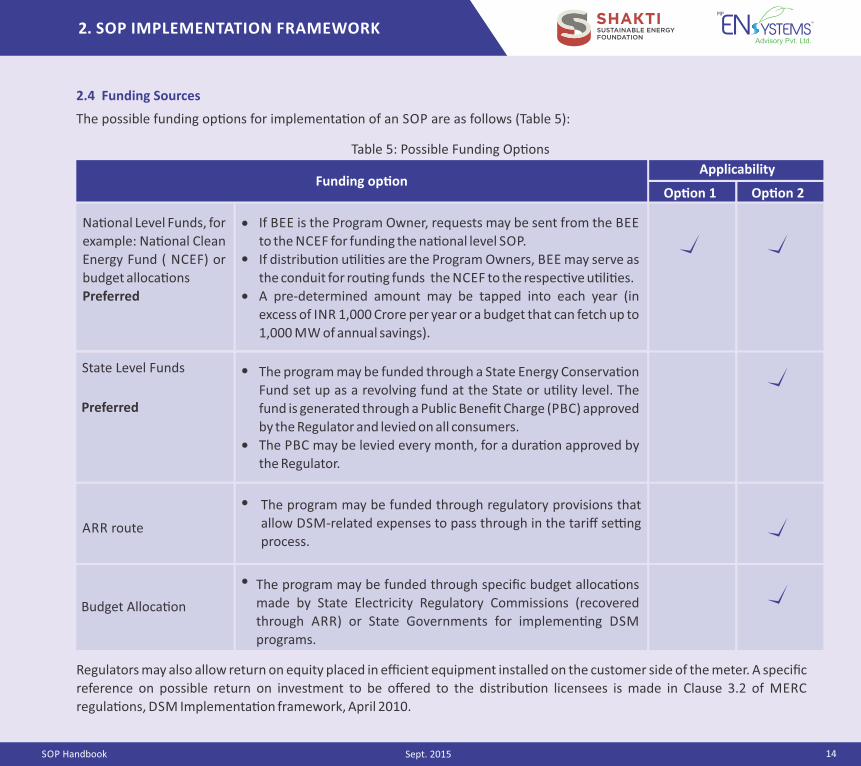
2.4 Funding Sources
Funding op�on
Budget Alloca�on
The program may be funded through specific budget alloca�ons
made by State Electricity Regulatory Commissions (recovered
through ARR) or State Governments for implemen�ng DSM
programs.
Regulators may also allow return on equity placed in efficient equipment installed on the customer side of the meter. A specific
reference on possible return on investment to be offered to the distribu�on licensees is made in Clause 3.2 of MERC
regula�ons, DSM Implementa�on framework, April 2010.
Table 5: Possible Funding Op�ons
Applicability
Op�on 1 Op�on 2
The possible funding op�ons for implementa�on of an SOP are as follows (Table 5):
Na�onal Level Funds, for
example: Na�onal Clean
Energy Fund ( NCEF) or
budget alloca�ons
Preferred
If BEE is the Program Owner, requests may be sent from the BEE
to the NCEF for funding the na�onal level SOP.
If distribu�on u�li�es are the Program Owners, BEE may serve as
the conduit for rou�ng funds the NCEF to the respec�ve u�li�es.
A pre‐determined amount may be tapped into each year (in
excess of INR 1,000 Crore per year or a budget that can fetch up to
1,000 MW of annual savings).
State Level Funds The program may be funded through a State Energy Conserva�on
Fund set up as a revolving fund at the State or u�lity level. The
fund is generated through a Public Benefit Charge (PBC) approved
by the Regulator and levied on all consumers.
The PBC may be levied every month, for a dura�on approved by
the Regulator.
Preferred
ARR route
The program may be funded through regulatory provisions that
allow DSM‐related expenses to pass through in the tariff se�ng
process.
15 SOP Handbook
2. SOP IMPLEMENTATION FRAMEWORK
Sept. 2015
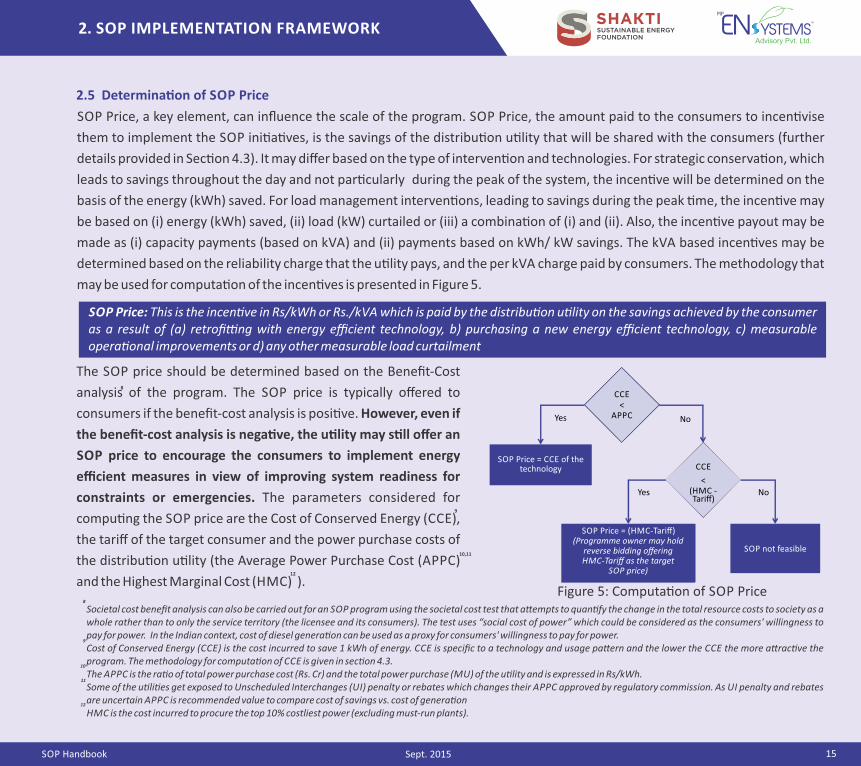
SOP Price: This is the incen�ve in Rs/kWh or Rs./kVA which is paid by the distribu�on u�lity on the savings achieved by the consumer as a result of (a) retrofi�ng with energy efficient technology, b) purchasing a new energy efficient technology, c) measurable opera�onal improvements or d) any other measurable load curtailment
SOP Price, a key element, can influence the scale of the program. SOP Price, the amount paid to the consumers to incen�vise
them to implement the SOP ini�a�ves, is the savings of the distribu�on u�lity that will be shared with the consumers (further
details provided in Sec�on 4.3). It may differ based on the type of interven�on and technologies. For strategic conserva�on, which
leads to savings throughout the day and not par�cularly during the peak of the system, the incen�ve will be determined on the
basis of the energy (kWh) saved. For load management interven�ons, leading to savings during the peak �me, the incen�ve may
be based on (i) energy (kWh) saved, (ii) load (kW) curtailed or (iii) a combina�on of (i) and (ii). Also, the incen�ve payout may be
made as (i) capacity payments (based on kVA) and (ii) payments based on kWh/ kW savings. The kVA based incen�ves may be
determined based on the reliability charge that the u�lity pays, and the per kVA charge paid by consumers. The methodology that
may be used for computa�on of the incen�ves is presented in Figure 5.
The SOP price should be determined based on the Benefit‐Cost
analysis of the program. The SOP price is typically offered to
consumers if the benefit‐cost analysis is posi�ve. However, even if
the benefit‐cost analysis is nega�ve, the u�lity may s�ll offer an
SOP price to encourage the consumers to implement energy
efficient measures in view of improving system readiness for
constraints or emergencies. The parameters considered for
compu�ng the SOP price are the Cost of Conserved Energy (CCE),
the tariff of the target consumer and the power purchase costs of
the distribu�on u�lity (the Average Power Purchase Cost (APPC)
and the Highest Marginal Cost (HMC) ).
8
10,11
12
9
2.5 Determina�on of SOP Price
Societal cost benefit analysis can also be carried out for an SOP program using the societal cost test that a�empts to quan�fy the change in the total resource costs to society as a whole rather than to only the service territory (the licensee and its consumers). The test uses “social cost of power” which could be considered as the consumers' willingness to pay for power. In the Indian context, cost of diesel genera�on can be used as a proxy for consumers' willingness to pay for power. Cost of Conserved Energy (CCE) is the cost incurred to save 1 kWh of energy. CCE is specific to a technology and usage pa�ern and the lower the CCE the more a�rac�ve the program. The methodology for computa�on of CCE is given in sec�on 4.3. The APPC is the ra�o of total power purchase cost (Rs. Cr) and the total power purchase (MU) of the u�lity and is expressed in Rs/kWh. Some of the u�li�es get exposed to Unscheduled Interchanges (UI) penalty or rebates which changes their APPC approved by regulatory commission. As UI penalty and rebates are uncertain APPC is recommended value to compare cost of savings vs. cost of genera�on HMC is the cost incurred to procure the top 10% costliest power (excluding must-run plants).
8
9
10
11
12
Figure 5: Computa�on of SOP Price
CCE <
APPCYes No
SOP Price = CCE of the technology
Tariff)
< (HMC ‐Yes No
(Programme owner may hold reverse bidding offering HMC-Tariff as the target
SOP price)
SOP not feasible
CCE
SOP Price = (HMC‐Tariff)
16 SOP Handbook
2. SOP IMPLEMENTATION FRAMEWORK
Sept. 2015
The following scenarios can be considered:
( ) When the CCE is less than the APPC, the cost incurred
to save 1 kWh is less than the average cost incurred to
purchase 1 kWh. This makes the program economically
viable. In this case, the incen�ve offered to the
consumer, i.e. the SOP price, may be equal to the CCE.
(ii) When the CCE is more than the APPC (i.e. the cost
incurred to save 1 kWh is higher than the average cost
incurred to purchase 1 kWh), the tariff of the targeted
consumer needs to be compared with the highest
marginal cost of power purchase, to ascertain whether
the distribu�on u�lity would lose more by means of
lost revenue (tariff not paid by consumer due to kWh
saving) or gain more by not buying costly power. The
following two scenarios may be considered:
a. If the tariff of the target consumer is less than the
HMC, the loss of revenue for the distribu�on u�lity
is less than the savings of the costly power
purchased. This results in a net posi�ve benefit to
the distribu�on u�lity, computed as the difference
between the tariff of the target consumer and the
HMC.
b. If the tariff of the target consumer is more than the
HMC, the loss of revenue for the distribu�on u�lity
is greater than the savings of costly power
purchased. This results in a net nega�ve benefit to
the distribu�on u�lity and the program is not
feasible. However, the u�lity may support such
programs to promote energy efficiency by providing
low levels of incen�ves.
Further details on determina�on of the SOP Price are given
in Sec�on 4.3.
The schedule of incen�ve payment maybe decided based on
the end‐use being targeted, the first costs of the energy
efficient technology and the consumer type. The op�ons for
schedule of payment for savings from various types of end‐
uses can be as follows:
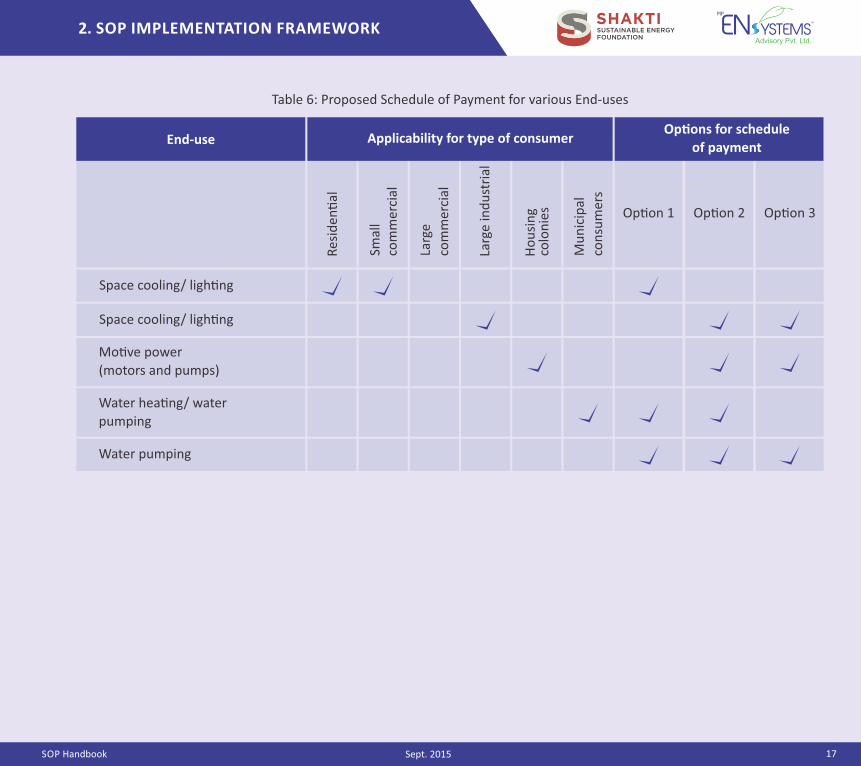
Ÿ Op�on 1: The en�re incen�ve is paid to the consumer as
a first cost rebate at the start of the program. The
incen�ve to be paid is based on the expected savings
for a specified period (e.g. 6 months or 1 year).Ÿ Op�on 2: The incen�ve is paid to the consumer partly at
the start of the program and partly based on proven
savings.Ÿ Op�on 3: The incen�ve is paid based on proven savings.
First‐cost rebates are op�onal in this case.
The proposed schedule of payment for various end‐uses is
given in Table 6.
I
17 SOP Handbook
2. SOP IMPLEMENTATION FRAMEWORK
Sept. 2015
Ho
usi
ng
colo
nie
s Op�on 1 Op�on 2 Op�on 3
Space cooling/ ligh�ng
Mo�ve power
(motors and pumps)
Water hea�ng/ water
pumping
Space cooling/ ligh�ng
Water pumping
Table 6: Proposed Schedule of Payment for various End‐uses
End‐use Applicability for type of consumerOp�ons for schedule
of payment
Res
iden
�al
Smal
lco
mm
erci
al
Larg
e
com
mer
cial
Larg
e in
du
stri
al
Mu
nic
ipal
con
sum
ers
18 SOP Handbook
2. SOP IMPLEMENTATION FRAMEWORK
Sept. 2015
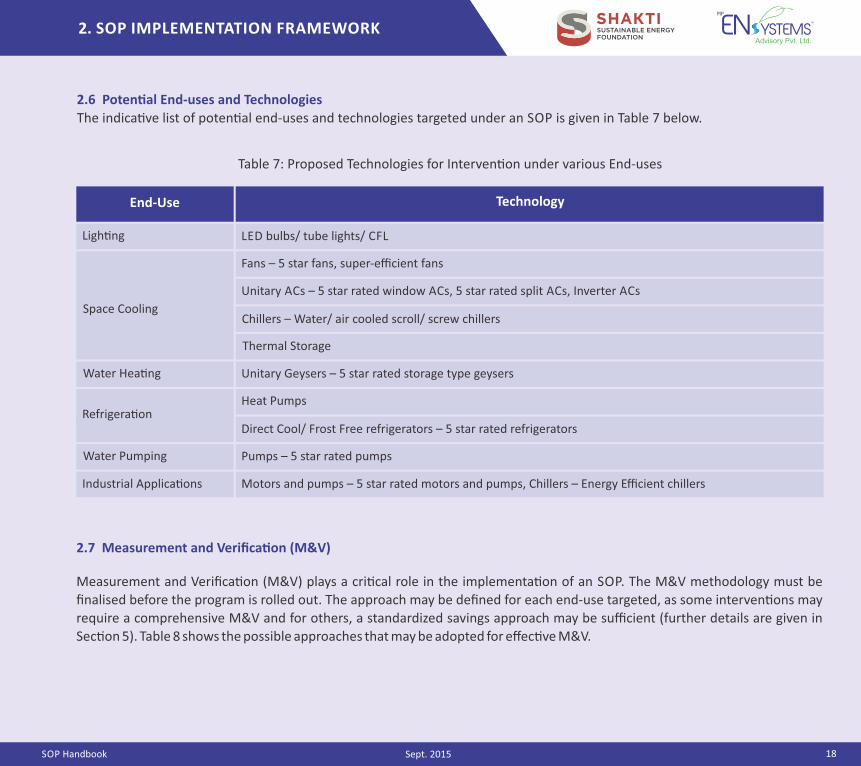
2.6 Poten�al End‐uses and Technologies
The indica�ve list of poten�al end‐uses and technologies targeted under an SOP is given in Table 7 below.
End‐Use Technology
Ligh�ng LED bulbs/ tube lights/ CFL
Fans – 5 star fans, super‐efficient fans
Unitary ACs – 5 star rated window ACs, 5 star rated split ACs, Inverter ACs
Chillers – Water/ air cooled scroll/ screw chillers
Unitary Geysers – 5 star rated storage type geysers Water Hea�ng
Heat PumpsRefrigera�on
Direct Cool/ Frost Free refrigerators – 5 star rated refrigerators
Water Pumping Pumps – 5 star rated pumps
Industrial Applica�ons Motors and pumps – 5 star rated motors and pumps, Chillers – Energy Efficient chillers
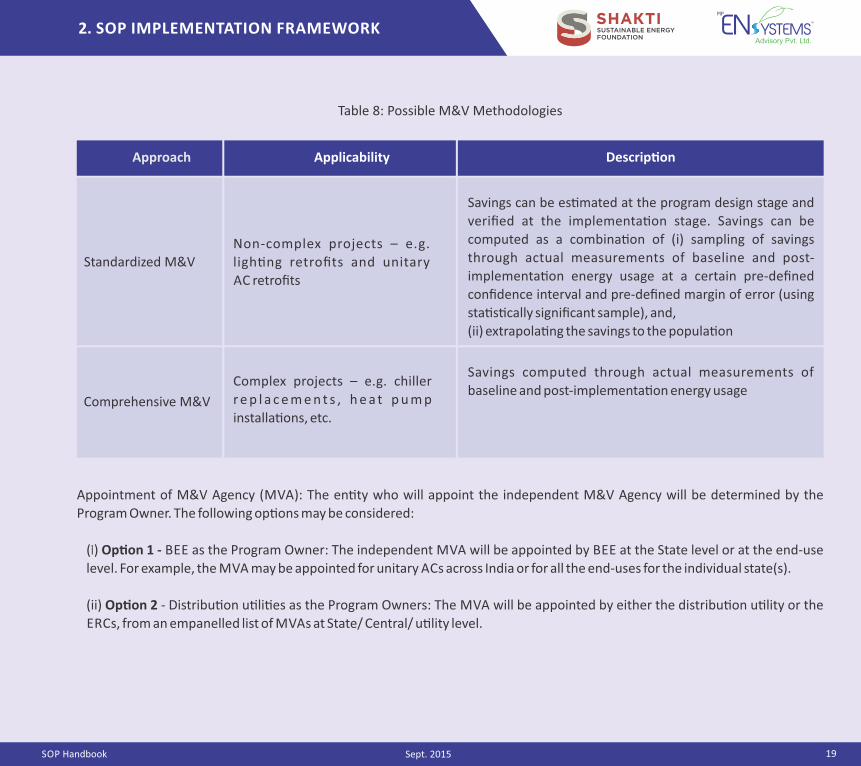
Measurement and Verifica�on (M&V) plays a cri�cal role in the implementa�on of an SOP. The M&V methodology must be finalised before the program is rolled out. The approach may be defined for each end‐use targeted, as some interven�ons may require a comprehensive M&V and for others, a standardized savings approach may be sufficient (further details are given in Sec�on 5). Table 8 shows the possible approaches that may be adopted for effec�ve M&V.
2.7 Measurement and Verifica�on (M&V)�
Table 7: Proposed Technologies for Interven�on under various End‐uses
Thermal Storage
Space Cooling
19 SOP Handbook
2. SOP IMPLEMENTATION FRAMEWORK
Sept. 2015
Approach Applicability Descrip�on
Standardized M&V Non‐complex projects – e.g.
ligh�ng retrofits and unitary
AC retrofits
Savings can be es�mated at the program design stage and
verified at the implementa�on stage. Savings can be
computed as a combina�on of (i) sampling of savings
through actual measurements of baseline and post‐
implementa�on energy usage at a certain pre‐defined
confidence interval and pre‐defined margin of error (using
sta�s�cally significant sample), and,
(ii) extrapola�ng the savings to the popula�on
Comprehensive M&V
Complex projects – e.g. chiller
r e p l a c e m e n t s , h e a t p u m p
installa�ons, etc.
Savings computed through actual measurements of
baseline and post‐implementa�on energy usage
Appointment of M&V Agency (MVA): The en�ty who will appoint the independent M&V Agency will be determined by the
Program Owner. The following op�ons may be considered:
( ) Op�on 1 ‐ BEE as the Program Owner: The independent MVA will be appointed by BEE at the State level or at the end‐use
level. For example, the MVA may be appointed for unitary ACs across India or for all the end‐uses for the individual state(s).
(ii) Op�on 2 ‐ Distribu�on u�li�es as the Program Owners: The MVA will be appointed by either the distribu�on u�lity or the
ERCs, from an empanelled list of MVAs at State/ Central/ u�lity level.
Table 8: Possible M&V Methodologies
28DRAFT SOP Handbook July2015
3. IMPLEMENTATION PROCESS
20
3. IMPLEMENTATION PROCESS
SOP Handbook Sept. 2015
The implementa�on of an SOP may broadly be undertaken in the following three phases:
1. Pre‐implementa�on Phase: This is the preparatory phase where target consumers and target energy efficiency measures are iden�fied based on u�lity load profiles and benefit‐cost assessment. The program documents are prepared and approvals are sought from the Central Ministry (in case of a na�onal level program) or the State Regulatory Commission (in case of a u�lity‐level program). M&V requirements for the program are iden�fied at this stage.
2. Implementa�on Phase:
A�er program approval, implementa�on is undertaken in this phase, by appoin�ng an aggregator at na�onal or u�lity level
(if applicable). Consumer outreach and enrolment, vendor �e‐ups and baseline energy es�ma�on is undertaken as part of
the M&V process and field installa�ons are undertaken in this phase.
3. Post‐implementa�on Phase:
In this phase, post‐installa�on energy use calcula�ons are undertaken as part of the M&V process, savings are determined
and incen�ve payouts to consumers are processed.
Elements of the implementa�on process are detailed in the following sub‐sec�ons.
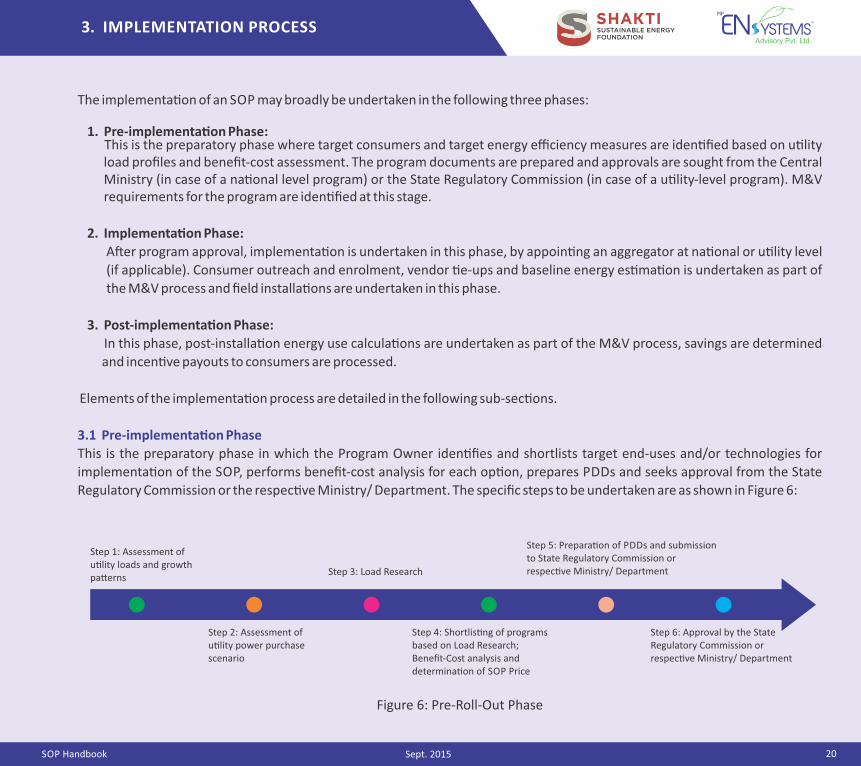
3.1 Pre‐implementa�on Phase
This is the preparatory phase in which the Program Owner iden�fies and shortlists target end‐uses and/or technologies for
implementa�on of the SOP, performs benefit‐cost analysis for each op�on, prepares PDDs and seeks approval from the State
Regulatory Commission or the respec�ve Ministry/ Department. The specific steps to be undertaken are as shown in Figure 6:
Step 6: Approval by the State Regulatory Commission or respec�ve Ministry/ Department
Step 5: Prepara�on of PDDs and submission to State Regulatory Commission or respec�ve Ministry/ Department
Step 4: Shortlis�ng of programs based on Load Research; Benefit‐Cost analysis and determina�on of SOP Price
Step 3: Load Research
Step 2: Assessment of u�lity power purchase scenario
Step 1: Assessment of u�lity loads and growth pa�erns
10
Figure 6: Pre‐Roll‐Out Phase
21 SOP Handbook
3. IMPLEMENTATION PROCESS
Sept. 2015
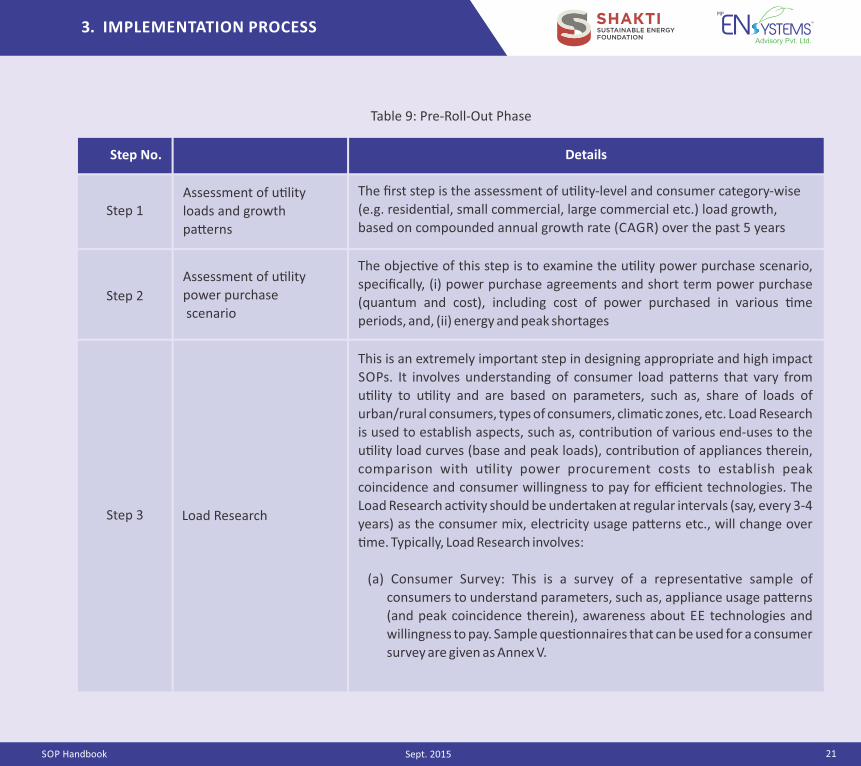
Step No. DetailsStep
Assessment of u�lity
loads and growth
pa�erns
The first step is the assessment of u�lity‐level and consumer category‐wise
(e.g. residen�al, small commercial, large commercial etc.) load growth,
based on compounded annual growth rate (CAGR) over the past 5 yearsStep 1
Step 2
Assessment of u�lity
power purchase
scenario
The objec�ve of this step is to examine the u�lity power purchase scenario,
specifically, (i) power purchase agreements and short term power purchase
(quantum and cost), including cost of power purchased in various �me
periods, and, (ii) energy and peak shortages
Step 3 Load Research
This is an extremely important step in designing appropriate and high impact
SOPs. It involves understanding of consumer load pa�erns that vary from
u�lity to u�lity and are based on parameters, such as, share of loads of
urban/rural consumers, types of consumers, clima�c zones, etc. Load Research
is used to establish aspects, such as, contribu�on of various end‐uses to the
u�lity load curves (base and peak loads), contribu�on of appliances therein,
comparison with u�lity power procurement costs to establish peak
coincidence and consumer willingness to pay for efficient technologies. The
Load Research ac�vity should be undertaken at regular intervals (say, every 3‐4
years) as the consumer mix, electricity usage pa�erns etc., will change over
�me. Typically, Load Research involves:
(a) Consumer Survey: This is a survey of a representa�ve sample of
consumers to understand parameters, such as, appliance usage pa�erns
(and peak coincidence therein), awareness about EE technologies and
willingness to pay. Sample ques�onnaires that can be used for a consumer
survey are given as Annex V.
Table 9: Pre‐Roll‐Out Phase
22 SOP Handbook
3. IMPLEMENTATION PROCESS
Sept. 2015
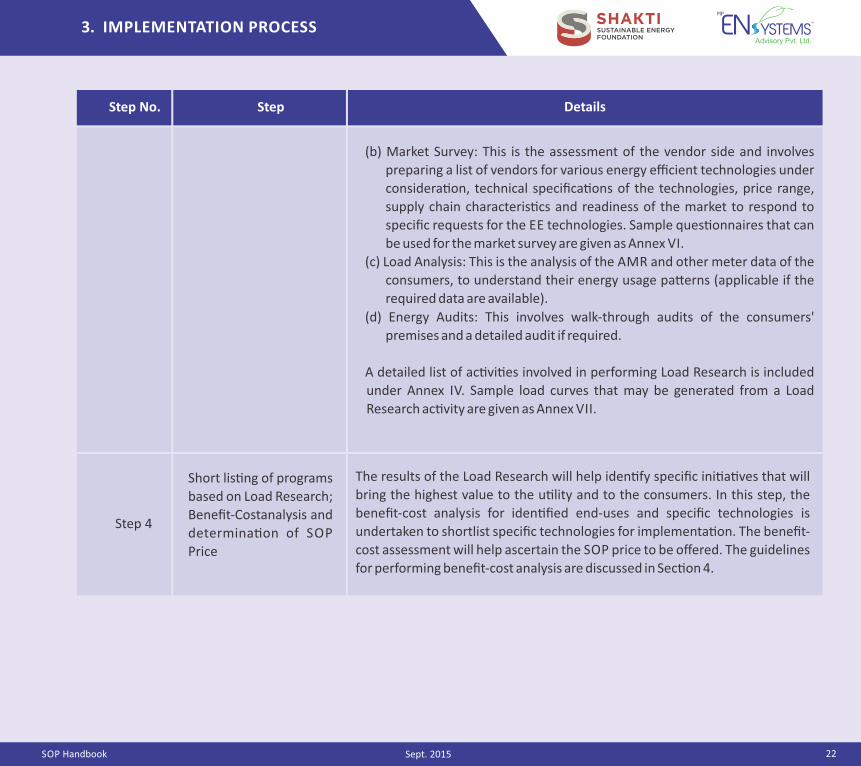
Step 4
Short lis�ng of programs
based on Load Research;
Benefit‐Costanalysis and
determina�on of SOP
Price
The results of the Load Research will help iden�fy specific ini�a�ves that will
bring the highest value to the u�lity and to the consumers. In this step, the
benefit‐cost analysis for iden�fied end‐uses and specific technologies is
undertaken to shortlist specific technologies for implementa�on. The benefit‐
cost assessment will help ascertain the SOP price to be offered. The guidelines
for performing benefit‐cost analysis are discussed in Sec�on 4.
Step No. DetailsStep
(b) Market Survey: This is the assessment of the vendor side and involves
preparing a list of vendors for various energy efficient technologies under
considera�on, technical specifica�ons of the technologies, price range,
supply chain characteris�cs and readiness of the market to respond to
specific requests for the EE technologies. Sample ques�onnaires that can
be used for the market survey are given as Annex VI.
(c) Load Analysis: This is the analysis of the AMR and other meter data of the
consumers, to understand their energy usage pa�erns (applicable if the
required data are available).
(d) Energy Audits: This involves walk‐through audits of the consumers'
premises and a detailed audit if required.
A detailed list of ac�vi�es involved in performing Load Research is included
under Annex IV. Sample load curves that may be generated from a Load
Research ac�vity are given as Annex VII.
23 SOP Handbook
3. IMPLEMENTATION PROCESS
Sept. 2015
PDD template included as Annex VIII
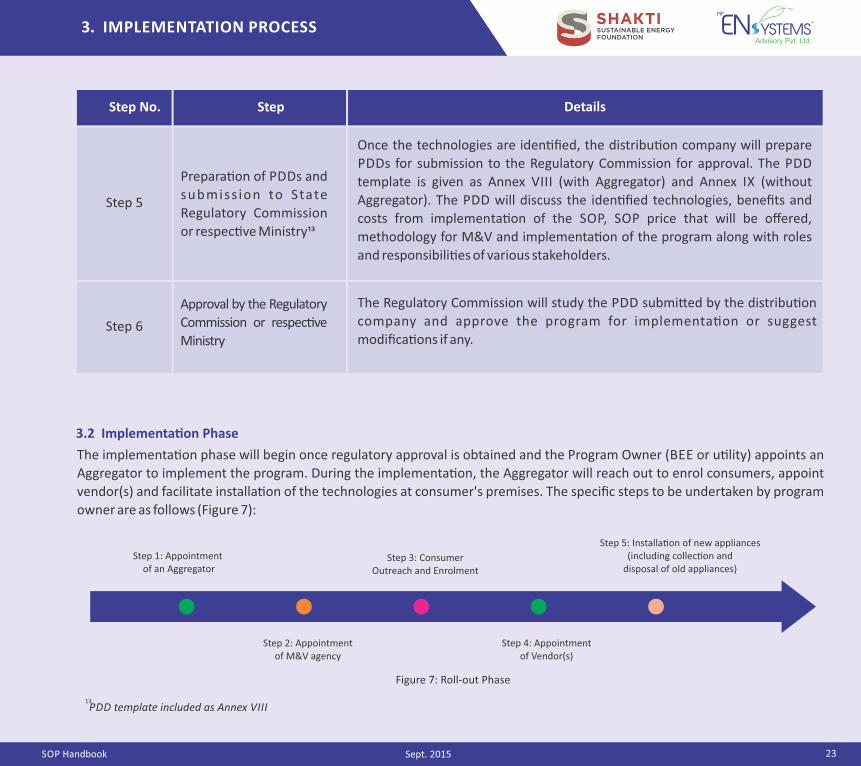
The implementa�on phase will begin once regulatory approval is obtained and the Program Owner (BEE or u�lity) appoints an
Aggregator to implement the program. During the implementa�on, the Aggregator will reach out to enrol consumers, appoint
vendor(s) and facilitate installa�on of the technologies at consumer's premises. The specific steps to be undertaken by program
owner are as follows (Figure 7):
13
3.2 Implementa�on Phase
Step 1: Appointment of an Aggregator
Step 2: Appointment of M&V agency
Step 3: Consumer Outreach and Enrolment
Step 4: Appointment of Vendor(s)
Step 5: Installa�on of new appliances (including collec�on and
disposal of old appliances)
Figure 7: Roll‐out Phase
Step 6
Approval by the Regulatory
Commission or respec�ve
Ministry
The Regulatory Commission will study the PDD submi�ed by the distribu�on
company and approve the program for implementa�on or suggest
modifica�ons if any.
Step No. DetailsStep
Step 5
Once the technologies are iden�fied, the distribu�on company will prepare
PDDs for submission to the Regulatory Commission for approval. The PDD
template is given as Annex VIII (with Aggregator) and Annex IX (without
Aggregator). The PDD will discuss the iden�fied technologies, benefits and
costs from implementa�on of the SOP, SOP price that will be offered,
methodology for M&V and implementa�on of the program along with roles
and responsibili�es of various stakeholders.
Prepara�on of PDDs and
submiss ion to State
Regulatory Commission
or respec�ve Ministry��
24 SOP Handbook
3. IMPLEMENTATION PROCESS
Sept. 2015
Step 2
Appointment of
an Aggregator
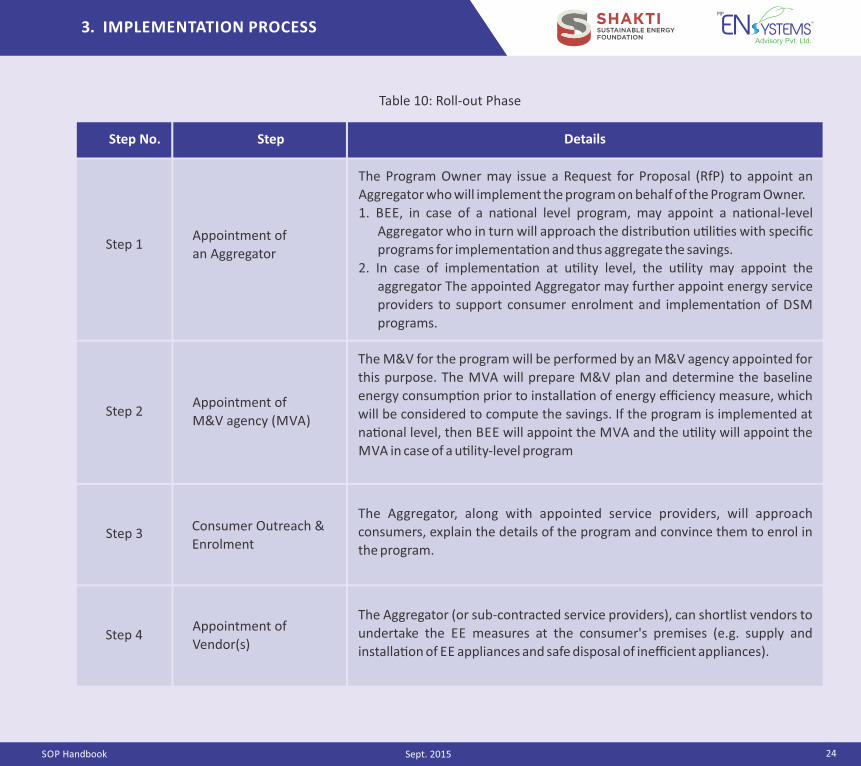
The Program Owner may issue a Request for Proposal (RfP) to appoint an
Aggregator who will implement the program on behalf of the Program Owner.
1. BEE, in case of a na�onal level program, may appoint a na�onal‐level
Aggregator who in turn will approach the distribu�on u�li�es with specific
programs for implementa�on and thus aggregate the savings.
2. In case of implementa�on at u�lity level, the u�lity may appoint the
aggregator The appointed Aggregator may further appoint energy service
providers to support consumer enrolment and implementa�on of DSM
programs.
Step 1
Appointment of
M&V agency (MVA)
The M&V for the program will be performed by an M&V agency appointed for
this purpose. The MVA will prepare M&V plan and determine the baseline
energy consump�on prior to installa�on of energy efficiency measure, which
will be considered to compute the savings. If the program is implemented at
na�onal level, then BEE will appoint the MVA and the u�lity will appoint the
MVA in case of a u�lity‐level program
Step 3
Step 4
Consumer Outreach &
Enrolment
The Aggregator, along with appointed service providers, will approach
consumers, explain the details of the program and convince them to enrol in
the program.
Appointment of
Vendor(s)
The Aggregator (or sub‐contracted service providers), can shortlist vendors to
undertake the EE measures at the consumer's premises (e.g. supply and
installa�on of EE appliances and safe disposal of inefficient appliances).
Table 10: Roll‐out Phase
Step No. DetailsStep
25 SOP Handbook
3. IMPLEMENTATION PROCESS
Sept. 2015
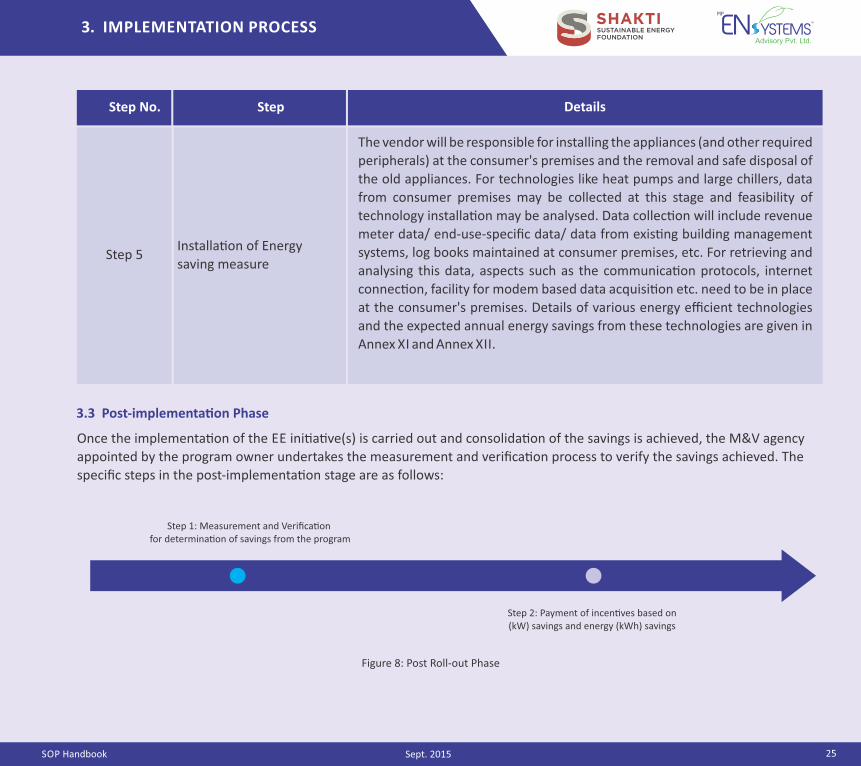
Step 1: Measurement and Verifica�on for determina�on of savings from the program
Step 2: Payment of incen�ves based on (kW) savings and energy (kWh) savings
Once the implementa�on of the EE ini�a�ve(s) is carried out and consolida�on of the savings is achieved, the M&V agency
appointed by the program owner undertakes the measurement and verifica�on process to verify the savings achieved. The
specific steps in the post‐implementa�on stage are as follows:
3.3 Post‐implementa�on Phase
Figure 8: Post Roll‐out Phase
Step No. DetailsStep
Step 5 Installa�on of Energy
saving measure
The vendor will be responsible for installing the appliances (and other required
peripherals) at the consumer's premises and the removal and safe disposal of
the old appliances. For technologies like heat pumps and large chillers, data
from consumer premises may be collected at this stage and feasibility of
technology installa�on may be analysed. Data collec�on will include revenue
meter data/ end‐use‐specific data/ data from exis�ng building management
systems, log books maintained at consumer premises, etc. For retrieving and
analysing this data, aspects such as the communica�on protocols, internet
connec�on, facility for modem based data acquisi�on etc. need to be in place
at the consumer's premises. Details of various energy efficient technologies
and the expected annual energy savings from these technologies are given in
Annex XI and Annex XII.
Step No. DetailsStep
26 SOP Handbook
3. IMPLEMENTATION PROCESS
Sept. 2015
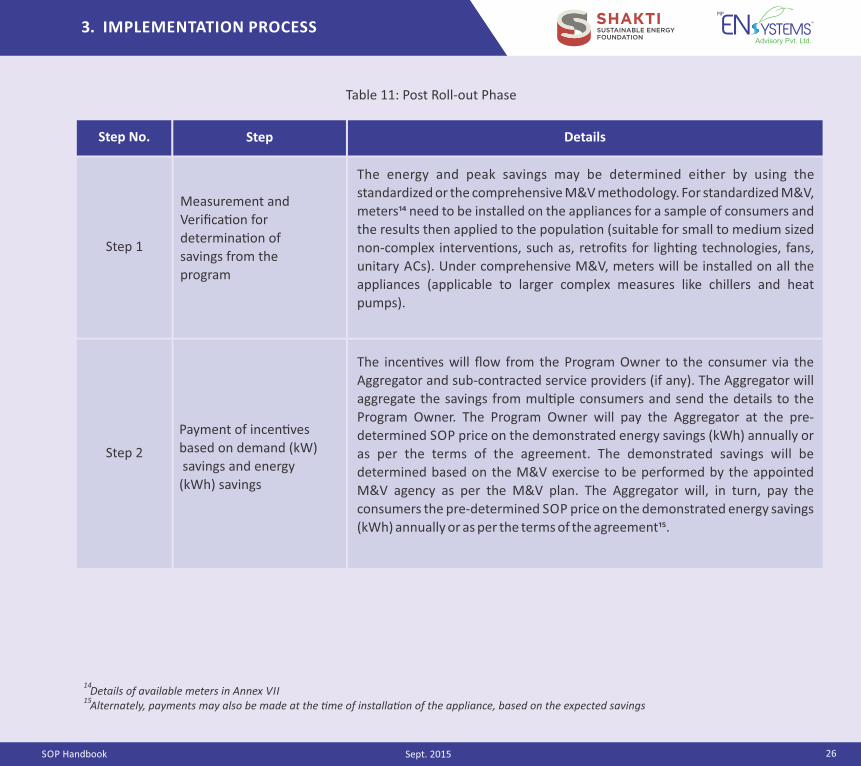
Details of available meters in Annex VII Alternately, payments may also be made at the �me of installa�on of the appliance, based on the expected savings
14
15
Table 11: Post Roll‐out Phase
Measurement and
Verifica�on for
determina�on of
savings from the
program
The energy and peak savings may be determined either by using the
standardized or the comprehensive M&V methodology. For standardized M&V,
meters�� need to be installed on the appliances for a sample of consumers and
the results then applied to the popula�on (suitable for small to medium sized
non‐complex interven�ons, such as, retrofits for ligh�ng technologies, fans,
unitary ACs). Under comprehensive M&V, meters will be installed on all the
appliances (applicable to larger complex measures like chillers and heat
pumps).
Step 1
Step 2
Payment of incen�ves
based on demand (kW)
savings and energy
(kWh) savings
The incen�ves will flow from the Program Owner to the consumer via the
Aggregator and sub‐contracted service providers (if any). The Aggregator will
aggregate the savings from mul�ple consumers and send the details to the
Program Owner. The Program Owner will pay the Aggregator at the pre‐
determined SOP price on the demonstrated energy savings (kWh) annually or
as per the terms of the agreement. The demonstrated savings will be
determined based on the M&V exercise to be performed by the appointed
M&V agency as per the M&V plan. The Aggregator will, in turn, pay the
consumers the pre‐determined SOP price on the demonstrated energy savings
(kWh) annually or as per the terms of the agreement��.
Step No. DetailsStep
27
4. SOP DESIGN PROCESS
SOP Handbook Sept. 2015
This chapter presents the guidelines for selec�ng
appropriate end‐uses and technologies for rolling out an
SOP, conduc�ng a benefit‐cost analysis and finalizing the
methodology for determining the SOP price.
4.1 Guidelines to select which SOP to offer
The selec�on of technology/ end‐use for an SOP will depend
on the objec�ve of the program. If the aim is to reduce peak
load, then the technologies or end‐uses contribu�ng to the
peak of the system will be targeted (e.g. ACs). If, however,
the aim is to conserve energy, then appliances like
refrigerators maybe targeted. The SOP price will be higher
for end‐uses that contribute to the peak as the power
purchase price is higher during peak periods.
As an ini�al step, a supply side analysis involving hourly load
of the system and cost of power purchase from various
sources to meet this load needs to be carried out. The
objec�ve of this exercise is to iden�fy the peak hours for
which the power purchase price and load shedding is high.
The u�li�es can then accordingly design SOPs to tackle
these issues.
To iden�fy what appliances contribute to the peak load or
energy consump�on,Load Research needs to be undertaken
by the u�lity. Load Research will involve conduc�ng a
ques�onnaire‐based survey, analysis of Automated Meter
Reading (AMR) data (if available) and analysis of billing data
of the consumers. Based on this analysis, appliance
ownership and usage pa�ern can be determined which will
further help in developing the system, category and
appliance curves. These curves can then be superimposed
on the system level curve to iden�fy end‐uses/ technologies
that contribute to the peak.
4.2 Guidelines to perform Benefit‐Cost Analysis
The benefit‐cost analysis considers all the costs to be
incurred by both par�cipants and distribu�on u�li�es and
the benefits accruing to them from the SOP. Benefit‐cost
analysis helps determine whether the program is
economically viable for both the par�es. The tests that may
be performed on the suggested programs are the Total
Resource Cost (TRC) test, the Rate Payer Impact Measure
(RIM) test and the Tariff Impact test. This sec�on outlines
the elements of benefits and costs to be computed,
approach for performing the benefit‐cost analysis and some
illustra�ons of the same using this approach.
4.2.1 Elements of Benefits and Costs
The benefits are computed as the peak power purchase cost
plus the off‐peak power purchase cost. These benefits
remain the same across all the tests. However, the tests
differ as per the cost elements to be computed. In case of the
TRC test, the total cost of the program is taken into
considera�on, whereas in the RIM test the cost to the u�lity,
including the revenue loss is taken into considera�on to
determine the tariff impact of the programs. The cost and benefit elements of the TRC, RIM and Tariff Impact tests are
given in Table 12. These components are further explained
in this sec�on.
4. SOP DESIGN PROCESS
28 SOP Handbook Sept. 2015
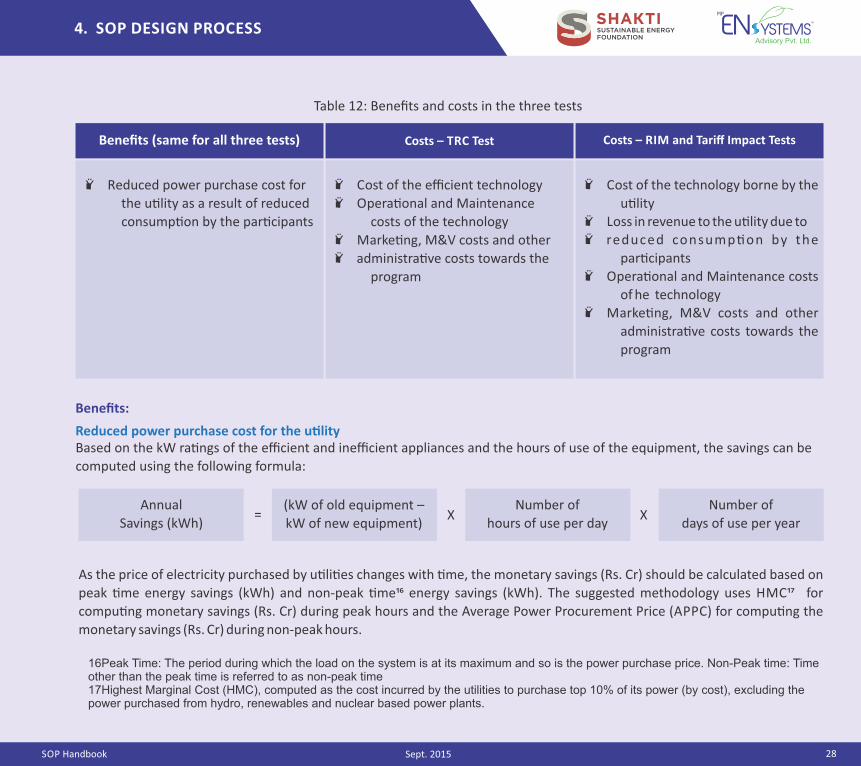
Benefits:
Reduced power purchase cost for the u�lityBased on the kW ra�ngs of the efficient and inefficient appliances and the hours of use of the equipment, the savings can be
computed using the following formula:
Annual
Savings (kWh)(kW of old equipment –
kW of new equipment)
Number of
hours of use per day
Number of
days of use per year= X X
16Peak Time: The period during which the load on the system is at its maximum and so is the power purchase price. Non-Peak time: Time other than the peak time is referred to as non-peak time17Highest Marginal Cost (HMC), computed as the cost incurred by the utilities to purchase top 10% of its power (by cost), excluding the power purchased from hydro, renewables and nuclear based power plants.
As the price of electricity purchased by u�li�es changes with �me, the monetary savings (Rs. Cr) should be calculated based on
peak �me energy savings (kWh) and non‐peak �me�� energy savings (kWh). The suggested methodology uses HMC�� for
compu�ng monetary savings (Rs. Cr) during peak hours and the Average Power Procurement Price (APPC) for compu�ng the
monetary savings (Rs. Cr) during non‐peak hours.
Benefits (same for all three tests) Costs – TRC Test Costs – RIM and Tariff Impact Tests
Table 12: Benefits and costs in the three tests
Ÿ Reduced power purchase cost for
the u�lity as a result of reduced
consump�on by the par�cipants
Ÿ Cost of the efficient technology
Ÿ Opera�onal and Maintenance
costs of the technology
Ÿ Marke�ng, M&V costs and other
Ÿ administra�ve costs towards the
program
Ÿ Cost of the technology borne by the
u�lityŸ Loss in revenue to the u�lity due toŸ reduced consump�on by the
par�cipantsŸ Opera�onal and Maintenance costs
of he technologyŸ Marke�ng, M&V costs and other
administra�ve costs towards the
program
33 SOP Handbook
4. SOP DESIGN PROCESS
29Sept. 2015
Costs:
Cost of the efficient technology
This cost includes (i) the cost of the efficient equipment, (ii)
installa�on cost, (iii) cost of removal and safe disposal of the
old equipment, and (iv) salvage value of the old equipment
(to be deducted from the total cost). U�li�es across India
typically invite quota�ons from equipment manufacturers
for supply of efficient equipment. Manufacturer(s), who
quote the lowest price for the given equipment, are
empaneled for the supply of the equipment. Although the
consumer pays for the equipment, the tendering process by
the u�lity reduces the costs of the equipment (due to
increased consump�on and large volumes) and increases
uptake. For example, the case of the Demand Side
Management (DSM) based Efficient Ligh�ng Program
(DELP) implemented by EESL in Puducherry helped reduce
the price of LED bulbs significantly. The case details are given
below:
In the Puducherry DELP program implemented by EESL in
2014-2015, the cost of 7 Wa� LED bulb was Rs. 320 (which
further reduced to Rs. 204 in subsequent bidding
undertaken in Guntur and Anantapur, Andhra Pradesh, and
to Rs. 104 in the bidding undertaken in Delhi in February
2015) whereas the Maximum Retail Price (MRP) of a 7 Wa�
LED bulb was more than Rs. 450. The total ini�al cost
towards the program was Rs. 22.8 crore and the annual
maintenance cost was 3% of the ini�al cost. Of the ini�al
cost, Electricity Department-Puducherry (ED-P) contributed
equity of 30% and the remaining 70% was taken as debt
from EESL. For repayment of the debt por�on, ED-P will pay
an annual amount of Rs. 46.4 Crore (at an interest rate of
12.5%), over a 10 year period. On the equity por�on, the
JERC has approved a Return on Equity (RoE) of 15.5%.
Key success factors of DELP: Aggregator model, price
reduc�on enabled due to bulk procurement, on‐bill
financing
Operations and Maintenance (O&M) Costs
This includes the costs incurred for operating the
appliance such as repairs and cleaning. Typically, annual
costs towards O&M are in the range of 0.5‐1% of the initial
cost of the equipment for the first year. O&M is a recurring
cost and needs to be escalated each year to account for
cost inflation.
Marketing and Administrative costs
This includes costs incurred towards promo�ng the
program, u�lity manpower costs, appoin�ng an Aggregator
and sub‐contracted energy service providers and other
administra�ve expenses. Typically, the marke�ng and
administra�ve costs are about 1‐2% of the ini�al cost of the
efficient equipment.
Measurement and Verification (M&V) costs
The M&V costs are typically about 1‐3% of the initial cost of
the equipment. The M&V cost will vary based on the
methodology used. For example, in case of standardized
M&V, meters are only installed at sample loca�ons (either
hourly or kWh) and hence the cost is lower than that of
adop�ng a comprehensive M&V approach where meters are
installed at all the par�cipants' loca�ons and possibly on all
the technologies. ��Joint Electricity Regulatory Commission's (JERC's) order approving the DELP program of ED-P, (h�p://jercuts.gov.in/writereaddata/Files/Order12825414.pdf)
18
SOP Handbook 30
4. SOP DESIGN PROCESS
Sept. 2015
Loss in revenue for the u�lity due to reduced consump�on
Energy consump�on of consumers is likely to reduce from
the use of EE appliances. The reduced consump�on implies
reduced sales for the u�lity and hence reduced revenue.
However, if the cost of power purchased by the u�lity at the
�me of energy saved is more than the tariff of that par�cular
consumer category, then the benefit to the u�lity will be the
difference in power procurement price and tariff of the
consumer. For example, the tariff for commercial and
industrial consumers would be typically higher than the cost
of power procured for the quantum of energy saved. Hence,
the u�lity will face a loss in revenue by implemen�ng the
SOP. In such cases, however, SOP can be jus�fied in view of
power system constraints and other suitable cost‐
effec�veness tests or guidelines.
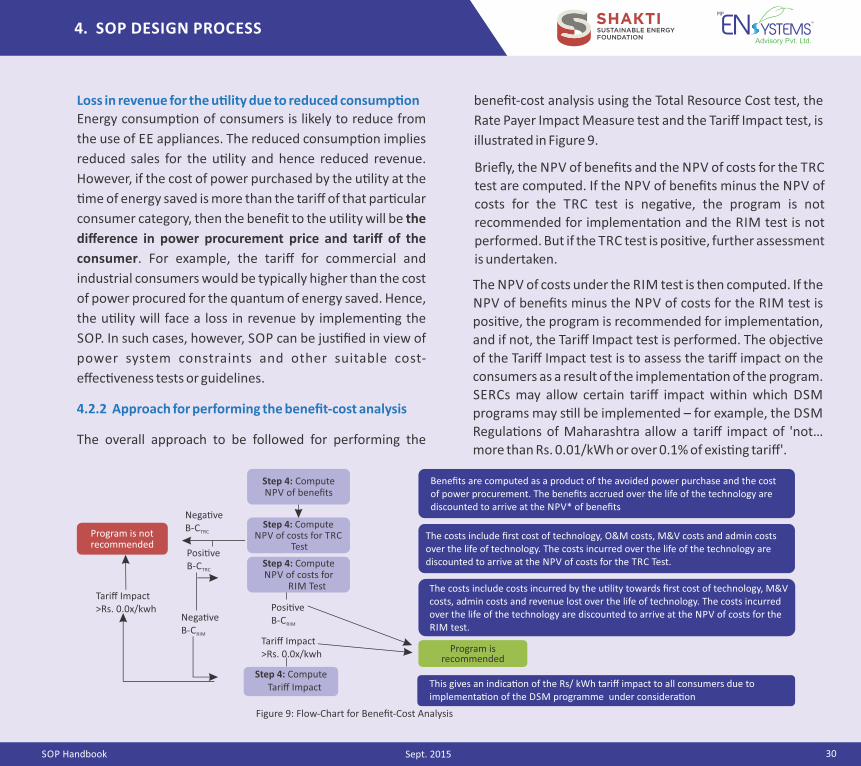
4.2.2 Approach for performing the benefit‐cost analysis
The overall approach to be followed for performing the
benefit‐cost analysis using the Total Resource Cost test, the
Rate Payer Impact Measure test and the Tariff Impact test, is
illustrated in Figure 9.
The NPV of costs under the RIM test is then computed. If the
NPV of benefits minus the NPV of costs for the RIM test is
posi�ve, the program is recommended for implementa�on,
and if not, the Tariff Impact test is performed. The objec�ve
of the Tariff Impact test is to assess the tariff impact on the
consumers as a result of the implementa�on of the program.
SERCs may allow certain tariff impact within which DSM
programs may s�ll be implemented – for example, the DSM
Regula�ons of Maharashtra allow a tariff impact of 'not…
more than Rs. 0.01/kWh or over 0.1% of exis�ng tariff'.
Program is recommended
This gives an indica�on of the Rs/ kWh tariff impact to all consumers due to implementa�on of the DSM programme under considera�on
Step 4: Compute Tariff Impact
The costs include costs incurred by the u�lity towards first cost of technology, M&V costs, admin costs and revenue lost over the life of technology. The costs incurred over the life of the technology are discounted to arrive at the NPV of costs for the RIM test.
Step 4: ComputeNPV of costs for
RIM Test
Step 4: ComputeNPV of costs for TRC
Test
Step 4: ComputeNPV of benefits
Program is not recommended
Nega�veB‐CTRC
Tariff Impact>Rs. 0.0x/kwh
Posi�veB‐CTRC
Nega�veB‐CRIM
Posi�veB‐CRIM
Tariff Impact>Rs. 0.0x/kwh
The costs include first cost of technology, O&M costs, M&V costs and admin costsover the life of technology. The costs incurred over the life of the technology are discounted to arrive at the NPV of costs for the TRC Test.
Benefits are computed as a product of the avoided power purchase and the cost of power procurement. The benefits accrued over the life of the technology are discounted to arrive at the NPV* of benefits
Figure 9: Flow‐Chart for Benefit‐Cost Analysis
Briefly, the NPV of benefits and the NPV of costs for the TRC
test are computed. If the NPV of benefits minus the NPV of
costs for the TRC test is nega�ve, the program is not
recommended for implementa�on and the RIM test is not
performed. But if the TRC test is posi�ve, further assessment
is undertaken.
35DRAFT SOP Handbook July2015 SOP Handbook
4. SOP DESIGN PROCESS
31Sept. 2015
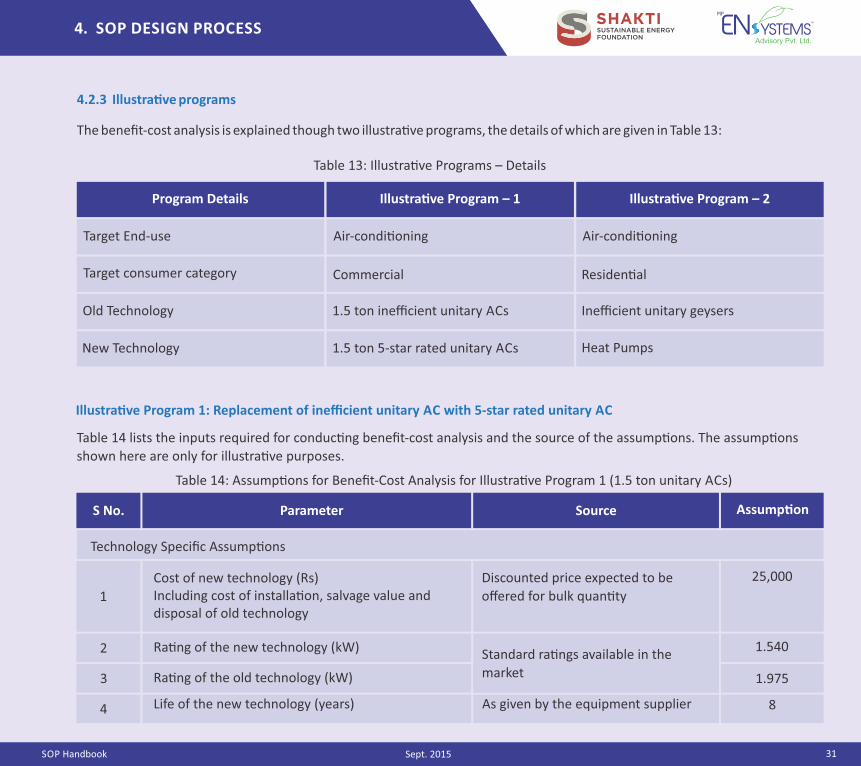
4.2.3 Illustra�ve programs
The benefit‐cost analysis is explained though two illustra�ve programs, the details of which are given in Table 13:
Program Details Illustra�ve Program – 1 Illustra�ve Program – 2
Air‐condi�oning
Commercial
1.5 ton inefficient unitary ACs
1.5 ton 5‐star rated unitary ACs
Air‐condi�oning
Residen�al
Inefficient unitary geysers
Heat Pumps
Illustra�ve Program 1: Replacement of inefficient unitary AC with 5‐star rated unitary AC
Table 14 lists the inputs required for conduc�ng benefit‐cost analysis and the source of the assump�ons. The assump�ons
shown here are only for illustra�ve purposes.
Target consumer category
Old Technology
New Technology
Target End‐use
Table 13: Illustra�ve Programs – Details
Technology Specific Assump�ons
1
Cost of new technology (Rs)Including cost of installa�on, salvage value and disposal of old technology
Discounted price expected to be
offered for bulk quan�ty
25,000
2 Ra�ng of the new technology (kW) Standard ra�ngs available in the
market
1.540
1.9753 Ra�ng of the old technology (kW)
ParameterS No. Source Assump�on
4 Life of the new technology (years) As given by the equipment supplier 8
Table 14: Assump�ons for Benefit‐Cost Analysis for Illustra�ve Program 1 (1.5 ton unitary ACs)
SOP Handbook 32
4. SOP DESIGN PROCESS
Sept. 2015
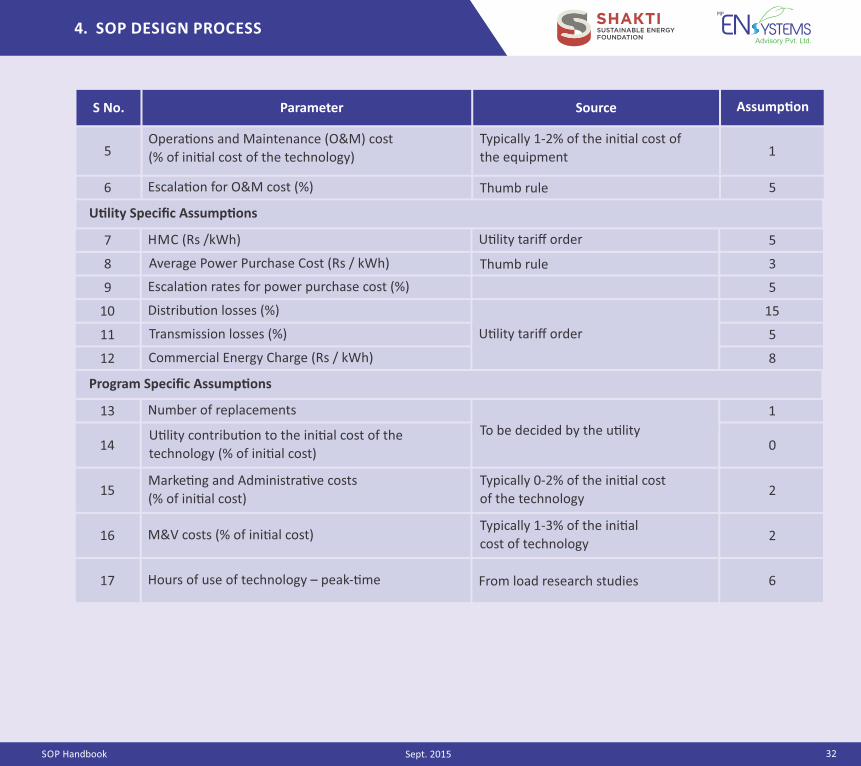
5Opera�ons and Maintenance (O&M) cost
(% of ini�al cost of the technology)
Typically 1‐2% of the ini�al cost of
the equipment 1
7 HMC (Rs /kWh) U�lity tariff order 5
8 Average Power Purchase Cost (Rs / kWh) 3
9 Escala�on rates for power purchase cost (%)
Thumb rule
5
10 Distribu�on losses (%) 15
11 Transmission losses (%) 5
Commercial Energy Charge (Rs / kWh) 8
Program Specific Assump�ons
13 Number of replacements 1
14U�lity contribu�on to the ini�al cost of the
technology (% of ini�al cost)0
16 M&V costs (% of ini�al cost)Typically 1‐3% of the ini�al
cost of technology2
17 Hours of use of technology – peak‐�me From load research studies 6
U�lity tariff order
To be decided by the u�lity
ParameterS No. Source Assump�on
6 Escala�on for O&M cost (%) Thumb rule 5
U�lity Specific Assump�ons
12
15Marke�ng and Administra�ve costs
(% of ini�al cost)
Typically 0‐2% of the ini�al cost
of the technology2
SOP Handbook 33
4. SOP DESIGN PROCESS
Sept. 2015
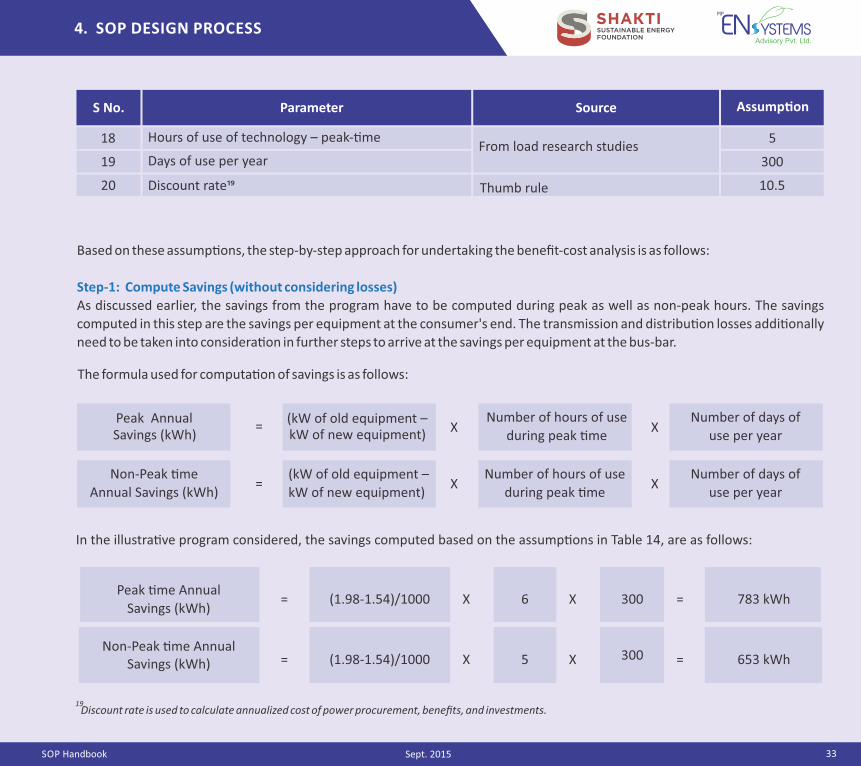
Based on these assump�ons, the step‐by‐step approach for undertaking the benefit‐cost analysis is as follows:
Step‐1: Compute Savings (without considering losses)
As discussed earlier, the savings from the program have to be computed during peak as well as non‐peak hours. The savings
computed in this step are the savings per equipment at the consumer's end. The transmission and distribu�on losses addi�onally
need to be taken into considera�on in further steps to arrive at the savings per equipment at the bus‐bar.
The formula used for computa�on of savings is as follows:
X XkW of new equipment)(kW of old equipment –
=Number of hours of use
during peak �me
Number of days of
use per year
Number of days of
use per year
Savings (kWh)Peak Annual
Non‐Peak �me
Annual Savings (kWh)(kW of old equipment –
kW of new equipment)
Number of hours of use
during peak �me
In the illustra�ve program considered, the savings computed based on the assump�ons in Table 14, are as follows:
X X=
Peak �me Annual
Savings (kWh)= (1.98‐1.54)/1000 X 6 X 300 = 783 kWh
Non‐Peak �me AnnualSavings (kWh) = (1.98‐1.54)/1000 X 5 X 300 = 653 kWh
19 Discount rate is used to calculate annualized cost of power procurement, benefits, and investments.
ParameterS No. Source Assump�on
19
Thumb rule
518 Hours of use of technology – peak‐�meFrom load research studies
Days of use per year
20 Discount rate��
300
10.5
SOP Handbook 34
4. SOP DESIGN PROCESS
Sept. 2015
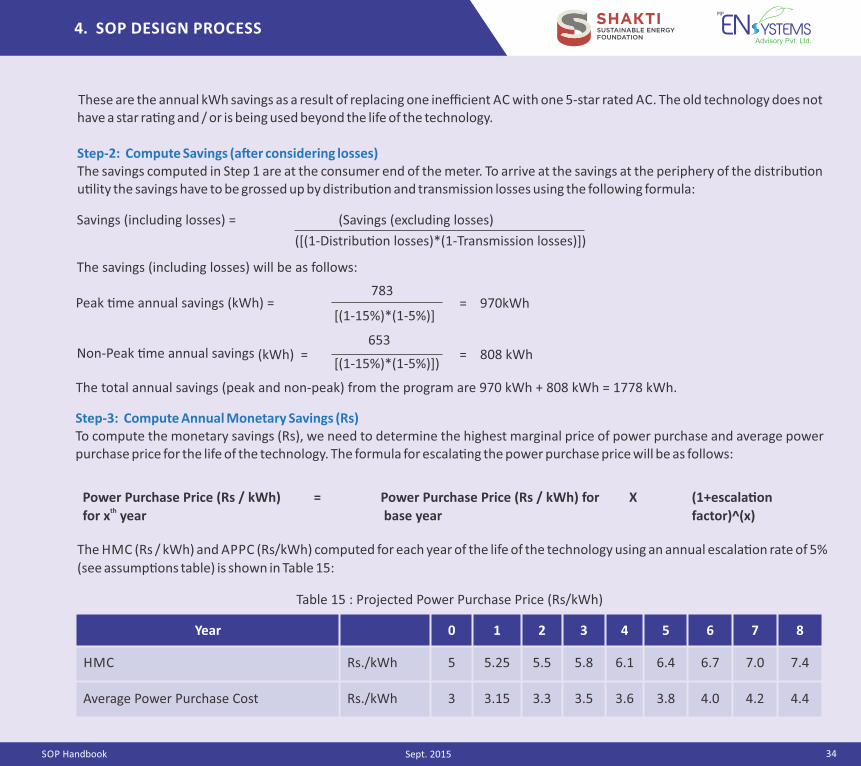
These are the annual kWh savings as a result of replacing one inefficient AC with one 5‐star rated AC. The old technology does not have a star ra�ng and / or is being used beyond the life of the technology.
Step‐2: Compute Savings (a�er considering losses)The savings computed in Step 1 are at the consumer end of the meter. To arrive at the savings at the periphery of the distribu�on u�lity the savings have to be grossed up by distribu�on and transmission losses using the following formula:
Savings (including losses) = (Savings (excluding losses)
Non‐Peak �me annual savings (kWh) = = 808 kWh
The total annual savings (peak and non‐peak) from the program are 970 kWh + 808 kWh = 1778 kWh.
([(1‐Distribu�on losses)*(1‐Transmission losses)])
The savings (including losses) will be as follows:
Peak �me annual savings (kWh) =783
[(1‐15%)*(1‐5%)] = 970kWh
[(1‐15%)*(1‐5%)])
653
Step‐3: Compute Annual Monetary Savings (Rs)To compute the monetary savings (Rs), we need to determine the highest marginal price of power purchase and average power purchase price for the life of the technology. The formula for escala�ng the power purchase price will be as follows:
Power Purchase Price (Rs / kWh) =thfor x year
Power Purchase Price (Rs / kWh) for X
base year
(1+escala�on
factor)^(x)
Year 0 1 2 3 4 5 6 7 8
HMC Rs./kWh 5 5.25 5.5 5.8 6.1 6.4 6.7 7.0 7.4
Average Power Purchase Cost Rs./kWh 3 3.15 3.3 3.5 3.6 3.8 4.0 4.2 4.4
Table 15 : Projected Power Purchase Price (Rs/kWh)
The HMC (Rs / kWh) and APPC (Rs/kWh) computed for each year of the life of the technology using an annual escala�on rate of 5%
(see assump�ons table) is shown in Table 15:
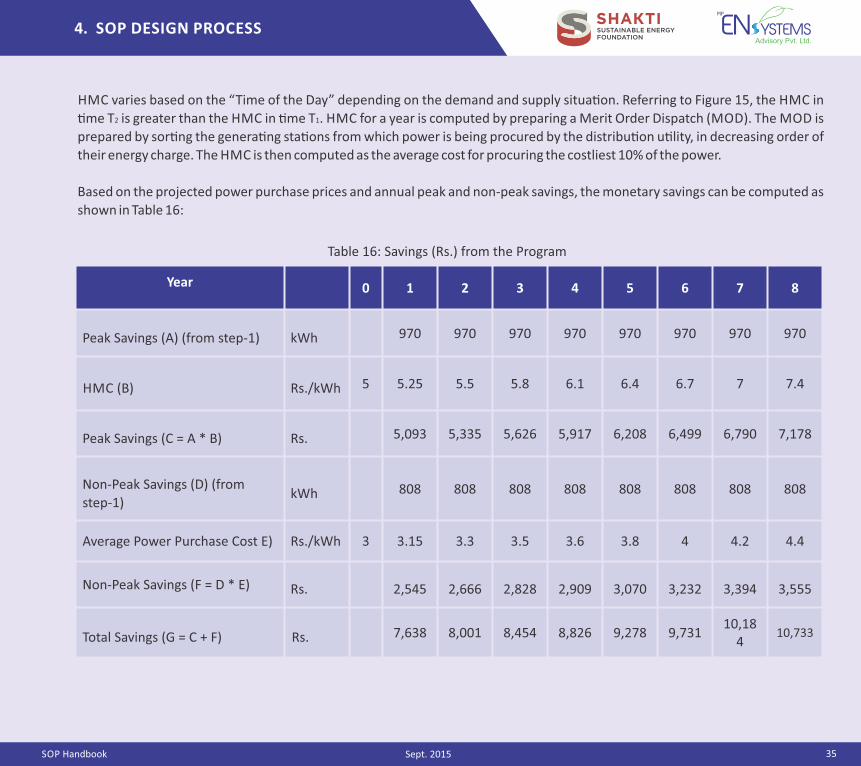
SOP Handbook
4. SOP DESIGN PROCESS
35Sept. 2015
HMC varies based on the “Time of the Day” depending on the demand and supply situa�on. Referring to Figure 15, the HMC in
�me T2 is greater than the HMC in �me T1. HMC for a year is computed by preparing a Merit Order Dispatch (MOD). The MOD is
prepared by sor�ng the genera�ng sta�ons from which power is being procured by the distribu�on u�lity, in decreasing order of
their energy charge. The HMC is then computed as the average cost for procuring the costliest 10% of the power.
Based on the projected power purchase prices and annual peak and non‐peak savings, the monetary savings can be computed as
shown in Table 16:
Year 0 1 2 3 4 5 6 7 8
Peak Savings (A) (from step‐1) kWh 970 970 970 970 970 970 970 970
HMC (B) Rs./kWh 5 5.25 5.5 5.8 6.1 6.4 6.7 7 7.4
Peak Savings (C = A * B) Rs. 5,093 5,335 5,626 5,917 6,208 6,499 6,790 7,178
Non‐Peak Savings (D) (from
step‐1)kWh 808 808 808 808 808 808 808 808
Average Power Purchase Cost E) Rs./kWh 3 3.15 3.3 3.5 3.6 3.8 4 4.2 4.4
Non‐Peak Savings (F = D * E) Rs. 2,545 2,666 2,828 2,909 3,070 3,232 3,394 3,555
Total Savings (G = C + F) Rs. 7,638 8,001 8,454 8,826 9,278 9,73110,18
410,733
Table 16: Savings (Rs.) from the Program
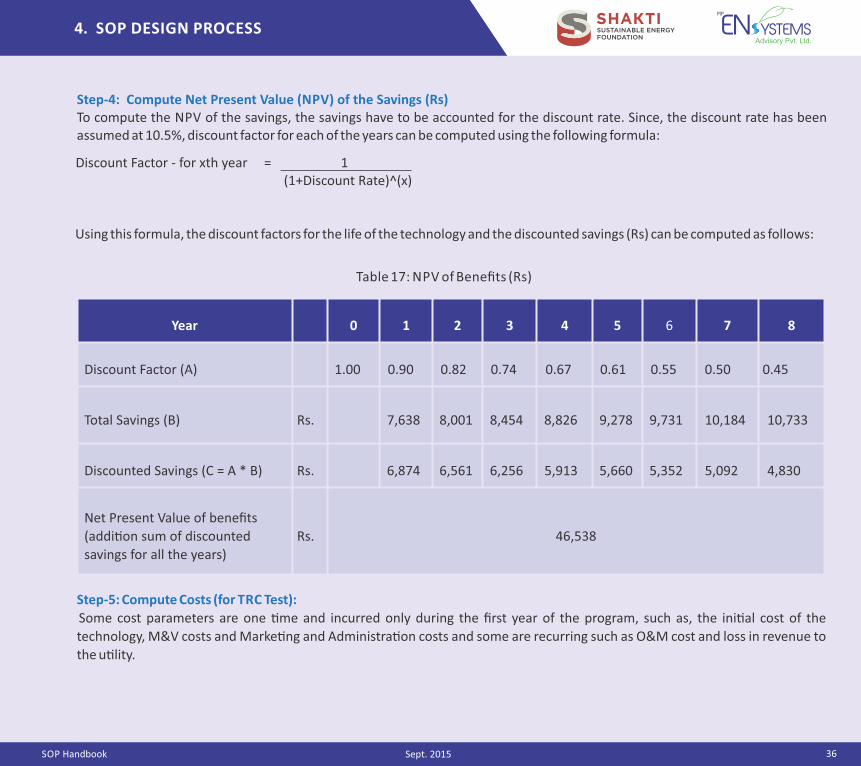
SOP Handbook 36
4. SOP DESIGN PROCESS
Sept. 2015
Step‐4: Compute Net Present Value (NPV) of the Savings (Rs)To compute the NPV of the savings, the savings have to be accounted for the discount rate. Since, the discount rate has been assumed at 10.5%, discount factor for each of the years can be computed using the following formula:
Discount Factor ‐ for xth year = 1(1+Discount Rate)^(x)
Using this formula, the discount factors for the life of the technology and the discounted savings (Rs) can be computed as follows:
Step‐5: Compute Costs (for TRC Test):
Some cost parameters are one �me and incurred only during the first year of the program, such as, the ini�al cost of the
technology, M&V costs and Marke�ng and Administra�on costs and some are recurring such as O&M cost and loss in revenue to
the u�lity.
Year 0 1 2 3 4 5 6 7 8
Discount Factor (A) 1.00 0.90 0.82 0.74 0.67 0.61 0.55 0.50 0.45
Total Savings (B) Rs. 7,638 8,001 8,454 8,826 9,278 9,731 10,184 10,733
Discounted Savings (C = A * B) Rs. 6,874 6,561 6,256 5,913 5,660 5,352 5,092 4,830
Net Present Value of benefits
(addi�on sum of discounted
savings for all the years)
Rs. 46,538
Table 17: NPV of Benefits (Rs)
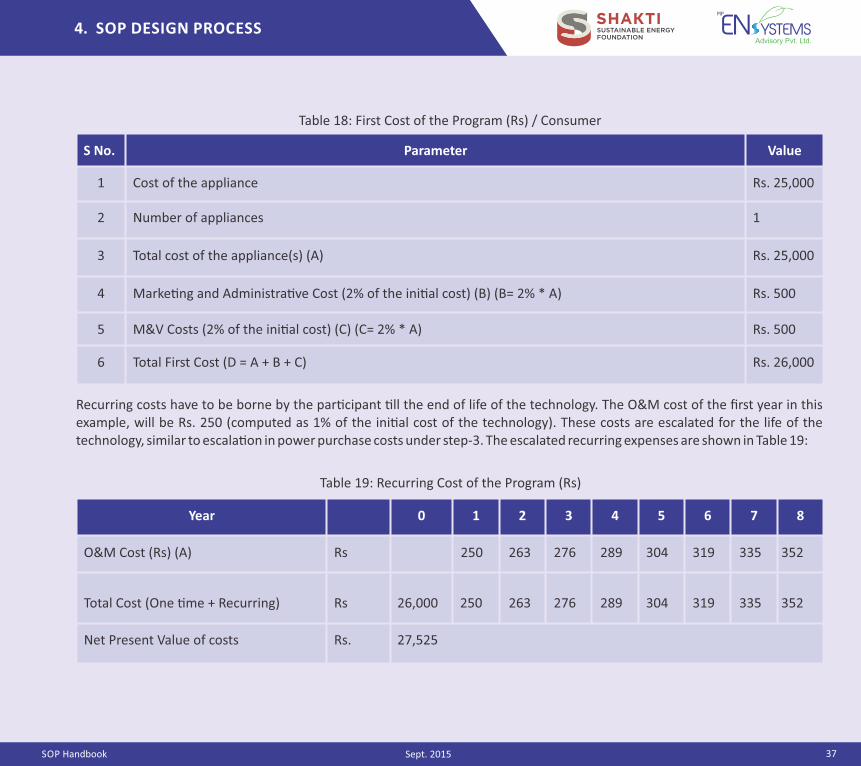
SOP Handbook
4. SOP DESIGN PROCESS
37Sept. 2015
S No. Parameter Value
1 Cost of the appliance Rs. 25,000
2 Number of appliances 1
3 Total cost of the appliance(s) (A) Rs. 25,000
4 Marke�ng and Administra�ve Cost (2% of the ini�al cost) (B) (B= 2% * A) Rs. 500
5 M&V Costs (2% of the ini�al cost) (C) (C= 2% * A) Rs. 500
6 Total First Cost (D = A + B + C) Rs. 26,000
Table 18: First Cost of the Program (Rs) / Consumer
Recurring costs have to be borne by the par�cipant �ll the end of life of the technology. The O&M cost of the first year in this example, will be Rs. 250 (computed as 1% of the ini�al cost of the technology). These costs are escalated for the life of the technology, similar to escala�on in power purchase costs under step‐3. The escalated recurring expenses are shown in Table 19:
Table 19: Recurring Cost of the Program (Rs)
Year 0 1 2 3 4 5 6 7 8
O&M Cost (Rs) (A) Rs 250 263 276 289 304 319 335 352
Total Cost (One �me + Recurring) Rs 26,000 250 263 276 289 304 319 335 352
Net Present Value of costs Rs. 27,525
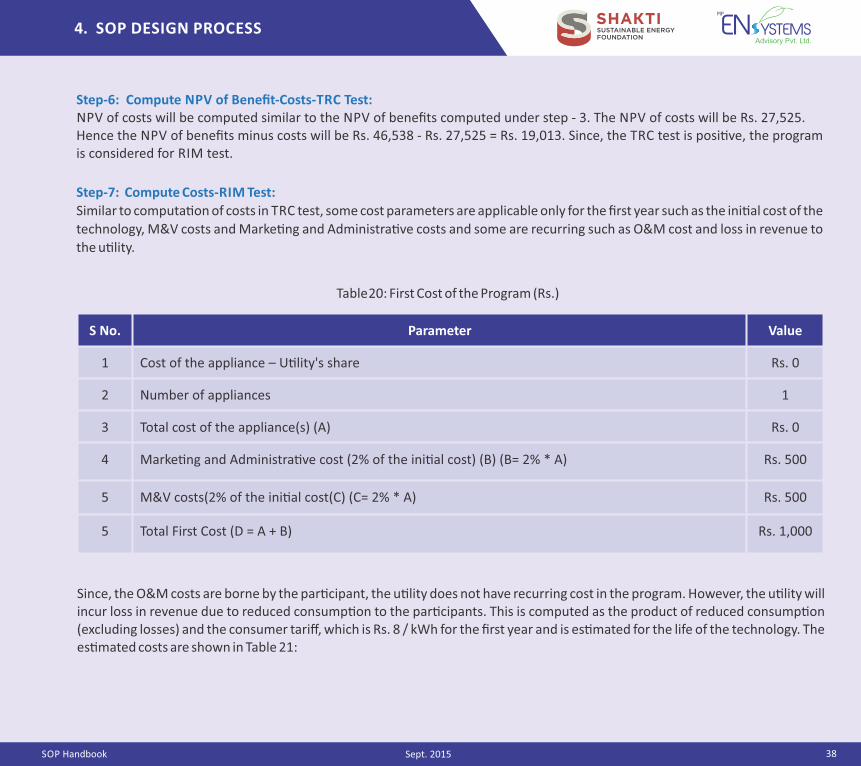
SOP Handbook
4. SOP DESIGN PROCESS
38Sept. 2015
Step‐6: Compute NPV of Benefit‐Costs‐TRC Test:NPV of costs will be computed similar to the NPV of benefits computed under step ‐ 3. The NPV of costs will be Rs. 27,525. Hence the NPV of benefits minus costs will be Rs. 46,538 ‐ Rs. 27,525 = Rs. 19,013. Since, the TRC test is posi�ve, the program is considered for RIM test.
Step‐7: Compute Costs‐RIM Test:
Similar to computa�on of costs in TRC test, some cost parameters are applicable only for the first year such as the ini�al cost of the
technology, M&V costs and Marke�ng and Administra�ve costs and some are recurring such as O&M cost and loss in revenue to
the u�lity.
S No. Parameter Value
1 Cost of the appliance – U�lity's share Rs. 0
2 Number of appliances 1
3 Total cost of the appliance(s) (A) Rs. 0
4 Marke�ng and Administra�ve cost (2% of the ini�al cost) (B) (B= 2% * A) Rs. 500
5 M&V costs(2% of the ini�al cost(C) (C= 2% * A) Rs. 500
5 Total First Cost (D = A + B) Rs. 1,000
Since, the O&M costs are borne by the par�cipant, the u�lity does not have recurring cost in the program. However, the u�lity will incur loss in revenue due to reduced consump�on to the par�cipants. This is computed as the product of reduced consump�on (excluding losses) and the consumer tariff, which is Rs. 8 / kWh for the first year and is es�mated for the life of the technology. The es�mated costs are shown in Table 21:
Table 20: First Cost of the Program (Rs.)
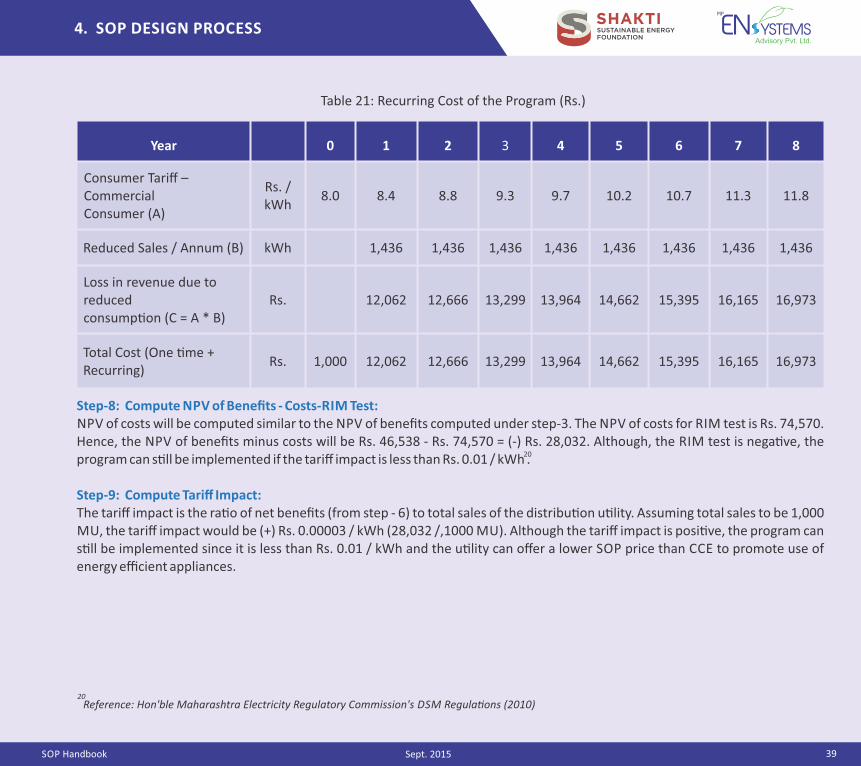
SOP Handbook
4. SOP DESIGN PROCESS
39Sept. 2015
Table 21: Recurring Cost of the Program (Rs.)
Year 0 1 2 3 4 5 6 7 8
Consumer Tariff – Commercial Consumer (A)
Rs. / kWh
8.0 8.4 8.8 9.3 9.7 10.2 10.7 11.3 11.8
Reduced Sales / Annum (B) kWh 1,436 1,436 1,436 1,436 1,436 1,436 1,436 1,436
Loss in revenue due to reduced consump�on (C = A * B)
Rs. 12,062 12,666 13,299 13,964 14,662 15,395 16,165 16,973
Total Cost (One �me + Recurring)
Rs. 1,000 12,062 12,666 13,299 13,964 14,662 15,395 16,165 16,973
Step‐8: Compute NPV of Benefits ‐ Costs‐RIM Test:NPV of costs will be computed similar to the NPV of benefits computed under step‐3. The NPV of costs for RIM test is Rs. 74,570. Hence, the NPV of benefits minus costs will be Rs. 46,538 ‐ Rs. 74,570 = (‐) Rs. 28,032. Although, the RIM test is nega�ve, the program can s�ll be implemented if the tariff impact is less than Rs. 0.01 / kWh .
Step‐9: Compute Tariff Impact:The tariff impact is the ra�o of net benefits (from step ‐ 6) to total sales of the distribu�on u�lity. Assuming total sales to be 1,000 MU, the tariff impact would be (+) Rs. 0.00003 / kWh (28,032 /,1000 MU). Although the tariff impact is posi�ve, the program can s�ll be implemented since it is less than Rs. 0.01 / kWh and the u�lity can offer a lower SOP price than CCE to promote use of energy efficient appliances.
Reference: Hon'ble Maharashtra Electricity Regulatory Commission's DSM Regula�ons (2010)20
20
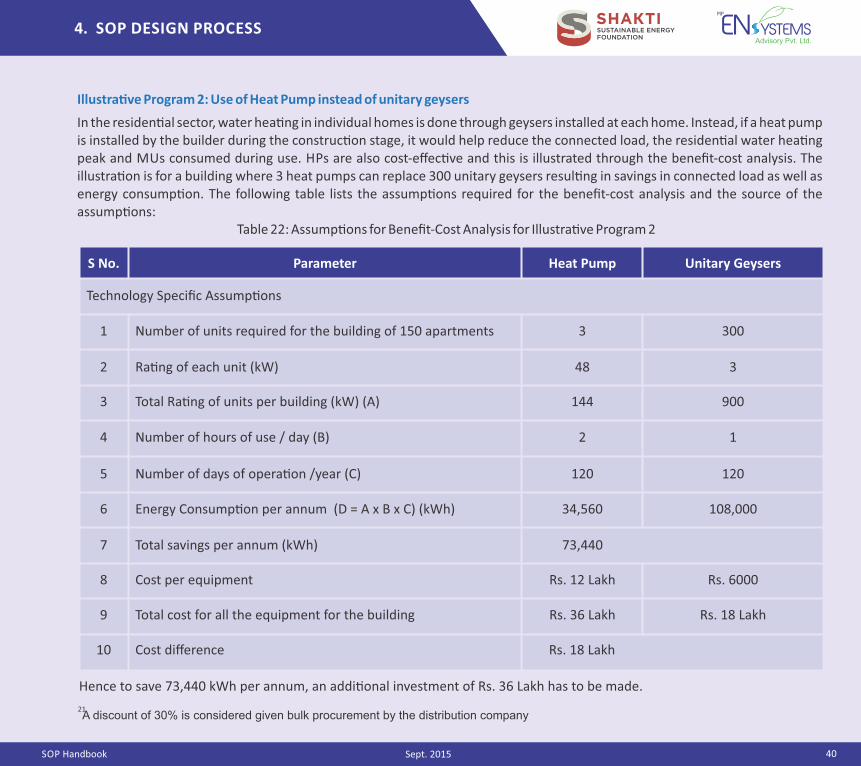
SOP Handbook
4. SOP DESIGN PROCESS
40Sept. 2015
In the residen�al sector, water hea�ng in individual homes is done through geysers installed at each home. Instead, if a heat pump is installed by the builder during the construc�on stage, it would help reduce the connected load, the residen�al water hea�ng peak and MUs consumed during use. HPs are also cost‐effec�ve and this is illustrated through the benefit‐cost analysis. The illustra�on is for a building where 3 heat pumps can replace 300 unitary geysers resul�ng in savings in connected load as well as energy consump�on. The following table lists the assump�ons required for the benefit‐cost analysis and the source of the assump�ons:
S No. Parameter Heat Pump Unitary Geysers
Technology Specific Assump�ons
1 Number of units required for the building of 150 apartments 3 300
2 Ra�ng of each unit (kW) 48 3
3 Total Ra�ng of units per building (kW) (A) 144 900
4 Number of hours of use / day (B) 2 1
5 Number of days of opera�on /year (C) 120 120
6 Energy Consump�on per annum (D = A x B x C) (kWh) 34,560 108,000
7 Total savings per annum (kWh) 73,440
8 Cost per equipment Rs. 12 Lakh Rs. 6000
9 Total cost for all the equipment for the building Rs. 36 Lakh Rs. 18 Lakh
10 Cost difference Rs. 18 Lakh
Table 22: Assump�ons for Benefit‐Cost Analysis for Illustra�ve Program 2
Illustra�ve Program 2: Use of Heat Pump instead of unitary geysers
A discount of 30% is considered given bulk procurement by the distribution company 21
Hence to save 73,440 kWh per annum, an addi�onal investment of Rs. 36 Lakh has to be made.
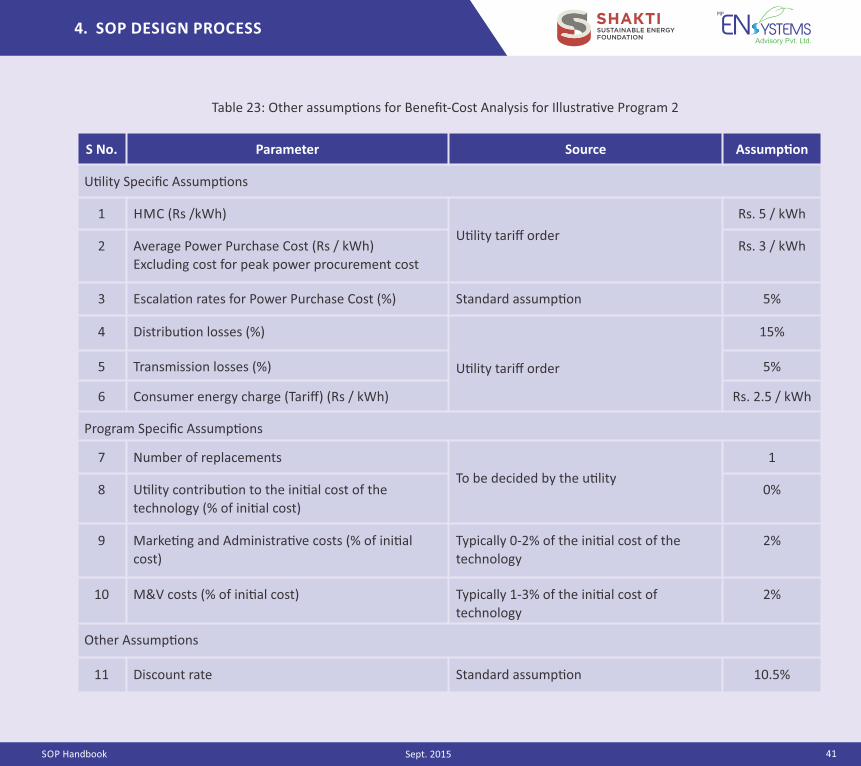
SOP Handbook
4. SOP DESIGN PROCESS
41Sept. 2015
S No. Parameter Source Assump�on
U�lity Specific Assump�ons
1 HMC (Rs /kWh)
U�lity tariff order
Rs. 5 / kWh
2 Average Power Purchase Cost (Rs / kWh)
Excluding cost for peak power procurement cost
Rs. 3 / kWh
3 Escala�on rates for Power Purchase Cost (%) Standard assump�on 5%
4 Distribu�on losses (%)
U�lity tariff order
15%
5 Transmission losses (%) 5%
6 Consumer energy charge (Tariff) (Rs / kWh) Rs. 2.5 / kWh
Program Specific Assump�ons
7 Number of replacements
To be decided by the u�lity
1
8 U�lity contribu�on to the ini�al cost of the
technology (% of ini�al cost)
0%
9 Marke�ng and Administra�ve costs (% of ini�al
cost)
Typically 0‐2% of the ini�al cost of the
technology
2%
10 M&V costs (% of ini�al cost) Typically 1‐3% of the ini�al cost of
technology
2%
Other Assump�ons
11 Discount rate Standard assump�on 10.5%
Table 23: Other assump�ons for Benefit‐Cost Analysis for Illustra�ve Program 2
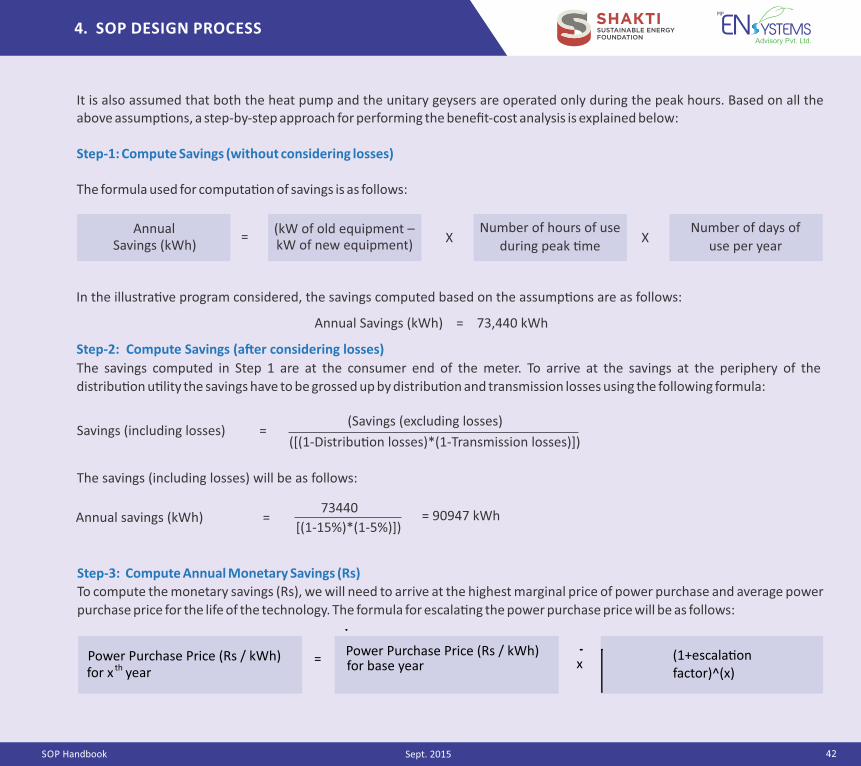
SOP Handbook
4. SOP DESIGN PROCESS
42Sept. 2015
It is also assumed that both the heat pump and the unitary geysers are operated only during the peak hours. Based on all the above assump�ons, a step‐by‐step approach for performing the benefit‐cost analysis is explained below:
Step‐1: Compute Savings (without considering losses)
The formula used for computa�on of savings is as follows:
X XkW of new equipment)(kW of old equipment –
=Savings (kWh)
Annual Number of hours of use
during peak �me
Number of days of
use per year
In the illustra�ve program considered, the savings computed based on the assump�ons are as follows:
Annual Savings (kWh) = 73,440 kWh
Savings (including losses) = (Savings (excluding losses)
([(1‐Distribu�on losses)*(1‐Transmission losses)])
The savings (including losses) will be as follows:
Annual savings (kWh) = = 90947 kWh[(1‐15%)*(1‐5%)])
73440
Step‐3: Compute Annual Monetary Savings (Rs)
To compute the monetary savings (Rs), we will need to arrive at the highest marginal price of power purchase and average power
purchase price for the life of the technology. The formula for escala�ng the power purchase price will be as follows:
x (1+escala�on
factor)^(x) Power Purchase Price (Rs / kWh)
for x th year =
Power Purchase Price (Rs / kWh) for base year
Step‐2: Compute Savings (a�er considering losses)
The savings computed in Step 1 are at the consumer end of the meter. To arrive at the savings at the periphery of the
distribu�on u�lity the savings have to be grossed up by distribu�on and transmission losses using the following formula:
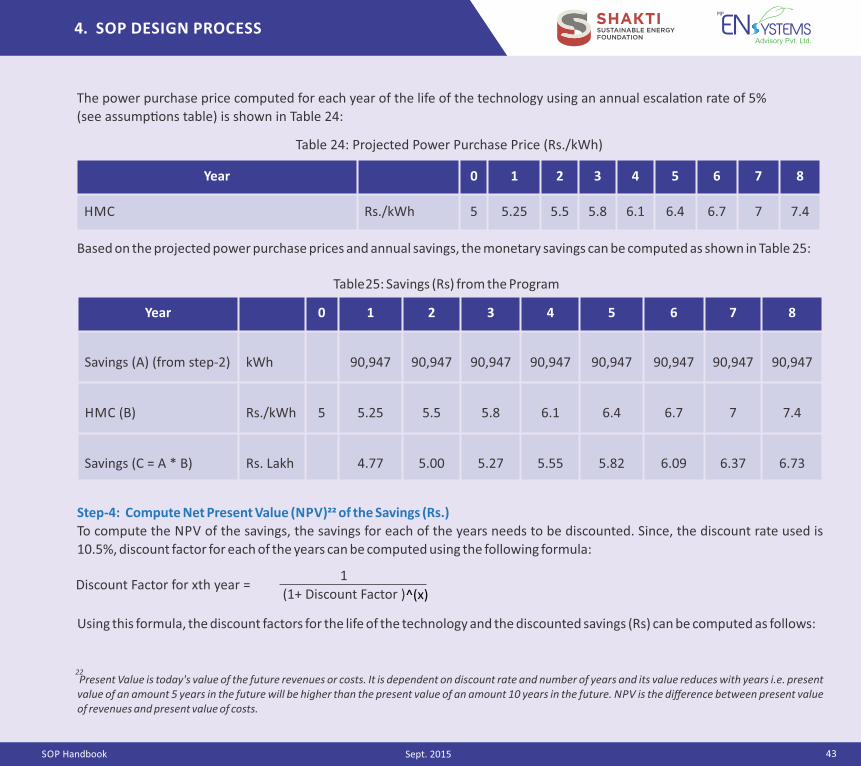
SOP Handbook
4. SOP DESIGN PROCESS
43Sept. 2015
Table 24: Projected Power Purchase Price (Rs./kWh)
Year 0 1 2 3 4 5 6 7 8
HMC Rs./kWh 5 5.25 5.5 5.8 6.1 6.4 6.7 7 7.4
Based on the projected power purchase prices and annual savings, the monetary savings can be computed as shown in Table 25:
Table 25: Savings (Rs) from the Program
Year 0 1 2 3 4 5 6 7 8
Savings (A) (from step‐2) kWh 90,947 90,947 90,947 90,947 90,947 90,947 90,947 90,947
HMC (B) Rs./kWh 5 5.25 5.5 5.8 6.1 6.4 6.7 7 7.4
Savings (C = A * B) Rs. Lakh 4.77 5.00 5.27 5.55 5.82 6.09 6.37 6.73
Year 0 1 2 3 4 5 6 7 8
Savings (A) (from step‐2) kWh 90,947 90,947 90,947 90,947 90,947 90,947 90,947 90,947
HMC (B) Rs./kWh 5 5.25 5.5 5.8 6.1 6.4 6.7 7 7.4
Savings (C = A * B) Rs. Lakh 4.77 5.00 5.27 5.55 5.82 6.09 6.37 6.73
Step‐4: Compute Net Present Value (NPV)�� of the Savings (Rs.)
To compute the NPV of the savings, the savings for each of the years needs to be discounted. Since, the discount rate used is
10.5%, discount factor for each of the years can be computed using the following formula:
Discount Factor for xth year = 1
(1+ Discount Factor )
Using this formula, the discount factors for the life of the technology and the discounted savings (Rs) can be computed as follows:
The power purchase price computed for each year of the life of the technology using an annual escala�on rate of 5%
(see assump�ons table) is shown in Table 24:
^(x)
22 Present Value is today's value of the future revenues or costs. It is dependent on discount rate and number of years and its value reduces with years i.e. present value of an amount 5 years in the future will be higher than the present value of an amount 10 years in the future. NPV is the difference between present value of revenues and present value of costs.
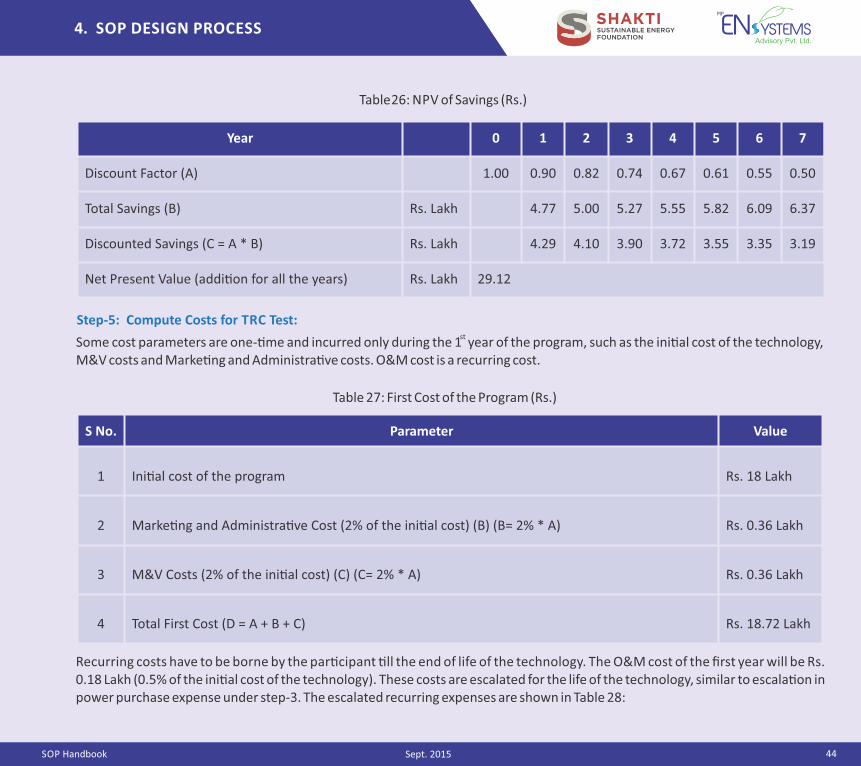
SOP Handbook
4. SOP DESIGN PROCESS
44Sept. 2015
Year 0 1 2 3 4 5 6 7
Discount Factor (A) 1.00 0.90 0.82 0.74 0.67 0.61 0.55 0.50
Total Savings (B) Rs. Lakh 4.77 5.00 5.27 5.55 5.82 6.09 6.37
Discounted Savings (C = A * B) Rs. Lakh 4.29 4.10 3.90 3.72 3.55 3.35 3.19
Net Present Value (addi�on for all the years) Rs. Lakh 29.12
S No. Parameter Value
1 Ini�al cost of the program Rs. 18 Lakh
2 Marke�ng and Administra�ve Cost (2% of the ini�al cost) (B) (B= 2% * A) Rs. 0.36 Lakh
3 M&V Costs (2% of the ini�al cost) (C) (C= 2% * A) Rs. 0.36 Lakh
4 Total First Cost (D = A + B + C) Rs. 18.72 Lakh
Table 26: NPV of Savings (Rs.)
Step‐5: Compute Costs for TRC Test:
Some cost parameters are one‐�me and incurred only during the 1 year of the program, such as the ini�al cost of the technology, M&V costs and Marke�ng and Administra�ve costs. O&M cost is a recurring cost.
st
Table 27: First Cost of the Program (Rs.)
Recurring costs have to be borne by the par�cipant �ll the end of life of the technology. The O&M cost of the first year will be Rs. 0.18 Lakh (0.5% of the ini�al cost of the technology). These costs are escalated for the life of the technology, similar to escala�on in power purchase expense under step‐3. The escalated recurring expenses are shown in Table 28:
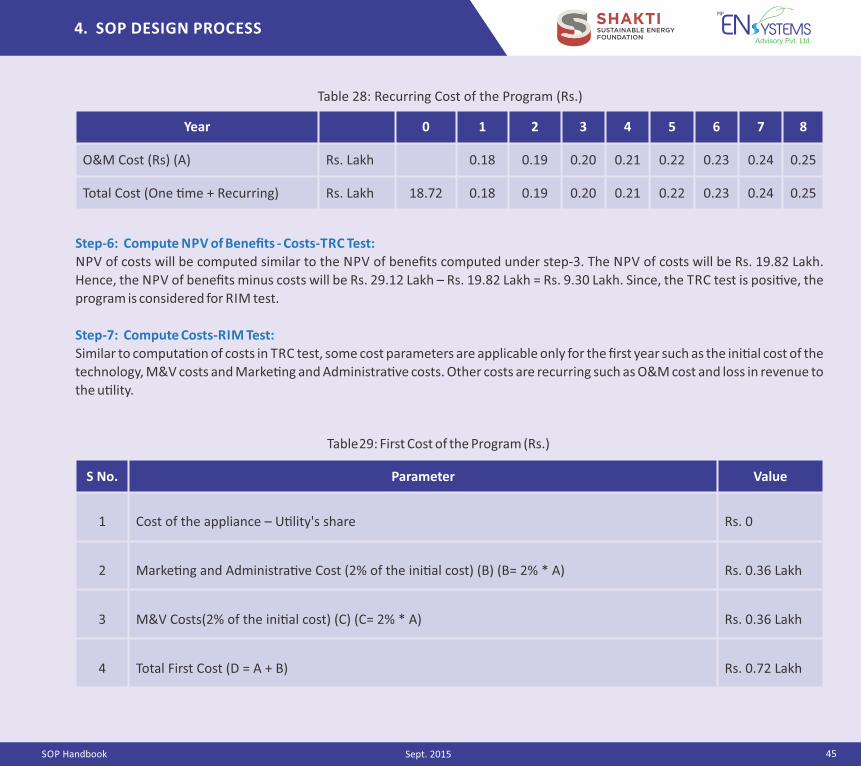
SOP Handbook
4. SOP DESIGN PROCESS
45Sept. 2015
Year 0 1 2 3 4 5 6 7 8
O&M Cost (Rs) (A) Rs. Lakh 0.18 0.19 0.20 0.21 0.22 0.23 0.24 0.25
Total Cost (One �me + Recurring) Rs. Lakh 18.72 0.18 0.19 0.20 0.21 0.22 0.23 0.24 0.25
Step‐6: Compute NPV of Benefits ‐ Costs‐TRC Test:
NPV of costs will be computed similar to the NPV of benefits computed under step‐3. The NPV of costs will be Rs. 19.82 Lakh.
Hence, the NPV of benefits minus costs will be Rs. 29.12 Lakh – Rs. 19.82 Lakh = Rs. 9.30 Lakh. Since, the TRC test is posi�ve, the
program is considered for RIM test.
Step‐7: Compute Costs‐RIM Test:
Similar to computa�on of costs in TRC test, some cost parameters are applicable only for the first year such as the ini�al cost of the
technology, M&V costs and Marke�ng and Administra�ve costs. Other costs are recurring such as O&M cost and loss in revenue to
the u�lity.
S No. Parameter Value
1 Cost of the appliance – U�lity's share Rs. 0
2 Marke�ng and Administra�ve Cost (2% of the ini�al cost) (B) (B= 2% * A) Rs. 0.36 Lakh
3 M&V Costs(2% of the ini�al cost) (C) (C= 2% * A) Rs. 0.36 Lakh
4 Total First Cost (D = A + B) Rs. 0.72 Lakh
Table 28: Recurring Cost of the Program (Rs.)
Table 29: First Cost of the Program (Rs.)
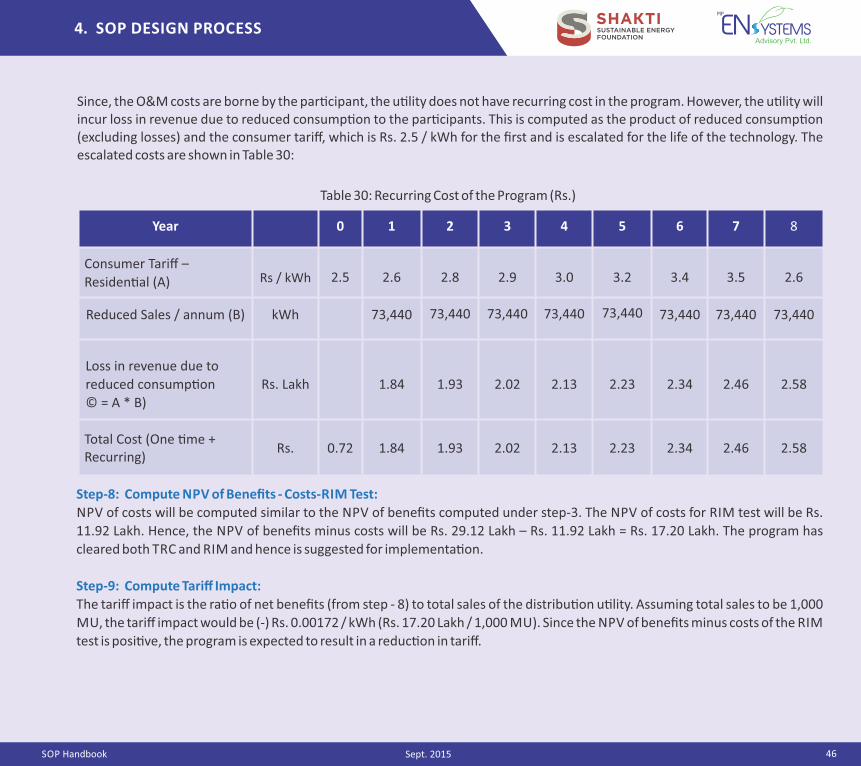
SOP Handbook
4. SOP DESIGN PROCESS
46Sept. 2015
Since, the O&M costs are borne by the par�cipant, the u�lity does not have recurring cost in the program. However, the u�lity will incur loss in revenue due to reduced consump�on to the par�cipants. This is computed as the product of reduced consump�on (excluding losses) and the consumer tariff, which is Rs. 2.5 / kWh for the first and is escalated for the life of the technology. The escalated costs are shown in Table 30:
Year 0 1 2 3 4 5 6 7 8
Consumer Tariff –
Residen�al (A) Rs / kWh 2.5 2.6 2.8 2.9 3.0 3.2 3.4 3.5 2.6
Reduced Sales / annum (B) kWh 73,440 73,440 73,440 73,440 73,440 73,440 73,440 73,440
Loss in revenue due to
reduced consump�on
© = A * B)
Rs. Lakh 1.84 1.93 2.02 2.13 2.23 2.34 2.46 2.58
Total Cost (One �me + Recurring)
Rs. 0.72 1.84 1.93 2.02 2.13 2.23 2.34 2.46 2.58
Step‐8: Compute NPV of Benefits ‐ Costs‐RIM Test:
NPV of costs will be computed similar to the NPV of benefits computed under step‐3. The NPV of costs for RIM test will be Rs.
11.92 Lakh. Hence, the NPV of benefits minus costs will be Rs. 29.12 Lakh – Rs. 11.92 Lakh = Rs. 17.20 Lakh. The program has
cleared both TRC and RIM and hence is suggested for implementa�on.
Step‐9: Compute Tariff Impact:
The tariff impact is the ra�o of net benefits (from step ‐ 8) to total sales of the distribu�on u�lity. Assuming total sales to be 1,000
MU, the tariff impact would be (‐) Rs. 0.00172 / kWh (Rs. 17.20 Lakh / 1,000 MU). Since the NPV of benefits minus costs of the RIM
test is posi�ve, the program is expected to result in a reduc�on in tariff.
Table 30: Recurring Cost of the Program (Rs.)
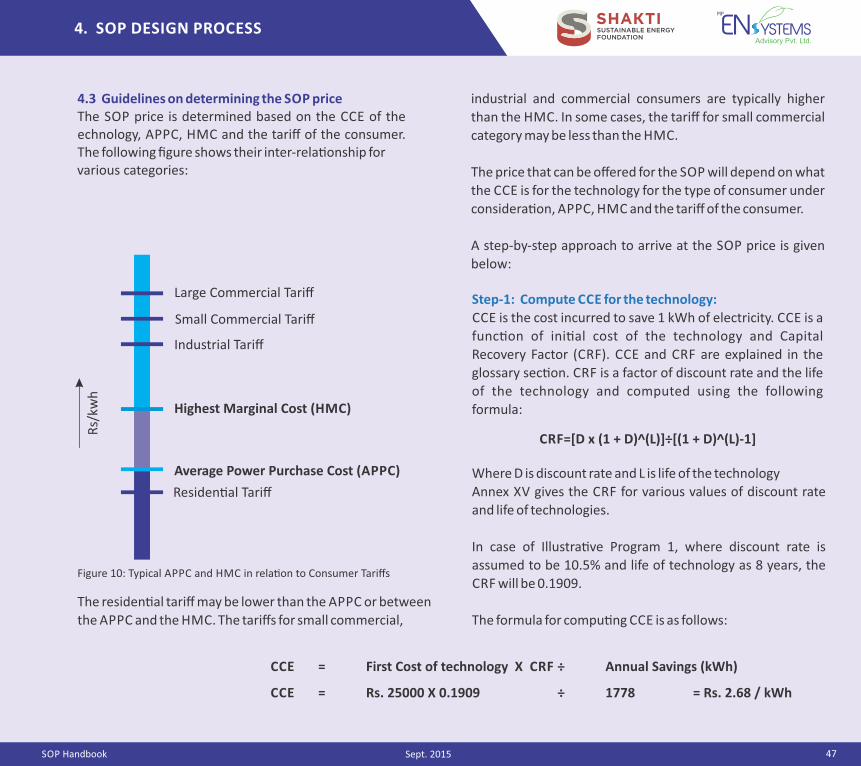
4.3 GUIDELINES ON DETERMINING THE SOP PRICE
SOP Handbook
4. SOP DESIGN PROCESS
47Sept. 2015
industrial and commercial consumers are typically higher
than the HMC. In some cases, the tariff for small commercial
category may be less than the HMC.
The price that can be offered for the SOP will depend on what
the CCE is for the technology for the type of consumer under
considera�on, APPC, HMC and the tariff of the consumer.
A step‐by‐step approach to arrive at the SOP price is given
below:
Step‐1: Compute CCE for the technology:
CCE is the cost incurred to save 1 kWh of electricity. CCE is a
func�on of ini�al cost of the technology and Capital
Recovery Factor (CRF). CCE and CRF are explained in the
glossary sec�on. CRF is a factor of discount rate and the life
of the technology and computed using the following
formula:
CRF=[D x (1 + D)^(L)]÷[(1 + D)^(L)‐1]
CCE = First Cost of technology X CRF ÷ Annual Savings (kWh)
CCE = Rs. 25000 X 0.1909 ÷ 1778 = Rs. 2.68 / kWh
Large Commercial Tariff
Small Commercial Tariff
Industrial Tariff
Highest Marginal Cost (HMC)
Average Power Purchase Cost (APPC)
Residen�al Tariff
Rs/
kwh
Figure 10: Typical APPC and HMC in rela�on to Consumer Tariffs
The residen�al tariff may be lower than the APPC or between
the APPC and the HMC. The tariffs for small commercial,
Where D is discount rate and L is life of the technology
Annex XV gives the CRF for various values of discount rate
and life of technologies.
In case of Illustra�ve Program 1, where discount rate is
assumed to be 10.5% and life of technology as 8 years, the
CRF will be 0.1909.
The formula for compu�ng CCE is as follows:
4.3 Guidelines on determining the SOP priceThe SOP price is determined based on the CCE of the echnology, APPC, HMC and the tariff of the consumer. The following figure shows their inter‐rela�onship for various categories:
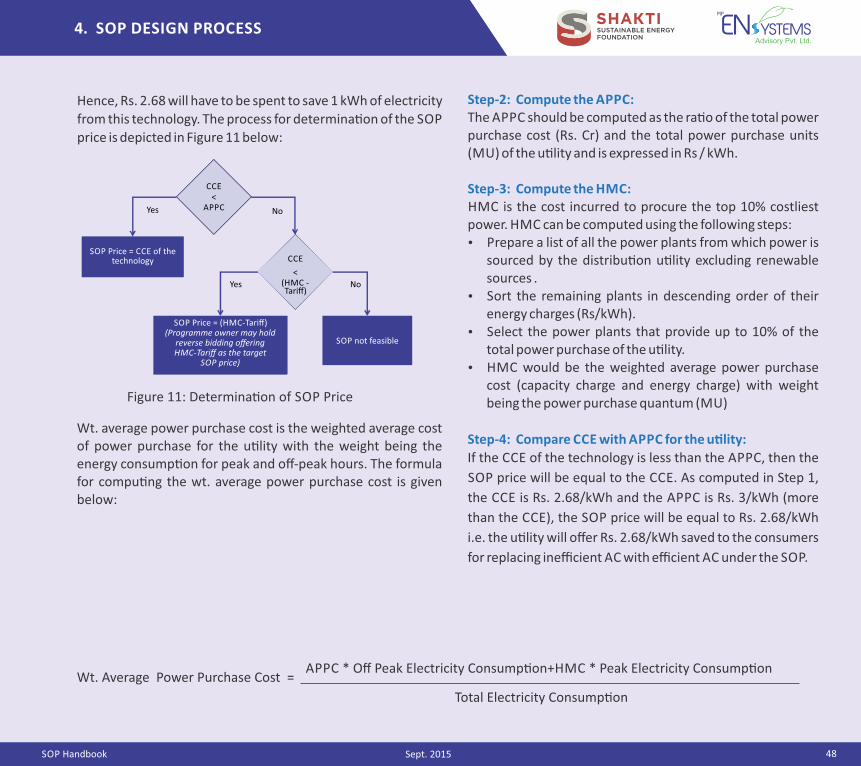
SOP Handbook
4. SOP DESIGN PROCESS
48Sept. 2015
Wt. Average Power Purchase Cost = APPC * Off Peak Electricity Consump�on+HMC * Peak Electricity Consump�on
Total Electricity Consump�on
Step‐2: Compute the APPC:The APPC should be computed as the ra�o of the total power purchase cost (Rs. Cr) and the total power purchase units (MU) of the u�lity and is expressed in Rs / kWh.
Step‐3: Compute the HMC:HMC is the cost incurred to procure the top 10% costliest power. HMC can be computed using the following steps: Prepare a list of all the power plants from which power is
sourced by the distribu�on u�lity excluding renewable sources .
Sort the remaining plants in descending order of their energy charges (Rs/kWh).
Select the power plants that provide up to 10% of the total power purchase of the u�lity.
HMC would be the weighted average power purchase cost (capacity charge and energy charge) with weight being the power purchase quantum (MU)
Step‐4: Compare CCE with APPC for the u�lity:
If the CCE of the technology is less than the APPC, then the
SOP price will be equal to the CCE. As computed in Step 1,
the CCE is Rs. 2.68/kWh and the APPC is Rs. 3/kWh (more
than the CCE), the SOP price will be equal to Rs. 2.68/kWh
i.e. the u�lity will offer Rs. 2.68/kWh saved to the consumers
for replacing inefficient AC with efficient AC under the SOP.
Figure 11: Determina�on of SOP Price
Hence, Rs. 2.68 will have to be spent to save 1 kWh of electricity
from this technology. The process for determina�on of the SOP
price is depicted in Figure 11 below:
Wt. average power purchase cost is the weighted average cost of power purchase for the u�lity with the weight being the energy consump�on for peak and off‐peak hours. The formula for compu�ng the wt. average power purchase cost is given below:
CCE <
APPCYes No
SOP Price = CCE of the technology
Tariff)
< (HMC ‐Yes No
(Programme owner may hold reverse bidding offering HMC-Tariff as the target
SOP price)
SOP not feasible
CCE
SOP Price = (HMC‐Tariff)
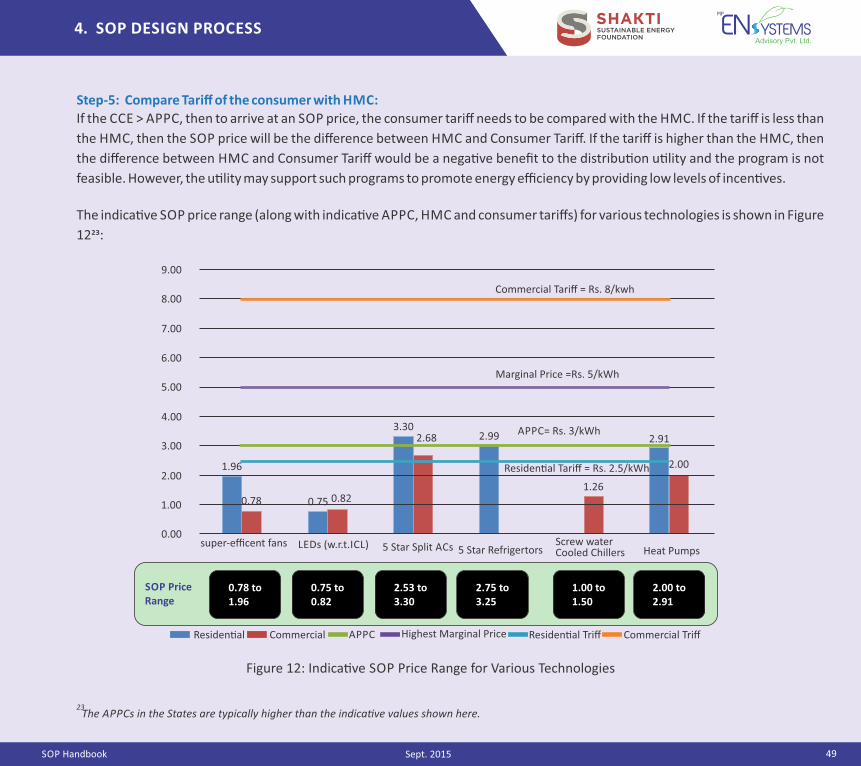
SOP Handbook
4. SOP DESIGN PROCESS
49Sept. 2015
Step‐5: Compare Tariff of the consumer with HMC:
If the CCE > APPC, then to arrive at an SOP price, the consumer tariff needs to be compared with the HMC. If the tariff is less than
the HMC, then the SOP price will be the difference between HMC and Consumer Tariff. If the tariff is higher than the HMC, then
the difference between HMC and Consumer Tariff would be a nega�ve benefit to the distribu�on u�lity and the program is not
feasible. However, the u�lity may support such programs to promote energy efficiency by providing low levels of incen�ves.
The indica�ve SOP price range (along with indica�ve APPC, HMC and consumer tariffs) for various technologies is shown in Figure
12��:
Figure 12: Indica�ve SOP Price Range for Various Technologies
Residen�al Triff Commercial TriffHighest Marginal PriceAPPCCommercialResiden�al
SOP PriceRange
0.78 to1.96
0.75 to0.82
2.53 to3.30
2.75 to3.25
1.00 to1.50
2.00 to2.91
1.96
0.78 0.75 0.82
2.683.30
2.99 2.91
2.00
1.26
Residen�al Tariff = Rs. 2.5/kWh
APPC= Rs. 3/kWh
Marginal Price =Rs. 5/kWh
Commercial Tariff = Rs. 8/kwh
super‐efficent fans LEDs (w.r.t.ICL) 5 Star Split ACs 5 Star Refrigertors Screw water Cooled Chillers Heat Pumps
9.00
8.00
7.00
6.00
5.00
4.00
3.00
2.00
1.00
0.00
23The APPCs in the States are typically higher than the indica�ve values shown here.
SOP Handbook
4. SOP DESIGN PROCESS
50Sept. 2015
The first step is to decide the dura�on of payment of incen�ves
to the consumer. This is typically 1 or 2 years and would depend
on the end‐use and/or technology. There are two op�ons in
which a u�lity can pay the consumer the incen�ves:
Es�mate the savings from the DSM measure for the
dura�on of the SOP (1 or 2 years). Pay the consumer an
amount at a price slightly less than the SOP price on the
es�mated savings at the start of the program. At the end of
the program, post‐M&V, the difference in savings can be
se�led. For example, if the es�mated savings is 100 kWh and
the SOP price is Rs. 1/kWh, then at the start of the program,
the u�lity can pay an amount of Rs. 0.8/kWh on the
es�mated savings i.e. Rs. 80. Pay monthly incen�ve based on the savings achieved. For
example, if the monthly savings is 10 kWh and the SOP price
is Rs. 1/kWh then the consumer would receive an amount of
Rs. 10 per month.
4.4 Guidelines on payment of incen�ves (SOP Price)
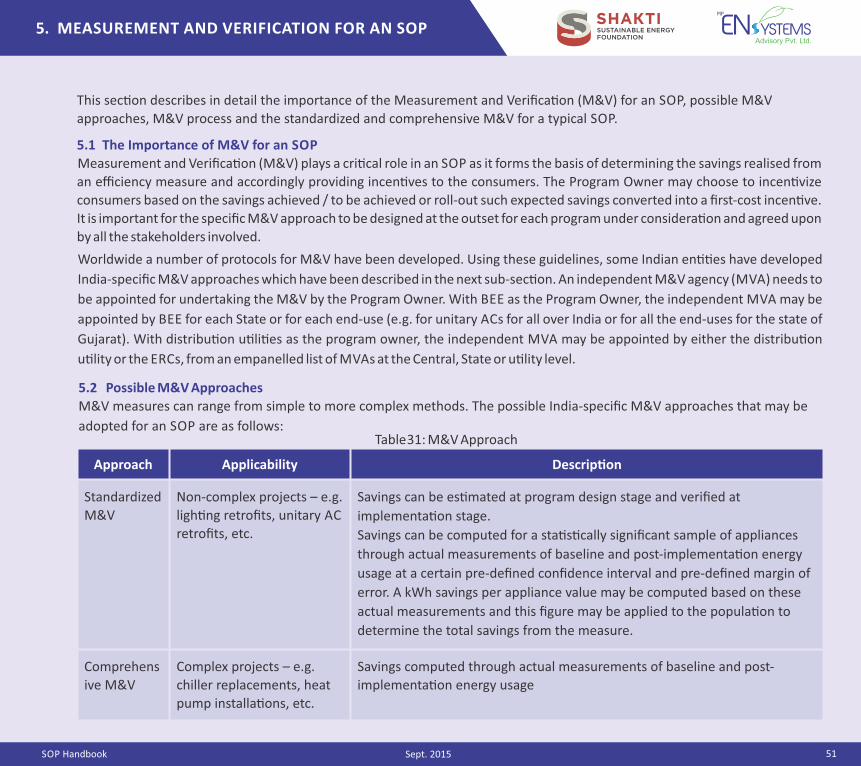
SOP Handbook
5. MEASUREMENT AND VERIFICATION FOR AN SOP
51Sept. 2015
Approach Applicability Descrip�on
Standardized
M&V
Non‐complex projects – e.g.
ligh�ng retrofits, unitary AC
retrofits, etc.
Savings can be es�mated at program design stage and verified at
implementa�on stage.
Savings can be computed for a sta�s�cally significant sample of appliances
through actual measurements of baseline and post‐implementa�on energy
usage at a certain pre‐defined confidence interval and pre‐defined margin of
error. A kWh savings per appliance value may be computed based on these
actual measurements and this figure may be applied to the popula�on to
determine the total savings from the measure.
Comprehens
ive M&V
Complex projects – e.g.
chiller replacements, heat
pump installa�ons, etc.
Savings computed through actual measurements of baseline and post‐
implementa�on energy usage
Worldwide a number of protocols for M&V have been developed. Using these guidelines, some Indian en��es have developed
India‐specific M&V approaches which have been described in the next sub‐sec�on. An independent M&V agency (MVA) needs to
be appointed for undertaking the M&V by the Program Owner. With BEE as the Program Owner, the independent MVA may be
appointed by BEE for each State or for each end‐use (e.g. for unitary ACs for all over India or for all the end‐uses for the state of
Gujarat). With distribu�on u�li�es as the program owner, the independent MVA may be appointed by either the distribu�on
u�lity or the ERCs, from an empanelled list of MVAs at the Central, State or u�lity level.
5.1 The Importance of M&V for an SOP
Measurement and Verifica�on (M&V) plays a cri�cal role in an SOP as it forms the basis of determining the savings realised from
an efficiency measure and accordingly providing incen�ves to the consumers. The Program Owner may choose to incen�vize
consumers based on the savings achieved / to be achieved or roll‐out such expected savings converted into a first‐cost incen�ve.
It is important for the specific M&V approach to be designed at the outset for each program under considera�on and agreed upon
by all the stakeholders involved.
Table 31: M&V Approach
5.2 Possible M&V Approaches
M&V measures can range from simple to more complex methods. The possible India‐specific M&V approaches that may be
adopted for an SOP are as follows:
This sec�on describes in detail the importance of the Measurement and Verifica�on (M&V) for an SOP, possible M&V
approaches, M&V process and the standardized and comprehensive M&V for a typical SOP.
5.3 MEASUREMENT AND VERIFICATION FOR AN SOP
SOP Handbook
5. MEASUREMENT AND VERIFICATION FOR AN SOP
52Sept. 2015
The M&V methodology needs to be decided before the launch
and implementa�on of the SOP and will differ for each end‐
use/ technology under considera�on. Some programs may
require comprehensive M&V and for some other programs a
standardized savings approach may be sufficient. The process
that may be followed for undertaking M&V for an SOP is as
follows:
Appointment of MVA by (i) BEE in case of a na�onal
level SOP, and, (ii) by the u�lity or SERC in case of a
u�lity or state level SOP
Prepara�on of M&V Plan by MVA at program outset,
for each technology under considera�on
Agreement of Program Owner, Aggregator and
Consumer on the M&V plan prepared by the MVA
Installa�on of meters and baseline measurements on
sampling basis, as e required under the M&V plan
Installa�on of EE technology and issuance of
installa�on cer�ficate by Aggregator. At this stage,
quality checks may be done by Program Owner/ MVA
on sampling basis
Payment of installa�on‐based incen�ve, if required
under the agreement (payment to be made by
Program Owner or Aggregator)
Post installa�on, the M&VA would perform sample
checks to assess successful running of EE equipment.
The checks would be done a�er a predefined period
(e.g. 6 months or 1 year)
Assessment of energy and peak savings as per the
M&V plan
Repor�ng of savings by MVA to u�lity for release of
payment to par�cipa�ng consumers(this will also
serve as an input to future SOP design)
5.4 Standardized M&V
Under standardized M&V, the savings are es�mated based
on actual measurement of a sample of equipment. The
process for performing standardized M&V is given below:
Applicable technologies/end‐uses: Ligh�ng equipment,
Fans, Air‐Condi�oning, Refrigerators, Geysers / Water‐
Heaters, Water Pumps etc.
S ample measurement of wa�age or energy
consump�on of old technology and new technology:
Wa�ages or energy consump�on of old and new
technologies may be measured using a wa� meter or a
kWh meter on a sample basis for both old and new
technology. The sample size for such measurement may
be computed by using a confidence level and rela�ve
precision of 90% and 10% respec�vely.
Measurement of hours of opera�on: Hours of opera�on
for a sample of equipment may be measured using an
“hour meter” before and a�er the installa�on of the new
equipment. This is because once the efficient product is
in place, there is a possibility that it is operated for longer
�mes than before. Post‐installa�on hours of opera�on
may however, also be assumed same as the pre‐
installa�on hours of opera�on. The sample size for such
measurement may be computed by using assump�ons
for confidence level and rela�ve precision.
Es�ma�on of savings: Based on the number of hours and
wa�age, the standardized savings will be computed and
used for processing the payments to the par�cipa�ng
consumers in the SOP program
5.3 The Measurement & Verifica�on Process
24
24 In case of large consumers
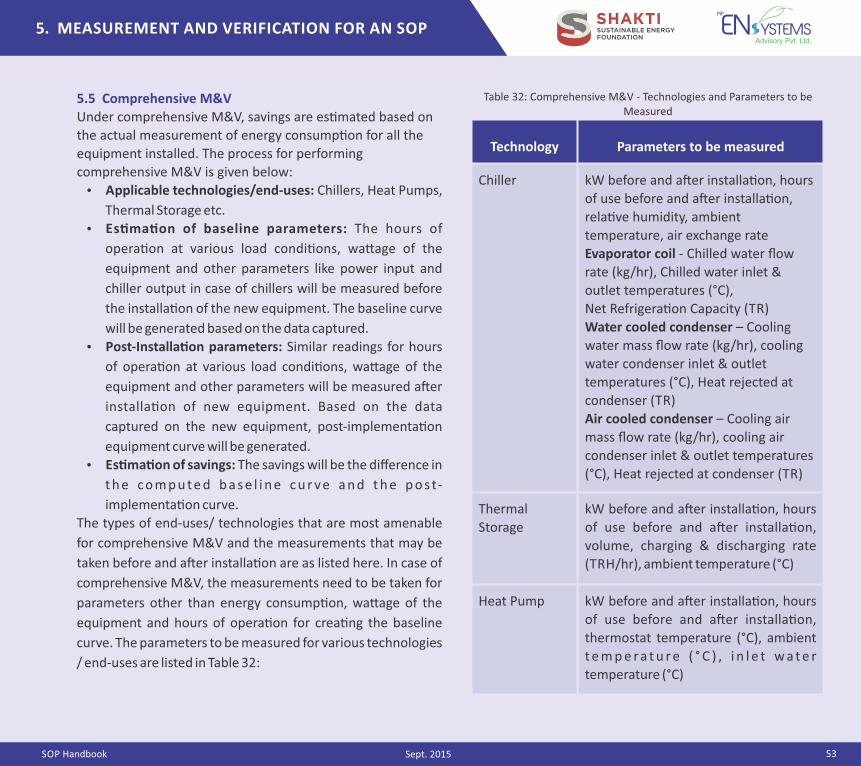
53
5. MEASUREMENT AND VERIFICATION FOR AN SOP
5.5 Comprehensive M&V
Under comprehensive M&V, savings are es�mated based on
the actual measurement of energy consump�on for all the
equipment installed. The process for performing
comprehensive M&V is given below:
Applicable technologies/end‐uses: Chillers, Heat Pumps,
Thermal Storage etc.
Es�ma�on of baseline parameters: The hours of
opera�on at various load condi�ons, wa�age of the
equipment and other parameters like power input and
chiller output in case of chillers will be measured before
the installa�on of the new equipment. The baseline curve
will be generated based on the data captured.
Post‐Installa�on parameters: Similar readings for hours
of opera�on at various load condi�ons, wa�age of the
equipment and other parameters will be measured a�er
installa�on of new equipment. Based on the data
captured on the new equipment, post‐implementa�on
equipment curve will be generated.
Es�ma�on of savings: The savings will be the difference in
t h e c o m p u te d b a s e l i n e c u r ve a n d t h e p o st‐
implementa�on curve.
The types of end‐uses/ technologies that are most amenable
for comprehensive M&V and the measurements that may be
taken before and a�er installa�on are as listed here. In case of
comprehensive M&V, the measurements need to be taken for
parameters other than energy consump�on, wa�age of the
equipment and hours of opera�on for crea�ng the baseline
curve. The parameters to be measured for various technologies
/ end‐uses are listed in Table 32:
Technology Parameters to be measured
Chiller kW before and a�er installa�on, hours
of use before and a�er installa�on,
rela�ve humidity, ambient
temperature, air exchange rate
Evaporator coil ‐ Chilled water flow
rate (kg/hr), Chilled water inlet &
outlet temperatures (°C),
Net Refrigera�on Capacity (TR)
Water cooled condenser – Cooling
water mass flow rate (kg/hr), cooling
water condenser inlet & outlet
temperatures (°C), Heat rejected at
condenser (TR)
Air cooled condenser – Cooling air
mass flow rate (kg/hr), cooling air
condenser inlet & outlet temperatures
(°C), Heat rejected at condenser (TR)
Thermal
Storage
kW before and a�er installa�on, hours
of use before and a�er installa�on,
volume, charging & discharging rate
(TRH/hr), ambient temperature (°C)
Heat Pump kW before and a�er installa�on, hours
of use before and a�er installa�on,
thermostat temperature (°C), ambient
t e m p e r a t u r e ( ° C ) , i n l e t w a t e r
temperature (°C)
Table 32: Comprehensive M&V ‐ Technologies and Parameters to be Measured
SOP Handbook Sept. 2015
SOP Handbook
6. ROLES AND RESPONSIBILITIES OF VARIOUS STAKEHOLDERS
54Sept. 2015
As covered in Sec�on 2.3, the roll‐out and implementa�on of
an SOP may either be at the na�onal level, in which case the
Program Owner will be the Bureau of Energy Efficiency
(BEE), or at a u�lity level, in which case the Program Owner
will be the distribu�on u�lity. In either case, Aggregators /
sub‐contracted energy service providers will implement the
SOP on behalf of the Program Owner and an independent
M&V Agency will be appointed to undertake the M&V for the
program. The roles and responsibili�es of various
stakeholders are discussed below.
6.1 Program Owner
Iden�fy end‐uses and/or technologies that can be
targeted for SOP based on load research,
assessment of energy and peak deficits, technology
availability and benefit‐cost analysis
Determine SOP price to be offered for each of the
end‐uses and/or technologies
Obtain required approvals from central ministry or
SERC
Tie in funding for the program through various
funding op�ons (discussed in Sec�on 2.4)
Dra� RfP for selec�ng Aggregator
Appoint Aggregator for program implementa�on
based on pre‐defined qualifica�on criteria
Sign agreement with Aggregator
Dra� RfP and appoint MVA
Ensure necessary data are provided to MVA
Ensure adherence to the accepted M&V plan and
verify savings reported by Aggregator
Pay Aggregator the pre‐determined SOP price
based on the demonstrated savings from the
implemented DSM programs as per the terms of the
agreement signed with the Aggregator. If Program
Owner has directly enrolled consumers (e.g. large
commercial establishments), directly pay the SOP
price on the demonstrated savings to the consumer.
6.2 Aggregator and/or Energy Service Provider (ESP)
Contract with Program Owner
Further sub‐contract required work to ESPs based
on end‐use (when at na�onal/u�lity level) or state
(when at na�onal level) and sign agreement(s) with
sub‐contracted ESPs
Prepare program outreach material
Reach out to consumers and enroll them into the
program
Oversee and regularly update Program Owner on
status of enrolment of consumers
Appoint vendor(s) through a bidding process and
sign contracts with selected vendors
Ensure installa�on of efficient technologies at
consumer's premises and/or provide assistance to
consumers for undertaking opera�onal efficiency
improvements (independently or through vendors)
Ensure safe disposal of old equipment
Oversee and regularly inform Program Owner on
status of implementa�on and incen�ves to be paid
as per the SOP
On receipt of the payment from Program Owner,
pass on incen�ves to the consumers as per terms of
agreement
Provide required support to MVA for determining
savings
SOP Handbook
6. ROLES AND RESPONSIBILITIES OF VARIOUS STAKEHOLDERS
55Sept. 2015
Make payments to sub‐contracted ESPs as per
terms of agreement
Provide regular updates to Program Owner on
status of implementa�on work
Provide necessary O&M support during the SOP
tenure
6.3 M&V Agency
Contract with Program Owner for M&V of the SOP
Adopt appropriate methodology to determine
consumer baseline consump�on for various end‐
uses before implementa�on of efficiency measure;
seek support from Aggregator/sub‐contracted
ESPs, as required
Discuss with concerned stake holders and get sign‐
off on M&V plan from Program Owner
Ascertain savings from efficiency measure as per
M& V plan
Provide regular updates to Program Owner on
status of M&V
6.4 Par�cipa�ng Consumers
Enroll in the program
Support Aggregator and sub‐contracted ESPs in
implemen�ng the efficiency measure and
undertaking safe disposal of old equipment, where
applicable
Support MVA in determining the savings achieved
from implementa�on of the program
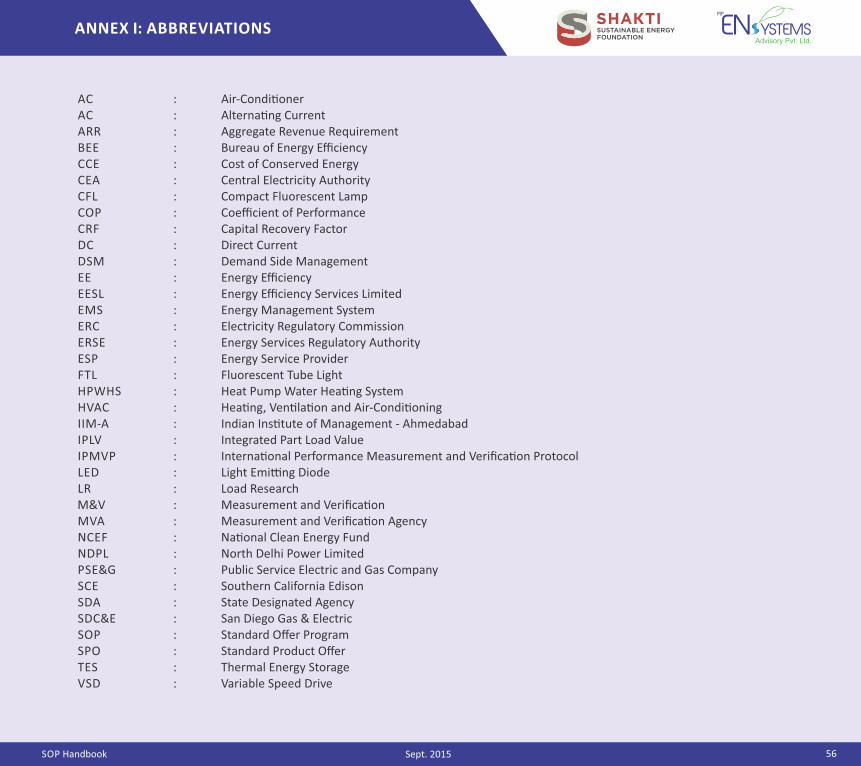
ANNEX I: ABBREVIATIONS
SOP Handbook 56Sept. 2015
AC : Air‐Condi�onerAC : Alterna�ng CurrentARR : Aggregate Revenue RequirementBEE : Bureau of Energy EfficiencyCCE : Cost of Conserved EnergyCEA : Central Electricity AuthorityCFL : Compact Fluorescent LampCOP : Coefficient of PerformanceCRF : Capital Recovery FactorDC : Direct CurrentDSM : Demand Side ManagementEE : Energy EfficiencyEESL : Energy Efficiency Services LimitedEMS : Energy Management SystemERC : Electricity Regulatory CommissionERSE : Energy Services Regulatory AuthorityESP : Energy Service ProviderFTL : Fluorescent Tube LightHPWHS : Heat Pump Water Hea�ng SystemHVAC : Hea�ng, Ven�la�on and Air‐Condi�oningIIM‐A : Indian Ins�tute of Management ‐ AhmedabadIPLV : Integrated Part Load ValueIPMVP : Interna�onal Performance Measurement and Verifica�on ProtocolLED : Light Emi�ng DiodeLR : Load ResearchM&V : Measurement and Verifica�onMVA : Measurement and Verifica�on AgencyNCEF : Na�onal Clean Energy FundNDPL : North Delhi Power LimitedPSE&G : Public Service Electric and Gas CompanySCE : Southern California EdisonSDA : State Designated AgencySDC&E : San Diego Gas & ElectricSOP : Standard Offer ProgramSPO : Standard Product OfferTES : Thermal Energy StorageVSD : Variable Speed Drive
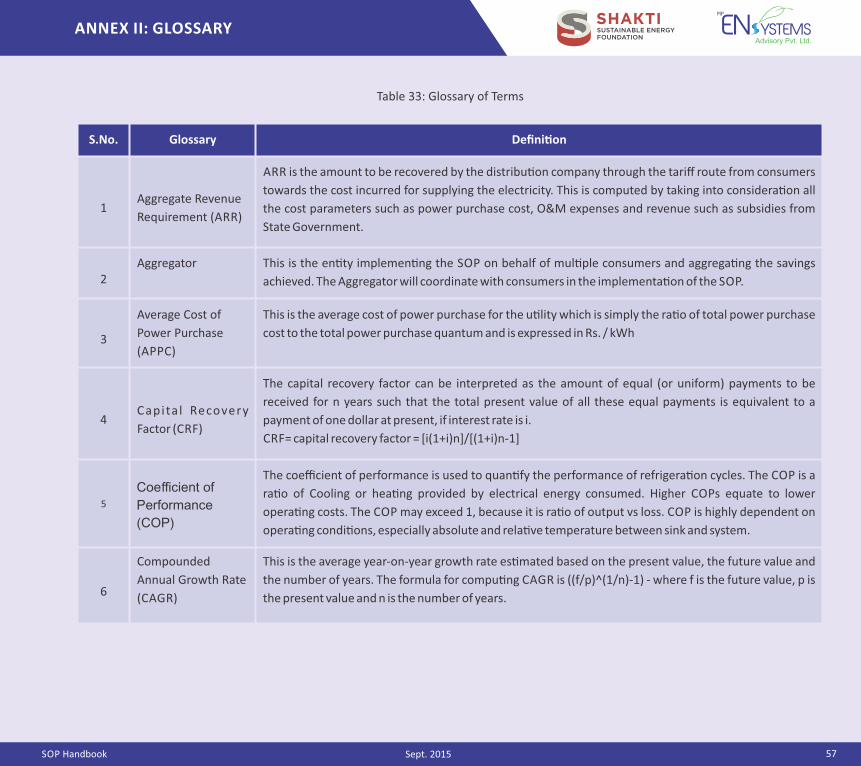
ANNEX II: GLOSSARY
SOP Handbook 57Sept. 2015
Table 33: Glossary of Terms
S.No. Glossary Defini�on
1Aggregate Revenue
Requirement (ARR)
ARR is the amount to be recovered by the distribu�on company through the tariff route from consumers
towards the cost incurred for supplying the electricity. This is computed by taking into considera�on all
the cost parameters such as power purchase cost, O&M expenses and revenue such as subsidies from
State Government.
2Aggregator This is the en�ty implemen�ng the SOP on behalf of mul�ple consumers and aggrega�ng the savings
achieved. The Aggregator will coordinate with consumers in the implementa�on of the SOP.
3
Average Cost of
Power Purchase
(APPC)
This is the average cost of power purchase for the u�lity which is simply the ra�o of total power purchase
cost to the total power purchase quantum and is expressed in Rs. / kWh
4Capita l Recovery
Factor (CRF)
The capital recovery factor can be interpreted as the amount of equal (or uniform) payments to be
received for n years such that the total present value of all these equal payments is equivalent to a
payment of one dollar at present, if interest rate is i.
CRF= capital recovery factor = [i(1+i)n]/[(1+i)n‐1]
The coefficient of performance is used to quan�fy the performance of refrigera�on cycles. The COP is a
ra�o of Cooling or hea�ng provided by electrical energy consumed. Higher COPs equate to lower
opera�ng costs. The COP may exceed 1, because it is ra�o of output vs loss. COP is highly dependent on
opera�ng condi�ons, especially absolute and rela�ve temperature between sink and system.
6
Compounded
Annual Growth Rate
(CAGR)
This is the average year‐on‐year growth rate es�mated based on the present value, the future value and
the number of years. The formula for compu�ng CAGR is ((f/p)^(1/n)‐1) ‐ where f is the future value, p is
the present value and n is the number of years.
Coefficient of
Performance
(COP)
5

ANNEX II: GLOSSARY
SOP Handbook 58Sept. 2015
S.No. Glossary Defini�on
Cost of Conserved
Energy (CCE)
8Demand Side
Management (DSM)
Demand side Management is used to describe the ac�ons of a u�lity, beyond the consumer's
meters, with the objec�ve of reducing electricity use through ac�vi�es or programs that promote
electric energy efficiency or conserva�on, or more efficient management of electric energy loads.
9Energy Management
System (EMS)
The Energy management system is a system of computer‐aided tools used by operators of electric
u�lity grids to monitor, control, and op�mize the performance of the genera�on and/or
transmission system.
11 Highest Marginal ost Cost incurred by the distribu�on company to purchase the top 10% of the costliest power.
12Integrated Part Load
Value (IPLV)
Integrated Part Load Value or IPLV is the ra�ng that was developed by the Air‐condi�oning and Refrigera�on Ins�tute. Unlike EER, however, the IPLV measures the efficiency of air condi�oners under a variety of condi�ons ‐ that is, when the unit is opera�ng at 25%, 50%, 75% and 100% of capacity and at different temperatures. IPLV is only calculated for non‐residen�al central air condi�oners ‐ if you are purchasing a central air condi�oning unit for your home, you should compare efficiency based on the SEER rather than the IPLV.
13 Load ManagementIt is the process of balancing the demand with supply by adjus�ng the load at the consumer's end.
14
Measurement and
Verifica�on (M&V)
The process for quan�fying savings delivered by the implemented energy efficiency measure, as
well as the sub‐sector of the energy industry involved with this prac�ce.
15
Na�onal Clean Energy
Fund (NCEF)
Fund, created through collec�on of clean energy cess on sale of coal, to be u�lised for suppor�ng
Clean Energy projects.
7 This is the cost to be incurred to save 1 kWh of electricity is expressed in Rs / kWh.
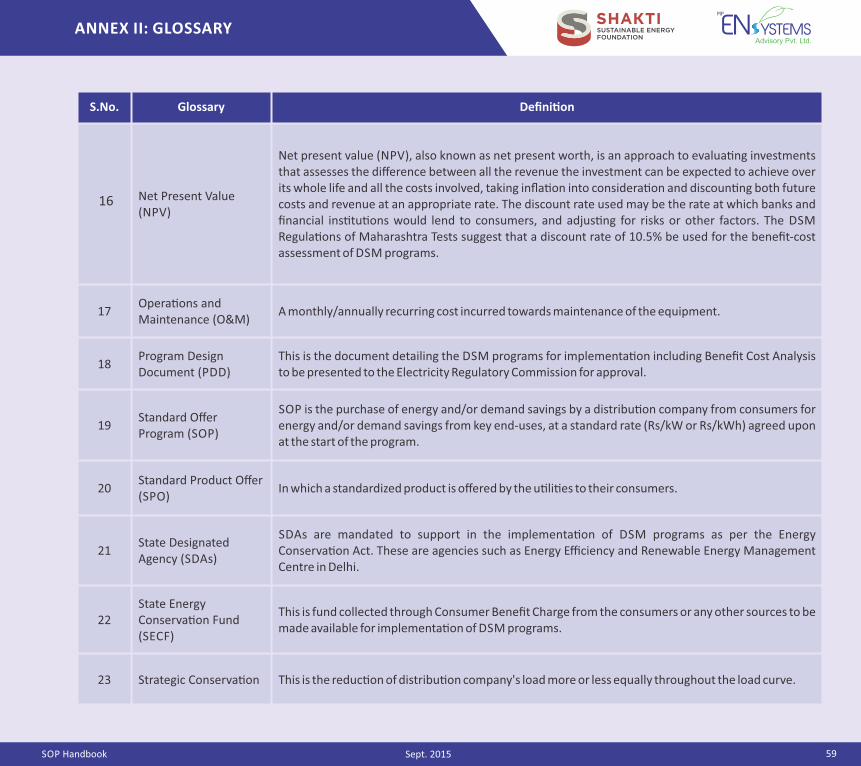
ANNEX II: GLOSSARY
SOP Handbook 59Sept. 2015
S.No. Glossary Defini�on
Net Present Value (NPV)
Net present value (NPV), also known as net present worth, is an approach to evalua�ng investments that assesses the difference between all the revenue the investment can be expected to achieve over its whole life and all the costs involved, taking infla�on into considera�on and discoun�ng both future costs and revenue at an appropriate rate. The discount rate used may be the rate at which banks and financial ins�tu�ons would lend to consumers, and adjus�ng for risks or other factors. The DSM Regula�ons of Maharashtra Tests suggest that a discount rate of 10.5% be used for the benefit‐cost assessment of DSM programs.
17Opera�ons and Maintenance (O&M)
A monthly/annually recurring cost incurred towards maintenance of the equipment.
18Program Design Document (PDD)
This is the document detailing the DSM programs for implementa�on including Benefit Cost Analysis to be presented to the Electricity Regulatory Commission for approval.
19Standard Offer Program (SOP)
SOP is the purchase of energy and/or demand savings by a distribu�on company from consumers for energy and/or demand savings from key end‐uses, at a standard rate (Rs/kW or Rs/kWh) agreed upon at the start of the program.
20Standard Product Offer (SPO)
In which a standardized product is offered by the u�li�es to their consumers.
21State Designated Agency (SDAs)
SDAs are mandated to support in the implementa�on of DSM programs as per the Energy Conserva�on Act. These are agencies such as Energy Efficiency and Renewable Energy Management Centre in Delhi.
22State Energy Conserva�on Fund (SECF)
This is fund collected through Consumer Benefit Charge from the consumers or any other sources to be made available for implementa�on of DSM programs.
23 Strategic Conserva�on This is the reduc�on of distribu�on company's load more or less equally throughout the load curve.
16
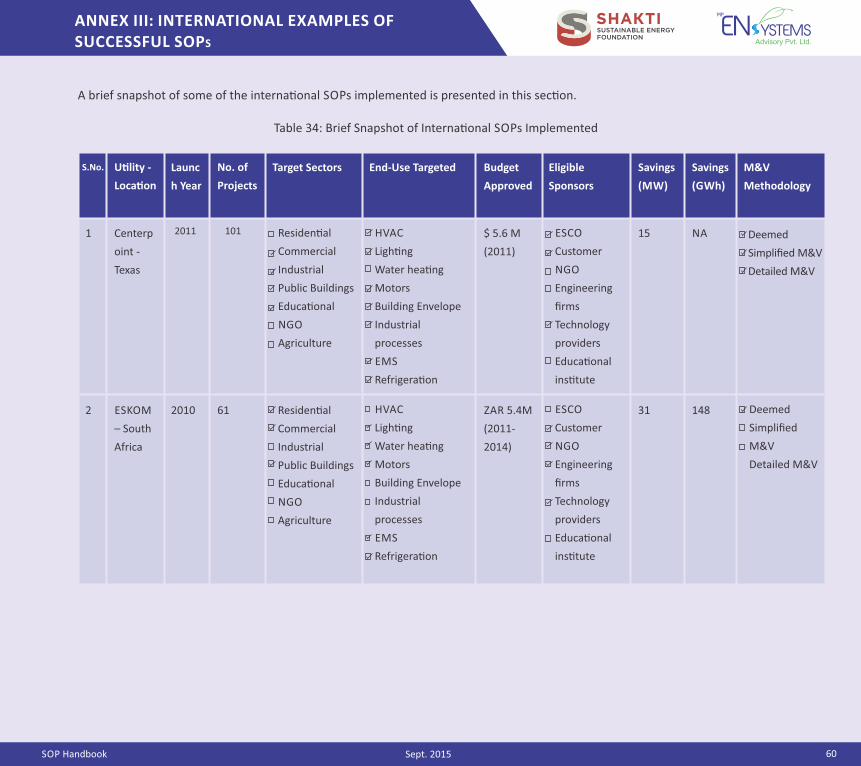
SOP Handbook
ANNEX III: INTERNATIONAL EXAMPLES OF SUCCESSFUL SOPS
60Sept. 2015
A brief snapshot of some of the interna�onal SOPs implemented is presented in this sec�on.
Table 34: Brief Snapshot of Interna�onal SOPs Implemented
U�lity ‐
Loca�on
Launc
h Year
No. of
Projects
Target Sectors End‐Use Targeted Budget
Approved
Eligible
Sponsors
Savings
(MW)
Savings
(GWh)
M&V
Methodology
1 Centerp
oint ‐
Texas
Residen�al
Commercial
Industrial
Public Buildings
Educa�onal
NGO
Agriculture
HVAC
Ligh�ng
Water hea�ng
Motors
Building Envelope
Industrial
processes
EMS
Refrigera�on
$ 5.6 M
(2011)
ESCO
Customer
NGO
Engineering
firms
Technology
providers
Educa�onal
ins�tute
15 NA
2 ESKOM
– South
Africa
2010 61 Residen�al
Commercial
Industrial
Public Buildings
Educa�onal
NGO
Agriculture
HVAC
Ligh�ng
Water hea�ng
Motors
Building Envelope
Industrial
processes
EMS
Refrigera�on
ZAR 5.4M
(2011‐
2014)
ESCO
Customer
NGO
Engineering
firms
Technology
providers
Educa�onal
ins�tute
31 148 Deemed
Simplified
M&V
Detailed M&V
2011 101
S.No.
Deemed
Simplified M&V
Detailed M&V
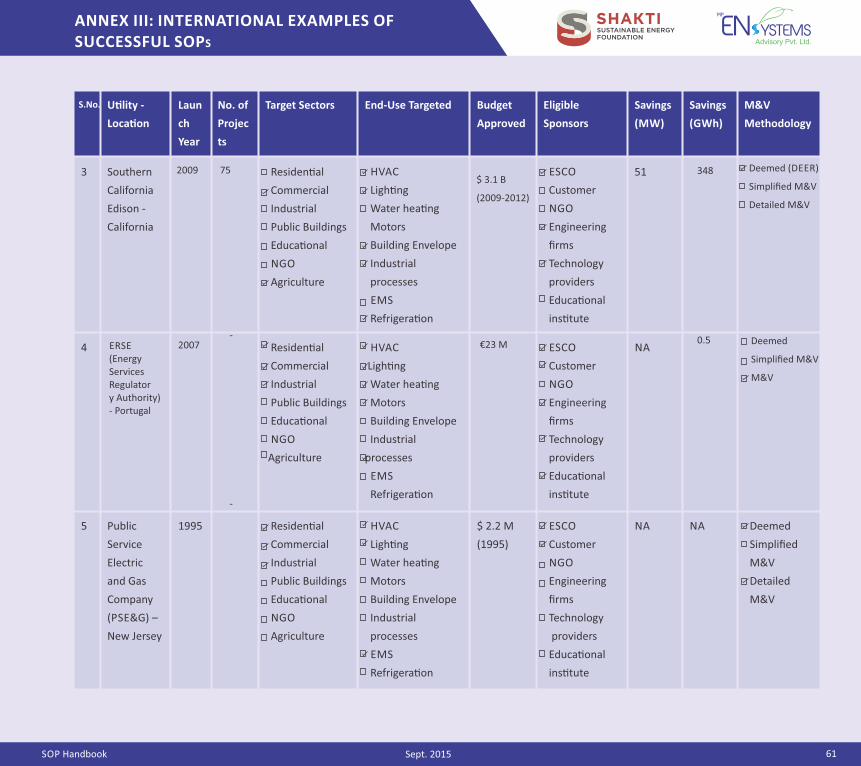
SOP Handbook
ANNEX III: INTERNATIONAL EXAMPLES OF SUCCESSFUL SOPS
61Sept. 2015
U�lity ‐
Loca�on
Laun
ch
Year
No. of
Projec
ts
Target Sectors End‐Use Targeted Budget
Approved
Eligible
Sponsors
Savings
(MW)
Savings
(GWh)
M&V
Methodology
3 Southern
California
Edison ‐
California
Residen�al
Commercial
Industrial
Public Buildings
Educa�onal
NGO
Agriculture
HVAC
Ligh�ng
Water hea�ng
Motors
Building Envelope
Industrial
processes
EMS
Refrigera�on
ESCO
Customer
NGO
Engineering
firms
Technology
providers
Educa�onal
ins�tute
51
4 Residen�al
Commercial
Industrial
Public Buildings
Educa�onal
NGO
Agriculture
HVAC
Ligh�ng
Water hea�ng
Motors
Building Envelope
Industrial
processes
EMS
Refrigera�on
ESCO
Customer
NGO
Engineering
firms
Technology
providers
Educa�onal
ins�tute
NA
5 Public
Service
Electric
and Gas
Company
(PSE&G) –
New Jersey
1995 Residen�al
Commercial
Industrial
Public Buildings
Educa�onal
NGO
Agriculture
HVAC
Ligh�ng
Water hea�ng
Motors
Building Envelope
Industrial
processes
EMS
Refrigera�on
$ 2.2 M
(1995)
ESCO
Customer
NGO
Engineering
firms
Technology
providers
Educa�onal
ins�tute
NA NA Deemed
Simplified
M&V
Detailed
M&V
$ 3.1 B
(2009‐2012)
3482009 75
‐
‐
2007 0.5
S.No.
€23 M Deemed
Simplified M&V
M&V
Deemed (DEER)
Simplified M&V
Detailed M&V
ERSE(EnergyServicesRegulatory Authority)‐ Portugal
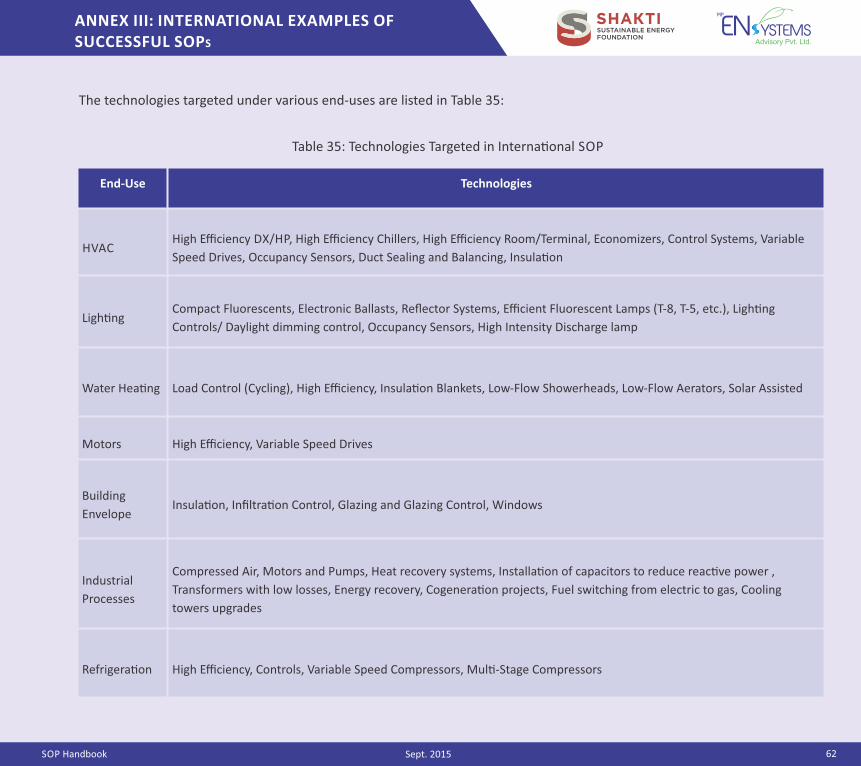
SOP Handbook
ANNEX III: INTERNATIONAL EXAMPLES OF SUCCESSFUL SOPS
62Sept. 2015
The technologies targeted under various end‐uses are listed in Table 35:
Table 35: Technologies Targeted in Interna�onal SOP
End‐Use Technologies
HVACHigh Efficiency DX/HP, High Efficiency Chillers, High Efficiency Room/Terminal, Economizers, Control Systems, Variable
Speed Drives, Occupancy Sensors, Duct Sealing and Balancing, Insula�on
Ligh�ngCompact Fluorescents, Electronic Ballasts, Reflector Systems, Efficient Fluorescent Lamps (T‐8, T‐5, etc.), Ligh�ng
Controls/ Daylight dimming control, Occupancy Sensors, High Intensity Discharge lamp
Water Hea�ng Load Control (Cycling), High Efficiency, Insula�on Blankets, Low‐Flow Showerheads, Low‐Flow Aerators, Solar Assisted
Motors High Efficiency, Variable Speed Drives
Building
EnvelopeInsula�on, Infiltra�on Control, Glazing and Glazing Control, Windows
Industrial
Processes
Compressed Air, Motors and Pumps, Heat recovery systems, Installa�on of capacitors to reduce reac�ve power ,
Transformers with low losses, Energy recovery, Cogenera�on projects, Fuel switching from electric to gas, Cooling
towers upgrades
Refrigera�on High Efficiency, Controls, Variable Speed Compressors, Mul�‐Stage Compressors
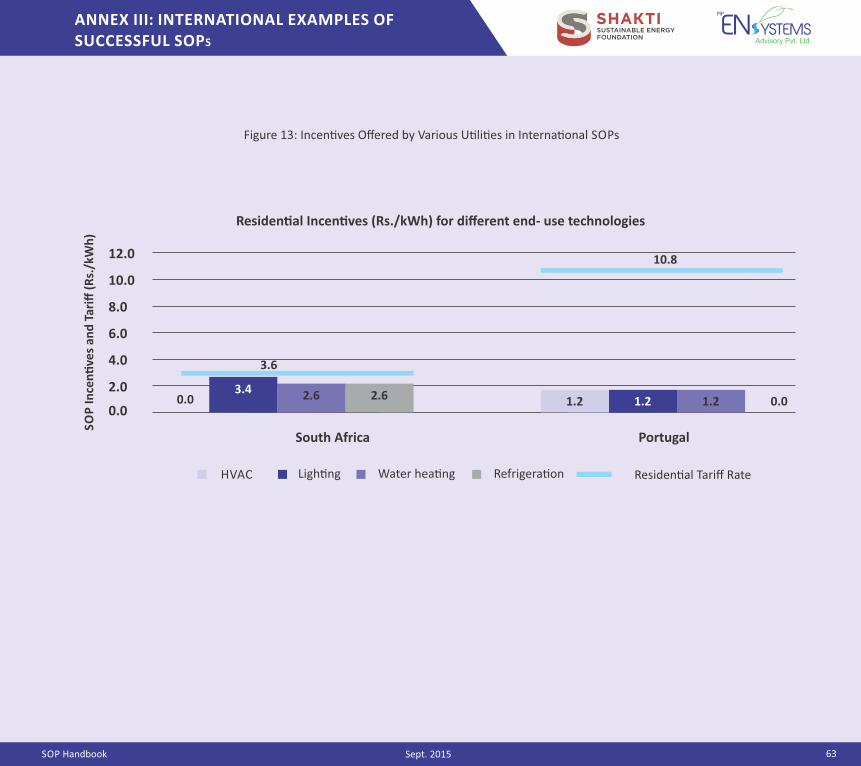
ANNEX III: INTERNATIONAL EXAMPLES OF SUCCESSFUL SOPS
SOP Handbook 63Sept. 2015
Figure 13: Incen�ves Offered by Various U�li�es in Interna�onal SOPs
4.0
2.0
6.0
8.0
10.0
12.0
0.0
South Africa Portugal
Residen�al Incen�ves (Rs./kWh) for different end‐ use technologies
1.21.2 1.2 0.03.4 2.6 2.6
3.6
HVAC Ligh�ng Water hea�ng Refrigera�on Residen�al Tariff Rate
10.8
0.0
SO
P In
cen
�ve
s an
d T
ariff
(R
s./k
Wh
)
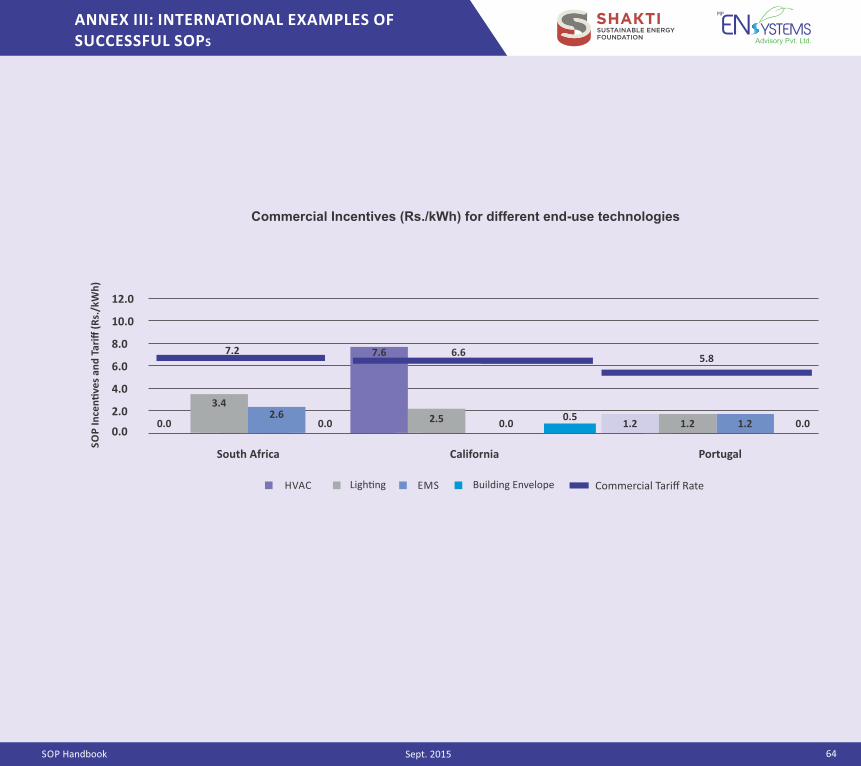
ANNEX III: INTERNATIONAL EXAMPLES OF SUCCESSFUL SOPS
SOP Handbook 64Sept. 2015
Commercial Incentives (Rs./kWh) for different end-use technologies
2.5
4.0
2.0
6.0
8.0
10.0
12.0
0.0
SO
P In
cen
�ve
s an
d T
ariff
(R
s./k
Wh
)
South Africa Portugal
1.21.2 1.2 0.0
7.25.8
0.00.0
7.6 6.6
0.50.0
California
3.42.6
HVAC Ligh�ng EMS Building Envelope Commercial Tariff Rate
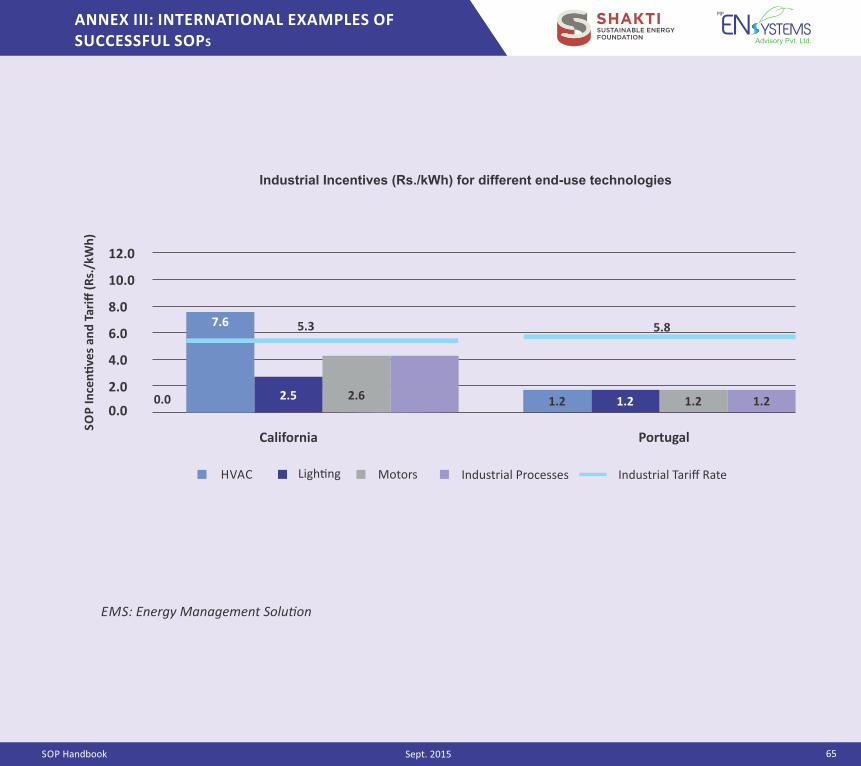
ANNEX III: INTERNATIONAL EXAMPLES OF SUCCESSFUL SOPS
SOP Handbook 65Sept. 2015
Industrial Incentives (Rs./kWh) for different end-use technologies
EMS: Energy Management Solu�on
1.21.2 1.2
4.0
2.0
6.0
8.0
10.0
12.0
0.0
Portugal
7.6
2.5 2.6
HVAC Ligh�ng Motors Industrial Processes
5.8
0.0
SO
P In
cen
�ve
s an
d T
ariff
(R
s./k
Wh
)
1.2
5.3
California
Industrial Tariff Rate
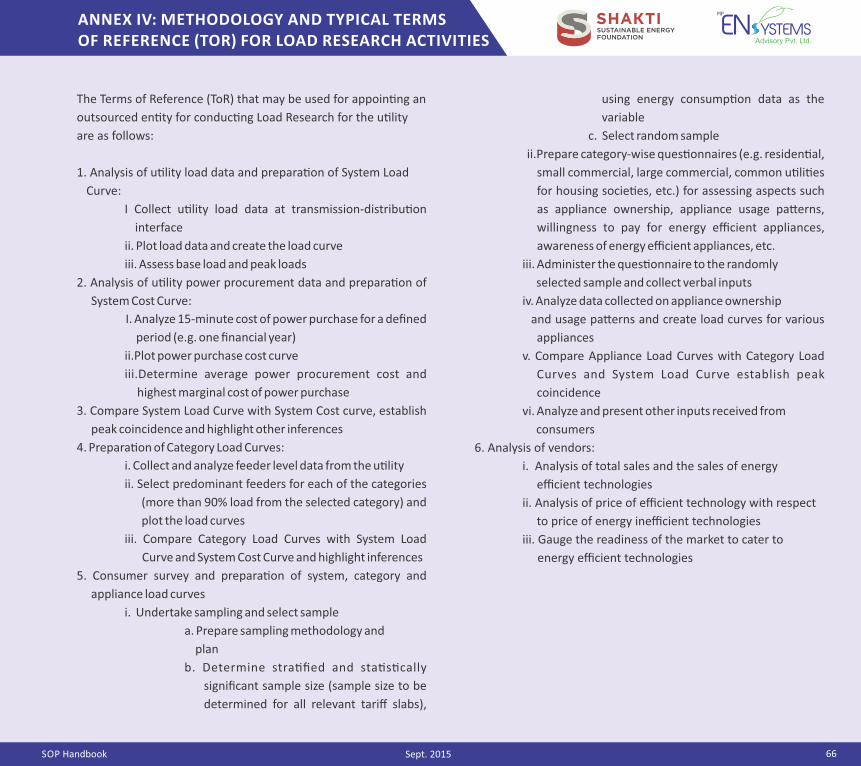
SOP Handbook
ANNEX IV: METHODOLOGY AND TYPICAL TERMS OF REFERENCE (TOR) FOR LOAD RESEARCH ACTIVITIES
66Sept. 2015
The Terms of Reference (ToR) that may be used for appoin�ng an
outsourced en�ty for conduc�ng Load Research for the u�lity
are as follows:
1. Analysis of u�lity load data and prepara�on of System Load
Curve:
I Collect u�lity load data at transmission‐distribu�on
interface
ii. Plot load data and create the load curve
iii. Assess base load and peak loads
2. Analysis of u�lity power procurement data and prepara�on of
System Cost Curve:
I. Analyze 15‐minute cost of power purchase for a defined
period (e.g. one financial year)
ii.Plot power purchase cost curve
iii.Determine average power procurement cost and
highest marginal cost of power purchase
3. Compare System Load Curve with System Cost curve, establish
peak coincidence and highlight other inferences
4. Prepara�on of Category Load Curves:
i. Collect and analyze feeder level data from the u�lity
ii. Select predominant feeders for each of the categories
(more than 90% load from the selected category) and
plot the load curves
iii. Compare Category Load Curves with System Load
Curve and System Cost Curve and highlight inferences
5. Consumer survey and prepara�on of system, category and
appliance load curves
i. Undertake sampling and select sample
a. Prepare sampling methodology and
plan
b. Determine stra�fied and sta�s�cally
significant sample size (sample size to be
determined for all relevant tariff slabs),
using energy consump�on data as the
variable
c. Select random sample
ii.Prepare category‐wise ques�onnaires (e.g. residen�al,
small commercial, large commercial, common u�li�es
for housing socie�es, etc.) for assessing aspects such
as appliance ownership, appliance usage pa�erns,
willingness to pay for energy efficient appliances,
awareness of energy efficient appliances, etc.
iii. Administer the ques�onnaire to the randomly
selected sample and collect verbal inputs
iv. Analyze data collected on appliance ownership
and usage pa�erns and create load curves for various
appliances
v. Compare Appliance Load Curves with Category Load
Curves and System Load Curve establish peak
coincidence
vi. Analyze and present other inputs received from
consumers
6. Analysis of vendors:
i. Analysis of total sales and the sales of energy
efficient technologies
ii. Analysis of price of efficient technology with respect
to price of energy inefficient technologies
iii. Gauge the readiness of the market to cater to
energy efficient technologies
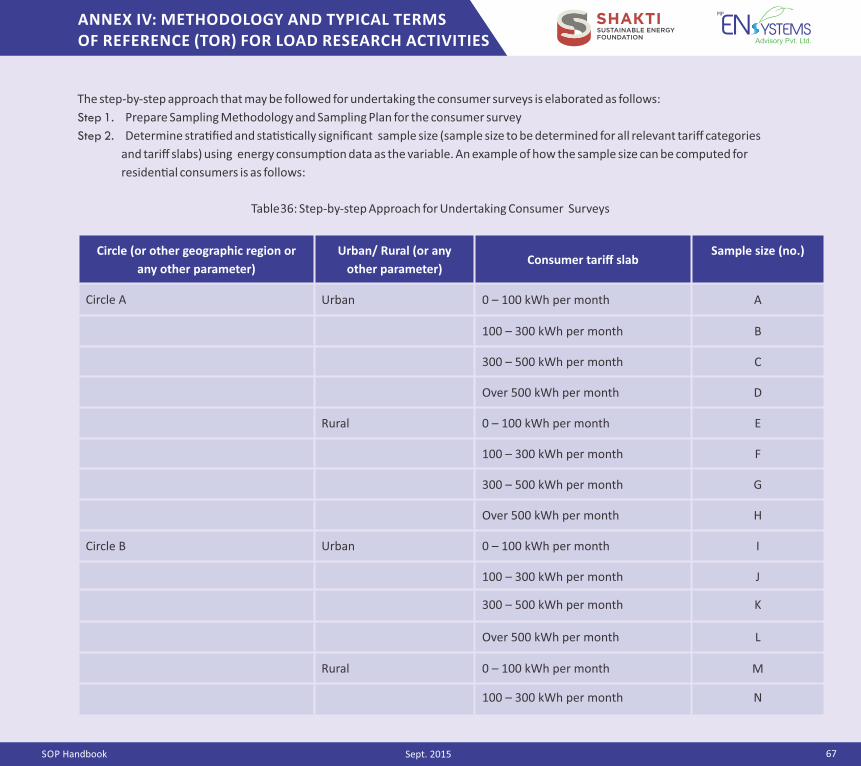
SOP Handbook
ANNEX IV: METHODOLOGY AND TYPICAL TERMS OF REFERENCE (TOR) FOR LOAD RESEARCH ACTIVITIES
67Sept. 2015
The step‐by‐step approach that may be followed for undertaking the consumer surveys is elaborated as follows:
Step 1. Prepare Sampling Methodology and Sampling Plan for the consumer survey
Step 2. Determine stra�fied and sta�s�cally significant sample size (sample size to be determined for all relevant tariff categories
and tariff slabs) using energy consump�on data as the variable. An example of how the sample size can be computed for
residen�al consumers is as follows:
Circle (or other geographic region or
any other parameter)
Urban/ Rural (or any
other parameter)Consumer tariff slab
Sample size (no.)
Circle A Urban 0 – 100 kWh per month A
100 – 300 kWh per month B
300 – 500 kWh per month C
Over 500 kWh per month D
Rural 0 – 100 kWh per month E
100 – 300 kWh per month F
300 – 500 kWh per month G
Over 500 kWh per month H
Circle B Urban 0 – 100 kWh per month I
100 – 300 kWh per month J
300 – 500 kWh per month K
Over 500 kWh per month L
Rural 0 – 100 kWh per month M
100 – 300 kWh per month N
Table 36: Step‐by‐step Approach for Undertaking Consumer Surveys
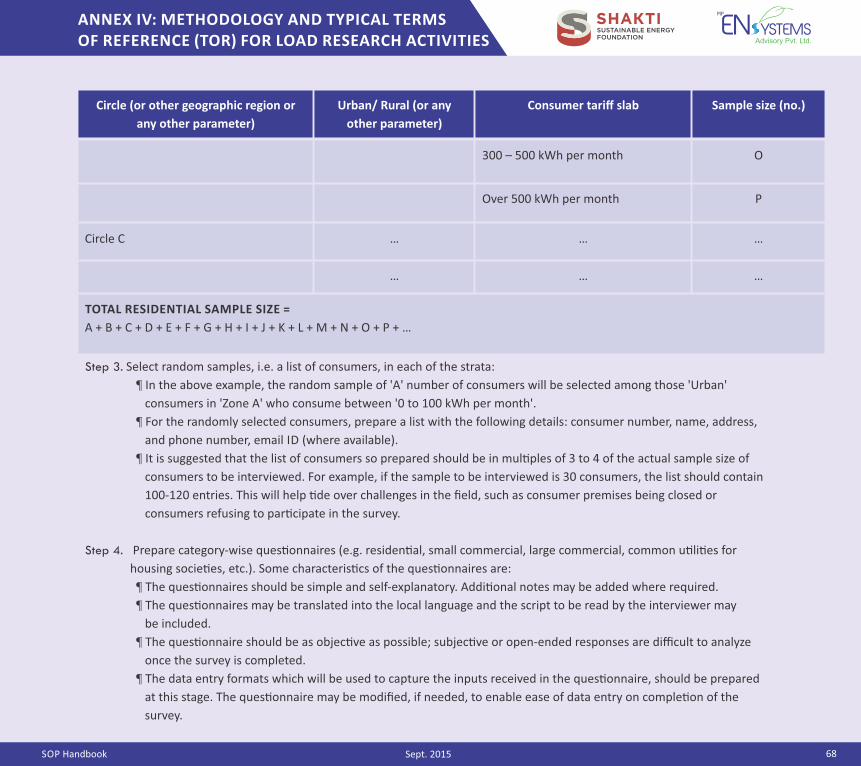
SOP Handbook
ANNEX IV: METHODOLOGY AND TYPICAL TERMS OF REFERENCE (TOR) FOR LOAD RESEARCH ACTIVITIES
68Sept. 2015
300 – 500 kWh per month O
Over 500 kWh per month P
Circle C … … …
… … …
TOTAL RESIDENTIAL SAMPLE SIZE =
A + B + C + D + E + F + G + H + I + J + K + L + M + N + O + P + …
Step 3. Select random samples, i.e. a list of consumers, in each of the strata:
In the above example, the random sample of 'A' number of consumers will be selected among those 'Urban'
consumers in 'Zone A' who consume between '0 to 100 kWh per month'.
For the randomly selected consumers, prepare a list with the following details: consumer number, name, address,
and phone number, email ID (where available).
It is suggested that the list of consumers so prepared should be in mul�ples of 3 to 4 of the actual sample size of
consumers to be interviewed. For example, if the sample to be interviewed is 30 consumers, the list should contain
100‐120 entries. This will help �de over challenges in the field, such as consumer premises being closed or
consumers refusing to par�cipate in the survey.
Step 4. Prepare category‐wise ques�onnaires (e.g. residen�al, small commercial, large commercial, common u�li�es for
housing socie�es, etc.). Some characteris�cs of the ques�onnaires are:
The ques�onnaires should be simple and self‐explanatory. Addi�onal notes may be added where required.
The ques�onnaires may be translated into the local language and the script to be read by the interviewer may
be included.
The ques�onnaire should be as objec�ve as possible; subjec�ve or open‐ended responses are difficult to analyze
once the survey is completed.
The data entry formats which will be used to capture the inputs received in the ques�onnaire, should be prepared
at this stage. The ques�onnaire may be modified, if needed, to enable ease of data entry on comple�on of the
survey.
Circle (or other geographic region or
any other parameter)
Urban/ Rural (or any
other parameter)
Consumer tariff slab Sample size (no.)
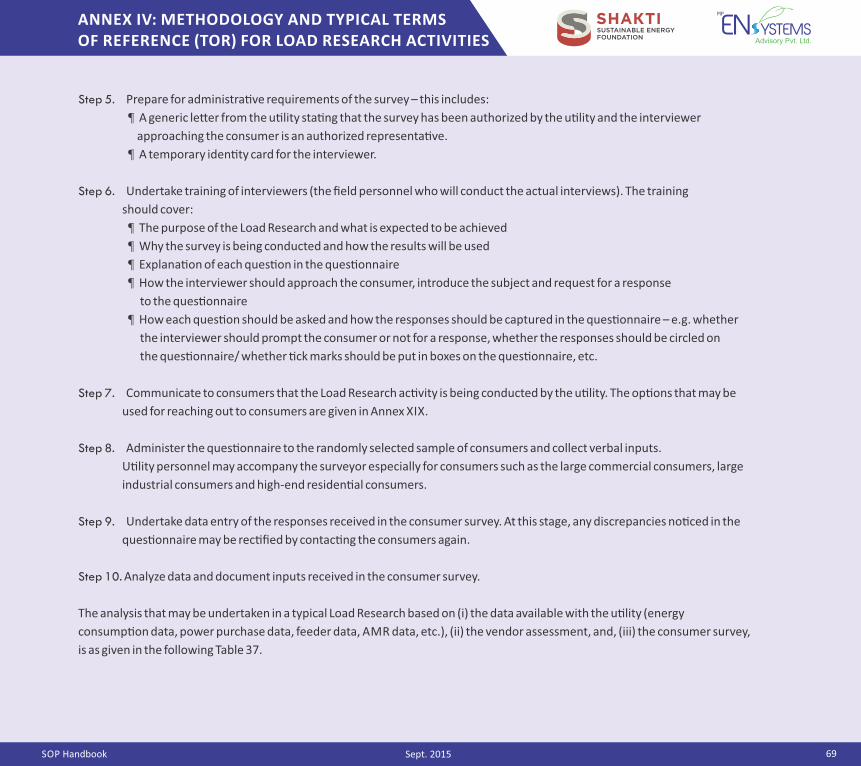
SOP Handbook
ANNEX IV: METHODOLOGY AND TYPICAL TERMS OF REFERENCE (TOR) FOR LOAD RESEARCH ACTIVITIES
69Sept. 2015
Step 5. Prepare for administra�ve requirements of the survey – this includes:
A generic le�er from the u�lity sta�ng that the survey has been authorized by the u�lity and the interviewer
approaching the consumer is an authorized representa�ve.
A temporary iden�ty card for the interviewer.
Step 6. Undertake training of interviewers (the field personnel who will conduct the actual interviews). The training
should cover:
The purpose of the Load Research and what is expected to be achieved
Why the survey is being conducted and how the results will be used
Explana�on of each ques�on in the ques�onnaire
How the interviewer should approach the consumer, introduce the subject and request for a response
to the ques�onnaire
How each ques�on should be asked and how the responses should be captured in the ques�onnaire – e.g. whether
the interviewer should prompt the consumer or not for a response, whether the responses should be circled on
the ques�onnaire/ whether �ck marks should be put in boxes on the ques�onnaire, etc.
Step 7. Communicate to consumers that the Load Research ac�vity is being conducted by the u�lity. The op�ons that may be
used for reaching out to consumers are given in Annex XIX.
Step 8. Administer the ques�onnaire to the randomly selected sample of consumers and collect verbal inputs.
U�lity personnel may accompany the surveyor especially for consumers such as the large commercial consumers, large
industrial consumers and high‐end residen�al consumers.
Step 9. Undertake data entry of the responses received in the consumer survey. At this stage, any discrepancies no�ced in the
ques�onnaire may be rec�fied by contac�ng the consumers again.
Step 10. Analyze data and document inputs received in the consumer survey.
The analysis that may be undertaken in a typical Load Research based on (i) the data available with the u�lity (energy
consump�on data, power purchase data, feeder data, AMR data, etc.), (ii) the vendor assessment, and, (iii) the consumer survey,
is as given in the following Table 37.
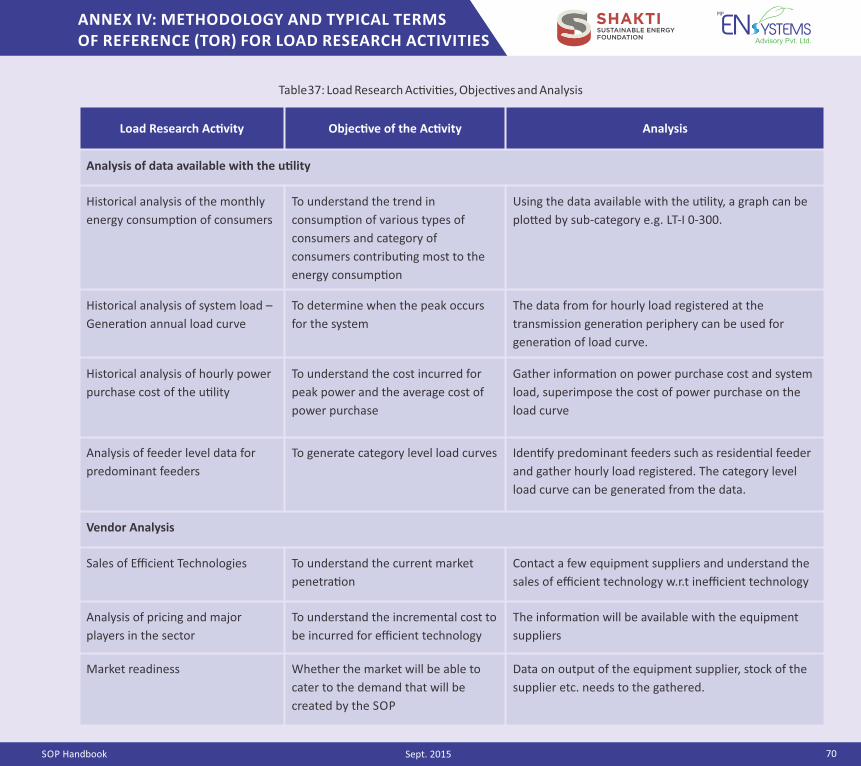
SOP Handbook
ANNEX IV: METHODOLOGY AND TYPICAL TERMS OF REFERENCE (TOR) FOR LOAD RESEARCH ACTIVITIES
70Sept. 2015
Load Research Ac�vity Objec�ve of the Ac�vity Analysis
Analysis of data available with the u�lity
Historical analysis of the monthly
energy consump�on of consumers
To understand the trend in
consump�on of various types of
consumers and category of
consumers contribu�ng most to the
energy consump�on
Using the data available with the u�lity, a graph can be
plo�ed by sub‐category e.g. LT‐I 0‐300.
Historical analysis of system load –
Genera�on annual load curve
To determine when the peak occurs
for the system
The data from for hourly load registered at the
transmission genera�on periphery can be used for
genera�on of load curve.
Historical analysis of hourly power
purchase cost of the u�lity
To understand the cost incurred for
peak power and the average cost of
power purchase
Gather informa�on on power purchase cost and system
load, superimpose the cost of power purchase on the
load curve
Analysis of feeder level data for
predominant feeders
To generate category level load curves Iden�fy predominant feeders such as residen�al feeder
and gather hourly load registered. The category level
load curve can be generated from the data.
Vendor Analysis
Sales of Efficient Technologies To understand the current market
penetra�on
Contact a few equipment suppliers and understand the
sales of efficient technology w.r.t inefficient technology
Analysis of pricing and major
players in the sector
To understand the incremental cost to
be incurred for efficient technology
The informa�on will be available with the equipment
suppliers
Market readiness Whether the market will be able to
cater to the demand that will be
created by the SOP
Data on output of the equipment supplier, stock of the
supplier etc. needs to the gathered.
Table 37: Load Research Ac�vi�es, Objec�ves and Analysis
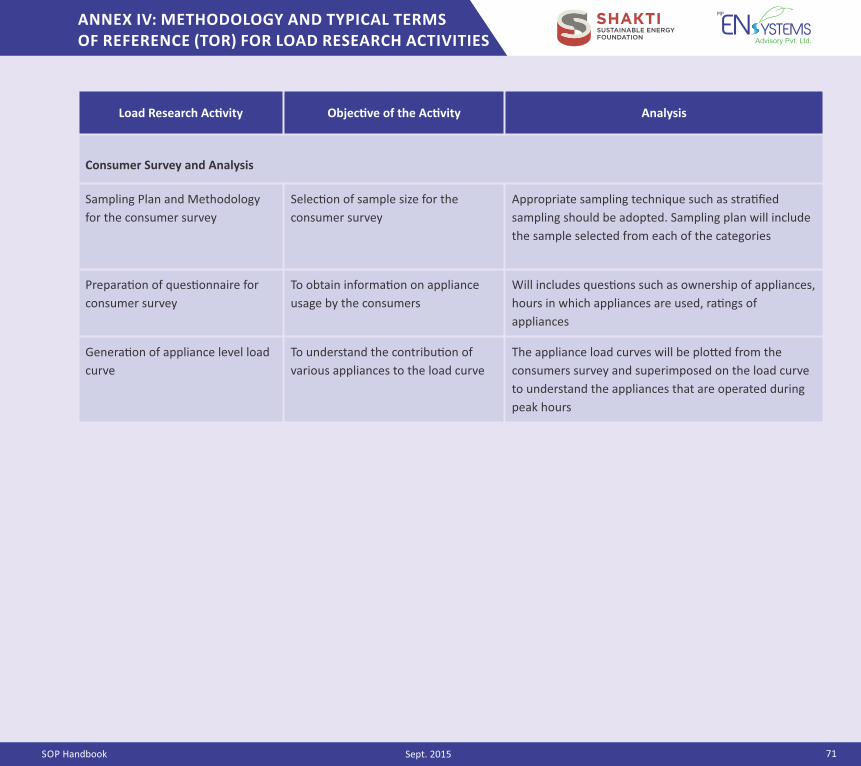
SOP Handbook
ANNEX IV: METHODOLOGY AND TYPICAL TERMS OF REFERENCE (TOR) FOR LOAD RESEARCH ACTIVITIES
71Sept. 2015
Load Research Ac�vity Objec�ve of the Ac�vity Analysis
Consumer Survey and Analysis
Sampling Plan and Methodology
for the consumer survey
Selec�on of sample size for the
consumer survey
Appropriate sampling technique such as stra�fied
sampling should be adopted. Sampling plan will include
the sample selected from each of the categories
Prepara�on of ques�onnaire for
consumer survey
To obtain informa�on on appliance
usage by the consumers
Will includes ques�ons such as ownership of appliances,
hours in which appliances are used, ra�ngs of
appliances
Genera�on of appliance level load
curve
To understand the contribu�on of
various appliances to the load curve
The appliance load curves will be plo�ed from the
consumers survey and superimposed on the load curve
to understand the appliances that are operated during
peak hours
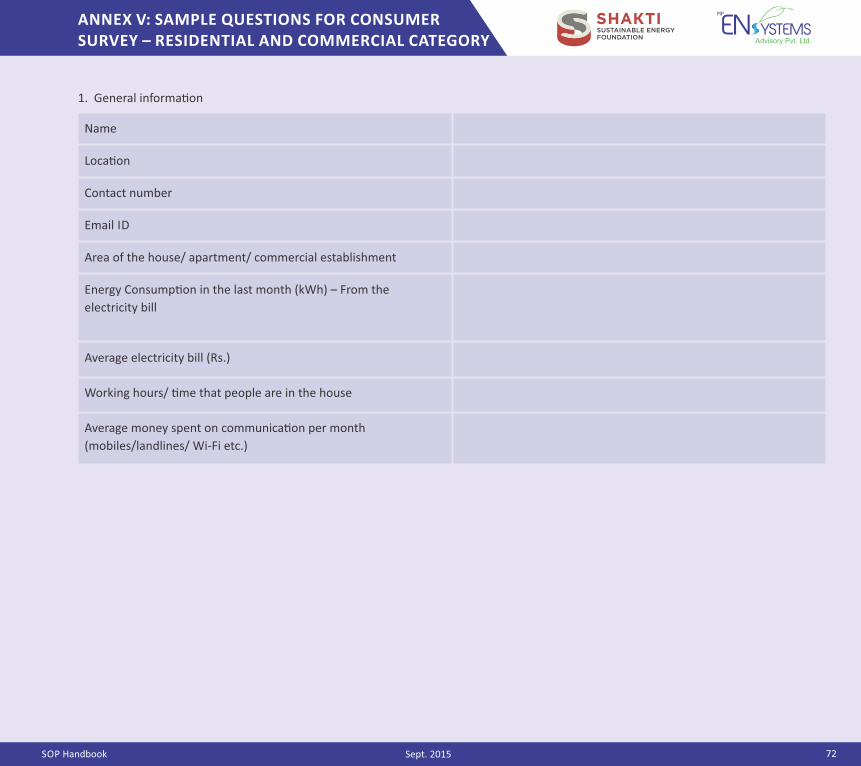
SOP Handbook
ANNEX V: SAMPLE QUESTIONS FOR CONSUMER SURVEY – RESIDENTIAL AND COMMERCIAL CATEGORY
72Sept. 2015
1. General informa�on
Name
Loca�on
Contact number
Email ID
Area of the house/ apartment/ commercial establishment
Energy Consump�on in the last month (kWh) – From the
electricity bill
Average electricity bill (Rs.)
Working hours/ �me that people are in the house
Average money spent on communica�on per month
(mobiles/landlines/ Wi‐Fi etc.)
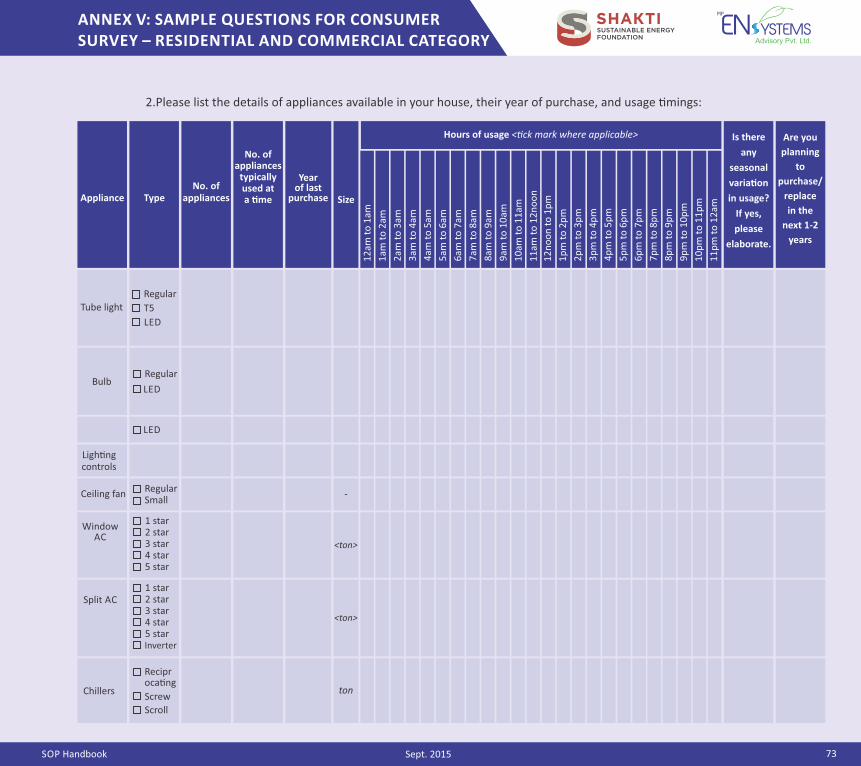
SOP Handbook
ANNEX V: SAMPLE QUESTIONS FOR CONSUMER SURVEY – RESIDENTIAL AND COMMERCIAL CATEGORY
73Sept. 2015
2. Please list the details of appliances available in your house, their year of purchase, and usage �mings:
Appliance TypeNo. of
appliances
No. of appliances
typically used at a �me
Year of last
purchase Size
Hours of usage <�ck mark where applicable> Is there
any
seasonal
varia�on
in usage?
If yes,
please
elaborate.
Are you
planning
to
purchase/
replace
in the
next 1‐2
years
1am
to
2am
2am
to
3am
3am
to
4am
4am
to
5am
12
am t
o 1
am
5am
to
6am
6am
to
7am
7am
to
8am
8am
to
9am
9am
to
10
am
10
am t
o 1
1am
11
am t
o 1
2n
oo
n
12
no
on
to
1p
m
1p
m t
o 2
pm
2p
m t
o 3
pm
3p
m t
o 4
pm
4p
m t
o 5
pm
5p
m t
o 6
pm
6p
m t
o 7
pm
7p
m t
o 8
pm
8p
m t
o 9
pm
9p
m t
o 1
0p
m
10
pm
to
11
pm
11
pm
to
12
am
Tube light
Bulb
Regular
T5
LED
Regular
LED
LED
Ligh�ng controls
Ceiling fan Regular Small
Window AC
1 star 2 star 3 star 4 star 5 star
Split AC 1 star 2 star 3 star 4 star 5 starInverter
‐
<ton>
<ton>
Reciproca�ng
Screw
Scroll
Chillers ton
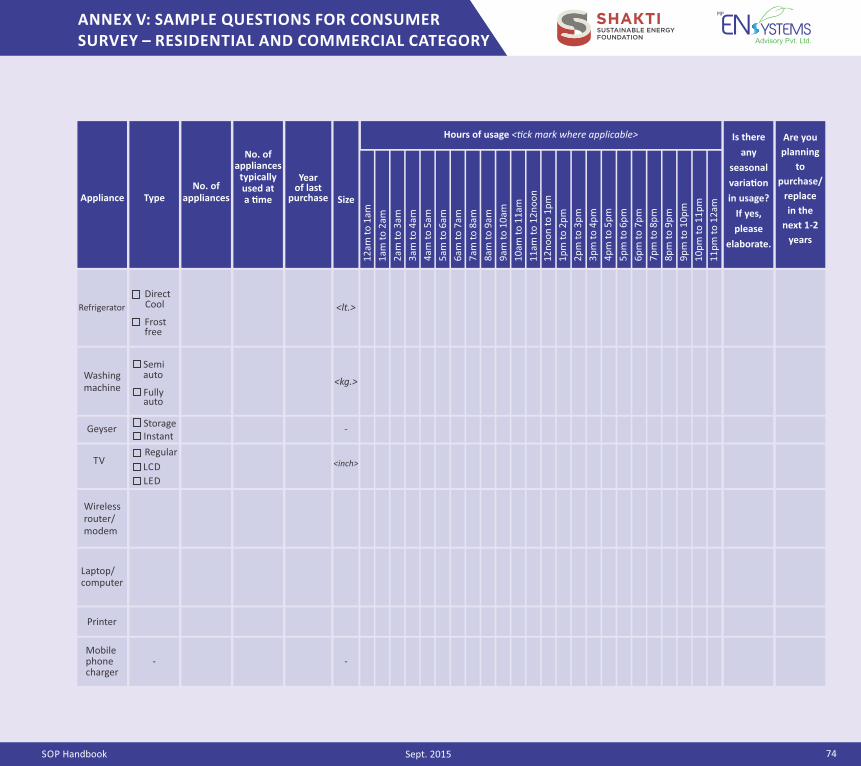
SOP Handbook
ANNEX V: SAMPLE QUESTIONS FOR CONSUMER SURVEY – RESIDENTIAL AND COMMERCIAL CATEGORY
74Sept. 2015
Appliance TypeNo. of
appliances
No. of appliances
typically used at a �me
Year of last
purchase Size
Hours of usage <�ck mark where applicable> Is there
any
seasonal
varia�on
in usage?
If yes,
please
elaborate.
Are you
planning
to
purchase/
replace
in the
next 1‐2
years
1am
to
2am
2am
to
3am
3am
to
4am
4am
to
5am
12
am t
o 1
am
5am
to
6am
6am
to
7am
7am
to
8am
8am
to
9am
9am
to
10
am
10
am t
o 1
1am
11
am t
o 1
2n
oo
n
12
no
on
to
1p
m
1p
m t
o 2
pm
2p
m t
o 3
pm
3p
m t
o 4
pm
4p
m t
o 5
pm
5p
m t
o 6
pm
6p
m t
o 7
pm
7p
m t
o 8
pm
8p
m t
o 9
pm
9p
m t
o 1
0p
m
10
pm
to
11
pm
11
pm
to
12
am
Refrigerator
Washingmachine
Direct Cool
TV
‐
<lt.>
Frost free
Semi auto
Fully auto
Storage Instant
Geyser
Regular
LCD
LED
<kg.>
<inch>
Wireless router/ modem
Laptop/ computer
Printer
Mobile phone charger
‐‐
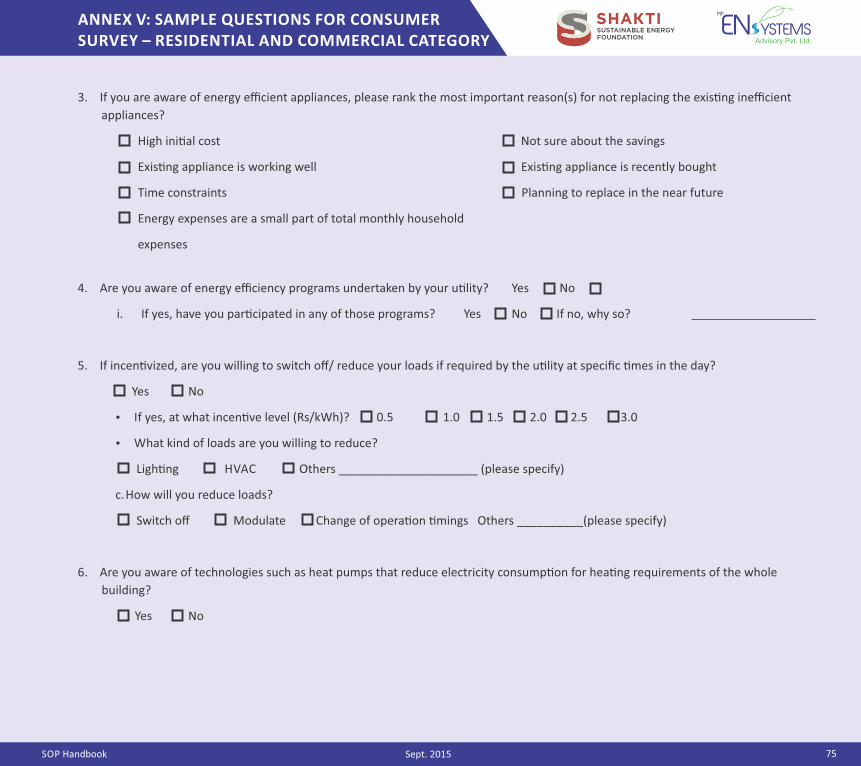
SOP Handbook
ANNEX V: SAMPLE QUESTIONS FOR CONSUMER SURVEY – RESIDENTIAL AND COMMERCIAL CATEGORY
75Sept. 2015
3. If you are aware of energy efficient appliances, please rank the most important reason(s) for not replacing the exis�ng inefficient
appliances?
High ini�al cost Not sure about the savings
Exis�ng appliance is working well Exis�ng appliance is recently bought
Time constraints Planning to replace in the near future
Energy expenses are a small part of total monthly household
expenses
4. Are you aware of energy efficiency programs undertaken by your u�lity?� Yes� No
i. If yes, have you par�cipated in any of those programs? � Yes� No� If no, why so?
5. If incen�vized, are you willing to switch off/ reduce your loads if required by the u�lity at specific �mes in the day?
Yes No�
If yes, at what incen�ve level (Rs/kWh)? 0.5� 1.0 1.5��� 2.0 2.5 3.0
What kind of loads are you willing to reduce?
Ligh�ng� HVAC � Others _____________________ (please specify)
c. How will you reduce loads?
Switch off � Modulate Change of opera�on �mings Others __________(please specify)
6. Are you aware of technologies such as heat pumps that reduce electricity consump�on for hea�ng requirements of the whole
building?
Yes No
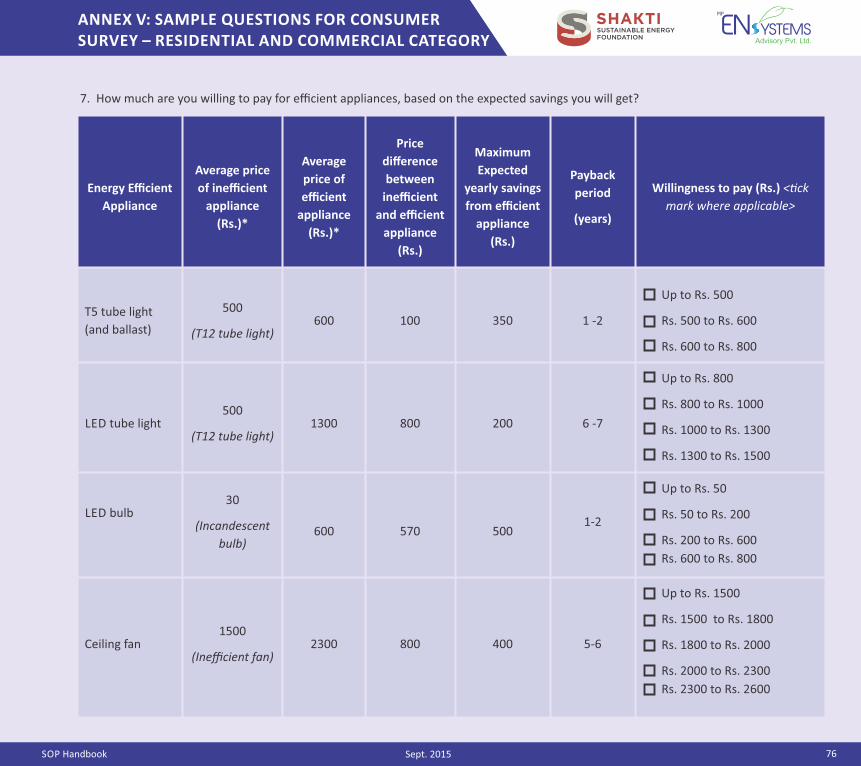
SOP Handbook
ANNEX V: SAMPLE QUESTIONS FOR CONSUMER SURVEY – RESIDENTIAL AND COMMERCIAL CATEGORY
76Sept. 2015
Energy Efficient
Appliance
Average price
of inefficient
appliance
(Rs.)*
Average
price of
efficient
appliance
(Rs.)*
Price
difference
between
inefficient
and efficient
appliance
(Rs.)
Maximum
Expected
yearly savings
from efficient
appliance
(Rs.)
Payback
period
(years)
Willingness to pay (Rs.) <�ck
mark where applicable>
T5 tube light
(and ballast)
500
(T12 tube light)600 100 350 1 ‐2
Up to Rs. 500
Rs. 500 to Rs. 600
Rs. 600 to Rs. 800
LED tube light500
(T12 tube light)1300 800 200 6 ‐7
Up to Rs. 800
Rs. 800 to Rs. 1000
Rs. 1000 to Rs. 1300
Rs. 1300 to Rs. 1500
LED bulb30
(Incandescent
bulb)600 570 500
1‐2
Up to Rs. 50
Rs. 50 to Rs. 200
Rs. 200 to Rs. 600
Rs. 600 to Rs. 800
Ceiling fan1500
(Inefficient fan)2300 800 400 5‐6
Up to Rs. 1500
Rs. 1500 to Rs. 1800
Rs. 1800 to Rs. 2000
Rs. 2000 to Rs. 2300
Rs. 2300 to Rs. 2600
7. How much are you willing to pay for efficient appliances, based on the expected savings you will get?
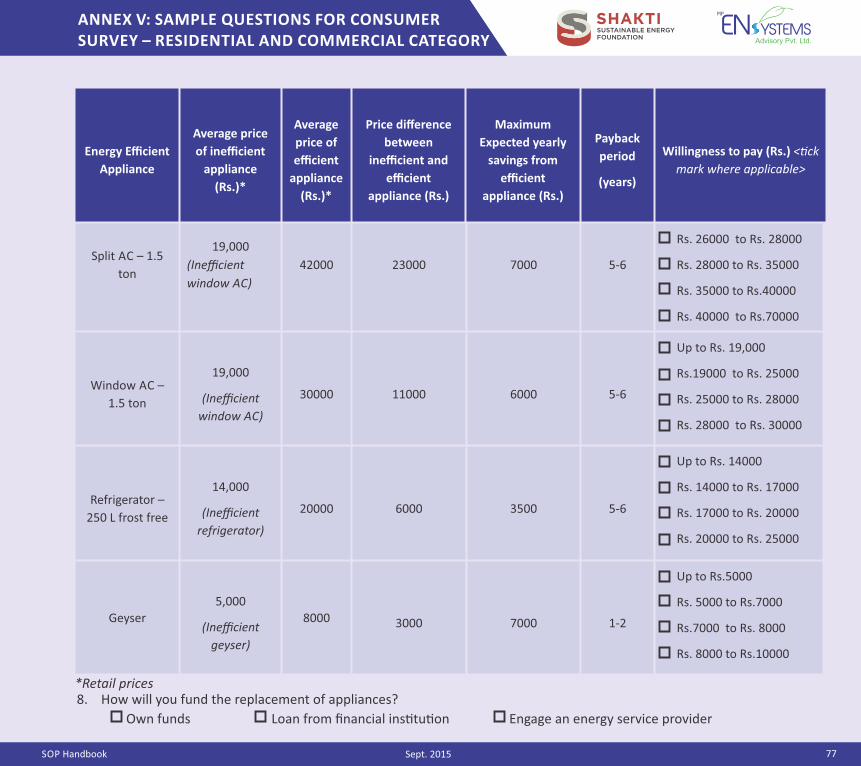
SOP Handbook
ANNEX V: SAMPLE QUESTIONS FOR CONSUMER SURVEY – RESIDENTIAL AND COMMERCIAL CATEGORY
77Sept. 2015
Split AC – 1.5
ton
19,000
(Inefficient
window AC)
42000 23000 7000 5‐6
Rs. 26000 to Rs. 28000
Rs. 28000 to Rs. 35000
Rs. 35000 to Rs.40000
Rs. 40000 to Rs.70000
Window AC –
1.5 ton
19,000
(Inefficient
window AC)
30000 11000 6000 5‐6
Up to Rs. 19,000
Rs.19000 to Rs. 25000
Rs. 25000 to Rs. 28000
Rs. 28000 to Rs. 30000
Refrigerator –
250 L frost free
14,000
(Inefficient
refrigerator)
20000 6000 3500 5‐6
Up to Rs. 14000
Rs. 14000 to Rs. 17000
Rs. 17000 to Rs. 20000
Rs. 20000 to Rs. 25000
Geyser
5,000
(Inefficient
geyser)
8000 3000 7000 1‐2
Up to Rs.5000
Rs. 5000 to Rs.7000
Rs.7000 to Rs. 8000
Rs. 8000 to Rs.10000
Own funds� � Loan from financial ins�tu�on� Engage an energy service provider
Energy Efficient
Appliance
Average price
of inefficient
appliance
(Rs.)*
Average
price of
efficient
appliance
(Rs.)*
Price difference
between
inefficient and
efficient
appliance (Rs.)
Maximum
Expected yearly
savings from
efficient
appliance (Rs.)
Payback
period
(years)
Willingness to pay (Rs.) <�ck
mark where applicable>
*Retail prices8. How will you fund the replacement of appliances? �
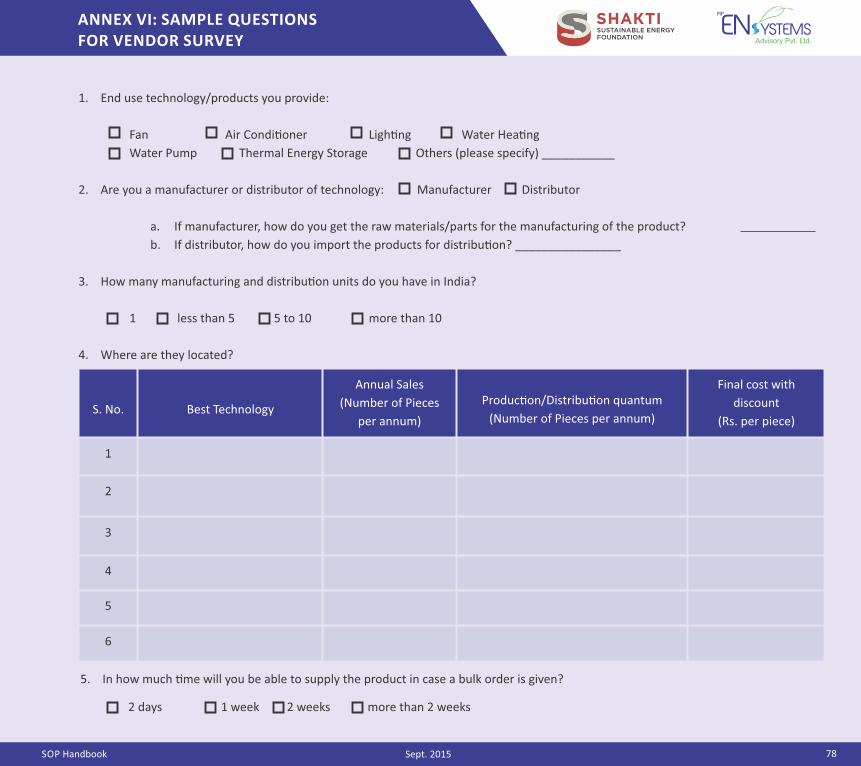
SOP Handbook
ANNEX VI: SAMPLE QUESTIONS FOR VENDOR SURVEY
78Sept. 2015
1. End use technology/products you provide:
Fan Air Condi�oner Ligh�ng Water Hea�ng
Water Pump Thermal Energy Storage Others (please specify) ___________
2. Are you a manufacturer or distributor of technology: Manufacturer Distributor
a. If manufacturer, how do you get the raw materials/parts for the manufacturing of the product?
b. If distributor, how do you import the products for distribu�on? ________________
3. How many manufacturing and distribu�on units do you have in India?
1 less than 5 5 to 10 more than 10
4. Where are they located?
S. No. Best Technology
Annual Sales
(Number of Pieces
per annum)
Produc�on/Distribu�on quantum
(Number of Pieces per annum)
Final cost with
discount
(Rs. per piece)
1
2
3
4
5
6
5. In how much �me will you be able to supply the product in case a bulk order is given?
2 days � 1 week � 2 weeks � more than 2 weeks
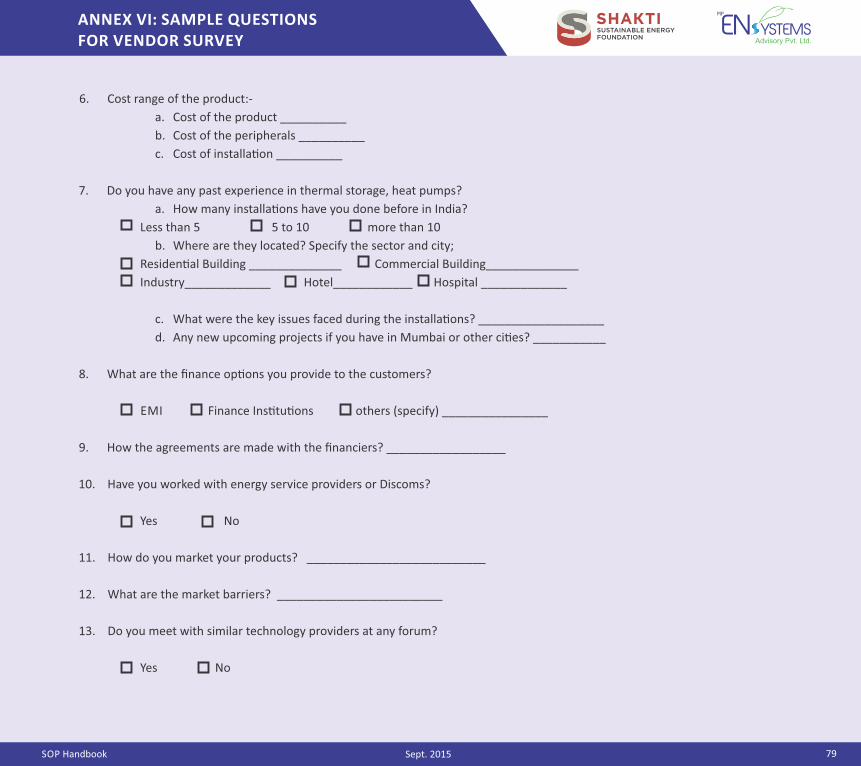
SOP Handbook
ANNEX VI: SAMPLE QUESTIONS FOR VENDOR SURVEY
79Sept. 2015
6. Cost range of the product:‐
a. Cost of the product __________
b. Cost of the peripherals __________
c. Cost of installa�on __________
7. Do you have any past experience in thermal storage, heat pumps?
a. How many installa�ons have you done before in India?
Less than 5� � 5 to 10 � more than 10
b. Where are they located? Specify the sector and city;
Residen�al Building ______________ Commercial Building______________
Industry_____________ Hotel____________ Hospital _____________
c. What were the key issues faced during the installa�ons? ___________________
d. Any new upcoming projects if you have in Mumbai or other ci�es? ___________
8. What are the finance op�ons you provide to the customers?
EMI Finance Ins�tu�ons others (specify) ________________
9. How the agreements are made with the financiers? __________________
10. Have you worked with energy service providers or Discoms?
Yes � � No
11. How do you market your products? ___________________________
12. What are the market barriers? _________________________
13. Do you meet with similar technology providers at any forum?
Yes� No
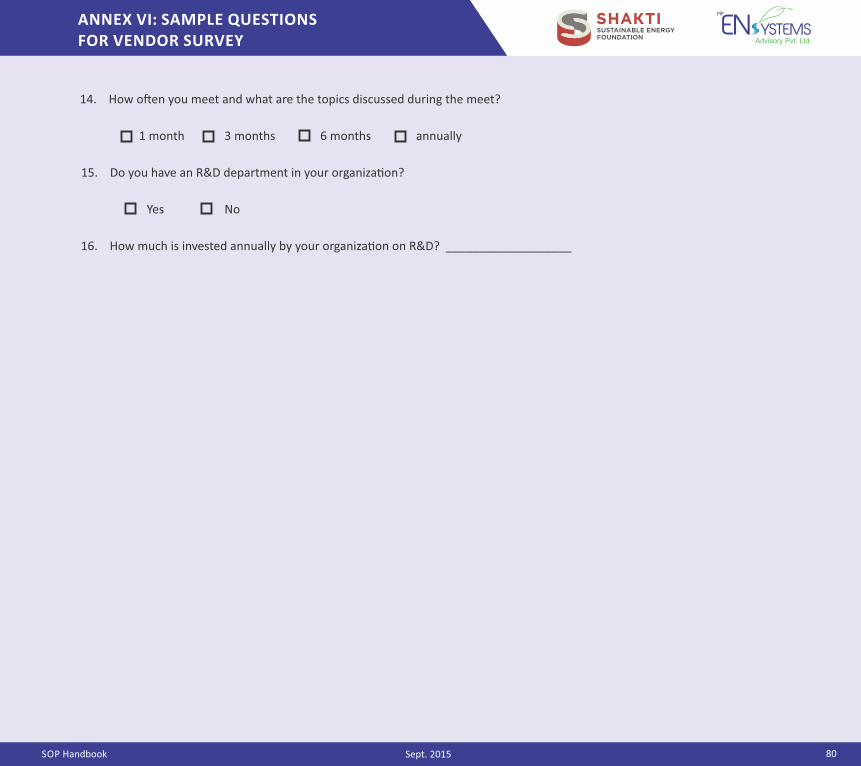
SOP Handbook
ANNEX VI: SAMPLE QUESTIONS FOR VENDOR SURVEY
80Sept. 2015
14. How o�en you meet and what are the topics discussed during the meet?
1 month� 3 months� 6 months� annually
15. Do you have an R&D department in your organiza�on?
Yes � � No
16. How much is invested annually by your organiza�on on R&D? ___________________
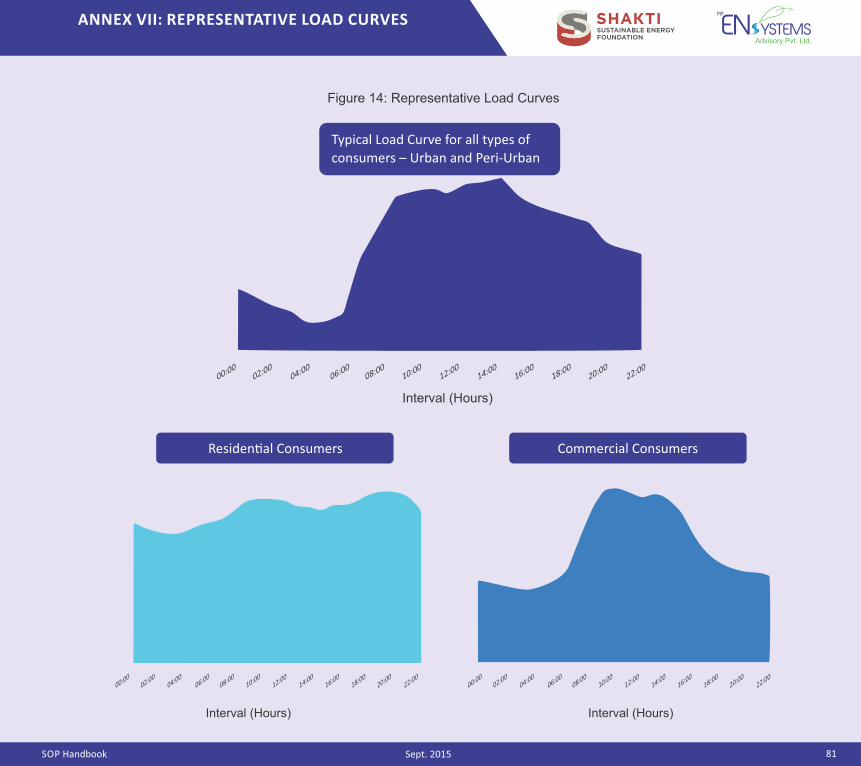
SOP Handbook
ANNEX VII: REPRESENTATIVE LOAD CURVES
81Sept. 2015
00:0002:00
04:0008:00
10:0012:00
14:0016:00
18:0020:00
22:0006:00
Figure 14: Representative Load Curves
Typical Load Curve for all types of
consumers – Urban and Peri‐Urban
00:0002:00
04:0008:00
10:0012:00
14:0016:00
18:0020:00
22:0006:00
00:0002:00
04:0008:00
10:0012:00
14:0016:00
18:0020:00
22:0006:00
Interval (Hours)
Interval (Hours) Interval (Hours)
Residen�al Consumers Commercial Consumers
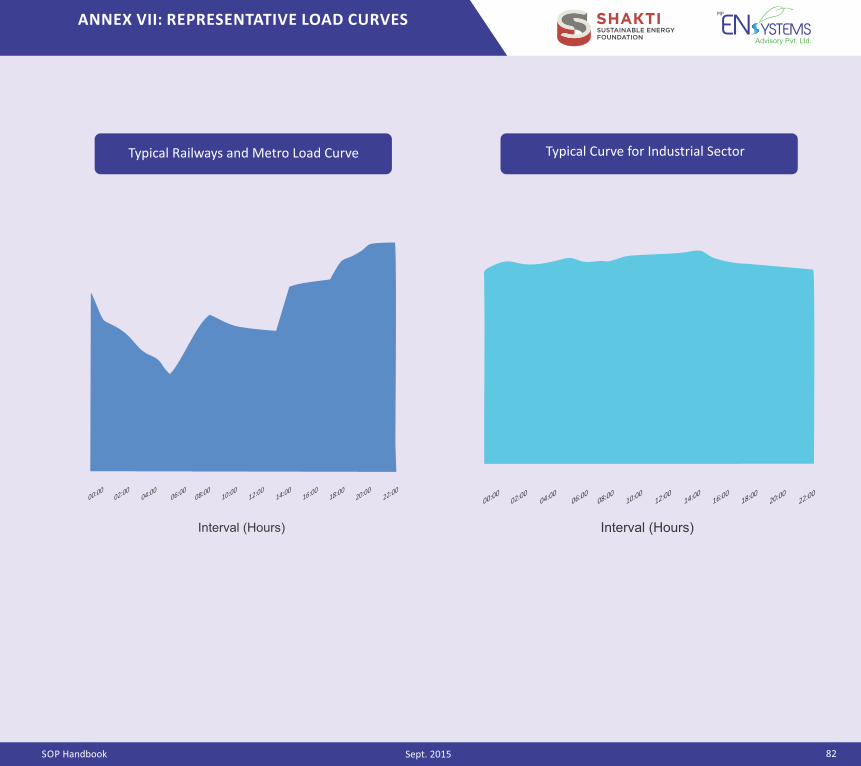
SOP Handbook
ANNEX VII: REPRESENTATIVE LOAD CURVES
82Sept. 2015
00:0002:00
04:0008:00
10:0012:00
14:0016:00
18:0020:00
22:0006:00
00:0002:00
04:0008:00
10:0012:00
14:0016:00
18:0020:00
22:0006:00
Interval (Hours) Interval (Hours)
Typical Railways and Metro Load Curve Typical Curve for Industrial Sector
SOP Handbook
ANNEX VIII: TEMPLATE FOR REGULATORY FILING (PROGRAM DESIGN DOCUMENT (PDD)) – WITH AGGREGATOR
83Sept. 2015
The template that may be used by a u�lity for preparing a
Program Design Document (PDD) for Regulatory Approval for a
Standard Offer Program is discussed here. The template may be
treated as a living guideline document that may be edited as per
u�lity specific requirements.
1. Summary
This document describes the <U�lity Name>'s Standard
Offer Program (SOP) for scaling up implementa�on of
Demand Side Management (DSM) measures in its area of
jurisdic�on.
Through the SOP, the <U�lity Name> will purchase
energy and peak‐demand savings from its consumers by
offering them incen�ves in return. Implementa�on of the
SOP is expected to result in reduced costly power
purchase cost and hence an overall reduced tariff for all
consumers.
The <U�lity Name> aims to implement the SOP for the
<type of consumer> consumers (e.g. residen�al and
commercial) in its distribu�on area and has iden�fied
certain end‐uses for interven�on, based on the
contribu�on of these end‐uses to the peak‐demand and
energy consump�on of the <U�lity Name>. These end‐
uses are <list of end uses targeted> (e.g. ligh�ng, air‐
condi�oning, etc.).
The implementa�on of the SOP will be undertaken by an
Aggregator, who in turn may appoint end‐use level
Aggregator s for program implementa�on. The
Aggregator will be responsible for all ac�vi�es related to
program implementa�on, such as consumer outreach,
enrolment of consumers in the programs, enrolment of
vendors/channel partners through a bidding process,
facilita�on in field implementa�on through vendor
partners (including facilita�on for safe disposal of the old
equipment), service as the conduit for flow of incen�ves
from <U�lity Name> to consumer, desk support,
monitoring and program management.
The Aggregator will be appointed through a bidding
process or on nomina�on once regulatory approval is
received by <U�lity Name>.
The Aggregator will receive incen�ves from the <U�lity
Name> for aggrega�on of the savings from mul�ple
consumers, based on the savings (kWh and kW) achieved
from the iden�fied end‐uses/technologies. The
Aggregator will in turn pass on the incen�ve to the
consumers, based on pre‐defined values. The SOP prices
(Rs / kWh and/or Rs/kW) that are proposed to be offered
by <U�lity Name>for various end‐uses/technologies, the
targeted MW and MU savings and the corresponding
budget requirement are as follows:
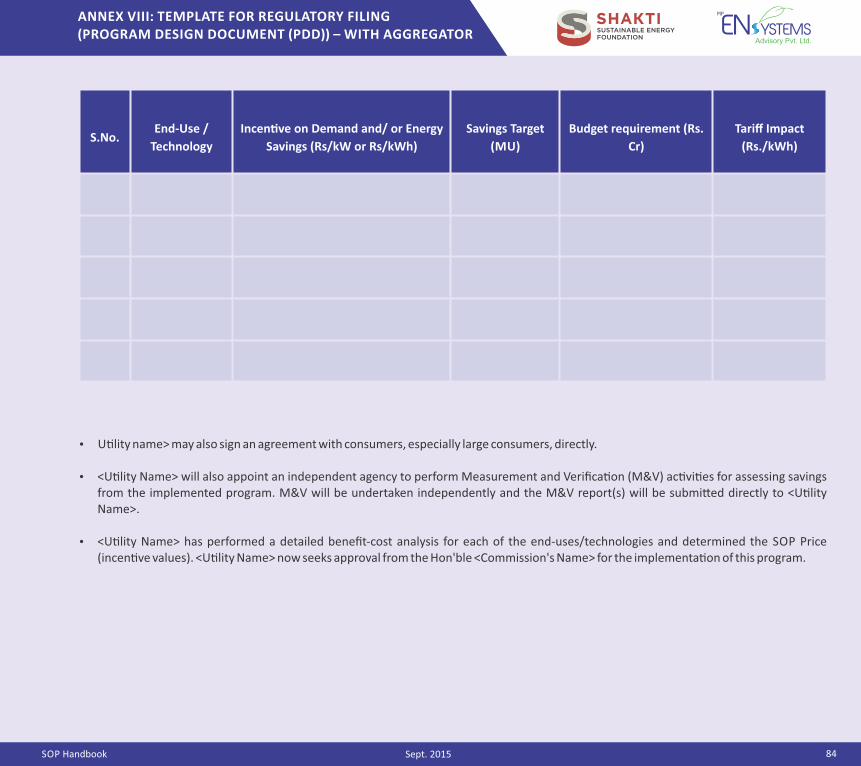
SOP Handbook
ANNEX VIII: TEMPLATE FOR REGULATORY FILING (PROGRAM DESIGN DOCUMENT (PDD)) – WITH AGGREGATOR
84Sept. 2015
S.No.End‐Use /
Technology
Incen�ve on Demand and/ or Energy
Savings (Rs/kW or Rs/kWh)
Savings Target
(MU)
Budget requirement (Rs.
Cr)
Tariff Impact
(Rs./kWh)
U�lity name> may also sign an agreement with consumers, especially large consumers, directly.
<U�lity Name> will also appoint an independent agency to perform Measurement and Verifica�on (M&V) ac�vi�es for assessing savings from the implemented program. M&V will be undertaken independently and the M&V report(s) will be submi�ed directly to <U�lity Name>.
<U�lity Name> has performed a detailed benefit‐cost analysis for each of the end‐uses/technologies and determined the SOP Price (incen�ve values). <U�lity Name> now seeks approval from the Hon'ble <Commission's Name> for the implementa�on of this program.
SOP Handbook
ANNEX VIII: TEMPLATE FOR REGULATORY FILING (PROGRAM DESIGN DOCUMENT (PDD)) – WITH AGGREGATOR
85Sept. 2015
2. Background and Ra�onale
Many u�li�es across the world were successful in scaling up the
implementa�on of DSM measures by way of SOP. South Africa
and USA are some of the countries that have demonstrated
successful SOP implementa�on. In India, the DSM based Efficient
Ligh�ng Program (DELP) SOP implemented by EESL in Puducherry
has been successful in driving economies of scale to achieve
savings at reduced costs. Some of the advantages of SOP are:
1. Simpler program roll‐out through approval for mul�ple
end‐uses or technologies
2. Consumers can choose technologies and/or opera�onal
changes – leading to pragma�c program delivery
3. Contracts between the Program Owner and consumers/
Aggregators are simplified and standardized
4. Economies of scale can be achieved – op�ons available to
go beyond u�lity territory; programs can promote
opera�onal innova�ons
5. Payments are made only for proven savings thus
achieving higher transparency and reduced risks
The <U�lity Name> has designed an SOP, determined the SOP
price to be offered for various end‐uses/technologies and now
seeks approval from <Regulatory Commission's name> for
implemen�ng the program.
3. Target Consumers and Market Segment(s)
The target consumers are the following:
<Target consumer category 1> (e.g. residen�al)
<Target consumer category1>(e.g. small commercial)
The number of consumers that will be enrolled in the program will
depend on savings targets for the par�cular end‐use. Consumers
will be enrolled on a first‐come‐first‐served basis.
4. Program Implementa�on Process
Following the approval from the <Commission's name>, the
following tasks will be carried out:
1. The <U�lity Name> will issue a Request for Proposal (RfP)
to appoint an Aggregator who will implement the
program on behalf of the u�lity��.
2. The appointed Aggregator may in turn appoint energy
service providers to support in consumer enrolment and
program implementa�on.
3. The Aggregator, along with appointed energy service
providers, will shortlist vendors to supply and install the
technologies considered under this program at the
consumer's premises and safely dispose of the exis�ng
technologies as per the required norms��.
If the program is implemented at a na�onal level, then BEE will be the Program Owner and BEE will appoint an Aggregator who will approach the distribu�on u�li�es with specific programs for implementa�on. Norms may be formulated by the respec�ve Pollu�on Control Board
25
26
SOP Handbook
ANNEX VIII: TEMPLATE FOR REGULATORY FILING (PROGRAM DESIGN DOCUMENT (PDD)) – WITH AGGREGATOR
86Sept. 2015
4. The Aggregator, along with appointed energy service
providers, will also approach consumers, explain the
details of the program and convince them to enroll in the
program. The Aggregator will keep upda�ng <U�lity
Name> on the status of enrolment of consumers to the
program.
5. The M&V for the new appliances will be performed by an
M&V agency appointed by the distribu�on u�lity. The
demonstrated savings will be determined based on the
M&V undertaken by the appointed M&V agency.
6. The Aggregator will aggregate the savings from mul�ple
consumers and convey the same to <U�lity> for
payment.
7. The <U�lity> will pay the Aggregator the pre‐determined
SOP price on the demonstrated energy savings (kWh)
annually as per the terms of the agreement.
8. The Aggregator in turn will pay the pre‐decided incen�ve
to the energy service providers and the consumers.
9. The Aggregator, with assistance from the M&V agency,
will prepare an analysis report on the incen�ves offered
and the savings realized and compare the results with
the benefit‐cost analysis undertaken at the program
design stage.
5. Measurement and Verifica�on
M&V will be done using one of the following methodologies to
arrive at the savings achieved by the consumers by
implementa�on of an energy efficiency measure:
1. Standardized M&V: Meters will be installed on the
technologies for a sample of consumers and the results
will be applied to the popula�on of technologies. This
method will be applied for small to medium technologies
such as ligh�ng, fans, unitary ACs.
2. Comprehensive M&V: Meters will be installed on all the
technologies. This method will be applied for large
technologies such as chillers, heat pumps.
6. Key Barriers Addressed
The incen�ves offered on demand savings (kW) and energy
savings (kWh) to the consumers will help reduce high ini�al
costs through economies of scale, increase consumer
par�cipa�on by providing pre‐determined SOP price and
increase scale‐up implementa�on of DSM ac�vi�es. It will
also help ensure early re�rement and safe disposal of old
technologies.
7. Technical Specifica�onsThe technical specifica�ons of the technologies under considera�on in this program are as follows:
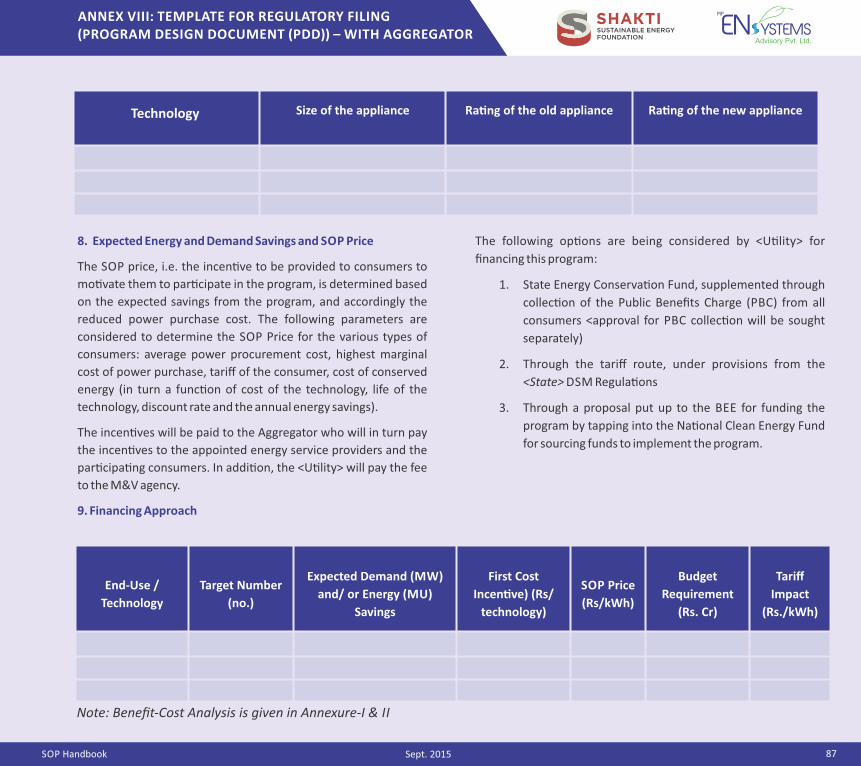
SOP Handbook
ANNEX VIII: TEMPLATE FOR REGULATORY FILING (PROGRAM DESIGN DOCUMENT (PDD)) – WITH AGGREGATOR
87Sept. 2015
End‐Use /
Technology
Target Number
(no.)
Expected Demand (MW)
and/ or Energy (MU)
Savings
First Cost
Incen�ve) (Rs/
technology)
SOP Price
(Rs/kWh)
Budget
Requirement
(Rs. Cr)
Tariff
Impact
(Rs./kWh)
Note: Benefit-Cost Analysis is given in Annexure-I & II
8. Expected Energy and Demand Savings and SOP Price
The SOP price, i.e. the incen�ve to be provided to consumers to
mo�vate them to par�cipate in the program, is determined based
on the expected savings from the program, and accordingly the
reduced power purchase cost. The following parameters are
considered to determine the SOP Price for the various types of
consumers: average power procurement cost, highest marginal
cost of power purchase, tariff of the consumer, cost of conserved
energy (in turn a func�on of cost of the technology, life of the
technology, discount rate and the annual energy savings).
The incen�ves will be paid to the Aggregator who will in turn pay
the incen�ves to the appointed energy service providers and the
par�cipa�ng consumers. In addi�on, the <U�lity> will pay the fee
to the M&V agency.
9. Financing Approach
The following op�ons are being considered by <U�lity> for
financing this program:
1. State Energy Conserva�on Fund, supplemented through
collec�on of the Public Benefits Charge (PBC) from all
consumers <approval for PBC collec�on will be sought
separately)
2. Through the tariff route, under provisions from the
<State> DSM Regula�ons
3. Through a proposal put up to the BEE for funding the
program by tapping into the Na�onal Clean Energy Fund
for sourcing funds to implement the program.
Size of the appliance Ra�ng of the old appliance Ra�ng of the new applianceTechnology
SOP Handbook
ANNEX VIII: TEMPLATE FOR REGULATORY FILING (PROGRAM DESIGN DOCUMENT (PDD)) – WITH AGGREGATOR
88Sept. 2015
10. Implementa�on Responsibili�es – BEE, Distribu�on
Company, Aggregator, M&V Agency, Consumers
<U�lity> (Program Owner)
Be responsible for offering/rolling out the SOP
Iden�fy end‐uses and/or technologies that can be targeted for
SOP based on Load Research, assessment of energy and peak
deficits, technology availability and benefit‐cost analysis
Determine SOP price to be offered for each of the end‐uses
and/or technologies
Obtain required approvals from Hon'ble SERCs (when u�lity is
the Program Owner)
Program funding:
BEE as program owner: Submit proposal to NCEF for
funding the na�onal level SOP
Distribu�on u�lity as the program owner: Seek funds either
through the BEE route (BEE can route funds from NCEF to
the u�lity), or, approach Hon'ble SERC for crea�on and
u�liza�on of funds from a State Energy Conserva�on Fund
(SECF)
Dra� RfP for selec�ng Aggregator
Appoint Aggregator for program implementa�on based on pre‐
defined qualifica�on criteria
Sign agreement with Aggregator
Dra� RfP and appoint M&V agency
Oversee savings reported by Aggregator
Pay Aggregator the pre‐determined SOP price based on the
demonstrated savings from the implemented DSM programs
as per the terms of the agreement signed with the Aggregator
In some cases, the program owner may directly enroll
consumers such as large commercial establishments. Then, the
program owner will directly pay the SOP price on the
demonstrated savings to the consumer.
Aggregator and/or energy service providers:
Contract with Program Owner
Further sub‐contract required work to ESPs based on end‐use
(when at na�onal/u�lity level) or state (when at na�onal level)
and sign agreement(s) with sub‐contracted ESPs
Prepare program outreach material
Reach out to consumers and enroll them into the program.
Oversee and regularly update Program Owner on status of
enrolment of consumers
Appoint vendor(s) through a bidding process and sign contracts
with selected vendors
Ensure installa�on of efficient technologies at consumer's
premises and/or provide assistance to consumers for
undertak ing opera�onal efficiency improvements
(independently or through vendors)
Ensure safe disposal of old equipment
Oversee and regularly inform Program Owner on status of
implementa�on and incen�ves towards the demand savings
(kW) to be paid as per the SOP
On receipt of the payment from Program Owner, pass on
incen�ves to the consumers as per terms of agreement
Provide required support to M&V agency for determining
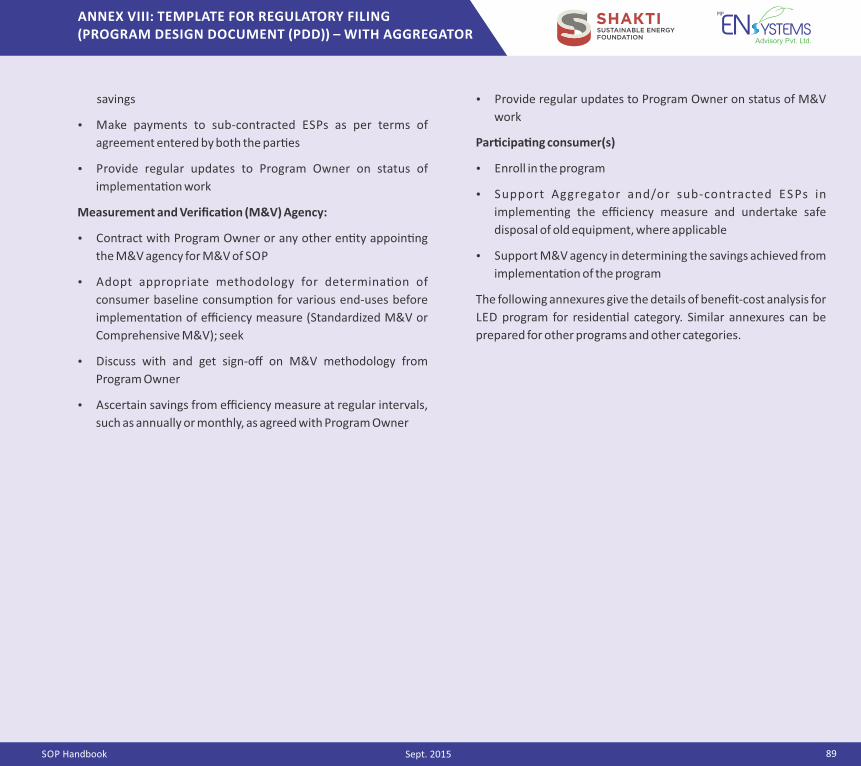
SOP Handbook
ANNEX VIII: TEMPLATE FOR REGULATORY FILING (PROGRAM DESIGN DOCUMENT (PDD)) – WITH AGGREGATOR
89Sept. 2015
savings
Make payments to sub‐contracted ESPs as per terms of
agreement entered by both the par�es
Provide regular updates to Program Owner on status of
implementa�on work
Measurement and Verifica�on (M&V) Agency:
Contract with Program Owner or any other en�ty appoin�ng
the M&V agency for M&V of SOP
Adopt appropriate methodology for determina�on of
consumer baseline consump�on for various end‐uses before
implementa�on of efficiency measure (Standardized M&V or
Comprehensive M&V); seek
Discuss with and get sign‐off on M&V methodology from
Program Owner
Ascertain savings from efficiency measure at regular intervals,
such as annually or monthly, as agreed with Program Owner
Provide regular updates to Program Owner on status of M&V
work
Par�cipa�ng consumer(s)
Enroll in the program
Support Aggregator and/or sub‐contracted ES Ps in
implemen�ng the efficiency measure and undertake safe
disposal of old equipment, where applicable
Support M&V agency in determining the savings achieved from
implementa�on of the program
The following annexures give the details of benefit‐cost analysis for
LED program for residen�al category. Similar annexures can be
prepared for other programs and other categories.
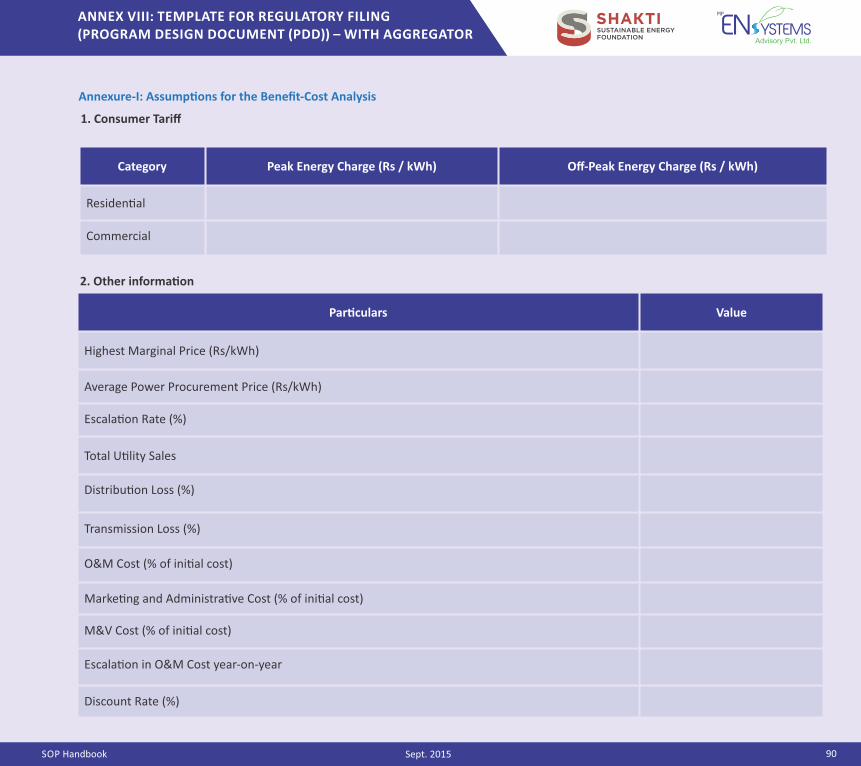
SOP Handbook
ANNEX VIII: TEMPLATE FOR REGULATORY FILING (PROGRAM DESIGN DOCUMENT (PDD)) – WITH AGGREGATOR
90Sept. 2015
1. Consumer Tariff
Category Peak Energy Charge (Rs / kWh) Off‐Peak Energy Charge (Rs / kWh)
Residen�al
Commercial
Annexure‐I: Assump�ons for the Benefit‐Cost Analysis
Par�culars Value
Highest Marginal Price (Rs/kWh)
Average Power Procurement Price (Rs/kWh)
Escala�on Rate (%)
Total U�lity Sales
Distribu�on Loss (%)
Transmission Loss (%)
O&M Cost (% of ini�al cost)
Marke�ng and Administra�ve Cost (% of ini�al cost)
M&V Cost (% of ini�al cost)
Escala�on in O&M Cost year‐on‐year
Discount Rate (%)
2. Other informa�on
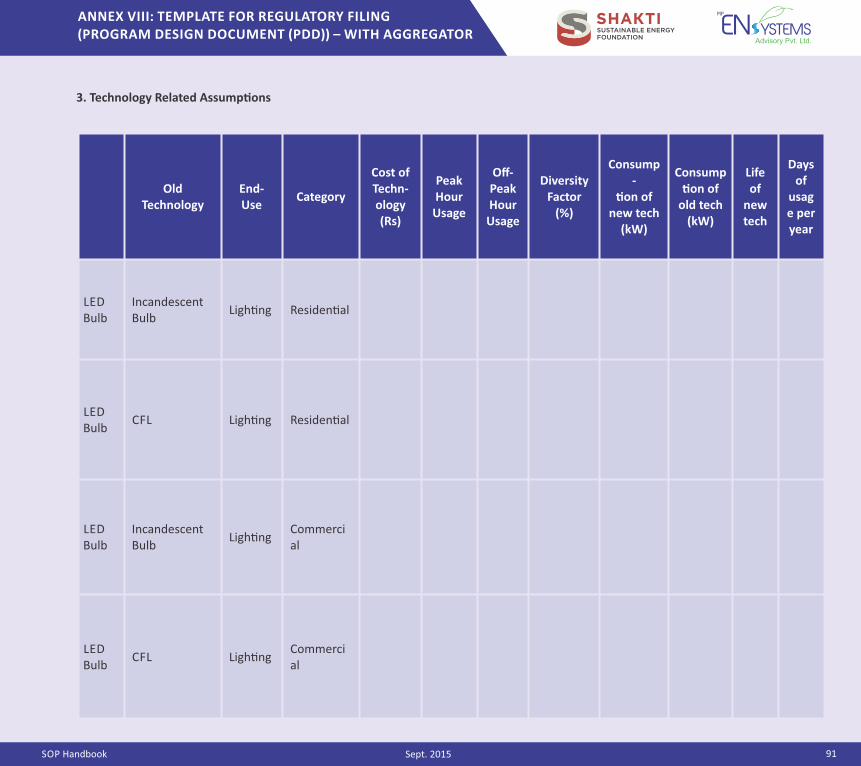
SOP Handbook
ANNEX VIII: TEMPLATE FOR REGULATORY FILING (PROGRAM DESIGN DOCUMENT (PDD)) – WITH AGGREGATOR
91Sept. 2015
3. Technology Related Assump�onsNew Technology
Old Technology
End‐Use
Category
Cost of Techn‐ology (Rs)
Peak Hour Usage
Off‐Peak Hour Usage
Diversity Factor
(%)
Consump‐
�on of new tech
(kW)
Consump�on of
old tech (kW)
Life of
new tech
Days of
usage per year
LED Bulb
Incandescent Bulb
Ligh�ng Residen�al
LED Bulb
CFL Ligh�ng Residen�al
LED Bulb
Incandescent Bulb
Ligh�ngCommercial
LED Bulb
CFL Ligh�ngCommercial
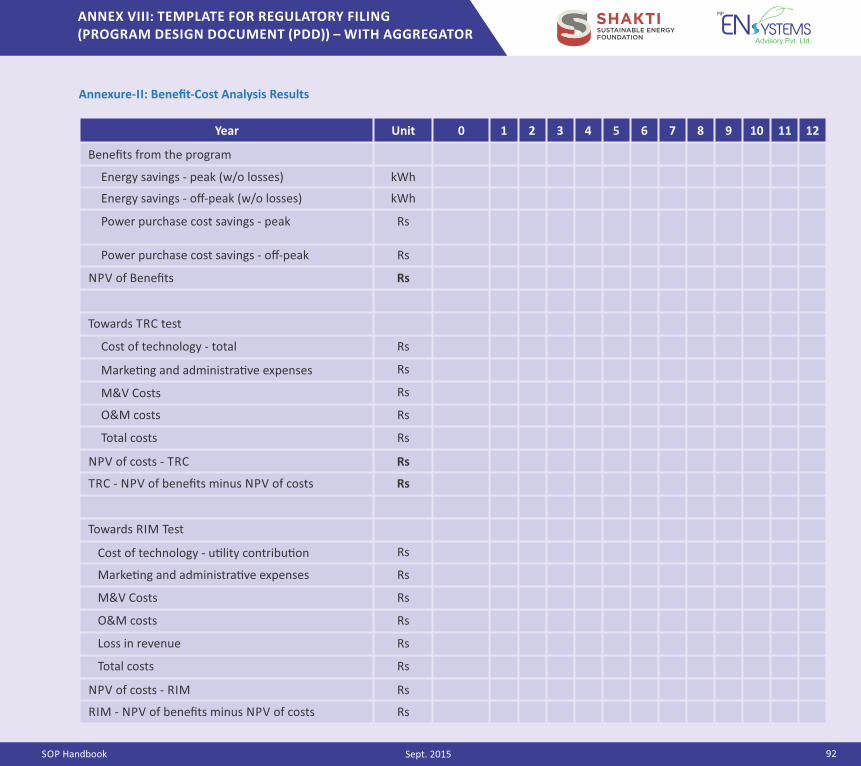
SOP Handbook
ANNEX VIII: TEMPLATE FOR REGULATORY FILING (PROGRAM DESIGN DOCUMENT (PDD)) – WITH AGGREGATOR
92Sept. 2015
Annexure‐II: Benefit‐Cost Analysis Results
Year Unit 0 1 2 3 4 5 6 7 8 9 10 11 12
Benefits from the program
Energy savings ‐ peak (w/o losses) kWh
Energy savings ‐ off‐peak (w/o losses) kWh
Power purchase cost savings ‐ peak Rs
Power purchase cost savings ‐ off‐peak Rs
NPV of Benefits Rs
Towards TRC test
Cost of technology ‐ total Rs
Marke�ng and administra�ve expenses Rs
M&V Costs Rs
O&M costs Rs
Total costs Rs
NPV of costs ‐ TRC Rs
TRC ‐ NPV of benefits minus NPV of costs Rs
Towards RIM Test
Cost of technology ‐ u�lity contribu�on Rs
Marke�ng and administra�ve expenses Rs
M&V Costs Rs
O&M costs Rs
Loss in revenue Rs
Total costs Rs
NPV of costs ‐ RIM Rs
RIM ‐ NPV of benefits minus NPV of costs Rs
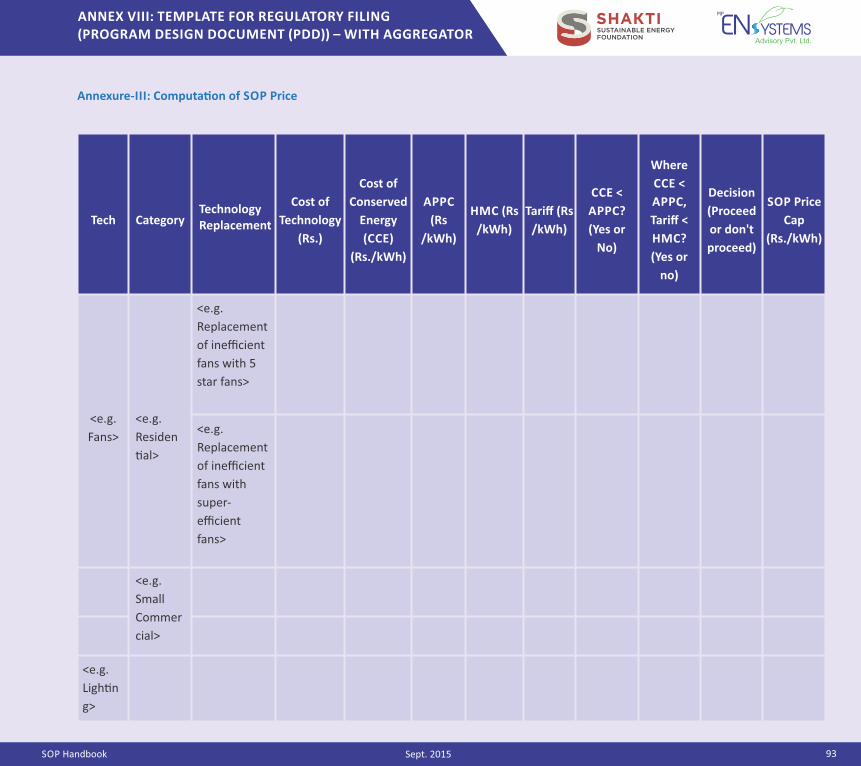
SOP Handbook
ANNEX VIII: TEMPLATE FOR REGULATORY FILING (PROGRAM DESIGN DOCUMENT (PDD)) – WITH AGGREGATOR
93Sept. 2015
Tech Category
Cost of
Technology
(Rs.)
Cost of
Conserved
Energy
(CCE)
(Rs./kWh)
APPC
(Rs
/kWh)
HMC (Rs
/kWh)
Tariff (Rs
/kWh)
CCE <
APPC?
(Yes or
No)
Where
CCE <
APPC,
Tariff <
HMC?
(Yes or
no)
Decision
(Proceed
or don't
proceed)
SOP Price
Cap
(Rs./kWh)
<e.g.
Fans>
<e.g.
Residen
�al>
<e.g.
Replacement
of inefficient
fans with 5
star fans>
<e.g.
Replacement
of inefficient
fans with
super‐
efficient
fans>
<e.g.
Small
Commer
cial>
<e.g.
Ligh�n
g>
Annexure‐III: Computa�on of SOP Price
Technology Replacement
SOP Handbook
ANNEX IX: TEMPLATE FOR REGULATORY FILING (PROGRAM DESIGN DOCUMENT (PDD)) – WITHOUT AGGREGATOR
94Sept. 2015
The template that may be used by a u�lity for preparing a
Program Design Document (PDD) for Regulatory Approval for a
Standard Offer Program is discussed here. The template may be
treated as a living guideline document that may be edited as per
u�lity specific requirements.
1. Summary
This document describes the <U�lity Name>'s Standard
Offer Program (SOP) for scaling up implementa�on of
Demand Side Management (DSM) measures in its area of
jurisdic�on.
Through the SOP, the <U�lity Name> will purchase
energy and peak‐demand savings from its consumers by
offering them incen�ves in return. Implementa�on of the
SOP is expected to result in reduced costly power
purchase cost and hence an overall reduced tariff for all
consumers.
The <U�lity Name> aims to implement the SOP for the
<type of consumer> consumers (e.g. residen�al and
commercial) in its distribu�on area and has iden�fied
certain end‐uses for interven�on, based on the
contribu�on of these end‐uses to the peak‐demand and
energy consump�on of the <U�lity Name>. These end‐
uses are <list of end uses targeted> (e.g. ligh�ng, air‐
condi�oning, etc.)
The <U�lity Name> will make incen�ve payments to the
consumers based on the savings (kWh and kW) achieved
from the iden�fied end‐uses/technologies. The SOP
prices (Rs / kWh and/or Rs/kW) that are proposed to be
o ffe re d b y < U � l i t y N a m e > fo r va r i o u s e n d ‐
uses/technologies, the targeted MW and MU savings
and the corresponding budget requirement are as
follows:
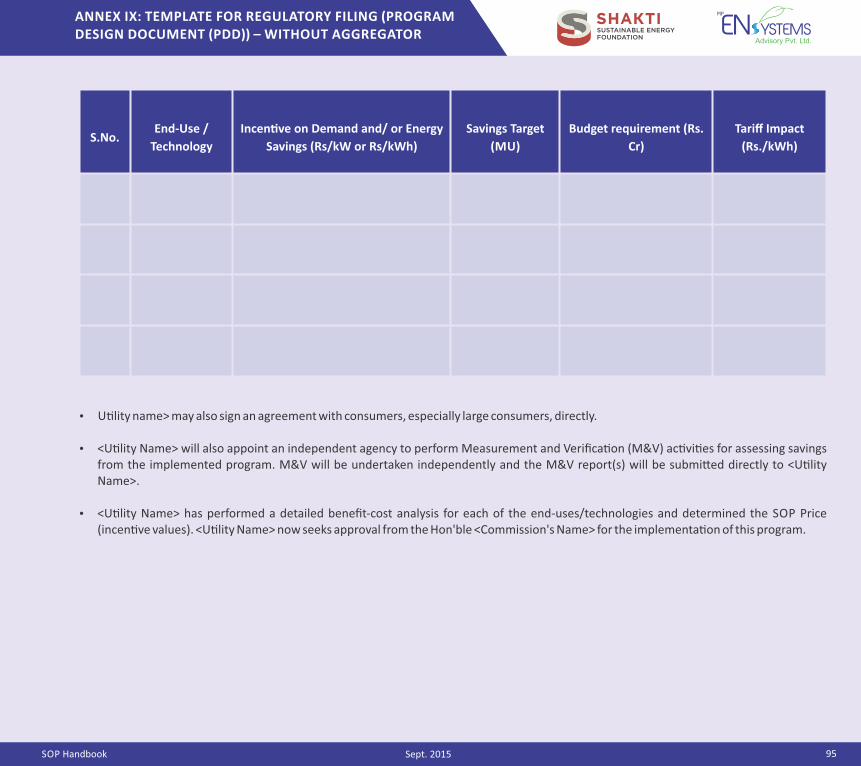
SOP Handbook
ANNEX IX: TEMPLATE FOR REGULATORY FILING (PROGRAM DESIGN DOCUMENT (PDD)) – WITHOUT AGGREGATOR
95Sept. 2015
S.No.End‐Use /
Technology
Incen�ve on Demand and/ or Energy
Savings (Rs/kW or Rs/kWh)
Savings Target
(MU)
Budget requirement (Rs.
Cr)
Tariff Impact
(Rs./kWh)
U�lity name> may also sign an agreement with consumers, especially large consumers, directly.
<U�lity Name> will also appoint an independent agency to perform Measurement and Verifica�on (M&V) ac�vi�es for assessing savings from the implemented program. M&V will be undertaken independently and the M&V report(s) will be submi�ed directly to <U�lity Name>.
<U�lity Name> has performed a detailed benefit‐cost analysis for each of the end‐uses/technologies and determined the SOP Price (incen�ve values). <U�lity Name> now seeks approval from the Hon'ble <Commission's Name> for the implementa�on of this program.

SOP Handbook
ANNEX IX: TEMPLATE FOR REGULATORY FILING (PROGRAM DESIGN DOCUMENT (PDD)) – WITHOUT AGGREGATOR
96Sept. 2015
2. Background and Ra�onale
Many u�li�es across the world were successful in scaling up the
implementa�on of DSM measures by way of SOP. South Africa
and USA are some of the countries that have demonstrated
successful SOP implementa�on. In India, the DSM based Efficient
Ligh�ng Program (DELP) SOP implemented by EESL in Puducherry
has been successful in driving economies of scale to achieve
savings at reduced costs. Some of the advantages of SOP are:
1. Simpler program roll‐out through approval for mul�ple
end‐uses or technologies
2. Consumers can choose technologies and/or opera�onal
changes – leading to pragma�c program delivery
3. Contracts between the Program Owner and consumers/
Aggregator s are simplified and standardized
4. Economies of scale can be achieved – op�ons available to
go beyond u�lity territory; programs can promote
opera�onal innova�ons
5. Payments are made only for proven savings thus
achieving higher transparency and reduced risks
The <U�lity Name> has designed an SOP, determined the SOP
price to be offered for various end‐uses/technologies and now
seeks approval from <Regulatory Commission's name> for
implemen�ng the program.
3. Target Consumers and Market Segment(s)
The target consumers are the following:
<Target consumer category 1> (e.g. residen�al)
<Target consumer category1>(e.g. small commercial)
The number of consumers that will be enrolled in the program will
depend on savings targets for the par�cular end‐use. Consumers
will be enrolled on a first‐come‐first‐served basis.
4. Program Implementa�on Process
Following the approval from the <Commission's name>, the
following tasks will be carried out:
1. The <U�lity Name> may appoint energy service
providers to support in consumer enrolment and
program implementa�on.
2. The <U�lity Name>, along with appointed energy service
providers, will shortlist vendors to supply and install the
technologies considered under this program at the
consumer's premises and safely dispose of the exis�ng
technologies as per the required norms.
3. The <U�lity Name>, along with appointed energy service
providers, will also approach consumers, explain the
details of the program and convince them to enroll in the
program.
If the program is implemented at a na�onal level, then BEE will be the Program Owner and BEE will appoint an Aggregator who will approach the distribu�on u�li�es with specific programs for implementa�on. Norms may be formulated by the respec�ve Pollu�on Control Board
25
26
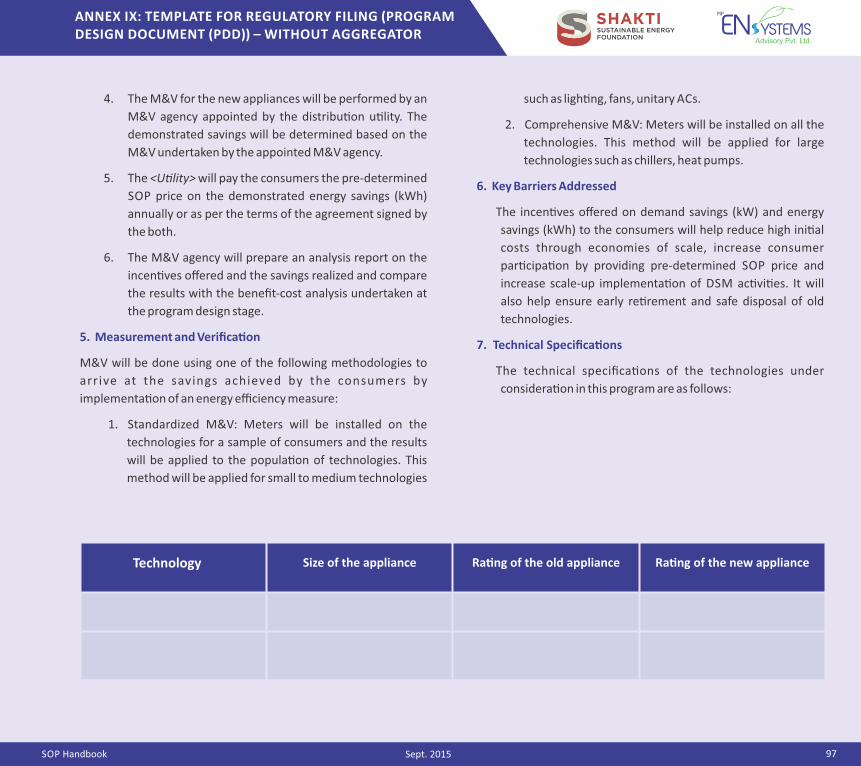
SOP Handbook
ANNEX IX: TEMPLATE FOR REGULATORY FILING (PROGRAM DESIGN DOCUMENT (PDD)) – WITHOUT AGGREGATOR
97Sept. 2015
4. The M&V for the new appliances will be performed by an
M&V agency appointed by the distribu�on u�lity. The
demonstrated savings will be determined based on the
M&V undertaken by the appointed M&V agency.
5. The <U�lity> will pay the consumers the pre‐determined
SOP price on the demonstrated energy savings (kWh)
annually or as per the terms of the agreement signed by
the both.
6. The M&V agency will prepare an analysis report on the
incen�ves offered and the savings realized and compare
the results with the benefit‐cost analysis undertaken at
the program design stage.
5. Measurement and Verifica�on
M&V will be done using one of the following methodologies to
arrive at the savings achieved by the consumers by
implementa�on of an energy efficiency measure:
1. Standardized M&V: Meters will be installed on the
technologies for a sample of consumers and the results
will be applied to the popula�on of technologies. This
method will be applied for small to medium technologies
such as ligh�ng, fans, unitary ACs.
2. Comprehensive M&V: Meters will be installed on all the
technologies. This method will be applied for large
technologies such as chillers, heat pumps.
6. Key Barriers Addressed
The incen�ves offered on demand savings (kW) and energy
savings (kWh) to the consumers will help reduce high ini�al
costs through economies of scale, increase consumer
par�cipa�on by providing pre‐determined SOP price and
increase scale‐up implementa�on of DSM ac�vi�es. It will
also help ensure early re�rement and safe disposal of old
technologies.
7. Technical Specifica�ons
The technical specifica�ons of the technologies under
considera�on in this program are as follows:
Size of the appliance Ra�ng of the old appliance Ra�ng of the new applianceTechnology
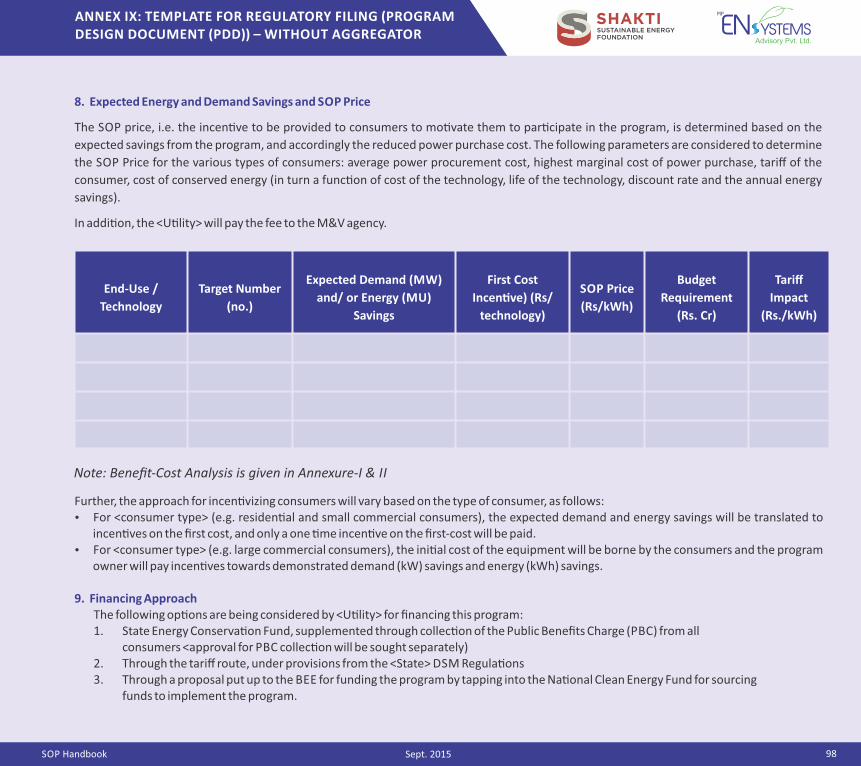
SOP Handbook
ANNEX IX: TEMPLATE FOR REGULATORY FILING (PROGRAM DESIGN DOCUMENT (PDD)) – WITHOUT AGGREGATOR
98Sept. 2015
8. Expected Energy and Demand Savings and SOP Price
The SOP price, i.e. the incen�ve to be provided to consumers to mo�vate them to par�cipate in the program, is determined based on the
expected savings from the program, and accordingly the reduced power purchase cost. The following parameters are considered to determine
the SOP Price for the various types of consumers: average power procurement cost, highest marginal cost of power purchase, tariff of the
consumer, cost of conserved energy (in turn a func�on of cost of the technology, life of the technology, discount rate and the annual energy
savings).
In addi�on, the <U�lity> will pay the fee to the M&V agency.
End‐Use /
Technology
Target Number
(no.)
Expected Demand (MW)
and/ or Energy (MU)
Savings
First Cost
Incen�ve) (Rs/
technology)
SOP Price
(Rs/kWh)
Budget
Requirement
(Rs. Cr)
Tariff
Impact
(Rs./kWh)
Note: Benefit-Cost Analysis is given in Annexure-I & II
Further, the approach for incen�vizing consumers will vary based on the type of consumer, as follows: For <consumer type> (e.g. residen�al and small commercial consumers), the expected demand and energy savings will be translated to
incen�ves on the first cost, and only a one �me incen�ve on the first‐cost will be paid. For <consumer type> (e.g. large commercial consumers), the ini�al cost of the equipment will be borne by the consumers and the program
owner will pay incen�ves towards demonstrated demand (kW) savings and energy (kWh) savings.
9. Financing ApproachThe following op�ons are being considered by <U�lity> for financing this program: 1. State Energy Conserva�on Fund, supplemented through collec�on of the Public Benefits Charge (PBC) from all consumers <approval for PBC collec�on will be sought separately)2. Through the tariff route, under provisions from the <State> DSM Regula�ons3. Through a proposal put up to the BEE for funding the program by tapping into the Na�onal Clean Energy Fund for sourcing funds to implement the program.
SOP Handbook
ANNEX IX: TEMPLATE FOR REGULATORY FILING (PROGRAM DESIGN DOCUMENT (PDD)) – WITHOUT AGGREGATOR
99Sept. 2015
10. Implementa�on Responsibili�es – BEE, Distribu�on Company, Aggregator, M&V Agency, Consumers
<U�lity> (Program Owner)
Be responsible for offering/rolling out the SOP
Iden�fy end‐uses and/or technologies that can be targeted for
SOP based on Load Research, assessment of energy and peak
deficits, technology availability and benefit‐cost analysis
Determine SOP price to be offered for each of the end‐uses
and/or technologies
Obtain required approvals from Hon'ble SERCs (when u�lity is
the Program Owner)
Program funding:
i) BEE as program owner: Submit proposal to NCEF for
funding the na�onal level SOP
ii) Distribu�on u�lity as the program owner: Seek funds
either through the BEE route (BEE can route funds from
NCEF to the u�lity), or, approach Hon'ble SERC for crea�on
and u�liza�on of funds from a State Energy Conserva�on
Fund (SECF)
Appoint Energy service providers for program implementa�on
based on pre‐defined qualifica�on criteria
Sign agreement with Energy service providers
Dra� RfP and appoint M&V agency
Es�mate the savings from various programs
Pay consumers the pre‐determined SOP price based on the
demonstrated savings from the implemented DSM programs
as per the terms of the agreement signed with them.
Energy service providers:
Contract with Program Owner
Prepare program outreach material
Reach out to consumers and enroll them into the program.
Oversee and regularly update Program Owner on status of
enrolment of consumers
Appoint vendor(s) through a bidding process and sign contracts
with selected vendors
Ensure installa�on of efficient technologies at consumer's
premises and/or provide assistance to consumers for
undertak ing opera�onal efficiency improvements
(independently or through vendors)
Ensure safe disposal of old equipment
Oversee and regularly inform Program Owner on status of
implementa�on and incen�ves towards the demand savings
(kW) to be paid as per the SOP
On receipt of the payment from Program Owner, pass on
incen�ves to the consumers as per terms of agreement
Provide required support to M&V agency for determining
savings
Make payments to sub‐contracted ESPs as per terms of
agreement entered by both the par�es
Provide regular updates to Program Owner on status of
implementa�on work
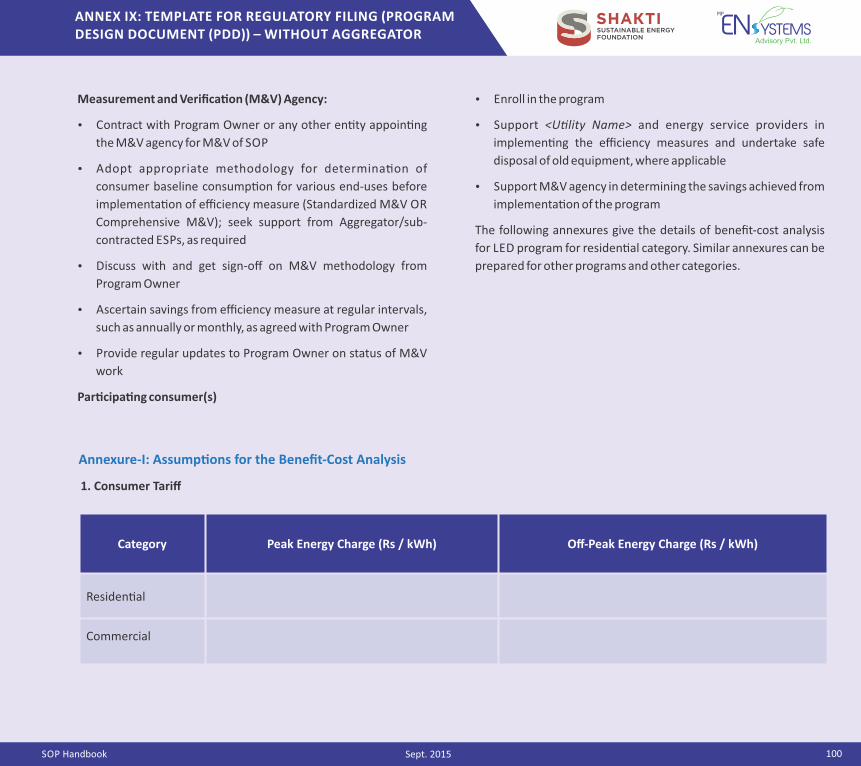
SOP Handbook
ANNEX IX: TEMPLATE FOR REGULATORY FILING (PROGRAM DESIGN DOCUMENT (PDD)) – WITHOUT AGGREGATOR
100Sept. 2015
1. Consumer Tariff
Category Peak Energy Charge (Rs / kWh) Off‐Peak Energy Charge (Rs / kWh)
Residen�al
Commercial
Annexure‐I: Assump�ons for the Benefit‐Cost Analysis
Measurement and Verifica�on (M&V) Agency:
Contract with Program Owner or any other en�ty appoin�ng
the M&V agency for M&V of SOP
Adopt appropriate methodology for determina�on of
consumer baseline consump�on for various end‐uses before
implementa�on of efficiency measure (Standardized M&V OR
Comprehensive M&V); seek support from Aggregator/sub‐
contracted ESPs, as required
Discuss with and get sign‐off on M&V methodology from
Program Owner
Ascertain savings from efficiency measure at regular intervals,
such as annually or monthly, as agreed with Program Owner
Provide regular updates to Program Owner on status of M&V
work
Par�cipa�ng consumer(s)
Enroll in the program
Support <U�lity Name> and energy service providers in
implemen�ng the efficiency measures and undertake safe
disposal of old equipment, where applicable
Support M&V agency in determining the savings achieved from
implementa�on of the program
The following annexures give the details of benefit‐cost analysis
for LED program for residen�al category. Similar annexures can be
prepared for other programs and other categories.
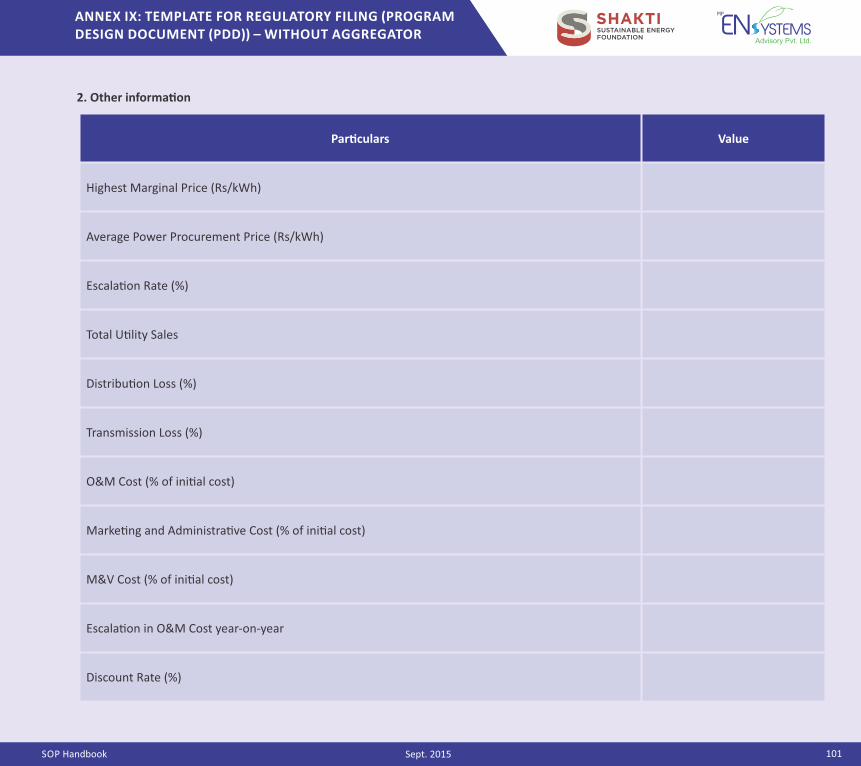
SOP Handbook
ANNEX IX: TEMPLATE FOR REGULATORY FILING (PROGRAM DESIGN DOCUMENT (PDD)) – WITHOUT AGGREGATOR
101Sept. 2015
2. Other informa�on
Par�culars Value
Highest Marginal Price (Rs/kWh)
Average Power Procurement Price (Rs/kWh)
Escala�on Rate (%)
Total U�lity Sales
Distribu�on Loss (%)
Transmission Loss (%)
O&M Cost (% of ini�al cost)
Marke�ng and Administra�ve Cost (% of ini�al cost)
M&V Cost (% of ini�al cost)
Escala�on in O&M Cost year‐on‐year
Discount Rate (%)
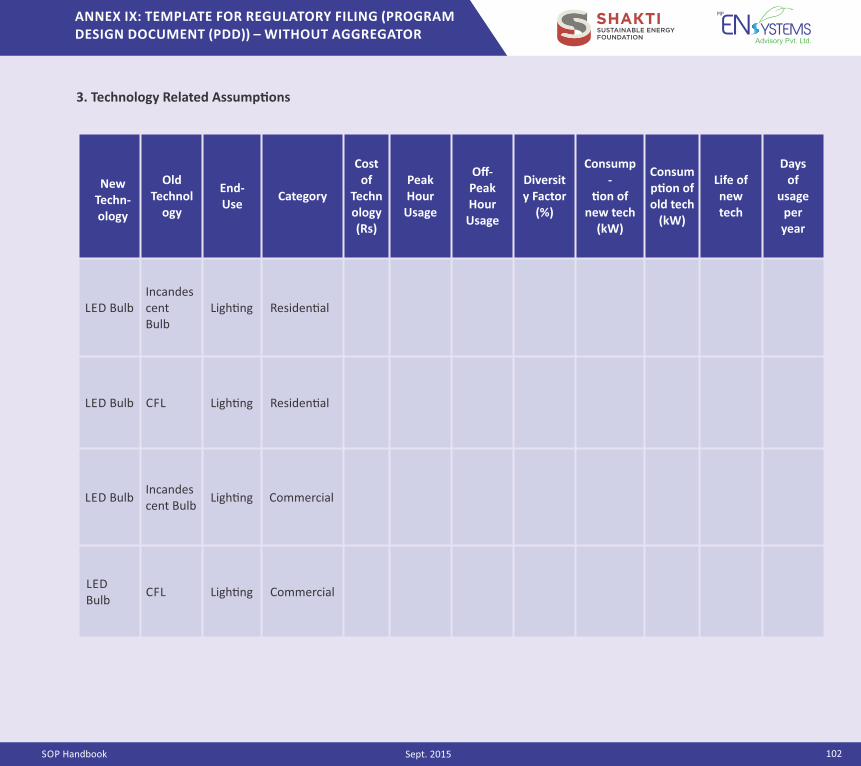
SOP Handbook
ANNEX IX: TEMPLATE FOR REGULATORY FILING (PROGRAM DESIGN DOCUMENT (PDD)) – WITHOUT AGGREGATOR
102Sept. 2015
3. Technology Related Assump�ons
Old Technol
ogy
End‐Use
Category
Cost of
Technology (Rs)
Peak Hour Usage
Off‐Peak Hour Usage
Diversity Factor
(%)
Consump‐
�on of new tech
(kW)
Consump�on of old tech
(kW)
Life of new tech
Days of
usage per year
LED BulbIncandescent Bulb
Ligh�ng Residen�al
LED Bulb CFL Ligh�ng Residen�al
LED BulbIncandescent Bulb
Ligh�ng Commercial
LED Bulb
CFL Ligh�ng Commercial
New Techn‐ology
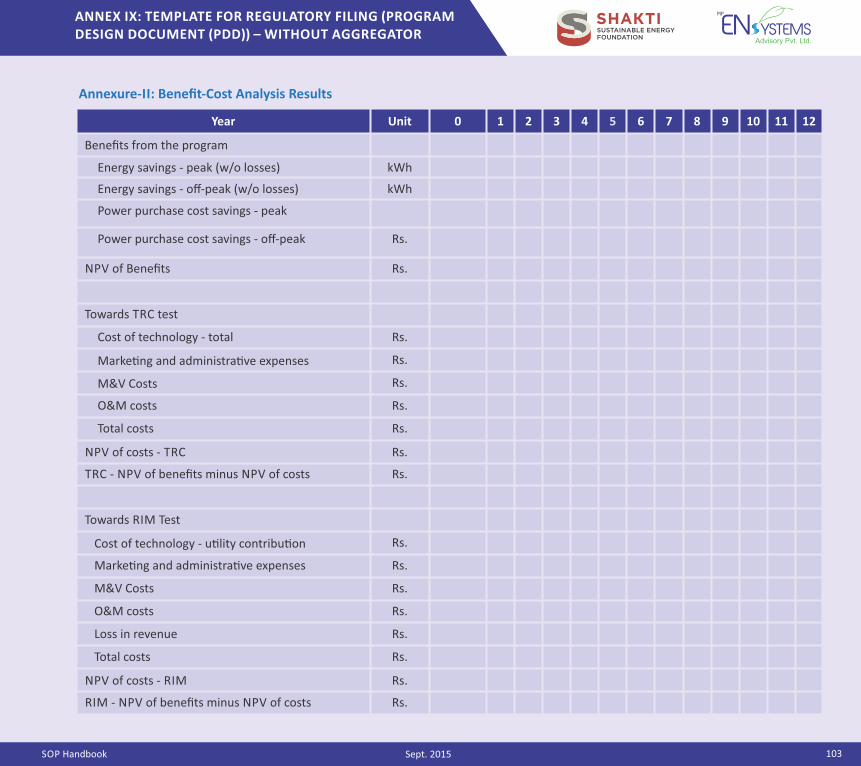
SOP Handbook
ANNEX IX: TEMPLATE FOR REGULATORY FILING (PROGRAM DESIGN DOCUMENT (PDD)) – WITHOUT AGGREGATOR
103Sept. 2015
Annexure‐II: Benefit‐Cost Analysis Results
Year Unit 0 1 2 3 4 5 6 7 8 9 10 11 12
Benefits from the program
Energy savings ‐ peak (w/o losses) kWh
Energy savings ‐ off‐peak (w/o losses) kWh
Power purchase cost savings ‐ peak
Rs.
Power purchase cost savings ‐ off‐peak Rs.
NPV of Benefits Rs.
Towards TRC test
Cost of technology ‐ total Rs.
Marke�ng and administra�ve expenses Rs.
M&V Costs Rs.
O&M costs Rs.
Total costs Rs.
NPV of costs ‐ TRC Rs.
TRC ‐ NPV of benefits minus NPV of costs Rs.
Towards RIM Test
Cost of technology ‐ u�lity contribu�on Rs.
Marke�ng and administra�ve expenses Rs.
M&V Costs Rs.
O&M costs Rs.
Loss in revenue Rs.
Total costs Rs.
NPV of costs ‐ RIM Rs.
RIM ‐ NPV of benefits minus NPV of costs Rs.

SOP Handbook
ANNEX IX: TEMPLATE FOR REGULATORY FILING (PROGRAM DESIGN DOCUMENT (PDD)) – WITHOUT AGGREGATOR
104Sept. 2015
Tech CategoryTechnology
Replacement
Cost of
Technology
(Rs.)
Cost of
Conserved
Energy
(CCE)
(Rs./kWh)
APPC (Rs
/kWh)
HMC (Rs
/kWh)
Tariff (Rs
/kWh)
CCE <
APPC?
(Yes or
No)
Where
CCE <
APPC,
Tariff <
HMC?
(Yes or
no)
Decision
(Proceed
or don't
proceed)
SOP Price
Cap
(Rs./kWh)
<e.g.
Fans>
<e.g.
Residen�
al>
<e.g.
Replacement
of inefficient
fans with 5
star fans>
<e.g.
Replacement
of inefficient
fans with
super‐
efficient
fans>
<e.g.
Small
Commer
cial>
<e.g.
Ligh�n
g>
Annexure‐III: Computa�on of SOP Price
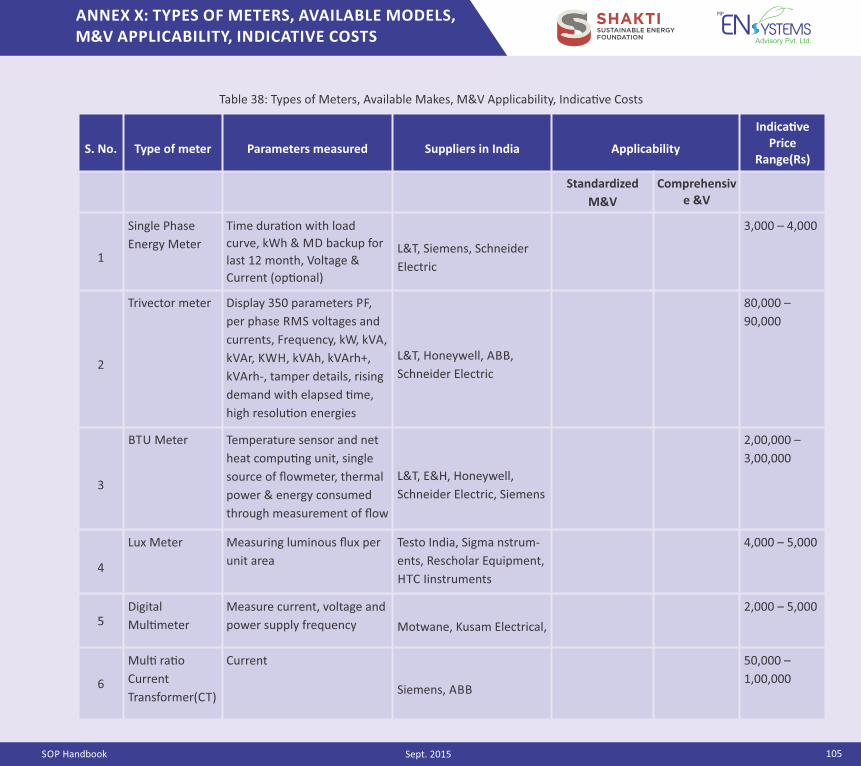
SOP Handbook
ANNEX X: TYPES OF METERS, AVAILABLE MODELS, M&V APPLICABILITY, INDICATIVE COSTS
105Sept. 2015
Table 38: Types of Meters, Available Makes, M&V Applicability, Indica�ve Costs
S. No. Type of meter Parameters measured Suppliers in India Applicability
Indica�ve Price
Range(Rs)
Standardized
M&V
Comprehensive &V
1
Single Phase
Energy Meter
Time dura�on with load
curve, kWh & MD backup for
last 12 month, Voltage &
Current (op�onal)
L&T, Siemens, Schneider
Electric
3,000 – 4,000
2
Trivector meter Display 350 parameters PF,
per phase RMS voltages and
currents, Frequency, kW, kVA,
kVAr, KWH, kVAh, kVArh+,
kVArh‐, tamper details, rising
demand with elapsed �me,
high resolu�on energies
L&T, Honeywell, ABB,
Schneider Electric
80,000 –
90,000
3
BTU Meter Temperature sensor and net
heat compu�ng unit, single
source of flowmeter, thermal
power & energy consumed
through measurement of flow
L&T, E&H, Honeywell,
Schneider Electric, Siemens
2,00,000 –
3,00,000
4
Lux Meter Measuring luminous flux per
unit area
Testo India, Sigma nstrum‐
ents, Rescholar Equipment,
HTC Iinstruments
4,000 – 5,000
5Digital
Mul�meter
Measure current, voltage and
power supply frequency Motwane, Kusam Electrical,
2,000 – 5,000
6
Mul� ra�o
Current
Transformer(CT)
Current
Siemens, ABB
50,000 –
1,00,000
SOP Handbook
ANNEX XI: BRIEF DESCRIPTION OF ENERGY EFFICIENT TECHNOLOGIES
106Sept. 2015
A brief descrip�on of various energy efficient technologies is given
in this annex:
Unitary AC:
Unitary ACs (window ACs, Split ACs and Split + Inverter ACs) are
small air‐condi�oning systems that typically use vapour
compression cycles. The en�re system uses a circula�ng liquid
refrigerant which absorbs and removes heat from the space to be
cooled and subsequently rejects that heat elsewhere. The vapour
compression system has four components (i) compressor, (ii)
condenser, (iii) expansion valve and (iv) evaporator.
Energy Efficient Chillers:
Chillers are used to remove heat from a liquid. In most of the
medium and large air condi�oning systems, chilled water is
typically circulated through heat exchangers or coils in air handling
units or other types of devices close to the load centers. This cools
the air in the respec�ve space(s), a�er which the water is re‐
circulated back to the chiller to be cooled again. The cooling coils
transfer sensible heat and latent heat from the air to the chilled
water, thus cooling and usually, dehumidifying the air. A typical
chiller for air condi�oning applica�ons is rated between 15 and
1,500 tons (180,000 to or 53 to 5,300 kW) in cooling capacity.
Chilled water temperatures can range from 35 to 45 degrees
Fahrenheit (1.5 to 7 degrees Celsius), depending upon applica�on
requirements.
There are three main types of conven�onal chillers, namely,
i. Reciproca�ng Chillers: Reciproca�ng chillers are used as
central AC systems for buildings and consist of one or
more reciproca�ng compressor‐motor assemblies. The
reciproca�ng compressors are posi�ve displacement
compressors and can be found in ranges from frac�onal
to very high horsepower.
ii. Screw Chillers: Screw chillers are used as central systems
for buildings and consist of one or more screw
compressor‐motor assemblies. The screw compressor
has a rotary‐type posi�ve displacement mechanism and
uses two meshing helical screws (rotors), to compress the
gas.
iii. Scroll Chillers: Scroll chillers use a scroll compressor in the
packaged unit. Scroll compressors are orbital mo�on,
posi�ve‐displacement machines that compress air or
refrigerant with two inter‐fi�ng, spiral‐shaped scroll
members. Scroll compressors are quiet, smooth‐
opera�ng units with high efficiency ra�os.
Refrigerators:
A refrigerator transfers heat from the refrigerator to the
environment and hence cools the food stored inside the
refrigerator. It also has a freezer, which maintains the temperature
in the compartment below the freezing point of water to make ice
and store frozen food. A refrigerator has (i) evaporator, (ii)
compressor, (iii) condenser and an (iv) expansion device.
Refrigerator also has a refrigerant, which is vaporized in the
evaporator through the heat from inside the refrigerator followed
by raise in pressure and temperature of the refrigerant through the
compressor. The high pressure vapor is then condensed into high
pressure
�� Vapor-compression refrigera�on” Wikipedia, n.d. Web. 21 June 2013.
�� HVAC Systems." 2009 ASHRAE Handbook: Fundamentals. Atlanta, GA.: ASHRAE, 2009. 158. Print.
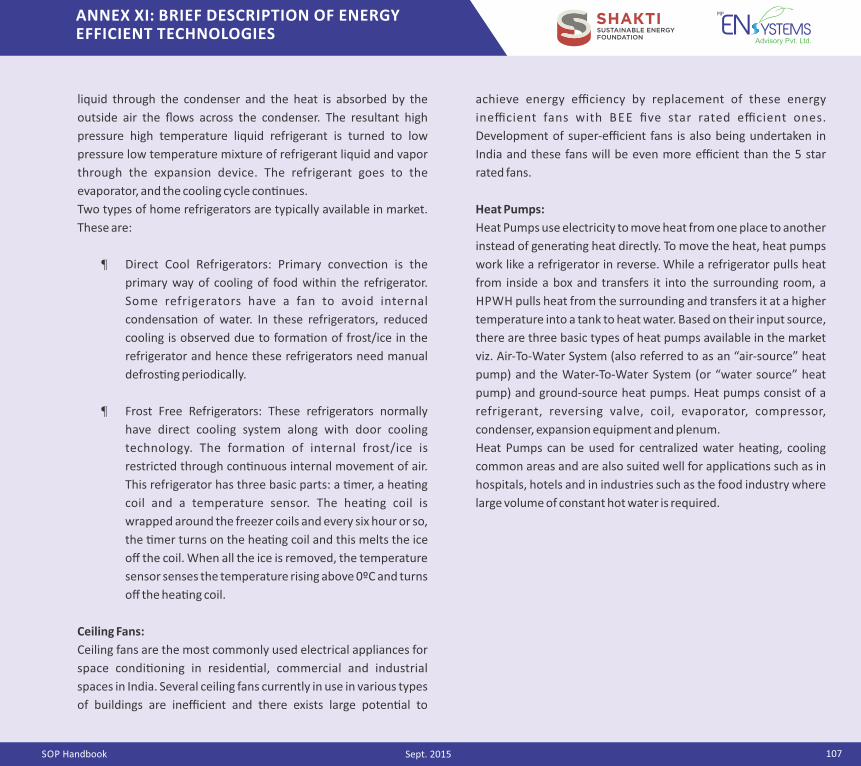
SOP Handbook
ANNEX XI: BRIEF DESCRIPTION OF ENERGY EFFICIENT TECHNOLOGIES
107Sept. 2015
liquid through the condenser and the heat is absorbed by the
outside air the flows across the condenser. The resultant high
pressure high temperature liquid refrigerant is turned to low
pressure low temperature mixture of refrigerant liquid and vapor
through the expansion device. The refrigerant goes to the
evaporator, and the cooling cycle con�nues.
Two types of home refrigerators are typically available in market.
These are:
Direct Cool Refrigerators: Primary convec�on is the
primary way of cooling of food within the refrigerator.
Some refrigerators have a fan to avoid internal
condensa�on of water. In these refrigerators, reduced
cooling is observed due to forma�on of frost/ice in the
refrigerator and hence these refrigerators need manual
defros�ng periodically.
Frost Free Refrigerators: These refrigerators normally
have direct cooling system along with door cooling
technology. The forma�on of internal frost/ice is
restricted through con�nuous internal movement of air.
This refrigerator has three basic parts: a �mer, a hea�ng
coil and a temperature sensor. The hea�ng coil is
wrapped around the freezer coils and every six hour or so,
the �mer turns on the hea�ng coil and this melts the ice
off the coil. When all the ice is removed, the temperature
sensor senses the temperature rising above 0ºC and turns
off the hea�ng coil.
Ceiling Fans:
Ceiling fans are the most commonly used electrical appliances for
space condi�oning in residen�al, commercial and industrial
spaces in India. Several ceiling fans currently in use in various types
of buildings are inefficient and there exists large poten�al to
achieve energy efficiency by replacement of these energy
inefficient fans with BEE five star rated efficient ones.
Development of super‐efficient fans is also being undertaken in
India and these fans will be even more efficient than the 5 star
rated fans.
Heat Pumps:
Heat Pumps use electricity to move heat from one place to another
instead of genera�ng heat directly. To move the heat, heat pumps
work like a refrigerator in reverse. While a refrigerator pulls heat
from inside a box and transfers it into the surrounding room, a
HPWH pulls heat from the surrounding and transfers it at a higher
temperature into a tank to heat water. Based on their input source,
there are three basic types of heat pumps available in the market
viz. Air‐To‐Water System (also referred to as an “air‐source” heat
pump) and the Water‐To‐Water System (or “water source” heat
pump) and ground‐source heat pumps. Heat pumps consist of a
refrigerant, reversing valve, coil, evaporator, compressor,
condenser, expansion equipment and plenum.
Heat Pumps can be used for centralized water hea�ng, cooling
common areas and are also suited well for applica�ons such as in
hospitals, hotels and in industries such as the food industry where
large volume of constant hot water is required.
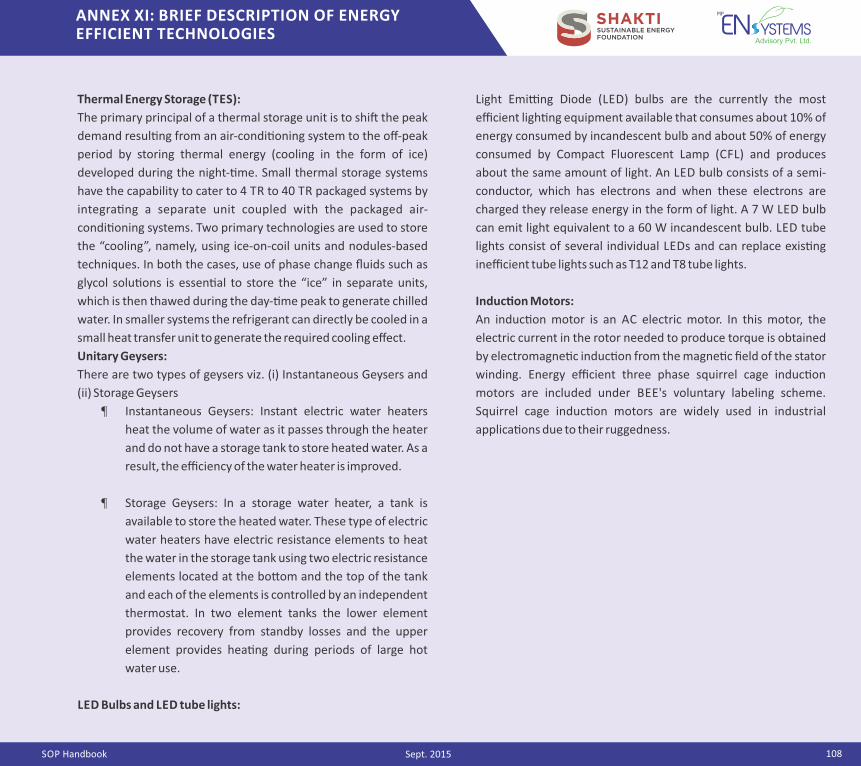
SOP Handbook
ANNEX XI: BRIEF DESCRIPTION OF ENERGY EFFICIENT TECHNOLOGIES
108Sept. 2015
Thermal Energy Storage (TES):
The primary principal of a thermal storage unit is to shi� the peak
demand resul�ng from an air‐condi�oning system to the off‐peak
period by storing thermal energy (cooling in the form of ice)
developed during the night‐�me. Small thermal storage systems
have the capability to cater to 4 TR to 40 TR packaged systems by
integra�ng a separate unit coupled with the packaged air‐
condi�oning systems. Two primary technologies are used to store
the “cooling”, namely, using ice‐on‐coil units and nodules‐based
techniques. In both the cases, use of phase change fluids such as
glycol solu�ons is essen�al to store the “ice” in separate units,
which is then thawed during the day‐�me peak to generate chilled
water. In smaller systems the refrigerant can directly be cooled in a
small heat transfer unit to generate the required cooling effect.
Unitary Geysers:
There are two types of geysers viz. (i) Instantaneous Geysers and
(ii) Storage Geysers
Instantaneous Geysers: Instant electric water heaters
heat the volume of water as it passes through the heater
and do not have a storage tank to store heated water. As a
result, the efficiency of the water heater is improved.
Storage Geysers: In a storage water heater, a tank is
available to store the heated water. These type of electric
water heaters have electric resistance elements to heat
the water in the storage tank using two electric resistance
elements located at the bo�om and the top of the tank
and each of the elements is controlled by an independent
thermostat. In two element tanks the lower element
provides recovery from standby losses and the upper
element provides hea�ng during periods of large hot
water use.
LED Bulbs and LED tube lights:
Light Emi�ng Diode (LED) bulbs are the currently the most
efficient ligh�ng equipment available that consumes about 10% of
energy consumed by incandescent bulb and about 50% of energy
consumed by Compact Fluorescent Lamp (CFL) and produces
about the same amount of light. An LED bulb consists of a semi‐
conductor, which has electrons and when these electrons are
charged they release energy in the form of light. A 7 W LED bulb
can emit light equivalent to a 60 W incandescent bulb. LED tube
lights consist of several individual LEDs and can replace exis�ng
inefficient tube lights such as T12 and T8 tube lights.
Induc�on Motors:
An induc�on motor is an AC electric motor. In this motor, the
electric current in the rotor needed to produce torque is obtained
by electromagne�c induc�on from the magne�c field of the stator
winding. Energy efficient three phase squirrel cage induc�on
motors are included under BEE's voluntary labeling scheme.
Squirrel cage induc�on motors are widely used in industrial
applica�ons due to their ruggedness.
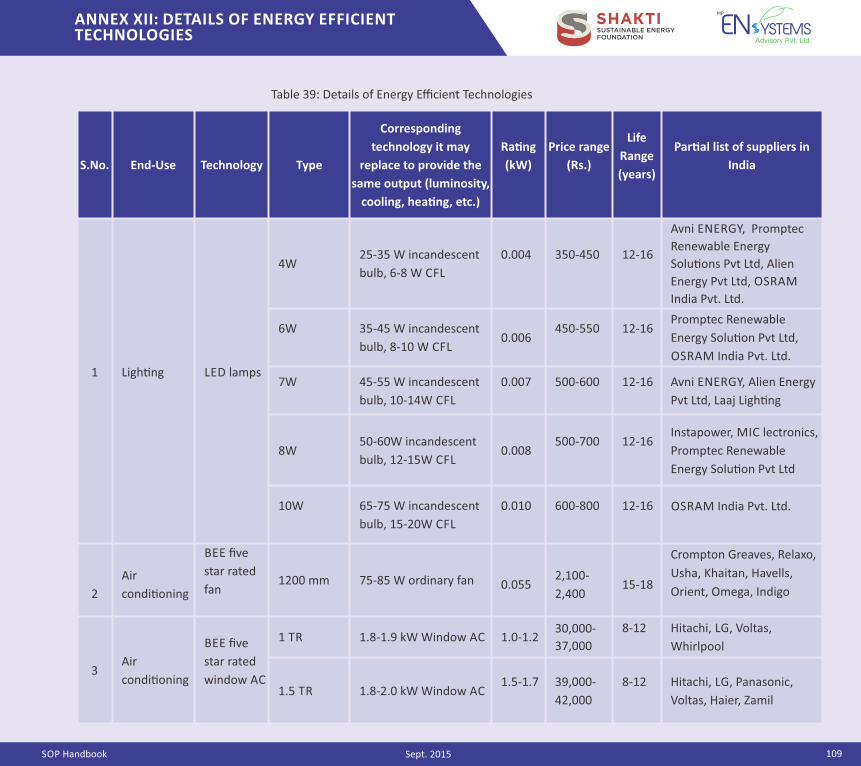
SOP Handbook 109
ANNEX XII: DETAILS OF ENERGY EFFICIENT TECHNOLOGIES
Sept. 2015
S.No. End‐Use Technology Type
Corresponding
technology it may
replace to provide the
same output (luminosity,
cooling, hea�ng, etc.)
Ra�ng
(kW)
Price range
(Rs.)
Life
Range
(years)
Par�al list of suppliers in
India
1 Ligh�ng LED lamps
4W25‐35 W incandescent
bulb, 6‐8 W CFL
0.004 350‐450 12‐16
Avni ENERGY, Promptec
Renewable Energy
Solu�ons Pvt Ltd, Alien
Energy Pvt Ltd, OSRAM
India Pvt. Ltd.
6W 35‐45 W incandescent
bulb, 8‐10 W CFL0.006
450‐550 12‐16Promptec Renewable
Energy Solu�on Pvt Ltd,
OSRAM India Pvt. Ltd.
7W 45‐55 W incandescent
bulb, 10‐14W CFL
0.007 500‐600 12‐16 Avni ENERGY, Alien Energy
Pvt Ltd, Laaj Ligh�ng
8W50‐60W incandescent
bulb, 12‐15W CFL0.008
500‐700 12‐16Instapower, MIC lectronics,
Promptec Renewable
Energy Solu�on Pvt Ltd
10W 65‐75 W incandescent
bulb, 15‐20W CFL
0.010 600‐800 12‐16 OSRAM India Pvt. Ltd.
2
Air
condi�oning
BEE five
star rated
fan1200 mm 75‐85 W ordinary fan 0.055
2,100‐
2,40015‐18
Crompton Greaves, Relaxo,
Usha, Khaitan, Havells,
Orient, Omega, Indigo
3Air
condi�oning
BEE five
star rated
window AC
1 TR 1.8‐1.9 kW Window AC 1.0‐1.230,000‐
37,000
8‐12 Hitachi, LG, Voltas,
Whirlpool
1.5 TR 1.8‐2.0 kW Window AC1.5‐1.7 39,000‐
42,000
8‐12 Hitachi, LG, Panasonic,
Voltas, Haier, Zamil
Table 39: Details of Energy Efficient Technologies
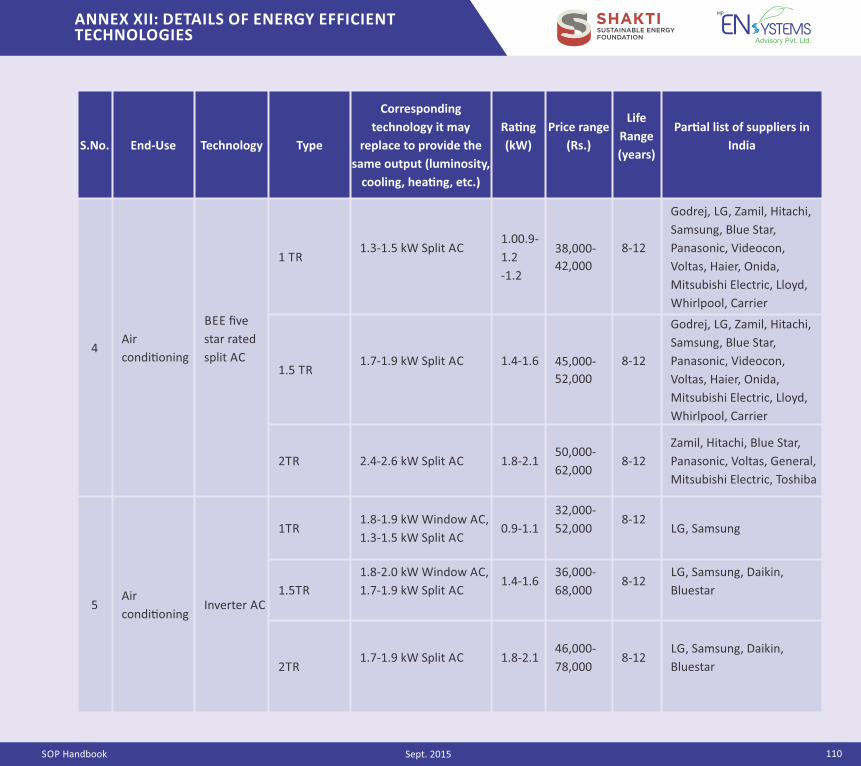
SOP Handbook
ANNEX XII: DETAILS OF ENERGY EFFICIENT TECHNOLOGIES
110Sept. 2015
S.No. End‐Use Technology Type
Corresponding
technology it may
replace to provide the
same output (luminosity,
cooling, hea�ng, etc.)
Ra�ng
(kW)
Price range
(Rs.)
Life
Range
(years)
Par�al list of suppliers in
India
4Air
condi�oning
BEE five
star rated
split AC
1 TR1.3‐1.5 kW Split AC
1.00.9‐
1.2
‐1.2
38,000‐
42,000
8‐12
Godrej, LG, Zamil, Hitachi,
Samsung, Blue Star,
Panasonic, Videocon,
Voltas, Haier, Onida,
Mitsubishi Electric, Lloyd,
Whirlpool, Carrier
1.5 TR1.7‐1.9 kW Split AC 1.4‐1.6 45,000‐
52,000
8‐12
Godrej, LG, Zamil, Hitachi,
Samsung, Blue Star,
Panasonic, Videocon,
Voltas, Haier, Onida,
Mitsubishi Electric, Lloyd,
Whirlpool, Carrier
2TR 2.4‐2.6 kW Split AC 1.8‐2.150,000‐
62,0008‐12
Zamil, Hitachi, Blue Star,
Panasonic, Voltas, General,
Mitsubishi Electric, Toshiba
5Air
condi�oningInverter AC
1TR1.8‐1.9 kW Window AC,
1.3‐1.5 kW Split AC0.9‐1.1
32,000‐
52,0008‐12
LG, Samsung
1.5TR
1.8‐2.0 kW Window AC,
1.7‐1.9 kW Split AC1.4‐1.6
36,000‐
68,0008‐12
LG, Samsung, Daikin,
Bluestar
2TR1.7‐1.9 kW Split AC 1.8‐2.1
46,000‐
78,0008‐12
LG, Samsung, Daikin,
Bluestar
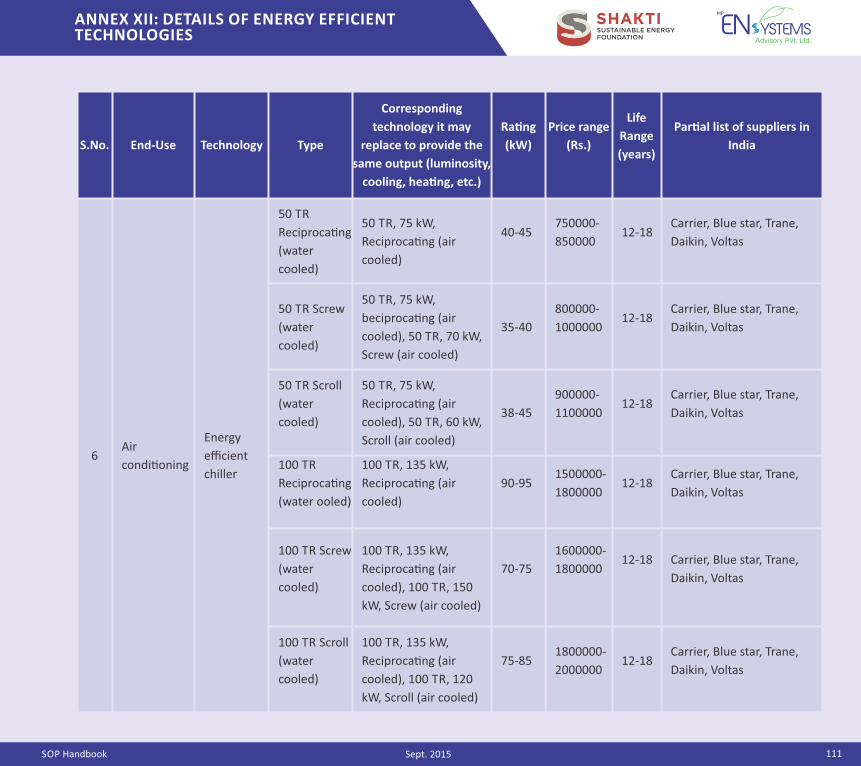
SOP Handbook
ANNEX XII: DETAILS OF ENERGY EFFICIENT TECHNOLOGIES
111Sept. 2015
S.No. End‐Use Technology Type
Corresponding
technology it may
replace to provide the
same output (luminosity,
cooling, hea�ng, etc.)
Ra�ng
(kW)
Price range
(Rs.)
Life
Range
(years)
Par�al list of suppliers in
India
6Air
condi�oning
Energy
efficient
chiller
50 TR
Reciproca�ng
(water
cooled)
50 TR, 75 kW,
Reciproca�ng (air
cooled)
40‐45750000‐
85000012‐18
Carrier, Blue star, Trane,
Daikin, Voltas
50 TR Screw
(water
cooled)
50 TR, 75 kW,
beciproca�ng (air
cooled), 50 TR, 70 kW,
Screw (air cooled)
35‐40
800000‐
100000012‐18
Carrier, Blue star, Trane,
Daikin, Voltas
50 TR Scroll
(water
cooled)
50 TR, 75 kW,
Reciproca�ng (air
cooled), 50 TR, 60 kW,
Scroll (air cooled)
38‐45
900000‐
110000012‐18
Carrier, Blue star, Trane,
Daikin, Voltas
100 TR
Reciproca�ng
(water ooled)
100 TR, 135 kW,
Reciproca�ng (air
cooled)
90‐951500000‐
180000012‐18
Carrier, Blue star, Trane,
Daikin, Voltas
100 TR Screw
(water
cooled)
100 TR, 135 kW,
Reciproca�ng (air
cooled), 100 TR, 150
kW, Screw (air cooled)
70‐75
1600000‐
180000012‐18 Carrier, Blue star, Trane,
Daikin, Voltas
100 TR Scroll
(water
cooled)
100 TR, 135 kW,
Reciproca�ng (air
cooled), 100 TR, 120
kW, Scroll (air cooled)
75‐851800000‐
200000012‐18
Carrier, Blue star, Trane,
Daikin, Voltas
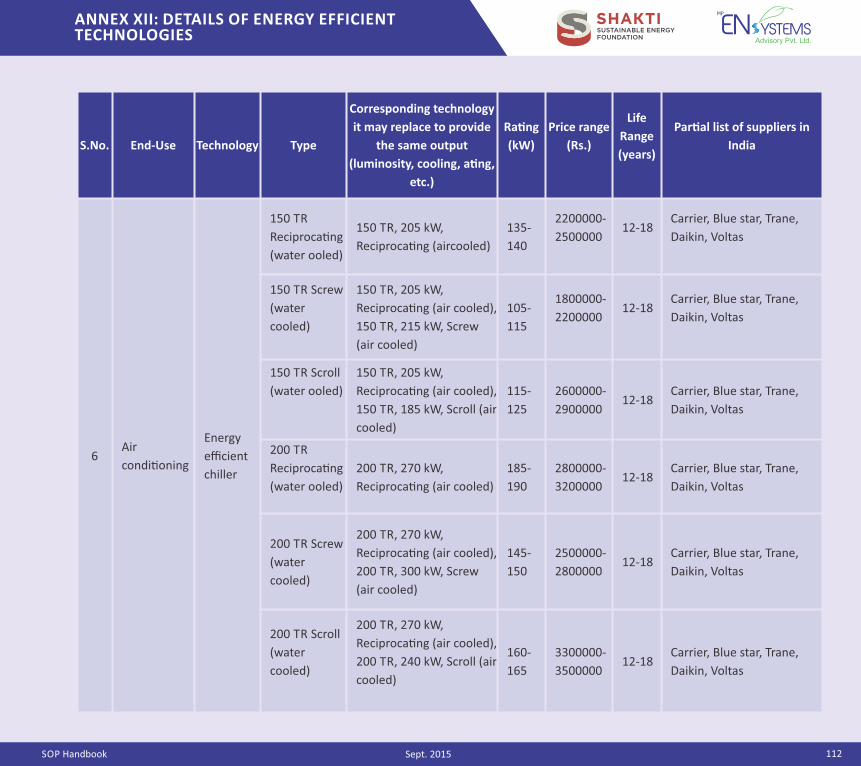
SOP Handbook
ANNEX XII: DETAILS OF ENERGY EFFICIENT TECHNOLOGIES
112Sept. 2015
S.No. End‐Use Technology Type
Corresponding technology
it may replace to provide
the same output
(luminosity, cooling, a�ng,
etc.)
Ra�ng
(kW)
Price range
(Rs.)
Life
Range
(years)
Par�al list of suppliers in
India
6Air
condi�oning
Energy
efficient
chiller
150 TR
Reciproca�ng
(water ooled)
150 TR, 205 kW,
Reciproca�ng (aircooled)
135‐
140
2200000‐
250000012‐18
Carrier, Blue star, Trane,
Daikin, Voltas
150 TR Screw
(water
cooled)
150 TR, 205 kW,
Reciproca�ng (air cooled),
150 TR, 215 kW, Screw
(air cooled)
105‐
115
1800000‐
220000012‐18
Carrier, Blue star, Trane,
Daikin, Voltas
150 TR Scroll
(water ooled)
150 TR, 205 kW,
Reciproca�ng (air cooled),
150 TR, 185 kW, Scroll (air
cooled)
115‐
125
2600000‐
290000012‐18
Carrier, Blue star, Trane,
Daikin, Voltas
200 TR
Reciproca�ng
(water ooled)
200 TR, 270 kW,
Reciproca�ng (air cooled)
185‐
190
2800000‐
320000012‐18
Carrier, Blue star, Trane,
Daikin, Voltas
200 TR Screw
(water
cooled)
200 TR, 270 kW,
Reciproca�ng (air cooled),
200 TR, 300 kW, Screw
(air cooled)
145‐
150
2500000‐
280000012‐18
Carrier, Blue star, Trane,
Daikin, Voltas
200 TR Scroll
(water
cooled)
200 TR, 270 kW,
Reciproca�ng (air cooled),
200 TR, 240 kW, Scroll (air
cooled)
160‐
165
3300000‐
350000012‐18
Carrier, Blue star, Trane,
Daikin, Voltas
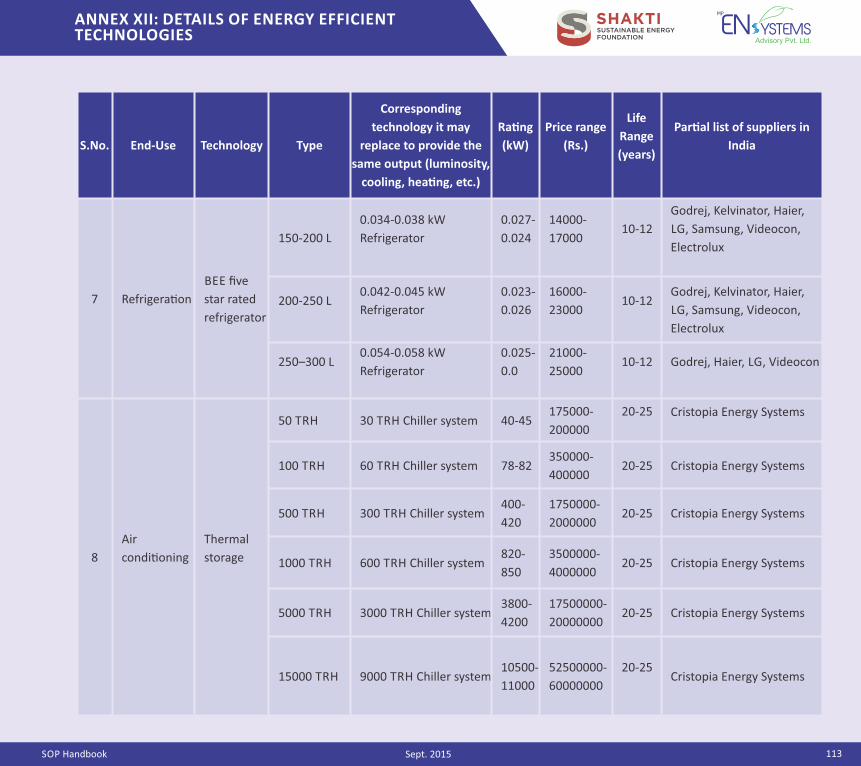
SOP Handbook
ANNEX XII: DETAILS OF ENERGY EFFICIENT TECHNOLOGIES
113Sept. 2015
S.No. End‐Use Technology Type
Corresponding
technology it may
replace to provide the
same output (luminosity,
cooling, hea�ng, etc.)
Ra�ng
(kW)
Price range
(Rs.)
Life
Range
(years)
Par�al list of suppliers in
India
7 Refrigera�on
BEE five
star rated
refrigerator
150‐200 L
0.034‐0.038 kW
Refrigerator
0.027‐
0.024
14000‐
1700010‐12
Godrej, Kelvinator, Haier,
LG, Samsung, Videocon,
Electrolux
200‐250 L0.042‐0.045 kW
Refrigerator
0.023‐
0.026
16000‐
2300010‐12
Godrej, Kelvinator, Haier,
LG, Samsung, Videocon,
Electrolux
250–300 L0.054‐0.058 kW
Refrigerator
0.025‐
0.0
21000‐
2500010‐12 Godrej, Haier, LG, Videocon
8
Air
condi�oning
Thermal
storage
50 TRH 30 TRH Chiller system 40‐45175000‐
200000
20‐25 Cristopia Energy Systems
100 TRH 60 TRH Chiller system 78‐82350000‐
40000020‐25 Cristopia Energy Systems
500 TRH 300 TRH Chiller system400‐
420
1750000‐
200000020‐25 Cristopia Energy Systems
1000 TRH 600 TRH Chiller system820‐
850
3500000‐
400000020‐25 Cristopia Energy Systems
5000 TRH 3000 TRH Chiller system3800‐
4200
17500000‐
2000000020‐25 Cristopia Energy Systems
15000 TRH 9000 TRH Chiller system10500‐
11000
52500000‐
60000000
20‐25Cristopia Energy Systems
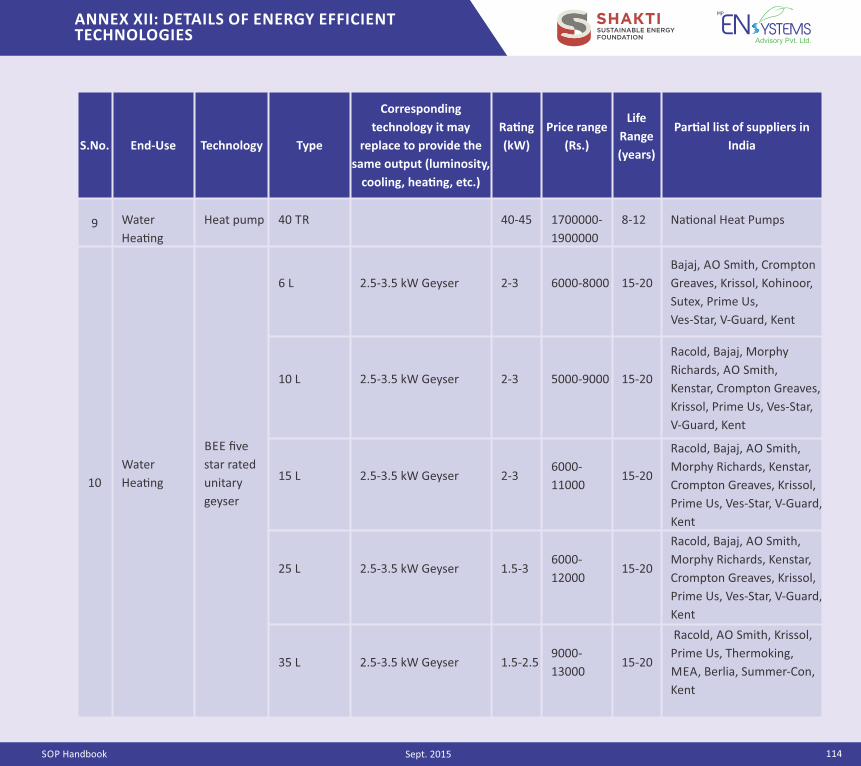
SOP Handbook
ANNEX XII: DETAILS OF ENERGY EFFICIENT TECHNOLOGIES
114Sept. 2015
S.No. End‐Use Technology Type
Corresponding
technology it may
replace to provide the
same output (luminosity,
cooling, hea�ng, etc.)
Ra�ng
(kW)
Price range
(Rs.)
Life
Range
(years)
Par�al list of suppliers in
India
9 Water
Hea�ng
Heat pump 40 TR 40‐45 1700000‐
1900000
8‐12 Na�onal Heat Pumps
10
Water
Hea�ng
BEE five
star rated
unitary
geyser
6 L 2.5‐3.5 kW Geyser 2‐3 6000‐8000 15‐20
Bajaj, AO Smith, Crompton
Greaves, Krissol, Kohinoor,
Sutex, Prime Us,
Ves‐Star, V‐Guard, Kent
10 L 2.5‐3.5 kW Geyser 2‐3 5000‐9000 15‐20
Racold, Bajaj, Morphy
Richards, AO Smith,
Kenstar, Crompton Greaves,
Krissol, Prime Us, Ves‐Star,
V‐Guard, Kent
15 L 2.5‐3.5 kW Geyser 2‐36000‐
1100015‐20
Racold, Bajaj, AO Smith,
Morphy Richards, Kenstar,
Crompton Greaves, Krissol,
Prime Us, Ves‐Star, V‐Guard,
Kent
25 L 2.5‐3.5 kW Geyser 1.5‐36000‐
1200015‐20
Racold, Bajaj, AO Smith,
Morphy Richards, Kenstar,
Crompton Greaves, Krissol,
Prime Us, Ves‐Star, V‐Guard,
Kent
35 L 2.5‐3.5 kW Geyser 1.5‐2.59000‐
1300015‐20
Racold, AO Smith, Krissol,
Prime Us, Thermoking,
MEA, Berlia, Summer‐Con,
Kent
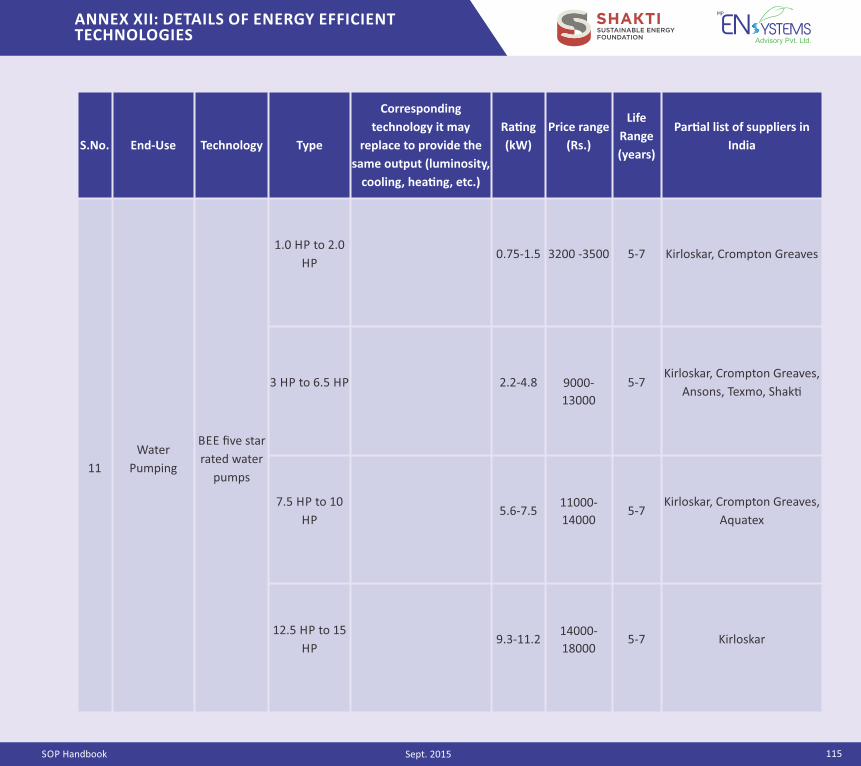
SOP Handbook
ANNEX XII: DETAILS OF ENERGY EFFICIENT TECHNOLOGIES
115Sept. 2015
S.No. End‐Use Technology Type
Corresponding
technology it may
replace to provide the
same output (luminosity,
cooling, hea�ng, etc.)
Ra�ng
(kW)
Price range
(Rs.)
Life
Range
(years)
Par�al list of suppliers in
India
11
Water
Pumping
BEE five star
rated water
pumps
1.0 HP to 2.0
HP0.75‐1.5 3200 ‐3500 5‐7 Kirloskar, Crompton Greaves
3 HP to 6.5 HP 2.2‐4.8 9000‐
13000
5‐7Kirloskar, Crompton Greaves,
Ansons, Texmo, Shak�
7.5 HP to 10
HP5.6‐7.5
11000‐
140005‐7
Kirloskar, Crompton Greaves,
Aquatex
12.5 HP to 15
HP9.3‐11.2
14000‐
180005‐7 Kirloskar
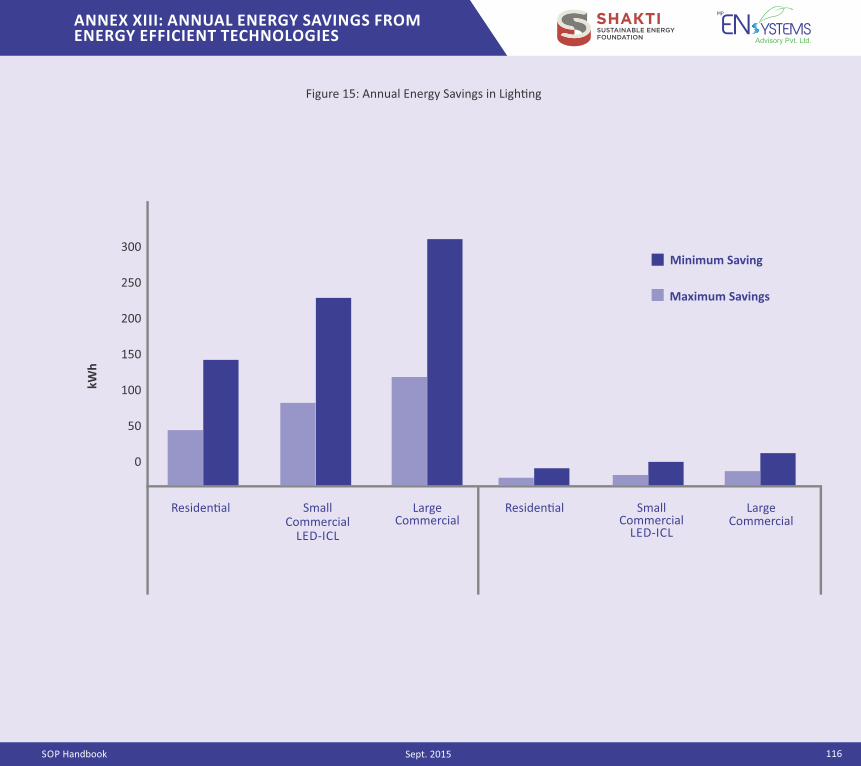
SOP Handbook
ANNEX XIII: ANNUAL ENERGY SAVINGS FROM ENERGY EFFICIENT TECHNOLOGIES
116Sept. 2015
Figure 15: Annual Energy Savings in Ligh�ng
300
250
200
150
100
50
0
Minimum Saving
Maximum Savings
kWh
Residen�al SmallCommercial
LED‐ICL
LargeCommercial
Residen�al SmallCommercial
LED‐ICL
LargeCommercial
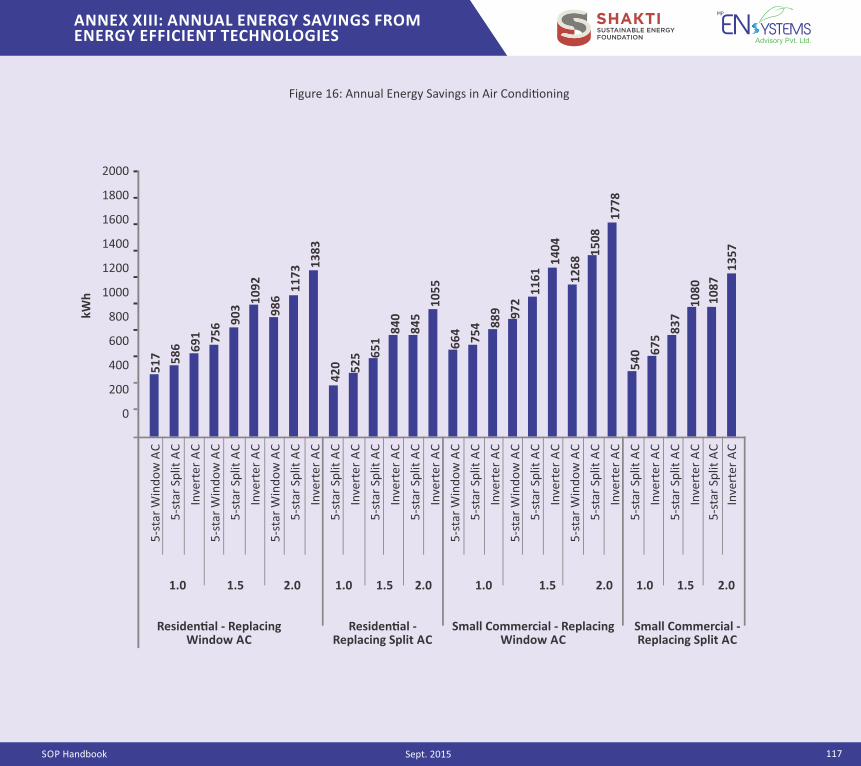
SOP Handbook 117
ANNEX XIII: ANNUAL ENERGY SAVINGS FROM ENERGY EFFICIENT TECHNOLOGIES
Sept. 2015
Figure 16: Annual Energy Savings in Air Condi�oning
2000
1800
1600
1400
1200
1000
800
600
400
200
0
kWh
5‐s
tar
Win
do
w A
C
5‐s
tar
Split
AC
Inve
rter
AC
5‐s
tar
Win
do
w A
C
5‐s
tar
Split
AC
Inve
rter
AC
5‐s
tar
Win
do
w A
C
5‐s
tar
Split
AC
Inve
rter
AC
5‐s
tar
Split
AC
Inve
rter
AC
5‐s
tar
Split
AC
Inve
rter
AC
5‐s
tar
Split
AC
Inve
rter
AC
5‐s
tar
Win
do
w A
C
5‐s
tar
Split
AC
Inve
rter
AC
5‐s
tar
Win
do
w A
C
5‐s
tar
Split
AC
Inve
rter
AC
5‐s
tar
Win
do
w A
C
5‐s
tar
Split
AC
Inve
rter
AC
5‐s
tar
Split
AC
Inve
rter
AC
5‐s
tar
Split
AC
Inve
rter
AC
5‐s
tar
Split
AC
Inve
rter
AC
1.0 1.5 2.0 1.0 1.5 2.01.0 1.5 2.0 1.0 1.5 2.0
Residen�al ‐ ReplacingWindow AC
Residen�al ‐ Replacing Split AC
Small Commercial ‐ ReplacingWindow AC
Small Commercial ‐ Replacing Split AC
5
17
58
6
6
91
75
6
90
3
10
92
9
86
11
73
13
83
42
0
5
25
65
1
8
40
8
45
10
55
6
64
75
4
88
9
9
72
1
16
1
1
40
4
1
26
8
15
08
17
78
5
40
6
75
8
37
10
80
10
87
13
57
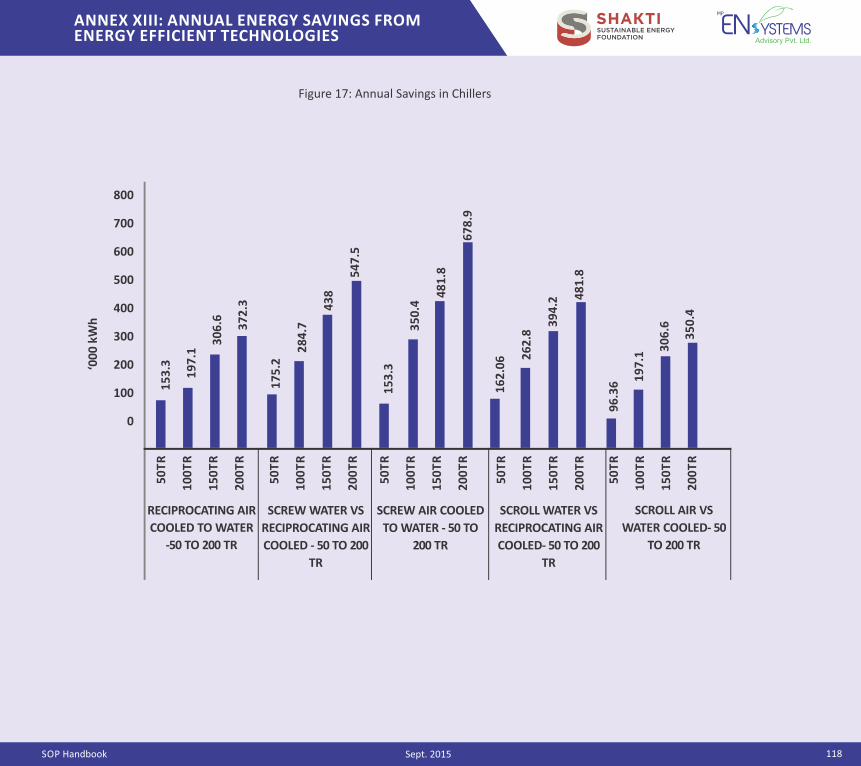
SOP Handbook 118
ANNEX XIII: ANNUAL ENERGY SAVINGS FROM ENERGY EFFICIENT TECHNOLOGIES
Sept. 2015
Figure 17: Annual Savings in Chillers
800
700
600
500
400
300
200
100
0
‘00
0 k
Wh
RECIPROCATING AIR
COOLED TO WATER
‐50 TO 200 TR
50
TR
10
0T
R
15
0T
R
20
0T
R
SCREW WATER VS
RECIPROCATING AIR
COOLED ‐ 50 TO 200
TR
SCREW AIR COOLED
TO WATER ‐ 50 TO
200 TR
SCROLL WATER VS
RECIPROCATING AIR
COOLED‐ 50 TO 200
TR
SCROLL AIR VS
WATER COOLED‐ 50
TO 200 TR
50
TR
10
0T
R
15
0T
R
20
0T
R
50
TR
10
0T
R
15
0T
R
20
0T
R
50
TR
10
0T
R
15
0T
R
20
0T
R
50
TR
10
0T
R
15
0T
R
20
0T
R
15
3.3
1
97
.1
3
06
.6
37
2.3
17
5.2
28
4.7
4
38
54
7.5
15
3.3
3
50
.4
48
1.8
6
78
.9
16
2.0
6
2
62
.8
3
94
.2
48
1.8
96
.36
1
97
.1
30
6.6
35
0.4
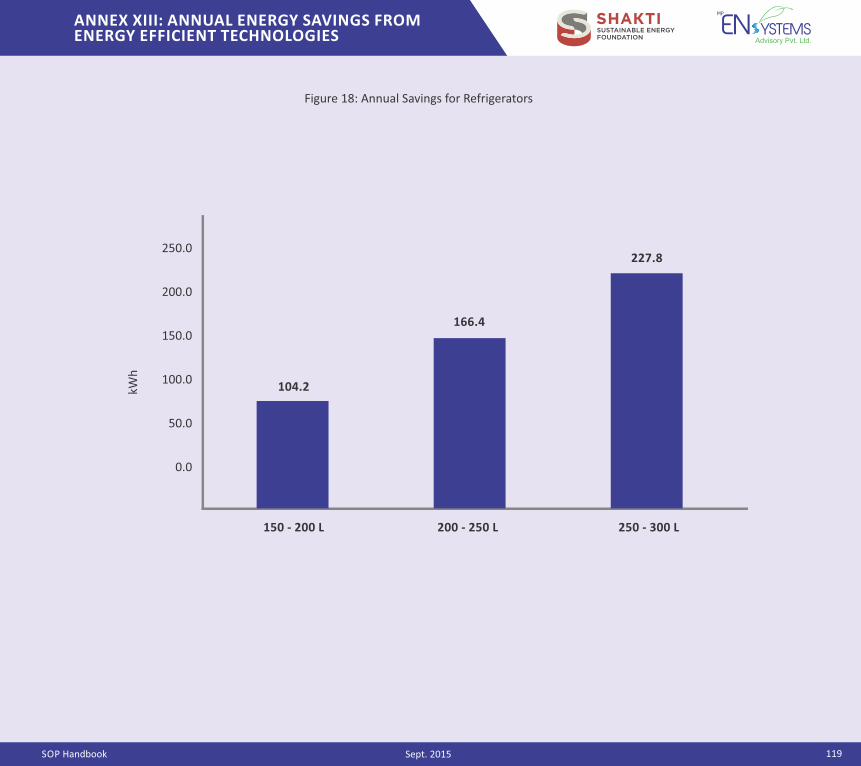
SOP Handbook
ANNEX XIII: ANNUAL ENERGY SAVINGS FROM ENERGY EFFICIENT TECHNOLOGIES
119Sept. 2015
Figure 18: Annual Savings for Refrigerators
250.0
200.0
150.0
100.0
50.0
0.0
150 ‐ 200 L 200 ‐ 250 L 250 ‐ 300 L
kWh
104.2
166.4
227.8
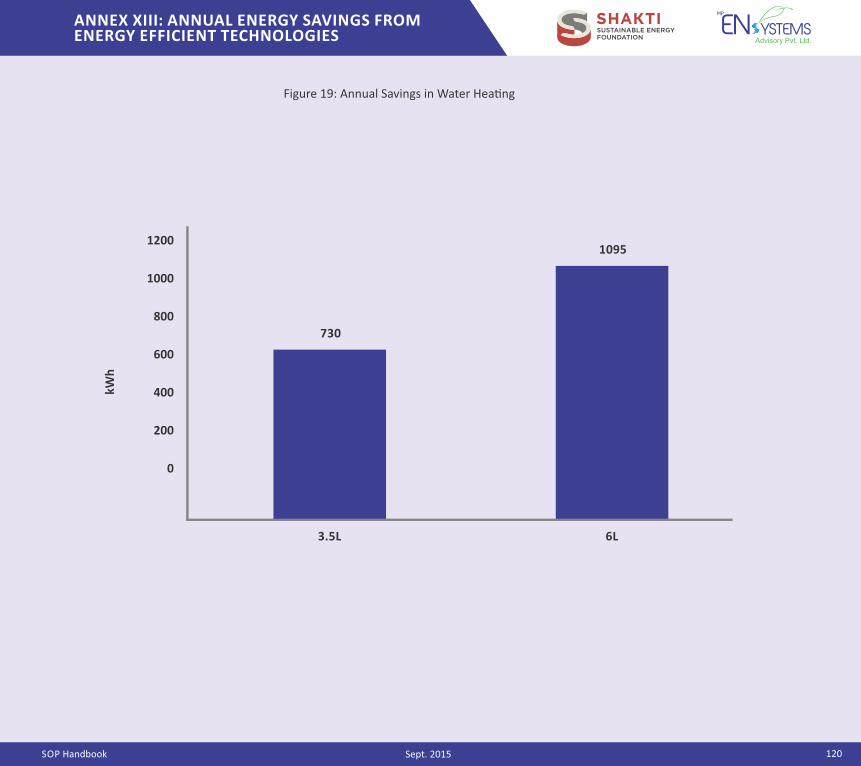
SOP Handbook
ANNEX XIII: ANNUAL ENERGY SAVINGS FROM ENERGY EFFICIENT TECHNOLOGIES
120Sept. 2015
Figure 19: Annual Savings in Water Hea�ng
1200
1000
800
600
400
200
0
3.5L
730
6L
1095
kWh
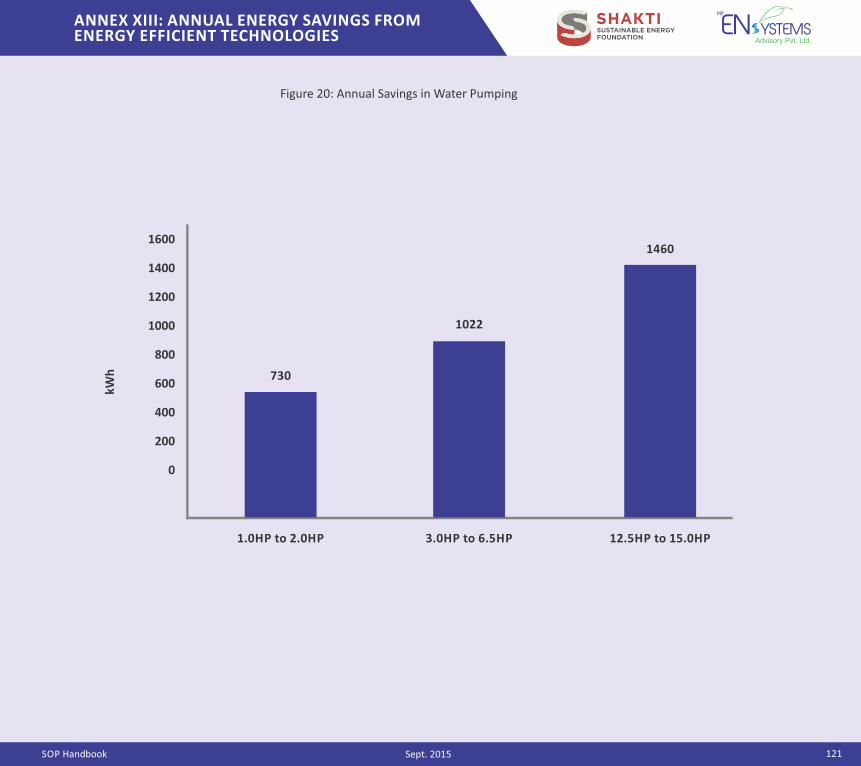
SOP Handbook
ANNEX XIII: ANNUAL ENERGY SAVINGS FROM ENERGY EFFICIENT TECHNOLOGIES
121Sept. 2015
Figure 20: Annual Savings in Water Pumping
1600
1400
1200
1000
800
600
400
200
0
1.0HP to 2.0HP
kWh 730
3.0HP to 6.5HP
1022
12.5HP to 15.0HP
1460
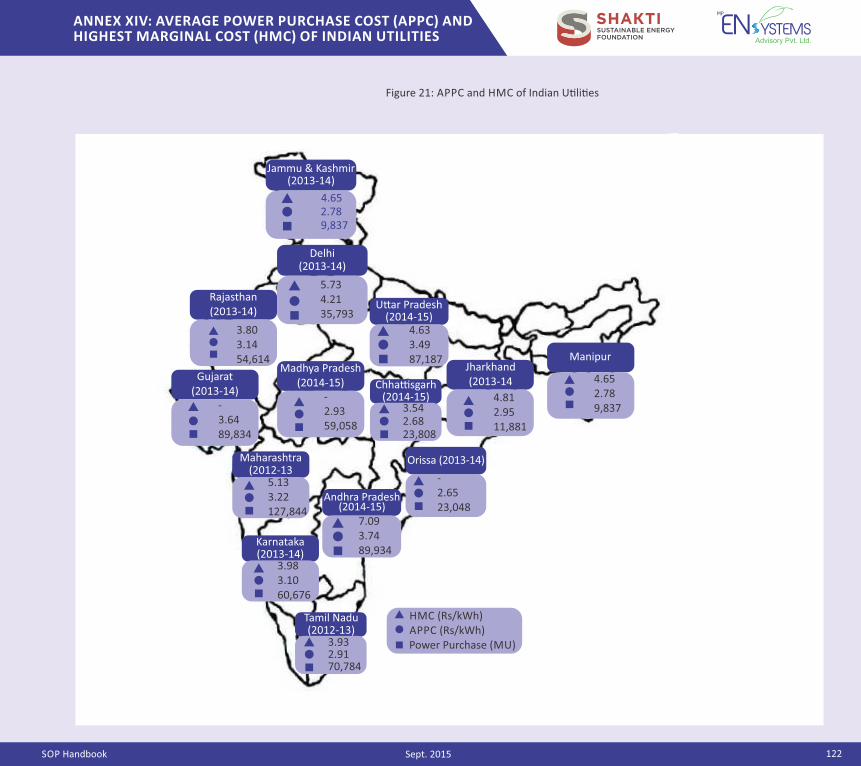
SOP Handbook
ANNEX XIV: AVERAGE POWER PURCHASE COST (APPC) AND HIGHEST MARGINAL COST (HMC) OF INDIAN UTILITIES
122Sept. 2015
Figure 21: APPC and HMC of Indian U�li�es
Jammu & Kashmir(2013‐14)
4.652.789,837
Rajasthan(2013‐14)
3.803.1454,614
Delhi(2013‐14)
5.734.2135,793
U�ar Pradesh(2014‐15)
4.633.4987,187
Gujarat(2013‐14)
‐3.6489,834
Madhya Pradesh(2014‐15)
‐2.9359,058
Jharkhand(2013‐14
4.812.9511,881
Manipur
4.652.789,837
Maharashtra(2012‐13
5.133.22127,844
Chha�sgarh (2014‐15)
3.542.6823,808
Orissa (2013‐14)
‐2.6523,048
Karnataka (2013‐14)
3.983.1060,676
7.093.7489,934
Andhra Pradesh (2014‐15)
3.932.9170,784
Tamil Nadu (2012‐13)
HMC (Rs/kWh)APPC (Rs/kWh)Power Purchase (MU)
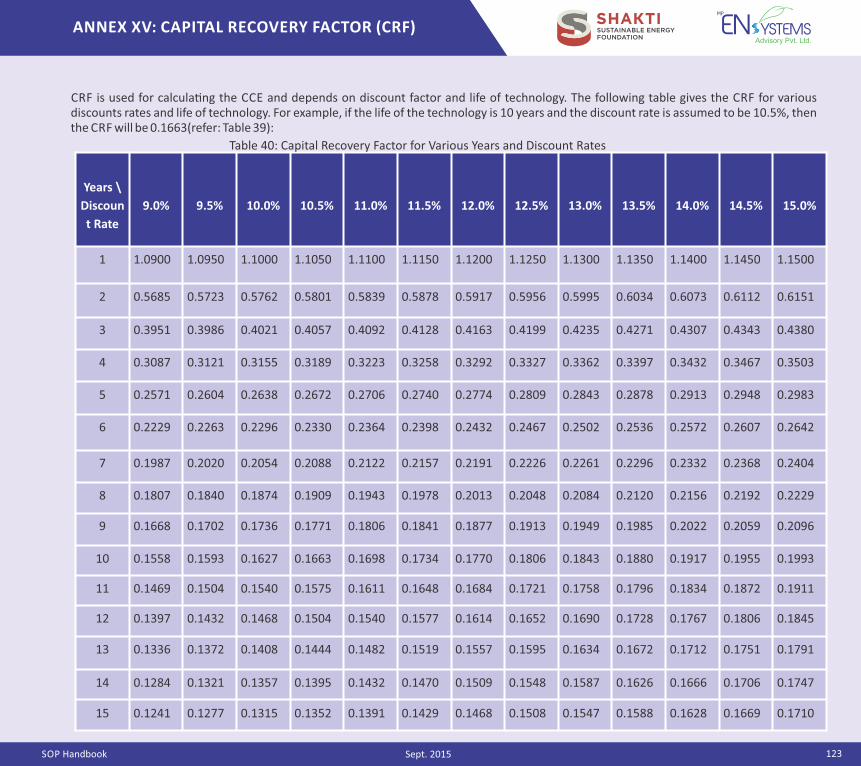
SOP Handbook
ANNEX XV: CAPITAL RECOVERY FACTOR (CRF)
123Sept. 2015
Years \
Discoun
t Rate
9.0% 9.5% 10.0% 10.5% 11.0% 11.5% 12.0% 12.5% 13.0% 13.5% 14.0% 14.5% 15.0%
1 1.0900 1.0950 1.1000 1.1050 1.1100 1.1150 1.1200 1.1250 1.1300 1.1350 1.1400 1.1450 1.1500
2 0.5685 0.5723 0.5762 0.5801 0.5839 0.5878 0.5917 0.5956 0.5995 0.6034 0.6073 0.6112 0.6151
3 0.3951 0.3986 0.4021 0.4057 0.4092 0.4128 0.4163 0.4199 0.4235 0.4271 0.4307 0.4343 0.4380
4 0.3087 0.3121 0.3155 0.3189 0.3223 0.3258 0.3292 0.3327 0.3362 0.3397 0.3432 0.3467 0.3503
5 0.2571 0.2604 0.2638 0.2672 0.2706 0.2740 0.2774 0.2809 0.2843 0.2878 0.2913 0.2948 0.2983
6 0.2229 0.2263 0.2296 0.2330 0.2364 0.2398 0.2432 0.2467 0.2502 0.2536 0.2572 0.2607 0.2642
7 0.1987 0.2020 0.2054 0.2088 0.2122 0.2157 0.2191 0.2226 0.2261 0.2296 0.2332 0.2368 0.2404
8 0.1807 0.1840 0.1874 0.1909 0.1943 0.1978 0.2013 0.2048 0.2084 0.2120 0.2156 0.2192 0.2229
9 0.1668 0.1702 0.1736 0.1771 0.1806 0.1841 0.1877 0.1913 0.1949 0.1985 0.2022 0.2059 0.2096
10 0.1558 0.1593 0.1627 0.1663 0.1698 0.1734 0.1770 0.1806 0.1843 0.1880 0.1917 0.1955 0.1993
11 0.1469 0.1504 0.1540 0.1575 0.1611 0.1648 0.1684 0.1721 0.1758 0.1796 0.1834 0.1872 0.1911
12 0.1397 0.1432 0.1468 0.1504 0.1540 0.1577 0.1614 0.1652 0.1690 0.1728 0.1767 0.1806 0.1845
13 0.1336 0.1372 0.1408 0.1444 0.1482 0.1519 0.1557 0.1595 0.1634 0.1672 0.1712 0.1751 0.1791
14 0.1284 0.1321 0.1357 0.1395 0.1432 0.1470 0.1509 0.1548 0.1587 0.1626 0.1666 0.1706 0.1747
15 0.1241 0.1277 0.1315 0.1352 0.1391 0.1429 0.1468 0.1508 0.1547 0.1588 0.1628 0.1669 0.1710
CRF is used for calcula�ng the CCE and depends on discount factor and life of technology. The following table gives the CRF for various discounts rates and life of technology. For example, if the life of the technology is 10 years and the discount rate is assumed to be 10.5%, then the CRF will be 0.1663(refer: Table 39):
Table 40: Capital Recovery Factor for Various Years and Discount Rates
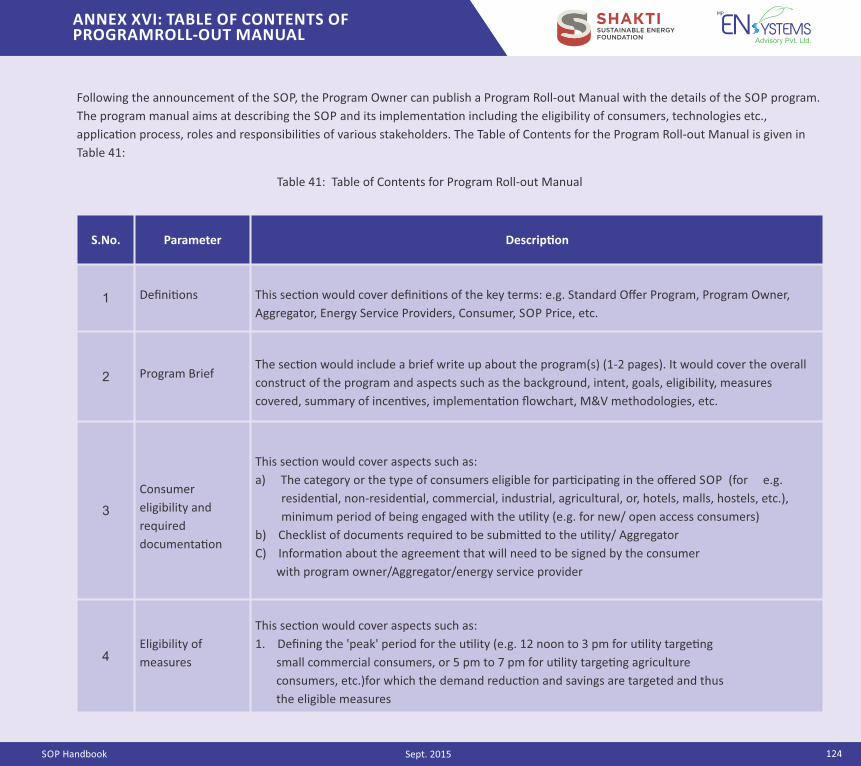
SOP Handbook July 2015 128 SOP Handbook 124
ANNEX XVI: TABLE OF CONTENTS OF PROGRAMROLL‐OUT MANUAL
Sept. 2015
Following the announcement of the SOP, the Program Owner can publish a Program Roll‐out Manual with the details of the SOP program.
The program manual aims at describing the SOP and its implementa�on including the eligibility of consumers, technologies etc.,
applica�on process, roles and responsibili�es of various stakeholders. The Table of Contents for the Program Roll‐out Manual is given in
Table 41:
Table 41: Table of Contents for Program Roll‐out Manual
S.No. Parameter Descrip�on
1 Defini�ons This sec�on would cover defini�ons of the key terms: e.g. Standard Offer Program, Program Owner,
Aggregator, Energy Service Providers, Consumer, SOP Price, etc.
2 Program BriefThe sec�on would include a brief write up about the program(s) (1‐2 pages). It would cover the overall
construct of the program and aspects such as the background, intent, goals, eligibility, measures
covered, summary of incen�ves, implementa�on flowchart, M&V methodologies, etc.
3
Consumer
eligibility and
required
documenta�on
This sec�on would cover aspects such as:
a) The category or the type of consumers eligible for par�cipa�ng in the offered SOP (for e.g.
residen�al, non‐residen�al, commercial, industrial, agricultural, or, hotels, malls, hostels, etc.),
minimum period of being engaged with the u�lity (e.g. for new/ open access consumers)
b) Checklist of documents required to be submi�ed to the u�lity/ Aggregator
C) Informa�on about the agreement that will need to be signed by the consumer
with program owner/Aggregator/energy service provider
4Eligibility of
measures
This sec�on would cover aspects such as:
1. Defining the 'peak' period for the u�lity (e.g. 12 noon to 3 pm for u�lity targe�ng
small commercial consumers, or 5 pm to 7 pm for u�lity targe�ng agriculture
consumers, etc.)for which the demand reduc�on and savings are targeted and thus
the eligible measures
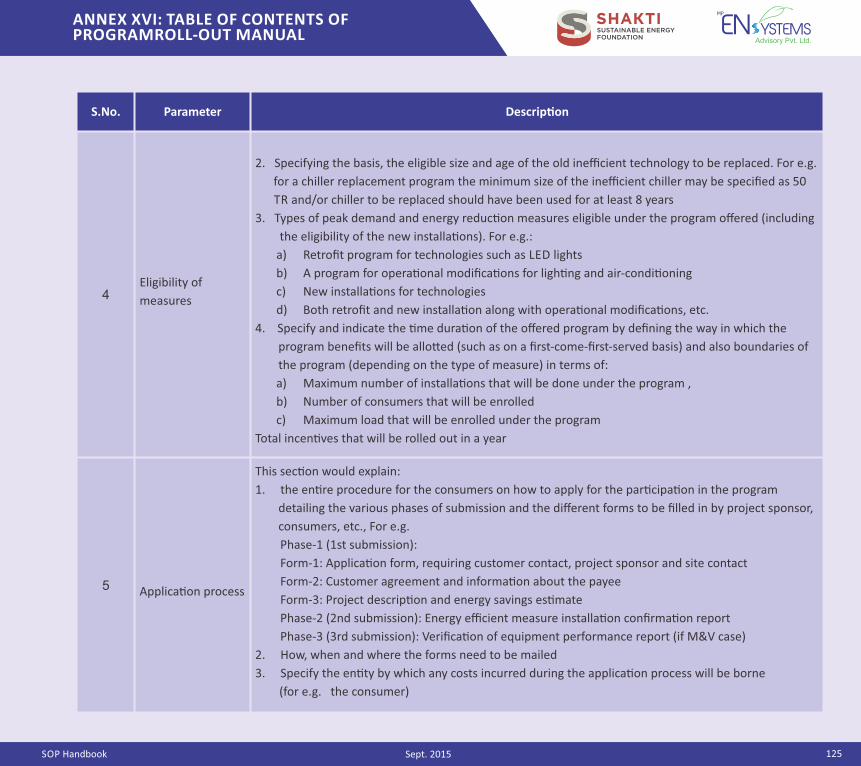
SOP Handbook July 2015 129 SOP Handbook
ANNEX XVI: TABLE OF CONTENTS OF PROGRAMROLL‐OUT MANUAL
125Sept. 2015
S.No. Parameter Descrip�on
4Eligibility of
measures
2. Specifying the basis, the eligible size and age of the old inefficient technology to be replaced. For e.g.
for a chiller replacement program the minimum size of the inefficient chiller may be specified as 50
TR and/or chiller to be replaced should have been used for at least 8 years
3. Types of peak demand and energy reduc�on measures eligible under the program offered (including
the eligibility of the new installa�ons). For e.g.:
a) Retrofit program for technologies such as LED lights
b) A program for opera�onal modifica�ons for ligh�ng and air‐condi�oning
c) New installa�ons for technologies
d) Both retrofit and new installa�on along with opera�onal modifica�ons, etc.
4. Specify and indicate the �me dura�on of the offered program by defining the way in which the
program benefits will be allo�ed (such as on a first‐come‐first‐served basis) and also boundaries of
the program (depending on the type of measure) in terms of:
a) Maximum number of installa�ons that will be done under the program ,
b) Number of consumers that will be enrolled
c) Maximum load that will be enrolled under the program
Total incen�ves that will be rolled out in a year
5 Applica�on process
This sec�on would explain:
1. the en�re procedure for the consumers on how to apply for the par�cipa�on in the program
detailing the various phases of submission and the different forms to be filled in by project sponsor,
consumers, etc., For e.g.
Phase‐1 (1st submission):
Form‐1: Applica�on form, requiring customer contact, project sponsor and site contact
Form‐2: Customer agreement and informa�on about the payee
Form‐3: Project descrip�on and energy savings es�mate
Phase‐2 (2nd submission): Energy efficient measure installa�on confirma�on report
Phase‐3 (3rd submission): Verifica�on of equipment performance report (if M&V case)
2. How, when and where the forms need to be mailed
3. Specify the en�ty by which any costs incurred during the applica�on process will be borne
(for e.g. the consumer)
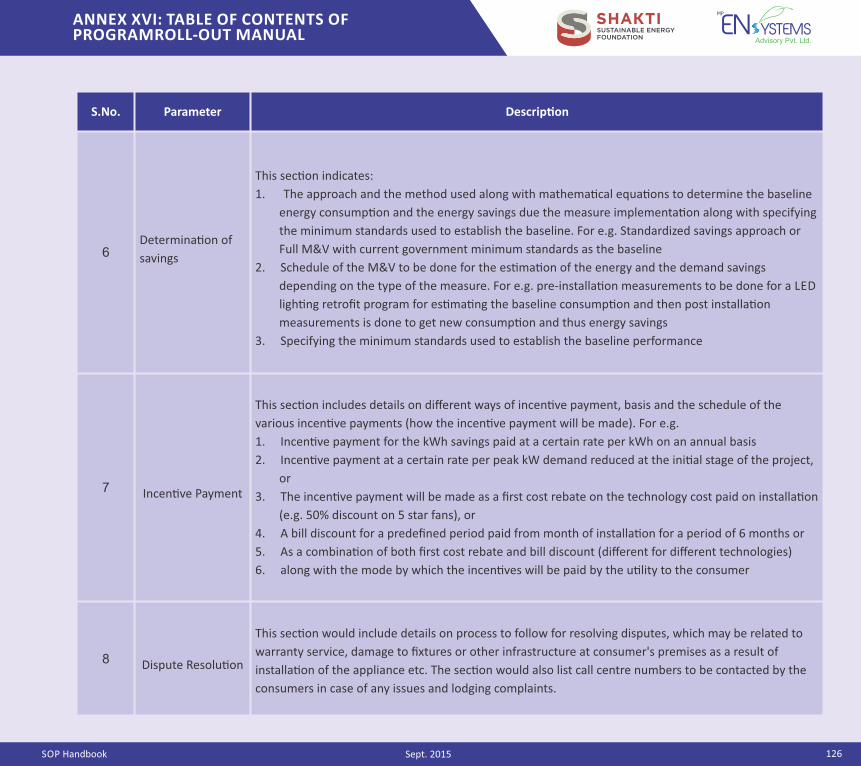
SOP Handbook
ANNEX XVI: TABLE OF CONTENTS OF PROGRAMROLL‐OUT MANUAL
126Sept. 2015
S.No. Parameter Descrip�on
6Determina�on of
savings
This sec�on indicates:
1. The approach and the method used along with mathema�cal equa�ons to determine the baseline
energy consump�on and the energy savings due the measure implementa�on along with specifying
the minimum standards used to establish the baseline. For e.g. Standardized savings approach or
Full M&V with current government minimum standards as the baseline
2. Schedule of the M&V to be done for the es�ma�on of the energy and the demand savings
depending on the type of the measure. For e.g. pre‐installa�on measurements to be done for a LED
ligh�ng retrofit program for es�ma�ng the baseline consump�on and then post installa�on
measurements is done to get new consump�on and thus energy savings
3. Specifying the minimum standards used to establish the baseline performance
7 Incen�ve Payment
This sec�on includes details on different ways of incen�ve payment, basis and the schedule of the
various incen�ve payments (how the incen�ve payment will be made). For e.g.
1. Incen�ve payment for the kWh savings paid at a certain rate per kWh on an annual basis
2. Incen�ve payment at a certain rate per peak kW demand reduced at the ini�al stage of the project,
or
3. The incen�ve payment will be made as a first cost rebate on the technology cost paid on installa�on
(e.g. 50% discount on 5 star fans), or
4. A bill discount for a predefined period paid from month of installa�on for a period of 6 months or
5. As a combina�on of both first cost rebate and bill discount (different for different technologies)
6. along with the mode by which the incen�ves will be paid by the u�lity to the consumer
8 Dispute Resolu�on
This sec�on would include details on process to follow for resolving disputes, which may be related to
warranty service, damage to fixtures or other infrastructure at consumer's premises as a result of
installa�on of the appliance etc. The sec�on would also list call centre numbers to be contacted by the
consumers in case of any issues and lodging complaints.
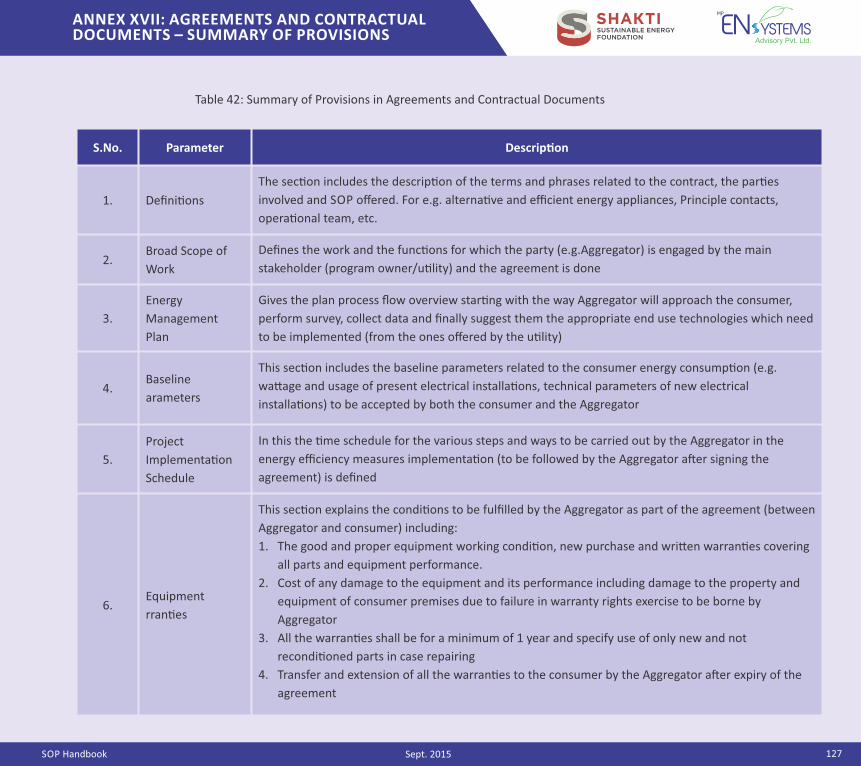
SOP Handbook
ANNEX XVII: AGREEMENTS AND CONTRACTUAL DOCUMENTS – SUMMARY OF PROVISIONS
127Sept. 2015
Table 42: Summary of Provisions in Agreements and Contractual Documents
S.No. Parameter Descrip�on
1. Defini�ons
The sec�on includes the descrip�on of the terms and phrases related to the contract, the par�es
involved and SOP offered. For e.g. alterna�ve and efficient energy appliances, Principle contacts,
opera�onal team, etc.
2.Broad Scope of
Work
Defines the work and the func�ons for which the party (e.g.Aggregator) is engaged by the main
stakeholder (program owner/u�lity) and the agreement is done
3.
Energy
Management
Plan
Gives the plan process flow overview star�ng with the way Aggregator will approach the consumer,
perform survey, collect data and finally suggest them the appropriate end use technologies which need
to be implemented (from the ones offered by the u�lity)
4.Baseline
arameters
This sec�on includes the baseline parameters related to the consumer energy consump�on (e.g.
wa�age and usage of present electrical installa�ons, technical parameters of new electrical
installa�ons) to be accepted by both the consumer and the Aggregator
5.
Project
Implementa�on
Schedule
In this the �me schedule for the various steps and ways to be carried out by the Aggregator in the
energy efficiency measures implementa�on (to be followed by the Aggregator a�er signing the
agreement) is defined
6.Equipment
rran�es
This sec�on explains the condi�ons to be fulfilled by the Aggregator as part of the agreement (between
Aggregator and consumer) including:
1. The good and proper equipment working condi�on, new purchase and wri�en warran�es covering
all parts and equipment performance.
2. Cost of any damage to the equipment and its performance including damage to the property and
equipment of consumer premises due to failure in warranty rights exercise to be borne by
Aggregator
3. All the warran�es shall be for a minimum of 1 year and specify use of only new and not
recondi�oned parts in case repairing
4. Transfer and extension of all the warran�es to the consumer by the Aggregator a�er expiry of the
agreement
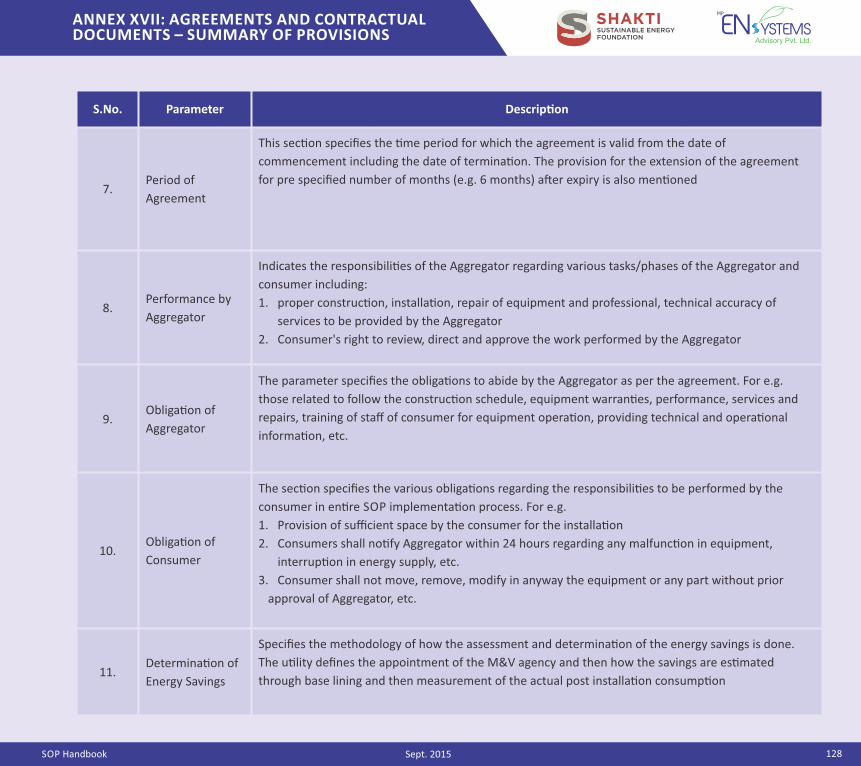
SOP Handbook
ANNEX XVII: AGREEMENTS AND CONTRACTUAL DOCUMENTS – SUMMARY OF PROVISIONS
128Sept. 2015
S.No. Parameter Descrip�on
7.Period of
Agreement
This sec�on specifies the �me period for which the agreement is valid from the date of
commencement including the date of termina�on. The provision for the extension of the agreement
for pre specified number of months (e.g. 6 months) a�er expiry is also men�oned
8.Performance by
Aggregator
Indicates the responsibili�es of the Aggregator regarding various tasks/phases of the Aggregator and
consumer including:
1. proper construc�on, installa�on, repair of equipment and professional, technical accuracy of
services to be provided by the Aggregator
2. Consumer's right to review, direct and approve the work performed by the Aggregator
9.Obliga�on of
Aggregator
The parameter specifies the obliga�ons to abide by the Aggregator as per the agreement. For e.g.
those related to follow the construc�on schedule, equipment warran�es, performance, services and
repairs, training of staff of consumer for equipment opera�on, providing technical and opera�onal
informa�on, etc.
10.Obliga�on of
Consumer
The sec�on specifies the various obliga�ons regarding the responsibili�es to be performed by the
consumer in en�re SOP implementa�on process. For e.g.
1. Provision of sufficient space by the consumer for the installa�on
2. Consumers shall no�fy Aggregator within 24 hours regarding any malfunc�on in equipment,
interrup�on in energy supply, etc.
3. Consumer shall not move, remove, modify in anyway the equipment or any part without prior
approval of Aggregator, etc.
11.Determina�on of
Energy Savings
Specifies the methodology of how the assessment and determina�on of the energy savings is done.
The u�lity defines the appointment of the M&V agency and then how the savings are es�mated
through base lining and then measurement of the actual post installa�on consump�on
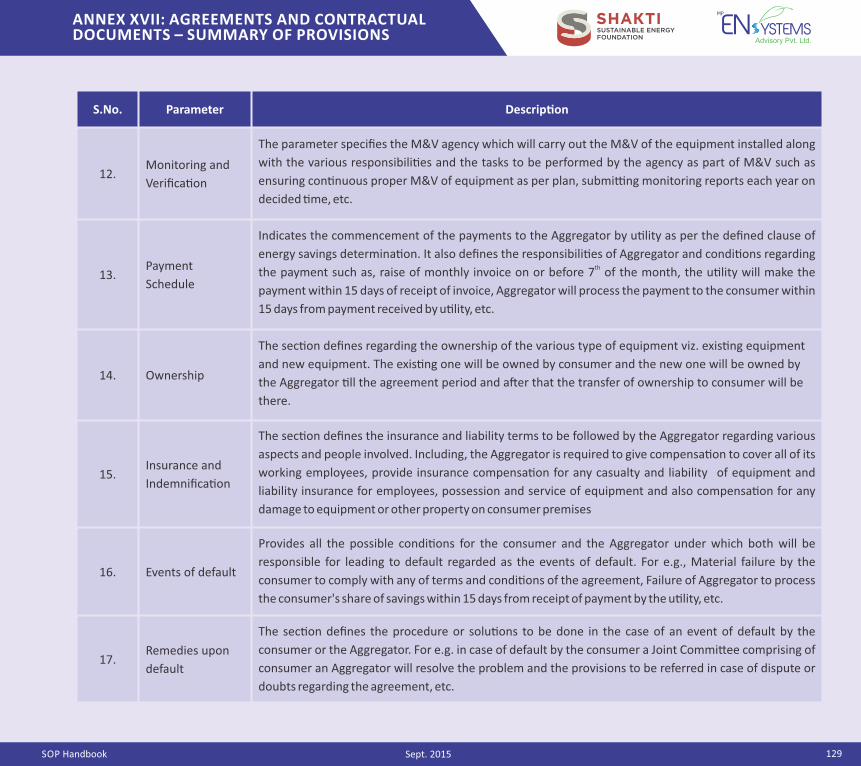
SOP Handbook
ANNEX XVII: AGREEMENTS AND CONTRACTUAL DOCUMENTS – SUMMARY OF PROVISIONS
129Sept. 2015
S.No. Parameter Descrip�on
12.Monitoring and
Verifica�on
The parameter specifies the M&V agency which will carry out the M&V of the equipment installed along
with the various responsibili�es and the tasks to be performed by the agency as part of M&V such as
ensuring con�nuous proper M&V of equipment as per plan, submi�ng monitoring reports each year on
decided �me, etc.
13.Payment
Schedule
Indicates the commencement of the payments to the Aggregator by u�lity as per the defined clause of
energy savings determina�on. It also defines the responsibili�es of Aggregator and condi�ons regarding ththe payment such as, raise of monthly invoice on or before 7 of the month, the u�lity will make the
payment within 15 days of receipt of invoice, Aggregator will process the payment to the consumer within
15 days from payment received by u�lity, etc.
14. Ownership
The sec�on defines regarding the ownership of the various type of equipment viz. exis�ng equipment
and new equipment. The exis�ng one will be owned by consumer and the new one will be owned by
the Aggregator �ll the agreement period and a�er that the transfer of ownership to consumer will be
there.
15.Insurance and
Indemnifica�on
The sec�on defines the insurance and liability terms to be followed by the Aggregator regarding various
aspects and people involved. Including, the Aggregator is required to give compensa�on to cover all of its
working employees, provide insurance compensa�on for any casualty and liability of equipment and
liability insurance for employees, possession and service of equipment and also compensa�on for any
damage to equipment or other property on consumer premises
16. Events of default
Provides all the possible condi�ons for the consumer and the Aggregator under which both will be
responsible for leading to default regarded as the events of default. For e.g., Material failure by the
consumer to comply with any of terms and condi�ons of the agreement, Failure of Aggregator to process
the consumer's share of savings within 15 days from receipt of payment by the u�lity, etc.
17.Remedies upon
default
The sec�on defines the procedure or solu�ons to be done in the case of an event of default by the
consumer or the Aggregator. For e.g. in case of default by the consumer a Joint Commi�ee comprising of
consumer an Aggregator will resolve the problem and the provisions to be referred in case of dispute or
doubts regarding the agreement, etc.
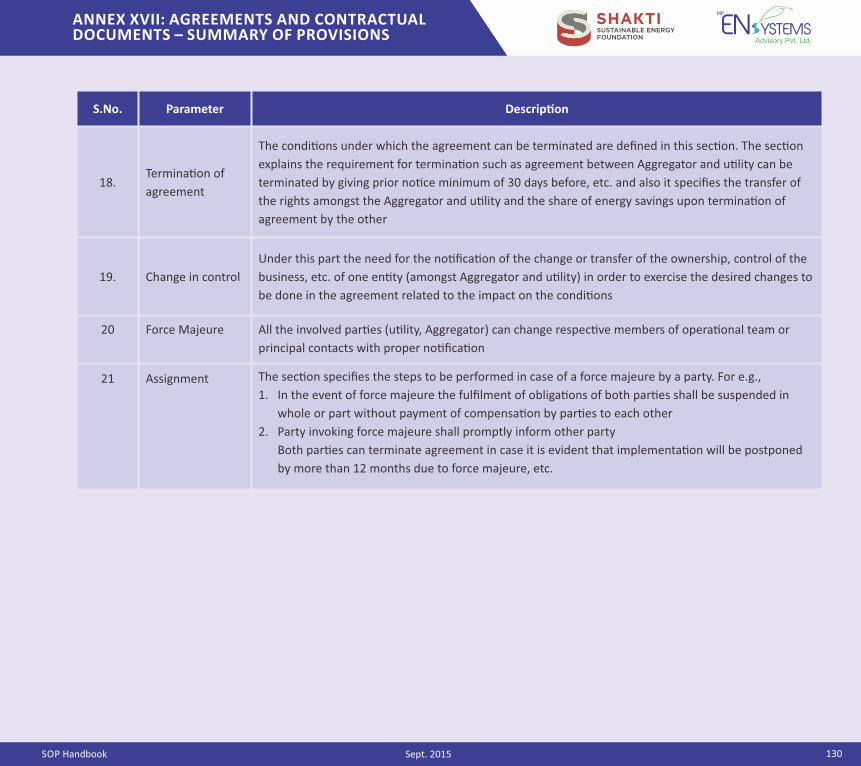
SOP Handbook 130
ANNEX XVII: AGREEMENTS AND CONTRACTUAL DOCUMENTS – SUMMARY OF PROVISIONS
Sept. 2015
S.No. Parameter Descrip�on
18.Termina�on of
agreement
The condi�ons under which the agreement can be terminated are defined in this sec�on. The sec�on
explains the requirement for termina�on such as agreement between Aggregator and u�lity can be
terminated by giving prior no�ce minimum of 30 days before, etc. and also it specifies the transfer of
the rights amongst the Aggregator and u�lity and the share of energy savings upon termina�on of
agreement by the other
19. Change in control
Under this part the need for the no�fica�on of the change or transfer of the ownership, control of the
business, etc. of one en�ty (amongst Aggregator and u�lity) in order to exercise the desired changes to
be done in the agreement related to the impact on the condi�ons
20 Force Majeure All the involved par�es (u�lity, Aggregator) can change respec�ve members of opera�onal team or
principal contacts with proper no�fica�on
21 Assignment The sec�on specifies the steps to be performed in case of a force majeure by a party. For e.g.,
1. In the event of force majeure the fulfilment of obliga�ons of both par�es shall be suspended in
whole or part without payment of compensa�on by par�es to each other
2. Party invoking force majeure shall promptly inform other party
Both par�es can terminate agreement in case it is evident that implementa�on will be postponed
by more than 12 months due to force majeure, etc.
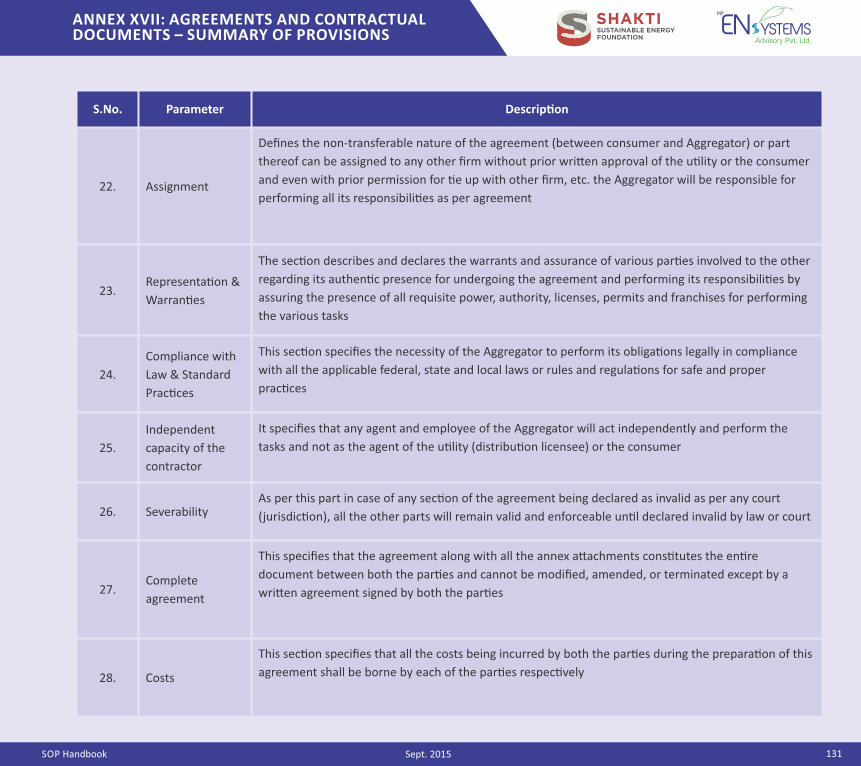
SOP Handbook 131
ANNEX XVII: AGREEMENTS AND CONTRACTUAL DOCUMENTS – SUMMARY OF PROVISIONS
Sept. 2015
S.No. Parameter Descrip�on
22. Assignment
Defines the non‐transferable nature of the agreement (between consumer and Aggregator) or part
thereof can be assigned to any other firm without prior wri�en approval of the u�lity or the consumer
and even with prior permission for �e up with other firm, etc. the Aggregator will be responsible for
performing all its responsibili�es as per agreement
23.Representa�on &
Warran�es
The sec�on describes and declares the warrants and assurance of various par�es involved to the other
regarding its authen�c presence for undergoing the agreement and performing its responsibili�es by
assuring the presence of all requisite power, authority, licenses, permits and franchises for performing
the various tasks
24.
Compliance with
Law & Standard
Prac�ces
This sec�on specifies the necessity of the Aggregator to perform its obliga�ons legally in compliance
with all the applicable federal, state and local laws or rules and regula�ons for safe and proper
prac�ces
25.
Independent
capacity of the
contractor
It specifies that any agent and employee of the Aggregator will act independently and perform the
tasks and not as the agent of the u�lity (distribu�on licensee) or the consumer
26. SeverabilityAs per this part in case of any sec�on of the agreement being declared as invalid as per any court
(jurisdic�on), all the other parts will remain valid and enforceable un�l declared invalid by law or court
27.Complete
agreement
This specifies that the agreement along with all the annex a�achments cons�tutes the en�re
document between both the par�es and cannot be modified, amended, or terminated except by a
wri�en agreement signed by both the par�es
28. Costs
This sec�on specifies that all the costs being incurred by both the par�es during the prepara�on of this
agreement shall be borne by each of the par�es respec�vely
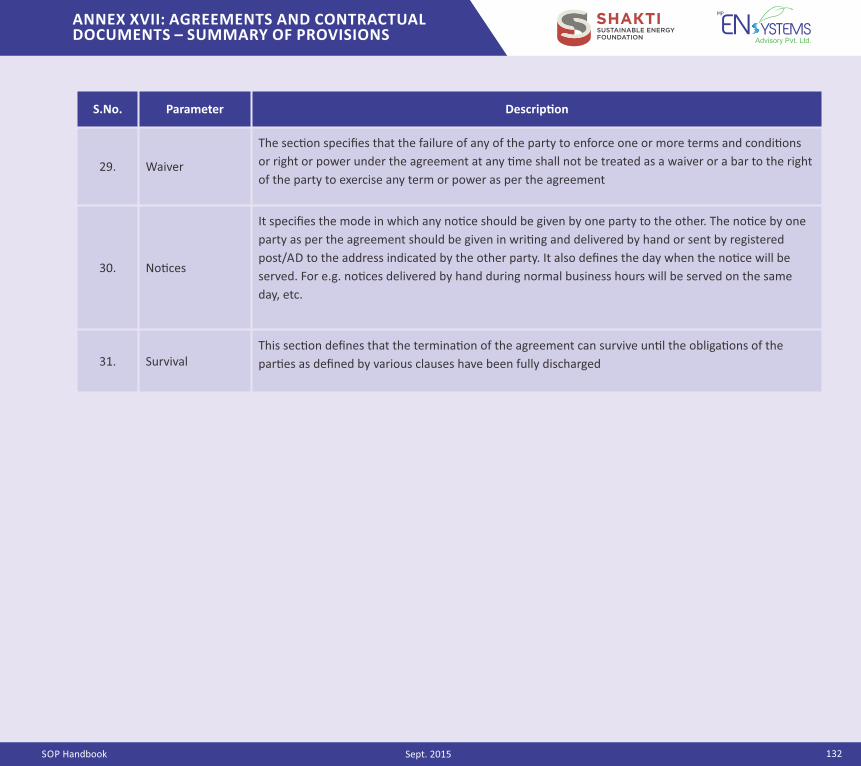
SOP Handbook 132
ANNEX XVII: AGREEMENTS AND CONTRACTUAL DOCUMENTS – SUMMARY OF PROVISIONS
Sept. 2015
S.No. Parameter Descrip�on
29. Waiver
The sec�on specifies that the failure of any of the party to enforce one or more terms and condi�ons
or right or power under the agreement at any �me shall not be treated as a waiver or a bar to the right
of the party to exercise any term or power as per the agreement
30. No�ces
It specifies the mode in which any no�ce should be given by one party to the other. The no�ce by one
party as per the agreement should be given in wri�ng and delivered by hand or sent by registered
post/AD to the address indicated by the other party. It also defines the day when the no�ce will be
served. For e.g. no�ces delivered by hand during normal business hours will be served on the same
day, etc.
31. SurvivalThis sec�on defines that the termina�on of the agreement can survive un�l the obliga�ons of the
par�es as defined by various clauses have been fully discharged
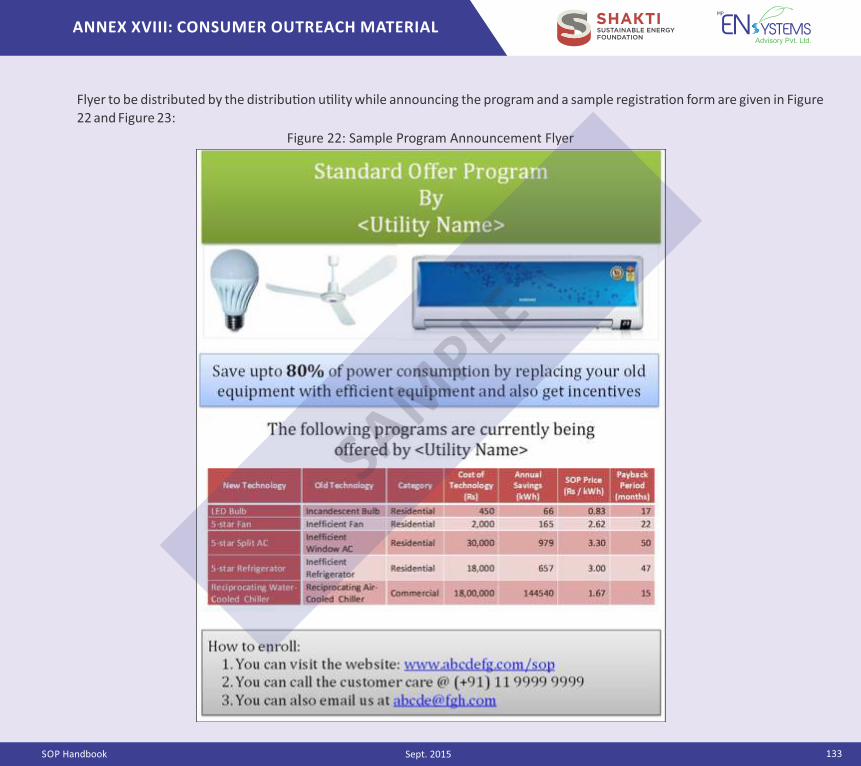
SOP Handbook
ANNEX XVIII: CONSUMER OUTREACH MATERIAL
133Sept. 2015
Flyer to be distributed by the distribu�on u�lity while announcing the program and a sample registra�on form are given in Figure
22 and Figure 23:
Figure 22: Sample Program Announcement Flyer
SAMPLE
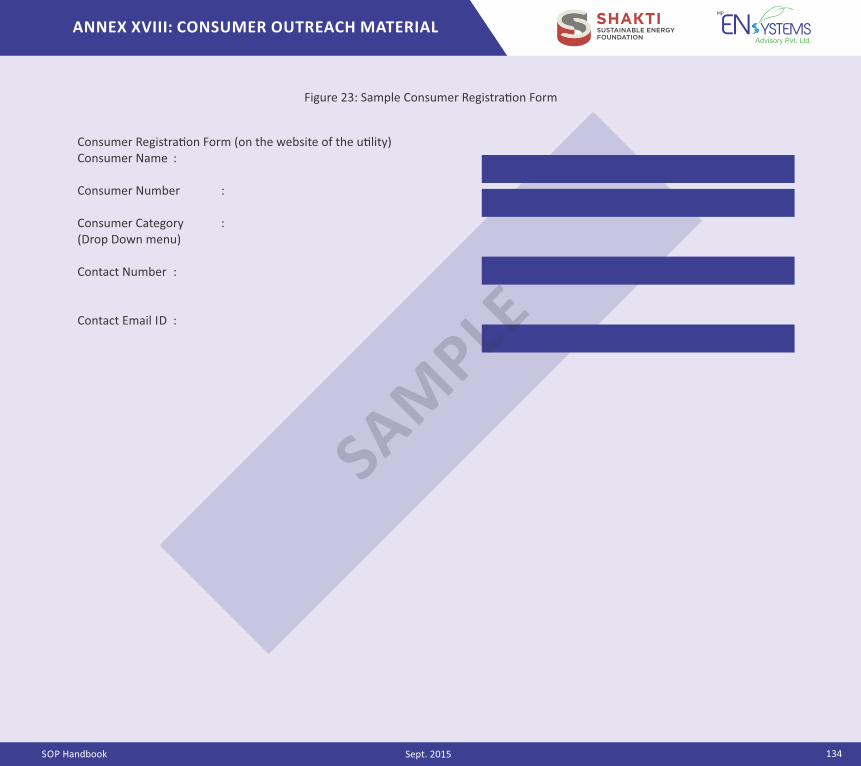
SOP Handbook 134
ANNEX XVIII: CONSUMER OUTREACH MATERIAL
Sept. 2015
Consumer Registra�on Form (on the website of the u�lity)Consumer Name :
Consumer Number :
Consumer Category :(Drop Down menu)
Contact Number :
Contact Email ID :
Figure 23: Sample Consumer Registra�on Form
SAMPLE

SOP Handbook
ANNEX XIX: COMMUNICATION AND MARKETING APPROACHES
135Sept. 2015
Various outreach, communica�ons and marke�ng approaches may be used for socializing the SOP concept, reaching out to consumers, convincing them about the SOP and enrolling them into the program. Some of the op�ons are as follows:
Prin�ng informa�on about the program on consumer electricity bills Sending separate flyers about the program along with the electricity bills�� Sending informa�on sent through sms or email Informa�on displayed on the u�lity website Informa�on displayed on social media pages and u�lity blogs�� Display of informa�on about the program at bill payment centers, housing colonies, industrial/ commercial hubs Conduc�ng demonstra�on projects in industrial hubs Conduc�ng focus mee�ngs in housing colonies and industrial/ commercial hubs Release of press note about the program Including informa�on about the program in other outreach ac�vi�es undertaken by the u�lity Crea�on of a separate Standard Offer Program website
Consumers are more likely to no�ce a separate flyer sent with the bill than informa�on printed on the bill E.g. Facebook, Twi�er
31
32
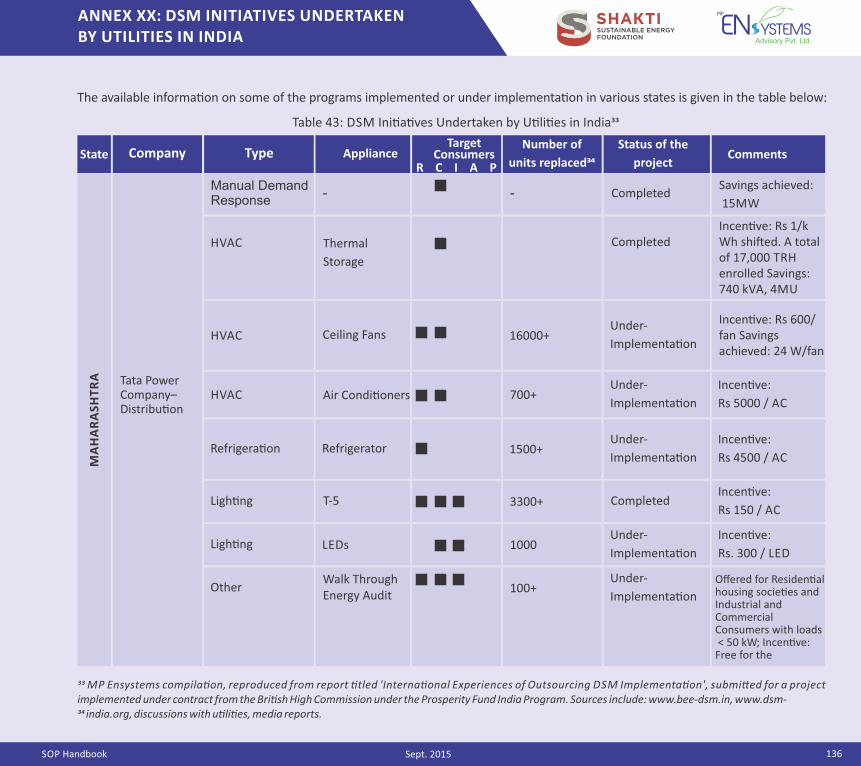
136 SOP Handbook
ANNEX XX: DSM INITIATIVES UNDERTAKEN BY UTILITIES IN INDIA
Sept. 2015
Manual Demand Response
- - CompletedSavings achieved:
15MW
CompletedIncen�ve: Rs 1/kWh shi�ed. A total of 17,000 TRH enrolled Savings: 740 kVA, 4MU
HVAC Ceiling Fans 16000+Under‐
Implementa�on
Incen�ve: Rs 600/ fan Savings achieved: 24 W/fan
HVAC Air Condi�oners 700+Under‐
Implementa�on
Incen�ve:
Rs 5000 / AC
Refrigera�on Refrigerator 1500+Under‐
Implementa�on
Incen�ve:
Rs 4500 / AC
Ligh�ng T‐5 3300+ CompletedIncen�ve:
Rs 150 / AC
Ligh�ng LEDs 1000Incen�ve:
Rs. 300 / LED
Under‐
Implementa�on
OtherWalk Through Energy Audit
100+Under‐
Implementa�on
Offered for Residen�al housing socie�es and Industrial and Commercial Consumers with loads < 50 kW; Incen�ve: Free for the
�� MP Ensystems compila�on, reproduced from report �tled 'Interna�onal Experiences of Outsourcing DSM Implementa�on', submi�ed for a project implemented under contract from the Bri�sh High Commission under the Prosperity Fund India Program. Sources include: www.bee-dsm.in, www.dsm-�� india.org, discussions with u�li�es, media reports.
The available informa�on on some of the programs implemented or under implementa�on in various states is given in the table below:
Table 43: DSM Ini�a�ves Undertaken by U�li�es in India��
HVAC Thermal
Storage
Tata Power Company– Distribu�on
?
?
Company Type ApplianceTarget
ConsumersNumber of
units replaced��Comments
Status of the
projectState
MA
HA
RA
SH
TR
A
R C I A P
?
?
?
?
?
?
?
?
?
?
?
?
?
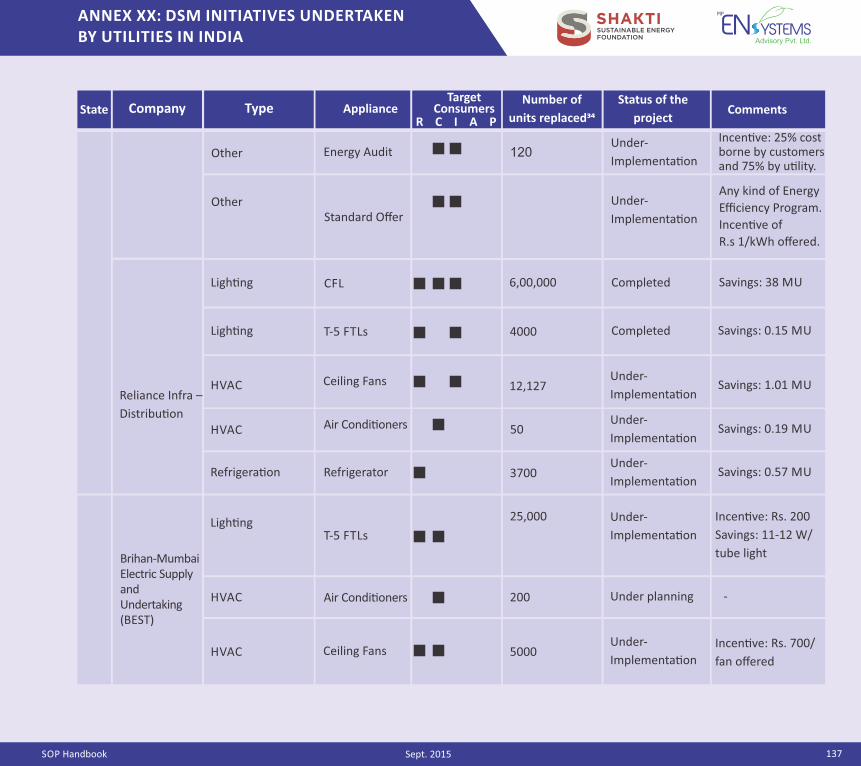
136 SOP Handbook July 2015
ANNEX XX: DSM INITIATIVES UNDERTAKEN BY UTILITIES IN INDIA
136 SOP Handbook July 2015
ANNEX XX: DSM INITIATIVES UNDERTAKEN BY UTILITIES IN INDIA
136 SOP Handbook July 2015
ANNEX XX: DSM INITIATIVES UNDERTAKEN BY UTILITIES IN INDIA
136 SOP Handbook July 2015
ANNEX XX: DSM INITIATIVES UNDERTAKEN BY UTILITIES IN INDIA
137 SOP Handbook
ANNEX XX: DSM INITIATIVES UNDERTAKEN BY UTILITIES IN INDIA
Sept. 2015
Energy Audit 120
Under‐
Implementa�on
Under‐
Implementa�on
Any kind of Energy
Efficiency Program.
Incen�ve of
R.s 1/kWh offered.
CFL 6,00,000 Savings: 38 MU
T‐5 FTLs 4000 Savings: 0.15 MU
HVAC Ceiling Fans 12,127Under‐
Implementa�onSavings: 1.01 MU
Air Condi�oners 50
Refrigera�on Refrigerator 3700 Savings: 0.57 MUUnder‐
Implementa�on
T‐5 FTLs 25,000 Under‐
Implementa�on
Incen�ve: Rs. 200
Savings: 11‐12 W/
tube light
Standard Offer
Reliance Infra –
Distribu�on
Other
Other
Incen�ve: 25% cost borne by customers and 75% by u�lity.
Ligh�ng
Ligh�ng
Completed
Completed
HVACUnder‐
Implementa�onSavings: 0.19 MU
Ligh�ng
HVAC Under planning ‐
HVAC
Air Condi�oners
Air Condi�oners
200
5000Under‐
Implementa�on
Incen�ve: Rs. 700/
fan offered
Brihan‐Mumbai Electric Supply andUndertaking (BEST)
Company Type ApplianceNumber of
units replaced��Comments
Status of the
projectState
Target Consumers
R C I A P
?
?
?
?
?
?
?
?
?
?
?
??
??
?
?
?
Energy Audit
Standard Offer
CFL
T‐5 FTLs
T‐5 FTLs
Ceiling Fans
Ceiling Fans
Air Condi�oners
Air Condi�oners
Refrigerator
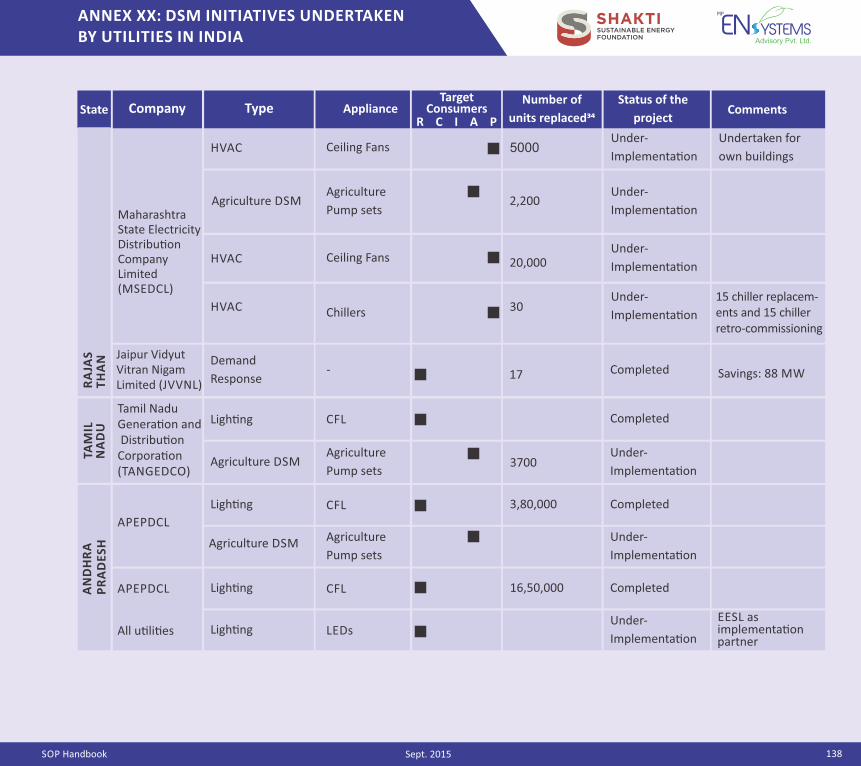
136 SOP Handbook July 2015
ANNEX XX: DSM INITIATIVES UNDERTAKEN BY UTILITIES IN INDIA
136 SOP Handbook July 2015
ANNEX XX: DSM INITIATIVES UNDERTAKEN BY UTILITIES IN INDIA
138 SOP Handbook
ANNEX XX: DSM INITIATIVES UNDERTAKEN BY UTILITIES IN INDIA
Sept. 2015
5000
Demand
Response ‐ 17 Completed Savings: 88 MW
Agriculture DSMAgriculture Pump sets 3700
Under‐
Implementa�on
CFL 3,80,000
Ceiling Fans
Ceiling Fans
Maharashtra State ElectricityDistribu�on Company Limited (MSEDCL)
APEPDCL
HVAC
HVAC
Agriculture DSM Agriculture P
ump sets
2,200
20,000
15 chiller replacem‐ents and 15 chiller retro‐commissioning
Under‐
Implementa�on
Under‐
Implementa�on
Undertaken for
own buildings
Under‐
Implementa�on
Under‐
Implementa�on30ChillersHVAC
Jaipur Vidyut Vitran Nigam Limited (JVVNL)
Completed
Completed
CFLLigh�ngTamil Nadu Genera�on and Distribu�on Corpora�on (TANGEDCO)
Ligh�ng
Agriculture DSM Agriculture Pump sets
Under‐
Implementa�on
Ligh�ngAPEPDCL CFL 16,50,000 Completed
All u�li�es Ligh�ng LEDsUnder‐
Implementa�on
EESL as implementa�on partner
Company Type ApplianceNumber of
units replaced��Comments
Status of the
projectState
RA
JAS
TH
AN
TAM
ILN
AD
UA
ND
HR
AP
RA
DE
SH
Target Consumers
R C I A P
?
?
?
?
?
?
?
?
?
?
Ceiling Fans
Ceiling Fans
Chillers
Agriculture
Pump sets
‐
CFL
CFL
CFL
LEDs
Agriculture
Pump sets
Agriculture
Pump sets
?
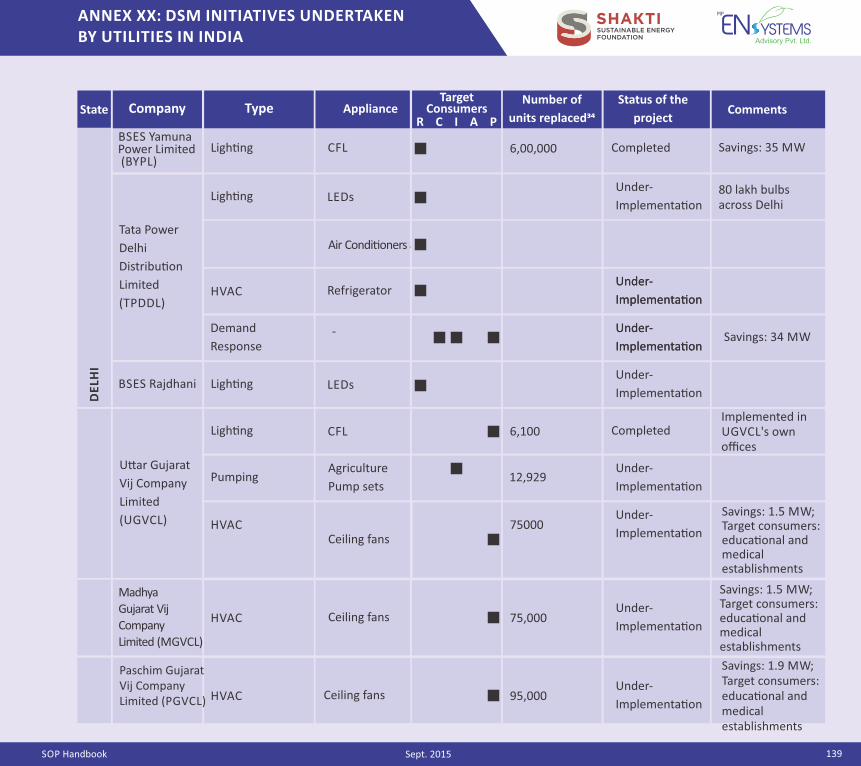
SOP Handbook
ANNEX XX: DSM INITIATIVES UNDERTAKEN BY UTILITIES IN INDIA
139Sept. 2015
Savings: 35 MWCompleted6,00,000CFLLigh�ngBSES Yamuna Power Limited (BYPL)
CFLLigh�ngUnder‐
Implementa�on80 lakh bulbs across Delhi
HVAC Air Condi�onersUnder‐
Implementa�on
RefrigeratorHVACUnder‐
Implementa�on
Under‐
Implementa�on
Demand
Response
Under‐
Implementa�on
Under‐
Implementa�onSavings: 34 MW
Tata Power
Delhi
Distribu�on
Limited
(TPDDL)
LEDsLigh�ngBSES Rajdhani Under‐
Implementa�on
Ligh�ng CFL 6,100 CompletedImplemented in UGVCL's own offices
PumpingAgriculture
Pump sets12,929
Under‐
Implementa�on
HVAC Ceiling fans 75000Under‐
Implementa�on
Savings: 1.5 MW; Target consumers: educa�onal and medical establishments
Savings: 1.5 MW; Target consumers: educa�onal and medical establishments
U�ar Gujarat
Vij Company
Limited
(UGVCL)
Madhya
Gujarat Vij
Company
Limited (MGVCL)
HVAC Ceiling fans 75,000Under‐
Implementa�on
Company Type ApplianceNumber of
units replaced��Comments
Status of the
projectState
DE
LHI
Target Consumers
R C I A P
CFL ?
?
?
?
?
LEDs
Air Condi�oners
Refrigerator
Agriculture
Pump sets
‐? ?
?
?
?
?
?
LEDs
CFL
Ceiling fans
Ceiling fans
Paschim Gujarat Vij Company Limited (PGVCL) HVAC Ceiling fans 95,000
Under‐
Implementa�on
Savings: 1.9 MW; Target consumers: educa�onal and medical establishments
?
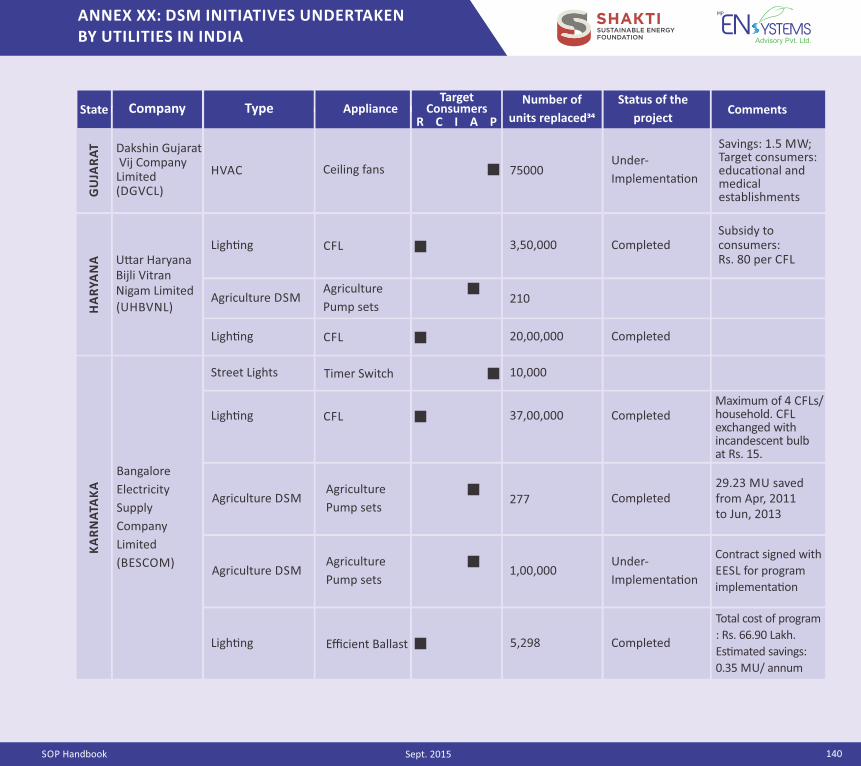
140 SOP Handbook
ANNEX XX: DSM INITIATIVES UNDERTAKEN BY UTILITIES IN INDIA
Sept. 2015
CommentsStatus of the
project
Savings: 1.5 MW; Target consumers: educa�onal and medical establishments
Under‐
Implementa�on75000
Company Type Appliance Target ConsumersNumber of
units replaced��
Ceiling fansHVAC
Dakshin Gujarat Vij Company Limited (DGVCL)
Ligh�ng CFL 3,50,000 CompletedSubsidy to consumers: Rs. 80 per CFLU�ar Haryana
Bijli Vitran Nigam Limited (UHBVNL)
Agriculture DSMAgriculture
Pump sets210
Ligh�ng CFL 20,00,000 Completed
Timer SwitchStreet Lights 10,000
Ligh�ng CFL 37,00,000 CompletedMaximum of 4 CFLs/household. CFL exchanged with incandescent bulb at Rs. 15.
Agriculture DSMAgriculture
Pump sets277 Completed
29.23 MU saved from Apr, 2011 to Jun, 2013
Agriculture DSMAgriculture
Pump sets1,00,000
Under‐
Implementa�on
Contract signed with
EESL for program
implementa�on
Ligh�ng Efficient Ballast 5,298 Completed
Total cost of program
: Rs. 66.90 Lakh.
Es�mated savings:
0.35 MU/ annum
Company Type ApplianceNumber of
units replaced��Comments
Status of the
projectState
GU
JAR
AT
Target Consumers
R C I A P
?
?
?
?
?
?
?
?
?
Bangalore
Electricity
Supply
Company
Limited
(BESCOM)
HA
RYA
NA
KA
RN
ATA
KA
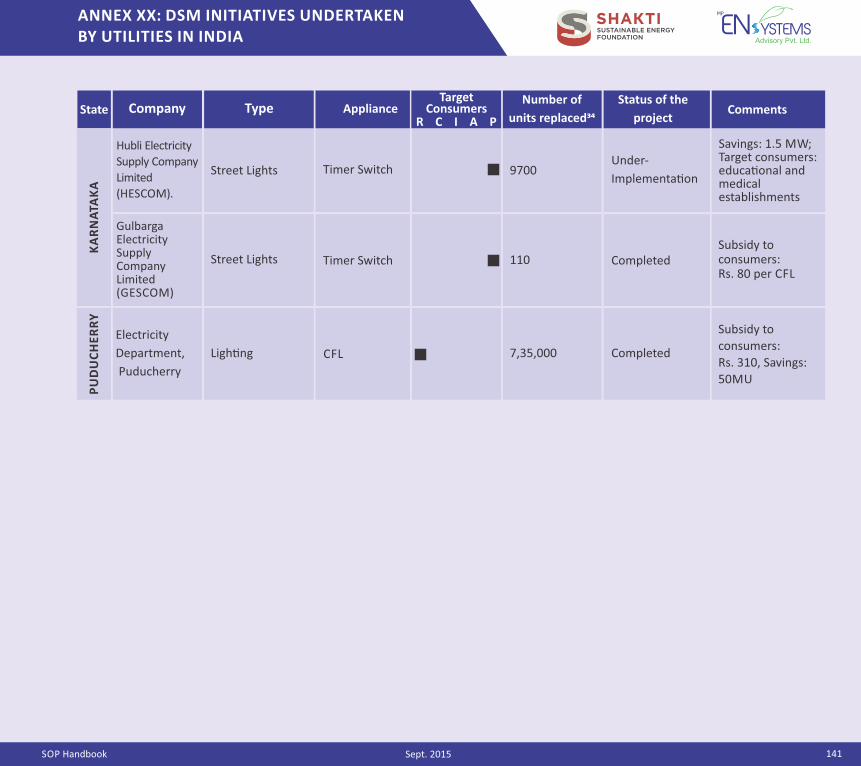
SOP Handbook
ANNEX XX: DSM INITIATIVES UNDERTAKEN BY UTILITIES IN INDIA
141Sept. 2015
Savings: 1.5 MW; Target consumers: educa�onal and medical establishments
Under‐
Implementa�on9700Timer SwitchStreet Lights
Hubli Electricity
Supply Company
Limited
(HESCOM).
110 CompletedSubsidy to consumers: Rs. 80 per CFL
Gulbarga Electricity Supply Company Limited (GESCOM)
Street Lights Timer Switch
Electricity
Department,
Puducherry
Ligh�ng CFL 7,35,000 Completed
Subsidy to
consumers:
Rs. 310, Savings:
50MU
Company Type ApplianceNumber of
units replaced��Comments
Status of the
projectState
KA
RN
ATA
KA
PU
DU
CH
ER
RY
Target Consumers
R C I A P
?
?
?