Embed Size (px)
Citation preview
Haplotype analysis of the apolipoprotein gene cluster on humanchromosome 11
Michael Oliviera,*, Xujing Wangb, Regina Colea, Brian Gaua, Jessica Kima, Edward M.Rubinc,d, and Len A. Pennacchioc,da Human and Molecular Genetics Center, Department of Physiology, Medical College of Wisconsin,8701 Watertown Plank Road, Milwaukee, WI 53226, USAbMcGee Center for Juvenile Diabetes, Medical College of Wisconsin, Milwaukee, WI 53226, USAc Genome Sciences Department, Lawrence Berkeley National Laboratory, Berkeley, CA, USAdJoint Genome Institute, Walnut Creek, CA, USA
AbstractMembers of the apolipoprotein gene cluster (APOA1/C3/A4/A5) on human chromosome 11q23 playan important role in lipid metabolism. Polymorphisms in both APOA5 and APOC3 are stronglyassociated with plasma triglyceride concentrations. The close genomic locations of these two genesas well as their functional similarity have hindered efforts to define whether each gene independentlyinfluences human triglyceride concentrations. In this study, we examined the linkage disequilibriumand haplotype structure of 49 SNPs in a 150-kb region spanning the gene cluster. We identified atotal of five common APOA5 haplotypes with a frequency of greater than 8% in samples of northernEuropean origin. The APOA5 haplotype block did not extend past the 7 SNPs in the gene and wasseparated from the other apolipoprotein gene in the cluster by a region of significantly increasedrecombination. Furthermore, one previously identified triglyceride risk haplotype of APOA5(APOA5*3) showed no association with three APOC3 SNPs previously associated with triglycerideconcentrations, in contrast to the other risk haplotype (APOA5*2), which was associated with allthree minor APOC3 SNP alleles. These results highlight the complex genetic relationship betweenAPOA5 and APOC3 and support the notion that APOA5 represents an independent risk gene affectingplasma triglyceride concentrations in humans.
KeywordsSingle nucleotide polymorphism; Apolipoprotein A5; Haplotype; Linkage disequilibrium;Recombination; Four-gamete test
The apolipoprotein gene cluster on human chromosome 11q23 contains four apolipoproteingenes (APOA1/C3/A4/A5) in a genomic interval of approximately 60 kb [1]. Three of thesegenes (APOA1/C3/A4) have been well described, and each plays an important role in lipidmetabolism in humans and mice. For example, mice lacking apoA1 have significantly reducedplasma high-density lipoprotein (HDL) cholesterol levels [2]. In contrast, mice lackingapoC3 show lower concentration of plasma triglycerides compared to control littermates [3].
In humans, analyses of genetic sequence variants around these three genes have revealedpolymorphisms associated with plasma lipid levels (for a review, see [4]). Sequence variants
*Corresponding author. Fax: +1-414-456-6516. [email protected] (M. Olivier).
NIH Public AccessAuthor ManuscriptGenomics. Author manuscript; available in PMC 2009 November 2.
Published in final edited form as:Genomics. 2004 May ; 83(5): 912–923. doi:10.1016/j.ygeno.2003.11.016.
NIH
-PA Author Manuscript
NIH
-PA Author Manuscript
NIH
-PA Author Manuscript
in APOA1 primarily affect HDL-cholesterol cocentrations, while variation in APOC3 isprimarily associated with altered plasma triglyceride concentrations. In APOC3, two rarealleles in the promoter region (−482C →T and −455T →C) and a minor allele in the 3′UTR(SstI polymorphism, 3238G →C) have repeatedly been associated with elevated plasmatriglyceride concentrations in several human populations [5–15]. However, the lack of strongfunctional data at least for the SstI polymorphism raises questions whether the association seenin humans is due to these sequence variants in APOC3 directly or due to other functionalvariants in APOC3 or possibly in one of the neighboring apolipoprotein genes.
Recently, we identified a fourth member (APOA5) of the chromosome 11 apolipoprotein genecluster, located approximately 27 kb distal to APOA4 and 37 kb from APOC3 [1]. Similar toAPOC3, APOA5 has been shown to be involved in plasma triglyceride level regulation in bothhumans and mice. Mice overexpressing human APOA5 have decreased plasma triglycerideconcentrations, while mice lacking apoA5 have increased plasma concentrations oftriglycerides [1]. Similarly, initial studies in humans showed that three single-nucleotidepolymorhisms (SNPs 1–3) in and around APOA5 were significantly associated with alteredplasma triglyceride concentrations in two human populations [1]. A fourth SNP (called SNP4), located between APOA5 and the proximal APOA4 gene, was not associated with any plasmalipid measures. Additional association analysis of the APOC3 SstI polymorphism in thispopulation revealed no association with triglycerides. This results suggested that theassociation found with APOA5 sequence variants was independent of the previously reportedeffect of the APOC3 SstI polymorphism on plasma triglyceride concentrations. The associationof APOA5 has been confirmed in other studies [16–19]. In our subsequent analysis of multipleethnic groups, we identified additional sequence variants in and around APOA5 and describedtwo haplotypes that were independently associated with increased plasma triglycerideconcentrations in Caucasians, African–Americans, and Hispanics [20]. Between 25 and 50%of individuals in these populations carry at least one of the two risk haplotypes, designatedAPOA5*2 and APOA5*3.
Despite these results, questions remain about the relationship between APOA5 and APOC3sequence variants and plasma triglyceride concentrations. Other than the initial results showingno association of SNP 4 (located between APOA5 and APOC3) and SstI in APOC3 with plasmatriglyceride concentrations in a single population [1], no data are available about the linkagedisequilibrium (LD) structure or haplotype patterns between APOA5 and APOC3. The purposeof this study was to analyze comprehensively sequence variants across the entire apolipoproteingene cluster and adjacent regions and to determine the LD and haplotype structure of the regionto assess any potential relationship between APOA5 and APOC3 haplotypes and theirindividual alleles. The data we present support that the APOA5 locus is separated from theother apolipoprotein genes by a region of increased recombination. Of all haplotypes acrossAPOA5, only one haplotype (APOA5*2) is significantly associated with the minor alleles ofthe APOC3 SstI (3238G →C) and the two promoter polymorphisms (−482C →T and −455T→C), indicating a complex and intricate relationship between different haplotypes across thisgene cluster on human chromosome 11. In contrast, the second risk haplotype (APOA5*3) isnot associated with other haplotypes or alleles in the neighboring apolipoprotein genes, thusestablishing that APOA5 independently contributes to interindividual differences in plasmatriglyceride concentrations in humans.
ResultsSNP genotyping
For our analysis of linkage disequilibrium and haplotype structure, we identified 67 SNPs inthe APOA1/C3/A4/A5 region from our resequencing efforts, published reports, and publicdatabases (dbSNP). SNPs were genotyped in individuals from 10 independent three-generation
Olivier et al. Page 2
Genomics. Author manuscript; available in PMC 2009 November 2.
NIH
-PA Author Manuscript
NIH
-PA Author Manuscript
NIH
-PA Author Manuscript
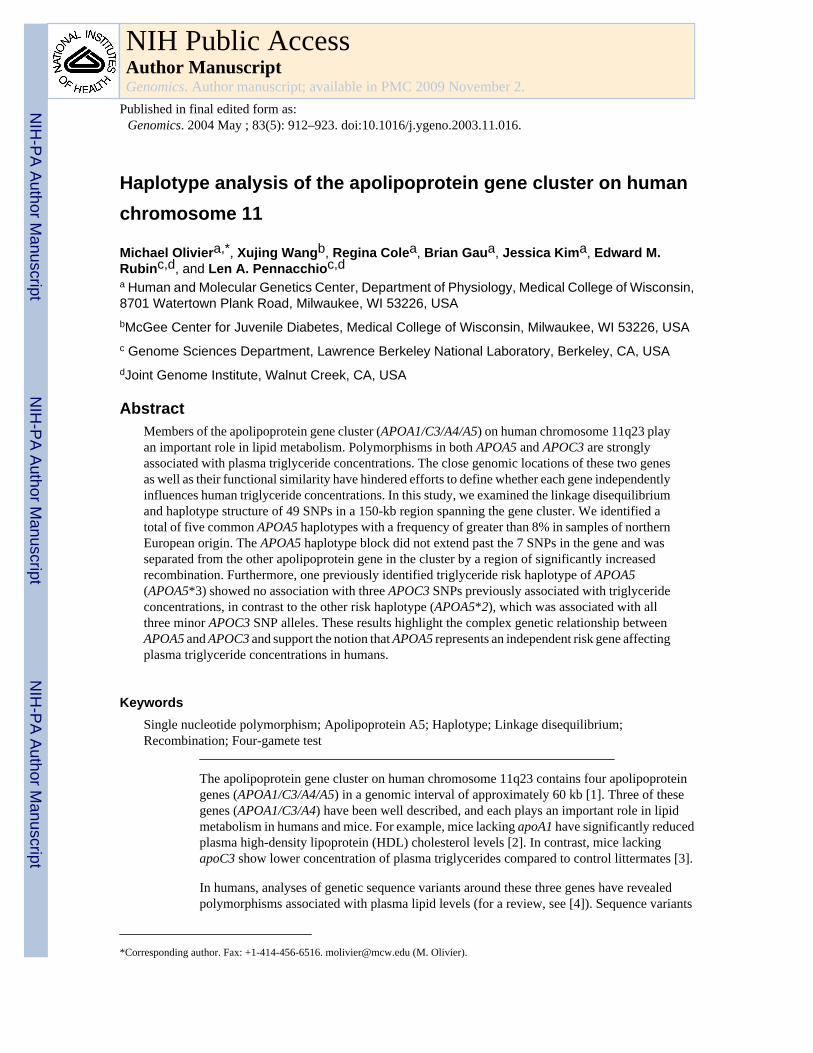
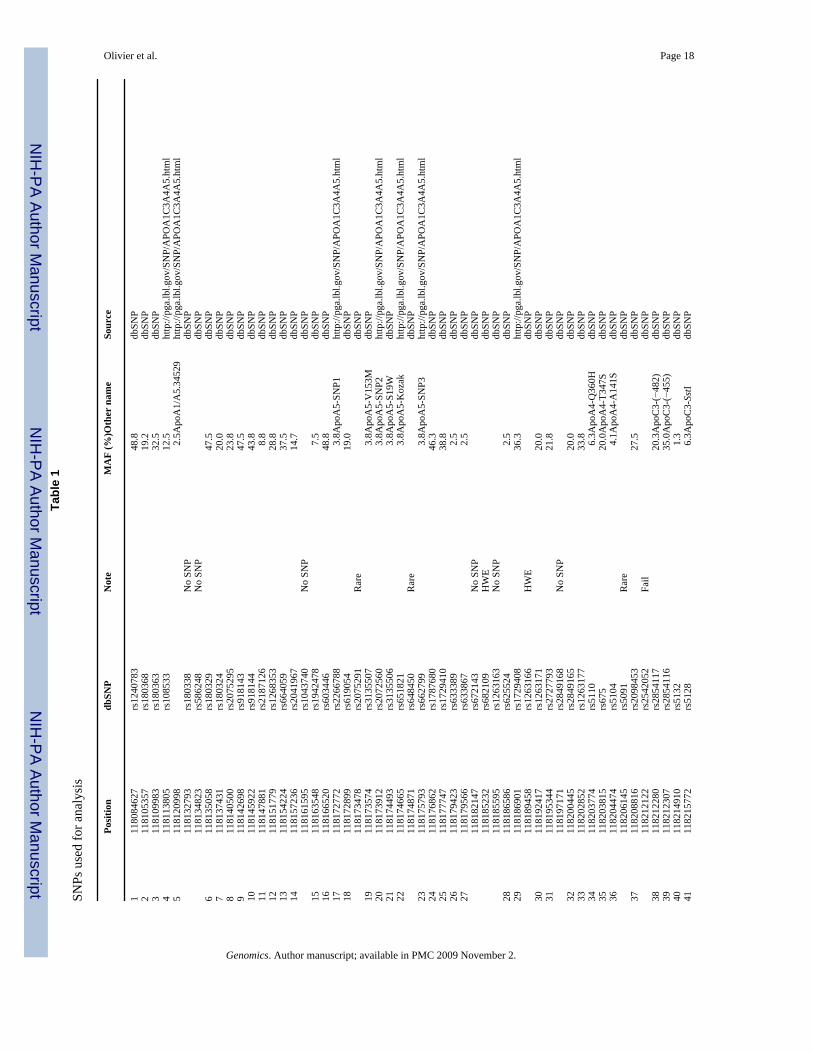
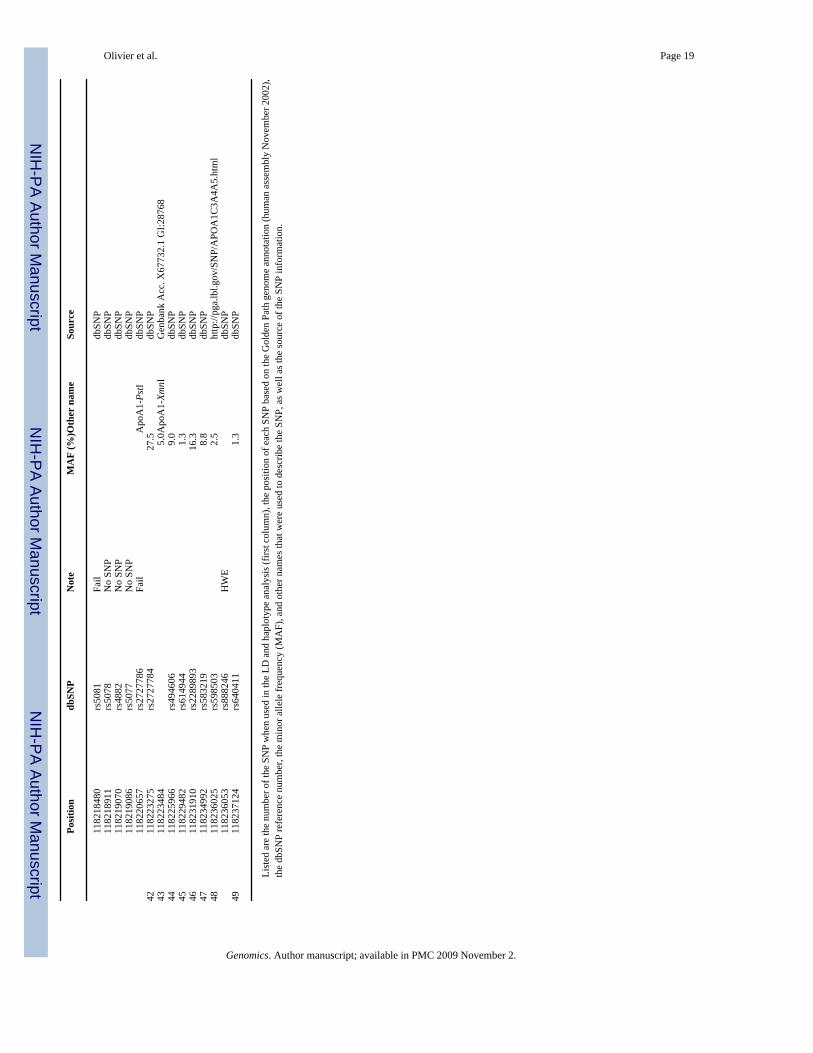
CEPH families from Utah and included all four grandparents, both parents, and two children(one boy and one girl). After removing SNPs that were not polymorphic in our sample or werenot in Hardy–Weinberg equilibrium, we analyzed 49 SNPs that spanned a total ofapproximately 152 kb of sequence on human chromosome 11q23, resulting in an averagedistance of 3112 bp between neighboring SNPs. Almost 82 kb of sequence distal to APOA5and over 60 kb of sequence proximal to APOA5 were investigated. Within the APOA5 gene(SNPs 17–23), the average distance between SNPs was 504 bp, spanning at total of 3021 bp.The flanking regions including the APOA4/C3/A1 gene cluster had an average distance of 3620bp between SNPs. Sixteen SNPs were located distal to APOA5, 26 SNPs were located proximal.Previous studies reported that LD between SNPs in different regions of the human genomeextended over a range of 6–110 kb [21–23], therefore we selected a high SNP density for ourstudy (1 SNP per 3–4 kb) to ensure our ability to detect any LD between neighboring SNPs.A complete list of all SNPs used for the analysis can be found in Table 1. The approximatelocation of all SNPs relative to the genes in this interval is depicted in Fig. 1.
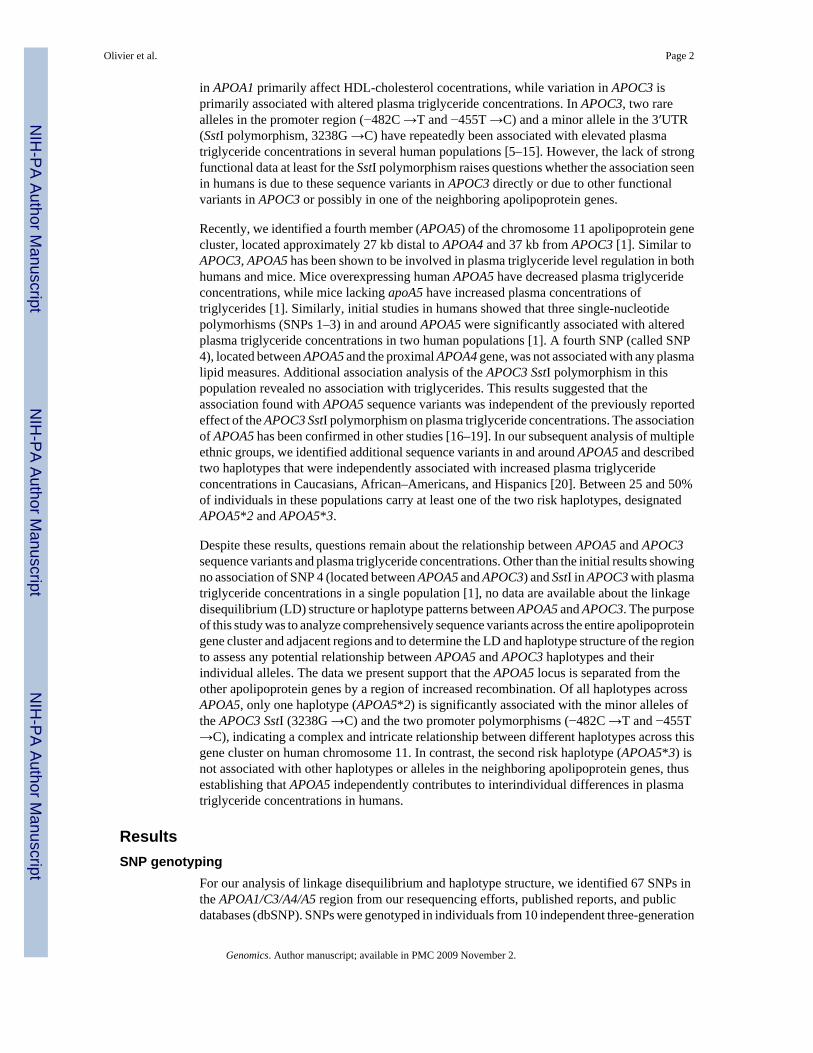
Analysis of linkage disequilibrium across the apolipoprotein gene clusterTo determine the extent of LD in our samples, |D′| was calculated for all pairs of SNPs accordingto Lewontin [24]. Only phased data from unrelated individuals were included in thecalculations. Data included all grandparental haplotypes of the CEPH families (a total of 80independent chromosomes), which were determined from genotyping data of the three-generation families using GENEHUNTER [25]. A schematic diagram of all pairwisecomparisons between the SNPs in the region based on the CEPH samples is shown in Fig. 2.As is evident from the graphic, there is significant LD between large numbers of SNPs. Sixty-four percent of all pairwise |D′| values equal 1, the maximum possible value, indicatingcomplete LD between the two SNPs. Sixty-four percent of all pairwise |D′| values are greaterthan 0.8. If only SNPs with a minor allele frequency greater than 10% are considered for thesepairwise calculations, 18% of pairwise |D′| values are 1, and 31% are greater than 0.8. Despitethe extensive LD across the region, the pattern is disrupted by several neighboring SNPs withlow LD (e.g., SNPs 29–32, see Fig. 2).
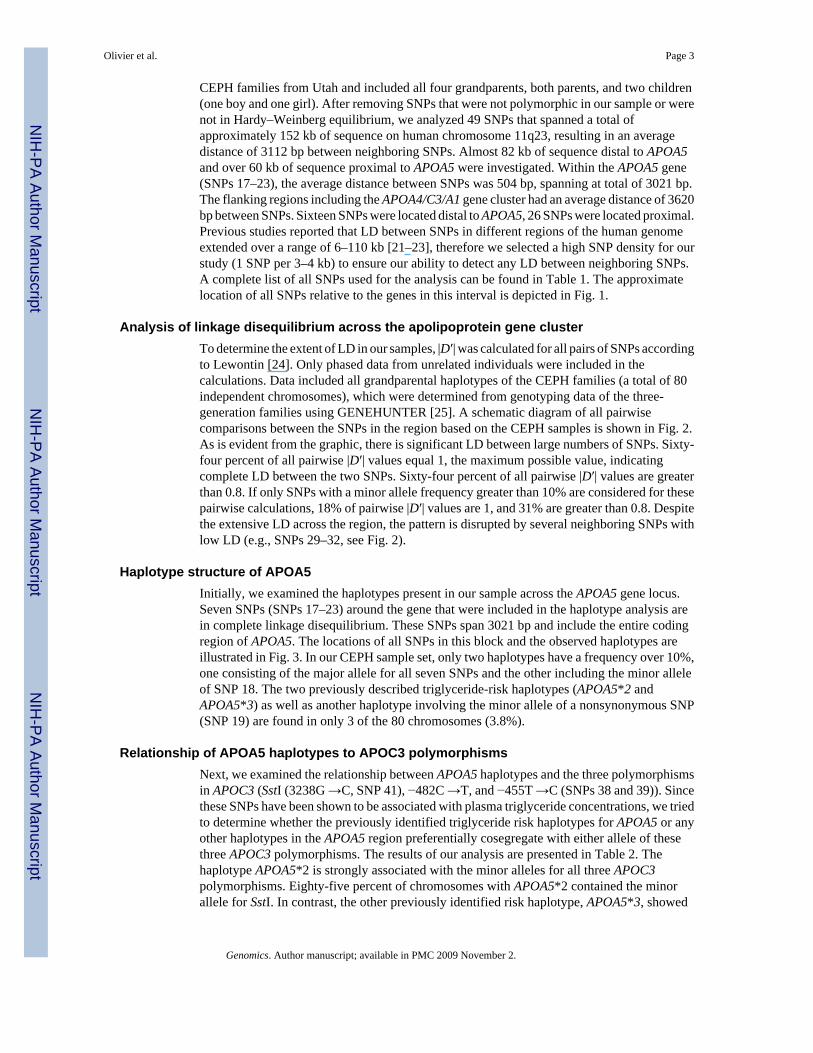
Haplotype structure of APOA5Initially, we examined the haplotypes present in our sample across the APOA5 gene locus.Seven SNPs (SNPs 17–23) around the gene that were included in the haplotype analysis arein complete linkage disequilibrium. These SNPs span 3021 bp and include the entire codingregion of APOA5. The locations of all SNPs in this block and the observed haplotypes areillustrated in Fig. 3. In our CEPH sample set, only two haplotypes have a frequency over 10%,one consisting of the major allele for all seven SNPs and the other including the minor alleleof SNP 18. The two previously described triglyceride-risk haplotypes (APOA5*2 andAPOA5*3) as well as another haplotype involving the minor allele of a nonsynonymous SNP(SNP 19) are found in only 3 of the 80 chromosomes (3.8%).
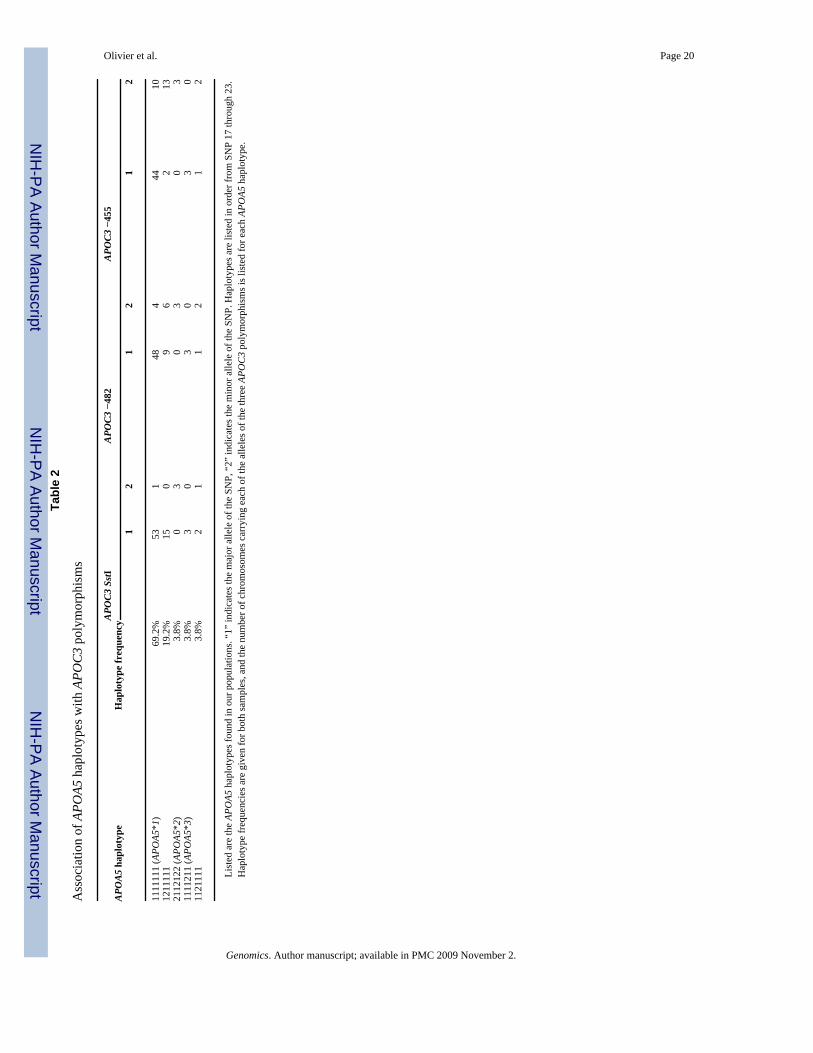
Relationship of APOA5 haplotypes to APOC3 polymorphismsNext, we examined the relationship between APOA5 haplotypes and the three polymorphismsin APOC3 (SstI (3238G →C, SNP 41), −482C →T, and −455T →C (SNPs 38 and 39)). Sincethese SNPs have been shown to be associated with plasma triglyceride concentrations, we triedto determine whether the previously identified triglyceride risk haplotypes for APOA5 or anyother haplotypes in the APOA5 region preferentially cosegregate with either allele of thesethree APOC3 polymorphisms. The results of our analysis are presented in Table 2. Thehaplotype APOA5*2 is strongly associated with the minor alleles for all three APOC3polymorphisms. Eighty-five percent of chromosomes with APOA5*2 contained the minorallele for SstI. In contrast, the other previously identified risk haplotype, APOA5*3, showed
Olivier et al. Page 3
Genomics. Author manuscript; available in PMC 2009 November 2.
NIH
-PA Author Manuscript
NIH
-PA Author Manuscript
NIH
-PA Author Manuscript
no significant association with the three minor APOC3 alleles. Only one haplotype with afrequency of greater than 10% that spans all SNPs from APOA5 to APOC3 (SNPs 17–41) canbe identified. In this haplotype, every SNP is represented by the common allele (data notshown). This analysis of the relationship of APOA5 risk haplotypes and SNP alleles in andaround APOC3 suggests that the APOA5*3 haplotype exerts its effect on triglyceridesindependent of SstI and the two promoter polymorphisms.
Analysis of recombination by the four-gamete testIf two neighboring SNPs occurred through single mutation events in human history, one wouldexpect to see only three of four possible allele combinations in the gametes in the absence ofrecombination between the two SNPs. Therefore, the four-gamete test [26] has traditionallybeen used as a measure of evidence of recombination. However, the presence of a fourth gametecould also be caused by gene conversion or multiple recurring mutations at the site. Thus, thetest has been used in other studies primarily as supporting evidence for recombination ordisruption in LD between SNPs [27].
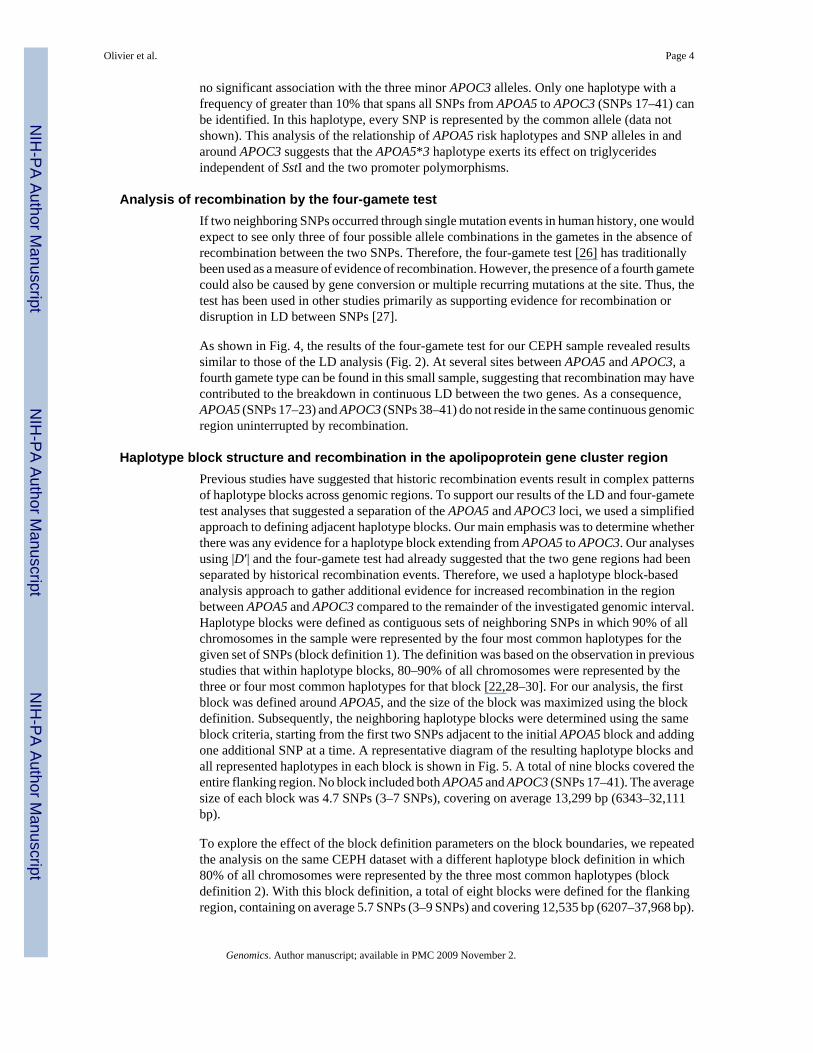
As shown in Fig. 4, the results of the four-gamete test for our CEPH sample revealed resultssimilar to those of the LD analysis (Fig. 2). At several sites between APOA5 and APOC3, afourth gamete type can be found in this small sample, suggesting that recombination may havecontributed to the breakdown in continuous LD between the two genes. As a consequence,APOA5 (SNPs 17–23) and APOC3 (SNPs 38–41) do not reside in the same continuous genomicregion uninterrupted by recombination.
Haplotype block structure and recombination in the apolipoprotein gene cluster regionPrevious studies have suggested that historic recombination events result in complex patternsof haplotype blocks across genomic regions. To support our results of the LD and four-gametetest analyses that suggested a separation of the APOA5 and APOC3 loci, we used a simplifiedapproach to defining adjacent haplotype blocks. Our main emphasis was to determine whetherthere was any evidence for a haplotype block extending from APOA5 to APOC3. Our analysesusing |D′| and the four-gamete test had already suggested that the two gene regions had beenseparated by historical recombination events. Therefore, we used a haplotype block-basedanalysis approach to gather additional evidence for increased recombination in the regionbetween APOA5 and APOC3 compared to the remainder of the investigated genomic interval.Haplotype blocks were defined as contiguous sets of neighboring SNPs in which 90% of allchromosomes in the sample were represented by the four most common haplotypes for thegiven set of SNPs (block definition 1). The definition was based on the observation in previousstudies that within haplotype blocks, 80–90% of all chromosomes were represented by thethree or four most common haplotypes for that block [22,28–30]. For our analysis, the firstblock was defined around APOA5, and the size of the block was maximized using the blockdefinition. Subsequently, the neighboring haplotype blocks were determined using the sameblock criteria, starting from the first two SNPs adjacent to the initial APOA5 block and addingone additional SNP at a time. A representative diagram of the resulting haplotype blocks andall represented haplotypes in each block is shown in Fig. 5. A total of nine blocks covered theentire flanking region. No block included both APOA5 and APOC3 (SNPs 17–41). The averagesize of each block was 4.7 SNPs (3–7 SNPs), covering on average 13,299 bp (6343–32,111bp).
To explore the effect of the block definition parameters on the block boundaries, we repeatedthe analysis on the same CEPH dataset with a different haplotype block definition in which80% of all chromosomes were represented by the three most common haplotypes (blockdefinition 2). With this block definition, a total of eight blocks were defined for the flankingregion, containing on average 5.7 SNPs (3–9 SNPs) and covering 12,535 bp (6207–37,968 bp).
Olivier et al. Page 4
Genomics. Author manuscript; available in PMC 2009 November 2.
NIH
-PA Author Manuscript
NIH
-PA Author Manuscript
NIH
-PA Author Manuscript
Again, no block included both APOA5 and APOC3. The block boundaries based on the twodifferent block definitions coincided only for the blocks immediately adjacent to the APOA5haplotype block. With increasing distance from APOA5, the blocks overlapped significantlyfor the majority of SNPs (>70%), but not entirely.
To verify that no continuous haplotype block that includes both APOA5 and APOC3 exists,we used the haplotype definition used by Gabriel et al. [29], which is based on measures ofLD across the region. As with our analysis, no single haplotype block can be identified thatspans both genes (data not shown). The same result is obtained when the HaploBlockFinder[31] is used. This approach, based on the greedy algorithm used by Patil et al. [28], also dividesthe entire dataset into sets of consecutive haplotype blocks. As in our approach, APOA5 SNPsare always grouped in one block, regardless of the parameters used, and this region is separatedfrom the APOC3 region by several interspersed small haplotype blocks (data not shown).
Next, we attempted to identify regions where recombination was increased between haplotypeblocks. If such a region separated APOA5 from any or all of the other apolipoprotein genes, itwould be highly unlikely that any association seen with an APOA5 haplotype could be causedby a SNP or haplotype at one of the other genes.
If no recombination had occurred between adjacent haplotype blocks, it would be predictedthat in every sample tested, a haplotype in one block would be paired with just one specifichaplotype in the adjacent block. In reality, however, all samples having a specific haplotypein one block do usually continue with more than just one haplotype in the neighboring block.This often results in a large number of observed haplotype combinations across blockboundaries. The more different haplotype combinations one would find, the higher would bethe number of necessary recombination events that “mixed” the ancestral haplotypes betweenthe two blocks.
To use this metric in our analysis, we determined the total number of “links” between allhaplotypes of adjacent blocks (i.e., the total number of combinations of haplotypes from twoadjacent blocks that were found in our sample set). These links are illustrated by lines in Fig.5. We then determined the minimum number of links needed to connect each haplotype to atleast one haplotype in the adjacent block (the set of links one would expect without anyrecombination). The difference between these two numbers represents the “excess”combinations, i.e., the number of combinations of haplotypes from adjacent blocks that arosethrough recombination of the ones included in the set of “minimum” combinations. Wecalculated the percentage of excess combinations and also the percentage of samplesrepresented by these excess combinations between haplotype blocks.
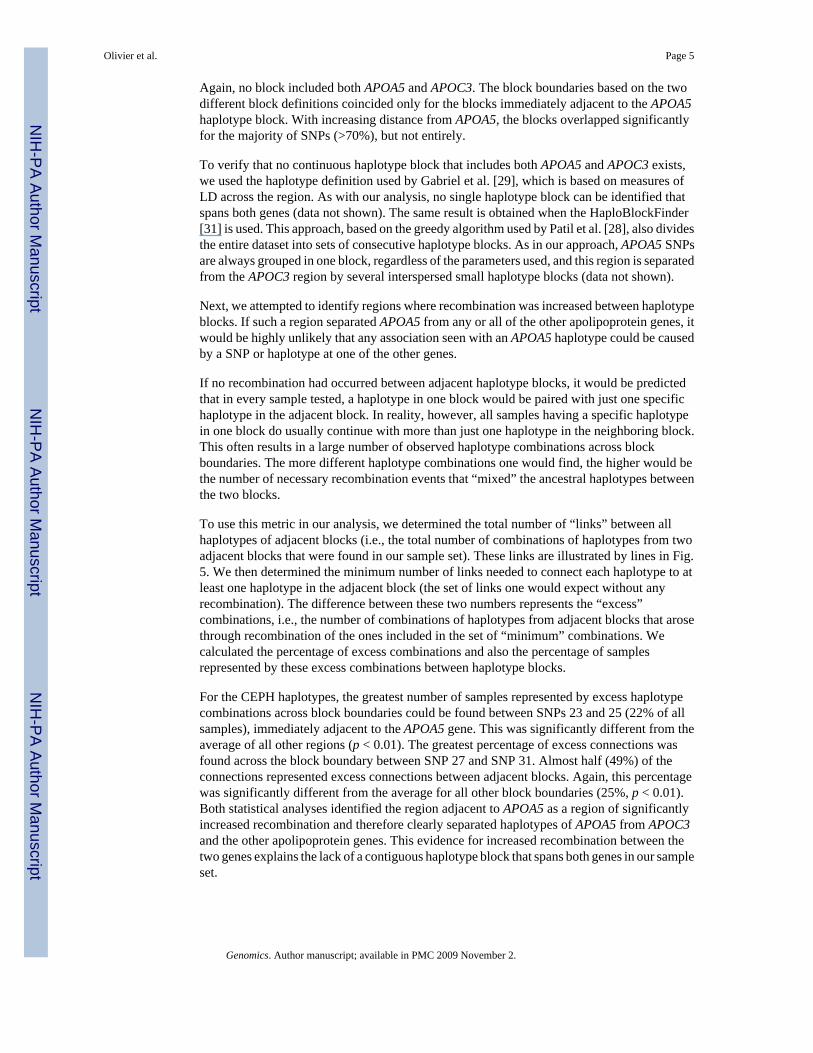
For the CEPH haplotypes, the greatest number of samples represented by excess haplotypecombinations across block boundaries could be found between SNPs 23 and 25 (22% of allsamples), immediately adjacent to the APOA5 gene. This was significantly different from theaverage of all other regions (p < 0.01). The greatest percentage of excess connections wasfound across the block boundary between SNP 27 and SNP 31. Almost half (49%) of theconnections represented excess connections between adjacent blocks. Again, this percentagewas significantly different from the average for all other block boundaries (25%, p < 0.01).Both statistical analyses identified the region adjacent to APOA5 as a region of significantlyincreased recombination and therefore clearly separated haplotypes of APOA5 from APOC3and the other apolipoprotein genes. This evidence for increased recombination between thetwo genes explains the lack of a contiguous haplotype block that spans both genes in our sampleset.
Olivier et al. Page 5
Genomics. Author manuscript; available in PMC 2009 November 2.
NIH
-PA Author Manuscript
NIH
-PA Author Manuscript
NIH
-PA Author Manuscript
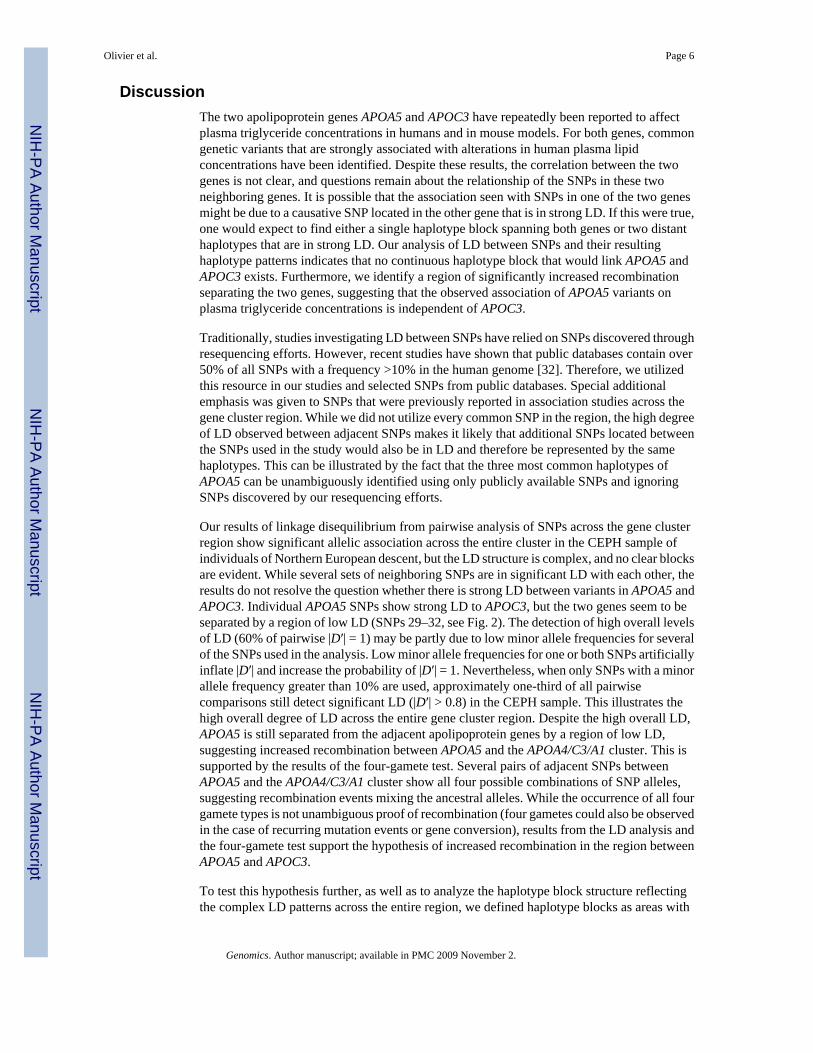
DiscussionThe two apolipoprotein genes APOA5 and APOC3 have repeatedly been reported to affectplasma triglyceride concentrations in humans and in mouse models. For both genes, commongenetic variants that are strongly associated with alterations in human plasma lipidconcentrations have been identified. Despite these results, the correlation between the twogenes is not clear, and questions remain about the relationship of the SNPs in these twoneighboring genes. It is possible that the association seen with SNPs in one of the two genesmight be due to a causative SNP located in the other gene that is in strong LD. If this were true,one would expect to find either a single haplotype block spanning both genes or two distanthaplotypes that are in strong LD. Our analysis of LD between SNPs and their resultinghaplotype patterns indicates that no continuous haplotype block that would link APOA5 andAPOC3 exists. Furthermore, we identify a region of significantly increased recombinationseparating the two genes, suggesting that the observed association of APOA5 variants onplasma triglyceride concentrations is independent of APOC3.
Traditionally, studies investigating LD between SNPs have relied on SNPs discovered throughresequencing efforts. However, recent studies have shown that public databases contain over50% of all SNPs with a frequency >10% in the human genome [32]. Therefore, we utilizedthis resource in our studies and selected SNPs from public databases. Special additionalemphasis was given to SNPs that were previously reported in association studies across thegene cluster region. While we did not utilize every common SNP in the region, the high degreeof LD observed between adjacent SNPs makes it likely that additional SNPs located betweenthe SNPs used in the study would also be in LD and therefore be represented by the samehaplotypes. This can be illustrated by the fact that the three most common haplotypes ofAPOA5 can be unambiguously identified using only publicly available SNPs and ignoringSNPs discovered by our resequencing efforts.
Our results of linkage disequilibrium from pairwise analysis of SNPs across the gene clusterregion show significant allelic association across the entire cluster in the CEPH sample ofindividuals of Northern European descent, but the LD structure is complex, and no clear blocksare evident. While several sets of neighboring SNPs are in significant LD with each other, theresults do not resolve the question whether there is strong LD between variants in APOA5 andAPOC3. Individual APOA5 SNPs show strong LD to APOC3, but the two genes seem to beseparated by a region of low LD (SNPs 29–32, see Fig. 2). The detection of high overall levelsof LD (60% of pairwise |D′| = 1) may be partly due to low minor allele frequencies for severalof the SNPs used in the analysis. Low minor allele frequencies for one or both SNPs artificiallyinflate |D′| and increase the probability of |D′| = 1. Nevertheless, when only SNPs with a minorallele frequency greater than 10% are used, approximately one-third of all pairwisecomparisons still detect significant LD (|D′| > 0.8) in the CEPH sample. This illustrates thehigh overall degree of LD across the entire gene cluster region. Despite the high overall LD,APOA5 is still separated from the adjacent apolipoprotein genes by a region of low LD,suggesting increased recombination between APOA5 and the APOA4/C3/A1 cluster. This issupported by the results of the four-gamete test. Several pairs of adjacent SNPs betweenAPOA5 and the APOA4/C3/A1 cluster show all four possible combinations of SNP alleles,suggesting recombination events mixing the ancestral alleles. While the occurrence of all fourgamete types is not unambiguous proof of recombination (four gametes could also be observedin the case of recurring mutation events or gene conversion), results from the LD analysis andthe four-gamete test support the hypothesis of increased recombination in the region betweenAPOA5 and APOC3.
To test this hypothesis further, as well as to analyze the haplotype block structure reflectingthe complex LD patterns across the entire region, we defined haplotype blocks as areas with
Olivier et al. Page 6
Genomics. Author manuscript; available in PMC 2009 November 2.
NIH
-PA Author Manuscript
NIH
-PA Author Manuscript
NIH
-PA Author Manuscript
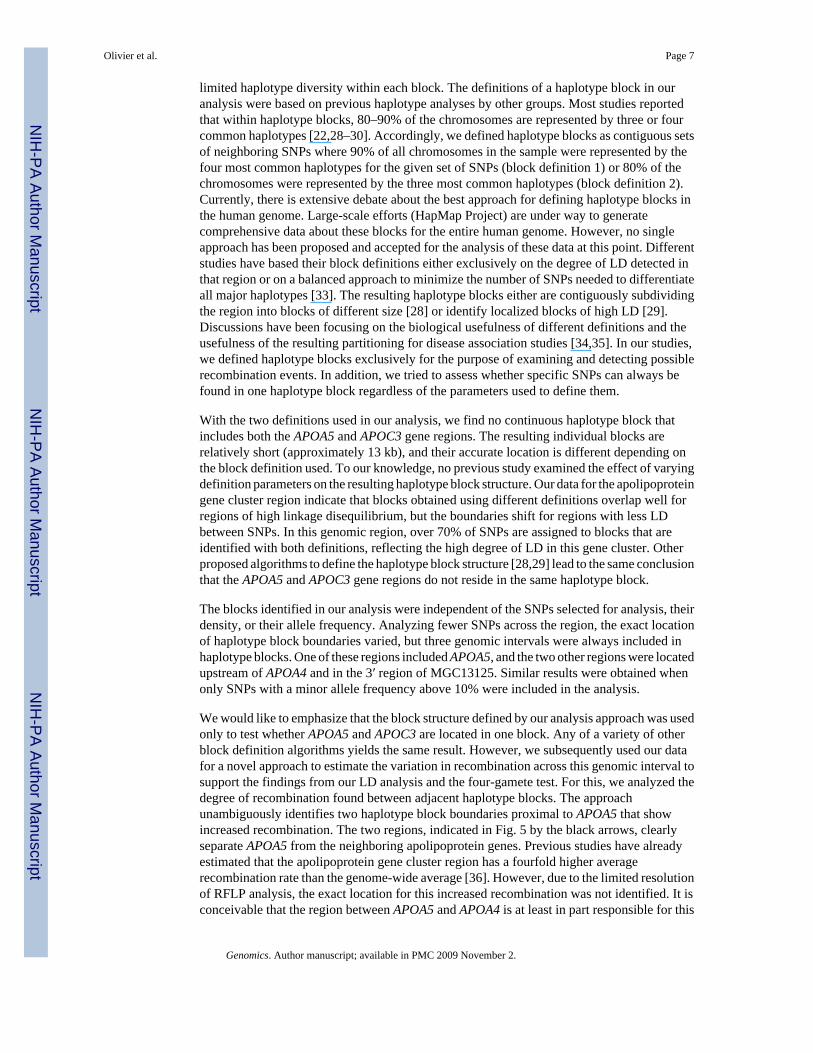
limited haplotype diversity within each block. The definitions of a haplotype block in ouranalysis were based on previous haplotype analyses by other groups. Most studies reportedthat within haplotype blocks, 80–90% of the chromosomes are represented by three or fourcommon haplotypes [22,28–30]. Accordingly, we defined haplotype blocks as contiguous setsof neighboring SNPs where 90% of all chromosomes in the sample were represented by thefour most common haplotypes for the given set of SNPs (block definition 1) or 80% of thechromosomes were represented by the three most common haplotypes (block definition 2).Currently, there is extensive debate about the best approach for defining haplotype blocks inthe human genome. Large-scale efforts (HapMap Project) are under way to generatecomprehensive data about these blocks for the entire human genome. However, no singleapproach has been proposed and accepted for the analysis of these data at this point. Differentstudies have based their block definitions either exclusively on the degree of LD detected inthat region or on a balanced approach to minimize the number of SNPs needed to differentiateall major haplotypes [33]. The resulting haplotype blocks either are contiguously subdividingthe region into blocks of different size [28] or identify localized blocks of high LD [29].Discussions have been focusing on the biological usefulness of different definitions and theusefulness of the resulting partitioning for disease association studies [34,35]. In our studies,we defined haplotype blocks exclusively for the purpose of examining and detecting possiblerecombination events. In addition, we tried to assess whether specific SNPs can always befound in one haplotype block regardless of the parameters used to define them.
With the two definitions used in our analysis, we find no continuous haplotype block thatincludes both the APOA5 and APOC3 gene regions. The resulting individual blocks arerelatively short (approximately 13 kb), and their accurate location is different depending onthe block definition used. To our knowledge, no previous study examined the effect of varyingdefinition parameters on the resulting haplotype block structure. Our data for the apolipoproteingene cluster region indicate that blocks obtained using different definitions overlap well forregions of high linkage disequilibrium, but the boundaries shift for regions with less LDbetween SNPs. In this genomic region, over 70% of SNPs are assigned to blocks that areidentified with both definitions, reflecting the high degree of LD in this gene cluster. Otherproposed algorithms to define the haplotype block structure [28,29] lead to the same conclusionthat the APOA5 and APOC3 gene regions do not reside in the same haplotype block.
The blocks identified in our analysis were independent of the SNPs selected for analysis, theirdensity, or their allele frequency. Analyzing fewer SNPs across the region, the exact locationof haplotype block boundaries varied, but three genomic intervals were always included inhaplotype blocks. One of these regions included APOA5, and the two other regions were locatedupstream of APOA4 and in the 3′ region of MGC13125. Similar results were obtained whenonly SNPs with a minor allele frequency above 10% were included in the analysis.
We would like to emphasize that the block structure defined by our analysis approach was usedonly to test whether APOA5 and APOC3 are located in one block. Any of a variety of otherblock definition algorithms yields the same result. However, we subsequently used our datafor a novel approach to estimate the variation in recombination across this genomic interval tosupport the findings from our LD analysis and the four-gamete test. For this, we analyzed thedegree of recombination found between adjacent haplotype blocks. The approachunambiguously identifies two haplotype block boundaries proximal to APOA5 that showincreased recombination. The two regions, indicated in Fig. 5 by the black arrows, clearlyseparate APOA5 from the neighboring apolipoprotein genes. Previous studies have alreadyestimated that the apolipoprotein gene cluster region has a fourfold higher averagerecombination rate than the genome-wide average [36]. However, due to the limited resolutionof RFLP analysis, the exact location for this increased recombination was not identified. It isconceivable that the region between APOA5 and APOA4 is at least in part responsible for this
Olivier et al. Page 7
Genomics. Author manuscript; available in PMC 2009 November 2.
NIH
-PA Author Manuscript
NIH
-PA Author Manuscript
NIH
-PA Author Manuscript
increased overall recombination rate. This increased recombination supports that theassociation found between SNPs and haplotypes in APOA5 and altered plasma triglycerideconcentrations is not due to linkage disequilibrium with causative APOC3 variants.
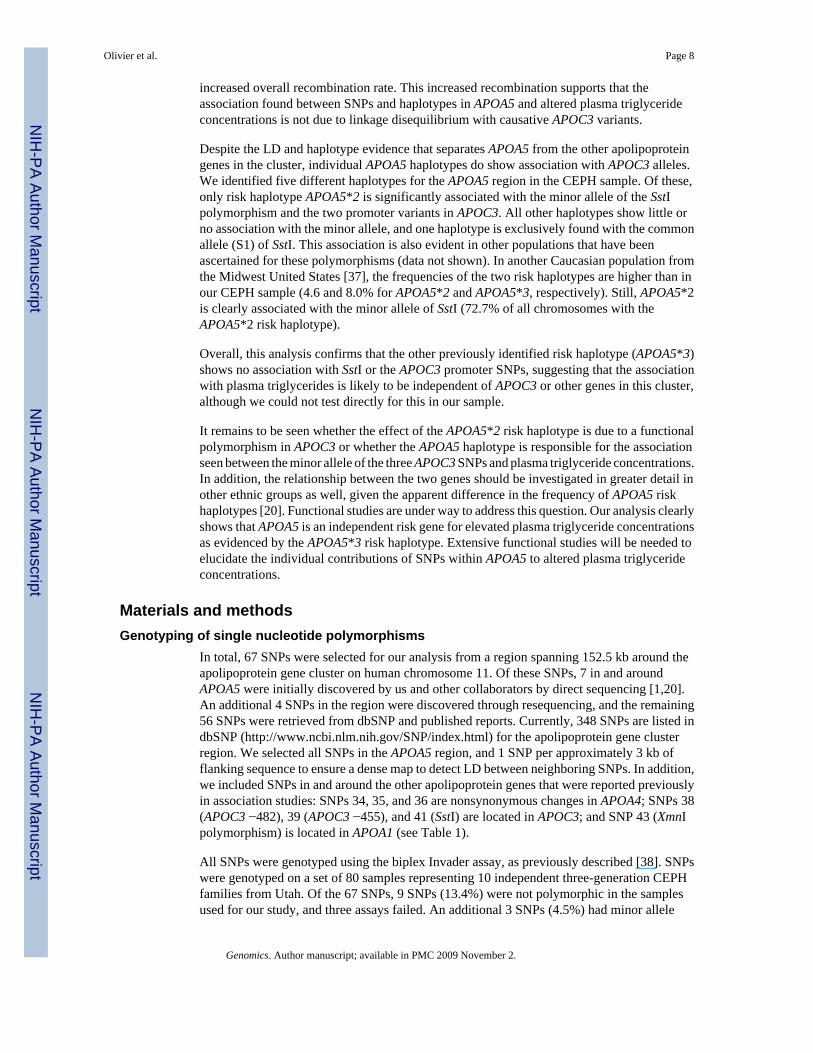
Despite the LD and haplotype evidence that separates APOA5 from the other apolipoproteingenes in the cluster, individual APOA5 haplotypes do show association with APOC3 alleles.We identified five different haplotypes for the APOA5 region in the CEPH sample. Of these,only risk haplotype APOA5*2 is significantly associated with the minor allele of the SstIpolymorphism and the two promoter variants in APOC3. All other haplotypes show little orno association with the minor allele, and one haplotype is exclusively found with the commonallele (S1) of SstI. This association is also evident in other populations that have beenascertained for these polymorphisms (data not shown). In another Caucasian population fromthe Midwest United States [37], the frequencies of the two risk haplotypes are higher than inour CEPH sample (4.6 and 8.0% for APOA5*2 and APOA5*3, respectively). Still, APOA5*2is clearly associated with the minor allele of SstI (72.7% of all chromosomes with theAPOA5*2 risk haplotype).
Overall, this analysis confirms that the other previously identified risk haplotype (APOA5*3)shows no association with SstI or the APOC3 promoter SNPs, suggesting that the associationwith plasma triglycerides is likely to be independent of APOC3 or other genes in this cluster,although we could not test directly for this in our sample.
It remains to be seen whether the effect of the APOA5*2 risk haplotype is due to a functionalpolymorphism in APOC3 or whether the APOA5 haplotype is responsible for the associationseen between the minor allele of the three APOC3 SNPs and plasma triglyceride concentrations.In addition, the relationship between the two genes should be investigated in greater detail inother ethnic groups as well, given the apparent difference in the frequency of APOA5 riskhaplotypes [20]. Functional studies are under way to address this question. Our analysis clearlyshows that APOA5 is an independent risk gene for elevated plasma triglyceride concentrationsas evidenced by the APOA5*3 risk haplotype. Extensive functional studies will be needed toelucidate the individual contributions of SNPs within APOA5 to altered plasma triglycerideconcentrations.
Materials and methodsGenotyping of single nucleotide polymorphisms
In total, 67 SNPs were selected for our analysis from a region spanning 152.5 kb around theapolipoprotein gene cluster on human chromosome 11. Of these SNPs, 7 in and aroundAPOA5 were initially discovered by us and other collaborators by direct sequencing [1,20].An additional 4 SNPs in the region were discovered through resequencing, and the remaining56 SNPs were retrieved from dbSNP and published reports. Currently, 348 SNPs are listed indbSNP (http://www.ncbi.nlm.nih.gov/SNP/index.html) for the apolipoprotein gene clusterregion. We selected all SNPs in the APOA5 region, and 1 SNP per approximately 3 kb offlanking sequence to ensure a dense map to detect LD between neighboring SNPs. In addition,we included SNPs in and around the other apolipoprotein genes that were reported previouslyin association studies: SNPs 34, 35, and 36 are nonsynonymous changes in APOA4; SNPs 38(APOC3 −482), 39 (APOC3 −455), and 41 (SstI) are located in APOC3; and SNP 43 (XmnIpolymorphism) is located in APOA1 (see Table 1).
All SNPs were genotyped using the biplex Invader assay, as previously described [38]. SNPswere genotyped on a set of 80 samples representing 10 independent three-generation CEPHfamilies from Utah. Of the 67 SNPs, 9 SNPs (13.4%) were not polymorphic in the samplesused for our study, and three assays failed. An additional 3 SNPs (4.5%) had minor allele
Olivier et al. Page 8
Genomics. Author manuscript; available in PMC 2009 November 2.
NIH
-PA Author Manuscript
NIH
-PA Author Manuscript
NIH
-PA Author Manuscript
frequencies of less than 1% in our samples, and were not included in the analysis. For all SNPs,we tested for Hardy–Weinberg equilibrium. Three SNPs significantly deviated fromequilibrium and were excluded from further analysis. The remaining 49 SNPs (73.1%) wereused for all subsequent analyses and are numbered in Table 1.
Analysis of linkage disequilibriumGenotypes obtained from the CEPH families were imported into GENEHUNTER [25]. TheHAPLO program option was used to determine the grandparental haplotypes across the entireregion. Less than 0.4% genotyping errors were detected, and all erroneous genotypes wererepeated and unambiguously resolved. Haplotype data for all independent samples(grandparents) were used to calculate pairwise linkage disequilibrium. Lewontin’s parameterof LD, |D′| [24], was calculated for all pairwise comparisons.
Four-gamete testThe four-gamete test was applied to the CEPH dataset as described in previous studies [26,27]. For any given two-SNP haplotype AB, mutation will lead to the formation of either Ab oraB. A haplotype consisting of the two alleles ab can arise only through recombination orrepeated mutation. The four-gamete test essentially examines the sample set for the presenceof all or a reduced number of gametic allele combinations. The test was applied as implementedin the software program DnaSP 3.51 [39].
Analysis of the haplotype block structureTo define haplotype blocks, the region in and around APOA5 was investigated first. SNPs 17–23 were defined as the starting block for our algorithm using MATLAB. Haplotype blockswere defined as regions where at least 90% of all haplotypes were represented by the four mostcommon haplotypes. Alternatively, the definitions were changed so that 80% of all haplotypeswere represented by the three most common haplotypes. In the first iteration, the initial blockof SNPs 17–23 was expanded by adding 1 neighboring SNP at a time from either the 3′ or the5′ end to maximize the size of the region. Once the maximal block size around APOA5 wasdetermined, the algorithm was started again to determine blocks in the neighboring SNPs. Here,the algorithm started with the first 2 SNPs outside the initial APOA5 block and then added thethird SNP and tested whether the haplotype block definition was still fulfilled. If the four major3-SNP haplotypes still represented more than 90% of all chromosomes in the sample, the nextSNP was added. The iterations stopped once the haplotype definition criteria were no longermet. The last set of SNPs fulfilling the conditions was defined as a new haplotype block, andthe algorithm was restarted using the first 2 SNPs outside the newly defined block. Haplotypeblocks were defined using the complete set of 49 SNPs, a set of SNPs comprising all SNPs inthe initial APOA5 haplotype block and all SNPs in the flanking regions with minor allelefrequencies above 10%, and finally a set of SNPs consisting of the APOA5 SNPs and onlyevery second SNP in the flanking regions. These two modified datasets were used to determinethe effects of allele frequencies and SNP density on the definition of haplotype blocks and theirboundaries in our sample.
Analysis of recombinationBased on the haplotype block structure determined as described above, we counted allcombinations of haplotypes across each boundary that could be found in our sample. Eachcombination is represented by a line in Fig. 4. We counted the total number of lines for eachboundary. Then we determined the minimum number of combinations needed to connect eachhaplotype in one block with at least one haplotype in the other block. These lines represent theminimum number of combinations needed to explain the observed data. With only thesecombinations of haplotypes, the sample set would still have all haplotypes for both blocks
Olivier et al. Page 9
Genomics. Author manuscript; available in PMC 2009 November 2.
NIH
-PA Author Manuscript
NIH
-PA Author Manuscript
NIH
-PA Author Manuscript
represented. Any additional connections found in the sample would have arisen throughrecombination between any of these “essential” haplotype combinations. Next we proceededto count the additional (excess) combinations of haplotypes found in our sample and the numberof chromosomes with these combinations. Calculating the ratio of these additional lines to thetotal number of lines (i.e., percentage excess connections between haplotype blocks) anddetermining the percentage of samples that are represented by these excess connections givea measure of recombination between the two blocks. Due to the non-normality of the data, thesignificance of difference in the dataset was assessed using nonparametric tests (Wilcoxon,Median, Kolmogorov–Smirnov).
AcknowledgmentsWe thank D. Savic and L. Smith (Medical College of Wisconsin) for excellent technical assistance in genotyping, andT. Wang (Medical College of Wisconsin) for statistical support. Thanks to S. Schaffner (Whitehead Institute) forgraciously analyzing our data using the LD-based haplotype block algorithm. This work was supported in part by theBiological and Environmental Research Program, the U.S. Department of Energy’s Office of Science, NIH GrantHL0748168 (M.O.), the NIH–NHLBI Programs for Genomic Application Grant HL66681 (E.M.R.), and NIH GrantHL071954A (E.M.R., L.A.P.) through the U.S. Department of Energy under Contract DE-AC03-76SF00098.
References1. Pennacchio LA, et al. An apolipoprotein influencing triglycerides in humans and mice revealed by
comparative sequencing. Science 2001;294(5540):169–173. [PubMed: 11588264]2. Plump AS, et al. ApoA-I knockout mice: characterization of HDL metabolism in homozygotes and
identification of a post-RNA mechanism of apoA-I up-regulation in heterozygotes. J Lipid Res 1997;38(5):1033–1047. [PubMed: 9186920]
3. Maeda N, et al. Targeted disruption of the apolipoprotein C-III gene in mice results inhypotriglyceridemia and protection from postprandial hypertriglyceridemia. J Biol Chem 1994;269(38):23610–23616. [PubMed: 8089130]
4. Groenendijk M, et al. The apoAI-CIII-AIV gene cluster. Atherosclerosis 2001;157(10):1–11.[PubMed: 11427198]
5. Dammerman M, et al. An apolipoprotein CIII haplotype protective against hypertriglyceridemia isspecified by promoter and 3′ untranslated region polymorphisms. Proc Natl Acad Sci USA 1993;90(10):4562–4566. [PubMed: 8099442]
6. Zeng Q, et al. An apolipoprotein CIII marker associated with hypertriglyceridemia in Caucasians alsoconfers increased risk in a west Japanese population. Hum Genet 1995;95(4):371–375. [PubMed:7705829]
7. Shoulders CC, et al. Variation at the apo AI/CIII/AIV gene complex is associated with elevated plasmalevels of apo CIII. Atherosclerosis 1991;87(2–3):239–247. [PubMed: 1906714]
8. Shoulders CC, et al. Characterization of genetic markers in the 5′ flanking region of the apo A1 gene.Hum Genet 1993;91(2):197–198. [PubMed: 8096496]
9. Ordovas JM, et al. Restriction fragment length polymorphisms of the apolipoprotein A-I, C-III, A-IVgene locus. Relationships with lipids, apolipoproteins, and premature coronorary artery disease.Atherosclerosis 1991;87(1):75–86. [PubMed: 1678604]
10. Surguchov AP, et al. Polymorphic markers in apolipoprotein C-III gene flanking regions andhypertriglyceridemia. Arterioscler Thromb Vasc Biol 1996;16(8):941–947. [PubMed: 8696957]
11. Stocks J, Paul H, Galton D. Haplotypes identified by DNA restriction-fragment-lengthpolymorphisms in the A-1 C-III A-IV gene region and hypertriglyceridemia. Am J Hum Genet1987;41(2):106–118. [PubMed: 2887109]
12. Tybjaerg-Hansen A, et al. Genetic markers in the apo AI-CIII-AIV gene cluster for combinedhyperlipidemia and preposition to atherosclerosis. Atherosclerosis 1993;100(2):157–169. [PubMed:8102848]
13. Paul H, Galton D, Stocks J. DNA polymorphic patterns and haplotype arrangements of the apo A-1,apo C-III, apo A-IV gene cluster in different ethnic groups. Hum Genet 1987;75(3):264–268.[PubMed: 2881879]
Olivier et al. Page 10
Genomics. Author manuscript; available in PMC 2009 November 2.
NIH
-PA Author Manuscript
NIH
-PA Author Manuscript
NIH
-PA Author Manuscript
14. Tas S. Strong association of a single nucleotide substitution in the 3′-untranslated region of theapolipoprotein-CIII gene with common hypertriglyceridemia in Arabs. Clin Chem 1989;35(2):256–259. [PubMed: 2914370]
15. Ahn YI, et al. DNA polymorphisms of the apolipoprotein AI/CIII/AIVgene cluster influence plasmacholesterol and triglyceride levels in the Mayans of the Yucatan Peninsula, Mexico. Hum Hered1991;41(5):281–299. [PubMed: 1778603]
16. Endo K, et al. Association found between the promoter region polymorphism in the apolipoproteinA –V gene and the serum triglyceride level in Japanese schoolchildren. Hum Genet 2002;111(6):570–572. [PubMed: 12436249]
17. Nabika T, et al. The genetic effect of the apoprotein AV gene on the serum triglyceride level inJapanese. Atherosclerosis 2002;165(2):201–204. [PubMed: 12417270]
18. Ribalta J, et al. Newly identified apolipoprotein AV gene predisposes to high plasma triglycerides infamilial combined hyperlipidemia. Clin Chem 2002;48(9):1597–1600. [PubMed: 12194944]
19. Talmud PJ, et al. Relative contribution of variation within the APOC3/A4/A5 gene cluster indetermining plasma triglycerides. Hum Mol Genet 2002;11(24):3039–3046. [PubMed: 12417525]
20. Pennacchio LA, et al. Two independent apolipoprotein A5 haplotypes influence human plasmatriglyceride levels. Hum Mol Genet 2002;11(24):3031–3038. [PubMed: 12417524]
21. Reich DE, et al. Linkage disequilibrium in the human genome. Nature 2001;411(6834):199–204.[PubMed: 11346797]
22. Olivier M, et al. Complex high-resolution linkage disequilibrium and haplotype patterns of single-nucleotide polymorphisms in 2.5 Mb of sequence on human chromosome 21. Genomics 2001;78(1–2):64–72. [PubMed: 11707074]
23. Abecasis GR, et al. Extent and distribution of linkage disequilibrium in three genomic regions. AmJ Hum Genet 2001;68(1):191–197. [PubMed: 11083947]
24. Lewontin RC. On measures of gametic disequilibrium. Genetics 1988;120(3):849–852. [PubMed:3224810]
25. Kruglyak L, et al. Parametric and nonparametric linkage analysis: a unified multipoint approach. AmJ Hum Genet 1996;58(6):1347–1363. [PubMed: 8651312]
26. Hudson RR, Kaplan NL. Statistical properties of the number of recombination events in the historyof a sample of DNA sequences. Genetics 1985;111(1):147–164. [PubMed: 4029609]
27. Bonnen PE, et al. Haplotype and linkage disequilibrium architecture for human cancer-associatedgenes. Genome Res 2002;12(12):1846–1853. [PubMed: 12466288]
28. Patil N, et al. Blocks of limited haplotype diversity revealed by high-resolution scanning of humanchromosome 21. Science 2001;294(5547):1719–1723. [PubMed: 11721056]
29. Gabriel SB, et al. The structure of haplotype blocks in the human genome. Science 2002;296(5576):2225–2229. [PubMed: 12029063]
30. Daly MJ, et al. High-resolution haplotype structure in the human genome. Nat Genet 2001;29(2):229–232. [PubMed: 11586305]
31. Zhang K, Jin L. HaploBlockFinder: haplotype block analyses. Bio-informatics 2003;19(10):1300–1301.
32. Reich DE, Gabriel SB, Altshuler D. Quality and completeness of SNP databases. Nat Genet 2003;33(4):457–458. [PubMed: 12652301]
33. Olivier M. A haplotype map of the human genome. Physiol Genom 2003;13(1):3–9.34. Wall JD, Pritchard JK. Assessing the performance of the haplotype block model of linkage
disequilibrium. Am J Hum Genet 2003;73(3):502–515. [PubMed: 12916017]35. Wall JD, Pritchard JK. Haplotype blocks and linkage disequilibrium in the human genome. Nat Rev
Genet 2003;4(8):587–597. [PubMed: 12897771]36. Antonarakis SE, et al. DNA polymorphism haplotypes of the human apolipoprotein APOA1-APOC3-
APOA4 gene cluster. Hum Genet 1988;80(3):265–273. [PubMed: 2903847]37. Kissebah AH, et al. Quantitative trait loci on chromosomes 3 and 17 influence phenotypes of the
metabolic syndrome. Proc Natl Acad Sci USA 2000;97(26):14478–14483. [PubMed: 11121050]38. Olivier M, et al. High-throughput genotyping of single nucleotide polymorphisms using new biplex
invader technology. Nucleic Acids Res 2002;30(12):e53. [PubMed: 12060691]
Olivier et al. Page 11
Genomics. Author manuscript; available in PMC 2009 November 2.
NIH
-PA Author Manuscript
NIH
-PA Author Manuscript
NIH
-PA Author Manuscript
39. Rozas J, Rozas R. DnaSP version 3: an integrated program for molecular population genetics andmolecular evolution analysis. Bio-informatics 1999;15(2):174–175.
Olivier et al. Page 12
Genomics. Author manuscript; available in PMC 2009 November 2.
NIH
-PA Author Manuscript
NIH
-PA Author Manuscript
NIH
-PA Author Manuscript
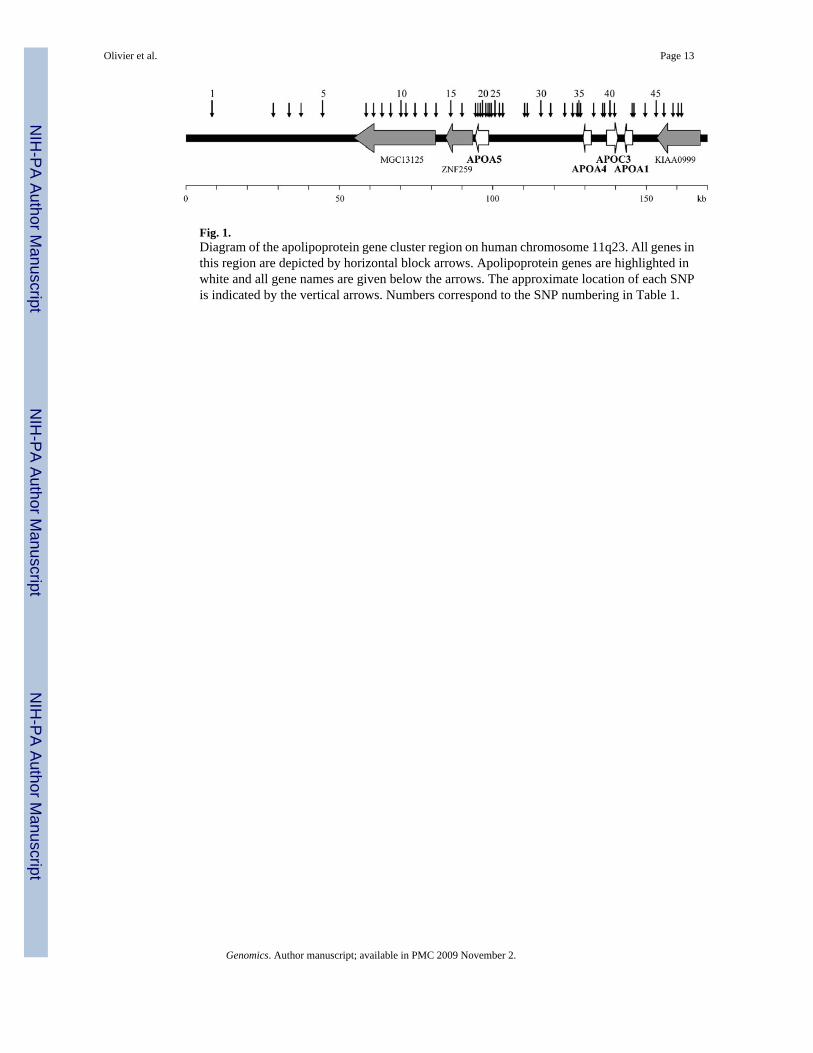
Fig. 1.Diagram of the apolipoprotein gene cluster region on human chromosome 11q23. All genes inthis region are depicted by horizontal block arrows. Apolipoprotein genes are highlighted inwhite and all gene names are given below the arrows. The approximate location of each SNPis indicated by the vertical arrows. Numbers correspond to the SNP numbering in Table 1.
Olivier et al. Page 13
Genomics. Author manuscript; available in PMC 2009 November 2.
NIH
-PA Author Manuscript
NIH
-PA Author Manuscript
NIH
-PA Author Manuscript
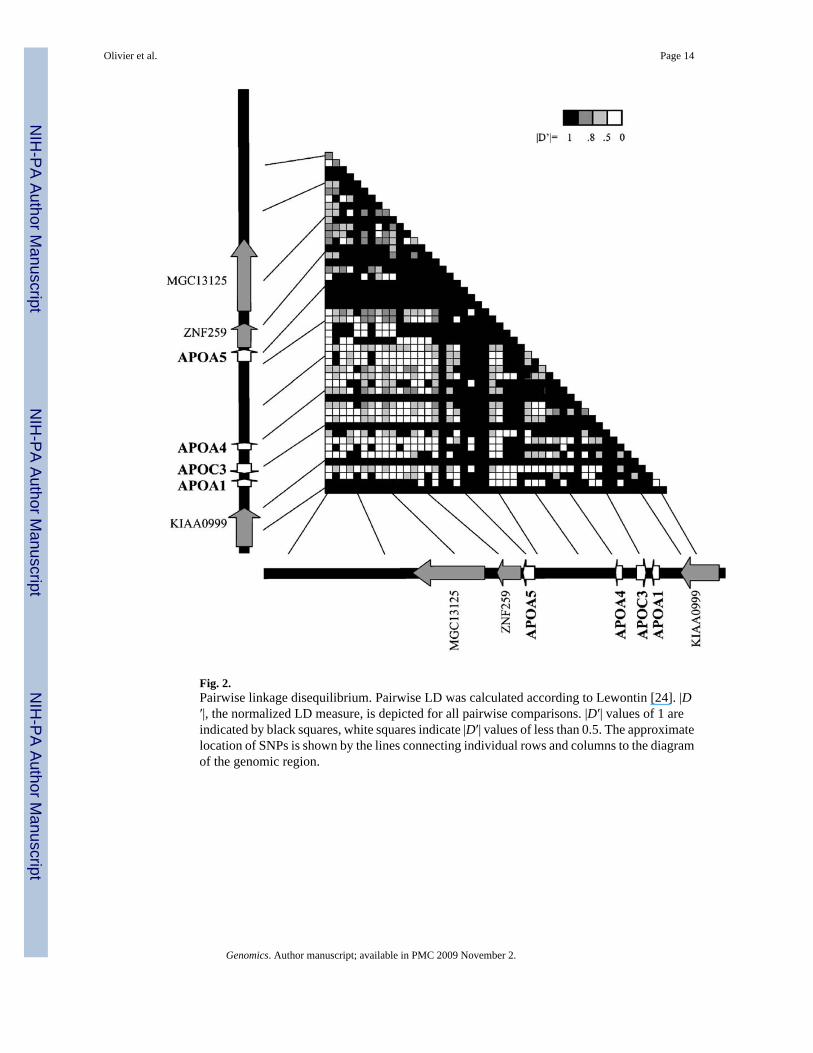
Fig. 2.Pairwise linkage disequilibrium. Pairwise LD was calculated according to Lewontin [24]. |D′|, the normalized LD measure, is depicted for all pairwise comparisons. |D′| values of 1 areindicated by black squares, white squares indicate |D′| values of less than 0.5. The approximatelocation of SNPs is shown by the lines connecting individual rows and columns to the diagramof the genomic region.
Olivier et al. Page 14
Genomics. Author manuscript; available in PMC 2009 November 2.
NIH
-PA Author Manuscript
NIH
-PA Author Manuscript
NIH
-PA Author Manuscript
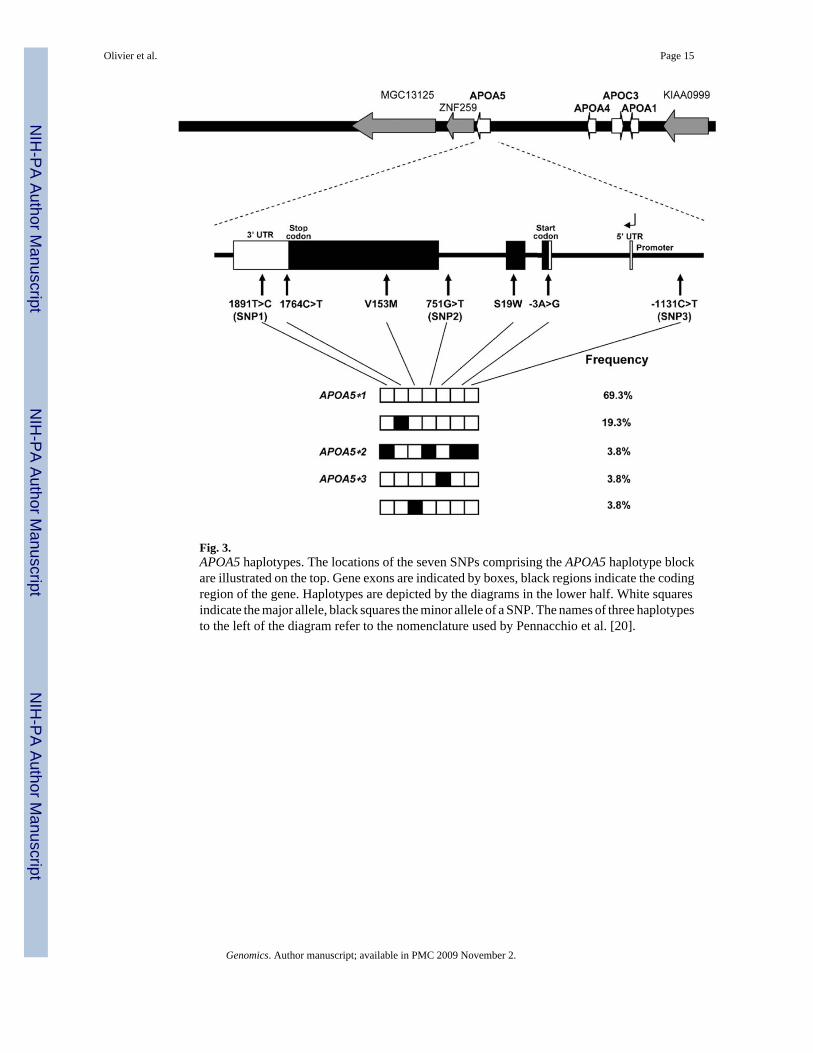
Fig. 3.APOA5 haplotypes. The locations of the seven SNPs comprising the APOA5 haplotype blockare illustrated on the top. Gene exons are indicated by boxes, black regions indicate the codingregion of the gene. Haplotypes are depicted by the diagrams in the lower half. White squaresindicate the major allele, black squares the minor allele of a SNP. The names of three haplotypesto the left of the diagram refer to the nomenclature used by Pennacchio et al. [20].
Olivier et al. Page 15
Genomics. Author manuscript; available in PMC 2009 November 2.
NIH
-PA Author Manuscript
NIH
-PA Author Manuscript
NIH
-PA Author Manuscript
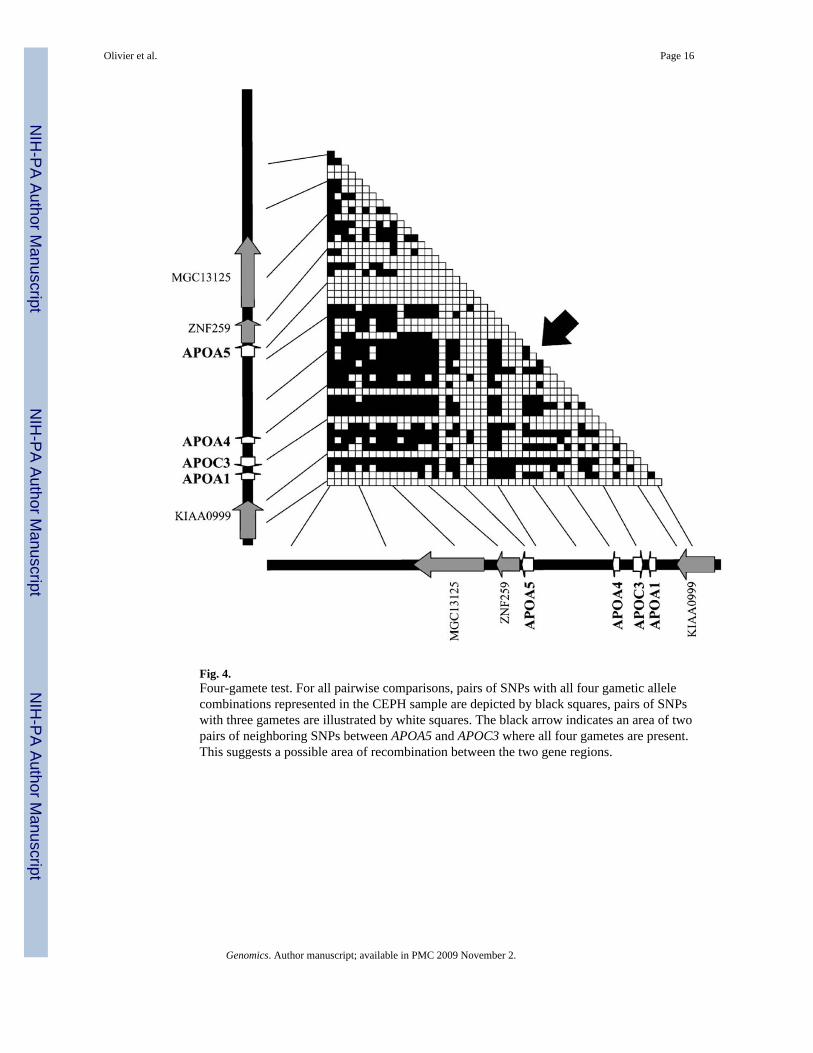
Fig. 4.Four-gamete test. For all pairwise comparisons, pairs of SNPs with all four gametic allelecombinations represented in the CEPH sample are depicted by black squares, pairs of SNPswith three gametes are illustrated by white squares. The black arrow indicates an area of twopairs of neighboring SNPs between APOA5 and APOC3 where all four gametes are present.This suggests a possible area of recombination between the two gene regions.
Olivier et al. Page 16
Genomics. Author manuscript; available in PMC 2009 November 2.
NIH
-PA Author Manuscript
NIH
-PA Author Manuscript
NIH
-PA Author Manuscript
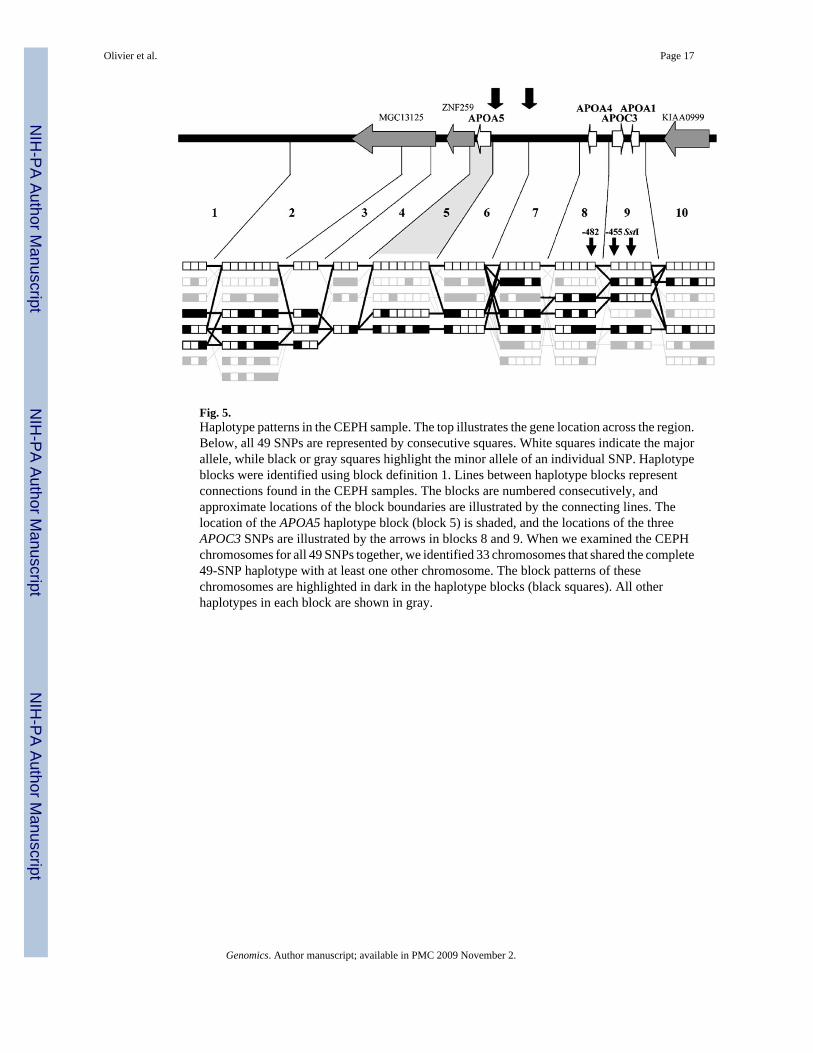
Fig. 5.Haplotype patterns in the CEPH sample. The top illustrates the gene location across the region.Below, all 49 SNPs are represented by consecutive squares. White squares indicate the majorallele, while black or gray squares highlight the minor allele of an individual SNP. Haplotypeblocks were identified using block definition 1. Lines between haplotype blocks representconnections found in the CEPH samples. The blocks are numbered consecutively, andapproximate locations of the block boundaries are illustrated by the connecting lines. Thelocation of the APOA5 haplotype block (block 5) is shaded, and the locations of the threeAPOC3 SNPs are illustrated by the arrows in blocks 8 and 9. When we examined the CEPHchromosomes for all 49 SNPs together, we identified 33 chromosomes that shared the complete49-SNP haplotype with at least one other chromosome. The block patterns of thesechromosomes are highlighted in dark in the haplotype blocks (black squares). All otherhaplotypes in each block are shown in gray.
Olivier et al. Page 17
Genomics. Author manuscript; available in PMC 2009 November 2.
NIH
-PA Author Manuscript
NIH
-PA Author Manuscript
NIH
-PA Author Manuscript
NIH
-PA Author Manuscript
NIH
-PA Author Manuscript
NIH
-PA Author Manuscript
Olivier et al. Page 18Ta
ble
1
SNPs
use
d fo
r ana
lysi
s
Posi
tion
dbSN
PN
ote
MA
F (%
)Oth
er n
ame
Sour
ce
111
8084
627
rs12
4078
348
.8db
SNP
211
8105
357
rs18
0368
19.2
dbSN
P3
1181
0998
3rs
1803
6332
.5db
SNP
411
8113
805
rs10
8533
12.5
http
://pg
a.lb
l.gov
/SN
P/A
POA
1C3A
4A5.
htm
l5
1181
2099
82.
5Apo
A1/
A5.
3452
9ht
tp://
pga.
lbl.g
ov/S
NP/
APO
A1C
3A4A
5.ht
ml
1181
3279
3rs
1803
38N
o SN
Pdb
SNP
1181
3482
3rs
5862
48N
o SN
Pdb
SNP
611
8135
058
rs18
0329
47.5
dbSN
P7
1181
3743
1rs
1803
2420
.0db
SNP
811
8140
500
rs20
7529
523
.8db
SNP
911
8142
698
rs91
8143
47.5
dbSN
P10
1181
4592
2rs
9181
4443
.8db
SNP
1111
8147
881
rs21
8712
68.
8db
SNP
1211
8151
779
rs12
6835
328
.8db
SNP
1311
8154
224
rs66
4059
37.5
dbSN
P14
1181
5723
6rs
2041
967
14.7
dbSN
P11
8161
595
rs10
4374
0N
o SN
Pdb
SNP
1511
8163
548
rs19
4247
87.
5db
SNP
1611
8166
520
rs60
3446
48.8
dbSN
P17
1181
7277
2rs
2266
788
3.8A
poA
5-SN
P1ht
tp://
pga.
lbl.g
ov/S
NP/
APO
A1C
3A4A
5.ht
ml
1811
8172
899
rs61
9054
19.0
dbSN
P11
8173
478
rs20
7529
1R
are
dbSN
P19
1181
7357
4rs
3135
507
3.8A
poA
5-V
153M
dbSN
P20
1181
7391
2rs
2072
560
3.8A
poA
5-SN
P2ht
tp://
pga.
lbl.g
ov/S
NP/
APO
A1C
3A4A
5.ht
ml
2111
8174
493
rs31
3550
63.
8Apo
A5-
S19W
dbSN
P22
1181
7466
5rs
6518
213.
8Apo
A5-
Koz
akht
tp://
pga.
lbl.g
ov/S
NP/
APO
A1C
3A4A
5.ht
ml
1181
7487
1rs
6484
50R
are
dbSN
P23
1181
7579
3rs
6627
993.
8Apo
A5-
SNP3
http
://pg
a.lb
l.gov
/SN
P/A
POA
1C3A
4A5.
htm
l24
1181
7686
2rs
1787
680
46.3
dbSN
P25
1181
7774
7rs
1729
410
38.8
dbSN
P26
1181
7942
3rs
6333
892.
5db
SNP
2711
8179
566
rs63
3867
2.5
dbSN
P11
8182
147
rs67
2143
No
SNP
dbSN
P11
8185
232
rs68
2109
HW
Edb
SNP
1181
8559
5rs
1263
163
No
SNP
dbSN
P28
1181
8658
6rs
6255
242.
5db
SNP
2911
8186
901
rs17
2940
836
.3ht
tp://
pga.
lbl.g
ov/S
NP/
APO
A1C
3A4A
5.ht
ml
1181
8945
8rs
1263
166
HW
Edb
SNP
3011
8192
417
rs12
6317
120
.0db
SNP
3111
8195
344
rs27
2779
321
.8db
SNP
1181
9717
1rs
2849
168
No
SNP
dbSN
P32
1182
0044
5rs
2849
165
20.0
dbSN
P33
1182
0285
2rs
1263
177
33.8
dbSN
P34
1182
0377
4rs
5110
6.3A
poA
4-Q
360H
dbSN
P35
1182
0381
5rs
675
20.0
Apo
A4-
T347
Sdb
SNP
3611
8204
474
rs51
044.
1Apo
A4-
A14
1Sdb
SNP
1182
0614
5rs
5091
Rar
edb
SNP
3711
8208
816
rs20
9845
327
.5db
SNP
1182
1212
2rs
2542
052
Fail
dbSN
P38
1182
1228
0rs
2854
117
20.3
Apo
C3-
(−48
2)db
SNP
3911
8212
307
rs28
5411
635
.0A
poC
3-(−
455)
dbSN
P40
1182
1491
0rs
5132
1.3
dbSN
P41
1182
1577
2rs
5128
6.3A
poC
3-Ss
tIdb
SNP
Genomics. Author manuscript; available in PMC 2009 November 2.
NIH
-PA Author Manuscript
NIH
-PA Author Manuscript
NIH
-PA Author Manuscript
Olivier et al. Page 19Po
sitio
ndb
SNP
Not
eM
AF
(%)O
ther
nam
eSo
urce
1182
1848
0rs
5081
Fail
dbSN
P11
8218
911
rs50
78N
o SN
Pdb
SNP
1182
1907
0rs
4882
No
SNP
dbSN
P11
8219
086
rs50
77N
o SN
Pdb
SNP
1182
2065
7rs
2727
786
Fail
Apo
A1-
PstI
dbSN
P42
1182
2327
5rs
2727
784
27.5
dbSN
P43
1182
2348
45.
0Apo
A1-
XmnI
Gen
bank
Acc
. X67
732.
1 G
I:287
6844
1182
2596
6rs
4946
069.
0db
SNP
4511
8229
482
rs61
4944
1.3
dbSN
P46
1182
3191
0rs
2289
893
16.3
dbSN
P47
1182
3499
2rs
5832
198.
8db
SNP
4811
8236
025
rs59
8503
2.5
http
://pg
a.lb
l.gov
/SN
P/A
POA
1C3A
4A5.
htm
l11
8236
053
rs88
8246
HW
Edb
SNP
4911
8237
124
rs64
0411
1.3
dbSN
P
List
ed a
re th
e nu
mbe
r of t
he S
NP
whe
n us
ed in
the
LD a
nd h
aplo
type
ana
lysi
s (fir
st c
olum
n), t
he p
ositi
on o
f eac
h SN
P ba
sed
on th
e G
olde
n Pa
th g
enom
e an
nota
tion
(hum
an a
ssem
bly
Nov
embe
r 200
2),
the
dbSN
P re
fere
nce
num
ber,
the
min
or a
llele
freq
uenc
y (M
AF)
, and
oth
er n
ames
that
wer
e us
ed to
des
crib
e th
e SN
P, a
s wel
l as t
he so
urce
of t
he S
NP
info
rmat
ion.
Genomics. Author manuscript; available in PMC 2009 November 2.
NIH
-PA Author Manuscript
NIH
-PA Author Manuscript
NIH
-PA Author Manuscript
Olivier et al. Page 20Ta
ble
2
Ass
ocia
tion
of A
POA5
hap
loty
pes w
ith A
POC
3 po
lym
orph
ism
s
APO
A5 h
aplo
type
Hap
loty
pe fr
eque
ncyAP
OC3
SstI
APO
C3 −
482
APO
C3 −
455
12
12
12
1111
111
(APO
A5*1
)69
.2%
531
484
4410
1211
111
19.2
%15
09
62
1321
1212
2 (A
POA5
*2)
3.8%
03
03
03
1111
211
(APO
A5*3
)3.
8%3
03
03
011
2111
13.
8%2
11
21
2
List
ed a
re th
e AP
OA5
hap
loty
pes f
ound
in o
ur p
opul
atio
ns. “
1” in
dica
tes t
he m
ajor
alle
le o
f the
SN
P, “
2” in
dica
tes t
he m
inor
alle
le o
f the
SN
P. H
aplo
type
s are
list
ed in
ord
er fr
om S
NP
17 th
roug
h 23
.H
aplo
type
freq
uenc
ies a
re g
iven
for b
oth
sam
ples
, and
the
num
ber o
f chr
omos
omes
car
ryin
g ea
ch o
f the
alle
les o
f the
thre
e AP
OC
3 po
lym
orph
ism
s is l
iste
d fo
r eac
h AP
OA5
hap
loty
pe.
Genomics. Author manuscript; available in PMC 2009 November 2.


