Embed Size (px)
Citation preview
Composite Structures 73 (2006) 458–477
www.elsevier.com/locate/compstruct
Hazard mitigation and strengthening of unreinforced masonrywalls using composites
W.W. El-Dakhakhni a,*, A.A. Hamid a, Z.H.R. Hakam b, M. Elgaaly c
a Department of Civil Engineering, McMaster University Centre for Effective Design of Structures, Hamilton, ON, Canada L8S 4L7b Bechtel Power Corporation, Frederick, MD 21703, USA
c Civil, Architectural and Environmental Engineering Department, Drexel University, Philadelphia, PA 19104, USA
Available online 9 April 2005
Abstract
An experimental investigation was conducted to study the behavior of unreinforced masonry (URM) walls retrofitted with com-
posite laminates. The first testing phase included testing 24 URM assemblages under different stress conditions present in masonry
walls. Tests included prisms loaded in compression normal and parallel to bed joints, diagonal tension specimens, and specimens
loaded under joint shear. In the second testing phase, five masonry-infilled steel frames were tested with and without retrofit.
The composite laminates increased the stiffness and strength and enhanced the post-peak behavior by stabilizing the masonry walls
and preventing their out-of-plane spalling. Tests reported in this paper demonstrate the efficiency of composite laminates in improv-
ing the deformation capacity of URM, containing the hazardous URM damage, preventing catastrophic failure and maintaining the
wall integrity even after significant structural damage.
� 2005 Elsevier Ltd. All rights reserved.
Keywords: Composite masonry; Concrete masonry; Fiber reinforced plastics; Retrofitting; Seismic hazard; Seismic loads; Steel frames
1. Introduction
Earthquakes have long been recognized as one of the
most damaging natural hazards, along with hurricanes,
tornadoes, floods and fire. No other force in nature
has the potential to wreak so much havoc in such a short
time. Earthquakes typically strike without warning and,
after only a few seconds, leave casualties and damage in
their wake. Although earthquakes cannot be prevented,
the current state-of-the-art in science and engineeringprovides new tools that can be used to reduce their dam-
aging effects. Through prudent action, the loss of life,
serious injury, and property damage as well as social
and economic disruptions resulting from earthquakes
can be reduced. The principal threat to human life and
0263-8223/$ - see front matter � 2005 Elsevier Ltd. All rights reserved.
doi:10.1016/j.compstruct.2005.02.017
* Corresponding author. Tel.: +1 905 525 9140x26109; fax: +1 905
529 9688.
E-mail address: [email protected] (W.W. El-Dakhakhni).
safety is the shaking damage and the collapse of build-
ings and other structures that have been inadequatelydesigned or poorly constructed. Major earthquakes
can severely disrupt regional or national economic activ-
ity by damaging social lifelines such as roads, railways,
water, power and communications infrastructures and
office and residential buildings.
A common type of construction in urban centers for
low-rise and mid-rise buildings is unreinforced masonry
(URM) walls filling the space bounded by the structuralframing members. Although considered non-structural
elements, yet under seismic excitation, infill walls tend
to interact with the surrounding frame and may result
in different undesirable failure modes both to the frame
and to the infill wall [1]. In general, URM infill walls
have demonstrated poor performance record even in
moderate earthquakes. Their behavior is usually brittle
with little or no ductility and they, typically, suffervarious types of damage ranging from invisible cracking

Nomenclature
DH horizontal extension
DV vertical shorteningc shear strain
AFRP cross-sectional area of the FRP per unit
length of wall
An net area of the diagonal tension specimen
As cross-sectional area of the steel reinforcement
per unit length of wall
EFRP modulus of elasticity of the FRP
Es modulus of elasticity of steel
g vertical gage length
h diagonal tension specimen heightn percentage of solid in the masonry unit
P applied load on the diagonal tension speci-
mens
Ss shear stress based on the net area
t diagonal tension specimen thickness
w diagonal tension specimen width
W.W. El-Dakhakhni et al. / Composite Structures 73 (2006) 458–477 459
to crushing and, eventually, disintegration and total col-
lapse. This behavior constitutes a major source of haz-
ard during seismic events and creates a major seismic
performance problem facing designers today.
Seismic upgrading by adding new structural frames
or shear walls, have been proven to be impractical, they
have been either too costly or restricted in use to certain
types of structures. Other strengthening methods such asgrout injection, insertion of reinforcing steel, prestress-
ing, jacketing and different surface treatments were sum-
marized elsewhere [2] and specified by the Federal
Emergency Management Agency documents [3,4]. Each
of these methods adds considerable mass and stiffness
leading to higher seismic loads. They also involve the
use of skilled labor and disrupt the normal function of
the building. The use of fiber reinforced polymer(FRP) laminates for retrofitting and strengthening is a
valid alternative because of their small thickness, high
strength-to-weight ratio, high stiffness, and relative ease
of application.
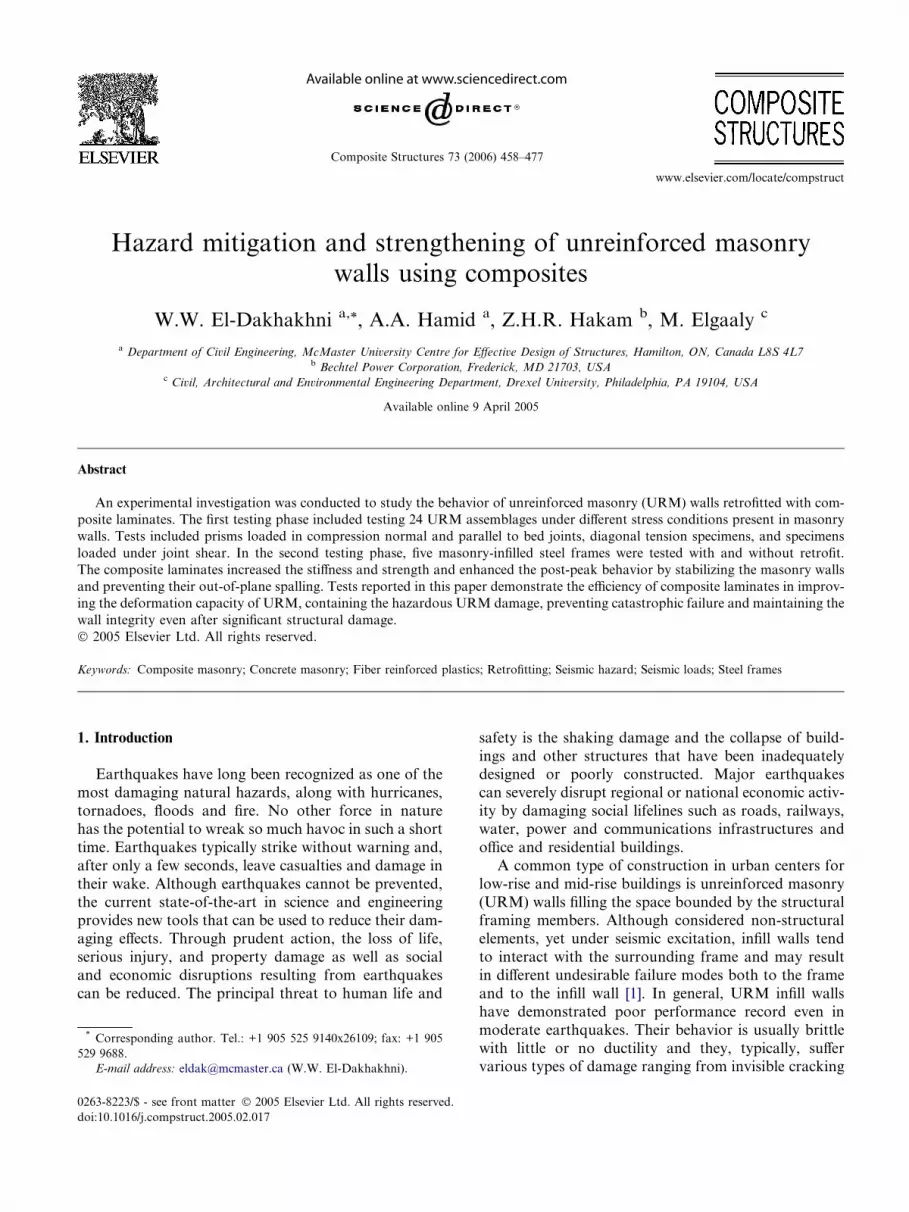
A strong earthquake introduces severe in-plane and
out-of-plane forces to masonry walls which may lead
to catastrophic collapse as seen in Fig. 1 during the
1999 Turkey earthquake. However, the majority ofwork conducted to date [5–11] has been concentrating
on the out-of-plane behavior of URM walls strength-
ened with externally applied FRPs. Infill panels (or large
portions of wall) may fall out of the surrounding frame
due to inadequate out-of-plane restraint at the frame–in-
fill interface, or due to out-of-plane flexural or shear fail-
ure of the infill panel. In undamaged infills, these failures
may result from out-of-plane inertial forces, especiallyfor infills at higher story levels and with large slender-
ness ratios. However, it is more likely for out-of-plane
failure to occur after the masonry units become dis-
lodged due to damage from in-plane loading [4].
The work presented herein investigates the effects of
applying FRP laminates on the in-plane behavior of
URM assemblages subjected to different stress condi-
tions present in masonry infill walls (Fig. 2c). One ofthe objectives of the present experimental study is to
investigate the effects of FRP laminates on altering the
failure modes and strength and deformation characteris-
tics of different assemblages. Another objective is to
demonstrate the potential of the FRP on enhancing
the shear and compressive strength of URM infill walls
and preventing brittle collapse by means of stabilizing
the face shell even after excessive damage. This would
also maintain the wall�s structural integrity and wouldreduce the possibility of URM walls collapsing and
spalling, which, in itself, is a major source of hazard dur-
ing earthquakes, even if the whole structure remained
safe and functioning.
2. Behavior of infill masonry walls
Masonry infill walls in frame structures have been
long known to affect the strength and stiffness of the in-
filled-frame structures. In seismic areas, ignoring the
frame–wall interaction is not always on the safe side,
since, under lateral loads, the infill walls dramatically in-
crease the stiffness by acting as a diagonal strut as seen
in Fig. 2a, thus resulting in possible change in the seis-
mic demand due to significant reduction in the naturalperiod of the composite structural system [1]. Also, the
composite action of the frame–wall system changes the
magnitude and the distribution of straining actions in
the frame members, i.e. critical sections in the infilled-
frame differ from those in the bare frame, which may
lead to unconservative or poorly detailed designs. More-
over, these designs may be uneconomical since an
important source of structural strength, which is partic-ularly beneficial in regions of low and, sometimes, mod-
erate seismic demand, is wasted. However, URM infill
walls exhibit poor seismic performance under moderate
and high seismic demand. This behavior is due to a ra-
pid degradation of stiffness, strength and low energy dis-
sipation capacity, resulting from the brittle and sudden
damage of the URM infill walls.
The rationale behind neglecting infill walls in thedesign process is partly attributed to incomplete
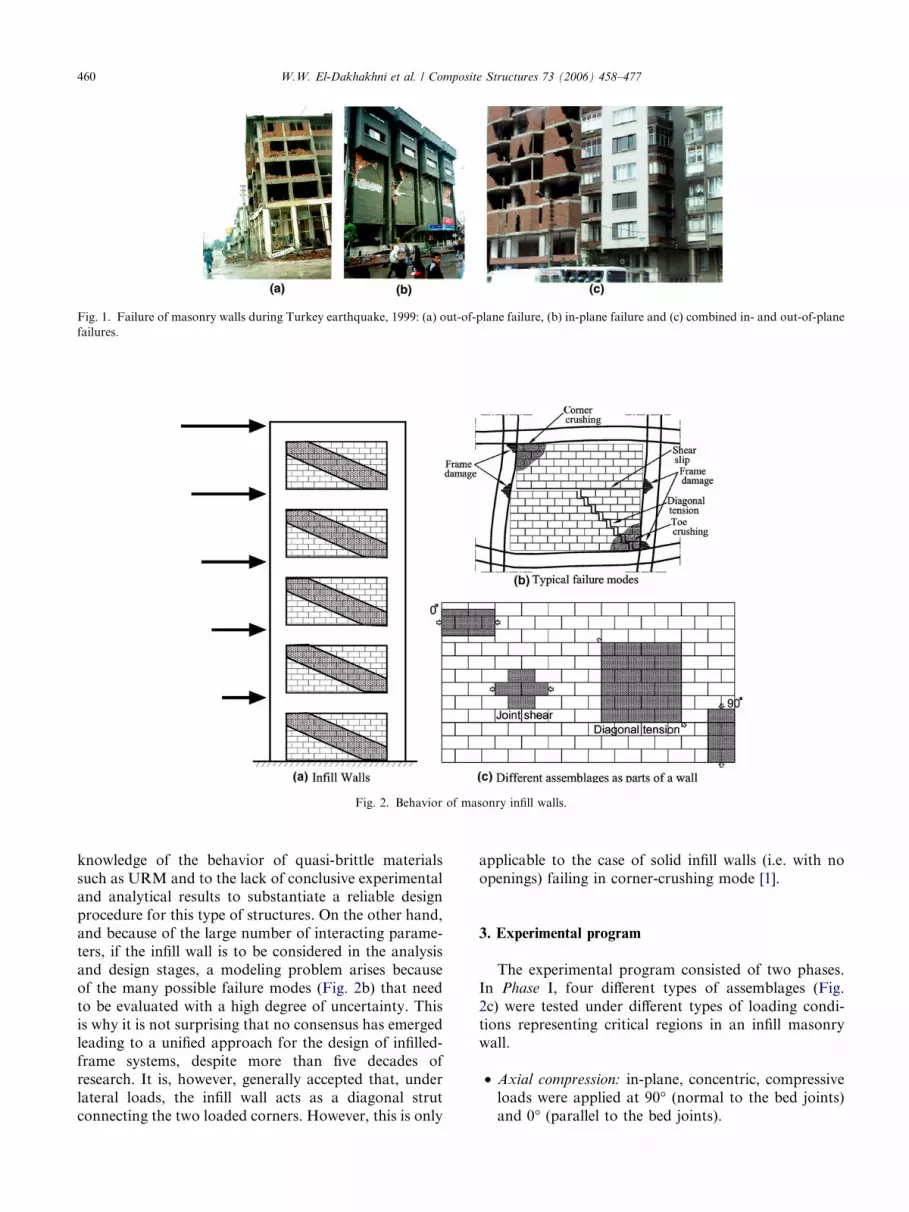
Fig. 1. Failure of masonry walls during Turkey earthquake, 1999: (a) out-of-plane failure, (b) in-plane failure and (c) combined in- and out-of-plane
failures.
Fig. 2. Behavior of masonry infill walls.
460 W.W. El-Dakhakhni et al. / Composite Structures 73 (2006) 458–477
knowledge of the behavior of quasi-brittle materials
such as URM and to the lack of conclusive experimentaland analytical results to substantiate a reliable design
procedure for this type of structures. On the other hand,
and because of the large number of interacting parame-
ters, if the infill wall is to be considered in the analysis
and design stages, a modeling problem arises because
of the many possible failure modes (Fig. 2b) that need
to be evaluated with a high degree of uncertainty. This
is why it is not surprising that no consensus has emergedleading to a unified approach for the design of infilled-
frame systems, despite more than five decades of
research. It is, however, generally accepted that, under
lateral loads, the infill wall acts as a diagonal strut
connecting the two loaded corners. However, this is only
applicable to the case of solid infill walls (i.e. with no
openings) failing in corner-crushing mode [1].
3. Experimental program
The experimental program consisted of two phases.
In Phase I, four different types of assemblages (Fig.
2c) were tested under different types of loading condi-
tions representing critical regions in an infill masonrywall.
• Axial compression: in-plane, concentric, compressive
loads were applied at 90� (normal to the bed joints)
and 0� (parallel to the bed joints).

Table 1
FRP composite and dry fibers properties
Composite laminate properties Dry fibers properties
Ultimate tensile strength in primary fibers direction (MPa) 309.0 Tensile strength (GPa) 3.24
Elongation at break (%) 1.6 Tensile modulus (GPa) 72.4
Tensile modulus (GPa) 19.3 Ultimate elongation (%) 4.5
Ultimate tensile strength 90� to primary fibers direction (MPa) 309.0 Density (g/cm3) 2.55
Laminate thickness (mm) 0.25 Weight (g/m2) 295.0
W.W. El-Dakhakhni et al. / Composite Structures 73 (2006) 458–477 461
• Diagonal tension: this is a standard testing procedure
used to evaluate the diagonal tensile (or shear)
strength of URM and creates a state of stress similar
to that occurring in infill walls.
• Joint shear: this enabled evaluating the strengthening
effect of the FRP laminates against the traditionally
weak and brittle horizontal shear slip failure mode.
In Phase II, five single-story/single-bay, one-third
scale, moment-resisting, structural steel frames infilled
with unretrofitted and retrofitted hollow block ma-
sonry walls were tested under displacement controlled
diagonal loading to evaluate the behavior of the
composite frame–wall system. Two series were
considered:
• Weak frames series: including three identical steel
frames tested as a bare (i.e. no infill) frame and two
frames were infilled with URM, one of which was ret-
rofitted with FRP.
• Strong frames series: including two identical steel
frames tested as both were infilled with URM and
one of which was retrofitted with FRP.
3.1. FRP selection
In order to select an FRP laminate for the URM
assemblages, an equivalent-stiffness-based approach
[12] was employed. The laminate required was equated
to the minimum steel reinforcement ratio of 0.2% (based
on the gross cross-sectional area of the wall) accordingto the requirement of the Masonry Standards Joint
Committee [13]. This minimum steel ratio is required
in high seismic zones to be distributed between the ver-
tical and horizontal directions in masonry walls. In
other words, the required thickness of FRP laminate
was determined based on the premise that, the stiffness
of the FRP laminate must be at least equal to or greater
than the axial stiffness of the reinforcement in the walls.The required thickness of the FRP laminate was there-
fore calculated by direct scaling of the reinforcement
area by the ratio of the elastic moduli of the steel and
FRP material as follows,
AFRP ¼Es
EFRP
As ð1Þ
where AFRP is the cross-sectional area of the FRP lam-
inate per unit length of wall, Es is Young�s modulus of
steel, EFRP is the modulus of elasticity of the FRP lam-
inate, and As is the cross-sectional area of the steel rein-
forcement per unit length of the wall. The numerical
procedure required to select the FRP laminate is given
elsewhere [14].
3.2. Material properties
The one-third-scale true-model blocks [15] used in
this investigation were replicas of the standard, full-scale
150 mm wide hollow concrete masonry units [16]. The
average net-area-based compressive strength of the
blocks was 27.87 MPa. The masonry assemblages were
constructed using scaled down mortar joints with anominal thickness of 3.2 mm. To simulate actual con-
struction practice, the mortar mix was designed as Type
S mortar [17] and all mortar joints were tooled to a con-
cave profile. The selected FRP was a bi-directional 0�/
90� Glass-FRP with 0.295 kg/m2 of E-glass fibers. The
properties of the GFRP composites, given in Table 1,
were determined according to ASTM D-3039 specifica-
tion [18] and were supplied by the manufacturer. How-ever, an average strength of 260 MPa (84% of the
specified strength in the GFRP data sheet) with 8.0%
C.O.V. was determined by testing five specimens accord-
ing to the ASTM D-3039 [18]. The steel used for the steel
frame sections was of A 36 grade (yield strength
243 MPa) for the Weak, W-Series, frames, and A572-
50 (yield strength 379 MPa) for the Strong, S-Series,
of frames.
4. Phase I testing: assemblages
4.1. Test setup and instrumentation
The test specimens were chosen to represent typical
loading cases of masonry infill walls as shown in Fig.
2c. A total of 24 1/3-scale specimens were constructed
in the laboratory and tested to failure under displace-
ment controlled loading. The overall displacement was
measured using Linear Variable Differential Transduc-ers (LVDTs) connected to a PC data acquisition system,
which also recorded the applied load on the specimens.

Fig. 3. Assemblages test setup and LVDTs configurations: (a) joint
shear and (b) diagonal tension.
Table 2
Phase I test results
Specimen Results
Test
number
Strength
Individual
(MPa)
Average
(MPa)
C.O.V.
(%)
90U 1 8.45 7.55 18.5
2 8.25
3 5.94
90R 1 13.10
2 11.75 12.17 6.6
3 11.67
00U 1 5.56
2 8.12 7.22 19.9
3 7.97
00R 1 11.49
2 11.27 11.76 5.6
3 12.51
DTU 1 0.85 0.88 12.5
2 0.79
3 1.00
DTR 1 3.73 4.01 6.3
2 4.23
3 4.07
JSU 1 0.97 0.82 18.9
2 0.83
3 0.66
JSR 1 6.28 6.53 6.4
2 7.02
3 6.30
Examples: DTU2 is the second, unretrofitted assemblage tested under
diagonal tension; 90R3 is the third, retrofitted assemblage tested under
axial compression normal to the bed joint.
462 W.W. El-Dakhakhni et al. / Composite Structures 73 (2006) 458–477
Typical LVDTs configurations are shown in Fig. 3 for
the diagonal tension and the joint shear specimens.
4.2. Preparation of test specimens
The two axial compression assemblages were of sim-
ilar dimensions in order to permit direct comparison of
their failure loads. Since it was not feasible to cut the 0�assemblages from a built URM walls, the individual
blocks for each assemblage were initially cut to shape
using a diamond saw. The head mortar joint between
the two middle blocks in the joint shear specimens was
left unfilled to allow for the specimen to fail in shear.
All specimens were constructed with face shell mortar
bedding. After air curing for at least 28 days, half of
the constructed specimens were retrofitted using two lay-ers of FRP laminates, one on each surface of the
specimens.
Before applying the FRP laminate, specimen surfaces
were first cleaned from mortar protrusions and dust
using a wire brush and air blasting, respectively. The
epoxy mixture was then applied using a paint roller to
both surfaces of the specimen. The pre-cut fabrics were
then placed on the wet surfaces and more epoxy was ap-plied to insure complete fabric saturation. The assem-
blages were tested in accordance with the ASTM E
477-92 [19] and ASTM E 519-81 [20] specifications.
5. Phase I test results
The test results are summarized in Table 2, and dis-cussed in the following sections in terms of failure
modes, strengths, and deformation characteristics. Each
specimen series was assigned a name according to the
notation shown with the examples at the bottom of
Table 2. The first two characters refer to the axial com-
pression (90� or 00�), diagonal tension (DT), or joint
shear (JS) assemblages. The third character is assigned
one of two letters, either ‘‘U’’ or ‘‘R,’’ indicating
whether the assemblage was Unretrofitted or Retrofit-
ted, respectively.
5.1. Axial compression
5.1.1. Failure modes
The unretrofitted axial compression assemblages 90U
(see Fig. 4a) and 00U (see Fig. 4b) assemblages exhibited
typical compression failure modes characterized by ver-
tical splitting along the webs of the two middle blocks
[21]. The splitting cracks left the two face shells to
deform individually, as shown in Fig. 4c, with a high
slenderness ratio. Finally, the specimens totally disinte-
grated as a result of the out-of-plane buckling and/orspalling of the face shells or a combination of both.
Noticeably, all failure modes were brittle and the assem-
blages disintegrated almost immediately after reaching
their respective maximum loads.
In contrast, all the retrofitted assemblages exhibited
one failure mode initiated by vertical splitting of the

Fig. 4. Failure modes of the unretrofitted axial compression assemblages: (a) Series 90U, (b) Series 00U and (c) web splitting mechanism of face shell
mortar bedded masonry [21].
Fig. 5. Failure modes of the retrofitted axial compression assemblages:
(a) Series 90R and (b) Series 00R.
Strain(a)
Stre
ss (M
Pa)
W.W. El-Dakhakhni et al. / Composite Structures 73 (2006) 458–477 463
interior webs followed by a gradual increase in the load
up to the peak load. After reaching the peak load, a sud-
den bang was heard as a result of the blocks webs com-
pletely breaking off the face shells. The specimens
continued to carry more load under the displacement
controlled loading with a gradual decrease in capacity.All the retrofitted assemblages were reduced to two in-
tact face shells with all interior webs damaged (see
Fig. 5).
00U2
0.00250.0
0.0000 0.0005 0.00150.0010 0.0020Strain
(b)
4.0
6.0
8.0
10.0
12.0
2.0
Stre
ss (M
Pa)
00R2
00R3
00U1
00U3
00R1
0.00350.0030
Fig. 6. Stress–strain relationships for the axial compression assem-
blages: (a) Series 90U and 90R, and (b) Series 00U and 00R.
5.1.2. Strength characteristics
Table 2 gives the variation of the compressive
strengths of the unretrofitted versus retrofitted assem-
blages. To facilitate comparison, the compressivestrengths of the assemblages were calculated as the max-
imum load-carrying capacity divided by the gross
assemblage area perpendicular to the direction of the
applied load (6431.0 mm2). It is clear that the values
of the coefficients of variation for the retrofitted assem-
blages are generally lower than those of the unretrofitted
specimens (see Table 2). This demonstrates the lami-
nate�s role in reducing the inevitable variations inURM construction.
In general, the retrofitted assemblages did not lose
all their strength nor disintegrated upon reaching the
maximum strength. In fact, in the majority of the
tests, a plateau region was attained during which
the compressive stress almost stabilized and began togradually decrease with increased displacement. Such
plateau can be regarded as residual strength after fail-
ure of the assemblages, an absent feature in the case
of URM.

464 W.W. El-Dakhakhni et al. / Composite Structures 73 (2006) 458–477
5.1.3. Deformation characteristics
The measured displacement and applied load were
used to generate the stress–strain relationships shown
in Fig. 6. In general, a good agreement can be observed
between the initial slopes for the prisms tested with
h = 0� and 90� in both the retrofitted and the unretrofit-ted series.
5.2. Diagonal tension
5.2.1. Failure modes
All the unretrofitted diagonal tension assemblages
exhibited shear slip failure along the mortar bed joints.
This is attributed to the mortar joint weak bond strengthcompared to the tensile strength of the concrete blocks.
The observed shear slip failure mode was highly brittle
and, as soon as shear slip along a bed joint was initiated,
the assemblages split into two parts and subsequently
Fig. 7. Failure modes of the diagonal tension assemblages: (a) specimen DTU
DTR web splitting.
disintegrated. In two out of the three assemblages
(DTU1 and DTU2) the shear slip occurred along the
middle bed joints (see Fig. 7a), while the third specimen
(DTU3) failed along the first bed joint (see Fig. 7b). No
signs of cracking or distress were observed prior to fail-
ure by shear slip.For the retrofitting assemblages, using the FRP lam-
inates effectively prevented any tension or shear failure
modes. All three retrofitted assemblages failed by local
crushing of their corners contained within the steel load-
ing shoes. Fig. 7c illustrates the local crushing failures.
Due to the compressive stress buildup at the toes, verti-
cal cracking through the webs was observed and ex-
tended into the first two courses as shown in Fig. 7d.Other than the local crushing and the minor delamina-
tion at the vicinity of the loading shoes, no other
signs of distress or cracking were observed in the
assemblages.
2, (b) specimen DTU3, (c) Series DTR corner crushing and (d) Series

W.W. El-Dakhakhni et al. / Composite Structures 73 (2006) 458–477 465
5.2.2. Strength characteristics
The maximum stresses sustained by the assemblages
are given in Table 2. In accordance with ASTM E
519-81 [20] standard specification, the diagonal tensile
or shear strength is calculated from,
Ss ¼0:707P
An
ð2Þ
where Ss is the shear stress based on the net area, P is theapplied load, and An is net area of the specimen calcu-
lated as follows:
An ¼wþ h
2
� �tn ð3Þ
where w, h and t are the specimen width, height and
thickness respectively, and n is the percentage of solid
in the unit, expressed as a decimal.
The average strength of the retrofitted diagonal ten-
sion specimens was 4.58 times that of the unretrofittedones and, as expected, the relatively low coefficient of
variation is indicative of the role of the laminates in
reducing the anisotropy and variability of URM.
5.2.3. Deformation characteristics
In accordance with ASTM E 519-81 [20] specifica-
tion, the shear strain was calculated using the vertical
shortening along the compression diagonal and the hor-izontal extension along the tension diagonal as follows:
c ¼ DV þ DHg
ð4Þ
where c is the shear strain, DV is the vertical shortening,
DH is the horizontal extension, and g is vertical gage.
Fig. 8 illustrates the shear stress versus shear strain
relationship for the diagonal tension assemblages. Due
to the sudden brittle failure mode, obtaining post-peak
behavior for the unretrofitted assemblages was not
feasible.
For the retrofitted specimens, the LVDTs installed atthe center of the assemblages at the 102 mm gage length,
did not record any appreciable deformations in any of
the tests. Furthermore, as the load approached its peak,
the long compression LVDT brackets on assemblages
0.0025
DTU3
2.0
Shea
r Str
ess
(MPa
)
0.00050.0000
0.50.0
1.01.5
DTU1
4.5
3.02.5
3.54.0
0.00150.0010
DTU2
0.0020Shear Strain
DTR3DTR2
DTR1
0.00350.0030
Fig. 8. The shear stress versus shear strain relationship for the
diagonal tension assemblages.
DTR2 and DTR3 detached due to local delamination
and crushing at the vicinity of the bottom loading shoe.
The same occurred in assemblage DTR1 towards the
end of the test, yet its shear stress versus strain curve
showed a load plateau with a slight increase in load.
In fact, all the assemblages were able to sustain residualloads under increasing displacement (even though the
resulting load plateaus could not be plotted for DTR2
and DTR3).
5.3. Joint shear
5.3.1. Failure modes
The unretrofitted specimen failed in a brittle shearslip debonding mode at very low load and displacement
levels. This is a result of the weak mortar joint bond
strength and the absence of friction resistance due to
the lack of compressive stresses normal to the mortar
bed joints. The failure was in the form of complete sep-
aration in the top and/or bottom mortar joints vicinity
(Fig. 9a). This failure mode is highly brittle and oc-
curred without much time elapse between the crack ini-tiation at the block–mortar interface and the
consequential debonding of the blocks.
In a manner similar to the retrofitted axial compres-
sion assemblages, none of the retrofitted assemblages
failed by shear slip along the block–mortar interface.
At most, minor signs of delamination and stretching
of the laminate were observed along a portion of the
bed joints. All assemblages ultimately failed after oneof the middle blocks cracked through the webs and split
open, though remaining attached to the assemblage as
shown in Fig. 9b. The splitting of the middle blocks is
attributed to the induced lateral tensile stresses devel-
oped in the laminates, which resisted the closing of the
head joint gap between the top and bottom blocks.
The tensile stresses induced in the middle block�s face
shells eventually resulted in cracking through the webs.This failure might also be attributed to the fact that,
with the presence of the laminates and their ability to
transfer shear stresses to the middle blocks, the blocks
were subjected to a state of stress similar to that occur-
ring in the specimens under compression parallel to the
bed joint, and thus the observed failure mode was devel-
oped. Nevertheless, this failure mode implies that shear
failure can be eliminated and the wall strength would begoverned by the compressive strength of the composite
prisms.
5.3.2. Strength characteristics
The strengths of the three unretrofitted joint shear
assemblages are presented in Table 2. In order to deter-
mine the joint shear strengths shown in the table, the
failure load for each assemblage was divided by therespective net-mortared area. Since face shell mortar
bedding was employed, the actual lengths of the

Fig. 9. Failure modes of the joint shear assemblages: (a) Series JSU and (b) Series JSR.
Average Slip (mm)0.015
JSU1
0.005
0.2
She
ar S
tres
s (M
Pa)
0.6
1.0
0.8
0.4
0.0000.0
JSU2
0.010
JSU3
0.020
Average Slip (mm)
Sh
ear
Str
ess
(MP
a)
0.00
9.0
8.0
7.0
6.0
5.0
4.0
3.0
2.0
1.0
0.00.10 0.20 0.400.30 0.50 0.60 0.70
Fig. 10. The shear stress versus slip relationship for the joint shear
assemblages.
466 W.W. El-Dakhakhni et al. / Composite Structures 73 (2006) 458–477
mortared bed joints less the head joint gap were mea-
sured using a caliper and multiplied by the average min-
imum bottom face shell thickness of 8.7 mm to
determine the net joint shear area.
The FRP laminates were cut precisely and adhered to
cover only the lengths of the mortared bed joints ensur-ing that the head joint gap between the middle blocks
was not obstructed. Therefore, similar to the unretrofit-
ted specimens, the shear area of the retrofitted assem-
blages is the net-mortared area of the bed joints
(excluding the head joint gap area). The increase in the
joint shear strength for the retrofitted assemblages was
8.2 times that of the unretrofitted ones.
5.3.3. Deformation characteristics
Fig. 10 illustrates the shear stress versus shear slip
behavior of the joint shear assemblages. The unretrofit-
ted assemblages exhibited dramatic load drop afterreaching their respective maximum stress at an average

W.W. El-Dakhakhni et al. / Composite Structures 73 (2006) 458–477 467
slip of 0.011 mm, with a coefficient of variation of
29.0%.
In general, as soon as the retrofitted assemblages
reached their respective maximum loads, a sudden load
drop occurred which signified the web splitting of one of
the middle blocks as discussed above. This was followedby a plateau with a gradually descending strength; the
assemblage at this stage was still able to carry more load
than the maximum load reached by the unretrofitted
specimens. Examination of the failed assemblages re-
vealed that the mortar bond between the top/bottom
and middle blocks was damaged and that the laminates
were entirely transferring the vertical applied load from
the top to the bottom block through the middle blocks.In all the retrofitted assemblages, the laminate was not
entirely torn and the assemblage could have resisted fur-
ther loads.
The average slip at the maximum shear stress was
0.379 mm within a coefficient of variation of 17.8%. This
is in excess of 34 times that of the unretrofitted joint
shear assemblages, thus indicative of the significant
deformation capability gained by using the FRPlaminate.
Beam W6x15
Beam W6x15
Column W6x
158 blocks wide
16co
urses
high
L6x6x3/8 Angle
L6x6x3/8 Angle
Column W
6x15
Reaction “Strong” Floor
Out-of-plane bracingplates held via C-clampsto the support angles
Load Cell
Top Loading Shoe
Rea
ctio
n C
olum
nW
14x9
0
AMSLERLoading Jack
Spherically-seatedActuator Head
AdjustableStilt
30.0
4"
Rea
ctio
nFr
ame
Brac
ing
Actuator and Reaction Frame Bracing connected to Top Girder
T ST SETUP FORCM & CR FRAMESDrawing Scale 1:20
6.00"
78.49"1.99 m
(a)
Fig. 11. Masonry infilled steel frame specime
6. Phase II testing: infilled frames
This phase focused on testing of one-third scale, mo-
ment-resisting, structural steel frames infilled with unret-
rofitted and retrofitted hollow block masonry walls.
Single-story/single-bay infilled frame subjected to diago-nal-compressive loading (as shown in Fig. 11a) were
used to evaluate the behavior of the composite frame–
wall system.
The interaction between the infill wall and the sur-
rounding columns and beams result in unequal contact
lengths along the boundaries of the infill with each of
the weak and strong frame members. This, in turn, re-
sults in different infill contribution with different frames.Table 3 lists the structural properties of the weak and
strong frame sections [22] and outlines the five frames
tested in Phase II.
One-third scaling of the typical clear floor height and
column span of the prototype structure was used to ob-
tain the dimensions of the model infilled frame [15]. A
clear height between the beams and columns of
1100 mm was used. This is equivalent to a full-scaledimension of 3.3 m. The masonry infill walls were built
LOCATIONS OF STRAIN GAGES AND LVDTs
Beam
BeamColu
mn
Column
MC
MC
MTMT LTLT ST ST
LC
LC
SC
SC
TEN
SIO
ND
IAG
ON
AL
TEN
SIO
ND
IAG
ON
AL
COMPRESSIONDIAGONAL
COMPRESSIONDIAGONAL
KEYMC = Main Compression LVDTMT = Main Tension LVDTLC = Long Compression LVDTLT = Long Tension LVDTSC = Short Compression LVDTST = Short Tension LVDT
= Strain gages (adhered tothe top of the upper andlower flanges)
Infill h
eight=
Infill l
ength
==
43.50
0"
hl
= Sectio
n
Depth
= d
d
l/2
6.000
"
Applied Load
(b)
ns: (a) test setup, (b) instrumentation.

Table 3
Structural properties and test matrix of the steel frames
Structural property Weak (W)
frame S3 · 5.7
Strong (S)
frame W6 · 15
Area 1077 mm2 2858 mm2
Depth 76 mm 152 mm
Web thickness 4 mm 6 mm
Flange width 59 mm 152 mm
Flange thickness 7 mm 7 mm
Strong axis (X-axis)
Elastic moment of inertia 1,049,000 mm4 12,112,000 mm4
Elastic section modulus 27,500 mm3 159,300 mm3
Plastic section modulus 31,950 mm3 176,980 mm3
Weak axis (Y-axis)
Elastic moment of inertia 189,400 mm4 3,879,300 mm4
Elastic section modulus 6390 mm3 50,960 mm3
Plastic section modulus 10,700 mm3 77,840 mm3
Infill type Specimen
Bare WB –
Unretrofitted WU SU
Retrofitted WR SR
Steel frame section: ‘‘W’’ weak frame S3 · 5.7 or ‘‘S’’ strong frame
W6 · 15.
Infill type: ‘‘B’’ bare (no infill), ‘‘U’’ unretrofitted-masonry infill, or
‘‘R’’ retrofitted-masonry infill.
Fig. 12. Load–deflection relationship for frame WB.
468 W.W. El-Dakhakhni et al. / Composite Structures 73 (2006) 458–477
eight blocks wide by 16 courses high. To ensure symme-
try in the construction, mortar was packed along all the
boundaries between the infill and the confining steel
frame with a nominal mortar joint thickness of 3 mm.
To identify the different frames tested in Phase II,
each specimen was assigned a name according to the
notation in the bottom of Table 3. The first character
is used to identify the steel section of the boundingframe whether S3 · 5.7 (Weak frame) or W6 · 15
(Strong frame). The second character describes the type
of infill, if any, ‘‘B’’ refers to no wall (Bare frame), ‘‘U’’
or ‘‘R,’’ indicating whether the wall was Unretrofitted or
Retrofitted, respectively.
For the stronger S-frames, the clear height between
the beams and the clear span between the columns
were similar to those of the W-frames. Moreover, thebeam-column connections were also designed as full-
moment-resisting and fabricated using complete-joint-
penetration groove welds to weld the beam flanges to
the column flanges while 3.0 mm fillet welds were used
to weld the beam webs to the column flanges. However,
due to the expected high diagonal-compressive loading
force, 10 mm thick stiffener plates were welded using
3.0 mm fillet welds between the column flanges in orderto prevent premature web buckling at the loaded ends.
To maintain symmetry, similar plates were also welded
at the four corners of the S-frames.
6.1. Test setup and instrumentation
The general test setup and loading assembly are
shown in Fig. 11a. The compressive top load was
applied using an AMSLER hydraulic jack with a load
capacity of 490 kN and a maximum stroke of 125 mm.
A lateral bracing system consisting of four L 6 · 6 · 3/
8 angles were used to prevent accidental out-of-plane
deformations during the in-plane loading of the frames.
Fig. 11b illustrates the typical instrumentation in-stalled on the infill wall and bounding frame, as well
as the locations of the critical sections along the steel
frame where strain gages were placed (an infilled
W6 · 15 steel frame is shown in the figure for illustra-
tion). All LVDTs, strain gages, and the load cell used
to measure the applied compressive load were all con-
nected to a PC data acquisition system.
7. Phase II test results
7.1. WB frame
As expected, the frame joints underwent severe rota-
tion and distortion. In addition, both joints along the
tension diagonal experienced tearing of the webs asshown in Fig. 12, although no signs of cracking were
noted in the welds between the columns and the beams
at these moment-resisting connections (thus indicative
of the strength of the weld). It was evident from the dis-
torted shape of the frame and the bent columns and
beams, that the permanent (i.e., plastic) deformations
propagated from the joints inwards.
The initial stiffness obtained from the load–deflectioncurve shown in Fig. 12 was determined to be 2.2 kN/mm.
A linear behavior was observed up to a load of a 25.8 kN
corresponding to an average top displacement of
11.9 mm. Subsequently, a load plateau of 27.0 kN was
attained at a top displacement of 14.0 mm. Attributed
to the strain hardening effects, a slight increase in load
occurred resulting in an ultimate load of 28.3 kN. The
actual load–deflection behavior closely resembles the ex-pected behavior in which an initial linear response occurs
until initiation of yielding followed by a plateau then a
slight load increase to attain the ultimate failure load.
7.2. WU frame
The maximum load-carrying capacity attained by the
infilled frame was 104.0 kN. A stepped diagonal crack

Deflection (mm)
00.0 20.0
Load
(kN
)
100
WB40
20
80
60
WU
40.0 60.0 80.0
Applied Load
Applied Load
Fig. 13. Load–deflection relationship for frames WU and WB.
W.W. El-Dakhakhni et al. / Composite Structures 73 (2006) 458–477 469
was observed at the center of the infill panel along the
compression diagonal as shown in Fig. 13, was an-
nounced by an audible bang and occurred at a load of
7.8 kN corresponding to 7.5% of the maximum attained
load. The load–deflection relation obtained for frame
WU is shown in Fig. 13. The load versus deflection
curve of the bare frame tested earlier is reproduced on
the same plot for comparison.Initially, the load–deflection curve was characterized
by a steady rise as shown in Fig. 13. Prior to attaining
the first peak at 97.7 kN at a corresponding deflection
of 1.9 mm and shortly afterwards, cracking noises were
continuously heard although no visible cracks were ob-
served, thus indicating possible damage in the interior
webs of the masonry infill panel resulting in a series of
quick load descents and ascents. Shortly afterwards, amajor off-diagonal crack parallel to the initial toothed
crack at the center of the infill panel was observed. This
crack occurred at a trough in the load–deflection curve
at approximately 5.1 mm. Unlike the initial toothed
crack, this crack propagated vertically through the
Fig. 14. Damage of frame WU: (a) at the left column, (b) at the wa
blocks and mortar joints. As the infill panel further
readjusted indicating redistribution of the transferred
load, the load steadily rose to reach the maximum load
carried by this infilled frame in spite of the occurrence of
local cracking due to crushing of the infill in the vicinity
of the bottom loading shoe at approximately 7.6 mm. At12.7 mm, crushing and cracking was observed in the in-
fill panel near the top loading shoe. Subsequently, a
steady decline in the load-carrying capacity of the frame
occurred as more off-diagonal cracks started appearing
on both sides of the first toothed crack in addition to
spalling of the block face shells near these cracks. At
approximately 15.0 mm, cracks along the infill bed
joints were observed and propagated at mid-length ofthe frame columns until a significant portion of the infill
panel face shell near the mid-length of the left frame col-
umn separated (approximately at 28.0 mm) as shown in
Fig. 14a. Face shell spalling continued rapidly (at
33.0 mm) resulting in severe deterioration and cracking
in the infill panel until, finally (at 56.0 mm), was attained
signifying the beginning of a load plateau. In turn, this
marks the point after which the infill panel ceased tocontribute in resisting the applied load. Extensive local
crushing and cracking at the toe of the infill panel near
the bottom loading shoe is shown in Fig. 14b. The sever-
ity of the damage at the center of the masonry infill is
illustrated in Fig. 14c. From 56.0 mm onwards, the steel
frame was entirely carrying the applied load and was de-
formed severely as shown in Fig. 14d. Similar to the WB
frame, the joints of the steel frame underwent severeplastic rotation at the joints along the tension diagonal,
ll toe, (c) at the infill center and (d) at the beam-column joint.

470 W.W. El-Dakhakhni et al. / Composite Structures 73 (2006) 458–477
in addition to local web buckling in the columns and
beams at the loaded joints.
The infilled WU frame attained a maximum load-car-
rying capacity of 104.0 kN which represents an increase
of 267.5% compared to the capacity of the bare WB
frame. The initial stiffness of the WU frame measuredas the secant stiffness at 50% of the maximum load-car-
rying capacity was determined as 55.7 kN/mm which is
25 times that of the bare frame. The significant increase
in WU frame�s load-carrying capacity and initial stiff-
ness compared to the WB frame was expected, particu-
larly in view of the fact that the infill panel is
relatively stiff compared to the frame. Ultimately, upon
attaining a load plateau at a displacement of 57.4 mmsignifying the end of the infill�s participation in in-plane
load resistance, the plastic load-carrying capacity of the
WU frame was determined from the test as 28.2 kN.
This is comparable to the bare frame�s ultimate load
capacity obtained previously from the WB frame test.
7.3. WR frame
The load versus deflection curves for the WR frame is
shown in Fig. 15a. The maximum load attained by the
frame was 218.9 kN which represents increases of 7.7
times and 2.2 times the maximum loads attained by
the WB and WU frames respectively. At an applied load
of 182.4 kN corresponding to 83.3% of the maximum
Fig. 15. Frame WR: (a) load–deflection relationship, (b)
load-carrying capacity, some hairline cracks were ob-
served in the blocks near the vicinity of the top loading
shoe. These cracks were visible underneath the clear
laminate adhered on the exterior of the masonry infill
panel. As the load began to decrease, cracking noises
and clicks were heard until suddenly at a load of175.1 kN, corresponding to 80.0% of the ultimate load
on the descending branch of the load curve, the interior
webs near the top portion of the infill panel were dam-
aged causing the separated retrofitted face shells near
the top loading shoe to snap outwards and moved out-
side the flanges of the frame members (Fig. 16a). Unfor-
tunately, shortly before and after this outward ‘‘burst,’’
the buckled face shell brushed against the main and infillcompression LVDTs, thus preventing further recording
of displacement.
Minor signs of delamination along the second bed
joint on the backside of the infill panel were evident.
There were no signs of distress in the steel frame, clearly
indicating that the applied load was primarily endured
by the retrofitted infill panel with minimal contribution
from the steel frame.A thorough understanding of the behavior and re-
sponse of the retrofitted infill panel was further facili-
tated upon its removal from the bounding steel frame
thereby enabling a closer inspection. Fig. 16b shows
the wall separation in the left side of the frame. The ret-
rofit technique using FRP laminates was very successful
delamination zone and (c) damaged webs region.

W.W. El-Dakhakhni et al. / Composite Structures 73 (2006) 458–477 471
in preserving the integrity of the highly brittle masonry.
The fact that the panel, simulating a story-high wall, was
removed in one intact piece (in spite of some damage to
the interior webs) is testimony to the beneficial effect of
retrofit with FRP overlay. At the toes of the infill panel
within the vicinity of the loaded corners of the frame, allinterior webs were damaged. As shown in Figs. 15c and
16c, the web damage extended inwards towards the cen-
ter of the panel to approximately one-quarter of the
diagonal length. Web damage was also evident along
the perimeter of the panel which was in contact with
the frame members. The web damage was minimal
near the corners of the tension diagonal.
However, the separated face shells were held intactby the strong laminate and, in general, there was min-
imal (if any) delamination between the overlay and
the block face shells (except in the location shown
in Fig. 15b). No web damage was evident at the cen-
ter of the infill. Furthermore, unlike in the unretrofit-
ted-masonry infill wall of the WU frame, the laminate
successfully prevented the occurrence of any diagonal
Fig. 16. Damage of frame WR: (a) out-of-plane wall burst, (
tension cracks or shear slip along the bed joints in
the infill. As shown in the various assemblage tests
discussed in Phase I of the experimental program,
the FRP laminate basically suppressed any tension
and shear failure modes in the masonry by reinforcing
the weak mortar joints. Thus, the resulting retrofitted-masonry infill wall has been transformed into two
very strong face shells connected by masonry webs
which are considered as the weak elements in the
assembly.
The secant stiffness at 50% of the maximum load, the
initial stiffness of the BR frame is 131.4 kN/mm which
represents increases of 58.7 times and 2.4 times the ini-
tial stiffness values of the WB and WU frames respec-tively. The peak load was reached at a compressive
deflection of 5.6 mm. Similar to the WU frame, the re-
corded deflections along the compression diagonal in
the direction of the applied load were greater than those
along the tension diagonal. This is attributed to the local
cracking at the infill�s loaded toes resulting in a reduced
stiffness along the loading direction.
b) infill wall separation and (c) extent of web splitting.

472 W.W. El-Dakhakhni et al. / Composite Structures 73 (2006) 458–477
Ultimately, as the infill panel was no longer in any
effective contact with the bounding steel frame, a load
plateau was attained which represents the bare frame�splastic load capacity. The load stabilized at a value of
28.9 kN which is comparable to the WB frame capacity.
7.4. SU frame
Plot of the applied top load versus deflections for the
SU frame is shown in Fig. 17. The initial secant stiffness
of the SU frame was 91.4 kN/mm. The ultimate load-
carrying capacity of the SU frame determined in the sec-
ond test was 284.4 kN. The unretrofitted-masonry infill
panel remained crack-free up to an applied diagonalload of 122.4 kN corresponding to 43.0% of the ultimate
load-carrying capacity of the SU frame. Thereafter, a
longitudinal crack at the middle of the panel occurred
similar to the WU frame. However, unlike the toothed
crack in the WU frame, which propagated along the
head and bed joints around the masonry units, the mid-
dle crack in the SU frame�s panel extended through both
the units and the mortar joints. As loading progressed,the middle crack extended further in addition to the for-
mation of some off-diagonal hairline cracks and a short
bed joint crack above the first masonry course. Near the
peak load, signs of crushing of the boundary mortar
joint between the steel frame and the infill panel in the
vicinity of the loaded corners were observed. Moreover,
a hairline separation crack between the panel and the
frame at the tension corners was observed to extendapproximately three courses long.
The cracking pattern of the masonry infill wall resem-
bles that encountered in the WU frame test in which a
central crack is first initiated along the loaded diagonal
of the wall followed by the formation of some off-diag-
onal cracks. In the second test attempt, the existing but
closed hairline cracks resulting from the first test wid-
ened as the frame reached a first peak load at266.9 kN at a corresponding deflection of 6.8 mm.
Shortly before reaching the peak load, minor cracking
was observed in the infill�s toe near the bottom loading
shoe. As the frame was pushed further in spite of the de-
creased load resistance, small off-diagonal cracks began
forming on the left and right sides of the central crack.
These cracks assisted in the redistribution of the load
0.00 20.00 80.0040.00 60.00Deflection (mm)
150.0
0.050.0
100.0
200.0250.0300.0
Load
(kN
)
Fig. 17. Frame SU load–deflection relationship and diagonal cracking.
within the infill panel as it adjusted to bear against the
deforming shape of the steel frame. Suddenly, face shell
spalling occurred in the tension corner regions (to the
left and right of the central crack where extensive off-
diagonal cracks were occurring) as shown in Fig. 18a.
This occurred at an approximate SU deflection of9.0 mm. In fact, this served as a major indicator of the
shift in load resistance between the infill panel and the
steel frame. As the frame was still being pushed diago-
nally, due to incompatible deformations between the
steel frame and the masonry wall, the infill wall was
quickly losing structural integrity accompanied with ra-
pid face shell spalling and collapse of massive ‘‘chunks’’
of the upper region of the wall (Fig. 18b).At the end, only the lower three courses of the ma-
sonry wall remained standing on the lower beam and
column of the frame as shown in Fig. 18c. As the load
increased, the SU frame was simply behaving as a bare
W6 · 15 moment-resisting frame and yielding com-
menced at the beam-column joints.
The formation of plastic hinges, eventually leading to
a plastic collapse mechanism, characterizes the failuremode of the CM frame in which the masonry infill panel
did not increase its load-carrying capacity. However,
failure of the masonry infill panel is attributed to a com-
bination of toe crushing (characterized by local com-
pressive crushing of the masonry at the vicinity of the
loaded corners) and diagonal-compression failure at
the center of the panel (characterized by the formation
of extensive diagonal and off-diagonal longitudinalcracks). The frame was unloaded after the full stroke
of the loading actuator was consumed.
7.5. SR frame
Fig. 19a shows the load–deflection relationship of the
SR frame which had a maximum load capacity of
343.0 kN and an initial stiffness of 262.7 kN/mm.At 0.8 mm, an audible bang was heard although no
crack was detected visually. Characterized by a small
shift in the load–deflection curve, the bang suggested
the occurrence of a crack in the interior webs, possibly
at one of the loaded toes of the infill wall. At 2.3 mm,
the crack location most probably occurred in the top
toe. At a deflection of 1.98 mm, the load increased fur-
ther until it reached the first peak of 270.1 kN. At thispoint, a greater load bang was heard and crushing at
the top loaded toe of the infill panel was observed. As
in the retrofitted assemblages, crushing at the top toe
of the retrofitted-masonry infill panel involved damage
of the interior webs leading to the laminated-face shells
snapping outwards. The damage extended along the in-
fill-frame boundary for a length of approximately six
courses (three block-lengths) and only one course wide(one half a block-length) as shown in Fig. 19b. A conse-
quential loss in load capacity occurred but gradually

Fig. 18. Damage of frame SU: (a) face shell spalling in the diagonally cracked region, (b) collapse of the upper infill region and (c) infill wall
remnants.
Fig. 19. Frame SR: (a) load–deflection relationship, (b) damage progress and (c) final damaged zones.
W.W. El-Dakhakhni et al. / Composite Structures 73 (2006) 458–477 473

474 W.W. El-Dakhakhni et al. / Composite Structures 73 (2006) 458–477
increased as the frame was further loaded. Similar crush-
ing also occurred at the bottom loaded toe of the infill
panel (Fig. 19b).
Separation between the infill panel and the steel
frame at the tension diagonal corners occurred as load-
ing progressed. At approximately 22.0 mm, the separa-tion gap was clearly visible as shown in Fig. 20a. As
the frame was pushed further beyond 22.0 mm, the sep-
aration between the frame and the infill increased. The
extent of toe crushing, which is defined as splitting of
the face shell and at times accompanied by minor delam-
ination between the overlay and the face shell itself, also
increased (Fig. 20b and c). The steel frame was consid-
erably deformed with significant plastic rotation at thetension joints as shown in Fig. 20d. Examination of
the infill panel at the end of the test (Fig. 20e) indicated
Fig. 20. Frame SR damage: (a) at left side, (b) at top loaded corner, (c) at b
configuration.
that, other than minor delamination at the infill-frame
boundaries and toe crushing and in spite of the separa-
tion between the infill and the frame at the tension diag-
onal corners, the central region of the wall was intact
without any cracking or damage. A schematic diagram
illustrating the state of the retrofitted infill wall at theend of the test is shown in Fig. 19c.
Even though the load–deflection curves indicated that
a load plateau was reached, it was decided to further
load the SR frame. This decision was triggered by the
fact that the plateau occurred at load of 339.0 kN which
is 21.0% greater than the expected plastic load-carrying
capacity of the bare W6 · 15 frame of 280.4 kN as deter-
mined experimentally from the prior SU frame test, thussuggesting that the retrofitted infill wall still contributed
to load resistance.
ottom loaded corner, (d) at beam-column joint and (e) final damaged

W.W. El-Dakhakhni et al. / Composite Structures 73 (2006) 458–477 475
8. Summary of Phase II test results
Beside local toe crushing, secondary signs of distress
resulting from severe face shell splitting such as tearing
of the laminate or minor delamination between the
block face shells and the laminates were the only ob-served damages as the FRP retrofitted infilled-frames
were pushed to severely deformed configuration. The
frames with the retrofitted infill walls depicted similar
behavior throughout the entire loading history. In both
the WR and SR tests, as soon as local crushing occurred
at the wall�s corners, clearly visible and wide separation
gaps between the panel and the frame constantly in-
creased unlike in the WU and SU frames. Unlike theunretrofitted-masonry infill walls which disintegrated
soon after the infilled-frame system reached its peak
load, the retrofitted infill walls remained supported with-
in the bounding steel frame until the end of the loading
and even after attainment of load plateau which signaled
that the frames reached the plastic load-carrying capac-
ity of the bare steel frame. This behavior demonstrates
the superior contribution of FRP laminates in alteringthe brittle hazardous behavior of URM infill walls to
a ductile and damage-tolerant wall with apparent post-
peak capacity and energy dissipation capabilities.
Table 4 summarizes the maximum diagonal-compres-
sive load sustained by the five tested frames. In addition,
the plastic load capacity of the bare W6 · 15 which was
experimentally determined through testing the SU frame
after the remains of the infill panel were removed (thethird test of the SU frame), is also included in the table.
The percentage and the corresponding multiple in-
creases in the load-carrying capacity compared to that
of the bare frame and the unretrofitted-masonry infilled
frame for each of the two steel frame types are also cal-
culated and presented in Table 4.
Table 4 also compares the initial secant stiffness of the
five tested frames in this study. The stiffness values werecalculated as the slope of line joining the origin and the
Table 4
Phase II test results
Frame Maximum
load (kN)
% Increase compared to X�s increase c
Bare frame Unretrofitted
infilled frame
Bare frame
W-Frames
(S3 · 5.7)
WB 28.3
WU 104.0 267.5% 3.67
WR 219.0 673.9% 110.6% 7.74
S-Frames
(W6 · 15)
SB 280.4b
SU 284.4 1.4% 1.01
SR 343.1 22.4% 20.6% 1.22
a Initial secant stiffness determined from the load–deflection curve of the te
50% of the maximum load-capacity.b Plastic load-carrying capacity of the bare W6 · 15 frame was experimenta
the infill wall were removed entirely.c Initial secant stiffness of the bare W6 · 15 frame was experimentally dete
point at 50% of the ultimate load using the applied diag-
onal load versus in-line compressive displacement
curves. Although a bare W6 · 15 steel frame was not
tested as a separate frame, its stiffness which is shown
in Table 4 was experimentally determined from the sec-
ond test of the SR frame whose infill panel was sepa-rated from the frame along the majority of its
perimeter and sustained local damage at its loaded toes
whereas the steel frame did not experience any distress in
the prior test. For each frame within the two main steel
frame types, the increases in stiffness compared to the
bare frame and the first test of the unretrofitted-masonry
infilled frame are computed and presented in the table.
9. Conclusions
This paper presents an experimental investigation on
the retrofitting of concrete masonry infill walls using
FRP laminates, which provides a strengthening alterna-
tive for URM infill walls. The relative ease with which
FRP laminates can be installed on the walls makes thisform of strengthening attractive to the owner, consider-
ing both reduced installation cost and down time of the
occupied structure. Another reason is to comply with
new seismic codes requirements without the need to
demolish the whole wall and rebuild it. The following
conclusions resulted from Phase I of the investigation:
1. The laminates significantly increased the load-carry-ing capacity of the masonry assemblages exhibiting
shear failures along the mortar joints (joint shear
and diagonal tension). The average joint shear
strength of the retrofitted specimens was equal to
eight times that of their unretrofitted counterparts.
2. The unretrofitted axial compression assemblages
failed suddenly and disintegrated totally upon reach-
ing peak stress. However, the FRP supplied the ten-sile strength required to stabilize the out-of-plane
ompared to Initial secant
stiffnessa (kN/mm)
X�s Increase Compared to
Unretrofitted
infilled frame
Bare frame Unretrofitted-
masonry
infilled frame
2.2
55.7 24.92
2.11 131.4 58.74 2.36
20.9c
91.4 4.38
1.21 175.1 8.40 1.92
sted frames as the slope of the line joining the origin and the point at
lly determined from the third test of the SU frame after the remains of
rmined from retesting the SR frame.

476 W.W. El-Dakhakhni et al. / Composite Structures 73 (2006) 458–477
buckling of the individual face shells, thus preventing
brittle failure after webs splitting and allowing the
specimen to carry more loads. This prevented cata-
strophic failure of the masonry–FRP composite
assemblages compared to their URM counterparts.
3. The FRP laminates resulted in a gradual prolongedfailure, and a stable wall with noticeable structurally
integrity and residual strength even after failure.
Thus, the long known hazard problem associated
with URM can be eliminated using the proposed ret-
rofit technique. In seismic zones, the prevention of
the brittle failure mode is highly desirable since it pro-
vides a means for energy dissipation and conse-
quently reduces the seismic forces on the framestructure.
The following conclusions resulted from Phase II of
the investigation:
4. Retrofitting the infill panel with externally, epoxy-
bonded FRP laminates resulted in an increase in
load-carrying capacity of 2.1 and 1.2 times that ofthe corresponding unretrofitted-masonry infilled
frames for the W-frames and the S-frames
respectively.
5. Even in the S-frames whose load capacity was not sig-
nificantly increased due to retrofit of the infill panel,
the laminates were able to completely alter the defor-
mation characteristics and behavior of the wall itself.
In the unretrofitted-masonry infilled frames, the wallswere completely destroyed and the blocks fell out-of-
plane which in real life poses a hazard to buildings�occupants. The failure mode of the two unretrofitted
frames was characterized as corner-crushing and
diagonal-compression respectively. In the retrofit-
ted-masonry infilled frames, no signs of diagonal
cracking were observed and both frame types failed
due to local crushing at the loaded corners. Examina-tion of the retrofitted panel indicated that the central
region remained intact and that the majority of the
damage occurred at the outermost perimeter and at
the loaded corners where the inner webs of the blocks
cracked resulting in the formation of separate lami-
nated-face shells.
6. The retrofitting technique maintained the walls struc-
tural integrity and prevented collapse and debris fall-out. The FRP laminates contained and localized the
damage of the URM walls even after ultimate failure
and no signs of distress were evident throughout the
wall except at the vicinity of the corners and around
the openings. In contrast to the URM walls, the
strengthened walls were stable after failure. In a real
building, this can reduce the seismic hazard associ-
ated with the wall tipping off or falling out of theframe, and eliminate injuries or loss of lives and
properties due to the wall collapse. This would also
maintain the wall�s structural integrity and would
reduce the possibility of URM walls collapsing and
spalling, which, in itself, is a major source of hazard
during earthquakes, even if the whole structure
remained safe and functioning.
7. The masonry–FRP composite walls do not fail cata-strophically as their URM counterparts. The FRP
laminates resulted in a gradual prolonged failure
and a stronger wall with more energy dissipation
and apparent post-peak strength. This should result
in a higher response modification factor than that
typically selected for the analysis of URM structures.
8. By supplying the shear strength at the mortar joints,
FRP laminates can serve as external reinforcementfor unreinforced or under-reinforced masonry walls,
thus providing a quick and cost-effective solution to
conform to the more restrict emerging seismic codes
requirements.
Acknowledgments
The work presented herein was supported under
Grant No. CMS-9730646 from the National Science
Foundation (NSF). The results, opinions, and conclu-
sions expressed in this paper are solely those of the
authors and do not necessarily reflect those of the
NSF. The authors would like to gratefully acknowledgeassistance of Edward Fyfe, Peter Milligan and Sarah
Cruickshank, Fyfe Co. LLC, California, for providing
the FRP, and John Sabia, D.M. Sabia Co., Pennsylva-
nia for providing the mason. The authors would also
like to thank Mr. Omar El-Dakhakhni for his
assistance.
References
[1] El-Dakhakhni WW, Elgaaly M, Hamid AA. Three-Strut model
for concrete masonry-infilled steel frames. ASCE J Struct Eng
2003;129(2):177–85.
[2] Hamid AA, Mahmoud ADS, El Magd SA. Strengthening and
repair of unreinforced masonry structures: State-of-the-art. Proc
10th Int Brick and Block Masonry Conf, vol. 2. London: Else-
vier Applied Science; 1994. p. 485–97.
[3] FEMA-273. NEHRP guidelines for the seismic rehabilitation of
buildings, Federal Emergency Management Agency, Washington,
DC, 1997.
[4] FEMA-274. NEHRP commentary on the guidelines for the
seismic rehabilitation of buildings, Federal Emergency Manage-
ment Agency, Washington, DC, 1997.
[5] Triantafillou TC. Strengthening of masonry structures using
epoxy-bonded FRP laminates. J Compos Construct, ASCE
1998;2(2):96–104.
[6] Velazquez-Dimas JI, Ehsani MR. Modeling out-of-plane behavior
of URM walls retrofitted with fiber composites. J Compos
Construct, ASCE 2000;4(4):172–81.

W.W. El-Dakhakhni et al. / Composite Structures 73 (2006) 458–477 477
[7] Albert ML, Elwi AE, Cheng JJR. Strengthening of unreinforced
masonry walls using FRPs. J Compos Construct, ASCE
2001;5(2):76–84.
[8] Hamoush SA, McGinley MW, Mlakar P, Scott D, Murray K.
Out-of-plane strengthening of masonry walls with reinforced
composites. J Compos Construct, ASCE 2001;5(3):139–45.
[9] Hamilton III HR, Dolan CW. Flexural capacity of glass FRP
strengthened concrete masonry walls. J Compos Construct, ASCE
2001;5(3):170–8.
[10] Kuzik MD, Elwi AE, Cheng JJR. Cyclic flexure tests of masonry
walls reinforced with glass fiber reinforced polymer sheets. J
Compos Construct, ASCE 2003;7(1):20–30.
[11] Tan KH, Patoary MKH. Strengthening of masonry walls against
out-of-plane loads using fiber–reinforced polymer reinforcement.
J Compos Construct, ASCE 2004;8(1):79–87.
[12] Seible F. Repair and seismic retest of a full-scale reinforced
masonry building. In: Proceedings of the Sixth International
Conference on Structural Faults and Repair, vol 3, 1995. p. 229–
36.
[13] MSJC. Masonry Standards Joint Committee ‘‘Building Code
Requirements for Masonry Structures (ACI 530-04/ASCE 5-04/
TMS 402-04)’’, reported by the Masonry Standards Joint Com-
mittee, 2005.
[14] Hamid AA, El-Dakhakhni WW, Hakam ZR, Elgaaly M. Behav-
ior of composite unreinforced masonry—fiber–reinforced polymer
wall assemblages under in-plane loading. J Compos Construct,
ASCE 2004;9(1):73–83.
[15] Harris HG, Sabnis A, Gajanan M. Structural modeling
and experimental techniques. 2nd ed. New York: CRC Press;
1999.
[16] American Society for Testing and Materials, ASTM C 90-92b
Standard specification for load-bearing concrete masonry units.
Annual Book of ASTM Standards, vol 04.05, West Conshohoc-
ken, Pennsylvania.
[17] American Society for Testing and Materials, ASTM C 270-92a.
Standard specification for mortar for unit masonry. Annual Book
of ASTM Standards, vol 04.05, West Conshohocken,
Pennsylvania.
[18] American Society for Testing and Materials, ASTM D 3039/D
3039M-93. Standard test method for tensile properties of polymer
matrix composite materials. Annual Book of ASTM Standards,
vol 15.03, West Conshohocken, Pennsylvania.
[19] American Society for Testing and Materials, ASTM E 447-92b.
Standard test methods for compressive strength of masonry
prisms. Annual Book of ASTM Standards, vol 04.05, West
Conshohocken, Pennsylvania.
[20] American Society for Testing and Materials, ASTM E 519-81.
Standard test method for diagonal tension (shear) in masonry
assemblages. Annual Book of ASTM Standards, vol 04.05, West
Conshohocken, Pennsylvania.
[21] Drysdale RG, Hamid A, Baker LR. Masonry structures: behavior
and design. 2nd ed. Boulder, CO: The Masonry Society; 1999.
[22] AISC. LRFD manual of steel construction. 3rd ed. Chicago,
IL: American Institute of Steel Construction; 2003.


