Embed Size (px)
Citation preview

CBP/p300 and P/CAF in neuronal outgrowth
1
HDAC inhibition promotes neuronal outgrowth and counteracts growth cone collapse
through CBP/p300 and P/CAF-dependent p53 acetylation
Running Title CBP/p300 and P/CAF in neuronal outgrowth
Perrine Gaub1,2, Andrea Tedeschi1,2, Radhika Puttagunta1, Tuan Nguyen1, Antonio
Schmandke1, and Simone Di Giovanni1.
1Laboratory for NeuroRegeneration and Repair, Center for Neurology, Hertie Institute for
Clinical Brain Research, University of Tuebingen, Tuebingen, Germany.
2Graduate School for Cellular and Molecular Neuroscience, University of Tuebingen,
Tuebingen, Germany.
To whom correspondence should be addressed: Simone Di Giovanni, MD, PhD Laboratory for NeuroRegeneration and Repair Hertie Institute for Clinical Brain Research University of Tuebingen Otfried-Mueller Strasse 27 D-72076 Tuebingen, Germany tel: 0049 (0) 7071 29 80449 fax: 0049 (0) 7071 29 4521 e.mail: [email protected] LIST OF ABBREVIATIONS CGN: Cerebellum Granular Neuron CPB: CREB Binding Protein CSPG: Chondroitin Sulfate Proteoglycan GAP-43: Growth Associated Protein-43 HAT: Histone Acetyltransferase HDAC: Histone Deacetylase PB: sodium Phenyl Butyrate P/CAF: p300/CBP Associated factor PDL: Poly-D-Lysine RCN: Rat Cortical Neuron SAHA: Suberoylanilide Hydroxamic Acid TSA: Trichostatin A
peer
-005
0493
6, v
ersi
on 1
- 22
Jul
201
0Author manuscript, published in "Cell Death and Differentiation n/a, n/a (2010) n/a-n/a"
DOI : 10.1038/cdd.2009.216

CBP/p300 and P/CAF in neuronal outgrowth
2
ASTRACT
Neuronal outgrowth is guided by both extrinsic and intrinsic factors, involving
transcriptional regulation. The acetylation of histones and transcription factors, which
facilitates promoters’ accessibility, ultimately promotes transcription, and depends upon the
balance between histone deacetylases and histone acetyltransferases activities. However, a
critical role for specific acetylation modifying enzymes in neuronal outgrowth has yet to be
investigated. To address this issue, we have employed an epigenetic approach to facilitate
gene expression in neurons, by using specific histone deacetylase (HDAC) inhibitors.
Neurons treated with a combination of HDAC and transcription inhibitors display an
acetylation and transcription-dependent increase in outgrowth and a reduction in growth cone
collapse on both “permissive” (poly-D-lysine) and “non-permissive” substrates (myelin and
CSPGs). Next, we specifically demonstrate that the expression of the histone
acetyltransferases CBP/p300 and P/CAF is repressed in neurons by inhibitory substrates,
while it is triggered by HDAC inhibition on both permissive and inhibitory conditions. Gene
silencing and gain of function experiments show that CBP/p300 and P/CAF are key players in
neuronal outgrowth, acetylate histone H3 at K9-14 and the transcription factor p53, thereby
initiating a pro-neuronal outgrowth transcriptional program. These findings contribute to the
growing understanding of transcriptional regulation in neuronal outgrowth and may lay the
molecular groundwork for the promotion of axonal regeneration following injury.
Keywords: acetylation, CBP/p300, P/CAF, p53, neuronal outgrowth
peer
-005
0493
6, v
ersi
on 1
- 22
Jul
201
0

CBP/p300 and P/CAF in neuronal outgrowth
3
INTRODUCTION
Control of transcription has been proven to be important for axonal and dendritic
growth during development and for axonal regeneration in the peripheral nervous system. On
the contrary, lack of specific gene transcription appears to contribute to the failure in axon re-
growth following injury in the central nervous system (CNS) (1, 2).
Gene transcription is regulated by epigenetic modifications that contribute to the
conformation of chromatin, which allows differential accessibility to promoters (3). A
permissive or relaxed chromatin conformation (euchromatin) correlates with a relative high
level of acetylated histones and is a preferential chromatin state during early embryogenesis,
nervous system development and synaptic plasticity (4, 5).
The degree of acetylation is the result of a balance between histone acetyltransferases
(HATs) and histone deacetylases (HDACs). These two classes of enzymes respectively either
acetylate or deacetylate lysine residues of histones and various transcription factors (TFs),
which form part of the transcription initiation complex. HATs and HDACs are found
embedded in large multiprotein complexes within or near euchromatin (6, 7). HATs modify
core histone tails by acetylation of specific lysine residues, and induce a relaxed chromatin
conformation, which along with acetylation of a set of transcription factors promotes DNA
accessibility, promoter binding and gene expression (8, 9). In contrast, HDACs attenuate the
transcription process at a particular site by deacetylating these targets, resulting in a more
compact chromatin (heterochromatin). The HAT–HDAC system is therefore an essential
regulatory switch of gene expression. Enhancement of acetylation can be achieved through
the inhibition of deacetylation. This can be accomplished by using several classes of HDAC
inhibitors including the hydroxamic acid, Trichostatin A (TSA), SAHA, and sodium phenyl
butyrate (PB), all of which shifts the overall balance in favour of HAT activity (7).
peer
-005
0493
6, v
ersi
on 1
- 22
Jul
201
0

CBP/p300 and P/CAF in neuronal outgrowth
4
Previously, increased acetylation of histones and transcription factors in neurons has
been shown to protect from apoptosis in animal models of neurodegeneration (10) and to
promote neuronal differentiation (11-13), whose molecular mechanisms are partially shared
during neurite/axonal outgrowth. Among several HATs, the CREB binding protein/p300
(CBP/p300) and the p300-CBP associated factor (P/CAF) have been associated with the
control of neuronal fate (14-16). They acetylate histones and transcription factors that confer
protection from neuronal cell death (10, 17). Recently, we found that neuronal acetylation of
p53 at specific lysines in its C-terminus promotes neurite and axonal outgrowth in permissive
conditions and is required for axonal regeneration in vivo (18, 19). However, it is still
unknown whether the enhancement of neuronal acetylation and the facilitation of transcription
by HDAC inhibition as well as specific histone acetylating enzymes may promote neuronal
outgrowth in physiological conditions and on inhibitory substrates.
We hypothesize that an increase in histone and transcription factor acetylation might
play a role in promoting axonal outgrowth by boosting or re-activating the pro-outgrowth
transcriptional machinery in neurons in permissive conditions as well as in neurons exposed
to outgrowth inhibitory signals such as myelin and proteoglycans.
Here, we specifically show that neuronal hyperacetylation mediated by HDACs
inhibition results in transcription- dependent increased neuronal outgrowth on both permissive
and non-permissive substrates, which is accompanied by enhanced promoter acetylation and
gene expression of CBP/p300 and P/CAF. Next, gene silencing and overexpression
experiments show that neuronal outgrowth on permissive and non-permissive substrates is
specifically mediated by CBP/p300 and P/CAF, whose expression is diminished by myelin
signalling. Finally, CBP/p300 and P/CAF together acetylate histones and the transcription
factor p53, whose acetylation of specific lysines on its C-terminus by both of these HATs is
required for neurite outgrowth and to overcome myelin inhibition.
peer
-005
0493
6, v
ersi
on 1
- 22
Jul
201
0

CBP/p300 and P/CAF in neuronal outgrowth
5
RESULTS
Inhibition of deacetylation promotes neuronal outgrowth
Given the requirement for gene expression during maturation and process outgrowth
and the decreased capacity of neurite outgrowth during neuronal maturation, we wanted to
verify if this decrease might be correlated to histone acetylation levels that may affect gene
expression. In order to address this question, we first decided to measure the level of histone
acetylation in purified cortical and cerebellar neurons at selected developmental stages: E17,
P7, and adult (12 weeks). Immunoblotting showed that H3 K9-14 acetylation was clearly
elevated in homogenates of freshly dissociated primary neurons at E17 and P7 in comparison
to the adult (Figure 1 A).
We believe this suggests that the level of histone H3 acetylation may correlate with the
plasticity of neurons and their capacity to develop processes.
Given these findings, we decided to further examine whether increased acetylation
could indeed enhance neuronal outgrowth in primary neurons. To this end, we employed
inhibitors of histone deacetylases (HDAC I and II) such as the hydroxamic acid derivative
TSA and PB in primary neurons to enhance the level of overall acetylation and promote
neuronal outgrowth.
In initial experiments, we ascertained the toxicity of TSA in primary post-natal P7
cerebellar granule neurons (CGN). CGN were plated on Poly-D-Lysine (PDL) and stimulated
with TSA 1 ng/ml, 10 ng/ml and 100 ng/ml for 8 or 24 hours. We found that TSA at a
concentration of 100 ng/ml resulted in cell death of almost all CGN after both 8 and 24 hours
in culture (data not shown).
We then quantified cell viability by counting the number of apoptotic nuclei out of the
total number of cells stained with Hoechst in CGN treated with vehicle or TSA at 1 ng/ml and
10 ng/ml. TSA at a concentration of 10 ng/ml induced significant cell loss and promoted
peer
-005
0493
6, v
ersi
on 1
- 22
Jul
201
0

CBP/p300 and P/CAF in neuronal outgrowth
6
apoptotic features in surviving neurons (Figure 1 B). Whereas, 1 ng/ml TSA was found to be
non-toxic and displayed a minor increase in cell viability (Figure 1 B). Given that 1 ng/ml of
TSA does not harm cells, we next examined whether this dose of TSA is sufficient to induce
histone acetylation. By immunocytochemistry and immunoblotting for H3 AcK9-14 we found
that TSA at 1 ng/ml is not only non-toxic, but also sufficient to induce histone
hyperacetylation in primary neurons as early as 4 hours in culture (Figure 1 C and D). This
dose regiment is supported by previous findings in cancer cells (20) and was used in all the
subsequent experiments.
Having established the correct dose of TSA, we next investigated the specific effects
of TSA on CGN neurite outgrowth. TSA induced a significant increase in total average
neurite length as well as the number of neurites/100 cells (Figure 2 A). Hyperacetylation in
CGN also significantly increased the rate of non-collapsed growth cones and the growth cone
surface area (Figure 2 B).
To examine whether this hyperacetylation-mediated neuronal outgrowth is
transcription-dependent, we treated cultured CGN with a RNA polymerase II inhibitor,
Flavopiridol (21), and measured neuronal outgrowth both in the presence and absence of
TSA. Results showed that Flavopiridol (1 μM) was able to inhibit physiological and TSA
mediated outgrowth by significantly inhibiting the increase in total average neurite length and
the number of neurites/100 cells (Figure 2 A). In addition, Flavopiridol decreases the
percentage of non-collapsed growth cones as well as the growth cone surface area (Figure 2
B). Also, we show by immunoblotting analysis that TSA triggers the expression of the axonal
outgrowth marker GAP-43, which is counteracted by Flavopiridol (Figure 2 C). Importantly,
Flavopiridol at this concentration did not promote neuronal cell death, as measured by the
number of surviving cells and the number of cells with fragmented or pyknotic chromatin
(data not shown). In order to verify whether the effects observed with TSA were specific to its
peer
-005
0493
6, v
ersi
on 1
- 22
Jul
201
0

CBP/p300 and P/CAF in neuronal outgrowth
7
role in inhibition of HDACs I and II, we utilized another well characterized HDACs I and II
inhibitor, PB. These experiments showed a similar enhancement in histone acetylation and in
process outgrowth 24 hours after administration of 0.5 μM PB (supplementary Figure 1, A
and B). In addition, here we asked the question of whether the well described enhancement of
the pro-outgrowth intrinsic properties of neurons through cAMP would lead to similar neurite
outgrowth as HDAC inhibition. We also tested whether the use of another transcriptional
inhibitor, Actinomycin D, would block these effects. Indeed, neurons treated with the cAMP
analogue dbcAMP showed similar neurite outgrowth as neurons treated with TSA and
Actinomycin D (supplementary Figure 1, C).
Taken together, these results indicate that hyperacetylation promotes neuronal
outgrowth and growth cone remodelling in cultured CGN through inhibition of HDACs I and
II by a transcription-dependent mechanism.
Hyperacetylation partially overcomes the inhibitory environment to neuronal outgrowth
So far we have shown that hyperacetylation promotes neuronal outgrowth through
transcriptional modulation and therefore it is likely to enhance promoter accessibility to pro-
growth genes.
Neuronal acetylation at H3 K9-14 is higher in embryonic and early post-natal than in
adult neurons (Figure 1), which are also more sensitive to myelin and proteoglycan inhibition
of axon outgrowth as compared to younger neurons. Thus, we next asked whether
enhancement of acetylation could protect from neuronal growth cone collapse and outgrowth
inhibition on inhibitory substrates such as myelin and CSPGs. Myelin and CSPGs are in fact
known to inhibit outgrowth and induce growth cone collapse, and are important inhibitors of
axon outgrowth following central nervous system injury (22).
peer
-005
0493
6, v
ersi
on 1
- 22
Jul
201
0

CBP/p300 and P/CAF in neuronal outgrowth
8
P7 CGN were plated on either myelin or CSPGs with TSA (1 ng/ml) or vehicle.
Outgrowth and growth cone collapse assays were performed at 8 and 24 hours post-plating.
Indeed, data analysis showed that TSA significantly overcomes myelin and CSPGs mediated
inhibition of process outgrowth and growth cone collapse (Figure 3 A-C, and supplementary
Figure 2). Hyperacetylation induced an increase in total average neurite length as well as an
increase in the number of neurites/100 cells on myelin and on CSPGs. In addition, we
observed a TSA-dependent increase in the number of non-collapsed growth cones at 8 and 24
hours in culture on myelin and CSPGs respectively.
Analogously to what done on permissive substrates, we also assessed whether another
HDAC inhibitor such as PB and the enhancement of cAMP using the analogue dbcAMP
would lead to improved neurite outgrowth on myelin. Results show that indeed both PB and
dbcAMP promote neurite outgrowth similarly to TSA (supplementary Figure 3, A). In
addition, the transcriptional inhibitors Actinomycin D and Flavopiridol were able to block the
pro-outgrowth effects of TSA, showing that rescue of neurite outgrowth is transcription-
dependent (supplementary Figure 3, B).
Interestingly, when we measured global changes in H3 K9-14 acetylation in neurons
plated on myelin versus neurons plated on PDL, we found no difference in H3 K9-14
acetylation (supplementary Figure 3, C). This suggests that TSA may affect outgrowth by
enhancing transcription via H3 K9-14 acetylation of specific promoters and not aspecifically
throughout the genome.
Together, these data indicate that TSA significantly overcomes an inhibitory
environment by promoting neuronal outgrowth, and by limiting growth cone collapse. This
suggests that hyperacetylation might promote neuronal outgrowth on both permissive and
inhibitory substrates in a “substrate-independent” manner, perhaps by affecting the intrinsic
transcription-dependent pro-growth program.
peer
-005
0493
6, v
ersi
on 1
- 22
Jul
201
0

CBP/p300 and P/CAF in neuronal outgrowth
9
P/CAF, p300 and CBP are required for hyperacetylation dependent neuronal outgrowth
H3 K9-14 acetylation is mediated by the HATs CBP/p300 and P/CAF (23), which are
also essential transcriptional co-factors involved in the overall protection of neurons from cell
death in diverse stress conditions (7, 10).
In order to investigate if CBP/p300 and P/CAF are required for neuronal outgrowth,
we have measured neuronal outgrowth in CGN following electroporation with specific RNA
interference constructs and oligonucleotides to silence the expression of CBP/p300 and
P/CAF after the administration of TSA or vehicle. Control for RNA interference was
performed by transfecting scrambled sequences and naked DNA. Electroporated neurons were
identified by co-transfection with GFP, and neuronal outgrowth was visualized by using
antibodies against β-III-tubulin as a neuronal marker. Also, only CGN with strongly impaired
expression by immunofluorescence for each of these HATs were included in the analysis.
Gene silencing with these RNAi was robust as shown by RT-PCR and by
immunofluorescence in individually electroporated CGN both in vehicle and TSA treated
cells (supplementary Figure 4 A-C). Importantly, CBP/p300 or P/CAF gene silencing also
correlated with reduced histone H3 K9-14 acetylation (supplementary Figure 4 D, E). In
addition, cell viability was not affected by gene silencing as shown by counting the number of
electroporated CGN with apoptotic features as shown by nuclear morphology and by the
expression of cleaved-caspase 3 in control versus experimental conditions (supplementary
Figure 4, F and G).
Results showed that gene silencing of CBP/p300 and P/CAF induces a significant
decrease in TSA-mediated neuronal outgrowth, and in average number of neurites/100 cells
(Figure 4 A). In addition, we observed that silencing of CBP/p300 or P/CAF shows a
tendency, but not a significant decrease in neurite length without TSA, as opposed to a
significant decrease in the average number of neurites/100 cells.
peer
-005
0493
6, v
ersi
on 1
- 22
Jul
201
0

CBP/p300 and P/CAF in neuronal outgrowth
10
Given that silencing of CBP/p300 and P/CAF on a permissive substrate inhibited the
ability of TSA to induce neuronal outgrowth, we further investigated whether CBP/p300 and
P/CAF would also play a role in TSA-dependent outgrowth in neurons cultured on myelin, a
potent inhibitor of neuronal outgrowth. We electroporated CGN with RNAi in order to silence
CBP/p300 and P/CAF and we detected neuronal outgrowth on myelin in analogous
experiments to what we performed on permissive substrates. We found that silencing of both
CBP/p300 or P/CAF significantly reduced the “recovery effects” of TSA and further
enhanced the inhibitory properties of myelin as shown by total average neurite length in GFP
positively transfected neurons; by the average number of neurites /100 cells; and by the
percentage of non collapsed growth cones (Figure 4 B). Together these data demonstrate that
CBP/p300 and P/CAF are essential mediators of hyperacetylation-dependent neuronal
outgrowth on both permissive and inhibitory substrates.
The evidence that gene silencing of CBP/p300 or P/CAF abrogates the effect of TSA
hyperacetylation in neuronal outgrowth, combined with the fact that hyperacetylation induces
gene expression by facilitating transcription at specific promoters, led us to ask whether TSA
is able to specifically promote gene expression of CBP/p300 and P/CAF.
Indeed, RT-PCR experiments showed that TSA induces a significant increase in gene
expression for CBP, p300 and P/CAF in cultured CGN (Figure 5 A). Interestingly, we also
found that gene expression of CBP, p300 and P/CAF was repressed by plating CGN on
myelin as compared to PDL, and that TSA rescued this inhibition by triggering their
overexpression (Figure 5 B). As histone acetylation levels following TSA (see Figure 1 C) are
somewhat inhomogeneous showing significant difference from cell to cell, we investigated
whether the acetylation levels of H3 K9-14 correlated with the single cell expression of
CBP/p300 as well as with neurite outgrowth. Indeed, H3 K9-14 acetylation levels positively
peer
-005
0493
6, v
ersi
on 1
- 22
Jul
201
0

CBP/p300 and P/CAF in neuronal outgrowth
11
correlated with CBP and p300 expression and with the degree of neurite outgrowth
(supplementary Figure 5).
We then performed chromatin immunoprecipitation experiments (ChIP) in CGN to
verify whether the gene expression changes of CBP/p300 and P/CAF correlated with an
increase in the acetylation status of histone H3 on their promoter regions following TSA
administration. ChIP followed by real-time quantitative PCR (qPCR) demonstrated an
increase of H3 acetylation at K9-14 on the promoters of CBP, p300 and P/CAF following
stimulation with TSA compared to vehicle. This increase of H3 acetylation is not present on
the promoter of the control gene RPL13a (Figure 5 B). These data suggest that TSA induces
gene expression of the HATs, CBP, p300 and P/CAF in CGN, by specific histone
hyperacetylation on their promoters.
Hyperacetylation-mediated neuronal outgrowth is dependent upon acetylated p53
signalling and drives pro-outgrowth gene targets
We have recently found that p53 forms pro-axonal outgrowth transcriptional
complexes with CBP/p300 and P/CAF on the promoter of pro-growth genes such as GAP-43
and Coronin 1b (18, 19). We therefore examined whether p53 could transduce transcription
signals within the pro-outgrowth hyperacetylation dependent CBP/p300-P/CAF signalling
cascade.
First, we examined whether p53 was acetylated following TSA treatment in CGN.
Western blots of cultured CGN treated with TSA showed that p53 was indeed acetylated at
K373 and K320, with peak in acetylation respectively at 8 and 4 hours post-TSA (Figure 6
A). Next, we measured the expression of the two previously described p53 transcription
targets and pro-axonal outgrowth proteins GAP-43 and Coronin 1b in order to assess whether
in hyperacetylated neurons, p53 dependent pro-outgrowth signalling is activated. Quantitative
peer
-005
0493
6, v
ersi
on 1
- 22
Jul
201
0

CBP/p300 and P/CAF in neuronal outgrowth
12
RT-PCR (qRT-PCR) and immunoblotting revealed that the gene and protein expression of
Coronin 1b and GAP-43 were induced following TSA treatment in hyperacetylated CGN
(Figure 6 B and C).
Then, ChIP assays were carried out in CGN to investigate the acetylation status of the
promoters of these pro-axonal outgrowth factors by immunoprecipitation of DNA-protein
complexes with an anti-acetyl H3 K9-14 antibody. Results showed that at both 8 (peak
increase) and 24 hours histones were acetylated on the promoters (5´site) of GAP-43 and
Coronin 1b. However, TSA induced further histone hyperacetylation on these promoters at
neither 8 nor 24 hours (Figure 6 D). Therefore, we hypothesized that the TSA-dependent
acetylation of p53 would be responsible for the transcriptional activation of GAP-43 and
Coronin 1b. To this end, we performed ChIP assays on CGN by using antibodies that
recognize specifically acetylated p53 at lysine 320 and 373 and measured by qPCR the
promoter occupancy of p53 on the promoters of Coronin 1b and GAP-43 (respectively).
Indeed, hyperacetylation increased the promoter occupancy of p53 AcK373 on the promoters
of both GAP-43 and Coronin 1b, while p53 AcK320 showed increased occupancy for
Coronin 1b only, whereas no occupancy was found on GAP-43 (Figure 6 E). Together, these
experiments show that following TSA treatment, p53 is hyperacetylated and the expression of
specific p53-dependent pro-outgrowth targets such as GAP-43 and Coronin 1b are induced by
increased promoter occupancy by acetylated p53 and not by histone hyperacetylation on their
promoters, where histones are already acetylated in physiological growth conditions (Figure 6
D).
In order to address the effects of hyperacetylation on driving the expression of several
other well known pro-neurite and axonal outgrowth genes that contain putative transcriptional
binding sites for p53, we performed qRT-PCR experiments on selected targets, including
SCG-10, α-tubulin 1a, Chl1, L1cam, CAP-23 and Lgals1 (supplementary Figure 6, A and B).
peer
-005
0493
6, v
ersi
on 1
- 22
Jul
201
0

CBP/p300 and P/CAF in neuronal outgrowth
13
In fact, the expression of most of these putative p53 target genes, with the exception of
CAP-23, was also driven in a hyperacetylated environment (supplementary Figure 6, A and
B), suggesting that multiple p53 dependent pro-neuronal outgrowth pathways could be
activated by hyperacetylation.
Then, to evaluate whether acetylated p53-dependent cell signalling had a direct role in
neuronal outgrowth during hyperacetylation, we electroporated CGN with a p53 mutant
plasmid DNA, which carries a lysine to arginine transition at K320, K372-3-82 (p53 K320-
72-3-82R, that we called here p53 K-R). These mutations do not allow acetylation of p53 by
neither CBP/p300 (K373-82-3) nor by P/CAF (K320). The p53 K-R transfected neurons did
not display increased cell toxicity by cell counting nor they showed increased apoptotic
features by Hoechst nuclear staining or cleaved caspase 3 expression compared to control
transfected cells (supplementary Figure 7 A and B). Importantly, neurite measurements
demonstrated that neuronal outgrowth was significantly impaired in neurons transfected with
p53 K-R both in the presence of TSA and in physiological culture conditions (Figure 7 A).
Electroporation of p53 K-R induced a significant decrease in the total average neurite length
and an impaired number of neurites/100 cells (Figure 7 A).
To further investigate whether the C-terminal acetylation of p53 would be required for
hyperacetylation-dependent partial recovery of outgrowth in neurons cultured on inhibitory
substrates, similar electroporation experiments were then performed on GCN plated on
myelin.
Results demonstrated that neurons expressing p53 K-R show a very strong reduction
in outgrowth even in the presence of TSA. Total average neurite outgrowth as well as the
average number of neurites/100 cells were markedly impaired in neurons transfected with p53
K-R as compared to GFP transfected only (Figure 7 B). Furthermore, the percentage of
collapsed growth cones was increased in the p53 K-R expressing neurons (Figure 7 B).
peer
-005
0493
6, v
ersi
on 1
- 22
Jul
201
0

CBP/p300 and P/CAF in neuronal outgrowth
14
To finally conclusively prove that CBP/p300, P/CAF and acetylated p53 are truly
important to drive neurite outgrowth in primary neurons, overexpression experiments were
performed on both PDL and myelin. Overexpression was carried out in cultured CGN via
electroporation and neurite outgrowth was measured at 24 hours. A significant difference in
outgrowth was observed when CBP/p300, P/CAF or the acetylation mimic p53 K-Q (K320-
72-3-82 Q- lysine to glutamine) were overexpressed on either PDL or myelin (Figure 8). This
shows that both on permissive substrates such as PDL and on myelin, their overexpression
promotes a significant enhancement in outgrowth to levels comparable to the effects of TSA.
In summary, we have shown here that CBP/p300 as well as P/CAF and their related
acetylation-dependent p53 signalling are key events in allowing physiological pro-outgrowth
signals in primary neurons, and in driving outgrowth on inhibitory substrates, thereby
transducing the hyperacetylation-dependent pro-outgrowth cascade on both permissive and
non-permissive substrates (Figure 9, a diagram illustrating the molecular pathway elucidated
here).
DISCUSSION
Our work shows for the first time that pharmacological hyperacetylation mediated by
HDAC I and II inhibition promotes neuronal outgrowth on both permissive and inhibitory
substrates through induction of gene expression via histone H3 K9-14 acetylation on the
promoters of CBP/p300 and P/CAF, which in turn promote neuronal outgrowth and mediate
H3 K9-14 as well as p53 acetylation. These modifications lead to chromatin remodeling and
enhanced p53-dependent promoter accessibility that drive the expression of specific pro-
neuronal outgrowth genes.
Recent experiments in primary neurons showed that specific nitrosylation of HDAC2
increases acetylation of histones surrounding neurotrophin-dependent gene promoters and
peer
-005
0493
6, v
ersi
on 1
- 22
Jul
201
0

CBP/p300 and P/CAF in neuronal outgrowth
15
stimulate transcription. Inhibition of HDAC2 expression also facilitated dendritic growth and
branching in embryonic cortical neurons (26). This supports our findings that inhibition of
HDACs promotes neuronal outgrowth.
However, currently no studies have implicated CBP, p300 and the closely related
P/CAF in neuronal outgrowth on permissive or inhibitory substrates. Here, we have shown
that these HATs are required for physiological neuronal outgrowth and for the pro-outgrowth
TSA-hyperacetylation dependent signal transduction. Specifically, TSA promotes not only
histone H3 K9-14 acetylation, but also stimulates CBP, p300 and P/CAF gene expression by
hyperacetylating their promoters, thereby facilitating transcription. This suggests the presence
of a positive feedback loop initiated by the relative increase in acetyltransferase activity
through inhibition of HDACs. This leads to histone hyperacetylation and activation of the
CBP, p300 and P/CAF promoters, enhancement of gene expression further fueling this
hyperacetylation loop. Given the shift in balance, the unchecked CBP, p300 and P/CAF
acetylate p53, which is essential to transduce the hyperacetylation-dependent pro-neuronal
outgrowth program (Figure 9). In fact, the expression of specific p53-dependent genes,
including GAP-43 and Coronin 1b, is triggered by hyperacetylation through increased
occupancy of their promoters by acetylated p53. This may be facilitated by the presence of
histone acetylation on their promoters that enhances the DNA accessibility of p53 and of its
transcriptional co-factors.
Our data also suggests that hyperacetylation stimulates this pro-growth program
independent of the plated substrate, for it also promotes growth cone remodeling and inhibits
growth cone collapse in neurons when plated on inhibitory substrates (myelin and CSPGs).
Importantly, overexpression of CBP/p300, P/CAF and of an acetylation mutant of p53
that mimics CBP/p300 and P/CAF acetylation on its C-terminus promotes neurite outgrowth
on permissive substrates and importantly is able to overcome myelin inhibition. Acetylation
peer
-005
0493
6, v
ersi
on 1
- 22
Jul
201
0

CBP/p300 and P/CAF in neuronal outgrowth
16
of p53 mediated by CBP, p300 and P/CAF on its C-terminus re-directs p53 towards specific
promoters and cellular effects (27).
Here, we show that the CBP/p300 and P/CAF-dependent acetylation of p53 is required
for neuronal outgrowth and largely mediates the pro-outgrowth properties of TSA-induced
hyperacetylation. Currently, we cannot exclude that others transcription factors that have been
already shown to be acetylated and to be involved in neuronal survival or outgrowth, such as
CREB and NFkB (15, 17, 24, 29), might also participate in the TSA-mediated enhancement
of neuronal outgrowth.
As far as the potential downstream targets are concerned, overexpression of GAP-43
and Coronin 1b might at least partially overcome myelin dependent growth cone collapse by
several potential mechanisms.
GAP-43 is a phospho-membrane bound glycoprotein, whose expression is often
correlated with axonal outgrowth and regeneration in the peripheral nervous system, in dorsal
root ganglia, in the facial nerve nuclei, in the optic nerve and in descending serotoninergic
fibers in the spinal cord. It has also been shown to be associated with the overcoming of
myelin and proteoglycan dependent inhibitory signalling of axon outgrowth in the optic nerve
following pro-regeneration stimuli (30-33). In addition, cerebellar Purkinje cells that
overexpress GAP-43 are able to sprout their axons into white matter and show a pronounced
tendency to lose myelin (34). Coronin 1b an actin binding protein that was previously shown
by us to promote neurite outgrowth in primary neurons (35). A recent work suggested that
Coronin 1b can dephosphorylate cofilin during actin filament and cytoskeleton remodeling at
the leading edge of lamellipodia (36). Phosphorylation of cofilin by ROCK and LIMK is a
critical step in growth cone collapse mediated by inhibitory substrates, therefore the
dephosphorylation activity of Coronin 1b on cofilin may contribute to the inhibition of growth
cone collapse. In addition to GAP-43 and Coronin 1b, the expression level of a set of putative
peer
-005
0493
6, v
ersi
on 1
- 22
Jul
201
0

CBP/p300 and P/CAF in neuronal outgrowth
17
p53-dependent pro-neurite outgrowth genes was also enhanced by TSA. This suggests the
multiplicity of the p53 pathway during hyperacetylation on the activation of several pro-
outgrowth factors.
Future challenges include the discovery of the fine regulation of the TSA dependent
effects on neuronal outgrowth. For example, it would be interesting to combine the
administration of TSA with other compounds such as neurotrophins, including NGF (Nerve
Growth Factor), RA (Retinoic acid), BDNF (Brain Derived Neurotrophic Factor), or cAMP
analogues that might enhance TSA pro-neuronal outgrowth effects. Also, non transcriptional
dependent effects of HDAC inhibitors could be investigated.
In summary, we believe that our work provides solid evidence for a positive role of
HDAC inhibition and CBP/p300 and P/CAF acetylation-dependent transcriptional pathways
in neuronal outgrowth. Further studies are warranted to elucidate additional acetylation-
dependent transcriptional targets that may promote outgrowth in vitro, and to investigate
whether hyperacetylation may trigger a pro-axonal regenerative genetic program in adult
neurons following axonal lesions in vivo.
MATERIALS and METHODS
Drugs
Trichostatin A (T-8552, Sigma); Sodium Phenyl Butyrate (El-320, Biomol), dbcAMP
(CN-125, Enzo Life Sciences), Actinomycin D (A1410, Sigma). Flavopiridol was provided by
the Developmental Therapeutics Program, Division of Cancer Treatment and Diagnosis,
National Cancer Institute, National Institutes of Heath.
Cell culture
peer
-005
0493
6, v
ersi
on 1
- 22
Jul
201
0
CBP/p300 and P/CAF in neuronal outgrowth
18
Primary cortical neurons. Rat Cortical Neuronal cultures (RCN) were derived from rat (CD)
embryonic cortices. Cortices from 17-day-old embryos were extracted, dissociated and
cultured as previously described (38). Briefly, the cortices were minced and dissociated in a
buffer containing 1,800 U/mL trypsin at 37°C for 20 min. Followed by addition of 200 U/mL
DNase I and 3,600U/mL soybean trypsin inhibitor to the suspension, cells were triturated
through a 5-mL pipette. After the tissue was allowed to settle for 5 to 10 min, the supernatant
was collected, and the remaining tissue pellet re-triturated. The combined supernatants were
centrifuged through a 4% BSA layer and the cell pellet was resuspended in neuronal seeding
medium (NSM), which consisted of B27-Neurobasal Medium (Life Technologies)
supplemented with 1.1% of a 100X antibiotic-antimycotic solution, 25 µM Na-glutamate, 0.5
mM l-glutamine, and 2% B27 Supplement (Life Technologies).
Primary cerebellar granule neurons. Cerebella Granule Neurons (CGN) were prepared from
cerebella of 7-8 day-old rats (CD) as previously described by (39). Briefly, the cerebella were
collected, and incubated for 15 min at 37 °C in an ionic medium with 0.025% trypsin and
0.05% DNase I (Sigma). Then trypsin inhibitor (0.04%, Sigma) was added and the tissue was
collected by centrifugation. The pellet was triturated, centrifuged and suspended in the growth
medium, namely in the basal Eagle’s medium supplemented with 10% bovine calf serum,
25mM KCl, 4mM glutamine and gentamycin (100 ng/ml).
Immunocytochemistry
Glass coverslips were coated with poly-D-lysine (PDL) at 0,1mg/ml for 2h at 37°C. For the
experiment on myelin or CSPG, the glass coverslips were additionally coated with myelin 4
µg/cm² and CSPG 1.25 µg/cm² for 2h at 37°C. Cells were grown on glass coverslips for 8 and
24h. Cultured cells were fixed with 4% paraformaldehyde/ 4% sucrose. Cells were blocked in
10% albumin and 0.2% Triton-X100. Immunostaining was performed by incubation overnight
peer
-005
0493
6, v
ersi
on 1
- 22
Jul
201
0

CBP/p300 and P/CAF in neuronal outgrowth
19
at 4°C with several antibodies: rabbit anti-acetylated-H3 (H3 AcK9-14, Upstate); mouse anti-
β-III Tubulin (Promega); rabbit anti-p53 (Ab1, Ab6, Oncogene); mouse anti-MAP2 (Sigma);
rabbit anti-TAU; rabbit anti-p300 (3G230); rabbit anti-CBP (AC238) (Abcam); mouse anti-
P/CAF (E-8) (Santa-Cruz), rabbit anti-cleaved Caspase-3 (Cell Signalling). Staining for F-
actin was performed with the Alexa Fluor 568 Phalloidin (Molecular Probes) and incubated
for 1 hour at room temperature. After several rinses in PBS, the sections were incubated with
the appropriate Alexa 488, 546 or 564-coupled secondary antibodies (goat anti-rabbit IgG,
goat anti-mouse IgG, Pierce) As a control, we stained with Hoechst 33258 (Molecular Probes)
and then washed in PBS before mounting on slides with Fluorsave (Calbiochem, Darmstadt,
Germany).
RT-PCR and quantitative RT-PCR (qRT-PCR)
RNA was extracted from CGN using TRIZOL reagent (Invitrogen) and cDNA was
synthesized from 1µg of RNA using oligodT and random hexamers from the SuperScript II
Reverse Transcriptase kit (Invitrogen). 1µl of cDNA was used in a RT-PCR using Master
Mix (Invitrogen) and for quantitative RT-PCR we used SYBR-greenER (Invitrogen).
The RPL13A gene was used for normalization. The sequences of the primers used were
P/CAF forward 5’-TGGCGCACTTGTAGTACTCG-3’ and reverse
5’-ATGGAACCAGTGAAGCGAAC-3’ (124bp), CBP forward
5’-ATCCCATAGACCCCAGTTCC-3’ and reverse 5’-CGGCTGCTGATCTGTTGTTA-3’
(206bp), p300 forward 5’-GGGACTAACCAATGGTGGTG-3’ and reverse
5’-ATTGGGAGAAGTCAAGCCTG-3’ (386bp), GAP-43 forward 5’-
AAGCTACCACTGATAACTCGCC-3’ and reverse 5’- CTTCTTTACCCTCATCCTGTCG-
3’ (246bp); Coronin1b forward 5’-GACCTGTGCCCACATAACGATCAGG5C -3’ and
reverse 5’-CACGATGCCGACTCTCTTTGA-3’; α-Tubulin 1a forward 5’-
peer
-005
0493
6, v
ersi
on 1
- 22
Jul
201
0

CBP/p300 and P/CAF in neuronal outgrowth
20
GCTTCTTGGTTTTCCACAGC-3’ and reverse 5’- TGGAATTGTAGGGCTCAACC-3’
(162bp); SCG10 forward 5’- CCACCATTGCCTAGTGACCT-3’ and reverse 5’-
GAAGCACACACTCCACGAGA-3’ (202bp); Chl1 forward 5’-
CGCCTACACAGGAGCTAAGG-3’ and reverse 5’-TTCTTTTGGAAGGCAGTGCT-3’
(231bp); L1cam forward 5’-CATCGCCTTTGTCAGTGCTA-3’ and reverse 5’-
CTGTACTCGCCGAAGGTCTC-3’ (162bp); Cap23 forward 5’-
GGCGGCAGCGCTCCAACTCG-3’ and reverse 5’-CCGCCTGGGGTTCGCTCTCC-3’
(304bp); Lgals1 forward 5’-GCTGGTGGAGCAGGTCTCAGGAATCT-3’ and reverse 5’-
AAGGTGATGCACTCCTCTGTGATGCTC-3’ (314bp); RPL13A forward
5’-CCCTCCACCCTATGACAAGA-3’ and reverse 5’-CCTTTTCCTTCCGTTTCTCC-3’
(167bp). All primers were initially tested for their specificity by running RT-PCR samples on
an agarose gel. Only primers that under specific PCR conditions gave a single band of the
appropriate molecular weight were then used for real time PCR experiments. Quantification
of RT-PCR blot was performed by densitometry of the representative bands and normalized to
the levels of the housekeeping gene (RPL13A) for each lane. For qRT-PCR, fold changes
were calculated following manufacture instructions (Invitrogen).
Gene silencing and overexpression experiments
The different p53, CBP, p300 and P/CAF expression constructs were transfected in
CGN cells by using Amaxa electroporation kit, following the manufacturer’s suggestions
(Amaxa Nucleofector Technology). For gene silencing, a maximum of 3 µg of DNA was
used, with a ratio of 0.5 µg GFP/ 2,5 µg DNA and 10 nM of siRNA for CBP/p300. Gene
silencing for P/CAF was performed by shRNA. For P/CAF gene silencing by shRNA, both
hairpin sequences, which were designed and synthesized (Invitrogen) with specific overhangs
peer
-005
0493
6, v
ersi
on 1
- 22
Jul
201
0

CBP/p300 and P/CAF in neuronal outgrowth
21
for cloning into the pENTR/U6 entry vector, and oligonucleotides were employed. The
sequences of the 2 primer pairs used for P/CAF silencing were:
1: ORF1 5’-CACCGCTCGTTTGACCCGAAACACGAATGTTTCGGGTCAAAGAC
GAGC-3’, ORF2 5’-AAAAGCTCGTCTTTGACCCGAAACATTCGTGTTTCGGGT
CAAAGACGAGC-3’; 2:
ORF1 5’-CACCGCCTCAGGAACAGGTACTATGCGAACATAGTACCTGTTCCTG
AGGC-3’; ORF 2 5’-AAAAGCCTCAGGAACAGGTACTATGTTCGCATAGTACCT
GTTCCTGAGGA-3’.
siRNA oligonucleotides were used for rat CBP and p300 gene silencing and were a gift from
Dr. Katsuhide Miyake (40).
siRNAs with the following sense and antisense sequences were used:
CBP forward 5'-CCCACAGCUAAUGGCAGCUdTdT-3' and reverse 5'-
AGCUGCCAUUAGCUGUGGGdTdT-3', p300 forward 5'-CCCCAUGGAACAGCAUdTdT-
3' and reverse 5'-AUGCCCUUGGUU UUCCAUGGGGdTdT-3'.
The inhibitory effect of RNA interference on expression of CBP, p300 was tested by RT-PCR
and in CGN by immunofluorescence that allowed quantification in individually electroporated
cells.
The overexpression experiments were performed by electroporating GCN with pcDNA 3.1
vector as control, pCMVb p300 HA (Addgene, plasmid 10718), pRc/RSV CBP HA
(Addgene, plasmid 16701) and pCl flag PCAF (Addgene, plasmid 8941) at the same ratio
GFP/DNA as employed for gene silencing experiments. p53 K320-72-3-82 R (p53 K-R) and
p53 K320-72-3-82 Q (p53 K-Q) were cloned in a CMV promoter with a GFP tag and
transfected by electroporation as described.
Chromatin immunoprecipitation Assays (ChIP)
peer
-005
0493
6, v
ersi
on 1
- 22
Jul
201
0
CBP/p300 and P/CAF in neuronal outgrowth
22
ChIP assays were performed according to the manufacturer’s recommendations
(Upstate). Briefly, 8 x 10⁷ CGN were grown in the absence or presence of TSA (1 ng/ml) for
24 hours and subsequently fixed in a 1% formaldehyde solution for 10 min. at 37°C.
Following cell lysis (0.5% SDS, 100 mM NaCl, 50 mM Tris HCl, ph 8.0, 5 mM EDTA),
extracts were sonicated to shear DNA to lengths of 200-600 bp.
Chromatin solutions were incubated overnight with rotation using 4 μg of rabbit
polyclonal anti-Acetyl Histone H3 antibody (Upstate), anti-p53 acetyl-lysine K373/2
(Upstate) or rabbit anti-p53 acetyl-lysine K320 (Upstate). The following day protein A
agarose beads, that had been blocked with salmon sperm DNA, were added to each reaction to
precipitate antibody complexes. The precipitated complexes were washed and then incubated
for 4 hours at 65°C in parallel with input samples to reverse the crosslink. DNA was isolated
by P:C:I extraction, which was followed by ethanol precipitation in the presence of sodium
acetate.
Input, IP and Mock fractions were then analyzed by PCR on an agarose gel in order to detect
the presence of the single band of the appropriate molecular weight in Input and IP fractions,
as well as its absence in Mock samples. This allows evaluating for both the specificity of the
primers and of the immunoprecipitation. Only samples that respected these conditions were
then analysed by quantitative real time PCR (ABI 7000) analysis with appropriate primer
pairs. The primers used were as follows: CBP 5’ site < 1 kb forward 5’-
CACAGGTTTCTCGCTTAGGG-3’ and reverse 5’-CCAAGGGCTTCGATGTTTTA-3’;
CBP 3’ site forward 5’-CTGGGGACATCCTTTTCAGA-3’ and reverse 5’-
CTGGGCACTCCAGCTCTTAC-3’; p300 5’ site < 1 kb forward 5’-
GCCCCTACCATTTCTGTTGA-3’ and reverse 5’-CGGAGATACAACCGAGGAAA-3’;
p300 3’ site forward 5’-CCTGCACTTAGAGGCAAAGG-3’ and reverse 5’-
TGCTGCCTGAATGAGTTGTC-3’; PCAF 5’ site < 1 kb forward 5’-
peer
-005
0493
6, v
ersi
on 1
- 22
Jul
201
0

CBP/p300 and P/CAF in neuronal outgrowth
23
ATGTGTCCCCTGGCTTTATTCA-3’ and reverse 5’-ACCCTCAGTTCGGTCTCCTT-3’;
PCAF 3’ site forward 5’- CTGGCATGTCCAGTAGCTGA-3’ and reverse 5’-
TCACCGCACAGGTGTATCAT-3’; Coronin 1b 5’ site < 1 kb forward 5’-
CTCCCAGCGTTATCATGTCA-3’ and reverse 5’-GGGAGACTCGAATGTCCTCA-3’;
Coronin 1b 3’ site ~ 10 kb forward 5’-ACTGTTGTGGAGGGCTATGG-3’ and reverse 5’-
TGGAGGTCAGATGCCTCTCT-3’; GAP-43 5’ site < 1 kb forward 5’-
GCAGCTGTAACTTGTGTGCA-3’ and reverse 5’-GGTCCAGATTGGAGGTGTTTA-3’;
GAP-43 3’ site ~ 10 kb forward 5’-TTCCTTAGGCAATGTTTTGGAAAG-3’ and reverse 5’-
TCAGGCATGTTCTTGGTCAG-3’; RPL13A 5’ site <1 kb forward 5’-
TTCAGCACACCAAGAGGTTG-3’ and reverse 5’-GTTCAGGTGTCCGTGATGTG-3’;
RPL13A 3’ site ~ 10 kb forward 5’- GGCCATAAACATCTGGGAGA-3’ and reverse 5’-
GGGCAAGAGAGACTCAGGTG-3’. For real time quantitation of PCR products and fold
change measurements after ChIP, each experimental sample was normalized to Input and
Mock fractions before undergoing the standardized fold change calculation performed
following manufacture instructions (Invitrogen). Only real time expression profiles that
showed reproducible triplicate measurements were included in the analysis. In addition,
samples included in the analysis had corresponding Mock fractions that displayed CT values
close to background.
Immunoblotting
For immunoblotting, cultured CGN were collected at different time point (4h, 8h and
24h) and lysed as described above for tissue extraction. A portion of the lysate (30-50 µg of
protein) was then fractionated by SDS-polyacrylamide gel electrophoresis (PAGE), and the
separated proteins were transferred to a PVDF membrane. After the transfer of samples, the
membrane was then probed with rabbit anti-acetylated-H3 (K9, K14, Upstate), rabbit anti-p53
peer
-005
0493
6, v
ersi
on 1
- 22
Jul
201
0

CBP/p300 and P/CAF in neuronal outgrowth
24
acetyl-lysine K373/2 (Upstate), rabbit anti-p53 acetyl-lysine K320 (Upstate), rabbit anti-p53
FL (Santa-Cruz); rabbit anti-GAP-43 (Chemicon) and rabbit anti-Coronin 1b (custom
antibody from Betyl Laboratories). Mouse anti-β-actin (Sigma) was used as control for gel
loading and transfer. Immune complexes were detected with appropriate secondary antibodies
(goat anti-rabbit IgG, goat anti-mouse IgG, label with horseradish peroxidase, Thermo
Scientific) and chemiluminescence reagents (Pierce ECL Western blotting Substrate).
Quantitation of protein expression was performed by densitometry of the representative bands
of the immunoblots and normalized to the respective levels of β-actin.
Adult primary neurons from the cortex or the cerebellum were also prepared as mentioned
before for RCN or CGN cultures respectively. After dissociation, cells were immediately
collected by centrifugation and homogenized for immunoblotting as described. This
procedure results into an enriched neuronal population at the time of blotting.
Neuronal process outgrowth measurements
Immunofluorescence was detected using a Zeiss Microscope (Axiovert 200, Zeiss
Inc.) and pictures were taken at a 20x and 100x (oil immersion) magnification (Zeiss) at room
temperature using a CDD camera (Axiocam MRm, Zeiss). Neurite analysis and measurements
were performed using the Neurolucida software (MicroBrightField, Colchester, VT). For each
experimental condition and three replicates in triplicate experiments were analysed. Between
80 and 100 cells per replicate were counted (for specific numbers, please see figure legend).
Neurite outgrowth was evaluated by calculating the number of processes per 100 cells and the
average process length per cell. A growth-cone was defined collapsed when the diameter was
not bigger than the diameter of the neuronal process. The area of the non-collapsed growth-
cones was measured on an average of 100 growth cones for each triplicate. Measurements
peer
-005
0493
6, v
ersi
on 1
- 22
Jul
201
0

CBP/p300 and P/CAF in neuronal outgrowth
25
were taken from three individual experiments by two different operators. Statistical analysis
was performed on these three individual experiments by using a two-tailed unpaired T-test.
Densitometry analysis
To correlate histone acetylation and neurite outgrowth, we used densitometric analysis of the
immunofluorescent signal (AlphaEaseFC software). First, we calculated the mean intensity
for AcH3 K9-14 in control (vehicle) and TSA (1ng/ml) treated CGN cells (50 cells per
experiments were counted, in triplicate). Each mean intensity was then employed as a
threshold to determine cells with a high or low intensity of AcH3 K9-14 immunosignal
following TSA. Cells with a signal equal or superior to AcH3 K9-14 mean intensity of TSA
treated cells were considered as high intensity cells. On the contrary, cells with a densitometry
value equal or inferior to AcH3 K9-14 mean intensity of control were considered as low
intensity cells. Cells showing pyknotic nuclei were not included in the study. Neurites
outgrowth was then quantified in these two classes of cells and compared as described above.
Statistical analysis was performed on these three individual experiments by using a two-tailed
unpaired T-test.
Acknowledgments: we thank Dr. Maria Laura Avantaggiati for providing the p53 acetylation
mutant plasmid DNAs, and Dr. Katsuhide Miyake for providing the CBP/p300 RNAi. We
also thank Dr. Richard Goodman for providing the CBP plasmid, Dr. Yoshihiro Nakatani for
providing the P/CAF plasmid and Dr. William Sellers for providing the p300 plasmid. This
work was supported by the Hertie Foundation; the Fortune Grant, University of Tuebingen,
the NIH R21 NS052640 and the DFG DI 1497/1-1 grants (all granted to Simone Di
Giovanni).
peer
-005
0493
6, v
ersi
on 1
- 22
Jul
201
0

CBP/p300 and P/CAF in neuronal outgrowth
26
FIGURE LEGENDS Figure 1. Acetylation of Histone H3 at K9-14 correlates with neuronal maturation and
is induced after inhibition of HDAC by TSA.
(A) Immunoblotting analysis for AcH3K9-14 was performed on proteins extracts from
dissociated rat cortical neurons (RCN) and cerebellar granule neurons (CGN) at E17, P7 and
12 weeks adult (Ad). A decrease of acetylation with age was observed. β-actin was used as a
loading control.
(B) Bar graphs represent the percentage of surviving CGN or CGN with pyknotic nuclei
following treatment with 10 ng/ml or 1 ng/ml TSA (24 hours) in comparison to vehicle (Ctrl).
The result of three independent measurements with an average of 100 cells each is shown. 10
ng/ml TSA was found to be toxic (29.8% ± 2.5 SD of surviving cells TSA versus vehicle, set
as 100% and 73.3% ± 3.5 pyknotic nuclei TSA versus 20.4% ± 2.8 vehicle), while 1 ng/ml is
comparable to vehicle and considered non-toxic (9.2% ± 1.8 cell survival TSA increase versus
vehicle and 17.5% ± 0.7 pyknotic nuclei TSA versus 20.4% ± 2.4 vehicle). Asterisks:
unpaired two-tailed T-test, ** p value < 0,01. Error bars represent SD.
(C) Immunofluorescence for H3 AcK9-14 in CGN cultured for 24h and treated with 1 ng/ml
TSA or vehicle. Arrows document cells that show an increase of staining intensity following
TSA treatment. Scale bar: 20 µm.
(D) Immunoblotting analysis for H3 AcK9-14 in CGN cultured for 24h and treated with
1ng/ml TSA or vehicle. Shown is a marked increase in the expression of H3 AcK9-K14
following TSA. β-actin was used as a loading control.
Figure 2. HDAC-inhibition promotes neurite outgrowth through increased
transcription.
peer
-005
0493
6, v
ersi
on 1
- 22
Jul
201
0

CBP/p300 and P/CAF in neuronal outgrowth
27
(A) Immunofluorescence of CGN shows the effect of 1 ng/ml TSA and 1 µM Flavopiridol
following 24h treatment in comparison to vehicle (Ctrl). Scale bar: 50 µm. Bar graphs show
quantification of neurite measurements from three independent measurements (n: 100 cells
each), including the average neurite length per cell in µm and number of neurites/100 cells.
Neurite measurements show a significant enhancement in neurite length (104 µm ± 16.8 SD
TSA versus 61 µm ± 10.2 vehicle) and numbers (111 ± 6.5 TSA versus 72 ± 8 vehicle)
following TSA (1 ng/ml) in CGN at 24h. Flavopiridol (1 µM) significantly counteracts the
effects of TSA in terms of neurite length (104 µm ± 16.8 SD TSA versus 65 µm ± 10.2
Flavopiridol+TSA) and numbers (111 ± 6.5 TSA versus 81 ± 7 Flavopiridol+TSA). Asterisks:
unpaired two-tailed T-test, * p value < 0,05. Error bars represent SD.
(B) F-actin and β-III tubulin staining allow the visualization of growth cones. Scale bar: 5
µm. In the growth cone collapse assay, non-collapsed growth cones were counted and
represented by the bar graphs as a percentage from three independent experiments (n: 100
cells each). The surface area of growth cones was also measured and quantified (three
independent measurements, n: 100 growth cones each). TSA increases the percentage of non-
collapsed growth cones (18% ± 1.52 TSA versus 10% ± 4.2 vehicle) and the surface area (113
µm² ± 17 TSA versus 67 µm² ± 11 vehicle), while Flavopiridol promotes growth cone
collapse with or without TSA in terms of percentage (18% ± 1.52 TSA versus 6% ± 4.2
Flavopiridol+TSA) and of surface area (113 µm² ± 17 TSA versus 21 µm² ± 19
Flavopiridol+TSA). Asterisks: unpaired two-tailed T-test, * p value < 0,05, ** p value < 0,01.
Error bars represent SD.
(C) Immunoblotting analysis for GAP-43 shows an increase in GAP-43 protein expression
following 24h treatment with TSA (1 ng/ml), which is counteracted by Flavopiridol in
addition to TSA. Flavopiridol itself reduces levels of GAP-43 protein expression. β-actin
was used as a loading control.
peer
-005
0493
6, v
ersi
on 1
- 22
Jul
201
0

CBP/p300 and P/CAF in neuronal outgrowth
28
Figure 3. HDAC-inhibition overcomes myelin and CSPGs inhibition by promoting
neurite outgrowth and preventing growth cone collapse.
(A-B) Immunofluorescence of CGN double stained with β-III Tubulin and Hoechst shows the
effects of 1 ng/ml TSA treatment for 24h on myelin (A) or CSPGs (B) versus vehicle (Ctrl).
Scale bar: 20 µm. TSA treatment of CGN increases the average neurite length per cell (37.6
µm ± 7.5 SD TSA versus 19.8 µm ± 1.6 vehicle on myelin and 55 µm ± 5.1 TSA versus 22
µm ± 3.2 vehicle on CSPG) and the number of neurites per 100 cells (37.5 ± 7.7 TSA versus
25 ± 1.1 vehicle on myelin and 24 ± 1.4 TSA versus 12 ± 2 vehicle on CSPG) as represented
in the bar graphs of three independent measurements (n: 100 cells each). Asterisks: unpaired
two-tailed T-test, ** p value < 0,01. Error bars represent SD.
(C) A growth cone collapse assay was performed on CGN plated either on myelin or CSPGs.
The bar graphs represent the percentage of non-collapsed growth cones following 8 and 24h
of treatment on each substrate of three independent experiments (n:100 growth cones each).
TSA increases the percentage of non-collapsed growth cones on both myelin and CSPG
respectively (24h: 21% ± 3.6 TSA versus 1.5% ± 1 vehicle; 67% ± 7 TSA versus 27% ± 4.8
vehicle). Asterisks: unpaired two-tailed T-test, * p value < 0,05, ** p value < 0,01. Error bars
represent SD.
Figure 4. CBP/p300 and P/CAF are required for hyperacetylation-dependent neurite
outgrowth on permissive and non-permissive substrates.
On a permissive substrate, such as PDL, immunofluorescence of CGN electroporated with
either GFP-scrambled (ctrl) or GFP plus RNAi for CBP/p300 or shRNA for P/CAF in the
absence or presence of 1ng/ml TSA for 24 hours show markedly reduced neurite outgrowth
(total neurite length: 245 µm ± 18.4 SD TSA/control versus 88 µm ± 15 TSA/RNAi
peer
-005
0493
6, v
ersi
on 1
- 22
Jul
201
0

CBP/p300 and P/CAF in neuronal outgrowth
29
CBP/p300, and 78 µm ± 16.5 TSA/RNAi P/CAF; average number of neurites/100 cells: 119 ±
2 TSA/control versus 56 ± 14 TSA/RNAi CBP/p300, and 58 ± 12 TSA/RNAi P/CAF; 88 ± 13
control versus 51 ± 8 RNAi CBP/p300 and 44 ± 9 RNAi P/CAF) (A). Hoechst dye was used
as a nuclear stain. The same result was observed when plated on the inhibitory substrate,
myelin (total neurite length: 18.0 μm ± 2.5 SD vehicle versus 57.4 ± 2.6 TSA; 3.6 ± 0.3
vehicle + RNAi CBP/p300 versus 5.0 ± 0.2 TSA + RNAi CBP/p300; 5.0 ± 0.2 vehicle +
RNAi P/CAF versus 5.7 ± 0.5 TSA + RNAi P/CAF; average number of neurites /100 cells: 25
± 1.1 vehicle versus 37.5 ± 7.7 TSA; 11.45 ± 4.3 vehicle + RNAi CBP/p300 versus 13.7± 3.5
TSA + RNAi CBP/p300; 8.1 ± 2.7 vehicle + RNAi P/CAF versus 14 ± 2.8 TSA + RNAi
P/CAF) (B). Co-immunolabeling for β-III tubulin was also used in these experiments (not
shown). Scale bar: 30 µm (A); 15µm (B). Arrows in (B) show representative growth cones in
control and TSA treated neurons. Gene silencing of either CBP/p300 or P/CAF significantly
reduced average of neurite length per cell and number of neurites/100 cells on both PDL and
myelin with and without TSA in three independent experiments (n: 100 cells each) as
represented in the bar graphs (A-B). In addition, the percentage of non-collapsed growth
cones from the neurons electroporated with either CBP/p300 or P/CAF on myelin with or
without TSA was significantly less than control GFP electroporated cells in three independent
experiments (n: 100 cells each) (7.4 % ± 1.4 vehicle versus 31.8 ± 1.7 TSA; 1.6 ± 0.4 vehicle
+ RNAi CBP/p300 versus 4.7 ± 2.1 TSA + RNAi CBP/p300; 1.1 ± 0.3 vehicle + RNAi
P/CAF versus 4.3 ± 0.5 TSA + RNAi P/CAF) (B). Asterisks: unpaired two-tailed T-test, * p
value < 0,05, ** p value < 0,01. Error bars represent SD.
Figure 5. TSA-dependent hyperacetylation enhances the mRNA expression of CBP/p300
and P/CAF and promotes binding of acetylated H3 K9-14 to their promoters.
peer
-005
0493
6, v
ersi
on 1
- 22
Jul
201
0

CBP/p300 and P/CAF in neuronal outgrowth
30
(A) Representative RT-PCR of mRNA levels for p300, CBP, and P/CAF. The upregulation of
CBP, p300 and P/CAF mRNA observed by RT-PCR following 1 ng/ml TSA treatment versus
vehicle is represented in the bar graphs of densitometry (arbitrary units), normalized to the
ribosomal RNA gene RPL13A.
(B) Bar graphs show real time RT-PCR gene expression data for CBP, p300 and P/CAF in
CGN plated on myelin or PDL (24h) and treated with vehicle or TSA. Myelin represses gene
expression of CBP, p300 and P/CAF (-3,3 fold ± 0,5 SD CBP ;-2,6 fold ± 0,4 SD p300 and -
2,3 fold ± 0,2 SD P/CAF compare to RPL13A), while TSA rescues myelin inhibition by
inducing their overexpression (6,5 fold ± 1 SD CBP; 1,9 ±0,1 SD p300 and 4,02 fold ± 0,6 SD
P/CAF). Expression changes are quantified in fold changes as an average from three
independent experiments. Asterisks: unpaired two-tailed T-test, * p value < 0,05, ** p value <
0,01. Error bars represent SD.
(C) Chromatin IP (ChIP) assay in CGN shows increased occupancy of the CBP, p300 and
P/CAF promoters by acetylated H3 K9-14 in comparison to the housekeeping gene RPL13A
following 24h 1 ng/ml TSA treatment versus vehicle ( CBP: 2.95 fold ± 0.05 SD, p300: 3.31
fold ± 0.2 and P/CAF: 4.9 fold ± 0.1). Fold change was calculated as a ratio of promoter
occupancy between TSA treated CGN versus vehicle in three independent experiments run
triplicate. The 3’end regions of CBP, p300 and P/CAF were used as a control for specificity
of acetylated H3 K9-14 to the promoter regions. Asterisks: unpaired two-tailed T-test, ** p
value < 0.01. Error bars represent SD.
Figure 6. TSA hyperacetylates p53 and increases the expression of the p53 targets GAP-
43 and Coronin 1b.
peer
-005
0493
6, v
ersi
on 1
- 22
Jul
201
0

CBP/p300 and P/CAF in neuronal outgrowth
31
(A) Immunoblotting analysis of CGN for acetylated p53 at K373 and K320 revealed that 1
ng/ml TSA induces p53 acetylation versus vehicle (Ctrl). We confirmed the presence of
increased acetylated H3 K9-14 following TSA treatment in these samples.
(B) Real time RT-PCR, as represented in the bar graphs, shows a significant fold increase in
GAP-43 and Coronin 1b mRNA following 24h treatment with 1 ng/ml TSA versus vehicle in
three independent experiments in triplicate (1,9 fold ± 0,5 SD GAP-43 and 2,9 fold ± 0,3 SD
Coronin 1b). Asterisks: unpaired two-tailed T-test, * p value < 0,05. Error bars represent SD.
(C) Immunoblotting analysis shows an overexpression of both pro-axon outgrowth p53 target
proteins GAP-43 and Coronin 1b following treatment of CGN with 1 ng/ml TSA versus
vehicle (Ctrl). β-actin was used as a loading control.
(D) Chromatin IP (ChIP)-real time PCR assay (top panel) shows the presence of H3 K9-14
acetylation on the promoters of GAP-43 and Coronin 1b in CGN at 8 and 24 hours in culture
(GAP-43 8 hours: 19 fold ± 2.7 SD vehicle, 5´ versus 3´site; 20 fold ± 4 TSA, 5´ versus 3´site
and Coronin 1b 8 hours: 5.7 fold ± 1.1 SD vehicle, 5´ versus 3´site; 4.3 fold ± 1 SD TSA, 5´
versus 3´site). However, in the same experiment, acetylation of their promoters is not
enhanced by TSA (bottom panel). On the top panel, fold change was calculated as a ratio of
promoter occupancy between the 5’ (promoter) versus 3’ site. On the bottom panel, fold
change was calculated as a ratio of promoter occupancy between TSA versus vehicle treated
CGN. This has been done in three independent experiments in triplicate. 3’end regions of
GAP-43 and Coronin 1b were used as a control of the specificity of the acetylation of H3 at
K9-14 on the promoter region.
Asterisks: unpaired two-tailed T-test, * p value < 0,05, ** p value < 0,01. Error bars represent
SD.
(E) A schematic diagram representing the position of the p53 binding sites on GAP-43 and
Coronin 1b (top panel).
peer
-005
0493
6, v
ersi
on 1
- 22
Jul
201
0
CBP/p300 and P/CAF in neuronal outgrowth
32
ChIP-real time PCR assay (bottom panel) shows increased occupancy of acetylated p53
(α−320) on the promoter of Coronin1b (4 hours) (3,5 fold ± 0,8 SD), and acetylated p53
(α−373) on the promoter of GAP-43 and Coronin 1b (8 hours) (2,2 fold ± 0,5 SD GAP-43
and 3,1 fold ± 0,4 SD Coronin 1b) in CGN following TSA (1 ng/ml). No promoter occupancy
on GAP-43 was found for acetylated p53 α−320. Fold change was calculated as a ratio of
promoter occupancy between TSA treated CGN versus vehicle in three independent
experiments in triplicate. Asterisks: unpaired two-tailed T-test, * p value < 0,05, ** p value <
0,01. Error bars represent SD.
Figure 7. Hyperacetylation mediated neurite outgrowth requires acetylation of p53 by
CBP/p300 and PCAF.
Immunofluorescence staining in CGN for p53 (red) and Hoechst (blue) plated on PDL (A).
CGN were electroporated with either GFP (ctrl) or GFP and a p53 mutant plasmid carrying K-
R mutations at lysines 373-82-83 (p53 K-R) with or without 1 ng/ml TSA for 24 hours. In
addition, these cells were plated on myelin (B) where they were stained with F-actin (red), for
growth cone analysis, and Hoechst (blue). β-III tubulin immunostaining was also used in
these experiments (not shown). Neurons transfected with p53 K-R on both PDL (total average
neurite length: 128 µm ± 10 SD control versus 17 ± 4.3 p53 K-R; 245 ± 18.5 control/TSA
versus 11 ± 52 p53 K-R/TSA; number of neurites/100 cells 88 ± 13 control versus 55 ± 14
p53 K-R; 119 ± 2 control/TSA versus 65 ± 12 p53 K-R/TSA) and myelin (total average
neurite length: 5.17 μm ± 0.49 SD p53 K-R/vehicle and 4.7 ±0.7 p53 K-R/TSA; average
number of neurites/100 cells: 3.2 ± 0.3 SD p53 K-R/vehicle and 3.3 ± 0.35 p53 K-R/TSA)
show impairment in neurite outgrowth and enhancement of growth cone collapse (only 1% ±
0.57 SD p53 K-R+vehicle and 1.33% ± 0.75 p53 K-R+TSA non-collapsed growth cones) (A-
B). Importantly, when p53 K-R is expressed in the cytoplasm where it is transcriptionally
peer
-005
0493
6, v
ersi
on 1
- 22
Jul
201
0

CBP/p300 and P/CAF in neuronal outgrowth
33
inactive, physiological outgrowth does occur, neuron indicated by the arrow (A). Scale bar:
30 µm (A); 15µm (B). Arrows in (B) show representative growth cones in control and TSA
treated neurons. Measurement for average of neurite length per cell (µm) and number of
neurites/100 cells in three independent experiments (n: 100 cells each) are represented in the
bar graphs (A-B). Asterisks: unpaired two-tailed T-test, * p value < 0,05, ** p value < 0,01.
Error bars represent SD.
Additionally, we quantified the percentage of non-collapsed growth cones in electroporated
neurons plated on myelin, which showed a clear impairment in outgrowth in p53 K-R
transfected cells with and without TSA in three independent experiments (n:100 growth cones
each). Asterisks: unpaired two-tailed T-test, ** p value < 0.01. Error bars represent SD.
Figure 8. Overexpression of CBP/p300, P/CAF or p53 K-Q promote neurite outgrowth
on permissive substrate and rescue the myelin-dependent inhibition of neurite
outgrowth.
(A) and (B) p53 K-Q (p53 K320-72-3-82Q), CBP-p300 and P/CAF were overexpressed in
CGN plated on PDL (A) or myelin (B) for 24h. Cells were electroporated with either GFP and
pcDNA 3.1 vector (ctrl); GFP and p53 K-Q; GFP and CBP/p300 plasmids, or GFP and
P/CAF plasmid. The panels show immunocytochemistry for β-III tubulin and GFP signal.
Scale bar: 20µm. Bar graphs show quantification of neurite outgrowth, including average of
length per cell (three independent experiments, n: 100 cells each). Neurons transfected with
p53 K-Q, CBP/p300 or P/CAF show an increase in neurite outgrowth as compared to control
(PDL: 117,4 µm ± 0,7 SD p53 K-Q; 141 µm ± 3,2 SD CBP/p300 and 124,7 µm ± 10,6 P/CAF
versus 82,2 µm ± 6,5 SD pcDNA; Myelin :57,4 µm ± 9,9 SD p53 K-Q; 92,8 µm ± 7,9 SD
CBP/p300 and 73,0 µm ± 3,7 SD P/CAF versus 27,9 µm ± 3 SD pcDNA). Asterisks: unpaired
two-tailed T-test, * p value < 0,05, ** p value < 0,01. Error bars represent SD.
peer
-005
0493
6, v
ersi
on 1
- 22
Jul
201
0

CBP/p300 and P/CAF in neuronal outgrowth
34
Figure 9. The hyperacetylation-dependent molecular pathway to neuronal outgrowth.
In a non-permissive chromatin state, HDACs, class I and II, ensure that H3 remains
hypoacetylated. Under these conditions transcription complexes, including p53 and its
corresponding cofactors, have a low affinity for promoters. When cells are treated with TSA
HDACs are directly inhibited. This allows for the HATs, CBP/p300 and P/CAF, whose
expression we found to be induced by TSA, to hyperacetylated H3 at K9-14 and p53 at its C-
terminus, which then in concert with CBP/p300 and P/CAF, occupy specific promoters within
the newly formed permissive chromatin state. Finally, this promoter occupancy leads to the
increased transcription of pro-growth genes involved in neuronal outgrowth.
REFERENCES
1. Teng FY, Tang BL. Axonal regeneration in adult CNS neurons--signaling molecules and pathways. J Neurochem 2006 Mar; 96(6): 1501-1508.
2. Makwana M, Raivich G. Molecular mechanisms in successful peripheral regeneration.
Febs J 2005 Jun; 272(11): 2628-2638. 3. Mellor J. The dynamics of chromatin remodeling at promoters. Molecular cell 2005
Jul 22; 19(2): 147-157. 4. Reik W. Stability and flexibility of epigenetic gene regulation in mammalian
development. Nature 2007 May 24; 447(7143): 425-432. 5. Guan JS, Haggarty SJ, Giacometti E, Dannenberg JH, Joseph N, Gao J, et al. HDAC2
negatively regulates memory formation and synaptic plasticity. Nature 2009 May 7; 459(7243): 55-60.
6. Thiagalingam S, Cheng KH, Lee HJ, Mineva N, Thiagalingam A, Ponte JF. Histone
deacetylases: unique players in shaping the epigenetic histone code. Ann N Y Acad Sci 2003 Mar; 983: 84-100.
7. Yang XJ, Seto E. HATs and HDACs: from structure, function and regulation to novel
strategies for therapy and prevention. Oncogene 2007 Aug 13; 26(37): 5310-5318. 8. Struhl K. Histone acetylation and transcriptional regulatory mechanisms. Genes Dev
1998 Mar 1; 12(5): 599-606.
peer
-005
0493
6, v
ersi
on 1
- 22
Jul
201
0

CBP/p300 and P/CAF in neuronal outgrowth
35
9. Wolffe AP, Guschin D. Review: chromatin structural features and targets that regulate transcription. J Struct Biol 2000 Apr; 129(2-3): 102-122.
10. Saha RN, Pahan K. HATs and HDACs in neurodegeneration: a tale of disconcerted
acetylation homeostasis. Cell Death Differ 2006 Apr; 13(4): 539-550. 11. Schwechter BR, Millet LE, Levin LA. Histone deacetylase inhibition-mediated
differentiation of RGC-5 cells and interaction with survival. Investigative ophthalmology & visual science 2007 Jun; 48(6): 2845-2857.
12. Siebzehnrubl FA, Buslei R, Eyupoglu IY, Seufert S, Hahnen E, Blumcke I. Histone
deacetylase inhibitors increase neuronal differentiation in adult forebrain precursor cells. Experimental brain research Experimentelle Hirnforschung 2007 Feb; 176(4): 672-678.
13. Balasubramaniyan V, Boddeke E, Bakels R, Kust B, Kooistra S, Veneman A, et al.
Effects of histone deacetylation inhibition on neuronal differentiation of embryonic mouse neural stem cells. Neuroscience 2006 Dec 28; 143(4): 939-951.
14. Jiang H, Poirier MA, Liang Y, Pei Z, Weiskittel CE, Smith WW, et al. Depletion of
CBP is directly linked with cellular toxicity caused by mutant huntingtin. Neurobiology of disease 2006 Sep; 23(3): 543-551.
15. Arany Z, Huang LE, Eckner R, Bhattacharya S, Jiang C, Goldberg MA, et al. An
essential role for p300/CBP in the cellular response to hypoxia. Proceedings of the National Academy of Sciences of the United States of America 1996 Nov 12; 93(23): 12969-12973.
16. Rouaux C, Jokic N, Mbebi C, Boutillier S, Loeffler JP, Boutillier AL. Critical loss of
CBP/p300 histone acetylase activity by caspase-6 during neurodegeneration. Embo J 2003 Dec 15; 22(24): 6537-6549.
17. Glozak MA, Sengupta N, Zhang X, Seto E. Acetylation and deacetylation of non-
histone proteins. Gene 2005 Dec 19; 363: 15-23. 18. Di Giovanni S, Knights CD, Rao M, Yakovlev A, Beers J, Catania J, et al. The tumor
suppressor protein p53 is required for neurite outgrowth and axon regeneration. Embo J 2006 Sep 6; 25(17): 4084-4096.
19. Tedeschi A, Nguyen T, Puttagunta R, Gaub P, Di Giovanni S. A p53-CBP/p300
transcription module is required for GAP-43 expression, axon outgrowth, and regeneration. Cell Death Differ 2008 Dec 5.
20. Yoshida M, Kijima M, Akita M, Beppu T. Potent and specific inhibition of
mammalian histone deacetylase both in vivo and in vitro by trichostatin A. The Journal of biological chemistry 1990 Oct 5; 265(28): 17174-17179.
21. Blagosklonny MV. Flavopiridol, an inhibitor of transcription: implications, problems
and solutions. Cell cycle (Georgetown, Tex 2004 Dec; 3(12): 1537-1542.
peer
-005
0493
6, v
ersi
on 1
- 22
Jul
201
0

CBP/p300 and P/CAF in neuronal outgrowth
36
22. Filbin MT. Myelin-associated inhibitors of axonal regeneration in the adult mammalian CNS. Nat Rev Neurosci 2003 Sep; 4(9): 703-713.
23. Allis CD, Berger SL, Cote J, Dent S, Jenuwien T, Kouzarides T, et al. New
nomenclature for chromatin-modifying enzymes. Cell 2007 Nov 16; 131(4): 633-636. 24. Freeland K, Boxer LM, Latchman DS. The cyclic AMP response element in the Bcl-2
promoter confers inducibility by hypoxia in neuronal cells. Brain research 2001 Aug 15; 92(1-2): 98-106.
25. Guo Z, Boekhoudt GH, Boss JM. Role of the intronic enhancer in tumor necrosis
factor-mediated induction of manganous superoxide dismutase. The Journal of biological chemistry 2003 Jun 27; 278(26): 23570-23578.
26. Nott A, Watson PM, Robinson JD, Crepaldi L, Riccio A. S-nitrosylation of histone
deacetylase 2 induces chromatin remodelling in neurons. Nature 2008 Aug 27. 27. Knights CD, Catania J, Di Giovanni S, Muratoglu S, Perez R, Swartzbeck A, et al.
Distinct p53 acetylation cassettes differentially influence gene-expression patterns and cell fate. J Cell Biol 2006 May 22; 173(4): 533-544.
28. Tang Y, Zhao W, Chen Y, Zhao Y, Gu W. Acetylation is indispensable for p53
activation. Cell 2008 May 16; 133(4): 612-626. 29. Gao Y, Deng K, Hou J, Bryson JB, Barco A, Nikulina E, et al. Activated CREB is
sufficient to overcome inhibitors in myelin and promote spinal axon regeneration in vivo. Neuron 2004 Nov 18; 44(4): 609-621.
30. Jung M, Petrausch B, Stuermer CA. Axon-regenerating retinal ganglion cells in adult
rats synthesize the cell adhesion molecule L1 but not TAG-1 or SC-1. Mol Cell Neurosci 1997; 9(2): 116-131.
31. Aigner L, Arber S, Kapfhammer JP, Laux T, Schneider C, Botteri F, et al.
Overexpression of the neural growth-associated protein GAP-43 induces nerve sprouting in the adult nervous system of transgenic mice. Cell 1995 Oct 20; 83(2): 269-278.
32. Aigner L, Caroni P. Depletion of 43-kD growth-associated protein in primary sensory
neurons leads to diminished formation and spreading of growth cones. J Cell Biol 1993 Oct; 123(2): 417-429.
33. Benowitz LI, Perrone-Bizzozero NI, Neve RL, Rodriguez W. GAP-43 as a marker for
structural plasticity in the mature CNS. Prog Brain Res 1990; 86: 309-320. 34. Gianola S, Rossi F. GAP-43 overexpression in adult mouse Purkinje cells overrides
myelin-derived inhibition of neurite growth. The European journal of neuroscience 2004 Feb; 19(4): 819-830.
peer
-005
0493
6, v
ersi
on 1
- 22
Jul
201
0

CBP/p300 and P/CAF in neuronal outgrowth
37
35. Di Giovanni S, De Biase A, Yakovlev A, Finn T, Beers J, Hoffman EP, et al. In vivo and in vitro characterization of novel neuronal plasticity factors identified following spinal cord injury. J Biol Chem 2005 Jan 21; 280(3): 2084-2091.
36. Cai L, Marshall TW, Uetrecht AC, Schafer DA, Bear JE. Coronin 1B coordinates
Arp2/3 complex and cofilin activities at the leading edge. Cell 2007 Mar 9; 128(5): 915-929.
37. Stresemann C, Lyko F. Modes of action of the DNA methyltransferase inhibitors
azacytidine and decitabine. International journal of cancer 2008 Jul 1; 123(1): 8-13. 38. Di Giovanni S, Movsesyan V, Ahmed F, Cernak I, Schinelli S, Stoica B, et al. Cell
cycle inhibition provides neuroprotection and reduces glial proliferation and scar formation after traumatic brain injury. Proc Natl Acad Sci U S A 2005 Jun 7; 102(23): 8333-8338.
39. Schousboe A, Drejer J, Hansen GH, Meier E. Cultured neurons as model systems for
biochemical and pharmacological studies on receptors for neurotransmitter amino acids. Dev Neurosci 1985; 7(5-6): 252-262.
40. Dohda T, Kaneoka H, Inayoshi Y, Kamihira M, Miyake K, Iijima S. Transcriptional
coactivators CBP and p300 cooperatively enhance HNF-1alpha-mediated expression of the albumin gene in hepatocytes. J Biochem (Tokyo) 2004 Sep; 136(3): 313-319.
peer
-005
0493
6, v
ersi
on 1
- 22
Jul
201
0

Figure 1
A.
RCN CGN
H3 AcK9-14
β-actin
E17 P7Ad AdP7
43 KD
17KD
RCN CGN
B.
80100120
60708090
CtrlTSA 10 ng/mlTSA 1 ng/ml
of C
GN
ykno
tic n
ucle
i**
0204060
01020304050
% n
umbe
r
% o
f CG
N w
ith p
y
**
C.H3 AcK9-14
Ctrl TSAHoechst
H3 AcK9-14
D. TSA
H3 AcK9-14
Ctrl 4h 8h 24h
β−actin
17KD
43 KD
peer
-005
0493
6, v
ersi
on 1
- 22
Jul
201
0

A.
Figure 2
Ctrl TSA
TSA+FlavoFlavopiridol
β III TubulinHoechst
ell lls
20406080
100120140
rage
neu
rite
leng
th/c
e
**
60
2040
80100120
er o
f neu
rites
/100
cel *
*
Flavopiridol
Ctrl TSA Ctrl TSA0
Aver 0
Num
be
Ctrl TSA
Flavopiridol
Ctrl TSA
peer
-005
0493
6, v
ersi
on 1
- 22
Jul
201
0

Figure 2
B.Ctrl TSA 20
25
ones
-(%
)
*Ctrl TSA
Ctrl TSA Ctrl TSAFlavopiridol
05
101520
CG
N g
row
th c
ono
n-co
llaps
ed
**
Flavopiridol TSA+Flavoa op do
**
GN
gro
wth
con
es
area
(µm
²)
20406080
100120140
**
*
F actinβ III Tubulin
CG
020
Ctrl TSA Ctrl TSAFlavopiridol
β−actin
GAP-43
C.
43 KD
43 KD β actin43 KD
peer
-005
0493
6, v
ersi
on 1
- 22
Jul
201
0

A.Figure 3 Ctrl TSA
Myelin
β III TubulinHoechst
of ce
lls 40
50
urite
ll 50
6070
****
Ctrl TSAN
umbe
r one
urite
s/10
0 0
10
20
30
Ctrl TSA
Ave
rage
neu
leng
th/c
e
010203040
B.Ctrl TSA
CSPGs
e 70 ** 30 **
Hoechst β III Tubulin
ls
Ctrl TSA
Ave
rage
neu
rite
leng
th/c
ell
010203040506070
Ctrl TSA05
10152025
Num
ber o
fne
urite
s/10
0 ce
l
peer
-005
0493
6, v
ersi
on 1
- 22
Jul
201
0

Figure 3
CCtrlTSAC.
owth
con
es-
laps
ed (%
) **
304050607080
**grow
th c
ones
-co
llaps
ed (%
)
304050607080
TSA
8h 24hCSPG
CG
N g
rono
n-co
l
*
0102030
8h 24hMyelin
**
CG
N g
non-
c
0102030
peer
-005
0493
6, v
ersi
on 1
- 22
Jul
201
0

Figure 4
RNAi CBP/ p300Ctrl RNAi P/CAFA.
TSA TSA+RNAi CBP/ 300 TSA RNAi P/CAFTSA TSA+RNAi CBP/ p300 TSA+RNAi P/CAF
** 140
****
HoechstGFP
CtrlTSA
CtrlTSA
vera
ge n
eurit
e
ngth
/cel
l (µm
)
100
200
300 ****
Ave
rage
num
ber
f neu
rites
/100
cel
ls
40
80
120100
60
*
RNAi CBP/p300
Av le
Ctrl0
RNAi P/CAF RNAi CBP/p300
o
020
Ctrl RNAi P/CAF
peer
-005
0493
6, v
ersi
on 1
- 22
Jul
201
0

Figure 4
B. RNAi CBP/p300 RNAi P/CAFCtrl RNAi
Ctrl
TSA
F actin HoechstGFP
CtrlTSA
**
CtrlTSA
age
neur
ite
h/ce
ll (µ
m)
ge n
umbe
rte
s/10
0 ce
lls
30
40
50
60
**
****
* 20
30
40
50 *
*
* *
*
Ave
rale
ngth
Ave
rag
of n
eurit
Ctrl RNAi P/CAFRNAi CBP/p3000
10
20
Ctrl RNAi P/CAFRNAi CBP/p300
0
10
h co
nes-
non-
sed
(%)
20
2530
35 **** ** Ctrl
TSA
CG
N g
row
thco
llaps
RNAi CBP/p3000
510
15
Ctrl RNAi P/CAF
* *
peer
-005
0493
6, v
ersi
on 1
- 22
Jul
201
0

A.
Ctrl 4h 8h 24hTSA
Figure 5
2 Ctrl
CBP
p300
Ctrl 4h 8h 24h
P/CAF Arb
itrar
y U
nits
0.5
1
1.5 8h24h
4h
RPL13A
B
CBP0
p300 P/CAF
CBPMyelin / PDL
hang
e
3
5
7
9P/CAF
Myelin + TSA / Myelin + vehicle
p300
*
**
**
B.
Fold
c
-5
-3
-1
1
3
**
*
C.
4
5
6
hang
e/ -
TSA
****
**
0
1
2
3
Fold
ch
+ TS
A /
5' site< 1 kb
3' site 5' site< 1 kb
3' site 5' site< 1 kb
3' site 5' site< 1 kb
3' site
CBP p300 P/CAF RPL13A
peer
-005
0493
6, v
ersi
on 1
- 22
Jul
201
0

Figure 6
A.TSA
Ctrl 4h 8h 24hTSA
Ctrl 4h 8h 24h
p53 K373
β−actin
H3 AcK9-1417 KD
43 KD
53 KD p53 K320β-actin43 KD
53 KD
TSACtrl 4h 8h 24h
Coronin 1b
C.
36 KD
B.
2
3
hang
e/ -
TSA
*
*
β−actin
GAP-4343 KD
43 KD0
1
GAP-43 Coronin 1b
Fold
c+T
SA /
peer
-005
0493
6, v
ersi
on 1
- 22
Jul
201
0

D.
Figure 6
Fold
cha
nge
5’ s
ite /
3’ s
ite
5
10
15
20
25
308h24h**
**
** **
* ***
GAP-43 Coronin 1b
0
5
ctrl TSA ctrl TSA
2,58h
0,5
1
1,5
2
Fold
cha
nge
+ TS
A / -
TSA
8h24h
05' site 3' site 5' site 3' site
GAP-43 Coronin 1b
E.
Trans. starting sitep53 binding site
+1
+1GAP-43
Coronin 1b
-4000 -5000 -3000 -2000 -1000
GAP 43
Fold
cha
nge
+ TS
A / -
TSA
1
2
3
4
*
** GAP-43
Coronin1b**
F +
0
1
α-373 α-320
peer
-005
0493
6, v
ersi
on 1
- 22
Jul
201
0

Figure 7
A. Ctrl-GFP p53 K-R
Ctrl
TSA
300
rite
µm)
120140
mbe
r 0
cells
**
****
**
p53 HoechstGFP
CtrlTSA
CtrlTSA
* *
Ctrl0
100
200
Ave
rage
neu
rle
ngth
/cel
l (µ
P53 K-R0
20406080
100
Ave
rage
num
of n
eurit
es/1
00
Ctrl P53 K-R
peer
-005
0493
6, v
ersi
on 1
- 22
Jul
201
0

Figure 7
B. Ctrl-GFP p53 K-R
Ctrl
TSA
60 **
F actin HoechstGFP
Ctrl Ctrl**
253035404550
ge n
umbe
res
/100
cel
ls
**
age
neur
ite
th/c
ell (
µm)
30
40
50
CtrlTSA
CtrlTSA
**
05
101520
Ctrl
Ave
rag
of n
eurit
e
Ave
rale
ngt
0
10
20
Ctrl P53 K-R P53 K-R
**
20
2530
35
wth
con
es-n
on-
psed
(%)
**CtrlTSA
**
0
510
15
CG
N g
row
colla
p
Ctrl P53 K-R
**
peer
-005
0493
6, v
ersi
on 1
- 22
Jul
201
0

Figure 8
A.
Ctrl p53K-Q P/CAFCBP/p300
GFP
β III tubulin
* *
age
of n
eurit
e
gth/
cell
(µm
)
6080
100120140160
*
Ctrl p53K-Q CBP/p300 P/CAF
Ave
rale
ng
0204060
peer
-005
0493
6, v
ersi
on 1
- 22
Jul
201
0
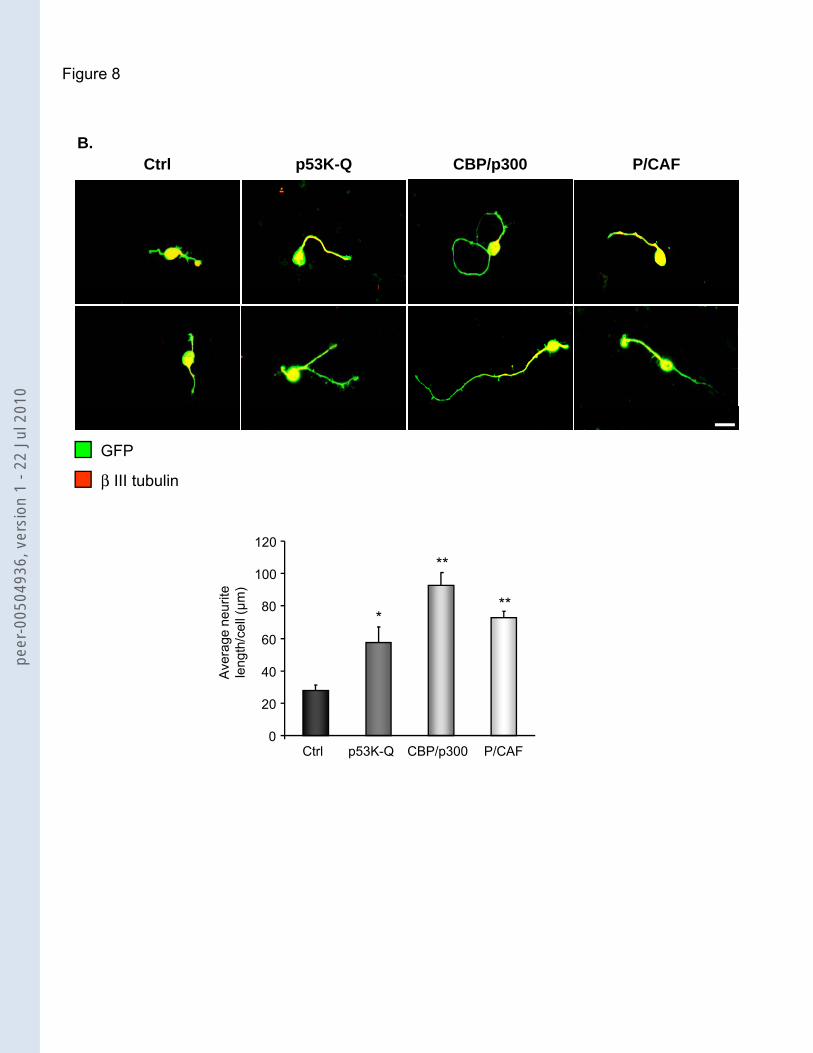
Figure 8
Ctrl p53K-Q P/CAFCBP/p300B.
Ctrl p53K Q P/CAFCBP/p300
GFP
β III tubulin
60
80
100
120
age
neur
ite
h/ce
ll (µ
m)
*
**
**
0
20
40
Ctrl p53K-Q CBP/p300 P/CAF
Ave
rale
ngth
peer
-005
0493
6, v
ersi
on 1
- 22
Jul
201
0

Figure 9
HATs
p300
P/CAF
p53
Ac
p53HDAC I/II
TSATSA
TSA
HATsCBP
P/CAF
HDAC I/II TSA
p53HDAC I/II
TSA
HATsCBP
p300
P/CAFH3 AcK9-14
CBP/p300 PCAF
H3 AcK9-14HATs
CBP
p300
P/CAF
p53
Ac
H3 A K9 14CBP
p300 P/CAF
Coronin 1b GAP-43
H3 AcK9-14 H3 AcK9-14 HATs
p53
Ac
peer
-005
0493
6, v
ersi
on 1
- 22
Jul
201
0


