Embed Size (px)
Citation preview

promoting access to White Rose research papers
White Rose Research Online [email protected]
Universities of Leeds, Sheffield and York http://eprints.whiterose.ac.uk/
This is an author produced version of a paper accepted for publication in Developmental Medicine & Child Neurology.
White Rose Research Online URL for this paper: http://eprints.whiterose.ac.uk/8759/
Published paper Elders, V., Sheehan, S., Wilson, A.D., Levesley, M., Bhakta, B. and Mon-Williams, M. (2009) Head–torso–hand coordination in children with and without developmental coordination disorder. Developmental Medicine & Child Neurology . ISSN 1469-8749 (In Press) http://dx.doi.org/10.1111/j.1469-8749.2009.03347.x

Head-torso-hand coordination in children
with and without developmental coordination
disorder (DCD)
Vera Elders1, Sinéad Sheehan
1, Andrew D. Wilson
2*,
Martin Levesley3, Bipin Bhakta
4 & Mark Mon-Williams
5
1College of Life Sciences and Medicine, University of Aberdeen, Aberdeen AB24 2UB
2Department of Psychology, University of Warwick, Coventry, CV4 7AL
3 Department of Mechanical Engineering,
4Department of Rehabilitation Medicine,
5Institute of Psychological Sciences,
University of Leeds, Leeds LS2 9JT
* Corresponding author
ph: +44/0 24 761 50485
fax: +44/0 24 765 24225
email: [email protected]
Keywords: movement, coordination, eye-hand, DCD, neurodevelopmental
Word Count: 3000

Abstract
Aim: The current study investigated the nature of coordination and control problems in children
with developmental coordination disorder (DCD).
Methods: 7 adults (5 female, 20-28 years, mean/SD = 23/2.73), 8 children with (2 female, 7-9
years, 8.05/0.67) and 10 without DCD (3 female, 7-9 years, 8.01/0.57 sat in a swivel chair and
looked or pointed to targets. Optoelectronic apparatus recorded head, torso, and hand movements,
and the spatial and temporal characteristics of the movements were computed.
Results: Children with DCD had longer head movement times than controls even in the looking
task, suggesting these children experience problems at the lowest level of coordination (the
coupling of synergistic muscle groups within a single degree-of-freedom). Increasing the task
demands with the pointing condition affected the performance of children with DCD to a much
greater extent than the other groups, most noticeably in key feed-forward kinematic landmarks.
Temporal coordination data indicated that all three groups attempted to produce similar movement
patterns to each other, but that the children with DCD were much less successful than their age
matched controls.
Interpretation: Children with DCD have difficulty coordinating and controlling single degree-of-
freedom movements; this problem makes more complex tasks disproportionately difficult for
them. Quantitative analysis of kinematics provides key insights into the nature of the problems
faced by children with DCD.
Running foot: Head-Torso Coordination in DCD
Word count: 216

Children with developmental coordination disorder (DCD) show profound difficulties in a range
of motor tasks, despite normal IQ and with no evidence of neurological, biological or physical
impairment1. The consequences of DCD are severe and studies have linked poor movement skills
in early childhood with poor educational outcome2, and social and emotional difficulties
3.
Unfortunately the factors that contribute to their poor execution of actions are not well
documented and there is a pressing need for such data.
The name of the disorder suggests the problem is one of coordination. However, there are at least
three broad levels where a coordination difficulty might arise in DCD. First, even a single
behavioural degree-of-freedom (e.g. turning the head) requires the coordination of numerous
elements. Second, deficits might not arise until two or more degrees of freedom or effectors need
to be coordinated (e.g. turning the head and torso). Third, both of these may be intact, but deficits
might still arise when coordinating with external factors or objects.
This study investigated the type of coordination difficulties in a population of children with DCD.
Two everyday tasks that have received remarkably little attention - moving the head to look at a
target, and moving the hand to point at a target4, 5
- were used because they allowed us to vary the
task complexity across the noted levels. In the looking task, participants simply looked at targets
on ether side of a central target; the targets were located in positions that elicit gaze shifts through
head rather than eye movements4. This task could be accomplished through a single degree-of-
freedom rotation of the head relative to the shoulders. We reasoned that deficits here would
indicate coordination problems at the first suggested level. The pointing task was more complex
as it required movement of the arm and head. Moreover, targets on the contralateral (opposite the
pointing hand) side required rotation of the torso (through chair movement). Thus, the pointing
task required coordination of multiple body segments. Group differences in this task, in the
absence of group differences in the looking condition, would indicate deficiencies in the second

suggested level. A lack of group differences in either looking or pointing tasks would prompt us
to investigate other factors to understand coordination problems in DCD.
Coordination is not the only potential problem. Therefore we also examined kinematic data to
assess the integrity of the control processes in DCD. One suggestion is that children with DCD
may have a problem with pre-programming movements, which may account for slower/more
variable movement times and time-to-peak speeds compared to typically developing children6, 7
.
The time from movement onset until peak speed is reached (the ‘time-to-peak speed’, or TPS) is
generally accepted to index the part of a movement under pre-programmed, feed-forward control.
The time from TPS until movement offset (deceleration time, or DT) is when the movement
comes under feed-back control (generally visual).8, 9
Deficits in feedforward control are reflected
in differences in the magnitude of peak speed and/or the time to peak speed, and deficits in
feedback control are reflected by group differences in deceleration time.
In summary, we investigated looking and pointing behaviour in children with DCD, age-matched
control children and adults. The paradigm allowed us to separate out various levels of
coordination, as well as to study feed-forward and feedback processes.
Methods
Participants: There were three groups:
1. Seven adults (five female) aged 20-28 years (mean age = 23 years, SD = 2.73) were
recruited from the University of Aberdeen. All of the adults had normal or corrected-to-
normal vision and none reported any movement abnormalities or disabilities.
2. Eight children (2 female) aged 7-9 years (mean = 8.05, SD = .67) with DCD were recruited
via Occupational Therapy at the Royal Aberdeen Children’s Hospital. These children all
scored below the 5th percentile on the Movement Assessment Battery for Children (M-
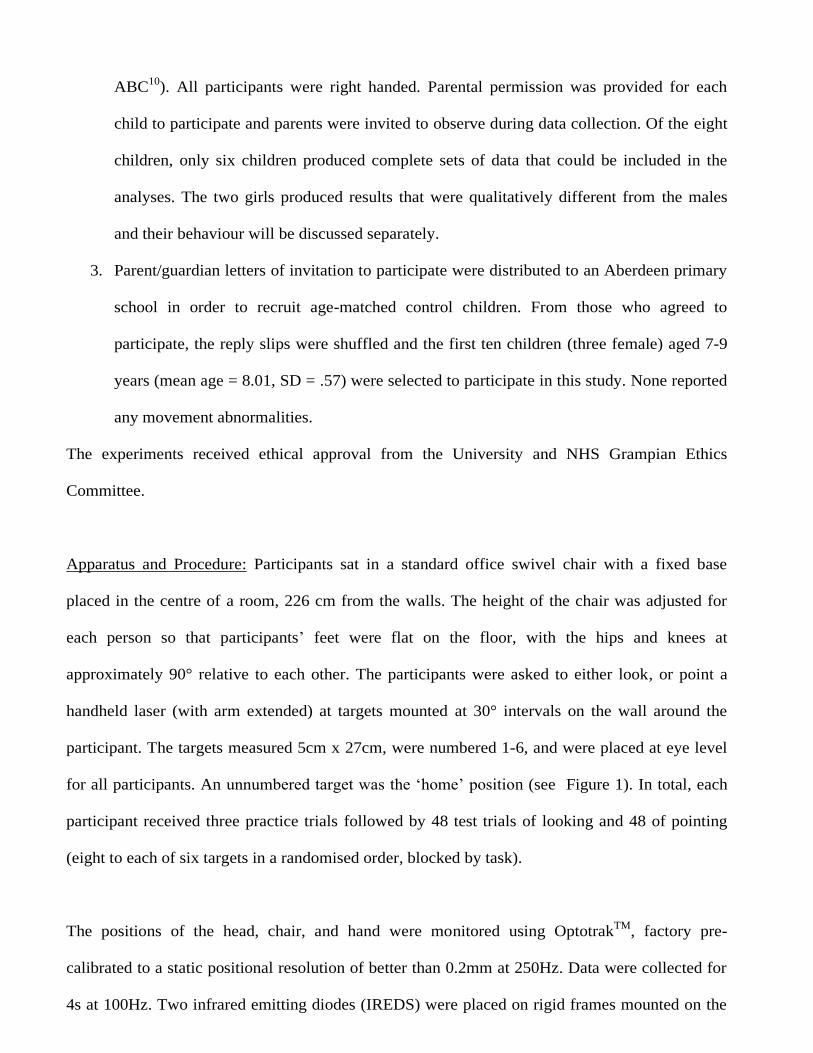
ABC10
). All participants were right handed. Parental permission was provided for each
child to participate and parents were invited to observe during data collection. Of the eight
children, only six children produced complete sets of data that could be included in the
analyses. The two girls produced results that were qualitatively different from the males
and their behaviour will be discussed separately.
3. Parent/guardian letters of invitation to participate were distributed to an Aberdeen primary
school in order to recruit age-matched control children. From those who agreed to
participate, the reply slips were shuffled and the first ten children (three female) aged 7-9
years (mean age = 8.01, SD = .57) were selected to participate in this study. None reported
any movement abnormalities.
The experiments received ethical approval from the University and NHS Grampian Ethics
Committee.
Apparatus and Procedure: Participants sat in a standard office swivel chair with a fixed base
placed in the centre of a room, 226 cm from the walls. The height of the chair was adjusted for
each person so that participants’ feet were flat on the floor, with the hips and knees at
approximately 90° relative to each other. The participants were asked to either look, or point a
handheld laser (with arm extended) at targets mounted at 30° intervals on the wall around the
participant. The targets measured 5cm x 27cm, were numbered 1-6, and were placed at eye level
for all participants. An unnumbered target was the ‘home’ position (see Figure 1). In total, each
participant received three practice trials followed by 48 test trials of looking and 48 of pointing
(eight to each of six targets in a randomised order, blocked by task).
The positions of the head, chair, and hand were monitored using OptotrakTM
, factory pre-
calibrated to a static positional resolution of better than 0.2mm at 250Hz. Data were collected for
4s at 100Hz. Two infrared emitting diodes (IREDS) were placed on rigid frames mounted on the

head, chair, and wrist. The frames increased the spatial separation of the markers so that small
angular rotations of the effectors produced large movements of the IREDs, increasing our ability
to detect the movements. In the pointing condition, participants held the laser pointer so that their
index finger was aligned along the length of the laser. Participants started each pointing trial with
their arm pointing downwards by the side of their body. On the go signal, participants were
instructed to first point at the ‘home’ target with their arm outstretched and then to move to the
target location whilst keeping their arm straight.
The stored data files were analysed using Labview 8. The data were filtered using a dual-pass
Butterworth second order filter with a cut-off frequency of 16Hz (equivalent to a fourth order zero
phase lag filter of 10Hz). The tangential velocity of the markers was computed and these signals
were combined to generate a resultant speed profile of the movement. The speed profiles were
used to determine the onset and offset of the movement using a standard algorithm (threshold for
movement onset and offset was 7°/s). Movement Time (MT) was the difference between onset
and offset of movement. Peak speed (PS), time-to-peak-speed (TPS) and deceleration time (DT)
were also computed, plus the signed and unsigned (i.e. the absolute values) differences in
movement onset and offset. The unsigned data indexes the magnitude of temporal asynchrony,
whereas the signed data indexes temporal ordering between segments.
For each participant and each condition, the median value of the eight measurements of the
variables of interest was analysed (the median is robust to outliers). For all analyses α-level was
set at 0.05.
Results
1. Qualitative Observations: The children with DCD found it difficult to sit upright in the chair,
had problems holding their arm up during the pointing task, and struggled to maintain balance on

trials where the chair moved. The children sometimes bent their arm to point at peripheral targets
rather than keeping their arm extended. This strategy aided them but meant they failed to obey
task instructions. These trials were replaced at the end of the session. The two girls with DCD
both produced data that were qualitatively different from the other participants, as they used a
strategy of shuffling their feet along the ground until they reached the target location, thereby
locking out the degrees of freedom normally associated with coordinating movements between
body segments. These two children were excluded from the group kinematic analysis.
2. Kinematic Data (Head)
Design: All kinematic analyses across Task were performed on head movements, the common
feature of the Looking and Pointing tasks. All ANOVAs were mixed design, with Task (2 levels:
Looking, Pointing) and Target location (6 levels: 0°, 30°, 60°, 120°, 150°, 180°) as within subject
factors, and Group (3 levels: DCD, control children, adults) as a between subject factor.
Differences due to Target location are expected (kinematics vary with target distance, etc) and so
will not be analysed in detail – the key results are between Task and Group. We also collapsed
Target location over contra- vs. ipsi-lateral movements as there were no statistically reliable
differences between these movements.
2.1. Head Movement Time (MT: Figure 2a)
MT is a useful measure of task difficulty; in general MT increases when a task is more difficult.
There was a main effect of Task (F(1,20) = 14.55; p<0.01). MT was significantly longer in the
Pointing condition as compared to the looking condition. There was also a main effect of Group
(F(2,20) = 11.96; p<0.01). Planned pairwise comparisons showed that this effect was caused by
the MTs of the children with DCD being longer than both the adults and control children, which
were not significantly different from each other. No other effects were significant.

2.2. Head Peak Speed (PS), Time to Peak Speed (TPS) and Deceleration Time (DT)
The primary component of the movement pattern for all groups was a bell-shaped speed profile.
This profile was seen in the head, chair, and finger movements. The prevailing consensus is that
PS and TPS reflect stages under feed-forward control, whilst DT reflects stages under feedback
control.7 We therefore analysed these variables across the groups.
2.2a. Peak Speed. There was a main effect of Task (F(1,20) = 77.2, p<.01) and Target (F(5,100) =
90.9, p<.01), but these were modified by a significant Task x Target interaction (F(5, 100) = 4.2,
p<.01). There was also a Target x Group interaction (F(10,100) = 3.30; p< 0.01). The children
with DCD reached lower peak speed to the further targets but a higher peak speed to the
intermediate targets compared to the control children.
2.2b. Time-to-Peak-Speed (Figure 2b). There was a main effect of Task (F(1,20) = 87.1, p<.01),
Target (F(5, 100) = 3.7, p<.01) and Group (F(2,20) = 55.4, p<.01) but these were modified by two
interactions. There was a significant Task x Target interaction (F(5,100) = 8.1, p<.01), and a
significant Task x Group interaction (F(2,20) = 35.4, p< 0.01). The latter showed that the children
with DCD showed a larger increase in TPS from the looking to the pointing task than the control
children or adults.
The significant results in TPS might be driven by the observed changes in overall MT. To
investigate this we repeated the ANOVA on TPS expressed as a proportion of MT (Figure 3a).
There was a main effect of Group (F(2, 20) = 9.9, p<.01) but most importantly both interactions
remained significant (Task x Group: F(2,20) = 9.2, p<.01; Task x Target: F(5, 100) = 2.8, p<.05).
This result suggests that the changes in MT were not the cause of the changes in TPS; rather, the
reverse. Most of the difficulty experienced by the DCD population was in the feed-forward
component of the movements, prior to peak-speed.

2.2c. Deceleration Time (Figure 2c). There were no significant main effects or interactions in DT.
We repeated the ANOVA with DT expressed as a proportion of MT (Figure 3b). There was a
main effect of Task (F(1,20) = 6.5, p<.01) and Group (F(2,20) = 3.6, p<.05), but these were both
modified by a Task x Group interaction (F(2,20) = 4.5, p<.05). Children with DCD spent
relatively less time decelerating in the Pointing condition compared to both the adults and control
children, reflecting the fact that they spent so much more of their total movement time in the early
phase of the movement.
3. Coordination Data (Figure 4; supplementary online material)
Coordination data are all from the Pointing task; the inclusion of the adult group allowed us to
interpret the results in the context of the most skilled strategy. We computed both signed and
unsigned onset and offset asynchronies for Head-Chair, Head-Finger and Chair-Finger. Signed
asynchronies provide a measure of the temporal ordering of the movements, while unsigned
asynchronies provide a measure of the magnitude of differences. All ANOVAs were mixed
design, with Coordination (3 levels: Head-Chair, Head-Finger, Chair-Finger) and Target location
(6 levels: 0°, 30°, 60°, 120°, 150°, 180°) as within subject factors, and Group (3 levels: DCD,
control children, adults) as a between subject factor.
3.1. Signed and Unsigned Onset Asynchronies
In the signed onset data, there was only a main effect of Coordination (F(2,40) = 21.9, p<.01).
There were no effects involving Group; children with DCD, control children and adults started the
movement of the head, chair and arm at about the same time on average. The unsigned onset data
did show a main effect of Group (F(2,20) = 5.4, p<0.05), in which the DCD population showed a
greater overall onset asynchrony than the adults (i.e. more variable coupling of the components).
Overall, all groups began the three movements at roughly the same time, but the children with

DCD were less skilled.
3.2. Signed and Unsigned Offset Asynchronies
In the signed offset data, there was a significant main effect of Coordination (F(2,40) = 36.5,
p<.01), and significant Coordination x Group (F(4,40) = 2.6, p<.05) and Coordination x Target
(F(10,200) = 5.6, p<.01) interactions. In all groups, the chair stopped moving before either the
finger or the head, which stopped at approximately the same time as each other; the Coordination
x Group effect showed that adults were more tightly coupled than the children.
In the unsigned data, there were significant main effects of Group (F(2,20) = 4.8, p<.05) and
Target (F(5,100) = 3.1, p<.05), and significant Coordination x Group (F(4,40) = 5.6, p<.01) and
Coordination x Target x Group (F(20, 200) = 2.1, p<.01) interactions. The Coordination x Group
interaction showed that the DCD population showed much less coordination between the finger
and the head or chair. This reflects their difficulty in controlling the hand as they swung it around
to point at a target. The head and chair were more tightly coordinated in the children with DCD
than the other two groups, suggesting they were relying on the chair to help control their head
movements.
Overall, the chair stopped first, followed by the head and finger. The children with DCD were
attempting to do this as well, but with much less success than either the control children or adults.
In general, the children were performing a version of the skilled adult strategy, rather than
adopting a different solution that reflected their maturational state.
Discussion
The present study used a relatively small number of participants. This was a necessity because of
the technical difficulties in running experiments of this complexity with children, with or without

DCD. Nonetheless, the quantitative differences found between groups were profound - the
children with DCD found both looking and pointing tasks difficult in comparison to controls.
Most notably, the children with DCD had difficulties in the looking task (i.e. longer MT) where
success only required a single rotation of the head relative to the torso. This suggests that the
coordination difficulties experienced by the children were at a single degree-of-freedom level.
This interpretation is supported by the pointing results, in which children with DCD were
disproportionately affected by the increase in task complexity relative to the other groups. It is
true that simply moving the head relative to the torso is not a trivial control problem. Nonetheless,
we suggest that difficulties with this fairly common and typical one degree-of-freedom action
suggest quite fundamental control problems. It is therefore unsurprising that the children perform
so poorly on the complex tasks contained in standardised movement assessment batteries (e.g. M-
ABC).
The results also suggest that not all control processes are equally affected in DCD. The kinematic
analyses suggest that much of the difficulty is in the feed-forward part of the movement. This was
indexed by the increase in TPS in DCD compared to controls, even when the overall increase in
MT is controlled for. These data are consistent with other studies that have found similar
problems with the feed-forward aspect of motor control in DCD6,7
.
The children with DCD attempted to adopt strategies that decreased the problems they
experienced, especially when pointing. The most extreme strategy was shown by the two girls
with DCD, who both walked the chair around to the targets. The strategy resulted in very slow
movements but did ensure that the children did not have to cope with the dynamically altering
inertial forces produced by separate head, arm, and torso movements.
These compensation strategies were the only qualitative differences between the groups, however.

The general coordination pattern of the movement was otherwise identical across the groups when
they were successfully following task instructions. This suggests that the children with DCD were
trying to coordinate the start and end of the head and finger movement (the skilled adult strategy)
and on average they achieved this. However, the unsigned asynchronies showed that they failed to
reliably couple these different segments on a trial-by-trial basis, clearly indicating that they were
operating beyond their skill level. Interestingly, therefore, the problems associated with DCD may
not only arise from fundamental difficulties in the coordination and control of action, but in the
too-complex actions that the children choose to try and perform.
The difficulties observed within the laboratory have serious practical implications in the everyday
environments the children encounter. Numerous tasks at home and school require complex
coordination; a child might need to sit still enough to be able to read from a board and then take
notes. Coordinating a seated posture with a second action such as writing might readily lead to the
kind of difficulties we observed, causing problems in the child being able to stay on task and
complete their work in good time. These difficulties might account for the fact that children with
DCD often meet the diagnostic criteria for ADHD6. Our results suggest that improving the
stability of the postural platform with special seating might simplify the task faced by these
children, and allow them to focus on taught material.

Acknowledgements
First and second authors funded by the Wellcome Trust summer research scholarship. This study
was supported by Action Medical Research and a SPARK award.

References
1. American Psychiatric Association. (1994). Diagnostic and statistical manual of mental
disorders (4th ed.). Washington, DC.
2. Losse A, Henderson SE, Elliman D, Hall D, Knight E, Jongmans, M. Clumsiness in children -
do they grow out of it? A ten-year study. Developmental Medicine and Child Neurology 1991:33,
5568.
3. Cousins M, Smyth MM. Developmental coordination impairments in adulthood. Human
Movement Science 2003:22, 433-459.
4. Stahl JS. Eye-head coordination and the variation of eye-movement accuracy with orbital
eccentricity. Experimental Brain Research 2001: 136, 200-210.
5. Hollands MA, Ziavra NV, Bronstein AM. A new paradigm to investigate the roles of head and
eye movements in the coordination of whole-body movements. Experimental Brain Research
2004:154, 261 266.
6. Plumb MS, Wilson AD, Mulroue AM, Brockman A, Williams JHG, Mon-Williams M. On-line
corrections in children with and without DCD. Human Movement Science 2008: 27, 695-704.
7. Wilmut K, Wann JP, Brown JH. Problems in the coupling of eye and hand in the sequential
movements of children with developmental coordination disorder. Child Care, Health and
Development 2006: 32, 665-678.
8. Prablanc C, Echallier JE, Jeannrod M, Komilis E. Optimal response of eye and hand motor
systems in pointing at a visual target. II. Static and dynamic visual cues in the control of hand
movement. Biological Cybernetics 1979:35, 183-187.
9. Prablanc C, Echallier JF, Komilis E, Jeannrod M. Optimal response of eye and hand motor
systems in pointing at a visual target. I. Spatio¬temporal characteristics of eye and hand
movements and their relationships when varying the amount of visual information. Biological
Cybernetics 1979:35, 113-124
10. Henderson SE, Sugden DA. Movement assessment battery for children. The Psychological

Corporation. New York: Brace and Jovanovic, 1992.

Figure captions
Figure 1. Schematic of experimental set-up. Targets were located at eye level at a fixed distance to
the right and left at 90, 60 and 30 degrees from the participant in the chair. The starting ‘Home’
target was along the midline.
Figure 2. Head kinematics as a function of Group (DCD, Control children and Adults) and Task
(Looking (open squares), Pointing (closed diamonds)). Figure 2a shows Movement Time (MT);
Figure 2b shows Time to Peak Speed (TPS), which typically reflects feed-forward control time
and Figure 2c shows Deceleration Time (DT), which typically reflects feedback control time. The
results suggest that the large increase in MT in the children with DCD is primarily caused by
changes in the feed-forward part of the action.
Figure 3. Head Time to Peak Speed (TPS) and Deceleration Time (DT) expressed as a proportion
of total Movement Time (MT). By controlling for changes in MT, this analysis indicates that the
main cause of changes in the MT of children with DCD is in the feed-forward stage indexed by
TPS, rather than the feedback stage indexed by DT.
Figure 4 (supplementary online material). Temporal coordination data from the Pointing task, as a
function of Group (DCD, Control children and Adults) and Coordination type (Head-Chair (open
squares), Head-Finger (closed squares), Chair-Finger (open triangles/dotted line)). The top row
shows onset asynchronies; the bottom row shows offset asynchronies. The left column shows
signed asynchronies, and the right column shows unsigned asynchronies. The results suggest that
the groups all attempted to produce essentially the same coordination pattern (three distinct
movements starting at the same time, with the chair finishing before the head or finger), although
the children with DCD were much less skilled (greater unsigned asynchronies) than the Adults or
the Control children.

4 15
X
0°
120° 60°
226cm
HOME
30° 150°
180°

1
1.2
1.4
1.6
1.8
2
2.2
2.4
2.6
2.8
3
DCD Control Adults
Group
Movem
ent
Tim
e (s
)
Looking
Pointing
0
0.2
0.4
0.6
0.8
1
1.2
1.4
1.6
DCD Control Adults
Group
Tim
e to
Pea
k S
pee
d (
s)
Looking
Pointing
0
0.2
0.4
0.6
0.8
1
1.2
1.4
1.6
DCD Control Adults
Group
Dec
eler
ati
on
Tim
e (s
)
Looking
Pointing

0
0.1
0.2
0.3
0.4
0.5
0.6
0.7
0.8
0.9
1
DCD Control Adults
Group
Tim
e to
Pea
k S
pee
d / M
ov
emen
t T
ime
Looking
Pointing
0
0.1
0.2
0.3
0.4
0.5
0.6
0.7
0.8
0.9
1
DCD Control Adults
Group
Dec
eler
ati
on
Tim
e / M
ov
emen
t T
ime
Looking
Pointing

-1
-0.8
-0.6
-0.4
-0.2
0
0.2
0.4
0.6
0.8
1
DCD Control Adults
Group
Sig
ned
On
set
Asy
nch
ron
y (
s)
Head - Chair
Head - Finger
Chair - Finger
0
0.1
0.2
0.3
0.4
0.5
0.6
0.7
0.8
0.9
1
DCD Control Adults
Group
Un
sign
ed O
nse
t A
syn
chro
ny (
s)
Head - Chair
Head - Finger
Chair - Finger
-1
-0.8
-0.6
-0.4
-0.2
0
0.2
0.4
0.6
0.8
1
DCD Control Adults
Group
Sig
ned
Off
set
Asy
nch
ron
y (
s)
Head - Chair
Head - Finger
Chair - Finger
0
0.1
0.2
0.3
0.4
0.5
0.6
0.7
0.8
0.9
1
DCD Control Adults
Group
Un
sig
ned
Off
set
Asy
nch
ron
y (
s)
Head - Chair
Head - Finger
Chair - Finger


