Embed Size (px)
Citation preview
IEEE TRANSACTIONS ON SYSTEMS, MAN, AND CYBERNETICS, VOL. SMC-IO, NO. 12, DECEMBER 1980
Health and Socioeconomic Change
ERNST 0. ATTINGER, FELLOW, IEEE, AND DILIP R. AHUJA
Abstract-A cross national and cross temporal analysis of the statisticsof 29 developed and 25 less developed countries (DCs and LDCs) from1950 to 1975 shows that the relationship between the Indicators char-acterizing the performance of seven socioeconomic subsectors (demogra-phy, economy, education, communication, housing, nutrition, and healthresources) and population health levels are not only quantitatively differentfor DC's and LDCs but also change at different rates. Changes in onesubsector may be closely associated with changes in another subsector onlyuntil a certain level of development is reached. Correspondingly thedevelopment gap between the two groups has increased in some sectorsand decreased in others. Furthermore the correlations between the socio-economic Indicators used and health have become progressively weakerover this period for the DC's, while they are stil increasing for LCD's.The ranking of all the countries along a socioeconomic and a healthdimension showed that economy-a social dimension consisting of hous-ing, nutrition, and medical resources-health, and education contributemost to the rank order for LDCs, while a social dimension consisting ofcommunication, housing, and education assumes that role for DCs. Al-though many countries in both groups show a relatively balanced develop-ment with respect to the socioeconomic and the health dimensions, twospecial groups could be identified as either "health eMcient" or "healthInefficient." We found no common denominator for this difference exceptconsistent differences in crude death rate and violence between the twogroups. The model developed for the quantitative description of theseinteractions explains health levels on the basis of performance of othersocietal sectors better for less developed than for developed countries. Incontrast, health levels affect socioeconomic performance more in devel-oped than in less developed countries. Education and housing contributemost to health, while the effects of education and communication pre-dominate with respect to economic output.
I. INTRODUCTION
I MPROVING health levels of populations is not only adesirable goal per se, it is also a prerequisite for man's
optimal performance in all social sectors. Ill health is thusnot only a matter of personal and individual concern, butit becomes a problem of social liability. Although theWorld Health Organization (WHO) in its definition ofhealth clearly emphasized the multidimensional nature ofhealth (without, however, providing appropriate indica-tions on how to measure these dimensions) and demogra-phers, epidemiologists, and sociologists established theclose interrelations between psychosocial factors, socio-economic environment, and health, the health care sectoris still dominated by the proponents of traditional curativemedical care.
Despite the alarming increase in the rate at whichhealth care costs in industrialized countries have beenrising since the early sixties, the concomitant improve-ment in the health level of populations has been disap-
Manuscript received May 30, 1980; revised September 2, 1980.E. 0. Attinger is with the Division of Biomedical Engineering, Univer-
sity of Virginia, Charlottesville, VA 22908.D. R. Ahuja is with Interdisciplinary Programs in Health, School of
Public Health, Harvard University, Cambridge, MA 02138.
pointing [1], [2]. For example, between 1940 and 1975 theaverage life span increased in the U.S.A. by 15 percent,while per capita disease care expenditures rose 314 per-cent in constant 1967 dollars [3]. Present attempts toameliorate the situation at national levels can be classifiedinto two groups. The first, based on the traditional con-cepts of health care provided under strict control bylicensed physicians, focuses on more efficient distributionof resources, including stratification and control of healthcare facilities, easier and more equitable access to healthcare and better health education of the public. Emphasiz-ing the delivery of medical care, it stresses the biophysicalaspects to the detriment of the psychosocial and socioeco-nomic dimensions of health. As Bryant [4] notes, "Therehas been great reluctance to deviate from the patterns ofmedical care and education developed in Western coun-tries, even though they are often seriously irrelevant forthe less developed countries and, as is now becomingincreasingly clear, often not well suited for the moredeveloped countries where they originated."The second approach, championed by WHO [5] and
directed primarily to the needs of less developed nations,emphasizes improvements in education, nutrition, andsanitation as well as the provision of essential health careneeds by specifically trained health care workers. Yet,until the relationships between implied causes, host, andenvironment are better understood, it is difficult to seehow large-scale preventive measures can be successfullyand efficiently implemented except in the general terms ofchanges in "life style" or "health habits" [6]-[10]. Thepresent state of the global malaria eradication programprovides an excellent demonstration of such a problem[11]. Although the impact of demographic, psychosocial,and socioeconomic factors on health has been established,the relationship between these variables and particularlytheir change with socioeconomic development has notbeen quantitatively assessed to the point where it could beused reliably for policy decisions.
For example, the Surgeon General's report [12] esti-mates that as much as half of the U.S. mortality in 1976was due to unhealthy behavior or life style, 20 percent toenvironmental factors, 20 percent to human biologicalfactors (aging?), and only 10 percent to inadequacies inhealth care. Gori and Richter in their analysis of riskfactors [3] were more conservative. From comparisons ofdisease specific mortalities for 1973 between countries ofsimilar levels of development (and presumably healthcare), they estimated that the prevention potential for thefour major causes of death in the U.S.A. (heart disease,malignant neoplasms, accidents, and cerebrovascular dis-
0018-9472/80/1200-0781$00.75 0 1980 IEEE
781
IEEE TRANSACTIONS ON SYSTEMS, MAN, AND CYBERNETICS, VOL. SMC-10, NO. 12, DECEMBER 1980
ease) amounts to between 40 and 75 percent. The prema-ture mortality from these diseases in the U.S. translatesnot only into the loss of about eight million productive lifeyears per year but also into a significantly larger amountof morbidity. They estimated that both the elimination ofsmoking and the enforcement of a proper diet represent aprevention potential of 30 percent each for mortality fromcardiovascular and neoplastic disease, while drug abuse,occupational hazards, and alcohol account for 30 percentof accidental deaths. They also note that a comprehensivepolicy toward health and longevity gains implies anorganizational framework for disease prevention and avigorous research commitment to the clarification of com-peting etiologic factors of morbidity and mortality, ofpreferred control strategies, and of better therapeutic ap-proaches.Since the process of development is characterized by a
changing complex of factors, moving at different rates inrelation to each other and changing in level of importanceat different levels of development and in different types ofsocieties, the past is not necessarily a reliable guide for thefuture, particularly in periods of rapid socioeconomicchange. This is especially apparent when one comparesthe impact of infectious diseases across civilizations andtime, or if one examines the changes in mortality andmorbidity due to violent deaths among different races,sexes, and age groups during the last twenty years [8], [10],[16], [17].
Statistical data are collected at national and state levelsin large numbers, but there have been only a few efforts torelate sets of socioeconomic and psychosocial variablesquantitatively to health status. Usually such data aredisplayed as functions of time in either table or graphform for each variable separately, and relationships amongthem are estimated qualitatively [13]. The few quantitativeassessments of multiple interrelationships are mostly basedon data sets at a single point of time [14], [15] despiteCassel's emphasis on the fact that these relationships maychange rapidly under the influence of socioeconomic de-velopments or cultural change [16]. For example, thecorrelation between infant mortality levels and levels ofincome has been estimated to be sufficiently strong thatinfant mortality rates have on occasion been used asindicators of income levels when the requisite data weremissing for computing the latter, although, as we willshow, the form of the relationship has been rapidly chang-ing over the last four decades [17]. However, a number ofquantitative models have been developed with the goal ofpredicting some aspects of the quality of life in the futureunder various scenarios of socioeconomic and environ-mental changes. The best known of these are econometricinput- output type models [ 18], predictions based onbrainstorming, Delphi, and similar techniques [19], andthe Forrester type models sponsored by the Club of Rome[20], [21]. Surpsriingly enough, all of these neglect theessential aspects of the health sector.Based on the type of evidence summarized in the previ-
ous paragraphs, we hypothesize that not only does thelevel of socioeconomic development correlate strongly with
the health level of a population but that the magnitude ofthe impact of any socioeconomic factor on health dependson the level of development of the society in which itoperates.
In this paper we present a quantitative analysis of thechanges in the relationships between economic, social andhealth indicators over the last 25 years. The analysis isbased on cross national and cross temporal comparisonsof data from 54 countries. They comprise about 75 per-cent of the world population and include all prevalentforms of government and most social value systems. Smallcity and island states were excluded. The study was desig-ned to meet three objectives:
1) to assess levels of development based on a combi-nation of social, economic, and health indicators,
2) to analyze the relationship between these indicatorsand their impact on health as a function of time,and
3) to identify those sectors that contribute most to theachieved health levels in the different countries.
II. METHODS
A. Selection of Indicators
The testing of the hypothesis required appropriatestatistical analysis of 1) data from a large enough sampleof countries to cover a wide spectrum of developmentlevels both with respect to health and socioeconomicdimensions, 2) a sufficient number of variables to ade-quately characterize the different socioeconomic subsec-tors which have been shown to affect population healthlevels, and 3) data that reflect not only physical but alsomental and social well being.
The choice of indicators for cross national comparisonsalways involves a trade-off between significance, availabil-ity, and reliability of the collection of a given indicator.Additional constraints are based upon the selection by therequirements of the analytical methods to be employed,which set boundaries on the numerical relations betweenthe number of countries and the number of variables to beanalyzed. We selected a total of 29 indicators as char-acterizing seven social sectors (see Table I): demography(seven indicators), health resources (two), nutrition (seven),economy (four), communications (three), housing (three),and education (three). Six indicators (male, female, andtotal life expectancy, infant mortality, crude death rate,and violent deaths per 100000 persons) were chosen forthe assessment of health levels. Violence was selectedbecause it can be considered as a reflection of dissatisfac-tion with life styles as well as of societal unbalance andthus, to some extent, as an indicator of public mentalhealth. (A good discussion of the significance of the otherindicators is presented in [24]. Although on theoreticalgrounds some of them are not the most appropriate mea-sures of systems performance, they are nevertheless themost reliably collected for national statistics and usednationally and internationally for policy analysis andpolicy decisions.) Unfortunately, most national statistics
782
ATrINGER: HEALTH AND SOCIOECONOMIC CHANGE
TABLE ILIST OF VARIABLES AND TIHIR SOURCES
Variable
populationsex ratiopopulation classified urbanpopulation in cities > 20 000crude birth rateland under agriculturepopulation density
life expectancy at birth, maleslife expectancy at birth, femaleslife expectancy at birth, totalinfant mortalitycrude death ratedeath rate due to violence
population per physicianpopulation per hospital bed
calorie supplycalorie requirementscaloric needs metprotein supplyfats supplycereals supplysugar supply
AbbreviationPOPSRURBCITYCBRHECTDENS
LEMLEFLETIMCDRVIOL
Unitsmillionsmales/10001 femalespercent of total populationpercent of total populationlive births/ 1000 populationhectarespersons/hectare
yearsyearsyearsinfant deaths/ 1000 live Birthsdeaths/ 1000 populationdeaths/ 100 000 population
DOC number of personsBED number of persons
CALRQPCRQPROTFATSCRLSSUGR
calories/day/personcalories/day/personpercent of requirementsg/day/persong/day/persong/day/persong/day/person
SourcesUNDYUNDY, UNCSSUNDYUNDYUNDY, WHSAFAOPY
UNDY, WHSAUNDY, WHSA
UNDY, WHSAUNDY, WHSAUNDY
UNSA, WHSAUNSA, WHSA
FAOPYFAO(1975)
FAOPYFAOPYFAOPYFAOPY
adult population withpostsecondary educationmedian educational leveladult illiteracy rate
Average occupational densityof dwellingsdwellings with piped water insidedwellings with toilets
daily newspaper circulationradio receiverstelephones
per capita gross domesticproductunemployment ratecapital investment rateper capita energy
consumption
PSECMEDNILIT
ROOMWATRWC
NEWSRADSPHON
PGDP
UNMPIRENERG
percent of over 25 populationyears for over 25 populationpercent of over 15 population
persons/roompercent of dwellingspercent of dwellings
newspaper/ 1000 populationradios/1000 populationtelephones/ 1000 population
$/person/annum
percent of labour forcepercent of GDPkg equivalent/person/annum
UNESCOYBUNESCOYBUNESCOYB, UNCSS
UNCH, UNSYUNCH, UNSYUNCHS UNSY
UNSYUNSYUNSY
UNYNAS
ILOLSYUNYNASWES
*Derived variables
Major Sources of Data
FAOPYILOLSYUNCHSUNCSSUNDYUNESCOYBsUNSA, UNSYUNYNASWESWHSA
Food and Agricultural Organization Production YearbooksInternational Labour Organization's Labour Statistics YearbooksUnited Nations Compendium of Housing StatisticsUnited Nations Compendium of Social StatisticsUnited Nations Demographic YearbooksUnited Nations Educational, Scientific, and Cultural Organization YearbooksUnited Nations Statistical Annuals or YearbooksUnited Nations Yearbook of National Account StatisticsWorld Energy Supplies (United Nations)World Health Statistics Annuals
have only recently begun to reflect inequalities in the the first decile and from 21.3 percent (Sweden) to 30.4access to consumer goods. Even in industrialized countries percent (France) for the last decile [10]. In less developedthese differences are still quite significant. For example, countries the proportion of poor with limited access tothe Organization for Economic Cooperation and Develop- better quality goods and services in health promotingment (OECD) statistics for ten member countries show sectors (type of employment, education, nutrition, andthat the distribution of post-tax household income varies housing) is even larger. Hence our data probably under-from 1.4 percent (France) to 2.8 percent (Germany) for estimate the effects of poverty.
SectorDemographic
Health
Medicalresources
Nutritional
Educational
Housing
Communicational
Economic anddevelopmental
783
IEEE TRANSACTIONS ON SYSTEMS, MAN, AND CYBERNETICS, VOL. SMC-10, NO. 12, DECEMBER 1980
B. Data Base
The data were collected for the period 1950 to 1975 infive year intervals for the 54 countries selected. Mortalitydata were provided by WHO, the other data were ob-tained from national and international statisticalyearbooks and the literature. The data base as well as adetailed list of data sources have been published elsewhere[22]. For most countries there were data gaps for severalvariables and specific years. Wherever possible the valuesof these missing data were estimated by appropriate extra-or interpolation techniques [22]. The extrapolations, how-ever, never exceeded a period of five years. In the finaledited data base there were 15 percent missing values (outof a total of 11 340). More than half of these concerned sixvariables: unemployment (11.2 percent), water and toilets(26.3 percent), and median years of post secondary educa-tion (18.3 percent). Except for median years of education,none of these indicators were retained as key indicators.Among the countries, Canada and Norway had the fewestmissing values (4 percent)-this may well be one of thereasons why Canada was able to develop the most imagin-ative health policy plan since 1960 [23]-China (52 per-cent) and South Africa (30 percent) had the most. Mc-Granahan et al. [24] have shown that such a proportion ofmissing data does not significantly affect the results of themultivariate analysis (except probably for the ranking ofChina).
C. Data Analysis
In order to obtain a general perspective on the type ofrelationships between the health indicators and the socio-economic variables, scattergrams of each of the healthindicators versus each of the socioeconomic variables wereplotted. The results showed that the relationship betweenthe health indicators and the economic and communica-tion variables (as well as fat intake and housing withpiped water supply) was strongly curvilinear, indicatingthat the data set contained at least two subgroups, repre-senting different levels of health and/or socioeconomicdevelopment.
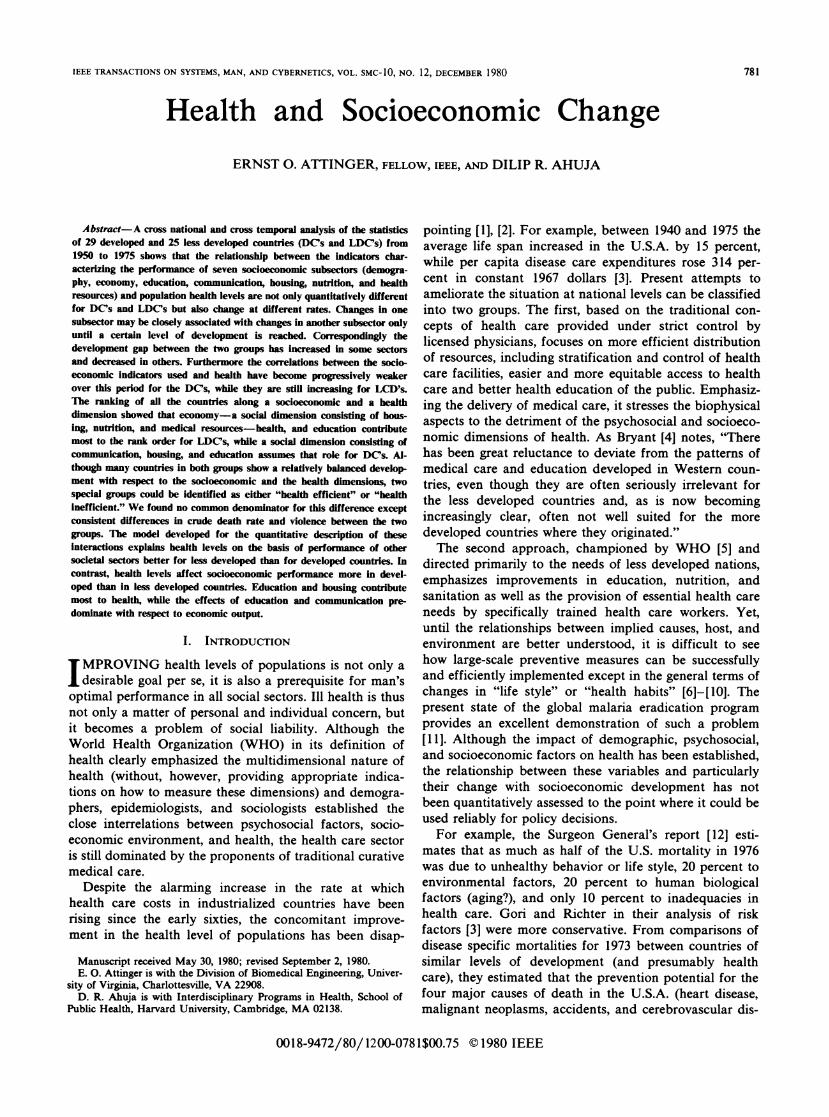
Since differences in health levels are to be explainedand since life expectancy is one of the most importantoutcome measures of a public health system [17], [24], weused the life expectancy statistics as the criterion fordividing the countries into two groups. From the curva-ture of the relation between LET' and PCDP, the cutoffpoint for 1950 was determined as 61 years and increasedin appropriate intervals to 70.4 years in 1975 (Fig. 1).Except for transition countries such as Barbados, Cuba,Panama, Argentina, Japan, and Taiwan, the membershipin the two groups was quite stable and, in general, similarto the more conventional separation between developedand less developed nations based on economic criteriaalone (Table V and Figs. 3 and 4).
'The list of abbreviations is given in Table I.
75
"I
50
45
SUB-DIUI5SONI
45 60 75 90
YE99
Fig. 1. Means and standard deviation for lower (L=group 1) andhigher (D=group 2) life expectancy groups and dividing criteria(asterisks).
Since the number of countries in each of the two groupswas smaller than the number of the socioeconomic varia-bles, it became necessary to reduce the number of thelatter for some of the analyses of the subgroups (cluster,principal component, and regression analyses). For thispurpose, all the variables were correlated against eachother for each subsector. The correlations for each varia-ble were summed and the two with the highest averagecorrelations within the group were retained for furtheranalysis. Thus the 14 variables with the highest averageintrasectorial correlation were selected as key indicatorsfor the analysis of the two groups. From the values of theindicators the countries were rank ordered for each sub-sector. A final rank order on a socioeconomic and ahealth scale was then established by averaging the rankorders of the different countries in the two main dimen-sions: a socioeconomic and a health level. From thisanalysis the relative efficiency of the national socioeco-nomic environment in terms of achieving higher healthlevels was estimated. Since no a priori reason existed fordoing otherwise, all the socioeconomic subsectors wereequally weighted. Because of its importance as a healthindicator, LET was replaced by LEM and LEF, thusgiving LET twice the weight of the other indicators on thehealth scale.
Next, two sets of correlation matrices were constructed.The first contained all the variables for each of the twogroups and for each of the six temporal points (Pearsonmoment correlation). The second set was based on therank orders for all subsectors (Spearman rank order corre-lation), at three points in time: 1955, 1965, and 1975. Thismatrix formed the basis for a principal component analy-sis [25]. From the different series of bivariate and multiplecorrelations and of regression analyses, the interdepen-dence between individual variables was assessed and theresults used to develop a model of these relationshipsusing pathanalysis [28]. Finally, a vector was constructed
J) L' _ _-I. -. Ia
784
ATTINGER: HEALTH AND SOCIOECONOMIC CHANGE
for each country from the rank orders of the differentsubsectors in 1955, 1965, and 1975, and this data setsubjected to cluster and principal component analysis.
III. RESULTS
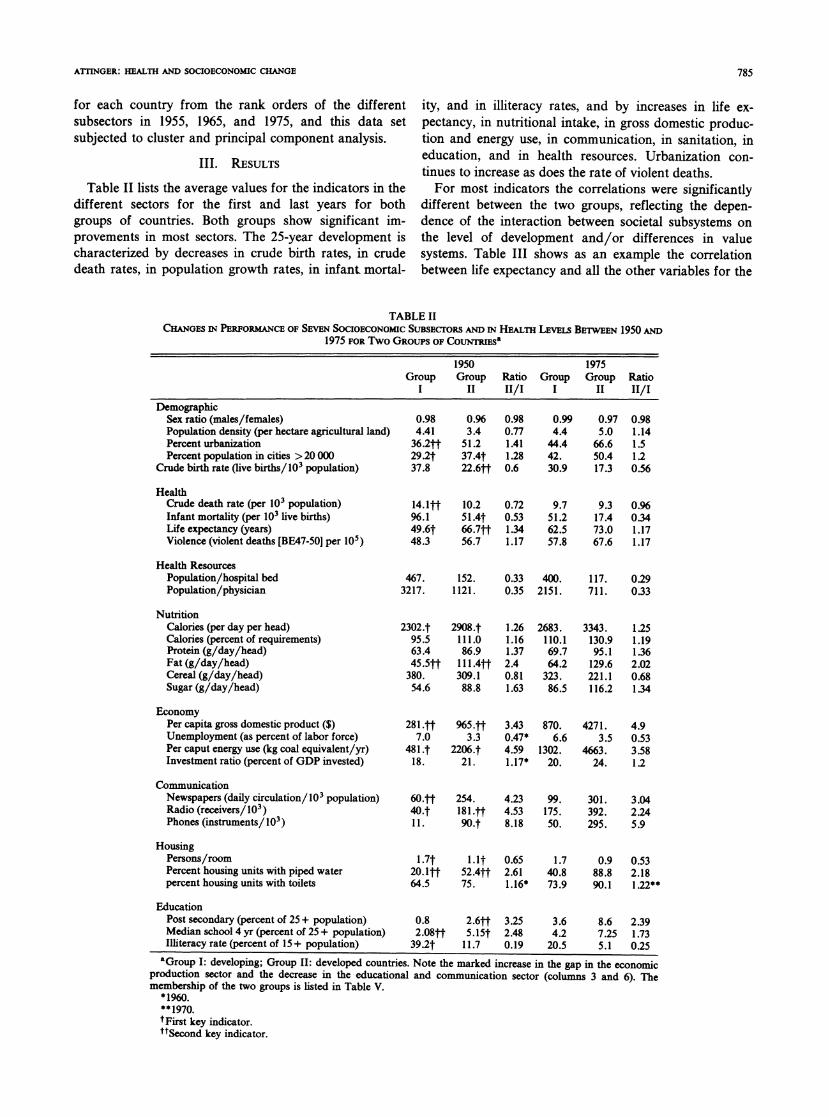
Table II lists the average values for the indicators in thedifferent sectors for the first and last years for bothgroups of countries. Both groups show significant im-provements in most sectors. The 25-year development ischaracterized by decreases in crude birth rates, in crudedeath rates, in population growth rates, in infant mortal-
ity, and in illiteracy rates, and by increases in life ex-
pectancy, in nutritional intake, in gross domestic produc-tion and energy use, in communication, in sanitation, ineducation, and in health resources. Urbanization con-tinues to increase as does the rate of violent deaths.For most indicators the correlations were significantly
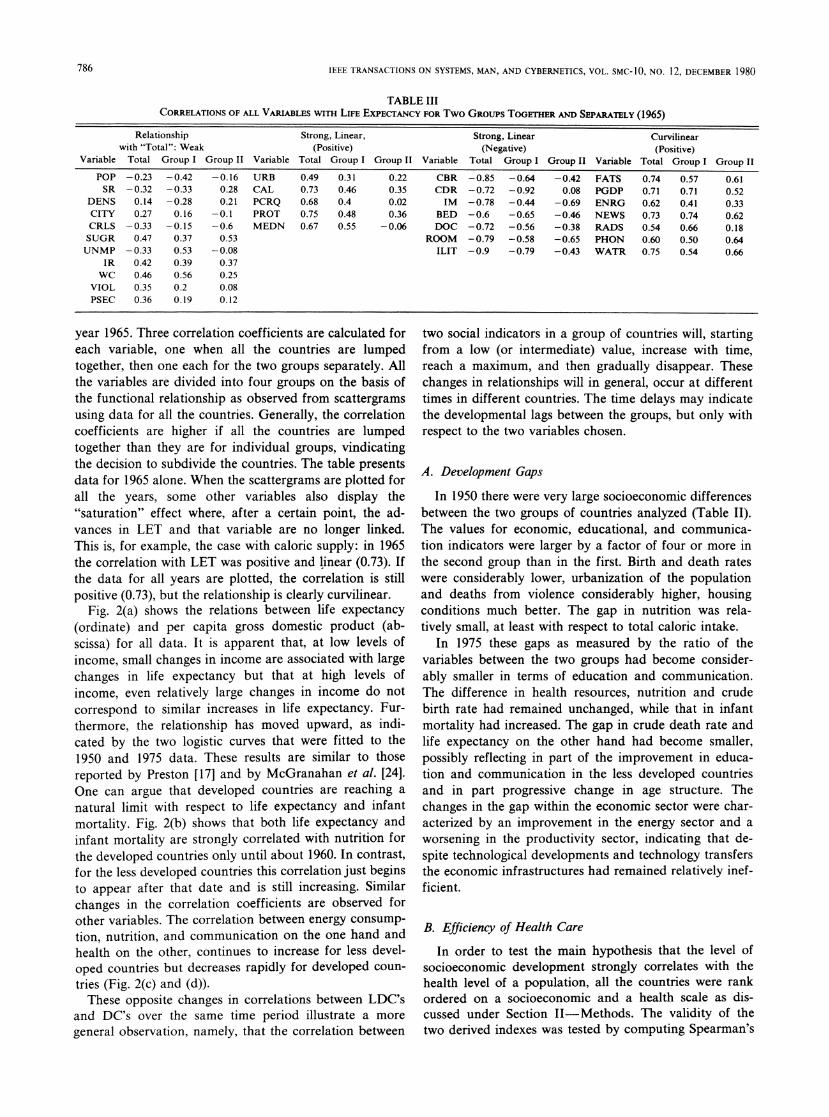
different between the two groups, reflecting the depen-dence of the interaction between societal subsystems onthe level of development and/or differences in valuesystems. Table III shows as an example the correlationbetween life expectancy and all the other variables for the
TABLE IICHANGES IN PERFORMANCE OF SEVEN SOCIOECONOMIC SuBsECTORS AND IN HEALTH LEVELS BETWEEN 1950 AND
1975 FOR Two GROUPS OF COUNTRIESa
1950 1975Group Group Ratio Group Group Ratio
I II II/I I II II/IDemographic
Sex ratio (males/females)Population density (per hectare agricultural land)Percent urbanizationPercent population in cities > 20 000
Crude birth rate (live births/ 103 population)
0.984.41
36.2ft29.2137.8
0.963.4
51.237.4t22.6tt
0.980.771.411.280.6
0.994.4
44.442.30.9
0.975.0
66.650.417.3
0.981.141.51.20.56
HealthCrude death rate (per 103 population)Infant mortality (per 103 live births)Life expectancy (years)Violence (violent deaths [BE47-50] per 105)
Health ResourcesPopulation/hospital bedPopulation/physician
NutritionCalories (per day per head)Calories (percent of requirements)Protein (g/day/head)Fat (g/day/head)Cereal (g/day/head)Sugar (g/day/head)
EconomyPer capita gross domestic product ($)
Unemployment (as percent of labor force)Per caput energy use (kg coal equivalent/yr)Investment ratio (percent of GDP invested)
CommunicationNewspapers (daily circulation/103 population)Radio (receivers/103)Phones (instruments/103)
HousingPersons/roomPercent housing units with piped waterpercent housing units with toilets
14.1tt96.149.6t48.3
10.251.4t66.7tt56.7
0.72 9.70.53 51.21.34 62.51.17 57.8
9.3 0.9617.4 0.3473.0 1.1767.6 1.17
467. 152. 0.33 400. 117. 0.293217. 1121. 0.35 2151. 711. 0.33
2302.t95.563.445.5tt
380.54.6
281.tt7.0
481t18.
60.tt40.t11.
1.7t20.1tt64.5
2908.t111.086.9
111.4ff309.188.8
965.tf3.3
2206.t21.
254.18.ftt90.1t
52.4ff75.
1.26 2683.1.16 110.11.37 69.72.4 64.20.81 323.1.63 86.5
3.43 870.0.47* 6.64.59 1302.1.17* 20.
4.23 99.4.53 175.8.18 50.
0.652.611.16*
3343.130.995.1129.6221.1116.2
4271.3.5
4663.24.
1.251.191.362.020.681.34
4.90.533.581.2
301. 3.04392. 2.24295. 5.9
1.7 0.9 0.5340.8 88.8 2.1873.9 90.1 1.22**
EducationPost secondary (percent of 25 + population)Median school 4 yr (percent of 25 + population)Illiteracy rate (percent of 15 + population)
0.82.08tt
39.2t
2.6tf5.15t11.7
3.252.480.19
3.6 8.6 2.394.2 7.25 1.73
20.5 5.1 0.25aGroup I: developing; Group II: developed countries. Note the marked increase in the gap in the economic
production sector and the decrease in the educational and communication sector (columns 3 and 6). Themembership of the two groups is listed in Table V.
*1960.** 1970.tFirst key indicator.ttSecond key indicator.
785
IEEE TRANSACTIONS ON SYSTEMS, MAN, AND CYBERNETICS, VOL. SMC-IO, NO. 12, DECEMBER 1980
TABLE IIICORRELATIONS OF ALL VARIABLES WITH LIFE EXPECTANCY FOR Two GROUPS TOGETR AND SEPARATELY (1965)
Relationship Strong, Linear, Strong, Linear Curvilinearwith "Total": Weak (Positive) (Negative) (Positive)
Variable Total Group I Group II Variable Total Group I Group II Variable Total Group I Group II Variable Total Group I Group II
POP -0.23 -0.42 -0.16 URB 0.49 0.31 0.22 CBR -0.85 -0.64 -0.42 FATS 0.74 0.57 0.61SR -0.32 -0.33 0.28 CAL 0.73 0.46 0.35 CDR -0.72 -0.92 0.08 PGDP 0.71 0.71 0.52
DENS 0.14 -0.28 0.21 PCRQ 0.68 0.4 0.02 IM -0.78 -0.44 -0.69 ENRG 0.62 0.41 0.33CITY 0.27 0.16 -0.1 PROT 0.75 0.48 0.36 BED -0.6 -0.65 -0.46 NEWS 0.73 0.74 0.62CRLS -0.33 -0.15 -0.6 MEDN 0.67 0.55 -0.06 DOC -0.72 -0.56 -0.38 RADS 0.54 0.66 0.18SUGR 0.47 0.37 0.53 ROOM -0.79 -0.58 -0.65 PHON 0.60 0.50 0.64UNMP -0.33 0.53 -0.08 ILIT -0.9 -0.79 -0.43 WATR 0.75 0.54 0.66
IR 0.42 0.39 0.37WC 0.46 0.56 0.25
VIOL 0.35 0.2 0.08PSEC 0.36 0.19 0.12
year 1965. Three correlation coefficients are calculated foreach variable, one when all the countries are lumpedtogether, then one each for the two groups separately. Allthe variables are divided into four groups on the basis ofthe functional relationship as observed from scattergramsusing data for all the countries. Generally, the correlationcoefficients are higher if all the countries are lumpedtogether than they are for individual groups, vindicatingthe decision to subdivide the countries. The table presentsdata for 1965 alone. When the scattergrams are plotted forall the years, some other variables also display the"saturation" effect where, after a certain point, the ad-vances in LET and that variable are no longer linked.This is, for example, the case with caloric supply: in 1965the correlation with LET was positive and linear (0.73). Ifthe data for all years are plotted, the correlation is stillpositive (0.73), but the relationship is clearly curvilinear.
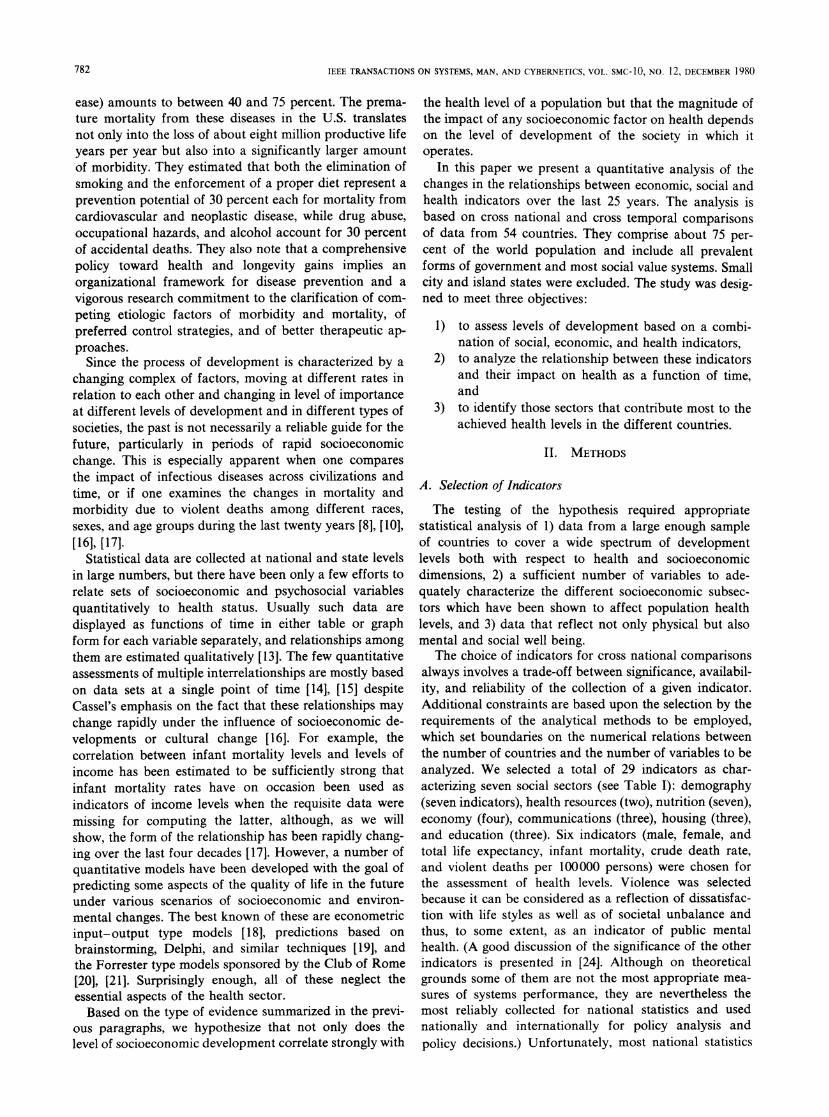
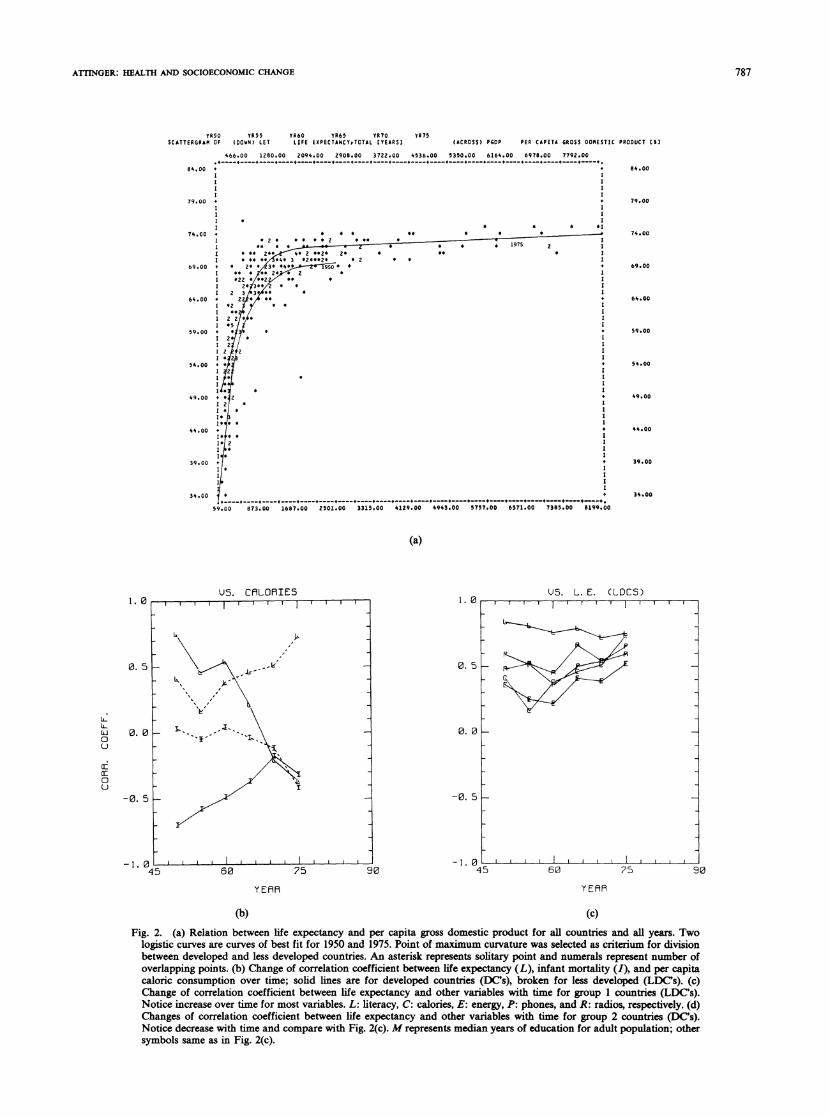
Fig. 2(a) shows the relations between life expectancy(ordinate) and per capita gross domestic product (ab-scissa) for all data. It is apparent that, at low levels ofincome, small changes in income are associated with largechanges in life expectancy but that at high levels ofincome, even relatively large changes in income do notcorrespond to similar increases in life expectancy. Fur-thermore, the relationship has moved upward, as indi-cated by the two logistic curves that were fitted to the1950 and 1975 data. These results are similar to thosereported by Preston [17] and by McGranahan et al. [24].One can argue that developed countries are reaching a
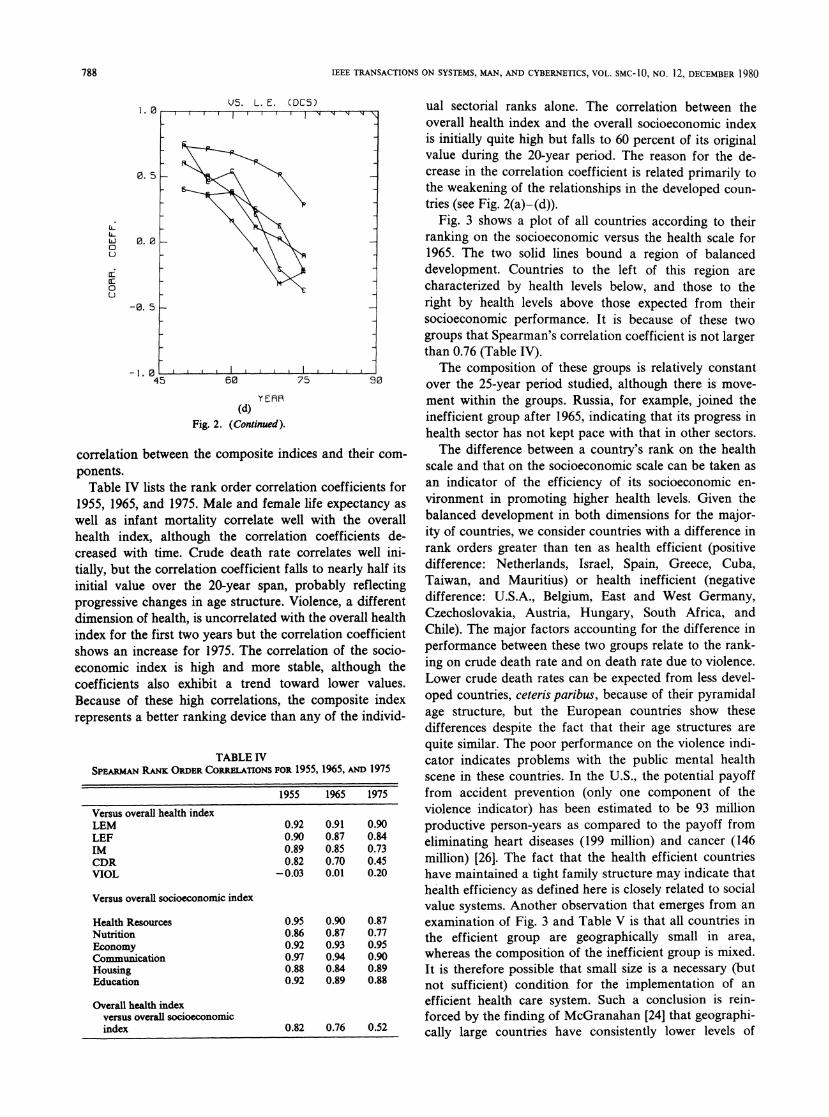
natural limit with respect to life expectancy and infantmortality. Fig. 2(b) shows that both life expectancy andinfant mortality are strongly correlated with nutrition forthe developed countries only until about 1960. In contrast,for the less developed countries this correlation just beginsto appear after that date and is still increasing. Similarchanges in the correlation coefficients are observed forother variables. The correlation between energy consump-tion, nutrition, and communication on the one hand andhealth on the other, continues to increase for less devel-oped countries but decreases rapidly for developed coun-
tries (Fig. 2(c) and (d)).These opposite changes in correlations between LDC's
and DC's over the same time period illustrate a moregeneral observation, namely, that the correlation between
two social indicators in a group of countries will, startingfrom a low (or intermediate) value, increase with time,reach a maximum, and then gradually disappear. Thesechanges in relationships will in general, occur at differenttimes in different countries. The time delays may indicatethe developmental lags between the groups, but only withrespect to the two variables chosen.
A. Development Gaps
In 1950 there were very large socioeconomic differencesbetween the two groups of countries analyzed (Table II).The values for economic, educational, and communica-tion indicators were larger by a factor of four or more inthe second group than in the first. Birth and death rateswere considerably lower, urbanization of the populationand deaths from violence considerably higher, housingconditions much better. The gap in nutrition was rela-tively small, at least with respect to total caloric intake.
In 1975 these gaps as measured by the ratio of thevariables between the two groups had become consider-ably smaller in terms of education and communication.The difference in health resources, nutrition and crudebirth rate had remained unchanged, while that in infantmortality had increased. The gap in crude death rate andlife expectancy on the other hand had become smaller,possibly reflecting in part of the improvement in educa-tion and communication in the less developed countriesand in part progressive change in age structure. Thechanges in the gap within the economic sector were char-acterized by an improvement in the energy sector and aworsening in the productivity sector, indicating that de-spite technological developments and technology transfersthe economic infrastructures had remained relatively inef-ficient.
B. Efficiency of Health Care
In order to test the main hypothesis that the level ofsocioeconomic development strongly correlates with thehealth level of a population, all the countries were rankordered on a socioeconomic and a health scale as dis-cussed under Section II-Methods. The validity of thetwo derived indexes was tested by computing Spearman's
786
ArINGER: HEALTH AND SOCIOECONOMIC CHANGE
0R50 Y055 0R60 YR65 YR70SCATTERGRAM OF (DOWN) LET LIFE EXPECTANCT*TOTAL (YEARS]
YR75(ACROSS) PGDP PER CAPITA GROSS DOMESTIC PRODUCT ES8
466.00 1280.00 2094.00 2908.00 3722.00 4536.00 5350.00 6164.00 6978.00 7792.00
84.00 + +I XI II Il l
79.00 +I I1 II * II * * *30
74.00 + * 4 * *9 * * *
I * * 4*2 I
1 :*2 0*020***** . * 17
I 46 2 **23 2* * 8* * II *3*3***4* 3 *2**0* * 2 * *
69.00 + 4 2* 3* 4*4 0* *+
I 2** 3* 0 8 4 I1 233
64.00 + Z22*4 4414*2 X * * I
I *5459.00 + *
0 2*1 * II2 I0 2 f2 III*2
54.00 + *
I * * II
04* 4 I49.00 + 42
I02 * I104 * III*0
0* * I
I* I
39.00 +I0 IIII II
34.00 *
59.00 873.00 1687.00 2501.00 33150.00 4129.00 4943.00 5757.00 607.100 7380.00 8199.00
84.00
79.00
74.00
69.00
64.00
59.00
54.00
49.00
44.00
39.00
34.00
(a)
US. CRLORIES1. 0
0. 5 _
0. 0 _
-0. 5 _
-1. 045
US. L. E. CLDCS)
60 75 90
Y EfR
(b) (c)
Fig. 2. (a) Relation between life expectancy and per capita gross domestic product for all countries and all years. Twologistic curves are curves of best fit for 1950 and 1975. Point of maximum curvature was selected as criterium for divisionbetween developed and less developed countries. An asterisk represents solitary point and numerals represent number ofoverlapping points. (b) Change of correlation coefficient between life expectancy (L), infant mortality (I), and per capitacaloric consumption over time; solid lines are for developed countries (DC's), broken for less developed (LDC's). (c)Change of correlation coefficient between life expectancy and other variables with time for group I countries (LDCs).Notice increase over time for most variables. L: literacy, C: calories, E: energy, P: phones, and R: radios, respectively. (d)Changes of correlation coefficient between life expectancy and other variables with time for group 2 countries (DC's).Notice decrease with time and compare with Fig. 2(c). M represents median years of education for adult population; othersymbols same as in Fig. 2(c).
787
1. 0
0.
{L-0
0~
CEU
0.
-0.
I.,~~ ~~ ~~~~~~~~.
I
t
IEEE TRANSACTIONS ON SYSTEMS, MAN, AND CYBERNETICS, VOL. SMC- 1O, NO. 12, DECEMBER 1980
I. 0
0. 5
LL
LL
a:
u
0. 0
-0. 5
-1. 04'
Us. L. E. (DES)
5 60 90
YEAR(d)
Fig. 2. (Continued).
correlation between the composite indices and their com-ponents.Table IV lists the rank order correlation coefficients for
1955, 1965, and 1975. Male and female life expectancy aswell as infant mortality correlate well with the overallhealth index, although the correlation coefficients de-creased with time. Crude death rate correlates well ini-tially, but the correlation coefficient falls to nearly half itsinitial value over the 20-year span, probably reflectingprogressive changes in age structure. Violence, a differentdimension of health, is uncorrelated with the overall healthindex for the first two years but the correlation coefficientshows an increase for 1975. The correlation of the socio-economic index is high and more stable, although thecoefficients also exhibit a trend toward lower values.Because of these high correlations, the composite indexrepresents a better ranking device than any of the individ-
TABLE IVSPEARMAN RANK ORDER CORRELATIONS FOR 1955, 1965, AND 1975
1955 1965 1975
Versus overall health indexLEM 0.92 0.91 0.90LEF 0.90 0.87 0.84IM 0.89 0.85 0.73CDR 0.82 0.70 0.45VIOL -0.03 0.01 0.20
Versus overall socioeconomic index
Health Resources 0.95 0.90 0.87Nutrition 0.86 0.87 0.77Economy 0.92 0.93 0.95Communication 0.97 0.94 0.90Housing 0.88 0.84 0.89Education 0.92 0.89 0.88
Overall health indexversus overall socioeconomicindex 0.82 0.76 0.52
ual sectorial ranks alone. The correlation between theoverall health index and the overall socioeconomic indexis initially quite high but falls to 60 percent of its originalvalue during the 20-year period. The reason for the de-crease in the correlation coefficient is related primarily tothe weakening of the relationships in the developed coun-tries (see Fig. 2(a)-(d)).
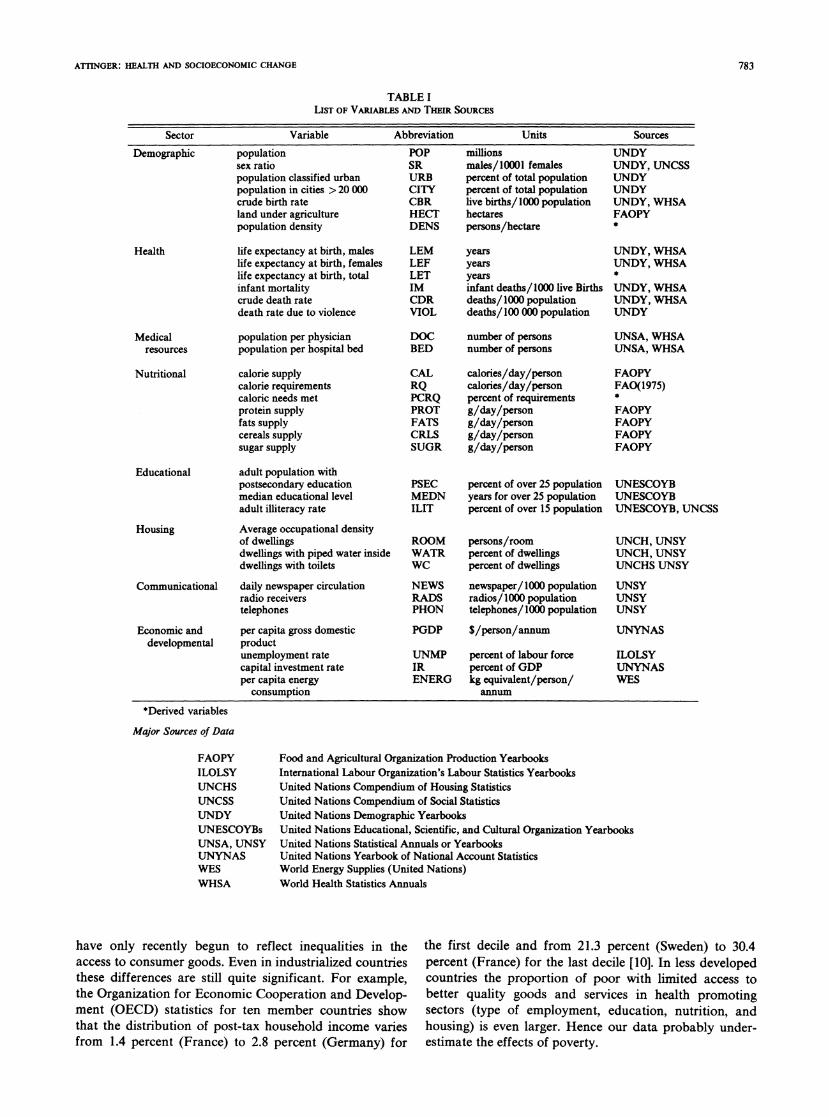
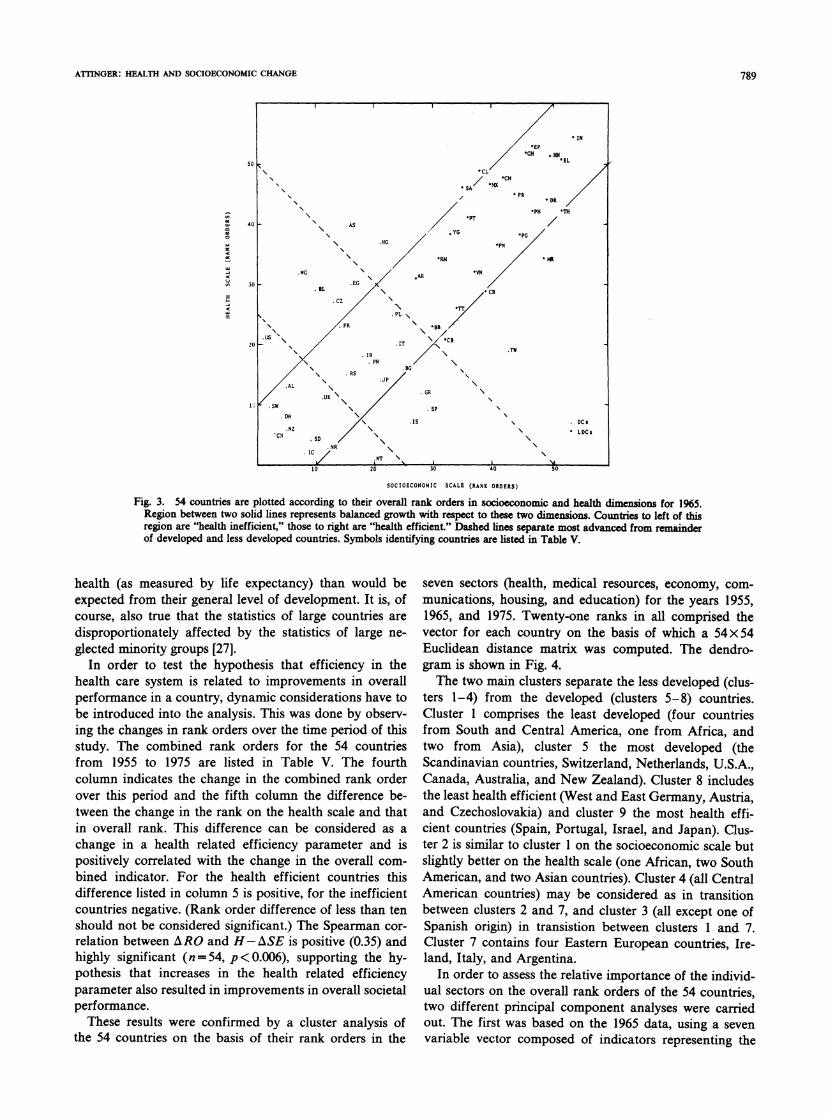
Fig. 3 shows a plot of all countries according to theirranking on the socioeconomic versus the health scale for1965. The two solid lines bound a region of balanceddevelopment. Countries to the left of this region arecharacterized by health levels below, and those to theright by health levels above those expected from theirsocioeconomic performance. It is because of these twogroups that Spearman's correlation coefficient is not largerthan 0.76 (Table IV).
The composition of these groups is relatively constantover the 25-year period studied, although there is move-ment within the groups. Russia, for example, joined theinefficient group after 1965, indicating that its progress inhealth sector has not kept pace with that in other sectors.The difference between a country's rank on the health
scale and that on the socioeconomic scale can be taken asan indicator of the efficiency of its socioeconomic en-vironment in promoting higher health levels. Given thebalanced development in both dimensions for the major-ity of countries, we consider countries with a difference inrank orders greater than ten as health efficient (positivedifference: Netherlands, Israel, Spain, Greece, Cuba,Taiwan, and Mauritius) or health inefficient (negativedifference: U.S.A., Belgium, East and West Germany,Czechoslovakia, Austria, Hungary, South Africa, andChile). The major factors accounting for the difference inperformance between these two groups relate to the rank-ing on crude death rate and on death rate due to violence.Lower crude death rates can be expected from less devel-oped countries, ceteris paribus, because of their pyramidalage structure, but the European countries show thesedifferences despite the fact that their age structures arequite similar. The poor performance on the violence indi-cator indicates problems with the public mental healthscene in these countries. In the U.S., the potential payofffrom accident prevention (only one component of theviolence indicator) has been estimated to be 93 millionproductive person-years as compared to the payoff fromeliminating heart diseases (199 million) and cancer (146million) [26]. The fact that the health efficient countrieshave maintained a tight family structure may indicate thathealth efficiency as defined here is closely related to socialvalue systems. Another observation that emerges from anexamination of Fig. 3 and Table V is that all countries inthe efficient group are geographically small in area,whereas the composition of the inefficient group is mixed.It is therefore possible that small size is a necessary (butnot sufficient) condition for the implementation of an
efficient health care system. Such a conclusion is rein-forced by the finding of McGranahan [24] that geographi-cally large countries have consistently lower levels of
,--T --1- N N \
IX
I 1 1.--
788
ATTINGER: HEALTH AND SOCIOECONOMIC CHANGE
PT/40 AS
.05 ~~~~~~YGo '~~~~~~~~~~~~~~~~~~~~~~~~PG
'RN MRi
.RCN30 .EG
IL 'CR
.PL
20 *~IT "' 'C
I10 TNFN
AL
.UK .GR
DN~~~~~~~~~~~~SC.Nz S LDCs
R
10 20 30 40 so
SOCIOECONOMIC SCALR (RANK ORDRRS)
Fig. 3. 54 countries are plotted according to their overall rank orders in socioeconomic and health dimensions for 1965.Region between two solid lines represents balanced growth with respect to these two dimensions. Countries to left of thisregion are "health inefficient," those to right are "health efficient." Dashed lines separate most advanced from remainderof developed and less developed countries. Symbols identifying countries are listed in Table V.
health (as measured by life expectancy) than would beexpected from their general level of development. It is, ofcourse, also true that the statistics of large countries aredisproportionately affected by the statistics of large ne-glected minority groups [27].
In order to test the hypothesis that efficiency in thehealth care system is related to improvements in overallperformance in a country, dynamic considerations have tobe introduced into the analysis. This was done by observ-ing the changes in rank orders over the time period of thisstudy. The combined rank orders for the 54 countriesfrom 1955 to 1975 are listed in Table V. The fourthcolumn indicates the change in the combined rank orderover this period and the fifth colunm the difference be-tween the change in the rank on the health scale and thatin overall rank. This difference can be considered as achange in a health related efficiency parameter and ispositively correlated with the change in the overall com-bined indicator. For the health efficient countries thisdifference listed in column 5 is positive, for the inefficientcountries negative. (Rank order difference of less than tenshould not be considered significant.) The Spearman cor-relation between ARO and H-ASE is positive (0.35) andhighly significant (n = 54, p < 0.006), supporting the hy-pothesis that increases in the health related efficiencyparameter also resulted in improvements in overall societalperformance.These results were confirmed by a cluster analysis of
the 54 countries on the basis of their rank orders in the
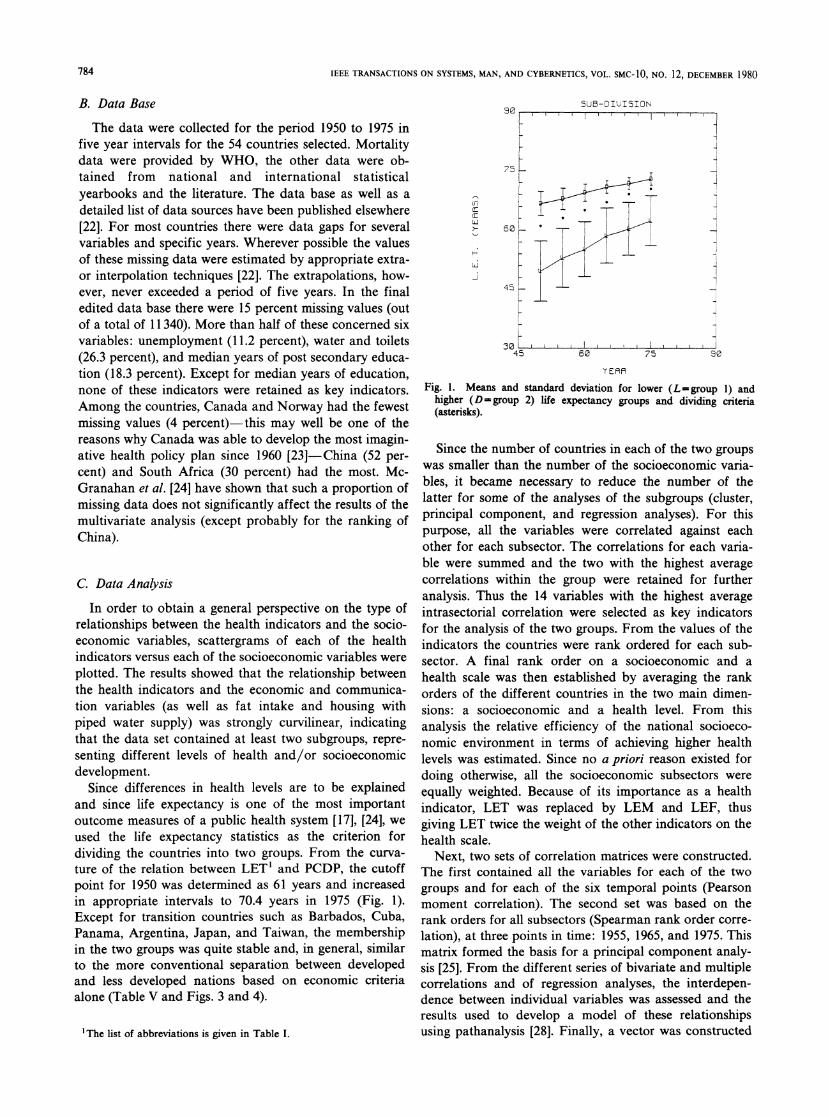
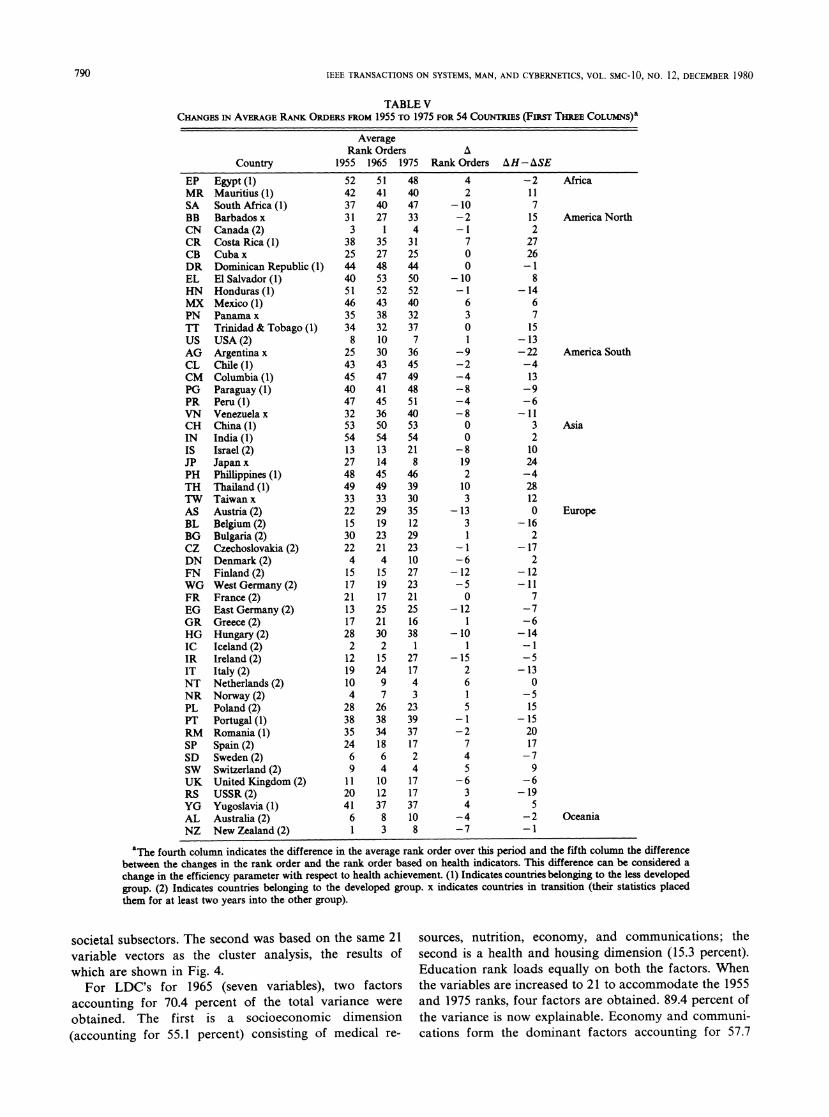
seven sectors (health, medical resources, economy, com-munications, housing, and education) for the years 1955,1965, and 1975. Twenty-one ranks in all comprised thevector for each country on the basis of which a 54x 54Euclidean distance matrix was computed. The dendro-gram is shown in Fig. 4.The two main clusters separate the less developed (clus-
ters 1-4) from the developed (clusters 5-8) countries.Cluster 1 comprises the least developed (four countriesfrom South and Central America, one from Africa, andtwo from Asia), cluster 5 the most developed (theScandinavian countries, Switzerland, Netherlands, U.S.A.,Canada, Australia, and New Zealand). Cluster 8 includesthe least health efficient (West and East Germany, Austria,and Czechoslovakia) and cluster 9 the most health effi-cient countries (Spain, Portugal, Israel, and Japan). Clus-ter 2 is similar to cluster 1 on the socioeconomic scale butslightly better on the health scale (one African, two SouthAmerican, and two Asian countries). Cluster 4 (all CentralAmerican countries) may be considered as in transitionbetween clusters 2 and 7, and cluster 3 (all except one ofSpanish origin) in transistion between clusters 1 and 7.Cluster 7 contains four Eastern European countries, Ire-land, Italy, and Argentina.
In order to assess the relative importance of the individ-ual sectors on the overall rank orders of the 54 countries,two different principal component analyses were carriedout. The first was based on the 1965 data, using a sevenvariable vector composed of indicators representing the
789
IEEE TRANSACTIONS ON SYSTEMS, MAN, AND CYBERNETICS, VOL. SMC-10, NO. 12, DECEMBER 1980
TABLE VCHANGES IN AVERAGE RANK ORDiERS FROM 1955 TO 1975 FOR 54 COUNTRIES (FIRST THREE COLUMNS)a
Country
AverageRank Orders A
1955 1965 1975 Rank Orders AH-ASE
EP Egypt (1)MR Mauritius (1)SA South Africa (1)BB Barbados x
CN Canada (2)CR Costa Rica (1)CB Cuba x
DR Dominican Republic (1)EL El Salvador (1)HN Honduras (1)MX Mexico (I)PN Panama x
TT Trinidad & Tobago (1)US USA (2)AG Argentina x
CL Chile (1)CM Columbia (1)PG Paraguay (I)PR Peru (I)VN Venezuela x
CH China (I)IN India (1)IS Israel (2)JP Japan x
PH Phillippines (1)TH Thailand (1)TW Taiwan x
AS Austria (2)BL Belgium (2)BG Bulgaria (2)CZ Czechoslovakia (2)DN Denmark (2)FN Finland (2)WG West Germany (2)FR France (2)EG East Germany (2)GR Greece (2)HG Hungary (2)IC Iceland (2)IR Ireland (2)IT Italy (2)NT Netherlands (2)NR Norway (2)PL Poland (2)PT Portugal (1)RM Romania (1)SP Spain (2)SD Sweden (2)SW Switzerland (2)UK United Kingdom (2)RS USSR (2)YG Yugoslavia (1)AL Australia (2)NZ New Zealand (2)
524237313
38254440514635348
2543454047325354132748493322153022415172113172821219104
2838352469
1120416I
51 4841 4040 4727 33
1 435 3127 2548 4453 5052 5243 4038 3232 3710 730 3643 4547 4941 4845 5136 4050 5354 5413 2114 845 4649 3933 3029 3519 1223 2921 234 1015 2719 2317 2125 2521 1630 382 115 2724 179 47 3
26 2338 3934 3718 176 24 410 1712 1737 378 103 8
42
-10-2
-I70
0
-10-I630
1-9-2-4-8-4-80
0
-8
192103
-1331
-1-6-12-50
-12
-10I
-1526
-1-2745
-634
-4-7
-2117152
2726-1
8-14
6715
-13-22-413-9
-6-11
321024-428120
-162
-172
-12-11
7-7-6-14-1
-5
-130
-515
-152017-79
-6-19
S
-2-1
Africa
America North
America South
Asia
Europe
Oceania
aThe fourth column indicates the difference in the average rank order over this period and the fifth coliumn the differencebetween the changes in the rank order and the rank order based on health indicators. This difference can be considered achange in the efficiency parameter with respect to health achievement. (1) Indicates countries belonging to the less developedgroup. (2) Indicates countries belonging to the developed group. x indicates countries in transition (their statistics placedthem for at least two years into the other group).
societal subsectors. The second was based on the same 21 sources, nutrition, economy, and communications; thevariable vectors as the cluster analysis, the results of second is a health and housing dimension (15.3 percent).which are shown in Fig. 4. Education rank loads equally on both the factors. When
For LDC's for 1965 (seven variables), two factors the variables are increased to 21 to accommodate the 1955accounting for 70.4 percent of the total variance were and 1975 ranks, four factors are obtained. 89.4 percent ofobtained. The first is a socioeconomic dimension the variance is now explainable. Economy and communi-(accounting for 55.1 percent) consisting of medical re- cations form the dominant factors accounting for 57.7
790
ArINGER: HEALTH AND SOCIOECONOMIC CHANGE
0,0 0,2 0,4 0,6 08 1,0
CM
PREPEL
HNIN
CH
MR
DR2PH
2 THPG
TWSAVN
MX
3~ CL
PT
DN=
DNT
RSBL
CR
CNDNUSW
BL
IC
AS
us
N1Z
AGRJSG
Fig. 4. Cluster analysis of development of 54 countries based on their
performance change in six societal subsectors and in health levels.
Two main clusters separate developed from less developed countries.
symbols as in Fig. 5. Scale at top line represents increasing levels of
dissimilanity.
percent; the second is now a "social" factor (13.1 percent)consisting of medical resources, nutrition, and housing.Health and education form separate clusters contributing11 and 7.9 percent, respectively, to the explained variance.For the DC's, two factors are obtained when only seven
variables are used. Economy, communication, education,and housing constitute an affluence dimension (40.3 per-cent). Health and medical resources form the secondfactor (16.6 percent) while nutrition loads weakly on boththe factors. Increasing the variables to 21 gives finersubdivisions; this time five factors account for 83.2 per-cent of the variation in sectorial ranks. Communication,housing, and education still form the major dimension(43.2 percent): economy is now a separate factor (9.9percent). Health (15.6 percent), medical resources (8.6percent), and nutrition (5.6 percent) form the other fac-tors. For the development during the last decade (1975values) the loadings for economy and education are re-
versed; i.e., economy joins the other variables loading on
factor 1 while education becomes the only variable load-ing on factor 3. This may reflect the large increase inenrollment in post secondary education following the
Sputnik episode. The amount of variances attributable tothe factor is an indication of the importance of the factorsin explaining the observed differences among the coun-tries.
C. Multiple Regression Model
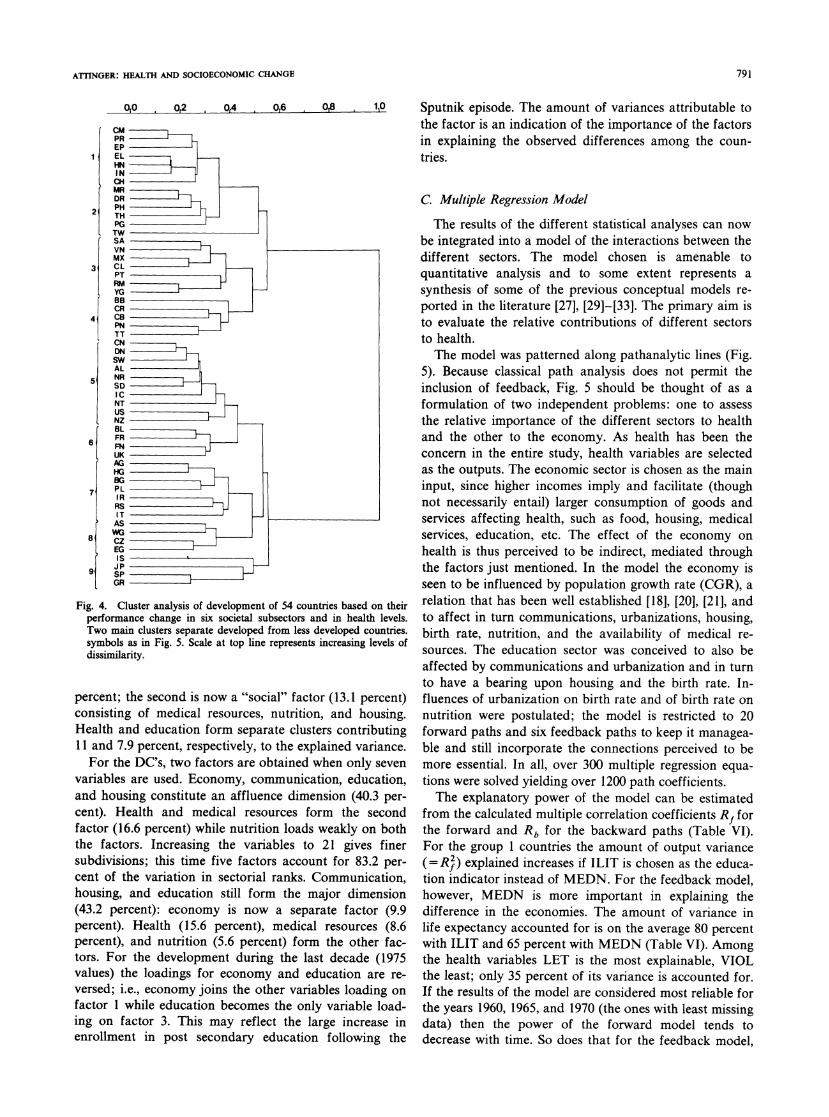
The results of the different statistical analyses can nowbe integrated into a model of the interactions between thedifferent sectors. The model chosen is amenable toquantitative analysis and to some extent represents asynthesis of some of the previous conceptual models re-ported in the literature [27], [29]-[33]. The primary aim isto evaluate the relative contributions of different sectorsto health.The model was patterned along pathanalytic lines (Fig.
5). Because classical path analysis does not permit theinclusion of feedback, Fig. 5 should be thought of as aformulation of two independent problems: one to assessthe relative importance of the different sectors to healthand the other to the economy. As health has been theconcern in the entire study, health variables are selectedas the outputs. The economic sector is chosen as the maininput, since higher incomes imply and facilitate (thoughnot necessarily entail) larger consumption of goods andservices affecting health, such as food, housing, medicalservices, education, etc. The effect of the economy onhealth is thus perceived to be indirect, mediated throughthe factors just mentioned. In the model the economy isseen to be influenced by population growth rate (CGR), arelation that has been well established [18], [20], [21], andto affect in turn communications, urbanizations, housing,birth rate, nutrition, and the availability of medical re-sources. The education sector was conceived to also beaffected by communications and urbanization and in turnto have a bearing upon housing and the birth rate. In-fluences of urbanization on birth rate and of birth rate onnutrition were postulated; the model is restricted to 20forward paths and six feedback paths to keep it managea-ble and still incorporate the connections perceived to bemore essential. In all, over 300 multiple regression equa-tions were solved yielding over 1200 path coefficients.The explanatory power of the model can be estimated
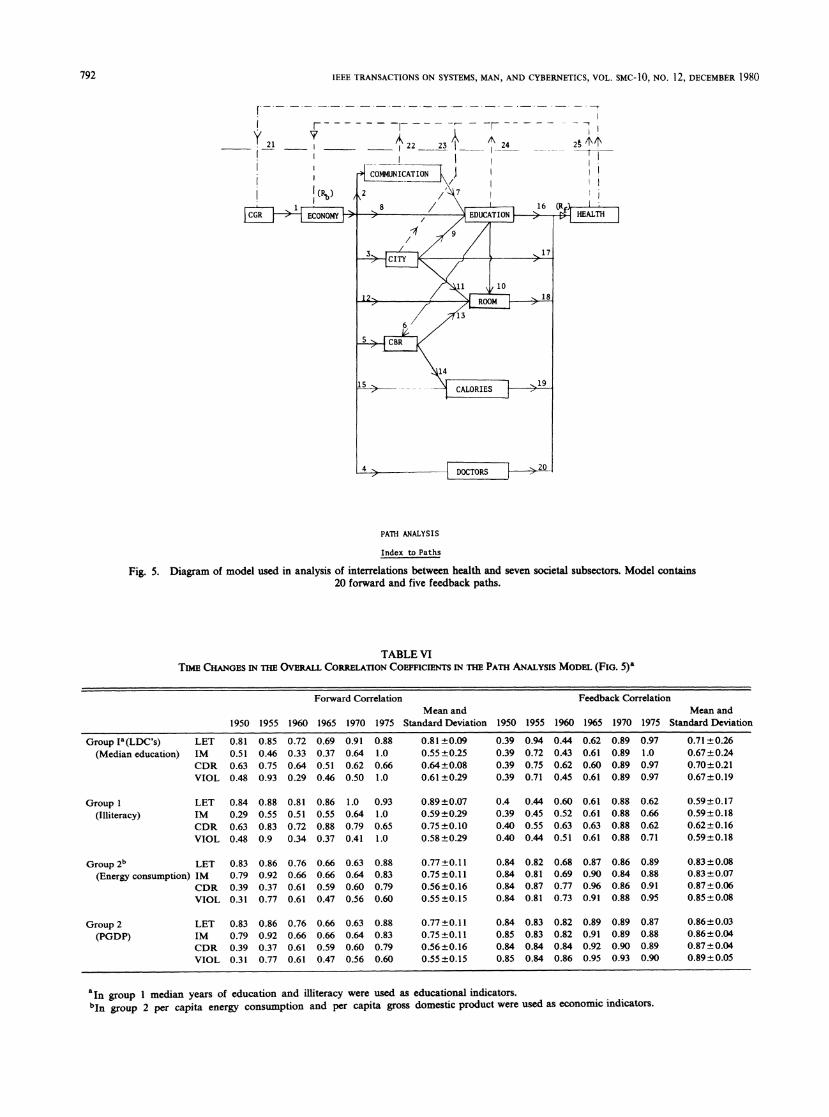
from the calculated multiple correlation coefficients Rf forthe forward and Rb for the backward paths (Table VI).For the group 1 countries the amount of output variance(=R ) explained increases if ILIT is chosen as the educa-tion indicator instead of MEDN. For the feedback model,however, MEDN is more important in explaining thedifference in the economies. The amount of variance inlife expectancy accounted for is on the average 80 percentwith ILIT and 65 percent with MEDN (Table VI). Amongthe health variables LET is the most explainable, VIOLthe least; only 35 percent of its variance is accounted for.If the results of the model are considered most reliable forthe years 1960, 1965, and 1970 (the ones with least missingdata) then the power of the forward model tends todecrease with time. So does that for the feedback model,
791
IEEE TRANSACTIONS ON SYSTEMS, MAN, AND CYBERNETICS, VOL. SMC-1O, NO. 12, DECEMBER 1980
y 21
F--- - - -v-----
_ 22 23
4 COMMUNICATION \
{ (R,) / 2 /'
-r _- -
A 24
- --,
II
II7'I
PATH ANALYSIS
Index to Paths
Fig. 5. Diagram of model used in analysis of interrelations between health and seven societal subsectors. Model contains20 forward and five feedback paths.
TABLE VITIME CHANGES IN THE OVERALL CORMLATION COEFFICIENTS IN THE PATH ANALYSIS MODEL (FIG. 5)"
Forward Correlation Feedback CorrelationMean and Mean and
1950 1955 1960 1965 1970 1975 Standard Deviation 1950 1955 1960 1965 1970 1975 Standard Deviation
Group Ia(LDC's) LET 0.81 0.85 0.72 0.69 0.91 0.88 0.81 ±0.09 0.39 0.94 0.44 0.62 0.89 0.97 0.71±0.26(Median education) IM 0.51 0.46 0.33 0.37 0.64 1.0 0.55+±0.25 0.39 0.72 0.43 0.61 0.89 1.0 0.67±0.24
CDR 0.63 0.75 0.64 0.51 0.62 0.66 0.64±0.08 0.39 0.75 0.62 0.60 0.89 0.97 0.70±0.21VIOL 0.48 0.93 0.29 0.46 0.50 1.0 0.61±0.29 0.39 0.71 0.45 0.61 0.89 0.97 0.67+0.19
Group I LET 0.84 0.88 0.81 0.86 1.0 0.93 0.89±0.07 0.4 0.44 0.60 0.61 0.88 0.62 0.59+0.17(Illiteracy) IM 0.29 0.55 0.51 0.55 0.64 1.0 0.59+0.29 0.39 0.45 0.52 0.61 0.88 0.66 0.59±0.18
CDR 0.63 0.83 0.72 0.88 0.79 0.65 0.75 ±0.10 0.40 0.55 0.63 0.63 0.88 0.62 0.62±+ 0.16VIOL 0.48 0.9 0.34 0.37 0.41 1.0 0.58±0.29 0.40 0.44 0.51 0.61 0.88 0.71 0.59+0.18
Group 2b LET 0.83 0.86 0.76 0.66 0.63 0.88 0.77 ±0.1 1 0.84 0.82 0.68 0.87 0.86 0.89 0.83 ±0.08(Energy consumption) IM 0.79 0.92 0.66 0.66 0.64 0.83 0.75+±0.11 0.84 0.81 0.69 0.90 0.84 0.88 0.83+±0.07
CDR 0.39 0.37 0.61 0.59 0.60 0.79 0.56±0.16 0.84 0.87 0.77 0.96 0.86 0.91 0.87+0.06VIOL 0.31 0.77 0.61 0.47 0.56 0.60 0.55+0.15 0.84 0.81 0.73 0.91 0.88 0.95 0.85+0.08
Group 2 LET 0.83 0.86 0.76 0.66 0.63 0.88 0.77-±0.11 0.84 0.83 0.82 0.89 0.89 0.87 0.86+0.03(PGDP) IM 0.79 0.92 0.66 0.66 0.64 0.83 0.75+0.11 0.85 0.83 0.82 0.91 0.89 0.88 0.86+0.04
CDR 0.39 0.37 0.61 0.59 0.60 0.79 0.56+±0.16 0.84 0.84 0.84 0.92 0.90 0.89 0.87+0.04VIOL 0.31 0.77 0.61 0.47 0.56 0.60 0.55±0.15 0.85 0.84 0.86 0.95 0.93 0.90 0.89+0.05
'In group 1 median years of education and illiteracy were used as educational indicators.bIn group 2 per capita energy consumption and per capita gross domestic product were used as economic indicators.
792
ATINGER: HEALTH AND SOCIOECONOMIC CHANGE
even though less than half the variance, on an average, isexplained.
For the group 2 countries (DC's) the amount of vari-ance accounted for by other subsystems is of the order of60 percent for LET and IM, and 30 percent for CDR andVIOL, both generally decreasing with time. The feedbacksto the economy explain about three-quarters of the vari-ance, the explanation getting better with time. Thus themodel explains the nonmedical determinant of life ex-pectancy better for the LDC's, while the economies of theDC's seem to be more explainable for the variables cho-sen.The relative contribution of the sectors is assessed from
the fraction of the overall variance explained by its sec-torial indicator. In group 1 countries education has con-sistently the largest impact with respect to LET (47 per-cent of the variance but decreasing with time), followedby housing (17 percent) and medical resources (5 percent).For IM housing, urbanization and medical resourcesaccount each for about 10 percent of the variance, theimportance of all three increasing with time. For CDReducation plays the most important role (18 percent),increasing with time. Both nutrition and medical resourcesaccount for about 9 percent of the variance each, but theirrole is decreasing. Violent deaths are most affected byhousing (14 percent), while education and urbanizationaccount for 9 and 7 percent, respectively. In group 2countries housing accounts for 36 percent of the variancewith respect to LET, followed by education (18 percent)and nutrition (14 percent). The impact of the latter twodecreases with time. For IM housing constitutes also themost important sector (34 percent), while nutrition andurbanization account for 11 percent and 6 percent of thevariance, respectively. CDR is most affected by urbaniza-tion (12 percent), education (11 percent), and housing (18percent), while nutrition (9 percent), education (7 percent),and housing (3 percent) play the dominant role for vio-lence.The influence of health and mortality upon economic
processes appears to be minor as compared to the reverserelations. This is also in accordance with Preston's [17]contention and Malenbaum's [34] results. The feedbackmultiple correlations tend to be the same, no matter whichhealth variable is chosen, because the effects of the educa-tion and communication sector predominate in bothgroups of countries. The contributions of health variablesto the variations of economic indicators are only sporadi-cally high in group I countries; in group 2 countries, onlyVIOL and CDR are significantly associated. The contri-bution of the urbanization index is slight except for theMEDN/ENRG combination of the model for group 1countries. To summarize, education and housing seem tohave the largest impacts upon national health levels, whileeducation and communication seem to be most closelyrelated to the economy.
IV. DiscusSION
The study presented here deals with overall healthlevels of populations at the national scale and not with
morbidity, disability, and mortality associated with specificdiseases. It can only be considered as a first step toward aquantitative analysis of the many factors that affect healthlevels. Despite the large number of data points, the inter-pretation of the results requires considerable caution be-cause of the questionable reliability of some of the data,the inhomogeneity of the populations from which nationalstatistics are derived and because cause-effect relation-ships can only be inferred but not firmly established fromour data.
Yet despite these shortcomings, the fact that the resultsobtained by different analytic methods are consistent tendto support our conclusions. For example, the separation ofthe 54 countries under study into DC's and LDC's on thebasis of life expectancy statistic (undertaken because ofthe curvilinear relation between life expectancy and aneconomic indicator) was later validated by both clusterand principal component analysis. The shape of this rela-tionship also indicates that developed countries are ap-proaching a natural limit with respect to life expectancy inthe neighborhood of 78 years. The fact that life ex-pectancy varied in DC's between 70.4 and 76.3 years in1975 can be explained by the predominance of differentrisk factors in different countries [3]. If this is true, theefforts of the health care delivery systems in these coun-tries should be directed less toward life-prolonging effortsand more toward the elimination of risk factors and theimprovement of the quality of life.Our results also provide insight into changes in interac-
tions between societal subsystems that have not beenavailable before [27] and reemphasize the need for consid-ering health care systems within the context of the entiresocial structure. As Myrdal [36] puts it, "A generalizedmodel, in aggregate financial terms, visualizing a sum ofinputs of preventive and curative measures giving rise toan output of health conditions cannot be of any help inplanning. In fact, such a model presupposes the solutionof the planning problem, for it is premised on an optimumcombination of all policy measures, which cannot beachieved without taking account of circular causationwithin the health field and in the whole social system."
There have, of course, been other attempts to assesssocietal performance empirically on the basis of com-posite indicators. McGranahan et al. [24] evaluated socio-economic development using a composite index derivedfrom 18 core indicators. Although they used a differentapproach, five of the seven key indicators used in ourstudy are also on their list of health care indicators. TheOverseas Development Council [37] developed a physicalquality of life index, consisting of three components: lifeexpectancy, infant mortality, and literacy rates. It is ap-parent from our results that more components are neededfor such an indicator, particularly since literacy rate is apoor indicator in countries where its value approaches 100percent [33]. Neither author explained the interaction be-tween societal subsectors, since the primary purpose ofthose studies was to develop indicators that permitted theassessment of socioeconomic development and of thequality of life.
793
IEEE TRANSACTIONS ON SYSTEMS, MAN, AND CYBERNETICS, VOL. SMC-10, NO. 12, DECEMBER 1980
The curvilinear relationships between many variables,on the basis of which we separated the countries into twogroups, clearly indicates that changes in one subsectormay be closely associated with changes in another sectoronly until a certain level of development is reached. Inparticular, improvements in the health sector throughsupport from other sectors depend on the level of develop-ment in a society. Therefore, appropriate technologytransfers should be promoted, apart from the health sec-
tor, in those sectors that have a maximum chance ofproviding support to the health sector. The increase ingaps in economic productivity in the last 25 years indi-cates that the transfers in this sector have been ineffectivein many countries. Also, since there are important aspectsto the efforts to raise the educational levels of a popula-tion and to provide better housing, sanitation, and nutri-tion, these should be encouraged and supported.For most countries the development in the socioeco-
nomic dimension parallels that in the health dimension(Fig. 3 and Table V). The health variables account, how-ever, for a larger fraction of the variance in our data forthe developed as compared to the less developed coun-
tries, where the effects of the economic sector still pre-
dominate. Five countries have improved their rank in thehealth dimension by more than 20 compared to the changein overall rank. In only two countries the opposite oc-
curred (Table V). From the results obtained from our
model and from the principal component analyses carriedout on the relative importance of the model components(Fig. 5) and of the factors contributing to the overall rankorder (Table V) at different stages of development, we can
infer a general development path. The initial improvementin the economic and communication sector is followed byan increase in the levels of nutrition, housing, sanitation,and medical resources on the one hand, and in educationon the other hand. As a result, an increase in the healthlevel occurs, further stimulated by education and housingand leading to a general increase in education. Subse-quent developments in the level of housing (crowding)
[35], communications, nutrition (excess caloric intake),and education (over education with respect to job availa-bility) then become associated with changes in socialnorms and social disintegration (increase in the contribu-tion of violence to the health dimension).
It is also clear that factors not considered in our analy-sis account for many of the observed changes. For exam-
ple, the rapid attainment of health levels exceeding by farthe level expected from the performance of other societalsubsystems, as well as the inverse, occurred in countries ofwidely different cultural, socioeconomic, and politicalstructure and cannot be assessed on the basis of a singlecommon denominator. For instance, the U.S. and theNetherlands are about equidistant, but on opposite sides,from the path of balanced development. The same holdstrue, at a somewhat lower level of development for Austriaand Taiwan (Fig. 3).The major factors accounting for the difference in health
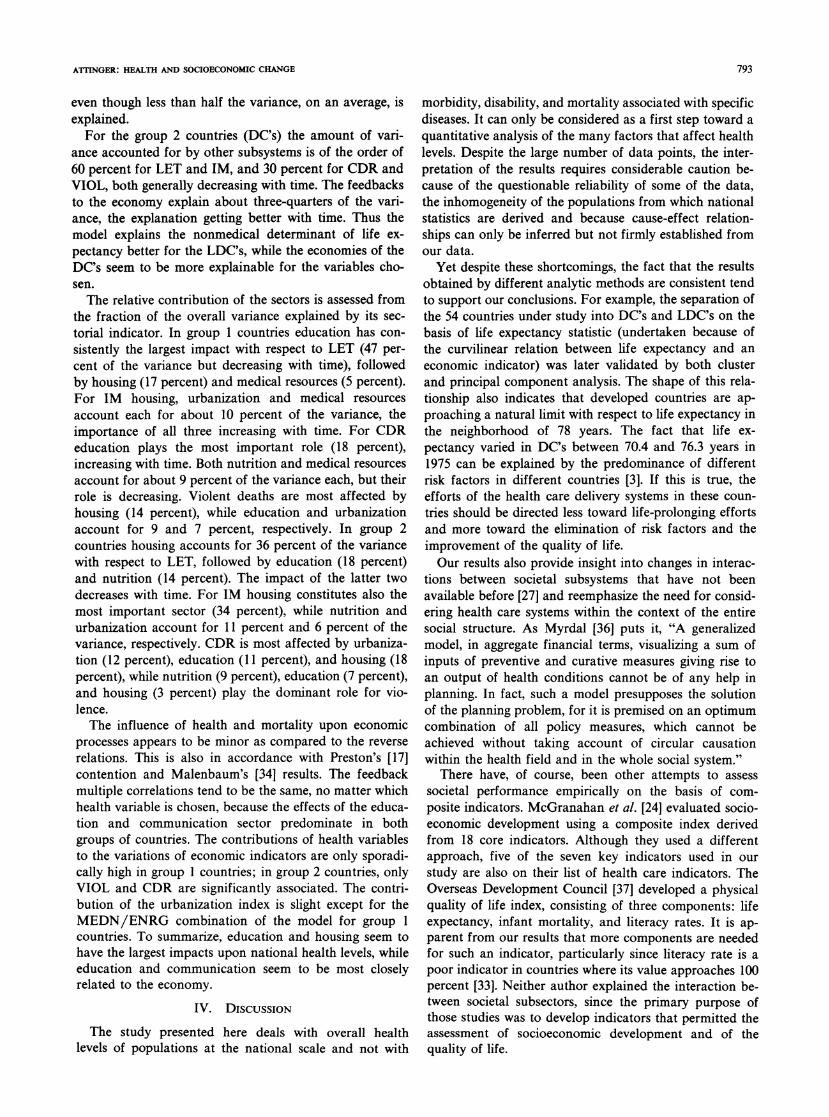
levels between the efficient and the less efficient countriesrelate to crude death rate and violence. These differencesin crude death rate are observed despite the fact that theage structure of the population in the Western countries isquite similar. Table VII shows that both average andrange of ranks overlap for the first three indicators forboth groups. In contrast there is no overlap for crudedeath rate and violent deaths. The average of the rankorders for inefficient countries is 38 to 44, respectively, incontrast to the values for efficient countries (12 and 13,respectively). All the efficient countries are also relativelysmall while the inefficient group contains both large andsmall countries. This may indicate that it is easier toimplement effective health care systems on a smallerregional than on a national centralized basis. For exam-
ple, Kerela, a state in southern India, ranks far below theIndian average in economic performance but does as wellas the best less developed countries in terms of healthlevels [37]. However, size alone is clearly not the answer
for these differences. From our development model, we
suspect that the health inefficient countries are char-
TABLE VIIRANK ORDERS FOR FIVE HEALTH INDICATORS FOR HEALTH
INEFFICIENT AND HRALTH EFFICIENT COUNNTRIES
Life Expectancy Infant Crude Death Deaths due toMale Female Mortality Rate Violence
Inefficient groupUSA 23 13 14 23 39West Germany 22 21 21 39 46Belgium 18 14 18 43 42Czechoslovakia 24 18 13 33 43East Germany 10 16 20 46 49Austria 25 22 23 45 50Hungary 26 29 32 35 41Efficient groupThe Netherlands 3 3 3 11 18Israel 11 28 19 2 15Spain 15 19 26 13 7Greece 7 20 24 29 8Cuba 28 32 25 10 16Taiwan 32 37 16 1 22Costa Rica 37 38 42 6 11Mauritius 40 40 41 27 6
794
ATrINGER: HEALTH AND SOCIOECONOMIC CHANGE
acterized by a less stable society than balanced or healthefficient countries. This unstability manifests itself notonly in social unrest and dissatisfaction, but also inchanges in life styles and could thus affect both violenceand CDR. Of particular interest are the opposite positionof the two neighboring countries, Belgium and Holland,the first being inefficient and the second the most effi-cient. There are no significant differences in size nor ineconomic development, both countries are constitutionalmonarchies with well developed social programs. Thereare, however, some striking differences; Holland has amore homogeneous population and no long-standing in-ternal conflict between two populations with differentlanguages and cultures. It had to dissolve a large empireduring the last two decades, with a concomitant influx ofreturning settlers, and practices far more exercise (bicy-cling) than the population of Belgium. It is clear thatstudies at much lower levels of aggregation are needed toexplore the reasons for these differences.
Although health resources undoubtedly affect healthlevels, they do not appear to be their primary determinant.It is unfortunate that this fact is not adequately stressed inthe education of health manpower and health planners.Furthermore, there seems to exist an optimum in terms ofhealth resources investment (which has been exceeded bymost developed nations) beyond which further benefits atthe population level are at best marginal. Thus, dependingon existing infrastructures and cultural backgrounds, moreattention should be paid to other societal subsectors in theselection and implementation of health policies. Of partic-ular interest in this context are two results obtained fromour model, namely, that health levels are predicted betteron the basis of performance of other societal sectors forless developed countries than for developed countries, andthat, in contrast, health levels affect socioeconomic factorsmore in developed than in less developed countries. Thelatter is in agreement with Mandelbaum's results [34]. Heattempted to relate agricultural productivity in less devel-oped countries to a series of economic, educational, andhealth indicators, but his results accounted for only 40-50percent of the total variance, health indicators represent-ing between 5 and 80 percent of that total. He pointed outthat the conventional economic production function mustbe modified by including not only quality changes incapital but also in labor. With respect to the latter, hestressed the importance of motivation and attitudes. Thisview supports our earler results that a production functionmust contain both material and nonmaterial productionfactors and that substitutions between the two groups areonly possible within a limited range [33]. The factors ofmotivation and attitude will, of course, enter into theproblem of efficiency of health care and may explainsome of the differences in violence in the developedcountries. This may also require a direct connection be-tween communication and health in our model, particu-larly since Phillips showed that suicides as well as motorvehicle fatalities increase markedly immediately followingwell publicized suicide stories [38].
V. CONCLUSION
The results of the analysis confirm our hypothesis thatthe level of socioeconomic development is strongly corre-lated with population health levels and that the magnitudeof the impact of any socioeconomic factor on healthdepends on the level of development of the society inwhich it operates. The changes in the correlation betweensocioeconomic and health indicators indicate that suchcorrelations in general start at a low level, reach a peak,and then eventually disappear. The time course of thesechanges in correlation can be interpreted as a measure ofa development gap, but only as far as the two factors areconcerned. Education and housing consistently showedthe largest impact on improvements in health levels, fol-lowed by nutrition, urbanization, and medical resources.Education and communication contributed most to theranking of the 54 countries along the socioeconomic scale.We interpret the deviation from a path of balanced devel-opment, where progress in health parallels progress alongsocioeconomic dimensions as a health efficiency parame-ter. Health inefficient countries differ from health efficientcountries primarily in crude death rate and rate of vio-lence, which indicates that their health problems are prim-arily of a social rather than a medical nature.
REFERENCES
[1]
[2]
[3]
[4]
[5]
[6]
[7]
[8]
[9]
[10]
[11]
[12]
[13]
[14]
[15]
[161
[17]
[18]
J. H. Knowles, Ed., "Doing better and feeling worse: Health in theUnited States," Daedalus, Winter 1977.K. White, "Health care arrangements in the United States,"Milbank Mem. Fund Quart., vol. 50, pp. 17-40, 1972.G. B. Gori and B. T. Richter, "Macroeconomics of disease preven-tion in the U.S.A.,"Science, vol. 200, pp. 1124-1130, 1978.J. Bryant, Health and the Developing World. Ithaca, NY: CornellUniv. Press, 1969.J. Mahler, "Health, a demystification of medical technology,"Lancet, 7940, pp. 829-833, 1975.M. Susser, Causal Thinking in the Health Sciences. New York:Oxford Univ. Press, 1973.L. Breslow, "A quantitative approach to the WHO definition ofhealth," Int. J. Epidemiol., vol. 1, pp. 347-355, 1972.K. L. White, "Contemporary edidemiology," Int. J. Edpidemiol.,vol. 3, pp. 295-303, 1974.G. L. Engel, "The need for a new medical model," Science, vol.196, pp. 129-136, 1977.T. McKeown, The Modern Rise of Populations. New York:Academic, 1976.M. A. Farid, "The malaria programme-From euphoria toanarchy," World Health Forum, vol. 1, pp. 8-21, 1980."Healthy people: The surgeon general's report on health promo-tion and disease prevention, DHEW (PHS) Pub. 79-55071,Washington, 1979."Social indicators," OMB, U.S. Government Printing Office,Washington, DC, 1973.T. H. Wan, "Predicting self assessed health status," Health ServicesRes., vol. 11, pp. 464-477, 1976.J. G. Anderson, "Effects of social and cultural processes onhealth," Socioecon. Plan. Sci., vol. 8, pp. 9-22, 1974.J. Cassel, R. Patrick, and D. Jenkins, "Epidemiological analysis ofthe health implications of cultural change," Ann. N.Y. Acad. Sci.,vol. 84, pp. 938-949, 1960.S. H. Preston, Mortality Patterns in National Populations. NewYork: Academic, 1976.W. Leontieff, "The future of the world economy," Socio. Ec. Plan.Sci., vol. 11, pp. 171-182, 1977.
795
IEEE TRANSACTIONS ON SYSTEMS, MAN, AND CYBERNETICS, VOL. SMC- 10, NO. 12, DECEMBER 1980
H. Kahn, "The year 2000," Daedalus, 1967.N. Mesarovic and E. Pestel, Mankind at the Turning Point-The 2ndReport to the Club of Rome. New York: Dutton, 1975.D. H. Meadows et al., The Limits of Growth. New York: Uni-verse, 1972.D. Ahuja, "Analysis of the socioeconmonic correlates of nationalhealth indicators," Ph.D. theses, Univ. of Virginia, Charlottesville,1978.M. A. Lalonde, A New Perspective on the Health of Canadians: AWorking Document. Ohawa, 1974.D. V. McGranahan, C. Richard-Proust, N. V. Sovani, and H.Subramanian, Contents and Measurements of Socieconomic Develop-ment. New York: Praeger, 1972.D. F. Morrison, Multivariate Statistical Methods. New York:McGraw-Hill, 1976."Health 1976-1977: United States chart book," DHEW Publ.(HRA) 77-1233, Washington, DC, 1977.E. 0. Attinger and G. C. Theordoridis, "Engineering approaches tosocietal systems," Adv. Biomed. Engr. S, pp. 217-312, 1975.H. M. Blalock, Jr., Causal Models in the Social Sciences. Chicago,IL: Aldine, 1971.E. 0. Attinger, and J. Millendorfer, "Performance control ofbiological and social systems," Persp. Biol. Med., vol. 12, pp.
103-123, 1967.[301 J. Millendorfer and C. Gaspari, "Immaterielle und Materielle
Faktoren der Entwicklung," Ansatze Zu einer Ailgemeinen Pro-duktionsfunktion. Zeitschr. f. Nat. Okonomie 31, pp. 81-120,1971.
[31] B. Christian, D. Benyoussef, and T. Tanahashi, "Health and socio-economic developments: An intersectoral model," Soc. Sci. Med.,vol. 2, pp. 63-69, 1977.
[32] T. G. Anderson, "Effects of social and cultural processes on
health," Socio-Econ. Plan. Sci., vol. 8, pp. 1-22, 1974.[33] H. Millendorfer and E. 0. Attinger, "Global systems dynamics,"
Med. Care, vol. 6, pp. 467-489, 1968.[34] W. Mandelbaum, "Health and productivity in poor areas," Empiri-
cal Studies in Health Economics, H. E. Klarman, Ed. Baltimore,MD: Johns Hopkins Press, 1970.
[35] T. B. Calhoun, "Population density and social pathology," Sci.Amer., vol. 206, pp. 139-146, 1962.
[36] G. Myrdal, Asian Drama: An Inquiry into the Poverty of Nations.New York: Pantheon, 1968.
[37] Overseas Development Council, Washington, DC, Communique on
Development Issues # 32.[381 D. P. Phillips, "Motor vehicle fatalities increase just after publi-
cized suicide stories, Science, vol. 196, pp. 1464-1465, 1977.
Interactive Multiobjective Decisionmaking forLarge-Scale Systems and Its Application
to Environmental Systems
MASATOSHI SAKAWA AND FUMIKO SEO
Abstract A new interactive multiobjective decisionmaking techniquefor solving large-scale multiobjective optimization problems is presented.Our method combines the desirable features of both the surrogate worthtrade-off (SWT) method and the multiattribute utility function (MUF)method bv incorporating the dual decomposition method to obtain Pareto-optimal solutions. B' assessing the marginal rates of substitution of thedecisionmaker (DM) and maximizing the local proxy preference functionssequentialIv, we can interactively derive his preferred solution efficientlyfrom among the Pareto-optimal solutions obtained by the dual decomposi-tion method. The industrial pollution control problem in industrializedOsaka City in Japan is formulated, and it is demonstrated that theproblem can be effectively solved by the proposed method.
I. INTRODUCTION
T HE DEVELOPMENT of decisionmaking methodol-ogies under multiple conflicting objectives has been
Manuscript received December 17, 1979; revised August 14, 1980.M. Sakawa is with the Department of Systems Engineering, Faculty of
Engineering, Kobe University, Rokko, Nada, Kobe 657, Japan.F. Seo is with the Kyoto Institute of Economic Research, Kyoto
University, Kyoto 606, Japan.
one of the most active areas of research in recent years.
The main aim of decisionmaking under multiple conflict-ing objectives is to select as the preferred solution the bestcompromise among Pareto-optimal solutions. There havebeen more than 100 papers dealing with multiobjectivedecisionmaking problems and at least 20 different solu-tion techniques have been proposed [I]-[12], [191, [22]-[24], [26]-[28]; among them two competitive methods,namely, the multiattribute utility function (MUF) method[1 1], [ 12] and the surrogate worth trade-off (SWT) method[7], [8] use global and local utility (preference) modeling,respectively.The MUF method developed by Keeney et al., global
utility function modeling, uses two assumptions of prefer-ence independence and utility independence to limit theutility function to specialized forms. Once the representa-tion form is selected, a few assessments determine the freeparameters. These global functions are mathematicallysimple and convenient, but they have a drawback. Theassumptions are reasonable locally, but when assumed
0018-9472/80/1200-0796$00.75 1980 IEEE
[19][201
[21]
[22]
[23]
[24]
[25]
[26]
[27]
[28]
[29]
796


