Embed Size (px)
Citation preview

Queensland Health
Queens andGovernment
Health
Determinants
Chapter One
Queensland 2004
Whole of Population

HEALTH DETERMINANTS QUEENSLAND 2004
Chapter 1. WHOLE OF POPULATION
PUBLIC HEALTH SERVICES ANDHEALTH INFORMATION CENTRE

1ii Health Determinants Queensland 2004
WHOLE OF POPULATION
© Queensland Health 2004
ISBN 0 7345 2957 0
Copyright protects this publication. However, Queensland Health has no objection to this material being reproduced with acknowledgment, except for commercial purposes. Permission to reproduce for commercial purposes should be sought from the Policy and Quality Offi cer, Queensland Health, GPO Box 48, Brisbane Q 4001.
ABS data used with the permission of the Australian Bureau of Statistics.
This document is also available on:
• Queensland Health Internet and intranet site at http://www.health.qld.gov.au/phs/documents/phpru/22418dmp.htm
• CD.
Suggested citation
Queensland Health: Harper C, Cardona M, Bright M, Neill A, McClintock C, McCulloch B, Hunter I, Bell M. Health Determinants Queensland 2004 Public Health Services, Queensland Health. Brisbane 2004.
For further information on this report e-mail the appropriate Zonal contact:
Northern Zone [email protected]
Central Zone [email protected]
Southern Zone [email protected]
Corporate Offi ce [email protected]
For further advice or information on best practice interventions, contact your local Public Health Unit listed on http://www.health.qld.gov.au/phs/site_map.htm

1iii
WHOLE OF POPULATION
Health Determinants Queensland 2004
ForewordThe health of the people of Queensland is very good overall and continues to improve. However, recent declines in the amount of physical activity undertaken, poor nutrition, an increase in overweight and obesity, as well as high levels of smoking and alcohol misuse, tell us that this is not a time for complacency. In addition, the increasing inequalities in health and the poor health of Indigenous peoples require specifi c attention.
In order for us to address these issues, Queensland Health and others whose work impacts on health and wellbeing, need to focus on the areas that will have the greatest gains for all Queenslanders. Information is critical to enable us to make decisions about where to focus and invest.
Health Determinants Queensland 2004 is a key resource in this regard. It provides a summary of the most important factors infl uencing the health status of Queenslanders today and the areas of potential gain, and highlights the key responses needed to address them. This report brings together indicators of the major behavioural, social, economic and environmental determinants of health and their recent trends in Queensland. In doing so, it provides valuable guidance to government, non-government agencies and the community for improving health and reducing the burden of disease tomorrow and into the future.
It is absolutely clear that the infl uences on the health of Queenslanders go well beyond the scope of health agencies. All parts of society are and need to be engaged in the effort. Promoting and sustaining the health of the public is one of the most important functions of government and Queensland Health’s new strategic intention highlights this.
Our mission is to promote a healthier Queensland. Our vision is to be leaders in health and partners for life. We will be successful in promoting a healthier Queensland through acting on the following fi ve strategic intents:
• Healthier staff – optimise staffi ng levels, provide staff with the right knowledge and skills, and provide an environment that values their experience and which supports positive ideas to drive innovation, creativity and health enhancements
• Healthier partnerships – work with others to harmonise programs and activities that impact on health
• Healthier people and communities – promote healthier lifestyles and environments for individuals, families and communities and improve community-based chronic disease management
• Healthier hospitals – provide high quality and equitable acute emergency care, integrated with enhanced community-based services
• Healthier resources – use fi nite resources to maximum advantage.
Health Determinants Queensland 2004 provides an information basis from which we can make informed decisions about how to best action each of these intents – what initiatives need to be implemented in which areas to achieve the greatest possible gains in health.
I encourage everyone with an interest in health – which is all of us – to familiarise yourself with the information in this report and to use this information in planning priority setting, and decisions about resource allocation.
Dr Steve BucklandDirector-GeneralQueensland Health

1iv Health Determinants Queensland 2004
WHOLE OF POPULATION
Acknowledgments Health Determinants Queensland 2004 was undertaken by Public Health Services in collaboration with Health Information Centre, Queensland Heath.
Specialist advice and assistance relevant to all chapters was received from William Fox (alcohol, tobacco and illicit drugs), Fran McFadzen and Di James (graphics), Danny Youlden (ICD coding), Liz Davis and Trisha Johnson (mental health), Amanda Lee, Terry Coyne, Torukiri Ibiebele, Simone Lowson and Christina Stubbs (nutrition), Paul Wood and Penny Slater (oral health), Ruth Miller, Brigid Walsh, Kate Swanton and Paula Nihot (physical activity), Natalie Baig, Paul Harris and Garth Henniker (social determinants and community capacity) and Jennifer Muller (women’s cancer screening). In addition, Angela Taft, Kelsey Hegarty, Emad Nimri, Ross Thompson, Vicki Poxon, Annette Dobson, Elvia Ramirez and Jennifer Muller contributed during the consultation on selection of indicators and literature review.
Specialist advice relevant to Whole of population chapter specifi cally was received from Environmental Health Unit and Communicable Disease Unit (environmental factors), Kirsty Pickering (physical activity environment), Amanda Baker (QIMR: metabolic syndrome).
The intervention sections in this report were managed by Helen Clifford and provided by Steve Anstis (alcohol), Margaret Young (communicable disease), Kerry Bell (food safety), Paul Vardon and Phil Carswell (injury), Liz Davis (mental health), Amanda Lee and Christina Stubbs (nutrition), Paul Wood and Linda Bertram (oral health), Mark Counter (sexual health), Paul Harris and Natalie Baig (social determinants), Mark West (smoking), Cameron Earl (sun protection), Brigid Walsh (physical activity), Jennifer Muller and Angela Beitz (women’s cancer screening).
Health Determinants Queensland 2004 Chapter 1 Whole of population Chapter 2 Children Chapter 3 Young people Chapter 4 Older people Chapter 5 Indigenous peoples Chapter 6 Health service district profi les
Companion documents Health Determinants Queensland 2004 at a glance Health Determinants Queensland 2004: Statistical report.

1v
WHOLE OF POPULATION
Health Determinants Queensland 2004
Table of Contents 1.1 Whole of population summary......................................................................................................................1-1
1.2 Introduction ....................................................................................................................................................1-5
1.2.1 Life course approach ............................................................................................................................1-6 1.2.2 Social determinants of health................................................................................................................1-71.3 Health status and health outcomes..............................................................................................................1-9
1.3.1 Burden of disease .................................................................................................................................1-9 1.3.2 Life expectancy .....................................................................................................................................1-2 Infant mortality rate .............................................................................................................................1-13 1.3.3 Quality of life and wellbeing ................................................................................................................1-14 Quality of life .......................................................................................................................................1-14 Self reported health status ..................................................................................................................1-14 Health and life satisfaction ..................................................................................................................1-15 1.3.4 Activity limitation .................................................................................................................................1-15 1.3.5 National health priority area conditions...............................................................................................1-16 Cancer ................................................................................................................................................1-18 Lung cancer ........................................................................................................................................1-19 Colorectal cancer ................................................................................................................................1-20 Breast cancer......................................................................................................................................1-21 Prostate cancer...................................................................................................................................1-22 Melanoma of the skin..........................................................................................................................1-23 Cervical cancer ...................................................................................................................................1-23 Coronary heart disease.......................................................................................................................1-24 Stroke..................................................................................................................................................1-26 Hypertension.......................................................................................................................................1-26 Mental health ......................................................................................................................................1-28 Suicide ................................................................................................................................................1-31 Injury and poisoning............................................................................................................................1-32 Road transport injury...........................................................................................................................1-32 Diabetes..............................................................................................................................................1-33 Asthma................................................................................................................................................1-36 Chronic obstructive pulmonary disease ..............................................................................................1-38 Musculoskeletal disease .....................................................................................................................1-39 1.3.6 Health behaviour outcomes ................................................................................................................1-40 Alcohol ................................................................................................................................................1-40 Tobacco smoking ................................................................................................................................1-41 Illicit drugs ...........................................................................................................................................1-43 Physical inactivity................................................................................................................................1-45 1.3.7 Oral health ..........................................................................................................................................1-46 1.3.8 Communicable diseases.....................................................................................................................1-48 Invasive meningococcal disease ........................................................................................................1-48 Invasive pneumococcal disease .........................................................................................................1-48 Blood-borne conditions .......................................................................................................................1-50 Gastrointestinal conditions..................................................................................................................1-50 Sexually transmitted conditions ..........................................................................................................1-51 Vector-borne conditions ......................................................................................................................1-52 Zoonotic conditions .............................................................................................................................1-521.4 Health determinants.....................................................................................................................................1-53
1.4.1 Environmental factors .........................................................................................................................1-54 Air quality ............................................................................................................................................1-54 Water quality .......................................................................................................................................1-55 Water fl uoridation................................................................................................................................1-55 Food safety and security.....................................................................................................................1-56 Healthy food access............................................................................................................................1-56 Physical activity environment..............................................................................................................1-57

1vi Health Determinants Queensland 2004
WHOLE OF POPULATION
Housing...............................................................................................................................................1-58 Homelessness ....................................................................................................................................1-59 Household safety devices ...................................................................................................................1-60 1.4.2 Socioeconomic factors........................................................................................................................1-61 Income ................................................................................................................................................1-61 Income inequality ................................................................................................................................1-62 Pensions and disability support ..........................................................................................................1-63 Socioeconomic disadvantage .............................................................................................................1-63 Education ............................................................................................................................................1-64 Employment ........................................................................................................................................1-65 1.4.3 Community capacity............................................................................................................................1-67 Social capital.......................................................................................................................................1-67 Household characteristics...................................................................................................................1-69 Sense of control ..................................................................................................................................1-69 Volunteerism .......................................................................................................................................1-70 Carers .................................................................................................................................................1-70 Transport.............................................................................................................................................1-71 Safety and crime .................................................................................................................................1-72 Computer and Internet access............................................................................................................1-74 Gambling.............................................................................................................................................1-74 1.4.4 Health behaviours ...............................................................................................................................1-76 Tobacco smoking ................................................................................................................................1-76 Alcohol ................................................................................................................................................1-77 Illicit drugs ...........................................................................................................................................1-78 Physical activity...................................................................................................................................1-79 Metabolic syndrome............................................................................................................................1-80 Healthy weight ....................................................................................................................................1-81 Nutrient intake.....................................................................................................................................1-82 Fruit and vegetable consumption........................................................................................................1-84 Milk consumption ................................................................................................................................1-85 Cholesterol..........................................................................................................................................1-85 GP and dentist attendance .................................................................................................................1-86 Breast cancer screening .....................................................................................................................1-88 Cervical screening ..............................................................................................................................1-89 Sun protection.....................................................................................................................................1-90 First aid certifi cation ............................................................................................................................1-901.5 Interventions to address the burden of disease .......................................................................................1-91
Alcohol ................................................................................................................................................1-92 Communicable disease.......................................................................................................................1-94 Food safety .........................................................................................................................................1-95 Immunisation.......................................................................................................................................1-96 Injury ...................................................................................................................................................1-97 Mental health ......................................................................................................................................1-99 Nutrition.............................................................................................................................................1-101 Oral health ........................................................................................................................................1-103 Physical activity.................................................................................................................................1-104 Sexual health ....................................................................................................................................1-106 Smoking ............................................................................................................................................1-107 Social determinants ..........................................................................................................................1-109 Sun protection................................................................................................................................... 1-112 Women’s cancer screening............................................................................................................... 1-1131.6 Methodology and guide for users............................................................................................................. 1-114
1.7 List of tables ...............................................................................................................................................1-130
1.8 List of fi gures..............................................................................................................................................1-133
1.9 References..................................................................................................................................................1-135

11
WHOLE OF POPULATION
Health Determinants Queensland 2004
1.1 Whole of population summaryHealth status or levels of ill health and early death depend on a variety of factors or ‘determinants’ that surround individuals, families and communities. Factors in the socioeconomic and physical environment, as well as early childhood experiences, personal health behaviours and biology, all have a major impact on health.
For the fi rst time in Queensland, Health Determinants Queensland 2004 combines indicators of the major behavioural, social, economic and environmental determinants of health. This report describes the relationship between health determinants and health outcomes. In doing so, it provides: evidence for investment in population health, both in the health sector and across government; priority areas for investment; and interventions, which can most improve the health of Queenslanders.
In Queensland, as in other developed countries, the greatest burden of ill health is borne by the most disadvantaged groups. As a result, social and economic disparities are one of the major public health challenges confronting the state.
However, the risks to health are not confi ned to those within the population with the highest levels of health risk factors. Rather, as the level of many health risk factors increase from low to medium to high levels, the risk of ill health or premature death also increases. Key fi ndings of this report underline the gains that can be made by intervening before people reach recognised levels of these risk factors. This is particularly so for coronary heart disease, diabetes, stroke, hip fracture and neural tube defects.
How healthy are Queenslanders? • The life expectancy of Queenslanders born in 1999-2001 was 76.9 years for males and 82.5
years for females, similar to that of Australia. Australia has one of the highest life expectancies in the world. In Queensland, premature mortality accounts for 56% of the burden of disease in males and 49% in females, close to that of Australia.
• By and large, Queenslanders were satisfi ed with their lives and their health. The vast majority of Queenslanders were satisfi ed with their health and rated their quality of life as good or very good and their health as excellent, very good or good.
• In comparison to Australia, Queensland had higher rates of deaths preventable through primary prevention for females, and potentially avoidable hospitalisations for males and females. Rates of death preventable through secondary and tertiary prevention were somewhat higher in Queensland than the national average. As the highest numbers of avoidable deaths were due to primary prevention, targeted efforts to reduce overweight and obesity levels, increase physical activity and improve diet among men and women would result in signifi cant improvements in health in Queensland.
• Death rates due to coronary heart disease (CHD) in Queensland were the highest of the Australian states. Queensland also has high levels of overweight and obesity, physical inactivity and smoking. About half of the large decline in CHD in recent decades was due to a better control of risk factors: high blood cholesterol, smoking and high blood pressure.
• In recent years, more Queenslanders are experiencing diabetes. In 2000, one in four adults had diabetes or impaired glucose metabolism, which is a major risk factor for diabetes. Risk factors, which can be changed, contribute signifi cantly to the rate of onset of diabetes and its complications.
• Health behaviours such as tobacco smoking, physical inactivity, poor nutrition, and behaviours heading to obesity and high blood pressure, contribute to a sizeable proportion of the total burden of disease.
Key population groups The health status of Aboriginal and Torres Strait Islanders, children, young people and older people in Queensland are fully described in the population specifi c chapters of Health Determinants Queensland 2004. Insuffi cient information is available to describe the health status of culturally and linguistically diverse populations in Queensland.
Indigenous status, the level of socioeconomic disadvantage, and to a lesser extent rural or remote location, all have a major effect on health. However, with current data the effect of each of these factors is unable to be separated from the effect of the other factors. This is because, Indigenous peoples most often live in areas of most socioeconomic disadvantage, and 55% live in rural and remote areas of Queensland. The result is that each of these factors combines and interacts to infl uence the

12 Health Determinants Queensland 2004
WHOLE OF POPULATION
health of a particular population. Thus, it is important to be aware that the key health issues for the socioeconomically disadvantaged groups, and rural and remote population groups outlined below, and those for Indigenous peoples, are not independent.
Males • The rate of preventable deaths in Queensland males is twice as high as for females. The total
burden of disease and injury in males is 17% higher than for females. CHD, stroke, lung cancer and suicide were the top four causes of burden of disease for Queensland males - most of which can be prevented by primary, secondary and tertiary measures.
• Men are more likely to die prematurely than women. In contrast to women, men are more likely to die of lung cancer, colorectal cancer, melanoma, CHD, stroke, suicide, injury and poisoning, road traffi c injury, diabetes and chronic obstructive pulmonary disease (COPD).
• Men are more likely than women to have substance abuse disorders, with higher prevalence of harmful and hazardous alcohol consumption and illicit drug use. Males have more deaths and hospitalisations due to hazardous and harmful consumption of alcohol, tobacco smoking and illicit drug use.
• Men are less likely than women to consume suffi cient fruits, vegetables and skim or low fat milk and are less likely to ‘do the right thing’ in the sun. Melanoma incidence and death rates for all Queenslanders are increasing, and men experience more melanoma than women.
Females • Women are more likely than men to rate their quality of life as good or very good. • While women live longer than men, they are more likely to experience and to die from
asthma, and to have arthritis, anxiety disorders, affective disorders (including depression) and psychological distress.
• Stroke, CHD, depression and breast cancer were the top four causes of burden of disease for females, much of which can be prevented by primary, secondary and tertiary prevention.
• In the last seven years, fewer women have died of breast cancer. This reduction is due to both mammography screening and improved treatment.
• The death rate due to lung cancer is increasing for women, and 20% of women currently smoke. If the rates of smoking among young women are not reduced, lung cancer rates among women will continue to climb.
Socioeconomically disadvantaged groups
• At least 17% of the total burden of disease and injury in Australia is due to socioeconomic disadvantage. The greatest differences in burden between the least and most socioeconomically disadvantaged groups were for diabetes, intentional and unintentional injuries and mental disorders.
• On every rung up the socioeconomic disadvantage ladder, from least disadvantaged to most disadvantaged, people experience more sickness, shorter life expectancy and poorer health.
• Only 76% of Queenslanders in the most socioeconomically disadvantaged group rate their health as excellent, very good or good, compared with 82% in the least disadvantaged group.
• There were higher death rates due to lung cancer, CHD, injury and poisoning, road traffi c injury, diabetes, asthma and COPD in areas of high socioeconomic disadvantage in Queensland, and similarly, these people were more likely to have arthritis.
• Socioeconomically disadvantaged people were less likely to have a functional dentition and more likely to have no natural teeth than those of lower disadvantage.
• In areas of most socioeconomic disadvantage, there were higher death and hospitalisation rates due to hazardous and harmful consumption of alcohol and tobacco smoking, as well as a higher proportion of harmful and hazardous alcohol consumption.
• People in the most socioeconomically disadvantaged areas were more likely to be overweight or obese and physically inactive.
• Women in the most socioeconomically disadvantaged areas are less likely to be screened for cervical cancer.
• People in areas of low socioeconomic disadvantage had a higher death rate due to illicit drugs.

13
WHOLE OF POPULATION
Health Determinants Queensland 2004
Rural and remote populations • People living in remote areas of Queensland reported higher satisfaction with life, particularly with
safety and feeling part of the community, and were more willing to help each other, compared with urban and rural areas.
• People in remote areas are more likely to die of lung cancer, CHD, stroke, suicide, injury and poisoning, road traffi c injury, diabetes, asthma and COPD.
• In remote areas, there were higher death and hospitalisation rates due to hazardous and harmful consumption of alcohol and tobacco smoking, as well as a higher proportion of harmful and hazardous alcohol consumption.
• People in remote areas were more likely to be overweight or obese, and physically inactive. • Healthy food costs more in remote areas of Queensland. • In accessible areas, people were more likely to die or be hospitalised due to illicit drugs.
Overseas-born people • Very little is known of the health of overseas-born people in Queensland. • People born overseas were less likely to rate their health as excellent or very good, compared
with other Australians. • People born in the South Pacifi c regions, the Middle East/North Africa, Southern Asia and
Southern Europe were more likely to have diabetes. • People born in Asia were less likely to be overweight or obese than the other Australians. • Females born in Asia were less likely to smoke tobacco than other Australians.
What are the health determinants impacting on the health of Queenslanders? Health determinants can be broadly divided into:
– ‘upstream’ (education, employment, income, living and working conditions); – ‘midstream’ (health behaviours and psychosocial factors); and – ‘downstream’ (physiological and biological factors).
In this report, ‘upstream’ determinants are addressed in environmental and socioeconomic factors, and ‘midstream’ determinants in community capacity and health behaviours. The downstream effects are addressed through health behaviours.
These health determinants have short, medium and long term impacts on the overall health of individuals and populations, specifi cally rates of hospitalisation and death. Actions to address these determinants are described in this report. Such actions themselves will have short and long term impacts.
Environmental factors • Basic healthy food costs more in rural and remote areas of Queensland. In 2001, the cost of a
basket of healthy food was 24% higher in the very remote areas compared with highly accessible areas of the state.
• Food safety is critical to human health and wellbeing. In 2002, 26% of food businesses in Queensland had a food safety program and 64% had adequate hand washing facilities.
• Less than 5% of Queensland people had satisfactory water fl uoride levels, compared with 69% of Australians.
• Many injuries to adults and children occur in the home. Two thirds of Queensland households had smoke alarms or detectors, two thirds had a circuit breaker on the electrical system and half had adjustable hot water thermostats.
• Ambient air quality in Queensland is generally very good. In 2002, the maximum levels for carbon monoxide and nitrogen dioxide concentration were not exceeded, although ozone levels were more variable. There were a number of days where atmospheric fi ne particles exceeded the desired level (these mainly resulted from dust storms and bush fi res).

14 Health Determinants Queensland 2004
WHOLE OF POPULATION
Socioeconomic factors • In 2000, the weekly income of one in three men and one in two women was less than $300. The
median gross weekly income of one parent households was $386 and was two and a half times lower than for couple-with-dependants households ($933). Forty three percent of Queensland households reported some diffi culty in making ends meet.
• There were inequalities in income in Queensland, particularly for women, people aged 15-24 years and 65 years and older, and one parent family households. Indications are that income inequality has increased in the last decade. Large gaps in income distribution lead to increases in social problems and poorer health among the population as a whole.
• Forty one percent of Queenslanders had post school qualifi cations, compared with 44% nationally. Queenslanders with low educational attainment are more likely to be unemployed, experience socioeconomic disadvantage and, therefore, to suffer poorer health and premature death than those with high levels of education.
• Socioeconomically disadvantaged people felt less able to infl uence government and had lower access to transportation, including access to motor vehicles.
Community capacity • Generally, Queenslanders are a caring people. They report high levels of social support,
willingness to help one another, caring for others, volunteerism and civic participation. • Queenslanders with higher social capital were more likely to rate their quality of life as good or
very good, their health as excellent, very good or good, to be satisfi ed with their health, and to have good health behaviours.
• Most Queenslanders felt in control of the decisions that affect their lives. • One in ten Queenslanders live alone, and the average number of people in each house is
expected to decrease by 2021. In 1996, 19.8% of Queensland children lived in one parent families and, by 2021 this is expected to increase to up to one in three children.
• In 2001, 24,569 people in Queensland were homeless, where 50% were less than 24 years and 10% less than 12 years of age.
• Women are less likely than men to feel safe either during the day or at home after dark.
Health behaviours • In 1999-2001 tobacco smoking caused 3,402 deaths (19% of all male deaths and 10% of all
female deaths) and 30,453 hospitalisations each year. One quarter of males and 20% of females smoke daily. One in eight youths aged 14-17 smoke daily.
• In 2001, levels of physical inactivity increased to 55%. Rates of physical activity drop as age increases and males are more active than females. In 1999-2001, insuffi cient physical activity caused 646 deaths and 7,004 hospitalisations each year.
• More than half of adult Queenslanders are overweight or obese. If current trends continue, three of four Australians will be overweight or obese by 2020.
• In 1999-2001, there were 812 deaths and 20,912 hospitalisations due to hazardous and harmful alcohol consumption each year. Suicide was the leading cause of such deaths. In 2001, 28% of male and female adults, and 25% of young males and 45% of young females aged 14-17 years drank hazardous or harmful levels of alcohol.
• In 2000 in Queensland, 16% of adults had untreated and 12% treated hypertension. • Queenslanders consume too few fruits and vegetables. • Increasing breast and cervical cancer screening will result in immediate health gains. • In 1999-2001, illicit drug use caused 94 deaths and 4,187 hospitalisations each year, mostly in
the 15-49 year age group.
Evidence-based strategies, which address the determinants of health, have the potential to reduce the burden of ill health and premature death in the lives of all Queenslanders, particularly those who are most disadvantaged.

15
WHOLE OF POPULATION
Health Determinants Queensland 2004
1.2 IntroductionQueenslanders enjoy a quality of life and health that is comparable to, or exceeds that found almost anywhere else in the world. Good health is one of Queensland’s greatest assets.1 The health of Queenslanders generally continues to improve.2,3 Despite this overall high standard, it is important to ensure that health is shared equally among all populations in Queensland and that the rate of improvement equals that of other states.
Many factors determine and infl uence health. In the last few decades there have been signifi cant developments in thinking about the causes of good health or ‘a state of complete physical, mental and social wellbeing, and not merely the absence of disease or infi rmity’.4 Twenty years ago disease was seen as an outcome of the interaction of human biology, lifestyle factors and environmental factors, as well as being modifi ed by healthcare.5,3 It is now understood that “health status results from a complex interaction of social, economic, environmental, behavioural and genetic factors”.2 As reported in The State of Health of the Queensland Population: “The diverse determinants of health status and health inequalities across the population need to continue to be addressed to meet the challenges for health (in Queensland) over the next 20 years.”2
The factors that lead to someone developing disease are likely to have had their beginnings years earlier, through a complex chain of events fashioned by interactions of the individual, the environment, and broader social and economic factors. Determinants of health is the term used for those factors that have either a positive or negative infl uence on health at the individual or population level. Health determinants can be broadly divided into ‘upstream’ determinants (education, employment, income, living and working conditions), ‘midstream’ (health behaviours and psychosocial factors) and ‘downstream’ (physiological and biological factors).6
Health Determinants Queensland 2004 is the second in a series of Health Indicator reports produced by Queensland Health. This report compiles a consolidated set of indicators of the major behavioural, social, economic and environmental determinants of health and their recent trends in Queensland. Selected health outcome indicators are also reported. This report describes the relationship between the determinants and health outcomes, and recommends evidence-based interventions to improve the health of Queenslanders. More detailed statistics and information are provided in Health Determinants Queensland 2004: Statistical report.
The sequence and scope of indicators in this report are structured following the National Health Performance Framework.7 This framework has three tiers: health status and outcomes; determinants of health; and health system performance. This framework was chosen for consistency with national and state directions; to help readers access and reference their particular areas of interest; and, to better identify challenges and points of intervention. As the focus of this report is determinants of health, limited health outcome indicators are presented. Extensive health outcome indicators were previously reported for Queensland in the fi rst Health Indicators report, Health Indicators for Queensland.8-10 The third tier of the framework, measurement of health system performance, is beyond the scope of this publication. The National Health Performance Framework is included in section 1.6 of this report. An explanation of the terms used in this report, as well as the data sources and limitations are also described in section 1.6.
Health Determinants Queensland 2004 is comprised of fi ve population based chapters, refl ecting the life course approach and the age specifi c nature of health determinants and outcomes. This Whole of population chapter reports the determinants of health that affect the entire population, key health outcomes and interventions to address these determinants. This chapter includes health determinants for socioeconomically disadvantaged, rural and remote and culturally and linguistically diverse populations. The Children, Young people, Older people and Indigenous peoples chapters refl ect the health determinants of specifi c relevance to those populations.
This report provides the burden of disease and injury data for Queensland to allow assessment of the relative impact of conditions and health behaviours on the health of the population. Population groups within Queensland with excess mortality and morbidity associated with conditions and determinants are also identifi ed. This information is then related to the sociodemographic profi le of each Health Service
The diverse determinants of health status
and health inequalities across the population
need to continue to be addressed, to meet
the challenges for health in Queensland over
the next 20 years.

16 Health Determinants Queensland 2004
WHOLE OF POPULATION
District to estimate those conditions and health determinants that warrant specifi c attention. Interventions to address these determinants in each population group are also included in each chapter.
Health Determinants Queensland 2004 provides epidemiological evidence for investment in population health both in the health sector and across government and will assist policy development and decision making on balanced investment in line with national and state priorities. At a Health Service District level, these reports will complement district population and health status profi les to support decision makers at the local level to identify priority areas for primary prevention and practical interventions where investments can be made.
1.2.1 Life course approachHealth outcomes refl ect the accumulation of exposures to advantageous and disadvantageous experiences and environments over varying stages of life. In recent years, a life course approach to the study of health and illness has helped to explain the existence of wide socioeconomic differentials in adult mortality and morbidity rates. Evidence suggests that such exposures accumulate throughout life and increase the risk of illness and premature death.11
Exposure to disadvantageous experiences and environments do not equally impact on all people, or all stages through the life cycle. Some determinants have an immediate impact on health, while other early life or continuous physical and psychosocial exposures have a lag time and manifest in compromised health status later in life.
Associations between environmental and social exposures and health status are bi-directional, with a stronger infl uence of social disadvantage on poor health. The underlying nature of these associations and interactions is not yet fully understood. Some hypotheses indicate that the duration and intensity of exposure to adverse social and environmental determinants and subsequent risk factors are important in selected health outcomes.12 For example, the risk of adverse effects of smoking is believed to proportionally increase if exposure commences early in life and if duration of exposure reaches older age. Similarly, longer exposures to poor diet, poverty, alcohol and/or a lack of physical activity are all seen to be more strongly predictive of negative health outcomes than shorter exposures. However, removal of some exposures can dramatically alter the course of health outcomes. For example, the adverse health effects of smoking are reduced following cessation of smoking at any age.
The association between intrauterine and neonatal exposures and adverse health outcomes in adults has been extensively explored. The Barker hypothesis attempts to explain these associations.13 Some risks for adult health are predetermined at birth. Defi cient maternal nutrition can impact on foetal growth and development, and lead to organ impairment and chronic disease later in life. Likewise, low birth weight babies, adjusted for gestational age, have an increased risk of early death and, if they survive, an increased risk of disability and chronic disease during childhood and adult life.14
Air pollution, urbanisation, residential proximity to mines and factories, occupational exposure to fumes, exposure to cigarette smoking, and inadequate nutrition during childhood and early adulthood have been identifi ed as having potential for life time damaging effects and for generating and/or maintaining social class differentials in health.15
Chronic illness in childhood, more common in socially disadvantaged groups, can have long term consequences both for health and socioeconomic circumstances in later life. Exclusive breastfeeding for at least six months has been identifi ed as a protective factor for emotional wellbeing and chronic diseases such as diabetes and asthma.16 Slow growth and short adult stature may be a refl ection of nutritional status and adverse socioeconomic and psychosocial conditions in childhood.17 Lifestyle factors such as a high fat diet and lack of physical activity are associated with the development of obesity and pathological cardiovascular lesions as early as four years of age, and certainly by young adulthood.18 The presence of chronic disease in early life, such as infectious diseases or respiratory illness, can also lead to both long term ill health and possible socioeconomic disadvantage later in life as a consequence of disability or unemployment.19
Adult lifestyle is also known to add to the ill effects of an inadequate intrauterine environment. People who had low birth weight have an adverse profi le of later glucose and insulin metabolism.20 In addition to birth weight, childhood growth and adult lifestyle affect the risk of impaired glucose tolerance and diabetes.13
Evidence suggests that such
exposure to disadvantgeous
experiences and environments
accumulate throughout life and
increase the risk of illness and
premature death.

17
WHOLE OF POPULATION
Health Determinants Queensland 2004
1.2.2 Social determinants of healthThe greatest burden of ill health is borne by those most disadvantaged in Australia. One of the dominant features affecting the health situation of all industrialised countries is the social gradient in health and disease.21 This gradient in health and disease is prevalent in all socioeconomic strata of society. On every rung up the socioeconomic disadvantage ladder from least to most disadvantaged, people experience more sickness, shorter life expectancy and poorer health.
People of greater socioeconomic disadvantage, experience worse health than those of higher socioeconomic status for almost every major cause of mortality or morbidity.22 Moreover, socioeconomic differences in health are evident for both females and males at every stage of the life course. Socioeconomic inequalities in health have been extensively reported for Queensland.2 Social and economic disparities are one of the major public health challenges confronting Queensland.6
A safe environment, adequate income, meaningful social roles, secure housing, higher levels of education and social support are all associated with better health and wellbeing.23-26 In addition to health behaviours, these social, cultural, economic and environmental factors comprise what we call population health determinants and are the focus of this report. While each of these infl uences is dealt with in a separate section of this report, the interaction of all these factors ultimately determines the health of individuals, families and communities.27
Access to health services, the ability to act on health advice, and the capacity to modify health risk factors are all infl uenced by the circumstances in which people live and work.28 Studies have shown that those most needing care are least likely to receive it.29,30 The quality of care received by people with higher socioeconomic disadvantage is different from those with lower levels of disadvantage.31 In addition, socioeconomically disadvantaged people living in rural or remote areas also have reduced access to some preventive or illness management services. Differential access to ambulance services and travel time to health facilities were found to be associated with higher myocardial infarction mortality rates in rural areas of New South Wales.32 In 1981-95, mortality rates among working age adults were signifi cantly higher for males and females in the most disadvantaged Local Government Areas in New South Wales, than in the least disadvantaged areas.33,34
A wealth of evidence supports the strong association between poverty and ill health.6,11,35 In Australia, children living in single-parent households and without both biological parents, or with parents with lower formal education and income, are more likely to experience behavioural and emotional problems as well as physical limitations, than their less disadvantaged counterparts.36 Socioeconomically disadvantaged adults who are less formally educated or poorly educated experience the highest rates of illness such as cardiovascular disease and diabetes.37 They also have the highest prevalence of risky behaviours such as smoking and hazardous use of alcohol.37 In addition, income inequality has a signifi cant impact on population health.38 Specifi cally, income and wealth inequalities have been correlated with increased all-cause mortality.39,40-42
While our socioeconomic position connects us to the physical and social resources that can make our life better, the feelings of empowerment and status that go with the connection to these resources are also important. This second dimension is important because people who feel in control of their lives are also more likely to take control of their health.43
A lack of control over work and home life has powerful effects on our health.21 Like continuing anxiety, feelings of insecurity and social isolation, the psychosocial impact of a lack of control at home or at work accumulate during life and increase the chances of poor mental health, physiological wear and tear and premature death.
Psychosocial factors affect physical health through the stress response. Although the stresses of modern life rarely demand strenuous or even moderate physical responses, turning on the stress response diverts energy and resources away from many physiological processes important to long term health maintenance.21 For brief periods, this stress response has minimal impact, however, if people feel tense too often or the tension goes on for too long, they become more vulnerable to a wide range of conditions including infections, diabetes, high blood pressure, heart attack, stroke, depression and aggression. The lower people are in the social hierarchy of industrialised countries such as Australia, the more common these problems become.21
Social and economic disparities
are one of the major public
health challenges confronting
Queensland.

18 Health Determinants Queensland 2004
WHOLE OF POPULATION
While many population health interventions target lifestyle factors where health gains can be made, the social infl uences on health behaviours must be considered in both the design and implementation of these interventions.35 The World Health Organisation identify the need to understand the interaction between material disadvantage and social meanings.21 “It is not simply that poor material circumstances are harmful to health; the social meaning of being poor, unemployed, socially excluded, or otherwise stigmatised also matters.”
As well as income and education, other social factors are also known to affect the health of populations. For example, unmarried and divorced people,44 and men have consistently higher age-adjusted death rates than married people and women. Additionally, social trends such as the increase in one-parent families, the ageing population and an increase in the age of people starting families are already infl uencing the economic environment and the health status of the population.35
Ethnicity also can infl uence health outcomes. This may be due to limited service knowledge, poor language skills, employment discrimination,45 an associated low socioeconomic living environment, and absence of social networks46 within minority migrant communities and refugees, as well as due to genetic determinants. For example, racial minorities in Britain experience interpersonal violence, institutional discrimination, or socioeconomic disadvantage, all of which have independent detrimental effects on health, regardless of the health indicator used.47
Social determinants of health are often beyond the control of the individual. Addressing them through multidisciplinary efforts at the population level can assist in preventing illness and improving the overall health of the community. While universal access to healthcare is one of the social determinants of health, more important to the health of the population as a whole are the social and economic conditions that make people ill and in need of healthcare in the fi rst place.21

19
WHOLE OF POPULATION
Health Determinants Queensland 2004
1.3 Health status and health outcomes“The factors that lead to someone developing disease on a particular day are likely to have roots in a complex chain of environmental events that may have begun years previously, which in turn were shaped by broader socioeconomic determinants.”
The World Health Report 200211
Determinants of health are the principal focus of this report. However, an initial overview of the health status and health outcomes for all Queenslanders provides the context for the importance of the health determinants that follow in section 1.4.
The aim of this section is to answer the following questions.
• How healthy are Queenslanders? • Is it the same for everyone? • Where is the most opportunity for improvement from a population health perspective?
These questions are addressed by reporting on indicators of burden of disease, life expectancy, quality of life and wellbeing, disability, and deaths, hospital separations, incidence and prevalence of key diseases and conditions in the National Health Priority Areas.
Actions to address these health needs are described in section 1.5.
1.3.1 Burden of disease The burden of disease and injury in Queensland is the sum of the impact to the community of premature mortality, non-fatal outcomes and disability. Aggregating these health status and outcomes measures leads to a more complete understanding of the risks to health in Queensland than by using mortality and hospital separation statistics alone. The combined burden of fatal and non-fatal health outcomes is represented in a single measure: the Disability-Adjusted Life Year or DALY. The DALY adds together the years of life lost due to premature mortality (YLL) and years of life lost due to disability (YLD). The burden of disease techniques enable us to put health priorities in a population perspective.48 Data derived can be used to make cost-effectiveness evaluations, rethink service orientation, project infrastructure needs, and guide investment decisions.
In 1996-98 in Queensland, the burden of disease for males was 17% higher than for females.49 Premature mortality (YLL) was responsible for 56% of the total burden of disease for males and 49% for females. Males lost 34% more years of life due to premature mortality than females.
Coronary heart disease (CHD), stroke, lung cancer and suicide were the top four causes of burden of disease among males, due to their very high mortality component (Figure 1.1). For females, mental health conditions of affective disorders (including depression, anxiety disorders, Alzheimer’s and dementias) followed stroke and CHD, with breast cancer listed as the fourth largest cause of disease burden. Females generally have greater incidence and prevalence of the more common non-fatal health problems. Males generally have greater incidence of the major diseases and injuries associated with high case mortality.
Between 1996 and 1998, premature mortality was responsible for nearly 240,000 years of life lost on average each year in Queensland. CHD was clearly the largest cause of premature years of life lost among both males and females (Table 1.1). CHD was followed by suicide, lung cancer and stroke among males, and by stroke, breast cancer and lung cancer among females. The top 15 causes of premature mortality comprised 67.2% and 64.8% of the total premature mortality for males and females respectively. Years of life lost due to disability (YLD) represent the disability component of the burden of disease. The non-fatal disease burden presents a very different picture to that provided by traditional mortality statistics (Table 1.1). As a category, mental disorders were the leading cause of YLD, accounting for more than a quarter (27%) of the non- fatal burden of disease in Queensland.
The burden of disease and injury for children, young people and older people is reported in the relevant chapters of Health Determinants Queensland. The burden of disease for Indigenous peoples in Queensland or Australia has not been formally assessed by these methods.

110 Health Determinants Queensland 2004
WHOLE OF POPULATION
Figure 1.1: Top ten causes of disease and injury burden (DALYs) in total population by sex, Queensland 1996-98
Source: QH Quantifying the burden of disease and injury in Queensland 1996-98
Table 1.1: Top 10 causes of premature mortality (YLL) and years of life lost due to disability (YLD) in total population, Queensland 1996-98
Source: QH Quantifying the burden of disease and injury in Queensland 1996-98
YLL (persons) % of total YLD (persons) % of totalCoronary heart disease 20.1 Affective disorders 9.8Stroke 6.8 Anxiety disorders 6.7Lung cancer 6.4 Sense organ disorders 6.5Suicide and self-inflicted injuries 5.9 Asthma 5.1Colorectal cancer 4.1 Alzheimer and other dementias 4.9COPD 3.7 Osteoarthritis 4.8Road traffic accidents 3.5 Substance use disorders 4.2Breast cancer 2.8 Diabetes - type 2 3.4Diabetes - type 2 2.0 COPD 3.4Lower respiratory tract infections 1.9 Stroke 3.2
Male
0
2
4
6
8
10
12
14
16
Coronary heartdisease
Stroke Lung cancer Suicide andself-inflicted
injuries
Chronicobstructivepulmonary
disease
Road trafficaccidents
Diabetesmellitus
Substance usedisorders
Depression Colorectalcancer
Per
cent
age
ofto
talD
ALY
's
Female
0
2
4
6
8
10
12
14
16
Stroke Coronary heartdisease
Depression Breast cancer Anxietydisorders
Dementias Asthma Diabetesmellitus
Osteoarthritis Chronicobstructivepulmonary
disease
Per
cent
age
ofto
talD
ALY
's

111
WHOLE OF POPULATION
Health Determinants Queensland 2004
Australian data suggests that at least 17% of the total disease burden in 1996 can be attributed to socioeconomic disadvantage.50 The burden for males in areas of greatest socioeconomic disadvantage was 37% greater than in areas of lowest disadvantage and 27% higher for females. There were signifi cant differences in DALYs per 1,000 population for almost all disease categories for males and females (Table 1.2). Males in socioeconomically disadvantaged areas had more than 50% excess burden of disease due to diabetes, diseases of the digestive system, intentional and unintentional injuries. Females in socioeconomically disadvantaged areas had more than 50% excess burden of disease due to diabetes, mental disorders, diseases of the digestive system and intentional injuries.
Health risk behaviours such as tobacco smoking, physical inactivity, obesity and high blood pressure contribute to a sizeable proportion of the total burden of disease in Australia (Figure 1.2). The burden of disease due to these risk factors ranks in size with the top ten diseases. The overall burden of disease due to nutrition has not been assessed due to data limitations, although it is estimated to be at least as high as tobacco smoking.51
Table 1.2: Differentials in the burden of disease and injury between top and bottom quintile of socioeconomic disadvantage, by selected main disease categories and sex, Australia 1996
Source: AIHW Burden of disease and injury in Australia 1996 *Rate ratio differs signifi cantly (p<0.05) from 1.0
Figure 1.2: Percentage of total burden attributed to selected risk factors by sex, Australia 1996
Source: AIHW Burden of disease and injury in Australia 1996
Disease category Male FemaleInfectious and parasitic diseases and acute respiratory infections 1.30 * 1.43 *Neonatal causes 1.34 * 1.32 *Malignant neoplasms 1.19 * 1.11 *Diabetes mellitus 1.64 * 2.26 *Endocrine and metabolic disorders 1.21 * 1.37 *Mental disorders 1.43 * 1.53 *Nervous system disorders 1.32 0.84Cardiovascular disease 1.30 * 1.22Chronic respiratory disease 1.48 * 1.34 *Diseases of the digestive system 2.11 * 1.54 *Genito-urinary diseases 1.16 * 1.23 *Musculoskeletal diseases 1.44 * 1.44 *Unintentional injuries 1.79 * 1.39 *Intentional injuries 1.76 * 1.54 *Other causes 1.17 1.20 *TOTAL 1.37 * 1.27 *
DALY ratio
-4 -2 0 2 4 6 8 10 12 14
Tobacco
Physical inactivity
High blood pressure
Alcohol harm
Alcohol benefit
Obesity
Lack of fruit/veg.
High blood cholesterol
Illicit drugs
Occupation
Unsafe sex
Percentage of total DALYs
Male
Female

112 Health Determinants Queensland 2004
WHOLE OF POPULATION
1.3.2 Life expectancy Most Queenslanders can expect to live relatively long and healthy lives. In Queensland in 1999- 2001, life expectancy at birth was 76.9 years and 82.5 years for males and females respectively, similar to that of Australia (Table 1.3).52 Australian men and women aged 65 years had a total life expectancy of 82.2 years and 85.7 years respectively, while 85-year-olds could expect to live a further fi ve to seven years (Table 1.4). Australians continue to have one of the highest life expectancies in the world. Australian life expectancies are comparable with those in Japan, which has the highest life expectancy of any country. Australia is in the top 10 OECD countries for life expectancy.48 Healthy life expectancy for Australian males is 70.1 years and for females 73.2 years, which equals around 9% of life ‘lost’ due to illness.53 Healthy life expectancy is life expectancy weighted for health status.
Socioeconomic differences are evident, with generally longer life expectancy in areas of lower socioeconomic disadvantage in Queensland (Figure 1.3). Areas of lowest life expectancy at birth in Queensland were areas of greatest proportion of Indigenous population. In 2002, Indigenous life expectancy at birth was about 20 years less than for the total population.54 In 2001, in Queensland, the median age at death for Indigenous peoples was 24 years lower than for non-Indigenous peoples.55 While the median age at death for non-Indigenous Australians rose steadily over the period 1990 to 2001, the median age for Indigenous Australians remained at a much lower level.55
The life expectancy of people of culturally and linguistically diverse backgrounds is unknown. However, in Australia, the proportion of older persons is greater among overseas-born population (17.7%) compared with 10.9% of those born in Australia,56 indicating the relatively high impact of such people on the life expectancy of the Australian population.
During the past century, age specifi c life expectancy in Australia has increased continuously for all age groups, but particularly those aged 45 years and older. The increase has been rapid since the 1970s and has been largely attributed to the decrease in death rates for selected conditions such as cardiovascular disease. There is evidence that about two thirds of the gain in life expectancy over the past decade is taken in a state of disability.57 Future progress in population health must increasingly relate to improving quality of life rather than quantity of life.58
Table 1.3: Life expectancy at birth by sex, Queensland, Australia and other states 1999-2001
Source: ABS Deaths 2001
Table 1.4: Expectation of life, by age, Australia and selected countries
Source: ABS Deaths 2001
Male FemaleQueensland 76.9 82.5New South Wales 76.9 82.4Victoria 77.5 82.7South Australia 77.0 82.5Western Australia 77.3 82.8Tasmania 76.0 80.2Northern Territory 70.8 76.5Australian Capital Territory 78.5 82.9Australia 77.0 82.4
Expectation of life Male Female Male Female Male Female Male Female Male FemaleAge 0 77.0 82.4 76.1 81.8 74.1 79.7 76.8 82.9 73.3 80.1Age 1 76.5 81.8 75.6 81.3 73.6 79.3 76.2 82.3 72.9 79.6Age 25 53.2 58.2 52.2 57.6 50.6 55.8 52.8 58.6 49.8 56.0Age 45 35.5 38.8 33.4 38.2 31.9 36.5 33.7 39.2 31.7 36.9Age 65 17.2 20.7 16.6 20.5 15.3 19.2 16.8 20.9 15.7 19.5Age 85 5.6 6.8 5.9 7.3 5.1 6.6 5.3 6.7 5.3 6.8
USA1995-2000
Australia1999-2001
Japan1995-2000
New Zealand1995-2000
Canada1995-2000

113
WHOLE OF POPULATION
Health Determinants Queensland 2004
Figure 1.3: Life expectancy at birth by sex and area of socioeconomic disadvantage (Statistical Division), Queensland, 1999-2001
Source: ABS Deaths 2001
Infant mortality rate The infant mortality rate in Queensland in 2000 was 6.2 deaths per 1,000 live births (Table 1.5).59 The infant mortality rate in Queensland is higher than Australia and all states and territories excluding the Northern Territory. In 1999-2001, the Aboriginal and Torres Straits Islander infant mortality rate for Western Australia, Northern Territory and South Australia was three times the rate for all Australians.60 Infant mortality rates are on average 27% higher in boys than in girls.59 Infant mortality is further discussed in the Indigenous peoples and Children chapters. Infant mortality is recognised internationally as one of the most important measures of the health of a nation and its children. It is also an important indicator of the health of pregnant women. A low infant mortality rate is a major contributor to increased life expectancy.59
The rate of infant deaths in Australia has declined dramatically from 10.7 deaths per 1,000 live births in 1900 to 5.2 deaths per 1,000 live births in 2000. These dramatic gains have been achieved through improvements in public sanitation and health education, the development of vaccines and the effective use of antibiotics.
Table 1.5: Infant mortality rate, by state and territory, Australia 1980, 1990 and 2000
Source: ABS Australian social trends 2002. Rate per 1,000 live births
Male
920
940
960
980
1000
1020
70 72 74 76 78 80Life expectancy at birth
SE
IFA
Inde
xof
disa
dvan
tage
Female
920
940
960
980
1000
1020
77 78 79 80 81 82 83 84Life expectancy at birth
SE
IFA
Inde
xof
disa
dvan
tage
State/Territory 1980 1990 2000Queensland 10.9 7.7 6.2Australian Capital Territory 8.0 9.4 4.2Western Australia 11.7 8.6 4.3Victoria 10.0 7.8 4.5South Australia 10.1 8.5 4.6New South Wales 10.9 8.1 5.2Tasmania 12.8 8.9 5.8Northern Territory 14.2 15.2 11.7Australia 10.7 8.2 5.2

114 Health Determinants Queensland 2004
WHOLE OF POPULATION
1.3.3 Quality of life and wellbeingThe majority of Queenslanders rate their quality of life, health status and satisfaction with health as high.
Quality of life In 2002, 91.5% of adults in Queensland aged 18 years and older rated their quality of life as good or very good, with women more inclined to rate higher quality of life than men (Table 1.6). Young males and females (aged 18-29 years) reported signifi cantly higher quality of life than older males and females (aged 65 years and older). Reported quality of life was signifi cantly lower for people in areas of high socioeconomic disadvantage, however, no signifi cant differences were reported across area accessibility categories.
Using an objective measure of quality of life, in 2003 Australia was rated as the highest in the world.61 This rating was based on factors including relative income, environmental quality, health status and access to services. Increasing from its ranking in 2002, Australia’s quality of life is now ranked ahead of all countries.
Self reported health status Eighty six per cent of Queensland adults reported their health as either excellent or good in 2002 (Table 1.6).62 People in areas of highest socioeconomic disadvantage reported signifi cantly lower health status than people in areas of low disadvantage. Reported health status was generally lower for males, and for Older people than younger people. No signifi cant differences were reported across area accessibility categories. Using alternative data for 200263 in Australia, 84.1% of people reported excellent, very good or good health. People who were not profi cient in English and who were born in other countries were less likely to report health (63%), compared with Australian born people (85%), people born in mostly English speaking countries (86%) and people with profi cient English who were born in other countries (84%). The impact of poor profi ciency in English on response to this survey question is unknown. People’s perception of their own health has been shown to be a powerful, independent predictor of their survival in several populations, including older Australians.64,65,66 This association of self rated health and objective health stands even after controlling for demographic factors, a range of illnesses, disability, personality and social supports.
Table 1.6: Self reported quality of life and self rated health (proportion; 95%CI) by sex, age, accessibility and socioeconomic disadvantage, Queensland 2002
Source: QH Social capital survey 2002
Quality of life Self reported health Satisfaction with health
Very good or goodExcellent, very good
or good Very satisfied, satisfied
Persons 18+ 91.5 (90.3-92.6) 86.4 (85.0-87.8) 78.7 (77.0-80.4)Male 18+ 90.4 (88.7-92.1) 85.6 (83.6-87.7) 79.5 (77.1-81.9)
Female 18+ 92.6 (91.0-94.7) 87.2 (85.1-89.1) 78.0 (75.5-80.4)
Male 18-29 95.9 (93.6-98.2) 87.5 (83.7-91.4) 79.9 (75.3-84.6)30-64 89.7 (87.0-91.3) 86.2 (84.0-88.8) 79.0 (76.2-81.9)65+ 82.7 (77.1-88.2) 71.4 (64.8-78.1) 77.0 (70.8-80.0)
Female 18-29 95.3 (92.8-97.8) 85.7 (81.6-88.9) 74.0 68.7-76.1)30-64 92.2 (90.3-94.1) 88.9 (86.7-91.1) 80.2 (77.5-83.0)65+ 87.3 (82.9-91.8) 78.6 (73.2-84.1) 71.8 (65.8-77.8)
Accessability Urban 91.8 (90.5-93.1) 86.4 (84.7-88.1) 78.5 (76.5-80.5)Rural 90.3 (87.7-92.8) 86.0 (83.1-89.0) 78.5 (74.9-82.0)Remote 92.3 (87.0-92.3) 87.5 (80.8-94.1) 83.7 (76.3-91.17)
Socioeconomic quintile 1 (least) 94.0 (91.7-96.2) 89.7 (86.8-92.5) 80.1 (76.3-83.9)disadvantage quintile 2 93.7 (91.6-95.7) 85.8 (82.8-88.8) 78.7 (75.3-82.2)
quintile 3 92.2 (89.7-94.6) 88.9 (86.0-91.8) 80.4 (76.8-84.1)quintile 4 89.9 (87.1-92.7) 86.6 (83.4-89.8) 79.8 (76.1-83.6)quintile 5 (most) 86.0 (82.5-89.7) 79.6 (75.3-83.8) 73.4 (68.7-78.1)

115
WHOLE OF POPULATION
Health Determinants Queensland 2004
Health and life satisfaction The majority of Queenslanders (78.7%) were satisfi ed with their health in 2002 (Table 1.6). Self reported satisfaction with health was generally lower for older females (aged 65 years and older) and people in areas of greater socioeconomic disadvantage than comparable groups. However, no signifi cant differences were reported across these sex, age groups, or area accessibility categories.
Queenslanders reported high levels of overall life satisfaction, and also satisfaction with feelings of safety, home and neighbourhood in 2001 (Table 1.7). Signifi cantly more males reported high levels of feelings of safety than females. Less than one third (30%) of Queenslanders reported high levels of satisfaction with their fi nancial situation. In general, more female Queenslanders reported high level of satisfaction than males. In comparison to Australians, Queenslanders reported signifi cantly lower levels of satisfaction with most of the life domains.
Older people, aged 65 years and older, were signifi cantly more likely to report higher satisfaction with life than younger people. People in remote areas of Queensland were signifi cantly more likely to report high levels of satisfaction in a number of domains including employment opportunities (72% compared with 50-53% for metropolitan and rural areas) and feelings of safety (82% compared with 68% for metropolitan and 77% for rural areas). In contrast, people in urban areas were signifi cantly less likely to report high level of satisfaction with feeling part of the community, 36% compared with 49% for metropolitan and rural areas.
Table 1.7: Satisfaction with life by domain (percentage; 95% CI) by sex, persons aged 15 years and older, Queensland and Australia 2001
Source: HILDA 2001 low = score of 1-3 on a 10 point scale, high = score 8-10
1.3.4 Activity limitation In 1998, the prevalence of severe or profound core activity limitation for all Queenslanders was 6.6%; 6.5% for females and 6.8% for males.67 Core activities comprise communication, mobility and self care. In Australia the prevalence of severe or profound activity limitation for people was similar in 1988 and 1993 (about 4%), however this rate increased to 6.1% in 1998.68,69 Much of this increase was attributed to changes in survey methods. The prevalence of severe or profound activity limitation increases markedly with advancing age (Figure 1.4).
One in fi ve (19.9%) Queenslanders reported they had a disability, including those with profound/severe, moderate or mild activity restriction, or a schooling or employment restriction. The Queensland age standardised prevalence was 20.4%, in comparison to 19.3% in Australia.67 The prevalence of disability increases markedly with advancing age (Figure 1.4).
Queensland Australia Queensland Male Queensland Female
High satisfaction
Health 62.2 (62.2-62.3) 62.5 (62.5-62.5) 62.9 (62.8-63) 61.5 (61.4-61.6)
Home 65.9 (65.8-66) 67.5 (67.5-67.5) 65.9 (65.8-66) 65.8 (65.7-65.9)
Employment opportunities 50.3 (50.2-50.4) 50.8 (50.8-50.9) 49.6 (49.5-49.7) 51.1 (51-51.2)
Financial situation 30 (29.9-30.1) 32.5 (32.5-32.5) 28.6 (28.5-28.6) 31.6 (31.5-31.7)
Feelings of safety 69.9 (69.8-70) 68.2 (68.2-68.2) 73.5 (73.4-73.6) 65.9 (65.9-66)
Feeling part of community 38.7 (38.6-38.7) 40.2 (40.1-40.2) 36.9 (36.8-37) 40.6 (40.5-40.7)
Neighbourhood 69.6 (69.5-69.6) 69.3 (69.3-69.4) 69.3 (69.3-69.4) 69.8 (69.7-69.9)
Free time 38.9 (38.9-39) 39.1 (39.1-39.1) 37.6 (37.5-37.7) 40.4 (40.3-40.5)
Overall life satisfaction 67.4 (67.3-67.4) 67.7 (67.7-67.7) 66.5 (66.5-66.6) 68.2 (68.1-68.3)
Low satisfaction
Health 4 (4-4) 3.3 (3.3-3.3) 3.5 (3.5-3.6) 4.5 (4.5-4.6)
Home 5.2 (5.1-5.2) 3.5 (3.5-3.5) 4.8 (4.8-4.9) 5.6 (5.5-5.6)
Employment opportunities 11.3 (11.3-11.4) 9.5 (9.5-9.5) 11.5 (11.5-11.6) 11.1 (11.1-11.2)
Financial situation 16.5 (16.4-16.5) 13.1 (13-13.1) 16.4 (16.3-16.4) 16.6 (16.5-16.7)
Feelings of safety 2.6 (2.6-2.6) 2.6 (2.6-2.7) 2 (2-2) 3.3 (3.2-3.3)
Feeling part of community 10.2 (10.2-10.2) 8.9 (8.8-8.9) 9.8 (9.7-9.8) 10.7 (10.6-10.7)
Neighbourhood 4 (4-4) 2.6 (2.6-2.6) 4.4 (4.3-4.4) 3.6 (3.5-3.6)
Free time 16.3 (16.3-16.4) 15.9 (15.9-16) 16 (16-16.1) 16.7 (16.6-16.7)
Overall life satisfaction 0.8 (0.8-0.8) 0.9 (0.9-0.9) 0.8 (0.8-0.8) 0.8 (0.8-0.8)

116 Health Determinants Queensland 2004
WHOLE OF POPULATION
From a more recent Australian survey in 2002,63 12.5% of Australians reported a disability or long term health condition (with core activity limitation). The prevalence of such disability was 20.7% for people born in non English speaking countries and who were not profi cient in English. This compares with 12.6% in Australian born people, 13.6% in those born in mainly English speaking countries, and 9.2% in people who were born in non English speaking countries but had good profi ciency in English. The impact of poor profi ciency in English to answer this question correctly is unknown.
Almost 2% (1.9%) of the burden of disease in Queensland for 1996-98 was attributed to adult- onset hearing loss, 70% of which was in males.49 For males aged 65 years and older, adult-onset hearing loss is the ninth leading cause of disease burden in Australia.50 In 2001, almost one in fi ve (19.7%) adult males reported partial or complete deafness, compared to 10% for females (Table 1.8). Almost 1% (0.8%) of the burden of disease in Queensland in 1996-98 was attributed to age related vision disorders, of which 78% was in females.49 For females aged 65 years and older, adult-onset hearing loss is the 8th leading cause of disease burden in Australia.50 In 2001, about half of adults reported either short or long sightedness (Table 1.8).
Figure 1.4: Age specifi c percentage of population reporting a disability and severe or profound core activity limitations, Queensland 1998
Source: ABS Disability, ageing and carers 2000
Table 1.8: Prevalence of vision and hearing loss disorders, by age and sex, Queensland 2001
Source: ABS National health survey 2001
1.3.5 National health priority area conditions The seven National Health Priority Areas (NHPA) are asthma, cancer control, cardiovascular health, diabetes mellitus, injury prevention and control, mental health, and arthritis and musculoskeletal conditions. In 1996-98, the NHPAs account for 76% of the burden of disease and injury in Queensland, as measured by disability adjusted life years (DALYs).49 The NHPAs were chosen as priorities for Australia because of the:
• importance of the ‘area’ to the community • high overall burden of disease in terms of mortality, morbidity and disability • potential for health gain through prevention or lessening of the impact • measurability of the impact of interventions undertaken in relation to the ‘area’.
This report includes indicators for key NHPA conditions, where mortality and hospital separation indicators provide useful data to assess the burden of disease attributed to the NHPA. Further information on NHPAs was reported in Health Indicators Queensland 2001.8-10
With a disability
0
20
40
60
80
100
0-4 5-14 15-24 25-34 35-44 45-54 55-59 60-64 65-69 70-74 75-79 80-84 85+
Per
cent
age
ofag
egr
oup
popu
latio
n
Profound or severe activity restriction
0
20
40
60
80
100
0-4 5-14 15-24 25-34 35-44 45-54 55-59 60-64 65-69 70-74 75-79 80-84 85+
Per
cent
age
ofag
egr
oup
popu
latio
n
0-17years
18+years Male Female
Short sightedness 3.9 25.9 22.7 29.1
Long sightedness 4.1 30.8 27.3 34.2
Deafness (complete/partial) 2.0 14.7 19.7 10.0
Persons 18+ years

117
WHOLE OF POPULATION
Health Determinants Queensland 2004
There have been substantial gains in mortality and hospital separation rates for most of the NHPAs, in the period 1989 to 2001 (Figure 1.5 and Figure 1.6). The change in mortality and hospital separation rates for each NHPA are discussed below. Age standardised rates for Torres Statistical Local Area (SLA) and areas of increasing proportion of Indigenous peoples are discussed where annual case numbers are greater then one. Due to small numbers in these SLAs for some conditions, the results should be interpreted with caution. Further discussion of the health status of Aborigines and Torres Strait Islanders is included in the Indigenous peoples chapter.
Figure 1.5: Percentage change in age standardised mortality rates for key National Health Priority Area conditions in Queensland between 1989-91 and 1999-2001
Source: ABS Cause of death Note: * ICD-9 to ICD-10 change in 1999 reduces comparability
Figure 1.6: Percentage change in age standardised hospital separation rates for key National Health Priority Area conditions in Queensland between 1989/90-91/92 and 1999/2000-01/02**
Source: Queensland hospital admitted patient data collection Note: *ICD-9-CM to ICD-10-AM change in 1999/00 reduces comparability **Trends are from 1989/90-91/92 to 1999/2000-01/02 unless specifi ed
For the total population in 2001, the rate of mortality avoidable through primary prevention is signifi cantly higher in females in Queensland, than the national average (Figure 1.7).55 In addition, Queensland has higher than the national average rates for mortality avoidable through secondary and tertiary prevention for females, and through primary, secondary and tertiary prevention for males. It was estimated in 2001, using current methodology, that 2380 deaths in Queensland males were avoidable through primary prevention interventions (143.4 deaths per 1000,000), and 1,106 deaths in females (66.3 deaths per 100,000). An additional 1,496 deaths were avoidable through secondary prevention and 1,380 through tertiary prevention. The level of overall preventable mortality is twice as high in men as women. As the highest avoidable mortality is due to primary prevention, targeted efforts to reduce overweight and obesity, increase physical activity and improve nutrition among men and women would result in signifi cant improvements in mortality.
-60 -40 -20 0 20 40
CHD (persons 0-79 yrs)
Stroke (persons 0-79 yrs)
Suicide & self-inflicted injury
Injury and poisoning
Road transport related injury
Diabetes (principle condition)
Asthma*
COPD males to 1998/98
COPD females to 1996/98
Musculoskeletal conditions-male
Musculoskeletal conditions-female
Percentage change in rates over the decade
Increasing ratesDecreasing rates
-50 -40 -30 -20 -10 0 10 20 30
CHD (persons 0-79 yrs)
Stroke (persons 0-79 yrs)
Injury and poisoning
Road transport related injury
Diabetes (principle condition) to 1997/98-99/00
Asthma*
COPD males to 1996/97-98/99
COPD females to 1996/97-98/99
Musculoskeletal conditions
Percentage change in rates over the decade
Increasing ratesDecreasing rates

118 Health Determinants Queensland 2004
WHOLE OF POPULATION
There were 116,847 potentially avoidable hospital separations in Queensland in 2001/02,70 a rate of 32.4 per 1,000 population. This rate is statistically higher than Australia as a whole. In Queensland, as in the rest of Australia, this large proportion of hospitalisations is potentially avoidable through primary, secondary and tertiary prevention. Queensland had signifi cantly higher rates of preventable separations due to dental conditions, ear, nose and throat infections, all chronic conditions, and specifi cally chronic obstructive pulmonary disease and hypertension. The rate of preventable hospital separations due to asthma in Queensland was signifi cantly less than Australia.
Figure 1.7: Primary, secondary and tertiary avoidable mortality: age standardised mortality rates by sex, Australia 2001
Source: ABS Cause of death
Cancer Cancer accounted for 19% of the burden of disease and injury in Queensland in 1996-98, as measured by DALYs.49 This section presents aggregated trends for six of the seven National Health Priority cancers: lung, colorectal (large bowel), prostate, breast, cervix and melanoma. Non-Hodgkin’s lymphoma, a National Health Priority cancer, is not reported. Additional data for age, gender and population specifi c cancers are presented in the Children, Older people and Indigenous peoples chapters. Age standardised cancer mortality and incidence rates for Queensland and 16 smaller geographic areas for 1986-98 and Queensland age specifi c mortality and incidence rates have previously been reported.8-10 Detailed information on trends are reported in Health Information Centre (Queensland Health) Information Circulars.71,72, 73
In 1999-2001, there were on average 6,247 deaths per year due to malignant neoplasms in Queensland, where males contributed 58.4% of those deaths. The age standardised mortality rate was signifi cantly higher for males than females. Between 1996 and 2001, mortality rates for all cancers changed by -1.6% per year for males and females (Figure 1.8).73 Mortality rates for all cancers in both males and females were increasing prior to the mid-1990s. Compared with other developed countries, mortality rates for the NHPA cancers in Queensland were within the middle third of the range, with the exception of melanoma.
For women, the recent mortality decline was due to decreases in mortality from breast cancer; continuing decreases in mortality from cervical and stomach cancer; and, to a lesser extent, decreases in colorectal and ovarian cancer. For men, the recent mortality decline was due to a decrease in mortality from prostate cancer; continuing decreases in lung and stomach cancer; and, to a lesser extent, colorectal cancer.
In 2001, there were 17,125 cancers diagnosed among Queenslanders, 54.4% for males. During the 1982-2001 period, incidence rates for all cancers combined have increased among females (driven by breast and lung cancer and non-Hodgkin’s lymphoma), while there has been a recent decrease in cancer incidence among males (driven by prostate, stomach and lung cancer).73
0
20
40
60
80
100
120
140
160
Primary Secondary Tertiary
Avoidable mortality category
Age
-sta
ndar
dise
dm
orta
lity
rate
per
100,
000
Queensland-Males Australia-Males Queensland-Females Australia-Females

119
WHOLE OF POPULATION
Health Determinants Queensland 2004
Figure 1.8: Annual percentage change in age standardised mortality rates for priority cancers in Queensland between 1982 and 2001*
Source: Queensland cancer registry Note: *Trends are from 1982 to 2001 unless specifi ed
While the specifi c causal pathways of cancers remain largely unclear, a large number of modifi able determinants of the condition have been identifi ed. Diet and tobacco smoking are the leading preventable determinants of cancer.74,75 Around 30% of all cancers are estimated to be preventable by dietary means.75 Other leading factors known to play a role in carcinogenesis or associated with cancer incidence are harmful alcohol consumption, physical inactivity,76 endogenous synthesis of carcinogens, pre-existing pathological conditions, and exposure to environmental hazards such as UV radiation, exogenous chemicals, and infectious agents.74
In identifying social determinants of cancer, a recent analysis of Australia-wide data on survival by geographic and socioeconomic categories indicates that people who live outside metropolitan areas and large rural centres in Australia have lower fi ve year survival rates.77 Males living in these areas had relative survival rates signifi cantly below the national average for all cancers. Females living in some of these areas were signifi cantly below the national relative survival average for lung and cervical cancer. Possible infl uences on poorer survival in these areas include relatively poorer access to and appropriateness of both primary healthcare and detection and treatment services; and the effect of greater proportion of Aboriginal and Torres Strait Islander people living in remote areas.
Lung cancer In 2001, there were 1,578 new cases of trachea, bronchus and lung cancer (lung cancer) diagnosed in Queensland, a male to female ratio of 2:1. Incidence rates in males were signifi cantly greater than in females. Between 1982 and 2001, lung cancer incidence rates continued to decrease among males (-1.5% per year) and increase among females (2.5% per year).73 Lung cancer mortality among Queensland men is 7% higher than the Australian average.
Since survival from lung cancer is poor, mortality rates have followed similar trends to those reported for incidence. That is, decreased mortality rates for men, but increased mortality for women. In 1999-2001, there were on average 1,260 deaths per year due to lung cancer in Queensland, where men accounted for 69.9% of those deaths. Between 1982 and 2001, mortality rates for lung cancer decreased annually for men (-1.4% per annum), but increased for women (2.8% per annum: Figure 1.8). In 1999-2001, mortality due to lung cancer was signifi cantly higher in males than females; in areas with greater than 10% Indigenous population; the Torres Strait; moderately accessible and remote areas; and areas of high socioeconomic disadvantage (Figure 1.9). The proportion of Indigenous population, socioeconomic disadvantage and rurality of an area are not independent factors. However, the independent effect of each factor is not clear. The greater lung cancer mortality in these areas may be partially due to an interplay between some or all of these factors. This is further discussed in the Indigenous peoples chapter and must also be considered in the implementation of interventions described in section 1.5.
-3 -2 -1 0 1 2 3
All cancers 94-01-male
All cancers 96-01-female
Lung -male
Lung-female
Colorectal 86-01-male
Colorectal-female
Breast (50-69 yrs) 94-01-female
Prostate 93-01
Melanoma-male
Melanoma -female
Cervical (females aged 20-69 yrs)
Annual percentage change in rates
Increasing ratesDecreasing rates

120 Health Determinants Queensland 2004
WHOLE OF POPULATION
More than 90% of cases of lung cancer are caused by smoking78 with incidence trends refl ecting smoking patterns more than 20 years ago. Smoking cessation leads to a marked and rapid fall in the risk of heart, stroke and vascular disease.79 Within two to fi ve years of cessation of smoking, the risk of a coronary event or stroke among former smokers approaches that of people who have never smoked.80,81
Figure 1.9: Lung cancer in total population, age standardised mortality rate by sex, socioeconomic disadvantage, accessibility and proportion Indigenous peoples, Queensland 1999-2001
Source: ABS Cause of death
Colorectal cancer In 2001, there were 2,380 new cases of colorectal cancer diagnosed in Queensland, a male to female ratio of 1.3:1. Between 1982 and 2001, colorectal cancer incidence rates increased by 1.1% per year for males (signifi cant increased) and 0.3% for females.73
In 1999-2001, on average there were 866 deaths per year due to colorectal cancer in Queensland, with men accounting for 56.4%. Mortality due to colorectal cancer has decreased in recent years. Between 1986 and 2001, mortality rates for colorectal cancer annually decreased for men and women between 1982 and 2001 (-0.6% and –1.2% per annum respectively: Figure 1.8). The mortality decline might be due to gains in case survival as a result of earlier detection and advances in clinical management. In 1999-2001, mortality due to colorectal cancer was signifi cantly higher in males than females (Figure 1.10). No statistically signifi cant differences were observed between areas of socioeconomic disadvantage, accessibility or proportion of Indigenous population.
Inadequate intake of fruit and vegetables82 and physical inactivity83 have been specifi cally linked to incidence of colorectal cancer. Little is known of the precise mechanisms whereby chemically disparate nutrients affect the development and progression of tumours at various sites.82
0
10
20
30
40
50
60
70
80
Male
Female
SEIFA
quint
ile1 (le
ast)
SEIFA
quint
ile2
SEIFA
quint
ile3
SEIFA
quint
ile4
SEIFA
quint
ile5
(mos
t)
Highly
acce
ssibl
e
Acces
sible/
mod
erat
elyac
cess
ible
Remot
e/ve
ryre
mot
e
<10
%In
digen
ous po
pulat
ion
10an
d20
%In
digen
ous po
pulat
ion
20an
d40
%In
digen
ous po
pulat
ion
>40
%In
digen
ous po
pulat
ion
Torre
s SLA
Age
stan
dard
ised
rate
(per
100,
000
popu
latio
n).

121
WHOLE OF POPULATION
Health Determinants Queensland 2004
Figure 1.10: Colorectal cancer in total population, age standardised mortality rate by sex, socioeconomic disadvantage, accessibility and proportion Indigenous peoples, Queensland 1999-2001
Source: ABS Cause of death Note: <1 case pa for Torres SLA
Breast cancer Breast cancer is the most common cancer diagnosed among women in Queensland. About 1 in 10 women in Queensland will be diagnosed with breast cancer before the age of 75, based on 2001 data.84
During 2001, there were 2,182 new cases of breast cancer diagnosed in Queensland women. Between 1982 and 2001, female breast cancer incidence rates signifi cantly increased by 2.0% per year.73 This increase in incidence is mainly due to increased screening.
In 1999-2001, there were on average 170 deaths per year due to breast cancer in Queensland women aged 50-69 years. In 1999-2001, mortality due to breast cancer in women 50-69 years was signifi cantly higher in areas of 20-40% Indigenous population in comparison to all of Queensland (Figure 1.11). In this period, mortality due to breast cancer in women 50-69 years was not signifi cantly different between areas of accessibility or socioeconomic disadvantage. Between 1982 and 1994, mortality rates for breast cancer in the total female population increased annually by 0.5%, however in the latter period 1994-2001, the mortality rate decreased annually (- 2.7% per year: Figure 1.8). These reductions in mortality are due to both regular mammography screening and better treatments, although the extent of reduction by each cause is unclear. However, many experts consider that mammography screening has made a substantial contribution to the decline in breast cancer mortality.72 The causes of breast cancer are unclear, and there is no known cure for the disease. Nine out of 10 women who get breast cancer do not have a family history of breast cancer.85
0
5
10
15
20
25
30
35
Male
Female
SEIFA
quint
ile1 (le
ast)
SEIFA
quint
ile2
SEIFA
quint
ile3
SEIFA
quint
ile4
SEIFA
quint
ile5
(mos
t)
Highly
acce
ssibl
e
Acces
sible/
mod
erat
elyac
cess
ible
Remot
e/ve
ryre
mot
e
<10
%In
digen
ous po
pulat
ion
10an
d20
%In
digen
ous po
pulat
ion
20an
d40
%In
digen
ous po
pulat
ion
>40
%In
digen
ous po
pulat
ion
Age
stan
dard
ised
rate
(per
100,
000
popu
latio
n).

122 Health Determinants Queensland 2004
WHOLE OF POPULATION
Figure 1.11: Breast cancer in women aged 50-69 years, age standardised mortality rate by sex, socioeconomic disadvantage, accessibility and proportion Indigenous peoples, Queensland 1999-2001
Source: ABS Cause of death Note: <1 case pa for areas of >40% Indigenous pop. & Torres SLA
Prostate cancer In 2001, there were 1,868 new cases of prostate cancer diagnosed in Queensland. During 1999-2001, there were on average 489 deaths per year due to prostate cancer in Queensland. Between 1982 and 1993, mortality rates for prostate cancer in the total male population increased annually by 3.9%, however, in the latter period 1993-2001, the mortality rate decreased annually; -2.7% per year (Figure 1.8). In 1999-2001, mortality due to prostate cancer was not signifi cantly different between areas of accessibility, socioeconomic disadvantage or proportion of Indigenous population (Figure 1.12).
Figure 1.12: Prostate cancer in total male population, age standardised mortality rate by socioeconomic disadvantage, accessibility and proportion Indigenous peoples, Queensland 1999-2001
Source: ABS Cause of death Note: <1 case pa for areas of >40% Indigenous pop. & Torres SLA
0
5
10
15
20
25
30
35
40
Male
SEIFA
quint
ile1 (le
ast)
SEIFA
quint
ile2
SEIFA
quint
ile3
SEIFA
quint
ile4
SEIFA
quint
ile5
(mos
t)
Highly
acce
ssibl
e
Acces
sible/
mod
erat
elyac
cess
ible
Remot
e/ve
ryre
mot
e
<10
%In
digen
ous po
pulat
ion
10an
d20
%In
digen
ous po
pulat
ion
20an
d40
%In
digen
ous po
pulat
ion
Age
stan
dard
ised
rate
(per
100
,000
popu
latio
n)
0
20
40
60
80
100
120
140
160
180
Female
SEIFA
quint
ile1 (le
ast)
SEIFA
quint
ile2
SEIFA
quint
ile3
SEIFA
quint
ile4
SEIFA
quint
ile5
(mos
t)
Highly
acce
ssibl
e
Acces
sible/
mod
erat
elyac
cess
ible
Remot
e/ve
ryre
mot
e
<10
%In
digen
ous po
pulat
ion
10an
d20
%In
digen
ous po
pulat
ion
20an
d40
%In
digen
ous po
pulat
ion
Age
stan
dard
ised
rate
(per
100,
000
popu
latio
n).

123
WHOLE OF POPULATION
Health Determinants Queensland 2004
Melanoma of the skin In 2001, there were 2,336 new cases of melanoma of the skin diagnosed in Queensland. Males continue to be more likely than females to develop the disease, with a male/female ratio of 1.4:1.0 in 2001. Between 1982 and 2001, melanoma incidence rates signifi cantly increased by 2.5% per year for males and 1.1% for females, where these increases were statistically signifi cant.73
In 1999-2001, there were on average 214 deaths per year due to melanoma in Queensland. Males accounted for 68% of those deaths. Between 1982 and 2001, mortality rates for melanoma annually increased by 1.2% for males (signifi cant increase) and 0.3% for females (Figure 1.8). In 1999-2001, mortality due to melanoma was signifi cantly higher in males than females (Figure 1.13). In this period, mortality due to melanoma was not signifi cantly different between areas of accessibility, socioeconomic disadvantage or proportion Indigenous population.
Queensland has the highest rates of melanoma incidence and mortality of any country or Australian state.2 Exposure to sunlight is the primary risk factor for both melanocytic and non-melanocytic skin cancer.86 Exposure to the sun in childhood and teenage years potentially accounts for a large proportion of skin cancer risk.87 Incidence rates of melanoma can fl uctuate according to public awareness, which makes incidence trends diffi cult to interpret. The best measures of progress in controlling this disease are mortality trends.
Figure 1.13: Melanoma of the skin in total population, age standardised mortality rate by sex, socioeconomic disadvantage, accessibility and proportion Indigenous peoples, Queensland 1999-2001
Source: ABS Cause of death Note: <1 case pa for areas of >20% Indigenous pop. & Torres SLA
Cervical cancer In 2001, there were 150 new cases of cervical cancer diagnosed in Queensland. Between 1982 and 2001, cervical cancer incidence rates signifi cantly decreased (-3.4% per year).73 In 1999-2001, there were on average 33 deaths per year due to cervical cancer in Queensland women aged 20-69 years and a total of 50 deaths per year for women of all ages. Between 1982 and 2001, mortality rates for cervical cancer for Queensland women decreased; an average rate of -2.5% per year (Figure 1.8). In 1999-2001, mortality due to cervical cancer was not signifi cantly different between areas of accessibility, socioeconomic disadvantage or proportion Indigenous population (Figure 1.14). However, the incidence of cervical cancer among women living in discreet Indigenous communities was fi ve times the Queensland average, with mortality 13 times the Queensland average.88
Regular Pap smears are known to reduce the incidence and mortality rates of invasive cervical cancer. Three out of four women who develop cancer of the cervix have not had regular two-yearly screening, or have never had a Pap smear.89
0
1
2
3
4
5
6
7
8
9
Male
Female
SEIFA
quint
ile1 (le
ast)
SEIFA
quint
ile2
SEIFA
quint
ile3
SEIFA
quint
ile4
SEIFA
quint
ile5
(mos
t)
Highly
acce
ssibl
e
Acces
sible/
mod
erat
elyac
cess
ible
Remot
e/ve
ryre
mot
e
<10
%In
digen
ous po
pulat
ion
10an
d20
%In
digen
ous po
pulat
ion
Age
stan
dard
ised
rate
(per
100,
000
popu
latio
n).

124 Health Determinants Queensland 2004
WHOLE OF POPULATION
Figure 1.14: Cervical cancer in women aged 20-69 years, age standardised mortality rate by sex, socioeconomic disadvantage, accessibility and proportion Indigenous peoples, Queensland 1999-2001
Source: ABS Cause of death Note: <1 case pa for areas of >20% Indigenous pop. & Torres SLA
Coronary heart disease Coronary heart disease (CHD) accounted for 12.4% of the burden of disease and injury in Queensland in 1996-98, as measured by DALYs.49 CHD is the largest cause of burden of disease in Queensland and Australia.
Among people aged 0-79 years, there were on average 2,387 deaths per year due to CHD in Queensland in 1999-2001. Men accounted for 68% of those deaths. In 1999-2001, mortality due to CHD was signifi cantly higher in males than females; in areas with greater than 20% Indigenous population; the Torres Strait; moderately accessible and remote areas; and areas of high socioeconomic disadvantage (Figure 1.15). The proportion of Indigenous population, socioeconomic disadvantage and rurality of an area are not independent factors. However, the independent effect of each factor is not clear. The greater CHD mortality in these areas may be partially due to an interplay between some or all these factors. This is further discussed in the Indigenous peoples chapter and must also be considered when implementing interventions described in section 1.5. Between 1989-91 and 1999-2001, age standardised mortality rates due to CHD declined by 43.1% in males and by 46.1% in females, an estimated rate of -3.6% and - 3.9% per year respectively (Figure 1.5). In that period, males aged 0-79 years, remained at least twice as likely as females in the same age bracket to die of CHD. This fall in mortality has been due to both a fall in the incidence of CHD, and better survival.90 Between 1993-94 and 2000-01 the incidence of CHD for Australians aged 40 to 90 years fell 23%.91 It is estimated that about half of the dramatic decline in CHD between 1980 and 1990 is attributed to reductions in risk factors.
The CHD mortality rate in Queensland was 10% higher than the Australian average in 1997-99, and Queensland has the highest rate of CHD of all the Australian states.92 The mortality rate due to CHD in Australia ranked 15th highest, when compared with 30 other developed countries, and were about fi ve times that of Korea (which had the lowest rate) and about three times those of Japan and France.55
0
1
2
3
4
5
6
7
8
9
Female
SEIFA
quint
ile1 (le
ast)
SEIFA
quint
ile2
SEIFA
quint
ile3
SEIFA
quint
ile4
SEIFA
quint
ile5
(mos
t)
Highly
acce
ssibl
e
Acces
sible/
mod
erat
elyac
cess
ible
Remot
e/ve
ryre
mot
e
<10
%In
digen
ous po
pulat
ion
10an
d20
%In
digen
ous po
pulat
ion
Age
stan
dard
ised
rate
(per
100,
000
popu
latio
n).

125
WHOLE OF POPULATION
Health Determinants Queensland 2004
Figure 1.15: Coronary heart disease in persons aged 0-79 years, age standardised mortality rate by sex, socioeconomic disadvantage, accessibility and proportion Indigenous peoples, Queensland 1999-2001
Source: ABS Cause of death
In the three years 1999/2000-01/02, there were on average 25,668 hospital separations each year due to CHD among 0-79 year olds, 68% for males. Between 1989/91-91/92 and 1999/2000- 01/02, age standardised hospital separation rates due to CHD increased by 24.4% in males and 24.6% in females, at an estimated rate of 4.6% per year for males and females (Figure 1.6). An estimated 25-30% of hospitalisations for CHD are for second, third or fourth CHD events.93
The burden of CHD in Queensland is further discussed in the Indigenous peoples and Older people chapters. Age standardised CHD mortality and hospital separation rates for Queensland and 16 smaller geographic areas for 1986-98, and Queensland age specifi c mortality and hospital separation rates have previously been reported.8-10
There is convincing epidemiological evidence that there are substantial opportunities to reduce CHD mortality and morbidity rates through life style changes to tobacco smoking, nutrition and physical activity. These changes can both prevent these diseases and reduce the incidence of further events or death in people with existing disease. About 40% of the current deaths and more than 30% of hospital episodes can be avoided through better use of existing knowledge.55 The MONICA studies show that mortality rates from CHD in Australia are not going to be reduced to the levels of Southern Europe through improved hospital treatment services,93 as the standards of hospital care in Australia are already world class. A recent Cochrane systematic review concluded that dietary advice to those with cardiovascular disease can reduce mortality and morbidity, as well as modify risk factors.94 Specifi cally, following dietary intervention, a 72% reduction in cardiac deaths and non-fatal CHD events was reported.95
Key risk factors for CHD are overweight and obesity, smoking, high blood cholesterol, inadequate vegetable and fruit consumption, physical inactivity and hypertension. There is a continuous association between risk of CHD and healthy and excess weight (as assessed by body mass index),96 serum cholesterol,96 fruit and vegetable intake97 and diastolic blood pressure.96 In addition, there is strong and consistent evidence of an independent causal association between depression, social isolation, work-related stressors (job control, demands and strain) and lack of quality of social support, and causes and prognosis of CHD.98 The increased risk contributed by these psychosocial factors is of similar order to the more conventional CHD risk factors, such as smoking, dyslipidaemia and hypertension. These risk and protective factors are all discussed in the sections below.
Along with Queensland having the highest rate of CHD of all the Australian states,92 Queensland has correspondingly high rates of smoking, overweight and physical inactivity. A steady increase in the proportion of Australians and Queenslanders who were overweight was noted in the 1980s and this has continued. As overweight children are more likely to develop chronic diseases such as CHD, type 2 diabetes and some forms of cancer,99 CHD prevention must include prevention of unhealthy weight in children and young people. The Children and Young people chapters discuss this further.
0
20
40
60
80
100
120
140
160
Male
Female
SEIFA
quint
ile1 (le
ast)
SEIFA
quint
ile2
SEIFA
quint
ile3
SEIFA
quint
ile4
SEIFA
quint
ile5
(mos
t)
Highly
acce
ssibl
e
Acces
sible/
mod
erat
elyac
cess
ible
Remot
e/ve
ryre
mot
e
<10
%In
digen
ous po
pulat
ion
10an
d20
%In
digen
ous po
pulat
ion
20an
d40
%In
digen
ous po
pulat
ion
>40
%In
digen
ous po
pulat
ion
Torre
s SLA
Age
stan
dard
ised
rate
(per
100,
000
popu
latio
n).

126 Health Determinants Queensland 2004
WHOLE OF POPULATION
Stroke Stroke accounted for 5.0% of the burden of disease and injury in Queensland in 1996-98 (12.4% CHD and 5.0% stroke), as measured by DALYs.49
In Queensland in 1999-2001, there were on average 726 deaths per year due to stroke among people aged 0-79 years, where males accounted for 54% of deaths. In 1999-2001, mortality due to stroke was signifi cantly higher in males than females; in areas with greater than 40% Indigenous population; and remote areas (Figure 1.16). Between 1989-91 and 1999-2001, there was a decline in stroke mortality for both males (39.0%) and females (43.0%). The decline occurred at a rate of -4.8% per year for males and -5.5% for females (Figure 1.5). The mortality rates for stroke in Queensland are similar to the Australian average for both males and females.2
Figure 1.16: Stroke in persons aged 0-79 years, age standardised mortality rate by sex, socioeconomic disadvantage, accessibility and proportion Indigenous peoples, Queensland 1999-2001
Source: ABS Cause of death
There were on average 6,056 hospital separations due to stroke for Queenslanders aged 0-79 years in 1999/2000-01/02, 59% for males. In the period from 1989/90-91/92 to 1999/2000-01/02, stroke separation rates declined by 17.6% in males and 18.8% in females, annual rates of -1.6% and -1.7% respectively (Figure 1.6). Hypertension is the single most important risk factor for stroke.100
The risk of stroke can be reduced by up to 30% through participation in moderate levels of physical activity.101 There is a continuous association between healthy and excess levels of diastolic blood pressure and risk of haemorrhagic and ischaemic stroke.102 Age standardised stroke mortality and hospital separation rates for Queensland and 16 smaller geographic areas for 1986-98, and Queensland age specifi c mortality and hospital separation rates have previously been reported.8-10
Hypertension In Australia in 1996, hypertension was the cause of 5.1% of the total burden for males and 5.8% for females.49
The prevalence of untreated hypertension, as assessed through clinical measurement in 2000, in Queensland males aged 25 years and older was 16.0%, and 12.0% prevalence of treated hypertension (Table 1.9). For females, the prevalence of untreated hypertension was 8.7%, and 13.7% for treated hypertension. Untreated and treated hypertension rates in Queensland were similar to Australia. Untreated and treated hypertension prevalence increases markedly with age, with prevalence higher in males than females in all age groups. The proportion of treated hypertension of total prevalence in males was 40% and in females 58%, where these ratios were similar in all age groups. Over the period 1980-99, the prevalence of measured high blood pressure in Australia declined steadily for both males and females. In males, prevalence more than halved, from 46.7% to 21.3%. In females, prevalence dropped by half, from 31.7% to 16.4%.
0
10
20
30
40
50
60
Male
Female
SEIFA
quint
ile1 (le
ast)
SEIFA
quint
ile2
SEIFA
quint
ile3
SEIFA
quint
ile4
SEIFA
quint
ile5
(mos
t)
Highly
acce
ssibl
e
Acces
sible/
mod
erat
elyac
cess
ible
Remot
e/ve
ryre
mot
e
<10
%In
digen
ous po
pulat
ion
10an
d20
%In
digen
ous po
pulat
ion
20an
d40
%In
digen
ous po
pulat
ion
>40
%In
digen
ous po
pulat
ion
Torre
s SLA
Age
stan
dard
ised
rate
(per
100,
000
popu
latio
n).

127
WHOLE OF POPULATION
Health Determinants Queensland 2004
Table 1.9: Prevalence of treated and untreated hypertension by age and sex, Australia and Queensland 2000
Source: AusDiab 2000
Considering categories of hypertension, the prevalence of borderline mild hypertension, as assessed through clinical measurement in 2000, in Queenslanders aged 25 years and older was 13.3% for males and 7.4% for females (Table1.10). Mild hypertension prevalence (above borderline) was 3.9% for males and 2.3% for females, and moderate and severe hypertension prevalence was 0.9% for males and 0.2% for females. Prevalence of all hypertension categories increases markedly with age, with male prevalence higher than female prevalence in all age groups.
In 1998, more than one fi fth of adult Queenslanders aged 18 years and older (22.1%) reported having been diagnosed with hypertension at any stage of their lives. This included 16.1% chronic, 2.9% temporary and 3% during pregnancy. A third of these people had been advised by their doctor to modify their diet or initiate physical activity to control their hypertension.103
The factors contributing to high blood pressure include stress,104 obesity, alcohol misuse, physical inactivity, high dietary salt intake and nutrition patterns which involve a low intake of fruit and vegetables and a high intake of saturated fat.
Table 1.10: Prevalence of hypertension by severity (clinical and self report) by age and sex, Queensland 1998, 2000
Source: Clinical measurement - AusDiab 2000 Self report - QH Omnibus 1998
Male FemaleUntreated Treated Untreated Treated Untreated Treated Untreated Treated
25+ 19.1 11.5 16 12 25+ 11.8 15.3 8.7 13.7
25-34 7 0 7.6 0 25-34 2.7 1.2 2 0
35-44 14 2.9 8 0.8 35-44 4.3 3.2 6.3 3
45-54 20 10.5 16.9 14.5 45-54 11.1 11.9 8.6 7.1
55-64 26.3 20.5 24.5 22 55-64 21.1 21.7 16 21.3
65-74 33.3 34.5 28.3 34.5 65-74 25.1 41.8 20.2 44.1
75+ 44.8 33.3 40.2 35.6 75+ 25.8 48.7 14.7 48.2
QueenslandAustralia Queensland Australia
Self report (%)
Borderline mildhypertension
Mild (aboveborderline)
hypertension
Moderate andsevere
hypertensionHypertension
Male 25+ 13.3 3.9 0.9 17.4Female 25+ 7.4 2.3 0.2 17.5
Male 25-34 6.7 0.9 0.0 7.535-44 4.9 1.9 1.4 11.945-54 16.4 3.3 0.0 19.255-64 27.5 3.3 0.0 29.465-74 27.4 11.6 3.4 33.475+ 28.4 28.5 5.6 25.8
Female 25-34 2.0 0.0 0.0 5.935-44 2.7 1.0 0.0 8.545-54 8.4 0.8 0.0 20.355-64 15.1 4.6 0.7 27.165-74 22.3 13.0 1.0 39.575+ 22.7 5.1 0.0 36.0
Prevalence (%) of clinical hypertension

128 Health Determinants Queensland 2004
WHOLE OF POPULATION
Mental health Mental disorders accounted for 13.0% of the burden of disease and injury in Queensland in 1996-98, as measured by DALYs.49 Almost the entire burden of disease due to mental disorders relates to years of life lost due to disability (96%), rather than mortality. Mental disorders were the leading cause of disability burden in Queensland, accounting for 26.7% of the burden. Affective disorders (including depression and bipolar affective disorder) were the largest specifi c cause of disability within mental disorders among males and females, accounting for 35% of the total burden attributed to mental disorders.50
Mental health is the embodiment of social, emotional and spiritual wellbeing. Mental health provides individuals with the vitality necessary to achieve goals and to interact with one another in ways that are respectful and just.105 There is evidence that having strong social support, being free from discrimination and violence, and having a satisfying job provides protection for mental health and wellbeing.106 Unemployed people and people who are socially isolated have higher prevalence of mental health disorders than do people who are employed and socially connected.106 It is widely accepted that experiences in childhood and negotiation of life changes have profound effects on mental health across the life span. However these effects can be minimised within a strong and supportive community environment. In addition, there is strong and consistent evidence of an independent causal association between depression, social isolation, work-related stressors (job control, demands and stress), and causes and prognosis of coronary heart disease (CHD).98 The increased risk contributed by these psychosocial factors is of similar order to the more conventional CHD risk factors, such as smoking, dyslipidaemia and hypertension.
It is acknowledged that mental illness results from complex causal interactions and is infl uenced by a number of risk and protective factors, as discussed in section 1.4.3; Community Capacity indicators. However, there is not an established standard set of indicators with which to measure and monitor these factors. Work is currently underway at national and state levels to defi ne indicative data, integrate data collection tools and coordinate information systems. This section reports on available indicators of incidence and prevalence of mental disorders and illnesses in Queensland.
Mental disorders have defi ned diagnostic criteria that must be met for a disorder to be diagnosed, including symptoms that cause clinically signifi cant impairment in ability to function. Mental health problems also affect the individual’s ability to function, but are defi ned at a lower threshold of symptoms than mental disorders.
Relatively few people die of mental disorders. In the period 1999-2001, there were on average 381 deaths per year in Queensland due to all mental disorders. Of these, organic conditions (arising from cerebral disease or brain injury) were the main cause (89% of female deaths and 62% of male deaths). In males, psychoactive substance use was the second major cause of death, with an average of 56 deaths per year (34% of total).
In contrast, there were on average 49,683 hospital separations per year in the three-year period 1999/2000-01/02 due to all mental disorders. The separation rate in females was signifi cantly higher than for males. Affective disorders including depression, mania and bipolar disorders were the major component of this burden, representing 24% of total male separations and 41% of female. Mental and behavioural disorders due to psychoactive substance use accounted for a further 24% of male and 12% of female separations. This latter group of disorders includes substance use disorders such as mental conditions due to alcohol, illicit drugs, tobacco, volatile solvents, as well as psychotic disorders following psychoactive substance use. Schizophrenia represented the third major component, accounting for 15% of male separations for mental disorders and 8% of female separations. There is a sharp rise in hospital separation rates due to all mental disorders in the teenage years with a plateau from 20-24 to 50-54 years, and a rise in older age groups (Figure 1.17). The peak in male rates in the age group 50-54 can be attributed to a peak in hospitalisation for psychoactive substance use.
The age profi le of specifi c mental conditions varies considerably and is reported in the companion document Health Determinants Queensland 2004: Statistical report. Age standardised mental disorders mortality and hospital separation rates for Queensland and 16 smaller geographic areas for 1986-98 have previously been reported.8-10 Hospital separation rates for mental disorders must be interpreted with caution as variable admission practices and access to services, re- admissions and coding methods substantially affect rates. In addition, hospital separations due to mental disorders represent a very small proportion of the burden of mental disorders in the community.

129
WHOLE OF POPULATION
Health Determinants Queensland 2004
Figure 1.17: Mental disorders in total population, age specifi c hospital separation rate by sex, Queensland 1999/2000-01/02
Source: Queensland hospital admitted patient data collection
In 1997, almost one in fi ve Queenslanders (17.2%) had a mental disorder during the 12 months prior to the survey (Table 1.11), where anxiety, affective, alcohol use and drug use disorders were the subset of mental disorders considered. Depression prevalence was 4.5% for males and 7.3% for females, where depression accounted for the majority (90%) of affective disorders in males and females (95%). The prevalence of mental disorders generally decreased with age (Figure 1.18). Young people aged 18-24 years had the highest prevalence (22%), with prevalence decreasing steadily to 7% for those aged 65 years and older. The overall prevalence of mental disorders was similar for both males and females between Brisbane and the rest of the state. Queenslanders born in non English speaking countries were more likely to report anxiety and affective disorders than those born in Australia,107 based on point estimates, although due to small relatively small numbers these differences should be interpreted with caution.
Table 1.11: Prevalence of mental disorders and physical conditions, in persons aged 18 years and older by sex, Queensland and Australia 1997
Source: ABS Survey of mental health and wellbeing 1997 *Individuals may report multiple disorders
While males and females had similar overall prevalence of the mental disorders included in the survey, there were differences by type of mental disorder. Females were more likely to have experienced anxiety disorders and affective disorders. In contrast, males were more than twice as likely as females to have substance use disorders. Substance use disorders were markedly higher in young people, while affective disorders and anxiety disorders were generally maximal in the age group 25-64 (Figure 1.18). The prevalence of different types of mental disorders was similar between Brisbane and the rest of the state.
0
500
1000
1500
2000
2500
3000
3500
0-4
5-9
10-1
415
-19
20-2
425
-29
30-3
435
-39
40-4
445
-49
50-5
455
-59
60-6
465
-69
70-7
475
-79
80-8
485
+
Age
spec
ific
rate
(per
100,
000
popu
latio
n)Male Female
Male Female Persons Male Female Persons
Mental disorders total 17.4 18 17.7 17.6 16.7 17.2Anxiety disorders* 7.1 12.1 9.7 7 10.7 8.9Affective disorders* 4.2 7.4 5.8 5 7.8 6.4Substance use disorders* 11.1 4.5 7.7 11.5 4.2 7.8
Physical conditions 36.2 41.3 38.8 37 42.3 39.7
Neither 53.3 49 51.1 52.4 49.2 50.8
Australia Queensland

130 Health Determinants Queensland 2004
WHOLE OF POPULATION
Figure 1.18: Prevalence of mental disorders and physical conditions in persons aged 18 years and older by age, Queensland 1997
Source: ABS Survey of mental health and wellbeing 1997
The occurrence of more than one disorder is commonly found among people with mental disorders.108 For example, in Australia in 1997, nearly one in three people with an anxiety disorder also had an affective disorder, and one in fi ve also had a substance use disorder. Comorbidity with a physical condition is also commonly found among people with mental disorders. Almost 43% of people with a mental disorder had one or more physical conditions, such as heart problems, diabetes or cancer, which is higher than the rate for Australia as a whole (39%). There is strong consensus that the impact of substance abuse on individuals with a serious mental illness such as schizophrenia is profound and has implications for assessment, the course of the illness and clinical management.109-111 The signifi cance of this area is supported by the increasing prevalence estimates of ‘dual diagnosis’,112 reported to be as high as 51% among those with psychotic disorders.113
In Queensland in 2001, a greater proportion of females (13.5%) than males (9.9%) reported high or very high levels of psychological distress over the previous four week period (Table 1.12). In all age groups under 55 years, a greater proportion of women reported high or very high levels of psychological distress than males. Females aged 18-24 years reported highest levels of psychological distress followed by 25-34 years, with the rate declining with age. Male rates varied between age groups, with peaks in the age group 25-34 years and 55-64 years, before declining in older age groups. The prevalence of high levels of psychological distress was higher in areas of most socioeconomic disadvantage. In Australia, the proportion of adults reporting high or very high levels of psychological distress in the 2001 National Health Survey (12.6%) was higher than in the 1997 Survey of Mental Health and Wellbeing (8.2%). Some of this difference may be due to methodological issues.114
The burden of mental health in Queensland is further discussed in each of the population specifi c chapters; Children, Young people, Older people and Indigenous peoples. Age standardised and age specifi c hospital separation rates for depression, dementia, bipolar affective disorders and schizophrenia in Queensland and 16 smaller geographic areas for 1992-99 have previously been reported.8-10
Table 1.12: Prevalence of high or very high levels of psychological distress, percentage of population, by age, sex, socioeconomic disadvantage and region, Queensland 2001
Source: ABS National health survey 2001
0
10
20
30
40
50
60
70
80
18-24 25-34 35-44 45-54 55-64 65+
Per
cent
age
ofpo
pula
tion
Mental disorders Physical condition Neither
0
2
4
6
8
10
12
14
16
18
18-24 25-34 35-44 45-54 55-64 65+
Per
cent
age
ofpo
pula
tion
Anxiety disorders Affective disorders Substance use disorders
type of mental disorder
Male Female Persons Male Female Persons
18+ 9.9 13.5 11.9 Major cities 9.4 13.5 11.5Inner regional 11.3 13.6 12.5
18-24 8.9 17.9 13.3 Remainder 9.9 14.9 12.325-34 15.2 17.0 16.1 Socioeconomic disadvantage35-44 8.4 16.4 12.5 Quintile 1 (least) 3.9 10.1 6.945-54 7.8 13.5 10.6 Quintile 2 5.6 12.3 9.155-64 12.1 9.9 10.9 Quintile 3 7.9 12.0 9.965-74 7.1 6.0 6.5 Quintile 4 13.0 14.8 13.975 + 5.6 7.8 6.9 Quintile 5 (most) 16.2 17.9 17.1

131
WHOLE OF POPULATION
Health Determinants Queensland 2004
Suicide Intentional injuries accounted for 3.7% of the burden of disease and injury in Queensland in 1996- 98, as measured by DALYs.49
There were on average 504 suicides per year in Queensland in 1999-2001. Men accounted for 80% of those deaths. In 1999-2001, suicide rates were signifi cantly higher in males than females; in areas with greater than 10% Indigenous population; areas of highest socioeconomic disadvantage; and, remote areas (Figure 1.19). The proportion of Indigenous population, socioeconomic disadvantage and rurality of an area are not independent factors. However, the independent effect of each factor is not clear. The greater suicide rates in these areas may be partially due to an interplay between some or all of these factors. This is further discussed in the Indigenous peoples chapter and must also be considered when implementing interventions described in section 1.5. Between 1989-91 and 1999-2001, age standardised suicide rates declined by 3.6% in males and by 1.4% in females; an estimated rate of 0.4% and 0.1% respectively per year (Figure 1.5). Suicide rates for males are greatest in the age group 20-39 years.8-10 In 1997-98, the suicide rate in Queensland was 8% higher than the national average.2
Suicide is the fi nal outcome of a complex, cumulative and interacting set of risk factors.115 Protective factors include connectedness to family and school,116 responsibility for children,117 the presence of a signifi cant other,117 personal resilience and problem solving,118 good physical and mental health119 and economic security in older age.119 There is compelling evidence that having a mental disorder places a person, whatever their age, at considerably higher risk of suicide.120 A signifi cant proportion of people (28-98%) who die by suicide are suffering from mental illness at the time. Depression is the largest single risk factor for suicide and suicidal behaviour.121 The relationship between depression and suicide becomes increasing strong with age, although depression becomes less common among Older people.120
The burden of suicide in Queensland is reported in the Indigenous peoples and Young people chapters. Age standardised mental disorders, suicide and self-infl icted injury mortality and hospital separation rates for Queensland and 16 smaller geographic areas for 1986-98 and Queensland age specifi c mortality and hospital separation rates have previously been reported.8-10
Figure 1.19: Suicide in total population, age standardised mortality rate by sex, socioeconomic disadvantage, accessibility and proportion Indigenous peoples, Queensland 1999-2001
Source: ABS Cause of death Note: <1 case pa in Torres SLA
0
10
20
30
40
50
60
70
Male
Female
SEIFA
quint
ile1 (le
ast)
SEIFA
quint
ile2
SEIFA
quint
ile3
SEIFA
quint
ile4
SEIFA
quint
ile5
(mos
t)
Highly
acce
ssibl
e
Acces
sible/
mod
erat
elyac
cess
ible
Remot
e/ve
ryre
mot
e
<10
%In
digen
ous po
pulat
ion
10an
d20
%In
digen
ous po
pulat
ion
20an
d40
%In
digen
ous po
pulat
ion
>40
%In
digen
ous po
pulat
ion
Age
stan
dard
ised
rate
(per
100,
000
popu
latio
n).
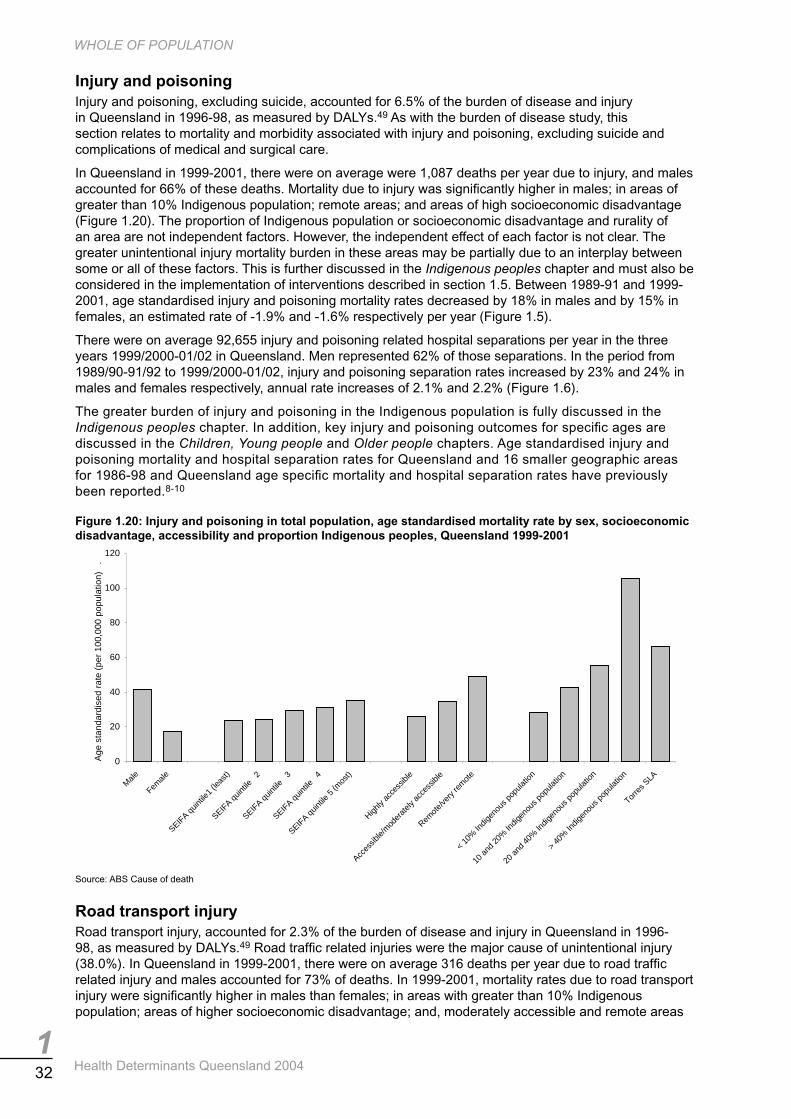
132 Health Determinants Queensland 2004
WHOLE OF POPULATION
Injury and poisoning Injury and poisoning, excluding suicide, accounted for 6.5% of the burden of disease and injury in Queensland in 1996-98, as measured by DALYs.49 As with the burden of disease study, this section relates to mortality and morbidity associated with injury and poisoning, excluding suicide and complications of medical and surgical care.
In Queensland in 1999-2001, there were on average were 1,087 deaths per year due to injury, and males accounted for 66% of these deaths. Mortality due to injury was signifi cantly higher in males; in areas of greater than 10% Indigenous population; remote areas; and areas of high socioeconomic disadvantage (Figure 1.20). The proportion of Indigenous population or socioeconomic disadvantage and rurality of an area are not independent factors. However, the independent effect of each factor is not clear. The greater unintentional injury mortality burden in these areas may be partially due to an interplay between some or all of these factors. This is further discussed in the Indigenous peoples chapter and must also be considered in the implementation of interventions described in section 1.5. Between 1989-91 and 1999-2001, age standardised injury and poisoning mortality rates decreased by 18% in males and by 15% in females, an estimated rate of -1.9% and -1.6% respectively per year (Figure 1.5).
There were on average 92,655 injury and poisoning related hospital separations per year in the three years 1999/2000-01/02 in Queensland. Men represented 62% of those separations. In the period from 1989/90-91/92 to 1999/2000-01/02, injury and poisoning separation rates increased by 23% and 24% in males and females respectively, annual rate increases of 2.1% and 2.2% (Figure 1.6).
The greater burden of injury and poisoning in the Indigenous population is fully discussed in the Indigenous peoples chapter. In addition, key injury and poisoning outcomes for specifi c ages are discussed in the Children, Young people and Older people chapters. Age standardised injury and poisoning mortality and hospital separation rates for Queensland and 16 smaller geographic areas for 1986-98 and Queensland age specifi c mortality and hospital separation rates have previously been reported.8-10
Figure 1.20: Injury and poisoning in total population, age standardised mortality rate by sex, socioeconomic disadvantage, accessibility and proportion Indigenous peoples, Queensland 1999-2001
Source: ABS Cause of death
Road transport injury Road transport injury, accounted for 2.3% of the burden of disease and injury in Queensland in 1996-98, as measured by DALYs.49 Road traffi c related injuries were the major cause of unintentional injury (38.0%). In Queensland in 1999-2001, there were on average 316 deaths per year due to road traffi c related injury and males accounted for 73% of deaths. In 1999-2001, mortality rates due to road transport injury were signifi cantly higher in males than females; in areas with greater than 10% Indigenous population; areas of higher socioeconomic disadvantage; and, moderately accessible and remote areas
0
20
40
60
80
100
120
Male
Female
SEIFA
quint
ile1 (le
ast)
SEIFA
quint
ile2
SEIFA
quint
ile3
SEIFA
quint
ile4
SEIFA
quint
ile5
(mos
t)
Highly
acce
ssibl
e
Acces
sible/
mod
erat
elyac
cess
ible
Remot
e/ve
ryre
mot
e
<10
%In
digen
ous po
pulat
ion
10an
d20
%In
digen
ous po
pulat
ion
20an
d40
%In
digen
ous po
pulat
ion
>40
%In
digen
ous po
pulat
ion
Torre
s SLA
Age
stan
dard
ised
rate
(per
100,
000
popu
latio
n).

133
WHOLE OF POPULATION
Health Determinants Queensland 2004
(Figure 1.21). The proportion of Indigenous population, socioeconomic disadvantage and rurality of an area are not independent factors. However, the independent effect of each factor is not clear. The greater road transport injury mortality in these areas may be partially due to an interplay between some or all of these factors.
This is further discussed in the Indigenous peoples chapter and must also be considered when implementing the interventions described in section 1.5. Between 1989-91 and 1999-2001, age standardised mortality rates due to road transport injury declined by 32.8% in males and by 47.5% in females; an estimated rate of -3.9% and -6.2% per year respectively (Figure 1.5). This reduction can be attributed to random breath tests, speed cameras, better roads and improved safety of motor vehicles.122
In the three years 1999/2000-01/02, there were on average 8,827 hospital separations each year due to road transport injury, 67% for males. Between 1989/91-91/92 and 1999/2000-01/02, age standardised hospital separation rates due to road transport injury decreased by 17.6% in males and by 21% in females, average annual changes of -1.9% and -2.3% respectively (Figure 1.6).
Figure 1.21: Road transport related injury in total population, age standardised mortality rate by sex, socioeconomic disadvantage, accessibility and proportion Indigenous peoples, Queensland 1999-2001
Source: ABS Cause of death Note: <1 case pa in Torres SLA
Diabetes Diabetes accounted for 3.0% of the burden of disease and injury in Queensland in 1996-98,49 and Australia in 1996,50 as measured by DALYs. If the burden of cardiovascular diseases attributable to diabetes in Australia is included with diabetes, its total attributable burden increases to 4.9%.
In Queensland in 1999-2001, there were on average 522 deaths where diabetes was the principal diagnosis. Males accounted for 53% of these deaths. In this period the ratio of deaths due to diabetes as a principal diagnosis compared with deaths due to diabetes as principal diagnosis or other diagnosis was 1:3.1. As diabetes is variably reported as an underlying cause in hospital separations and deaths, such data must be interpreted with caution. In 1999-2001, mortality rates due to diabetes as the principal diagnosis were signifi cantly higher in males than females; in areas with greater than 10% Indigenous population; the Torres Strait; areas of higher socioeconomic disadvantage; and in moderately accessible and remote areas (Figure 1.22). The diabetes mortality rate in the Torres Strait is more than 10 times that of Queensland as a whole. The proportion of Indigenous population, socioeconomic disadvantage and rurality of an area are not independent factors. However, the independent effect of each factor is not clear and thus the greater diabetes mortality in these areas may be partially due to an interplay between some or all of these factors. This is further discussed in the Indigenous peoples chapter and must also be considered in the implementation of interventions described in section 1.5. In the decade 1989-91 to 1999-2001, there was an increase of 31.5% in diabetes (principal cause) mortality for males and 8.2% for females; an annual increase of 2.8% and 0.8% per year respectively (Figure 1.5).
0
2
4
6
8
10
12
14
16
18
20
Male
Female
SEIFA
quint
ile1 (le
ast)
SEIFA
quint
ile2
SEIFA
quint
ile3
SEIFA
quint
ile4
SEIFA
quint
ile5
(mos
t)
Highly
acce
ssibl
e
Acces
sible/
mod
erat
elyac
cess
ible
Remot
e/ve
ryre
mot
e
<10
%In
digen
ous po
pulat
ion
10an
d20
%In
digen
ous po
pulat
ion
20an
d40
%In
digen
ous po
pulat
ion
>40
%In
digen
ous po
pulat
ion
Age
stan
dard
ised
rate
(per
100,
000
popu
latio
n).

134 Health Determinants Queensland 2004
WHOLE OF POPULATION
Numerous epidemiological studies have highlighted the susceptibility of certain ethnic groups to high rates of diabetes.123 In 2003, overseas-born Australians at highest risk of diabetes were those born in the South Pacifi c region, the Middle East/North Africa, Southern Asia and Southern Europe.124 Hospitalisation and death rates were highest in South Pacifi c Islanders (about twice the rates of Australian born people), followed by Middle East and North Africa. Prevalence rates, hospitalisation and death rates for diabetes varied across all groups of overseas-born people.
Queensland has similar diabetes mortality rates to the national average for both males and females. Diabetes mortality rates in Australia were in the top third when ranked against other developed countries, and were more than twice the rate of Greece, the best of the comparison countries.125
Figure 1.22: Diabetes (principal cause) in total population, age standardised mortality rate by sex, socioeconomic disadvantage, accessibility and proportion Indigenous peoples, Queensland 1999-2001
Source: ABS Cause of death Note: Y axis of different scale
There were on average 6,777 hospital separations each year in Queensland in the three years 1999/2000-01/02 due to diabetes (principal diagnosis) and 33,113 separations where diabetes was the principal or other diagnosis. In this period, the ratio of hospital separations due to diabetes as principal diagnosis compared to those due to diabetes as principal diagnosis or other diagnosis was 1:4.9. Between 1989/90-91/92 and 1997/98-99/00, there was a 32% increase in diabetes (principal diagnosis) hospital separations for males and 13% for females, an annual increase of 3.5% and 1.5% per year respectively (Figure 1.6). Changes in the practice of coding diabetes as a principal cause of hospital separations in 2000/01 preclude comparisons between the most recent period and the years preceding this change.
In 2000, an estimated 7.0% of adults aged 25 years and older in Queensland had diabetes, based on blood sugar levels.126 The prevalence of diabetes was similar in males (7.1%) and females (7.0%: Table 1.13), similar to Australia. The prevalence of diabetes increased dramatically with age. Due to methodological considerations, the data may underestimate the true prevalence of diabetes.127
In 2000, 7.9% of adults aged 18 years and older in Queensland reported that they have ever been told they have diabetes and have had a blood test to confi rm this diagnosis (Table 1.14). When gestational diabetes was excluded, the prevalence was 7.0%. Self reported diabetes prevalence was lower in males (6.8%) than in females (8.9%), where most of this difference was due to gestational diabetes in females. Self reported diabetes prevalence increased dramatically with age. Self reported diabetes prevalence generally increased with increasing socioeconomic disadvantage. Self reported diabetes prevalence has increased dramatically in the past two decades.127 This fi ve to six fold rise since 1980 may be partly due to an increase in awareness of diabetes in the community and an increase in screening levels. However, consistent with international fi ndings, this increase also partly refl ects an increase in the incidence of diabetes over this period.
The greater burden of diabetes in the Aboriginal and Torres Strait Islander populations is further discussed in the Indigenous peoples chapter. Age standardised diabetes (principal and underlying cause) mortality and hospital separation rates for Queensland and 16 smaller geographic areas for 1986-98 and Queensland age specifi c mortality and hospital separation rates have been reported previously.8-10,127
0
10
20
30
40
Male
Female
SEIFA
quint
ile1
(leas
t)
SEIFA
quint
ile2
SEIFA
quint
ile3
SEIFA
quint
ile4
SEIFA
quint
ile5
(mos
t)
Highly
acce
ssibl
e
Acces
sible/
mod
erat
elyac
cess
ible
Remot
e/ve
ryre
mot
e
Age
stan
dard
ised
rate
(per
100,
000
popu
latio
n).
0
20
40
60
80
100
120
140
160
<10
%In
digen
ous po
pulat
ion
10an
d20
%In
digen
ous po
pulat
ion
20an
d40
%In
digen
ous po
pulat
ion
>40
%In
digen
ous po
pulat
ion
Torre
s SLA
Age
stan
dard
ised
rate
(per
100,
000
popu
latio
n).
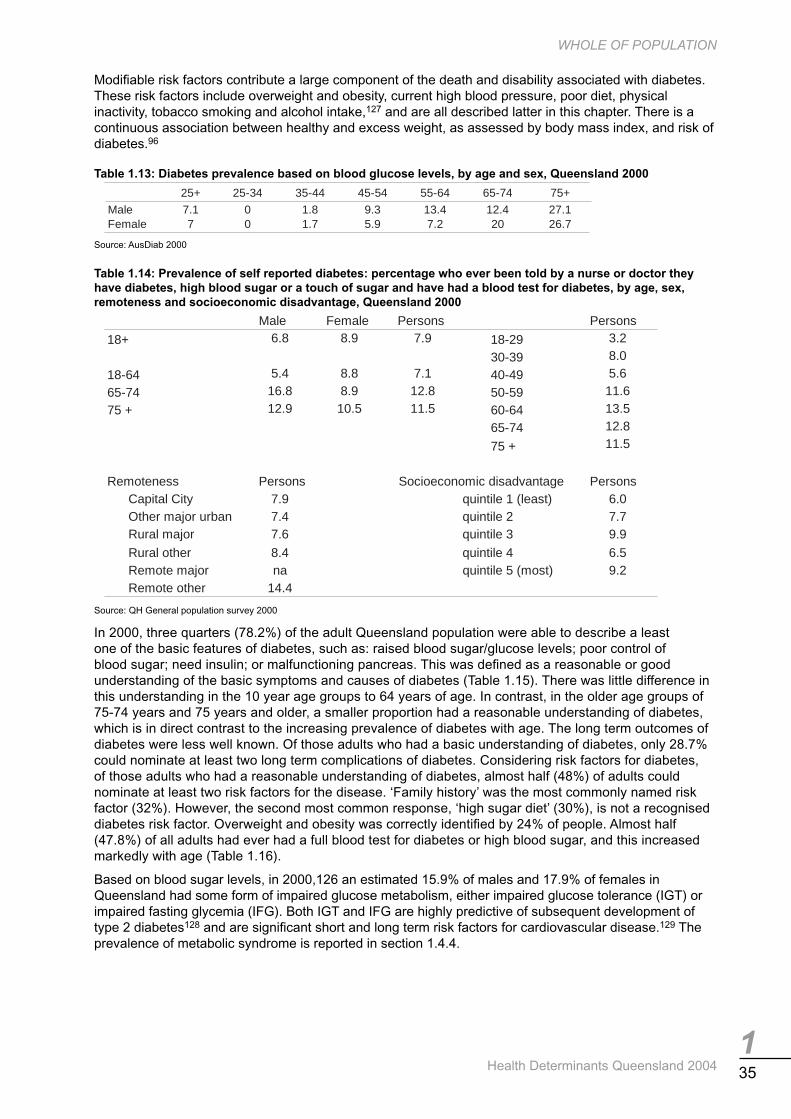
135
WHOLE OF POPULATION
Health Determinants Queensland 2004
Modifi able risk factors contribute a large component of the death and disability associated with diabetes. These risk factors include overweight and obesity, current high blood pressure, poor diet, physical inactivity, tobacco smoking and alcohol intake,127 and are all described latter in this chapter. There is a continuous association between healthy and excess weight, as assessed by body mass index, and risk of diabetes.96
Table 1.13: Diabetes prevalence based on blood glucose levels, by age and sex, Queensland 2000
Source: AusDiab 2000
Table 1.14: Prevalence of self reported diabetes: percentage who ever been told by a nurse or doctor they have diabetes, high blood sugar or a touch of sugar and have had a blood test for diabetes, by age, sex, remoteness and socioeconomic disadvantage, Queensland 2000
Source: QH General population survey 2000
In 2000, three quarters (78.2%) of the adult Queensland population were able to describe a least one of the basic features of diabetes, such as: raised blood sugar/glucose levels; poor control of blood sugar; need insulin; or malfunctioning pancreas. This was defi ned as a reasonable or good understanding of the basic symptoms and causes of diabetes (Table 1.15). There was little difference in this understanding in the 10 year age groups to 64 years of age. In contrast, in the older age groups of 75-74 years and 75 years and older, a smaller proportion had a reasonable understanding of diabetes, which is in direct contrast to the increasing prevalence of diabetes with age. The long term outcomes of diabetes were less well known. Of those adults who had a basic understanding of diabetes, only 28.7% could nominate at least two long term complications of diabetes. Considering risk factors for diabetes, of those adults who had a reasonable understanding of diabetes, almost half (48%) of adults could nominate at least two risk factors for the disease. ‘Family history’ was the most commonly named risk factor (32%). However, the second most common response, ‘high sugar diet’ (30%), is not a recognised diabetes risk factor. Overweight and obesity was correctly identifi ed by 24% of people. Almost half (47.8%) of all adults had ever had a full blood test for diabetes or high blood sugar, and this increased markedly with age (Table 1.16).
Based on blood sugar levels, in 2000,126 an estimated 15.9% of males and 17.9% of females in Queensland had some form of impaired glucose metabolism, either impaired glucose tolerance (IGT) or impaired fasting glycemia (IFG). Both IGT and IFG are highly predictive of subsequent development of type 2 diabetes128 and are signifi cant short and long term risk factors for cardiovascular disease.129 The prevalence of metabolic syndrome is reported in section 1.4.4.
25+ 25-34 35-44 45-54 55-64 65-74 75+
Male 7.1 0 1.8 9.3 13.4 12.4 27.1Female 7 0 1.7 5.9 7.2 20 26.7
Male Female Persons Persons
18+ 6.8 8.9 7.9 18-29 3.2
30-39 8.0
18-64 5.4 8.8 7.1 40-49 5.6
65-74 16.8 8.9 12.8 50-59 11.6
75 + 12.9 10.5 11.5 60-64 13.5
65-74 12.8
75 + 11.5
Remoteness Persons PersonsCapital City 7.9 quintile 1 (least) 6.0Other major urban 7.4 quintile 2 7.7Rural major 7.6 quintile 3 9.9
Rural other 8.4 quintile 4 6.5Remote major na quintile 5 (most) 9.2Remote other 14.4
Socioeconomic disadvantage

136 Health Determinants Queensland 2004
WHOLE OF POPULATION
Table 1.15: Diabetes knowledge; percentage who have a reasonable/good idea of what diabetes is, by age and sex, Queensland 2000
Source: QH General population survey 2000
Table 1.16: Diabetes blood test; percentage who have ever had a full blood test for diabetes or for high blood sugar (not just a fi nger prick test), by age and sex, Queensland 2000
Source: QH General population survey 2000
Asthma Asthma accounted for 2.8% of the burden of disease and injury in Queensland in 1996-98, as measured by DALYs.49 Years of life lost due to disability account for the majority of the burden of disease due to asthma (87%).
There were on average 72 deaths per year due to asthma in Queensland in 1999-2001, where males accounted for 36% of those deaths. Between 1989-91 and 1999-2001, age standardised asthma mortality rates declined by 63% in males and 56% in females, an estimated rate of -9.6% and -7.9% respectively per year (Figure 1.5). However, this decrease must be interpreted with caution as the international classifi cation for diseases changed in 1999 from ICD-9 to ICD-10 and the comparability ratio for asthma across these classifi cations was less than 1 (Table 1.83). Furthermore, caution must be used in the interpretation of this data, as recording of asthma on death certifi cates is known to be problematic.
There were on average 8,088 asthma hospital separations per year in the three year period 1999/2000-01/02. Males represented 46% of those separations. Hospital separations due to asthma were signifi cantly higher in females than males; in areas of greater than 10% Indigenous population; Torres SLA: moderately accessible and remote areas; and areas of higher socioeconomic disadvantage (Figure 1.23). In the period from 1989/90-91/92 to 1999/2000-01/02, asthma separation rates decreased by 48% in males and 42% in females; annual rates of -6.3% and -5.3% respectively (Figure 1.6). Again this change must be interpreted with caution, as the disease group classifi cation change from version 9 to version 10 reduced comparability of asthma rates over the reporting period.
The large burden of asthma for children is more fully discussed in the Children chapter. Age standardised asthma mortality and hospital separation rates for Queensland and 16 smaller geographic areas for 1986-98 and Queensland age specifi c mortality and hospital separation rates have been reported previously.8-10
Male Female Persons
18+ 77.3 79.0 18-29 79.0
18-64 78.7 81.8 30-39 83.9
65-74 74.5 68.0 40-49 80.9
75 + 59.7 61.2 50-59 78.3
60-64 75.2
65-74 71.2
75 + 60.6
Male Female Persons18+ 45.6 49.9 18-29 31.518-64 42.7 48.0 30-39 45.265-74 63.8 60.2 40-49 45.375 + 61.3 58.2 50-59 62.0
60-64 59.665-74 62.075 + 59.5

137
WHOLE OF POPULATION
Health Determinants Queensland 2004
Figure 1.23: Asthma in total population, age standardised hospital separation rate by sex, socioeconomic disadvantage, accessibility and proportion Indigenous peoples, Queensland 1999-2001
Source: ABS Cause of death
In 2000, 10.9% of Queenslanders aged 18 years and older reported a diagnosis of asthma that remains a current problem, as determined by symptoms or treatment for asthma in the last 12 months (Table 1.17). One in fi ve adults (21.4%) have ever been told they have asthma, 20.6% for males and 23.8% for females (Table 1.18). This diagnosis was on the basis of being told by a doctor, nurse or someone at a hospital that they had asthma. Overall, the prevalence of asthma does not differ substantially between cities, regional and remote areas, or between areas of differing socioeconomic disadvantage. It is however, higher among Indigenous adults compared to non Indigenous adults based on a recent national report.130 The self reported prevalence of asthma in Queensland is consistent with that reported nationally.130 The prevalence of asthma in Australia is high by international standards.
The environmental causes of asthma have been extensively investigated and reviewed.131-133 Exposure to environmental tobacco smoke in childhood is a recognised risk factor for the development of asthma symptoms, and also for the worsening of pre-existing asthma. Smokers with asthma have additional morbidity. Environmental and other related factors, such as diet and lifestyle, may affect the risk of acquiring asthma; change the course of the disease; or trigger attacks of airway narrowing and symptoms.
Table 1.17: Prevalence of self reported asthma: percentage who have had symptoms of asthma or been treated for asthma in the last 12 months, by age, sex and remoteness, Queensland 2000
Source: QH Chronic diseases survey 2000
0
100
200
300
400
500
600
Male
Female
SEIFA
quint
ile1 (le
ast)
SEIFA
quint
ile2
SEIFA
quint
ile3
SEIFA
quint
ile4
SEIFA
quint
ile5
(mos
t)
Highly
acce
ssibl
e
Acces
sible/
mod
erat
elyac
cess
ible
Remot
e/ve
ryre
mot
e
<10
%In
digen
ous po
pulat
ion
10an
d20
%In
digen
ous po
pulat
ion
20an
d40
%In
digen
ous po
pulat
ion
>40
%In
digen
ous po
pulat
ion
Torre
s SLA
Age
stan
dard
ised
rate
(per
100,
000
popu
latio
n).
Male Female Male Female Persons
18+ 8.1 13.7 Capital city 7.3 15.1 11.218-29 7.6 21.6 Other major urban 10.0 11.3 10.730-39 6.7 12.7 Rural major 5.2 11.7 8.840-49 6.5 14.6 Rural other 9.1 14.5 11.650-59 9.9 12.3 Remote major - 26.5 19.360-64 16.4 7.1 Remote other 16.3 19.5 17.365-74 8.9 6.575 + 8.1 6.0

138 Health Determinants Queensland 2004
WHOLE OF POPULATION
Table 1.18: Prevalence of self reported asthma: percentage who have ever been told by a doctor, nurse or at a hospital that they have asthma, by age, sex and remoteness, Queensland 2000
Source: QH Chronic diseases survey 2000
Chronic obstructive pulmonary disease Chronic obstructive pulmonary disease (COPD) accounted for 3.5% of the burden of disease and injury in Queensland in 1996-98, as measured by DALYs.49
There were on average 947 deaths per year due to COPD in Queenslanders in 1999-2001, where males accounted for 65% of those deaths. Mortality due to COPD was signifi cantly higher in males than females; in areas of high proportion of Indigenous population; moderately accessible and remote areas; and, areas of high socioeconomic disadvantage (Figure 1.24). The proportion of Indigenous population, socioeconomic disadvantage and rurality of an area are not independent factors. However, the independent effect of each factor is not clear. The greater COPD mortality in these areas may be partially due to an interplay between some or all of these factors. This is further discussed in the Indigenous peoples chapter and must also be considered when implementing the interventions described in section 1.5. Between 1989-91 and 1996-98, age standardised mortality rates due to COPD declined by 26.7% in males and increased by 13.3% in females, an estimated change of -4.3% and 1.8% per year respectively (Figure 1.5). Lack of comparability between international classifi cation of diseases versions 9 and 10 preclude comparison of mortality rates for COPD in the most recent period with rates prior to the change.
In 1999/2000-01/02, in Queensland, there were on average 9,328 hospital separations per year due to COPD, 62% for males. In the period from 1989/90-91/92 to 1996/97-98/99, there was a 9.1% decrease in hospital separations rates due to COPD for males and an increase of 13.9% in rates for females, annual changes of -1.4% and 1.9% respectively (Figure 1.6). Rates prior to the change from international classifi cation of diseases version 9 to version 10, cannot be compared with rates in the most recent period due to lack of comparability of coding for COPD between the two versions.
Age standardised COPD mortality and hospital separation rates for Queensland and 16 smaller geographic areas for 1986-98 and Queensland age specifi c mortality and hospital separation rates have been reported previously.8-10 Additional data for COPD is presented in the Older people chapter.
Figure 1.24: COPD in total population, age standardised mortality rate by sex, socioeconomic disadvantage, accessibility and proportion Indigenous peoples, Queensland 1999-2001
Source: ABS Cause of death Note: <1 case pa in Torres SLA
Male Female Male Female
18+ 20.6 23.8 Capital city 19.4 25.918-29 24.6 32.8 Other major urban 23.6 21.130-39 21.1 23.2 Rural major 16.4 20.440-49 21.3 24.9 Rural other 21.5 24.250-59 18.3 21.6 Remote major 0.0 26.560-64 21.8 16.7 Remote other 34.2 38.965-74 13.7 12.875 + 14.5 16.5
0
10
20
30
40
50
60
Male
Female
SEIFA
quint
ile1 (le
ast)
SEIFA
quint
ile2
SEIFA
quint
ile3
SEIFA
quint
ile4
SEIFA
quint
ile5
(mos
t)
Highly
acce
ssibl
e
Acces
sible/
mod
erat
elyac
cess
ible
Remot
e/ve
ryre
mot
e
<10
%In
digen
ous po
pulat
ion
10an
d20
%In
digen
ous po
pulat
ion
20an
d40
%In
digen
ous po
pulat
ion
>40
%In
digen
ous po
pulat
ion
Age
stan
dard
ised
rate
(per
100,
000
popu
latio
n).

139
WHOLE OF POPULATION
Health Determinants Queensland 2004
Musculoskeletal disease Musculoskeletal diseases accounted for 3.6% of the burden of disease and injury in Queensland in 1996-98, as measured by DALYs.49 Osteoarthritis is the cause of 63% of the burden attributed to musculoskeletal diseases. Almost the entire burden due to musculoskeletal diseases relates to years of life lost due to disability (92.4%), rather than mortality.
In Queensland, there were on average 152 deaths per year due to musculoskeletal diseases (including osteoporosis, rheumatism and osteoarthritis) in the period 1999-2001, with 88% of these in people 65 years and older. Females accounted for 66% of all deaths due to musculoskeletal disease, both in the total population and in Older people. Between 1989-91 and 1999-2001, age standardised mortality rates due to musculoskeletal diseases increased by 2.3% in males and decreased by 13.6% in females, an increase of 0.2% per year in males and decrease of 1.5% per year in females over the decade (Figure 1.5). In the period 1999/2000- 01/02, there were on average 53,851 hospital separations per year due to musculoskeletal diseases, and of these 52% were for males. Thirty one per cent of all separations in this period were in the age group 65 years and older. In the decade, 1989/90-91/92 to 1999/2000-01/02, there was an increase in hospital separations due to musculoskeletal diseases of 13.4% for males and 9.4% for females (Figure 1.6).
In 2001, one in three Queenslanders reported a long-standing musculoskeletal condition (six months or greater: Table 1.19). Back pain and neck/disc disorders were the most prevalent conditions reported. Arthritis was reported by one in seven people and was more prevalent in females than males, people living in regional Australia, people living in areas of greater socioeconomic disadvantage and among healthcare card-holders (Table 1.20). Prevalence of arthritis was similar in people born in Australia and those born overseas, and between those who spoke English only at home or those whose main language spoken at home was not English.
Regular physical activity is necessary for maintaining normal muscle strength, joint structure and joint function.134 Physical activity has a benefi cial effect on bone development and the maintenance of bone density.135,136 Participation in physical activity throughout life can maintain and reduce the decline in musculoskeletal health associated with ageing.137
Table 1.19: Prevalence of musculoskeletal disease as a long term condition, percentage of population, Queensland and Australia 2001
Source: ABS National health survey 2001
Table 1.20: Prevalence of arthritis as a long term condition, percentage of population by selected sociodemographic indicators, Queensland 2001
Source: ABS National health survey 2001 *Includes small number of not known card status
Queensland AustraliaTotal musculoskeletal disease 33.7 32.0
Arthritis 14.1 13.6Rheumatism 1.1 1.3Back pain/problems neck/disc disorders 22.8 20.8Osteoporosis 1.6 1.6Other 4.6 5.0
Male Female Male FemaleCountry of birth Socioeconomic disadvantage
Australia 11.5 15.4 Most 12.9 18.4Overseas 12.8 15.9 Least 8.6 11.0
Main language spoken at home Government health cardEnglish only 15.9 21.1 With card 31.4 29.5Language other than English 15.7 16.8 Without card* 5.6 8.0
LocationMajor cities of Australia 10.7 14.9Inner regional Australia 13.2 18.1Outer regional Australia/other areas 12.7 14.0

140 Health Determinants Queensland 2004
WHOLE OF POPULATION
1.3.6 Health behaviour outcomes The effect of a health determinant on mortality and hospital separation rates is estimated using aetiological fractions.138,139 An aetiological fraction is the estimated proportion of cases of the disease that would be eliminated in the absence of the risk factor. Aetiological fractions are available only for four health behaviours: risky alcohol consumption, tobacco smoking, illicit drug use and physical inactivity.
Alcohol In 1999-2001, there were on average 812 deaths per year attributed to hazardous and harmful alcohol consumption in Queensland, of which 74% were male. The risk of death attributed to hazardous and harmful alcohol consumption increases with age for both men and women, with a steep rise from age 60-64 years (Figure 1.25). However, the mortality rate gap between males and females is obvious from youth and widens from age 50-54 years. Mortality rates due to hazardous or harmful alcohol consumption were signifi cantly higher in males than females; in socioeconomically disadvantaged areas than advantaged areas; in remote and very remote areas than in accessible or highly accessible areas in Queensland; and, in areas with greater than 10% Indigenous population (Figure 1.26). Of the deaths attributed to risky alcohol consumption, suicide was the leading cause (19%), followed by alcoholic liver cirrhosis (15%) and oesophageal cancer (9.4%). In women alone however, breast cancer was the leading cause of deaths attributed to risky alcohol consumption, accounting for 22% of cases.
Figure 1.25: Hazardous and harmful alcohol consumption; age specifi c mortality and hospital separation rates by sex, Queensland 1999-2001 and 1999/2000-01/02, respectively
Source: ABS Cause of death Source: Queensland hospital admitted patient data collection
Figure 1.26: Deaths attributed to hazardous and harmful alcohol consumption; age standardised mortality rates by sex, socioeconomic advantage/disadvantage*, accessibility and proportion Indigenous peoples, Queensland 1999-2001
Source: ABS Cause of death *ABS Index of relative socioeconomic advantage/disadvantage 2001
Mortality
0
50
100
150
200
250
0-4
5-9
10-1
415
-19
20-2
425
-29
30-3
435
-39
40-4
445
-49
50-5
455
-59
60-6
465
-69
70-7
475
-79
80-8
485
+
Age
spec
ific
rate
(per
100,
000
popu
latio
n)
Male Female
Hospital separations
0
500
1000
1500
2000
2500
0-4
5-9
10-1
415
-19
20-2
425
-29
30-3
435
-39
40-4
445
-49
50-5
455
-59
60-6
465
-69
70-7
475
-79
80-8
485
+
Age
spec
ific
rate
(per
100,
000
popu
latio
n)
Male Female
0
10
20
30
40
50
60
70
80
90
100
Male
Female
Socioe
cono
mic
adva
ntag
e
quint
ile4
quint
ile3
quint
ile2
Socioe
cono
mic
disad
vant
age
Highly
acce
ssibl
e
Acces
sible/
moder
ately
acce
ssibl
e
Remot
e/ve
ryre
mote
<10
%In
digen
ous po
pulat
ion
10an
d20
%In
digen
ous po
pulat
ion
20an
d40
%In
digen
ous po
pulat
ion
>40
%In
digen
ous po
pulat
ion
Torre
s SLA
Age
stan
dard
ised
rate
(per
100,
000
popu
latio
n).

141
WHOLE OF POPULATION
Health Determinants Queensland 2004
In the three years 1999/2000-01/02, there were on average 20,912 hospital separations per year attributed to hazardous and harmful alcohol consumption in Queensland, of which 66% were male. A sharp rise in rates is evident in males in the age group 15-19 years, with a similar sharp rise of smaller magnitude in female rates. This is followed by a steady increase in rates for both sexes (Figure 1.25), with males experiencing higher rates at all ages. Rates of hospitalisation for conditions attributed to risky alcohol consumption were signifi cantly higher in males; socioeconomically disadvantaged areas than advantaged areas; in remote and very remote areas than in accessible or highly accessible areas; and, in areas with greater than 10% Indigenous population (Figure 1.27). Of the hospital separations attributed to risky alcohol consumption, alcohol dependence was the leading cause (18%), followed by injuries due to falls (13%) and assault (11%).
Some 37 conditions have been identifi ed as signifi cantly affected by hazardous and harmful alcohol consumption.140,138 Using the 2001 fractions,140 which were an update on the 1995 fractions,138 it was estimated that 43% of road injuries in males aged 25 to 29 years and 34% of falls injuries in females aged 70 years and older were directly attributable to such alcohol consumption.139
Figure 1.27: Hospital separations attributed to hazardous and harmful alcohol consumption; age standardised hospital separation rates by sex, socioeconomic advantage/disadvantage*, accessibility and proportion Indigenous peoples, Queensland 1999/2000-01/02
Source: Queensland hospital admitted patient data collection *ABS Index of relative socioeconomic advantage/disadvantage 2001
Tobacco smoking In 1999-2001, there were on average 3,402 deaths per year attributed to tobacco smoking in Queensland, of which 69% were male. This represents 19% of all male deaths and 10% of all female deaths in Queensland.141 Mortality rates attributed to tobacco smoking increase dramatically with age after age 50, particularly for males (Figure 1.28), with 76% of deaths occurring in the age group 65 years and older. The greatest difference between genders is observed in the 75-79 year old group, where males are three times more likely to die of a smoking related condition than women. Mortality rates due to tobacco smoking were signifi cantly higher in males than females; socioeconomically disadvantaged areas than advantaged areas; in remote and very remote areas than in accessible or highly accessible areas; and, in areas with greater than 10% Indigenous population and Torres SLA (Figure 1.29). Lung cancer accounted for 31% of the deaths attributed to tobacco smoking, followed by CHD (22%) and COPD (21%). This pattern was evident in males and females.
0
500
1000
1500
2000
2500
3000
3500
4000
Male
Female
Socioe
cono
mic
adva
ntag
e
quint
ile4
quint
ile3
quint
ile2
Socioe
cono
mic
disad
vant
age
Highly
acce
ssibl
e
Acces
sible/
mod
erat
elyac
cess
ible
Remot
e/ve
ryre
mot
e
<10
%In
digen
ous po
pulat
ion
10an
d20
%In
digen
ous po
pulat
ion
20an
d40
%In
digen
ous po
pulat
ion
>40
%In
digen
ous po
pulat
ion
Torre
s SLA
Age
stan
dard
ised
rate
(per
100,
000
popu
latio
n).

142 Health Determinants Queensland 2004
WHOLE OF POPULATION
In 1999/2000-01/02, there were on average 30,453 hospital separations per year attributed to tobacco smoking in Queensland, of which 67% were male. Hospital separation rates increase with age due to duration of exposure, with 49% occurring in people aged 65 years and older (Figure 1.28). A steady increase in tobacco smoking related morbidity requiring hospital admission occurs from age 45-49 for both sexes, with males experiencing higher rates at all ages. Rates of hospitalisation for conditions attributed to smoking were signifi cantly higher in males; socioeconomically disadvantaged areas; remote and very remote areas; and, in areas with greater than 10% Indigenous population and Torres SLA (Figure 1.30). CHD and COPD together accounted for nearly 50% of hospital separations attributed to tobacco smoking (24% and 24% respectively), and lung cancer accounted for a further 9% of separations.
Figure 1.28: Smoking; age specifi c mortality and hospital separation rates by sex, Queensland 1999-2001 and 1999/2000-01/02, respectively
Source: ABS Cause of death Source: Queensland hospital admitted patient data collection
Figure 1.29: Deaths attributed to smoking; age standardised mortality rates by sex, socioeconomic advantage/disadvantage*, accessibility and proportion Indigenous peoples, Queensland 1999-2001
Source: ABS Cause of death *ABS Index of relative socioeconomic advantage/disadvantage 2001
Mortality
0
500
1000
1500
2000
2500
3000
0-4
5-9
10-1
415
-19
20-2
425
-29
30-3
435
-39
40-4
445
-49
50-5
455
-59
60-6
465
-69
70-7
475
-79
80-8
485
+
Age
spec
ific
rate
(per
100,
000
popu
latio
n)
Male Female
Hospital separations
0
1000
2000
3000
4000
5000
6000
7000
8000
9000
0-4 5-910-1
415-1
920-2
425-2
930-3
435-3
940-4
445-4
950-5
455-5
960-6
465-6
970-7
475-7
980-8
485+
Age
spec
ific
rate
(per
100,
000
popu
latio
n)
Male Female
0
20
40
60
80
100
120
140
160
Male
Female
Socioe
cono
mic
adva
ntag
e
quint
ile4
quint
ile3
quint
ile2
Socioe
cono
mic
disad
vant
age
Highly
acce
ssibl
e
Acces
sible/
mod
erat
elyac
cess
ible
Remot
e/ve
ryre
mot
e
<10
%In
digen
ous po
pulat
ion
10an
d20
%In
digen
ous po
pulat
ion
20an
d40
%In
digen
ous po
pulat
ion
>40
%In
digen
ous po
pulat
ion
Torre
s SLA
Age
stan
dard
ised
rate
(per
100,
000
popu
latio
n).
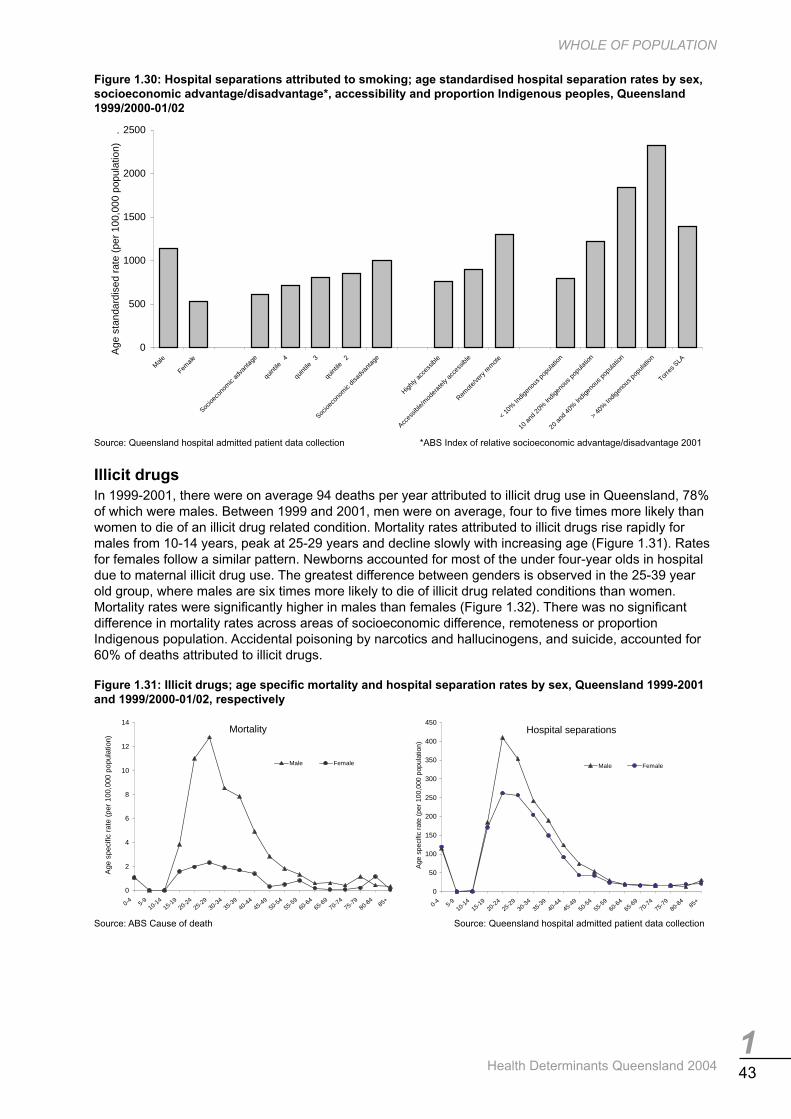
143
WHOLE OF POPULATION
Health Determinants Queensland 2004
Figure 1.30: Hospital separations attributed to smoking; age standardised hospital separation rates by sex, socioeconomic advantage/disadvantage*, accessibility and proportion Indigenous peoples, Queensland 1999/2000-01/02
Source: Queensland hospital admitted patient data collection *ABS Index of relative socioeconomic advantage/disadvantage 2001
Illicit drugs In 1999-2001, there were on average 94 deaths per year attributed to illicit drug use in Queensland, 78% of which were males. Between 1999 and 2001, men were on average, four to fi ve times more likely than women to die of an illicit drug related condition. Mortality rates attributed to illicit drugs rise rapidly for males from 10-14 years, peak at 25-29 years and decline slowly with increasing age (Figure 1.31). Rates for females follow a similar pattern. Newborns accounted for most of the under four-year olds in hospital due to maternal illicit drug use. The greatest difference between genders is observed in the 25-39 year old group, where males are six times more likely to die of illicit drug related conditions than women. Mortality rates were signifi cantly higher in males than females (Figure 1.32). There was no signifi cant difference in mortality rates across areas of socioeconomic difference, remoteness or proportion Indigenous population. Accidental poisoning by narcotics and hallucinogens, and suicide, accounted for 60% of deaths attributed to illicit drugs.
Figure 1.31: Illicit drugs; age specifi c mortality and hospital separation rates by sex, Queensland 1999-2001 and 1999/2000-01/02, respectively
Source: ABS Cause of death Source: Queensland hospital admitted patient data collection
0
500
1000
1500
2000
2500
Male
Female
Socioe
cono
mic
adva
ntag
e
quint
ile4
quint
ile3
quint
ile2
Socioe
cono
mic
disad
vant
age
Highly
acce
ssibl
e
Acces
sible/
mod
erat
elyac
cess
ible
Remot
e/ve
ryre
mote
<10
%In
digen
ous po
pulat
ion
10an
d20
%Ind
igeno
uspo
pulat
ion
20an
d40
%Ind
igeno
uspo
pulat
ion
>40
%In
digen
ous po
pulat
ion
Torre
s SLA
Age
stan
dard
ised
rate
(per
100,
000
popu
latio
n).
Mortality
0
2
4
6
8
10
12
14
0-4 5-910-14
15-1920-24
25-2930-34
35-3940-44
45-4950-54
55-5960-64
65-6970-74
75-7980-84
85+
Age
spec
ific
rate
(per
100,
000
popu
latio
n)
Male Female
Hospital separations
0
50
100
150
200
250
300
350
400
450
0-4 5-910-1
415-1
920-2
425-2
930-3
435-3
940-4
445-4
950-5
455-5
960-6
465-6
970-7
475-7
980-8
485+
Age
spec
ific
rate
(per
100,
000
popu
latio
n)
Male Female

144 Health Determinants Queensland 2004
WHOLE OF POPULATION
Figure 1.32: Deaths attributed to illicit drugs; age standardised mortality rates by sex, socioeconomic advantage/disadvantage*, accessibility and proportion Indigenous peoples, Queensland 1999-2001
Source: ABS Cause of death *ABS Index of relative socioeconomic advantage/disadvantage 2001 Note: <1 average case pa in Torres SLA
In the three years 1999/2000-01/02, there were on average 4,187 hospital separations per year attributed to illicit drug use in Queensland, 57% of which were male. Hospital separation rates follow the same pattern as mortality rates for males and females (Figure 1.31), with 7% of all cases occurring in the newborn and 52% occurring in the age group 15-29 years. Rates of hospitalisation for conditions attributed to illicit drugs were signifi cantly higher in males; socioeconomically advantaged areas than disadvantaged areas; and, in accessible or highly accessible areas than more remote areas (Figure 1.33). The principal conditions caused by illicit drug use were mental and behavioural disorders, although for females, self harm was a leading cause accounting for one in ten hospital separations attributed to illicit drug use.
Figure 1.33: Hospital separations attributed to illicit drugs; age standardised hospital separation rates by sex, socioeconomic advantage/disadvantage*, accessibility and proportion Indigenous peoples, Queensland 1999/2000-01/02
Source: Queensland hospital admitted patient data collection *ABS Index of relative socioeconomic advantage/disadvantage 2001
0
1
2
3
4
5
6
Male
Female
Socioe
cono
mic
adva
ntag
e
quint
ile4
quint
ile3
quint
ile2
Socioe
cono
mic
disad
vant
age
Highly
acce
ssibl
e
Acces
sible/
mod
erat
elyac
cess
ible
Remot
e/ve
ryre
mot
e
<10
%In
digen
ous po
pulat
ion
10an
d20
%In
digen
ous po
pulat
ion
20an
d40
%In
digen
ous po
pulat
ion
>40
%In
digen
ous po
pulat
ion
Age
stan
dard
ised
rate
(per
100,
000
popu
latio
n).
0
20
40
60
80
100
120
140
160
180
Male
Female
Socioe
cono
mic
adva
ntag
e
quint
ile4
quint
ile3
quint
ile2
Socioe
cono
mic
disad
vant
age
Highly
acce
ssibl
e
Acces
sible/
mod
erat
ely ac
cess
ible
Remot
e/ve
ryre
mot
e
<10
%In
digen
ous po
pulat
ion
10an
d20
%In
digen
ous po
pulat
ion
20an
d40
%In
digen
ous po
pulat
ion
>40
%In
digen
ous po
pulat
ion
Torre
s SLA
Age
stan
dard
ised
rate
(per
100,
000
popu
latio
n).

145
WHOLE OF POPULATION
Health Determinants Queensland 2004
Physical inactivity In 1999-2001, in Queensland, there were on average 408 deaths per year attributed to no physical activity or sedentary behaviour in the age group 0-79 years. Physical activity refers to activity which includes walking, or moderate or vigorous activity.142 There were on average 238 deaths each year due to insuffi cient physical activity for a health benefi t, a total of 646 deaths in people aged 0-79 years. Males accounted for the majority of deaths attributed to physical inactivity (62%) and insuffi cient physical activity (56%), and the mortality rates were signifi cantly higher in males in both categories of physical activity. Mortality rates attributed to physical inactivity and insuffi cient physical activity rise with increasing age for both males and female (Figure 1.34). There was no signifi cant difference in mortality rates for either no physical activity or insuffi cient physical activity across areas of socioeconomic difference, remoteness or proportion Indigenous population (Figure 1.35). Coronary heart disease (CHD) accounted for 81% of male deaths and 66% of female deaths attributed to either insuffi cient physical activity or physical inactivity, with colon cancer the second leading cause in males (10%) and breast cancer the second leading cause in females (12%).
Figure 1.34: Deaths attributed to insuffi cient physical activity and physical inactivity in people 0-79 years; age specifi c mortality rates by sex, Queensland 1999-2001
Source: ABS Cause of death
Figure 1.35: Deaths attributed to insuffi cient physical activity and physical inactivity in people 0-79 years; age standardised mortality rates by sex, socioeconomic advantage/disadvantage*, accessibility and proportion Indigenous peoples, Queensland 1999-2001
Source: ABS Cause of death *ABS Index of relative socioeconomic advantage/disadvantage, 2001
In the three years 1999/2000-01/02 in Queensland, there were on average 4,165 hospital separations per year attributed to no physical activity and 2,840 separations due to insuffi cient physical activity for a health benefi t in people aged 0-79 years, a total of 7,004. Males accounted for the majority of separations attributed to physical inactivity (62%) and insuffi cient physical activity (58%). As for mortality rates, separation rates attributed to physical inactivity and insuffi cient physical activity rise rapidly with increasing age, particularly for males (Figure 1.36). Hospital separation rates for conditions attributed to physical inactivity or insuffi cient physical activity were signifi cantly higher in males; socioeconomically disadvantaged areas; remote and very remote areas; and, in areas with greater than 40% Indigenous population (Figure 1.37). CHD accounted for 82% of male separations and 67% of female separations attributed to either insuffi cient physical activity or physical inactivity, with stroke the second leading cause in males (8%) and breast cancer the second leading cause in females (11%).
Insufficient physical activity
0
10
20
30
40
50
60
70
80
90
5-9 ye
ars
10-14
years
15-19
years
20-24
years
25-29
years
30-34
years
35-39
years
40-44
years
45-49
years
50-54
years
55-59
years
60-64
years
65-69
years
70-74
years
75-79
years
Age
spe
cific
rat
e (p
er 1
00,0
00 p
opul
atio
n)
Male Female
Physical inactivity
0
5
10
15
20
25
30
35
Mal
e
Fem
ale
Socio
econ
omic
adva
ntag
e
quin
tile
4
quin
tile
3
quin
tile
2
Socio
econ
omic
disa
dvan
tage
Hig
hly
acce
ssib
le
Acce
ssib
le/m
oder
atel
y ac
cess
ible
Rem
ote/
very
rem
ote
< 10
% In
dige
nous
pop
ulat
ion
10
and
20%
Indi
geno
us p
opul
atio
n
20
and
40%
Indi
geno
us p
opul
atio
n
> 40
% In
dige
nous
pop
ulat
ion
Torre
s SL
A
Age
sta
ndar
dise
d ra
te (
per
100,
000
popu
latio
n)
.
Insufficient physical activity
0
5
10
15
20
25
Male
Female
Socioe
cono
mic adv
antag
e
quint
ile 4
quint
ile 3
quint
ile 2
Socioe
cono
mic disa
dvan
tage
Highly
acce
ssible
Acces
sible/
modera
tely a
cces
sible
Remote
/very
remote
< 10%
Indige
nous
popu
lation
10 an
d 20%
Indige
nous
popu
lation
20 an
d 40%
Indige
nous
popu
lation
> 40%
Indige
nous
popu
lation
Torre
s SLA
Age
sta
ndar
dise
d ra
te (
per
100,
000
popu
latio
n)
.
0
50
100
150
200
250
5-9 ye
ars
10-14
years
15-19
years
20-24
years
25-29
years
30-34
years
35-39
years
40-44
years
45-49
years
50-54
years
55-59
years
60-64
years
65-69
years
70-74
years
75-79
years
Age
spe
cific
rat
e (p
er 1
00,0
00 p
opul
atio
n)
Male Female
Physical inactivity

146 Health Determinants Queensland 2004
WHOLE OF POPULATION
Sedentary behaviour or no physical activity is defi ned for measurement purposes as no leisure time physical activity in the one week period prior to survey.142 Insuffi cient physical activity is defi ned as less than 150 minutes of moderate or vigorous intensity activity occurring over fi ve sessions in the week prior to survey. In this latter defi nition, vigorous intensity time is weighted by a factor of two accounting for additional benefi t accrued. This time and intensity is deemed as suffi cient for a health benefi t.134 It is likely that the number of deaths and hospital separations attributed to physical inactivity and insuffi cient physical is an underestimate of the total impact of diabetes. This is because diabetes is often not coded as a principal cause of death, or principal diagnosis.
Figure 1.36: Hospital separations attributed to insuffi cient physical activity and physical inactivity in people 0-79 years; age specifi c hospital separation rates by sex, Queensland 1999-2001
Source: Queensland hospital admitted patient data collection
Figure 1.37: Hospital separations attributed to insuffi cient physical activity and physical inactivity in people 0-79 years; age standardised hospital separation rates by sex, socioeconomic advantage/disadvantage*, accessibility and proportion Indigenous peoples, Queensland 1999-2001
Source: Queensland hospital admitted patient data collection *ABS Index of relative socioeconomic advantage/disadvantage 2001
1.3.7 Oral health Oral health accounted for 1.0% of the burden of disease and injury in Queensland in 1996-98, as measured by DALYs.49 Oral health problems are very common in the population, ranked as the fourth most frequent illness condition, behind headache, hypertension and colds.143 In Australia in 1996, dental caries was the most prevalent reported condition affecting health.66 Oral health is integral to general health, and oral health status can be regarded as a risk marker for general health.
No clinical epidemiological surveys of the oral health status of the Queensland adult population have been conducted since 1987-88. From self report in 2002, the majority of adult Queenslanders (79.9%) reported they had a functional dentition, or at least 21 natural teeth (Table 1.21). The proportion declined with age, with only 36% of those aged 70 years and older possessing a functional dentition. While there is little difference between men and women overall, men aged 50-69 years are more likely to have a functional dentition. This difference is, however, reversed in those aged 70 years and older. The proportion of adults with a functional dentition decreases as socioeconomic disadvantage increases. The effect is most marked in those aged 50 years and older. In general, accessibility to services appears to have little effect on whether adults retain a functional dentition.
Physical inactivity
0
200
400
600
800
1000
1200
0-4 5-910
-1415
-1920
-2425
-2930
-3435
-3940
-4445
-4950
-5455
-5960
-6465
-6970
-7475
-79
Age
spe
cific
rat
e (p
er 1
00,0
00 p
opul
atio
n)
Male Female
Insufficient physical activity
0
50
100
150
200
250
Mal
e
Fem
ale
Socio
econ
omic
adva
ntag
e
quin
tile
4
quin
tile
3
quin
tile
2
Socio
econ
omic
disa
dvan
tage
Hig
hly
acce
ssib
le
Acce
ssib
le/m
oder
atel
y ac
cess
ible
Rem
ote/
very
rem
ote
< 10
% In
dige
nous
pop
ulat
ion
10
and
20%
Indi
geno
us p
opul
atio
n
20
and
40%
Indi
geno
us p
opul
atio
n
> 40
% In
dige
nous
pop
ulat
ion
Torre
s SL
A
Age
sta
ndar
dise
d ra
te (
per
100,
000
popu
latio
n)
.
Insufficient physical activity
0
100
200
300
400
500
600
0-4 5-910
-1415
-1920
-2425
-2930
-3435
-3940
-4445
-4950
-5455
-5960
-6465
-6970
-7475
-79
Age
spe
cific
rat
e (p
er 1
00,0
00 p
opul
atio
n)
Male Female
Physical inactivity
0
50
100
150
200
250
300
Mal
e
Fem
ale
Socio
econ
omic
adva
ntag
e
quin
tile
4
quin
tile
3
quin
tile
2
Socio
econ
omic
disa
dvan
tage
Hig
hly
acce
ssib
le
Acce
ssib
le/m
oder
atel
y ac
cess
ible
Rem
ote/
very
rem
ote
< 10
% In
dige
nous
pop
ulat
ion
10
and
20%
Indi
geno
us p
opul
atio
n
20
and
40%
Indi
geno
us p
opul
atio
n
> 40
% In
dige
nous
pop
ulat
ion
Torre
s SL
A
Age
sta
ndar
dise
d ra
te (
per
100,
000
popu
latio
n)
.
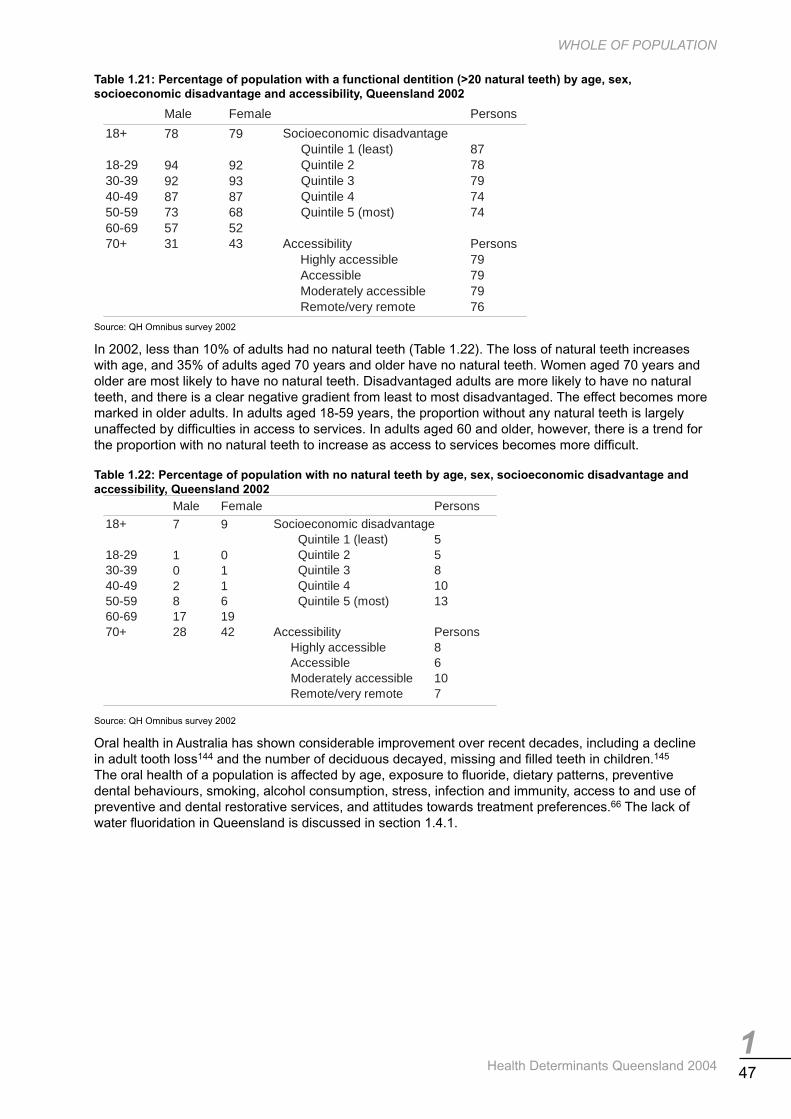
147
WHOLE OF POPULATION
Health Determinants Queensland 2004
Table 1.21: Percentage of population with a functional dentition (>20 natural teeth) by age, sex, socioeconomic disadvantage and accessibility, Queensland 2002
Source: QH Omnibus survey 2002
In 2002, less than 10% of adults had no natural teeth (Table 1.22). The loss of natural teeth increases with age, and 35% of adults aged 70 years and older have no natural teeth. Women aged 70 years and older are most likely to have no natural teeth. Disadvantaged adults are more likely to have no natural teeth, and there is a clear negative gradient from least to most disadvantaged. The effect becomes more marked in older adults. In adults aged 18-59 years, the proportion without any natural teeth is largely unaffected by diffi culties in access to services. In adults aged 60 and older, however, there is a trend for the proportion with no natural teeth to increase as access to services becomes more diffi cult.
Table 1.22: Percentage of population with no natural teeth by age, sex, socioeconomic disadvantage and accessibility, Queensland 2002
Source: QH Omnibus survey 2002
Oral health in Australia has shown considerable improvement over recent decades, including a decline in adult tooth loss144 and the number of deciduous decayed, missing and fi lled teeth in children.145 The oral health of a population is affected by age, exposure to fl uoride, dietary patterns, preventive dental behaviours, smoking, alcohol consumption, stress, infection and immunity, access to and use of preventive and dental restorative services, and attitudes towards treatment preferences.66 The lack of water fl uoridation in Queensland is discussed in section 1.4.1.
Male Female Persons
18+ 78 79 Socioeconomic disadvantageQuintile 1 (least) 87
18-29 94 92 Quintile 2 7830-39 92 93 Quintile 3 7940-49 87 87 Quintile 4 7450-59 73 68 Quintile 5 (most) 7460-69 57 5270+ 31 43 Accessibility Persons
Highly accessible 79Accessible 79Moderately accessible 79Remote/very remote 76
Male Female Persons18+ 7 9 Socioeconomic disadvantage
Quintile 1 (least) 518-29 1 0 Quintile 2 530-39 0 1 Quintile 3 840-49 2 1 Quintile 4 1050-59 8 6 Quintile 5 (most) 1360-69 17 1970+ 28 42 Accessibility Persons
Highly accessible 8Accessible 6Moderately accessible 10Remote/very remote 7

148 Health Determinants Queensland 2004
WHOLE OF POPULATION
1.3.8 Communicable diseases In the fi ve-year period 1997-2001 in Queensland, 115,014 notifi cations of more than 50 communicable diseases were received (Table 1.23). This was an average of 23,003 per year. Although notifi ed cases are likely to represent only a percentage of the total cases in the community, they provide an estimate of the burden of disease. The Notifi able Disease Report 1997-2001146 includes detailed analysis of notifi able conditions in Queensland and national comparisons.
Care needs to be exercised in drawing conclusions from trends in the numbers of notifi cations. While the fi gurers for some conditions can be highly indicative of temporary or long term changes in incidence, this cannot be applied to all conditions. Factors infl uencing numbers of notifi cations differ from condition to condition. Such factors include: the symptomatic to asymptomatic ratio; the proportion of those becoming ill seeking medical advice; the physician’s diagnostic skill; and the seriousness of the condition and its public health implications. The selection and timing of tests and the pathology laboratories success in establishing the diagnosis, and even the lack of successful transport media from remote communities in north Queensland, can also play a role. Awareness programs directed at the public or physicians and the development of new and better tests may also infl uence notifi cation rates.
Invasive meningococcal disease About 100 cases per year of invasive meningococcal disease (IMD) are notifi ed in Queensland, with rates (3-4 cases per 100,000 people) similar to national levels (Table 1.23). These data refl ect the true burden of disease, as ascertainment of cases for this disease is complete. Notifi cations include laboratory-confi rmed cases and a small number of clinically probable cases. Year to year fl uctuations in case numbers and deaths are typical of this disease. About three quarters of cases are in people aged less than 25 years, with young children aged under fi ve years (36%) and older teenagers (15 to 19 years – 19%) comprising the largest groups. Cases occur throughout the year, although winter to early spring is the peak season. Cases are mostly sporadic, as outbreaks or related cases occur infrequently.
In Queensland, the two most common types of the bacterium isolates of IMD are serogroup B (about 50% of cases annually) and serogroup C (about 36% of cases annually). Serogroup C is more common in southern states of Australia.147,148 In recent years, serogroup C has been more common in late teen and young adult age groups. The case fatality rate averages about 9%, but varies from year to year. Serogroup C cases have a higher risk of death, as do cases presenting with septicaemia. The risk of death generally increases with the delay in presenting to hospital for treatment.
The risk of infection is higher in individuals exposed to cigarette smoke, both active and passive smoking.149 Close contacts, in particular household contacts of cases, have a small but signifi cant increased risk of infection.149
Invasive pneumococcal disease Invasive pneumococcal disease (IPD) is relatively uncommon, although more common than invasive meningococcal disease (IMD). IPD notifi cation rates peaked in 2000 at about 12 cases per 100,000 people rates (Table 1.23). National rates, available only since 2001, are lower than Queensland rates, at about 9 cases per 100,000 people. IPD rates have increased since 1997, most likely due to improved case ascertainment, and perhaps from improved surveillance and awareness. As with IMD, there is a clear seasonal pattern with most notifi cations occurring in late- winter and spring.
Males are more commonly reported with IPD than females (1.3:1). In recent surveillance, children under fi ve years comprised the largest single age group (40%), followed by people aged at least 50 years (32%). The most common presentation across all age groups was pneumonia (46%) and bacteraemia (32%). In children less than fi ve years, bacteraemia (42%) was more common than pneumonia (26%). IPD can also present as meningitis. Smoking and smoking near children are known risk factors for IPD. The reported death rate for IPD was 1.1% in 1997-2001; slightly higher in children aged less than fi ve years. This rate is lower than the Australian average of 9%,150 although the death rate for people with an underlying chronic illness may be as high as 20- 40%. The death rate for cases presenting with meningitis varies between 10-30%, but may be as high as 80% in the elderly.151

149
WHOLE OF POPULATION
Health Determinants Queensland 2004
Table 1.23: Notifi cations and crude notifi cation rates, by year and sex, Queensland 1997-2001
Source: QH Notifi able diseases report 1997-2001 Note: Rates per 100,000 population
notifications rate notifications rate notifications rate notifications rate notifications rateBlood borne conditionsHepatitis B 887 26.1 945 27.3 887 25.3 941 26.4 818 22.9Hepatitis C 2,874 84.5 2,784 80.5 3,069 87.4 3,341 93.7 3,128 87.7Hepatitis D 6 0.2 4 0.1 5 0.1 5 0.1 3 0.1Total 3,767 110.8 3,733 107.9 3,961 112.8 4,287 120.2 3,949 110.7
Gastrointestinal conditionsCampylobacter enteritis 4,087 120.2 4,387 126.9 3,202 91.2 3,676 103.1 3,964 111.1Cholera 1 0.0Cryptosporidiosis 528 15.5 962 27.8 335 9.5 459 12.9 419 11.7Enterohaemorrhagic E.coli 4 0.1 4 0.1 5 0.1 6 0.2 14 0.4Hepatitis A 917 27.0 1,050 30.4 360 10.2 133 3.7 119 3.3Listeriosis 9 0.3 4 0.1 11 0.3 13 0.4 20 0.6Salmonellosis 1,909 56.1 2,836 82.1 2,245 63.9 1,825 51.2 2,198 61.6Shigellosis 208 6.0 152 4.5 129 3.6 108 3.0 108 3.0Typhoid 8 0.2 11 0.3 3 0.1 2 0.1 9 0.3Yersiniosis 181 5.3 133 3.8 101 2.9 59 1.7 51 1.4Total 7,851 230.7 9,540 276.0 6,391 181.8 6,281 176.3 6,902 193.4
Sexually transmitted conditionsChlamydia infection 3,508 103.1 4,076 117.9 4,475 127.4 4,931 138.3 5,632 157.9Donovanosis 6 0.2 9 0.3 5 0.1 11 0.3 19 0.5Gonorrhoea 934 27.5 1,119 32.4 1,183 33.7 1,138 31.9 1,102 30.9Syphilis- data collected in 2001 189 5.3Total 4448* 130.8 5204* 150.6 5,663* 161.2 6,080* 170.5 6,942 194.6*No Syphilis data
Vector borne conditionsBarmah Forest 362 10.6 332 9.6 309 8.8 346 9.7 603 16.9Dengue fever 129 3.8 475 13.7 62 1.8 84 2.4 44 1.2Malaria 376 11.1 297 8.6 304 8.7 409 11.5 300 8.4Ross River 2,366 69.6 1,946 56.3 2,306 65.7 1,477 41.4 1,573 44.1Total 3,233 95.1 3,050 88.2 2,981 85.0 2,316 65.0 2,520 70.6
Zoonotic conditionsAnthrax 1 0.0Brucellosis 34 1.0 35 1.0 49 1.4 26 0.7 17 0.5Chryptococcus 39 1.1 28 0.8 28 0.8 34 1.0 38 1.1Hydatid disease 13 0.4 10 0.3 5 0.1 8 0.2 7 0.2Leptospirosis 45 1.3 112 3.2 221 6.3 134 3.8 129 3.6Q fever 244 7.2 249 7.2 294 8.4 391 11.0 450 12.6Total 375 11.0 435 12.5 597 17.0 593 16.7 641 18.0
Vaccine preventableHaemophilis influenza type b 14 0.4 12 0.3 12 0.3 12 0.3 6 0.2Measles 268 7.9 35 1.0 33 0.9 28 0.8 11 0.3Mumps 16 0.5 31 0.9 12 0.3 3 0.1Influenza* 391 11.0Pertussis 1,902 55.9 1,393 40.3 963 27.4 535 15.0 1,632 45.8Rubella 539 15.8 372 10.8 157 4.5 46 1.3 134 3.8Tetanus 2 0.1 1 0.0 1 0.0 2 0.1Total 2,741 80.6 1,844 53.3 1,178 33.4 623 17.5 2,177 61.2*Influenza became notifiable in July 2001
OthersInvasive Meningococcal 72 2.1 108 3.1 93 2.6 66 1.9 128 3.6Invasive Pneumococcal 154 4.5 259 7.5 271 7.7 435 12.2 424 11.9Legionallosis 11 0.3 36 1.0 34 1.0 47 1.3 37 1.0Meliodosis* 20 0.6 39 1.1 13 0.4*Meliodosis (notifiable condition since mid 1999)Acute rheumatic fever 18 0.5 36 1.0 35 1.0Atypical mycobacterial disease 137 4.0 166 4.8 153 4.4 144 4.0 130 3.6Cigateura 11 0.3 13 0.4 19 0.5 61 1.7 35 1.0Lyssa/rabies 1 0.0Tuberculosis (all) 110 3.2 98 2.8 94 2.7 90 2.5 92 2.6
20011997 1998 1999 2000

150 Health Determinants Queensland 2004
WHOLE OF POPULATION
Blood-borne conditions Blood-borne conditions such as hepatitis B, C, D and E (not hepatitis A) comprised more than 15% of all notifi cations between 1997 and 2001, with hepatitis C comprising the third most commonly notifi able condition (12%).
Notifi cation rates for hepatitis C ranged between 80–94 cases per 100,000 people during the fi ve- year period 1997-2001 (Table 1.23), with Queensland rates generally below the national rates (which ranged between 84-112 cases per 100,000 people). Fluctuations in rates relate more to changes in screening and detection patterns than a change in the burden of disease. Hepatitis C is more commonly reported in males than females (1.8:1), with most cases (81%) reported in the 20-44 year age group. Annual notifi cation rates should not be used to estimate the year of the acquisition, as it is not possible to differentiate between chronic and acute infections. Within Queensland, notifi cation rates were highest in the Southern Zone, with rates generally increasing over time. Annual notifi cation rates should not be used to estimate trends in incident cases, as information on recency of infection is not collected. The national rate for incident hepatitis C cases was reported at 2.8 cases per 100,000 people.
There are 800-930 notifi cations of hepatitis B each year (3.4% of all notifi cations: Table 1.23). Males outnumbered females 1.3:1 and people aged 15-39 years comprised 63% of all cases. Between 1997 and 2001, annual rates in Queensland varied between 23 and 27 cases per 100,000 people, which is lower than the national rates (38-45 cases per 100,000). Over the same period, notifi cation rates for acute cases ranged between 1.2-1.6 cases per 100,000 people in Queensland, slightly less than national rates at 1.4-2.2 per 100,000. Rates in north Queensland were more than twice the Queensland rate, although there were small numbers overall.
In 2003, a range of 24% to 59% of Queensland adults could correctly identify potential risk factors for hepatitis C.152 There remains considerable ignorance and confusion regarding risk factors for acquiring hepatitis C and hepatitis A, which is of concern for health policy makers and service providers.
Gastrointestinal conditions Gastrointestinal diseases, notably campylobacteriosis and salmonellosis, are common notifi able diseases in Queensland. Notifi cations of laboratory-confi rmed infections with these organisms fl uctuate from year to year depending on environmental, behavioural and other factors. A recent survey indicated both that notifi ed cases represent only a small proportion of the community illness (most going untested and therefore unreported) and that there is a bias in testing of young children compared with adults.153 Less than 9% of children and less than 3% of adults (half of which were carers of children) with gastroenteric illness submitted a stool specimen for laboratory testing. Deaths, while rare, may occur in the immuno-compromised.
It has been estimated that about one third of all gastroenteric illness is food-borne, and that there are between 1.6 and 1.9 million cases of food-borne illness in Queensland per year.154 Of these, 0.1% to 1.0% has a confi rmed diagnosis with a notifi able pathogen.
Between 1997 and 2001, notifi cation rates of campylobacteriosis ranged between 91-127 cases per 100,000 people in Queensland (Table 1.23). Over the same period, national rates were generally lower, ranging between 84-107 notifi cations per 100,000 people. Slightly more males than females were notifi ed (1.2:1), with children under fi ve years comprising 17% of notifi cations and young adults aged 20-24 years comprising 11% of notifi cations. Notifi cation rates in the Northern Zone of Queensland were generally lower than other zones for most years. In years of peak activity, notifi cations tend to peak in hotter months. Inadequate handling of food (particularly poultry), contamination of food, water and milk, person-to-person contact and animal-to-person contact are accepted risk factors for campylobacteriosis.
Salmonellosis constituted about 10% of notifi cations in Queensland and was the fourth most commonly notifi ed condition. In 1997-2001 notifi cation rates ranged between 51 and 82 per 100,000 people (Table 1.23). A seasonal pattern for notifi cations is evidenced by a peak in late summer/early autumn each year. As noted above, a bias in testing children contributes to the high proportion of notifi ed salmonellosis for children aged less than fi ve years (47%). In contrast to campylobacteriosis, highest notifi cation rates for salmonellosis were in north Queensland. While Indigenous identifi cation data was poorly provided, notifi cation rates for salmonellosis were generally higher in areas where Indigenous peoples represent a higher proportion of the population. Most notifi ed cases are sporadic, although a number of outbreaks are identifi ed each year and many others may go unreported. Most identifi ed outbreaks result from poor food preparation, handling and storage.

151
WHOLE OF POPULATION
Health Determinants Queensland 2004
Hepatitis A notifi cations in Queensland have declined signifi cantly after peaking in 1998, dropping by at least eight fold in recent years (from 30.4 to 3.4 per 100,000 people: Table 1.23). Hospitalisation rates for this condition also fell over the same period. Specifi cally, notifi cations from northern Queensland have declined in recent years and refl ect the success of an Indigenous hepatitis A vaccination program. National notifi cation rates were lower than Queensland rates and also fell over the same period. National death rates are low at 0.2 per 100,000 people. Hepatitis A was more commonly reported in males compared with females (1.6:1.0) and in adults aged 20-39 years. Recent enhanced surveillance determined that overseas travel, consumption of shellfi sh, contact with known cases and attendance at child care are the most frequent identifi ed risk factors for this disease.146
Notifi cations for cryptosporidiosis may vary markedly from year to year. Very high numbers were reported in 1998 and again in 2003 (Table 1.23), with late summer/early autumn being the peak periods. Documented outbreaks of this infection have occurred through contaminated bodies of water including swimming pools.155,156 In addition, person-to-person transmission (faecal-oral) is very common. During peak periods, it is likely that heightened community awareness increases case ascertainment. Equal numbers of males and females are notifi ed. More than half of all cases during 1997 and 2001 were aged less than fi ve years, although higher numbers in this age group may relate to a bias in faecal testing of young children compared with adults.
Sexually transmitted conditions Chlamydia infections were the most commonly notifi ed sexually transmitted infection in Queensland in all years between 1997 and 2001, and account for nearly a quarter of all notifi cations. It is recognised that notifi cations signifi cantly underestimate burden of disease, as 70% or more infections in women and at least 50% of infections in men, are asymptomatic.157 Notifi cations increased signifi cantly each year during this period in Queensland and throughout Australia. The increases are largely due to improved case ascertainment, resulting from improved testing methods, increased awareness of the disease, and screening programs (particularly the Indigenous Urinary PCR Screening Program). The male to female ratio of chlamydial notifi cations was 1:1.9 in all years except in 1997, when it was 1:2.2. Notifi cation rates ranged between 103.1 per 100,000 and 157.9 per 100,000 in the period 1997 and 2001 (Table 1.23). Highest rates were amongst 15-19 year-old females, and in north Queensland (2.5-3 times higher), refl ecting active screening programs. Notifi cation rates were highest in areas where Indigenous peoples represent a higher proportion of the population (up to 25 times more), refl ecting at least in part, active screening programs. Safer sex practices (particularly among young people) are required to reduce the incidence of chlamydial infections. Early detection and treatment of cases and their contacts are vital to the control of this sexually transmitted infection.
In 2001, gonococcal infections were the seventh most commonly notifi ed condition accounting for 4.6% of all notifi cations. In 1997-2001, notifi cation rates ranged between 27.5 and 32.4 per 100,000 people (Table 1.23). National rates were similar at 25.3-33.4 per 100,000. As with chlamydial infections, highest rates were reported in north Queensland, but unlike chlamydia, male to female ratio for gonorrhoea was reversed (1.5:1). In males the highest rates were in the age group 20-24 years, while in females, highest rates were in the age group, 15-19 years. Notifi cation rates were highest in areas of higher Indigenous population (up to 35 times more). Limited enhanced surveillance of gonococcal infections indicates that one risk group for gonococcal infections are men who have sex with men.
In 2002, there were 117 new HIV notifi cations, the highest number since 1996 (119 cases).158 The number of cases living with HIV/AIDS in Queensland is increasing each year due to better treatment and outcomes for cases. The peak year for notifi cations of new AIDS diagnoses in Queensland was 1995, with 102 new cases, the highest number since was in 1997 (119 cases). By 2002, new diagnoses have declined to less than half the cases from 1995. Males have predominated in each year comprising more than 90% of new HIV/AIDS diagnoses. More than 40% of new male AIDS cases were aged 30-39 years, and more than 30% aged 40-49 years. Since 1993, there has been a slow but continuous increase in the proportion of AIDS cases who are late presenters. There was an increase in sero-converters in 2002 and this has been most marked in the 20-29 age group. In 2002, the number of cases living with HIV/AIDS that were receiving treatment declined from 42% in 2001 to 30%, most likely refl ecting a desire to delay starting treatment as long as possible. Also in 2002, there was an increase in the number of people never on treatment.

152 Health Determinants Queensland 2004
WHOLE OF POPULATION
Vector-borne conditions Ross River Virus infection was the most common vector-borne disease notifi ed in Queensland in the 1997-2001. It was the sixth most common notifi ed condition in Queensland in 2001, and accounted for 6.5% of notifi cations. Adults aged 25-54 years comprised 69% of all cases. In 1997-2001, notifi cation rates ranged between 41.1 and 69.6 per 100,000 people (Table 1.23), twice as high as national rates (16.7-35.9 per 100,000 people). Rates were highest in north Queensland in most years. Highest notifi cation rates occur in late summer/early autumn.
Barmah Forest Virus notifi cation rates ranged between 8.8-16.9 per 100,000 people, higher than national rates (2.8-6.0 per 100,000 people: Table 1.23). Males slightly outnumbered females 1.2:1.0. As with Ross River Virus, most notifi cations were in adults aged 30-59 years and were in central and north Queensland.
Between 1997 and 2003, dengue rates in Queensland were generally higher than national rates. They ranged between 1.2 cases per 100,000 persons in 2001 (a year when there was no local transmission in Queensland) and 19.6 cases per 100,000 persons in 2003 (a year in when there were two major outbreaks involving local transmission). More than half the cases were aged between 25 and 49 years.
Dengue has emerged as a disease of global importance159 and is transmitted within Australia where the vector mosquito Aedes aegypti is endemic. Aedes aegypti mosquitoes breed around the house and bite indoors. In recent years, there has been local transmission dengue fever in several outbreaks, predominantly in Cairns and the Torres Strait, and to a lesser extent in Townsville.160 Most imported cases are sourced from Papua New Guinea and southeast Asia. Serotypes involved in the outbreaks in recent years have been type 2 (in largest numbers), type 1 and type 4. Two cases of dengue hemorrhagic fever were notifi ed in late 2003, due to an outbreak in the Torres Strait.
Sustained increases in the number of cases of dengue worldwide are likely to occur through increasing urban populations and ineffective mosquito control efforts.161 Computer modelling suggest that the number of people living in areas of higher dengue risk will increase from 1.5 billion in 1990 to over seven billion in 2085, as a result of the effects of climate change.162
Between 1997 and 2003, Queensland rates for malaria were generally higher than national rates, ranging between 3.5 and 11.5 cases per 100,000. More than half of all cases between 1997 and 2001 were aged between 15 and 34 years. Most imported cases are sourced from Papua New Guinea. In Australia, the mosquito Anopheles farauti, which occurs near the coast in the Northern Territory and north of the 18th latitude in Queensland, is the most signifi cant potential vector for malaria.161
Vector-borne diseases are usually seasonal, with cases varying over time due to different weather and tidal patterns. Notifi cations also may be affected by mosquito control programs run by Local Government and by changes in peoples behaviour such as use of repellent, avoidance of mosquito-areas and high biting times. Dengue fever and malaria outbreaks continue to occur in north Queensland, usually through importation by an overseas traveller. Notifi cation rates need to be interpreted with caution as people may be bitten by mosquitoes outside their normal place of residence in areas where they work or engage in recreational activity.
Zoonotic conditions Q-Fever was the most commonly notifi ed zoonosis in all years between 1997 and 2001, and the tenth most common of all notifi able diseases in Queensland (2% of all notifi cations). Between 1997 and 2001, notifi cation rates ranged between 7.2-12.6 per 100,000 (Table 1.23), higher than national rates (2.7-3.6 per 100,000 people). More males than females were notifi ed (4.6:1.0). This infection is uncommon in children (<2%) and most common in the 15-49 year age group. The increasing rate (especially among older males) may be due in part to raised awareness of the disease, particularly in rural areas. Southern and Central Zones have more cases than north Queensland.
In recent years, the notifi cation rate for Q-Fever has declined signifi cantly, particularly in younger males. This decrease may be partially due to the introduction of the National Q-Fever Management Program in November 2001. Other factors that may contribute to the decrease include: a change in climatic conditions, a decrease in stock numbers (including calving and lambing numbers), greater public awareness about risk factors, and a decrease in the number of animals sent for slaughter.
Vaccine preventable conditions In addition to invasive pneumococcal disease, invasive meningococcal disease and hepatitis B discussed above, vaccine preventable conditions are fully discussed in the Children and Young people chapters. Specifi cally measles, pertussis and Haemophilus infl uenza type B (Hib), are discussed in the Children chapter and measles, pertussis and rubella in the Young people chapters. Vaccination rates for children and Older people are reported in the health behaviour sections of the respective chapters.

153
WHOLE OF POPULATION
Health Determinants Queensland 2004
1.4 Health determinantsThe factors that lead to someone developing disease or a mental disorder are likely to have their beginnings years earlier, through a complex chain of events and interactions among the individual, the environment, and broader social and economic factors.11 Determinants of health is the term used for those factors that have either a positive or negative infl uence on physical and mental health at the individual or population level.
The aim of this section is to answer the following questions:
• Are the factors that determine good health for Queenslanders changing for the better? • Is it the same for everyone? • Where and for whom are these factors changing?
Health determinants can be broadly divided into ‘upstream’ determinants (education, employment, income, living and working conditions), ‘midstream’ (health behaviours and psychosocial factors) and ‘downstream’ (physiological and biological factors).6 In this section, the upstream determinants are addressed in sections on environmental factors and socioeconomic factors, and midstream determinants in community capacity and health behaviour sections. Environmental, socioeconomic and community capacity dimensions impact on physical and mental health within the spheres of societal or community, household and individual determinants of health.
As this report focuses on modifi able determinants of health, the person-related factors dimension of the National Health Performance Framework is not included. All determinants of health indicators are reported in the domain where there is the greatest opportunity for health gains. Thus, physiological and biological factors, which may be partially addressed through behaviour change, have been included in the health behaviour section of this report.
Actions to address these health determinants are described in section 1.5.

154 Health Determinants Queensland 2004
WHOLE OF POPULATION
1.4.1 Environmental factors
“Human beings are at the centre of concerns for sustainable development. They are entitled to a healthy and productive life in harmony with nature.”
Rio Declaration, United Nations 1993163
Queenslanders enjoy a relatively healthy physical environment. We have one of the safest food supplies in the world, the overall quality of our air and drinking water is good, and the built environment is generally clean and healthy. The quality of the physical environment cannot be taken for granted however, because there are regional differences.
Population health status is infl uenced by the interaction of social, economic and environmental health determinants.164 The biological, physical and chemical environments have the potential to impact on health. The extent of this impact is modifi ed by the scale and nature of human activities. Human activities include agricultural, industrial and energy production; the use and management of water and wastes; urbanisation; the quality of health services; and the extent of protection for the living, working, and natural environment.
The impact of environmental factors on population health outcomes is diffi cult to assess due to the multi-factorial nature of many outcomes of importance. Thus, indicators relating exposure to environmental determinants and processes to manage such exposures are commonly used to measure the infl uence of the environment on health, rather than health outcomes indicators. The need for environmental health indicators was highlighted by the National Environmental Health Strategy (1999).164 Development of a national set of environmental health indicators is now occurring. In future, indicators to monitor environmental health and quality data to support these indicators should be more readily available and more clearly defi ned.
This section examines some key environmental factors that infl uence health. Other environmental factors are included in other sections in this document. These include: Mosquitoes (notifi cations of vector-borne conditions – section 1.3.8), UV radiation (sun protection attitudes, knowledge and behaviours – section 1.4.4), and passive or environmental tobacco smoke (Children chapter). Specifi c environmental factors relating to Indigenous health are described in the Indigenous peoples chapter.
There are other less well characterised environmental factors that have the potential to impact on health. Many of these factors have evolved from changes in our society and present new potential health risks. These include changes in the ways in which we manage our waste, changes in construction materials for our housing, issues relating to securing adequate and safe water supplies, increased urbanisation and urban densities, and global climate change resulting from increased greenhouse gas emissions. The extent to which these emerging issues impact on the environment and population health is not well characterised.
External environmental factors
Air quality
Air quality is infl uenced by emissions of pollutants from industrial sources (eg power stations, oil refi neries); transport sources (eg motor vehicles, trucks, aircraft) domestic sources (eg lawn mowers, wood burning), agricultural sources (eg cane burning, chemical spraying) and other sources, such as controlled burning, bushfi res and vegetation.
Respiratory health is the primary health outcome related to exposure to a range of air pollutants. A number of health endpoints such as lung function, respiratory symptoms and exacerbations of respiratory disease, hospital admissions and mortality are commonly used when investigating relationships between air pollution and health. As a number of the air toxic pollutants are known carcinogens, cancer is also an outcome of interest. There also is increasing evidence of impacts from air quality on cardiovascular health. A quantitative measure of the contribution of air pollution to respiratory, cardiovascular and cancer burden in the Queensland population has not been derived.
One way the quality of the air environment is assessed in Australia is by comparing monitored air pollution levels with the National Environment Protection Measure (NEPM) for air quality. The NEPM provides a common set of air quality standards designed to protect the health of the majority of Australians. In Queensland in 2002, ambient air quality was measured at up to seven sites, where the locations of sites varied depending upon the pollutant. Excess levels of ozone, sulfur dioxide and particles measured as PM10 (particulate matter with a diameter of <10 micrometres), were recorded at some sites (Table

155
WHOLE OF POPULATION
Health Determinants Queensland 2004
1.24).165 No excess carbon monoxide, nitrogen dioxide or lead levels were recorded at the monitoring sites. The recorded particle exceedences mainly resulted from dust storms and bush fi re smoke, and the ozone exceedences mainly resulted from bush fi res. In south-east Queensland, biomass burning accounts for 4% of total oxides of nitrogen (NOx) emissions, 66% of total PM10 emissions, 24% of total carbon monoxide emissions and 6% of total volatile organic compounds (VOC) emissions. These activities are commonly associated with exceedence of NEPM standards.
In the urban areas of Queensland, and particularly the south-east region, motor vehicle emissions account for 62% of NOx emissions, 68% of carbon monoxide emissions and a signifi cant amount of VOC emissions.166 The total number of emissions produced in any one region is infl uenced by the emissions per vehicle kilometre travelled (VKT) and the number of vehicle kilometres travelled. These two factors are infl uenced by many variables including fuel type, vehicle technology, and number and length of trips.
Table 1.24: Sites of excess pollutants in monitored ambient air, Queensland 2002
Source: Environmental Protection Agency 2002
In south-east Queensland, regional VKT is expected to increase at more than twice the rate of the population from 2000 to 2011, due mainly to the continued trend towards higher private mode share, lower vehicle occupancies and longer trip lengths. Around 75% of estimated PM10 emissions are attributed to diesel fuelled vehicles, which only contribute to 19% of all VKT to the region. Diesel fuelled vehicles also contribute a higher proportion of NOx emissions (39%) compared to their 10% VKT contribution.
Water quality
Water is used for a variety of purposes, eg drinking, irrigation and recreation. Depending on its intended use, the source and potential for human exposure, water is subject to different levels of treatment. Human exposure to polluted water (potable or otherwise) or a limited potable water supply can present a risk to human health. The promotion of water recycling, within the context of future demand and sustainability, can increase public health risks if not managed correctly.
Microbiological contamination of water supplies can lead to many adverse health effects ranging from diarrhoeal disease to death. Outbreaks of Cryptosporidiosis, E. coli and Campylobacter can have severe impacts on communities. Notifi cation rates for conditions associated with these microbiological contaminants are reported in Table 1.23 in section 1.3.8. The contribution that contaminated water makes to the incidence of conditions reported in Table 1.23 is not known. Chemical pollutants (dioxins, heavy metals, arsenic, pesticides, etc) may also pose a serious health hazard, although effects may not be immediate.
The proportion of human disease that can be attributed to poor water quality in Australia is unknown and the importance of some micro-organisms and chemicals to health is unclear. Water contamination has the potential to present a signifi cant risk to human health, and the greatest risk comes from contamination of drinking water.167 Queensland Health is investigating mechanisms to require drinking water providers to develop ‘Water Quality Management Plans’.
Water fl uoridation
In 2003, less than 5% (4.7%) of the Queensland population live in areas with satisfactory fl uoridation levels,168 compared with 69.1% of Australians. Queensland has the lowest proportion of population living in areas with fl uoridated water in Australia, with the proportion in other states and territories in the range 77-100%.169 Both children and adults benefi t from fl uoridation. Water fl uoridation at optimal levels
Pollutant and NEPM reporting time Days reported excess (site)
Carbon monoxideNitrogen dioxideOzone - 1 hour
- 4 hourSulfur dioxide - 1 hour
- 24 hourPM10 - 24 hour
Lead
002 (Rocklea)1 (Rocklea)49 (Mt Isa)1 (Mt Isa)8 (Mountain Creek, Sunshine Coast), 7 (Rocklea), 7(Springwood), 1 (Helensvale, Gold Coast), 7 (FlindersView), 5 (Gladstone) and 6 (West Mackay)0

156 Health Determinants Queensland 2004
WHOLE OF POPULATION
provides signifi cant benefi ts in the prevention of caries for both deciduous and permanent teeth. Current estimates are that fl uoridation reduces coronal and root caries over a lifetime by 20-40%.170,171 These benefi ts are additional to those obtained from discretionary sources of fl uoride such as toothpaste.
Food safety and security
The safety and wholesomeness of the food supply is critical to human health and wellbeing, making food safety and food standards signifi cant public health issues.
In 2002, 6,833 cases of food-borne illness due to nine pathogens or conditions were notifi ed to Queensland Health. Notifi cations of specifi c gastrointestinal conditions are reported in section 1.3.8. These notifi cation numbers are small in comparison to the estimated 1.6 to 1.9 million cases in Queensland,154 and 100 deaths in Australia each year.172
Many cases of food-borne illness could be reduced through better food handling practices. The Queensland Food Handling Baseline Survey 2002173 examined the food handling practices in 403 Queensland food businesses and provides insights on the determinants of food-borne illness. The survey included restaurants, catering businesses, schools, child care centres, supermarkets, nursing homes, retirement villages, hostels, food manufacturers and food processors. One quarter (26%) of businesses had a food safety program at the time of the survey. A food safety program is a written document where potential food hazards of the business are identifi ed. Control measures, regular monitoring and record keeping procedures are then put into place by the business. There was strong statistical evidence in 18 aspects of food safety practices, that possession of food safety plans was associated with safer food handling practices. Food safety programs are current industry best practice and a due diligence defence. To date, food businesses in Queensland are not legislatively required to have a food safety program, however, the review of the Food Act 1981 has highlighted the need for ‘high risk’ food businesses to develop and implement such programs.
Hand washing is one of the most important practices to prevent contamination and the spread of illness. In 2002, hand washing facilities were inadequate at many Queensland food businesses. Only 64% of the businesses surveyed had hand washing facilities that met all requirements. That is, hand washing facilities that were suffi cient, accessible, supplied with soap and/or hand cleanser, had running water and supplied with single use towels. Improving hand washing practices should lead to a reduction in food-borne illnesses.
In 2002 in Queensland, half (53%) of the food handling businesses had a probe thermometer, and in such businesses, most staff (97%) knew how to use the probe. Most businesses (91%) had adequate space to store potentially hazardous food in the cool room. Most Queensland businesses store, cook, transport and display potentially hazardous chilled and hot food at the correct temperature, or have an alternative system for ensuring that food is being stored safely. A minority of businesses do not check the temperature of potentially hazardous food when delivered or displayed (Table 1.25). Transporting food offered the greatest opportunity for breaches of food safety guidelines.
Table 1.25: Food safety practices in food handling businesses, Queensland 2002
Source: QH Queensland food handling baseline survey 2002
Healthy food access
In 2001, as in previous years, basic healthy food costs more in rural and remote areas of Queensland, compared to urban and metropolitan areas.174,175 Items in a healthy food basket are defi ned as the most commonly available foods that meet nutritional requirements of a reference family of six people for two weeks. In Queensland in 2001, the cost of a healthy food access basket was 24% higher in the very remote ARIA category than in the highly accessible ARIA category. The difference in price between accessible and remote areas was greatest for meat and alternatives, and dairy food groups, and least for fruit, vegetables and legumes. There was little difference in the cost of tobacco and take away snack items between areas, with costs in the very remote category being only 11% higher than in the highly accessible category.
Food safety criteria % complying% with an alternative
system% do not follow
temperature guidelines
Chilled food stored at correct temperature 90 3 7Hot food stored at the correct temperature 89 3 8Food transported at correct temperature 67 13 20Cooked at the correct temperature 90 1 9Displayed at the correct temperature 84 16

157
WHOLE OF POPULATION
Health Determinants Queensland 2004
This difference is important. Every time we buy food, we make a decision whether to buy healthy food or unhealthy food, and cost is a factor in this decision. In the very remote areas of Queensland, healthy food costs 24% more than in highly accessible areas, yet snack and takeaway food costs only 11% more. The cost differential favours take away and snack foods more, in very remote areas, than it does in the highly accessible areas of Queensland.
There has been a marked increase in the price of basic healthy food throughout Queensland in the period from April-June 2000 to April-June 2001, in excess of consumer price index changes. Contrary to expectations, price rises were greatest in the three most accessible ARIA categories (Figure 1.38). Price increases were most dramatic for vegetables and fruit, which increased by nearly 30% in moderately accessible areas.
Many social determinants impact on good nutrition and access to food namely: transport for delivery of goods and access to nutritious food outlets; education and literacy to interpret labels and nutrition panels; housing and associated whitegoods for appropriate storage and preparation of foods; income, especially where the price and availability of healthy food is high; and discrimination issues around cultural appropriateness of foods.
Figure 1.38: Mean percent annual change in costs in the same stores, by accessibility, Queensland, 1998- 2000 to 2001
Source: QH Healthy food access basket survey
Physical activity environment
In 2002, half the population of Brisbane (53.3%) reported that availability of facilities infl uenced their participation in recreational physical activity.176 Specifi cally, easy access to bike paths, walking trails, gyms and swimming pools were reported as infl uencing physical activity levels. Physical activity levels were also infl uenced by safety (43.3%), aesthetics (31.6%) and neighbourhood design (23.3%), specifi cally footpaths, lighting, hills, local shops and services.
Increasing physical activity in communities is linked to the physical environment as well as behavioural and social determinants. Proximity and density of places for physical activity within neighbourhoods is associated with physical activity participation.176-182 Evidence is accumulating that indicates the importance of accessibility to facilities such as cycleways, footpaths, health clubs and swimming pools.176-178 Other neighbourhood and environmental characteristics such as safety lighting, hilly terrain, frequent observation of others engaging in physical activity and enjoyable scenery also affect physical activity levels.181,182 In addition, people living in ‘traditional’ neighbourhoods, characterised by higher residential density, mixture of land uses and grid-like street patterns with short block lengths, engage in more walking and cycling trips for transport than people living in sprawling neighbourhoods.179
0
2
4
6
8
10
12
14
Queensland highlyaccessible
accessible moderatelyaccessible
remote very remote
Mea
n%
CPI 2001BrisbaneAustralia
CPI 2000AustraliaBrisbane

158 Health Determinants Queensland 2004
WHOLE OF POPULATION
Household environmental factors There are many facets of housing that have the potential to infl uence health. Access to quality housing is a key determinant, along with aspects of housing design and construction, adequate maintenance, uptake and use of household safety devices and the appropriate use of household appliances.
Housing
In 2001, two thirds (62.4%) of Queenslanders either fully own their own home or are currently purchasing a home (Table 1.26).183 In Queensland, just under a third of the population live in rented premises, and a small proportion in caravan parks. Less than a third (32%) of Indigenous peoples own their homes, in comparison with 69% of other Australian households.92 Households with Indigenous peoples (63%) were more than twice as likely as other households (27%) to be living in rented accommodation. Rental occupancy is more commonly associated with low affordability of home purchase, but can also be related to lifestyle choice, increased job mobility and higher reliance on superannuation as the main source of investment for retirement.184
Table 1.26: Distribution of occupied private dwellings by type of occupancy, Queensland 2001
Source: ABS Census of population and housing 2001
Many Queenslanders on low incomes or with complex needs are not having their housing needs met by the private market. About 62% of low income renters were able to meet their need in the private market in 2001. Moderate affordability need was experienced by 17%, with rental payments ranging between 31% and 40% of their income. The remaining 21% had greater need. This pattern is similar to the Australian average.185
Just over half (55%) of all Queensland households have one or two people in the household, and 10.7% of households contain fi ve or more people (Table 1.27). In comparison, 27% of households, which include Indigenous peoples, have fi ve or more people in the dwelling. Using the international occupancy standard that there should be no more than two persons per bedroom and other criteria, 3.3% of Queensland households have insuffi cient bedrooms, compared to 3.7% for Australia (Table 1.28).92 Considering households including Indigenous peoples, the proportion with insuffi cient bedrooms increased to 12.7% in Australia. Housing for Indigenous peoples is further discussed in the Indigenous peoples chapter.
Housing tenure is directly linked to mortality rates, specifi cally cardiovascular disease. People in rented accommodation have higher death rates than owner-occupiers, even after other socioeconomic variables are considered.186 Housing insecurity increases relocation rates, which have a signifi cant impact on the educational attainment of children in these situations. Those living in poor quality housing where overcrowding and damp conditions are present are more likely to suffer both physical and mental health problems.184 Inadequate housing and housing stress caused by the need to spend more than 30% of a low income on housing can lead to family confl ict and breakdown.187
Table 1.27: Number of persons usually resident in occupied private dwellings as a percentage of total dwellings, all dwellings and dwellings containing Indigenous households, Queensland 2001
Source: ABS Census of population and housing 2001
Fully owned 36.6Being purchased 25.8Rented Housing authority 3.5
Other 26.2Other and not stated 7.9
% of dwellings
PersonsQueensland
totalContaining Indigenous
households
1 24.3 14.62 33.1 21.83-4 32.0 36.45-6 9.8 20.27-9 0.9 5.610 or more 0.1 1.3
% of Dwellings

159
WHOLE OF POPULATION
Health Determinants Queensland 2004
Table 1.28: Selected housing indicators, percentage of total dwellings, Queensland 2001
Source: ABS Census of population and housing 2001
In 2001, the majority of Queenslanders rated their housing as adequate, based on a number of criteria (Table 1.29). More males generally rated their housing adequate than females, although no signifi cant differences were reported. Results for Australia were similar to those for Queensland. Distance from public transport was rated as the least satisfactory feature of housing for both males and females. Only 73.9% of the population perceived the distance as adequate, in contrast with fi ve other housing characteristics. Adults in remote (47.4%) and outer regional (55.8%) areas perceived signifi cantly less adequacy of their housing in relation to distance from public transport than in metropolitan areas (83.6%).
Table 1.29: Adequacy of housing by selected aspects, percentage of dwellings (95%CI), by sex, Queensland and Australia 2001
Source: HILDA 2001
Homelessness
It was estimated that in 2001, 24,569 people in Queensland were homeless.188 This represented 69.8 persons per 100,000 people. Queensland and Western Australian rates of homelessness were signifi cantly higher than southern states. In Australia, of those people defi ned as homeless, about 50% were aged less than 24 years of age; including 10% who were children under 12 years of age (Table 1.30). More males than females were homeless (58% and 42% respectively). Compared with 30-40 years ago, women make up a substantial minority of homeless people in Australia.
Homelessness in childhood can contribute to ill health, behavioural problems and poor educational outcomes.189 Homeless young people have a much higher prevalence of physical and psychological problems (including sexual health, nutrition and oral health problems as well as higher levels of substance abuse) than the general population.190 Homelessness is further discussed in the Young people and Children chapters.
Table 1.30: Estimates of homelessness by age, Australia 2001
Source: ABS Counting the homelessness 2001
Households withinsufficientbedrooms
Households with twoor more bedrooms
above requirements
Queensland 3.3 39.4New South Wales 4.4 35.8Victoria 4.5 33.1South Australia 2.4 35.7West Australia 2.2 44.8Tasmania 1.6 37.9Northern Territory 6.3 22.0Australian Capital Territory 3.0 40.2Australia 3.7 36.8
Queensland persons Australia personsMale Female 18+ years 18+ years
Living space 89.4 (89.3-89.5) 89.3 (89.2-89.3) 89.3 (89.3-89.4) 88.4 (88.4-88.4)Number of bedrooms 91.2 (91.7-91.8) 91.3 (91.3-91.4) 91.6 (91.5-91.6) 90.4 (90.4-90.4)Comfort 94.3 (94.2-94.3) 93.4 (93.4-93.5) 93.8 (93.8-93.9) 92.6 (92.6-92.6)Distance from public transport 74.8 (74.7-74.9) 74.2 (74.1-74.3) 74.5 (74.4-74.5) 81.5 (81.5-81.6)Access to services normally used 84.5 (84.5-84.6) 84.2 (84.1-84.3) 84.4 (84.3-84.4) 87.5 (87.5-87.5)Housing needs in general 94.8 (94.7-95.0) 93.7 (93.6-93.7) 94.2 (94.2-94.2) 94.2 (94.1-94.2)
Queensland 18+ years
Number% agegroup
% totalhomeless
under 12 9,941 0.3 10.012-18 26,060 1.4 26.119-24 10,113 0.7 10.125-34 16,567 0.6 16.635-44 12,992 0.5 13.045-54 10,349 0.4 10.455-64 7,883 0.5 7.965+ 5,995 0.3 6.0total 99,900 0.5 100.0
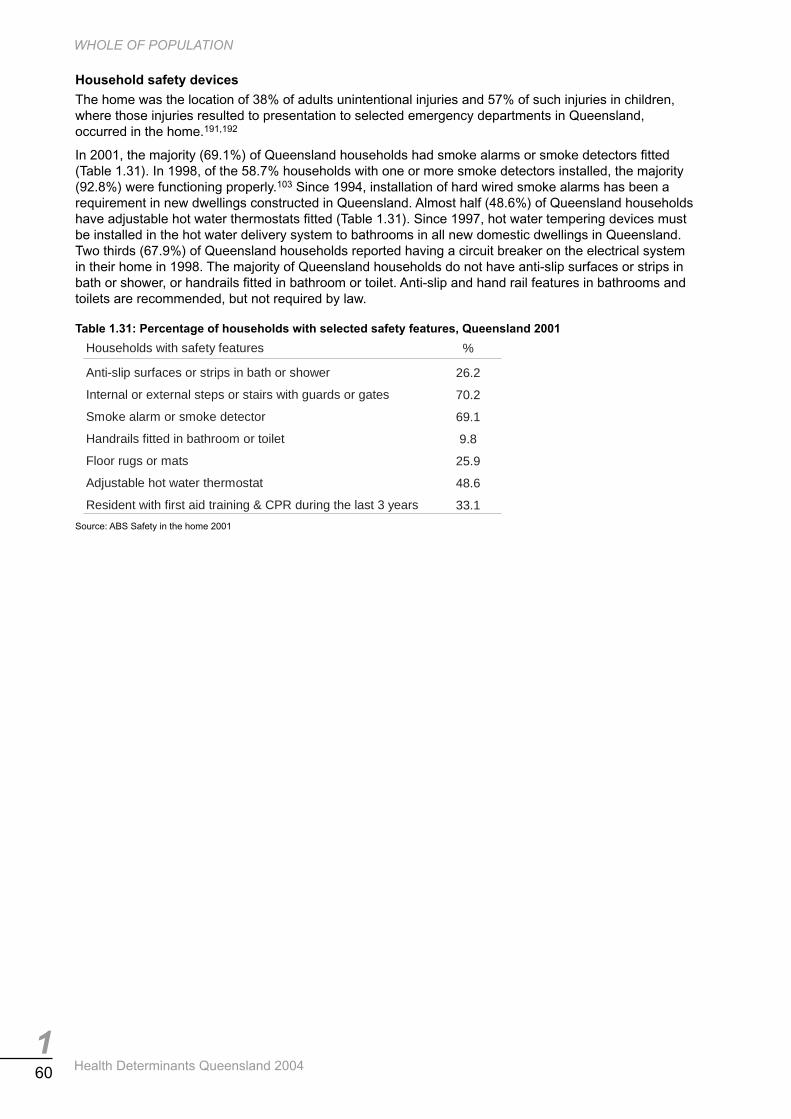
160 Health Determinants Queensland 2004
WHOLE OF POPULATION
Household safety devices
The home was the location of 38% of adults unintentional injuries and 57% of such injuries in children, where those injuries resulted to presentation to selected emergency departments in Queensland, occurred in the home.191,192
In 2001, the majority (69.1%) of Queensland households had smoke alarms or smoke detectors fi tted (Table 1.31). In 1998, of the 58.7% households with one or more smoke detectors installed, the majority (92.8%) were functioning properly.103 Since 1994, installation of hard wired smoke alarms has been a requirement in new dwellings constructed in Queensland. Almost half (48.6%) of Queensland households have adjustable hot water thermostats fi tted (Table 1.31). Since 1997, hot water tempering devices must be installed in the hot water delivery system to bathrooms in all new domestic dwellings in Queensland. Two thirds (67.9%) of Queensland households reported having a circuit breaker on the electrical system in their home in 1998. The majority of Queensland households do not have anti-slip surfaces or strips in bath or shower, or handrails fi tted in bathroom or toilet. Anti-slip and hand rail features in bathrooms and toilets are recommended, but not required by law.
Table 1.31: Percentage of households with selected safety features, Queensland 2001
Source: ABS Safety in the home 2001
Households with safety features %
Anti-slip surfaces or strips in bath or shower 26.2
Internal or external steps or stairs with guards or gates 70.2
Smoke alarm or smoke detector 69.1
Handrails fitted in bathroom or toilet 9.8
Floor rugs or mats 25.9
Adjustable hot water thermostat 48.6
Resident with first aid training & CPR during the last 3 years 33.1

161
WHOLE OF POPULATION
Health Determinants Queensland 2004
1.4.2 Socioeconomic factors
‘‘Even in the most affl uent countries, people who are less well off have substantially shorter life expectancies and more illnesses than the rich.”
WHO 200321
Evidence shows that health is linked to socioeconomic position, with the socioeconomically disadvantaged having higher mortality rates for most major causes of death. Their morbidity pattern indicates they experience more ill health37 and their use of healthcare services suggests they are less likely to act to prevent disease or to detect it at an asymptomatic stage.193
Socioeconomic differences are reported for many outcome indicators in section 1.3 of this chapter and where possible in Children, Young people, Older people and Indigenous peoples chapters. Socioeconomic differences are also reported for many health related behaviours and risk factors in section 1.4.4. This section examines some key socioeconomic factors that infl uence health. Complementary socioeconomic factors are included in other sections in this document. These include housing and homelessness indicators in section 1.4.1, and use of computers and Internet, gambling and transport access indicators in section 1.4.3.
Income In 2001, a larger proportion of males (52.3%) than females (27.0%) were in the higher income categories (greater than $500 per week: Table 1.32).194 The income of the majority of males aged 15-24 years or 65 years and older was less than $500 per week, with 62-64% of males earning less than $300 per week. More females than males earned less than $300 per week in each age group. Income is considered the single most important modifi able determinant of health.35 Details of income by age group are reported in each chapter of this report.
The weekly income of a quarter (25.3%) of Queensland families was less than $500 per week in 2001, where 27% of such families were one-parent families and 30% were couple families with children (Table 1.33). In 2001, the median gross weekly income of one parent households was $386 and the median gross weekly income of couple-with-dependants households was two and a half times higher ($933).56
Table 1.32: Individual income received by age and sex, percentage of persons, Queensland 2001
Source: ABS Census of population and housing 2001
Table 1.33: Weekly family income received (percentage) and numbers of families by type of family in occupied private dwellings, Queensland 2001
Source: ABS Census of population and housing 2001
$ per week Male Female Male Female Male Female Male Female
< 300 61.9 66.5 22.7 42.4 63.8 77.4 35.5 52.0300-499 19.4 20.3 15.9 24.1 21.1 15.6 17.3 22.1500-999 17.1 12.8 41.2 27.0 11.6 5.5 32.8 21.21000-1499 1.1 0.4 20.1 6.6 3.5 1.5 14.5 4.71500+ 0.4 0.1 6.9 1.5 1.6 0.7 5.0 1.1
15+15-24 25-64 65+
Couple familywith children
Couple familywithout children
One parentfamily Other family Total
Number of families 353,854 315,837 133,162 15,111 817,964
Family income ($ weekly)< 300 1.4 2.7 13.6 7.7 4.0300-499 7.4 29.5 37.9 26.0 21.3500-999 34.2 29.8 35.1 37.8 32.71000-1499 28.3 19.5 9.6 18.8 21.71500+ 28.7 18.4 3.8 9.7 20.3

162 Health Determinants Queensland 2004
WHOLE OF POPULATION
In Queensland, almost half (43.3%) the households in 2001 reported having at least some diffi culty making ends meet (Table 1.34). A signifi cantly lower proportion of households in remote areas of Australia had diffi culty makes ends meet, than in urban and regional areas. Consistent with the measure of socioeconomic disadvantage, a greater proportion of households in the highest 60% of socioeconomically disadvantaged areas had diffi culty making ends meet. Considering individuals rather than households, in 2001 5.5% of Queensland adult males and 6.6% of females reported running out of food and being unable to afford to buy more (Table 1.35). A greater proportion of young males (18-24 years) and women younger than 45 years were unable to afford to buy more food once they had run out. One in 10 people in areas of greatest socioeconomic disadvantage reported being unable to buy required additional food due to fi nancial constraints.
Table 1.34: Percentage of households having trouble making ends meet (95%CI), by region and socioeconomic disadvantage, Queensland and Australia 2001
Source: HILDA 2001
Table 1.35: Percentage of people who reported running out of food and being unable to afford to buy more, in past 12 months, by age, sex and socioeconomic disadvantage, Queensland 2001
Source: ABS National health survey 2001 *Relative SE of the estimate = 25-50%; **Relative SE of estimate >50%
Income inequality Between 1994-95 and 1997-98, the real income of Australian households increased for all levels of socioeconomic disadvantage (Table 1.36).195 The close to uniform changes in the average income of households with low, middle and high incomes over this period suggests that there has been little change in the income gap between households. However, for the longer period 1990-2000, there is evidence that the growth in incomes over the decade has benefi ted high income earners to a greater degree than those on low income, and thus increased income inequality. Income inequality in Queensland was similar to Australia in 1997-98, as determined by the gini coeffi cient (Table 1.37). The gini coeffi cient is expressed as a ratio that is always between 0 and 1, with lower values refl ecting lower inequality. The similarity between Queensland and Australia is shown in the similar shares of high and low income received by Queenslanders and Australians.
Table 1.36: Household income increase, weekly estimates, Australia 1994-95 to 1997-98
Source: CSIRO Measuring Australia’a progress 2002
Increase%
Increase in weeklydisposable income
Most disadvantaged households 5 $408 to $427Households in the middle level of disadvantage 5 $687 to $720Households with least disadvantage 6 $1,566 to $1,642
With some difficulty, withdifficulty, or great difficulty (%)
With some difficulty, withdifficulty, or great difficulty (%)
Queensland 41.9 (41.8-42.0) Australia: (socioeconomic disadvantage)Australia 40.1 (40.1-40.2) quintile 1(least) 32.7 (32.7-32.8)
Australia: quintile 2 37.0 (36.8-37.1)Major cities and Inner regional 39.9 (39.8-39.9) quintile 3 41.4 (41.3-41.5)Outer regional 44.1 (44.0-44.2) quintile 4 43.1 (43.0-43.2)Remote, very remote and migratory 27.9 (27.6-28.2) quintile 5 (most) 47.8 (47.7-47.8)
Male Female Male Female Persons
18+ 5.5 6.6
18-24 13.9 8.1* Quintile 1 (least) 1.1** 2.8* 2.0*
25-34 7.6 9.9 Quintile 2 4.3* 3.8* 4.0
35-44 6.3 9.7 Quintile 3 4.2* 6.8 5.5
45-54 2.1* 4.7* Quintile 4 6.1 7.5 6.8
55-64 3.4* 4.7* Quintile 5 (greatest) 10.3 10.5 10.4
Socioeconomic disadvantage:

163
WHOLE OF POPULATION
Health Determinants Queensland 2004
Table 1.37: Selected income inequality indicators, Queensland and Australia 1997-98
Source: ABS Australian social trends 2002
Pensions and disability support Almost half of all Queensland children aged under 16 years (48.2%) lived in families receiving income support payments in 1996 (Table 1.38).22 Income support payments include age, disability, Newstart allowance; sickness and special benefi ts; youth training allowance; sole parent pensions and family allowance payments.
The proportion of children in families receiving income support payments was generally higher in Brisbane than in most other capital cities in Australia, while Queensland’s non-metropolitan areas were similar to non-metropolitan areas in other states. The number and proportion of dependent children in families receiving an income support payment in Brisbane increased in the period 1989-96. Unskilled and semi skilled workers and early school leavers were signifi cantly more likely to receive support payment. In contrast, high income families, managers and administrators, and professionals were less likely to receive support payment.
The percentage of Older people on an aged pension and the percentage of people on disability support pensions in Queensland in 2001 were similar to Australia (Table 1.39). However, in 1997- 98, government payments were the main income source of a greater proportion of Queensland households of couples with dependent children and one-parent families than comparable households in Australia.
Table 1.38: Dependent children of selected pensioners and benefi ciaries, percentage of population aged 15 years and younger, Queensland and Australia 1989, 1996
Source: A social health atlas for Australia, 1999
Table 1.39: Selected income support indicators, Queensland and Australia 2001
Source: Australian social trends 2002 *Calculated by QH **1997-98
Socioeconomic disadvantage In 2001, there were 47 Statistical Local Areas in Queensland with substantial socioeconomic disadvantage, defi ned as greater than 60% of the population in the quintile of greatest socioeconomic disadvantage (Table 1.40).197 These disadvantaged areas were located in outer Brisbane metropolitan, coastal rural and northern remote areas. In the 2001 census, the criteria used by ABS to construct the socioeconomic indices were modifi ed, thus comparison between 1996 and 2001 census is not reported
Queensland Australia
1996Capital city 43.7 39.2Other major urban centres 48.4 44.0Rest of State 52.5 51.4Total 48.2 43.5
1989Rest of State 41.0 37.8
Queensland Australia
Share of total income received by households withhigh incomes (%) 38.9 39.2low incomes (%) 10.3 10.2
Gini coefficient 0.316 0.322
Queensland Australia
65.3 67.8
4.1 4.13.3 3.6
in occupied private dwellings)*
12.2 11.1(of couple with dependant households)
66.5 64.6(of one parent households)
Aged on aged pension (%)
Single parent payment (% of all persons in families
Main income source from government payments (%)**
Main income source from government payments (%)**
Disability support pensioners (% of persons 15+ years)*

164 Health Determinants Queensland 2004
WHOLE OF POPULATION
in this document. Socioeconomic disadvantage is reported for small areas in Queensland in Chapter 6: Health Service District profi les.
Table 1.40: Socioeconomic disadvantage by Statistical Local Area, Queensland 2001
Source: ABS Index of socioeconomic advantage/disadvantage 2001
Education In 2001, 41.1% of the Queensland population aged 15 years and older had post school qualifi cations (Table 1.41), compared with 43.8% nationally. Full time employed people were twice as likely to have a post school qualifi cation as unemployed people, 51.7% and 27.6% respectively. Of the Queensland population aged 15 years and older, 62.8% of females and 50.6% of males had no recognised post school qualifi cations (Table 1.42). Some groups of people, such as Aboriginal and Torres Strait Islander peoples and people with disabilities, are disadvantaged in gaining access to education and training.198 In contrast, people who were born overseas generally had higher educational attainment, with higher attainment where language spoken was not English (Table 1.43). This refl ects Australia’s immigration policies, which require education and skills as prerequisites for entry into Australia.
In 2001, Queensland’s apparent retention rate for secondary school students from Year 7/8 to Year 12 was 79%, compared with the Australian average of 73.4%.1 The apparent retention rate for female students was 83.2% and males 74.9%. Children’s education is more fully discussed in the Children chapter of this report.
Table 1.41: Highest educational attainment by labour force, percentage of persons aged 15 years and older, Queensland 2001
Source: ABS survey of education and training 2001
Table 1.42: Percentage of persons aged 15 years and older with post school qualifi cation by sex, Queensland 2001
Source: ABS census of population and housing 2001
% population in quintile ofgreatest disadvantage Number (%of SLAs)
80-100% 28 6%60-80% 19 4%40-60% 45 10%20-40% 55 12%20% or less 305 67%
Employedfull-time
Employedpart-time Unemployed
Not in thelabour force Total
Postgraduate degree 2.6 1.7 0.4 0.8 1.9Graduate diploma / Graduate certificate 4.2 1.9 1.5 2.3 3.1Bachelor degree 13.0 9.1 4.3 5.1 10.0Advanced diploma / Diploma 8.1 7.9 5.7 5.5 7.4Certificate 23.8 14.0 15.7 12.1 18.7Year 11 or 12 22.2 31.7 36.0 20.5 24.8Year 10 or below 24.8 32.0 34.8 52.2 32.6Level not determined 1.2 1.5 1.6 1.3 1.3Never attended school 0.0 0.3 0.0 0.2 0.1Total 100.0 100.0 100.0 100.0 100.0
Male Female
Postgraduate degree 1.7 1.0
Bachelor degree 7.6 9.1
Graduate diploma and graduate certificate 0.9 1.4
Advanced diploma and diploma 5.0 6.0
Certificate 24.2 8.1Do not have a qualification or within scope ofAustralian classification
50.6 62.8
Not stated 10.0 11.6

165
WHOLE OF POPULATION
Health Determinants Queensland 2004
Table 1.43: Highest educational attainment by language and country of birth, percentage of persons aged 15 years and older, Queensland 2001
Source: ABS survey of education and training 2001
Generally, people with the worst health status have lower education levels and people with lower levels of education face a much higher risk of becoming unemployed.199 Literacy infl uences health and health determinants in a variety of ways, including the choice of activities of daily living, coping skills, safety risks in the workplace/home, and vulnerability to changes in social and medical circumstances. All of these can lead to errors in following medical instructions, lower or late access of health services, lifestyles which can lead to chronic illness and eventually preventable morbidity and mortality.200
Employment In January 2004, the unemployment rate in Queensland was 5.9%, compared with the Australian rate of 5.6% (Table 1.44).201 The unemployment rate for females in Queensland was higher than the male rate. Unemployment rates in Queensland have fallen over the past two years, and are currently being driven by population increase. Rates in Queensland regions vary. In February 2003, rates varied from 5.2% to 15.1%, with generally higher rates in non-metropolitan regions.202 Long term unemployment as a proportion of total unemployment in February 2003 was lower in Queensland than in Australia, 15.7% compared with 21.5% respectively, where long term unemployment was defi ned as 52 weeks or longer.202
The proportion of long term unemployment to total unemployment has varied over time in Australia peaking in 1993 for both males and females (Figure 1.39). Long term unemployment has been a higher component of total unemployment for males than females.202 The unemployment rate for Indigenous peoples in Queensland is double that of the total population,56 as discussed in the Indigenous peoples chapter of this report.
Table 1.44: Unemployment by sex and location, proportion of persons aged 15 years and older looking for work, Queensland and Australia by state 2003, 2004
Bachelordegree
Grad. diploma /grad. certificate Year 12
Year 10 orbelow
English - born in Australia 9.1 2.6 19.0 36.1English - born overseas 10.2 3.5 18.3 28.7Other language - born in Australia 12.1 4.7 16.1 30.4Other language - born overseas 12.5 6.0 20.6 21.6Total 9.5 3.0 19.0 34.2
Queensland Australia Queensland Australia
Unemployment rate (%) Unemployment rate (%)Persons 5.9 5.6 Persons 7.7 6.7Male 5.4 5.3 Male 7.1 6.7Female 6.5 6.0 Female 8.5 6.7
Queensland 15.9 RangeNew South Wales 29.9 Brisbane metropolitan 6.9 5.2-7.9Victoria 23.3 Balance of State 8.5 6.8-15.1South Australia 30.5Western Australia 22.0Tasmania 37.2Australian Capital Territory 27.2Australia 24.7
Long term unemployment as aproportion of total unemployment Queensland
Unemployment rate (%)
Source: ABS January 2004 Labour force Source: ABS February 2003 Labour force
Source: ABS February 2003 Labour force

166 Health Determinants Queensland 2004
WHOLE OF POPULATION
Figure 1.39: Trends in ratio (seasonally adjusted) of long term unemployed (greater than 104 weeks) to total unemployed by gender, Australia 1986-2003
Source: ABS Labour force Australia
Employment provides income. Unemployment reduces people’s ability to purchase goods and services, such as adequate nutrition and housing. In addition, employment is a primary source of status in industrialised countries, while also signifi cant in providing social support, structure to life and a means of participating in society.35,203 Unemployment rates fl uctuate and are strongly associated with periods of economic downturn. Unemployment in Queensland has remained consistently higher than the national average in recent years.2 The employment trend for both Queensland and Australia has been toward higher growth in part-time and casual employment rather than full-time employment, although current growth in employment was reported in full-time positions.201 The trend towards part-time and casual employment is likely to continue into the foreseeable future.
Males continue to outnumber females in the labour force, particularly on a full time basis.183 Similar proportions of males and females are unemployed and seeking work. More than twice as many females than males are employed part-time (Table 1.45). Employed females are equally likely to be employed part time or full-time. However, more females (36.4% of all female employees) than males (28.9% of all male employees) are employed without leave entitlements. This social disadvantage is greater in Queensland than for Australia as a whole, where the proportions employed without leave entitlements are 31.9% for females and 23.5% for males.204
Table 1.45: Labour force status by age and sex, Queensland 2001
Source: ABS Census of population and housing 2001
Male Female Male Female Male Female Male Female
Total labour force (% of total population, aged 15+ years) 69.7 66.4 83.6 64.7 70.9 55.6 70.9 55.6
Not in the labour force (% of total population, aged 15+ years 30.3 33.6 16.4 35.3 29.1 44.4 29.1 44.4
Employed: working full-time (% of labour force) 47.6 35.5 74.9 48.4 69.4 45.5 69.4 45.5Employed: working part-time (% of labour force) 31.9 47.4 15.3 43.3 18.9 44.3 18.9 44.3Total employed (% of labour force) 83.3 86.1 92.8 94.1 91.2 92.5 91.2 92.5Total unemployed (% of labour force) 16.7 13.9 7.2 5.9 8.8 7.5 8.8 7.5
15-24 years 25-64 years 65+ years 15+ years
0
10
20
30
40
1986 1987 1988 1989 1990 1991 1992 1993 1994 1995 1996 1997 1998 1999 2000 2001 2002 2003
Rat
io(p
erce
nt)
.
Males Females

167
WHOLE OF POPULATION
Health Determinants Queensland 2004
1.4.3 Community capacity
‘‘You may have the greatest bunch of individual stars in the world, but if they don’t play together the club won’t be worth a dime.”
Babe Ruth
The health and wellbeing of Queenslanders is generally enhanced by social participation and community life. Current evidence indicates that active, participant directed communities are healthy places to live. Furthermore, health outcomes are more likely to be maximised when government and communities work together in partnership.205 This requires support for communities to develop the capacity to become active partners in the process.206 This includes involvement in identifying relevant health determinant issues, and planning, implementing and evaluating activities to address these issues.
While the impact of community factors on population health is generally accepted, a standard set of indicators to measure and monitor community capacity is yet to be established. This section reports on available indicators of safety, social capital, social supports, sense of control, volunteerism and transport access. Because there is considerable interaction and overlap amongst determinants some community capacity indicators are reported in other sections of this document. For example, a range of housing indicators such as housing tenure, adequacy, homelessness, and safety and access to healthy food are reported in section 1.4.1. Socioeconomic indicators such as disadvantage, income, education and employment are reported in section 1.4.2, and demographic indicators in the Health Service District profi les of chapter 6. Health literacy is diffi cult to measure; however indicators of diabetes knowledge are reported in section 1.3.5, and some knowledge and awareness of communicable disease in section 1.3.8. This suite of community capacity indicators is incomplete due to lack of data or limited quality data, such as some community support services. It is envisaged that in future, indicators to monitor community capacity and quality data to support these indicators will be more readily available, and more clearly defi ned.
Social capital In 2002, 79% of people aged 18 years and older in Queensland reported that people in their neighbourhood were generally willing to help one another (Table 1.46), signifi cantly greater in males than females. The majority of people (83%) felt like they belonged in their neighbourhood. This was signifi cantly greater for people aged 40 years and older, than 18-29 year olds. Three quarters (72%) of Queenslanders believed people in their neighbourhood could be trusted. This was signifi cantly greater for people aged 50 years and older, compared with 18-29 year olds. The majority of Queenslanders (85%) enjoy living among people of different lifestyles, with little difference across the age categories. Less than half (40%) people in Queensland reported working with others (often or sometimes) to improve their neighbourhood. This was signifi cantly less for young people (18-29 years) than for older age groups (all age groups over 40 years). People in rural areas and in remote areas were signifi cantly more likely to report working with others than people in urban areas. About half of Queenslanders reported being involved in volunteer activities intended to benefi t their community. People in the age range 30-39 years and 40-49 years reported signifi cantly higher rates of volunteering as did people in rural areas (compared to urban areas). Seventy percent of people participated in social activities in their neighbourhood with friends or neighbours on a monthly basis or more frequently. This was signifi cantly less for people aged 50 years and older, than 18-29 year olds. There were signifi cant differences in several of these social capital indicators across areas of differing socioeconomic disadvantage, but no predicable pattern of difference was evident. This data is more fully documented in the companion document, Health Determinants Queensland 2004: Statistical report.
The social capital survey conducted by Queensland Health in 2002,62 included the questions listed above. These seven questions represent part of the 27-question Social Capital Index©.207 The Index© identifi es seven dimensions of social capital: generalised reciprocity and cohesion; community identity; generalised trust; tolerance of diversity; civic trust; community involvement; and informal social networks. Signifi cant differences in these domains were reported across gender and age groups (Table 1.47). Social capital, represented by these domains, was signifi cantly associated with better quality of life, self reported health and satisfaction with health.208 People with higher social capital generally reported a greater number of healthy behaviours: suffi cient physical activity, not smoking, healthy weight and consumption of suffi cient fruit and vegetables.

168 Health Determinants Queensland 2004
WHOLE OF POPULATION
Social capital has been defi ned as ‘social relations of mutual benefi t characterised by norms of trust and reciprocity’.209 It describes features of social life such as how involved we are in our community, how much we trust each other and our governments and institutions, how connected we are to our communities and families and how much we help each other.210 People who actively participate in their community and have strong and supportive family, cultural and community relationships have better health than people who are socially isolated.35
Table 1.46: Selected variables refl ecting social capital concepts (95%CI), proportion of population aged 18 years and older, by sex, Queensland 2002
Source: QH Social capital survey 2002 * agree/strongly agree ** often or sometimes *** monthly or more frequently
Table 1.47: Dimensions of social capital by age and sex, persons aged 18 years and older, Queensland 2002
Source: QH Social capital survey 2002 Note:Social Capital Index©
Social capital dimension Gender difference Age group differences
Female significantly higher than male No significant difference
Community identity No significant difference Significantly lower in young people than in adults aged30-64 and people 65+ years
Generalised trust No significant difference Gradient across age groups. Significantly higher scoresin people aged 65+ years
Tolerance of diversity Female significantly higher than male No significant difference
Civic trust No significant difference Highest trust in 65+, followed by 18-29 year olds, andsignificantly lower in people aged 30-64 years
Community involvement Female significantly higher than male Significant difference across all age groups. Highest in30-64 year olds, then older and lowest in 18-29 years
Informal social networks Female significantly higher than male Young people and adults 30-64 years higher than olderpeople.
Generalised reciprocity andcohesion
Persons Male Female
People in my neighbourhood are willing to help one another* 79.2 (76.4-82.1) 84.2 (80.5-87.9) 74.4 (70.1-78.8)
I feel like I belong in this neighbourhood* 83.8 (81.2-86.4) 84.8 (80.9-88.2) 83.1 (79.4-86.9)
Most people in my neighbourhood can be trusted* 71.9 (68.7-75.1) 75.5 (71.1-79.9) 68.5 (63.9-73.1)
I enjoy living among people of different lifestyles* 85.4 (82.9-87.9) 81.8 (77.9-85.7) 88.8 (85.7-91.9)
I have worked with others on something to improve myneighbourhood**
40.2 (36.7-43.7) 38.6 (33.7-43.5) 41.8 (36.8-46.7)
I have been actively involved in volunteer activities intended tobenefit my community**
52.4 (48.9-56.0) 48.9 (43.8-53.9) 55.9 (50.9-60.8)
How often do you actively participate in any social activities withfriends or neighbours in your own community***
71.4 (68.6-74.7) 69.9 (65.5-74.3) 73.3 (69.1-77.4)

169
WHOLE OF POPULATION
Health Determinants Queensland 2004
Household characteristics In 2001, 9.1% of Queenslanders living in private households were living alone (Table 1.48). People with strong family, cultural and community ties have better health than people who are socially isolated.35 People living alone as well as single-parent families, people with mental illness, people with disabilities, older people and unemployed people are vulnerable to social isolation.
It is predicted that in Australia between 1996 and 2021, the average size of households will decline from 2.6 persons to 2.2-2.3 persons.211 It is also predicted that the number of children living in one parent households will increase. In 1996 in Queensland, 19.8% of children lived in one-parent families. By 2021, this is expected to increase to between 20.3% and 34.1%.212 In 2021, it is estimated that 35-40% of older Australians will be living alone, with 75% of these likely to be women.
Table 1.48: Relationship in private households, proportion of population by sex, Queensland 2001
Source: ABS Census of population and housing 2001
Sense of control The majority of Queensland adults in 2002 (86.6%) felt they had control over the decisions that affect their lives, with similar prevalence for males and females (Table 1.49). The majority of people felt they had a good understanding of the political issues which confront our society (79.2%) and that by working together, people could infl uence decisions which affect the neighbourhood (79.5%). Half to one third of people felt they could infl uence government or neighbourhood decisions. Signifi cantly more males than females felt knowledgeable regarding political issues and able to infl uence government.
There were no signifi cant differences in any sense of control indicators between urban, rural and remote areas of Queensland. People in remote areas felt less able to infl uence what the government does and people in urban areas felt less able to infl uence decisions that affect their neighbourhood, but neither difference was signifi cant. People in the more socioeconomically disadvantaged areas of Queensland felt signifi cantly less able to infl uence what the government does (32.2%), compared with 45.7% of the least socioeconomically disadvantaged quintile.
Young males aged 18-29 years were the most likely to report feeling control over the decisions which affect their life, where the proportion of males feeling such control signifi cantly decreased with increasing age. Young males and females were signifi cantly less likely to feel they had a good understanding of the important political issues that confront our society.
A sense of control over the decisions which affect your life was signifi cantly associated with better quality of life, self reported health and satisfaction with health.208
Table 1.49: Percentage of population aged 18 years and older who agreed or strongly agreed with selected sense of control statements (95%CI), by sex, Queensland 2002
Source: QH Social capital survey 2002 *strongly disagree or agree
Male Female Persons
I have control over the decisions that affect my life 85.1 (83-87.1) 88.2 (86.3-90.1) 86.6 (85.2-88)
I can influence decisions that affect my neighbourhood 42.2 (39.3-45) 46.5 (43.5-49.5) 44.3 (42.2-46.3)By working together, people in my neighbourhood can influencedecisions that affect the neighbourhood 77.3 (74.9-79.7) 81.8 (79.5-84.1) 79.5 (77.8-81.2)
I have the knowledge and skills to influence my community 57 (54.2-59.9) 51.6 (48.6-54.5) 54.4 (52.3-56.5)
People like me don't have a say in what the state government does* 33.4 (30.7-36.1) 40.5 (37.6-43.4) 36.8 (34.8-38.8)I feel like I have a pretty good understanding of the importantpolitical issues which confront our society 82.1 (79.9-84.3) 76 (73.5-78.6) 79.2 (77.5-80.9)
I can influence decisions made by government agencies 24 (21.5-26.4) 26.2 (23.6-28.8) 25 (23.3-26.8)
Male Female
Registered marriage partner 40.2 39.7De facto marriage partner 6.5 6.4Lone parent 1.6 7.6Child under 15 23.3 21.4Dependent student (15-24) 4.6 4.6Other indiv in family household 10.6 7.2Group household member 4.6 3.5Lone person household 8.7 9.6

170 Health Determinants Queensland 2004
WHOLE OF POPULATION
Volunteerism In 2002, 52% of Queenslanders aged 18 years and older reported being actively involved (often or sometimes) in volunteer activities intended to benefi t their community (Table 1.46), and 32% reported never being involved.62
In 2000, 32% of Australians aged 18 years and older contributed to the community through volunteer work, an increase from 24% in 1995.213 A volunteer was defi ned as a person who in the past 12 months had willingly given unpaid help in the form of time, service or skills through an organisation or group. Volunteer rates were slightly higher for Australian women than men (33% compared to 31%). People aged 35-44 years reported the highest rate of volunteering (40%), and this is likely to be associated with family commitments. Female partners with dependant children had a volunteer rate of 45% compared with 28% for female partners without dependant children. People born in Australia were more likely to undertake voluntary work (35%) than those born outside Australia (25%). Volunteer rates in metropolitan Queensland (about 30%) were similar to metropolitan rates in most other states, however rates in non metropolitan Queensland (about 32%) were low compared with other states.213
In 2000, the median number of hours of voluntary work was 1.4 hours per week or 72 hours per year for Australians aged 18 years and older.213 Women worked more hours than men, and older people more than younger people. The activities most frequently reported by volunteers were fundraising (56%), management (45%), teaching (44%) and administration (41%).
Carers In Queensland in 1998, 83,600 people aged 18 years and older undertook a primary carer role,68,107 or 2.4% of the Queensland population, similar to the Australian rate.67 One in ten (12%) Queenslanders aged 18 years and older were primary or secondary carers in 1998.107 A primary carer is defi ned as a person who provides any kind of assistance to a person with one or more disabilities lasting at least six months and which restrict everyday activities. This includes ongoing assistance to Older people (persons aged 60 years and older). In Queensland, 76% of all primary carers were female compared to 70% in Australia. Primary carers in Queensland were more likely to be younger, with 72% under 55 years of age compared with 61% nationally. In 1998, 33% of primary carers also had a disability, with older primary carers more likely to have a disability than younger carers.214 Carers mostly cared for a person in the same household (74%) compared with 26% outside the household. Of this latter group, almost three quarters were female.107
The proportion of the population undertaking a primary carer role increased with age, with highest rates in women aged 45-64 years and highest rates in men over 75 years of age (Figure 1.40). This is further discussed in the Older people chapter. Family responsibilities were the major reasons for undertaking the carer role (61.3%: Table 1.50). Lack of alternative care providers was the reason for undertaking the carer role in a signifi cant proportion of cases.
Figure 1.40: Percentage of population who were primary carers by age and sex, Australia 1998
Source: ABS Survey of disability, ageing and carers 1998
0
1
2
3
4
5
6
7
8
< 18 yrs 18-24 25-34 35-44 45-54 55-64 65-74 75 +
Per
cent
age
ofag
egr
oup
popu
latio
n
Male Female

171
WHOLE OF POPULATION
Health Determinants Queensland 2004
Partner Other Total% % %
Family responsibility 24.6 36.7 61.3Could provide better care 21.1 18.1 39.2Emotional obligation 18.8 15.7 34.3Alternative care unavailable 12.7 10.7 23.4No other family or friends available 10.6 12.7 23.3Had no choice 10.3 10.1 20.3No other family or friends willing 4.6 8.1 12.9Other reason/not stated 4.6 6.9 11.5
Table 1.50: Reasons for undertaking carer role by relationship to recipient of care, all persons 15 years and older, Queensland 1998
Source: ABS Survey of disability, ageing and carers 1998
Transport In 2002, 87% of Queenslanders aged 18 years and older felt they could easily get to the places they needed to go, while 3.5% reported having diffi culty.63 Diffi culty with transport was felt to be a larger problem for females of all age groups and for Older people than younger age groups (Figure 1.41). In Australia, people in the lowest income quintile reported greater diffi culty with transport than people in the highest income quintile, 8.6% compared with 1.1%.63 People born in non English speaking countries and who were not profi cient in spoken English, reported higher levels of diffi culty - 12% compared with 3.5% of people born in Australia. In addition, people who reported poor health reported greater diffi culty with transport - 17.5% compared with 2.5% of people who reported excellent health. Lack of access to transport due to affordability, safety, availability, convenience, and appropriateness of the type of transport can act as a barrier to people’s participation in a range of activities and access to services.
In 2002, 85% of Australians had access to a motor vehicle to drive, with proportionally more men than women having access, similarly for younger people compared to older people and higher income compared to lower income groups (Table 1.51).
Figure 1.41: Percentage of population who report diffi culty with transport; cannot, or often have diffi culty, getting to the places needed, by age, Australia 2002
Source: ABS General social survey 2002
0
5
10
15
18-24 25-34 35-44 45-54 55-64 65-74 75+
Pro
port
ion
ofpo
pula
tion
Males Females

172 Health Determinants Queensland 2004
WHOLE OF POPULATION
Table 1.51: Access to motor vehicle/s to drive, proportion of adult population by age, sex, region and income, Australia 2002
Source: ABS General social survey 2002
In 1996, 88% of households in Queensland had at least one motor vehicle, and of those households, 34% had two and 12% had three or more motor vehicles. Households in areas of least socioeconomic disadvantage had a signifi cantly greater mean number of cars that those in the three quintiles of greatest socioeconomic disadvantage (Table 1.52). Households in remote areas have signifi cantly more cars per household than metropolitan and regional areas of Australia. In 1997, more than two million motor vehicles were registered in Queensland. While this high level of car ownership could be an advantage in terms of access to health services, the impact on the quality of the environment is considerable: ie. CO2 emissions, waste oils, tyres and batteries, noise pollution, and death and injury from accidents.215
In Queensland, more people drive themselves to work than use any other means of transport. Between 1986 and 1991, use of public transport remained below 10%. More recently (1996) in Queensland, only 3.6% of workers and students used a bicycle, and only 6.4% walked to work or study.215 Active commuting, such as walking or cycling for transport, has cardiovascular, musculoskeleteal and mental health benefi ts.
People without their own means of transport are distinct groups within the community, particularly if they live in low density areas. Lack of transport increases social isolation and decreases community cohesion.26 Low income, disability and increasing age may restrict access to transport in some areas and hence to employment, education and community participation opportunities. People’s use of healthcare services declines as distance from a facility increases.216 Distance has been related to delays in treatment and increased mortality for coronary heart disease for older populations.32
Table 1.52: Mean number of vehicles per household (95%CI), by region and socioeconomic disadvantage, Queensland and Australia 2001
Source: HILDA 2001
Safety and crime In 2002, the majority of Queenslanders (82.5%) felt very safe or safe at home during the day and 73% felt safe at home alone after dark, slightly higher than for Australia as a whole (Table 1.53). Males generally felt safer than females and younger people safer than Older people. People outside capital cities reported greater feelings of safety than people living in capital cities (67% and 72.8% respectively). People born in Australia reported stronger feelings of safety than those born overseas (70.5% compared to 65.3%). Despite these reports of feeling safe, the majority of Queenslanders (70%) considered there were problems in their neighbourhood with crime and/or public nuisance issues, a lower rate than for Australia as a whole (75%).204 Housebreaking / burglary and dangerous driving in the neighbourhood were the leading concerns.
Mean number of vehiclesper households
Mean number of vehiclesper households
Queensland 1.68 (1.68-1.68) Australia: Socioeconomic disadvantage
Australia 1.73 (1.73-1.73) quintile 1 (least) 1.85 (1.85-1.85)Australia: quintile 2 1.81 (1.81-1.81)
Major cities and Inner regional 1.73 (1..73-1.73) quintile 3 1.71 (1.71-1.72)
Outer regional 1.73 (1.73-1.73) quintile 4 1.65 (1.65-1.65)
Remote, Very remote and Migratory 2.05 (2.05-2.06) quintile 5 (most) 1.59 (1.59-1.59)
Male Female Persons
18+ 89.7 80.4 RemotenessMajor cities 83.4
18-24 79.4 75.3 Inner regional 88.925-34 89.6 88.2 Other areas 87.735-44 93.5 90.9 All persons 85.045-54 95.4 87.555-64 95.5 81.8
Income quintile
65-74 85.5 65.5
Lowest quintile 67.6
75+ 75.3 38.3
Second quintile 79.3Third quintile 88.4Fourth quintile 92.6Highest quintile 95.4
Persons
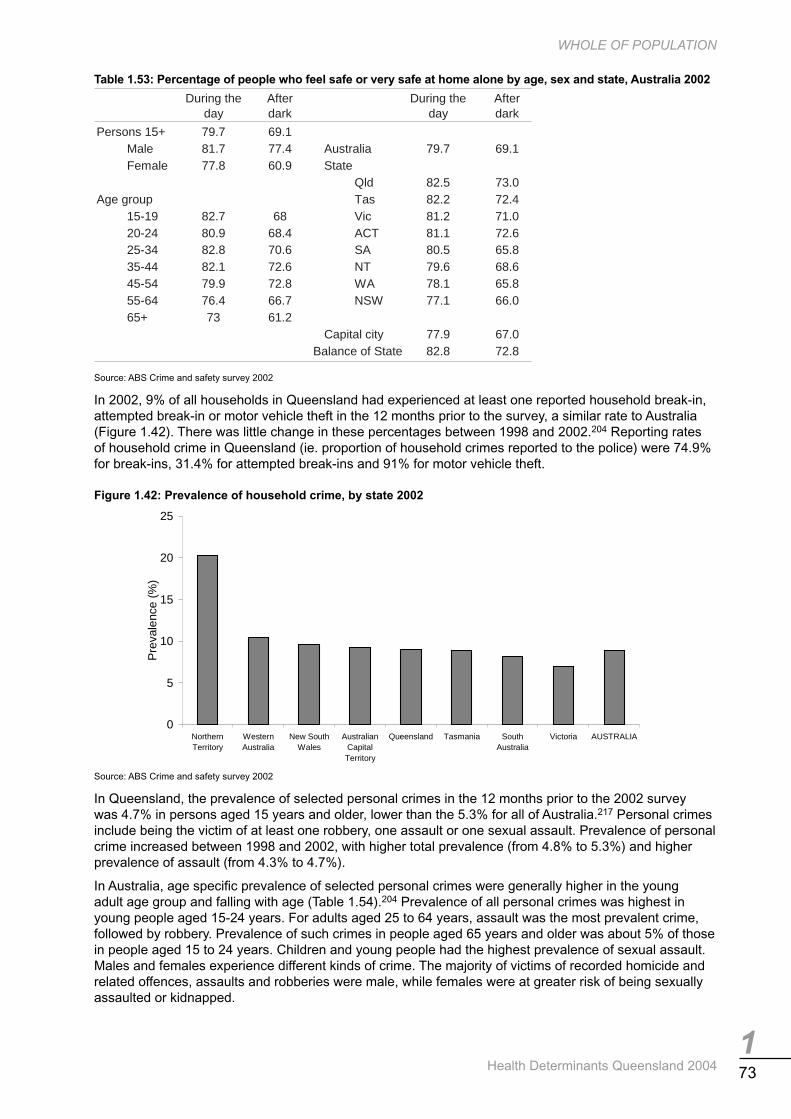
173
WHOLE OF POPULATION
Health Determinants Queensland 2004
Table 1.53: Percentage of people who feel safe or very safe at home alone by age, sex and state, Australia 2002
Source: ABS Crime and safety survey 2002
In 2002, 9% of all households in Queensland had experienced at least one reported household break-in, attempted break-in or motor vehicle theft in the 12 months prior to the survey, a similar rate to Australia (Figure 1.42). There was little change in these percentages between 1998 and 2002.204 Reporting rates of household crime in Queensland (ie. proportion of household crimes reported to the police) were 74.9% for break-ins, 31.4% for attempted break-ins and 91% for motor vehicle theft.
Figure 1.42: Prevalence of household crime, by state 2002
Source: ABS Crime and safety survey 2002
In Queensland, the prevalence of selected personal crimes in the 12 months prior to the 2002 survey was 4.7% in persons aged 15 years and older, lower than the 5.3% for all of Australia.217 Personal crimes include being the victim of at least one robbery, one assault or one sexual assault. Prevalence of personal crime increased between 1998 and 2002, with higher total prevalence (from 4.8% to 5.3%) and higher prevalence of assault (from 4.3% to 4.7%).
In Australia, age specifi c prevalence of selected personal crimes were generally higher in the young adult age group and falling with age (Table 1.54).204 Prevalence of all personal crimes was highest in young people aged 15-24 years. For adults aged 25 to 64 years, assault was the most prevalent crime, followed by robbery. Prevalence of such crimes in people aged 65 years and older was about 5% of those in people aged 15 to 24 years. Children and young people had the highest prevalence of sexual assault. Males and females experience different kinds of crime. The majority of victims of recorded homicide and related offences, assaults and robberies were male, while females were at greater risk of being sexually assaulted or kidnapped.
During theday
Afterdark
During theday
Afterdark
Persons 15+ 79.7 69.1Male 81.7 77.4 Australia 79.7 69.1Female 77.8 60.9 State
Qld 82.5 73.0Age group Tas 82.2 72.4
15-19 82.7 68 Vic 81.2 71.020-24 80.9 68.4 ACT 81.1 72.625-34 82.8 70.6 SA 80.5 65.835-44 82.1 72.6 NT 79.6 68.645-54 79.9 72.8 WA 78.1 65.855-64 76.4 66.7 NSW 77.1 66.065+ 73 61.2
Capital city 77.9 67.082.8 72.8Balance of State
0
5
10
15
20
25
NorthernTerritory
WesternAustralia
New SouthWales
AustralianCapitalTerritory
Queensland Tasmania SouthAustralia
Victoria AUSTRALIA
Pre
vale
nce
(%)

174 Health Determinants Queensland 2004
WHOLE OF POPULATION
Table 1.54: Prevalence of personal crime, by type of crime and age, Australia 2002
Source: ABS Crime and safety survey 2002 *Note: Rate per 100,000 population
Computer and Internet access Nearly half the Queensland population used computers at home in 2001 (Table 1.55). Older people had substantially lower use of computers than younger people. More than one third (35.7%) used the Internet, principally at home (Table 1.55). In 2002, households with incomes of $50,000 and more were nearly three times as likely to have access to the Internet at home, than those with incomes under $50,000 (57% compared to 21%).218 Employed people were more likely to report use of computers and Internet use than unemployed and similarly, people in major cities than other areas.63 The increasing prevalence of computers and the Internet means that people who are not able to use or access these facilities may have restricted access to information and services, skills development, and special offers and savings. This may adversely affect educational outcomes, employment prospects and other aspects of wellbeing.219 There are however, health concerns about the excessive use of computers particularly among children, resulting in sedentary activity and causing/compounding the problems of being overweight and obese.
Table 1.55: Computer access at home by age and sex, and Internet use by location, percentage of total population, Queensland 2001
Source: ABS Census of population and housing 2001
Gambling Of the Queensland adult population, 73% reported they did not gamble in 2000-01 (Table 1.56).220 A further 15% reported they were non-problem gamblers, that is gambling with no adverse consequences. About 0.8% of adults experienced problem gambling, where 70% of this group were male (Table 1.57). In the problem gambling group, there were disproportionate numbers of people in the 18-34 age group (55%). Only 19% of the problem gambling group sought help for their problems. One quarter (26%) of the problem gambling group considered that they had an alcohol or drug problem, compared with 20% in the moderate risk gambling group and 2% of the non-problem gamblers. Half the problem gamblers (51%) felt seriously depressed in the last 12 months, and 29% have been under doctor care in the last 12 months because of stress. More than half (55%) of people with problem gambling identifi ed an immediate family member with a problem with alcohol or drugs, and 44% identifi ed gambling problems in the immediate family. Two thirds (67%) of the problem gambling group indicate that gambling has caused fi nancial problems for them or their household, signifi cantly higher than the moderate risk group (8%). The 2.7% of Queensland adults who report moderate risk gambling habits display some of the associated behaviours of problem gamblers.
Computer use: Male Female Uses the Internet: Male Female
Total population 43.5 42.2 At home 19.0 18.6At work 4.3 4.9
0-14 45.4 45.8 Elsewhere 3.8 4.015-24 56.7 58.1 Multiple sites 9.3 7.525-64 45.4 45.4 Total users 36.5 35.065+ 14.3 7.6 Does not use the Internet 59.2 60.8
Not stated 4.3 4.2
Homicide andrelated offences Assault
Sexualassault Kidnapping Robbery
0-14 2.3 279.2 173.3 5.9 29.515-24 8.5 1,572.30 191.7 10.6 337.825-34 8.3 1,049.50 73.8 4.3 141.835-44 6.3 900.8 38.6 2 88.345-54 4.0 51.0 17.0 0.7 69.555-64 4.2 265.6 6.7 0.5 55.665+ 2.6 88.3 3.4 0.2 31.4

175
WHOLE OF POPULATION
Health Determinants Queensland 2004
Table 1.56: Prevalence of gambling problems, proportion of adult population, by age, Queensland 2001
Source: Queensland household gambling survey 2001
Table 1.57: Gambling group, percentage of group, by sex and age, Queensland 2001
Source: Queensland household gambling survey 2001
18+ years
Non-problem gambling 15.1Low risk gambling 8.2Moderate risk gambling 2.7Problem gambling 0.8
Non gambling 73.2
Male Female 18-34 yrs 35-54 yrs 55+ yrsNon problem gambling 48 52 32 41 27Low risk gambling 49 51 37 41 21Moderate risk gambling 75 25 36 35 29Problem gambling 70 30 55 37 8
18+ years Persons

176 Health Determinants Queensland 2004
WHOLE OF POPULATION
1.4.4 Health behaviours
‘‘It makes little sense to expect individuals to behave differently from their peers; it is more appropriate to seek general change in behavioural norms and in the circumstances which facilitate their adoption. “
Geoffrey Rose 1992 221
Health risk factors such as physical inactivity, being overweight, smoking, excessive alcohol consumption, hypertension, high blood cholesterol and insuffi cient fruit and vegetable consumption are responsible for a substantial proportion of the overall burden of disease in Australia.50 The burden of disease attributed to health risk factors is described in section 1.3.1. Indicators of these major risk factors and others are reported below. In addition, the health impact of these health behaviours is described where possible. Section 1.5 describes interventions to address these key health behaviours.
Tobacco smoking Tobacco smoking was the leading single cause of the burden of disease in Australia in 1996, where 12.1% of the total burden for males was attributed to tobacco smoking and 6.8% for females.50
In Queensland, the proportion of males, 18 years or older, who smoke daily in 2001 was 24.6% (Table 1.58), compared with the Australian average of 22.3%. The corresponding fi gures for females aged 18 years and older were 19.7% in Queensland compared to the national average of 18.7%. The greater prevalence in males than females, and the increased prevalence in Queensland in comparison to Australia were not signifi cantly different. Between 1998 and 2001 there have been small, but not signifi cant, decreases in smoking prevalence in adults. In young people aged 14-17 years, about one in eight smoke daily, similar to Australian fi gures.
In the Queensland adult population, the proportion of males and females who smoked daily signifi cantly decreased with increasing age (Table 1.58). Daily smoking prevalence for males signifi cantly increased with increasing socioeconomic disadvantage. Females reported similar trends, however these differences were not signifi cant. The prevalence of daily smoking generally increased as accessibility reduced, however these differences were again not signifi cant. These trends also were observed for Australia. Deaths and hospital separations attributed to tobacco smoking are described in section 1.3.6.
In 2002, a report released by AIHW222 reported prevalence of health risk factors by birthplace in males and females using 1995 national data.223 Tobacco smoking rates varied across overseas birthplace regions but were not signifi cantly different to rates in Australian born people except for females born in Asia, where prevalence rates were signifi cantly lower.
Smoking is the largest contributor to preventable mortality in Australia224 and it is known to increase the risk of lung cancer, cardiovascular disease, chronic obstructive pulmonary disease, and several other conditions. More than 90% of cases of lung cancer are caused by smoking225 with incidence trends refl ecting smoking patterns more than 20 years ago. Smoking cessation leads to a marked and rapid fall in the risk of heart, stroke and vascular disease.79 The risk of a coronary event or stroke among former smokers has been reported to approach that of people who have never smoked within two to fi ve years of cessation of smoking.80,81
Uptake of smoking is more important than cessation in explaining socioeconomic differentials in smoking prevalence rates.226 A greater proportion of upper white collar Australians are non- smokers, in comparison to lower blue collar workers, because they never started rather than because they quit. In 1997 in Victoria, more than 60% of smokers had tried to quit more than once, with 23% having tried at least fi ve times.227 Self reported data from the United States of America in 1987 suggest that 50% of people who ever smoked have since successfully quit smoking.79

177
WHOLE OF POPULATION
Health Determinants Queensland 2004
Table 1.58: Percentage of the population who smoke daily (95%CI), by age, sex, accessibility and socioeconomic disadvantage, Queensland 1998, 2001
Source: National drug strategy household survey 1998, 2001
Alcohol Alcohol consumption is associated with harm and benefi ts to health. In Australia in 1996, alcohol consumption was the cause of 4.2% of the total burden of disease for males, which comprised 6.6% attributed to alcohol harm and –2.4% to alcohol benefi t.50 For females, alcohol consumption was the cause of –0.1% of the total burden, which comprised 3.1% attributed to alcohol harm and –3.2% to alcohol benefi t. Road traffi c accidents and liver cirrhosis were the leading causes of the mortality burden due to alcohol in Australia.
In Queensland in 2001, the proportion of males, 18 years and older, who usually drank hazardous or harmful levels of alcohol was 28.3% (14.8% for hazardous and 13.5% for harmful) compared with the Australian average of 24.5% (Table 1.59). The corresponding fi gures for females aged 18 years and over were 28.7% in Queensland compared to the national average of 27.3%. The greater prevalence in females than males, and the increased prevalence in Queensland in comparison to Australia were not signifi cantly different.
In young Queenslanders aged 14-17 years, the proportion of males who usually drank hazardous or harmful levels of alcohol was 25.7% (6.6% for hazardous and 19.1% for harmful) compared with the Australian male average of 29.0%. The corresponding fi gures for females aged 14-17 years were 45.6% in Queensland compared to the national average of 40.6%. Signifi cantly more young people usually drank alcohol at hazardous or harmful levels, than for adult population. The greater prevalence in females than males, and the increased prevalence in Queensland in comparison to Australia were not signifi cantly different. In the adult population, the proportion of males and females who usually drank harmful quantities of alcohol signifi cantly decreased with increasing age (Table 1.59). Deaths and hospital separations attributed to harmful and hazardous alcohol consumption are described in section 1.3.6.
In Queensland, usual alcohol consumption at hazardous or harmful levels did not signifi cantly differ between quintiles of the socioeconomic disadvantage. Usual alcohol consumption at hazardous or harmful levels increased as accessibility reduced, however these differences were not signifi cant. These trends were also observed for Australia. In 2001, NHMRC modifi ed the guidelines for safe alcohol consumption.228 All information in Health Determinants Queensland 2004 relates to the pre-2001 guidelines.
Male Female Male Female18+ 25.1 (21.7-28.5) 22.6 (19.8-25.4) 18+ 24.6 (21.5-27.7) 19.7 (17.2-22.2)
14-17 11.5 (3.6-19.4) 19.7 (10.4-29) 14-17 13.5 (2.9-24.1) 13.5 (3.5-23.5)18-29 24.8 (18.7-30.9) 35.3 (29.7-40.9) 18-29 29.8 (21.3-38.3) 25.6 (19.6-31.6)30-39 32.6 (25.3-39.9) 26.4 (20.9-31.9) 30-39 32.5 (24.9-40.1) 26.6 (20.9-32.3)40-49 31.9 (22.7-41.1) 23.2 (15.6-30.8) 40-49 27.1 (19.6-34.6) 23 (17.2-28.8)50-59 23.7 (13.7-33.7) 20.5 (12.1-28.9) 50-59 18.9 (12.2-25.6) 16.7 (10.8-22.6)60-64 18.1 (4.3-31.9) 4.1 (-2-10.2) 60-64 17.5 (7.8-27.2) 7 (0.3-13.7)65+ 8.6 (1.8-15.4) 6.5 (1.3-11.7) 65+ 10.6 (5.5-15.7) 5.7 (1.7-9.7)
Acessibility 2001 Socioeconomic disadvantage 2001Highly 21.4 (17.9-24.9) 17.2 (14.5-19.9) Quintile 1 (least) 12.5 (6.3-18.7) 14.3 (8.7-19.9)Accessible 27.2 (19.3-35.1) 25.1 (18.3-31.9) Quintile 2 22.6 (14.8-30.4) 19.4 (13.2-25.6)Moderately 29.3 (19.8-38.8) 21.6 (13.2-30) Quintile 3 15.3 (8.2-22.4) 13.8 (7.6-20)Remote 42.6 (17.6-67.6) 28.1 (9.7-46.5) Quintile 4 27.5 (21.9-33.1) 20.6 (16.2-25)Very remote Quintile 5 (greatest) 30.3 (24-36.6) 22.4 (17.3-27.5)
2001 (95%CI)1998 (95%CI)

178 Health Determinants Queensland 2004
WHOLE OF POPULATION
Table 1.59: Percentage of the population who usually drank either low, hazardous or harmful quantities of alcohol in the 12 months prior (95%CI), by age and sex, Queensland 2001
Source: National drug strategy household survey 2001
Illicit drugs In Australia in 1996, illicit drugs were the cause of 2.2% of the total burden of disease for males and 1.3% for females.50
In Queensland, the proportion of males 18 years and older who used any illicit drug in the 12 months prior to the 2001 survey was 19.0% (Table 1.60), similar to the Australian average of 19.1%. The corresponding fi gures for females aged 18 years and older were 13.0% in Queensland and 13.3% in Australia. Prevalence in males was signifi cantly greater than for females in Queensland and Australia, in 1998 and 2001. Between 1998 and 2001, prevalence has signifi cantly decreased for females in Queensland.
In the adult population, the proportion of males and females who had used an illicit drug in the past 12 months signifi cantly decreased with increasing age. Almost half of young men (42.4%) had used an illicit drug in this period. There was no signifi cant difference in the prevalence of illicit drug use between quintiles of socioeconomic disadvantage or areas of different accessibility. These trends also were observed for Australia. Deaths and hospital separations attributed to illicit drug consumption are described in section 1.3.6.
Table 1.60: Percentage of the population who used any illicit drug in the 12 months prior to survey (95% CI) by age, sex, accessibility and socioeconomic disadvantage, Australia and Queensland 1998, 2001
Source: National drug strategy household survey 1998, 2001
Level 18+ 14-17 18-24 18-29
Queensland Male Low 57.4 (53.8 - 61) 36.2 (21.3 - 51.1) 38.4 (25.7 - 51.1) 44.9 (35.6 - 54.2)
Hazardous 14.8 (12.2 - 17.4) 6.6 (-1.1 - 14.3) 26.3 (14.8 - 37.8) 24.5 (16.5 - 32.5)
Harmful 13.5 (11.0 - 16.0) 19.1 (6.9 - 31.3) 25.8 (14.3 - 37.3) 22.8 (15.0 - 30.6)
Queensland Female Low 48.0 (44.9 - 51.1) 26.6 (13.7 - 39.5) 22.9 (14.7 - 31.1) 29.7 (23.4 - 36)
Hazardous 16.6 (14.3 - 18.9) 15.3 (4.8 - 25.8) 21.9 (13.9 - 29.9) 23.7 (17.8 - 29.6)
Harmful 12.1 (10.0 - 14.2) 30.3 (16.9 - 43.7) 43.5 (33.9 - 53.1) 33.4 (26.9 - 39.9)
Australia Male Low 60.3 (58.9 - 61.7) 30.2 (25.2 - 35.2) 41.7 (37.5 - 45.9) 46.6 (43.4 - 49.8)
Hazardous 12.7 (11.8 - 13.6) 9.5 (6.3 - 12.7) 19.3 (15.9 - 22.7) 18.1 (15.6 - 20.6)
Harmful 11.8 (10.9 - 12.7) 19.5 (15.1 - 23.9) 26.8 (23 - 30.6) 24.3 (21.5 - 27.1)
Australia Female Low 49.3 (48.1 - 50.5) 25.9 (21.2 - 30.6) 26.1 (22.9 - 29.3) 32.3 (29.8 - 34.8)
Hazardous 17.2 (16.3 - 18.1) 15.2 (11.4 - 19.0) 23.8 (20.7 - 26.9) 24.8 (22.5 - 27.1)
Harmful 10.1 (9.4 - 10.8) 25.4 (20.8 - 30.0) 34.9 (31.4 - 38.4) 27.8 (25.4 - 30.2)
Level 30-39 40-49 50-59 65+
Queensland Male Low 59.3 (51.3 - 67.3) 62.4 (54.3 - 70.5) 64.4 (56.3 - 72.5) 53.9 (45.7 - 62.1)
Hazardous 15.0 (9.2 - 20.8) 13.9 (8.1 - 19.7) 11.3 (5.9 - 16.7) 6.6 (2.5 - 10.7)
Harmful 17.4 (11.3 - 23.5) 11.9 (6.5 - 17.3) 8.6 (3.8 - 13.4) 3.8 (0.7 - 6.9)
Queensland Female Low 50.6 (44.2 - 57) 50.8 (43.9 - 57.7) 60.6 (52.9 - 68.3) 47.4 (38.8 - 56)
Hazardous 20.4 (15.2 - 25.6) 18.4 (13 - 23.8) 12.4 (7.2 - 17.6) 7.7 (3.1 - 12.3)
Harmful 11.8 (7.6 - 16.0) 9.1 (5.1 - 13.1) 2.8 (0.2 - 5.4) 0.5 (-0.7 - 1.7)
Australia Male Low 62.8 (59.8 - 65.8) 66.0 (63.0 - 69.0) 64.8 (61.6 - 68) 61.7 (58.6 - 64.8)
Hazardous 12.4 (10.4 - 14.4) 11.8 (9.8 - 13.8) 12.9 (10.6 - 15.2) 6.6 (5 - 8.2)
Harmful 12.8 (10.7 - 14.9) 8.1 (6.4 - 9.8) 7.6 (5.8 - 9.4) 3.0 (1.9 - 4.1)
Australia Female Low 51.3 (48.8 - 53.8) 54 (51.1 - 56.9) 57.6 (54.5 - 60.7) 52.3 (49.1 - 55.5)
Hazardous 20.3 (18.3 - 22.3) 20.8 (18.5 - 23.1) 13.9 (11.7 - 16.1) 5.5 (4.1 - 6.9)
Harmful 9.6 (8.1 - 11.1) 6.9 (5.4 - 8.4) 3.5 (2.4 - 4.6) 0.8 (0.2 - 1.4)
Male Female Male Female
Qld Age group 2001Qld (18+ years) 1998 22.8 (19.5-26.1) 17.9 (15.4-20.5) 18+ 19 (16.2-21.9) 13 (10.9-15.1)
2001 19 (16.2-21.9) 13 (10.9-15.1) 18-24 42.4 (29.5-55.3) 32.2 (23.1-41.3)30-39 25.1 (18.1-32.1) 13.1 (8.8-17.5)
Aust (18+ years) 1998 23.6 (21.6-25.7) 17.1 (15.7-18.6) 40-49 12.9 (7.3-18.5) 9.3 (5.3-13.3)2001 19.1 (18-20.2) 13.3 (12.5-14.1) 50-59 7.2 (2.8-11.6) 6 (2.3-9.7)
Qld Accessibility 2001 Qld Socioeconomic disadvantage 2001
Highly accessible 19.6 (16.3-23) 13.2 (10.8-15.6) Quintile 1 (least) 15.6 (8.9-22.4) 15.7 (9.9-21.5)Accessible 19.1 (12.2-26.1) 18.5 (12.4-24.6) Quintile 2 24.9 (16.8-33) 14.5 (9-20)Moderately accessible 13.3 (6.2-20.4) 11.4 (4.9-17.9) Quintile 3 19.4 (11.7-27.2) 11.4 (5.7-17.1)Remote 15.6 (-2.8-34) 18.4 (2.6-34.2) Quintile 4 18.1 (13.3-23) 13.6 (9.9-17.3)Very remote na na Quintile 5 (greatest) 17.6 (12.4-22.8) 14.6 (10.3-18.9)

179
WHOLE OF POPULATION
Health Determinants Queensland 2004
Physical activity Physical inactivity was the second leading single cause of burden of disease in Australia in 1996, where 6.0% of the total burden for males was attributed to physical inactivity and 7.5% for females.50
In Queensland in 2001, 45% of people aged 18-75 undertook suffi cient physical activity to achieve a health benefi t (Table 1.61). Suffi cient physical activity for health benefi t was more prevalent in the age group 18-29 years, and generally declined with increasing age. This was consistent with increased self reported sedentary prevalence in Older people. Males were signifi cantly more likely than females to undertake suffi cient physical activity for health benefi t. Concordantly, females were signifi cantly more likely to undertake insuffi cient physical activity for health benefi t. Sedentary prevalence was higher in areas of greater socioeconomic disadvantage. Suffi cient physical activity for health benefi t was more prevalent in areas highly accessible to services, decreasing as areas became more remote. This was consistent with increased self reported sedentary prevalence in remote areas. Caution needs to be used in the interpretation of this physical activity data in remote areas, as the measurement tools have not been validated for remote populations.
In 2001, walking was the most popular physical activity in Queensland, where 74.7% of adults aged 18-75 years undertook one or more walking sessions during the previous week. The popularity of walking was consistent across both genders and all ages. In 2001, Queenslanders did more physical activity than the national average for 2000.134 Deaths and hospital separations attributed to sedentary and insuffi cient physical activity are described in section 1.3.6.
Between 1997 and 2001 the proportion of Queensland adults achieving suffi cient physical activity to provide a health benefi t decreased from 49.4% to 45.1%.134 This decrease in suffi cient physical activity was greatest for females (50% to 41%), and in the 18-29 year age group (61.1% to 50.6%). The average amount of time Queensland adults spent in moderate leisure-time physical activity also declined between 1997 and 2001 (66 to 51 minutes). In addition, the average amount of time spent in vigorous leisure-time physical activity has also declined (86 to 68 minutes).
Overseas-born Australians varied considerably in reporting physical inactivity during leisure-time, based on a report released by AIHW in 2002.124 Signifi cantly higher rates of inactivity were reported in Asian born males and females and also in European born males and females (not including UK or Ireland).
Consistent with national guidelines,229 in this 2001 survey, suffi cient physical activity for health benefi t was defi ned as more than 150 minutes or more per week, using the sum of walking, moderate-intensity and vigorous intensity activity (weighted by two), accrued over ate least fi ve sessions of activity per week. This time and intensity is deemed as suffi cient for a health benefi t. Insuffi cient physical activity is defi ned as some physical activity but not suffi cient physical activity. Sedentary behaviour or no physical activity is defi ned for measurement purposes as no leisure time physical activity in the one week period prior to survey.
Table 1.61: Physical activity prevalence in last two weeks (self reported; 95% CI) in persons aged 18-75 years, by age, sex, socioeconomic disadvantage and accessibility, Queensland 2001
Source: QH Omnibus survey 2001
% Sedentary % Insufficient % SufficientAge group (yrs)
18-29 9.2 (6.5-11.9) 40.2 (35.6-44.8) 50.6 (45.9-55.3)30-39 12.5 (9.8-15.1) 40.5 (36.6-44.4) 47.1 (43.1-51.0)40-49 15.2 (12.6-17.8) 39.2 (35.6-42.7) 45.7 (42.1-49.3)50-59 20.7 (17.3-24.1) 39.6 (35.5-43.7) 39.7 (35.6-43.9)60-75 22.6 (19.3-26.0) 38.9 (35.0-42.9) 38.4 (34.5-42.3)
Sexmale 14.5 (12.7-16.3) 36.4 (34.0-38.9) 49.1 (46.5-51.7)female 15.9 (14.1-17.8) 43.1 (40.5-45.6) 41.0 (38.4-43.5)
Socioeconomic disadvantagequintile 1 (least) 10.8 (8.3-13.3) 41.1 (37.1-45.1) 48.1 (44.0-52.1)quintile 2 13.5 (10.8-16.2) 41.0 (37.1-45.0) 45.5 (41.5-49.5)quintile 3 16.9 (13.8-20.1) 39.5 (35.4,43.6) 43.5 (39.4-47.7)quintile 4 17.9 (14.8-21.0) 40.6 (36.6-44.5) 41.5 (37.6-45.5)quintile 5 (most) 17.4 (14.3-20.5) 36.0 (32.1-40.0) 46.5 (42.4-50.6)
Accessibility/remotenessHighly accessible 14.6 (13.1-16.2) 39.3 (37.2-41.4) 46.1 (43.9-48.2)Accessible 14.7 (11.4-18.0) 40.3 (35.7-44.8) 45.0 (40.4-49.7)Moderately accessible 17.7 (13.6-21.9) 41.8 (36.4-47.1) 40.5 (35.2-45.8)Remote 22.6 (11.7-33.4) 39.3 (26.6-52.0) 38.2 (25.5-50.8)Very remote 22.9 (39.5-62.3) 44.1 (24.5-63.7) 33.0 (14.4-51.5)

180 Health Determinants Queensland 2004
WHOLE OF POPULATION
Physical activity is essential for physical and mental health and general wellbeing. A large and growing proportion of Queenslanders see the health benefi ts of physical activity.134 In 2001, the majority of adults (87%) believe that their health could be improved by being generally more active for at least 30 minutes each day. Between 1997 and 2001, there has been an increase in overall knowledge of the health benefi ts of physical activity and awareness of physical activity messages.
Increasing epidemiological evidence confi rms that lack of regular physical activity is directly linked with several chronic diseases including heart disease, type 2 diabetes, hypertension, colon cancer, depression, obesity and osteoporosis.230 Specifi cally, physical activity improves glucose metabolism, reduces body fat and lowers blood pressure.11 Participation in moderate physical activity can reduce the risk of type 2 diabetes by up to 35%.101 There is increasing evidence that those who are physically active are less likely to be depressed than those who are physically inactive.231
Metabolic syndrome The metabolic syndrome is a cluster of abnormalities that are associated with increased risk of developing coronary heart disease (CHD). Core components of the metabolic syndrome include: insulin resistance, type 2 diabetes or impaired glucose tolerance, hypertension, dyslipidaemia and central obesity.
In the 2000 AusDiab study,126 the age standardised prevalence of metabolic syndrome in Queenslanders aged 25 years and older was 11.7% using the European Group for the Study of Insulin Resistance (EGIR) criteria for diagnosis, minus the insulin resistance requirement.232 As data on insulin levels was not available at time of analysis, this fi gure is likely to be an under- estimate of the true fi gure. The prevalence rate of metabolic syndrome has varied widely between studies, possibly because of the range of criteria used.233,234 In the Unites States in 1994, a prevalence rate of nearly 24% was found in the adult population using an alternative defi nition,234 while the prevalence of metabolic syndrome in a Finnish population ranged from 8.8% to 14.3%, depending on defi nition used.233
Prevalence of metabolic syndrome increases signifi cantly with age (Table 1.62). The age group at which the increase became statistically signifi cant was 45 to 54 year olds with 5.7 times greater risk of developing metabolic syndrome.232 The odds ratio increased further with age. The signifi cant rise in prevalence of metabolic syndrome occurred later in women and increased more sharply with age than in men.232 Researchers in Finland found a similar trend with an increased prevalence of CHD risk factors in older women compared with men.235 Metabolic syndrome was signifi cantly less prevalent in physically active respondents, and those consuming a prudent diet based on the Australian Guide to Healthy Eating.232,236
Metabolic syndrome can signifi cantly increase the risk of developing CHD and type 2 diabetes. Men with metabolic syndrome are nine times more likely to develop type 2 diabetes.237 Men aged 42-60 years with metabolic syndrome are up to 4.2 times more likely to die from CHD and are more than twice as likely to die of any cause within twelve years.237
Table 1.62: Age specifi c prevalence of metabolic syndrome, Queensland 2000
Source: AusDiab 2000 *age adjusted to Australian 2001 population
Age % males OR (95%CI) % females OR (95%CI)
25-34 2.8 Reference 2.3 Reference35-44 5.8 2.1 (0.5-8.7) 4.6 2.04 (0.4-10.2)45-54 14.9 6.2 (1.8-21.4) 10.6 5.10 (1.1-23.4)
55-64 21.0 9.4 (2.7-32.6) 14.8 7.43 (1.6-34.0)65-74 25.1 11.9 (3.4-41.3) 30.0 18.4 (4.0-83.8)75+ 31.1 16.0 (4.3-59.5) 22.2 12.2 (2.4-61.4)25+ 12.5 11.2Age-adj. rate* 12.6 10.8

181
WHOLE OF POPULATION
Health Determinants Queensland 2004
Healthy weight In Australia in 1996, overweight and obesity were the cause of 4.4% of the total burden for males and 4.3% for females.50
In 2000, by physical measurement, 37.0% of all adult Queenslanders aged 25 years and older were considered overweight, with men having higher prevalences (46.8%) than women (27.2%).126 Overweight and obesity levels were assessed using standard Body Mass Index (BMI) categories. An additional 21.9% were measured as obese, with little difference between men (20.3%) and women (23.6%). Prevelance of overweight and obesity were not signifi cantly different in Queensland to Australia as a whole.238 Due to possible selection bias on the basis of socioeconomic status, smoking rates, and dietary intake, it is estimated that the prevalence of overweight and obesity derived from this 2000 survey is an underestimate of the true prevalence.239
By self reported BMI, 55.1% of adult males and 41.4% of adult females aged 18-75 years were overweight or obese in 2001 (Table 1.63). The prevalence of overweight and obesity increased with age. Obesity prevalence was markedly higher in areas of greater socioeconomic disadvantage. The limited reliability of self reported BMI has been widely documented, with varying proportions of women tending to under report their weight and men over reporting their height. It is estimated that self reported BMI underestimates the true prevalence of obesity by an average of around 6%, and the true prevalence of overweight, but not obese, by an average of around 5%.240 Using 1995 self reported data, the levels of overweight and obesity in Queensland are the highest of the Australian states for both males and females.92
Almost one in fi ve (17.6%) of 18-29 year olds, self reported underweight in 2001, where the prevalence of underweight is three times higher in females than males in this age group (Table 1.63). Body weights below the healthy weight range may be a sign of current or impending health problems, including the eating disorders anorexia and bulimia.241
Overseas-born people from several regions reported lower prevalence of overweight and obesity, based on 1995 data reported by AIHW in 2002.222 Asian born people (males and females) reported signifi cantly lower rates of overweight and obesity. They also reported signifi cantly lower rates of other health risk factors (smoking in females, risky alcohol consumption in both sexes). More recent reports, (2003)124 have shown high rates of overweight and obesity in people born in Southern and Eastern Europe and in North Africa and the Middle East, compared to Australian born people (60.6% compared with 54.4% and 46.4% respectively).
Table 1.63: Body Mass Index prevalence (% self reported; 95% CI) in persons aged 18-75 years, by age, sex, socioeconomic disadvantage and accessibility, Queensland 2001
Source: QH Omnibus survey 2001
BMI <20 BMI 20-24 BMI 25-29 BMI 30-39 BMI 40+Underweight Acceptable weight Overweight Obese Severely obese
Age (years)18-29 17.6 (13.9-21.4) 47.5 (42.7-52.4) 26.9 (22.6-31.1) 7.2 (4.8-9.6) 0.7 (0.0-1.6)30-39 8.6 (6.3-10.8) 44.1 (40.0-48.2) 33.7 (29.8-37.6) 12.4 (9.7-15.1) 1.2 (0.3-2.0)40-49 8.0 (6.0-10.1) 41.2 (37.6-44.8) 35.1 (31.5-38.6) 14.1 (11.6-16.7) 1.6 (0.6-2.5)50-59 4.3 (2.6-6.1) 36.9 (32.7-41.0) 40.1 (35.9-44.4) 16.8 (13.6-20.0) 1.9 (0.7-3.1)60-75 5.8 (3.9-7.7) 36.8 (32.8-40.7) 38.7 (34.7-42.7) 17.0 (13.9-20.0) 1.8 (0.7-2.9)
SexMale 4.9 (3.6-6.1) 40.0 (37.3-42.7) 40.8 (38.1-43.4) 13.3 (11.6-15.1) 1.0 (0.5-1.5)Female 14.6 (12.5-16.7) 44.1 (41.3-46.8) 27.2 (24.7-29.6) 12.5 (10.7-14.2) 1.7 (1.0-2.4)
Socioeconomic disadvantageQuintile 1 (least) 11.8 (8.6-15.0) 43.2 (38.9-47.5) 36.8 (32.6-40.9) 7.6 (5.5-9.8) 0.6 (0.0-1.2)Quintile 2 10.8 (8.0-13.5) 43.6 (39.3-47.9) 34.8 (30.7-38.8) 10.1 (7.7-12.6) 0.8 (0.1-1.4)Quintile 3 9.5 (6.8-12.3) 40.5 (36.0-44.9) 35.6 (31.4-39.8) 13.8 (10.9-16.7) 0.6 (0.0-1.2)Quintile 4 8.3 (5.8-10.8) 41.7 (37.5-46.0) 33.1 (29.1-37.1) 13.9 (11.1-16.7) 3.0 (1.5-4.4)Quintile 5 (most) 7.2 (4.8-9.7) 40.6 (36.3-44.9) 30.2 (26.2-34.2) 20.1 (16.7-23.5) 1.8 (0.6-3.0)
Accessibility/remotenessHighly accessible 10.4 (8.9-11.9) 43.0 (40.7-45.3) 33.2 (31.1-35.4) 12.0 (10.5-13.4) 1.4 (0.9-1.9)Accessible 6.8 (4.1-9.5) 39.2 (34.3-44.1) 39.7 (34.8-44.6) 13.7 (10.4-17.0) 0.6 (0.0-1.3)Moderately accessible 8.3 (5.0-11.7) 38.4 (32.8-44.1) 33.7 (28.3-39.0) 17.3 (13.1-21.4) 2.3 (0.7-3.9)Remote 8.3 (0.0-16.7) 41.7 (27.8-55.6) 36.2 (22.9-49.5) 13.8 (5.0-22.7) 0.0 (0.0-0.0)Very remote 8.6 (0.0-21.1) 45.9 (25.7-66.2) 18.1 (2.4-33.9) 24.4 (7.0-41.7) 2.9 (0.0-9.0)

182 Health Determinants Queensland 2004
WHOLE OF POPULATION
National data indicates the prevelance of overweight and obesity is increasing rapidly in Australia. Between 1989 and 2001, the prevalence of self reported overweight and obesity among Australians aged 18 years and older increased from 32% to 42% for females, and 46% to 58% for males.242 From 1983 to 1995 the proportion of the adult population classifi ed as obese doubled to nearly one in fi ve.243 From 1983 to 1995, the median BMI of Australian adults aged 25–64 increased from 25.1 to 26.8 for men, and from 23.4 to 25.6 for women.244 The WHO recommends that for optimum health, the median BMI of the population should be in the range 21 to 23, while the range for individuals should be 18.5-24.9.245 By 2020, if current trends continue, three out of four Australians will be overweight or obese.
As the weight of Queenslanders has increased so too have our waistlines. Healthy weight is also assessed by waist circumference (WC). Several studies found that WC is more closely associated with intra-abdominal fat and central adiposity than BMI.246,247 Intra-abdominal fat is more closely related to disease risk than overall body fat. WC is a convenient and simple measurement that is independent of height and is an approximate index of intra-abdominal fat mass and total body fat. WC or abdominal mass can vary greatly within a narrow range of total body fat or BMI.248 Waist- hip ratio has also been used as a measure of abdominal fat. However, recently WC alone has been found to be as reliable and more easily measured, and a reliable indicator of disease risk.246 There is an increased risk of metabolic complications in Caucasian men with a waist circumference of 94cm or more, and in women with a waist circumference of 80cm or more. Risk is substantially increased for a waist circumference of 102cm or more for men and 88cm or more for women.249
In the 2000 health measurement survey,126 using BMI, 37.0% of adults (46.8% males and 27.2% females) were considered overweight, in comparison with 51.5% using WC (51.7% males and 51.4% females). The prevelance of obesity was 21.9% according to BMI (20.3% males and 23.6% females) and 29.3% using WC (27.2% males and 31.5% females). As BMI and WC measure different aspects of obesity, prevalence using the two methods should not be directly compared. Prevelance of overweight and obesity, as assessed by WC and BMI were similar in Queensland to Australia as a whole.238
In the decade between 1985 and 1995, the prevalence of overweight in Australian children has doubled and the prevalence of obesity trebled.250 For four-year-old children, prevalence of overweight had risen from 12.9% (girls) and 10.6% (boys) in 1995 to 21.5% (girls) and 18.4% (boys) in 2002.251 Healthy weight in Queensland children is more fully discussed in the Children chapter.
Despite obesity having strong genetic determinants, the genetic composition of the population does not change rapidly. Therefore, the large increase in obesity in recent years must refl ect major changes in non-genetic factors.252 The underlying determinants of the current epidemic of obesity are related to environmental, technological, social and economic changes in society. Urban design, ready availability of inexpensive and heavily marketed energy-dense foods and drinks, globalisation, our reliance on cars and consumer changes, have all contributed to reduced physical activity and to increased consumption of energy-dense foods.253
Overweight and obesity are now contributing to the very substantial increases in chronic disease morbidity, and are responsible for escalating personal and health system costs.254 It is estimated the health sector spends less than $1 per person each year on preventing obesity, against $70 per person per year on treating its consequences.254 Overweight and obesity are substantial risk factors for many diseases including type 2 diabetes, hypertension, coronary heart disease (CHD), stroke, and psychosocial disorders.248 The risk of CHD and diabetes are not confi ned to overweight and obese populations. Rather, the risk of CHD and diabetes increase linearly with increasing BMI.96 There is an association between depression and overweight and obesity, where the causal pathway is unknown.255
Nutrient intake The Australian burden of disease and injury study in 1996 was unable to assess the total impact of nutrition on the burden of disease.50 It is likely that nutrition contributes at least as signifi cantly as tobacco smoking (9.7%) to the burden of disease throughout Australia.51
In 1995, fat contributed 31-33% of the energy in the diet of Queensland males and females aged 19 years and older (Table 1.64), greater than the 30% recommended by WHO.256 Specifi cally, the diet contained excess saturated fat (12-13% of energy compared with the recommended proportion of 10%), and a smaller proportion of polyunsaturated fat (4% compared with the recommended 6-10%). Total sugars contributed about 20% of the energy of Queensland adults, with almost one third of that derived from free sugars, ie. jams; spreads; syrups; confectioneries; sugars added to food by a manufacturer, cook or consumer; plus sugar naturally present in honey, soft drinks, fl avoured waters and sport drinks.257

183
WHOLE OF POPULATION
Health Determinants Queensland 2004
WHO also recommends that no more than 10% of energy should come from free sugars. There was no signifi cant difference in the macronutrient intake of Queensland adults in areas of different socioeconomic disadvantage, or between Brisbane, other metropolitan or rural areas. The nutrient intake of children in Queensland is more fully discussed in the Children chapter.
Substantial proportions of the adult population in Queensland potentially did not meet recommended daily intake (RDI) for a number of key micronutrients (Table 1.65). The RDI used in this analysis were as recommended in 1991 and are currently under revision. It is quite likely that some nutrients, particularly folate, may be changed. Due to methodical limitations, a more accurate measure of the proportion of Queenslanders who consume the recommended daily intake of these micronutrients cannot be assessed. Specifi cally, potentially 50-90% of Queensland women do not consume enough vitamin A (retinol equivalent), folate, calcium, iron and zinc. For males, potentially 50-75% do not consume enough vitamin A (retinol equivalent), calcium and zinc. There are no substantial differences or trends reported in the proportion of males or females who consume less than the recommended daily intake of micronutrients in quintiles of socioeconomic disadvantage in Queensland, or between Brisbane, other metropolitan or rural areas. Additional information about macro- and micro-nutrient intake in Queensland is available from the Health Information Centre, Queensland Health.
During the decade 1985 to 1995, comparison of food and nutrient intake among Australian adults indicated that mean energy intake increased 3-4%. Among children aged 10-15 years, mean energy intake increased by 11% for girls and 15% for boys, the main sources was a 20% increase in both total carbohydrate and sugars.244 Similar trends are likely in Queensland.
In 1998, 41% of Queensland adults reported consuming take away food twice a week, and 8.3% ate take way food three or more times a week.103 A recent Brisbane study found that persons from socioeconomically disadvantaged backgrounds were less likely to purchase grocery foods that were comparatively high in fi bre and low in fat, salt and sugar.258 The least educated, those employed in manual occupations and residents of low income households purchased fewer types of fruit and vegetables, and less regularly, that their higher income counterparts. It is unlikely that where people live in Brisbane shapes their procurement of food, over and above these personal characteristics.259
Table 1.64: Median percentage contribution of carbohydrate, protein, total starch and total sugars (kJ) as a proportion of total energy (J) by age and sex, Queensland 1995
Source: ABS National nutrition survey 1995
Table 1.65: Percentage of population who exceeded recommended daily intake of micronutrients by age and sex, Queensland 1995
Source: ABS National nutrition survey 1995 Note: Calculated by QH Data was not adjusted for within perosn variation
Male 2-3 4-7 8-11 12-15 16-18 19-24 25-44 45-64 65+
Protein 14.2 14.5 14.7 15.6 16.3 15.9 16.9 17.1 15.9Total fat 33.3 32.0 32.0 34.7 34.2 33.6 33.1 32.9 31.1
Saturated fat 14.8 14.6 13.9 15.7 14.2 13.8 12.8 12.4 12.4Monosaturated fat 10.2 11.2 11.3 11.6 12.1 11.7 12.0 11.9 10.9Polyunsaturated fat 3.9 3.9 4.4 3.6 4.2 4.1 4.1 4.4 4.4
Carbohydrate 52.2 52.0 52.5 49.8 46.7 47.7 45.1 45.0 47.5Total sugars 31.6 25.7 24.3 22.5 21.4 23.3 19.0 18.7 20.6Total starch 21.3 24.5 27.6 26.3 21.7 24.7 23.5 24.4 24.6
Female 2-3 4-7 8-11 12-15 16-18 19-24 25-44 45-64 65+Protein 14.2 14.0 14.0 15.8 14.9 16.1 16.7 17.2 16.9Total fat 35.2 33.4 35.3 33.2 33.2 33.0 32.0 32.2 31.0
Saturated fat 17.6 15.7 15.2 14.6 14.6 13.8 13.0 12.5 12.4Monosaturated fat 11.3 11.1 11.8 11.5 12.2 11.7 11.2 11.4 11.0Polyunsaturated fat 3.6 3.9 4.5 4.1 3.6 4.3 4.3 4.3 4.3
Carbohydrate 51.1 51.8 50.1 49.8 47.6 47.6 47.2 45.7 48.2Total sugars 27.2 26.1 23.5 25.5 26.2 22.2 20.3 20.6 21.0Total starch 24.7 24.2 25.4 24.9 23.9 24.3 24.5 23.9 24.8
Male Female Male Female Male Female Male Female
Vit A - retinol equiv 50 25 50 50 50 25 50 50Folate 50 50 75 50 75 50 50 50Vitamin C 50 75 75 75 75 75 75 75Calcium 50 25 25 25 25 25 25 10Iron 90 25 90 75 90 25 90 90Zinc 50 25 50 25 50 10 25 10
25-44 years 45-64 years 65+ years19-24 years

184 Health Determinants Queensland 2004
WHOLE OF POPULATION
Fruit and vegetable consumption In Australia in 1996, inadequate fruit and vegetable consumption was estimated to cause 3.0% of the total burden of disease for males and 2.4% for females.50 This was based on a recommended consumption of two serves of fruit and three serves of vegetables. However, the 1999 Australian Guide to Healthy Eating recommends for adults two serves of fruit (300g) and fi ve serves of vegetables (375g) daily for optimum health benefi ts.260
On average, in 2001 Queensland adults reported consuming just under two serves of vegetables per day, including cooked vegetables, salad vegetables and potatoes.261 One in eight males (12%) and 21% of adult females in Queensland consumed more than four serves of vegetables per day (Table 1.66). Lower vegetable consumption was more prevalent in males, the 18-29 year age group, and in areas of least socioeconomic disadvantage. As the national guidelines suggest consumption of fi ve serves of vegetables per day,260 Queensland adults consume insuffi cient vegetables.
Table 1.66: Daily serves of vegetables and fruit (self reported; 95% CI) in persons aged 18 years and older, by age, sex, socioeconomic disadvantage and accessibility, Queensland 2001
Source: QH Omnibus survey 2001
The National Nutrition Survey 1995 reported that more than 70% of the Australian population had eaten vegetables the day before interview.262 Potatoes were the most commonly consumed vegetable. The average intake of vegetables by adults was highest in rural and remote areas with a greater intake of potatoes, carrots, peas and beans, and other fruit and vegetables.
On average, in 2001 Queensland adults reported consuming one serve of fruit per day, including fresh, dried, frozen and tinned fruit.261 Forty nine per cent of the population reported two or more serves of fruit per day, consistent with national guidelines;260 41.9% of males and 55.5% of females (Table 1.66). Lower fruit consumption was signifi cantly more prevalent in younger males. In 1997, fruit intake in Australia varied with age and was highest in the 2-3 year old age group (77%).262 Females were more likely to have eaten fruit than males in all age groups, except for the 2-3 year olds. Adults living in areas of least socioeconomic disadvantage had the highest average intake of most fruit products and dishes.
Using 1995 National Health Survey data, a report released by AIHW in 2003 reported prevalence of low or no intake of fruit by region of birth.124 Australian born people reported the highest prevalence of low fruit intake; 49%, compared with 32% in people born in Southern and Eastern Europe and 38.5% in North Africa and Middle East. In all regions of place of birth, males were more likely to report low fruit intake.
Fruit and vegetables enhance health because of their high fi bre and micronutrient content, and because a higher intake of fruit and vegetables displaces substances like saturated fat. There is very good evidence
% consumed four or moreserves of vegetables
% consumed two or moreserves of fruit
Age (yrs)18-29 8.5 (5.9-11.2) 38.7 (34.1-43.4)30-39 15.6 (12.7-18.5) 47.8 (43.8-51.8)40-49 14.0 (11.4-16.5) 44.7 (41.1-48.3)50-59 21.3 (17.8-24.8) 53.5 (49.2-57.6)60-69 24.4 (20.2-28.6) 59.1 (54.3-63.9)70+ 25.3 (20.6-30.0) 63.1 (58.0-68.1)
Sexmale 12.1 (10.5-13.8) 41.9 (39.3-44.5)female 20.6 (18.6-22.7) 55.5 (52.9-58.1)
Socioeconomic disadvantagequintile 1 (least) 12.6 (10.0-15.3) 52.0 (47.9-56.2)quintile 2 14.8 (12.0-17.5) 48.7 (44.6-52.7)quintile 3 16.1 (13.0-19.1) 48.0 (43.7-52.2)quintile 4 19.9 (16.8-23.0) 47.0 (43.0-51.0)quintile 5 (most) 18.8 (15.6-22.0) 47.9 (43.7-52.0)
Accessibility/remotenessHighly accessible 15.7 (14.1-17.2) 49.3 (47.1-51.5)Accessible 17.2 (13.8-20.6) 46.5 (41.8-51.2)Moderately accessible 17.7 (13.4-22.0) 47.9 (42.4-53.4)Remote 30.8 (18.3-43.3) 48.5 (35.5-61.6)Very remote 14.6 (1.7-28.0) 51.1 (31.5-70.6)

185
WHOLE OF POPULATION
Health Determinants Queensland 2004
that people who regularly eat diets high in fruit and vegetables, including legumes, have substantially lower risks of coronary heart disease (CHD), stroke, several major cancers and possible hypertension, type 2 diabetes, cataract and macular degeneration of the eye.260, 263 The risk of CHD is not confi ned to populations who do not consume the recommended quantity of fruits and vegetables.97 Rather, the risk of CHD decreases linearly with increasing consumption from 0.5 to 4.5 serves per day.
Milk consumption Skim or low fat milk was reported as usually drunk by 54.8% of females aged 15 years and older in Queensland in 2001 (Table 1.67). In contrast, only 39.1% of males usually drank skim or low fat milk. A higher proportion of males and females in older age groups in 2001, reported drinking skim or low fat milk in comparison to younger age groups. For males and females, people in most socioeconomically disadvantaged areas were less likely to report usually drink skim or low fat milk. A greater proportion of males and females reported that they usually drank skim or low fat milk, rather than whole fat milk in 2001 than in 1995.
Table 1.67: Type of milk usually consumed, percentage of population by age, sex and socioeconomic disadvantage, Queensland 1995, 2001.
Source: ABS National health survey 1995, 2001
Cholesterol In Australia in 1996, high blood cholesterol was the cause of 3.2% of the total burden for males and 1.9% for females.50
In 2001, 51.1% of males and 47.4% of females aged 25 years and older had raised blood cholesterol levels.126 These rates were similar for Australia as a whole. The prevalence of total cholesterol, LDL-cholesterol, HDL-cholesterol and triglycerides rose markedly with age (Table 1.68).
In 1998, 13.4% of Queenslanders aged 18 years and older reported that they had ever been told they had high blood cholesterol, where no level was stipulated by the question. Substantially fewer Queensland adults self reported high blood cholesterol, compared to the proprtion reported by clinical measurement in 2001 Of those with self reported high blood cholesterol, 47.6% had been advised by their doctors to modify their diet or initiate physical activity to reduce it. This discrepancy between clinical measurment and self report is most likely explained by the respondents lack of awareness of the nature of blood tests taken by their doctors. The prevalence of self reported high cholesterol increased with age up to 70 years (Table 1.69). The prevalence reported in males and females was similar. The prevalence of high blood cholesterol was similar across areas of different socioeconomic disadvantage and across areas of different accessibility to services.
High blood cholesterol is a risk factor for stroke and coronary heart disease (CHD).11 The risk of CHD is not confi ned to populations with high blood cholesterol. Rather, the risk of CHD increases linearly with increasing levels.96
WholefatSkim orlow fat Wholefat
Skim orlow fat Wholefat
Skim orlow fat
15+ Male 66.2 33.8 60.9 39.1 MaleFemale 52.5 47.5 45.2 54.8 Quintile 1 (least) 42.3 57.7
15-24 Male 79.7 20.3 71.9 28.1 Quintile 2 54.0 46.0Female 63.0 37.0 55.4 44.6 Quintile 3 62.0 38.0
25-34 Male 74.6 25.4 66.5 21.1 Quintile 4 63.8 36.2Female 56.2 43.8 51.2 48.8 Quintile 5 (most) 70.1 29.9
35-44 Male 59.8 40.2 67.3 32.7Female 51.1 48.9 49.7 50.3 Female
45-54 Male 60.5 39.5 49.2 50.8 Quintile 1 (least) 28.9 71.1Female 45.9 54.1 35.2 64.8 Quintile 2 39.4 60.6
55-64 Male 63.4 36.6 50.7 10.5 Quintile 3 42.3 57.8Female 37.7 62.4 34.2 65.8 Quintile 4 47.7 52.3
65+ Male 49.9 50.1 52.7 47.3 Quintile 5 (most) 54.0 46.0Female 51.0 49.0 39.4 60.6
1995 2001 Socioeconomic disadvantage 2001

186 Health Determinants Queensland 2004
WHOLE OF POPULATION
Table 1.68: Prevalence of abnormal blood lipids, percentage of population, by type, age and sex, Queensland 2000
Source: AusDiab 2000
Table 1.69: High blood cholesterol prevalence (self reported), by age, sex, socioeconomic disadvantage and accessibility, Queensland 1998
Source: QH Statewide survey 1998
GP and dentist attendance Each year most adult Queenslanders (84.8% in 1998103 and 86.6% in 2002264) visit a general practitioner (GP) as a patient. In Queensland in 1998, 10.8% of adults reported being an admitted patient in a public hospital and 16.6% reported attending as an outpatient in the previous 12 months.
In 2001, 26% of Queenslanders aged 18 years or older reported they had visited a GP as a patient in the past 2 weeks. More females attended a GP than males (30% and 22% respectively). About double the proportion of males aged 55-64 years attended a GP, in comparison with those aged 25-44 years (Table 1.70). For women, a gradual increase in the proportion attending a GP is reported with increasing age. Attendance at a GP for both males and females varied with socioeconomic disadvantage. More adults in the most and least disadvantaged areas attended the GP in comparison with the other areas (Table 1.71). People in major cities were more likely to report attending a specialist or GP than people in regional or other areas (Table 1.71). People in major cities and regional areas were more likely to report attending a dentist than people in other areas. In 2001, 24% of all Australians reported consulting a GP in the previous two weeks, similar to the 23% in 1995 and greater than the 20% in 1989-90.265
Apart from health status, social factors can infl uence decisions to access health services such as hospitals or general practitioners. Such factors may include, low levels of education, a low degree of health literacy, poor access to support networks, and dissatisfaction at previous contact with the health system.35
% High cholesterol (95%CI) % High cholesterol (95%CI)
Age (yrs) Socioeconomic disadvantage18-29 2.5 (1.5-3.5) quintile 1 (least) 12.7 (10.7-14.7)30-39 7.9 (6.4-9.4) quintile 2 15.8 (13.5-18.0)40-49 13.7 (11.9-15.6) quintile 3 12.9 (11.1-14.8)50-59 24.9 (22.1-27.7) quintile 4 12.5 (10.6-14.4)60-69 26.6 (23.2-30.0) quintile 5 (most) 13.4 (11.4-15.4)70+ 23.2 (19.5-26.9) Accessibility
Highly accessible 13.4 (12.4-14.5)Sex Accessible 15.0 (12.4-17.5)
male 13.3 (12.0-14.6) Moderately accessible 11.9 (9.3-14.5)female 13.5 (12.2-14.8) Remote 12.5 (7.5-17.6)
Very remote 9.4 (2.2-16.6)

187
WHOLE OF POPULATION
Health Determinants Queensland 2004
Table 1.70: Percentage of persons reporting health seeking behaviour in past two weeks by age and sex, Queensland 2001
Source: ABS National health survey 2001 *Relative SE of the estimate =25-50% of the estimate; **Relative SE of estimte >50%
Table 1.71: Percentage of persons aged 18 years and older reporting health seeking behaviour in past two weeks by socioeconomic disadvantage and remoteness, Queensland 2001
Source: ABS National health survey 2001
In 2002, more than half (51.9%) of Queensland adults reported that they attended a dentist in the previous 12 months (Table 1.72). Generally, more females attended a dentist, at each age group. Adults in areas of greater socioeconomic disadvantage were less likely to attend a dentist, than those in areas of lower disadvantage. There was a clear negative gradient between dentist attendance and socioeconomic disadvantage at all age groups, where this effect was most marked in 18-29 year olds and in those aged 60 years and older. In general, adults were less likely to have attended a dentist within the last 12 months if they lived in areas of reduced accessibility. There were, however, some marked differences between age groups. While all age groups were less likely to have attended a dentist within the last 12 months if access were poor, older adults aged 60 years and older were most severely affected. While about half of Queensland adults attended a dentist in the last year, a further third attended a dentist in the last one to fi ve years (Table 1.73). A small proportion of the population reported highly infrequent visits to the dentist (most recent visit more than 10 years ago) and this proportion increased with age. One in four people over the age of 80 years had not visited a dentist in 10 years.
In 2002, about one quarter (23.8%) of Queensland adults reported that they generally attended a dentist for a regular check up (Table 1.74). Women were more likely to report seeking regular dental attention than men, and young men were the least likely to seek regular attention, with only 15 percent of 18-29 year olds saying they attended for a check up regularly. Disadvantaged adults were less likely to seek regular check ups, and this trend was evident across all age groups. Young adults are the least likely to seek regular dental check ups across all levels of disadvantage. The attitudes of adults to regular dental care are strongly infl uenced by access factors. With the exception of adults aged 30-39 years, there is a clear trend in all age groups for the proportion of adults who attend for regular dental check ups to fall as access decreases.
Table 1.72: Percentage of the population who attended a dentist within the last 12 months, by age and sex, Queensland 2002
Source: QH Omnibus survey 2002
Male Female Male Female Male Female Male Female Male Female Male Female
visited dentist 4.3* 3.7* 3.7* 4.4* 3.6* 7.6 8.3 6.7 5.5* 3.7* 7.6* 1.5**visited specialist 2.9* 10.1 3.2* 3.6* 3.6* 5.8 8.6 6.3* 10.1* 11.5* 15.3* 11.6*visited GP 13.5 25.9 14.4 18.6 20.1 25.5 27.2 27.3 34.7 27.3 33.8 33
55-64 65-74 75+25-34 35-44 45-54
Socioeconomic disadvantageQuintile 1
(least) Quintile 2 Quintile 3 Quintile 4Quintile 5
(most)visited dentist 4.3 5.5 4.5 5.3 4.6visited specialist 5.8 5.5 5.1 8.8 6.6visited GP 27.6 25.8 17.1 19.9 23.3
RemotenessMajorcities
Innerregional Remainder
visited dentist 5 5.2 4.3visited specialist 7.8 5.3 3.7visited GP 24.8 22.6 17.8
Male Female Persons
18+ 49 56 Socioeconomic disadvantageQuintile 1 (least) 61
18-29 45 56 Quintile 2 5630-39 48 55 Quintile 3 4940-49 51 66 Quintile 4 5150-59 50 59 Quintile 5 (most) 4660-69 50 4970+ 54 43 Accessibility Persons
Highly accessible 55Accessible 48Moderately accessible 47Remote/very remote 47

188 Health Determinants Queensland 2004
WHOLE OF POPULATION
Table 1.73: Frequency of last visit to the dentist as proportion of the population, by age, Queensland 2002
Source: QH Omnibus survey 2002
Table 1.74: Reasons for dentist attendance by sex, and prevalence of regular check up, as proportion of the population, by age, sex and socioeconomic disadvantage, Queensland 2002
Source: QH Omnibus survey 2002
Breast cancer screening In 2001-02, little more than half (58.8%) of Queensland women aged 50-69 years participated in breast cancer screening through Breastscreen Queensland (Table 1.75). The BreastScreen Queensland Program provides free breast screens (screening mammograms) to women in the target age group of 50 to 69 years. Research has shown this is the age group where the benefi ts from screening have been most clearly demonstrated. Women aged 40 to 49 years and women aged over 70 years are also able to access free breast cancer screening services. About one third of women in the age groups 40-49 years and 70-79 years also participated in Breastscreen Queensland in 2001-02. Fewer women living in areas of least socioeconomic disadvantage and in Brisbane participated in Breastscreen Queensland. It should be noted that mammography services provided outside the BreastScreen Program are not included in this data. It is estimated that a reduction in mortality from breast cancer of 25-30% is possible if 70% of women aged 50- 69 years are screened every two years.266
Almost all women aged 45-69 years reported they had ever heard of a mammogram, and have ever had a mammogram in 1995 and 2001 (Table 1.76). Between 1995 and 2001, the percentage of women aged 45-69 years reporting that they had ever had a mammogram increased by about 10 percent. In 2001, women aged 50-69 years living in areas outside Brisbane or inner regional areas were less likely to have ever had a mammogram than women of that age living in Brisbane or inner regional areas (Table 1.77). Similar percentages of women had heard of a mammogram, and had had a mammogram in each quintile of socioeconomic disadvantage in both the 50-69 and 40 years and older age groups.
Table 1.75: Breastscreen Queensland participation rates, percentage of women by age, area of socioeconomic disadvantage and remoteness, Queensland 2001-02
Source: Breastscreen Queensland *Target age group
18+ 18-29 30-39 40-49 50-59 60-69 70-79 80+
1 year ago or less 51.9 51.4 51.1 57.8 53.4 48.5 51.6 30.81 to 5 years ago 32.7 34.1 37.7 33.0 31.9 30.2 24.4 23.05 to 10 years ago 6.9 9.1 5.9 5.5 4.9 6.7 8.8 13.7More than 10 years ago 7.4 4.8 4.8 3.1 8.9 13.1 14.1 25.9Never 0.2 0.0 0.2 0.3 0.2 0.0 0.5 0.0
Male Female
Regular check up 21.4 26.1Occasional check up 16.6 19.5Only when having trouble 56.6 48.5Never 5.1 5.5
Regular check up18-29 15.4 16.4 Socioeconomic disadvantage Persons30-39 19.0 25.0 Quintile 1 (least) 31.740-49 25.6 34.8 Quintile 2 25.450-59 24.0 33.0 Quintile 3 19.860-69 27.3 29.1 Quintile 4 23.170+ 21.7 30.8 Quintile 5 (most) 17.0
18+ yrs

189
WHOLE OF POPULATION
Health Determinants Queensland 2004
Table 1.76: Percentage of women self reporting mammography by age, Queensland 1995, 2001
Source: ABS National health survey 1995, 2001
Table 1.77: Percentage of women self reporting mammography by age and remoteness, Queensland 2001
Source: ABS National health survey 2001
Cervical screening The Queensland Cervical Screening Program reported that more than half (56.7%) of Queensland women aged 20-69 years undertook a Pap smear test as a screen for cervical cancer in 2001-02, as registered by the Queensland Pap Smear Registry. The target age group for Pap screening is 20 to 69 years, and screens are advised every two years. Fewer women living in areas of greatest socioeconomic disadvantage were registered as having had a Pap smear on the Pap Smear Registry (Table 1.78). Similarly, fewer women living in metropolitan areas other than Brisbane and remote areas were registered as having had a Pap smear.
Almost all women aged 20-69 reported they had ever heard of a Pap screen, and had ever had a Pap screen in 1995 and 2001 (Table 1.79). In 2001, women aged 18-24 years and 65 years and older were less likely to have had a Pap screen, than women of other ages. However there was a 7% increase between 1995 and 2001 in the proportion of women aged 65 years or older who had had a Pap screen. In 2001, similar proportions of women in the age group 20-69 years had ever heard of a Pap screen, and had had a Pap screen in each quintile of socioeconomic disadvantage and in major cities, inner regional areas and the remainder of Queensland.
Table 1.78: Pap smear participation rates, percentage of women aged 20-69 years by socioeconomic disadvantage and remoteness, Queensland 2001
Source: Pap smear registry
Table 1.79: Percentage of women self reporting Pap screening by age, Queensland 1995, 2001
Source: ABS National health survey 1995, 2001
50-69 25-34 35-44 45-54 55-64 60-69 70+
1995 Ever heard of a mammogram 94.0 90.6 91.4 94.1 95.2 91.0 83.3Ever had a mammogram 74.9 9.4 42.2 78.2 71.6 74.5 56.1
2001 Ever heard of a mammogram 99.3 96.4 98.3 98.5 99.2 100.0 95.7Ever had a mammogram 90.8 10.3 37.9 82.8 92.3 91.7 72.2
Major cities Inner regional Remainder
50-69 yearsEver heard of a mammogram 99.8 100.0 96.9
Ever had a mammogram 93.1 94.9 79.340 years and older
Ever heard of a mammogram 99.2 97.7 97.4Ever had a mammogram 78.4 78.5 76.7
Socieconomic disadvantageDecile 1 (least) 56.7Deciles 2-9 57.3Decile 10 (most) 51.8
RemotenessCapital city 59.1Other metro 50.6Rural 56.6Remote 53.3
20-69 18-24 25-34 35-44 45-54 55-64 65+
1995 Ever heard of a Pap screen 98.3 95.6 98.6 99.2 100.0 96.5 92.2Ever had a Pap screen 94.0 66.6 96.0 98.1 97.6 95.4 77.8
2001 Ever heard of a Pap screen 99.1 98.6 99.0 100.0 99.1 99.1 93.6Ever had a Pap screen 95.3 67.7 94.5 98.6 98.3 98.1 84.6

190 Health Determinants Queensland 2004
WHOLE OF POPULATION
Sun protection Between 1988/89 and 2000, attitudes to suntan among Queensland adults have markedly changed.54 In 2000, fewer people agreed that they felt healthier with a suntan, that a suntanned person looked healthier and that most of their friends thought a suntan was a good thing. More than three quarters of Queensland adults (76.8%) are concerned about getting skin cancer (Table 1.80). Females are signifi cantly more concerned about getting skin cancer than males.
Regarding sun protection behaviours, in 2000 more than half (53%) of respondents wore either a hat or sunscreen on a weekday, while 60% wore either on a Sunday. About 87% used at least one of the four sun protective behaviours on a weekday or Sunday: wore hat/cap/visor, wore sunscreen, wore sunglasses, and stayed mostly in the shade or half shade. Since 1988/89, more people report that they wear a hat outdoors whenever it is sunny. The vast majority of people seek shade outdoors and will change locations to fi nd shade.
Table 1.80: Sun protection awareness and attitudes, percentage of people aged 18 years and older, Queensland 2000
Source: QH Sunsafe survey 2000
First aid certifi cation In 2002, 41.3% of Queensland adults reported that they had (ever) completed a formal fi rst aid training course. Younger people reported higher rates of completion of fi rst aid training, with higher rates in males than females in all age groups, except those aged 75 years and older. (Table 1.81). However only one third (35.1%) of respondents who had completed their training had done so in the last three years. Given that the remaining two thirds of respondents may have undertaken their courses many years ago, some respondents may not have retained the skills required for current use.
In comparison, in 1998,103 36% of Queenslanders reported holding a current fi rst aid certifi cate where current is defi ned as having undertaken or updated in the last three years. This indicates that levels of current fi rst aid certifi cate holdings remained roughly steady between 1998 and 2002.
First Aid courses provide training in cardiopulmonary resuscitation (CPR) and basic treatment for injury and illness and also include important information about management of emergency situations. Given the rate of falls and out-of-hospital cardiac arrest in the older population, it is important that Older people participate in these courses. Cost and accessibility of fi rst aid and CPR training courses have been identifi ed as major barriers to Older people in particular.
Table 1.81: Percentage of persons who have completed a fi rst aid training course, by age and sex, Queensland 2002
Source: QH Omnibus survey 2002
18+ years
AwarenessHow concerned are you about getting skin cancer? Very/somewhat concerned 76.8How likely is it, do you think, that you would develop any form of skin cancer at some time during your life? Very/somewhat likely 70.3
Attittudes and behaviours in relation to tanningHow important is it to you to have a tan? Very/somewhat important 17.1What degree of tan do you like to get? A light tan 40.1
Likelihood of using shadeIf you were planning a picnic on a sunny day in summer, how important would it be to you that shade was available? Extremely/very important 93.9And if it was a sunny day in winter, how important would it be? Extremely/very important 52.6If you think it unlikely to find shade for a summer picnic, how likely would you be to take your shade with you? Very/somewhat likely 68.8And how likely would you go to another place with shade Very/somewhat likely 92.1
Attitudes to suntansI feel more healthy with a suntan Agree/strongly agree 27.0A suntanned person looks more healthy Agree/strongly agree 38.8Most of my friends think that a sun tan is a good thing Agree/strongly agree 31.0It's important to take care to avoid getting sunburnt Agree/strongly agree 98.4
Attitudes to sun exposueThe more exposed to the sun, the more it ages your skin Agree/strongly agree 96.7
Attitudes to sun protection behavioursI wear a hat outdoors whenever it's sunny Agree/strongly agree 75.3I should try to minimise the amount of sunlight I get on my skin Agree/strongly agree 81.4
18+ 18-55 55-64 65-74 75+
Persons 41.3 45.3 35.8 24.2 31.8Males 42.8 46.5 39.0 27.9 28.4Females 39.8 44.1 32.3 20.7 34.1

191
WHOLE OF POPULATION
Health Determinants Queensland 2004
1.5 Interventions to address the burden of diseaseThe work of many government and non-government agencies, industry and community groups impacts directly and indirectly on the health of Queenslanders. Health Determinants Queensland 2004 has been produced to assist these organisations to gain a clearer understanding of the determinants and risks of ill health, as well as the broader social implications to the whole population and specifi c target groups. The interventions outlined build upon the Queensland Health directions statement Smart State: Health 2020 Strategic Vision for Queensland Health.
There is now good evidence that a range of interventions are effective in preventing disease, illness and injury, and in promoting health and wellbeing through action on the broad range of determinants of health and ill health. The key challenges are to ensure these initiatives are ongoing and widespread, and at a level suffi cient to achieve broad based population-wide outcomes as well as reduce health inequalities across population subgroups.
Since population health issues need to be addressed by multiple organisations and communities, the aim of these intervention sections is to identify key evidence based strategies that are currently being undertaken, are planned or are required to be undertaken, based upon best practice. This intervention list is intended to be a useful resource for about three years. These interventions will be led by many organisations in partnership with other sectors. Interventions unique to sub-populations of Queensland, eg. children or Indigenous peoples, are detailed in the relevant chapters of Health Determinants Queensland 2004.
There are a number of ways of infl uencing systems and settings to improve population health and wellbeing, or to create healthy environments that are conducive to health and wellbeing. These include, but are not limited to:
• Community public health planning: A broad range of bottom-up planning processes that engage communities and partner agencies,267 and,
• Health Impact Assessment: An approach used to assess and judge an initiative or policy for its potential effects on the health of the population and the distribution of those effects within the population.268,269
It is clear that there are no simple, quick fi xes to these complex health issues facing Queensland. Action on all determinants requires multi-strategy approaches which:
• include both population wide and at risk group approaches• involve sectors working together at state and local levels• focus on both risk and protective factors• address social, behavioural, economic and environmental factors• specifi cally address equity and reduce disparities by focusing on the needs of the most
disadvantaged communities and population groups• take a life course perspective.

192 Health Determinants Queensland 2004
WHOLE OF POPULATION
AlcoholKey action areas Key evidence based strategies
Community awareness
• Implement social marketing campaigns to increase community awareness of the harms associated with alcohol use.
• Promote awareness and use of standard drinks and national safe alcohol consumption guidelines to encourage responsible and safe drinking.
• Implement programs, such as the Water and Alcohol Safety Project, to raise awareness of the dangerous effects of alcohol on reaction time, and on comprehension and judgement in and around water activities such as boating.
Protection of those at higher risk
• Deliver diversion programs to manage public intoxication and prevent potential self-harm.
• Implement targeted social marketing approaches to increase awareness of the harms associated with alcohol use, for specifi c high risk groups, settings and behaviours such as prisons, licensed venues and driving.
• Endorse the Queensland Water Safety Plan, and implement social marketing campaigns to increase community awareness and education regarding alcohol related drownings in 15-34 year olds.
• Provide skills training and job creation for young people and other disadvantaged groups.
Effective legislation and regulation
• Review legislation and regulations regarding liquor production, sale and consumption to ensure they refl ect government, community and industry expectations.
• Promote and enforce under-age drinking legislation.• Amend the Liquor Act to prohibit irresponsible liquor products that are not in
the public interest.• Review legislation to strengthen actions against and penalties related to drink
driving.• Implement targeted enforcement strategies for compliance with the Liquor Act
based on information and evidence from the Queensland Police Service about alcohol related incidents.
• Conduct investigations for licensed premises to reduce incidents where minors purchase and/or consume alcohol in and around licensed premises, with particular focus on celebratory events such as ‘Schoolies Week’.
• Investigate incidents and impose fi nes on minors for the production of false identifi cation, follow-up on false identifi cation confi scated by licensees and issue fi nes where appropriate.
Safe drinking environments
• Promote safe and responsible alcohol consumption at major events such as Big Day Out and ‘Schoolies Week’, eg. Event Management Planning Guide.
• Implement drink spiking programs to help prevent its occurrence and to improve service provider response to victims.
Drink driving • Implement random breath testing programs to enforce drink driving legislation. • Use engineering and environmental changes to create safer environments
that reduce the potential harms of drink driving and drink walking.• Implement social marketing campaigns to increase awareness of the
consequences of drink driving and drink walking.• Conduct programs specifi cally targeting offenders and repeat offenders, to
reduce the likelihood that they reoffend.Treatment • Provide a range of alcohol treatment options across both government and
non-government sectors including: - comprehensive assessment and referral - withdrawal management through inpatient and outpatient settings - residential treatment and rehabilitation - non-residential counselling/therapy - relapse prevention and continuity of care.• Deliver the 24-hour telephone Alcohol and Drug Information Service to
provide information, counselling and referral for anyone across Queensland with concerns related to the use of alcohol.

193
WHOLE OF POPULATION
Health Determinants Queensland 2004
Workforce capacity • Provide training programs for police, Community Justice Groups and Magistrates around prevention, sentencing and penalties to address alcohol related problems.
• Implement the Operational Protocol to Guide Interaction between the Queensland Police Service and the Liquor Licensing Division; Notes on the Liquor Act for Offi cers of the Queensland Police Service, and Guide to preparing comments on applications relating to the Liquor Act for Offi cers of the Queensland Police Service.
Further information regarding the intervention strategies above can be accessed from:1. Commonwealth Government (2001) National Alcohol Strategy: A plan for action 2001 to 2003-04,
Canberra.2. Queensland Government (unpublished) Finding the Balance: Queensland Alcohol Action Plan
2003/04 to 2006/07.3. National Drug Strategy Framework - http://www.nationaldrugstrategy.gov.au4. Event Management Planning Guidelines - http://www.liquor.qld.gov.au5. Water and Alcohol Safety Project, Drug and Alcohol Coordination Unit, Queensland Police Service.

194 Health Determinants Queensland 2004
WHOLE OF POPULATION
Communicable diseaseKey action areas Key evidence based strategies
Community awareness and supportive environments
• Implement early warning systems for selected diseases, eg. infl uenza.• Implement preventive measures for threats to the general population, eg.
invasive pneumococcal disease, dengue fever in north Queensland, and emerging infections such as SARS and avian fl u.
• Implement proactive Aedes Aegypti control programs in north Queensland urban areas to prevent breeding of these mosquitoes.
• Implement SARS preparedness activities, such as planning and desktop exercises, with key partners, Health Service Districts, local government and general practice.
• Assist the Torres Strait Council to secure funding to support the removal of likely mosquito breeding sites from domestic and commercial premises.
• Undertake outbreak investigations of gastrointestinal and foodborne illness outbreaks utilising epidemiological and environmental studies, and link with national counterparts through the OzFoodNetwork.
• Undertake preparedness planning for infl uenza and other emergent diseases with key partners.
• Develop a generic outbreak management plan to be used for respiratory diseases and potentially other communicable diseases.
• Increase adoption of sustainable disease specifi c education and prevention strategies by industry and professional groups, eg. Q-Fever.
• Undertake risk assessment of West Nile virus in urban Queensland, in collaboration with Aust Biosecurities CRC.
• Implement control measures to prevent cryptosporidiosis, including hygiene practices in child care settings, and public and resort swimming facilities and spas.
• Promote and enforce legislation for the prevention and control of communicable diseases, including the Health Act, Health Regulations and Personal Appearance Act.
• Implement infection control surveillance processes and appropriate sterilisation management information systems that comply with Australian standards, to monitor, control and prevent healthcare associated infections.
Workforce capacity • Provide training for health professionals responsible for sterilising services and infection control to continuously improve practices.
• Implement education and awareness programs for GPs and the community to increase knowledge of how to prevent and detect communicable disease, and their role in such, eg. invasive meningococcal disease, food-borne outbreaks, mosquito-borne infections such as Ross River virus and Barmah Forest virus, and dengue fever in north Queensland.
Further information regarding the intervention strategies above can be accessed from:
1. Annual reports of the Communicable Diseases Unit, Queensland Health, available at http://qheps.health.qld.gov.au/phs/home.htm or http://www.health.qld.gov.au/HealthyLiving/home.htm or http://www.health.qld.gov.au/health_information/public/default.asp
2. Information sheets on various diseases, accessed through http://qheps.health.qld.gov.au/phs/home.htm or http://www.health.qld.gov.au/HealthyLiving/home.htm or http://www.health.qld.gov.au/health_information/public/default.asp
3. Communicable Diseases Control Manual - http://qheps.health.qld.gov.au/phs/Documents/cdu/19682.pdf.
4. Communicable Disease Network for Australasia - http://www1.health.gov.au/cda/Source/CDA-index.cfm
5. National OzFoodNet Program report for Queensland for 2002 - http://qheps.health.qld.gov.au/phs/Documents/cdu/20912.pdf.
6. Australian Standard Vaccination schedule - http://immunise.health.gov.au/schedule.pdf

195
WHOLE OF POPULATION
Health Determinants Queensland 2004
Food safetyKey action areas Key evidence based strategies
Effective legislation and regulation
• High risk food businesses to implement a food safety program as a best practice method of demonstrating compliance with the Food Safety Standards.
• Inspect/audit businesses to monitor compliance of Food Safety Standards.• Enforcement agencies to adopt inspection, investigation, licensing and
auditing system protocols.• Review the Food Act and develop a best practice regulatory system to support
its implementation.• Provide an accreditation program for food businesses.
Community awareness and workforce capacity
• Provide training for food business staff to increase knowledge and skills in the Food Safety Standards.
• Implement a social marketing campaign using mass media to increase awareness of food safety in the home.
• Work with key industry groups, such as the baking industry, to develop a range of targeted resources to increase food standards and food safety outcomes.
• Improve the capacity of State Government food businesses to produce safe and suitable food through:
- improving design and construction - supporting the implementation of food safety programs,
eg. school tuckshop project.• Ensure integration and coordination of the statewide food surveillance and
monitoring system at national and local levels.
Further information regarding the intervention strategies above can be accessed from:
1. Australian Consumers’ Association website provides information for consumers on a range of food safety issues - www.choice.com.au
2. Australian Government Department of Agriculture, Fisheries and Forestry site provides a database for agricultural and fi sheries-related matters - www.affa.gov.au
3. Australian Government Department of Health and Ageing site provides information on the role of the department and outlines work being done to improve food safety in Australia - www.health.gov.au/pubhlth/strateg/foodpolicy/foodsafety.htm
4. Communicable Diseases Australia site provides information on a wide range of diseases. It includes OzFoodNet research on food-borne illness - www.health.gov.au/pubhlth/cdi/cdihtml.htm
5. Food Safety Information Council site includes information and quizzes aimed at young people and consumers. The Food Safety Information Council is a not-for-profi t organisation that promotes food safety to consumers - www.foodsafety.asn.au
6. Food Safety Victoria, a Victorian Department of Human Services website includes topics on food safety, keeping food safe and food poisoning. The website is written for adult consumers - www.foodsafety.vic.gov.au
7. Food Science Australia, a joint web service from CSIRO and the Australian Food Industry Science Centre provides an extensive snapshot of food safety issues through fact sheets and consumer leafl ets. The Internet resources are extensive but may not appeal to students - www.foodscience.afi sc.csiro.au
8. Food Standards Australia and New Zealand, is an extensive site suited to adults and industry, and includes ‘Food Safety’ and ‘For the Consumer’. It also includes Australian legislative standards for food safety, food composition and labelling.- www.foodstandards.gov.au
9. New Zealand Food Safety Authority for both consumer and industry information. - www.nzfsa.govt.nz/10. OzFoodNet, a collaborative research project by Australian governments about the causes and
incidence of food-borne disease in Australia - www.ozfoodnet.org.au

196 Health Determinants Queensland 2004
WHOLE OF POPULATION
Immunisation
Key action areas Key evidence based strategies
Community awareness and immunisation uptake
• Endorse the Queensland Immunisation Strategy and develop and implement:
− social marketing campaigns to improve community confi dence in the safety and effectiveness of the Queensland Immunisation Program
− alternative service models to increase the effectiveness of Vaccine Service Providers in meeting community need and/or inequities in immunisation rates across the community.
• Implement social marketing campaigns to increase and maintain public support for immunisation.
• Develop resources for the community (including schools and the child care sector) on the risks and benefi ts of immunisation and all aspects of the standard vaccination schedule.
Workforce capacity • Improve the reliability of data on adverse events following immunisation through improved reporting from service providers, the review and amendment of protocols and regular monitoring and evaluation.
• Increase provider awareness of targeted immunisation programs to increase vaccine uptake in special needs groups, eg. Indigenous Pneumococcal and Infl uenza Program and Older Australians Infl uenza Program.
• Provide resources for service providers and parents on the risks and benefi ts of immunisations and the standard vaccination schedule.
• Provide training for service providers in response to identifi ed issues such as vaccine management, data collection and use and risk communication.
Integrate immunisation into primary healthcare practice
• Promote immunisation as part of community health needs identifi cation and planning processes to ensure that at risk groups are identifi ed.
• Promote immunisation service delivery as integral to the provision of comprehensive primary healthcare practice, to ensure at risk groups such as Aboriginal and Torres Strait Islander peoples and overdue children, are targeted for immunisation service delivery and/or follow up to ensure completion of vaccination schedules.
• Identify where alternative models of service delivery are required to vaccinate at risk groups, eg. outreach models.
Further information regarding the intervention strategies above can be accessed from:
1. Annual reports of the Communicable Diseases Unit, Queensland Health, available at http://qheps.health.qld.gov.au/phs/home.htm or http://www.health.qld.gov.au/HealthyLiving/home.htm or http://www.health.qld.gov.au/health_information/public/default.asp
2. Information sheets on various vaccine-preventable diseases, accessed through http://qheps.health.qld.gov.au/phs/home.htm or http://www.health.qld.gov.au/HealthyLiving/home.htm or http://www.health.qld.gov.au/health_information/public/default.asp
3. Australian Standard Vaccination schedule - http://immunise.health.gov.au/schedule.pdf

197
WHOLE OF POPULATION
Health Determinants Queensland 2004
Injury
Key action areas
Key evidence based strategies
Community awareness
• Implement social marketing campaigns to increase awareness of the preventability of ”accidents” eg. Safe Communities program and Poisons Information Centre.
• Provide fi rst aid courses to increase individual’s knowledge and skills in the event of injury.
• Increase public awareness of the importance of maintaining a current fi rst aid certifi cate and competence in Cardio-pulmonary resuscitation (CPR).
• Increase public awareness of the Poisons Information Centre. • Increase awareness of the need to identify high-risk environments, maintain
equipment, and use safety features and protective equipment, eg. pool fencing, playgrounds/play equipment and workshops.
Supportive public policies and safer environments
• State and local authorities manage legislation and regulations/standards (including enforcement), eg. random breath testing, dog breed controls and pool fencing.
• Local governments adopt the state sustainable housing code.• Incorporate safety promotion/injury prevention considerations into all local and regional
planning processes, to create safer physical environments, eg. Integrated Planning Act, urban planning and community public health planning.
• Smart housing guidelines adopted by building designers and constructors.• Endorse the Queensland Water Safety Plan and support the implementation of: – social marketing campaigns to increase public awareness and education regarding
responsible and informed water safety behaviour when in and around beaches, pools, dams and lakes
– effi cient and responsive rescue services to minimise or eliminate death by drowning or other misadventure.
• Implement and evaluate treatment protocols in Emergency Departments for cases of poisoning.
• Review, amend and enforce legislation to assist in the creation of safe environments, eg. pool fencing, hot water tempering devices, smoke alarms and electrical safety switches.
• Rectify potential hazards in public areas and work environments, eg. footpaths.• Provide and maintain safe playground equipment, particularly under-surfaces and heights.• Promote, encourage and support the installation of safety devices and features (such
as pool fencing, hot water tempering devices, smoke alarms, electrical safety switches and hand rails) in all public and private sector housing, both new and existing, using programs such as the Queensland Fire and Rescue Operation Safe Home Program.
• Improve and strengthen relevant product design and standards, eg. toys and child resistant closures.
Further information regarding the intervention strategies above can be accessed from:
1. Strategic Injury Prevention Partnership (2001) National Injury Prevention Plan 2001 – 2003, Commonwealth Department of Health and Aged Care, Canberra.
2. Pointer, S, Harrison, J and Bradley, C (2003) National Injury Prevention Plan Priorities for 2004 and Beyond (Discussion Paper), Australian Institute of Health and Welfare, Canberra.
3. National Injury Prevention Advisory Council (1999), Directions in Injury Prevention. Report 1: Research needs, Commonwealth Department of Health and Aged Care, Canberra.
4. National Injury Prevention Advisory Council (1999), Directions in Injury Prevention. Report 2: Prevention interventions – good buys for the next decade, Commonwealth Department of Health and Aged Care, Canberra.
5. Australian Institute of Health and Welfare and Commonwealth Department of Health and Family Services (1997), National Health Priority Areas Report on Injury Prevention and Control, Australian Institute of Health and Welfare and Commonwealth Department of Health and Family Services, Canberra.
6. Queensland Health (2000), Health Outcomes Plan Injury Prevention and Control 2000–2004, Queensland Health, Brisbane.
7. Monash University Accident Research Centre (1995), Injury Research and Prevention: A Text, Monash University Accident Research Centre, Melbourne.
198 Health Determinants Queensland 2004
WHOLE OF POPULATION
8. Health Department of Western Australia and Injury Control Council of Western Australia (1996), Injury Prevention Resource Package, Health Department of Western Australia and Injury Control Council of Western Australia, Perth.
9. QISU Injury Bulletins - www.qisu.qld.gov.au10. Smart housing - www.smarthousing.qld.gov.au11. Safe communities – www.phs.ki.se/csp and www.safecommunitiesqld.org12. The National Injury Prevention Plan is due for release in 2004.

199
WHOLE OF POPULATION
Health Determinants Queensland 2004
Mental health
Key action areas Key evidence based strategies
Supportive environments and infrastructure
• Implement policies that promote emotional, cultural and spiritual wellbeing in learning, working and recreational environments, eg. health promoting schools, workplaces that support staff participation in cultural and religious practices and cultural awareness training.
• Implement family-friendly policies and practices in workplaces and community settings, eg. workplace policies that support breastfeeding, fl exible working hours and job-share practices.
• Implement policies and practices that encourage community participation of older adults, eg. accessible and affordable transport, and 60 and Better program.
• Provide safe, nurturing and consistent quality child care in formal and informal child care settings, eg. Promoting Health in Early Child Care Environments pilot project.
• Provide learning, working and recreational environments that develop mental health and health literacy, eg. Safe Schools, University of the Third Age, and Supportive Environments for Active Living (SEAL).
Social support and sense of connectedness to family and community
• Provide a range of programs to support the development of early parental attachment, eg. antenatal classes, breastfeeding programs and father/infant reading projects.
• Establish networks and social support in communities to reduce the social isolation of parents and carers, eg. play groups, Infant Home Visiting Program, carers support groups, and Home and Community Care Program.
• Implement community based programs to increase acceptance, and valuing, of social and cultural diversity, eg. Strong in the City Program, cultural and arts festivals, youth festivals and Putting Families First.
• Implement programs that promote the establishment of positive peer relationships among children and young people, eg. Friends, anti-bullying programs, and sporting and cultural programs.
• Implement strategies to enhance volunteerism to build trust, reciprocity and community identity through the promotion of opportunities to actively participate in school and community events, eg. Volunteer teacher aides, sports clubs, Land Care Groups, Meals On Wheels and Safe Communities.
Personal effi cacy and resiliency to positively manage life transitions and adverse life events
• Implement parenting programs, eg. Triple P Positive Parenting Program, confl ict resolution programs, teenage parenting programs, and young parents support programs.
• Implement programs to increase self-worth, social competency, coping skills and resilience in children, young people and older people, especially during periods of transition, including:
– from home to child care and from child care to pre-school, eg. School Readiness Initiative
– to primary school – from primary school to secondary school – from secondary school to employment or tertiary education – from childhood to young adulthood – from work to retirement or unemployment, including retrenchment – to parenthood.• Increase community knowledge of the available information and health services
they can access for assistance.
Further information regarding the intervention strategies above can be accessed from:
1. Department of Health and Aged Care (2000) National Action Plan for Promotion, Prevention and Early Intervention for Mental Health 2000.
2. Department of Health and Aged Care (2000) Promotion, Prevention and Early Intervention for Mental Health: A Monograph 2000.
3. Department of Health and Aged Care (2000) National Mental Health Report 2000.4. Commonwealth of Australia (2002) Building capacity for mental health.

1100 Health Determinants Queensland 2004
WHOLE OF POPULATION
5. Queensland Health (2002) A Strategic Policy Framework for Children’s and Young People’s Health 2002 – 2007, Queensland Health.
6. Queensland Government (2003) Reducing Suicide: The Queensland Government Suicide Prevention Strategy 2003 – 2008.
7. Queensland Health (2003) Mental Health Promotion Outcome Area Plan 2003 – 2006.8. Queensland Health (2003) Reducing Suicide: Action Plan 2003, The Queensland Government
Suicide Prevention Strategy 2003–2008.

1101
WHOLE OF POPULATION
Health Determinants Queensland 2004
NutritionKey action areas Key evidence based strategies
Healthy eating • Increase community awareness of and access to the NHMRC Dietary Guidelines for Australians series.
• Promote the NHMRC Dietary Guidelines to health service providers and other sectors such as local government, education and community services or organisations. This includes public health, community, child and oral health, nursing and allied health, Indigenous health, food service staff, staff within a general practice setting, and private and non-government health organisations.
• Implement social marketing campaigns using radio, television and other mass media to:
– promote healthy food choices and consumption – increase awareness of recommended consumption levels. • Limit the size of servings and reduce energy content of less healthy take-away
and pre-prepared meals and snacks, eg. develop less energy dense products.• Promote the extension of water fl uoridation, in collaboration with local
governments, communities and other key stakeholders. • Increase consistency with healthy eating guidelines in food advertising,
especially in food advertising targeting children.• Provide consumer education, in partnership with food retailers, including point
of sale advice, to improve understanding of food labels; dietary guidelines; and the links between weight, energy intake and physical activity levels.
• Provide supermarket tours, in-store promotions, point-of-sale marketing and consumer tested information resources on healthy food choices and cooking.
• Promote media responsibility for promoting healthy eating.• Implement national food supply accreditation of facilities.• Provide programs that assist families and individuals, particularly
disadvantaged groups to effectively plan, budget, shop for and cook nutritious meals, eg. Fresh Choice and Food Cents.
• Implement policies and guidelines regarding the sale of food at sporting, other venues and major events.
• Promote use of best practice guidelines for food services provided at workplaces.• Promote healthy choices through Queensland Health food services, eg. Royal
Brisbane Hospital A Better Choice menu.Fruit and vegetable consumption
• Implement social marketing campaigns to increase awareness of recommended levels of fruit and vegetable consumption.
• Promote sustainable production systems that improve the quality, consistency and productivity of the fruit and vegetable supply.
Nutritional health of mothers, infants and children
• Implement Queensland Health’s Optimal infant nutrition: evidence based guidelines 2003–2008 including:
– policies and practices consistent with the guidelines of the World Health Organisation supported Baby Friendly Hospital Initiative
– workplace policies which support breastfeeding – quality counselling and support for mothers who wish to breastfeed – collaboration with industry and the media to promote breastfeeding as
the normal and optimal method of infant feeding.• Incorporate evidence based approaches to nutrition advice and support as
part of all antenatal care programs, especially for young women, Indigenous women, and other high risk groups.

1102 Health Determinants Queensland 2004
WHOLE OF POPULATION
Healthy weight • Include screening for poor nutrition in health assessments in multiple settings and refer to appropriate services, eg. general practice, community health and hospitals.
• Provide group based intervention programs, eg. Lighten Up to a Healthy Lifestyle and Healthy Weight Program.
• Ensure appropriate discharge planning for those identifi ed as being at risk of poor nutrition, including liaison with community service providers.
• Implement referral pathways and NHMRC Clinical Guidelines for Weight Control and Obesity Management.
Food supply • Ensure equitable access and availability of healthy, quality, safe and affordable foods through:
– food safety and standards legislation – promotion of training and incentive schemes for producers, manufacturers,
wholesalers, transporters, and retailers, particularly in rural and remote areas.• Improve availability of and access to affordable healthy food in rural and remote
areas and in Indigenous communities through: – supporting cold chain management initiatives to improve the quality and
safety of fresh produce in rural and remote areas – implementation of improvements in store infrastructure and management to
improve the supply, storage, promotion and sale of fresh produce, eg. DATSIP and Queensland Health Nutrition Policy for Remote Retail Stores
– development of a national accreditation system for food service outlets and Indigenous community controlled stores, based on sales of healthy food
– encouraging funding bodies to recognise accreditation when funding.Workforce and infrastructure capacity
• Provide professional development for health workers in nutrition, physical activity and chronic disease prevention.
• Increase the capacity of health services to participate in primary prevention and nutrition promotion, eg. Creating a Healthier Queensland, coordinating program development, and broader implementation.
• Implement a sustainable, coordinated nutrition and overweight and obesity monitoring and surveillance system.
Further information regarding the intervention strategies above can be accessed from:
1. Queensland Public Health Forum (2002) Eat Well Queensland 2002-2012: Smart Eating for a Healthier State. Brisbane - http://www.health.qld.gov.au/QPHF/FoodNutrition.htm
2. National Obesity Taskforce (2003) Healthy Weight 2008 – Shaping Australia’s Future: Report to the Australian Health Ministers Advisory Council, Canberra.
3. World Health Organisation (2004). Global strategy on diet, physical activity and health 2004. Geneva: WHO.
4. World Health Organisation (2003) Diet, nutrition and the prevention of chronic diseases. Geneva: WHO.5. NHMRC (2003) Dietary Guidelines for Australian Adults. Canberra: National Health and Medical
Research Council.6. NHMRC (2003) Dietary Guidelines for Children and Adolescents in Australia. Canberra: National
Health and Medical Research Council.7. NHMRC (2003) Clinical Guidelines for Weight Control and Obesity Management in Adults. Canberra:
National Health and Medical Research Council.8. NHMRC (2003) Clinical Guidelines for Weight Control and Obesity Management in Children and
Adolescents. Canberra: National Health and Medical Research Council.9. DATSIP (2001) Nutrition Policy for Remote Retail Stores. Brisbane, Department of Aboriginal and
Torres Strait Islander Policy and Queensland Health10. Queensland Health programs and resources - http://www.health.qld.gov.au/healthyliving/11. Australian Guide to Healthy Eating - http://www.health.gov.au/pubhlth/strateg/food/guide12. SIGNAL (Strategic Inter-Governmental Nutrition Alliance) - http://www.nphp.gov.au/workprog/signal13. NHMRC nutrition publications - http://www.health.gov.au/nhmrc/publications.14. Queensland Action Plan to Promote Vegetables and Fruit consumption

1103
WHOLE OF POPULATION
Health Determinants Queensland 2004
Oral health
Key action areas Key evidence based strategies
Supportive policies and treatment
• Promote the broader use of fl uoride, including water fl uoridation, particularly in high risk areas.
• Progress the development of more specialised oral healthcare services for children, older people, and those with signifi cant conditions that can impact on oral health.
• Incorporate clinical pathways to assess, treat and provide preventive services.• Adopt clinical governance to enhance the quality of clinical interventions.• Target service investment to communities with high levels of oral disease.• Implement clinical audit for oral health services.• Promote oral health promotion practices within relevant episodes of general
health care, eg. services for children and older people.Community awareness
• Implement social marketing initiatives to increase the community’s awareness, acceptance and adoption of effective public health interventions to improve oral health, eg. fl uoridation and good nutrition.
• Implement initiatives to increase the proportion of the population using fl uoride toothpaste regularly, especially in high risk communities, eg. Brushing for Life program.
• Promote the adoption of NHMRC Dietary Guidelines to enhance oral health status, using a common risk approach.
Workforce capacity and infrastructure
• Implement innovative recruitment and retention strategies to attract and retain clinical staff especially in rural and remote areas.
• Provide training for oral health professions to be able to respond to the oral health needs of communities and eligible clients.
• Implement enhanced service models to make more effective use of allied oral health professionals within oral health teams to reduce the costs of care and improve oral health outcomes.
• Establish surveillance of the oral health status of adults and children to inform the development of good public health policy and strategies.
• Implement an integrated model of specialist dental services to meet contemporary community needs.
• Implement credentialing of dental practitioners.• Implement the Oral Health Information System to enable more effective
monitoring and evaluation of oral health service provision.
Further information regarding the intervention strategies above can be accessed from:
1. Queensland Health (2003) Oral Health Outcome Area Team Plan 2003-2006.2. Queensland Health (2003) Improving Public Oral Health Services – Options for Change.3. Queensland Health (2003) Review of Queensland Health Responsibilities and Interests in LGPS.
Discussion Paper, Environmental Health Unit.

1104 Health Determinants Queensland 2004
WHOLE OF POPULATION
Physical activityKey action areas Key evidence based strategies
Community awareness and provision of physical activity options
• Implement social marketing campaigns that increase community awareness of the benefi ts of physical activity and motivation to participate in regular physical activity in organised and non-organised settings.
• Promote the range of physical activity participation options (free and fee-paying) available within the local area, eg. ourbrisbane.com, Townsville and Thuringowa Recreation Directory.
• Implement physical activity programs, eg. local walking programs, active Brisbane directory.
• Provide infrastructure, such as cycling and walking facilities and programs like Travelsmart, that increase use of local public transport services.
• Expand community physical activity initiatives to achieve greater reach and coverage across the whole population, eg. 10,000 Steps Rockhampton, ActiveAte and worksite projects.
• Promote the National Physical Activity Guidelines for Australians and other good practice guidelines to health professionals and relevant partners, eg. Getting Started, Physical Activity Facts and Getting Australia Active.
• Link Government websites to improve access to programs, on-line learning, resources and general information about physical activity, healthy eating and healthy weight.
Supportive environments and policies
• Increase awareness of the social, health and economic benefi ts of participation in regular, moderate physical activity among key decision-makers across government and the community through existing networks at the local and regional level, eg. Regional Managers’ Forums, presentations at intersectoral forums.
• Include structured and incidental physical activity considerations in the planning of the physical environment, eg. South East Queensland Regional Trails Network multi sector partnership, planning schemes and community public health planning.
• Promote guidelines for planners, including transport, recreation, open space, schools and child care settings to encourage supportive environments for physical activity, eg. Supportive Environments for Active Living (SEAL).
• Incorporate urban design guidelines to shape and support public transport, cycling, walking and physical activity options, eg. Shaping Up and Queensland Transport-Integrated Planning.
• Implement regulatory policies to advocate for the development of appropriate infrastructure, land use and planning that is supportive of physical activity.
• Implement industry standards and guidelines to ensure safe and quality physical activity experiences for participants, eg. Fitness Industry Code of Practice.
• Implement policies that enhance links between schools, local governments and sport and recreation providers and encourage shared use of state school facilities by the community.
At risk groups • Include screening for physical activity in health assessments in multiple settings, eg. general practice, community health and hospitals, and refer to appropriate services/programs as required.
• Promote physical activity through the inclusion of individual and group education in relevant programs, eg. cardiac rehabilitation, diabetes education.
• Implement evidence based referral pathways and NHMRC Clinical Guidelines for Weight Control and Obesity Management.
• Ensure appropriate discharge planning for those identifi ed as being at risk of chronic disease due to physical activity, including liaison with community service providers as appropriate.
Workforce capacity • Increase workforce and community capacity to engage in an intersectoral and multi-strategy approach to promote physical activity.
• Monitor physical activity patterns through regular population surveys.
1105
WHOLE OF POPULATION
Health Determinants Queensland 2004
Further information regarding the intervention strategies above can be accessed from:
1. Getting Australia Active – Towards a Better Practice for the Promotion of Physical Activity (2002) - www.nphp.gov.au/publications/wa_index.htm#sigpah
2. Promoting Active Transport – An Intervention Portfolio to increase Physical activity as a means of Transport - www.nphp.gov.au/publications/wa_index.htm#sigpah
3. National Obesity Taskforce (2003) Healthy Weight 2008 – Shaping Australia’s Future: Report to the Australian Health Ministers Advisory Council, Canberra.
4. World Health Organisation (2003) Global Strategy on Diet, Physical Activity and Health 2004. World Health Organisation, Geneva.
5. National Physical Activity Guidelines - www.health.gov.au/pubhlth/publicat/document/physguide.pdf6. Physical Activity Patterns of Queensland Adults 2003 Discussion paper: the role of Public Health
Services in Secondary and Tertiary Prevention of Chronic Disease (2000) Queensland Health.7. Health Priorities: The Role of Physical Activity, Background Paper (2003) Queensland Health.8. Supportive Environments for Active Living (SEAL) A Strategic Framework for Action - http://
www.health.qld.gov.au/phs/Documents/sphun/13331d.pdf9. The Active Australia Survey – the guide for implementation, analysis and reporting of this survey
www.aihw.gov.au/publications/index.cfm?type=detail&id=855910. Physical Activity and Health, A Report of the Surgeon General 1996 - http://www.cdc.gov/nccdphp/sgr11. Western Australia Premiers Taskforce on Physical Activity – www.patf.dpc.wa/index.cfm?fuseaction=t
askforce.background#communication 12. Queensland Health programs and resources -
http://www.health.qld.gov.au/healthyliving/Physical_Activity_P.htm13. National Physical Activity Action Plan through the Strategic Inter-Government Forum on Physical
Activity and Health (to be launched 2004).

1106 Health Determinants Queensland 2004
WHOLE OF POPULATION
Sexual health
Key action area Key evidence based strategies
Supportive environments
• Develop legislation that is supportive of the guiding principles of the national HIV/AIDS and Hepatitis C virus (HCV) strategies, and the relevant recommendations of the National Public Health Partnership (NPHP).
• Provide accessible and culturally appropriate programs and services that aim to reduce discrimination, social isolation and violence. These are particularly for gay men; Indigenous peoples; lesbian, bisexual and transgender people; people from culturally and linguistically diverse backgrounds; people in correctional centres; people living with or affected by HIV/AIDS, HCV and sexually transmitted infections; people who inject drugs; sex workers; and young people.
• Strengthen links between local government and non-government services through inter-agency planning, development of local networks, and collaboration to improve coordination and delivery of local services.
• Foster cross-border partnerships and collaborative activities with Papua New Guinea and other states and territories for preventing the risk of transmission of HIV/AIDS, HCV and sexually transmitted infections (STIs) and to enhance cross border management of people infected with and affected by HIV/AIDS, HCV and STIs.
Prevention of transmission
• Implement short educational interventions that promote safe behaviours in healthcare settings and Needle Support Programs.
• Implement education programs for people who are able to infl uence at risk populations to increase awareness of safe behaviour messages, eg. teachers, GPs, parents and youth workers.
• Provide culturally appropriate education resources.• Provide access to and informed use of equipment to support adoption of safe
behaviours and practices, eg. condoms and injecting equipment.Early detection, treatment and care services
• Provide targeted screening for at risk populations/groups for HIV/AIDS, HCV and STIs, consistent with national testing policies.
• Increase statewide access to occupational and non-occupational HIV/AIDS post exposure prophylaxis.
• Implement contact tracing for HIV/AIDS, HCV and STIs consistent with state and national policy and guidelines.
• Provide continuity of care through improved inter-departmental and inter-agency collaboration, and the development of local referral mechanisms.
• Coordinate local services to address the health and social wellbeing issues impacting on people with HIV/AIDS, HCV and STIs, eg. alcohol consumption, diet, relaxation, employment and shelter.
Workforce capacity • Provide access to appropriate and targeted local training and education opportunities.
• Work with relevant organisations, academic and other training institutions to establish career paths and opportunities to encourage prospective trainees and workers in HIV/AIDS, HCV and STIs services and programs.
Further information regarding the intervention strategies above can be accessed from:
1. Queensland HIV/AIDS Strategy 1999–2002 - http://www.health.qld.gov.au/sexhealth2. National HIV/AIDS Strategy 1999-2000 to 2003-2004 Changes and Challenges -
http://www.health.gov.au/pubhlth/publicat/hac.htm3. National Hepatitis C Strategy 1999–2000 to 2003–2004 -
http://www.health.gov.au/pubhlth/publicat/hac.htm4. Queensland Health Website - www.health.qld.gov.au/sexhealth/
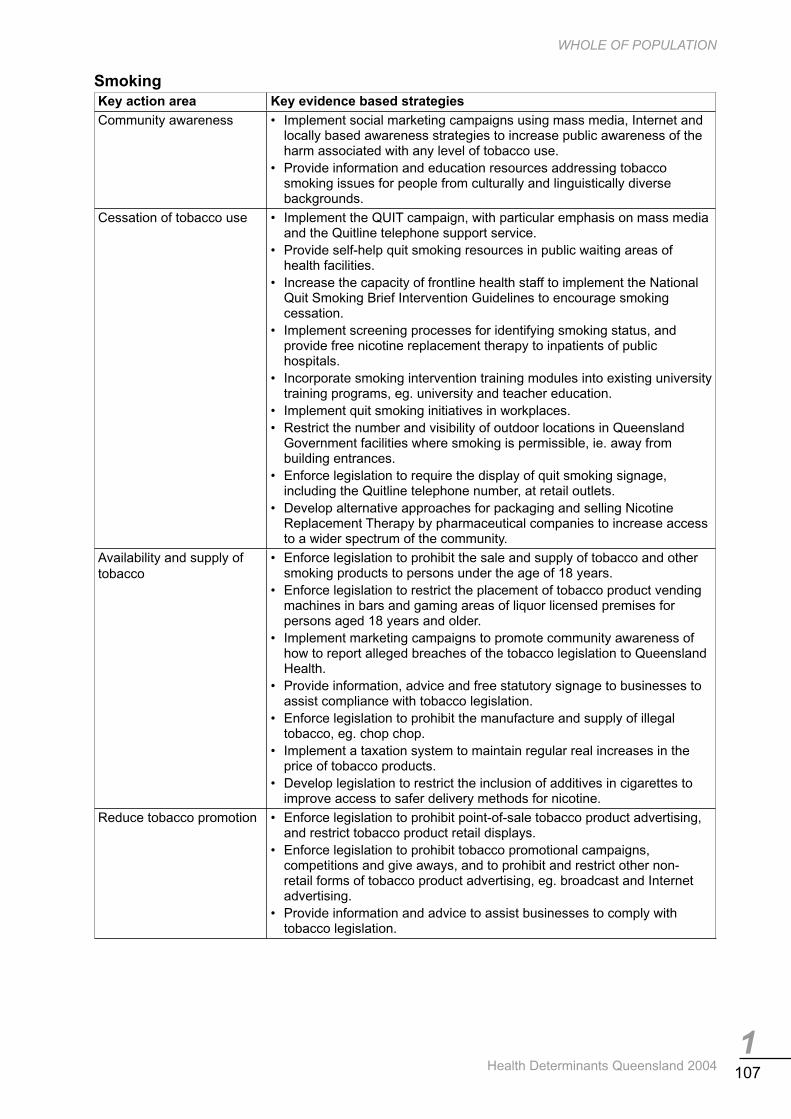
1107
WHOLE OF POPULATION
Health Determinants Queensland 2004
Smoking Key action area Key evidence based strategies
Community awareness • Implement social marketing campaigns using mass media, Internet and locally based awareness strategies to increase public awareness of the harm associated with any level of tobacco use.
• Provide information and education resources addressing tobacco smoking issues for people from culturally and linguistically diverse backgrounds.
Cessation of tobacco use • Implement the QUIT campaign, with particular emphasis on mass media and the Quitline telephone support service.
• Provide self-help quit smoking resources in public waiting areas of health facilities.
• Increase the capacity of frontline health staff to implement the National Quit Smoking Brief Intervention Guidelines to encourage smoking cessation.
• Implement screening processes for identifying smoking status, and provide free nicotine replacement therapy to inpatients of public hospitals.
• Incorporate smoking intervention training modules into existing university training programs, eg. university and teacher education.
• Implement quit smoking initiatives in workplaces.• Restrict the number and visibility of outdoor locations in Queensland
Government facilities where smoking is permissible, ie. away from building entrances.
• Enforce legislation to require the display of quit smoking signage, including the Quitline telephone number, at retail outlets.
• Develop alternative approaches for packaging and selling Nicotine Replacement Therapy by pharmaceutical companies to increase access to a wider spectrum of the community.
Availability and supply of tobacco
• Enforce legislation to prohibit the sale and supply of tobacco and other smoking products to persons under the age of 18 years.
• Enforce legislation to restrict the placement of tobacco product vending machines in bars and gaming areas of liquor licensed premises for persons aged 18 years and older.
• Implement marketing campaigns to promote community awareness of how to report alleged breaches of the tobacco legislation to Queensland Health.
• Provide information, advice and free statutory signage to businesses to assist compliance with tobacco legislation.
• Enforce legislation to prohibit the manufacture and supply of illegal tobacco, eg. chop chop.
• Implement a taxation system to maintain regular real increases in the price of tobacco products.
• Develop legislation to restrict the inclusion of additives in cigarettes to improve access to safer delivery methods for nicotine.
Reduce tobacco promotion • Enforce legislation to prohibit point-of-sale tobacco product advertising, and restrict tobacco product retail displays.
• Enforce legislation to prohibit tobacco promotional campaigns, competitions and give aways, and to prohibit and restrict other non-retail forms of tobacco product advertising, eg. broadcast and Internet advertising.
• Provide information and advice to assist businesses to comply with tobacco legislation.

1108 Health Determinants Queensland 2004
WHOLE OF POPULATION
Exposure to environmentaltobacco smoke (ETS)
• Implement social marketing campaigns using the mass media, Internet and locally based awareness strategies to:
– increase public awareness of the harm associated with exposure to ETS
– promote and encourage smokers to refrain from smoking in the home and car.
• Implement comprehensive smoke-free workplace policies. • Enforce legislation to reduce exposure to ETS in enclosed workplaces
and public places.
Further information regarding the intervention strategies above can be accessed from:
1. Queensland Government (2000) Queensland Tobacco Action Plan 2000/01 to 2003/04. Brisbane. - www.health.qld.gov.au/atods
2. Ministerial Council on Drug Strategy (1999) National Tobacco Strategy 1999 to 2003/04. Canberra. - www.health.gov.au/pubhlth
3. World Health Organisation (2003) Framework Convention on Tobacco Control. World Health Organisation, Geneva.
4. QuitLine – www.quitbow.info.au

1109
WHOLE OF POPULATION
Health Determinants Queensland 2004
Social determinants Key action areas Key evidence based strategies
Structural determinants
• Implement social marketing, including the provision of information and other resources, to increase community awareness about health determining social and environmental conditions and trends.
• Implement health promoting policies and programs in non-health sectors, eg. health promoting schools and child care centres, and health promoting workplaces.
• Engage communities and partners in community public health planning initiatives, such as Supportive Environments for Active Living (SEAL), Community Public Health Planning in Rural and Remote Areas Project, and community public health planning.
• Implement local and regional planning schemes under The Integrated Planning Act that consider social determinant issues, eg. local government planning schemes and regional growth management frameworks.
• Undertake joint planning initiatives with other agencies, such as community renewal, place management, regional transport plans and District Youth Achievement planning, to ensure integrated responses that meet the health needs of the community.
• Apply health impact assessment methodology to signifi cant projects, planning schemes and programs to assess their potential direct and/or indirect impact on the health of the population (positive or negative), in the short, medium or long term.
• Assess the potential impact of economic policies on the health of the population, as an integral part of the policy development cycle using the health impact assessment process.
• Develop and implement policies to provide adequate stocks of housing for disadvantaged people.
• Support residential developments that promote community cohesion.• Provide alternate health service delivery models to ensure access to healthcare
for homeless people.• Develop and implement whole-of-government approaches to structural
determinants through participation in regional coordination mechanisms such as Regional Managers Forums and Regional Organisation of Councils.
Community capacity development
• Engage communities in planning, implementing, monitoring and evaluating initiatives to address local health determinants, eg. community capacity building projects.
• Build resilient communities by enhancing social connectedness, sense of control and health literacy, eg. health promoting schools approach.
• Work with local organisations to enhance existing services and structures that support communities to improve health and wellbeing through local organisations, eg. developing service networks, and integrating services and activities.
• Use community capacity development processes to build both social capital and a sense of control for those involved.
• Undertake initiatives such as Supportive Environments for Active Living (SEAL) and the Helping Friends Program which connect young people, diverse cultural groups, rural and remote communities, older people, unemployed people and other groups to each other and to the wider community.

1110 Health Determinants Queensland 2004
WHOLE OF POPULATION
Settings and partnerships
• Develop whole-of-community responses and approaches to health issues using models such as Safe communities, Safe schools, Healthy communities initiative, Regional communities initiative.
• Create health promoting environments, including promoting health in early childhood settings, health promoting schools, health promoting workplaces and recreation systems.
• Invest in early childhood development and learning, eg. Family Care Program. • Strengthen partnerships between health and education sectors to enhance the
health of children and young people, eg. Joint Work Plan and School Based Youth Health Nurse Program.
• Strengthen partnerships between health and local government sectors to provide a coordinated response to public health issues, eg. Health Impact Assessment.
• Strengthen learning communities and opportunities for lifelong learning to develop intellectual, economic and social capital, eg. Lifelong Learning Council of Queensland.
• Participate in the development and monitoring of Youth Achievement Plans, and Education Training Reforms for the Future planning processes.
• Enhance access to education, and school and community support for highly transient children.
Ethnicity, culture and discrimination
• Develop functional health literacy for people from diverse cultural backgrounds including provision of information for new arrivals on the Australian healthcare system and how to access it, eg. Healthways.
• Implement initiatives to support: – increased community control of primary healthcare services – increased participation in the development of policy and planning, delivery,
management and evaluation of health programs and services – culturally appropriate service provision – needs based criteria for service provision and resource allocation, as outlined
in the Queensland Aboriginal and Torres Strait Islander Health Policy. • Increase access to culturally and linguistically relevant services and health
promotion programs.Life course • Invest in periods of transition, eg. birth, school, adolescence, changes in
employment, ageing, retirement and pre-retirement.• Promote and support healthy pregnancy, positive parenting, early childhood
development and participation in education programs and healthy ageing.• Assist older people to maintain mobility, independence, social contact and
accessibility to health and social services.Transport • Implement social marketing campaigns to promote physically active forms of
transport.• Increase the provision of accessible, affordable and timely public transport.• Develop supportive and safe environments for active transport, eg. Integrated
Planning Act and Supportive Environments for Active Living (SEAL).Employment and working conditions
• Implement initiatives to ensure completion of Year 10 to provide a solid foundation for future learning, as outlined in the Queensland Government’s Education and Training Reforms for the Future.
• Develop and participate in local District Youth Achievement Planning and other partnership approaches to promote self-confi dence.
• Provide training, recreational and other participatory programs that actively engage unemployed people and promote social inclusion that builds their confi dence, knowledge and skills, and strengthen social networks and thus increase their employment options.

1111
WHOLE OF POPULATION
Health Determinants Queensland 2004
The work of a multitude of government and non-government agencies impacts directly and indirectly on the social determinants of health. Further information regarding the intervention strategies above can be accessed from:
1. Within Queensland Health, the Social Determinant of Health: Support Package for Public Health Services http://qheps.health.qld.gov.au/phs/social_determinants has been developed to support actions to address the social determinants of health. This includes reference documents, good practice resources, advocacy tools and health planning and impact assessment resources.
2. Queensland Health Multicultural Policy3. Queensland Transport www.transport.qld.gov.au or QT Call Centre on 132380.4. Lifelong Learning Council of Queensland - http://www.llcq.org/5. World Health Organisation Solid Facts 2003 - http://www.who.dk/document6. NHMRC, Using socioeconomic evidence in clinical practice guidelines, 2002 -
http://www.health.gov.au/nhmrc/publications

1112 Health Determinants Queensland 2004
WHOLE OF POPULATION
Sun protection
Key action areas Key evidence based strategies
Community awareness
• Provide appropriate information on sun protection behaviours through a variety of formats and mediums.
• Implement social marketing campaigns to increase awareness of appropriate sun protective behaviours.
Supportive policies and environments
• Implement sun protection policies in government and non-government settings, eg. Queensland Cancer Fund’s SunSmart policies for workplaces, schools and childcare centres.
• Implement sun protection policies in community-based organisations, eg. tourism industry.
• Integrate sun protection into other policies within community based organisations, eg. Just Walk It and Walking Bus programs within physical activity policies.
• Recognise and reward good sun protection practices within community-based organisations, eg. awards.
Shade provision • Implement sun protection policies and media campaigns to increase the use of existing shade.
• Provide advice on quality shade structures and fund community-based organisations to increase shade.
• Incorporate shade issues in the design of public facilities, eg. local government planning schemes and regional growth management frameworks.
Community capacity to prevent skin cancer
• Incorporate sun protection training modules into existing training programs, eg. teacher education, coaching and early childhood training.
• Promote the Queensland Cancer Fund community speakers program and other educational opportunities to the community.
Further information regarding the intervention strategies above can be accessed from:
1. Queensland Skin Cancer Prevention Strategic Plan 2001 - 2005 available at - www.health.qld.gov.au/phs/Documents/shpu/12082.pdf
2. Priorities for Action in Cancer Control 2001-2003 - Queensland Cancer Fund - www.qldcancer.com.au

1113
WHOLE OF POPULATION
Health Determinants Queensland 2004
Women’s cancer screening
Key action areas Key evidence based strategies
Recruitment and screening programs
• Implement community education and awareness strategies to increase participation in the Queensland Cervical Screening and BreastScreen Queensland (BSQ) Programs.
• Provide reminders to women when they are due and overdue for a screen, using the BreastScreen Queensland and Pap Smear Registries.
Access and quality service provision
• Implement innovative service delivery models that maximise the use of available resources and promote partnerships, including for Indigenous women and women from culturally and linguistically diverse backgrounds, eg. Healthy Women’s Project.
• Facilitate models of service delivery that provide integrated multi-disciplinary management, treatment and support services across the continuum of care for women diagnosed with breast cancer.
• Implement the NHMRC Guidelines for the Management of Asymptomatic Women with Screen Detected Abnormalities.
• Provide complementary services through the continuing support of Mobile Women’s Health Nurses, and Rural and Remote Women’s Health Program, for women in rural and remote areas.
• Develop and implement the Queensland Cervical Screening Program policy and procedures manual.
• Maintain accreditation of BSQ services and implement BDQ policy and procedures manual.
• Promote service level implementation of the Queensland Health Policy and Protocol for the Use of ThinPrep.
Workforce capacity • Monitor workforce trends and continue strategies to maintain an adequate radiology and radiography workforce.
• Implement training programs to meet requirements of BSQ staff, in particular medical offi cers and nurses.
• Implement interventions to address workforce needs and trends in relation to Pap smear providers.
• Develop the role of practice nurses as Pap smear providers in rural and remote areas.
• Implement a training and education strategy for medical practitioners and registered nurse Pap smear providers to increase screening options for women.
Further information regarding the intervention strategies above can be accessed from:
1. National Breast Cancer Centre (2000) Advice About Familial Aspects of Breast Cancer and Ovarian Cancer NBCC.
2. International Agency for Research on Cancer (2002) Mammography Screening Can Reduce Deaths from Breast Cancer, www.iarc.fr.
3. Baade P and Coory M (2002) Queensland Health Information Circular 63, Health Information Centre.4. Kirk M, Hoban E, Dunne A and Manderson L. 1998. Barriers to and Appropriate Delivery Systems
for Cervical Cancer Screening in Indigenous communities in Queensland. A Report to Queensland Health. ISBN 0-7242-0843-X.
5. Kirk M. McMichael, C. Potts, H Hoban L, Hill, Deb C. and Manderson, L. 2000.‘Breast Cancer: Screening, Diagnosis, Treatment and Care for Indigenous women in Queensland Report, Queensland Health.
6. Women’s Cancer Screening Services (2002) Queensland Cervical Screening Program: Phase 3 State Plan 2002-2006, Queensland Health.
7. Women’s Cancer Screening Services (2001) Queensland Health BreastScreen Queensland State Plan 2001 – 2006, Queensland Health.
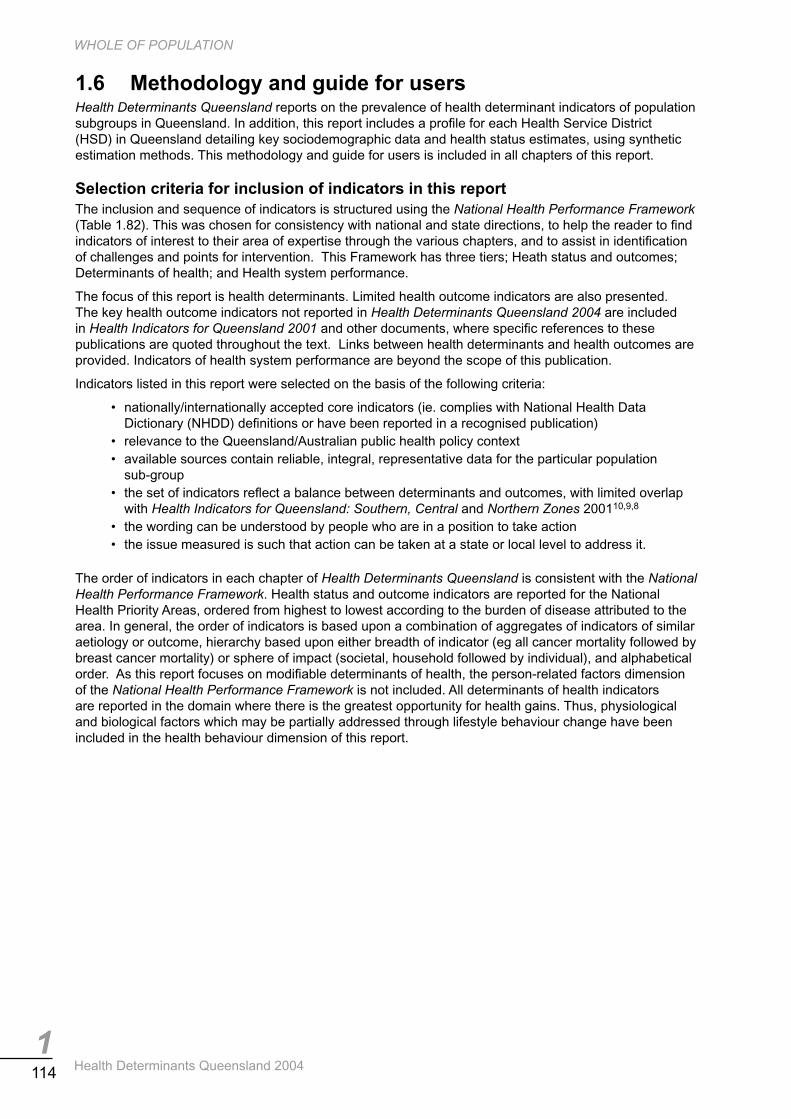
1114 Health Determinants Queensland 2004
WHOLE OF POPULATION
1.6 Methodology and guide for usersHealth Determinants Queensland reports on the prevalence of health determinant indicators of population subgroups in Queensland. In addition, this report includes a profi le for each Health Service District (HSD) in Queensland detailing key sociodemographic data and health status estimates, using synthetic estimation methods. This methodology and guide for users is included in all chapters of this report.
Selection criteria for inclusion of indicators in this reportThe inclusion and sequence of indicators is structured using the National Health Performance Framework (Table 1.82). This was chosen for consistency with national and state directions, to help the reader to fi nd indicators of interest to their area of expertise through the various chapters, and to assist in identifi cation of challenges and points for intervention. This Framework has three tiers; Heath status and outcomes; Determinants of health; and Health system performance.
The focus of this report is health determinants. Limited health outcome indicators are also presented. The key health outcome indicators not reported in Health Determinants Queensland 2004 are included in Health Indicators for Queensland 2001 and other documents, where specifi c references to these publications are quoted throughout the text. Links between health determinants and health outcomes are provided. Indicators of health system performance are beyond the scope of this publication.
Indicators listed in this report were selected on the basis of the following criteria:
• nationally/internationally accepted core indicators (ie. complies with National Health Data Dictionary (NHDD) defi nitions or have been reported in a recognised publication)
• relevance to the Queensland/Australian public health policy context• available sources contain reliable, integral, representative data for the particular population
sub-group• the set of indicators refl ect a balance between determinants and outcomes, with limited overlap
with Health Indicators for Queensland: Southern, Central and Northern Zones 200110,9,8
• the wording can be understood by people who are in a position to take action• the issue measured is such that action can be taken at a state or local level to address it.
The order of indicators in each chapter of Health Determinants Queensland is consistent with the National Health Performance Framework. Health status and outcome indicators are reported for the National Health Priority Areas, ordered from highest to lowest according to the burden of disease attributed to the area. In general, the order of indicators is based upon a combination of aggregates of indicators of similar aetiology or outcome, hierarchy based upon either breadth of indicator (eg all cancer mortality followed by breast cancer mortality) or sphere of impact (societal, household followed by individual), and alphabetical order. As this report focuses on modifi able determinants of health, the person-related factors dimension of the National Health Performance Framework is not included. All determinants of health indicators are reported in the domain where there is the greatest opportunity for health gains. Thus, physiological and biological factors which may be partially addressed through lifestyle behaviour change have been included in the health behaviour dimension of this report.

1115
WHOLE OF POPULATION
Health Determinants Queensland 2004
Table 1.82: National Health Performance Framework
HEALTH STATUS AND OUTCOMESHow healthy are Australians? Is it the same for everyone?
Where is the most opportunity for improvement?Health conditions Human function Life expectancy and
wellbeingDeaths
Prevalence of disease, disorder, injury or trauma or other health-related states.
Alterations to body, structure or function (impairment), activities (activity limitation) and participation (restrictions in participation).
Broad measures of physical, mental, and social wellbeing of individuals and other derived indicators such as Disability Adjusted Life Expectancy (DALE).
Age and/or condition specifi c mortality rates.
DETERMINANTS OF HEALTHAre the factors determining health changing for the better? Do the determinants affect everyone in the
same way? Where and for whom are they changing?Environmental factors
Socioeconomic factors
Community capacity Health behaviours
Person-related factors
Physical, chemical and biological factors such as air, water, food and soil quality resulting from pollution and waste disposal.
Socioeconomic factors such as education, employment, per capita expenditure on health, and average weekly earnings.
Characteristics of communities and families such as population density, age distribution, health literacy, housing, community support services and transport.
Attitudes, beliefs, knowledge and behaviours e.g. patterns of eating, physical activity, excess alcohol consumption and smoking.
Genetic related susceptibility to disease and other factors such as blood pressure, cholesterol levels and body weight.
HEALTH SYSTEM PERFORMANCEHow well is the health system performing in delivering quality health actions to improve the health of all
Australians? Is it the same for everyone?Effective Appropriate Effi cient
Care, intervention or action achieves desired outcome.
Care/intervention/action provided is relevant to the client’s needs and based on established standards.
Achieving desired results with most cost effective use of resources.
Responsive Accessible Safe
Service provides respect for persons and is client orientated and includes respect for dignity, confi dentiality, participation in choices, promptness, quality of amenities, access to social support networks, and choice of provider.
Ability of people to obtain healthcare at the right place and right time irrespective of income, physical location and cultural background.
The avoidance or reduction to acceptable limits of actual or potential harm from healthcare management or the environment in which healthcare is delivered.
Continuous Capable Sustainable
Ability to provide uninterrupted, coordinated care or service across programs, practitioners, organisations and levels over time.
An individual’s or service’s capacity to provide a health service based on skills and knowledge.
System or organisation’s capacity to provide infrastructure such as workforce, facilities and equipment, and be innovative and respond to emerging needs (research, monitoring).
AnalysisAll mortality and hospital separation rates and ratios were calculated using the Health Information Analysis System (HIAS). HIAS calculates the direct age standardised rate per 100,000 population using the 1991 Australian population (persons) as the standard population, 95% confi dence intervals for these rates, actual and expected counts and rate ratios with 95% confi dence limits. Year of death registration

1116 Health Determinants Queensland 2004
WHOLE OF POPULATION
was used. Confi dence intervals were estimated by assuming Normal approximations to the Poisson distribution. The Queensland population in the comparable year, by sex, was used as the standard population for calculation of standardised ratios, where the reference fi gure of 100 for Queensland was applied in all cases.
Throughout this report the term ‘signifi cant’ is used to indicate ‘statistically signifi cant’ rather than necessarily of clinical or public health importance. Determination of statistically signifi cant differences was based on the standardised ratio, where differences are reported as statistically signifi cant if the 95% confi dence limits population group do not include 100.
All rates and ratios are reported to limited decimal points. Thus statistical signifi cance for some differences may not be apparent from the reported data. No statistical methods were applied for adjustment of multiple comparisons. Therefore caution must be used in the interpretation of individual or small numbers of data points.
Due to the small population numbers in some disease or age groups, numbers for some specifi c causes of deaths or hospital separations were very small or zero in a single year. In an attempt to produce meaningful rates and reduce the fl uctuation from year to year, three-year averages were calculated instead of single year counts. Generally case numbers, and age standardised and age specifi c mortality and hospital separation rates are reported in the Health Determinants Queensland 2004: Statistical Report.
Poisson regression models in SPSS statistical software (version 10) were used to test for age adjusted linear trends in mortality and hospital separation rates in the period 1992-2001. The predictor variables in these multivariate analyses were single year of death or single year of hospital separation and age, which was generally expressed in fi ve-year age groups as indicator variables. The outcome variable was the number of deaths or hospital separations, with the log of the age specifi c populations used as the offset variable in the Poisson model. The Poisson regression model assumed that the annual trend in rates was linear, and hence departures from this linear trend have not been tested. Linear trends were expressed in terms of the per cent change per year, based on the parameter estimates of the Poisson model. The standard errors of the parameter estimates were corrected for evident overdispersion. Confi dence intervals (95%) for the per cent change per year were calculated using the parameter estimates of the Poisson model and standard error of those estimates.
Comparability between ICD-9 and ICD-10In 1997, the ABS implemented an Automated Coding System (ACS) for cause of death coding. The coding system changed from ICD-9 to ICD-10. From 1999, deaths were coded using ICD-10 and from 1999/00 hospital separations were coded using ICD-CM-10. The comparability factors between data coded using ICD-9 and ICD-10 are listed in Table 1.83. These factors were generated from mortality data from the years of joint coding, 1997 and 1998.
There were differences in the number of deaths coded by the two systems for many mortality indicators in this report. However where the comparability factor was in the range 0.9 to 1.1, comparability issues were not highlighted in the text and Poisson trend analysis was reported. Where the comparability factor was outside this range, no Poisson trend analysis was reported and the issue of lack of comparability was noted in the text. An additional consideration for diabetes was the effect of changes in instructions to coders between ICD-10 version 1 and version 2 in 2000, resulting in a larger number of cases being coded as diabetes principle cause. Changes in hospital separation rates over the period prior to 2000 were reported. No comparisons of diabetes hospital separation rates prior to 2000 with rates after 2000 were conducted. Lack of comparability of coding for COPD between ICD-9 and ICD-10 precluded comparison of rates across the reporting period.

1117
WHOLE OF POPULATION
Health Determinants Queensland 2004
Table 1.83: Comparability factors for pre 1997 manual coding of ICD-9 and Automatic Coding System for ICD-10, for reported diseases and conditions
Source: Calculated by QH 2004
Attributable fractionsAttributable fractions, also referred to as aetiologic or aetiological fractions, are used to measure the impact of risk factors on morbidity and mortality. Calculation of fractions takes into account both the age and sex specifi c prevalence of a risk factor in the population of interest, and the strength of the relationship between the risk factor and outcome conditions (relative risk) for that age group and sex. The number of deaths or hospital separations caused by (or preventable for) a risk factor can then be calculated by multiplying the number of age and sex specifi c cases of each outcome condition related to the risk factor, by the corresponding attributable fraction.
Disease ICD-9/ ICD-9-CM ICD-10/ ICD-10-CMCalculatedComparabilityFactor
Malignant Neoplasms140 - 208
C00 - C97 1.01
Colorectal cancer 153 - 154C18 - C21 1.00
Lung cancer 162C33, C34 0.99
Melanoma of skin 172C43 1.01
Breast cancer in women174
C50 1.01
Cervical cancer in females180
C530.99
Prostate cancer in males185
C61 1.01
Diabetes (principal cause)250
E10 - E14 1.03
Mental and behavioural disorders290 - 319
F00 - F99 0.79
Coronary Heart Disease410 - 414 I20 - I25 1.01
Stroke 430 - 438G45, G46, I60–I69 1.02
COPD (not including Asthma) 491, 492, 496 J41-J44 1.11
Asthma493
J45,J46 0.71
Musculoskeletal 710-739 M00-M99 1.10
SIDS 798 R95 0.67
Injury and poisoning, excludesintentional self harm and complicationsof medical and surgical care
E800-869, E880-929, E960-999 V01-Y98, excluding X60 - 84 and Y40-84 1.07
Road transport related injury E810-819, E826-829
V02-04 (.1,.9); V09.2; V12-V14(.3-.9); V19 (.4-.9); V20-28 (.3-.9); V29 (.4-.9); V30-V39 (.4-.9); V40-49 (.4-.9);V50-59 (.4-.9); V60-69 (.4-.9); V70-79 (.4-.9); V80 (.3-.5); V81.1, V82.1;V83-.V86 (.0-.3); V87 (.0-.8); V89(.2);V01 (.0,.1,.9); V06 (.0,.1,.9); V09 (.1,.3,.9);V10-V11(.0-.5,.9); V16-V18 (.0-.5,.9);V19 (.3,.8,.9); V80 (.0-.2,.7-.9); V82(.2-.7,.9); V87.9; V88.9, V89 (.1,.3,.9)
1.04
Accidental Poisoning E850 - 869 X40 - X49 1.01
Falls E880 - E886, E889 W00 - W1999 1.00
Fires, Burns and Scalds E890 - E899, E924 X00 - X19 1.00
Drowning E910 W65 - W74 1.04
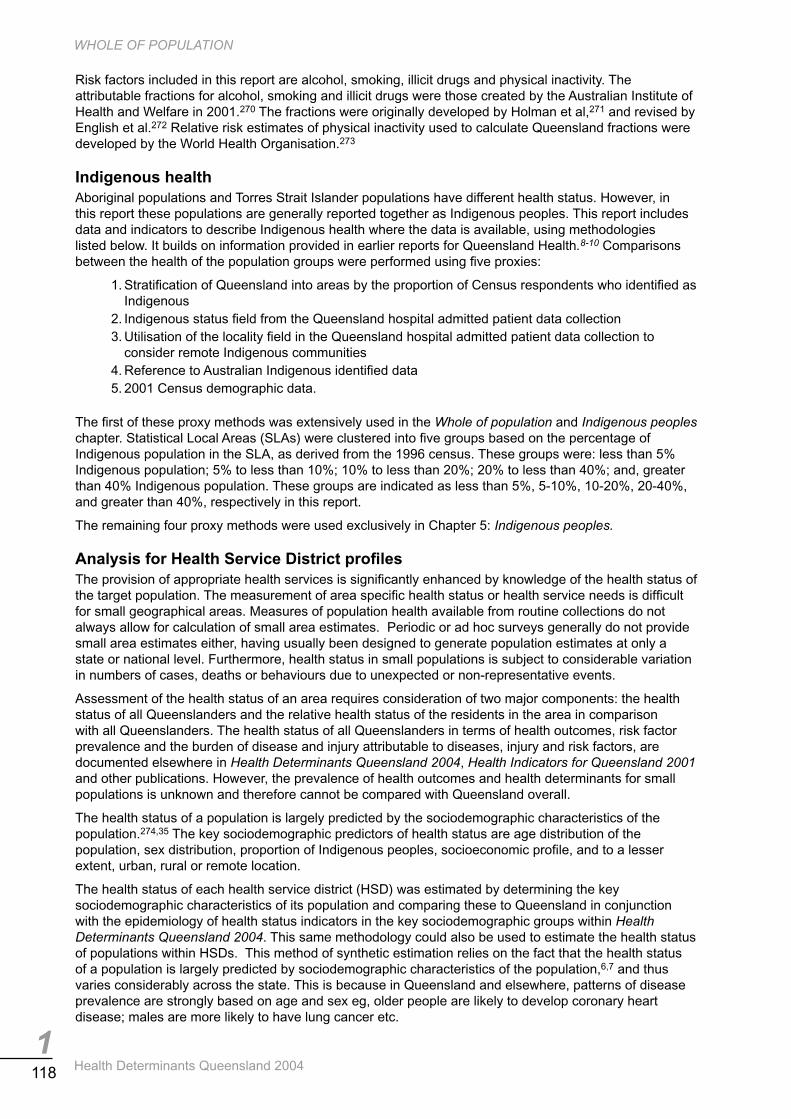
1118 Health Determinants Queensland 2004
WHOLE OF POPULATION
Risk factors included in this report are alcohol, smoking, illicit drugs and physical inactivity. The attributable fractions for alcohol, smoking and illicit drugs were those created by the Australian Institute of Health and Welfare in 2001.270 The fractions were originally developed by Holman et al,271 and revised by English et al.272 Relative risk estimates of physical inactivity used to calculate Queensland fractions were developed by the World Health Organisation.273
Indigenous healthAboriginal populations and Torres Strait Islander populations have different health status. However, in this report these populations are generally reported together as Indigenous peoples. This report includes data and indicators to describe Indigenous health where the data is available, using methodologies listed below. It builds on information provided in earlier reports for Queensland Health.8-10 Comparisons between the health of the population groups were performed using fi ve proxies:
1. Stratifi cation of Queensland into areas by the proportion of Census respondents who identifi ed as Indigenous
2. Indigenous status fi eld from the Queensland hospital admitted patient data collection3. Utilisation of the locality fi eld in the Queensland hospital admitted patient data collection to
consider remote Indigenous communities4. Reference to Australian Indigenous identifi ed data5. 2001 Census demographic data.
The fi rst of these proxy methods was extensively used in the Whole of population and Indigenous peoples chapter. Statistical Local Areas (SLAs) were clustered into fi ve groups based on the percentage of Indigenous population in the SLA, as derived from the 1996 census. These groups were: less than 5% Indigenous population; 5% to less than 10%; 10% to less than 20%; 20% to less than 40%; and, greater than 40% Indigenous population. These groups are indicated as less than 5%, 5-10%, 10-20%, 20-40%, and greater than 40%, respectively in this report.
The remaining four proxy methods were used exclusively in Chapter 5: Indigenous peoples.
Analysis for Health Service District profi lesThe provision of appropriate health services is signifi cantly enhanced by knowledge of the health status of the target population. The measurement of area specifi c health status or health service needs is diffi cult for small geographical areas. Measures of population health available from routine collections do not always allow for calculation of small area estimates. Periodic or ad hoc surveys generally do not provide small area estimates either, having usually been designed to generate population estimates at only a state or national level. Furthermore, health status in small populations is subject to considerable variation in numbers of cases, deaths or behaviours due to unexpected or non-representative events.
Assessment of the health status of an area requires consideration of two major components: the health status of all Queenslanders and the relative health status of the residents in the area in comparison with all Queenslanders. The health status of all Queenslanders in terms of health outcomes, risk factor prevalence and the burden of disease and injury attributable to diseases, injury and risk factors, are documented elsewhere in Health Determinants Queensland 2004, Health Indicators for Queensland 2001 and other publications. However, the prevalence of health outcomes and health determinants for small populations is unknown and therefore cannot be compared with Queensland overall.
The health status of a population is largely predicted by the sociodemographic characteristics of the population.274,35 The key sociodemographic predictors of health status are age distribution of the population, sex distribution, proportion of Indigenous peoples, socioeconomic profi le, and to a lesser extent, urban, rural or remote location.
The health status of each health service district (HSD) was estimated by determining the key sociodemographic characteristics of its population and comparing these to Queensland in conjunction with the epidemiology of health status indicators in the key sociodemographic groups within Health Determinants Queensland 2004. This same methodology could also be used to estimate the health status of populations within HSDs. This method of synthetic estimation relies on the fact that the health status of a population is largely predicted by sociodemographic characteristics of the population,6,7 and thus varies considerably across the state. This is because in Queensland and elsewhere, patterns of disease prevalence are strongly based on age and sex eg, older people are likely to develop coronary heart disease; males are more likely to have lung cancer etc.

1119
WHOLE OF POPULATION
Health Determinants Queensland 2004
To estimate the relative prevalence of key health outcomes and determinants in a population the following process was undertaken:
A. Determine the sociodemographic characteristics of the population, specifi cally: • age distribution • sex distribution • proportion of Indigenous peoples • socioeconomic advantage/disadvantage profi le • classifi cation as urban, rural or remote location, or accessibility category.
B. Source the distribution of health status indicators (deaths, hospital separations, risk and protective factor prevalence) between sociodemographic groups for Queensland in Health Determinants Queensland 2004.
C. Where the area has a greater proportion of a sociodemographic group in comparison with Queensland, determine those health status indicators that are more prevalent in that sociodemographic group.
For example:If a population has a higher proportion than Queensland of Indigenous peoples, it is estimated that this population will have a higher prevalence of deaths due to all causes and in particular; cardiovascular disease, diabetes and suicide. Determinants of these conditions include tobacco smoking and overweight and obesity, excessive alcohol consumption and poor nutrition.
Note: This methodology only provides an estimate of health status in populations. In addition, where the method indicates that in all probability a population will have an excess prevalence of a health status indicator, the method does not provide information on the health signifi cance of this excess.
The state and HSD-level estimates of the prevalence of asthma, diabetes and overweight/obesity were based on the following data sources. Self report asthma in children (ages 0 to 9 years) from the 2001 National Health Survey (NHS 2001) was consistent with epidemiological studies in NSW, in which more rigorous clinical diagnosis techniques were adopted. The NHS 2001 was used, therefore, to derive both state and HSD level relativities for this condition. Measured diabetes status in adults (ages 25 years and older) from the AusDiab study was considered to be the most up-to-date and reliable source of the prevalence on diabetes at a state level. Due to sampling considerations, however, self-report diabetes from the NHS 2001 was chosen over AusDiab to derive HSD level relativities. Diabetes prevalence in Indigenous populations was calculated separately using information from the Well Person’s Health Check. Similarly, measured body mass index (BMI) from AusDiab was considered to be the most current and reliable source for the prevalence of overweight/obesity in adults (ages 20 years and older). Again, self report information from the NHS 2001 was used to derive HSD level relativities, except for Indigenous populations where a synthesis of information from the Well Person’s Health Check and the self report information from the Indigenous component of NHS 2001 was used. Due to the lack of current information (both measured or self report) on overweight/obesity in children (ages 5 to 14 years), state and HSD level estimates of the prevalence of this risk factor were derived using a synthesis of information on measured BMI from the 1995 National Nutrition Survey (NNS) and the relationship between self report childhood and adult obesity, and diabetes observed in the NHS2001. Case numbers are based on the age and sex distribution of the HSD according to estimated resident population fi gures for 2001 and were calculated using simple and multinomial survey logistic regression techniques using index of socioeconomic advantage/disadvantage, proportion Indigenous population and accessibility score as covariates where appropriate.
Excess prevalence of sociodemographic factors and health status in HSDsIn Chapter 6, an excess population was determined for those Health Service Districts where the proportion of a sociodemographic group was greater than the Queensland mean. Of those HSDs where there was an excess proportion, half of the HSDs were called ‘greater than’ and the other half, ‘much greater than’. Excess sociodemographic groups were reported in the HSD profi le if there were:
– much greater proportion of a current or projected age group (with age groups; 0-4, 5-14, 15-24, 65-74 and 75+ years);
– much greater proportion of a current sex; – greater or much greater than proportion of Indigenous peoples;

1120 Health Determinants Queensland 2004
WHOLE OF POPULATION
– greater or much greater than proportion of people living in the most socioeconomically disadvantaged quintile;
– greater or much greater than proportion of people who speak a main language other than English at home;
– greater or much greater than proportion of people who speak a main language other than English at home and who speak English not well or not at all.
This same methodology was applied to the thematic mapping of age groups, Indigenous population and proportion of population in the socioeconomically disadvantaged quintile. In the maps however, excess was based on stratifi cation by all Collection Districts in Queensland, rather than by HSDs as above. The minimum areas for shading were Collection Districts (an area of approximately 225 dwellings with fewer dwellings in rural areas as population densities decrease).
Interventions to address the burden of risk factorsIntervention sections are included in each of the fi ve population based chapters of this report. These sections aim to provide the key audiences (health sector managers, planners and service managers, local government and other key partners) with a snapshot of the effective interventions that can and should be implemented to impact positively on the health determinants of Queensland or smaller populations. A whole of government approach has been taken; where the action by numerous partners is required to effectively meet the health needs of the population. Population health interventions to address the burden of disease and injury caused by the reported health determinants were derived from published national and state strategic documents, and other published international literature. Specifi cally where these interventions are currently implemented or proposed for Queensland Health, they are described in the Outcome Area Plans and Health Outcome Plans of Queensland Health.
Data sources and specifi c limitations
ABS Cause of deathMortality data were derived from the Queensland Registrar of Births, Deaths and Marriages, where cause of death and usual residential address were recorded on death certifi cates. All disease specifi c mortality data were derived using the principal cause of death. In addition, deaths in 1999-2001 where diabetes was reported as an underlying cause in deaths were also reported. The external causes of injuries and poisoning are reported. These data were coded by the ABS using the International Classifi cation of Diseases, version 10 (ICD-10) (Table 1.83). There have been two major changes in death coding practices by the ABS in the reported period; conversion from manual ICD-9 coding to automatic ICD-9 coding; and, conversion from ICD-9 to ICD-10. The comparability factors between data coded at the start and end of the reported period are listed in Table 1.83.
For consistency with national reporting, year of registration of the death rather than year of death is used for all indicators, except those for reporting of Indigenous health outcomes. Year of death is used for reporting of Indigenous health outcomes due to the variable time between death and registration in some Indigenous communities in Queensland.
AusDiabThe Australian Diabetes, Obesity and Lifestyle Study (AusDiab) was a national survey conducted in 2000 by the International Diabetes Institute. The objectives of the survey were to estimate the prevalence of diabetes and related conditions (using blood tests), to assess the distribution and relationships of cardiovascular risk factors and trends in risk factor levels as compared with those obtained in previous surveys in Australia. The AusDiab study employed stratifi ed cluster sampling to recruit subjects. In Queensland, 1,634 adults from six urban centres completed the biomedical examinations. The response rate in the study was low, with only 29% of those estimated to be eligible in the total population, 34% of those estimated to be eligible from contacted households and 50% of those invited actually completed the study. These response rates are just slightly below the national AusDiab rates.
Data from the Queensland cohort suggest that the Queensland-AusDiab participants may have been from lower socioeconomic disadvantaged areas and/or may have been more health conscious than the general Queensland population; with lower smoking rates and higher intakes of vegetables and fruit than the general population.275 These possible biases may result in underestimates of the true prevalence cardiovascular risk factors.

1121
WHOLE OF POPULATION
Health Determinants Queensland 2004
Bettering the evaluation and care of health (BEACH)The BEACH project is an ongoing survey of general practice conducted by the Australian Institute of Health and Welfare (AIHW) and the General Practitioner Statistics Collection Unit, University of Sydney. Approximately 1,000 general practitioners (selected from the Medical Benefi ts Scheme provider database) from across Australia are surveyed annually. The program aims to establish an ongoing database of GP-patient encounter information and to assess patient risk factors and the relationship these factors have with health service activity.
Cancer deathsCancer death data was reported from the Queensland Registrar of Births, Deaths and Marriages, and is consistent with all other death data in this report. Cancer death data was also reported directly from other sources in Queensland Health where the Queensland Cancer Registry was used.73,72,276 The registry fi le is based on place of fi rst diagnosis of the cancer, in contrast to the ABS coded fi le based on place of usual residence of death.
Census of population and housingThe national census is conducted every fi ve years by the Australian Bureau of Statistics (ABS) to collect detailed demographic information about individuals which can be reported at levels, ranging from small area through to national data. Data from the 1996 and 2001 census are reported. Age and sex distributions were derived from 2001 census and 2002 estimated resident populations (ERP)1. Indigenous population, birthplace, and language spoken at home were derived from the 2001 Census. Population growth and projections for Health Service Districts reported in Chapter 6 Health Service District profi les were derived from the 1996 Census. Denominator populations for rates and ratios were calculated using data from the 1991, 1996 and 2001 Census’ with estimations for the intervening years.
All maps in this report were prepared using Cdata 2001 software with MapInfo (version 7.0).
Cancer screening: breast and cervical cancerBreast cancer screening information was derived from data collected at all BreastScreen Queensland Program sites throughout the state. It should be noted that mammagraphic services provided outside the BreastScreen Program are not included in this data. Pap smear data was derived from the PAP Smear Register.
Child health dental survey• The prevalence of dental caries in children was obtained from the National Child Health Dental
survey conducted by the AIHW Dental Statistics and Research Unit. It was reported using defi nitions consistent with the national survey reports. Although the results of the Child Health Dental survey provide an indication of the trends in oral diseases. It should be noted that therefore be unrepresentative of the child population
• different sampling regimes adopted by states and territories may mean that the results are not comparable
• potential biases due to variations in the assessment of decay and lack of standardisation of the large number of examiners
• the small size of the sample precludes small area or regional analysis of the results• variations exist in compliance with the sampling requirements.277
Community housing and infrastructure needs survey (CHINS)This survey was undertaken by the ABS in 1999 and then again in 2001, following on from the 1992 Housing and Community Infrastructure Needs Survey commissioned by ATSIC. The 1999 survey was developed to provide a new baseline for data on the adequacy and condition of housing, infrastructure and facilities in discrete Indigenous communities, and the housing stock provided to Aboriginal and Torres Strait Islander peoples by Indigenous Housing Organisations (IHO). In 2001, this survey collected information for 616 IHOs, which managed a total of 21,287 permanent dwellings. This represented 1,216 discrete indigenous communities in 2001 and a total reported usual population of 108,085 people. Although called a survey, CHINS was a complete enumeration of all larger Indigenous housing organisations and discrete communities. Smaller organisations were considered out of scope.278 Data were collected by personal interview, following extensive testing and validation to confi rm the suitability of the survey method. Results from the validation process indicated that aggregated data are considered fi t for the intended purpose. Data quality on some un-aggregated data items was considered unsatisfactory. This represents a limitation to the data.

1122 Health Determinants Queensland 2004
WHOLE OF POPULATION
Crime and safety surveyThis survey was conducted by the ABS in 2002 throughout Australia. It focuses on those categories of serious crime that affect the largest number of people including household break-in, motor vehicle theft, assault and robbery. The survey was conducted as part of the ABS Monthly Population Survey where questions on labour force are asked and in scope respondents were then sent a paper questionnaire for self-completion. Information was sought from 54,000 persons (aged 15 years and older), of which 76% responded. Household data was sought from 27,100 households with 20,400 (75%) responding. A complex set of multistage weighting procedures was used to adjust for non-response and for the particular demographic characteristics of respondents to the Monthly Population Survey.
General social surveyInformation about family and community involvement, perceptions of safety and experiences with crime was obtained from the General Social Survey conducted by the ABS. The survey was conducted throughout Australia from March to July 2002, and information collected by trained interviewers by personal interview with 15,500 people aged 18 years and over. The response rate (fully responding, adequate/complete) was 79.3%. Individual information and household information was collected. Population estimates were weighted according to the age and sex distribution of the Queensland population and the number of adults per household. The results were not age standardised.
Household income and labour dynamics for Australia (HILDA) HILDA is a longitudinal survey, commenced in 2001, and is funded by the Commonwealth Department of Family and Community Services. This survey aims to support research questions related to three broad areas; income dynamics, labour market dynamics and family dynamics, and to undertake annual surveying for an undefi ned period. Data from the fi rst wave was used in this report. Full responses were received from 6872 (in scope) Australian households comprising 13,969 individuals. Four questionnaires were utilised, three of which involved face to face interview with the fourth being a self-completion questionnaire. The household response rate was 58.8% (full responders) and the person response rate within those households was 92.3% (37% for self-completion questionnaire). Population estimates were weighted to the Australian population according to age and sex and number of adults per household. The results were not age standardised.
National drug strategy household survey The prevalence of alcohol consumption, tobacco smoking and illicit drug use were obtained from the 1998 and 2001 National Drug Strategy Household Survey, and reported using defi nitions consistent with the national survey reports. Population estimates were weighted according to the age and sex distribution of the 2000 Estimated Resident Population for Queensland, with adjustment for changes to the survey period. The results are not age standardised. These estimates are based on data obtained through the Australian Social Science Data Archives of the Australian National University. The data were deposited with the Archives by the AIHW. The estimates however, have been calculated within the Alcohol, Tobacco and Other Drug Services Unit of Queensland Health, and the latter takes full responsibility for the analysis and interpretation.
National health survey Information about the prevalence of health risk factors and health-related behaviours was obtained from the 1995 and 2001 National Health Surveys (NHS) conducted by the ABS. The 2001 survey was conducted by personal interview with people in 19,408 private dwellings in Australia, with completed questionnaires from 26,863 people from these dwellings279. Household response rates for non sparse households was 89% (including sample losses) and 58% in sparse households (including sample losses). Person responses varied. Population estimates were weighted according to the age and sex distribution and the number of adults per household. Some age standardisation was undertaken for reporting Indigenous and non Indigenous data.
National nutrition survey Information relating to diet and items derived from measured height, weight and body circumference was obtained from the 1995 National Nutrition Survey (NNS) conducted by the ABS although jointly sponsored by the ABS and the Commonwealth Department of Health and Family Services. A sample of 13,800 people was invited to participate in the NNS having previously been included in the 1995 NHS.280 A sub sample

1123
WHOLE OF POPULATION
Health Determinants Queensland 2004
of 1,490 NNS participants provided additional (day 2) food intake data. Detailed information was collected from people aged two years and older and nutrient information was later derived from reported food and beverage intake. Population estimates were weighted according to the age and sex distribution of the Queensland population and the number of adults per household. The results were not age standardised.
Recommended daily intakes (RDI) of micronutrients are the amounts of nutrients that should be available per head of a population group, if the needs of practically all members of the population group are to be met. All RDIs calculated from the 1995 National Nutrition Survey are based upon the 1982-1988 revised nutrient intake requirements and the 1989 revised energy requirements. All RDIs are based upon estimates of requirements with a generous ‘safety factor` added. RDIs for thiamine, ribofl avin, niacin and vitamin B-6 are based on energy requirements in existence when these B vitamin recommendations were revised260. Niacin values are presented as a single fi gure, the midpoint of the range adopted in 1984. Iron is expressed as a range to allow for differences in bioavailability of iron from different Australian foods. The RDIs for pregnancy are for the second and third trimesters. The following factors were used: thiamine - 0.1 mg/1000 kJ; ribofl avin - 0.15 mg/1000 kJ; niacin - 1.6 mg/1000 kJ; vitamin B-6 - 0.02 mg/g protein (based on protein as 10-15 per cent of recommended energy intake).
National survey of mental health and wellbeing of adultsThis survey was conducted by the ABS in 1997 as part of the National Mental Health Strategy. Approximately 10,600 people aged 18 years and older participated in the survey, representing a response rate of 78%. Mental health was measured in this survey using a modifi ed version of the Composite International Diagnostic Interview. This is a comprehensive computer based interview for adults which can be used to assess current and lifetime prevalence of mental disorders through symptoms and their impact on day to day activities. Where standardisation of data was undertaken, the estimated total Australian population was used.
Notifi able conditionsNotifi able condition data were derived from the Queensland Health Notifi able Conditions System (NOCS). Crude notifi cation rates for all years were calculated using estimated resident populations. Identifi cation of Indigenous status remains poorly completed within NOCS.
Persons aged fi fty years and over surveyThis survey was conducted by the ABS throughout Queensland in 1998. It was a supplement to the Australia-wide Monthly Population Survey. The survey was conducted using a multi-stage area sample with information obtained from approximately 1,800 private dwellings with usual residents aged fi fty years and over. One person per household was surveyed. Information was obtained by interview using trained interviewers. Estimation procedures accounted for independent estimated distributions of the total population by age, sex and area. This procedure compensates for under-enumeration and leads to more reliable estimates.
Perinatal death collectionData on perinatal statistics are collected under state legislation. These data provide a source of information for research into obstetrics and neonatal care, and assist with the planning of Queensland’s health services. The data collection forms are forwarded to Queensland Health by all public hospitals, private hospitals and home birth practitioners.
Population projectionsThe Queensland Government population projections released in 2003, (based on Census 2001) were developed by the Queensland Centre for Population Research at the University of Queensland in conjunction with the Offi ce of Economic and Statistical Research. These projections have been produced for Queensland Statistical Divisions and Local Government Areas, but are not currently available for Statistical Local Areas. Consequently all projections used in this report are those developed from the 1996 Census by Department of Information, Local Government and Planning, with Health Service District groupings added by Health Information Centre Queensland Health, and last updated August 2002.
Queensland household gambling survey
The Offi ce of the Government Statistician conducted this survey in 2001 by computer assisted telephone interviewing. People 18 years and over were included, with a total of 13,082 completed interviews achieved, giving a response rate of 72.3%. Technical details have been published. 220

1124 Health Determinants Queensland 2004
WHOLE OF POPULATION
Queensland Health telephone surveysSelf reported quality of life, general health, oral health, chronic disease status, health determinant prevalence and social capital were obtained from the Omnibus health surveys, conducted by Queensland Health between 1993 and 2003. The majority of surveys were conducted for a random sample of Queensland adults, aged 18 years and older, except where noted in Table 1.84. All surveys were conducted using computer-assisted telephone interview (CATI) methodology. Response rates for these surveys ranged from 72% to 92% (Table 1.84). For all adult health data, population estimates were weighted according to the age and sex distribution of the Queensland population for the relevant period, and the number of adults per household. For children related data, the estimates were weighted according to the age and sex of the child concerned. The results were not age standardised.
Table 1.84: Queensland Health surveys 1998 to 2003
Year Survey title Response rate
Number surveyed
Comments (eg oversampled rural)
1998 Statewide Health Survey 72% 5,594
1999 Parenting Survey 82% 4,010 Respondents were principal care-givers of children aged 0-12yrs
2000 Chronic Diseases-General Population Survey 80% 1,625
2000 Sunsafe Survey 81% 1,534
2001 Omnibus Survey 77% 3,083
2002 Omnibus Survey 75% 2,481
2002 Social Capital Survey 79% 2,667 Oversampling in rural and remote areas
2003 Omnibus-General Population 73% 1,575
2003 Omnibus-Infant Nutrition 92% 1,200 Respondents were biological mothers of children 0-4yrs
2003 Omnibus-Child Health 87% 1,596 Respondents were principal care-givers of children aged 0-12yrs
Source: Epidemiology Services Unit, Health Information Centre, Queensland Health
Queensland hospital admitted patient data collectionHospital separation data were derived from the Queensland Hospital Admitted Patient Data Collection, including private and public hospitals. All disease-specifi c hospital separations were derived using the principal diagnosis of inpatient episodes of care, except for episodes of care in 2000/01 where diabetes was identifi ed as an underlying condition in episodes of care due to diabetes-related conditions. The external cause(s) of injury and poisoning is reported. All separations were coded using the International Classifi cation of Diseases version 10 Clinical Modifi cation (ICD-10-CM: Table 1.83).
Recorded crimeThis publication presents national crime statistics relating to victims of a selected range of offences that have been recorded by police. Data on offi cial crime reports are provided to the ABS in aggregated form by the reporting authorities in each jurisdiction. The aim of national crime statistics is to provide one view of crime (police reported) and to provide comparisons across states and territories and provide a basis for measuring changes over time. National crime statistics are produced annually. The offence categories are based on the Australian Standard Offence Classifi cation. Rates are based on the Estimated Resident Population for each of the states and territories for the reference period. Variations in the recording of crime occur across jurisdictions, however, national crime statistics are compiled to maximise comparability.
Safety in the homeThis survey was conducted by the ABS in Queensland in 2001 as a supplement to the Australia- wide Monthly Population Survey. The supplementary survey provided a sample of approximately 4,700 dwellings from which a full response was obtained. Any responsible adult aged 15 years or over was interviewed either by telephone or personal interview.
Socioeconomic indicesThe 1996 Index of Relative Socioeconomic Disadvantage281 was used to undertake mortality stratifi cations in the Whole of population chapter. The 2001 Index of Relative Socioeconomic Advantage/Disadvantage197 was used for aetiological mortality analyses in Whole of population chapter, for mapping
1125
WHOLE OF POPULATION
Health Determinants Queensland 2004
in Chapter 6 Health Service District profi les and in selected socioeconomic discussions in other chapters. Both indices were reported in fi ve quintiles based on Collection Districts in Queensland. These indices were developed by the ABS from the relevant Census’. There are a number of general limitations which apply to these indices and are detailed by ABS.197 Specifi cally, Collection Districts (CD) are excluded from analysis where one or more of the following characteristics are found:
– populations smaller than ten– fi ve people or fewer employed– 70% or more people not responding to questions included in the Index as variables– more than 20% of dwellings non-private– off shore and migratory CDs.
CDs not included in analysis were noted in maps in Chapter 6 Health Service District profi les.
Survey of disability, ageing and carersThis survey was conducted by the ABS in 1998.67 It is the fourth survey in a series with a fi ve-six year frequency of collection. The fi rst survey was conducted in 1981 and the next survey scheduled for 2003. The survey collects information on three population groups; people aged 60 and older, people with disabilities, and their carers. Concepts and defi nitions used in this survey were taken from the International Classifi cation of Impairments, Disabilities and Handicaps. The fi nal sample in 1998 comprised 36,951 persons in private and non-private dwelling units, and 5,716 persons in cared accommodation. Personal computer assisted interviews were conducted with adults over 15 years of age and proxy interviews for young people under 15 years, interviews with those aged between 15 and 17 years was based on parent permission. Data were weighted to account for different sampling fractions, to represent the entire Australian population. This weighting included age group, sex, territory/state, and capital city/balance of state.
Survey of education and training (1997) and education and training experience (2001)These surveys were conducted by the ABS in 1997 and 2001.282 Information collected included sociodemographic characteristics and work history details together with educational qualifi cations held, recent and intended study, and details of training courses completed in the last 12 months. The survey included persons 15-64 years who met selected criteria for inclusion282 the effective survey sample was approximately 13,800 dwellings yielding 22,700 completed interviews in 1997. Data were collected by personal interview conducted by trained interviewers.
Vaccinations ratesVaccination data for children were derived from the Australian Childhood Immunisation Register (ACIR). Pneumococcal, infl uenza and Hepatitis B vaccination data for older persons and Indigenous peoples were derived from Queensland Health Vaccination Information and Vaccination Administration System (VIVAS).
Well person’s health check The Well person’s health check was a community based screening program designed to provide early detection and treatment of sexually transmitted infections and non-communicable disease risk factors. It provides health information to assist the community and health services in planning for improved health. The program was implemented in remote Indigenous communities in North Queensland and represented a collaborative effort of the Tropical Public Health Unit Network, Apunipima-Cape York Health Council, Health Service Districts of Queensland Health and the individual communities. The screening was conducted in 1998-2000.

1126 Health Determinants Queensland 2004
WHOLE OF POPULATION
General limitations of data
Cause of death or hospital separationRecorded ‘cause of death’ and ‘cause of hospital separation’ are well known to suffer from signifi cant error throughout the world. Notably, hospital separation statistics refl ect events of separation rather than individuals; thus re-admissions to another hospital or the same hospital are included in the statistics. Further to these general sources of error, specifi c mention must be made of the underestimation of recording of diabetes, mental disorders and self-infl icted injury burden of disease in these databases,55 and the exclusion of psychiatric hospitals from the hospital separation data prior to 1997. Death and hospitalisation results are presented without attempts at correction for underlying cause. Furthermore coding practice may vary over time and between areas. Knowledge of specifi c changes (eg change in coding practice related to diabetes hospital separations in 2000/01) has precluded certain comparisons. These limitations are noted in the text, where applicable. Lack of comparability of conditions based on coding using ICD-9 and ICD-10 has been identifi ed as a limitation in some trend analyses in this report. These limitations have been noted in the text where applicable and derive from comparability data reported in Table 1.83.
Indigenous identifi cationPoor Indigenous identifi cation in death and hospital separation data is one of the main limitations of these data sets. A variable proportion of the death certifi cation and hospital separation data presented here does not include any Indigenous identifi cation. Identifi cation that is recorded is a mixture of self-identifi cation and identifi cation assigned by the person completing the form. Census data records ethnicity according to self-identifi cation, and there are indications of possible under-enumeration of Indigenous peoples in remote areas in the 2001 census. Due to these problems with both the case number and population, accurate rates in Indigenous peoples cannot be calculated.
Using rates in geographic areas with a high proportion of Indigenous population as a proxy for Indigenous rates could be subject to four possible sources of bias:
• Under-estimation of the proportion of Indigenous population in areas leading to inaccurate classifi cation of areas by Indigenous population, leading to exaggeration of the excess mortality and hospitalisation
• In the cluster of fi ve Statistical Local Areas (SLAs) with the greatest proportion of Indigenous population there may be “dilution” of the Indigenous population by about 30% non-Indigenous population. The health status of the non-Indigenous peoples is likely to be better than the Indigenous, thus underestimating the true morbidity and mortality of Indigenous peoples in these areas
• The fi ve SLAs with the greatest proportion of Indigenous population are all in remote parts of the state where the general health status of people is considered to be worse than in towns or cities. Therefore, using these areas as proxies for Indigenous health status throughout the state would fail to differentiate between the health status of Indigenous peoples living in larger towns or cities and those living in remote areas
• In Torres SLA, a signifi cant number of deaths for Indigenous peoples were unregistered in the period 1992-98. In addition, research indicates that the health of Torres Strait Islanders is better than that of Aboriginal people for most health indicators, excluding diabetes
Survey biasesEach of the surveys sourced in this report are subject to a number of biases, specifi cally recall bias, exclusion of Indigenous and Culturally and Linguistically Diverse (CALD) populations due to telephone access, cultural appropriateness and language barriers. Most ABS and Queensland Health surveys had very good response rates of 75% or above indicating that response bias has been minimised as much as is practicable. In contrast, AusDiab achieved very low response rates, as discussed under that survey heading.

1127
WHOLE OF POPULATION
Health Determinants Queensland 2004
Glossary of termsAccessibility/remoteness – Three measures of accessibility/remoteness were used in this report: Rural, Remote and Metropolitan Area classifi cation (RRMA), the Accessibility/Remoteness Index of Australia (ARIA) and the Remoteness Areas (RA). The measure used depended primarily upon data availability. Due to small numbers in some sub-classifi cations, categories have been aggregated where appropriate.
The three zone/seven category Rural, Remote and Metropolitan Area classifi cation (RRMA) was developed in 1994 jointly by the Commonwealth Department of Primary Industries and Energy and the Commonwealth Department of Human Services and Health. The seven RRMA categories are ‘capital cities’, and ‘other metropolitan centres’ within the metropolitan zone, ‘large rural centres’, ‘small rural centres’ and ‘other rural centres’ within the rural zone, and ‘remote centres’ and ‘other remote centres’ within the remote zone.283 Accessibility/remoteness was determined using the Accessibility/Remoteness Index of Australia (ARIA) 284 In ARIA, remoteness, a geographic variable, is measured in terms of how far the population must travel to access services. Remoteness was also determined using the six category Remoteness areas (RA); Major cities, Inner regional, Outer regional, Remote, Very remote and Migratory.285 This latter classifi cation was introduced in 2002, and was based on the ARIA Index scores. The Remoteness area classifi cation has been adopted to generate consistency with other recent published analyses.
Body Mass Index (BMI) estimates the proportion of body fat, calculated from height and weight where BMI=weight (kg)/height (m)2. BMI values are grouped into categories. For adults 18 years and older, underweight is BMI score less than 20, acceptable weight is 20-24.9, overweight 25-29.9 and obese 30. In 2003, NHMRC and WHO amended these defi nitions to underweight is a BMI score less than 18.5, acceptable weight is 18.5-24.9, overweight 25-29.9 and obese >30. All studies reported in Health Determinants Queensland use the former defi nitions. For children, BMI is compared with age and gender-specifi c BMI percentile charts.
Children not fully immunised – the proportion of children reported as not having received all the required vaccinations for diphtheria, tetanus, poliomyelitis, whooping cough, measles and mumps for their age. The required vaccinations are based on the 1986 National Health and Medical Research Council Standard Childhood Vaccination Schedule.
Cholesterol – by clinical assessment, classifi cation of blood lipid values:
Blood lipid concentration (mmol/L)Classifi cation Cholesterol HDL-cholesterol Triglycerides LDL-cholesterolNormal <5.5 1.0 <2.0 <3.5Abnormal 5.5 <1.0 2.0 3.5
Community capacity is a collection of characteristics and resources which, when combined, improve the ability of a community to recognise, evaluate and address key problems.286
Dental caries prevalence is the proportion of the population with one or more teeth that are either decayed (D), missing (M), or fi lled (F) due to caries.
Diabetes prevalence by clinical assessment, classifi cation of abnormal blood glucose based on values for the oral glucose tolerance test and venous plasma glucose concentrations:
Glucose Tolerance Fasting glucose (mmol/l) 2-hr glucose (mmol/l)Type 2 Diabetes 7.0 Or 11 .1Impaired glucose tolerance (IGT) < 7.0 And 7.8 – 11.0Impaired fasting glucose (IFG) 6.1-6.9 And < 7.8
Disability with selected restrictions – people with a disability which restricts their participation in self-care, mobility, communication, employment and/or education. Includes all children with a disability aged less than 5 years.67
Foetal death (stillbirth) rate – the number of foetal deaths as a proportion of the total number of births.
1128 Health Determinants Queensland 2004
WHOLE OF POPULATION
Hazardous and harmful alcohol consumption – the levels of risk associated with alcohol consumption calculated from the 1998 and 2001 National Drug Strategy Household Surveys were as below.287 These guidelines were revised by NHMRC in October 2001.
Gender Low Risk Hazardous HarmfulMale < 40 grams of pure alcohol or
four standard drinks per day41- 60 grams or fi ve or six standard drinks per day
> 60 grams of pure alcohol or more than six standard drinks per day
Female < 20 grams of pure alcohol or two standard drinks per day
21-40 grams or three or four standard drinks per day
> 40 grams of pure alcohol or more than four standard drinks per day
Hospital separation rate – the total number of separations in all hospitals (public and private) providing acute care services per 100,000 estimated resident population at 31 December of the reference year. A separation is an episode of care which can be a total hospital stay (from admission to discharge, transfer or death) or a portion of a hospital stay ending in a change of status (for example from acute care to rehabilitation). The inclusion of status changes has been progressively introduced since 1995-96. Hospitals providing acute care services are those in which the treatments typically require short durations of stay. Rates and case numbers are reported using fi nancial years.
Hypertension – by clinical assessment, untreated hypertension was defi ned as systolic pressure greater than or equal to 140mmHG or diastolic pressure greater than or equal to 90mmHg and not on hypertensive treatment. Classifi cation of blood pressure:
Blood pressure (mmHg)Classifi cation Systolic Diastolic
Normal <140 And <90Borderline mild hypertension 140-159.9 Or 90-94.9Mild (above borderline) hypertension 160-179.9 Or 95-104.9Moderate and Severe hypertension 180 Or 105
Index of socioeconomic disadvantage/ SEIFA – Five indices are compiled by the ABS following each population Census. Each index summarises different aspects of the socioeconomic condition of areas. The Index of Relative Socioeconomic Disadvantage is the SEIFA index most frequently used in health analysis. The particular attributes summarised by this index include low income, low educational attainment, high unemployment and jobs in relatively unskilled occupations.
Most commonly, SEIFA indices are used to group survey respondents into quintiles or deciles of a particular index. Comparisons can then be made between respondents living in areas based on SEIFA quintiles (or deciles) across a range of health-related characteristics such as self-assessed health status.
The Indices are compiled at the level of the Census Collector’s District (CD) in which a person lives but are most commonly reported at the Statistical Local Area (SLA) level.
Infant mortality rate – the number of deaths of children under one year of age per 1,000 live births.
Life expectancy – the average number of years a newborn infant of a given sex would be expected to live if the age specifi c death rates of the reference period continued throughout his or her lifetime. For persons aged 65 years of a given sex, it is the average additional years of life expected if the age specifi c death rates of the reference period continued throughout his or her remaining life.
Live birth – the delivery of a child weighing at least 500 grams at delivery (or, when birthweight is unavailable, of at least 22 weeks gestation) who after being born, breathed or showed any other evidence of life such as a heart beat.
Metabolic syndrome – the term given to a clustering of CHD risk factors with insulin resistance at its core.288,289 The European Group for the Study of Insulin Resistance (EGIR) defi nes metabolic syndrome as the presence of insulin resistance and at least two of the following components: impaired glucose metabolism (impaired glucose tolerance (IGT) or impaired fasting glycaemia (IFG) or diabetes), hypertension, dyslipidaemia or central obesity.290 Analysis of AusDiab data reported in the HDQ used the EGIR defi nition, minus the insulin resistance requirement.232

1129
WHOLE OF POPULATION
Health Determinants Queensland 2004
Neonatal death – death of any child weighing at least 500 grams at delivery (or, when birthweight is unavailable, of at least 22 weeks gestation) who was born alive (as defi ned under live birth) and who died within 28 days of birth.
Notifi able conditions – Under section 32(1) of the Health Act 1937 any disease or disability may be declared notifi able. The list of notifi able conditions appears in the schedule of the Health Regulations 1996. Medical practitioners and laboratories are required to notify the Chief Health Offi cer of Queensland Health of any person suffering from a notifi able condition.
Perinatal mortality rate – the annual number of foetal and neonatal deaths per 1,000 live births foetal deaths combined.
Primary prevention is the protection of health by measures which eliminate causes and determinants of departures from good health and control exposure to risk. Primary prevention decreases the number of new cases of a disorder or illness and premature death (reduces incidence).291
Secondary prevention is defi ned as the measures available to individuals and populations for the early detection and prompt and effective intervention to correct departures from good health. Secondary prevention may lower the rate of established disease in the community.291
Social capital consists of those features of social organisation such as density of association membership, levels of interpersonal trust and norms of reciprocity (ie give and take or mutual action) which act as resources for individuals and facilitate collective action. It is a collective dimension of society external to the individual and is an ecological characteristic.
Standardisation of rates is a method used to compare populations which have different age-sex structures thereby precluding the comparison of unadjusted outcome rates. Two methods are available: direct and indirect standardisation. The direct rate is the rate experienced by a standard population, if the age specifi c rates of the population in the geographical area of interest applied to the standard population. The indirect rate is the ratio of the total number of people observed (actual number) having an attribute compared to the total number of people expected (expected number) having an attribute (disease or condition, cause of death) in the geographical area of interest. The expected number is calculated based upon the assumption that the population in the geographical area of interest experienced the same age specifi c rates as the standard population.
The standard population used in this report varies according to the years of data that are being considered for the population of interest. Typically the standard population is the estimated resident population for Australia 1991.
Tertiary prevention consists of the measures available to reduce or eliminate long term impairments, disabilities and complications from established disease, and to minimise suffering caused by existing departures from good health.291
1130 Health Determinants Queensland 2004
WHOLE OF POPULATION
1.7 List of tablesTable 1.1: Top 10 causes of premature mortality (YLL) and years of life lost due to disability (YLD) in total
population, Queensland 1996-98........................................................................................................ 1-10
Table 1.2: Differentials in the burden of disease and injury between top and bottom quintile of socioeconomic disadvantage, by selected main disease categories and sex, Australia 1996 ........... 1-11
Table 1.3: Life expectancy at birth by sex, Queensland, Australia and other states 1999-2001 ......................... 1-12
Table 1.4: Expectation of life, by age, Australia and selected countries .............................................................. 1-12
Table 1.5: Infant mortality rate, by state and territory, Australia 1980, 1990 and 2000........................................ 1-13
Table 1.6: Self reported quality of life and self rated health (proportion; 95%CI) by sex, age, accessibility and socioeconomic disadvantage, Queensland 2002 ........................................................................ 1-14
Table 1.7: Satisfaction with life by domain (percentage; 95% CI) by sex, persons aged 15 years and older, Queensland and Australia 2001.......................................................................................................... 1-15
Table 1.8: Prevalence of vision and hearing loss disorders, by age and sex, Queensland 2001........................ 1-16
Table 1.9: Prevalence of treated and untreated hypertension by age and sex, Australia and Queensland 2000................................................................................................................................ 1-27
Table1.10: Prevalence of hypertension by severity (clinical and self report) by age and sex, Queensland 1998, 2000...................................................................................................................... 1-27
Table 1.11: Prevalence of mental disorders and physical conditions, in persons aged 18 years and older by sex, Queensland and Australia 1997 ............................................................................................. 1-29
Table 1.12: Prevalence of high or very high levels of psychological distress, percentage of population, by age, sex, socioeconomic disadvantage and region, Queensland 2001......................................... 1-30
Table 1.13: Diabetes prevalence based on blood glucose levels, by age and sex, Queensland 2000 ................. 1-35
Table 1.14: Prevalence of self reported diabetes: percentage who ever been told by a nurse or doctor they have diabetes, high blood sugar or a touch of sugar and have had a blood test for diabetes, by age, sex, remoteness and socioeconomic disadvantage, Queensland 2000 ................................ 1-35
Table 1.15: Diabetes knowledge; percentage who have a reasonable/good idea of what diabetes is, by age and sex, Queensland 2000................................................................................................................. 1-36
Table 1.16: Diabetes blood test; percentage who have ever had a full blood test for diabetes or for high blood sugar (not just a fi nger prick test), by age and sex, Queensland 2000..................................... 1-36
Table 1.17: Prevalence of self reported asthma: percentage who have had symptoms of asthma or been treated for asthma in the last 12 months, by age, sex and remoteness, Queensland 2000............... 1-37
Table 1.18: Prevalence of self reported asthma: percentage who have ever been told by a doctor, nurse or at a hospital that they have asthma, by age, sex and remoteness, Queensland 2000....................... 1-38
Table 1.19: Prevalence of musculoskeletal disease as a long term condition, percentage of population, Queensland and Australia 2001.......................................................................................................... 1-39
Table 1.20: Prevalence of arthritis as a long term condition, percentage of population by selected sociodemographic indicators, Queensland 2001................................................................................ 1-39
Table 1.21: Percentage of population with a functional dentition (>20 natural teeth) by age, sex, socioeconomic disadvantage and accessibility, Queensland 2002 .................................................... 1-47
Table 1.22: Percentage of population with no natural teeth by age, sex, socioeconomic disadvantage and accessibility, Queensland 2002........................................................................................................... 1-47
Table 1.23: Notifi cations and crude notifi cation rates, by year and sex, Queensland 1997-2001 ......................... 1-49
Table 1.24: Sites of excess pollutants in monitored ambient air, Queensland 2002.............................................. 1-55
Table 1.25: Food safety practices in food handling businesses, Queensland 2002.............................................. 1-56
Table 1.26: Distribution of occupied private dwellings by type of occupancy, Queensland 2001 .......................... 1-58
Table 1.27: Number of persons usually resident in occupied private dwellings as a percentage of total dwellings, all dwellings and dwellings containing Indigenous households, Queensland 2001. .......... 1-58
Table 1.28: Selected housing indicators, percentage of total dwellings, Queensland 2001.................................. 1-59
Table 1.29: Adequacy of housing by selected aspects, percentage of dwellings (95%CI), by sex, Queensland and Australia 2001.......................................................................................................... 1-59
Table 1.30: Estimates of homelessness by age, Australia 2001............................................................................ 1-59
Table 1.31: Percentage of households with selected safety features, Queensland 2001 ..................................... 1-60
Table 1.32: Individual income received by age and sex, percentage of persons, Queensland 2001.................... 1-61

1131
WHOLE OF POPULATION
Health Determinants Queensland 2004
Table 1.33: Weekly family income received (percentage) and numbers of families by type of family in occupied private dwellings, Queensland 2001.................................................................................... 1-61
Table 1.34: Percentage of households having trouble making ends meet (95%CI), by region and socioeconomic disadvantage, Queensland and Australia 2001.......................................................... 1-62
Table 1.35: Percentage of people who reported running out of food and being unable to afford to buy more, in past 12 months, by age, sex and socioeconomic disadvantage, Queensland 2001 ...................... 1-62
Table 1.36: Household income increase, weekly estimates, Australia 1994-95 to 1997-98.................................. 1-62
Table 1.37: Selected income inequality indicators, Queensland and Australia 1997-98 ....................................... 1-63
Table 1.38: Dependent children of selected pensioners and benefi ciaries, percentage of population aged 15 years and younger, Queensland and Australia 1989, 1996 ........................................................... 1-63
Table 1.39: Selected income support indicators, Queensland and Australia 2001................................................ 1-63
Table 1.40: Socioeconomic disadvantage by Statistical Local Area, Queensland 2001........................................ 1-64
Table 1.41: Highest educational attainment by labour force, percentage of persons aged 15 years and older, Queensland 2001................................................................................................................................ 1-64
Table 1.42: Percentage of persons aged 15 years and older with post school qualifi cation by sex, Queensland 2001................................................................................................................................ 1-64
Table 1.43: Highest educational attainment by language and country of birth, percentage of persons aged 15 years and older, Queensland 2001................................................................................................ 1-65
Table 1.44: Unemployment by sex and location, proportion of persons aged 15 years and older looking for work, Queensland and Australia by state 2003, 2004 ................................................................... 1-65
Table 1.45: Labour force status by age and sex, Queensland 2001 ..................................................................... 1-66
Table 1.46: Selected variables refl ecting social capital concepts (95%CI), proportion of population aged 18 years and older, by sex, Queensland 2002.................................................................................... 1-68
Table 1.47: Dimensions of social capital by age and sex, persons aged 18 years and older, Queensland 2002................................................................................................................................ 1-68
Table 1.48: Relationship in private households, proportion of population by sex, Queensland 2001 ................... 1-69
Table 1.49: Percentage of population aged 18 years and older who agreed or strongly agreed with selected sense of control statements (95%CI), by sex, Queensland 2002......................................... 1-69
Table 1.50: Reasons for undertaking carer role by relationship to recipient of care, all persons 15 years and older, Queensland 1998............................................................................................................... 1-71
Table 1.51: Access to motor vehicle/s to drive, proportion of adult population by age, sex, region and income, Australia 2002 ..................................................................................................................................... 1-72
Table 1.52: Mean number of vehicles per household (95%CI), by region and socioeconomic disadvantage, Queensland and Australia 2001.......................................................................................................... 1-72
Table 1.53: Percentage of people who feel safe or very safe at home alone by age, sex and state, Australia 2002........................................................................................................................................... 1-73
Table 1.54: Prevalence of personal crime, by type of crime and age, Australia 2002 ........................................... 1-74
Table 1.55: Computer access at home by age and sex, and Internet use by location, percentage of total population, Queensland 2001 ..................................................................................................... 1-74
Table 1.56: Prevalence of gambling problems, proportion of adult population, by age, Queensland 2001........... 1-75
Table 1.57: Gambling group, percentage of group, by sex and age, Queensland 2001 ....................................... 1-75
Table 1.58: Percentage of the population who smoke daily (95%CI), by age, sex, accessibility and socioeconomic disadvantage, Queensland 1998, 2001 ..................................................................... 1-77
Table 1.59: Percentage of the population who usually drank either low, hazardous or harmful quantities of alcohol in the 12 months prior (95%CI), by age and sex, Queensland 2001.................................. 1-78
Table 1.60: Percentage of the population who used any illicit drug in the 12 months prior to survey (95% CI) by age, sex, accessibility and socioeconomic disadvantage, Australia and Queensland 1998, 2001 .............................................................................................................................................1-78
Table 1.61: Physical activity prevalence in last two weeks (self reported; 95% CI) in persons aged 18-75 years, by age, sex, socioeconomic disadvantage and accessibility, Queensland 2001 ..................... 1-79
Table 1.62: Age specifi c prevalence of metabolic syndrome, Queensland 2000 .................................................. 1-80
Table 1.63: Body Mass Index prevalence (% self reported; 95% CI) in persons aged 18-75 years, by age, sex, socioeconomic disadvantage and accessibility, Queensland 2001............................................. 1-81

1132 Health Determinants Queensland 2004
WHOLE OF POPULATION
Table 1.64: Median percentage contribution of carbohydrate, protein, total starch and total sugars (kJ) as a proportion of total energy (J) by age and sex, Queensland 1995.................................................... 1-83
Table 1.65: Percentage of population who exceeded recommended daily intake of micronutrients by age and sex, Queensland 1995................................................................................................................. 1-83
Table 1.66: Daily serves of vegetables and fruit (self reported; 95% CI) in persons aged 18 years and older, by age, sex, socioeconomic disadvantage and accessibility, Queensland 2001 ................................ 1-84
Table 1.67: Type of milk usually consumed, percentage of population by age, sex and socioeconomic disadvantage, Queensland 1995, 2001. ............................................................................................. 1-85
Table 1.68: Prevalence of abnormal blood lipids, percentage of population, by type, age and sex, Queensland 2000................................................................................................................................ 1-86
Table 1.69: High blood cholesterol prevalence (self reported), by age, sex, socioeconomic disadvantage and accessibility, Queensland 1998........................................................................................................... 1-86
Table 1.70: Percentage of persons reporting health seeking behaviour in past two weeks by age and sex, Queensland 2001................................................................................................................................ 1-87
Table 1.71: Percentage of persons aged 18 years and older reporting health seeking behaviour in past two weeks by socioeconomic disadvantage and remoteness, Queensland 2001..................................... 1-87
Table 1.72: Percentage of the population who attended a dentist within the last 12 months, by age and sex, Queensland 2002................................................................................................................................ 1-87
Table 1.73: Frequency of last visit to the dentist as proportion of the population, by age, Queensland 2002....... 1-88
Table 1.74: Reasons for dentist attendance by sex, and prevalence of regular check up, as proportion of the population, by age, sex and socioeconomic disadvantage, Queensland 2002 .................................. 1-88
Table 1.75: Breastscreen Queensland participation rates, percentage of women by age, area of socioeconomic disadvantage and remoteness, Queensland 2001-02 ............................................... 1-88
Table 1.76: Percentage of women self reporting mammography by age, Queensland 1995, 2001...................... 1-89
Table 1.77: Percentage of women self reporting mammography by age and remoteness, Queensland 2001 ..... 1-89
Table 1.78: Pap smear participation rates, percentage of women aged 20-69 years by socioeconomic disadvantage and remoteness, Queensland 2001 ............................................................................. 1-89
Table 1.79: Percentage of women self reporting Pap screening by age, Queensland 1995, 2001....................... 1-89
Table 1.80: Sun protection awareness and attitudes, percentage of people aged 18 years and older, Queensland 2000................................................................................................................................ 1-90
Table 1.81: Percentage of persons who have completed a fi rst aid training course, by age and sex, Queensland 2002................................................................................................................................ 1-91
Table 1.82: National Health Performance Framework......................................................................................... 1-115
Table 1.83: Comparability factors for pre 1997 manual coding of ICD-9 and Automatic Coding System for ICD-10, for reported diseases and conditions................................................................................... 1-117
Table 1.84: Queensland Health surveys 1998 to 2003........................................................................................ 1-124

1133
WHOLE OF POPULATION
Health Determinants Queensland 2004
1.8 List of fi guresFigure 1.1: Top ten causes of disease and injury burden (DALYs) in total population by sex,
Queensland 1996-98 .......................................................................................................................... 1-10
Figure 1.2: Percentage of total burden attributed to selected risk factors by sex, Australia 1996......................... 1-11
Figure 1.3: Life expectancy at birth by sex and area of socioeconomic disadvantage (Statistical Division), Queensland, 1999-2001 ..................................................................................................................... 1-13
Figure 1.4: Age specifi c percentage of population reporting a disability and severe or profound core activity limitations, Queensland 1998.............................................................................................................. 1-16
Figure 1.5: Percentage change in age standardised mortality rates for key National Health Priority Area conditions in Queensland between 1989-91 and 1999-2001.............................................................. 1-17
Figure 1.6: Percentage change in age standardised hospital separation rates for key National Health Priority Area conditions in Queensland between 1989/90-91/92 and 1999/2000-01/02** .............................. 1-17
Figure 1.7: Primary, secondary and tertiary avoidable mortality: age standardised mortality rates by sex, Australia 2001 ..................................................................................................................................... 1-18
Figure 1.8: Annual percentage change in age standardised mortality rates for priority cancers in Queensland between 1982 and 2001* .................................................................................................................... 1-19
Figure 1.9: Lung cancer in total population, age standardised mortality rate by sex, socioeconomic disadvantage, accessibility and proportion Indigenous peoples, Queensland 1999-2001 ................. 1-20
Figure 1.10: Colorectal cancer in total population, age standardised mortality rate by sex, socioeconomic disadvantage, accessibility and proportion Indigenous peoples, Queensland 1999-2001 ................. 1-21
Figure 1.11: Breast cancer in women aged 50-69 years, age standardised mortality rate by sex, socioeconomic disadvantage, accessibility and proportion Indigenous peoples, Queensland 1999-2001 ................. 1-22
Figure 1.12: Prostate cancer in total male population, age standardised mortality rate by socioeconomic disadvantage, accessibility and proportion Indigenous peoples, Queensland 1999-2001 ................. 1-22
Figure 1.13: Melanoma of the skin in total population, age standardised mortality rate by sex, socioeconomic disadvantage, accessibility and proportion Indigenous peoples, Queensland 1999-2001 ................. 1-23
Figure 1.14: Cervical cancer in women aged 20-69 years, age standardised mortality rate by sex, socioeconomic disadvantage, accessibility and proportion Indigenous peoples, Queensland 1999-2001 ...................................................................................................................... 1-24
Figure 1.15: Coronary heart disease in persons aged 0-79 years, age standardised mortality rate by sex, socioeconomic disadvantage, accessibility and proportion Indigenous peoples, Queensland 1999-2001........................................................................................................................................... 1-25
Figure 1.16: Stroke in persons aged 0-79 years, age standardised mortality rate by sex, socioeconomic disadvantage, accessibility and proportion Indigenous peoples, Queensland 1999-2001 ................. 1-26
Figure 1.17: Mental disorders in total population, age specifi c hospital separation rate by sex, Queensland 1999/2000-01/02................................................................................................................................. 1-29
Figure 1.18: Prevalence of mental disorders and physical conditions in persons aged 18 years and older by age, Queensland 1997................................................................................................................... 1-30
Figure 1.19: Suicide in total population, age standardised mortality rate by sex, socioeconomic disadvantage, accessibility and proportion Indigenous peoples, Queensland 1999-2001......................................... 1-31
Figure 1.20: Injury and poisoning in total population, age standardised mortality rate by sex, socioeconomic disadvantage, accessibility and proportion Indigenous peoples, Queensland 1999-2001 ................. 1-32
Figure 1.21: Road transport related injury in total population, age standardised mortality rate by sex, socioeconomic disadvantage, accessibility and proportion Indigenous peoples, Queensland 1999-2001 ...................................................................................................................... 1-33
Figure 1.22: Diabetes (principal cause) in total population, age standardised mortality rate by sex, socioeconomic disadvantage, accessibility and proportion Indigenous peoples, Queensland 1999-2001........................................................................................................................................... 1-34
Figure 1.23: Asthma in total population, age standardised mortality rate by sex, socioeconomic disadvantage, accessibility and proportion Indigenous peoples, Queensland 1999-2001......................................... 1-37
Figure 1.24: COPD in total population, age standardised mortality rate by sex, socioeconomic disadvantage, accessibility and proportion Indigenous peoples, Queensland 1999-2001......................................... 1-38
Figure 1.25: Hazardous and harmful alcohol consumption; age specifi c mortality and hospital separation rates by sex, Queensland 1999-2001 and 1999/00-2001/02, respectively......................................... 1-40

1134 Health Determinants Queensland 2004
WHOLE OF POPULATION
Figure 1.26: Deaths attributed to hazardous and harmful alcohol consumption; age standardised mortality rates by sex, socioeconomic advantage/disadvantage*, accessibility and proportion Indigenous peoples, Queensland 1999-2001........................................................................................................ 1-40
Figure 1.27: Hospital separations attributed to hazardous and harmful alcohol consumption; age standardised hospital separation rates by sex, socioeconomic advantage/disadvantage*, accessibility and proportion Indigenous peoples, Queensland 1999/00-2001/02.......................................................... 1-41
Figure 1.28: Smoking; age specifi c mortality and hospital separation rates by sex, Queensland 1999-2001 and 1999/00-2001/02, respectively..................................................................................................... 1-42
Figure 1.29: Deaths attributed to smoking; age standardised mortality rates by sex, socioeconomic advantage/disadvantage*, accessibility and proportion Indigenous peoples, Queensland 1999-2001 ...................................................................................................................... 1-42
Figure 1.30: Hospital separations attributed to smoking; age standardised hospital separation rates by sex, socioeconomic advantage/disadvantage*, accessibility and proportion Indigenous peoples, Queensland 1999/00-2001/02 ............................................................................................................ 1-43
Figure 1.31: Illicit drugs; age specifi c mortality and hospital separation rates by sex, Queensland 1999-2001 and 1999/00-2001/02, respectively..................................................................................................... 1-43
Figure 1.32: Deaths attributed to illicit drugs; age standardised mortality rates by sex, socioeconomic advantage/disadvantage*, accessibility and proportion Indigenous peoples, Queensland 1999-2001 ...................................................................................................................... 1-44
Figure 1.33: Hospital separations attributed to illicit drugs; age standardised hospital separation rates by sex, socioeconomic advantage/disadvantage*, accessibility and proportion Indigenous peoples, Queensland 1999/00-2001/02 ............................................................................................................ 1-44
Figure 1.34: Deaths attributed to insuffi cient physical activity and physical inactivity in people 0-79 years; age specifi c mortality rates by sex, Queensland 1999-2001 .............................................................. 1-45
Figure 1.35: Deaths attributed to insuffi cient physical activity and physical inactivity in people 0-79 years; age standardised mortality rates by sex, socioeconomic advantage/disadvantage*, accessibility and proportion Indigenous peoples, Queensland 1999-2001............................................................. 1-45
Figure 1.36: Hospital separations attributed to insuffi cient physical activity and physical inactivity in people 0-79 years; age specifi c hospital separation rates by sex, Queensland 1999-2001........................... 1-46
Figure 1.37: Hospital separations attributed to insuffi cient physical activity and physical inactivity in people 0-79 years; age standardised hospital separation rates by sex, socioeconomic advantage/disadvantage*, accessibility and proportion Indigenous peoples, Queensland 1999-2001................ 1-46
Figure 1.38: Mean percent annual change in costs in the same stores, by accessibility, Queensland, 1998-2000 to 2001.............................................................................................................................. 1-57
Figure 1.39: Trends in ratio (seasonally adjusted) of long term unemployed (greater than 104 weeks) to total unemployed by gender, Australia 1986-2003.............................................................................. 1-66
Figure 1.40: Percentage of population who were primary carers by age and sex, Australia 1998 ......................... 1-70
Figure 1.41: Percentage of population who report diffi culty with transport; cannot, or often have diffi culty, getting to the places needed, by age, Australia 2002 ......................................................................... 1-71
Figure 1.42: Prevalence of household crime, by state 2002................................................................................... 1-73

1135
WHOLE OF POPULATION
Health Determinants Queensland 2004
1.9 References1. Queensland Government. Priorities in Progress. A report to all Queenslanders on outcomes under the Charter of
Social and Fiscal Responsibility 2001-02.
2. Queensland Health. The state of health of the Queensland population. Brisbane 2001.
3. Australian Institute of Health and Welfare. Australia’s Health 1996: The fi fth biennial health report from the Australian Institute of Health and Welfare. Canberra: Australian Institute of Health and Welfare; 1996.
4. World Health Organization. Constitution of the WHO. Basic Documents, 37th ed. Geneva; 1946.
5. Lalonde M. A new perspective on the health of Canadians. Ottawa: Information Canada; 1974.
6. Turrell G, Oldenburg B, McGuffog I, Dent R. Socioeconomic determinants of health: towards a national research program and a policy and intervention agenda. Canberra: Queensland University of Technology; April 1999.
7. National Health Performance Committee. National report on health sector performance indicators 2001. Report to Australian Health Ministers’ Conference. Paper presented at: Australian Health Ministers’ Conference, 2002.
8. Queensland Health. Health indicators for Queensland: Central Zone 2001. Brisbane: Public Health Services, Queensland Health; 2001.
9. Queensland Health. Health indicators for Queensland: Northern Zone 2001. Brisbane: Public Health Services, Queensland Health; 2001.
10. Queensland Health. Health indicators for Queensland: Southern Zone 2001. Brisbane: Public Health Services, Queensland Health; 2001.
11. World Health Organization. The World Health Report 2002: Reducing risks, promoting healthy life. France 2002.
12. Schidmt KS. Programmed at birth. New Scientist. 1999;2195:26 - 31.
13. Osmond C, Barker DJ. Fetal, infant and childhood growth are predictors of coronary heart disease, diabetes, and hypertension in adult men and women. Environmental Health Perspectives. June 2000;108(Supplement 3):545-553.
14. Australian Institute of Health and Welfare. Australia’s Health 1998: The sixth biennial health report from the Australian Institute of Health and Welfare. Canberra: Australian Institute of Health and Welfare; 1998.
15. Blane D, Montgomery SM, Berney LR. Research note: social class differences in lifetime exposures to environmental hazards. Sociology of Health and Illness. 1998;20(4):532-536.
16. National Health and Medical Research Centre. Infant feeding guidelines. Canberra 2002.
17. Zimet GD, Owens R, Dahms W, Cutler M, Litvene M, Cuttler L. Psychosocial outcome of children evaluated for short stature. Archives of Pediatrics & Adolescent Medicine. 1997;151(10):1017-1023.
18. Wissler RW. An overview of the quantitative infl uence of several risk factors on progression of atherosclerosis in young people in the United States. Pathobiological determinants of atherosclerosis in youth (PDAY Research Group). American Journal of Medical Science. 1995;310:S29 - S36.
19. Holland P, Berney L R, Blane D, Davey Smith G, Gunnell D J, Montgomery S M. Life course accumulation of disadvantage: childhood health and hazard exposure during adulthood. Social Science and Medicine. 2000;50:1285-1295.
20. Newsome CA, Schiell A W, Fall CH, Phillips DI, Schier R, Law CM. Is birth weight related to later glucose and insulin metabolism, a systematic review. Diabetes Medicine. 2003;20(5):339-348.
21. World Health Organization. Social determinants of health: the solid facts. 2003.
22. University of Adelaide PHIDU. A social health atlas of Australia. Second ed: Openbook Publishers; 1999.
23. Queensland Health. Discrimination: A Factsheet. Social Determinants of Health. Brisbane: Southern Public Health Unit Network, Queensland Health; 2003.
24. Queensland Health. Education: A Factsheet. Social Determinants of Health. Brisbane: Southern Public Health Unit Network, Queensland Health; 2003.
25. Queensland Health. Indigenous People: A Factsheet. Social Determinants of Health. Brisbane: Southern Public Health Unit Network, Queensland Health; 2003.
26. Queensland Health. Transport. Social Determinants Factsheet. 2003.
27. Federal Provincial and Territorial Advisory Committee on Population Health. Toward a healthy future: Second report on the health of Canadians. Charlottetown: P.E.I.; September, 1999.
28. Wilkinson R, Marmot M, eds. Social determinants of health: the solid facts. 2 ed. Copenhagen: World Health Organisation; 1998.
29. Hart JT. The inverse care law. Lancet. 1997;1971(i):405-412.

1136 Health Determinants Queensland 2004
WHOLE OF POPULATION
30. Furler J, Harris E, Chondros P, Powell-Davies PG, Harris MF, Young DYL. The inverse law revisited: impact of disadvantaged location on accessing longer GP consultation times. Medical Journal of Australia. 2002;177:80-83.
31. Harris MF, Pridden D, Ruscoe W, Infante FA, O’Toole BI. Quality of care provided by general practitioners using or not using division based diabetes registers. Medical Journal of Australia. 2002;177:250-252.
32. Burnley IH. Transitions and inequalities in acute myocardial infarction mortality in NSW, 1969-94. Australian and New Zealand Journal of Public Health. 1999;23(4):343 - 351.
33. Yue XQ, Robertson C, Brett I. Socioeconomic correlates of mortality differentials by local government area in rural Northern New South Wales, 1981 - 1995. Australian and New Zealand Journal of Public Health. 2000;24(4):365 - 369.
34. Kennedy BP Kawachi I, Prothrow-Stith D. Income distribution and mortality: cross sectional ecological study of the Robin Hood index in the United States. British Medical Journal. 1996;312(7037):1004 - 1007.
35. Queensland Health. Social determinants of health: The role of public health services. Brisbane 2001.
36. Spurrier N, Sawyer M, Clark JJ, Baghurst P. Socio-economic differentials in the health-related quality of life of Australian children: Results of a national study. Australian and New Zealand Journal of Public Health. 2003;27(1):27 - 33.
37. Australian Institute of Health and Welfare. National Health Priority Areas Report: cardiovascular health. Canberra: Australian Institute of Health and Welfare and Commonwealth Department of Health, Ageing and Community Services; 1998. AIHW Cat. no. PHE 9.
38. Kennedy BP, Kawachi I, Prothrow-Stith D. Income distribution and mortality: Cross Sectional Ecological Study of the Robin Hood index in the United States. British Medical Journal. 1996;312(7037):1004 -1007.
39. Black D, Morris J N, Smith C, Townsend P, Whitehead M. Inequalities in health. The Black report: The health divide. London: Penguin; 1988.
40. Kawachi I, Kennedy B P. The relationship of income inequality to mortality: Does the choice of indicator matter? Social Science and Medicine. 1997;45(7):1121-1127.
41. Kawachi I Kennedy B. The relationship of income inequality to mortality: does the choice of indicator matter? Social Science & Medicine. 1997;45(7):1121 1127.
42. National Health Strategy. Pathways to better health. Canberra 1993.
43. McCulloch A.. An examination of social capital and social disorganisation in neighbourhoods in the British household panel survey. Social Science and Medicine. 2003;56:1427.
44. Wyke S, Ford G. Competing explanations for associations between marital status and health. Social Science and Medicine. 1992;36:907-917.
45. Darity WJ. Employment discrimination, segregation, and health. American Journal of Public Health. 2003;93(2):226-231.
46. Kawachi I, Colditz GA, Ascherio A, et al. A prospective study of social networks in relation to total mortality and cardiovascular disease in men in the USA. Journal of Epidemiology and Community Health. 1996;50:245 - 251.
47. Karlsen S, Nazroo DBJ. Relation between racial discrimination, social class, and health among ethnic minority groups. American Journal of Public Health. 2002;94(4):624 - 631.
48. CD Mathers CJLM, JA Salomon, R Sadana, A Tandon, AD Lopez, B Ustun and S Chatterji. Healthy life expectancy; comparison of OECD countries in 2001. Australian and New Zealand J. Public Health. 2003;27(1):5-11.
49. Pike A, Baade P, Harper C, Muller S, Kennedy B. Quantifying the burden of disease and injury in Queensland 1996 - 1998. Brisbane: Health Information Centre, Queensland Health; October 2002. Information Circular 61.
50. Mathers C, Vos T, Stevenson C. The burden of disease and injury in Australia. Canberra: Australian Institute of Health and Welfare; 1999.
51. Queensland Health. Primary prevention of chronic diseases: The role of nutrition: Public health nutrition background paper. Brisbane July 2003.
52. Australian Bureau of Statistics. Deaths. Canberra: Australian Bureau of Statistics; 2001. Cat. no. 3302.0.
53. D. T. Australian Social Trends 2003. Canberra: ABS; 2003.
54. Australian Bureau of Statistics. Deaths, Australia 2002. Catalogue no. 3302.0.
55. Queensland Health. Health Information Centre: Personal Communication.
56. Australian Bureau of Statistics. Census of population and housing. Canberra: Australian Bureau of Statistics; 2001. Cat. no. 2015.0.
57. Davis B, Healthcote C, O’Neill T, Puza B. The health expectancies of older Australians. Canberra: Australian National University; 2002.

1137
WHOLE OF POPULATION
Health Determinants Queensland 2004
58. Mathers C, Douglas B. Measuring progress in population health and well-being. In: Eckersley R, ed. Measuring Progress - is life getting better. Victoria: CSIRO; 1998.
59. Australian Bureau of Statistics. Australian Social Trends. Canberra: Australian Bureau of Statistics; 2002. Cat. no. 4102.0.
60. Australian Bureau of Statistics. Births, Australia 2001. Canberra: Australian Bureau of Statistics; 2002. Cat. no. 3301.0.
61. IMD International. World Competitiveness Yearbook. 2003.
62. Queensland Health. Social Capital Survey. Brisbane: Public Health Services and Health Information Centre, Queensland Health; 2002.
63. Australian Bureau of Statistics. General Social Survey. Canberra: Australian Bureau of Statistics; 2002. Cat. no. 4159.0.
64. Idler E, Benyamini Y. Self rated health and mortality: a review of twenty-seven community studies. Journal of Health and Social Behaviour. 1997;38:21-37.
65. McCallum J, Shadbolt B, Wang D. Self-rated health and survival: a 7-year follow-up study of Australian elderly. American Journal of Public Health. 1994;84:1100-1105.
66. Australian Institute of Health and Welfare. Australia’s Health 2000: The seventh biennial health report of the Australian Institute of Health and Welfare. Canberra: Australian Institute of Health and Welfare; 2000.
67. Australian Bureau of Statistics. Disability, ageing and carers: summary of fi ndings, Australia. Canberra: Australian Bureau of Statistics; 1998. Cat. no. 4430.0.
68. Australian Institute of Health and Welfare. Disability and ageing: Australian population patterns and implications. Canberra: Australian Institute of Health and Welfare; 2000. Cat No. DIS 19.
69. Australian Bureau of Statistics. Accounting for change in disability and severe restriction, 1981-1988. Canberra: Australian Bureau of Statistics; 2001. 2001/1.
70. Australian Institute of Health and Welfare. Australian hospital statistics 2001-02. Canberra 2001-2002. AIHW cat. no. HSE 25.
71. Muller S, Baade P, Coory M. Mortality and incidence trends for leading cancers in Queensland, 1992 to 1999: Information Circular 59. Brisbane: Health Information Centre, Queensland Health; January 2002 2002.
72. Baade P, M C. Update on mortality and incidence trends for leading cancers in Queensland, 1982 to 2000. Brisbane: Health Information Centre, Queensland Health; 2002. Information Circular 63.
73. Queensland Health. Mortality and incidence trends for leading cancers in Queensland, 1982 to 2001: Health Information Centre, Information and Business Management Unit; 2004. Information Circular 65.
74. Stadtlander CT, Waterbor JW. Molecular epidemiology, pathogenesis and prevention of gastric cancer. Carcinogenesis. 1999;20(12):2195-2208.
75. World Cancer Research Fund, American Institute for Cancer Research. Food, nutrition and the prevention of cancer: a global perspective. Washington, DC: AICR; 1997.
76. Thune I, Furberg AS. Physical activity and cancer risk: dose-response and cancer, all sites and site-specifi c. Medicine and Science in Sports and Exercise. 2001;33(6 Supp):S472-483.
77. Australian Institute of Health and Welfare, Australian Association of Cancer Registries. Cancer survival in Australia 1992 - 1997: geographic categories and socioeconomic status. Canberra: Australian Institute of Health and Welfare; 2002.
78. Davilia DG, Williams DE. The etiology of lung cancer. Mayo Clinic Proceedings. 1993;68:170-182.
79. US Department of Health and Human Services. Smoking cessation and cardiovascular disease 1990.
80. Kawachi I, Colditz G, Stampfer MJ,. Smoking cessation and decreased risk of stroke in women. Journal of American Medical Association. 1993.
81. Negri E, La Vecchia C, D’Avanzo B,. Acute myocardial infarctions: association with time since stopping smoking in Italy. Journal of Epidemiology and Community Health. 1994.
82. United Kingdom Department of Health. Nutritional aspects of the development of cancer. Report of the Working Group on diet and cancer of the Committee on Medical Aspects of the Food Supply. Norwich: The Stationery Offi ce; 1998.
83. Colditz GA, Cannuscio C, Frazier A. Physical activity and reduced risk of colon cancer: implications for prevention. Cancer Causes and Control. 1997;8:649-667.
84. Queensland Cancer Registry. Cancer in Queensland: Incidence and mortality, 1981-2001. Brisbane October 2003.
85. National Breast Cancer Centre. Advice about familial aspects of breast cancer and ovarian cancer 2000.

1138 Health Determinants Queensland 2004
WHOLE OF POPULATION
86. Stenbeck M, Balanda KP, et al. Patterns of treated non-melanoma skin cancer in Queensland - the region with the highest incidence rates in the world. The Medical Journal of Australia. 1990;153.
87. Marks R, Stapples M, Giles G. Trends in non-melanocytic skin cancer in Australia: the second national survey. International Journal of Cancer. 1993;53:585-590.
88. Coory M, Ganguly I, Thompson A. Cancer among people living in rural and remote Indigenous communities in Queensland. Brisbane: Health Information Centre, Queensland Health; February 2001. Information Circular 54.
89. Queensland Health. Cancer Prevention and Control. Outcome Area Plan 2002-2005, Public Health Services 2002.
90. McGill HCJ, McMahan C A. Starting earlier to prevent heart disease. Journal of the American Medical Association. 2003;290(17):2320.
91. Hunink MG, Goldman L, Tosteson A N, et al. The recent decline in mortality from coronary heart disease, 1980-1990: the effect of secular trends in risk factors and treatment. Journal of the American Medical Association. 1997;1997(277):535-542.
92. Australian Bureau of Statistics. Australian social trends, 2003. Canberra: Australian Bureau of Statistics; 2003. Cat. no. 4102.0.
93. McElduff P, Dobson A J, Jamrozik K, Hobbs M S. Opportunities for control of coronary heart disease in Australia. Australian and New Zealand Journal of Public Health. 2001;25:24-30.
94. Phillips P, Wilson D, Beilby J, al e. Diabetes complications and risk factors in an Australian population: how well are they managed? International Journal of Epidemiology. 1998;27:853-859.
95. Javitt JC, Aiello I, Lloyd PA, al e. Detecting and treating retinopathy in patients with type 1 diabetes: savings associated with improved implementation of current guidelines. Opthalmology. 1991;98:1565-1574.
96. Law MR, Wald N J. Risk factor thresholds: their existence under scrutiny. British Medical Journal. 2002;324:1570-1576.
97. Joshipura KJ, Hu F B, Manson JE, et al. The effect of fruit and vegetable intake on risk for coronary heart disease. Annals of Internal Medicine. 2001;134(12):1106-1114.
98. Bunker S, Colquhoun D, Esler M, et al. “Stress” and coronary heart disease: psychosocial risk factors National Heart Foundation position statement. Medical Journal of Australia. 2003;178:272-276.
99. The Center for Weight and Health. Prevention of childhood overweight - what should be done?: University of California,; 2001.
100. Queensland Health. Patterns of mortality from stroke in Queensland. Brisbane: Health Information Centre, Queensland Health; July 2002. Information Circular 60.
101. Armstrong T, Dixon T. The global burden of physical inactivity (In prep). Brisbane 2002.
102. Eastern Stroke and Coronary Hearty Disease Collaborative Group. Blood pressure, cholesterol and stroke in eastern Asia. Lancet. 1998;352:1801-1807.
103. Queensland Health. 1998 Statewide Health Survey. Brisbane: Health Information Centre, Queensland Health; 1998.
104. Rutledge T, Hogan E. A quantitative review of prospective evidence linking psychosocial factors with hypertension development. Psychosomatic Medicine. 2002;64:758-766.
105. VicHealth. Mental health promotion plan: Foundation document 1999 - 2002: VicHealth; 1999.
106. VicHealth. Mental Health and Wellbeing. VicHealth Letter. 2003;Spring(21).
107. Australian Bureau of Statistics. Disability, ageing and carers: summary tables, Queensland. Canberra: Australian Bureau of Statistics; 1998. Cat. no. 4430.3.40.001.
108. Australian Bureau of Statistics. National survey of mental health and wellbeing of adults 1Canvberra: Australian Bureau of Statistics. Cat no. 1997.
109. Mueser K, Bellack, AS, Blanchard J,. Comorbidity of schizophrenia and substance abuse: implications for treatment. Journal of Consulting and Clinical Psychology. 1992;60:845-856.
110. Sonne S, Brady KT, Moreton WA. Substance abuse and bipolar affective disorder. The Journal of Nervous and Mental Disease. 1994;182(6):349-352.
111. Miller N, Klamen D, Hoffman NG, Flaherty JA,. Prevalence of depression and alcohol and other drug dependence in addictions treatment populations. Journal of Psychoactive Drugs. 1996;28(2):111-124.
112. Cuffell B. Prevalence estimates of substance abuse in schizophrenia and their correlates. The Journal of Nervous and Mental Disease. 1992;180:598-592.
113. Caton C, Gralnick A, Bender S, Simon R. Young chronic patients and substance abuse. Hospital and Community Psychiatry. 1989;40:1037-1040.
114. Australian Bureau of Statistics. Information Paper - Use of the Kessler Psychological Distress Scale in Australian Bureau of Statistics health surveys. Canberra: Australian Bureau of Statistics; 2003. Cat. no. 4817.0.55.001.

1139
WHOLE OF POPULATION
Health Determinants Queensland 2004
115. Commonwealth Department of Health and Aged Care. A framework for prevention of suicide and self-harm in Australia 2000.
116. Resnick MD BP, Blum RW, Bauman KE, Harris KM, Jones J, Tabor J, Beuhring T, Sieving RE, Shew M, Ireland M, Bearinger LH, Udry JR,. Protecting adolescents from harm: fi ndings from the national longitudinal study on adolescent health. 1997.
117. Smith J Mercy J, Conn J,. Marital status and the risk of suicide. American Journal of Public Health 1988;78(1):78-80.
118. Frederico M DC, Barber J. Growing up in Australia: The role of parents in promoting positive adolescent development. 1999.
119. De Leo D HP, Neulinger K, Cantor CH. Ageing and suicide: A report to the commonwealth department of health and aged care 1999.
120. Commonwealth Department of Health and Aged Care. A framework for prevention of suicide and self-harm in Australia. 2000.
121. Beautrais A. Risk factors for suicide and attempted suicide amongst young people 1998.
122. Queensland Health. Injury prevention and control. Background Paper. Health Outcomes Plan June 2000.
123. McCarty D, Zimmett P, Dalton P, Segal L, Welborn T. The Rise and Rise of Diabetes in Australia, 1996. New South Wales: Diabetes Australia NSW; 1996.
124. Australian Institute of Health and Welfare: Holdenson Z CL, Phillips G, Waters AM,. A picture of diabetes in overseas-born Australians. Canberra 2003. Bulletin No 9 AIHW Cat. No. AUS 38.
125. OECD. OECD Health Data 2000: Comparative analysis of 29 countries. Accessed May 2000.
126. Dunstan D, Cameron A, M d, Coyne T. The Australian Diabetes Obesity and Lifestyle study (AusDiab) data report: Queensalnd. Brisbane: Queensland Health; 2004.
127. Cardona M, Coyne T, McClintock C, Muller S. The impact of diabetes on the health of Queenslanders: Health Information Circular 62. Brisbane: Health Information Centre, Queensland Health; November 2002.
128. Alberti K. The clinical implications of impaired glucose tolerance. Diabetic Medicine. 1996;13:927-937.
129. Barzilay JI, Spiekerman C F, Kulier L H, et al. Prevalence of clinical and isolated subclinical cardiovascular disease in older adults with glucose disorders: the cardiovascular disease in older adults with glucose disorders: the Cardiovascular Health Study. Diabetes Care. 2001;24(7):1233-1239.
130. Australian Centre for Asthma Monitoring. Asthma in Australia 2003. Asthma Series 1. Canberra: Australian Institute of Health and Welfare; 2003. Cat. no. ACM 1.
131. NSW Department of Health. Asthma and the environment: perspectives on the prevention of asthma. Sydney: NSW Health Department; 1997.
132. Perk JK. The rising trend in allergic illness: which environmental factors are important? Clinical & Experimental Allergy. 1994;24:797-800.
133. Stewart A, Huang N. Review of public health interventions for asthma (in press). Melbourne: Victorian Department of Human Services; 2003.
134. Queensland Health. Health priorities: The role of physical activity: Public health physical activity background paper. Brisbane September 2003.
135. American College of Sports Medicine (ACSM). ACSM position stand on osteoporosis and exercise. Medicine and Science in Sports and Exercise. 1995;27:i-vii.
136. Drinkwater B. CH McCloy research lecture: does physical activity play a role in preventing osteoporosis? Research Quarterly for Exercise and Sport. 1994:197-206.
137. Brill P, Macera C, Davis D, Blair, et al. Muscular strength and physical function. Medicine and Science in Sports and Exercise. 2000;32(2):412-416.
138. English D, Holman CDJ, Milne E, Winter MG, Hulse GK, Coddle JP, Bower CI, Corti B, de klerk N, Knuiman MW, Kurinzicuk JJ, Lewin GF, Ryan GA. The quantifi cation of drug caused morbidity and mortality in Australia, 1995 edition. Canberra: Commonwealth Department of community Services and Health; 1995.
139. Ridolfo B, Stevenson C,. The quantifi cation of drug-caused mortality and morbidity in Australia, 1998. Canberra: Australian Institute of Health and Welfare; 2001. Cat. no. PHE29.
140. Queensland Health. The contribution of hazardous and harmful alcohol consumption to mortality and hospital morbidity in Queensland. Brisbane: Health Information Centre, Queensland Health; November 2000. Information Circular 50.
141. Queensland Health. An update on the contribution of cigarette smoking to mortality and hospitalisation in Queensland. Brisbane: Epidemiology Services Unit and Alcohol Tobacco and Other Drug Services, Queensland Health; 31 May 2003. Information Circular 64.
142. Australian Institute of Health and Welfare, Queensland Health. Physical activity patterns of Queensland adults: trends from 1997 to 2001. Brisbane: Australian Institute of Health and Welfare and Queensland Health; 2002.
1140 Health Determinants Queensland 2004
WHOLE OF POPULATION
143. Spencer AJ, Lewis J M. The delivery of dental services information, issues and directions. Community Health Studies. 1988;XII:16-30.
144. Carter KD, Stewart J, Spencer A J. National Dental Telephone Interview Survey 1999. Australian Institute of Health and Welfare and Dental Statistics and Research Unit (DSRU), University of Adelaide. Available at: www.adelaide.edu.au.
145. Armfi eld JM, Roberts-Thomson KF, Spencer AJ. The child dental health survey, Australia 1997. Adelaide: University of Adelaide; 2000.
146. Queensland Health. Queensland Health 1997-2001 Notifi able diseases report. Brisbane: Communicable Diseases Unit, Queensland Health; 2002.
147. Commonwealth Department of Health and Aging. Annual report of the Australian Meningococcal Surveillance Programme, 2000. Communicable Disease Intelligence. August 2001 2000;25(3).
148. Commonwealth Department of Health and Aging. Annual report of the Australian Meningococcal Surveillance Programme, 2001. Communicable Diseases Intelligence. September 2002 2001;26(3).
149. Queensland Health. Meningococcal Disease Fact Sheet. Public Health Services, Queensland Health.
150. Communicable Disease Intelligence. Communicable Disease Intelligence. 2003;27(4):466-477.
151. National Health and Medical Research Centre. The Australian immunisation handbook, 8th Edition; 2003.
152. Queensland Health HIC. Omnibus survey-2003 2003.
153. Stafford R. A survey of community diarrhoeal illness among adults and young children in Queensland.: Communicable Diseases Unit, Queensland Health; 2002.
154. Queensland OzFoodNet, Communicable Diseases Unit. A survey of community diarrhoeal illness among adults and young children in Queensland. Brisbane: Queensland Health; 2002.
155. Chappell C, Okhuyen PC. Current opinion in infectious diseases. Communicable Diseases Intelligence. 2002;15(5):523-527.
156. Communicable Disease Intelligence. Still waiting. Communicable Disease Intelligence. 2000;24(8):236-239.
157. Mandell D, Bennett S. Principles and practice of infectious diseases, 5th edition; 2000.
158. Queensland Health. HIV/AIDs Report, period to 31 December 2002 2003.
159. Guzman M, Kouri G. Dengue: an update. Lancet Infect Dis. 2002.
160. Hanna J, Ritchie S, Hills S, Pyke A, Montgomery B, Richards A. Dengue in north Queensland. Communicable Disease Intelligence. 2002.
161. Surveillance and Epidemiology Section. Australia’s notifi able disease status, 2002: annual report of the national notifi able diseases surveillance system December 2003.
162. Hales S, de Wet M, Maindonald J, Woodward A. Potential effect of population and climate changes on global distribution of dengue fever: an empirical model. Lancet. 2002.
163. United Nations. Rio Declaration, Principle 1. Earth Summit - Agenda 21: the United nations programme of action from Rio. New York 1993.
164. Commonwealth Department of Health and Aged Care. The National Environmental Health Strategy. Canberra 1999.
165. Environmental Protection Agency. Queensland 2002 Air Monitoring Report 2002.
166. Brisbane City Council and Queensland Environmental Protection Agency. Air emissions Inventory - South-east Queensland Region. Available at: http://www.epa.qld.gov.au/.
167. Commonwealth of Australia. The National Environmental Health Strategy. enHealth. 1999.
168. National Health and Medical Research Council. The Effectiveness of Water Fluoridation. Canberra: Australian Government Publishing Service; 1991.
169. Queensland Health. Public Health Services. Personal communication. 2003.
170. Burt B, Eklund S. Community-based strategies for preventing dental caries. In: Pine C, ed. Community Oral Health. Oxford: Wright; 1997.
171. US Department of Health and Human Services. Oral health in America: A report of the Surgeon General. Rockville: National Institute of Dental and Craniofacial Research, National Institute of Health; 2000.
172. Food Science Australia & Minter Ellison Consulting. National risk validation project fi nal report 2002.
173. Queensland Health. Queensland Food Handling Baseline Survey (in preparation). Brisbane: Public Health Services, Queensland Health; 2002.
174. Queensland Health. The 2001 Healthy Food Access Basket (HFAB) Survey. Brisbane 2001.
175. Queensland Health. The 2003 Healthy Food Access Basket (HFAB) Survey. Brisbane 2003.

1141
WHOLE OF POPULATION
Health Determinants Queensland 2004
176. Burton N, Turrell G, Oldenburg B. Participation in recreational physical activity: why do socio-economic groups differ? Health Education and Behaviour. 2003;30(2):225-244.
177. Giles-Corti B. The relative infl uence of, and interactions between, environmental and individual determinants of recreational physical activity in sedentary workers and home makers: A summary: Health Promotion Evaluation Unit, Department of Public Health and Graduate School of Management, University of Western Australia; 1998.
178. Humpel N, Owen N, Leslie E, Martin J L. Environmental factors associated with adults’ participation in physical activity. American Journal of Preventive Medicine. 2002;22(3):188-199.
179. Saelens B, Sallis J, Frank L. Environmental correlates of walking and cycling: fi ndings from the transport, urban design, and planning literatures. Annals of Behavioural Medicine. 2003;25(2):80-91.
180. Sallis J, Owen N. Physical activity and behavioural medicine: Sage Publications, USA; 1999.
181. Task Force on Community Preventative Services. Recommendations to increase physical activity in communities. American Journal of Preventive Medicine. 2002;22:67-72.
182. Trost S, Owen N, Bauman A, Sallis J, Brown W. Correlates of adult physical activity. Medicine and Science in Sports and Exercise. 2002;34(12):1996-2001.
183. Australian Bureau of Statistics . Australian Social Trends 2002. Canberra: Australian Bureau of Statistics; 2002. Cat. no. 4102.0.
184. Best R. The Housing Dimension. In: Benzeval JaW, ed. Tackling Inequalities in health: An agenda for action. London: Kings Fund; 1995.
185. Commonwealth Department of Family and Community Services. Housing Dataset of Centrlink Recipients June 2001 2001.
186. Woodward M, Shewry M, Smith W, Tunstall-Pedoe H. Social status and coronary heart disease: results from the Scottish heart health study. Preventive Medicine. 1992;21:136-148.
187. Neville A. A state of family: Anglicare, Australia; 2002.
188. Australian Bureau of Statistics. Counting the homeless. Australian census analytical program 2001. Cat. no. 2050.0.
189. Townson M. Health and wealth: how social and economic factors affect our well being. Ottawa, Canada: The Canadian Centre for Policy Alternatives; 1999.
190. Queensland Health. Health education guidelines for disadvantaged young people. Brisbane: Youth Health Policy Unit, Queensland Health; 1993.
191. Queensland Injury Surveillance Unit. Injuries in the home-children. Injury Bulletin. 2001;No 66(June).
192. Queensland Injury Surveillance Unit. Injuries in the home-adults. Injury Bulletin. 2001;No 65(April).
193. Sleigh T, Turrell G. Measuring Socioeconomic Position in Population Health Monitoring and Health research: Current Issues and Future Directions. Brisbane: School of Public Health, Queensland University of Technology; unpublished.
194. Australian Bureau of Statistics. Measuring Australia’s Progress 2002. The headline indicators: Economic disadvantage and inequality. Canberra; Australian Bureau of Statistics. Cat. no. 1370.0; 2002.
195. Public Health Information Development Unit. A Social Health Atlas of Australia: University of Adelaide and Commonwealth Department of Family and Community Services; 1996.
196. National Centre for Social and Economic Modeling. Trends in income and expenditure inequality in Australia in the 80s and 90s. Canberra; University of Canberra. 2001.
197. Australian Bureau of Statistics. Socioeconomic Indexes for Areas. Canberra: Australian Bureau of Statistics; 2001. Cat. no. 2039.0.
198. NSW Department of Health. The health of the people of NSW. Report of the Chief Health Offi cer: NSW Department of Health; 2002.
199. Broom D. The distribution of illness: is Australia more equal? Social Science and Medicine. 1984;18(11):909-917.
200. National Advisory Committee on Health and Disability. The social, cultural and economic determinants of health in New Zealand: action to improve health. Wellington 1998.
201. Queensland Treasury. Labour force, 2004. Brisbane: Economic Policy Branch; 12 February 2004 2004.
202. Australian Bureau of Statistics. Labour force, Australia. Canberra: Australian Bureau of Statistics; 2003. Cat. no. 6202.0.
203. Australian Bureau of Statistics. Census of Population and Housing. Canberra: Australian Bureau of Statistics; 2001. Cat. no. 2015.0.
204. Australian Bureau of Statistics. Crime and safety. Canberra: Australian Bureau of Statistics; 2002. Cat. no. 4509.0.
205. Queensland Health. Communities and Local Government Partnership Area Plan 2002-2005.

1142 Health Determinants Queensland 2004
WHOLE OF POPULATION
206. Queensland Health. Community Action Planning and Information Resource. Available at: http://www.health.qld.gov.au/capir/.
207. Dillon J. Social Capital Index. 2002.
208. Bright M, Baig N, Cardona M, et al. Is social capital associated with health? Paper presented at: Joint Scientifi c Meeting of the International Epidemiological Association European Epidemiology Federation & the Spanish Society of Epidemiology; October, 2003; Toledo, Spain.
209. Winter I. Major themes and debates in the social capital literature: the Australian connection. Melbourne: Australian Institute of Family Studies; 2000.
210. Queensland Health. Social Capital: A Factsheet. Social Determinants of Health 2003.
211. Australian Bureau of Statistics. Household and family projections, Australia: 1996 - 2021 1999. Catalogue no. 3236.0.
212. Australian Bureau of Statistics. Household and family projections. Australia, 1996 to 2021. Canberra: Australian Bureau of Statistics; 1999. Cat. no. 3236.0.
213. Australian Bureau of Statistics. Voluntary Work, Australia. Canberra: Australian Bureau of Statistics. 2001. Cat. no. 4441.0.
214. Australian Bureau of Statistics. Caring in the community, Australia. Canberra: Australian Bureau of Statistics; 2000. Cat. no. 4436.0.
215. Environmental Protection Agency. State of the environment Queensland 1999. Brisbane 1999.
216. McCarthy M, ed. Transport and Health. New York: Oxford University Press; 1999. Marmot M, Wilkinson R, eds. Social Determinants of Health.
217. Statistics ABo. Australian Social Trends 2003. 2003.
218. Australian Bureau of Statistics. Use of the Internet by Householders, Australia 2000. Catalgogue No. 8147.0.
219. Australian Bureau of Statistics. Australian Social Trends. Canberra: Australian Bureau of Statistics; 2003. Cat. no. 4102.0.
220. Queensland Treasury. Queensland Household Gambling Survey 2001. Brisbane 2002.
221. Rose G. The strategy of preventive medicine. Oxford: Oxford University Press; 1992.
222. Singh M, de Looper M. Australian health inequalities: 1 birthplace. Bulletin no. 2. Canberra: Australian Instititue of Health and Welfare; 2002. AIHW cat. no. AUS 27.
223. Australian Bureau of Statistics. National Health Survey: Summary Results, Australian States and Territories. Canberra: Australian Bureau of Statistics; 1995. Cat. no. 4368.0.
224. DG Davilia DW. The etiology of lung cancer. Mayo Clin Proc. 1993;68:170-182.
225. Ridolfo B SC. The quantifi cation of drug-caused mortality and morbidity in Australia, 1998 2001. Catalogue no. PHE29.
226. Hill D, White V, Scollo M. Smoking Behaviours of Australian Adults in 1995; trends and concerns. Medical Journal of Australia. 1995;168:209-213.
227. Tan N, Wakefi eld M, Freeman J,. Changes associated with the National Tobacco Campaign: results of the second follow-up survey. In: Hassard K, ed. Australia’s National Tobacco Campaign: evaluation report volume 2. Canberra: Commonwealth of Australia; 2000.
228. National Health and Medical Research Council. Australian alcohol guidelines: health risks and benefi ts. Canberra 2001.
229. Armstrong T, Bowman A, Davies J. Physical activity patterns of Australian adults. Results of the 1999 National Physical Activity Survey. Canberra: Australian Institute of Health and Welfare; 2000. Cat. no. CVD10.
230. United States Department of Health and Human Services. The Surgeon general’s report on physical activity and health. Washington, DC: US Government Printing Offi ce; 1996.
231. Brown D, Blanton C. Physical activity, sport participation, and suicidal behaviour among college students. Medicine and Science in Sports and Exercise. 2001:1087-1096.
232. Baxter A. Metabolic syndrome and dietary patterns in Queensland [Honours]. Brisbane, University of Queensland; 2003.
233. Lakka H, Laaksonen DE, Lakka TA, Niskanen LK, Kumpusalo E, Tuomilehto J, Salonen JT. The metabolic syndrome and total and cardiovascular disease mortality in middle-aged men. Journal of American Medical Association. 2002;288(21):2709-2716.
234. Ford E, Giles WH, Dietz WH. Prevalence of the metabolic syndrome among US adults: Findings from the Third National Health and Nutrition Examination Survey. Journal of American Medical Association. 2002;287(3):356-359.

1143
WHOLE OF POPULATION
Health Determinants Queensland 2004
235. Jousilahti P, Vartiainen E, Tuomilehto J, Puska P. Sex, age, cardiovascular risk factors, and coronary heart disease: a prospective follow-up study of 14,786 middle-aged men and women in Finland. Circulation. 1999;99(9):1165-1172.
236. Department of Health and Aging. Australian guide to healthy eating 2001.
237. Laaksonen D, Lakka H, Niskanen L, Kaplan G, Salonen J, Lakka T. Metabolic syndrome and development of diabetes mellitus: application and validation of recently suggested defi nitions of the metabolic syndrome in a prospective cohort study. American Journal of Epidemiology. 2002;156(11):1070-1077.
238. Dunstan D, Cameron A, de Courten M, et al. The Australian Diabetes, Obestiy and Lifestyle Study (AusDiab). Brisbane: International Diabetes Institute; 2001.
239. Coyne T, Findlay M, Firman D, Ibiebele T. Overweight and obesity in Australia - an UNDERestimate of true prevalence? Medical Journal of Australia. to be published.
240. Dixon T, Waters AM. A growing problem: trends and patterns in overweight and obesity among adults in Australia, 1980 to 2001. Canberra: Australian Institute of Health and Welfare; 2003. AIHW Cat. no. AUS 36 Bulletin No. 8.
241. Health and Welfare Canada. Canadian guidelines for healthy weights: Report of an expert group convened by the Health Promotion Directorate. Ottawa: Ministry of Supply and Services; 1989.
242. Bennett S. Obesity trends in older Australians. Canberra: Australian Institute of Health and Welfare; 2003.
243. SIGNAL. Eat well Australia: An agenda for action for public health nutrition 2001-2010. Canberra: National Public Health Partnership; 2001.
244. Cook T, Rutishauser IHE, Seelig M,. Comparable data on food and nutrient intake and physical measurements from the 1983, 1985 and 1995 national nutrition surveys 2001.
245. World Health Organisation. Diet, nutrition and the prevention of chronic diseases 2003.
246. Wang J. Waist circumference: a simple, inexpensive, and reliable tool that should be included as part of physical examinations the doctor’s offi ce. American Journal of Clinical Nutrition. 2003;78(5):902-903.
247. Welborn TD, SS, Bennett, SA. Waist-hip ratio is the dominant risk factor predicting cardiovascular death in Australia. Medical Journal of Australia. 2003;179:580-584.
248. World Health Organization. Obesity: Preventing and managing the global epidemic. Report of a WHO Consultation on Obesity. Geneva 1997.
249. National Health and Medical Research Centre. Clinical guidelines for weight control and obesity management in adults. Canberra 2003.
250. Magarey AM, Daniels L A, Boulton T J. Prevalence of overweight and obesity in Australian children and adolescents: reassessment of 1985 and 1995 data against new standard international defi nitions. Medical Journal of Australia. 2001;174(11):561-564.
251. Department of Human Services. Social health atlas of young South Australians. Adelaide 2003.
252. Hill JO, Trowbridge F L. Childhood obesity: future directions and research priorities. Paediatrics. 1998;1998(Supplement):571.
253. Hill JO, Peters J C. Environmental contributions to the obesity epidemic. Science. 1998;280(5368):1371-1374.
254. Catford JC, Caterson I D. Snowballing obesity: Australians will get run over if they sit there. Medical Journal of Australia. 1/15 December 2003;179:577-579.
255. Goodman E, Whitaker R. A prospective study of the role of depression in the development and persistence of adolescent obesity. Pediatrics. 2002;110(September):497-504.
256. World Health Organization. Diet, nutrition and the prevention of chronic diseases. Geneva 2003.
257. Australian Bureau of Statistics. National Nutrition Survey - Nutrient Intakes and Physical Measurements, Australia 1995. Canberra: Australian Bureau of Statistics and Commonwealth Department of Health and Aged Care; 1995. Cat. no. 4805.0.
258. Turrell G, Hewitt B, Patterson C, Oldenburg B, Gould T. Socioeconomic differences in food purchasing behaviour and suggested implications for diet-related health promotion. Journal of Human Nutrition and Dietetics. 2002;15:1-10.
259. Turrell G, Blakely T, Patterson C, Oldenburg B. A multilevel analysis of socioeconomic (small area) differences in household food purchasing behaviour. Journal of Epidemiology and Community Health. 2004;58(3):208-215.
260. National Health and Medical Research Centre. Dietary guidelines for Australians. Canberra 2002.
261. Queensland Health. Omnibus Survey. Centre Health Information Centre; 2001.
262. Australian Bureau of Statistics. National Nutrition Survey: Foods Eaten. Canberra: Australian Bureau of Statistics; 1995. Cat. no. 4804.0.
263. Baghurst P, Beaumont-Smith N, Baghurst K, Cox D. The relationship between the consumption of fruits and vegetables and health status. Report to Department of Health and Aged Care and the Strategic Intergovernmental Nutrition Alliance 1999.

1144 Health Determinants Queensland 2004
WHOLE OF POPULATION
264. Queensland Health. Indigenous identifi cation survey. Health Information Centre; 2002.
265. Australian Bureau of Statistics. National health survey - summary of results, Australia 2002. Canberra: Australian Bureau of Statistics. Cat. no. 4364.0.
266. International Agency for Research on Cancer. Mammography screening can reduce deaths from breast cancer. www.iarc.fr. 2002.
267. Davey P, Stewart D, Spork H. Community Public Health Planning Review: Final Report. Brisbane: Queensland Centre for Public Health; 2003.
268. Commonwealth of Australia. Health Impact Assessment Guidelines. Canberra: enHealth; 2001.
269. European Centre for Health Policy. Health Impact Assessment: main concepts and suggested approach. The Gothenburg Consensus Paper, December 1999: World Health Organisation Regional Offi ce for Europe; 1999.
270. Ridolfo B, Stevenson C. The quantifi cation of drug-caused mortality and morbidity in Australia, 1998. Canberra: Australian Institute of Health and Welfare; 2001. Catalogue no. PHE29.
271. Holman CDJ, Armstrong B K, Arias L N, et al. The quantifi cation of drug caused morbidity and mortality in Australia 1998. Canberra: Commonwealth Department of Health and Community Services; 1990.
272. English DR, Holman C D J, Milne E, et al. The quantifi cation of drug caused morbidity and mortality in Australia, 1995 edition. Canberra: Commonwealth Department of Human Services and Health; 1995.
273. Bull F, Armstrong T, Dixon T, Ham S, Neiman A, Pratt M. Physical Inactivity. In: Ezzati M, Lopez A, Rodgers A, Murray C, ed. Comparative Quantifi cation of Health Risks: Global and Regional Burden of Disease due to Selected Major Risk Factors. Geneva: World Health Organisation; in press.
274. Harper C, Baade P, Kennedy B. The socio-demographic determinants of small area population health in Queensland: Queensland Health; 2002.
275. Coyne T, Findlay M, Firman D, Ibiebele T. Overweight and obesity in Australia - an underestimate of true prevalence? Medical Journal of Australia. 2004;180:93-94.
276. Muller S, Baade P, Coory M. Mortality and incidence trends for leading cancers in Queensland, 1992 to 1999. Brisbane: Health Information Centre, Queensland Health; 2002. Information Circular 59.
277. Australian Institute of Health and Welfare. Dental Statistics and Research Unit 2000.
278. Australian Bureau of Statistics. Housing and Infrastructure in Aboriginal and Torres Strait Islander Communities, Australia. Canberra 1999, 2001. Cat. No. 4710.0.
279. Australian Bureau of Statistics. National health survey users guide- statistical concepts library. Canberra: Australian Bureau of Statistics; 2001. Cat. no. 4363.0.5.001.
280. Australian Bureau of Statistics. Information Paper: National Nutrition Survey, Confi dentialised Unit Record File. Canberra: Australian Bureau of Statistics; 1995. Cat. no. 4807.0.
281. Australian Bureau of Statistics. Information Paper. Socioeconomic Indexes for Areas. Canberra: Australian Bureau of Statistics; 1996. Cat. no. 2039.0.
282. Australian Bureau of Statistics. Information Paper: Education and Training Experience. Confi dentialised Unit Record File. Canberra: Australian Bureau of Statistics; 1997. Cat. no. 6274.0.
283. Australian Institute of Health and Welfare. Health in Rural and Remote Australia. Canberra 1994. AIHW Cat no. PHE 6.
284. Department of Health and Aged Care and the National Key Centre for Social Applications of Geographical Information Systems (GISCA) University of Adelaide. Accessibility/Remoteness Index of Australia (ARIA) 1999. Occasional Papers Series no. 6.
285. Australian Bureau of Statistics. Australian Standard Geographical Classifi cation (ASGC). Canberra: Australian Bureau of Statistics; 2002. Cat. no. 1216.0.
286. Bush R, Mutch A, Dower J. Community Capacity Index. Brisbane, Queensland: Centre of Primary Health Care, University of Queensland; 2001.
287. Pols RG, Hawks D V. Is there are safe level of daily consumption of alcohol for men and women? Canberra: National Health and Medical Research Council; 1992.
288. Reaven G. Role of insulin resistance in human disease. Diabetes. 1988;38(12):1595-1607.
289. Kaplan N. The deadly quartet: upper-body obesity, glucose intolerance, hypertriglyceridemia, and hypertension. Arch of Int Medicine. 1989;149(7):1514-1520.
290. Balkau B, Charles M. Comment on the provisional report from the WHO consultation. Diabetic Medicine. 1999; 16(5):442-443.
291. National Public Health Partnership. Preventing Chronic Disease: A strategic framework. Canberra: Department of Health and Ageing; 2001.

Queensland Health
Queens andGovernment