Embed Size (px)
Citation preview

!
!! !
Institute of Clinical Medicine, Faculty of Health Sciences
Hearing in rock musicians !Carl Christian Lein Størmer A dissertation for the degree of Philosophiae Doctor – June 2018
!

! 2!
Dedicated to my dear friends and punk rock colleagues
Ståle “Sntzl” Brauten (1975 - 2013)
Morten Rydland Høyning (1982 – 2014)
© 2018 by Carl Christian Lein Størmer. All rights reserved.
Cover photo:
The Box of Mothers, live at Bastard Bar, Tromsø, Norway, 2011. Photo by the author.
ISBN 987&82&7589&594&1

! 3!
Abstract
Musicians are known to have an increased prevalence of hearing loss and tinnitus due to
noise-induced cochlear damage. Rock music is popularly considered a major culprit in terms
of excessive sound levels, but the literature on hearing in rock musicians is sparse. In this
dissertation the hearing levels of a large number of rock musicians are assessed in relation to
factors such as degree of exposure, instrument category, use of hearing protection and the
presence of various psychological characteristics.
In the first part of the dissertation, the degree of hearing loss is assessed using transient
evoked otoacoustic emissions (TEOAEs), under the assumption that cochlear injury could be
identified at an early stage by measuring otoacoustic emissions in musical noise-exposed
individuals. Within the rock musician sample, a loss of TEOAE SNR in the 4 kHz half-
octave frequency band was observed. However, this loss was strongly predicted by age and
pure-tone thresholds in the 3 - 6 kHz range.
In the second part of the dissertation, the degree of hearing loss is assessed using pure-tone
audiometry. A hearing loss in 37.8% (95% C.I.: 28.8 - 46.8%) of the rock musicians was
observed and significantly poorer hearing thresholds were found at most pure-tone
frequencies with the most pronounced threshold shift at 6 kHz. The use of hearing protection
had a preventive effect. Unexpectedly, the degree of musical performance exposure was
inversely related to degree of hearing loss.
In the third part of the dissertation, the prevalence and symptomatology of tinnitus is
assessed, and the distribution of anxiety and depression symptoms among rock musicians
with or without tinnitus is analyzed. The aim was to study how mental health indicators and
internal locus of control influence their tinnitus-related concerns, and to what degree tinnitus
affects their life. A prevalence of permanent tinnitus at 19.8% (95% C.I.: 14.3 - 29.7%) was
identified in rock musicians, which is significantly higher than in a normal population. There
is an association between chronic tinnitus and depressive symptoms in rock musicians, but
the results are ambiguous. There was an increased risk for anxiety and alcohol abuse in the
rock musician sample, but these factors were unrelated to severity of tinnitus.
! 4!
Neither pure-tone hearing thresholds nor TEOAEs differed significantly between the tinnitus-
affected musicians and non-tinnitus-affected musicians. This suggests that cochlear damage
is not the sole causative agent in tinnitus sufferers.
This work contributes to the understanding of the relationship between rock musical noise
exposure and hearing loss. Rock musicians are at increased risk for developing cochlear
damage leading to hearing loss and tinnitus, but tinnitus may also be caused by other factors.
These findings merit further research.

! 5!
Preface
This dissertation contains a cross-sectional survey of a sample of rock musicians (median age
30.4) based in Oslo, Norway. Various ear -/ hearing - and psychologically related parameters
have been studied in order to assess hearing loss and prevalence and severity of tinnitus. It
contains the results and conclusions from the following peer-reviewed publications, which
will be referred to as Paper I, Paper II and Paper III in the text.
I. Transient evoked otoacoustic emissions in rock musicians. Høydal E, Størmer CC,
Laukli E, Stenklev NC. Int J Audiol. 2017 Sep;56(0)685-691
II. Hearing loss and tinnitus in rock musicians: A Norwegian survey. Størmer CC, Laukli
E, Høydal EH, Stenklev NC. Noise Health. 2015 Nov-Dec;17(79):411-21
III. Tinnitus, anxiety, depression and substance abuse in rock musicians A Norwegian
survey. Størmer CC, Sørlie T, Stenklev NC. Int Tinnitus J. 2017 Jun 1;21(1):50-57

! 6!
Acknowledgements
The studies described in the dissertation were performed at the offices of Norsk Musikkråd
(Norwegian Music Council) in Oslo (musicians) and the Ear, Nose and Throat (ENT)
department at the University Hospital of Northern Norway (controls).
The author would like to sincerely thank:
Niels Christian Stenklev, whom has guided and inspired me over the past 12 years in the
work and continuous thought-process manifested in this dissertation.
Einar Laukli for offering his time, dedication and profound knowledge.
Tore Sørlie for enlightened and thought-provoking reflections and advice.
Erik Harry Høydal for invaluable contribution at critical parts and throughout the entirety of
the remaining project.
Jackie Coleman for literary advice.
Anders Kjærmann Jensen and Geir Inge Skinningsrud at Norsk Musikkråd for their
invaluable assistance with data collection in rock musicians. Claes Olsen of the Øya festival
for providing the list of bands and contact info. Thomas Leirvik and Bjørn Helge Handegård
for assistance with statistics.
Institute of Clinical Medicine at UiT The Arctic University of Tromsø for their continuous
belief and willingness to support this project.
My mother, father and sister for their support in and throughout all my endeavors.
My girlfriend.

! 7!
Contents
Abstract ………………………………………………………………………………………………………..... 3
Preface ………………………………………………………………………………………………………........ 5
Acknowledgements …………………………………………………………………………….……………….. 6
Contents ……….……………………………………………………………………………………….………... 7
Papers ………………………………………………………………………………………………. …………. 13
Notation ………………………………………………………………………………………………………... 14
Chapter 1
Introduction………….………………………………………………………………………………………….. 15
Chapter 2
Background …………………………………………………………………………………………………….. 17
2.1. The cochlea and sound processing ………………………………………………………………………... 17
2.2. Noise ……………..……………………………………………………………………………………….. 18
2.2.1. Measuring noise levels …………………………………………………………………………. 19
2.2.1.1. Sound pressure level ………………………………………………………………… 19
2.2.1.2. Sound level ………………………………………………………………………….. 19
2.2.1.3. Equivalent sound levels …………………………………………………………….. 19
2.2.2. Regulations ………………………………………………………………………………………20

! 8!
2.2.2.1. Occupational noise ……………………………………………………………….... . 20
2.2.2.2. Music ………………………………………………………………………………... 20
2.3. Noise-induced hearing disorders …………………………………………………………………………... 21
2.3.1. Noise-induced hearing loss ……………………………….…………………………………. 21
2.3.2. Tinnitus ………………………………………………………………………………………… 24
2.4. The rock musician ……………… ………………………………………………………………………… 29
2.5. Sound levels in musical performance ……………… …………………………………………………….. 31
2.6. Hearing protection ……………………………………………………………………………………….… 32
2.7. Hearing disorders in musicians ………………..…………………………………………………………... 33
2.7.1. Rock music and hearing disorders…….……………………….……………………………… 34
2.7.1.1. Rock music and hearing loss: Pure-tone audiometry………………………………... 34
2.7.1.2. Rock music and hearing loss: Otoacoustic emissions …..………………………….. 34
2.7.1.3. Rock music and tinnitus ….. ……………………………………........…………….. 35
2.7.1.4. Rock music and psychiatry …..………………………………………..…………… 35
2.8. Purpose of the dissertation ……. ………………………………………………………………………… 36
2.9. Examination of the auditory system ………………………………………………………………………. 37
2.9.1. Otomicroscopy ………………… …………………………………………………… ……….. 37
2.9.2. Tympanometry………………… …………………………………………………………….... 37
2.9.3. Pure-tone audiometry………………………………………………………………………….. 37

! 9!
2.9.4. Transient-evoked otoacoustic emissions ………………… ……………………………………38
2.9.5. Questionnaire ………………… ………………………………………………………………..38
2.9.5.1 Hearing-related questions ………………… ………………………………………...39
2.9.5.2. Psychiatric assessment instruments ………………………………………………… 39
2.9.5.2.1. Brief Illness Perception Questionnaire (BIPQ) …. ………………………39
2.9.5.2.2. Internal Health Locus of Control (IHLC) ………………………………. 39
2.9.5.2.3. Hospital Anxiety and Depression Scale (HADS) …. …………………….40
2.9.5.2.4. Sleep disturbance …………………………………………………………40
2.9.5.2.5. The Alcohol Use Disorders Identification Test (AUDIT) ………………. 40
2.9.5.2.5. The Drug Use Disorders Identification Test
(DUDIT) …………………………………………………………………………… 40
Chapter 3
Contribution of the present work ………………………………………………………………………………. 41
3.1. Aims of the study………………… …………………………………………………… …………………. 41
3.1.1. Paper I …………………………………… ……………………………………………………. 41
3.1.2. Paper II…………………………………… ……………………………………………………. 41
3.1.3. Paper III……………… ………………… …………………………………………………….. 41
3.2. Materials and methods ………………… ………………… ……………………………………………. . 42
3.2.1 Subjects ………………… ………………… …………………………………………………... 42

! 10!
3.2.1.1. Rock musicians …………………………………… ………………………………………… 42
3.2.1.2. Control group ………………………………………………………………………………… 43
3.3. Methods ………………… ………………………………………………………………………………... 44
3.4. Statistical analysis ………………………………………………………………………………………… 46
3.5. Ethics ………………… ……………………………………………………………………………………46
3.6. Results ………………… …………………………………………………………………………………. 47
3.6.1. Paper I ………………… ………………………………………………………………………. 47
3.6.1.1. TEOAEs in rock musicians ………………… ………………… ……………………47
3.6.1.2. TEOAEs: Instruments …………………………………………………….. ………. 49
3.6.1.3. TEAOEs: Exposure …………………………………… …………………. ………. 49
3.6.1.4. TEOAEs: Hearing protection ………………………………………………………. 49
3.6.1.5. TEOAEs: Tinnitus ………………… ………………………………………………. 51
3.6.1.6. Exposure to leisure noise………………… ………………… ……………..………. 52
3.6.2. Paper II ………………………………………………………………………………………… 53
3.6.2.1. Hearing threshold levels ………………… ……………………………….. 53
3.6.2.2. Hearing threshold levels: Instruments ….. ……………………………….. 57
3.6.2.3. Hearing threshold levels: Exposure …… ………………… ……………... 57
3.6.2.4. Hearing threshold levels: Hearing protection …..………………………… 58
3.6.2.5. Hearing threshold levels: Tinnitus …….…………………………………. 61
3.6.2.6. Otomicroscopy ………..…………………………………………………… 61

! 11!
3.6.2.7. Tympanometry …………………………………………………………… 62
3.6.3. Paper III ………… …………..………………………………………………………………… 63
3.6.3.1. Tinnitus in rock musicians ………………………………………………………….. 63
3.6.3.2. Mental health related parameters, internal health locus
of control and illness perception …………………….…………………………….. 65
3.7. Discussion …………………………………………………………………………………………………..71
3.7.1. Methodical considerations ……………………………………………………………………… 71
3.7.1.1. Design ………………… ……………………………………………………………..71
3.7.1.2. Subjects ………………… …………………………………………………………...71
3.7.2. The effect of rock music on the auditory system …….. ………………………………………..72
3.7.2.1. The outer ear canal and middle ear status …………………………………………... 72
3.7.2.2. Cochlear status ………………… ……………………………………………………72
3.7.2.2.1. Cochlear status: Instrument……………………………………………………..... 74
3.7.2.2.2. Cochlear status: Exposure ………………………………………………………... 77
3.7.2.2.3. Cochlear status: Hearing protection ……………………………………………… 75
3.7.2.2.4. Cochlear status: Tinnitus ………………………………………………………… 76
3.7.3. Gender effects …………………………………………………………………………………. 79
3.7.4. Intraear comparisons …………………………………………………………………………… 80
3.7.5. Potential interferences………………………………………………………………………….. 80

! 12!
3.7.5.1. Subjects ………………… …………………………………………………………..80
3.7.5.2. Age ………………………………………………………………………………….. 81
3.7.5.3. TEOAE ……………………………………………………………………………… 82
3.7.5.4. Pure-tone audiometry ……………………………………………………………….. 82
3.7.5.5. Questionnaire ……………………………………………………………………….. 83
3.8. Conclusions ………………………………………………………………………………………………… 86
3.9. Future work ………………… ……………………………...……………………………………………… 87
Bibliography …………………………………………………………………………………………………… 88
Appendix 1 ………………… …………………………………………………………………………………. 99
Papers
Paper I ………………… ………………………………………………………………………………………114
Paper II ………………… ……………………………………………………………………………………..121
Paper III ……………………………………………………………………………………………………..... 132
! 13!
Papers
I. Transient evoked otoacoustic emissions in rock musicians. Høydal E, Størmer CC,
Laukli E, Stenklev NC. Int J Audiol. 2017 Sep;56(0)685-691
II. Hearing loss and tinnitus in rock musicians: A Norwegian survey. Størmer CC, Laukli
E, Høydal EH, Stenklev NC. Noise Health. 2015 Nov-Dec;17(79):411-21
III. Tinnitus, anxiety, depression and substance abuse in rock musicians A Norwegian
survey. Størmer CC, Sørlie T, Stenklev NC. Int Tinnitus J. 2017 Jun 1;21(1):50-57

! 14!
Notation
ANOVA Analysis of variance
C.I. Confidence interval
dB Decibel
DPOAE Distortion product otoacoustic emissions
ECV Ear canal volume
ENT Ear, nose and Throat
kHz Kilohertz
MHF Mean high frequency
NIHL Noise-induced hearing loss
PTS Permanent threshold shift
SE Standard error
SOAE Spontaneous otoacoustic emissions
SNR Signal to noise ratio
TEOAE Transient evoked otoacoustic emissions
TTS Temporary threshold shift
X2 Chi-squared test

! 15!
Chapter 1
“We just like it loud, you know?”
Lemmy Kilmister of Motörhead (1945 - 2015)
Introduction
Exposure to excessive noise is a multifaceted health issue with huge socio-economical
consequence, responsible for an estimated annual loss of one million life years in the Western
European countries according to World Health Organization (Etienne Krug et al., 2015).
Alongside the development of progressively sophisticated public announcement (PA)
systems and in-ear/portable listening devices (from Walk-mans to iPods and smart phones),
there has been a growing societal and academic concern about a possible hearing loss
epidemic, especially in the young population (Twardella et al., 2017, Welch and Fremaux,
2017, Tronstad and Gelderblom, 2016). WHO estimated in 2015 that 1.1 billion young
people could be at risk of hearing loss due to unsafe listening, and that nearly half of the 12 -
35 year old population in middle and high-income countries is exposed to potentially
damaging sound exposure related to use of personal listening devices (Etienne Krug et al.,
2015). Musicians are, by the nature of their work, susceptible to hearing impairment through
their musical practice, and their ears could be considered their most important instrument.
Rock music is, by popular belief, considered to be a major culprit in terms of excessive sound
production (Kaharit et al., 2003). Moreover, has it has been suggested that rock musicians
show addiction-like behavior with regards listening to loud music (Schmuziger et al., 2012).
The earliest studies on sound exposure in musicians date back to the 1960s and, over the last
five decades, increasing numbers of studies on the subject have been published. Much of the
previous work suffers from small samples, methodical weaknesses, and conflicting findings.

! 16!
In this study, the hearing and hearing related symptomatology of a large number of active
rock musicians is assessed with regards to exposure, type of instrument, use of hearing
protection, and various relevant psychological factors and substance abuse. The study group
results are compared to a control group of healthy students.

! 17!
Chapter 2
Background
2.1. The cochlea and sound processing
Sound waves travel through the outer ear canal and set the tympanic membrane in motion.
The subsequent vibration of the membrane transmits energy through the three middle-ear
ossicles (malleus, incus, stapes). The stapes is attached to the oval window, a bone-covered
opening that leads from the middle ear to the vestibule of the inner ear. The cochlea is made
up of three semicircular canals: the scala tympani and scala vestibule, which contain the
perilymphatic fluid and in between these two lies the scala media, containing potassium-rich
endolymph. In the scala media the organ of Corti is located on the basilar membrane,
separating scala tympani and scala media. Energy transmitted through the oval window
results in a fluid wave across the basilar membrane. The organ of Corti has sensory
epithelium which run lengthwise down the cochlea’s entire scala media and its “hair cells”,
columnar cells each with bundles of 100-200 specialized cilias on top, that transform the
fluid waves into nerve signals. The cochlea is tonotopically organized, meaning that defined
geographic regions of the basilaris membrane vibrate at different sinusoidal frequencies due
to variations in thickness and width along the length of the membrane. The outermost hair
cells (near the oval window) register the highest frequencies, whereas cells close to the apex
register the lowest frequencies.
There are two separate types of hair cells: The outer hair cells, which have contractile
functions, and inner hair cells that are connected to afferent nerve fibers of the
vestibulocochlear nerve. A complete loss of outer hair cells would result in a hearing loss of
approximately 60 dB across the entire spectrum of frequencies. Since mammalian hair cells
do not regenerate, either spontaneously or after damage, noise-induced hearing cochlear
damage is irreversible.

! 18!
Auditory messaging is conveyed via two pathways in the nervous system, a primary and non-
primary (reticular sensory) pathway. The primary pathway consists of 3 to 4 relays, connected
through large myelinated fibers that conveys the auditory signal from the cochlea through the
cochlear nuclei (brainstem), superior olivary complex, superior colliculus (mesencephalus),
medial geniculate body (thalamus) to the auditory cortex. The majority of the auditory fibers
has crossed the midline before the second relay station, hence a unilateral cortical lesion
results in a moderate or subclinical hearing loss, while bilateral destruction would entail
cortical deafness. The primary auditory cortex is located bilaterally within the lateral fissure
and comprising parts of Heschl’s gyrus and superior temporal gyrus. In addition to receiving
afferent information, the area transmits efferent input to the lower areas of the auditory
system. As within the cochlea, the primary auditory cortex is tonotopically organized.
The non-primary (reticular sensory) pathway runs unilaterally, from the cochlea through the
cochlear nuclei (brainstem), a non-specific thalamus nuclei before ending in the polysensory
(associative) cortex. It is here that the auditory information is integrated with other sensory
modalities.
2.2. Noise
There is no clear physical distinction between sound and noise. In 1991, the US National
Institute for Occupational Safety and Health (NIOSH) defined noise as any unwarranted
disturbance within a useful frequency band (NIOSH, 1991). Furthermore noise is usually
classified either as occupational noise (e.g., noise in the workplace), or as environmental
noise (e.g., traffic, sports, playgrounds, music).
Occupational noise is considered a global health issue. In the United States of America more
than 30 million workers are exposed to hazardous noise (Tak et al., 2009) and according to
The Ministry of Climate and Environment half a million people in Norway are affected by
noise (MCE, 2015).
According to World Health Organization’s guidelines on community noise, adverse health
effects of noise includes noise-induced hearing loss, hearing impairment, tinnitus,
hypertension, ear discomfort, aural pain, interference with speech communication, sleep
disturbance, headaches, fatigue, irritability, affected performance (task performance,

! 19!
distraction, productivity) and annoyance (WHO, 2001). Occupational noise may also be
associated with ischemic heart disease (Suadicani et al., 2012).
2.2.1. Measuring noise levels
2.2.1.1. Sound pressure level
Sound is defined as a local pressure deviation from ambient atmospheric pressure that is
caused by a sound wave. The sound pressure level (SPL) is a measure of the air vibrations
that make up sound. It is measured on a logarithmic scale in units of decibels (dB), which
indicate the loudness of the sound and are expressed as dB SPL. In a normal hearing subject,
the auditory threshold is 0 dB SPL, normal conversation sound pressure levels are around 40 -
60 dB SPL, and pain threshold at upper middle frequencies is around 130 - 140 dB SPL.
2.2.1.2. Sound level
The human ear is not equally sensitive to sounds at different frequencies. To adjust for the
perceived loudness of the sound, a spectral sensitivity factor is used to weigh the sound
pressure level at different frequencies. These so called A-weighted sound pressure levels are
expressed in units of dB(A).
2.2.1.3. Equivalent sound levels
When sound levels fluctuate over time, the equivalent sound level is determined for a specific
period. The A-weighted sound level is averaged over a period of time (T) and is designated by
LpAT. A common exposure period, T, in regulations is 8 h, which is designated by the LpA8h.
The C-weighted sound level, or the “Peak sound pressure level”, represents the absolute peak
value to be measured. It is designated by LpCpeak. LpAFmax refers to maximum sound pressure
level, the highest reading a conventional sound level meter gives over a period for given time-
weighting.

! 20!
2.2.2. Regulations
2.2.2.1. Occupational noise
Noise regulations are frequently based on the International Organization for Standardization’s
ISO 1999 (ISO, 1990) and/or the European Directive 2003/10/EC of the European Parliament
and the Council of 6 February 2003 (EU, 2003)) that regulates occupational noise exposure.
In general the WHO Guideline values for the effect of noise is >55 dB(A) by day and >45
dB(A) by night. According to the ISO standard, an employee can be exposed to 85 dB LpA8h
without contracting noise-induced hearing loss. The European Directive limits the exposure to
87 dB L pA8h , and also sets a lower and upper action limit to 80 and 85 dB(A). ISO 1999 is
also based on the Equal Energy Hypothesis (EEH), which assumes that an equal amount of
sound energy always leads to the same potential for damage. Thus one can change the
exposure distribution and/or increase sound levels while reducing exposure time, or vice
versa, with the damage remaining constant so long as the energy remains constant. In
Norway, The Working Environment Act defines the limits of allowed noise exposure in a
work environment (The Working Environment Act § 4 - 4). The act states that workers
should not be exposed to a LpAT that exceeds 85 dB(A) over the duration of an 8 hour work
day and/or the maximum peak sound level (LpCpeak) should not exceed 130 dB(C) (max sound
level) (Tronstad and Gelderblom, 2016).
2.2.2.2. Music
In general, WHO recommends for festivals and events that the LpA4h does not exceed 100 dB,
and the number of such exposures be limited to less than five per year. The LpAFmax is
recommended to not surpass 110 dB. Various countries have individually set regulations
(Berglund et al., 2000). In Sweden, the government differentiates attendees over and under 13
years of age: For those under 13 years the limit is set at LpAT 97 dB(A) and LpAFmax 110
dB(A); For those over 13 years LpAT 100 dB(A) and LAFmax 115 dB(A) (SOSFS, 2005). In
Norway, The Norwegian Directorate of Health has produced a guideline for concert and

! 21!
festival organizers, setting a critical limit of LpA30min at 99 dB (applies to the loudest 30
minutes of a concert) and LpCpeak at 130 dB(C) (Health, 2011). Hence, the WHO standard is
slightly less restrictive but limits the musician and/or concert attendee to no more than five
episodes per year, whilst the Norwegian guideline does not limit the frequency.
With regards to personal listening devices, the International Electrotechnical Commission
specifies standards for sound level limits. These are defined as a standard acoustic output
level LpAT not greater than 85 dB(A), and a maximum output from player and listening device
not greater than 100 dB(A) (IEC, 2014).
2.3. Noise-induced hearing disorders
Noise exposure is associated with auditory injury that entails hearing loss and tinnitus. It can
also lead to less frequent conditions which include diplacusis and hyperacusis. Diplacusis is
the perception of single auditory stimulus as two separates sounds. Hyperacusis is an
increased sensitivity to certain frequencies or volume ranges of sound, or a collapsed
tolerance to usual sound environment. In this dissertation the focus is on the two most
prevalent conditions: Hearing loss and tinnitus.
2.3.1. Noise-induced hearing loss
Approximately 5 % of the world’s population suffer from noise-induced hearing loss (NIHL),
and the US National Institute for Occupational Safety and Health has deemed that NIHL is
the most prevalent form of hearing loss, surpassing presbyacusis (age-related hearing loss)
(Oishi and Schacht, 2011). While NIHL due to occupational noise has been reported to have
become less prevalent in industrialized countries (Nelson et al., 2005, Lie et al., 2016), NIHL
is still regarded as one of the most reported work-related diseases worldwide (Lie et al.,
2017). Occupational groups at risk of NIHL include military, construction, and agriculture
workers as well as others with high noise exposure. However, in the last decades another form
of environmental noise hazard as a result of recreational music listening has arisen as a
primary societal and scientific health concern. It has been proposed that the rise is partly
caused by the increased use of personal listening audio devices (PADs), in which a 75%

! 22!
increase in use from 1990 to 2005 has been reported (Henderson et al., 2011). A 2010 study
showed that the prevalence of hearing loss among US teenagers (12 - 19 years old) rose from
3.5% to 5.3% between the years of 1994 and 2006 (Shargorodsky et al., 2010f). In recent
years smartphones have replaced the role of PADs, with world-wide sales in 2011 at
approximately 470 million units and rising (Etienne Krug et al., 2015). Still, the literature on
hearing loss due to leisure musical exposure per PADs is ambiguous. A large Norwegian
population study published in 2016, based on data collected between 1996 and 1998,
concluded that a history of recreational exposure to loud music, such as playing in a band or
going to rock concerts, was not associated with notched audiograms. These results were in
corroboration with previous findings (Tambs et al., 2003, Lie et al., 2016). In contrast,
Meyer-Bisch found a significant threshold increase in frequent PAD-users (>7 hours per
week) compared to less frequent users (2 - 7 hours per week) (Meyer-Bisch, 1996). A
Chinese systematic review from 2015, citing a total of 26 studies, reported that up to 58.2% of
participants exceeded the 100% daily dose, particularly in the presence of background noise.
Noise exposure can lead to a temporary threshold shift (TTS), or leave a residual permanent
threshold shift (PTS). TTS is often viewed as a less severe form of PTS, but recent studies
have indicated that TTS may be mediated by distinct mechanisms (Housley et al., 2013,
Telang et al., 2010). The association between transient and permanent threshold shifts is not
fully established, but recovery of even extensive TTS (up to 50 dB) over time has been
observed (Ryan and Bone, 1978).
However, given sufficient noise exposure, the cochlear ability to recover is overwhelmed, and
the damage becomes irreversible (PTS).
The pathophysiological pathways of cochlear damage have been the focus of intense research
in the last 20 years. A complex explanatory model encompasses outer hair cell damage
inflicted by reactive oxygen species (Kopke et al., 1999), active stimulation of intracellular
stress pathways and even direct mechanical disruption of HC stereociliar arrays and
compromised integrity of sensory epithelium (breaching of the barrier between the endo- and
perilymph). This damage is thought to lead to either programmed (apoptosis) or necrotic hair
cell death (Kurabi et al., 2017). Recent studies have suggested that cochlear synaptopathy
may also be a key contributor to hearing loss and perceptual difficulties (Kobel et al., 2017).
In addition to cochlear damage, noise trauma can cause damage in the central auditory
pathways. Overstimulation can cause early cell loss in the ventral cochlear nucleus following

! 23!
noise exposure. The subsequent loss in cell mass in higher auditory structures is, however,
caused by sensory deprivation. This is believed to be partially compensated by changes in
network homeostasis. However, central nervous processing of auditory signaling is
considered to be permanently impaired by neuroplastic changes (Basta et al., 2017).
Noise-induced hearing loss is most frequently diagnosed using pure-tone audiometry. In the
audiogram, it usually presents itself with a notch-shaped high-frequency sensorineural loss at
3, 4 and/or 6 kHz (Rosler, 1994). However, variations occur and there is an ongoing debate
regarding the application of notches to distinguish NIHL from other causes of hearing loss
(Engdahl et al., 2005, McBride and Williams, 2001, Osei-Lah and Yeoh, 2010). A
Norwegian study from 2017 concluded that a bilateral audiometric notch was indicative of
NIHL only when coupled with a comprehensive noise exposure history as disclosed by the
subject (Lie et al., 2017). Coles et al proposed in 2000 three main requirements (R) for the
diagnosis of NIHL: R1, High frequency hearing impairment; R2, Potentially hazardous
amount of noise exposure; R3, identifiable high-frequency audiometric notch. In addition
they introduced four modifying factors (MF): MF1, the clinical picture; MF2, compatibility
with age and noise exposure; MF3, Robinson’s criteria for other causation; MF4,
complications such as asymmetry, mixed disorder, conductive hearing impairment (Coles et
al., 2000). Furthermore, if harmful noise exposure continues, it has been demonstrated that
affected frequencies will broaden and progress in severity (Chen and Tsai, 2003). WHO’s
definition of hearing impairment is shown in Table 1 (WHO, 2000).
Antioxidants have been shown to be effective in reducing acoustic trauma in animal models,
but this has not been confirmed in humans (Kramer et al., 2006). There have been claims of
advances in gene therapy (Sun et al., 2011) and the development of pharmacological agents
for prevention or reversal of NIHL (Oishi and Schacht, 2011), but at present there are no
cures available for NIHL apart from limited management options, such as hearing aids and
counseling. Furthermore, there are other known associated risk factors, such as genetic
predisposition, age, diabetes, hypertension, ototoxic medications and cigarette smoking.
Because of the difficulties in identifying the most susceptible individuals, prevention is
considered the most effective strategy according to WHO (Etienne Krug et al., 2015).

! 24!
Grade of impairment
Audiometric ISO value
(average of 500, 1000,
2000, 4000 Hz) Impairment description
0 (No impairment) 25 dBHL or less (better ear)
No or very slight hearing
problems.
1 (Slight impairment) 26 - 40 dBHL (better ear)
Able to hear and repeat words
spoken in normal voice at 1
meter
2 (Moderate impairment) 41 - 60 dBHL (better ear)
Able to hear and repeat words
using raised voice at 1 meter
3 (Severe impairment) 61 - 80 dBHL (better ear)
Able to hear some words
when shouted into better ear
4 (Profound impairment)
81 dBHL or greater (better
ear)
Unable to hear and understand
even a shouted voice
Table 1: WHO-grades of hearing impairment (WHO, 2000).
2.3.2. Tinnitus
The word tinnitus comes from Latin “tinnire” – “to ring”, which, when referring to subjective
tinnitus, describes the phenomenon of phantom sound perception (Jastreboff, 1990) or the
perception of an internal sound in the absence of an external stimulus (Lockwood et al.,
2002). In objective tinnitus the perceived sound has an objective somatic source, e.g.,
myoclonic contractions of the tensor tympani muscle or blood vessel bruits, and is far less
common than the subjective form. In this dissertation, “tinnitus” is used to describe
subjective tinnitus.
Tinnitus can appear as an isolated idiopathic symptom, or associated with any type of hearing
loss. It can also be associated with drug toxicity, acoustic neuroma, middle ear disease and
depression (Savage and Waddell, 2014). The diagnosis is, to a large extent, based on the
patient’s own description. Tinnitus can be present in one or both ears, as a ringing, buzzing,
cricket-like, hissing, whistling or humming sound (Lockwood et al., 2002). The pitch of
tinnitus usually corresponds to the frequency at which hearing loss becomes clinically
significant (Meikle et al., 1984). Mono-frequency tinnitus is most common, but monaural
double frequency tinnitus occurs, most commonly in sudden onset tinnitus (Zagolski and

! 25!
Strek, 2017). A 1990 study showed that the mean elapsed time from symptom onset to
seeking medical attention among 500 tinnitus patients was 5.4 - 8.6 years (Stouffer and Tyler,
1990).
The prevalence of mild tinnitus in industrial countries has been reported to be up to 18%,
whereas 0.5% report that their tinnitus has severe negative effects on their daily life function
(Savage and Waddell, 2014). WHO estimates the Disability-Adjusted Life Year (DALY) for
noise-induced tinnitus to be 22.000 years for the European adult population (WHO, 2011). In
Norway, a 2010 population study including 32430 adult participants documented a tinnitus
prevalence of 11% in subjects that had no history of childhood hearing disorders, and 15% in
cases with childhood hearing disorders (Aarhus et al., 2015). A 2010 US study documented
that tinnitus had occurred in 25.3% of US adults, with 7.9% experiencing it frequently
(Shargorodsky et al., 2010a). Studies from Europe (Krog et al., 2010), Asia (Michikawa et
al., 2010) and Africa (Lasisi et al., 2010) corroborate these observations, indicating a global
health issue. The socio-economic consequences of tinnitus and hearing loss are substantial, as
illustrated by a Swedish study that documented a threefold increase in risk of disability
pension in patients with sickness leave due to otoaudiological diagnoses, especially tinnitus
and hearing loss, compared to those with absence due to non-otoaudiological diagnoses
(Friberg et al., 2012).
Pathophysiology and treatment of tinnitus are fields of intensive research, yet the mechanisms
causing the phantom sound perception remain unclear. Noise-induced hearing loss has been
known to be the most prevalent risk factor for developing tinnitus (Coles, 1984) and tinnitus
is often associated with peripheral hearing loss. However, tinnitus remains after auditory
nerve transection or lesions in the cochlear nucleus, suggesting involvement of more central
mechanisms (Brozoski and Bauer, 2005). Noise-induced damage can lead to tinnitus
occurring at the level of the inner hair cell synapse and partial degeneration of the cochlear
nerve, which can occur even after moderate noise exposure (Bing et al., 2015). The prevailing
view is that a decrease in afferent input to the auditory cortex is associated with abnormal
cortical activity and cortical reorganization resulting in the phantom sound perception (Sun et
al., 2008). In a 2008 study by Del Bo et al., a group of normal hearing people were placed in a
sound-proof room for 5 - 10 minutes, after which almost all of them described hearing sounds
resembling those of tinnitus. This was interpreted as the result of a short-term synaptic gain
increase along the auditory pathway or a release from inhibition in the absence of auditory
! 26!
input (Del Bo et al., 2008). It has also been shown that tinnitus is mediated by a cortical area
lacking map reorganization, suggesting that homeostatic plasticity plays a role. Sensory
deprivation-induced homeostatic down-regulation of inhibitory synapses may contribute to
tinnitus perception (Yang et al., 2011). Moreover, in patients with hearing loss, the
deafferentation of tonotopically-organized central auditory structures can lead to increased
synchronized firing rates and neural synchrony in the hearing loss frequency region. Also,
cross-modal compensation in subcortical structures can contribute to tinnitus. Pinchoff et al.
showed that two out of three tinnitus patients could alter the tinnitus perception by clenching
their jaw or neck muscles (Pinchoff et al., 1998). While current studies do not converge on a
consensus regarding the role of non-auditory centers in tinnitus, there is a growing view that
multiple brain areas controlling executive functions may be linked to each other through
temporally coordinated activity, which could explain the mechanism behind the phantom
sound (Buckner et al., 2009). Rauschecker et al. reported in 2010 a model in which paralimbic
structures interact with the thalamo-cortical sensory/perceptual systems in a noise-cancelling
feedback loop. Under normal circumstances, the tinnitus signal is cancelled out at the level of
the thalamus by the inhibitory feedback loop involving the ventromedial prefrontal cortex and
nucleus accumbens, reaching the thalamic reticular nucleus, which in turn inhibits the medial
geniculate nucleus, acting as a tinnitus-canceller. They suggest that if these paralimbic
structures are compromised, inhibition of the tinnitus signal at the thalamic gate is lost, and
the signal is further relayed to the auditory cortex, resulting in cortical reorganization and
chronic tinnitus (Rauschecker et al., 2010).
Furthermore, tinnitus in different frequencies may be associated with different underlying
mechanisms of tinnitus generation (Zhao et al., 2010). A 2014 study indicated that there is an
association between the concentrations of selected stress cytokines and degree of tinnitus
severity (Szczepek et al., 2014). Probst et al. found that even if stress hormones show a
circadian rhythm, tinnitus severity and loudness was dependent on time-of-day independent
of circadian stress hormone variations, with increased symptoms at night and early morning
(Probst et al., 2017).
There are also several studies suggesting that tinnitus cannot be explained by auditory damage
and/or malfunction alone. Salviata et al. claim that the perception of tinnitus severity is
correlated more closely with psychological and general health factors than with audiometric
parameters (Salviati et al., 2014), identifying a prevalence of psychiatric conditions in their

! 27!
tinnitus sample to be 44%. It has been shown that depression and anxiety are significantly
associated with variations in tinnitus symptomatology (Geocze et al., 2013, Ooms et al.,
2012). A Swedish study found that a decrease in depression was associated with a decrease in
tinnitus prevalence, and even more markedly associated with a decrease in tinnitus severity
(Hebert et al., 2012). A Brazilian study systematically reviewing 15 articles, reported a high
prevalence of psychiatric disorders in tinnitus-affected patients, with the presence of disorders
correlating with tinnitus-related severity and annoyance (Pinto et al., 2014). Probst et al.
found that emotional valence had an at least equally strong mediating influence on how
tinnitus loudness leads to tinnitus distress (Probst et al., 2016)
Few studies have investigated psychiatric disorders in tinnitus patients using validated
diagnostic interviews (Sahlsten et al., 2017), and whether psychiatric disorders are causal,
pre-disposing or consequences of tinnitus is unclarified. In addition to DSM-IV diagnosis of
psychiatric disorders (axis-I), personality traits and disorders (axis-II) such as high levels of
neuroticism, psychasthenia (psychological disorders characterized by phobias, obsessions,
compulsions, or excessive anxiety), alexithymia (a personality trait with tendencies to express
psychological stress somatically) and schizoid traits have also been found to be associated
with tinnitus perception (Mucci et al., 2014, Wielopolski et al., 2017). Neuroticism is known
to correlate strongly with symptoms of general distress or negative affectivity (Watson and
Naragon-Gainey, 2014). Sahlsten et al. reported in 2017 that the lifetime rate of obsessive-
compulsive personality disorder in tinnitus patients was 8.4% (Sahlsten et al., 2017). Tinnitus
is more symptomatic when patients focus their attention on the perceived sound.
Correspondingly, the severity of tinnitus has been found to correlate positively with external
locus of control and negatively with internal locus of control (Budd and Pugh, 1995). In their
study, the locus of control was observed to affect tinnitus severity only indirectly, as partial
correlations indicated that this effect was mediated by the locus of control on anxiety.
Contrary to popular belief, alcohol abuse has not been identified as a significant risk factor for
tinnitus (Park et al., 2014).
There are no standardized treatments for tinnitus, and studies of the therapeutic effect of
tricyclic antidepressants, benzodiazepines, acupuncture, hypnosis, electromagnetic
stimulation, hearing aids, ginkgo biloba (plant extract), acamprosate and carbamazepine have
not shown significant effects. Rauschecker et al. suggest that identifying the transmitter
systems involved in the brain’s intrinsic noise-cancellation systems involving paralimbic

! 28!
structures could merit future drug treatments of tinnitus (Rauschecker et al., 2010).
Cognitive-behavioral treatment may improve overall symptoms, but has not been shown to
reduce tinnitus loudness (Savage and Waddell, 2014). There are other established treatment
methods that are designed to increase input to the auditory system, such as cochlear implants
and hearing aids (Schaette et al., 2010), neurobiofeedback and different forms of electrical
stimulation of brain structures. However, evidence of the effectiveness of these methods is
scarce (Hoare et al., 2011).
Tinnitus retraining therapy combines directive counseling and acoustic enrichment to
promote habituation and reduce tinnitus annoyance and awareness. Acoustic enrichment is
implemented with white noise generators, hearing aids or combination devices, and
counseling is designed to address false perceptions, emotional reactions and cognitive
distortions. In 1971 Feldman discovered that tinnitus patients experienced a temporary
reduction of their tinnitus after being exposed to masking sounds (Feldmann, 1971). This
phenomenon has since been described as residual inhibition (RI), or post-masking
suppression (Tyler et al., 1984), which is the basis for masking therapy. RI is produced by
presenting masking sounds at levels exceeding the loudness of tinnitus for at least 10 seconds
(Terry et al., 1983). The duration of subsequent RI is usually around tens of seconds, but
there are reports of RI lasting several minutes (Vernon and Meikle, 2003). A 2006 US study
showed significantly better outcome from TRT treatment as compared to masking in patients
with severe tinnitus (Henry et al., 2006). A Cochrane review from 2012 concluded that the
literature failed to show strong evidence for the efficacy of sound therapy in tinnitus
management (Hobson et al., 2012). However, it was observed that a lack of quality in the
research area, plus widespread use of combined treatments (sound therapy and counseling)
could in part be responsible for the lack of conclusive evidence. It is also suggested that the
heterogeneity of the clinical features of tinnitus and underlying pathophysiological
mechanisms cause difficulties in creating a standardized model for clinical tinnitus trials, thus
yielding suboptimal research results (Landgrebe et al., 2012). Beukes et al. highlight the
importance of providing tinnitus interventions that can assist people in coping with tinnitus,
especially in patients less likely to associate their tinnitus with any positive experience
(Beukes et al., 2017). Salviati et al. recommend supplemented diagnostic studies with
psychiatric evaluation in any patient scoring greater than 36 on their Tinnitus Handicap
Inventory (THI)-questionnaire (Salviati et al., 2013).

! 29!
2.4. The rock musician
An exact number of active rock musicians is not known. In 2010, approximately 176.000
Americans earned a living as a “musician or singer” according to the US Bureau of Labor
Statistics (Bureau of Labor Statistics, 2013), but genre is not defined. Similar figures in
Norwegian registers was not available. In addition, it is conceivable that only a minor
proportion of active rock musicians are able to live off their craft, hence it is difficult to
obtain a representative number of rock musicians from official registers.
“Rock music” is a broad musical genre rooted in the African-American musical traditions of
blues, rhythm and blues and country music. One generally considers that the genre came into
its own in the 1950s and from that period developed into the loose term “rock music”. Today
rock music comprises a hundred-fold of subgenres, from soft rock to black metal, punk to
psychedelic rock, death metal to jazz-rock, grunge to Britpop, grindcore to shoegaze, college
rock to indie pop, indie rock to heartland rock, post-grunge to alternative metal, nu-metal to
new wave of American metal, folk rock to post-britpop, emo to screamo, new wave to rap
rock, indietronica to dance-punk, rap metal to garage rock, post-punk to post-rock, post-metal
to alternative rock and so forth (Studwell W.E., 1999).
Instrumentally, the core of rock music is the amplified guitar, supported by the electric bass
and percussion from a drum kit combining drums and cymbals. This classic trio is often
complemented by inclusion of one or more instruments (such as keyboards, piano,
synthesizer and/or brass instruments). A rock band typically consists of three to five
members (Curtis M, 1987).
Contrasting other styles of popular music, rock has since its conception been characterized by
a rebellious, anti-establishment attitude, as manifested lyrically through themes addressing
social injustice, sex and alternative lifestyles (Ammer, 2004). In an anthropologic
perspective, it is debated whether young rock musicians in certain musical collectives (or
subcultures) could be conceived as belonging to specific scenes and/or or tribes (or neo-
tribes), however there is no consensus on this at present (Hesmondhalgh, 2005). According to
the encyclopedic definition, a subculture is “a group that has belief and behaviors that are
different from the main groups within a culture or society”. Furthermore, rock music has

! 30!
been popularly associated with alternative and unhealthy lifestyles. A US trans-sectional
study (n=3278) showed that one third of the participating musicians perceived drug use
amongst their peers was common and that non-classical musicians used significantly more
drugs than classical musicians. The most frequent drug used included marijuana, cocaine and
amphetamine (Chesky, 1999). A Finnish study showed a tight and complex, yet
contradictory, connection between music-making in non-professional rock musicians and
substance abuse (Grønnerød, 2002). Furthermore, academic interest in the phenomenon of
rock musician life has led to a wide array of studies, including understanding substance abuse
and addiction through Black Sabbath lyrics (Conway and McGrain, 2016), manifestations of
psychosis through the music of Pink Floyd (Fusar-Poli, 2007) and several studies
investigating the psychological characteristics associated with various musical
genres/subcultures. Martin et al. claim in their 1993 to have found significant associations
between rock/metal and suicidal thoughts and drug use (Martin et al., 1993). An Australian
review found that several studies observed a relationship between specific genres and anti-
social behaviors. The investigators rejected, however, that music was a causal factor (Baker
and Bor, 2008). In contrast, it has been suggested that listening to heavy metal music could
represent a valuable resource for young people in difficulties (Baker and Brown, 2016). In an
Australian review of 96 autobiographies of recognized musicians or rock stars 82% described
addictions, with the most common being alcoholism, opiate addiction and cocaine addiction.
The mean age of the authors at the time of book releases was 50 years and 17% were female
(Oksanen, 2013).
Professional female instrumentalist are uncommon in many rock subgenres such as heavy
metal. Schaap and Berkers claim that women are likely to be subjected to gender-biased
evaluations, however they also observe that these attitudes are changing (Schaap and
Berkers, 2014). According to a 1993 US study, the marked gender-bias is also present in the
musical preferences in young people, with findings that 70.7% of males prefer rock music
versus 74% of females prefer pop music (Martin et al., 1993).

! 31!
2.5. Sound levels in musical performances
Sound levels in a classical orchestras vary between 80 and 100 dB LpAFmax (Laitinen et al.,
2003). O’Brien et al. found that the principal trumpet, first and third horns and the principal
trombone were at greatest risk of exposure to excessive, sustained noise levels, whereas
percussion and kettledrums are at greatest risk of exposure to peak noise levels (O'Brien et
al., 2014e). Jansson and Karlsson observed that the permitted sound dose from “heavy”
symphonic music was reached for exposed positions (e.g., in front of trumpet players) after
10 hours per week and after 25 hours in “normal” positions (Jansson and Karlsson, 1983). In
opera, sound levels have been reported to vary between 92 and 94 dB(A) (Laitinen et al.,
2003) and there are data to show that maximum levels of more than 110 dB LpAFmax can be
produced in choir singing (Steurer et al., 1998). Gopal et al reported sound levels ranging
from 95 - 105 dB(A) in jazz bands (Gopal et al., 2013) and another study reported sound
levels of up to 108 dB(A) in dance music night clubs (Bray et al., 2004). Gunderson et al.
reported performance levels in 31 music night clubs ranging from 94.9 to 106.7 dB(A), and
an overall sound level average, including both performance and ambient sound, from 91.9 to
99.8 dB(A) (Gunderson et al., 1997).
A 2017 German study identified 2143 students’ personal audio device user habits in which
85% reported using PADs. Exposure levels exceeded 80 dB(A) in one third and 85 dB(A) in
one quarter of the students. An audiometric notch was found in 2.3% of the students, but this
finding was not significantly associated with higher PAD exposure (Twardella et al., 2017).
Rock music is commonly performed at high sound levels. It contains all audible frequencies,
though dominated by the lower frequency spectra and variations of sound levels during rock
concerts are minor (Axelsson and Lindgren, 1977).
Sound levels at rock concerts vary between 100 and 115 dB LpAFmax with peak values
exceeding 140 dB LpCpeak (Kaharit et al., 2003). A 2012 US study was performed using noise
dosimeters on members of a rock band during one 2 hour rehearsal and one 4 hour
performance, measuring time-weighted averages (TWA) and daily dose values using
Occupational Safety and Health Administration (OSHA) and NIOSH criteria. They found
values ranging from 84.3 - 90.4 dB(A) (OSHA) and 90.0 - 96.4 dB(A) (NIOSH) during
rehearsal and daily doses ranging from 45.5% to 106.7% (OSHA) and 317.7% to 1396.1%

! 32!
(NIOSH). For performance values ranged from 91.0 - 99.7 dB(A) (OSHA) and 94.0 - 102.9
dB(A) (NIOSH) with daily doses ranging from 114.7% - 382.5% (OSHA) and 793.3% -
5970.2% (McIlvaine et al., 2012). Another US study among music students (genre not
disclosed) reported that the musicians in average were subject to a mean level of 98 dB LpAT
through 11,5 hours of rehearsal per week, whereas the 94% reporting to attend nightclubs
and/or concerts at least once a week were exposed to a mean of 98.9 dB LpAT over the course
of a mean 4.5 hour period. The authors suggested an extremely high hazard of excessive
noise exposure, both through practice and attending clubs/shows (Barlow, 2010). Meyer-
Bisch also reported an increased risk of NIHL in frequent concert attendees (Meyer-Bisch,
1996).
2.6. Hearing protection
There are numerous forms of hearing protection available for musicians. Historically, hearing
protectors such as earmuffs and disposable foam earplugs have been available, but hardly
tolerated by musicians due to the high degree of spectral distortion. However, researchers in
the late 80s developed custom-molded “musician’s earplugs”, which acoustically favors the
musician’s hearing by incorporating a filter that offers 9, 15 or 25 dB attenuation across the
frequencies. This yields minimal spectral distortion up to 8 kHz resulting in a more even
attenuation across the frequency spectrum (Killion et al., 1988).
Several studies address the use of hearing protection in classical musicians (Jansen et al.,
2009, Laitinen, 2005, Laitinen and Poulsen, 2008, Zander et al., 2008). An Australian review
concludes that earplug use is poor, especially for use during performance. The majority of
musicians used custom-molded musician earplugs. Other less frequent types included
disposable foam earplugs, generic musician’s earplugs and “improvised” earplugs (e.g.,
cotton, wool). Reasons for negative attitudes towards earplugs included limitation of one
own’s performance and difficulties hearing the sonority, dynamics and articulation of other
musicians (O'Brien et al., 2014a).
A recent innovation in the field is electronic earplugs that only attenuate when sound levels
become excessive. However, classical musicians reported issues that included difficulties

! 33!
with assessing orchestral balance, perception of dynamics and quality of sound when using
such devices (O'Brien et al., 2014a).
In classical music, another protective measure is acoustic screens. These are transparent
screens that are placed between musicians at request. However, these measures have been
shown to have a minor sound-reducing capacity, only contributing 3 - 6 dB in attenuation of
sound (O'Brien et al., 2014a). Wenmaekers et al also concluded that it seems impossible to
use physical measures, including risers and alternative use of available space, to be effective
enough to replace earplugs (Wenmaekers et al., 2017).
2.7. Hearing disorders in musicians
In a study based on self-reporting, Zander et al. found that approximately 25% reported
hearing impairment (Zander et al., 2008), which is significantly higher than the 13% reported
in the background population. In studies based on audiological testing, the findings are
ambiguous. Some report limited evidence of hearing loss (Jansson and Karlsson, 1983,
Kaharit et al., 2001), while others have found greater incidence of noise-related hearing
disorders, including permanent threshold shifts, tinnitus and hyperacusis, compared with the
general population (Emmerich et al., 2008, Pawlaczyk-Luszczynska et al., 2011). Other
genres have also been investigated, although to a lesser degree. Gopal et al found that college
jazz-performers suffered significant bilateral temporary threshold shifts at 4 kHz after a single
50 minute instructional session (Gopal et al., 2013), while Jin et al found no sign of
permanent threshold shifts in a group of marching band members (Jin et al., 2013).
2.7.1. Rock music and hearing disorders
Loss of cochlear hair cells has been observed in animals that were exposed to pop music
(Lipscomb, 1969). Rock musicians are known to be at risk of cochlear injury from musical
exposure (Kaharit et al., 2003, Schmuziger et al., 2006, Stormer and Stenklev, 2007).
Several risk factors for the development of hearing disorders have been cited. A Swedish
study concluded that age, years of playing, hours of playing per week, playing drums,
previous military service and leisure pop music listening were factors contributing to the risk

! 34!
of NIHL (Axelsson and Lindgren, 1981). To some degree, the risk of cochlear injury is
addressed by musicians by using hearing protection. A Swiss study found a significantly
better mean hearing threshold of 5.8 dB in musicians regularly using hearing protection than
those who never used protection (Schmuziger et al., 2006). In this dissertation, a novel
hypothesis that repeated use of insert material for hearing protection could lead to external
ear canal or tympanic membrane problems in rock musicians, is proposed.
2.7.1.1. Rock music and hearing loss: Pure-tone audiometry
A 2007 review based on a Medline search identified seven articles about hearing disorders in
rock musicians, with a mean prevalence of hearing loss at 20% (Stormer and Stenklev, 2007).
The prevalence range defined by pure-tone audiometry varied greatly, from 5 % (Axelsson
and Lindgren, 1977) to 74 % (Kaharit et al., 2003), and was dependent on the criterion for
hearing loss used in the respective study. One follow-up study showed almost unchanged
hearing in musicians after 16 years of musical activity (Axelsson et al., 1995). Several
studies have investigated transient hearing threshold shifts after one concert (Bogoch et al.,
2005, West and Evans, 1990, Yassi et al., 1993). Yassi et al. found that 81% showed TTS of
10 dB or more after 25 minutes of exposure; of these, 76% showed continued TTS after 40 to
60 minutes (Yassi et al., 1993). A British study from 1992 showed threshold shifts across the
entire spectrum of frequencies but most pronounced in the lower frequencies after one single
concert in the members of ManOWar, allegedly “The Most Noisy Heavy Metal-band on
Earth.” (Drake-Lee, 1992).
2.7.1.2. Rock music and hearing loss: Otoacoustic emissions
Otoacoustic emission (OAE) analysis has been shown to detect sub-clinical cochlear damage
before evidence of hearing loss manifest itself in the patient’s audiogram (Lucertini et al.,
2002). OAE investigations have previously been used by some authors to study the changes
in the cochlea with noise exposure in rock musicians (Maia and Russo, 2008, Samelli et al.,
2012). These authors, respectively, reported lower TEOAE amplitudes for all half-octave
frequency bands regardless of audiometric discrepancies, and lower TEOAE amplitudes in
the 4 kHz frequency band region in musicians with normal audiometric thresholds. Musician

! 35!
samples were small, with sample sizes ranging from 16 to 23. Furthermore, Santoni and
Fiorini studied 23 young pop/rock musicians with TEOAE and DPOAE protocols, and found
an absence of emissions in 47.8% (TEOAEs) and 34.8% (DPOAEs) of their samples (Santoni
and Fiorini, 2010).
2.7.1.3. Rock music and tinnitus
There are few studies investigating the prevalence and characteristics of tinnitus in rock
musicians. Kaharit et al. found a 43% prevalence of tinnitus in rock musicians (Kaharit et al.,
2003), which is higher than numbers reported by Schmuziger et al (17%) (Schmuziger et al.,
2006) and Halevi-Katz et al (31,8%) (Halevi-Katz et al., 2015). However, all results were
higher than the 15% estimate of the normal hearing population (Kaharit et al., 2001).
2.7.1.4. Rock music and psychiatry
Searches in Medline using combinations of the words “rock musician” and various
psychiatric disorders yielded no results. Hence, the psychiatric status of the rock musicians is
unclarified. However, there are studies on the psychiatric status of musicians which do not
specify genre. Van Fenema et al. reported a 82% prevalence of Axis I disorders in their cross-
sectional study (n= 50) and a significantly increased prevalence of narcissistic traits compared
to non-musician general psychiatric out-patients and controls (van Fenema et al., 2013).

! 36!
2.8. Purpose of the dissertation
Noise-induced hearing loss and tinnitus are high-prevalent diagnoses of global proportions.
Rock musicians are exposed to high sound pressure levels. Previous studies on the effect of
noise exposure in rock musicians are limited in number, consist mostly of small sample sizes,
and offer conflicting findings. There is a need for an expansion of our knowledge base on
these issues with a large, controlled study. The main aim of this study has been to assess the
cochlear status in a large sample of rock musicians, investigating pure-tone hearing
thresholds and transient otoacoustic emissions. Furthermore, the aim was to elucidate the
occurrence of tinnitus in rock musicians and to compare musicians with and without tinnitus
with regards to cochlear damage and psychological and general health parameters. Detailed
aims include the following:
1. Assess the actual prevalence of hearing loss in rock musicians using both pure-tone
audiometry and TEOAE, and investigate the association between the two assessment
instruments. Furthermore, it is of interest whether TEOAEs can be used to identify
cochlear damage at an earlier stage than conventional pure-tone audiometry.
2. Identify risk factors for hearing loss that are associated with musical performance.
3. Assess the prevalence and severity of tinnitus in rock musicians and investigate the
association between perceived tinnitus and cochlear status as defined by pure-tone
audiometry and TEOAE.
4. Identify the prevalence of anxiety, depression, alcohol/drug-abuse in rock musicians
and assess if these factors are associated with the presence and severity of tinnitus.
5. Explore whether inner control is correlated to the degree of tinnitus symptomatology
and if various general health factors and the abovementioned psychiatric conditions
correlated with the dimensions of illness perception and inner control.!

! 37!
2.9. Examination of the auditory system
2.9.1. Otomicroscopy
The clinical examination is performed using an otomicroscope and visualizing the
periauricular area, outer ear, outer ear canal, tympanic membrane and, if possible, the middle
ear. Deviations from the clinically normal state were observed and categorized. In addition,
Weber’s and Rinne’s tests were performed using a standard 512 Hz tuning fork.
2.9.2. Tympanometry
Tympanometry is used for objective assessment of the middle ear. A probe with incorporated
earphone, microphone and pressure-regulator is inserted into the external ear canal, and a 226
Hz pure tone is presented through the earphone. The sound pressure level of this tone is
recorded at varying air pressures in the ear canal. The output includes ear canal volume
(cm3), middle ear pressure (daPa) and middle ear compliance (cm3). The test may be used for
the diagnosis of middle ear disorders, or for the comparison of middle ear characteristics in
various samples for research purposes.
2.9.3. Pure-tone audiometry
Pure-tone audiometry is based on the subject’s ability to respond to the detection of an
audible signal. Tones are presented monaurally through earphones using an audiometer
calibrated according to ISO-389-1:2017 (ISO, 2017), assessing hearing threshold levels in the
conventional frequency range 0.125 to 8 kHz. The threshold is described in decibel hearing
level (dB HL), which is the subject’s hearing threshold relative to the average threshold for
healthy adults aged 18 - 25 years. There is a debate whether traditional audiometry is able to
predict the complexity of supra-threshold speech perception. Instead, Extended High-
Frequency audiometry (EHF, performed in the range 8 kHz to 16 kHz) is used by some
clinicians and researchers (Moore, 2017). In addition, some studies show that EHF
audiometry is able to detect signs of pre-clinical auditory deterioration in the presence of
! 38!
normal audiometric thresholds and/or otoacoustic amplitudes (Moore, 2017). However, as
there is no consensus at present in the true value of adding EHF audiometry to the clinical
examination, it was not included in the test battery.
2.9.4. Transient-evoked otoacoustic emissions
Otoacoustic Emissions (OAEs) are cochlear signals produced as a response to an acoustic
stimulus. Emissions can also appear spontaneously as Spontaneous Otoacousic Emissions
(SOAE). It is hypothesized that the acoustic energy is generated in the outer hair cells.
Hence, present and robust OAEs suggest good integrity of the outer hair cell (Hamdan et al.,
2008). The most common methods for evoking emissions involve the use of broadband clicks
(transient-evoked otoacoustic emissions, TEOAE), simultaneous pure-tone (distortion
product otoacoustic emissions, DPOAE) or continuous pure-tone stimulation (stimulus-
frequency otoacoustic emissions). Several studies have shown poor reproducibility between
DPOAE threshold and pure-tone audiometry thresholds (Gorga et al., 1997). Based on this, in
the clinical practice at the local University Hospital, TEOAE is the preferred assessment
instrument, and the one used in this study.
The output is evaluated by assessing the signal to noise ratio. TEOAEs reflect the cochlear
status in the frequency range 0.5 - 4 kHz. If there is a hearing loss of more than 35 - 40 dB
HL, there are usually no TEOAEs (Ferguson et al., 2000). Some studies have indicated that
OAEs have a higher sensitivity than pure-tone audiometry for the detection of inner ear
dysfunction (Hamdan et al., 2008, Henderson et al., 2011, Lapsley Miller et al., 2006),
although this issue is unresolved (Gorga et al., 1997, Prieve et al., 2015).
2.9.5. Questionnaire
All participants responded to a web-based questionnaire with 85 items (Appendix 1),
distributed electronically via NSD (Norwegian Social Science Data Service). The
questionnaire was comprised of hearing-related questions and psychometric assessment
instruments.

! 39!
2.9.5.1. Hearing-related questions
There is no standardized questionnaire for musicians with regards to audiological-related
history and symptomatology. The questionnaire in this study was based on previous articles
on the subject, with emphasis on the risk factors cited in a Swedish study (Axelsson and
Lindgren, 1977). The questionnaire included questions about audiological symptoms such as
presence, duration and quality of tinnitus, noise exposure, musical instrument type, music-
related activities and use of hearing protection.
2.9.5.2. Psychometric assessment instruments
2.9.5.2.1. Brief Illness Perception Questionnaire (BIPQ)
The BIPQ was designed to provide rapid assessment of a patient’s personal perception of his
or her illness (Broadbent et al., 2006). BIPQ consists of eight items related to illness
perception rated on a 0 – 10 scale. The eight aspects of illness perceptions are; consequences,
timeline, personal control, treatment control, symptom frequency, illness concern,
understanding and emotional effect. The scoring for the items 3, 4 and 7 are reversed, and
higher scores are considered to be beneficial. The BIPQ has good test-retest reliability
(Broadbent et al., 2006). To adapt the questionnaire to individuals with tinnitus complaints,
the word “illness” was replaced with “tinnitus complaints” for this study. Two of the items,
IP1 “How much does your tinnitus affect your life” and IP6 “How concerned are you
regarding your tinnitus”, were used as dependent variables in the regression analyses
concerning those reporting tinnitus.
2.9.5.2.2. Internal Health Locus of Control (IHLC)
IHCL is a 6 item subscale of the Multidimensional Health Locus of Control Scales (MHLC)
(Ross et al., 2015), which also includes external control by powerful others (e.g., doctors,
government officials, or the police) and external chance control. Conceptually, HLC is a
personality style variable, which has commonly been used as a predictor of medical
outcomes, and of the individuals’ adaptation to a variety of threatening health issues (Sorlie
et al., 2000). In this study only the Internal sub-scale is used, which comprises 5 of the 6

! 40!
items. Higher scores are known to be associated with both somatic and mental health.
Questions address illness in general, and are not specific for hearing problems.
2.9.5.2.3. Hospital Anxiety and Depression Scale (HADS)
The HADS is a 14-item scale that measures anxiety (HADS-A, 7 items) and depression
(HADS-D, 7 items). A grand total score may be calculated, or HADS-A and HADS-D sum
scores can be calculated individually. For this study, a cutoff score ≥ 8 within each subscale
indicates a possible presence of a depression or anxiety disorder (Herrmann, 1997).
2.9.5.2.4. Sleep disturbance
Each participant answered questions based on the Basic Nordic Sleep Questionnaire (BNSQ)
(Partinen and Gislason, 1995) and Karolinska Sleep Questionnaire (Nordin et al., 2013). The
score of the five questions was computed, yielding a sleep disturbance sum score.
2.9.5.2.5. The Alcohol Use Disorders Identification Test (AUDIT)
AUDIT is a standardized 10-item questionnaire that is used to identify persons with
hazardous or harmful patterns of alcohol consumption. Three domains are addressed;
hazardous alcohol use, dependence symptoms and harmful alcohol use. In this study, a cutoff
score of ≥ 8 (male) and ≥ 6 (female) was used as an indication of risk (Babor et al., 2001).
2.9.5.2.5. The Drug Use Disorders Identification Test (DUDIT)
DUDIT is a parallel assessment instrument to AUDIT for identifying drug-related problems.
The questionnaire consists of 11 items. In this study, a cutoff score of ≥ 6 (men) and ≥ 2
(female) indicates risk (Berman et al., 2007).

! 41!
Chapter 3
Contribution of the present work
3.1. Aims of the study
3.1.1. Paper I
In Paper 1, the objective was to assess TEOAEs in a large sample of rock musicians, and to
evaluate the association between exposure to rock music and TEOAE reproducibility and
SNR. A further aim was to explore the association between tinnitus severity and TEOAE
parameters in rock musicians.
3.1.2. Paper II
The main aim of Paper 2 was to assess the cochlear status in a large sample of rock
musicians, with a focus on pure-tone hearing thresholds, and to elucidate the occurrence of
tinnitus in rock musicians in relation to their cochlear status. A further goal was to study the
relationships between hearing problems and influencing factors such as exposure, type of
instrument and protective measures in rock musicians. In addition, ear canal and tympanic
membrane problems were addressed.
3.1.3. Paper III
In Paper 3, the aim was to assess the prevalence of various mental health indicators in a rock
musician sample and furthermore to examine how these indicators, in combination with
internal locus of control and illness perception, influences their tinnitus symptom concerns
and the degree to which the tinnitus affects their lives.

! 42!
3.2. Materials and methods
3.2.1. Subjects
3.2.1.1. Rock Musicians
A precise definition of “rock music” and its countless subgenres is problematic. In this
dissertation the term is used with reference to guitar-based, rough popular music performed
with the aid of amplifiers and PA-systems. The “rock musician inclusion criterion” was, in
essence, based on two factors; 1. the pools from which participants were invited to join the
study, which were musicians either registered in the Norwegian Music Council’s BandOrg -
register and musicians in bands performing at the acknowledged rock music festival Øya and;
2. Self-reporting, in that the musician him/herself considered him/herself a rock musician.
Several of the participants reported that they were also performing in other musical genres,
including pop, jazz, electro, hip-hop, country and others. In the analyses, all musicians were
pooled into the rock musician category.
The musician sample was recruited in two sessions. Norsk Musikkråd (Norwegian Music
Council) gave access to their BandOrg database of active rock musicians in the Oslo region.
This database included 330 subscribing members. All were invited to participate via
electronic mail (e-mail). Twenty responded initially via e-mail, a further 26 responded to a
follow-up telephone call inviting them to participate, yielding a total of 46 participants from
the BandOrg sample. This part of the musician sample was not recruited randomly due to the
low response rate (7.8% via e-mail, 6% via telephone, total response rate 13.9%).
Access to a comprehensive list of musicians performing at the Øya festival in the years 2011
- 2012 was provided by the director of the festival. Øya is regarded as the most important
Norwegian rock music festival. The rationale behind recruiting from this pool of musicians
was that the activity level of bands playing at the Øya festival would guarantee that the study
population was active on a professional level. The list contained 110 bands, each consisting
of 3 - 5 members. Using the randbetween function in Microsoft Excel (Microsoft Corp.,
USA), 25 bands were randomly chosen from this sample. A total of 102 musicians were

! 43!
invited by e-mail or phone, of which 71 (69.6%) musicians were included in the study. The
most common reason for not participating was conflicting time schedules.
In total, 117 rock musicians (consisting of 46 musicians from the BandOrg sample and 71
from the Øya sample), were included in the study. The sample consisted of 102 males and 15
females. The two rock musician subsamples were compared with regards in every variable in
the study, including audiometry, TEOAE, tympanometry, otomicroscopy and questionnaire
items. No significant differences were found and we pooled the two groups together for the
rock musician sample.
During the data sampling phase, 6 of the 117 musicians were excluded from the study for
cerumen occlusion, failure to answer the questionnaire or failure to attend the clinical
examination. Hence, the total number of subjects in the musician group that was included in
the study was n=111 (97 male, 14 female). The mean age of the musicians was 30.4 years,
and the median was age 30.0 years.
The subgenre declared by 13.5% was rock, 9.0% punk/hardcore, 9.9% metal, 6.3% pop,
0.9% jazz, 0.9% electro, 0.9% hip-hop, 1.8% country, 29.7% two or more of the
aforementioned genres and 5.4% other genres than the abovementioned. 20.7% did not
disclose their subgenre.
3.2.1.2. Control group
For the control group, an age- and gender-matched sample of students at UiT The Arctic
University of Norway was recruited by providing information about the project during
lectures and inviting them to participate. The students were instructed to leave their contact
information if interested in participating in the project. The aim was to recruit a random
sample by inviting a random selection of the volunteering student population. However, this
was only possible in female students due to low number of male volunteers.
The students were from the Economy, Law, Health and computer science faculties. In total,
40 students were recruited for the control sample, consisting of 32 males and 8 females. An
exclusion criterion was current or previous performance in a band. The mean age of the

! 44!
control group 25.5 years, median age 26. Table 2 summarized the age and gender distribution
of both musicians and controls.
Rock musicians Controls
Total 111 40
Males (%) 97 (87.4) 32 (80)
Females (%) 14 (12.6) 8 (20)
Age, yrs., median
(range) 30 (16 - 52) 26 (19 - 39)
Table 2: Age and gender distribution of rock musicians and controls.
3.3. Methods
Clinical examinations of the musicians were performed at the offices of Norsk Musikkråd in
Oslo (musicians), and the control subjects were examined at the Ear, Nose and Throat (ENT)
department at the University Hospital of Northern Norway (controls). The staff and technical
equipment were equivalent in both locations. All audiometric equipment that was used in the
study had been calibrated according to ISO-389 standards within 6 months of data collection.
All participants were examined with bilateral otomicroscopy by a qualified physician and
cerumen was removed before hearing tests where necessary. Deviations from the normal
audiological state were noted and categorized as follows: Normal; External otitis; Cerumen
occlusion; Tympanic retraction; Tympanic perforation; Atrophic parts of tympanic
membrane; Scars; Other conditions of tympanic membrane. Tuning fork tests, including the
Weber’s and Rinne’s tests, were performed at 512 Hz.
Pure-tone audiometry was performed in both ears using a Madsen Itera II audiometer with
TDH-39 earphones in an IAC Mini 250 audiometric booth, complying fully with ISO – 8253
-1. For the control group, measurements were done at the University Hospital of Northern
Norway in a sound-attenuating room meeting the ISO criteria for background noise (ISO-
8253-1, 2010). Audiometry was performed by an experienced audiologists, using the

! 45!
ascending method (ISO 8253-1, 2010) with a random first ear. Pure-tone audiometric results
are presented as hearing threshold levels for individual frequencies, and for a selected portion
of the analyses, as the mean threshold levels of the frequencies 3, 4 and 6 kHz (dB HL). This
variable is referred to as the mean high frequency (MHF).
Tympanometry was performed on all subjects using a handheld Titan IMP440
(Interacoustics, Denmark). Ear canal volume (ECV), compliance and pressure were
registered.
TEOAEs were measured bilaterally using the handheld Otoport OAE Systems (Otodynamics
Ltd, UK). TEOAEs were recorded in the nonlinear mode at default settings. The time
window was 2.5 - 12.5 ms or 4 - 10 ms after the start of the stimulus at a level of 80 - 85 dB
SPL peak. The total number of stimuli was 260. Subjects were instructed to remain immobile
when TEOAEs were measured. The parameters selected were overall signal to noise ratio
(SNR, dB) and total SNR (dB) in the five half-octave frequency bands. Centre frequencies
were 1 kHz, 1.4 kHz, 2 kHz, 2.8 kHz and 4 kHz bilaterally. The half-octave bands with
center frequencies of 1.4 kHz and 2.8 kHz will be referred to as 1.5 kHz and 3 kHz for this
study. Presence of TEOAEs was defined automatically by the Otoport software according to
a pass/fail algorithm. The default pass settings for the Otoport are a minimum SNR overall
signal to noise ratio of 6 dB and a minimum half-octave frequency band signal cut-off at –5
dB. All ears, including no-pass ears, were included in most of the statistical analyses, and
where they were excluded, this is addressed explicitly. For parts of the analyses, the worst
hearing ear according to OAE SNRs in the different half-octave frequency bands was
identified. For the OAE, the testing was based on clinical practice, where there are no set
criteria for background noise. However, a max level of acceptable noise at 35 dB(A) was
defined, and this criterion was met for rock musicians and controls at both locations.
All participants responded to a web-based questionnaire with 85 items (Appendix 1),
distributed electronically via the Norwegian Social Science Data Services (NSD). The
questionnaire consisted of questions about audiological symptoms including presence,
duration and degree of tinnitus, noise exposition, musical instrument type, music-related
activities, and use of hearing protection. Additionally, the following psychometric
assessments were included: Brief Illness Perception Questionnaire (BIPQ); Internal Health
Locus of Control (IHLC); Hospitality Anxiety and Depression Scale (HADS); Sleep

! 46!
disturbance; The Alcohol Use Disorders Identification Test (AUDIT); The Drug Use
Disorders Identification Test (DUDIT). Survey items about physical activity and whether the
musician had sought professional help for psychological problems were also included
(Appendix 1).
The questionnaire response rate was 97.3% in the musician sample and 100% in the control
sample. The one musician who failed to respond was not included in the study. In addition
to gender and age, the following data related to tinnitus and musical practice and exposure
were assessed in this study; presence, duration and degree of tinnitus, frequency and duration
of musical practice including performances, genre, instrument, use of hearing protection and
frequency of leisure musical exposure.
3.4. Statistical analysis
Results were entered into a computer database and analyzed using the Statistical Package for
the Social Sciences (SPSS) version 22 (IBM, USA), according to common standards for
medical statistics. The distributions of all parameters were assessed using normal plots. The
statistical tests that was used were Student’s t-test, Pearson’s chi-squared test, paired-samples
t-test, ANOVA, linear regression and stepwise multiple regression analysis. For statistical
significance, a cutoff at p ≤ 0.05 was chosen.
3.5. Ethics
Informed consent was obtained from all participants. The protocol was approved by the
regional ethics committee (2012/127/REK Nord). Where pathological findings were
encountered at the clinical examination, subjects were advised to contact their general
practitioner for a consultation.

! 47!
3.6. Results
3.6.1. Paper I
3.6.1.1. TEOAEs in rock musicians
TEOAEs were absent in 9 ears in the musician sample (5 musicians unilaterally, 2 musicians
bilaterally), and in 3 ears in the control sample (1 bilaterally, 1 unilaterally). Table 3 presents
a cross-power spectra of the half-octave frequency bands of the TEOAE SNR in both ears for
musicians and controls. When analyzed with Student’s t-test, musicians had significantly
lower SNR levels at the 4 kHz in both ears (right ear p=0.01, df 149, left ear p=0.02, df 149)
and 1.5 kHz in the left ear (p=0.041, df 149) than controls. The difference was also significant
when the no-pass ears were excluded on both sides for 4 kHz (right ear p=0.039, df 140, left
ear 0.048, df 140), but not for 1.5 kHz (p>0.05). Gender was not a significant predictor, but
age was a significant predictor that removed the musician versus control group effect in both
ears at 4 kHz and 1.5 kHz (left ear) when the association was studied with multiple linear
regression using the 4 kHz SNR and 1.5 kHz SNR, respectively, as dependents (p<0.05).
Excluding no-pass ears in both groups removed age as a significant predictor in the left ear. In
the control group, age was a significant predictor for TEOAEs at p < 0.05 (right ear), while in
the musician sample, the MHF was the only significant predictor for SNR 4 kHz as the
dependent variable in both ears (p<0.05). No significant difference between the musician and
control samples for total SNR or overall wave reproducibility (85.5% right ear, 84% left ear
in musicians, 87.5% right ear, 87.1% left ear in controls) was found in either ear in the
Student’s t-test (p>0.05) (Table 3).
At linear regression of MHF on SNR 4 kHz, a significant association in rock musicians was
found, although not in the control group, in either ear. The relationship between MHF and
TEOAE SNR at 4 kHz is represented with scatterplots for both ears (Figure 1). At multiple
linear regression, age (p=0.048, df 146) and MHF (p=0.001, df 146) were the only significant
predictors as opposed to group (rock musicians and controls, p=0.401, df 146) or gender for
SNR at 4 kHz in the right ear, but MHF was the only significant predictor in the left ear
(p=0.031, df 146). No significant difference was found between the two groups with regards
to total SNR in either ear.

! 48!
TEOAE SNR (dB)
Frequency
Hz
Right ear (mean) Left ear (mean)
Rock musicians
SNR dB (SD)
Controls
SNR dB (SD) p
Rock musicians
SNR dB (SD)
Controls
SNR dB (SD) p
1000 7.43 (7.2) 7.07 (8.7) .797 5.60 (7.2) 5.89 (9.0) .839
1500 10.17 (5.3) 10.50 (4.7) .723 8.99 (5.2) 10.93 (4.8) .041
2000 10.07 (5.4) 10.39 (4.4) .739 9.65 (4.4) 9.72 (4.8) .926
3000 7.18 (5.3) 8.87 (3.8) .064 7.60 (4.5) 7.57 (5.2) .975
4000 3.33 (4.8) 5.70 (5.1) .010 4.19 (4.8) 6.27 (4.9) .020
Total
8.18 (3.0) 8.80 (2.9) .270 7.12 (6.7) 8.42 (2.9) .239
Reprod.: 85.8 % (7.1) 87.5 % (6.5) .184 84.0 % (10.3) 87.1 % (6.1) .078
Table 3: Transient evoked otoacoustic emissions (TEOAE) in rock musicians (n=111) and control group
(n=40).
Figure 1: Comparison of TEOAE SNRs 4 kHz with MHF (Mean High Frequency) hearing threshold levels.
N=111 (musicians), N = 40 (controls).

! 49!
3.6.1.2. TEOAEs: Instruments
The distribution of instruments in the musician group were as follows; vocals 6.3%, guitar
27.9%, bass 15.3%, drums 20.7%, 25.2% multiple instruments and 4.6% other instruments
than the abovementioned. If the musician was a singer and played an additional instrument,
he or she was allocated to the relevant instrument group, under the assumption that the
exposure would be that of the instrument he or she was playing in addition to singing. No
significant differences in SNR in the 4 kHz half-octave frequency band where found between
the instrument groups when compared using the ANOVA (p>0.05). After removal of no-pass
ears (n=7), there were still no significant inter-group differences.
3.6.1.3. TEAOEs: Exposure
For assessment of the relationship between exposure to musical noise and TEOAE SNR, the
musicians were quantified and re-categorized into three groups (low, medium and high
exposure) and further differed between three types of exposure (performance, practice and
length of activity). For performance exposure, low exposure was defined as less than once
every third month, medium exposure as more than once per third month but less than once
every two weeks, and high exposure as more than once every two weeks. Weekly practice
exposure and length of active musician careers were also assessed separately. High weekly
practice exposure was defined as 10 hours per week or more, medium practice exposure less
than ten hours but more than two hours per week, and low practice exposure less than two
hours per week. With regards to length of the activity reported above, high exposure was
defined as five years or more, medium exposure 2 – 5 years, and low exposure as less than 2
years. The distribution within the exposure groups were as follows. For performance
exposure; low 9.9%, medium 49.5% and high 40.6%. For practice exposure; low 22.5%,
medium 73.8% and high 3.7%. For length of activity; low 6.3%, medium 22.5% and high
71.2%. No statistical associations were identified at the ANOVA analyses (p>0.05) between
SNR in the 4 kHz half-octave frequency band and degree of exposure (low, medium and
high) with regards to performance exposure, concert exposure or length of active musician
career.

! 50!
3.6.1.4. TEOAEs: Hearing protection
21.6% of the musicians reported they never used hearing protection. 47.7% used hearing
protection during performances, 64.9% during practice and 64.9% when attending
performances by other musicians. Musicians were re-categorized into one group which never
used hearing protection and another group which used hearing protection during practice and
performance. A significant, protective effect that demonstrated lower SNR at 4 kHz in non-
users was observed for the right ear only (p=0.027, df 109). When no-pass ears were excluded
from the analyses, this difference was no longer significant (p=0.090, df 102). Figure 2
represents musicians with and without hearing protection with TEOAE SNRs for all half-
octave frequency bands in their worst hearing ear (defined by lowest SNR at each given
frequency), where a significant difference was observed at 4 kHz (p=0.041, df 109). Overall
wave reproducibility was also significantly different between the two groups (p=0.042, df
109). Using multiple regression analysis, age was found to be the only significant predictor
(p=0.005, df 107) for the SNR 4 kHz, using age, gender and hearing protection as
independent predictors.
Figure 2: Comparison of mean TEOAEs SNRs in the worst ear for musicians using hearing protection and
those who do not. N=104.

! 51!
3.6.1.5. TEOAEs: Tinnitus
The prevalence of permanent tinnitus in the musician sample was assessed using Item 2 in the
questionnaire, and found to be 19.8%, whereas none of the control group subjects reported
permanent tinnitus (Table 4). There was a significantly higher prevalence of permanent
tinnitus in the musician group (p<0.05), when studied by the Pearson chi-squared test
(p=0.002, df 1).
The relationship between tinnitus severity and TEOAE SNRs in musicians was studied using
Item 3 in the questionnaire. Participants were asked to grade their tinnitus severity on a
categorical scale from 0 (no affection of quality of life) to 10 (enormous affection of quality
of life). None of the musicians recorded a severity above 5 on the scale. Figure 3 shows the
relationship between tinnitus-affection and TEOAE SNRs at 4 kHz in the worst ear, where no
significant difference was found using ANOVA (p=0.601, df 5). Although a tendency towards
a higher TEOAE output in musicians with more advanced tinnitus severity could be inferred
from the figure, no significant association between SNR and degree of tinnitus
symptomatology was observed using ANOVA, for any half-octave frequency band in either
ear (p > 0.05).
Rock musicians Controls
% (Count) 95% C.I. % (Count)
Permanent tinnitus 19.8 (22) 14.3-29.7% 0.0 (0)
No tinnitus 80.2 (89) 83.2-94.8% 100 (40)
Table 4: Prevalence of tinnitus in rock musicians and controls.

! 52!
Figure 3: Tinnitus symptomatology and TEOAE in rock musicians in worst ear.
0: No impact, 10: Enormous impact. N=111.
3.6.1.6. Exposure to leisure noise
The exposure to leisure noise (loud music in car, at home, on iPod, iPhone or such) in
musicians and controls is presented in Table 5. The rock musician sample was slightly more
exposed, although there was no significant difference between the groups when analyzed with
the Pearson chi-squared test (p=0.641, df 3). 76.9% of the controls reported a high degree of
exposure, while the prevalence in the rock musician sample was 81.1%.
Exposure to leisure noise Musicians Controls
Every day 38.7% 28.2%
Every other day 9% 7.70%
Several time a week 33.3% 41%
Once a month or less 18.9% 23.1%
Table 5: Leisure musical noise exposure for rock musicians (outside performance/practice) and controls. N=
111 (rock musicians), N= 40 (controls).

! 53!
3.6.2. Paper II
3.6.2.1. Hearing threshold levels
The chosen criterion for presence of hearing loss was ≥ 2 frequencies ≥ 25 dB HL in ≥ 1 ear
or one frequency ≥ 30 dB HL in ≥ 1 ear, based on a previous Finnish study (Kaharit et al.,
2003). By this definition the prevalence of hearing loss in the rock musician sample was
37.8% (95% C.I.: 28.8 - 46.8%). The percentage of male hearing loss was 36.1% (95% C.I.:
26.5 - 45.7%) and 50% (95% C.I.: 23.8 - 76.2%) of female musicians had a hearing loss. In
the control group, 2.5% (95% C.I.: 0 - 7.3%) had a hearing loss according to the chosen
criterion (male 3.1% (95% C.I.: 0 - 9.1%) and female 0%). The distribution of instruments in
the hearing loss group was as follows: Vocals 7%; Guitar 21%; Bass 19%; Drums 24%; 22%
multiple instruments. A detailed distribution of degrees of hearing loss is presented in Table
6.
Hearing threshold levels in male and female musicians were significantly different only at
0.25 kHz in the left ear, and in the control group at 0.125 and 0.25 kHz in the left ear. Hence,
mean threshold levels for the two genders are pooled together in Table 7.
Figure 4 shows the average pure-tone audiogram of the rock musicians and controls. The
musicians had significantly poorer hearing at 0.25 (both ears), 0.5 (both ears), 1 (both ears), 2
(left ear), 3 (both ears), 4 (both ears), 6 (both ears) and 8 kHz (right ear) (Figure 4).
Figure 5 shows the worst-ear mean hearing threshold for both groups (p<0.05). Significant
differences were found at frequencies 0.25, 0.5, 1, 2, 3, 4 and 6 kHz, using both Student’s t-
test and ANOVA.
After performing a linear regression analysis with all the individual frequencies as dependent
variables, and age, gender and group (rock musicians versus controls) as independent
variables, age was a significantly contributing factor at the frequencies 0.125 in the right ear
and 3, 4, 6 and 8 kHz in both ears. The hearing thresholds of rock musicians were
significantly higher than the control group at 0.25 (left ear), 0.5 (bilaterally), 1 (left ear) and 6
kHz (bilaterally) after correcting for the age factor. MHF thresholds were significantly higher

! 54!
in the musician group (right ear: 6.3 dB HL, left ear: 6.6 dB HL, p<0.05) than in the control
group. However, at the linear regression with MHF as dependent variable, and age and group
as independent variables, the difference between rock musicians and controls was significant
only in the left ear (p<0.05). A scatterplot serves to illustrate the MHF as a function of age for
both musicians and controls (Figure 6).
Rock musicians
N=111
Count
(%)
Median
age Tinnitus* (%)
N ≤ 20 dB HL all test frequencies and both ears 42 (37.8) 29 9 (21.4)
N > 20 dB HL but ≤ 25 dB HL one ear, the other normal 22 (19.8) 30 4 (18.2)
N > 20 dB HL but ≤ 25 dB HL both ears 7 (6.3) 30 2 (28.2)
N > 25 dB HL but ≤ 35 dB HL one ear, the other normal
16 (14.4) 30 3 (18.8)
N > 25 dB HL but ≤ 35 dB HL both ears 11 (9.9) 28 2 (18.2)
N ≥ 35 dB HL one ear, the other ≤ 35 dB HL 6a (5.4) 36.5 11 (16.7)
N > 35 dB HL both ears 7b (6.3) 36 1 (14.3)
Controls
N=40
Count
(%)
Median
age Tinnitus* (%)
N ≤ 20 dB HL all test frequencies and both ears 36 (90) 26 0 (0)
N > 20 dB HL but ≤ 25 dB HL one ear, the other normal 2 (5.0) 27.5 0 (0)
N > 20 dB HL but ≤ 25 dB HL both ears 1c (2.5) 35 0 (0)
N > 25 dB HL but ≤ 35 dB HL one ear, the other normal 1 (2.5) 30 0 (0)
N > 25 dB HL but ≤ 35 dB HL both ears - - -
N ≥ 35 dB HL one ear, the other ≤ 35 dB HL - . -
N > 35 dB HL both ears - . -
*Permanent tinnitus
a. 1 sound technician, 1 roadie. b. 1 Cleft palate c. Acoustic trauma during army service.
Table 6: Hearing in rock musicians and controls: High frequency hearing (Mean 3, 4, 6, 8 kHz) with median age
and presence of tinnitus

! 55!
Pure-tone audiometric threshold levels
Frequency
kHz
Right ear (dB HL) Left ear (dB HL)
Rock
musicians dB
HL (SD)
Controls
dB HL (SD) p
Rock musicians
dB HL (SD)
Controls dB
HL (SD) p
0.125 6.9 (4.6) 6.0 (4.1) .306 7.3 (5.0) 5.1 (5.1) .097
0.25 5.4 (5.4) 3.3 (4.3) .027 5.7 (4.8) 3.0 (4.4) .002
0.5 5.2 (5.2) 2.8 (4.1) .006 5.2 (5.2) 2.4 (3.9) .001
1 4.1 (4.5) 2.0 (3.5) .011 5.0 (4.7) 0.9 (3.4) .000
2 3.4 (7.9) 1.6 (4.4) .090 5.5 (8.0) 1.9 (6.0) .011
3 6.4 (11.2) 2.1 (6.1) .023 7.6 (9.8) 3.5 (6.4) .016
4 9.0 (14.0) 4.1 (6.2) .037 9.9 (11.5) 5.9 (6.7) .041
6 21.3 (11.5) 11.5 (7.1) .000 22.4 (11.3) 10.8 (7.6) .000
8 8.7 (10.0) 5.0 (5.5) .030 8.6 (10.8) 7.3 (7.2) .477
Table 7: Mean pure-tone audiometric threshold levels (dB HL) for rock musicians (n=111) and controls (n=40),
right and left ears with standard deviations and p-values.
Figure 4: Average pure-tone audiogram for rock musicians and controls. N= 111 (rock musicians),
N= 40 (controls). O = Right ear and X = Left ear

! 56!
Figure 5: Mean hearing thresholds (worst ear) in rock musicians (n=111) and controls (n=40).
Figure 6: MHF in relation to age in rock musicians (n=111) and controls (n=40).

! 57!
3.6.2.2. Hearing threshold levels: Instruments
When musicians were stratified into categories according to instrument, guitarists (n=31) had
4.1 dB HL higher hearing thresholds than vocalists (n=7) at 1 kHz in the right ear (p<0.05),
bass players (n=17) had 3.9 dB poorer hearing than vocalists at 1 kHz in the right ear
(p<0.05), bass players had 7.8 dB HL at 3 kHz and 9.5 dB HL poorer hearing at 4 kHz than
guitar players in their right ear (p<0.05). When drummers (n=23) were compared to all
categories of non-percussive instrumentalists, there were no significant differences.
Comparisons of instrument categories were made using the Student’s t-test. When using
ANOVA to study differences in the entire spectrum of instruments, no significant differences
in the worst ears were observed.
3.6.2.3. Hearing threshold levels: Exposure
Using ANOVA one found that the musicians in the low performance exposure group had
significantly poorer hearing thresholds in their worst ear at 6 kHz (32.3 dB HL (SD 17.1))
compared to the medium (26.0 dB HL (SD 10.7)) and highly exposed (23.3 dB HL (SD 8.5))
musicians. Musicians in the low performance group also showed significantly poorer hearing
threshold in their worst ear at 8 kHz (17.7 dB HL (SD 12.1) versus 13.5 dB HL (SD 11.33) in
the medium exposed group, and 9.3 dB HL (SD 8.4) in the highly exposed group (p>0.05))
(Figure 7). There was no significant difference in hearing thresholds within the
practice/length of activity-groups, except for a significant difference found at 250 kHz in the
highly exposed group.

! 58!
Figure 7: Pure tone hearing thresholds in the worst ear related to performance exposure in rock musicians (low
exposure group, n=11, medium exposure group, n= 55 and high exposure group, n=45).
3.6.2.4. Hearing threshold levels: Hearing protection
Musicians were categorized into either a group that never, or infrequently, used hearing
protection (n=63), or a group who always used hearing protection during practice and
performances (n=48). Using the Student’s t-test, non-user hearing thresholds were
significantly higher at 0.125 kHz (both ears), 0.25 kHz (left ear), 0.5 kHz (left ear), 1 kHz
(left ear), 3 kHz (both ears), 4 kHz (left ear), 6 kHz (right ear) and 8 kHz (left ear) (p<0.05).
The 6 kHz mean threshold difference in the right ear was 5 dB HL. In Figure 8, the worst ear
pure-tone hearing thresholds of hearing protection users and non-users are presented.
Hearing thresholds were compared between musicians using custom fitted earplugs (54%),
pre-molded earplugs (37%) and musicians using cotton (5%). Custom fitted earplugs refers to
High Fidelity earplugs (“Musicians’ earplugs”), that provide equal sound reduction across the
frequency spectrum. The study data did not include information about the type of sound filter
that each individual musician was using. Pre-molded earplugs refer to non-customized

! 59!
earplugs made out of silicone, plastic or rubber, and do not offer an equally efficient sound
attenuation.
Those using cotton showed significantly poorer hearing and most pronouncedly at 6 kHz
(11.8 dB HL left ear, 11.1 dB HL right ear) than those using either custom-fitted or pre-
molded earplugs (Student’s t-test: p<0.05), but no significant difference was found between
custom-fitted and pre-molded earplugs (Figure 9).
Figure 8: Pure-tone hearing thresholds in rock musicians (worst ear) that always used hearing protection
during concerts and practice (n=48), and rock musicians that never, or occasionally, used hearing protection
(n=63).

! 60!
Figure 9: Pure-tone hearing thresholds in rock musicians (worst ear) using custom fitted earplugs (n=60) and
cotton (n=6).

! 61!
3.6.2.5. Hearing threshold levels: Tinnitus
The chronic tinnitus group (n=22) was compared with other musicians, and there were no
significant differences in hearing thresholds at any frequency between the two groups, when
analyzed with the Student’s t-test (p>0.05).
Six of the musicians declared that they had considered terminating their career due to hearing
problems. When those were compared with the remaining musicians, there were no
significant threshold differences at 6 kHz, in either ear (Student’s t-test: p>0.05). Comparing
those (n=8) who found hearing-related symptoms to be a problem when performing with
musicians that did not report this issue, no significant differences in hearing thresholds was
found using the Student’s t-test (p>0.05). Using Pearson’s chi-squared test, no significant
difference in musicians with constant tinnitus (n=22) and remaining musicians (n=89) was
observed when the musicians were asked whether hearing problems were an obstacle to
performing (p<0.05).
3.6.2.6. Otomicroscopy
The results of the otomicroscopic examination are presented in Table 8. No statistically
significant differences between the musician sample and control group were identified using
the Pearson’s chi-squared test (p>0.05).
Right ear Left ear
Rock musicians Controls Rock musicians Controls
% (95% C.I.) % (95% C.I.) % (95% C.I.) % (95% C.I.)
Normal 73% (65 - 81%) 75% (62 -
89%) 78% (70 - 85%) 80% (63 -
92%)
External otitis 1% (0 - 3%) 0% (0%) 1% (1 - 3%) 0%
Cerumen occlusion 14% (7 - 20%) 15% (4 -
26%) 14% (8 - 22%) 10% (1 - 20%)
Tympanic retraction 3% (0 - 6%) 3% (0 - 7%) 4% (0 - 7%) 3% (0 - 7%)
Perforation 1% (0 - 3%) 0% 0% 0%
Scars 4% (0 - 7%) 5% (0 - 12%) 2% (0 - 4%) 5% (0 - 12%)
Table 8: Otomicroscopic findings in both ears for the rock musician (n=111) and control (n=40) samples.

! 62!
3.6.2.7. Tympanometry
No significant differences in ECV, compliance or pressure were found between the musician
and control samples when measured with the Student’s t-test (p>0.05). In musicians, mean
pressure was negative in both ears (right: -8 daPa, SD 28.5, left: -5 daPa, SD 35.0), which was
attributable to a few outliers.

! 63!
3.6.3. Paper III
3.6.3.1. Tinnitus in rock musicians
The prevalence of permanent tinnitus in the musician sample was assessed using item 1 in the
questionnaire, and found to be 19.8% (95% C.I.: 14.3 - 29.7%). With regards to gender,
20.6% of male musicians and 14.3% of female musicians reported permanent tinnitus, but
there were significant differences between genders. The mean age of the musicians with
chronic tinnitus was 33.4 (SD +/- 5.6, range 23 - 47) years, and in the musician group as a
whole it was 30.4 (SD +/- 6.6, range 16 - 52) years). 4.5% had never experienced tinnitus,
31.5% for less than two minutes, 36.9% for 1 - 2 days, 6.3% for weeks and 0.9% for months.
In the control group, no one reported chronic tinnitus, 22.5% had never experienced tinnitus,
and 77.5% reported having experienced tinnitus for less than two minutes. The mean age in
controls was 25.5 (SD +/- 4.7) years. Figure 10 shows the distribution of experiencing
varying degrees of temporary tinnitus.
Figure 10: Prevalence in categories according to duration of tinnitus in rock musicians (n=111) and controls
(n=40).

! 64!
The instrument distribution within the chronic tinnitus group was as follows: Guitar 36.4%;
Bass 13.6%; Drums 27.3%; Other instruments 9.1%; Multiple instruments 13.6%. There was
no significant difference in prevalence between gender.
A majority of the affected musicians (68.2%) described their tinnitus as a “beeping sound”
and 54% had bilateral symptoms. No significant differences in hearing thresholds were found
between the tinnitus-affected and non-tinnitus affected musicians, using Student’s t-test
(p>0.05).
Table 8 shows the distribution of responses to relevant items in the questionnaire in both the
tinnitus and hearing loss sub-samples. In the musician sample 40.9% had consulted their
doctor about hearing disorders and 18.2% had sought professional help for psychological
problems. The chronic tinnitus group (n=22) was compared with other musicians, and there
were no significant differences in hearing thresholds at any frequency between the two
categories when analyzed with the Student’s t-test (p>0.05).
Tinnitus-group Hearing loss-group
% (95% CI) % (95% CI)
Do you use hearing protection?
Yes, when I play concerts 68.2% (48.4 - 87.6%) 47.6% (32.5 - 62.7%)
Yes, when I practice 81.8% (65.7 - 97.9%) 61.9% (47.2 - 76.6%)
Yes, when I attend other concerts 68.2% (48.4 - 87.6%) 57.1% (42.1 - 72.1%)
No, never 4.5% (-5.1 - 13.2%) 23.8% (10.1 - 36.7%)
Do you consider hearing disorders related to playing music a problem?
(yes)
13.6% (0.7 - 27.9%) 9.5% (0.6 - 18.4%)
Have you considered quitting playing music due to hearing disorders?
(yes)
22.7% (5.2 - 40.2%) 4.8% (-1.7 - 11.3%)
Have you consulted a doctor about your hearing disorders/ear
symptoms? (yes)
40.9% (20.4 - 61.4%) 19% (7.1 - 30.9%)
Have you ever sought professional help for psychological problems?
(yes)
18.2% (2.1 - 34.3%) 11.9% (2.1 - 21.7%)
Table 8: Tinnitus-group (n =22) and hearing-loss group (n=42): Responses to relevant items in the
questionnaire.

! 65!
Table 9 shows the prevalence of chronic tinnitus in musicians across degree of musical
exposure. When analyzed by the Pearson’s chi-squared test, no statistically significant
associations were found between those variables (p>0.05).
Table 9: Prevalence of chronic tinnitus in musicians across degree of musical exposure (n=22).
Performance exposure
Low Medium High
1 (4.5%) 10 (45.5%) 11 (50%)
Practice exposure
Low Medium High
5 (22.7%) 15 (68.2%) 2 (9.1%)
Length of activity exposure
Low Medium High
0 (0%) 3 (13.6%) 19 (86.4%)
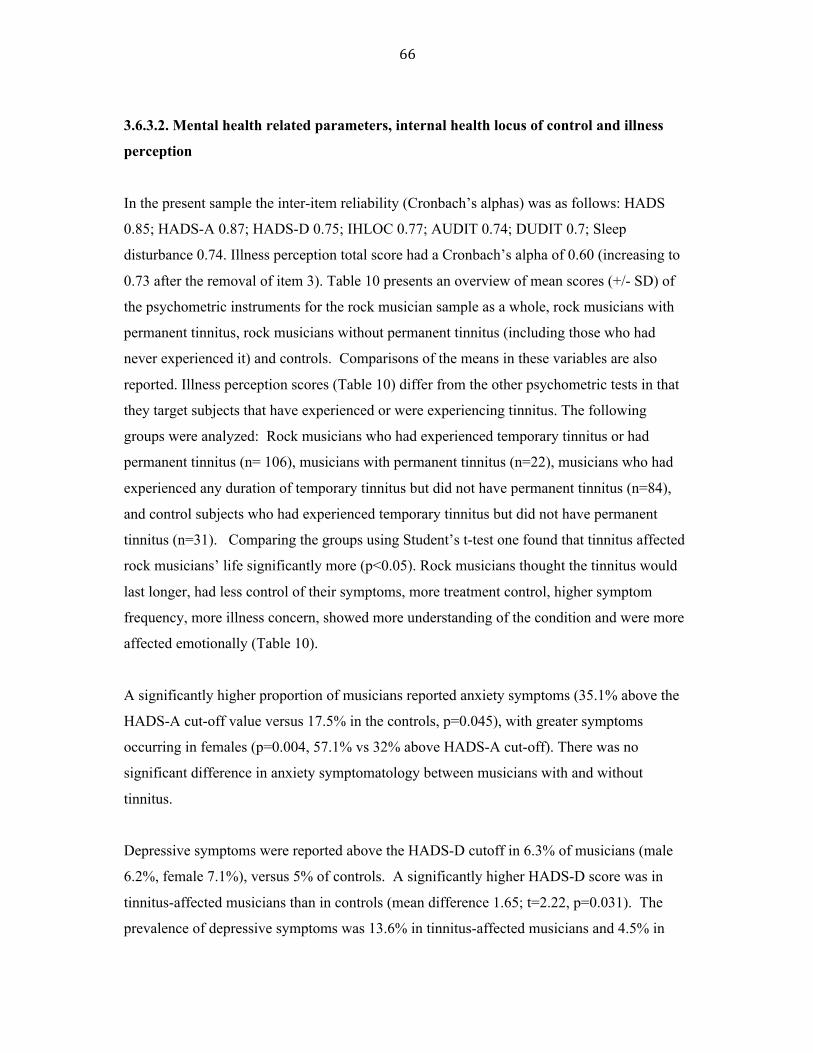
! 66!
3.6.3.2. Mental health related parameters, internal health locus of control and illness
perception
In the present sample the inter-item reliability (Cronbach’s alphas) was as follows: HADS
0.85; HADS-A 0.87; HADS-D 0.75; IHLOC 0.77; AUDIT 0.74; DUDIT 0.7; Sleep
disturbance 0.74. Illness perception total score had a Cronbach’s alpha of 0.60 (increasing to
0.73 after the removal of item 3). Table 10 presents an overview of mean scores (+/- SD) of
the psychometric instruments for the rock musician sample as a whole, rock musicians with
permanent tinnitus, rock musicians without permanent tinnitus (including those who had
never experienced it) and controls. Comparisons of the means in these variables are also
reported. Illness perception scores (Table 10) differ from the other psychometric tests in that
they target subjects that have experienced or were experiencing tinnitus. The following
groups were analyzed: Rock musicians who had experienced temporary tinnitus or had
permanent tinnitus (n= 106), musicians with permanent tinnitus (n=22), musicians who had
experienced any duration of temporary tinnitus but did not have permanent tinnitus (n=84),
and control subjects who had experienced temporary tinnitus but did not have permanent
tinnitus (n=31). Comparing the groups using Student’s t-test one found that tinnitus affected
rock musicians’ life significantly more (p<0.05). Rock musicians thought the tinnitus would
last longer, had less control of their symptoms, more treatment control, higher symptom
frequency, more illness concern, showed more understanding of the condition and were more
affected emotionally (Table 10).
A significantly higher proportion of musicians reported anxiety symptoms (35.1% above the
HADS-A cut-off value versus 17.5% in the controls, p=0.045), with greater symptoms
occurring in females (p=0.004, 57.1% vs 32% above HADS-A cut-off). There was no
significant difference in anxiety symptomatology between musicians with and without
tinnitus.
Depressive symptoms were reported above the HADS-D cutoff in 6.3% of musicians (male
6.2%, female 7.1%), versus 5% of controls. A significantly higher HADS-D score was in
tinnitus-affected musicians than in controls (mean difference 1.65; t=2.22, p=0.031). The
prevalence of depressive symptoms was 13.6% in tinnitus-affected musicians and 4.5% in

! 67!
musicians without tinnitus. However, this difference was not statistically significant
(p=0.116).
In the regression analysis with HADS-D as the dependent variable and group (musicians vs
controls), age, gender and tinnitus duration as independents, tinnitus duration was the only
statistically significant predictor (F=2.579; p=0.013).
Alcohol abuse was more prevalent in rock musicians than controls (chi-squared value 6.835
p=0.009) with 57.7% of musicians at risk with an AUDIT score above cutoff. There was no
significant difference in AUDIT scores between musicians with and without tinnitus. No
significant differences were observed between musician and controls, or musicians with or
without tinnitus regarding drug abuse, when assessed by the DUDIT instrument (p>0.05).
Musicians engage in physical exercise significantly less than controls (p<0.05). No significant
differences in total sleep disturbance score were found between musicians and controls, nor
between musicians with and without tinnitus using the Student’s t-test (p>0.05). Examining
each sleep item separately, musicians had a lesser tendency to fall asleep while at work than
controls. Using the Student’s t-test and ANOVA, no significant difference in IHLOC sum
score between musicians with and without tinnitus (p>0.05) was observed.
When analyzed by ANOVA, there was no significant differences in HADS-A, HADS-D,
AUDIT or DUDIT between different musicians according to genre or instrument (p>0.05).
Item 1 (“How much does your tinnitus affect for your life?” and Item 6 (“How concerned are
you about your tinnitus?”) are both aspects of health-related quality of life. The linear
regression analyses revealed that sleep disturbance, tinnitus duration, IHLOC and anxiety
were the significant predictors for both items 1 and 6, explaining 11.8/13.5%, 42.8/5.9%,
5.3/6.1% and 5.3/13.3% of their variation, respectively. Table 11 shows a correlation matrix
for age, gender and relevant psychometric instrument scores for the musician subsample who
is constantly tinnitus-affected (n=22). Table 12 and 13 show the results of a series of linear
regression analysis with these items as dependent variables and age, gender, IHLOC, duration
of tinnitus and the various mental health related variables as predictors.

! 68!
Table 10: Psychometric assessment instruments, mean score values and differences between musicians in total,
musicians with tinnitus (Mt), musicians without tinnitus (Mwt) and controls. Significant differences in mean score
that were identified using the Student’s t-test are labeled with *. IP items, IHLC questions and sleep disturbance
(SD) questions are found in the questionnaire in Appendix 1. a : Only those who had experienced tinnitus (ranging from less than two minutes to constant tinnitus) answered the Illness
Perception items, hence for IP Musicians N = 106, Musicians with tinnitus N = 22, Musicians without tinnitus N = 84 and
Controls N = 31.

! 69!
!Age$$ Gender$ HADS$
HADS,D$
HADS,A$ AUDIT$ DUDIT$ IHLC$$$ Sleep$
Age$ !! 0.19! &0.2! &0.2! &0.2! 0.2! 0.3! 0.3! 0.0!
Gender$ 0.2! !! 0.2! 0.1! 0.3! &0.1! &0.1! 0.1! 0.2!
HADS$ &0.2! 0.2! !! 0.9**! 1.0**! 0.3! 0.4! 0.2! 0.2!
HADS,D$ &0.2! 0.1! 0.9**! !! 0.8**! 0.4! 0.4**! 0.1! 0.1**!
HADS,A$ &0.2! 0.3! 1.0**! 0.8**! !! 0.3! 0.3! 0.2! 0.3!
AUDIT$ 0.2! &0.1! 0.3! 0.4! 0.3! !! 0.7**! &0.0! 0.1!
DUDIT$ 0.2! &0.1! 0.4! 0.4! 0.3! 0.7**! !! &0.2! 0.5!
IHLC$ 0.3! 0.1! 0.2! 0.1! 0.2! 0.0! &0.2! !! 0.1!
Sleep$ 0.0! 0.2! 0.2! 0.13! 0.3! 0.1! 0.5*! 0.1! !!
IP$1$ 0.3! 0.4! 0.2! 0.1! 0.2! &1.0! 0.0! 0.3! 0.5*!
IP$2$ 0.4! 0.1! &0.4! &0.4! &0.4! &0.2! *&0.5! 0.3! 0.5*!
IP$3$ 0.0! 0.0! 0.1! &0.1! 0.3! &0.1! 0.1! 0.2! *0.07*!
IP$4$ 0.4! 0.1! 0.1! 0.0! 0.1! &0.2! &0.2! 0.5*! *&0.048!
IP$5$ 0.2! 0.2! 0.1! &0.1! 0.2! &0.1! 0.1! 0.2! 0.3*!
IP$6$ 0.6**! 0.1! 0.0! 0.1! &0.1! 0.0! 0.0! 0.5*! *&0.05!
IP$7$ 0.3! 0.1! 0.0! 0.0! 0.0! 0.1! &0.1! 0.4*! 0.04*!
IP$8$ 0.0! &0.1! 0.1! 0.0! 0.2! 0.0! 0.2! 0.2! 0.25*!
Table 11: Correlations between age, gender and the various assessment instruments and their subscales within
the chronic tinnitus musician sample (n=22)
Correlations by Pearson’s r correlation.
** Correlation is significant at the 0.01 level (2-tailed).
* Correlation is significant at the 0.05 level (2-tailed).

! 70!
Predictors β 1 SD2 Beta2 t P 3ΔR2
Age .361 .613 .166 1.713 .090 .027
Gender .348 .402 .085 .866 .388 .007
IHLOC .080 .033 .231 2.420 .017 .053
Tinnitus duration .601 .068 .654 8.818 .000 .428
Sleep disturbance .144 .039 .343 3.728 .000 .118
HADS-A .079 .033 .230 2.414 .018 .053
HADS-D .077 .047 .159 1.641 .104 .025
AUDIT .022 .027 .082 .840 .403 .007
DUDIT .057 .041 .134 1.379 .171 .018
Sum R2
.736 1 β is the unstandardized regression coefficient. 2Beta is the standardized coefficient. 3ΔR2 is the explained variance.
Table 12: Linear regression analysis for the illness perception items Consequences (”How much does your
tinnitus affect your life?”) in musicians who have experienced temporary tinnitus or have constant tinnitus
(n=106).
Predictors β1 SD2 Beta2 t P 3ΔR2
Age .045 .038 .117 1.201 .232 .014
Gender .760 .769 .097 .989 .325 .009
IHLOC .163 .063 .256 2.590 .011 .061
Tinnitus duration .427 .167 .243 2.556 .012 .059
Sleep disturbance .295 .073 .367 4.026 .000 .135
HADS-A .239 .060 .365 3.993 .000 .133
HADS-D .159 .090 .171 .1766 .080 .029
AUDIT .065 .051 .125 1.287 .201 .016
DUDIT .063 .080 .078 .793 .430 .006
Sum R2
.491
For footnotes see Table 12.
Table 13: Linear regression analysis for the illness perception item Concern (”How concerned are you about
your tinnitus?”) in musicians who have experienced temporary tinnitus or have constant tinnitus (n=106).

! 71!
3.7. Discussion
3.7.1. Methodical considerations
3.7.1.1 Design
The study was designed as a cross-sectional survey with the goal of a randomized case-
control design. Due to difficulties in recruiting sufficient numbers of participants, musicians
were grouped into randomized and non-randomized groups. After performing individual
analyses comparing the two groups for each parameter and finding no significant differences,
the groups were pooled together. For the control group, only the female subsample was
selected at random due to difficulties in recruiting male participants.
Preferentially, musicians and controls should have been tested in the same location.
However, due to the increased availability of musicians in the Oslo region the musicians
were tested in Oslo, whilst the controls were tested at the local University Hospital.
Calibrated equipment meeting ISO-standards was used and the criterion of background noise
were met in both locations, as explained in detail in the Methods section.
3.7.1.2 Subjects
It is problematic to assume that the musician sample consisted of subjects who were 100%
rock musicians. “Rock musician” is not a protected title, and even if the musician plays rock
music, the genre is broad and interlinked with other genres. Several of the musicians in the
sample reported to be playing within other genres. It is also noteworthy that very few of
active rock musicians in Norway are able to make a living from their music. They have other
work, and it is conceivable that a sample of musicians in full time musician jobs would be
more exposed to noise. In retrospect, one could have included a variable to assess whether
music was a full-time occupation or not. In addition several of the musicians had jobs aside
! 72!
from performing as musicians that put them at risk for additional noise exposure (i.e. sound
technicians, music venue bartenders).
The musician sample consisted of two subgroups, a non-randomized population (n=43) and a
randomized population (n=68). Between these samples, the only significant difference found
between any of the relevant audiometric variables was the SNR 2 kHz in the right ear, using
the Student’s t-test (p<0.05).
With regards to the controls, in addition to not being ideally gender and age matched, it is
conceivable that the control sample is not fully representative of a normal population. They
were all university students, with the majority in a medical faculty education facility, and it is
conceivable that there may be socio-demographic differences between the rock musician and
control sample that could introduce bias in the results.
3.7.2. The effect of rock music on the auditory system
3.7.2.1. The outer ear canal and middle ear status
No evidence of damage or structural changes to either the outer ear canal or middle ear was
found. Only one previous study on musicians had included tympanometry in their test battery
(Emami, 2014), in which no significant findings were reported. It is conceivable that
musicians could be prone to increased risk of ear canal problems (such as cerumen, otitis
externa), but this hypothesis is not supported by this study’s data.
3.7.2.2. Cochlear status
The results from paper I and paper II are inconsistent. From Paper II one can deduce that
excessive musical noise inflicts damage on the cochlea, leading to hearing loss across most of
the entire spectrum of frequencies but most pronounced at 6 kHz. This finding corroborates
previous work (Axelsson and Lindgren, 1981, Kaharit et al., 2003, Samelli et al., 2012,

! 73!
Santoni and Fiorini, 2010, Schmuziger et al., 2006). However, no significant signs of cochlear
damage were identified in TEOAE SNRs. The significantly lower TEOAE SNRs found at the
4 kHz (both ears) and 1.5 kHz (left ear) half-octave frequency bands in musicians were
associated with the MHF and age in the regression analysis, and as such, no TEOAE
parameter was independently associated with rock music. This contradicts the results of
Samelli et al, who observed a statistically significant difference between mean TEOAE
amplitude in rock musicians versus controls for all half-octave band frequencies (1, 1.5, 2, 3
and 4 kHz) (Samelli et al., 2012). On the contrary, these findings corroborate Jansen et al.
who concluded that otoacoustic emissions cannot be used as an objective test for early
detection of NIHL (Jansen et al., 2009). TEOAEs were absent in only 6.3% of the musicians,
which is much lower than the number reported by Santoni and Fiorini al (47.8%) (Santoni and
Fiorini, 2010), although this finding should be interpreted with caution as they did not state
their cut-off criterion for presence of otoacoustic emissions. As stated previously, the use of
otoacoustic emissions for assessing noise induced hearing loss is unclarified, and from the
results in this study pure-tone audiometry is considered to be the instrument of choice in
detecting cochlear damage from noise exposure.
3.7.2.2.1. Cochlear status: Instrument
Contrary to prior results (Axelsson and Lindgren, 1977), drummers did not have poorer
hearing thresholds than non-percussive instrumentalists. Guitarists and bassists had worse
hearing than other instrumentalists at 1 kHz in their right ear, and guitarists had poorer
hearing than bassists at 3 and 4 kHz (right ear). The most pronounced difference was
observed in guitarists in the 4 kHz frequency (9.5 dB HL). No significant difference in SNR
in the 4 kHz half-octave frequency band was detected when instrument groups were
compared. Hence, a significant difference in hearing loss across different instrument groups
has not been observed in this study’s data.
3.7.2.2.2. Cochlear status: Exposure and training
The finding of better hearing in the highly performance exposed musicians than the low
exposed corroborates previous findings. Axelsson and Lindgren (1977) found elevated

! 74!
thresholds when comparing short with long sessioning musicians and Kaharit et al. found
significantly lower hearing threshold levels at 4 kHz in the right ear in highly exposed
musicians (Kaharit et al., 2003). An Israeli study showed that the number of hours played
each week had a greater effect on hearing loss than the number of years playing, when
examined with pure-tone audiometry (Halevi-Katz et al., 2015). This could be related to what
has been described as a “training effect” (Kaharit et al., 2003, Canlon et al., 1988, Miyakita
et al., 1992). In Canlon’s study, guinea pigs pre-exposed to a low level acoustic stimulus and
then exposed to a stimulus known to yield permanent threshold shifts, one found that the pre-
exposed animals had a 20 dB reduction in threshold shift and a complete recovery from
threshold shift after two months (Canlon et al., 1988). Ahroon and Hamernik showed that
interrupted noise exposure “toughens” the auditory system. Exposure to 115 dB SPL 1 kHz
narrow band transients presented once per second, six hours per day, to chinchillas produced
a 10-28 dB toughening effect across the entire 0.5 - 8 kHz frequency spectrum (Ahroon and
Hamernik, 1999).
The effect of low level acoustic stimulation on temporary threshold shift has also been shown
in young people (Miyakita et al., 1992). In 1983, Lindgren and Axelsson showed that
identical noise exposure could result in variable TTS, based on the individual’s perception of
the fatiguing signal. Subjects who listened to music they liked produced less TTS than when
being exposed to the same amount of sound energy presented as noise (Lindgren and
Axelsson, 1983). Their study was replicated by Swanson et al, which also found that being
exposed to music they disliked resulted in more TTS than listening to music they liked
(Swanson et al., 1987). One theory explaining this is that the release of catecholamine during
stress leads to decreased perfusion of the inner ear and TTS resulting from cochlear anoxia
(Hawkins, 1971).
One needs to interpret the results with regards to exposure in this dissertation with care, as the
accumulated exposure of each musician will vary based on several other factors, including
length of activity, practice exposure and correspondent sound levels. Another potential bias in
this study is the musician’s ability to recall the exact degree of noise exposure. Although the
questionnaire to some extent addresses the degree of chronic noise exposure, it is conceivable
that a direct acoustic investigation of concert halls, stages and/or practice spaces under
performance/practice conditions could yield a more realistic estimate of true noise exposure in
rock musicians. A WHO-initiated systematic review from 2017, conducted to assess whether

! 75!
an exposure-response relationship could be established between non-occupational noise and
permanent hearing damage such as hearing loss and tinnitus, concluded that specific threshold
analyses focused on stratifying risk according to clearly defined levels of exposure were
missing (Sliwinska-Kowalska and Zaborowski, 2017).
3.7.2.2.3 Cochlear status: Hearing protection
Custom-fitted earplugs were used by 54% and 43% used pre-molded earplugs. Only 39% of
the musicians reported that they were using hearing protection during performances. The
number was higher for musical practice (72%). A possible explanation could be that hearing
protection lowers the musician’s ability to perceive subtle tonal nuances, which is considered
important by many musicians when performing. A significantly poorer hearing at 6 kHz in
musicians that did not use hearing protection (right: 5 dB HL, left: 4.6 dB HL) was found.
This corroborates the significant MHF difference of 2.4 dB HL that was observed in a
previous study of users and non-users of hearing protection (Schmuziger et al., 2006). There
were no significant differences in hearing thresholds between those using custom fitted
earplugs and pre-molded earplugs at 6 kHz, but those using custom fitted plugs had
significantly better hearing than those using cotton for protection (right: 11 dB HL, left 11.8
dB HL).
Despite these significant audiometric findings, it is noteworthy that the TEAOE results are
less clear. Musicians who always used hearing protection during performances and practice
had a higher 4 kHz SNR compared to those who never used protection, but this was only
significant for the right ear. After no-pass ears were removed from the analysis, the effect was
no longer statistically significant. It could be that this finding reflects unilateral hearing
protection in some musicians, or that musicians have a fixed position during performances,
leading to differences in noise exposition between ears. However, the conclusion is that the
the data must be regarded as ambiguous on this issue. The use of hearing protection is an
active measure that requires a conscious wish to prevent hearing loss or tinnitus, and some
musicians may have started to wear hearing protection after they have registered symptoms
originating in the inner ear, such as TTS, PTS or tinnitus. It is also conceivable that
musicians that suffer from hearing loss tend to use hearing protection less than musicians with

! 76!
intact hearing because protection could further inhibit their ability to perceive subtle tonal and
rhythmic nuances, hence inflicting on their performance.
The use of hearing protection in the rock music sample was in line with previous findings in
classical musicians (O'Brien et al., 2014a). In both studies relatively few used earplugs,
especially during performance and most rock musicians prefer custom-molded earplugs.
However, it seems rock musicians are a bit more protective than their classically-trained
counterparts, as in this study 47.7% used it during performance and 64.9% during practice. In
comparison, in Laitinen’s study of classical musicians only 6% reported constant use
(Laitinen, 2005), while 38.4% of Zander’s sample used it occasionally or frequently (Zander
et al., 2008), and only 29% in Jansen’s study reported using plugs during concerts (Jansen et
al., 2009).
It is also noteworthy that the percentage of frequent earplug users was higher (68.2 vs 47.6%)
in the tinnitus-affected subsample than in the NIHL-subsample. This is possibly because
tinnitus could be perceived as a more prominent or bothersome symptom than hearing loss.
3.7.2.2.4. Cochlear status: Tinnitus
In the present study, 19.8% (95% C.I.: 14.3 - 29.7%) of young adult rock musicians have
permanent tinnitus. This is significantly different than in the control sample, where none of
the healthy students reported chronic tinnitus. The median age in the musician sample was 30
years. Shargorodsky et al. demonstrated in their 2010 study a prevalence of frequent tinnitus
in the 30 - 39 age group of 2.6% (Shargorodsky et al., 2010a). Hence, this study’s results
indicate a greater than sevenfold increase in the prevalence of tinnitus in rock musicians in
comparison to the general population. When the musician subjects were further stratified into
permanent tinnitus sufferers and non-tinnitus sufferers, there were no statistically significant
differences between hearing threshold levels or SNR levels in the two groups. Interestingly,
the degree of tinnitus severity was unrelated to TEOAE SNRs at any frequency, nor did one
identify any significant relationship between pure-tone audiometric thresholds and degree of
tinnitus severity. One could interpret the findings shown in Figure 3 as a trend of increased
SNR levels with increased tinnitus severity, but these findings were not statistically
significant.

! 77!
The literature on the relationship between tinnitus and OAEs contains conflicting results. A
French study (Nottet et al., 2006) found that otoacoustic emissions in military personnel
exposed to an acute acoustic trauma had significantly lower TEOAE and DPOAE amplitudes
at 24 hours after the acoustic trauma in subjects showing a longer lasting tinnitus (tinnitus >72
hours post acoustic trauma vs those with tinnitus <72 hours). In contrast, a British study
(Ceranic et al., 1998) found higher TEOAE amplitudes in head injury patients with tinnitus,
compared to those without post-head injury tinnitus. These contrasting results may be due to
the the multifactorial etiology of tinnitus, and the complexity of OAE assessment in tinnitus
sufferers. On one hand, a decreased cochlear activity is identified after acute acoustic trauma,
and on the other hand, a putative reduction of central stimulus inhibition is found after head
injury. Zhao et al. found significantly higher prevalence of DPOAE notches in 44 tinnitus
patients versus controls, whose central frequencies matched the tinnitus frequencies in only
the mid-frequency (Zhao et al., 2010).
Based on the findings in the present study, it is conceivable that extra-cochlear factors play a
major role in the development and subjective perception of tinnitus.
Even though rock musicians are at risk for developing chronic tinnitus, it is noteworthy that
none of the tinnitus-affected participants scored higher than 5 on the illness perception
consequence scale (0 - 10), indicating that none of the musicians were severely affected.
Additionally, less than one fourth considered tinnitus to be an obstacle to performing. This
could be correlated to previous findings of young tinnitus sufferers who tend to display more
positive experiences with tinnitus compared to older patients, with regards to coping, personal
development, support and outlook (Beukes et al., 2017). There is a possibility that severely
affected musicians could already have terminated their musical career due to tinnitus. The
musician are also relatively young, and it is conceivable that the duration of their career has
been too short for the development of tinnitus. Tinnitus appears to increase with age in this
study’s sample, which is in line with Shargorodsky et al’s study from 2010, in which frequent
tinnitus is found to increase with age, ranging from 2.6% <30 years to a peak at 14.3% around
60 - 69 years (Shargorodsky et al., 2010a).
An increased prevalence of anxiety in rock musicians was identified, which correlates with
previous studies that show an increased risk of anxiety in musicians (van Fenema et al.,
2013). This could be related to personality trait characteristics within a musician/artist sample.

! 78!
Tinnitus severity has been found to be associated with somatic anxiety (Ooms, 2012), but
personality traits that have been found to be associated with a creative style,
conscientiousness and openness (Gelade, 2002), have also been shown to have weak
associations to emotional disorders (Watson and Naragon-Gainey, 2014). However, in a
recent study alexithymia was found to be associated with tinnitus severity (Wielopolski et al.,
2017) and may be conductive to a better understanding of affect regulation that influence
psychological adaptation in individuals suffering from tinnitus. In the present study,
musicians with tinnitus did not report higher anxiety levels than those without tinnitus. This
contrasts with Ooms et al. who found a significant relationship between both cognitive and
somatic anxiety and tinnitus severity (Ooms et al., 2012) and Shargorodsky et al.’s study
which found frequent tinnitus to be associated with general anxiety disorder (Shargorodsky et
al., 2010a).
In addition, an increased prevalence of depression in tinnitus-affected musicians compared to
controls was found. Whether increased presence of depression in the tinnitus-subject group is
partly due to tinnitus, or if depression is a risk factor for the symptom, is unknown. Sahlsten
et al. reported in 2017 that tinnitus patients are prone to experience episodes of major
depression, but concluded that psychiatric disorders appeared to be comorbid or predisposing
conditions rather than consequences of tinnitus (Sahlsten et al., 2017). Unterrainer et al.
claimed that depression predicts the severity of tinnitus (Unterrainer et al., 2003), while
Shargorodsky et al. failed to establish an association between depression and frequent tinnitus
(Shargorodsky et al., 2010a). Geocze et al. proposed three possible associations between the
two, with depression affecting tinnitus, tinnitus predisposing depression or tinnitus being a
comorbidity in tinnitus patients (Geocze et al., 2013).
As stated previously, Schmutziger et al. detected traits of addiction-like behavior to loud
music (Schmuziger et al., 2012). A 2017 New Zealand study proposes the use of the model
Conditioning, Adaption and Acculturation to Loud Music (CAALM) to explain the
musicians’ need to perform and consume music at high sound levels (Welch and Fremaux,
2017). According to the model, the musician experiences both psychological conditioning and
auditory adaptation with increased tolerance. In addition there is a cultural element
manifested in expectations for high volumes in both performers, staff and audience, which
according to Welch and Fremaux perpetuates the cycle.

! 79!
Tinnitus is known to cause disruption of sleep patterns (Savage and Waddell, 2014) and
people reporting little sleep (<6 hours) have reported greater levels of tinnitus (Kim et al.,
2015). However, no significant differences in reported sleep quality between musicians with
and without tinnitus were identified, but sleep disturbance positively predicted the degree of
tinnitus-affection and concern.
Several studies have previously demonstrated a negative correspondence between internal
locus of control and tinnitus impairment (Budd and Pugh, 1995, Unterrainer et al., 2003). No
significant differences in internal health locus of control was found when the chronic tinnitus
group was compared with other musicians, but one found IHLOC to be positively correlated
with the degree of concern and the degree to which tinnitus affected the musician’s life when
looking at the whole tinnitus (any duration)- affected group. This contrasts the findings of
Budd and Pugh, who reported that internal control may correlate with introversion, which in
turn is associated with greater attention to all intrapsychic phenomena – also disturbing ones
(Budd and Pugh, 1995). However, this issue merits further study.
3.7.3. Gender effects
Gender was unequally distributed in the study subjects, with a higher proportion of males in
the musician (87.4%) and control (80%) samples. However, one could argue that this unequal
gender distribution represents the actual gender distribution in the background rock musician
population (Schaap and Berkers, 2014).
There were significant differences between the genders for hearing threshold levels at 0.25
kHz (left ear) in the musician group and 0.125 kHz and 0.25 kHz (left ear), total OAE
reproducibility (left ear) and SNR 2 kHz (both ears) in the control group. There were no
significant difference in tinnitus prevalence between genders. Significantly higher HADS-A
scores in female musicians than male were found, which is in line with previous studies
showing that women have higher rates of life time anxiety diagnosis than men (McLean et al.,
2011). However, given the small female sample sizes (musicians n=15, controls n= 8), these
findings should be interpreted with caution.

! 80!
3.7.4. Intraear comparisons
Intraear comparisons indicated minor interaural differences in musicians, where hearing
thresholds were elevated at 1 and 2 kHz in left vs. right ears. Previous work indicates poorer
hearing at most frequencies in professional musicians’ left ears (Kaharit et al., 2003,
Schmuziger et al., 2006), which is characterized by findings in classical musicians (Kaharit et
al., 2001) where string players hold their instrument close to their left ear. In rock music,
however, sound is amplified and multidirectional, which could explain the minor interaural
differences in the rock musician sample. The question of asymmetric NIHL is highly debated,
but the current literature indicates that asymmetric hearing loss and asymmetrically increased
tinnitus frequency from noise could be due to unique differences in susceptibility to noise
injury within individuals (Le et al., 2017). Sulaiman et al.’s study of young personal listening
device users documented that deterioration of high-frequency thresholds and decrease in
DPOAE in amplitudes were more prominent in the right ear than the left (Sulaiman et al.,
2014).
3.7.5. Potential Interferences
3.7.5.1. Subjects
In the musician subsample originating from the BandOrg register (n=46) the response rate
was only 13.9%, whereas in the Øya sample (n=65) the response rate was 69.6%. There could
be several reasons for this discrepancy. One possible explanation is that the BandOrg list was
not kept up-to-date and contained several individuals who were not currently active
musicians, or did not play regularly, whilst the Øya-list was comprised of artists that were
verifiably active. With this in mind, one could also hypothesize that the more active
musicians were more interested in an examination of their own hearing and the subject of
hearing disorders, as the study gave them access to a complete audiological screening free of
charge. Furthermore it is conceivable that musicians with manifest hearing disorders either
would be more motivated to attend such an examination, leading to a falsely high prevalence

! 81!
of hearing disorders in this study’s material. Or, to the contrary, musicians with manifest
symptoms would not attend in fear of being diagnosed. It is also conceivable that the
prevalence of hearing disorders in this study’s material is artificially low, if musicians with
hearing-related disorders already had terminated their careers because of hearing problems.
Axelsson and Lindgren previously suggested that noise-sensitive musicians might quit
performing earlier than the noise-resistant (Axelsson and Lindgren, 1981).
The controls were recruited by informing of the study during lectures at the University. It is
conceivable that some of those who volunteered did so knowing they would receive a free,
extensive auditory check-up. Given Norway’s universal welfare system this is, however, an
unlikely interpretation. It is conceivable that controls volunteered because they suspected they
had hearing problems. On the contrary, none of the controls reported chronic tinnitus, which
is lower than the expected prevalence. Neither musicians nor controls were compensated in
any other manner for participating in the study.
3.7.5.2. Age
The two subject groups were not ideally age matched due to difficulties in recruiting. The
mean age of the musicians was 30.4 versus 25.5 years in the control group. For every analysis
that is presented, additional multiple regression analyses with age and other relevant
parameters were performed to ensure any significant finding was not in fact predicted by age.
When a finding was found to be significant, this is clearly reported in the text. A larger and
better age-matched control group would have improved this study. However, based on
recommendations from statisticians, the statistical power of the study is such that the number
of controls was sufficient in producing data that would uncover significant differences
between musicians and controls.

! 82!
3.7.5.3. TEOAE
The TEOAE analyses were performed in office settings at different locations for the
musicians and the controls, so one could argue that the background ambient noise level were
different. However, the TEOAE investigation was based on common clinical practice where
there is no set criteria for background noise. Noise-level readings was conducted and a
maximum level of background noise was set at 35 dB(A), which criterion was met at both
locations. Furthermore SNR was chosen instead of OAE amplitude in the analyses, as it takes
into account both surrounding and biological noise.
With regards to cut-off criterion, after consulting the producer of the OAE equipment, default
settings was used. The criterion of -5dB represented the minimum band signal. Regarding the
acceptable number of rejected sweeps, the test ended automatically when the noisy data
collected was three times greater than the low noise data collected. The TEOAE noise reject
level scale used in the chosen software was in milliPascals with the default setting of 6 mPa
equating to 49.5 dB SPL. Several studies have shown poor reproducibility between DPOAE
threshold and pure tone audiometry thresholds (Gorga et al., 1997, Scherf et al., 2006). Based
on this and the clinical practice at the local University Hospital and in Norway in general,
TEOAE was used instead of DPOAE. There is a scientific controversy surrounding cut-off
criterion for the presence of otoacoustic emissions, in which different manufactures use
different “pass” and “fail” criteria. No-pass ears were included in the analyses, but one also
repeated all analyses excluding no-pass ears. This is explicitly addressed in Paper I.
3.7.5.4. Pure-tone audiometry
The audiometry was performed at different locations for the rock musicians and controls. At
both locations testing was performed in sound-attenuating rooms meeting the ISO-criterion
for background noise, with the same TDH-39 earphones, and by the same personnel.
The control sample also had an incipient hearing threshold elevation bilaterally at 6 kHz.
This could be interpreted as a latent noise-induced hearing loss in the young adult general
population, although one need to be aware of concerns that the reference value in the ISO-
389-1 may not be entirely correct (Lutman and Davis, 1994). Schlauch and Carney argue

! 83!
that failure to exclude subjects with outer and/or middle ear problems could yield falsely high
prevalence of minimal hearing loss in audiograms of teens, and also suggest that a calibration
error in the TDH-39 earphones makes detecting minimal hearing loss challenging (Schlauch
and Carney, 2012). Dawson et al. found that TDH earphones with different types of cushions
(Model 51 vs MX41/AR) yielded differences in earphone sensitivity at 6 kHz up to 2.8 dB
(Dowson et al., 1991).
It is also noteworthy that there is no present consensus on the true exposure-injury
relationship for leisure noise. An 2014 Australian literature review found that opinions vary
significantly, from minimal to severe effect of leisure noise, and concluded that the nature of
the exposure-injury relationship is yet to be determined (Carter et al., 2014).
The prevalence of hearing loss could vary due to use of different criteria. The criterion used in
this study was the criterion applied in Kaharit’s 2003 article (Kaharit et al., 2003). This was
based on it being the hearing study in the largest sample of rock musicians identified at the
onset of this project.
The value of use of Extended High-Frequency Audiometry (9 - 20 kHz) in detecting damage
from NIHL is a controversial issue (Wei et al., 2017). A 2017 study showed significant
differences in hearing thresholds of personal listening device users at high frequencies (3, 4,
6, 9, 10, 11, 13, 14, 15, 16 kHz), arguing that extended high frequency can be used for early
detection of NIHL (Kumar et al., 2017). This is corroborated by other investigators (Sulaiman
et al., 2014, Kumar et al., 2017). Including EHF audiometry in the clinical assessment-battery
could have yielded a further understanding of the status of the musician’s cochlea.
3.7.5.5. Questionnaire
Exact quantization of noise exposure from the questionnaire is troublesome. Also, recall bias
could represent a problem, especially when it comes to quantifying previous noise exposure.
Also, if a subject did report previous otological conditions, the questionnaire did not specify
on which side (although this was mostly specified during the subsequent clinical
examination).

! 84!
To keep the questionnaire as concise as possible, other survey parameters exploring the
severity of tinnitus affection (e.g., the Tinnitus Handicap Inventory (THI) (Kleinstauber et al.,
2015)) were not included. The inclusion of the THI could have provided a more detailed
insight into the symptomatology of the musician’s tinnitus. However, it is the view of the
author that the illness perception questionnaire items are adequate for exploring essential
health-related quality of life aspects of the condition. However, this also serves to illustrate
the problematic heterogenic nature of current tinnitus research as pointed out by Hobson et
al., where the investigators address the need for a standardized tinnitus assessment research
protocol in order to increase the overall quality of tinnitus research (Hobson et al., 2012).
One can argue that hyperacusis-related variables could have been included in the
questionnaire, and also that loudness discomfort level (LDL) could have been assessed during
the clinical evaluation. Hyperacusis is commonly associated with tinnitus, as 86% of adult
patients with a primary hyperacusis complaint experience tinnitus, and 40% of patients with
primary tinnitus complaints report hyperacusis. Tinnitus characteristics has been shown to
differ between tinnitus patients with and without hyperacusis (Ralli et al., 2017). Sanchez et
al. found in their tinnitus patient sample evidence of hypersensitivity to sound despite normal
audiometric and otoacoustic readings. Their findings suggest that a decrease in LDL indicates
an increased auditory sensitivity, pre-dating possible future hearing impairment in tinnitus
patients with normal cochlear function as per audiometry/TEOAE (Sanchez et al., 2016).
Accordingly, one would consider including analyses of hyperacusis in future work.
With regards to drug use, several of the musicians commented in their questionnaire on
DUDIT’s lack of specification for type of drug. It is perhaps conceivable that central nervous
stimulants (e.g., cocaine) through sympathetic activation could increase tinnitus severity. A
literature search was conducted in Medline with “tinnitus” and “cocaine” as keywords. No
literature was found that support this theory. Also, in the sample, tinnitus-affected musicians
did not have a higher alcohol or drug consumption than those without tinnitus, and though
alcohol consumption was increased in rock musicians versus controls, this was not the case
for drug use. This contradicts the popular belief that rock music culture is conducive to
several ”unhealthy” lifestyle aspects, such as alcohol-and substance abuse (Grønnerød, 2002),
A central ethical focus in anthropology is vulnerability and sources of vulnerability vary
immensely in different societies/subcultures (Iphofen, 2013). Although one could argue that
rock music has become an integral part of mainstream popular culture, one could perceive

! 85!
rock musicians as belonging to a subculture. In this study several of the investigated factors
could be associated with vulnerability, such as anxiety, depression, substance/alcohol abuse
and even tinnitus in itself, and social vulnerability in musical subcultures is previously
described (Ulusoy and Fırat, 2016). An American study from 2013 points out the
shortcomings of traditional social science in depicting so-called “DIY” (Do It Yourself)
musical subcultures (Downes et al., 2013). Given tinnitus’ complex etiology, whether it is of
cochlear, supra-cochlear or psychological origin, or a combination of any of these factors, it is
possible that the integration of qualitative research methodology with quantitative
questionnaires or physical investigations could potentially yield a broadened and deeper
understanding of tinnitus in rock musicians.

! 86!
3.8. Conclusions
According to this study’s chosen definition, the prevalence of hearing loss in Norwegian
young adult rock musicians is 37.8%. This is significantly higher than in the background
population and the control population. Hence, rock musicians are at risk for developing
hearing loss due to noise exposure. The musicians display a moderate hearing threshold
elevation at 0.25, 0.5, 1, 2, 3, 4 and 6 kHz with the most prominent hearing loss at 6 kHz.
The most performance-exposed musicians had lower hearing thresholds at 6 kHz than the
least exposed, which could be related to a conditioning effect in individuals that are
habitually exposed to noise.
Routine users of hearing protection had better hearing thresholds than non-users. A
significant loss in TEOAE SNRs amongst rock musicians was not detected, and in such it is
concluded that pure-tone audiometry is a better diagnostic tool for early detection of hearing
loss in rock musicians.
Around 20% of young adult rock musicians have permanent tinnitus, which can present with
or without TEOAE or audiometric evidence of cochlear damage. Rock musicians have an
increased prevalence of anxiety, which is not associated with the presence of permanent
tinnitus. Depression could be associated with tinnitus in rock musicians, but the present
study’s results are ambiguous. Anxiety, sleep disturbance and internal health locus of control
predict the degree of affection and concern in tinnitus-affected rock musicians. Rock
musicians have an increased risk of alcohol abuse, not drug abuse, but none of those factors
are associated with presence of tinnitus. Neither pure tone hearing thresholds nor TEOAEs
differed significantly between tinnitus-affected and non-tinnitus-affected musicians and it is
conceivable that cochlear damage is not the sole causative agent for tinnitus development in
musicians. Further work on these issues is warranted.

! 87!
3.9. Future work
This study is the largest study to date on hearing disorders in rock musicians, further
elaborating on the issue and producing more robust statistical results. It is clear that being an
active rock musician is a risk factor for developing both hearing loss and tinnitus. Proper use
of earplugs protects the musician from developing NIHL.
Additional studies are required to clarify the exposure-response relationship between noise
and hearing disorders. Regarding tinnitus, further research is required on extra-cochlear
factors, which should include psychometric evaluations and qualitative research methods.

! 88!
Bibliography
AARHUS,!L.,!ENGDAHL,!B.,!TAMBS,!K.,!KVESTAD,!E.!&!HOFFMAN,!H.!J.!2015.!Association!Between!Childhood!Hearing!Disorders!and!Tinnitus!in!Adulthood.!JAMA$Otolaryngol$Head$Neck$Surg,!141,!983&9.!
AHROON,!W.!A.!&!HAMERNIK,!R.!P.!1999.!Noise&induced!hearing!loss!in!the!noise&toughened!auditory!system.!Hear$Res,!129,!101&10.!
AMMER!2004.!The!Facts!on!File!Dictionary!of!Music.!(New!York,!NY:!Infobase,!4th!edn.,!2004),!ISBN!0&8160&5266&2,!pp.!251–2.!
AXELSSON,!A.,!ELIASSON,!A.!&!ISRAELSSON,!B.!1995.!Hearing!in!pop/rock!musicians:!a!follow&up!study.!Ear$Hear,!16,!245&53.!
AXELSSON,!A.!&!LINDGREN,!F.!1977.!Factors!increasing!the!risk!for!hearing!loss!in!'pop'!musicians.!Scand$Audiol,!6,!127&31.!
AXELSSON,!A.!&!LINDGREN,!F.!1981.!Pop!music!and!hearing.!Ear$Hear,!2,!64&9.!BABOR,!T.!F.,!HIGGINS&BIDDLE,!J.!C.,!SAUNDERS,!J.!B.!&!MONTEIRO,!M.!G.!2001.!AUDIT!&!
The!Alcohol!Use!Disorders!Idenfitication!Test.!World$Health$Organization.!BAKER,!C.!&!BROWN,!B.!2016.!Suicide,!Self&Harm!and!Survival!Strategies!in!
Contemporary!Heavy!Metal!Music:!A!Cultural!and!Literary!Analysis.!J$Med$Humanit,!37,!1&17.!
BAKER,!F.!&!BOR,!W.!2008.!Can!music!preference!indicate!mental!health!status!in!young!people?!Australas$Psychiatry,!16,!284&8.!
BARLOW,!C.!2010.!Potential!hazard!of!hearing!damage!to!students!in!undergraduate!popular!music!courses.!Med$Probl$Perform$Art,!25,!175&82.!
BASTA,!D.,!GROSCHEL,!M.!&!ERNST,!A.!2017.![Central!and!peripheral!aspects!of!noise&induced!hearing!loss].!HNO.!
BERGLUND,!B.,!LINDVALL,!T.,!SCHWELA,!D.,!GOH,!K.&T.!&!EDITORS.!2000.!Guidelines!for!Community!Noise.!Geneva,!Switzerland:!World!Health!Organization;!2000.![Guideline!Document!(ISBN:!9971&88&770&3)].!
BERMAN,!A.!H.,!BERGMAN,!H.,!PALMSTIERNA,!T.!&!SCHLYTER,!F.!2007.!DUDIT!The!Drug!Use!Disorders!Identification!Test.!Karolinska$Institutet,$Institutionen$för$klinisk$neurovetenskap.!
BEUKES,!E.!W.,!MANCHAIAH,!V.,!VALIEN,!T.!E.,!BAGULEY,!D.!M.,!ALLEN,!P.!M.!&!ANDERSSON,!G.!2017.!Positive!experiences!related!to!living!with!tinnitus:!A!cross§ional!survey.!Clin$Otolaryngol.!
BING,!D.,!LEE,!S.!C.,!CAMPANELLI,!D.,!XIONG,!H.,!MATSUMOTO,!M.,!PANFORD&WALSH,!R.,!WOLPERT,!S.,!PRAETORIUS,!M.,!ZIMMERMANN,!U.,!CHU,!H.,!KNIPPER,!M.,!RUTTIGER,!L.!&!SINGER,!W.!2015.!Cochlear!NMDA!receptors!as!a!therapeutic!target!of!noise&induced!tinnitus.!Cell$Physiol$Biochem,!35,!1905&23.!
BOGOCH,!II,!HOUSE,!R.!A.!&!KUDLA,!I.!2005.!Perceptions!about!hearing!protection!and!noise&induced!hearing!loss!of!attendees!of!rock!concerts.!Can$J$Public$Health,!96,!69&72.!
BRAY,!A.,!SZYMANSKI,!M.!&!MILLS,!R.!2004.!Noise!induced!hearing!loss!in!dance!music!disc!jockeys!and!an!examination!of!sound!levels!in!nightclubs.!J$Laryngol$Otol,!118,!123&8.!

! 89!
BROADBENT,!E.,!PETRIE,!K.!J.,!MAIN,!J.!&!WEINMAN,!J.!2006.!The!brief!illness!perception!questionnaire.!J$Psychosom$Res,!60,!631&7.!
BROZOSKI,!T.!J.!&!BAUER,!C.!A.!2005.!The!effect!of!dorsal!cochlear!nucleus!ablation!on!tinnitus!in!rats.!Hear$Res,!206,!227&36.!
BUCKNER,!R.!L.,!SEPULCRE,!J.,!TALUKDAR,!T.,!KRIENEN,!F.!M.,!LIU,!H.,!HEDDEN,!T.,!ANDREWS&HANNA,!J.!R.,!SPERLING,!R.!A.!&!JOHNSON,!K.!A.!2009.!Cortical!hubs!revealed!by!intrinsic!functional!connectivity:!mapping,!assessment!of!stability,!and!relation!to!Alzheimer's!disease.!J$Neurosci,!29,!1860&73.!
BUDD,!R.!J.!&!PUGH,!R.!1995.!The!relationship!between!locus!of!control,!tinnitus!severity,!and!emotional!distress!in!a!group!of!tinnitus!sufferers.!J$Psychosom$Res,!39,!1015&8.!
BUREAU!OF!LABOR!STATISTICS,!U.!S.!D.!O.!L.!2013.!Occupational!Outlook!Handbook!2012&13.!Edition,!Musicians!and!Singers.!
CANLON,!B.,!BORG,!E.!&!FLOCK,!A.!1988.!Protection!against!noise!trauma!by!pre&exposure!to!a!low!level!acoustic!stimulus.!Hear$Res,!34,!197&200.!
CARTER,!L.,!WILLIAMS,!W.,!BLACK,!D.!&!BUNDY,!A.!2014.!The!leisure&noise!dilemma:!hearing!loss!or!hearsay?!What!does!the!literature!tell!us?!Ear$Hear,!35,!491&505.!
CERANIC,!B.!J.,!PRASHER,!D.!K.,!RAGLAN,!E.!&!LUXON,!L.!M.!1998.!Tinnitus!after!head!injury:!evidence!from!otoacoustic!emissions.!J$Neurol$Neurosurg$Psychiatry,!65,!523&9.!
CHEN,!J.!D.!&!TSAI,!J.!Y.!2003.!Hearing!loss!among!workers!at!an!oil!refinery!in!Taiwan.!Arch$Environ$Health,!58,!55&8.!
CHESKY,!K.!S.!H.,!JOHN!1999.!Musicians'!Perceptions!of!Widespread!Drug!Use!among!Musicians.!Medical$Problems$of$Performing$Artists,!Volume!14,!187.!
COLES,!R.!R.!1984.!Epidemiology!of!tinnitus:!(1)!prevalence.!J$Laryngol$Otol$Suppl,!9,!7&15.!
COLES,!R.!R.,!LUTMAN,!M.!E.!&!BUFFIN,!J.!T.!2000.!Guidelines!on!the!diagnosis!of!noise&induced!hearing!loss!for!medicolegal!purposes.!Clin$Otolaryngol$Allied$Sci,!25,!264&73.!
CONWAY,!K.!P.!&!MCGRAIN,!P.!2016.!Understanding!Substance!Use!and!Addiction!Through!the!Lyrics!of!Black!Sabbath:!A!Content!Analysis.!Substance$Use$&$Misuse,!51,!1655&1663.!
CURTIS!M,!E.!R.!1987.!Interpretations!of!Music!and!Society,!1954–1984!(Madison,$WI:$Popular$Press,$1987),$ISBN$0T87972T369T6,$pp.$68–73.$.!
DEL!BO,!L.,!FORTI,!S.,!AMBROSETTI,!U.,!COSTANZO,!S.,!MAURO,!D.,!UGAZIO,!G.,!LANGGUTH,!B.!&!MANCUSO,!A.!2008.!Tinnitus!aurium!in!persons!with!normal!hearing:!55!years!later.!Otolaryngol$Head$Neck$Surg,!139,!391&4.!
DOWNES,!J.,!BREEZE,!M.!&!GRIFFIN,!N.!2013.!Researching!DIY!Cultures:!Towards!a!Situated!Ethical!Practice!for!Activist&Academia.!Graduate$Journal$of$Social$Science.!
DOWSON,!S.,!MCNEILL,!H.!&!TORR,!G.!1991.!The!performance!and!calibration!of!TDH39!earphones!fitted!with!Model!51!and!MX41/AR!cushions.!Br$J$Audiol,!25,!419&22.!
DRAKE&LEE,!A.!B.!1992.!Beyond!music:!auditory!temporary!threshold!shift!in!rock!musicians!after!a!heavy!metal!concert.!J$R$Soc$Med,!85,!617&9.!
EMAMI,!S.!F.!2014.!Acoustic!sensitivity!of!the!saccule!and!daf!music.!Iran$J$Otorhinolaryngol,!26,!105&10.!
EMMERICH,!E.,!RUDEL,!L.!&!RICHTER,!F.!2008.!Is!the!audiologic!status!of!professional!musicians!a!reflection!of!the!noise!exposure!in!classical!orchestral!music?!Eur$Arch$Otorhinolaryngol,!265,!753&8.!

! 90!
ENGDAHL,!B.,!TAMBS,!K.,!BORCHGREVINK,!H.!M.!&!HOFFMAN,!H.!J.!2005.!Screened!and!unscreened!hearing!threshold!levels!for!the!adult!population:!results!from!the!Nord&Trondelag!Hearing!Loss!Study.!Int$J$Audiol,!44,!213&30.!
ETIENNE!KRUG,!M.!A.,!RCOS!CIEZA,!S.!C.,!LAURA!SMINKEY,!THAIS!MORATA,,!DEWET!SWANEPOEL,!A.!F.,!WARWICK!WILLIAMS,!JOSEPH!CERQUONE,,!RICARDO!MARTINEZ,!G.!S.,!MARGIE!PEDEN,!SOWMYA!RAO,!PARAS!AGARWAL,!&!EIGHMEY!ZEECK,!A.!B.,!MALACHI!ARUNDA,!AILEEN!NCUBE!2015.!Hearing!loss!due!to!recreational!exposure!to!loud!sounds!&!A!review.!
EU!2003.!European!Commission.!Directive!2003/10/EC!of!the!European!parliament!and!of!the!council!of!6!February!2003!on!the!minimum!health!and!safety!requirements!regarding!exposure!of!workers!to!the!risks!arising!from!physical!agents!(noise)!Official!Journal!of!the!European!Union.!2003.!
FELDMANN,!H.!1971.!Homolateral!and!contralateral!masking!of!tinnitus!by!noise&bands!and!by!pure!tones.!Audiology,!10,!138&44.!
FERGUSON,!M.!A.,!SMITH,!P.!A.,!DAVIS,!A.!C.!&!LUTMAN,!M.!E.!2000.!Transient&evoked!otoacoustic!emissions!in!a!representative!population!sample!aged!18!to!25!years.!Audiology,!39,!125&34.!
FRIBERG,!E.,!JANSSON,!C.,!MITTENDORFER&RUTZ,!E.,!ROSENHALL,!U.!&!ALEXANDERSON,!K.!2012.!Sickness!absence!due!to!otoaudiological!diagnoses!and!risk!of!disability!pension:!a!nationwide!Swedish!prospective!cohort!study.!PLoS$One,!7,!e29966.!
FUSAR&POLI,!P.!2007.!Roger!Keith!"Syd"!Barrett!(1946&2006).!Am$J$Psychiatry,!164,!1028.!
GELADE,!G.!A.!2002.!Creative!style,!personality,!and!artistic!endeavor.!Genet$Soc$Gen$Psychol$Monogr,!128,!213&34.!
GEOCZE,!L.,!MUCCI,!S.,!ABRANCHES,!D.!C.,!MARCO,!M.!A.!&!PENIDO!NDE,!O.!2013.!Systematic!review!on!the!evidences!of!an!association!between!tinnitus!and!depression.!Braz$J$Otorhinolaryngol,!79,!106&11.!
GOPAL,!K.!V.,!CHESKY,!K.,!BESCHONER,!E.!A.,!NELSON,!P.!D.!&!STEWART,!B.!J.!2013.!Auditory!risk!assessment!of!college!music!students!in!jazz!band&based!instructional!activity.!Noise$Health,!15,!246&52.!
GORGA,!M.!P.,!NEELY,!S.!T.,!OHLRICH,!B.,!HOOVER,!B.,!REDNER,!J.!&!PETERS,!J.!1997.!From!laboratory!to!clinic:!a!large!scale!study!of!distortion!product!otoacoustic!emissions!in!ears!with!normal!hearing!and!ears!with!hearing!loss.!Ear$Hear,!18,!440&55.!
GRØNNERØD,!J.!S.!2002.!The!Use!of!Alcohol!and!Cannabis!in!Non&Professional!Rock!Bands!in!Finland.!Contemporary$Drug$Problems,!29,!417&443.!
GUNDERSON,!E.,!MOLINE,!J.!&!CATALANO,!P.!1997.!Risks!of!developing!noise&induced!hearing!loss!in!employees!of!urban!music!clubs.!Am$J$Ind$Med,!31,!75&9.!
HALEVI&KATZ,!D.!N.,!YAAKOBI,!E.!&!PUTTER&KATZ,!H.!2015.!Exposure!to!music!and!noise&induced!hearing!loss!(NIHL)!among!professional!pop/rock/jazz!musicians.!Noise$Health,!17,!158&64.!
HAMDAN,!A.!L.,!ABOUCHACRA,!K.!S.,!ZEKI!AL!HAZZOURI,!A.!G.!&!ZAYTOUN,!G.!2008.!Transient&evoked!otoacoustic!emissions!in!a!group!of!professional!singers!who!have!normal!pure&tone!hearing!thresholds.!Ear$Hear,!29,!360&77.!
HAWKINS,!J.!E.,!JR.!1971.!The!role!of!vasoconstriction!in!noise&induced!hearing!loss.!Ann$Otol$Rhinol$Laryngol,!80,!903&13.!

! 91!
HEALTH,!T.!N.!D.!O.!2011.!Musikkanlegg!og!helse!−!Veileder!til!arrangører!og!kommuner!(in!Norwegian,!Musical!equipment!and!health!−!Guideline!for!organizers!and!municipalities)!2011:IS–0327.!
HEBERT,!S.,!CANLON,!B.,!HASSON,!D.,!MAGNUSSON!HANSON,!L.!L.,!WESTERLUND,!H.!&!THEORELL,!T.!2012.!Tinnitus!severity!is!reduced!with!reduction!of!depressive!mood&&a!prospective!population!study!in!Sweden.!PLoS$One,!7,!e37733.!
HENDERSON,!E.,!TESTA,!M.!A.!&!HARTNICK,!C.!2011.!Prevalence!of!noise&induced!hearing&threshold!shifts!and!hearing!loss!among!US!youths.!Pediatrics,!127,!e39&46.!
HENRY,!J.!A.,!SCHECHTER,!M.!A.,!ZAUGG,!T.!L.,!GRIEST,!S.,!JASTREBOFF,!P.!J.,!VERNON,!J.!A.,!KAELIN,!C.,!MEIKLE,!M.!B.,!LYONS,!K.!S.!&!STEWART,!B.!J.!2006.!Outcomes!of!clinical!trial:!tinnitus!masking!versus!tinnitus!retraining!therapy.!J$Am$Acad$Audiol,!17,!104&32.!
HERRMANN,!C.!1997.!International!experiences!with!the!Hospital!Anxiety!and!Depression!Scale&&a!review!of!validation!data!and!clinical!results.!J$Psychosom$Res,!42,!17&41.!
HESMONDHALGH,!D.!2005.!Subcultures,!Scenes!or!Tribes?!None!of!the!Above.!Journal$of$Youth$Studies,!8,!21&40.!
HOARE,!D.!J.,!KOWALKOWSKI,!V.!L.,!KANG,!S.!&!HALL,!D.!A.!2011.!Systematic!review!and!meta&analyses!of!randomized!controlled!trials!examining!tinnitus!management.!Laryngoscope,!121,!1555&64.!
HOBSON,!J.,!CHISHOLM,!E.!&!EL!REFAIE,!A.!2012.!Sound!therapy!(masking)!in!the!management!of!tinnitus!in!adults.!Cochrane$Database$Syst$Rev,!11,!CD006371.!
HOUSLEY,!G.!D.,!MORTON&JONES,!R.,!VLAJKOVIC,!S.!M.,!TELANG,!R.!S.,!PARAMANANTHASIVAM,!V.,!TADROS,!S.!F.,!WONG,!A.!C.,!FROUD,!K.!E.,!CEDERHOLM,!J.!M.,!SIVAKUMARAN,!Y.,!SNGUANWONGCHAI,!P.,!KHAKH,!B.!S.,!COCKAYNE,!D.!A.,!THORNE,!P.!R.!&!RYAN,!A.!F.!2013.!ATP&gated!ion!channels!mediate!adaptation!to!elevated!sound!levels.!Proc$Natl$Acad$Sci$U$S$A,!110,!7494&9.!
IEC!2014.!IEC!60065:2014.!International$Electrotechnical$Commision.!IPHOFEN,!R.!2013.!Research!Ethics!in!Ethnography/Anthropology.!Europen$Commission,$
DG$Research$and$Innovation.!ISO!1990.!ISO!1999:1990:!Acoustics—Determination!of!Occupational!Noise!Exposure!
and!Estimation!of!Noise&Induced!Hearing!Impairment.!International!Standard!Organization;!Geneva,!Switzerland.!
ISO!2017.!ISO&389&1:2017.!.!International$Organisation$for$Standardization.$Acoustics:$Estimation$of$NoiseTinduced$Hearing$Loss$(ISO$1999:2013)$Geneva:$ISO$Technical$Committee;$2013.$
JANSEN,!E.!J.,!HELLEMAN,!H.!W.,!DRESCHLER,!W.!A.!&!DE!LAAT,!J.!A.!2009.!Noise!induced!hearing!loss!and!other!hearing!complaints!among!musicians!of!symphony!orchestras.!Int$Arch$Occup$Environ$Health,!82,!153&64.!
JANSSON,!E.!&!KARLSSON,!K.!1983.!Sound!levels!recorded!within!the!symphony!orchestra!and!risk!criteria!for!hearing!loss.!Scand$Audiol,!12,!215&21.!
JASTREBOFF,!P.!J.!1990.!Phantom!auditory!perception!(tinnitus):!mechanisms!of!generation!and!perception.!Neurosci$Res,!8,!221&54.!
JIN,!S.!H.,!NELSON,!P.!B.,!SCHLAUCH,!R.!S.!&!CARNEY,!E.!2013.!Hearing!conservation!program!for!marching!band!members:!a!risk!for!noise&induced!hearing!loss?!Am$J$Audiol,!22,!26&39.!

! 92!
KAHARIT,!K.,!ZACHAU,!G.,!EKLOF,!M.,!SANDSJO,!L.!&!MOLLER,!C.!2003.!Assessment!of!hearing!and!hearing!disorders!in!rock/jazz!musicians.!Int$J$Audiol,!42,!279&88.!
KAHARIT,!K.!R.,!AXELSSON,!A.,!HELLSTROM,!P.!A.!&!ZACHAU,!G.!2001.!Hearing!assessment!of!classical!orchestral!musicians.!Scand$Audiol,!30,!13&23.!
KILLION,!M.,!DEVILBISS,!E.!&!STEWARD,!J.!1988.!An!earplug!with!uniform!15&dB!attenuation.!Hear$14&7.!
KIM,!H.!J.,!LEE,!H.!J.,!AN,!S.!Y.,!SIM,!S.,!PARK,!B.,!KIM,!S.!W.,!LEE,!J.!S.,!HONG,!S.!K.!&!CHOI,!H.!G.!2015.!Analysis!of!the!prevalence!and!associated!risk!factors!of!tinnitus!in!adults.!PLoS$One,!10,!e0127578.!
KLEINSTAUBER,!M.,!FRANK,!I.!&!WEISE,!C.!2015.!A!confirmatory!factor!analytic!validation!of!the!Tinnitus!Handicap!Inventory.!J$Psychosom$Res,!78,!277&84.!
KOBEL,!M.,!LE!PRELL,!C.!G.,!LIU,!J.,!HAWKS,!J.!W.!&!BAO,!J.!2017.!Noise&induced!cochlear!synaptopathy:!Past!findings!and!future!studies.!Hear$Res,!349,!148&154.!
KOPKE,!R.,!ALLEN,!K.!A.,!HENDERSON,!D.,!HOFFER,!M.,!FRENZ,!D.!&!VAN!DE!WATER,!T.!1999.!A!radical!demise.!Toxins!and!trauma!share!common!pathways!in!hair!cell!death.!Ann$N$Y$Acad$Sci,!884,!171&91.!
KRAMER,!S.,!DREISBACH,!L.,!LOCKWOOD,!J.,!BALDWIN,!K.,!KOPKE,!R.,!SCRANTON,!S.!&!O'LEARY,!M.!2006.!Efficacy!of!the!antioxidant!N&acetylcysteine!(NAC)!in!protecting!ears!exposed!to!loud!music.!J$Am$Acad$Audiol,!17,!265&78.!
KROG,!N.!H.,!ENGDAHL,!B.!&!TAMBS,!K.!2010.!The!association!between!tinnitus!and!mental!health!in!a!general!population!sample:!results!from!the!HUNT!Study.!J$Psychosom$Res,!69,!289&98.!
KUMAR,!P.,!UPADHYAY,!P.,!KUMAR,!A.,!KUMAR,!S.!&!SINGH,!G.!B.!2017.!Extended!high!frequency!audiometry!in!users!of!personal!listening!devices.!Am$J$Otolaryngol,!38,!163&167.!
KURABI,!A.,!KEITHLEY,!E.!M.,!HOUSLEY,!G.!D.,!RYAN,!A.!F.!&!WONG,!A.!C.!2017.!Cellular!mechanisms!of!noise&induced!hearing!loss.!Hear$Res,!349,!129&137.!
LAITINEN,!H.!2005.!Factors!affecting!the!use!of!hearing!protectors!among!classical!music!players.!Noise$Health,!7,!21&9.!
LAITINEN,!H.!&!POULSEN,!T.!2008.!Questionnaire!investigation!of!musicians'!use!of!hearing!protectors,!self!reported!hearing!disorders,!and!their!experience!of!their!working!environment.!Int$J$Audiol,!47,!160&8.!
LAITINEN,!H.!M.,!TOPPILA,!E.!M.,!OLKINUORA,!P.!S.!&!KUISMA,!K.!2003.!Sound!exposure!among!the!Finnish!National!Opera!personnel.!Appl$Occup$Environ$Hyg,!18,!177&82.!
LANDGREBE,!M.,!AZEVEDO,!A.,!BAGULEY,!D.,!BAUER,!C.,!CACACE,!A.,!COELHO,!C.,!DORNHOFFER,!J.,!FIGUEIREDO,!R.,!FLOR,!H.,!HAJAK,!G.,!VAN!DE!HEYNING,!P.,!HILLER,!W.,!KHEDR,!E.,!KLEINJUNG,!T.,!KOLLER,!M.,!LAINEZ,!J.!M.,!LONDERO,!A.,!MARTIN,!W.!H.,!MENNEMEIER,!M.,!PICCIRILLO,!J.,!DE!RIDDER,!D.,!RUPPRECHT,!R.,!SEARCHFIELD,!G.,!VANNESTE,!S.,!ZEMAN,!F.!&!LANGGUTH,!B.!2012.!Methodological!aspects!of!clinical!trials!in!tinnitus:!a!proposal!for!an!international!standard.!J$Psychosom$Res,!73,!112&21.!
LAPSLEY!MILLER,!J.!A.,!MARSHALL,!L.,!HELLER,!L.!M.!&!HUGHES,!L.!M.!2006.!Low&level!otoacoustic!emissions!may!predict!susceptibility!to!noise&induced!hearing!loss.!J$Acoust$Soc$Am,!120,!280&96.!
LASISI,!A.!O.,!ABIONA,!T.!&!GUREJE,!O.!2010.!Tinnitus!in!the!elderly:!Profile,!correlates,!and!impact!in!the!Nigerian!Study!of!Ageing.!Otolaryngol$Head$Neck$Surg,!143,!510&5.!

! 93!
LE,!T.!N.,!STRAATMAN,!L.!V.,!LEA,!J.!&!WESTERBERG,!B.!2017.!Current!insights!in!noise&induced!hearing!loss:!a!literature!review!of!the!underlying!mechanism,!pathophysiology,!asymmetry,!and!management!options.!J$Otolaryngol$Head$Neck$Surg,!46,!41.!
LIE,!A.,!ENGDAHL,!B.,!HOFFMAN,!H.!J.,!LI,!C.!M.!&!TAMBS,!K.!2017.!Occupational!noise!exposure,!hearing!loss,!and!notched!audiograms!in!the!HUNT!Nord&Trondelag!hearing!loss!study,!1996&1998.!Laryngoscope,!127,!1442&1450.!
LIE,!A.,!SKOGSTAD,!M.,!JOHANNESSEN,!H.!A.,!TYNES,!T.,!MEHLUM,!I.!S.,!NORDBY,!K.!C.,!ENGDAHL,!B.!&!TAMBS,!K.!2016.!Occupational!noise!exposure!and!hearing:!a!systematic!review.!Int$Arch$Occup$Environ$Health,!89,!351&72.!
LINDGREN,!F.!&!AXELSSON,!A.!1983.!Temporary!threshold!shift!after!exposure!to!noise!and!music!of!equal!energy.!Ear$Hear,!4,!197&201.!
LIPSCOMB,!D.!M.!1969.!Ear!damage!from!exposure!to!rock!and!roll!music.!Arch$Otolaryngol,!90,!545&55.!
LOCKWOOD,!A.!H.,!SALVI,!R.!J.!&!BURKARD,!R.!F.!2002.!Tinnitus.!N$Engl$J$Med,!347,!904&10.!
LUCERTINI,!M.,!MOLETI,!A.!&!SISTO,!R.!2002.!On!the!detection!of!early!cochlear!damage!by!otoacoustic!emission!analysis.!J$Acoust$Soc$Am,!111,!972&8.!
LUTMAN,!M.!E.!&!DAVIS,!A.!C.!1994.!The!distribution!of!hearing!threshold!levels!in!the!general!population!aged!18&30!years.!Audiology,!33,!327&50.!
MAIA,!J.!R.!&!RUSSO,!I.!C.!2008.![Study!of!the!hearing!of!rock!and!roll!musicians].!Pro$Fono,!20,!49&54.!
MARTIN,!G.,!CLARKE,!M.!&!PEARCE,!C.!1993.!Adolescent!suicide:!music!preference!as!an!indicator!of!vulnerability.!J$Am$Acad$Child$Adolesc$Psychiatry,!32,!530&5.!
MCBRIDE,!D.!I.!&!WILLIAMS,!S.!2001.!Audiometric!notch!as!a!sign!of!noise!induced!hearing!loss.!Occup$Environ$Med,!58,!46&51.!
MCE!2015.!"Handlingsplan!mot!støy"!by!Norwegian!Ministry!of!Climate!and!Environment.!
MCILVAINE,!D.,!STEWART,!M.!&!ANDERSON,!R.!2012.!Noise!exposure!levels!for!musicians!during!rehearsal!and!performance!times.!Med$Probl$Perform$Art,!27,!31&6.!
MCLEAN,!C.!P.,!ASNAANI,!A.,!LITZ,!B.!T.!&!HOFMANN,!S.!G.!2011.!Gender!differences!in!anxiety!disorders:!prevalence,!course!of!illness,!comorbidity!and!burden!of!illness.!J$Psychiatr$Res,!45,!1027&35.!
MEIKLE,!M.!B.,!VERNON,!J.!&!JOHNSON,!R.!M.!1984.!The!perceived!severity!of!tinnitus.!Some!observations!concerning!a!large!population!of!tinnitus!clinic!patients.!Otolaryngol$Head$Neck$Surg,!92,!689&96.!
MEYER&BISCH,!C.!1996.!Epidemiological!evaluation!of!hearing!damage!related!to!strongly!amplified!music!(personal!cassette!players,!discotheques,!rock!concerts)&&high&definition!audiometric!survey!on!1364!subjects.!Audiology,!35,!121&42.!
MICHIKAWA,!T.,!NISHIWAKI,!Y.,!KIKUCHI,!Y.,!SAITO,!H.,!MIZUTARI,!K.,!OKAMOTO,!M.!&!TAKEBAYASHI,!T.!2010.!Prevalence!and!factors!associated!with!tinnitus:!a!community&based!study!of!Japanese!elders.!J$Epidemiol,!20,!271&6.!
MIYAKITA,!T.,!HELLSTROM,!P.!A.,!FRIMANSON,!E.!&!AXELSSON,!A.!1992.!Effect!of!low!level!acoustic!stimulation!on!temporary!threshold!shift!in!young!humans.!Hear$Res,!60,!149&55.!
MOORE,!D.!H.,!L;!MUNRO,!K!2017.!Benefits!of!Extended!High&Frequency!Audiometry!for!Everyone.!The$Hearing$Journal,!70,!50,52,55.!

! 94!
MUCCI,!S.,!GEOCZE,!L.,!ABRANCHES,!D.!C.,!ANTUNEZ,!A.!E.!&!PENIDO!NDE,!O.!2014.![Systematic!review!of!evidence!on!the!association!between!personality!and!tinnitus].!Braz$J$Otorhinolaryngol,!80,!441&7.!
NELSON,!D.!I.,!NELSON,!R.!Y.,!CONCHA&BARRIENTOS,!M.!&!FINGERHUT,!M.!2005.!The!global!burden!of!occupational!noise&induced!hearing!loss.!Am$J$Ind$Med,!48,!446&58.!
NIOSH!1991.!Noise&induced!loss!of!hearing.!Cincinnati,$OH,$National$Institute$for$$Occupational$Safety$and$Health.$.!NORDIN,!M.,!ÅKERSTEDT,!T.!&!NORDIN,!S.!2013.!Psychometric!evaluation!and!
normative!data!for!the!Karolinska!Sleep!Questionnaire.!Sleep$and$Biological$Rhythms,!11,!216&226.!
NOTTET,!J.!B.,!MOULIN,!A.,!BROSSARD,!N.,!SUC,!B.!&!JOB,!A.!2006.!Otoacoustic!emissions!and!persistent!tinnitus!after!acute!acoustic!trauma.!Laryngoscope,!116,!970&5.!
O'BRIEN,!I.,!ACKERMANN,!B.!J.!&!DRISCOLL,!T.!2014a.!Hearing!and!hearing!conservation!practices!among!Australia's!professional!orchestral!musicians.!Noise$Health,!16,!189&95.!
O'BRIEN,!I.,!DRISCOLL,!T.,!WILLIAMS,!W.!&!ACKERMANN,!B.!2014e.!A!clinical!trial!of!active!hearing!protection!for!orchestral!musicians.!J$Occup$Environ$Hyg,!11,!450&9.!
OISHI,!N.!&!SCHACHT,!J.!2011.!Emerging!treatments!for!noise&induced!hearing!loss.!Expert$Opin$Emerg$Drugs,!16,!235&45.!
OKSANEN,!A.!2013.!Addiction!and!rehabilitation!in!autobiographical!books!by!rock!artists,!1974&2010.!Drug$Alcohol$Rev,!32,!53&9.!
OOMS,!E.,!VANHEULE,!S.,!MEGANCK,!R.,!VINCK,!B.,!WATELET,!J.!B.!&!DHOOGE,!I.!2012.!Tinnitus!severity!and!its!association!with!cognitive!and!somatic!anxiety:!a!critical!study.!Eur$Arch$Otorhinolaryngol,!269,!2327&33.!
OSEI&LAH,!V.!&!YEOH,!L.!H.!2010.!High!frequency!audiometric!notch:!an!outpatient!clinic!survey.!Int$J$Audiol,!49,!95&8.!
PARK,!B.,!CHOI,!H.!G.,!LEE,!H.!J.,!AN,!S.!Y.,!KIM,!S.!W.,!LEE,!J.!S.,!HONG,!S.!K.!&!KIM,!H.!J.!2014.!Analysis!of!the!prevalence!of!and!risk!factors!for!tinnitus!in!a!young!population.!Otol$Neurotol,!35,!1218&22.!
PARTINEN,!M.!&!GISLASON,!T.!1995.!Basic!Nordic!Sleep!Questionnaire!(BNSQ):!a!quantitated!measure!of!subjective!sleep!complaints.!J$Sleep$Res,!4,!150&155.!
PAWLACZYK&LUSZCZYNSKA,!M.,!DUDAREWICZ,!A.,!ZAMOJSKA,!M.!&!SLIWINSKA&KOWALSKA,!M.!2011.!Evaluation!of!sound!exposure!and!risk!of!hearing!impairment!in!orchestral!musicians.!Int$J$Occup$Saf$Ergon,!17,!255&69.!
PINCHOFF,!R.!J.,!BURKARD,!R.!F.,!SALVI,!R.!J.,!COAD,!M.!L.!&!LOCKWOOD,!A.!H.!1998.!Modulation!of!tinnitus!by!voluntary!jaw!movements.!Am$J$Otol,!19,!785&9.!
PINTO,!P.!C.,!MARCELOS,!C.!M.,!MEZZASALMA,!M.!A.,!OSTERNE,!F.!J.,!DE!MELO!TAVARES!DE!LIMA,!M.!A.!&!NARDI,!A.!E.!2014.!Tinnitus!and!its!association!with!psychiatric!disorders:!systematic!review.!J$Laryngol$Otol,!128,!660&4.!
PRIEVE,!B.!A.,!SCHOOLING,!T.,!VENEDIKTOV,!R.!&!FRANCESCHINI,!N.!2015.!An!Evidence&Based!Systematic!Review!on!the!Diagnostic!Accuracy!of!Hearing!Screening!Instruments!for!Preschool!and!School&age!Children.!Am$J$Audiol.!
PROBST,!T.,!PRYSS,!R.,!LANGGUTH,!B.!&!SCHLEE,!W.!2016.!Emotional!states!as!mediators!between!tinnitus!loudness!and!tinnitus!distress!in!daily!life:!Results!from!the!"TrackYourTinnitus"!application.!Sci$Rep,!6,!20382.!
PROBST,!T.,!PRYSS,!R.!C.,!LANGGUTH,!B.,!RAUSCHECKER,!J.!P.,!SCHOBEL,!J.,!REICHERT,!M.,!SPILIOPOULOU,!M.,!SCHLEE,!W.!&!ZIMMERMANN,!J.!2017.!Does!Tinnitus!

! 95!
Depend!on!Time&of&Day?!An!Ecological!Momentary!Assessment!Study!with!the!"TrackYourTinnitus"!Application.!Front$Aging$Neurosci,!9,!253.!
RALLI,!M.,!SALVI,!R.!J.,!GRECO,!A.,!TURCHETTA,!R.,!DE!VIRGILIO,!A.,!ALTISSIMI,!G.,!ATTANASIO,!G.,!CIANFRONE,!G.!&!DE!VINCENTIIS,!M.!2017.!Characteristics!of!somatic!tinnitus!patients!with!and!without!hyperacusis.!PLoS$One,!12,!e0188255.!
RAUSCHECKER,!J.!P.,!LEAVER,!A.!M.!&!MUHLAU,!M.!2010.!Tuning!out!the!noise:!limbic&auditory!interactions!in!tinnitus.!Neuron,!66,!819&26.!
ROSLER,!G.!1994.!Progression!of!hearing!loss!caused!by!occupational!noise.!Scand$Audiol,!23,!13&37.!
ROSS,!T.!P.,!ROSS,!L.!T.,!SHORT,!S.!D.!&!CATALDO,!S.!2015.!THE!MULTIDIMENSIONAL!HEALTH!LOCUS!OF!CONTROL!SCALE:!PSYCHOMETRIC!PROPERTIES!AND!FORM!EQUIVALENCE.!Psychol$Rep,!116,!889&913.!
RYAN,!A.!&!BONE,!R.!C.!1978.!Noise&induced!threshold!shift!and!cochlear!pathology!in!the!Mongolian!gerbil.!J$Acoust$Soc$Am,!63,!1145&51.!
SAHLSTEN,!H.,!TAIMINEN,!T.,!KARUKIVI,!M.,!SJOSTEN,!N.,!NIKKILA,!J.,!VIRTANEN,!J.,!PAAVOLA,!J.,!JOUTSA,!J.,!NIINIVIRTA&JOUTSA,!K.,!TAKALA,!M.,!HOLM,!A.,!RAUHALA,!E.,!LOYTTYNIEMI,!E.,!JOHANSSON,!R.!&!JAASKELAINEN,!S.!K.!2017.!Psychiatric!(Axis!I)!and!personality!(Axis!II)!disorders!and!subjective!psychiatric!symptoms!in!chronic!tinnitus.!Int$J$Audiol,!1&11.!
SALVIATI,!M.,!BERSANI,!F.!S.,!TERLIZZI,!S.,!MELCORE,!C.,!PANICO,!R.,!ROMANO,!G.!F.,!VALERIANI,!G.,!MACRI,!F.,!ALTISSIMI,!G.,!MAZZEI,!F.,!TESTUGINI,!V.,!LATINI,!L.,!DELLE!CHIAIE,!R.,!BIONDI,!M.!&!CIANFRONE,!G.!2014.!Tinnitus:!clinical!experience!of!the!psychosomatic!connection.!Neuropsychiatr$Dis$Treat,!10,!267&75.!
SALVIATI,!M.,!MACRI,!F.,!TERLIZZI,!S.,!MELCORE,!C.,!PROVENZANO,!A.,!CAPPARELLI,!E.,!ALTISSIMI,!G.!&!CIANFRONE,!G.!2013.!The!Tinnitus!Handicap!Inventory!as!a!screening!test!for!psychiatric!comorbidity!in!patients!with!tinnitus.!Psychosomatics,!54,!248&56.!
SAMELLI,!A.!G.,!MATAS,!C.!G.,!CARVALLO,!R.!M.,!GOMES,!R.!F.,!DE!BEIJA,!C.!S.,!MAGLIARO,!F.!C.!&!RABELO,!C.!M.!2012.!Audiological!and!electrophysiological!assessment!of!professional!pop/rock\!musicians.!Noise$Health\,!14\,!6&12\.!
SANCHEZ,!T.!G.,!MORAES,!F.,!CASSEB,!J.,!COTA,!J.,!FREIRE,!K.!&!ROBERTS,!L.!E.!2016.!Tinnitus!is!associated!with!reduced!sound!level!tolerance!in!adolescents!with!normal!audiograms!and!otoacoustic!emissions.!Sci$Rep,!6,!27109.!
SANTONI,!C.!B.!&!FIORINI,!A.!C.!2010.!Pop&rock!musicians:!assessment!of!their!satisfaction!provided!by!hearing!protectors.!Braz$J$Otorhinolaryngol,!76,!454&61.!
SAVAGE,!J.!&!WADDELL,!A.!2014.!Tinnitus.!BMJ$Clin$Evid,!2014.!SCHAAP,!J.!&!BERKERS,!P.!2014.!Grunting!Alone?!Gender!Inequality!in!Extreme!Metal!
Music.!Journal$of$the$International$Association$for$the$Study$of$Popular$Music.!SCHAETTE,!R.,!KONIG,!O.,!HORNIG,!D.,!GROSS,!M.!&!KEMPTER,!R.!2010.!Acoustic!
stimulation!treatments!against!tinnitus!could!be!most!effective!when!tinnitus!pitch!is!within!the!stimulated!frequency!range.!Hear$Res,!269,!95&101.!
SCHERF,!F.,!BROKX,!J.,!WUYTS,!F.!L.!&!VAN!DE!HEYNING,!P.!H.!2006.!The!ASSR:!clinical!application!in!normal&hearing!and!hearing&impaired!infants!and!adults,!comparison!with!the!click&evoked!ABR!and!pure&tone!audiometry.!Int$J$Audiol,!45,!281&6.!
SCHLAUCH,!R.!S.!&!CARNEY,!E.!2012.!The!challenge!of!detecting!minimal!hearing!loss!in!audiometric!surveys.!Am$J$Audiol,!21,!106&19.!

! 96!
SCHMUZIGER,!N.,!PATSCHEKE,!J.!&!PROBST,!R.!2006.!Hearing!in!nonprofessional!pop/rock!musicians.!Ear$Hear,!27,!321&30.!
SCHMUZIGER,!N.,!PATSCHEKE,!J.,!STIEGLITZ,!R.!&!PROBST,!R.!2012.!Is!there!addiction!to!loud!music?!Findings!in!a!group!of!non&professional!pop/rock!musicians.!Audiol$Res,!2,!e11.!
SHARGORODSKY,!J.,!CURHAN,!G.!C.!&!FARWELL,!W.!R.!2010a.!Prevalence!and!characteristics!of!tinnitus!among!US!adults.!Am$J$Med,!123,!711&8.!
SHARGORODSKY,!J.,!CURHAN,!S.!G.,!CURHAN,!G.!C.!&!EAVEY,!R.!2010f.!Change!in!prevalence!of!hearing!loss!in!US!adolescents.!JAMA,!304,!772&8.!
SLIWINSKA&KOWALSKA,!M.!&!ZABOROWSKI,!K.!2017.!WHO!Environmental!Noise!Guidelines!for!the!European!Region:!A!Systematic!Review!on!Environmental!Noise!and!Permanent!Hearing!Loss!and!Tinnitus.!Int$J$Environ$Res$Public$Health,!14.!
SORLIE,!T.,!SEXTON,!H.!C.,!BUSUND,!R.!&!SORLIE,!D.!2000.!Predictors!of!satisfaction!with!surgical!treatment.!Int$J$Qual$Health$Care,!12,!31&40.!
SOSFS!2005.!Socialstyrelsens!författningssamling.!7.!STEURER,!M.,!SIMAK,!S.,!DENK,!D.!M.!&!KAUTZKY,!M.!1998.!Does!choir!singing!cause!
noise&induced!hearing!loss?!Audiology,!37,!38&51.!STORMER,!C.!C.!&!STENKLEV,!N.!C.!2007.![Rock!music!and!hearing!disorders].!Tidsskr$
Nor$Laegeforen,!127,!874&7.!STOUFFER,!J.!L.!&!TYLER,!R.!S.!1990.!Characterization!of!tinnitus!by!tinnitus!patients.!J$
Speech$Hear$Disord,!55,!439&53.!STUDWELL!W.E.,!L.!D.!F.!1999.!The!Classic!Rock!and!Roll!Reader:!Rock!Music!from!its!
Beginnings!to!the!mid&1970s.!SUADICANI,!P.,!HEIN,!H.!O.!&!GYNTELBERG,!F.!2012.!Occupational!noise!exposure,!social!
class,!and!risk!of!ischemic!heart!disease!and!all&cause!mortality&&a!16&year!follow&up!in!the!Copenhagen!Male!Study.!Scand$J$Work$Environ$Health,!38,!19&26.!
SULAIMAN,!A.!H.,!HUSAIN,!R.!&!SELUAKUMARAN,!K.!2014.!Evaluation!of!early!hearing!damage!in!personal!listening!device!users!using!extended!high&frequency!audiometry!and!otoacoustic!emissions.!Eur$Arch$Otorhinolaryngol,!271,!1463&70.!
SUN,!H.,!HUANG,!A.!&!CAO,!S.!2011.!Current!status!and!prospects!of!gene!therapy!for!the!inner!ear.!Hum$Gene$Ther,!22,!1311&22.!
SUN,!W.,!ZHANG,!L.,!LU,!J.,!YANG,!G.,!LAUNDRIE,!E.!&!SALVI,!R.!2008.!Noise!exposure&induced!enhancement!of!auditory!cortex!response!and!changes!in!gene!expression.!Neuroscience,!156,!374&80.!
SWANSON,!S.!J.,!DENGERINK,!H.!A.,!KONDRICK,!P.!&!MILLER,!C.!L.!1987.!The!influence!of!subjective!factors!on!temporary!threshold!shifts!after!exposure!to!music!and!noise!of!equal!energy.!Ear$Hear,!8,!288&91.!
SZCZEPEK,!A.!J.,!HAUPT,!H.,!KLAPP,!B.!F.,!OLZE,!H.!&!MAZUREK,!B.!2014.!Biological!correlates!of!tinnitus&related!distress:!an!exploratory!study.!Hear$Res,!318,!23&30.!
TAK,!S.,!DAVIS,!R.!R.!&!CALVERT,!G.!M.!2009.!Exposure!to!hazardous!workplace!noise!and!use!of!hearing!protection!devices!among!US!workers&&NHANES,!1999&2004.!Am$J$Ind$Med,!52,!358&71.!
TAMBS,!K.,!HOFFMAN,!H.!J.,!BORCHGREVINK,!H.!M.,!HOLMEN,!J.!&!SAMUELSEN,!S.!O.!2003.!Hearing!loss!induced!by!noise,!ear!infections,!and!head!injuries:!results!from!the!Nord&Trondelag!Hearing!Loss!Study.!Int$J$Audiol,!42,!89&105.!
TELANG,!R.!S.,!PARAMANANTHASIVAM,!V.,!VLAJKOVIC,!S.!M.,!MUNOZ,!D.!J.,!HOUSLEY,!G.!D.!&!THORNE,!P.!R.!2010.!Reduced!P2x(2)!receptor&mediated!regulation!of!endocochlear!potential!in!the!ageing!mouse!cochlea.!Purinergic$Signal,!6,!263&72.!

! 97!
TERRY,!A.!M.,!JONES,!D.!M.,!DAVIS,!B.!R.!&!SLATER,!R.!1983.!Parametric!studies!of!tinnitus!masking!and!residual!inhibition.!Br$J$Audiol,!17,!245&56.!
TRONSTAD,!T.!V.!&!GELDERBLOM,!F.!B.!2016.!Sound!exposure!during!outdoor!music!festivals.!Noise$Health,!18,!220&8.!
TWARDELLA,!D.,!RAAB,!U.,!PEREZ&ALVAREZ,!C.,!STEFFENS,!T.,!BOLTE,!G.!&!FROMME,!H.!2017.!Usage!of!personal!music!players!in!adolescents!and!its!association!with!noise&induced!hearing!loss:!A!cross§ional!analysis!of!Ohrkan!cohort!study!data.!Int$J$Audiol,!56,!38&45.!
TYLER,!R.!S.,!CONRAD&ARMES,!D.!&!SMITH,!P.!A.!1984.!Postmasking!effects!of!sensorineural!tinnitus:!a!preliminary!investigation.!J$Speech$Hear$Res,!27,!466&74.!
ULUSOY,!E.!&!FIRAT,!F.!A.!2016.!Toward!a!theory!of!subcultural!mosaic:!Fragmentation!into!and!within!subcultures.!Journal$of$Consumer$Culture.!
UNTERRAINER,!J.,!GREIMEL,!K.!V.,!LEIBETSEDER,!M.!&!KOLLER,!T.!2003.!Experiencing!tinnitus:!which!factors!are!important!for!perceived!severity!of!the!symptom?!Int$Tinnitus$J,!9,!130&3.!
VAN!FENEMA,!E.,!JULSING,!J.!E.,!CARLIER,!I.!V.,!VAN!NOORDEN,!M.!S.,!GILTAY,!E.!J.,!VAN!WEE,!N.!J.!&!ZITMAN,!F.!G.!2013.!Musicians!seeking!psychiatric!help:!a!preliminary!study!of!psychiatric!characteristics.!Med$Probl$Perform$Art,!28,!9&18.!
VERNON,!J.!A.!&!MEIKLE,!M.!B.!2003.!Tinnitus:!clinical!measurement.!Otolaryngol$Clin$North$Am,!36,!293&305,!vi.!
WATSON,!D.!&!NARAGON&GAINEY,!K.!2014.!Personality,!Emotions,!and!the!Emotional!Disorders.!Clin$Psychol$Sci,!2,!422&442.!
WEI,!W.,!HEINZE,!S.,!GERSTNER,!D.!G.,!WALSER,!S.!M.,!TWARDELLA,!D.,!REITER,!C.,!WEILNHAMMER,!V.,!PEREZ&ALVAREZ,!C.,!STEFFENS,!T.!&!HERR,!C.!E.!W.!2017.!Audiometric!notch!and!extended!high&frequency!hearing!threshold!shift!in!relation!to!total!leisure!noise!exposure:!An!exploratory!analysis.!Noise$Health,!19,!263&269.!
WELCH,!D.!&!FREMAUX,!G.!2017.!Understanding!Why!People!Enjoy!Loud!Sound.!Semin$Hear,!38,!348&358.!
WENMAEKERS,!R.,!NICOLAI,!B.,!HORNIKX,!M.!&!KOHLRAUSCH,!A.!2017.!Why!orchestral!musicians!are!bound!to!wear!earplugs:!About!the!ineffectiveness!of!physical!measures!to!reduce!sound!exposure.!J$Acoust$Soc$Am,!142,!3154.!
WEST,!P.!D.!&!EVANS,!E.!F.!1990.!Early!detection!of!hearing!damage!in!young!listeners!resulting!from!exposure!to!amplified!music.!Br$J$Audiol,!24,!89&103.!
WHO!2000.!World!Health!Organization:!Global!Burden!of!Hearing!Loss!in!the!Year!2000.!Available$online:$http://www.who.int/healthinfo/statistics/bod_hearingloss.pdf.$
WHO!2001.!World!Health!Organization!Guidelines!on!Community!Noise!Presentation$at$the$TRB$Session$391$"Setting$an$Agenda$for$Transportation$Noise$Management$Policies$in$the$United$States".!
WHO!2011.!Burden!of!disease!from!environmental!noise.!WIELOPOLSKI,!J.,!KLEINJUNG,!T.,!KOCH,!M.,!PETER,!N.,!MEYER,!M.,!RUFER,!M.!&!WEIDT,!
S.!2017.!Alexithymia!Is!Associated!with!Tinnitus!Severity.!Front$Psychiatry,!8,!223.!
YANG,!S.,!WEINER,!B.!D.,!ZHANG,!L.!S.,!CHO,!S.!J.!&!BAO,!S.!2011.!Homeostatic!plasticity!drives!tinnitus!perception!in!an!animal!model.!Proc$Natl$Acad$Sci$U$S$A,!108,!14974&9.!
YASSI,!A.,!POLLOCK,!N.,!TRAN,!N.!&!CHEANG,!M.!1993.!Risks!to!hearing!from!a!rock!concert.!Can$Fam$Physician,!39,!1045&50.!
ZAGOLSKI,!O.!&!STREK,!P.!2017.!Double!tinnitus!in!a!single!ear.!Int$J$Audiol,!1&4.!

! 98!
ZANDER,!M.!F.,!SPAHN,!C.!&!RICHTER,!B.!2008.!Employment!and!acceptance!of!hearing!protectors!in!classical!symphony!and!opera!orchestras.!Noise$Health,!10,!14&26.!
ZHAO,!F.,!MANCHAIAH,!V.!K.,!FRENCH,!D.!&!PRICE,!S.!M.!2010.!Music!exposure!and!hearing!disorders:!an!overview.!Int$J$Audiol,!49,!54&64.!

! 99!
Appendix 1
Questionnaire: Rock music and hearing disorders
ID-number
Allocated ID-number: ____
Age
Year of birth: _____
Gender
__ Male
__ Female
In what genre do you perform?
Pick the category that is most appropriate. You can choose multiple categories
__ Rock
__ Punk/Hardcore
__ Metal
__ Pop
__ Jazz
__ Electro
__ Hip-hop
__ Country
__ Other
If “other” is selected, please describe genre: ________

! 100!
Which instrument do you play?
If you play several instruments, check all of them.
__ Vocal
__ Guitar
__ Bass
__ Drums
__ Piano
__ Other
If “other” is selected, please specify: _________
Have you experienced tinnitus, and how long does it last?
__ Yes, less than two minutes
__ Yes, 1-2 days
__ Yes, weeks
__ Yes, months
__ Yes, all the time
__ No
How would you categorize your tinnitus?
It is possible to check several categories.
__ Constant
__ Now and then
__ Pulsating
__ Beep
__ Murmur
__ One tone
__ Several tones
__ Right ear
__ Left ear
__ Both ears
__ Other characteristics
If other, please describe: ________

! 101!
Severity of tinnitus
How much does your tinnitus affect your life?
0 = No effect, 10 = Enormous effect
0 1 2 3 4 5 6 7 8 9 10
How long do you think the symptoms will last
0 = Very short time, 10 = Forever
0 1 2 3 4 5 6 7 8 9 10
How much control do you feel you have regarding the symptoms?
0 = Absolutely no control, 10 = Very much control
0 1 2 3 4 5 6 7 8 9 10
How much do you think treatment can help?
0= Not at all, 10 = Very helpful
0 1 2 3 4 5 6 7 8 9 10
To what degree do you experience symptoms of your condition?
0 = No symptoms at all, 10 = Many serious symptoms
0 1 2 3 4 5 6 7 8 9 10

! 102!
How worried are you regarding your condition?
0 = Not worried, 10 = Very worried
0 1 2 3 4 5 6 7 8 9 10
How well do you feel you understand the reasons for your condition?
0 = Don’t understand, 10 = Understand very well
0 1 2 3 4 5 6 7 8 9 10
How much does your condition affect you emotionally (for example, does
it make you angry, afraid, anxious or depressed?)
0 = Not affected, 10 = Very affected
0 1 2 3 4 5 6 7 8 9 10
Have you consulted a doctor about your hearing disorders/ear symptoms?
__ Yes
__ No
If yes, please specify the diagnosis: ______________
Have you ever sought professional help for psychological problems?
__ Yes
__ No
Have you used medication known to cause damage to the ear (gentamycin, streptomycin, quinine,
furosemid, acetylsalicylic acid)?

! 103!
__ Yes
__ No
__ I don’t know
Do you have work (for musicians: not musical work) where you are exposed to daily noise?
__ Yes
__ No
If yes, please specify: ____________
Have you been in the military?
__ Yes
__ No
How often do you perform, on average?
__ Once every other week, or more often
__ Once a month
__ Once every third month
__ Less
How many hours do you practice per week with band, on average?
__ 10 hours or more
__ 5-10 hours
__ 2-5 hours
__ Less
How long have you been playing music, as described in the two former questions?
__ 5 years or longer
__ 2-5 years
__ 1-2 years or shorter
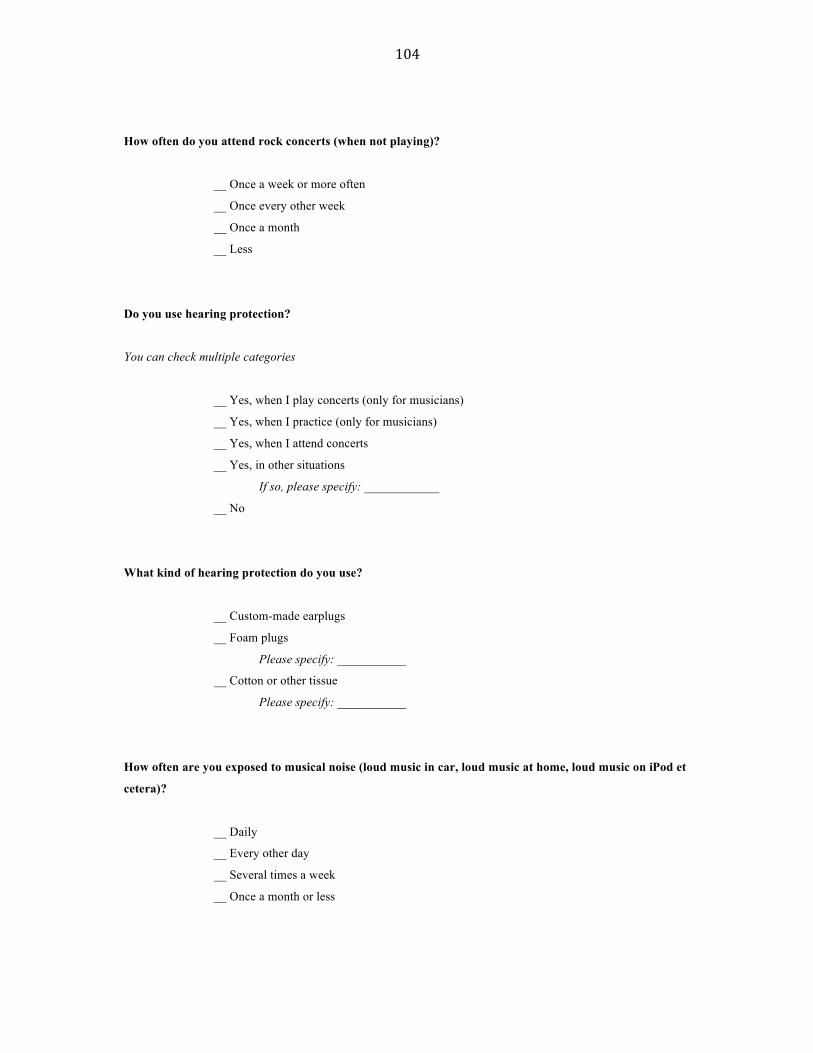
! 104!
How often do you attend rock concerts (when not playing)?
__ Once a week or more often
__ Once every other week
__ Once a month
__ Less
Do you use hearing protection?
You can check multiple categories
__ Yes, when I play concerts (only for musicians)
__ Yes, when I practice (only for musicians)
__ Yes, when I attend concerts
__ Yes, in other situations
If so, please specify: ____________
__ No
What kind of hearing protection do you use?
__ Custom-made earplugs
__ Foam plugs
Please specify: ___________
__ Cotton or other tissue
Please specify: ___________
How often are you exposed to musical noise (loud music in car, loud music at home, loud music on iPod et
cetera)?
__ Daily
__ Every other day
__ Several times a week
__ Once a month or less

! 105!
Do you consider hearing disorders related to playing music to be a problem?
__ Yes
Please specify: ____________
__ No
Have you considered quitting playing music due to hearing disorders?
__ Yes
__ No
Comments: ____________
How often do you exercise?
__ Never
__ Less than once a week
__ Once a week
__ 2-3 times a week
__ Every day
Questions about control
The following questions address illness in general, not specifically hearing disorders.
About control
If I get sick, my own behavior decides how fast I will get well?
__Disagree completely __ Disagree partly __ Slightly disagree __Slightly agree __ Agree
partly __ Completely agree

! 106!
When I get sick, it is my own fault
__Disagree completely __ Disagree partly __ Slightly disagree __Slightly agree __ Agree
partly __ Completely agree
What primarily affects my health, is what I do myself
__Disagree completely __ Disagree partly __ Slightly disagree __Slightly agree __ Agree
partly __ Completely agree
If I take good care of myself, I can avoid getting sick
__Disagree completely __ Disagree partly __ Slightly disagree __Slightly agree __ Agree
partly __ Completely agree
If I take the right precautions, I can remain healthy
__Disagree completely __ Disagree partly __ Slightly disagree __Slightly agree __ Agree
partly __ Completely agree
Questions about sleep hygiene
Have you experienced any of the following the last three months?
Do you have difficulties falling asleep
__ Never __ Rarely (couple of times per year __sometimes (some times per month) __ Mostly
(several times per week) __ Always (every day)
Do you wake up repeatedly, having trouble going back to sleep?
__ Never __ Rarely (couple of times per year __sometimes (some times per month) __ Mostly
(several times per week) __ Always (every day)
Are you tired at school/work or in your leisure?
__ Never __ Rarely (couple of times per year __sometimes (some times per month) __ Mostly
(several times per week) __ Always (every day)

! 107!
Unexpected “naps” during work?
__ Never __ Rarely (couple of times per year __sometimes (some times per month) __ Mostly
(several times per week) __ Always (every day)
Unexpected “naps” during spare time?
__ Never __ Rarely (couple of times per year __sometimes (some times per month) __ Mostly
(several times per week) __ Always (every day)
When do you normally go to sleep?
Workdays/Week days: _______
Off days/Weekends: ________
When do you usually wake up?
Workdays/Week days: _______
Off days/Weekends: ________
How long do you usually lie awake before falling asleep?
Workdays/Week days: _______
Off days/Weekends: ________
How often do you take a “power nap” during the day time?
__ Never
__ Seldom (some times per year)
__ Sometimes (some times per month)
__ Mostly (several times per week)
__ Always (every day)
Questions about the use of alcohol
These questions regard your alcohol consumption in the last 12 months. We are grateful if you answer
them truthfully
How often do you have a drink containing alcohol

! 108!
__ Never __ Monthly or less __ 2-4 times a month __ 2-3 times a week __ 4 or more times a
week
How many units of alcohol do you drink on a typical day when you are drinking?
__ 1-2 __ 3-4 __ 5-6 __ 7-9 __ 10 or more
How often during the last year have you found that you were not able to stop drinking
once you had started?
__ Never __ Monthly or less __ 2-4 times a month __ 2-3 times a week __ 4 or more times a
week
How often during the last year have you failed to do what was normally expected from
you because of your drinking?
__ Never __ Monthly or less __ 2-4 times a month __ 2-3 times a week __ 4 or more times a
week
How often during the last year have you needed an alcoholic drink in the morning to get
yourself going after a heavy drinking session?
__ Never __ Monthly or less __ 2-4 times a month __ 2-3 times a week __ 4 or more times a
week
How often during the last year have you had a feeling of guilt or remorse after drinking?
__ Never __ Monthly or less __ 2-4 times a month __ 2-3 times a week __ 4 or more times a
week
How often during the last year have you been unable to remember what happened the
night before because you had been drinking?
__ Never __ Monthly or less __ 2-4 times a month __ 2-3 times a week __ 4 or more times a
week
How you or any anyone else been injured as a result of your drinking?
__ No, never

! 109!
__ Yes, but not in the last year
__ Yes, during in the last year
Has a relative or friend or a doctor or another health worker been concerned about your
drinking or suggested you cut down?
__ No, never
__ Yes, but not in the last year
__Yes, during the last year
Questions about drug use
These questions regard recreational drug use. We are grateful if you answer them truthfully
How often do you use drugs other than alcohol?
__ Never __ Once a month or less __ 2-4 times a month __ 2-3 times a week __4
times a week or more
Do you use more than one type of drug on the same occasion?
__ Never __ Once a month or less __ 2-4 times a month __ 2-3 times a week __4
times a week or more
How many times do you take drugs on a typical day when you use drugs?
__ 0
__ 1-2
__ 3-4
__ 5-6
__ 7 or more
How often are you heavily influenced by drugs?
__ Never __ Less than once a month __ Every month __ Every week __ Daily or almost every
day
Over the past year, have you felt that your longing for drugs was so strong that you could
not resist it?

! 110!
__ Never __ Less than once a month __ Every month __ Every week __ Daily or almost every
day
Has it happened, over the past year, that you have not been able to stop taking drugs
once you started?
__ Never __ Less than once a month __ Every month __ Every week __ Daily or almost every
day
How often over the past year have you taken drugs and then neglected to do something
you should have done?
__ Never __ Less than once a month __ Every month __ Every week __ Daily or almost every
day
How often over the past year have you needed to take a drug the morning after heavy
drug use the day before?
__ Never __ Less than once a month __ Every month __ Every week __ Daily or almost every
day
How often over the past year have you had guilt feelings or a bad conscience because you
used drugs?
__ Never __ Less than once a month __ Every month __ Every week __ Daily or almost every
day
Have you or anyone else been hurt (mentally or physically) because you used drugs?
__ No
__ Yes, but not over the last year
__ Yes, during the last year
Has a relative or a friend, a doctor or a nurse, or anyone else, been worried about your
drug use or said to you that you should stop using drugs?
__ No
__ Yes, but not over the last year
__ Yes, during the last year

! 111!
Hospital Anxiety & Depression Scale (January 1999)
The doctor knows that emotions play an important part in most diseases. If your doctor knows more about your
feelings, he’ll be better able to help you.
Here are some questions that address how you feel. For every question, please check the answer that best
describes how you’ve felt in the last week. Please give the first answer that comes to mind.
I feel nervous and anxious
__ Always
__ Most of the time
__ From time to time
__ Not at all
I look forward to things like I used to
__ Definitely as much
__ Not so much
__ Only slightly
__ Not at all
I have an anxious feeling inside, like something terrible will happen
__ Yes, and something really terrible
__ Yes, nothing bad
__ A little, worries little
__ Not at all
I can laugh and see the funny side of things
__ Same now as before
__ Not as much now, compared to before
__ Definitely not like before
__ Not at all
My head is full of worries
__ Very often
__ Fairly often
__ Sometimes
__ Every now and then
I’m in a good mood

! 112!
__ Never
__ Sometimes
__ Fairly often
__ Most of the time
I can sit at ease and feel relaxed
__ Yes, definitely
__ Usually
__ Not so often
__ Not at all
I feel like I’m slowed down
__ Almost all the time
__ Very often
__ From time to time
__ Not at all
I get a sort of frightened feeling like butterflies in the stomach
__ Not at all
__ From time to time
__ Fairly often
__ Very often
I don’t care anymore about my appearance
__ Yes, I don’t care anymore
__ Not like I should
__ Maybe not enough
__ I care like I did before
I feel restless and have to be on the move
__ Without a doubt, very much
__ Fairly much
__ Not so much
__ Not at all
I look forward with enjoyment to things
__ As much as before
__ Rather less than before
__ Definitely less than before
__ Almost not at all

! 113!
I get sudden feelings of panic
__ Without a doubt, very often
__ Fairly often
__ Not very often
__ Not at all
I can enjoy a good book, radio or TV program
__ Often
__ From time to time
__ Not so often
__ Very often
Remarks:
If you have any remarks related to tinnitus that has not been highlighted in the questionnaire, please feel free to
comment below:
Thank you for your contribution!


