Embed Size (px)
Citation preview
Heat exposure induces tissue stress in heat-intolerant,but not heat-tolerant, mice
AMINUL ISLAM, PREETHA ABRAHAM, CHRISTOPHER D. HAPNER,
BRIAN ANDREWS-SHIGAKI, PATRICIA DEUSTER, & YIFAN CHEN
Department of Military and Emergency Medicine, Uniformed Services University of the Health Sciences, Bethesda, MD, USA
(Received 28 February 2012; revised 29 April 2012; accepted 2 May 2012)
AbstractWe investigated the association of systemic and local tissue stress responses with heat–tolerant (TOL) levels in mice.Thirty-eight mice were assigned into control and three heat exposure groups—TOL, moderately tolerant, and intolerant(INT), based on their overall thermal responses. Real-time core temperature, blood pressure, and heart rate (HR) wereassessed during heat exposure (39.58C) under conscious condition. Tissue samples were collected 18–22 h following heatexposure. INT mice had significantly higher peak mean arterial pressure and HR than TOL mice during heat exposure.Plasma corticosterone levels were significantly higher in INT than in control mice. No significant changes in plasma cytokinesor markers of oxidative status were observed. INT mice showed significant increases in HSP72 and HSP90 protein andmRNA levels in liver, heart, and gastrocnemius muscles compared to TOL and control mice. In contrast, INT mice hadsignificantly lower heat shock factor 1 and glucocorticoid receptor protein and mRNA levels in these tissues than TOL andcontrol mice. These results indicate that acute heat exposure induces stress responses in various tissues of INT mice, but notTOL mice. Upregulation of stress proteins by acute heat exposure involves both transcriptional and translational pathways.
Keywords: Thermoregulation, hyperthermia, rodent, left ventricle, liver, kidney
Introduction
Exposure to high temperatures may cause illness and
even heat stroke in some people (Bouchama and
Knochel 2002). Identifying heat-intolerant (INT)
individuals will help prevent injuries and possible
life-threatening complications especially during var-
ious physical activities in warm or hot environments.
Unfortunately, physiological characteristics of heat
intolerance remain undefined. Several studies have
investigated stress-related responses to heat exposure
in animals and humans and shown that heat
intolerance is indeed associated with an altered stress
response. However, the results are inconsistent. For
example, Michel et al. (2007) reported that heat-INT
rats demonstrated activation of the hypothalamic–
pituitary–adrenocortical axis as characterized by
increased stress and inflammatory changes. The
response included elevations in mRNA levels for
cytokines and heat shock protein 70 (HSP70) in
pituitary and hypothalamic regions immediately
following heat exposure in heat-INT as compared to
heat-tolerant (TOL) rats. In contrast, Moran et al.
(2006) showed inadequate stress responses in heat-
INT compared to heat-TOL individuals; differences
included a lower expression of HSP72, an inducible
member of the HSP70 family, and heat shock factor 1
(HSF1) in lymphocytes 1 h following heat exposure.
Reasons for the discrepancy between the heat stress
responses of the brain and blood cells remain unclear.
Information on heat-induced changes in additional
tissues/organs is needed to determine stress-related
alterations associated with heat intolerance, since
responses of different tissues or organs to heat may vary
markedly (Flanagan et al. 1995; Ruell et al. 2004).
The objective of this study was to determine the
association between heat-induced stress responses and
heat tolerance levels in mice. Our hypothesis was that
heat exposure induces more extensive stress responses
Correspondence: Y. Chen, Department of Military and Emergency Medicine, Uniformed Services University of the Health Sciences,4301 Jones Bridge Road, Bethesda, MD 20814, USA. Tel: 301 295 4526. Fax: 301 295 6779. E-mail: [email protected]
Stress, March 2013; 16(2): 244–253q Informa Healthcare USA, Inc.ISSN 1025-3890 print/ISSN 1607-8888 onlineDOI: 10.3109/10253890.2012.696754
Stre
ss D
ownl
oade
d fr
om in
form
ahea
lthca
re.c
om b
y JH
U J
ohn
Hop
kins
Uni
vers
ity o
n 06
/07/
13Fo
r pe
rson
al u
se o
nly.
in heat-INT than heat-TOL mice. We examined
stress-related responses in mice during and following
heat exposure. During heat exposure, real-time
thermal and cardiovascular changes were assessed in
conscious mice. Specifically, stress-related changes
in proteins and protein transcription were evaluated in
multiple organs 18–22 h following heat exposure.
INT mice showed a significantly higher cardiovascular
workload than TOL mice during heat exposure.
Moreover, INT, but not TOL, mice had significant
upregulation of stress proteins in all tested tissues/
organs. Acute heat exposure induced stress responses
at both the transcriptional and translational levels in
INT mice.
Methods
Animals
The experiments were conducted using 38 adult male
C57BL/6J mice (Jackson Laboratories, Bar Harbor,
ME, USA). The mice were 12–16 weeks old and
weighed 23–29 g when tests were performed. They
were maintained in conventional animal facilities
(,218C) with ad libitum food and water at the
Uniformed Services University Laboratory Animal
Medicine facility. All procedures performed on
animals were approved by the Uniformed Services
University Institutional Animal Care and Use
Committee.
All experimental mice were surgically implanted
with a temperature transponder (Model G2 E-Mitter,
Mini Mitter Corp., Bend, OR, USA) and a blood
pressure (BP) transmitter (Model PA-C10, Data
Science International, DSI, St. Paul, MN, USA).
The temperature transponder was placed in the
abdominal cavity via a mid-line abdominal incision.
The BP transmitter catheter was placed into the left
carotid artery, and the transmitter body was tunneled
subcutaneously to a small pouch along the right-
ventral flank. All instrumentation was performed with
the use of aseptic surgical procedures under anesthesia
(#2% isoflurane in 100% oxygen). Together, the two
implants weighed ,2.5 g. Sham implants were
installed in control mice (n ¼ 10). At least 2 weeks
were allowed for recovery. At the time of the
experimental protocols, all mice were healthy as
evidenced by body weight gains ($presurgical levels),
normal activity, and no sign of infection.
Experimental procedure
Heat tests were conducted in an environmental
chamber (Model 3950, Thermo Forma, Marietta,
OH, USA). Mice were placed in the chamber at
,218C (relative humidity: ,22–30%) a day before
experimentation to minimize stress-induced
hyperthermia (Leon et al. 2005). Heat exposures
began the following morning after stable baseline data
were obtained. Food and water were removed from
cages before exposure. We used a heat protocol
modified from the laboratory of Michel et al. (2007)
such that heat exposure continued a maximum of 3 h,
including ,1 h of heating the chamber to a
predetermined temperature (39.5 ^ 0.28C). Heat
exposure was terminated at core temperature (Tc) of
,42.48C or 3 h into heat exposure, whichever
happened first. Based on our preliminary data (not
shown), this protocol allowed sufficient heat exposure
to test sensitivity to heat stress without any risk to the
animals. Some INT mice reached 42.48C before 3 h of
heat exposure. Thus, all INT mice had a hyperthermic
response to the same or shorter duration of heat
exposure as compared to other mice. Upon com-
pletion, the chamber door was immediately opened
and fresh air was supplied through an external fan.
The chamber temperature rapidly dropped to below
258C within ,15 min. Each animal underwent two
heat tests separated by an interval of 7 days. All control
mice remained in their housing units and were not
exposed to heat.
Real-time Tc BP and heart rate (HR) were recorded
continuously during experiments. Mice were housed
individually and up to two mice were tested each time.
The two telemetry systems worked simultaneously in a
sandwich layout, with the pressure receiver on the
top of the cage and the temperature receiver under the
cage. The pressure receiver was placed upside down to
facilitate radio signal reception. An open plastic insert
was added between the pressure receiver and the
mouse cage lid to assure sufficient air ventilation and
rapid temperature equilibration in the cage. The
pressure receiver was ,30 cm from the bottom of the
cage, a distance to allow high-quality signal trans-
mission over the entire cage range without inter-
ference between the two telemetry systems.
Custom applications written in LabView 8.6
(National Instruments, Austin, TX, USA) with a
Windows XP desktop computer were used to control
and synchronize the recording process of the two
telemetry systems. The temperature data acquisition
with LabView was established using the communi-
cation protocols provided by Mini Mitter Corp. Under
dynamic mode analysis, the DSI telemetry system can
calculate and export the dual-channel pressure
parameters, HR and activities to Microsoft Excel
every 10 s. The DSI-exported data (active Excel) were
temporarily stored in internal memory and updated
every 10 s. Microsoft provides the ActiveX components
for Excel to make the spreadsheets fully accessible from
external applications. LabView offers support for
ActiveX automation as a server as well as support for
ActiveX Containers and ActiveX Events. The real-time
data transfer from the active Excel worksheet to the
LabView was achieved by using a callback for an
ActiveX event. The LabView applications provide an
Stress and heat intolerance 245
Stre
ss D
ownl
oade
d fr
om in
form
ahea
lthca
re.c
om b
y JH
U J
ohn
Hop
kins
Uni
vers
ity o
n 06
/07/
13Fo
r pe
rson
al u
se o
nly.
interface to process and display the real-time Tc, HR,
systolic BP (SBP), diastolic BP (DBP), mean arterial
pressure (MAP), activity obtained from the telemetry
systems, chamber temperature, and relative humidity
(HumidiProbe, Pico Technology, Eaton Socon, UK).
These data were obtained and displayed every 10 s and
recorded every 60 s.
Collection and processing of blood and tissues
Collection of blood and tissues was performed under
anesthesia ,18–22 h following the last heat test.
Blood, taken from a carotid artery, was collected in a
heparin-primed tube and immediately centrifuged to
obtain plasma. Subsequently, the liver, kidneys, heart
(left ventricle), and gastrocnemius and soleus muscles
were removed, cleaned in ice-cold phosphate-buffered
saline (PBS), frozen immediately in liquid nitrogen,
and stored at 2808C.
Tissue samples were homogenized and further
processed before analyses. Briefly, frozen tissues were
placed into polypropylene test tubes containing 1 ml
of ice-cold PBS and homogenized (5–10 s) with a
Tissue-Tearor homogenizer (Bartlesville, OK, USA).
The Tissue-Tearor was cleaned in a series of fresh
PBS-filled beakers before homogenizing each sample
tissue. Homogenates were centrifuged at 14,000 rpm
for 3 min. The supernatants were obtained and placed
into new 1.5 ml Eppendorf tubes and stored at
2808C. The remaining pellets were evaporated to
dryness and weighed for data correction.
Plasma assays
Cytokine assays were performed in duplicate by using
the MasterPlex QT System (Luminex, Austin, TX,
USA). The MasterPlex QT System incorporated a
fluorescent multi-analyte profiling bead immunoassay
specific for murine cytokines. A 20-plex (FGF basic,
GM-CSF, IFN-g, IL-1a, IL-1b, IL-2, IL-4, IL-5,
IL-6, IL-10, IL-12p40p70, IL-13, IL-17, IP-10, KC,
MCP-1, MIG, MIP-1a, TNF-a, and VEGF) cyto-
kine bead-based kit (Invitrogen Corp., Carlsbad, CA,
USA) was used to screen selective samples. A custom
6-plex cytokine panel was designed (Affymetrix, Inc.,
Santa Clara, CA, USA) to analyze IL-1b/IL-1F2,
IL-6, IL10/CSIF, IL-12/IL-23 p40, IL-12 p70, and
VEGF-A in each 25ml plasma sample. Sensitivity of
the assay was 2 pg/ml per cytokine.
Plasma samples (50ml) were analyzed for cortico-
sterone and 8-isoprostane individually in duplicate
samples by commercial enzyme-linked immunosorbant
assay (ELISA) kits specific for murine samples
(Cayman, Ann Arbor, MI, USA) with the Magellan
Data Analysis System (Tecan, Grodig, Austria). Sensi-
tivity of the assays was 30 and 2 pg/ml, respectively.
Plasma superoxide dismutase (SOD) capacity was
determined based on the inhibition of superoxide
anion produced by xanthine oxidase (Hapner et al.
2010). Lucigenin (5mM)-enhanced chemilumines-
cence was used to assess changes in xanthine oxidase-
dependent superoxide. The reaction was initiated by
adding xanthine (100mM) to PBS solutions contain-
ing xanthine oxidase and plasma samples in a tube
luminometer (Berthold AutoLumat Plus LB 953) at
room temperature. The chemiluminescence signal
was adjusted to background and continuously
measured at 2 Hz. The measurements were performed
in duplicate. Inhibition of superoxide was calculated
as relative reductions in chemiluminescence, and the
plasma SOD activity was calculated from a standard
curve of inhibition of superoxide by Cu/Zn-SOD
(Sigma-Aldrich, St. Louis, MO, USA). All plasma
samples were run in the same assays to avoid inter-
assay variability.
Enzyme-linked immunosorbant assay
Tissue homogenate supernatant and plasma samples
were measured in duplicates using commercial ELISA
kits sensitive to murine samples. The following ELISA
kits were used for HSP72 (Stressgen, Ann Arbor, MI,
USA), HSP90 (TSZ ELISA, Framingham, MA,
USA), glucocorticoid receptor (GR) (TSZ ELISA),
and HSF1 (Enzo Life Sciences, Plymouth, PA, USA)
as per the manufacturers’ instructions. The aspira-
ting and washing cycles were completed by using an
automatic microplate washer (Tecan Group Ltd.,
Mannedorf, Switzerland). Samples were analyzed
using the Magellan Data Analysis System (Tecan)
and normalized to dry tissue weight (dw). Sensitivity of
the assays were 35, 200, 10, and 60 pg/ml, respectively.
Intra- and inter-assay coefficients of variation for
ELISA concentrations were less than 5% per assay.
Quantitative RT-PCR
RNA was isolated from tissue using RNeasy Mini Kit
and QIAshredder (Qiagen, Valencia, CA, USA), and
cDNA templates were prepared with the Maloney
murine leukemia virus reverse transcriptase-directed
iScript One-Step RT-PCR system (Hercules, CA,
USA). The following primers were synthesized by the
Genomics Core at the Biomedical Instrumentation
Center (USUHS, MD, USA) and utilized for RT-
PCR: HSF1 (5-CCTGGCCCATACTCAGCTC-3
and 5-CTCTTGCTTGACACGGACC-3), HSP72
(5-CTCCCTCTTGCGTTGCCTC-3 and 5-ACC-
CGCAGTAATAGCCATCTG-3), HSP90 (5-GAC-
GCTCTGGATAAAATCCGTT-3 and 5-TGGGAA-
TGAGATTGATGTGCAG-3), GR (5-AGCTCCC-
CCTGGTAGAGAC-3 and 5-GGTGAAGACGCA-
GAAACCTTG-3), and glyceraldehyde-3-phosphate
dehydrogenase (GAPDH) (5-TGACAACTTTGG-
TATCGTGGAAGG-3 and 5-AGGGATGATGTT-
CTGGAGAGCC-3). RT-PCR was performed for
A. Islam et al.246
Stre
ss D
ownl
oade
d fr
om in
form
ahea
lthca
re.c
om b
y JH
U J
ohn
Hop
kins
Uni
vers
ity o
n 06
/07/
13Fo
r pe
rson
al u
se o
nly.
40 cycles using the Bio-Rad iCycler iQ RT-PCR
thermocycler and iScript SYBR green PCR supermix
(Hercules, CA, USA). Quantification of the RT-PCR
products normalized to GAPDH expression was
performed using iCycler iQ data analysis software.
Data processing and statistical analysis
Data are expressed as mean ^ SEM. Baseline, peak,
and recovery values of Tc, BPs, and HR were
calculated as steady-state averages before heat
exposure, during the last 5 min of heat exposure and
during a lowest Tc period following heat exposure,
respectively. A heat stress index (HSI) was calculated
as the sum of the product of peak Tc and rate to
peak from baseline in two heat tests: HSI ¼ peak Tc
(heat 1) £ rate (heat 1) þ peak Tc (heat 2) £ rate
(heat 2). The HSI was used to assess the level of heat
tolerance. One-way ANOVA with Dunnett’s post hoc
tests and two-way ANOVA with Bonferroni’s post hoc
tests were used for comparison. The results were
considered significant at P # 0.05.
Results
Thermal responses during heat exposure
Twenty-eight mice exposed to heat were assigned to
one of three groups: TOL, moderately tolerant (MT),
and INT to reflect their level of heat tolerance based
on thermal responses during the two heat tests. Table I
presents baseline and peak Tc, rate to peak Tc,
and recovery from exposures to Heat 1 and Heat 2
tests. Mice with a HSI of ,1.800 were placed in
TOL group (n ¼ 10), those with a HSI of .2.500 in
INT group (n ¼ 10), and the remaining mice in MT
group (n ¼ 8). INT mice had a higher peak Tc and
faster hyperthermic rate than TOL or MT mice
during each heat experiment. INT mice also showed a
greater hypothermic response than TOL or MT mice
following the first heat exposure. No differences in
recovery Tc were noted among the three groups
following the second heat exposure.
Cardiovascular responses during heat exposure
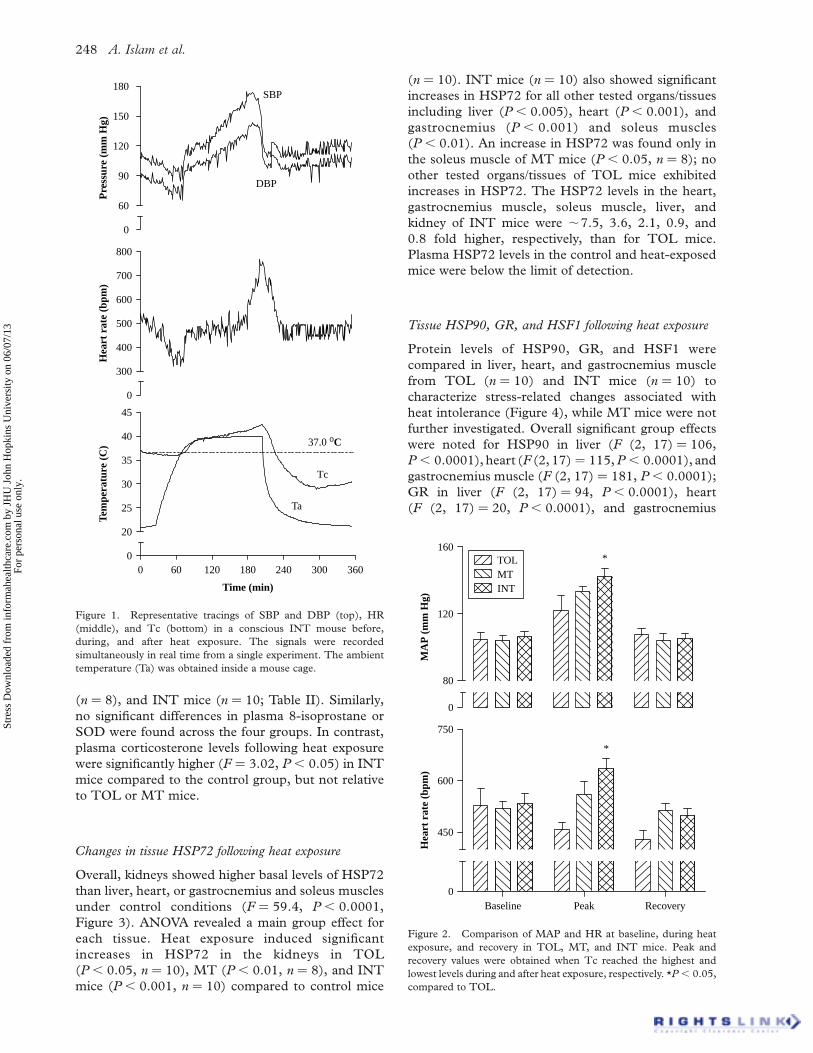
Figure 1 shows typical Tc, SBP, DBP, and HR
changes in an INT mouse in response to heat
exposure. All mice experienced two steady states of
Tc, one around the physiological temperature 37.08C
followed by the other around the chamber set
temperature 39.58C (actual peak temperature
measured in mouse cage using a E-Mitter transpon-
der: 39.6–39.78C) during heat exposure. However,
Tc in INT mice increased earlier and faster from the
second steady state than in TOL and MT mice (not
shown). Correspondingly, SBP, DBP, and HR in INT
mice increased markedly during the late stage of heat
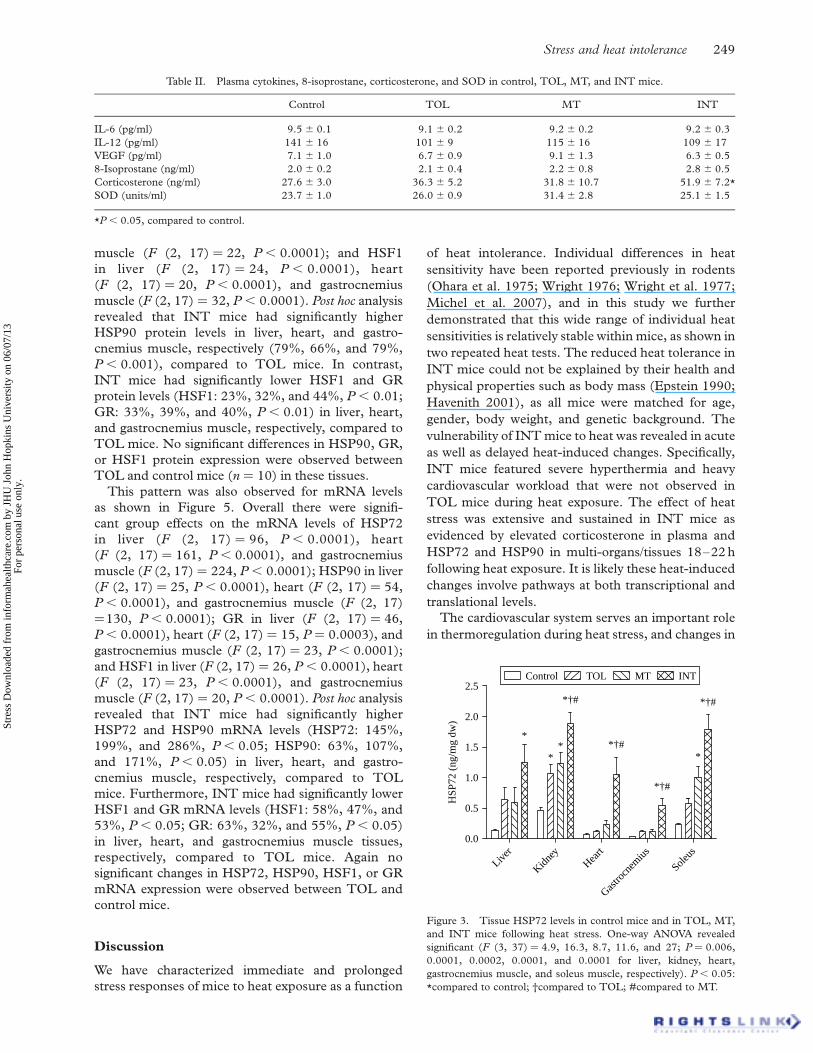
exposure. As shown in Figure 2, heat exposure
resulted in significantly higher peak MAP during
heat exposure than their pre-exposure, baseline levels
(F (2, 52) ¼ 35.48, P , 0.0001). Moreover, post hoc
analysis revealed significantly higher peak MAP
(P , 0.01) during exposure for INT mice compared
to TOL and MT mice. A significant overall
group effect was also noted for HR during heat
exposure (F (2, 53) ¼ 5.27, P ¼ 0.008) and post hoc
analysis revealed a significantly higher peak HR in
INT mice (P , 0.05). No significant differences in
MAP or HR were found during recovery compared to
baseline.
Changes in plasma variables following heat exposure
Among the tested cytokines, only IL-6, IL-12, and
VEGF were consistently detectable in the plasma
samples collected 18–22 h following the second heat
exposure. No significant differences were noted for
these cytokines among control, TOL (n ¼ 10), MT
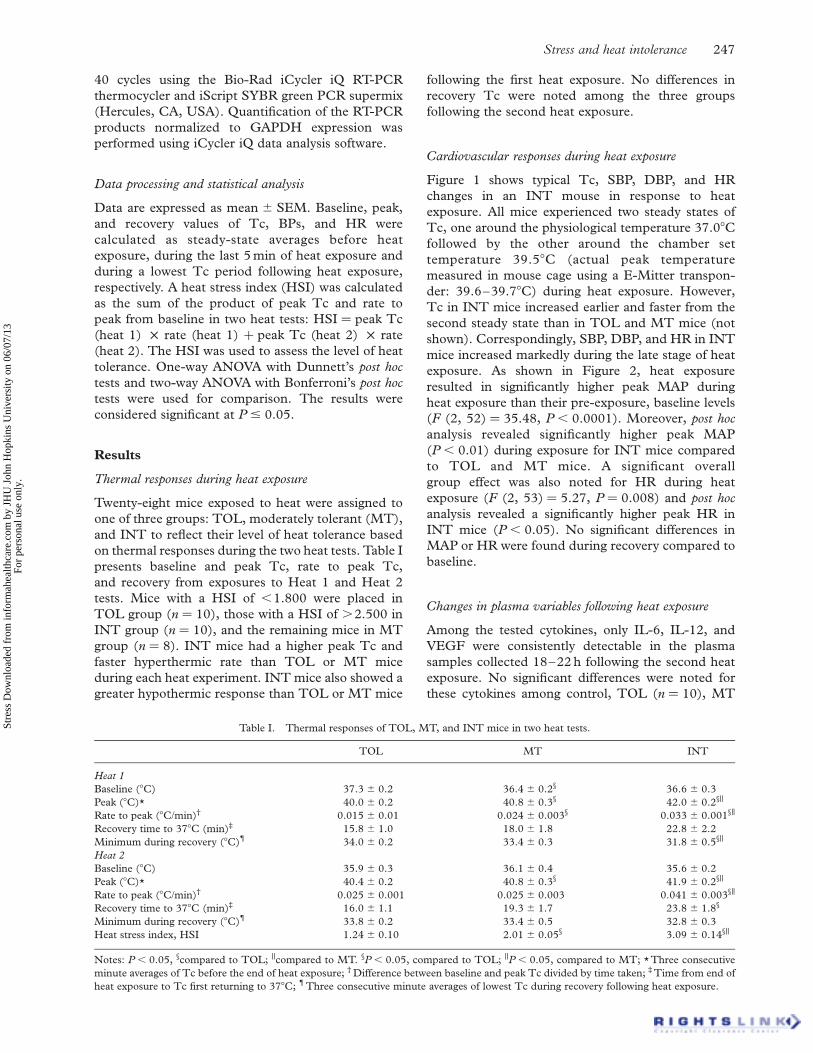
Table I. Thermal responses of TOL, MT, and INT mice in two heat tests.
TOL MT INT
Heat 1
Baseline (8C) 37.3 ^ 0.2 36.4 ^ 0.2§ 36.6 ^ 0.3
Peak (8C)* 40.0 ^ 0.2 40.8 ^ 0.3§ 42.0 ^ 0.2§k
Rate to peak (8C/min)† 0.015 ^ 0.01 0.024 ^ 0.003§ 0.033 ^ 0.001§k
Recovery time to 378C (min)‡ 15.8 ^ 1.0 18.0 ^ 1.8 22.8 ^ 2.2
Minimum during recovery (8C){ 34.0 ^ 0.2 33.4 ^ 0.3 31.8 ^ 0.5§k
Heat 2
Baseline (8C) 35.9 ^ 0.3 36.1 ^ 0.4 35.6 ^ 0.2
Peak (8C)* 40.4 ^ 0.2 40.8 ^ 0.3§ 41.9 ^ 0.2§k
Rate to peak (8C/min)† 0.025 ^ 0.001 0.025 ^ 0.003 0.041 ^ 0.003§k
Recovery time to 378C (min)‡ 16.0 ^ 1.1 19.3 ^ 1.7 23.8 ^ 1.8§
Minimum during recovery (8C){ 33.8 ^ 0.2 33.4 ^ 0.5 32.8 ^ 0.3
Heat stress index, HSI 1.24 ^ 0.10 2.01 ^ 0.05§ 3.09 ^ 0.14§k
Notes: P , 0.05, §compared to TOL; kcompared to MT. §P , 0.05, compared to TOL; kP , 0.05, compared to MT; * Three consecutive
minute averages of Tc before the end of heat exposure; † Difference between baseline and peak Tc divided by time taken; ‡ Time from end of
heat exposure to Tc first returning to 378C; {Three consecutive minute averages of lowest Tc during recovery following heat exposure.
Stress and heat intolerance 247
Stre
ss D
ownl
oade
d fr
om in
form
ahea
lthca
re.c
om b
y JH
U J
ohn
Hop
kins
Uni
vers
ity o
n 06
/07/
13Fo
r pe
rson
al u
se o
nly.
(n ¼ 8), and INT mice (n ¼ 10; Table II). Similarly,
no significant differences in plasma 8-isoprostane or
SOD were found across the four groups. In contrast,
plasma corticosterone levels following heat exposure
were significantly higher (F ¼ 3.02, P , 0.05) in INT
mice compared to the control group, but not relative
to TOL or MT mice.
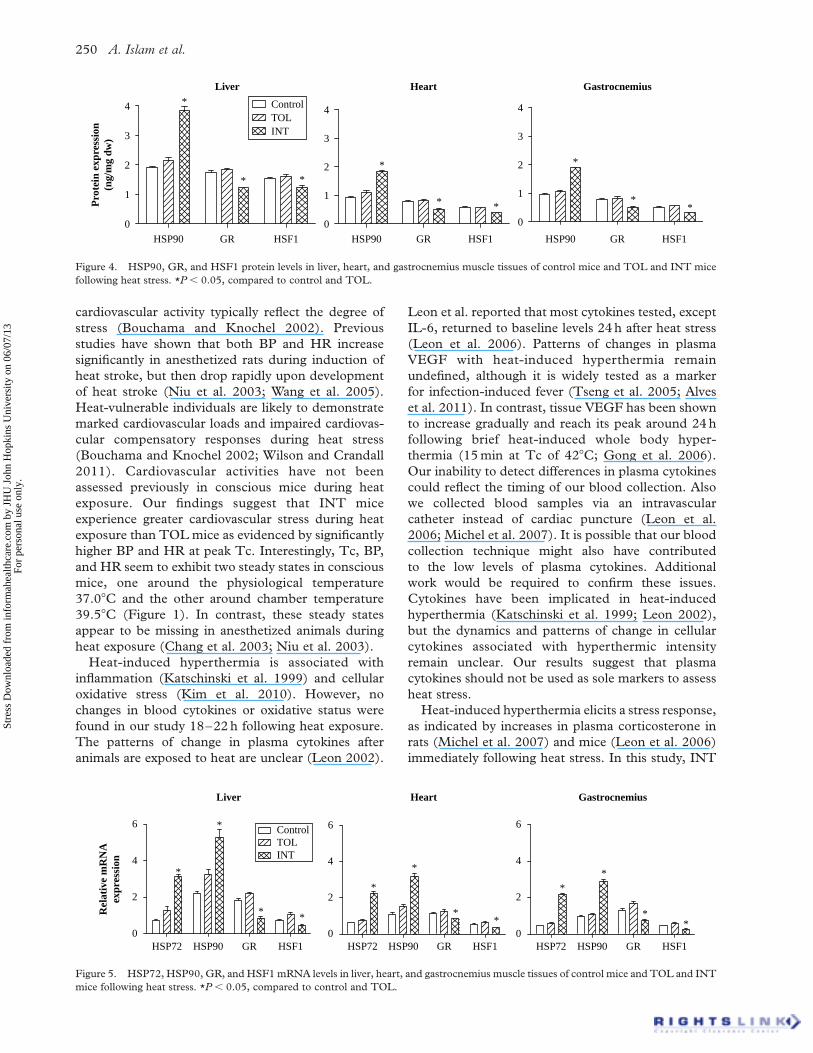
Changes in tissue HSP72 following heat exposure
Overall, kidneys showed higher basal levels of HSP72
than liver, heart, or gastrocnemius and soleus muscles
under control conditions (F ¼ 59.4, P , 0.0001,
Figure 3). ANOVA revealed a main group effect for
each tissue. Heat exposure induced significant
increases in HSP72 in the kidneys in TOL
(P , 0.05, n ¼ 10), MT (P , 0.01, n ¼ 8), and INT
mice (P , 0.001, n ¼ 10) compared to control mice
(n ¼ 10). INT mice (n ¼ 10) also showed significant
increases in HSP72 for all other tested organs/tissues
including liver (P , 0.005), heart (P , 0.001), and
gastrocnemius (P , 0.001) and soleus muscles
(P , 0.01). An increase in HSP72 was found only in
the soleus muscle of MT mice (P , 0.05, n ¼ 8); no
other tested organs/tissues of TOL mice exhibited
increases in HSP72. The HSP72 levels in the heart,
gastrocnemius muscle, soleus muscle, liver, and
kidney of INT mice were ,7.5, 3.6, 2.1, 0.9, and
0.8 fold higher, respectively, than for TOL mice.
Plasma HSP72 levels in the control and heat-exposed
mice were below the limit of detection.
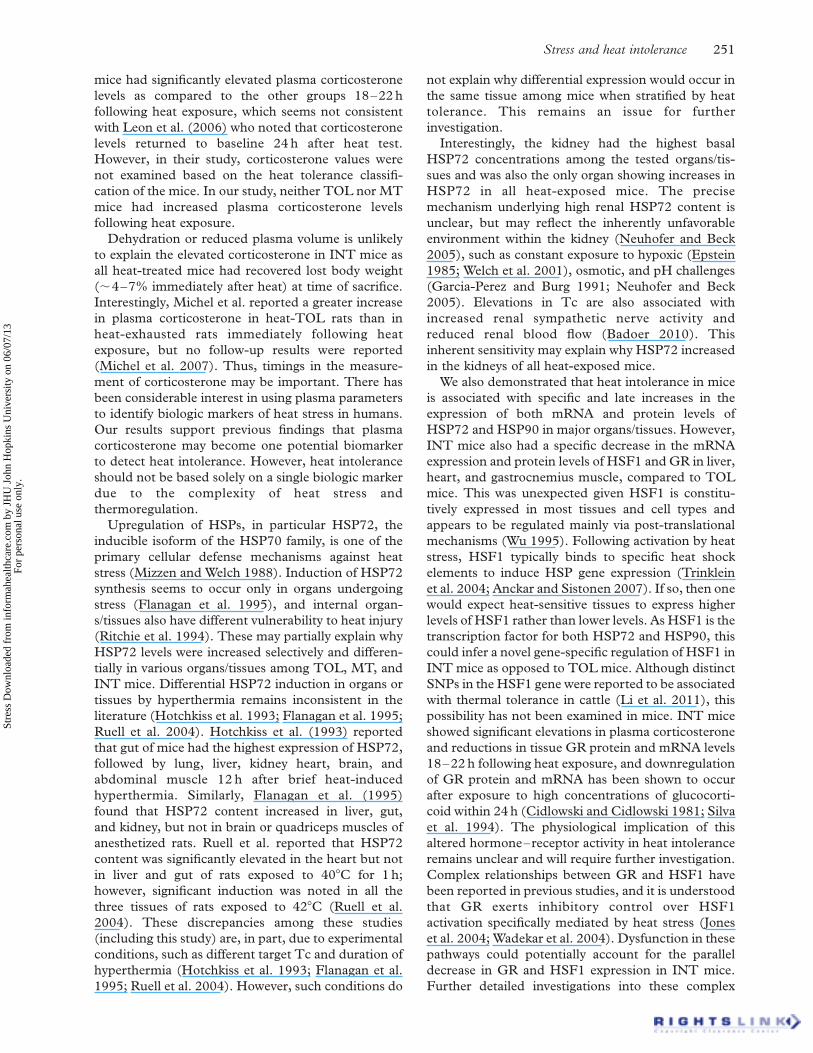
Tissue HSP90, GR, and HSF1 following heat exposure
Protein levels of HSP90, GR, and HSF1 were
compared in liver, heart, and gastrocnemius muscle
from TOL (n ¼ 10) and INT mice (n ¼ 10) to
characterize stress-related changes associated with
heat intolerance (Figure 4), while MT mice were not
further investigated. Overall significant group effects
were noted for HSP90 in liver (F (2, 17) ¼ 106,
P , 0.0001), heart (F (2, 17) ¼ 115,P , 0.0001), and
gastrocnemius muscle (F (2, 17) ¼ 181, P , 0.0001);
GR in liver (F (2, 17) ¼ 94, P , 0.0001), heart
(F (2, 17) ¼ 20, P , 0.0001), and gastrocnemius
MA
P (
mm
Hg)
0
80
120
160TOLMTINT
*
Hea
rt r
ate
(bpm
)
Baseline Peak Recovery0
450
600
750
*
Figure 2. Comparison of MAP and HR at baseline, during heat
exposure, and recovery in TOL, MT, and INT mice. Peak and
recovery values were obtained when Tc reached the highest and
lowest levels during and after heat exposure, respectively. *P , 0.05,
compared to TOL.
Pre
ssur
e (m
m H
g)
0
60
90
120
150
180SBP
DBP
Hea
rt r
ate
(bpm
)
0
300
400
500
600
700
800
Time (min)
Tem
pera
ture
(C
)
0 60 120 180 240 300 3600
20
25
30
35
40
45
Tc
Ta
37.0 οC
Figure 1. Representative tracings of SBP and DBP (top), HR
(middle), and Tc (bottom) in a conscious INT mouse before,
during, and after heat exposure. The signals were recorded
simultaneously in real time from a single experiment. The ambient
temperature (Ta) was obtained inside a mouse cage.
A. Islam et al.248
Stre
ss D
ownl
oade
d fr
om in
form
ahea
lthca
re.c
om b
y JH
U J
ohn
Hop
kins
Uni
vers
ity o
n 06
/07/
13Fo
r pe
rson
al u
se o
nly.
muscle (F (2, 17) ¼ 22, P , 0.0001); and HSF1
in liver (F (2, 17) ¼ 24, P , 0.0001), heart
(F (2, 17) ¼ 20, P , 0.0001), and gastrocnemius
muscle (F (2, 17) ¼ 32, P , 0.0001). Post hoc analysis
revealed that INT mice had significantly higher
HSP90 protein levels in liver, heart, and gastro-
cnemius muscle, respectively (79%, 66%, and 79%,
P , 0.001), compared to TOL mice. In contrast,
INT mice had significantly lower HSF1 and GR
protein levels (HSF1: 23%, 32%, and 44%, P , 0.01;
GR: 33%, 39%, and 40%, P , 0.01) in liver, heart,
and gastrocnemius muscle, respectively, compared to
TOL mice. No significant differences in HSP90, GR,
or HSF1 protein expression were observed between
TOL and control mice (n ¼ 10) in these tissues.
This pattern was also observed for mRNA levels
as shown in Figure 5. Overall there were signifi-
cant group effects on the mRNA levels of HSP72
in liver (F (2, 17) ¼ 96, P , 0.0001), heart
(F (2, 17) ¼ 161, P , 0.0001), and gastrocnemius
muscle (F (2, 17) ¼ 224, P , 0.0001); HSP90 in liver
(F (2, 17) ¼ 25, P , 0.0001), heart (F (2, 17) ¼ 54,
P , 0.0001), and gastrocnemius muscle (F (2, 17)
¼130, P , 0.0001); GR in liver (F (2, 17) ¼ 46,
P , 0.0001), heart (F (2, 17) ¼ 15, P ¼ 0.0003), and
gastrocnemius muscle (F (2, 17) ¼ 23, P , 0.0001);
and HSF1 in liver (F (2, 17) ¼ 26, P , 0.0001), heart
(F (2, 17) ¼ 23, P , 0.0001), and gastrocnemius
muscle (F (2, 17) ¼ 20, P , 0.0001). Post hoc analysis
revealed that INT mice had significantly higher
HSP72 and HSP90 mRNA levels (HSP72: 145%,
199%, and 286%, P , 0.05; HSP90: 63%, 107%,
and 171%, P , 0.05) in liver, heart, and gastro-
cnemius muscle, respectively, compared to TOL
mice. Furthermore, INT mice had significantly lower
HSF1 and GR mRNA levels (HSF1: 58%, 47%, and
53%, P , 0.05; GR: 63%, 32%, and 55%, P , 0.05)
in liver, heart, and gastrocnemius muscle tissues,
respectively, compared to TOL mice. Again no
significant changes in HSP72, HSP90, HSF1, or GR
mRNA expression were observed between TOL and
control mice.
Discussion
We have characterized immediate and prolonged
stress responses of mice to heat exposure as a function
of heat intolerance. Individual differences in heat
sensitivity have been reported previously in rodents
(Ohara et al. 1975; Wright 1976; Wright et al. 1977;
Michel et al. 2007), and in this study we further
demonstrated that this wide range of individual heat
sensitivities is relatively stable within mice, as shown in
two repeated heat tests. The reduced heat tolerance in
INT mice could not be explained by their health and
physical properties such as body mass (Epstein 1990;
Havenith 2001), as all mice were matched for age,
gender, body weight, and genetic background. The
vulnerability of INT mice to heat was revealed in acute
as well as delayed heat-induced changes. Specifically,
INT mice featured severe hyperthermia and heavy
cardiovascular workload that were not observed in
TOL mice during heat exposure. The effect of heat
stress was extensive and sustained in INT mice as
evidenced by elevated corticosterone in plasma and
HSP72 and HSP90 in multi-organs/tissues 18–22 h
following heat exposure. It is likely these heat-induced
changes involve pathways at both transcriptional and
translational levels.
The cardiovascular system serves an important role
in thermoregulation during heat stress, and changes in
Table II. Plasma cytokines, 8-isoprostane, corticosterone, and SOD in control, TOL, MT, and INT mice.
Control TOL MT INT
IL-6 (pg/ml) 9.5 ^ 0.1 9.1 ^ 0.2 9.2 ^ 0.2 9.2 ^ 0.3
IL-12 (pg/ml) 141 ^ 16 101 ^ 9 115 ^ 16 109 ^ 17
VEGF (pg/ml) 7.1 ^ 1.0 6.7 ^ 0.9 9.1 ^ 1.3 6.3 ^ 0.5
8-Isoprostane (ng/ml) 2.0 ^ 0.2 2.1 ^ 0.4 2.2 ^ 0.8 2.8 ^ 0.5
Corticosterone (ng/ml) 27.6 ^ 3.0 36.3 ^ 5.2 31.8 ^ 10.7 51.9 ^ 7.2*SOD (units/ml) 23.7 ^ 1.0 26.0 ^ 0.9 31.4 ^ 2.8 25.1 ^ 1.5
*P , 0.05, compared to control.
HSP
72 (
ng/m
g dw
)
Liver
Kidney
Heart
Gastro
cnem
ius
Soleus
0.0
0.5
1.0
1.5
2.0
2.5Control TOL MT INT
*†#
*†#
*†#*
**
*†#
*
Figure 3. Tissue HSP72 levels in control mice and in TOL, MT,
and INT mice following heat stress. One-way ANOVA revealed
significant (F (3, 37) ¼ 4.9, 16.3, 8.7, 11.6, and 27; P ¼ 0.006,
0.0001, 0.0002, 0.0001, and 0.0001 for liver, kidney, heart,
gastrocnemius muscle, and soleus muscle, respectively). P , 0.05:
*compared to control; †compared to TOL; #compared to MT.
Stress and heat intolerance 249
Stre
ss D
ownl
oade
d fr
om in
form
ahea
lthca
re.c
om b
y JH
U J
ohn
Hop
kins
Uni
vers
ity o
n 06
/07/
13Fo
r pe
rson
al u
se o
nly.
cardiovascular activity typically reflect the degree of
stress (Bouchama and Knochel 2002). Previous
studies have shown that both BP and HR increase
significantly in anesthetized rats during induction of
heat stroke, but then drop rapidly upon development
of heat stroke (Niu et al. 2003; Wang et al. 2005).
Heat-vulnerable individuals are likely to demonstrate
marked cardiovascular loads and impaired cardiovas-
cular compensatory responses during heat stress
(Bouchama and Knochel 2002; Wilson and Crandall
2011). Cardiovascular activities have not been
assessed previously in conscious mice during heat
exposure. Our findings suggest that INT mice
experience greater cardiovascular stress during heat
exposure than TOL mice as evidenced by significantly
higher BP and HR at peak Tc. Interestingly, Tc, BP,
and HR seem to exhibit two steady states in conscious
mice, one around the physiological temperature
37.08C and the other around chamber temperature
39.58C (Figure 1). In contrast, these steady states
appear to be missing in anesthetized animals during
heat exposure (Chang et al. 2003; Niu et al. 2003).
Heat-induced hyperthermia is associated with
inflammation (Katschinski et al. 1999) and cellular
oxidative stress (Kim et al. 2010). However, no
changes in blood cytokines or oxidative status were
found in our study 18–22 h following heat exposure.
The patterns of change in plasma cytokines after
animals are exposed to heat are unclear (Leon 2002).
Leon et al. reported that most cytokines tested, except
IL-6, returned to baseline levels 24 h after heat stress
(Leon et al. 2006). Patterns of changes in plasma
VEGF with heat-induced hyperthermia remain
undefined, although it is widely tested as a marker
for infection-induced fever (Tseng et al. 2005; Alves
et al. 2011). In contrast, tissue VEGF has been shown
to increase gradually and reach its peak around 24 h
following brief heat-induced whole body hyper-
thermia (15 min at Tc of 428C; Gong et al. 2006).
Our inability to detect differences in plasma cytokines
could reflect the timing of our blood collection. Also
we collected blood samples via an intravascular
catheter instead of cardiac puncture (Leon et al.
2006; Michel et al. 2007). It is possible that our blood
collection technique might also have contributed
to the low levels of plasma cytokines. Additional
work would be required to confirm these issues.
Cytokines have been implicated in heat-induced
hyperthermia (Katschinski et al. 1999; Leon 2002),
but the dynamics and patterns of change in cellular
cytokines associated with hyperthermic intensity
remain unclear. Our results suggest that plasma
cytokines should not be used as sole markers to assess
heat stress.
Heat-induced hyperthermia elicits a stress response,
as indicated by increases in plasma corticosterone in
rats (Michel et al. 2007) and mice (Leon et al. 2006)
immediately following heat stress. In this study, INT
Liver
Rel
ativ
e m
RN
Aex
pres
sion
HSP72 HSP90 GR HSF10
2
4
6 ControlTOLINT
*
*
**
Heart
HSP72 HSP90 GR HSF10
2
4
6
*
*
**
Gastrocnemius
HSP72 HSP90 GR HSF10
2
4
6
**
**
Figure 5. HSP72, HSP90, GR, and HSF1 mRNA levels in liver, heart, and gastrocnemius muscle tissues of control mice and TOL and INT
mice following heat stress. *P , 0.05, compared to control and TOL.
LiverP
rote
in e
xpre
ssio
n(n
g/m
g dw
)
HSP90 GR HSF1
0
1
2
3
4 *
* *
ControlTOLINT
Heart
HSP90 GR HSF1
0
1
2
3
4
*
* *
Gastrocnemius
HSP90 GR HSF1
0
1
2
3
4
*
**
Figure 4. HSP90, GR, and HSF1 protein levels in liver, heart, and gastrocnemius muscle tissues of control mice and TOL and INT mice
following heat stress. *P , 0.05, compared to control and TOL.
A. Islam et al.250
Stre
ss D
ownl
oade
d fr
om in
form
ahea
lthca
re.c
om b
y JH
U J
ohn
Hop
kins
Uni
vers
ity o
n 06
/07/
13Fo
r pe
rson
al u
se o
nly.
mice had significantly elevated plasma corticosterone
levels as compared to the other groups 18–22 h
following heat exposure, which seems not consistent
with Leon et al. (2006) who noted that corticosterone
levels returned to baseline 24 h after heat test.
However, in their study, corticosterone values were
not examined based on the heat tolerance classifi-
cation of the mice. In our study, neither TOL nor MT
mice had increased plasma corticosterone levels
following heat exposure.
Dehydration or reduced plasma volume is unlikely
to explain the elevated corticosterone in INT mice as
all heat-treated mice had recovered lost body weight
(,4–7% immediately after heat) at time of sacrifice.
Interestingly, Michel et al. reported a greater increase
in plasma corticosterone in heat-TOL rats than in
heat-exhausted rats immediately following heat
exposure, but no follow-up results were reported
(Michel et al. 2007). Thus, timings in the measure-
ment of corticosterone may be important. There has
been considerable interest in using plasma parameters
to identify biologic markers of heat stress in humans.
Our results support previous findings that plasma
corticosterone may become one potential biomarker
to detect heat intolerance. However, heat intolerance
should not be based solely on a single biologic marker
due to the complexity of heat stress and
thermoregulation.
Upregulation of HSPs, in particular HSP72, the
inducible isoform of the HSP70 family, is one of the
primary cellular defense mechanisms against heat
stress (Mizzen and Welch 1988). Induction of HSP72
synthesis seems to occur only in organs undergoing
stress (Flanagan et al. 1995), and internal organ-
s/tissues also have different vulnerability to heat injury
(Ritchie et al. 1994). These may partially explain why
HSP72 levels were increased selectively and differen-
tially in various organs/tissues among TOL, MT, and
INT mice. Differential HSP72 induction in organs or
tissues by hyperthermia remains inconsistent in the
literature (Hotchkiss et al. 1993; Flanagan et al. 1995;
Ruell et al. 2004). Hotchkiss et al. (1993) reported
that gut of mice had the highest expression of HSP72,
followed by lung, liver, kidney heart, brain, and
abdominal muscle 12 h after brief heat-induced
hyperthermia. Similarly, Flanagan et al. (1995)
found that HSP72 content increased in liver, gut,
and kidney, but not in brain or quadriceps muscles of
anesthetized rats. Ruell et al. reported that HSP72
content was significantly elevated in the heart but not
in liver and gut of rats exposed to 408C for 1 h;
however, significant induction was noted in all the
three tissues of rats exposed to 428C (Ruell et al.
2004). These discrepancies among these studies
(including this study) are, in part, due to experimental
conditions, such as different target Tc and duration of
hyperthermia (Hotchkiss et al. 1993; Flanagan et al.
1995; Ruell et al. 2004). However, such conditions do
not explain why differential expression would occur in
the same tissue among mice when stratified by heat
tolerance. This remains an issue for further
investigation.
Interestingly, the kidney had the highest basal
HSP72 concentrations among the tested organs/tis-
sues and was also the only organ showing increases in
HSP72 in all heat-exposed mice. The precise
mechanism underlying high renal HSP72 content is
unclear, but may reflect the inherently unfavorable
environment within the kidney (Neuhofer and Beck
2005), such as constant exposure to hypoxic (Epstein
1985; Welch et al. 2001), osmotic, and pH challenges
(Garcia-Perez and Burg 1991; Neuhofer and Beck
2005). Elevations in Tc are also associated with
increased renal sympathetic nerve activity and
reduced renal blood flow (Badoer 2010). This
inherent sensitivity may explain why HSP72 increased
in the kidneys of all heat-exposed mice.
We also demonstrated that heat intolerance in mice
is associated with specific and late increases in the
expression of both mRNA and protein levels of
HSP72 and HSP90 in major organs/tissues. However,
INT mice also had a specific decrease in the mRNA
expression and protein levels of HSF1 and GR in liver,
heart, and gastrocnemius muscle, compared to TOL
mice. This was unexpected given HSF1 is constitu-
tively expressed in most tissues and cell types and
appears to be regulated mainly via post-translational
mechanisms (Wu 1995). Following activation by heat
stress, HSF1 typically binds to specific heat shock
elements to induce HSP gene expression (Trinklein
et al. 2004; Anckar and Sistonen 2007). If so, then one
would expect heat-sensitive tissues to express higher
levels of HSF1 rather than lower levels. As HSF1 is the
transcription factor for both HSP72 and HSP90, this
could infer a novel gene-specific regulation of HSF1 in
INT mice as opposed to TOL mice. Although distinct
SNPs in the HSF1 gene were reported to be associated
with thermal tolerance in cattle (Li et al. 2011), this
possibility has not been examined in mice. INT mice
showed significant elevations in plasma corticosterone
and reductions in tissue GR protein and mRNA levels
18–22 h following heat exposure, and downregulation
of GR protein and mRNA has been shown to occur
after exposure to high concentrations of glucocorti-
coid within 24 h (Cidlowski and Cidlowski 1981; Silva
et al. 1994). The physiological implication of this
altered hormone–receptor activity in heat intolerance
remains unclear and will require further investigation.
Complex relationships between GR and HSF1 have
been reported in previous studies, and it is understood
that GR exerts inhibitory control over HSF1
activation specifically mediated by heat stress (Jones
et al. 2004; Wadekar et al. 2004). Dysfunction in these
pathways could potentially account for the parallel
decrease in GR and HSF1 expression in INT mice.
Further detailed investigations into these complex
Stress and heat intolerance 251
Stre
ss D
ownl
oade
d fr
om in
form
ahea
lthca
re.c
om b
y JH
U J
ohn
Hop
kins
Uni
vers
ity o
n 06
/07/
13Fo
r pe
rson
al u
se o
nly.
pathways regulating the HSF1 gene are needed to fully
characterize heat intolerance in mice.
Several limitations regarding this study need to be
acknowledged. First, we determined heat tolerance
based on peak Tc and rate of rise in Tc during heat
exposure. Two types of heat protocols are commonly
used to assess heat tolerance in animals, targeted peak
Tc or fixed exposure duration. In the heat protocols
with targeted peak Tc, exposure duration or heat load
(area under curve) is used to determine heat tolerance
(Furuyama et al. 2003). That is, the shorter duration
or the smaller heat load, the more severe the heat
intolerance. In heat protocols with fixed duration,
peak Tc is primarily used to determine heat tolerance
levels (Lin and Chai 1975; Szelenyi et al. 2004; Michel
et al. 2007). That is, the higher peak Tc, the more
severe the heat intolerance. In these fixed duration
protocols, a maximal peak Tc is usually chosen as an
early endpoint to prevent heat injury or stroke
(Szelenyi et al. 2004). We used a fixed duration heat
protocol in this study. All INT mice had a significantly
higher peak Tc before or at end of heat exposure
(Table I). Second, we used a HSI, which included the
peak Tc and rate of rise in Tc, to classify mice into
TOL, MT, and INT groups. The cut-off points were
selected to obtain similar numbers of mice among the
three groups. The average peak Tc in INT mice was
similar to that reported in heat-INT rats exposed at
408C for 90 min (Michel et al. 2007) though studies
on heat-INT mice remain unavailable. Both the
thermal and cardiovascular responses support that
INT mice were different from others in heat tolerance
and stress levels. Third, baseline Tc values were not
consistent in this study as shown in Table I. The
reason for these variations remains unknown, but does
not seem to reflect differences in acclimation or the
experimental setting among TOL, MT, and INT
mice. All mice were placed in the chamber the night
before each experiment, and all heat tests started
in the morning around 9:00 am. Also a trend of a
lower baseline Tc in Heat 2 than in Heat 1 was noted,
which may reflect improved acclimation in all
mice. Importantly, peak Tc between the two heat
tests was very similar within each group, suggesting
that heat tolerance may not be affected by basal Tc.
Finally, tissue and blood samples were only assessed at
a single time point (18–22 h after the second heat
exposure). Thus, we cannot rule out potential
alterations in many of the undetected or unchanged
biochemical parameters at any other time following
heat exposure. Within the confines of these limi-
tations, the data clearly indicate that INT mice
experienced a more robust response to heat stress than
TOL and MT mice.
In conclusion, we have identified a subset of age-
and gender-matched mice from the same strain that is
INT. INT mice were characterized by severe
hyperthermia, intensive cardiovascular activity, and
extensive tissue stress in response to acute heat
exposure; these responses were not observed in TOL
mice. Tissue stress was associated with release of
glucocorticoids and induction of HSPs, which
resulted in downregulation of GR and upregulation
of HSPs at both protein and mRNA levels. INT mice
also showed another novel feature of the reduced
HSF1 protein and mRNA levels. Genetic compari-
sons between INTand TOL mice for HSF1 regulation
of HSPs would merit further investigation as it may
provide insight into thermoregulatory compromise or
help identify individuals with thermoregulatory
limitations.
Acknowledgements
The authors would like to thank Dr. Ling-Ling Tsai of
National Chung-Cheng University for her assistance
programing the Mini Mitter communication and
Adrianna Levesque for her assistance in data analysis.
This work was supported by Uniformed Services
University of the Health Sciences Intramural Grant
R091EH and the Office of Naval Research Grant
N0001411MP20025.
Declaration of interest: The authors report no
conflicts of interest. The authors alone are responsible
for the content and writing of the paper.
References
Alves BE, Montalvao SA, Aranha FJ, Lorand-Metze I, De Souza CA,
Annichino-Bizzacchi JM, De Paula EV. 2011. Time-course of
sFlt-1 and VEGF-A release in neutropenic patients with sepsis
and septic shock: A prospective study. J Transl Med 9:23.
Anckar J, Sistonen L. 2007. Heat shock factor 1 as a coordinator of
stress and developmental pathways. Adv Exp Med Biol 594:
78–88.
Badoer E. 2010. Role of the hypothalamic PVN in the regulation
of renal sympathetic nerve activity and blood flow during
hyperthermia and in heart failure. Am J Physiol Renal Physiol
298:F839–F846.
Bouchama A, Knochel JP. 2002. Heat stroke. N Engl J Med 346:
1978–1988.
Chang CP, Hsu YC, Lin MT. 2003. Magnolol protects against
cerebral ischaemic injury of rat heatstroke. Clin Exp Pharmacol
Physiol 30:387–392.
Cidlowski JA, Cidlowski NB. 1981. Regulation of glucocorticoid
receptors by glucocorticoids in cultured HeLa S3 cells.
Endocrinology 109:1975–1982.
Epstein FH. 1985. Hypoxia of the renal medulla. Q J Med 57:
807–810.
Epstein Y. 1990. Heat intolerance: Predisposing factor or residual
injury? Med Sci Sports Exerc 22:29–35.
Flanagan SW, Ryan AJ, Gisolfi CV, Moseley PL. 1995. Tissue-
specific HSP70 response in animals undergoing heat stress. Am J
Physiol 268:R28–R32.
Furuyama F, Murakami M, Tanaka E, Hida H, Miyazawa D, Oiwa T,
Isobe Y, Nishino H. 2003. Regulation mode of evaporative
cooling underlying a strategy of the heat-tolerant FOK rat for
enduring ambient heat. Am J Physiol Regul Integr Comp Physiol
285:R1439–R1445.
A. Islam et al.252
Stre
ss D
ownl
oade
d fr
om in
form
ahea
lthca
re.c
om b
y JH
U J
ohn
Hop
kins
Uni
vers
ity o
n 06
/07/
13Fo
r pe
rson
al u
se o
nly.
Garcia-Perez A, Burg MB. 1991. Renal medullary organic
osmolytes. Physiol Rev 71:1081–1115.
Gong B, Asimakis GK, Chen Z, Albrecht TB, Boor PJ, Pappas TC,
Bell B, Motamedi M. 2006. Whole-body hyperthermia induces
up-regulation of vascular endothelial growth factor accompanied
by neovascularization in cardiac tissue. Life Sci 79:1781–1788.
Hapner CD, Deuster P, Chen Y. 2010. Inhibition of oxidative
hemolysis by quercetin, but not other antioxidants. Chem Biol
Interact 186:275–279.
Havenith G. 2001. Human surface to mass ratio and body
core temperature in exercise heat stress—a concept revisited.
J Thermal Biol 26:387–393.
Hotchkiss R, Nunnally I, Lindquist S, Taulien J, Perdrizet G, Karl I.
1993. Hyperthermia protects mice against the lethal effects of
endotoxin. Am J Physiol 265:R1447–R1457.
Jones TJ, Li D, Wolf IM, Wadekar SA, Periyasamy S, Sanchez ER.
2004. Enhancement of glucocorticoid receptor-mediated gene
expression by constitutively active heat shock factor 1. Mol
Endocrinol 18:509–520.
Katschinski DM, Wiedemann GJ, Longo W, d’Oleire FR, Spriggs D,
Robins HI. 1999. Whole body hyperthermia cytokine induction:
A review, and unifying hypothesis for myeloprotection in the
setting of cytotoxic therapy. Cytokine Growth Factor Rev 10:
93–97.
Kim JI, Jung SW, Yang E, Park KM, Eto M, Kim IK. 2010. Heat
shock augments angiotensin II-induced vascular contraction
through increased production of reactive oxygen species.
Biochem Biophys Res Commun 399:452–457.
Leon LR. 2002. Invited review: Cytokine regulation of fever:
Studies using gene knockout mice. J Appl Physiol 92:
2648–2655.
Leon LR, DuBose DA, Mason CW. 2005. Heat stress induces a
biphasic thermoregulatory response in mice. Am J Physiol Regul
Integr Comp Physiol 288:R197–R204.
Leon LR, Blaha MD, DuBose DA. 2006. Time course of cytokine,
corticosterone, and tissue injury responses in mice during heat
strain recovery. J Appl Physiol 100:1400–1409.
Li QL, Ju ZH, Huang JM, Li JB, Li RL, Hou MH, Wang CF,
Zhong JF. 2011. Two novel SNPs in HSF1 gene are associated
with thermal tolerance traits in Chinese Holstein cattle. DNA
Cell Biol 30:247–254.
Lin MT, Chai CY. 1975. Effects of sodium acetylsalicylate on body
temperature of monkeys under heat exposure. J Pharmacol
Exp Ther 194:165–170.
Michel V, Peinnequin A, Alonso A, Buguet A, Cespuglio R,
Canini F. 2007. Decreased heat tolerance is associated with
hypothalamo–pituitary–adrenocortical axis impairment.
Neuroscience 147:522–531.
Mizzen LA, Welch WJ. 1988. Characterization of the thermo-
tolerant cell. I. Effects on protein synthesis activity and the
regulation of heat-shock protein 70 expression. J Cell Biol 106:
1105–1116.
Moran DS, Eli-Berchoer L, Heled Y, Mendel L, Schocina M,
Horowitz M. 2006. Heat intolerance: Does gene transcription
contribute? J Appl Physiol 100:1370–1376.
Neuhofer W, Beck FX. 2005. Cell survival in the hostile
environment of the renal medulla. Annu Rev Physiol 67:
531–555.
Niu KC, Lin KC, Yang CY, Lin MT. 2003. Protective effects of
alpha-tocopherol and mannitol in both circulatory shock and
cerebral ischaemia injury in rat heatstroke. Clin Exp Pharmacol
Physiol 30:745–751.
Ohara K, Furuyama F, Isobe Y. 1975. Prediction of survival time of
rats in severe heat. J Appl Physiol 38:724–729.
Ritchie KP, Keller BM, Syed KM, Lepock JR. 1994. Hyperthermia
(heat shock)-induced protein denaturation in liver, muscle and
lens tissue as determined by differential scanning calorimetry. Int
J Hyperthermia 10:605–618.
Ruell PA, Hoffman KM, Chow CM, Thompson MW. 2004. Effect
of temperature and duration of hyperthermia on HSP72
induction in rat tissues. Mol Cell Biochem 267:187–194.
Silva CM, Powell-Oliver FE, Jewell CM, Sar M, Allgood VE,
Cidlowski JA. 1994. Regulation of the human glucocorticoid
receptor by long-term and chronic treatment with glucocorti-
coid. Steroids 59:436–442.
Szelenyi Z, Hummel Z, Szolcsanyi J, Davis JB. 2004. Daily body
temperature rhythm and heat tolerance in TRPV1 knockout and
capsaicin pretreated mice. Eur J Neurosci 19:1421–1424.
Trinklein ND, Murray JI, Hartman SJ, Botstein D, Myers RM.
2004. The role of heat shock transcription factor 1 in the
genome-wide regulation of the mammalian heat shock response.
Mol Biol Cell 15:1254–1261.
Tseng CS, Lo HW, Teng HC, Lo WC, Ker CG. 2005. Elevated
levels of plasma VEGF in patients with dengue hemorrhagic
fever. FEMS Immunol Med Microbiol 43:99–102.
Wadekar SA, Li D, Sanchez ER. 2004. Agonist-activated
glucocorticoid receptor inhibits binding of heat shock factor 1
to the heat shock protein 70 promoter in vivo. Mol Endocrinol
18:500–508.
Wang NL, Chang CK, Liou YL, Lin CL, Lin MT. 2005.
Shengmai San, a Chinese herbal medicine protects against rat
heat stroke by reducing inflammatory cytokines and nitric oxide
formation. J Pharmacol Sci 98:1–7.
Welch WJ, Baumgartl H, Lubbers D, Wilcox CS. 2001. Nephron
pO2 and renal oxygen usage in the hypertensive rat kidney.
Kidney Int 59:230–237.
Wilson TE, Crandall CG. 2011. Effect of thermal stress on cardiac
function. Exerc Sport Sci Rev 39:12–17.
Wright GL. 1976. Critical thermal maximum in mice. J Appl
Physiol 40:683–687.
Wright G, Knecht E, Wasserman D. 1977. Colonic heating patterns
and the variation of thermal resistance among rats. J Appl
Physiol 43:59–64.
Wu C. 1995. Heat shock transcription factors: Structure and
regulation. Annu Rev Cell Dev Biol 11:441–469.
Stress and heat intolerance 253
Stre
ss D
ownl
oade
d fr
om in
form
ahea
lthca
re.c
om b
y JH
U J
ohn
Hop
kins
Uni
vers
ity o
n 06
/07/
13Fo
r pe
rson
al u
se o
nly.


