Embed Size (px)
Citation preview

HHO AND EMISSIONS P a g e | 0
HHO A VIABLE MEANS OR REDUCING EMISSIONS
Jeffery Morse
Brandman University
Methods and Applications Final
Author Note
For correspondence concerning this paper Jeffery Morse can be reached at

HHO AND EMISSIONS P a g e | 1
Abstract
This paper explores current HHO technologies. It concludes with the findings that an HHO cell is a viable
alternative for further exploration and experimentation. Further, it finds that the cost of electric
production is high in the previous experiment due to the nature of HHO cells to have a high current
draw at voltages at or around auto batteries and charging systems. Alternative voltages of 30 volts or
higher are recommended for use. Further findings include alternating current to be acceptable only
when put through a half or full wave rectifier to create a pulse. Constant d.c. voltages are shown to have
too high a cost in heat production so a pulse is recommended. An HHO cell can be tuned to have very
little or even 0 current draw when the frequency of the pulse is adjusted. In this experiment, it was
found that a voltage of about 30 volts at 22440 Hz was sufficient to produce 28 mL of gas per minute
with a very small HHO cell that cost less than 20 dollars to produce. Finally, this technology is
recommended for further study, but is not recommended for continual used as better alternatives are
available.
Keywords: HHO, Hydroxy, Hydroxyl, Browns Gas, Gas Cell, fuel from water, alternative fuels.

HHO AND EMISSIONS P a g e | 2
LIST OF ABBREVIATIONS AND NOMENCLATURE
HHO : Hydroxy, Hydroxyl, BG Browns Gas, SI : Spark Ignition, CI : Compression Ignition, LPG : Liquefied
Petroleum Gas, CO : Carbon monoxide, HC : Hydrocarbon, CO2 : Carbon dioxide, NOx : Nitrogen oxide,
HEV : Hybrid Electric Vehicle, H2ICE : Hydrogen fueled Internal Combustion Engine, KOH : Potassium
Hydroxide, NaOH : Sodium Hydroxide, NaCl : Sodium Chloride, EEW: : Electrically Expanded Water W :
Watt, SFC : Specific Fuel Consumption, HECU : Hydroxy Electronic Control Unit, TDC : Top Dead Center
BDC : Bottom Dead Center, EEPROM : Electrically Erasable Programmable Read-Only Memory, F : Force,
T : Torque, rev. : Revolution, Pb : Brake Power, bmep : Brake Mean Effective Pressure BSFC : Brake
Specific Fuel Consumption, bth h : Thermal Efficiency, CR : Compression Ratio, AFR : Air-Fuel Ratio, EGR :
Exhaust Gas Recirculation, rpm : Revolutions Per Minute, CATIA : Computer Aided Three-dimensional
Interactive Application, V : Volt, A : Ampere, CCM : Cubic Centimeters per Minute, SLM : Standard Liters
per Minute, DC : Direct Current, AC : Alternating Current mF : Micro Farad, MOSFET : Metal Oxide
Semiconductor Field Effect Transistor, PWM : Pulse Width Modulation, f : Frequency, MAP : Manifold
Absolute Pressure, ADC: Analog to Digital Converter, DAC: Digital to analog converter, PLC:
Programmable Logic Controller, STP: Standard temperature and pressure: 298.15 K, 101.325 kPa

HHO AND EMISSIONS P a g e | 3
Introduction
Any business person will tell you that the problem with dependence on any non-renewable
energy source such as fossil fuels is that it has no sustainability and thus in the long term it is a
strategically bad plan. At best such efforts are a race, the dash for the cash until such resources run dry.
We in the U.S. have, never the less, chose fossil fuels as our main source of energy. We use it in a
spectrum that ranges from the creating of electricity to traveling the world. We even use it to make our
drinking glasses, shopping bags and plastics of all sorts. Unfortunately, too often we dismiss evidence
linking climate change and air pollution to fossil fuel consumption. These changes have been so gradual
that many believe them not to be true. Further, many are blinded to these changes purposely in order
to keep the “common comforts” of life. Though many people today deny any change in the climate this
is a documented truth. Cars and the pollution from cars are the single greatest polluter in our nation’s
cities (Tekin and Çavuşoğlu, 1997). It is hard to imagine that as little as 100 years ago electric power and
the internal combustion engine (ICE) was rarely even heard of. Auto pollution comes from by-products
of the combustion of fossil fuel (exhaust) and from the vapor of the fuel itself. Since this combustion is
not perfect an automobile emits several types of pollutants. These are: Hydrocarbons (HC)--unburned
fuel, Nitrogen oxides NOx—under high-pressure combustion nitrogen and oxygen create various NOx.
Like hydrocarbons, these interfere with the formation of ozone and
contribute to acid rain. Carbon Monoxide CO—CO is a product of
the incomplete combustion of fossil fuels; when inhaled CO reduces
the flow of oxygen in the bloodstream, this is very dangerous,
especially to persons with heart disease. Carbon Dioxide CO2—The
EPA views this compound as a product of a perfect combustion, though not threatening to humans CO2
is a contributor to Global Warming as a greenhouse gas (EPA, 1994). Gasoline and diesel fuels are
mixtures of HC (Hydro Carbons), compounds which contain hydrogen and carbon atoms. Smog is

HHO AND EMISSIONS P a g e | 4
proportional to the amount of HCs present in exhaust. Many things in an engine can produce HCs such
as advanced timing, or a bad catalytic converter though we cannot see it as CO2 a colorless and odorless
which makes this gas a killer. NOx (Nitrogen Oxides) are also very harmful to humans and contribute to
smog, greenhouse effects, acid rain, and form toxic compounds which are also toxic to humans. Because
of this maximum limits on NOx emissions are continually being reduced (Walsh, 2001)(Bowman, 1992).
NOx, HC’s and CO top the list as the worst offenders for health and smog (Musmar, 2011). Catalytic
converters introduced in 1975 significantly reduced hydrocarbon and carbon monoxide emissions,
however, lead inactivates the catalyst is catalytic converters so oil companies had no choice but to once
again remove lead from fuel. Today normal petrol combustion has the following emissions: Carbon
monoxide 1-2% of volume, HC <.25% of volume, Nitrogen 71% of volume, CO2 14% of volume, water
vapor 12% of volume, NOx <.25% of volume, SOx < .03% of volume (Rajeshkumar et al, 2016).
The EPA (Environmental Protection Agency) functions under The “Clean Air Act” of 1970 to
regulate motor vehicles. This has led to devices to manage the exhaust caused by burning fossil fuels.
The first regulation was through engine design, next the catalytic converter, mentioned above, to burn
off HCs and CO, the Oxygen Sensor to help prevent combustion problems and finally the Exhaust Gas
Recirculation (EGR) to manage NOx (EPA, 1994). By slowing down the combustion rate the EGR system is
able to lowers NO and NO. Emissions and Greenhouse Gasses come from
many sources as viewed by the chart to the right which was published by the
EPA. We see that the production of electricity is the biggest offender in total
not just in cities which is followed by transportation and then industry.
According to Harper 2007, electricity is produced mainly by fossil fuels,
coal and natural gas being the most widely used, on the other hand, in
transportation gasoline and diesel are the mostly used fossil fuels.
Reportedly fossil fuel accounts for approx. 90% of our energy

HHO AND EMISSIONS P a g e | 5
consumption. If this is the case and in light of Industrialization and technology growth which have
spurned growth in population and economy we can expect an even larger demand for fossil fuels, which
will create a greater production of Emissions and Greenhouse Gases. We find this to be an unending
circle. It is evident since fossil fuels cause damage to human life and the environment this cycle must be
dealt with (Venkataraman and Elango, 1998). As a a result of this fact fossil fuel-based energy sources
are facing increasing pressure on a host of environmental fronts, including a serious challenge for coal to
meet the greenhouse gas reduction targets, but we are not likely to do enough in time to curve
expected damages we must come up with more ways to curb emission and greenhouse gas production
(Herzog et al., 2006).
Problems
Recent changes in the world’s economy afford us an
opportunity to see our end if we stay on this current course. Global
warming is a problem faced by the scientific community but China
provides us with the best evidence to date of the negative effects of
fossil fuel dependency. China used to have the lowest heart disease
rate in the world. It also enjoyed the cleanest air quality, however,
with China’s industrial revolution we see an increase in coal-based
electric plants. The industrial revolution in China is being driven by
the conversion of fossil fuels to energy just like here in the U.S. As a
result of the short time frame and exorbitant growth we can view
china as a petri dish declaring the end results of an economy based
on fossil fuels. True there seem to be correlations with the increase
of fossil fuel use and greenhouse gas, but in the last ten years, this

HHO AND EMISSIONS P a g e | 6
fossil fuel revolution correlates with an increase in heart disease--a number that now leads the world.
Further, air quality is also reported among the worst in the world. Most residents of Chinese cities brag
on the model of air purifier in their homes. Schools are closed, businesses and mass transportation stop
due to dangerous air quality. There is no doubt, we can no longer ignore these facts. We must move
away from fossil fuels. In addition, those countries not having these resources are facing energy crises.
The use of fossil fuels has led to several environmental problems such as reduction carbon energy
sources, water pollution, and habitat destruction. Meanwhile, CO2 levels are still climbing and the
greenhouse effect is growing as a function of burnt fuel along with increased acid rain (Durairai et al,
2012).
All these are problems with our current source of fuel, but our biggest hurdle will be the implementation
of alternative fuels sources.
Many other sources of fuel for the ICE are readily available. I
even found one that shows how wood gas can be used to run any ICE
(Wyer, 1905). Articles of people using many forms of biomass to
operate an ICE are available now. One interesting video on YouTube
that explains gasification pretty well states that his gasifier will run off
anything other than glass, metal, or rocks man (Kieth, 2012). I find it
amazing that most have not heard of alternative fuel sources for ICE’s. Operating an engine from grass
clippings is totally possible yet we make movies about it like it is an impossibility. Here is a picture from
the beginning of the century of a gasifier mounted on a truck which at that time were commercially
available. Yet today this information is suppressed. Charles Nelson Pogue made headlines in 1933 by
driving his 1932 Ford (to the right) about 200 miles on a single gallon of gas. After a demonstration
conducted by the Ford Motor Company in Winnipeg-the Pogue Carb went into production. However,
this required White Gas. White Gas is gasoline which contains no additives- one of the crucial factors for

HHO AND EMISSIONS P a g e | 7
these carbonators to run efficiently. When oil companies found this out they began to add lead to the
production gasoline. This rendered Pogue’s carburetor as inefficient and unusable. Unfortunately not
long after this Pogue was found dead. Once more Shell oil completed tests in 1975 that resulted in an
opal getting an astounding 350 mpg by using the vapors of heated fuel to run a car (Shell, 1975), the
same technology Pogue used. Amazingly all these tests were done on
a private closed track with the results never being made known to the
public. As a boy I recall Stanford University doing an experiment that
included just re-porting a carburetor. The results, if I remember
correctly, where an astounding 60mpg. Most of today’s hybrids do
not even come close to that. Later when lead became a problem and the Pogue carb now reported as a
myth lead was removed from gasoline. The man who patented the first AC Motor, the technology that
runs cellphone towers, and invented the production of alternating current was Nicola Tesla (Tesla,
1889). At that time Mr. Tesla envisioned to supply the world with free power, but J.P. Morgan pulled
funding because it had no meter and could not make money. Later Edison using Tesla patents began
equipping everyone with the AC current that Tesla patented through wires and meters through funding
granted by, you guessed it, J.P. Morgan. If it is not known, J.P. Morgan is Morgan/Chase bank. Every
time one pays the power bill one should remember that bill is brought to you by Chase Bank. We were
warned about such monopolizing of power by President Eisenhower who warned against the Military
Industrial Complex (MIC). It is when a corporation becomes so large that the population is basically in
service to them. Eisenhower feared incoming John F. Kennedy would not have the wisdom to withstand
the pressures brought by such a complex or corporation (MedHursta, 2009). When Kennedy gave his
great speech in which he said, “I look forward to a great future for America - a future in which our
country will match its military strength with our moral restraint”. Shortly thereafter Kennedy was killed
This is the first foreseen problem Walter Adam in his article points not to the MIC but to Giant

HHO AND EMISSIONS P a g e | 8
Corporation as the dominator and controller of all economic environments. He points out that while
they will operate outside of the law being immunized from all oversight (Adams, 1968). According to Dr.
Steven Greer who produced the movies “Sirius” and “The Disclosure Project,” these are one in the same.
Who are these giants of corporation? Reportedly Bank of America owns Exxon oil, Wells Fargo
owns Chevron oil, J.P. Morgan/Chase owns Shell oil, and Citi-Bank owns Arco, Bp, and Tesoro oil, and all
these together own the Federal Reserve—that correct the U.S. does not own the Federal reserve. From
here on out we will call them the four horsemen. The MIC is their biggest customer of the four
horsemen. This is the biggest problem. Though we know that the burning of fossil fuels correlates with
climate change, poor air quality, sickness, and death, we have not the influence individually or
economically to do much about it. These four horseman trade trillions of dollars monthly, an amount
equal or exceeding our national Annual Gross Product. As a result, nations, governments, and peoples
are enslaved to their domination and have little or no recourse. These companies have proved that they
have little concern for anything that would create any opposition to their own economic security. How
many lives have been lost in the procurement power and money by oil spills, mass killings to run
pipelines, whole areas being devastated, not to mention the small threat of a simple inventor
mysteriously disappearing. It seems if anyone government or person rocks the boat they can expect to
be silenced by whatever means necessary, like Mr. Pogue, President Kennedy, and Tesla. So to recap, by
looking at China and the EPA we see that we must move from fossil fuels to reduce negative emission,
climate change, poor air quality, and to save lives. However, those that form the upper tier of the
banking and oil industries are in direct opposition to this and in times past subverted any attempt. As a
result, we will have to start small and work with the situation. We must come up with something that
will lower emissions while still using the fossil fuels until those in opposition while allowing a retiring of
fossil fuels.

HHO AND EMISSIONS P a g e | 9
Various forms of energy
“Energy is a quantity that can be assigned to every particle, object and system of objects as a
consequence of the state of that particle, object or system (Harper, 2007).” Kinetic, potential, thermal,
gravitational, sound, elastic, light and electromagnetic energy are all different forms of energy. The
production of energy is important in all areas of the economy. To add to this, per capita, energy
consumption is directly related to our standard of living (Vader and Joshi, 2005). Currently being
researched by science are alternative energy sources such as solar, wind, biogas/biomass, tidal,
geothermal, fuel cell, hydrogen energy, small hydropower, etc. (Alias, 2005). This paper will focus on
Biodiesel, Hydrogen as (HHO) and Electric. Vegetable oils and animal fats and Algae are what is used to
create Biodiesel, an alternative diesel fuel. These are renewable biological sources that are normally
biodegradable and non-toxic. Biomass is a bio-source of H2 and water that is burnable through a gasifier.
Electricity is both a power that can be produced cleanly and used cleanly. All these can have low
emission profiles and be environmentally beneficial (Krawczyk, 1996). However, due to these
characteristics, researchers are focusing much attention on hydrogen as an alternative fuel in ICEs
(Saravanan and Nagarajan, 2008).
Hydrogen energy
Though H2 has been looked at for an alternative because it enhances
engine efficiency and produces less pollution (Boretti, 2010), the expensive to
include in manufacture is too high (White et al, 2006). H2 can be produced from
electrolysis of water, coal gasification, from biomass, and solar photoelectrolysis (Saravanan and
Nagarajan, 2008). However, though H2 is one of the most common elements in the universe it is found
rarely in nature by itself. Using H2 can theoretically extend the lean limit--the least amount necessary to
burn-- of a fuel mixture, by simply adding a small amount of hydrogen to a liquid or gaseous fossil fuel.

HHO AND EMISSIONS P a g e | 10
This makes a more complete combustion, improves efficiency and the decrease in operating
temperatures lowers NOx (Jingding et al., 1998)(Stebar and Parks, 1974). To add to this during ultra-
lean operation NOx formation rates are so low that engine out emissions are near zero (Das, 1991). On
the other hand, there are several problems with using H2 alone as a fuel, foremost of which is the cost of
production.
Brown’s Gas
Brown’s Gas is a mixed form of H2 that is easily produced
at a fraction of the cost of pure H2. Brown’s Gas has a few aliases:
Hydroxy, HHO, and H2O2 to name a few. Basically, it is the vapor
from the water after electrolysis. Hydroxy gas (Brown's Gas) is a
mixture of monoatomic and diatomic hydrogen and oxygen referred to as “Electrically Expanded Water
(EEW)” or “Santilli Magnecules”. Browns gas has a cool flame about 130°C yet is able to melt just about
anything. Although the flame is cool Brown’s Gas can fuse brick, steel, sublimate tungsten, glaze quarts,
and neutralize nuclear waste. This Gas burns with a clean flame. It uses no atmospheric oxygen and
creates only pure water as its combustion product. (Michrowski, 1993). This gas cannot be stored safely
it is very volatile and highly explosive at standard temperatures and pressures when mixed with air
(Cameron, 2012). As a result, the forming and implementation must be done without ever storing or
pressurizing the gas, i.e., it must be used as it is produced. This necessitates the need for a production
unit or--HHO cell--for every application. When water is electrolyzed (when an electric current is passed
through) Rydberg clusters may be formed. Clusters of hydrogen and oxygen including water molecules
in the “highly energized trigonal-by pyramidal geometry, monatomic and diatomic hydrogen, free
electrons and oxygen” (Eckman, 2010). Rydberg clusters are in solids and liquids and are very stable for
hours. In the case of HHO or Brown’s Gas, these clusters have shown a life span of about 10 (Santilli,

HHO AND EMISSIONS P a g e | 11
2006). The make use of the hydrogen bond, a relatively weak bond when compared to the covalent
bond (Mccarthy, 2008).
HHO Cells
There are two types of HHO cells currently. The Dry Cell
where only the centers of the plates have electrolyte and the Wet
Cell where the entire plates are submerged. The advantages for
the dry cell water is less, generated heat is smaller due to the
circulation between cell and reservoir and easy access for testing
plate voltages. The electric current used is also smaller because less
of the power is converted into heat. The plate usage are is only 60%
versus 100% in a wet cell.
The Wet Cell is a generator with the electrodes fully immersed in the electrolyte. The
advantages of the wet cell type gas production has more quantity, the flow is stable, construction and
maintenance is easier (Bambagn et al, 2016).
Stakeholders
Since HHO production is not centralized, and storage is dangerous, it cannot be metered and
monopolized. As a result, such technology will be in offense to the four horseman stakeholders because
they cannot sell it which in turn cuts into profits. It is Tesla’s dilemma all over again. Since the
population at large is our other stakeholder let us hope that we have better luck than him. Remember
Tesla died bankrupt and alone in a small apartment after all his patents were stolen and used for profit.
Although his science is still changing the world today, after all, who does not have a cell phone? My only
solution to this problem is that the changes be small. Unable to address the first foreseen problem

HHO AND EMISSIONS P a g e | 12
more than that, we will concentrate on the other foreseen problems.
Stockholm environment institute suggests we might begin by simply
limiting the amount of permitted fossil fuel licenses we allow. In their
declaration that avoiding dangerous climate change requires rapid
transition away from fossil fuels and that a full phase-out of global
fossil fuel consumption – particularly coal and oil—will have to be completed within the next 50 years
(Rogelj et al, 2015), reports a tentative reduction in CO2 emission by simply limiting the permitted
extractions of fossil fuels. Under such a policy coal production in the U.S. would steadily decline. To add
to this oil and gas extraction would drop as well. They conclude the phasing out of federal leases for
fossil fuel extraction would reduce global CO2 emissions by 100 million tons per year. These findings
suggest that policy-makers should give greater attention slowing down the expansion of fossil fuel
supplies. Fossil fuel expansion is at an all-time high and are only moving upwards (Rystad, 2015).
Investments like this will lock in long-term fuel supplies while trying the population to fossil revenues
(Erickson et al. 2015).
Internal Combustion Fundamentals.
The engine used mostly powered by burning fossil fuel is the internal combustion Engine (ICE).
These come in two main models the spark ignition (SI) known as a gasoline engine, and the
compression-ignition (CI) engine known as the diesel engine. Each of these come in a range of styles and
types. The four stroke, the two-stroke, and rotary are among these types; the stroke is defined as how
many times the piston travels up and down in one cycle. We will be dealing with the four stroke models
mostly to help us understand engine fundamentals (Kahraman, 2005; Haywood, 1998). The following
pictures are from Haywood, 1998.

HHO AND EMISSIONS P a g e | 13
The picture on the left references the four stroke per cycle, and the picture on the right is two
typical types for fuel carburetion. Basically, fuel travels through the carburetor or injector to the cylinder
on the intake down stroke. The fuel is compressed on the following compression upstroke. Combustion
occurs either due to spark on SI engines of compression on CI engines which pushes the piston down on
the combustion stroke and the leftovers and evacuated on the last upstroke called the exhaust stroke.
Then the process repeats (Haywood, 1998). In our literature reviews, engine torque will normally be
measured with a dynamometer. The engines output shaft is coupled to the dynamometer much like a
transmission is to an auto. Then torque coefficient is found using an equation.
P (kW) = 2p w (rev / s) ´ T (Nm) x 10-3 brake mean effective pressure (bmep ).
where,
When doing the math it is found that a perfect energy conversion is not attainable. The best that is
found is about 96% (Kahraman, 2005; Haywood, 1998) (Yilmaz, 2010).

HHO AND EMISSIONS P a g e | 14
Electrons, Water and Conductivity
Water H2O is a compound that is most important in life.
Because of this, I am against using water hydrolysis as a formal
means of producing power. I much prefer reclamation and the
recycling of Biomass and human and animal waste as the formal means of producing H2, HHO, Methane,
or other usable sources of fuel. However, that being said let the research go on. Water consists of a
compound of 2 molecules hydrogen H2 and one molecule Oxygen. When separated we have 2H2O ->
2H2+ O2. Since this is so simple and lite, compared to the much heavier petroleum, we have a much
greater bang for the buck. Water can be turned into HHO gas through electrolysis (Durairai et al, 2012).
Hydrogen has a calorific value of 120MJ/kg, a value that is much greater than gasoline, diesel or natural
gas (Verhelst, 2009). Electrolysis is achieved by passing an electric current through two electrodes
submerged in water. Electrolysis occurs when DC electron flows from a cathode to the anode via an
electrolytic solution (Bureau, 2011). However, this produces heat so to reduce heat often an electrolyte
is used as a catalyst which reduces heat. A bubbler unit must be used to prevent flashback. Hydrogen at
or above 2500psi can easily lead to a blast. Using DC current the electrodes are have two poles; a
positive--the anode, and negative-- the cathode. The following reactions are found:
Base equilibrium reaction:
Cathode (Reduction) 2H2O(l)+2e-H2(g)+2OH-(aq)
Anode (Oxidation) 4OH-(aq)O2(g)+2H2O(l)+4e-
Overall reaction 2H2O(l)2H2(g)+O2(g)
Acid equilibrium reaction:
Cathode (reduction) 2H+ (aq) + 2e- H2 (aq)
Anode (Oxidation) 2H2O (l) O2 (g) +4H+ (aq) +4e-

HHO AND EMISSIONS P a g e | 15
(Bambagn et al, 2016)
Bio Diesel
Biodiesel is diesel fuel made from vegetable oils, animal fats, recycled restaurant greases, algae,
and other biomass. It is normally safe, biodegradable, and produces fewer air pollutants than
petroleum-based diesel. Biodiesel can be used in its pure form or blended with petroleum diesel. Bio
Diesel production Transesterification can be performed by continuous or batch systems. It is a process
where vegetable oil or other biomass is reacted with alcohol or methanol and is catalyzed by bases,
acids or enzymes to form esters and glycerol. The viscosity of the oil is changed to something that is very
close to petroleum diesel (Durairai et al, 2012). Drop in replacement for diesel or CI engine of biodiesel
with HHO is thought to be a valid alternative for the workhorses of our nation.
Literature Review
In this study and review, we will be looking at one of the enduring alternatives to gasoline and
diesel. However, the idea, for now, is not to replace gasoline, nor improve mileage so drastically that it
would warrant attention by those in opposition. Hydrogen has been researched for a long time. We will
examine data from a NASA experiment with Hydrogen to see what effects on mileage and emission it
will have when using it as an additive to common ICE fuels. Physical and environmental factors according
to this and other studies will be reviewed. Some of the reviews will be of the smaller nature just
answering specific questions, while others will be presented more extensively as to provide template
information and background for further exploration. Both results in support of and against the
hypothesis that HHO offers an acceptable alternative fuel source will be reviewed.
The papers in the following literature review offer answers to the many initial hurdles. In
reviewing this literature I am looking for answers to the following questions. 1. Can H2 burn in an

HHO AND EMISSIONS P a g e | 16
engine? 2. Is it real--can one produce a burnable form of H2 from water easily and cheaply? 3. Does HHO
have significant data supporting the decrease of auto emission to warrant further study? 4. Is it true that
one can build and HHO cell at little cost? 5. How does design affect production? 6. At what amperage
and voltage values is a Cell likely to operate best at? 7. Will HHO cells operate with A.C. or D.C. best, or
what happens if one uses a D.C. to carry A.C.? 8. What happens to production when the frequency is
changed?
Q. Can H2 burn in an engine?
Rudolf A. Erren made hydrogen-fueled engines in the 1920s including trucks and buses. Allies of
World found a submarine and even torpedoes converted by Erren to hydrogen power (Erren and
Campbell, 1933). Since drinkable water is the exhaust hydrogen and oxygen as fuel they have been
considered for the submarine since the end of the world wars (King and Rand, 1955).
Robert Zweig converted a pickup truck to run on H2. It still operates and can be seen at The
American Hydrogen Association where it is displayed in public exhibits (Zweig, 1992).
NASA, in 1977, done an experiment using a multi-cylinder engine to extend the efficient lean
operating range of gasoline by adding hydrogen. It was hypothesized that the lean mixture –ratio
combustion in internal combustion engines-- has the potential of producing low emissions and higher
efficiency for several reasons. This list is directly out of their paper: 1. Excess oxygen in the charge
further oxidizes unburned hydrocarbons and carbon monoxide. 2. Excess oxygen lowers the peak
combustion temperatures, which inhibits the formation of oxides of nitrogen. 3. The lower combustion
temperatures increase the mixture specific heat ratio by decreasing the net dissociation losses. 4. As
the specific heat ratio increases, the cycle thermal efficiency also increases, the cycle thermal efficiency

HHO AND EMISSIONS P a g e | 17
also increases which gives the potential for better fuel economy. NOx is produced by high combustion
engines. Lee and Brehob indicated slightly increased hydrocarbon emissions will come from higher
compression ratios. It is believed that a 10% increase in efficiency is possible (Lee and Brehob, 1971). In
order to provide a basis for comparison, the engine was operated with varying amounts of hydrogen to
gasoline ratios. Torque was measured at 55mph.
The results indicated that flame Speed was increased significantly. In leaner mixtures mixing
hydrogen with gasoline reduced emissions favorably even NOx was reduced by a factor of 19, however,
engine performance reduced also. At the useable performance settings, the NOx values actually
increased. At an idle Hydrocarbon are slightly higher and Carbon Monoxide dropped. It should be noted
that JPL conducted similar experiments with the same results. Please refer to the data in the graphs.
The conclusion of the review, positive, H2 can burn in an engine (Lee and Brehob, 1971).
Q. Is it real--can one produce a burnable form of H2 from water easily and cheaply?
Two different researchers have shown that HHO can reduce diesel consumption (Yilmaz, 2010)
(Bari, 2010). However, another team found a reduction in engine efficiency (Birtas, 2011). As a result,
the University of Southern Queensland attempted to validate the effects of onboard HHO addition on
fuel economy and emissions in a 28kW diesel generator. The results, HHO was shown to increase diesel
consumption proportional to the rate of injection – up to a 5.2% increase at 55% load with 6L/min of
HHO addition. The addition of water and HHO reduced Oxides of nitrogen (NOx) emissions up to 11.8%.

HHO AND EMISSIONS P a g e | 18
It was found that the thermal losses in the engine stage would outweigh the economy gains from
onboard HHO addition. To accurately automate and data-log the experiment an industrial control
system was used.
Review,
Adnan et al found gaseous hydrogen injection rate of 20L/min at standard temperature and
pressure (STP) doubled oxides of nitrogen (NOx) emission. Also due to the amount of current used in
this experiment the generator is left with only about 29% of the engines power available for useful work,
this dramatically increasing diesel consumption (Adnan et al,
2009). The Bose and Maji supported these findings and showed
NOx emissions increased 70% and 90% at 20% and 40% load
respectively due to hydrogen injection. The efficiency of the
diesel engine increased due to the increased lean limit and flame
speed due to the properties of hydrogen combustion (Bose, Maji,
2009). Lilik tested the effects of smaller ratios of hydrogen injection shown in Table 1. H2 had a negative
impact. The hydrogen injection in the turbo diesel engine had the opposite effect on diesel consumption
showing a decrease in fuel economy (Lilik, 2010).
It was felt that a small rate of water injection could offset cylinder temperatures created from hydrogen
and therefore reduce NOx emissions. As a result, Yilmaz et al injected small rates of HHO instead of H2
into a diesel engine. Experiments performed showed positive results in improving the fuel efficiency of
the engines. Tauzia et al compared the effects of EGR and water injection. This was more effective for
reducing NOx emissions. NOx was reduced by 50%. Either water injection alone or onboard HHO
addition alone both appear to reduce fuel economy of the diesel engines (Tauzia et al, 2010). Cameron
found that there are no reliable indicators that onboard HHO has the potential to decrease diesel fuel
consumption in a naturally aspirated generator based on the literature reviewed. The problem seemed

HHO AND EMISSIONS P a g e | 19
to be the amount of energy it took to make the HHO was offsetting the contributing factors. He further
found that HHO needs to be produced onboard and on-demand and factors of fuel and efficiency are
connected to the water content in HHO and added water injection.
Template and design,
A sodium hydroxide salt solution was used for an electrolyzer. A dry cell design with dead plates
for higher voltage electrolysis was manufactured to perform an experiment to prove the effects of
onboard HHO and water addition to a diesel generators to enhance performance. A PLC system was
used for the sake of repeatability. The key results of the test include HHO additions, water injection, and
generator load along with the diesel fuel consumption and total NOx emissions. The plates in the
electrolyzer are set up the same as in a car battery. The end plates were supplied 12.5-14V DC resulting
in a 2.08V to 2.33V drop across each successive plate in the electrolyzer. The total amperage rating was
18A connected in series and 30A electrolyzers connected in series. Water was pumped in at 10% of the
fuel consumption, it then was converted to steam and injected into the intake. A voltage over the
potential of typically 0.6V above the 1.48V thermo-neutral voltage is required for any significant current
o flow at STP. This is due to a low reaction rate, the activation energy barrier, electrical resistance of the
electrolyte and electrodes, and bubble formation (Zeng, Zhang, 2010).
Final Results,
HHO on-demand did not reduce diesel consumption. As the rate of HHO production increased
so did the energy required to run the electrolyzer, resulting in a net loss. HHO and water injection
reduced NOx between 1.3% and 11.8%. At 30% engine load, NOx was most affected by HHO injection,
when combined with water injection there was a total reduction of 11.8% NOx emissions.
HHO AND EMISSIONS P a g e | 20
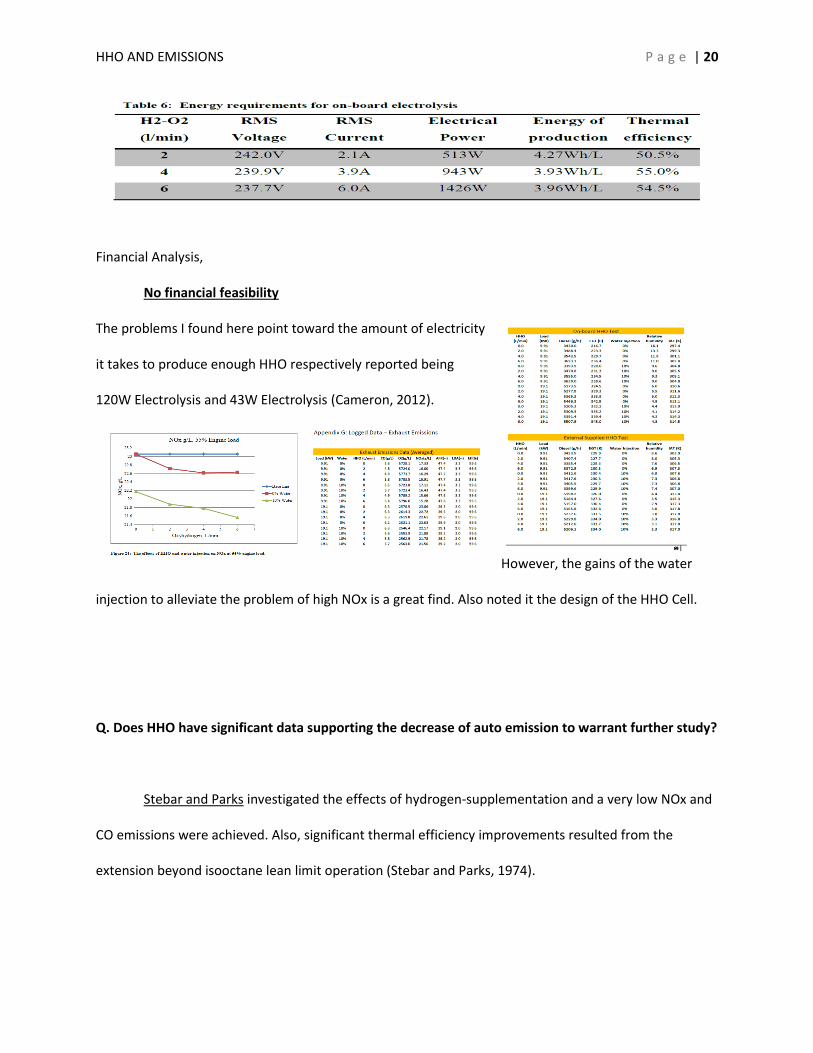
Financial Analysis,
No financial feasibility
The problems I found here point toward the amount of electricity
it takes to produce enough HHO respectively reported being
120W Electrolysis and 43W Electrolysis (Cameron, 2012).
However, the gains of the water
injection to alleviate the problem of high NOx is a great find. Also noted it the design of the HHO Cell.
Q. Does HHO have significant data supporting the decrease of auto emission to warrant further study?
Stebar and Parks investigated the effects of hydrogen-supplementation and a very low NOx and
CO emissions were achieved. Also, significant thermal efficiency improvements resulted from the
extension beyond isooctane lean limit operation (Stebar and Parks, 1974).

HHO AND EMISSIONS P a g e | 21
Masood et al test results showed that the hydrogen–diesel co-fueling solved the drawback of
lean operation of hydrocarbon fuels such as diesel. This reduced misfires, improved emissions,
performance and fuel economy (Masood et al., 2006).
Ji and Wang studied hydrogen–gasoline mixtures in engines and concluded that wide
flammability and fast burning velocity of hydrogen yielded reduced CO and HC emissions at idle and lean
conditions (Wang, Ji 2009).
Rajeshkumar et al in this paper introduced four methods to reduce the exhaust emissions. 1.
Adding additives. 2. HHO technology 3. Charcoal absorption to reduce the CO, HC and 4. A NaOH
silencer to reduce more than two-thirds or carbon dioxide. The result showed fossil fuel was much
nearer to complete combustion which intern ensures that there are no unburned hydrocarbons.
Oxidation of the partially oxidized carbon i.e. CO was also more completely oxidized CO2 (Rajeshkumar
et al, 2016).
Masood et al studies found that though power output of an engine was 20% more than for a
gasoline engine and 42% more when using a carburetor. Studies further suggested this will lead to
higher NOx emissions for injection of H2 alone (Masood et al., 2007).
Jingding studies have shown that if mixtures are made lean and spark timing is retarded NOx can
be reduced below the current standards for emissions (Jingding, 1998).
Bambagn et al manufactured a PWM to control temperature. Instead of water injection to cool
the cylinder, it was thought that Pulse width modulation temperatures might be controlled better. A
PWM is an electronic circuit that is able to regulate current input by quickly turning the current on and
off. This duty cycle and frequency can be set and adjusted (Ghiffari, 2013). One goal is to keep the Cell
below 60° C (Musmar et al, 2011). The objective of this study is to see if these advantages remained with
original engine specifications. A Dry Cell HHO device was used and optimization of PWM was done by

HHO AND EMISSIONS P a g e | 22
varying the duty cycle of pulse width modulation i.e. 20%, 40%, 80%, and 100%. A venturi style
mechanism mounted intake was used to port HHO. Measured was the effects of HHO gas on the
performance and the temperature of the Cell. The results show optimum performance is generated by a
PWM system with a 40% duty cycle. Documented increase BMEP, thermal efficiency, engine torque,
power. The thermal efficiency increased respectively to 2.27%, 2.76%, and 3.05% while the performance
increased by 6.55%, 7.65%, and 15.50%. The electrolyte used is an alkaline solution of KOH. The HHO
Gas generator is composed of two basic components. Tube generator and a power source (battery). A
Dry cell type generator with a separated bubbler and water fill (Bambagn et al, 2016).
The Performance parameters (taken directly from the study) (Bambagn et al, 2016).
1. Generator Power Input. The Formulation to find the input power is P=VxI. Watts=volts x amps.
2. HHO Gas production= measured by a gas flow meter.
3. Specific Energy Input defined as the amount of energy required to process the electrolysis of
water in kjoule to produce 1kg of HHO gas.
4. Generator efficiency, the ratio of useful energy to the energy supplied to the system.
5. Generator HHO Temperature
6. The PWM system. PWM is an electronic circuit to control the amount of electric Current that
enters the equipment and to avoid excessive
power dissipation in the battery. Also, Voltage
is regulated by percentage of pulse width to the
period of a square signal in the form of a
periodic voltage applied to the motor as a
power source. PWM signal can be constructed
using analog methods using op-amp circuit or

HHO AND EMISSIONS P a g e | 23
by using a digital method that could be affected by the resolution of the PWM itself. PWM
electronic circuits can be make using a 555 timer ic or IC LM324N. Timer IC is one type of timer
that has the ability PWM controller with pulse width control features 0 to 100%. Mosfet drivers
are needed to the use of PWM.
Results
Generator temp was maintained at 60 ° C. Application of HHO gas generator in point above on
standard ignition timing engine produce in an increase of performance such as torque, power, BMEP
and thermal efficiency respectively of 2.27%, 2.76%, and 3.05% and decrease of bsfc 7.76% (Bambagn et
al, 2016).
Yimaz et al at Mutah University showed that a mixture of HHO, air, and gasoline cause a
reduction in emission pollutants and enhancement in engine efficiency. Emission of NO and NOx were
reduced by an astounding 50%. Moreover, carbon monoxide concentrations were reduced by 20%.
While fuel consumption was reduced by 20-30 (Yimaz et al, 2010).
Template and design,
The fuel cell used in this research is basically an electrolyte cell
which decomposes water into HHO. The heat generated is due the
electrolysis process so a sodium bicarbonate is added to accelerate the

HHO AND EMISSIONS P a g e | 24
decomposition. HHO has a caloric value three times that of gasoline.
Plates of stainless steel are used to prevent degradation. The effect of
adding HHO gas to the air/fuel mixture on the carbon monoxide
concentration is presented, in fig 4. Using a blend of HHO gas reduces
the presence of CO.
The conclusion from the study shows that HHO cell may be integrated easily with existing engine
systems. Further, that the combustion efficiency has been enhanced when HHO gas has been
introduced, consequently reducing fuel consumption. Concentrations of nitrogen oxide have been
reduced by 50%. Carbon monoxide has been reduced to 20%. NOx concertation was reduced to about
54%. Finally, HC concentrations were highly affected by the engine speed and the presence of HHO
(Yimaz et al, 2010).
Q. Is it true that one can build and HHO cell at little cost?
Cunningham et al made researches on methods and apparatus for enhancing combustion in an
ICE through electrolysis and produced hydrogen along with oxygen yielding an enhanced combustion at
low engine loads for all types of engines (Cunningham et al, 1992).

HHO AND EMISSIONS P a g e | 25
Ammar A presents work in the design of a device attached to the engine to integrate an HHO
production system with the gasoline engine. He states this device can be easily installed in any engine
compartment.
Review,
Studies at Mutah University include the reduction of cylinder liner wear, the filtration process,
fuel mixing processes, as well as the introduction of the HHO fuel cell (FC). In the theoretical
background, in “Properties of hydrogen” Momirlan elaborated upon the hydrogen H2 technology,
economics and the environmental impact on the world at the end of the 20th century. In the 21st
century studies have been centering on browns gas or HHO (Momirlan, Veziroglu, 2002).
Dunn in his paper talked about how the decisions made today will likely determine which
countries and companies seize the enormous political power and economic prizes associated with the
hydrogen age now downing (Dunn, 2002).
Schulti et al done studies on acceptance, risk perception and customer satisfaction gave
suggestions on how to use marketing methods, education projects, and product exposure in order to
attain the successful introduction of hydrogen as an alternative fuel (Schulti et al, 2004).
Hekkert et al discusses the role of governments in the transition to hydrogen (Hekkert et al, 2005).
Template and Design,
The type cells used in this experiment was a Wet Cell filled with
water and sodium bicarbonate. Two cells were constructed being the
same type with different configurations FCb and FCc. Cell FCc is half the dimension of cell b, with an
electrode placed closer.

HHO AND EMISSIONS P a g e | 26
Results, (list is taken directly from study)
1. An increase in efficiency of about 3% for cell b and 8% for cell c.
2. Fuel consumption was reduced especially with cell c.
3. fig 10 shows a reduction in exhaust gasses this leads to better combustion
and cleaner gas
4. Increased power.
Conclusions,
1. The use of HHO in gasoline engines enhances combustion efficiency,
consequently reducing fuel consumption and thereby decreasing pollution.
2. The optimal size of the FC is when the service area of an electrolyte needed to generate sufficient
amount of HHO is twenty times that of the piston surface area. Also, the volume of water needed in the
cell is about one and a half that of the engine capacity.
The FC which can be used in simple, easily constructed, and easily integrated
with existing engines at low costs, about 15 dollars per cylinder. How does
design affect production?
(Ammar, 2010)
HHO with Diesel Design
Durairai et al wrote a paper dealing with bio-diesel and HHO gas from hydrolysis. This report
states that the using of water powered biodiesel results in a substantial reduction in emission.
Preheating the air improves the thermal efficiency. This is a strange finding since most CI engines make

HHO AND EMISSIONS P a g e | 27
use of an intercooler to cool the air and prevent run away. The main focus deals with implementation of
oxy-hydrogen as a duel fuel with biodiesel (Durairai et al, 2012).
Biodiesel
Biodiesel is a clean burning mono-alkyl ester-based fuel
very close the consistency of fossil-based diesel but is made
from renewable sources such as vegetable oils and animal fats.
Findings. (list is taken from original paper) (Durairai et al, 2012).
1. The HHO/Bio-diesel shows evidence of producing low emissions
and higher thermal efficiency.
2. Reduces the formation of unburned hydrocarbons and reduces the unburned fuel in the combustion
chamber.
3. Due to this the combustion process will be done in an efficient manner and the hydrogen is four times
highly effective when compared to ordinary fuels.
4. Due to this it will increase the combustion reaction and lead to an increase in efficiency and torque, and
horsepower.
5. The HHO compounds will be used to reduce the formation of CO2 and CO and other harmful compounds
produced in the engine and increase in mileage and performance of the engine.
6. Heat energy is recovered from the exhaust gasses which causes lower heat addition, thus improving
engine thermal efficiency.
7. NOx emission is reduced with the exhaust heat recovery system. Higher inlet air temperature is caused
the lower ignition delay, which is responsible for lower NOx formation with air preheating. Uniform or
better combustion will occur due to the pre-heating of inlet air, which also causes lower engine noise.

HHO AND EMISSIONS P a g e | 28
8. Due to better evaporation and shorter ignition delay, there is less fuel adhering to the combustion
chamber wall and therefore a small amount of fuel accumulated in the combustion chamber before
ignition is started which may produce low NOx emission as well as low noise vibration.
Q. At what amperage and voltage values is a Cell likely to operate best at, what is a good design?
Mohamed et al in this experiment attempts to find the optimal number of neutral plates, the
distance between them, and type and quantity of the catalysts. Looking at sodium hydroxide NaOH, and
potassium hydroxide KOH. NOx, CO and NOx emission were measured. Using 2 neutral plates with a
1mm distance and 6 g/L of KOH a maximum productivity was established of 18L/h (Mohamed et al,
2015).
Bhavesh et al did a study of the effect that changing the compression ratio has on a Diesel/HHO
powered CI engine. Emission characteristics and combustion characteristics under 5 different loads were
measured and graphed. The results show small changes. Conclusion inconclusive (Bhavesh et al, 2016).
Yilmaz at the Cukurova University in his study on the best catalyst for HHO compared KOH(aq),
NaOH(aq), NaCL(aq). Various electrode designs were evaluated. Molecular bonds are weakened by the
use of Catalysts. Hydroxy gas is used as a supplementary fuel in both SI and Ci engines without
modifications. The effect on HC, CO, as well as on the specific fuel consumption (SFC) is investigated
NaOH was found to be the best Catalyst (Yilmaz, 2010). High corrosion resistance is considered,
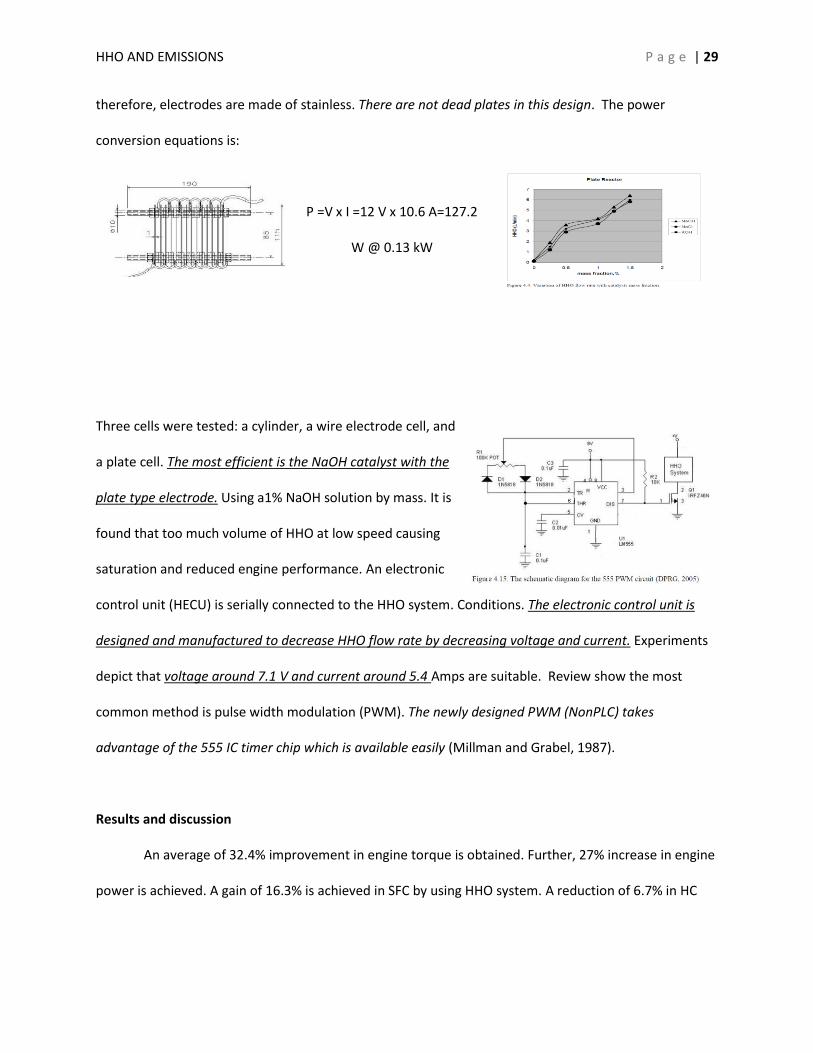
HHO AND EMISSIONS P a g e | 29
therefore, electrodes are made of stainless. There are not dead plates in this design. The power
conversion equations is:
P =V x I =12 V x 10.6 A=127.2
W @ 0.13 kW
Three cells were tested: a cylinder, a wire electrode cell, and
a plate cell. The most efficient is the NaOH catalyst with the
plate type electrode. Using a1% NaOH solution by mass. It is
found that too much volume of HHO at low speed causing
saturation and reduced engine performance. An electronic
control unit (HECU) is serially connected to the HHO system. Conditions. The electronic control unit is
designed and manufactured to decrease HHO flow rate by decreasing voltage and current. Experiments
depict that voltage around 7.1 V and current around 5.4 Amps are suitable. Review show the most
common method is pulse width modulation (PWM). The newly designed PWM (NonPLC) takes
advantage of the 555 IC timer chip which is available easily (Millman and Grabel, 1987).
Results and discussion
An average of 32.4% improvement in engine torque is obtained. Further, 27% increase in engine
power is achieved. A gain of 16.3% is achieved in SFC by using HHO system. A reduction of 6.7% in HC

HHO AND EMISSIONS P a g e | 30
emissions. A reduction of 14.4% in CO emissions. A 19.1% increase in total engine torque is obtained. A
reduction of 5% in HC and 13.5% in CO emission at an engine speed of 1750 rpm.
Conclusions (directly from paper) (Yilmaz, 2010).
The results of this experimental study are summarized as follows:
1. At mid and higher engine speeds, the HHO system with diesel fuel and gasoline yields higher engine
torque output compared to pure diesel and gasoline fueled engine operation unless HECU is

HHO AND EMISSIONS P a g e | 31
added to the system. High burning velocity and low ignition energy of HHO-air mixture
minimize the effect of the weakened in cylinder charge flow and increased residual gas fraction
which blocks the fuel to be fast and completely burnt at high speeds. Also, high burning
velocity of HHO yields higher resistance against knocking which provides higher compression
ratio (CR) and increased thermal efficiency. However, increased CR may cause pre-ignition and
this can be minimized by direct HHO injection into the cylinder. At low engine speeds, low lean
flammability limits of HHO causes challenges at higher equivalence ratios. Due to the long
opening time of intake manifold at low speeds, high volume occupation (reduced volumetric
efficiency) of HHO becomes inevitable. Since minimum ignition energy of HHO-air mixture is a
decreasing function of equivalence ratio till stoichiometric (richer) conditions, torque is
reduced after HHO addition. A control unit has to be used to obtain appropriate electrolysis
voltage and current (gas flow rate) to terminate the impairments of HHO gas at low speeds.
2. Uniform and improved mixing of HHO-air and oxygen content of HHO stimulate combustion which
has a major effect on SFC by using an adequate capacity HHO system. Wide flammability range,
high flame speed and short quenching distance of HHO yield gasoline and diesel fuel to be
combusted completely under high-speed conditions without HECU and low-speed conditions
with HECU.
3. High burning velocity, wide flammability range, oxygen content, and absence of carbon make HHO
gas an appropriate fuel addition in obtaining adequate combustion which yields reputable
reduction of HC and CO emissions when a sufficient HHO system is used at mid and higher
speeds of the engine without HECU and low-speed conditions with HECU.
4. A control unit, which decreases electrolysis voltage and current automatically when the engine
speed decreases under 1750 rpm for CI and 2500 rpm for SI (critical speeds for this

HHO AND EMISSIONS P a g e | 32
experimental study), has to be designed and manufactured to eliminate the impairments of
HHO enriched diesel fuel combustion at low speeds and to provide energy economy.
5. The average power increment in test engines during experiments is bigger than the electrical power
consumed and fuel economy obtained with the aid of HHO system as well. This indicates that
the system is efficient.
Wang et al have conducted a number of experiments investigating H2/gasoline blends. Their
results are outlined in their studies (Wang et al, 2009,2011,2011,2011,2012,2014).
HHO design
The generator used consists of a
separation tank, an HHO cell, with continuous
flow. This style is referred to as a Dry Cell.
Stainless steel electrodes were used, 16 electrodes
16x20x.2 cm thick. Configured as shown. Neutral
plates divide the voltage while all plates carry the same amperage. The
space between the plates was reduced to 1mm by the use of rubber
gaskets. The voltage ranged from 12-14 volt DC. HHO cell results. It is
found that 6g/L of KOH as catalyst gives better efficiency (Notice different from the last study who said
NaOH was best). It is found the 4g/L of NaOH gives better thermal efficiency compared to other NaOH.

HHO AND EMISSIONS P a g e | 33
The Picture shows the results comparing 6g/L KOH to 4g/L of NaOH. It is found that the KOH gives the
highest efficiency.
Engine emissions,
NOx is expected to increase, however, it is noted that when the gasoline mixture is leaned out to
accommodate for the HHO there is a reduction in NOx as well.
Conclusion (taken directly from paper) (Wang et al, 2014).
1.
HHO cell can be integrated easily with existing engine systems.
2. The engine thermal efficiency has been increased up to 10% when HHO gas has been introduced
into the air/fuel mixture, consequently reducing fuel consumption by up to 34%
3. The concentration of NOx, CO, and HC gasses has been reduced to almost 15%, 18%, 14%
respectively on average when HHO is introduced into the system.
4. The best available catalyst was found to be KOH, with a concentration of 6g/L.
5. The proposed design for separation tank takes into consideration the safety precaution needed

HHO AND EMISSIONS P a g e | 34
Widhiyanuriyawan did an experiment using simple NaHCO3 in a water solution. He used six
pieces Stainless Steel for electrodes. The results indicated that distilled water consumed 353.52 Watts to
produce Brown's gas of 0.00123 l/s. However, if NaHCO3 (baking soda and water) was added into
distilled water with the mass fraction of 1.33% consumed power decreased to 27.89 Watts and Brown's
gas was produced 0.0017 l/s. The efficiency of distilled water had the greatest efficiency only 5.53% by
using current of 2 Ampere and power reached 31.043Watts. This is a 1400% power drop and a net
increase in production (Widhiyanuriyawan, 2016).
Literature Review Summation.
1. Yes H2 and HHO can be burned in an engine. Erren and Campbell in 1920 were successful.
2. Yes HHO can be produced from electrolysis for little cost (Yull Brown patent, in 1977).
3. Though H2 alone is not suitable as an alternative fuel source for a drop-in replacement, in
the future it is still a viable alternative due to the weight to power ratio, however, engines
design specifically for H2 would have to be engineered, in the meantime HHO with the water
content that it has will reduce all emissions and enhance power and torque when the fossil
fuels are leaned out to accommodate for the HHO, with the addition of a control unit to
control the flow rate into the intake for this reason more experimentation is advised Lee
and Brehob in 1971 showed H2 to be an insufficient drop in replacement for fossil fuel(Lee
and Brehob, 1971).
4. Engineering an HHO cell seems to be inexpensive, however, after the experiment, we will
further elaborate on our findings, is it possible to build an HHO cell for 20 dollars or less.
5. Design effects production.

HHO AND EMISSIONS P a g e | 35
i. All studies use Plexiglas or a material that does not have a substantial risk if flashback
occurs. As a result in our main experiment, we will be using plastic (Bambagn et al,
2016).
ii. According to reviews, it is found that the electrode plate is the best choice, due to
increased volume and these plates should be stainless steel (Millman and Grabel,
1987).
iii. It is found that the dead plate or blank plate design is the best to provide insulation
for electric currents (Millman and Grabel, 1987).
iv. It is found that NaHCO3 is the best catalyst for the following reasons
(Widhiyanuriyawan, 2016) (Yimaz et al, 2010).
a. KOH is not readily available, and production of it is time-consuming and
hazardous when compared to baking soda and water.
b. NaOH is mostly derived from a chemical reaction that emits chlorine gas which
is hazardous to humans.
c. The benefits for reducing power requirements as well as the increase in
productivity is desirable.
v. It is found that gas measurement can be done by water displacement.
vi. It is found that because of cost and ease the Wet Cell type is preferable.
6. Most experiments were done at 12-14 volts DC, some went up to 35v. These studies show 14
volts at 2 amps was the preferred volts and amp, however, for a perfect reaction
amperage should be much lower (Zeng, Zhang, 2010).
Q. 7. Will HHO cells operate with A.C. or D.C. best, or what happens if one uses a D.C. to carry A.C.?
Will be determined in the experiment.

HHO AND EMISSIONS P a g e | 36
Q. 8. What happens to production when A.C. frequency is changed?
Will be determined in the experiment.
Conclusion
For a complete answer to questions 4, 7 and 8 it is advised to continue experimentation, further,
it is felt that the next step in the process is to find what effect in any production of HHO from
electrolysis has under different electrical energy forums.
Experiment Hypothesis
1. With increased voltage amount their sound be a net gain of production of HHO due to the
increased electron count. A voltage over the potential of typically 0.6V above the 1.48V (Zeng,
Zhang, 2010).
2. A.C. voltage may show and increase in production amount as the poles of the current reverse
making it possible for all electrodes to be more efficient due to a more efficient use of surface
area. Millman and Grabel were able to change production rates with their PWM.
3. A frequency in Hz of the current that matches the resident frequency of either the electrode or
the aqueous solution should cause the hydrogen bonds to break more readily. Millman and
Grabel were able to change temperature and keep it below 60° C with their PWM.
4. An A.C. current carried by a D.C. voltage should increase production due to the increased force
breaking the Hydrogen bonds Eckman states that the Hydrogen bond is weak so any added
stress to this bond should be effective (Eckman, 2010).
5. An Audio signal carried by a D.C. voltage should cause greater production as the audio
frequency draws nearer to the resident frequency of the electrode or the aq solution do to

HHO AND EMISSIONS P a g e | 37
vibration. Bambagn et al state that the Pulsing of current was effective in weakening Hydrogen
bonds (Bambagn et al, 2016). Any added stress to this bond should be effective in weakening
the bond and increasing production (Eckman, 2010).
Stages
This experiment will be carried out in stages.
Stage one: Engineer and HHO Cell as cheaply as possible to verify Q. 4.
Stage two. Engineer a Cell that is safe in the case of flashback and test outputs D.C. volts and amps from
1V to 20V.
Stage three: Test various voltages above 20V at varying Amperages.
Stage four: Test with A.C. Voltage 0-20V low Amperages.
Stage five: Test High A.C. Voltages Varying Amperage.
Stage Six: Audio signals from an amplifier as a power source set at different frequencies.
Stage Seven: Repeat stage 6 using both full and half wave rectifiers using as much at the info from the
other stages as possible to guide the settings.
Methods
Data for stage one is visibly observed with the eye, and given by store receipt.
Data for Stages 2-5 will be gathered by 3 Digital Multi Meters, and a temperature reading
Device. And a Graduated Bottle to read volumetric production of HHO.
Data for Stages 6-8 will include all previous data recording devices, with the addition of an
Oscilloscope app for frequency reading.

HHO AND EMISSIONS P a g e | 38
Stage one: The Mission is to Engineer or Build an HHO Wet Cell as cheaply as possible using
products from local hardware stores. Assemble using decided configurations from the literature review
and hypothesis. The purpose of this experiment is to make observations of gas production, i.e. is gas
produced? D.C. Voltages from 1v dc to 20 v dc. Will be used. Also, a test with pure tap water vs NaHCO3
(aq) will be compared visually. Funding for this stage is supplied by Jeffery Morse.
Stage two. Engineer a Cell that is safe in the case of flashback. We will use the 6 g/L amount in
Mohammad’s tests of NaHCO3 (aq) and test volumetric outputs using the water displacement method.
D.C. volts and amps from 1V to 25V produced by a variable power supply. Three DVMs will read A.C.
volts, D.C. Volts, and Amperage. Data will be recorded for Temperature, Volts, Amps, and Volume of
HHO produced. Also, a run with distilled water will be done for baseline comparison. Also, a run with
Tap water only will be run for a baseline comparison.
Stage thee: Using the setup from stage two Test various voltages above 20V D.C. at varying
Amperages will be recorded. Also, one test using an in-circuit spark gap.
Stage four: Using current set up a test with A.C. Voltage 0-20V low Amperages.
Stage five: Test High A.C. Voltages Varying Amperage (fire and explosive precautions for this
experiment will include shielding and fire protection).
Stage six: Test A.C. a small A.C. generator must be constructed to vary Hz.
Stage Seven: Repeat stage 6 using both full and half wave rectifiers using as much at the info
from the other stages as possible to guide the settings.
Results Stage One: Cost
1. 9 Stainless Steel washers ½ x 2 inches. .65 cents each at Lowes.
2. 1 nylon bolt ½ by 4 inches from Home Depot $1
3. 4 nylon nuts for bolts .65 cents each

HHO AND EMISSIONS P a g e | 39
4. 9 nylon washers for spacers. .20 cents each
5. 1 old olive jar and lid, free
6. Old speaker wire I had laying around.
7. 1 tablespoon Baking Soda free.
Total cost: Less than $20.00.
Build:
The first negative power lead is slide on the nylon bolt and then the first plate washer slides on the
nylon bolt, 3 nylon washer for spacers then each of the three neutral stainless washers with nylon
washer spacers in between. Then a nylon bolt for distance. The Positive Plate washer and electric supply
line with another nylon bolt on top of that, then three neutral plate washers, a spacer, and the last
negative plate washer and supply line, lastly the final nylon nut to hold it together. A whole in the top
for ventilation and electric access.
Results stage one:
1. Using Distilled water NO visible gas is produced.
2. Using Water with a tablespoon of Bicarbonate visible gas is produced.
3. It is noted that with increased DC voltage more production is seen.

HHO AND EMISSIONS P a g e | 40
Conclusions stage one:
1. A simple HHO was achieved at a cost less than $20 U.S.
2. Production rises with D.C. voltage.
3. Due to the nature of HHO, it is recommended to abandon glass as a casing in case of an
explosion.
4. Since Q4 is “True”, and production of HHO is visible with bicarbonate solution it is
recommended to proceed to stage two.
Method: Stages two and three
Stage two. Engineer a Cell that is safe in the case of flashback. We will use the 6 g/L amount in
Mohammad’s tests of NaHCO3 (aq) and test volumetric outputs using the water displacement
method. D.C. volts and amps from 1V to 20V produced by a variable power supply. Three DVMs
will read A.C. volts, D.C. Volts, and Amperage. Data will be recorded for Temperature, Volts,
Amps, and Volume of HHO produced. Also, a run with distilled water will be done for baseline
comparison. Also, a run with Tap water only will be run for a baseline comparison.
Design
1. We used the cell assembly made in the last stage and placed it
in a sealed plastic water bottle with contact points for electricity
and an exhaust spout. The bottle was purchased at the
Goodwill for less than 1 dollar.

HHO AND EMISSIONS P a g e | 41
2. The water displacement device was made from an old chain fuel mixture container graduated at
15, 30 and 45 Ml. At the HHO is produced it passes through the hose to the main section of the
white container forcing water into the top mixture reservoir.
Measurements
1. We used a variable d.c. power supply from 1-25v. For lower voltages, and higher voltages were
created through running the supply voltage through a transformer, also we used a 2100 volt
transformer with a half wave rectifier to achieve kilovolts.
2. We used voltmeters at the output of the supply as well as voltmeters on the posts of the cell for
reading. Further, we used amp meters in both places. For kilovolt measurements, a resistance
was added to the probes to allow for higher voltage measurement.
3. Please refer to the appendix for the data tables on all charts.
Results Stages two and three: appendix A:
Results from stages two and three show that only a very high voltage will produce HHO gas from
distilled water. Further the temperatures created would be a challenge to manage. One note is that
there seems to be some correlation between the increase in amperage and the production of HHO. It is
0
500
1000
1500
2000
2500
1 2 3 4 5 6 7 8 9
volts vrs heat DC with Distilled
water
Volts delta T
0%
20%
40%
60%
80%
100%
1 2 3 4 5 6 7 8 9 10
Current -vs-Production
amps ml
05
101520253035
0 2000 4000
Production -vs-Voltage
HHO AND EMISSIONS P a g e | 42
recommended that before proceeding to stage four measurement be taken of values voltage versus
amperage. Conclusion HHO cell is not economically useful under this condition using distilled water, the
costs outway the benefits.
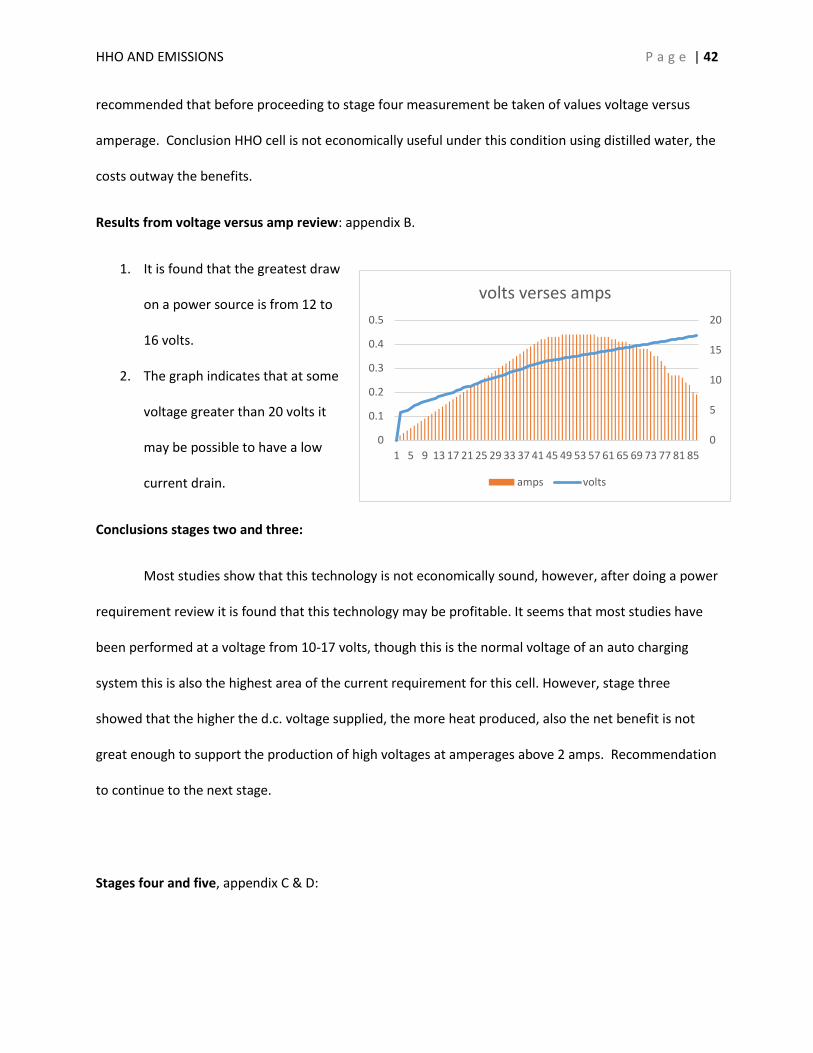
Results from voltage versus amp review: appendix B.
1. It is found that the greatest draw
on a power source is from 12 to
16 volts.
2. The graph indicates that at some
voltage greater than 20 volts it
may be possible to have a low
current drain.
Conclusions stages two and three:
Most studies show that this technology is not economically sound, however, after doing a power
requirement review it is found that this technology may be profitable. It seems that most studies have
been performed at a voltage from 10-17 volts, though this is the normal voltage of an auto charging
system this is also the highest area of the current requirement for this cell. However, stage three
showed that the higher the d.c. voltage supplied, the more heat produced, also the net benefit is not
great enough to support the production of high voltages at amperages above 2 amps. Recommendation
to continue to the next stage.
Stages four and five, appendix C & D:
0
5
10
15
20
0
0.1
0.2
0.3
0.4
0.5
1 5 9 13 17 21 25 29 33 37 41 45 49 53 57 61 65 69 73 77 81 85
volts verses amps
amps volts

HHO AND EMISSIONS P a g e | 43
Results Stages four and five: A.C.
power will not produce HHO in the
cell. Though it was thought that the
cathode and anode would oscillate,
the net result is that they never polarize, as a result no production is done.
Conclusion Stages four and five
Alternating current will not work to produce HHO gas in an HHO cell. The recommendation is to
go on to step six.
Stage Six
The use of an audio amp to provide an A.C. signal at the resonant frequency of the cell. The
resonance frequency is found by recording the metal of the cell after being struck. Then the file is
analyzed with an audio frequency analyzer to determine resonant frequencies. The resonance
frequencies are found to be 46.7. 53, and 127 Hz. A signal from a frequency generator was running
through an audio amplifier, in this way an alternating current at the desired frequency was obtained.
0
20
40
60
80
0 5000 10000 15000 20000 25000
Amp ma
0
1

HHO AND EMISSIONS P a g e | 44
Results stage six: appendix E.
1. Since an audio signal is an A.C. current it made no difference what frequency was supplied,
no HHO was produced. Recommendation to go on to stage seven.
2. It was found that as frequency increased voltage decreased.
Conclusion stage six:
Since the studies show that continuous D.C. voltage produces too great a delta T, and no
production is made from any audio frequency it is recommended to continue to stage seven.
Stage Seven. Audio Signal through a full wave rectifier.
A full wave rectifier if a diode bridge that in essence splits the
positive and negative portions of the alternating wave. It then inverts the negative portion to positive.
The end result is a positively charged pulse at twice the frequency rate.
Results stage seven: appendix G, voltage values with full wave rectifier.
It first is noticed that the voltage value of the rectified audio signal follows the characteristics of
the continuous d.c. voltages studied in stages two and three as
shown in the Volts at post-DC graph to the right. As a result, it may
be possible to find a frequency that will have a very small current
draw.
Results stage seven a: Production and current results of using an audio signal through a full wave
rectifier with the voltage held at 10 volts. Appendix G.

HHO AND EMISSIONS P a g e | 45
Discussion
It is shown that voltage seems to be the deciding factor on production. No matter what Hz the
production value was stable at 7.5 mL per minute. An unexpected outcome is a drastic reduction in
current needed. Current has dropped to 50 milliamps or less, also it is noticed that at extremely high
frequencies production remains the same but amperage draw drops to zero. This is very promising and
greatly reduces the cost of producing HHO. However, 7.5 mL per minute is not enough production to
sustain need.
Results stage seven b: Production and current results of using an audio signal through a full wave
rectifier with only Hz being changed and voltage and amperage being the result of the given Hz.
Appendix H.
0
2
4
6
8
10
12
14
16
18
0 10000 20000 30000
volts at post DC
0
10
20
30
40
50
0
5000
10000
15000
20000
25000
1 4 7 10 13 16 19 22 25 28 31 34 37 40 43 46 49 52 55
production at 10 volts
Amps ma@P Hz after Rect Volts @P
Ml Delta T

HHO AND EMISSIONS P a g e | 46
Discussion stage seven b: Again the results show that at 22440 Hz current draw drops to zero. While
the production did reduce by 2 mL per minute this is an acceptable loss to have the net cost drop so
radically. Delta T (temperature increase) is also lower at this point. The other alternative is to use a
Pulse Width Modulator, and from our research, the current reduction can also be achieved.
Results stage seven c: Half-wave rectified audio signal.
Discussion stage seven c:
-50
0
50
100
150
200
250
0 5000 10000 15000 20000 25000
Half wave rectified audio
half wave rectifier DC volts
half wave rectifier DC amps
half wave rectifier DC ml
half wave rectifier DC delta t
-20
0
20
40
60
80
100
120
0 5000 10000 15000
Half wave audio at 10 volts
half wave rectifier DC volts
half wave rectifier DC amps
half wave rectifier DC ml
half wave rectifier DC delta t
-10
0
10
20
30
40
50
60
70
0
5000
10000
15000
20000
25000
30000
35000
1 3 5 7 9 11 13 15 17 19 21 23 25 27 29 31 33 35 37 39 41 43 45 47 49 51 53 55 57
Full wave rectified audio
Hz after Rect Volts @P Amps ma @P Ml Delta T

HHO AND EMISSIONS P a g e | 47
The Half wave rectifier required much more current to operate, also the current never reached
0 but got very close at .1 amp. The production also never went about 20 mL per minute.
Conclusion stage seven c:
The half wave does not function as good with its limitations of never making it to zero amp
draw. Further, any delta T offset that would have been gain from the longer interval is lost in the
increased current draw. Finally, this model may be usable due to the decrease in production costs in
installation as only one diode is required.
Final Analysis and Discussion
HHO has been looked at as an alternative additive to fossil fuels to help relieve the stresses
caused by used of such fuels as well as hardships caused by the limitation of supply. Several questions
were posed at the beginning of this paper and an effort has been made to determine if HHO is
economically and real world alternative. Through the stages one through seven we have found many
answers to these questions. An HHO cell was engineered for less than 20 dollars American. Many
answers came through the literature review as it was found that H2 can burn in engines, usually needing
the timing changed to function properly. It has further been shown in the literature review that HHO
does significantly reduce all auto emissions. Also found is that design does indeed affect production, and
it is recommended that experiments in design continue. This experiment centered more on the problem
of the cost of creating the electricity nullifying any net gain from the use of the cell. It was found that no
alternating current by itself can create the polarization needed for the electrodes of the cell to produce
HHO. To add to this we found that D.C. voltages around the voltages of auto batteries and charging
systems are in the range of the highest current draw, as a result voltages above 20 volts and below 100
volts are suggested, in this experiment about 30 volts was good. Further, it was found that a full wave
rectifier outperformed the half wave by reducing current requirements by a factor of about eight of the

HHO AND EMISSIONS P a g e | 48
half wave rectifier, however, it should be noted that both outperform our literature review current
requirements by a factor of about 100. It was further noted that it is possible through the manipulation
of frequency to tune the cell to have a 0 current draw. This reduces the cost of production to almost
nothing. The frequency that was found to lower the current to zero was about 22440 Hz while
production of 28 mL of HHO gas was measured. This is not the highest on the chart for production but
should be sufficient to do the job while keeping the cost of electricity to almost nothing.
Interpreting the data
The findings show that HHO is a viable alternative additive to fossil fuels and is an excellent
candidate for further study. the production electrical net cost is so low that a small solar panel would be
able to supply the need, or if ran off the battery, the zero amp draw would allow one to produce HHO
for long periods of time without recharging. This is a game changer for this technology. HHO can easily
increase mileage while lowering emissions on an auto, the problem of the big money not liking it may be
reduced as it can be used as an additive and not a replacement until such a time the people of the world
are allowed without danger to use a free technology.
Final conclusions
1. Can H2 burn in an engine? YES!
2. Is it real--can one produce a burnable form of H2 from water easily? YES!
3. Does HHO have significant data supporting the decrease of auto emission to warrant further study?
YES!
4. Is it true that one can build and HHO cell at little cost? YES!
5. How does design affect production? The design does affect production.

HHO AND EMISSIONS P a g e | 49
6. At what amperage and voltage values is a Cell likely to operate best at? About 30 volts or about, at
Zero amps.
7. Will HHO cells operate with A.C. or D.C. best, or what happens if one uses a D.C. to carry A.C.?
HHO cells will not operate on A.C. but a pulsed D.C. charge is preferable over a continuous
charge.
8. What happens to production when the frequency is changed? The voltage and amperage are affected
as well as production. It is possible to tune a cell using frequency so it will produce HHO gas with a
gross electrical current cost of zero.
Recommendations
It is recommended to further experiments using PWM’s and high voltages. Further, it is
recommended cell design continue to be experimented with. Lastly using a D.C. pulsed wave to carry
and A.C. frequency is yet to be tested. This is a technology that should be distributed only on a
temporary basis. Using water as a source of fuel is not really a good idea as it is the lifeblood of
everything on the planet. Once more recycling biomatter in a gasifier is just as efficient and we have
tons of that. Grass clipping to run your car is something that is renewable as well as an efficient means
of disposal. To make pellets from biomatter is an easy process and the gas is burnable in most vehicles
especially CI engines.
References
Adams, Walter (1968) The American Economic Review. Vol. 58, No. 2, Papers and Proceedings of the Eightieth Annual Meeting of the American Economic Association (May, 1968), pp. 652-665 Published by: ( URL: http://www.jstor.org/stable/1831851 Adnan, R.; Masjuki, H.; Mahlia, T. (2009) An experimental investigation of unmodified DI diesel engine with hydrogen addition. 2009, pp. 45-49. Alias A. (2005) Two Days National Seminar on Alternative Energy Resources. August, 27-28, Thane, India.

HHO AND EMISSIONS P a g e | 50
Ammar A. Al-Rouson (2010) Reduction of fuel consumption is gasoline engines by introducing HHO gas into intake manifold. Department of Mechanical Engineering, Faculty of Engineering, Mutah University Mutah, Al-Karuk 61710 Jordan. 10 March 2010. Antonia V.; Herzog, Timothy E.; Lipman, Daniel M. (2001) Sources Report. Encyclopedia of Life Support Systems Publication. University of California, Berkeley USA, 63 p. Laboratory (RAEL), URL: http://socrates.berkeley.edu/~rael Bacon, F.T. (1960) The high-pressure hydrogen-oxygen cell. J Ind Eng Chem 1960;52(4):301-3 Bambagn, Sudaramanta; Sudjud, Darsopuspito; Djoko, Sungkono (2016) Fuels, and Combustion Engineering Laboratory. Department of Mechanical Engineering, Sepuluh Nopember Institute of Technology, Surabaya, Indonesia. Bambagn, Sudaramanta; Sudjud, Darsopuspito, Djoko, Sungkono (2016) Application of dry cell HHO gas generator with pulse width modulation on spark ignition engine performance. Fuels and Combustion Engineering Laboratory, Department of Mechanical Engineering, Sepuluh November Institute of Technology, Surabaya, Indonesia. Ijret International Journal of Research in Engineering and Technology, 2016. Bari, S.; Esmaeil, M. M. (2010) Effect of H2/O2 addition in increasing the thermal efficiency of a diesel engine. Fuel, vol. 89, pp. 378-383, 2010. Bell S.R.; Gupta, M. (1997) Extension of The Lean Operating Limit For Natural Gas Fueling of a Spark Ignited Engine Using Hydrogen Blending. Combustion Science and Technology, 123:23–48. Benkataraman, B.; Elangoe, D. (1998) Renewable Energy Sources. Hindustan College of Engineering, Padur, India, 235 p. Bhavesh, V.; Chauhan, M.E.; Rathod, Gaurav P.; Patel, Tushar M. (2016) An Experimental Investigation of HHO Gas and Varying Compression Ratio on Emission Characteristics of Constant Speed Diesel Engine (CI). Indian Journal of Research Issue 4 April 2016 Patel Associate professors, L.D.R.P-ITR, Near KHA-5 Circle, Sector-15, Gandhinagar. Bhardwaj. S.; Verma, A.S.; Sharma, S.K. (2014) Effect of Browns gas on the performance of a four-stroke gasoline engine. Int. Journal of Emerging Technology and Advanced Engineering (Online). Volume 4, Special Issue 1 Feb 2014 Birtas, A.; Voicu, I; Petcu, C.; Chiriac, R.; Apostolescu, N. (2011) The effect of HRG gas addition on diesel engine combustion characteristics and exhaust emissions. International Journal of Hydrogen Energy, vol. 36, pp. 12007-12014, 2011 Boretti, A.(2010) Comparison of Fuel economies of high-efficiency diesel and hydrogen engines powering a compact car with a flywheel-based kinetic energy recovery system, Int. Journal of Hydrogen Energy 35 (2010) 8417-8424 Bose, P.K.; Maji, D. (2009) An experimental investigation on engine performance and emissions of a single cylinder diesel engine using hydrogen as inducted fuel and diesel as injected fuel with exhaust gas recirculation. International Journal of Hydrogen Energy, vol. 34, pp. 4847-4854, 2009. Bowman, C.T. (1992) Control of combustion-generated nitrogen oxide emissions: technology driven by regulation. 1992, pp. 859-878. Brown, Yull. (1977), A technique to generate HHO gas based on electrolysis process. Brown Y. Brown’s gas. United States Patent. US Patent 4014,777; March 28, 1978 Bureau of Agriculture, (2011) Energy in Australia 2011. D. of and E. a. T. Resources, Eds., ed. Canberra: Australian Bureau of Agriculture and Resource Economics and Sciences, 2011. Cameron, R. (2012) Surveying Effects of Onboard HHO and Water Injection in a Diesel Generator. A dissertation submitted by Rick Cameron, University of Southern Queensland Faculty of Engineering and Submitted: October 2012.

HHO AND EMISSIONS P a g e | 51
Cunningham, J.E.; Goodenough, R. (1992) Method and Apparatus for Enhancing Combustion in an Internal Combustion Engine through Electrolysis. United States Patent, April, 21, 1992. Das, L.M. (2002) Near-Term Introduction of Hydrogen Engines For Automotive and Agriculture Application. International Journal of Hydrogen Energy, 27:479–87. Das, L.M. (1991) Exhaust Emission Characterization of Hydrogen Operated Engine System: Nature of Pollutants and Their Control Techniques. International Journal of Hydrogen Energy, 16:765–75. Dunn, S. (2002) Hydrogen futures toward a sustainable energy system. Int. Journal of Hydrogen Energy 2002;27:235-64 Durairai, R.B.; Shanker, J.; Silvasankar. M. (2012) HHO Gas with Bio Diesel as a Dual Fuel with Air Preheating Technology. SciVerse ScienceDirect. Procedia Engineering 38 2012 1112-1119 Faculty of Engineering and Technology, SRM University, Chennai India. Professor and Director Center for BioMedical Research, Arunai engineering college, Thirubanamalai, India. 2012 published by Elsevier LTD. Selection and/or peer-review under responsibility of Noorul Islam Centre for Higher Education Eckman, C. (2006) Plasma orbital expansion of the electrons in water. Proc. NPA, vol. 7, pp. 142-144, 2010. EPA, Environmental protection agency (1994) EPA 400-f-92-007 Fact Sheet OMS-5 August, 1994 Automobile Emissions: An Overview. Erickson, Peter; Lazarus, Michael (2016) How would phasing out U.S. federal leases for fossil fuel extraction affect CO2 emission and 2°C goals. Stockholm environment institute working paper no. 2016-12 Stockholm Environment Institute – U.S. Center. Erickson P.; Lazarus, M.; Tempest, K. (2015) Carbon Lock-in from Fossil Fuel Supply Infrastructure. SEI discussion brief. Stockholm Environment Institute. Seattle, WA, US. http://www.sei-internationsl.org/publications?pid=2805 Erren, R. A.; Campbell, W.H. (1933) Hydrogen: A Commercial Fuel for Internal Combustion Engines and Other Purposes. Journal of Inst. Fuel. 6:277-90. Fanhua Ma; Mingyue Wang. (2010) Performance and emission characteristic of a turbocharged spark- ignition hydrogen-enriched compressed natural gas with high hydrogen ratio. Int. Journal of Hydrogen Energy 2010;356438-47 Ghiffari. Y.A.; Sungkono, D. (2013) Study of HHO Gas Generator Characteristics Wet Cry Cell and Cell type with dimensions of 80x 80 mm with the addition of PWM E-3 FF (1 kHz). Pomits engineering Journal Vol. 1 No. 1. (2013). Harper, D. (2007) Online Etymology Dictionary. (Access date: 12 April 2010) http://www.etymonline.com/index.php?search=energy&searchmode=none Hekkert, M.P.; Van-Giessel, J.F.;,Ros, M.; Wietschel, M.; Meeus, M.T.H. (2005) The evolution of hydrogen research: is Germany heading for an early lock-in? Int. Journal of Hydrogen Energy 2005;30:1045-52 Herzog, A.V.; Lipman T. E., Kammen D. M.; (2006) Renewable Energy Haywood, J. B. (1998) Internal Combustion Engine Fundamentals. McGraw-Hill Publication. Massachusetts Institute of Technology, Boston, USA. 15-371. Hoehn, F. W.; Parks, M. W. (1974) Feasibility Demonstration of a Road Vehicle Fueled with Hydrogen-Enriched Gasoline, Ninth Intersociety Energy Conversion Engineering Conference. Am, Soc. Mech. Eng., 1974, pp. 956-964 Hoehn, R. W.; Baisley, R. L.; and Dowdy, M. W. (1975) Advantages in Ultra-lean Combustion Technology Using Hydrogen-Enriched Gasoline. Tenth Intersociety Energy Conversion Engineering Conference. Inst. Electric. Electron. Eng., 1975, pp 1156-1164 Ijret International (2015) Application of dry cell HHO gas generator with pulse width modulation on spark ignition engine performance. Journal of Research in Engineering and Technology

HHO AND EMISSIONS P a g e | 52
Jingding, L.; Linsong, G.; Tianshen, D. (1998) Formation and Restraint of Toxic Emissions in Hydrogen– gasoline Mixture Fueled Engines. International Journal of Hydrogen Energy, 23(10):971-5. Kahraman, E. (2005) Analysis of a Hydrogen-Fueled Internal Combustion Engine. The Graduate School of Engineering and Sciences of İzmir Institute of Technology. M.Sc. Thesis 71 p. Keith, Wayne (2012) Wood Gas Video Series. https://www.youtube.com/watch?v=_tA0stq9rjg King, R. O.; Rand, M. (1955) The Hydrogen Engine. Canadian Journal of Technology. Krawczyk, T. (1996) Biodiesel– Alternative Fuel Makes Inroads but Hurdles Remain. American Oil Chemists Society Second Edition.California, USA, Lee, R. C. Brehob, W. (1971) Effect of compression Ratio, Mixture Strength, Spark Timing, and Coolant Temperature Upon Exhaust Emissions and Power. SAE Paper 710832, Oct. 1971 NASA Lee, R. C. Brehob, W. (1971) Mechanisms of Pollutant Formation and Control from Automotive Sources. SAE Paper 710483, June 1971 NASA Lilik, G.K.; Zhang, H.J.; Herreros, M.D.; Haworth, C.; Boehman, A. L. (2010) Hydrogen assisted diesel combustion. International Journal of Hydrogen Energy, vol. 35, pp. 4382-4398, 2010. Masood, M.; Ishraat, M. M.; Reddy, A. S. (2007) Computational Combustion and Emission Analysis of Hydrogen–Diesel Blends with Experimental Verification. International Journal of Hydrogen Energy,32:2539-47. Masood, M.; Isharat, M.M.; Reddy, A.S. (2006) Computational Combustion and Emission Analysis of Hydrogen–Diesel Blends with Experimental Verification. International Journal of Hydrogen Energy, 32:2548-52. MCcarthy J. (2008) Hydrogen Study. Stanford University. (Access date: 10 March, 2010) http://wwwformal.stanford.edu/jmc/progress/hydrogen.html Medhursta, Martin J. (2009) The Military-Industrial Complex and the New Industrial State. Re- conceptualizing rhetorical history: Eisenhower's farewell address pages 195-218, Publishing models and article dates explained Published online: 05 Jun 2009. Michrowski, A. (1993) Anomalous Water Explained by Brown's Gas Research. Planetary Association for Clean Energy Newsletter. 6 (4):10-11. 74 -- 1993. Yull Brown’s Gas. Planet. Assoc. Clean Energy News, 6 (4):10- 11. Millman, J.; Grabel, A. (1987) Microelectronics. Second Edition. McGraw-Hill Inc. Publication. New York, USA. 690 p. Mohamed, M.; Kassaby, EL.; Yehia, A.; Eldrainy, Mohamed E.; Khidr, Kareen; Khidr, I.(2015) Effect of hydroxy (HHO) gas addition on gasoline engine performance and emissions. Alexandria University, Alexandria Engineering Journal. Mechanical Engineering Department, Faculty of Engineering, Alexandria University, Egypt. 8 June 2015. Faculty of Engineering, Alexandria University. Production and hosting by Elsevier B.V. This is an open access article under the CC BY-NC-ND License. Momirlan ,M.; Veziroglu, TN. (2002) Current status of hydrogen energy. Renewable Sustainable Energy Rev. 2002;6:141-79 Musmar, Sa’ed A.; Ammar A. Al-Rousan. (2011) Effect of HHO gas on combustion emission in gasoline engines. Department of Mechanical Engineering , Faculty of Engineering, Mutah University, Mutah, Al-Karak 61710, Jordan 16 Feb 2011 Pogue, (1962) US Patent Pogue carb, U.S. Pat. 2,025,798. CARBURETOR Filed Sept. 2'7, 1935 https://www.google.com/patents/US3049850 Rajaram, S. (2014) Effectiveness of oxygen enriched hydrogen-HHO gas addition on direct injection diesel engine performance, emission, and combustion characteristics. 18(1), 259-268. Rajeshkumar G.; Rajapandian R.; Surendrakumar G.; Anathakumar P.; Vasanthanseelan S.; Senthil Ganesh A. (2016) Experimental investigation of emission control in IC Engines By introducing

HHO AND EMISSIONS P a g e | 53
various techniques. Engineering & Technology in India www.engineeringand technologyinindia.com Vol 1:2 March 2016 Shell; Richard, Michael Graham (2008) 350mpg Shell Car. (Online). http://www.treehugger.com/cars/souped-down-1959-opel-t-1-gets-37659-mpg.html Rogelj, J,; Schaeffer. M.; Meinshausen,M.; Knutti, R.; Alsomo, J.; Riahi, K.; and Hare, W. (2015). Zero emission targets as long-term global goals for climate protection. Environmental Research Letters. 10(10). 105007. DOI:10.1088/1748-9326/10/10/105007. Rystad, Energy (2015). UCube, Version 1.18 Oslo. Norway. http://www.rystadenergy.com/Databases/UCube. Media Sankar, T. (2014) The effect of oxy-hydrogen (HHO) on the performance and emission characteristics of diesel and karanj in single cylinder four stroke diesel engine. 2(1), 12-18 Santilli, R.M. (2006) A new gaseous and combustible form of water. International Journal of Hydrogen Energy, vol. 31, pp. 1113-1128, 2006. Saravanan, N.; Nagarajan, G. (2008) An Experimental Investigation of Hydrogen-Enriched Air Induction in a Diesel Engine System. International Journal of Hydrogen Energy. Schulti, I.; Hart, D.; Vorst, R. (2004) Issues affecting the acceptance of hydrogen fuel. Int. Journal of Hydrogen Energy, 2004;29:677-85 Sierens, R; Rosseel, E. (1995) Sequential injection of gaseous fuels. In: proceeding of the 5th International congress: the European automotive industry meets the challenges of the year 2000; 1995 June 21-23. Strasbourg: EAEC Congress; 1995. P. SIA 9506A03 Sierens, T.; Rosseel, E. (1998) Variable composition hydrogen/natural gas mixtures for increased engine efficiency and decreased emissions. In: proceeding of the spring engine technology conference; FortLauderadale; 1998 April 26-29. ASME; 1998. P. 98-ICE-105. Stebar, R.F.; Parks, F.B. (1974) Emission Control with Lean Operation Using Hydrogen-Supplemented Fuel. SAE Paper (Document No.740187). Tauzia, X.; Maiboom, A.; Shah, S.R. (2010) Experimental study of inlet manifold water injection on combustion and emissions of an automotive direct injection Diesel engine. Energy, vol. 35, pp. 3628-3639, 2010. Tekin, M.; Cavusoglu, Y. (1997) Pollutant Formation and Its Control in Internal Combustion Engines. 1st Automotive Technology Congress with International Participation, May, 26-30, Adana, Turkey. Tesla, N. (1889) Thermo-Magnetic Motor. Patent 396,121, Specification forming part of Letters Patent No. 396,121, dated January 15, 1889. Application filed March 30, 1886. Serial No. 197,115. Vader, N.V.; Joshi, V.A. (2005) Wind Power Generation Technology. Two Days National Seminar on Alternative Energy Resources. August, 27-28, Thane, India. Venkataraman, B.; Elango, D. (1998) Renewable Energy Sources, Hudustan College of Engg, Padur-603 103 Tamil Nadu Verhelst, S.; Wallner, T. (2009) Hydrogen-fueled internal combustion engines. Progress in Energy and Combustion Science 35 (2009) 490-527 Walsh, M. P. (2001) Global Trends in Diesel Emissions Regulation-A 2001 Update. SAE paper, pp. 01- 0183, 2001. Wang, S.; Ji, C.; Zhang, B.; Liu, X. (2014) Realizing the part load control of a hydrogen-blended gasoline engine at the wide open throttle condition. Int. Journal of Hydrogen Energy 39(2014) 7428-7436 Wang, S.; Ji, C. (2012) Cyclic variation in a hydrogen-enriched spark-ignition gasoline engine under various operation conditions. Int. Journal of Hydrogen Energy 37 (2012) 1112-1119 Wang, S.; Ji, C.; Zhang, B.; Liu, X. (2012) Performance of a hydro-oxygen-blended gasoline engine at different hydrogen volume fractions in the hydro-oxygen. Int. Journal of Hydrogen Energy 37 (2012) 13209-13218

HHO AND EMISSIONS P a g e | 54
Wang, S.; Ji, C.; Zhang, B. (2011) Starting a spark-ignited engine with the gasoline-hydrogen mixture. Int. Journal of Hydrogen Energy 36 (2011) 4461-4498 Wang, S.; Ji, C.; Zhang, B.; Zhang, J. (2011) Comparison of the performance of a spark-ignited gasoline engine blended with hydrogen and hydrogen-oxygen mixtures, Energy 36 (2011) 5832-5837 Wang, S.; Ji, C.; Zhang, B.; Zhang, J. (2011) Improving the performance of a gasoline engine with the addition of hydrogen-oxygen mixtures. Int. Journal of Hydrogen Energy 36(2011) 11164-11173 Wang, S.; Ji, C.; Zhang, B. (2010) Effect of spark timing on the performance of a hybrid hydrogen-gasoline engine at lean conditions, Int. Journal of Hydrogen Energy 35 (2010) 2203-2012. Wang, S.; Ji, C. (2010) Experimental study on combustion and emissions performance of a hybrid hydrogen-gasoline engine at lean burn limits. Int. Journal of Hydrogen Energy 35 (2010) 1453- 1462 Wang, S.; Ji, C. (2009) Combustion And Emissions Performance of a Hybrid Hydrogen–Gasoline Engine at Idle and Lean Conditions. International Journal of Hydrogen Energy, 35(1): 346-55. Wang, S.; Ji, C. (2009) Effect of hydrogen addition on combustion and emissions performance of a spark ignition gasoline engine at lean conditions. Int. Journal of Hydrogen Energy 34 (2009) 7823-7834 White, C.M.; Steeper, T.T.; Lutz, A.E. (2006) The hydrogen-fueled internal combustion engine: a technical review, Int. J. Hydrogen Energy 31 (2006) 1292-1305 Widhiyanuriyawan, Denny (2016) 325999: All other miscellaneous chemical product manufacturing. 325998: All Other Miscellaneous Chemical Product and Preparation Manufacturing. 221210: Natural Gas Distribution. 325181: Alkali and chlorine manufacturing. 325180: Other Basic Inorganic Chemical Manufacturing. 325189: All other basic inorganic chemical manufacturing. Applied Mechanics & Materials; 2016, Vol. 836, p294-298, 5p (2016). Wyer, Samuel S. (1906) A Treatise on Producer- gas and Gas producers. American society mechanical engineers, Library of the University of California, Hill Publishing Company New York and London, The Engineering and Mining Journal, Power, American Machinist. 1907 http://www.driveonwood.com/static/media/uploads/pdf/treatise_on_producer_gas_and_gas_ producers.pdf Yilmaz, A.C.; Ulundamar, E; Aydin, K (2010) Effect of Hydroxy (HHO) gas addition on performance and exhaust emissions in compression ignition engines. Int. Journal of Hydrogen Energy 2010;35:11366-72 http://doi.org/10.1016/j.jihydene.2010.07.040 Yilmaz, Ali Can (2010) Design and application of Hydroxy HHO system. Cukurova University Institute of Natural and applied sciences MSc Thesis Ali Can Yilmaz. Department of Mechanical Engineering Adana, 2010 12-07-2010. Yilmaz, A. C.; Uludamar, E.; Aydin, K. (2010) Effect of hydroxy (HHO) gas addition on performance and exhaust emissions in compression ignition engines. International Journal of Hydrogen Energy, vol. 35, pp. 11366-11372, 2010. Zeng K.; Zhang, D. (2010) Recent progress in alkaline water electrolysis for hydrogen production and applications. Progress in Energy and Combustion Science, vol. 36, pp. 307-326, 2010. Zweig, R. M. (1992) Proceedings of the Ninth World Hydrogen Energy Conference. October, 8-12, Paris, France.

HHO AND EMISSIONS P a g e | 55

HHO AND EMISSIONS P a g e | 56
Appendix
A. D.C. Voltages in distilled water.
d.c. Volts amps ml by sight minutes delta T
2 0 0 no 0 0
5 0 0 no 0 0
9 0 0 no 0 0
12 0 0 no 0 0
15 0 0 no 0 0
20 0 0 no 0 0
112 0 0 no 0 0
190 0.02 2 yes 20 2
2100 0.25 30 yes 2 10
B. D.C Volt versus Amps Comparison.
Volts:amps
0:0 4.6:0.02 4.7:0.03 5:0.04 5.3:0.05 5.8:0.06 5.9:0.07 6.2:0.08 6.4:0.09 6.6:0.1 6.8:0.11 7:0.12 7.3:0.13 7.4:0.14 7.6:0.15 7.8:0.16 8:0.17 8.3:0.18 8.5:0.19 8.7:0.2 8.9:0.21 9:0.22 9.2:0.23 9.5:0.24 9.7:0.25 9.9:0.26 10.1:0.27 10.3:0.28 10.5:0.29 10.6:0.3 10.8:0.31 11:0.32 11.2:0.33 11.4:0.34 11.6:0.35 11.8:0.36 12:0.37 12.2:0.38 12.4:0.39 12.6:0.4 12.8:0.41 13:0.42 13.1:0.42 13.2:0.43 13.3:0.43 13.4:0.43 13.5:0.43 13.6:0.44 13.7:0.44 13.8:0.44 13.9:0.44 14:0.44 14.1:0.44 14.2:0.44 14.3:0.44 14.4:0.44 14.5:0.44 14.6:0.43 14.7:0.43 14.8:0.43 14.9:0.43 15:0.42 15.1:0.42 15.2:0.41 15.3:0.41 15.4:0.41 15.5:0.4 15.6:0.39 15.7:0.39 15.8:0.38 15.9:0.38 16:0.38 16.1:0.37 16.2:0.35 16.3:0.35 16.4:0.33 16.5:0.31 16.6:0.28 16.7:0.27 16.8:0.27 16.9:0.27 17:0.26 17.1:0.24 17.2:0.23 17.3:0.2 17.4:0.19
C. Data from test with A.C. voltages and Distilled Water
A.C Volts current to supply current at the cell Ml/min production time
9 0.001 0 0 no 20 min
50 2 0 0 no 20 min
75 2 0 0 no 20 min
85 3 0 0 no 20 min
110 3 0 0 no 20 min
2100 4 0 0 no 20 min
50000 4 0 0 no 20 min

HHO AND EMISSIONS P a g e | 57
D. Data from the test with A.C. voltages with electrolyte.
AC with 6g/liter sodium bicarbonate
Volt Draw Amp Draw Time Ml Delta T
25 4 2 0 0
50 7.6 2 0 0
75 8.4 2 0 0
100 7.1 2 0 0
110 5.4 2 0 0
150 12 2 0 0
200 0.96 2 0 0
260 1.2 2 0 0
300 1.5 2 0 0
600 2.6 2 0 0
2000 1.5 2 0 0
2700 3.2 2 0 0
3000 1.2 2 0 0
41000 1.8 2 0 0
58000 2.5 2 0 0
E. Audio Signal voltage and amperage with distilled water.
Hz Amp ma Volts Hz Amp ma Volts Hz Amp ma Volts Hz Amp ma Volts
20 27.7 0.2 30 30 0.3 40 25.7 0.4 50 27.8 0.4 60 35.3 0.4 70 39.7 0.4 80 42.5 0.4 90 44.7 0.4 100 46.9 0.4 110 48.8 0.4 120 50.5 0.4 130 51.9 0.4 140 53.2 0.4 150 54.2 0.5 160 55.3 0.5 170 56.2 0.5 180 57.2 0.5 190 57.9 0.5 200 58.6 0.5 210 59.2 0.5 220 59.8 0.5 230 60.4 0.5 240 61 0.5 250 61.3 0.5 260 61.7 0.6 270 61.9 0.6 280 62.1 0.6 290 62.4 0.6 300 62.8 0.6 310 63 0.6 320 62.9 0.6 330 62.9 0.6 340 63 0.6 350 62.8 0.6 360 63.2 0.6 370 63.3 0.6 380 63.2 0.6 390 63 0.6 400 62.8 0.6 410 62.7 0.6 420 62.3 0.6 430 62.5 0.6 440 62.5 0.65 450 62 0.6 460 62.8 0.7 470 62.6 0.7 480 62.3 0.7 490 62.9 0.7 500 61.8 0.7 510 61.5 0.65 520 61.4 0.65 530 61.2 0.69 540 60.9 0.7 550 60.8 0.7 560 60.5 0.7 570 60.3 0.7 580 60.6 0.7 590 59.9 0.7 600 59.9 0.7 610 60.1 0.7 620 59.5 0.7 630 58.9 0.7 640 59 0.7 650 59.6 0.7 660 58.6 0.7 670 58.9 0.7 680 58.3 0.7 690 58.6 0.7 700 58.6 0.7 710 58 0.7 720 57.6 0.7 730 57.3 0.7 740 57.1 0.7 750 57 0.7 760 57.1 0.7 770 56.5 0.7

HHO AND EMISSIONS P a g e | 58
780 56.1 0.7 790 56.1 0.7 800 55.9 0.6 810 55.7 0.6 820 55.6 0.6 830 55.4 0.6 840 55.3 0.6 850 55.1 0.6 860 55 0.6 870 54.9 0.6 880 54.7 0.6 890 54.6 0.6 900 54.3 0.6 910 54.2 0.6 920 54.1 0.6 930 54 0.6 940 53.8 0.6 950 53.7 0.6 960 53.6 0.6 970 53.4 0.6 980 53.3 0.6 990 53.2 0.6 1000 53.2 0.6 1010 52.9 0.6 1020 52.8 0.6 1030 52.6 0.6 1040 52.5 0.6 1050 52.3 0.6 1060 52.2 0.6 1070 52.1 0.6 1080 51.9 0.6 1090 51.8 0.6 1100 51.7 0.6 1110 51.5 0.6 1120 51.4 0.6 1130 51.2 0.6 1140 50.9 0.65 1150 50.9 0.65 1160 50.7 0.69 1170 50.5 0.7 1180 50.4 0.7 1190 50.3 0.7 1200 50.3 0.7 1210 50.2 0.7 1220 50.1 0.7 1230 50 0.7 1240 49.8 0.7 1250 49.7 0.7 1260 49.5 0.7 1270 49.5 0.7 1280 49.4 0.7 1290 49.3 0.7 1300 49.2 0.7 1310 49.1 0.7 1320 48.9 0.7 1330 48.8 0.7 1340 48.7 0.7 1350 48.5 0.7 1360 48.4 0.7 1370 48.3 0.7 1380 48.2 0.7 1390 48.1 0.7 1400 48 0.7 1410 47.9 0.7 1420 47.8 0.7 1430 47.6 0.7 1440 47.5 0.7 1450 47.4 0.7 1460 47.2 0.7 1470 47.2 0.7 1480 47.1 0.7 1490 47 0.7 1500 46.8 0.7 1510 46.7 0.7 1520 46.6 0.7 1530 46.5 0.7 1540 46.3 0.7 1550 46.2 0.7 1560 46.1 0.7 1570 46 0.7 1580 45.9 0.7 1590 45.8 0.7 1600 45.7 0.7 1610 45.6 0.7 1620 45.5 0.7 1630 45.4 0.7 1640 45.3 0.7 1650 45.2 0.7 1660 45.1 0.7 1670 45 0.7 1680 44.9 0.7 1690 44.9 0.7 1700 44.8 0.7 1710 44.7 0.7 1720 44.6 0.7 1730 44.5 0.7 1740 44.4 0.7 1750 44.3 0.7 1760 44.2 0.7 1770 44 0.7 1780 43.9 0.7 1790 43.8 0.7 1800 43.7 0.7 1810 43.6 0.7 1820 43.5 0.7 1830 43.4 0.7 1840 43.3 0.7 1850 43.2 0.7 1860 43.1 0.7 1870 43 0.7 1880 42.9 0.7 1890 42.8 0.7 1900 42.7 0.7 1910 42.6 0.7 1920 42.5 0.7 1930 42.4 0.7 1940 42.3 0.7 1950 42.2 0.7 1960 42.2 0.7 1970 42.1 0.7 1980 42 0.7 1990 41.9 0.7 2000 41.8 0.7 2010 41.7 0.7 2020 41.6 0.7 2030 41.5 0.7 2040 41.4 0.7 2050 41.3 0.7 2060 41.2 0.7 2070 41.1 0.7 2080 41 0.7 2090 40.9 0.7 2100 40.8 0.7 2110 40.7 0.7 2120 40.6 0.7 2130 40.5 0.7 2140 40.4 0.7 2150 40.3 0.7 2160 40.2 0.7 2170 40.2 0.7 2180 40.1 0.7 2190 40 0.7 2200 39.9 0.7 2210 39.8 0.7 2220 39.7 0.7 2230 39.6 0.7 2240 39.5 0.7 2250 39.4 0.7 2260 39.3 0.7 2270 39.2 0.7 2280 39.2 0.7 2290 39.1 0.7 2300 39 0.7 2310 38.9 0.7 2320 38.8 0.7 2330 38.7 0.7 2340 38.6 0.7 2350 38.5 0.7 2360 38.4 0.7 2370 38.3 0.7 2380 38.2 0.7 2390 38.1 0.7 2400 38.1 0.7 2410 38 0.7 2420 37.9 0.7 2430 37.9 0.7 2440 37.8 0.7 2450 37.7 0.7 2460 37.6 0.7 2470 37.6 0.7 2480 37.5 0.7 2490 37.5 0.7 2500 37.4 0.7 2510 37.3 0.7 2520 37.2 0.7 2530 37.2 0.7 2540 37.1 0.7 2550 37 0.7 2560 36.9 0.7 2570 36.8 0.7 2580 36.8 0.7 2590 36.7 0.7 2600 36.6 0.7 2610 36.5 0.7 2620 36.5 0.7 2630 36.4 0.7 2640 36.3 0.7 2650 36.2 0.7 2660 36.1 0.7 2670 36 0.7 2680 35.9 0.7 2690 35.9 0.7

HHO AND EMISSIONS P a g e | 59
2700 35.8 0.7 2710 35.7 0.7 2720 35.6 0.7 2730 35.6 0.7 2740 35.5 0.7 2750 35.5 0.7 2760 35.4 0.7 2770 35.4 0.7 2780 35.3 0.7 2790 35.3 0.7 2800 35.2 0.7 2810 35.1 0.7 2820 35.1 0.7 2830 35 0.7 2840 34.9 0.7 2850 34.9 0.7 2860 34.8 0.7 2870 34.8 0.7 2880 34.7 0.7 2890 34.6 0.7 2900 34.6 0.7 2910 34.5 0.7 2920 34.4 0.7 2930 34.4 0.7 2940 34.3 0.75 2950 34.3 0.75 2960 34.2 0.75 2970 34.1 0.75 2980 34.1 0.75 2990 34 0.75 3000 33.9 0.75 3010 33.8 0.75 3020 33.8 0.75 3030 33.7 0.75 3040 33.6 0.75 3050 33.6 0.75 3060 33.5 0.75 3070 33.5 0.75 3080 33.4 0.75 3090 33.3 0.75 3100 33.3 0.75 3110 33.2 0.75 3120 33.1 0.75 3130 33.1 0.75 3140 33 0.75 3150 32.9 0.75 3160 32.8 0.75 3170 32.8 0.75 3180 32.8 0.75 3190 33.7 0.75 3200 32.7 0.75 3210 32.6 0.75 3220 32.6 0.75 3230 32.5 0.75 3240 32.4 0.75 3250 32.4 0.75 3260 32.3 0.75 3270 32.3 0.75 3280 32.2 0.75 3290 32.2 0.75 3300 32.1 0.75 3310 32.1 0.75 3320 32 0.75 3330 31.9 0.75 3340 31.9 0.75 3350 31.8 0.75 3360 31.8 0.75 3370 31.7 0.75 3380 31.7 0.75 3390 31.6 0.75 3400 31.6 0.75 3410 31.5 0.75 3420 31.5 0.75 3430 31.4 0.75 3440 31.4 0.75 3450 31.3 0.75 3460 31.3 0.75 3470 31.2 0.75 3480 31.2 0.75 3490 31.1 0.75 3500 31 0.75 3510 31 0.75 3520 30.9 0.75 3530 30.8 0.75 3540 30.8 0.75 3550 30.7 0.75 3560 30.7 0.75 3570 30.6 0.75 3580 30.5 0.75 3590 30.5 0.75 3600 30.4 0.75 3610 30.4 0.75 3620 30.3 0.75 3630 30.3 0.75 3640 30.2 0.75 3650 30.1 0.75 3660 30.1 0.75 3670 30 0.75 3680 30 0.75 3690 30 0.75 3700 29.9 0.75 3710 29.9 0.75 3720 29.8 0.75 3730 29.8 0.75 3740 29.7 0.75 3750 29.7 0.75 3760 29.7 0.75 3770 29.6 0.75 3780 29.6 0.75 3790 29.6 0.75 3800 29.5 0.75 3810 29.5 0.75 3820 29.5 0.75 3830 29.4 0.75 3840 29.4 0.75 3850 29.4 0.75 3860 29.3 0.75 3870 29.3 0.75 3880 29.2 0.75 3890 29.2 0.75 3900 29.2 0.75 3910 29.1 0.75 3920 29.1 0.75 3930 29 0.75 3940 29 0.75 3950 29 0.75 3960 28.9 0.75 3970 28.9 0.75 3980 28.8 0.75 3990 28.8 0.75 4000 28.8 0.75 4010 28.7 0.75 4020 28.7 0.75 4030 28.6 0.75 4040 28.6 0.75 4050 28.5 0.75 4060 28.5 0.75 4070 28.5 0.75 4080 28.4 0.75 20000 5.4 0.8 F. Audio Signal with Full Wave Rectifier, Voltages at Cell electrodes. Hz: hz after full wave: volts at post DC 20 40 2.8: 120 240 2.5: 220 440 2.4: 320 640 2.3 420 840 2 520 1040 2.5 620 1240 2.6 720 1440 2.7 820 1640 2.7 920 1840 2.8 1020 2040 2.8 1120 2240 2.9 1220 2440 2.9 1320 2640 3 1420 2840 3.1 1520 3040 3.2 1620 3240 3.3 1720 3440 3.3 1820 3640 3.4 1920 3840 3.5 2020 4040 3.6 2120 4240 3.6 2220 4440 3.7 2320 4640 3.8 2420 4840 3.8 2520 5040 3.9 2620 5240 4 2720 5440 4.1

HHO AND EMISSIONS P a g e | 60
2820 5640 4.2 2920 5840 4.2 3020 6040 4.3 3120 6240 4.4 3220 6440 4.5 3320 6640 4.6 3420 6840 4.7 3520 7040 4.8 3620 7240 4.9 3720 7440 4.9 3820 7640 5 3920 7840 5.1 4020 8040 5.2 4120 8240 5.2 4220 8440 5.3 4320 8640 5.4 4420 8840 5.5 4520 9040 5.6 4620 9240 5.6 4720 9440 5.7 4820 9640 5.8 4920 9840 5.9 5020 10040 6 5520 11040 6.4 6020 12040 7 6520 13040 7.2 7020 14040 7.8 7520 15040 8.2 8020 16040 8.8 8520 17040 9.3 9020 18040 9.8 9520 19040 10.3 10020 20040 11 10520 21040 11.2 11020 22040 11.8 11520 23040 12.1 12020 24040 12.4 12520 25040 12.7 13020 26040 13.2 13520 27040 13.4 14020 28040 17 G. Production and current results from an audio signal through a full wave rectifier. With voltage held at 10 Volts.
Hz from source
Hz after Rectifier
Volts @P
Amps @P Ml Delta T Visual Time
20 40 10 0.37 15 0 yes 2
23.5 47 10 0.45 15 0 yes 2
26.75 53.5 10 0.42 15 0 yes 2
63.75 127.5 10 0.44 16 0 yes 2
120 240 10 0.37 15 0.3 yes 2
220 440 10 0.37 15 0.3 yes 2
320 640 10 0.36 15 0 yes 2
420 840 10 0.37 15 -0.3 yes 2
520 1040 10 0.37 15 0.6 yes 2
620 1240 10 0.37 15 0.3 yes 2
720 1440 10 0.37 15 0 yes 2
820 1640 10 0.37 15 0 yes 2
920 1840 10 0.37 15 -0.3 yes 2
1020 2040 10 0.37 15 0 yes 2
1120 2240 10 0.36 15 0.6 yes 2
1220 2440 10 0.36 15 0 yes 2
1320 2640 10 0.29 15 0.3 yes 2
1420 2840 10 0.29 15 0 yes 2
1520 3040 10 0.29 15 0.3 yes 2
1620 3240 10 0.29 15 0 yes 2
1720 3440 10 0.29 15 0 yes 2
1820 3640 10 0.29 15 0.3 yes 2
1920 3840 10 0.27 15 0 yes 2
2020 4040 10 0.28 15 0 yes 2
2120 4240 10 0.27 15 0 yes 2
2220 4440 10 0.27 15 0 yes 2
2320 4640 10 0.27 15 0 yes 2
2420 4840 10 0.27 15 0 yes 2
2520 5040 10 0.29 15 0 yes 2

HHO AND EMISSIONS P a g e | 61
2620 5240 10 0.29 15 0 yes 2
2720 5440 10 0.28 15 0 yes 2
2820 5640 10 0.28 15 0.2 yes 2
2920 5840 10 0.27 15 0 yes 2
3020 6040 10 0.27 15 0 yes 2
3120 6240 10 0.26 15 0 yes 2
3220 6440 10 0.17 15 0 yes 2
3320 6640 10 0.18 15 0 yes 2
3420 6840 10 0.18 15 0 yes 2
3520 7040 10 0.19 15 0 yes 2
3620 7240 10 0.18 15 0 yes 2
3720 7440 10 0.18 15 -0.6 yes 2
3820 7640 10 0.18 15 0.4 yes 2
3920 7840 10 0.18 15 0 yes 2
4020 8040 10 0.18 15 0.9 yes 2
4120 8240 10 0.17 15 0.9 yes 2
4220 8440 10 0.17 15 0.2 yes 2
4320 8640 10 0.17 15 0 yes 2
4420 8840 10 0.17 15 0 yes 2
4520 9040 10 0.16 15 -0.2 yes 2
4620 9240 10 0.16 15 -0.3 yes 2
4720 9440 10 0.15 15 -0.3 yes 2
4820 9640 10 0.15 15 0 yes 2
4920 9840 10 0.15 15 0 yes 2
5020 10040 10 0.14 16 0 yes 2
9840 19680 10 0 16 0 yes 2 H. Production and current results from an audio signal through a full wave rectifier.
Hz from source
Hz after Rect
Volts @P
Amps ma @P Ml Delta T Visual Time
20 40 10 32 10 0 yes 1
23.5 47 10.8 40 14 0 yes 1
26.5 53 13.7 60 14 0 yes 1
63.75 127.5 13.5 60 15 0 yes 1
120 240 16.8 54 22 0 yes 1
220 440 18.4 50 15 2.7 yes 1
320 640 18.9 40 30 0.6 yes 1
420 840 19.1 36 30 1.2 yes 1
520 1040 19.3 32 31 0.3 yes 1
620 1240 19.4 25 32 0.5 yes 1
720 1440 19.2 24 32 0.6 yes 1
820 1640 19 22 33 0.9 yes 1
920 1840 18.9 21 32 1.2 yes 1

HHO AND EMISSIONS P a g e | 62
1020 2040 18.8 20 35 0.9 yes 1
1120 2240 18.8 19 36 0.3 yes 1
1220 2440 22 19 36 0 yes 1
1320 2640 21.3 19 38 1 yes 1
1420 2840 20.7 18 38 1.8 yes 1
1520 3040 20.7 18 38 1.2 yes 1
1620 3240 20.5 14 35 1.5 yes 1
1720 3440 20.5 13 34 1.2 yes 1
1820 3640 20.3 13 32 0.9 yes 1
1920 3840 20.6 13 38 1.8 yes 1
2020 4040 20.5 13 35 1.2 yes 1
2120 4240 20.2 11 35 0.9 yes 1
2220 4440 20 11 35 1.2 yes 1
2320 4640 19.8 11 34 1.5 yes 1
2420 4840 19.6 11 30 0.8 yes 1
2520 5040 19.4 10 31 0.9 yes 1
2620 5240 18.1 10 30 0.6 yes 1
2720 5440 18.1 10 30 0 yes 1
2820 5640 18.1 10 30 0 yes 1
2920 5840 18 10 29 0 yes 1
3020 6040 17.9 10 29 0 yes 1
3120 6240 17.7 10 29 0.6 yes 1
3220 6440 17.6 10 28 0.6 yes 1
3320 6640 19.9 10 29 0.6 yes 1
3420 6840 20.1 10 29 0.7 yes 1
3520 7040 19.8 10 32 0.9 yes 1
3620 7240 19.6 10 29 1.2 yes 1
3720 7440 19.1 9 29 1.5 yes 1
3820 7640 19.1 9 29 0.6 yes 1
3920 7840 18.9 9 29 -0.1 yes 1
4020 8040 18.8 9 30 0 yes 1
4120 8240 18.9 9 29 -0.3 yes 1
4220 8440 18.7 6 30 -0.1 yes 1
4320 8640 18.5 6 29 0 yes 1
4420 8840 18.3 6 28 1.5 yes 1
4520 9040 18.3 6 29 1.5 yes 1
4620 9240 18 6 29 1.8 yes 1
4720 9440 17.8 5 29 0.9 yes 1
4820 9640 17.7 5 28 1.6 yes 1
4920 9840 17.6 5 28 0.6 yes 1
5020 10040 17.2 6 29 0.9 yes 1
11220 22440 17.2 0 28 1.1 yes 1
11320 22640 16.4 0 21 0 yes 1
16220 32440 16.7 0 25 0 yes 1

HHO AND EMISSIONS P a g e | 63
I. Half-wave rectified audio signal at 10 volts.
half wave rectifier DC
Hz volts amps ml time delta t
20 8 0.72 7.5 1 0
40 9.5 0.92 7.5 1 1
46.67 9.7 0.94 8 1 2.4
53 9.9 0.96 9 1 0
80 10 0.98 8.5 1 0.3
127.5 10 0.9 11 1 0.3
240 10 0.85 16 1 0
1240 10 0.81 20 1 0
2240 10 0.79 15 1 0.6
3240 10 0.76 17.5 1 1.5
4240 10 0.74 18.5 1 0
5240 10 0.71 15 1 1.5
6240 10 0.68 14 1 0.9
7240 10 0.65 18.5 1 -1.8
8240 10 0.63 16.5 1 1.5
9240 10 0.59 15 1 -0.9
10240 10 0.56 15.5 1 2.1
J. Half-wave rectified audio signal with Hz determining volts and amps.
half wave rectifier DC
Hz volts amps ml time delta t
20 8 0.72 7.5 1 0
40 9.5 0.92 7.5 1 1
46.67 9.7 0.94 8 1 2.4
53 9.9 0.96 9 1 0
80 10 0.98 8.5 1 0.3
127.5 10 0.9 11 1 0.3
240 10 0.85 16 1 0
1240 19.4 1.82 20 1 0
2240 18.8 1.85 15 1 0.6
3240 20.5 1.93 17.5 1 1.5
4240 20.2 1.88 18.5 1 0
5240 18.1 1.72 15 1 1.5
6240 17.7 1.65 14 1 0.9
7240 19.6 1.76 18.5 1 -1.8
8240 18.9 1.61 16.5 1 1.5
9240 18 1.55 15 1 -0.9

HHO AND EMISSIONS P a g e | 64
10240 17.2 1.46 15.5 1 2.1
19882 16.6 1 15 1 0


