Embed Size (px)
Citation preview

http://jbx.sagepub.com/Journal of Biomolecular Screening
http://jbx.sagepub.com/content/9/2/103The online version of this article can be found at:
DOI: 10.1177/1087057103262335
2004 9: 103J Biomol ScreenSusan M. Young, Mark S. Curry, John T. Ransom, Juan A. Ballesteros, Eric R. Prossnitz, Larry A. Sklar and Bruce S. Edwards
High-Throughput Microfluidic Mixing and Multiparametric Cell Sorting for Bioactive Compound Screening
Published by:
http://www.sagepublications.com
On behalf of:
Journal of Biomolecular Screening
can be found at:Journal of Biomolecular ScreeningAdditional services and information for
http://jbx.sagepub.com/cgi/alertsEmail Alerts:
http://jbx.sagepub.com/subscriptionsSubscriptions:
http://www.sagepub.com/journalsReprints.navReprints:
http://www.sagepub.com/journalsPermissions.navPermissions:
http://jbx.sagepub.com/content/9/2/103.refs.htmlCitations:
What is This?
- Mar 1, 2004Version of Record >>
by guest on October 11, 2013jbx.sagepub.comDownloaded from by guest on October 11, 2013jbx.sagepub.comDownloaded from by guest on October 11, 2013jbx.sagepub.comDownloaded from by guest on October 11, 2013jbx.sagepub.comDownloaded from by guest on October 11, 2013jbx.sagepub.comDownloaded from by guest on October 11, 2013jbx.sagepub.comDownloaded from by guest on October 11, 2013jbx.sagepub.comDownloaded from by guest on October 11, 2013jbx.sagepub.comDownloaded from by guest on October 11, 2013jbx.sagepub.comDownloaded from by guest on October 11, 2013jbx.sagepub.comDownloaded from
10.1177/1087057103262335Young et al.Microfluidic Mixing and Cell Sorting
High-Throughput Microfluidic Mixing and MultiparametricCell Sorting for Bioactive Compound Screening
SUSAN M. YOUNG,1 MARK S. CURRY,1 JOHN T. RANSOM,2 JUAN A. BALLESTEROS,2
ERIC R. PROSSNITZ,1 LARRY A. SKLAR,1 and BRUCE S. EDWARDS1
HyperCyt®, an automated sample handling system for flow cytometry that uses air bubbles to separate samples sequentiallyintroduced from multiwell plates by an autosampler. In a previously documented HyperCyt® configuration, air bubble–sepa-rated compounds in one sample line and a continuous stream of cells in another are mixed in-line for serial flow cytometriccell response analysis. To expand capabilities for high-throughput bioactive compound screening, the authors investigated us-ing this system configuration in combination with automated cell sorting. Peptide ligands were sampled from a 96-well plate,mixed in-line with fluo-4-loaded, formyl peptide receptor-transfected U937 cells, and screened at a rate of 3 peptide reactionsper minute with ~ 10,000 cells analyzed per reaction. Cell Ca2+ responses were detected to as little as 10–11 M peptide with nodetectable carryover between samples at up to 10–7 M peptide. After expansion in culture, cells sort-purified from the 10%highest responders exhibited enhanced sensitivity and more sustained responses to peptide. Thus, a highly responsive cellsubset was isolated under high-throughput mixing and sorting conditions in which response detection capability spanned a1000-fold range of peptide concentration. With single-cell readout systems for protein expression libraries, this technologyoffers the promise of screening millions of discrete compound interactions per day. (Journal of Biomolecular Screening2004:103-111)
Key words: drug discovery, flow cytometry, automation, cell sorting, sample handling
INTRODUCTION
IN THE BIOTECHNOLOGY INDUSTRY, accurate analysis of interac-tions between cells and compounds is essential to drug discov-
ery. The current cost of compounds renders sample size paramountand favors microfluidic analysis systems and microliter volumes.The flow cytometer is a microfluidics-based instrument that, be-cause of its ability to make multiple optical measurements of cellu-lar responses in real time, is becoming an increasingly importanttool for drug discovery.1 A limitation has been the rate at which
multiple samples of compounds or cells can be sequentiallyprocessed. To address this, flow cytometric techniques have beenaugmented by the addition of flow injection analysis (FIA)–basedtechniques, incorporating high-precision valves and steppermotor-driven syringes and automated sample delivery systems.2-7
We have recently reported the development of an automatedsample handling system for flow cytometry, called HyperCyt®,that uses air bubbles to separate samples sequentially introducedfrom multiwell plates by an autosampler.8 Samples of 1-5microliters in volume are delivered through a microfluidic tubingline to the flow cytometer with a peristaltic pump. Air bubbles arerequired to prevent mixing and spreading of samples due to para-bolic flow during transit. Endpoint assays, in which parallel reac-tions proceed for minutes to hours before sampling, have been suc-cessfully processed at rates of up to 100 samples per minute.8
High-throughput in-line mixing protocols have also been devel-oped in which air bubble–separated compounds in one sample lineand a continuous stream of cells in another sample line are mergedat a common outlet and are mechanically mixed with a micro-stirbar just before reaching the flow cytometer.9,10 Processing ratesof up to 9 samples per minute have been achieved with thisapproach.9
Flow cytometric cell sorting is an established method used toseparate and enrich target populations of cells. Recently, commer-
© 2004 The Society for Biomolecular Screening www.sbsonline.org 103
Journal of Biomolecular Screening 9(2); 2004DOI: 10.1177/1087057103262335Published by Sage Publications in association with The Society for BiomolecularScreening
1Cytometry, Cancer Research and Treatment Center, University of New MexicoHealth Sciences Center, Albuquerque.2Novasite, Inc., 11095 Flintkote Avenue, San Diego, CA.
This work was performed at the Cancer Research Facility, Cancer Research andTreatment Center, University of New Mexico Health Sciences Center, Albuquer-que, NM, 87131. This work was presented in part at the 1st InternationalCytomics Conference, Newport, Wales, May, 2003.
Received Apr 29, 2003 and in revised form Sep 11, 2003. Accepted for publica-tion Nov 11, 2003.

cial flow cytometers have been designed for high-speed sorting atrates of up to 70,000 cells/second.11 However, sorting has yet to beused in combination with automated high-throughput compoundsampling/mixing approaches. To fully exploit the potential of flowcytometry for high-throughput screening (HTS) of bioactive com-pounds, we here investigated the use of the HyperCyt® system incombination with automated cell sorting (Fig. 1). The G-protein-coupled receptor (GPCR) system is involved in the mechanism ofaction of approximately 50% of all prescription drugs on the mar-ket.12 Therefore, this family of receptors is a logical choice as thefocus of HTS efforts to identify new lead compounds of potentialtherapeutic importance. U937 cells transfected with the formylpeptide receptor,13 a prototypic GPCR, were mixed with parentalU937 cells to determine the efficacy with which the receptor-ex-pressing cells could be detected and purified via HyperCyt® sort-ing. We show that cells responding to peptide stimulation by re-leasing intracellular Ca2+ can be sorted from a population ofnonresponding cells in an automated protocol that requires a pro-cessing time of ~ 20 seconds per peptide sample. This method al-lows not only the rapid determination of a bioactive compound butalso the ability to sort the responding cells for expansion and fur-ther characterization.
MATERIALS AND METHODS
Cells and reagents. Fluorescein-labeled and unlabeledformyl-methionine-leucine-phenylalanine (fMLF) peptide wasobtained from Penninsula Labs (San Carlos, CA). Cells of themyeloid U937 cell line transfected with a mutant formyl peptidereceptor with glycine/alanine-substituted tail region serine andthreonine residues (DeltaST) were cultured in RPMI-1640 me-dium supplemented with 10% fetal bovine serum (Hyclone), 2mML-glutamine, 10 mM HEPES, 10 U/ml penicillin, and 10 µg/mlstreptomycin, 4 µg/ml CIPRO, and 500 µg/ml Geneticin(Invitrogen, Japan). Cultures were grown at 37 °C with 5% CO2
and passaged every 3 days. These DeltaST cells show a sustainedCa2+ response upon stimulation with fMLF and do not internalizethe receptor.13 U937 cells do not express the formyl peptide recep-tor and, therefore, are not stimulated by fMLF.
Fluorescence labeling. 107 cells were resuspended in 10 ml ofwarm medium containing 200 nM fluo-4 acetoxymethyl ester(Molecular Probes, Eugene, OR) and incubated at 37 °C for 30min, with mixing every 10 min. After incubation, cells were centri-fuged and resuspended in fresh medium, centrifuged, and resus-pended in complete HHB (0.11M NaCl, 30 mM HEPES, 10 mMKCL, 1mM MgCl2, 10 mM glucose, and 0.1% [v/v] human serumalbumin, and 1.5 mM CalCl2). PKH26 dye was obtained fromSigma (St. Louis, MO) and used according to manufacturer’s in-structions. DeltaST cells were loaded with fluo-4 and U937 cellsloaded with a combination of fluo-4 and PKH26. Thus, both celllines contained the fluo-4 Ca2+ indicator and, when mixed togetherin Ca2+ response experiments, could be distinguished from one an-
other on the basis of differences in red PKH26 fluorescenceintensity.
Flow cytometry. For fluorescence analysis of fluo-4 andfluorescein-labeled fMLF, excitation was at 488 nm from an air-cooled argon laser and emission was detected at 520 nm. PKH26fluorescence was excited at 488 nm and emission detected at 630nm. MoFlo® sorting conditions ranged from 10 to 30 psi, 500 to2000 events/sec, and exclusively used sort single mode. Fluo-4 flu-orescence intensity was recorded on a linear scale. The MoFloflow cytometer was also fitted with a modified nozzle holder, de-scribed elsewhere,14 in which the sample tube was extended an ad-ditional 5 mm closer to the nozzle exit relative to the standardconfiguration (see Discussion).
HyperCyt®. The configuration of HyperCyt® for automatedmixing and delivery of cells to the flow cytometer was as previ-ously described9 with minor modifications (Fig. 1). Cells at 0.5-1.0× 10⁶/ml are delivered by syringe (FIAlab Instruments, Bellevue,WA) through 0.010” inner diameter (ID) PVC tubing (SpectraHardware, Inc., West Moreland City, PA) at 2 µl/sec. A peristalticpump (Gilson Minipuls 3) rotating at 15 rpm (2 µl/sec) is used todeliver peptide from wells of a 96-well V-bottom PVC microtiterplate through a 12-inch, 0.010” ID stainless steel probe (SmallParts, Inc., Miami Lake, FL) attached to a 41” length of 0.010” IDPVC tubing. A model 223 Sample Changer autosampler (Gilson,Inc., Middleton, WI) moves the probe from well to well. The 2PVC tubing components for transporting cells and peptide meet ata 23 gauge “Y” connector (Small Parts, Inc.) connected to a mixingline of 0.01” ID PVC tubing that ranged in length from 30” to 60”,as indicated. This is attached to the sample insertion rod of thecytometer using a short length of 0.020” ID silicone tubing. A.059” × .009” × .003" (length × width × thickness) micro-stirbar,prepared from Metaglass Magnetic Alloy 2714A (Allied Signal,Morristown, NJ), was positioned 1” downstream of the “Y” con-nector and rotated at ~ 500 rpm with a magnetic stirrer for optimalmixing of reagents and cells as previously described.10
In practice, the peristaltic pump runs continuously as theautosampler moves the sampling probe from well to well with atrip to the rinse station between each well. The sample size and airbubble size are determined by the time that the probe is in a well (orrinse station) or above a well (or rinse station) taking in air, respec-tively. During the time at the rinse station, the probe is raised andlowered multiple times to create multiple air bubble-separatedrinse volumes as indicated in specific experiments. The probe typi-cally requires ~ 0.5 seconds to move from well to well and ~ 0.3seconds to move up and down in the rinse station. Based upon theobserved liquid displacement rate of 2 µl/sec, initial air bubble vol-umes (prior to compression by bounding liquid volumes) were es-timated to range between 0.6 and 1 µl.
Data analyses. Data analyses were done off-line on flowcytometry list-mode data files stored in FCS 2.0 format. CellQuest(BD BioSciences, San Jose, CA), Summit (Cytomation, Fort Col-lins, CO), FCSQuery (in-house analysis program)/Microsoft®
Young et al.
104 www.sbsonline.org Journal of Biomolecular Screening 9(2); 2004

Excel® (Redmond, WA), and Prizm™ (San Diego, CA) softwarewere used to generate graphs and statistical analyses.
RESULTS
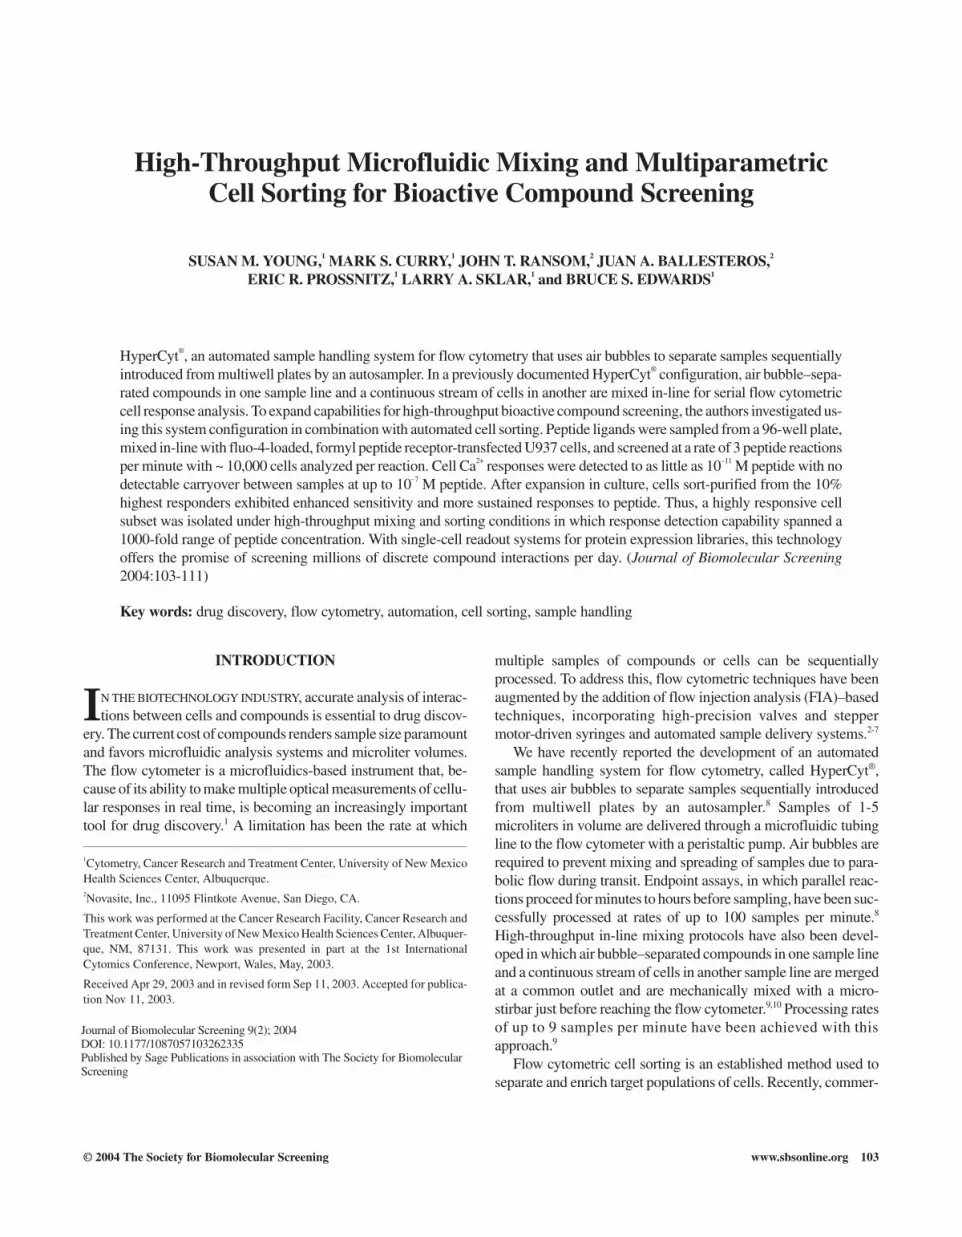
Characterization of Ca2+ responses in receptor-transfected andparental U937 cells. DeltaST cells are U937 cells that have beentransfected to express the formyl peptide receptor13 and thus, un-like parental U937 cells, release intracellular Ca2+ when stimulatedwith fMLF peptide, an activating ligand of the receptor. To sepa-rately evaluate intracellular Ca2+ in both cell lines in the same as-say, DeltaST cells were loaded with fluo-4 and parental U937 cellswith a combination of fluo-4 and red fluorescent PKH26. In plotsof green versus red cell fluorescence, both dim red fluorescentDeltaST cells and bright red fluorescent U937 cells exhibited simi-lar levels of dim green fluo-4 fluorescence in the absence of treat-ment (Fig. 2A). By contrast, only in the DeltaST cell populationdid the fluo-4 fluorescence intensity increase in response to treat-ment with fMLF (Fig. 2B). When fMLF was manually added to atube containing a 1:1 mixture of the 2 cell lines, the median fluo-
rescence intensity of fluo-4 in DeltaST cells increased from a base-line value of 38 to a peak of 247 fluorescence units at 30 seconds, a7-fold increase, after which it gradually declined (Fig. 2C). Bycontrast, there was no detectable Ca2+ response by parental U937cells, consistent with their lack of the fMLF peptide receptor (Fig.2D). Stimulation of the parental U937 cells with ATP, however,produced a significant elevation in intracellular Ca2+, an indicationthat these cells were capable of eliciting a detectable response (datanot shown).
Sampling/rinsing protocol efficiency. An extensive series of ex-periments was done to define an optimal HyperCyt® sampling/rinsing protocol that would most efficiently eliminate intersamplecarryover. Fluorescein-labeled fMLF peptide (30 nM) was aspi-rated from a sample well for 10 seconds, then the sampling probewas moved to a rinse station and repeatedly immersed in rinsebuffer 1 to 4 times (to generate different numbers of rinse-associ-ated air bubbles) for 2 to 10 seconds per rinse before aspirating thenext fMLF peptide sample. Thus, each large volume sample offMLF peptide was followed by a series of bubble-separated rinsevolumes of varying number and size. Binding of peptide to cellular
Microfluidic Mixing and Cell Sorting
Journal of Biomolecular Screening 9(2); 2004 www.sbsonline.org 105
FIG. 1. HyperCyt® configuration for on-line mixing in combination with cell sorting. An air-segmented stream of peptides, sampled from microplatewells by an autosampler, joins a continuously flowing stream of cells at a “Y” junction. The 2 conjoined streams are mixed by an in-line micro-stirbar enroute to the flow cytometer. Cells with elevated intracellular Ca2+ are sorted into microplate wells and expanded in culture for subsequent reanalysis.
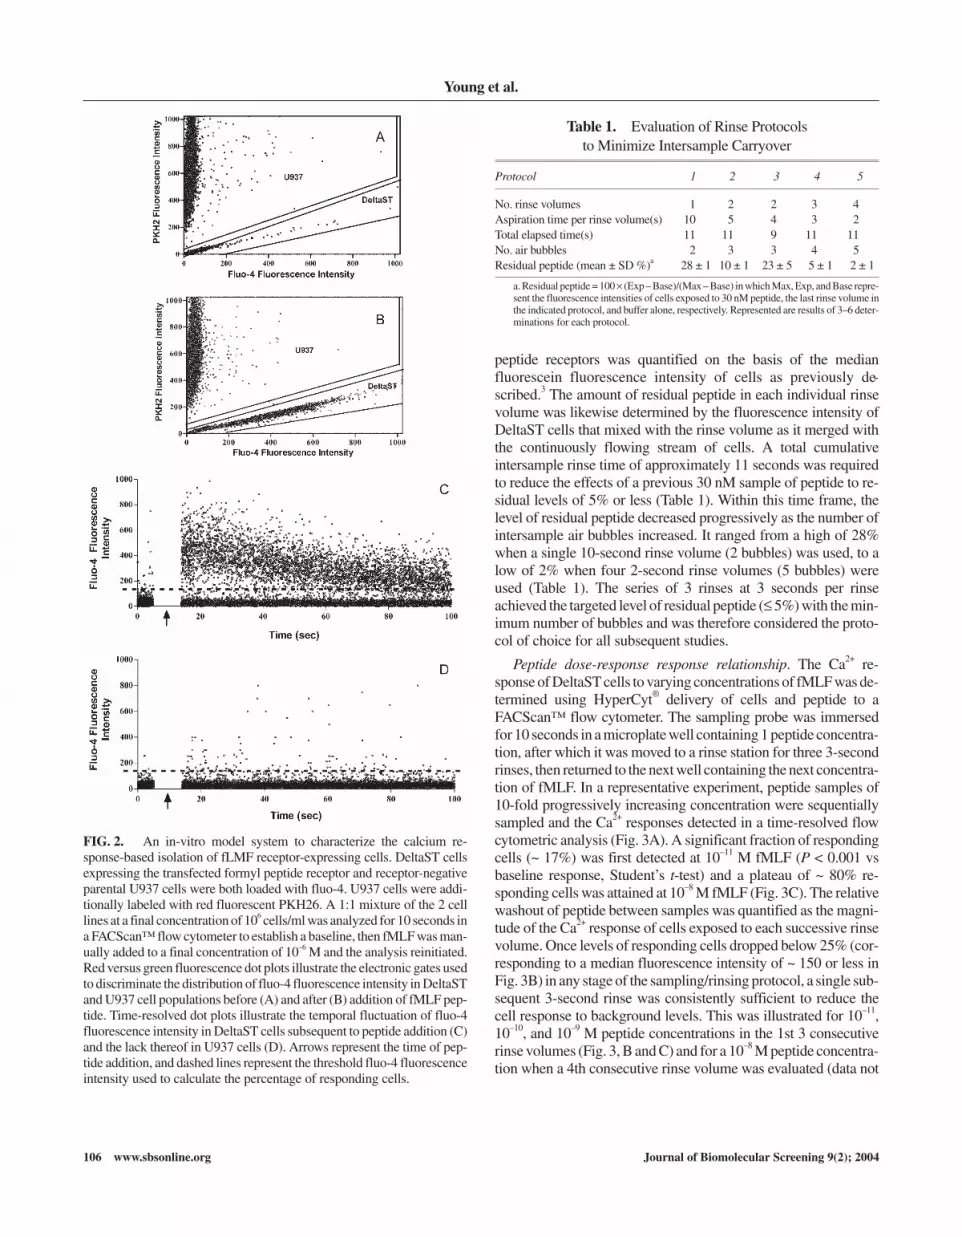
peptide receptors was quantified on the basis of the medianfluorescein fluorescence intensity of cells as previously de-scribed.3 The amount of residual peptide in each individual rinsevolume was likewise determined by the fluorescence intensity ofDeltaST cells that mixed with the rinse volume as it merged withthe continuously flowing stream of cells. A total cumulativeintersample rinse time of approximately 11 seconds was requiredto reduce the effects of a previous 30 nM sample of peptide to re-sidual levels of 5% or less (Table 1). Within this time frame, thelevel of residual peptide decreased progressively as the number ofintersample air bubbles increased. It ranged from a high of 28%when a single 10-second rinse volume (2 bubbles) was used, to alow of 2% when four 2-second rinse volumes (5 bubbles) wereused (Table 1). The series of 3 rinses at 3 seconds per rinseachieved the targeted level of residual peptide (≤ 5%) with the min-imum number of bubbles and was therefore considered the proto-col of choice for all subsequent studies.
Peptide dose-response response relationship. The Ca2+ re-sponse of DeltaST cells to varying concentrations of fMLF was de-termined using HyperCyt® delivery of cells and peptide to aFACScan™ flow cytometer. The sampling probe was immersedfor 10 seconds in a microplate well containing 1 peptide concentra-tion, after which it was moved to a rinse station for three 3-secondrinses, then returned to the next well containing the next concentra-tion of fMLF. In a representative experiment, peptide samples of10-fold progressively increasing concentration were sequentiallysampled and the Ca2+ responses detected in a time-resolved flowcytometric analysis (Fig. 3A). A significant fraction of respondingcells (~ 17%) was first detected at 10–11 M fMLF (P < 0.001 vsbaseline response, Student’s t-test) and a plateau of ~ 80% re-sponding cells was attained at 10–8 M fMLF (Fig. 3C). The relativewashout of peptide between samples was quantified as the magni-tude of the Ca2+ response of cells exposed to each successive rinsevolume. Once levels of responding cells dropped below 25% (cor-responding to a median fluorescence intensity of ~ 150 or less inFig. 3B) in any stage of the sampling/rinsing protocol, a single sub-sequent 3-second rinse was consistently sufficient to reduce thecell response to background levels. This was illustrated for 10–11,10–10, and 10–9 M peptide concentrations in the 1st 3 consecutiverinse volumes (Fig. 3, B and C) and for a 10–8 M peptide concentra-tion when a 4th consecutive rinse volume was evaluated (data not
Young et al.
106 www.sbsonline.org Journal of Biomolecular Screening 9(2); 2004
FIG. 2. An in-vitro model system to characterize the calcium re-sponse-based isolation of fLMF receptor-expressing cells. DeltaST cellsexpressing the transfected formyl peptide receptor and receptor-negativeparental U937 cells were both loaded with fluo-4. U937 cells were addi-tionally labeled with red fluorescent PKH26. A 1:1 mixture of the 2 celllines at a final concentration of 106 cells/ml was analyzed for 10 seconds ina FACScan™ flow cytometer to establish a baseline, then fMLF was man-ually added to a final concentration of 10–6 M and the analysis reinitiated.Red versus green fluorescence dot plots illustrate the electronic gates usedto discriminate the distribution of fluo-4 fluorescence intensity in DeltaSTand U937 cell populations before (A) and after (B) addition of fMLF pep-tide. Time-resolved dot plots illustrate the temporal fluctuation of fluo-4fluorescence intensity in DeltaST cells subsequent to peptide addition (C)and the lack thereof in U937 cells (D). Arrows represent the time of pep-tide addition, and dashed lines represent the threshold fluo-4 fluorescenceintensity used to calculate the percentage of responding cells.
Table 1. Evaluation of Rinse Protocolsto Minimize Intersample Carryover
Protocol 1 2 3 4 5
No. rinse volumes 1 2 2 3 4Aspiration time per rinse volume(s) 10 5 4 3 2Total elapsed time(s) 11 11 9 11 11No. air bubbles 2 3 3 4 5Residual peptide (mean ± SD %)a 28 ± 1 10 ± 1 23 ± 5 5 ± 1 2 ± 1
a. Residual peptide = 100 × (Exp – Base)/(Max – Base) in which Max, Exp, and Base repre-sent the fluorescence intensities of cells exposed to 30 nM peptide, the last rinse volume inthe indicated protocol, and buffer alone, respectively. Represented are results of 3–6 deter-minations for each protocol.

shown). Therefore, the HyperCyt® sampling/washing protocolpermitted detection of peptide over a 3-decade range of concentra-tion (10–11 – 10–8 M) without detectable peptide carryover betweensamples. Similar results were obtained when peptide concentra-tions were sampled in reversed order (ie, progressively decreasingconcentration, data not shown).
Comparison of manual and HyperCyt® mixing protocols. Us-ing manual mixing and delivery of peptide and cells to a FACScanflow cytometer, DeltaST cells were analyzed to determine the cellfraction responding to varying concentrations of fMLF. In pooledresults of 4 separate experiments, an effective concentration of
peptide that promoted 50% of the maximum Ca2+ response (EC50)was 10–11 M (Fig. 4A). By comparison, an EC50 of 6 × 10–11 M wasobtained with HyperCyt® when using a mixing line of 60 inches inlength (Fig. 4B). The dose-response profiles were consistent withligand-receptor binding and demonstrated HyperCyt® delivery toachieve estimates of EC50 within a similar order of magnitude (6-fold difference) as the manual method.
It was noteworthy that halving the length of the mixing line to30 inches resulted in a 30-fold increase in the apparent EC50 (3 ×10⁻¹⁰ M, Fig. 4B) relative to manual analysis results. Thus, thelength of the mixing line, in addition to proper functioning of the
Microfluidic Mixing and Cell Sorting
Journal of Biomolecular Screening 9(2); 2004 www.sbsonline.org 107
FIG. 3. Relationship between fMLF concentration and intersample carryover. A continuously flowing suspension of fluo-4-loaded DeltaST cells wasmixed in-line with 10–11 to 10–6 M concentrations of fMLF and delivered to a flow cytometer for determination intracellular calcium responses. Theautosampler probe was immersed for 10 seconds in a microplate well containing 1 peptide concentration, moved to a rinse station and immersed 3 separatetimes for 3 seconds each to rinse the probe, then returned to the next well containing the next concentration of fMLF. The intracellular Ca2+ responses ofcells to each peptide concentration and the subsequent rinse volumes were quantified on the basis of a time-resolved dot plot (A) in which each cluster ofdots represents the indicated cell exposure conditions. Ca2+ responses were quantified as the median fluo-4 fluorescence intensity within a 0 to 1024 fluo-rescence units range of intensity (B) and the percent of cells with fluo-4 fluorescence exceeding a threshold of fluorescence intensity (C). The dashed linein A illustrates the fluo-4 fluorescence intensity threshold.

in-line micro-stirbar, was of importance for optimal cell responsedetection in the flow cytometer. Results obtained with the longerline probably reflected the effects of 2 counterbalancing factors. Alonger transit time permits longer receptor-ligand interaction time,which in turn permits the Ca2+ response to develop more fully to-ward levels achieved with the manual approach. On the other hand,peptide solutions are progressively diluted during transit throughtubes. As the peptide sample volume moves through the tubing, itleaves behind a thin film on the tubing wall and it takes up rinse so-
lution from the thin film left behind by the preceding rinse volumes(manuscript in preparation). Thus, a longer tube leads to a greaterdilution of peptide. This dilution effect was likely a contributingfactor in the apparent 6-fold higher response EC50 observed duringHyperCyt® analysis with the longer tube as compared to results inmanual assays.
Young et al.
108 www.sbsonline.org Journal of Biomolecular Screening 9(2); 2004
FIG. 4. The optimized HyperCyt® mixing protocol results in a Ca2+ re-sponse profile approaching that obtained with a manual mixing protocol.(A) DeltaST cells were loaded with fluo-4 and tested for Ca2+ responses toa range of fMLF peptide concentrations in a manual mixing protocol.Represented are pooled results of 4 separate experiments in which 10–11 Mwas the effective concentration that promoted a response that was 50% ofthe maximum (EC50). (B) DeltaST cells were exposed to the same range offMLF peptide concentrations via the HyperCyt® mixing protocol of Fig-ure 3. Illustrated are results of a representative experiment in which thelength of the line between the mixing “Y” and the flow cytometer was 30inches (squares) or 60 inches (triangles). The peptide EC50s were deter-mined to be 3 × 10⁻¹⁰ M and 6 × 10–11 M for the 30- and 60-inch mixinglines, respectively.
FIG. 5. Sorting of DeltaST cells in conjunction with HyperCyt®.DeltaST and parental U937 cells were labeled and combined together at a1:1 ratio as in Figure 2. A continuously flowing suspension of these cellswas then exposed to fMLF peptide sampled from separate wells of a 96-well plate using the HyperCyt® sampling rinsing protocol of Figure 3 ex-cept that each peptide sample was aspirated for 30 rather than 10 seconds.For each sorting experiment, an electronic sorting gate was establishedaround 10% of the input DeltaST population with the strongest Ca2+ re-sponse. (A) Sorting was initiated only for cells exposed to the fullconcentration of sampled peptide. Immediately subsequent to sorting,the sort-selected cells were evaluated to determine the frequency of con-taminating red fluorescent parental U937 cells. (B) Illustrated are resultsof a representative experiment in which cells exposed to 10–6 M peptidewere sorted in a MoFlo® flow cytometer at a sheath stream pressure of 10psi and an event rate of 700 cells per second. In this experiment, 126 con-taminating U937 cells were detected in a total of 3467 sorted cells (3.6%).Results are representative of all tested conditions of sheath pressure andevent rates.

Sorting with HyperCyt®. Sorting experiments were done usinga 1:1 ratio of DeltaST cells and parental U937 cells, prepared as in
Figure 2, as the starting population. Figure 5A illustrates the sortgate enclosing the 10% of DeltaST cells with the strongest re-sponse to fMLF, defined on the basis of bright fluo-4 fluorescenceintensity and exclusion of dim fluo-4, bright PKH26 fluorescentparental U937 cells. Sorting conditions varied with experimentsand ranged from 10 to 30 psi sheath pressure and from 700 to 2000events/second. Over the entire range of tested conditions of pres-sure and event rate, results were comparable with respect to presortCa2+ response profiles and postsort frequencies of contaminatingparental cells. In 6 separate experiments, the frequency of parentalU937 cells contaminating the sorted DeltaST cells was determinedto be 3.3 ± 1.3% (mean ± SD). Figure 5B illustrates results of a rep-resentative experiment in which the sorted cell population was de-termined to contain ~ 3% contaminating PKH26-stained cells.Similar frequencies of contaminating cells were detected in paral-lel control experiments in which cells and peptide were manuallymixed and presented for sorting in a conventional fashion (1.8 ±0.8%, n = 4, P ≤ 0.07).
A noteworthy observation, however, was that the sort streamwas always transiently perturbed by the passage of eachintersample set of air bubbles. Although the sort stream dropletprofile would often spontaneously revert to the original configura-tion subsequent to bubble passage, typically only a limited andvariable number of samples could be processed before the sortstream was ultimately irreversibly shifted to a new droplet configu-ration. This altered the critical timing relationship between eventdetection and droplet charging essential for accurate sorting andrequired manual intervention to correct. An exception to this pat-tern was observed when HyperCyt® sorting was performed at thelowest tested sheath pressure (10 psi), under which conditions sortstream droplet configuration was more resilient, consistently re-covering from the effects of each set of bubbles for up to an hour ofcontinuous sample processing.
Analysis of sort-purified cells after expansion in culture. To as-sess the ability of HyperCyt® sorting to isolate cells with alteredCa2+ response characteristics, peptide-responsive cells fromDeltaST/U937 cell mixtures were sorted into a sterile 96-well plateat up to 100 cells/well. The sorted cells were cultured for 8 days inthe absence of any selecting agent, then for an additional 4 or moredays in the presence of geneticin to prevent spontaneous loss offLMF receptor expression. When compared with the originalsource DeltaST cell culture from which they were purified, thesort-selected DeltaST cells exhibited a higher peak Ca2+ response,attained the peak response more rapidly, and attenuated the re-sponse more slowly (Fig. 6A). In peptide dose-response compari-sons, the sort-selected DeltaST cells also exhibited higher re-sponse frequencies over a 5-decade range of peptideconcentrations (Fig. 6B). Cell subsets with similarly enhanced re-sponse characteristics were successfully isolated and expanded us-ing input peptide sample concentrations that ranged from 10–9 to10–6 M. Predictably, the numbers of highly responsive cells thatwere detected and sorted increased with increasing peptide con-centration, ranging from less than 100 cells per sort at 10–9 M pep-tide to many hundreds of cells per sort at 10–7 M peptide or more.
Microfluidic Mixing and Cell Sorting
Journal of Biomolecular Screening 9(2); 2004 www.sbsonline.org 109
FIG. 6. Comparison of the calcium response profiles of source andsort-selected DeltaST cells. DeltaST and U937 cells were labeled, com-bined together in a 1:1 ratio, and sorted as described in Figure 4 except thatfMLF peptide concentrations ranging from 10–6 to 10–10 M from separatesource microplate wells were used in a single sorting experiment, eachpeptide sample was aspirated for only 10 seconds prior to the 3-rinse probewash sequence, and sorting was done at 30 psi sheath pressure and 2000events/second. The sorted cells were deposited into wells of a sterile 96-well plate at up to 100 cells/well and cultured for in a 5% CO2 atmosphereat 37° C. After 8 days, geneticin was added and the cells were cultured foran additional 4 or more days until adequate cell numbers were present foranalysis. The source DeltaST cells were cultured in parallel in the contin-ual presence of geneticin. At the end of the culture period, the Ca2+ re-sponse profiles of sorted and source DeltaST cells were compared. (A)The temporal Ca2+ response to 10–6 M fMLF of unsorted DeltaST cells (▲)and DeltaST cells sort-selected on the basis of responsiveness to 10–6 MfMLF (■). (B) fMLF dose-response of DeltaST cells originally sort-se-lected in the presence of 10–6 (▲), 10–7 (▼), 10–8 (◆), and 10–9 (■) M fMLF,and of unsorted DeltaST cells (�).

DISCUSSION
The present studies document the successful use of aHyperCyt®-based automated in-line mixing protocol in conjunc-tion with cell sorting to achieve isolation and expansion of a subsetof highly responsive DeltaST cells. The peptide was deliveredfrom the wells of a 96-well microplate, mixed with a continuouslyflowing suspension of cells and delivered to the point of analysis inthe flow cytometer in a time frame conducive to detection of peakcell Ca2+ responses. Sort-purified cells exhibited enhanced sensi-tivity to formyl peptide concentrations as low as 10–11 M and moresustained responses to all stimulatory peptide concentrations incomparison to the DeltaST cell population from which they werederived (Fig. 6). Distinctively labeled parental U937 cells wereseeded in equal proportions with DeltaST cells in each source cellpopulation used for sorting. This permitted an estimate of sortpurities to be in the range of 96% to 97% from a 1:1 cell mixtureunder all tested conditions of HyperCyt® sorting. This level of sort-ing efficiency was therefore sufficient to permit isolation and ex-pansion of a subset of cells from the input DeltaST population withenhanced sensitivity to fMLF. In a separate series of HyperCyt®
sorting experiments, the sort-purified cells were determined to ex-press several-fold higher average numbers of peptide receptorsthan the source cells from which they were derived (data notshown). Thus, the observed increase in peptide responsivenesslikely reflected sort selection of a subpopulation of cells with in-creased receptor expression levels.
The present study characterized a method for detection andsort-isolation of cells on the basis of a transient receptor-mediatedphysiological response. Although the present focus was upon aGPCR-coupled Ca2+ response, such an analysis approach shouldbe readily adaptable to other types of rapid transient cell responsesmeasurable by flow cytometry. For example, we have recently re-ported a flow cytometric approach to detect and quantify transientchanges in integrin receptor affinity as they occur in real time overa span of tens-of-seconds.15 Such affinity changes were triggeredby ligands interacting not only with GPCR but also with mem-brane receptors to IgE and interleukin-5. Likewise fluorescentprobes are available to measure other types of rapid transient re-sponses (eg, membrane potential, intracellular pH, etc) triggeredby ligands to a wide range of receptor classes. Thus, assays similarto the one described here should not be limited to GPCR as the tar-geted receptor nor to intracellular Ca2+ fluctuation as the receptor-elicited response. Also of note is that the present approach specifi-cally addresses physiological responses that are rapid (seconds)and reversible. If working with cell responses of a more sustainednature, the range of potential flow cytometry–based assays can begreatly extended (eg, multiparameter protein/gene expression, cellcycle perturbation, apoptosis, etc) and performed more efficientlyas HyperCyt® endpoint assays (in-line mixing not required) as wehave recently described.16
The HyperCyt® sampling/rinsing protocol permitted screeningof peptides at a rate of 3 peptide samples per minute with negligible
intersample carryover over a broad range of input peptide concen-trations. It was noteworthy that each successive 3-second rinse stepresulted in an additional order-of-magnitude increase in the upperlimit of peptide concentration that could be sampled without theoccurrence of carryover. For example, the stimulatory effects of10–11, 10–10, 10–9, and 10–8 M input peptide samples were eliminatedin the 1st, 2nd, 3rd, and 4th rinse volumes, respectively (Fig. 3 anddata not shown). Thus, the use of three 3-second sample proberinses between each peptide sample eliminated carryover frompeptide concentrations up to 10–8 M (Fig. 3), 16- to 100-foldgreater than the peptide EC50 of 0.1 to 0.6 nM (Fig. 4). Inclusion ofadditional intersample rinse steps would further extend the upperlimit of carryover-free peptide detection at the expense of de-creased sample throughput rate.
Cell responses were detectable at a peptide concentration of10–11 M (Fig. 3), which represented 2% to 10% of the measuredpeptide EC50. This suggests that in practice compound concentra-tions used for screening can be as low as 10% of the threshold EC50
of interest. Thus, for example, the use of 5 µM concentrations insource wells should enable detection of compounds with an EC50
of up to 50 µM.Several other factors were also noted to be of critical impor-
tance in the efficacy of sorting with the HyperCyt® system. First, itwas only possible to do long-term trouble-free sorting operationswhen the sheath stream pressure was reduced to 10 psi. This ap-peared to reflect a destabilizing effect of air bubbles upon the sortdroplet configuration that occurred at the higher pressures. Thus,for purposes of long-term sample processing such as required in anautomated screening operation, the HyperCyt® system was unableto take advantage of the Mo Flo high-speed sorting capabilities thatrequired sheath stream pressure levels of 20 psi or more. Neverthe-less, it was possible to routinely screen up to 1000 cells per secondfor a total of 10,000 cells per peptide sample, with a peptide sampleaspiration time of 10 seconds as in the present study. Aspiration ofpeptide for longer time intervals up to 60 seconds did not result inincreased levels of intersample carryover (data not shown), an in-dication that larger numbers of cells could be screened by increas-ing peptide aspiration time without requiring the inclusion of addi-tional rinses between samples.
Another factor determined to be of importance in HyperCyt®
sorting was the design of the flow cytometer nozzle. The standardMoFlo nozzle provided with the instrument tended to accumulateair bubbles during the course of a sorting session. These ultimatelycoalesced into a large bubble that obstructed sample flow and dis-rupted sorting. DakoCytomation provided a modified nozzleholder in which the sample tube was extended an additional 5 mmcloser to the nozzle exit relative to the standard configuration. Thisshortened path facilitated the passage of air bubbles through thenozzle exit and thus prevented the deleterious effects of intranozzlebubble accumulation. This modified nozzle has also recently beenshown to ameliorate intranozzle disturbances of sample fluid flowassociated with rapid sample delivery protocols.14
Young et al.
110 www.sbsonline.org Journal of Biomolecular Screening 9(2); 2004

The use of air bubbles to separate samples is an essential featureof the HyperCyt® system that enables multiple microvolume samplesof cells, particles, or soluble compounds to be transported over tensof cm distances with minimal intersample cross-contamination(Table 1).8,9 Conventional wisdom in flow cytometry has been thatair bubbles in the sample stream are to always be avoided, in thatthey represent a source of aberrant optical signals unrelated tocharacteristics of the sample particles in question. However, withthe advent of time-resolved flow cytometry, bubble-related opticalartifacts are easily excluded from the analysis by time-gating, asexemplified in Figure 3A. Air bubbles are more of a limiting factorwhen sorting is implemented as in the present study. The use of airbubbles would be of less consequence if it were possible to extractthe air bubbles from the sample stream just prior to sample intro-duction into the flow cytometer. For example, an appropriatelymodified Plug Flow microfluidic valving system,3,17 in combina-tion with an upstream air bubble detector to trigger valve switch-ing, might serve as a viable air bubble–extraction approach to en-able HyperCyt® for high-speed sorting. Methods have beendeveloped to express peptide and protein libraries in cells so as torender each single cell a virtual library element for functional test-ing.18-22 The present results suggest that up to 10,000 such cellularlibrary elements could be screened against 3 compounds each min-ute for a cumulative analysis of over 1.8 million compound/cell in-teractions in an hour and 43 million per day. Cells of the appropri-ate functional response phenotype could be sort-selected duringthe progress of the screen as the means by which phenotype-conferring library elements are ultimately identified. Enabling ofHyperCyt® with high-speed sorting capabilities (ie, from the pres-ent 1000 cells/sec to at least 24,000 cells/sec) offers the theoreticalpromise of single-cell library element throughput approaching abillion assays per day.
ACKNOWLEDGMENTS
This work was supported in part by NIH grants AI48517, R24-GM60799 (now EB00264), and R24-CA88339, and the Univer-sity of New Mexico Cancer Research and Treatment Center. Tech-nical and instrument support was provided by the University ofNew Mexico Shared Flow Cytometry Resource.
REFERENCES
1. Nolan JP, Lauer S, Prossnitz ER, Sklar LA: Flow cytometry: a versatile toolfor all phases of drug discovery. Drug Discov Today 1999;4:173-180.
2. Edwards BS, Kuckuck F, Sklar LA: Plug flow cytometry: an automated cou-pling device for rapid sequential flow cytometric sample analysis. Cytometry1999;37:156-159.
3. Edwards BS, Kuckuck FW, Prossnitz ER, Ransom JT, Sklar LA: HTPS flowcytometry: a novel platform for automated high-throughput drug discoveryand characterization. J Biomol Screen 2001;6:83-90.
4. Lindberg W, Ruzicka J, Christian GD: Flow injection cytometry: a new ap-proach for sample and solution handling in flow cytometry. Cytometry
1993;14:230-236.
5. Zao R, Natarajan A, Srienc S: A flow injection flow cytometry system for on-line monitoring of bioreactors. Biotechnol Bioeng 1999;62:609-617.
6. Sklar LA, Seamer LC, Kuckuck F, et al: Sample handling for kinetics and mo-lecular assembly in flow cytometry. Proc SPIE 1998;3256:144-153.
7. Seamer LC, Kuckuck F, Sklar LA: Sheath fluid control to permit stable flowin rapid mix flow cytometry. Cytometry 1999;35:75-79.
8. Kuckuck FW, Edwards BS, Sklar LA: High throughput flow cytometry.Cytometry 2001;44:83-90.
9. Jackson WC, Kuckuck F, Edwards BS, et al: Mixing small volumes for con-tinuous high-throughput flow cytometry: performance of a mixing Y and peri-staltic sample delivery. Cytometry 2002;47:183-191.
10. Jackson WC, Bennett TA, Edwards BS, Prossnitz E, Lopez GP, Sklar LA:Performance of in-line microfluidic mixers in laminar flow for high-throughputflow cytometry. Biotechniques 2002;33:220-226.
11. MoFlo Sorters [Online]: Retrieved from http://www.cytomation.com/products/moflo_sorters_index.html.
12. Ma P, Zemmel R: Value of novelty? Nat Rev Drug Discov 2002;1:571-572.
13. Prossnitz ER: Desensitization of N-formylpeptide receptor-mediated activa-tion is dependent upon receptor phosphorylation. J Biol Chem1997;272:15213-15219.
14. Graves SW, Nolan JP, Jett JH, Martin JC, Sklar LA: Nozzle design parametersand their effects on rapid sample delivery in flow cytometry. Cytometry
2002;47:127-137.
15. Chigaev A, Blenc AM, Braaten JV, et al: Real time analysis of the affinity reg-ulation of alpha 4-integrin. The physiologically activated receptor is interme-diate in affinity between resting and Mn(2+) or antibody activation. J BiolChem 2001;276:48670-48678.
16. Ramirez S, Aiken CT, Andrzejewski B, Sklar LA, Edwards BS: High-throughput flow cytometry: validation in microvolume bioassays. Cytometry2003;53A:55-65.
17. Edwards BS, Sklar LA: Plug flow cytometry. Curr Prot Cytometry2001:1.17.1-1.17.10.
18. Lorens JB, Bennett MK, Pearsall DM, et al: Retroviral delivery of peptidemodulators of cellular functions. Mol Ther 2000;1:438-447.
19. Lorens JB, Sousa C, Bennett MK, Molineaux SM, Payan DG: The use ofretroviruses as pharmaceutical tools for target discovery and validation in thefield of functional genomics. Curr Opin Biotechnol 2001;12:613-621.
20. Wittrup KD: The single cell as a microplate well. Nat Biotechnol2000;18:1039-1040.
21. Sepp A, Tawfik DS, Griffiths AD: Microbead display by in vitro compart-mentalisation: selection for binding using flow cytometry. FEBS Lett2002;532:455-458.
22. Griffiths AD, Tawfik DS: Directed evolution of an extremely fastphosphotriesterase by in vitro compartmentalization. Embo J 2003;22:24-35.
Address reprint requests to:Bruce S. Edwards, Ph.D.
MSC08 4630CRF Building #229, Room 217
Cytometry and Pathology2325 Camino de Salud
Albuquerque, NM 87131
E-mail: [email protected]
Microfluidic Mixing and Cell Sorting
Journal of Biomolecular Screening 9(2); 2004 www.sbsonline.org 111


