Embed Size (px)
Citation preview

Ecological Applications, 17(3), 2007, pp. 765–778� 2007 by the Ecological Society of America
HISTORICAL EUTROPHICATION IN A RIVER–ESTUARY COMPLEX INMID-COAST MAINE
DORTE KOSTER,1 JOHN LICHTER,1,4 PETER D. LEA,2 AND ANDREA NURSE3
1Biology Department and Environmental Studies Program, Bowdoin College, Brunswick, Maine 04011 USA2Geology Department, Bowdoin College, Brunswick, Maine 04011 USA
3Laboratory of Paleoecology and Paleohydrology, Sawyer Research Center, University of Maine, Orono, Maine 04469 USA
Abstract. European settlement of New England brought about a novel disturbanceregime that impacted rivers and estuaries through overfishing, deforestation, dams, and waterpollution. The negative consequences of these activities intensified with industrialization in the19th and 20th centuries, often resulting in ecosystem degradation. Since environmentallegislation was implemented in the 1970s, improvement in water quality has been tangible andwidespread; however, ecological recovery can require substantial amounts of time and maynever be complete. To document the natural baseline conditions and investigate the recoveryof a severely degraded river–estuary complex in mid-coast Maine, we examined diatoms,pollen, total organic carbon, total nitrogen, stable isotopes, total phosphorus, biogenic silica,and trace metals in intertidal sediments and established a chronology with 14C, 210Pb, andindicator pollen horizons. Both climate variability and human effects were evident in thesedimentary record of Merrymeeting Bay, the freshwater tidal portion of the Kennebecestuary. Natural climate variability was apparent in an episode of high sedimentation andaltered diatom abundance during the 12th and 13th centuries and in changing pollenabundances between the 16th and 19th centuries, indicative of regional cooling. During the18th century, colonial land clearance began an era of high sedimentation and eutrophicationthat strongly intensified with industrialization during the late 19th and 20th centuries.Improvements in water quality over the past 30 years in response to environmental regulationhad little effect on ecosystem recovery as represented by the sedimentary record. Diatomcomposition and productivity and high fluxes of organic C, total P, and biogenic Si in recentsediments indicate that rates of nutrient loading remain high. These environmental proxiesimply that aquatic productivity in Merrymeeting Bay was originally nutrient limited and waterclarity high, relative to today. Further recovery may require more stringent regulation ofnutrient inputs from industrial and municipal point sources. This historical study cancontribute to public debate about the environmental management of this unusual river–estuary complex by describing its long-term natural baseline, thereby illustrating the upperlimit of its potential for recovery.
Key words: coastal ecosystem; diatom record; ecosystem degradation; ecosystem recovery; eutrophi-cation; historical ecology; Maine, USA; pollution; shifting baseline.
INTRODUCTION
European settlement of the Atlantic coast of North
America brought about a novel disturbance regime that
was widespread and prolonged (Foster et al. 1998).
Overharvest of wild populations, deforestation, agricul-
ture, and raw industrial and municipal pollution altered
terrestrial and aquatic ecosystems (Foster et al. 2003,
Lotze and Milewski 2004). Because rivers provided a
means of transportation, abundant natural resources,
and waterpower, key locations at waterfalls and heads-
of-tide developed into early industrial centers (Wells
1869). By the mid-20th century, the cumulative effects of
a century and a half of commercial, municipal, and
industrial growth resulted in severe degradation of
several major ‘‘industrial’’ rivers in New England
(Walker 1931, Steinberg 1991). Although the egregious
pollution of the 19th and 20th centuries has abated,
rivers and estuaries continue to receive excess nutrients
from paper mills, wastewater treatment facilities, runoff,
and atmospheric deposition (Roman et al. 2000).
Numerous dams still alter the flow regime of rivers
and prevent anadromous fish from reaching their
spawning habitat (Poff et al. 1997), and trophic web
structure has been altered by species loss and vastly
reduced population sizes (Jackson et al. 2001, Lotze and
Milewski 2004).
In coastal Maine, the Kennebec and Androscoggin
Rivers played important roles during European settle-
ment and later industrialization of the mid-coast region
(Fig. 1). In 1753, the first dam spanning the Andro-
scoggin at Brunswick-Topsham was constructed to
power sawmills (Wheeler and Wheeler 1878). Tanneries,
Manuscript received 16 May 2006; accepted 24 August 2006.Corresponding Editor: K. N. Eshleman.
4 Corresponding author: [email protected]
765

textile mills, and foundries soon followed. By 1815,
migrating salmon could no longer pass the dam at
Brunswick to upstream spawning habitat (Foster and
Atkins 1869). In 1837, a dam completed across the
Kennebec at Augusta to power several sawmills, a grist
mill, and a machine shop (North 1870) caused the
immediate collapse of the commercial salmon fishery
throughout the watershed (Foster and Atkins 1869).
Severe water pollution began in the latter 19th century,
and by the mid-20th century, contributed to the final
collapse of the remaining commercial fisheries. Pulp and
paper mills discharged large quantities of organic
matter, which resulted in anoxia, H2S production, and
frequent fish kills. Industry harnessed the waterpower of
the rivers, and the rivers conveniently disposed of
industry’s waste (Steinberg 1991).
Although flagrant organic pollution no longer causes
widespread oxygen depletion in the Kennebec and
Androscoggin Rivers (Lichter et al. 2006), portions of
the Androscoggin River periodically experience algal
blooms and reduced oxygen concentrations (Maine
Department of Environmental Protection 2000). Of the
limiting nutrients entering the Androscoggin River,
;77% of P originates from treatment of paper mill
effluents, 13% derives from municipal wastewater
treatment facilities, and 10% from runoff. Although less
impacted, the Kennebec River also experiences occa-
sional algal blooms (Maine Department of Environ-
mental Protection 2000).
There is widespread public interest in restoring
Maine’s rivers and estuaries. However, a significant
problem faced in garnering public support for more
stringent environmental regulation is the ‘‘shifting
baseline’’ syndrome described by Pauly (1995). In the
case of Maine’s rivers and estuaries, public and
institutional memory does not extend back in time far
enough to understand and value the true potential of a
degraded ecosystem, only far enough to recognize
improvement over the appalling conditions of the
middle 20th century. As such, a shifting baseline lowers
expectations for recovery. Historical ecology can inform
public debate about environmental policy by document-
ing the long-term natural baseline and in so doing,
illustrate the upper endpoint of the potential for
ecosystem recovery. In the case of coastal eutrophica-
tion, understanding the potential for clean water,
restored aquatic habitat, and increased secondary
production can contribute to public debate about the
benefits and costs of environmental regulation by
illustrating the potential opportunity cost of failing to
reduce nutrient inputs with the best available technol-
ogies. This may be especially relevant for Maine, where
tourism and recreation are vital economic activities that
would benefit from restoration of coastal ecosystems.
To document natural baseline conditions and ecosys-
tem response to the Clean Water Act of 1972 for a river–
estuary complex in coastal Maine, we reconstructed an
environmental history of Merrymeeting Bay based on
diatom, pollen, stratigraphic, and chemical records
preserved in intertidal sediments. Merrymeeting Bay is
the freshwater tidal portion of the Kennebec estuary and
receives water from the Kennebec and Androscoggin
Rivers as well as four minor rivers (Fig. 1). Our
objectives were to (1) determine baseline conditions
associated with natural climatic variability, (2) investi-
gate the effects of European settlement and industrial-
FIG. 1. Map of Merrymeeting Bay region showing core sites and location on the coast of Maine, USA. Bordering towns ofBrunswick, Topsham, and Bath are shown. Gray shaded area in the inset map shows the combined watershed of the Kennebec andAndroscoggin Rivers.
DORTE KOSTER ET AL.766 Ecological ApplicationsVol. 17, No. 3

ization within the watershed, and (3) examine ecosystem
response to environmental regulation in the late 20th
century. This historical study increases our understand-
ing of the causes and consequences of coastal eutrophi-
cation in Maine, and contributes to ongoing discussion
of the benefits and costs of environmental regulation.
STUDY REGION
Merrymeeting Bay is formed by the confluence of the
Kennebec, Androscoggin, Cathance, Abbagadasett,
Muddy, and Eastern rivers, 30 km inland from the
Atlantic coast of Maine (Fig. 1). Water draining one-
fourth of the area of Maine and part of New Hampshire
(24 755 km2) exits Merrymeeting Bay into the lower
Kennebec estuary through a narrow (215-m wide)
channel called ‘‘the Chops.’’ The substantial river flow
through this narrow channel and a series of underwater
sills constrain the upstream mixing of seawater into
Merrymeeting Bay (Wong and Townsend 1999, Kistner
and Pettigrew 2001). Although elevated salinities occur
seasonally during periods of low river flow, salinity
values generally range below the 5 g/L threshold that
distinguishes freshwater from brackish water ecosystems
(Odum et al. 1984). The Kennebec estuary is a drowned
river valley typical of New England estuaries. Tides
range up to 3.5 m at the mouth of the Kennebec but
attenuate to ;1.8 m at the Chops. Wild rice (Zizanea
aquatica) and other freshwater emergents dominate
expansive tidal marshes in Merrymeeting Bay and
provide forage for migratory waterfowl. Historically,
Merrymeeting Bay also provided important spawning
and nursery habitat for several species of anadromous
fish. Until the early 19th century, the Kennebec was
famous for its spawning runs of Atlantic salmon (Salmo
salar) and hosted prolific spawning runs of alewive
(Alosa pseudoharengus), American shad (Alosa sapid-
issima), blue-back herring (Alosa aestivalis), and striped
bass (Morona saxatalis; Foster and Atkins 1869).
Although Europeans first settled in the region during
the early 17th century, the harsh physical environment
and recurrent wars with the native Abenaki limited
immigration and population growth (Ghere 1995,
Bourque 2001). The nearby towns of Brunswick, Top-
sham, Woolwich, Cork (later Dresden), Richmond, and
Bowdoinham were being settled by 1717 (McKeen 1853,
Wheeler and Wheeler 1878, Allen 1931); and by 1760,
the area surrounding Merrymeeting Bay was a mixture
of farms, houses, and forests (Allen 1931). By 1800,
Brunswick and Topsham were industrial centers, as was
Augusta on the upstream Kennebec (Wheeler and
Wheeler 1878, North 1870). Sawmills loaded the rivers
with sawdust, textile mills discharged fibers and dyes,
and foundries dispersed trace metals. The most destruc-
tive sources of pollution were the pulp and paper mills.
The sulfite pulp process in use between 1880 and the
1960s discharged tons of lignosulphonic acid (Suter-
meister 1941) weekly into both the Kennebec and
Androscoggin rivers (Water Improvement Commission
1960, 1966, Lawrence 1967). The rivers became anoxic
as bacteria metabolized the organic matter stimulatinganaerobic bacteria to reduce the sulfite wastes to H2S.
As early as 1893, the Androscoggin had a reputation forbeing polluted (Owen 1936). By the 1940s, the river
achieved infamy as H2S emanating from its watersblackened the paint on nearby buildings and thedistinctive rotten egg odor could be smelled miles away
(Chase 1949). As a remedy for the odor, 6694 tons ofCaNO3 were dumped into the river upstream of the
Lewiston-Auburn between 1948 and 1960 (Lawrance1967). Denitrifying bacteria made use of the NO3 as an
electron acceptor, outcompeting the sulfate-reducingbacteria and effectively halting H2S production. Al-
though this quick fix made the river less obnoxious, itprobably magnified downstream eutrophication. Wide-
spread fish kills occurred in 1947, 1957, 1963, 1965, and1973 (Water Improvement Commission 1960, 1966,
Maine Department of Environmental Protection 1971).With the installation and operation of primary treat-
ment facilities at several towns and at the pulp and papermills, seasonal anoxia subsided and water quality
improved (Lichter et al. 2006). Today, the Kennebec israted a class B river (i.e., dissolved oxygen �7 mg/L andEscherichia coli mean counts ,64/100 mL), whereas the
Androscoggin is rated a class C river (i.e., dissolvedoxygen �5 mg/L and Escherichia coli mean counts
,142/100 mL).
METHODS
Sedimentary record and analyses
To reconstruct an environmental history, we collected
two cores of intertidal sediments at each of two sites inMerrymeeting Bay. The first coring site was near the
mouth of the Abagadasset River in an area knownlocally as ‘‘The Sands’’ (Fig. 1). The Sands is a deltaicstructure formed by upriver sediment transport driven
by strong flood tides. It was noted as an area of shallowwater in the 17th century prior to widespread land
clearance (Wheeler and Wheeler 1878). Examination ofa series of aerial photographs dating back to 1953
indicates that neither the Abagadasset River channel norany connecting tidal channels have migrated laterally
across the core location over this time period. Thesecond coring site, Butler Cove, is a small embayment
lacking stream or tidal channels (Fig. 1). Both coringsites are dominated by wild rice (Zizanea aquatica) and
consist of sandy sediments with organic matter percent-ages ranging between 5 and 10 percent. We vibrated a
7.6 cm diameter aluminum tube into the intertidalsediments to a depth of 1 m, plugged the top, and
retrieved each core with a hand jack. Visible stratigra-phy was recorded and cores were sectioned into 1-cmslices and stored at 48C.
A chronology was established for each site using 14C,210Pb, and 137Cs dating, as well as Rumex and Ambrosia
pollen horizons indicative of land settlement. BetaAnalytic, Miami, Florida, USA, analyzed plant tissue
April 2007 767COASTAL EUTROPHICATION IN MAINE
and small pieces of wood for 14C age. GEOTOP
laboratory, Montreal, Canada, analyzed prepared sed-
iments for 210Pb and 137Cs activity. The 210Pb concen-
tration was inferred by measurement of the activity of
the daughter product 210Po with alpha spectrometry
assuming secular equilibrium between the two isotopes
(Flynn 1968). 210Pb ages were estimated assuming a
constant rate of supply of 210Pb to the sediments
(Binford 1990). The 137Cs peak identified sediments
deposited in 1963–1964, the period of maximum activity
of atmospheric nuclear weapon testing (Milan et al.
1995).
Diatom analysis was carried out in 4-cm steps on one
of the Abagadasset River cores (i.e., Abby-1). To
prepare the samples, 1 cm3 of sediment was treated
overnight with 25 mL of a 50:50 solution of H2SO4 and
HNO3 and then digested for three hours at 908C.
Samples were washed in several steps with deionized
water and allowed to settle for 24 hours between
washings. This procedure was repeated until the sample
was neutralized. To remove sand, samples were mixed
and allowed to settle for 10 seconds; the decanted
solution was used for diatom counting. A known
concentration of microspheres was added to each sample
solution, and 750 lL was dried on a cover glass and
mounted in Naphrax (a synthetic resin dissolved in
toluene) on microscope slides. A minimum of 500
diatom valves was counted with 10003 magnification
using an Olympus BX51 microscope (Center Valley,
Pennsylvania, USA) with phase contrast. Diatom taxa
were identified to the species level using freshwater and
coastal references (Krammer and Lange-Bertalot 1986,
1988, 1991a, b, Witkowski et al. 2000). These references
also provided information about salinity and habitat
tolerances of individual diatom species. Diatom assem-
blages were divided into four zones based on an optimal
partitioning algorithm implemented with the software
ZONE (Lotter and Juggins 1991).
Patterns in diatom assemblages, as well as their
relation to other proxies measured in the sediments,
were explored using several ordination techniques.
Because detrended correspondence analysis (DCA)
determined that the variation in diatom data was ,2
SD, we analyzed diatom assemblages with linear
methods (Birks 1995), such as DCA for identification
of changes over time and redundancy analysis (RDA)
for identification of correlations with other sedimentary
proxies. Principal component analysis (PCA) was used
for summarizing patterns in pollen, as the variation in
these data was .2 SD (Birks 1995). Ordinations were
carried out with CANOCO software version 4.5 (ter
Braak and Smilauer 2002).
Pollen analysis was completed on 16 samples from the
upper 80 cm of one core from each of the two sites.
Because of the high sand content in the estuary
sediments, we used a pollen floatation technique
developed for sandy sediments (Vandergoes 2000). After
deflocculation, samples were sieved through 125-lm
Nitex mesh, and then suspended in viscous sodium
polytungstate solution with a specific gravity of 2.32.Pollen and organic particles float in the polytungstate
and are decanted for treatment with glacial acetic acid todehydrate cells and remove cellulose (Faegri et al. 1989).
Fine-grained silts and clays were removed by sieving thesample through 6-lm Nitex sieving mesh (Cwynar et al.1979). The remaining sediment was permanently sus-
pended in silicon oil. At 403 magnification, a minimumof 300 arboreal and herbaceous pollen cells were
counted and identified. Pollen data were plotted asrelative percentage using Tilia and TGView 2.0.2
software (E. Grimm, Illinois State Museum, Researchand Collections Center, Springfield, Illinois, USA).
Elemental carbon and nitrogen stable-isotope analy-ses were conducted on sediments from both core
locations. Sediments were dried for 48 h in a convectionoven and subsamples ground to a fine powder with a
ball mill. C, N, 13C, and 15N concentrations weremeasured by the University of California, Davis stable
isotope laboratory using continuous flow isotope-ratiomass spectrometry (IRMS, 20-20 mass spectrometer,
PDZEuropa, Northwich, UK) after combusting samplesat 10008C in an on-line elemental analyzer (ANCA-
GSL, PDZEuropa). Total phosphorus (TP) and biogen-ic silica (BSi) were analyzed for both sediment cores. Thelaboratory methods used for determining TP and BSi in
sediments are described in the standard operatingprocedures of the NOAA/Great Lakes Environmental
Research laboratory (Johengen 1996).
RESULTS
Chronology and sedimentation rate
The Abagadasset River core (i.e., Abby-1) that was
analyzed for a sedimentary record exhibited excess 210Pbactivity from the sediment surface to a depth of 34 cm
(Fig. 2). A strong linear relationship between log-transformed excess 210Pb activity and cumulative
sediment dry mass between 0 and 34 cm depth (R2 ¼0.97, P , 0.001) indicates a lack of physical andbiological disturbance (e.g., Zimmerman and Canuel
2000). The resulting 210Pb chronology is consistent withthe timing of the onset of rapid deposition of numerous
trace metals and fly-ash particles in the late 19th century(P. Lea, unpublished data), which reflect increasing
industrialization and technological change along thetributary rivers. The 137Cs profile of the Abby-1 core,
however, is inconsistent with the fallout history of 137Cs,suggesting post-depositional mobility and delayed in-
puts of 137Cs (Davis et al. 1984). 137C first appears at 24cm depth, which corresponds to a 210Pb date of 1912,
much earlier than the beginning of atmospheric falloutof 137Cs derived from thermonuclear testing in 1952.
Also, excess 137Cs activity does not reflect episodes ofpeak atmospheric fallout in 1959 and 1963, but instead iscorrelated with sediment organic matter content (r ¼0.72, P , 0.001). These inconsistencies in the 137Csrecord are explained by (1) mobility of 137Cs in
DORTE KOSTER ET AL.768 Ecological ApplicationsVol. 17, No. 3

sediments with low clay content, (2) delayed inputs of137Cs via transport of sediments from upriver, and (3)137Cs adsorption to organic matter (Davis et al. 1984,
Crusius and Anderson 1995, Milan et al. 1995).
Generally, Cs is immobilized in sediments by adsorption
to clay minerals at the time of deposition (Davis et al.
1984). However, in sediments of low clay content, which
is indicated by low aluminum content (,1%) in the
Abby-1 sediments, 137Cs can diffuse freely both upward
and downward within the sediment column. Delayed
deposition of 137Cs occurs when sediments deposited
upriver are eroded, transported downriver, and rede-
posited in Merrymeeting Bay at a later date than the
original atmospheric fallout. Such a time delay would
smear the 137Cs signal upward in the sediment column.210Pb is generally less mobile in sediments, and because
it derives from continuous atmospheric deposition
rather than episodic fallout events, it is less affected by
delayed transport of sediments from upriver. The
upward mobility of 137Cs and/or delayed deposition of
sediments washing in from upriver are illustrated by the
strong 137Cs peak at the sediment surface in both of our
cores, despite a decline in atmospheric fallout following
the end of thermonuclear testing in 1982 (Crusius and
Anderson 1995, Milan et al. 1995). These problems with
the 137Cs record in the Abby-1 core invalidate its use as a
complementary dating technique to 210Pb for the recent
sediments.
Excess 210Pb activity was more variable at the Butler
Cove site (i.e., BC-1 core) than at the Abagadasset site
and indicates sediment mixing (Fig. 2). A linear
regression of log-transformed excess 210Pb activity on
cumulative sediment dry mass between 0 and 14 cm
depth indicates a poor linear relationship (R2¼ 0.46, P¼0.067). This clear evidence of sediment mixing in the BC-
1 core precludes its use as an environmental record.
However, comparison with the Abby-1 210Pb profile
supports our conclusion that the Abby-1 core represents
a continuous environmental record without episodes of
sediment mixing (Fig. 2). The 137Cs profile of the BC-1
core exhibited similar post-depositional mobility, de-
layed inputs, and correlation with sediment organic
matter as the Abby-1 137Cs profile. We therefore based
our environmental history entirely on the Abby-1 core.
Its location at the head of the Sands area, which
accumulates sediments delivered by both of the major
rivers, provided a high sedimentation rate and more
consistent depositional environment than the Butler
Cove site. The overall average sedimentation rate was
0.046 cm/yr for the Abby-1 core and 0.029 cm/yr for the
BC-1 core.
Pollen indicators of local land clearance, Rumex and
Ambrosia, first occur at 44 cm depth in the Abby-1 core.
We assigned a date of AD 1717 to this depth because
several towns in the area were settled at this time
(Wheeler and Wheeler 1878, Baxter 1916, Allen 1931). A
distinct sediment color change occurred below the
settlement horizon at 48 cm depth. Sediments below 48
cm depth were dark organic, while those above 48 cm
depth were light gray-brown. A gradual transition back
to darker organic sediments occurred at 20 cm depth.
We dated plant tissue from sediments at 48 cm depth to
FIG. 2. Total activity (disintegrations per minute per gram) of 210Pb and 137Cs in the sediments of the Abby-1 and BC-1 cores.Open symbols represent 210Pb measurements, and closed symbols represent 137Cs measurements. [Conversion to SI units: 1 Ci ¼2.22 3 1012 dpm; 1 Ci¼ 3.7 3 1010 Bq; 1 Bq ¼ 1 dps.]
April 2007 769COASTAL EUTROPHICATION IN MAINE
estimate the timing of the sediment color change,
sediments at 52 cm and 64 cm depths to bracket a
period of change in the diatom record, and basal
sediments at 82 cm depth. The timing of the sediment
color change was estimated to be AD 1540 (95% CI ¼AD 1440–1640), and the period of change in diatom
record between 52 cm and 64 cm depths was estimated
to be AD 1170 (AD 1050–1240) and AD 1265 (AD
1230–1300; Table 1). A basal radiocarbon date at 82 cm
indicated that the portion of the sedimentary record that
is the focus of this study spanned the past 1800 6 40
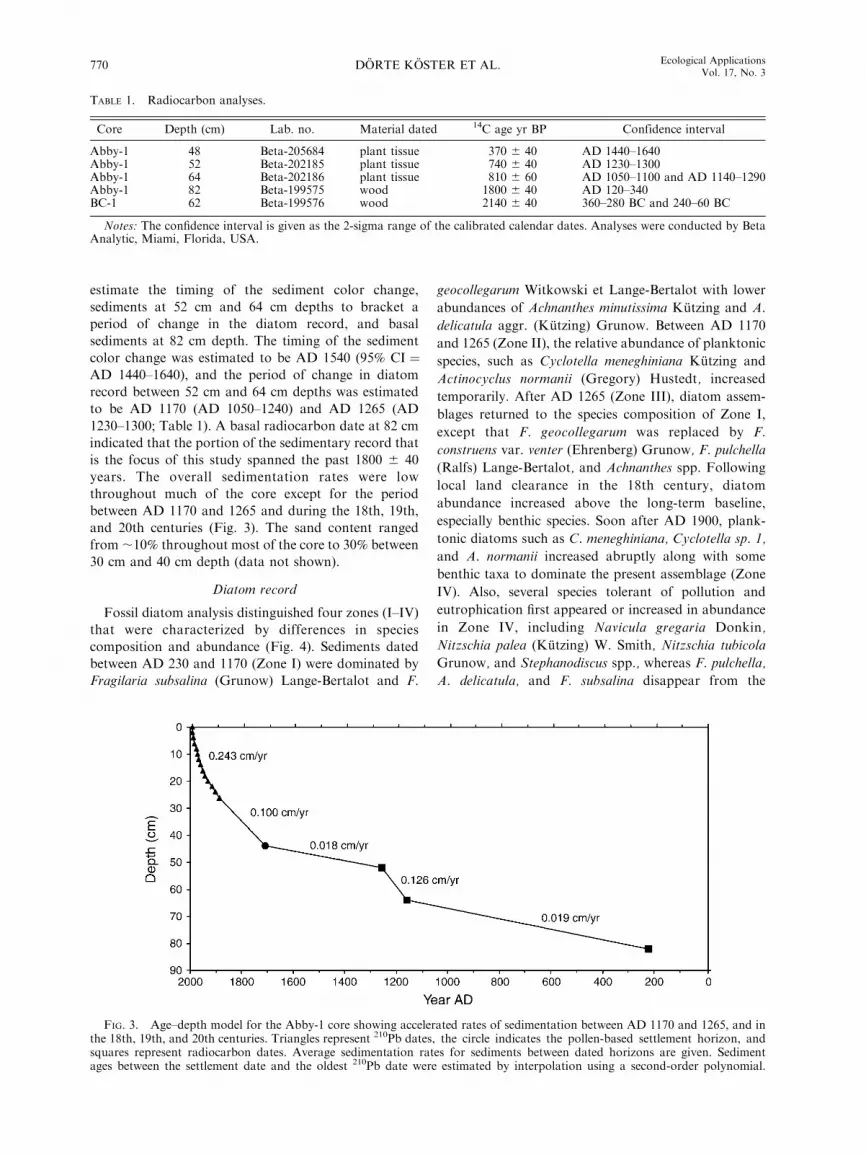
years. The overall sedimentation rates were low
throughout much of the core except for the period
between AD 1170 and 1265 and during the 18th, 19th,
and 20th centuries (Fig. 3). The sand content ranged
from ;10% throughout most of the core to 30% between
30 cm and 40 cm depth (data not shown).
Diatom record
Fossil diatom analysis distinguished four zones (I–IV)
that were characterized by differences in species
composition and abundance (Fig. 4). Sediments dated
between AD 230 and 1170 (Zone I) were dominated by
Fragilaria subsalina (Grunow) Lange-Bertalot and F.
geocollegarum Witkowski et Lange-Bertalot with lower
abundances of Achnanthes minutissima Kutzing and A.
delicatula aggr. (Kutzing) Grunow. Between AD 1170
and 1265 (Zone II), the relative abundance of planktonic
species, such as Cyclotella meneghiniana Kutzing and
Actinocyclus normanii (Gregory) Hustedt, increased
temporarily. After AD 1265 (Zone III), diatom assem-
blages returned to the species composition of Zone I,
except that F. geocollegarum was replaced by F.
construens var. venter (Ehrenberg) Grunow, F. pulchella
(Ralfs) Lange-Bertalot, and Achnanthes spp. Following
local land clearance in the 18th century, diatom
abundance increased above the long-term baseline,
especially benthic species. Soon after AD 1900, plank-
tonic diatoms such as C. meneghiniana, Cyclotella sp. 1,
and A. normanii increased abruptly along with some
benthic taxa to dominate the present assemblage (Zone
IV). Also, several species tolerant of pollution and
eutrophication first appeared or increased in abundance
in Zone IV, including Navicula gregaria Donkin,
Nitzschia palea (Kutzing) W. Smith, Nitzschia tubicola
Grunow, and Stephanodiscus spp., whereas F. pulchella,
A. delicatula, and F. subsalina disappear from the
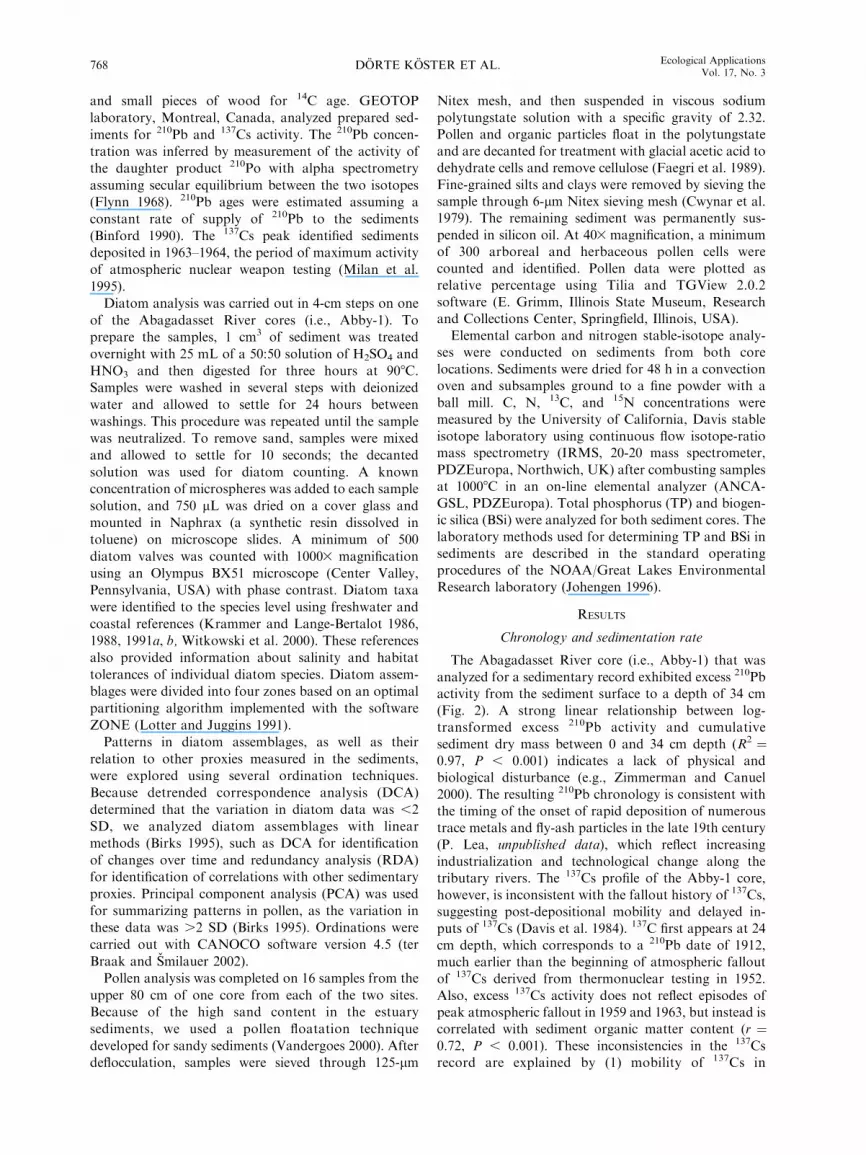
TABLE 1. Radiocarbon analyses.
Core Depth (cm) Lab. no. Material dated 14C age yr BP Confidence interval
Abby-1 48 Beta-205684 plant tissue 370 6 40 AD 1440–1640Abby-1 52 Beta-202185 plant tissue 740 6 40 AD 1230–1300Abby-1 64 Beta-202186 plant tissue 810 6 60 AD 1050–1100 and AD 1140–1290Abby-1 82 Beta-199575 wood 1800 6 40 AD 120–340BC-1 62 Beta-199576 wood 2140 6 40 360–280 BC and 240–60 BC
Notes: The confidence interval is given as the 2-sigma range of the calibrated calendar dates. Analyses were conducted by BetaAnalytic, Miami, Florida, USA.
FIG. 3. Age–depth model for the Abby-1 core showing accelerated rates of sedimentation between AD 1170 and 1265, and inthe 18th, 19th, and 20th centuries. Triangles represent 210Pb dates, the circle indicates the pollen-based settlement horizon, andsquares represent radiocarbon dates. Average sedimentation rates for sediments between dated horizons are given. Sedimentages between the settlement date and the oldest 210Pb date were estimated by interpolation using a second-order polynomial.
DORTE KOSTER ET AL.770 Ecological ApplicationsVol. 17, No. 3

diatom assemblage. F. subsalina reappears in low
abundances in the most recent samples.
The percentage of the diatom taxa characterized as
freshwater species increased from 20% to 30% in Zone I
to 62% in Zone II, followed by a decrease to 30% at the
start of Zone III. Later in Zone III, freshwater taxa rose
to a peak at 60% at depths of 24 cm and 28 cm, followed
by declining relative proportions ranging between 30%
and 45% in Zone IV. These changes are inversely
proportional to the portion of brackish species for most
of the core, except in the upper 15 cm, where species
common to both freshwater and brackish water replaced
some of the freshwater species.
The ordination results of the diatom data support the
separation of four zones established by optimal parti-
tioning (Fig. 5a). Two major excursions from the
baseline conditions occurred from AD 1170 to 1265
(Zone II) and from AD 1920 to the present. Analysis of
diatom–environment relationships with redundancy
analysis (RDA) revealed that the major source of
variation (eigenvalue 0.46) in diatom assemblage was
accounted for by indicators of productivity such as total
phosphorus, biogenic silica, percent carbon, and diatom
flux, which loaded positively, and by diatom diversity,
which loaded negatively (Fig. 5b). Variables loading on
the second axis include sand content, presumed to
increase with increasing land clearance, as well as with
variation in flow. Pollen assemblage accounted for a
significant, but lower, proportion of variation, indicated
by the eigenvalue of the second axis (0.21).
Pollen record
The earliest change in pollen abundance was exhibited
by Picea sp. (spruce), which began to increase above its
baseline percentages between AD 1265 and 1540 (Fig.
6). In the 17th century, pollen of Pinus strobus (white
pine), Tsuga canadensis (eastern hemlock), and Fagus
grandifolia (American beech) declined in relative abun-
dance. Coincident with these decreases in tree pollen was
a decline in Poaceae pollen in the 32–38 lm size class,
which we assume to be Zizanea (wild rice) because of cell
size (Lee et al. 2004), its continuous presence throughout
the core, and the vigorous population of Zizanea in
Merrymeeting Bay today. Pollen records representing
terrestrial landscapes in Maine show little grass pollen
prior to land clearance (see Russell et al. 1993). Along
with Rumex and Ambrosia, alder (Alnus sp.) and
hazelnut (Corylus sp.) increase at the time of local land
clearance. Pollen of the aquatic macrophyte Isoetes
(quillwort) also appears in the record at AD 1717, rising
to a peak at AD 1880, followed by a sudden
disappearance. However, this increase was not observed
in the sediment core from Butler Cove, suggesting that
the Isoetes rise in Abby-1 was a local phenomenon.
Spruce and hemlock pollen declined after AD 1900, and
Zizanea pollen increased to pre-AD 1540 levels.
FIG. 4. Diatom stratigraphy of the Abby-1 core with salinity preferences and fluxes of planktonic and benthic species.Relative abundances of diatom species are ordered from left to right corresponding to their chronological appearance in the corefrom the past to the present. Major diatom zones are indicated by Roman numerals (right). Salinity preferences are shown as theproportion of freshwater (f ), freshwater and brackish (f þ b), and brackish water (b) species, represented by white, gray, andblack areas, respectively. The numbers of planktonic and benthic diatoms are given as fluxes in units of 10 000 valves�cm�2�yr�1.
April 2007 771COASTAL EUTROPHICATION IN MAINE

Sediment chemistry
Changes in C and N content and in 13C and 15N
isotopic composition observed between AD 1170 and
1265, and again during the 19th and 20th centuries (Fig.
7), corresponded to diatom zone changes (Fig. 4).
Between AD 1170 and 1265, C and N percentage,
organic C flux, total P flux, biogenic Si flux, and diatom
abundance indicate greater primary productivity than
during the time periods immediately before and after.
After AD 1540, sediment C and N percentages declined
coinciding with a change to lighter colored sediments
that lasted into the 20th century. Around AD 1880,
organic C, total P, biogenic Si, and diatom abundance
rose rapidly to their highest values in the 1800-year
record. Stable isotopes also changed directionally with
decreasing d13C, indicating proportionally more of the
lighter isotope. Conversely, increasing d15N indicated
proportionally more of the heavy isotope.
FIG. 5. Results of ordination analyses to discriminate patterns in fossil diatom assemblages and to evaluate relationshipsbetween variation in diatom assemblages and environmental variables: (a) detrended correspondence analysis plot showing fourdiatom zones consistent with results of optimal partitioning (Fig. 4); (b) redundancy analysis (RDA) plot showing that indicators ofproductivity (i.e., total phosphorus [TP], biogenic silica [BSi], organic C, and diatom flux) accounted for much of the variation indiatom assemblage and that indicators of land clearance accounted for a lesser proportion of the variation in diatom assemblage.polPCA1 and polPCA2 summarize the main patterns in fossil pollen data. They represent the sample scores of the samples on axes1 and 2, respectively, on a PCA run with the fossil pollen data only.
DORTE KOSTER ET AL.772 Ecological ApplicationsVol. 17, No. 3

DISCUSSION
Natural climatic variability, as well as human land
use, influenced the sedimentary record of Merrymeeting
Bay. Climate variability is evident in the episode of
accelerated sedimentation and change in diatom abun-
dances in the 12th and 13th centuries and in a longer
period of climatic cooling coincident with the Little Ice
Age (i.e., AD 1500–1900). Human land-use effects began
with European settlement in the 17th or early 18th
century and intensified with industrialization and
municipal growth in the late 19th and 20th centuries.
The diatom record showed little evidence of ecosystem
recovery following implementation of environmental
legislation in the 1960s and 1970s. These results are
consistent with regional vegetation histories indicating
broad-scale climate trends in New England (e.g., Russell
et al. 1993, Fuller et al. 1998, Pederson et al. 2005),
historical studies documenting eutrophication in estuar-
ies throughout the 19th and 20th centuries (Cooper and
Brush 1993, Cooper 1995, Cooper et al. 2004), and with
biogeochemical studies quantifying rising nutrient con-
centrations in rivers and estuaries throughout the latter
20th century (Jaworski et al. 1997, Cloern 2001).
Natural climatic variability is evident in changes in
sedimentation rate, diatom abundance and composition,
the ratio of planktonic to benthic diatoms, and the
pollen record. Between AD 1170 and 1265, sedimenta-
tion increased above background levels, and the
abundances of several diatom taxa varied from previous
centuries. An increase in the ratio of planktonic to
benthic diatoms indicates increased turbidity associated
with greater sediment influx and algal productivity
(Cooper and Brush 1993). Pederson et al. (2005)
interpret a similar episode of increased sedimentation
in a Hudson River salt marsh, as indicative of regional
drought during the Medieval Warm Period. Drought
may increase tree mortality and fire frequency, leading
to increased erosion and sedimentation. Between AD
1265 and 1540, spruce pollen increased from low relative
percentages to amounts exceeding 10% of total tree
pollen. Similar increases in the relative percentage of
spruce pollen have been related to lower temperatures
and higher precipitation in northeastern North America
FIG. 6. Relative pollen abundances for the Abby-1 core. The total upland pollen count comprises tree, shrub, and herbaceousspecies. Abundances of aquatic and emergent species are calculated relative to total upland pollen. Hatched areas are exaggeratedby 10 times.
April 2007 773COASTAL EUTROPHICATION IN MAINE

(Russell et al. 1993, Schauffler and Jacobsen 2002,
Lindbladh et al. 2003). Also at this time, Zizanea pollen
declined in relative abundance suggesting a shorter ice-
free growing season that reduced the establishment and
growth of this annual grass on the intertidal mudflats.
The section of lighter colored sediments between 20
cm and 48 cm depths is related to greater inputs of
mineral sediments relative to organic matter than in
sediments above and below. The 95% confidence interval
of the radiocarbon estimate of the timing of this change
ranged from AD 1440 to 1640, suggesting that the initial
increase in sedimentation was either associated with
land-use changes very early in the Colonial Era or with
natural climate variability that destroyed vegetation and
promoted erosion. English families began settling along
the tidal Androscoggin and Kennebec rivers in the 1650s
(Churchill 2001); however, there were few settlers before
1640. Alternatively, a cooler climate associated with the
Little Ice Age may have increased the duration of winter
ice cover, thereby decreasing vegetative growth and in
situ organic matter production on the intertidal flats,
resulting in the observed change in sediment color.
Colonial impacts on the landscape are unambiguous at
44 cm depth, where pollen indicators of land clearance
first appear, sedimentation accelerates, and diatom
productivity increases. Several studies have implicated
land clearance and agriculture as the underlying causes
of increased sedimentation in estuaries (e.g., Brush 1989,
Neubauer et al. 2002, Cooper et al. 2004), although
accelerated sea-level rise along the Maine coast begin-
ning around AD 1800 may also have contributed to
increased sedimentation rates (Gehrels et al. 2002). Local
historians reported that land-use changes along the lower
Androscoggin and other rivers resulted in the filling in of
Merrymeeting Bay with sand during the 18th century
(McKeen 1853). Whereas the largest ships of the 17th
century could navigate through Merrymeeting Bay and
up the lower Androscoggin River to the falls at
Brunswick, ships had to unload a part of their cargo at
Merrymeeting Bay by the mid-19th century before
proceeding up the Androscoggin because of the shallow-
ness of its channel (Wheeler and Wheeler 1878). By AD
1800, benthic diatom productivity increased markedly
along with a relative increase in the proportion of
freshwater diatom taxa. Increased nutrient inputs and
run-off from cleared land probably triggered these early
changes in diatom composition (e.g., Cooper 1995).
A larger and more abrupt change in diatom assem-
blage and sediment chemistry occurred at the end of the
19th century corresponding with population growth and
accelerating industrial activity within the watershed
(Babcock et al. 1995). Benthic diatoms indicative of
polluted waters (e.g., Navicula gregaria and Nitzschia
palea) became abundant, as did planktonic species often
dominant in eutrophic waters (e.g., Cyclotella mene-
ghiniana and Actinocyclus normanii). The productivity of
benthic taxa declined temporarily between AD 1900 and
1940, probably because of increased turbidity associated
FIG. 7. Sediment chemistry for the Abby-1 core. From left to right, percentage carbon (%C), C flux, carbon to nitrogen ratio(C:N), 13C and 15N stable isotopes, total phosphorus (TP), biogenic silica (BSi), and diatom fluxes are illustrated. D ¼[Rsam/Rstd � 1] 3 1000, with R representing the 13C/12C and 15N/14N ratios in the sample and the PDB (Pee Dee Belemnite)and Air (air stable isotope ratio) standard, respectively. The numbers of planktonic and benthic diatoms are given as fluxesin units of 10 000 valves�cm�2�yr�1.
DORTE KOSTER ET AL.774 Ecological ApplicationsVol. 17, No. 3

with pulp-mill effluents and frequent blooms of blue-
green algae (Walker 1931, Maine Department of
Environmental Protection 1979). Planktonic diatoms
increased in both relative and absolute abundance
throughout the 20th century, suggesting that nutrient
loading has continued without reduction.
C flux to sediments supports the evidence of eutrophi-
cation in the diatom record. High organic content
beginning in the mid-19th century and lasting through-
out the 20th century indicates high primary productivity
and probably increasing inputs of organic matter from
industry and growing municipalities (Lichter et al. 2006).
Although decomposition is likely to reduce the C content
of the very recent sediments, the late 20th century
produced the highest quantities of organic C throughout
the sedimentary record. Since the mid-19th century, d15Nhas undergone an oscillating increase, while d13C has
declined by ;1.5ø. Increasing d15N values are consis-
tent with high productivity (Bratton et al. 2003) as well as
wastewater input (Hodell and Schelske 1998). Declines in
d13C in recent sediments of Chesapeake Bay have been
interpreted as increases in terrestrial relative to marine
sources of organic C associated with wetter climates
(Bratton et al. 2003). However, the decline in C:N ratio
of organic matter in the Merrymeeting Bay sediments
indicates that algal productivity increased relative to
terrestrial C inputs during the last century, which is
supported by increases in diatom flux, total P, and
biogenic Si. It is possible that the decline in sediment
d13C resulted from a decrease in d13C of atmospheric
CO2. The timing of the shift in the upper sediments is
consistent with a decline in atmospheric d13C attributed
to fossil fuel burning (Francey et al. 1999).
The evidence of eutrophication in Merrymeeting Bay
conforms with historical studies of Chesapeake Bay
(Cooper and Brush 1993, Zimmerman and Canuel
2002), New Bedford Harbor (Chmura et al. 2004), and
of the Pamlico and Neuse estuaries (Cooper et al. 2004).
Like these studies, indicators of eutrophication showed
little evidence of ecosystem recovery following the Clean
Water Act. Benthic diatom productivity increased after
a period of low abundance between AD 1900 and 1970,
suggesting that primary wastewater treatment improved
water clarity. However, high sedimentation rate, high
diatom productivity, high planktonic to benthic diatom
ratio, and high levels of organic C, total P, and biogenic
Si indicate that the ecosystem is more eutrophic than its
long-term baseline conditions. The primary sources of N
in coastal Maine are atmospheric deposition and
municipal wastewater facilities (Roman et al. 2000),
whereas the primary sources of P are emissions from
paper mills (McCubbin Consultants 2003). It is also
possible that P is recycled from sediments (Coelho et al.
2004). Fertilization experiments indicate that both N
and P limit phytoplankton productivity within Merry-
meeting Bay (Lichter, unpublished data), and P emis-
sions from paper mills have been implicated as causes of
upriver algal blooms (McCubbin Consultants 2003).
Implications for management and restoration
The accelerated sedimentation and cultural eutrophi-cation that characterized the last two centuries of
Merrymeeting Bay history had important consequencesfor the ecosystem. In addition to algal blooms, oxygen
depletion, fish kill, and loss of biodiversity, increasedturbidity is likely to have reduced the abundance of
submerged aquatic vegetation (SAV) and consequently,altered the benthic food web. Aerial photographs show
that SAV in Merrymeeting Bay currently inhabits ,5%
of shallows ,3 m deep at low tide. Reductions in SAV
have been attributed to increased turbidity associatedwith eutrophication and high sedimentation in the
Hudson River estuary (Nieder et al. 2004), ChesapeakeBay (Orth and Moore 1984, Stevenson et al. 1993, Orth
et al. 2002), the Potomac River (Carter and Rybicki1986), and Waquoit Bay (Short and Burdick 1996). SAV
provides vital habitat and food for invertebrates and fish(Menzie 1980, Catling et al. 1994, Fluharty 2000), foodfor waterfowl (Noordhuis et al. 2002), and beneficial
ecosystem effects such as nutrient uptake, oxygengeneration, and sediment stabilization (Barko et al.
1991, Carter and Rybicki 1991). As such, the loss ofSAV may hinder efforts to restore populations of native
anadromous fish such as American shad and stripedbass because of the lack of nursery habitat and forage
for juvenile fish.Although the extent to which turbidity associated
with ongoing nutrient loading interferes with therecovery of SAV in Merrymeeting Bay is unclear, the
diatom record indicates that current nutrient inputs pluspotential recycling of P from sediments are sufficient to
maintain the high diatom productivity and alteredcommunity composition that characterized the era of
raw pollution during the mid-20th century. This issomewhat enigmatic because region-wide analyses of
nutrient-loading rates in New England estuaries indicatethat the Kennebec estuary is one of the least impacted by
nonpoint nutrient sources because the watersheds of theAndroscoggin and Kennebec rivers are largely forestedwith little agriculture and few urban areas (Boyer et al.
2002). It is likely that prehistoric nutrient inputs andproductivity were extremely low in the undisturbed
watershed (Nixon 1997). Consequently, even the rela-tively low levels of anthropogenic nutrient inputs into
the Androscoggin and Kennebec rivers may be sufficientto maintain the altered community composition and
elevated productivity observed in the diatom record ofMerrymeeting Bay.
Much research would be needed to evaluate the effectsof ongoing nutrient loading on the water clarity of
Merrymeeting Bay. There are particular areas withinMerrymeeting Bay and its small tributaries that are
characterized by excessive turbidity. In addition to highalgal productivity, turbidity may result from the activity
of introduced benthivorous fish such as carp (Cyprinuscarpio; Zambrano et al. 2001) as well as tidal resuspen-
sion of sediments. However, should it be determined
April 2007 775COASTAL EUTROPHICATION IN MAINE

that algal productivity strongly influences water turbid-
ity, nutrient inputs to Merrymeeting Bay and its
tributaries would have to be reduced. While primary
and secondary wastewater treatments effectively elimi-
nate organic matter, tertiary treatment is required to
remove significant percentages of the nutrients in
municipal wastewaters. Much of the P emitted by paper
mills on the Androscoggin could also be eliminated as
technology is available that would reduce P discharges
by as much as 65% (McCubbin Consultants 2003).
While it is true that environmental regulation can be
costly, the opportunity cost of continuing to pollute
rivers and estuaries should be considered in making
management decisions. Because the paper industry
constitutes an important source of economic activity in
Maine and provides relatively high-paying jobs that are
essential in rural areas, it wields considerable influence
in the politics of environmental management. However,
tourism, recreation, and shellfish fisheries are also vital
components of the Maine economy, and all would
benefit from sustained recovery of coastal ecosystems.
A shifting baseline may contribute to the political
difficulty of legislating more stringent regulation of
nutrient pollution. Public and institutional memory does
not extend back in time far enough to recognize the
potential for ecosystem recovery, only far enough to
recognize the substantial improvement since the time
when Merrymeeting Bay and its tributary rivers were
described as open sewers. Public debate continues to
focus on whether or not industry and municipalities
meet the minimum standards, rather than what this
unusual and important river–estuary complex could be
and how to best manage it to achieve long-term
restoration goals. Environmental history can inform
debate about ecosystem management in light of
economic tradeoffs by documenting the long-term
baseline of the ecosystem, and thereby illustrate the
upper limit of the potential for ecosystem recovery.
ACKNOWLEDGMENTS
This work is part of a comprehensive investigation of theecology and environmental history of Merrymeeting Bay byBowdoin College. The Henry Luce Foundation, the Henry L.and Grace Doherty Foundation, and Geoffrey and AllisonRusack generously provided funds for the research. We thankElizabeth Harvey, Heather Caron, Jaret Reblin, and EileenJohnson for their invaluable help, and are especially indebted toBob Stevens for building a core-extruding tool on extremelyshort notice. Discussion with DeWitt John stimulated ourunderstanding of the public debate about management ofindustrial discharges of P into the Androscoggin River and therelevance of our data to those issues.
LITERATURE CITED
Allen, C. E. 1931. History of Dresden, Maine. KennebecJournal Print Shop, Augusta, Maine, USA.
Babcock, R. H., Y. Frenette, C. A. Scontras, and E. Eagan.1995. Work and workers in the Industrial Age, 1865–1930.Pages 448–479 in R. W. Judd, E. A. Churchill, and J. W.Eastman, editors. Maine: The Pine Tree State fromprehistory to the present. University of Maine Press, Orono,Maine, USA.
Barko, J. W., D. Gunnison, and S. R. Carpenter. 1991.Sediment interactions with submersed macrophyte growthand community dynamics. Aquatic Botany 41:41–65.
Baxter, J. P. 1916. The Baxter manuscripts. Documentaryhistory of the State of Maine. Volume XXII. Portland, MaineHistorical Society, Portland, Maine, USA.
Binford, M. W. 1990. Calculation and uncertainty analysis of210Pb dates for PIRLA project lake sediment cores. Journalof Paleolimnology 3:253–267.
Birks, H. J. B. 1995. Quantitative paleoenvironmental recon-structions. Pages 161–254 in D. Maddy and J. S. Brew,editors. Statistical modeling of Quaternary Science data.Quaternary Research Association, Cambridge, UK.
Bourque, B. J. 2001. Twelve thousand years: American Indiansin Maine. University of Nebraska Press, Lincoln, Nebraska,USA.
Boyer, E. W., C. L. Goodale, N. A. Jaworski, and R. W.Howarth. 2002. Anthropogenic nitrogen sources and relation-ships to riverine nitrogen export in the northeastern U.S.A.Biogeochemistry 57:137–169.
Bratton, J. F., S. M. Colman, and R. R. Seal. 2003.Eutrophication and carbon sources in Chesapeake Bay overthe last 2700 yr: human impacts in context. Geochimica EtCosmochimica Acta 67:3385–3402.
Brush, G. S. 1989. Rates and patterns of estuarine sedimentaccumulation. Limnology and Oceanography 34:1235–1246.
Carter, V., and N. B. Rybicki. 1990. Light attenuation andsubmersed macrophyte distribution in the tidal PotomacRiver. Estuaries 13:441–452.
Catling, P. M., K. W. Spicer, M. Biernacki, and J. L. Doust.1994. The biology of Canadian weeds. 103. Vallisneriaamericana Michx. Canadian Journal of Plant Science 74:883–897.
Chase, E. S. 1949. Pollution of the Androscoggin River byindustrial wastes and control measures thereof. BostonSociety of Civil Engineering 36:357–381.
Chmura, G. L., A. Santos, V. Pospelova, Z. Spasojevic, R.Lam, and J. S. Latimer. 2004. Response of three paleo-primary production proxy measures to development of anurban estuary. Science of the Total Environment 320:225–243.
Churchill, E. A. 2001. English beachheads in Seventeenth-Century Maine. Pages 51–75 in R. W. Judd, E. A. Churchill,and J. W. Eastman, editors. Maine: The Pine Tree State fromprehistory to the present. University of Maine Press, Orono,Maine, USA.
Cloern, J. E. 2001. Our evolving conceptual model of thecoastal eutrophication problem. Marine Ecology ProgressSeries 210:223–253.
Coelho, J. P., M. R. Flindt, H. S. Jensen, A. I. Lillebo, andM. A. Pardal. 2004. Phosphorus speciation and availability inintertidal sediments of a temperate estuary: relation toeutrophication and annual P-fluxes. Estuarine, Coastal andShelf Science 61:583–590.
Cooper, S. R. 1995. Chesapeake Bay watershed historical land-use–impact on water quality and diatom communities.Ecological Applications 5:703–723.
Cooper, S. R., and G. S. Brush. 1993. A 2500-year history ofanoxia and eutrophication in Chesapeake Bay. Estuaries 16:617–626.
Cooper, S. R., S. K. McGlothlin, M. Madritch, and D. L.Jones. 2004. Paleoecological evidence of human impacts onthe Neuse and Pamlico Estuaries of North Carolina, USA.Estuaries 27:617–633.
Crusius, J., and R. F. Anderson. 1995. Evaluating the mobilityof Cs-137, Pu-239þ240, and Pb-210 from their distributionsin laminated lake sediments. Journal of Paleolimnology 13:119–141.
Cwynar, L. C., E. Burden, and J. H. McAndrews. 1979. Aninexpensive sieving method for concentrating pollen and
DORTE KOSTER ET AL.776 Ecological ApplicationsVol. 17, No. 3

spores from fine-grained sediments. Canadian Journal ofEarth Sciences 16:1115–1120.
Davis, R. B., C. T. Hess, S. A. Norton, D. W. Hanson, K. D.Hoagland, and D. S. Anderson. 1984. 137Cs and 210Pb datingof sediments from soft-water lakes in New England (USA)and Scandinavia, a failure of Cs dating. Chemical Geology44:151–185.
Faegri, K., P. E. Kaland, and K. Krzywinski. 1989. Textbookof pollen analysis. Fourth edition. J. Wiley and Sons, NewYork, New York, USA.
Fluharty, D. 2000. Habitat protection, ecological issues, andimplementation of the Sustainable Fisheries Act. EcologicalApplications 10:325–337.
Flynn, W. W. 1968. Determination of low levels of polonium-210 in environmental materials. Analytical Chimica Acta 43:221–227.
Foster, D. R., G. Motzkin, and B. Slater. 1998. Land-usehistory as long-term broad-scale disturbace: regional forestdynamics in central New England. Ecosystems 1:96–119.
Foster, D. R., F. Swanson, J. Aber, I. Burke, N. Brokaw, D.Tilman, and A. Knapp. 2003. The importance of land-uselegacies to ecology and conservation. Bioscience 53:77–88.
Foster, N. W., and C. G. Atkins. 1869. Reports of theCommissioners of Fisheries of the State of Maine for theyears 1867 and 1868. Owen and Nash, Augusta, Maine,USA.
Francey, R. J., C. E. Allison, D. M. Etheridge, C. M.Trudinger, I. G. Enting, M. Leuenberger, R. L. Langen-felds, E. Michel, and L. P. Steele. 1999. A 1000-year highprecision record of d13C in atmospheric CO2. Tellus 51B:170–193.
Fuller, J. L., D. R. Foster, J. S. McLachlan, and N. Drake.1998. Impact of human activity on regional forest composi-tion and dynamics in central New England. Ecosystems 1:76–95.
Gehrels, W. R., D. F. Belknap, S. Black, and R. M. Newnham.2002. Rapid sea-level rise in the Gulf of Maine, USA, sinceAD 1800. The Holocene 12:383–389.
Ghere, D. L. 1995. Diplomacy and war on the Maine frontier,1678–1759. Pages 120–142 in R. W. Judd, E. A. Churchill,and J. W. Eastman, editors. Maine: The Pine Tree State fromprehistory to the present. University of Maine Press, Orono,Maine, USA.
Hodell, D. A., and C. L. Schelske. 1998. Production,sedimentation, and isotopic composition of organic matterin Lake Ontario. Limnology and Oceanography 43:200–214.
Jackson, J. B. C., et al. 2001. Historical overfishing and therecent collapse of coastal ecosystems. Science 293:629–638.
Jaworski, N. A., R. W. Howarth, and L. J. Hetling. 1997.Atmospheric deposition of nitrogen oxides onto the land-scape contributes to coastal eutrophication in the NortheastUnited States. Environmental Science and Technology 31:1995–2004.
Johengen, T. 1996. Standard operating procedures for deter-mining total phosphorus, available phosphorus, and biogenicsilica concentrations of Lake Michigan sediments andsediment trap material. NOAA/Great Lakes EnvironmentalResearch Lab, Ann Arbor, Michigan, USA.
Kistner, D. A., and N. R. Pettigrew. 2001. A variable turbiditymaximum in the Kennebec estuary, Maine. Estuaries 24:680–687.
Krammer, K., and H. Lange-Bertalot. 1986. Bacillariophyceae,1. Teil: Naviculaceae. Gustav Fischer Verlag, Stuttgart,Germany.
Krammer, K., and H. Lange-Bertalot. 1988. Bacillariophyceae,2. Teil: Bacillariaceae, Epithemiaceae, Surirellaceae. GustavFischer Verlag, Stuttgart, Germany.
Krammer, K., and H. Lange-Bertalot. 1991a. Bacillariophy-ceae, 3. Teil: Centrales, Fragilariaceae, Eunotiacea. GustavFischer Verlag, Stuttgart, Gemany.
Krammer, K., and H. Lange-Bertalot. 1991b. Bacillariophy-ceae, 4. Teil: Achnanthaceae. Gustav Fischer Verlag,Stuttgart, Germany.
Lawrance, W. A. 1967. A twenty-five year review of Andro-scoggin River pollution control activities. A report to theAndroscoggin River Technical Committee. Sanitary WaterBoard, State of Maine, Lewiston, Maine, USA.
Lee, G.-A., A. M. Davis, D. G. Smith, and J. H. McAndrews.2004. Identifying fossil wild rice (Zizanea) pollen fromCootes Paradise, Ontario: a new approach using scanningelectron microscopy. Journal of Archeological Science 31:411–421.
Lichter, J., H. Caron, T. S. Pasakarnis, S. L. Rodgers, T. S.Squiers, Jr., and C. S. Todd. 2006. The ecological collapseand partial recovery of a freshwater tidal ecosystem.Northeastern Naturalist 13:153–178.
Lindbladh, M., G. L. Jacobson, Jr., and M. Schauffler. 2003.The postglacial history of three Picea species in NewEngland, USA. Quaternary Research 59:61–69.
Lotter, A., and S. Juggins. 1991. POLPROF, TRAN andZONE: Programs for plotting, editing and zoning pollen anddiatom data. INQUA Commission for the Study of theHolocene Newsletter 6:17–24.
Lotze, H. K., and I. Milewski. 2004. Two centuries of multiplehuman impacts and successive changes in a North Atlanticfood web. Ecological Applications 14:1428–1447.
Maine Department of Environmental Protection. 1971. Kenne-bec Basin interim water quality plan. EnvironmentalImprovement Commission. Augusta, Maine, USA.
Maine Department of Environmental Protection. 1979. TheKennebec River, 1978 water quality, a historic perspective.Maine Department of Environmental Protection, Augusta,Maine, USA.
Maine Department of Environmental Protection. 2000. Kenne-bec River modeling report. Bureau of Land and WaterQuality, Division of Environmental Assessment, Augusta,Maine, USA.
McCubbin Consultants. 2003. Current technology for controlof phosphorus and BOD discharges in effluents from threeKraft pulp mills on the Androscoggin River. Reportprepared for the State of Maine Department of Environ-mental Protection. Augusta, Maine, USA.
McKeen, J. 1853. Some accounts of the early settlements atSagadahock and on the Androscoggin river. Article V.Collection of the Maine Historical Society V. III. Portland,Maine, USA.
Menzie, C. A. 1980. The chironomid (Insecta: Diptera) andother fauna of a Myriophyllum spicatum L. plant bed in thelower Hudson River. Estuaries 3:38–54.
Milan, C. S., E. M. Swenson, R. E. Turner, and J. M. Lee.1995. Assessment of the Cs-137 method for estimatingsediment accumulation rates–Louisiana Salt Marshes. Jour-nal of Coastal Research 11:296–307.
Neubauer, S. C., I. C. Anderson, J. A. Constantine, and S. A.Kuehl. 2002. Sediment deposition and accretion in a mid-Atlantic (USA) freshwater marsh. Estuarine, Coastal andShelf Science 54:713–727.
Nieder, W. C., E. Barnaba, S. E. G. Findlay, S. Hoskins, N.Holochuck, and E. A. Blair. 2004. Distribution andabundance of submerged aquatic vegetation and Trapanatans in the Hudson River estuary. Journal of CoastalResearch Special Issue 45:150–161.
Nixon, S. W. 1997. Prehistoric nutrient inputs and productivityin Narragansett Bay. Estuaries 20:253–261.
Noordhuis, R., D. T. van der Molen, and M. S. van der Berg.2002. Response of herbivorous water-birds to the return ofChara in Lake Veluwemeer, The Netherlands. AquaticBotany 72:349–367.
North, J. W. 1870. The history of Augusta. Clapp and North,Augusta, Maine, USA.
April 2007 777COASTAL EUTROPHICATION IN MAINE

Odum, W. E., T. J. Smith, J. K. Hoover, and C. C. McIvor.1984. The ecology of tidal freshwater marshes of the UnitedStates east coast: a community profile. FWS/OBS-83117.U.S. Fish and Wildlife Service, Washington, D.C., USA.
Orth, R. J., R. A. Batiuk, P. W. Bergstrom, and K. A. Moore.2002. A perspective on two decades of policies andregulations influencing the protection and restoration ofsubmerged aquatic vegetation in Chesapeake Bay, USA.Bulletin of Marine Science 71:1391–1403.
Orth, R. J., and K. A. Moore. 1984. Chesapeake Bay: anunprecedented decline in submerged aquatic vegetation.Science 222:51–53.
Owen, H. W., Jr. 1936. The Edward Clarence Plummer historyof Bath, Maine. The Times Company, Bath, Maine, USA.
Pauly, D. 1995. Anecdotes and the shifting baseline syndromeof fisheries. Trends in Ecology and Evolution 10:430.
Pederson, D. C., D. M. Peteet, D. Kurdyla, and T. Guilderson.2005. Medieval warming, Little Ice Age, and Europeanimpact on the environment during the last millennium in thelower Hudson Valley, New York, USA. Quaternary Re-search 63:238–249.
Poff, N. L., J. D. Allan, M. B. Bain, J. R. Karr, K. L.Prestegaard, B. D. Richter, R. E. Sparks, and J. S.Stromberg. 1997. The natural flow regime. Bioscience 47:769–784.
Roman, C. T., N. Jaworski, F. T. Short, S. Findlay, and R. S.Warren. 2000. Estuaries of the northeastern United States:habitat and land use signatures. Estuaries 23:743–764.
Russell, E. W. B., R. B. Davis, R. S. Anderson, T. E. Rhodes,and D. S. Anderson. 1993. Recent centuries of vegetationalchange in the glaciated north-eastern United States. Journalof Ecology 81:647–664.
Schauffler, M., and G. L. Jacobson. 2002. Persistence of coastalspruce refugia during the Holocene in northern NewEngland, USA, detected by stand-scale pollen stratigraphies.Journal of Ecology 90:235–250.
Short, F. T., and D. M. Burdick. 1996. Quantifying eelgrasshabitat loss in relation to housing development and nitrogenloading in Waquoit Bay, Massachusetts. Estuaries 19:730–739.
Steinberg, T. 1991. Nature incorporated: industrialization andthe waters of New England. Cambridge University Press,Cambridge, UK.
Stevenson, J. C., L. W. Staver, and K. W. Staver. 1993. Waterquality associated with survival of submersed aquaticvegetation along an estuarine gradient. Estuaries 16:346–361.
Sutermeister, E. 1941. Chemistry of pulp and paper making.John Wiley and Sons, New York, New York, USA.
ter Braak, C. J. F., and P. Smilauer. 2002. CANOCO referencemanual and CanoDraw for Windows user’s guide: softwarefor canonical community ordination (v. 4.5). MicrocomputerPower, Ithaca, New York, USA.
Vandergoes, M. J. 2000. High resolution record of lateQuaternary vegetation and climate change, south Westland,New Zealand. Dissertation. University of Otago, Dunedin,New Zealand.
Walker, C. L. 1931. Survey and report of river and streamconditions in the State of Maine 1930. Biennial Report to theGovenor. State of Maine, Augusta, Maine, USA.
Water Improvement Commission. 1960. The Kennebec Riverwater classification report. Augusta, Maine, USA.
Water Improvement Commision. 1966. Addendum to 1960Kennebec water classification report. Augusta, Maine, USA.
Wells, W. 1869. Water-power of Maine. Hydrographic surveyof Maine. Sprague, Owen, and Nash, Augusta, Maine, USA.
Wheeler, G. A., and H. W. Wheeler. 1878. History ofBrunswick, Topsham, and Harpswell, Maine. Alfred Mudgeand Son, Boston, Massachusetts, USA.
Witkowski, A., H. Lange-Bertalot, and D. Metzeltin. 2000.Diatom flora of marine coasts 1. Koeltz Scientific Books,Konigstein, Germany.
Wong, M. W., and D. W. Townsend. 1999. Phytoplankton andhydrography of the Kennebec estuary, Maine, USA. MarineEcology Progress Series 178:133–144.
Zambrano, L., M. Scheffer, and M. Martinez-Ramos. 2001.Catastrophic response of lakes to benthivorous fish intro-duction. Oikos 94:344–350.
Zimmerman, A. R., and E. A. Canuel. 2000. A geochemicalrecord of eutrophication and anoxia in Chesapeake Baysediments: anthropogenic influence on organic matter com-position. Marine Chemistry 69:117–137.
Zimmerman, A. R., and E. A. Canuel. 2002. Sedimentgeochemical records of eutrophication in the mesohalineChesapeake Bay. Limnology and Oceanography 47:1084–1093.
DORTE KOSTER ET AL.778 Ecological ApplicationsVol. 17, No. 3