Embed Size (px)
Citation preview
80
Basis of presentation of combined financial statements of the Hydraulic Systems segment within the Haldex Group (Concentric)Description of businessConcentric offers innovative proprietary solutions to the glo-bal manufactures of construction machinery, diesel engines and large trucks. The main focus is on products related to fuel efficiency and reduced emission.
The businessThe business (Group) consists of Concentric AB group owned by Haldex AB. All companies are consolidated in the Haldex Group’s consolidated financial statement.
During 2010, Haldex AB separated the Hydraulic Sys-tems business to Concentric AB through share transfers. The shares that were not transferred relate to Concentric Hy-dramax Inc.
On December 31, the Concentric AB Group consists of the following wholly-owned subsidiaries: Concentric Hydraulics Plc, Haldex Hydraulics AB, Haldex Hydraulics Gmbh, Con-centric S.A.S, Concentric Korea LLC, Concentric Srl and Hal-dex Hydraulics (Hong Kong) Company Ltd.
The Concentric AB group has been established during the year 2010. The acquisitions of the subsidiaries are common control transactions; therefore an accounting policy has been established for these business combinations as IFRS is cur-rently silent on the treatment of those transactions.
The combined financial statement is based on the uniting of interests method (predecessor accounting). This method requires that the assets and liabilities of the combining enti-ties are presented using the book values for the highest level of common control (i.e. Haldex AB) for which financial state-ments are prepared and the transaction is presented and as if it had taken place at the beginning of the earliest period presented (i.e. comparatives are restated).
Basis of presentation regarding the combined financial statementsSince the business does not form a legal group, consolidated financial information does not exist. Accordingly the com-bined carve-out financial statements represent an aggrega-tion of the historical financial information of the entities in the Group. The aggregation is based on the financial infor-mation of each entity reported to Haldex AB for consolida-tion purposes.
Adjustments have been made to eliminate transactions between members of the Group. During the periods present-ed, the Group functioned as part of the larger group of com-panies controlled by Haldex AB, and accordingly, certain services and functions were managed and provided by Hal-dex AB or another company within the Haldex Group
Had the business been fully integrated throughout the periods presented, the financial position, results of opera-tions, and cash flows of the Group may have been different. Accordingly the combined financial statements may not be indicative of the Company’s future performance and do not necessarily reflect what its combined results of operations, financial position and cash flows would have been had the Company operated as an independent company during the periods presented. To the extent that an asset, liability, rev-enue or expense is directly associated with the Company, it is reflected in the accompanying combined financial state-ments.
ConsolidationThe combined carve-out financial statements include Con-centric AB and all those companies in which the company holds more than 50 percent of the voting rights as well as Concentric Inc.
The business's combined carve-out financial statements represent a combination of the former Hydraulic Systems segment within the Haldex Group.
The Haldex Group’s audited consolidated financial state-ments have been prepared applying the acquisition method. Intercompany transactions, balances and unrealised gains on transactions between Group companies are eliminated. The net investment balance represents the cumulative net investment by Haldex AB in the group through that date, in-cluding any prior net income or loss or other comprehensive income or loss attributed to the group. Certain transactions between the Company and other related parties within the Haldex Group, including allocated expenses, are also includ-ed in net investment.
Basis of preparationThe Combined Financial Statements of the business have been prepared in accordance with the International Finan-cial Reporting Standards (IFRS) and IFRIC Interpretations as adopted by the European Union, the Swedish Annual Ac-counts Act and the recommendations published by the Swed-ish Financial Reporting Board. The basis of accounting and the accounting policies adopted in preparing these combined financial statements are consistent for all periods presented.
Balance sheetThe combined financial statements for the years ended December 31, 2009 and 2010 represent the historical operations of the Hydraulic Systems segment within the Haldex AB Group as described above. These combined carve-out financial statements are derived from the audited con-solidated financial statements and accounting records of Haldex AB.
Historical financial statements
81
Furthermore a portion of Haldex ABs consolidated debt has been allocated to the Group, on inception of the new parent undertaking, based on a reasonable debt/equity ratio. This debt in the parent undertaking has been assumed to be in existence throughout the period presented in these finan-cial statements. Interest expense has been allocated based on borrowings terms.
Income StatementOverhead costsHaldex AB currently provides certain corporate functions to the business and costs associated with these functions have been allocated to the entity. These functions include for ex-ample business development, human resources, treasury and corporate controller. The costs of such services have been al-located to the entity based on the most relevant allocation method to the service provided, primarily based on relative percentage of total revenue. Management believes such al-locations are reasonable; and is indicative of the actual ex-pense that would have been incurred had the entity been operating as an independent company for the periods pre-sented. The charges for these functions are included prima-rily in the administrative expenses in the statement of com-prehensive income.
TaxesTax expense is based on actual current and deferred tax re-lated to the entities.
Cash flow statementThe cash generated from operations and capital expenditures in the cash flow from investing activities are representative of the historical cash flows of the business. Taxes paid in the cash flow statement include taxes paid by the entities includ-ed in the combined financial statements of the business ad-justed with the allocated income tax receivables and liabil-ities as well as change of deferred tax assets and liabilities.
Financial Risks The Group is exposed to financial risks such as market, cred-it, liquidity and financing risks. To reduce the impact of these risks, Concentric works in accordance with a policy that reg-ulates their management. This policy has been adopted by the Group. Follow-up and control occurs continuously in each particular company and at the corporate level, via a regular monthly review.
Exchange rate risksThrough its international operations, Concentric is exposed to exchange rate risks. Exchange rate changes affect the con-solidated income statement and balance sheet in part in the form of transaction risks and in part translation risks.
Transaction risksThe Group’s net flows of payments in foreign currencies give rise to transaction risk. In 2010, the value of net flows in for-eign currencies totaled approximately SEK 147 m (64). The currency flows with the largest potential impact on earnings is the inflow of EUR into SEK, USD into GBP and EUR into GBP. An exchange rate difference of 10 percent between EUR and SEK affects the Groups earnings after tax by approx-imately SEK 3 m (nil), USD into GBP affects Group earn-ings after tax by SEK 4 m (2) and between EUR into GBP af-fects the Groups earnings after tax by some SEK 4 m (3). In accordance with the current treasury policy, 70 percent of anticipated net flows for the estimated volumes during the forthcoming 12-month period are hedged, with a permissi-ble deviation of +/–10 percent. The Group’s treasury policy governs the types of derivative instruments that can be used for hedging purposes as well as counterparties with whom contracts may be signed. Currency forward contracts are in place to hedge invoiced and forecasted currency flows. How-ever, hedge accounting has not been applied.
Translation risksThe net assets (i.e. equity) of the non-Swedish subsidiar-ies represent investments in foreign currencies which, when consolidated into SEK, give rise to a translation difference. In its treasury policy, the Group has established a framework for how the translation exposure that arises, shall be man-aged in order to control the impact of translation differences on the Group’s capital structure. The treasury policy stipu-lates that the Group’s net debt shall be distributed in pro-portion to the capital employed per currency. Wherever nec-essary, this goal is achieved by raising loans in the various currencies used by the subsidiaries.
Gains or losses on such loans that are adjudged as effec-tive hedging of translation differences are recognized direct-ly in shareholders’ equity, while gains and losses on loans that cannot be adjudged as effective hedging are recognized in the income statement as a financial item.
Interest rate risk Interest rate risk is the risk that changes in interest rates will have a negative impact on Group earnings. Since the Group has no significant holdings of interest-bearing assets, reve-nues and cash flow from operating activities are, in all sig-nificant respects, independent of changes in market interest rates. The Group’s interest rate risk arises from its borrow-ing. According to the treasury policy, the average fixed in-terest term must be between 1 and 12 months. The risk must also be spread over time so that a lesser part of the total debt is renegotiated at the same time. However, the loan structure in place 2010 has predominately been intercompany loans with Haldex. In anticipation to the planned separation of the Concentric Group from Haldex in June 2011, all long term
82
loans were reclassified at the end of 2010 to short term loans. The total intercompany short term loans amounted to SEK 439 m by 31 December 2010. The loan structure as of Decem-ber 2010 will be replaced by external loan facilities in 2011. See note 2 in the notes to the Group’s combined financial statements. The interest costs in 2010 are not representa-tive for the level of financing costs going forward as an inde-pendent Concentric Group.
Credit riskCredit risk arises when a party to a transaction cannot fulfill his obligations and thereby creates a loss for the other party.
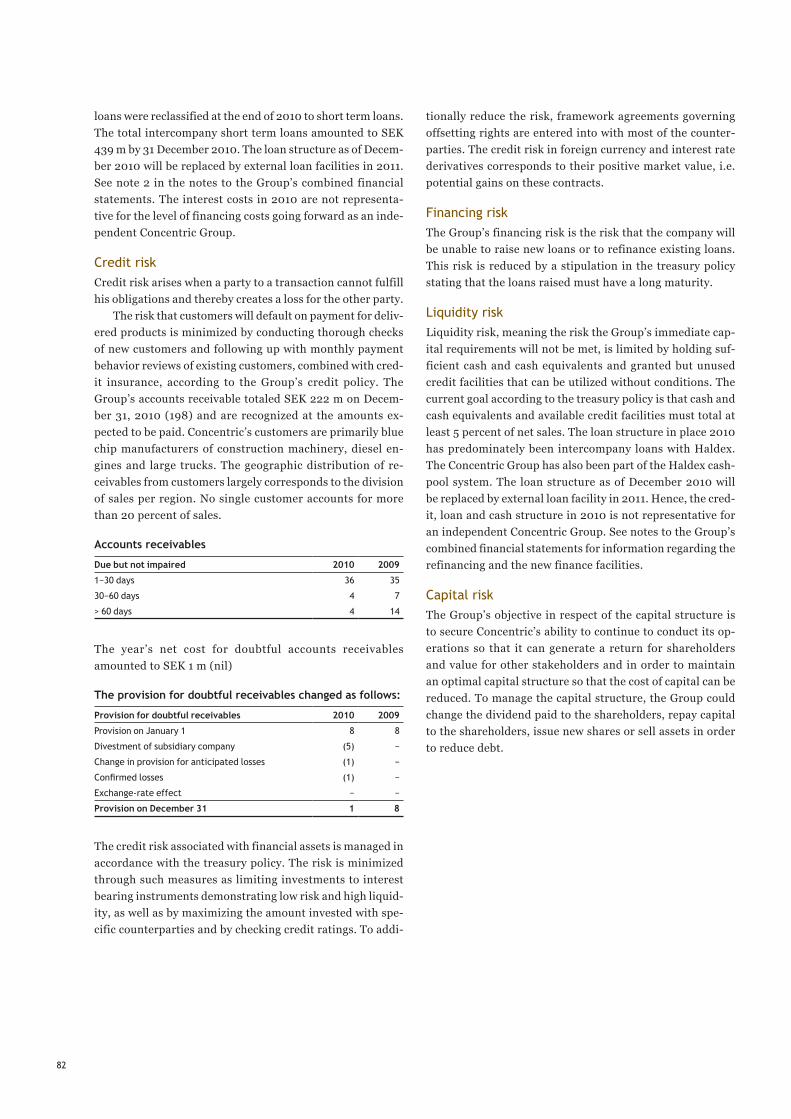
The risk that customers will default on payment for deliv-ered products is minimized by conducting thorough checks of new customers and following up with monthly payment behavior reviews of existing customers, combined with cred-it insurance, according to the Group’s credit policy. The Group’s accounts receivable totaled SEK 222 m on Decem-ber 31, 2010 (198) and are recognized at the amounts ex-pected to be paid. Concentric’s customers are primarily blue chip manufacturers of construction machinery, diesel en-gines and large trucks. The geographic distribution of re-ceivables from customers largely corresponds to the division of sales per region. No single customer accounts for more than 20 percent of sales.
Accounts receivables
Due but not impaired 2010 2009
1−30 days 36 35
30−60 days 4 7
> 60 days 4 14
The year’s net cost for doubtful accounts receivables amounted to SEK 1 m (nil)
The provision for doubtful receivables changed as follows:
Provision for doubtful receivables 2010 2009
Provision on January 1 8 8
Divestment of subsidiary company (5) −
Change in provision for anticipated losses (1) −
Confirmed losses (1) −
Exchange-rate effect − −
Provision on December 31 1 8
The credit risk associated with financial assets is managed in accordance with the treasury policy. The risk is minimized through such measures as limiting investments to interest bearing instruments demonstrating low risk and high liquid-ity, as well as by maximizing the amount invested with spe-cific counterparties and by checking credit ratings. To addi-
tionally reduce the risk, framework agreements governing offsetting rights are entered into with most of the counter-parties. The credit risk in foreign currency and interest rate derivatives corresponds to their positive market value, i.e. potential gains on these contracts.
Financing riskThe Group’s financing risk is the risk that the company will be unable to raise new loans or to refinance existing loans. This risk is reduced by a stipulation in the treasury policy stating that the loans raised must have a long maturity.
Liquidity riskLiquidity risk, meaning the risk the Group’s immediate cap-ital requirements will not be met, is limited by holding suf-ficient cash and cash equivalents and granted but unused credit facilities that can be utilized without conditions. The current goal according to the treasury policy is that cash and cash equivalents and available credit facilities must total at least 5 percent of net sales. The loan structure in place 2010 has predominately been intercompany loans with Haldex. The Concentric Group has also been part of the Haldex cash-pool system. The loan structure as of December 2010 will be replaced by external loan facility in 2011. Hence, the cred-it, loan and cash structure in 2010 is not representative for an independent Concentric Group. See notes to the Group’s combined financial statements for information regarding the refinancing and the new finance facilities.
Capital riskThe Group’s objective in respect of the capital structure is to secure Concentric’s ability to continue to conduct its op-erations so that it can generate a return for shareholders and value for other stakeholders and in order to maintain an optimal capital structure so that the cost of capital can be reduced. To manage the capital structure, the Group could change the dividend paid to the shareholders, repay capital to the shareholders, issue new shares or sell assets in order to reduce debt.
83
Combined income statement
Combined statement of comprehensive income
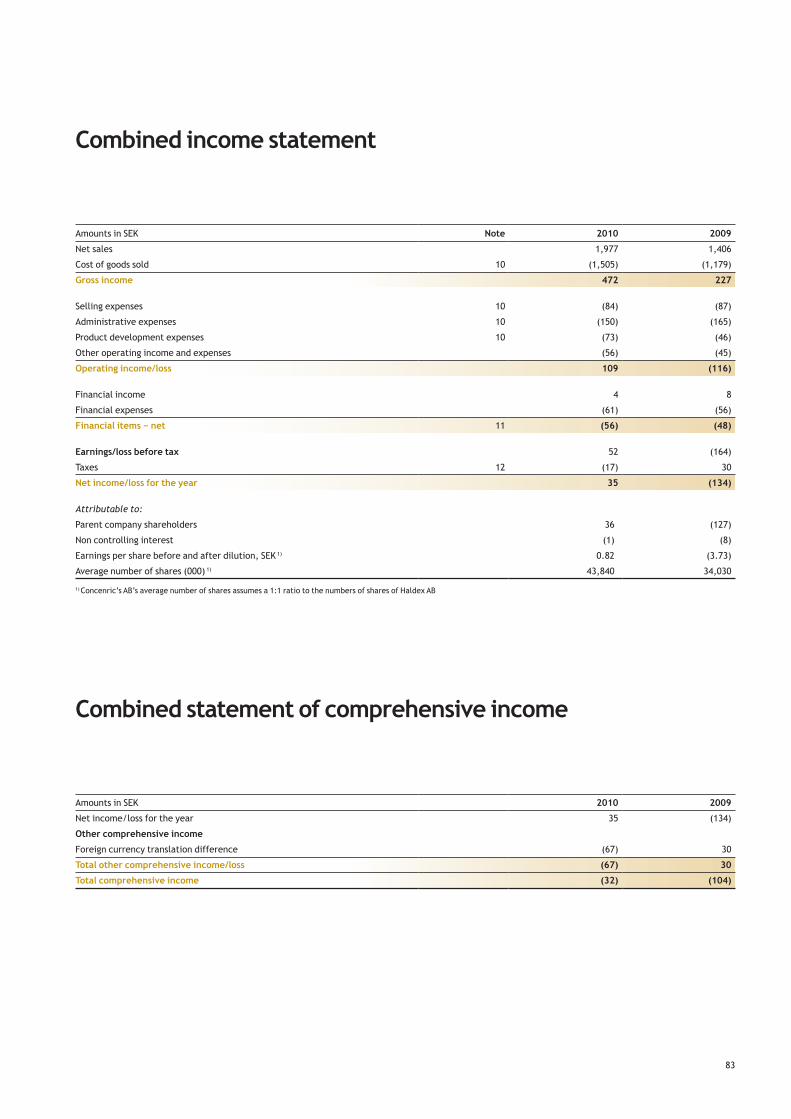
Amounts in SEK Note 2010 2009
Net sales 1,977 1,406
Cost of goods sold 10 (1,505) (1,179)
Gross income 472 227
Selling expenses 10 (84) (87)
Administrative expenses 10 (150) (165)
Product development expenses 10 (73) (46)
Other operating income and expenses (56) (45)
Operating income/loss 109 (116)
Financial income 4 8
Financial expenses (61) (56)
Financial items − net 11 (56) (48)
Earnings/loss before tax 52 (164)
Taxes 12 (17) 30
Net income/loss for the year 35 (134)
Attributable to:
Parent company shareholders 36 (127)
Non controlling interest (1) (8)
Earnings per share before and after dilution, SEK 1) 0.82 (3.73)
Average number of shares (000) 1) 43,840 34,030
1) Concenric’s AB’s average number of shares assumes a 1:1 ratio to the numbers of shares of Haldex AB
Amounts in SEK 2010 2009
Net income/loss for the year 35 (134)
Other comprehensive income
Foreign currency translation difference (67) 30
Total other comprehensive income/loss (67) 30
Total comprehensive income (32) (104)
84
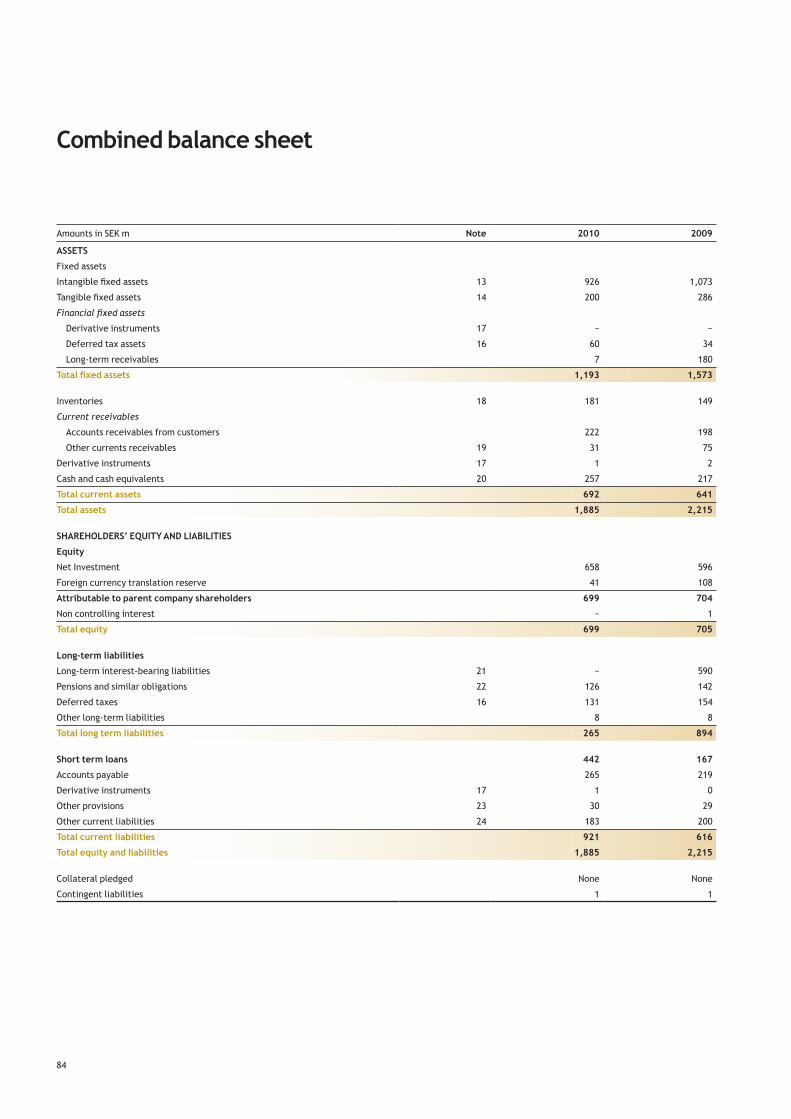
Combined balance sheet
Amounts in SEK m Note 2010 2009
ASSETS
Fixed assets
Intangible fixed assets 13 926 1,073
Tangible fixed assets 14 200 286
Financial fixed assets
Derivative instruments 17 − −
Deferred tax assets 16 60 34
Long-term receivables 7 180
Total fixed assets 1,193 1,573
Inventories 18 181 149
Current receivables
Accounts receivables from customers 222 198
Other currents receivables 19 31 75
Derivative instruments 17 1 2
Cash and cash equivalents 20 257 217
Total current assets 692 641
Total assets 1,885 2,215
SHAREHOLDERS’ EQUITY AND LIABILITIES
Equity
Net Investment 658 596
Foreign currency translation reserve 41 108
Attributable to parent company shareholders 699 704
Non controlling interest − 1
Total equity 699 705
Long-term liabilities
Long-term interest-bearing liabilities 21 − 590
Pensions and similar obligations 22 126 142
Deferred taxes 16 131 154
Other long-term liabilities 8 8
Total long term liabilities 265 894
Short term loans 442 167
Accounts payable 265 219
Derivative instruments 17 1 0
Other provisions 23 30 29
Other current liabilities 24 183 200
Total current liabilities 921 616
Total equity and liabilities 1,885 2,215
Collateral pledged None None
Contingent liabilities 1 1
85
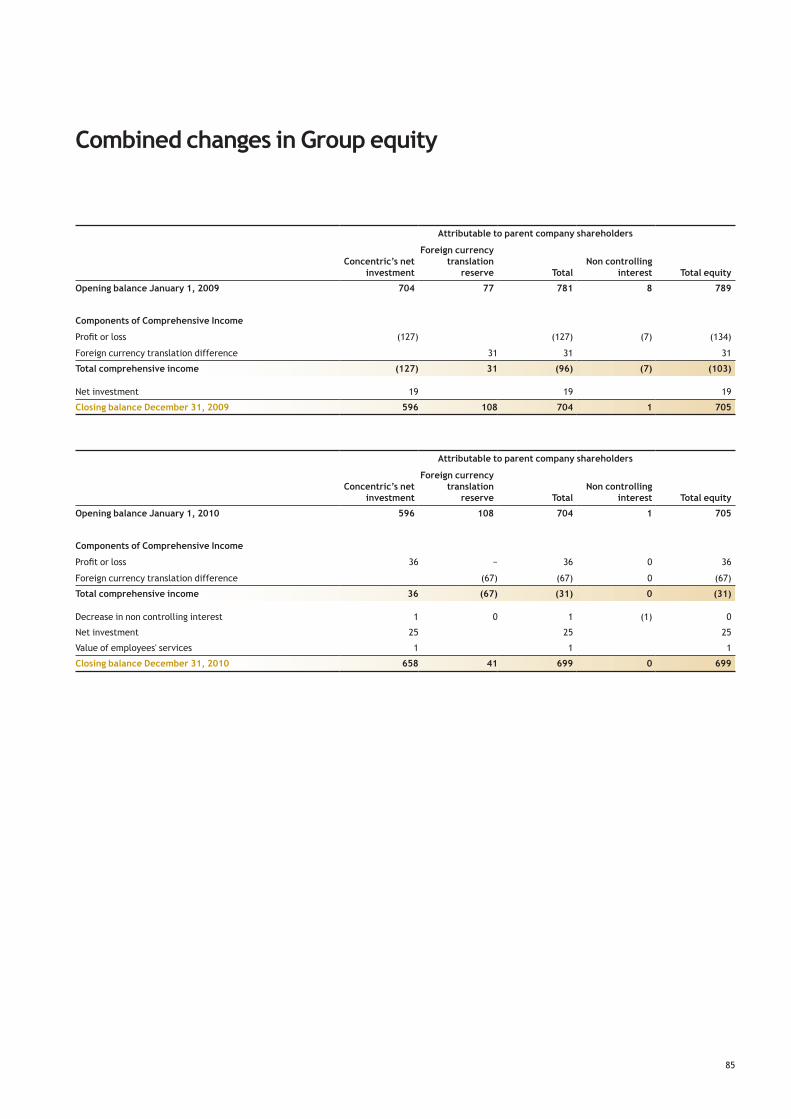
Attributable to parent company shareholders
Concentric’s net investment
Foreign currency translation
reserve TotalNon controlling
interest Total equity
Opening balance January 1, 2009 704 77 781 8 789
Components of Comprehensive Income
Profit or loss (127) (127) (7) (134)
Foreign currency translation difference 31 31 31
Total comprehensive income (127) 31 (96) (7) (103)
Net investment 19 19 19
Closing balance December 31, 2009 596 108 704 1 705
Attributable to parent company shareholders
Concentric’s net investment
Foreign currency translation
reserve TotalNon controlling
interest Total equity
Opening balance January 1, 2010 596 108 704 1 705
Components of Comprehensive Income
Profit or loss 36 − 36 0 36
Foreign currency translation difference (67) (67) 0 (67)
Total comprehensive income 36 (67) (31) 0 (31)
Decrease in non controlling interest 1 0 1 (1) 0
Net investment 25 25 25
Value of employees' services 1 1 1
Closing balance December 31, 2010 658 41 699 0 699
Combined changes in Group equity
86
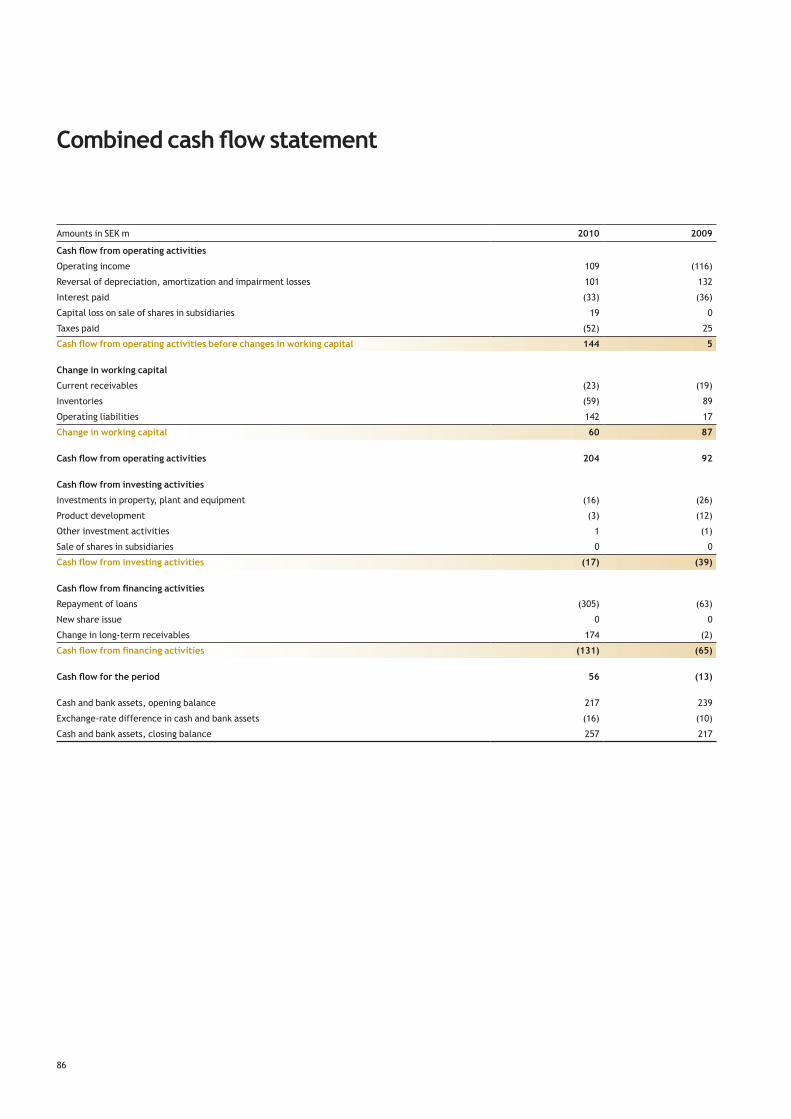
Combined cash flow statement
Amounts in SEK m 2010 2009
Cash flow from operating activities
Operating income 109 (116)
Reversal of depreciation, amortization and impairment losses 101 132
Interest paid (33) (36)
Capital loss on sale of shares in subsidiaries 19 0
Taxes paid (52) 25
Cash flow from operating activities before changes in working capital 144 5
Change in working capital
Current receivables (23) (19)
Inventories (59) 89
Operating liabilities 142 17
Change in working capital 60 87
Cash flow from operating activities 204 92
Cash flow from investing activities
Investments in property, plant and equipment (16) (26)
Product development (3) (12)
Other investment activities 1 (1)
Sale of shares in subsidiaries 0 0
Cash flow from investing activities (17) (39)
Cash flow from financing activities
Repayment of loans (305) (63)
New share issue 0 0
Change in long-term receivables 174 (2)
Cash flow from financing activities (131) (65)
Cash flow for the period 56 (13)
Cash and bank assets, opening balance 217 239
Exchange-rate difference in cash and bank assets (16) (10)
Cash and bank assets, closing balance 257 217
87
NOTE 1 General information
Concentric AB (parent company) and its subsidiaries form the Con-centric Group. Concentric offers innovative proprietary solutions to the global manufactures of construction machinery, diesel engines and large trucks. The main focus is on products related to fuel effi-ciency and reduced emission.
Concentric AB, corp. ID. No. 556828-4995, is a registered limited liability corporation with its registered office in Stockholm, Sweden.
NOTE 2 Summary of important accounting principles
Basis of preparationThe combined financial statement of the Concentric AB group have been prepared in accordance with International Financial Reporting Standards (IFRS) and IFRIC interpretations as adopted by the EU, RFR 1 “Additional rules for Group Accounting” and related interpreta-tions issued by the Swedish Financial Reporting Board and the Swed-ish Annual Accounts Act. The basis of accounting and the accounting policies adopted in preparing these combined financial statements are consistent for all periods presented. The financial statements of Con-centric AB Group are based on the predecessor values of the consoli-dated accounts of the Haldex AB Group.
The Concentric AB Group has been established during the year. The acquisitions of the subsidiaries are common control transactions; therefore an accounting policy has been established for these business combinations as IFRS is currently silent on the treatment of those transactions.
The combined financial statement is based on the uniting of inter-ests model (predecessor accounting). This method requires that the assets and liabilities of the combining entities are presented using the book values for the highest level of common control (i.e. Haldex AB) for which financial statements are prepared and the transaction is pre-sented and as if it had taken place at the beginning of the earliest period presented (i.e. comparatives are restated).
All transactions and balances between entities included in the combined financial statements are eliminated
Going ConcernThe combined financial statement of the Concentric AB Group have been prepared on a going concern basis, taking it to account the fol-lowing new debt facilities entered into subsequent to December 31, 2010, namely:• a revolving multi currency credit facility for EUR 40 m (approxi-
mately SEK 360 m), with a term of three years, repayable in full at the end of the term, and
• a corporate bond with SEK, novated from Haldex AB, totaling SEK 175 m, with a term of three years six months, also repayable in full at the end of the term.
ConsolidationSubsidiaries are all entities over which the group has the power to gov-ern the financial and operating policies generally accompanying a shareholding of more than one half of the voting rights. The existence
and effect of potential voting rights that are currently exercisable or convertible are considered when assessing whether the group controls another entity. Subsidiaries are fully consolidated from the date on which control is transferred to the group. They are deconsolidated from the date that control ceases.
The group uses the acquisition method of accounting to account for business combinations. The consideration transferred for the acquisi-tion of a subsidiary is the fair values of the assets transferred, the lia-bilities incurred and the equity interests issued by the group. The con-sideration transferred includes the fair value of any asset or liability resulting from a contingent consideration arrangement. Acquisition-related costs are expensed as incurred. Identifiable assets acquired and liabilities and contingent liabilities assumed in a business combi-nation are measured initially at their fair values at the acquisition date. On an acquisition-by-acquisition basis, the group recognizes any non-controlling interest in the acquiree either at fair value or at the non-controlling interest’s proportionate share of the acquirer’s net assets.
The excess of the consideration transferred the amount of any non-controlling interest in the acquiree and the acquisition-date fair value of any previous equity interest in the acquiree over the fair value of the group’s share of the identifiable net assets acquired is recorded as goodwill. If this is less than the fair value of the net assets of the sub-sidiary acquired in the case of a bargain purchase, the difference is recognized directly in the statement of comprehensive income. Inter-company transactions, balances and unrealized gains on transactions between group companies are eliminated. Unrealized losses are also eliminated. Accounting policies of subsidiaries have been changed where necessary to ensure consistency with the policies adopted by the group.
Transactions with non-controlling interestThe group treats transactions with non-controlling interests as trans-actions with equity owners of the group. For purchases from non-con-trolling interests, the difference between any consideration paid and the relevant share acquired of the carrying value of net assets of the subsidiary is recorded in equity. Gains or losses on disposals to non-controlling interests are also recorded in equity.
Translation of foreign currencyThe functional currency for the Concentric Group and the presenta-tion currency is Swedish kronor (SEK).
Transactions and balance sheet itemsTransactions in foreign currency are translated into SEK using the exchange rates at the transaction date. Exchange gains and losses resulting from these transactions and the translation of monetary assets and liabilities at the closing rate are recognized in the consoli-dated income statement exchange rate gains or losses from transac-tions that fulfill the requirements for hedge accounting are recognized in other comprehensive income (OCI).
SubsidiariesThe balance sheets and income statements of subsidiaries with a dif-ferent functional currency than the groups’ presentation currency are
Notes, Group
88
translated by translating assets and liabilities at the closing rate and income and expenses at the average rate during the year. Translation differences resulting from the translation of foreign subsidiaries’ net assets at different rates on the opening and the closing dates are recog-nized directly in the translation reserves in OCI.
Exchange rate differences on loans and other instruments that are used as hedging instruments for net investments in foreign currency are recognized directly in the translation reserves in OCI.
Revenue recognitionIncome from the sale of goods and services is recognized when the goods/services are delivered in accordance with the terms of delivery with the customer, as soon as significant risk and rewards associated with ownership are adjudged to have been transferred to the pur-chaser. The income is reported at fair value net of vat, discounts granted and returned goods.
Intra-Group transactions are eliminated.
LeasingAs lesseeLeasing is classified in the consolidated financial statements as either finance or operating leases, depending on whether the Company retains all the risks and benefits associated with ownership of the underlying asset. A requirement for the reporting of financial leasing is that the fixed asset be posted as an asset item in the balance sheet and that the leasing obligation be recognized as a liability in the bal-ance sheet. Fixed assets are depreciated according to plan over their useful life, while lease payments are recognized as interest expenses and amortization of debt. Leasing agreements which are not financial are operating leases. No asset or liability items are recognized in the balance sheet in the case of operating leases.
The lease payments of operating leases are expensed in the income statement on a straight-line basis over the term of the lease.
Tangible fixed assetsTangible fixed assets consist of buildings (offices, factories, ware-houses), land and land improvements, machines, tools and installa-tions. These assets are measured at cost less depreciation and any impairment losses. Scheduled depreciation is based on the acquisition value and estimated economic life of the assets. Buildings are depreci-ated over 25–50 years. Machinery and equipment are usually depreci-ated over 3–10 years, while heavier machinery, has an economic life of 20 years. Land is not depreciated. The assets’ residual values and use-ful lives are reassessed every closing day and adjusted if needed. The tangible assets are free from any pledges or other encumbrances.
Intangible assetsProduct developmentCosts for developing new products are recognized as intangible fixed assets when the following criteria are met: it is likely that the assets will result in future financial benefits to the company; the acquisition value can be calculated reliably; the company intends to finish the asset and has technical and financial resources to complete its devel-opment. The documentary basis for capitalizing product development costs can consist of business plans, budgets or the company’s forecasts of future earnings. The acquisition value is the sum of the direct and indirect expenses accruing from the point in time when the intangible asset fulfills the above criteria. Intangible assets are recognized at cost less accumulated amortization taking into account any impairment losses. Amortization begins when the asset becomes usable and is applied in line with the estimated useful life and in relation to the
financial benefits that are expected to be generated by the product development. The useful life is not normally assessed as exceeding five years.
Brands, licenses and patentsBrands, licenses and patents are recognized at cost less accumulated amortization plus any impairment losses. Brands, licenses and pat-ents, which are acquired through business acquisitions, are recog-nized at fair value on the day of acquisition. Brands, licenses and pat-ents have a determinable useful life over which straight-line amortiza-tion is applied to distribute the cost in the income statement. The expected useful life of licenses and patents is estimated at 3–15 years. The expected useful life of brands is estimated at 20 years.
Customer relationsCustomer relations acquired through business combinations are rec-ognized at fair value on the day of the acquisition and subsequently at cost less accumulated amortization and any impairment losses. Cus-tomer relations have a determinable useful life estimated at 11–17 years. Straight-line amortization is applied over the estimated useful life of customer relations.
Software and IT systemsAcquired software licenses and costs for development of software that are expected to generate future financial benefits for the Group for more than three years are capitalized and amortized over the expected useful life (3–5 years).
GoodwillThe excess of the consideration transferred the amount of any non-controlling interest in the acquiree and the acquisition-date fair value of any previous equity interest in the acquiree over the fair value of the identifiable net assets acquired is recorded as goodwill.
Financial instrumentsThe Group classifies its financial instruments in the following catego-ries: financial assets valued at fair value through profit or loss, loans and receivables, financial instruments held to maturity and financial assets available for sale. The classifications are based on the purpose of the acquired instrument. Management determines the classification of the instruments when they are first recognized. During the fiscal year, the Group had financial instruments belonging to financial assets measured at fair value through profit or loss, as well as loans and receivables.
Financial assets measured at fair value through profit or loss This category has two sub-categories: financial assets held for trading and assets that from the very beginning are attributed to the category measured at fair value through profit or loss. A financial asset is classi-fied in this category if it has been acquired primarily with a view to being resold in the near future or if this classification is determined by company management. Derivative instruments are also categorized as being held for sale, assuming that they have not been identified as hedging instruments.
Loans and receivablesLoans and receivables are non-derivative financial assets with estab-lished or determinable payments that are not listed on an active mar-ket. They occur when the Group supplies money, products or services directly to the customer without intending to trade the resulting claim.
89
They are included in current assets, with the exception of items with due dates more than 12 months after the closing day, which are classi-fied as fixed assets.
Recognition of derivative instrumentsDerivative instruments are recognized in the balance sheet as of the trade date and are measured at fair value, both initially and during subsequent revaluations. The method used for recognizing the profit or loss arising at every revaluation occasion depends on whether the derivative has been identified as a hedging instrument and, if this is the case, the nature of the hedged item. The Group identifies certain derivatives as either: 1) hedging of the fair value of assets or liabilities; 2) hedging of forecast flows (cash flow hedging) or 3) hedging of net investment in a foreign operation. To qualify for hedge accounting, certain documentation is required concerning the hedging instrument and its relation to the hedged item. The Group also documents goals and strategies for risk management and hedging measures, as well as an assessment of the hedging relationship’s effectiveness in terms of countering changes in fair value or cash flow for hedged items, both when the hedging is first entered into and subsequently on an ongoing basis.
Fair value hedgesChanges in fair value of derivatives that are classified as fair value hedges and fulfill the conditions for hedge accounting are recognized in the income statement with the changes in the fair value of the asset or liability that caused the hedged risk.
Cash flow hedgingCash flow hedging is applied for future flows from sales. The portion of changes in the value of derivatives that satisfy the conditions for hedge accounting is recognized directly in OCI. The ineffective portion of profit or loss is recognized directly in the income statement, among financial items. The unrealized profit or loss that is accumulated in OCI is reversed and recognized in the income statement when the hedged item affects profit or loss (for example, when the forecast sale that has been hedged actually occurs).
If a derivative instrument no longer meets the requirements for hedge accounting, is sold or terminated, what remains is any accumu-lated fair value in OCI, which is recognized in the income statement at the same time as the forecast transaction is finally recognized in the income statement. When a forecast transaction is no longer expected to occur, the accumulated profit or loss recognized in equity is imme-diately transferred to the income statement.
Hedging of net investmentsAccumulated gains/losses from revaluation of hedges of net invest-ments that fulfill the conditions for hedge accounting are recognized in OCI. When operations are divested, the accumulated effects are transferred to the Income Statement and affect the Company’s net profit/loss from the divestment.
Calculation of fair valueFair value of financial instruments that are traded in an active market (for example, publicly quoted derivative instruments, financial assets that are held for trade and financial assets that are held for sale) is based on the quoted market rate on the closing day. The quoted mar-ket rates used for the Company’s financial assets are the actual bid prices; quoted market rates used for financial liabilities are the actual asked prices. These instruments are categorized as level 1 in the fair value hierarchy.
The fair value of financial instruments that are not traded in an active market (for example, over-the-counter derivatives) is determined by using valuation techniques. These valuation techniques maximise the use of observable market data where it is available and rely as little as possible on entity specific estimates. If all significant inputs required to fair value an instrument are observable, the instrument is included in level 2 of the fair value hierarchy.
The only financial instruments that are measured at fair value are forward contracts which are categorized in level 2.
InventoriesInventories are valued at the lowest of the acquisition cost, in accord-ance with the first-in first-out principle and the net realizable value.
The cost of finished goods and work in progress comprises raw materials, direct labor, other direct costs and related production over-heads (based on normal operating capacity).
Accounts receivable from customersAfter individual valuation, receivables are valued in the amounts in which they are expected to be paid.
Cash and cash equivalentsCash and cash equivalents includes cash, cash in banks, other short-term investments that fall due in less than three months and bank overdraft facilities. Bank overdraft facilities are recognized in the bal-ance sheet as borrowing under current liabilities.
Receivables and liabilitiesReceivables and liabilities in foreign currencies are valued at the year-end rate. Exchange gains and losses pertaining to operational cur-rency flows are recognized in operating income.
Current and long-term interest-bearing liabilities are recognized in the balance sheet at amortized cost.
ProvisionsProvisions are recognized in the balance sheet when the Group has future obligations resulting from an event that is likely to result in expenses that can be reasonably estimated. Provisions for restructur-ing costs are recognized when the Group has presented a plan for car-rying out the measures and the plan has been communicated to all affected parties.
Employee benefitsPension commitmentsThe Group has both defined-benefit and defined-contribution pension plans. Administration of the plans is handled by a third party at e.g. a fund management company, an insurance company or a bank. The plans are fee-financed and the financing is recognized in profit and loss. The size of the fee depends on actuarial estimations that are per-formed once annually.
Defined-benefit plans state which amount an employee can expect to receive after retirement, calculated on the basis of factors such as age, length of service and future salary.
Defined-contribution plans mainly include retirement pensions, disability pensions and family pensions, and a defined contribution, normally expressed as a percentage of current salary, is paid to a sepa-rate legal entity. The employee is responsible for the risk inherent in these plans and the Group does not have any further obligations if the fund’s assets decline in value. No debt is recognized in the balance sheet.
90
The debt recognized in the balance sheet pertaining to defined-benefit pension plans is the present value of the defined-benefit obligation on the closing day less the fair value of the plan assets, adjusted for any non-recognized actuarial gains/losses. Defined-benefit pension obli-gations are calculated annually by independent actuaries using the projected unit credit method. The present value of the obligations is determined by discounting the estimated future cash flow.
Actuarial gains/losses from experience-based adjustments and changes in actuarial assumptions exceeding the highest of 10 percent of the value of the plan assets and 10 percent of the defined-benefit obligation are recognized as an expense or revenue over the employ-ees’ average remaining period of service in accordance with the “corri-dor method”.
Swedish Group companies apply UFR 4, which means that tax on pension costs is calculated on the difference between pension costs in accordance with IAS 19 and pension costs determined in accordance with local regulations.
Share-based paymentThe Group has a share-based payment plan in the form of an incentive program directed at senior executives and key employees. The com-pany obtains services from employees as compensation for equity instruments (options) in the Group.
The fair value of the service that entitles employees to an allotment of options is expensed and based on the fair value of the allotted options. The cost is distributed over the vesting period, meaning the period during which the stated vesting conditions shall be fulfilled. For further information about the incentive program, see Note 8.
TaxesThe tax expense for the period comprises current and deferred tax. Tax is recognized in the income statement, except to the extent that it relates to items recognized in OCI or directly in equity. In this case, the tax is also recognized in OCI or directly in equity, respectively. The current income tax charge is calculated on the basis of the tax laws enacted or substantively enacted at the balance sheet date in the coun-tries where the company and its subsidiaries operate and generate tax-able income. Management periodically evaluates positions taken in tax returns with respect to situations in which applicable tax regulation is subject to interpretation. It establishes provisions where appropriate on the basis of amounts expected to be paid to the tax authorities.
Deferred income tax is recognized, using the liability method, on temporary differences arising between the tax bases of assets and lia-bilities and their carrying amounts in the consolidated financial state-ments. However, deferred tax liabilities are not recognized if they arise from the initial recognition of goodwill; deferred income tax is not accounted for if it arises from initial recognition of an asset or lia-bility in a transaction other than a business combination that at the time of the transaction affects neither accounting nor taxable profit or loss. Deferred income tax is determined using tax rates (and laws) that have been enacted or substantially enacted by the balance sheet date and are expected to apply when the related deferred income tax asset is realized or the deferred income tax liability is settled.
Deferred income tax assets are recognized only to the extent that it is probable that future taxable profit will be available against which the temporary differences can be utilized. Deferred income tax is provided on temporary differences arising on investments in subsidiaries and associates, except for deferred income tax liability where the timing of the reversal of the temporary difference is controlled by the group and it is probable that the temporary difference will not reverse in the fore-
seeable future. Deferred income tax assets and liabilities are offset when there is a legally enforceable right to offset current tax assets against current tax liabilities and when the deferred income taxes assets and liabilities relate to income taxes levied by the same taxation authority on either the same taxable entity or different taxable entities where there is an intention to settle the balances on a net basis.
Cash flow statementThe Cash Flow Statement is prepared using the indirect method. This means that the operating income is adjusted for transactions that do not entail receipts or disbursements during the period, and for any income and expenses referable to cash flows for investing or financing activities.
Government assistanceGovernment assistance connected to the acquisition of fixed assets has reduced the acquisition value of the particular assets. This means that the asset has been recognized at a net acquisition value, on which the size of depreciation has been based.
Amendments to accounting principles and informative statements
New and amended standards adopted by the group as of January 1, 2010The following new standards and amendments to standards are man-datory for the first time for the financial year beginning 1 January 2010. This concerns those standards and interpretations that are deemed material for the company.
IFRS 3 (revised), ‘Business combinations’, and consequential amendments to IAS 27, ‘Consolidated and separate financial state-ments’, IAS 28, ‘Investments in associates’, and IAS 31, ‘Interests in joint ventures’, are effective prospectively to business combinations for which the acquisition date is on or after the beginning of the first annual reporting period beginning on or after 1 July 2009. The revised standard continues to apply the acquisition method to business com-binations but with some significant changes compared with IFRS 3. For example, all payments to purchase a business are recorded at fair value at the acquisition date, with contingent payments classified as debt subsequently re-measured through the statement of comprehen-sive income. There is a choice on an acquisition-by-acquisition basis to measure the non-controlling interest in the acquiree either at fair value or at the non-controlling interest’s proportionate share of the acquiree’s net assets. All acquisition-related costs are expensed.
IAS 27 (revised) requires the effects of all transactions with non-controlling interests to be recorded in equity if there is no change in control and these transactions will no longer result in goodwill or gains and losses. The group will apply the standard prospectively.
IFRS 5 (amendment), ‘Non-current assets held for sale and discon-tinued operations’. The amendment clarifies that IFRS 5 specifies the disclosures required in respect of non-current assets (or disposal groups) classified as held for sale or discontinued operations.
New standards, amendments and interpretations issued but not effective for the financial year beginning January 1, 2010 and not early adopted
IFRS 9, ‘Financial instruments’, issued in November 2009. This standard is the first step in the process to replace IAS 39, ‘Financial instruments: recognition and measurement’. IFRS 9 introduces new requirements for classifying and measuring financial assets. The project is divided into several parts and will be finalized during 2011.
91
This is to be considered to the standard is not applicable until 1 Janu-ary 2013 but is available for early adoption. However, the standard has not yet been endorsed by the EU. The group has not evaluated the effect of IFRS 9 of the financial reports.
Revised IAS 24 (revised), ‘Related party disclosures’, issued in November 2009. It supersedes IAS 24, ‘Related party disclosures’, issued in 2003. IAS 24 (revised) is mandatory for periods beginning on or after 1 January 2011. Earlier application, in whole or in part, is permitted. However, the standard has not yet been endorsed by the EU.
The revised standard clarifies and simplifies the definition of a related party. The group will apply the revised standard from 1 Janu-ary 2011. When the revised standard is applied, the group and the par-ent will need to disclose any transactions between its subsidiaries and its associates. The group is currently putting systems in place to cap-ture the necessary information. It is, therefore, not possible at this stage to disclose the impact, if any, of the revised standard on the related party disclosures.
Several other changes have been made of standards and interpreta-tions however they are not considered to have any impact on the group’s financial statements.
NOTE 3 Important estimations and assumptions
The Consolidated Financial Statements contain estimations and assumptions about the future. These are based on both historical experience and expectations for the future. The areas with the highest risk for future adjustments of carrying amounts are mentioned below.
Goodwill During 2010, the Group’s goodwill was tested for impairment. As per 31 December 2010, the total goodwill amounted to SEK 494 m (558). The testing was performed at operating segment level. Americas seg-ment and Europe and RoW segment constitute the Group’s cash gen-erating units. The goodwill value assigned to Americas segment amounts to SEK 172 m and to Europe and RoW segment amounts to SEK 322 m. The impairment testing is performed by discounting expecting future cash flows, as determined in the individual segments business plans. The value is set in relation to the carrying amount of the segment’s goodwill. Future cash flow is calculated on the basis of official market data relevant to Concentric’s type of industry, while consideration is also taken for the Concentric’s historical financial performance and future benefits from current improvement pro-grams.
The forecast period for testing of goodwill is five years and after the explicit forecast period, a residual value is assigned, which is assumed to represent the value of the business following the final year of the forecast period. The residual value has been calculated on the basis of an assumption concerning a sustainable level for the free cash flow (after the forecast period) and the level of growth. The residual value has been calculated on the basis of an assumption concerning a sus-tainable level for the free cash flow after the end of the forecast period. The growth after the end of forecast period has been estimated to 2 percent (2 percent). The calculation of the residual value includes all future cash flows after the end of the forecast period.
When discounting expected future cash flows, a weighted average cost of capital before tax (WACC) is used, currently 9 percent (9 per-cent). The weighted average cost of capital has been calculated on the basis of the following assumptions: • Risk-free interest rate: Ten year government bond rate.
• Markets risk premium: 5 percent.• Beta: Established beta value for the Group.• Interest expense: Has been calculated as a weighted interest rate
on the basis of the Group’s financing structure in various curren-cies, and taking a loan premium into account.
• Tax rate: According to the tax rate applying in the specific country.
The impairment tests performed in 2010 and 2009 did not reveal any need to impair goodwill. A 1 percent change in the discount rate or a 10 percent decrease in cash flow does not change the outcome of the assessment.
Development projectsConcentric capitalizes costs concerning development projects. These capitalized development projects are tested for impairment each year or when there is an indication of a decrease in value. The tests are based on a prediction of future revenue and corresponding production costs. In case the future volumes, prices or costs diverge negatively from the predictions, an impairment loss may arise.
Development projects are considered to be a normal part of Con-centric’s business. Generally impairment tests are carried out with the same assumptions (i.e. WACC) as the impairment test on goodwill. However, since individual risk assessment points out different risks in the different projects, the WACC is adjusted to consider the estimated risk in each individual project. Development projects considered a higher risk are tested with a higher WACC than a project with a consid-ered lower risk.
A 1 percent change in the discount rate or a 10 percent decrease in cash flow does not change the outcome of the assessment.
Income taxesThe Group pays tax in many different countries. Detailed calculations of future tax obligations are completed for each tax object within the Group. The Group recognizes liabilities for anticipated tax audit issues based on estimates of whether additional taxes will be due. Where the final tax outcome of these matters is different from the amounts that were initially recorded, such differences will impact the current and deferred income tax assets and liabilities in the period in which such determination is made.
Warranty reservesThe Group continuously assesses the value of the reserves in relation to the estimated need. The warranty reserve represented 1.3 percent of net sales as of December 31, 2010 (2.1).
PensionsThe pension liabilities recognized in the balance sheet are actuary-estimated and are based on annual assumptions. These assumptions are described in Note 22.
A change in estimate has been done regarding discount rate of the Swedish defined benefit pension plans. Haldex Group has previously used government bonds but as of 2010-12-31 Swedish mortgage-bonds are used, which are considered to be high quality corporate bonds. The change in estimate of discount rate has lead to an actuarial gain for the reporting period.
NOTE 4 Segment reporting
Operating segments reported in a manner that matches how internal reporting is submitted to the Group's highest executive decision-
92
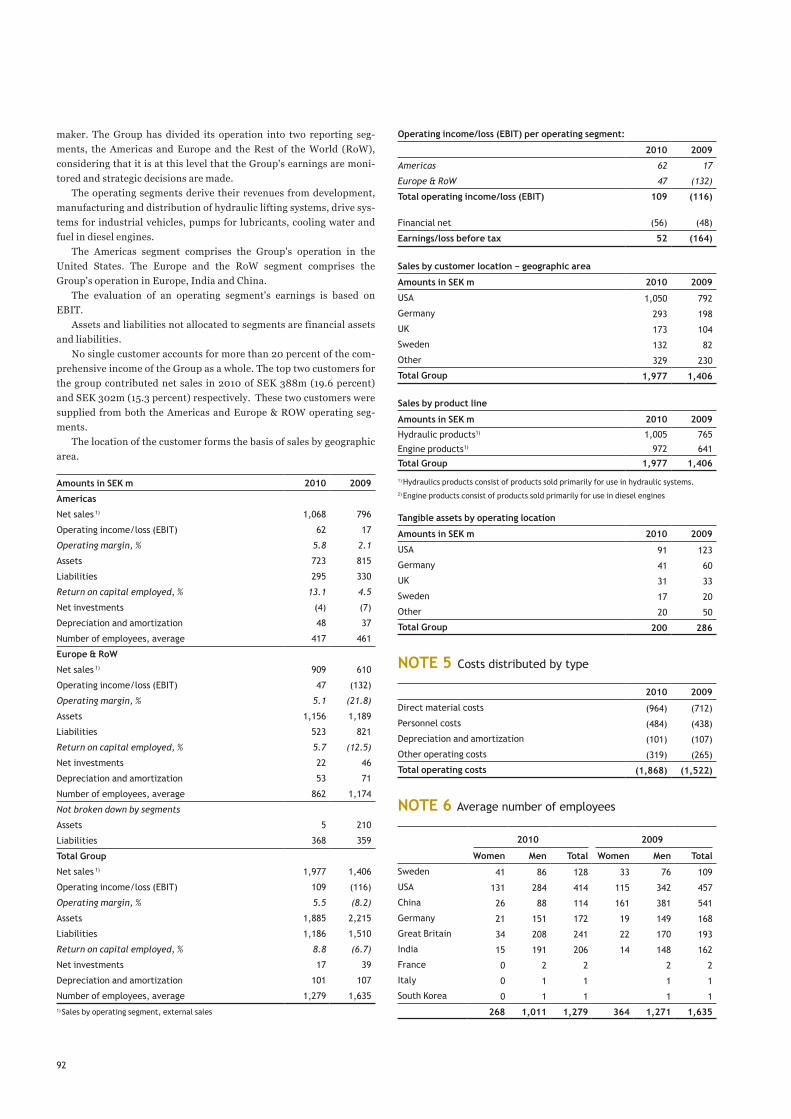
maker. The Group has divided its operation into two reporting seg-ments, the Americas and Europe and the Rest of the World (RoW), considering that it is at this level that the Group's earnings are moni-tored and strategic decisions are made.
The operating segments derive their revenues from development, manufacturing and distribution of hydraulic lifting systems, drive sys-tems for industrial vehicles, pumps for lubricants, cooling water and fuel in diesel engines.
The Americas segment comprises the Group's operation in the United States. The Europe and the RoW segment comprises the Group's operation in Europe, India and China.
The evaluation of an operating segment's earnings is based on EBIT.
Assets and liabilities not allocated to segments are financial assets and liabilities.
No single customer accounts for more than 20 percent of the com-prehensive income of the Group as a whole. The top two customers for the group contributed net sales in 2010 of SEK 388m (19.6 percent) and SEK 302m (15.3 percent) respectively. These two customers were supplied from both the Americas and Europe & ROW operating seg-ments.
The location of the customer forms the basis of sales by geographic area.
Amounts in SEK m 2010 2009
Americas
Net sales 1) 1,068 796
Operating income/loss (EBIT) 62 17
Operating margin, % 5.8 2.1
Assets 723 815
Liabilities 295 330
Return on capital employed, % 13.1 4.5
Net investments (4) (7)
Depreciation and amortization 48 37
Number of employees, average 417 461
Europe & RoW
Net sales 1) 909 610
Operating income/loss (EBIT) 47 (132)
Operating margin, % 5.1 (21.8)
Assets 1,156 1,189
Liabilities 523 821
Return on capital employed, % 5.7 (12.5)
Net investments 22 46
Depreciation and amortization 53 71
Number of employees, average 862 1,174
Not broken down by segments
Assets 5 210
Liabilities 368 359
Total Group
Net sales 1) 1,977 1,406
Operating income/loss (EBIT) 109 (116)
Operating margin, % 5.5 (8.2)
Assets 1,885 2,215
Liabilities 1,186 1,510
Return on capital employed, % 8.8 (6.7)
Net investments 17 39
Depreciation and amortization 101 107
Number of employees, average 1,279 1,6351) Sales by operating segment, external sales
Operating income/loss (EBIT) per operating segment:
2010 2009
Americas 62 17
Europe & RoW 47 (132)
Total operating income/loss (EBIT) 109 (116)
Financial net (56) (48)
Earnings/loss before tax 52 (164)
Sales by customer location − geographic area
Amounts in SEK m 2010 2009
USA 1,050 792
Germany 293 198
UK 173 104
Sweden 132 82
Other 329 230
Total Group 1,977 1,406
Sales by product line
Amounts in SEK m 2010 2009
Hydraulic products1) 1,005 765
Engine products1) 972 641
Total Group 1,977 1,406
1) Hydraulics products consist of products sold primarily for use in hydraulic systems.2) Engine products consist of products sold primarily for use in diesel engines
Tangible assets by operating location
Amounts in SEK m 2010 2009
USA 91 123
Germany 41 60
UK 31 33
Sweden 17 20
Other 20 50
Total Group 200 286
NOTE 5 Costs distributed by type
2010 2009
Direct material costs (964) (712)
Personnel costs (484) (438)
Depreciation and amortization (101) (107)
Other operating costs (319) (265)
Total operating costs (1,868) (1,522)
NOTE 6 Average number of employees
2010 2009
Women Men Total Women Men Total
Sweden 41 86 128 33 76 109
USA 131 284 414 115 342 457
China 26 88 114 161 381 541
Germany 21 151 172 19 149 168
Great Britain 34 208 241 22 170 193
India 15 191 206 14 148 162
France 0 2 2 2 2
Italy 0 1 1 1 1
South Korea 0 1 1 1 1
268 1,011 1,279 364 1,271 1,635
93
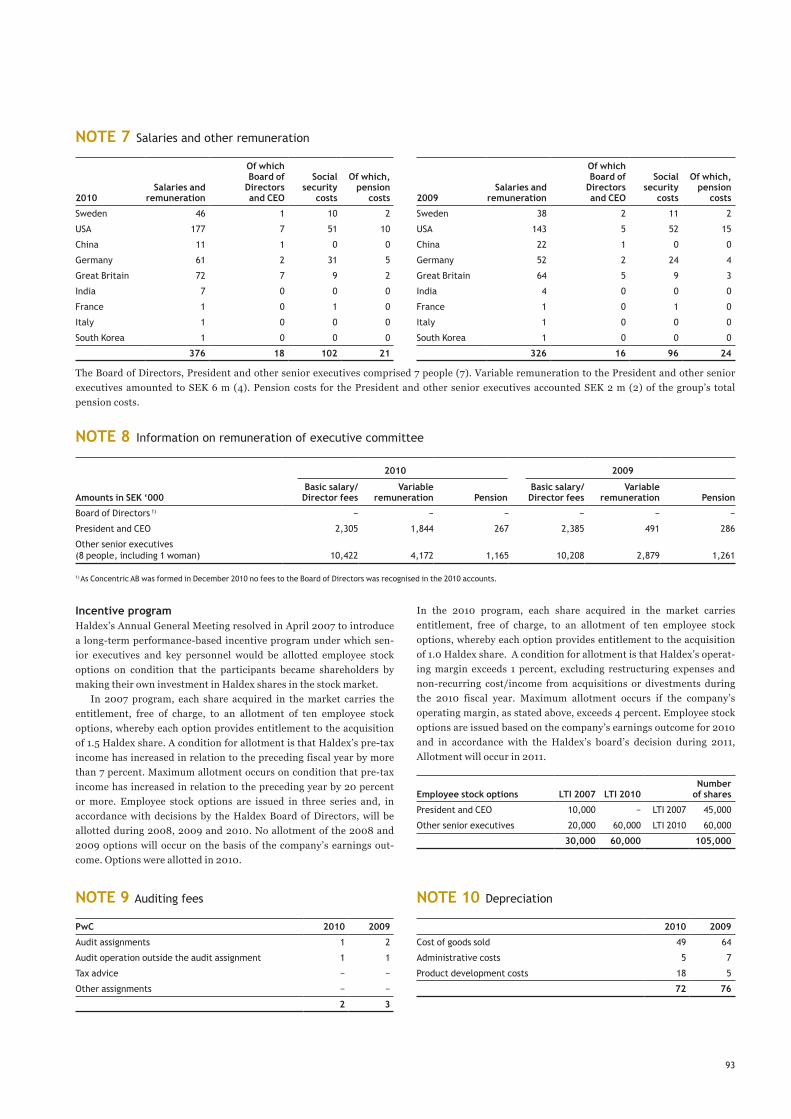
NOTE 7 Salaries and other remuneration
2010Salaries and
remuneration
Of which Board of
Directorsand CEO
Social security
costs
Of which,pension
costs
Sweden 46 1 10 2
USA 177 7 51 10
China 11 1 0 0
Germany 61 2 31 5
Great Britain 72 7 9 2
India 7 0 0 0
France 1 0 1 0
Italy 1 0 0 0
South Korea 1 0 0 0
376 18 102 21
The Board of Directors, President and other senior executives comprised 7 people (7). Variable remuneration to the President and other senior executives amounted to SEK 6 m (4). Pension costs for the President and other senior executives accounted SEK 2 m (2) of the group’s total pension costs.
NOTE 8 Information on remuneration of executive committee
2010 2009
Amounts in SEK ‘000Basic salary/Director fees
Variableremuneration Pension
Basic salary/Director fees
Variableremuneration Pension
Board of Directors 1) − − − − − −
President and CEO 2,305 1,844 267 2,385 491 286
Other senior executives(8 people, including 1 woman) 10,422 4,172 1,165 10,208 2,879 1,261
1) As Concentric AB was formed in December 2010 no fees to the Board of Directors was recognised in the 2010 accounts.
In the 2010 program, each share acquired in the market carries entitlement, free of charge, to an allotment of ten employee stock options, whereby each option provides entitlement to the acquisition of 1.0 Haldex share. A condition for allotment is that Haldex’s operat-ing margin exceeds 1 percent, excluding restructuring expenses and non-recurring cost/income from acquisitions or divestments during the 2010 fiscal year. Maximum allotment occurs if the company’s operating margin, as stated above, exceeds 4 percent. Employee stock options are issued based on the company’s earnings outcome for 2010 and in accordance with the Haldex’s board’s decision during 2011, Allotment will occur in 2011.
Employee stock options LTI 2007 LTI 2010Number
of shares
President and CEO 10,000 − LTI 2007 45,000
Other senior executives 20,000 60,000 LTI 2010 60,000
30,000 60,000 105,000
NOTE 9 Auditing fees
PwC 2010 2009
Audit assignments 1 2
Audit operation outside the audit assignment 1 1
Tax advice − −
Other assignments − −
2 3
NOTE 10 Depreciation
2010 2009
Cost of goods sold 49 64
Administrative costs 5 7
Product development costs 18 5
72 76
2009Salaries and
remuneration
Of which Board of
Directorsand CEO
Social security
costs
Of which,pension
costs
Sweden 38 2 11 2
USA 143 5 52 15
China 22 1 0 0
Germany 52 2 24 4
Great Britain 64 5 9 3
India 4 0 0 0
France 1 0 1 0
Italy 1 0 0 0
South Korea 1 0 0 0
326 16 96 24
Incentive programHaldex’s Annual General Meeting resolved in April 2007 to introduce a long-term performance-based incentive program under which sen-ior executives and key personnel would be allotted employee stock options on condition that the participants became shareholders by making their own investment in Haldex shares in the stock market.
In 2007 program, each share acquired in the market carries the entitlement, free of charge, to an allotment of ten employee stock options, whereby each option provides entitlement to the acquisition of 1.5 Haldex share. A condition for allotment is that Haldex’s pre-tax income has increased in relation to the preceding fiscal year by more than 7 percent. Maximum allotment occurs on condition that pre-tax income has increased in relation to the preceding year by 20 percent or more. Employee stock options are issued in three series and, in accordance with decisions by the Haldex Board of Directors, will be allotted during 2008, 2009 and 2010. No allotment of the 2008 and 2009 options will occur on the basis of the company’s earnings out-come. Options were allotted in 2010.
94
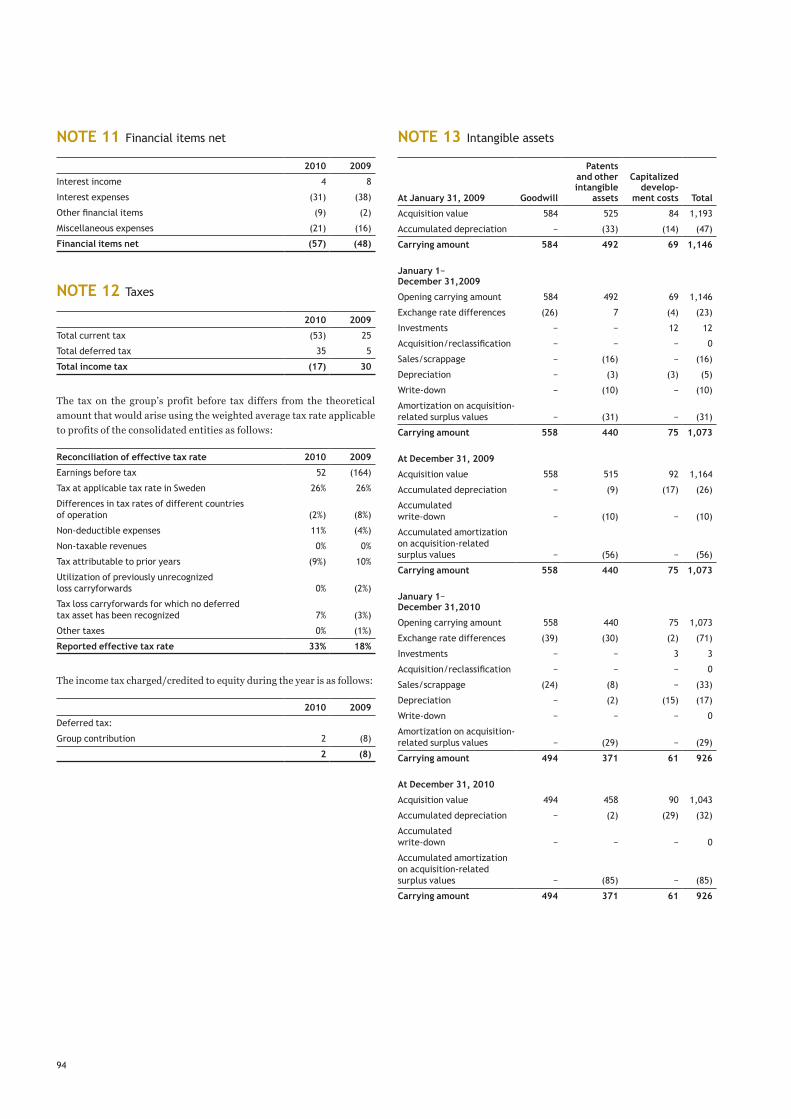
NOTE 11 Financial items net
2010 2009
Interest income 4 8
Interest expenses (31) (38)
Other financial items (9) (2)
Miscellaneous expenses (21) (16)
Financial items net (57) (48)
NOTE 12 Taxes
2010 2009
Total current tax (53) 25
Total deferred tax 35 5
Total income tax (17) 30
The tax on the group’s profit before tax differs from the theoretical amount that would arise using the weighted average tax rate applicable to profits of the consolidated entities as follows: Reconciliation of effective tax rate 2010 2009
Earnings before tax 52 (164)
Tax at applicable tax rate in Sweden 26% 26%
Differences in tax rates of different countries of operation (2%) (8%)
Non-deductible expenses 11% (4%)
Non-taxable revenues 0% 0%
Tax attributable to prior years (9%) 10%
Utilization of previously unrecognized loss carryforwards 0% (2%)
Tax loss carryforwards for which no deferred tax asset has been recognized 7% (3%)
Other taxes 0% (1%)
Reported effective tax rate 33% 18%
The income tax charged/credited to equity during the year is as follows:
2010 2009
Deferred tax:
Group contribution 2 (8)
2 (8)
NOTE 13 Intangible assets
At January 31, 2009 Goodwill
Patents and other intangible
assets
Capitalized develop-
ment costs Total
Acquisition value 584 525 84 1,193
Accumulated depreciation − (33) (14) (47)
Carrying amount 584 492 69 1,146
January 1−December 31,2009
Opening carrying amount 584 492 69 1,146
Exchange rate differences (26) 7 (4) (23)
Investments − − 12 12
Acquisition/reclassification − − − 0
Sales/scrappage − (16) − (16)
Depreciation − (3) (3) (5)
Write-down − (10) − (10)
Amortization on acquisition-related surplus values − (31) − (31)
Carrying amount 558 440 75 1,073
At December 31, 2009
Acquisition value 558 515 92 1,164
Accumulated depreciation − (9) (17) (26)
Accumulated write-down − (10) − (10)
Accumulated amortization on acquisition-related surplus values − (56) − (56)
Carrying amount 558 440 75 1,073
January 1−December 31,2010
Opening carrying amount 558 440 75 1,073
Exchange rate differences (39) (30) (2) (71)
Investments − − 3 3
Acquisition/reclassification − − − 0
Sales/scrappage (24) (8) − (33)
Depreciation − (2) (15) (17)
Write-down − − − 0
Amortization on acquisition- related surplus values − (29) − (29)
Carrying amount 494 371 61 926
At December 31, 2010
Acquisition value 494 458 90 1,043
Accumulated depreciation − (2) (29) (32)
Accumulated write-down − − − 0
Accumulated amortization on acquisition-related surplus values − (85) − (85)
Carrying amount 494 371 61 926
95
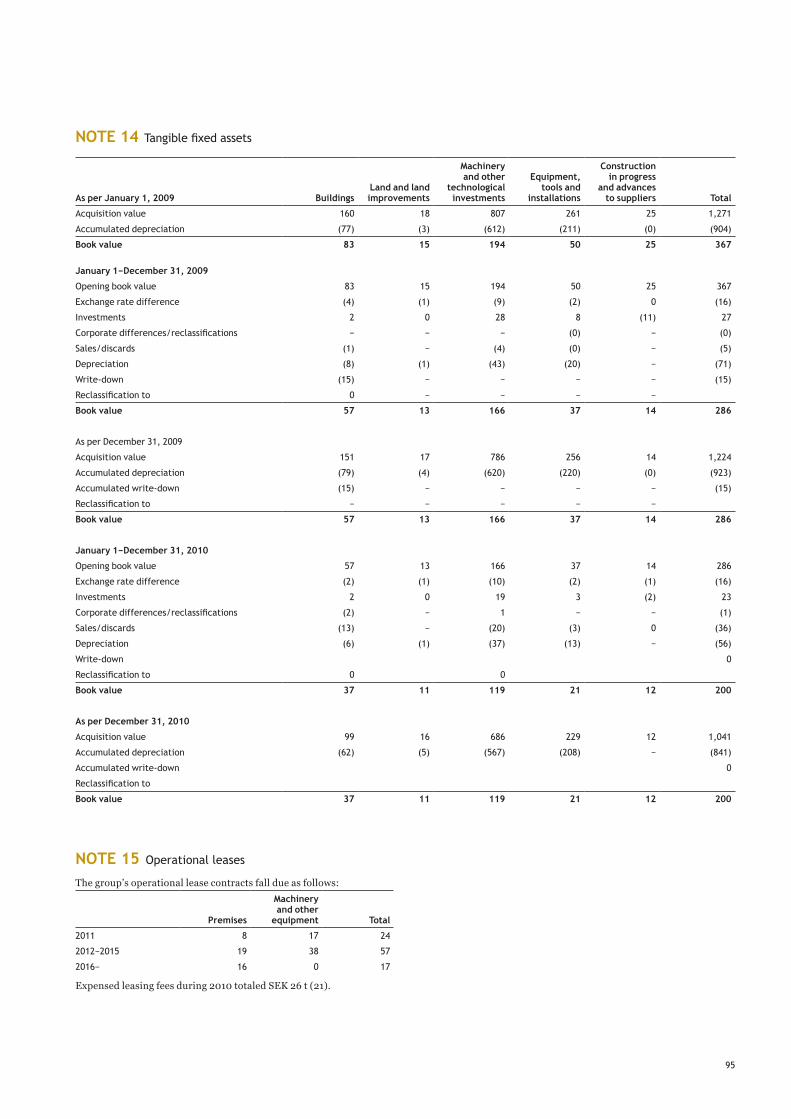
NOTE 14 Tangible fixed assets
As per January 1, 2009 BuildingsLand and land improvements
Machineryand other
technological investments
Equipment,tools and
installations
Constructionin progress
and advances to suppliers Total
Acquisition value 160 18 807 261 25 1,271
Accumulated depreciation (77) (3) (612) (211) (0) (904)
Book value 83 15 194 50 25 367
January 1−December 31, 2009
Opening book value 83 15 194 50 25 367
Exchange rate difference (4) (1) (9) (2) 0 (16)
Investments 2 0 28 8 (11) 27
Corporate differences/reclassifications − − − (0) − (0)
Sales/discards (1) − (4) (0) − (5)
Depreciation (8) (1) (43) (20) − (71)
Write-down (15) − − − − (15)
Reclassification to 0 − − − −
Book value 57 13 166 37 14 286
As per December 31, 2009
Acquisition value 151 17 786 256 14 1,224
Accumulated depreciation (79) (4) (620) (220) (0) (923)
Accumulated write-down (15) − − − − (15)
Reclassification to − − − − −
Book value 57 13 166 37 14 286
January 1−December 31, 2010
Opening book value 57 13 166 37 14 286
Exchange rate difference (2) (1) (10) (2) (1) (16)
Investments 2 0 19 3 (2) 23
Corporate differences/reclassifications (2) − 1 − − (1)
Sales/discards (13) − (20) (3) 0 (36)
Depreciation (6) (1) (37) (13) − (56)
Write-down 0
Reclassification to 0 0
Book value 37 11 119 21 12 200
As per December 31, 2010
Acquisition value 99 16 686 229 12 1,041
Accumulated depreciation (62) (5) (567) (208) − (841)
Accumulated write-down 0
Reclassification to
Book value 37 11 119 21 12 200
NOTE 15 Operational leases
The group’s operational lease contracts fall due as follows:
Premises
Machineryand other
equipment Total
2011 8 17 24
2012−2015 19 38 57
2016− 16 0 17
Expensed leasing fees during 2010 totaled SEK 26 t (21).
96
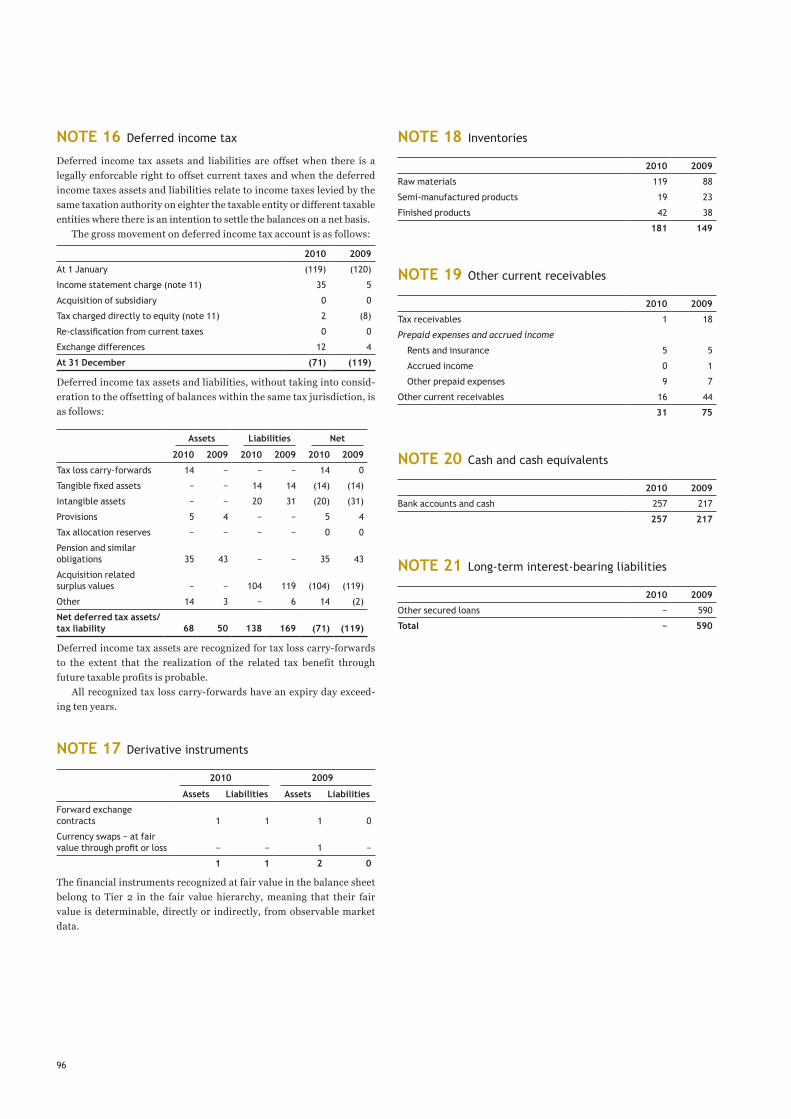
NOTE 16 Deferred income tax
Deferred income tax assets and liabilities are offset when there is a legally enforcable right to offset current taxes and when the deferred income taxes assets and liabilities relate to income taxes levied by the same taxation authority on eighter the taxable entity or different taxable entities where there is an intention to settle the balances on a net basis.
The gross movement on deferred income tax account is as follows:
2010 2009
At 1 January (119) (120)
Income statement charge (note 11) 35 5
Acquisition of subsidiary 0 0
Tax charged directly to equity (note 11) 2 (8)
Re-classification from current taxes 0 0
Exchange differences 12 4
At 31 December (71) (119)
Deferred income tax assets and liabilities, without taking into consid-eration to the offsetting of balances within the same tax jurisdiction, is as follows:
Assets Liabilities Net
2010 2009 2010 2009 2010 2009
Tax loss carry-forwards 14 − − − 14 0
Tangible fixed assets − − 14 14 (14) (14)
Intangible assets − − 20 31 (20) (31)
Provisions 5 4 − − 5 4
Tax allocation reserves − − − − 0 0
Pension and similar obligations 35 43 − − 35 43
Acquisition related surplus values − − 104 119 (104) (119)
Other 14 3 − 6 14 (2)
Net deferred tax assets/tax liability 68 50 138 169 (71) (119)
Deferred income tax assets are recognized for tax loss carry-forwards to the extent that the realization of the related tax benefit through future taxable profits is probable.
All recognized tax loss carry-forwards have an expiry day exceed-ing ten years.
NOTE 17 Derivative instruments
2010 2009
Assets Liabilities Assets Liabilities
Forward exchange contracts 1 1 1 0
Currency swaps − at fair value through profit or loss − − 1 −
1 1 2 0
The financial instruments recognized at fair value in the balance sheet belong to Tier 2 in the fair value hierarchy, meaning that their fair value is determinable, directly or indirectly, from observable market data.
NOTE 18 Inventories
2010 2009
Raw materials 119 88
Semi-manufactured products 19 23
Finished products 42 38
181 149
NOTE 19 Other current receivables
2010 2009
Tax receivables 1 18
Prepaid expenses and accrued income
Rents and insurance 5 5
Accrued income 0 1
Other prepaid expenses 9 7
Other current receivables 16 44
31 75
NOTE 20 Cash and cash equivalents
2010 2009
Bank accounts and cash 257 217
257 217
NOTE 21 Long-term interest-bearing liabilities
2010 2009
Other secured loans − 590
Total − 590
97
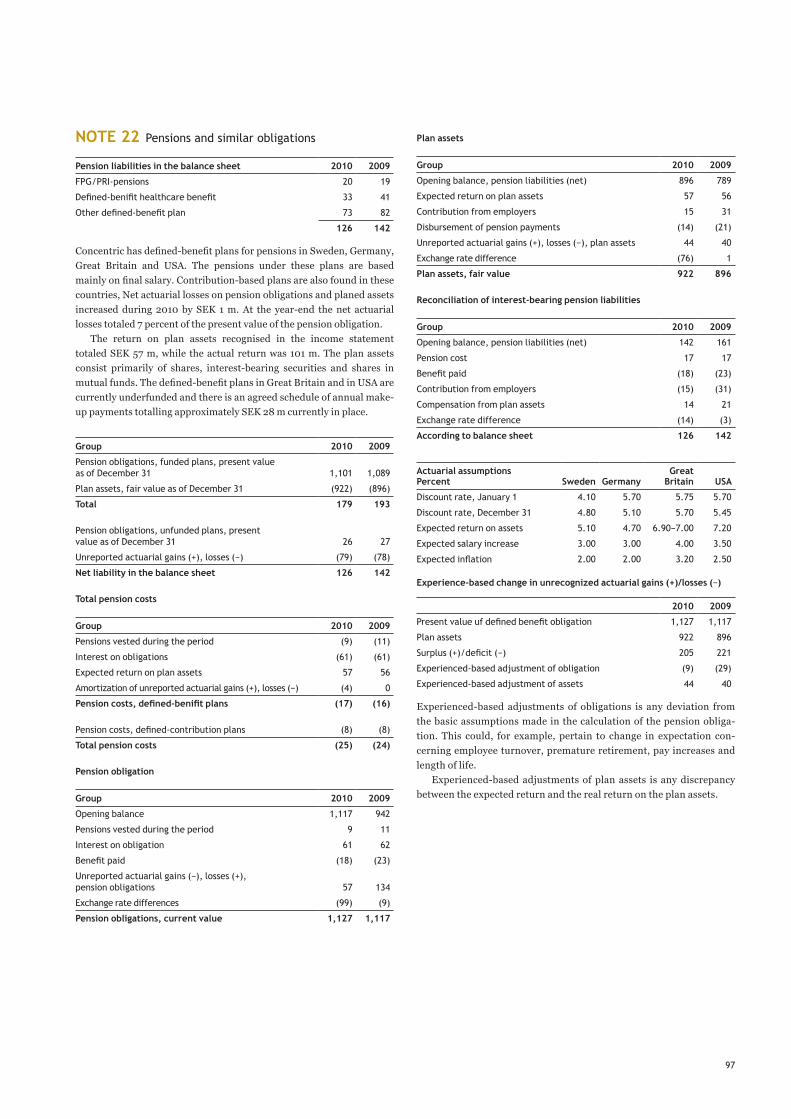
NOTE 22 Pensions and similar obligations
Pension liabilities in the balance sheet 2010 2009
FPG/PRI-pensions 20 19
Defined-benifit healthcare benefit 33 41
Other defined-benefit plan 73 82
126 142
Concentric has defined-benefit plans for pensions in Sweden, Germany, Great Britain and USA. The pensions under these plans are based mainly on final salary. Contribution-based plans are also found in these countries, Net actuarial losses on pension obligations and planed assets increased during 2010 by SEK 1 m. At the year-end the net actuarial losses totaled 7 percent of the present value of the pension obligation.
The return on plan assets recognised in the income statement totaled SEK 57 m, while the actual return was 101 m. The plan assets consist primarily of shares, interest-bearing securities and shares in mutual funds. The defined-benefit plans in Great Britain and in USA are currently underfunded and there is an agreed schedule of annual make-up payments totalling approximately SEK 28 m currently in place.
Group 2010 2009
Pension obligations, funded plans, present value as of December 31 1,101 1,089
Plan assets, fair value as of December 31 (922) (896)
Total 179 193
Pension obligations, unfunded plans, present value as of December 31 26 27
Unreported actuarial gains (+), losses (−) (79) (78)
Net liability in the balance sheet 126 142
Total pension costs
Group 2010 2009
Pensions vested during the period (9) (11)
Interest on obligations (61) (61)
Expected return on plan assets 57 56
Amortization of unreported actuarial gains (+), losses (−) (4) 0
Pension costs, defined-benifit plans (17) (16)
Pension costs, defined-contribution plans (8) (8)
Total pension costs (25) (24)
Pension obligation
Group 2010 2009
Opening balance 1,117 942
Pensions vested during the period 9 11
Interest on obligation 61 62
Benefit paid (18) (23)
Unreported actuarial gains (−), losses (+), pension obligations 57 134
Exchange rate differences (99) (9)
Pension obligations, current value 1,127 1,117
Plan assets
Group 2010 2009
Opening balance, pension liabilities (net) 896 789
Expected return on plan assets 57 56
Contribution from employers 15 31
Disbursement of pension payments (14) (21)
Unreported actuarial gains (+), losses (−), plan assets 44 40
Exchange rate difference (76) 1
Plan assets, fair value 922 896
Reconciliation of interest-bearing pension liabilities
Group 2010 2009
Opening balance, pension liabilities (net) 142 161
Pension cost 17 17
Benefit paid (18) (23)
Contribution from employers (15) (31)
Compensation from plan assets 14 21
Exchange rate difference (14) (3)
According to balance sheet 126 142
Actuarial assumptionsPercent Sweden Germany
Great Britain USA
Discount rate, January 1 4.10 5.70 5.75 5.70
Discount rate, December 31 4.80 5.10 5.70 5.45
Expected return on assets 5.10 4.70 6.90−7.00 7.20
Expected salary increase 3.00 3.00 4.00 3.50
Expected inflation 2.00 2.00 3.20 2.50
Experience-based change in unrecognized actuarial gains (+)/losses (−)
2010 2009
Present value uf defined benefit obligation 1,127 1,117
Plan assets 922 896
Surplus (+)/deficit (−) 205 221
Experienced-based adjustment of obligation (9) (29)
Experienced-based adjustment of assets 44 40
Experienced-based adjustments of obligations is any deviation from the basic assumptions made in the calculation of the pension obliga-tion. This could, for example, pertain to change in expectation con-cerning employee turnover, premature retirement, pay increases and length of life.
Experienced-based adjustments of plan assets is any discrepancy between the expected return and the real return on the plan assets.
98
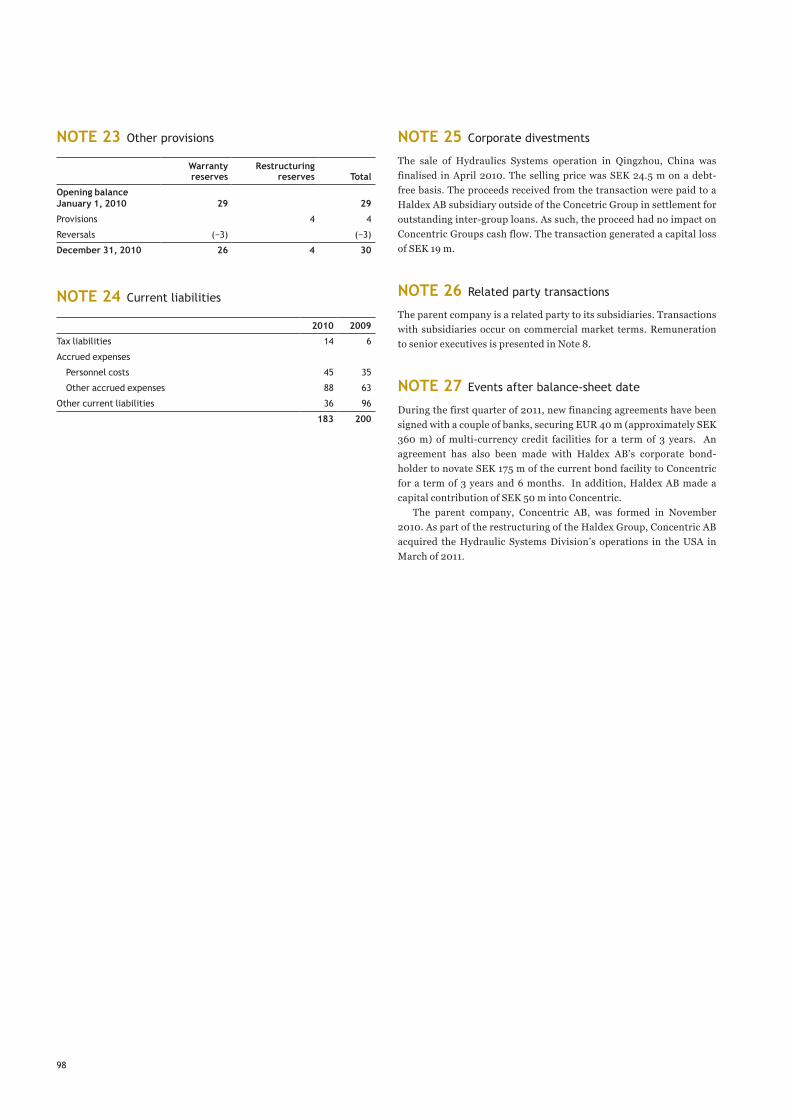
NOTE 23 Other provisions
Warranty reserves
Restructuringreserves Total
Opening balance January 1, 2010 29 29
Provisions 4 4
Reversals (−3) (−3)
December 31, 2010 26 4 30
NOTE 24 Current liabilities
2010 2009
Tax liabilities 14 6
Accrued expenses
Personnel costs 45 35
Other accrued expenses 88 63
Other current liabilities 36 96
183 200
NOTE 25 Corporate divestments
The sale of Hydraulics Systems operation in Qingzhou, China was finalised in April 2010. The selling price was SEK 24.5 m on a debt-free basis. The proceeds received from the transaction were paid to a Haldex AB subsidiary outside of the Concetric Group in settlement for outstanding inter-group loans. As such, the proceed had no impact on Concentric Groups cash flow. The transaction generated a capital loss of SEK 19 m.
NOTE 26 Related party transactions
The parent company is a related party to its subsidiaries. Transactions with subsidiaries occur on commercial market terms. Remuneration to senior executives is presented in Note 8.
NOTE 27 Events after balance-sheet date
During the first quarter of 2011, new financing agreements have been signed with a couple of banks, securing EUR 40 m (approximately SEK 360 m) of multi-currency credit facilities for a term of 3 years. An agreement has also been made with Haldex AB’s corporate bond-holder to novate SEK 175 m of the current bond facility to Concentric for a term of 3 years and 6 months. In addition, Haldex AB made a capital contribution of SEK 50 m into Concentric.
The parent company, Concentric AB, was formed in November 2010. As part of the restructuring of the Haldex Group, Concentric AB acquired the Hydraulic Systems Division’s operations in the USA in March of 2011.
99
Auditor’s report on historical financial statements
To the Board of Directors of Concentric AB (publ) Corp. ID No. 556828-4995
We have audited the financial statements for Concentric AB on pages 80–99, which comprise the balance sheet as of De-cember 31, 2010 and December 31, 2009 and the income state-ment, cash flow statement and statement of changes in equity for the years then ended, and a summary of significant ac-counting policies and other explanatory notes.
The Board of Directors and the Managing Directors responsibility for the financial statements The Board of Directors and the Managing Director are respon-sible for the preparation and the fair presentation of the fi-nancial statements in accordance with International Report-ing Standards as adopted by the EU and as described in note 2 Summary of important accounting principles and the require-ments of the Prospectus Directive Implementing Regulation 809/2004/EC. This responsibility includes designing, imple-menting and maintaining the internal control relevant to pre-pare and appropriately present the financial statements free from material misstatements, whether due to fraud or error.
The Auditor’s responsibility Our responsibility is to express an opinion on these financial statements based on our audit. We conducted our audit in ac-cordance with Fars Recommendation RevR 5 Examination of Prospectus. This recommendation requires that we have com-plied with ethical guidelines and that we have planned and per-formed the audit to obtain reasonable assurance that the finan-cial statements are free from material misstatements.
An audit in accordance with Fars Recommendation RevR 5 Examination of Prospectus involves performing procedures to obtain audit evidence corroborating the amounts and dis-closures in the financial statements. The audit procedures se-lected depend on our assessment of the risks of material mis-statements in the financial statements, whether due to fraud or error. In making those risk assessments, we consider internal control relevant the Company´s preparation and presentation of the financial statements as a basis for designing audit pro-cedures that are applicable under those circumstances but not for the purpose of expressing an opinion on the effectiveness of the Company´s internal control. An audit also involves evalu-ating the accounting policies applied and the reasonableness of the significant accounting estimates made by the Board of Directors and the Managing Director and evaluating the over-all financial statement presentation.
We believe that the audit evidence received is sufficient and appropriate supporting documentation for our opinion.
Opinion In our opinion, the financial statements give a true and fair view of the financial position, financial performance, changes in equity and cash flow of Concentric AB as of December 31, 2010 and December 31, 2009, in accordance with Internation-al Financial Standards as adopted by EU and as described in note 2 “Summary of important accounting principles”.
Stockholm May 23 2011
ÖhrlingsPricewaterhouseCoopers AB
Michael BengtssonAuthorized Public Accountant
100
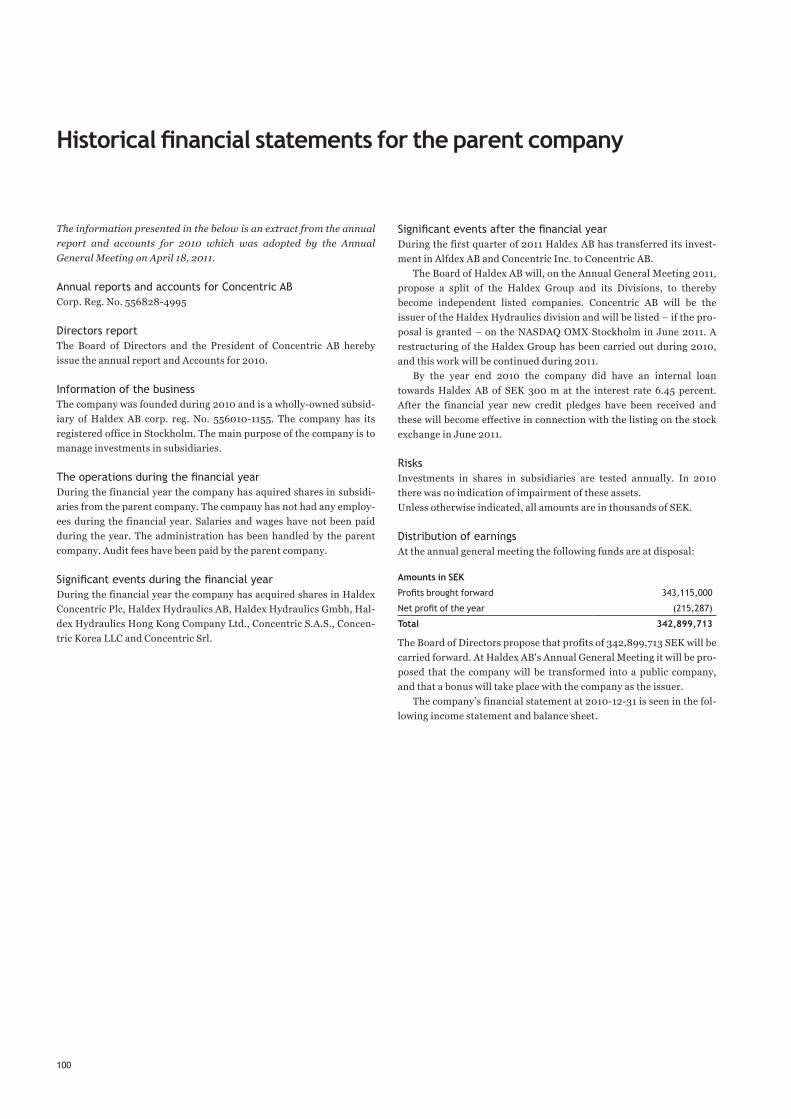
The information presented in the below is an extract from the annual report and accounts for 2010 which was adopted by the Annual General Meeting on April 18, 2011.
Annual reports and accounts for Concentric ABCorp. Reg. No. 556828-4995
Directors reportThe Board of Directors and the President of Concentric AB hereby issue the annual report and Accounts for 2010.
Information of the businessThe company was founded during 2010 and is a wholly-owned subsid-iary of Haldex AB corp. reg. No. 556010-1155. The company has its registered office in Stockholm. The main purpose of the company is to manage investments in subsidiaries.
The operations during the financial yearDuring the financial year the company has aquired shares in subsidi-aries from the parent company. The company has not had any employ-ees during the financial year. Salaries and wages have not been paid during the year. The administration has been handled by the parent company. Audit fees have been paid by the parent company.
Significant events during the financial yearDuring the financial year the company has acquired shares in Haldex Concentric Plc, Haldex Hydraulics AB, Haldex Hydraulics Gmbh, Hal-dex Hydraulics Hong Kong Company Ltd., Concentric S.A.S., Concen-tric Korea LLC and Concentric Srl.
Significant events after the financial yearDuring the first quarter of 2011 Haldex AB has transferred its invest-ment in Alfdex AB and Concentric Inc. to Concentric AB.
The Board of Haldex AB will, on the Annual General Meeting 2011, propose a split of the Haldex Group and its Divisions, to thereby become independent listed companies. Concentric AB will be the issuer of the Haldex Hydraulics division and will be listed – if the pro-posal is granted – on the NASDAQ OMX Stockholm in June 2011. A restructuring of the Haldex Group has been carried out during 2010, and this work will be continued during 2011.
By the year end 2010 the company did have an internal loan towards Haldex AB of SEK 300 m at the interest rate 6.45 percent. After the financial year new credit pledges have been received and these will become effective in connection with the listing on the stock exchange in June 2011.
RisksInvestments in shares in subsidiaries are tested annually. In 2010 there was no indication of impairment of these assets. Unless otherwise indicated, all amounts are in thousands of SEK.
Distribution of earningsAt the annual general meeting the following funds are at disposal:
Amounts in SEK
Profits brought forward 343,115,000
Net profit of the year (215,287)
Total 342,899,713
The Board of Directors propose that profits of 342,899,713 SEK will be carried forward. At Haldex AB's Annual General Meeting it will be pro-posed that the company will be transformed into a public company, and that a bonus will take place with the company as the issuer.
The company’s financial statement at 2010-12-31 is seen in the fol-lowing income statement and balance sheet.
Historical financial statements for the parent company
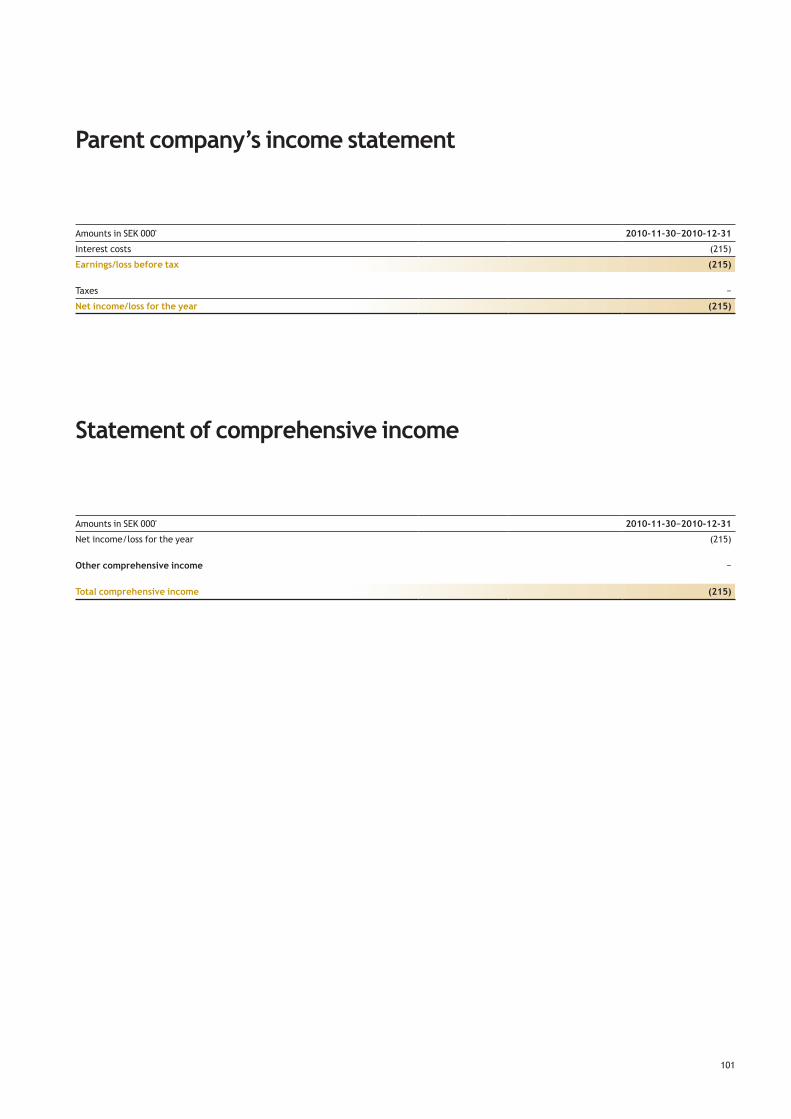
101
Parent company’s income statement
Statement of comprehensive income
Amounts in SEK 000' 2010-11-30−2010-12-31
Interest costs (215)
Earnings/loss before tax (215)
Taxes −
Net income/loss for the year (215)
Amounts in SEK 000' 2010-11-30−2010-12-31
Net income/loss for the year (215)
Other comprehensive income −
Total comprehensive income (215)

102
Parent company’s balance sheet
Amounts in SEK 000' Note 2010
Financial fixed assets
Shares in subsidiaries 1 649,186
Total fixed assets 649,186
Current assets
Cash and cash equivalents 50
Total current assets 50
Total assets 649,236
Equity and liabilities
Equity
Share capital (500 shares of SEK 100) 50
Shareholders' contribution 343,115
Net income/loss for the year (215)
Total equity 342,950
Current liabilities
Liabilities to group companies 306,287
Total current liabilities 306,287
Total equity and liabilites 649,236
Collateral pledged None
Contingent liabilites None
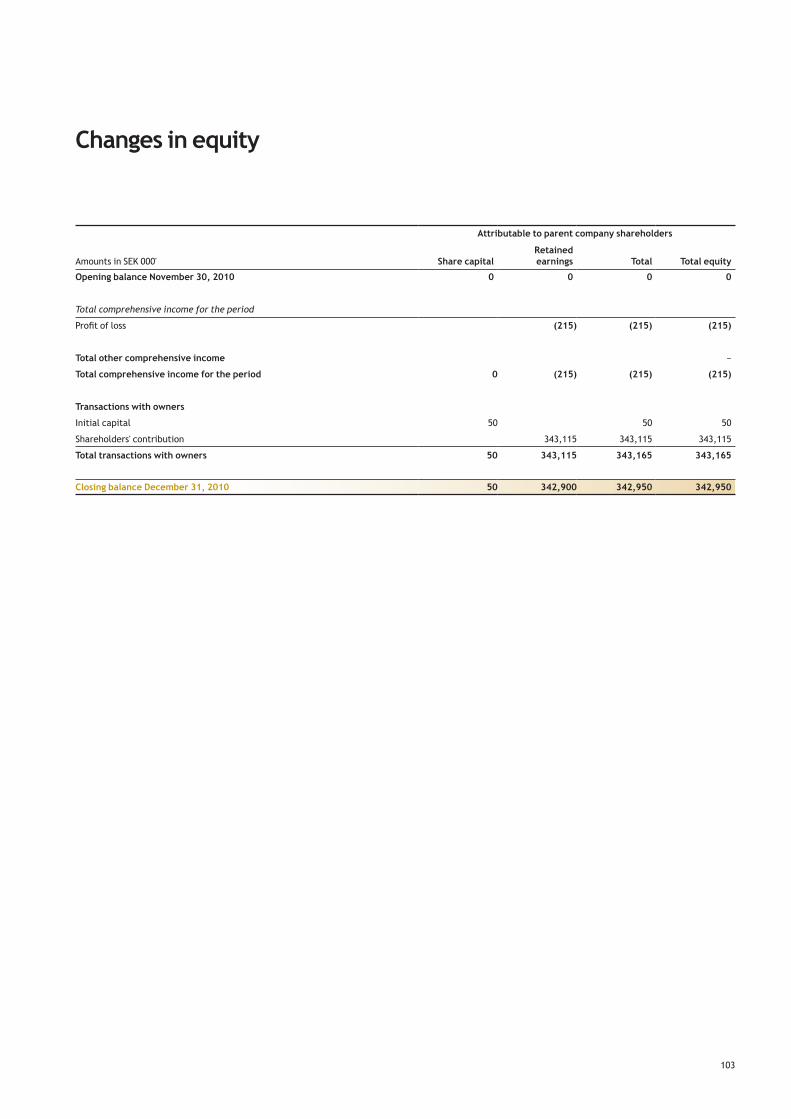
103
Attributable to parent company shareholders
Amounts in SEK 000' Share capitalRetained earnings Total Total equity
Opening balance November 30, 2010 0 0 0 0
Total comprehensive income for the period
Profit of loss (215) (215) (215)
Total other comprehensive income −
Total comprehensive income for the period 0 (215) (215) (215)
Transactions with owners
Initial capital 50 50 50
Shareholders' contribution 343,115 343,115 343,115
Total transactions with owners 50 343,115 343,165 343,165
Closing balance December 31, 2010 50 342,900 342,950 342,950
Changes in equity
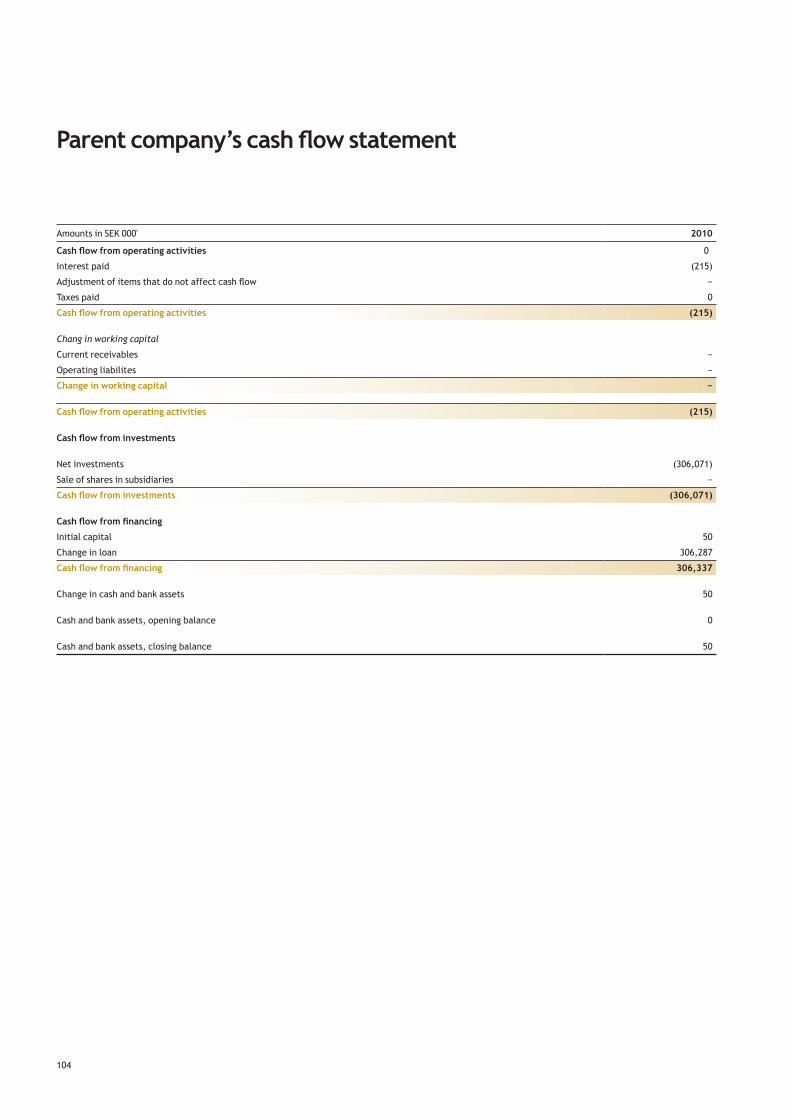
104
Parent company’s cash flow statement
Amounts in SEK 000' 2010
Cash flow from operating activities 0
Interest paid (215)
Adjustment of items that do not affect cash flow −
Taxes paid 0
Cash flow from operating activities (215)
Chang in working capital
Current receivables −
Operating liabilites −
Change in working capital −
Cash flow from operating activities (215)
Cash flow from investments
Net investments (306,071)
Sale of shares in subsidiaries −
Cash flow from investments (306,071)
Cash flow from financing
Initial capital 50
Change in loan 306,287
Cash flow from financing 306,337
Change in cash and bank assets 50
Cash and bank assets, opening balance 0
Cash and bank assets, closing balance 50
105
The Financial Statements have been prepared in accordance with Årsredovisningslagen and RFR 2, Redovisning för juridiska personer.
Group accounting has not been prepared in accordance with Årsre-dovisningslagen chapter 7, 2§.
Shares in subsidiariesShares in subsidiaries are carried at cost less any impairment. The cost includes acquisition-related costs. Dividends received are recorded as financial income. When there is an indication that stocks and shares in subsidiaries or associated companies decreased in value, an estimate of its recovera-
ble amount is set. If this is lower than the carrying amount a write down is done. Impairment losses are recognized in the items Income from investments in subsidiaries and Profit from associated compa-nies.
BorrowingsBorrowings are recognized initially at fair value, net of transaction costs. Borrowings are subsequently stated at amortized cost and any difference between proceeds (net of transaction costs) and the redemption value is recognized in the income statement over the period of the borrowings using the effective interest method.
Accounting principles
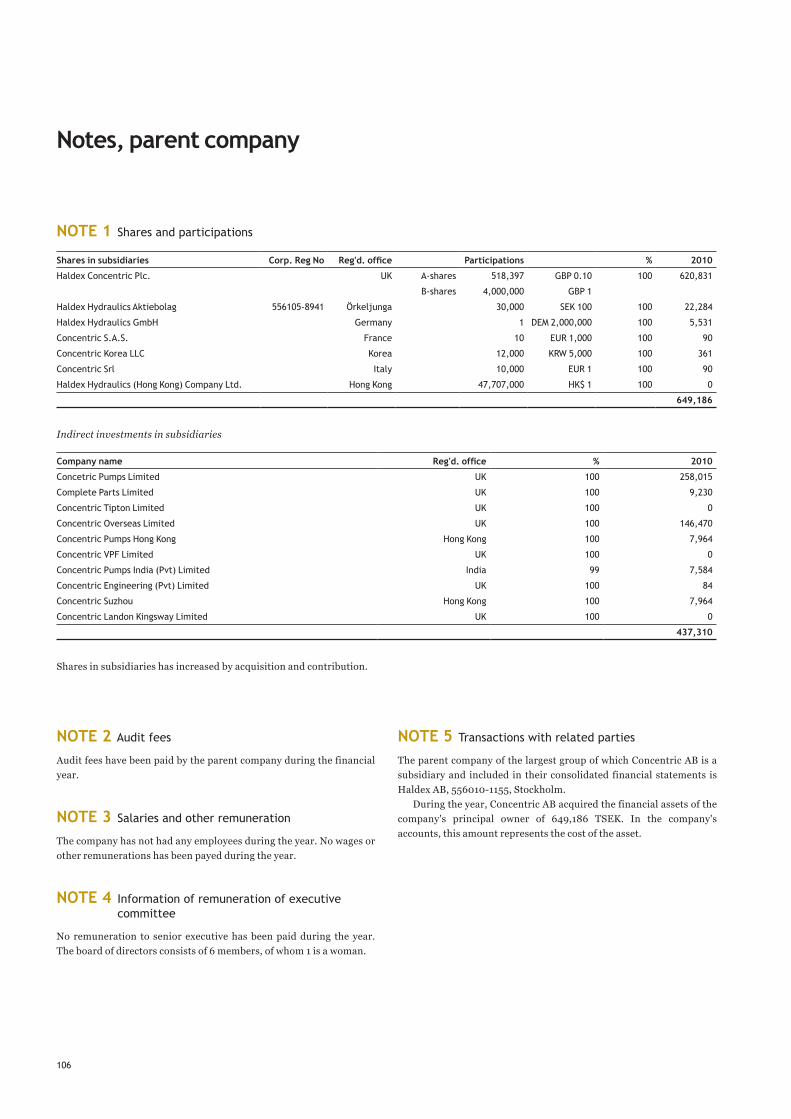
106
NOTE 2 Audit fees
Audit fees have been paid by the parent company during the financial year.
NOTE 3 Salaries and other remuneration
The company has not had any employees during the year. No wages or other remunerations has been payed during the year.
NOTE 4 Information of remuneration of executive committee
No remuneration to senior executive has been paid during the year. The board of directors consists of 6 members, of whom 1 is a woman.
NOTE 5 Transactions with related parties
The parent company of the largest group of which Concentric AB is a subsidiary and included in their consolidated financial statements is Haldex AB, 556010-1155, Stockholm.
During the year, Concentric AB acquired the financial assets of the company's principal owner of 649,186 TSEK. In the company's accounts, this amount represents the cost of the asset.
Notes, parent company
NOTE 1 Shares and participations
Shares in subsidiaries Corp. Reg No Reg'd. office Participations % 2010
Haldex Concentric Plc. UK A-shares 518,397 GBP 0.10 100 620,831
B-shares 4,000,000 GBP 1
Haldex Hydraulics Aktiebolag 556105-8941 Örkeljunga 30,000 SEK 100 100 22,284
Haldex Hydraulics GmbH Germany 1 DEM 2,000,000 100 5,531
Concentric S.A.S. France 10 EUR 1,000 100 90
Concentric Korea LLC Korea 12,000 KRW 5,000 100 361
Concentric Srl Italy 10,000 EUR 1 100 90
Haldex Hydraulics (Hong Kong) Company Ltd. Hong Kong 47,707,000 HK$ 1 100 0
649,186
Indirect investments in subsidiaries
Company name Reg'd. office % 2010
Concetric Pumps Limited UK 100 258,015
Complete Parts Limited UK 100 9,230
Concentric Tipton Limited UK 100 0
Concentric Overseas Limited UK 100 146,470
Concentric Pumps Hong Kong Hong Kong 100 7,964
Concentric VPF Limited UK 100 0
Concentric Pumps India (Pvt) Limited India 99 7,584
Concentric Engineering (Pvt) Limited UK 100 84
Concentric Suzhou Hong Kong 100 7,964
Concentric Landon Kingsway Limited UK 100 0
437,310
Shares in subsidiaries has increased by acquisition and contribution.
107
Auditor’s report on historical financial statements
To the Annual General Meeting of shareholders of Concentric ABCorporate identity number 556828-4995
We have audited the annual accounts, the accounting records and the administration of the board of directors and the man-aging director of Concentric AB for the year 2010-11-30 – 2010-12-31. These accounts and the administration of the com-pany and the application of the Annual Accounts Act when preparing the annual accounts are the responsibility of the board of directors and the managing director. Our responsi-bility is to express an opinion on the annual accounts and the administration based on our audit.
We conducted our audit in accordance with generally ac-cepted auditing standards in Sweden. Those standards require that we plan and perform the audit to obtain reasonable as-surance that the annual accounts are free of material misstate-ment. An audit includes examining, on a test basis, evidence supporting the amounts and disclosures in the accounts. An audit also includes assessing the accounting principles used and their application by the board of directors and the man-aging director and significant estimates made by the board of directors and the managing director when preparing the an-nual accounts as well as evaluating the overall presentation of information in the annual accounts. As a basis for our opinion
concerning discharge from liability, we examined significant decisions, actions taken and circumstances of the company in order to be able to determine the liability, if any, to the com-pany of any board member or the managing director. We also examined whether any board member or the managing direc-tor has, in any other way, acted in contravention of the Com-panies Act, the Annual Accounts Act or the Articles of Asso-ciation. We believe that our audit provides a reasonable basis for our opinion set out below.
The annual accounts have been prepared in accordance with the Annual Accounts Act and give a true and fair view of the company’s financial position and results of operations in accordance with generally accepted accounting principles in Sweden. The statutory administration report is consistent with the other parts of the annual accounts.
We recommend to the annual meeting of shareholders that the income statement and balance sheet be adopted, that the profit be dealt with in accordance with the proposal in the ad-ministration report and that the members of the board of di-rectors and the managing director be discharged from liabili-ty for the financial year.
Stockholm March 30, 2011
ÖhrlingsPricewaterhouseCoopers AB
Ann-Christine HägglundAuthorized Public Accountant
Lead Partner


