Embed Size (px)
Citation preview
HOLTINTERN AT I
ECONAL
Holtec Center, 555 Lincoln Drive West, Marlton, NJ 08053Telephone (856) 797- 0900Fax (856) 797 - 0909
SPENT FUEL POOL RACKS MODIFICATIONSWITH POISON MATERIAL INSERTS
IN ANO UNIT I
FOR
ENTERGY
Holtec Report No: HI-2022867
Holtec Project No: 1196
Report Class : SAFETY RELATED
7-111S j)oeC11y74W;y- AS IJ07-
.Sgg PA6g
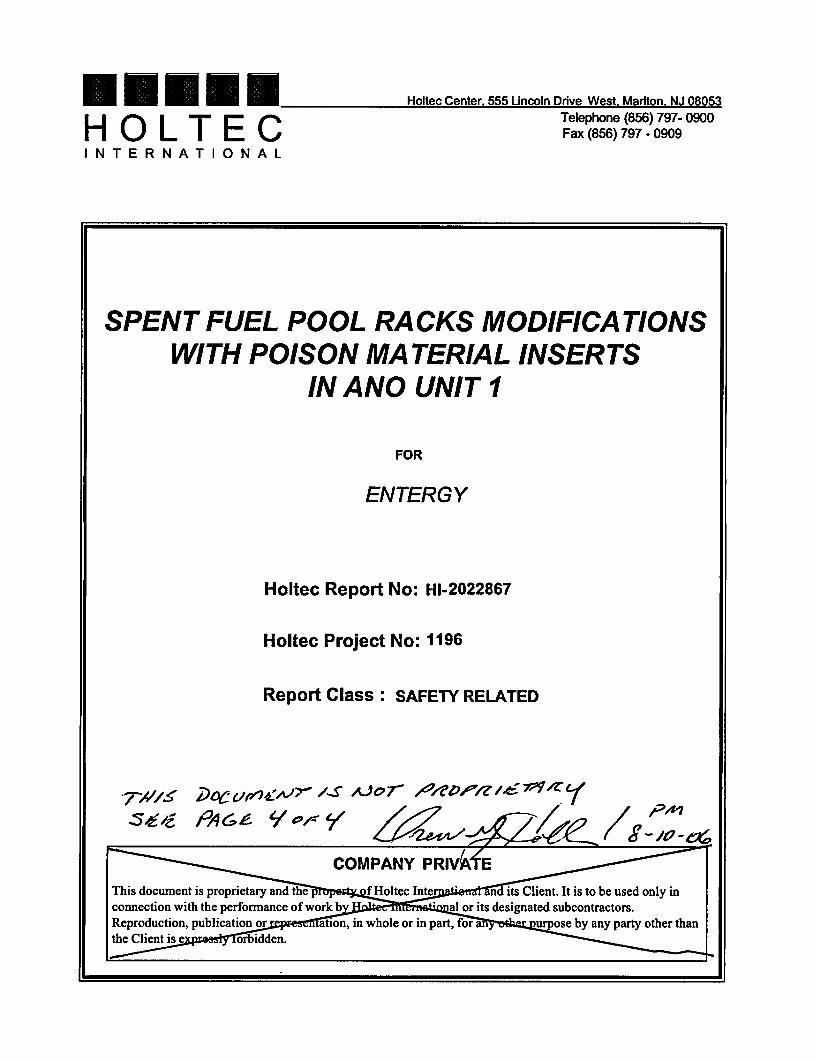
HOLTEC INTERNATIONALDOCUMENT NUMBER: HI-2022867 PROJECT NUMBER: 1196
DOCUMENT ISSUANCE AND REVISION STATUS
DOCUMENT NAME: SPENT FUEL POOL RACKS MODIFICATIONSWITH POISON MATERIAL INSERTS IN ANO UNIT- SPECIFIC
REVISION No. _0_ REVISION No. 1 REVISION No. 2
Author's Date Author's Date VIR # Author's DatepproNo. Portiontt Initials Approved Initials Approved Initials Approved
I CHAPO1 DMM 11/16/02 202651 - DMM 1/17/02 7269111.
2. CHAP02 CWB 11/16/02 871854 - CWB 1/17/02 807558
CHAP03 CWB 11/16/02 504354 - CWB 1/17/02 711269
CHAP04 ST 11/16/02 788335 ST 11/21/02 816617 DMM 1/17/02 734332
5. CHAP05 EBR 11/16/02 691366 - EBR 1/17/02 980931
6. CHAP06 CWB 11/16/02 406182 CWB 11/21/02 623799 CWB 1/17/02 14788
7. CHAP07 JZ 11/16/02 458172 - JZ 1/17/02 886712
** Chapter or section number.
Page 1 of 4
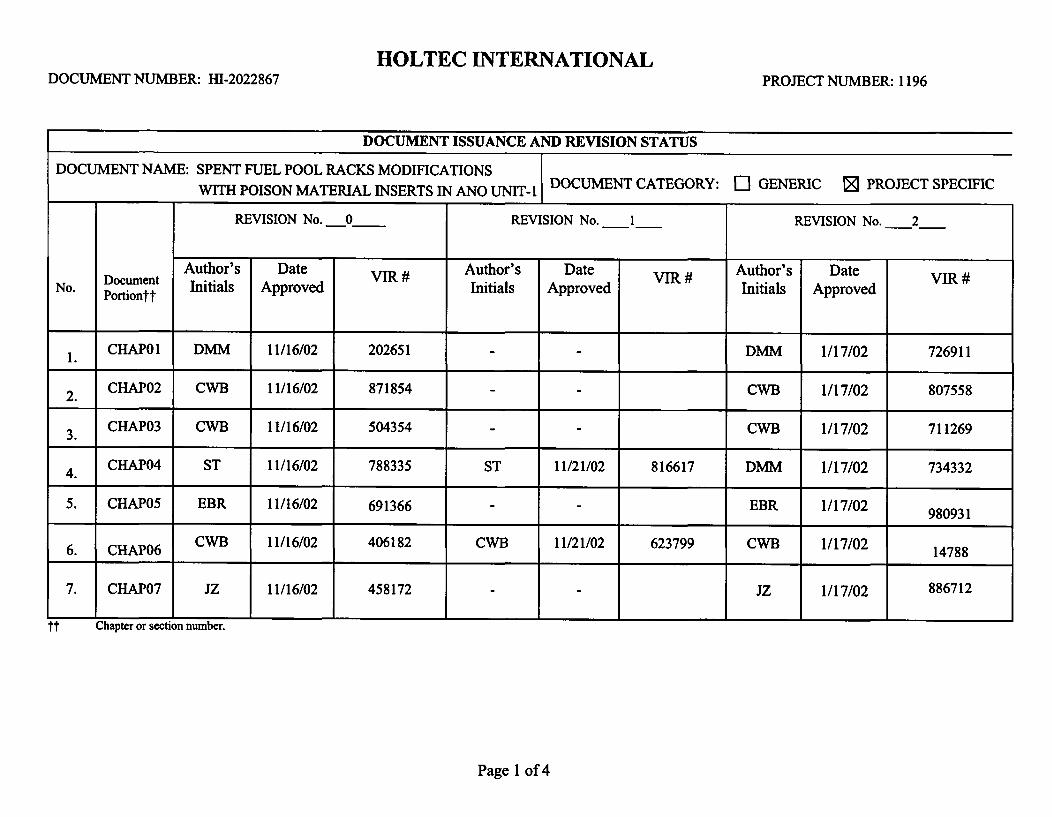
HOLTEC INTERNATIONALDOCUMENT NUMBER: HI-2022867 PROJECT NUMBER: 1196
DOCUMENT ISSUANCE AND REVISION STATUS
DOCUMENT NAME: SPENT FUEL POOL RACKS MODIFICATIONSWIT POSO MAERAL NSETSiN NOUNI-iDOCUMENT CATEGORY: LI GENERIC [] PROJECT SPECIFICWITH POISON MATERIAL INSERTS IN ANO UNIT-1I
REVISION No._3 REVISION No. _4 REVISION No. 5
Author's Date VIR # Author's Date VIR # Author's Date VIR #No. Portiontt Initials Approved Initials Approved Initials Approved
CHAPO1 DMM 2/25/03 686344 - - DMM 12/19/03 701998
2. CHAP02 AK 2/25/03 195327 - - DMM 12/19/03 754039
CHAP03 AK 2/25/03 962934 - - DMM 12/19/03 968723
CHAP04 DMM 2/25/03 266472 DMM 11/18/03 165227 DMM 12/19/03 122189
5. CHAP05 EBR 2/25/03 138108 - - - -
CHAP06 AK 2/25/03 531949 - CWB 12/19/03 905606
7. CHAP07 Jztt Chapter or section number.
Page 2 of 4
HOLTEC INTERNATIONALDOCUMENT NUMBER: HI-2022867 PROJECT NUMBER: 1196
DOCUMENT ISSUANCE AND REVISION STATUS
DOCUMENT NAME: SPENT FUEL POOL RACKS MODIFICATIONSWiT POSONMAERIL ISERS N AO u -iDOCUMENT CATEGORY: E] GENERIC [] PROJECT SPECIFIC
WITH POISON MATERIAL INSERTS IN ANO UNIT-1I
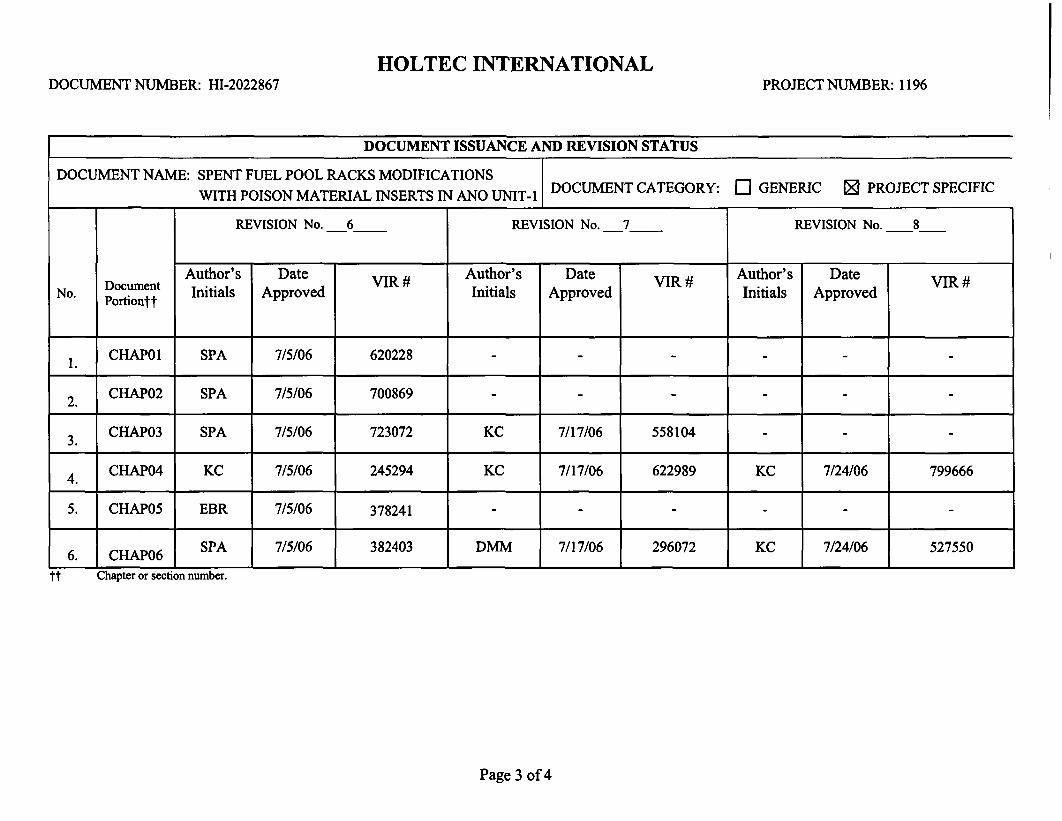
REVISION No. 6 REVISION No. _7 REVISION No. 8
Author's Date 'WR # Author's Date VIR # Author's Date VII#DocumentVR#VI#VI#No. Portiontt Initials Approved Initials Approved Initials Approved
CHAPO0 SPA 7/5/06 620228
2. CHAP02 SPA 7/5/06 700869 - -
CHAP03 SPA 7/5/06 723072 KC 7/17/06 558104 - -
CHAP04 KC 7/5/06 245294 KC 7/17/06 622989 KC 7/24/06 799666
5. CHAP05 EBR 7/5/06 378241 - - - -
6. CHAP06 SPA 7/5/06 382403 DMM 7/17/06 296072 KC 7/24/06 527550
ft Chapter or section number.
Page 3 of 4
HOLTEC INTERNATIONALDOCUMENT NUMBER: HI-2022867 PROJECT NUMBER: 1196
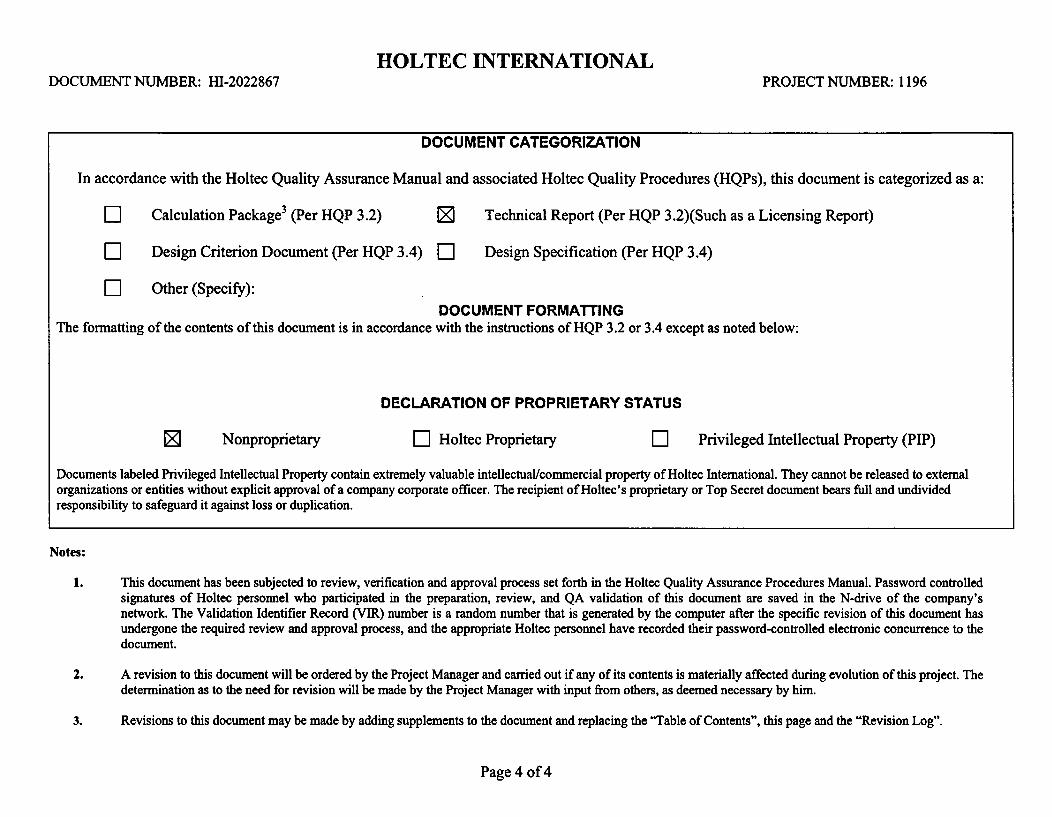
DOCUMENT CATEGORIZATION
In accordance with the Holtec Quality Assurance Manual and associated Holtec Quality Procedures (HQPs), this document is categorized as a:
[- Calculation Package 3 (Per HQP 3.2) E
L" Design Criterion Document (Per HQP 3.4) '-
Technical Report (Per HQP 3.2)(Such as a Licensing Report)
Design Specification (Per HQP 3.4)
LI Other (Specify):DOCUMENT FORMATTING
The formatting of the contents of this document is in accordance with the instructions of HQP 3.2 or 3.4 except as noted below:
DECLARATION OF PROPRIETARY STATUS
Nonproprietary ["] Holtec Proprietary Privileged Intellectual Property (PIP)
Documents labeled Privileged Intellectual Property contain extremely valuable intellectual/commercial property of Holtec International. They cannot be released to externalorganizations or entities without explicit approval of a company corporate officer. The recipient of Holtec's proprietary or Top Secret document bears full and undividedresponsibility to safeguard it against loss or duplication.
Notes:
1. This document has been subjected to review, verification and approval process set forth in the Holtec Quality Assurance Procedures Manual. Password controlledsignatures of Holtec personnel who participated in the preparation, review, and QA validation of this document are saved in the N-drive of the company'snetwork. The Validation Identifier Record (VIR) number is a random number that is generated by the computer after the specific revision of this document hasundergone the required review and approval process, and the appropriate Holtec personnel have recorded their password-controlled electronic concurrence to thedocument.
2. A revision to this document will be ordered by the Project Manager and carried out if any of its contents is materially affected during evolution of this project. The
determination as to the need for revision will be made by the Project Manager with input from others, as deemed necessary by him.
3. Revisions to this document may be made by adding supplements to the document and replacing the "Table of Contents", this page and the "Revision Log".
Page 4 of 4
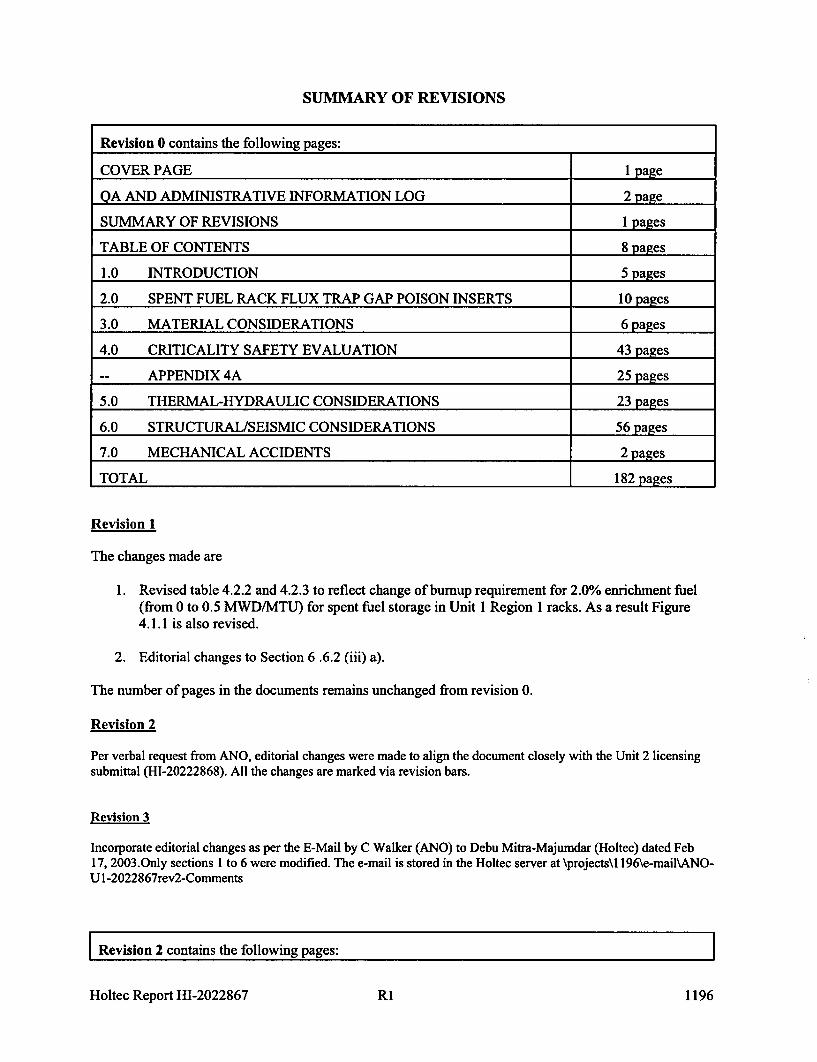
SUMMARY OF REVISIONS
Revision 0 contains the following pages:
COVER PAGE 1 page
QA AND ADMINISTRATIVE INFORMATION LOG 2 page
SUMMARY OF REVISIONS 1 pages
TABLE OF CONTENTS 8 pages
1.0 INTRODUCTION 5 pages
2.0 SPENT FUEL RACK FLUX TRAP GAP POISON INSERTS 10 pages
3.0 MATERIAL CONSIDERATIONS 6 pages
4.0 CRITICALITY SAFETY EVALUATION 43 pages
-- APPENDIX 4A 25 pages
5.0 THERMAL-HYDRAULIC CONSIDERATIONS 23 pages
6.0 STRUCTURAL/SEISMIC CONSIDERATIONS 56 pages
7.0 MECHANICAL ACCIDENTS 2 pages
TOTAL 182 pages
Revision 1
The changes made are
1. Revised table 4.2.2 and 4.2.3 to reflect change of burnup requirement for 2.0% enrichment fuel(from 0 to 0.5 MWD/MTU) for spent fuel storage in Unit 1 Region 1 racks. As a result Figure4.1.1 is also revised.
2. Editorial changes to Section 6 .6.2 (iii) a).
The number of pages in the documents remains unchanged from revision 0.
Revision 2
Per verbal request from ANO, editorial changes were made to align the document closely with the Unit 2 licensingsubmittal (HI-20222868). All the changes are marked via revision bars.
Revision 3
Incorporate editorial changes as per the E-Mail by C Walker (ANO) to Debu Mitra-Majumdar (Holtec) dated Feb17, 2003.Only sections 1 to 6 were modified. The e-mail is stored in the Holtec server at \projects\1 196\e-mail\ANO-U 1-2022867rev2-Comments
Revision 2 contains the following pages: I
Holtec Report HI-2022867 RI 1196
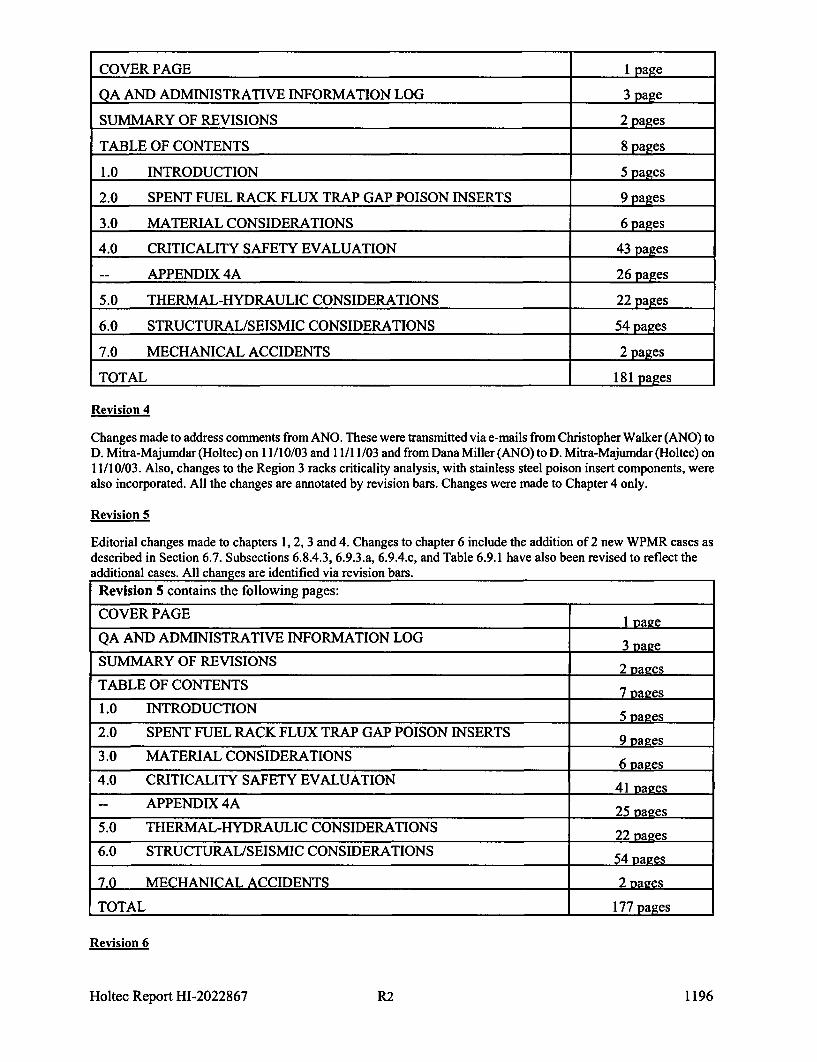
COVER PAGE 1 age
QA AND ADMINISTRATIVE INFORMATION LOG 3 page
SUMMARY OF REVISIONS 2 pages
TABLE OF CONTENTS 8 pages
1.0 INTRODUCTION 5 pages
2.0 SPENT FUEL RACK FLUX TRAP GAP POISON INSERTS 9 pages
3.0 MATERIAL CONSIDERATIONS 6 pages
4.0 CRITICALITY SAFETY EVALUATION 43 pages
-- APPENDIX 4A 26 pages
5.0 THERMAL-HYDRAULIC CONSIDERATIONS 22 pages
6.0 STRUCTURAL/SEISMIC CONSIDERATIONS 54 pages
7.0 MECHANICAL ACCIDENTS 2 pages
TOTAL 181 pages
Revision 4
Changes made to address comments from ANO. These were transmitted via e-mails from Christopher Walker (ANO) toD. Mitra-Majumdar (Holtec) on 11/10/03 and 11/11/03 and from Dana Miller (ANO) to D. Mitra-Majumdar (Holtec) on11/10/03. Also, changes to the Region 3 racks criticality analysis, with stainless steel poison insert components, werealso incorporated. All the changes are annotated by revision bars. Changes were made to Chapter 4 only.
Revision 5
Editorial changes made to chapters 1, 2, 3 and 4. Changes to chapter 6 include the addition of 2 new WPMR cases asdescribed in Section 6.7. Subsections 6.8.4.3, 6.9.3.a, 6.9.4.c, and Table 6.9.1 have also been revised to reflect theadditional cases. All changes are identified via revision bars.
Revision 5 contains the following pages:
COVER PAGE 1 page
QA AND ADMINISTRATIVE INFORMATION LOG 3 page
SUMMARY OF REVISIONS 2 pages
TABLE OF CONTENTS 7 pages
1.0 INTRODUCTION 5 pages
2.0 SPENT FUEL RACK FLUX TRAP GAP POISON INSERTS 9 pames
3.0 MATERIAL CONSIDERATIONS 6 pages
4.0 CRITICALITY SAFETY EVALUATION 41 pages-- APPENDIX 4A 25 pages
5.0 THERMAL-HYDRAULIC CONSIDERATIONS 22 pages
6.0 STRUCTURAL/SEISMIC CONSIDERATIONS 54 pages
7.0 MECHANICAL ACCIDENTS 2 pages
TOTAL 177 pages
Revision 6
Holtec Report HI-2022867 R2 1196
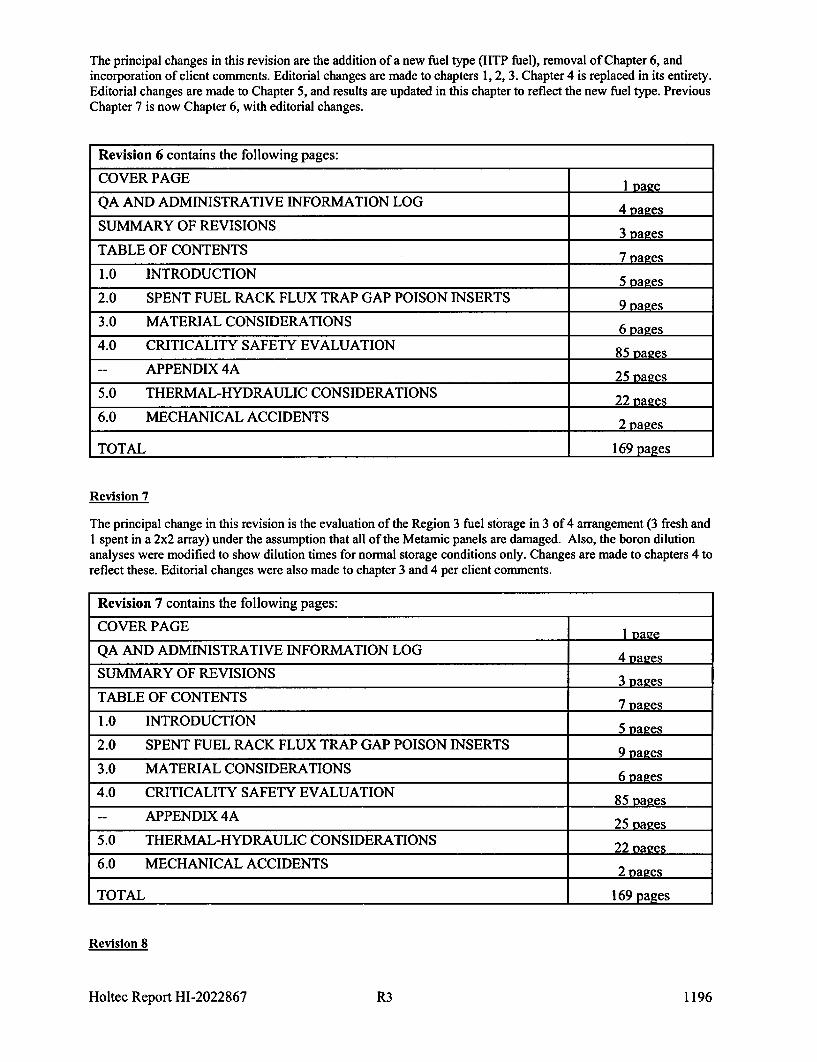
The principal changes in this revision are the addition of a new fuel type (HTP fuel), removal of Chapter 6, andincorporation of client comments. Editorial changes are made to chapters 1, 2, 3. Chapter 4 is replaced in its entirety.Editorial changes are made to Chapter 5, and results are updated in this chapter to reflect the new fuel type. PreviousChapter 7 is now Chapter 6, with editorial changes.
Revision 6 contains the following pages:
COVER PAGE 1 page
QA AND ADMINISTRATIVE INFORMATION LOG 4 pages
SUMMARY OF REVISIONS 3 pages
TABLE OF CONTENTS 7 pages
1.0 INTRODUCTION 5 vages
2.0 SPENT FUEL RACK FLUX TRAP GAP POISON INSERTS 9 vanes
3.0 MATERIAL CONSIDERATIONS 6 nages
4.0 CRITICALITY SAFETY EVALUATION 85 vages
-- APPENDIX 4A 25 Dues
5.0 THERMAL-HYDRAULIC CONSIDERATIONS 22 pages6.0 MECHANICAL ACCIDENTS 2 pages
TOTAL 169 pages
Revision 7
The principal change in this revision is the evaluation of the Region 3 fuel storage in 3 of 4 arrangement (3 fresh and1 spent in a 2x2 array) under the assumption that all of the Metamic panels are damaged. Also, the boron dilutionanalyses were modified to show dilution times for normal storage conditions only. Changes are made to chapters 4 toreflect these. Editorial changes were also made to chapter 3 and 4 per client comments.
Revision 7 contains the following pages:
COVER PAGE I page
QA AND ADMINISTRATIVE INFORMATION LOG 4 pages
SUMMARY OF REVISIONS 3 pages
TABLE OF CONTENTS 7 Dages
1.0 INTRODUCTION 5 pages2.0 SPENT FUEL RACK FLUX TRAP GAP POISON INSERTS 9 vanes
3.0 MATERIAL CONSIDERATIONS 6 pages
4.0 CRITICALITY SAFETY EVALUATION 85 pages
-- APPENDIX 4A 25 pages
5.0 THERMAL-HYDRAULIC CONSIDERATIONS 22 vanes6.0 MECHANICAL ACCIDENTS 2 pages
TOTAL 169 pages
Revision 8
Holtec Report HI-2022867 R3 1196
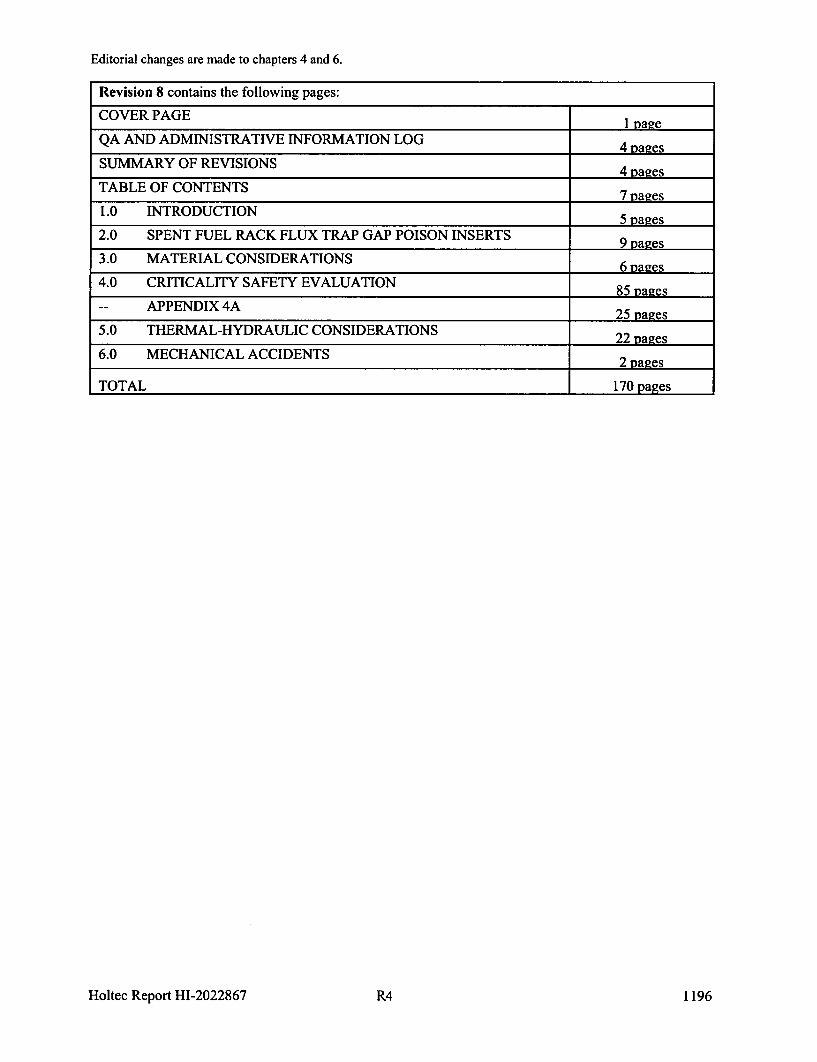
Editorial changes are made to chapters 4 and 6.
Revision 8 contains the following pages:
COVER PAGE I page
QA AND ADMINISTRATIVE INFORMATION LOG 4 pages
SUMMARY OF REVISIONS 4 pages
TABLE OF CONTENTS 7 pages
1.0 INTRODUCTION 5 pages
2.0 SPENT FUEL RACK FLUX TRAP GAP POISON INSERTS 9
3.0 MATERIAL CONSIDERATIONS 6 pages
4.0 CRITICALITY SAFETY EVALUATION 85 pages
-- APPENDIX 4A 25 pages
5.0 THERMAL-HYDRAULIC CONSIDERATIONS 22 pages
6.0 MECHANICAL ACCIDENTS 2 pages
TOTAL 170 pages
Holtec Report HI-2022867 R4 1196
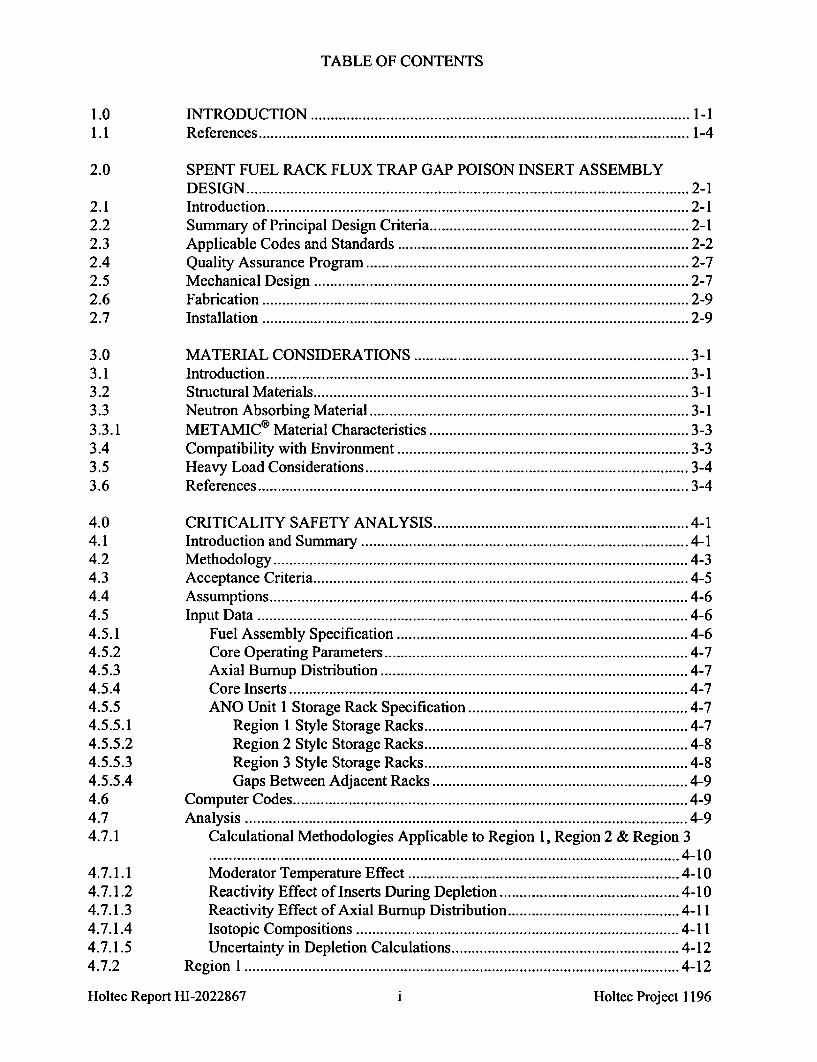
TABLE OF CONTENTS
1.0 INTRODU CTION ............................................................................................... 1-11.1 References ............................................................................................................ 1-4
2.0 SPENT FUEL RACK FLUX TRAP GAP POISON INSERT ASSEMBLYD ESIGN ............................................................................................................... 2-1
2.1 Introduction .......................................................................................................... 2-12.2 Sum m ary of Principal Design Criteria ................................................................. 2-12.3 Applicable Codes and Standards ......................................................................... 2-22.4 Quality A ssurance Program ................................................................................. 2-72.5 M echanical Design .............................................................................................. 2-72.6 Fabrication ........................................................................................................... 2-92.7 Installation ........................................................................................................... 2-9
3.0 M ATERIAL CON SID ERATION S ..................................................................... 3-13.1 Introduction .......................................................................................................... 3-13.2 Structural M aterials .............................................................................................. 3-13.3 N eutron Absorbing M aterial ................................................................................ 3-13.3.1 M ETAM IC® M aterial Characteristics ................................................................. 3-33.4 Com patibility w ith Environm ent ......................................................................... 3-33.5 Heavy Load Considerations ................................................................................. 3-43.6 References ............................................................................................................ 3-4
4.0 CRITICA LITY SAFETY AN ALY SIS ................................................................ 4-14.1 Introduction and Sum m ary .................................................................................. 4-14.2 M ethodology ........................................................................................................ 4-34.3 Acceptance Criteria .............................................................................................. 4-54.4 A ssum ptions ......................................................................................................... 4-64.5 Input Data ............................................................................................................ 4-64.5.1 Fuel A ssem bly Specification ......................................................................... 4-64.5.2 Core Operating Param eters ............................................................................ 4-74.5.3 Axial Bum up D istribution ............................................................................. 4-74.5.4 Core Inserts .................................................................................................... 4-74.5.5 AN O Unit 1 Storage Rack Specification ....................................................... 4-74.5.5.1 Region 1 Style Storage Racks .................................................................. 4-74.5.5.2 Region 2 Style Storage Racks .................................................................. 4-84.5.5.3 Region 3 Style Storage Racks .................................................................. 4-84.5.5.4 Gaps Betw een A djacent Racks ................................................................ 4-94.6 Com puter Codes ................................................................................................... 4-94.7 Analysis ............................................................................................................... 4-94.7.1 Calculational Methodologies Applicable to Region 1, Region 2 & Region 3
...................................................................................................................... 4-104.7.1.1 M oderator Tem perature Effect .................................................................... 4-104.7.1.2 Reactivity Effect of Inserts During D epletion ............................................. 4-104.7.1.3 Reactivity Effect of Axial Burnup Distribution ........................................... 4-114.7.1.4 Isotopic Com positions ................................................................................. 4-114.7.1.5 Uncertainty in D epletion Calculations ......................................................... 4-124.7.2 Region 1 ............................................................................................................. 4-12
Holtec Report HI-2022867 i Holtec Project 1196
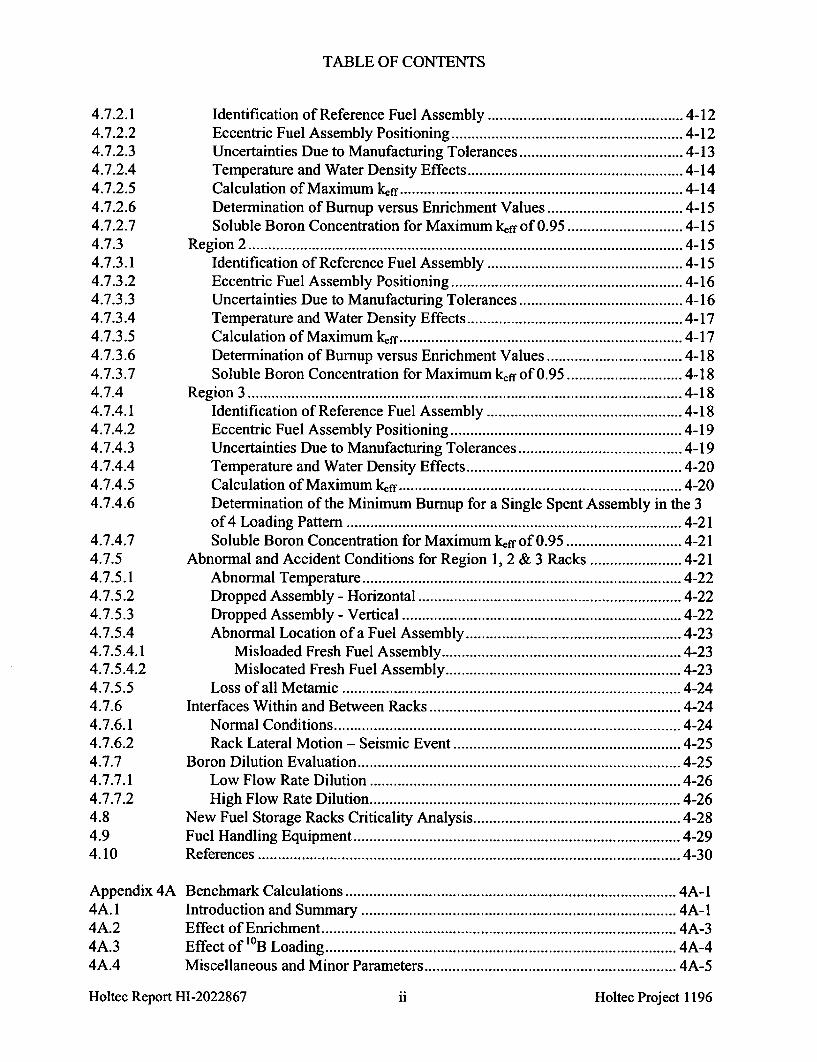
TABLE OF CONTENTS
4.7.2.1 Identification of Reference Fuel Assembly.................................... 4-124.7.2.2 Eccentric Fuel Assembly Positioning .......................................... 4-124.7.2.3 Uncertainties Due to Manufacturing Tolerances.............................. 4-134.7.2.4 Temperature and Water Density Effects ....................................... 4-144.7.2.5 Calculation of Maximum k,,f................................................... 4-144.7.2.6 Determination of Burnup versus Enrichment Values......................... 4-154.7.2.7 Soluble Boron Concentration for Maximum k,,ff of 0.95 ..................... 4-154.7.3 Region 2............................................................................... 4-154.7.3.1 Identification of Reference Fuel Assembly.................................... 4-154.7.3.2 Eccentric Fuel Assembly Positioning .......................................... 4-164.7.3.3 Uncertainties Due to Manufacturing Tolerances.............................. 4-164.7.3.4 Temperature and Water Density Effects ....................................... 4-174.7.3.5 Calculation of Maximum k,,f................................................... 4-174.7.3.6 Determination of Burnup versus Enrichment Values......................... 4-184.7.3.7 Soluble Boron Concentration for Maximum k.,fr of 0.95 ..................... 4-184.7.4 Region 3............................................................................... 4-184.7.4.1 Identification of Reference Fuel Assembly.................................... 4-184.7.4.2 Eccentric Fuel Assembly Positioning .......................................... 4-194.7.4.3 Uncertainties Due to Manufacturing Tolerances.............................. 4-194.7.4.4 Temperature and Water Density Effects ....................................... 4-204.7.4.5 Calculation of Maximum kef ................................................... 4-204.7.4.6 Determination of the Minimum Burnup, for a Single Spent Assembly in the 3
of 4 Loading Pattern............................................................. 4-214.7.4.7 Soluble Boron Concentration for Maximum kff of 0.95 ..................... 4-214.7.5 Abnormal and Accident Conditions for Region 1, 2 & 3 Racks................. 4-214.7.5.1 Abnormal Temperature.......................................................... 4-224.7.5.2 Dropped Assembly - Horizontal................................................ 4-224.7.5.3 Dropped Assembly - Vertical................................................... 4-224.7.5.4 Abnormal Location of a Fuel Assembly ....................................... 4-234.7.5.4.1 Misloaded Fresh Fuel Assembly ........................................... 4-234.7.5.4.2 Mislocated Fresh Fuel Assembly........................................... 4-234.7.5.5 Loss of all Metamic.............................................................. 4-244.7.6 Interfaces Within and Between Racks.............................................. 4-244.7.6.1 Normal Conditions............................................................... 4-244.7.6.2 Rack Lateral Motion - Seismic Event ......................................... 4-254.7.7 Boron Dilution Evaluation........................................................... 4-254.7.7.1 Low Flow Rate Dilution......................................................... 4-264.7.7.2 High Flow Rate Dilution ........................................................ 4-264.8 New Fuel Storage Racks Criticality Analysis...................................... 4-284.9 Fuel Handling Equipment ........................................................... 4-294.10 References............................................................................. 4-30
Appendix 4A Benchmark Calculations ............................................................ 4A-14A. I Introduction and Summary ......................................................... 4A-14A.2 Effect of Enrichment ................................................................ 4A-34A.3 Effect of loB3 Loading................................................................ 4A-44A.4 Miscellaneous and Minor Parameters.............................................. 4A-5
Holtec Renort HI-2022867 ii Holtec Proiect 1196
TABLE OF CONTENTS
4A .4.1 Reflector M aterial and Spacings ................................................................. 4A -54A .4.2 Fuel Pellet D iam eter and Lattice Pitch ....................................................... 4A -54A .4.3 Soluble Boron Concentration Effects ......................................................... 4A -54A .5 M OX Fuel ......................................................................................................... 4A -64A .6 References ......................................................................................................... 4A -7
5.0 THERMAL-HYDRAULIC CONSIDERATIONS .............................................. 5-15.1 Introduction .......................................................................................................... 5-15.2 Cooling System D escription ................................................................................ 5-25.3 Spent Fuel Pool Decay H eat Loads ..................................................................... 5-35.4 Minimum Time-to-Boil and Maximum Boiloff Rate .......................................... 5-45.5 M axim um SFP Local W ater Tem perature ........................................................... 5-55.6 Fuel Rod Cladding Tem perature .......................................................................... 5-75.7 Results .................................................................................................................. 5-95.7.1 D ecay Heat ........................................................................................................... 5-95.7.2 Minimum Time-to-Boil and Maximum Boiloff Rate .......................................... 5-95.7.3 Local W ater and Fuel Cladding Tem peratures .................................................... 5-95.8 References .......................................................................................................... 5-10
6.0 M ECHANICAL A CCIDENTS ........................................................................... 6-16.1 Introduction .......................................................................................................... 6-16.2 Description of M echanical Accidents .................................................................. 6-16.3 Evaluation of M echanical A ccidents ................................................................... 6-16.4 Conclusion ........................................................................................................... 6-26.5 References ............................................................................................................ 6-2
Holtec Renort HI-2022867 iii Holtec Proiect 1196.......... It- ............. .......... j .......
TABLE OF CONTENTS
Tables
3.3.1 Chemical Composition and Physical Properties of Aluminum (6061 Alloy) .................. 3-53.3.2 Chemical Composition and Physical Properties of Boron Carbide ................................. 3-6
4.5.1 PW R Fuel Assembly Specifications .............................................................................. 4-314.5.2 Core Operating Parameters for Depletion Analysis ...................................................... 4-324.5.3 A xial Bum up Profile ...................................................................................................... 4-334.5.4 B PR A D ata ..................................................................................................................... 4-344.5.5 Weight Percents of BPRA Material (3.5wt% B4C) ....................................................... 4-344.5.6 A P SR D ata ..................................................................................................................... 4-344.5.7 Fuel Rack Specifications - Region 1 Racks .................................................................. 4-354.5.8 Fuel Rack Specifications - Region 2 Racks .................................................................. 4-364.5.9 Fuel Rack Specifications - Region 3 Racks .................................................................. 4-374.5.10 Identification of Possible Rack Interaction and Minimum Distances Between Racks.. 4-384.7.1 Summary of the Criticality Safety Analyses for Region 1 without Soluble Boron at 0
Y ears C ooling Tim e ....................................................................................................... 4-394.7.2 Summary of the Criticality Safety Analyses for Region 1 with Soluble Boron at 0 Years
C ooling T im e ................................................................................................................. 4-404.7.3 Summary of the Criticality Safety Analyses for Region 1 without Soluble Boron for a
2x2 Checkerboard of Fresh Fuel and Empty Cells ........................................................ 4414.7.4 Summary of the Criticality Safety Analyses for Region 1 with Soluble Boron for a 2x2
Checkerboard of Fresh Fuel and Empty Cells .......................................................... 4-424.7.5 Summary of the Criticality Safety Analyses for Region 2 without Soluble Boron at 0
Y ears C ooling Tim e ....................................................................................................... 4-434.7.6 Summary of the Criticality Safety Analyses for Region 2 with Soluble Boron at 0 Years
C ooling T im e ................................................................................................................. 4-444.7.7 Summary of the Criticality Safety Analyses for Region 2 without Soluble Boron for a
2x2 Checkerboard of Fresh Fuel and Empty Cells ........................................................ 4-454.7.8 Summary of the Criticality Safety Analyses for Region 2 with Soluble Boron for a 2x2
Checkerboard of Fresh Fuel and Empty Cells ............................................................... 4-464.7.9 Summary of the Criticality Safety Analyses for Region 3 without Soluble Boron for a
2x2 Checkerboard of 3 Fresh Fuel Assemblies and 1 Spent Fuel Assembly at 0 YearsC ooling T im e ................................................................................................................. 4-47
4.7.10 Summary of the Criticality Safety Analyses for Region 3 with Soluble Boron for a 2x2Checkerboard of 3 Fresh Fuel Assemblies and 1 Spent Fuel Assembly at 0 Years CoolingT im e ............................................................................................................................... 4-4 8
4.7.11 Summary of the Criticality Safety Analyses for Region 3 without Soluble Boron ....... 4-494.7.12 Summary of the Criticality Safety Analyses for Region 3 with Soluble Boron ............ 4-504.7.13 Burmup Value at which APSRs and BPRAs have Equivalent Reactivity Effect ........... 4-514.7.14 Maximum Burnup versus Enrichment Values for Region 1 Racks with Spent Fuel ..... 4-524.7.15 Maximum Burnup versus Enrichment Values for Region 2 Racks with Spent Fuel ..... 4-534.7.16 Reactivity Effect of Insert Type, Enrichment 5.0 wt% 235U, 0 Cooling Time .............. 4-544.7.17 Reactivity Effect of Fuel and Rack Tolerances for Region 1 Racks ............................. 4-554.7.18 Reactivity Effect of Temperature Variation in Region 1 Racks .................................... 4-564.7.19 Reactivity Effect of Fuel and Rack Tolerances for Region 2 Racks ............................. 4-57
Holtec Report HI-2022867 iv Holtec Project 1196
TABLE OF CONTENTS
4.7.20 Reactivity Effect of Temperature Variation in Region 2 Racks .................................... 4-584.7.21 Reactivity Effect of Fuel and Rack Tolerances for Region 3 Racks ............................. 4-594.7.22 Reactivity Effect of Temperature Variation in Region 3 Racks .................................... 4-604.7.23 Region 1 Accident Conditions ....................................................................................... 4-614.7.24 Region 2 Accident Conditions ....................................................................................... 4-624.7.25 Region 3 Accident Conditions ....................................................................................... 4-634.7.26 Interface Calculations .................................................................................................... 4-644.8.1 Summary of New Fuel Vault Criticality Safety Analysis .............................................. 4-65
4A.1 Summary of Criticality Benchmark Calculations ....................................... 4A-9 thru 4A-134A.2 Comparison of MCNP4a and Keno5a Calculated Reactivities
for V arious Enrichm ents ............................................................................................. 4A -144A.3 MCNP4a Calculated Reactivities for Critical Experiments
w ith N eutron A bsorbers .............................................................................................. 4A -154A.4 Comparison of MCNP4a and KENO5a Calculated Reactivities for Various
I0B L oadings ............................................................................................................... 4A -164A.5 Calculations for Critical Experiments with Thick Lead and Steel Reflectors ............ 4A-174A.6 Calculations for Critical Experiments with Various Soluble Boron
C oncentrations ............................................................................................................ 4A -184A.7 Calculations for Critical Experiments with MOX Fuel .............................................. 4A-19
5.3.1 Key Input Data for Decay Heat Computations .............................................................. 5-115.3.2 O ffload Schedule ........................................................................................................... 5-125.4.1 Key Input Data for Time-To-Boil Evaluation ............................................................... 5-135.5.1 Key Input Data for Local Temperature Evaluation ....................................................... 5-145.7.1 Result of SFP Decay Heat Calculations ........................................................................ 5-155.7.2 Results of Loss-of-Forced Cooling Evaluations ............................................................ 5-165.7.3 Results of Maximum Local Water and Fuel Cladding Temperature Evaluations ........ 5-17
Holtec Report HI-2022867 V Holtec Project 1196
TABLE OF CONTENTS
Figures
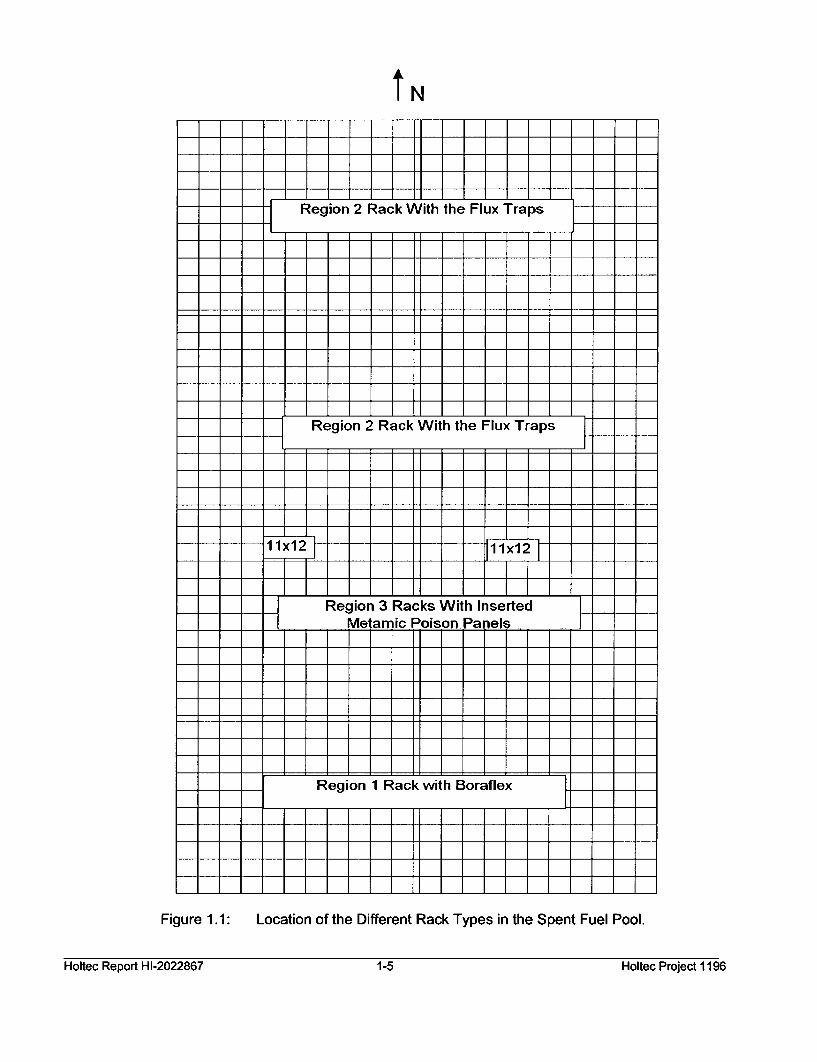
1.1 Location of the Different Rack Types in the Spent Fuel Pool
2.5.1 Schematic of the Poison Insert Assembly Mechanism2.5.2 Lead-in Device
4.5.1 A Two-Dimensional Representation of the Actual Calculational Model Used for theRegion 1 Rack Analysis for Uniform Loading of Spent Fuel. This Figure was Drawn (ToScale) with the Two-Dimensional Plotter in MCNP4a.
4.5.2 A Two-Dimensional Representation of the Actual Calculational Model Used for theRegion 1 Rack Analysis for Checkerboard Loading of Fresh Fuel. This Figure wasDrawn (To Scale) with the Two-Dimensional Plotter in MCNP4a.
4.5.3 A Two-Dimensional Representation of the Actual Calculational Model Used for theRegion 2 Rack Analysis for Uniform Loading of Spent Fuel. This Figure was drawn(To Scale) with the Two-Dimensional Plotter in MCNP4a.
4.5.4 A Two-Dimensional Representation of the Actual Calculational Model Used for theRegion 2 Rack Analysis for Checkerboard Loading of Fresh Fuel. This Figure wasDrawn (To Scale) with the Two-Dimensional Plotter in MCNP4a.
4.5.5 A Two-Dimensional Representation of the Actual Calculational Model Used for theRegion 3 Rack Analysis for Uniform Loading of Fresh Fuel. This Figure was drawn(To Scale) with the Two-Dimensional Plotter in MCNP4a.
4.5.6 A Two-Dimensional Representation of the Actual Calculational Model Used for theRegion 3 Rack Analysis for "3 of 4" Loading of Spent and Fresh Fuel. This Figurewas drawn (To Scale) with the Two-Dimensional Plotter in MCNP4a.
4.5.7 A Two-Dimensional Representation of the ANO Unit 1 Spent Fuel Pool Layout withRack Region Layout and Gaps between Adjacent Racks.
4.5.8 Sketch Illustrating Locations of Measurements of Water Gaps Between Adjacent Racks.4.5.9 Sketch of Region 1 Racks, Detailing Important Dimensions and Tolerances.4.5.10 Sketch of Region 2 Racks, Detailing Important Dimensions and Tolerances.4.5.11 Sketch of Region 3 Racks, Detailing Important Dimensions and Tolerances.4.7.1 Interface Calculation for Adjacent Region 1 Racks Containing Fresh Fuel Checkerboards
with Fresh Fuel Assemblies Facing Across the Gap.4.7.2 Fresh Fuel Checkerboard and Spent Fuel in same Region 1 Rack.4.7.3 Interface Calculation for Adjacent Region 2 Racks Containing Fresh Fuel Checkerboards
with Fresh Fuel Assemblies Facing Across the Gap.4.7.4 Fresh Fuel Checkerboard and Spent Fuel in same Region 2 Rack.4.7.5 Interface Calculation for Adjacent Region 3 Racks with 3 of 4 Pattern and Fresh Fuel
Facing Across the Gap.4.7.6 Interface Calculation for Region 3 Racks. Fresh Fuel in one Region 3 Rack Facing Fresh
and Spent Fuel in the Adjacent Rack.4.7.7 Interface Calculation for Region 3 Racks. All Fresh Fuel (4.35 wt%) in one Rack, 3 of 4
Pattern with Fresh Fuel Facing Gap in Adjacent Rack.4.7.8 Interface Calculation for Region 3 Racks. All Fresh Fuel (4.35 wt%) in one Rack, 3 of 4
Pattern with Fresh and Spent Fuel Facing Gap in Adjacent Rack.4.7.9 Interface Calculation for Region 1 and Region 3 Racks. Fresh Fuel Checkerboard in
Region 1 Rack, 3 of 4 pattern in Region 3 Rack with Fresh Fuel Facing Gap.
Holtec Report HI-2022867 Vi Holtec Project 1196
TABLE OF CONTENTS
4.7.10 Interface Calculation for Region 1 and Region 3 Racks. Spent Fuel in Region 1 Rack, 3of 4 Pattern in Region 3 Rack with Fresh Fuel Facing Gap.
4.7.11 Interface Calculation for Region 2 and Region 3 Racks. Fresh Fuel Checkerboard inRegion 2 Rack, 3 of 4 pattern in Region 3 Rack with Fresh Fuel Facing Gap.
4.7.12 Interface Calculation for Region 2 and Region 3 Racks. Spent Fuel in Region 2 Rack, 3of 4 Pattern in Region 3 Rack with Fresh Fuel Facing Gap.
4.7.13 3 of 4 Loading Pattern and Fresh Fuel (4.35 wt%) in same Region 3 Rack, All fresh 5.0wt% facing all fresh 4.35 wt%.
4.7.14 3 of 4 Loading Pattern and Fresh Fuel (4.35 wt%) in same Region 3 Rack, Fresh andSpent 5.0 wt% facing all fresh 4.35 wt%.
4.8.1 Reactivity of the New Fuel Vault as a Function of Moderator Density for 4.95 wt% Fuel.4.8.2 Acceptable New Fuel Storage Vault Configuration for up to 4.95 wt%/o Enrichment Fresh
Fuel.4.8.3 Acceptable New Fuel Storage Vault Configuration for up to 4.2 wt% Enrichment Fresh
Fuel.
4A. 1 MCNP Calculated k-eff Values for Various Values of the Spectral Index4A.2 KENO5a Calculated k-eff Values for Various Values of the Spectral Index4A.3 MCNP Calculated k-eff Values at Various U-235 Enrichments4A.4 KENO Calculated k-eff Values at Various U-235 Enrichments4A.5 Comparison of MCNP and KENO5a Calculations for Various Fuel Enrichments4A.6 Comparison of MCNP and KENOSa Calculations for Various Boron-10 Areal Densities
5.5.1 Schematic of the CFD Model of the ANO-1 SFP5.7.1 Partial Core Offload Bounding Spent Fuel Pool Heat Load5.7.2 Full Core Offload Bounding Spent Fuel Pool Heat Load5.7.3 Contours of Static Temperature in a Vertical Plane Through the Center of the SFP5.7.4 Velocity Vector Plot in a Vertical Plane Through the Center of the SFP
Holtec Report HI-2022867 vii Holtec Project 1196
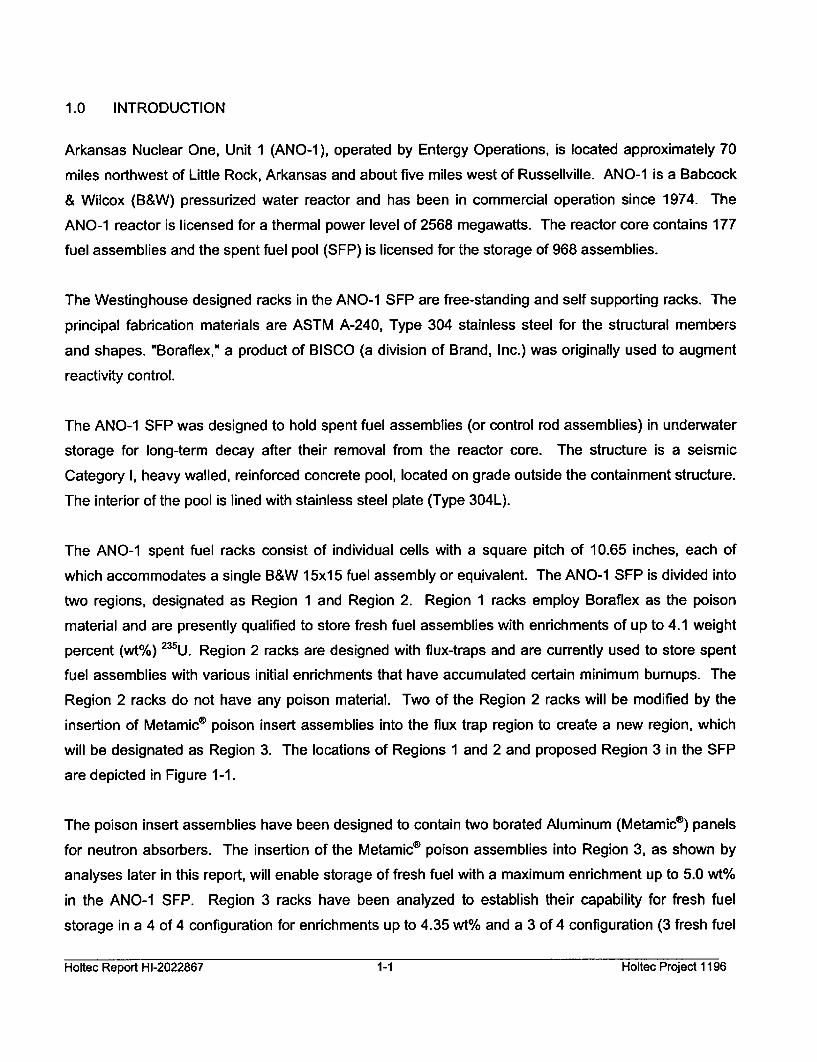
1.0 INTRODUCTION
Arkansas Nuclear One, Unit 1 (ANO-1), operated by Entergy Operations, is located approximately 70
miles northwest of Little Rock, Arkansas and about five miles west of Russellville. ANO-1 is a Babcock
& Wilcox (B&W) pressurized water reactor and has been in commercial operation since 1974. The
ANO-1 reactor is licensed for a thermal power level of 2568 megawatts. The reactor core contains 177
fuel assemblies and the spent fuel pool (SFP) is licensed for the storage of 968 assemblies.
The Westinghouse designed racks in the ANO-1 SFP are free-standing and self supporting racks. The
principal fabrication materials are ASTM A-240, Type 304 stainless steel for the structural members
and shapes. "Boraflex," a product of BISCO (a division of Brand, Inc.) was originally used to augment
reactivity control.
The ANO-1 SFP was designed to hold spent fuel assemblies (or control rod assemblies) in underwater
storage for long-term decay after their removal from the reactor core. The structure is a seismic
Category I, heavy walled, reinforced concrete pool, located on grade outside the containment structure.
The interior of the pool is lined with stainless steel plate (Type 304L).
The ANO-1 spent fuel racks consist of individual cells with a square pitch of 10.65 inches, each of
which accommodates a single B&W 15x15 fuel assembly or equivalent. The ANO-1 SFP is divided into
two regions, designated as Region 1 and Region 2. Region 1 racks employ Boraflex as the poison
material and are presently qualified to store fresh fuel assemblies with enrichments of up to 4.1 weight
percent (wt%) 235U. Region 2 racks are designed with flux-traps and are currently used to store spent
fuel assemblies with various initial enrichments that have accumulated certain minimum burnups. The
Region 2 racks do not have any poison material. Two of the Region 2 racks will be modified by the
insertion of Metamic® poison insert assemblies into the flux trap region to create a new region, which
will be designated as Region 3. The locations of Regions 1 and 2 and proposed Region 3 in the SFP
are depicted in Figure 1-1.
The poison insert assemblies have been designed to contain two borated Aluminum (Metamice) panels
for neutron absorbers. The insertion of the Metamic® poison assemblies into Region 3, as shown by
analyses later in this report, will enable storage of fresh fuel with a maximum enrichment up to 5.0 wt%
in the ANO-1 SFP. Region 3 racks have been analyzed to establish their capability for fresh fuel
storage in a 4 of 4 configuration for enrichments up to 4.35 wt% and a 3 of 4 configuration (3 fresh fuel
Holtec Report HI-2022867 1-1 Holtec Project 1196
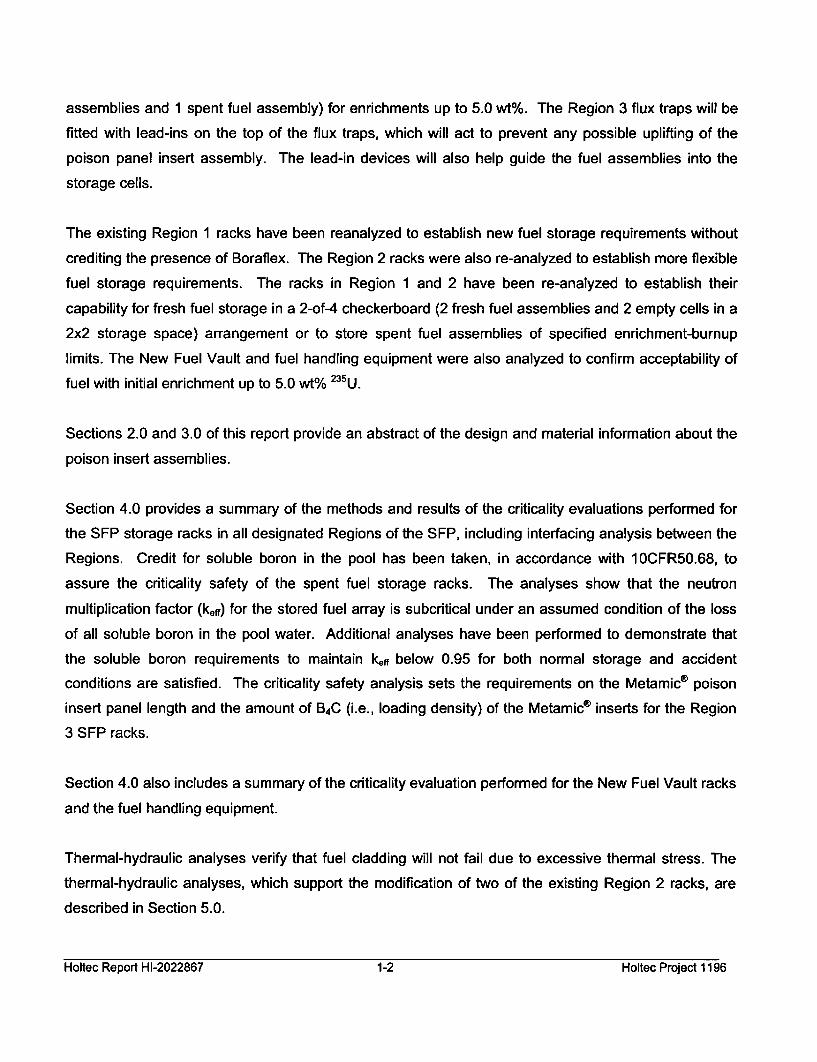
assemblies and 1 spent fuel assembly) for enrichments up to 5.0 wt%. The Region 3 flux traps will be
fitted with lead-ins on the top of the flux traps, which will act to prevent any possible uplifting of the
poison panel insert assembly. The lead-in devices will also help guide the fuel assemblies into the
storage cells.
The existing Region 1 racks have been reanalyzed to establish new fuel storage requirements without
crediting the presence of Boraflex. The Region 2 racks were also re-analyzed to establish more flexible
fuel storage requirements. The racks in Region 1 and 2 have been re-analyzed to establish their
capability for fresh fuel storage in a 2-of-4 checkerboard (2 fresh fuel assemblies and 2 empty cells in a
2x2 storage space) arrangement or to store spent fuel assemblies of specified enrichment-burnup
limits. The New Fuel Vault and fuel handling equipment were also analyzed to confirm acceptability of
fuel with initial enrichment up to 5.0 wt% 235U.
Sections 2.0 and 3.0 of this report provide an abstract of the design and material information about the
poison insert assemblies.
Section 4.0 provides a summary of the methods and results of the criticality evaluations performed for
the SFP storage racks in all designated Regions of the SFP, including interfacing analysis between the
Regions. Credit for soluble boron in the pool has been taken, in accordance with 10CFR50.68, to
assure the criticality safety of the spent fuel storage racks. The analyses show that the neutron
multiplication factor (keff) for the stored fuel array is subcritical under an assumed condition of the loss
of all soluble boron in the pool water. Additional analyses have been performed to demonstrate that
the soluble boron requirements to maintain ker below 0.95 for both normal storage and accident
conditions are satisfied. The criticality safety analysis sets the requirements on the Metamic® poison
insert panel length and the amount of B4C (i.e., loading density) of the Metamic® inserts for the Region
3 SFP racks.
Section 4.0 also includes a summary of the criticality evaluation performed for the New Fuel Vault racks
and the fuel handling equipment.
Thermal-hydraulic analyses verify that fuel cladding will not fail due to excessive thermal stress. The
thermal-hydraulic analyses, which support the modification of two of the existing Region 2 racks, are
described in Section 5.0.
Holtec Report HI-2022867 1-2 Holtec Project 1196
The structural qualification requires that the subcriticality of the stored fuel be maintained under all
postulated mechanical accident scenarios and is presented in Section 6.0 of this report.
Results of the analyses presented in this report establish acceptable restrictions on combinations of
initial enrichment and discharge burnups for Region 1 and Region 2, and show that the insertion of
poison insert assemblies into the newly defined Region 3 racks will permit storage of fresh fuel
assemblies in these racks. The storage racks meet all requirements of the applicable USNRC
guidelines and regulations, and applicable ANSI/ANS standards (References 2 - 6). The analysis
methodologies employed are a direct evolution of previous license applications reviewed and approved
by the USNRC, including nuclear subcriticality, thermal-hydraulic safety and integrity following a
mechanical accident.
All computer programs utilized to perform the analyses documented in Sections 2.0 through 6.0 are
benchmarked and verified. These programs have been utilized by Holtec International in numerous
license applications over the past decade. The analyses presented herein clearly demonstrate that the
rack module arrays with the addition of the poison insert assemblies and the lead-ins possess wide
margins of safety in respect to all considerations of safety specified in the OT Position Paper [3],
namely, nuclear subcriticality, thermal-hydraulic safety, and mechanical integrity.
Holtec Report HI-2022867 1-3 Holtec Project 1196Holtec Report HI-2022867 1-3 Holtec Project 1196
1.1 REFERENCES
[1] American Society of Mechanical Engineers (ASME), Boiler & Pressure Vessel Code, Section III,1989 Edition, Subsection NF, and Appendices.
[2] General Design Criterion 62, Prevention of Criticality in Fuel Storage and Handling.
[3] USNRC, "OT Position for Review and Acceptance of Spent Fuel Storage and HandlingApplications," April 14, 1978, and Addendum dated January 18, 1979.
[4] Code of Federal Regulations 1 OCFR50.68, Criticality Accident Requirements
[5] ANSI-8.17-1984, Criticality Safety Criteria for the Handling, Storage and Transportation of LWRFuel Outside Reactors.
[6] L. I. Kopp, "Guidance on the Regulatory Requirements for Criticality Analysis Of Fuel Storage AtLight-Water Reactor Plants," USNRC Internal Memorandum L. Kopp to Timothy Collins, August191998.
Holtec Report HI-2022867 1-4 Holtec Project 1196
Region 2 Rack With the Flux Traps
Region 2 Rack With the Flux Traps
11x12- -11x121
Region 3 Racks With InsertedMetamic Poison Panels
Region 1 Rack with Boraflex
Figure 1.1: Location of the Different Rack Types in the Spent Fuel Pool.
Holtec Report HI-2022867 1-5 Holtec Project 1196
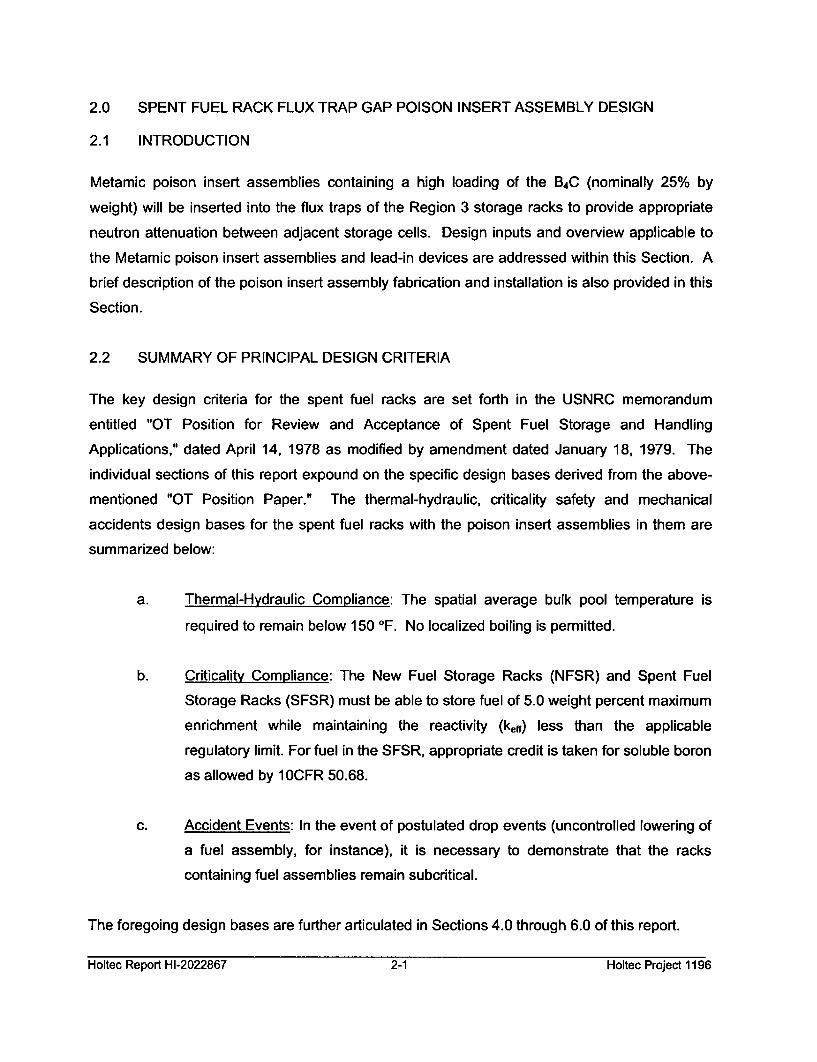
2.0 SPENT FUEL RACK FLUX TRAP GAP POISON INSERT ASSEMBLY DESIGN
2.1 INTRODUCTION
Metamic poison insert assemblies containing a high loading of the B4C (nominally 25% by
weight) will be inserted into the flux traps of the Region 3 storage racks to provide appropriate
neutron attenuation between adjacent storage cells. Design inputs and overview applicable to
the Metamic poison insert assemblies and lead-in devices are addressed within this Section. A
brief description of the poison insert assembly fabrication and installation is also provided in this
Section.
2.2 SUMMARY OF PRINCIPAL DESIGN CRITERIA
The key design criteria for the spent fuel racks are set forth in the USNRC memorandum
entitled "OT Position for Review and Acceptance of Spent Fuel Storage and Handling
Applications," dated April 14, 1978 as modified by amendment dated January 18, 1979. The
individual sections of this report expound on the specific design bases derived from the above-
mentioned "OT Position Paper." The thermal-hydraulic, criticality safety and mechanical
accidents design bases for the spent fuel racks with the poison insert assemblies in them are
summarized below:
a. Thermal-Hydraulic Compliance: The spatial average bulk pool temperature is
required to remain below 150 OF. No localized boiling is permitted.
b. Criticality Compliance: The New Fuel Storage Racks (NFSR) and Spent Fuel
Storage Racks (SFSR) must be able to store fuel of 5.0 weight percent maximum
enrichment while maintaining the reactivity (kff) less than the applicable
regulatory limit. For fuel in the SFSR, appropriate credit is taken for soluble boron
as allowed by 10CFR 50.68.
c. Accident Events: In the event of postulated drop events (uncontrolled lowering of
a fuel assembly, for instance), it is necessary to demonstrate that the racks
containing fuel assemblies remain subcritical.
The foregoing design bases are further articulated in Sections 4.0 through 6.0 of this report.
Holtec Report HI-2022867 2-1 Holtec Project 1196
2.3 APPLICABLE CODES AND STANDARDS
The following codes, standards and practices are used as applicable for the design,
construction, and assembly of the poison insert assemblies and lead-in devices. Additional
specific references related to detailed analyses are given in each section.
a. Design Codes
(1) American Society for Nondestructive Testing SNT-TC-IA, June 1984,Recommended Practice for Personnel Qualifications and Certification inNon-destructive Testing.
(2) American Society of Mechanical Engineers (ASME) Y14.5M,
Dimensioning and Tolerancing
(3) ASME B & PV Code, Section II-Part D, 1998 Edition.
(4) ASME, Boiler and Pressure Vessel Code, Section III, Subsection NF,1983 Edition, No Addenda.
(5) ASME, Boiler and Pressure Vessel Code, Section II - Parts A and C,1983 Edition, No Addenda.
b. Standards of American Society for Testinq and Materials (ASTM)
(1) ASTM A240 - Standard Specification for Heat-Resisting Chromium andChromium-Nickel Stainless Steel Plate, Sheet and Strip for PressureVessels.
(2) ASTM A262 - Standard Practices for Detecting Susceptibility toIntergranular Attack in Austenitic Stainless Steel.
(3) ASTM C750 - Standard Specification for Nuclear-Grade Boron CarbidePowder.
(4) ASTM A380 - Standard Practice for Cleaning, Descaling, and Passivationof Stainless Steel Parts, Equipment and Systems.
(5) ASTM C992 - Standard Specification for Boron-Based Neutron AbsorbingMaterial Systems for Use in Nuclear Spent Fuel Storage Racks.
(6) ASTM E3 - Standard Practice for Preparation of MetallographicSpecimens.
(7) ASTM E190 - Standard Test Method for Guided Bend Test for Ductility ofWelds.
Holtec Report HI-2022867 2-2 Holtec Project 1196
c. Welding Code
(1) ASME B & PV Code, Section IX - Welding and Brazing Qualifications,latest applicable edition and addenda.
(2) ASME, Boiler and Pressure Vessel Code, Section III, Subsection NF,1989 Edition, No Addenda.
d. Quality Assurance, Cleanliness, Packaging, Shipping, Receiving, Storage, andHandling
(1) ANSI N45.2.1 - Cleaning of Fluid Systems and Associated Componentsduring Construction Phase of Nuclear Power Plants - 1980 (RegulatoryGuide (RG) 1.37).
(2) ANSI N45.2.2 - Packaging, Shipping, Receiving, Storage and Handling ofItems for Nuclear Power Plants - 1978 (RG 1.38).
(3) ANSI N45.2.6 - Qualifications of Inspection, Examination, and TestingPersonnel for the Construction Phase of Nuclear Power Plants - 1973.(RG 1.58).
(4) ANSI N45.2.8 - Supplementary Quality Assurance Requirements forInstallation, Inspection and Testing of Mechanical Equipment andSystems for the Construction Phase of Nuclear Plants - 1975 (RG 1.116).
(5) ANSI N45.2.11 - Quality Assurance Requirements for the Design ofNuclear Power Plants - 1978 (RG 1.64).
(6) ANSI N45.2.12 - Requirements for Auditing of Quality AssurancePrograms for Nuclear Power Plants - 1977 (RG 1.144).
(7) ANSI N45.2.13 - Quality Assurance Requirements for Control ofProcurement of Items and Services for Nuclear Power Plants - 1976 (RG1.123).
(8) ANSI N45.2.23 - Qualification of Quality Assurance Program AuditPersonnel for Nuclear Power Plants - 1978 (RG 1.146).
(9) ASME B & PV Code, Section V, Nondestructive Examination, 1983Edition.
(10) ANSI N16.9-75 - Validation of Calculation Methods for Nuclear CriticalitySafety.
(11) ASME NQA-1 - Quality Assurance Program Requirements for NuclearFacilities.
Holtec Report HI-2022867 2-3 Holtec Project 1196Holtec Report HI-2022867 2-3 Hottec Project 1196
(12) ASME NQA-2 - Quality Assurance Requirements for Nuclear PowerPlants.
e. USNRC Documents
(1) "OT Position for Review and Acceptance of Spent Fuel Storage andHandling Applications," dated April 14, 1978, and the modifications to thisdocument of January 18, 1979.
(2) NUREG 0612, "Control of Heavy Loads at Nuclear Power Plants,"USNRC, Washington, D.C., July, 1980.
(3) NUREG 0800, "Standard Review Plan for the Review of Safety AnalysisReports for Nuclear Power Plants," USNRC, Washington, D.C., July1981.
(4) NUREG-1233, Seismic Design Criteria.
f. Other ANSI Standards (not listed in the precedingq)
(1) ANSI/ANS 8.1/N16.1 - Nuclear Criticality Safety in Operations withFissionable Materials Outside Reactors, 1975.
(2) ANSI N45.2.9 - Requirements for Collection, Storage and Maintenance ofQuality Assurance Records for Nuclear Power Plants - 1974.
(3) ANSI N45.2.10 - Quality Assurance Terms and Definitions - 1973.
(4) ANSI/ASME N626-3 - Qualification and Duties of SpecializedProfessional Engineers, 1977.
g. Code-of-Federal Regulations (CFR)
(1) 10 CFR 20 - Standards for Protection Against Radiation.
(2) 10 CFR 21 - Reporting of Defects and Non-compliance.
(3) 10 CFR 50 Appendix A - General Design Criteria for Nuclear PowerPlants.
(4) 10 CFR 50 Appendix B - Quality Assurance Criteria for Nuclear PowerPlants and Fuel Reprocessing Plants.
(5) 10 CFR 100 - Reactor Site Criteria
Holtec Report HI-2022867 2-4 Hottec Project 1196
h. Regulatory Guides (RG)
(1) RG 1.13 - Spent Fuel Storage Facility Design Basis (Revision 2Proposed).
(2) RG 1.25 - Assumptions Used for Evaluating the Potential RadiologicalConsequences of a Fuel Handling Accident in the Fuel Handling andStorage Facility for Boiling and Pressurized Water Reactors, Rev. 0 -March, 1972.
(3) RG 1.28 - Quality Assurance Program Requirements - Design andConstruction, Rev. 2 - February 1979 (endorses ANSI N45.2).
(4) RG 1.33 - Quality Assurance Program Requirements.
(5) RG 1.31 - Control of Ferrite Content in Stainless Steel Weld Metal, Rev.3.
(6) RG 1.37 - Cleaning of Fluid Systems and Associated Components duringConstruction Phase of Nuclear Power Plants.
(7) RG 1.38 - Quality Assurance Requirements for Packaging, Shipping,Receiving, Storage and Handling of Items for Water-Cooled NuclearPower Plants, Rev. 2 - May, 1977 (endorses ANSI N45.2.2).
(8) RG 1.44 - Control of the Use of Sensitized Stainless Steel.
(9) RG 1.58 - Qualification of Nuclear Power Plant Inspection, Examination,and Testing Personnel, Rev. 1 - September 1980 (endorses ANSIN45.2.6)
(10) RG 1.64 - Quality Assurance Requirements for the Design of Nuclear
Power Plants, Rev. 2 - June, 1976 (endorses ANSI N45.2.11).
(11) RG 1.71 - Welder Qualifications for Areas of Limited Accessibility.
(12) RG 1.74 - Quality Assurance Terms and Definitions, Rev. 2 - February,1974 (endorses ANSI N45.2.10).
(13) RG 1.85 - Materials Code Case Acceptability - ASME Section III, Division1.
(14) RG 1.88 - Collection, Storage and Maintenance of Nuclear Power PlantQuality Assurance Records, Rev. 2 - October, 1976 (endorses ANSIN45.2.9).
(15) RG 1.116 - Quality Assurance Requirements for Installation, Inspectionand Testing of Mechanical Equipment and Systems, Rev. 0-R - May,1977(endorses ANSI N45.2.8-1975)
Holtec Report HI-2022867 2-5 Holtec Project 1196
(16) RG 1.123 - Quality Assurance Requirements for Control of Procurementof Items and Services for Nuclear Power Plants, Rev. 1 - July, 1977(endorses ANSI N45.2.13).
(17) RG 1.144 - Auditing of Quality Assurance Programs for Nuclear PowerPlants, Rev.1 - September, 1980 (endorses ANSI N45.2.12-1977)
(18) RG 8.8 - Information Relative to Ensuring that Occupational RadiationExposures at Nuclear Power Stations will be as Low as ReasonablyAchievable (ALARA).
(19) RG 8.38 - Control of Access to High and Very High Radiation Areas in
Nuclear Power Plants, June, 1993.
Branch Technical Position
(1) CPB 9.1-1 - Criticality in Fuel Storage Facilities.
j. American Welding Society (AWS) Standards
(1) AWS D1.1 - Structural Welding Code - Steel.
(2) AWS D1.3 - Structure Welding Code - Sheet Steel.
(3) AWS D9.1 - Sheet Metal Welding Code.
(4) AWS A2.4 - Standard Symbols for Welding, Brazing and NondestructiveExamination.
(5) AWS A3.0 - Standard Welding Terms and Definitions.
(6) AWS A5.12 - Specification for Tungsten and Tungsten Alloy Electrodesfor Arc-Welding and Cutting
(7) AWS QC1 - Standard for AWS Certification of Welding Inspectors.
(8) AWS 5.4 - Specification for Stainless Steel Electrodes for Shielded MetalArc Welding.
(9) AWS 5.9 - Specification for Bare Stainless Steel Welding Electrodes andRods.
k. Other References
(1) ANO Unit 1 Operating License and Technical Specifications, License No.DPR-51.
(2) ANO Unit 1 Updated Final Safety Analysis Report (UFSAR).
Holtec Report HI-2022867 2-6 Holtec Project 1196
(3) IE Information Notice 83-29 - Fuel Binding Caused by Fuel RackDeformation.
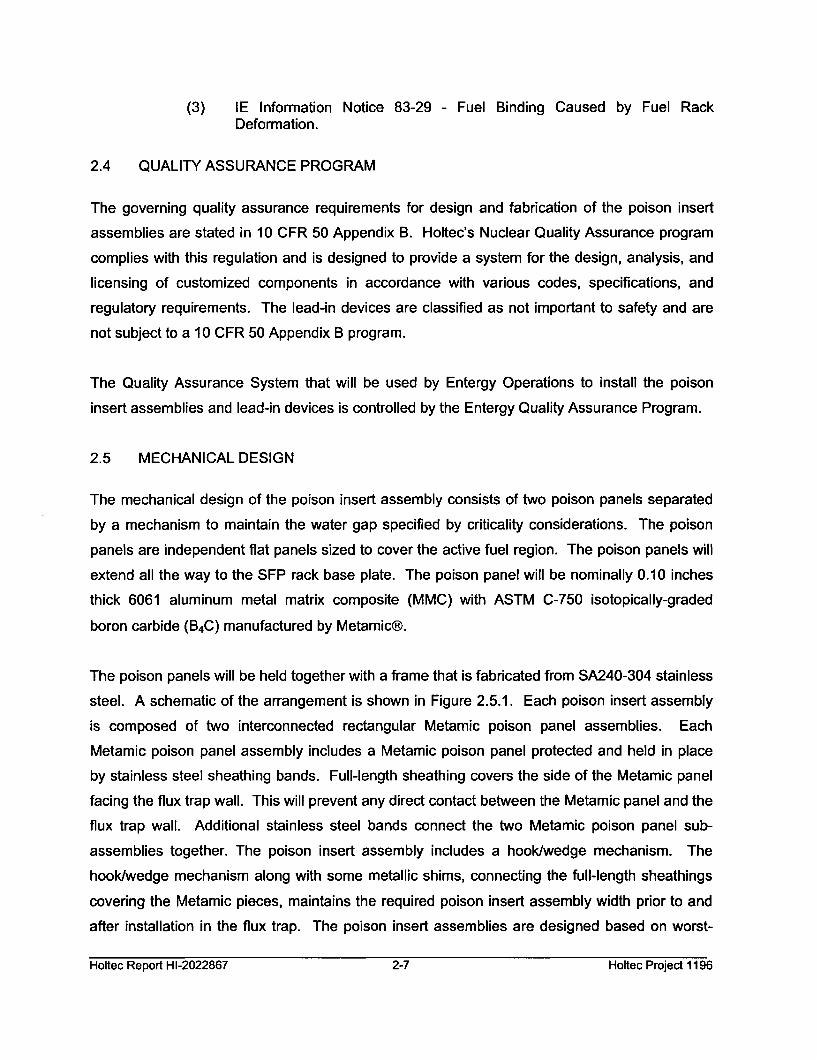
2.4 QUALITY ASSURANCE PROGRAM
The governing quality assurance requirements for design and fabrication of the poison insert
assemblies are stated in 10 CFR 50 Appendix B. Holtec's Nuclear Quality Assurance program
complies with this regulation and is designed to provide a system for the design, analysis, and
licensing of customized components in accordance with various codes, specifications, and
regulatory requirements. The lead-in devices are classified as not important to safety and are
not subject to a 10 CFR 50 Appendix B program.
The Quality Assurance System that will be used by Entergy Operations to install the poison
insert assemblies and lead-in devices is controlled by the Entergy Quality Assurance Program.
2.5 MECHANICAL DESIGN
The mechanical design of the poison insert assembly consists of two poison panels separated
by a mechanism to maintain the water gap specified by criticality considerations. The poison
panels are independent flat panels sized to cover the active fuel region. The poison panels will
extend all the way to the SFP rack base plate. The poison panel will be nominally 0.10 inches
thick 6061 aluminum metal matrix composite (MMC) with ASTM C-750 isotopically-graded
boron carbide (B4C) manufactured by Metamic®.
The poison panels will be held together with a frame that is fabricated from SA240-304 stainless
steel. A schematic of the arrangement is shown in Figure 2.5.1. Each poison insert assembly
is composed of two interconnected rectangular Metamic poison panel assemblies. Each
Metamic poison panel assembly includes a Metamic poison panel protected and held in place
by stainless steel sheathing bands. Full-length sheathing covers the side of the Metamic panel
facing the flux trap wall. This will prevent any direct contact between the Metamic panel and the
flux trap wall. Additional stainless steel bands connect the two Metamic poison panel sub-
assemblies together. The poison insert assembly includes a hook/wedge mechanism. The
hook/wedge mechanism along with some metallic shims, connecting the full-length sheathings
covering the Metamic pieces, maintains the required poison insert assembly width prior to and
after installation in the flux trap. The poison insert assemblies are designed based on worst-
Holtec Report HI-2022867 2-7 Holtec Project 1196

case measured dimensions of the flux trap and maximizing use of the allowable space in each
flux trap for criticality safety purposes.
<21 IlL>b-.:, ý :1FAV
Figure 2.5.1 Schematic of the Poison Insert Assembly Mechanism
The lead-in device, which is depicted in Figure 2.5.2, is fabricated from SA240-304L stainless
steel. The device is designed to rest on top of the flux trap, and it is secured in place by two
slotted plates, which straddle the cell wall at the corners external to the flux trap. The size and
shape of the lead-in is such that it will not interfere with the square opening of the cell. The
lead-in contains flow holes in the mounting plate to provide an uninterrupted flow path for the
water entering at the bottom of the flux trap and exiting at the top of the flux trap. Each poison
insert assembly and lead-in device together weighs less than 50 lbs.
Figure 2.5.2 Lead-in Device
Holtec Report HI-2022867 2-8 Holtec Project 1196
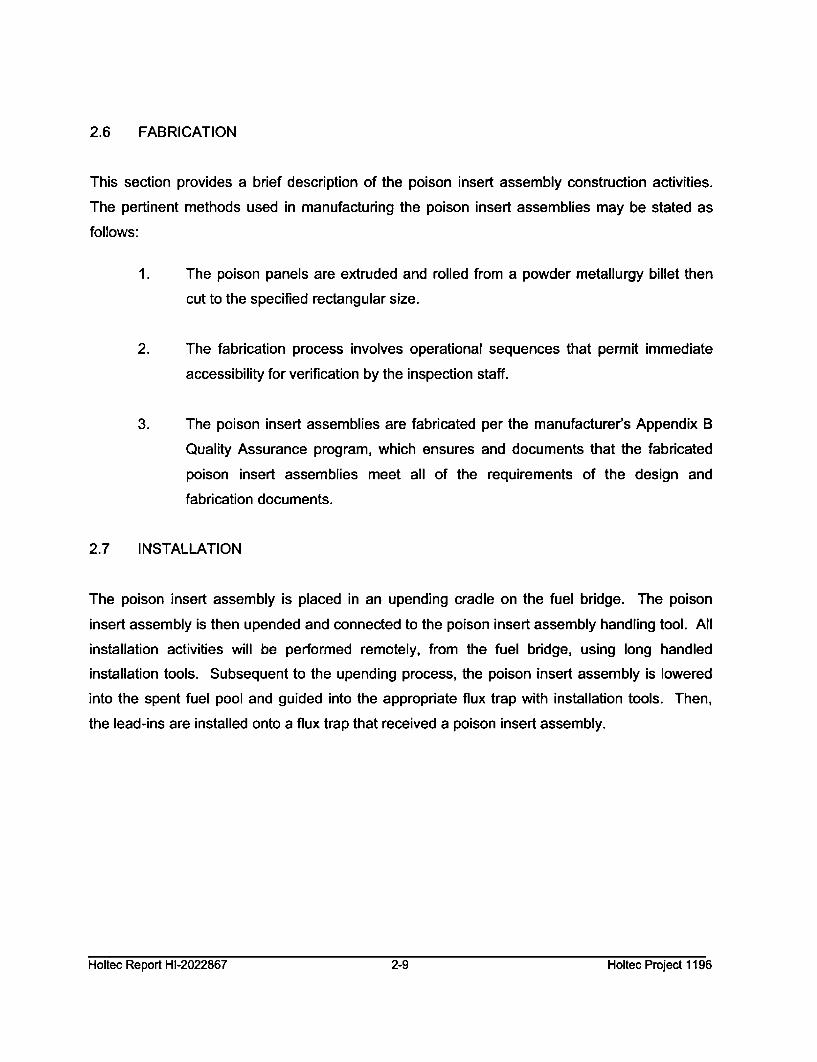
2.6 FABRICATION
This section provides a brief description of the poison insert assembly construction activities.
The pertinent methods used in manufacturing the poison insert assemblies may be stated as
follows:
1. The poison panels are extruded and rolled from a powder metallurgy billet then
cut to the specified rectangular size.
2. The fabrication process involves operational sequences that permit immediate
accessibility for verification by the inspection staff.
3. The poison insert assemblies are fabricated per the manufacturer's Appendix B
Quality Assurance program, which ensures and documents that the fabricated
poison insert assemblies meet all of the requirements of the design and
fabrication documents.
2.7 INSTALLATION
The poison insert assembly is placed in an upending cradle on the fuel bridge. The poison
insert assembly is then upended and connected to the poison insert assembly handling tool. All
installation activities will be performed remotely, from the fuel bridge, using long handled
installation tools. Subsequent to the upending process, the poison insert assembly is lowered
into the spent fuel pool and guided into the appropriate flux trap with installation tools. Then,
the lead-ins are installed onto a flux trap that received a poison insert assembly.
Holtec Report HI-2022867 2-9 Holtec Project 1196
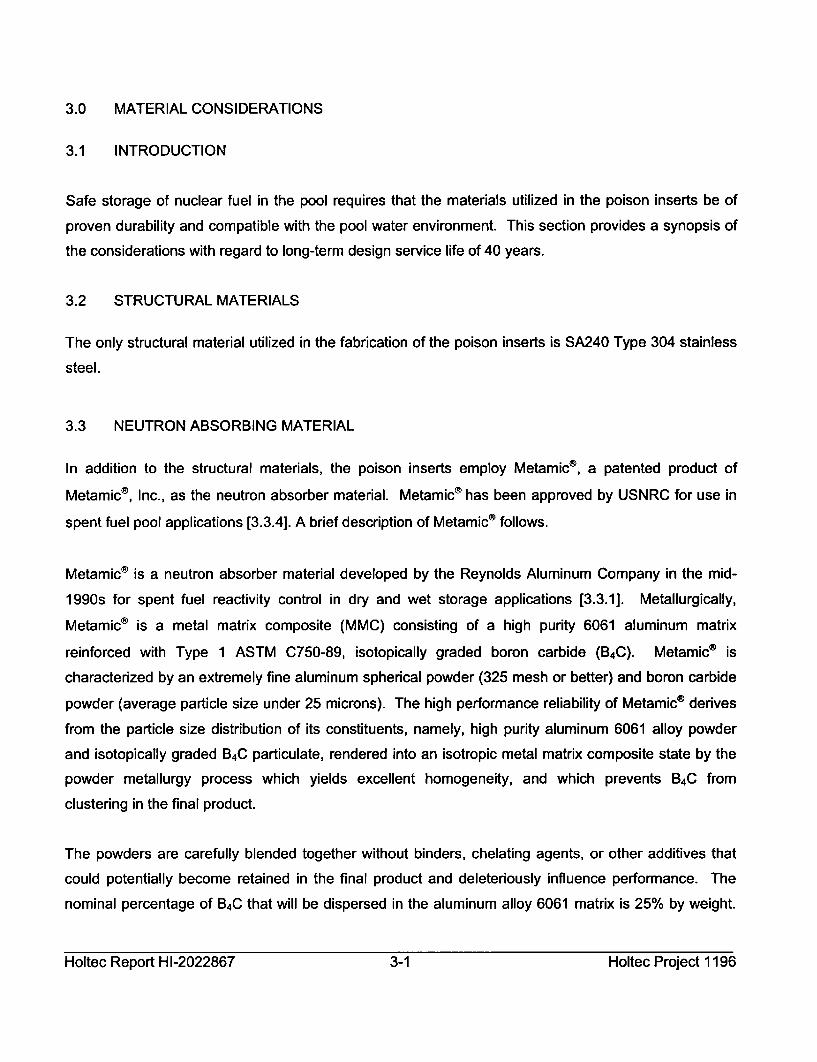
3.0 MATERIAL CONSIDERATIONS
3.1 INTRODUCTION
Safe storage of nuclear fuel in the pool requires that the materials utilized in the poison inserts be of
proven durability and compatible with the pool water environment. This section provides a synopsis of
the considerations with regard to long-term design service life of 40 years.
3.2 STRUCTURAL MATERIALS
The only structural material utilized in the fabrication of the poison inserts is SA240 Type 304 stainless
steel.
3.3 NEUTRON ABSORBING MATERIAL
In addition to the structural materials, the poison inserts employ Metamic®, a patented product of
Metamic®, Inc., as the neutron absorber material. Metamic® has been approved by USNRC for use in
spent fuel pool applications [3.3.41. A brief description of Metamic® follows.
Metamic® is a neutron absorber material developed by the Reynolds Aluminum Company in the mid-
1990s for spent fuel reactivity control in dry and wet storage applications [3.3.1]. Metallurgically,
Metamic® is a metal matrix composite (MMC) consisting of a high purity 6061 aluminum matrix
reinforced with Type 1 ASTM C750-89, isotopically graded boron carbide (B4C). Metamic® is
characterized by an extremely fine aluminum spherical powder (325 mesh or better) and boron carbide
powder (average particle size under 25 microns). The high performance reliability of Metamic® derives
from the particle size distribution of its constituents, namely, high purity aluminum 6061 alloy powder
and isotopically graded B4C particulate, rendered into an isotropic metal matrix composite state by the
powder metallurgy process which yields excellent homogeneity, and which prevents B4C from
clustering in the final product.
The powders are carefully blended together without binders, chelating agents, or other additives that
could potentially become retained in the final product and deleteriously influence performance. The
nominal percentage of B4C that will be dispersed in the aluminum alloy 6061 matrix is 25% by weight.
Holtec Report HI-2022867 3-1 Holtec Project 1196
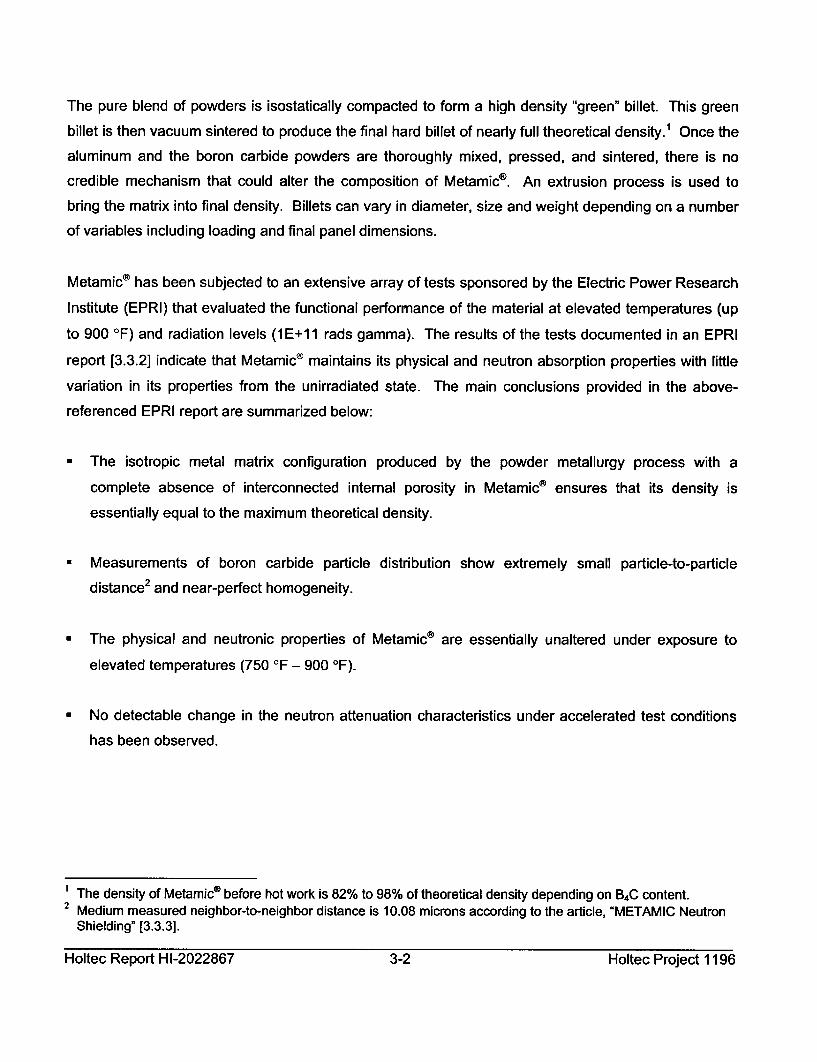
The pure blend of powders is isostatically compacted to form a high density "green" billet. This green
billet is then vacuum sintered to produce the final hard billet of nearly full theoretical density.1 Once the
aluminum and the boron carbide powders are thoroughly mixed, pressed, and sintered, there is no
credible mechanism that could alter the composition of Metamic®. An extrusion process is used to
bring the matrix into final density. Billets can vary in diameter, size and weight depending on a number
of variables including loading and final panel dimensions.
Metamic® has been subjected to an extensive array of tests sponsored by the Electric Power Research
Institute (EPRI) that evaluated the functional performance of the material at elevated temperatures (up
to 900 OF) and radiation levels (1 E+1 1 rads gamma). The results of the tests documented in an EPRI
report [3.3.2] indicate that Metamic® maintains its physical and neutron absorption properties with little
variation in its properties from the unirradiated state. The main conclusions provided in the above-
referenced EPRI report are summarized below:
" The isotropic metal matrix configuration produced by the powder metallurgy process with a
complete absence of interconnected internal porosity in Metamic® ensures that its density is
essentially equal to the maximum theoretical density.
" Measurements of boron carbide particle distribution show extremely small particle-to-particle
distance 2 and near-perfect homogeneity.
" The physical and neutronic properties of Metamic® are essentially unaltered under exposure to
elevated temperatures (750 OF - 900 IF).
" No detectable change in the neutron attenuation characteristics under accelerated test conditions
has been observed.
The density of Metamic® before hot work is 82% to 98% of theoretical density depending on B4C content.
2 Medium measured neighbor-to-neighbor distance is 10.08 microns according to the article, "METAMIC Neutron
Shielding" [3.3.3].
Holtec Report HI-2022867 3-2 Holtec Project 1196
Independent tests and investigations by Holtec International [3.3.5] confirm the conclusions
summarized above, and present additional data on the fundamental characteristics of Metamic® and
the applicability of the material in wet storage applications.
Holtec International's Q.A. program ensures that Metamic® is manufactured under the control and
surveillance of a Quality Assurance/Quality Control Program that conforms to the requirements of
10 CFR 50 Appendix B, "Quality Assurance Criteria for Nuclear Power Plants."
3.3.1 METAMIC® Material Characteristics
Aluminum: Aluminum is a silvery-white, ductile metallic element. The 6061 alloy aluminum is used
extensively in heat exchangers, pressure and storage tanks, chemical equipment, reflectors, and sheet
metal work.
It has high resistance to corrosion in industrial and marine atmospheres. Aluminum has atomic number
of 13, atomic weight of 26.98, specific gravity of 2.69 and valence of 3. The physical, mechanical and
chemical properties of the 6061 alloy aluminum are listed in Table 3.3.1.
The excellent corrosion resistance of the 6061 alloy aluminum is provided by the protective oxide film
that quickly develops on its surface from exposure to the atmosphere or water. This film prevents the
loss of metal from general corrosion or pitting corrosion.
Boron Carbide: The boron carbide contained in Metamic® is a fine granulated powder that conforms to
ASTM C750-89 nuclear grade Type I. The material conforms to the chemical composition and
properties listed in Table 3.3.2.
References [3.3.1] and [3.3.2] provide further discussion as to the suitability of these materials for use
in spent fuel storage applications.
3.4 COMPATIBILITY WITH ENVIRONMENT
All materials used in the construction of the poison inserts have been determined to be compatible with
the ANO-1 SFP, and have an established history of in-pool usage. Austenitic stainless steel (e.g., Type
Holtec Report HI-2022867 3-3 Holtec Project 1196
304) is a widely used stainless alloy in nuclear power plants, and it has an established history of in-pool
usage. Metamic® is likewise an excellent material for spent fuel applications based on its high
resistance to corrosion and its functional performance at elevated temperatures and radiation levels.
3.5 HEAVY LOAD CONSIDERATIONS
There are no heavy loads involved in the proposed installation of poison inserts. The weight of a single
poison insert and a lead-in is less than 50 pounds.
3.6 REFERENCES
[3.3.1] "Use of METAMIC in Fuel Pool Applications," Holtec International, HI-2022871, Revision 1,August 2002.
[3.3.2] "Qualification of METAMIC for Spent Fuel Storage Application," EPRI, 1003137, Final Report,October 2001.
[3.3.3] K. Anderson et al., "METAMIC Neutron Shielding," EPRI Boraflex Conference, November 19-20,1998.
[3.3.41 Safety Evaluation By The Office Of Nuclear Reactor Regulation Related To Holtec InternationalReport HI-2022871 Regarding Use Of Metamic- In Fuel Pool Applications, Facility OperatingLicense Nos. DPR-51 and NPF-6, Entergy Operations, Inc., Arkansas Nuclear One, Unit Nos. 1and 2, Docket Nos. 50-313 and 50-368
[3.3.5] "Sourcebook for Metamic Performance Assessment", Holtec International, HI-2043215,Revision 1, February 2005
Holtec Report H 1-2022867 3-4 Holtec Project 1196Holtec Report HI-2022867 3-4 Holtec Project 1196
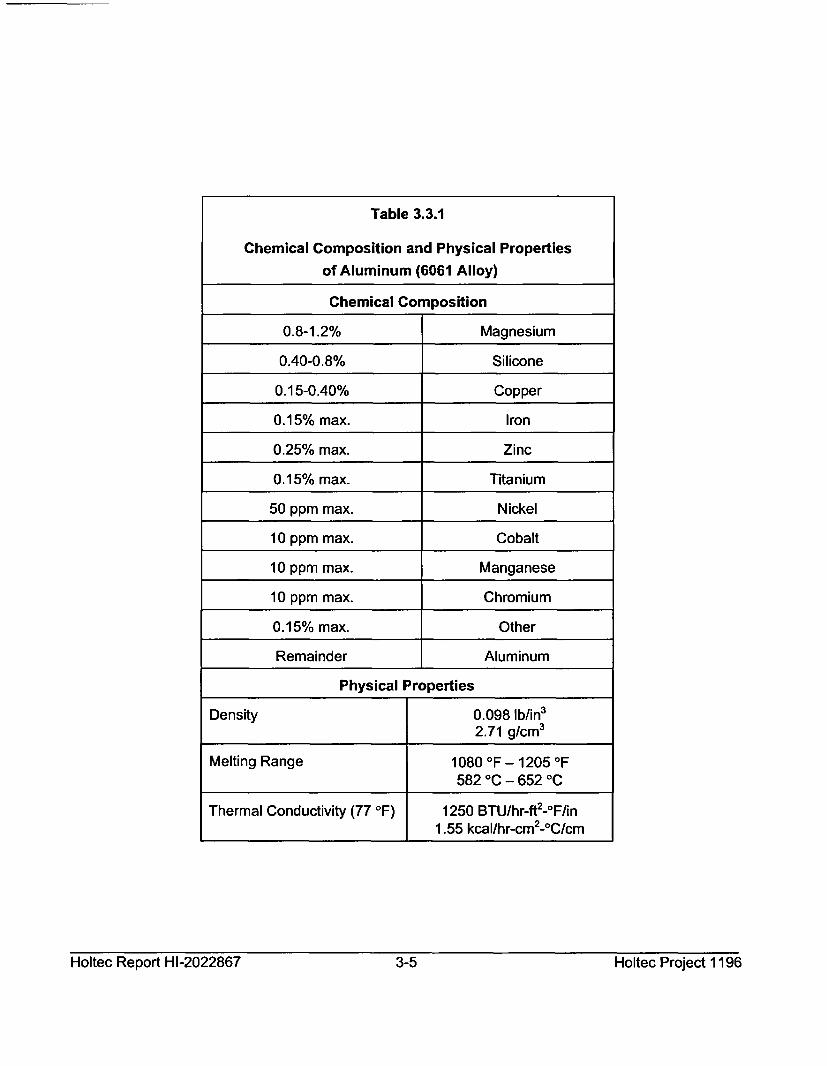
Table 3.3.1
Chemical Composition and Physical Properties
of Aluminum (6061 Alloy)
Chemical Composition
0.8-1.2% Magnesium
0.40-0.8% Silicone
0.15-0.40% Copper
0.15% max. Iron
0.25% max. Zinc
0.15% max. Titanium
50 ppm max. Nickel
10 ppm max. Cobalt
10 ppm max. Manganese
10 ppm max. Chromium
0.15% max. Other
Remainder Aluminum
Physical Properties
Density 0.098 lb/in3
2.71 g/cm3
Melting Range 1080 OF - 1205 OF
582 °C - 652 °C
Thermal Conductivity (77 OF) 1250 BTU/hr-ft2-°F/in1.55 kcal/hr-cm 2-°C/cm
Holtec Report H 1-2022867 3-5 Holtec Project 1196Holtec Report HI-2022867 3-5 Holtec Project 1196
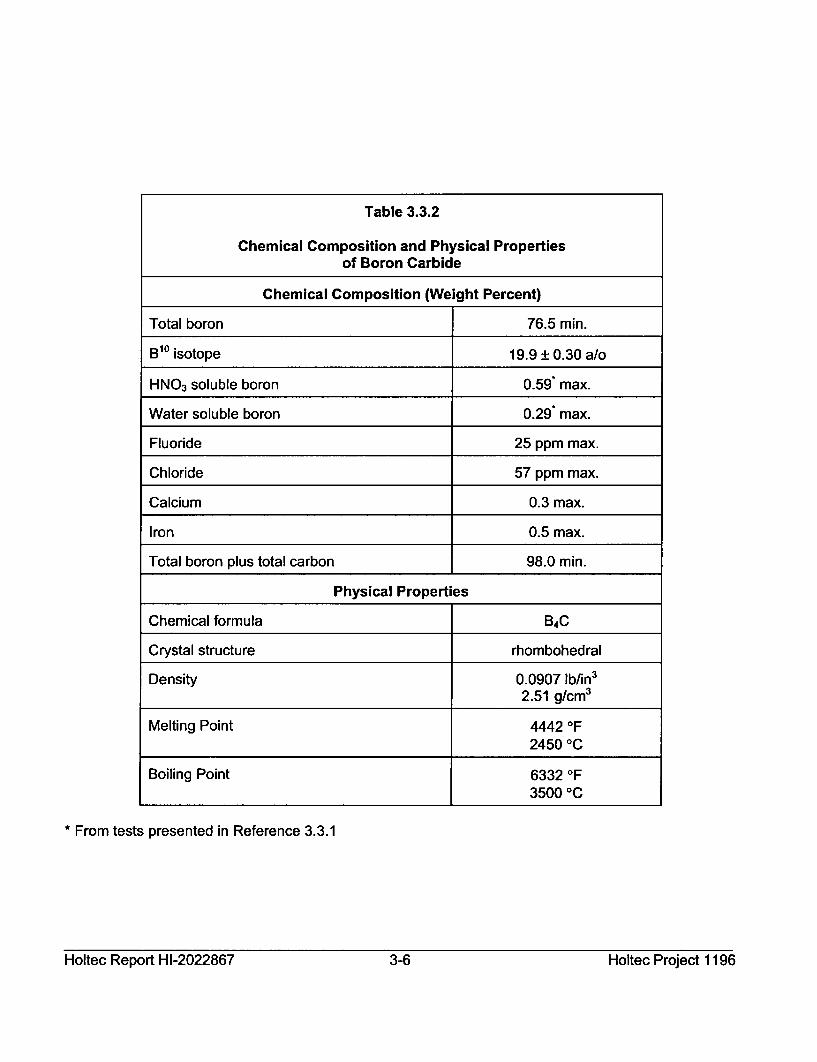
Table 3.3.2
Chemical Composition and Physical Propertiesof Boron Carbide
Chemical Composition (Weight Percent)
Total boron 76.5 min.
B10 isotope 19.9 ± 0.30 a/o
HNO 3 soluble boron 0.59* max.
Water soluble boron 0.29 max.
Fluoride 25 ppm max.
Chloride 57 ppm max.
Calcium 0.3 max.
Iron 0.5 max.
Total boron plus total carbon 98.0 min.
Physical Properties
Chemical formula B4C
Crystal structure rhombohedral
Density 0.0907 lb/in3
2.51 g/cm3
Melting Point 4442 OF2450 °C
Boiling Point 6332 OF3500 °C
* From tests presented in Reference 3.3.1
Holtec Report HI-2022867 3-6 Holtec Project 1196
4.0 CRITICALITY SAFETY ANALYSIS
4.1 Introduction and Summary
This section documents the criticality safety evaluation for the storage of PWR fresh and spentnuclear fuel in Region 1, 2 & 3 style high-density spent fuel storage racks at the ANO Unit 1nuclear power plant operated by Entergy. This section also documents the criticality safetyevaluation for the storage of fresh fuel in the new fuel vault (NFV) at the ANO Unit 1 nuclearpower plant.
The objective of the spent fuel pool analysis is to ensure that the effective neutron multiplicationfactor (k.ff) is less than or equal to 0.95 with the storage racks fully loaded with fuel of thehighest permissible reactivity and the pool flooded with borated water at a temperaturecorresponding to the highest reactivity. In addition, it is demonstrated that keff is less than 1.0under the assumed loss of soluble boron in the pool water, i.e., assuming unborated water in thespent fuel pool. The maximum calculated reactivities include a margin for uncertainty in reac-tivity calculations, including manufacturing tolerances, and are calculated with a 95%probability at a 95% confidence level [4.1]. Reactivity effects of abnormal and accidentconditions have also been evaluated to assure that under all credible abnormal and accidentconditions, the reactivity will not exceed the regulatory limit of 0.95.
The ANO Unit 1 spent fuel pool currently contains two unique types of racks:
1. Region 1 racks: These racks were originally designed with Boraflex as the poisonmaterial in a flux-trap configuration.
2. Region 2 racks: These racks are designed to store spent fuel assemblies of a specifiedcombination of initial enrichment and discharge burnup. These racks do not currentlycontain neutron absorber material.
Due to the Boraflex degradation in the Region 1 racks, future credit for Boraflex in these racks isnot feasible. The proposed resolution is to re-evaluate the criticality safety of the Region 1 rackswithout credit for Boraflex. Additionally, some of the Region 2 racks will be modified byplacing a neutron absorbing poison insert assembly into the existing Region 2 rack water gapsbetween storage cells. These modified Region 2 racks are identified as Region 3 racks. The newRegion 3 racks will enable unrestricted storage of fresh fuel up to 4.35 wt% 235U or a "3 of 4"pattern with 3 fresh fuel assemblies with enrichments up to 5.0 wt% 235U and a single assemblywith a maximum nominal initial enrichment of 5.0 wt% 235U and a specified minimum burnuprequirement.
Specifically, the following evaluations were performed for the ANO Unit 1 spent fuel pool:
The Region I racks were evaluated for storage of spent fuel assemblies with specificburnup requirements as a function of initial enrichment between 2.0 wt% and 5.0 wt%
Holtec Report HI-2022867 4-1 Holtec Project 1196
23 5U and decay times between 0 and 20 years. Results are summarized in Table 4.7.14and calculation of the maximum keff for 5.0 wt% 235U at 0 years cooling time is given inTable 4.7.1 with no soluble boron and Table 4.7.2 with soluble boron.
* The Region 1 racks were evaluated for storage of fresh fuel assemblies with a maximumnominal enrichment of 5.0 wt% 235U in a checkerboard configuration with empty storagecells. Calculation of the maximum krff is presented in Table 4.7.3 for the case withoutsoluble credit and in Table 4.7.4 for the case with soluble boron credit.
* The Region 2 racks were evaluated for storage of spent fuel assemblies with specificburnup requirements as a function of initial enrichment between 2.0 wt% and 5.0 wt0/o235U and decay times between 0 and 20 years. Results are summarized in Table 4.7.15and calculation of the maximum k&ff for 5.0 wt/ 235U at 0 years cooling time is given inTable 4.7.5 with no soluble boron and Table 4.7.6 with soluble boron.
* The Region 2 racks were evaluated for storage of fresh fuel assemblies with a maximumnominal enrichment of 5.0 wt% 235U in a checkerboard configuration with empty storagecells. Calculation of the maximum keff is presented in Table 4.7.7 for the case withoutsoluble credit and in Table 4.7.8 for the case with soluble boron credit.
* The Region 3 racks were evaluated for storage of fresh and spent fuel assemblies in a 3of 4 configuration of 3 fresh fuel assemblies with a maximum nominal enrichment of5.0 wt% 235U and 1 spent fuel assembly with a maximum nominal initial enrichment of5.0 wt% 235U that has accumulated a minimum specified burnup. Calculation of themaximum k.ff is given in Table 4.7.9 with no soluble boron and Table 4.7.10 with solubleboron.
* The Region 3 racks were evaluated for unrestricted storage of fresh fuel assemblies witha maximum nominal enrichment of 4.35 wt% 235U. Calculation of the maximum krf ispresented in Table 4.7.11 for the case without soluble credit and in Table 4.7.12 for thecase with soluble boron credit.
Reactivity effects of abnormal and accident conditions have also been evaluated. A summary ofthe types of accidents analyzed and the soluble boron required to ensure that the maximum kearemains below 0.95 are shown in Table 4.7.23, Table 4.7.24 and Table 4.7.25 for Region 1,Region 2 and Region 3, respectively. The most limiting accident condition involves placing afresh fuel assembly, enriched to 5.0 wt% 235 U, outside the storage rack, adjacent to other fuelassemblies in the rack. A minimum soluble boron concentration of 889 ppm must be maintainedin the spent fuel pool to ensure that the maximum k.ff is less than 0.95 under accident conditions.
In addition to the analysis for each individual rack detailed above, the possibility of an increasedreactivity effect due to the rack interfaces within and between the racks was analyzed. Table4.7.26 provides a summary of the various interface calculations performed for the ANO Unit 1spent fuel pool. Interfaces within the rack include spent and fresh fuel loading patterns withinthe same rack to determine acceptability. Interface calculations between racks include Region 1-Region 1, Region 2-Region 2, Region 3-Region 3, Region 1-Region 3 and Region 2-Region 3.The calculated reactivity from the interface calculation is then compared to the calculatedreactivity from the reference infinite array calculations. From the summary of the results in
Holtec Report HI-2022867 4-2 Holtec Project 1196
Table 4.7.26 the following conclusions may be drawn regarding the reactivity effect of theinterfaces:
" In the Region 1 and Region 2 racks, a fresh fuel checkerboard and uniform spent fuelloading may be placed in the same rack.
* In Region 1 and Region 2 racks, if adjacent racks contain a checkerboard of fresh fuelassemblies, the checkerboard must be maintained across the gap, i.e., fresh fuelassemblies may not face each other across a gap.
* In Region 3, uniform loading of fresh fuel at 4.35 wt% 2 35U may be combined with 3 of 4loading in the same rack as long as a row of fresh and spent fuel in the 3 of 4 loadingpattern faces the uniform loading of all fresh fuel at 4.35 wt% 235U.
* If adjacent Region 3 racks contain different loading patterns (one rack contains all freshfuel at 4.35 wt% and the other rack contains a 3 of 4 loading pattern), both fresh andspent fuel must be in the outer row of the rack containing the 3 of 4 pattern.
* If adjacent Region 3 racks both contain 3 of 4 loading patterns, both racks may not havefresh fuel facing the other rack. Calculations with both Region 3 racks containing 3 of 4patterns with all fresh fuel in the outer row of one rack and fresh and spent fuel in theouter row of the second rack shows a slight increase in reactivity (Ak = +0.0017)compared to the reference case. This increase is accommodated by the margin in thecalculations (max k.ff for Region 3 racks with 3 of 4 pattern is 0.9958). Therefore, thiscondition is allowed.
* All interfaces between dissimilar racks (Region 1-Region 3 and Region 2-Region 3) donot result in an increase in the reactivity, and therefore, are permitted. Calculations wereperformed with a 3 of 4 loading pattern in the Region 3 racks, with fresh fuel (5.0 wt%2 35U) in the outer row facing the other rack. This is bounding for the Region 3 rackcontaining all fresh fuel at 4.35 wt%, because the analyzed cases have higher reactivityfuel in the outer row of the rack.
4.2 METHODOLOGY
The principal method for the criticality analysis of the high-density storage racks is the three-dimensional Monte Carlo code MCNP4a [4.3]. MCNP4a is a continuous energy three-dimensionalMonte Carlo code developed at the Los Alamos National Laboratory. MCNP4a was selectedbecause it has been used previously and verified for criticality analyses and has all of thenecessary features for this analysis. MCNP4a calculations used continuous energy cross-sectiondata based on ENDF/B-V and ENDF/B-VI. Exceptions are two lumped fission productscalculated by the CASMO-4 depletion code that do not have corresponding cross sections inMCNP4a. For these isotopes, the CASMO-4 cross sections are used in MCNP4a. This approachhas been validated [4.4] by showing that the cross sections result in the same reactivity effect inboth CASMO-4 and MCNP4a.
Benchmark calculations, presented in Appendix 4A, indicate a bias of 0.0009 with an uncertainty of± 0.0011 for MCNP4a, evaluated with a 95% probability at the 95% confidence level [4.1]. The
Holtec Report HI-2022867 4-3 Holtec Project 1196
calculations for this analysis utilize the same computer platform and cross-section libraries used forthe benchmark calculations discussed in Appendix 4A.
The convergence of a Monte Carlo criticality problem is sensitive to the following parameters:(1) number of histories per cycle, (2) the number of cycles skipped before averaging, (3) the totalnumber of cycles and (4) the initial source distribution. The MCNP4a criticality output containsa great deal of useful information that may be used to determine the acceptability of the problemconvergence. This information has been used in parametric studies to develop appropriatevalues for the aforementioned criticality parameters to be used in storage rack criticalitycalculations. Based on these studies, a minimum of 10,000 histories were simulated per cycle, aminimum of 100 cycles were skipped before averaging, a minimum of 150 cycles wereaccumulated, and the initial source was specified as uniform over the fueled regions(assemblies). Further, the output was reviewed to ensure that each calculation achievedacceptable convergence. These parameters represent an acceptable compromise betweencalculational precision and computational time.
Fuel depletion analyses during core operation were performed with CASMO-4 (using the 70-groupcross-section library), a two-dimensional multigroup transport theory code based on captureprobabilities [4.7-4.9]. CASMO-4 is used to determine the isotopic composition of the spent fuel.In addition, the CASMO-4 calculations are restarted in the storage rack geometry, yielding the two-dimensional infinite multiplication factor (kinf) for the storage rack to determine the reactivity effectof fuel and rack tolerances, temperature variation, depletion uncertainty, and to perform variousstudies. For all calculations in the spent fuel pool racks, the Xe-135 concentration in the fuel isconservatively set to zero.
The evaluation performed to establish the burnup versus enrichment curve (loading curve) forthe Region 1 and Region 2 racks, consists of MCNP4a calculations performed at selectedenrichments between 2.0 wt% and 5.0 wt%, and for burnup values slightly above and below theexpected loading curve. Points on the proposed loading curve are then calculated by linearinterpolation for each enrichment, based on an appropriate target value (max kff = 0.9950) forthe reactivity. Bumup versus enrichment values are calculated for cooling times of 0, 5, 10, 15and 20 years. For the Region 3 racks the minimum required burnup for the single spent fuelassembly was determined with MCNP4a calculations, performed at an enrichment of 5.0 wt%235U and at burnup values slightly above and below the expected required bumup. The minimumburnup was then calculated by linear interpolation, based on an appropriate target value (max kff= 0.9958) for the reactivity.
The maximum klff is determined from the MCNP4a calculated klff, the calculational bias, thetemperature bias, and the applicable uncertainties and tolerances (bias uncertainty, calculationaluncertainty, rack tolerances, fuel tolerances, depletion uncertainty) using the following formula:
Holtec Report HI-2022867 4-4 Holtec Project 1196
Max k•'1 = Calculated kff + biases + [Y, (Uncertaintyi) 2]1/2
In the geometric models used for the calculations, each fuel rod and its cladding were describedexplicitly and reflecting or periodic boundary conditions were used in the radial direction which hasthe effect of creating an infinite radial array of storage cells, except for the assessment of certainabnormal/accident conditions in which neutron leakage is inherent.
4.3 ACCEPTANCE CRITERIA
The high-density spent fuel PWR storage racks for ANO are analyzed in accordance with theapplicable codes and standards listed below. The objective of this analysis is to ensure that theeffective neutron multiplication factor (keff) is less than or equal to 0.95 with the storage racksfully loaded with fuel of the highest permissible reactivity and the pool flooded with boratedwater at a temperature corresponding to the highest reactivity. In addition, it is demonstrated thatkeff is less than 1.0 under the assumed loss of soluble boron in the pool water, i.e. assumingunborated water in the spent fuel pool. The maximum calculated reactivities include a margin foruncertainty in reactivity calculations, including manufacturing tolerances, and are calculatedwith a 95% probability at a 95% confidence level [4. 1].
Applicable codes, standard, and regulations or pertinent sections thereof, include the following:
* Code of Federal Regulations, Title 10, Part 50, Appendix A, General Design Criterion62, "Prevention of Criticality in Fuel Storage and Handling."
* USNRC Standard Review Plan, NUREG-0800, Section 9.1.2, Spent Fuel Storage, Rev. 3- July 1981.
* USNRC letter of April 14, 1978, to all Power Reactor Licensees - OT Position forReview and Acceptance of Spent Fuel Storage and Handling Applications, includingmodification letter dated January 18, 1979.
* L. Kopp, "Guidance on the Regulatory Requirements for Criticality Analysis of FuelStorage at Light-Water Reactor Power Plants," NRC Memorandum from L. Kopp to T.Collins, August 19, 1998.
* USNRC Regulatory Guide 1.13, Spent Fuel Storage Facility Design Basis, Rev. 2(proposed), December 1981.
I The maximum klff value listed in Table 4.7.1 through Table 4.7.12 may differ from the calculated value basedon this formula (Ak = 0.0001) due to rounding.
Holtec Report HI-2022867 4-5 Holtec Project 1196Holtec Report HI-2022867 4-5 Holtec Project 1196
* ANSI ANS-8.17-1984, Criticality Safety Criteria for the Handling, Storage andTransportation of LWR Fuel Outside Reactors.
* Code of Federal Regulation 1 OCFR50.68, Criticality Accident Requirements (for solubleboron).
4.4 ASSUMPTIONS
To assure the true reactivity will always be less than the calculated reactivity, the followingconservative design criteria and assumptions were employed:
1) Moderator is borated or unborated water at a temperature in the operating range that resultsin the highest reactivity, as determined by the analysis.
2) Neutron absorption in minor structural members is neglected, i.e., spacer grids are replacedby water.
3) The effective multiplication factor of an infinite radial array of fuel assemblies was used in theanalyses, except for the assessment of certain abnormal/accident conditions in which neutronleakage is inherent.
4) The B4 C loading in the neutron absorber panels is nominally 25 wt%, with an uncertainty of± 0.5 wt%
5) Axial Power Shaping Rods (APSRs) and Burnable Poison Rod Assemblies (BPRAs) areassumed to cover the entire active fuel length of the assembly during depletion. No credit istaken in the rack criticality calculations for the APSRs and BPRAs.
4.5 INPUT DATA
4.5.1 Fuel Assembly Specification
The spent fuel storage racks are designed to accommodate B&W 15x15 fuel assemblies (HTP[ 2'and NON-HTP). The design specifications for these fuel assemblies, which were used for thisanalysis, are given in Table 4.5.1.
[21 HTP - High Thermal Performance
Holtec Report HI-2022 867 4-6 Holtec Project 1196Holtec Report HI-2022867 4-6 Holtec Project 1196
4.5.2 Core Operating Parameters
Core operating parameters are necessary for fuel depletion calculations performed withCASMO-4. The core parameters necessary for the depletion calculations are presented in Table4.5.2. Temperature and soluble boron values are taken as the upper bound (most conservative)of the core operating parameters of ANO Unit 1. The neutron spectrum is hardened by each ofthese parameters, leading to a greater production of plutonium during depletion, which results inconservative reactivity values.
4.5.3 Axial Burnup Distribution
Axial burnup profiles were provided by Entergy and are documented in Table 4.5.3 for lowburnup assemblies (<25 GWD/MTU). For assemblies with burnup greater than or equal to25 GWD/MTU, the axial burnup distribution from [4.12] was specified and is also provided inTable 4.5.3 under the Holtec column. This distribution has been used and approved in previouswet storage rack submittals to the NRC (Docket W's: 50-368, ANO Unit 2; 50-395, V.C.Summer; 50-275/50-323, Diablo Canyon).
4.5.4 Core Inserts
There is the potential for an insert (BPRA or APSR or both, but not simultaneously) to belocated in the assembly during different exposure intervals in the assembly's core lifetime. Thedesign specifications for the BPRAs and APSRs are given in Tables 4.5.4 through 4.5.6. Thecore inserts are conservatively considered only in the depletion calculations; no credit is takenfor core inserts in the rack criticality calculations.
4.5.5 ANO Unit I Storage Rack Specification
The storage cell characteristics for the Region 1, 2 & 3 storage racks which are used in thecriticality evaluations are summarized in Table 4.5.7 through Table 4.5.9.
4.5.5.1 Region 1 Style Storage Racks
The Region 1 storage cells are composed of stainless steel boxes separated by a gap withBoraflex neutron absorber panels, (attached by stainless steel sheathing) centered on each side ofthe storage cell. The steel walls define the storage cells and the stainless steel sheathing supportsthe Boraflex neutron absorber panel and defines the boundary of the flux-trap water-gap used toaugment reactivity control. The Boraflex is conservatively assumed to be completely degraded
Holtec Report HI-2022867 4-7 Holtec Project 1196
and replaced with water. Stainless steel channels connect the storage cells in a rigid structureand define the flux-trap between the sheathing of the neutron absorber panels. Figure 4.5.9provides a sketch of the Region 1 racks along with the critical dimensions. Additionally, theRegion 1 racks contain sheathing on the side of the racks that faces another rack, however thereis no sheathing on the side of the racks that faces the spent fuel pool wall.
The calculational models consist of either a single storage cell or a group of 25 storage cells(5x5) with reflecting boundary conditions or a group of four storage cells (2x2) with periodicboundary conditions through the centerline of the water gap on the outer boundary of the fourcells, thus simulating an infinite array of Region 1 storage cells. Figure 4.5.1 and Figure 4.5.2show the actual MCNP4a calculational model of the nominal Region 1 spent fuel storage cell, asdrawn by the two-dimensional plotter in MCNP4a for the individual cell model and the 2x2model, respectively.
4.5.5.2 Region 2 Style Storage Racks
The Region 2 storage cells are composed of stainless steel walls with no neutron absorber panels.The stainless steel walls are formed in such a way as to create a water gap between adjacentcells. Figure 4.5.10 provides a sketch of the Region 2 racks along with the critical dimensions.
The calculational models consist of either a single storage cell or a group of 25 storage cells(5x5) with reflecting boundary conditions or a group of four storage cells (2x2) with periodicboundary conditions through the centerline of the water gap on the outer boundary of the fourcells, thus simulating an infinite array of Region 2 storage cells. Figure 4.5.3 and Figure 4.5.4shows the actual MCNP4a calculational model of the nominal Region 2 spent fuel storage cell,as drawn by the two-dimensional plotter in MCNP4a for the individual cell model and the 2x2model, respectively.
4.5.5.3 Region 3 Style Storage Racks
The Region 3 storage cells are identical to the Region 2 storage cells, with the single exceptionof a metamic insert centrally located in the water gap between storage cells. Figure 4.5.11provides a sketch of the Region 3 racks along with the critical dimensions.
The calculational models consist of either a single storage cell or a group of 25 storage cells(5x5) with reflecting boundary conditions or a group of four storage cells (2x2) with periodicboundary conditions through the centerline of the water gap on the outer boundary of the fourcells, thus simulating an infinite array of Region 3 storage cells. Figure 4.5.5 and Figure 4.5.6shows the actual MCNP4a calculational model of the nominal Region 3 spent fuel storage cell,as drawn by the two-dimensional plotter in MCNP4a for the individual cell model and the 2x2model, respectively.
Holtec Report HI-2022867 4-8 Holtec Project 1196Holtec Report HI-2022867 4-8 Holtec Project 1196
4.5.5.4 Gaps Between Adjacent Racks
In addition to the calculations for each style of rack in the ANO Unit 1 spent fuel pool, thereactivity effect of potential interaction between adjacent racks and between different loadingpatterns is addressed. Figure 4.5.7 shows a diagram of the spent fuel pool layout, includinglocation of the different styles of racks, with respect to each other, and the distances of the gapsbetween adjacent racks. The values taken from this figure are the minimum distances from thecenter of one storage cell to the center of the storage cell in the adjacent rack, denoted by a "C"and followed by the dimension in inches. Table 4.5.10 identifies the possible rack-to-rackinteractions, the centerline-to-centerline distance, and the calculated gap between the adjacentracks. Figure 4.5.8 presents a diagram as to how the distance between racks listed in Table4.5.10 is measured.
4.6 COMPUTER CODES
The following computer codes were used during this analysis.
* MCNP4a [4.3] is a three-dimensional continuous energy Monte Carlo code developed at LosAlamos National Laboratory. This code offers the capability of performing full three-dimensional calculations for the loaded storage racks. MCNP4a was run on the PCs atHoltec.
* CASMO-4, Version 2.05.14 [4.7-4.9] is a two-dimensional multigroup transport theory codedeveloped by Studsvik of Sweden. CASMO-4 performs cell criticality calculations andburnup. CASMO-4 has the capability of analytically restarting burned fuel assemblies in therack configuration. This code was used to determine the reactivity effects of tolerances andfuel depletion. The CASMO-4 code was run on a PC at Holtec.
4.7 ANALYSIS
This section describes the calculations that were used to determine the acceptable storage criteriafor the Region 1, Region 2 and Region 3 style racks. In addition, this section discusses thepossible abnormal and accident conditions.
Unless otherwise stated, all calculations assumed nominal characteristics for the fuel and the fuelstorage cells. The effect of the manufacturing tolerances is accounted for with a reactivityadjustment as discussed below.
As discussed in Section 4.2, MCNP4a was the primary code used in the PWR calculations.CASMO-4 was used to determine the reactivity effect of tolerances and for depletioncalculations. MCNP4a was used for reference cases and to perform calculations which are notpossible with CASMO-4 (e.g. eccentric fuel positioning, axial burnup distributions, and fuelmisloading).
Holtec Report HI-2022867 4-9 Holtec Project 1196
Figures 4.5.1 through 4.5.6 are pictures of the basic calculational models used in MCNP4a.These pictures were created with the two-dimensional plotter in MCNP4a and clearly indicatethe explicit modeling of fuel rods in each fuel assembly. In CASMO-4, a single cell is modeled,and since CASMO-4 is a two-dimensional code, the fuel assembly hardware above and belowthe active fuel length is not represented. The three-dimensional MCNP4a models that includedaxial leakage assumed approximately 30 cm of water above and below the active fuel length.Additional models with more than four cells were generated with MCNP4a to investigate theeffect of accident conditions. These models are discussed in the appropriate section.
4.7.1 Calculational Methodologies Applicable to Region 1, Region 2 & Region 3
4.7.1.1 Moderator Temperature Effect
For the depletion calculations, the temperature at the top of the active region is used as themoderator temperature (see Table 4.5.2). However, the reactivity in the rack is dominated by thearea slightly below the top of the active region, where the moderator temperature in the core islower. Since the reactivity increases significantly with increasing moderator temperature, theassumption used in the depletion calculations is conservative.
4.7.1.2 Reactivity Effect of Inserts During Depletion
Due to variations in plant operation, it is impossible to predict the exact exposure intervals thatBPRAs and APSRs will be in the assemblies during core operation. Therefore, for conservatism,BPRAs are assumed to be present early in the assembly's life, when the BPRA has a strongerreactivity effect than the APSR. APSRs are then assumed to be inserted into the assembly oncethe BPRA has received a high enough bumup for their reactivity effect to be less than that of theAPSRs, typically around 15 GWD/MTU.
To determine the burnup at which to change from a BPRA to an APSR, termed here as the"crossover burnup", depletion calculations are performed in CASMO-4 with the HTP assemblycontaining an APSR, a BPRA or no insert. The assembly and the insert, if the assembly has one,is then transferred into the Region 1 rack. The calculated reactivities as a function of bumup arecompared between the three assemblies (with APSR, with BPRA and with no insert) and thebumup at which the reactivity of the assembly with the BPRA is equal to the reactivity of theassembly with the APSR is calculated. Calculations to determine the reactivity of the assemblywith an APSR or BPRA were performed for enrichments between 2.0 and 5.0 wto 235U in0.5 wt% increments and for cooling times between 0 and 20 years. Table 4.7.16 presents anexample of the reactivity effect of the presence of fuel inserts (BPRA, APSR and no insert) foran enrichment of 5.0 wt% 235U and a cooling time of 0 years. From the calculations it wasdetermined that the crossover burnup is dependent upon enrichment, but shows only littlevariation with cooling time. Therefore, the crossover bumup for each enrichment is calculated
Holtec Report HI-2022867 4-10 Holtec Project 1196
by averaging the crossover bumup for each enrichment at cooling times of 0, 5, 10, 15 and20 years. The enrichment dependency of the crossover burnup is shown in Table 4.7.13. Thesevalues are used in all subsequent depletion calculations.
4.7.1.3 Reactivity Effect of Axial Burnup Distribution
Initially, fuel loaded into the reactor will burn with a slightly skewed cosine power distribution.As burnup progresses, the burnup distribution will tend to flatten, becoming more highly burnedin the central regions than in the upper and lower ends. At high burnup, the more reactive fuelnear the ends of the fuel assembly (less than average burnup) occurs in regions of lowerreactivity worth due to neutron leakage. Consequently, it would be expected that over most ofthe burnup history, distributed burnup fuel assemblies would exhibit a slightly lower reactivitythan that calculated for the average bumup. As burnup progresses, the distribution, to someextent, tends to be self-regulating as controlled by the axial power distribution, precluding theexistence of large regions of significantly reduced burnup.
Generic analytic results of the axial burnup effect for assemblies without axial blankets havebeen provided by Turner [4.12] based upon calculated and measured axial bumup distributions.These analyses confirm the minor and generally negative reactivity effect of the axiallydistributed burnup compared to a flat distribution, becoming positive at burnups greater thanabout 30 GWD/MTU. The trends observed in [4.12] suggest the possibility of a small positivereactivity effect above 30 GWD/MTU increasing to slightly over 1% Ak at 40 GWD/MTU. Therequired burnup for the maximum enrichment is slightly higher than 30 GWD/MTU. Therefore,a positive reactivity effect of the axially distributed burnup is possible. Calculations areperformed with the HTP axial burnup distribution from Table 4.5.3 for bumups at or below25 GWD/MTU and with the Holtec axial burnup distribution for burnups above 25 GWD/MTU.As Section 4.5.3 discusses, the Holtec axial burnup distribution is specified to be used forbumups at 25 GWD/MTU. However, use of the HTP axial burnup distribution specified inTable 4.5.3 at 25 GWD/MTU is conservative, due to the significantly lower relative burnupsnear the ends of the active fuel region.
4.7.1.4 Isotopic Compositions
To perform the criticality evaluation for spent fuel in MCNP4a, the isotopic composition of thefuel is calculated with the depletion code CASMO-4 and then specified as input data in theMCNP4a run. The CASMO-4 calculations to obtain the isotopic compositions for MCNP4awere performed generically, with one calculation for each enrichment, and bumups inincrements of 2.5 GWD/MTU or less. The isotopic composition for any given bumup is thendetermined by linear interpolation.
Holtec Report HI-2022867 4-11 Holtec Project 1196
4.7.1.5 Uncertainty in Depletion Calculations
Since critical experiment data with spent fuel is not available for determining the uncertainty inburnup-dependent reactivity calculations, an allowance for uncertainty in reactivity was assignedbased upon other considerations. Assuming the uncertainty in depletion calculations is less than5% of the total reactivity decrement, a burnup dependent uncertainty in reactivity for burnupcalculations may be assigned [4.10]. This allowance is statistically combined with the otherreactivity allowances in the determination of the maximum kff for normal conditions whereassembly burnup is credited.
4.7.2 Region I
The purpose of the criticality calculations for the Region 1 style racks is to qualify the racks forstorage of spent fuel assemblies with design specifications as shown in Table 4.5.1 and amaximum nominal initial enrichment of 5.0 wt% 235U that have accumulated a minimum bumupwith credit for cooling times between 0 and 20 years. The purpose of the criticality calculationsis to determine the initial enrichment and burnup combinations required for the storage of spentfuel assemblies with nominal initial enrichments up to 5.0 wt% 2351U and for cooling times up to20 years. Additionally, the Region 1 racks are qualified for storage of fresh fuel assemblies, in acheckerboard pattern with empty storage cells, at a maximum nominal enrichment of 5.0 wt0/o 2 3 5U.
4.7.2.1 Identification of Reference Fuel Assembly
CASMO-4 calculations were performed to determine which of the two assemblies in Table 4.5.1is bounding in the Region 1 racks. In the calculations, the fuel assembly is burned in the coreconfiguration and restarted in the rack configuration. Three different scenarios were analyzed:empty guide tubes in the core, BPRAs in the guide tubes in the core, and APSRs in the guidetubes in the core. In all scenarios, the insert was removed when the assembly was modeled inthe rack. The HTP assembly was determined to have the highest reactivity for all burnup andenrichment combinations. This assembly type is therefore used in all subsequent calculations.
4.7.2.2 Eccentric Fuel Assembly Positioning
The fuel assembly is assumed to be normally located in the center of the storage rack cell. In theabsence of a fixed neutron absorber, the eccentric location of fuel assemblies in the storage cellsmay produce a positive reactivity effect. Therefore, MCNP4a calculations for a uniform loadingof spent fuel assemblies and a checkerboard of fresh fuel assemblies and empty storage locationswere performed with the fuel assemblies assumed to be in the comer of the storage rack cell(four-assembly cluster at closest approach). Three different enrichment and bumupcombinations were analyzed for the spent fuel configuration. These calculations indicate thateccentric fuel positioning results in an increase in reactivity.
Holtec Report HI-2022867 4-12 Holtec Project 1196
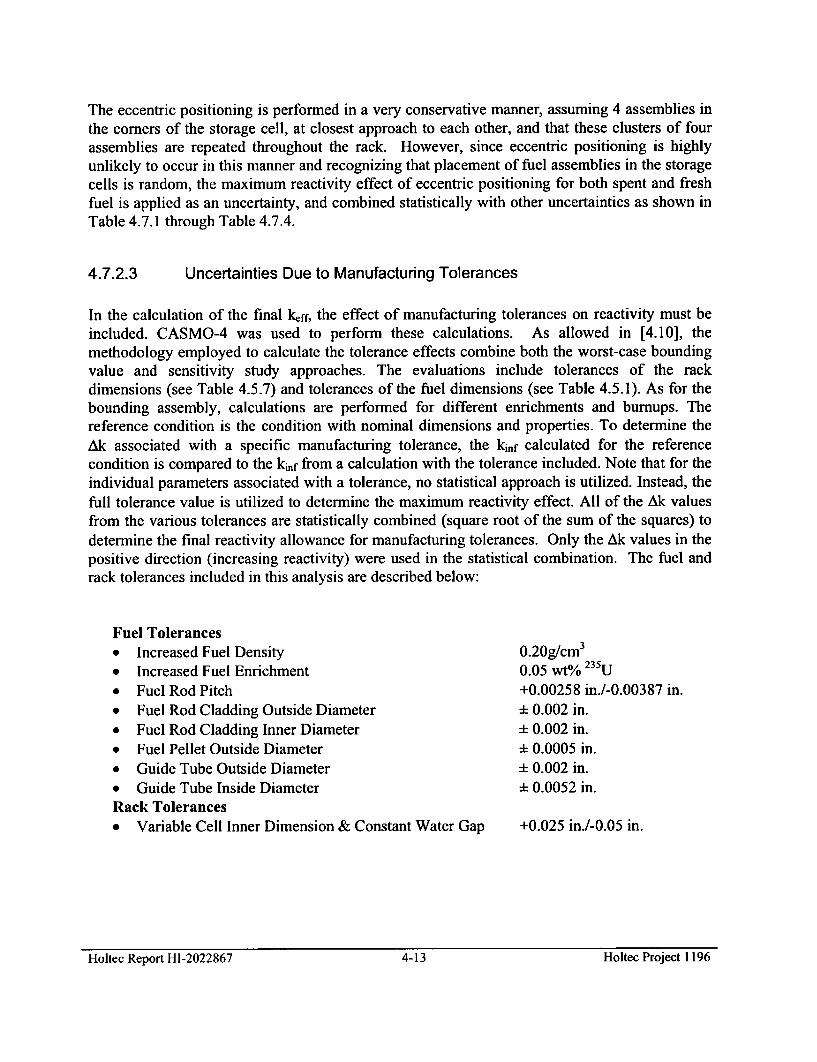
The eccentric positioning is performed in a very conservative manner, assuming 4 assemblies inthe comers of the storage cell, at closest approach to each other, and that these clusters of fourassemblies are repeated throughout the rack. However, since eccentric positioning is highlyunlikely to occur in this manner and recognizing that placement of fuel assemblies in the storagecells is random, the maximum reactivity effect of eccentric positioning for both spent and freshfuel is applied as an uncertainty, and combined statistically with other uncertainties as shown inTable 4.7.1 through Table 4.7.4.
4.7.2.3 Uncertainties Due to Manufacturing Tolerances
In the calculation of the final kcff, the effect of manufacturing tolerances on reactivity must beincluded. CASMO-4 was used to perform these calculations. As allowed in [4.10], themethodology employed to calculate the tolerance effects combine both the worst-case boundingvalue and sensitivity study approaches. The evaluations include tolerances of the rackdimensions (see Table 4.5.7) and tolerances of the fuel dimensions (see Table 4.5.1). As for thebounding assembly, calculations are performed for different enrichments and bumups. Thereference condition is the condition with nominal dimensions and properties. To determine theAk associated with a specific manufacturing tolerance, the kinf calculated for the referencecondition is compared to the kinf from a calculation with the tolerance included. Note that for theindividual parameters associated with a tolerance, no statistical approach is utilized. Instead, thefull tolerance value is utilized to determine the maximum reactivity effect. All of the Ak valuesfrom the various tolerances are statistically combined (square root of the sum of the squares) todetermine the final reactivity allowance for manufacturing tolerances. Only the Ak values in thepositive direction (increasing reactivity) were used in the statistical combination. The fuel andrack tolerances included in this analysis are described below:
Fuel Tolerances* Increased Fuel Density* Increased Fuel Enrichment* Fuel Rod Pitch* Fuel Rod Cladding Outside Diameter* Fuel Rod Cladding Inner Diameter* Fuel Pellet Outside Diameter* Guide Tube Outside Diameter* Guide Tube Inside DiameterRack Tolerances* Variable Cell Inner Dimension & Constant Water Gap
0.20g/cm3
0.05 wt% 2 3 5U
+0.00258 in./-0.00387 in.± 0.002 in.± 0.002 in.* 0.0005 in.± 0.002 in.± 0.0052 in.
+0.025 in./-0.05 in.
Holtec Report HI-2022867 4-13 Holtec Project 1196Holtec Report HI-2022867 4-13 Holtec Project 1196
" Variable Water Gap & Constant Pitch +0.05 in./-0.025 in.[31
" Box Wall Thickness ± 0.004 in.* Sheathing Thickness ± 0.004 in." Poison Gap Thickness ± 0.010 in.
The reactivity effects of the fuel and rack tolerances shown above were calculated forenrichments between 2.0 and 5.0 wt% 235U and for 0 cooling time. For longer cooling times thefuel and rack tolerances from 0 cooling time are used. Table 4.7.17 provides representativeexamples of the reactivity effect of the fuel and rack tolerances for the Region 1 racks.
4.7.2.4 Temperature and Water Density Effects
Pool water temperature effects on reactivity in the Region 1 racks have been calculated withCASMO-4 for enrichments from 2.0 to 5.0 wt/o 213U and cooling times from 0 years to 20 years.The results in Table 4.7.18 for 5.0 wt 0 235U show that the spent fuel pool temperaturecoefficient of reactivity is positive, i.e. a higher temperature results in a higher reactivity.Consequently, all CASMO-4 calculations are evaluated at 150 *F. Temperatures higher than 150'F are treated as accidents and discussed in Section 4.7.5.
In MCNP4a, the Doppler treatment and cross-sections are valid only at 300K (27 °C). Therefore,a Ak is determined in CASMO-4 from 27 *C (80.33 *F) to 150 *F, and is included in the final klffcalculation as a bias. The temperature bias is shown on Table 4.7.1 through Table 4.7.4.
4.7.2.5 Calculation of Maximum keff
Using the calculational model shown in Figure 4.5.1 and 4.5.2 and the reference HTP 15x15 fuelassembly, the kerr in the Region 1 storage racks has been calculated with MCNP4a. A summaryof the calculation of the maximum kelf, which is based on the formula in Section 4.2, for spentfuel of maximum nominal initial enrichment of 5 wt 0 235U and for the fresh fuel checkerboard isshown in Table 4.7.1 and Table 4.7.3 without soluble boron. Uncertainties associated withdepletion are not applicable to the Region 1 checkerboard of fresh fuel assemblies and emptystorage cells. Results show that the maximum krff of the Region 1 racks is less than 1.0 at a 95%probability at a 95% confidence level with no credit for soluble boron.
[31 No tolerance was given for the water gap, therefore it was assumed that the water gap tolerance is consistent withthe tolerance for the storage cell inner dimension.
Holtec Report HI-2022867 4-14 Holtec Project 1196Holtec Report HI-2022867 4-14 Holtec Project 1196
4.7.2.6 Determination of Burnup Versus Enrichment Values
To establish a burnup versus enrichment curve (loading curve), calculations were performed atselected enrichments between 2.0 wt% and 5.0 wt%, and for burnup values slightly above andbelow the expected loading curve. Points on the proposed loading curve are then calculated bylinear interpolation for each enrichment, based on an appropriate target value (max klf = 0.9950)for the reactivity. Bumup versus enrichment values are calculated for cooling times of 0, 5, 10,15 and 20 years and presented in Table 4.7.14.
4.7.2.7 Soluble Boron Concentration for Maximum ke. of 0.95
Calculations crediting soluble boron in the spent fuel pool to ensure that the reactivity does notexceed 0.95 are also performed. Calculations for a uniform loading of spent fuel are performedfor enrichment and cooling time combinations of 2.0 wto 235U at 0 years cooling, 5.0 wto 230 Uat 0 years cooling and 5.0 wt%/ 235U at 20 years cooling at a soluble boron level of 0 ppm and400 ppm. For a checkerboard of fresh fuel and empty cells, calculations are performed at5.0 wt% 235U and with a soluble boron level of 0 ppm and 400 ppm. The minimum solubleboron requirement is determined by linear interpolation between soluble boron levels to achievea target maximum klfr of 0.9450. In all cases, the maximum leff including all applicable biasesand uncertainties is below the regulatory limit of 0.95. The results for 5.0 wt% initial enrichmentare also listed in Table 4.7.2 and Table 4.7.4 for uniform loading of spent fuel and acheckerboard of fresh fuel assemblies and empty storage cells, respectively.
4.7.3 Region 2
The purpose of the criticality calculations for the PWR Region 2 style racks is to qualify theracks for storage of fuel assemblies with design specifications as shown in Table 4.5.1 and amaximum nominal initial enrichment of 5.0 wt% 230U that have accumulated a minimum burnupwith credit for cooling times between 0 and 20 years. The purpose of the criticality calculationsis to determine the initial enrichment and burnup combinations required for the storage of fuelassemblies with nominal initial enrichments up to 5.0 wt 0 235U and for cooling times up to 20years. Additionally, the Region 2 racks are qualified for storage of fresh fuel assemblies, in acheckerboard pattern with empty storage cells, at a maximum nominal enrichment of 5.0 wt 0 Z5U.
4.7.3.1 Identification of Reference Fuel Assembly
CASMO-4 calculations were performed to determine which of the two assemblies in Table 4.5.1is bounding in the Region 2 racks. In the calculations, the fuel assembly is burned in the coreconfiguration and restarted in the rack configuration. Three different scenarios were analyzed:empty guide tubes in the core, BPRAs in the guide tubes in the core, and APSRs in the guide
Holtec Report HI-2022867 4-15 Holtec Project 1196
tubes in the core. In all scenarios, the insert was removed when the assembly was modeled inthe rack. The HTP assembly was determined to have the highest reactivity for all burnup andenrichment combinations. This assembly type is therefore used in all subsequent calculations.
4.7.3.2 Eccentric Fuel Assembly Positioning
The fuel assembly is assumed to be normally located in the center of the storage rack cell. In theabsence of a fixed neutron absorber, the eccentric location of fuel assemblies in the storage cellsmay produce a positive reactivity effect. Therefore, MCNP4a calculations for a uniform loadingof spent fuel assemblies and a checkerboard of fresh fuel assemblies and empty storage locationswere performed with the fuel assemblies assumed to be in the comer of the storage rack cell(four-assembly cluster at closest approach). Three different enrichment and bumupcombinations were analyzed for the spent fuel configuration. These calculations indicate thateccentric fuel positioning results in an increase in reactivity.
The eccentric positioning is performed in a very conservative manner, assuming 4 assemblies inthe comers of the storage cell, at closest approach to each other, and that these clusters of fourassemblies are repeated throughout the rack. However, since eccentric positioning is highlyunlikely to occur in this manner and recognizing that placement of fuel assemblies in the storagecells is random, the maximum reactivity effect of eccentric positioning for both spent and freshfuel is applied as an uncertainty, and combined statistically with other uncertainties as shown inTable 4.7.5 through Table 4.7.8.
4.7.3.3 Uncertainties Due to Manufacturing Tolerances
In the calculation of the final kff, the effect of manufacturing tolerances on reactivity must beincluded. CASMO-4 was used to perform these calculations. As allowed in [4.10], themethodology employed to calculate the tolerance effects combine both the worst-case boundingvalue and sensitivity study approaches. The evaluations include tolerances of the rackdimensions (see Table 4.5.8) and tolerances of the fuel dimensions (see Table 4.5.1). As for thebounding assembly, calculations are performed for different enrichments and bumups. Thereference condition is the condition with nominal dimensions and properties. To determine theAk associated with a specific manufacturing tolerance, the kf calculated for the referencecondition is compared to the kif from a calculation with the tolerance included. Note that for theindividual parameters associated with a tolerance, no statistical approach is utilized. Instead, thefull tolerance value is utilized to determine the maximum reactivity effect. All of the Ak valuesfrom the various tolerances are statistically combined (square root of the sum of the squares) todetermine the final reactivity allowance for manufacturing tolerances. Only the Ak values in thepositive direction (increasing reactivity) were used in the statistical combination. The fuel andrack tolerances included in this analysis are described below:
Holtec Report HI-2022867 4-16 Holtec Project 1196Holtec Report HI-2022867 4-16 Holtec Project 1196
Fuel Tolerances" Increased Fuel Density" Increased Fuel Enrichment* Fuel Rod Pitch" Fuel Rod Cladding Outside Diameter" Fuel Rod Cladding Inner Diameter" Fuel Pellet Outside Diameter" Guide Tube Outside Diameter* Guide Tube Inside DiameterRack Tolerances" Variable Cell Inner Dimension & Constant Water Gap* Variable Water Gap & Constant Pitch" Box Wall Thickness
0.20g/cm3
0.05 wt0/o 235U
+0.00258 in./-0.00387 in.* 0.002 in.* 0.002 in.* 0.0005 in.* 0.002 in.* 0.0052 in.
+0.05 in./-0.025 in.+0.166 in./-0.221 in.± 0.004 in.
The reactivity effect of the fuel and rack tolerances shown above were calculated forenrichments between 2.0 and 5.0 wt% 235U and for 0 cooling time. For longer cooling times thefuel and rack tolerances from 0 cooling time are used. Table 4.7.19 provides representativeexamples of the reactivity effect of the fuel and rack tolerances for the Region 2 racks.
4.7.3.4 Temperature and Water Density Effects
Pool water temperature effects on reactivity in the Region 2 racks have been calculated withCASMO-4 for enrichments from 2.0 to 5.0 wt%/o 235U and cooling times from 0 to 20 years. Theresults in Table 4.7.20 for 5.0 wt% 235U show that the spent fuel pool temperature coefficient ofreactivity is positive, i.e. a higher temperature results in a higher reactivity. Consequently, allCASMO-4 calculations are evaluated at 150 'F. Temperatures higher than 150 °F are treated asaccidents and discussed in Section 4.7.5.
In MCNP4a, the Doppler treatment and cross-sections are valid only at 300K (27 'C). Therefore,a Ak is determined in CASMO-4 from 27 °C (80.33 'F) to 150 °F, and is included in the final krffcalculation as a bias. The temperature bias is shown on Table 4.7.5 through Table 4.7.8.
4.7.3.5 Calculation of Maximum keff
Using the calculational model shown in Figure 4.5.3 and 4.5.4 and the reference HTP 15x15 fuelassembly, the keff in the Region 2 storage racks has been calculated with MCNP4a. Summary ofthe calculation of the maximum kerr, which is based on the formula in Section 4.2, for spent fuelof maximum nominal enrichment of 5.0 wt% 235U and for the fresh fuel checkerboard are shownin Table 4.7.5 and Table 4.7.7 without soluble boron. Uncertainties associated with depletion arenot applicable to the Region 2 checkerboard of fresh fuel assemblies and empty storage cells.Results show that the maximum keff of the Region 2 racks is less than 1.0 at a 95% probability ata 95% confidence level with no credit for soluble boron.
Holtec Report HI-2022867 4-17 Holtec Project 1196
4.7.3.6 Determination of Burnup Versus Enrichment Values
To establish a burnup versus enrichment curve (loading curve), calculations were performed atselected enrichments between 2.0 wt% and 5.0 wt%/o, and for burnup values slightly above andbelow the expected loading curve. Points on the proposed loading curve are then calculated bylinear interpolation for each enrichment, based on an appropriate target value (max kff = 0.9950)for the reactivity. Burnup versus enrichment values are calculated for cooling times of 0, 5, 10,15 and 20 years and presented in Table 4.7.15.
4.7.3.7 Soluble Boron Concentration for Maximum keff of 0.95
The calculations crediting soluble boron in the spent fuel pool to ensure that the reactivity doesnot exceed 0.95 are also performed. Calculations for a uniform loading of spent fuel areperformed for enrichment and cooling time combinations of 2.0 wto 235U at 0 years cooling,5.0 wt% 235U at 0 years cooling and 5.0 wt%/ 235U at 20 years cooling at a soluble boron level of0 ppm and 400 ppm. For a checkerboard of fresh fuel and empty storage cells, calculations areperformed at 5.0 wt 0 235U and with a soluble boron concentration of 0 ppm and 400 ppm. Theminimum soluble boron requirement is determined by linear interpolation between soluble boronlevels to achieve a target maximum kff of 0.9450. In all cases, the maximum keff including allapplicable biases and uncertainties is below the regulatory limit of 0.95. The results for 5.0 wt%initial enrichment is also listed in Table 4.7.6 and Table 4.7.8 for uniform loading of spent fueland a checkerboard of fresh fuel assemblies and empty storage cells, respectively.
4.7.4 Region 3
The purpose of the criticality calculations for the PWR Region 3 style racks is to qualify theracks for storage of new unburned fuel assemblies with design specifications as shown in Table4.5.1 and a maximum nominal enrichment of 4.35 wt 0 235U. Additionally, the Region 3 styleracks are qualified for storage of a "3 of 4" configuration of 3 fresh fuel assemblies with amaximum nominal enrichment of 5.0 wt%/o 235U and 1 spent fuel assembly with a maximumnominal initial enrichment of 5.0 wt% 235U that have accumulated a minimum burnup of 20.1GWD/MTU with 0 years cooling time. No credit was taken in the "3 of 4" configuration forlonger cooling times, as this would provide only a small reduction in the required burnup for thesingle spent fuel assembly in this configuration.
4.7.4.1 Identification of Reference Fuel Assembly
CASMO-4 calculations were performed to determine which of the two assemblies in Table 4.5.1is bounding in the Region 3 racks. In the calculations, the fuel assembly is burned in the coreconfiguration and restarted in the rack configuration. Three different scenarios were analyzed:empty guide tubes in the core, BPRAs in the guide tubes in the core, and APSRs in the guide
Holtec Report HI-2022867 4-18 Hottec Project 1196
tubes in the core. In all scenarios, the insert was removed when the assembly was modeled inthe rack. The HTP assembly was determined to have the highest reactivity for all burnup andenrichment combinations. This assembly type is therefore used in all subsequent calculations.
4.7.4.2 Eccentric Fuel Assembly Positioning
The fuel assembly is assumed to be normally located in the center of the storage rack cell.Nevertheless, MCNP4a calculations were made with the fuel assemblies assumed to be in thecomer of the storage rack cell (four-assembly cluster at closest approach). These calculationsindicate that eccentric fuel positioning results in a decrease in reactivity. The highest reactivity,therefore, corresponds to the reference design with the fuel assemblies positioned in the center ofthe storage cells.
4.7.4.3 Uncertainties Due to Manufacturing Tolerances
In the calculation of the final ktT, the effect of manufacturing tolerances on reactivity must beincluded. CASMO-4 was used to perform these calculations. As allowed in [4.10], themethodology employed to calculate the tolerance effects combine both the worst-case boundingvalue and sensitivity study approaches. The evaluations include tolerances of the rackdimensions (see Table 4.5.9) and tolerances of the fuel dimensions (see Table 4.5.1).
The reference fuel assembly with an initial nominal enrichment of 4.35 wt0 235U and 5.0 wt%/o235U was used for these studies in the fresh fuel configuration and the "3 of 4" configuration,respectively. The reference condition is the condition with nominal dimensions and properties.To determine the Ak associated with a specific manufacturing tolerance, the reference kinf wascompared to the kinf from a calculation with the tolerance included. Note that for the individualparameters associated with a tolerance, no statistical approach is utilized. Instead, the fulltolerance value is utilized to determine the maximum reactivity effect. All of the Ak values fromthe various tolerances are statistically combined (square root of the sum of the squares) todetermine the final reactivity allowance for manufacturing tolerances. Only the Ak values in thepositive direction (increasing reactivity) were used in the statistical combination. The fuel andrack tolerances included in this analysis are described below:
Fuel Tolerances" Increased Fuel Density 0.20g/cm 3
* Increased Fuel Enrichment 0.05 wt0 235U" Fuel Rod Pitch +0.00258 in./-0.00387 in.* Fuel Rod Cladding Outside Diameter 1 0.002 in." Fuel Rod Cladding Inner Diameter ± 0.002 in.* Fuel Pellet Outside Diameter ± 0.0005 in.* Guide Tube Outside Diameter 1 0.002 in.* Guide Tube Inside Diameter ± 0.0052 in.
Holtec Report HI-2022867 4-19 Holtec Project 1196
Rack Tolerances" Cell Inner Dimension & Pitch* Cell Inner Dimension & Water Gap" Box Wall Thickness" Insert Sheathing Thickness" Insert Water Gap" Metamic Thickness• Metamic Width" Metamic B4C Weight Percent
+0.05 in./-0.025 in.+0.166 in./-0.221 in.141
* 0.004 in.* 0.003 in.* 0.05 in.d: 0.003 in.± 0.062 in.0.5 wt%/o
The reactivity effect of the fuel and rack tolerances shown above were calculated forenrichments of 4.35 wt% 235U and 5.0 wt 0 235U and for 0 cooling time. Table 4.7.21 providesrepresentative examples of the reactivity effect of the fuel and rack tolerances for the Region 3racks.
4.7.4.4 Temperature and Water Density Effects
Pool water temperature effects on reactivity in the Region 3 racks have been calculated withCASMO-4 for enrichments of 4.35 and 5.0 wt% 235U. The results in Table 4.7.22 for 4.35 wt%/o235U and 5.0 wt% 235U show that the spent fuel pool temperature coefficient of reactivity isnegative, i.e. a lower temperature results in a higher reactivity. Consequently, all CASMO-4calculations are evaluated at 4 °C, which corresponds to the highest density of water.
In MCNP4a, the Doppler treatment and cross-sections are valid only at 300K (27 °C). Therefore,a Ak is determined in CASMO-4 from 27 °C to 4 *C, and is included in the final keff calculationas a bias. The temperature bias is shown on Table 4.7.9 though Table 4.7.12.
4.7.4.5 Calculation of Maximum kef
Using the calculational model shown in Figure 4.5.5 and Figure 4.5.6 and the reference HTP15x15 fuel assembly, the klf in the Region 3 storage racks has been calculated with MCNP4a.Calculation of the maximum lff, which is based on the formula in Section 4.2, for the 3 of 4loading configuration and uniform loading of fresh fuel at 4.35 wt 0 235U, is summarized inTable 4.7.9 and Table 4.7.11 without soluble boron. Uncertainties associated with depletion
(4] The tolerances listed are for the water gap between storage cells. A reduction in the rack water gap causes an
equal increase in the storage cell inner dimension. The maximum reduction possible in the rack water gap is -0.21",as this would make the rack water gap just large enough to fit the metamic insert.
Holtec Report HI-2022867 4-20 Holtec Project 1196Holtec Report HI-2022867 4-20 Holtec Project 1196
(e.g., depletion uncertainty and axial burnup distribution penalty) are not applicable to theRegion 3 loading pattern with all fresh fuel of 4.35 wt/ 235U. Results show that the maximumkeff of the Region 3 racks is less than 1.0 at a 95% probability at a 95% confidence level with nocredit for soluble boron.
4.7.4.6 Determination of the Minimum Bumup for a Single Spent Assembly in the3 of 4 Loading Pattern
To establish a minimum required bumup for the loading pattern with 3 fresh fuel assemblies andone spent fuel assembly, calculations were performed with all assemblies having a maximumnominal initial enrichment of 5.0 wt 0 235U and the single spent fuel assembly having burnupvalues slightly above and below the expected burnup value. The acceptable burnup for the singlespent fuel assembly is then calculated by linear interpolation, based on an appropriate targetvalue (max kff = 0.9958) for the reactivity. All calculations were performed at 0 cooling time;no credit was taken for additional cooling time for the single spent assembly as the reduction inburnup would be minimal. The minimum burnup is shown for 3 of 4 loading in Table 4.7.9.
4.7.4.7 Soluble Boron Concentration for Maximum kef of 0.95
Calculations crediting soluble boron in the spent fuel pool to ensure that the reactivity does notexceed 0.95 are also performed. Calculations are performed at enrichments of 4.35 wt/o 235Uand 5.0 wt/ 235U for uniform loading of fresh fuel and a 3 of 4 configuration, respectively, at asoluble boron level of 400 ppm and 800 ppm. The minimum soluble boron requirement isdetermined by linear interpolation between soluble boron levels to achieve a target maximum kffof 0.9450. In all cases, the maximum keff including all applicable biases and uncertainties isbelow the regulatory limit of 0.95. The results for each loading pattern in Region 3 is also listedin Table 4.7.10 and Table 4.7.12 for a 3 of 4 configuration and uniform loading of fresh fuel,respectively.
4.7.5 Abnormal and Accident Conditions for Region 1, 2 & 3 Racks
The effects on reactivity of credible abnormal and accident conditions are examined in thissection. This section identifies which of the credible abnormal or accident conditions will resultin exceeding the limiting reactivity (keff < 0.95). For those accidents or abnormal conditions thatresult in exceeding the limiting reactivity, a minimum soluble boron concentration is determinedto ensure that keff < 0.95. The double contingency principal of ANS-8.1/N16.1-1975 [4.2] (andthe USNRC letter of April 1978) specifies that it shall require at least two unlikely independentand concurrent events to produce a criticality accident. This principle precludes the necessity ofconsidering the simultaneous occurrence of multiple accident conditions.
Holtec Report HI-2022867 4-21 Holtec Project 1196Holtec Report HI-2022867 4-21 Holtec Project 1196
4.7.5.1 Abnormal Temperature
All calculations for Region 1 & 2 are performed at the maximum temperature of 150*F. Asshown in Section 4.7.2.4 and 4.7.3.4 above, the temperature coefficient of reactivity is positive,and temperatures above the maximum would cause an increase in the reactivity, and thereforeare treated as accidents. Additional calculations for both spent fuel loading and checkerboardloading of fresh fuel at higher temperatures and with a soluble boron content of 400 ppm wereperformed to determine the minimum soluble boron concentration necessary to ensure that themaximum kcff is below 0.95. The soluble boron content necessary to offset the reactivity effectdue to an increase in temperature is shown on Table 4.7.23 and Table 4.7.24 for Region 1 andRegion 2, respectively.
All calculations for Region 3 are performed at a pool temperature of 4"C. As shown in Section4.7.4.4 above, the temperature coefficient of reactivity is negative, therefore any increase intemperature above the minimum would cause a reduction in the reactivity. Table 4.7.22 showsthe reactivity effects of increasing the temperature and boiling in the spent fuel pool.
4.7.5.2 Dropped Assembly - Horizontal
For the case in which a fuel assembly is assumed to be dropped on top of a rack, the fuel assemblywill come to rest horizontally on top of the rack with a minimum separation distance from the activefuel region of more than 12 inches, which is sufficient to preclude neutron coupling (i.e., aneffectively infinite separation). Consequently, the horizontal fuel assembly drop accident will notresult in a significant increase in reactivity. Furthermore, the soluble boron in the spent fuel poolwater assures that the true reactivity is always less than the limiting value for this dropped fuelaccident.
4.7.5.3 Dropped Assembly - Vertical
It is also possible to vertically drop an assembly into a location that might be occupied byanother assembly or that might be empty. Such a vertical impact would at most cause a smallcompression of the stored assembly, if present, or result in a small deformation of the baseplatefor an empty cell. These deformations could potentially increase reactivity. However, thereactivity increase would be small compared to the reactivity increase created by the abnormallocation of a fresh assembly discussed in the following section. The vertical drop is thereforebounded by this abnormal location accident and no separate calculation is performed for the dropaccident.
Holtec Report HI-2022867 4-22 Holtec Project 1196Holtec Report HI-2022867 4-22 Holtec Project 1196
4.7.5.4 Abnormal Location of a Fuel Assembly
4.7.5.4.1 Misloaded Fresh Fuel Assembly
The misloading of a fresh unburned fuel assembly could, in the absence of soluble poison, result inexceeding the regulatory limit (keff of 0.95). This could possibly occur if a fresh fuel assembly of thehighest permissible enrichment (5.0 wt%) were to be inadvertently misloaded into a storage cellintended to be used for spent fuel or misloaded into a storage cell intended to be empty in thecheckerboard patterns in Region 1 or Region 2. For the misloading accident in the Region 1 orRegion 2 racks filled with spent fuel, enrichment and burnup combinations of 2.0 wto 23 U at 0years cooling time, 5.0 wt0 U at 0 years cooling time and 5.0 wt/o 235U at 20 years cooling timewere analyzed at the appropriate burnup. The calculations for the misloading accident in the Region3 racks conservatively assume that all spent fuel assemblies are replaced with fresh fuel assemblies.This configuration will also conservatively bound the misloading accident in the Region 3 rack filledwith fresh fuel at 4.35 wt0 235U.
The corresponding calculational model for the Region 1 and Region 2 style storage racks consists ofa 5x5 array storage cells with a single, fresh unburned assembly in the center cell. The model issurrounded by periodic boundary conditions, which generates an infinite arrangement of 5x5 arrayswith a misloaded assembly. Calculations are performed with 400 ppm, 800 ppm and 1200 ppm (ifnecessary) soluble boron, and the final soluble boron concentration is determined by linearinterpolation.
The corresponding calculational model for the Region 3 style storage racks consists of a 2x2 away ofstorage cells with a fresh assembly of 5.0 wt0 235U in all cells. The model is surrounded byreflecting boundary conditions, which generates an infinite arrangement of Region 3 cells, all filledwith the maximum reactivity assembly. Calculations are performed with 400 ppm and 800 ppmsoluble boron, and the final soluble boron concentration is determined by linear interpolation.
4.7.5.4.2 Mislocated Fresh Fuel Assembly
The mislocation of a fresh unburned fuel assembly could, in the absence of soluble poison, result inexceeding the regulatory limit (ker of 0.95). This could possibly occur if a fresh fuel assembly of thehighest permissible enrichment (5.0 wt%) were to be accidentally mislocated outside of a storagerack adjacent to other fuel assemblies.
For the checkerboard pattern in the Region 1 and Region 2 style storage racks it is assumed that themislocated assembly is placed adjacent to a storage cell containing another fresh fuel assembly. Forthe mislocated assembly accident outside the Region 1 and Region 2 racks filled with spent fuel,o5. t/23 5T 235
enrichment and burnup combinations of 5.0 wt% 2 U at 0 years cooling time and 5.0 wto U at 20years cooling time were analyzed at the appropriate burnups.
Holtec Report HI-2022867 4-23 Holtec Project 1196Holtec Report HI-2022867 4-23 Holtec Project 1196
For the Region 3 racks it is assumed that no metamic panel is located between the mislocatedassembly and the assemblies in the rack. For the loading pattern with 3 fresh fuel assemblies and 1spent fuel assembly, it was assumed that all fresh fuel assemblies are facing the mislocatedassembly. This configuration would bound the case of a misplaced assembly with the Region 3 rackfilled with fresh fuel of maximum nominal enrichment of 4.35 wt% 235U.
The MCNP4a model consists of a 5x5 array of fuel storage cells with a single fresh, unburnedassembly placed adjacent to the rack and a 30cm water reflector. The other three sides of the modelconsist of reflecting boundary conditions. The mislocated assembly is placed as close to the rackface as possible to maximize the possible reactivity effect. Calculations are performed with 400pm,800 ppm and 1200 ppm (if necessary) soluble boron, and the final soluble boron concentration isdetermined by linear interpolation.
4.7.5.5 Loss of All Metamic
An additional calculation was performed to determine the reactivity of the Region 3 rack in theunlikely event that the neutron absorber was to be completely absent. Credit was taken for1600 ppm soluble boron (actual pool soluble boron concentration is higher) and the metamicmaterial was replaced with water. The Region 3 racks without any neutron absorber areanalyzed for both the 3 of 4 loading pattern and uniform loading of fresh fuel assemblies havinga maximum enrichment of 4.35wt% 235U (identified in Section 4.7.4). The results of thispostulated accident condition show that the maximum keff is 0.9388 including bias anduncertainties.
4.7.6 Interfaces Within and Between Racks
4.7.6.1 Normal Conditions
In addition to the calculations performed for each individual rack detailed in the precedingsections, the possibility of an increased reactivity effect due to the rack interfaces within andbetween the racks was determined. Figure 4.5.7 is a layout of the entire ANO Unit 1 spent fuelpool, with the gaps between racks detailed for each interface. The gaps provided in Figure 4.5.7,denoted by a "C" at the rack comers, are measured from the centerline of the adjacent storagecells. Table 4.5.10 summarizes the potential rack interfaces and the gaps between these racks.The gap distances provided in the last column of Table 4.5.10 are determined from the centerlinedistances between racks from Figure 4.5.7 and the geometric characteristics of each type of rack.Figure 4.5.8 illustrates the measurement of the distances between the outside surfaces of theracks.
Table 4.7.26 provides a summary of the various interface calculations performed for the ANOUnit 1 spent fuel pool. Interfaces within the rack include spent and fresh fuel loading patternswithin the same rack to determine acceptability. Interface calculations between racks include
Holtec Report HI-2022867 4-24 Holtec: Project 1196
Region 1-Region 1, Region 2-Region 2, Region 3-Region 3, Region 1-Region 3 and Region 2-Region 3. Figures 4.7.1 through 4.7.14 are referenced in Table 4.7.26 and provide a visualrepresentation of the interface calculation performed. The figures show the loading patternassumed in each rack and the value for the water gap between the racks. The calculatedreactivity from the interface calculation is then compared to the calculated reactivity from thereference infinite array calculations.
4.7.6.2 Rack Lateral Motion - Seismic Event
A seismic event, could, in the absence of soluble boron, result in exceeding the regulatory limit(maximum keff of 0.95). This could possibly occur if the seismic event caused sufficient movementof the rack to a closer proximity. The seismic analysis identifies a maximum differentialdisplacement between racks during a seismic event of 0.635 inches. Selected cases from theinterface calculations described in the previous section were chosen to address this potential accidentcondition. The MCNP4a models described above were modified to reduce the gap between racks byan additional 0.635 inches. Calculations were performed with 800 ppm of soluble boron. Thecalculated reactivities from MCNP4a show that all calculated reactivities for this accident conditionare below 0.90. Even with the addition of the applicable biases and uncertainties, the maximum kffwould be below 0.95.
4.7.7 Boron Dilution Evaluation
The soluble boron in the spent fuel pool water is conservatively analyzed to contain a minimumof 1600 ppm under operating conditions. Significant loss or dilution of the soluble boronconcentration is extremely unlikely, if not incredible. Nonetheless, an evaluation was performedbased on the ANO spent fuel pool data.
The required minimum soluble boron concentration is 457 ppm under normal conditions. Thevolume of water in the pool is approximately 268,000 gallons. Large amounts of unborated waterwould be necessary to reduce the boron concentration from 1600 ppm to 457 ppm. Abnormal oraccident conditions are discussed below for either low dilution rates (abnormal conditions) orhigh dilution rates (accident conditions). The general equation for boron dilution is,
F
C, =Coe v ,
where
Ct the boron concentration at time t,Co the initial boron concentration,V is the volume of water in the pool, andF is the flow rate of unborated water into the pool
Holtec Report HI-2022867 4-25 Holtec Project 1196
This equation conservatively assumes the unborated water flowing into the pool mixesinstantaneously with the water in the pool.
For convenience, the above equation may be re-arranged to permit calculating the time requiredto dilute the soluble boron from its initial concentration to a specified minimum concentration,which is given below.
t =- lin(Co / C,)F
If V is expressed in gallons and F in gallons per minute (gpm), the time, t, will be in minutes.
4.7.7.1 Low Flow Rate Dilution
Small dilution flow around pump seals and valve stems or mis-aligned valves could possiblyoccur in the normal soluble boron control system or related systems. Such failures might not beimmediately detected. These flow rates would be of the order of 2 gpm maximum and theincreased frequency of makeup flow might not be observed. However, an assumed loss flow-rateof 2 gpm dilution flow rate would require some 118 days to reduce the boron concentration tothe minimum required 457 ppm under normal conditions. Routine surveillance measurements ofthe soluble boron concentration would readily detect the reduction in soluble boronconcentration with ample time for corrective action.
Administrative controls require a measurement of the soluble boron concentration in the poolwater at least weekly. Thus, the longest time period that a potential boron dilution might existwithout a direct measurement of the boron concentration is 7 days. In this time period, anundetected dilution flow rate of 33.7 gpm would be required to reduce the boron concentration to457 ppm. No known dilution flow rate of this magnitude has been identified. Further, a total ofmore than 300,000 gallons of unborated water would be associated with the dilution event andsuch a large flow of unborated water would be readily evident by high-level alarms and by visualinspection on daily walk-downs of the storage pool area.
4.7.7.2 High Flow Rate Dilution
Under certain accident conditions, it is conceivable that a high flow rate of unborated watercould flow onto the top of the pool. Such an accident scenario could result from rupture of aunborated water supply line or possibly the rupture of a fire protection system header, bothevents potentially allowing unborated water to spray onto the pool. A flow rate of up to 2500gpm could possibly spray onto the spent fuel pool as a result of a rupture of the fire protectionline. This would be the most serious condition and bounds all other accident scenarios.
Holtec Report HI-2022867 4-26 Holtec Project 1196
Conservatively assuming that all the unborated water from the break poured onto the top of thepool and further assuming instantaneous mixing of the unborated water with the pool water, itwould take approximately 136 minutes to dilute the soluble boron concentration to 457 ppm,which is the minimum required concentration to maintain k1ff below 0.95 under normallyoperating conditions. In this dilution accident, some 340,000 gallons of water would spill on theauxiliary building floor and into the air-conditioning duct system. Well before the spilling ofsuch a large volume of water, multiple alarms would have alerted the control room of theaccident consequences (including the fuel pool high-level alarm, the fire protection system pumpoperation alarm, and the floor drain receiving tank high level alarm).
Instantaneous mixing of pool water with the water from the rupture of the unborated watersupply line is an extremely conservative assumption. Water falling on to the pool surface wouldmix with the top layer of pool water and the portions of the mixed volumes would continuouslyspill out of the pool. The density difference between water at 150 TF (maximum permissible poolbulk water temperature) and at the temperature of the unborated water supply is small. Thisdensity difference will not cause the water falling on to the pool surface to instantaneously sinkdown into the racks overcoming the principal driving force for the flow in the pool, which is thebuoyancy force generated in the spent fuel pool racks region due to the heat generation from thespent fuel in the racks. This would further enhance the mixing process between the pool waterand spilled water above the racks.
For the fire protection system line break, upon the initial break, the fire protection system headerpressure would drop to the auto start set point of the fire protection pumps. The start isaccompanied with an alarm in the main control room. The annunciator response is to dispatch anoperator to find the source of the pump start. Approximately 3 minutes into the event, a spentfuel pool high level alarm would be received in the main control room, assuming that the spentfuel pool level started at the low alarm. The annunciator response for high spent fuel pool level isto investigate the cause. The coincidence of the 2 alarms would quickly lead to the discovery ofthe failure of the fire protection system and sufficient time to isolate the failure.
The maximum flow rate from demineralized water supply would provide approximately 900gpm into the spent fuel pool. Failure of the demineralized water header is not accompanied withan alarm; however, the time to dilute the spent fuel pool from 1600 to 457 ppm is greater thanthe bounding case described above. An alarm on high spent fuel pool level would be receivedapproximately 9 minutes into the event in the main control room, assuming that the spent fuelpool level started at the low alarm. In this scenario, there is sufficient time to isolate the failureand to prevent the spilling of some 340,000 gallons of water.The analysis assumes that for a double-ended break in the a fire protection system piping, thestream of water will arch through the air some 40 feet falling on top of the pool. This is virtuallyan incredible event. Should the stream of water fall upon the pool deck, a 3 inch high curb wouldchannel some of the water to the pool drain and prevent all of the water from reaching the pool.Furthermore, the evaluation also assumes at least 3 independent and concurrent accidents occursimultaneously:
4 Large amount of water flowing from the double-ended pipe break would remain un-detected and is ignored.
Holtec Report HI-2022867 4-27 Holtec Project 1196
* Pool water high level alarms either fail or are ignored.* Alarms indicating large amounts of water flowing into the floor drain have failed or are
ignored.
Considering all related facts, a significant dilution of the pool soluble boron concentration in ashort period of time without corrective action is not considered a credible event.
It is not considered credible that multiple alarms would fail or be ignored or that the spilling oflarge volumes of water would not be observed. Therefore, such a major failure would bedetected in sufficient time for corrective action to avoid violation of an administrative guidelineand to assure that the health and safety of the public is protected.
4.8 New Fuel Storage Racks Criticality Analysis
The New Fuel Storage Vault is intended for the receipt and storage of fresh fuel under normallydry conditions where the reactivity is very low. To assure the criticality safety under accidentconditions and to conform to the requirements of General Design Criterion 62, "Prevention ofCriticality in Fuel Storage and Handling," two separate criteria must be satisfied as defined inNUREG-0800, Standard Review Plan 9.1.1, "New Fuel Storage." These criteria are as follows:
" When fully loaded with fuel of the highest anticipated reactivity and flooded with clean,unborated water, the maximum reactivity, including uncertainties, shall not exceed a kffof 0.95.
" With fuel of the highest anticipated reactivity in place and assuming optimumhypothetical low density moderation (i.e., fog or foam), the maximum reactivity shall notexceed a keff of 0.98.
The New Fuel Storage Vault provides two 4 x 9 storage rack modules with cell array storagelocation arranged on a 21 inch lattice spacing. Calculations were made with 238-groupNITAWL/KENOSa code package (SCALE 4.3), a three-dimensional Monte Carlo analyticaltechnique, with fresh fuel assemblies with 4.95 wt%/o nominal intitial enrichment. Thesecalculations were made for various moderator densities and the results are shown in Figure 4.8.1;the peak reactivity (optimum moderation) occurs at 9% moderator density. The calculations forthe configuration illustrated in Figure 4.8.2 confirms that five locations in each of the storageracks are required to remain empty in order to meet the regulatory limits. Results of thecriticality safety analysis are summarized in Table 4.8.1 for the two accident conditions for fuelassemblies of 4.95 ± 0.05 wt% initial enrichment. The maximum reactivity at 9% moderatordensity is 0.9726, including uncertainties, which is within the regulatory limit of 0.98, thusconfirming the acceptability of the New Fuel Vault for 4.95 ± 0.05 wt%/o fuel.
Additional calculations at 9% moderator density, performed for the storage pattern depicted inFigure 4.8.3, show that this storage configuration is acceptable for storage of fresh fuelassemblies of up to 4.20 wt0/o enrichment with four locations in each rack array required toremain empty.
Holtec Report HI-2022867 4-28 Holtec Project 1196
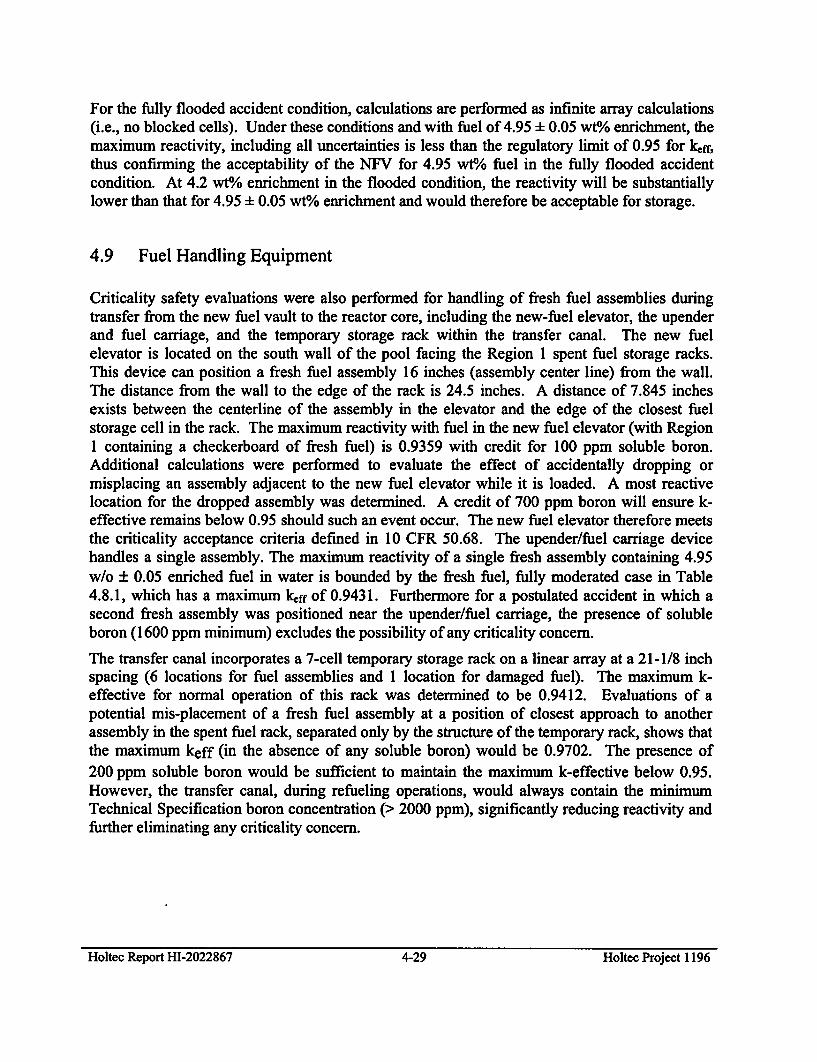
For the fully flooded accident condition, calculations are performed as infinite array calculations(i.e., no blocked cells). Under these conditions and with fuel of 4.95 ± 0.05 wt%/o enrichment, themaximum reactivity, including all uncertainties is less than the regulatory limit of 0.95 for kff,thus confirming the acceptability of the NFV for 4.95 wt/o fuel in the fully flooded accidentcondition. At 4.2 wt0/o enrichment in the flooded condition, the reactivity will be substantiallylower than that for 4.95 ± 0.05 wt% enrichment and would therefore be acceptable for storage.
4.9 Fuel Handling Equipment
Criticality safety evaluations were also performed for handling of fresh fuel assemblies duringtransfer from the new fuel vault to the reactor core, including the new-fuel elevator, the upenderand fuel carriage, and the temporary storage rack within the transfer canal. The new fuelelevator is located on the south wall of the pool facing the Region 1 spent fuel storage racks.This device can position a fresh fuel assembly 16 inches (assembly center line) from the wall.The distance from the wall to the edge of the rack is 24.5 inches. A distance of 7.845 inchesexists between the centerline of the assembly in the elevator and the edge of the closest fuelstorage cell in the rack. The maximum reactivity with fuel in the new fuel elevator (with Region1 containing a checkerboard of fresh fuel) is 0.9359 with credit for 100 ppm soluble boron.Additional calculations were performed to evaluate the effect of accidentally dropping ormisplacing an assembly adjacent to the new fuel elevator while it is loaded. A most reactivelocation for the dropped assembly was determined. A credit of 700 ppm boron will ensure k-effective remains below 0.95 should such an event occur. The new fuel elevator therefore meetsthe criticality acceptance criteria defined in 10 CFR 50.68. The upender/fuel carriage devicehandles a single assembly. The maximum reactivity of a single fresh assembly containing 4.95w/o ± 0.05 enriched fuel in water is bounded by the fresh fuel, fully moderated case in Table4.8.1, which has a maximum kff of 0.9431. Furthermore for a postulated accident in which asecond fresh assembly was positioned near the upender/fuel carriage, the presence of solubleboron (1600 ppm minimum) excludes the possibility of any criticality concern.
The transfer canal incorporates a 7-cell temporary storage rack on a linear array at a 21-1/8 inchspacing (6 locations for fuel assemblies and 1 location for damaged fuel). The maximum k-effective for normal operation of this rack was determined to be 0.9412. Evaluations of apotential mis-placement of a fresh fuel assembly at a position of closest approach to anotherassembly in the spent fuel rack, separated only by the structure of the temporary rack, shows thatthe maximum keff (in the absence of any soluble boron) would be 0.9702. The presence of200 ppm soluble boron would be sufficient to maintain the maximum k-effective below 0.95.However, the transfer canal, during refueling operations, would always contain the minimumTechnical Specification boron concentration (> 2000 ppm), significantly reducing reactivity andfurther eliminating any criticality concern.
Holtec Report HI-2022867 4-29 Holtec Project 1196Holtec: Report HI-2022867 4-29 Holtec Project 1196
4.10 REFERENCES
[4.1] M.G. Natrella, Experimental Statistics. National Bureau of Standards, Handbook 91,August 1963.
[4.2] ANS-8.1/NI6.1-1975, "American National Standard for Nuclear Criticality Safety inOperations with Fissionable Materials Outside Reactors," April 14, 1975.
[4.3] J.F. Briesmeister, Editor, "MCNP - A General Monte Carlo N-Particle Transport Code,Version 4A," LA-12625, Los Alamos National Laboratory (1993).
[4.4] "Lumped Fission Product and Pm148m Cross Sections for MCNP," Holtec Report HI-2033031, Rev 0, September 2003.
[4.5] Deleted
[4.6] Deleted
[4.7] M. Edenius, K. Ekberg, B.H. Forssdn, and D. Knott, "CASMO-4 A Fuel AssemblyBumup Program User's Manual," Studsvik/SOA-95/1, Studsvik of America, Inc. andStudsvik Core Analysis AB (proprietary).
[4.8] D. Knott, "CASMO-4 Benchmark Against Critical Experiments," SOA-94/13, Studsvikof America, Inc., (proprietary).
[4.9] D. Knott, "CASMO-4 Benchmark Against MCNP," SOA-94/12, Studsvik of America,Inc., (proprietary).
[4.10] L.I. Kopp, "Guidance on the Regulatory Requirements for Criticality Analysis of FuelStorage at Light-Water Reactor Power Plants," NRC Memorandum from L. Kopp to T.Collins, August 19, 1998.
[4.11] Deleted
[4.12] S.E. Turner, "Uncertainty Analysis - Burnup Distributions," presented at theDOE/SANDIA Technical Meeting on Fuel Burnup Credit, Special Session, ANS/ENSConference, Washington, D.C., November 2, 1988.
Holtec Report HI-2022867 4-30 Holtec Project 1196Holtec Report HI-2022867 4-30 Holtec Project 1196
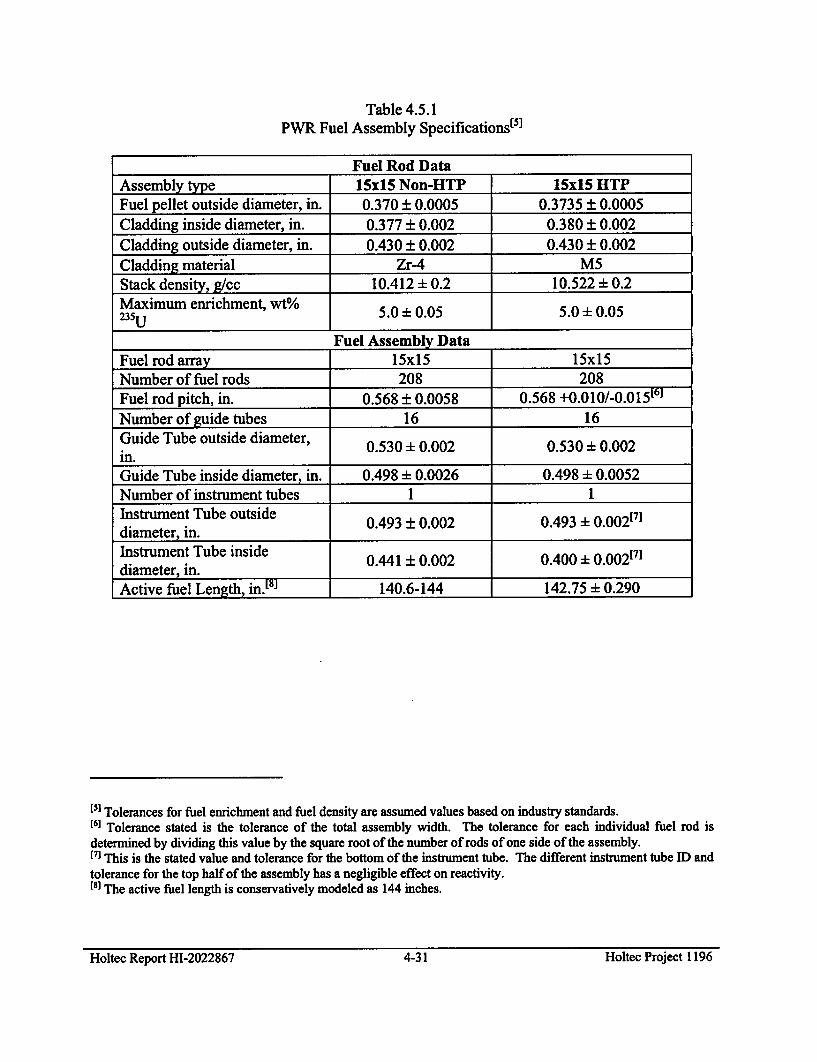
Table 4.5.1PWR Fuel Assembly Specifications[5s
Fuel Rod DataAssembly type 15x15 Non-HTP 15x15 HTPFuel pellet outside diameter, in. 0.370 ± 0.0005 0.3735 ± 0.0005Cladding inside diameter, in. 0.377 + 0.002 0.380 ± 0.002Cladding outside diameter, in. 0.430 ± 0.002 0.430 ± 0.002Cladding material Zr-4 M5Stack density, g/cc 10.412 ± 0.2 10.522 ± 0.2Maximum enrichment, wt%5235U 5.0±_- 0.05 5.0+_ - _0.05
Fuel Assembly DataFuel rod array 15xl5 15xl5Number of fuel rods 208 208Fuel rod pitch, in. 0.568 ± 0.0058 0.568 +0.0 10 /-0.0 15[61
Number of guide tubes 16 16Guide Tube outside diameter, 0.530 - 0.002 0.530 - 0.002in.Guide Tube inside diameter, in. 0.498 - 0.0026 0.498 + 0.0052Number of instrument tubes 1 1Instrument Tube outside 0.493 0.002 0.493 ± 0.002171diameter, in. 0.493_+_0.002 0.493__-_0.002_71Instrument Tube inside 0.441 0.002 0.400 ± 0.002173
diameter, in. 0.441_+_0.002 0.400__-_0.002 __1
Active fuel Length, in.IS] 140.6-144 142.75 ± 0.290
t3s Tolerances for fuel enrichment and fuel density are assumed values based on industry standards.161 Tolerance stated is the tolerance of the total assembly width. The tolerance for each individual fuel rod is
determined by dividing this value by the square root of the number of rods of one side of the assembly.(71 This is the stated value and tolerance for the bottom of the instrument tube. The different instrument tube ID and
tolerance for the top half of the assembly has a negligible effect on reactivity.[81 The active fuel length is conservatively modeled as 144 inches.
Holtec Report HI-2022867 4-31 Holtec Project 1196Holtec Report HI-2022867 4-31 Holtee: Project 1196
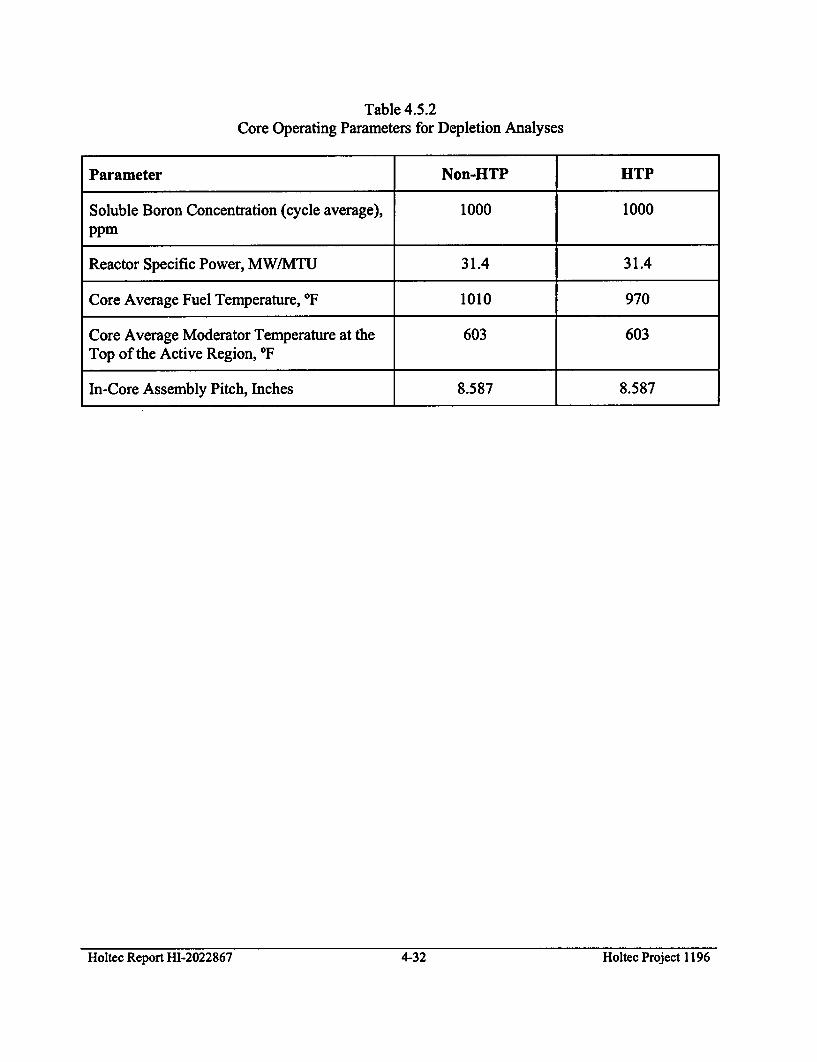
Table 4.5.2Core Operating Parameters for Depletion Analyses
Parameter Non-HTP HTP
Soluble Boron Concentration (cycle average), 1000 1000ppm
Reactor Specific Power, MW/MTU 31.4 31.4
Core Average Fuel Temperature, *F 1010 970
Core Average Moderator Temperature at the 603 603Top of the Active Region, *F
In-Core Assembly Pitch, Inches 8.587 8.587
Holtec Report HI-2022867 4-32 Holtec Project 1196Holtec Report HI-2022867 4-32 Holtec Project 1196
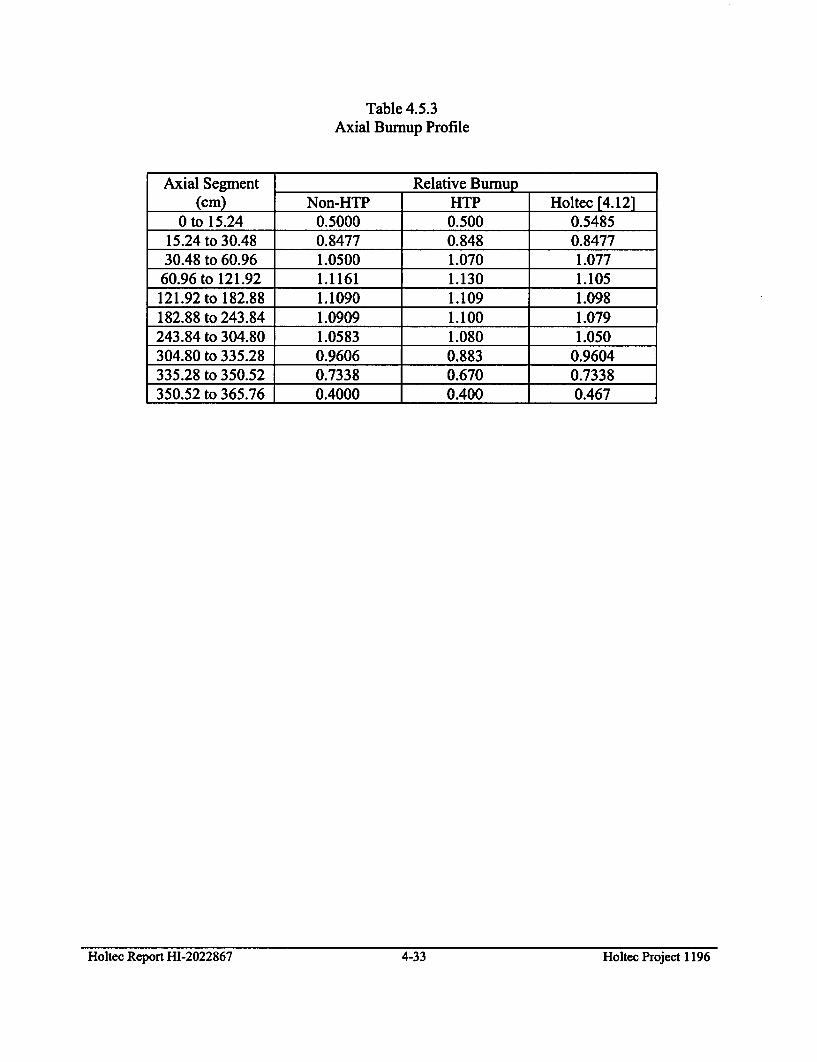
Table 4.5.3Axial Bumup Profile
Axial Segment Relative Bumup(cm) Non-HTP HTP Holtec [4.12]
0 to 15.24 0.5000 0.500 0.548515.24 to 30.48 0.8477 0.848 0.847730.48 to 60.96 1.0500 1.070 1.077
60.96 to 121.92 1.1161 1.130 1.105121.92 to 182.88 1.1090 1.109 1.098182.88 to 243.84 1.0909 1.100 1.079243.84 to 304.80 1.0583 1.080 1.050304.80 to 335.28 0.9606 0.883 0.9604335.28 to 350.52 0.7338 0.670 0.7338350.52 to 365.76 0.4000 0.400 0.467
Holtec Report HI-2022867 4-33 Holtec Project 1196Holtec Report HI-2022867 4-33 Holtec Project 1196
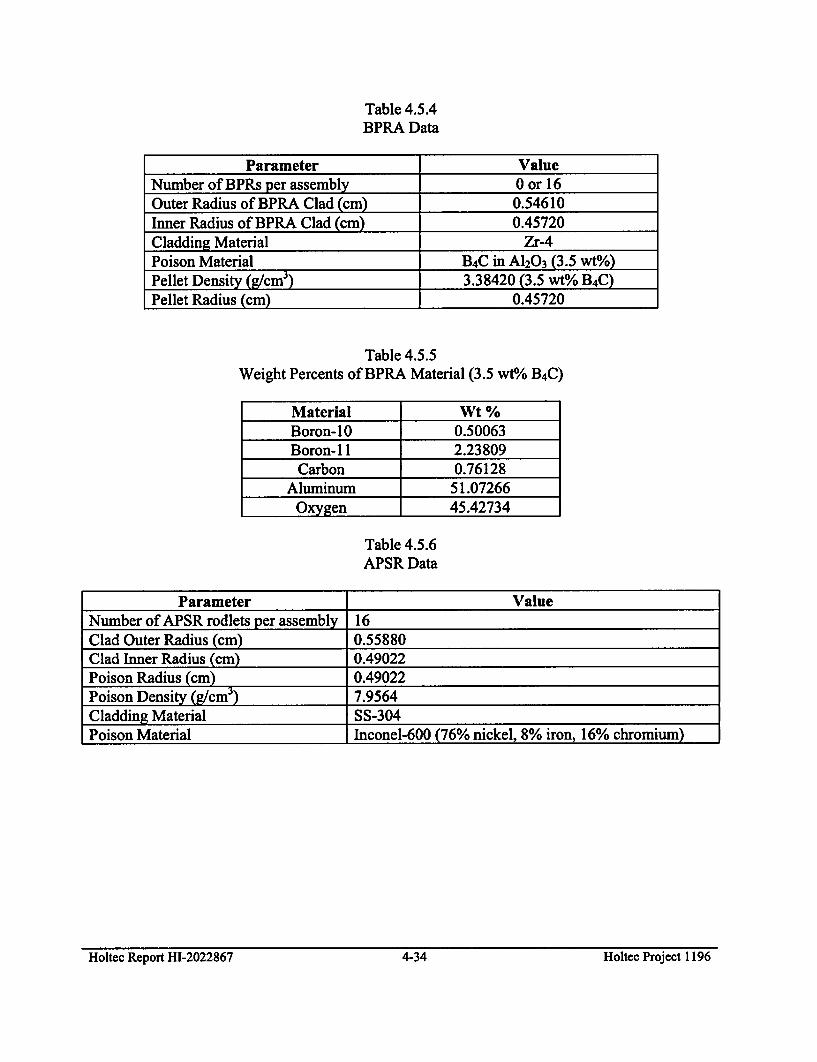
Table 4.5.4BPRA Data
Parameter ValueNumber of BPRs per assembly 0 or 16Outer Radius of BPRA Clad (cm) 0.54610Inner Radius of BPRA Clad (cm) 0.45720Cladding Material Zr-4Poison Material B4C in A120 3 (3.5 wt%)Pellet Density (g/cm3) 3.38420 (3.5 wt% B4 C)
Pellet Radius (cm) 0.45720
Table 4.5.5Weight Percents of BPRA Material (3.5 wt% B4 C)
Material Wt %Boron-10 0.50063Boron- 11 2.23809Carbon 0.76128
Aluminum 51.07266Oxygen 45.42734
Table 4.5.6APSR Data
Parameter ValueNumber of APSR rodlets per assembly 16Clad Outer Radius (cm) 0.55880Clad Inner Radius (cm) 0.49022Poison Radius (cm) 0.49022Poison Density (g/cm3) 7.9564Cladding Material SS-304Poison Material Inconel-600 (76% nickel, 8% iron, 16% chromium)
Holtec Report HI-2022867 4-34 Holtec Project 1196Holtec Report HI-2022867 4-34 Holtec Project 1196
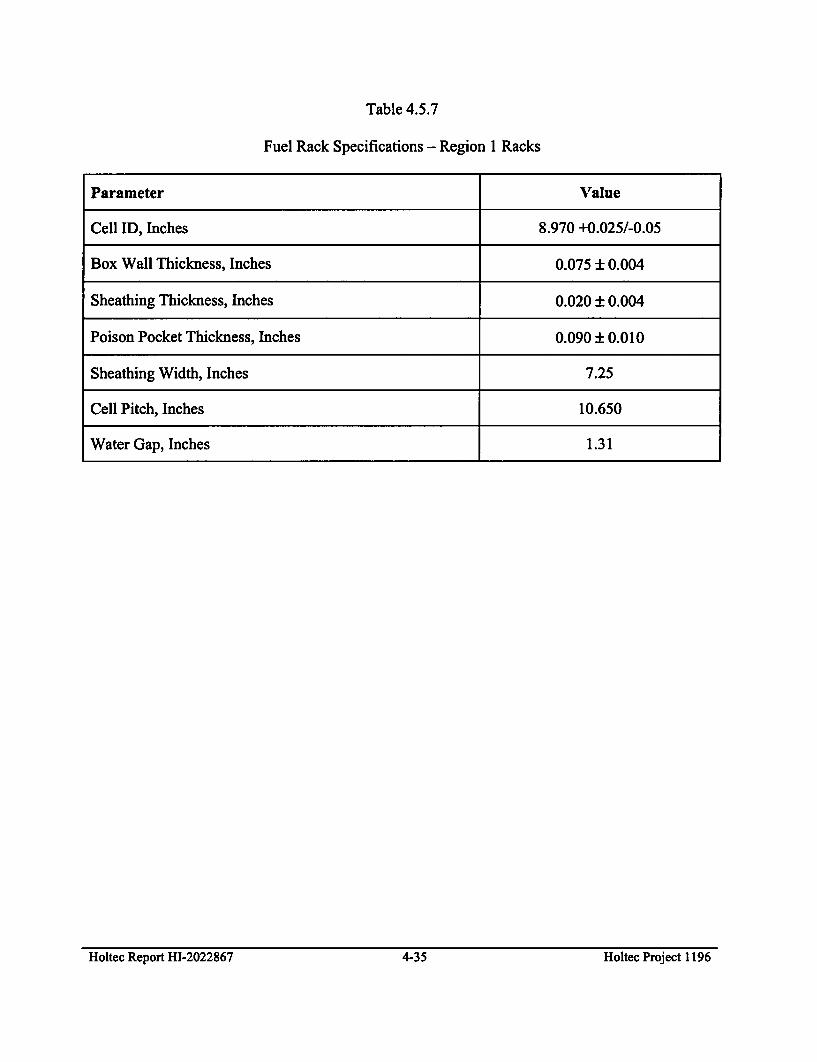
Table 4.5.7
Fuel Rack Specifications - Region 1 Racks
Parameter Value
Cell ID, Inches 8.970 +0.025/-0.05
Box Wall Thickness, Inches 0.075 ± 0.004
Sheathing Thickness, Inches 0.020 ± 0.004
Poison Pocket Thickness, Inches 0.090 ± 0.010
Sheathing Width, Inches 7.25
Cell Pitch, Inches 10.650
Water Gap, Inches 1.31
Holtec Report HI-2022867 4-35 Holtec Project 1196Holtec Report HI-2022867 4-35 Holtec Project 1196
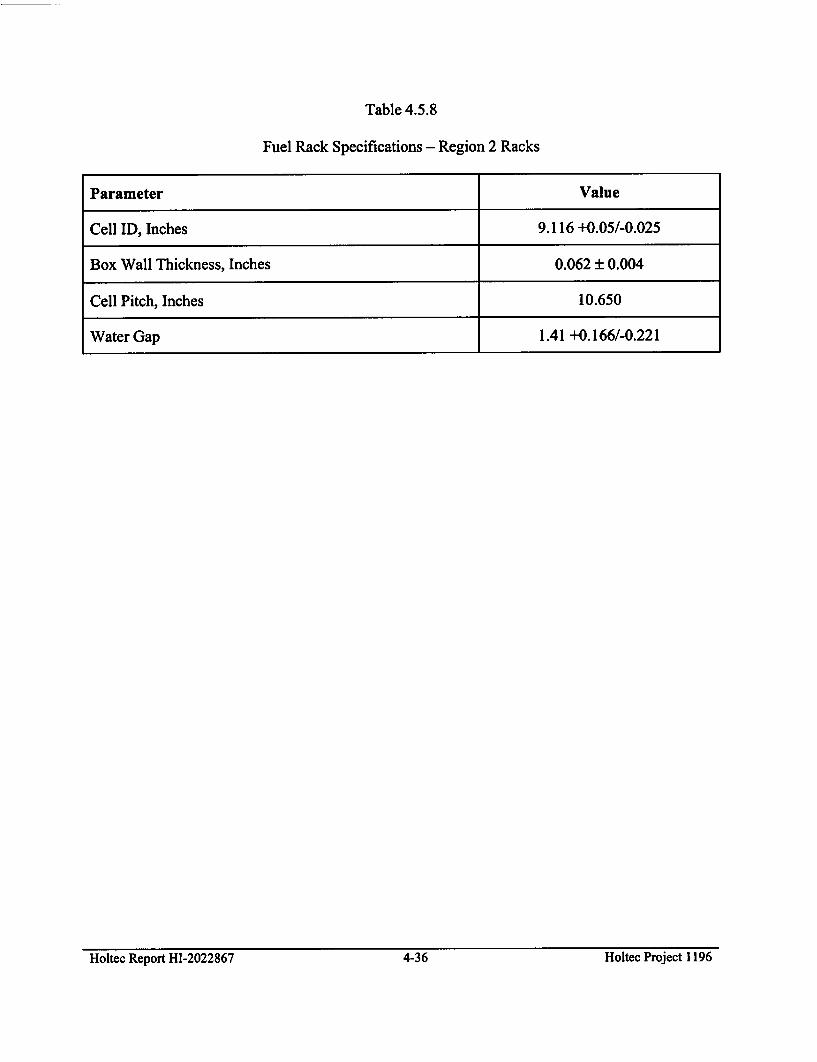
Table 4.5.8
Fuel Rack Specifications - Region 2 Racks
Parameter Value
Cell ID, Inches 9.116 +0.05/-0.025
Box Wall Thickness, Inches 0.062 ± 0.004
Cell Pitch, Inches 10.650
Water Gap 1.41 +0.166/-0.221
Holtec Report HI-2022867 4-36 Holtec Project 1196Holtec Report HI-2022867 4-36 Holtec Project 1196
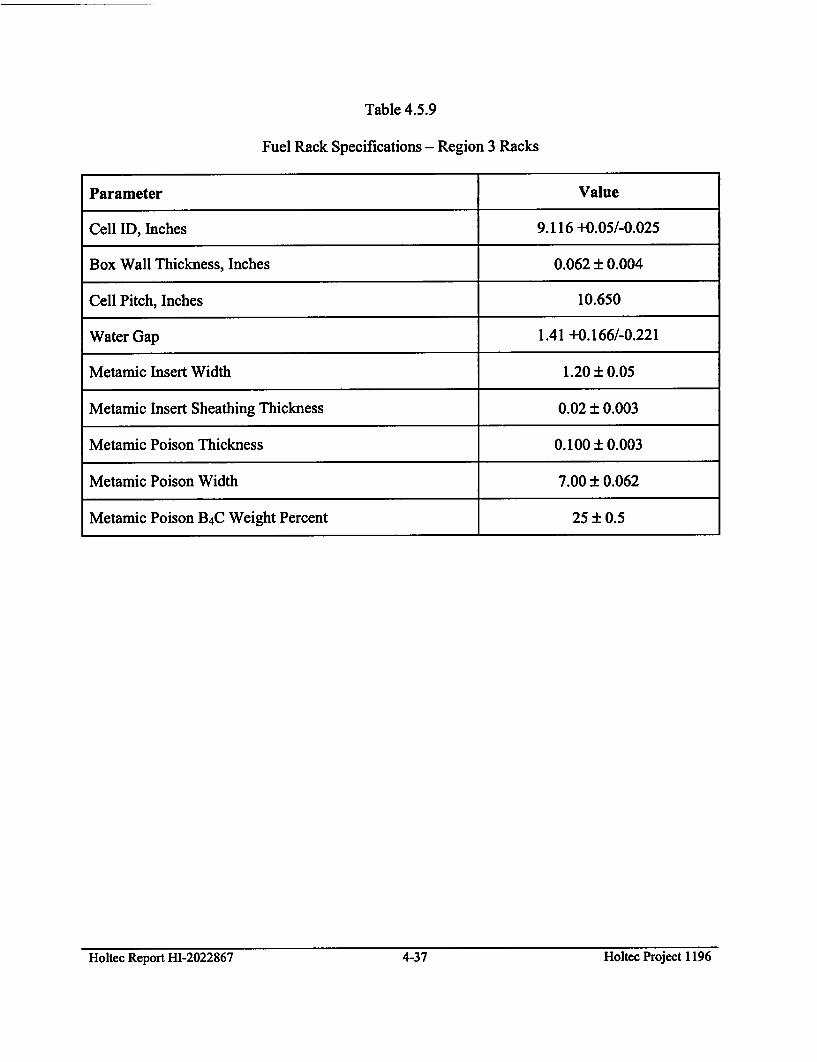
Table 4.5.9
Fuel Rack Specifications - Region 3 Racks
Parameter Value
Cell ID, Inches 9.116 +0.05/-0.025
Box Wall Thickness, Inches 0.062 ± 0.004
Cell Pitch, Inches 10.650
Water Gap 1.41 +0.166/-0.221
Metamic Insert Width 1.20 ± 0.05
Metamic Insert Sheathing Thickness 0.02 ± 0.003
Metamic Poison Thickness 0.100 ± 0.003
Metamic Poison Width 7.00 ± 0.062
Metamic Poison B4C Weight Percent 25 : 0.5
Holtec Report HI-2022867 4-37 Holtec Project 1196Holtec Report HI-2022867 4-37 Holtec Project 1196
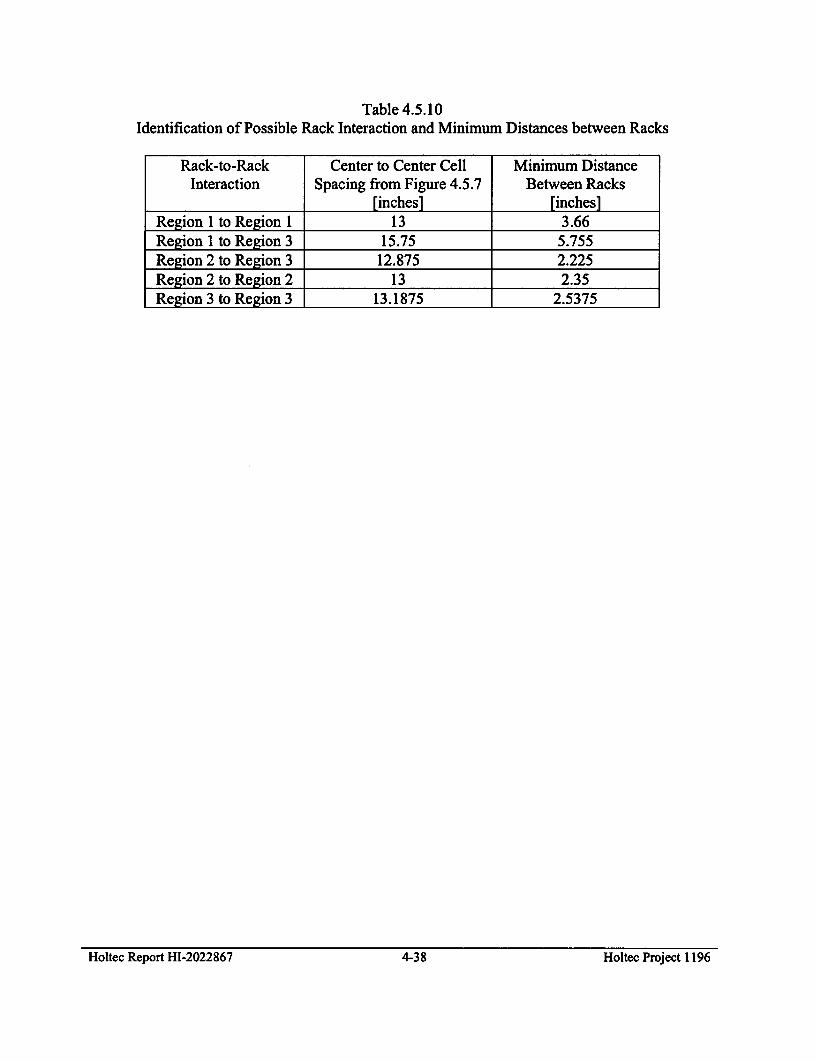
Table 4.5.10Identification of Possible Rack Interaction and Minimum Distances between Racks
Rack-to-Rack Center to Center Cell Minimum DistanceInteraction Spacing from Figure 4.5.7 Between Racks
[inches] [inches]Region 1 to Region 1 13 3.66Region I to Region 3 15.75 5.755Region 2 to Region 3 12.875 2.225Region 2 to Region 2 13 2.35Region 3 to Region 3 13.1875 2.5375
Holtec Report HI-2022867 4-38 Holtec Project 1196Holtec Report HI-2022867 4-38 Holtec: Project 1196
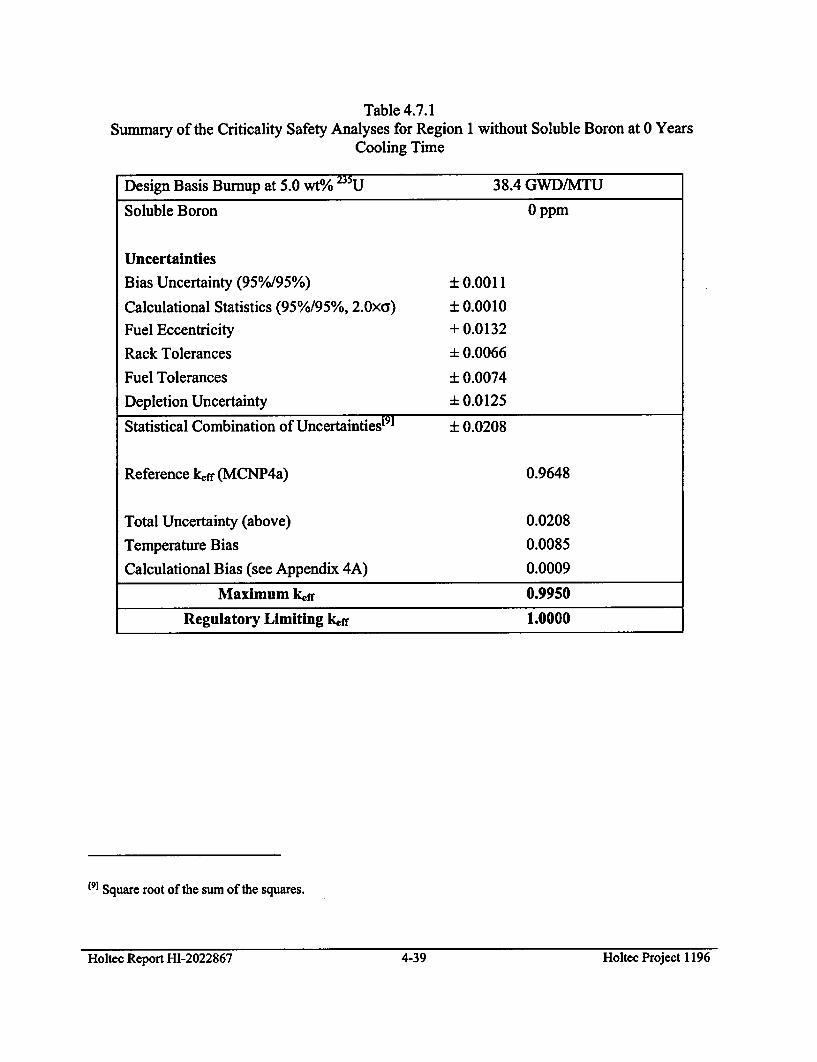
Table 4.7.1Summary of the Criticality Safety Analyses for Region 1 without Soluble Boron at 0 Years
Cooling Time
Design Basis Burnup at 5.0 wt% 235U 38.4 GWD/MTU
Soluble Boron 0 ppm
Uncertainties
Bias Uncertainty (95%/95%) ± 0.0011
Calculational Statistics (95%/95%, 2.Oxa) ± 0.0010
Fuel Eccentricity + 0.0132
Rack Tolerances - 0.0066
Fuel Tolerances ± 0.0074
Depletion Uncertainty - 0.0125
Statistical Combination of Uncertaintiest91 ± 0.0208
Reference keff (MCNP4a) 0.9648
Total Uncertainty (above) 0.0208
Temperature Bias 0.0085
Calculational Bias (see Appendix 4A) 0.0009
Maximum kff 0.9950
Regulatory Limiting kff 1.0000
(9] Square root of the sum of the squares.
Holtec Report HI-2022867 4-39 Holtec Project 1196Holtec Report HI-2022867 4-39 Holtec Project 1196

Table 4.7.2Summary of the Criticality Safety Analyses for Region 1 with Soluble Boron at 0 Years Cooling
Time
Design Basis Burnup, at 5.0 Wt% 211U 38.4 GVM/MTU
Soluble Boron 242 ppm
Uncertainties
Bias Uncertainty (95%/95%) ± 0.0011
Calculational Statistics (95%/95%, 2.Oxa) ± 0.0011Fuel Eccentricity + 0.0132
Rack Tolerances -0.0066
Fuel Tolerances ± 0.0074
Depletion Uncertainty ± 0.0125
Statistical Combination of Uncertaintiest1 0° ± 0.0208
Reference klff (MCNP4a) 0.9148
Total Uncertainty (above) 0.0208
Temperature Bias 0.0085
Calculational Bias (see Appendix 4A) 0.0009
Maximum l4ff 0.9450
Regulatory Limiting kff 0.9500
[Eo] Square root of the sum of the squares.
Holtec Report HI-2022867 4-40 Holtec Project 1196Holtec Report HI-2022867 4-40 Holtec Project 1196
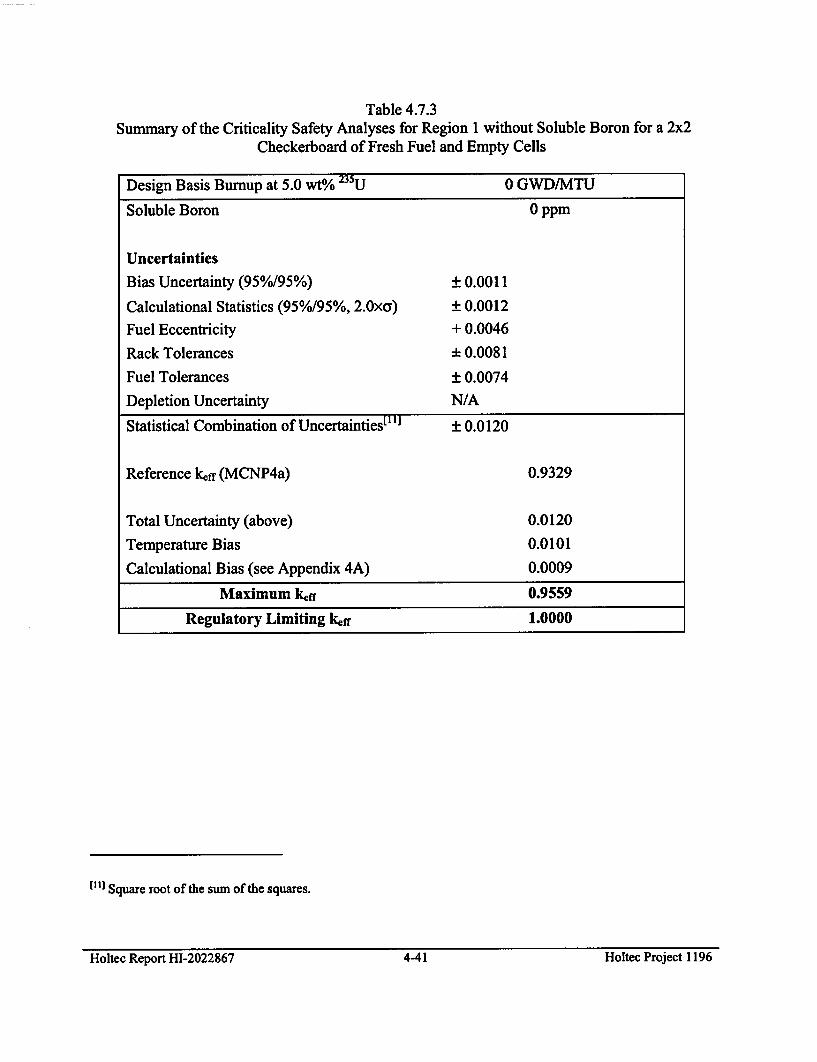
Table 4.7.3Summary of the Criticality Safety Analyses for Region 1 without Soluble Boron for a 2x2
Checkerboard of Fresh Fuel and Empty Cells
Design Basis Burnup at 5.0 wt% 23U 0 GWD/MTU
Soluble Boron 0 ppm
Uncertainties
Bias Uncertainty (95%/95%) ± 0.0011
Calculational Statistics (95%/95%, 2.Ox<) ± 0.0012
Fuel Eccentricity + 0.0046
Rack Tolerances -0.0081
Fuel Tolerances ± 0.0074
Depletion Uncertainty N/A
Statistical Combination of Uncertainties t[q ± 0.0120
Reference klff (MCNP4a) 0.9329
Total Uncertainty (above) 0.0120
Temperature Bias 0.0101
Calculational Bias (see Appendix 4A) 0.0009
Maximum kff 0.9559
Regulatory Limiting k~fr 1.0000
[El] Square root of the sum of the squares.
Holtec Report HI-2022867 4-41 Holtec Project 1196Holtec Report HI-2022867 4-41 Holtec Project 1196

Table 4.7.4Summary of the Criticality Safety Analyses for Region 1 with Soluble Boron for a 2x2
Checkerboard of Fresh Fuel and Empty Cells
Design Basis Burnup at 5.0 wt/ 2U 0 GWD/MTU
Soluble Boron 70 ppm
Uncertainties
Bias Uncertainty (95%/95%) ± 0.0011
Calculational Statistics (95%/95%, 2.Oxr) ± 0.0012
Fuel Eccentricity + 0.0046
Rack Tolerances -0.0081
Fuel Tolerances ± 0.0074
Depletion Uncertainty N/A
Statistical Combination of Uncertainties 1 21 ± 0.0120
Reference k~ff (MCNP4a) 0.9220
Total Uncertainty (above) 0.0120
Temperature Bias 0.0101
Calculational Bias (see Appendix 4A) 0.0009
Maximum kerr 0.9450
Regulatory Limiting kerr 0.9500
[12] Square root of the sum of the squares.
Holtec Report HI-2022867 4-42 Holtec Project 1196Holtec Report HI-2022867 4-42 Holtec Project 1196

Table 4.7.5Summary of the Criticality Safety Analyses for Region 2 without Soluble Boron at 0 Years
Cooling Time
Design Basis Burnup at 5.0 wt/ 2U 42.7 GWD/MTU
Soluble Boron 0 ppm
Uncertainties
Bias Uncertainty (95%/95%) ± 0.0011
Calculational Statistics (950/o/95%, 2.Oxo) ± 0.0011
Fuel Eccentricity + 0.0165
Rack Tolerances -0.0039
Fuel Tolerances + 0.0073
Depletion Uncertainty ± 0.0139
Statistical Combination of Uncertainties[13] ± 0.0232
Reference klff (MCNP4a) 0.9614
Total Uncertainty (above) 0.0232
Temperature Bias 0.0093
Calculational Bias (see Appendix 4A) 0.0009
Maximum kef" 0.9948
Regulatory Limiting keff 1.0000
[13] Square root of the sum of the squares.
Holtec Report HI-2022867 4-43 Holtec Project 1196Holtec Report HI-2022867 4-43 Holtec Project 1196
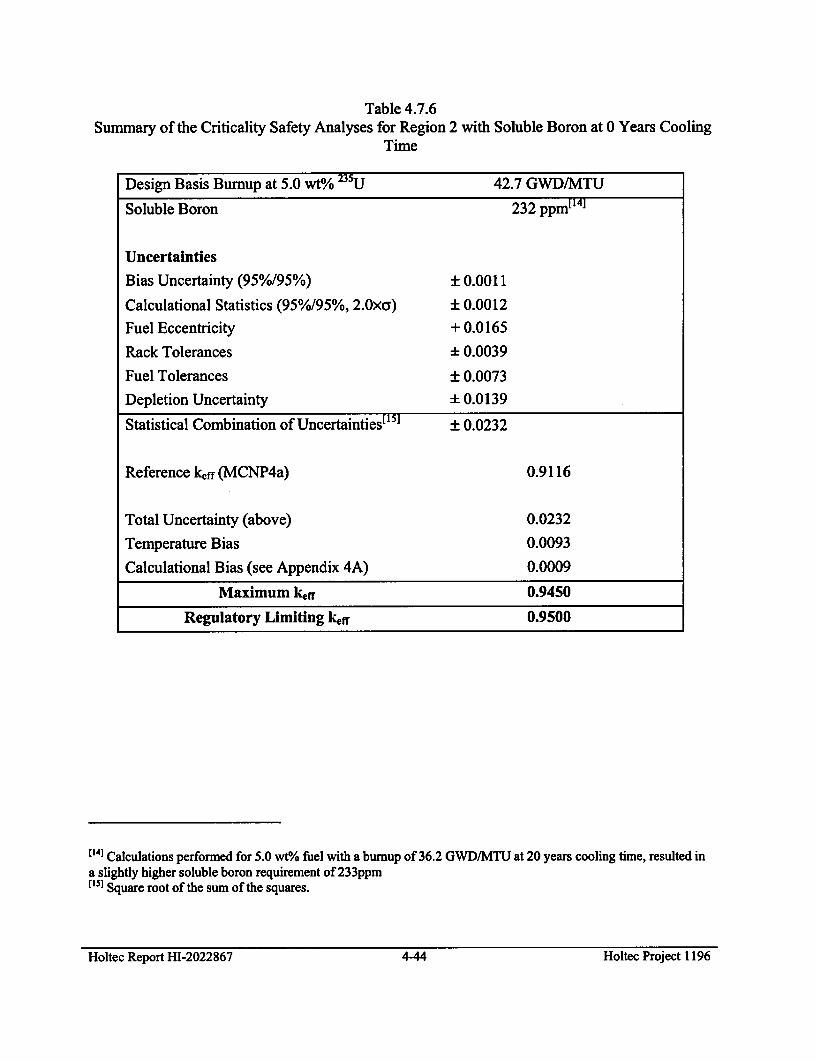
Table 4.7.6Summary of the Criticality Safety Analyses for Region 2 with Soluble Boron at 0 Years Cooling
Time
Design Basis Burnup at 5.0 wt/o 235U 42.7 GWD/MTU
Soluble Boron 232 ppm[141
Uncertainties
Bias Uncertainty (95%/95%) ± 0.0011
Calculational Statistics (95%/95%, 2.Oxo) ± 0.0012
Fuel Eccentricity + 0.0165
Rack Tolerances :h 0.0039
Fuel Tolerances + 0.0073
Depletion Uncertainty - 0.0139
Statistical Combination of Uncertaintiestl[1 ± 0.0232
Reference klff (MCNP4a) 0.9116
Total Uncertainty (above) 0.0232
Temperature Bias 0.0093
Calculational Bias (see Appendix 4A) 0.0009
Maximum kdf 0.9450
Regulatory Limiting kfn 0.9500
E14] Calculations performed for 5.0 wt%/h fuel with a burnup of 36.2 GWD/MTU at 20 years cooling time, resulted ina slightly higher soluble boron requirement of 233ppm[iS] Square root of the sum of the squares.
Holtec Report HI-2022867 4-44 Holtec Project 1196Holtec Report HI-2022867 4-44 Holtec: Project 1196

Table 4.7.7Summary of the Criticality Safety Analyses for Region 2 without Soluble Boron for a 2x2
Checkerboard of Fresh Fuel and Empty Cells
Design Basis Burnup at 5.0 wt% 235U 0 GWD/MTU
Soluble Boron 0 ppm
Uncertainties
Bias Uncertainty (95%/95%) ± 0.0011
Calculational Statistics (95%/95%, 2.Oxo) ± 0.0014Fuel Eccentricity + 0.0053
Rack Tolerances ± 0.0049
Fuel Tolerances ± 0.0071
Depletion Uncertainty N/A
Statistical Combination of Uncertainties1 161 ± 0.0103
Reference keff (MCNP4a) 0.9431
Total Uncertainty (above) 0.0103
Temperature Bias 0.0110
Calculational Bias (see Appendix 4A) 0.0009
Maximum kff 0.9653
Regulatory Limiting kff 1.0000
[16] Square root of the sum of the squares.
Holtec Report 111-2022867 4-45 Holtec Project 1196Holtec Report HI-2022867 4-45 Holtec Project 1196
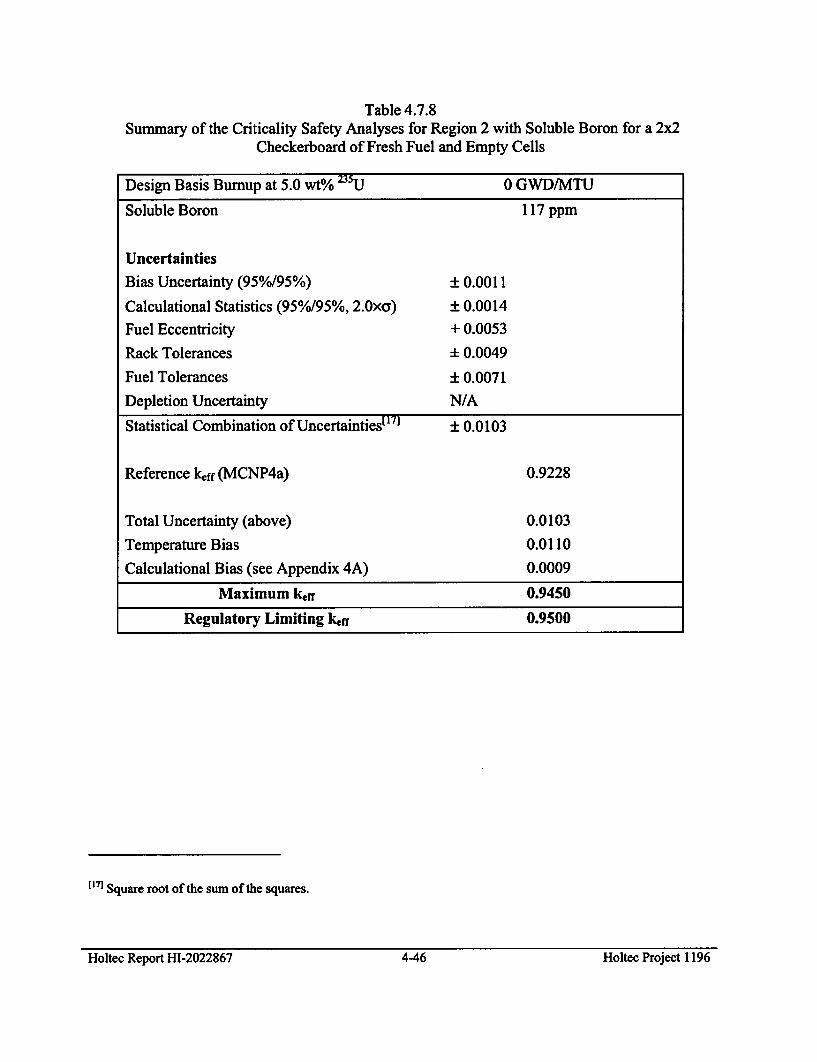
Table 4.7.8Summary of the Criticality Safety Analyses for Region 2 with Soluble Boron for a 2x2
Checkerboard of Fresh Fuel and Empty Cells
Design Basis Burnup at 5.0 wt% 35U 0 GWD/MTU
Soluble Boron 117 ppm
Uncertainties
Bias Uncertainty (95%/95%) ± 0.0011
Calculational Statistics (95%/95%, 2.0xa) ± 0.0014
Fuel Eccentricity + 0.0053
Rack Tolerances -0.0049
Fuel Tolerances ± 0.0071
Depletion Uncertainty N/A
Statistical Combination of Uncertainties [17 ± 0.0103
Reference kff (MCNP4a) 0.9228
Total Uncertainty (above) 0.0103
Temperature Bias 0.01 10
Calculational Bias (see Appendix 4A) 0.0009
Maximum kerr 0.9450
Regulatory Limiting ker 0.9500
[117 Square root of the sum of the squares.
Holtec Report HI-2022867 4-46 Holtec Project 1196Holtec Report HI-2022867 4-46 Holtec Project 1196
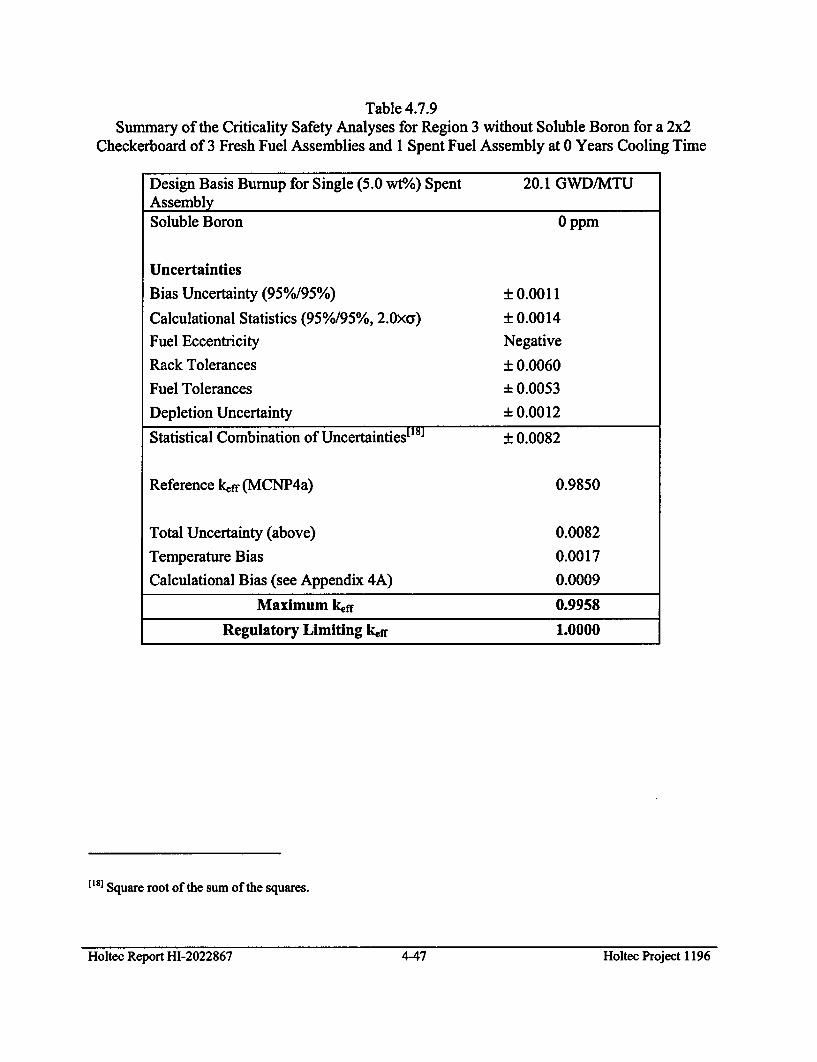
Table 4.7.9Summary of the Criticality Safety Analyses for Region 3 without Soluble Boron for a 2x2
Checkerboard of 3 Fresh Fuel Assemblies and 1 Spent Fuel Assembly at 0 Years Cooling Time
Design Basis Burnup for Single (5.0 wt%/o) Spent 20.1 GWD/MTUAssemblySoluble Boron 0 ppm
Uncertainties
Bias Uncertainty (95%/95%) ± 0.0011
Calculational Statistics (95%/95%, 2.Oxa) ± 0.0014Fuel Eccentricity Negative
Rack Tolerances + 0.0060
Fuel Tolerances -0.0053
Depletion Uncertainty -0.0012
Statistical Combination of Uncertaintiesp' 8] 0.0082
Reference kerr (MCNP4a) 0.9850
Total Uncertainty (above) 0.0082
Temperature Bias 0.0017
Calculational Bias (see Appendix 4A) 0.0009
Maximum kef 0.9958
Regulatory Limiting kff 1.0000
[IS] Square root of the sum of the squares.
Holtec Report HI-2022867 4-47 Holtec, Project 1196
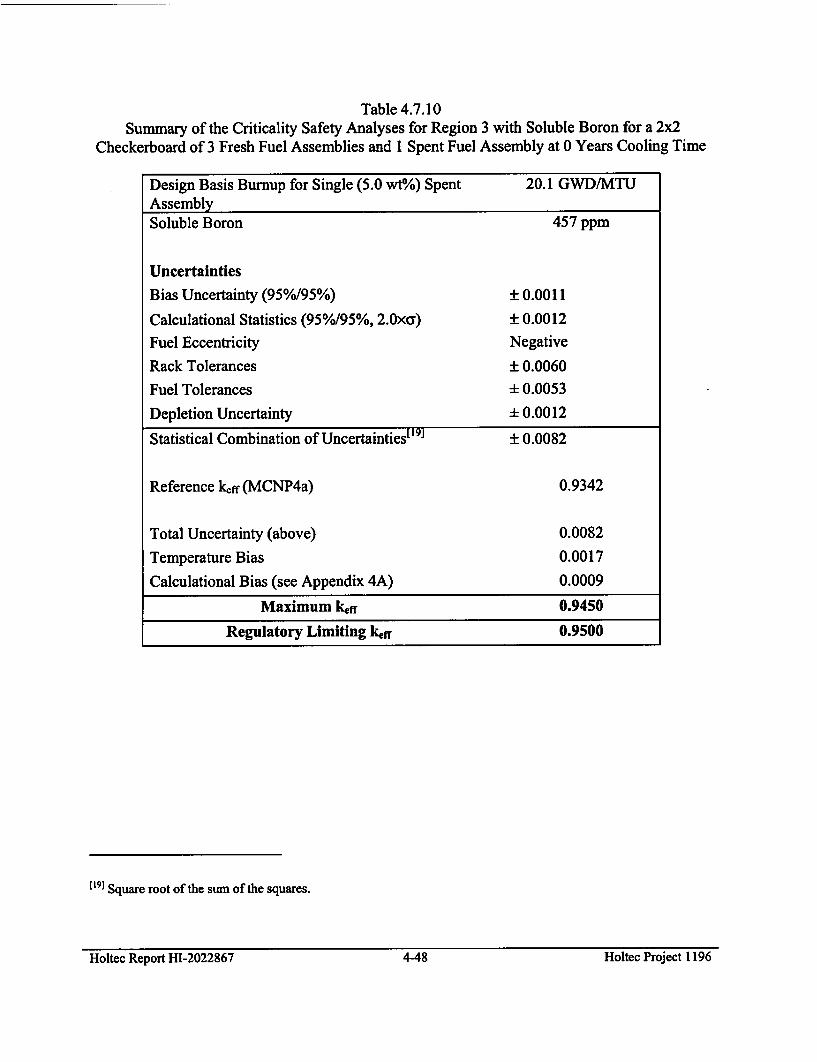
Table 4.7.10Summary of the Criticality Safety Analyses for Region 3 with Soluble Boron for a 2x2
Checkerboard of 3 Fresh Fuel Assemblies and 1 Spent Fuel Assembly at 0 Years Cooling Time
Design Basis Bumup for Single (5.0 wt0/o) Spent 20.1 GWD/MTUAssemblySoluble Boron 457 ppm
Uncertainties
Bias Uncertainty (95%/95%) ± 0.0011
Calculational Statistics (95%/95%, 2.Oxa) ± 0.0012
Fuel Eccentricity Negative
Rack Tolerances ± 0.0060
Fuel Tolerances ± 0.0053
Depletion Uncertainty ± 0.0012
Statistical Combination of Uncertainties [9 ] ± 0.0082
Reference krff (MCNP4a) 0.9342
Total Uncertainty (above) 0.0082
Temperature Bias 0.0017
Calculational Bias (see Appendix 4A) 0.0009
Maximum keff 0.9450
Regulatory Limiting ker 0.9500
I19] Square root of the sum of the squares.
Holtec Report HI-2022867 4-48 Holtec Project 1196Holtec Report HI-2022867 4-48 Holtec: Project 1196
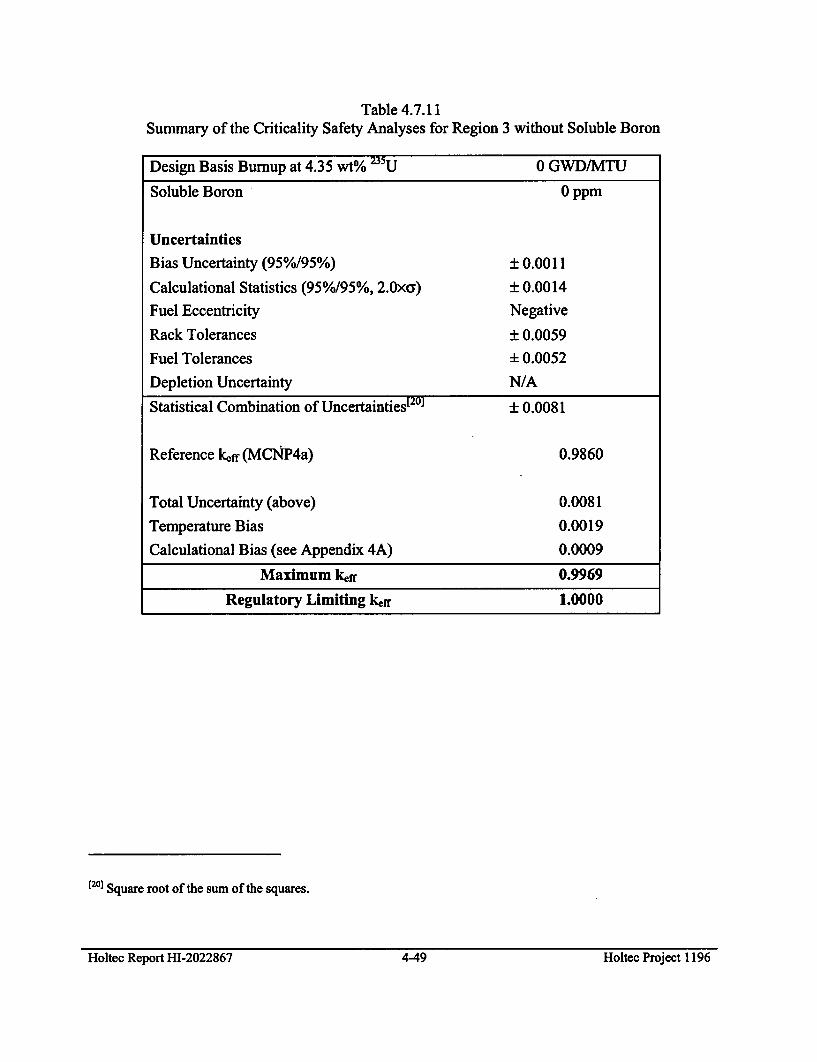
Table 4.7.11Summary of the Criticality Safety Analyses for Region 3 without Soluble Boron
Design Basis Burnup at 4.35 wt% 235U 0 GWD/MTU
Soluble Boron 0 ppm
Uncertainties
Bias Uncertainty (95%/95%) ± 0.0011
Calculational Statistics (95%/95%, 2.Oxa) ± 0.0014
Fuel Eccentricity Negative
Rack Tolerances ± 0.0059
Fuel Tolerances -0.0052
Depletion Uncertainty N/A
Statistical Combination of Uncertainties[20 ] ± 0.0081
Reference klff (MCNP4a) 0.9860
Total Uncertainty (above) 0.0081
Temperature Bias 0.0019
Calculational Bias (see Appendix 4A) 0.0009
Maximum kef 0.9969
Regulatory Limiting keff 1.0000
[201 Square root of the sum of the squares.
Holtec Report HI-2022867 4-49 Holtec Project 1196Holtec Report HI-2022867 4-49 Holtec Project 1196
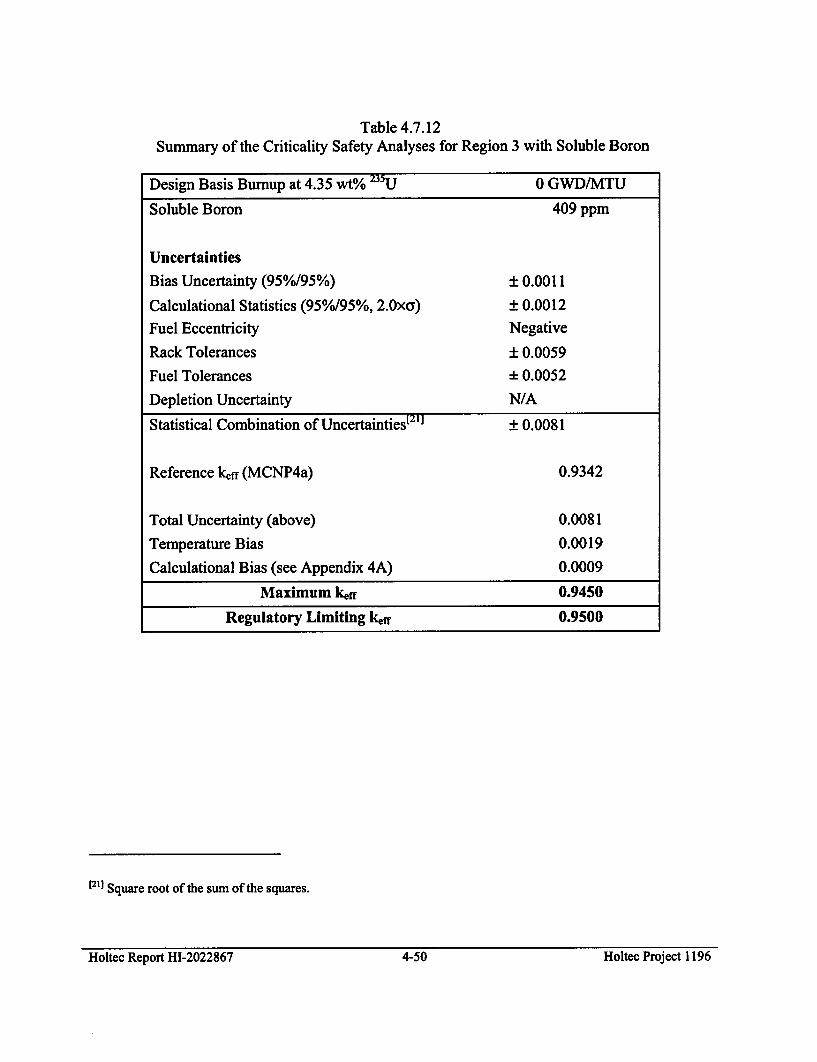
Table 4.7.12Summary of the Criticality Safety Analyses for Region 3 with Soluble Boron
Design Basis Burnup at 4.35 wt 0 Zu 0 GWD/MTU
Soluble Boron 409 ppm
Uncertainties
Bias Uncertainty (95%/95%) ± 0.0011
Calculational Statistics (95%/95%, 2.0×xa) ± 0.0012
Fuel Eccentricity Negative
Rack Tolerances ± 0.0059
Fuel Tolerances ±0.0052
Depletion Uncertainty N/A
Statistical Combination of Uncertainties [21 ] 0.0081
Reference kff (MCNP4a) 0.9342
Total Uncertainty (above) 0.0081
Temperature Bias 0.0019
Calculational Bias (see Appendix 4A) 0.0009
Maximum kff 0.9450
Regulatory Limiting kff 0.9500
[211 Square root of the sum of the squares.
Holtec Report HI-2022867 4-50 Holtec Project 1196Holtec Report HI-2022867 4-50 Holtec Project 1196
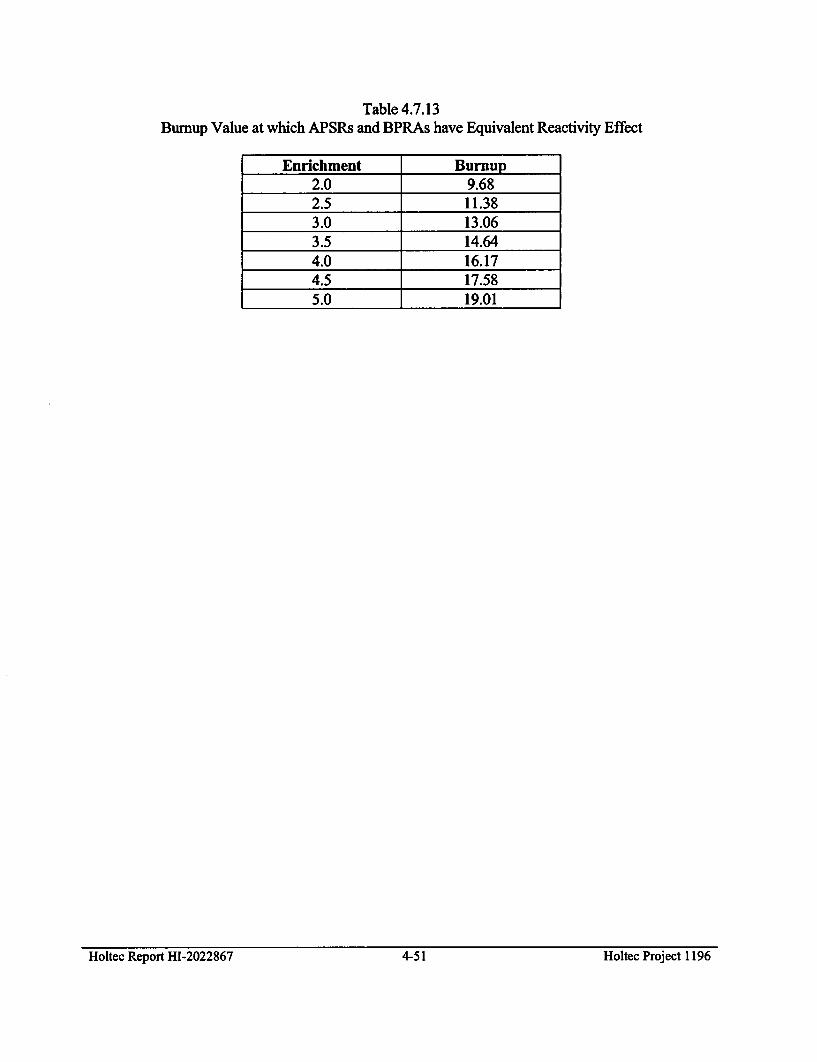
Table 4.7.13Burnup Value at which APSRs and BPRAs have Equivalent Reactivity Effect
Enrichment Burnup2.0 9.682.5 11.383.0 13.063.5 14.644.0 16.174.5 17.585.0 19.01
Holtec Report HI-2022867 4-51 Holtec: Project 1196
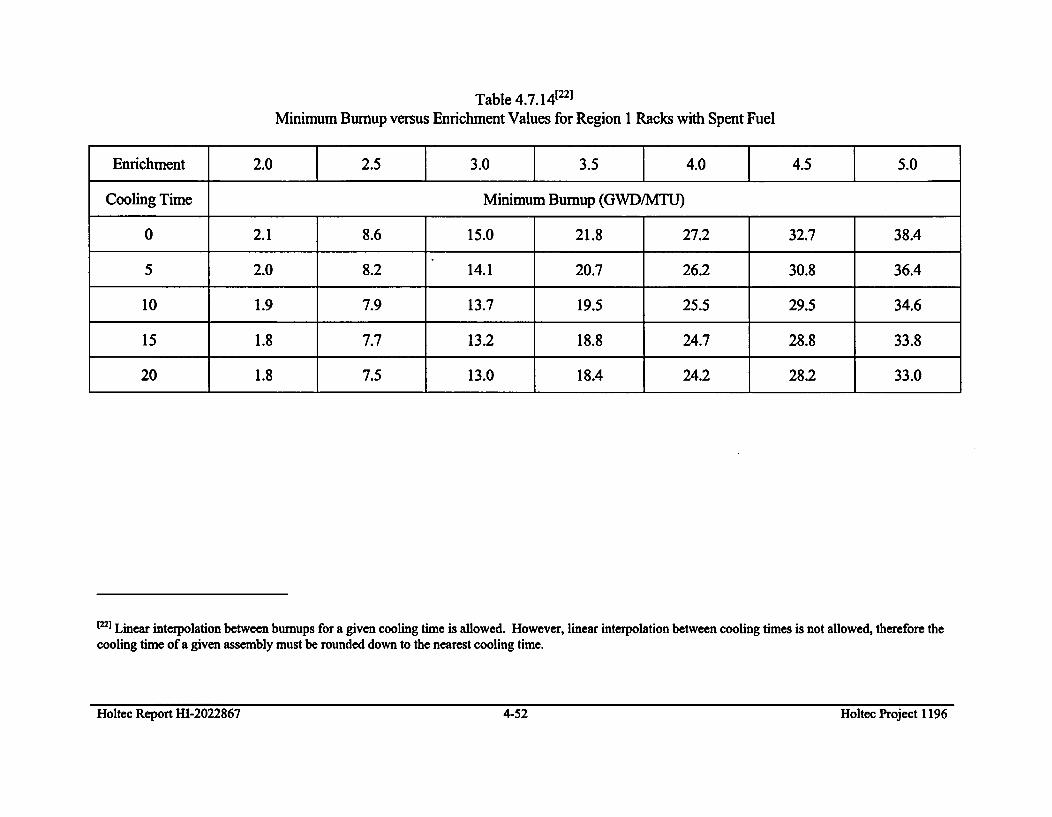
Table 4.7.14[22]Minimum Bumup versus Enrichment Values for Region 1 Racks with Spent Fuel
Enrichment 2.0 2.5 3.0 3.5 4.0 4.5 5.0
Cooling Time Minimum Bumup (GWD/MTU)
0 2.1 8.6 15.0 21.8 27.2 32.7 38.4
5 2.0 8.2 14.1 20.7 26.2 30.8 36.4
10 1.9 7.9 13.7 19.5 25.5 29.5 34.6
15 1.8 7.7 13.2 18.8 24.7 28.8 33.8
20 1.8 7.5 13.0 18.4 24.2 28.2 33.0
[22] Linear interpolation between burnups for a given cooling time is allowed. However, linear interpolation between cooling times is not allowed, therefore thecooling time of a given assembly must be rounded down to the nearest cooling time.
Holtec Report HI-2022867 4-52 Holtec Project 1196
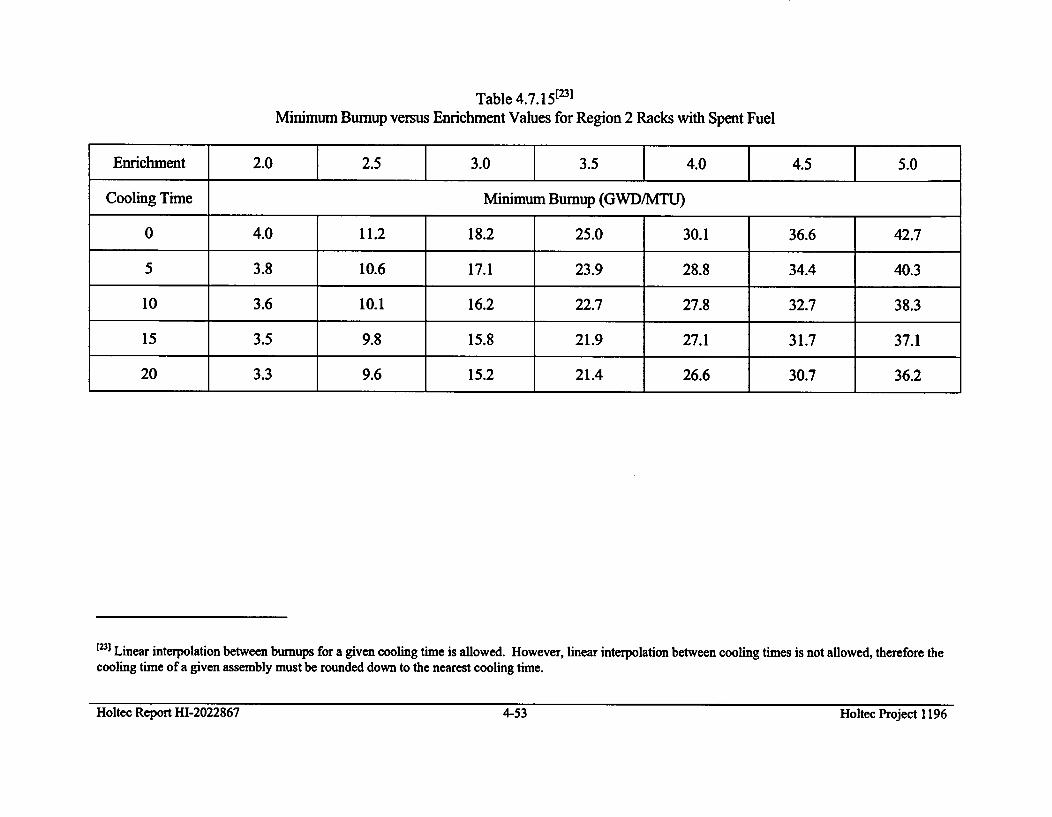
Table 4.7.15[23]Minimum Bumup versus Enrichment Values for Region 2 Racks with Spent Fuel
Enrichment 2.0 2.5 3.0 3.5 4.0 4.5 5.0
Cooling Time Minimum Bumup (GWD/MTU)
0 4.0 11.2 18.2 25.0 30.1 36.6 42.7
5 3.8 10.6 17.1 23.9 28.8 34.4 40.3
10 3.6 10.1 16.2 22.7 27.8 32.7 38.3
15 3.5 9.8 15.8 21.9 27.1 31.7 37.1
20 3.3 9.6 15.2 21.4 26.6 30.7 36.2
E23) Linear interpolation between burnups for a given cooling time is allowed. However, linear interpolation between cooling times is not allowed, therefore thecooling time of a given assembly must be rounded down to the nearest cooling time.
Holtec Report HI-2022867 4-53 Holtec Project 1196
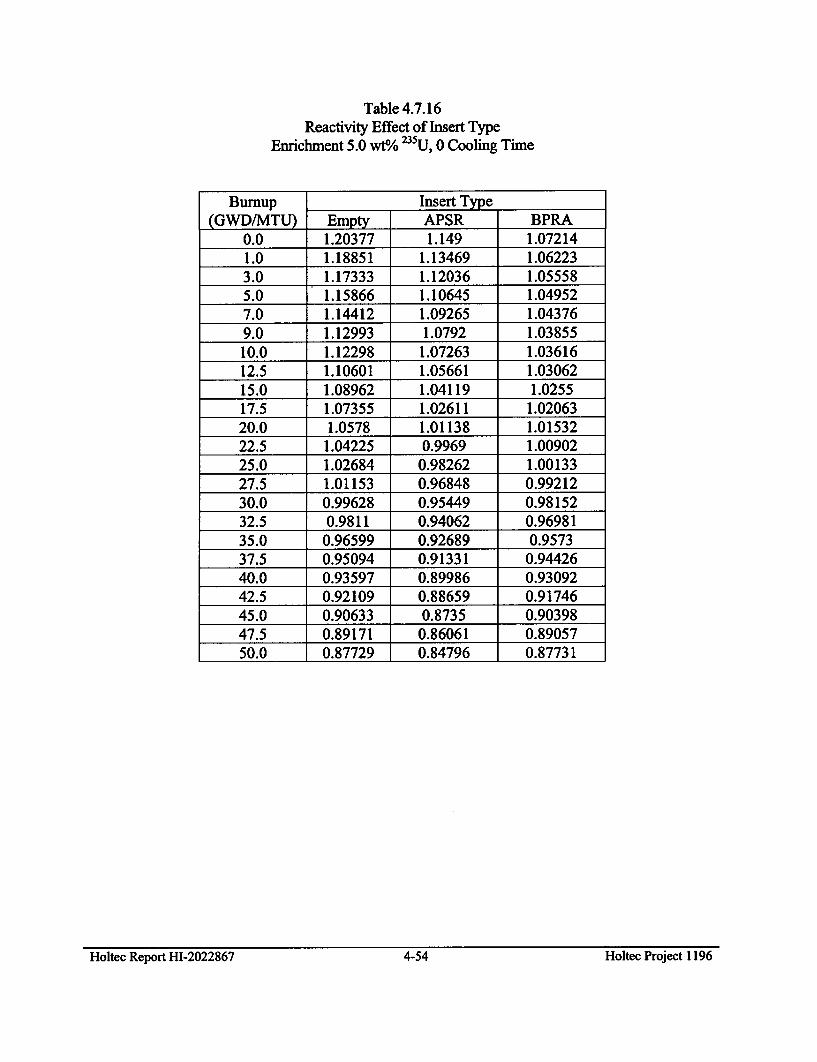
Table 4.7.16Reactivity Effect of Insert Type
Enrichment 5.0 wt/o 35U, 0 Cooling Time
Burnup Insert Type(GWD/MTU) Empty APSR BPRA
0.0 1.20377 1.149 1.072141.0 1.18851 1.13469 1.062233.0 1.17333 1.12036 1.055585.0 1.15866 1.10645 1.049527.0 1.14412 1.09265 1.043769.0 1.12993 1.0792 1.0385510.0 1.12298 1.07263 1.0361612.5 1.10601 1.05661 1.0306215.0 1.08962 1.04119 1.025517.5 1.07355 1.02611 1.0206320.0 1.0578 1.01138 1.0153222.5 1.04225 0.9969 1.0090225.0 1.02684 0.98262 1.0013327.5 1.01153 0.96848 0.9921230.0 0.99628 0.95449 0.9815232.5 0.9811 0.94062 0.9698135.0 0.96599 0.92689 0.957337.5 0.95094 0.91331 0.9442640.0 0.93597 0.89986 0.9309242.5 0.92109 0.88659 0.9174645.0 0.90633 0.8735 0.9039847.5 0.89171 0.86061 0.8905750.0 0.87729 0.84796 0.87731
Holtec Report HI-2022867 4-54 Holtec Project 1196Holtee Report HI-2022867 4-54 Holtec: Project 1196
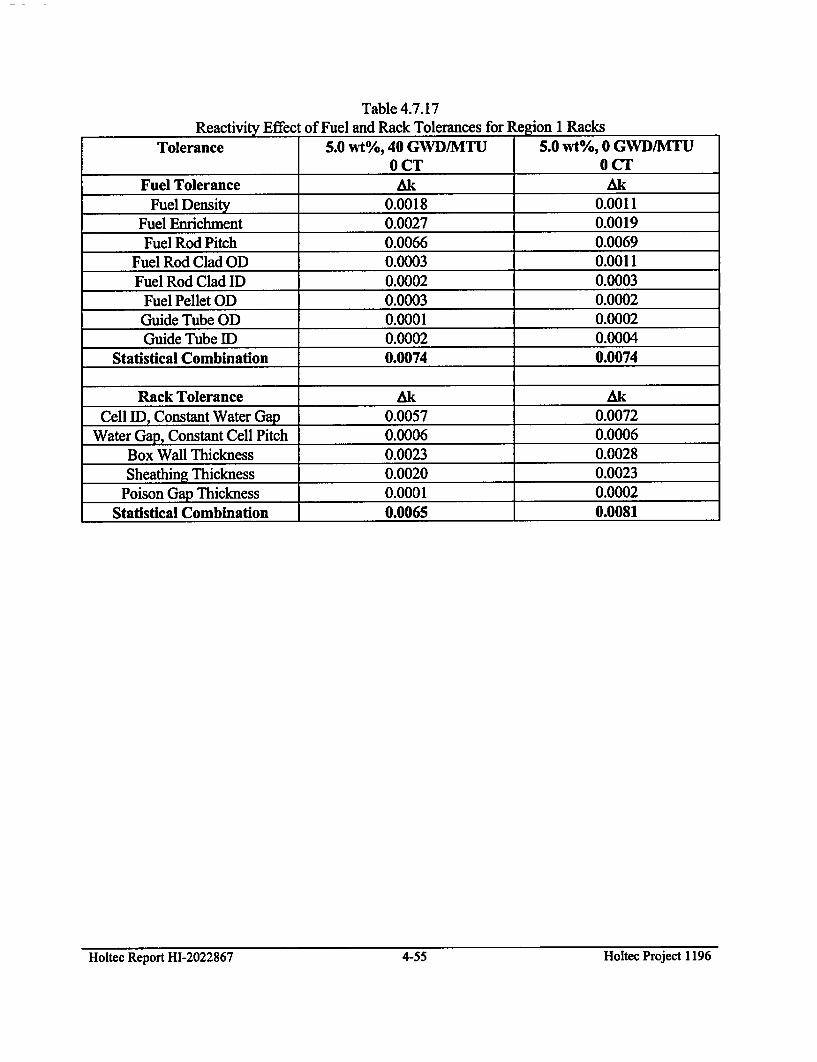
Table 4.7.17Reactivity Effect of Fuel and Rack Tolerances for Region 1 Racks
Tolerance 5.0 wt%, 40 GWD/MTU 5.0 wt%, 0 GWD/MTUOCT 0 CT
Fuel Tolerance Ak AkFuel Density 0.0018 0.0011
Fuel Enrichment 0.0027 0.0019Fuel Rod Pitch 0.0066 0.0069
Fuel Rod Clad OD 0.0003 0.0011Fuel Rod Clad ID 0.0002 0.0003
Fuel Pellet OD 0.0003 0.0002Guide Tube OD 0.0001 0.0002Guide Tube ID 0.0002 0.0004
Statistical Combination 0.0074 0.0074
Rack Tolerance Ak AkCell ID, Constant Water Gap 0.0057 0.0072
Water Gap, Constant Cell Pitch 0.0006 0.0006Box Wall Thickness 0.0023 0.0028Sheathing Thickness 0.0020 0.0023
Poison Gap Thickness 0.0001 0.0002Statistical Combination 0.0065 0.0081
Holtec Report HI-2022867 4-55 Holtec Project 1196Holtec Report HI-2022867 4-55 Holtec: Project 1196
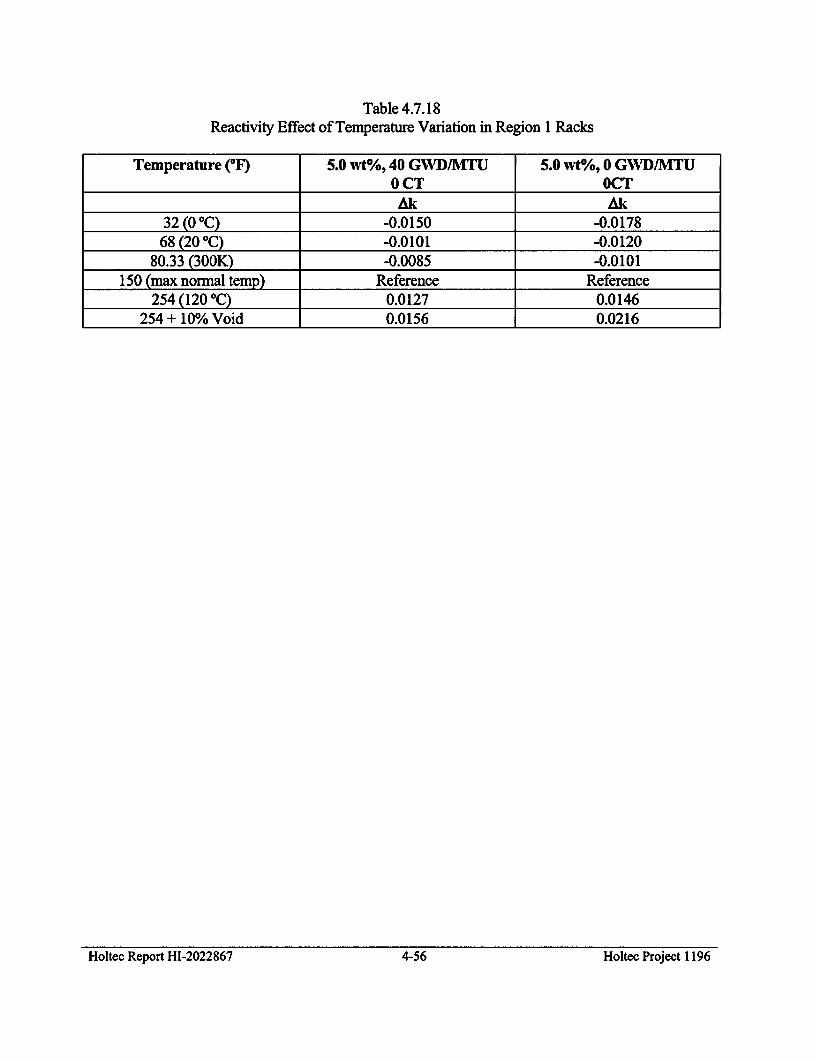
Table 4.7.18Reactivity Effect of Temperature Variation in Region 1 Racks
Temperature (OF) 5.0 wt%, 40 GWD/MTU 5.0 wt%, 0 GWD/MTU0 CT OCT
Ak Ak32 (0 °C) -0.0150 -0.0178
68 (20 -C) -0.0101 -0.012080.33 (300K) -0.0085 -0.0101
150 (max normal temp) Reference Reference254 (120 -C) 0.0127 0.0146
254 + 10% Void 0.0156 0.0216
Holtec Report HI-2022867 4-56 Holtec Project 1196
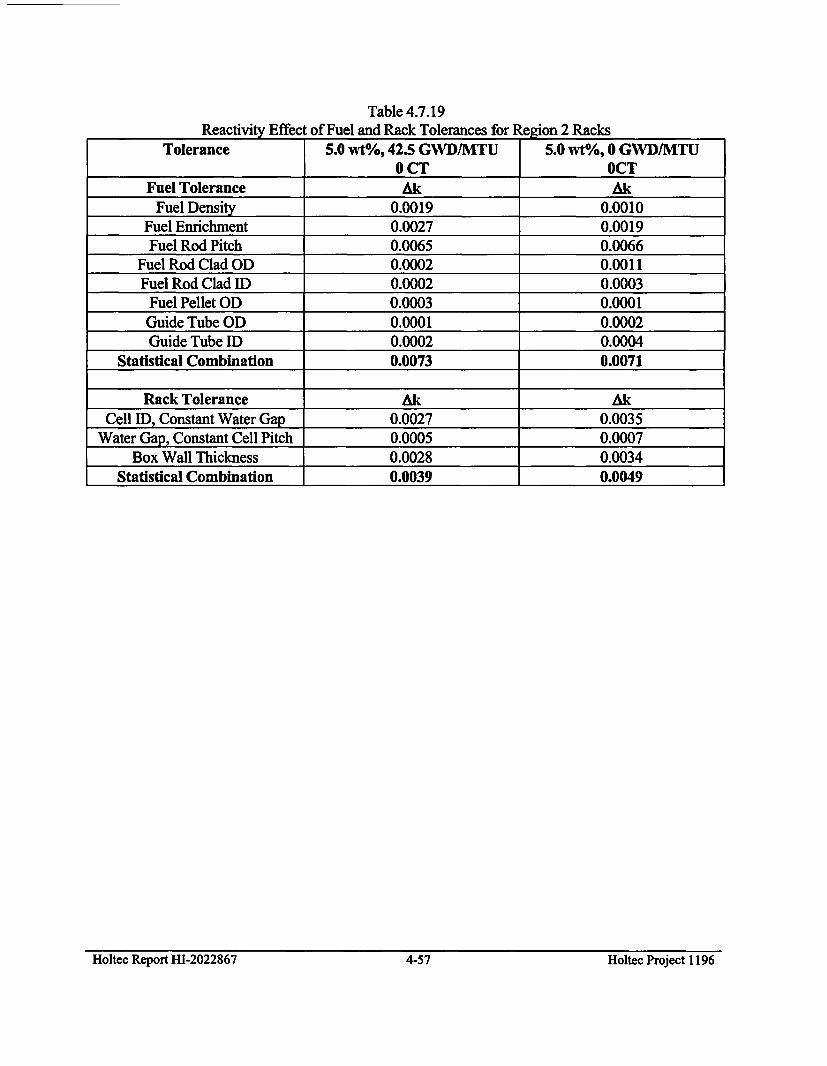
Table 4.7.19Reactivity Effect of Fuel and Rack Tolerances for Region 2 Racks
Tolerance 5.0 wt%, 42.5 GWD/MTU 5.0 vt%, 0 GWD/MTU0 CT OCT
Fuel Tolerance Ak AkFuel Density 0.0019 0.0010
Fuel Enrichment 0.0027 0.0019Fuel Rod Pitch 0.0065 0.0066
Fuel Rod Clad OD 0.0002 0.0011Fuel Rod Clad ID 0.0002 0.0003
Fuel Pellet OD 0.0003 0.0001Guide Tube OD 0.0001 0.0002Guide Tube lID 0.0002 0.0004
Statistical Combination 0.0073 0.0071
Rack Tolerance Ak AkCell ID, Constant Water Gap 0.0027 0.0035
Water Gap, Constant Cell Pitch 0.0005 0.0007Box Wall Thickness 0.0028 0.0034
Statistical Combination 0.0039 0.0049
Holtec Report 111-2022867 4-57 Holtec Project 1196Holtec Report HI-2022867 4-57 Holtec Project 1196
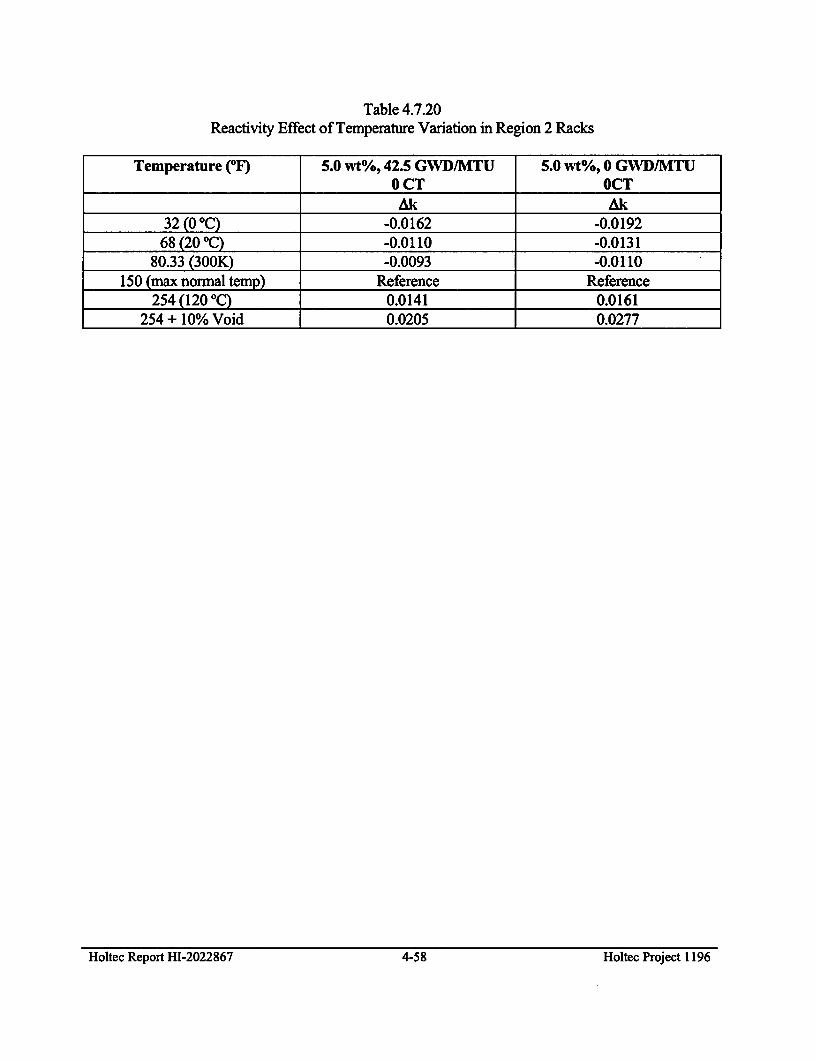
Table 4.7.20Reactivity Effect of Temperature Variation in Region 2 Racks
Temperature (°F) 5.0 wt%, 42.5 GWD/MTU 5.0 wt%, 0 GWD/MTU0 CT OCT
_Ak Ak32 (0 °C) -0.0162 -0.019268(20 -C) -0.0110 -0.0131
80.33 (300K) -0.0093 -0.0110150 (max normal temp) Reference Reference
254 (120 -C) 0.0141 0.0161254 + 10% Void 0.0205 0.0277
Holtec Report HI-2022867 4-58 Holtec Project 1196Holtec Report HI-2022867 4-58 Holtec Project 1196
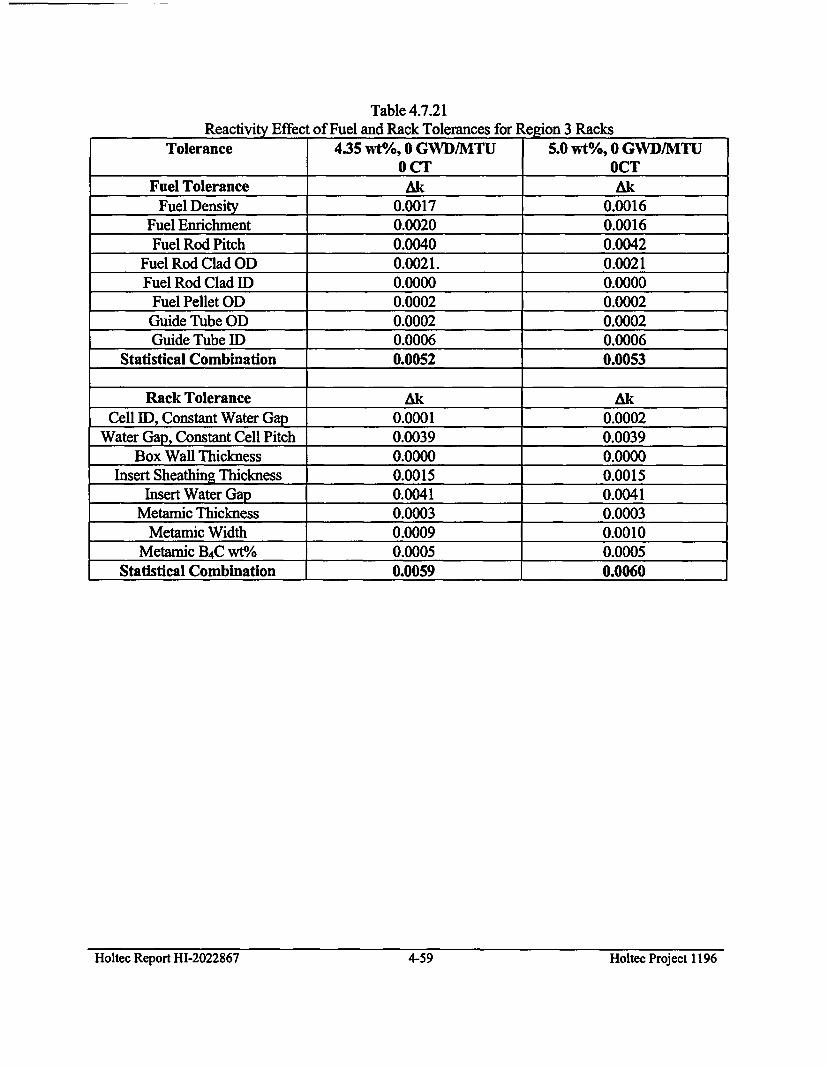
Table 4.7.21Reactivity Effect of Fuel and Rack Tolerances for Region 3 Racks
Tolerance 4.35 wt%, 0 GWD/MTU 5.0 wt%, 0 GWD/MTU0 CT OCT
Fuel Tolerance Ak Ak
Fuel Density 0.0017 0.0016
Fuel Enrichment 0.0020 0.0016
Fuel Rod Pitch 0.0040 0.0042
Fuel Rod Clad OD 0.0021. 0.0021
Fuel Rod Clad ID 0.0000 0.0000
Fuel Pellet OD 0.0002 0.0002
Guide Tube OD 0.0002 0.0002
Guide Tube ID 0.0006 0.0006
Statistical Combination 0.0052 0.0053
Rack Tolerance Ak Ak
Cell ID, Constant Water Gap 0.0001 0.0002
Water Gap, Constant Cell Pitch 0.0039 0.0039
Box Wall Thickness 0.0000 0.0000Insert Sheathing Thickness 0.0015 0.0015
Insert Water Gap 0.0041 0.0041Metamic Thickness 0.0003 0.0003
Metamic Width 0.0009 0.0010
Metamic B4C wt%/o 0.0005
Statistical Combination 0.0059 0.0060
Holtec Report HI-2022867 4-59 Holtec Project 1196Holtec Report HI-2022867 4-59 Holtec: Project 1196
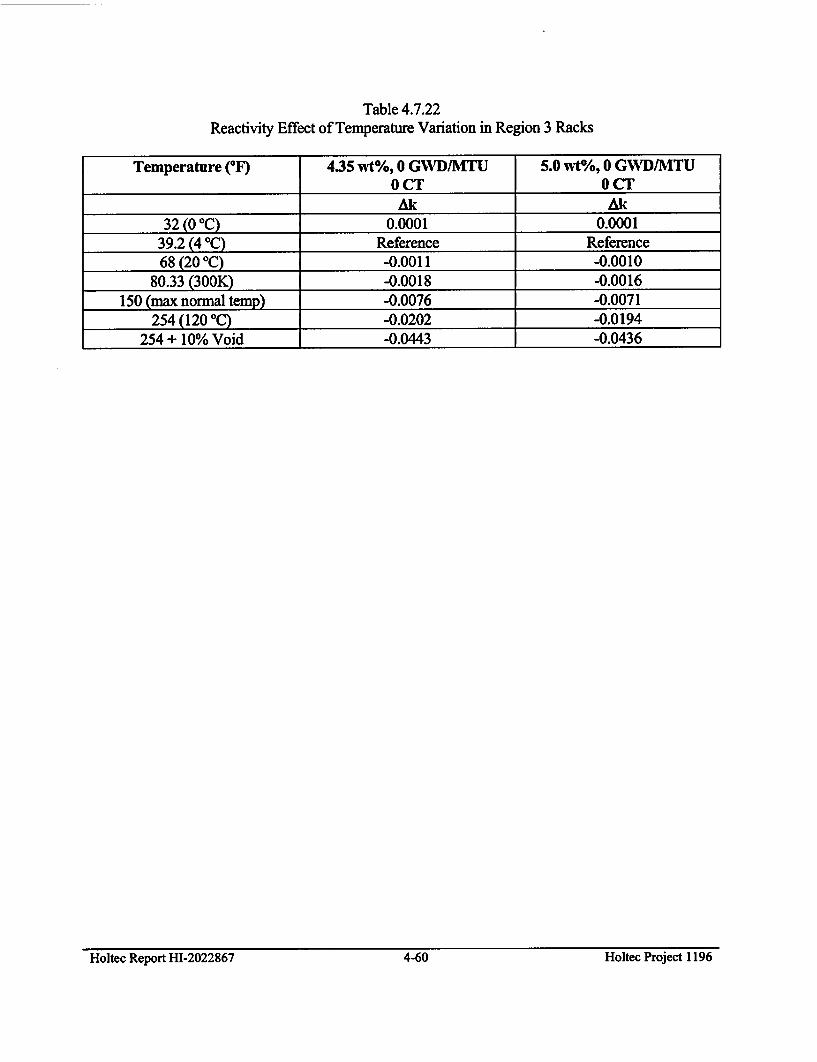
Table 4.7.22Reactivity Effect of Temperature Variation in Region 3 Racks
Temperature (°F) 4.35 wt%, 0 GWD/MTU 5.0 wt%, 0 GWD/MTU0 CT 0 CT
Ak Ak32 (0 0C) 0.0001 0.0001
39.2 (4 °C) Reference Reference68 (20 °C) -0.0011 -0.0010
80.33 (300K) -0.0018 -0.0016150 (max normal temp) -0.0076 -0.0071
254 (120 -C) -0.0202 -0.0194254 + 10% Void -0.0443 -0.0436
Holtec Report HI-2022867 4-60 Holtec Project 1196Holtec Report HI-2022867 4-60 Holtec Project 1196
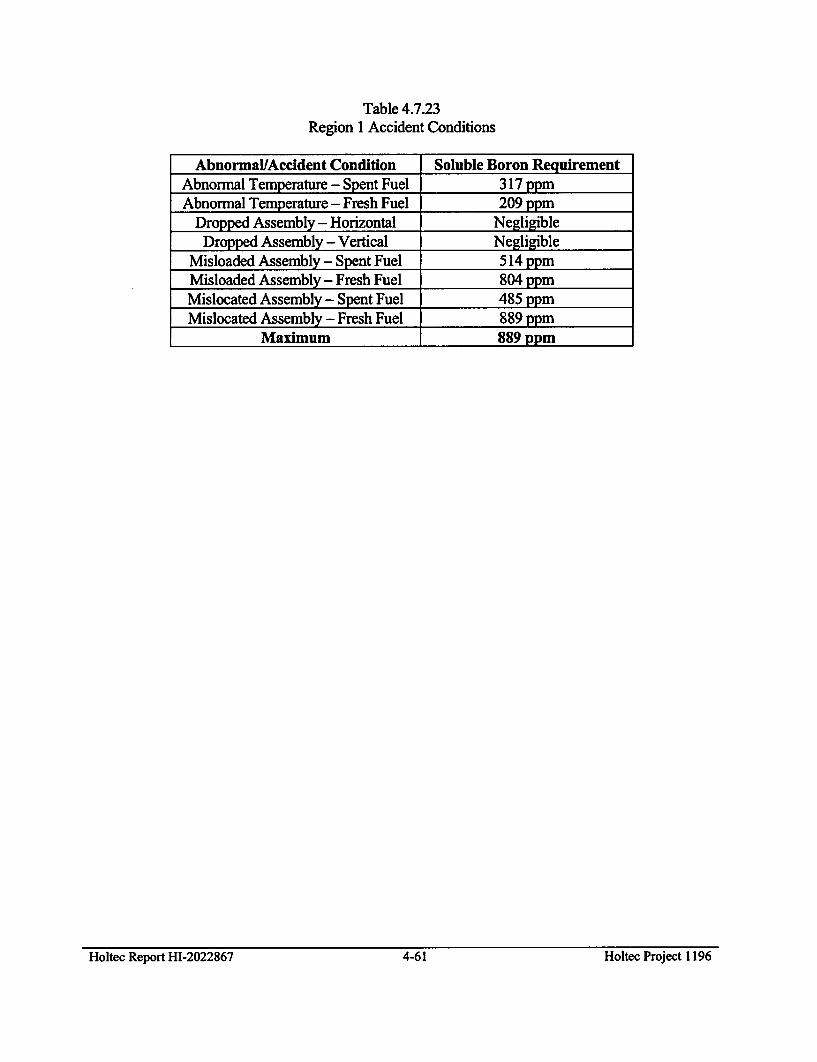
Table 4.7.23Region 1 Accident Conditions
Abnormal/Accident Condition Soluble Boron RequirementAbnormal Temperature - Spent Fuel 317 ppmAbnormal Temperature - Fresh Fuel 209 ppm
Dropped Assembly - Horizontal NegligibleDropped Assembly - Vertical Negligible
Misloaded Assembly - Spent Fuel 514 ppmMisloaded Assembly - Fresh Fuel 804 ppmMislocated Assembly - Spent Fuel 485 ppmMislocated Assembly - Fresh Fuel 889 ppm
Maximum 889 ppm
Holtec Report HI-2022867 4-61 Holtec Project 1196Holtec Report HI-2022867 4-61 Hottec: Project 1196
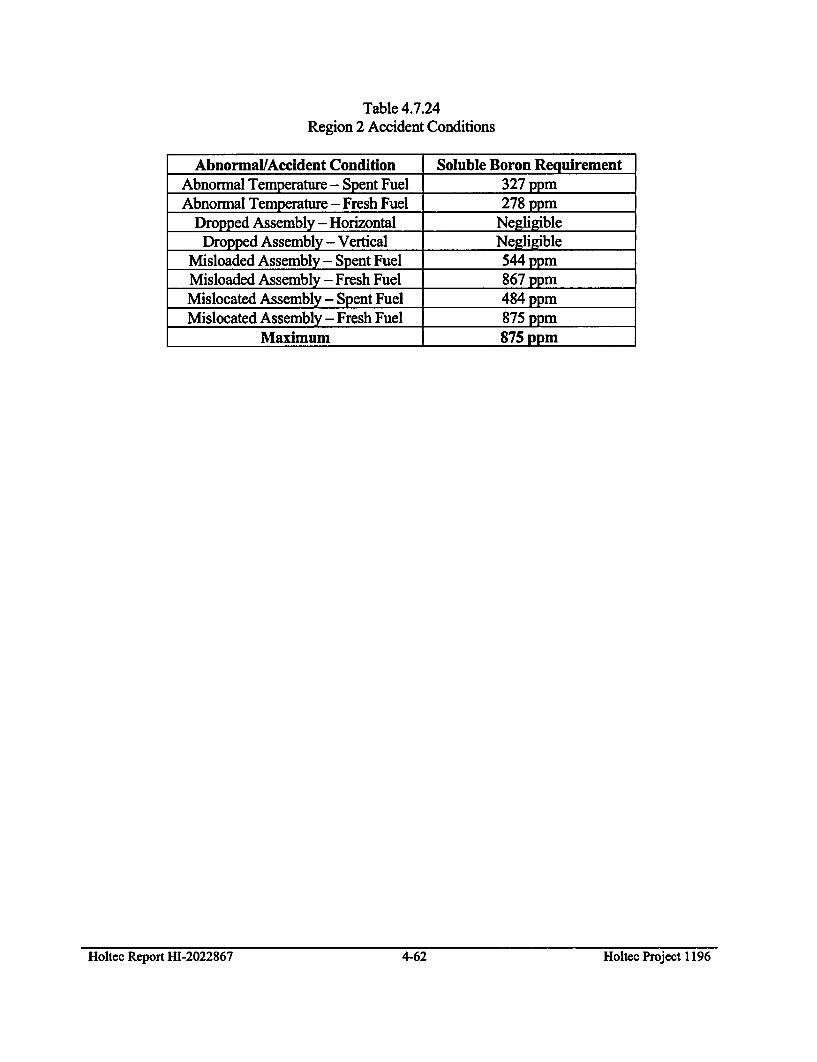
Table 4.7.24Region 2 Accident Conditions
Abnormal/Accident Condition Soluble Boron RequirementAbnormal Temperature - Spent Fuel 327 ppmAbnormal Temperature - Fresh Fuel 278 ppm
Dropped Assembly - Horizontal NegligibleDropped Assembly - Vertical Negligible
Misloaded Assembly - Spent Fuel 544 ppmMisloaded Assembly - Fresh Fuel 867 ppmMislocated Assembly - Spent Fuel 484 ppmMislocated Assembly - Fresh Fuel 875 ppm
Maximum 875 ppm
Holtec Report HI-2022867 4-62 Holtec: Project 1196
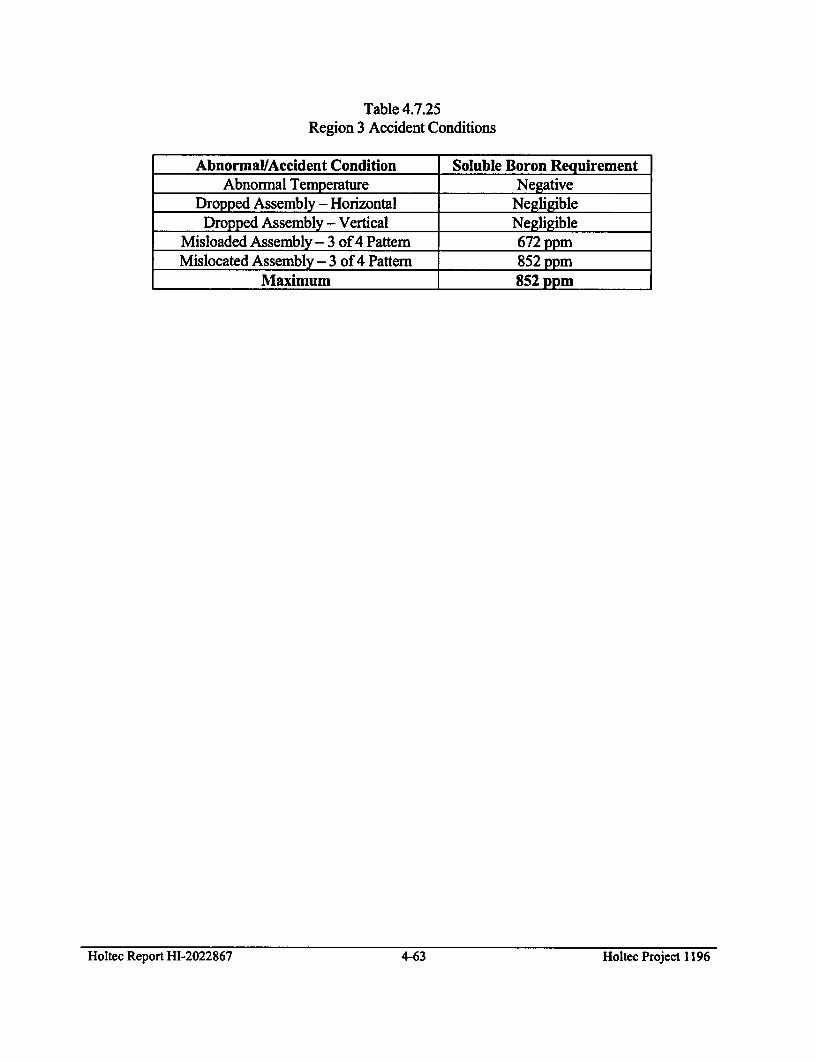
Table 4.7.25Region 3 Accident Conditions
Abnormal/Accident Condition Soluble Boron RequirementAbnormal Temperature Negative
Dropped Assembly - Horizontal NegligibleDropped Assembly - Vertical Negligible
Misloaded Assembly- 3 of 4 Pattern 672 ppmMislocated Assembly- 3 of 4 Pattern 852 ppm
Maximum 852 ppm
Holtec Report HI-2022867 4-63 Holtec Project 1196
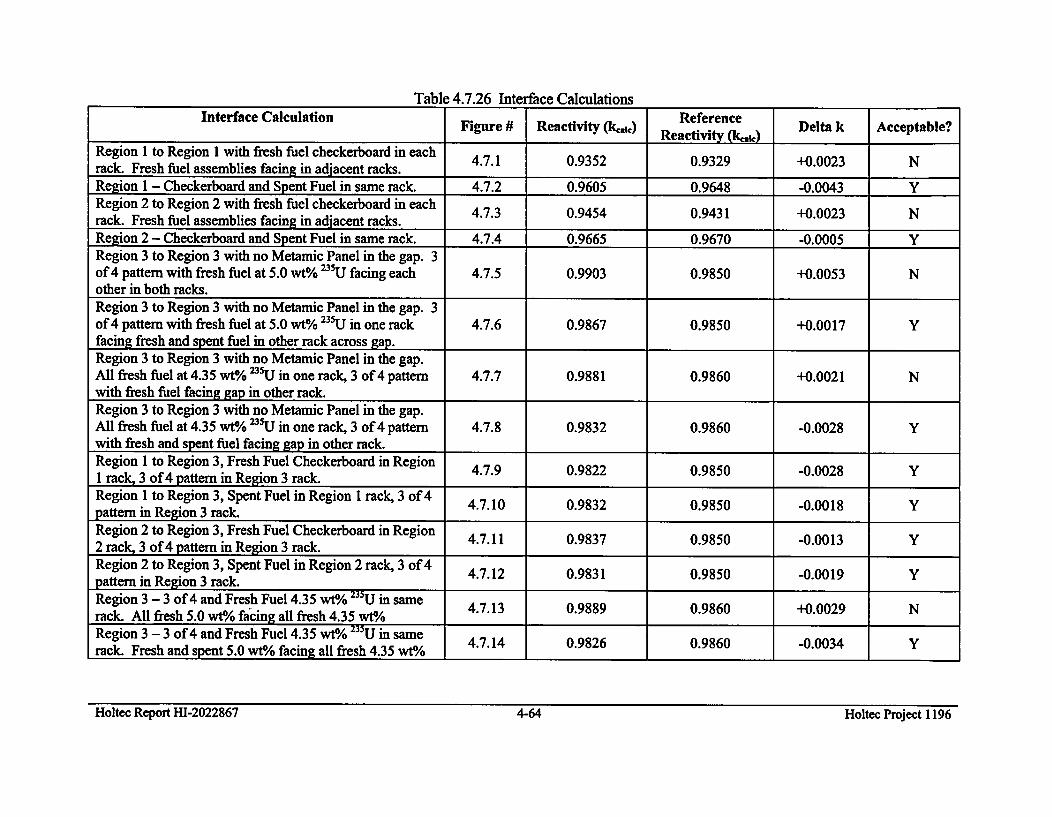
Table 4.7.26 Interface CalculationsInterface Calculation Figure # Reactivity k Reference Delta k Acceptable?
Figure_#Reativit k) Reactivity (k~k) DetkAcptbeRegion 1 to Region I with fresh fuel checkerboard in each 47.1 0.9352 0.9329 +0.0023 Nrack. Fresh fuel assemblies facing in adjacent racks.Region 1 - Checkerboard and Spent Fuel in same rack. 4.7.2 0.9605 0.9648 -0.0043 YRegion 2 to Region 2 with fresh fuel checkerboard in each 0.9454 0.9431 +0.0023 Nrack. Fresh fuel assemblies facing in adjacent racks.Region 2 - Checkerboard and Spent Fuel in same rack. 4.7.4 0.9665 0.9670 -0.0005 YRegion 3 to Region 3 with no Metamic Panel in the gap. 3of 4 pattern with fresh fuel at 5.0 wt% 235U facing each 4.7.5 0.9903 0.9850 +0.0053 Nother in both racks.Region 3 to Region 3 with no Metamic Panel in the gap. 3of 4 pattern with fresh fuel at 5.0 wt% 235U in one rack 4.7.6 0.9867 0.9850 +0.0017 Yfacing fresh and spent fuel in other rack across gap.Region 3 to Region 3 with no Metamic Panel in the gap.All fresh fuel at 4.35 wt% 2 35U in one rack, 3 of 4 pattern 4.7.7 0.9881 0.9860 +0.0021 Nwith fresh fuel facing gap in other rack.Region 3 to Region 3 with no Metamic Panel in the gap.All fresh fuel at 4.35 wt 0 235U in one rack, 3 of 4 pattern 4.7.8 0.9832 0.9860 -0.0028 Ywith fresh and spent fuel facing gap in other rack.Region 1 to Region 3, Fresh Fuel Checkerboard in Region 4.7.9 0.9822 0.9850 -0.0028 Y1 rack, 3 of 4 pattern in Region 3 rack.Region 1 to Region 3, Spent Fuel in Region I rack, 3 of 4 4.7.10 0.9832 0.9850 -0.0018 Ypattern in Region 3 rack. 4.7.10 0.9832_0.9850 -0.0018_YRegion 2 to Region 3, Fresh Fuel Checkerboard in Region 4.7.11 0.9837 0.9850 -0.0013 Y2 rack, 3 of 4 pattern in Region 3 rack.Region 2 to Region 3, Spent Fuel in Region 2 rack, 3 of 4 4.7.12 0.9831 0.9850 -0.0019 Ypattern in Region 3 rack. 4.7.12 0._3_0980_0.01_Region 3 - 3 of 4 and Fresh Fuel 4.35 wt% 235U in same 4.7.13 0.9889 0.9860 +0.0029 Nrack. All fresh 5.0 wtO/o facing all fresh 4.35 wt0/oRegion 3 - 3 of 4 and Fresh Fuel 4.35 wt% 235U in samerack. Fresh and spent 5.0 wt*/o facing all fresh 4.35 wt% 40
Holtec Report HI-2022867 4-64 Holtec Project 1196
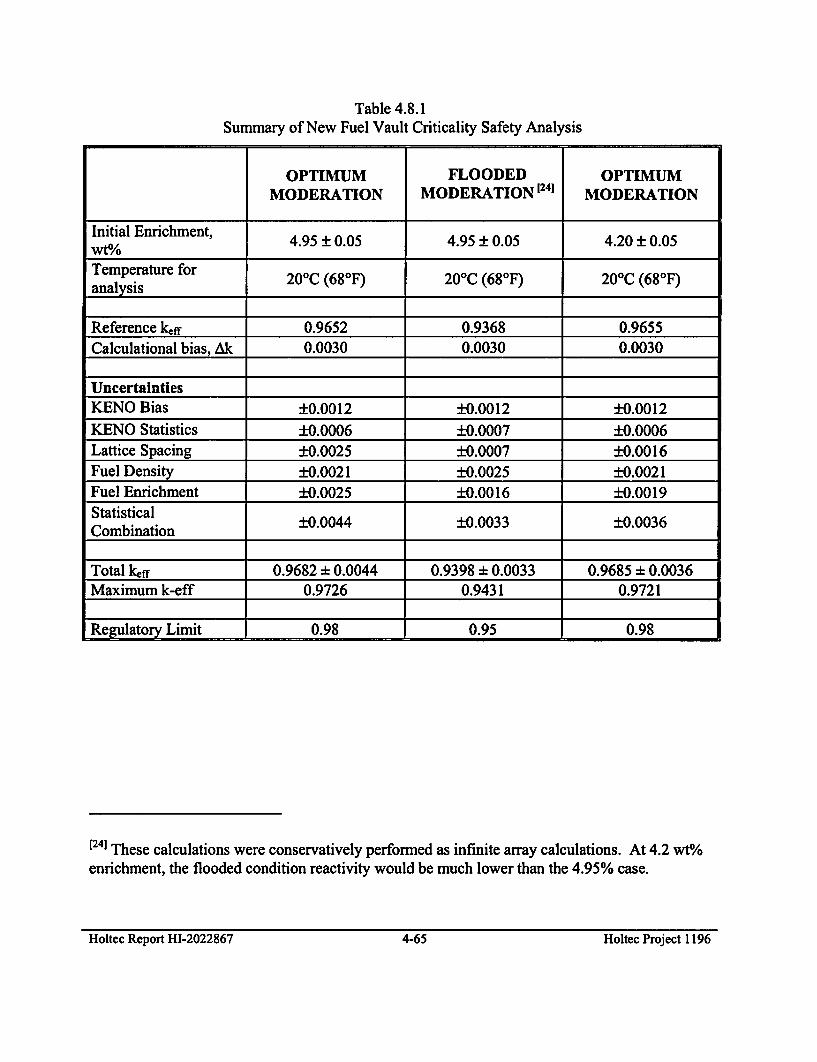
Table 4.8.1Summary of New Fuel Vault Criticality Safety Analysis
OPTIMUM FLOODED OPTIMUMMODERATION MODERATION 12 41 MODERATION
Initial Enrichment, 4.95 ± 0.05 4.95 ± 0.05 4.20 ± 0.05wt%Temperature for 200 C (680F) 20-C (68 0F) 200C (68°F)analysis
Reference keff 0.9652 0.9368 0.9655Calculational bias, Ak 0.0030 0.0030 0.0030
UncertaintiesKENO Bias ±0.0012 ±0.0012 ±0.0012KENO Statistics ±0.0006 ±0.0007 ±0.0006Lattice Spacing ±0.0025 ±0.0007 ±0.0016Fuel Density ±0.0021 ±0.0025 ±0.0021Fuel Enrichment ±0.0025 ±0.0016 ±0.0019StatisticalCombiation ±0.0044 ±0.0033 ±0.0036Combination
Total keff 0.9682 :k 0.0044 0.9398 ± 0.0033 0.9685 ± 0.0036Maximum k-eff 0.9726 0.9431 0.9721
Regulatory Limit 0.98 0.95 0.98
E243 These calculations were conservatively performed as infinite array calculations. At 4.2 wt0/oenrichment, the flooded condition reactivity would be much lower than the 4.95% case.
Holtec Report 111-2022867 4-65 Holtec Project 1196Holtec Report HI-2022867 4-65 Holtec Project 1196
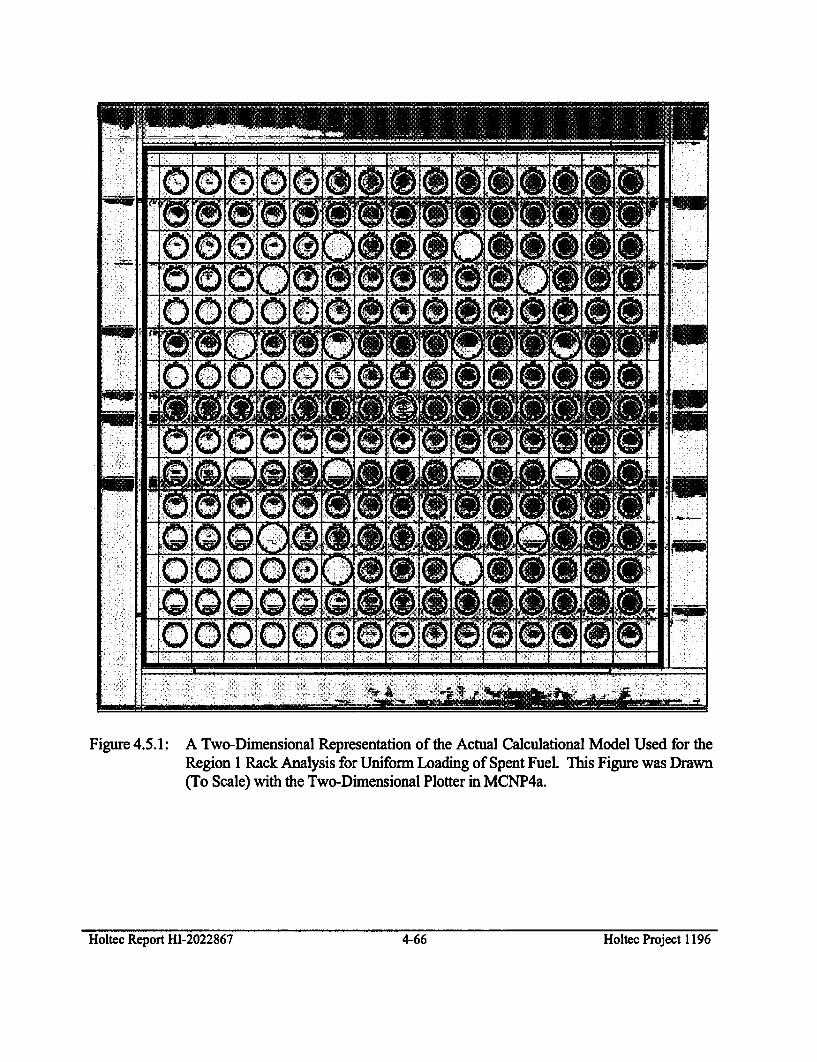
Figure 4.5.1: A Two-Dimensional Representation of the Actual Calculational Model Used for theRegion 1 Rack Analysis for Uniform Loading of Spent Fuel. This Figure was Drawn(To Scale) with the Two-Dimensional Plotter in MCNP4a.
Holtec Report HI-2022867 4-66 Holtec Project 1196
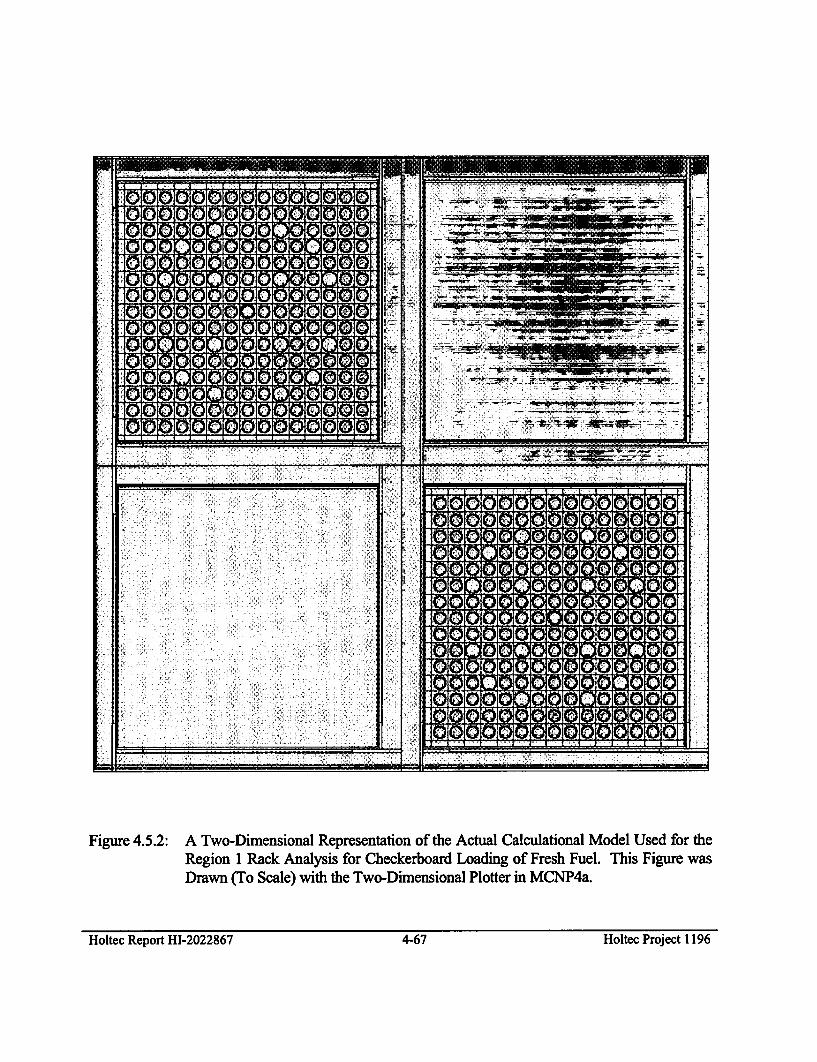
bzI
i- ,-•
I1 -OMN W--
~III
I1tIIIt
It
II
I
Figure 4.5.2: A Two-Dimensional Representation of the Actual Calculational Model Used for theRegion 1 Rack Analysis for Checkerboard Loading of Fresh Fuel. This Figure wasDrawn (To Scale) with the Two-Dimensional Plotter in MCNP4a.
Holtec Report 111-2022867 4-67 Holtec Project 1196Holtec Report HI-2022867 4-67 Holtec: Project 1196
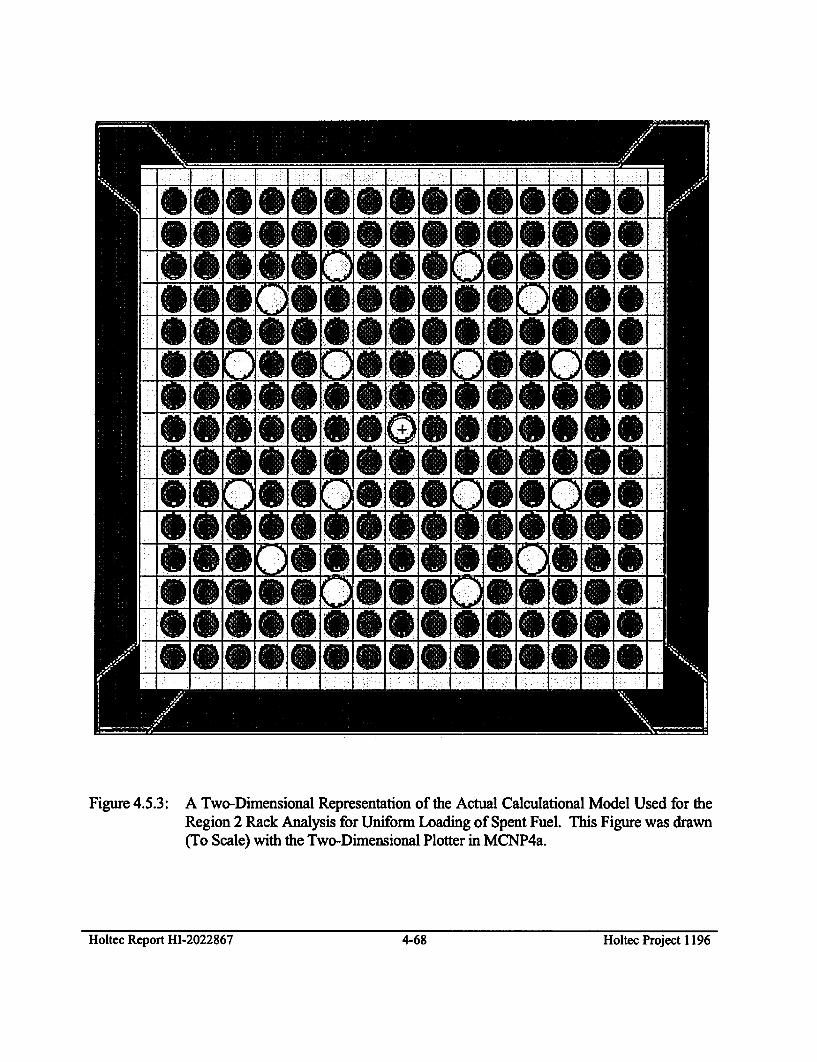
*1110100* NO, 111101110O* _ _ _DI
.00 SOSS ~SS0
0** .,,,,,010
Figure 4.5.3: A Two-Dimensional Representation of the Actual Calculational Model Used for theRegion 2 Rack Analysis for Uniform Loading of Spent Fuel. This Figure was drawn(To Scale) with the Two-Dimensional Plotter in MCNP4a.
Holtec Report HI-2022867 4-68 Holtec Project 1196Holtec Report HI-2022867 4-68 Holtec: Project 1196
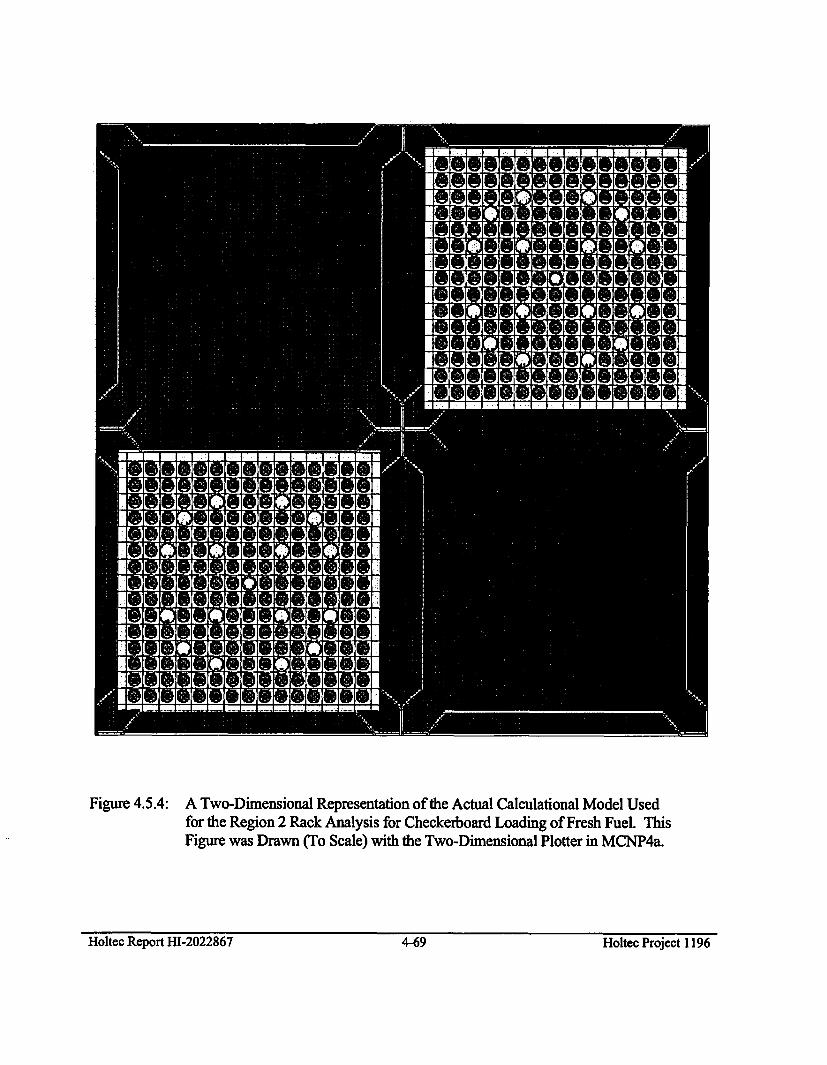
Figure 4.5.4: A Two-Dimensional Representation of the Actual Calculational Model Usedfor the Region 2 Rack Analysis for Checkerboard Loading of Fresh Fuel. ThisFigure was Drawn (To Scale) with the Two-Dimensional Plotter in MCNP4a.
Holtec Report HI-2022867 4-69 Holtec Project 1196
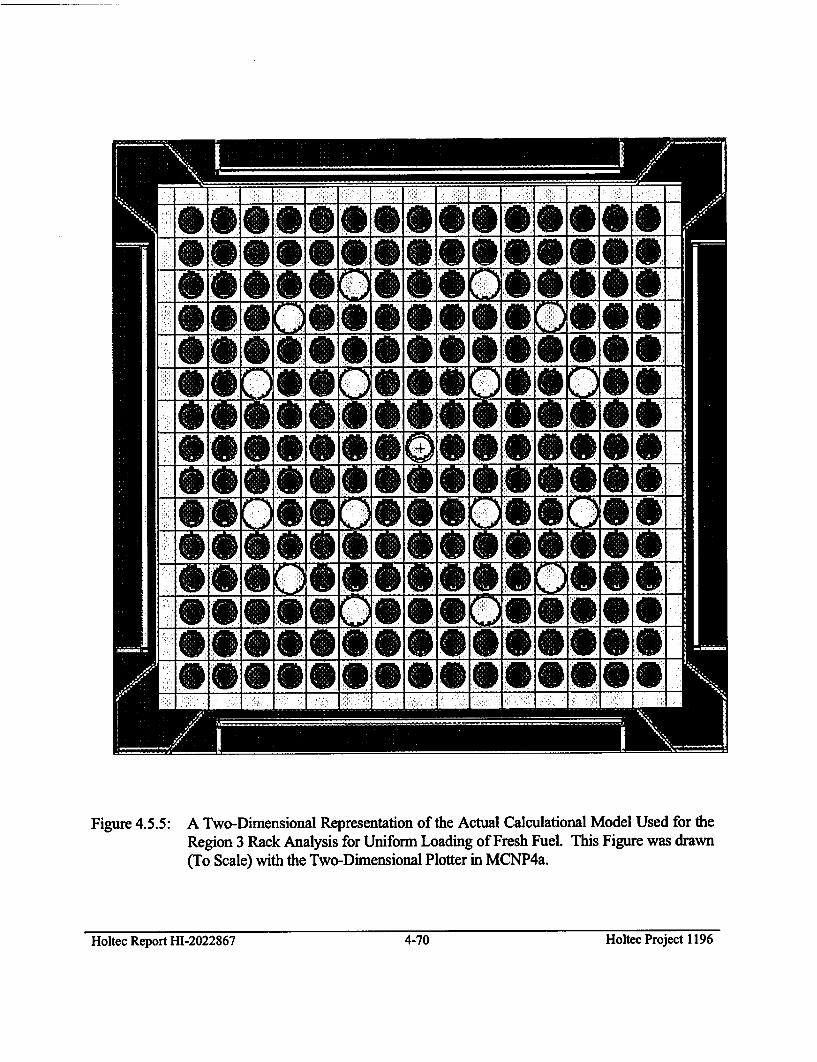
*; ,,,,,*
0@ *@....S.,...
Figure 4.5.5: A Two-Dimensional Representation of the Actual Calculational Model Used for theRegion 3 Rack Analysis for Uniform Loading of Fresh Fuel. This Figure was drawn(To Scale) with the Two-Dimensional Plotter in MCNP4a.
Holtec Report HI-2022867 4-70 Holtec Project 1196Holtec Report HI-2022867 4-70 Holtec: Project 1196
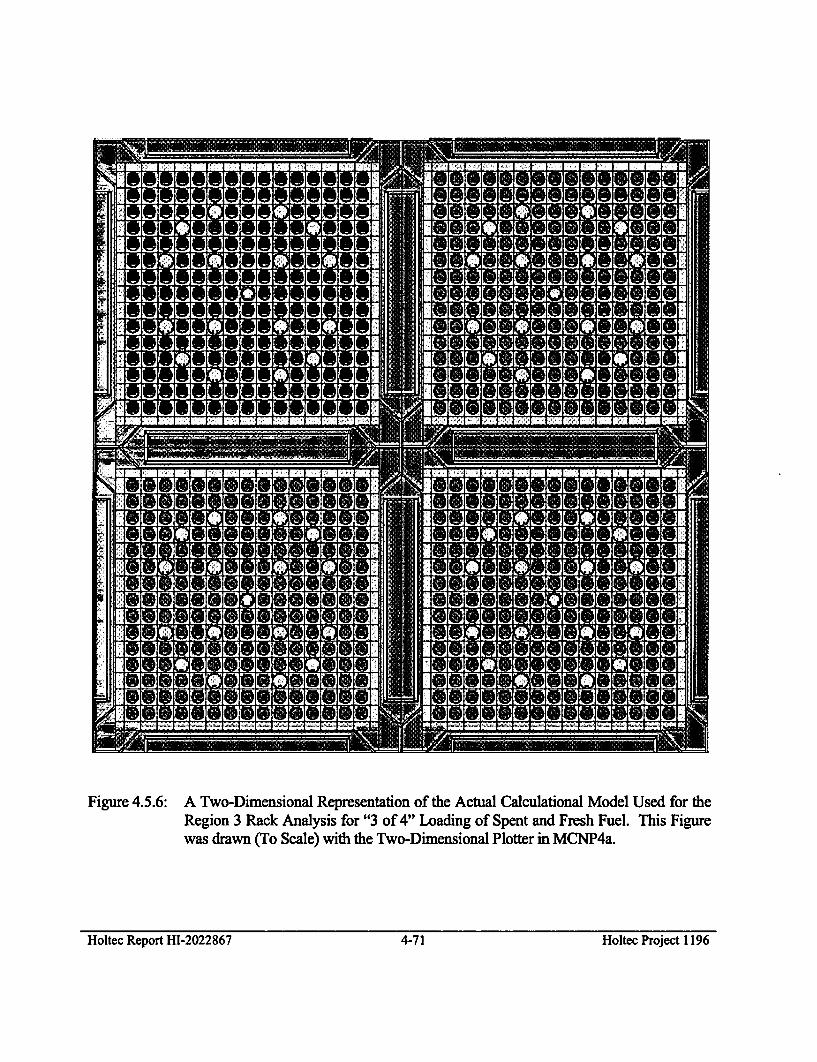
I
Figure 4.5.6: A Two-Dimensional Representation of the Actual Calculational Model Used for theRegion 3 Rack Analysis for "3 of 4" Loading of Spent and Fresh Fuel. This Figurewas drawn (To Scale) with the Two-Dimensional Plotter in MCNP4a.
Holtec Report HI-2022867 4-71 Holtec Project 1196
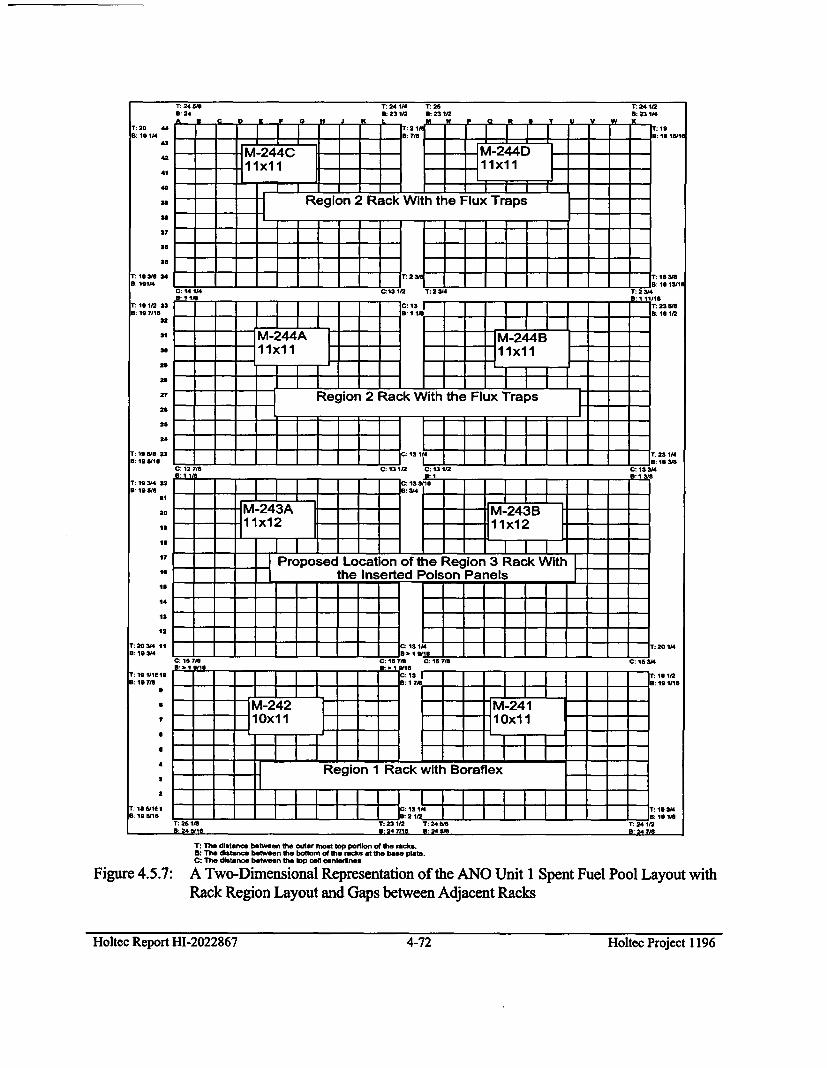
T: 24 WO T:241/4 T:25 T: 24 1/2
5:24 23 1/2 B: 23 122 6:231/4
I~ ~~ ~ JI Is:/2I I I; slifrT 2o
r: lB: iS 1/4
42
41
37
30
37
s4
3: 19 308 3
1:103/ 341
8: 191/4
T01:11/2 33
B: 107818 6
32
31
so
a.
27
26
So
24
T: 10/0 23
B: 10 11a
1:0M4 23
B: l710010
21
30
I
10
4
:1
13
r: 2 3/4 11
0:19 314
1:10 1e1l101710
7a
r: 100150: 1011
1
-
LM-244CIM-24D
1 X1xl 111xll
.. JiJ.111.11.....t1 I I I I
I Region 2 Rack With the Flux Traps
I ' 1 -r 1~ - T - T - T - - -r r - r - r - r T
-+- 0 - EI* T Th 3JE8 -0-9-0-4-
1C: 14114 C:13 1M3
C:___B:
M-244A i11xlI 1
T: 2lSK 1
T: 16 3M1B: 1I 13/1"
T:233
-I I it:i __ is:
1 1 1
/3 0/0/0 1/3
M-244B11xll
I I I I: : : : : : :
Region 2 Rack With the Flux Traps
In7
. .-- -1-- •-I- 4
KI I : 13 MR13C: 13 1/ C: 131/2
I I1I !1T Fh 13-I I
-4-9-I--
-4-9- I-I - -- - --T: 23 1MR. 1. -J
C: 13: /4
. . . I I I I
11x12 11x12I I I 12
1_ Proposed Location of the Region 3 Rack With Ithe Inserted Poison Panels J
I I I I I I I I I I I I I
C: 10 7/0 C: 157181301 101 .- 1_
C:1: 1 1o 1 c :187B
M-242lOxil
'Fill IIii't: 13 1145. 1 P/18
I C: 10
:13 r1 7A0
I I I I I I:30114
'/4¥is U: 151:114
IT:-10121SI I I
'9'9IM-41zm'I I I
Region I Rack with Boraflex Jf
-1-1-1-t-
1. 231 -12 T 240M
4-4-4--
LI]_:341/ 34T. 4118:ISI1:30110- 5:340115
'6118 247,,e 5, 24 510 9:24 718
T: The distance between the outer most top portion of the racks.6: The distance between the bottom of the racks at the base plots.C: The distance between the Op ctll centeulines
Figure 4.5.7: A Two-Dimensional Representation of the ANO Unit 1 Spent Fuel Pool Layout withRack Region Layout and Gaps between Adjacent Racks
Holtec Report HI-2022867 4-72 Holtec Project 1196
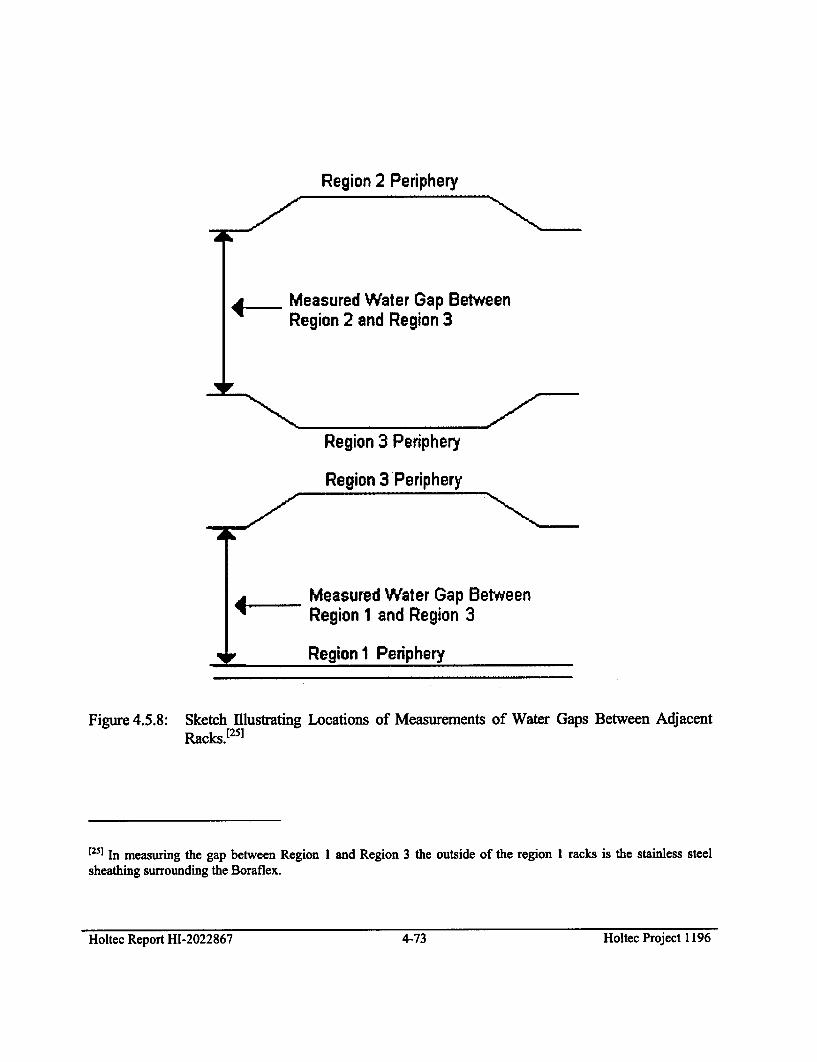
Region 2 Periphery
W-ý
!-'-Measured Water Gap BetweenRegion 2 and Region 3
Region 3 Periphery
I
Region 3 Periphery
Measured Water Gap BetweenRegion 1 and Region 3
Region I Periphery.~i. - - -
Figure 4.5.8: Sketch IllustratingRacks.[2
5 ]Locations of Measurements of Water Gaps Between Adjacent
E251 In measuring the gap between Region 1 and Region 3 the outside of the region 1 racks is the stainless steelsheathing surrounding the Boraflex.
Holtec Report HI-2022867 4-73 Holtec Project 1196
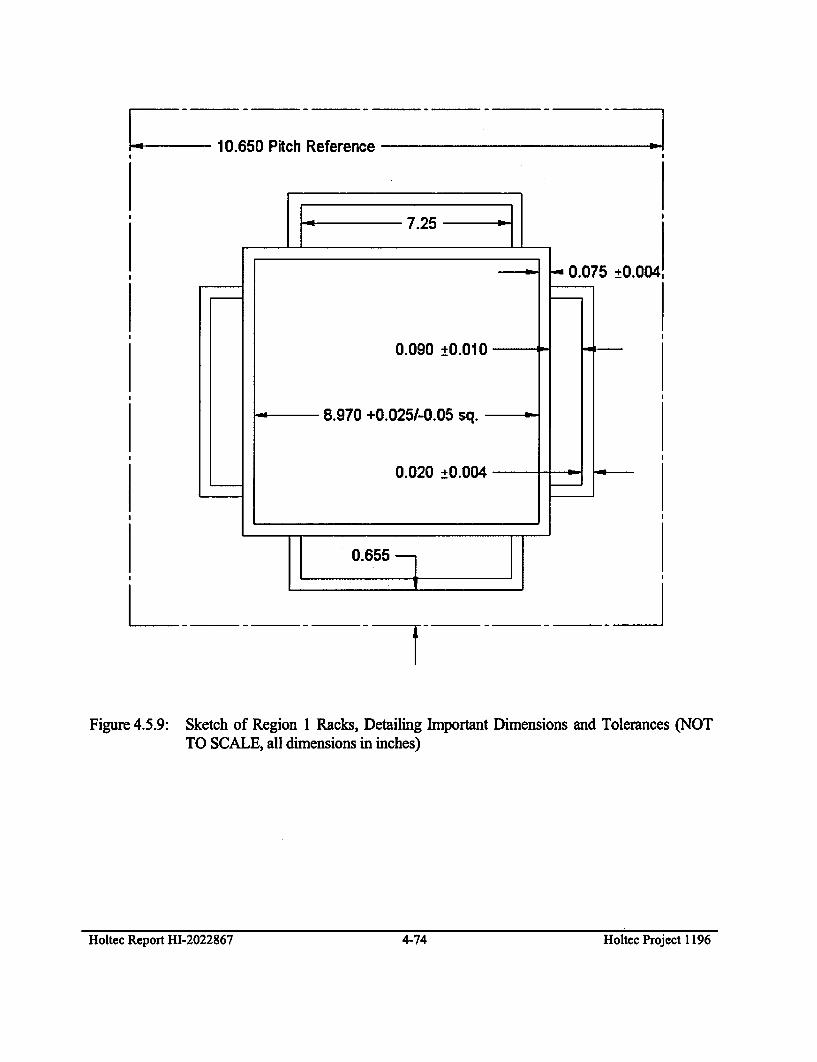
10.650 Pitch Reference
7.25
0.075 ±0.004
0.090 ±0.010
8.970 +0.025/-0.05 sq.
0.020 ±0.004
0.655
Figure 4.5.9: Sketch of Region 1 Racks, Detailing Important Dimensions and Tolerances (NOTTO SCALE, all dimensions in inches)
Holtec Report HI-2022867 4-74 Holtec Project 1196Holtec Report HI-2022867 4-74 Holtec Project 1196
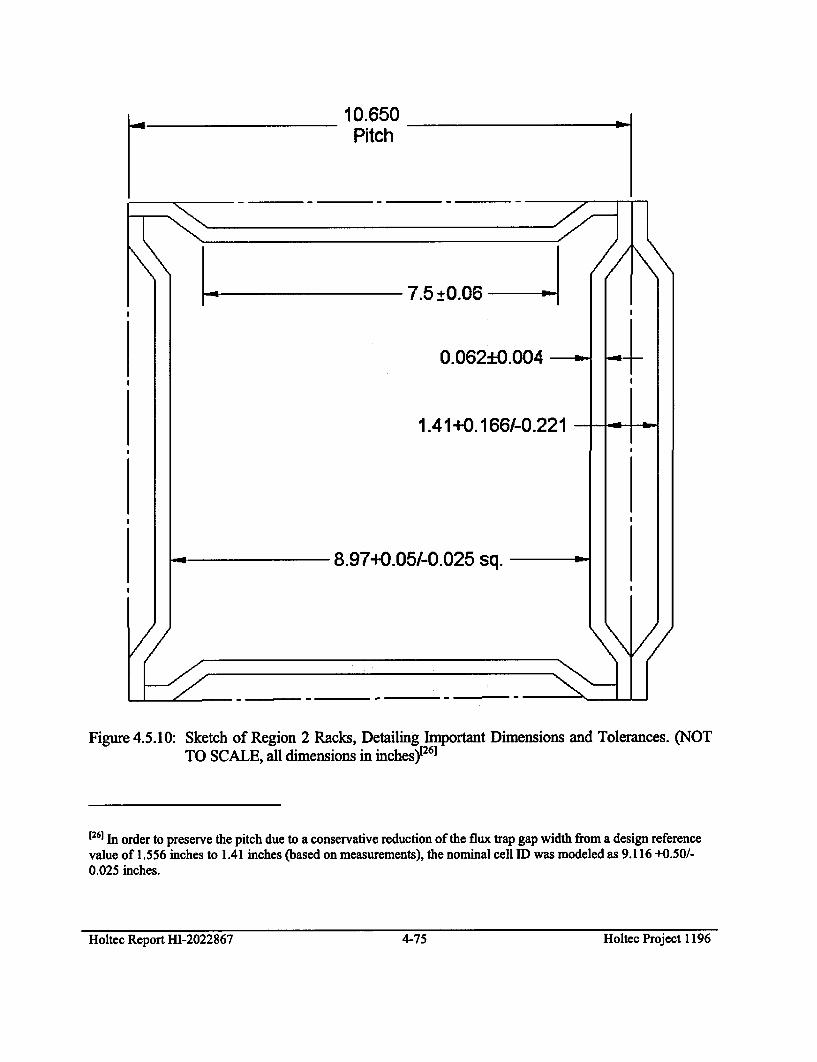
10.650Pitch
7.5±0.06
0.062±0.004
1.41+0.166/-0.221
8.97+0.05/-0.025 sq.
Figure 4.5.10: Sketch of Region 2 Racks, Detailing Important Dimensions and Tolerances. (NOTTO SCALE, all dimensions in inches)r261
[261 In order to preserve the pitch due to a conservative reduction of the flux trap gap width from a design reference
value of 1.556 inches to 1.41 inches (based on measurements), the nominal cell ID was modeled as 9.116 +0.50/-0.025 inches.
Holtec Report HI-2022867 4-75 Holtec Project 1196Holtec Report HI-2022867 4-75 Holtec Project 1196
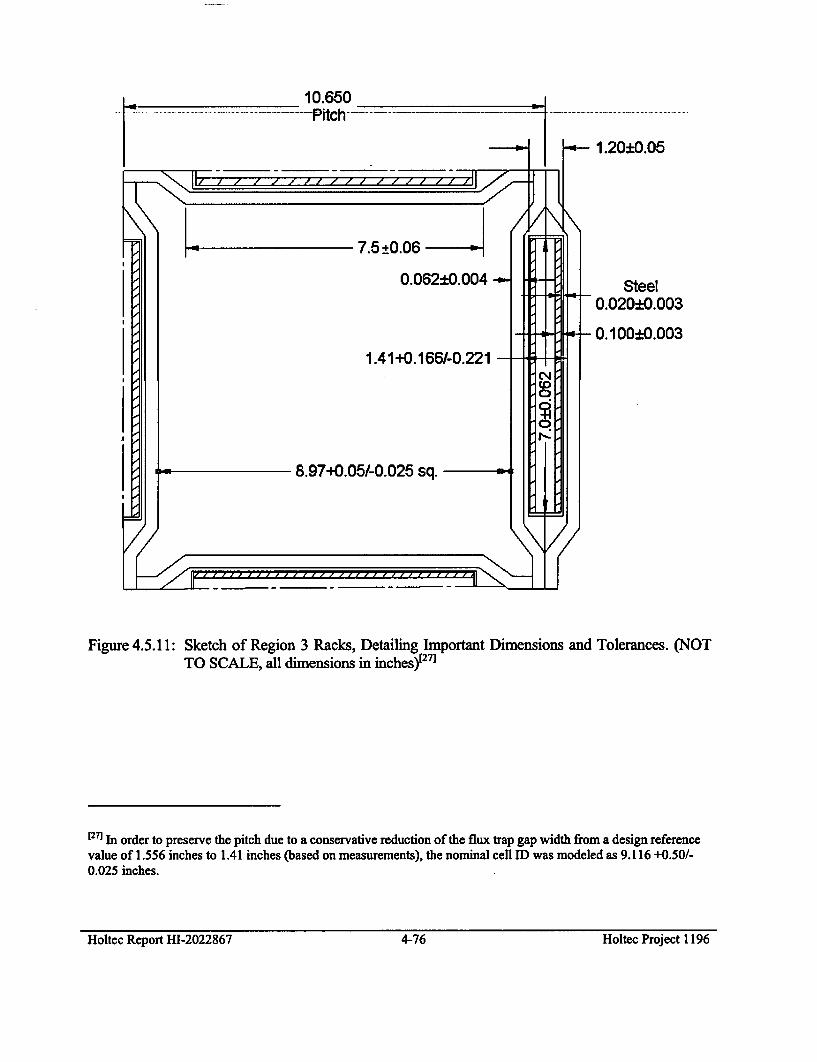
10.650
I -- 1.20±0.05
l g7 .5 _* 0 .0 6 -- o
0.062±0.004 Steel0.020±0.003
0.100±0.0031.41+0.166/-0.221
8.97+0.05/-0.025 sq.
Figure 4.5.11: Sketch of Region 3 Racks, Detailing Important Dimensions and Tolerances. (NOTTO SCALE, all dimensions in inches)E271
[271] In order to preserve the pitch due to a conservative reduction of the flux trap gap width from a design reference
value of 1.556 inches to 1.41 inches (based on measurements), the nominal cell ID was modeled as 9.116 +0.50/-0.025 inches.
Holtec Report HI-2022867 4-76 Holtec Project 1196Holtec Report HI-2022867 4-76 Holtec: Project 1196
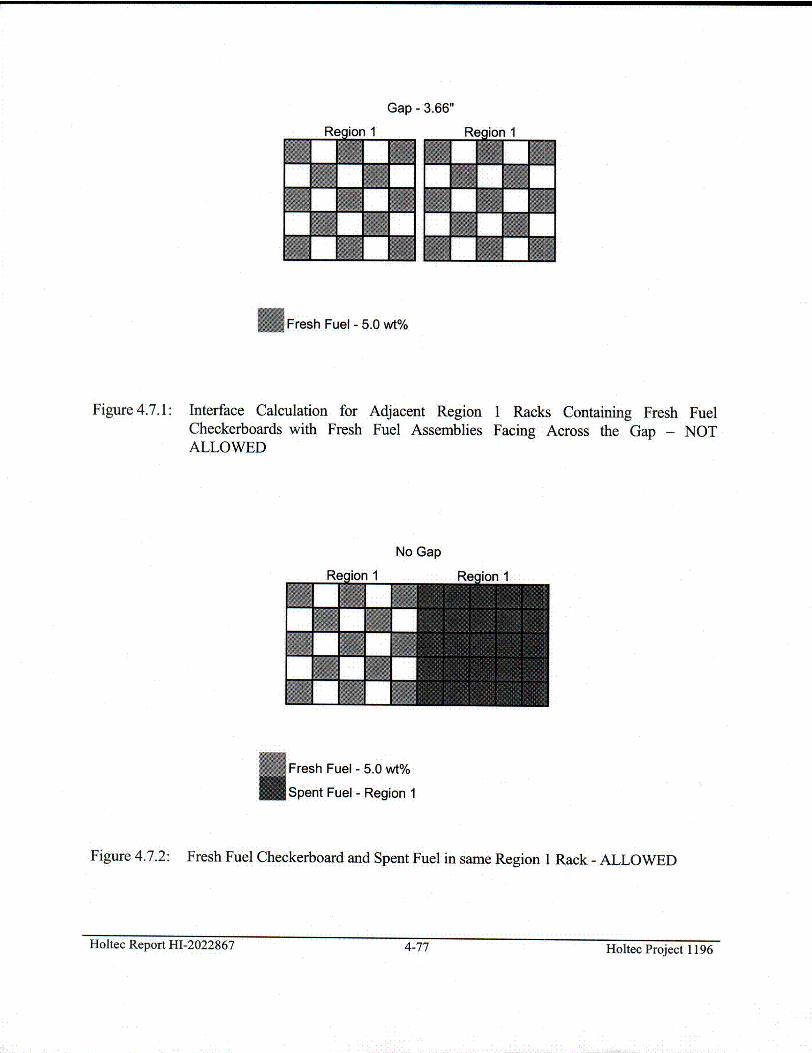
Gap - 3.66"
II
I Fresh Fuel - 5.0 wt%
Figure 4.7.1: Interface Calculation for Adjacent Region 1 Racks Containing Fresh FuelCheckerboards with Fresh Fuel Assemblies Facing Across the Gap - NOTALLOWED
No Gap
resh Fuel - 5.0 wt%
pent Fuel - Region 1
Figure 4.7.2: Fresh Fuel Checkerboard and Spent Fuel in same Region 1 Rack - ALLOWED
Holtec Report HI-2022867 4-77 Holtec Project 1196Holtec Report HI-2022867 4-77 Holtec Project 1196
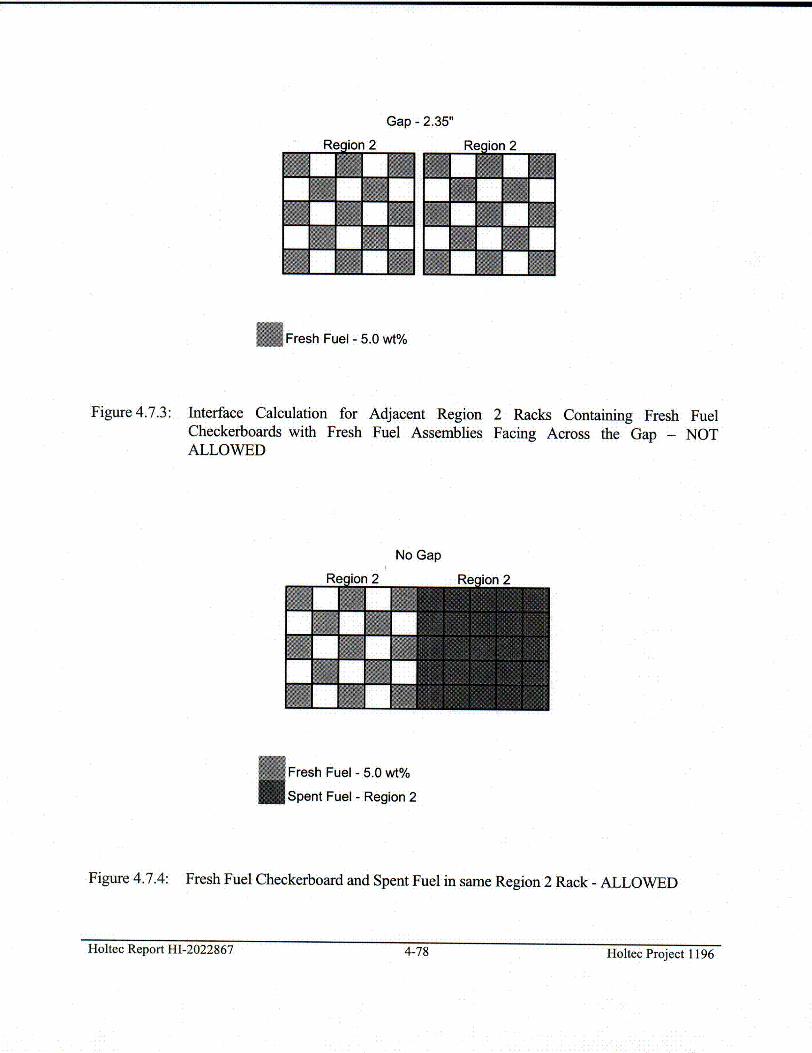
Gap - 2.35"
Fresh Fuel - 5.0 wt%
Figure 4.7.3: Interface Calculation for Adjacent Region 2 Racks Containing Fresh FuelCheckerboards with Fresh Fuel Assemblies Facing Across the Gap - NOTALLOWED
No Gap
:resh Fuel - 5.0 wt%
3pent Fuel - Region 2
Figure 4.7.4: Fresh Fuel Checkerboard and Spent Fuel in same Region 2 Rack - ALLOWED
Holtec Report HI-2022867 4-78 Holtec Project 1196Holtec Report HI-2022867 4-78 Holtec Project 1196
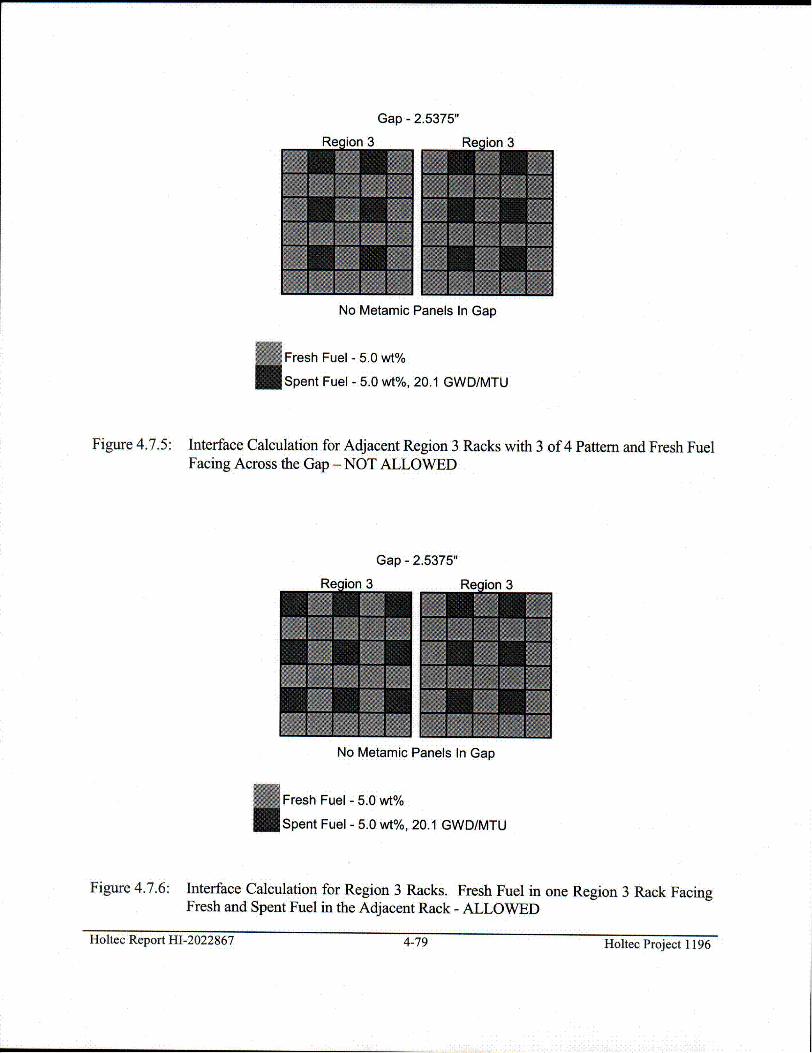
Gap - 2.5375"
No Metamic Panels In Gap
E Fresh Fuel - 5.0 wt%
Spent Fuel - 5.0 wt%, 20.1 GWD/MTU
Figure 4.7.5: Interface Calculation for Adjacent Region 3 Racks with 3 of 4 Pattern and Fresh FuelFacing Across the Gap - NOT ALLOWED
Gap - 2.5375"
No Metamic Panels In Gap
resh Fuel - 5.0 wt%
pent Fuel - 5.0 wt%, 20.1 GWD/MTU
Figure 4.7.6: Interface Calculation for Region 3 Racks. Fresh Fuel in one Region 3 Rack FacingFresh and Spent Fuel in the Adjacent Rack - ALLOWED
Holtec Report HI-2022867 4-79 Holtec Project 1196Holtec Report HI-2022867 4-79 Holtec Project 1196
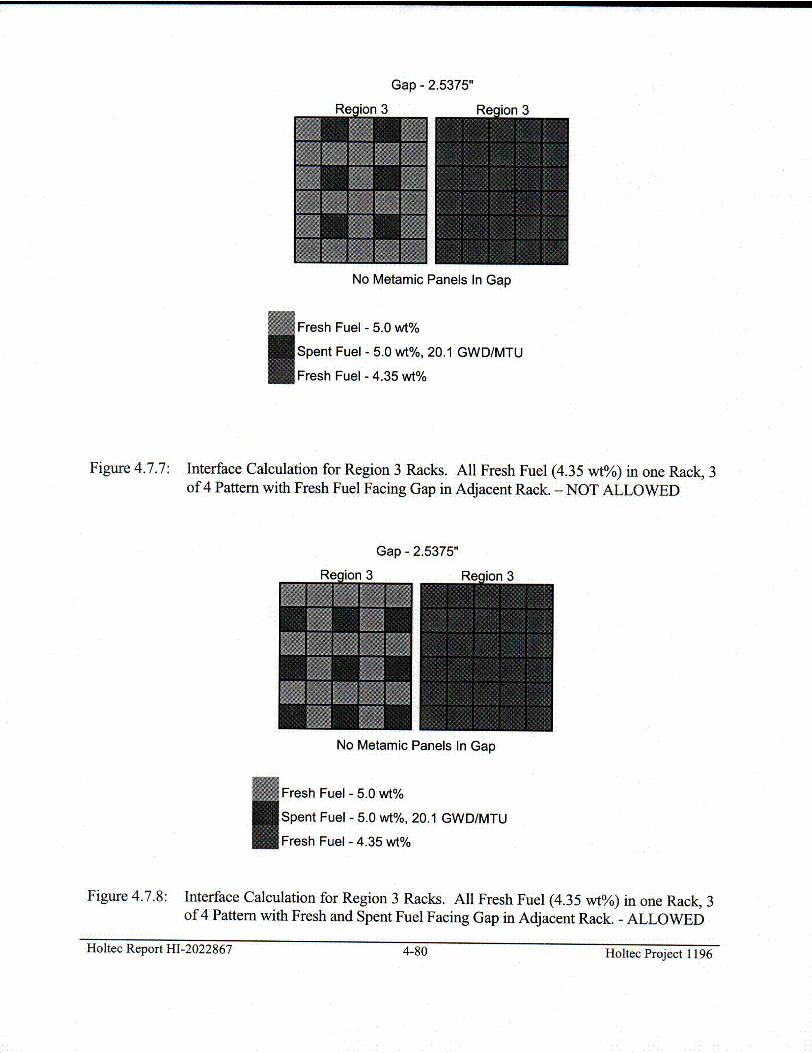
Gap - 2.5375"
No Metamic Panels In Gap
i Fresh Fuel - 5.0 wt%
Spent Fuel - 5.0 wt%, 20.1 GWD/MTU
Fresh Fuel - 4.35 wt%
Figure 4.7.7: Interface Calculation for Region 3 Racks. All Fresh Fuel (4.35 wt%/o) in one Rack, 3of 4 Pattern with Fresh Fuel Facing Gap in Adjacent Rack. - NOT ALLOWED
Gap - 2.5375"
No Metamic Panels In Gap
Fresh Fuel - 5.0 wt%
Spent Fuel - 5.0 wt%, 20.1 GWD/MTU
Fresh Fuel - 4.35 wt%
Figure 4.7.8: Interface Calculation for Region 3 Racks. All Fresh Fuel (4.35 wt%) in one Rack, 3of 4 Pattern with Fresh and Spent Fuel Facing Gap in Adjacent Rack. - ALLOWED
rioiiec I'~epon rlI-LULLZ5c, I 4-80 Holtec Project 1196Holtec Reportkil-2.02-2867 4-80 Holtec Project 1196
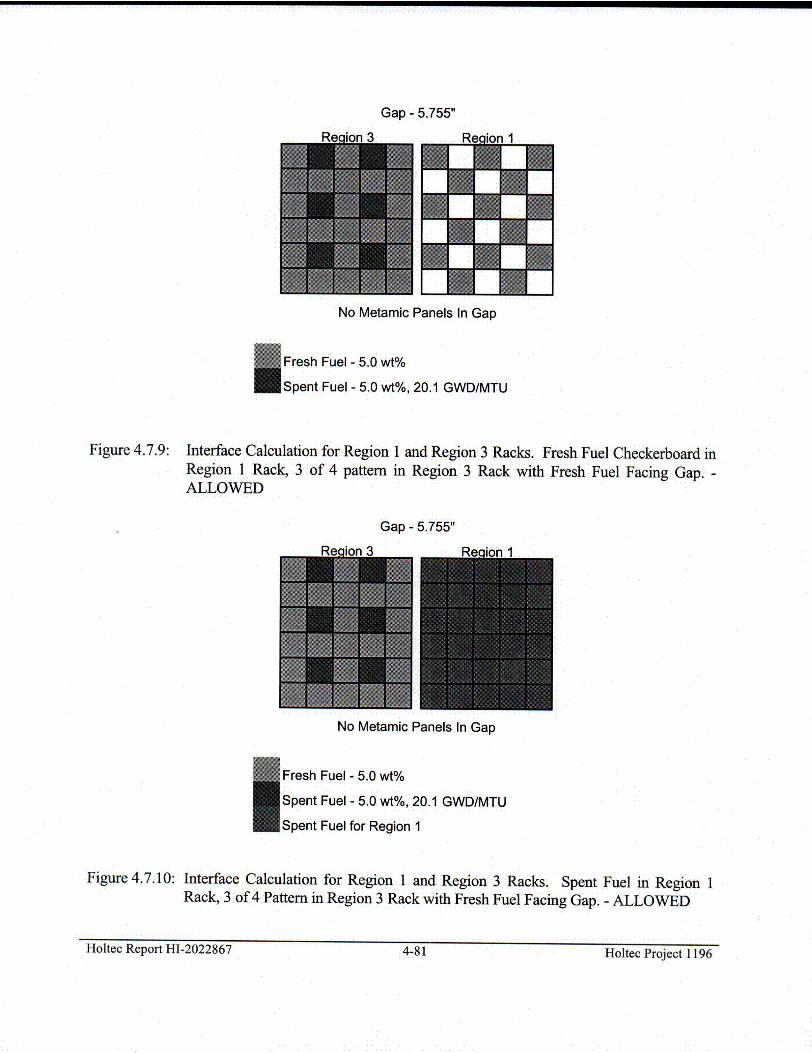
Gap - 5.755"
AMMLEINo Metamic Panels In Gap
Fresh Fuel - 5.0 wt%
Spent Fuel - 5.0 wt%, 20.1 GWD/MTU
Figure 4.7.9: Interface Calculation for Region 1 and Region 3 Racks. Fresh Fuel Checkerboard inRegion 1 Rack, 3 of 4 pattern in Region 3 Rack with Fresh Fuel Facing Gap. -ALLOWED
Gap - 5.755"
I
No Metamic Panels In Gap
Fresh Fuel - 5.0 wt%
Spent Fuel - 5.0 wt%, 20.1 GWD/MTU
Spent Fuel for Region 1
Figure 4.7.10: Interface Calculation for Region 1 and Region 3 Racks. Spent Fuel in Region 1Rack, 3 of 4 Pattern in Region 3 Rack with Fresh Fuel Facing Gap. - ALLOWED
Holtec Report HI-2022867 4-81 Holtec Project 1196Holtec Report HI-2022867 4-81 Holtec Project 1196
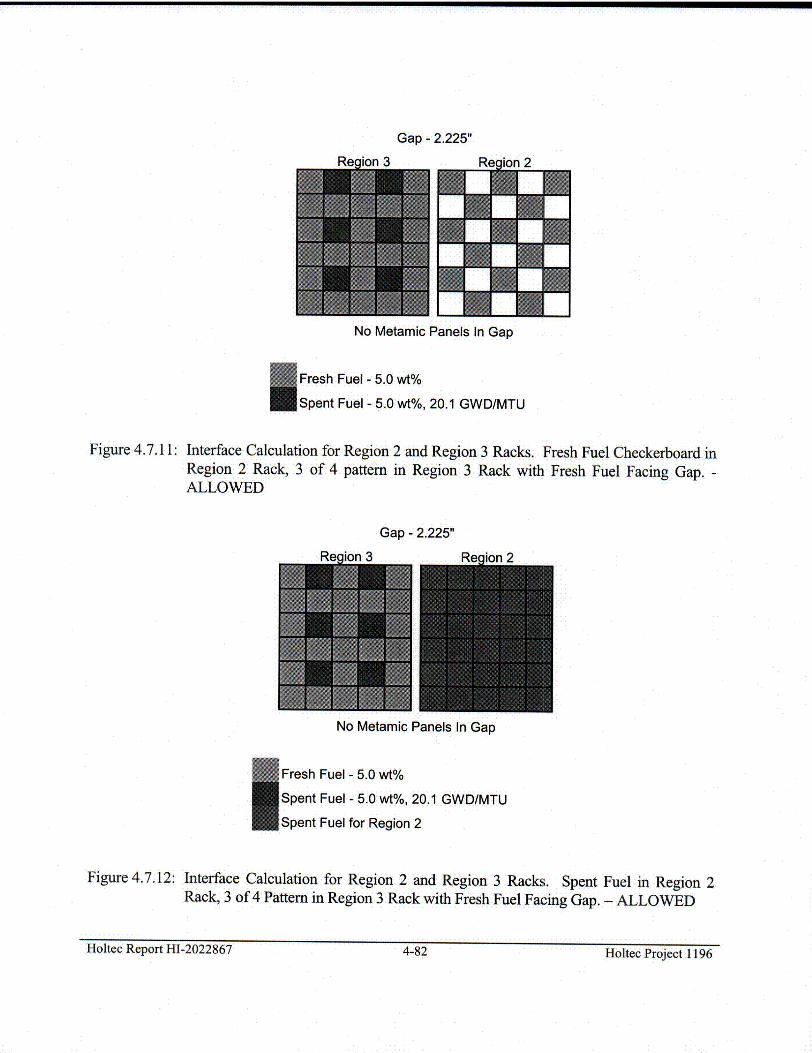
Gap - 2.225"
No Metamic Panels In Gap
Fresh Fuel - 5.0 wt%Spent Fuel - 5.0 wt%, 20.1 GWD/MTU
Figure 4.7.11: Interface Calculation for Region 2 and Region 3 Racks. Fresh Fuel Checkerboard inRegion 2 Rack, 3 of 4 pattem in Region 3 Rack with Fresh Fuel Facing Gap. -ALLOWED
Gap - 2.225"
No Metamic Panels In Gap
Fresh Fuel - 5.0 wt%
Spent Fuel - 5.0 wt%, 20.1 GWD/MTU
Spent Fuel for Region 2
Figure 4.7.12: Interface Calculation for Region 2 and Region 3 Racks. Spent Fuel in Region 2Rack, 3 of 4 Pattern in Region 3 Rack with Fresh Fuel Facing Gap. - ALLOWED
noitec ~eport tii-LU21~~ I 4-82 Holtec Project 1196Holtec Report HI-2022867 4-82 Holtec Project 1196
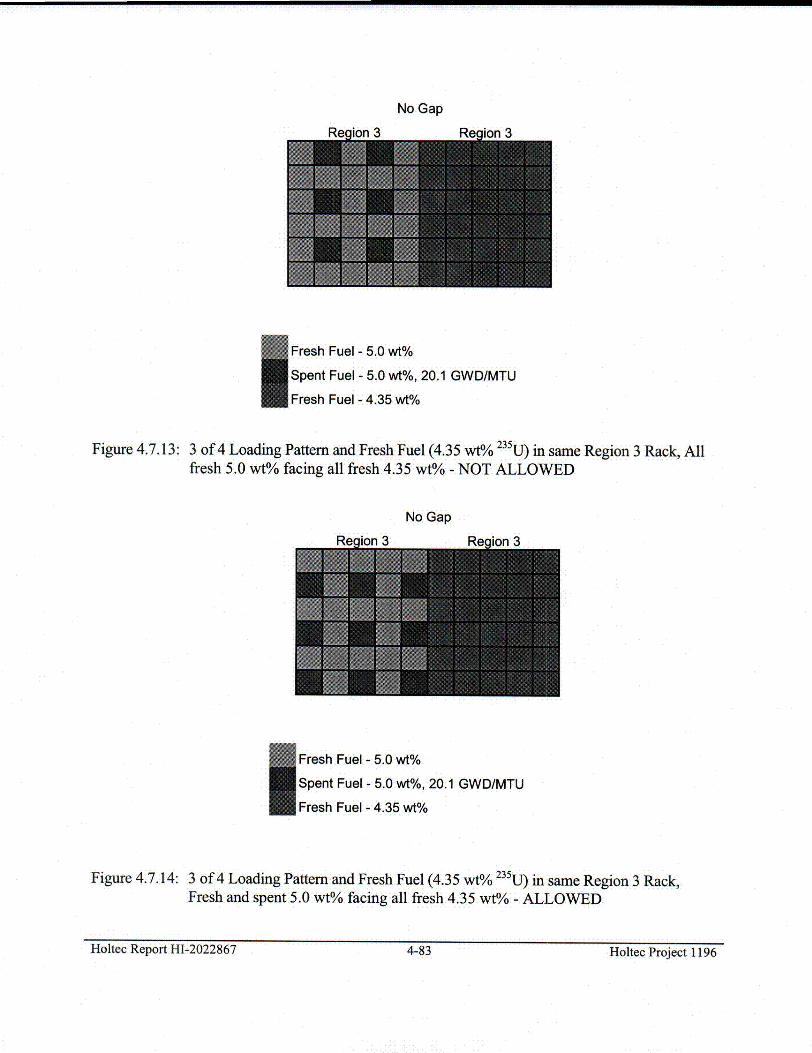
No Gap
Fresh Fuel - 5.0 wt%
Spent Fuel - 5.0 wt%, 20.1 GWD/MTU
Fresh Fuel - 4.35 wt%
Figure 4.7.13: 3 of 4 Loading Pattern and Fresh Fuel (4.35 wtO 235U) in same Region 3 Rack, Allfresh 5.0 wt% facing all fresh 4.35 wt% - NOT ALLOWED
No Gap
Fresh Fuel - 5.0 wt%
Spent Fuel - 5.0 wt%, 20.1 GWD/MTU
Fresh Fuel - 4.35 wt%
Figure 4.7.14: 3 of 4 Loading Pattern and Fresh Fuel (4.35 wt% 235U) in same Region 3 Rack,Fresh and spent 5.0 wt% facing all fresh 4.35 wt% - ALLOWED
Holtec Report HI-2022867 4-83 Holtec Project 1196
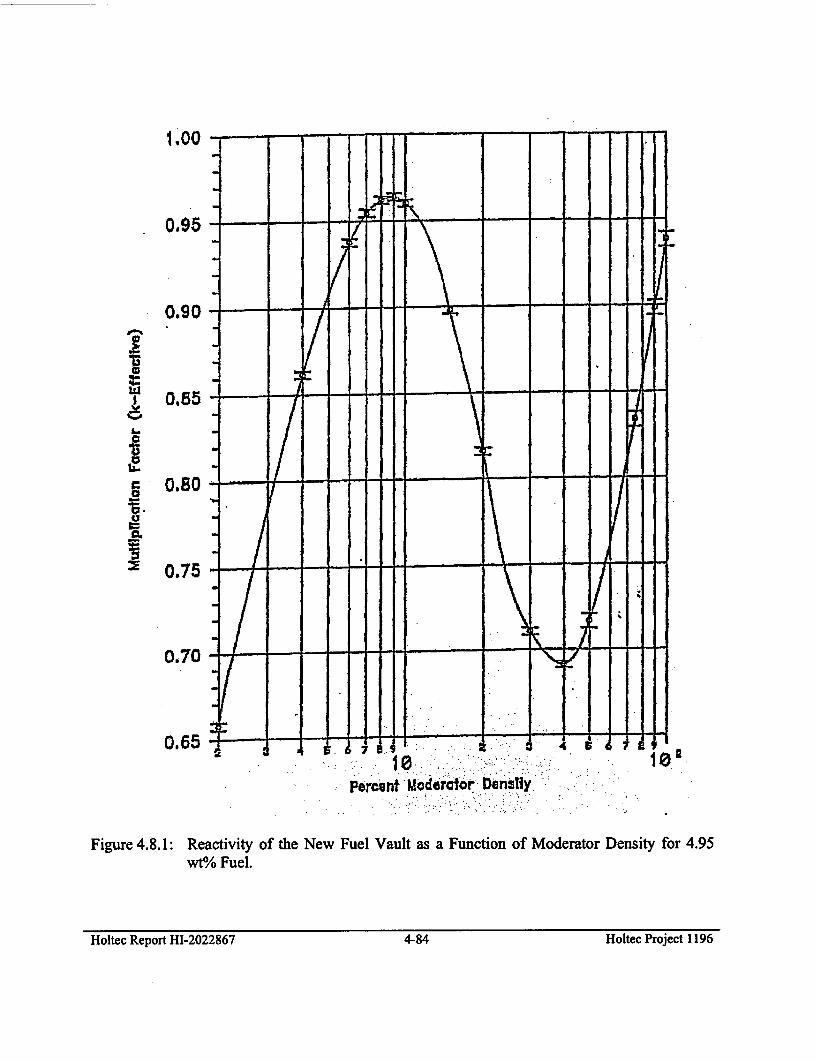
1.0 0
- - - - - -- - - - -
0.95 , - - . . - -• - ,, ,
0U90 - - - - -- . :
0.85----
0
13
0.8
0.7
0.70 --. " - -
0.65f I A - - 1 Z 4
10 10'
Percent Moderato Densiy
Figure 4.8.1: Reactivity of the New Fuel Vault as a Function of Moderator Density for 4.95wt0/o Fuel.
Holtec Project 1196Holtec Report HI-2022867 4-84 Holtec Project 1196
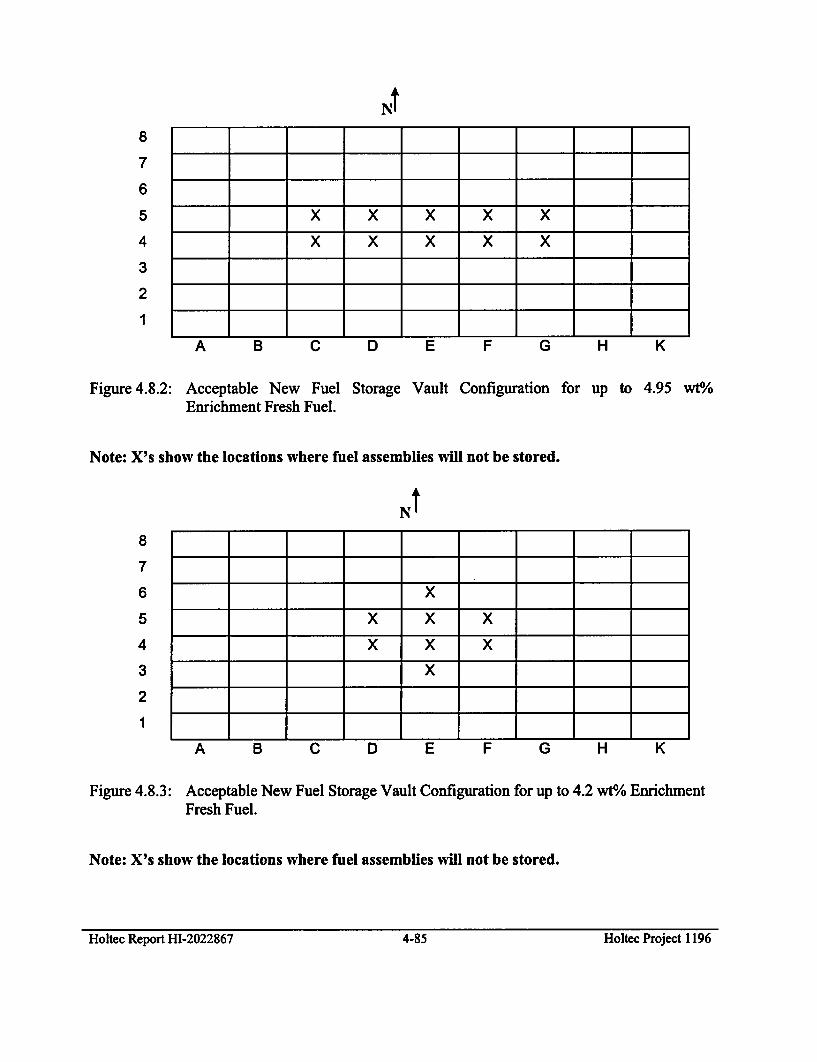
Nt
8
7
6
5
4
3
2
1
x x x x xx x x x x
A B C D E F G H K
Figure 4.8.2: Acceptable New FuelEnrichment Fresh Fuel.
Storage Vault Configuration for up to 4.95 wt%
Note: X's show the locations where fuel assemblies will not be stored.
Nt
8
7
6
5
4
3
2
1
Figure 4.8.3: Acceptable New Fuel Storage Vault Configuration for up to 4.2 wt0/o EnrichmentFresh Fuel.
Note: X's show the locations where fuel assemblies will not be stored.
Holtec Report HI-2022867 4-85 Holtec Project 1196
APPENDIX 4A: BENCHMARK CALCULATIONS
4A. 1 INTRODUCTIQN AND SUMMARY
Benchmark calculations have been made on selected critical experiments, chosen, in so faras possible, to bound the range of variables in the rack designs. Two independent methodsof analysis were used, differing in cross section libraries and in the treatment of the crosssections. MCNP4a [4A. 1] is a continuous energy Monte Carlo code and K.NO5a 14A.2]uses group-dependent cross sections. For the KENO5a analyses reported here, the 238-group library was chosen, processed through the NITAWL-II [4A.2] program to create aworking library and to account for resonance self-shielding in uranium-238 (Nordheimintegral treatment). The 238 group library was chosen to avoid or minimize the errorst(trends) that have been reported (e.g., [4A.3 through 4A.5]) for calculations with collapsedcross section sets.
In rack designs, the three most significant parameters affecting criticality are (1) the fuelenrichment, (2) the '%B loading in the neutron absorber, and (3) the lattice spacing (orwater-gap thickness if a flux-trap design is used). Other parameters, within the normalrange of rack and fuel designs, have a smaller effect, but are also included in the analyses.
Table 4A. 1 summarizes results of the benchmark calculations for all cases selected andanalyzed, as referenced in the table. The effect of the major variables are discussed insubsequent sections below. It is important to note that there is obviously considerableoverlap in parameters since it is not possible to vary a single parameter and maintaincriticality; some other parameter or parameters must be concurrently varied to maintaincriticality.
One possible way of representing the data is through a spectrum index that incorporates allof the variations in parameters. KENO5a computes and prints the "energy of the averagelethargy causing fission" (EALF). In MCNP4a, by utilizing the tally option with theidentical 238-group energy structure as in KENO5a, the number of fissions in each groupmay be collected and the EALF determined (post-processing).
Small but observable trends (errors) have been reported for calculations with the27-group and 44-group collapsed libraries. These errors are probably due to theuse of a single collapsing spectrum when the spectrum should be different for thevarious cases analyzed, as evidenced by the spectrum indices.
Appendix 4A, Page I
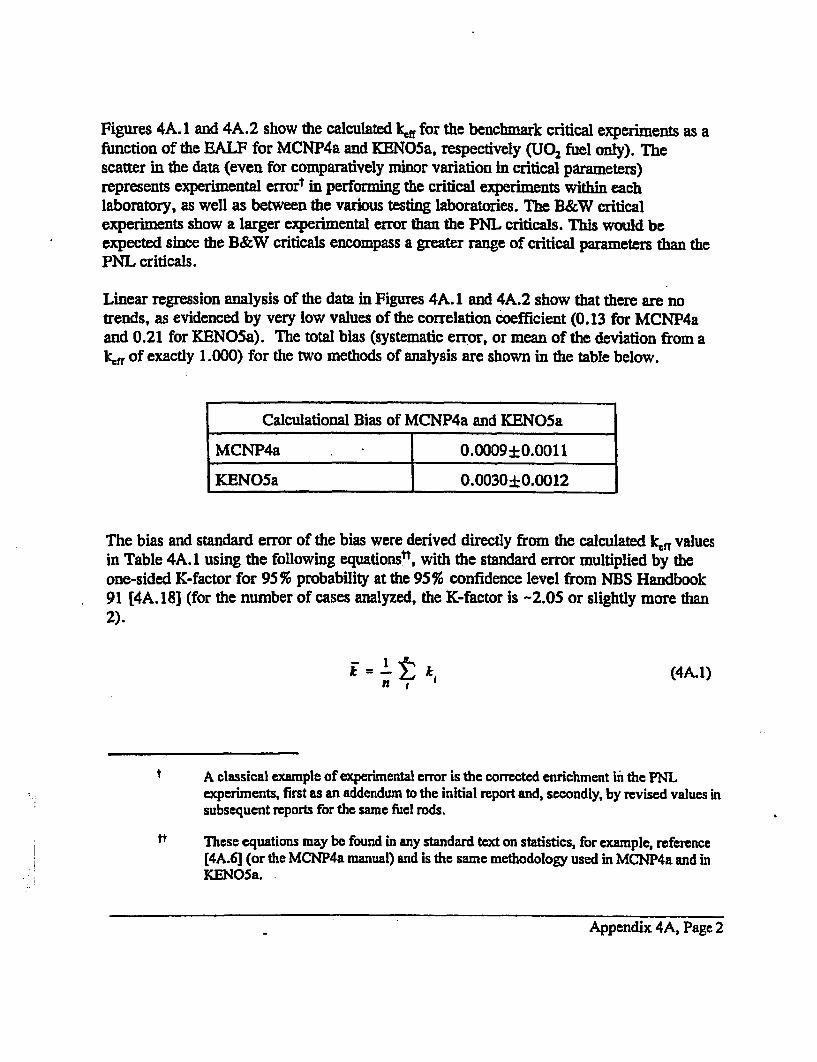
Figures 4A.1 and 4A.2 show the calculated kff for the benchmark critical experiments as afunction of the EALF for MCNP4a and KENO5a, respectively (U0 2 fuel only). Thescatter in the data (even for comparatively minor variation in critical parameters)represents experimental errort in performing the critical experiments within eachlaboratory, as well as between the various testing laboratories. The B&W criticalexperiments show a larger experimental error than the PNL criticals. This would beexpected since the B&W criticals encompass a greater range of critical parameters than thePNL criticals.
Linear regression analysis of the data in Figures 4A. 1 and 4A.2 show that there are notrends, as evidenced by very low values of the correlation coefficient (0.13 for MCNP4aand 0.21 for KENQ5a). The total bias (systematic error, or mean of the deviation from akl of exactly 1.000) for the two methods of analysis are shown in the table below.
Calculational Bias of MCNP4a and KENOSaMCNP4a 0.0009+0.0011
KENO5a 0.0030±0.0012
The bias and standard error of the bias were derived directly from the calculated lkr valuesin Table 4A. 1 using the following equations", with the standard error multiplied by theone-sided K-factor for 95 % probability at the 95 % confidence level from NBS Handbook91 [4A. 18] (for the number of cases analyzed, the K-factor Is -2.05 or slightly more than2).
(4A.1)
A classical example of experimental error is the corrected enrichment in the PNLexperiments, first as an addendum to the initial report and, secondly, by revised values insubsequent reports for the same fuel rods.
tt These equations may be found in any standard text on statistics, for example, reference[4A.6] (or the MCNP4a manual) and is the same methodology used in MCNP4a and inKENO5a.
Appendix 4A, Page 2
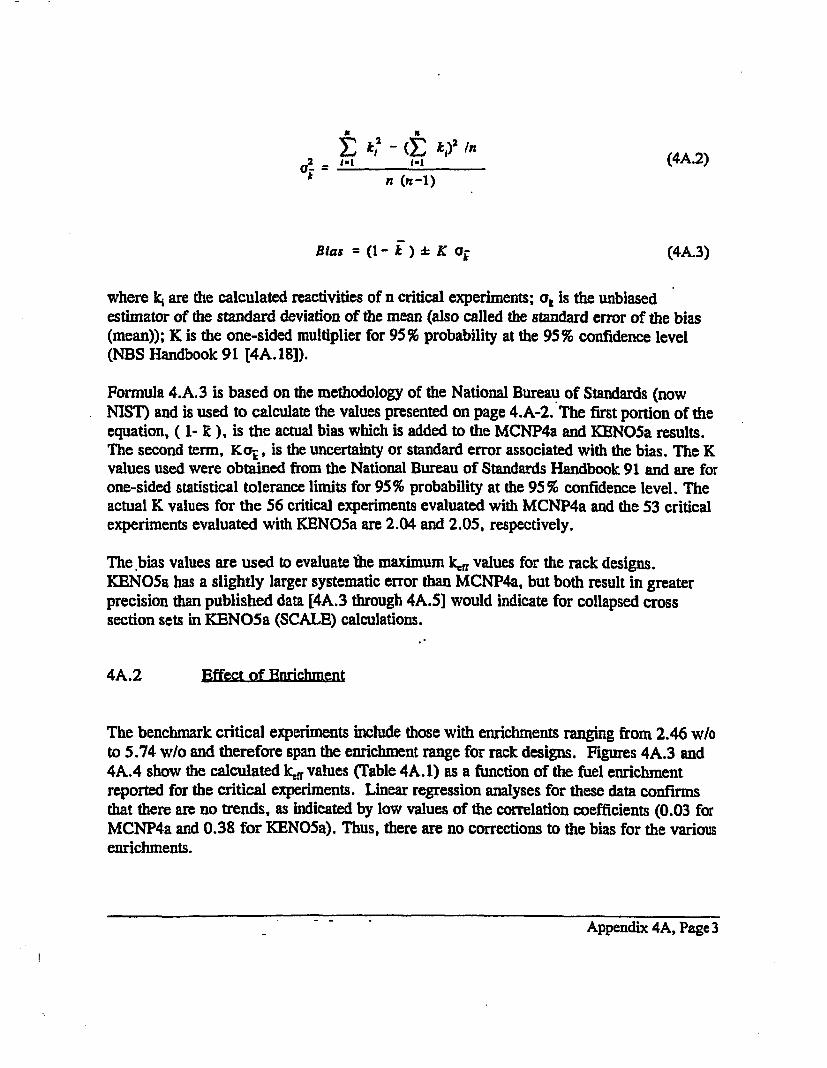
k2_(E t,)2 In-I- va 1 (4A.2)
n (n-1)
Bias = (I- ") d- Ko (4A.3)
where k, are the calculated reactivities of n critical experiments; o; is the unbiased
estimator of the standard deviation of the mean (also called the standard error of the bias
(mean)); K is the one-sided multiplier for 95 % probability at the 95 % confidence level
(NBS Handbook 91 [4A. 18]).
Formula 4.A.3 is based on the methodology of the National Bureau of Standards (now
NIST) and is used to calculate the values presented on page 4.A-2. The first portion of the
equation, ( 1- kc ), is the actual bias which is added to the MCNP4a and KENO5a results.
The second term, Koi, is the uncertainty or standard error associated with the bias. The K
values used were obtained from the National Bureau of Standards Handbook 91 and are for
one-sided statistical tolerance limits for 95 % probability at the 95 % confidence level. The
actual K values for the 56 critical experiments evaluated with MCNP4a and the 53 critical
experiments evaluated with KENO5a are 2.04 and 2.05, respectively.
The bias values are used to evaluate 1he maximum ki, values for the rack designs.
KENO5a has a slightly larger systematic error than MCNP4a, but both result in greater
precision than published data [4A.3 through 4A.5] would indicate for collapsed cross
section sets in KENO5a (SCALE) calculations.
4A.2 Effect of Enrichment
The benchmark critical experiments include those with enrichments ranging from 2.46 w/o
to 5.74 w/o and therefore span the enrichment range for rack designs. Figures 4A.3 and
4A.4 show the calculated kfr values (Table 4A.1) as a function of the fuel enrichment
reported for the critical experiments. Linear regression analyses for these data confirms
that there are no trends, as indicated by low values of the correlation coefficients (0.03 for
MCNP4a and 0.38 for KENO5a). Thus, there are no corrections to the bias for the various
enrichments.
Appendix 4A, Page 3
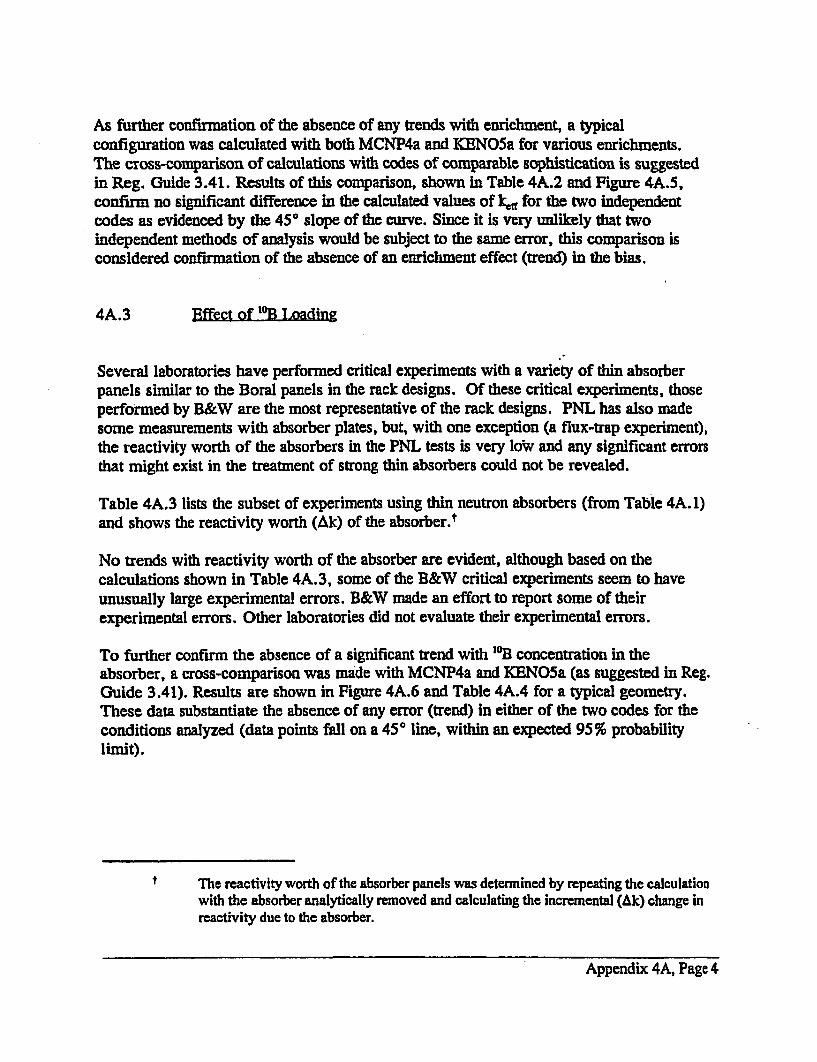
As further confirmation of the absence of any trends with enrichment, a typicalconfiguration was calculated with both MCNP4a and KENO5a for various enrichments.The cross-comparison of calculations with codes of comparable sophistication is suggestedin Reg. Guide 3.41. Results of this comparison, shown in Table 4A.2 and Figure 4A.5,confirm no significant difference in the calculated values of k., for the two independentcodes as evidenced by the 450 slope of the curve. Since it is very unlikely that twoindependent methods of analysis would be subject to the same error, this comparison isconsidered confirmation of the absence of an enrichment effect (trend) in the bias.
4A.3 Effect of I°B Loading
Several laboratories have performed critical experiments with a variety of thin absorberpanels similar to the Boral panels in the rack designs. Of these critical experiments, thoseperformed by B&W are the most representative of the rack designs. PNL has also madesome measurements with absorber plates, but, with one exception (a flux-trap experiment),the reactivity worth of the absorbers in the PNL tests is very low and any significant errorsthat might exist in the treatment of strong thin absorbers could not be revealed.
Table 4A.3 lists the subset of experiments using thin neutron absorbers (from Table 4A. 1)and shows the reactivity worth (Ak) of the absorber.t
No trends with reactivity worth of the absorber are evident, although based on thecalculations shown in Table 4A.3, some of the B&W critical experiments seem to haveunusually large experimental errors. B&W made an effort to report some of theirexperimental errors. Other laboratories did not evaluate their experimental errors.
To further confirm the absence of a significant trend with 10B concentration in theabsorber, a cross-comparison was made with MCNP4a and KENO5a (as suggested in Reg.Guide 3.41). Results are shown in Figure 4A.6 and Table 4A.4 for a typical geometry.These data substantiate the absence of any error (trend) in either of the two codes for theconditions analyzed (data points fall on a 45 0 line, within an expected 95 % probabilitylimit).
The reactivity worth of the absorber panels was determined by repeating the calculationwith the absorber analytically removed and calculating the incremental (Ak) change inreactivity due to the absorber.
Appendix 4A, Page 4
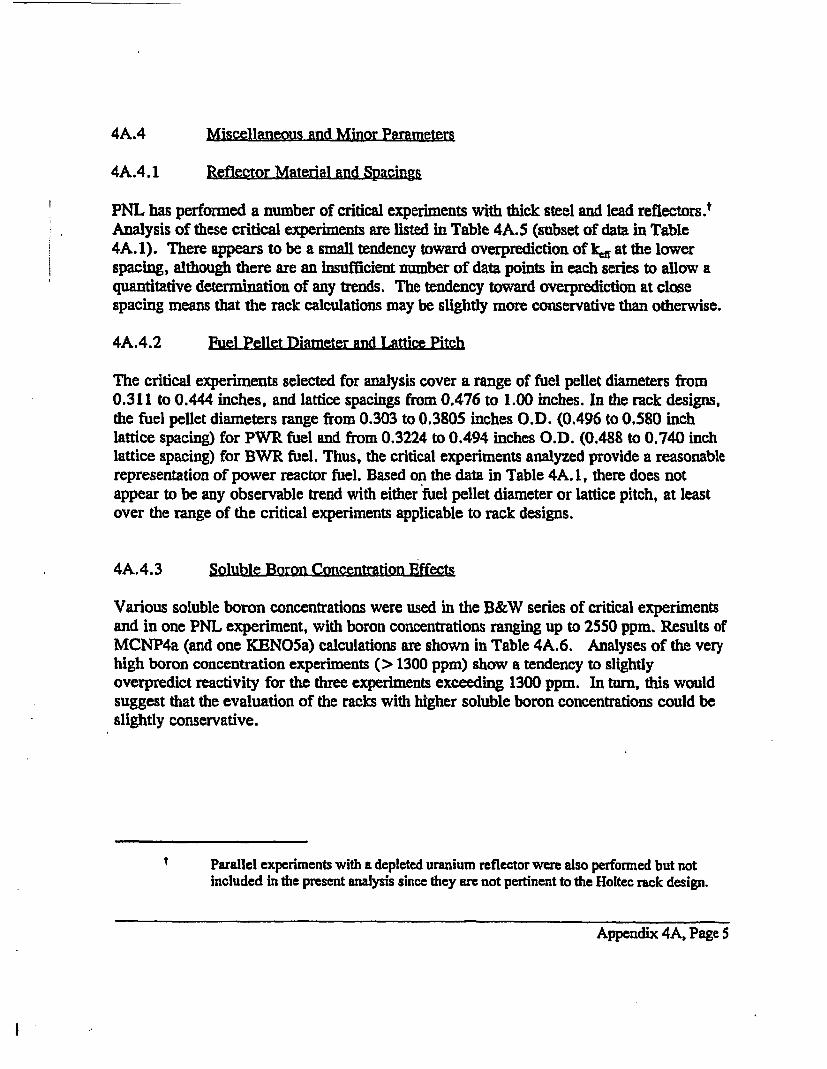
4A.4 Miscellaneous and Minor Parameters
4A.4.1 Reflector Material and Spacings
PNL has performed a number of critical experiments with thick steel and lead reflectors.t
Analysis of these critical experiments are listed in Table 4A.5 (subset of data in Table
4A. 1). There appears to be a small tendency toward overprediction of k, at the lower
spacing, although there are an insufficient number of data points in each series to allow aquantitative determination of any trends. The tendency toward overprediction at closespacing means that the rack calculations may be slightly more conservative than otherwise.
4A.4.2 Fuel Pellet Diameter and Lattice Pitch
The critical experiments selected for analysis cover a range of fuel pellet diameters from
0.311 to 0.444 inches, and lattice spacings from 0.476 to 1.00 inches. In the rack designs,
the fuel pellet diameters range from 0.303 to 0.3805 inches O.D. (0.496 to 0.580 inch
lattice spacing) for PWR fuel and from 0.3224 to 0.494 inches O.D. (0.488 to 0.740 inch
lattice spacing) for BWR fuel. Thus, the critical experiments analyzed provide a reasonable
representation of power reactor fuel. Based on the data in Table 4A. 1, there does not
appear to be any observable trend with either fuel pellet diameter or lattice pitch, at least
over the range of the critical experiments applicable to rack designs.
4A.4.3 Soluble Boron Concentration Effects
Various soluble boron concentrations were used in the B&W series of critical experiments
and in one PNL experiment, with boron concentrations ranging up to 2550 ppm. Results of
MCNP4a (and one KENQ5a) calculations are shown in Table 4A.6. Analyses of the very
high boron concentration experiments (> 1300 ppm) show a tendency to slightlyoverpredict reactivity for the three experiments exceeding 1300 ppm. In turn, this would
suggest that the evaluation of the racks with higher soluble boron concentrations could be
slightly conservative.
Parallel experiments with a depleted uranium reflector were also performed but not
included in the present analysis since they are not pertinent to the Holtec rack design.
Appendix 4A, Page 5
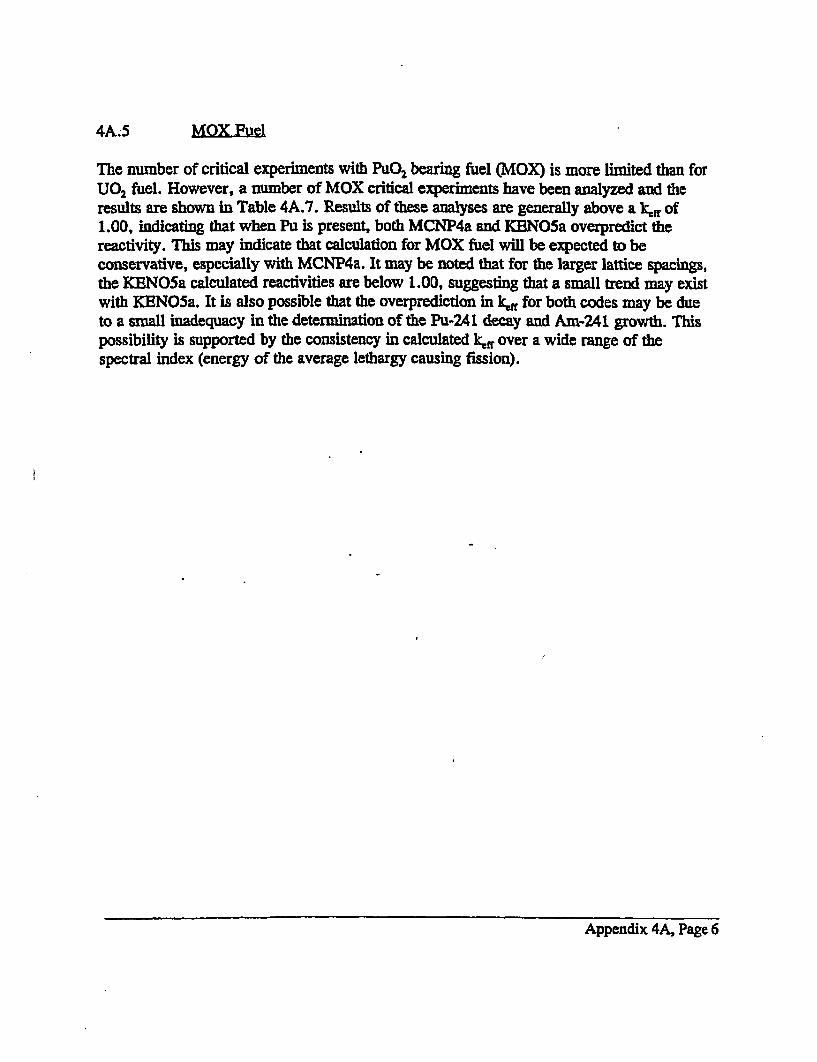
4A.5 MOX Fuel
The number of critical experiments with PuO2 bearing fuel (MOX) is more limited than forU0 2 fuel. However, a number of MOX critical experiments have been analyzed and the
results are shown in Table 4A.7. Results of these analyses are generally above a k, of1.00, indicating that when Pu is present, both MCNP4a and KENO5a overpredict thereactivity. This may indicate that calculation for MOX fuel will be expected to beconservative, especially with MCNP4a. It may be noted that for the larger lattice spacings,the KENQ5a calculated reactivities are below 1.00, suggesting that a small trend may existwith KENO5a. It is also possible that the overprediction in kr, for both codes may be dueto a small inadequacy in the determination of the Pu-241 decay and Am-241 growth. Thispossibility is supported by the consistency in calculated klf over a wide range of thespectral index (energy of the average lethargy causing fission).
Appendix 4A, Page 6
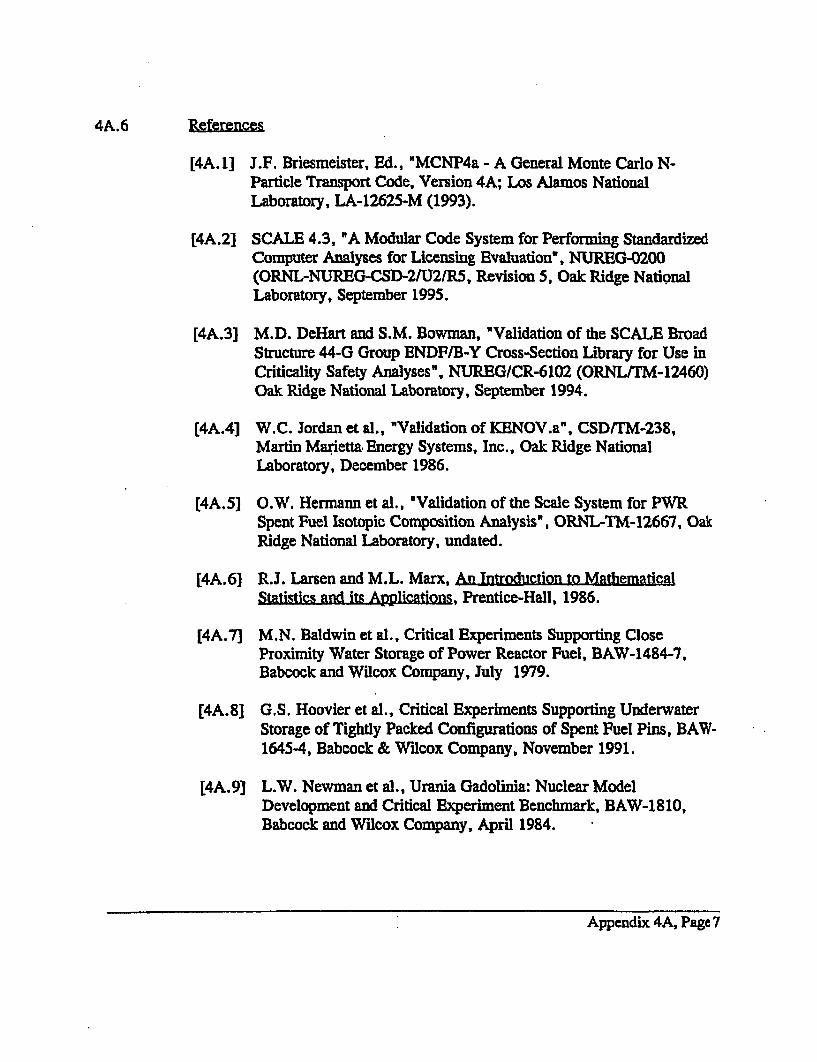
4A.6 References
[4A. 1] J.F. Briesmeister, Ed., "MCNP4a - A General Monte Carlo N-Particle Transport Code, Version 4A; Los Alamos NationalLaboratory, LA-12625-M (1993).
[4A.2] SCALE 4.3, "A Modular Code System for Performing StandardizedComputer Analyses for Licensing Evaluation%, NUREG-0200(ORNL-NUREG-CSD-21U21R5, Revision 5, Oak Ridge NationalLaboratory, September 1995.
[4A.3] M.D. DeHart and S.M. Bowman, "Validation of the SCALE BroadStructure 44-G Group ENDF/B-Y Cross-Section Library for Use inCriticality Safety Analyses", NUREG/CR-6102 (ORNL/TM-12460)Oak Ridge National Laboratory, September 1994.
[4A.41 W.C. Jordan et al., "Validation of KENOV.a", CSD/TM-238,Martin Marietta. Energy Systems, Inc., Oak Ridge NationalLaboratory, December 1986.
[4A.5] O.W. Hermann et al., "Validation of the Scale System for PWRSpent Fuel Isotopic Composition Analysis", ORNL-TM-12667, OakRidge National Laboratory, undated.
[4A.6] R.J. Larsen and M.L. Marx, An Introduction to MathematicalStatistics and its Applications, Prentice-Hall, 1986.
[4A.7] M.N. Baldwin et al., Critical Experiments Supporting CloseProximity Water Storage of Power Reactor Fuel, BAW-1484-7,Babcock and Wilcox Company, July 1979.
[4A.8] G.S. Hoovier et al., Critical Experiments Supporting UnderwaterStorage of Tightly Packed Configurations of Spent Fuel Pins, BAW-1645-4, Babcock & Wilcox Company, November 1991.
[4A.9] L.W. Newman et al., Urania Gadolinia: Nuclear ModelDevelopment and Critical Experiment Benchmark, BAW-1810,Babcock and Wilcox Company, April 1984.
Appendix 4A, Page 7
[4A. 10] J.C. Manaranche et al., "Dissolution and Storage ExperimentalProgram with 4.75 w/o Enriched Uranium-Oxide Rods," Trans.Am. Nucl. Soc. 33: 362-364 (1979).
[4A.11] S.R. Bierman and E.D. Clayton, Criticality Experiments withSubcritical Clusters of 2.35 wlo and 4.31 w/o 2"nU Enriched UO2Rods in Water with Steel Reflecting Walls, PNL-3602, BattellePacific Northwest Laboratory, April 1981.
[4A. 12] S.R. Bierman et al., Criticality Experiments with SuberiticalClusters of 2.35 w/o and 4.31 w/o 2U Enriched U0 2 Rods inWater with Uranium or Lead Reflecting Walls, PNL-3926, BattellePacific Northwest Laboratory, December, 1981.
[4A. 13] S.R. Bierman et al., Critical Separation Between SuberiticalClusters of 4.31 w/o 233U Enriched U0 2 Rods in Water with FixedNeutron Poisons, PNL-2615, Battelle Pacific Northwest Laboratory,October 1977.
[4A. 14] S.R. Bierman, Criticality Experiments with Neutron Flux TrapsContaining Voids, PNL-7167, Battelle Pacific NorthwestLaboratory, April 1990.
[4A.15] B.M. Durst et al., Critical Experiments with 4.31 wt % 23sU
Enriched U0 2 Rods in Highly Borated Water Lattices, PNL-4267,Battelle Pacific Northwest Laboratory, August 1982.
[4A. 16] S.R. Bierman, Criticality Experiments with Fast Test Reactor FuelPins in Organic Moderator, PNL-5803, Battelle Pacific NorthwestLaboratory, December 1981.
[4A. 17] E.G. Taylor et al., Saxton Plutonium Program Critical Experimentsfor the Saxton Partial Plutonium Core, WCAP-3385-54,Westinghouse Electric Corp., Atomic Power Division, December1965.
[4A. 18] M.G. Natrella, Experimental Statistics, National Bureau ofStandards, Handbook 91, August 1963.
Appendix 4A, Page 8
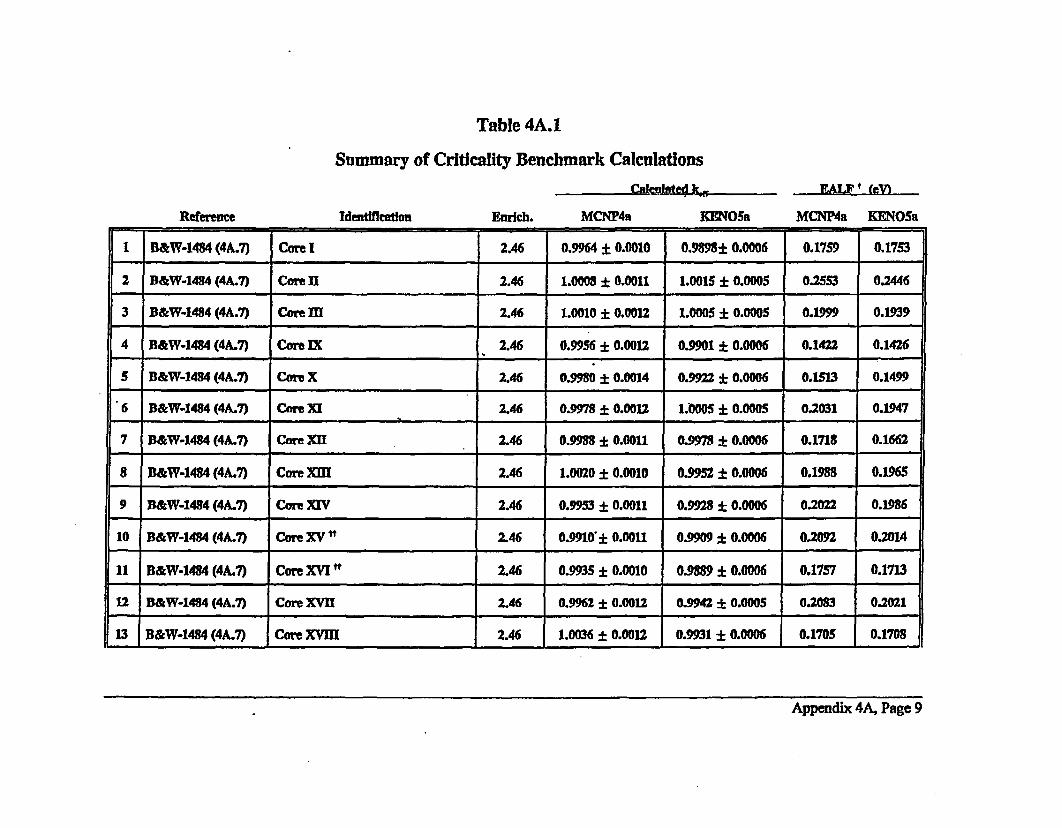
Table 4A.1
Summary of Criticality Benchmark Calculations
Calmired k-5
1=511
SMAL t (eVm
MCNP4a KENO5aReference Identification Enrich. MCNP4a
I B&W-1484 (4A.7) Core 1 2.46 0.9964.4 0.0010 0.9898± 0.0006 0.1759 0.1753
2 B&W-1494 (4A.7) Core II 2.46 1.0008±0.0011 1.0015 0.0005 0.2M553 0.2446
3 B&W-1484 (4A.7) Core M 2.46 1.0010 0.0012 1.0005 ± 0.0005 0.1999 0.1939
4 R&W-1484 (4A.7) Core IX 2.46 0.9956 0.0012 0.9901 0.0006 0.1422 0.1426
5 B&W-1484 (4A.7) Core X 2.46 0.9980 - 0.0014 0.9922 ± 0.0006 0.IM13 0.1499
6 B&W-1484 (4A.7) Core XI 2.46 0.9978 +0.0012 1.0005 -0.0005 0.2031 0.1947
7 B&W-1484 (4A.7) Core X1I 2.46 0.9998 ±0.0011 0.9978 0.0006 0.1718 0.1662
8 B&W-1484 (4A.7) Core KM 2.46 1.0020 ±0.0010 0.9952 ± 0.0006 0.1988 0.1965
9 B&W-1484 (4A.7) Core XIV 2.46 0.9953 ±0.0011 0.9928 0.0006 0.2022 0.1986
10 B&W-1484 (4A.7) Core XV" 2.46 0.9910". 0.0011 0.9909 + 0.0006 0.2092 0.2014
11 B&W-1434 (4A.7) Core XVI" 2.46 0.9935 ±0.0010 0.9889 0.0006 0.1757 0.1713
12 B&W-1484 (4A.7) Core XVII 2.46 0.9962 0.0012 0.9942 0.0005 0.2083 0.2021
13 B&W-1484 (4A,7) Core XVIII 2.46 1.0036 0.0012 0.9931±0.0006 0.1705 0.1708
Appendix 4A, Page 9
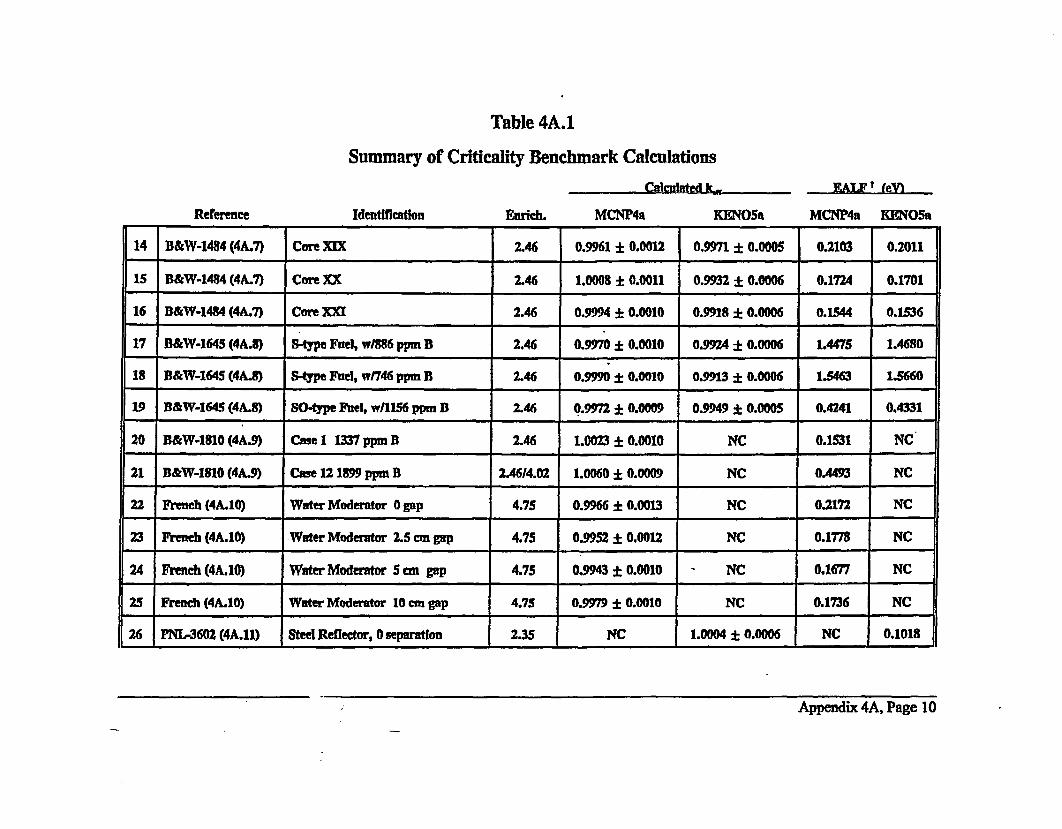
Table 4A.1
Summary of Criticality Benchmark CalculationsCalculated I.
Reference Identification MCNP4a KENOSa
F.A.LF ( eVa
MCNP4a KENOSa
14 B&W-1484 (4A.7) Core XIX 2.46 0.9961 ± 0.0012 0.9971 ± 0.0005 0.2103 0.2011
15 B&W-1484 (4A.7) Core XX 2.46 1.0008 - 0.0011 0.9932 - 0.0006 0.1724 0.1701
16 B&W-1484 (4A.7) Core XXI 2.46 0.999 4* 0.0010 0.9918 ± 0.0006 0.1344 0.1536
17 B&W-1645 (4A.8) S-type Fuel, w/86 ppm D 2.46 0.9970 ± 0.0010 0.9924 ± 0.0006 1.4475 1.4680
18 B&W-1645 (4A.8) S-type Fuel, w/746 ppm B 2.46 0.9990 0.0010 0.9913 ± 0.0006 1..463 1.5660
19 B&W-1645 (4A.8) SO-type Fuel, w/1156 ppm B 2.46 0.9972 0.0009 0.9949 0.0005 0.4241 0.4331
20 B&W-1810 (4A.9) Case 1 1337 ppm B 2.46 1.0023 - 0.0010 NC 0.1531 NC
21 B&W-110 (4A.9) Case 12 1899 ppm B 2.A614.02 1.0060 ± 0.0009 NC 0.4493 NC
22 French (4A.10) Water Moderator 0 ap 4.75 0.9966 0.0013 NC 0.2172 NC
23 French (4A.10) Water Moderator L. cm gap 4.75 0.9952 - 0.0012 NC 0.1778 NC
24 French (4A.10) Water Modertor 5n gap 4.75 0.9943 ±0.0010 - NC 0.1677 NC
25 French (4A.10) Water Moderator 10 cm gap 4.75 0.9979 ±0.0010 NC 0.1736 NC
26 PNL-3602 (4A.11) Steel Reflector, 0 separatn 2.35 NC 1.0004 ± 0.0006 NC 0.1018
Appendix 4A, Page 10
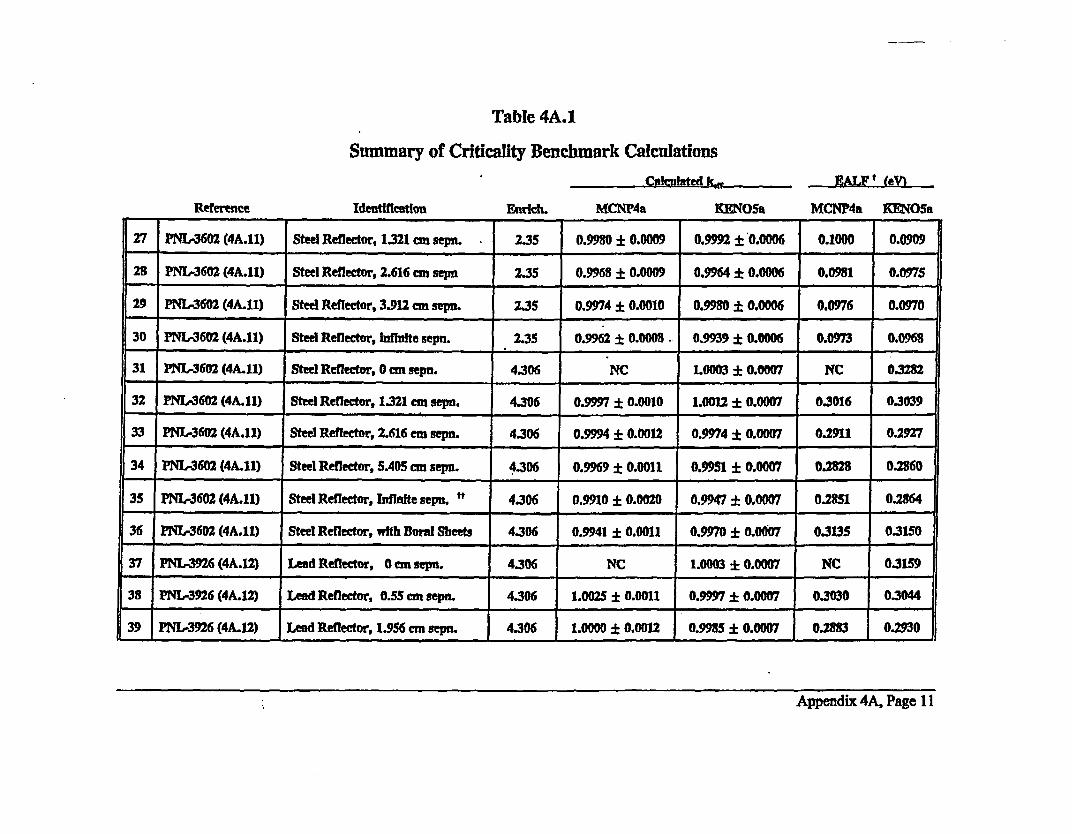
Table 4A.1
Summary of Criticality Benchmark Calculations
Calculated ho EALF t eVI
MCNP4a KlMOSaReference Identification Enrich. MCNP4a KENOSa
27 PNL-3602 (4A.11) Steel Reflector, 1321 cm sep. 2.35 0.9980 ± 0.0009 0.9992 ± 0.0006 0.1000 0.0909
28 PNL-3602 (4A.11) Steel Reflector, 2.616 cm sepn 2.35 0.9968 ± 0.0009 0.9964 ± 0.0006 0.0981 0.0975
29 PNL-3602 (4A.11) Steel Reflector, 3.912 cm sepn. 2.35 0.9974 ± 0.0010 0.9980 ± 0.0006 0.0976 0.0970
30 PNL-3602 (4A.11) Steel Reflector, Infinite sepn. 2.35 0.9962 ± 0.0008. 0.9939 ± 0.0006 0.0973 0.0968
31 PNL-3602 (4A.11) Steel Reflector, 0 cm sepn. 4.306 NC 1.0003 0.0007 NC 03282
32 PNL-602 (4A.11) Steel Reflector, IM1 cm sepn. 4.306 0.9997 ±0.0010 1.0012 ± 0.0007 0.3016 0.3039
33 PNL-3602 (4A.11) Steel Reflector, 2.616 cm sepn. 4.306 0.9994 - 0.0012 0.9974 ± 0.0007 0.2911 0.2927
34 ,NL-3602 (4A.11) Steel Reflector, 5.405 cm selm. 4.306 0.9969 ± 0.0011 0.9951 ± 0.0007 0.2828 0.2860
35 PNL-3602 (4A.11) Steel Reflector, Ififite sepn. " 4.306 0.9910 ± 0.0020 0.9947 ± 0.0007 0.2M51 0.2864
36 PNL-3602 (4A.11) Steel Reflector, with Dorad Sheets 4.306 0.9941 ± 0.0011 0.9970 ± 0.0007 0.3135 0.3150
37 PNL-3926 (4A.12) Lead Reflector, 0 cm sepn. 4.306 NC 1.0003 ± 0.0007 NC 0.3159
38 PNL-3926 (4A.12) Lead Reflector, 0.55 cm sepl. 4.306 1.0025 ± 0.0011 0.9997 0.0007 0.3030 0.3044
39 PNL-3926 (4A.12) Lead Reflector, 1.956 cm sepn. 4.306 1.0000 ± 0.0012 0.9985 ± 0.0007 0.2883 0.2930
Appendix 4A, Page 11
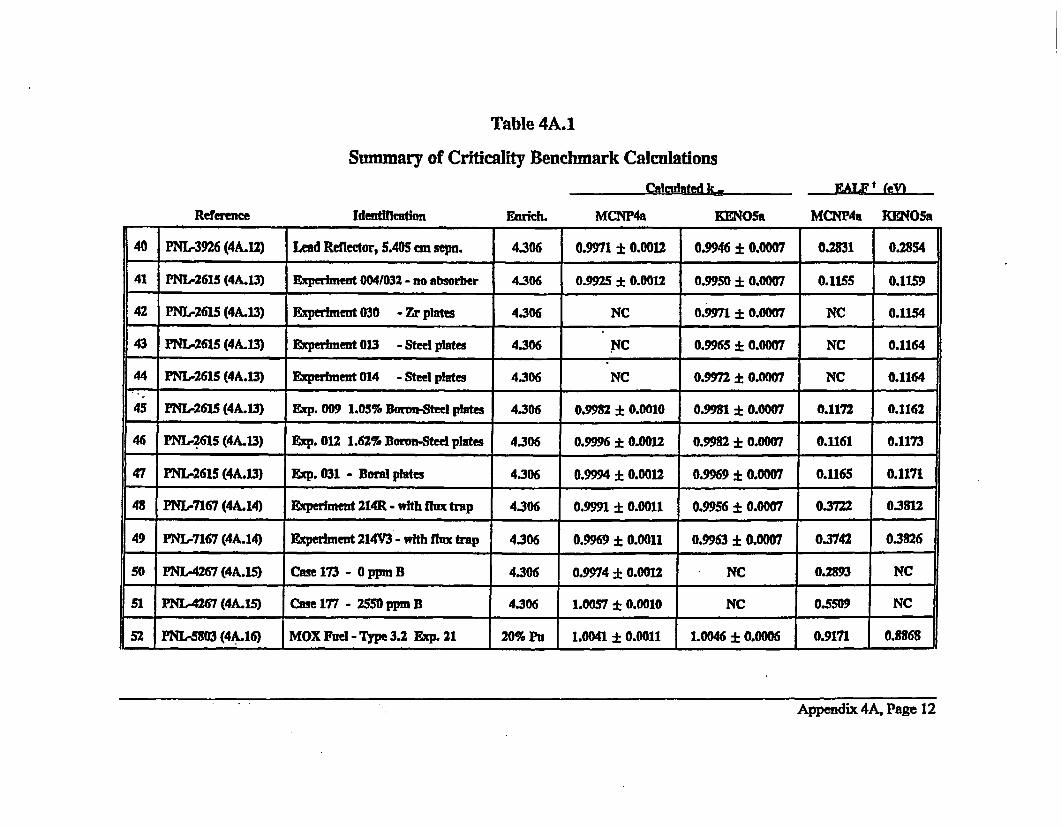
Table 4A.1
Summary of Criticality Benchmark Calculations
Cal uaed k-. EALF*t (eV)
MCNP4a KENO5aReference MdentlfMenfon Enrich. MCNP4a KHNO5a
40 PNL-3926 (4A"12) Lead Reflector, 5.405 cm sepn. 4.306 0.9971 ± 0.0012 0.9946 0.0007 0.2831 0.2854
41 PNL-2615 (4A.13) Experiment 0041032 - no absorber 4.306 0.9925 ± 0.0012 0.9950 ± 0.0007 0.1155 0.1159
42 PNL-2615 (4A.13) Experiment 030 - Zr plates 4.306 NC 0.9971± 0.0007 NC 0.1154
43 PN'L-2615 (4A.13) Experiment 013 - Steel plates 4.306 NC 0.9965 ±0.0007 NC 0.1164
44 PNL-2615 (4A.13) Experiment 014 - Steel plates 4.306 NC 0.9972 ± 0.0007 NC 0.1164
45 r-qL2615 (4A.13) ENp. 009 1.05% BonSt*eel plates 4.306 0.9982 ± 0.0010 0.9 ± 0.0007 0.1172 0.1162
46 PNL-2615 (4A.13) Exp. 012 1.62% Boron-Steel plates 4.306 0.9996 ± 0.0012 0."92 ± 0.0007 0.1161 0.1173
47 PMIL2615 (4A.13) Exp. 031 - Bloral plates 4.306 0.9994 ± 0.0012 0.9969 ::0.0007 0.1165 0.1171
48 PNL-7167 (4A.14) Experiment 214R - with flux trap 4.306 0.9991 ± 0.0011 0.9956 ± 0.0007 03722 0.3812
49 PNL-7167 (4A.14) Experiment 214V3 - with flux trap 4.306 0.9969 ± 0.0011 0.9963 :10.0007 0.3742 0.3826
50 PNL-4267 (4A.15) Case 173 - 0 ppm B 4.306 0.9974 ± 0.0012 NC 0.283 NC
51 PNL-4267 (4A.15) Case 177 - 2SSO ppm B 4.306 1.0057± 0.0010 NC 0.5509 NC
52 PNL-5903 (4A.16) MOX Fuel - Type 3.2 Exp. 21 20% Pu 1.0041 0.0011 1.0046 ± 0.0006 0.9171 0.8868
Appendix 4A. Page 12
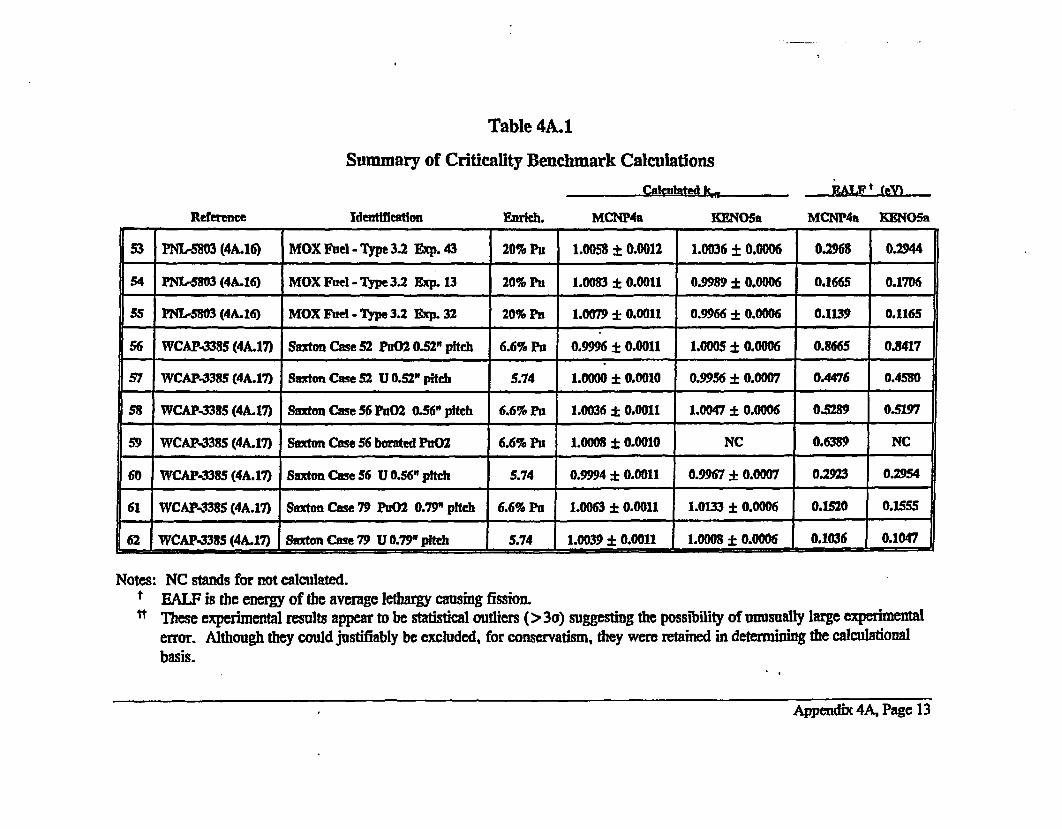
Table 4A.1
Summary of Criticality Benchmark Calculations
Calculated k- RALMt (-Vf
MCNP4a KENO5aReference Identification Enrich. MCNP4a KENOSa
53 PNL.S803 (4A.16) MOX Fuel - Type 3.2 Exp. 43 20% Pu 1.0053 + 0.0012 1.0036 ± 0.0006 0.2968 0.2944
54 PNL-5803 (4A.16) MOX Fuel - Type 3.2 Exp. 13 20% Pu 1.0083 ± 0.0011 0.9989 ± 0.0006 0.1665 0.1706
55 PNL-5'03 (4A.16) MOX Fuel - Type 3.2 Exp. 32 20% Pu 1.0079 ± 0.0011 0.9966 ± 0.0006 0.1139 0.1165
56 WCAP-3385 (4A.17) Saxton Case 52 FuO2 0.52" pitch 6.6% Pa 0.9996 ± 0.0011 1.0005 ± 0.0006 0.8665 0.8417
57 WCAP-33•5 (4A.17) Saxton Case 52 U 0.52" pitch 5.74 1.0000 ± 0.0010 0.9956 0.0007 0.4476 0.4580
58 WCAP-3385 (4A.17) Saxton Case 56 Pu02 0.56" pitch 6.6% Pa 1.0036 ± 0.0011 1.0047 0.0006 0.5289 0.5197
59 WCAP-3385 (4A.17) Sexton Case 56 borated PuO2 6.6% Pa 1.0008 ± 0.0010 NC 0.6389 NC
60 WCAP-3385 (4A.17) Saxton Case 56 U 0.56" pitch 5.74 0.9994 ± 0.0011 0.9967 ± 0.0007 0.2923 0.2954
61 WCAP-338S (4A.17) Saxton Case 79 PMO2 0.79" pitch 6.6% Pu 1.0063 ± 0.0011 1.0133 ± 0.0006 0.1520 0.1555
62 WCAP-3385 (4A.17) Saxton Case 79 U 0.79" pitch 5.74 1.0039 ± 0.0011 1.0008 ± 0.0006 0.1036 0.1047
Notes: NC stands for not calculated.
t EALF is the energy of the average lethargy causing fission.
• These experimental results appear to be statistical outliers (>36) suggesting the possibility of unusually large experimental
error. Although they could justifiably be excluded, for conservatism, they were retained in determining the calculational
basis.
Appendix 4A, Page 13
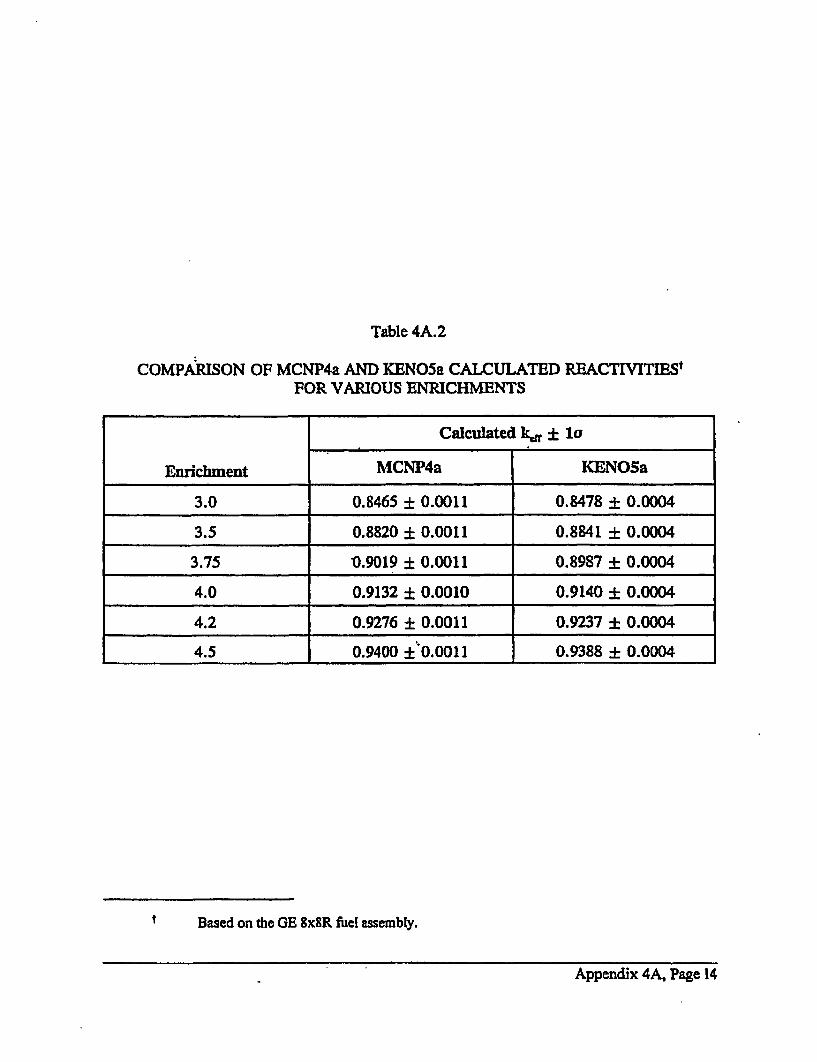
Table 4A.2
COMPARISON OF MCNP4a AND KENO5a CALCULATED REACTIVITIES'FOR VARIOUS ENRICHMENTS
Calculated kl ± la
Enrichment MCNP4a KENOSa
3.0 0.8465 + 0.0011 0.8478 ± 0.0004
3.5 0.8820 ± 0.0011 0.8841 ± 0.0004
3.75 0.9019 ± 0.0011 0.8987 ± 0.0004
4.0 0.9132 + 0.0010 0.9140 + 0.0004
4.2 0.9276 + 0.0011 0.9237 ± 0.0004
4.5 0.9400 ±'0.0011 0.9388 ± 0.0004
Based on the GE SxSR fuel assembly.
Appendix 4A, Page 14
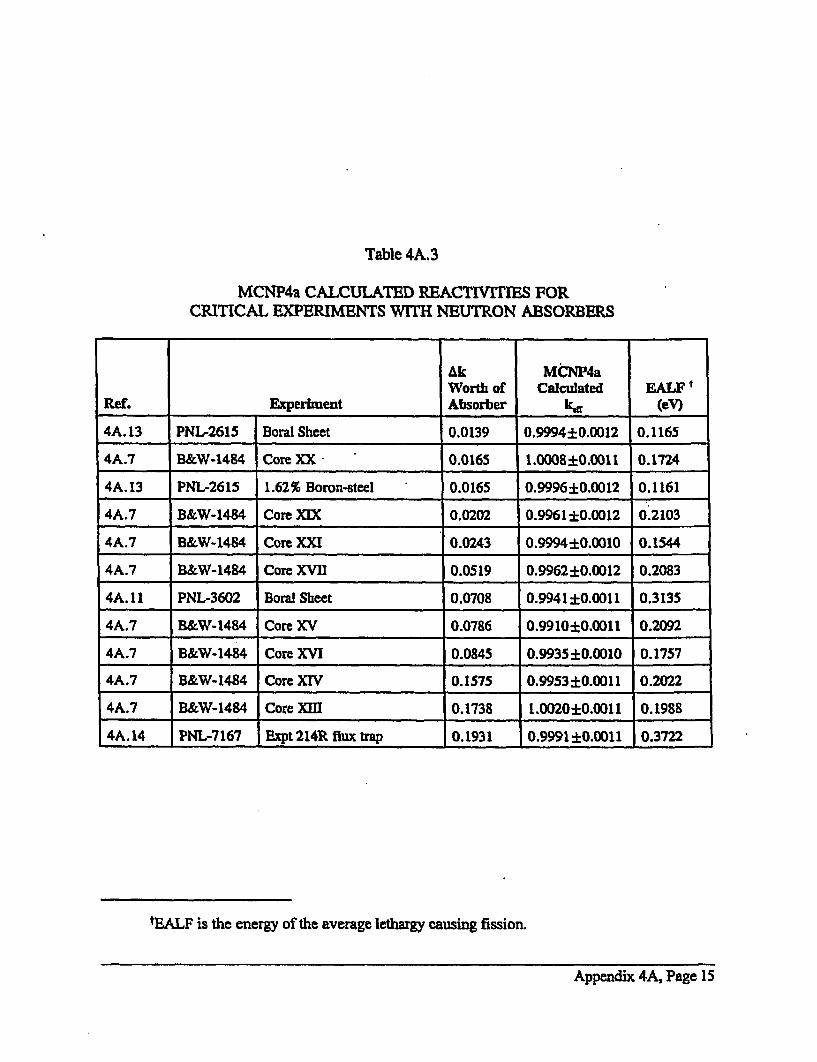
Table 4A.3
MCNP4a CALCULATED REACTIVITIES FORCRITICAL EXPERIMENTS WITH NEUTRON ABSORBERS
Ak MCNP4aWorth of Calculated F t
Ref. Experiment Absorber kf (eV)
4A.13 PNL-2615 Boral Sheet 0.0139 0.9994±0.0012 0.1165
4A.7 B&W-1484 Core XX • 0.0165 1.0008±0.0011 0.1724
4A. 13 PNL-2615 1.62% Boron-steel 0.0165 0.9996±0.0012 0.1161
4A.7 B&W-1484 Core XIX 0.0202 0.9961±0.0012 0.2103
4A.7 B&W-1484 Core XXI 0.0243 0.9994±0.0010 0.1544
4A.7 B&W-1484 Core XVII 0.0519 0.9962±0.0012 0.2083
4A. 11 PNL-3602 Boral Sheet 0.0708 0.9941±0.0011 0.3135
4A.7 B&W-1484 Core XV 0.0786 0.9910±0.0011 0.2092
4A.7 B&W-1484 Core XVI 0.0845 0.9935±0.0010 0.1757
4A.7 B&W-1484 Core XIV 0.1575 0.9953±0.0011 0.2022
4A.7 B&W-1484 Core XflH 0.1738 1.0020±0.0011 0.1988
4A. 14 PNL-7167 iExpt 214R flux trap 0.1931 0.9991 ±0.0011 0.3722
tEALF is the energy of the average lethargy causing fission.
Appendix 4A, Page 15
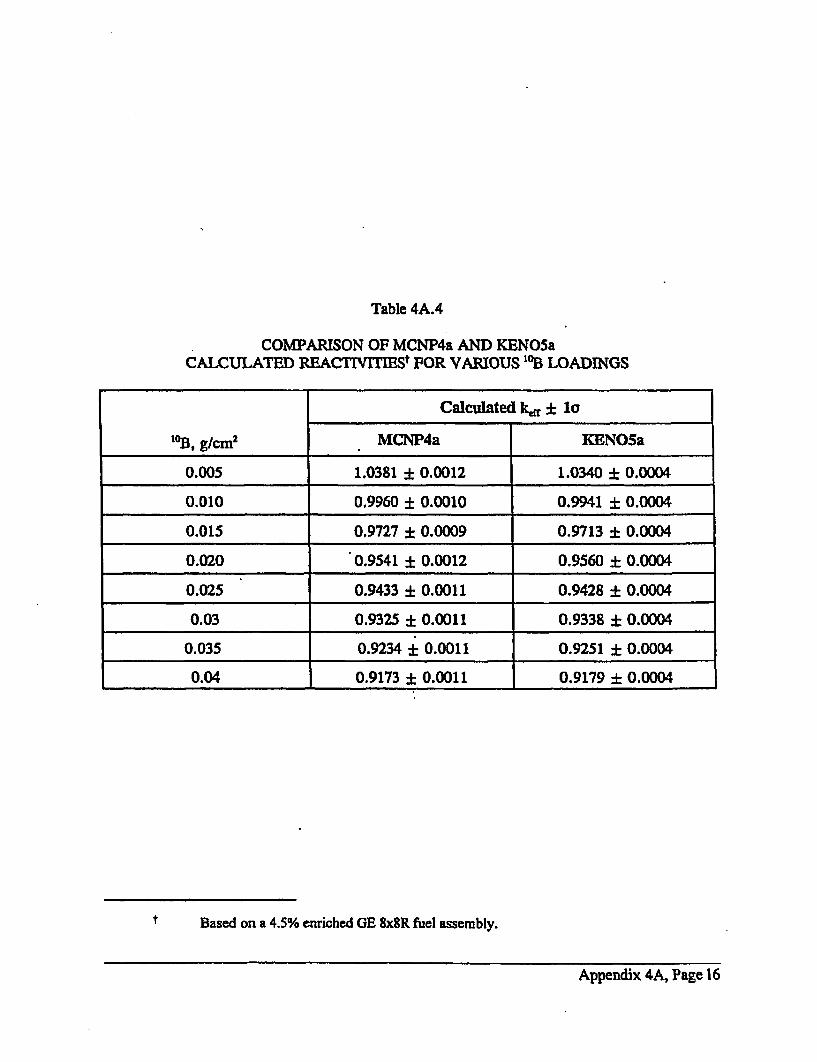
Table 4A.4
COMPARISON OF MCNP4a AND KENO5aCALCULATED REACTIVITIESt FOR VARIOUS '1 B LOADINGS
Calculated kt , lo
10B, g/cm2 MCNP4a KENO5a
0.005 1.0381 - 0.0012 1.0340 + 0.0004
0.010 0.9960 ± 0.0010 0.9941 + 0.0004
0.015 0,9727 - 0.0009 0.9713 - 0.0004
0.020 0.9541 + 0.0012 0.9560 ± 0.0004
0.025 0.9433 ± 0.0011 0.9428 ± 0.0004
0.03 0.9325 + 0.0011 0.9338 ± 0.0004
0.035 0.9234 ± 0.0011 0.9251 ± 0.0004
0.04 0.9173 + 0.0011 0.9179 ± 0.0004
Based on a 4.5% enriched GE 8xMR fuel assembly.
Appendix 4A, Page 16
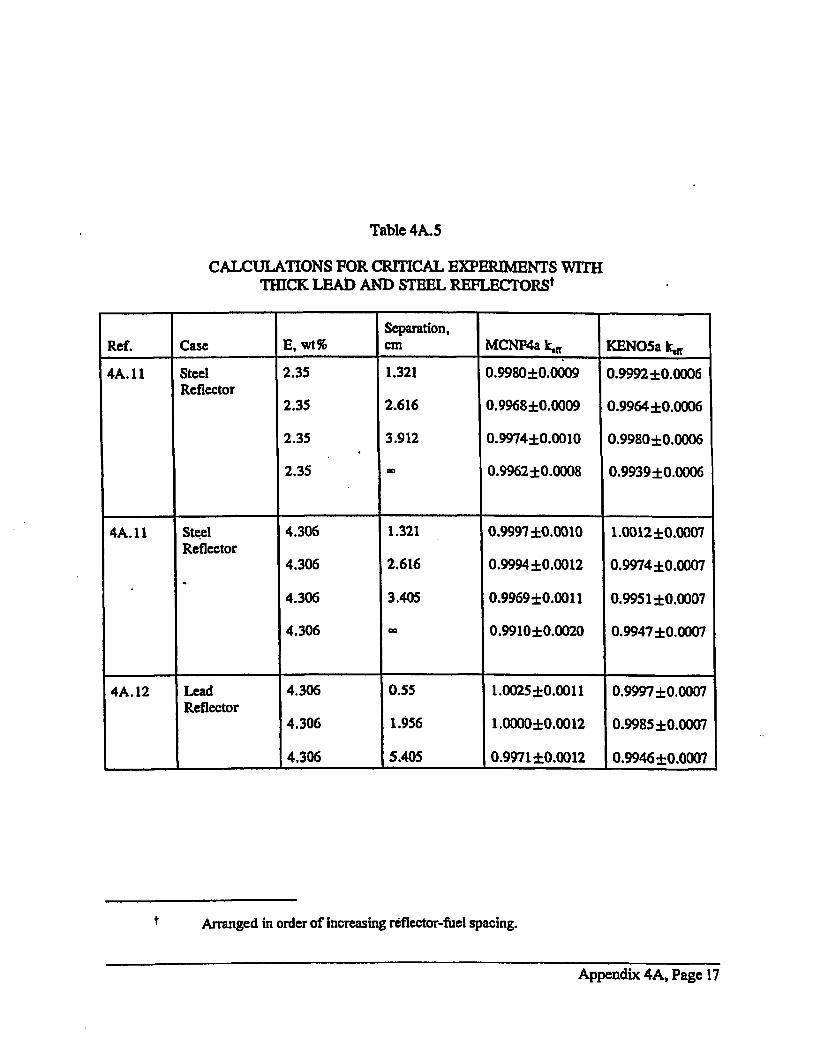
Table 4A.5
CALCULATIONS FOR CRMTICAL EXPERIMENTS WITHTHICK LEAD AND STEEL REFLECTORSt
Separation,Ref. Case E, wt% cm MCNP4a k,f KENOSa kd
4A. 11 Steel 2.35 1.321 0.9980±0.0009 0.9992±0.0006Reflector 2.35 2.616 0.99684±0.0009 0.9964±0.0006
2.35 3.912 0.9974±0.0010 0.9980±0.0006
2.35 - 0.9962±0.0008 0.9939±0.0006
4A. 11 Steel 4.306 1.321 0.9997±0.0010 1.0012±0.0007Reflector
4.306 2.616 0.9994±0.0012 0.9974±0.0007
4.306 3.405 0.9969±0.0011 0.9951±0.0007
4.306 c 0.9910±0.0020 0.9947±0.0007
4A.12 Lead 4.306 0.55 1.0025±0.0011 0.9997±0.0007Reflector
4.306 1.956 1.0000±0.0012 0.9985±0.0007
4.306 5.405 0.9971*0.0012 0.9946±0.0007
t Arranged in order of increasing reflector-fuel spacing.
Appendix 4A, Page 17
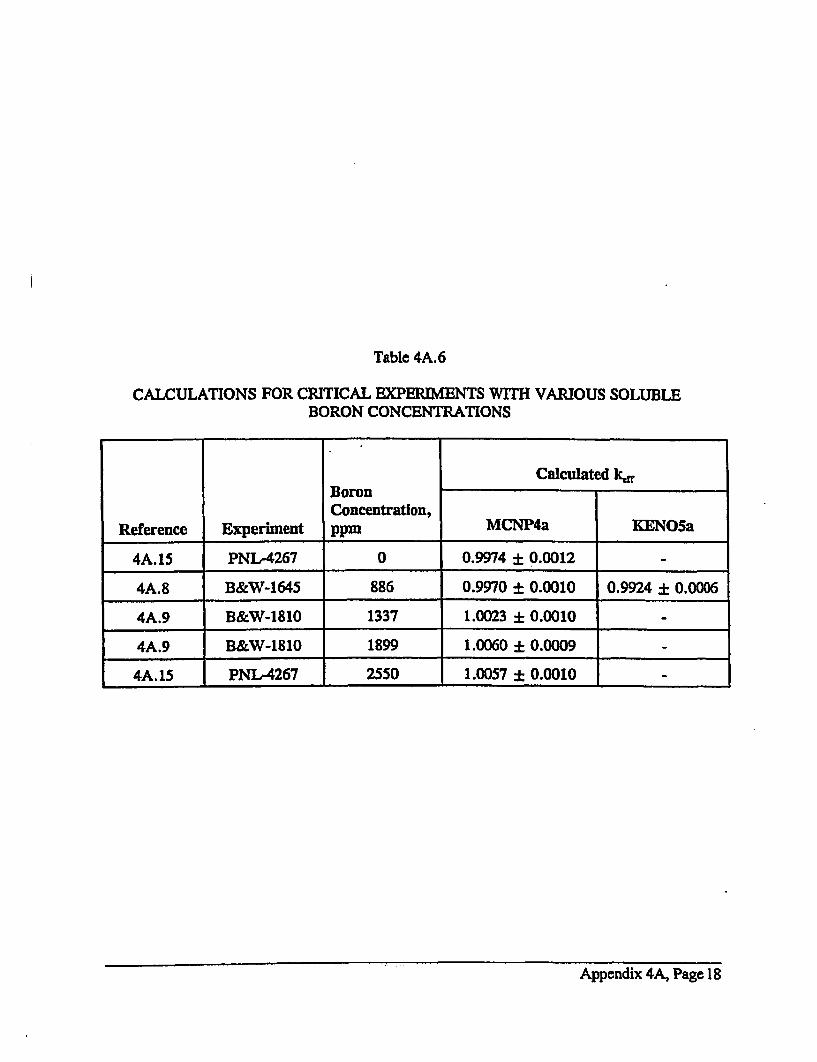
Table 4A.6
CALCULATIONS FOR CRITICAL EXPERIMENTS WITH VARIOUS SOLUBLEBORON CONCENTRATIONS
Calculated kr
BoronConcentration,
Reference Experiment ppm MCNP4a KENO5a
4A.15 PNL-4267 0 0.9974 - 0.0012
4A.8 B&W-1645 886 0.9970 ± 0.0010 0.9924 ± 0.0006
4A.9 B&W-1810 1337 1.0023 ± 0.0010
4A.9 B&W-1810 1899 1.0060 - 0.0009
4A.15 PNL-4267 2550 1.0057 ± 0.0010 -
Appendix 4A, Page 18
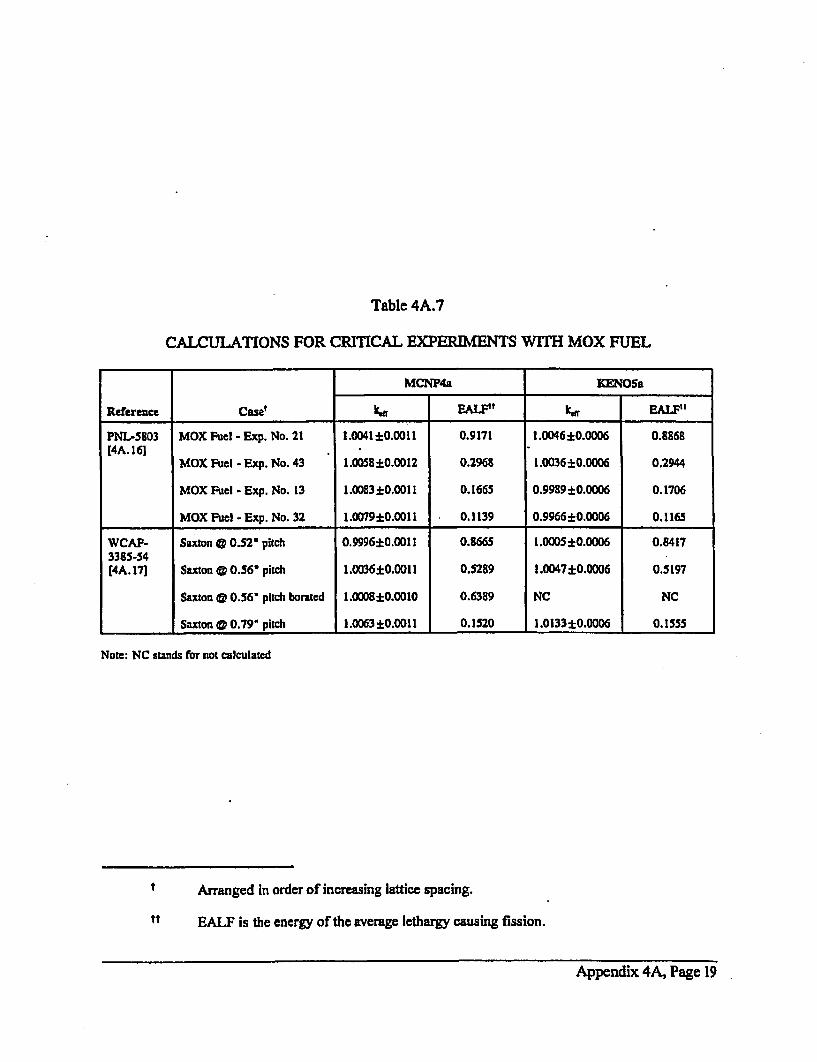
Table 4A.7
CALCULATIONS FOR CRITICAL EXPERIMENTS WITH MOX FUEL
MCNP4a KENOSa
Reference Caset kd EALF" kff EALF"
PNL-5S03 MOX Fuel - Exp. No. 21 1.004140.0011 0.9171 1.0046±0.0006 0.8868[4A. 161
MOX Fuel - Exp. No. 43 1.0058±0.0012 0.296K 1.0036±0.0006 0.2944
MOX Fuel - Exp. No. 13 1.0083±0.0011 0.1665 0.9989±0.0006 0.1706
MOX Fuel - Exp. No. 32 1.0079±0.0011 0.1139 0.9966±0.0006 0.1165
WCAP- Saxton @ 0.52' pitch 0.9996±0.0011 0.8665 1.0005±0.0006 0.84173385-54(4A. 17] Saxton @ 0.56' pitch 1.0036±0.0011 0.5289 1.0047±0.0006 0.5197
Saxton a 0.56' pitch borated 1.0008±0.0010 0.6389 NC NC
Saxton @ 0.79' pitch 1.0063 ±0.0011 0.1520 1.0133±0.0006 0.1555
Note: NC stands for not calculated
t Arranged in order of increasing lattice spacing.
tt EALF is the energy of the average lethargy causing fission.
Appendix 4A, Page 19
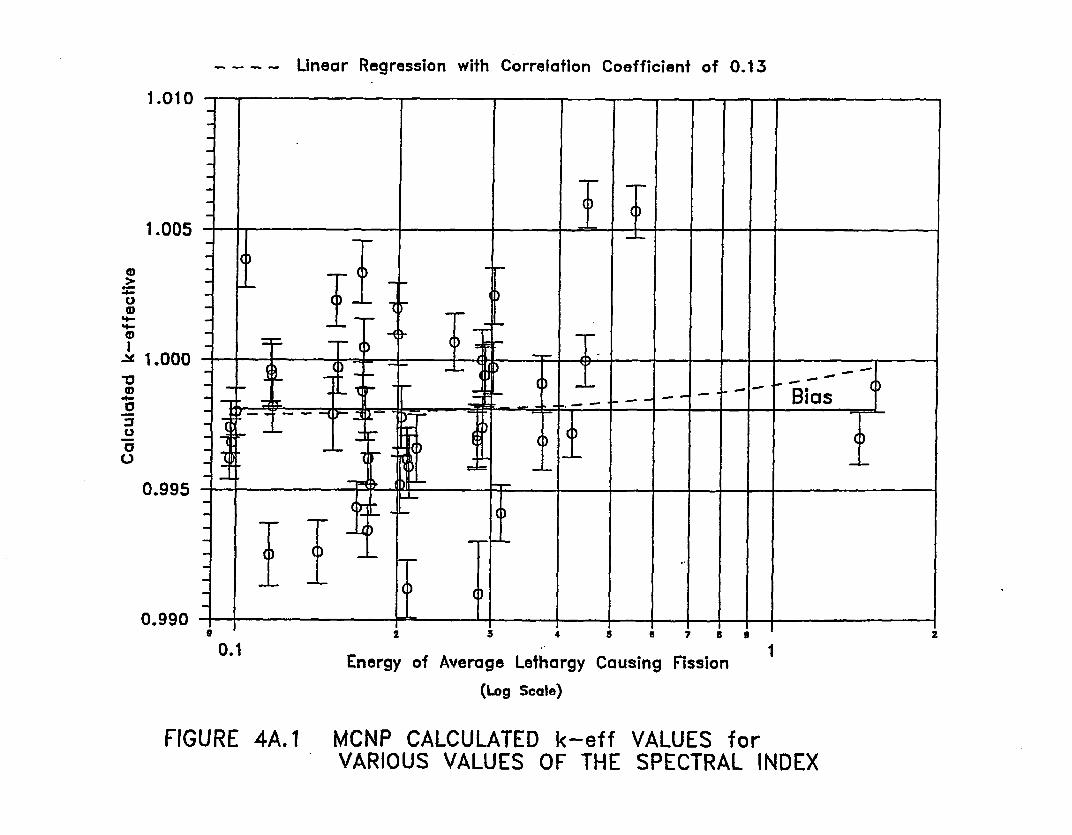
--- - Linear Regression with Correlation Coefficient of 0.13
1.010
1.005
1.00004.-
0.995
0.990
I
0.1 1Energy of Average Lethargy Causing Fission
(Log Scale)
FIGURE 4A. 1 MCNP CALCULATED k-effVARIOUS VALUES OF THE
VALUES forSPECTRAL INDEX
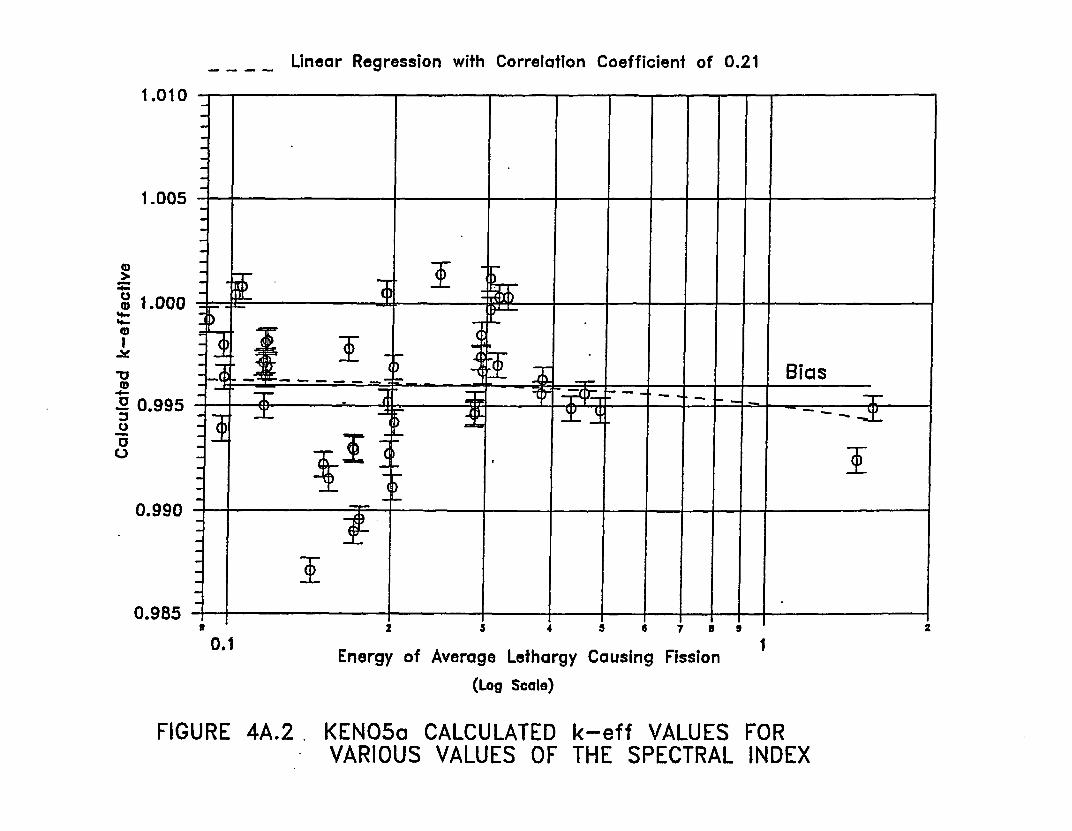
Linear Regression with Correlation Coefficient of 0.21
1.010-- -
II.1.005
Bi,.=1.ooo0--
S 0.995 - -- -
0.990 - -
0.985 T7
0.11 Energy of Average Lethargy Causing Fission
(Log Scale)
FIGURE 4A.2 KENO5a CALCULATED k-eff VALUES FORVARIOUS VALUES OF THE SPECTRAL INDEX
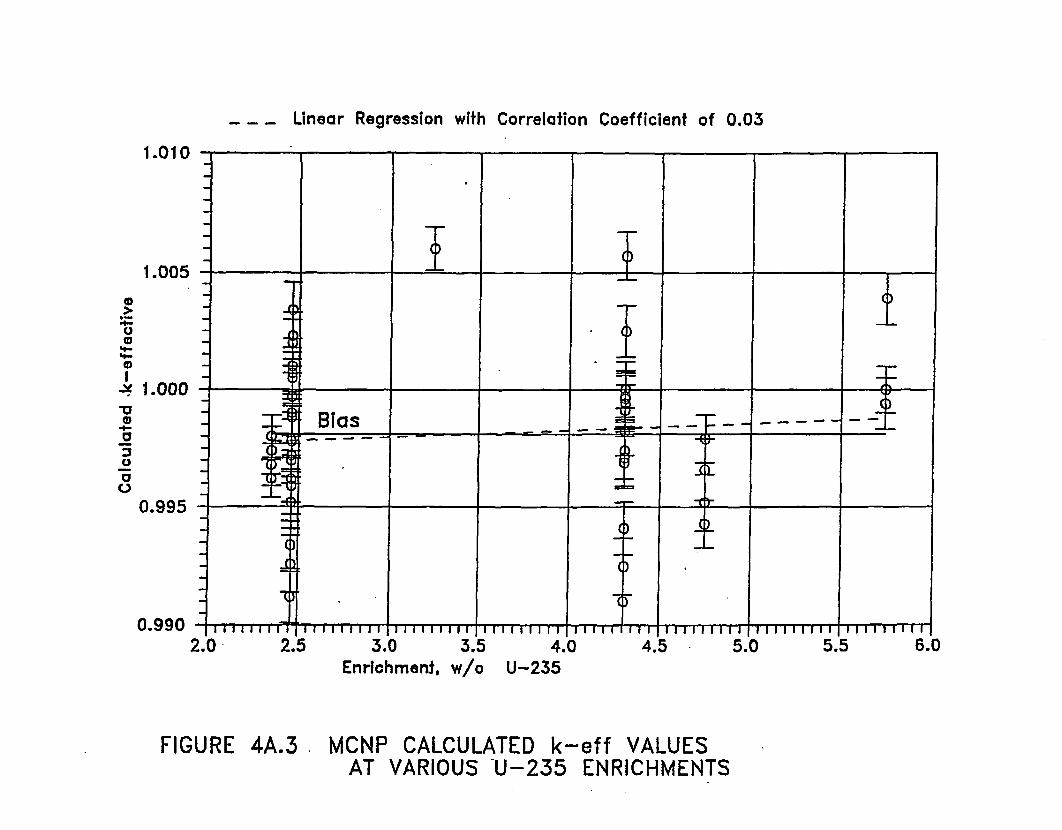
- - Linear Regression with Correlation Coefficient of 0.03
1.010
1.005
4-C,U'
4-4-
U'
U,.4-
U0U
1.000
- ___ __ _ I_ _ _ ---~ Ia
Bias - - - - - -
J I I I I I I i I'I I I I I I I I I I I
0.995
0.9902.0 2.5 3.0 3.5 4.0 4.5 5.0 5.5 6.0
Enrichment, w/o U-235
FIGURE 4A.3. MCNP CALCULATED k-eff VALUESAT VARIOUS -U-235 ENRICHMENTS
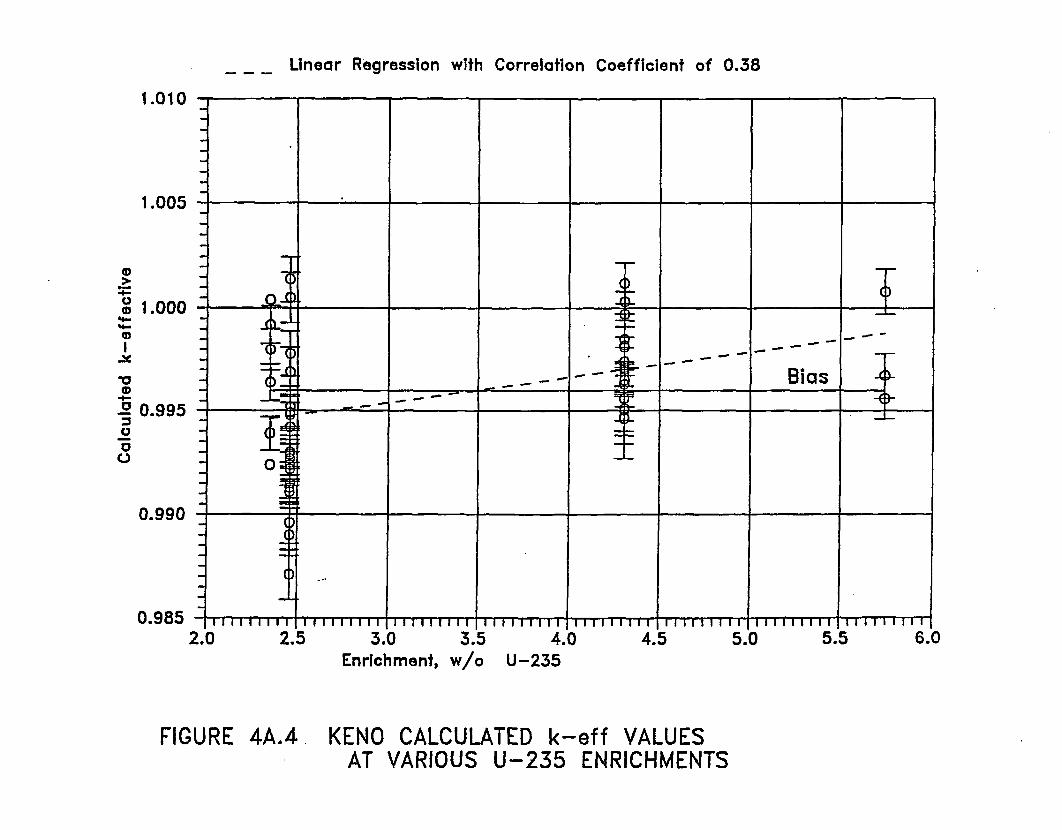
Linear Regression with Correlation Coefficient of 0.38
1.010
1.005
a 1.000
0 0.995
0.990
0.985
-Bias
I-- 1 -1- t110,
2.0 2.5 3.0 3.5Enrichment, w/o
4.0U-235
4.5 5.0 5.5 6.0
FIGURE 4A.4. KENO CALCULATED k-eff VALUESAT VARIOUS U-235 ENRICHMENTS
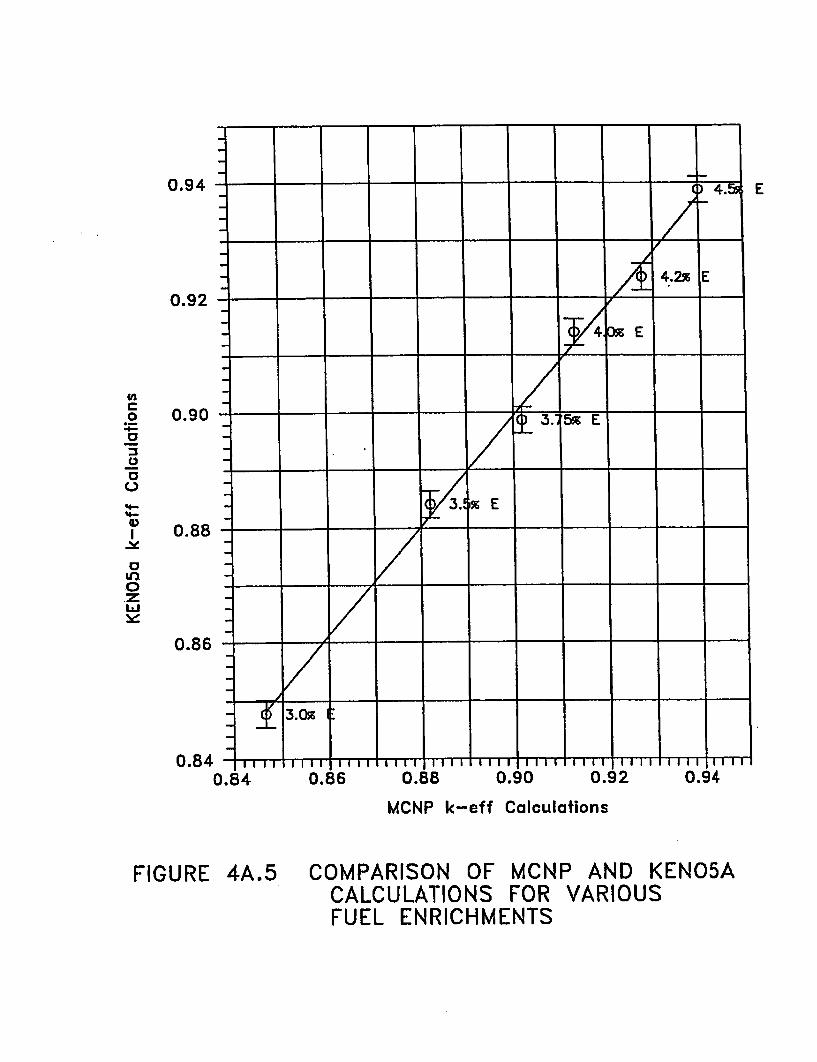
0.94
0.92
E
C-)'0-
Id
0.90
0.88
0.86
0.84 -
0.
MCNP k-eff Calculations
FIGURE 4A.5 COMPARISON OF MCNP AND KENO5ACALCULATIONS FOR VARIOUSFUEL ENRICHMENTS
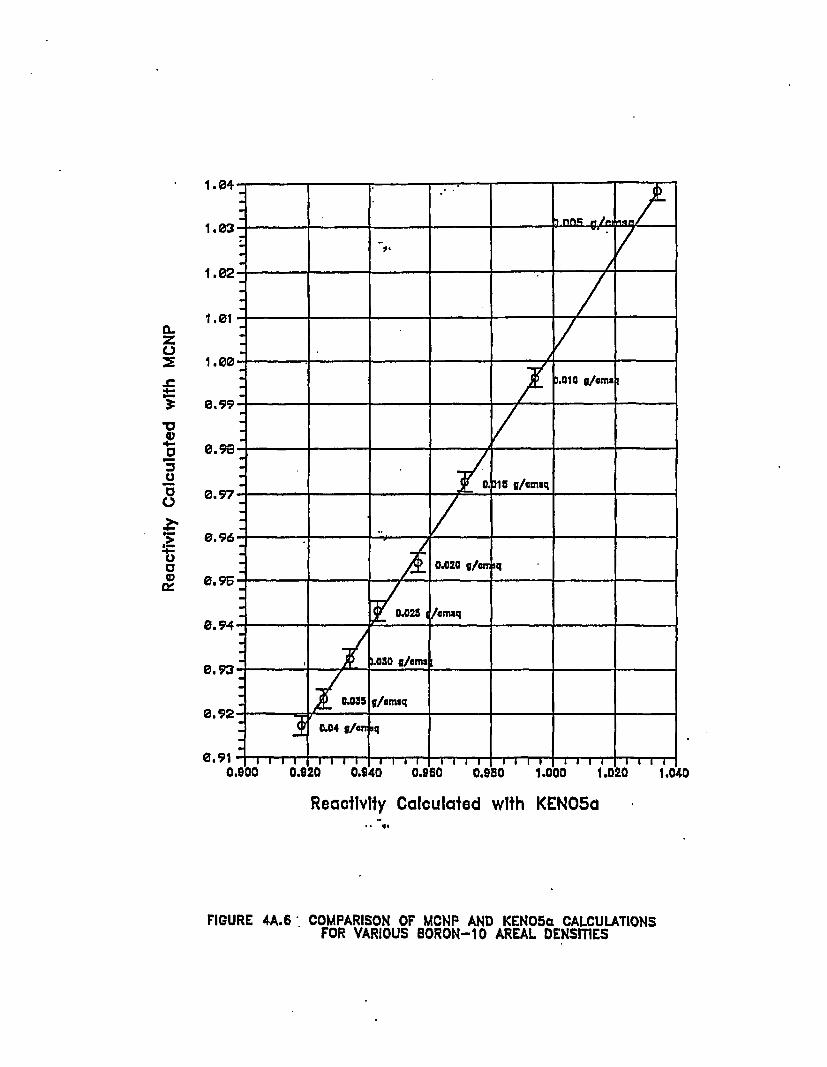
(Lz.C-
-ce
Reaclivity Calculated wlth KENOSa
FIGURE 4A.6. COMPARISON OF MCNP AND KEN05a CALCULATIONSFOR VARIOUS BORON-I0 AREAL DENSITIES
5.0 THERMAL-HYDRAULIC CONSIDERATIONS
5.1 INTRODUCTION
This section provides a summary of the thermal-hydraulic analyses performed to demonstrate
compliance of the SFP and its attendant cooling system with the provisions of USNRC Standard
Review Plan (SRP) 9.1.3 (Spent Fuel Pool Cooling and Cleanup System, Rev. 1, July 1981)
and Section III of the USNRC "OT Position Paper for Review and Acceptance of Spent Fuel
Storage and Handling Applications," (April 14, 1978). Similar methods of thermal-hydraulic
analysis have been used in the licensing evaluations for other SFP capacity expansion projects.
The thermal-hydraulic qualification analyses for the modified rack array may be broken down
into the following categories:
i. Evaluation of bounding maximum decay heat versus time profiles, used as inputto subsequent analyses.
ii. Evaluation of loss-of-forced cooling scenarios, to establish minimum times toperform corrective actions and the associated makeup water requirements.
iii. Determination of the maximum local water temperature, at the instant when thepool decay heat reaches its maximum value, to establish that localized boiling inthe Spent Fuel Storage Racks (SFSRs) is not possible while forced cooling isoperating. The bulk pool temperature is postulated to be at the maximum limit.
iv. Evaluation of the maximum fuel rod cladding temperature, at the instant when thepool decay heat reaches its maximum value, to establish that nucleate boiling isnot possible while forced cooling is operating. The bulk pool temperature ispostulated to be at the maximum limit.
The following sections present plant system descriptions, analysis methodologies and
assumptions, a synopsis of the input data employed, and summaries of the calculated results.
Holtec Report HI-2022867 5-1 Holtec Project 1196Holtec Report HI-2022867 5-1 Hoftec Project 1196
5.2 COOLING SYSTEM DESCRIPTION
The Spent Fuel Cooling (SFC) System is designed to maintain the water quality and clarity and
to remove the decay heat from the stored fuel in the SFP. It is designed to maintain the SFP
water at less than or equal to approximately 1500F. This is accomplished by recirculating spent
fuel coolant water from the SFP through the pumps and coolers and back to the pool. The SFP
coolers reject heat to the nuclear intermediate cooling water system, which subsequently rejects
its heat to the service water system. The spent fuel coolant pumps take suction from the SFP
and deliver the water through the tube side of two coolers arranged in parallel back to the pool.
In addition to its primary function, a bypass purification loop is provided to maintain the purity of
the water in the SFP. This loop is also utilized to purify the water in the Borated Water Storage
Tank (BWST) following refueling and to maintain clarity in the fuel transfer canal during
refueling. Water from the BWST or fuel transfer canal can be purified by using the borated water
recirculation pump. The system also provides for filling the fuel transfer canal, the incore
instrumentation tank, and the cask loading area from the BWST.
The SFP is provided with a makeup system design, which meets the intent of Safety Guide 13.
That is, the BWST is a Seismic Category 1 vessel; all connecting piping is located in a Seismic
Category 1 structure; a backup system for supplying water to the pool is provided through a
temporary connection to the Seismic Category 1 service water system; and, there is sufficient
time to rig a temporary makeup water supply to the pool in the event of failure of the normal
source. The service water system can be supplied from either Lake Dardanelle or the
emergency cooling pond.
Holtec Report HI-2022867 5-2 Hottec Project 1196
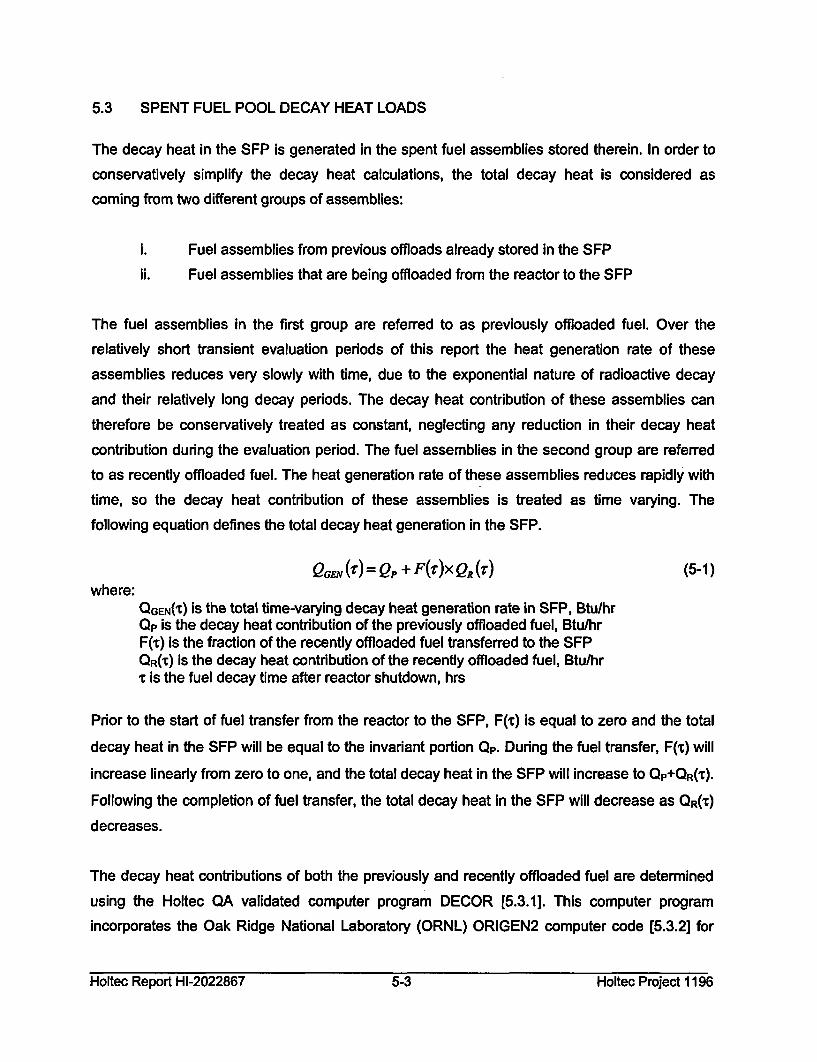
5.3 SPENT FUEL POOL DECAY HEAT LOADS
The decay heat in the SFP is generated in the spent fuel assemblies stored therein. In order to
conservatively simplify the decay heat calculations, the total decay heat is considered as
coming from two different groups of assemblies:
i. Fuel assemblies from previous offloads already stored in the SFP
ii. Fuel assemblies that are being offloaded from the reactor to the SFP
The fuel assemblies in the first group are referred to as previously offloaded fuel. Over the
relatively short transient evaluation periods of this report the heat generation rate of these
assemblies reduces very slowly with time, due to the exponential nature of radioactive decay
and their relatively long decay periods. The decay heat contribution of these assemblies can
therefore be conservatively treated as constant, neglecting any reduction in their decay heat
contribution during the evaluation period. The fuel assemblies in the second group are referred
to as recently offloaded fuel. The heat generation rate of these assemblies reduces rapidly with
time, so the decay heat contribution of these assemblies is treated as time varying. The
following equation defines the total decay heat generation in the SFP.
QGEN(r)= Qp, + F(T')x Q. (r) (5-1)where:
QGEN(T) is the total time-varying decay heat generation rate in SFP, Btu/hrQp is the decay heat contribution of the previously offloaded fuel, Btu/hrF(T) is the fraction of the recently offloaded fuel transferred to the SFPQR(T) is the decay heat contribution of the recently offloaded fuel, Btu/hr,z is the fuel decay time after reactor shutdown, hrs
Prior to the start of fuel transfer from the reactor to the SFP, F(T) is equal to zero and the total
decay heat in the SFP will be equal to the invariant portion Qp. During the fuel transfer, F(C) will
increase linearly from zero to one, and the total decay heat in the SFP will increase to QP+QR(X).
Following the completion of fuel transfer, the total decay heat in the SFP will decrease as QR(r)
decreases.
The decay heat contributions of both the previously and recently offloaded fuel are determined
using the Holtec QA validated computer program DECOR [5.3.1]. This computer program
incorporates the Oak Ridge National Laboratory (ORNL) ORIGEN2 computer code [5.3.2] for
Holtec Report HI-2022867 5-3 Holtec Project 1196
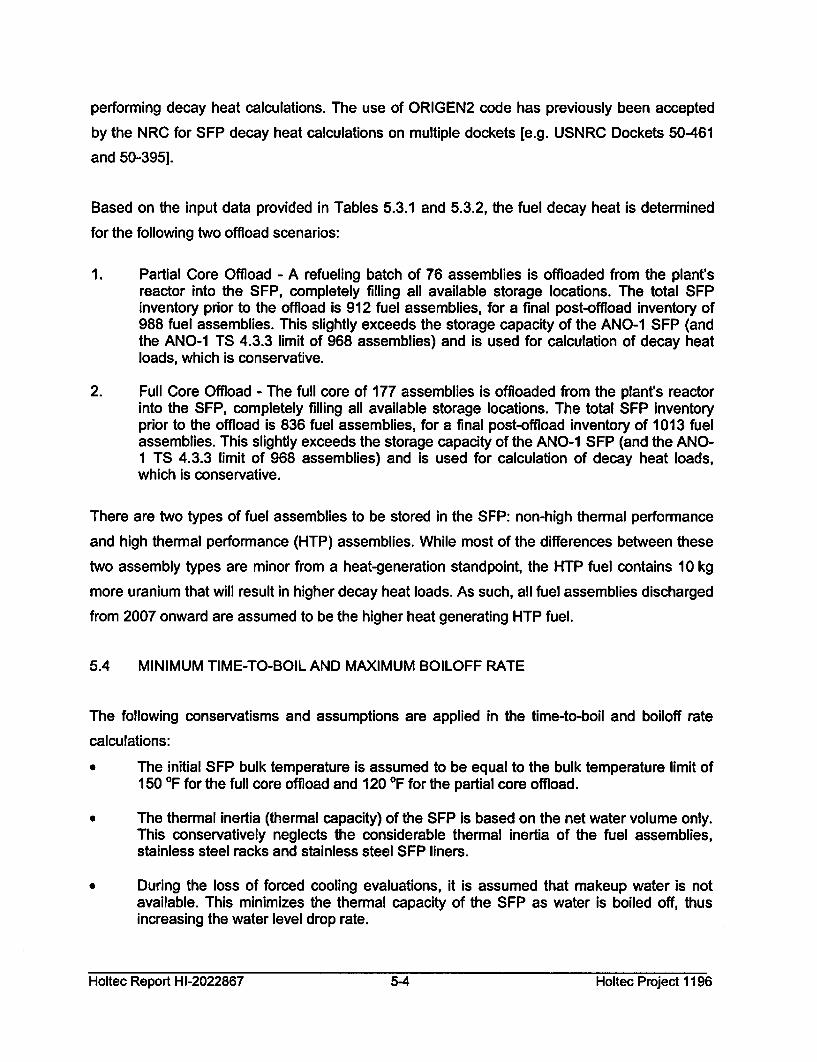
performing decay heat calculations. The use of ORIGEN2 code has previously been accepted
by the NRC for SFP decay heat calculations on multiple dockets [e.g. USNRC Dockets 50-461
and 50-395].
Based on the input data provided in Tables 5.3.1 and 5.3.2, the fuel decay heat is determined
for the following two offload scenarios:
1. Partial Core Offload - A refueling batch of 76 assemblies is offloaded from the plant'sreactor into the SFP, completely filling all available storage locations. The total SFPinventory prior to the offload is 912 fuel assemblies, for a final post-offload inventory of988 fuel assemblies. This slightly exceeds the storage capacity of the ANO-1 SFP (andthe ANO-1 TS 4.3.3 limit of 968 assemblies) and is used for calculation of decay heatloads, which is conservative.
2. Full Core Offload - The full core of 177 assemblies is offloaded from the plant's reactorinto the SFP, completely filling all available storage locations. The total SFP inventoryprior to the offload is 836 fuel assemblies, for a final post-offload inventory of 1013 fuelassemblies. This slightly exceeds the storage capacity of the ANO-1 SFP (and the ANO-1 TS 4.3.3 limit of 968 assemblies) and is used for calculation of decay heat loads,which is conservative.
There are two types of fuel assemblies to be stored in the SFP: non-high thermal performance
and high thermal performance (HTP) assemblies. While most of the differences between these
two assembly types are minor from a heat-generation standpoint, the HTP fuel contains 10 kg
more uranium that will result in higher decay heat loads. As such, all fuel assemblies discharged
from 2007 onward are assumed to be the higher heat generating HTP fuel.
5.4 MINIMUM TIME-TO-BOIL AND MAXIMUM BOILOFF RATE
The following conservatisms and assumptions are applied in the time-to-boil and boiloff rate
calculations:
* The initial SFP bulk temperature is assumed to be equal to the bulk temperature limit of150 OF for the full core offload and 120 OF for the partial core offload.
0 The thermal inertia (thermal capacity) of the SFP is based on the net water volume only.This conservatively neglects the considerable thermal inertia of the fuel assemblies,stainless steel racks and stainless steel SFP liners.
* During the loss of forced cooling evaluations, it is assumed that makeup water is notavailable. This minimizes the thermal capacity of the SFP as water is boiled off, thusincreasing the water level drop rate.
Holtec Report HI-2022867 5-4 Holtec Project 1196
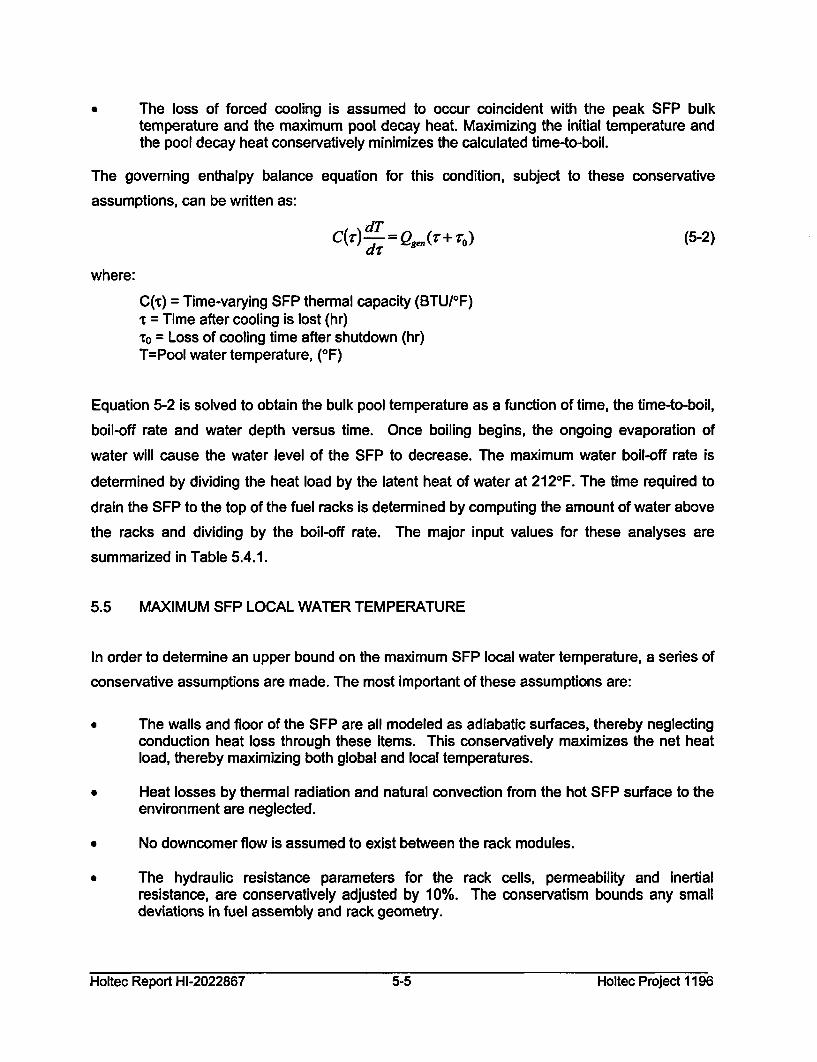
* The loss of forced cooling is assumed to occur coincident with the peak SFP bulktemperature and the maximum pool decay heat. Maximizing the initial temperature andthe pool decay heat conservatively minimizes the calculated time-to-boil.
The governing enthalpy balance equation for this condition, subject to these conservative
assumptions, can be written as:
C(T) d- = Qg', (" + VO) (5-2)
where:
C(t) = Time-varying SFP thermal capacity (BTU/°F),T = Time after cooling is lost (hr)x0 = Loss of cooling time after shutdown (hr)T=Pool water temperature, (OF)
Equation 5-2 is solved to obtain the bulk pool temperature as a function of time, the time-to-boil,
boil-off rate and water depth versus time. Once boiling begins, the ongoing evaporation of
water will cause the water level of the SFP to decrease. The maximum water boil-off rate is
determined by dividing the heat load by the latent heat of water at 212 0F. The time required to
drain the SFP to the top of the fuel racks is determined by computing the amount of water above
the racks and dividing by the boil-off rate. The major input values for these analyses are
summarized in Table 5.4.1.
5.5 MAXIMUM SFP LOCAL WATER TEMPERATURE
In order to determine an upper bound on the maximum SFP local water temperature, a series of
conservative assumptions are made. The most important of these assumptions are:
* The walls and floor of the SFP are all modeled as adiabatic surfaces, thereby neglectingconduction heat loss through these items. This conservatively maximizes the net heatload, thereby maximizing both global and local temperatures.
Heat losses by thermal radiation and natural convection from the hot SFP surface to the
environment are neglected.
No downcomer flow is assumed to exist between the rack modules.
The hydraulic resistance parameters for the rack cells, permeability and inertialresistance, are conservatively adjusted by 10%. The conservatism bounds any smalldeviations in fuel assembly and rack geometry.
Holtec Report HI-2022867 5-5 Holtec Project 1196
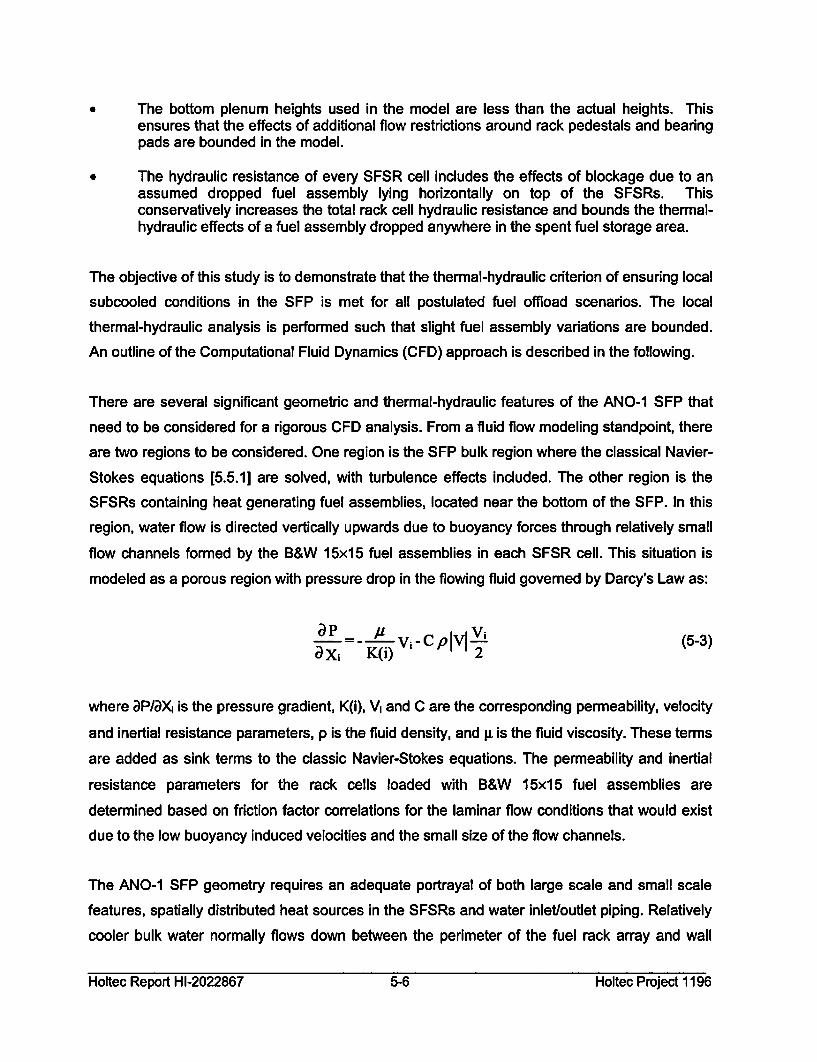
The bottom plenum heights used in the model are less than the actual heights. Thisensures that the effects of additional flow restrictions around rack pedestals and bearingpads are bounded in the model.
The hydraulic resistance of every SFSR cell includes the effects of blockage due to anassumed dropped fuel assembly lying horizontally on top of the SFSRs. Thisconservatively increases the total rack cell hydraulic resistance and bounds the thermal-hydraulic effects of a fuel assembly dropped anywhere in the spent fuel storage area.
The objective of this study is to demonstrate that the thermal-hydraulic criterion of ensuring local
subcooled conditions in the SFP is met for all postulated fuel offload scenarios. The local
thermal-hydraulic analysis is performed such that slight fuel assembly variations are bounded.
An outline of the Computational Fluid Dynamics (CFD) approach is described in the following.
There are several significant geometric and thermal-hydraulic features of the ANO-1 SFP that
need to be considered for a rigorous CFD analysis. From a fluid flow modeling standpoint, there
are two regions to be considered. One region is the SFP bulk region where the classical Navier-
Stokes equations [5.5.11 are solved, with turbulence effects included. The other region is the
SFSRs containing heat generating fuel assemblies, located near the bottom of the SFP. In this
region, water flow is directed vertically upwards due to buoyancy forces through relatively small
flow channels formed by the B&W 15x15 fuel assemblies in each SFSR cell. This situation is
modeled as a porous region with pressure drop in the flowing fluid governed by Darcy's Law as:
oaP - i- V Vi (5-3)
DX1 K(i) 2
where DP/aX; is the pressure gradient, K(i), V, and C are the corresponding permeability, velocity
and inertial resistance parameters, p is the fluid density, and gi is the fluid viscosity. These terms
are added as sink terms to the classic Navier-Stokes equations. The permeability and inertial
resistance parameters for the rack cells loaded with B&W 15x15 fuel assemblies are
determined based on friction factor correlations for the laminar flow conditions that would exist
due to the low buoyancy induced velocities and the small size of the flow channels.
The ANO-1 SFP geometry requires an adequate portrayal of both large scale and small scale
features, spatially distributed heat sources in the SFSRs and water inlet/outlet piping. Relatively
cooler bulk water normally flows down between the perimeter of the fuel rack array and wall
Holtec Report HI-2022867 5-6 Holtec Project 1196
liner, a clearance known as the downcomer. Near the bottom of the racks the flow turns from a
vertical to horizontal direction into the bottom plenum, supplying cooling water to the rack cells.
Heated water flowing out of the top of the racks mixes with the bulk water. An adequate
modeling of these features in the CFD program involves meshing the large scale bulk SFP
region and small scale downcomer and bottom plenum regions with sufficient number of
computational cells to capture both the global and local features of the flow field.
The distributed heat sources in the SFP racks are modeled by identifying distinct heat
generation zones considering recently offloaded fuel, bounding peaking effects, and the
presence of background decay heat from previous offloads. Two heat generating zones are
modeled. The first consists of background fuel from previous offloads. The second zone
consists of fuel from recently offloaded fuel assemblies. This is a conservative model, since all
of the hot fuel assemblies from the recent offload are placed in a contiguous area. A uniformly
distributed heat generation rate was applied throughout each distinct zone (i.e., there were no
variations in heat generation rate within a single zone).
The CFD analysis was performed on the commercially available FLUENT [5.5.2] Computational
Fluid Dynamics program, which has been benchmarked under Holtec's QA program. The
FLUENT code enables buoyancy flow and turbulence effects to be included in the CFD
analysis. Buoyancy forces are included by specifying a temperature-dependent density for water
and applying an appropriate gravity vector. Turbulence effects are modeled by relating time-
varying Reynolds' Stresses to the mean bulk flow quantities with the standard k-e turbulence
model.
Some of the major input values for this analysis are summarized in Table 5.5.1. An isometric
view of the assembled CFD model is presented in Figure 5.5.1.
5.6 FUEL ROD CLADDING TEMPERATURE
The maximum fuel rod cladding temperature is determined to establish that nucleate boiling is
not possible while forced cooling is operating. This requires demonstrating that the highest fuel
rod cladding temperatures are less than the local saturation temperature of the adjacent SFP
water. The maximum fuel cladding superheat above the local water temperature is calculated
for two different peak fuel rod heat emission rates.
Holtec Report HI-2022867 5-7 Holtec Project 1196
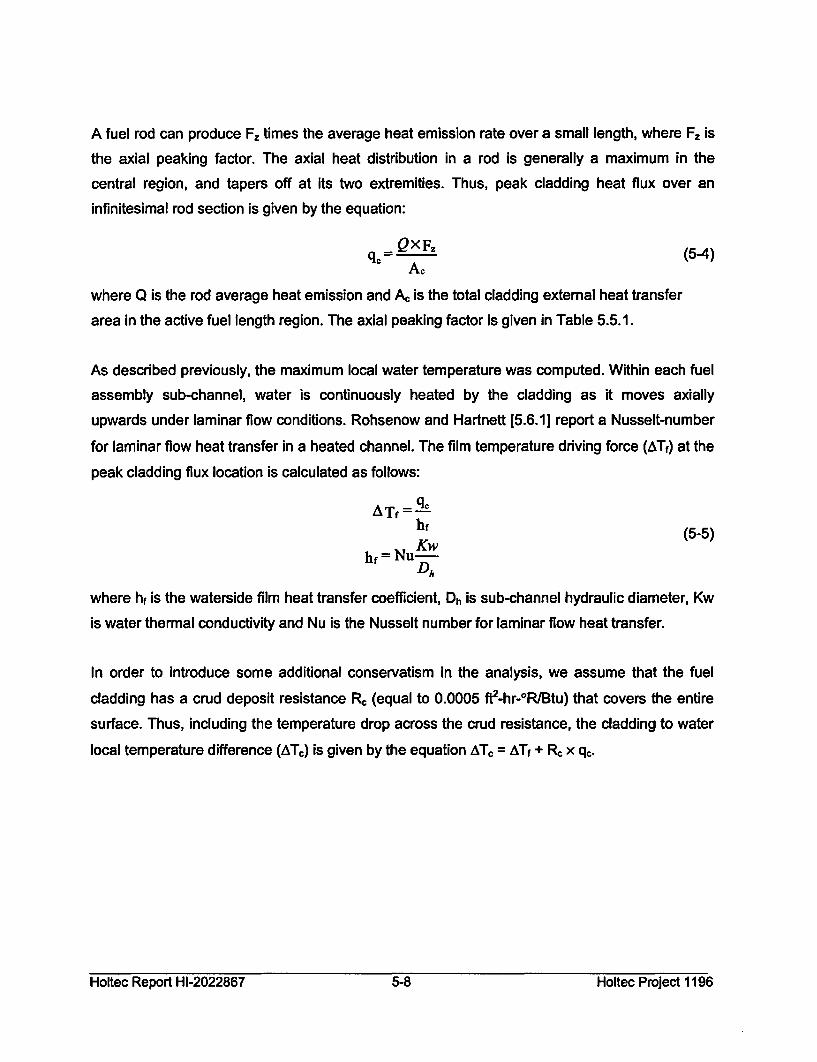
A fuel rod can produce F, times the average heat emission rate over a small length, where Fz is
the axial peaking factor. The axial heat distribution in a rod is generally a maximum in the
central region, and tapers off at its two extremities. Thus, peak cladding heat flux over an
infinitesimal rod section is given by the equation:
Q×FZqc- (5-4)A,
where Q is the rod average heat emission and A& is the total cladding external heat transfer
area in the active fuel length region. The axial peaking factor is given in Table 5.5.1.
As described previously, the maximum local water temperature was computed. Within each fuel
assembly sub-channel, water is continuously heated by the cladding as it moves axially
upwards under laminar flow conditions. Rohsenow and Hartnett [5.6.1] report a Nusselt-number
for laminar flow heat transfer in a heated channel. The film temperature driving force (ATf) at the
peak cladding flux location is calculated as follows:
AD- =q.c
hf (5-5)
hf = NuKwDh
where hf is the waterside film heat transfer coefficient, Dh is sub-channel hydraulic diameter, Kw
is water thermal conductivity and Nu is the Nusselt number for laminar flow heat transfer.
In order to introduce some additional conservatism in the analysis, we assume that the fuel
cladding has a crud deposit resistance R: (equal to 0.0005 ft2-hr-°R/Btu) that covers the entire
surface. Thus, including the temperature drop across the crud resistance, the cladding to water
local temperature difference (ATr) is given by the equation AT, = ATf + Rc x q,.
Holtec Report H 1-2022867 5-8 Holtec Project 1196Holtec Report HI-2022867 5-8 Holtec Project 1196
5.7 RESULTS
This section contains results from the analyses performed for the postulated offload scenarios.
5.7.1 Decay Heat
For the offload scenarios described in Section 5.3, the calculated SFP decay heat loads are
summarized in Table 5.7.1. Given the conservatisms incorporated into the calculations, actual
decay heat loads will be lower than these calculated values. Figures 5.7.1 and 5.7.2 each
present profiles of net decay heat load versus time for the evaluated transient scenarios.
5.7.2 Minimum Time-to-Boil and Maximum Boiloff Rate
For the offload/cooling described in Section 5.4, the calculated times-to-boil and maximum boil-
off rates are summarized in Table 5.7.2. These results show that, in the extremely unlikely event
of a failure of forced cooling to the SFP, there would be at least 3.18 hours available for
corrective actions prior to SFP boiling. Given the conservatisms incorporated into the
calculations, actual times-to-boil will be higher than these calculated values. It is noted that a
complete failure of forced cooling is extremely unlikely. The maximum water boiloff rate is less
than 87 gpm.
5.7.3 Local Water and Fuel Cladding Temperatures
Consistent with our approach to make conservative assessments of temperature, the local
water temperature calculations described in Section 5.5 are performed for a SFP with a total
decay heat generation equal to the calculated decay heat load coincident with the maximum
SFP bulk temperature. Thus, the local water temperature evaluation is a calculation of the
temperature increment over the theoretical spatially uniform value due to local hot spots (due to
the presence of highly heat emissive fuel assemblies). As described in Subsection 5.6, the peak
fuel clad superheats (i.e., the maximum clad-to-local water temperature difference) are
determined. The resultant bounding superheat values were used to calculate bounding
maximum fuel clad temperatures.
Holtec Report HI-2022867 5-9 Holtec Project 1196
The numeric results of the maximum local water temperature and the bounding fuel cladding
temperature evaluations are presented in Table 5.7.3. Figure 5.7.3 presents converged
temperature contours in a vertical slice through the hot fuel region. Figure 5.7.4 presents
converged velocity vectors in a vertical slice through the hot fuel region.
Both the maximum local water temperatures and the bounding fuel cladding temperatures are
substantially lower than the 240°F local boiling temperature at the top of the SFSRs. These
results demonstrate that boiling, including nucleate boiling on clad surfaces, cannot occur
anywhere within the ANO-1 SFP.
Under a postulated accident scenario of the loss of all cooling, the water temperature will rise.
Assuming a temperature of 2121F at the inlet to the rack cells, and conservatively using the
bounding bulk-to-local and local-to-clad temperature differences from Table 5.7.3, the maximum
possible cladding temperature will be 261.51F, which is greater than the saturation temperature
at the top of the active fuel length. Due to the low maximum assembly heat flux (approximately
7300 W/m 2) and the critical heat flux required for departure from nucleate boiling (on the order
of 106 W/m2), it can be concluded that the fuel cladding will not be subjected to departure from
nucleate boiling even under the postulated accident scenario of the loss of all SFP cooling and
the cladding integrity would be maintained.
5.8 REFERENCES
[5.3.11 "QA Documentation for DECOR," Holtec Report HI-971734, Revision 0.
[5.3.2] A.G. Croff, "ORIGEN2 - A Revised and Updated Version of the Oak Ridge IsotopeGeneration and Depletion Code," ORNL-5621, Oak Ridge National Laboratory, 1980.
[5.5.1] Batchelor, G.K., "An Introduction to Fluid Dynamics," Cambridge University Press, 1967.
[5.5.2] "Validation of FLUENT Version 5.1," Holtec Report HI-992276, Revision 0.
[5.6.1] Rohsenow, N.M., and Hartnett, J.P., "Handbook of Heat Transfer," McGraw Hill BookCompany, New York, 1973.
Holtec Report HI-2022867 5-10 Holtec Project 1196Holtec Report HI-2022867 5-10 Holtec Project 1196
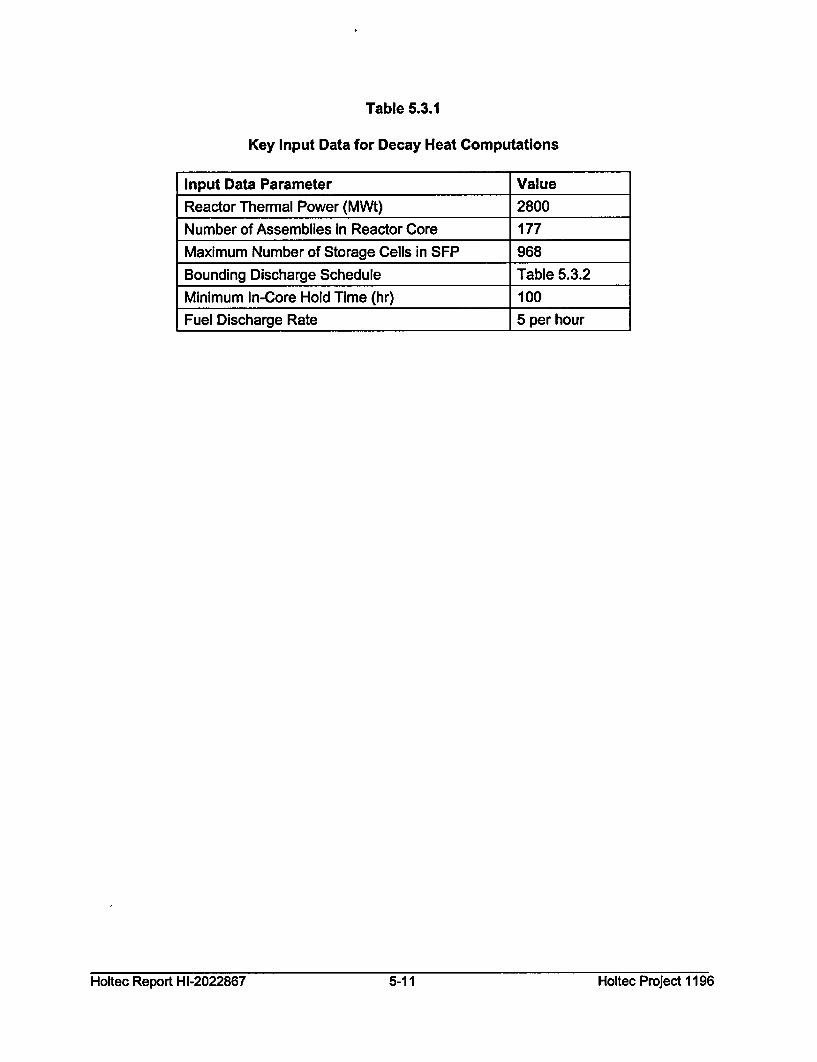
Table 5.3.1
Key Input Data for Decay Heat Computations
Input Data Parameter ValueReactor Thermal Power (MWt) 2800
Number of Assemblies in Reactor Core 177
Maximum Number of Storage Cells in SFP 968
Bounding Discharge Schedule Table 5.3.2Minimum In-Core Hold Time (hr) 100
Fuel Discharge Rate 5 per hour
Holtec Report HI-2022867 5-11 Holtec Project 1196
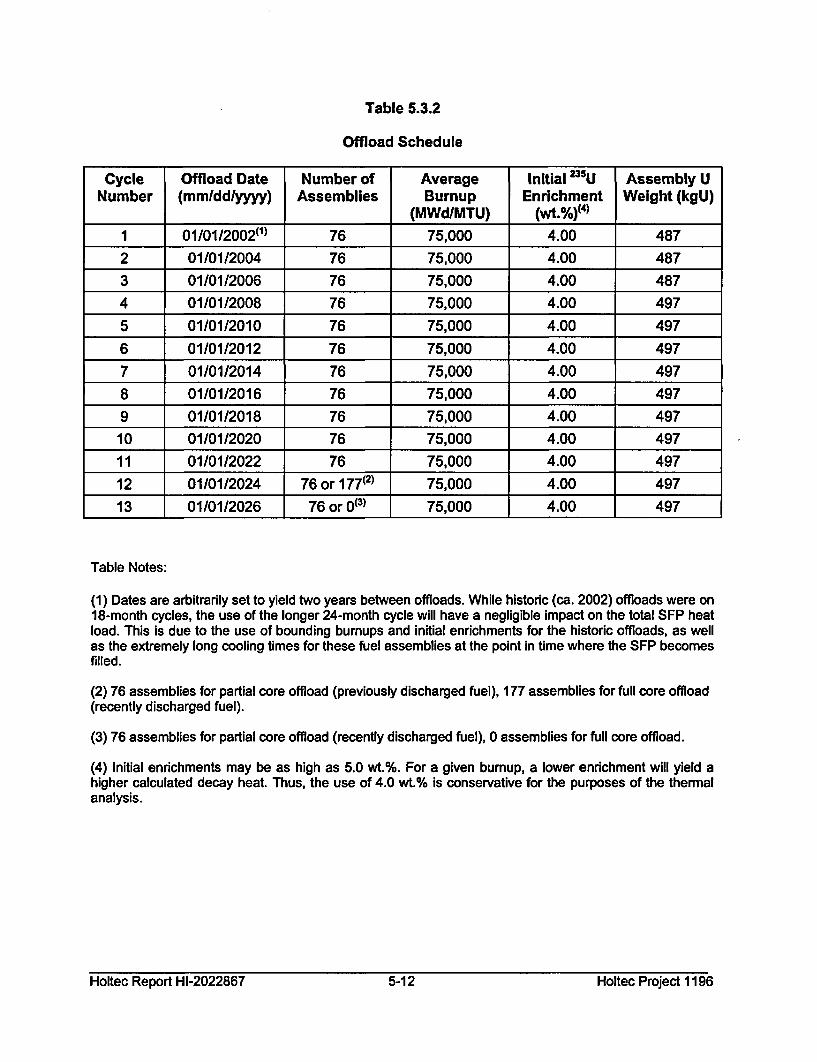
Table 5.3.2
Offload Schedule
Cycle Offload Date Number of Average Initial 235 U Assembly UNumber (mmlddlyyyy) Assemblies Burnup Enrichment Weight (kgU)
(MWd/MTU) (wt.%)(4)
1 01/01/2002(1) 76 75,000 4.00 487
2 01/01/2004 76 75,000 4.00 4873 01/01/2006 76 75,000 4.00 4874 01/01/2008 76 75,000 4.00 497
5 01/01/2010 76 75,000 4.00 497
6 01/01/2012 76 75,000 4.00 497
7 01/01/2014 76 75,000 4.00 497
8 01/01/2016 76 75,000 4.00 4979 01/01/2018 76 75,000 4.00 497
10 01/01/2020 76 75,000 4.00 497
11 01/01/2022 76 75,000 4.00 497
12 01/01/2024 76 or 177(2) 75,000 4.00 497
13 01/01/2026 76 or 0(3) 75,000 4.00 497
Table Notes:
(1) Dates are arbitrarily set to yield two years between offloads. While historic (ca. 2002) offloads were on18-month cycles, the use of the longer 24-month cycle will have a negligible impact on the total SFP heatload. This is due to the use of bounding bumups and initial enrichments for the historic offloads, as wellas the extremely long cooling times for these fuel assemblies at the point in time where the SFP becomesfilled.
(2) 76 assemblies for partial core offload (previously discharged fuel), 177 assemblies for full core offload(recently discharged fuel).
(3) 76 assemblies for partial core offiload (recently discharged fuel), 0 assemblies for full core offload.
(4) Initial enrichments may be as high as 5.0 wt.%. For a given bumup, a lower enrichment will yield ahigher calculated decay heat. Thus, the use of 4.0 wt.% is conservative for the purposes of the thermalanalysis.
Holtec Report HI-2022867 5-12 Holtec Project 1196
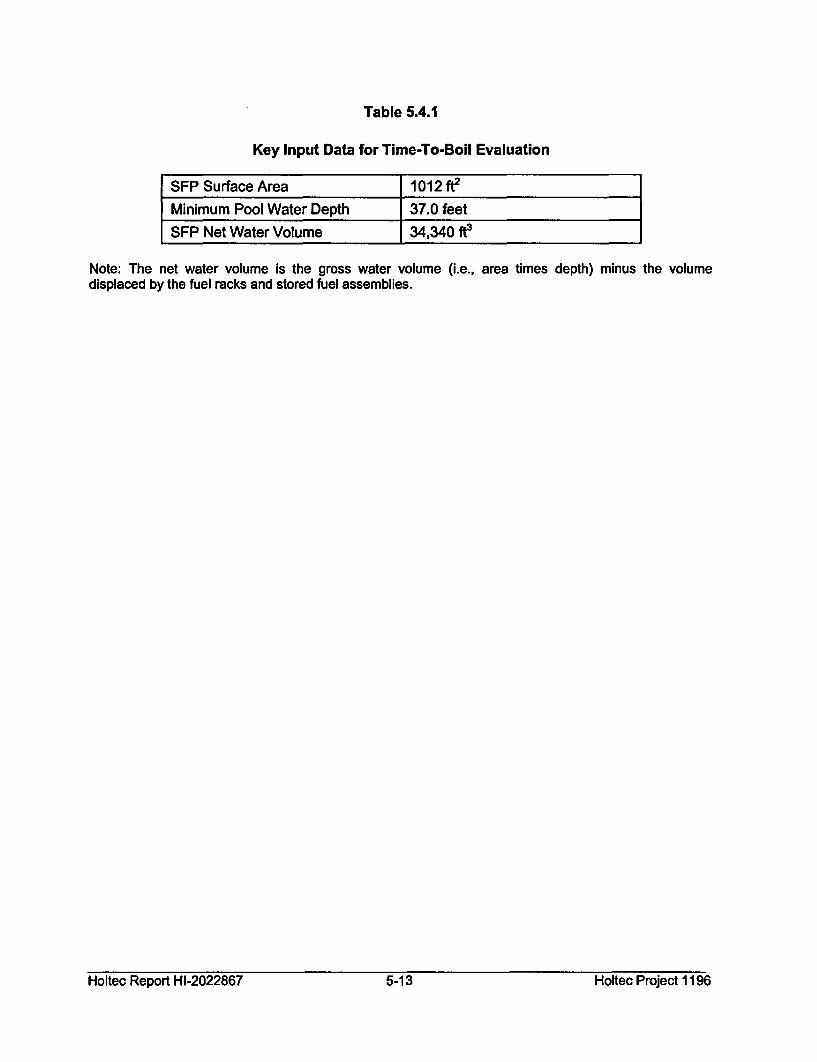
Table 5.4.1
Key Input Data for Time-To-Boil Evaluation
SFP Surface Area 1012 ft2
Minimum Pool Water Depth 37.0 feet
SFP Net Water Volume 34,340 ft3
Note: The net water volume is the gross water volume (i.e., area times depth) minus the volumedisplaced by the fuel racks and stored fuel assemblies.
Holtec Report HI-2022867 5-13 Holtec Project 1196Holtec Report HI-2022867 5-13 Holtec Project 1196
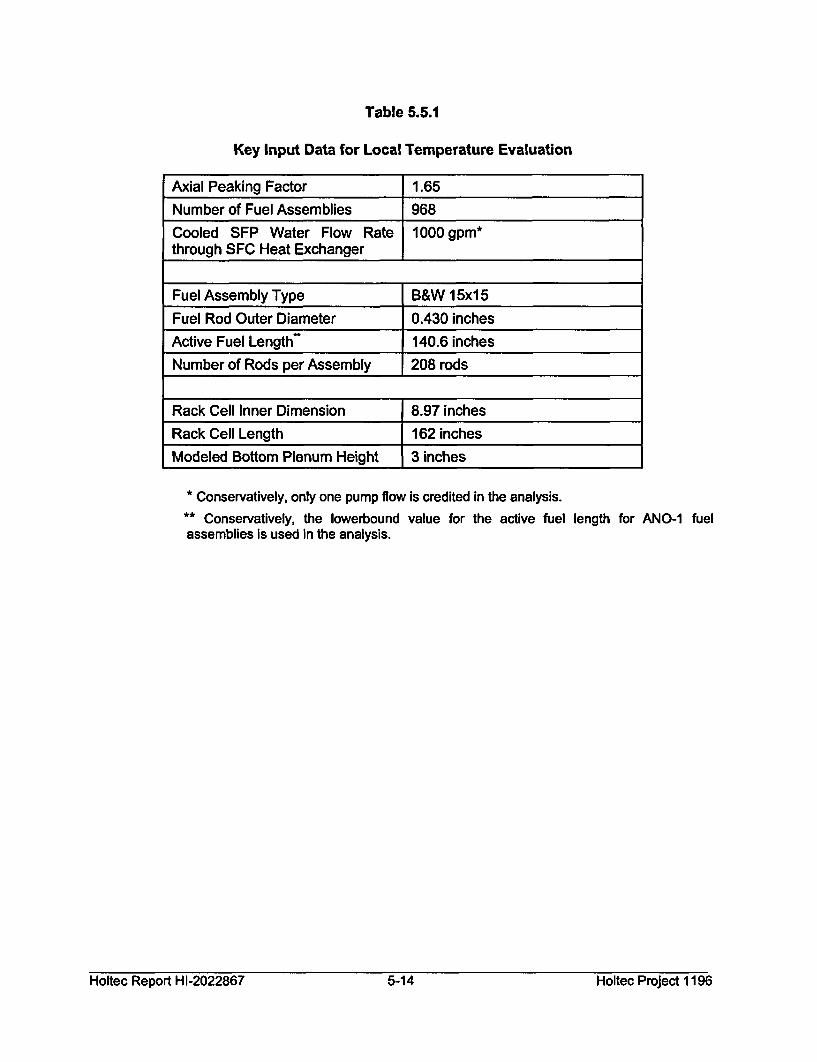
Table 5.5.1
Key Input Data for Local Temperature Evaluation
Axial Peaking Factor 1.65
Number of Fuel Assemblies 968
Cooled SFP Water Flow Rate 1000 gpm*through SFC Heat Exchanger
Fuel Assembly Type B&W 15xl 5
Fuel Rod Outer Diameter 0.430 inches
Active Fuel Length"* 140.6 inches
Number of Rods per Assembly 208 rods
Rack Cell Inner Dimension 8.97 inches
Rack Cell Length 162 inches
Modeled Bottom Plenum Height 3 inches
* Conservatively, only one pump flow is credited in the analysis.
** Conservatively, the lowerbound value for the active fuel length for ANO-1 fuelassemblies is used in the analysis.
Holtec Report HI-2022867 5-14 Holtec Project 1196
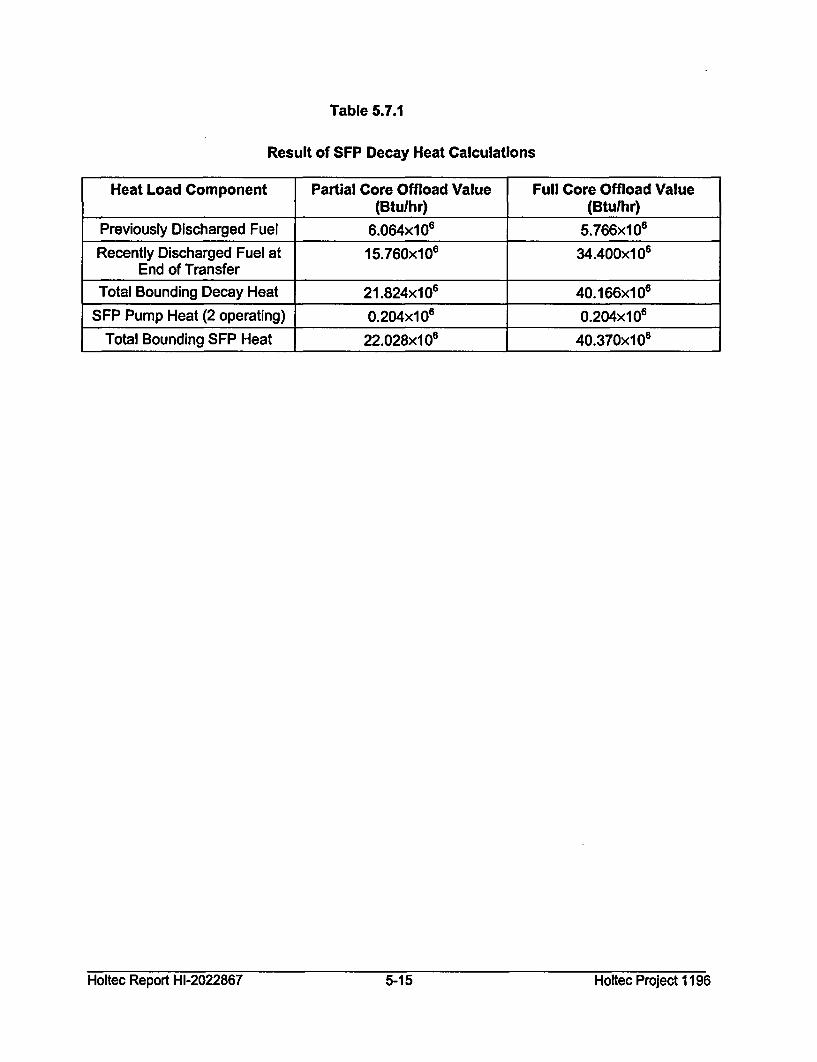
Table 5.7.1
Result of SFP Decay Heat Calculations
Heat Load Component Partial Core Offload Value Full Core Offload Value(Btulhr) (Btulhr)
Previously Discharged Fuel 6.0641 06 5.766x1 06
Recently Discharged Fuel at 15.760x10 6 34.400x10 6
End of TransferTotal Bounding Decay Heat 21.824×10 6 40.1661 06
SFP Pump Heat (2 operating) 0.204x10 6 0.204x10 6
Total Bounding SFP Heat 22.028x10⁶ 40.370x10 6
Holtec Report H 1-2022867 5-15 Holtec Project 1196Holtec Report HI-2022867 5-15 Holtec Project 1196
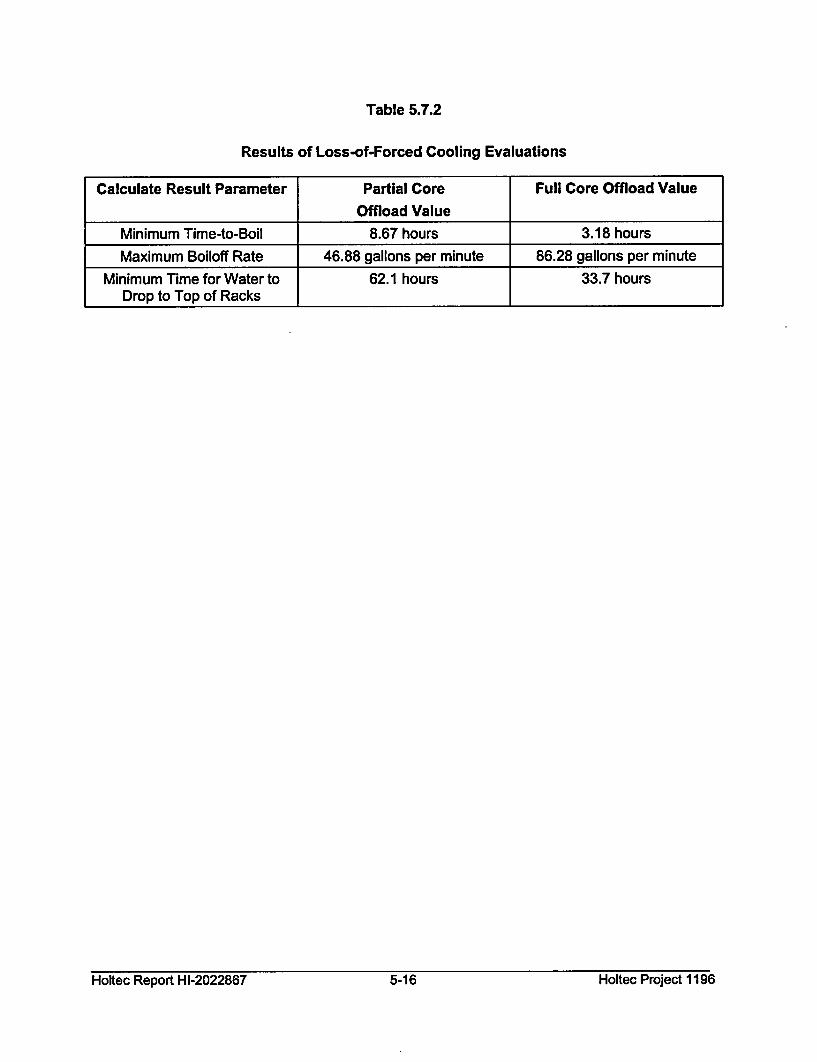
Table 5.7.2
Results of Loss-of-Forced Cooling Evaluations
Calculate Result Parameter Partial Core Full Core Offload Value
Offload Value
Minimum Time-to-Boil 8.67 hours 3.18 hours
Maximum Boiloff Rate 46.88 gallons per minute 86.28 gallons per minute
Minimum Time for Water to 62.1 hours 33.7 hoursDrop to Top of Racks
Holtec Report H 1-2022867 5-16 Holtec Project 1196Holtec Report HI-2022867 5-16 Holtec Project 1196
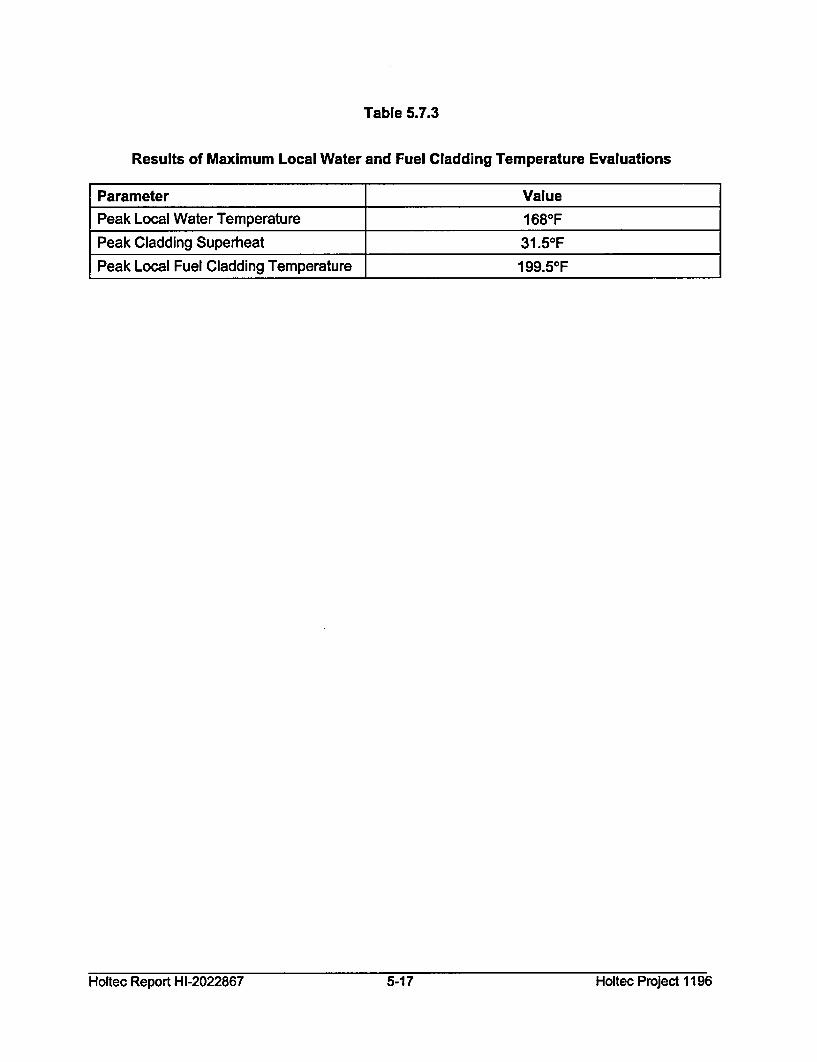
Table 5.7.3
Results of Maximum Local Water and Fuel Cladding Temperature Evaluations
Parameter ValuePeak Local Water Temperature 1680F
Peak Cladding Superheat 31.5 0F
Peak Local Fuel Cladding Temperature 199.50F
Holtec Report HI-2022867 5-17 Holtec Project 1196
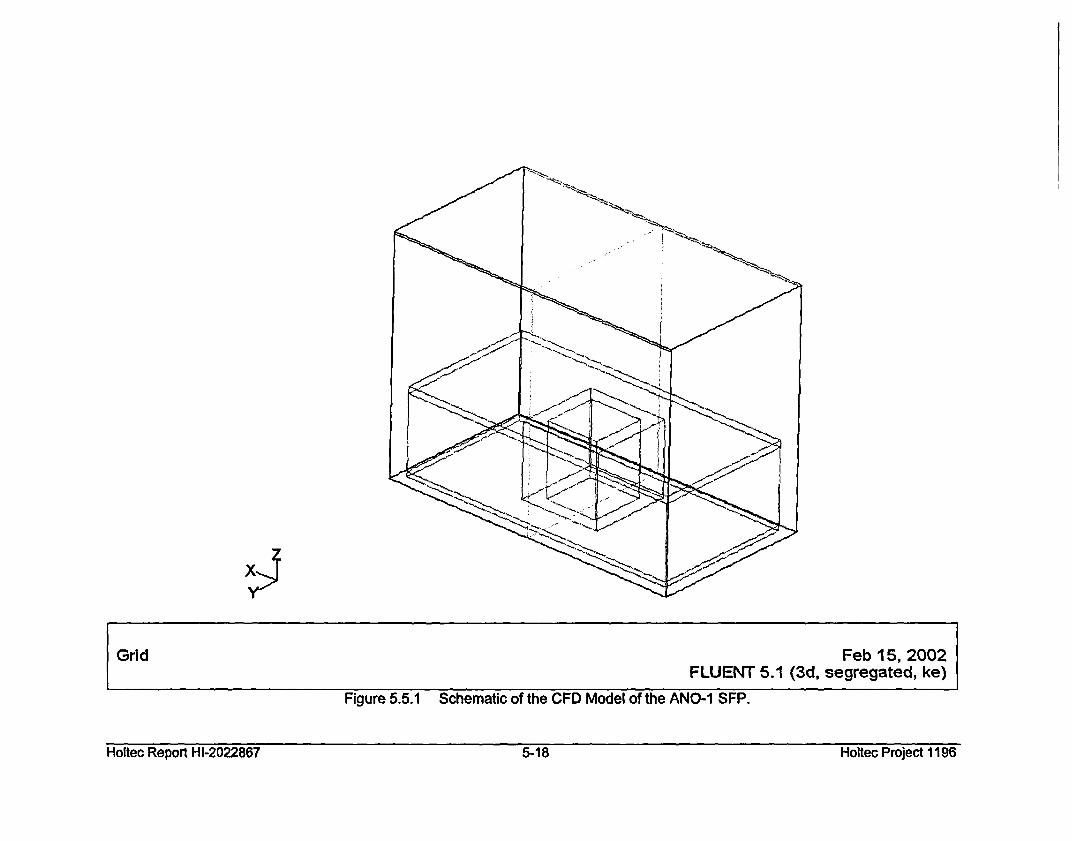
Grid Feb 15, 2002
FLUENT 5.1 (3d, segregated, ke)
Figure 5.5.1 Schematic of the CFD Model of the ANO-1 SFP.
Holtec Report HI-2022867 5-18 Holtec Project 1196
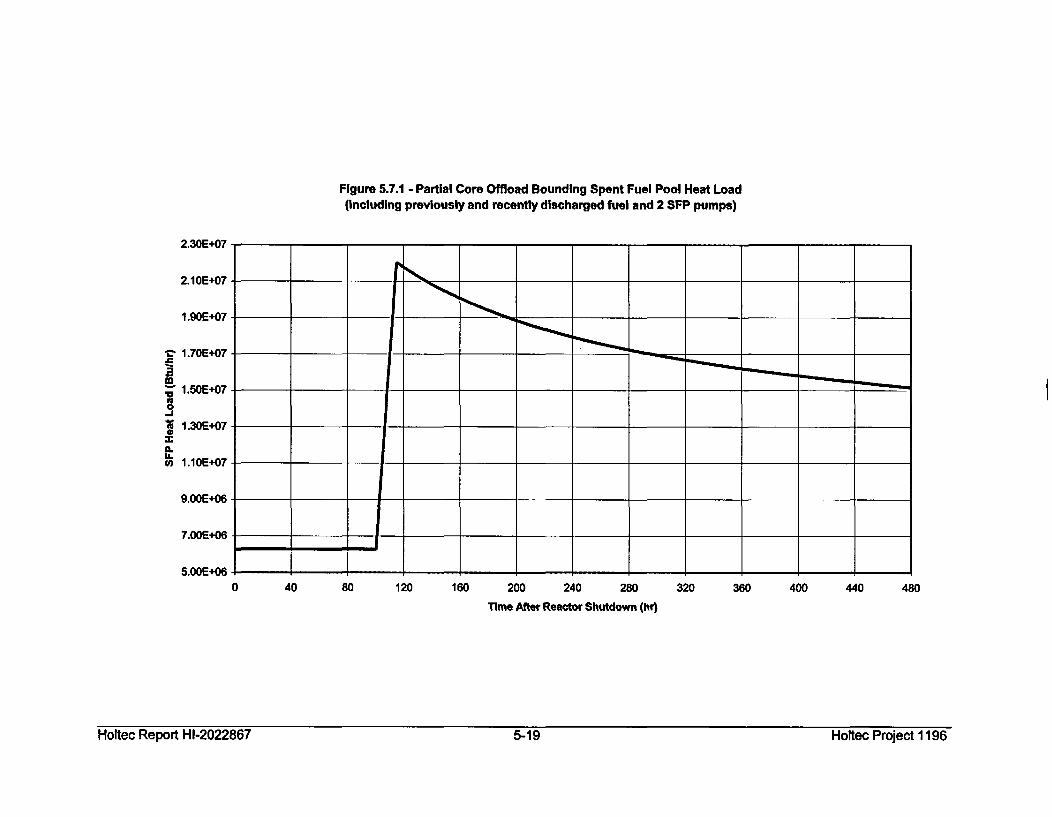
Figure 5.7.1 - Partial Core Offload Bounding Spent Fuel Pool Heat Load(including previously and recently discharged fuel and 2 SFP pumps)
2.30E+07
2.1012+07
1.90E+07
VC 1.70E+07
0
1.0E0
S1.30E+07
(0 .IOE+07
7.0012+06
7.OOE+06
I
0 40 80 120 160 200 240 280
Time After Reactor Shutdown (hr)
320 360 400 440 480
Hoitec Report H 1-2022867 5-19 Hoitec Project 1196Holtec Report HI-2022867 5-19 Holtec Project 1196
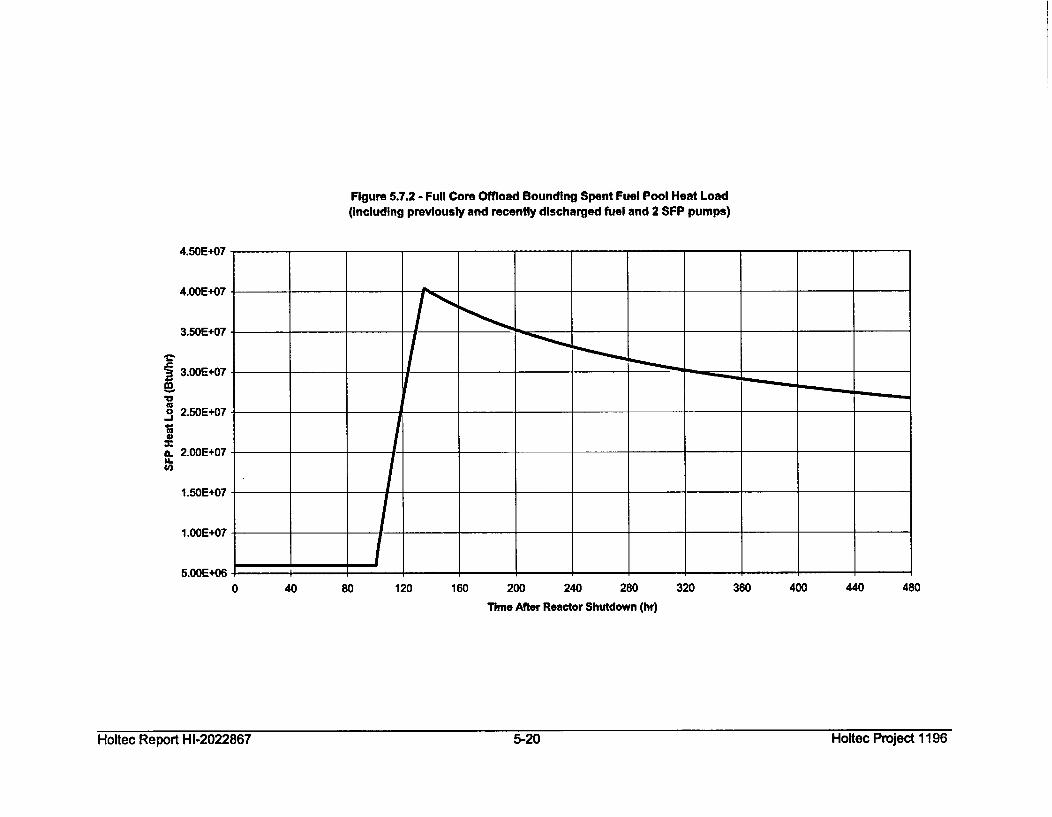
Figure 5.7.2 - Full Core Offload Bounding Spent Fuel Pool Heat Load(including previously and recently discharged fuel and 2 SFP pumps)
4.50E+07
4.OOE+07
3.50E+07
3.OOE+07
0 2.50E+07
a.2.OOE+07LL
1 .50E+07
I.OOE+07
5.OOE+060 40 80 120 160 200 240 280
Time After Reactor Shutdown (hr)
320 360 400 440 480
Holtec Report H 1-2022867 5-20 1-loltec Project 11 9~3Holtee Report HI-2022867 5-20 Holtec Proje 1196
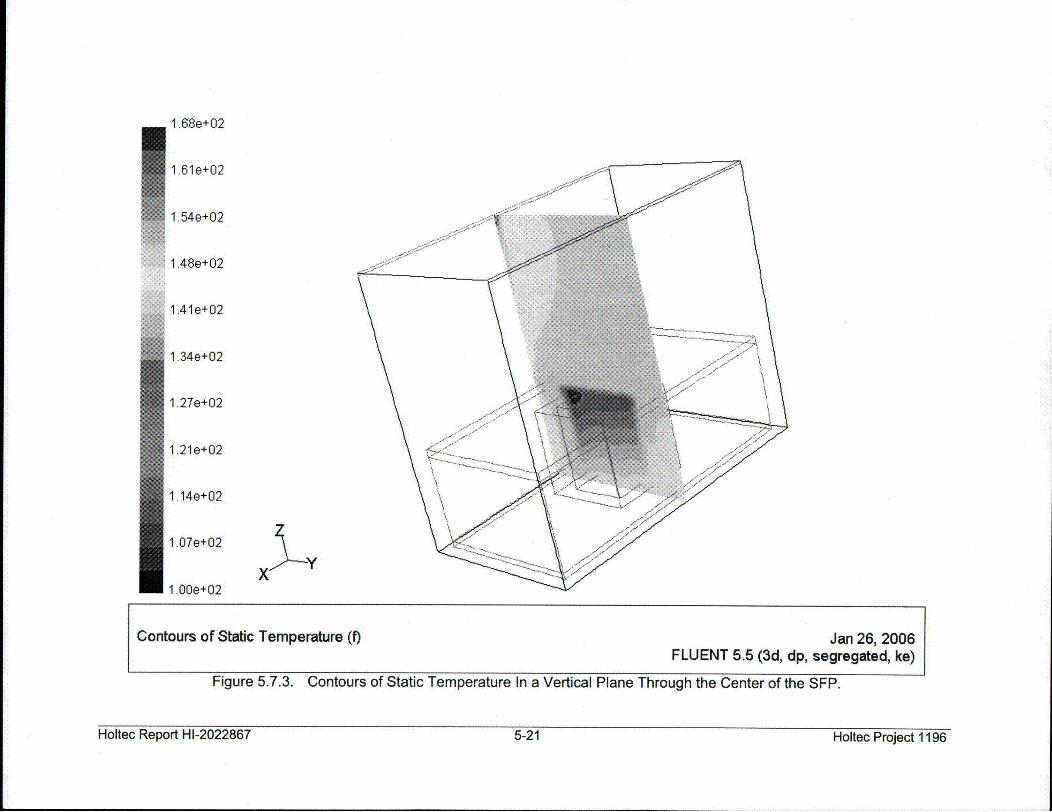
1.68e+02
1.61e+02
1.54e+02
1.48e+02
1.41e+02
1.34e+02
1.27e+02
1.21e+02
1.14e+02
1.07e+02
1.00e+02x
Contours of Static Temperature (f) Jan 26, 2006FLUENT 5.5 (3d, dp, segregated, ke)
Figure 5.7.3. Contours of Static Temperature In a Vertical Plane Through the Center of the SFP.Jan 26, 2006FLUENT 5.5 (3d, dp, segregated, ke)
Holtec Report H 1-2022867 5-21 Holtec Project 1196Holtec Report HI-2022867 5-21 Holtec Project 1196
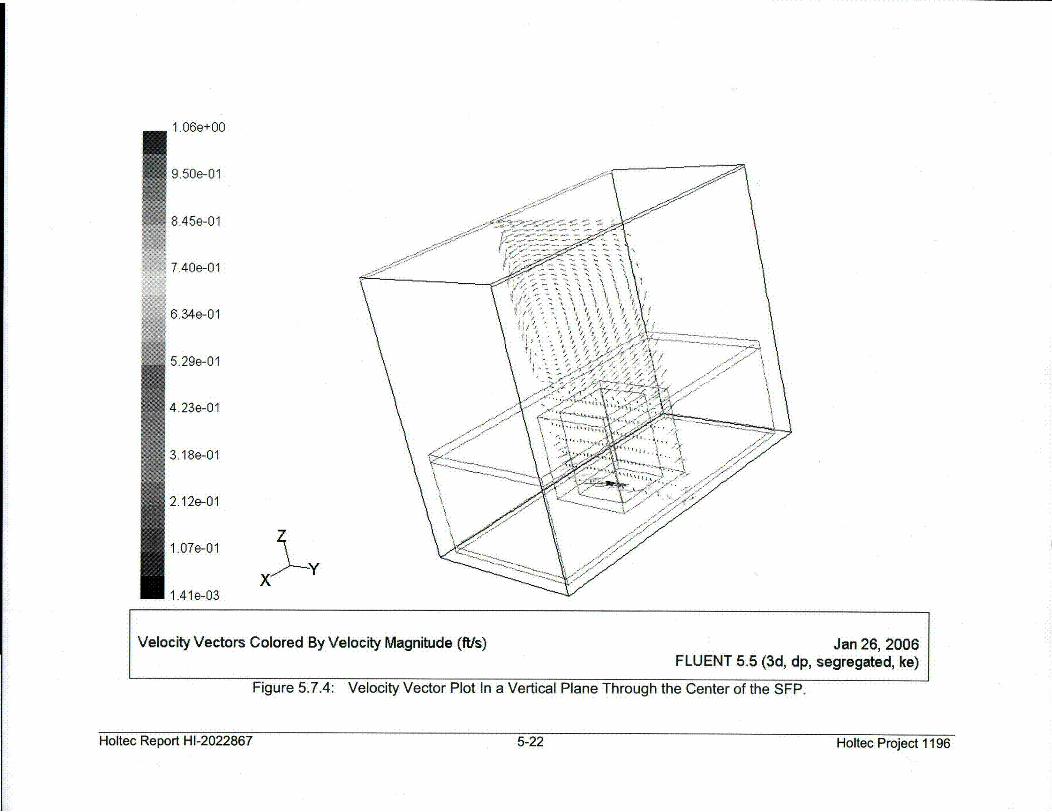
1.06e+00
9.50e-01
8.45e-01
7.40e-01
6.34e-01
5.29e-01
4.23e-01
3.18e-01
2.12e-01
1.07e-01
1.41e-03
Velocity Vectors
x -
Colored By Velocity Magnitude (ftls) Jan 26, 2006
FLUENT 5.5 (3d, dp, segregated, ke)
Figure 5.7.4: Velocity Vector Plot In a Vertical Plane Through the Center of the SFP.
Holtec Report HI-2022867 5-22 Holtec Project 1196
6.0 MECHANICAL ACCIDENTS
6.1 INTRODUCTION
The USNRC OT position paper [6.1.1] specifies that the design of the rack must ensure the
functional integrity of the spent fuel racks under all credible drop events.
The postulated fuel drop events on the ANO-1 SFP Region 3 racks, which will be inserted with
Metamic material in the rack flux traps with lead-ins installed on the top of flux traps, were
evaluated. The principal effect of this postulated drop accident would be damages to the poison
material in the Region 3 racks, which would increase reactivity in those storage racks. In this
report, the Region 1 racks have been analyzed for criticality safety under the assumption that
they do not contain any poison material. The Region 2 racks in the ANO-1 SFP do not contain
any poison material. Therefore, the reactivity effects of the postulated fuel drop accident for the
Region 3 racks are bounding.
6.2 DESCRIPTION OF MECHANICAL ACCIDENTS
The postulated drop accidents assume that a fuel assembly, along with a portion of the handling
tool, will drop vertically and hit the top of the rack at one of two enveloping locations: the cell
wall edge or the cell wall corner intersection.
6.3 EVALUATION OF MECHANICAL ACCIDENTS
To obtain conservative results, the postulated mechanical drop accidents were evaluated based
on the maximum impact energy, a thinner rack wall thickness, weakest weld size and
configuration, and worst case fabrication tolerance for the ANO-1 Region 3 racks. The
evaluation of the postulated drop events demonstrated that, with the previously described
conservative considerations, the postulated mechanical drop accidents would result in
significant damage to the impacted cell wall down into the active fuel region of the racks, leading
to the failure of Metamic® inserts inside the flux trap.
Holtec Report H 1-2022867 6-I Holtec Project 1196Holtec Report HI-2022867 6-1 Hoftec Project 1196
6.4 CONCLUSION
The fuel assembly drop events postulated for the ANO-1 spent fuel pool Region 3 racks were
conservatively evaluated and found that the poison inserts, as well as the cell wall, of the
impacted rack cell could be significantly damaged under the postulated accidental events. To
ensure the functional integrity of the rack, the criticality safety evaluation (reported in Section
4.0) conservatively analyzed the Region 3 racks under the postulated assumption that all poison
inserts are damaged. The racks were determined to remain subcritical even under this
extremely conservative postulated scenario, when credit was taken for a conservative value of
1600 ppm soluble boron in the pool. The minimum technical specification requirement for
soluble boron concentration in the pool water is greater than 2000 ppm.
6.5 REFERENCES
[6.1.1] "OT Position for Review and Acceptance of Spent Fuel Storage and HandlingApplications," dated April 14, 1978, and addendum dated 1979.
1-loltec Report HI-2022867 6-2 Holtec Project 1196Holtec Report HI-2022867 6-2 Holtec Project 1196