Embed Size (px)
Citation preview
HOMOGENEOUS AND HETEROGENEOUS CATALYSIS FOR BIOMASS
UPGRADING TO PLATFORM CHEMICALS AND END PRODUCTS
by
Angela M. Norton
A dissertation submitted to the Faculty of the University of Delaware in partial
fulfillment of the requirements for the degree of Doctor of Philosophy in Chemical
Engineering
Summer 2020
© Angela M. Norton
All Rights Reserved
HOMOGENEOUS AND HETEROGENEOUS CATALYSIS FOR BIOMASS
UPGRADING TO PLATFORM CHEMICALS AND END PRODUCTS
by
Angela M. Norton
Approved: __________________________________________________________
Eric M. Furst, Ph.D.
Chair of the Department of Chemical and Biomolecular Engineering
Approved: __________________________________________________________
Levi T. Thompson, Ph.D.
Dean of the College of Engineering
Approved: __________________________________________________________
Douglas J. Doren, Ph.D.
Interim Vice Provost for Graduate and Professional Education and
Dean of the Graduate College
I certify that I have read this dissertation and that in my opinion it meets
the academic and professional standard required by the University as a
dissertation for the degree of Doctor of Philosophy.
Signed: __________________________________________________________
Dionisios G. Vlachos, Ph.D.
Professor in charge of dissertation
I certify that I have read this dissertation and that in my opinion it meets
the academic and professional standard required by the University as a
dissertation for the degree of Doctor of Philosophy.
Signed: __________________________________________________________
Raul F. Lobo, Ph.D.
Member of dissertation committee
I certify that I have read this dissertation and that in my opinion it meets
the academic and professional standard required by the University as a
dissertation for the degree of Doctor of Philosophy.
Signed: __________________________________________________________
Bingjun Xu, Ph.D.
Member of dissertation committee
I certify that I have read this dissertation and that in my opinion it meets
the academic and professional standard required by the University as a
dissertation for the degree of Doctor of Philosophy.
Signed: __________________________________________________________
Michael Tsapatsis, Ph.D.
Member of dissertation committee

I certify that I have read this dissertation and that in my opinion it meets
the academic and professional standard required by the University as a
dissertation for the degree of Doctor of Philosophy.
Signed: __________________________________________________________
J. Anibal Boscoboinik, Ph.D.
Member of dissertation committee
v
This material is based upon the work supported by the Catalysis Center for
Energy Innovation, an Energy Frontier Research Center funded by the U.S.
Department of Energy, Office of Science, Office of Basic Energy under award number
DE‐SC0001004, and the National Science Foundation, award number 1434456.
I extend my sincerest gratitude to my advisor, Dion. You have been
instrumental in my growth and success as a researcher, and I would like to thank you
for every single opportunity you have given me. I hope to emulate your example and
teachings throughout my career.
I extend my thanks to my mentors, Dr. Anibal Boscoboinik and Prof. Michael
Tsapatsis. Thank you for your mentorship during my stay at Brookhaven National
Laboratory. Your expertise and support have been instrumental to my academic
success. I would also like to thank my good friend and colleague, Dr. Lily Cheng, for
always looking out for me and making me laugh.
Last but not least, I would like to express my deepest appreciation to my loved
ones. To my best friend and fiancé, John, I have cherished every moment we have
shared together, and I cannot thank you enough for all you have done to support me.
Thank you for making my dreams come true. To the Ruano-Salguero Family, thank
you for treating me so well and showing me your unconditional love and support.
And, to my parents, John and Grace Norton, and my brother, Jack, thank you for
everything you do. I could not do it without you.
ACKNOWLEDGMENTS
vi
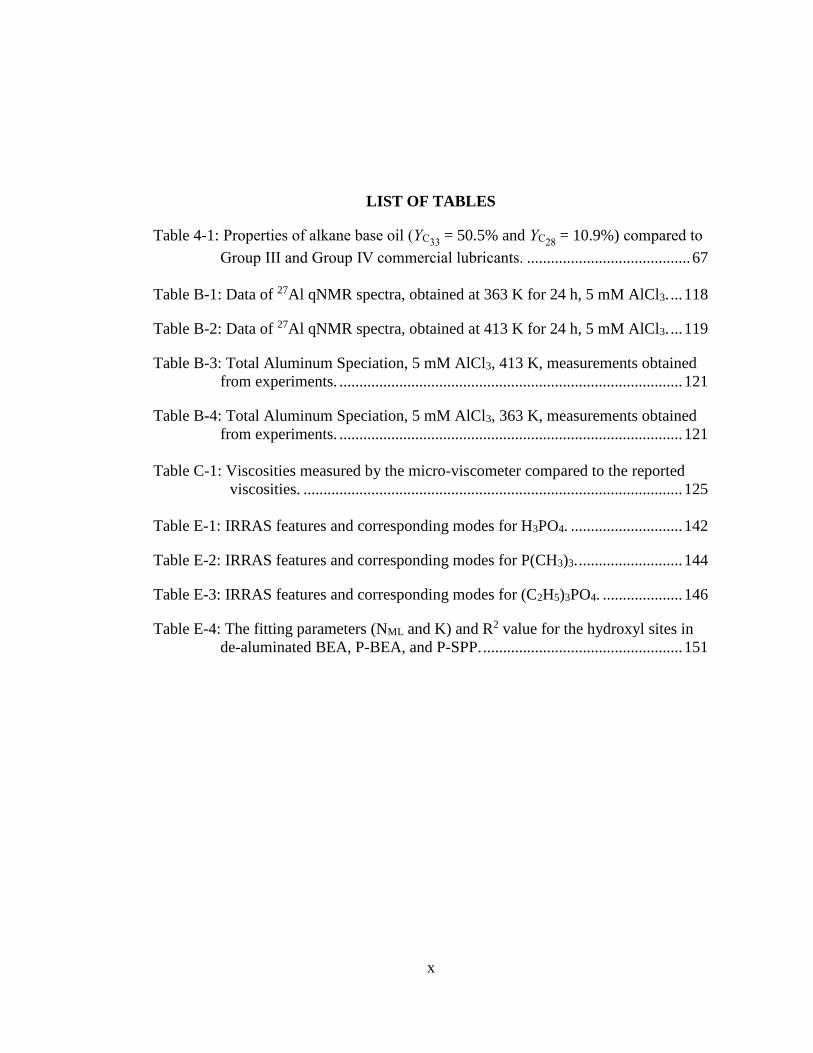
LIST OF TABLES ......................................................................................................... x
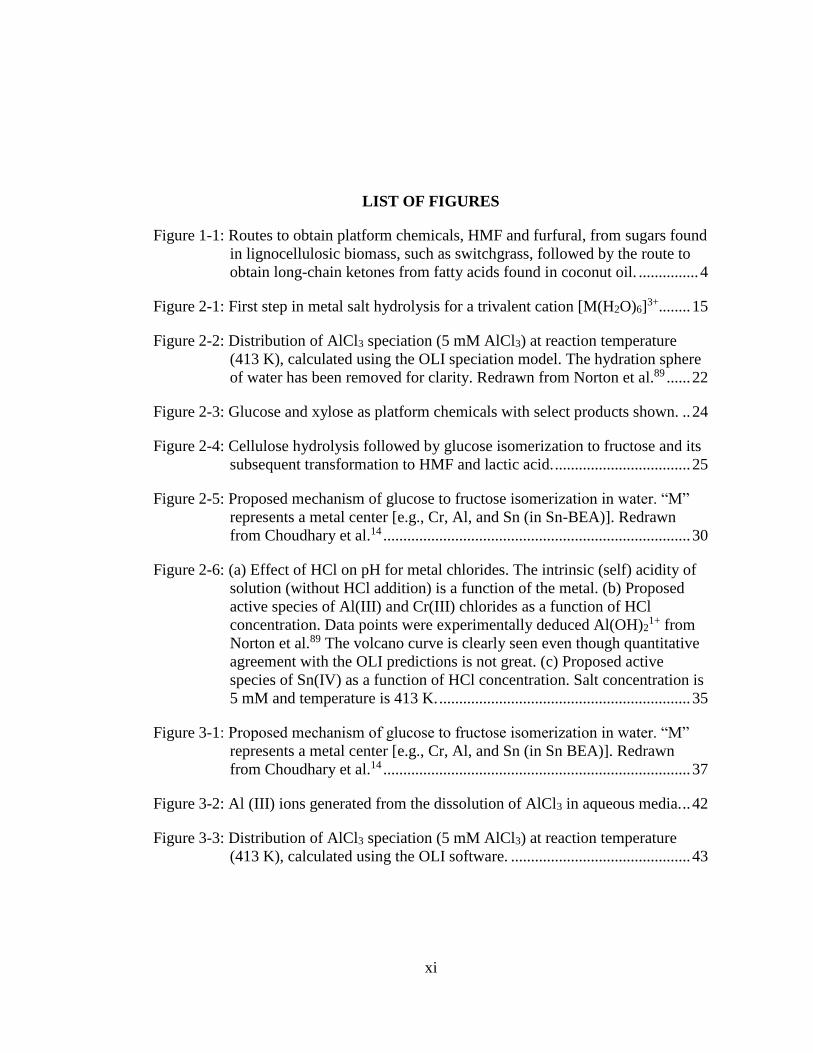
LIST OF FIGURES ....................................................................................................... xi ABSTRACT ................................................................................................................. xx
Chapter
1 INTRODUCTION .............................................................................................. 1
1.1 Homogeneous Metal Salt Solutions for Biomass Upgrading .................... 1 1.2 Bio-Lubricant Base Oils Produced by Biomass Upgrading ...................... 5
1.3 Mild Hydrothermal Treatment of Catalysts Involved in Biomass
Upgrading .................................................................................................. 7
1.3.1 Hydrothermal Treatment to Regenerate Catalysts ........................ 8 1.3.2 Hydrothermal Treatment to Anchor Metals .................................. 9
1.4 Thesis Objective and Overview ............................................................... 10
2 HOMOGENEOUS METAL SALT SOLUTIONS FOR BIOMASS
UPGRADING AND OTHER SELECT ORGANIC REACTIONS ................ 13
2.1 Introduction ............................................................................................. 13 2.2 Metal Salt Hydrolysis .............................................................................. 14
2.3 Measurements and Modeling of Elemental Speciation ........................... 16
2.3.1 Experimental Tools ..................................................................... 16 2.3.2 Computational Tools ................................................................... 20
2.4 Metal Salts in Biomass Upgrading .......................................................... 24
3 DIRECT SPECIATION METHODS TO QUANTIFY CATALYTICALLY
ACTIVE SPECIES OF AlCl3 IN GLUCOSE ISOMERIZATION .................. 36
3.1 Introduction ............................................................................................. 36 3.2 Methods ................................................................................................... 38
3.2.1 Speciation Model ......................................................................... 38
TABLE OF CONTENTS
vii
3.2.2 pH Measurements ........................................................................ 39 3.2.3 27Al Quantitative Nuclear Magnetic Resonance (qNMR)
Spectroscopy ................................................................................ 39 3.2.4 Ultrafiltration ............................................................................... 40 3.2.5 Inductively Coupled Plasma Mass Spectrometry (ICP-MS) ....... 40 3.2.6 Dynamic Light Scattering (DLS) ................................................ 40 3.2.7 Catalytic Measurements .............................................................. 41
3.3 Results and Discussion ............................................................................ 41
3.3.1 Model-Predicted AlCl3 Speciation in Aqueous Media ................ 41 3.3.2 Equilibration of AlCl3-HCl Catalyst Solutions ........................... 43
3.3.3 Direct Measurements of AlCl3 Speciation .................................. 46
3.3.3.1 Hexa-Aqua Aluminum (Al3+) ....................................... 47 3.3.3.2 Solid Aluminum ........................................................... 48 3.3.3.3 Hydrolyzed Aluminum Monomers (AlOH2+ and
Al(OH)21+) .................................................................... 48
3.3.3.4 Glucose Conversion and Catalytically Active Species
in Equilibrated Catalyst Solution .................................. 49
3.4 Conclusions ............................................................................................. 52
4 BRANCHED BIOLUBRICANT PRODUCTION THROUGH ALDOL
CONDENSATION ........................................................................................... 53
4.1 Introduction ............................................................................................. 53 4.2 Methods ................................................................................................... 56
4.2.1 Materials ...................................................................................... 56
4.2.2 Catalyst Preparation ..................................................................... 57 4.2.3 Reaction Procedures .................................................................... 57
4.2.3.1 Aldol Condensation ...................................................... 57
4.2.3.2 Hydrodeoxygenation (HDO) ........................................ 58 4.2.3.3 Analysis of Products ..................................................... 58
4.2.4 Lubricant Properties .................................................................... 59
4.3 Results and Discussion ............................................................................ 60
4.3.1 Reaction Conditions for Aldol Condensation .............................. 60 4.3.2 HDO to Produce Branched Alkane Base Oil .............................. 64 4.3.3 Lubricant Properties .................................................................... 66
viii
4.4 Conclusions ............................................................................................. 67
5 REVERSIBLE FORMATION OF SILANOL GROUPS IN TWO-
DIMENSIONAL SILICEOUS NANOMATERIALS UNDER MILD
HYDROTHERMAL CONDITIONS ............................................................... 69
5.1 Introduction ............................................................................................. 69 5.2 Methods ................................................................................................... 72
5.2.1 MFI Nanosheets ........................................................................... 72
5.2.2 Bilayer Silicate ............................................................................ 73 5.2.3 Scanning Electron and Atomic Force Microscopies (SEM and
AFM) ........................................................................................... 73
5.2.4 Infrared Reflection-Absorption Spectroscopy (IRRAS) ............. 73 5.2.5 X-ray Photoelectron Spectroscopy (XPS) ................................... 74
5.3 Results and Discussion ............................................................................ 75
5.3.1 IRRAS Characterization of 2-D Siliceous Nanomaterials .......... 75
5.3.2 Progressive Hydrothermal Applications to 2-D Nanomaterials .. 77 5.3.3 Single-Step Hydrothermal Application (573 K, 3 mbar H2O, 1
h) .................................................................................................. 83 5.3.4 Mechanistic Insights from H2
18O ................................................ 84
5.4 Conclusions ............................................................................................. 88
5.5 Acknowledgements ................................................................................. 88
6 CONCLUSIONS AND FUTURE WORK ....................................................... 90
6.1 Thesis Summary ...................................................................................... 90 6.2 Future Work ............................................................................................. 92
6.2.1 Metal Salt Catalyzed Glucose Isomerization .............................. 92 6.2.2 Bio-Lubricant Base Oil Production Through Aldol
Condensation ............................................................................... 93
6.2.3 Hydrothermal Conditions Applied to 2-D Siliceous
Nanomaterials .............................................................................. 94
REFERENCES ............................................................................................................. 96
Appendix
A SUPPLEMENTARY INFORMATION FOR CHAPTER 2 .......................... 108
ix
A.1 SnCl4 Speciation (5 mM) in Water at 413 K ......................................... 108 A.2 CrCl3 Speciation (5 mM) in Water at 413 K ......................................... 109
A.3 SnCl4 Species at Varying Concentrations ............................................. 110 A.4 AlCl3 Species at Varying Concentrations .............................................. 111 A.5 CrCl3 Species at Varying Concentrations .............................................. 112
B SUPPLEMENTARY INFORMATION FOR CHAPTER 3 .......................... 113
B.1 Assessment of 3300 HT pH probe and qNMR ...................................... 113
B.2 Aluminum Speciation as Function of Temperature ............................... 115 B.3 Ex Situ and In Situ pH Measurements .................................................. 116 B.4 Equilibration of AlCl3-HCl Catalyst Solutions ..................................... 117
B.5 27Al qNMR Quantification .................................................................... 118 B.6 Dynamic Light Scattering (DLS) .......................................................... 120 B.7 Measured Aluminum Speciation ........................................................... 121 B.8 Initial Rate Constant at 413 K ............................................................... 122
B.9 Initial Rate Constant at 363 K ............................................................... 123 B.10 Identifying the Active Species at 363 K ................................................ 124
C SUPPLEMENTARY INFORMATION FOR CHAPTER 4 .......................... 125
C.1 Micro-Viscometer Apparatus and Standard Measurements .................. 125 C.2 Proposed C-C Coupling Mechanism in C33 Alkane .............................. 126
C.3 GC Chromatographs for Aldol Condensation and HDO Products ........ 127 C.4 HRMS-LIFDI Chromatographs for Aldol Condensation and HDO
Products ................................................................................................. 128 C.5 NMR Results for Aldol Condensation and HDO Products ................... 129
D SUPPLEMENTARY INFORMATION FOR CHAPTER 5 .......................... 133
D.1 SEM and AFM Images of MFI Nanosheets .......................................... 133
D.2 XPS of MFI Nanosheets and Bilayer Silicate ....................................... 134
D.3 Additional IRRAS of MFI Nanosheets and Bilayer Silicate ................. 136
E A FUNDAMENTAL STUDY ON PHOSPHORUS-CONTAINING
ZEOSILS ........................................................................................................ 140
E.1 Background ............................................................................................ 140 E.2 Interaction Between Phosphorus and the Zeosil Framework ................ 140 E.3 Strength of the Acid Sites in P-zeosils .................................................. 147 E.4 Distribution of P-Sites During Steaming ............................................... 152
F PERMISSIONS FOR REPRINT .................................................................... 154
x
Table 4-1: Properties of alkane base oil (YC33 = 50.5% and YC28
= 10.9%) compared to
Group III and Group IV commercial lubricants. ......................................... 67
Table B-1: Data of 27Al qNMR spectra, obtained at 363 K for 24 h, 5 mM AlCl3. ... 118
Table B-2: Data of 27Al qNMR spectra, obtained at 413 K for 24 h, 5 mM AlCl3. ... 119
Table B-3: Total Aluminum Speciation, 5 mM AlCl3, 413 K, measurements obtained
from experiments. ...................................................................................... 121
Table B-4: Total Aluminum Speciation, 5 mM AlCl3, 363 K, measurements obtained
from experiments. ...................................................................................... 121
Table C-1: Viscosities measured by the micro-viscometer compared to the reported
viscosities. ............................................................................................... 125
Table E-1: IRRAS features and corresponding modes for H3PO4. ............................ 142
Table E-2: IRRAS features and corresponding modes for P(CH3)3. .......................... 144
Table E-3: IRRAS features and corresponding modes for (C2H5)3PO4. .................... 146
Table E-4: The fitting parameters (NML and K) and R2 value for the hydroxyl sites in
de-aluminated BEA, P-BEA, and P-SPP. .................................................. 151
LIST OF TABLES
xi
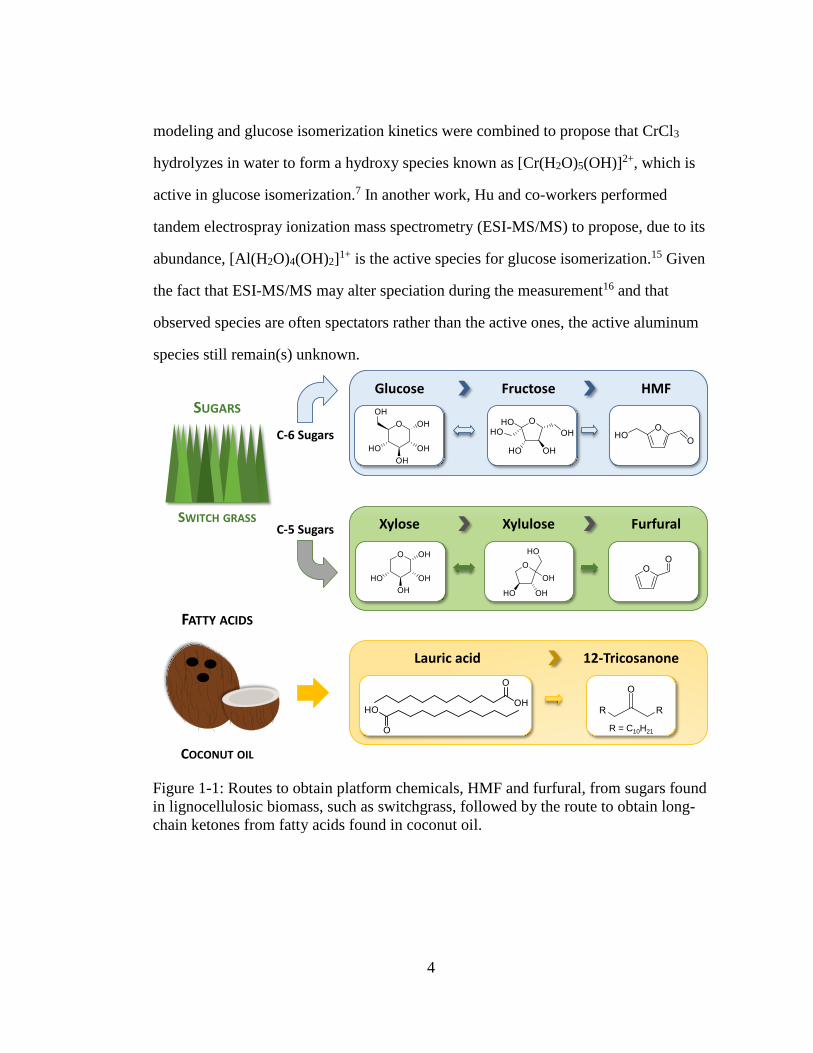
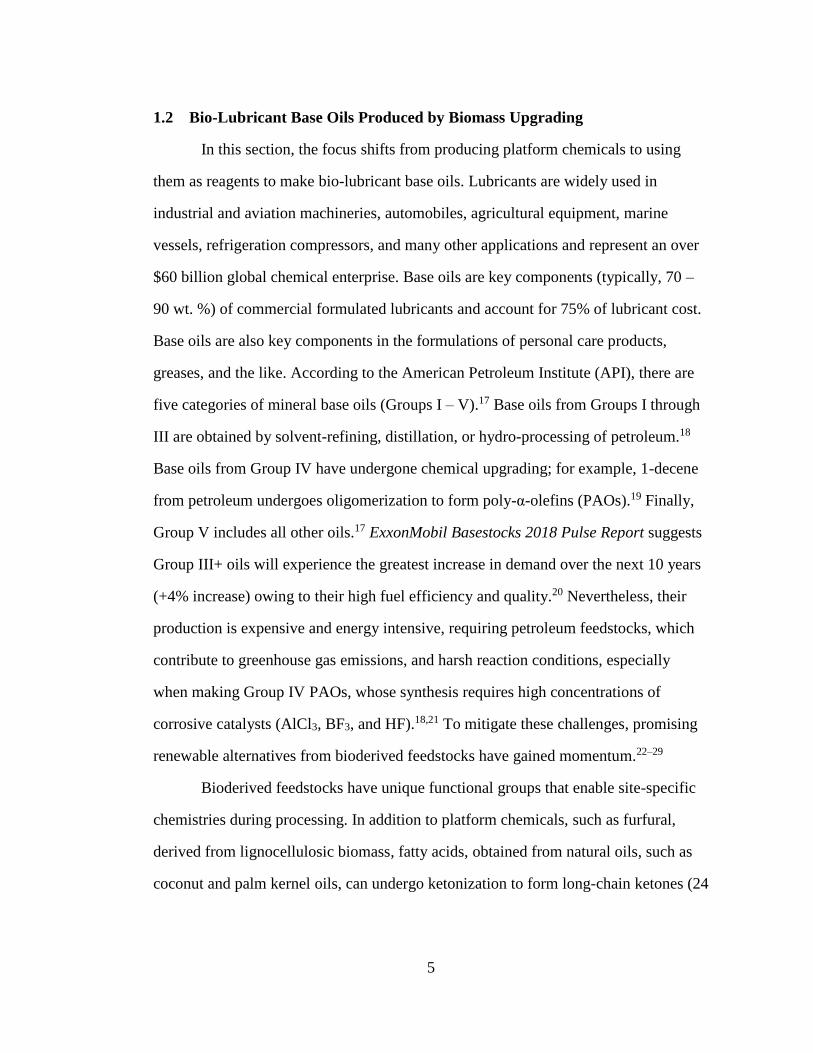
Figure 1-1: Routes to obtain platform chemicals, HMF and furfural, from sugars found
in lignocellulosic biomass, such as switchgrass, followed by the route to
obtain long-chain ketones from fatty acids found in coconut oil. ............... 4
Figure 2-1: First step in metal salt hydrolysis for a trivalent cation [M(H2O)6]3+........ 15
Figure 2-2: Distribution of AlCl3 speciation (5 mM AlCl3) at reaction temperature
(413 K), calculated using the OLI speciation model. The hydration sphere
of water has been removed for clarity. Redrawn from Norton et al.89 ...... 22
Figure 2-3: Glucose and xylose as platform chemicals with select products shown. .. 24
Figure 2-4: Cellulose hydrolysis followed by glucose isomerization to fructose and its
subsequent transformation to HMF and lactic acid. .................................. 25
Figure 2-5: Proposed mechanism of glucose to fructose isomerization in water. “M”
represents a metal center [e.g., Cr, Al, and Sn (in Sn-BEA)]. Redrawn
from Choudhary et al.14 ............................................................................. 30
Figure 2-6: (a) Effect of HCl on pH for metal chlorides. The intrinsic (self) acidity of
solution (without HCl addition) is a function of the metal. (b) Proposed
active species of Al(III) and Cr(III) chlorides as a function of HCl
concentration. Data points were experimentally deduced Al(OH)21+ from
Norton et al.89 The volcano curve is clearly seen even though quantitative
agreement with the OLI predictions is not great. (c) Proposed active
species of Sn(IV) as a function of HCl concentration. Salt concentration is
5 mM and temperature is 413 K. ............................................................... 35
Figure 3-1: Proposed mechanism of glucose to fructose isomerization in water. “M”
represents a metal center [e.g., Cr, Al, and Sn (in Sn BEA)]. Redrawn
from Choudhary et al.14 ............................................................................. 37
Figure 3-2: Al (III) ions generated from the dissolution of AlCl3 in aqueous media. .. 42
Figure 3-3: Distribution of AlCl3 speciation (5 mM AlCl3) at reaction temperature
(413 K), calculated using the OLI software. ............................................. 43
LIST OF FIGURES
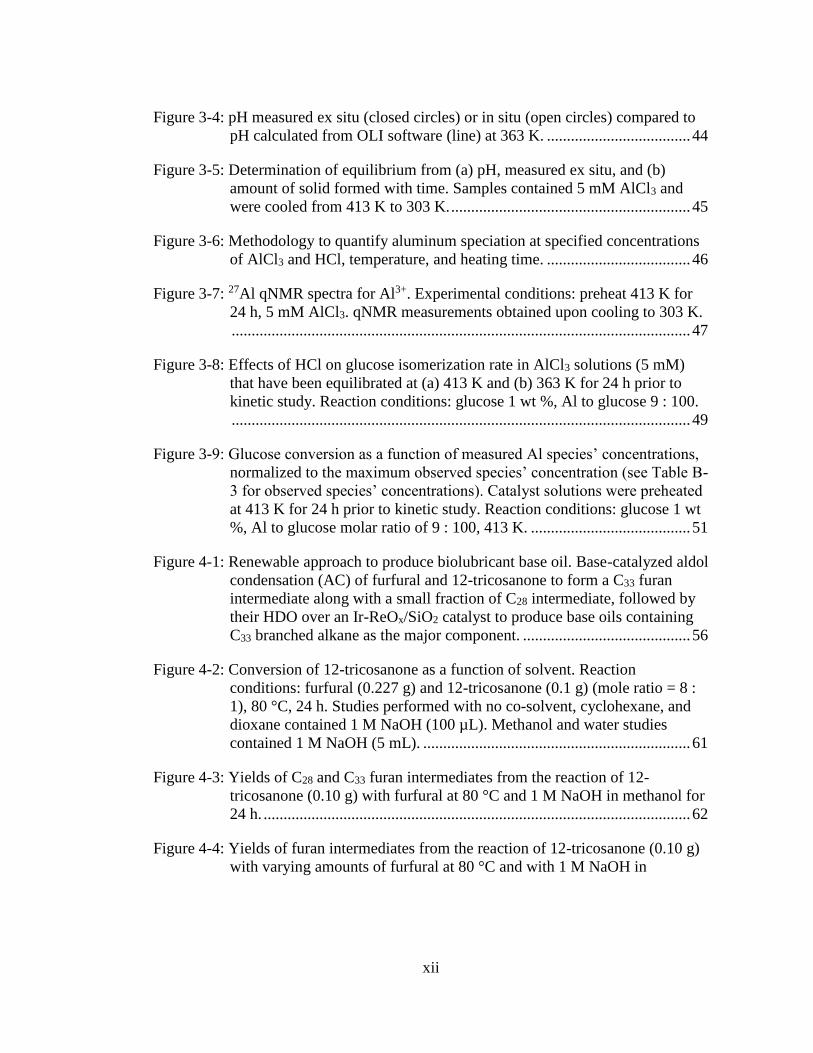
xii
Figure 3-4: pH measured ex situ (closed circles) or in situ (open circles) compared to
pH calculated from OLI software (line) at 363 K. .................................... 44
Figure 3-5: Determination of equilibrium from (a) pH, measured ex situ, and (b)
amount of solid formed with time. Samples contained 5 mM AlCl3 and
were cooled from 413 K to 303 K. ............................................................ 45
Figure 3-6: Methodology to quantify aluminum speciation at specified concentrations
of AlCl3 and HCl, temperature, and heating time. .................................... 46
Figure 3-7: 27Al qNMR spectra for Al3+. Experimental conditions: preheat 413 K for
24 h, 5 mM AlCl3. qNMR measurements obtained upon cooling to 303 K.
................................................................................................................... 47
Figure 3-8: Effects of HCl on glucose isomerization rate in AlCl3 solutions (5 mM)
that have been equilibrated at (a) 413 K and (b) 363 K for 24 h prior to
kinetic study. Reaction conditions: glucose 1 wt %, Al to glucose 9 : 100.
................................................................................................................... 49
Figure 3-9: Glucose conversion as a function of measured Al species’ concentrations,
normalized to the maximum observed species’ concentration (see Table B-
3 for observed species’ concentrations). Catalyst solutions were preheated
at 413 K for 24 h prior to kinetic study. Reaction conditions: glucose 1 wt
%, Al to glucose molar ratio of 9 : 100, 413 K. ........................................ 51
Figure 4-1: Renewable approach to produce biolubricant base oil. Base-catalyzed aldol
condensation (AC) of furfural and 12-tricosanone to form a C33 furan
intermediate along with a small fraction of C28 intermediate, followed by
their HDO over an Ir-ReOx/SiO2 catalyst to produce base oils containing
C33 branched alkane as the major component. .......................................... 56
Figure 4-2: Conversion of 12-tricosanone as a function of solvent. Reaction
conditions: furfural (0.227 g) and 12-tricosanone (0.1 g) (mole ratio = 8 :
1), 80 °C, 24 h. Studies performed with no co-solvent, cyclohexane, and
dioxane contained 1 M NaOH (100 µL). Methanol and water studies
contained 1 M NaOH (5 mL). ................................................................... 61
Figure 4-3: Yields of C28 and C33 furan intermediates from the reaction of 12-
tricosanone (0.10 g) with furfural at 80 °C and 1 M NaOH in methanol for
24 h. ........................................................................................................... 62
Figure 4-4: Yields of furan intermediates from the reaction of 12-tricosanone (0.10 g)
with varying amounts of furfural at 80 °C and with 1 M NaOH in
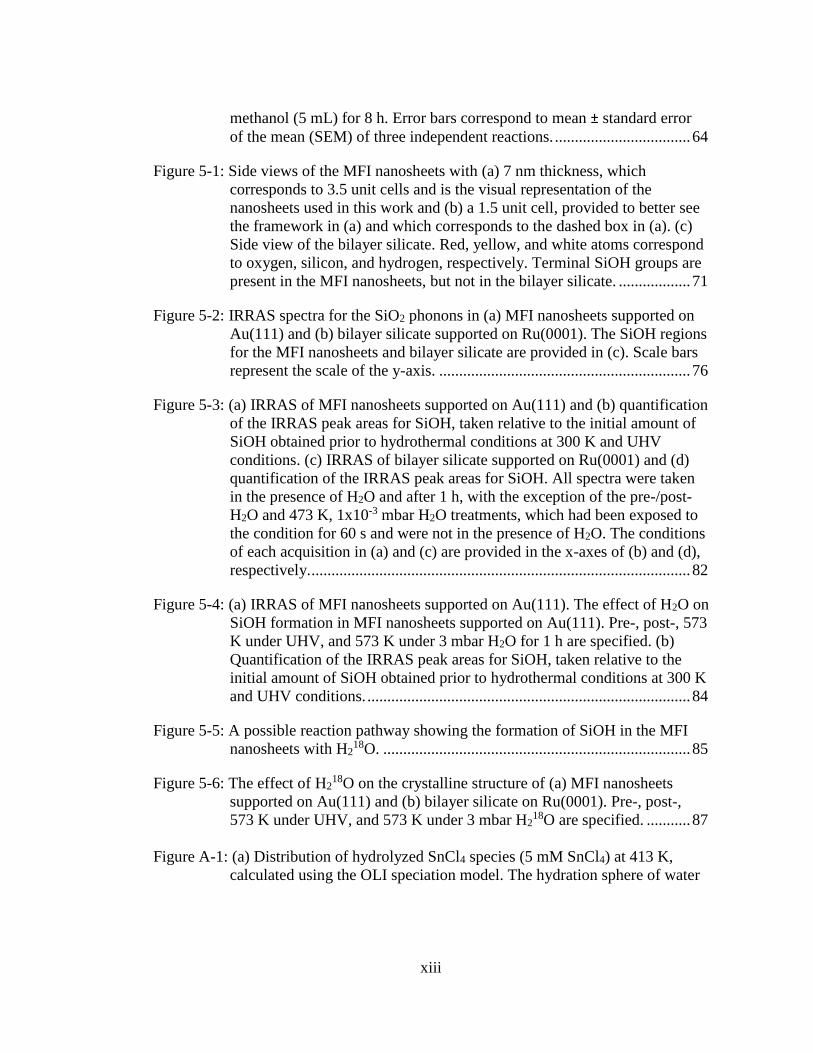
xiii
methanol (5 mL) for 8 h. Error bars correspond to mean ± standard error
of the mean (SEM) of three independent reactions. .................................. 64
Figure 5-1: Side views of the MFI nanosheets with (a) 7 nm thickness, which
corresponds to 3.5 unit cells and is the visual representation of the
nanosheets used in this work and (b) a 1.5 unit cell, provided to better see
the framework in (a) and which corresponds to the dashed box in (a). (c)
Side view of the bilayer silicate. Red, yellow, and white atoms correspond
to oxygen, silicon, and hydrogen, respectively. Terminal SiOH groups are
present in the MFI nanosheets, but not in the bilayer silicate. .................. 71
Figure 5-2: IRRAS spectra for the SiO2 phonons in (a) MFI nanosheets supported on
Au(111) and (b) bilayer silicate supported on Ru(0001). The SiOH regions
for the MFI nanosheets and bilayer silicate are provided in (c). Scale bars
represent the scale of the y-axis. ............................................................... 76
Figure 5-3: (a) IRRAS of MFI nanosheets supported on Au(111) and (b) quantification
of the IRRAS peak areas for SiOH, taken relative to the initial amount of
SiOH obtained prior to hydrothermal conditions at 300 K and UHV
conditions. (c) IRRAS of bilayer silicate supported on Ru(0001) and (d)
quantification of the IRRAS peak areas for SiOH. All spectra were taken
in the presence of H2O and after 1 h, with the exception of the pre-/post-
H2O and 473 K, 1x10⁻³ mbar H2O treatments, which had been exposed to
the condition for 60 s and were not in the presence of H2O. The conditions
of each acquisition in (a) and (c) are provided in the x-axes of (b) and (d),
respectively. ............................................................................................... 82
Figure 5-4: (a) IRRAS of MFI nanosheets supported on Au(111). The effect of H2O on
SiOH formation in MFI nanosheets supported on Au(111). Pre-, post-, 573
K under UHV, and 573 K under 3 mbar H2O for 1 h are specified. (b)
Quantification of the IRRAS peak areas for SiOH, taken relative to the
initial amount of SiOH obtained prior to hydrothermal conditions at 300 K
and UHV conditions. ................................................................................. 84
Figure 5-5: A possible reaction pathway showing the formation of SiOH in the MFI
nanosheets with H218O. ............................................................................. 85
Figure 5-6: The effect of H218O on the crystalline structure of (a) MFI nanosheets
supported on Au(111) and (b) bilayer silicate on Ru(0001). Pre-, post-,
573 K under UHV, and 573 K under 3 mbar H218O are specified. ........... 87
Figure A-1: (a) Distribution of hydrolyzed SnCl4 species (5 mM SnCl4) at 413 K,
calculated using the OLI speciation model. The hydration sphere of water
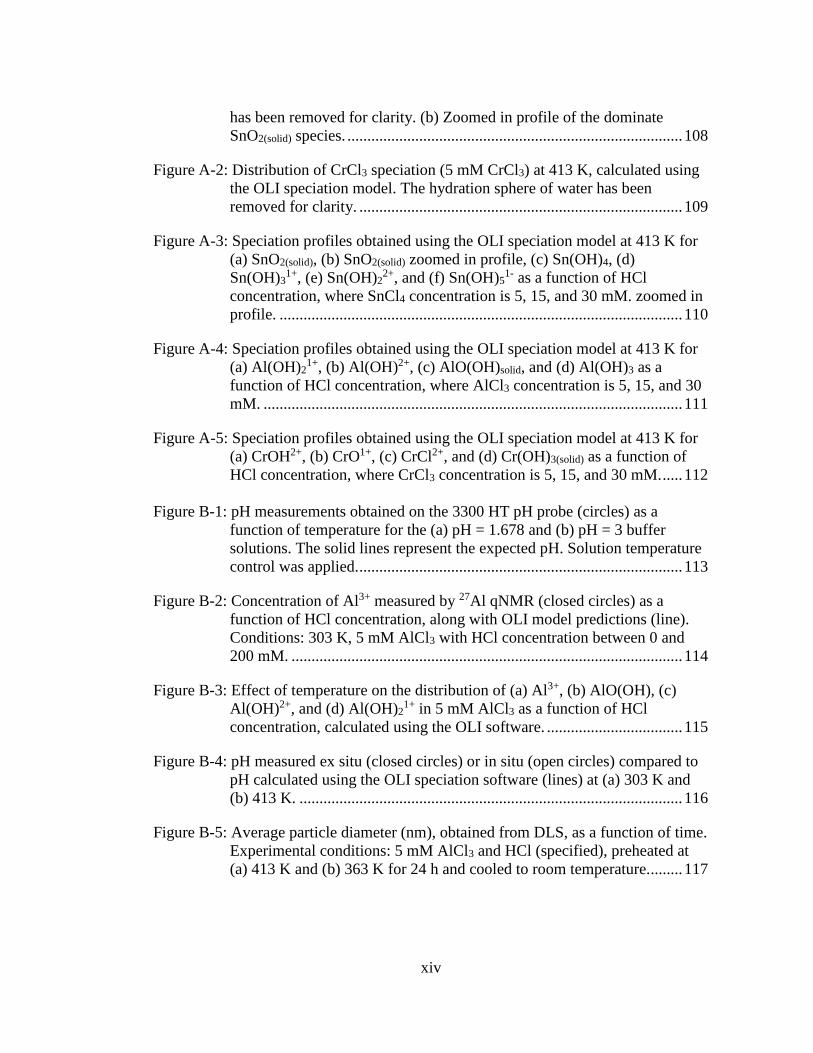
xiv
has been removed for clarity. (b) Zoomed in profile of the dominate
SnO2(solid) species. .................................................................................... 108
Figure A-2: Distribution of CrCl3 speciation (5 mM CrCl3) at 413 K, calculated using
the OLI speciation model. The hydration sphere of water has been
removed for clarity. ................................................................................. 109
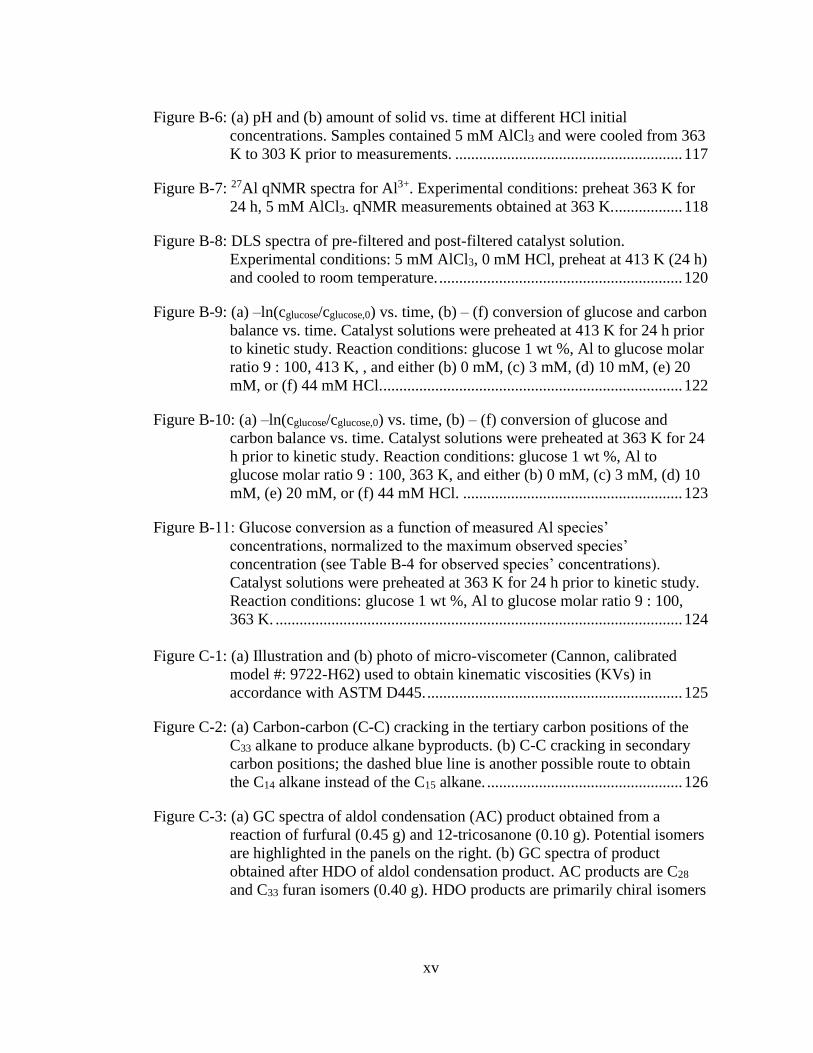
Figure A-3: Speciation profiles obtained using the OLI speciation model at 413 K for
(a) SnO2(solid), (b) SnO2(solid) zoomed in profile, (c) Sn(OH)4, (d)
Sn(OH)31+, (e) Sn(OH)2
2+, and (f) Sn(OH)51- as a function of HCl
concentration, where SnCl4 concentration is 5, 15, and 30 mM. zoomed in
profile. ..................................................................................................... 110
Figure A-4: Speciation profiles obtained using the OLI speciation model at 413 K for
(a) Al(OH)21+, (b) Al(OH)2+, (c) AlO(OH)solid, and (d) Al(OH)3 as a
function of HCl concentration, where AlCl3 concentration is 5, 15, and 30
mM. ......................................................................................................... 111
Figure A-5: Speciation profiles obtained using the OLI speciation model at 413 K for
(a) CrOH2+, (b) CrO1+, (c) CrCl2+, and (d) Cr(OH)3(solid) as a function of
HCl concentration, where CrCl3 concentration is 5, 15, and 30 mM. ..... 112
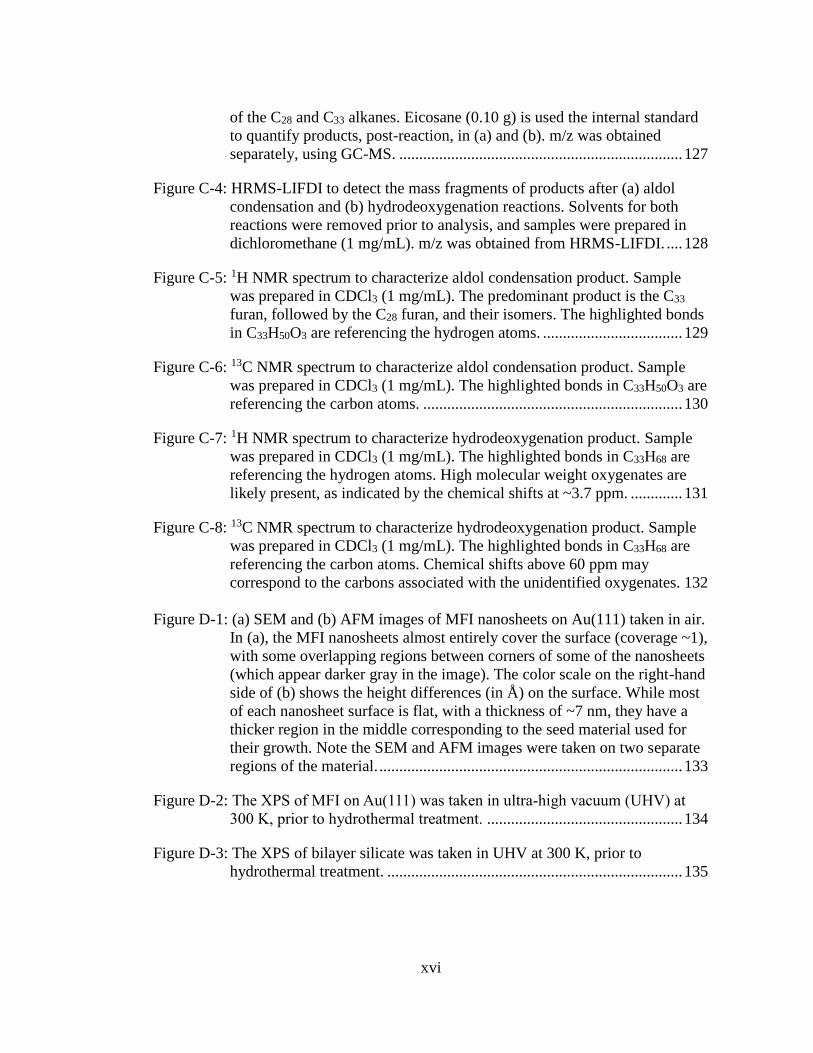
Figure B-1: pH measurements obtained on the 3300 HT pH probe (circles) as a
function of temperature for the (a) pH = 1.678 and (b) pH = 3 buffer
solutions. The solid lines represent the expected pH. Solution temperature
control was applied. ................................................................................. 113
Figure B-2: Concentration of Al3+ measured by 27Al qNMR (closed circles) as a
function of HCl concentration, along with OLI model predictions (line).
Conditions: 303 K, 5 mM AlCl3 with HCl concentration between 0 and
200 mM. .................................................................................................. 114
Figure B-3: Effect of temperature on the distribution of (a) Al3+, (b) AlO(OH), (c)
Al(OH)2+, and (d) Al(OH)21+ in 5 mM AlCl3 as a function of HCl
concentration, calculated using the OLI software. .................................. 115
Figure B-4: pH measured ex situ (closed circles) or in situ (open circles) compared to
pH calculated using the OLI speciation software (lines) at (a) 303 K and
(b) 413 K. ................................................................................................ 116
Figure B-5: Average particle diameter (nm), obtained from DLS, as a function of time.
Experimental conditions: 5 mM AlCl3 and HCl (specified), preheated at
(a) 413 K and (b) 363 K for 24 h and cooled to room temperature......... 117
xv
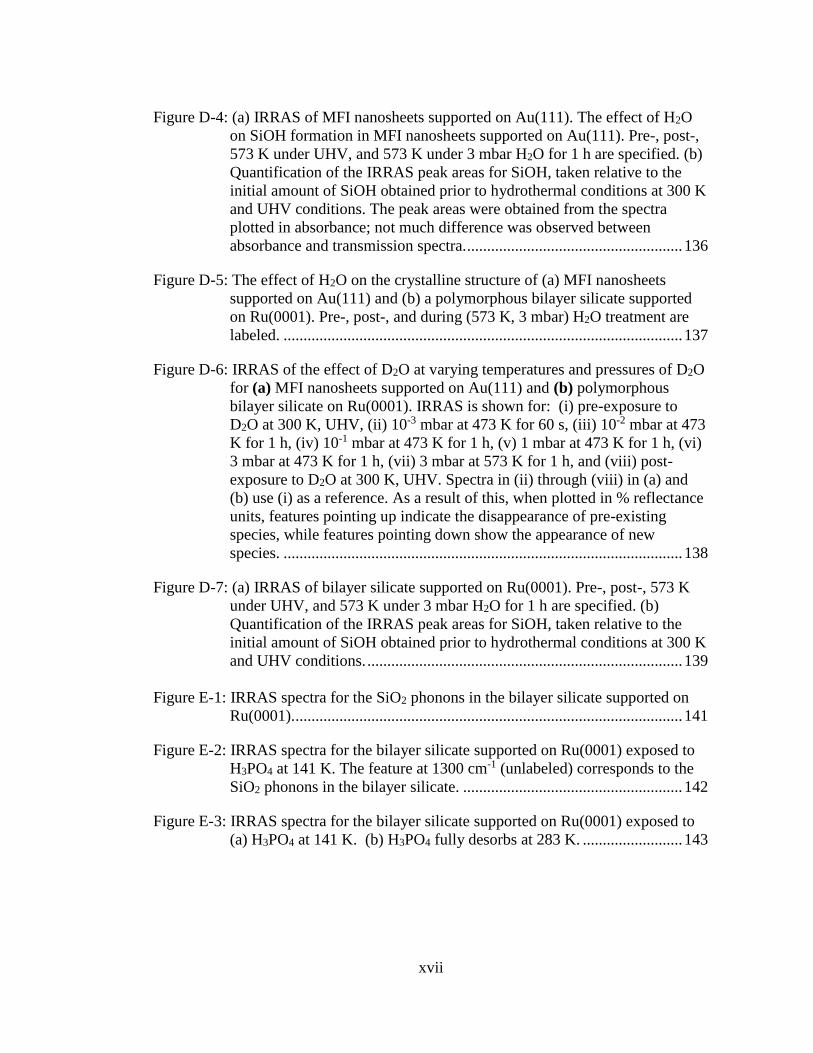
Figure B-6: (a) pH and (b) amount of solid vs. time at different HCl initial
concentrations. Samples contained 5 mM AlCl3 and were cooled from 363
K to 303 K prior to measurements. ......................................................... 117
Figure B-7: 27Al qNMR spectra for Al3+. Experimental conditions: preheat 363 K for
24 h, 5 mM AlCl3. qNMR measurements obtained at 363 K. ................. 118
Figure B-8: DLS spectra of pre-filtered and post-filtered catalyst solution.
Experimental conditions: 5 mM AlCl3, 0 mM HCl, preheat at 413 K (24 h)
and cooled to room temperature. ............................................................. 120
Figure B-9: (a) –ln(cglucose/cglucose,0) vs. time, (b) – (f) conversion of glucose and carbon
balance vs. time. Catalyst solutions were preheated at 413 K for 24 h prior
to kinetic study. Reaction conditions: glucose 1 wt %, Al to glucose molar
ratio 9 : 100, 413 K, , and either (b) 0 mM, (c) 3 mM, (d) 10 mM, (e) 20
mM, or (f) 44 mM HCl. ........................................................................... 122
Figure B-10: (a) –ln(cglucose/cglucose,0) vs. time, (b) – (f) conversion of glucose and
carbon balance vs. time. Catalyst solutions were preheated at 363 K for 24
h prior to kinetic study. Reaction conditions: glucose 1 wt %, Al to
glucose molar ratio 9 : 100, 363 K, and either (b) 0 mM, (c) 3 mM, (d) 10
mM, (e) 20 mM, or (f) 44 mM HCl. ....................................................... 123
Figure B-11: Glucose conversion as a function of measured Al species’
concentrations, normalized to the maximum observed species’
concentration (see Table B-4 for observed species’ concentrations).
Catalyst solutions were preheated at 363 K for 24 h prior to kinetic study.
Reaction conditions: glucose 1 wt %, Al to glucose molar ratio 9 : 100,
363 K. ...................................................................................................... 124
Figure C-1: (a) Illustration and (b) photo of micro-viscometer (Cannon, calibrated
model #: 9722-H62) used to obtain kinematic viscosities (KVs) in
accordance with ASTM D445. ................................................................ 125
Figure C-2: (a) Carbon-carbon (C-C) cracking in the tertiary carbon positions of the
C33 alkane to produce alkane byproducts. (b) C-C cracking in secondary
carbon positions; the dashed blue line is another possible route to obtain
the C14 alkane instead of the C15 alkane. ................................................. 126
Figure C-3: (a) GC spectra of aldol condensation (AC) product obtained from a
reaction of furfural (0.45 g) and 12-tricosanone (0.10 g). Potential isomers
are highlighted in the panels on the right. (b) GC spectra of product
obtained after HDO of aldol condensation product. AC products are C28
and C33 furan isomers (0.40 g). HDO products are primarily chiral isomers
xvi
of the C28 and C33 alkanes. Eicosane (0.10 g) is used the internal standard
to quantify products, post-reaction, in (a) and (b). m/z was obtained
separately, using GC-MS. ....................................................................... 127
Figure C-4: HRMS-LIFDI to detect the mass fragments of products after (a) aldol
condensation and (b) hydrodeoxygenation reactions. Solvents for both
reactions were removed prior to analysis, and samples were prepared in
dichloromethane (1 mg/mL). m/z was obtained from HRMS-LIFDI. .... 128
Figure C-5: 1H NMR spectrum to characterize aldol condensation product. Sample
was prepared in CDCl3 (1 mg/mL). The predominant product is the C33
furan, followed by the C28 furan, and their isomers. The highlighted bonds
in C33H50O3 are referencing the hydrogen atoms. ................................... 129
Figure C-6: 13C NMR spectrum to characterize aldol condensation product. Sample
was prepared in CDCl3 (1 mg/mL). The highlighted bonds in C33H50O3 are
referencing the carbon atoms. ................................................................. 130
Figure C-7: 1H NMR spectrum to characterize hydrodeoxygenation product. Sample
was prepared in CDCl3 (1 mg/mL). The highlighted bonds in C33H68 are
referencing the hydrogen atoms. High molecular weight oxygenates are
likely present, as indicated by the chemical shifts at ~3.7 ppm. ............. 131
Figure C-8: 13C NMR spectrum to characterize hydrodeoxygenation product. Sample
was prepared in CDCl3 (1 mg/mL). The highlighted bonds in C33H68 are
referencing the carbon atoms. Chemical shifts above 60 ppm may
correspond to the carbons associated with the unidentified oxygenates. 132
Figure D-1: (a) SEM and (b) AFM images of MFI nanosheets on Au(111) taken in air.
In (a), the MFI nanosheets almost entirely cover the surface (coverage ~1),
with some overlapping regions between corners of some of the nanosheets
(which appear darker gray in the image). The color scale on the right-hand
side of (b) shows the height differences (in Å) on the surface. While most
of each nanosheet surface is flat, with a thickness of ~7 nm, they have a
thicker region in the middle corresponding to the seed material used for
their growth. Note the SEM and AFM images were taken on two separate
regions of the material. ............................................................................ 133
Figure D-2: The XPS of MFI on Au(111) was taken in ultra-high vacuum (UHV) at
300 K, prior to hydrothermal treatment. ................................................. 134
Figure D-3: The XPS of bilayer silicate was taken in UHV at 300 K, prior to
hydrothermal treatment. .......................................................................... 135
xvii
Figure D-4: (a) IRRAS of MFI nanosheets supported on Au(111). The effect of H2O
on SiOH formation in MFI nanosheets supported on Au(111). Pre-, post-,
573 K under UHV, and 573 K under 3 mbar H2O for 1 h are specified. (b)
Quantification of the IRRAS peak areas for SiOH, taken relative to the
initial amount of SiOH obtained prior to hydrothermal conditions at 300 K
and UHV conditions. The peak areas were obtained from the spectra
plotted in absorbance; not much difference was observed between
absorbance and transmission spectra. ...................................................... 136
Figure D-5: The effect of H2O on the crystalline structure of (a) MFI nanosheets
supported on Au(111) and (b) a polymorphous bilayer silicate supported
on Ru(0001). Pre-, post-, and during (573 K, 3 mbar) H2O treatment are
labeled. .................................................................................................... 137
Figure D-6: IRRAS of the effect of D2O at varying temperatures and pressures of D2O
for (a) MFI nanosheets supported on Au(111) and (b) polymorphous
bilayer silicate on Ru(0001). IRRAS is shown for: (i) pre-exposure to
D2O at 300 K, UHV, (ii) 10-3 mbar at 473 K for 60 s, (iii) 10-2 mbar at 473
K for 1 h, (iv) 10-1 mbar at 473 K for 1 h, (v) 1 mbar at 473 K for 1 h, (vi)
3 mbar at 473 K for 1 h, (vii) 3 mbar at 573 K for 1 h, and (viii) post-
exposure to D2O at 300 K, UHV. Spectra in (ii) through (viii) in (a) and
(b) use (i) as a reference. As a result of this, when plotted in % reflectance
units, features pointing up indicate the disappearance of pre-existing
species, while features pointing down show the appearance of new
species. .................................................................................................... 138
Figure D-7: (a) IRRAS of bilayer silicate supported on Ru(0001). Pre-, post-, 573 K
under UHV, and 573 K under 3 mbar H2O for 1 h are specified. (b)
Quantification of the IRRAS peak areas for SiOH, taken relative to the
initial amount of SiOH obtained prior to hydrothermal conditions at 300 K
and UHV conditions. ............................................................................... 139
Figure E-1: IRRAS spectra for the SiO2 phonons in the bilayer silicate supported on
Ru(0001). ................................................................................................. 141
Figure E-2: IRRAS spectra for the bilayer silicate supported on Ru(0001) exposed to
H3PO4 at 141 K. The feature at 1300 cm-1 (unlabeled) corresponds to the
SiO2 phonons in the bilayer silicate. ....................................................... 142
Figure E-3: IRRAS spectra for the bilayer silicate supported on Ru(0001) exposed to
(a) H3PO4 at 141 K. (b) H3PO4 fully desorbs at 283 K. ......................... 143
xviii
Figure E-4: IRRAS spectra for the bilayer silicate supported on Ru(0001) exposed to
P(CH3)3 at 141 K. The feature for the bilayer silicate (1300 cm1) overlaps
with the C-H deformation bands. ............................................................ 144
Figure E-5: IRRAS spectra for the bilayer silicate supported on Ru(0001) exposed to
(C2H5)3PO4 at 141 K. The feature at 1300 cm-1 (unlabeled) corresponds to
the SiO2 phonons in the bilayer silicate. ................................................. 145
Figure E-6: IRRAS spectra for the bilayer silicate supported on Ru(0001) exposed to
(C2H5)3PO4 at 110 K. (C2H5)3PO4 fully desorbs at 210 K. ..................... 147
Figure E-7: P-BEA (Si/P = 27), P-SPP (Si/P = 27), and de-aluminated BEA
(deAlBEA) spectra, acquired at 300 K. Catalysts were pre-heated at 623 K
under vacuum (1×10⁻⁵ Torr) for 12 h. Spectra were acquired upon cooling
to 300 K. .................................................................................................. 148
Figure E-8: De-aluminated BEA was pre-heated at 623 K under vacuum (1×10⁻⁵ mbar)
for 12 h, followed by exposure to varying levels of D2O at 300 K for 1 h.
The corresponding pressures include: (i) 3.8×10⁻⁷ Torr, pre-D2O, (ii)
4.0×10⁻⁴ Torr D2O, (iii) 2.3×10⁻¹ Torr D2O, (iv) 2.3 Torr D2O, and (v)
3.9×10⁻⁴ Torr, post-D2O. SiOH (3732 cm-1) gradually exchanges to SiOD
(2748 cm-1). Likewise, SiOH nests (3472 cm-1) gradually exchange to
SiOD nests (2604 cm-1). .......................................................................... 149
Figure E-9: P-BEA was pre-heated at 623 K under vacuum (1×10⁻⁵ mbar) for 12 h,
followed by exposure to varying levels of D2O at 300 K for 1 h. The
corresponding pressures include: (i) 2.4×10⁻⁷ Torr, pre-D2O, (ii) 11.3×10⁻³
Torr D2O, (iii) 1.9×10⁻¹ Torr D2O, (iv) 4.0 Torr D2O, and (v) 5.6 Torr
D2O, (vi) 6.7 Torr D2O, (vii) 7.5×10⁻⁴ Torr, post-D2O. SiOH (3745 cm-1)
gradually exchanges to SiOD (2756 cm-1). POH (3666 cm-1) gradually
exchanges to POD (2692 cm-1). .............................................................. 150
Figure E-10: P-SPP was pre-heated at 623 K under vacuum (1×10⁻⁵ mbar) for 12 h,
followed by exposure to varying levels of D2O at 300 K for 1 h. The
corresponding pressures include: (i) 3.4×10⁻⁷ Torr, pre-D2O, (ii) 3.8×10⁻³
Torr D2O, (iii) 3.2×10⁻² Torr D2O, (iv), 1.4×10⁻¹ Torr D2O (v) 1.0 Torr
D2O, (vi) 2.0 Torr D2O, (vii) 3.0 Torr D2O, (viii) 4.4 Torr D2O, (ix) 5.0
Torr D2O, (x) 6.3 Torr D2O, (xi) 4.0×10⁻⁴ Torr, post-D2O . SiOH (3745
cm-1) gradually exchanges to SiOD (2760 cm-1). POH (3670 cm-1)
gradually exchanges to POD (2706 cm-1). .............................................. 150
Figure E-11: The band height decrease (N, y-axis), obtained from the transmission IR
spectra for the SiOH and POH groups in P-BEA, P-SPP, and de-
xix
aluminated BEA, were plotted as a function of increasing D2O pressure
(Torr). The data were fit with a Langmuir-type equation. ...................... 151
Figure E-12: (a) Transmission IR spectra collected for P-BEA (Si/P = 3), acquired
during pre-exposure to H2O at 1×10⁻⁵ mbar (pink), 10 Torr H2O (blue),
and post-exposure to H2O at 1×10⁻⁵ mbar (orange). All spectra were
acquired at 523 K. (b) Zooming in on the hydroxyl region of the IR
spectra for P-BEA, SiOH and POH groups appear at 3740 cm-1 and 3665
cm-1, respectively. Prior to acquisition, the catalyst sample was heated
under vacuum (1×10⁻⁵ mbar) at 673 K for 4 h. ....................................... 152
Figure E-13: (a) Transmission IR spectra collected for P-BEA (Si/P = 3), acquired
during pre-exposure at 523 K and 10 Torr H2O as a function of time. (b)
Zooming in on the hydroxyl region of P-BEA, SiOH and POH groups
appear at 3740 cm-1 and 3665 cm-1, respectively. Prior to acquisition, the
catalyst sample was heated under vacuum (1×10⁻⁵ mbar) at 673 K for 4 h.
................................................................................................................. 153
Figure F-1: Permission for Chapter 1 and Chapter 2 ................................................. 155
Figure F-2: Permission for Chapter 4 ......................................................................... 157
xx
Today, transportation fuels and lubricants, plastics, fabrics, and many other
products are derived from petroleum, a nonrenewable feedstock and contributing to
greenhouse gas emissions. Bioderived, renewable feedstocks can mitigate the
environmental impact of manufacturing commodity products, while providing
comparable or even superior properties to their petroleum-derived counterparts.
Among the renewable carbon sources, nonedible lignocellulosic biomass is one of the
most promising feedstock alternatives; however, its high oxygen content remains the
most significant barrier for its conversion into low-oxygen containing fuels and
chemicals traditionally derived from petroleum. As a result, multiple processes have
been studied for oxygen removal, such as the preparation of oxygenated furans from
biomass-derived sugars. From there, oxygenated furans can undergo additional
transformations to form high-value products, such as lubricants. All of these
transformations require a suitable homogeneous or heterogeneous catalyst to enable
highly selective and energy efficient processes. To this end, the objective of this thesis
is to investigate selected catalytic systems and processes to obtain valuable products
from biomass.
Chapter 3 of this thesis begins by identifying and investigating the molecular
species derived from the homogeneous metal salt, AlCl3, that enable the conversion of
sugar (glucose, C-6) in biomass to 5-hydroxymethylfurfural (HMF). While
homogeneous metal salts have been shown to catalyze sugar chemistries, direct
experimental evidence in support of a specific catalytic species remains elusive. Here,
ABSTRACT
xxi
direct speciation measurements are coupled with kinetics to provide convincing
evidence that [Al(H2O)4(OH)2]1+ is the active species for glucose conversion in water.
A speciation model is used to predict aluminum species as a function of composition,
while simultaneously an experimental protocol is used to quantify the various
aluminum species. Linear scaling between the glucose conversion rate and the
speciation measurements at sufficiently high temperatures indicates that the
[Al(H2O)4(OH)2]1+ complex is the active species in glucose conversion. Knowledge of
the active species can help improve future catalyst development for this and other
reactions.
In Chapter 4, biomass-derived platform chemicals are used to produce bio-
lubricant base oils. Our strategy involves coupling 12-tricosanone, obtained from
bioderived fatty acids, with furfural, a C-5 species, obtained from hemicellulose, to
form a highly branched bio-lubricant base oil. I show that the viscous properties of the
final product are comparable to commercial petroleum-derived Group III and Group
IV base oils.
Another major challenge in biomass conversion is catalyst deactivation.
Despite its importance, in situ characterization of catalytic materials is often difficult.
In Chapter 6 of this thesis, the effects of mild hydrothermal treatment on siliceous
nanomaterials are monitored in situ by infrared reflection absorption spectroscopy
(IRRAS). Well-ordered, siliceous materials called zeosils are employed as supports for
metal catalysts in biomass upgrading, but require frequent regeneration to remove
carbonaceous by-products from their pores. Monitoring the effects of mild
hydrothermal conditions, in situ, on siliceous materials has been challenging to
observe by IRRAS, which requires flat surfaces and benefits from electrically

xxii
conductive substrates. To address this challenge, I use 2-D siliceous nanomaterials
deposited on metal single crystals. In Chapter 6, it is shown that elevated temperatures
and water pressures increase the formation of silanol (SiOH) groups in the MFI
nanosheets, but do not change the polymorphous bilayer silicate. The effects are fully
reversible in the MFI nanosheets. The implications shown here may provide insights
into the effects of mild hydrothermal treatment applied to siliceous 3-D materials,
which are challenging to study using surface science.
1
INTRODUCTION
The vast majority of consumer products, including automotive fuels and
lubricants, plastics, and synthetic fabrics, are obtained from petroleum, a
nonrenewable feedstock, whose processing and combustion contributes to greenhouse
gas emissions. The use of bioderived, renewable feedstocks to produce these or similar
products can reduce the environmental impact, while providing materials with
comparable or even superior properties to their petroleum-derived counterparts.
Among the renewable energy sources, nonedible lignocellulosic biomass is one of the
most promising petroleum alternatives, as it is abundant, contains carbon, the
building-unit for many products of interest, does not interfere with food consumption,
and can result in a nearly “closed carbon balance” through CO2 capture during
photosynthesis. The U.S. Department of Energy (DOE) projects that the U.S. has the
potential to produce, by 2040, 1 billion dry tons of non-food biomass per year,
resulting in 50 billion gallons of biofuel and 50 billion pounds of bio-based chemicals
and bio-products annually,1 placing the U.S. in an advantageous position in the global
energy and climate landscape. To realize this projection, the high oxygen content in
biomass must be overcome.
1.1 Homogeneous Metal Salt Solutions for Biomass Upgrading
Nonedible lignocellulosic biomass includes switchgrass, cornstover,
agricultural waste, or any form of plant-derived material that does not interfere with
Chapter 1
2
food consumption. The three major components of lignocellulosic biomass are
cellulose, a polymer of glucose (C-6), hemicellulose, a polymer of both glucose (C-6)
and xylose (C-5), and lignin, a highly cross-linked polymer of aromatic compounds.2,3
The high oxygen content in biomass is one of the most significant barriers for its
conversion into low-oxygen containing fuels and chemicals traditionally derived from
petroleum. As a result, multiple processes have been studied for oxygen removal in
lignocellulosic biomass. For example, pyrolysis, a thermal process (>400 °C), breaks
down biomass, but typically results in unselective breaking of chemical bonds and is
highly energy intensive. In contrast, enzymatic catalysis employs low temperatures but
is rather limited as it is slow, has a narrow pH operating window, and requires a rather
purified reaction feedstock, aspects that restrict the cost-effective coupling of upstream
and downstream processes. Promising alternatives entail homogeneous and
heterogeneous acid catalysts to enable multiple reactions in a single-pot at low
temperatures (<170 °C).4–7 While heterogeneous catalysts are often favored over their
homogeneous counterpart, insoluble polymers known as humins,8 forming during
reaction can deposit in the catalyst pores, requiring frequent catalyst regeneration. In
this respect, homogeneous catalysts have clear advantages over thermal, biological,
and heterogeneous ones.
The reaction pathway to convert biomass to chemicals involves the conversion
of the cellulose and hemicellulose fractions into monomeric sugars, glucose (C-6) and
xylose (C-5), respectively. Glucose and xylose then undergo isomerization to fructose
and xylulose, followed by dehydration to form 5-hydroxymethylfurfural (HMF) and
furfural. HMF and furfural are “platform chemicals” for many products, including
biodiesel, biodegradable plastics, and biopharmaceuticals (Figure 1-1).9 Since 1921,
3
the Quaker Oats process has been established to convert the pentose (C-5) fraction of
agricultural waste to furfural,10 but the industrial production of HMF is not yet
economically viable, as HMF is derived from glucose, which often degrades in acidic
solution.9 Fructose can much more easily be dehydrated to HMF, but it is not as
naturally abundant as glucose. Consequently, research efforts have been focused on
improving the conversion of glucose to fructose.
Following the pioneering work of Davis and co-workers, who studied
heterogeneous Lewis acid catalysts, e.g., Sn-BEA, metal salts were exploited as
homogeneous Lewis acid catalysts for isomerization.11 In one of the first studies
involving metal salts, Heeres and co-workers found that Al3+, Cr2+, and Zn2+ resulted
in the highest conversion of glucose to either HMF or lactic acid, a by-product of
glucose conversion.12 Subsequently, Zhang and co-workers discovered that CrCl3 in
ionic liquids performed tandem catalysis of the isomerization and dehydration
chemistries.13 Vlachos and co-workers showed that the mechanism of glucose to
fructose, catalyzed by CrCl3 or AlCl3, was analogous to that of heterogeneous Sn-BEA
zeolite.14 It was proposed that the active species for both homogeneous and
heterogeneous catalysts likely exist as a bifunctional Lewis-acidic/Brønsted-basic
site;14 however, direct experimental evidence in support of the catalytic species has so
far been lacking. The mechanistic similarities observed between homogeneous and
heterogeneous catalysts suggest that knowledge from homogeneous catalysts, which
are easier to study and do not invoke synthesis challenges, could be applied to the
identification and improvement of heterogeneous catalysts.
Designing better catalysts requires understanding the active species responsible
for the chemistry. In a succeeding study by Vlachos and co-workers, speciation
4
modeling and glucose isomerization kinetics were combined to propose that CrCl3
hydrolyzes in water to form a hydroxy species known as [Cr(H2O)5(OH)]2+, which is
active in glucose isomerization.7 In another work, Hu and co-workers performed
tandem electrospray ionization mass spectrometry (ESI-MS/MS) to propose, due to its
abundance, [Al(H2O)4(OH)2]1+ is the active species for glucose isomerization.15 Given
the fact that ESI-MS/MS may alter speciation during the measurement16 and that
observed species are often spectators rather than the active ones, the active aluminum
species still remain(s) unknown.
Figure 1-1: Routes to obtain platform chemicals, HMF and furfural, from sugars found
in lignocellulosic biomass, such as switchgrass, followed by the route to obtain long-
chain ketones from fatty acids found in coconut oil.
FATTY ACIDS
Glucose Fructose
Xylose Xylulose Furfural
HMF
COCONUT OIL
SUGARS
SWITCH GRASS
Lauric acid 12-Tricosanone
R = C10H21
C-6 Sugars
C-5 Sugars
5
1.2 Bio-Lubricant Base Oils Produced by Biomass Upgrading
In this section, the focus shifts from producing platform chemicals to using
them as reagents to make bio-lubricant base oils. Lubricants are widely used in
industrial and aviation machineries, automobiles, agricultural equipment, marine
vessels, refrigeration compressors, and many other applications and represent an over
$60 billion global chemical enterprise. Base oils are key components (typically, 70 –
90 wt. %) of commercial formulated lubricants and account for 75% of lubricant cost.
Base oils are also key components in the formulations of personal care products,
greases, and the like. According to the American Petroleum Institute (API), there are
five categories of mineral base oils (Groups I – V).17 Base oils from Groups I through
III are obtained by solvent-refining, distillation, or hydro-processing of petroleum.18
Base oils from Group IV have undergone chemical upgrading; for example, 1-decene
from petroleum undergoes oligomerization to form poly-α-olefins (PAOs).19 Finally,
Group V includes all other oils.17 ExxonMobil Basestocks 2018 Pulse Report suggests
Group III+ oils will experience the greatest increase in demand over the next 10 years
(+4% increase) owing to their high fuel efficiency and quality.20 Nevertheless, their
production is expensive and energy intensive, requiring petroleum feedstocks, which
contribute to greenhouse gas emissions, and harsh reaction conditions, especially
when making Group IV PAOs, whose synthesis requires high concentrations of
corrosive catalysts (AlCl3, BF3, and HF).18,21 To mitigate these challenges, promising
renewable alternatives from bioderived feedstocks have gained momentum.22–29
Bioderived feedstocks have unique functional groups that enable site-specific
chemistries during processing. In addition to platform chemicals, such as furfural,
derived from lignocellulosic biomass, fatty acids, obtained from natural oils, such as
coconut and palm kernel oils, can undergo ketonization to form long-chain ketones (24
6
+ carbon atoms). Ideal lubricant base oils contain anywhere between 18 to 40 carbon
atoms and consist of a long hydrocarbon backbone with a high level of branching to
enhance the oil’s physical properties, including viscosity index, pour point, and
oxidative stability.21
In one of the early attempts to make biobased products, Corma and co-workers
produced n-tricosane, a linear alkane product with 23 carbons, from lauric acid, a fatty
acid found in coconut and palm kernel oils.26 This process involved ketonization of
lauric acid to form 12-tricosanone, containing 23 carbons, followed by its
hydrodeoxygenation (HDO) to produce n-tricosane (58.2% selectivity) and C10
through C22 alkanes (13.9% selectivity total). Although the final product would not be
suitable as a Group III base oil owing to its poor viscosity and high melting point, the
short-chain alkanes may be a suitable for ultra-low sulfur diesel (ULSD) fuel. Even so,
USLD blends ($3.15 per gallon)30 are not as price competitive as Group III base oils
($5.01 per gallon).31 Despite these obstacles, the strategy proposed by Corma and co-
workers is appealing. The intermediate ketone, 12-tricosanone, can be obtained in
89% yield by ketonization of lauric acid (Figure 1-1) and is an ideal starting material
for lubricant synthesis because it contains a high number of carbon atoms and can
partake in carbon-carbon coupling reactions due to the presence of a ketonic group.
Ketones are excellent platforms to incorporate branching because of their
acidic -CH group at the α carbon position.28,29,32–35 Previously, Bell and co-workers
performed multiple cross-ketonization reactions, starting from short-chain length C3 –
C5 carboxylic acids, followed by HDO, to produce C12 – C33 branched and cyclic
alkane diesel fuels and lubricant base oils.27 Wang and co-workers produced C23
biolubricant base oil with ~50% yield from acetone and furfural via successive aldol
7
condensation and HDO steps.25 Although these routes use renewable feedstocks, for
example, carboxylic acid and acetone, which can be produced from sugar
fermentation, or lignocellulosic biomass-derived furfural, they require multiple
reaction steps and extractions. This results in carbon loss, the need for excessive
amounts of solvent, and high production costs. Accordingly, there is still a need to
provide novel strategies to synthesize a highly branched bio-lubricant base oil,
preferably using one or more bioderived starting material(s), for example a long chain
ketone obtained from bioderived fatty acids, and substituted or unsubstituted furfural,
obtained from lignocellulosic biomass.
1.3 Mild Hydrothermal Treatment of Catalysts Involved in Biomass Upgrading
This section focuses on mild hydrothermal treatment of catalysts. To put this
into context, well-ordered, siliceous materials called zeosils are commonly employed
as supports for metal catalysts in biomass upgrading, but as mentioned previously,
require frequent regeneration to remove carbonaceous by-products from their pores. It
is thought that studying the effects of mild hydrothermal treatment on silica-containing
materials will aid in understanding how regeneration methods affect the zeosil
framework and will provide information on how defect sites called silanol (SiOH)
groups may form in siliceous materials. Developing methods to enhance the number of
SiOH groups may be useful when aiming to incorporate more anchoring points for
metals into zeosils. The following two sub-sections provide more information on
hydrothermal treatment as it pertains to catalyst regeneration and the formation of
anchoring points for metals in silica-containing materials.
8
1.3.1 Hydrothermal Treatment to Regenerate Catalysts
Hydrothermal treatment involves steaming materials for an extended time at
high temperatures. In previous work, solid-state NMR experiments indicated that well-
ordered siliceous materials lose their crystallinity after being exposed to steam for
extended times, e.g., for 80 days at 823 K and 11 bar of steam.36 More recently, it was
shown that, even though changes related to steaming may not be evident using
traditional characterization methods, there may be important structural changes
affecting catalyst activity.37 Calcination is another method of regeneration, in which
carbonaceous byproducts react with air at elevated temperatures to form carbon
dioxide and trace amounts of steam. Steam at low concentrations is likely to interact
with silica’s surface, but these atomic-level interactions are challenging to detect by
methods used to study powders, such as solid-state NMR and XRD, which are better
suited to study the material’s bulk rather than its surface.38,39 These surface
interactions are important, however, as numerous technological applications of silica
rely on its specific surface properties. In particular, as mentioned previously, surface
silanol groups (SiOH) serve as anchoring points for a variety of chemical species.40
Surface science techniques, such as Infrared Reflection Absorption
Spectroscopy (IRRAS) and X-Ray Photoelectron Spectroscopy (XPS), offer
extraordinary atomic-level precision but work best when the surface is electrically
conductive. Unfortunately, siliceous materials are not electrically conductive, and
many of those techniques are not applicable to these materials.41 One way to overcome
this lack of conductivity is by casting or growing 2-D silicate thin films onto metal
single crystal substrates. An example of this is the bilayer silicate, which can be
prepared on various metal supports, but Ru(0001) has received the most attention.42–45
The bilayer silicate consists of corner-sharing tetrahedral [SiO4] building blocks
9
arranged in a honeycomb structure and can contain amorphous regions in addition to
the crystalline bilayer.44 Often times, polymorphous regions are commonly found in
metals supported on siliceous supports.46 The bilayer does not, however, contain the
wide range of 3-D pores and channels present in zeosils. Recently, all-Si MFI
nanosheets have been deposited onto metal substrates, especially onto Au(111), due to
its inert nature and thermodynamically stable (111) facet.47–49 MFI nanosheets contain
interconnected pore networks and have the same framework that makes up self-
pillared pentasil (SPP), an important zeosil for biomass upgrading reactions.50,51 The
deposition of 2-D siliceous materials onto conductive supports now provides a model
system that can be investigated through the lens of surface science. While many
surface science techniques have been traditionally limited to ultra-high vacuum
(UHV) conditions, technical developments in the last few decades have allowed
operation at pressures and temperatures more relevant to practical applications.52 This
then enables monitoring the effects of low concentrations of water vapor (e.g., 3 mbar)
at elevated temperatures (e.g., 573 K) on 2-D surfaces, in situ, using surface science
techniques, such as IRRAS. Understanding the effects of mild hydrothermal
conditions on 2-D siliceous nanomaterials may aid in understanding the effects of
these conditions on 3-D ones.
1.3.2 Hydrothermal Treatment to Anchor Metals
Phosphorus-containing zeosils (P-zeosils) have gained much attention in the
pursuit to convert biomass-derived platform chemicals to useful products.50,51 In
particular, P-BEA and P-SPP were found to convert biomass-derived dimethylfuran
(DMF) to para-xylene with 97% yield. These P-zeosils were more active and selective
than Al-BEA, Zr-BEA, and H3PO4.50 In another report, P-BEA, P-MFI, and P-SPP
10
were highly selective (>85%) in the conversion of tetrahydrofuran (THF) to
butadiene.51 Although P-zeosils are highly active in biomass chemistries, there is still
a lack of fundamental understanding regarding how phosphorus interacts with the
zeosil framework. Given the structural complexities associated with 3-D materials, 2-
D materials may be a better starting point to determine the interaction between
phosphorus and the silica-containing surface. However, 2-D materials often times lack
enough suspected anchoring points, such as SiOH groups, to interact with metal
species.
In the past, attempts have been developed to create anchoring points, or SiOH
groups, on 2-D surfaces. Prior studies have shown when water interacts with a silica-
containing framework, Si-O-Si linkages undergo hydroxylation to form SiOH.53–55 In
particular, Freud and co-workers found that only small amounts of SiOH groups could
be formed in a bilayer silicate upon deposition of an ice-like film of water at 100 K
and subsequent heating to room temperature.55 In a later study, Sauer and co-workers
found that the number of SiOH groups increased only when an ice-like water film on
the bilayer silicate was bombarded with electrons at cryogenic conditions and then
heated to room temperature.56 The formation of more SiOH groups by electron
stimulation came at the expense of partial, irreversible destruction to the bilayer’s
crystalline framework.56 It has yet to be determined if hydrothermal treatment can
create SiOH groups on 2-D surfaces, such as the bilayer silicate and MFI nanosheets.
1.4 Thesis Objective and Overview
Lignocellulosic biomass offers a promising alternative feedstock to petroleum,
but technological challenges prevent its commercialization. The objective of this thesis
is threefold: (1) to investigate the active species of the metal salt, AlCl3, in glucose
11
conversion to fructose, (2) to develop a catalytic process for the production of a bio-
lubricant base oil from renewable feedstocks, and (3) to provide a fundamental
understanding on the effects of mild hydrothermal conditions experienced during
catalyst regeneration on siliceous nanomaterials. Such knowledge will aid in the
development of improved catalysts and processes to obtain products from biomass.
This thesis consists of six chapters in addition to the Introduction.
Chapter 2 reviews metal salt hydrolysis, provides the experimental and
computational tools developed to study metal salt speciation, and describes the
catalytic role of metal salts in biomass upgrading.
Chapter 3 expands on the review of metal salt speciation provided in Chapter 2
by highlighting experiments involving AlCl3. Direct speciation measurements are
coupled with kinetics to provide strong evidence for the active species of AlCl3 in
glucose to fructose isomerization in water. The interplay between Lewis (AlCl3) and
Brønsted (HCl) acids is examined using a speciation model, while simultaneously an
experimental protocol is developed to quantify the various aluminum species. Linear
scaling between the glucose isomerization rate and the speciation measurements at
sufficiently high temperatures indicates that the hydrolyzed [Al(H2O)4(OH)2]1+
complex is the active species in glucose isomerization.
Chapter 4 delves into the production of a bio-lubricant base oil from renewable
feedstocks. The strategy involves coupling 12-tricosanone, obtained from bioderived
fatty acids, with furfural, a platform chemical obtained from lignocellulosic biomass,
to form a highly branched bio-lubricant base oil. The viscous properties of the final
product are comparable to commercial petroleum-derived Group III and Group IV
base oils.
12
Chapter 5 explores the effects of mild hydrothermal treatment on all-Si MFI
nanosheets and a polymorphous bilayer silicate. In the past, monitoring the effects of
mild hydrothermal conditions, in situ, on siliceous materials has been challenging to
observe by surface science methods, which often require electrically conductive
substrates. The emergence of 2-D siliceous nanomaterials deposited on metal single
crystals overcomes this limitation. In this work, elevated temperatures and pressures of
water increase the formation of SiOH groups in the MFI nanosheets, but do not change
the polymorphous bilayer silicate. The effects are fully reversible in the MFI
nanosheets. Implications shown here may be useful when considering mild
hydrothermal treatment on 3-D materials used in biomass upgrading.
Chapter 6 summarizes the key conclusions from the research conducted in this
thesis and addresses remaining challenges and future directions to advance the field.
13
HOMOGENEOUS METAL SALT SOLUTIONS FOR BIOMASS UPGRADING
AND OTHER SELECT ORGANIC REACTIONS
2.1 Introduction
Speciation, a term borrowed from the biological sciences, referring to the
various chemical forms of an element, has gained significant attention in chemistry.57
It has become especially important in environmental policy, occupational health,
nutrition, and medicine, where the characteristics of just one species of an element
may have a radical impact on living systems. An extreme example is organotin
compounds.58 Although these compounds are effective as pesticides, antifungal
agents, and marine anti-fouling agents, they result in serious harm to the endocrine
system.59 Furthermore, they are only a minute part of the total amount of tin used in
such applications; the remainder being inert tin oxides.60 Measuring these individual
organotin compounds is therefore critical, as these species are the main threat to living
organisms.
In catalysis, an analogous case to that of tin occurs when we aim to study the
active species of metal salts as catalysts. Metal salts form multiple species upon
dissolution in aqueous media, yet determining the active species is challenging. The
concentrations of chemical species vary depending upon changes in temperature,
pressure, pH, humidity, presence of organic matter, etc.61 When developing techniques
to identify species, the following questions often arise:57 (1) What are the species we
want to measure? (2) How should we sample the material and/or isolate the species
Chapter 2
14
without changing its composition? (3) Can we detect very low amounts of isolated
species, which may represent only a minute fraction of the total, already ultra-trace
element concentration? In this section, we aim to answer these questions by presenting
an overview of metal salt hydrolysis and describing the experimental and
computational tools developed to study metal salt speciation. We then describe the
catalytic role of metal salts in biomass upgrading.
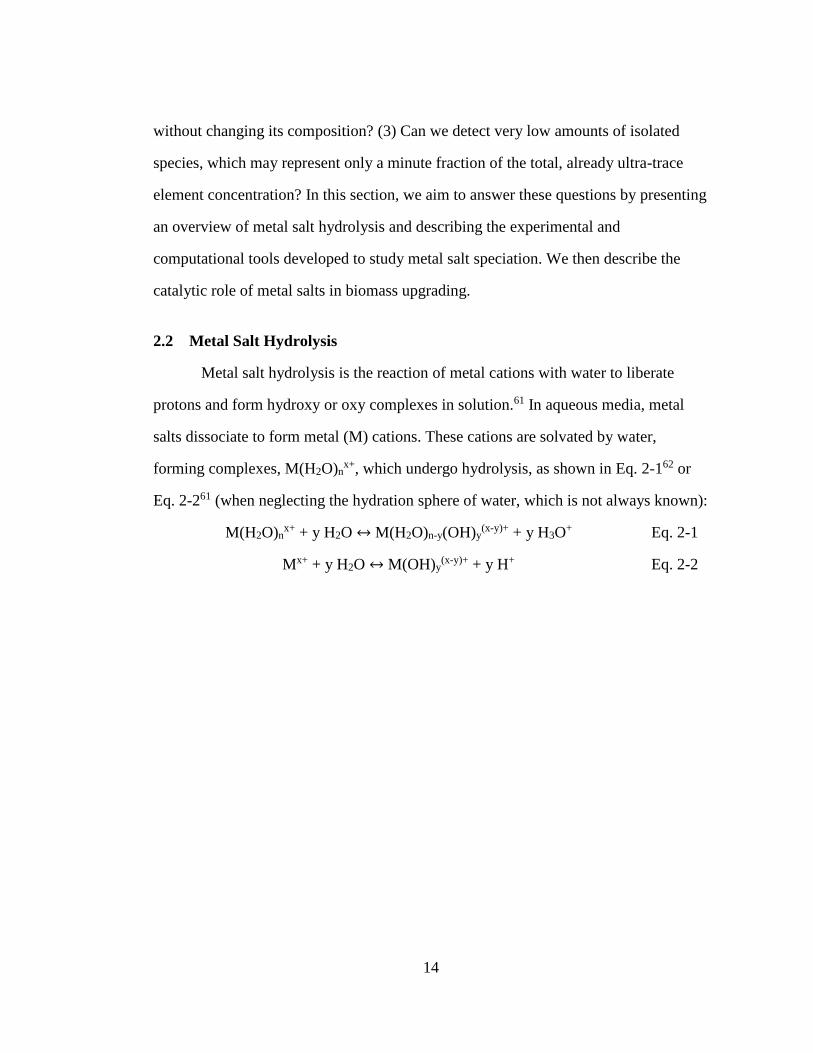
2.2 Metal Salt Hydrolysis
Metal salt hydrolysis is the reaction of metal cations with water to liberate
protons and form hydroxy or oxy complexes in solution.61 In aqueous media, metal
salts dissociate to form metal (M) cations. These cations are solvated by water,
forming complexes, M(H2O)nx+, which undergo hydrolysis, as shown in Eq. 2-162 or
Eq. 2-261 (when neglecting the hydration sphere of water, which is not always known):
M(H2O)nx+ + y H2O ↔ M(H2O)n-y(OH)y
(x-y)+ + y H3O+ Eq. 2-1
Mx+ + y H2O ↔ M(OH)y(x-y)+ + y H+ Eq. 2-2
15
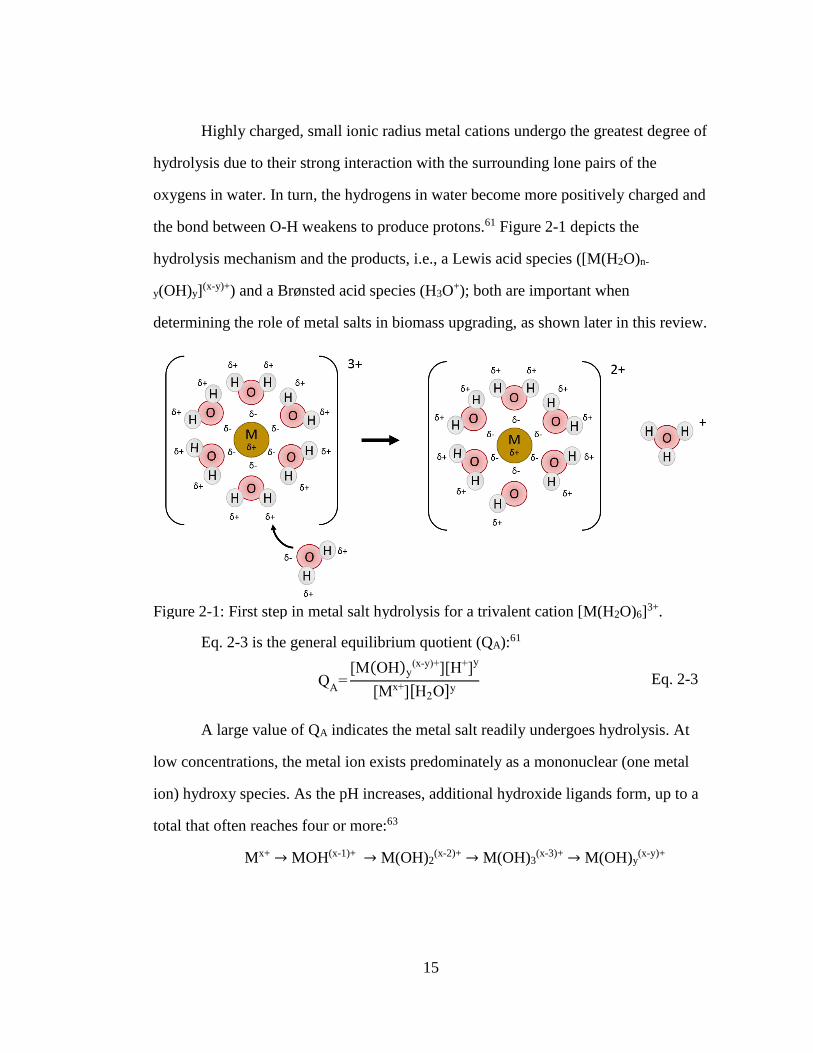
Highly charged, small ionic radius metal cations undergo the greatest degree of
hydrolysis due to their strong interaction with the surrounding lone pairs of the
oxygens in water. In turn, the hydrogens in water become more positively charged and
the bond between O-H weakens to produce protons.61 Figure 2-1 depicts the
hydrolysis mechanism and the products, i.e., a Lewis acid species ([M(H2O)n-
y(OH)y](x-y)+) and a Brønsted acid species (H3O
+); both are important when
determining the role of metal salts in biomass upgrading, as shown later in this review.
Eq. 2-3 is the general equilibrium quotient (QA):61
QA
=[M(OH)y
(x-y)+][H+]y
[Mx+][H2O]y Eq. 2-3
A large value of QA indicates the metal salt readily undergoes hydrolysis. At
low concentrations, the metal ion exists predominately as a mononuclear (one metal
ion) hydroxy species. As the pH increases, additional hydroxide ligands form, up to a
total that often reaches four or more:63
Mx+ → MOH(x-1)+ → M(OH)2(x-2)+ → M(OH)3
(x-3)+ → M(OH)y(x-y)+
Figure 2-1: First step in metal salt hydrolysis for a trivalent cation [M(H2O)6]3+.
16
Polynuclear (more than one metal ion) and solid species may form depending
on the pH and properties of the metal ion. Polynucleation occurs slowly and may
result in a variety of species. After long periods of time, and accelerated in basic
conditions, the polynuclear species form amorphous and eventually crystalline
solids.63 When studying metal salts as catalysts, although conditions are usually acidic,
polymeric species and solids may form over time and therefore should not be
overlooked. This speciation is critical to determining the active species and its
concentration for catalysis. Methods to achieve this are described next.
2.3 Measurements and Modeling of Elemental Speciation
2.3.1 Experimental Tools
Metal salt hydrolysis alters the speciation; quantifying the species and their
concentrations is an important research goal. Here, we review and discuss select
techniques to study speciation.
Electrospray ionization mass spectrometry (ESI-MS) is a soft ionization
technique that transfers pre-existing ions in solution to the gas phase and works best
for dilute solutions.16 ESI-MS yields the mass to charge ratio (m/z) and information on
the oxidation state of a metal ion, but should not be used to identify the structure of
metal complexes. This is because during the transition of charged droplets to the gas
phase, water molecules surrounding a metal center evaporate until the existing
solvation sphere is no longer able to stabilize the charge on the metal ion center. This
in turn reduces the overall charge on the metal ion complex through the loss (or
ionization) of the water ligands. The overall process is equivalent to a gas-phase
hydrolysis reaction.16 In addition, electrochemical processes at the electrospray
17
electrode can induce changes in the charge state and lead to alteration of the species in
solution.64 There are reports involving aqueous metal salt solutions where ESI-MS
detects only [M(H2O)n(OH)2]1+, n=0 – 4.65–68 For example, Urabe et al. only observed
monomeric [Al(H2O)n(OH)2]1+ species at any concentration of AlCl3 (0.02 – 100 mM).
This result is puzzling because (1) given the pH of their salt solutions (pH<3), the
hexa-aqua species is expected to predominate and (2) there were no differences
between the ESI-MS spectra at varying concentrations of AlCl3.65 This coincidence is
most likely because the actual species have been altered during the electrospray
ionization process.
Inductively coupled plasma mass spectrometry (ICP-MS) detects metals down
to ultra-trace concentrations, but cannot resolve individual metal species, since all
molecules are broken down when exposed to the high temperature ion source.57 It is
frequently used to determine if metals have leached from heterogeneous catalysts and
confirm the concentrations of metal salt catalysts.
Nuclear magnetic resonance (NMR) had until recently limited quantitative
accuracy. Today, NMR is quantitative up to three significant figures, is non-
destructive, and applies only a small energy perturbation to a system using a low-
energy electromagnetic wave. Furthermore, in situ analysis of reacting systems is
possible when the free energy change of the reaction is small and the reaction rate is
slow.69–71 When studying metal salt speciation, Maki et al. developed a method to
quantify the [Al(H2O)6]3+ species by creating a calibration curve with varying amounts
of aqueous Al(NO3)3 in HNO3.72 The calibration showed excellent linearity for the
[Al(H2O)6]3+ species, from 1×10⁻⁴ to 1 M. While the technique worked well for
18
aluminum speciation, it has not been applied to other trivalent metals, as the nuclei are
not as common and the signals are often broad.73
Ultraviolet-visible spectroscopy (UV-Vis) detects metal complexes that absorb
light at different wavelengths. In 1957, Elving et al. studied the coordination chemistry
of CrCl3 in aqueous solutions of HCl using UV-Vis.74 Wavelengths were observed for
species corresponding to the [Cr(H2O)6]3+, [Cr(H2O)5Cl]2+, [Cr(H2O)4Cl2]
1+, and
[Cr(H2O)3Cl3] complexes, where the chlorinated complexes appeared at increasing
wavelengths. Recently, others have performed similar studies with CrCl3 in ionic
liquids,75 highly concentrated LiCl,76 and choline chloride (CrCl3/xH2O/yChCl),77
which corroborate Elving et al.’s finding. To the best of our knowledge, the chromium
species have not been quantified through this method. UV-Vis is limited to solutions
that absorb light within the UV range (190 – 380 nm) and the visible light range (380
– 750 nm). Therefore, clear solutions, such as those containing aluminum salts, are not
well suited for this technique.
X-ray absorption spectroscopy (XAS) measures the transitions from the core
electronic states of the metal (X-ray absorption near-edge structure, XANES) to the
excited electronic states and the continuum (extended X-ray absorption fine structure,
EXAFS).78 XANES reports the electronic structure and symmetry of the metal site,
while EXAFS reveals the type of nearest neighbors, their distances from the metal
core, the coordination number, and the Debye-Waller factors, which are indicative of
the degree of vibrational and static disorder.57 Brown et al. combined XANES and
EXAFS to study the structure and speciation of complexes for Fe2+ and Fe3+ chloride
solutions as a function of pH, ionic strength, and chloride/ion ratios. XANES revealed
that less acidic solutions contain octahedral complexes, while acidic FeCl3 solutions
19
exist as tetrahedral complexes. For acidic solutions, EXAFS showed an increase in the
first-shell Fe3+-ligand distance, indicating the octahedral complex changes (Fe3+-O
bond distance of 2.10 Å) to a tetra-chloro complex (Fe3+-Cl bond distance of 2.23 Å).
FeCl2 solutions remained octahedral, but one of the ligands surrounding Fe2+ had
exchanged a water for a chloride ion. This study provided more direct evidence of Fe2+
and Fe3+ structural complexes compared to spectroscopic studies, which rely on the
assignment of absorption bands to particular species that are not always known for
metal species.79 In a recent study with CrCl3, Verdonck et al. performed EXAFS to
identify complexes observed at different spectral bands in UV-Vis.76 EXAFS revealed
each band corresponded to a different chromium species. EXAFS also detects catalyst-
reactant interactions. For example, EXAFS analysis by Choudhary et al. detected the
presence of a glucose molecule in the first coordination shell of the Cr cation,
indicating Cr assists in ring-opening and isomerization of glucose.7 While XAS is
powerful, data analysis is challenging, and, when performing EXAFS, it is often
difficult to distinguish between scattering atoms with similar atomic numbers (C, N, O
or S, Cl or Mn, Fe).78
Small angle neutron (SANS) and X-ray (SAXS) scattering as well as static
(SLS) and dynamic light (DLS) scattering apply radiation to a sample, causing the
particles in solution to scatter light and produce a scattering pattern to yield
information on the particles’ size, shape, and orientation.80 Light scattering techniques
are suitable for dilute particle solutions with a radius of gyration (Rg) between 10 and
1000 nm, while SAXS and SANS are suitable for structures on a smaller scale (as low
as 0.1 nm), as well as for probing particle internal structures and in highly
concentrated samples.81 Shafran et al. traced the size of soluble polymeric aluminum
20
species by DLS and found that particle size increases over time and in basic
conditions. These results supported the hypothesis that Al undergoes polymerization
from an Al13-mer to Al30-mer.82 In another study, Choudhary et al. explained that the
formation of Cr particles detected by DLS cause the pH of CrCl3 solutions to drop and
remain stable upon heating.7 Recently, SAXS determined the size and shape of SnO2
nanoparticles formed from SnCl4.83 SAS possesses low resolution and is unable to
distinguish closely related species (e.g., monomer and dimer)80 but can provide
valuable information on the formation of particulates that reduce the concentration of
the active species for catalysis.
2.3.2 Computational Tools
Models based on thermodynamic equilibria can quantify speciation. In our
experience, the OLI Systems, Inc. “Stream Analyzer” software (2018) is a powerful
modeling platforms for this purpose. It predicts metal salt speciation by considering
chemical equilibria of multicomponent systems and combining standard-state
thermochemical properties of solution species with an expression for the excess Gibbs
free energy.84–88 The standard state properties are calculated using the Helgeson-
Kirkham-Flowers (HFK) equation of state for aqueous ions and electrolytes at infinite
dilution, while the excess Gibbs free energy model incorporates short, middle, and
long-range electrostatic interactions. We have seen agreement between OLI’s
predictions and our experimental data for AlCl3 salt solutions.89 Furthermore, OLI has
established its model can reproduce the pH, solid solubilities, vapor-liquid equilibria,
and other properties for metal species in pure water and organic components. 84–88
The OLI software allows the user to select either an aqueous (AQ) or mixed
solvent electrolyte (MSE) framework to model speciation. The AQ framework allows
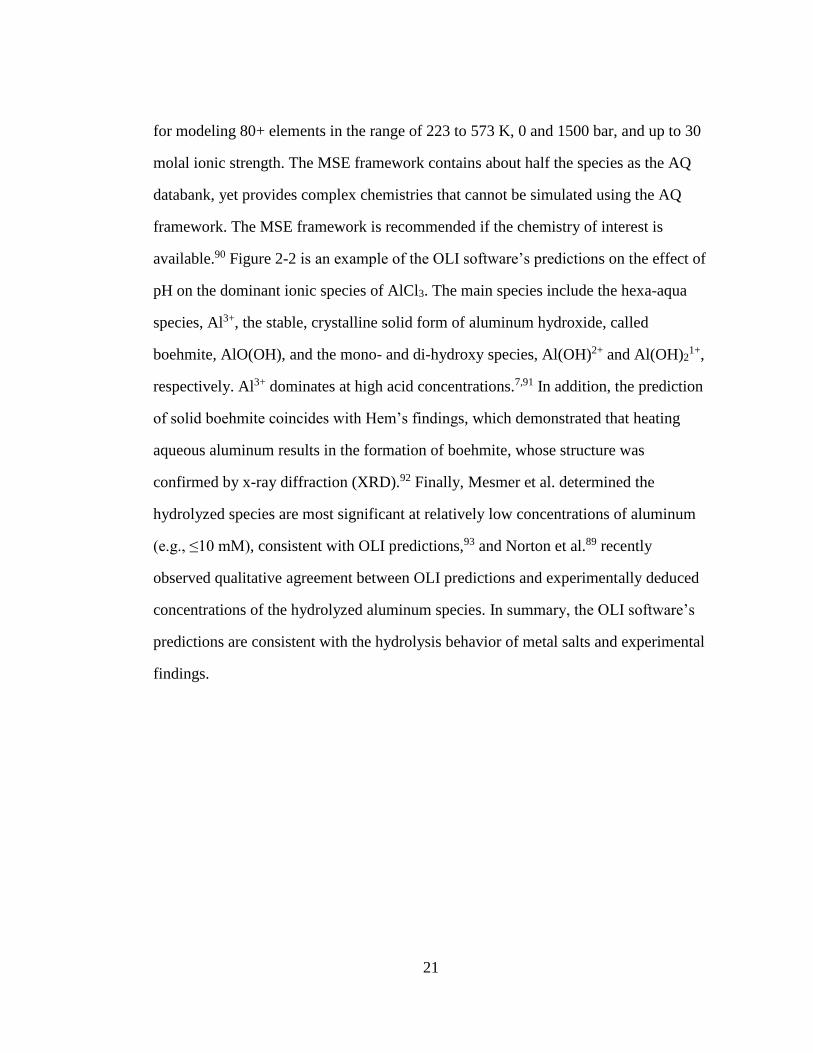
21
for modeling 80+ elements in the range of 223 to 573 K, 0 and 1500 bar, and up to 30
molal ionic strength. The MSE framework contains about half the species as the AQ
databank, yet provides complex chemistries that cannot be simulated using the AQ
framework. The MSE framework is recommended if the chemistry of interest is
available.90 Figure 2-2 is an example of the OLI software’s predictions on the effect of
pH on the dominant ionic species of AlCl3. The main species include the hexa-aqua
species, Al3+, the stable, crystalline solid form of aluminum hydroxide, called
boehmite, AlO(OH), and the mono- and di-hydroxy species, Al(OH)2+ and Al(OH)21+,
respectively. Al3+ dominates at high acid concentrations.7,91 In addition, the prediction
of solid boehmite coincides with Hem’s findings, which demonstrated that heating
aqueous aluminum results in the formation of boehmite, whose structure was
confirmed by x-ray diffraction (XRD).92 Finally, Mesmer et al. determined the
hydrolyzed species are most significant at relatively low concentrations of aluminum
(e.g., ≤10 mM), consistent with OLI predictions,93 and Norton et al.89 recently
observed qualitative agreement between OLI predictions and experimentally deduced
concentrations of the hydrolyzed aluminum species. In summary, the OLI software’s
predictions are consistent with the hydrolysis behavior of metal salts and experimental
findings.
22
Although our experience has mainly been with the OLI speciation model, other
platforms exist for modeling chemical speciation. We discuss two additional, open-
access speciation models for the reader’s reference. The first is called the Visual
MINTEQ, which can simulate the chemical composition in solutions in contact with
gases, solid compounds, and particle surfaces. It calculates the speciation of inorganic
ions and complexes in water and determines the conditions that result in precipitation
of solids.94 Compared to OLI, Visual MINTEQ only works for a limited number of
salts and conditions (e.g., most accurate between 273 and 313 K and near 1 atm). The
second model is a multi-purpose chemical speciation program called Geochem-EZ.95
It allows the user to perform equilibrium speciation computations, estimate solution
ion activities and pH, and determine interactions between metals and ligands. The
program is capable of modeling chemical speciation in soils, but, as with the Visual
MINTEQ, it is rather limited in the number of systems for which databases exist
compared to OLI.
0 10 20 30 40 500
1
2
3
4
5
AlO(OH)(solid)
Al3+
HCl (mM)
0.00
0.02
0.04
0.06
0.08
0.10
Al(OH)21+
AlOH2+
AlO
(OH
) (so
lid
), A
l3+
(mM
)
Al(
OH
) 21+, A
lOH
2+
(mM
)
Figure 2-2: Distribution of AlCl3 speciation (5 mM AlCl3) at reaction temperature
(413 K), calculated using the OLI speciation model. The hydration sphere of water has
been removed for clarity. Redrawn from Norton et al.89
23
Quantum chemistry based thermodynamic models, such as COSMO-RS
( COnductor like Screening MOdel for Real Solvents), provided the use of the
appropriate electrolyte extensions, can be powerful tools for the assessment of the
effect of metal salts in the thermodynamic properties of the solution, particularly in
biphasic systems.96 These effects become critical, as even small concentrations of salts
in solution can have a significant impact on phase equilibria and mutual solubilities of
solvents, all important properties for purification processes.97
Extensions to the current model such as those developed by Wang et al.98 and
Hsieh et al.99 have enabled the prediction of mean ionic activity coefficients in
electrolyte solutions by adding the Pitzer Debye–Hückel term to account for long-
range interactions and was successfully applied for few representative sodium salts.
Further advances by Ingram et al. enabled the use of COSMO based models for
solutions containing monoatomic fully dissociated salts.100 They introduced an
element specific COSMO-radii for alkali metals that consider cation hydration and
element specific hydrogen bonding contribution for anions. This extension proved
successful at: predicting mean ionic activity coefficients in mixed solvent systems,
describing salt effects on different liquid-liquid equilibria, predicting salt induced
separation of aqueous and organic systems, and calculating the partition coefficients of
organic solutes, such as HMF, into different organic solvents in the presence of metal
salts.100,101
Lastly, electronic structure calculations, such as ab initio molecular dynamics
(AIMD) and density functional theory (DFT) calculations, provide mechanistic
information on elementary reactions and (free) energy barriers that can complement
experimental work. For example, Mushrif et al. investigated the mechanism of glucose
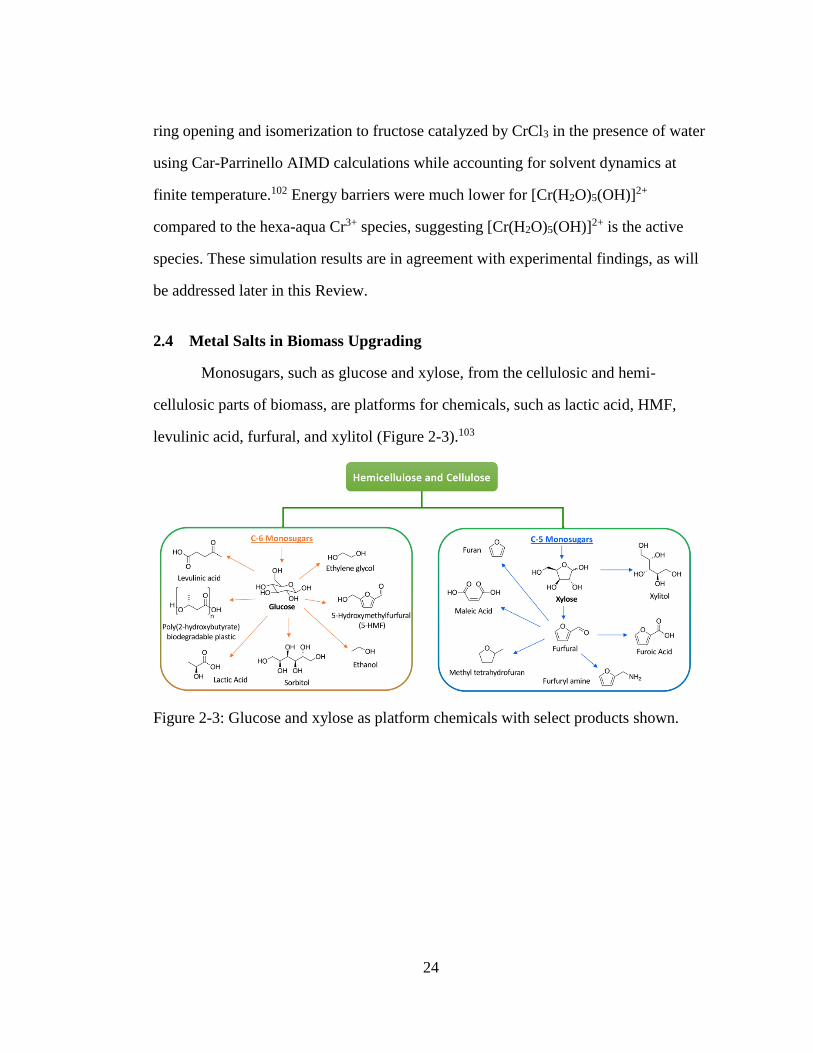
24
ring opening and isomerization to fructose catalyzed by CrCl3 in the presence of water
using Car-Parrinello AIMD calculations while accounting for solvent dynamics at
finite temperature.102 Energy barriers were much lower for [Cr(H2O)5(OH)]2+
compared to the hexa-aqua Cr3+ species, suggesting [Cr(H2O)5(OH)]2+ is the active
species. These simulation results are in agreement with experimental findings, as will
be addressed later in this Review.
2.4 Metal Salts in Biomass Upgrading
Monosugars, such as glucose and xylose, from the cellulosic and hemi-
cellulosic parts of biomass, are platforms for chemicals, such as lactic acid, HMF,
levulinic acid, furfural, and xylitol (Figure 2-3).103
Figure 2-3: Glucose and xylose as platform chemicals with select products shown.
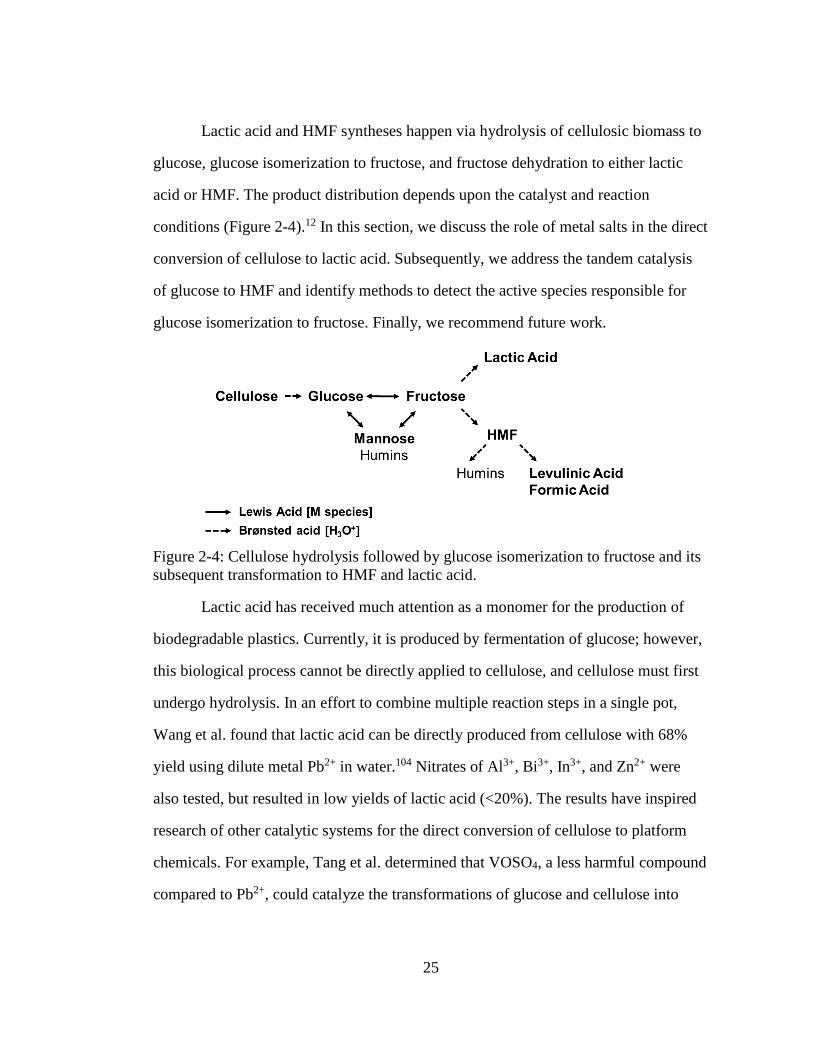
25
Lactic acid and HMF syntheses happen via hydrolysis of cellulosic biomass to
glucose, glucose isomerization to fructose, and fructose dehydration to either lactic
acid or HMF. The product distribution depends upon the catalyst and reaction
conditions (Figure 2-4).12 In this section, we discuss the role of metal salts in the direct
conversion of cellulose to lactic acid. Subsequently, we address the tandem catalysis
of glucose to HMF and identify methods to detect the active species responsible for
glucose isomerization to fructose. Finally, we recommend future work.
Lactic acid has received much attention as a monomer for the production of
biodegradable plastics. Currently, it is produced by fermentation of glucose; however,
this biological process cannot be directly applied to cellulose, and cellulose must first
undergo hydrolysis. In an effort to combine multiple reaction steps in a single pot,
Wang et al. found that lactic acid can be directly produced from cellulose with 68%
yield using dilute metal Pb2+ in water.104 Nitrates of Al3+, Bi3+, In3+, and Zn2+ were
also tested, but resulted in low yields of lactic acid (<20%). The results have inspired
research of other catalytic systems for the direct conversion of cellulose to platform
chemicals. For example, Tang et al. determined that VOSO4, a less harmful compound
compared to Pb2+, could catalyze the transformations of glucose and cellulose into
Figure 2-4: Cellulose hydrolysis followed by glucose isomerization to fructose and its
subsequent transformation to HMF and lactic acid.
26
either formic acid or lactic acid by simply changing the reaction atmosphere from O2
to N2.105 VOSO4 exhibited even higher yield to lactic acid under O2 than Pb2+ does.
51V NMR spectroscopy and electron spin resonance (ESR) suggested that VO2+ was
the active species responsible for converting the intermediate glucose into lactic acid.
In another study, lanthanide triflates were found to convert cellulose into lactic acid.106
Yields as high as 89.6% were obtained with Er(OTf)3. ErCl3, a less expensive
alternative, also resulted in high yield of lactic acid (91.1%). In summary, these
studies suggest that metal cations play an important role in the conversion of cellulose
to lactic acid.107
In addition to lactic acid formation, recent efforts have focused on the
conversion of glucose to HMF, a platform chemical for biofuel, biochemical, and
biopolymer industries. A bottleneck in the production of HMF is the glucose
isomerization, an equilibrium limited reaction. Currently, industrial practice uses
immobilized D-xylose ketoisomerase to catalyze the isomerization;108 however, these
catalysts are expensive, operate under narrow pH conditions, and require highly pure
glucose.109 One way to overcome the equilibrium limitations is to combine the
isomerization and dehydration steps in a single pot. This tandem reaction scheme
requires a catalyst that is compatible with the Brønsted acidity and high temperatures
associated with the dehydration reaction. As a result, over the past decade, research
has turned to the development of chemo-catalysts to carry out glucose isomerization.
Following the pioneering work of Davis and co-workers,11 who combined
heterogeneous Lewis acid catalysts, e.g., Sn-BEA, with strong inorganic Brønsted
acids, e.g., HCl, metal salts were exploited as homogeneous Lewis acid catalysts for
isomerization. In one of the first studies involving metal salts, Heeres and co-workers
27
found that Al3+, Cr2+, and Zn2+ resulted in the highest conversion of glucose to either
HMF or lactic acid.110 Subsequently, Zhang and co-workers discovered that CrCl3 in
ionic liquid performed tandem catalysis of the isomerization as well as dehydration
chemistry,13 and this was originally puzzling. Following this work, it was proposed,
consistent with the hydrolysis reaction (Eq. 2-3), that metal salts function as Lewis
acids (metal species) and Brønsted acids (hydronium ion).111 However, because
acidification of the solution is not as strong (it depends on metal and salt
concentration), Brønsted acids are added to metal salts to further acidify the solution,
speed up the dehydration chemistry, and promote the selective formation of HMF
(Figure 2-4).
Pagán-Torres et al. studied the conversion of glucose to HMF with HCl and
either AlCl3, SnCl4, VCl3, InCl3, GaCl3, LaCl3, DyCl3, or YbCl3. The results indicated
that the effectiveness of the metal salts in glucose conversion depended upon the salt’s
Lewis acid hardness and the size of the ionic radius.112 Hard Lewis acids interact with
hard Lewis bases. AlCl3, the hardest of the Lewis acids studied, is the most active and
interacts strongly with the hard Lewis bases in the hydroxyl groups in glucose.
Similarly, the size of the salt’s ionic radius correlates to its reactivity of glucose.
Glucose conversion increases with decreasing ionic radii from In3+ > Ga3+ > Al3+ and
for the lanthanide series from La3+ > Dy3+ > Yb3+. This behavior is most likely due to
the strong electrostatic interaction between glucose and the smaller cations.
In another screening study by Enslow et al., SnCl4 was identified as the most
selective Lewis acid for converting glucose to HMF (yield < 17%) in water.113 The
presence of HMF was an indication SnCl4 underwent hydrolysis to form complexes,
namely the octahedrally coordinated aquachlorotin(IV), [Sn(H2O)6-xClx](4-x)+ and/or
28
the hexaaquatin(IV), [Sn(H2O)6-y(OH)y](4-y)+, to drive glucose isomerization and
protons to drive fructose dehydration. 119Sn-NMR showed low concentrations of
SnCl4 (<100 mM) led to only a single peak corresponding to hexaaquatin(IV) ions,
suggesting chloride-containing complexes do not form. In addition, water-insoluble
SnO2 species were observed after SnCl4 solutions (10 – 60 mM) were kept at room
temperature for 24 hr. The exact distribution on SnO2 in sub-100 mM SnCl4 solutions
was unknown, but these species in combination with the [Sn(H2O)6-y(OH)y](4-y)+ were
thought to contribute to the Lewis acidity necessary for glucose isomerization.
Similarly, Barros dos Santos et al. found that Sn4+ containing homogeneous catalysts,
including butylstannoic acid (BTA), di-n-butyl-oxo-stannane (DBTO), and dibutyltin
dilaurate (DBTDL), were active in converting cellulose to glucose, fructose, lactic
acid, and HMF.114 Each catalyst resulted in similar cellulose consumption and yield. In
an effort to determine the active species, SnO2, a species common to all of the tested
Sn4+ containing catalysts, was also studied and gave comparable conversion and yield
as the other tested Sn4+ catalysts. This suggests an oxide was the active Sn4+ species,
consistent with Enslow et al.’s proposition when using SnCl4 as a catalyst to make
HMF from glucose.114
While SnCl4 is selective to HMF in water, CrCl3 and AlCl3 are highly active in
glucose isomerization to fructose. To better understand the differences in reactivity
between the Lewis acids, Tsilomelekis and co-workers studied the effects of the metal
salts on the ease of ring opening of glucose, the first step in glucose isomerization.115
At the same metal salt concentration, it was found that SnCl4 facilitates fast
mutarotation towards the β-anomer, while CrCl3 and AlCl3 favor the α-anomer. AlCl3
was the slowest on glucose ring opening, though this effect is highly dependent on pH.
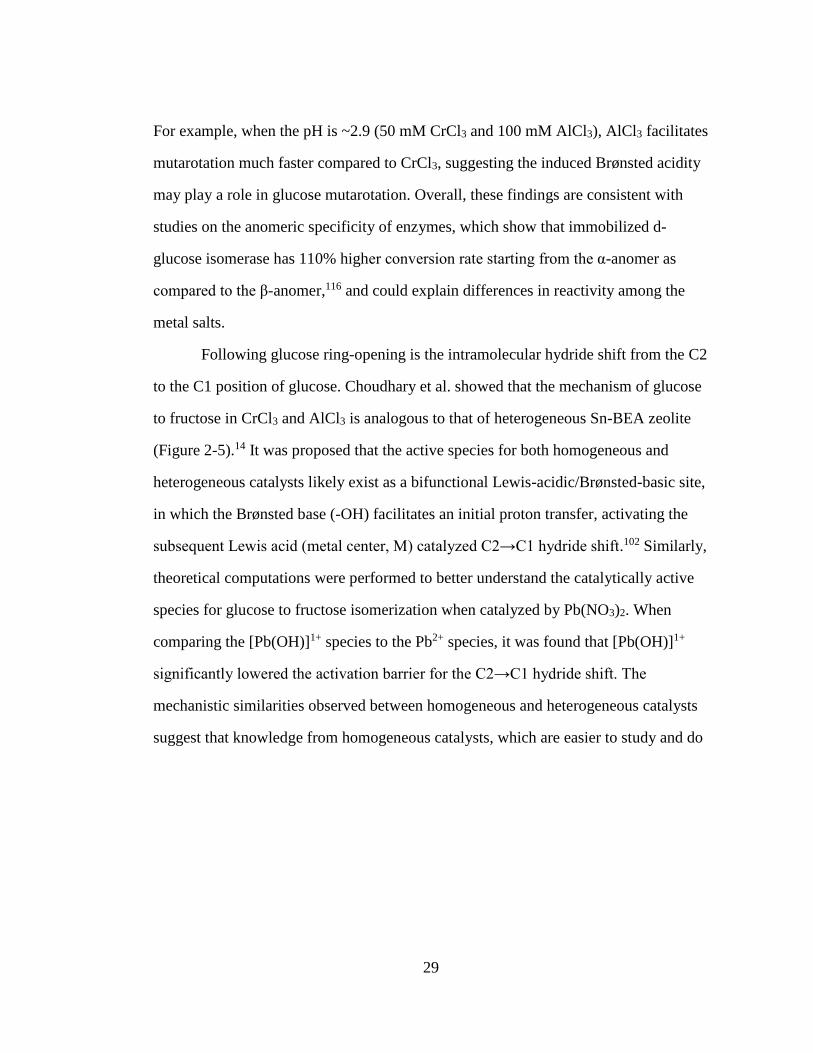
29
For example, when the pH is ~2.9 (50 mM CrCl3 and 100 mM AlCl3), AlCl3 facilitates
mutarotation much faster compared to CrCl3, suggesting the induced Brønsted acidity
may play a role in glucose mutarotation. Overall, these findings are consistent with
studies on the anomeric specificity of enzymes, which show that immobilized d-
glucose isomerase has 110% higher conversion rate starting from the α-anomer as
compared to the β-anomer,116 and could explain differences in reactivity among the
metal salts.
Following glucose ring-opening is the intramolecular hydride shift from the C2
to the C1 position of glucose. Choudhary et al. showed that the mechanism of glucose
to fructose in CrCl3 and AlCl3 is analogous to that of heterogeneous Sn-BEA zeolite
(Figure 2-5).14 It was proposed that the active species for both homogeneous and
heterogeneous catalysts likely exist as a bifunctional Lewis-acidic/Brønsted-basic site,
in which the Brønsted base (-OH) facilitates an initial proton transfer, activating the
subsequent Lewis acid (metal center, M) catalyzed C2→C1 hydride shift.102 Similarly,
theoretical computations were performed to better understand the catalytically active
species for glucose to fructose isomerization when catalyzed by Pb(NO3)2. When
comparing the [Pb(OH)]1+ species to the Pb2+ species, it was found that [Pb(OH)]1+
significantly lowered the activation barrier for the C2→C1 hydride shift. The
mechanistic similarities observed between homogeneous and heterogeneous catalysts
suggest that knowledge from homogeneous catalysts, which are easier to study and do
30
not invoke synthesis challenges, could be applied to the identification and
improvement of heterogeneous catalysts.
Designing better catalysts requires understanding the active species responsible
for the chemistry. Different approaches have emerged to identify the catalytically
active species of homogeneous metal salts in the glucose isomerization reaction.
Choudhary et al. combined speciation modeling using the OLI software and glucose
isomerization kinetics to propose an active species of CrCl3.7 The initial rate increased
linearly with the concentration of the [Cr(H2O)5(OH)]2+ species, suggesting this is the
most active species. Furthermore, Car-Parrinello molecular dynamics (CPMD)
simulations and EXAFS confirmed that Cr3+ exists as a hexahydrate species,
surrounded by six oxygens in the absence of glucose. Upon glucose addition, two
oxygen atoms of the hydroxyl groups in glucose replace two of the oxygen molecules
in the inner coordination sphere. The metal center is then coordinated to three water
molecules, one OH-, and two oxygen atoms of the glucose molecule. This
complexation of glucose with the active [Cr(H2O)5OH]2+ species is critical in the
isomerization of glucose to fructose.62
While active species have been proposed, direct experimental evidence in
support of the catalytic species has been lacking. This lack of understanding stems
1
2
D-glucose D-fructose
2
1
1
2
Deprotonation
transition state
Intermediate-1 Hydride shift
transition state
Reprotonation
transition state
Intermediate-2
Figure 2-5: Proposed mechanism of glucose to fructose isomerization in water. “M”
represents a metal center [e.g., Cr, Al, and Sn (in Sn-BEA)]. Redrawn from
Choudhary et al.14
31
from (1) a number of metal hydrolysis steps and self-condensation leading to
oligomeric species and potentially metal nanoparticles and (2) the concentration of
metal salts being low (e.g., 5 – 30 mM), making it difficult to observe and quantify the
metallic species. Despite these challenges, experimental studies have been performed
to elucidate the interaction between the active metal species and glucose. Tang et al.
observed a complex corresponding to [Al(OH)2(Glucose)]1+ (m/z=385) using ESI-
MS/MS15 and proposed [Al(OH)2]1+ is active for glucose isomerization. This finding
was in line with mechanistic results by Qi et al., which showed glucose isomerization
with AlCl3 proceeds with either [Al(H2O)4(OH)]2+ or [Al(H2O)2(OH)2]1+ as the active
species;117 however, this is not conclusive, as ESI-MS may alter the species’ structure.
Similar studies have been performed with metal salts that have moderate Lewis
acid strength (pH ~ 5 – 7). For example, Cu(NO3)2 was recently studied for glucose to
fructose isomerization, and the influence of pH was carefully monitored before and
after the reaction. Depending on the pH value, the thermodynamic equilibrium shifts
towards either Cu2+ or Cu(OH)1+ and Cu(OH)2. Correlation of the fructose yield with
the concentration of Cu(OH)1+ suggested this was the active Lewis acidic species.
According to the thermodynamics, the highest concentration of Cu(OH)1+ was
achieved at pH 5.3 – 5.5, which also provided the highest fructose yield of 16% at 383
K. ESI-MS was employed to investigate the interactions between different Cu species
and glucose. The resulting spectrum of glucose and Cu(NO3)2 revealed the presence of
the single-charged ion complex. FeCl3, another metal salt with moderate Lewis acid
strength, was also studied in glucose isomerization to fructose.68 Fe has two major
oxidation states, Fe2+ or Fe3+. Up until this study, the active species was expected to be
32
Fe3+. A combination of mass spectrometry, UV-Vis, and XAS showed that Fe3+ is
readily reduced to Fe2+ (over 95%) in the early stage of carbohydrate conversion.
Thus far, we have presented cases where metal species have been postulated,
but never experimentally quantified, as this is challenging. Norton et al. showed that
Al species’ concentrations can be deduced by combining experiments, modeling, and
glucose isomerization kinetics.89 In that work, 27Al-NMR detected the dominant
Al(H2O)63+ complex. These measurements combined with pH and equilibrium
expressions for the aluminum hydrolysis reactions were used to estimate the
concentrations of the [Al(H2O)4(OH)2]1+ and [Al(H2O)5(OH)]2+ species. DLS detected
aluminum particles upon heating the salt solutions. Over time and in the presence of
heat, it was suggested the polymeric Al species undergo nucleation to form stable
solid precipitates, such as boehmite. Solid aluminum was then quantified by coupling
ultrafiltration with ICP-MS. It was found that after heating catalyst solutions for 24 h,
the solid species and pH remained constant. Therefore, to ensure equilibrium of
aluminum species and avoid speciation changes during kinetic experiments, catalyst
solutions were preheated for 24 h prior to performing glucose isomerization. Finally,
the concentrations of the aqueous and solid aluminum species were correlated to the
glucose isomerization rate. At sufficiently high temperatures (e.g., 413 K), the
hydrolyzed [Al(H2O)4(OH)2]1+ species scales linearly with the glucose isomerization
rate, indicating this complex is the active one. This finding supports the idea that the
catalytic species responsible for the isomerization exists as a bifunctional Lewis-
acidic/Brønsted-basic site and provides additional support for the Al(OH)21+ active
species proposed by Tang et al.15
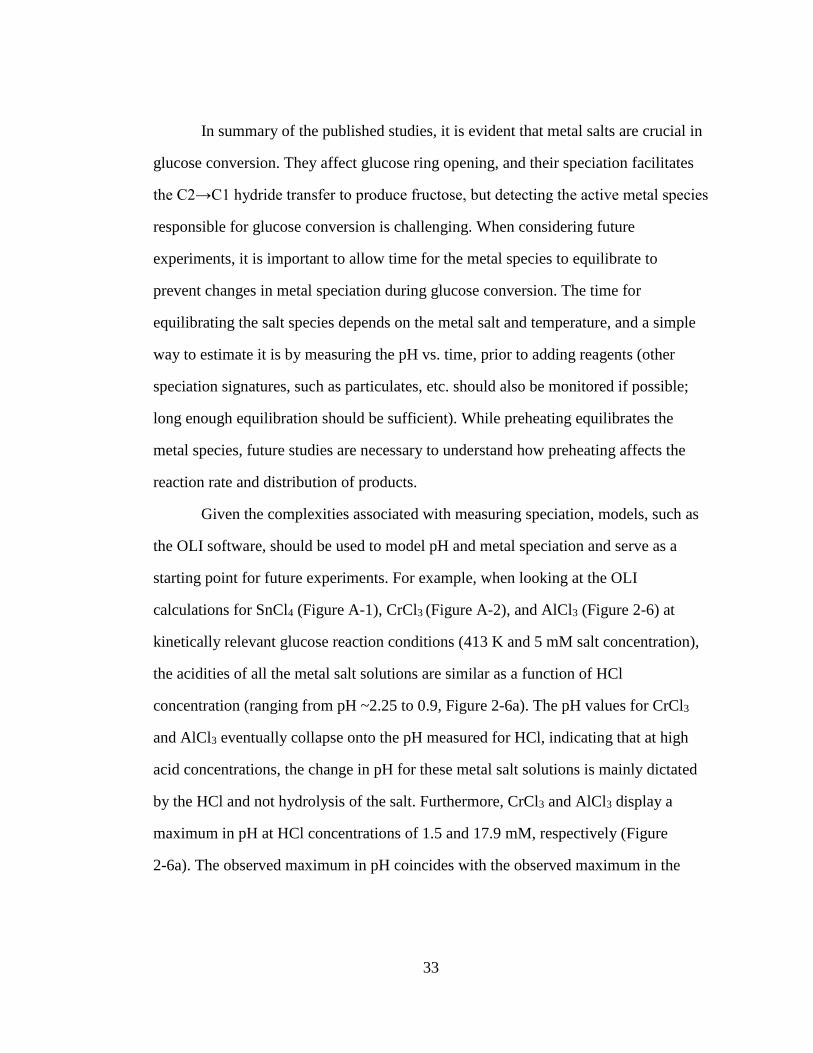
33
In summary of the published studies, it is evident that metal salts are crucial in
glucose conversion. They affect glucose ring opening, and their speciation facilitates
the C2→C1 hydride transfer to produce fructose, but detecting the active metal species
responsible for glucose conversion is challenging. When considering future
experiments, it is important to allow time for the metal species to equilibrate to
prevent changes in metal speciation during glucose conversion. The time for
equilibrating the salt species depends on the metal salt and temperature, and a simple
way to estimate it is by measuring the pH vs. time, prior to adding reagents (other
speciation signatures, such as particulates, etc. should also be monitored if possible;
long enough equilibration should be sufficient). While preheating equilibrates the
metal species, future studies are necessary to understand how preheating affects the
reaction rate and distribution of products.
Given the complexities associated with measuring speciation, models, such as
the OLI software, should be used to model pH and metal speciation and serve as a
starting point for future experiments. For example, when looking at the OLI
calculations for SnCl4 (Figure A-1), CrCl3 (Figure A-2), and AlCl3 (Figure 2-6) at
kinetically relevant glucose reaction conditions (413 K and 5 mM salt concentration),
the acidities of all the metal salt solutions are similar as a function of HCl
concentration (ranging from pH ~2.25 to 0.9, Figure 2-6a). The pH values for CrCl3
and AlCl3 eventually collapse onto the pH measured for HCl, indicating that at high
acid concentrations, the change in pH for these metal salt solutions is mainly dictated
by the HCl and not hydrolysis of the salt. Furthermore, CrCl3 and AlCl3 display a
maximum in pH at HCl concentrations of 1.5 and 17.9 mM, respectively (Figure
2-6a). The observed maximum in pH coincides with the observed maximum in the
34
proposed active species. High concentrations of Brønsted acids dissolve the solid to
increase the concentration of active species but also retard hydrolysis (Eq. 2-1) that
produces the active species; this tradeoff creates a volcano. This volcano-like behavior
was observed experimentally for the Al(OH)21+ species by Norton et al.89 It is shown
as the data points in Figure 2-6.
In contrast, for SnCl4, the pH continues to drop upon increasing HCl
concentration, and the speciation profile shows that solid formation proliferates upon
the addition of acid (Figure 2-6, Figure A-1), consistent with previous reports of solid
formation.83 Sn4+ is also more acidic compared to the other metal salts and HCl. This
may be because SnCl4 has a higher propensity to deprotonate water, always resulting
in a lower acidity compared to the other metal salts and HCl. Figure A-3 shows that
increasing the SnCl4 concentration results in high amounts of SnO2(solid) formation. All
the results combined, it is important to consider in future experiments, the relationship
between pH, the maximum active species concentration, and the maximum yield of
fructose, as well as the role of solids, such as SnO2, in glucose conversion.
The maximum active species concentration increases modestly with increasing
salt concentration (Figure A-4 and Figure A-5). Given that solids form at low external
acid concentration, increasing the rate beyond that corresponding to the volcano
maximum would not be possible. Anchoring the actives species on a support to
prevent agglomeration may be worth pursuing in future work. While analogy to
heterogeneous catalysts has been drawn, more work is needed to fully delineate the
similarities to and differences from heterogeneous catalysts. Furthermore, the number
of ab initio molecular dynamics and classical molecular dynamics calculations for this
class of catalysts has been rather limited. These calculations can provide further
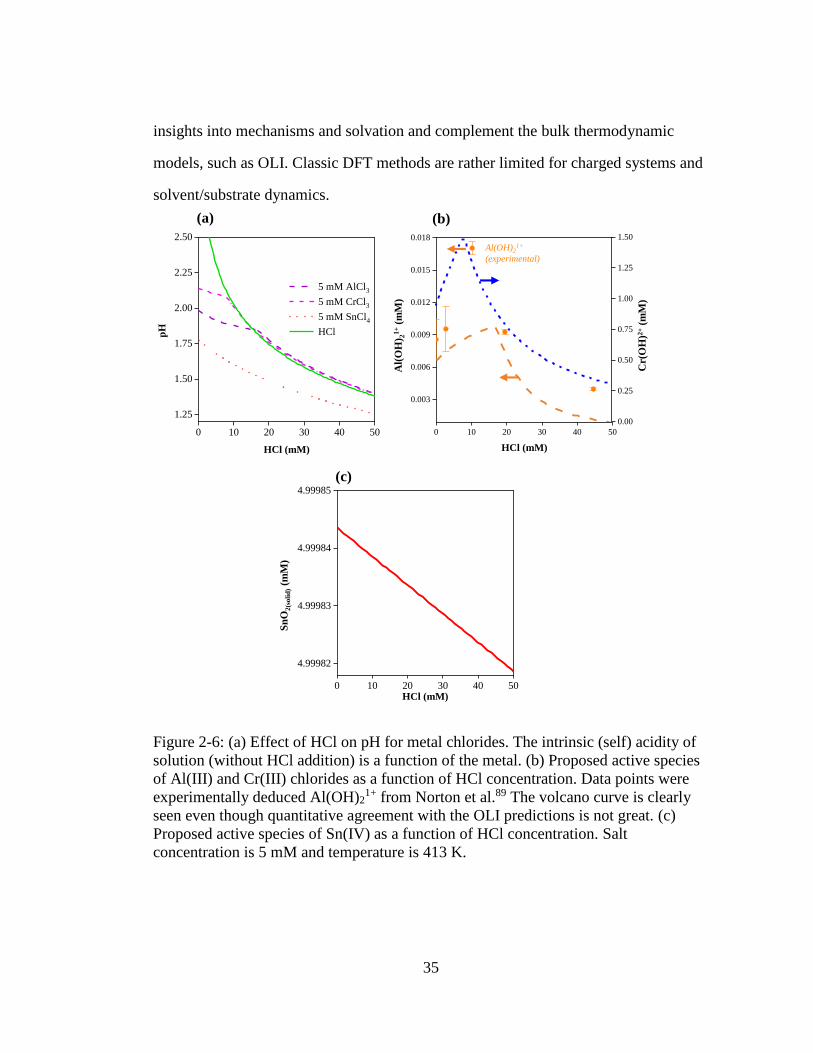
35
insights into mechanisms and solvation and complement the bulk thermodynamic
models, such as OLI. Classic DFT methods are rather limited for charged systems and
solvent/substrate dynamics.
Figure 2-6: (a) Effect of HCl on pH for metal chlorides. The intrinsic (self) acidity of
solution (without HCl addition) is a function of the metal. (b) Proposed active species
of Al(III) and Cr(III) chlorides as a function of HCl concentration. Data points were
experimentally deduced Al(OH)21+ from Norton et al.89 The volcano curve is clearly
seen even though quantitative agreement with the OLI predictions is not great. (c)
Proposed active species of Sn(IV) as a function of HCl concentration. Salt
concentration is 5 mM and temperature is 413 K.
0 10 20 30 40 50
4.99982
4.99983
4.99984
4.99985
HCl (mM)
0 10 20 30 40 50
1.25
1.50
1.75
2.00
2.25
2.50
pH
HCl (mM)
5 mM AlCl3
5 mM CrCl3
5 mM SnCl4
HCl
(a) (b)
(c)
0 10 20 30 40 50
0.003
0.006
0.009
0.012
0.015
0.018
0.00
0.25
0.50
0.75
1.00
1.25
1.50
HCl (mM)
Al(
OH
) 21
+(m
M)
Cr(
OH
)2+
(mM
)
Al(OH)21+
(experimental)
Sn
O2
(so
lid
)(m
M)
36
DIRECT SPECIATION METHODS TO QUANTIFY CATALYTICALLY
ACTIVE SPECIES OF AlCl3 IN GLUCOSE ISOMERIZATION
3.1 Introduction
The need to reduce greenhouse gas emissions and our dependence on fossil
fuels has prompted considerable research in the production of fuels and chemicals
from lignocellulosic biomass.12 Biomass is a promising renewable feedstock due to its
abundance and its ability to capture CO2 from the atmosphere via photosynthesis.118
Among the top biomass-derived chemicals, 5-(hydroxymethyl) furfural (HMF) has
gained significant interest as a platform chemical.118 HMF synthesis results from the
hydrolysis of cellulosic biomass to glucose, glucose isomerization to fructose, and
fructose dehydration to HMF.12 When the isomerization and dehydration steps occur
in a single pot, dehydration drives the equilibrium-limited isomerization resulting in
higher yields.14 This then requires an isomerization catalyst that is compatible with the
Brønsted acid catalyst and high temperatures associated with the dehydration reaction.
Currently, industrial applications use immobilized D-xylose ketoisomerase to catalyze
the isomerization;108,119 however, these catalysts are expensive, operate under narrow
conditions, and require highly pure glucose.120 As a result, research has turned to the
development of chemo-catalytic processes to carry out glucose isomerization, starting
with the pioneering work of Davis and co-workers on Sn-BEA zeolite that enable
HMF production in a single pot.11,121
Chapter 3
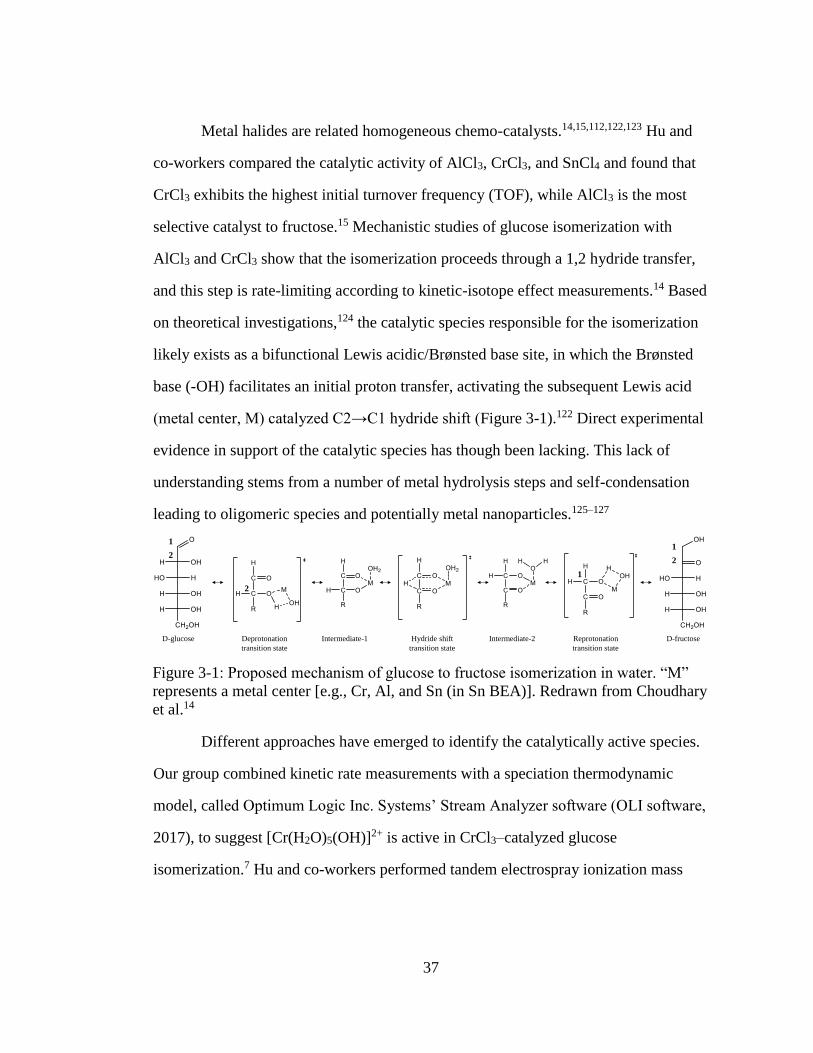
37
Metal halides are related homogeneous chemo-catalysts.14,15,112,122,123 Hu and
co-workers compared the catalytic activity of AlCl3, CrCl3, and SnCl4 and found that
CrCl3 exhibits the highest initial turnover frequency (TOF), while AlCl3 is the most
selective catalyst to fructose.15 Mechanistic studies of glucose isomerization with
AlCl3 and CrCl3 show that the isomerization proceeds through a 1,2 hydride transfer,
and this step is rate-limiting according to kinetic-isotope effect measurements.14 Based
on theoretical investigations,124 the catalytic species responsible for the isomerization
likely exists as a bifunctional Lewis acidic/Brønsted base site, in which the Brønsted
base (-OH) facilitates an initial proton transfer, activating the subsequent Lewis acid
(metal center, M) catalyzed C2→C1 hydride shift (Figure 3-1).122 Direct experimental
evidence in support of the catalytic species has though been lacking. This lack of
understanding stems from a number of metal hydrolysis steps and self-condensation
leading to oligomeric species and potentially metal nanoparticles.125–127
Different approaches have emerged to identify the catalytically active species.
Our group combined kinetic rate measurements with a speciation thermodynamic
model, called Optimum Logic Inc. Systems’ Stream Analyzer software (OLI software,
2017), to suggest [Cr(H2O)5(OH)]2+ is active in CrCl3–catalyzed glucose
isomerization.7 Hu and co-workers performed tandem electrospray ionization mass
1
2
D-glucose D-fructose
2
1
1
2
Deprotonation
transition state
Intermediate-1 Hydride shift
transition state
Reprotonation
transition state
Intermediate-2
Figure 3-1: Proposed mechanism of glucose to fructose isomerization in water. “M”
represents a metal center [e.g., Cr, Al, and Sn (in Sn BEA)]. Redrawn from Choudhary
et al.14
38
spectrometry (ESI-MS/MS) to propose, due to its abundance, [Al(H2O)4(OH)2]1+ is the
active species when AlCl3 is used as a catalyst.15,128 Given the difference in the active
species between CrCl3 and AlCl3, the fact that ESI-MS/MS may alter speciation
during the measurement,16 and that observed species are often spectators rather than
the active ones, the active aluminum species still remain(s) unknown.
In this work, we integrate kinetics with more direct speciation measurements
for the first time to provide evidence for the active species of AlCl3. Our judicious
choice of AlCl3 is based on the fact that it is a selective catalyst in glucose
isomerization and an excellent salt to be followed spectroscopically.129–133 We
investigate the interplay between Lewis (AlCl3) and Brønsted (HCl) acids using the
OLI software, while simultaneously developing an experimental protocol to quantify
the various aluminum species. We use 27Al quantitative nuclear magnetic resonance
(qNMR) and pH to measure the aqueous aluminum species and protons, respectively,
and combine inductively coupled plasma – mass spectrometry (ICP-MS), dynamic
light scattering (DLS), and ultrafiltration to measure the aluminum nanoparticles.
Finally, we correlate the glucose isomerization rate with the aluminum species
concentrations to propose an active species.
3.2 Methods
3.2.1 Speciation Model
AlCl3 speciation was predicted using the mixed-solvent electrolyte OLI
software.134,135 The model predicts speciation by solving chemical equilibria of
multicomponent systems and combining standard-state thermochemical properties of
solution species with an expression for the excess Gibbs free energy. The standard-
39
state properties are calculated using the Helgeson-Kirkham-Flowers (HKF) equation
of state for aqueous ions and electrolytes at infinite dilution, while the excess Gibbs
free energy model incorporates short, middle, and long-range electrostatic interactions.
Further details regarding these calculations can be found in our previous work.7 The
OLI model has been parameterized at conditions that differ from those typically
encountered in isomerization chemistry and thus, its accuracy is unknown. We address
this point in this paper by more direct measurements of Al speciation.
3.2.2 pH Measurements
pH measurements were obtained using the 3300 High Temperature (HT)
PERpH-X sensor (Rosemount) and the 56 Advanced Dual-Input analyzer
(Rosemount). A typical measurement was conducted in a 100 mL thick-walled glass
vessel (Fisher Scientific) containing catalyst solution. The catalyst solution was stirred
and heated for a specified time. The pH sensor was then inserted into the vessel and
pH was obtained in situ. Heated samples were then cooled to room temperature and
pH was obtained ex situ. The sensor was confirmed to measure the pH of buffer
solutions (Fisher Scientific) within their specified temperature range (298 to 373 K,
see Figure B-1).
3.2.3 27Al Quantitative Nuclear Magnetic Resonance (qNMR) Spectroscopy
27Al qNMR was carried out on an Avance III 400 MHz NMR spectrometer
(Bruker). Spectra were measured at 104.27 MHz (pulse width: 12.50 µs, acquisition
time: 0.1966 s, scans: 64, solvent: 90% H2O, 10% D2O) and processed using
Mestrelab Research software (mNOVA). The samples were prepared in quartz NMR
tubes (NewEra), containing 0.5 mL of reaction mixture and were studied at 303 or 363
40
K. For quantification purposes, an external standard of Al(H2O)63+ was prepared with
5 mM AlCl3 and 100 mM HCl (Figure B-2).
3.2.4 Ultrafiltration
Ultrafiltration was performed using Vivaspin 500 concentrators (Sartorius)
with a 10,000 molecular weight cut-off (MWCO). The concentrators were filled with
500 µL of either freshly prepared or heat-treated catalyst solutions and placed into the
centrifuge (Eppendorf Centrifuge 5424) for 15 minutes at a spin speed of 15,000 g.
Samples were then recovered from the bottom of the concentrate pocket with a pipette.
3.2.5 Inductively Coupled Plasma Mass Spectrometry (ICP-MS)
ICP-MS measurements on freshly prepared and heat-treated catalyst solutions
were carried out using an Agilent 7500cx Series instrument (Wilmington, DE).
Samples underwent ultrafiltration, followed by acid treatment prior to ICP-MS
analysis. The aluminum standards (Agilent) were prepared in HNO3 (70 w/w %,
Sigma Aldrich) and diluted for the ICP-MS calibration.
3.2.6 Dynamic Light Scattering (DLS)
DLS experiments were conducted on a Brookhaven ZETAPALS instrument.
DLS measurements were obtained both before and after heating the catalyst solutions.
The autocorrelation functions were analyzed using the Multimodal Size Distribution
algorithm of the accompanying software, where the viscosity of the solutions was
assumed to equal that of water.
41
3.2.7 Catalytic Measurements
All chemicals were purchased from Sigma Aldrich and used as received. The
reactions were conducted in 10 mL glass vials (Sigma Aldrich) heated in an aluminum
reactor block with controlled stirring (Fisher Scientific). Catalyst solutions of AlCl3∙6
H2O (Sigma Aldrich) and HCl (37 w/w %, Sigma Aldrich) were stirred and preheated
at reaction temperature for 24 h. Kinetic experiments were then carried out in sealed
reactor vials containing the preheated catalyst solution (2 mL) and glucose. The Al-to-
reactant molar ratio was kept at 9:100, which corresponds to 5 mM AlCl3 and 1 wt %
glucose solution. The HCl concentration varied from 3 to 44 mM when used with
AlCl3 (except for the external standard mentioned above). At different time points, the
vials were removed from the oil bath, quenched in ice to stop the reaction, and filtered
with a 0.2 μm filter (Fisher Scientific).
Quantification of the liquid products was achieved using high-performance
liquid chromatography (HPLC, Waters Alliance Instruments e2695), equipped with a
refractive index (RI) detector and a photodiode array (PDA) detector. Sugars were
separated using a Biorad HPX87C column at 348 K with HPLC-grade water flowing
at 0.5 mL min-1 as the mobile phase. Acid byproducts and HMF were separated using
a Biorad HPX87H column heated to 323 K with 5 mM sulfuric acid flowing at 0.5 mL
min-1 as the mobile phase.
3.3 Results and Discussion
3.3.1 Model-Predicted AlCl3 Speciation in Aqueous Media
In aqueous media, AlCl3 dissociates to form metal cations. These cations are
solvated by water, forming complexes, such as [Al(H2O)6]3+, which can be further
hydrolyzed, as shown in Eq. 3-1.126,127,136
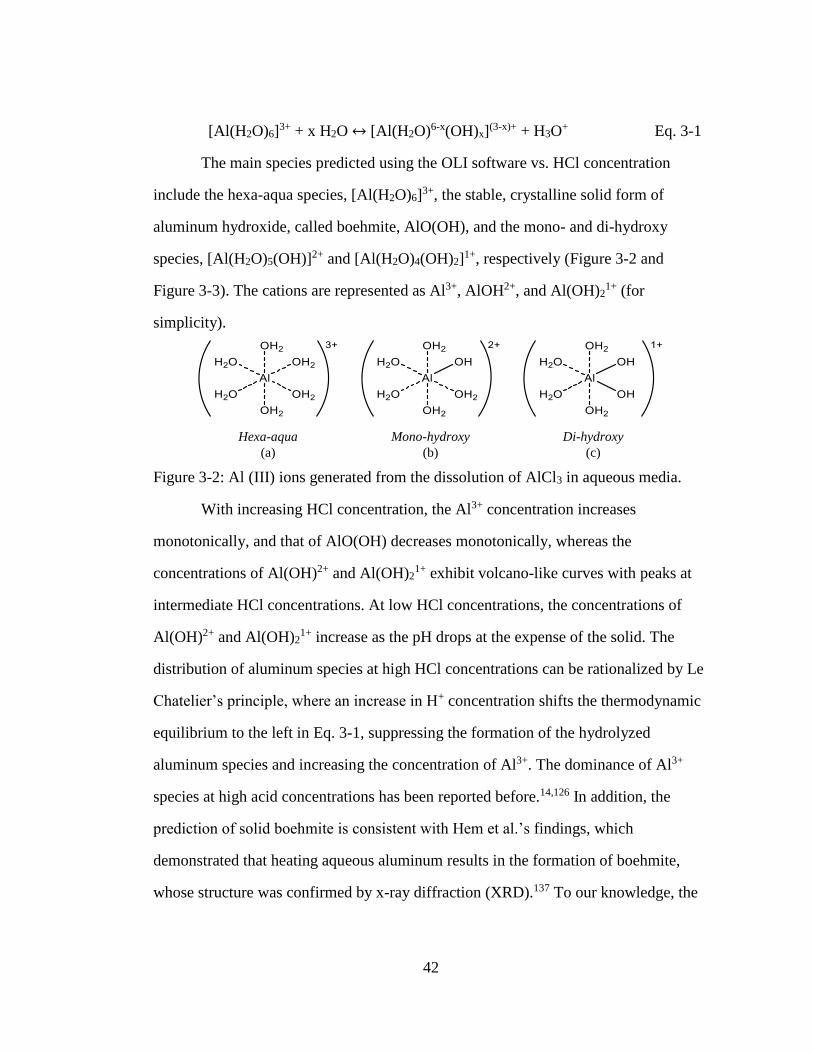
42
[Al(H2O)6]3+ + x H2O ↔ [Al(H2O)6-x(OH)x]
(3-x)+ + H3O+ Eq. 3-1
The main species predicted using the OLI software vs. HCl concentration
include the hexa-aqua species, [Al(H2O)6]3+, the stable, crystalline solid form of
aluminum hydroxide, called boehmite, AlO(OH), and the mono- and di-hydroxy
species, [Al(H2O)5(OH)]2+ and [Al(H2O)4(OH)2]1+, respectively (Figure 3-2 and
Figure 3-3). The cations are represented as Al3+, AlOH2+, and Al(OH)21+ (for
simplicity).
With increasing HCl concentration, the Al3+ concentration increases
monotonically, and that of AlO(OH) decreases monotonically, whereas the
concentrations of Al(OH)2+ and Al(OH)21+ exhibit volcano-like curves with peaks at
intermediate HCl concentrations. At low HCl concentrations, the concentrations of
Al(OH)2+ and Al(OH)21+ increase as the pH drops at the expense of the solid. The
distribution of aluminum species at high HCl concentrations can be rationalized by Le
Chatelier’s principle, where an increase in H+ concentration shifts the thermodynamic
equilibrium to the left in Eq. 3-1, suppressing the formation of the hydrolyzed
aluminum species and increasing the concentration of Al3+. The dominance of Al3+
species at high acid concentrations has been reported before.14,126 In addition, the
prediction of solid boehmite is consistent with Hem et al.’s findings, which
demonstrated that heating aqueous aluminum results in the formation of boehmite,
whose structure was confirmed by x-ray diffraction (XRD).137 To our knowledge, the
Mono-hydroxy
(b)
Di-hydroxy
(c)
Hexa-aqua
(a)
Figure 3-2: Al (III) ions generated from the dissolution of AlCl3 in aqueous media.
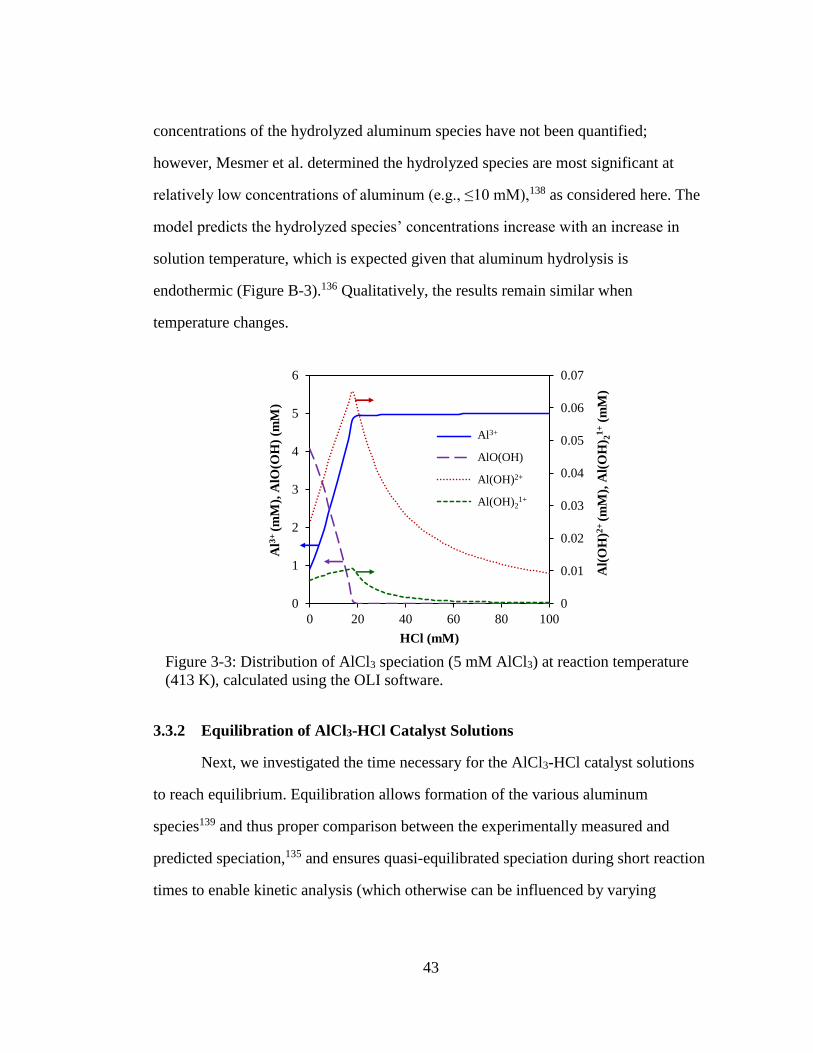
43
concentrations of the hydrolyzed aluminum species have not been quantified;
however, Mesmer et al. determined the hydrolyzed species are most significant at
relatively low concentrations of aluminum (e.g., ≤10 mM),138 as considered here. The
model predicts the hydrolyzed species’ concentrations increase with an increase in
solution temperature, which is expected given that aluminum hydrolysis is
endothermic (Figure B-3).136 Qualitatively, the results remain similar when
temperature changes.
3.3.2 Equilibration of AlCl3-HCl Catalyst Solutions
Next, we investigated the time necessary for the AlCl3-HCl catalyst solutions
to reach equilibrium. Equilibration allows formation of the various aluminum
species139 and thus proper comparison between the experimentally measured and
predicted speciation,135 and ensures quasi-equilibrated speciation during short reaction
times to enable kinetic analysis (which otherwise can be influenced by varying
Figure 3-3: Distribution of AlCl3 speciation (5 mM AlCl3) at reaction temperature
(413 K), calculated using the OLI software.
0
0.01
0.02
0.03
0.04
0.05
0.06
0.07
0
1
2
3
4
5
6
0 20 40 60 80 100
Al(
OH
)2+
(m
M),
Al(
OH
) 21
+(m
M)
Al3
+ (
mM
), A
lO(O
H)
(mM
)
HCl (mM)
Al+3
AlO(OH) - Sol
AlOH+2
Al(OH)2+1
Al3+
AlO(OH)
Al(OH)2+
Al(OH)21+
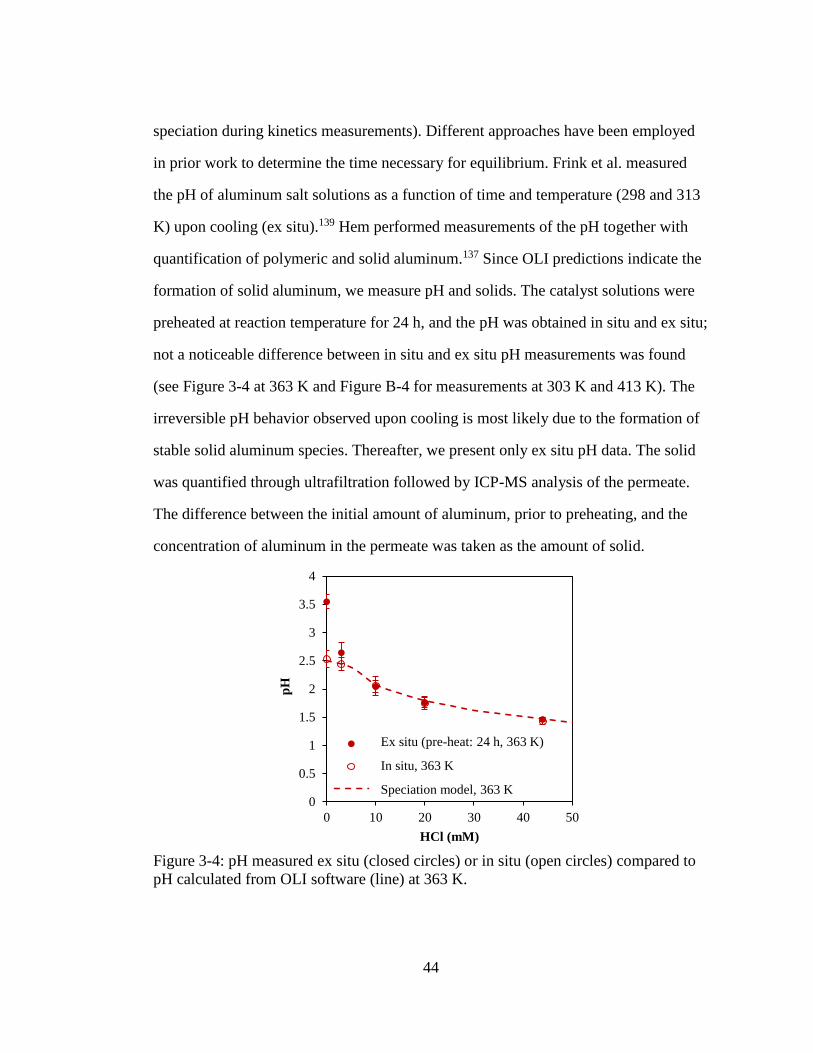
44
speciation during kinetics measurements). Different approaches have been employed
in prior work to determine the time necessary for equilibrium. Frink et al. measured
the pH of aluminum salt solutions as a function of time and temperature (298 and 313
K) upon cooling (ex situ).139 Hem performed measurements of the pH together with
quantification of polymeric and solid aluminum.137 Since OLI predictions indicate the
formation of solid aluminum, we measure pH and solids. The catalyst solutions were
preheated at reaction temperature for 24 h, and the pH was obtained in situ and ex situ;
not a noticeable difference between in situ and ex situ pH measurements was found
(see Figure 3-4 at 363 K and Figure B-4 for measurements at 303 K and 413 K). The
irreversible pH behavior observed upon cooling is most likely due to the formation of
stable solid aluminum species. Thereafter, we present only ex situ pH data. The solid
was quantified through ultrafiltration followed by ICP-MS analysis of the permeate.
The difference between the initial amount of aluminum, prior to preheating, and the
concentration of aluminum in the permeate was taken as the amount of solid.
0
0.5
1
1.5
2
2.5
3
3.5
4
0 10 20 30 40 50
pH
HCl (mM)
24 hr
Series3
Series1
Ex situ (pre-heat: 24 h, 363 K)
In situ, 363 K
Speciation model, 363 K
Figure 3-4: pH measured ex situ (closed circles) or in situ (open circles) compared to
pH calculated from OLI software (line) at 363 K.
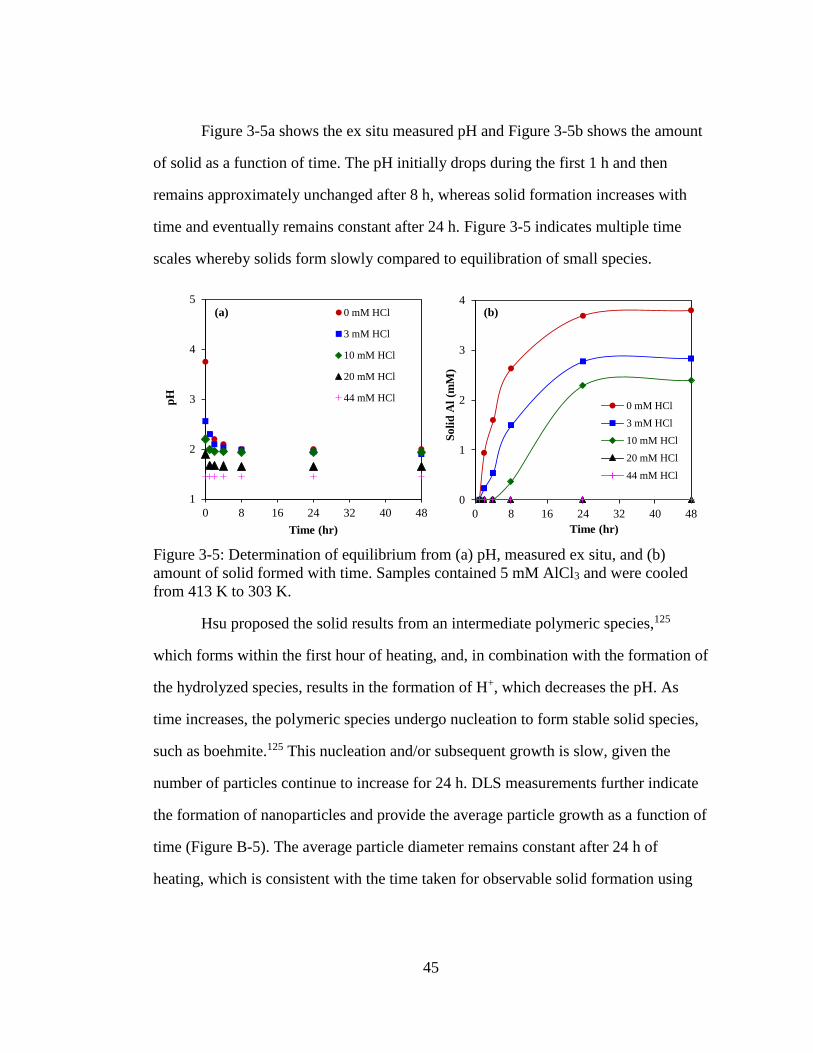
45
Figure 3-5a shows the ex situ measured pH and Figure 3-5b shows the amount
of solid as a function of time. The pH initially drops during the first 1 h and then
remains approximately unchanged after 8 h, whereas solid formation increases with
time and eventually remains constant after 24 h. Figure 3-5 indicates multiple time
scales whereby solids form slowly compared to equilibration of small species.
Hsu proposed the solid results from an intermediate polymeric species,125
which forms within the first hour of heating, and, in combination with the formation of
the hydrolyzed species, results in the formation of H+, which decreases the pH. As
time increases, the polymeric species undergo nucleation to form stable solid species,
such as boehmite.125 This nucleation and/or subsequent growth is slow, given the
number of particles continue to increase for 24 h. DLS measurements further indicate
the formation of nanoparticles and provide the average particle growth as a function of
time (Figure B-5). The average particle diameter remains constant after 24 h of
heating, which is consistent with the time taken for observable solid formation using
Figure 3-5: Determination of equilibrium from (a) pH, measured ex situ, and (b)
amount of solid formed with time. Samples contained 5 mM AlCl3 and were cooled
from 413 K to 303 K.
1
2
3
4
5
0 8 16 24 32 40 48
pH
Time (hr)
0 mM HCl
3 mM HCl
10 mM HCl
20 mM HCl
44 mM HCl
0
1
2
3
4
0 8 16 24 32 40 48
So
lid
Al
(mM
)
Time (hr)
0 mM HCl
3 mM HCl
10 mM HCl
20 mM HCl
44 mM HCl
(a) (b)
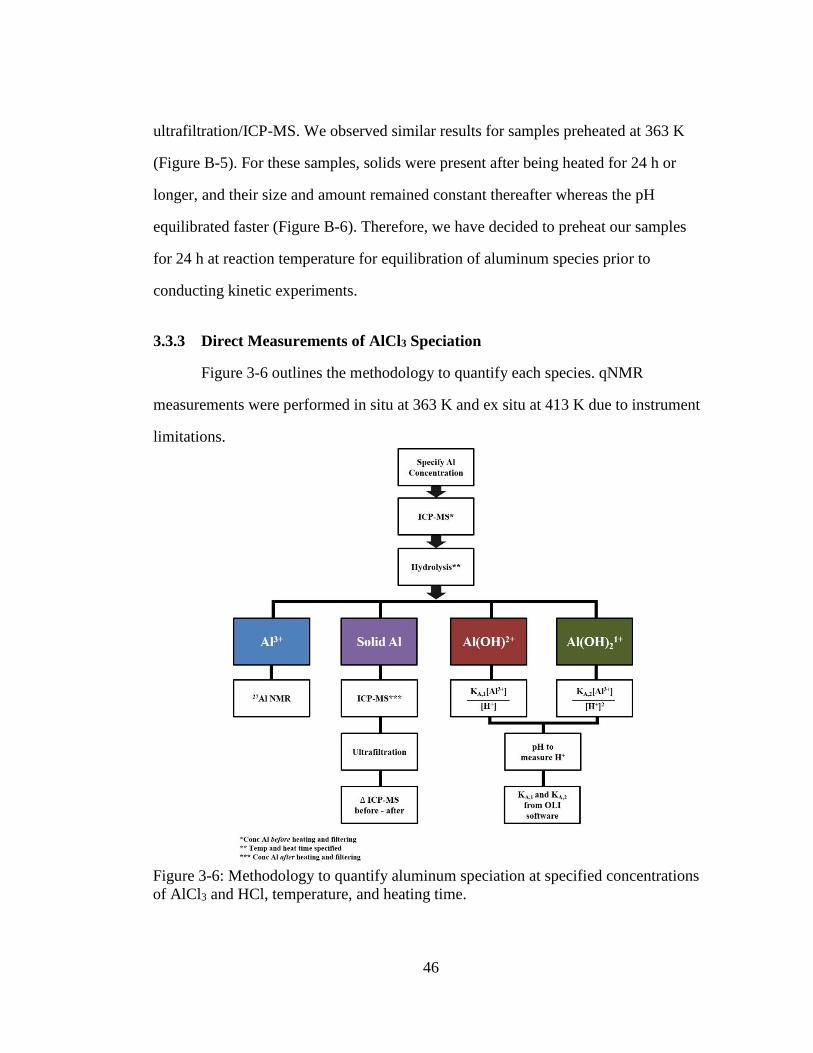
46
ultrafiltration/ICP-MS. We observed similar results for samples preheated at 363 K
(Figure B-5). For these samples, solids were present after being heated for 24 h or
longer, and their size and amount remained constant thereafter whereas the pH
equilibrated faster (Figure B-6). Therefore, we have decided to preheat our samples
for 24 h at reaction temperature for equilibration of aluminum species prior to
conducting kinetic experiments.
3.3.3 Direct Measurements of AlCl3 Speciation
Figure 3-6 outlines the methodology to quantify each species. qNMR
measurements were performed in situ at 363 K and ex situ at 413 K due to instrument
limitations.
Figure 3-6: Methodology to quantify aluminum speciation at specified concentrations
of AlCl3 and HCl, temperature, and heating time.
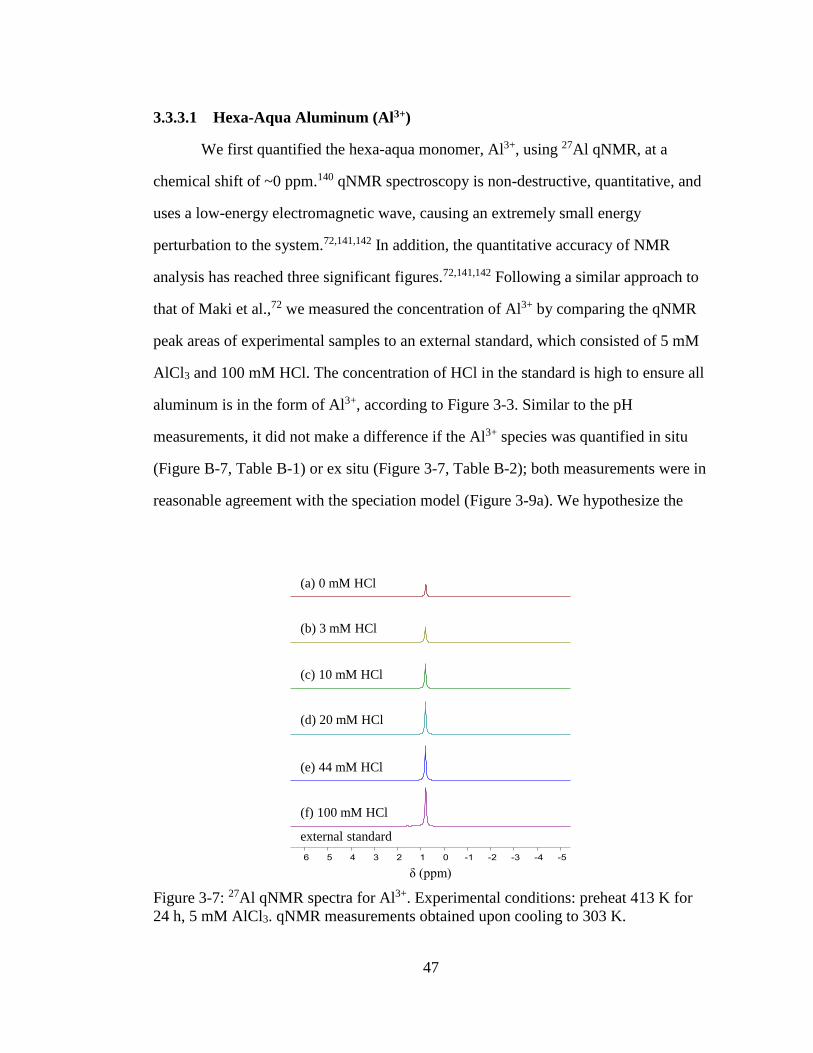
47
3.3.3.1 Hexa-Aqua Aluminum (Al3+)
We first quantified the hexa-aqua monomer, Al3+, using 27Al qNMR, at a
chemical shift of ~0 ppm.140 qNMR spectroscopy is non-destructive, quantitative, and
uses a low-energy electromagnetic wave, causing an extremely small energy
perturbation to the system.72,141,142 In addition, the quantitative accuracy of NMR
analysis has reached three significant figures.72,141,142 Following a similar approach to
that of Maki et al.,72 we measured the concentration of Al3+ by comparing the qNMR
peak areas of experimental samples to an external standard, which consisted of 5 mM
AlCl3 and 100 mM HCl. The concentration of HCl in the standard is high to ensure all
aluminum is in the form of Al3+, according to Figure 3-3. Similar to the pH
measurements, it did not make a difference if the Al3+ species was quantified in situ
(Figure B-7, Table B-1) or ex situ (Figure 3-7, Table B-2); both measurements were in
reasonable agreement with the speciation model (Figure 3-9a). We hypothesize the
Figure 3-7: 27Al qNMR spectra for Al3+. Experimental conditions: preheat 413 K for
24 h, 5 mM AlCl3. qNMR measurements obtained upon cooling to 303 K.
δ (ppm)
(f) 100 mM HCl
external standard
(e) 44 mM HCl
(d) 20 mM HCl
(c) 10 mM HCl
(b) 3 mM HCl
(a) 0 mM HCl
48
unaccounted aluminum exists primarily as suspended solids, which are not detect by
liquid-phase qNMR.126
3.3.3.2 Solid Aluminum
We next quantified the solid aluminum species. Techniques such as dialysis
and ultrafiltration are commonly used to separate fine colloidal mineral aluminum and
polymeric aluminum species from soluble aluminum.126 Therefore, we combined
ultrafiltration with DLS and ICP-MS measurements to quantify solid aluminum
species in our catalyst solutions. DLS measurements detected the presence of
aluminum particles and provided the average particle diameter. This allowed for
selection of an ultrafiltration membrane with a pore diameter of 5 nm, significantly
less than that detected by DLS (Figure B-8). The samples then underwent heating and
ultrafiltration. ICP-MS determined the concentration of aluminum in the permeate.
Our experimentally inferred data are consistent with the calculated amount of solid
aluminum (Figure 3-9b).
3.3.3.3 Hydrolyzed Aluminum Monomers (AlOH2+ and Al(OH)21+)
The low concentration and rapid proton exchange associated with the
hydrolyzed species make them difficult to observe experimentally.136 Therefore, we
deduced their concentration through the fundamental equilibrium relation (Table B-3
and ). This required the Al3+ and H+ concentrations and the acid dissociation constants
(KA,1 and KA,2). The Al3+ and H+ concentrations were obtained by qNMR and pH
measurements, respectively. The acid dissociation constants were obtained from the
OLI software (Table B-3 and Table B-4). The experimentally estimated mono- and di-
hydrolyzed concentrations exhibit the same volcano-like behavior predicted by the
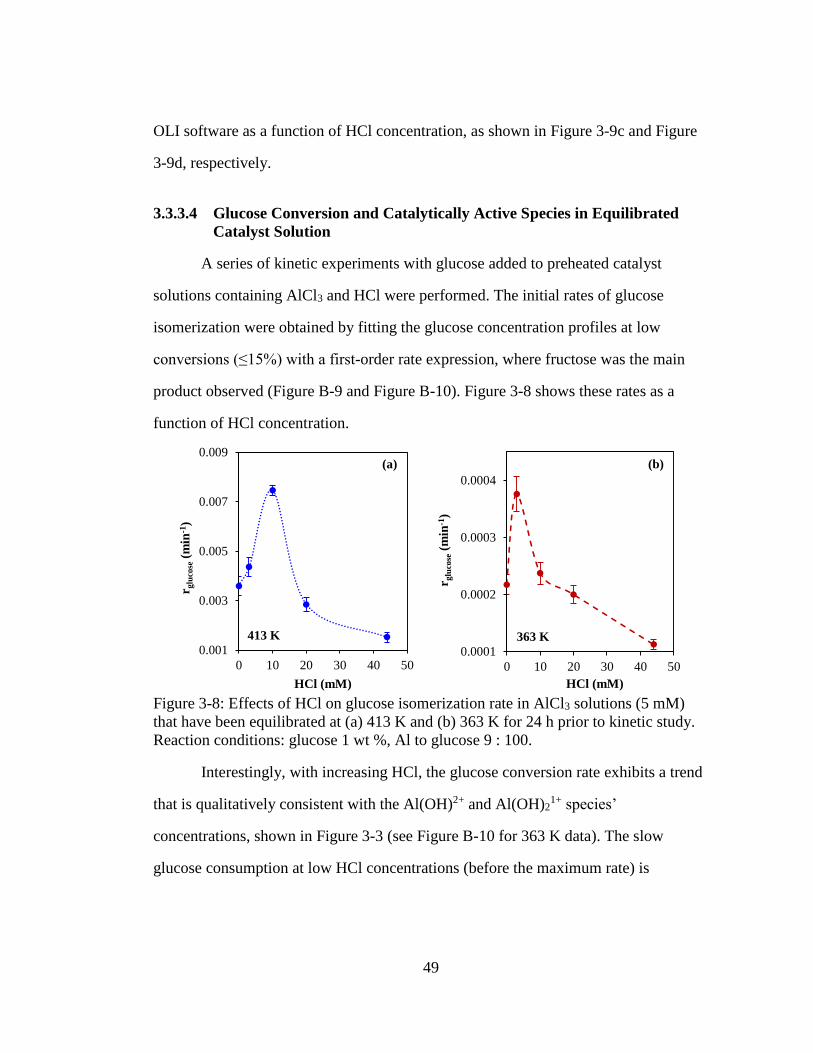
49
OLI software as a function of HCl concentration, as shown in Figure 3-9c and Figure
3-9d, respectively.
3.3.3.4 Glucose Conversion and Catalytically Active Species in Equilibrated
Catalyst Solution
A series of kinetic experiments with glucose added to preheated catalyst
solutions containing AlCl3 and HCl were performed. The initial rates of glucose
isomerization were obtained by fitting the glucose concentration profiles at low
conversions (≤15%) with a first-order rate expression, where fructose was the main
product observed (Figure B-9 and Figure B-10). Figure 3-8 shows these rates as a
function of HCl concentration.
Interestingly, with increasing HCl, the glucose conversion rate exhibits a trend
that is qualitatively consistent with the Al(OH)2+ and Al(OH)21+ species’
concentrations, shown in Figure 3-3 (see Figure B-10 for 363 K data). The slow
glucose consumption at low HCl concentrations (before the maximum rate) is
Figure 3-8: Effects of HCl on glucose isomerization rate in AlCl3 solutions (5 mM)
that have been equilibrated at (a) 413 K and (b) 363 K for 24 h prior to kinetic study.
Reaction conditions: glucose 1 wt %, Al to glucose 9 : 100.
0.001
0.003
0.005
0.007
0.009
0 10 20 30 40 50
r glu
cose
(min
-1)
HCl (mM)
413 K
0.0001
0.0002
0.0003
0.0004
0 10 20 30 40 50
r glu
cose
(min
-1)
HCl (mM)
363 K
(a) (b)
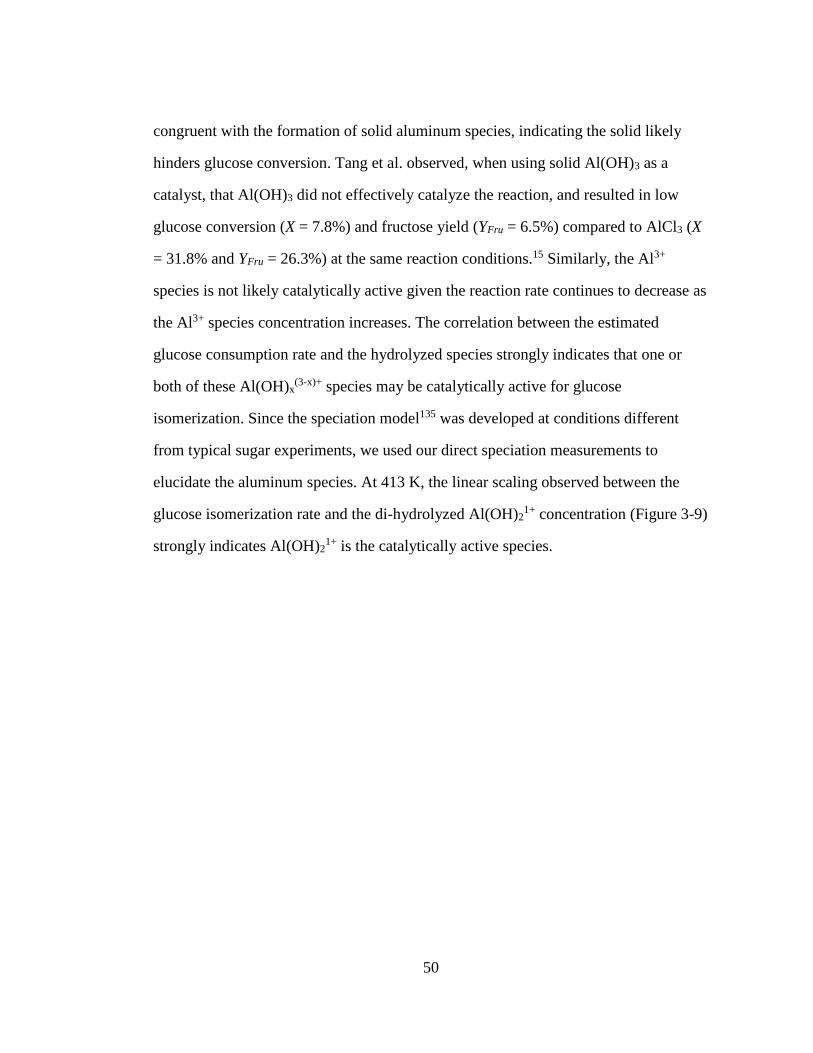
50
congruent with the formation of solid aluminum species, indicating the solid likely
hinders glucose conversion. Tang et al. observed, when using solid Al(OH)3 as a
catalyst, that Al(OH)3 did not effectively catalyze the reaction, and resulted in low
glucose conversion (X = 7.8%) and fructose yield (YFru = 6.5%) compared to AlCl3 (X
= 31.8% and YFru = 26.3%) at the same reaction conditions.15 Similarly, the Al3+
species is not likely catalytically active given the reaction rate continues to decrease as
the Al3+ species concentration increases. The correlation between the estimated
glucose consumption rate and the hydrolyzed species strongly indicates that one or
both of these Al(OH)x(3-x)+ species may be catalytically active for glucose
isomerization. Since the speciation model135 was developed at conditions different
from typical sugar experiments, we used our direct speciation measurements to
elucidate the aluminum species. At 413 K, the linear scaling observed between the
glucose isomerization rate and the di-hydrolyzed Al(OH)21+ concentration (Figure 3-9)
strongly indicates Al(OH)21+ is the catalytically active species.
51
At 363 K, the low reaction rate, extremely small values of the rate constants
and low concentrations of the aluminum species (see Table B-4 and Figure B-11)
render our data inconclusive regarding the active species.
0
0.002
0.004
0.006
0.008
0 0.25 0.5 0.75 1
r glu
cose
(min
-1)
Al3+ / Al3+(max)
0
0.002
0.004
0.006
0.008
0 0.25 0.5 0.75 1r g
luco
se(m
in-1
)Solid Al / Solid Al (max)
0
0.002
0.004
0.006
0.008
0 0.25 0.5 0.75 1
r glu
cose
(min
-1)
Al(OH)2+ / Al(OH)2+(max)
0
0.002
0.004
0.006
0.008
0 0.25 0.5 0.75 1
r glu
cose
(min
-1)
Al(OH)21+ / Al(OH)2
1+(max)
(a) (b)
(c) (d)
Figure 3-9: Glucose conversion as a function of measured Al species’ concentrations,
normalized to the maximum observed species’ concentration (see Table B-3 for
observed species’ concentrations). Catalyst solutions were preheated at 413 K for 24 h
prior to kinetic study. Reaction conditions: glucose 1 wt %, Al to glucose molar ratio
of 9 : 100, 413 K.
52
3.4 Conclusions
We have coupled kinetic studies with direct speciation measurements to
elucidate the active species of AlCl3 in glucose to fructose isomerization. Experiments
were designed based on insights obtained from modeling the aluminum hydrolysis
using the OLI software. We established an experimental protocol to quantify the
various aluminum species that employs 27Al qNMR for the hexa-aqua aluminum
monomer, ultrafiltration and ICP-MS for the solid, and pH measurements combined
with equilibrium relations for the mono- and di-hydroxy aluminum species. We found
that speciation reaches equilibrium after heating the catalyst solutions for long times.
Linear scaling between the glucose isomerization rate and the speciation
measurements at sufficiently high temperatures indicates that the hydrolyzed Al(III)
complex [Al(H2O)4(OH)2]1+ is the active species in glucose isomerization. This
finding supports the hypothesis of Hu and co-workers, who observed
[Al(H2O)4(OH)2]1+ using ESI-MS/MS.15 Furthermore, our findings support the idea
that the catalytic species responsible for the isomerization exists as a bifunctional
Lewis acidic/Brønsted base site.14 The approach developed here can be applied to
study the speciation of other metal halides. For metals not observed by qNMR, such as
CrCl3, other spectroscopic techniques, such as ultraviolet visible light spectrometry
(UV-Vis), could possibly be employed to study the dominant hexa-aqua species.
53
BRANCHED BIOLUBRICANT PRODUCTION THROUGH ALDOL
CONDENSATION
4.1 Introduction
Innovations in transportation, industrial production, and alternative energies
have led to an increased demand for lubricants. By 2025, the lubricants’ market is
projected to be worth $166.25 billion USD, up by about $47 billion USD compared to
2016.143 Increased global demand, combined with higher consumption index and
economic growth, warrant continued development of lubricants that are high-
performing and result in minimal harmful impacts on the environment.
Base oils play a major role in determining a lubricant’s performance. They
account for the majority of a lubricant’s cost and comprise anywhere between 75 and
99% of a lubricant’s formulation.19 According to the American Petroleum Institute
(API), there are five categories of mineral base oils (Groups I – V).17 Base oils from
Groups I through III are obtained by solvent-refining, distillation, or hydro-processing
of petroleum.18 Base oils from Group IV have undergone chemical upgrading; for
example, 1-decene from petroleum undergoes oligomerization to form poly-α-olefins
(PAOs).19 Finally, Group V includes all other oils.17 ExxonMobil Basestocks 2018
Pulse Report suggests Group III+ oils will experience the greatest increase in demand
over the next 10 years (+4% increase) owing to their high fuel efficiency and quality.20
Nevertheless, their production is expensive and energy intensive, requiring petroleum
feedstocks, which contribute to greenhouse gas emissions, and harsh reaction
Chapter 4
54
conditions, especially when making Group IV PAOs, the synthesis of which requires
corrosive catalysts (AlCl3, BF3, and HF).18,21 To mitigate these challenges, promising
renewable alternatives from bioderived feedstocks have gained momentum.22–29
Biobased feedstocks can result in a nearly “closed carbon balance” through CO2
capture during photosynthesis and have unique functional groups that enable site-
specific chemistries during processing.
In one of the early attempts to make biobased products, Corma et al. produced
n-tricosane, a linear alkane product with 23 carbons, from lauric acid, a fatty acid
found in coconut and palm kernel oils.26 This process involved ketonization of lauric
acid to form 12-tricosanone, containing 23 carbons, followed by its
hydrodeoxygenation (HDO) to produce n-tricosane (58.2% selectivity) and C10
through C22 alkanes (13.9% selectivity total). Although the final product would not be
suitable as a Group III base oil (18 to 40 carbons) owing to its poor viscosity and high
melting point, the short-chain alkanes may be a suitable for ultra-low sulfur diesel
(ULSD) fuel. Even so, USLD blends ($3.15 per gallon)30 are not as price competitive
as Group III base oils ($5.01 per gallon).31 Despite these obstacles, the strategy
proposed by Corma et al. is appealing. The intermediate ketone, 12-tricosanone, can
be obtained in 89% yield by ketonization of lauric acid and is an ideal starting material
for lubricant synthesis because it contains a high number of carbon atoms and can
partake in carbon-carbon coupling reactions due to the presence of a ketonic group.
Ketones are excellent platforms to incorporate branching because of their
acidic -CH group at the α carbon position.28,29,32–35 Previously, Bell and co-workers
performed multiple cross-ketonization reactions, starting from short-chain length C3 –
C5 carboxylic acids, followed by HDO, to produce C12 – C33 branched and cyclic
55
alkane diesel fuels and lubricant base oils.27 Wang and co-workers produced C23
biolubricant base oil with ~50% yield from acetone and furfural via successive aldol
condensation and HDO steps.25 Although these routes use renewable feedstocks, for
example, carboxylic acid and acetone, which can be produced from sugar
fermentation, or lignocellulosic biomass-derived furfural, they require multiple
reaction steps and extractions. This results in carbon loss, the need for excessive
amounts of solvent, and high production costs.
In the present work, we combine strategies to synthesize a highly branched
biolubricant base oil in fewer steps using 12-tricosanone and furfural as the starting
feedstock. The synthesis of 12-tricosanone in high yield from lauric acid is discussed
above.26 We perform selective aldol condensation followed by HDO to afford the final
products, C28 and C33 branched alkanes (Figure 4-1), having comparable viscosity to
petroleum-derived Group III and Group IV base oils.
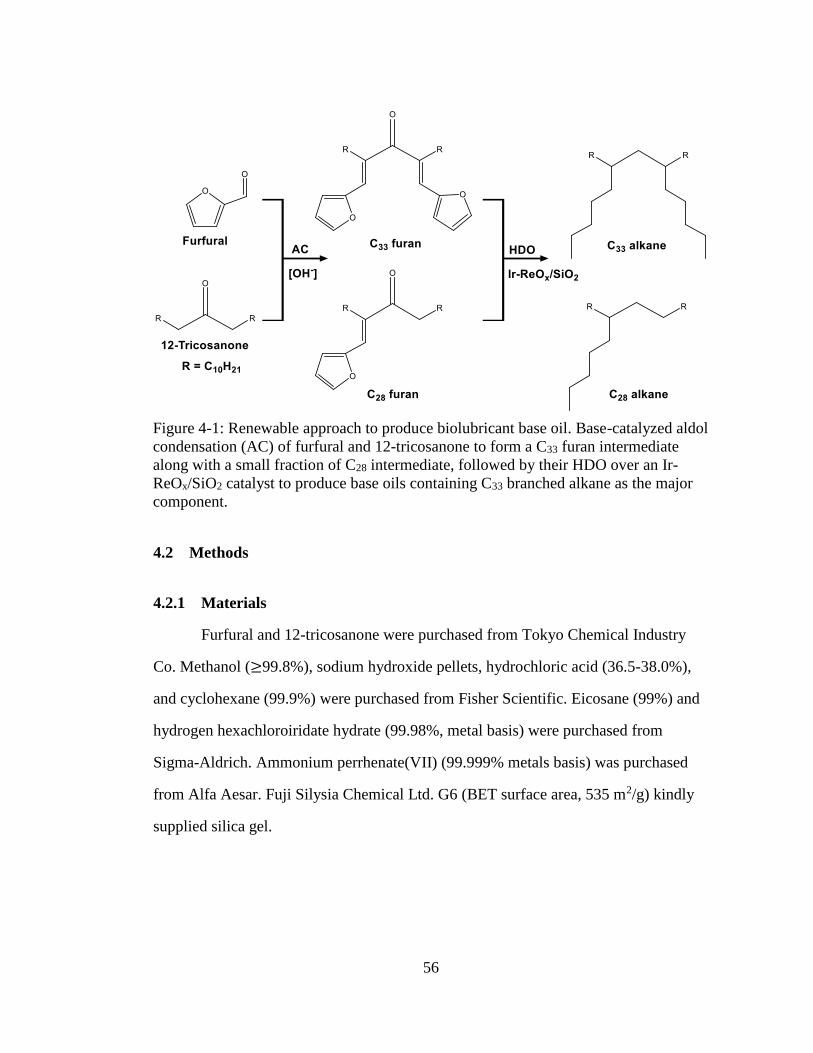
56
4.2 Methods
4.2.1 Materials
Furfural and 12-tricosanone were purchased from Tokyo Chemical Industry
Co. Methanol (≥99.8%), sodium hydroxide pellets, hydrochloric acid (36.5-38.0%),
and cyclohexane (99.9%) were purchased from Fisher Scientific. Eicosane (99%) and
hydrogen hexachloroiridate hydrate (99.98%, metal basis) were purchased from
Sigma-Aldrich. Ammonium perrhenate(VII) (99.999% metals basis) was purchased
from Alfa Aesar. Fuji Silysia Chemical Ltd. G6 (BET surface area, 535 m2/g) kindly
supplied silica gel.
Figure 4-1: Renewable approach to produce biolubricant base oil. Base-catalyzed aldol
condensation (AC) of furfural and 12-tricosanone to form a C33 furan intermediate
along with a small fraction of C28 intermediate, followed by their HDO over an Ir-
ReOx/SiO2 catalyst to produce base oils containing C33 branched alkane as the major
component.
57
4.2.2 Catalyst Preparation
The Ir-ReOx/SiO2 (Ir 4 wt% loading, Re/Ir =2, molar) catalyst was prepared by
a sequential impregnation method.144 First, Ir/SiO2 was prepared by impregnating Ir on
SiO2 (Fuji Silysia G-6) with an aqueous solution of hydrogen hexachloroiridate
hydrate. Next, the solvent was evaporated at 75 °C on a hotplate (IKA) and dried at
110 °C for 12 h in an oven (Fisher Scientific). The resulting Ir/SiO2 was impregnated
with ReOx by using an aqueous solution of ammonium perrhenate(VII). The catalyst
was calcined in a crucible in air at 500 °C for 3 h at a 10 °C/min temperature ramp.
The reported metal loadings in the catalyst are based on the theoretical amount of
metals used for impregnation. The catalyst was used in powder form with a granule
size of <400 mesh. BET surface area measurements were performed on a
Micromeritics ASAP 2020 Accelerated Surface Area and Porosimetry instrument at
the Advanced Materials Characterization Laboratory at the University of Delaware.
The measured BET surface area of Ir-ReOx/SiO2 was 368.6 m2/g.
4.2.3 Reaction Procedures
4.2.3.1 Aldol Condensation
All reactions were conducted in 10 mL glass vials (Sigma-Aldrich) heated in
an aluminum heating block with controlled stirring (Fisher Scientific). In a standard
reaction, the reactants, furfural (4.68 mmol, 0.45 g) and 12-tricosanone (0.295 mmol,
0.10 g), were combined with the solvent, methanol (5 mL), and catalyst, sodium
hydroxide (1 M, 0.20 g). The catalyst concentration was selected from a prior report.25
Temperature and stirring rate were maintained at 80 °C and 400 rpm, respectively.
After reaction for the set time, the reaction vials were removed from the heating block
and cooled to room temperature. Methanol and unconverted furfural were removed by
58
rotatory evaporation (Buchi). The products were washed and neutralized with a dilute
solution of hydrochloric acid (1 M) and extracted with dichloromethane (20 mL).
Dichloromethane was removed by rotary evaporation prior to HDO. The products
formed by aldol condensation were solids at room temperature.
4.2.3.2 Hydrodeoxygenation (HDO)
HDO reactions of aldol condensation products were conducted in a 50 mL Parr
reactor with an inserted Teflon liner and a magnetic bar. The catalyst, Ir-ReOx/SiO2
(0.15 g), and solvent, cyclohexane (5 mL), were added to the reactor for catalyst pre-
reduction. The reactor was sealed with a fitted reactor head that contained a
thermocouple, a rupture disk, a pressure gauge, and a gas release valve. The mixture
was heated at 200 °C and 5 MPa H2 for 1 h at 240 rpm. Upon pre-reduction, the
reactor was cooled to room temperature, and H2 was released. Next, the aldol
condensation products (0.40 g) were mixed with cyclohexane (15 mL) and added to
the reactor. The reactor head was immediately closed, purged with 1 MPa H2 three
times, and pressurized to 5 MPa H2. The reaction occurred over 18 h at 180 °C and
with continuous stirring at 500 rpm. The heating time to reach the set temperature was
approximately 25 min and was not included in the total reaction time. Upon
completion, the reactor was immediately transferred to a water bath. The catalyst was
separated from the solution by centrifugation.
4.2.3.3 Analysis of Products
The products were analyzed by GC (Agilent 7890A), equipped with an HP-1
column and a flame ionization detector. Products were quantified using eicosane (C20)
as the internal standard (0.10 g). The products were identified by GC-MS (Agilent
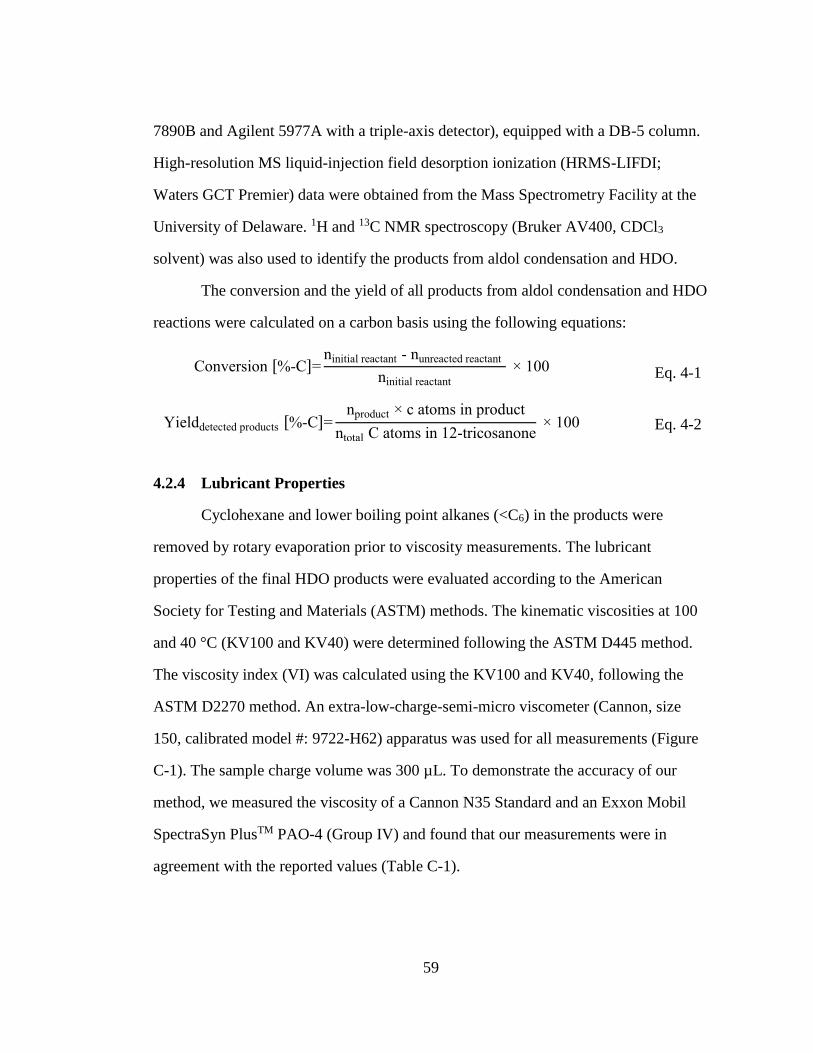
59
7890B and Agilent 5977A with a triple-axis detector), equipped with a DB-5 column.
High-resolution MS liquid-injection field desorption ionization (HRMS-LIFDI;
Waters GCT Premier) data were obtained from the Mass Spectrometry Facility at the
University of Delaware. 1H and 13C NMR spectroscopy (Bruker AV400, CDCl3
solvent) was also used to identify the products from aldol condensation and HDO.
The conversion and the yield of all products from aldol condensation and HDO
reactions were calculated on a carbon basis using the following equations:
Conversion [%-C]=ninitial reactant - nunreacted reactant
ninitial reactant
× 100 Eq. 4-1
Yielddetected products [%-C]=nproduct × c atoms in product
ntotal C atoms in 12-tricosanone × 100 Eq. 4-2
4.2.4 Lubricant Properties
Cyclohexane and lower boiling point alkanes (<C6) in the products were
removed by rotary evaporation prior to viscosity measurements. The lubricant
properties of the final HDO products were evaluated according to the American
Society for Testing and Materials (ASTM) methods. The kinematic viscosities at 100
and 40 °C (KV100 and KV40) were determined following the ASTM D445 method.
The viscosity index (VI) was calculated using the KV100 and KV40, following the
ASTM D2270 method. An extra-low-charge-semi-micro viscometer (Cannon, size
150, calibrated model #: 9722-H62) apparatus was used for all measurements (Figure
C-1). The sample charge volume was 300 µL. To demonstrate the accuracy of our
method, we measured the viscosity of a Cannon N35 Standard and an Exxon Mobil
SpectraSyn PlusTM PAO-4 (Group IV) and found that our measurements were in
agreement with the reported values (Table C-1).
60
4.3 Results and Discussion
4.3.1 Reaction Conditions for Aldol Condensation
We began with the aldol condensation reaction between furfural and 12-
tricosanone. All reactions were catalyzed by 1 M NaOH (unless otherwise specified),
and the reaction temperature was 80 °C for all experiments to ensure 12-tricosanone
(melting point = 68 °C) was a liquid at reaction temperature. Our goal was to identify
a suitable solvent and the best reaction conditions (reaction time, feed ratio) to obtain
high yields of the desired C28 and C33 furan intermediates, especially the C33
intermediate, which has two branches.
Figure 4-2 shows the yield of products and conversion of 12-tricosanone in
different solvents. Previous works have shown that aldol condensation may occur
with25 or without a solvent.145 We found low conversion of 12-tricosanone (<25%)
and no detected C28 or C33 furan intermediates without a solvent, indicating the
observed conversion of 12-tricosanone was likely due to its oligomerization with itself
and/or furfural. Del Rio and Philip suggested that carboxyl and hydroxyl groups may
promote oligomerization to form high-molecular-weight-organic compounds found in
oils and source rocks.146 These oligomers, however, are difficult to detect by
conventional GC columns owing to their high molecular weights (>C40).144,147
Similarly, we believe the carboxyl and hydroxyl groups in 12-tricosanone and furfural
promote the formation of high molecular weight, solid oligomeric species, called
humins, whose characterization is reported in our prior work.8
Because the absence of solvent led to low conversion of 12-tricosanone, we
next screened different solvents as a function of their polarity. Non-polar, aprotic
solvents, cyclohexane and dioxane, resulted in very low yield of condensation product,
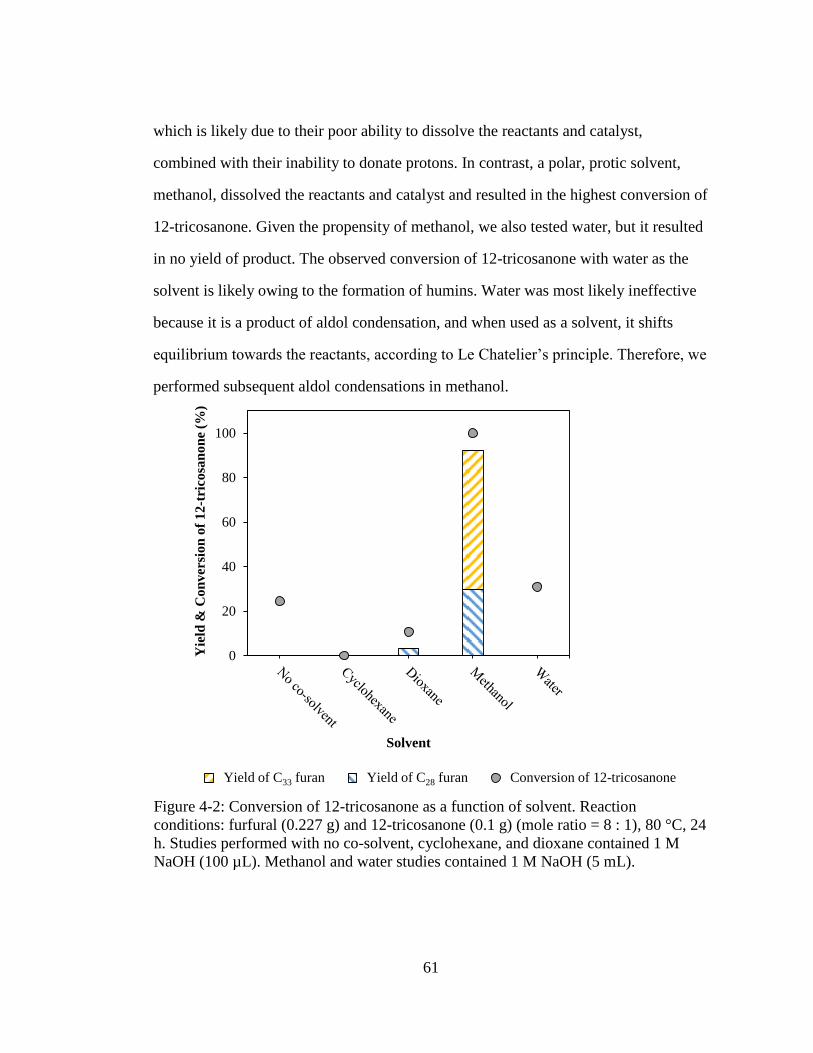
61
which is likely due to their poor ability to dissolve the reactants and catalyst,
combined with their inability to donate protons. In contrast, a polar, protic solvent,
methanol, dissolved the reactants and catalyst and resulted in the highest conversion of
12-tricosanone. Given the propensity of methanol, we also tested water, but it resulted
in no yield of product. The observed conversion of 12-tricosanone with water as the
solvent is likely owing to the formation of humins. Water was most likely ineffective
because it is a product of aldol condensation, and when used as a solvent, it shifts
equilibrium towards the reactants, according to Le Chatelier’s principle. Therefore, we
performed subsequent aldol condensations in methanol.
0
20
40
60
80
100
Yie
ld &
Con
ver
sion
of
12-t
rico
san
on
e (%
)
Solvent
C-33 Furan C-28 Furan ConversionYield of C33 furan Yield of C28 furan Conversion of 12-tricosanone
Figure 4-2: Conversion of 12-tricosanone as a function of solvent. Reaction
conditions: furfural (0.227 g) and 12-tricosanone (0.1 g) (mole ratio = 8 : 1), 80 °C, 24
h. Studies performed with no co-solvent, cyclohexane, and dioxane contained 1 M
NaOH (100 µL). Methanol and water studies contained 1 M NaOH (5 mL).
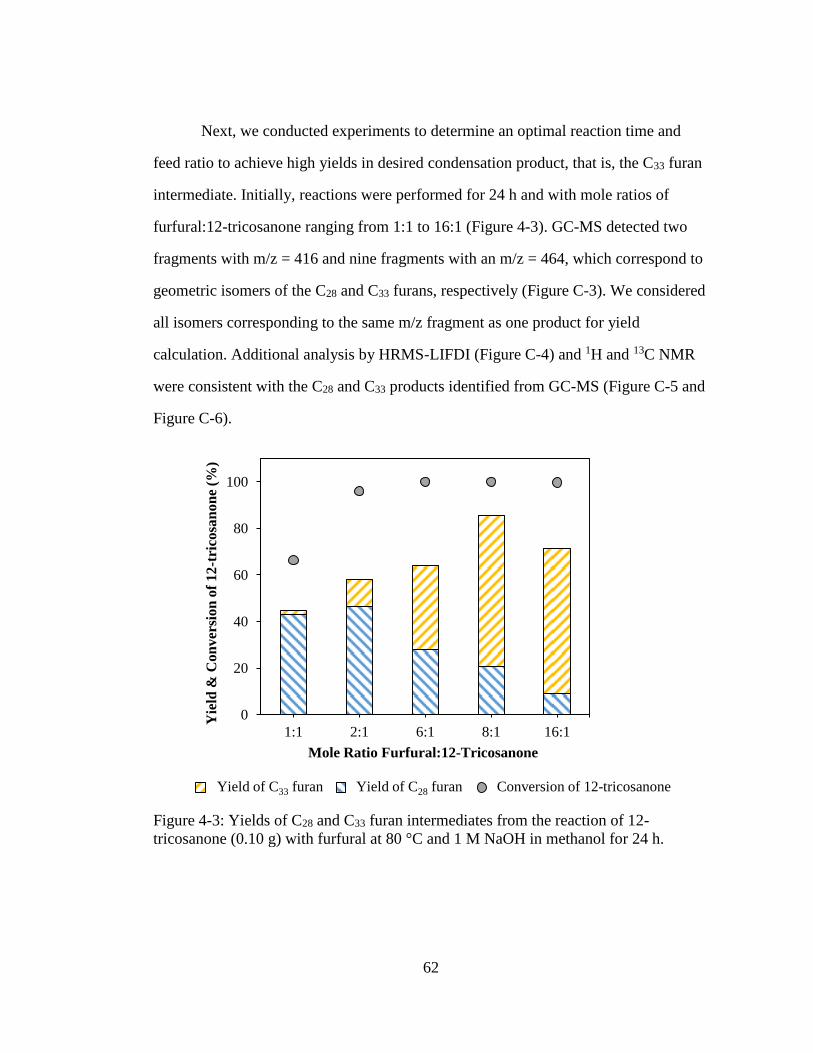
62
Next, we conducted experiments to determine an optimal reaction time and
feed ratio to achieve high yields in desired condensation product, that is, the C33 furan
intermediate. Initially, reactions were performed for 24 h and with mole ratios of
furfural:12-tricosanone ranging from 1:1 to 16:1 (Figure 4-3). GC-MS detected two
fragments with m/z = 416 and nine fragments with an m/z = 464, which correspond to
geometric isomers of the C28 and C33 furans, respectively (Figure C-3). We considered
all isomers corresponding to the same m/z fragment as one product for yield
calculation. Additional analysis by HRMS-LIFDI (Figure C-4) and 1H and 13C NMR
were consistent with the C28 and C33 products identified from GC-MS (Figure C-5 and
Figure C-6).
0
20
40
60
80
100
1:1 2:1 6:1 8:1 16:1
Yie
ld &
Co
nv
ersi
on
of
12
-tri
cosa
no
ne
(%)
Mole Ratio Furfural:12-Tricosanone
C-33 Furan C-28 Furan Total ConversionYield of C33 furan Yield of C28 furan Conversion of 12-tricosanone
Figure 4-3: Yields of C28 and C33 furan intermediates from the reaction of 12-
tricosanone (0.10 g) with furfural at 80 °C and 1 M NaOH in methanol for 24 h.
63
Importantly, the product distribution could be tuned depending upon the feed
ratio, for which high amounts of furfural favored the C33 furan (YC33furan = 64.8% for
furfural/12-tricosanone=8:1, Figure 4-3). The yields of total detected C28 and C33
furans are lower than the 12-tricosanone conversion, which could be due to the
formation of humins. Higher selectivity to desired condensation products was
achieved by decreasing the reaction time from 24 h (Figure 4-3) to 8 h (Figure 4-4). A
maximum 94.3% yield of branched furan intermediates containing C33 as the major
product (YC28furan = 14.8% and YC33furan = 79.5%, Figure 4-4) was obtained for 8 h and
at furfural/12-tricosanone molar ratio of 16:1. Excess furfural can be recycled upon
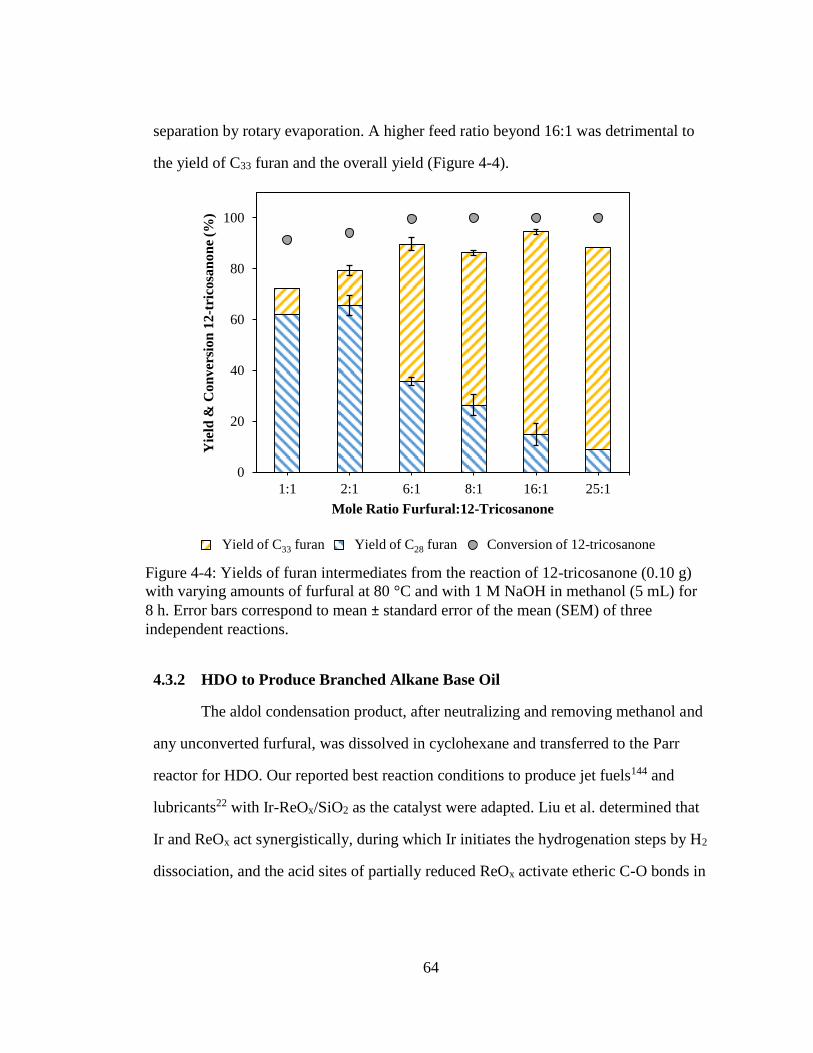
64
separation by rotary evaporation. A higher feed ratio beyond 16:1 was detrimental to
the yield of C33 furan and the overall yield (Figure 4-4).
4.3.2 HDO to Produce Branched Alkane Base Oil
The aldol condensation product, after neutralizing and removing methanol and
any unconverted furfural, was dissolved in cyclohexane and transferred to the Parr
reactor for HDO. Our reported best reaction conditions to produce jet fuels144 and
lubricants22 with Ir-ReOx/SiO2 as the catalyst were adapted. Liu et al. determined that
Ir and ReOx act synergistically, during which Ir initiates the hydrogenation steps by H2
dissociation, and the acid sites of partially reduced ReOx activate etheric C-O bonds in
0
20
40
60
80
100
1:1 2:1 6:1 8:1 16:1 25:1
Yie
ld &
Co
nv
ersi
on
12
-tri
cosa
no
ne
(%)
Mole Ratio Furfural:12-Tricosanone
C33 furan C28 furan Total ConversionYield of C33 furan Yield of C28 furan Conversion of 12-tricosanone
Figure 4-4: Yields of furan intermediates from the reaction of 12-tricosanone (0.10 g)
with varying amounts of furfural at 80 °C and with 1 M NaOH in methanol (5 mL) for
8 h. Error bars correspond to mean ± standard error of the mean (SEM) of three
independent reactions.
65
the furan ring.144 Our prior X-ray photoelectron spectroscopy (XPS) characterization
of Ir-ReOx/SiO2 showed that Re undergoes reduction to form Re2+ and Re4+ (41% and
11%, respectively) and Re0.144 In addition, pyridine adsorption studies, monitored by
Fourier-transform infrared spectroscopy (FTIR), were performed in our prior work to
distinguish acid sites on the in situ-reduced catalyst.144 The FTIR data showed that the
catalyst contains mainly Lewis acid sites (1490 cm-1), which are likely the partially
reduced ReOx species, and a weak but distinctive band at 1540 cm-1 for the Brønsted
acid sites.144
HDO of C28 and C33 furans mixture (YC28furan = 14.8% and YC33furan = 79.5%)
over Ir-ReOx/SiO2 yielded 61.4% of total lubricant-ranged branched alkanes (C28 and
C33) at 180 °C and 5 MPa H2 in cyclohexane for 18 h. The major products are C33
(YC33 = 50.5%) and C28 (YC28
= 10.9%) alkanes, followed by C15, C14, C13 and C10
alkanes (𝑌combine < 11%), which likely result from carbon-carbon (C-C) cracking in the
tertiary and secondary carbon atoms of the C33 and C28 alkanes (Figure C-2, Figure C-
3). Similar C-C bond breaking was observed in prior work for HDO of a trifuran.144 In
this work, C5 alkane is also likely to form through C-C cracking (Figure C-2), but it
was not quantified because of difficulty arising from the solvent, cyclohexane,
forming C1 – C6 alkanes during pre-reduction of the catalyst and during the HDO
reaction, as demonstrated in our prior work.144 Thus, alkanes with less than six carbon
atoms were not quantified. In addition to C5 alkane, gaseous C1 – C4 alkanes could
also form from the substrates in the HDO step to account for some of the carbon loss,
but gas-phase products were not quantified in this work. Furthermore, coke formation
on the catalyst and unidentified oxygenated intermediates may contribute to the
remaining carbon loss. Coke formation is not expected to hinder recycling the catalyst
66
because Liu et al. have demonstrated that upon recalcination the catalyst can be
regenerated with similar activity to that of the fresh catalyst.144 GC-MS and HRMS-
LIFDI detected mass fragments expected for C28 and C33 alkane products (Figure C-3
and Figure C-4), and the NMR spectra were congruent with that expected for the C33
alkane product (Figure C-7 and Figure C-8).
4.3.3 Lubricant Properties
The biolubricant alkane base oil obtained by our method is a viscous liquid at
room temperature and even at low temperature of approximately 3 °C, whereas n-
tricosane, containing 23 carbons and produced by HDO of 12-tricosanone, is solid.26
This suggests the addition of branches on linear alkanes by our method can
significantly improve the low-temperature flow property. The viscous properties of
our synthesized base oil are determined by extra-low charge, micro-viscosity
measurements and are compared to those of Phillips 66 Ultra-S 3TM (Group III) and
Exxon Mobil SpectraSyn PlusTM PAO-3.6 (Group IV) base oils. When considering
lubricant base oils, at high temperatures (100 °C), an oil’s viscosity (KV100) should
be high to create a thick hydrodynamic film between surfaces. Upon decreasing
temperature (40 °C), an oil’s viscosity (KV40) should be low, or less resistant to flow,
to promote fluidity. The viscosity index (VI), calculated using the KV100 and KV40
values, measures viscosity stability of a fluid as a function of temperature.
Maximizing VI ensures that the oil’s viscosity varies as little as possible with
temperature. Table 4-1 shows that KV100, KV40, and VI of our base oil are
comparable to commercial Group III and Group IV base oils. The VI of our base oil is
115, which is higher than 100, suggesting our oil has high quality.21
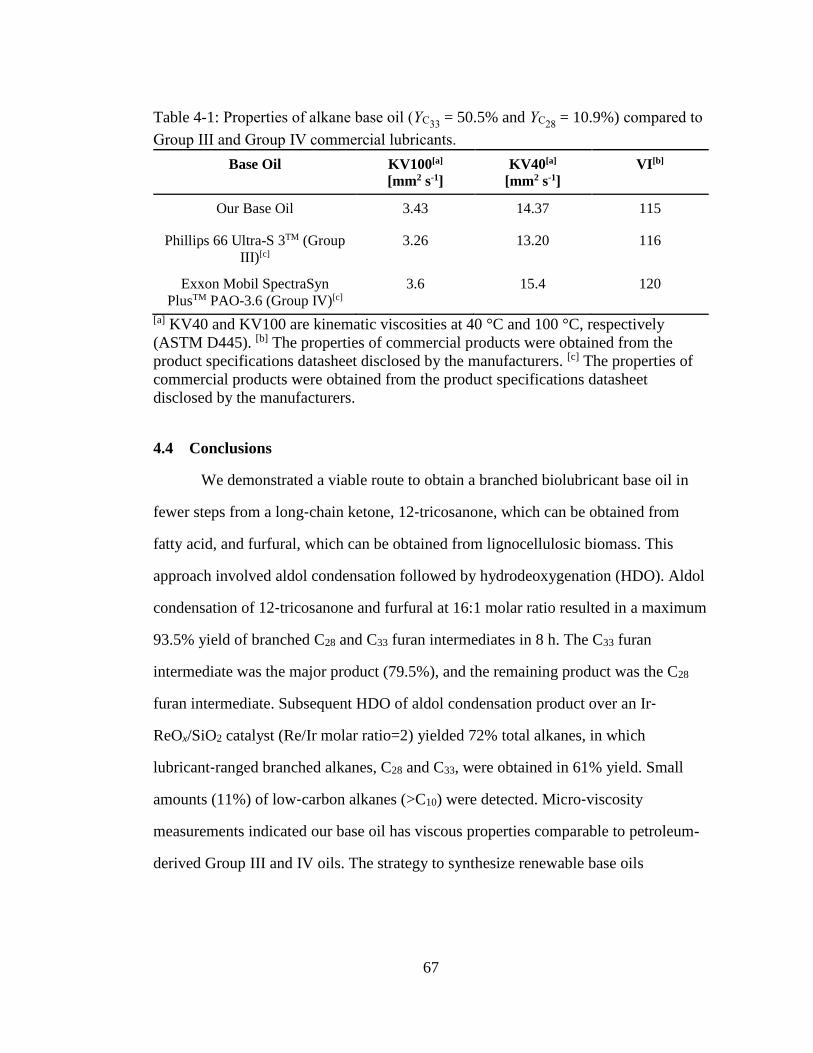
67
Table 4-1: Properties of alkane base oil (YC33 = 50.5% and YC28
= 10.9%) compared to
Group III and Group IV commercial lubricants.
[a] KV40 and KV100 are kinematic viscosities at 40 °C and 100 °C, respectively
(ASTM D445). [b] The properties of commercial products were obtained from the
product specifications datasheet disclosed by the manufacturers. [c] The properties of
commercial products were obtained from the product specifications datasheet
disclosed by the manufacturers.
4.4 Conclusions
We demonstrated a viable route to obtain a branched biolubricant base oil in
fewer steps from a long‐chain ketone, 12‐tricosanone, which can be obtained from
fatty acid, and furfural, which can be obtained from lignocellulosic biomass. This
approach involved aldol condensation followed by hydrodeoxygenation (HDO). Aldol
condensation of 12‐tricosanone and furfural at 16:1 molar ratio resulted in a maximum
93.5% yield of branched C28 and C33 furan intermediates in 8 h. The C33 furan
intermediate was the major product (79.5%), and the remaining product was the C28
furan intermediate. Subsequent HDO of aldol condensation product over an Ir‐
ReOx/SiO2 catalyst (Re/Ir molar ratio=2) yielded 72% total alkanes, in which
lubricant‐ranged branched alkanes, C28 and C33, were obtained in 61% yield. Small
amounts (11%) of low‐carbon alkanes (>C10) were detected. Micro‐viscosity
measurements indicated our base oil has viscous properties comparable to petroleum-
derived Group III and IV oils. The strategy to synthesize renewable base oils
Base Oil KV100[a]
[mm2 s-1] KV40[a]
[mm2 s-1]
VI[b]
Our Base Oil 3.43 14.37 115
Phillips 66 Ultra-S 3TM (Group
III)[c] 3.26 13.20 116
Exxon Mobil SpectraSyn
PlusTM PAO-3.6 (Group IV)[c] 3.6 15.4 120

68
described in this paper could be a potential stepping‐stone to replace petroleum‐
derived base oils, which in turn can reduce greenhouse gas emissions.
69
REVERSIBLE FORMATION OF SILANOL GROUPS IN TWO-
DIMENSIONAL SILICEOUS NANOMATERIALS UNDER MILD
HYDROTHERMAL CONDITIONS
Reproduced with permission from the Journal of Physical Chemistry C, in press.
Unpublished work copyright 2020 American Chemical Society.
5.1 Introduction
Silica (SiO2) is the most abundant oxide in the earth’s crust. It is used in many
applications, including as catalysts,148,149 supports,50 separation membranes,48 and
sorbents.150 Upon repeated use in some of these applications, siliceous materials
undergo regeneration to remove carbon-containing deposits from their pores.151
Hydrothermal treatment is an example of regeneration, involving steaming materials
for an extended time at high temperatures. Previous solid-state NMR experiments
have shown that well-ordered siliceous materials lose their crystallinity after being
exposed to steam for extended times, e.g., for 80 days at 823 K and 11 bar of steam.36
Recent work has shown that, even though changes related to steaming may not be
evident using traditional characterization methods, there could be important structural
changes affecting catalyst activity.37 Calcination is another method of regeneration, in
which carbonaceous byproducts react with air at elevated temperatures to form carbon
dioxide and trace amounts of steam. Steam at low concentrations is likely to interact
with silica’s surface; however, these atomic-level interactions are challenging to detect
by methods used to study powders, such as solid-state NMR and XRD, which are
Chapter 5
70
better suited to study the material’s bulk rather than its surface.38,39 These surface
interactions are important, as numerous technological applications of silica rely on its
specific surface properties. In particular, surface silanol groups (SiOH) serve as
anchoring points for a variety of chemical species.40
Surface science techniques, such as Infrared Reflection Absorption
Spectroscopy (IRRAS) and X-ray Photoelectron Spectroscopy (XPS), offer
extraordinary precision but work best when the surface is electrically conductive.
Unfortunately, siliceous materials are not electrically conductive, and many of those
techniques are not applicable to these materials.41 One way to overcome this lack of
conductivity is by casting or growing 2-D silicate thin films onto metal single crystal
substrates. An example of this is the bilayer silicate, which can be prepared on various
metal supports, but Ru(0001) has received the most attention.42–45 The bilayer silicate
consists of corner-sharing tetrahedral [SiO4] building blocks arranged in a honeycomb
structure (Figure 5-1) and can contain amorphous regions in addition to the crystalline
bilayer.44 By “amorphous,” we refer to small clusters above the bilayer, not the 2-D
vitreous regions commonly found within the bilayer structure. Polymorphous areas are
also found in metals supported on siliceous supports.46 The bilayer does not, however,
contain the wide range of 3-D pores and channels present in siliceous zeolites.
Recently, all-Si MFI nanosheets have been deposited onto metal substrates for surface
science studies, especially onto Au(111), which has the benefit of being inert in
nature.47–49 MFI nanosheets contain interconnected pore networks (Figure 5-1) and
have the same framework as ZSM-5, one of the most important zeolites for catalysis
applications.152 The deposition of 2-D siliceous materials onto conductive supports
now provides a model system that can be investigated through the lens of surface
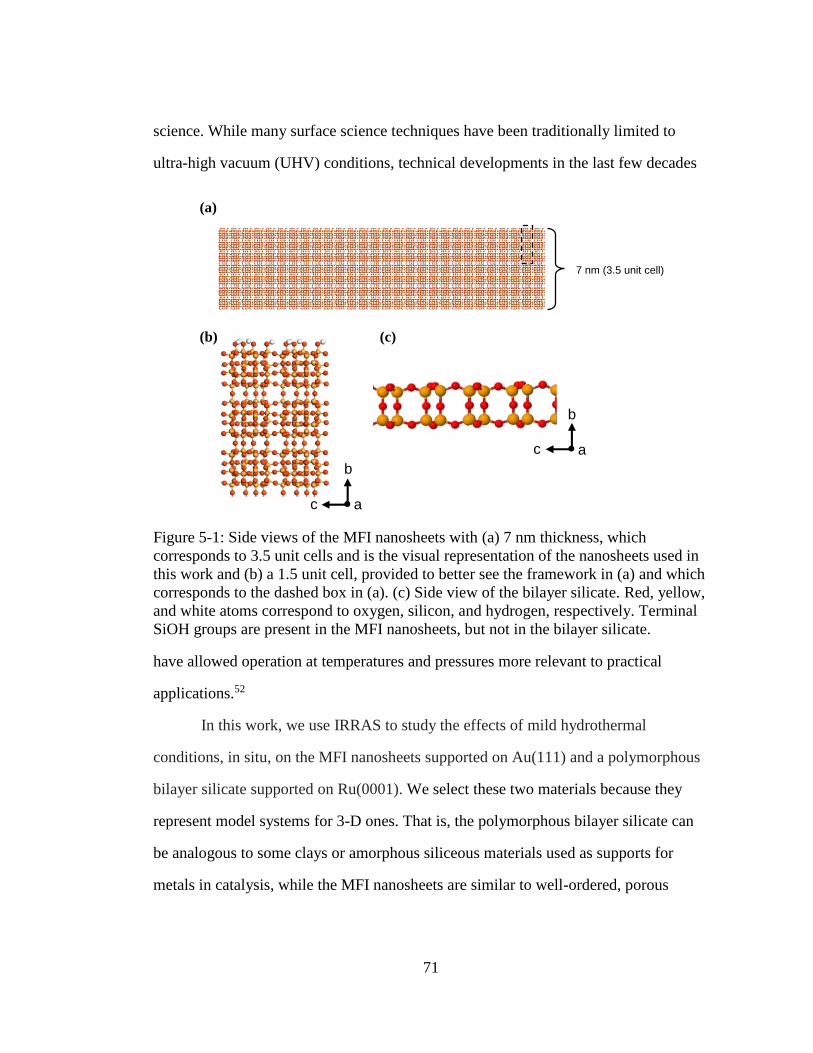
71
science. While many surface science techniques have been traditionally limited to
ultra-high vacuum (UHV) conditions, technical developments in the last few decades
have allowed operation at temperatures and pressures more relevant to practical
applications.52
In this work, we use IRRAS to study the effects of mild hydrothermal
conditions, in situ, on the MFI nanosheets supported on Au(111) and a polymorphous
bilayer silicate supported on Ru(0001). We select these two materials because they
represent model systems for 3-D ones. That is, the polymorphous bilayer silicate can
be analogous to some clays or amorphous siliceous materials used as supports for
metals in catalysis, while the MFI nanosheets are similar to well-ordered, porous
(a) (b)
Sid
e v
iew
To
p v
iew
(a)
(b) (c)
c a
b
7 nm (3.5 unit cell)
c a
b
Figure 5-1: Side views of the MFI nanosheets with (a) 7 nm thickness, which
corresponds to 3.5 unit cells and is the visual representation of the nanosheets used in
this work and (b) a 1.5 unit cell, provided to better see the framework in (a) and which
corresponds to the dashed box in (a). (c) Side view of the bilayer silicate. Red, yellow,
and white atoms correspond to oxygen, silicon, and hydrogen, respectively. Terminal
SiOH groups are present in the MFI nanosheets, but not in the bilayer silicate.
72
siliceous zeolite supports. We find that at 473 and 573 K and 3 mbar H2O, the number
of silanol groups (SiOH) increases in the MFI nanosheets, but does not change for the
case of polymorphous bilayer silicate. The effects of mild hydrothermal conditions in
the MFI nanosheets are reversible and do not result in framework degradation. The
work shown here improves the fundamental understanding of the effects of mild
hydrothermal conditions on 2-D siliceous nanomaterials and serves as a starting point
when considering these effects on 3-D ones.
5.2 Methods
5.2.1 MFI Nanosheets
Pure silica (no Al) zeolite nanosheets with structure-type MFI (MFI nanosheet)
were prepared by seeded growth with an organic structure-directing agent (OSDA,
bis-1,5(tripropyl ammonium) pentamethylene diiodide, denoted as dC5), as reported
previously;49 however, the synthetic conditions were slightly modified to improve
thickness uniformity. Briefly, the MFI nanosheets were fractured using a horn-
sonicator and separated from the large aggregates or MFI nanocrystals by
centrifugation. The nanosheet fragments were then processed with dC5-silica sol at
428 K for 3 days, yielding rectangular nanosheets with ~2 µm lateral dimension and 7
nm predominant thickness. Using the floating particle coating method,153 the
crystallized MFI nanosheets were transferred to a Au(111) crystal, which had been
cleaned through repeated cycles of Ar+ sputtering and vacuum-annealing at 900 K.
These supported nanosheets were then calcined at 673 K under air at near atmospheric
pressure with a flow rate of 100 cm3/min for 6 h to remove the OSDA in the pores.
73
5.2.2 Bilayer Silicate
A Ru(0001) single crystal surface was cleaned by several cycles of Ar+
sputtering followed by annealing at 1250 K. The surface was then exposed to 4×10⁻⁶
mbar O2 at 1200 K to form a chemisorbed (2×2)-3O/Ru(0001) overlayer. The bilayer
silicate film was grown on the (2×2)-3O/Ru(0001) surface as described elsewhere.43,44
Briefly, Si was thermally evaporated onto the (2×2)-3O/Ru(0001) surface at room
temperature and 2.7×10⁻⁷ mbar O2. Next, the film underwent crystallization at 1200 K
in 4×10⁻⁶ mbar O2 for 10 min and subsequent cooling in O2 (at the same pressure). The
resulting film was a polymorphous silicate, containing both the bilayer structure and
amorphous silica particles on top of the bilayer.
5.2.3 Scanning Electron and Atomic Force Microscopies (SEM and AFM)
SEM and AFM provide information on surface topography and roughness,
respectively. SEM images were acquired as described by Kim et al.154 AFM images
were acquired in tapping-mode at room temperature in a 5 µm × 5 µm region.
5.2.4 Infrared Reflection-Absorption Spectroscopy (IRRAS)
IRRAS provides information on phonon vibrations for the framework of
porous materials and adsorbed molecules within the pores. The instrument uses a
Bruker Vertex 80V spectrometer from which infrared light is directed into a UHV
analysis chamber to interact with the sample surface at a grazing incidence (~8°). The
reflected light is then collected on a liquid-nitrogen cooled mercury-cadmium-telluride
(MCT) detector located in an external chamber. Spectra were collected for
wavelengths in the range of 700 – 5000 cm-1. The analysis chamber has KBr windows
to allow IR light to enter and exit the sample compartment. The beam path is in
vacuum both between the IR source and analysis chamber entry port and between the
74
analysis chamber exit port at the MCT detector. The system incorporates a polarizer,
which can easily tune the IR light interacting with the sample from p-polarized to s-
polarized. In this work, the s-polarized spectrum was collected and subtracted from the
p-polarized spectrum for all experiments to eliminate gas-phase contributions when
working at elevated pressures. The samples were mounted on a stainless-steel flag-
type holder with a K-type thermocouple allowing for in situ temperature readings. The
sample was heated with a halogen lamp located on the back of the sample holder.
Before performing IRRAS, the samples were cleaned by annealing in 1×10⁻⁵ mbar O2
at 750 K for 5 min to remove surface contaminates. During the IRRAS measurements,
the temperature of the sample was maintained at either 300, 473, or 573 K. Millipore
DI water, D2O (>99 atom %, Sigma Aldrich), or H218O (97 atom %, Sigma Aldrich)
was held in a glass cylinder and underwent freeze-pump-thaw cycles to remove the
dissolved gases prior to entering the IRRAS analysis chamber. Water vapor was dosed
up to 3 mbar with a leak valve. All of the spectra underwent baseline correction using
the Bruker OPUS Version 7.5 software. The SiOH peak areas were obtained using the
Peak Analyzer tool in Origin 2019.
5.2.5 X-ray Photoelectron Spectroscopy (XPS)
XPS provides information on the chemical composition and the oxidation
states of all the elements in a sample. XPS experiments were performed using a
system equipped with a SPECS PHOIBOS NAP 150 hemispherical analyzer and a
monochromatic Al Kα X-ray source. Spectra were acquired at room temperature and
under UHV conditions (2×10⁻⁹ mbar). The spectra were acquired on sample areas
smaller than 300 µm × 300 µm and were processed in the CasaXPS Version
2.3.19PR1.0 software.
75
5.3 Results and Discussion
5.3.1 IRRAS Characterization of 2-D Siliceous Nanomaterials
Prior to hydrothermal conditions, the 2-D siliceous nanomaterials were
characterized by IRRAS. Crystalline materials show phonon framework vibrations
within the mid-IR range, i.e., 4000 – 400 cm-1.155 In the MFI nanosheets supported on
Au(111), we observed a high frequency (HF) mode of 1247 cm-1 and a low frequency
(LF) mode of 1174 cm-1 (Figure 5-2a), which are consistent with measurements shown
in a previous report.156 Kestell et al. previously suggested that the HF mode likely
corresponds to Si-O-Si linkages between the pores, while the LF mode corresponds to
internal linkages within the pores.156 The peak position at 3724 cm-1 (Figure 5-2c)
corresponds to SiOH groups. Figure D-1 shows the SEM and AFM images of the MFI
nanosheets after deposition, where most of the surface is covered by individual
nanosheets, with some regions showing the overlap between adjacent nanosheets. The
AFM image reveals the average nanosheet thickness is 7 nm, consistent with Figure
5-1a.
The bilayer silicate supported on Ru(0001) revealed a sharp band at 1287 cm-1,
characteristic of a bilayer structure, and a broad region centered at 1182 cm-1,
corresponding to amorphous silica (Figure 5-2b). Amorphous silica can be produced
in 2-D materials by depositing Si in excess to that which is needed for the bilayer.44
We want to emphasize that by amorphous silica we refer here to 3-D disordered silica,
and not to the vitreous form bilayer silica, which is indistinguishable from the
crystalline one by IR. As shown in Figure 5-1b, a perfectly crystalline bilayer would
not contain amorphous silica or SiOH groups; however, our bilayer contains some
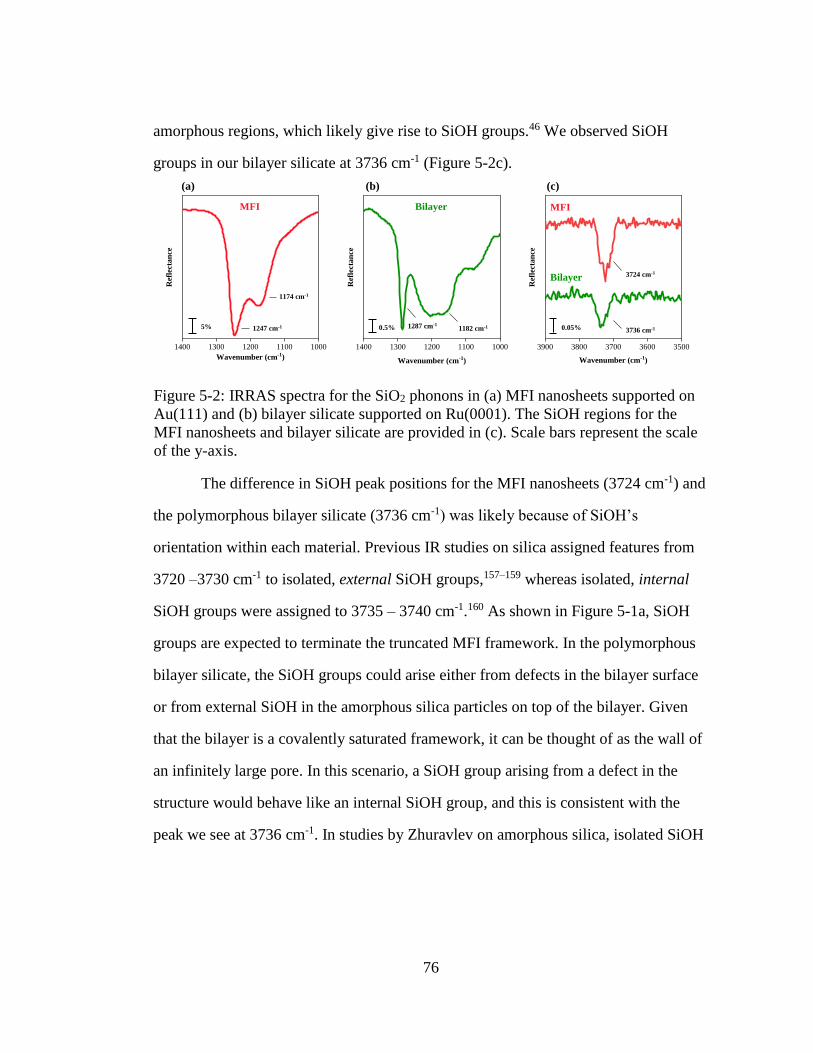
76
amorphous regions, which likely give rise to SiOH groups.46 We observed SiOH
groups in our bilayer silicate at 3736 cm-1 (Figure 5-2c).
The difference in SiOH peak positions for the MFI nanosheets (3724 cm-1) and
the polymorphous bilayer silicate (3736 cm-1) was likely because of SiOH’s
orientation within each material. Previous IR studies on silica assigned features from
3720 –3730 cm-1 to isolated, external SiOH groups,157–159 whereas isolated, internal
SiOH groups were assigned to 3735 – 3740 cm-1.160 As shown in Figure 5-1a, SiOH
groups are expected to terminate the truncated MFI framework. In the polymorphous
bilayer silicate, the SiOH groups could arise either from defects in the bilayer surface
or from external SiOH in the amorphous silica particles on top of the bilayer. Given
that the bilayer is a covalently saturated framework, it can be thought of as the wall of
an infinitely large pore. In this scenario, a SiOH group arising from a defect in the
structure would behave like an internal SiOH group, and this is consistent with the
peak we see at 3736 cm-1. In studies by Zhuravlev on amorphous silica, isolated SiOH
Figure 5-2: IRRAS spectra for the SiO2 phonons in (a) MFI nanosheets supported on
Au(111) and (b) bilayer silicate supported on Ru(0001). The SiOH regions for the
MFI nanosheets and bilayer silicate are provided in (c). Scale bars represent the scale
of the y-axis.
35003600370038003900
Ref
lect
an
ce
Wavenumber (cm-1)
10001100120013001400R
efle
ctan
ce
Wavenumber (cm-1)
10001100120013001400
Ref
lect
an
ce
Wavenumber (cm-1)
(b)(a) (c)
5% 0.5%1247 cm-1
1174 cm-1
1182 cm-11287 cm-1
Bilayer
MFI
3724 cm-1
3736 cm-10.05%
MFI Bilayer
77
groups also showed vibrational frequencies in the same range as internal SiOH groups
in crystalline porous silicates.161
In the following sections, we describe the results for applying hydrothermal
conditions to the MFI nanosheets and the bilayer silicate containing an amorphous
region. Throughout this report, we use the terms “bilayer” and “bilayer silicate”
interchangeably to reference the polymorphous bilayer silicate. Note the other regions
of the IRRAS for the MFI nanosheets and the bilayer silicate did not contain any
features and are therefore not shown. XPS spectra for the MFI nanosheets and the
bilayer silicate are provided in Figure D-2 and Figure D-3, respectively.
5.3.2 Progressive Hydrothermal Applications to 2-D Nanomaterials
Prior studies have shown when water interacts with a silica-containing
framework, Si-O-Si linkages undergo hydroxylation to form SiOH.53–55 An example of
the hydrolysis reaction to form two SiOH groups is shown in Eq. 5-1.54
Si-O-Si + H2O ↔ SiOH + SiOH Eq. 5-2
Given this reaction, we began by monitoring changes in SiOH formation in the
MFI nanosheets and the bilayer silicate in situ using IRRAS (Figure 5-3). We
calculated changes in SiOH formation by taking the ratio of the peak area obtained in
reflectance mode for SiOH during the hydrothermal condition relative to the peak area
obtained prior to treatment at 300 K and under UHV conditions. We denoted the ratio
as SiOH:SiOH300K, UHV throughout this work. The peak area was determined by taking
the area of the peak between the flat baselines on either side of the peak. In the silanol
region (3500 – 3900 cm-1), we found the peak areas obtained in the absorbance- and
reflectance-modes followed the same quantitative trends (Figure D-4). Therefore, for
the remainder of this manuscript, we have calculated the ratio of SiOH:SiOH300K, UHV
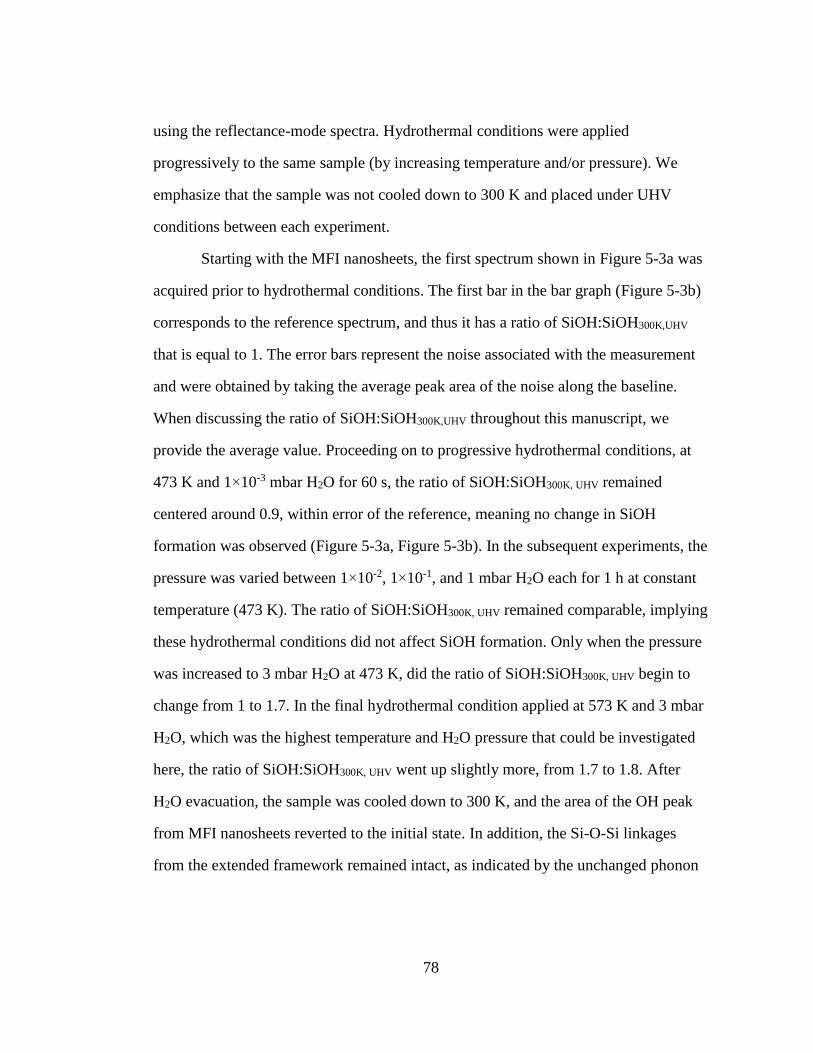
78
using the reflectance-mode spectra. Hydrothermal conditions were applied
progressively to the same sample (by increasing temperature and/or pressure). We
emphasize that the sample was not cooled down to 300 K and placed under UHV
conditions between each experiment.
Starting with the MFI nanosheets, the first spectrum shown in Figure 5-3a was
acquired prior to hydrothermal conditions. The first bar in the bar graph (Figure 5-3b)
corresponds to the reference spectrum, and thus it has a ratio of SiOH:SiOH300K,UHV
that is equal to 1. The error bars represent the noise associated with the measurement
and were obtained by taking the average peak area of the noise along the baseline.
When discussing the ratio of SiOH:SiOH300K,UHV throughout this manuscript, we
provide the average value. Proceeding on to progressive hydrothermal conditions, at
473 K and 1×10⁻³ mbar H2O for 60 s, the ratio of SiOH:SiOH300K, UHV remained
centered around 0.9, within error of the reference, meaning no change in SiOH
formation was observed (Figure 5-3a, Figure 5-3b). In the subsequent experiments, the
pressure was varied between 1×10⁻², 1×10⁻¹, and 1 mbar H2O each for 1 h at constant
temperature (473 K). The ratio of SiOH:SiOH300K, UHV remained comparable, implying
these hydrothermal conditions did not affect SiOH formation. Only when the pressure
was increased to 3 mbar H2O at 473 K, did the ratio of SiOH:SiOH300K, UHV begin to
change from 1 to 1.7. In the final hydrothermal condition applied at 573 K and 3 mbar
H2O, which was the highest temperature and H2O pressure that could be investigated
here, the ratio of SiOH:SiOH300K, UHV went up slightly more, from 1.7 to 1.8. After
H2O evacuation, the sample was cooled down to 300 K, and the area of the OH peak
from MFI nanosheets reverted to the initial state. In addition, the Si-O-Si linkages
from the extended framework remained intact, as indicated by the unchanged phonon
79
vibrations in IRRAS spectra shown in Figure D-5. Note there was a shift in the SiO2
phonons during hydrothermal conditions, but this was due to temperature change, no
H2O; we address the effects of temperature in more detail later in this Chapter (Figure
5-6.
Fully reversible hydrolysis and lack of framework degradation observed here
were also shown for a bulk zeolite in work by Heard et al.54 In that study, the zeolite
chabazite (CHA) was immersed in room temperature oxygen-17 labeled water
(H217O).54 The CHA framework underwent exchange from Si-16O-Si to Si-17O-Si.
Later in this Chapter, we will address isotopic labeling studies, which were performed
to gain insights about the location of the new SiOH groups formed in the MFI
framework. We want to emphasize that, even though our work and the work of Heard
et al. both show reversible hydrolysis without framework degradation, the materials
and the conditions are very different.54 In this work, we use thin (nm scale) films of
pure SiO2 while in Heard et al.’s work, the material studied is an aluminosilicate CHA
structure (a bulk material, which also contains Al in the framework). Additionally, in
our work, the experiments are carried out in an ultra-high vacuum chamber (UHV),
with controlled exposure to water vapor at low relative humidity, while in Heard et
al.’s work the experiments are carried out under liquid conditions.
For the bilayer silicate, hydrothermal conditions did not increase the number of
SiOH groups in the bilayer silicate. The ratio of SiOH:SiOH300K, UHV remained
centered at ~1 for all treatments (Figure 5-3c, Figure 5-3d). These results were not
surprising, as prior works suggest the bilayer silicate is a durable surface that requires
extreme treatment to undergo any form of degradation. For example, in a previous
study by Yang et al., only small amounts of SiOH groups could be formed in the
80
bilayer silicate upon deposition of an ice-like film of water at 100 K and subsequent
heating to room temperature.55 In a later study, Yu et al. found that the number of
SiOH groups increased only when an ice-like water film on the bilayer silicate was
exposed to an electron beam at cryogenic conditions and then heated to room
temperature.56 The formation of more SiOH groups by electron stimulation came at
the expense of partial, irreversible destruction to the bilayer’s crystalline framework.56
Dissolution of the bilayer silicate was also observed by Kaden et al. under basic
(pH>10) and highly acidic conditions (pH<1), both at room temperature and 363 K.53
Consistently, in our work, we did not observe any degradation in the crystalline
framework of the bilayer silicate when applying these mild hydrothermal conditions
(Figure D-5). We note that the bilayer silicates are comprised of an extended
framework of hexagonal prisms; however, these silicates do not have pores like
zeolites do, so the possibility of “internal” silanol groups can be discarded.
The above conclusions remain the same in experiments using D2O (Figure D-
6). Initially, the MFI nanosheets and bilayer silicate contained SiOH. Upon applying
hydrothermal conditions at 473 K and low pressures of D2O, we observed an exchange
from SiOH to SiOD. At 573 K and 3 mbar D2O, the peak area for SiOD (2740 cm-1) in
the MFI nanosheets grew substantially larger compared to all other treatments and
decreased in size once all D2O had been evacuated. The bilayer silicate maintained the
same peak area for SiOD (2760 cm-1) at the most extreme condition and upon removal
of D2O. In summary, the 2-D nanomaterials behaved similarly when exposed to H2O
and D2O. Namely, the formation of SiOH/SiOD increased at 573 K and 3 mbar
H2O/D2O in the MFI nanosheets, and the effects were fully reversible. In contrast, the
formation of new SiOH/SiOD groups did not occur in the bilayer silicate.
81
In summary, new SiOH groups form at mild temperatures and pressures on the
MFI nanosheets, but not the bilayer silicate. The reason behind the differences
observed between both materials could be related to higher thermodynamic stability of
the bilayer silicate compared to the MFI nanosheets. Additionally, the bilayer silicate
is a denser, self-containing framework, that has no dangling bonds, i.e., if there are no
defects in the structure, all bonds are covalently saturated. In contrast, MFI nanosheets
are less dense, truncated versions of a 3-D framework, whose exposed surface needs to
reconstruct or hydroxylate in the truncation plane. A way to illustrate this further is by
considering the higher thermal stability of bilayer silicates (synthesized at 1200 K)
compared to MFI nanosheets, which exhibit changes in morphology at temperatures
above 1000 K, or lower in the presence of steam.37
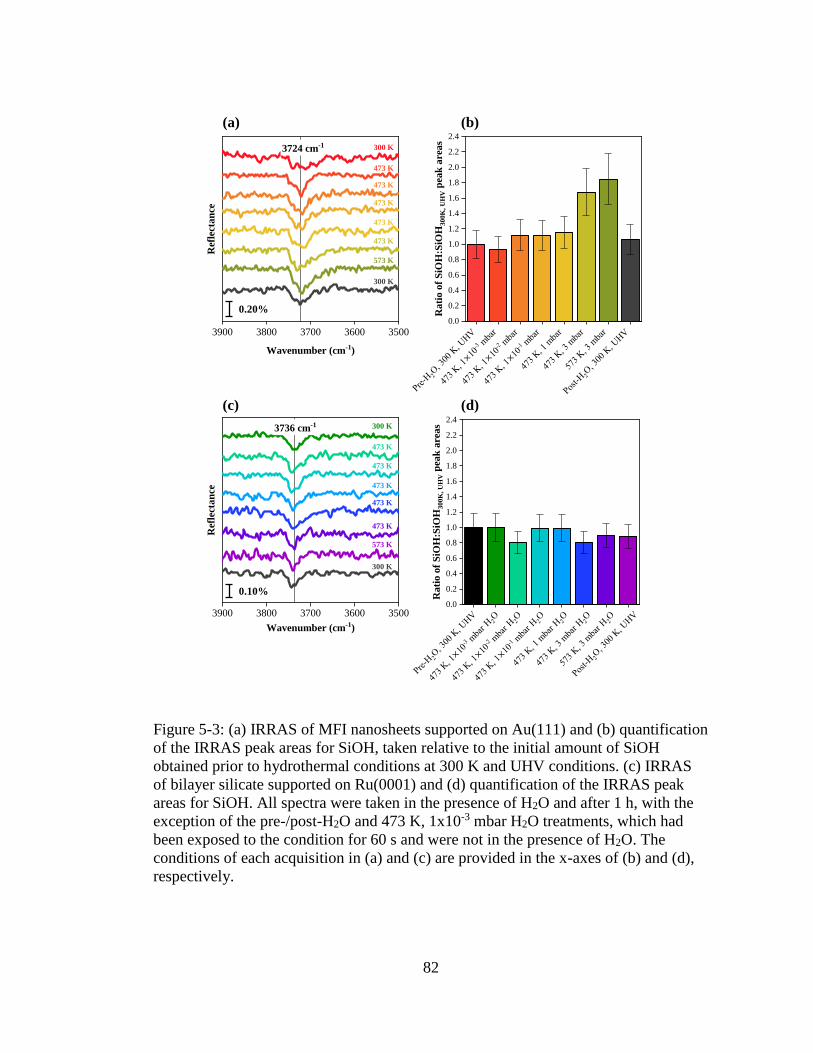
82
0.0
0.2
0.4
0.6
0.8
1.0
1.2
1.4
1.6
1.8
2.0
2.2
2.4
Ra
tio
of
SiO
H:S
iOH
30
0K
, U
HV p
eak
are
as
0.0
0.2
0.4
0.6
0.8
1.0
1.2
1.4
1.6
1.8
2.0
2.2
2.4
Ra
tio
of
SiO
H:S
iOH
30
0K
, U
HV p
eak
are
as
35003600370038003900
Ref
lect
an
ce
Wavenumber (cm-1)
3736 cm-1
35003600370038003900
Ref
lect
an
ce
Wavenumber (cm-1)
3724 cm-1
(b)
0.10%
300 K
473 K
573 K
300 K
300 K
473 K
573 K
300 K
0.20%
(a)
(c) (d)
473 K
473 K
473 K
473 K
473 K
473 K
473 K
473 K
Figure 5-3: (a) IRRAS of MFI nanosheets supported on Au(111) and (b) quantification
of the IRRAS peak areas for SiOH, taken relative to the initial amount of SiOH
obtained prior to hydrothermal conditions at 300 K and UHV conditions. (c) IRRAS
of bilayer silicate supported on Ru(0001) and (d) quantification of the IRRAS peak
areas for SiOH. All spectra were taken in the presence of H2O and after 1 h, with the
exception of the pre-/post-H2O and 473 K, 1x10⁻³ mbar H2O treatments, which had
been exposed to the condition for 60 s and were not in the presence of H2O. The
conditions of each acquisition in (a) and (c) are provided in the x-axes of (b) and (d),
respectively.
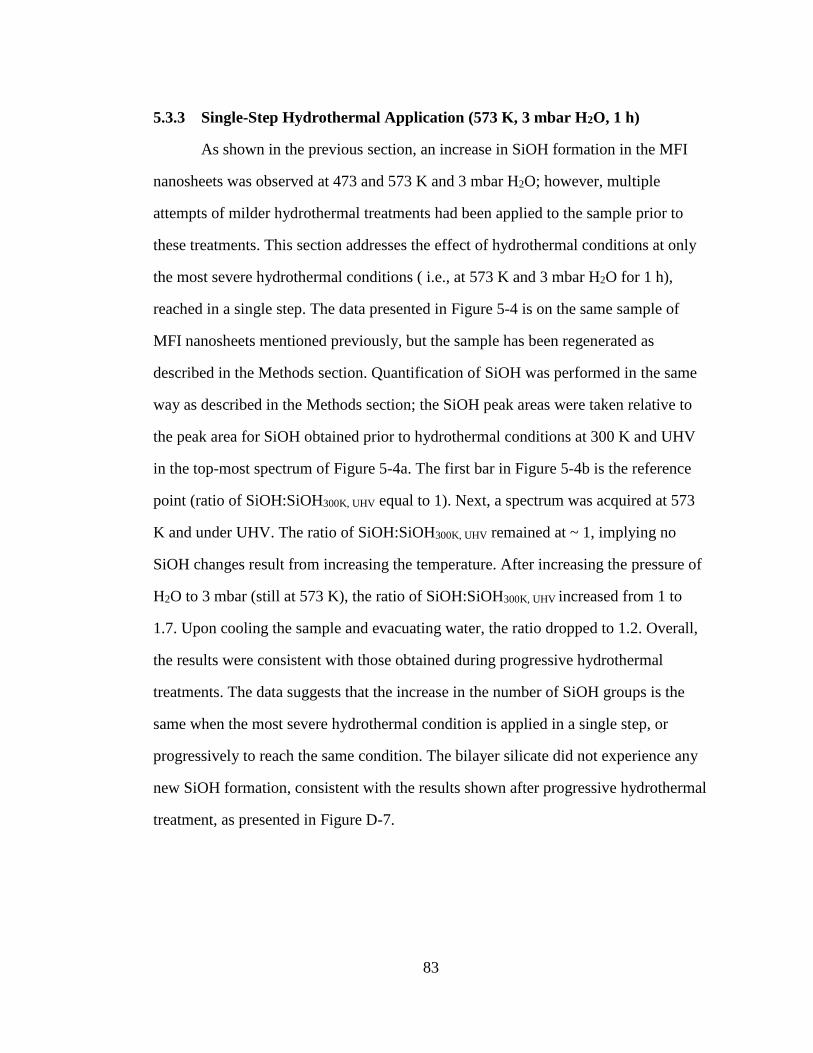
83
5.3.3 Single-Step Hydrothermal Application (573 K, 3 mbar H2O, 1 h)
As shown in the previous section, an increase in SiOH formation in the MFI
nanosheets was observed at 473 and 573 K and 3 mbar H2O; however, multiple
attempts of milder hydrothermal treatments had been applied to the sample prior to
these treatments. This section addresses the effect of hydrothermal conditions at only
the most severe hydrothermal conditions ( i.e., at 573 K and 3 mbar H2O for 1 h),
reached in a single step. The data presented in Figure 5-4 is on the same sample of
MFI nanosheets mentioned previously, but the sample has been regenerated as
described in the Methods section. Quantification of SiOH was performed in the same
way as described in the Methods section; the SiOH peak areas were taken relative to
the peak area for SiOH obtained prior to hydrothermal conditions at 300 K and UHV
in the top-most spectrum of Figure 5-4a. The first bar in Figure 5-4b is the reference
point (ratio of SiOH:SiOH300K, UHV equal to 1). Next, a spectrum was acquired at 573
K and under UHV. The ratio of SiOH:SiOH300K, UHV remained at ~ 1, implying no
SiOH changes result from increasing the temperature. After increasing the pressure of
H2O to 3 mbar (still at 573 K), the ratio of SiOH:SiOH300K, UHV increased from 1 to
1.7. Upon cooling the sample and evacuating water, the ratio dropped to 1.2. Overall,
the results were consistent with those obtained during progressive hydrothermal
treatments. The data suggests that the increase in the number of SiOH groups is the
same when the most severe hydrothermal condition is applied in a single step, or
progressively to reach the same condition. The bilayer silicate did not experience any
new SiOH formation, consistent with the results shown after progressive hydrothermal
treatment, as presented in Figure D-7.
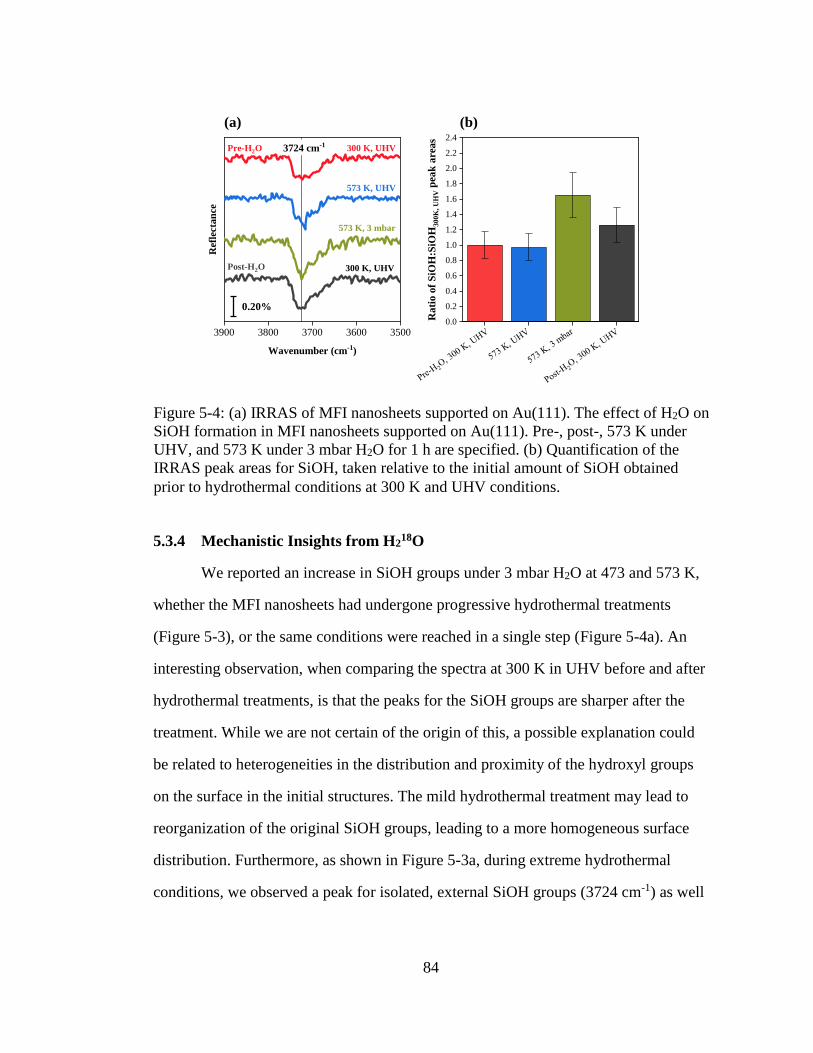
84
5.3.4 Mechanistic Insights from H218O
We reported an increase in SiOH groups under 3 mbar H2O at 473 and 573 K,
whether the MFI nanosheets had undergone progressive hydrothermal treatments
(Figure 5-3), or the same conditions were reached in a single step (Figure 5-4a). An
interesting observation, when comparing the spectra at 300 K in UHV before and after
hydrothermal treatments, is that the peaks for the SiOH groups are sharper after the
treatment. While we are not certain of the origin of this, a possible explanation could
be related to heterogeneities in the distribution and proximity of the hydroxyl groups
on the surface in the initial structures. The mild hydrothermal treatment may lead to
reorganization of the original SiOH groups, leading to a more homogeneous surface
distribution. Furthermore, as shown in Figure 5-3a, during extreme hydrothermal
conditions, we observed a peak for isolated, external SiOH groups (3724 cm-1) as well
Figure 5-4: (a) IRRAS of MFI nanosheets supported on Au(111). The effect of H2O on
SiOH formation in MFI nanosheets supported on Au(111). Pre-, post-, 573 K under
UHV, and 573 K under 3 mbar H2O for 1 h are specified. (b) Quantification of the
IRRAS peak areas for SiOH, taken relative to the initial amount of SiOH obtained
prior to hydrothermal conditions at 300 K and UHV conditions.
0.0
0.2
0.4
0.6
0.8
1.0
1.2
1.4
1.6
1.8
2.0
2.2
2.4
Ra
tio
of
SiO
H:S
iOH
30
0K
, U
HV p
eak
are
as
35003600370038003900
Ref
lect
an
ce
Wavenumber (cm-1)
3724 cm-1
(b)(a)
300 K, UHV
573 K, UHV
573 K, 3 mbar
300 K, UHV
0.20%
Pre-H2O
Post-H2O
85
as a broad region extending to ~3620 cm-1, which likely corresponds to hydrogen-
bonded SiOH groups.158,159 In a previous work, Karbowiak et al. found that hydrogen-
bonded SiOH groups formed in silicalite-1, a pure silica MFI-type zeolite, when
exposed to pressures between 80 and 100 MPa H2O followed by evacuation of H2O at
room temperature.159 Hydrogen-bonded SiOH groups were also observed post-H2O in
Figure 5-4a, though not in Figure 5-3a. The presence of these hydrogen-bonded SiOH
groups in one case but not the other was most likely because H2O had been evacuated
upon cooling down to 300 K and trace amount of water remained (Figure 5-4a). In
contrast, in Figure 5-3a, H2O was evacuated at elevated temperature and then cooled.
Note we included both isolated and hydrogen-bonded SiOH groups in the peak area
for SiOH (Figure 5-3b and Figure 5-4b); however, these SiOH groups have different
extinction coefficients, making it difficult to deduce quantitative comparisons between
the two.162 Qualitatively, however, the number of all SiOH groups increases upon
exposure to H2O at these mild hydrothermal conditions
To acquire insights about the location of new SiOH groups, we exposed the
MFI nanosheets to oxygen-18 labeled water (H218O). H2
18O can be used to determine
if an isotopic exchange occurs between H218O and the internal Si-16O-Si framework in
IRRAS. In Figure 5-5, we have proposed a mechanism in which H218O cleaves the Si-
16O-Si linkage to form two hydrogen-bonded SiOH groups.
Figure 5-5: A possible reaction pathway showing the formation of SiOH in the MFI
nanosheets with H218O.
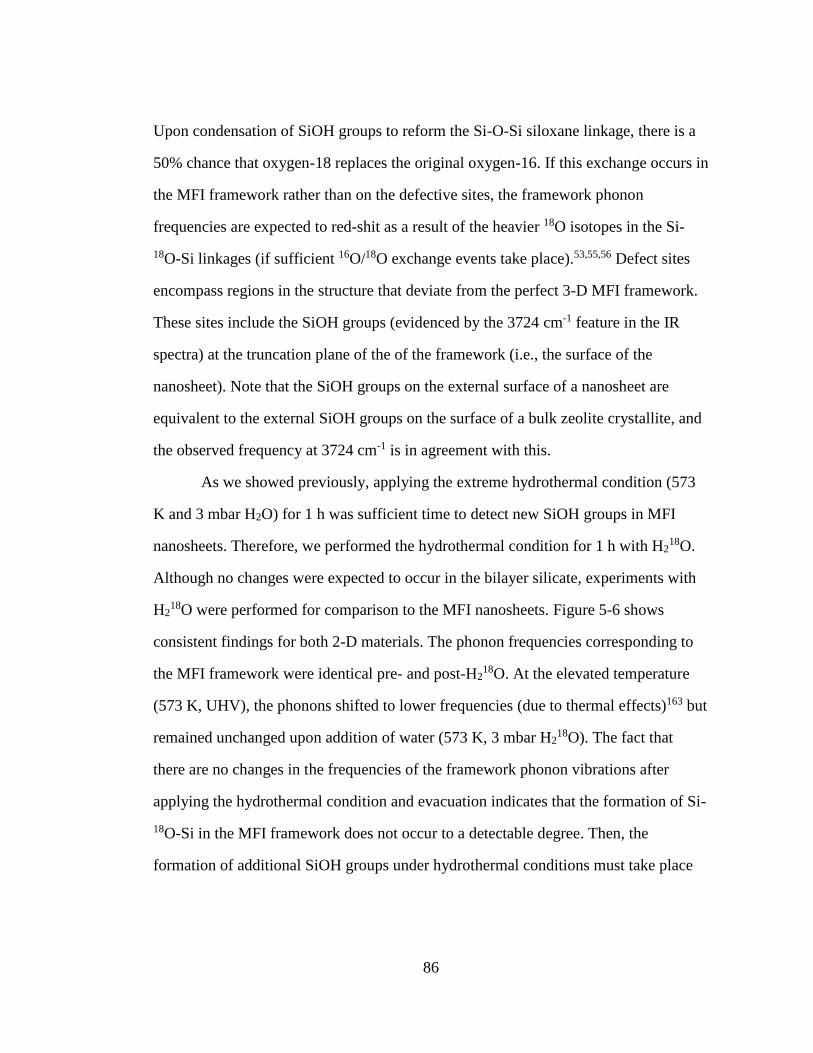
86
Upon condensation of SiOH groups to reform the Si-O-Si siloxane linkage, there is a
50% chance that oxygen-18 replaces the original oxygen-16. If this exchange occurs in
the MFI framework rather than on the defective sites, the framework phonon
frequencies are expected to red-shit as a result of the heavier 18O isotopes in the Si-
18O-Si linkages (if sufficient 16O/18O exchange events take place).53,55,56 Defect sites
encompass regions in the structure that deviate from the perfect 3-D MFI framework.
These sites include the SiOH groups (evidenced by the 3724 cm-1 feature in the IR
spectra) at the truncation plane of the of the framework (i.e., the surface of the
nanosheet). Note that the SiOH groups on the external surface of a nanosheet are
equivalent to the external SiOH groups on the surface of a bulk zeolite crystallite, and
the observed frequency at 3724 cm-1 is in agreement with this.
As we showed previously, applying the extreme hydrothermal condition (573
K and 3 mbar H2O) for 1 h was sufficient time to detect new SiOH groups in MFI
nanosheets. Therefore, we performed the hydrothermal condition for 1 h with H218O.
Although no changes were expected to occur in the bilayer silicate, experiments with
H218O were performed for comparison to the MFI nanosheets. Figure 5-6 shows
consistent findings for both 2-D materials. The phonon frequencies corresponding to
the MFI framework were identical pre- and post-H218O. At the elevated temperature
(573 K, UHV), the phonons shifted to lower frequencies (due to thermal effects)163 but
remained unchanged upon addition of water (573 K, 3 mbar H218O). The fact that
there are no changes in the frequencies of the framework phonon vibrations after
applying the hydrothermal condition and evacuation indicates that the formation of Si-
18O-Si in the MFI framework does not occur to a detectable degree. Then, the
formation of additional SiOH groups under hydrothermal conditions must take place
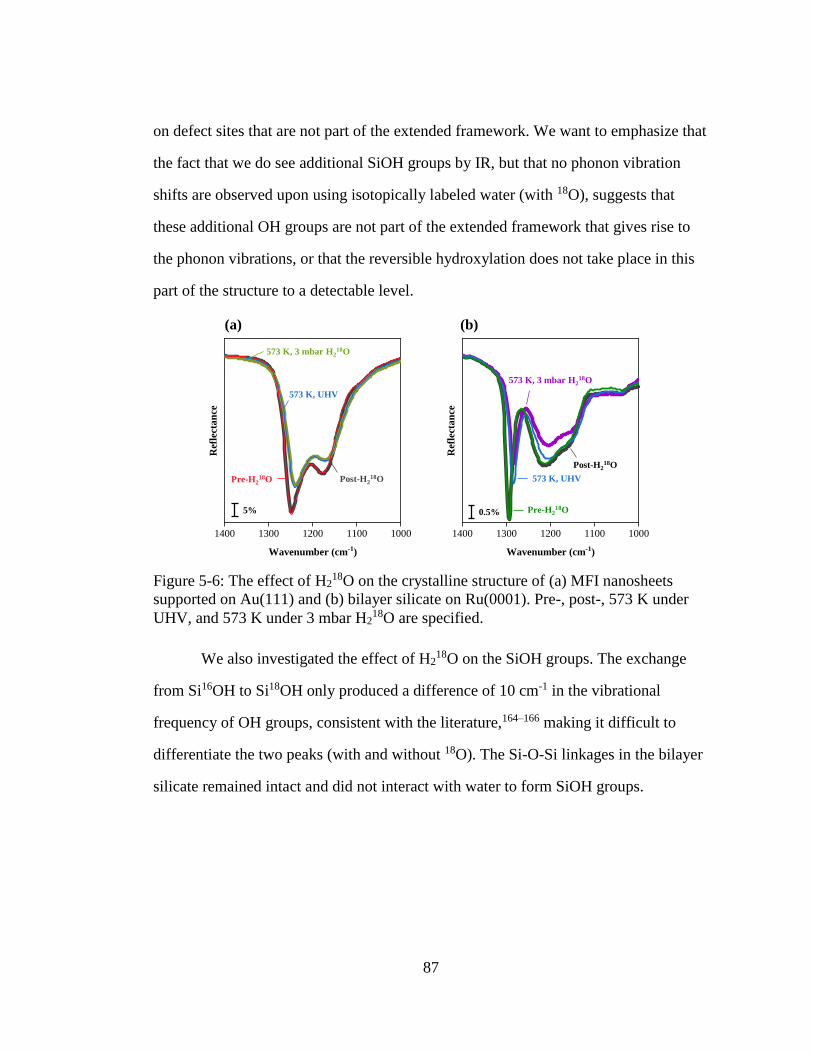
87
on defect sites that are not part of the extended framework. We want to emphasize that
the fact that we do see additional SiOH groups by IR, but that no phonon vibration
shifts are observed upon using isotopically labeled water (with 18O), suggests that
these additional OH groups are not part of the extended framework that gives rise to
the phonon vibrations, or that the reversible hydroxylation does not take place in this
part of the structure to a detectable level.
We also investigated the effect of H218O on the SiOH groups. The exchange
from Si16OH to Si18OH only produced a difference of 10 cm-1 in the vibrational
frequency of OH groups, consistent with the literature,164–166 making it difficult to
differentiate the two peaks (with and without 18O). The Si-O-Si linkages in the bilayer
silicate remained intact and did not interact with water to form SiOH groups.
Figure 5-6: The effect of H218O on the crystalline structure of (a) MFI nanosheets
supported on Au(111) and (b) bilayer silicate on Ru(0001). Pre-, post-, 573 K under
UHV, and 573 K under 3 mbar H218O are specified.
10001100120013001400
Ref
lect
an
ce
Wavenumber (cm-1)
10001100120013001400
Ref
lect
an
ce
Wavenumber (cm-1)
573 K, UHV
Pre-H218O
573 K, 3 mbar H218O
Post-H218O
0.5%
573 K, UHV
(b)(a)
573 K, 3 mbar H218O
Pre-H218O Post-H2
18O
5%
88
5.4 Conclusions
In this work, in situ IRRAS studies revealed the effects of mild hydrothermal
conditions on 2-D model systems, namely all-Si MFI nanosheets supported on
Au(111) and a polymorphous bilayer silicate supported on Ru(0001). We were able to
detect changes in SiOH formation, which were previously difficult to study using bulk
techniques, such NMR and XRD. In particular, we found that SiOH groups increased
in the MFI nanosheets at 473 and 573 K under a H2O pressure of 3 mbar, but were
unaffected in the bilayer silicate at the same conditions. Furthermore, the effects in the
MFI nanosheets were the same if these mild hydrothermal conditions were reached
progressively or in one step. A fraction of the SiOH groups formed in the MFI
nanosheets were hydrogen-bonded and were deduced to form in defect sites, not in the
extended framework. In the MFI nanosheets, the effects of mild hydrothermal
conditions were fully reversible and did not result in framework degradation. The
results shown here suggest that well-ordered, porous materials, inherently terminated
in SiOH groups, such as the MFI nanosheets, are susceptible to an increase in SiOH
groups under mild hydrothermal conditions. In contrast, covalently saturated ones,
such as bilayer silicates, which lack SiOH groups in their ideal structure, are not
affected. These conclusions improve our fundamental understanding of the effects of
mild hydrothermal conditions on 2-D siliceous nanomaterials and may aid in
understanding the impact of these conditions on 3-D ones.
5.5 Acknowledgements
This work was financially supported by the Catalysis Center for Energy
Innovation, an Energy Frontier Research Center funded by the U.S. Department of
Energy, Office of Science, Office of Basic Energy Sciences under Award Number

89
DE-SC0001004. Research is carried out in part at the Center for Functional
Nanomaterials, which is a U.S. DOE Office of Science Facility at Brookhaven
National Laboratory under Contract No. DE-SC0012704. The authors thank John S.
Ruano-Salguero for his helpful discussions.
90
CONCLUSIONS AND FUTURE WORK
Lignocellulosic biomass offers a promising alternative feedstock to petroleum,
but its high oxygen content is one of the most significant barriers for its conversion
into low-oxygen containing fuels and chemicals traditionally derived from petroleum.
This thesis focuses on the catalytic systems and processes involved in biomass
upgrading, including: (1) an investigation into the active species of the metal salt,
AlCl3, in glucose to fructose isomerization, (2) the development of a catalytic process
for the production of a bio-lubricant base oil from biomass-derived platform
chemicals, and (3) a fundamental understanding on the effects of mild hydrothermal
conditions experienced during catalyst regeneration on siliceous nanomaterials. Such
knowledge will aid in the development of improved catalysts and processes to obtain
products from biomass. This section provides a holistic set of conclusions and their
impact on future research directions.
6.1 Thesis Summary
In Chapter 2, a review of the literature on the critical role metal salts play in
glucose conversion was provided. It was shown that metal salts affect glucose ring
opening, and their speciation facilitates a C2 → C1 hydride transfer to produce
fructose, but detecting the active metal species responsible for glucose conversion is
challenging.
Chapter 6
91
Chapter 3 showed that the Al species’ concentrations can be deduced by
combining experiments, modeling, and glucose isomerization kinetics. It was found
that 27Al NMR detected the dominant Al(H2O)63+ complex. These measurements
combined with pH and equilibrium expressions for the aluminum hydrolysis reactions
were used to estimate the concentrations of the [Al(H2O)4(OH)2]1+ and
[Al(H2O)5(OH)]2+ species. Aluminum nanoparticles were quantified through a
combination of ICP-MS, DLS, and ultrafiltration. The concentrations of the aqueous
and solid aluminum species were correlated to the glucose isomerization rate. At
sufficiently high temperatures, the hydrolyzed [Al(H2O)4(OH)2]1+ species scales
linearly with the glucose isomerization rate, indicating this complex is the active one.
In Chapter 4, a strategy was developed to synthesize branched alkanes for
lubricant base oil in two steps from 12-tricosanone, which can be obtained from
bioderived fatty acids, and furfural, which can be obtained from lignocellulosic
biomass. The reaction pathway involved carbon-carbon coupling through aldol
condensation followed by HDO. Various solvents (non-polar, aprotic and polar,
protic) and reaction conditions were screened to achieve a maximum yield of 94.3% of
aldol condensation products, containing the majority of a C33 furan (79.5%) followed
by a C28 furan (14.8%). Subsequent HDO of aldol condensation products over an Ir-
ReOx/SiO2 catalyst produced lubricant-ranged branched alkanes (C28 and C33) with
61.4 % yield and small fractions (< 11%) of alkanes with carbon numbers between C15
and C10. The viscous properties of the produced bio-lubricant base oil were
comparable to commercial petroleum-derived base oils. This approach serves as a
potential stepping-stone to replace petroleum-derived base oils and, in turn, reduce
greenhouse gas emissions associated with current lubricant production.
92
In Chapter 5, the effects of mild hydrothermal conditions, in situ, on siliceous
nanomaterials, namely all-Si MFI nanosheets supported on Au(111) and a
polymorphous bilayer silicate supported on Ru(0001), were observed by IRRAS. It
was found that mild hydrothermal conditions, i.e., 473 and 573 K and 3 mbar H2O,
increase the formation of SiOH groups in the MFI nanosheets, but do not change the
polymorphous bilayer silicate. The effects of mild hydrothermal conditions were
reversible and did not result in framework degradation. Implications provided in this
work provided a fundamental understanding on the effects of mild hydrothermal
conditions on 2-D siliceous nanomaterials and serve as a starting point when
considering these effects on 3-D ones.
6.2 Future Work
6.2.1 Metal Salt Catalyzed Glucose Isomerization
Chapter 3 of this thesis shows that the partially hydrolyzed aluminum ion
[Al(H2O)4(OH)2]1+ is the most active species for glucose to fructose isomerization in
water. It is shown that sufficient time is necessary to prevent changes in metal salt
speciation during glucose conversion. The time for equilibrating the salt species
depends on the metal salt and temperature, and a simple way to estimate it is by
measuring signatures, such as pH vs. time, prior to adding reagents. Future
experiments require understanding how much preheating time is necessary for other
highly effective metal salts in glucose isomerization, such as CrCl3. In addition, future
investigation is necessary to understand the effects of preheating on the glucose-
fructose reaction rate.
93
Anchoring the active species on a support to prevent agglomeration may be
worth pursuing in the future. In addition, more work is needed to delineate the
similarities and differences between homogeneous and heterogeneous catalysts studied
thus far in glucose isomerization. For example, prior work found that SnCl4 is not as
active as Sn-BEA in the isomerization reaction, even though both contained Sn.
Therefore, there is a need to understand the influence of the framework on Lewis
acidity of the metal center, potentially by ab initio calculations. In addition, the effects
of the size and structure of the reactant compared to the pore size and shape of the
heterogeneous catalyst require better understanding.
6.2.2 Bio-Lubricant Base Oil Production Through Aldol Condensation
Chapter 4 of this thesis develops a strategy to synthesize branched alkanes for
lubricant base oil in two steps from 12-tricosanone, obtained from bioderived fatty
acids, and furfural, obtained from lignocellulosic biomass. The reaction pathway
involves carbon-carbon coupling through aldol condensation followed by
hydrodeoxygenation (HDO). While reaction parameters, such as time, solvent, and
ratio of reagents in aldol condensation, are studied, additional parameters, including
feedstocks, catalysts, and separation procedures should be considered.
Other fatty acids to derive long-chain ketones for aldol condensation are
recommended. In the current strategy, the ketone, 12-tricosanone, is derived from
lauric acid, a fatty acid naturally found in coconut and palm kernel oils. Although
these oils are renewable, growing concerns indicate that the increase in the demand for
products derived from coconut and palm kernel oils could lead to the mass
deforestation of rainforests. If possible, other sources of fatty acids, especially those
that may still be present in waste cooking oils, should be considered.
94
There is also potential to explore different catalysts for the aldol condensation
and HDO steps. Solid organic bases to consider for aldol condensation include Al2O3,
TiO2, MgO, CaO, and KCN. In the HDO reaction, additional solid acid supported
metal-based catalysts should be explored as alternatives to Ir-ReOx/SiO2, since Ir and
Re are rare elements. These catalysts are industrially available and include Pd/C,
Pd/SiO2, and Pt/C, among others. In addition, other promising HDO catalysts of the
form 1M2MO/SiO2 will likely be effective. Combinations to consider include 1M = Ru,
Ni, Co, Pd, Pt, or Rh and 2M = Mo, W, Nb, Mn, V, Ce, Cr, Zn, Co, Y, or Al.
Currently, the products obtained from aldol condensation are separated from
the catalyst through extraction into dichloromethane (CH2Cl2). CH2Cl2 is then
removed by rotary evaporation. As the extraction solvent, CH2Cl2, possesses health
risks, other extraction solvents should be considered, or potentially eliminated,
depending upon catalyst selection.
6.2.3 Hydrothermal Conditions Applied to 2-D Siliceous Nanomaterials
Chapter 5 of this thesis studies the effect of mild hydrothermal conditions on 2-
D siliceous nanomaterials, namely MFI nanosheets supported on Au(111) and a
polymorphous bilayer silicate supported on Ru(0001). It is shown that SiOH groups
form at elevated temperatures and pressure of H2O, i.e., 473 and 573 K and 3 mbar
H2O, in the MFI nanosheets, but not in the polymorphous bilayer silicate. The effects
are reversible and do not result in framework degradation.
SiOH groups serve as anchoring points for various chemical species. In the
future, it is recommended that experiments target understanding how metals anchor to
siliceous supports, as this could aid in catalysts design. Appendix E highlights initial
attempts to anchor phosphorus species onto a crystalline bilayer silicate. It is shown
95
that phosphorus species desorb from the surface, likely because there are not any
SiOH anchoring points in a crystalline bilayer. In the future, it is recommended to
explore how phosphorus species interact with surfaces containing SiOH groups. Mild
hydrothermal treatment is one way to incorporate more SiOH groups onto MFI
nanosheets, but the effects are reversible, only being observed during the hydrothermal
treatment. Therefore, future studies should attempt dosing phosphorus species while
applying the hydrothermal treatment, or developing permanent SiOH groups through
more intense hydrothermal conditions than those tested previously. Currently, the
maximum condition that can be implemented in the IRRAS chamber is 573 K and 3
mbar H2O. A new experimental set-up, such as an autoclave, is worth attempting to
test hydrothermal conditions beyond the current maximum. It is suggested that the
material be examined by IRRAS before and after the hydrothermal treatment to
determine if irreversible SiOH formation has occurred. It may also be worthwhile to
consider dosing the phosphorus species in an external chamber to avoid contaminating
the IRRAS chamber.
96
(1) Langholtz, B. M. H. J.; Stokes, L. M.; Eaton. 2016 BILLION-TON REPORT
Advancing Domestic Resources for a Thriving Bioeconomy. Oak Ridge Natl.
Lab. 2016.
(2) Mamman, A. S.; Lee, J.-M.; Kim, Y.-C.; Hwang, I. T.; Park, N.-J.; Hwang, Y.
K.; Chang, J.-S.; Hwang, J.-S. Furfural: Hemicellulose/Xylosederived
Biochemical. Biofuels, Bioprod. Biorefining 2008, 2, 438–454.
(3) Alonso, D. M.; Bond, J. Q.; Dumesic, J. A. Catalytic Conversion of Biomass to
Biofuels. Green Chem. 2010, 12, 1493–1513.
(4) Matson, T. D.; Barta, K.; Iretskii, A. V.; Ford, P. C. One-Pot Catalytic
Conversion of Cellulose and of Woody Biomass Solids to Liquid Fuels. J. Am.
Chem. Soc. 2011.
(5) Dutta, S.; De, S.; Alam, M. I.; Abu-Omar, M. M.; Saha, B. Direct Conversion
of Cellulose and Lignocellulosic Biomass into Chemicals and Biofuel with
Metal Chloride Catalysts. J. Catal. 2012.
(6) Zhou, S.; You, K.; Yi, Z.; Liu, P.; Luo, H. Metal Salts with Highly
Electronegative Cations as Efficient Catalysts for the Liquid-Phase Nitration of
Benzene by NO 2 to Nitrobenzene.
(7) Choudhary, V.; Mushrif, S. H.; Ho, C.; Anderko, A.; Nikolakis, V.;
Marinkovic, N. S.; Frenkel, A. I.; Sandler, S. I.; Vlachos, D. G. Insights into the
Interplay of Lewis and Brønsted Acid Catalysts in Glucose and Fructose
Conversion to 5-(Hydroxymethyl)Furfural and Levulinic Acid in Aqueous
Media. J. Am. Chem. Soc. 2013, 135, 3997–4006.
(8) Cheng, Z.; Everhart, J. L.; Tsilomelekis, G.; Nikolakis, V.; Saha, B.; Vlachos,
D. G. Structural Analysis of Humins Formed in the Brønsted Acid Catalyzed
Dehydration of Fructose. Green Chem. 2018, 20, 997–1006.
(9) Teong, S. P.; Yi, G.; Zhang, Y. Hydroxymethylfurfural Production from
Bioresources: Past, Present and Future. Green Chem. 2014, 16, 2015–2026.
(10) Brownlee, H. J.; Miner, C. S. Industrial Development of Furfural. Ind. Eng.
Chem. 1948, 40, 201–204.
(11) Moliner, M.; Roman-Leshkov, Y.; Davis, M. E. Tin-Containing Zeolites Are
Highly Active Catalysts for the Isomerization of Glucose in Water. Proc. Natl.
Acad. Sci. 2010, 107, 6164–6168.
(12) van Putten, R.-J.; van der Waal, J. C.; de Jong, E.; Rasrendra, C. B.; Heeres, H.
J.; de Vries, J. G. Hydroxymethylfurfural, A Versatile Platform Chemical Made
from Renewable Resources. Chem. Rev. 2013, 113, 1499–1597.
(13) Zhao, H.; Holladay, J. E.; Brown, H.; Zhang, Z. C. Metal Chlorides in Ionic
REFERENCES
97
Liquid Solvents Convert Sugars to 5-Hydroxymethylfurfural. Science (80-. ).
2007, 316, 1597–1600.
(14) Choudhary, V.; Pinar, A. B.; Lobo, R. F.; Vlachos, D. G.; Sandler, S. I.
Comparison of Homogeneous and Heterogeneous Catalysts for Glucose-to-
Fructose Isomerization in Aqueous Media. ChemSusChem 2013, 6, 2369–2376.
(15) Tang, J.; Guo, X.; Zhu, L.; Hu, C. Mechanistic Study of Glucose-to-Fructose
Isomerization in Water Catalyzed by [Al(OH)<inf>2</Inf>(Aq)]+. ACS Catal.
2015, 5, 5097–5103.
(16) Stewart, I. I. Electrospray Mass Spectrometry: A Tool for Elemental Speciation.
Spectrochim. acta, Part B At. Spectrosc. 1999, 54, 1649–1695.
(17) American Petroleum Institute. Annex E- API Base Oil Interchangeaility
Guidelines for Passenger Car Motor Oils and Diesel Engine Oils; 2015.
(18) Brown, S. Base Oil Groups: Manufacture, Properties, and Performance.
Tribology & Lubrication Technology. April 2015, pp 32–35.
(19) Ray, S.; Rao, P. V. C.; Choudary, N. V. Poly-α-Olefin-Based Synthetic
Lubricants: A Short Review on Various Synthetic Routes. Lubr. Sci. 2012, 24,
23–44.
(20) ExxonMobil. ExxonMobil Basestocks 2018 Pulse Report
http://www.exxonmobil.com/en/basestocks/news-insights-and-
resources/industry-insights/2018-industry-pulse-report.
(21) Rudnick, L. R. Synthetics, Mineral Oils, and Bio-Based Lubricants: Chemistry
and Technology; 2005.
(22) Liu, S.; Josephson, T. R.; Athaley, A.; Chen, Q. P.; Norton, A.; Ierapetritou,
M.; Siepmann, J. I.; Saha, B.; Vlachos, D. G. Renewable Lubricants with
Tailored Molecular Architecture. Sci. Adv. 2019, 5, 1–8.
(23) Ji, H.; Zhang, X.; Tan, T. Preparation of a Water-Based Lubricant from
Lignocellulosic Biomass and Its Tribological Properties. Ind. Eng. Chem. Res.
2017, 56, 7858–7864.
(24) Ji, H.; Wang, B.; Zhang, X.; Tan, T. Synthesis of Levulinic Acid-Based Polyol
Ester and Its Influence on Tribological Behavior as a Potential Lubricant. RSC
Adv. 2015, 5, 100443–100451.
(25) Gu, M.; Xia, Q.; Liu, X.; Guo, Y.; Wang, Y. Synthesis of Renewable Lubricant
Alkanes from Biomass-Derived Platform Chemicals. ChemSusChem 2017, 10,
4102–4108.
(26) Corma, A.; Renz, M.; Schaverien, C. Coupling Fatty Acids by Ketonic
Decarboxylation Using Solid Catalysts for the Direct Production of Diesel,
Lubricants, and Chemicals. ChemSusChem 2008, 1, 739–741.
(27) Shylesh, S.; Gokhale, A. A.; Sun, K.; Grippo, A. M.; Jadhav, D.; Yeh, A.; Ho,
C. R.; Bell, A. T. Integrated Catalytic Sequences for Catalytic Upgrading of
Bio-Derived Carboxylic Acids to Fuels, Lubricants and Chemical Feedstocks.
Sustain. Energy Fuels 2017, 1, 1805–1809.
(28) Balakrishnan, M.; Sacia, E. R.; Sreekumar, S.; Gunbas, G.; Gokhale, A. A.;
Scown, C. D.; Toste, F. D.; Bell, A. T. Novel Pathways for Fuels and
98
Lubricants from Biomass Optimized Using Life-Cycle Greenhouse Gas
Assessment. Proc. Natl. Acad. Sci. 2015, 112, 7645–7649.
(29) Sacia, E. R.; Balakrishnan, M.; Deaner, M. H.; Goulas, K. A.; Toste, F. D.;
Bell, A. T. Highly Selective Condensation of Biomass-Derived Methyl Ketones
as a Source of Aviation Fuel. ChemSusChem 2015, 8, 1726–1736.
(30) U.S. Energy Information Administration. Petroleum & Other Liquids
https://www.eia.gov/dnav/pet/PET_PRI_GND_A_EPD2DXL0_PTE_DPGAL_
W.htm (accessed Jun 6, 2019).
(31) Wheeler, G. U.S. Base Oil Price Report. Lubes “N” Greases 2019, 2.
(32) Serrano-Ruiz, J. C.; Dumesic, J. A. Catalytic Routes for the Conversion of
Biomass into Liquid Hydrocarbon Transportation Fuels. Energy Environ. Sci.
2011, 4, 83–99.
(33) Corma, A.; Oliver-Tomas, B.; Renz, M.; Simakova, I. L. Conversion of
Levulinic Acid Derived Valeric Acid into a Liquid Transportation Fuel of the
Kerosene Type. J. Mol. Catal. A Chem. 2014, 388–389, 116–122.
(34) Corma, A.; De La Torre, O.; Renz, M. Production of High Quality Diesel from
Cellulose and Hemicellulose by the Sylvan Process: Catalysts and Process
Variables. Energy Environ. Sci. 2012, 5, 6328–6344.
(35) Anbarasan, P.; Baer, Z. C.; Sreekumar, S.; Gross, E.; Binder, J. B.; Blanch, H.
W.; Clark, D. S.; Dean Toste, F. Integration of Chemical Catalysis with
Extractive Fermentation to Produce Fuels. Nature 2012, 491, 235–239.
(36) Elyassi, B.; Zhang, X.; Tsapatsis, M. Long-Term Steam Stability of MWW
Structure Zeolites (MCM-22 and ITQ-1). Microporous Mesoporous Mater.
2014, 193, 134–144.
(37) Guefrachi, Y.; Sharma, G.; Xu, D.; Kumar, G.; Vinter, K. P.; Abdelrahman, O.
A.; Li, X.; Alhassan, S.; Dauenhauer, P. J.; Navrotsky, A.; et al. Steam-Induced
Coarsening of Single-Unit-Cell MFI Zeolite Nanosheets and Its Effect on
External Surface Brønsted Acid Catalysis. Angew. Chemie - Int. Ed. 2020, 59,
2–9.
(38) Paul, G.; Bisio, C.; Braschi, I.; Cossi, M.; Gatti, G.; Gianotti, E.; Marchese, L.
Combined Solid-State NMR, FT-IR and Computational Studies on Layered and
Porous Materials. Chem. Soc. Rev. 2018, 47, 5684–5739.
(39) Holder, C. F.; Schaak, R. E. Tutorial on Powder X-Ray Diffraction for
Characterizing Nanoscale Materials. ACS Nano 2019, 13, 7359–7365.
(40) Sulpizi, M.; Gaigeot, M. P.; Sprik, M. The Silica-Water Interface: How the
Silanols Determine the Surface Acidity and Modulate the Water Properties. J.
Chem. Theory Comput. 2012, 8, 1037–1047.
(41) Boscoboinik, J. A.; Shaikhutdinov, S. Exploring Zeolite Chemistry with the
Tools of Surface Science: Challenges, Opportunities, and Limitations. Catal.
Letters 2014, 144, 1987–1995.
(42) Löffler, D.; Uhlrich, J. J.; Baron, M.; Yang, B.; Yu, X.; Lichtenstein, L.;
Heinke, L.; Büchner, C.; Heyde, M.; Shaikhutdinov, S.; et al. Growth and
Structure of Crystalline Silica Sheet on Ru(0001). Phys. Rev. Lett. 2010, 105,
99
146104(1)-146104(4).
(43) Boscoboinik, J. A.; Yu, X.; Yang, B.; Fischer, F. D.; Wodarczyk, R.; Sierka,
M.; Shaikhutdinov, S.; Sauer, J.; Freund, H. J. Modeling Zeolites with Metal-
Supported Two-Dimensional Aluminosilicate Films. Angew. Chemie - Int. Ed.
2012, 51, 6005–6008.
(44) Yang, B.; Kaden, W. E.; Yu, X.; Boscoboinik, J. A.; Martynova, Y.;
Lichtenstein, L.; Heyde, M.; Sterrer, M.; Włodarczyk, R.; Sierka, M.; et al. Thin
Silica Films on Ru(0001): Monolayer, Bilayer and Three-Dimensional
Networks of [SiO 4] Tetrahedra. Phys. Chem. Chem. Phys. 2012, 14, 11344–
11351.
(45) Yu, X.; Yang, B.; Anibal Boscoboinik, J.; Shaikhutdinov, S.; Freund, H. J.
Support Effects on the Atomic Structure of Ultrathin Silica Films on Metals.
Appl. Phys. Lett. 2012, 100, 151608-1-151608–4.
(46) Goldsmith, B. R.; Peters, B.; Johnson, J. K.; Gates, B. C.; Scott, S. L. Beyond
Ordered Materials: Understanding Catalytic Sites on Amorphous Solids. ACS
Catal. 2017, 7, 7543–7557.
(47) Agrawal, K. V.; Topuz, B.; Jiang, Z.; Nguenkam, K.; Elyassi, B.; Francis, L. F.;
Tsapatsis, M.; Navarro, M. Solution-Processable Exfoliated Zeolite Nanosheets
Purified by Density Gradient Centrifugation. AIChE J. 2013, 59, 3458–3467.
(48) Varoon, K.; Zhang, X.; Elyassi, B.; Brewer, D. D.; Gettel, M.; Kumar, S.; Lee,
J. A.; Maheshwari, S.; Mittal, A.; Sung, C. Y.; et al. Dispersible Exfoliated
Zeolite Nanosheets and Their Application as a Selective Membrane. Science
(80-. ). 2011, 334, 72–75.
(49) Jeon, M. Y.; Kim, D.; Kumar, P.; Lee, P. S.; Rangnekar, N.; Bai, P.; Shete, M.;
Elyassi, B.; Lee, H. S.; Narasimharao, K.; et al. Ultra-Selective High-Flux
Membranes from Directly Synthesized Zeolite Nanosheets. Nature 2017, 543,
690–694.
(50) Cho, H. J.; Ren, L.; Vattipalli, V.; Yeh, Y. H.; Gould, N.; Xu, B.; Gorte, R. J.;
Lobo, R.; Dauenhauer, P. J.; Tsapatsis, M.; et al. Renewable P-Xylene from
2,5-Dimethylfuran and Ethylene Using Phosphorus-Containing Zeolite
Catalysts. ChemCatChem 2017, 9, 398–402.
(51) Abdelrahman, O. A.; Park, D. S.; Vinter, K. P.; Spanjers, C. S.; Ren, L.; Cho,
H. J.; Vlachos, D. G.; Fan, W.; Tsapatsis, M.; Dauenhauer, P. J. Biomass-
Derived Butadiene by Dehydra-Decyclization of Tetrahydrofuran. ACS Sustain.
Chem. Eng. 2017, 5, 3732–3736.
(52) Somorjai, G. A.; Li, Y. Impact of Surface Chemistry. Proc. Natl. Acad. Sci. U.
S. A. 2011, 108, 917–924.
(53) Kaden, W. E.; Pomp, S.; Sterrer, M.; Freund, H. J. Insights into Silica Bilayer
Hydroxylation and Dissolution. Top. Catal. 2017, 60, 471–480.
(54) Heard, C. J.; Grajciar, L.; Rice, C. M.; Pugh, S. M.; Nachtigall, P.; Ashbrook,
S. E.; Morris, R. E. Fast Room Temperature Lability of Aluminosilicate
Zeolites. Nat. Commun. 2019, 10.
(55) Yang, B.; Emmez, E.; Kaden, W. E.; Yu, X.; Boscoboinik, J. A.; Sterrer, M.;
100
Shaikhutdinov, S.; Freund, H. J. Hydroxylation of Metal-Supported Sheet-like
Silica Films. J. Phys. Chem. C 2013, 117, 8336–8344.
(56) Yu, X.; Emmez, E.; Pan, Q.; Yang, B.; Pomp, S.; Kaden, W. E.; Sterrer, M.;
Shaikhutdinov, S.; Freund, H. J.; Goikoetxea, I.; et al. Electron Stimulated
Hydroxylation of a Metal Supported Silicate Film. Phys. Chem. Chem. Phys.
2016, 18, 3755–3764.
(57) Stockwell, P. B. Handbook of Elemental Speciation: Techniques and
Methodology; 2004.
(58) Kimbrough, R. D. Toxicity and Health Effects of Selected Organotin
Compounds: A Review. Environ. Health Perspect. 1976.
(59) Nakanishi, T. Endocrine Disruption Induced by Organotin Compounds;
Organotins Function as a Powerful Agonist for Nuclear Receptors Rather than
an Aromatase Inhibitor. J. Toxicol. Sci. 2008.
(60) Sunday, A. O.; Alafara, B. A.; Oladele, O. G. Toxicity and Speciation Analysis
of Organotin Compounds. Chem. Speciat. Bioavailab. 2012.
(61) Mesmer, R. E.; Baes, C. F. Review of Hydrolysis Behavior of Ions in Aqueous
Solutions. MRS Proc. 1990, 180, 85.
(62) Jurinak, J. J.; Baes Jr, C. F. Jr., and Mesmer, R. The Hydrolysis of Cations;
1976.
(63) Baes, C. F.; Mesmer, R. F. The Thermodynamics of Cation Hydrolysis. Am. J.
Sci. 1981, 281, 935–962.
(64) Van Berkel, G. J.; Kertesz, V. Using the Electrochemistry of the Electrospray
Ion Source. Analytical Chemistry. 2007.
(65) Urabe, T.; Tanaka, M.; Kumakura, S.; Tsugoshi, T. Study on Chemical
Speciation in Aluminum Chloride Solution by ESI-Q-MS. J. Mass Spectrom.
2007.
(66) Stewart, I. I.; Horlick, G. Investigations into Chromium Speciation by
Electrospray Mass Spectrometry. J. Anal. At. Spectrom. 1996.
(67) Mensah, J. B.; Delidovich, I.; Hausoul, P. J. C.; Weisgerber, L.; Schrader, W.;
Palkovits, R. Mechanistic Studies of the Cu(OH)+-Catalyzed Isomerization of
Glucose into Fructose in Water. ChemSusChem 2018.
(68) Jiang, Y.; Yang, L.; Bohn, C. M.; Li, G.; Han, D.; Mosier, N. S.; Miller, J. T.;
Kenttämaa, H. I.; Abu-Omar, M. M. Speciation and Kinetic Study of Iron
Promoted Sugar Conversion to 5-Hydroxymethylfurfural (HMF) and Levulinic
Acid (LA). Org. Chem. Front. 2015, 2, 1388.
(69) Diehl, B.; Malz, F.; Holzgrabe, U. Quantitative NMR Spectroscopy in the
Quality Evaluation of Active Pharmaceutical Ingredients and Excipients.
Spectrosc. Eur. 2007.
(70) Holzgrabe, U. Quantitative NMR Spectroscopy in Pharmaceutical Applications.
Prog. Nucl. Magn. Reson. Spectrosc. 2010.
(71) Luan, J.; Feng, R.; Yu, C.; Wu, X.; Shen, W.; Chen, Y.; Di, B.; Su, M.
Quantitative Assessment of the Absolute Purity of Thiopeptcin Reference
Standard by 1H-NMR. Anal. Sci. 2018.
101
(72) Maki, H.; Sakata, G.; Mizuhata, M. Quantitative NMR of Quadrupolar Nucleus
as a Novel Analytical Method: Hydrolysis Behaviour Analysis of Aluminum
Ion. Analyst 2017, 142, 1790–1799.
(73) Kalbitzer, H. R. Protein NMR Spectroscopy. Principles and Practice. Zeitschrift
für Phys. Chemie 2011.
(74) Elving, P. J.; Zemel, B. Absorption in the Ultraviolet and Visible Regions of
Chloroaquochromium(III) Ions in Acid Media. J. Am. Chem. Soc. 1957.
(75) Abbott, A. P.; Al-Barzinjy, A. A.; Abbott, P. D.; Frisch, G.; Harris, R. C.;
Hartley, J.; Ryder, K. S. Speciation, Physical and Electrolytic Properties of
Eutectic Mixtures Based on CrCl3·6H2O and Urea. Phys. Chem. Chem. Phys.
2014.
(76) Verdonck, T.; Verpoort, P.; De Strycker, J.; De Cleene, A.; Banerjee, D.;
Nockemann, P.; Van Deun, R.; Van Hecke, K. Combining MCR-ALS and
EXAFS as Tools for Speciation of Highly Chlorinated Chromium(Iii) in
Mixtures of Deep Eutectic Solvents and Water. Dalt. Trans. 2019.
(77) McCalman, D. C.; Sun, L.; Zhang, Y.; Brennecke, J. F.; Maginn, E. J.;
Schneider, W. F. Speciation, Conductivities, Diffusivities, and Electrochemical
Reduction as a Function of Water Content in Mixtures of Hydrated Chromium
Chloride/Choline Chloride. J. Phys. Chem. B 2015.
(78) Yano, J.; Yachandra, V. K. X-Ray Absorption Spectroscopy. Photosynth. Res.
2009.
(79) Apted, M. J.; Waychunas, G. A.; Brown, G. E. Structure and Specification of
Iron Complexes in Aqueous Solutions Determined by X-Ray Absorption
Spectroscopy. Geochim. Cosmochim. Acta 1985.
(80) Stetefeld, J.; McKenna, S. A.; Patel, T. R. Dynamic Light Scattering: A
Practical Guide and Applications in Biomedical Sciences. Biophysical Reviews.
2016.
(81) Chu, B.; Liu, T. Characterization of Nanoparticles by Scattering Techniques. J.
Nanoparticle Res. 2000.
(82) Shafran, K. L.; Perry, C. C. A Systematic Investigation of Aluminium Ion
Speciation at High Temperature. Part. 1. Solution Studies. Dalt. Trans. 2005.
(83) Caetano, B. L.; Meneau, F.; Santilli, C. V.; Pulcinelli, S. H.; Magnani, M.;
Briois, V. Mechanisms of SnO2 Nanoparticles Formation and Growth in Acid
Ethanol Solution Derived from SAXS and Combined Raman-XAS Time-
Resolved Studies. Chem. Mater. 2014.
(84) Kosinski, J. J.; Wang, P.; Springer, R. D.; Anderko, A. Modeling Acid-Base
Equilibria and Phase Behavior in Mixed-Solvent Electrolyte Systems. Fluid
Phase Equilib. 2007.
(85) Wang, P.; Anderko, A.; Springer, R. D.; Young, R. D. Modeling Phase
Equilibria and Speciation in Mixed-Solvent Electrolyte Systems: II. Liquid-
Liquid Equilibria and Properties of Associating Electrolyte Solutions. J. Mol.
Liq. 2006.
(86) Wang, P.; Springer, R. D.; Anderko, A.; Young, R. D. Modeling Phase
102
Equilibria and Speciation in Mixed-Solvent Electrolyte Systems. In Fluid Phase
Equilibria; 2004.
(87) Wang, P.; Anderko, A.; Springer, R. D.; Kosinski, J. J.; Lencka, M. M.
Modeling Chemical and Phase Equilibria in Geochemical Systems Using a
Speciation-Based Model. J. Geochemical Explor. 2010.
(88) Wang, P.; Anderko, A.; Young, R. D. A Speciation-Based Model for Mixed-
Solvent Electrolyte Systems. Fluid Phase Equilib. 2002.
(89) Norton, A. M.; Nguyen, H.; Xiao, N. L.; Vlachos, D. G. Direct Speciation
Methods to Quantify Catalytically Active Species of AlCl 3 in Glucose
Isomerization. RSC Adv. 2018, 8, 17101-17109.
(90) A Guide to Using OLI Analyzer; 2014.
(91) Driscoll, C. T. The Chemistry of Aluminum in Surface Waters. Environ. Chem.
Alum. 1989.
(92) Hem, J. D. Study and Interpretation of the Chemical Characteristics of Natural
Water, 73rd ed.; Gould, R. F., Ed.; American Chemical Society: Washington,
D.C., 1970.
(93) Mesmer, R. E.; Baes, C. F. Acidity Measurements at Elevated Temperatures. V.
Aluminum Ion Hydrolysis. Inorg. Chem. 1971.
(94) Gustafsson, J. P. Visual MINTEQ https://vminteq.lwr.kth.se/ (accessed Jul 16,
2019).
(95) Shaff, J. E.; Schultz, B. A.; Craft, E. J.; Clark, R. T.; Kochian, L. V.
GEOCHEM-EZ: A Chemical Speciation Program with Greater Power and
Flexibility. Plant Soil 2010.
(96) Klamt, A.; Eckert, F.; Arlt, W. COSMO-RS: An Alternative to Simulation for
Calculating Thermodynamic Properties of Liquid Mixtures. Rev. Adv. Annu.
Rev. Chem. Biomol. Eng. 2010 2010, 1, 101–122.
(97) Kiepe, rn; Noll, O.; Gmehling, rgen. Modified LIQUAC and Modified
LIFACsA Further Development of Electrolyte Models for the Reliable
Prediction of Phase Equilibria with Strong Electrolytes. Ind. Eng. Chem. Res.
2006, 45, 2361–2373.
(98) Wang, S.; Song, Y.; Chen, C.-C. Extension of COSMO-SAC Solvation Model
for Electrolytes. Ind. Eng. Chem. Res. 2011, 50, 176–187.
(99) MT, H.; ST, L. A Predictive Model for the Excess Gibbs Free Energy of Fully
Dissociated Electrolyte Solutions. AIChE J. 2011, 57, 1061–1074.
(100) Ingram, T.; Gerlach, T.; Mehling, T.; Smirnova, I. Extension of COSMO-RS
for Monoatomic Electrolytes: Modeling of Liquid-Liquid Equilibria in Presence
of Salts. Fluid Phase Equilib. 2011, 314, 29–37.
(101) Mohammad, S.; Held, C.; Altuntepe, E.; Köse, T.; Gerlach, T.; Smirnova, I.;
Sadowski, G. Salt Influence on MIBK/Water Liquid-Liquid Equilibrium:
Measuring and Modeling with EPC-SAFT and COSMO-RS. Fluid Phase
Equilib. 2016, 416, 83–93.
(102) Mushrif, S. H.; Varghese, J. J.; Vlachos, D. G. Insights into the Cr(Iii)
Catalyzed Isomerization Mechanism of Glucose to Fructose in the Presence of
103
Water Using Ab Initio Molecular Dynamics. Phys. Chem. Chem. Phys. 2014.
(103) Isikgor, F. H.; Remzi Becer, C. Lignocellulosic Biomass: A Sustainable
Platform for Production of Bio-Based Chemicals and Polymers.
(104) Wang, Y.; Deng, W.; Wang, B.; Zhang, Q.; Wan, X.; Tang, Z.; Wang, Y.; Zhu,
C.; Cao, Z.; Wang, G.; et al. Chemical Synthesis of Lactic Acid from Cellulose
Catalysed by Lead(II) Ions in Water. Nat. Commun. 2013, 4.
(105) Tang, Z.; Deng, W.; Wang, Y.; Zhu, E.; Wan, X.; Zhang, Q.; Wang, Y.
Transformation of Cellulose and Its Derived Carbohydrates into Formic and
Lactic Acids Catalyzed by Vanadyl Cations. ChemSusChem 2014, 7, 1557–
1567.
(106) Wang, F. F.; Liu, C. L.; Dong, W. S. Highly Efficient Production of Lactic
Acid from Cellulose Using Lanthanide Triflate Catalysts. Green Chem. 2013,
15, 2091–2095.
(107) Lei, X.; Wang, F. F.; Liu, C. L.; Yang, R. Z.; Dong, W. S. One-Pot Catalytic
Conversion of Carbohydrate Biomass to Lactic Acid Using an ErCl3 Catalyst.
Appl. Catal. A Gen. 2014, 482, 78–83.
(108) Fenn, T. D.; Ringe, D.; Petsko, G. A. Xylose Isomerase in Substrate and
Inhibitor Michaelis States: Atomic Resolution Studies of a Metal-Mediated
Hydride Shift. Biochemistry 2004, 43, 6464–6474.
(109) Delidovich, I.; Palkovits, R. Catalytic Isomerization of Biomass-Derived
Aldoses: A Review. ChemSusChem. 2016.
(110) Rasrendra, C.; Makertihartha, I.; Adisasmito, S.; Heeres, H. Green Chemicals
from D-Glucose: Systematic Studies on Catalytic Effects of Inorganic Salts on
the Chemo-Selectivity and Yield in Aqueous Solutions. Top. Catal. 2010, 53,
1241–1247.
(111) Dallas Swift, T.; Nguyen, H.; Anderko, A.; Nikolakis, V.; Vlachos, D. G.
Tandem Lewis/Brønsted Homogeneous Acid Catalysis: Conversion of Glucose
to 5-Hydoxymethylfurfural in an Aqueous Chromium(Iii) Chloride and
Hydrochloric Acid Solution. Green Chem. 2015.
(112) Pagán-Torres, Y. J.; Wang, T. F.; Gallo, J. M. R.; Shanks, B. H.; Dumesic, J. A.
Production of 5-Hydroxymethylfurfural from Glucose Using a Combination of
Lewis and Brønsted Acid Catalysts in Water in a Biphasic Reactor with an
Alkylphenol Solvent. ACS Catal. 2012, 2, 930–934.
(113) Enslow, K. R.; Bell, A. T. SnCl4-Catalyzed Isomerization/Dehydration of
Xylose and Glucose to Furanics in Water. Catal. Sci. Technol. 2015, No. 5,
2839–2847.
(114) Dos Santos, J. B.; Da Silva, F. L.; Altino, F. M. R. S.; Da Silva Moreira, T.;
Meneghetti, M. R.; Meneghetti, S. M. P. Cellulose Conversion in the Presence
of Catalysts Based on Sn(Iv). Catal. Sci. Technol. 2013, 3, 673–678.
(115) Ramesh, P.; Kritikos, A.; Tsilomelekis, G. Effect of Metal Chlorides on
Glucose Mutarotation and Possible Implications on Humin Formation. React.
Chem. Eng. 2019.
(116) Lee, H. S.; Hong, J. Kinetics of Glucose Isomerization to Fructose by
104
Immobilized Glucose Isomerase: Anomeric Reactivity of D-Glucose in Kinetic
Model. J. Biotechnol. 2000.
(117) Qi, T.; He, M.-F.; Zhu, L.-F.; Lyu, Y.-J.; Yang, H.-Q.; Hu, C.-W. Cooperative
Catalytic Performance of Lewis and Brønsted Acids from AlCl 3 Salt in
Aqueous Solution Toward Glucose-to-Fructose Isomerization. J. Phys. Chem. C
2019.
(118) Corma Canos, A.; Iborra, S.; Velty, A. Chemical Routes for the Transformation
of Biomass into Chemicals. Chem. Rev. 2007, 107, 2411–2502.
(119) Di Cosimo, R.; McAuliffe, J.; Poulose, A. J.; Bohlmann, G. Industrial Use of
Immobilized Enzymes. Chem. Soc. Rev. 2013, 42, 6437–6374.
(120) Bhosale, S. H.; Rao, M. B.; Deshpande, V. V. Molecular and Industrial Aspects
of Glucose Isomerase. Microbiol. Rev. 1996, 60, 280–300.
(121) Nikolla, E.; Rom An-Leshkov, Y.; Moliner, M.; Davis, M. E. “One-Pot”
Synthesis of 5-(Hydroxymethyl)Furfural from Carbohydrates Using Tin-Beta
Zeolite. ACS Catal 2011, 1, 408–410.
(122) Swift, T. D.; Nguyen, H.; Anderko, A.; Nikolakis, V.; Vlachos, D. G. Tandem
Lewis/Brønsted Homogeneous Acid Catalysis: Conversion of Glucose to 5-
Hydoxymethylfurfural in an Aqueous Chromium(Iii) Chloride and
Hydrochloric Acid Solution. Green Chem. 2015, 17, 4725–4735.
(123) Choudhary, V.; Sandler, S. I.; Vlachos, D. G. Conversion of Xylose to Furfural
Using Lewis and Brønsted Acid Catalysts in Aqueous Media. ACS Catal. 2012,
2, 2022–2028.
(124) Bermejo-Deval, R.; Assary, R. S.; Nikolla, E.; Moliner, M.; Román-Leshkov,
Y.; Hwang, S. J.; Palsdottir, A.; Silverman, D.; Lobo, R. F.; Curtiss, L. A.; et al.
Metalloenzyme-like Catalyzed Isomerizations of Sugars by Lewis Acid
Zeolites. Proc. Natl. Acad. Sci. U. S. A. 2012, 109, 9727–9732.
(125) Hsu, P. H. Mechanisms of Gibbsite Crystallization from Partially Neutralized
Aluminum Chloride Solutions. Clays Clay Miner. 1988, 36, 25–30.
(126) Sposito, G. The Environmental Chemistry of Aluminum, Second Edition; 1995.
(127) Baes, C. F.; Mesmer, R. E. The Hydrolysis of Cations; 1977.
(128) Tang, J.; Zhu, L.; Fu, X.; Dai, J.; Guo, X.; Hu, C. Insights into the Kinetics and
Reaction Network of Aluminum Chloride-Catalyzed Conversion of Glucose in
NaCl-H2O/THF Biphasic System. ACS Catal. 2017, 7, 256–266.
(129) Bertsch, P. M.; Barnhisel, R. I.; Thomas, G. W.; Layton, W. J.; Smith, S. L.
Quantitative Determination of Aluminum-27 by High-Resolution Nuclear
Magnetic Resonance Spectrometry. Anal. Chem. 1986, 58, 2583–2585.
(130) Curtin, M. A.; Ingalls, L. R.; Campbell, A.; James-Pederson, M. Hydrolysis
Studies and Quantitative Determination of Aluminum Ions Using 27Al NMR.
An Undergraduate Analytical Chemistry Experiment. J. Chem. Educ. 2008, 85,
291–293.
(131) Faust, B. C.; Labiosa, W. B.; Dai, K. H.; MacFall, J. S.; Browne, B. A.;
Ribeiro, A. A.; Richter, D. D. Speciation of Aqueous Mononuclear Al(III)-
Hydroxo and Other Al(III) Complexes at Concentrations of Geochemical
105
Relevance by Aluminum-27 Nuclear Magnetic Resonance Spectroscopy.
Geochim. Cosmochim. Acta 1995, 59, 2651–2661.
(132) Shafran, K.; Deschaume, O.; Perry, C. C. High-Temperature Speciation Studies
of Al-Lon Hydrolysis. Adv. Eng. Mater. 2004, 6, 836–839.
(133) Singhal, A.; Keefer, K. D. A Study of Aluminum Speciation in Aluminum
Chloride Solutions by Small Angle X-Ray Scattering and 27A1 NMR. J. Mater.
Res. 1994, 9, 1973–1983.
(134) Wang, P.; Anderko, A. Computation of Dielectric Constants of Solvent
Mixtures and Electrolyte Solutions. Fluid Phase Equilib. 2001, 186, 103–122.
(135) Wang, P.; Anderko, A.; Young, R. D. A Speciation-Based Model for Mixed-
Solvent Electrolyte Systems. Fluid Phase Equilib. 2002, 203, 123–142.
(136) Baes, C. F.; Mesmer, R. F. The Thermodynamics of Cation Hydrolysis. Am. J.
Sci. 1981, 281, 935–962.
(137) Hem, J. D. Trace Inorganics in Water, 73rd ed.; Gould, R. F., Ed.; American
Chemical Society: Washington, D.C., 1970; Vol. 73.
(138) Mesmer, R. E.; Baes, C. F. Acidity Measurements at Elevated Temperatures. V.
Aluminum Ion Hydrolysis. Inorg. Chem. 1971, 10, 2290–2296.
(139) Frink, C. R.; Peech, M. Hydrolysis of the Aluminum Ion in Dilute Aqueous
Solutions. Inorg. Chem. 1963, 2, 473–478.
(140) Mason, J. Multinuclear NMR. In Multinuclear NMR; 1987; pp 259–292.
(141) Malz, F.; Jancke, H. Validation of Quantitative NMR. J. Pharm. Biomed. Anal.
2005, 38, 813–823.
(142) Pauli, G. F.; Jaki, B. U.; Lankin, D. C. Quantitative 1H NMR: Development
and Potential of a Method for Natural Products Analysis. J. Nat. Prod. 2005,
68, 133–149.
(143) Lubricants Market Size, Share & Trends Analysis Report By Application
(Industrial, Automotive, Marine, Aerospace), By Region (North America,
Europe, APAC, CSA, MEA), Competitive Landscape, And Segment Forecast,
2018-2025 https://www.grandviewresearch.com/industry-analysis/lubricants-
market.
(144) Liu, S.; Dutta, S.; Zheng, W.; Gould, N. S.; Cheng, Z.; Xu, B.; Saha, B.;
Vlachos, D. G. Catalytic Hydrodeoxygenation of High Carbon Furylmethanes
to Renewable Jet-Fuel Ranged Alkanes over a Rhenium-Modified Iridium
Catalyst. ChemSusChem 2017, 10, 3225–3234.
(145) Raston, C. L.; Scott, J. L. Chemoselective, Solvent-Free Aldol Condensation
Reaction. Green Chem. 2000, 2, 49–52.
(146) Del Rio, J. C.; Philp, R. P. Oligomerization of Fatty Acids as a Possible Source
for High Molecular Weight Hydrocarbons and Sulphur-Containing Compounds
in Sediments. Org. Geochem. 1992, 18, 869–880.
(147) Wijaya, Y. P.; Kristianto, I.; Lee, H.; Jae, J. Production of Renewable Toluene
from Biomass-Derived Furans via Diels-Alder and Dehydration Reactions: A
Comparative Study of Lewis Acid Catalysts. Fuel 2016, 182, 588–596.
(148) Corma, A. From Microporous to Mesoporous Molecular Sieve Materials and
106
Their Use in Catalysis. Chem. Rev. 1997, 97, 2373–2420.
(149) Davis, M. E. Ordered Porous Materials for Emerging Applications. Nature
2002, 417, 813–821.
(150) Meininghaus, C. K. W.; Prins, R. Sorption of Volatile Organic Compounds on
Hydrophobic Zeolites. Microporous Mesoporous Mater. 2000, 35, 349–365.
(151) Kreiter, R.; Rietkerk, M. D. A.; Castricum, H. L.; Van Veen, H. M.; Ten Elshof,
J. E.; Vente, J. F. Evaluation of Hybrid Silica Sols for Stable Microporous
Membranes Using High-Throughput Screening. J. Sol-Gel Sci. Technol. 2011,
57, 242–252.
(152) Luo, G.; McDonald, A. G. Conversion of Methanol and Glycerol into Gasoline
via ZSM-5 Catalysis. Energy and Fuels 2014, 28, 600–606.
(153) Kim, D.; Jeon, M. Y.; Stottrup, B. L.; Tsapatsis, M. Para-Xylene Ultra-
Selective Zeolite MFI Membranes Fabricated from Nanosheet Monolayers at
the Air–Water Interface. Angew. Chemie - Int. Ed. 2018, 57, 480–485.
(154) Kim, D.; Shete, M.; Tsapatsis, M. Large-Grain, Oriented, and Thin Zeolite MFI
Films from Directly Synthesized Nanosheet Coatings. Chem. Mater. 2018, 30,
3545–3551.
(155) Flanigen, E. M.; Khatami, H.; Szymanski, H. A. Infrared Structural Studies of
Zeolite Frameworks; 1974.
(156) Kestell, J. D.; Zhong, J. Q.; Shete, M.; Waluyo, I.; Sadowski, J. T.; Stacchiola,
D. J.; Tsapatsis, M.; Boscoboinik, J. A. Studying Two-Dimensional Zeolites
with the Tools of Surface Science: MFI Nanosheets on Au(111). Catal. Today
2017, 280, 283–288.
(157) Bisio, C.; Martra, G.; Coluccia, S.; Massiani, P. FT-IR Evidence of Two
Distinct Protonic Sites in BEA Zeolite: Consequences on Cationic Exchange
and on Acido-Basic Properties in the Presence of Cesium. J. Phys. Chem. C
2008, 112, 10520–10530.
(158) Warring, S. L.; Beattie, D. A.; McQuillan, A. J. Surficial Siloxane-to-Silanol
Interconversion during Room-Temperature Hydration/Dehydration of
Amorphous Silica Films Observed by ATR-IR and TIR-Raman Spectroscopy.
Langmuir 2016, 32, 1568–1576.
(159) Karbowiak, T.; Saada, M. A.; Rigolet, S.; Ballandras, A.; Weber, G.;
Bezverkhyy, I.; Soulard, M.; Patarin, J.; Bellat, J. P. New Insights in the
Formation of Silanol Defects in Silicalite-1 by Water Intrusion under High
Pressure. Phys. Chem. Chem. Phys. 2010, 12, 11454–11466.
(160) Maier, S. M.; Jentys, A.; Lercher, J. A. Steaming of Zeolite BEA and Its Effect
on Acidity: A Comparative NMR and IR Spectroscopic Study. J. Phys. Chem.
C 2011, 115, 8005–8013.
(161) Zhuravlev, L. T. The Surface Chemistry of Amorphous Silica. Zhuravlev
Model. Colloids Surfaces A Physicochem. Eng. Asp. 2000, 173, 1–38.
(162) Gallas, J. P.; Goupil, J. M.; Vimont, A.; Lavalley, J. C.; Gil, B.; Gilson, J. P.;
Miserque, O. Quantification of Water and Silanol Species on Various Silicas by
Coupling IR Spectroscopy and In-Situ Thermogravimetry. Langmuir 2009, 25,
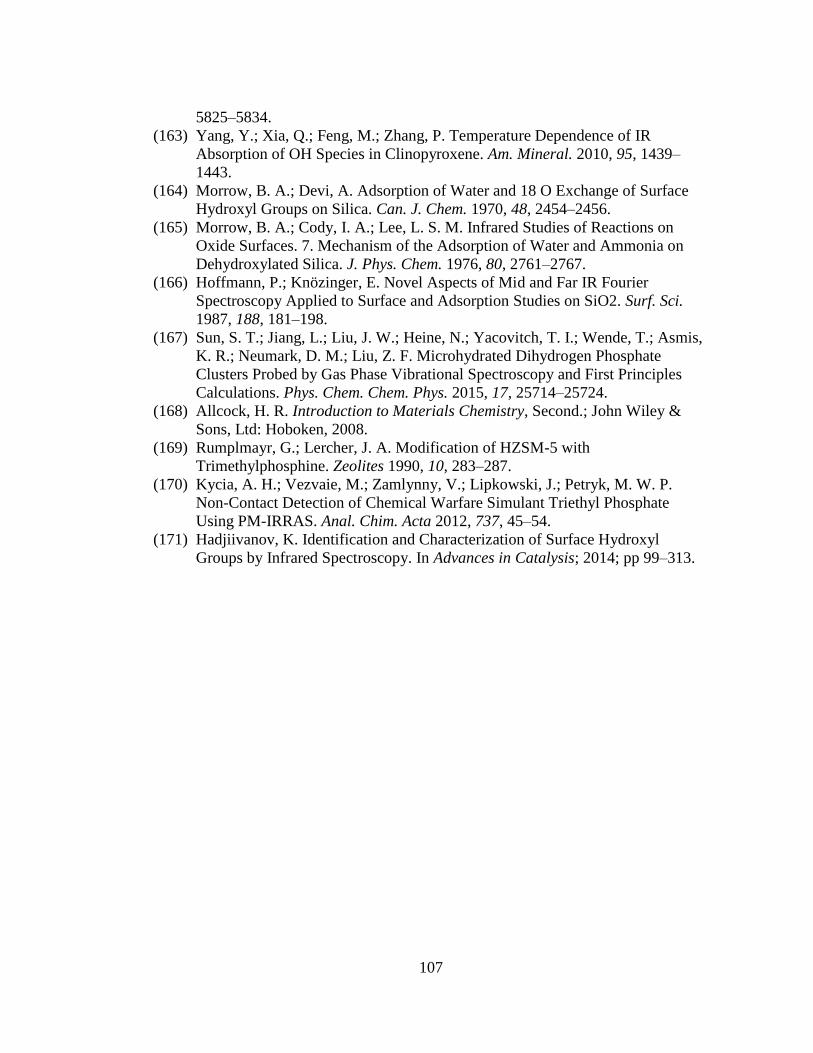
107
5825–5834.
(163) Yang, Y.; Xia, Q.; Feng, M.; Zhang, P. Temperature Dependence of IR
Absorption of OH Species in Clinopyroxene. Am. Mineral. 2010, 95, 1439–
1443.
(164) Morrow, B. A.; Devi, A. Adsorption of Water and 18 O Exchange of Surface
Hydroxyl Groups on Silica. Can. J. Chem. 1970, 48, 2454–2456.
(165) Morrow, B. A.; Cody, I. A.; Lee, L. S. M. Infrared Studies of Reactions on
Oxide Surfaces. 7. Mechanism of the Adsorption of Water and Ammonia on
Dehydroxylated Silica. J. Phys. Chem. 1976, 80, 2761–2767.
(166) Hoffmann, P.; Knözinger, E. Novel Aspects of Mid and Far IR Fourier
Spectroscopy Applied to Surface and Adsorption Studies on SiO2. Surf. Sci.
1987, 188, 181–198.
(167) Sun, S. T.; Jiang, L.; Liu, J. W.; Heine, N.; Yacovitch, T. I.; Wende, T.; Asmis,
K. R.; Neumark, D. M.; Liu, Z. F. Microhydrated Dihydrogen Phosphate
Clusters Probed by Gas Phase Vibrational Spectroscopy and First Principles
Calculations. Phys. Chem. Chem. Phys. 2015, 17, 25714–25724.
(168) Allcock, H. R. Introduction to Materials Chemistry, Second.; John Wiley &
Sons, Ltd: Hoboken, 2008.
(169) Rumplmayr, G.; Lercher, J. A. Modification of HZSM-5 with
Trimethylphosphine. Zeolites 1990, 10, 283–287.
(170) Kycia, A. H.; Vezvaie, M.; Zamlynny, V.; Lipkowski, J.; Petryk, M. W. P.
Non-Contact Detection of Chemical Warfare Simulant Triethyl Phosphate
Using PM-IRRAS. Anal. Chim. Acta 2012, 737, 45–54.
(171) Hadjiivanov, K. Identification and Characterization of Surface Hydroxyl
Groups by Infrared Spectroscopy. In Advances in Catalysis; 2014; pp 99–313.
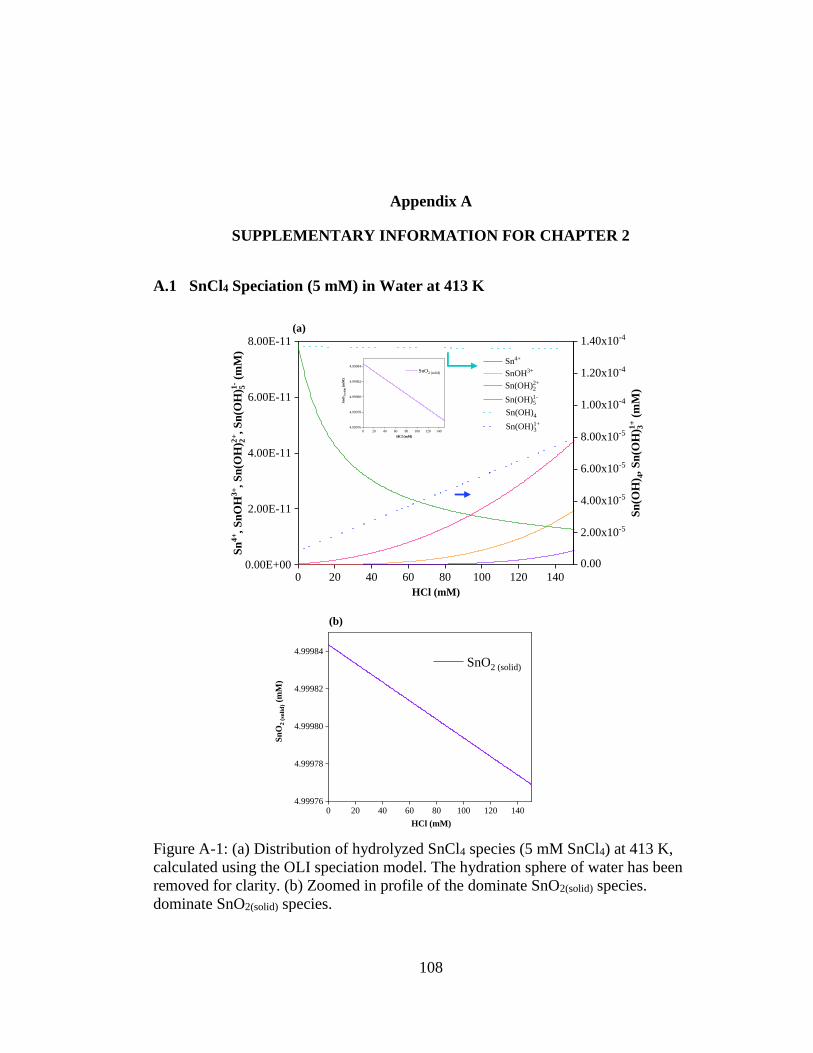
108
SUPPLEMENTARY INFORMATION FOR CHAPTER 2
A.1 SnCl4 Speciation (5 mM) in Water at 413 K
Appendix A
Figure A-1: (a) Distribution of hydrolyzed SnCl4 species (5 mM SnCl4) at 413 K,
calculated using the OLI speciation model. The hydration sphere of water has been
removed for clarity. (b) Zoomed in profile of the dominate SnO2(solid) species.
dominate SnO2(solid) species.
0 20 40 60 80 100 120 1400.00E+00
2.00E-11
4.00E-11
6.00E-11
8.00E-11
Sn4+
SnOH3+
Sn(OH)2+2
Sn(OH)1-5
Sn
(OH
) 4,
Sn
(OH
)1+
3 (
mM
)
Sn
4+,
Sn
OH
3+,
Sn
(OH
)2+
2,
Sn
(OH
)1-
5 (
mM
)
HCl (mM)
0.00
2.00x10⁻⁵
4.00x10⁻⁵
6.00x10⁻⁵
8.00x10⁻⁵
1.00x10⁻⁴
1.20x10⁻⁴
1.40x10⁻⁴
0 20 40 60 80 100 120 1404.99976
4.99978
4.99980
4.99982
4.99984
Sn
O2
(so
lid
) (m
M)
HCl (mM)
SnO2 (solid)
Sn(OH)4
Sn(OH)1+3
0 20 40 60 80 100 120 1404.99976
4.99978
4.99980
4.99982
4.99984
Sn
O2
(so
lid
) (m
M)
HCl (mM)
SnO2 (solid)
(a)
(b)
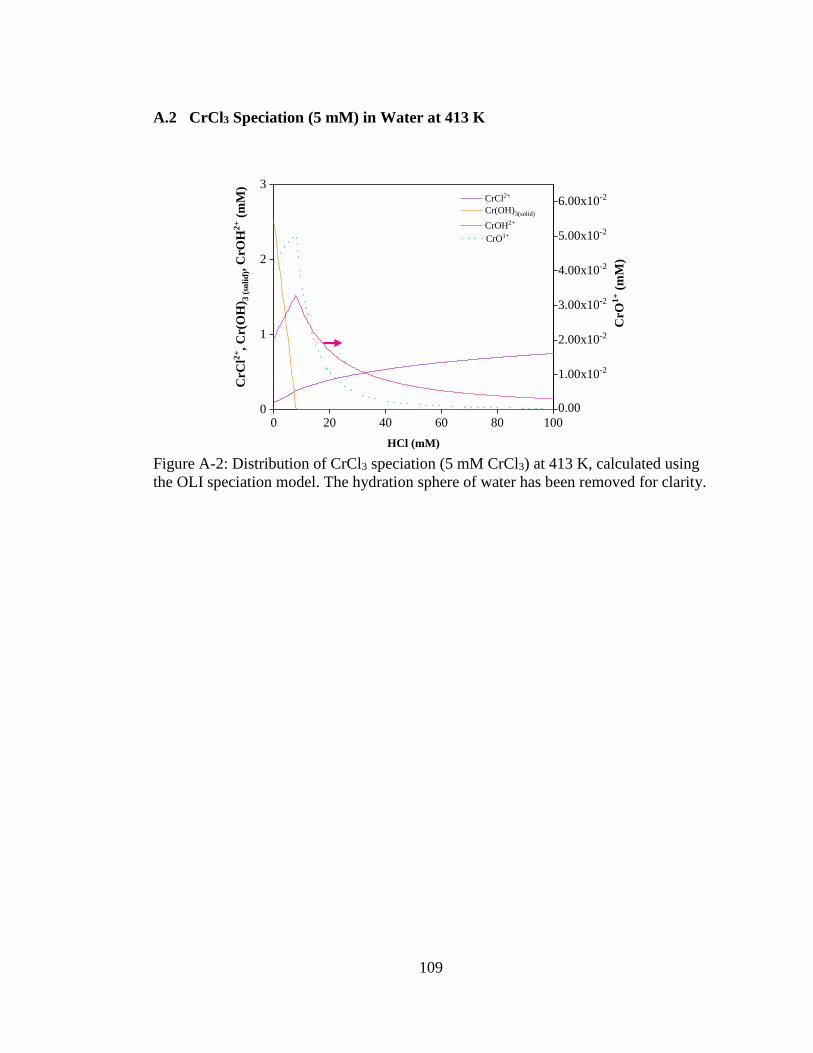
109
A.2 CrCl3 Speciation (5 mM) in Water at 413 K
Figure A-2: Distribution of CrCl3 speciation (5 mM CrCl3) at 413 K, calculated using
the OLI speciation model. The hydration sphere of water has been removed for clarity.
0 20 40 60 80 1000
1
2
3
CrO
1+ (
mM
)
CrC
l2+, C
r(O
H) 3
(so
lid
), C
rOH
2+ (
mM
)
HCl (mM)
CrCl2+
Cr(OH)3(solid)
CrOH2+
0.00
1.00x10⁻²
2.00x10⁻²
3.00x10⁻²
4.00x10⁻²
5.00x10⁻²
6.00x10⁻²
CrO1+
110
A.3 SnCl4 Species at Varying Concentrations
Figure A-3: Speciation profiles obtained using the OLI speciation model at 413 K for
(a) SnO2(solid), (b) SnO2(solid) zoomed in profile, (c) Sn(OH)4, (d) Sn(OH)31+, (e)
Sn(OH)22+, and (f) Sn(OH)5
1- as a function of HCl concentration, where SnCl4
concentration is 5, 15, and 30 mM. zoomed in profile.
0 20 40 60 80 1000
4
8
12
16
20
24
28
Sn
O2
(so
lid
) (m
M)
HCl (mM)
5 mM SnCl4
15 mM SnCl4
30 mM SnCl4
0 20 40 60 80 1000.0001348
0.0001352
0.0001356
0.0001360
0.0001364
Sn
(OH
) 4 (m
M)
HCl (mM)
5 mM SnCl4
15 mM SnCl4
30 mM SnCl4
0 20 40 60 80 1000.00000
0.00002
0.00004
0.00006
0.00008
0.00010
Sn
(OH
)1+
3 (m
M)
HCl (mM)
5 mM SnCl4
15 mM SnCl4
30 mM SnCl4
0 20 40 60 80 1000.00
2.00E-11
4.00E-11
6.00E-11
Sn
(OH
)2+
2 (m
M)
HCl (mM)
5 mM SnCl4
15 mM SnCl4
30 mM SnCl4
0 20 40 60 80 1000.00
2.00E-11
4.00E-11
6.00E-11
Sn
(OH
)1-
5 (
mM
)
HCl (mM)
5 mM SnCl4
15 mM SnCl4
30 mM SnCl4
0 20 40 60 80 1004.99979
4.99980
4.99981
4.99982
4.99983
4.99984
4.99985
Sn
O2
(so
lid
) (m
M)
HCl (mM)
5 mM SnCl4
(c) (d)
(a) (b)
(c) (d)
HCl (mM)
HCl (mM)
HCl (mM)
HCl (mM)
HCl (mM) HCl (mM)
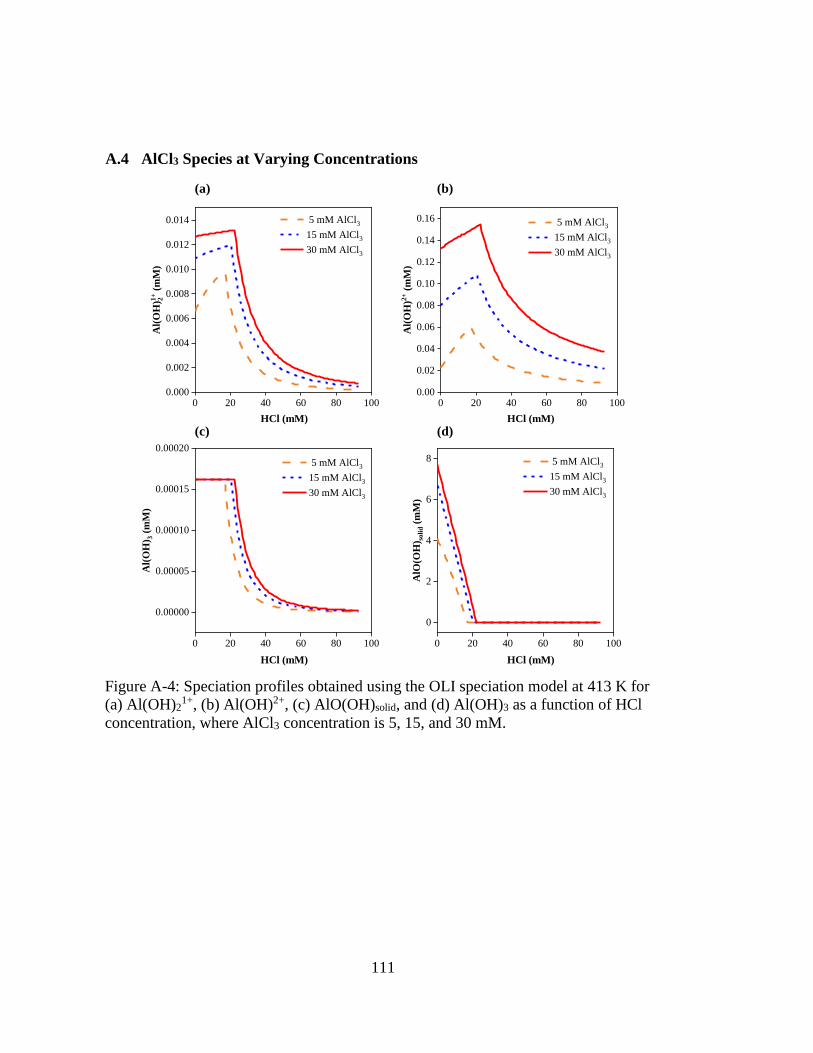
111
A.4 AlCl3 Species at Varying Concentrations
Figure A-4: Speciation profiles obtained using the OLI speciation model at 413 K for
(a) Al(OH)21+, (b) Al(OH)2+, (c) AlO(OH)solid, and (d) Al(OH)3 as a function of HCl
concentration, where AlCl3 concentration is 5, 15, and 30 mM.
0 20 40 60 80 1000.000
0.002
0.004
0.006
0.008
0.010
0.012
0.014
Al(
OH
)1+
2 (
mM
)
HCl (mM)
5 mM AlCl3
15 mM AlCl3
30 mM AlCl3
0 20 40 60 80 100
0
2
4
6
8
AlO
(OH
) so
lid (
mM
)
HCl (mM)
5 mM AlCl3
15 mM AlCl3
30 mM AlCl3
0 20 40 60 80 1000.00
0.02
0.04
0.06
0.08
0.10
0.12
0.14
0.16
Al(
OH
)2+ (
mM
)HCl (mM)
5 mM AlCl3
15 mM AlCl3
30 mM AlCl3
0 20 40 60 80 100
0.00000
0.00005
0.00010
0.00015
0.00020
Al(
OH
) 3 (
mM
)
HCl (mM)
5 mM AlCl3
15 mM AlCl3
30 mM AlCl3
(a) (b)
(c) (d)
HCl (mM)
HCl (mM)HCl (mM)
HCl (mM)
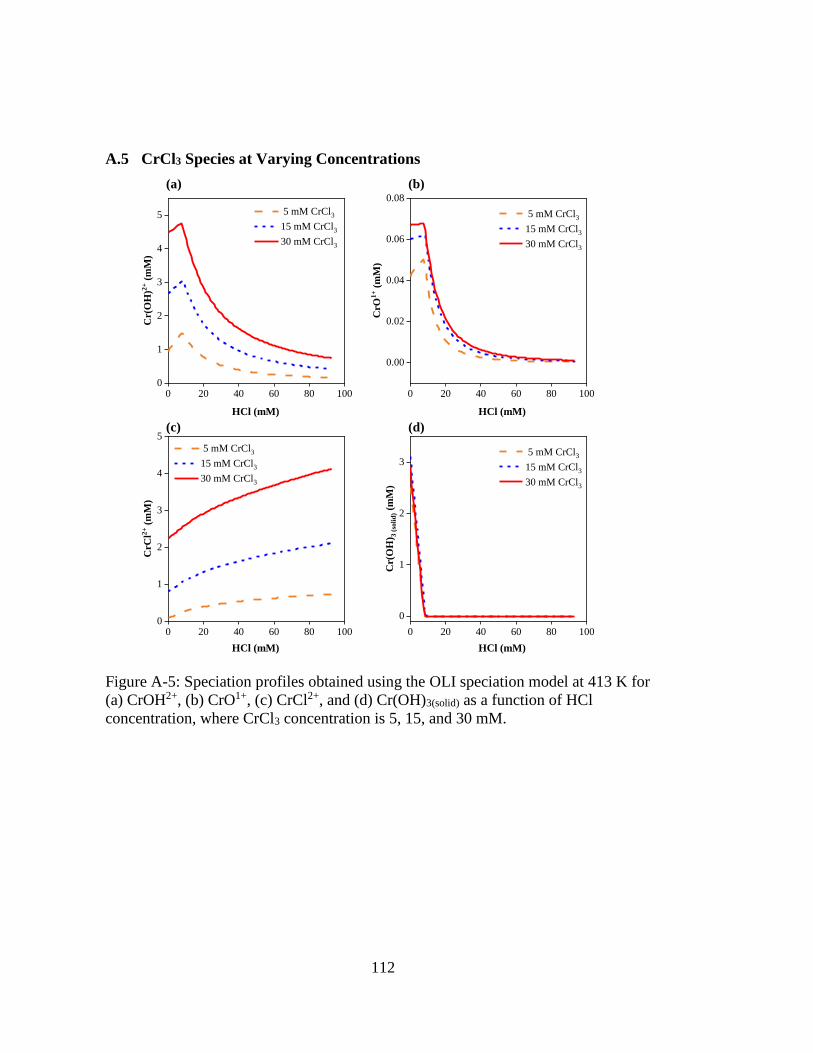
112
A.5 CrCl3 Species at Varying Concentrations
Figure A-5: Speciation profiles obtained using the OLI speciation model at 413 K for
(a) CrOH2+, (b) CrO1+, (c) CrCl2+, and (d) Cr(OH)3(solid) as a function of HCl
concentration, where CrCl3 concentration is 5, 15, and 30 mM.
0 20 40 60 80 1000
1
2
3
4
5
Cr(
OH
)2+ (
mM
)
HCl (mM)
5 mM CrCl3
15 mM CrCl3
30 mM CrCl3
0 20 40 60 80 100
0
1
2
3
Cr(
OH
) 3 (
soli
d) (m
M)
HCl (mM)
5 mM CrCl3
15 mM CrCl3
30 mM CrCl3
0 20 40 60 80 1000
1
2
3
4
5
CrC
l2+ (
mM
)
HCl (mM)
5 mM CrCl3
15 mM CrCl3
30 mM CrCl3
0 20 40 60 80 100
0.00
0.02
0.04
0.06
0.08
CrO
1+ (
mM
)
HCl (mM)
5 mM CrCl3
15 mM CrCl3
30 mM CrCl3
(a) (b)
(c) (d)
HCl (mM)
HCl (mM)
HCl (mM)
HCl (mM)
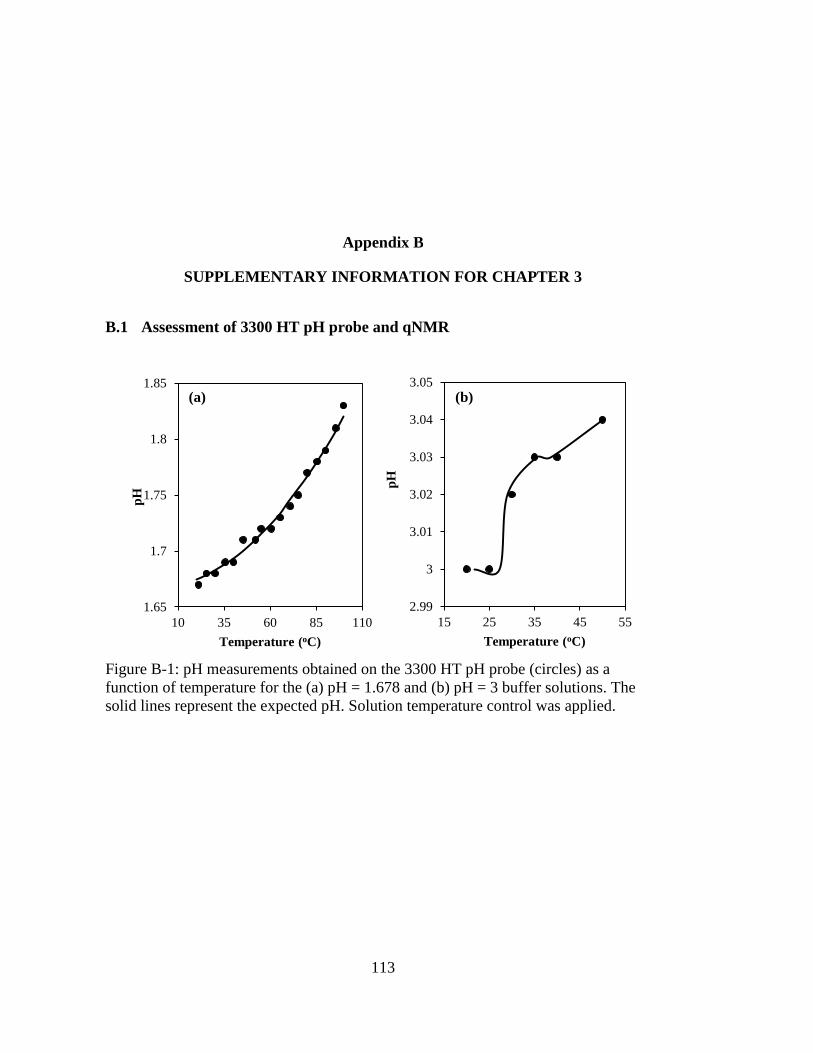
113
SUPPLEMENTARY INFORMATION FOR CHAPTER 3
B.1 Assessment of 3300 HT pH probe and qNMR
Appendix B
1.65
1.7
1.75
1.8
1.85
10 35 60 85 110
pH
Temperature (oC)
(a)
2.99
3
3.01
3.02
3.03
3.04
3.05
15 25 35 45 55
pH
Temperature (oC)
(b)
Figure B-1: pH measurements obtained on the 3300 HT pH probe (circles) as a
function of temperature for the (a) pH = 1.678 and (b) pH = 3 buffer solutions. The
solid lines represent the expected pH. Solution temperature control was applied.
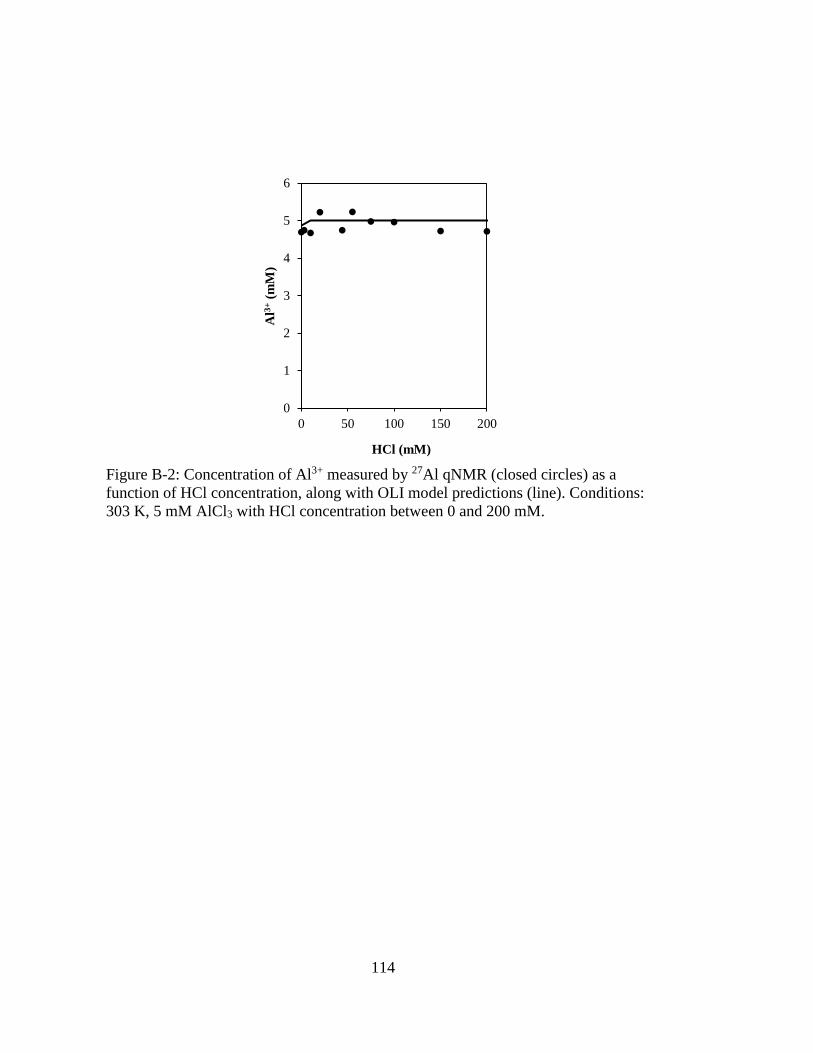
114
0
1
2
3
4
5
6
0 50 100 150 200
Al3
+(m
M)
HCl (mM)
Figure B-2: Concentration of Al3+ measured by 27Al qNMR (closed circles) as a
function of HCl concentration, along with OLI model predictions (line). Conditions:
303 K, 5 mM AlCl3 with HCl concentration between 0 and 200 mM.
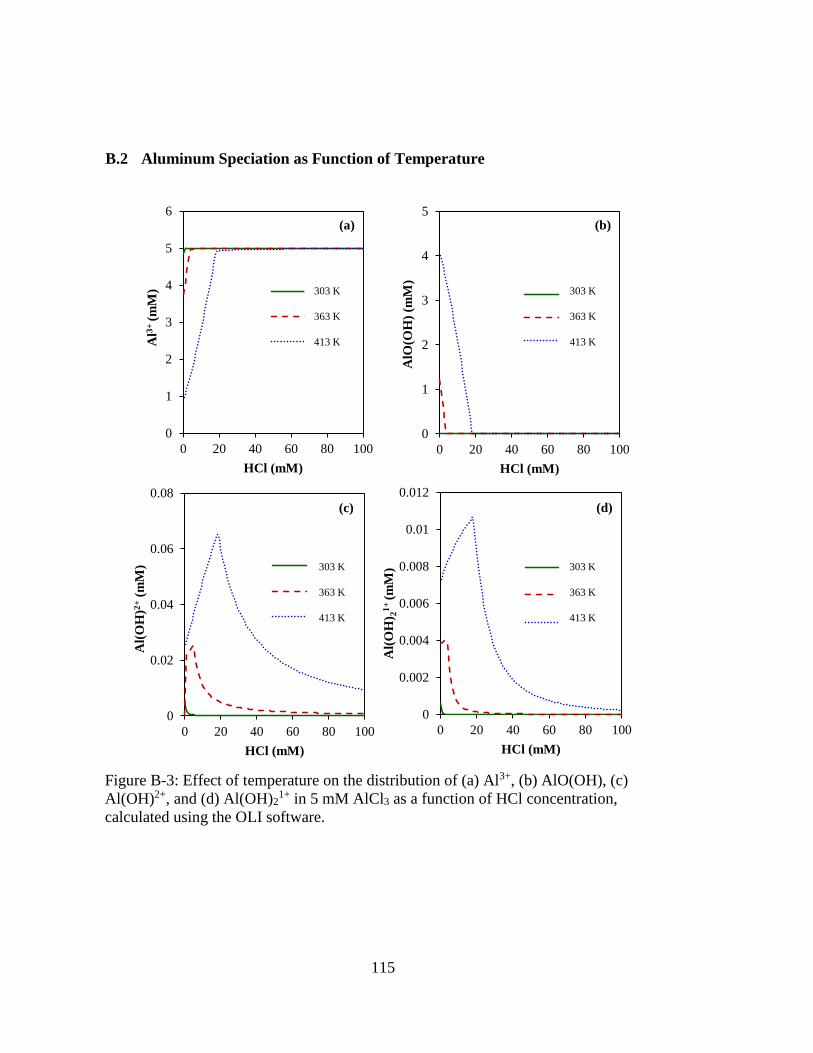
115
B.2 Aluminum Speciation as Function of Temperature
0
1
2
3
4
5
6
0 20 40 60 80 100
Al3
+ (
mM
)
HCl (mM)
30 C
90 C
140 C
0
0.02
0.04
0.06
0.08
0 20 40 60 80 100
Al(
OH
)2+
(mM
)
HCl (mM)
30 C
90 C
140 C
0
0.002
0.004
0.006
0.008
0.01
0.012
0 20 40 60 80 100
Al(
OH
) 21
+ (m
M)
HCl (mM)
30 C
90 C
140 C
303 K
363 K
413 K
0
1
2
3
4
5
0 20 40 60 80 100
AlO
(OH
) (m
M)
HCl (mM)
30 C
90 C
140 C
303 K
363 K
413 K
303 K
363 K
413 K
303 K
363 K
413 K
(a) (b)
(c) (d)
Figure B-3: Effect of temperature on the distribution of (a) Al3+, (b) AlO(OH), (c)
Al(OH)2+, and (d) Al(OH)21+ in 5 mM AlCl3 as a function of HCl concentration,
calculated using the OLI software.
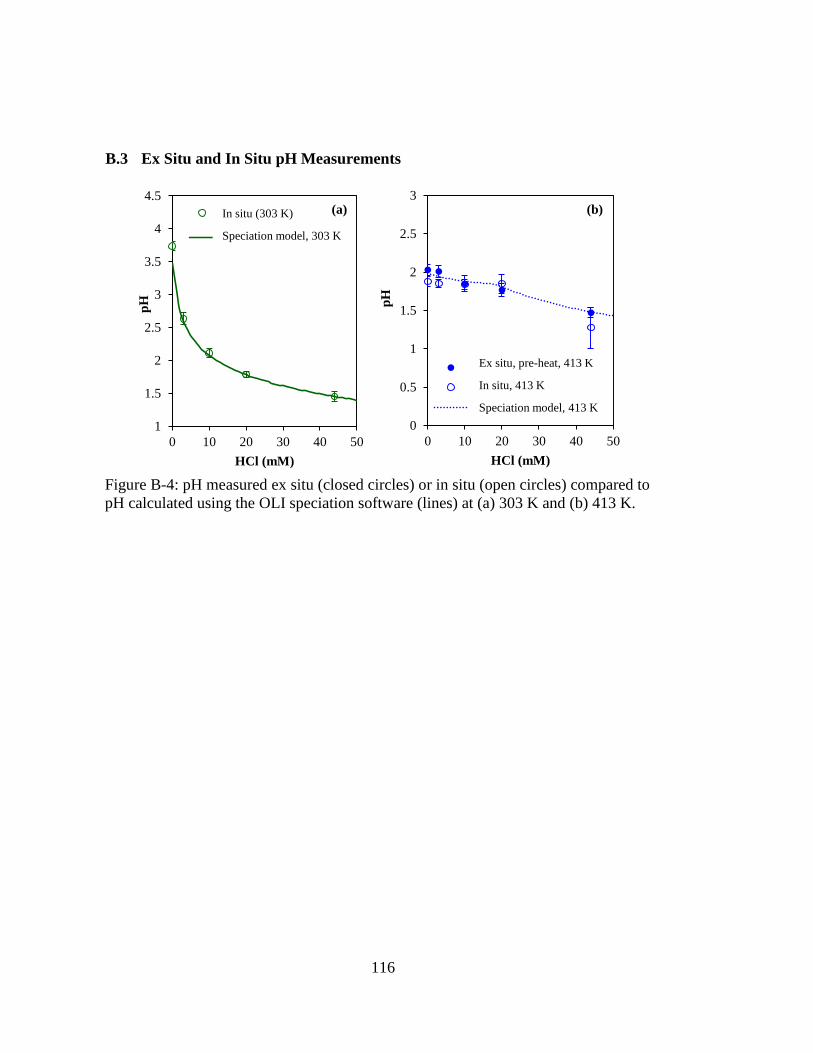
116
B.3 Ex Situ and In Situ pH Measurements
0
0.5
1
1.5
2
2.5
3
0 10 20 30 40 50
pH
HCl (mM)
24 hr
Series3
pH
Ex situ, pre-heat, 413 K
In situ, 413 K
Speciation model, 413 K
1
1.5
2
2.5
3
3.5
4
4.5
0 10 20 30 40 50
pH
HCl (mM)
30 C
Speciation Model, 30 C
In situ (303 K)
Speciation model, 303 K
(a) (b)
Figure B-4: pH measured ex situ (closed circles) or in situ (open circles) compared to
pH calculated using the OLI speciation software (lines) at (a) 303 K and (b) 413 K.
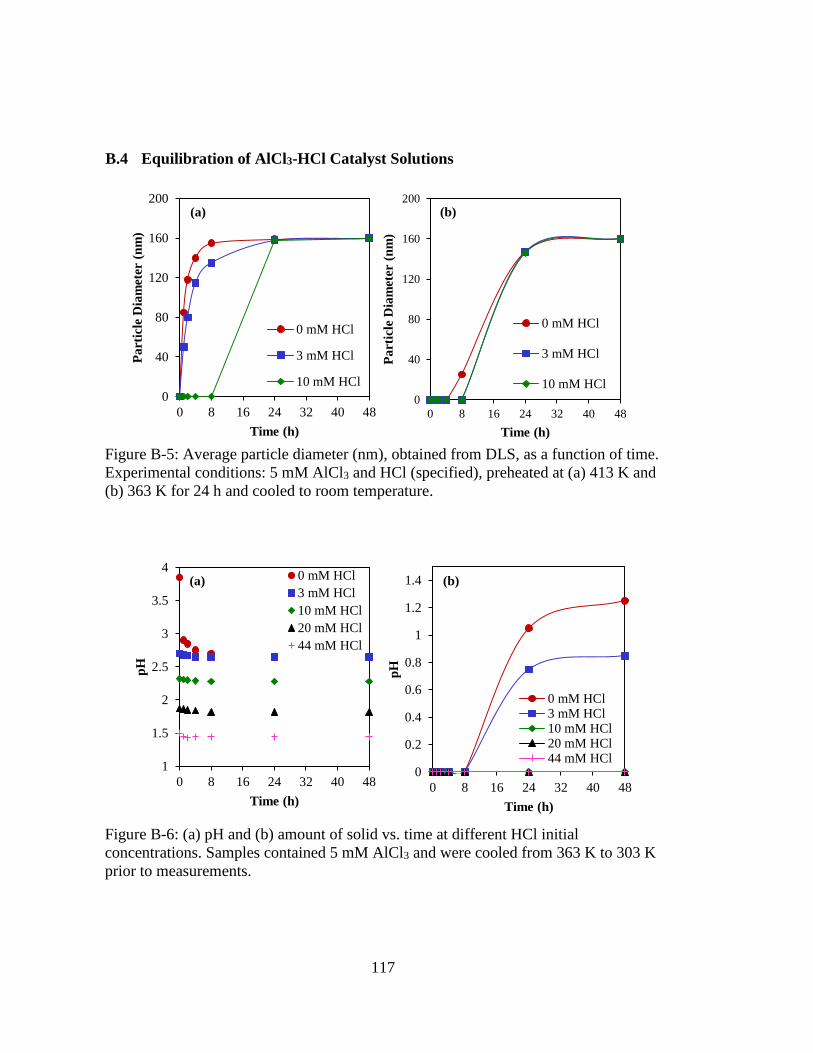
117
B.4 Equilibration of AlCl3-HCl Catalyst Solutions
0
40
80
120
160
200
0 8 16 24 32 40 48
Pa
rtic
le D
iam
eter
(n
m)
Time (h)
0 mM HCl
3 mM HCl
10 mM HCl
0
40
80
120
160
200
0 8 16 24 32 40 48
Pa
rtic
le D
iam
eter
(n
m)
Time (h)
0 mM HCl
3 mM HCl
10 mM HCl
(a) (b)
Figure B-5: Average particle diameter (nm), obtained from DLS, as a function of time.
Experimental conditions: 5 mM AlCl3 and HCl (specified), preheated at (a) 413 K and
(b) 363 K for 24 h and cooled to room temperature.
1
1.5
2
2.5
3
3.5
4
0 8 16 24 32 40 48
pH
Time (h)
0 mM HCl
3 mM HCl
10 mM HCl
20 mM HCl
44 mM HCl
0
0.2
0.4
0.6
0.8
1
1.2
1.4
0 8 16 24 32 40 48
pH
Time (h)
0 mM HCl3 mM HCl10 mM HCl20 mM HCl44 mM HCl
(a) (b)
Figure B-6: (a) pH and (b) amount of solid vs. time at different HCl initial
concentrations. Samples contained 5 mM AlCl3 and were cooled from 363 K to 303 K
prior to measurements.
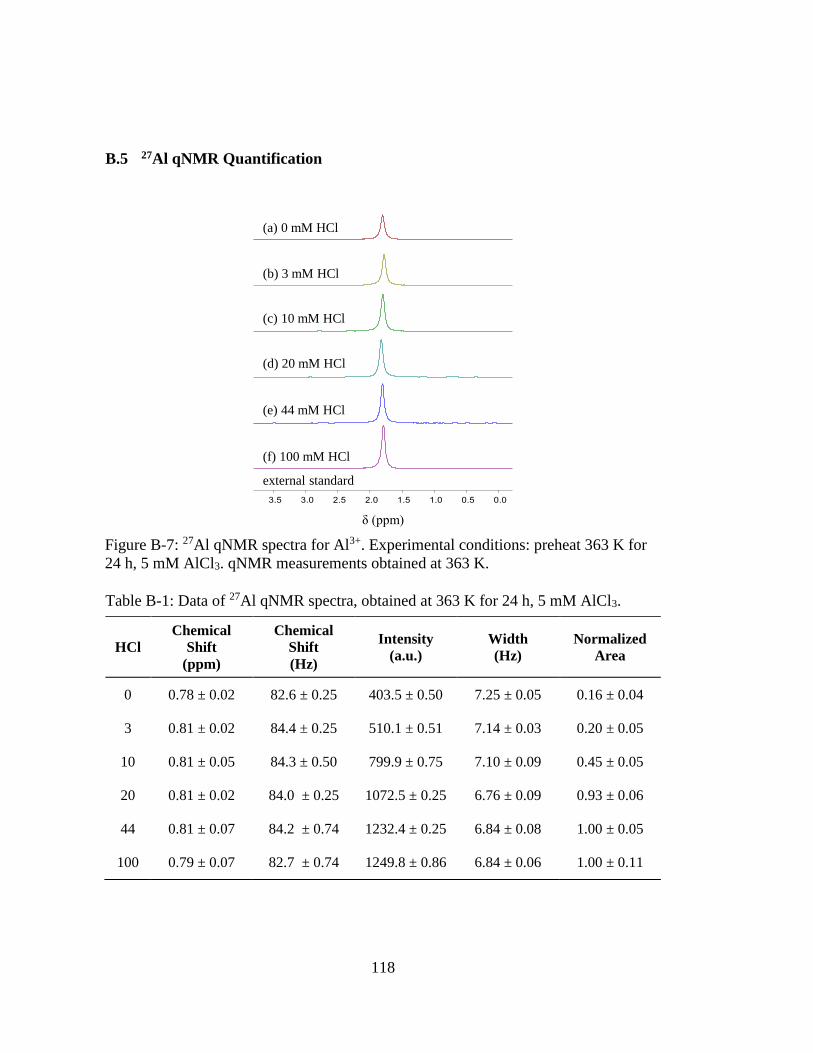
118
B.5 27Al qNMR Quantification
Table B-1: Data of 27Al qNMR spectra, obtained at 363 K for 24 h, 5 mM AlCl3.
HCl
Chemical
Shift
(ppm)
Chemical
Shift
(Hz)
Intensity
(a.u.)
Width
(Hz)
Normalized
Area
0 0.78 ± 0.02 82.6 ± 0.25 403.5 ± 0.50 7.25 ± 0.05 0.16 ± 0.04
3 0.81 ± 0.02 84.4 ± 0.25 510.1 ± 0.51 7.14 ± 0.03 0.20 ± 0.05
10 0.81 ± 0.05 84.3 ± 0.50 799.9 ± 0.75 7.10 ± 0.09 0.45 ± 0.05
20 0.81 ± 0.02 84.0 ± 0.25 1072.5 ± 0.25 6.76 ± 0.09 0.93 ± 0.06
44 0.81 ± 0.07 84.2 ± 0.74 1232.4 ± 0.25 6.84 ± 0.08 1.00 ± 0.05
100 0.79 ± 0.07 82.7 ± 0.74 1249.8 ± 0.86 6.84 ± 0.06 1.00 ± 0.11
δ (ppm)
(f) 100 mM HCl
external standard
(e) 44 mM HCl
(d) 20 mM HCl
(c) 10 mM HCl
(b) 3 mM HCl
(a) 0 mM HCl
Figure B-7: 27Al qNMR spectra for Al3+. Experimental conditions: preheat 363 K for
24 h, 5 mM AlCl3. qNMR measurements obtained at 363 K.
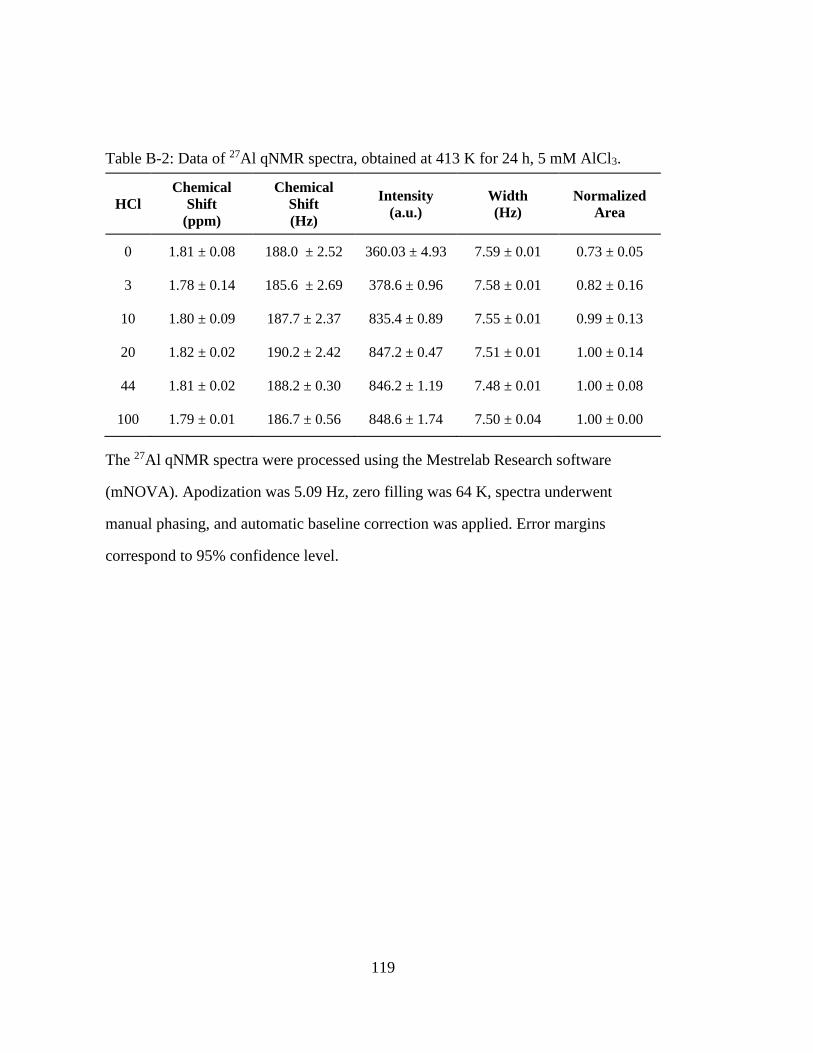
119
Table B-2: Data of 27Al qNMR spectra, obtained at 413 K for 24 h, 5 mM AlCl3.
The 27Al qNMR spectra were processed using the Mestrelab Research software
(mNOVA). Apodization was 5.09 Hz, zero filling was 64 K, spectra underwent
manual phasing, and automatic baseline correction was applied. Error margins
correspond to 95% confidence level.
HCl Chemical
Shift
(ppm)
Chemical
Shift
(Hz)
Intensity
(a.u.) Width
(Hz) Normalized
Area
0 1.81 ± 0.08 188.0 ± 2.52 360.03 ± 4.93 7.59 ± 0.01 0.73 ± 0.05
3 1.78 ± 0.14 185.6 ± 2.69 378.6 ± 0.96 7.58 ± 0.01 0.82 ± 0.16
10 1.80 ± 0.09 187.7 ± 2.37 835.4 ± 0.89 7.55 ± 0.01 0.99 ± 0.13
20 1.82 ± 0.02 190.2 ± 2.42 847.2 ± 0.47 7.51 ± 0.01 1.00 ± 0.14
44 1.81 ± 0.02 188.2 ± 0.30 846.2 ± 1.19 7.48 ± 0.01 1.00 ± 0.08
100 1.79 ± 0.01 186.7 ± 0.56 848.6 ± 1.74 7.50 ± 0.04 1.00 ± 0.00
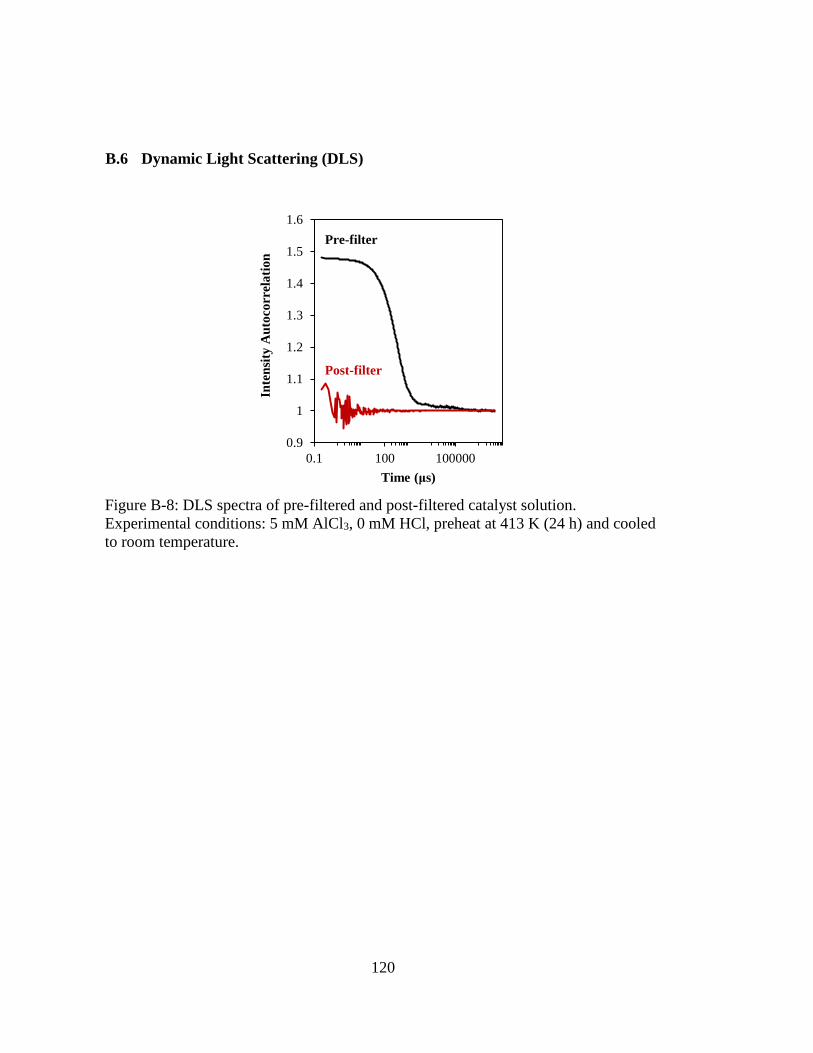
120
B.6 Dynamic Light Scattering (DLS)
0.9
1
1.1
1.2
1.3
1.4
1.5
1.6
0.1 100 100000
Inte
nsi
ty A
uto
corr
ela
tio
n
Time (μs)
Pre-filter
Post-filter
Figure B-8: DLS spectra of pre-filtered and post-filtered catalyst solution.
Experimental conditions: 5 mM AlCl3, 0 mM HCl, preheat at 413 K (24 h) and cooled
to room temperature.
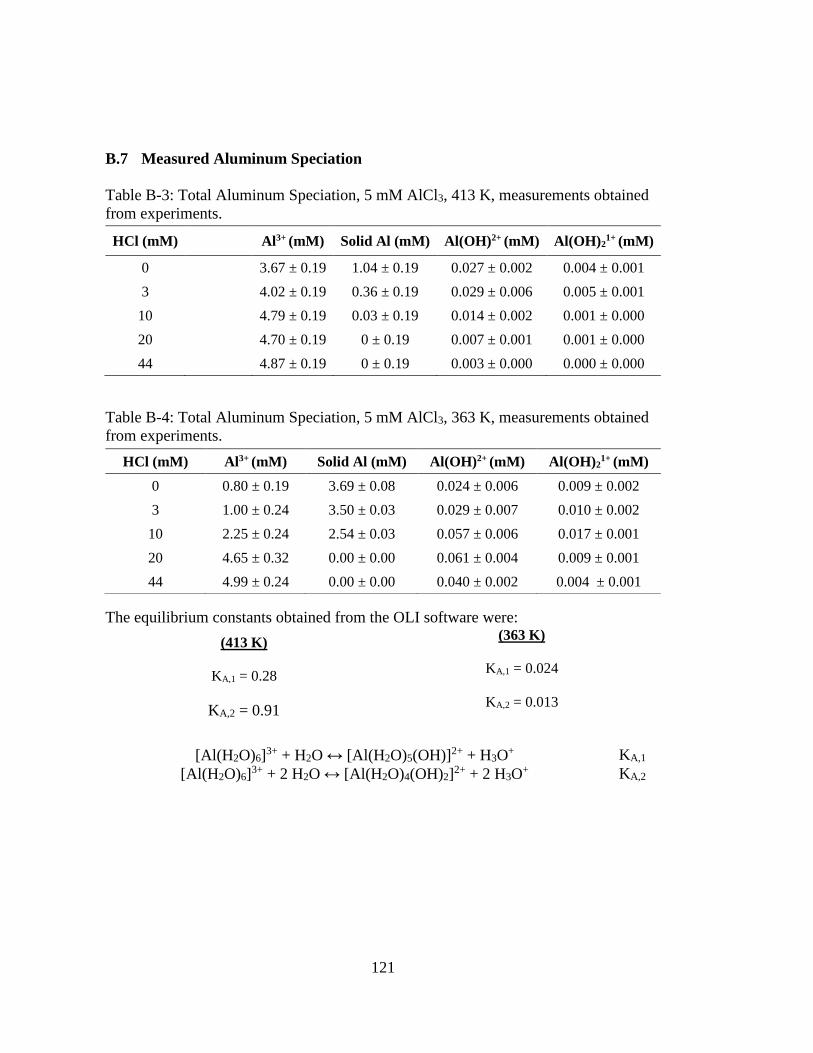
121
B.7 Measured Aluminum Speciation
Table B-3: Total Aluminum Speciation, 5 mM AlCl3, 413 K, measurements obtained
from experiments.
Table B-4: Total Aluminum Speciation, 5 mM AlCl3, 363 K, measurements obtained
from experiments.
The equilibrium constants obtained from the OLI software were:
(413 K)
KA,1 = 0.28
KA,2 = 0.91
(363 K)
KA,1 = 0.024
KA,2 = 0.013
[Al(H2O)6]3+ + H2O ↔ [Al(H2O)5(OH)]2+ + H3O
+ KA,1
[Al(H2O)6]3+ + 2 H2O ↔ [Al(H2O)4(OH)2]
2+ + 2 H3O+ KA,2
HCl (mM) Al3+ (mM) Solid Al (mM) Al(OH)2+ (mM) Al(OH)21+ (mM)
0 3.67 ± 0.19 1.04 ± 0.19 0.027 ± 0.002 0.004 ± 0.001
3 4.02 ± 0.19 0.36 ± 0.19 0.029 ± 0.006 0.005 ± 0.001
10 4.79 ± 0.19 0.03 ± 0.19 0.014 ± 0.002 0.001 ± 0.000
20 4.70 ± 0.19 0 ± 0.19 0.007 ± 0.001 0.001 ± 0.000
44 4.87 ± 0.19 0 ± 0.19 0.003 ± 0.000 0.000 ± 0.000
HCl (mM) Al3+ (mM) Solid Al (mM) Al(OH)2+ (mM) Al(OH)21+ (mM)
0 0.80 ± 0.19 3.69 ± 0.08 0.024 ± 0.006 0.009 ± 0.002
3 1.00 ± 0.24 3.50 ± 0.03 0.029 ± 0.007 0.010 ± 0.002
10 2.25 ± 0.24 2.54 ± 0.03 0.057 ± 0.006 0.017 ± 0.001
20 4.65 ± 0.32 0.00 ± 0.00 0.061 ± 0.004 0.009 ± 0.001
44 4.99 ± 0.24 0.00 ± 0.00 0.040 ± 0.002 0.004 ± 0.001
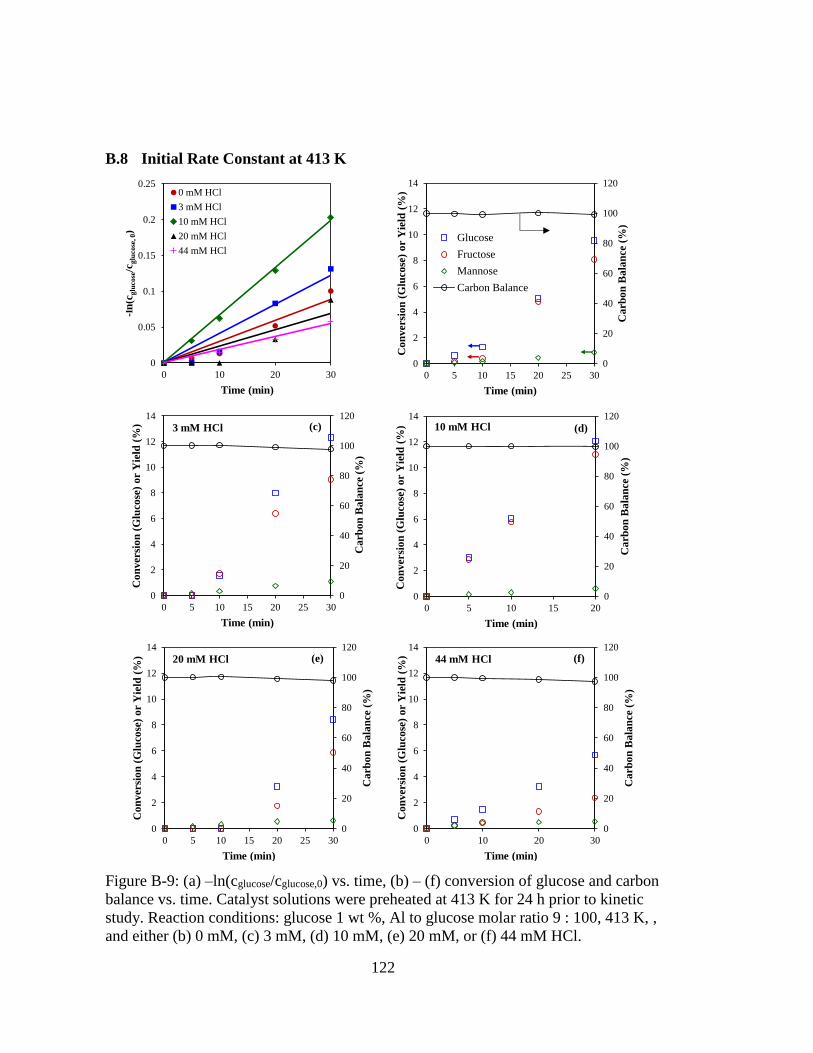
122
B.8 Initial Rate Constant at 413 K
0
0.05
0.1
0.15
0.2
0.25
0 10 20 30
-ln
(cg
luco
se/c
glu
cose
, 0)
Time (min)
0 mM HCl
3 mM HCl
10 mM HCl
20 mM HCl
44 mM HCl
0
20
40
60
80
100
120
0
2
4
6
8
10
12
14
0 5 10 15 20 25 30
Ca
rbo
n B
ala
nce
(%
)
Co
nv
ersi
on
(G
luco
se)
or
Yie
ld (
%)
Time (min)
Glucose
Fructose
Mannose
Carbon Balance
0
20
40
60
80
100
120
0
2
4
6
8
10
12
14
0 5 10 15 20 25 30
Ca
rbo
n B
ala
nce
(%
)
Co
nv
ersi
on
(G
luco
se)
or
Yie
ld (
%)
Time (min)
0
20
40
60
80
100
120
0
2
4
6
8
10
12
14
0 5 10 15 20
Ca
rbo
n B
ala
nce
(%
)
Co
nv
ersi
on
(G
luco
se)
or
Yie
ld (
%)
Time (min)
0
20
40
60
80
100
120
0
2
4
6
8
10
12
14
0 5 10 15 20 25 30
Ca
rbo
n B
ala
nce
(%
)
Co
nv
ersi
on
(G
luco
se)
or
Yie
ld (
%)
Time (min)
0
20
40
60
80
100
120
0
2
4
6
8
10
12
14
0 10 20 30
Ca
rbo
n B
ala
nce
(%
)
Co
nv
ersi
on
(G
luco
se)
or
Yie
ld (
%)
Time (min)
3 mM HCl 10 mM HCl
20 mM HCl 44 mM HCl
(c) (d)
(e) (f)
Figure B-9: (a) –ln(cglucose/cglucose,0) vs. time, (b) – (f) conversion of glucose and carbon
balance vs. time. Catalyst solutions were preheated at 413 K for 24 h prior to kinetic
study. Reaction conditions: glucose 1 wt %, Al to glucose molar ratio 9 : 100, 413 K, ,
and either (b) 0 mM, (c) 3 mM, (d) 10 mM, (e) 20 mM, or (f) 44 mM HCl.
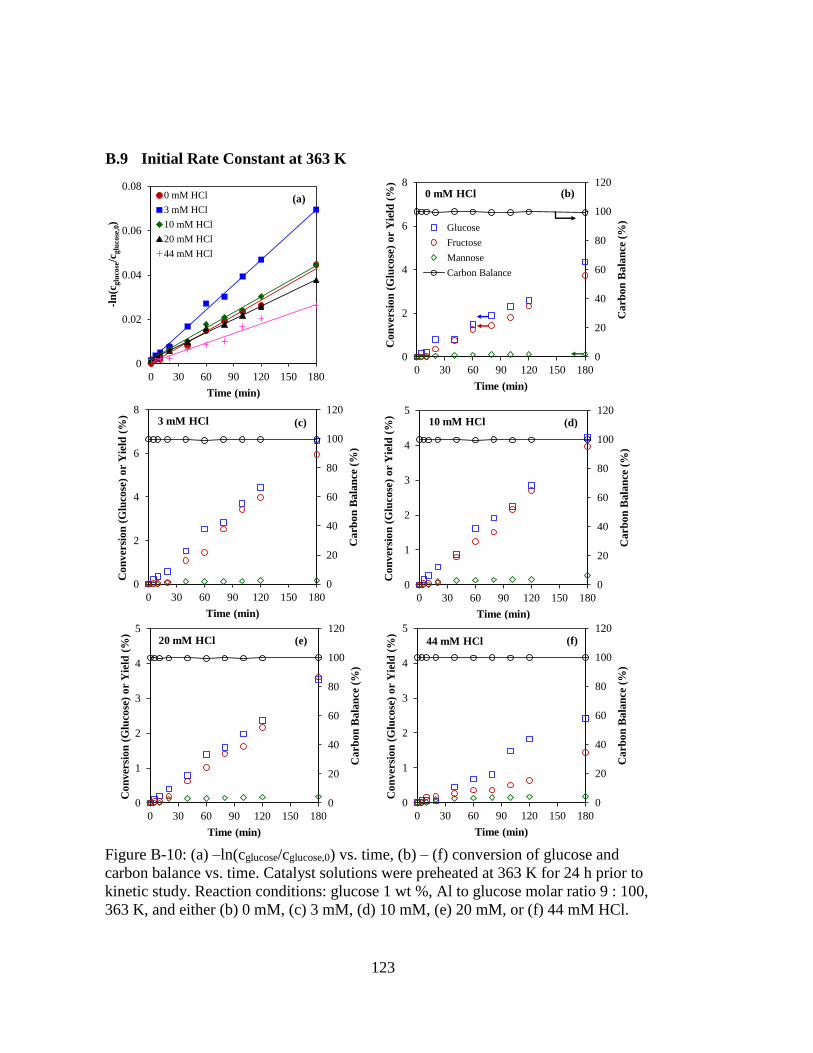
123
B.9 Initial Rate Constant at 363 K
0
0.02
0.04
0.06
0.08
0 30 60 90 120 150 180
-ln
(cg
luco
se/c
glu
cose
,0)
Time (min)
0 mM HCl
3 mM HCl
10 mM HCl
20 mM HCl
44 mM HCl
0
20
40
60
80
100
120
0
2
4
6
8
0 30 60 90 120 150 180
Ca
rbo
n B
ala
nce
(%
)
Co
nv
ersi
on
(G
luco
se)
or
Yie
ld (
%)
Time (min)
Glucose
Fructose
Mannose
Carbon Balance
0 mM HCl
0
20
40
60
80
100
120
0
2
4
6
8
0 30 60 90 120 150 180
Ca
rbo
n B
ala
nce
(%
)
Co
nv
ersi
on
(G
luco
se)
or
Yie
ld (
%)
Time (min)
3 mM HCl
0
20
40
60
80
100
120
0
1
2
3
4
5
0 30 60 90 120 150 180
Ca
rbo
n B
ala
nce
(%
)
Co
nv
ersi
on
(G
luco
se)
or
Yie
ld (
%)
Time (min)
10 mM HCl
0
20
40
60
80
100
120
0
1
2
3
4
5
0 30 60 90 120 150 180
Ca
rbo
n B
ala
nce
(%
)
Co
nv
ersi
on
(G
luco
se)
or
Yie
ld (
%)
Time (min)
20 mM HCl
0
20
40
60
80
100
120
0
1
2
3
4
5
0 30 60 90 120 150 180
Ca
rbo
n B
ala
nce
(%
)
Co
nv
ersi
on
(G
luco
se)
or
Yie
ld (
%)
Time (min)
44 mM HCl
(a)(b)
(c) (d)
(e) (f)
Figure B-10: (a) –ln(cglucose/cglucose,0) vs. time, (b) – (f) conversion of glucose and
carbon balance vs. time. Catalyst solutions were preheated at 363 K for 24 h prior to
kinetic study. Reaction conditions: glucose 1 wt %, Al to glucose molar ratio 9 : 100,
363 K, and either (b) 0 mM, (c) 3 mM, (d) 10 mM, (e) 20 mM, or (f) 44 mM HCl.
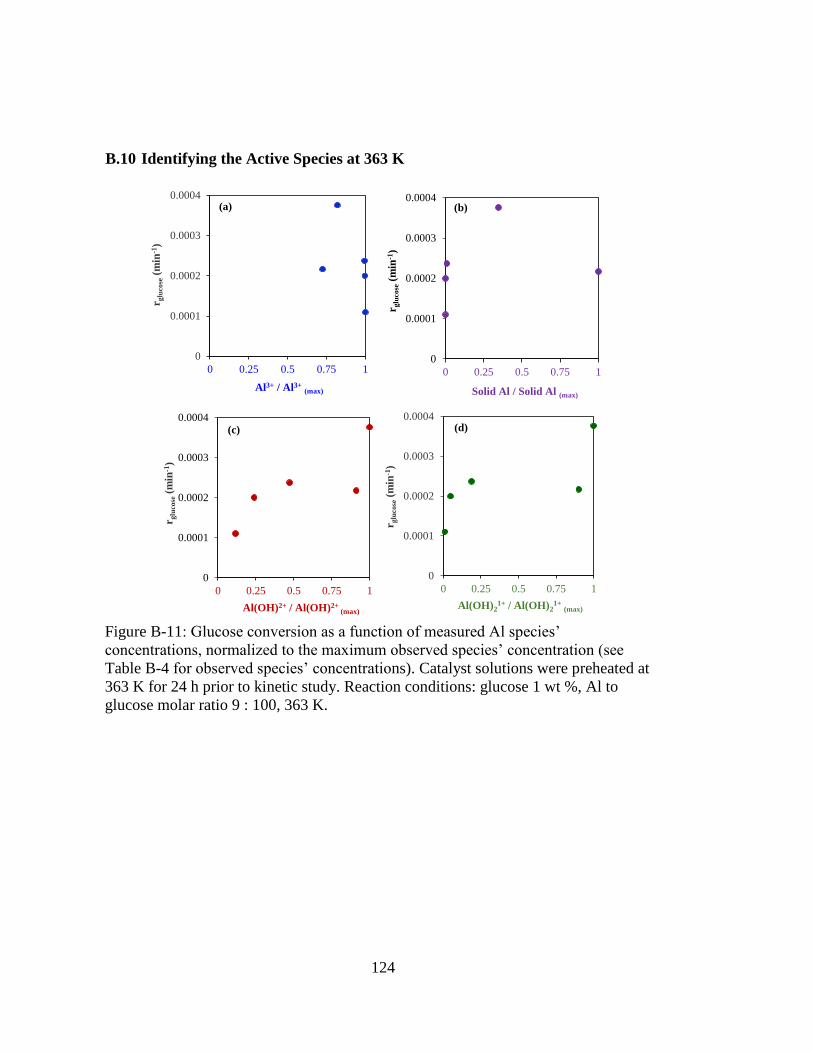
124
B.10 Identifying the Active Species at 363 K
0
0.0001
0.0002
0.0003
0.0004
0 0.25 0.5 0.75 1
r glu
cose
(min
-1)
Al3+ / Al3+(max)
0
0.0001
0.0002
0.0003
0.0004
0 0.25 0.5 0.75 1
r glu
cose
(min
-1)
Solid Al / Solid Al (max)
0
0.0001
0.0002
0.0003
0.0004
0 0.25 0.5 0.75 1
r glu
cose
(min
-1)
Al(OH)2+ / Al(OH)2+ (max)
0
0.0001
0.0002
0.0003
0.0004
0 0.25 0.5 0.75 1
r glu
cose
(min
-1)
Al(OH)21+ / Al(OH)2
1+(max)
(a) (b)
(c) (d)
Figure B-11: Glucose conversion as a function of measured Al species’
concentrations, normalized to the maximum observed species’ concentration (see
Table B-4 for observed species’ concentrations). Catalyst solutions were preheated at
363 K for 24 h prior to kinetic study. Reaction conditions: glucose 1 wt %, Al to
glucose molar ratio 9 : 100, 363 K.
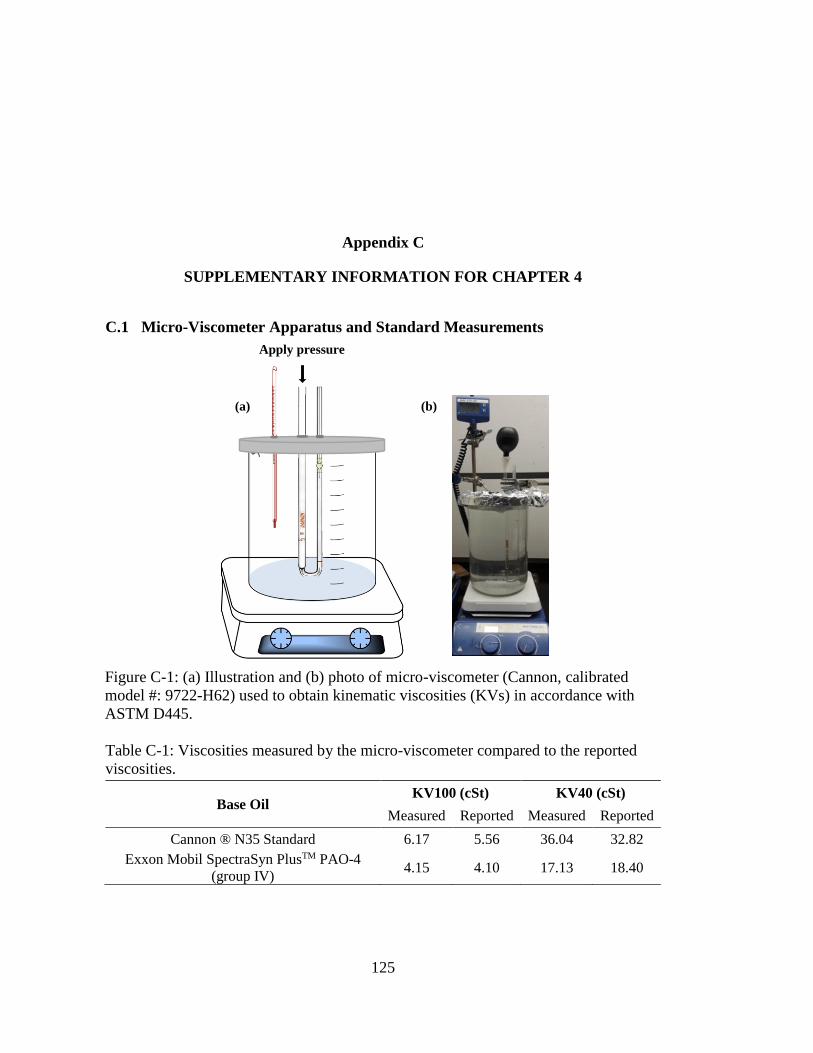
125
SUPPLEMENTARY INFORMATION FOR CHAPTER 4
C.1 Micro-Viscometer Apparatus and Standard Measurements
Table C-1: Viscosities measured by the micro-viscometer compared to the reported
viscosities.
Appendix C
Base Oil KV100 (cSt) KV40 (cSt)
Measured Reported Measured Reported
Cannon ® N35 Standard 6.17 5.56 36.04 32.82
Exxon Mobil SpectraSyn PlusTM PAO-4
(group IV) 4.15 4.10 17.13 18.40
Apply pressure
(a) (b)
Figure C-1: (a) Illustration and (b) photo of micro-viscometer (Cannon, calibrated
model #: 9722-H62) used to obtain kinematic viscosities (KVs) in accordance with
ASTM D445.
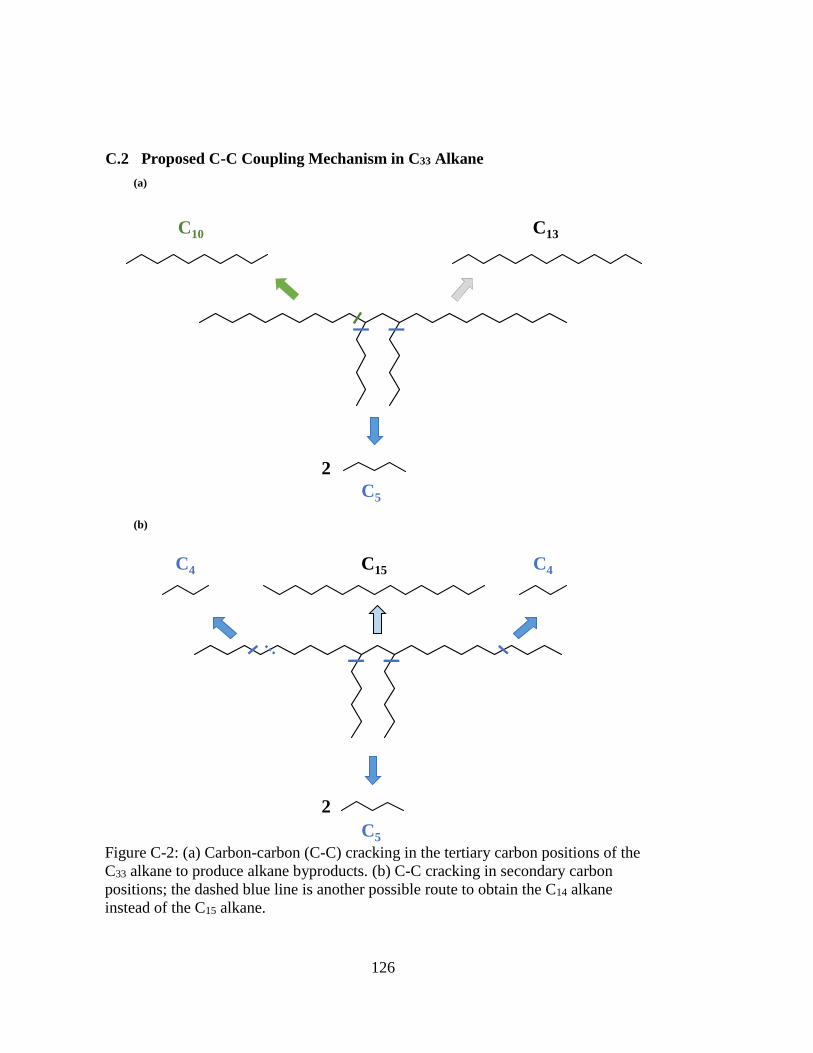
126
C.2 Proposed C-C Coupling Mechanism in C33 Alkane
C5
C10 C13
C5
C15C4 C4
(a)
(b)
2
2
Figure C-2: (a) Carbon-carbon (C-C) cracking in the tertiary carbon positions of the
C33 alkane to produce alkane byproducts. (b) C-C cracking in secondary carbon
positions; the dashed blue line is another possible route to obtain the C14 alkane
instead of the C15 alkane.
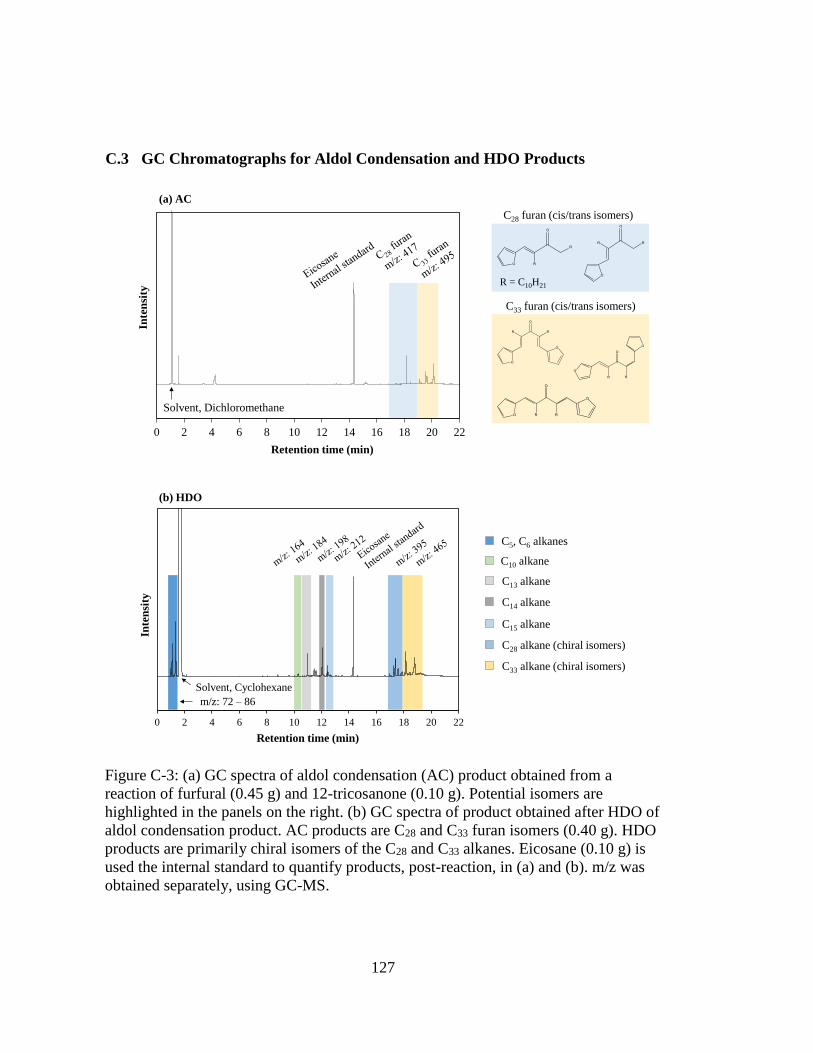
127
C.3 GC Chromatographs for Aldol Condensation and HDO Products
0 2 4 6 8 10 12 14 16 18 20 22
Inte
nsi
ty
Retention time (min)
C33 furan (cis/trans isomers)
C28 furan (cis/trans isomers)
(a) AC
(b) HDO
R = C10H21
C13 alkane
C14 alkane
C15 alkane
C28 alkane (chiral isomers)
C33 alkane (chiral isomers)
Solvent, Dichloromethane
Solvent, Cyclohexane
m/z: 72 – 86
C5, C6 alkanes
C10 alkane
0 2 4 6 8 10 12 14 16 18 20 22
Inte
nsi
ty
Retention time (min)
Figure C-3: (a) GC spectra of aldol condensation (AC) product obtained from a
reaction of furfural (0.45 g) and 12-tricosanone (0.10 g). Potential isomers are
highlighted in the panels on the right. (b) GC spectra of product obtained after HDO of
aldol condensation product. AC products are C28 and C33 furan isomers (0.40 g). HDO
products are primarily chiral isomers of the C28 and C33 alkanes. Eicosane (0.10 g) is
used the internal standard to quantify products, post-reaction, in (a) and (b). m/z was
obtained separately, using GC-MS.
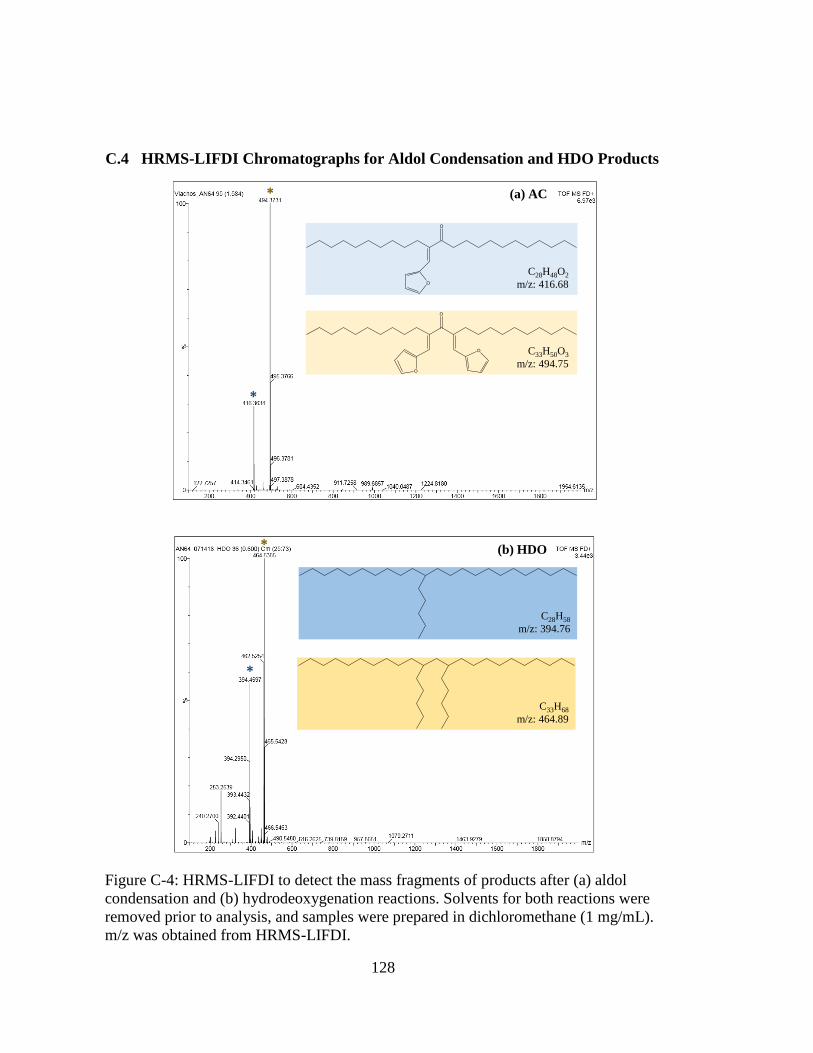
128
C.4 HRMS-LIFDI Chromatographs for Aldol Condensation and HDO Products
*
*
C33H50O3
m/z: 494.75
C28H48O2
m/z: 416.68
C33H68
m/z: 464.89
C28H58
m/z: 394.76
(a) AC
(b) HDO*
*
Figure C-4: HRMS-LIFDI to detect the mass fragments of products after (a) aldol
condensation and (b) hydrodeoxygenation reactions. Solvents for both reactions were
removed prior to analysis, and samples were prepared in dichloromethane (1 mg/mL).
m/z was obtained from HRMS-LIFDI.
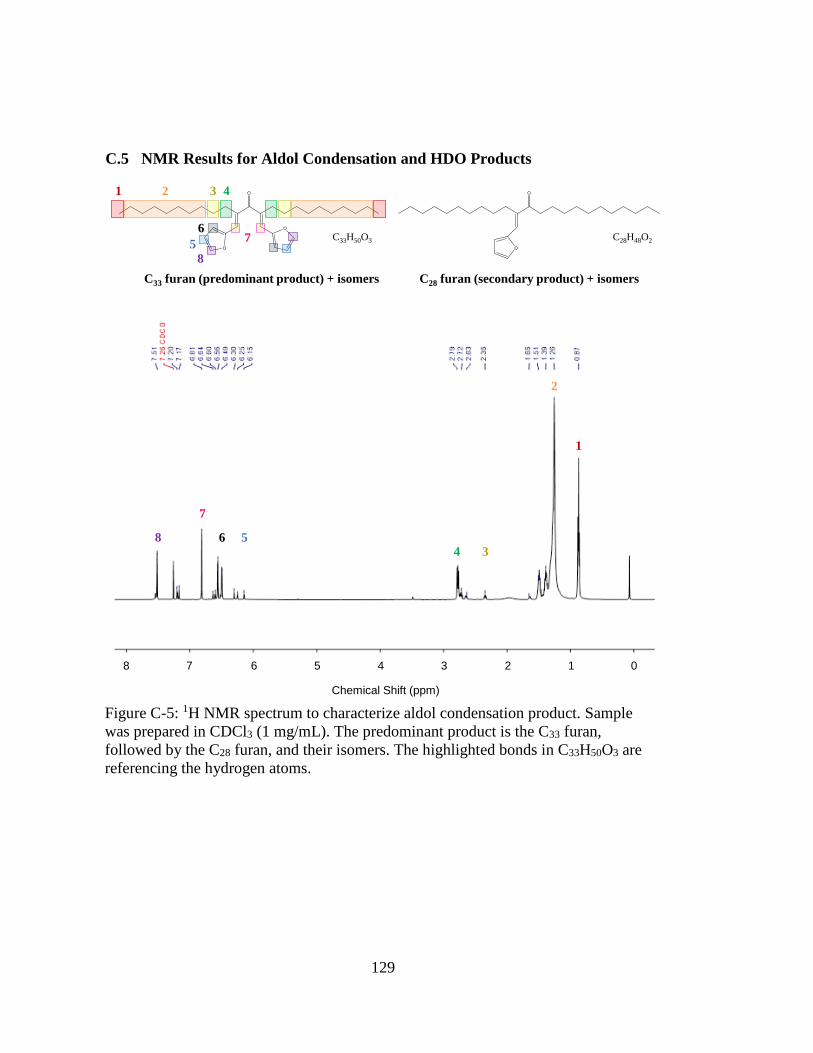
129
C.5 NMR Results for Aldol Condensation and HDO Products
C33 furan (predominant product) + isomers
1 2 3 4
76
5
8
1
2
3456
7
8
Chemical Shift (ppm)
8 7 6 5 4 3 2 1 0
C28 furan (secondary product) + isomers
C28H48O2C33H50O3
Figure C-5: 1H NMR spectrum to characterize aldol condensation product. Sample
was prepared in CDCl3 (1 mg/mL). The predominant product is the C33 furan,
followed by the C28 furan, and their isomers. The highlighted bonds in C33H50O3 are
referencing the hydrogen atoms.
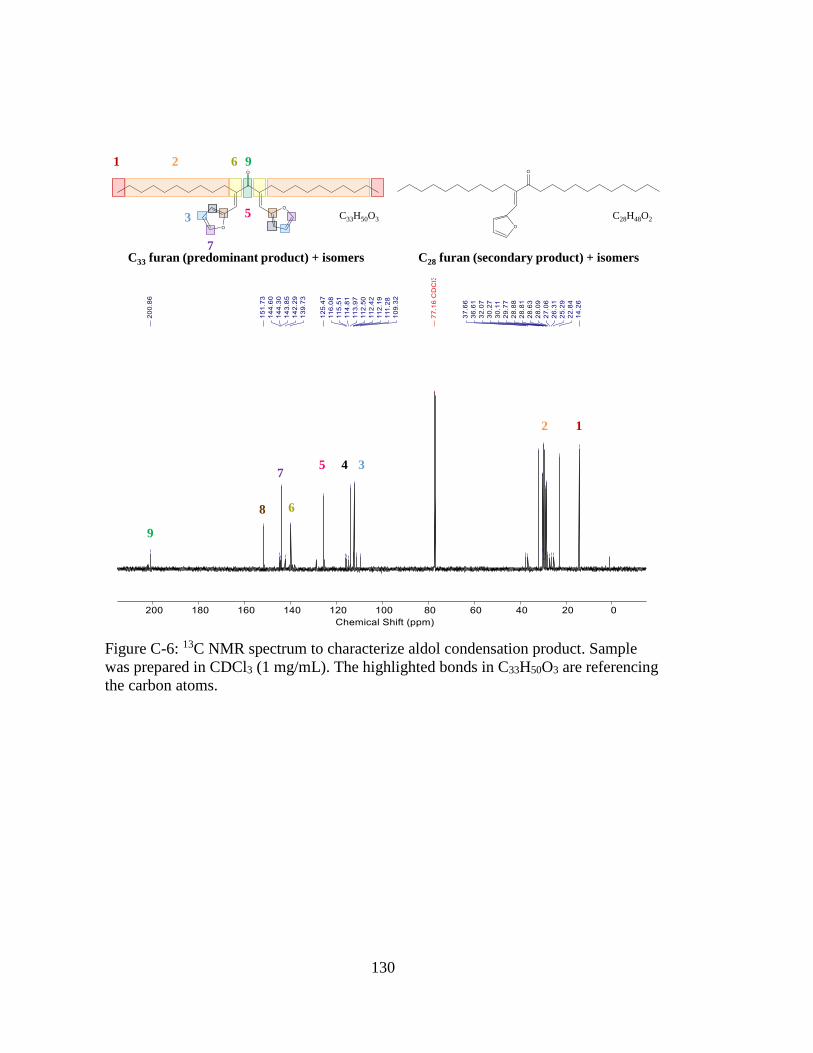
130
1 2 6 9
3 5
7C33 furan (predominant product) + isomers C28 furan (secondary product) + isomers
C28H48O2C33H50O3
12
37
4
6
5
8
9
Figure C-6: 13C NMR spectrum to characterize aldol condensation product. Sample
was prepared in CDCl3 (1 mg/mL). The highlighted bonds in C33H50O3 are referencing
the carbon atoms.
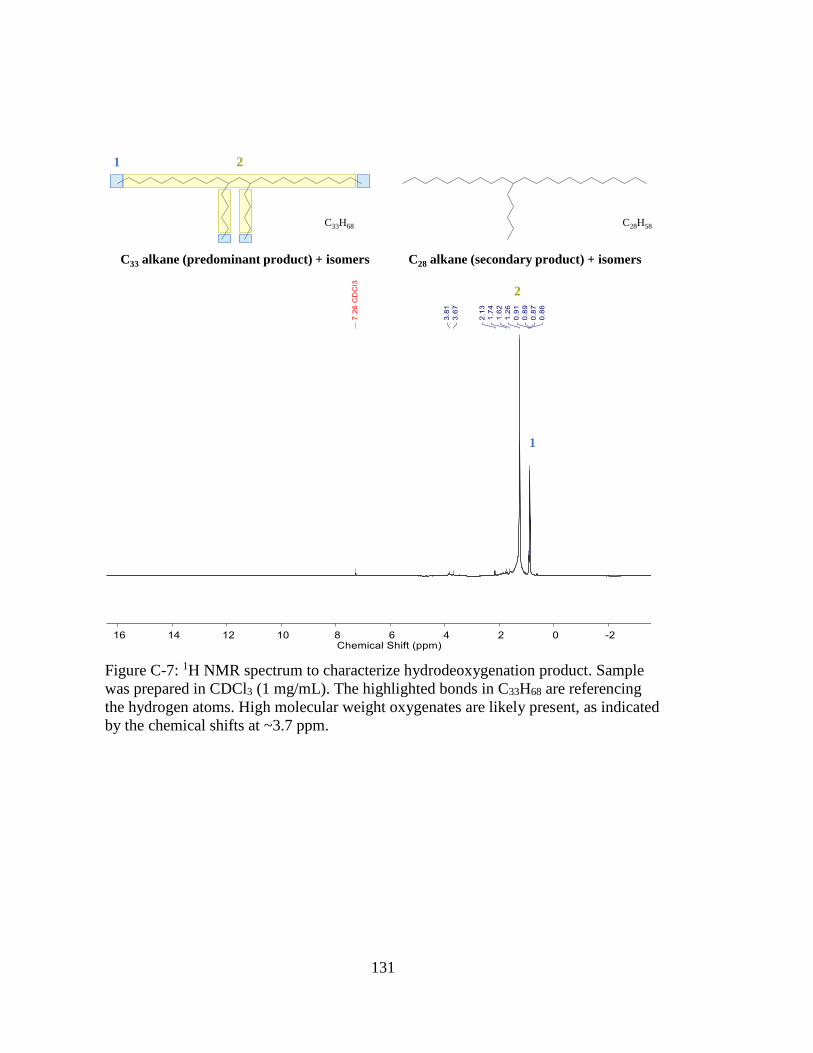
131
1 2
1
2
C28H58
C28 alkane (secondary product) + isomersC33 alkane (predominant product) + isomers
C33H68
Figure C-7: 1H NMR spectrum to characterize hydrodeoxygenation product. Sample
was prepared in CDCl3 (1 mg/mL). The highlighted bonds in C33H68 are referencing
the hydrogen atoms. High molecular weight oxygenates are likely present, as indicated
by the chemical shifts at ~3.7 ppm.
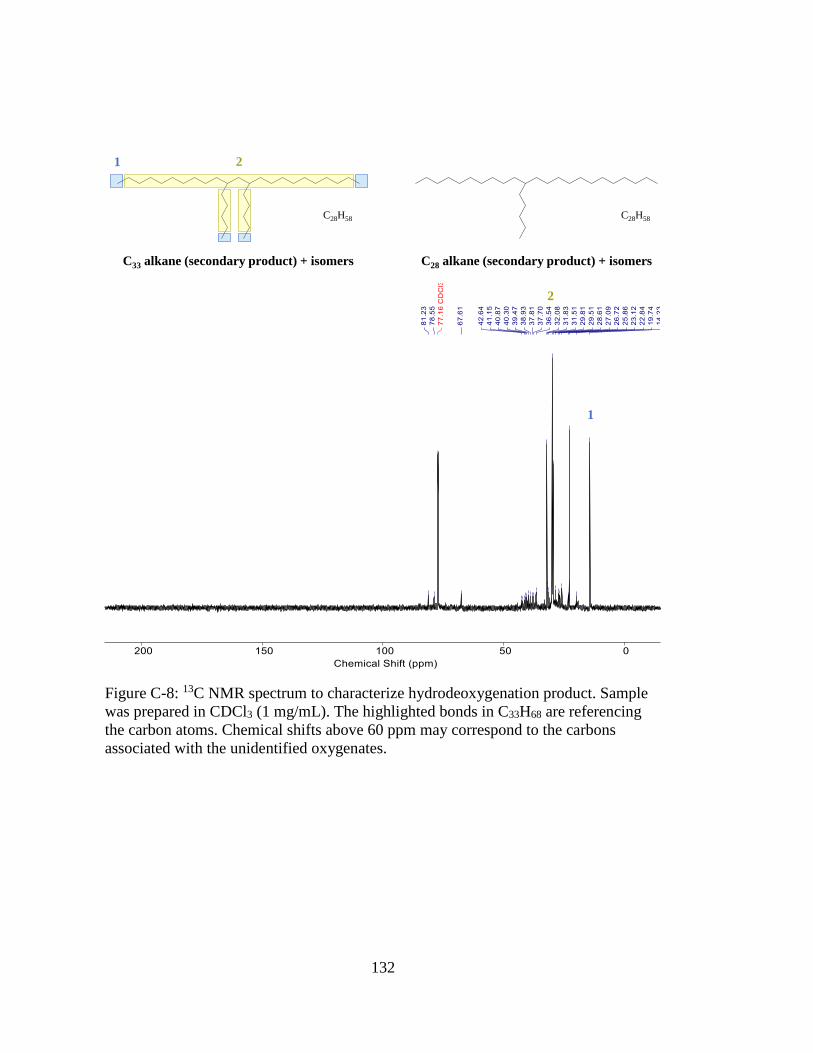
132
1 2
1
2
C28H58
C28 alkane (secondary product) + isomers
C28H58
C33 alkane (secondary product) + isomers
Figure C-8: 13C NMR spectrum to characterize hydrodeoxygenation product. Sample
was prepared in CDCl3 (1 mg/mL). The highlighted bonds in C33H68 are referencing
the carbon atoms. Chemical shifts above 60 ppm may correspond to the carbons
associated with the unidentified oxygenates.
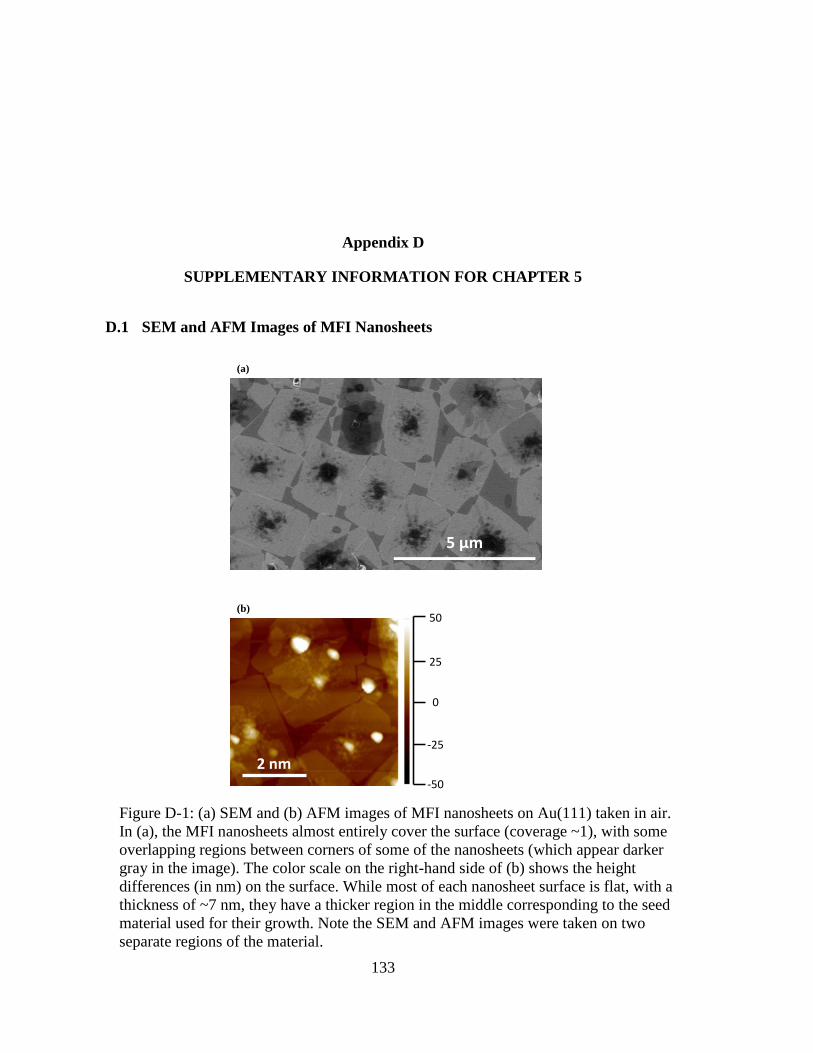
133
SUPPLEMENTARY INFORMATION FOR CHAPTER 5
D.1 SEM and AFM Images of MFI Nanosheets
Appendix D
2 nm-50
-25
0
25
50
5 µm
(a)
(b)
Figure D-1: (a) SEM and (b) AFM images of MFI nanosheets on Au(111) taken in air.
In (a), the MFI nanosheets almost entirely cover the surface (coverage ~1), with some
overlapping regions between corners of some of the nanosheets (which appear darker
gray in the image). The color scale on the right-hand side of (b) shows the height
differences (in nm) on the surface. While most of each nanosheet surface is flat, with a
thickness of ~7 nm, they have a thicker region in the middle corresponding to the seed
material used for their growth. Note the SEM and AFM images were taken on two
separate regions of the material.
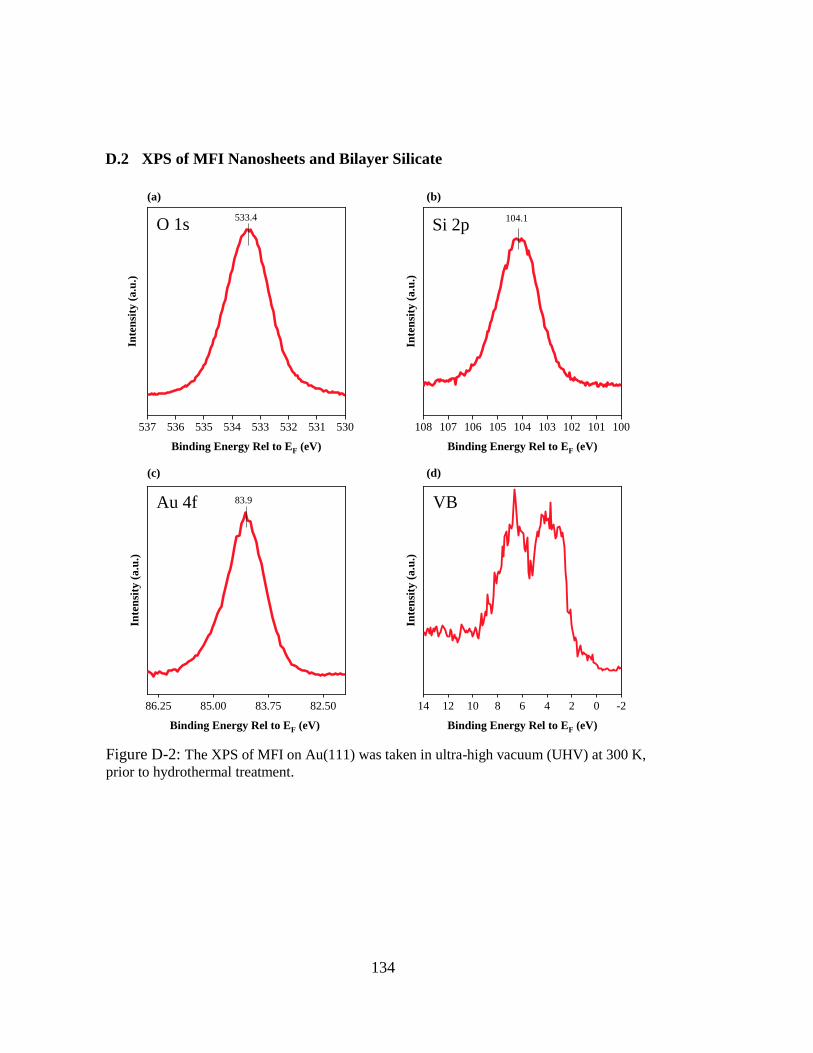
134
D.2 XPS of MFI Nanosheets and Bilayer Silicate
-202468101214
Inte
nsi
ty (
a.u
.)
Binding Energy Rel to EF (eV)
82.5083.7585.0086.25
Inte
nsi
ty (
a.u
.)
Binding Energy Rel to EF (eV)
100101102103104105106107108
Inte
nsi
ty (
a.u
.)
Binding Energy Rel to EF (eV)
530531532533534535536537
Inte
nsi
ty (
a.u
.)
Binding Energy Rel to EF (eV)
O 1s533.4
(a)
(c)
(b)
Au 4f
(d)
VB
Si 2p104.1
83.9
Figure D-2: The XPS of MFI on Au(111) was taken in ultra-high vacuum (UHV) at 300 K,
prior to hydrothermal treatment.
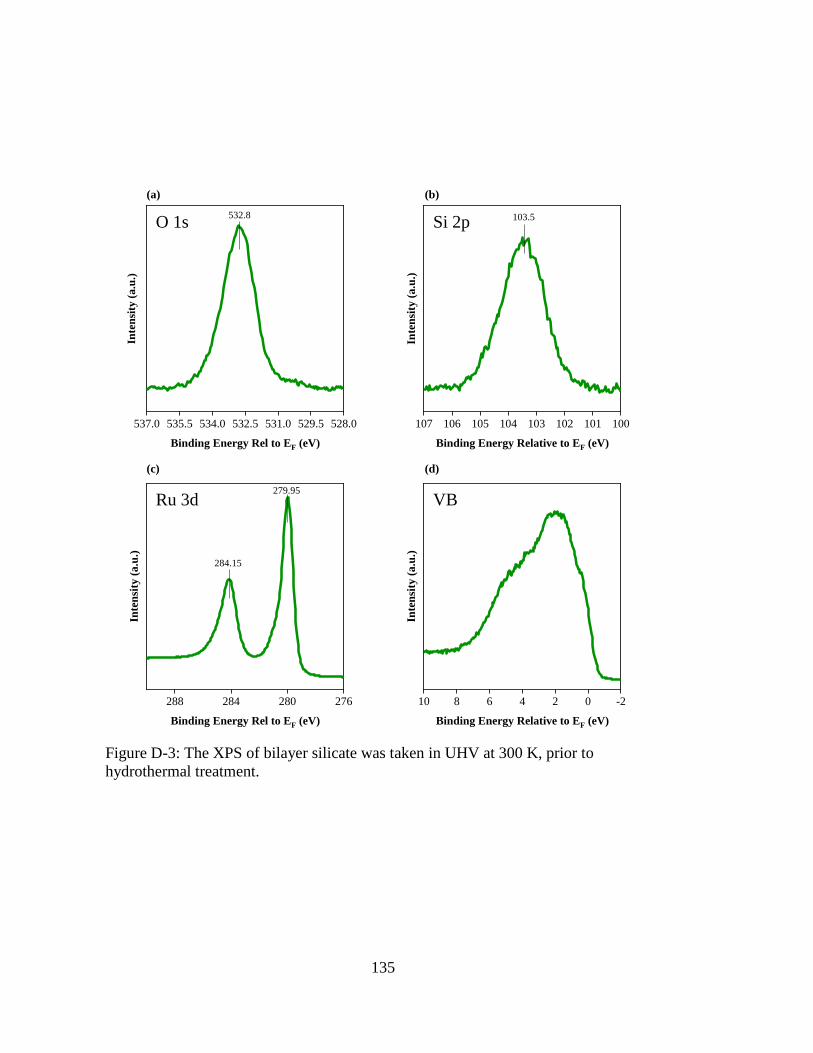
135
-20246810
Inte
nsi
ty (
a.u
.)
Binding Energy Relative to EF (eV)
100101102103104105106107In
ten
sity
(a.u
.)
Binding Energy Relative to EF (eV)
528.0529.5531.0532.5534.0535.5537.0
Inte
nsi
ty (
a.u
.)
Binding Energy Rel to EF (eV)
276280284288
Inte
nsi
ty (
a.u
.)
Binding Energy Rel to EF (eV)
Si 2p 103.5
VB
(a) (b)
Ru 3d
(d)(c)
O 1s532.8
284.15
279.95
Figure D-3: The XPS of bilayer silicate was taken in UHV at 300 K, prior to
hydrothermal treatment.
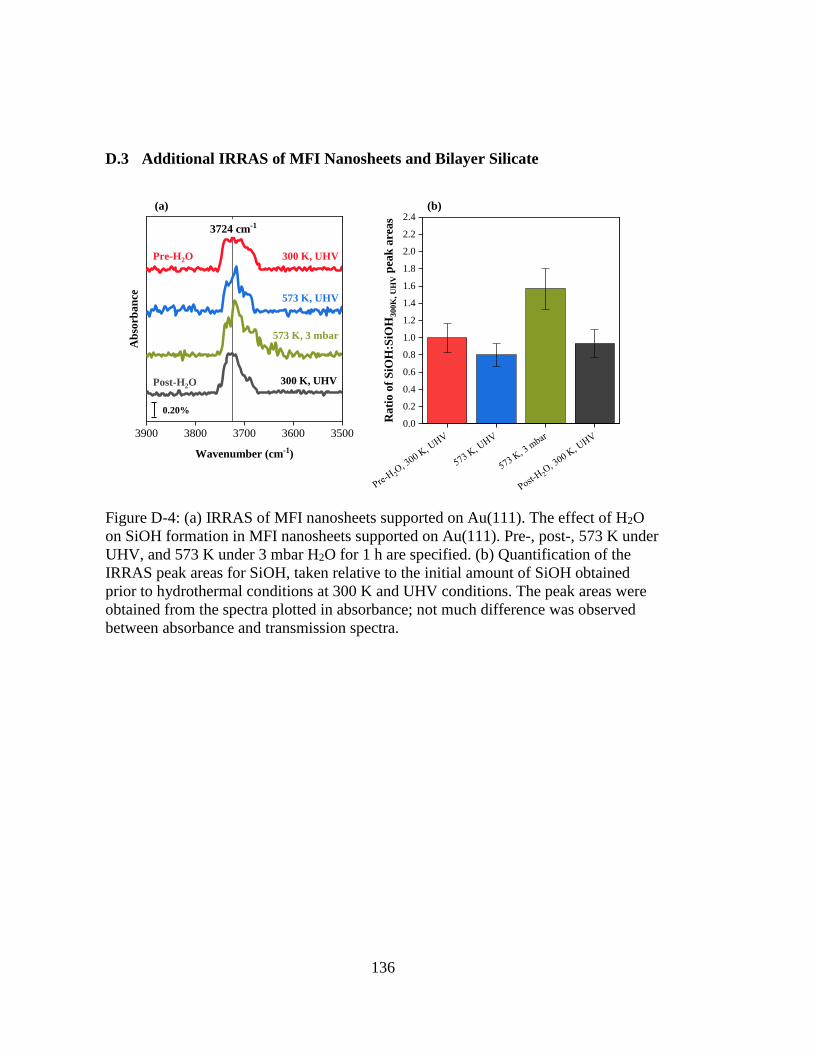
136
D.3 Additional IRRAS of MFI Nanosheets and Bilayer Silicate
0.0
0.2
0.4
0.6
0.8
1.0
1.2
1.4
1.6
1.8
2.0
2.2
2.4
Ra
tio
of
SiO
H:S
iOH
30
0K
, U
HV p
eak
are
as
35003600370038003900
Ab
sorb
an
ce
Wavenumber (cm-1)
3724 cm-1
300 K, UHV
573 K, UHV
573 K, 3 mbar
300 K, UHV
(a) (b)
Pre-H2O
Post-H2O
0.20%
Figure D-4: (a) IRRAS of MFI nanosheets supported on Au(111). The effect of H2O
on SiOH formation in MFI nanosheets supported on Au(111). Pre-, post-, 573 K under
UHV, and 573 K under 3 mbar H2O for 1 h are specified. (b) Quantification of the
IRRAS peak areas for SiOH, taken relative to the initial amount of SiOH obtained
prior to hydrothermal conditions at 300 K and UHV conditions. The peak areas were
obtained from the spectra plotted in absorbance; not much difference was observed
between absorbance and transmission spectra.
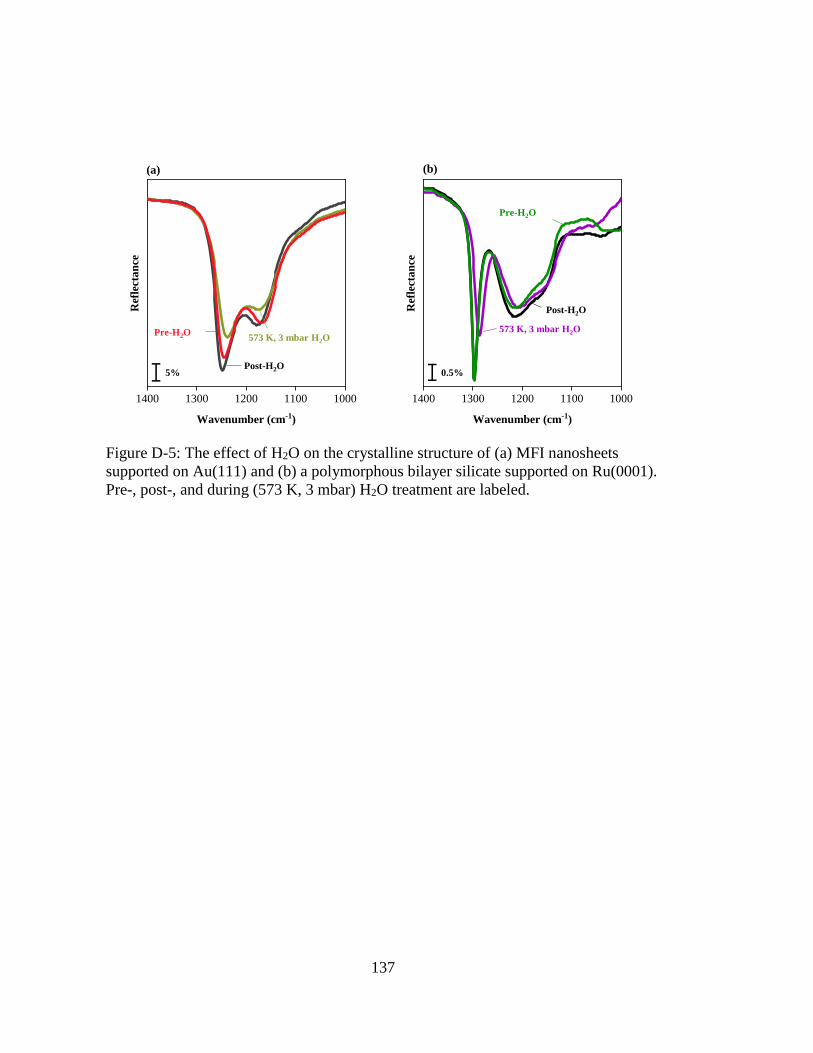
137
10001100120013001400R
efle
ctan
ceWavenumber (cm-1)
10001100120013001400
Ref
lect
an
ce
Wavenumber (cm-1)
573 K, 3 mbar H2O
Pre-H2O
Post-H2O
Pre-H2O 573 K, 3 mbar H2O
Post-H2O
(a) (b)
5% 0.5%
Figure D-5: The effect of H2O on the crystalline structure of (a) MFI nanosheets
supported on Au(111) and (b) a polymorphous bilayer silicate supported on Ru(0001).
Pre-, post-, and during (573 K, 3 mbar) H2O treatment are labeled.
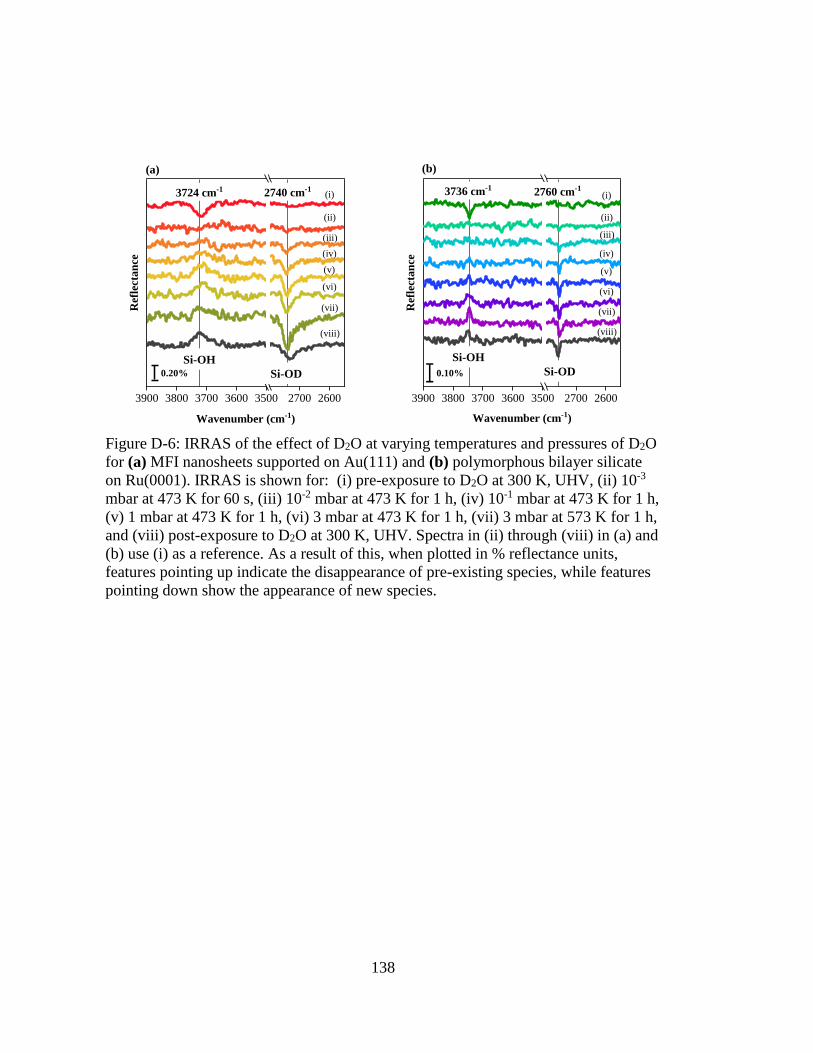
138
2600270035003600370038003900R
efle
cta
nce
Wavenumber (cm-1)
3736 cm-12760 cm-1
2600270035003600370038003900
Ref
lect
an
ce
Wavenumber (cm-1)
3724 cm-1 2740 cm-1
Si-OH
Si-OD0.20%
(a)
Si-OD
Si-OH
0.10%
(b)
(i)
(ii)
(iii)
(iv)
(v)
(vi)
(vii)
(viii)
(i)
(ii)
(iii)
(iv)
(v)
(vi)
(vii)
(viii)
Figure D-6: IRRAS of the effect of D2O at varying temperatures and pressures of D2O
for (a) MFI nanosheets supported on Au(111) and (b) polymorphous bilayer silicate
on Ru(0001). IRRAS is shown for: (i) pre-exposure to D2O at 300 K, UHV, (ii) 10-3
mbar at 473 K for 60 s, (iii) 10-2 mbar at 473 K for 1 h, (iv) 10-1 mbar at 473 K for 1 h,
(v) 1 mbar at 473 K for 1 h, (vi) 3 mbar at 473 K for 1 h, (vii) 3 mbar at 573 K for 1 h,
and (viii) post-exposure to D2O at 300 K, UHV. Spectra in (ii) through (viii) in (a) and
(b) use (i) as a reference. As a result of this, when plotted in % reflectance units,
features pointing up indicate the disappearance of pre-existing species, while features
pointing down show the appearance of new species.
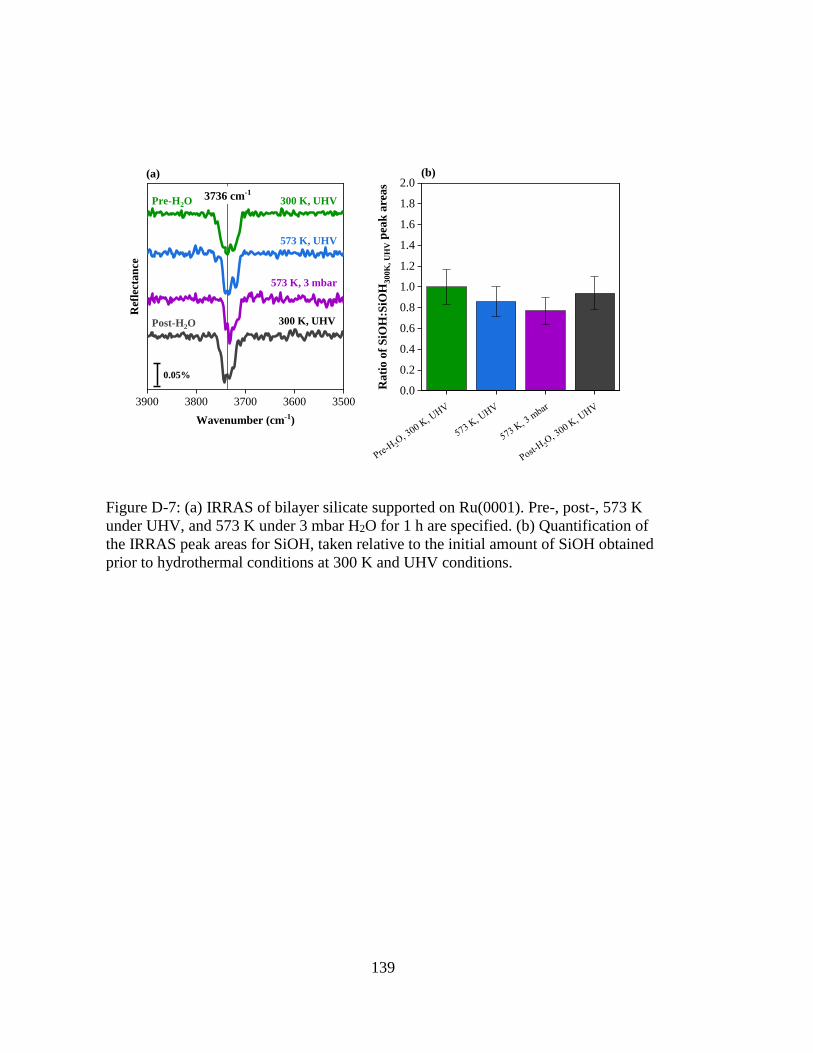
139
0.0
0.2
0.4
0.6
0.8
1.0
1.2
1.4
1.6
1.8
2.0
Rati
o o
f S
iOH
:SiO
H3
00
K,
UH
V p
eak
are
as
35003600370038003900
Ref
lect
an
ce
Wavenumber (cm-1)
3736 cm-1
0.05%
300 K, UHV
573 K, UHV
573 K, 3 mbar
300 K, UHV
Pre-H2O
Post-H2O
(a) (b)
Figure D-7: (a) IRRAS of bilayer silicate supported on Ru(0001). Pre-, post-, 573 K
under UHV, and 573 K under 3 mbar H2O for 1 h are specified. (b) Quantification of
the IRRAS peak areas for SiOH, taken relative to the initial amount of SiOH obtained
prior to hydrothermal conditions at 300 K and UHV conditions.
140
A FUNDAMENTAL STUDY ON PHOSPHORUS-CONTAINING ZEOSILS
E.1 Background
In an effort to reduce our greenhouse gas emissions and dependence on fossil
fuels, recent endeavors have focused on upgrading lignocellulosic biomass to fuels
and chemicals.12 Phosphorus-containing zeosils (P-zeosils) have gained much
attention in this pursuit.50,51 In particular, P-BEA and P-SPP were found to convert
biomass-derived dimethylfuran (DMF) to para-xylene with 97% yield. These P-zeosils
were more active and selective than Al-BEA, Zr-BEA, and H3PO4.50 In another report,
P-BEA, P-MFI, and P-SPP were highly selective (>85%) in the conversion of
tetrahydrofuran (THF) to butadiene.51 Although P-zeosils are highly active in biomass
chemistries, we still lack a fundamental understanding in the following areas: (1) the
interaction between phosphorus and the zeosil framework, (2) the strength of the acid
sites in P-zeosils, and (3) the distribution of the P-sites in the presence of steam. In the
present work, we provide insights into each of these areas.
E.2 Interaction Between Phosphorus and the Zeosil Framework
In this section, we investigated the effects of monolayer deposits of P-
molecules, including phosphoric acid (H3PO4), trimethylphosphine (P(CH3)3), and
triethylphosphate ((C2H5)3PO4) on two-dimensional (2-D) covalently saturated
(essentially silanol-free) silicates. These 2-D models are well defined and
Appendix E
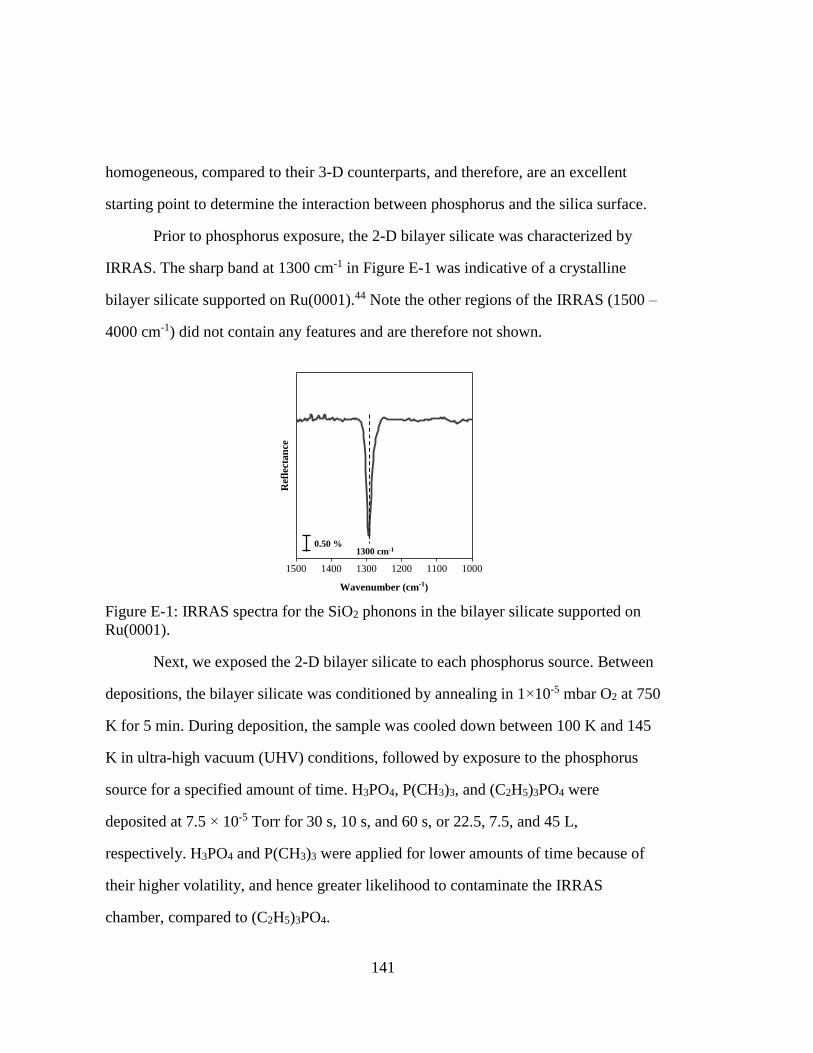
141
homogeneous, compared to their 3-D counterparts, and therefore, are an excellent
starting point to determine the interaction between phosphorus and the silica surface.
Prior to phosphorus exposure, the 2-D bilayer silicate was characterized by
IRRAS. The sharp band at 1300 cm-1 in Figure E-1 was indicative of a crystalline
bilayer silicate supported on Ru(0001).44 Note the other regions of the IRRAS (1500 –
4000 cm-1) did not contain any features and are therefore not shown.
Next, we exposed the 2-D bilayer silicate to each phosphorus source. Between
depositions, the bilayer silicate was conditioned by annealing in 1×10⁻⁵ mbar O2 at 750
K for 5 min. During deposition, the sample was cooled down between 100 K and 145
K in ultra-high vacuum (UHV) conditions, followed by exposure to the phosphorus
source for a specified amount of time. H3PO4, P(CH3)3, and (C2H5)3PO4 were
deposited at 7.5 × 10⁻⁵ Torr for 30 s, 10 s, and 60 s, or 22.5, 7.5, and 45 L,
respectively. H3PO4 and P(CH3)3 were applied for lower amounts of time because of
their higher volatility, and hence greater likelihood to contaminate the IRRAS
chamber, compared to (C2H5)3PO4.
100011001200130014001500
Ref
lect
an
ce
Wavenumber (cm-1)
0.50 %1300 cm-1
Figure E-1: IRRAS spectra for the SiO2 phonons in the bilayer silicate supported on
Ru(0001).
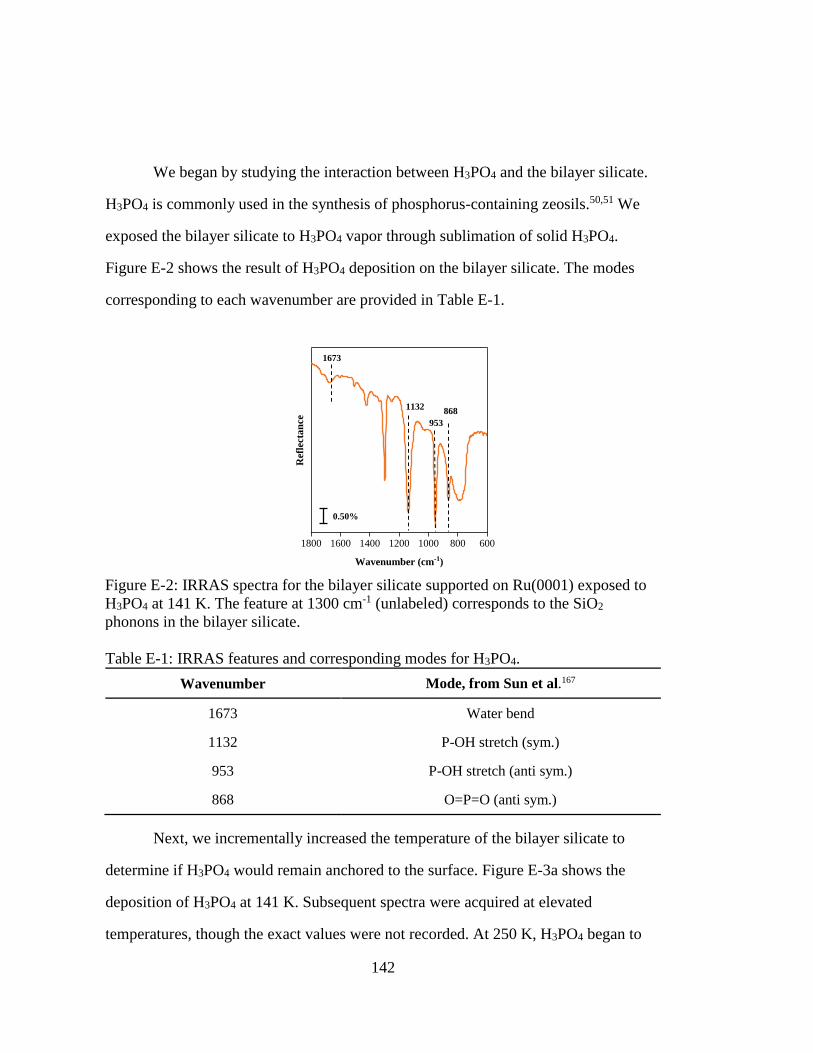
142
We began by studying the interaction between H3PO4 and the bilayer silicate.
H3PO4 is commonly used in the synthesis of phosphorus-containing zeosils.50,51 We
exposed the bilayer silicate to H3PO4 vapor through sublimation of solid H3PO4.
Figure E-2 shows the result of H3PO4 deposition on the bilayer silicate. The modes
corresponding to each wavenumber are provided in Table E-1.
Table E-1: IRRAS features and corresponding modes for H3PO4.
Wavenumber Mode, from Sun et al.167
1673 Water bend
1132 P-OH stretch (sym.)
953 P-OH stretch (anti sym.)
868 O=P=O (anti sym.)
Next, we incrementally increased the temperature of the bilayer silicate to
determine if H3PO4 would remain anchored to the surface. Figure E-3a shows the
deposition of H3PO4 at 141 K. Subsequent spectra were acquired at elevated
temperatures, though the exact values were not recorded. At 250 K, H3PO4 began to
60080010001200140016001800
Ref
lect
an
ce
Wavenumber (cm-1)
1673
1132
953
868
0.50%
Figure E-2: IRRAS spectra for the bilayer silicate supported on Ru(0001) exposed to
H3PO4 at 141 K. The feature at 1300 cm-1 (unlabeled) corresponds to the SiO2
phonons in the bilayer silicate.
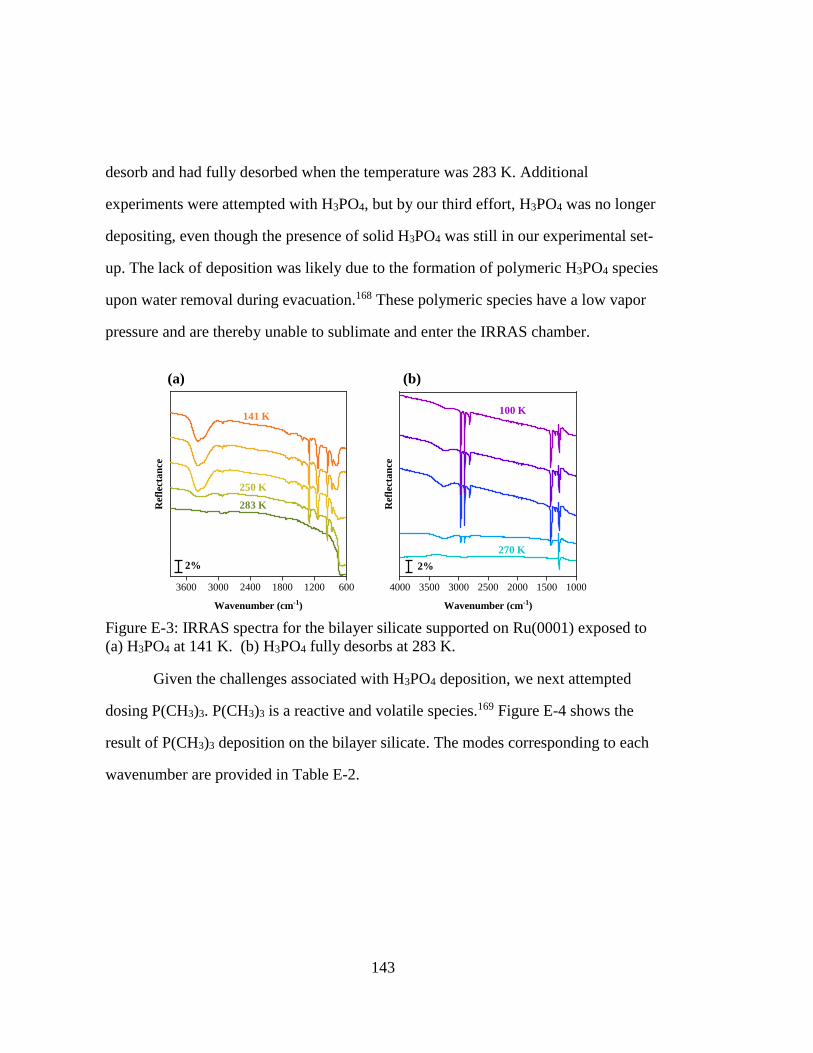
143
desorb and had fully desorbed when the temperature was 283 K. Additional
experiments were attempted with H3PO4, but by our third effort, H3PO4 was no longer
depositing, even though the presence of solid H3PO4 was still in our experimental set-
up. The lack of deposition was likely due to the formation of polymeric H3PO4 species
upon water removal during evacuation.168 These polymeric species have a low vapor
pressure and are thereby unable to sublimate and enter the IRRAS chamber.
Given the challenges associated with H3PO4 deposition, we next attempted
dosing P(CH3)3. P(CH3)3 is a reactive and volatile species.169 Figure E-4 shows the
result of P(CH3)3 deposition on the bilayer silicate. The modes corresponding to each
wavenumber are provided in Table E-2.
60012001800240030003600
Ref
lect
an
ce
Wavenumber (cm-1)
141 K
283 K
250 K
2%
1000150020002500300035004000
Ref
lect
an
ce
Wavenumber (cm-1)
270 K
100 K
2%
(b)(a)
Figure E-3: IRRAS spectra for the bilayer silicate supported on Ru(0001) exposed to
(a) H3PO4 at 141 K. (b) H3PO4 fully desorbs at 283 K.
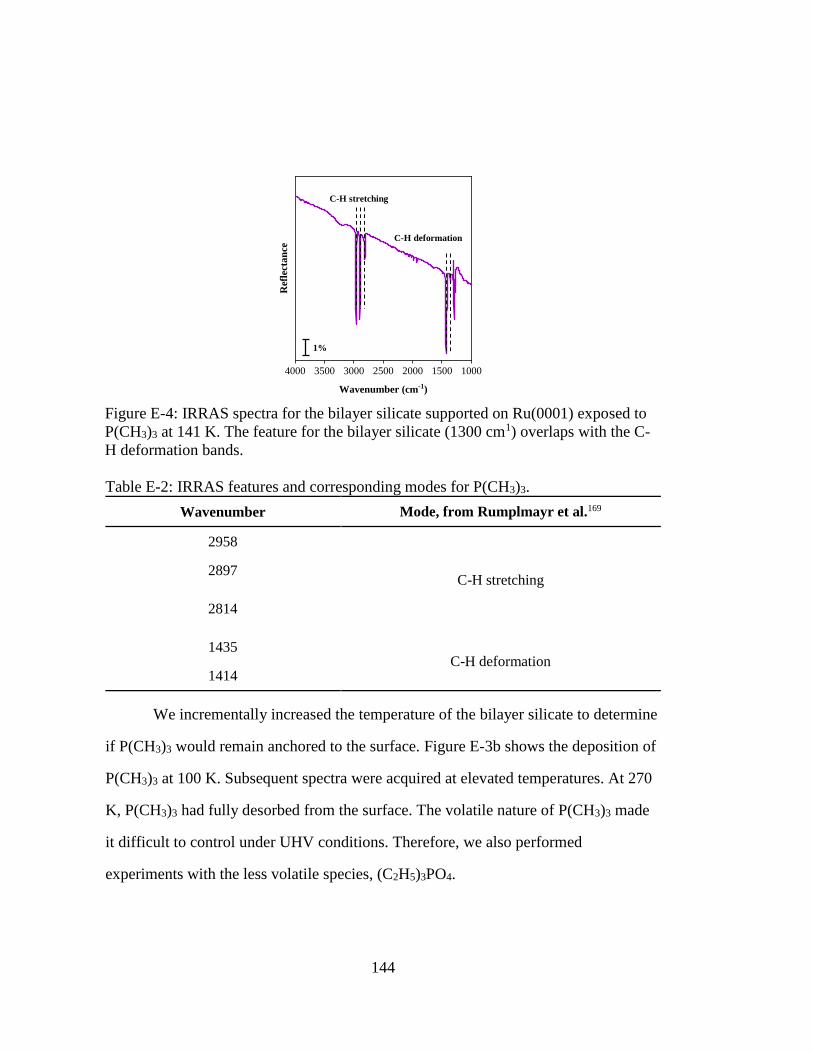
144
Table E-2: IRRAS features and corresponding modes for P(CH3)3.
Wavenumber Mode, from Rumplmayr et al.169
2958
C-H stretching 2897
2814
1435 C-H deformation
1414
We incrementally increased the temperature of the bilayer silicate to determine
if P(CH3)3 would remain anchored to the surface. Figure E-3b shows the deposition of
P(CH3)3 at 100 K. Subsequent spectra were acquired at elevated temperatures. At 270
K, P(CH3)3 had fully desorbed from the surface. The volatile nature of P(CH3)3 made
it difficult to control under UHV conditions. Therefore, we also performed
experiments with the less volatile species, (C2H5)3PO4.
1000150020002500300035004000
Ref
lect
an
ce
Wavenumber (cm-1)
C-H stretching
C-H deformation
1%
Figure E-4: IRRAS spectra for the bilayer silicate supported on Ru(0001) exposed to
P(CH3)3 at 141 K. The feature for the bilayer silicate (1300 cm1) overlaps with the C-
H deformation bands.
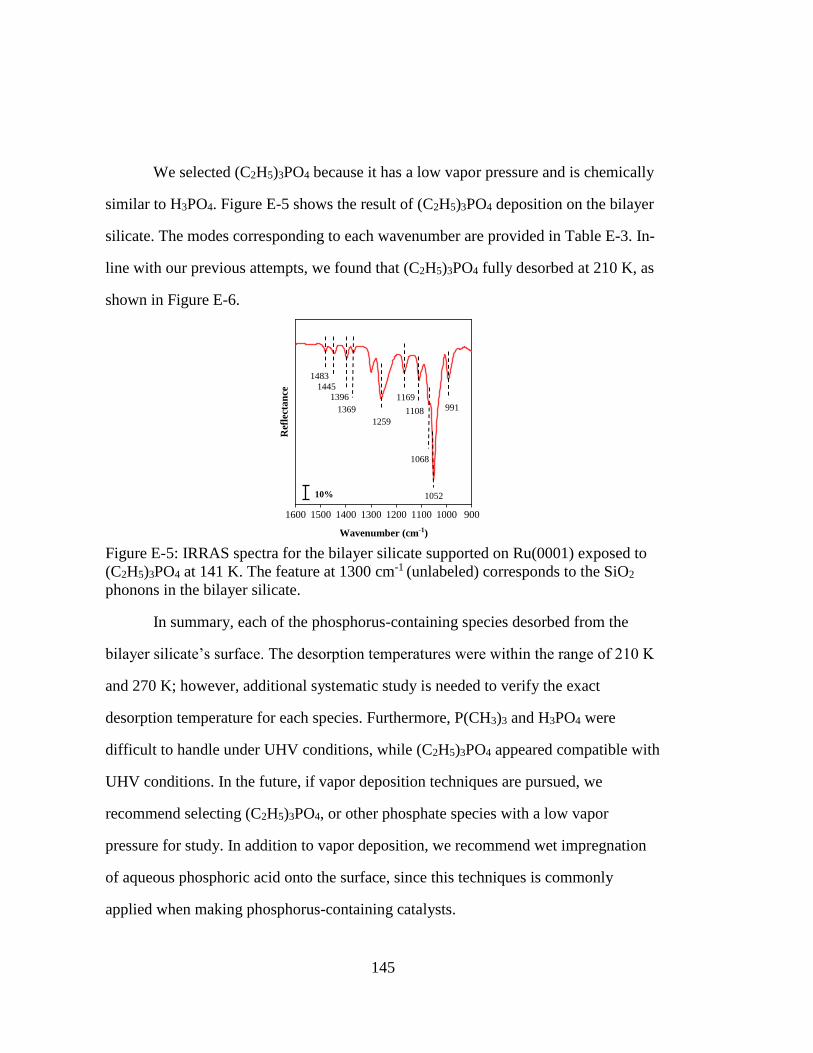
145
We selected (C2H5)3PO4 because it has a low vapor pressure and is chemically
similar to H3PO4. Figure E-5 shows the result of (C2H5)3PO4 deposition on the bilayer
silicate. The modes corresponding to each wavenumber are provided in Table E-3. In-
line with our previous attempts, we found that (C2H5)3PO4 fully desorbed at 210 K, as
shown in Figure E-6.
In summary, each of the phosphorus-containing species desorbed from the
bilayer silicate’s surface. The desorption temperatures were within the range of 210 K
and 270 K; however, additional systematic study is needed to verify the exact
desorption temperature for each species. Furthermore, P(CH3)3 and H3PO4 were
difficult to handle under UHV conditions, while (C2H5)3PO4 appeared compatible with
UHV conditions. In the future, if vapor deposition techniques are pursued, we
recommend selecting (C2H5)3PO4, or other phosphate species with a low vapor
pressure for study. In addition to vapor deposition, we recommend wet impregnation
of aqueous phosphoric acid onto the surface, since this techniques is commonly
applied when making phosphorus-containing catalysts.
9001000110012001300140015001600
Ref
lect
an
ce
Wavenumber (cm-1)
991
1052
1108
1169
1259
1369
1483
14451396
1068
10%
Figure E-5: IRRAS spectra for the bilayer silicate supported on Ru(0001) exposed to
(C2H5)3PO4 at 141 K. The feature at 1300 cm-1 (unlabeled) corresponds to the SiO2
phonons in the bilayer silicate.
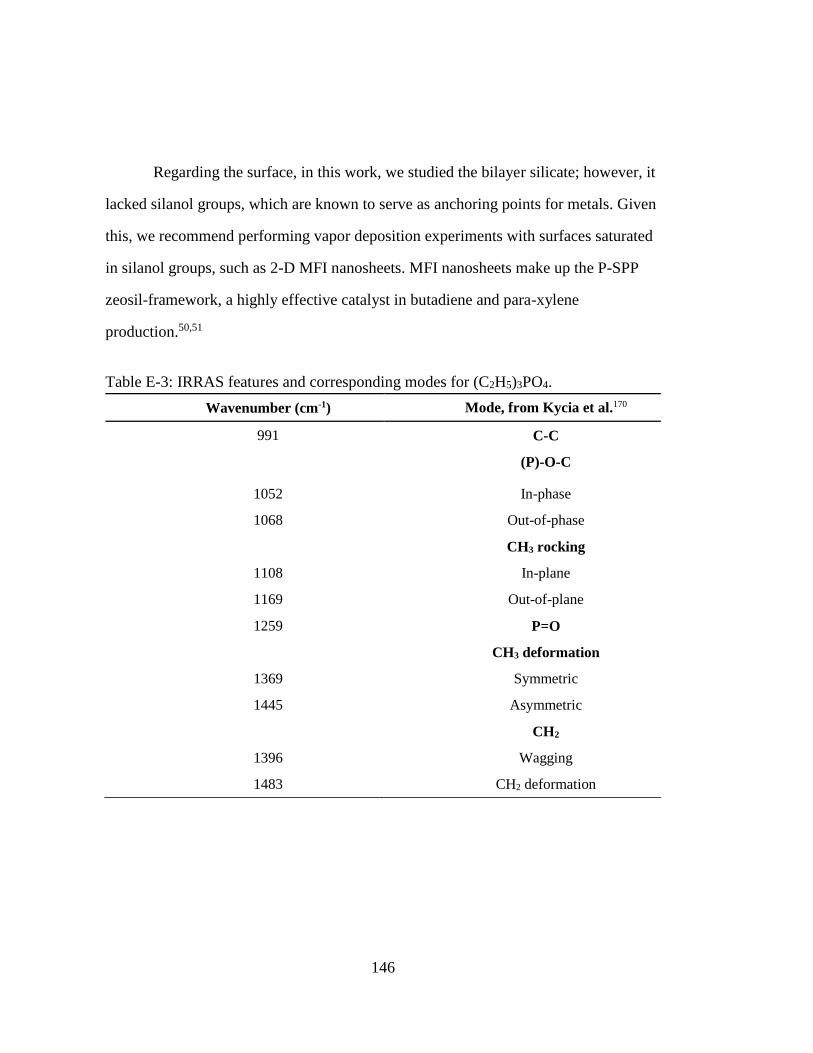
146
Regarding the surface, in this work, we studied the bilayer silicate; however, it
lacked silanol groups, which are known to serve as anchoring points for metals. Given
this, we recommend performing vapor deposition experiments with surfaces saturated
in silanol groups, such as 2-D MFI nanosheets. MFI nanosheets make up the P-SPP
zeosil-framework, a highly effective catalyst in butadiene and para-xylene
production.50,51
Table E-3: IRRAS features and corresponding modes for (C2H5)3PO4.
Wavenumber (cm-1) Mode, from Kycia et al.170
991 C-C
(P)-O-C
1052 In-phase
1068 Out-of-phase
CH3 rocking
1108 In-plane
1169 Out-of-plane
1259 P=O
CH3 deformation
1369 Symmetric
1445 Asymmetric
CH2
1396 Wagging
1483 CH2 deformation
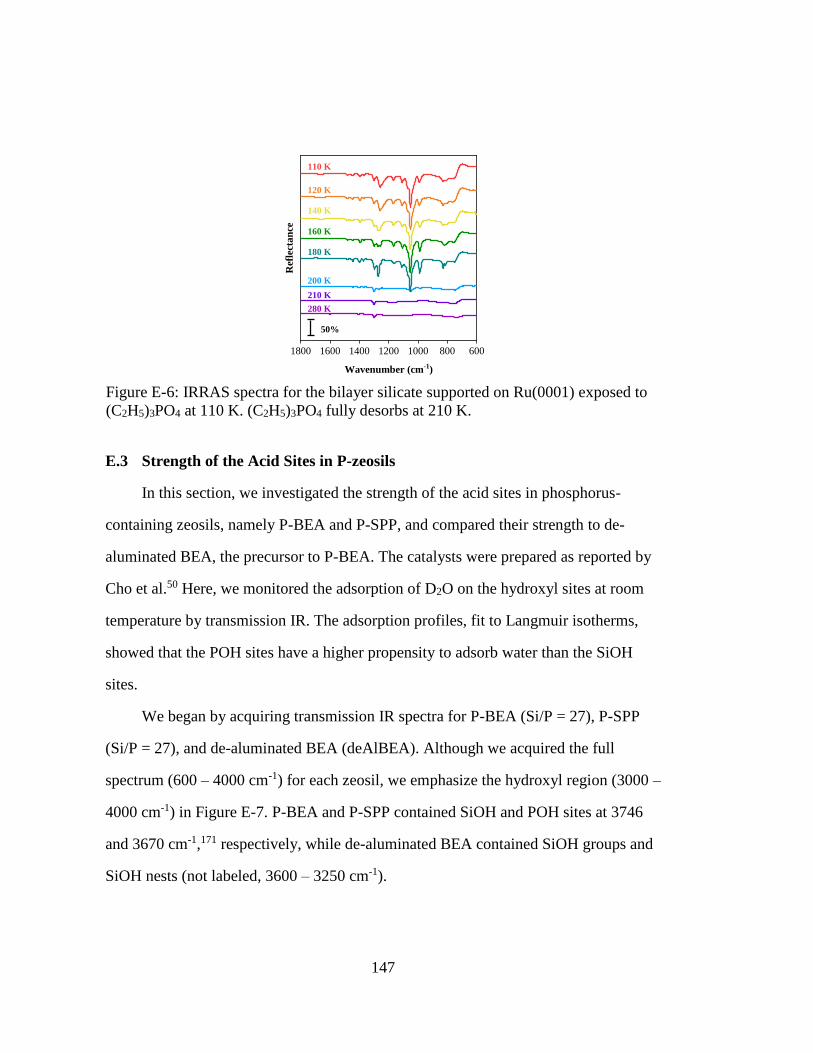
147
E.3 Strength of the Acid Sites in P-zeosils
In this section, we investigated the strength of the acid sites in phosphorus-
containing zeosils, namely P-BEA and P-SPP, and compared their strength to de-
aluminated BEA, the precursor to P-BEA. The catalysts were prepared as reported by
Cho et al.50 Here, we monitored the adsorption of D2O on the hydroxyl sites at room
temperature by transmission IR. The adsorption profiles, fit to Langmuir isotherms,
showed that the POH sites have a higher propensity to adsorb water than the SiOH
sites.
We began by acquiring transmission IR spectra for P-BEA (Si/P = 27), P-SPP
(Si/P = 27), and de-aluminated BEA (deAlBEA). Although we acquired the full
spectrum (600 – 4000 cm-1) for each zeosil, we emphasize the hydroxyl region (3000 –
4000 cm-1) in Figure E-7. P-BEA and P-SPP contained SiOH and POH sites at 3746
and 3670 cm-1,171 respectively, while de-aluminated BEA contained SiOH groups and
SiOH nests (not labeled, 3600 – 3250 cm-1).
60080010001200140016001800
Ref
lect
an
ce
Wavenumber (cm-1)
110 K
120 K
140 K
160 K
180 K
200 K
210 K
280 K
50%
Figure E-6: IRRAS spectra for the bilayer silicate supported on Ru(0001) exposed to
(C2H5)3PO4 at 110 K. (C2H5)3PO4 fully desorbs at 210 K.
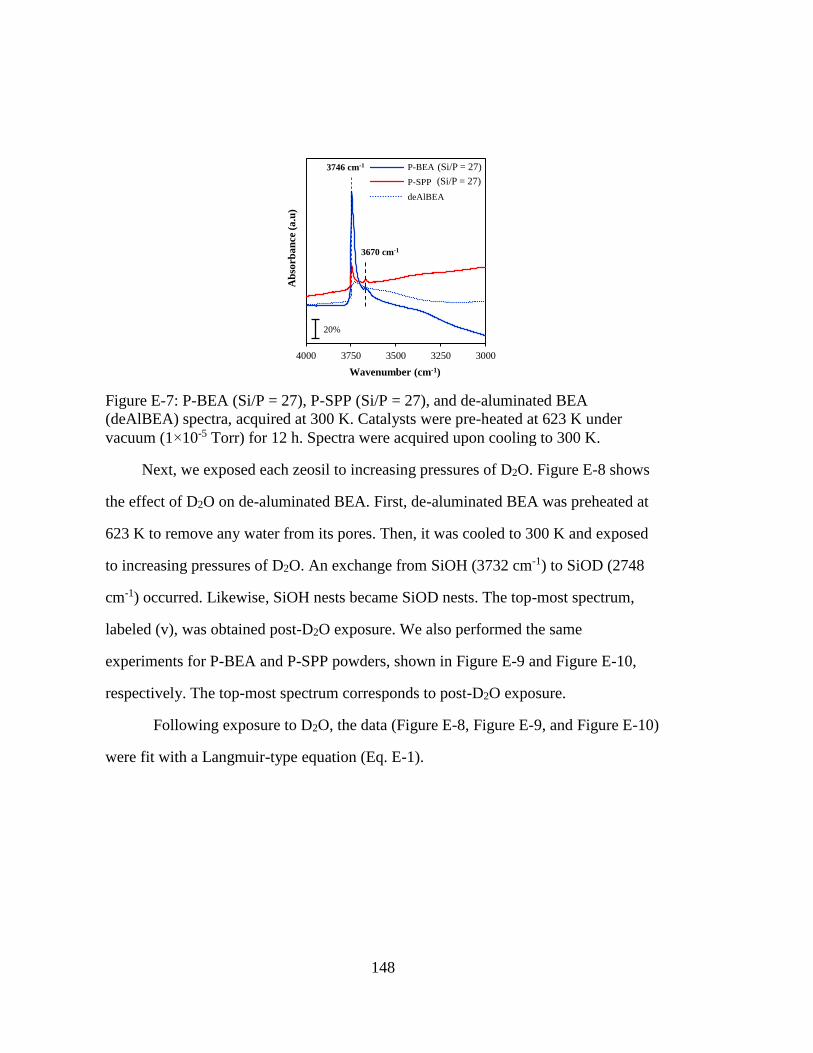
148
Next, we exposed each zeosil to increasing pressures of D2O. Figure E-8 shows
the effect of D2O on de-aluminated BEA. First, de-aluminated BEA was preheated at
623 K to remove any water from its pores. Then, it was cooled to 300 K and exposed
to increasing pressures of D2O. An exchange from SiOH (3732 cm-1) to SiOD (2748
cm-1) occurred. Likewise, SiOH nests became SiOD nests. The top-most spectrum,
labeled (v), was obtained post-D2O exposure. We also performed the same
experiments for P-BEA and P-SPP powders, shown in Figure E-9 and Figure E-10,
respectively. The top-most spectrum corresponds to post-D2O exposure.
Following exposure to D2O, the data (Figure E-8, Figure E-9, and Figure E-10)
were fit with a Langmuir-type equation (Eq. E-1).
30003250350037504000
Ab
sorb
an
ce (
a.u
)
Wavenumber (cm-1)
P-BEA
P-SPP
deAlBEA
(Si/P = 27)
(Si/P = 27)
3670 cm-1
3746 cm-1
20%
Figure E-7: P-BEA (Si/P = 27), P-SPP (Si/P = 27), and de-aluminated BEA
(deAlBEA) spectra, acquired at 300 K. Catalysts were pre-heated at 623 K under
vacuum (1×10⁻⁵ Torr) for 12 h. Spectra were acquired upon cooling to 300 K.
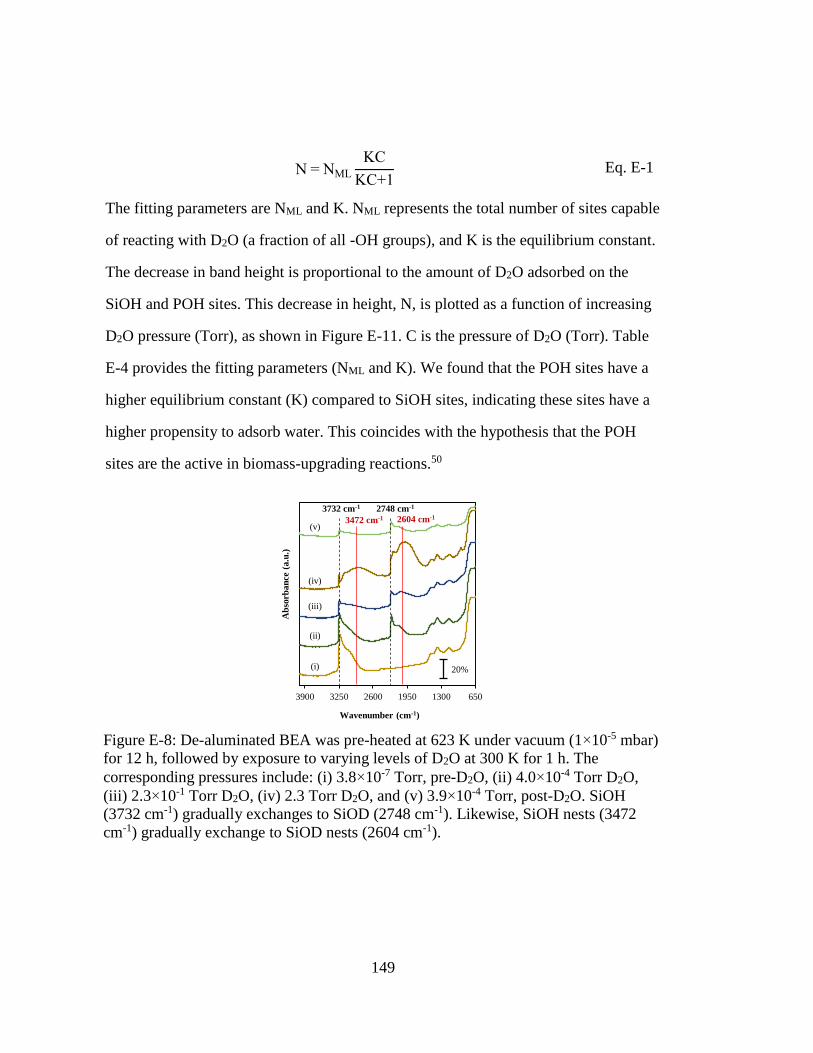
149
N = NML
KC
KC+1 Eq. E-1
The fitting parameters are NML and K. NML represents the total number of sites capable
of reacting with D2O (a fraction of all -OH groups), and K is the equilibrium constant.
The decrease in band height is proportional to the amount of D2O adsorbed on the
SiOH and POH sites. This decrease in height, N, is plotted as a function of increasing
D2O pressure (Torr), as shown in Figure E-11. C is the pressure of D2O (Torr). Table
E-4 provides the fitting parameters (NML and K). We found that the POH sites have a
higher equilibrium constant (K) compared to SiOH sites, indicating these sites have a
higher propensity to adsorb water. This coincides with the hypothesis that the POH
sites are the active in biomass-upgrading reactions.50
65013001950260032503900
Ab
sorb
an
ce (
a.u
.)
Wavenumber (cm-1)
3732 cm-1
3472 cm-1
2748 cm-1
2604 cm-1
(i)
(ii)
(iii)
(iv)
(v)
20%
Figure E-8: De-aluminated BEA was pre-heated at 623 K under vacuum (1×10⁻⁵ mbar)
for 12 h, followed by exposure to varying levels of D2O at 300 K for 1 h. The
corresponding pressures include: (i) 3.8×10⁻⁷ Torr, pre-D2O, (ii) 4.0×10⁻⁴ Torr D2O,
(iii) 2.3×10⁻¹ Torr D2O, (iv) 2.3 Torr D2O, and (v) 3.9×10⁻⁴ Torr, post-D2O. SiOH
(3732 cm-1) gradually exchanges to SiOD (2748 cm-1). Likewise, SiOH nests (3472
cm-1) gradually exchange to SiOD nests (2604 cm-1).
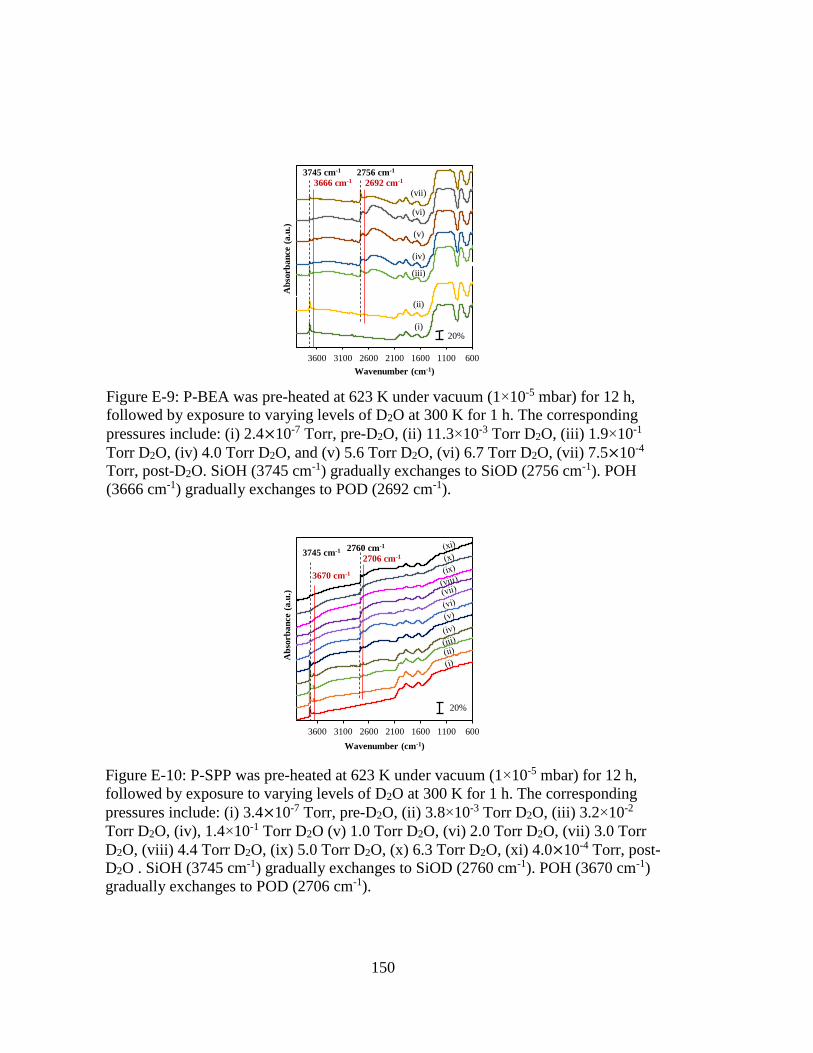
150
600110016002100260031003600
Ab
sorb
an
ce (
a.u
.)
Wavenumber (cm-1)
3745 cm-1
3670 cm-1
2760 cm-1
2706 cm-1
20%
Figure E-10: P-SPP was pre-heated at 623 K under vacuum (1×10⁻⁵ mbar) for 12 h,
followed by exposure to varying levels of D2O at 300 K for 1 h. The corresponding
pressures include: (i) 3.4×10⁻⁷ Torr, pre-D2O, (ii) 3.8×10⁻³ Torr D2O, (iii) 3.2×10⁻²
Torr D2O, (iv), 1.4×10⁻¹ Torr D2O (v) 1.0 Torr D2O, (vi) 2.0 Torr D2O, (vii) 3.0 Torr
D2O, (viii) 4.4 Torr D2O, (ix) 5.0 Torr D2O, (x) 6.3 Torr D2O, (xi) 4.0×10⁻⁴ Torr, post-
D2O . SiOH (3745 cm-1) gradually exchanges to SiOD (2760 cm-1). POH (3670 cm-1)
gradually exchanges to POD (2706 cm-1).
600110016002100260031003600
Ab
sorb
an
ce (
a.u
.)
Wavenumber (cm-1)
3745 cm-1
3666 cm-1
2756 cm-1
2692 cm-1
(i)
(ii)
(iii)
(iv)
(v)
(vi)
(vii)
20%
Figure E-9: P-BEA was pre-heated at 623 K under vacuum (1×10⁻⁵ mbar) for 12 h,
followed by exposure to varying levels of D2O at 300 K for 1 h. The corresponding
pressures include: (i) 2.4×10⁻⁷ Torr, pre-D2O, (ii) 11.3×10⁻³ Torr D2O, (iii) 1.9×10⁻¹
Torr D2O, (iv) 4.0 Torr D2O, and (v) 5.6 Torr D2O, (vi) 6.7 Torr D2O, (vii) 7.5×10⁻⁴
Torr, post-D2O. SiOH (3745 cm-1) gradually exchanges to SiOD (2756 cm-1). POH
(3666 cm-1) gradually exchanges to POD (2692 cm-1).
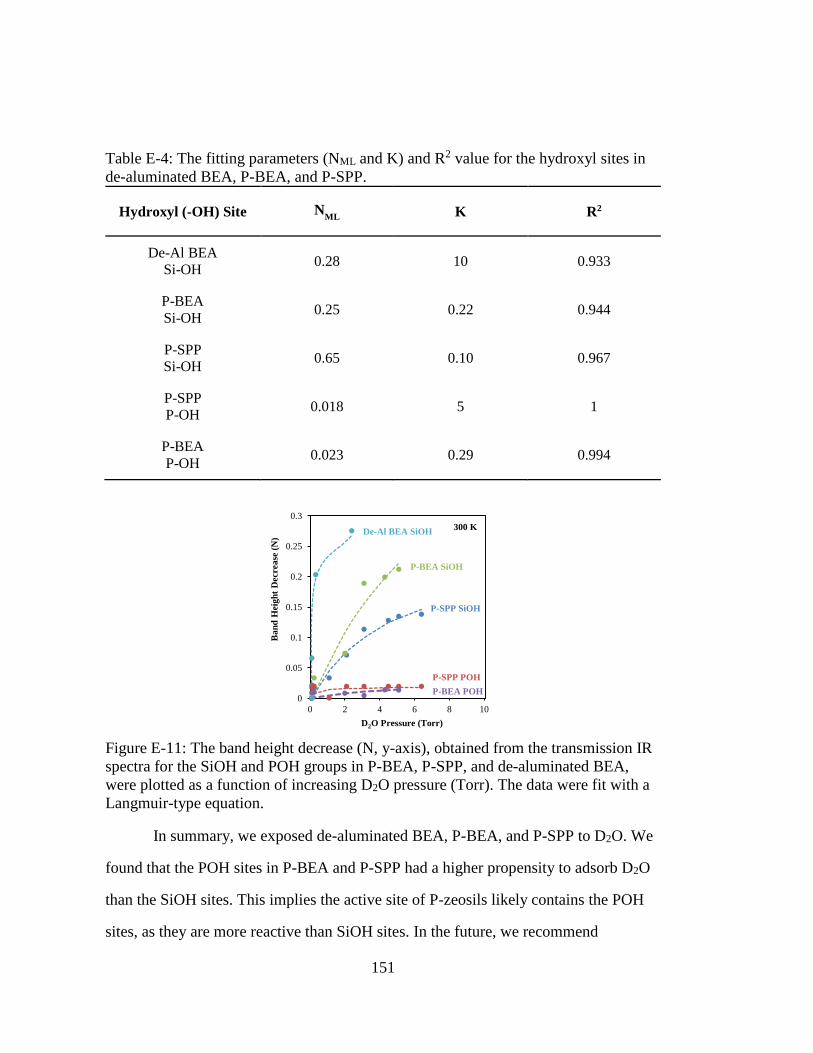
151
Table E-4: The fitting parameters (NML and K) and R2 value for the hydroxyl sites in
de-aluminated BEA, P-BEA, and P-SPP.
Hydroxyl (-OH) Site NML
K R2
De-Al BEA
Si-OH 0.28 10 0.933
P-BEA Si-OH
0.25 0.22 0.944
P-SPP Si-OH
0.65 0.10 0.967
P-SPP P-OH
0.018 5 1
P-BEA P-OH
0.023 0.29 0.994
In summary, we exposed de-aluminated BEA, P-BEA, and P-SPP to D2O. We
found that the POH sites in P-BEA and P-SPP had a higher propensity to adsorb D2O
than the SiOH sites. This implies the active site of P-zeosils likely contains the POH
sites, as they are more reactive than SiOH sites. In the future, we recommend
0
0.05
0.1
0.15
0.2
0.25
0.3
0 2 4 6 8 10
Ba
nd
Hei
gh
t D
ecr
ease
(N
)
D2O Pressure (Torr)
De-Al BEA SiOH
P-BEA SiOH
P-SPP SiOH
P-SPP POH
P-BEA POH
300 K
Figure E-11: The band height decrease (N, y-axis), obtained from the transmission IR
spectra for the SiOH and POH groups in P-BEA, P-SPP, and de-aluminated BEA,
were plotted as a function of increasing D2O pressure (Torr). The data were fit with a
Langmuir-type equation.
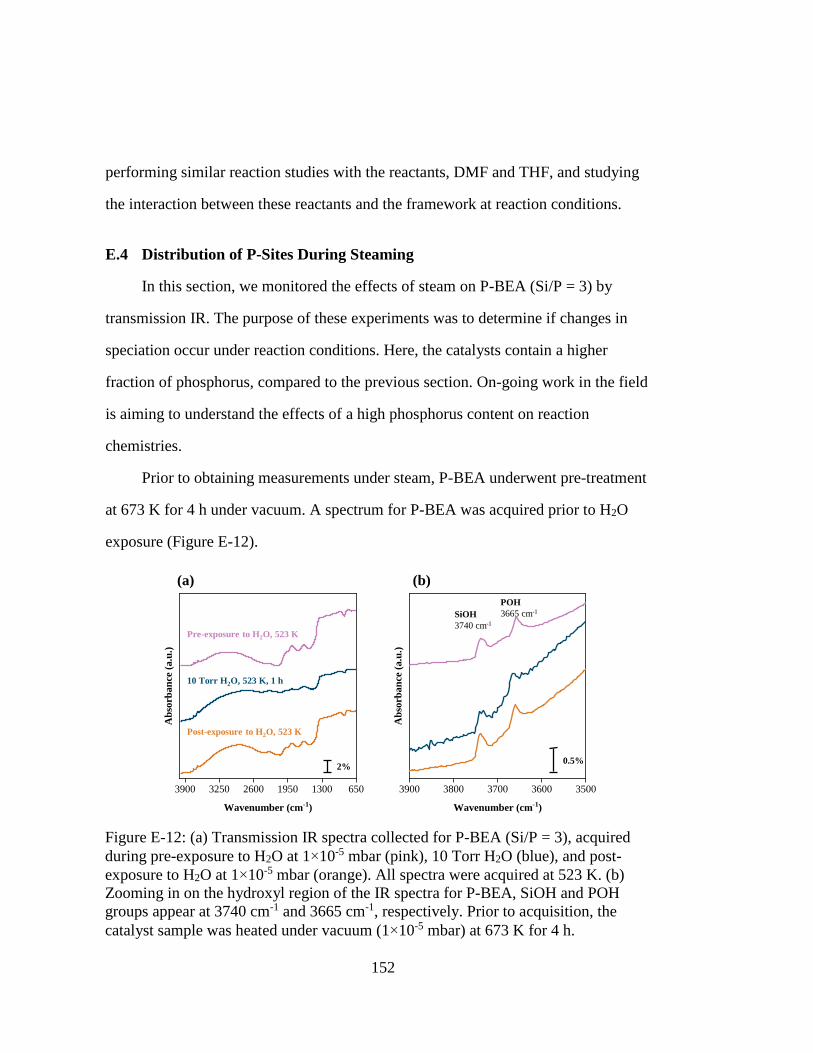
152
performing similar reaction studies with the reactants, DMF and THF, and studying
the interaction between these reactants and the framework at reaction conditions.
E.4 Distribution of P-Sites During Steaming
In this section, we monitored the effects of steam on P-BEA (Si/P = 3) by
transmission IR. The purpose of these experiments was to determine if changes in
speciation occur under reaction conditions. Here, the catalysts contain a higher
fraction of phosphorus, compared to the previous section. On-going work in the field
is aiming to understand the effects of a high phosphorus content on reaction
chemistries.
Prior to obtaining measurements under steam, P-BEA underwent pre-treatment
at 673 K for 4 h under vacuum. A spectrum for P-BEA was acquired prior to H2O
exposure (Figure E-12).
35003600370038003900
Ab
sorb
an
ce (
a.u
.)
Wavenumber (cm-1)
0.5%
65013001950260032503900
Ab
sorb
an
ce (
a.u
.)
Wavenumber (cm-1)
2%
Post-exposure to H2O, 523 K
Pre-exposure to H2O, 523 K
10 Torr H2O, 523 K, 1 h
(b)(a)
POH
3665 cm-1SiOH
3740 cm-1
Figure E-12: (a) Transmission IR spectra collected for P-BEA (Si/P = 3), acquired
during pre-exposure to H2O at 1×10⁻⁵ mbar (pink), 10 Torr H2O (blue), and post-
exposure to H2O at 1×10⁻⁵ mbar (orange). All spectra were acquired at 523 K. (b)
Zooming in on the hydroxyl region of the IR spectra for P-BEA, SiOH and POH
groups appear at 3740 cm-1 and 3665 cm-1, respectively. Prior to acquisition, the
catalyst sample was heated under vacuum (1×10⁻⁵ mbar) at 673 K for 4 h.
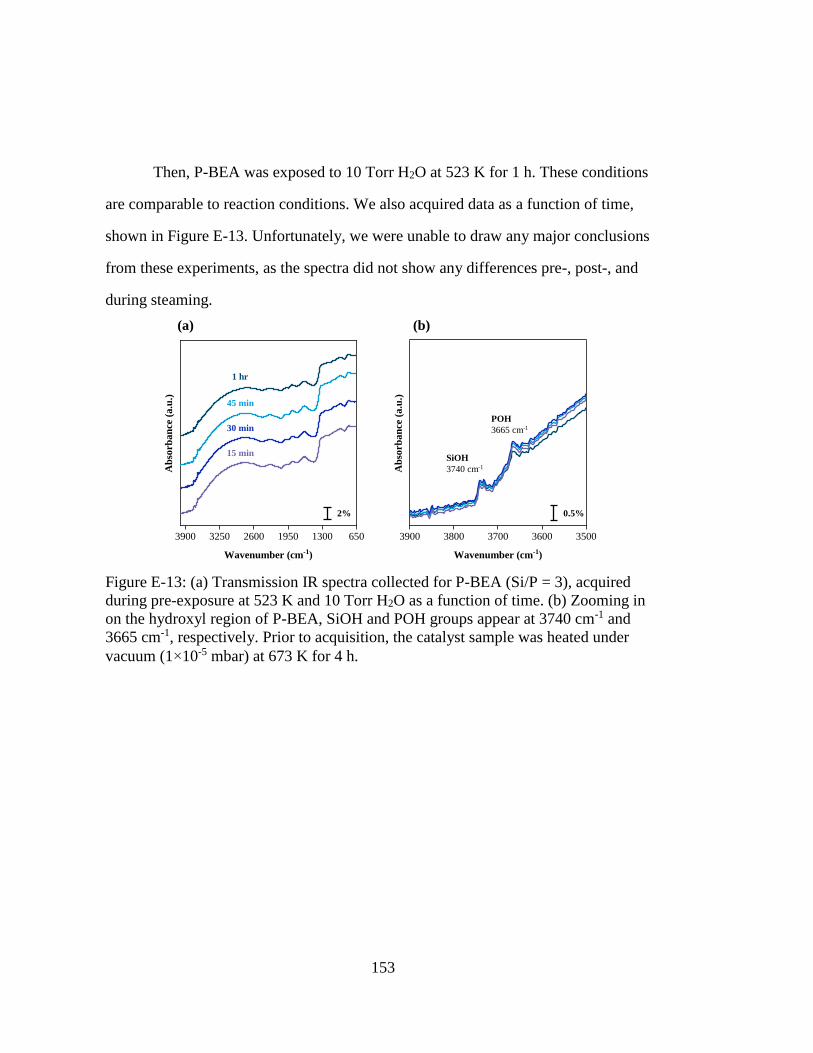
153
Then, P-BEA was exposed to 10 Torr H2O at 523 K for 1 h. These conditions
are comparable to reaction conditions. We also acquired data as a function of time,
shown in Figure E-13. Unfortunately, we were unable to draw any major conclusions
from these experiments, as the spectra did not show any differences pre-, post-, and
during steaming.
65013001950260032503900
Ab
sorb
an
ce (
a.u
.)
Wavenumber (cm-1)
1 hr
15 min
30 min
45 min
2%
35003600370038003900
Ab
sorb
an
ce (
a.u
.)
Wavenumber (cm-1)
POH
3665 cm-1
SiOH
3740 cm-1
0.5%
(b)(a)
Figure E-13: (a) Transmission IR spectra collected for P-BEA (Si/P = 3), acquired
during pre-exposure at 523 K and 10 Torr H2O as a function of time. (b) Zooming in
on the hydroxyl region of P-BEA, SiOH and POH groups appear at 3740 cm-1 and
3665 cm-1, respectively. Prior to acquisition, the catalyst sample was heated under
vacuum (1×10⁻⁵ mbar) at 673 K for 4 h.
154
PERMISSIONS FOR REPRINT
Parts of Chapter 1 and all of Chapter 2 were reproduced with permission from
(https://doi.org/10.1021/acscatal.9b01853) Copyright © 2019 American Chemical
Society.
Chapter 3 was reproduced from work by Norton et al.89 with permission from the
Royal Society of Chemistry Advances (https://doi.org/10.1039/C8RA03088J).
Chapter 4 was reprinted with permission from
(https://doi.org/10.1002/cssc.201901838) Copyright © 2019 John Wiley and Sons.
Chapter 5 was reproduced with permission from the Journal of Physical Chemistry C,
in press. Unpublished work copyright 2020 American Chemical Society.
Appendix F
155
Figure F-1: Permission for Chapter 1 and Chapter 2
156
157
Figure F-2: Permission for Chapter 4


