Embed Size (px)
Citation preview

How Accurate Is Food-For-Work Self-Targeting In The Presence ofImperfect Factor Markets?
Evidence from Ethiopia
Christopher B. BarrettDepartment of Applied Economics and Management
Cornell University
and
Daniel C. ClayInstitute for International Agriculture
Michigan State University
February 2001
Seniority of authorship is shared equally. Barrett is the corresponding author at 315 Warren Hall,Cornell University, Ithaca, NY 14853-7801, email: [email protected], phone: 607-255-4489, fax:607-255-9984. We thank Stein Holden, Daniel Molla, David Pelletier, Menno Pradhan, DavidSahn, Scott Swinton, Amare Teklu, Steve Younger and participants at the 2000 NortheastUniversities Development Conference for helpful comments and discussions. Any remainingerrors are ours alone.
© Copyright 2001 by Christopher B. Barrett and Daniel C. Clay. All rights reserved. Readers may make verbatim copies of this document fornon-commercial purposes by any means, provided that this copyright notice appears on all such copies.

How Accurate Is Food-For-Work Self-Targeting In The Presence ofImperfect Factor Markets?
Evidence from Ethiopia
Abstract: Effective targeting of transfers is a key issue in public policy to combat poverty.Much faith is presently placed in self-targeting mechanisms such as publicemployment schemes supported by food-for-work transfers. Where targetingerrors have been observed, these are usually attributed to mismanagement of keyoperational details, such as the project’s wage rate. Using a unique data set fromrural Ethiopia, we demonstrate that targeting errors run far deeper in some low-income countries. We hypothesize that imperfect factor markets generate apredictable dispersion across households in reservation wage rates that breaksdown the unconditionally positive relation between income and shadow wages onwhich the theory of self-targeting public employment programs rests.
2
1 Some good reviews can be found in Besley and Kanbur (1988), Lipton and van der Gaag(1993), van de Walle and Nead (1995), Sharp (1997), Devereux (1999) and Barrett(forthcoming).
How Accurate Is Food-For-Work Self-Targeting In The Presence ofImperfect Factor Markets?
Evidence from Ethiopia
Introduction
The problem of targeting transfers is a key issue among scholars and development professionals
concerned about poverty, food insecurity, and vulnerability. Given a fixed amount of resources
available to transfer to a population, what method of screening prospective recipients does one
employ so as to generate the greatest aggregate reduction in income poverty, malnutrition, or
another indicator of choice?1
In low-income settings, administrative targeting requiring documentation of individuals’
assets and incomes is typically infeasible, although it can be a relatively accurate means of
identifying the poor in higher income settings (Besley and Kanbur 1988, Barrett forthcoming).
So-called “indicator” targeting is frequently used instead, distributing to subpopulations readily
identifiable by age, gender, or location because in aggregate those cohorts are worse off than
other broad, identifiable groups. Like targeting based on administrative screening of applicants’
asset and income status, this method restricts participation administratively, but the indicators
used make enacting the restriction (e.g., to feed only children below a certain age at a center, to
deliver food just to a region that has suffered severe drought) relatively simple. A major concern,
however, is that indicator targeting often entails substantial leakage to the nonneedy within the
targeted subpopulation, thereby weakening the safety net and pitting the transfer system against

3
2 Clay (1986), Besley and Kanbur (1988), Ravallion (1989, 1990, 1991) and von Braun(1995) present the theory and much empirical evidence on the efficacy of such schemes.
the commercial production and distribution system that otherwise serves consumers of sufficient
means.
The fashion now favors “self-targeting” transfers that have no administrative restrictions
on participation, but the nature of which is suppose to induce only those within a target
beneficiary group to self-select into participating. In principle, there is no need for costly
administrative screening nor for significant leakage to the non-needy. The characteristics of the
transfer should suffice to create incentives for participation that vary across individuals. Common
self-targeting features of transfers include the (low) quality of a subsidized foodstuff, queuing to
receive transfers, or a work requirement that carries a high opportunity cost of time for the
relatively better-off. The cost (benefit) of participation is made an increasing (decreasing)
function of one’s pre-participation income or wealth, so that only the needy find project
participation attractive. Self-targeting methods have been used by governments for a long time
(Drèze and Sen 1990) but have become especially prominent in the past decade. The government
of Ethiopia, for example, now devotes 80 percent of its food assistance resources to food-for-
work (FFW) programs based on the principle of self-targeting(FDRE 1996).
Food-for-work is the most common type of self-targeting transfer in low-income rural
settings.2 The idea is to offer unlimited employment, but at a wage low enough that only the truly
destitute are willing to participate. The Employment Guarantee Scheme in Maharashtra state,
India, is perhaps the most well-known example of a self-targeting employment program (Herring
4
and Edwards 1983, Ravallion 1991, Ravallion et al. 1993). FFW has become increasingly popular
in Sub-Saharan Africa over the past decade (Devereux 1999, von Braun et al. 1999).
FFW programs are increasingly promoted as an effective means to provide food assistance
to needy households in low-income rural economies while simultaneously achieving development
objectives (Clay 1986, Ravallion 1991, von Braun 1995). Most FFW projects employ able-bodied
individuals at a below-market wage rate, often but not always paid in grain, flour, oil, or other
foodstuffs, typically in public works projects such as road construction or rehabilitation. There
are many potentially appealing features of FFW programs, of which the most commonly cited is
its self-targeting character.
But the efficacy of FFW projects in reaching the needy has come under scrutiny of late.
While much of the empirical evidence supports the claim that FFW – and self-targeting
employment schemes more broadly – effectively reaches intended beneficiaries (Ravallion 1991,
von Braun 1995), several recent studies have found evidence that many nonpoor participate in
FFW schemes, calling into question the efficacy of the self-targeting feature (Clay et al. 1999,
Devereux 1999, Jayne et al. 1999, Teklu and Asefa 1999, Gebremedhin and Swinton 2000). The
most common explanation is that the FFW wages were set too high, inducing substitution of
money wage work in the local labor market for FFW work, and thereby limiting the additionality
of the FFW transfer since it largely substitutes for other income that would have been earned in
the project’s absence (Ravallion et al. 1993, von Braun 1995, Teklu and Asefa 1999). Moreover,
when wages are set too high, project managers commonly face excess labor supply and have to
ration participation in some fashion. There are good reasons to believe local elites enjoy a higher

5
3 Herring and Edwards (1993) tell an interesting story of manipulation and corruption thatarise due to the many different opportunities for local FFW managers to exercise discretion (e.g.,over project duration, location, wage rates, payment terms, etc.) and how this may affectparticipation profiles, even in a seemingly successful program like Maharashtra’s EmploymentGuarantee Scheme.
probability of selection for participation than do outcasts.3 In addition to there commonly being
unintended beneficiaries, many intended recipients get missed by FFW programs. In some cases
this is because they get crowded out by participating elites. Other times finite transfer resources
limit the geographic reach of the program to a few administratively selected locations (Devereux
1999, Gebremedhin and Swinton 2000). The common feature of these explanations of the
targeting deficiencies of FFW is the suggestion that targeting errors can be corrected by a change
in operational methods: a lower FFW wage, closer auditing of employment roles, a larger budget
to expand geographic coverage, etc. We accept these important points.
In this paper we argue, however, that in addition to explanations resting upon such
operational details, the accuracy of the self-targeting component of food-for-work schemes may
be fundamentally limited by factor market failures affecting the nature of local labor supply in low-
income agrarian settings. Factor markets in land, labor and capital are often incomplete in poor,
rural economies, so labor and cultivable land do not necessarily move freely between households
so as to equalize (quality-adjusted) land/labor ratios. Therefore household willingness to
participate in a FFW project need not be strongly, inversely related to household pre-transfer
income on an unconditional basis, as the conventional wisdom assumes. Put differently, even if
managers get all the operational details right, FFW projects may still experience considerable
leakage to the relatively better-off and may still miss many of the poorest due to factor market
failures. A household’s reservation FFW wage may indeed increase in income, but only

6
conditional on other structural factors – in particular, the composition of households’ productive
asset endowments – that influence shadow wages and nonwage factors affecting willingness to
participate in the FFW scheme. Put differently, the very structural weaknesses that motivate
transfers to the poor may impede the effective self-targeting of transfers meant to relieve their
poverty.
The remainder of the paper proceeds as follows. First we situate the work in its empirical
context, Ethiopia in the latter part of the 1990s, describe the unique data set we use, and
document the targeting errors observable in household data on FFW participation in Ethiopia.
We then offer a simple model of household willingness to participate in a food-for-work scheme,
emphasizing the role of endogenous shadow wage formation in households facing factor markets
characterized by frictions that induce households to self-select out of particular markets and that
render household and hired labor imperfectly substitutable. We then estimate the structural model
using the Ethiopian data, taking care to control for censoring and unobserved heterogeneity
issues. A brief concluding section draws out the implications of this work.
Food Aid and Food-For-Work in Ethiopia
Ethiopia is a large nation of more than 60 million people in the Greater Horn of Africa.
Annual per capita income is among the lowest in the world and the nation is among the largest
food aid recipients in the world, historically and currently. The 1984-85 drought was extensively
profiled in the western media, and elicited unprecedented humanitarian response. According to
data from the World Food Programme, Ethiopia lagged only Bangladesh in volume of food aid
received, 1994-98, the most recent five year period for which data are available, averaging just
7
4 Data available electronically at http://www.wfp.org/reports/wfpstats/98/table6.htm.
under 600,000 metric tons of shipments per year.4 As we write this, Ethiopia’s short belg rains
again failed or came late in much of the country, precipitating massive livestock deaths and a food
security crisis attracting international attention and massive relief food aid shipments.
The effectiveness of Ethiopia’s food aid delivery system at reaching the country’s most
vulnerable households has come under considerable recent scrutiny. In a qualitative review of
food aid programs in recipient districts (weredas) Sharp (1997) found widespread food aid
leakage to unintended beneficiaries. In a nationwide empirical study of food aid targeting, Clay et
al. (1999) found little correlation between food needs and food aid receipts either at the district or
household levels. Poor targeting, they concluded, arises due to four factors. 1) The primary
beneficiaries of food aid programs are households at the extremes in terms of food availability:
those with the least and those with the most food available. 2) A disproportionate number of
female and aged heads of households receive food aid even though their food needs do not differ
significantly from those of the general population. 3) Unwarranted regional concentrations of food
aid appear. 4) Built up “inertia” in the food aid delivery system seems to maintain the flow of
food aid to historically deficit areas irrespective of current food needs. Follow-on research has
underscored the importance of the inertia effect or of project objectives other than poverty
assistance in understanding Ethiopia’s inability to target vulnerable households (Jayne, et al. 1999,
Gebremedhin and Swinton 2000).
It is especially perplexing to the food aid establishment how Ethiopia’s FFW programs,
widely presumed to be additionally self-selecting due to the theoretically below-market wage
rates offered, could show a degree of targeting inefficiency equal to that found among free food
8
distributions. This has become an increasingly contentious issue as FFW schemes, often dubbed
“development food aid,” supplant traditional free food distribution throughout Ethiopia.
As in other places where FFW efficacy has been questioned, the operational details of
FFW programs appear to have some explanatory power. The wage rates set by communities
implementing FFW programs are not always set below local market rates. Indeed, Sharp (1997)
reports that it is not uncommon for such rates to exceed prevailing market rates specifically to
attract enough labor to make the programs successful.
But is the explanation wholly to be found in the institutional design and operational details
of FFW programs? We think not and provide both a theoretical rationale and empirical evidence
that there are more fundamental, structural problems that lie behind the apparent targeting errors
of FFW in Ethiopia. But first, we need to establish more concretely the severity of the targeting
problems of FFW in Ethiopia.
Data
We make use of what appears to be a unique data set. Existing studies of food aid examine only
actual participation behavior. This limits analysts’ ability to study how participation profiles might
change with shifts in the offered FFW wage rate since there is typically relatively little variability
in this rate, particularly within a community. As a result, the wage rate offered and used as a
regressor in explaining participation behavior may pick up community level fixed effects unrelated
to wage rates and cannot capture the potentially heterogeneous rents accruing to households that
may value their time differently but are employed at the same wage rate.

9
5Under the auspices of the USAID-funded Grain Market Research Project, implementedby Michigan State University.
The nationally representative data set we employ elicited households’ reservation wage
rates for participation in FFW projects using methods well established in nonmarket valuation
studies. As we demonstrate below, this permits us to trace out FFW participation profiles for the
relevant range of wage rates, permitting both direct testing of the hypothesis that targeting
improves as the FFW wage rate falls, and direct study of interhousehold variation in willingness to
participate in a FFW scheme as a function of structural attributes of the household.
The data derive principally from the June 1996 Food Security Survey fielded by the
Ethiopia Central Statistical Authority.5 The sample was randomly drawn as a 4,218 household
subset of the CSA’s annual agricultural survey. By design, the CSA obtained objectively measured
estimates of crop production for only 3,244 of these households; the rest contain production
measured by farmer recall only. For consistency in data, we use the reduced sample of 3,244
households in this research. As such, it is a nationally representative sample of rural, agricultural
households. The sample is further reduced by “don’t know” responses to the reservation wage
questions. As to be expected, these occurred predominantly in weredas where there were no FFW
programs reported. Thus, the number of observations varies across the particular form of payment
(cash or various types of grain), between 2,611 and 2,796 households. We adjust all reported
results appropriately for sampling weights reflecting each household’s probability of sample
selection. The survey addressed a broad array of grain marketing and food security issues,
including grain production and marketing, food aid use, impacts of food aid program

10
6 The questions were translated into local languages in the fielded questionnaires.
participation, land ownership and use, household labor and demographics, and various farming
practices. The variables used in this study are described in Appendix A.
The dependent variable that makes this study unique is the household’s reservation FFW
wage, which was elicited in the following manner. Each household was asked “If a food-for-work
program were implemented in this area next month to plant trees or build roads, would you (or
another adult from this household) work a six hour day, five days each week for a month, in
return for ” a daily wage of a particular quantity and form of grain or of cash.6 In the case of in
kind payments, the enumerators’ instructions were to start with the response 4 kilograms, which
is on the high end of prevailing FFW wage rates in Ethiopia at the time. If respondent answered
“no,” the enumerator increased the amount of grain by one kilogram until the respondent’s answer
switched to “yes,” at which point that minimum acceptable wage was recorded. The enumerators
stopped at ten kilograms, so the data are censored from above. If the respondent initially
answered “yes” to 4 kilograms, the enumerator decreased the amount of grain by one kilogram
until the respondent’s answer changed to “no,” and the lowest “yes” response was recorded as the
minimum acceptable wage. The enumerators stopped at one kilogram, so there may be some
(very modest) censoring from below as well. All respondents were asked this for three different
grain types – white wheat, red wheat and maize – so as to control for ethnic and regional
differences in preferences. They were also asked their willingness to participate for cash wages
where the same procedure was followed, starting at eight birr (worth just over US$1 at the time)
and increasing by one birr to a ceiling of 18, or decreasing by one birr.

11
7 Since we are concerned about the potential role of stigma in causing households todemand a higher FFW wage, we also considered the possibility that this omission might lead tosample selection bias, but a probit model to estimate selectivity into the subsample of respondentsto this elicitation process proved uninformative.
So the reservation wage elicitation process was in the spirit of the iterative bidding process
common to many contingent valuation studies in environmental economics (Arrow et al. 1995).
The particular starting point chosen might matter to the establishment of the precise level of the
labor supply curve due to anchoring effects, but since all households were presented with the
same offer process, this should have no effect on the estimated slope of the FFW labor supply
curve nor on the correlates of willingness to participate in a FFW program at any given offered
wage rate.
While food aid and FFW programs are commonplace throughout Ethiopia, not everyone is
familiar enough with either the program or particular commodities to offer a well-informed
answer. No effort was made to push respondents for answers to these questions if they felt
uncomfortable. So betweem 13.8 and 19.5 percent of the full sample, depending on the particular
commodity form chosen, did not reply (or replied “I don’t know”) to the elicitation question. We
have checked these missing values and find no statistically significant difference in income,
household assets or composition, or region, so there is no evidence that the missing observations
create any sort of bias.7
These data offer a novel opportunity to explore households’ willingness to participate in
FFW programs in the nation with the largest food aid distribution and FFW programs in Africa.
Other studies have relied solely on realizations of households’ participation decisions by studying
observed behavior. The findings of such studies (e.g., Ravallion 1991, von Braun 1995, Teklu
12
8 The supply curve is estimated by aggregating across households weighted by the inverseof their sampling probability (i.e., the number of households in the population they “represent” inthe survey).
9 The ray elasticities for white wheat and cash (in white wheat equivalents) are 2 or greaterup to 4 kilograms, but below 0.6 beyond 7 kilograms. Qualitatively similar patterns emerge forred wheat and maize.
and Asefa 1999) tend to support the claim that FFW effectively self-targets poor households. We
are concerned, however, that previous studies either (a) draw on data from areas where large
landless subpopulations and reasonably well-developed rural labor and land markets (e.g., India,
where the Maharashtra Employment Guarantee Scheme has been extensively studied) dampen our
concerns about the effects of rural factor market failures, or (b) fail to control adequately for
either alternative (self-)employment opportunities faced by prospective participants or for the self-
selection mechanism itself. Direct elicitation of reservation FFW participation wages in Ethiopia
provide a unique opportunity to explore the determinants of self-selection into a self-targeting
transfer program amid incomplete rural factor markets.
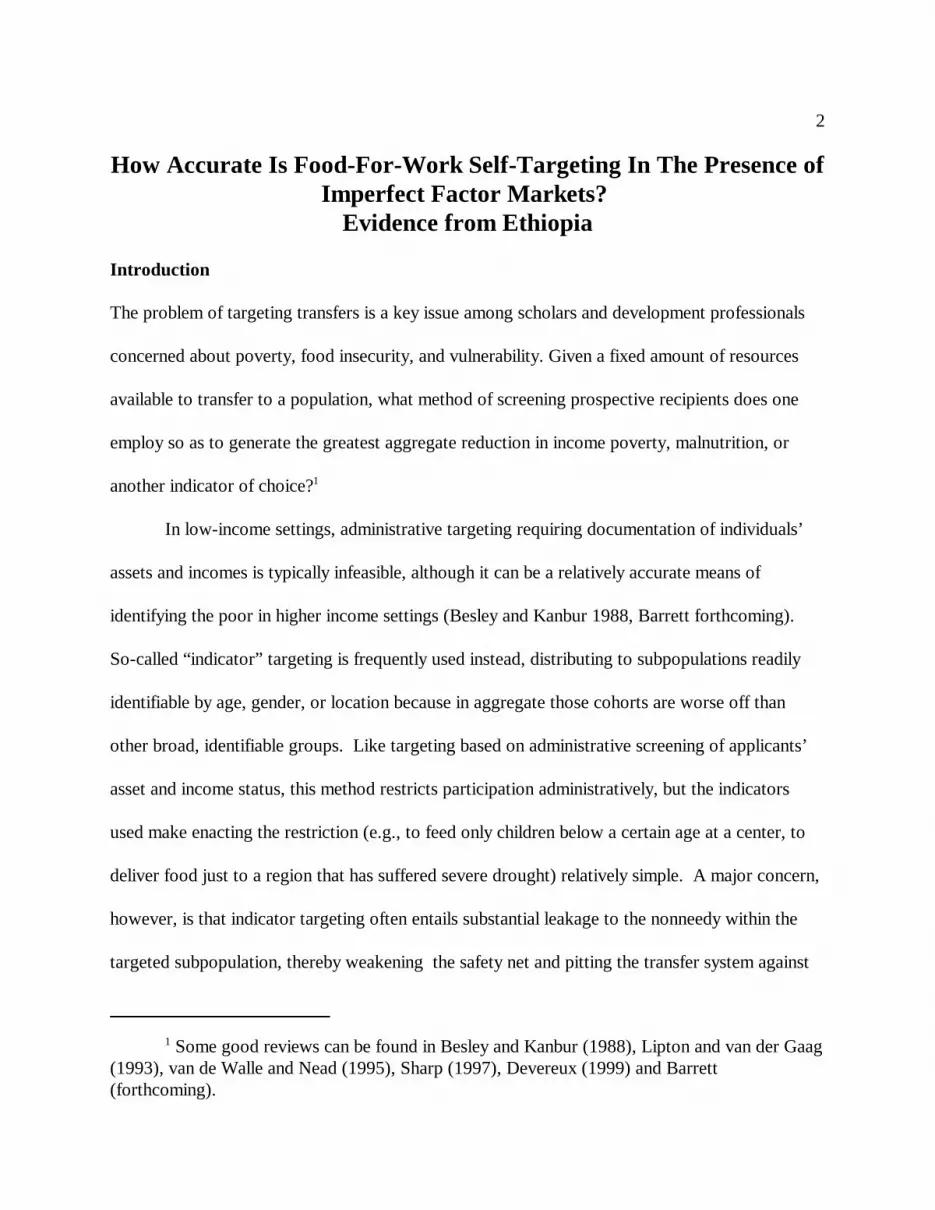
Figure 1 displays the estimated national labor supply curve for a FFW program with
payments in white wheat (measured against the lefthand Y-axis).8 It slopes upwards, as one
would expect, with highly elastic labor supply at very low wages and modestly inelastic labor
supply at higher wages (of 8 or 9 kilograms per day).9 Figure 1 also shows labor supply based on
cash reservation FFW wages converted to white wheat equivalents using local (zone-level)
producer and retail prices for net food sellers and net food buyers, respectively, so as to capture
households’ marginal value of the wheat.
The received wisdom regarding self-targeting in FFW is that the upward slope in the
aggregate labor supply curve reflects differing opportunity costs of labor supply that are strongly
13
and positively correlated with household income. There are two sources to this supposed effect.
First, individuals endowed with greater skills or human capital are more productive and therefore
earn a higher wage, making them less willing to forego private employment for FFW
participation. Because they earn a higher wage, they are also less likely to be poor and in need of
the support. So by making the opportunity cost of time higher for richer households, the theory
holds that FFW effectively self-targets poor households when wages are set low enough.
Second, if leisure is a normal good, especially if it is a luxury good (i.e., characterized by
an income elasticity of demand in excess of one), then higher income households will want to
consume more leisure than lower income households and so will be less willing, ceteris paribus, to
participate in a FFW program with a significant minimum hours requirement, as is true of most
programs in practice and of the question posed to the respondents in the survey we use.
Table 1 shows that the conventional wisdom finds little support in the Ethiopian data.
While mean household income is indeed (nonmonotonically) increasing across the reservation
wage levels, the increase is statistically insignificant at any reasonable confidence level. Large
standard deviations in household income per adult equivalent at each reservation wage level
indicate considerable income heterogeneity among households willing to participate at any given
wage rate. The opportunity cost of time appears only quite weakly related to household income
per capita on an unconditional basis. So the wage rate does a relatively poor job of inducing
disproportionate participation by the poor even in FFW programs offering relatively low wages.
Targeting questions also arise obliquely in the interesting pattern that appears when one
comparing the estimated aggregate labor supply curves for payment in cash and kind. Above two
kilograms, up to which point labor supply is negligible, labor supply is everywhere greater when

14
10 Note that this premium estimate ignores the additional costs of procurement, transport,storage, handling and loss of physical commodities, which only magnify the differences betweenfood and cash distributions.
11 Our finding is therefore consistent with the well-established “cash-out puzzle” related towelfare transfers more generally.
payment is in cash rather than in kind, revealing a nontrivial fungibility premium prospective FFW
participants place on the form in which the transfer is received. We estimate the fungibility
premium as the percent additional employment the sponsoring agency could attract using cash
instead of wheat to pay a given wage rate. One can clearly employ more households for a given
budget if compensation is made in cash rather than in kind. The fungibility premium (depicted by
the line marked with ovals and plotted against the righthand Y-axis) decreases in the wage rate,
from 65 percent at a low of 3 kilograms of white wheat, down to 12% at high end of the wage
range considered.10 This observation reinforces Drèze and Sen’s (1990) point that the justification
for transfers in kind turns on the need to resolve a local supply problem for the foodstuff in
question since the transfers become more expensive per recipient to achieve the same desired end
of support.
It is important to consider why such a cash premium might exist. As has been understood
at least since Southworth (1945), if recipients are net food buyers and the transfer is infra-
marginal (i.e., the recipient still buys food post transfer), then the form of the transfer should not
matter.11 The most likely explanation for the observed premium is that the transfer is not infra-
marginal for some beneficiaries at any given wage rate. This would be the case if recipient
households are net grain sellers. Since there is typically a strong positive correlation between

15
12 The declining premium likely reflects the fixed cost associated with selling food. Unitaverage receipts net of sales expenses tend to rise with sales volumes among smallholders.
household marketable food surplus, land holdings and income in rural Africa (Barrett and Dorosh
1996), the observation of a substantial cash premium again suggests mistargeting.12
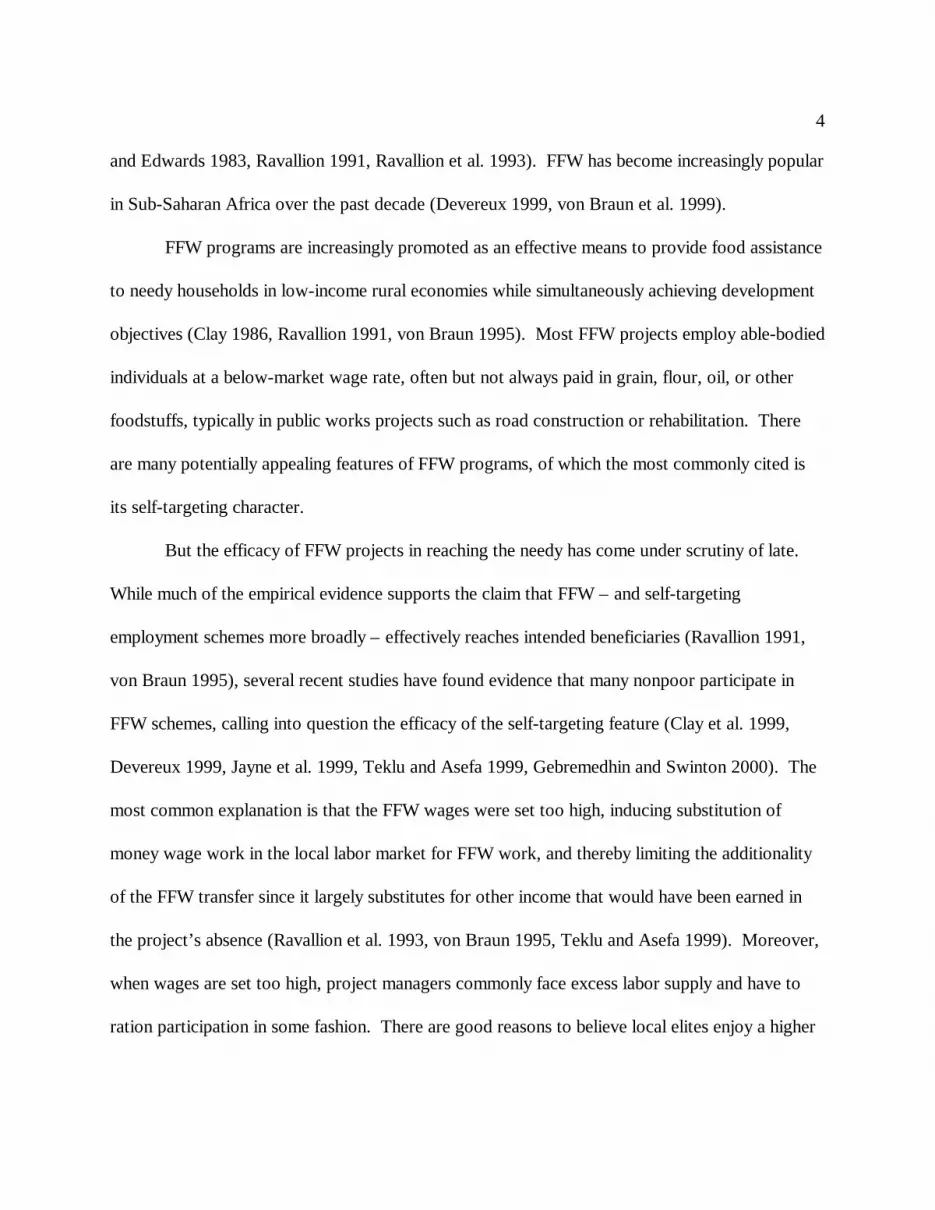
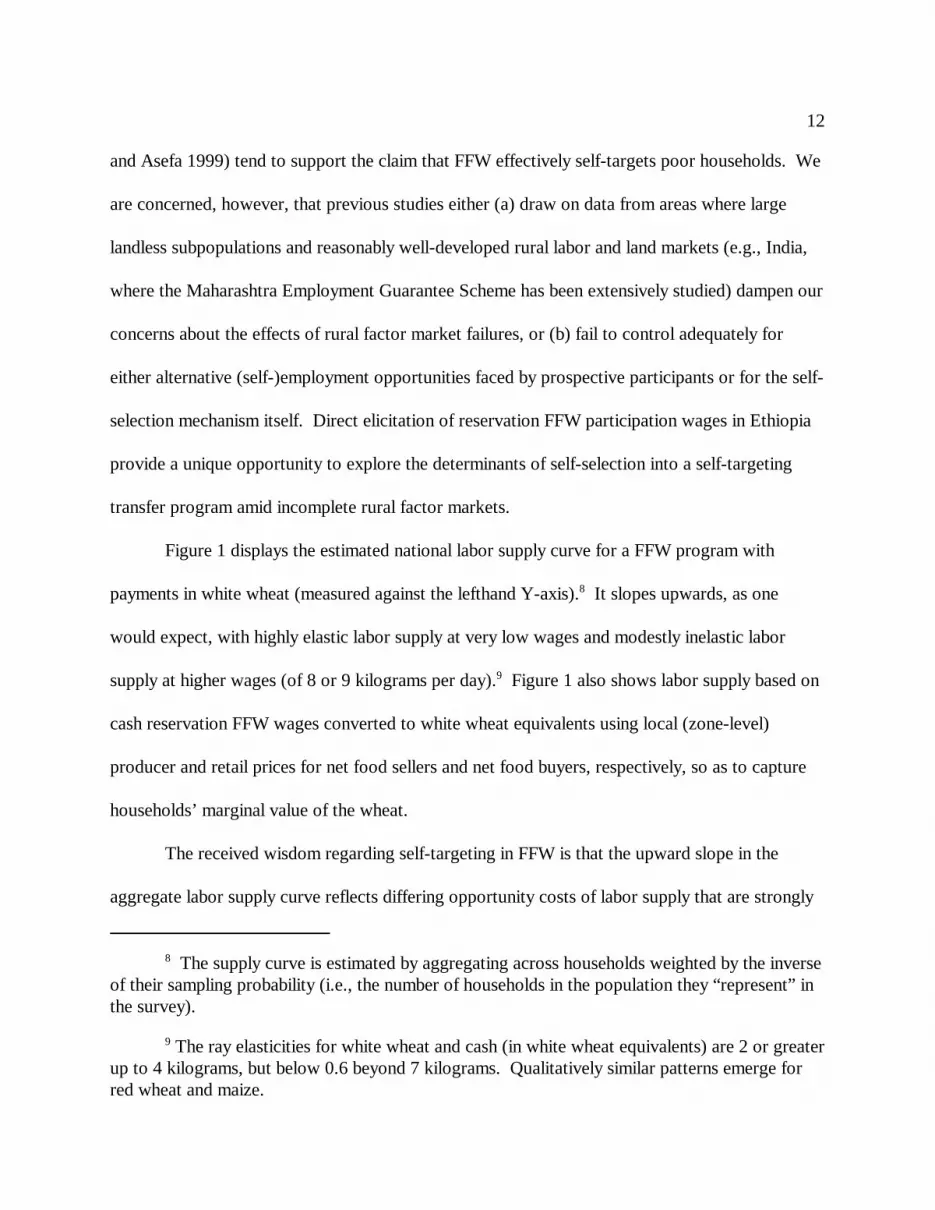
An ideally targeted program would have neither errors of exclusion – members of the
target subpopulation who self-select out of the program – nor errors of inclusion – individuals not
in the target subpopulation who self-select into the program. Assuming the target subpopulation
consists of those below a certain threshold income level, ideal targeting would generate a
participation probability function that is piecewise linear, like the stylized one depicted in Figure
2, with a horizontal line at value one (i.e., 100% frequency of participation) until the threshold
income level, at which point the curve falls straight to a horizontal line at value zero (i.e., 0%
frequency of participation beyond the threshold identifying the target subpopulation). While no
actual transfer scheme attains this unrealistic ideal standard, the extent of deviations from this
benchmark are informative nonetheless.
Moreover, if the conjecture that targeting errors in FFW programs are attributable to
incorrectly set wage rates, then one should be able to use such participation probability function
estimates to see if wage rate variation indeed affects targeting. For wage rate reduction to be
successful in improving the targeting of the FFW transfer, then as the wage rate falls the
participation probability function must pivot downward from the upper boundary at the targeting
threshold point, steepening its (negative) slope so as to reduce errors of inclusion, while
maintaining its intercept, so as to preclude increased errors of omission. By contrast, if a lower
FFW wage induces parallel downward shifts of the participation probability function, then

16
13 This variable takes value one if the household was willing to participate in the programat the indicated wage rate (or a lower one) and zero otherwise.
14 Qualitatively identical patterns emerge for other reservation wage rates. These threewere chosen as illustrative of the broader pattern.
program changes merely trade reduced errors of inclusion (lower probability of participation on
the high end of the income distribution) for increased errors of exclusion (lower probability of
participation on the low end).
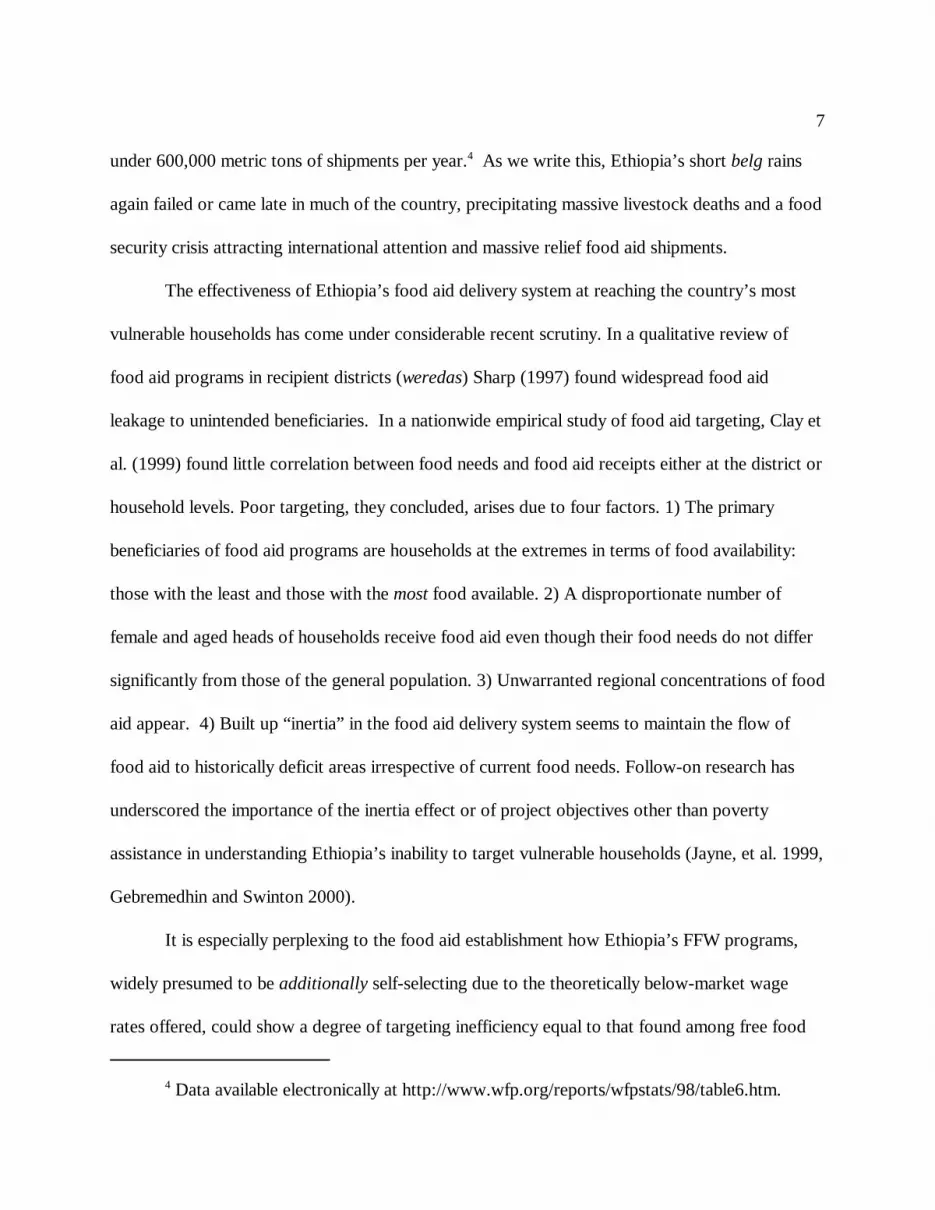
Figure 3 presents nonparametric nearest-neighbor regressions of a willingness to
participate indicator variable13 on household income per adult equivalent for three different wage
rates: three, six and nine kilograms of white wheat.14 The desirable pivoting effect is indeed
evident as one moves from an above-market wage rate of nine kilograms down to six (the median
and mean reservation FFW wage were between five and six kilograms in these data). So wage
rate determination clearly matters to FFW project participation profiles, as the existing literature
emphasizes. Pushing FFW wage rates lower still, however, appears to backfire, leading mainly to
a sharp increase in errors of exclusion. So the oft-heard claim that one can improve targeting in
FFW programs merely by lowering real wages seems only weakly supported in these data.
Moreover, even though participation by the relatively well-off responds in the desired
direction to wage adjustments, errors of inclusion remain rather large. Median annual income per
adult equivalent is 885 birr in this sample, just over US$100, and the participation probability of a
household with income equal to twice the sample median is always at least 80 percent of the
participation probability of a household in the lowest decile. Even in a self-targeting program like
FFW, leakage to unintended beneficiaries appears considerable.

17
Furthermore, errors of exclusion among the poorest become very high, especially as one
approaches the mean reservation FFW wage. At a FFW wage of six kilograms of wheat, one
would expect almost one-third of the poorest quintile to choose not to participate in the FFW
program. And at a wage of five kilograms (not shown), the fraction of the lowest income quintile
self-selecting out of the FFW program increases to roughly one-half. Many of Ethiopia’s able-
bodied poor appear to have better uses for their time than participation in low-wage FFW
programs.
The question remains: why such errors in an ostensibly self-targeting transfer? The next
section offers a simple explanation of why even operationally ideal FFW programs (i.e., those free
of corruption and offering below-market wages) may fail in the present of imperfect rural factor
markets. The subsequent section successfully tests the predictions of that model before we turn
to discussing the implication for designing effective transfer schemes in low-income rural areas
suffering incomplete markets.
A Model of Household Willingness to Participate in a FFW Program
The relationship between labor supply and transfers has received recent attention in the context of
potential work disincentive associated with transfers (Moffitt 1992, Kanbur et al. 1994, Sahn and
Alderman 1996). We are unaware, however, of any published research relating labor supply
decisions to household willingness to participate in FFW projects or related transfer schemes.
This section develops a simple model, which we then estimate from the Ethiopian data.
The reservation wage at which a household becomes willing to participate in a FFW
program depends on the opportunity cost of both the labor committed to the program and

18
15 The literature on public assistance programs in the United States pays considerableattention to the possible role of stigma in impeding participation by eligible households (Moffitt1992, Blank 1994, Barrett forthcoming). Sen (1995) relatedly notes that participation in publicemployment schemes likely depends in part on issues of self-respect and independence.
whatever disutility acceptance of public assistance might impose on the household, perhaps due to
stigma or self-esteem effects.15 So one can specify the reservation FFW wage as
(1) wijFFW = wij* + ?(hij
FFW,xij,yij)
where wijFFW is the wage at which the ith household in the jth community is willing to participate in
the FFW program, w* is the shadow wage the household could receive for its labor applied
elsewhere, and ? is a premium the household might demand due to the potential stigma or
differential transactions costs (e.g., queuing, or distance to project site) associated with FFW
participation. If stigma or self-esteem effects are greatest on initial receipt of assistance, then this
premium should be a decreasing function of the household’s FFW participation history, hFFW,
expressed in terms of years of past participation. The disutility associated with stigma is likely
increasing in income, y – i.e., reputation and self-esteem are normal goods – and elements of the
household characteristics vector, x (e.g., gender), likely also affect the production of disutility due
to stigma or self-esteem.
While the potential disutility effects of participation in a public assistance scheme must be
taken into account in trying to explain households’ declared reservation FFW wages, the
opportunity cost of time is likely the main determinant of a household’s willingness to participate.
So we emphasize primarily the determination of the household shadow wage, w*, reflecting the
opportunity cost of the household’s time prospectively spent in a FFW program. The theory
behind the self-targeting feature of FFW is that households with substantial endowments of

19
16 The literature on nonseparable household modeling offers many possible explanationsfor household market nonparticipation, including risk, transactions costs, asymmetric informationor contract enforcement problems, etc. (Singh et al. 1986, De Janvry et al. 1991). The reasons forhousehold-specific markets failure are not of direct concern in this paper.
productive assets (e.g., land, livestock) enjoy relatively high marginal returns to labor from self-
employment and so have higher shadow wages than their less wealthy, lower-income neighbors.
Similarly, relatively healthy and well-educated persons may exhibit higher labor productivity due
to superior human capital endowments, so the market wage they earn should be higher than that
received by less healthy or well-educated persons. So if one wants to make an unrestricted offer
of employment but have only the poor – in human and physical capital terms – take up that offer,
setting a low wage rate should effectively induce self-selection into the program by the poor and
out of the program by the wealthy.
The problem with this reasoning is that where markets in labor, land, livestock, and other
assets and factors of production are missing for many households, factor endowment ratios are
not readily equalized through markets. In such a setting, it is not the absolute level of a
household’s wealth or income that determines its shadow wage, but rather the composition of its
wealth, the ratios relating household’s endowment of labor, land, livestock, etc. A poor
household may have relatively little land, but if it has proportionately even less labor and does not
hire in labor for whatever reason,16 then that household’s shadow wage in self-employment on-
farm may nonetheless exceed the shadow wage of a wealthier household possessing more land but
also proportionately greater labor. Frictions in factor markets that inhibit households’ ability to

20
17 This observation has spawned an important recent literature on structural labor supplyestimation in low-income agriculture (Jacoby 1993, Newman and Gertler 1994, Skoufias 1994,Barrett et al. 2000).
18 A more formal, mathematical treatment can be found in Jacoby (1993), Newman andGertler (1994) or Barrett et al. (2000).
equalize factor ratios across production units, may thereby result in considerable variability in
marginal rates of labor productivity, i.e., in shadow wages.17
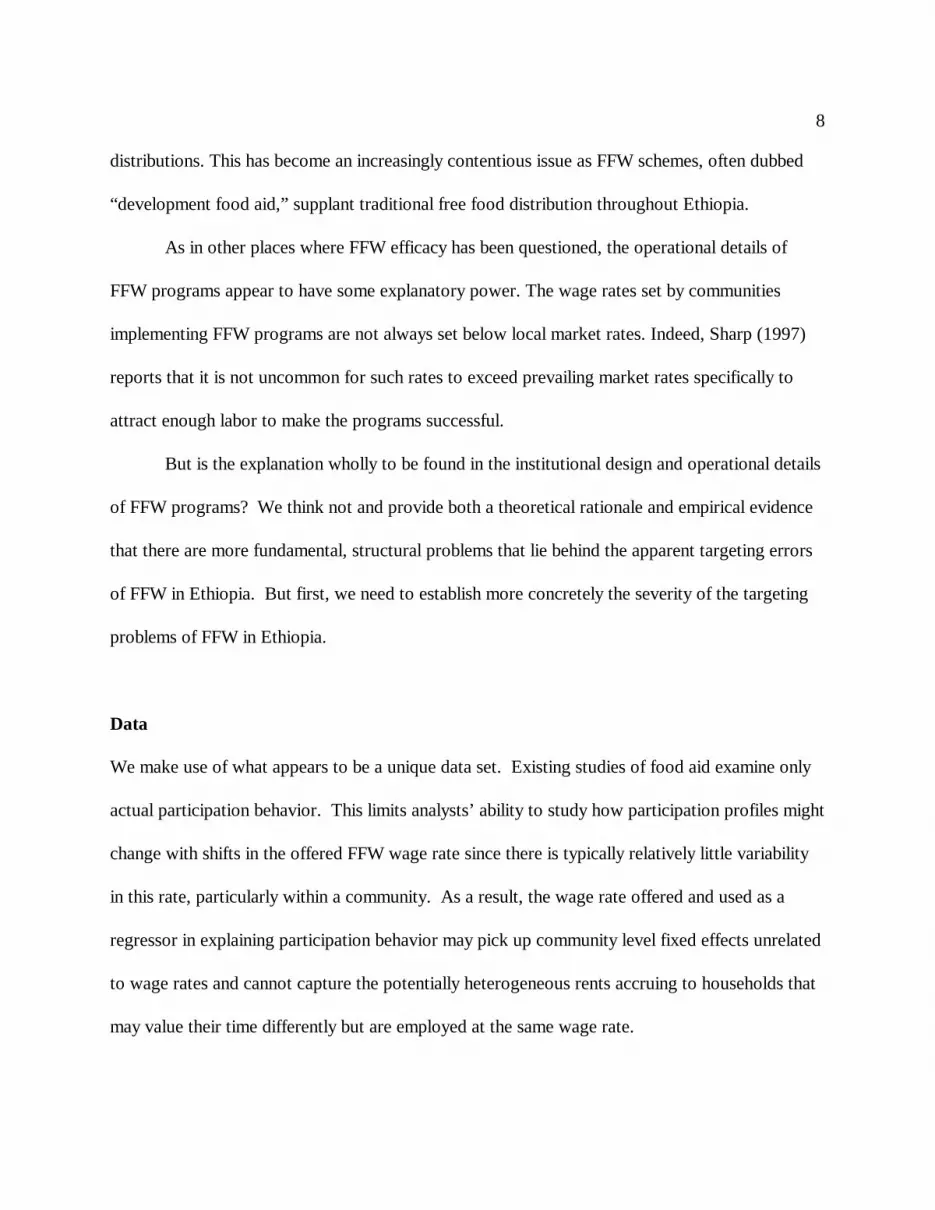
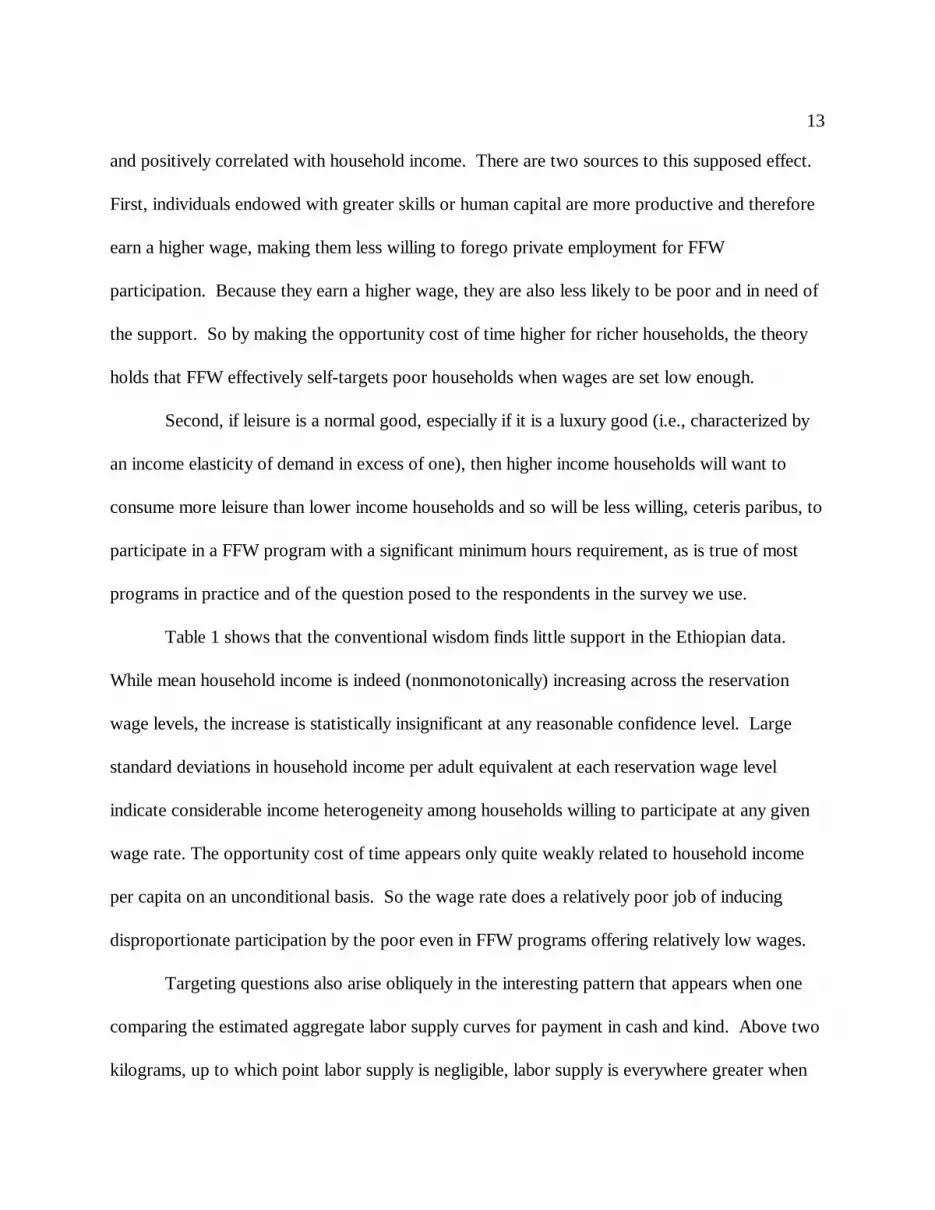
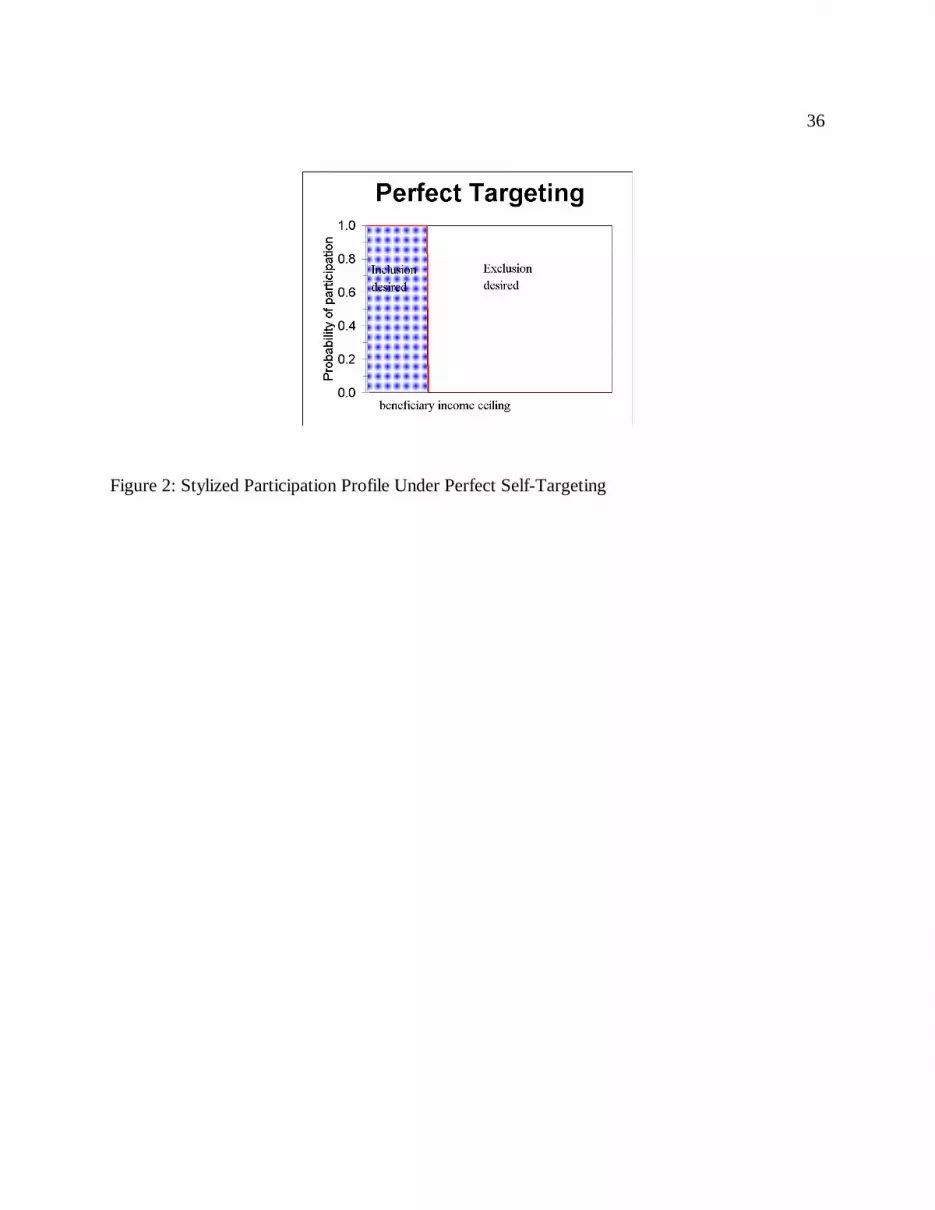
The basic structural model of shadow wage determination can be depicted in simple
graphics.18 Assume an agricultural household endowed with a fixed stock of land and employing
a production technology that is strictly concave in variable inputs. Figure 4 depicts that
household’s budget constraint, a nonlinear combination of exogenous income (the line segment
from LT to B), own farm production (the arc from B to F), and wage income (the line segment
from to D to E, having slope equal to the real wage rate). Diminishing marginal productivity of
labor in own production implies the shadow wage falls as the household spends more labor on
farm work. The household maximizes its welfare by choosing a labor allocation pattern like that
at L*, where it utility curve is tangent to its budget set. A concave production function implies
that there is some point of work effort (leisure consumption), Lc, above (below) which the
marginal revenue product of labor allocated to own production falls below the prevailing market
real wage rate (graphically, the tangent line to the budget set has flatter slope than the wage/price
line). In that portion of work-consumption space, households self-select into the market and the
prevailing market wage is their shadow wage. The rationality of labor market participation in this
range is obvious when one recognizes that labor market participation then expands the
household’s budget set (LTBDE versus LTBDF). At lower (higher) levels of work effort (leisure),

21
the optimal allocation is to devote all available labor to own production and not to participate in
the wage labor market, yielding a marginal revenue product of labor that may well exceed the
market wage rate.
The expectation that FFW will induce self-selection into the program by poorer, intended
beneficiaries rests on an implicit assumption that households operate on the linear portion of this
budget set. If wealthier households have more skilled labor and thereby enjoy higher wage rates,
wH, than the unskilled rate earned by poor households, wU, then selection of a FFW wage rate, w? ,
somewhere between the two, wU < w? <wH, will effectively expand the poorer households’ budget
set and induce its participation in the FFW program, without expanding the wealthier households’
budget set or inducing their participation.
However, many rural households in low-income economies do not participate in wage
labor markets. Since the budget constraint is nonlinear, there is no unique shadow wage rate that
obtains across all levels of input/output allocation, nor is there a unique level of full income
available for expenditure on consumption of goods and leisure. So one must linearize the budget
constraint locally at the household’s optimum to employ traditional demand (labor supply)
estimation techniques. This linearization yields an endogenous shadow wage (w*) that is a
function of household preferences, shadow income, endowments of other productive assets
(including human capital that effects the wage rate one can earn in the labor market), and
prevailing prices for farm output. This permits recovery of an inverse labor supply function for
household i in location j:
(2) wij* = w*(yij*,xij, pj)

22
where y* is shadow income, x is a vector of household characteristics including both productive
inputs to farming (land, livestock, rainfall, land improvements, nonlabor variable inputs), and
human capital characteristics (gender, age, education) that affect labor productivity and wages,
while p is a vector of local prices. Prices are presumed to be uniform for all households in a given
region while the other variables vary across individual households even with regions.
An important implication of this structural approach to the determination of household-
specific shadow wages is that there will likewise be a household-specific reservation FFW wage
that is the minimum compensation necessary to induce participation in the program. Figure 5
offers a stylized depiction of the reservation FFW wages for three different households. The first
two households, 1 and 2, differ only by their labor endowment (i.e., the land/labor ratio in their
productive asset endowment). Household 1 has more labor available, so it enjoys higher income,
as reflected by its larger budget set. But the marginal productivity of the better endowed
household’s labor is nonetheless lower than that of the lesser endowed household, 2, for any given
level of leisure consumption as reflected in the shallower slope of household’s tangent shadow
reservation wage line, w1, as compared to w2. Households 1 and 3 differ only by the marketability
of their labor. Household 3 has the same endowments, save that some of its labor is more
valuable, perhaps due to educational attainment that has no effect on agricultural labor
productivity (else the curvilinear portion of the budget set would differ too) but commands a
premium in the wage labor market. So household 3 can earn a private wage rate, w3, in excess of
household 1, driving up its reservation FFW wage. The theory of self-targeting is that a FFW
wage rate between w3FFW and w1
FFW will induce participation by the poorer household 1, but not
by the wealthier household 3. But as this stylized example demonstrates, it is actually the poorest

23
household 2 that would be the last among these three to participate, because the marginal value of
its scarce time is greatest. The key point is that is not so much households’ absolute endowments
– i.e., their wealth – as their relative endowments – especially the ratio of labor to nonlabor
productive inputs – that drives shadow wage determination when households do not face a
parametric wage rate due to local market frictions that impede participation and substitutability.
We hypothesize that imperfect markets in rural Ethiopia thus explain much of the errors of
exclusion and inclusion observed in the data because factor market failures constrain households’
ability to trade assets and services, thereby rendering shadow wages endogenous and breaking
down the unconditionally positive relation between income and shadow wage that underpins the
theory of self-targeting public employment programs.
We can combine the results to this point to yield an estimable reduced form expression for
the reservation FFW wage of household i in region j as a function of income, productive assets,
human capital, and prices:
(3) wijFFW = f(hij
FFW,xij,yij*, pj) = f(zij)
where zij = (hijFFW,xij,yij*, pj). The next section estimates this relation econometrically using the
Ethiopian data.
Reservation FFW Wage Determination in Ethiopia
The preceding model emphasizes the centrality of households’ relative productive asset
endowment to their endogenous shadow wages and therefore their reservation wage rates for
FFW participation. If these factors are correlated with per capita income in such a way that
higher incomes are typically associated with higher ratios of labor to nonlabor productive assets,

24
19 This may be because members are less likely to perish or to outmigrate or because thesehouseholds are more likely to retain adult children and other relatives because they are able toprovide for them. Whatever the demographic dynamic behind the positive correlation betweenincome and household labor force size, it may affect household reservation FFW wage in anenvironment of imperfect markets for labor and land.
then factor market failures could well explain what appears to be a weak unconditional
relationship between per capita income and FFW reservation wages. Indeed, in the Ethiopian
data, household labor supply is strongly positively correlated with income. A history of land
reform and underdeveloped rural asset markets combine with the positive relationship between
income and household size in Ethiopia to generate correlation coefficients relating per capita
income to land and livestock holdings per capita that equal -0.299 and -0.288, respectively, both
of which have a p-value of zero against the null hypothesis of zero correlation. The inaccuracy of
FFW work targeting stems directly from the basic facts that (i) in rural Ethiopia, higher income
households are endowed with more labor per unit land or animal, and (ii) factor markets in land
and livestock do not function well. These two phenomena break the unconditional link between
income and reservation FFW wage rates on which the theory of self-targeting depends by
reducing the productivity of higher income household labor at the margin, ceteris paribus.
A further factor that might contribute to poor households’ greater than expected
reluctance to participate in FFW projects might be the lumpiness of the labor requirement.
Household size is positively correlated with per capita income in rural Ethiopia (r=0.286).19 The
common FFW project requirement of forty hours per week of labor therefore represents a larger
share of the labor endowment of smaller, poorer households, on average, than it does of larger,
wealthier ones. Unequal capacity to bear the minimum required contribution likely also inhibits
participation by poorer households.

25
20 In the cash payment model, the upper censoring limit is 18 birr rather than 10 kilograms.
With these raw correlations in mind, we now estimate household reservation FFW wage
rates, the minimum wage rate a household declared acceptable for it to contribute a member to
work on the project. First, however, we must attend to two crucial features of the data that
demand careful econometric treatment. Recall that respondents’ declared reservation FFW wages
were bounded from above by the value ten kilograms and from below by one kilogram for in kind
payments, we estimate the reservation FFW wage using doubly-censored reservation wage
models. The basic estimation strategy follows a generalized Tobit approach, regressing the latent
variable w? on a linear approximation of the general reduced form expression in (3):
(4) w?FFWij = ß?zij + eij
wFFWij = 1 if w?FFW
ij ? 1
wFFWij = w?FFW
ij if 1 < w?FFWij < 10
wFFWij = 10 if w?FFW
ij ? 10
with the residuals,eij, assumed iid normal with mean zero.20
The second econometric obstacle we must hurdle arises from the absence of data on
market wage rates, prices, local histories with projects, etc. Under the assumption that these
missing relevant variables share a common value for all households within each of the 53 killil
zones, we can use a fixed effects estimator to control for those unobserved factors that can be
reasonably taken to vary only between communities but not between households within a given
community. Letting w?FFWij = wFFW
ij - w? FFWj and z?ij = zij - z?j, where w? FFW
j and z?j represent the
community means of their respective variables, the doubly-censored model of equation (4) can be
rewritten as

26
21 Controlling for unobserved spatial heterogeneity comes at the price of additionaldegrees of freedom lost in adjusting for the 53 location-specific means. All reported standarderrors have been adjusted for the correct degrees of freedom.
(5) w?FFWij = ??z?ij + ?ij
wFFWij = cL
j if w?FFWij ? cL
j
wFFWij = w?FFW
ij if cLj < w?FFW
ij < cUj
wFFWij = cU
j if w?FFWij ? cU
j
where the lower and upper censoring limits, cLj?1 - w? FFW
j and cUj?10 - w? FFW
j, respectively, now
vary across communities. Because this doubly-censored fixed effects estimator controls for all
omitted community-level covariates and because the household-level variables implied by the
structural model developed in the previous section are available to us, the latent variable
specification in (5) should yield consistent estimates of the ? parameters of interest.21
Our regression results, presented in Table 2, exhibit several clear patterns consistent with
the structural model of the preceding section. These hold across all four payment forms: cash,
maize, red wheat, and white wheat. First, the FFW reservation wage is indeed increasing in
income, ceteris paribus, thereby confirming consumer preference for leisure as a normal good.
Second, the reservation wage rate is also increasing in productive nonlabor asset endowments,
land, livestock, and rainfall. More of any of these increases the on-farm productivity of a fixed
stock of labor, thereby increasing the minimum wage a household will accept to part with some of
its fixed stock of labor. But holding nonlabor endowments constant, more people in a household
decreases marginal labor productivity, thereby depressing the reservation wage rate acceptable for
participation in a FFW scheme. Ethiopian agricultural households do not behave as if they face a
complete set of rural factor markets offering labor, land, and livestock at fixed parametric prices.

27
Rather, factor pricing appears to have a significant household-specific component to it, leading to
heterogeneity of FFW reservation wages that depends on more than just income and consumer
preferences for leisure as a normal good.
As conventional labor economics theory predicts, human capital variables matter to labor
market participation, FFW included. Educational attainment appears to exert a positive effect on
the valuation of one’s time. Households headed by individuals who have completed primary
schooling require higher wage rates to participate in FFW schemes than do the default households
headed by illiterates or those headed by literate persons who have not completed primary school.
Women exhibit consistently higher reservation FFW wages than men do, with the differences
statistically significant at the one percent level for each payment form other than maize. Women
are likely more reluctant to participate in FFW programs because their domestic responsibilities
above and beyond income-earning activities on- or off-farm are typically much greater than men’s,
thereby increasing the opportunity cost of women’s time in spite of widespread market wage
disparities that favor men. Where women can commonly integrate some of those domestic tasks
(e.g., child care) into work on their own-farm, such integration is often harder or impossible away
from home in a FFW project.
The statistically significant correlates of FFW reservation wages are not solely those that
determine the household’s opportunity cost of time spent in FFW. A household’s history of FFW
participation seems to have a strong effect, reducing the reservation FFW wage, while its history
of receipt of free food aid (for which individuals do not have to work), has a much more muted,
but still negative, effect on the FFW reservation wage rate. The strength and consistency of these
effects would appear to signal that there is indeed a premium attached to the marginal value

28
product of labor, whether it is due to stigma or self-esteem effects that are decreasing at the
margin as one accumulates a history of FFW participation, increasing comfort with participation
due to familiarity, or some other mechanism.
Table 3 reports point estimates of the elasticity of the reservation FFW wage with respect
to the principal regressors. Doubling household labor supply, other things held constant, reduces
household FFW reservation wage 20-55 percent. Past FFW participation history also has a major
negative effect, with an elasticity of negative 10-18 percent. So a household that has four years
past participation would be expected to accept one-third to half the wage of an otherwise identical
household that has participated only once previously. On the other hand, increasing household
endowments of land and especially livestock exert significant upward pressure on reservation
wage rates. Doubling livestock holdings – which averaged about 2.5 head of cattle per household
in this sample – would be expected to increase the reservation wage by 40-70 percent, with the
elasticity of the reservation wage with respect to land holdings about half that level. FFW
reservation wages, and thus the economic surplus households derive from participation, varies
considerably across households based on their endowments of productive assets and past FFW
participation, not just based on income levels, as received wisdom suggests.
Conclusions and Implications
Both the research and policymaking communities have shown considerable interest in identifying
mechanisms that might improve the targeting of transfers to needy beneficiaries. Self-targeting
mechanisms such as food for work have attracted particular attention because of their purported
ability to induce self-selection out of the pool by the relatively well-off , thereby enabling

29
concentration of transfer resources on the neediest subpopulations with minimum expenditure on
administration. We applaud the general direction of these efforts. Nonetheless, in this paper we
call attention to an important oversight in the existing literature on self-targeting: its dependence
on households facing a parametric wage, or, put differently, the existence of complete and
competitive factor markets. Since imperfect factor markets plague many settings where FFW is
deployed, including rural Ethiopia, the case we study, this oversight matters.
Rural Ethiopian households’ declared reservation wage rates for FFW participation reveal
significant errors of both exclusion and inclusion. These errors appear unlikely to be resolved by
simply dropping the FFW wage, as revealed by a shallowly sloped estimated participation
probability function. More fundamentally, Ethiopian households’ revealed preferences appear
perfectly consistent with a simple structural model that allows for household-specific valuation of
labor as a function of relative factor endowments and human capital characteristics, with an added
premium for public project participation that depends on one’s history of past participation.
Because per capita endowments of productive nonlabor assets such as land or livestock are
negatively correlated with per capita income in rural Ethiopia, the resulting negative partial
correlation between income and household labor productivity works at cross-purposes with the
demand-for-leisure and returns-to-skills effects on which self-targeting relies. Hence the observed
errors of exclusion and inclusion, relative to household per capita incomes, in a uniform FFW
wage program.
But just because self-targeting FFW is less effective than is sometimes believed, this does
not mean it cannot perform as well as other targeting methods in reaching a target vulnerable
subpopulation with a fixed stock of transfer resources. Indicator targeting based on geography,

30
age or gender has a demonstrably poor record in Ethiopia as well (Clay et al. 1999, Jayne et al.
1999). Our results should instead be interpreted as debunking as overly optimistic any
expectations that self-targeting can effectively reach the poor without costly, complementary
targeting methods. One possibility our results raise is that of indicator-cum-self-targeting,
wherein different wage rates are offered to identifiably different types of people: women versus
men, past program participants versus new ones, residents in one area versus another, etc.
Another possibility is self-targeting at a market, or even above-market wage rate for those who
satisfy an indicator-based eligibility standard, for example by making FFW available only to those
with less than a certain amount of land or oxen or both, or more than a certain, high percentage of
children among household members.
Our results also lend further empirical support to the hard questions others, such as Drèze
and Sen (1990), have raised about the form in which transfers intended to relieve food insecurity
might best be delivered. By comparing reservation FFW wages across payment forms, we find a
substantial fungibility premium associated with cash versus in kind payment. FFW projects could
employ about one quarter more people if wages were paid at the same modal rate (about 5
kilograms per day), but in cash instead of in grain. In order to justify the markedly greater cost of
distributing a less desirable good that is more expensive to transport and store, FFW project
directors should be required to demonstrate a problem in inducing private traders to deliver food
to local markets at prices FFW participants could pay based on cash transfers. Surely there are
cases where such problems exist. But we suspect transfer budgets could help more people better
by ending the use of grain as the default payment form.

31
The accuracy of self-targeting may leave much to be desired in places like Ethiopia where
factor market failures are ubiquitous. Nonetheless, this does not mean that FFW cannot work,
nor does it reject the possibility that FFW might even be the most effective among a range of
relatively ineffective means of assisting the poor. The problem is not the targeting mechanisms.
Rather it is the underlying, structural weaknesses of many rural economies in low-income
countries. The very rural market imperfections that help foster the poverty motivating transfers
also restrict policymakers’ ability to use an otherwise-cost-effective transfer mechanism. The
hard reality is that it may be hardest to reach the truly needy where the need is greatest.

32
Appendix A: Variable Definitions
Household Income. Gross household income is computed as the sum of: (1) the value of ownproduction for all major food crops during the 1995 meher season as measured by standard crop-cutting methods employed by field agents of the Ethiopia Central Statistical Authority; (2) theself-reported value of non-food crops; (3) the value of 20 percent (estimated mean off-take rate)of total livestock; and (4) total cash income earned by household members during the preceding12 months. From this sum of inflows we subtracted the cash costs of all crop inputs, primarilyfertilizer. The principal agricultural production season in Ethiopia, meher, has a harvest fromSeptember through December, depending on crop and region of the country. No adjustmentswere made for cereal production during the belg harvest due to unreliable data for this secondaryseasonal harvest, which accounts for less than ten percent of total grain harvest nationally.
Household labor/Adult equivalents include children aged 10-14 and seniors age 65 and beyond athalf weight, with no difference in gender. Only current residents of the household were included. Because benefit incidence can be sensitive to the particular, inherently contestable householdequivalence scales used (Sahn et al. 1999), we reestimated the models using several alternatives. The findings reported here using a simple, crude scale appear robust to the choice of scale.
Land is measured as operational holdings of the household in hectares during the meher season.
Tropical Livestock Units (TLU) follows the International Livestock Centre for Africa standardsfor Ethiopia. Livestock to TLU conversion ratios are: cows = 0.7, sheep = 0.1, goats = 0.1,horses = 0.8, donkeys = 0.5, mules = 0.7, and camels = 1.0.
Average annual rainfall over the previous five years by farmer association or wereda, capturedfrom national meteorological data.
FFW receipts are the number of years in the past five in which the household received food forwork distributions.
Free food aid receipts represents the number of years in the previous five in which the householdreceived free food distributions.
Literate w/o primary schooling is a dummy variable taking value one for households whose headscan read and write yet have not completed primary school.
Primary schooling completed is a dummy variable taking value one for households whose headshave completed primary school or above.
Age of HH head is the age in years of the head of household.
Female HH head is a dummy variable where female = 1, and male = 0.

33
ReferencesBarrett, C.B. (forthcoming), “Food Security and Food Assistance Programs,” in B.Gardner and
G. Rausser, eds., Handbook of Agricultural Economics (Amsterdam: Elsevier Science).
Barrett, C.B. and P.A. Dorosh, “Farmers’ Welfare and Changing Food Prices: NonparametricEvidence From Rice In Madagascar,” American Journal of Agricultural Economics, 78 (3):656-669.
Barrett, C.B. , S.M. Sherlund, and A.A. Adesina (2000), “Shadow Wages, Allocative Inefficiency,and Labor Supply in Smallholder Agriculture,” paper presented at the winter meetings of theEconometric Society.
Besley, T. and R. Kanbur (1988), “Principles of Targeting,” in Michael Lipton and Jacques van derGaag, eds., Including the Poor. Washington: World Bank.
Clay, D.C., D. Molla, and D. Habtewold (1999), “Food aid targeting in Ethiopia: A study of whoneeds it and who gets it,” Food Policy 24: 391-409.
Clay, E.J. (1986), “Rural Public Works and Food-for-Work: A Survey,” World Development 14(10/11): 1237-1286.
Devereux, S. (1999), “Targeting Transfers: Innovative Solutions to Familiar Problems,” IDS Bulletin30(2): 61-74.
Drèze, J. and A. Sen (1990) Hunger and Public Action. Oxford: Oxford University Press.
FDRE (1996) Food Security Strategy 1996. Federal Democratic Republic of Ethiopia, Addis Ababa.
Gebremedhin, B. and S.M. Swinton (2000), “Reconciling Food-for-Work Project Feasibility withFood Aid Targeting in Tigray, Ethiopia,” Food Policy 26(1): 85-95.
Herring, R.J. and R.M. Edwards (1993), “Guaranteeing Employment to the Rural Poor: SocialFunctions and Class Interests in the Employment Guarantee Scheme in Western India,” WorldDevelopment 11, 7: 575-592.
Jacoby, H.G. (1993), “Shadow Wages and Peasant Family Labor Supply: An EconometricApplication to the Peruvian Sierra,” Review of Economic Studies 60, 3: 903-921.
Jayne, T.S., J. Strauss, T. Yamano (1999), “Targeting of Food Aid in Rural Ethiopia: Chronic Needor Inertia,” mimeo.
Kanbur, R. M. Keen, and M. Tuomala (1994), “Labor Supply and Targeting in Poverty AlleviationPrograms.” World Bank Economic Review 8,2: 191-211.

34
Lipton, M. and J. van der Gaag, eds., Including the Poor. Washington: World Bank.
Moffitt, R. (1992) “Incentive Effects of the U.S. Welfare System: A Review,” Journal of EconomicLiterature 30, 1: 1-61.
Newman, J. L. and P. J. Gertler (1994), “Family Productivity, Labor Supply, and Welfare in a LowIncome Country,” Journal of Human Resources 29, 4: 989-1026.
Ravallion, M. (1990), “On the Coverage of Public Employment Schemes for Poverty Alleviation,’Journal of Development Economics 34,1: 57-79.
Ravallion, M. (1991), ‘ Reaching the Rural Poor through Public Employment: Arguments, Lessons,and Evidence from South Asia,” World Bank Research Observer 6, 1: 153-76.
Ravallion, M., G. Datt, and S. Chaudhuri (1993), “Does Maharashtra's Employment GuaranteeScheme Guarantee Employment? Effects of the 1988 Wage Increase,” EconomicDevelopment and Cultural Change 41, 2: 251-75.
Sahn, D.E. and H. Alderman (1996), “The Effect of Food Subsidies on Labor Supply in Sri Lanka,”Economic Development and Cultural Change 1,125-145.
Sahn, D.E., S. D. Younger, and K.R. Simler (1999), “Dominance Testing of Transfers in Romania,”Cornell Food and Nutrition Policy Program Working Paper 78.
Sen, A. (1995), “The political economy of targeting,” in D. van de Walle and K. Nead, eds., PublicSpending and the Poor. Baltimore: Johns Hopkins University Press.
Sharp, K. (1997), Targeting Food Aid in Ethiopia. Addis Ababa: Save the Children Fund (U.K.).
Skoufias, E. (1994), “Using Shadow Wages to Estimate Labor Supply of Agricultural Households,”American Journal of Agricultural Economics 76, 2: 215-227.
Southworth, H. (1945), “The Economics of Public Measures to Subsidize Food,” Journal of FarmEconomics, 68 (1): 37-43.
Teklu, T. and S. Asefa (1999), “Who Participates in Labor-Intensive Public Works in Sub-SaharanAfrica? Evidence from Rural Botswana and Kenya,” World Development 27, 2: 431-438.
van de Walle, D. and K. Nead, eds., Public Spending and the Poor. Baltimore: Johns HopkinsUniversity Press.
von Braun, J., ed. (1995), Employment for Poverty Reduction and Food Security. Washington:International Food Policy Research Institute.

35
Figure 1: Estimated aggregate FFW labor supply and fungibility premium
36
Figure 2: Stylized Participation Profile Under Perfect Self-Targeting

37
0.0
0.2
0.4
0.6
0.8
1.0
0 2000 4000 6000 8000 10000
INCPAE
IND
6
LOESS Fit (degree = 1, span = 0.3300)
0.0
0.2
0.4
0.6
0.8
1.0
0 2000 4000 6000 8000 10000
INCPAE
IND
9
LOESS Fit (degree = 1, span = 0.3300)
0.0
0.2
0.4
0.6
0.8
1.0
0 2000 4000 6000 8000 10000
INCPAE
IND
3
LOESS Fit (degree = 1, span = 0.3300)
Figure 3: Nearest neighbor (LOESS) regressions of willingness to participate in FFW on householdincome per adult equivalent, at daily payment rates of 9, 6, and 3 kilograms of white wheat,respectively.
38
Figure 4: Household Labor Supply Decisions and Shadow Wage Determination
Figure 5: Reservation FFW wages for different stylized households

39
Table 1: 1995-96 Annual Household Income Per Adult Equivalent Conditional on Reservation FFW Wage (Ethiopian birr)
White wheat Red wheat Maize Cash*
Kilograms Mean (Std Dev) Mean (Std Dev) Mean (Std Dev) Mean (Std Dev)
2 608(533)
615(546)
636(513)
590(699)
3 774(745)
695(666)
663(632)
775(781)
4 737(816)
761(710)
669(612)
849(811)
5 830(710)
768(783)
813(769)
854(808)
6 798(710)
820(735)
721(656)
791(764)
7 940(1035)
789(694)
786(832)
834(975)
8 1024(1000)
919(932)
874(750)
1174(953)
9 952(741)
1032(1001)
818(902)
1030(963)
* Expressed in kilograms of white wheat, converted using local retail prices for net buyer householdsand producer prices for net seller households.
Note: Only uncensored reservation wage rates (2-9 kilograms, or 2-17 birr) are included.

40
Table 2: Fixed Effects, Doubly-Censored Regression Estimatesof FFW Reservation Wage Functions, By Form of Payment
Form of FFW Payment
Cash (birr) Maize (kgs) Red Wheat (kgs) White Wheat (kgs)
Income 0.00016* (0.00004)
0.00012*(0.00004)
0.00009*(0.00003)
0.00008†(0.00003)
Labor -0.094†(0.047)
-0.050(0.050)
-0.064(0.039)
-0.081†(0.037)
Land 0.081†(0.036)
0.058(0.043)
0.085*(0.032)
0.116*(0.031)
Livestock 0.133*(0.032)
0.087*(0.035)
0.143*(0.026)
0.156*(0.024)
Avg. Rainfall 0.0008†(0.0003)
0.0005(0.0003)
0.0003(0.0003)
0.0004(0.0003)
Yrs. FFW -0.294*(0.092 )
-0.491*(0.097)
-0.402*(0.076)
-0.318*(0.073)
Yrs. Food Aid -0.147(0.080)
-0.197†(0.081)
-0.128†(0.063)
-0.166*(0.061)
Literate w/oPrimary Schooling
0.437†(0.202)
0.097(0.213)
0.241(0.163)
0.273(0.156)
Primary SchoolingCompleted
0.653*(0.191)
0.490†(0.205)
0.590*(0.155)
0.407*(0.149)
Age of HH head -0.007(0.005)
-0.004(0.005)
-0.007†(0.004)
-0.007(0.004)
Female HH head 0.521*(0.172)
0.107(0.183)
0.459*(0.138)
1.117*(0.133)
# observations 2796 2611 2677 2726
% censored obs. 3.3 34.9 16.3 13.4Standard errors in parentheses. * indicates statistical significance at the 1% level, † indicates
statistical significance at the 5% level.

41
Table 3: Elasticity Estimates of FFW Reservation Wage, By Form of Payment(estimated at sample means)
Cash Maize Red Wheat White WheatIncome 0.367 0.274 0.241 0.233Labor -0.552 -0.202 -0.302 -0.417 Land 0.390 0.287 0.162 0.239Livestock 0.665 0.397 0.565 0.674 Prior Years FFW -0.103 -0.095 -0.175 -0.150


