Embed Size (px)
Citation preview

Copyright is owned by the Author of the thesis. Permission is given for a copy to be downloaded by an individual for the purpose of research and private study only. The thesis may not be reproduced elsewhere without the permission of the Author.
HOW CORPORATE STRATEGY CONTRIBUTES TO FIRM PERFORMANCE: A CROSS-SECTIONAL STUDY OF RESOURCE GOVERNANCE DECISION MAKING
IN US FIRMS.
A thesis presented in partial fulfilment of the requirements for the degree of Doctor of Philosophy in Strategic Management,
at Massey University, Palmerston North.
Sondra Athene Monroe 2006

Copyright © Sondra Monroe 2006
The moral right of the author has been asserted.
Corporate strategy has been a neglected topic in both theoretical and empirical discussions on
superior firm performance. In addition to using competitive strategy to attain sustainable
competitive advantage, firms should also focus on achieving a corporate level measure of
performance, namely, persistent superior firm performance. The resource based theory paradigm
suggests that factors which lead to superior firm performance are largely endogenous to the firm.
Corporate strategy is one such factor. Empirical evidence has shown that corporate strategy
matters. It has a small but significant influence on the variance of both business unit
performance and firm performance. This research extends current knowledge by determining,
firstly, if corporate strategy could be used to d istinguish successful firms from nonsuccessful
firms and, secondly, if so, how does corporate strategy actually influence firm performance.
Fifteen Fortune 1 000 US firms were categorised into three subpopulations based on persistent
superior, average and inferior levels of performance. Eighteen indicators representing both
excellence in corporate strategy and the incidence of corporate strategy were col lected through
the content analysis of Wall Street Journal articles from 1 980 to 2004. Various inferential
statistical techniques were conducted to provide a broad profile of findings.
The frequency of resource governance decisions was found to distinguish the persistent superior
firm performance category from both the persistent average and inferior firm performance
categories. The corporate level decision making skill perspective provides an explanation for
this empirical evi dence. Superior performing firms, through the use of superior corporate level
decision making ski l ls, are able to simpl ify resource governance decision making (e.g., decision
making rules). This simplification results in superior resource governance decisions being made,
lowering the incidence of resource governance decisions. This research extends resource based
theory by providing empirical evidence of the importance of resource governance decis ions in
ach ieving persistent superior firm performance. This research also integrates the concept of
superior corporate level decision making ski l ls into existing resource based theory. The research
has impl ications also for both theoretical and practitioner literatures as it redefines corporate
strategy. It shows that corporate strategy matters to firm performance, and importantly, it shows
why corporate strategy matters .

ACKNOWLEDGEMENTS
I am grateful to a number of people who have provided assistance throughout this research.
Firstly, my supervisor Dr. James Lockhart who provided an essential and astute sounding board
for my ideas and potential issues and, consequently, this thesis benefited from his insightful
feedback.
I would l ike to thank the nine members of the expert panel who reviewed the theoretical and
conceptual foundations of corporate strategy and provided invaluable recommendations based on
their experience.
I would also l ike to thank Fong Mee Chin who obtained the share market price data from the
Centre for Research on Securities Prices database. I would also l ike to acknowledge Dr. Raj
Govindaraju who provided a discerning review of the statistical methodology, and Professor
Rank Wilcox (University of Southern Cal ifornia) who assisted in conducting the Brunner, Dette
and Munk heteroscedastic rank-based ANOVA test.
F inally, I would l ike to thank Wayne Bowler for his support and understanding during my
seemingly endless quest for knowledge and learning.
i i
Abstract Acknowledgements Table of Contents List of Abbreviations List of Tables List of Figures
TABLE OF CONTENTS
Chapter 1 Introduction
1 . 1 Research aims and objectives 1 .2 Research process 1 .3 Delimitation of scope 1 .4 Justification for the research 1 .5 Outline of the thesis
Chapter 2 Literature review
2.1 Chapter overview
Part 1: Theoretical literature review 2.2 What i s the aim of strategic management? 2.3 Defining persistent superior firm performance 2 .4 The exogenous perspective of sustainable competitive advantage
2.4. 1 Structure-conduct-performance paradigm 2.5 The endogenous perspective of sustainable competitive advantage
2 . 5 . 1 Resource based theory 2 .6 Differences between the exogenous and endogenous perspectives of
sustainable competitive advantage 2 .7 Theoretical summary: Part r
Part 11: Empirical literature review 2.8 Empirical overview 2.9 The empirical evidence of corporate effects
2.9. 1 Methodologies employed 2.9.2 Measurements of corporate effects 2.9.3 Validity issues with models employed to estimate corporate effects 2.9.4 Corporate effects research summary
2 . 1 0 Other empirical corporate strategy - performance research 2. 1 0 . 1 Specific corporate strategies and their effect on performance 2 . 1 0.2 Normative models of the parent, corporate advantage and performance 2 . 1 0.3 Impl icit assumptions of a relationship between corporate strategy and
performance 2 . 1 1 Empirical summary: Part I l
Chapter 3 Conceptual framework and operationalisation
Part 1: A conceptual framework of corporate strategy 3. 1 Conceptual overview
i i i i i v i i x xiv
1
2 3 7 8 9
11
II
11 1 1 1 2 1 4 1 5 25 26
4 1 42
4 7 47 48 54 55 60 65 66 66 68
70 72
75
75 75
i i i
3.2 What is corporate strategy? 75 3 .2 . 1 Corporate strategy as all strategy formulated within the organisation 76
3 .2 .2 Corporate strategy as strategy at the level of the corporate 76
3.2.3 Strategy at the corporate level 78 3 .2.4 The definition of corporate strategy employed in th is research 80
3 .3 The ends and means of corporate strategy 8 1 3 .3 . 1 Organisational d irection 82 3.3 .2 Means of achieving organisational direction 89
3 .4 Corporate strategy and persistent superior firm performance 1 02 3 .4. 1 The proposed relationship between corporate strategy and persistent
superior firm performance 1 04 3 .5 Conceptual framework summary: Part I 1 04
Part II: Operationalisation of corporate strategy attributes 105 3 .6 Introduction to operationalisation 1 06 3 .7 Operational ising firm performance 1 1 0 3 .8 Hypothesis five: Corporate strategy 1 1 2 3 .9 I ndicators ofthe corporate strategy attributes 1 1 3
3 .9. 1 Strategic intent 1 1 3 3 .9.2 Organisational domain 1 1 7 3 .9.3 Internal governance 1 2 1 3.9.4 Resource governance 1 24
3 . 1 0 The nature of the association between the firm performance categories 1 27 3 . 1 1 Potential confounds 1 27
3 . 1 1 . 1 The potential confounds considered 1 27 3 . 1 1 .2 The potential confounds selected 1 30
3 . 1 2 A model measuring the effect o f corporate strategy on persistent superior firm performance 1 34
3 . 1 3 Operational isation summary: Part 11 1 36
Chapter 4 Methodology and data 138
4 . 1 I ntroduction 1 3 8 4.2 Selection of the time frame 1 39 4.3 Share market price 1 39 4.4 Selection of sample firms 1 40
4.4. 1 Sample error 1 43 4.5 Data collection tool: Content analysis 1 44 4.6 Selection of the data source for explanatory variables: The Wal l Street Journal 1 45
4.6.1 The benefits of the Wall Street Journal 1 46 4 .6.2 Limitations of the data source 1 47
4.7 Data cleaning 1 47 4.7. 1 Missing data 1 48 4.7.2 I ndex creation 1 49 4 .7.3 Outliers 1 49 4 .7.4 Data transformation 1 55
4.8 Statistical analysis 1 55 4.8 . 1 Descriptive statistics 1 55 4.8.2 Inferential statistics: Tests of heterogeneity for three samples 1 56
4.9 Dataset summary 1 64 4. 1 0 Rel iabi lity 1 67
4. 1 0. 1 Stabi lity 1 68
IV
4. 1 0.2 Consistency 4. 1 0.3 Robustness
4. 1 1 Validity 4. 1 1 . 1 I nternal val idity 4 . 1 1 .2 External val idity
4 . 1 2 Potential confound variables 4. 1 2 . 1 Data source selection 4 . 1 2 .2 Potential confound results 4 . 1 2.3 Potential confound results summary
4. 1 3 Summary
Chapter 5 Results
Part 1: Preliminary data analysis 5 . 1 Prel im inary data analysis overview 5 .2 Tests for normality 5 .3 Tests for the assumption of homogeneity of variance 5.4 Exploratory data analysis
Part 11: Hypothesis testing: Between-firm performance categories 5 . 5 Hypothesis testing overview 5 .6 Hypothesis testing: Corporate strategy
5 .6. 1 Did the corporate strategy index differ between the firm performance categories?
5 .6.2 Could the corporate strategy index be used to distinguish the PSFP category from the non-PSFP categories?
5 .7 Hypothesis testing: Strategic intent 5 .8 Hypothesis testing: Organisational domain 5 .9 Hypothesis testing: Internal governance 5 . 1 0 Hypothesis testing: Resource governance
5 . 1 0. 1 Did the resource governance attribute index differ between the firm performance categories?
5 . 1 0 .2 Could the resource governance attribute index be used to d istinguish the PSFP from the category non-PSFP categories?
5 . 1 1 Hypothesis testing results summary: Part 11
Part Ill: Hypothesis testing: Excellence and quantity indices 5 . 1 2 Excellence and quantity overview 5 . 1 3 Hypothesis testing: Corporate strategy excellence
5 . 1 3 . 1 Did the corporate strategy excellence index differ between the firm performance categories?
5 . 1 4 Hypothesis testing: Corporate strategy quantity 5 .1 4 . 1 Did the corporate strategy quantity index differ between the firm
performance categories? 5 . 1 4.2 Could the corporate strategy quantity index be used to distinguish the
PS FP category from the non-PS FP categories? 5 . 1 5 Hypothesis testing: Quantity indices
5 . 1 5 .1 Did the quantity indices differ between the firm performance categories?
5 . 1 5 .2 Could the resource governance quantity index be used to distinguish the PSFP category from the non-PSFP categories?
5 . 1 6 Excellence and quantity indices results summary: Part III
1 68 1 69 1 69 1 69 1 72 1 73 1 73 1 75 1 76 1 77
1 79
179 1 79 1 79 1 8 1 1 8 1
182 1 82 1 83
1 83
1 85 1 87 1 87 1 88 1 88
1 89
1 9 1 1 92
193 1 93 1 94
1 94 1 96
1 96
1 98 1 99
1 99
202 203
v
5 . 1 7 Chapter summary
Chapter 6 Discussion
6. 1 6.2
6.3
6.4
6.5
6.6 6.7
6.8
Introduction Identifiable patterns in the dataset 6.2.1 Factors to consider when interpreting the statistically nonsignificant
results Distinction between the PSFP versus the non-PS FP firm performance
categories: Theoretical explanations 6.3 . 1 Alternative explanation 1 : Chance 6.3 .2 Alternative explanation 2: Spuriousness 6.3.3 Alternative explanation 3: Core competencies 6.3 .4 Alternative explanation 4: The role of corporate level resource
governance decision making ski l l Theoretical impl ications 6.4 . 1 Theoretical impl ications: Core competency theory 6.4.2 Theoretical implications: Corporate level decision making ski l l Empirical, conceptual and operational impl ications 6.5 . 1 Strategic intent 6.5 .2 Organisational domain 6.5.3 Internal governance 6.5 .4 Resource governance 6.5 .5 Corporate strategy Impl ications for the field of strategic management Implications for practitioners 6.7. 1 Impl ications for PI FP firms 6.7.2 Implications for PAFP firms 6.7.3 Impl ications for PSFP firms Summary
Chapter 7 Conclusion
7. 1 7.2
Chapter introduction The theory and results
7.3 7.4 7.5
7.2 .1 The corporate level decision making skill perspective Limitations: Exogenous to the results Directions for future research Recommendations for practitioners
References Appendix 1 Appendix 2 Appendix 3 Appendix 4 Appendix 5 Appendix 6
Coding book Examples of article coding Exploratory data analysis Hypothesis testing results Discriminant analysis results Excellence and quantity results
204
205
205 205
2 1 1
2 1 2 2 1 3 2 1 3 2 1 3
224 245 245 249 2 5 5 2 5 5 2 5 7 2 5 8 260 26 1 264 265 267 268 269 270
2 72
272 273 274 276 277 279
281
3 1 2 3 1 7 324 335 338 350
Vi

BUP Compustat CRSP DJIA FTC H-form 10 M-form PAFP PI FP PSFP RBT ROA R&D SBU SCA SCP SIC SMP SPSS U S U-form WSJ
Amerada BNSF CMS CSXC Duke Emerson FPL GenCorp Masco Northrop Raytheon Southern Sunoco Union Whirlpool
LIST OF ABBREVIATIONS
Text abbreviations
Business unit performance Standard and Poor's Compustat Business-Segment Reports database Centre for Research in Security Prices of the University of Chicago DOW Jones Industrial Average Federal Trade Commission database Holding firm organisational structure Industrial organisation economics Multidivisional firm organisational structure Persistent average firm performance Persistent inferior firm performance Persistent superior firm performance Resource based theory Return on assets Research and development Single business unit Sustainable competitive advantage Structure-conduct-performance paradigm Standard Industrial Classification codes Share market price Statistical Package for Social Science 1 3 .0 for Windows United States of America Functional firm organisational structure Wal l Street Journal
Sample firm abbreviations
Amerada Hess Corporation Burlington Northern Santa Fe Corporation CMS Energy Corporation CSX Corporation Duke Energy Corporation Emerson Electric Company FPL Group, Incorporated GenCorp Incorporated Masco Corporation Northrop Grumman Corporation Raytheon Company Southern Company Sunoco Incorporated Union Pacific Corporation Whirlpool Corporation
Hypotheses and subhypotheses abbreviations
E Error CS Corporate strategy index CSQ Quantity of corporate strategy decisions index
vi i
CSX FS HE Ho I G IGQ CLC OD ODQ ODX RG RGQ RGX S I SIQ SIX
Excellence in corporate strategy index Firm size (potential confound variable) Historical endowment (potential confound variable) Null hypothesis I nternal governance attribute index Quantity of internal governance decisions index Corporate level commitment to the status quo (potential confound variable) Organisational domain attribute index Quantity of organisat ional domain decisions index Excel lence in organisational domain index Resource governance attribute index Quantity of resource governance decisions index Excellence in resource governance index Strategic intent attribute index Quantity of strategic intent decisions index Excel lence in strategic intent index
Additional variables used in formulae
ASI Alignment (strategic intent excel lence variable) CIG Change in internal governance decision (internal governance quantity variable) CSI Change in strategic intent (strategic intent quantity variable) DFD Decrease in firm domain decision (organisational domain quantity variable) EMC Emotional connection (strategic intent excel lence variable) FDD Firm domain decision (organ isational domain quantity variable) FUT Futurity (strategic intent excellence variable) IFD Increase in firm domain decision (organisational domain quantity variable) IGC Consequences of internal governance (internal governance variable) JV Joint venture decision (organisational domain quantity variable) RAL Resource al location decision (resource governance quantity variable) RGD Resource governance decision (resource governance quantity variable) RL Resource leverage (resource governance excellence variable) RLM Resource leverage mechanisms (resource governance excellence variable) RNC Revealing the new and creativity (strategic intent excellence variable) SSD Statement of strategic direction (strategic intent variable) STR Stretch (strategic intent excellence variable) SYN Synergy (organisational domain excellence variable)
ANOVA l ANOVA B DM COY D df F GH H J JT KW
Statistical notations
One-way independent analysis of variance test Analysis of variance test Brunner, Detter and Munk heteroscedastic rank-based ANOV A test Variance components analysis test Kolmogorov-Smirnov test statistic Degrees of freedom Levene' s test statistic Games-Howell test Kruskal-Wallis test statistic Jonckheere-Terpstra test statistic Jonckheere-Terpstra test Kruskal-Wallis one-way analysis of variance by ranks test
v i i i

M Mdn M W N
112 P r s SC S ig
T2 T3 U v 0) Welch ' s F
Sample mean Sample median Mann-Whitney test Sample size KW effect size statistic The probabil ity value indicating the significance of a statistical test Effect size statistic for JT, MW and planned contrasts Sample standard deviation Siegel-CasteI lan critical difference test Significance Kendall's tau statistic Tamhane's T2 test Dunnett' s T3 test Mann-Whitney test statistic versus ANOVA 1 effect size statistic One-way independent analysis of variance test statistic for possible violation of the homogeneity of variance assumption Chi-square statistic Wilks' lambda statistic
IX
LIST OF TABLES
Table 2 . 1 Summary of the structure-conduct-performance and resource based theory paradigms. 43-45
Table 2 .2 Empirical research of corporate effects reported in academic literature during the period of 1 985 - 2006. 49-53
Table 3 . 1 Summary of research statements. 1 05
Table 3 .2 Levels of data analysis and the associated variables and indices. 1 08
Table 3 . 3 Performance variable. 1 1 0
Table 3 .4 Strategic intent variables. 1 1 6
Table 3 . 5 Organisational domain variables. 1 20
Table 3 .6 Internal governance variables. 1 23
Table 3 .7 Resource governance variables. 1 25
Table 3 . 8 Potential confounds. 1 3 1
Table 3 .9 Abbreviations for the corporate strategy equations. 1 35
Table 4 . 1 Outl ine o f methodological stages. 1 38
Table 4 .2 Process to select the three firm performance subpopulations. 1 40
Table 4.3 Selection of persistent superior firm performance category sample firms. 1 42
Table 4.4 Selection of persistent average firm performance category and persistent inferior firm performance category sample firms. 1 43
Table 4.5 Levels of data analysis and the associated variables and indices. 1 48
Table 4.6 Corporate strategy and attribute indices outliers by firm . 1 5 1
Table 4.7 Adjustments to corporate strategy and attribute index values by firm. 1 52
Table 4.8 Excellence and quantity indices outl iers. 1 53
Table 4.9 Adjustments to excellence and quantity indices outliers. 1 54
Table 4. 1 0 The corporate strategy index and the attribute indices by firm performance categories. 1 65
Table 4 . 1 1 Val idity and rel iabi l ity measurement methods. 1 67
Table 4. 1 2 Potential confound data sources. 1 74
x
Table 4. 1 3
Table 4. 1 4
Table 5 . 1
Table 5 .2
Table 5 .3
Table 5 .4
Table 5 .5
Table 5 .6
Table 5 .7
Table 5 .8
Table 5 .9
Table 6. 1
Table 6.2
Table 6 .3
Table 6 .4
Table 6 .5
Table 6.6
Table 6 .7
Table 6 .8
Kruskal-Wal l is one-way ANOVA by ranks test and Brunner, Detter and Munk heteroscedastic rank-based ANOV A test results for the potential confound variables.
One-way independent ANOV A test results for the potential confound
1 75
variables. 1 76
Kruskal-Wal l is test for the corporate strategy index. 1 84
Mann-Whitney tests for the corporate strategy index: Post-hoc test for Kruskal-Wal lis test. 1 85
S iegel-Castellan critical difference test for the corporate strategy index: Post-hoc test for Kruskal-Wall is test. 1 86
Discriminant analysis: Summary of results. 1 90
Summary of hypothesis results. 1 92
Descriptive statistics: The corporate strategy excellence index by firm performance category. 1 94
Descriptive statistics: The corporate strategy quantity index by firm performance category. 1 97
Descriptive statistics: The quantity indices by firm performance category. 200
Summary of excellence and quantity hypothesis results. 203
Hypothesis summary. 206
Mean and standard deviation: Corporate strategy and its attributes indices by firm performance category. 209
Mean and standard deviation : Quantity and excel lence indices by firm performance category. 2 1 0
Characteristics of core competencies across the firm performance categories. 2 1 5-2 1 6
Characteristics of attributes of corporate level decision makers across the firm performance categories. 227
Characteristics of frames of references across the firm performance categories. 232
Characteristics of search and evaluation of alternatives across the firm performance categories.
Characteristics of decision implementation across the firm performance categories.
236
239
xi
Table 6.9 Outcomes of heterogeneous corporate level decision making ski l l in resource governance. 243
Table A3. 1 Descriptive statistics: The corporate strategy index by firm performance category. 324
Table A3 .2 Descriptive statistics: The strategic intent attribute index by firm performance category. 327
Table A3 .3 Descriptive statistics: The organisational domain attribute index by firm performance category. 329
Table A3 .4 Descriptive statistics: The internal governance attribute index by firm performance category. 3 3 1
Table A3.5 Descriptive statistics: The resource governance attribute index by firm performance category. 3 3 3
Table A4.1 Kruskal-Wall is test for the organisational domain attribute index. 3 3 5
Table A4.2 Kruskal-Wallis test for the internal governance attribute index. 3 3 5
Table A4.3 Kruskal-Wal lis test for the resource governance attribute index. 336
Table A4.4 Mann-Whitney tests for the resource governance attribute index: Post hoc test for the Kruskal-Wallis test. 336
Table A4.5 Siegel-Castel lan critical difference test for the resource governance attribute index: Post-hoc test for the Kruskal-Wall is test. 3 3 7
Table A5 . l Discriminant analysis: Test of equal ity of group means. 3 38
Table A5.2 Discrim inant analysis: Eigenvalues. 339
Table A5.3 Discriminant analysis: Wi lks' lambda. 340
Table A5 .4 Discriminant analysis: Standardised canonical d iscriminant function coefficients. 3 4 1
Table A5.5 Discriminant analysis: Functions at group centro ids. 34 1
Table A5.6 Discriminant analysis: Classification results. 342
Table A5.7 Casewise results: Strategic intent versus resource governance model. 344
Table A5.8 Casewise results: Organisational domain versus resource governance model. 345
Table A5.9 Casewise results : Resource governance versus internal governance model. 346
Table A5 . 1 0 Discriminant analysis: Box's M results. 349
xii
Table A5 . 1 1 Discriminant analysis: Kappa. 349
Table A6. 1 lonckheere-Terpstra test for the corporate strategy quantity index. 3 5 1
Table A6.2 Kruskal-Wal l is test for the corporate strategy quantity index. 3 5 1
Table A6.3 S iegel-Castellan critical difference test for the corporate strategy quantity index. 3 5 1
Table A6.4 Mann-Whitney tests for the corporate strategy quantity index. 3 52
Table A6.5 Kruskal-Wal lis test for the quantity indices. 353
Table A6.6 Brunner, Detter and Munk heteroscedastic rank-based ANOVA test for the quantity indices. 354
Table A6.7 One-way independent ANOVA test for the quantity indices. 354
Table A6.8 S iegel-Castellan critical difference test for the resource governance index. 354
Table A6.9 Mann-Whitney tests for the resource governance quantity index. 3 5 5
xi i i
LIST OF FIGURES
Figure 1 . 1 The relationship between the indices. 4
Figure 1 .2 Theoretical model of the association between corporate level decision making skil l and the rate of resource governance dec isions. 6
Figure 2. 1 Conceptualisations of the relationship between strategy and firm performance. 1 3
Figure 2.2 Model of structure-conduct-performance paradigm . 1 8
F igure 2 .3 Model of resource based theory paradigm. 2 8
Figure 3 . 1 Strategy hierarchy. 77
Figure 3 .2 Corporate strategy conceptual framework. 1 03
F igure 3 .3 The proposed relationship between construct, attributes and concepts. 1 07
Figure 3 .4 The relationship between the indices. 1 09
F igure 3 .5 Monroe's (2002) sense of direction variables. 1 1 4
Figure 3 .6 Monroe's (2002) sense of discovery variables. 114
F igure 3 .7 Monroe's (2002) sense of destiny variables. 1 1 5
F igure 4.1 The relationship between the indices. 1 50
F igure 5 . 1 The relationship between the indices. 1 80
F igure 6. 1 Strategic intent by firm performance category. 207
Figure 6.2 Organisational domain by firm performance category. 207
Figure 6.3 Internal governance by firm performance category. 208
Figure 6.4 Resource governance by firm performance category. 208
F igure 6.5 Corporate strategy by firm performance category. 209
F igure 6.6 Theoretical model of the association between the adoption of the core competency approach and the rate of resource governance decisions. 2 1 4
F igure 6.7 Theoretical model of the association between corporate level decision making ski l l and the rate of resource governance decisions. 225
F igure 6 .8 Theoretical model of the association between corporate level decision making ski l l and the rate of resource governance decisions incorporating the core competency approach. 246
xiv
Figure 6.9 Theoretical model of the association between corporate level decision making ski l l and the rate of resource governance decisions. 25 1
Figure A3 . 1 Box plots of the corporate strategy index by firm performance category. 325
Figure A3 .2 Box plots of the strategic intent attribute index by firm performance category. 328
F igure A3.3 Box plots of the organisational domain attribute index by firm performance category. 3 30
Figure A3 .4 Box plots of the internal governance attribute index by firm performance category. 332
F igure A3 .5 Box p lots of the resource governance attribute index by firm performance category. 334
Figure A5 . 1 Function I versus Function 2 scatter plot: Strategic intent versus resource governance model . 347
F igure A5 .2 Function I versus Function 2 scatter plot: Organisational domain versus resource governance model . 347
Figure AS.3 Function I versus Function 2 scatter plot: Resource governance versus internal governance model . 348
Figure A6. 1 Box plots for the corporate strategy excel lence index. 350
F igure A6.2 Box plots of the quantity indices. 353
xv

1.0 INTRODUCTION
Strategic management research focuses on identifying reasons for firm performance (Hoskisson,
Hitt, Wan, & Yiu, 1 999). Firm performance heterogeneity has been l inked to a number of
sources, for example, opportunity responsiveness, creativity, and the redefining of customer
expectations ahead of competitors . Firm success has been attributed to and summarised as
arriving at the future, more prepared and better positioned than competitors (Hamel & Prahalad,
1 994). A number of theoretical frameworks have been developed to account for interfirm
performance heterogeneity, whether emphasising an endogenous perspective (the strengths and
weaknesses of firms) or an exogenous perspective (the opportunities and threats evident in the
firm' s environment) .
This research focuses on one largely endogenously derived source of interfirm performance
variation, namely, corporate strategy. Corporate strategy is distinct from competitive and
operational strategies because corporate strategy defines the firm ' s strategic intent and how the
firm should be structured and administered (Thompson, 200 1 ). Corporate strategy is a series or
pattern of consistent and systematic decisions over time made at the corporate level of a firm that
integrate "an organization' s major goals, pol icies, and action sequences into a cohesive whole"
(Quinn, Mintzberg & James, 1 988 , p. 3) . However, corporate strategy is not a singular element:
it appears to comprise a number of different constructs. The conceptual framework developed
and used in this study incorporates four such constructs, namely, strategic intent (representative
of strategy formulation), organisational domain, internal governance, and resource governance
(representative of strategy implementation).
Corporate strategy is a fundamental concept within the field of strategic management. Yet, since
corporate strategy's inception, it appears to have been successively misconstrued, at best
partially understood, or at the least ambiguously defined. If the term "corporate strategy" has
been m isconceived and misunderstood, strategy evident at the corporate level of the strategic
h ierarchy appears to be even more ambiguous. The proliferation of definitions has resulted in
unclear and distorted boundaries of corporate strategy, leading to confusion w ithin both
academic and practitioner fields of study. It is apparent then that the concept of corporate
strategy is both internally inconsistent and incomplete.
The majority of the corporate strategy literature has been inclined towards practitioner rather
than academic l iterature resulting in a predominantly normative model rather than the pursuit of
empirical knowledge. Consequently, empirical evidence l inking firm performance and corporate
strategy is lim ited. It should be noted that in addition to the possible direct impact of corporate
strategy on persistent firm performance, although beyond the scope of this piece of research,
corporate strategy has been found to influence business unit performance (BUP) which in turn
indirectly influences firm performance. However, corporate strategy has been perceived as only
playing a minor role on BUP (refer to Chapter Two for presentation of empirical evidence).
More specifical ly, a clear understanding of how corporate strategy successfully influences firm
performance does not yet appear to have been incorporated into the theory of strategic
management. What then is corporate strategy and does a firm ' s corporate strategy result in
sustained differences in performance? If so, can a model of corporate strategy be developed that
accounts for disparate levels of performance in the long term.
1 . 1 RESEARCH AIM AND OBJECTIVES
A central goal of strategy research is to uncover the determinants of firm performance. The
influences of corporate strategy on firm performance, that is heterogeneous corporate strategy,
may actually result in heterogeneous firm performance. Corporate strategy could then be used to
distinguish superior performing firms from other firms. Thi s research endeavours to develop on
the current l iterature on the construct of corporate strategy, and make an important contribution
to the empirical research on corporate strategy in terms of its possible impact on persistent
superior firm performance. A number of issues regarding the comprehensiveness of the
corporate strategy concept exist, because much of this l iterature has focused on either diversified
organisations or specific corporate strategies.
The aim of this research then is to elucidate and develop the extant corporate strategy l iterature
in terms of uncovering if, and how, corporate strategy may be used to distinguish between
persistently successful and nonsuccessfu l firms. Therefore:
The primary aim of this research is to determine whether corporate strategy actually contributes
to persistent firm performance.
To assist in fulfil ling the above research aim, a number of steps wi l l sequentially need to be
undertaken and completed, namely, the key attributes of corporate strategy wi l l be described and
a number of propositions presented to highl ight the primary principles fundamental to the
concept of corporate strategy. An integrative framework for uncovering the extent of the
2
attributes of corporate strategy within persistently successful firms wi l l then be formulated and
statistically tested. Therefore, the three objectives of the research are:
o To define corporate strategy and identify the key attributes (constructs) within corporate
strategy
o To develop a framework to evaluate each of the attributes that contribute to the concept
of corporate strategy
o To determine if any attributes of corporate strategy actually contribute to persistent firm
performance, namely, to learn how corporate strategy matters.
1.2 RESEARCH PROCESS
The construct of corporate strategy wil l be developed inductively from a comprehensive review
of the l iterature. From this clarification and definition of corporate strategy, four attributes
namely, strategic intent, organisational domain, internal governance, and resource governance,
wil l be identified. These attributes then provide a conceptual framework of corporate strategy.
An expert panel wil l be used to review the conceptual development and their contributions
subsequently incorporated into the model . A number of research statements wi l l be developed.
Each of these attributes are developed in a form that they are measurable, that is, various
indicators wil l be selected to represent the diverse aspects of each corporate strategy attribute.
Where relevant, these corporate strategy attributes comprise indicators represent ing both
excellence in the attribute, and the quantity (level of activity) of corporate level decisions made.
A number of hypotheses will be formulated representing the expected relationship between
corporate strategy and persistent firm performance.
Cross-sectional samples will test the distinctness of the corporate strategy construct in a process
similar to that used by Levitas and Chi (2002). Therefore, from the popUlation of firms l isted on
the New York Stock Exchange from 1 980 to 2003, three subpopulations of firm performance are
identified. These subpopulations are selected on the basis of demonstrable persistent superior
firm performance (PSFP), persistent average firm performance (PAFP) and persistent inferior
firm performance (PIFP) based on an effective corporate level measure of firm performance:
share market price (SMP). Five firms wil l be selected from each of the three firm performance
categories; they then represent the sample for this study. Content analysis wil l be performed on
all Wal l Street Journal (WSJ) articles col lected on each firm from 1 980 to 2004, providing an
estimation of both the level of excel lence and the rate of corporate strategy attribute decision
3
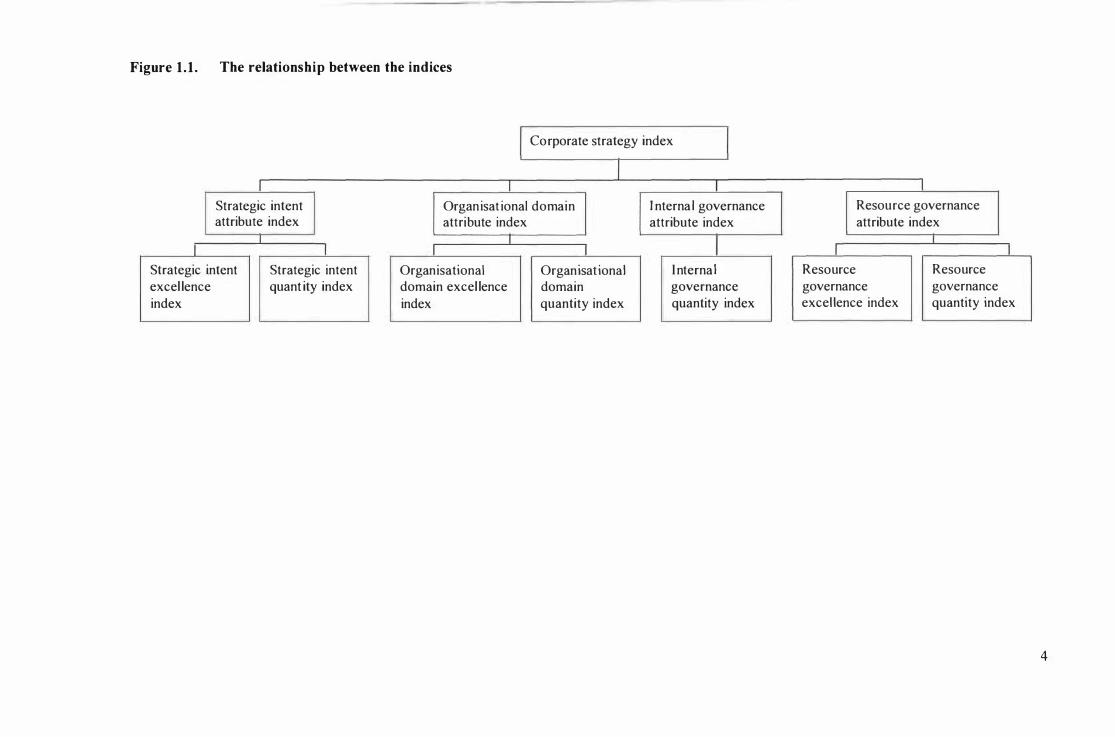
Figure 1 . 1 . The relationship between the indices
Corporate strategy index
Strategic intent Organisat ional domain I nterna I governance attribute index attribute index
I I Strategic intent Strategic intent excel lence quant ity index index
attribute index
I Organisational domain excel lence
index
I Organ isat iona I domain quantity index
Internal governance quantity index
Resource governance attribute index
I I Resource Resource governance governance excellence index quantity index
4

making within each firm . Various potential confounds wil l also be formulated and data wi l l be
collected uti l is ing the firm's annual reports, Security and Exchange Commission fil ings, and
websites of the sample firms.
Whi le the research is being reported in a supposed linear fash ion, it was not necessarily
conducted in th is manner. Providing a clear representation of the three levels of indices (Figure
1 .1 displays the three index stages) offers clarity to the research design and provides clear
signposts for the research, while not intended to necessarily reflect the process undertaken. The
indicators of each corporate strategy attribute wil l be transformed into a series of indices for each
firm, a process involving three stages: F irst, the excellence and quantity indices wi l l be
calculated. Second, attribute indices wi l l be computed from the excellence and quantity indices
and lastly, a corporate strategy index wi l l be formulated from the attribute indices.
Both parametric and distribution-free inferential statistical techniques will be conducted to
determine if the potential confound variables can be uti l ised to distinguish the PSFP category
from the other two firm performance categories. Descriptive statistics and box plots of the
attribute indices and the corporate strategy index will be analysed to provide a determination of
the various hypotheses created during the operational isation stage. Hypothesis testing util ising a
series of both parametric and distribution-free inferential statistical techniques wil l be conducted
in two stages: firstly, on the corporate strategy index and the corporate strategy attribute indices,
and secondly, on the various excellence and quantity indices.
The results of these tests wi l l then be discussed in terms of both the prior empirical evidence and
the theoretical l iterature. Specifical ly, two corporate level theoretical views on persistent firm
performance are discussed, namely, core competency theory and the corporate level decision
making skil l perspective. Core competency theory argues that core competencies provide the
basis for all corporate level decisions as they are the critical to firm surv ival. However, core
competency theory does not provide a comprehensive explanation of the curvi linear relationship
between persistent firm performance and the frequency of resource governance decisions.
The corporate level decision making ski l l perspective incorporates the expectation that
heterogeneous managerial abil ity could account for heterogeneity observed in firm performance.
Therefore, it fol lows that corporate level decision making skil l could also be heterogeneous.
Two areas of corporate level decision making ski l l exist which may explain the heterogeneity of
the rate of resource governance decisions observed (refer to Figure 1 .2). Firstly, the decision
5

Figure 1 .2. Theoretical model of the association between corporate level decision making skill and the rate of resource governance decisions
Core competency approach
Decision making
rules and routines
Groupthink
ALTERNATIVE SEARCH AND EVALUATION PROCESSES
Comprehensiveness :/ Appropriateness I
Removal o f possible inhibitors
I Foresight
/'
/ ATTRIBUTES OF CORPORATE LEVEL DECISION MAKERS
CORPORATE
LEVEL S K I LL�
IN RESOURCE GOVE RNANCE D ECISION
M A K ING
\
SIM PLIFICATION OF RESOURCE GOVERNANCE DECISION
M A K ING (reduction
in complexity and uncertainty e.g., through rules and standard operating
procedu res)
DECI SION MAKING
Rules and routines that govern employees
r
Decision review
RESOURCE GOVERNANCE D ECISION � MAKING
Q U ALITY
RATE O F RESOURCE � GOVERNANCE
D ECISIONS
NB: The model is depicted in l inear form as it is anticipated that it evolves from left to right (PSFP) over time
PERSISTENT SUPE RIOR FIRM PERFO RM ANCE
6
making frameworks employed within firms are heterogeneous. Decision making frameworks are
influenced both by the decision makers' attributes and frames of reference. Secondly, it i s
expected that quality decisions arise from superior decision making. The decision making
process involves a number of steps: setting objectives, searching for alternatives, evaluating
alternatives, making the decision, implementing the decision and, lastly, evaluating of the
success of the decision. Therefore, the second component centres on the decision making
process employed within firms, specifically, the search and evaluation of alternative processes
and implementation of the decision which may provide an explanation for the heterogeneity in
the incidence of resource governance decision making observed. Corporate level skill in
resource governance decision making appears to provide the most appropriate explanation for the
distinction i n persistent firm performance obtained from this dataset (refer to Figure 1 .2) .
1 .3 DELIMITATION OF SCOPE
Many theoretical frameworks could be used to provide an explanation of how corporate strategy
impacts on persistent firm performance as the field of strategic management overlaps w ith a
range of "management" subjects such as leadership, organisational theory, organisational
learning, upper echelon l iterature, corporate governance, decision making theory, and
organisational culture. However, as outlined above, two more appropriate corporate level
perspectives of the resource based theory (RBT) were applied to the findings, namely, core
competency theory and the perspective of corporate level ski ll in decision making.
All research is constrained by boundaries that are inherent in the research design . The findings
of this research are consequently l imited to the following research scope:
1 . Deliberate, realised strategic behaviour at the corporate level
2 . Large, publ icly listed firms registered in the United States of America (US)
3 . The theoretical framework employed as an explanatory tool was largely l imited to the
relevant aspects of RBT
4 . The four attributes of corporate strategy and the three potential confounds as presented
in this research. Interaction effects between the various attributes of corporate strategy
were not considered
5 . The characteristics o f corporate strategy across three categories o f firm performance
(Le., PSFP, PAFP and PIFP) rather than individual firm characteristics
6. The unit of analysis is at the corporate level
7
7. The relationship studied here centres on the role of corporate strategy on persistent
firm performance.
Focusing on del iberate, realised strategy was necessary due to the difficulties inherent in
measuring emergent strategy from the secondary data sources available to the researcher.
Therefore, th is piece of research must represent a minimum level of corporate strategy behaviour
evident within the sample firms. Large publicly listed firms were selected as the site to observe
corporate strategy due to two factors. They are, firstly, that some authors have suggested
corporate strategy does not occur w ithin single business firms and, secondly, that large publicly
listed firms were expected to more readily "broadcast" their corporate strategy decisions to the
media (the main data source for this research). Any possible interaction effects between the
corporate strategy attributes could not be accurately tested as the small sample size, in
conjunction with the large number of variables col lected, restricted the inferential statistical
techniques available to the researcher. As this research focused on categories of firm
performance, conducting a further in-depth analysis involving, for example, various interviews
with the corporate level decision makers of the 1 5 firms, would have both rendered analysis
unnecessarily complicated and beyond the resources avai lable to the researcher. Although
corporate strategy has been found to influence BUP and thus, indirectly influences firm
performance, the unit of analysis is selected to identify the possible relationship between
corporate strategy and persistent firm performance. Lastly, the role of corporate strategy on
persistent firm performance is the aim of this thesis. Therefore, reverse causality, that is, the
notion that firm performance can influence corporate strategy, will not be considered. In
addition, it could be suggested that the relationship between corporate strategy and firm
performance is one based on reciprocal causal ity. For example, corporate strategy and firm
performance move together through time as the firm actually changes. Again, this possible
association is outside the scope of this research.
This research util ises the terminology of organisation, corporation, firm and company
synonymously. The term business will be uti lised to define subunits of a firm, usual ly operating
in a single market or industry.
1 .4 JUSTIFICATION FOR THE RESEARCH
This research contributes to the knowledge of strategic management on four counts. First, as the
principal focus of the field of strategic management has been on business level strategy, little
8
theoretical and empirical research has been presented on corporate level strategy. This research
begins to address that imbalance.
Second, as strategic management primarily has a business level focus, the level of analysis is the
business unit. This research - attempts to transfer strategic management's spotlight from
ach ieving sustainable competitive advantage (SCA) to achieving PSFP. As this research
concerned corporate level strategy, as opposed to business level strategy, the unit of analysis was
moved from the business unit level to that of the firm. These points are more extensively treated
in Chapters Two and Three.
Third, as it is expected that corporate strategy can result in successful outcomes, it should be
conceptualised in terms of how firm decisions would be successful . This begins with the
development of a corporate strategy construct that integrates the various current definitions of
corporate strategy into a concise framework. Furthermore, the provision of clear empirical
evidence of the contribution of corporate strategy to superior firm performance (however that
may be measured) would provide clarity and greater appl icabil ity as a management tool .
Comparisons between the both the rate and quality of corporate level decisions between different
categories of firm performance wi l l provide a clearer understanding of the nature of the
relationship between corporate strategy and persistent firm performance. Additionally, if
corporate strategy can be used to distinguish between categories of persistent firm performance,
further insight may be gained from determining which attribute of corporate strategy contributes
to this d ifference, namely, the rate of resource governance decision making.
Fourth, the structure-conduct-performance paradigm (SCP) contends that SCA arises from
industry characteristics and the firm ' s position within that industry; whereas, RBT contends SeA
is based on imperfections in the resource market and discretionary firm decisions in response to
environmental uncertainty and complexity, that is, firm heterogeneity. Consequently, the
findings provide empirical support for the endogenous perspective of firm performance,
specifically, the rate that resource governance decisions can be uti l ised to distinguish the PSFP
category from other lesser categories of persistent firm performance.
1 .5 OUTLINE OF THE THESIS
This thesis proceeds with a review of the relevant theoretical l iterature. The examination of the
l iterature highl ights the difficulties within the theoretical treatment of corporate strategy, that is,
9
the concentration of both the theoretical and empirical l iterature on business level strategy. The
construct of corporate strategy employed in this study is outl ined in Chapter Three. The
approach fol lowed is that advocated by Berson, Avolio and Kahai (2003) . They recommended
that "the cycle of construct specification starts with an inductive process whereby researchers use
a priori observations, personal experience, or other authors' research to build some insight"
(p. 93) . Expl icitly defining the construct and attributes in terms of a firm level of analysis
defines the context and, thus, directs the methodology.
The next phase of research moves from a largely inductive to a deductive process. Chapter
Three also presents the three levels of indices that are created. The corporate strategy index is
comprised of four attribute indices, namely, strategic intent, organisational domain, internal
governance and resource governance. These four attribute indices are comprised of three
excellence and four quantity indices (except for internal governance which is not represented by
excellence in this research). The excellence and quantity indices are operationalised in terms of
1 8 indicators and proxies that could be empirically observed. The five research statements
outl ined in Chapter Three are also redefined into five hypotheses and nine subhypotheses to
assist in the verification of the conceptual isation of corporate strategy.
Chapter Four provides a detai led discussion of the methodology used for sample selection, data
col lection, and the statistical techniques employed in data analysis. The findings from the
dataset collected are reported in Chapter Five. The exploratory data analysis results are fol lowed
by the findings for the hypotheses testing for the corporate strategy index and the four corporate
strategy attribute indices. The last part of Chapter Five displays the results for the various
excellence and quantity indices. These two chapters are fol lowed by a discussion which
identifies a pattern that exists within the dataset collected. The main finding of this research wil l
be discussed in terms of various alternative explanations. This is fol lowed by a discussion of the
possible pattern in terms of the impl ications for the conceptual framework of corporate strategy.
Thereafter, this thesis is concluded with a summary of the significance and contribution of the
research, its l imitations, impl ications and potential avenues for future research.
1 0
2.0 LITERA TURE REVIEW
2.1 CHAPTER OVERVIEW
A literature review of relevant aspects within the field of strategic management has been
conducted and is now presented in two sequential parts: Part I presents a theoretical review while
Part II outl ines the empirical evidence of the effect of corporate strategy on subsequent firm
performance.
PART I : TH EORETICAL LITERATU RE REVIEW
The theoretical review opens with a presentation on the aims of strategic management. The
concept of persistent superior firm performance is then defined. The major component of the
theoretical review follows and encompasses a review of the two conceptual lenses employed to
interpret strategic management phenomena: in other words, exogenous and endogenous
perspectives of sustainable competitive advantage. The main paradigms evident within each of
these perspectives, the structure-conduct-performance paradigm and resource based theory, are
then outlined. Two aspects of the resource based theory which focus on the corporate level,
namely, core competency theory and the corporate level decision making ski l l perspective, are
then discussed. The differences between the two paradigms are then identified and discussed.
Part I concludes with a summary of the critical extant knowledge that contributes to this
research.
2.2 W HAT IS THE AIM OF STRATEGIC
MANAGEMENT?
The field of strategic management seeks to both explain and predict firm success. Strategy
involves decisions:
It is a basic proposition of the strategy field that these choices have critical influence on
the success or failure of the enterprise, and, that they must be integrated. It is the
integration (or reinforcing pattern) among these choices that makes the set a strategy
(RumeIt, Schendel & Teece, 1 99 1 , p. 6).
More specifically, as suggested by Carroll ( 1 993 , p . 247), "the fundamental question for strategic
management i s why successful firms differ." As noted by Rumelt et al ( 1 99 1 ), "strategic
1 1
management is about coordination and resource allocation inside the firm" (p. 1 9, italics in
original) rather than within markets and economies as evident in the field of economics. As the
field of strategic management was developed to explain the existence of firm performance
heterogeneity, the aim of strategic management can be defined as uncovering the determinants of
persi stent superior firm performance. Strategic management predicts that PSFP results from
better managed firms through mechanisms such as corporate strategy. Consequently, strategic
management seeks to develop an understanding of endogenous decisions with a v iew to
formulating explanations as to why some firms outperform others.
2.3 DEFINING PERSISTENT
PERFORMANCE
SUPERIOR FIRM
Theories have been developed to explain why some firms appear to consistently outperform
others. The concept of PSFP has many definitions focusing on the achievement of superior
performance relative to competitors and can include profit, survival or satisfaction (Arend,
2003). It is commonly assumed that a firm achieves PSFP through the possession of sustainable
competitive advantage (Powell , 200 I ; Wiggins & Ruefi i, 2002). Reed and DeFi l l ippi ( 1 990)
noted that two main concepts of SCA appear in the l iterature: Firstly, Hofer and Schendel 's
( 1 978) view that firm core competencies create SCA. This view is one of three represented in
F igure 2 . 1 . The second view of SCA was attributed to Day ( 1 984), and Porter ( 1 985) by Reed
and DeFi l l ippi ( 1 990). Here the objective of a firm 's strategy is to create advantage over rivals
that is, "superior performance is correlated with competitive advantage, and achieving an
advantage wil l automatically result in h igher performance" (Reed & DeFil li ppi, p. 90). In other
words, strategy can be uti l ised to manipulate the nature of competition, thus creating SCA (again
refer to Figure 2. 1 ).
Much published l iterature focuses on SCA and thus strategy conducted at the business level of
the firm, namely, competitive strategy. Therefore, l imited theoretical or empirical investigations
have concentrated on PSFP. Consequently, the predominant theoretical perspectives on firm
performance in strategic management have employed a business or industry unit of analysis (i .e. ,
SCA). Whi le some research on corporate strategy has been conducted at the firm level of
analysis, this research does not appear to be particularly fruitful as it provides an incomplete
understanding of firstly, the construct of corporate strategy and secondly, the possible effects of
corporate strategy on the persistent performance of the entire firm separate from the impact of
corporate strategy on business unit performance. Analyses conducted at such levels are then
1 2
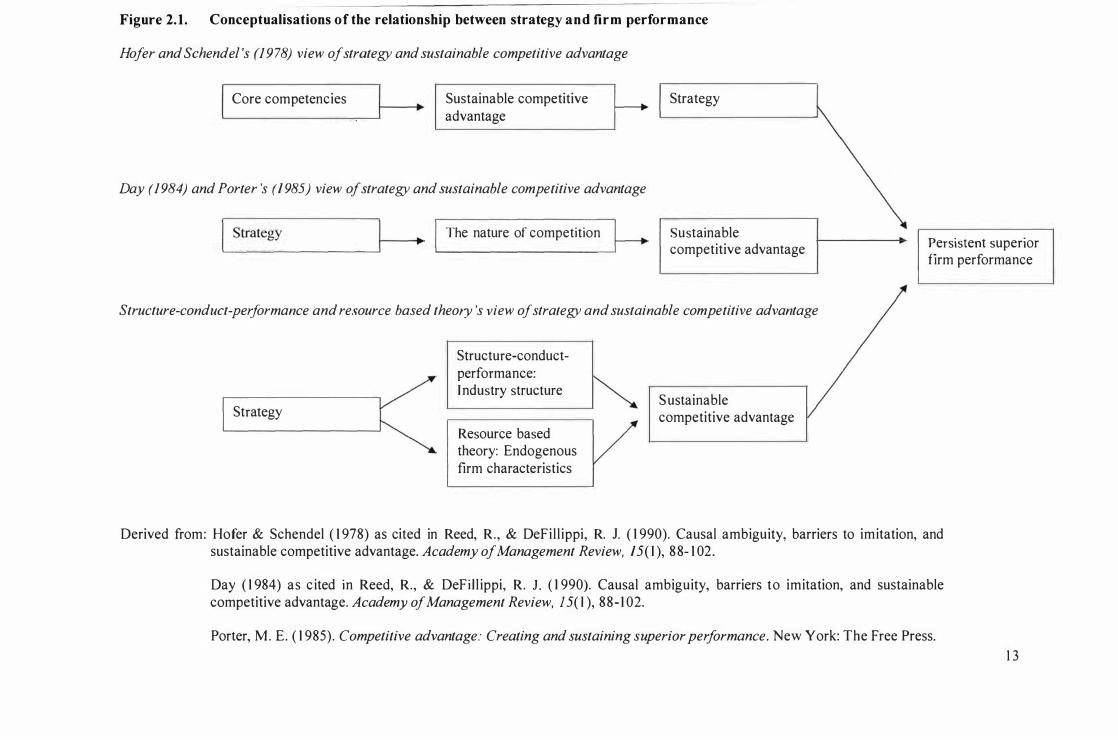
Figure 2. 1 . Conceptualisations of the relationship between strategy and firm performance
Hofer and Schendel 's (1978) view of strategy and sustainable competitive advantage
Core competencies Sustainable competitive advantage
Day (1984) and Porter 's (/985) view of strategy and sustainable competitive advantage
Strategy
'--S_tr
_a_te_g_y _____ --'I---•• I The nature of competition � Sustainable
competitive advantage Persistent superior firm performance
Structure-conduct-performance and resource based theory 's view of strategy and sustainable competitive advantage
Strategy ( �
Structure-conduct -performance: I ndustry structure
Resource based theory: Endogenous firm characteristics
Sustainable competitive advantage
Derived from: Hofer & Schendel ( 1 978) as cited in Reed, R. , & DeFil l ippi, R. 1. ( 1 990). Causal ambiguity, barriers to imitation, and sustainable competitive advantage. Academy of Management Review, /5( 1 ), 88- 1 02.
Day ( 1 984) as c ited in Reed, R., & DeFi I l ippi, R. 1. ( 1 990). Causal ambiguity, barriers to imitation, and sustainable competitive advantage. Academy of Management Review, J5( I ), 88- 1 02.
Porter, M. E. ( 1 985). Competitive advantage: Creating and sustaining superior performance. New York: The Free Press.
1 3
inappropriate for corporate strategy. Corporate strategy wil l be comprehensively defined in
Chapter Three. Instead, investigations into corporate strategy should employ a firm unit of
analysis (i .e. , PSFP).
For the purposes of this research, PS FP is defined in the following manner: "Persistent" refers to
long-term (in regards to time) performance (Porter, 1 985) . Wiggins and Ruefli (2002) noted thi s
definition can be operational ised quantitatively. The use of "firm" relates to the entire
organisation, in contrast to SCA which applies to single business units (SBU) . "Superior
performance" is defined as equivalent to above average returns, supernormal returns,
effectiveness or superior profitabi l ity . Quantitatively, PSFP is relative to the performance of
other firms, regardless of the industry or industries within which they operate.
Due to the limited theoretical discussion of the relationship between corporate strategy and
PSFP, it has been necessary to outl ine the alternative theoretical constructs, namely, sustainable
competitive advantage and its associated unit of measure, business unit performance. The two
main theoretical perspectives evident are the sources of SCA resulting from either exogenous or
endogenous factors. These perspectives theorise that certain elements (i .e. , industry structure for
SCP or firm specific attributes for RBT) can be developed or manipulated by strategy to create
SCA and thus, producing PS FP (refer to Figure 2. 1 ) . The two different theoretical perspectives
emphasise contrasting disciplines: an economic approach and the strategic management approach
respectively. Thus analysing the phenomena of firm performance by either theoretical logic has
led to the generation of different methodologies, predictions, explanations and knowledge. The
exogenous perspective will be outlined first.
2.4 THE EXOGENOUS PERSPECTIVE OF
SUSTAINABLE COMPETITIVE ADVANTAGE
The field of strategic management during the 1 970s and the 1 980s was dominated by the analysis
of the firm's external environment as the source of SCA (Hoskisson et ai, 1 999). The exogenous
perspective attempts to explain the performance heterogeneity displayed by industries and, as
such, seeks to uncover how the mechan ism of an industry works, creating SCA and, thus, firm
performance (Nelson, 1 99 1 ) .
A predominant exogenous theory of SCA is based on the principles of industrial organisation
economics (10) . 10 encompasses a group of theories that seeks to explain the impact of
1 4
imperfect competition on SCA whereby firms can maximise their performance beyond that
experienced by firms operating in a perfectly competitive environment. 10 offers theoretical
v iews on SCA as then being influenced by industry structure (Hansen & Wemerfelt, 1 989).
Conner ( 1 99 1 ) suggested that five predominant schools of thought exist within 10 separated by
assumptions on industry structure : First, neoclassical perfect competition which v iews firms as
profit maximisers who correctly ascertain the right input (capital and labour) mix to produce
end-products (e.g., McNulty, 1 968); Second, the Harvard tradition that conceived firm
profitabi l ity could be explained by the SCP paradigm (e.g., Bain, 1 954, 1 968; Mason, 1 939);
Third, Schumpeterian competition views firms as searching to change industry structure through
innovation (e.g., Nelson & Winter, 1 982; Schumpeter, 1 950); Fourth, the Chicago School
considered that industry structure does not determine SCA; rather it is an outcome of efficiency
seeking firm behaviour within the industry (e.g., Demsetz, 1 973); F ifth, transaction cost
economics where successful firms produce the most efficient outcome by minimising transaction
costs (e.g., Wil l iamson, 1 975, 1 980, 1 985) .
As the main aim of 10 is to study interindustry heterogeneity, 10 only considers the i mpact of
firms (their resources and decisions) on an industry in a broad sense. 10 provides industry based
explanations (e.g., industry membership) for the primary sources of SCA. Industries compete for
resources, and the successful competition increases the attractiveness of an industry, raising
industry profit; thus explain ing why some industries outperform others and why industry
affi liation affects SCA. 10 theory implicitly assumes that firms within an industry are
homogenous, except for size differences. 10 assumptions also include rational behaviour,
homogenous supply and demand, and markets in equi l ibrium (SubbaNarasimha, 200 1 ).
Therefore, 10 suffers from the l imitation of oversimplifying both the nature of firms and the
environment in which they operate.
2.4. 1 Structure-conduct -performance paradigm
The structure-conduct-performance paradigm has had a significant impact on strategic
management. The three components of SCP are : industry Structure, which includes such
examples as industry concentration, industry growth, product differentiation, and barriers to
entry. Conduct refers to product pricing, advertising intensity, and the degree of investment, for
example. While performance encompasses rates of efficiency, industry or firm profitabi l ity
usual ly determined by traditional accounting measurements such as, return on assets (ROA).
SCP provides a framework for assessing the nature of competition and for formulating strategy
(Jacobson, 1 992).
1 5
a) The aim of the structure-conduct-perJormance paradigm
SCP seeks to account for the detenninants of SCA in tenns of industry structure, specifically
entry and mobility barriers. Furthennore, SCP aims to produce a nonnative set of competitive
strategies which can be uti l ised to manipulate industry structure.
b) The assumptions of the structure-conduct-performance paradigm
A number of premises underlie the SCP paradigm. SCP presumes relatively static and repetitive
environments, perfect knowledge, rational decision making, and that persi stent perfonnance
heterogeneity exists in equil ibrium. The rationale behind the use of equil ibrium theory is that
stable systems are thought to be more common and best able to predict outcomes, therefore,
producing dupJ icable knowledge. As the unit of analysi s is the industry, SCP concentrates on the
collective properties of firms not the unique characteristics of indiv idual firms. SCP v iews the
firm as an i solated, internally closed, ahistorical, simple system, remain ing constant over time
(Tsoukas & Knudsen, 2002). F inns within industries are only heterogeneous in size due to
economies of scale or product differentiation. SCP assumes resources are homogeneous and are
not sources of SCA because h igh resource mobility restricts the development of long-term
resource heterogeneity (Barney, 200 1 a; Spanos, Zaralis & Lioukas, 2004). Finn behaviour is
detennined by external situations. Montgomery ( 1 994) noted that management is assumed to be
located at the business level, making "decisions without regard to the finn's participation in
other markets" (p. 1 63) . sep also presumes that firms seek to maximise profitabi l ity through the
achievement of SCA, and thus profitabil ity is the aim of strategy. Consequently, other aims,
such as managerial goals, are simply not considered or are at best embedded in profit. The
assumption of profit maximisation reflects a set of behavioural rules as a defined set of decisions.
c) Structure-conduct-perJormance paradigm predictions
The main SCP hypothesis states that "because structure determines conduct (or conduct is simply
a reflection of the industry environment), which in turn detennines perfonnance, conduct can be
ignored and perfonnance can, therefore, be explained by structure" (Hoskisson et ai, 1 999, p.
425) . Consequently, SCP presumes an industry structure-performance correlation; in other
words, variations in profitabi l ity between different firms are predicted to be detennined by
industry structure (Hawawini, Subramanian & Verdin, 2003 ; McGahan & Porter, 2002;
McWil liams & Smart, 1 993 ; Tsoukas & Knudsen, 2002). For example, "market structure . . . [is]
the principal explanation for the emergence of common patterns of behaviour and similar
performance outcomes for firms in the same industry" (Mauri & Michaels, 1 998, p. 2 1 2) .
1 6
Performance is predicted to arise from characteristics of the industry in which the firm competes
(Porter, 1 980), and the firm's position relative to its competitors (Prahalad & Hamel, 1 990). To
summarise, SCP predicts that industry effects on firm performance are of greater magnitude and
persistence compared to business and corporate effects (discussed more ful ly in Section 2 .9).
The SCP paradigm makes additional predictions on the manner in which industry structure
determines firm profitability (refer to Figure 2.2). For example, industry structure restricts
unrestrained competition as firms operating in h ighly concentrated industries are predicted to
cooperate, restricting rivalry, and thus increasing industry profitability. Secondly, SCP predicts
that industry structure protects above average profitabi l ity, for example, through mechanisms
such as h igh barriers of entry (Hi l l & Deeds, 1 996; Mc Williams & S mart, 1 993) . F irms are able
to set their prices above the competitive price as higher concentration and barriers to entry
produces higher collusion leading to lower competition and, consequently, higher industry
profits (McWil l iams & Smart, 1 993).
SCP suggests that the aim of strategy is to obtain pseudomonopol istic market power, thereby
reducing competition and increasing profit (refer to Figure 2 .2). By implication, rent
appropriation occurs within the industry (Coff, 2003). Barriers to entry (such as economies of
scale or product differentiation) can be manipulated to create or preserve pseudomonopolistic
power (Conner, 1 99 1 ) . In addition to high entry barriers, SCP predicts that large firms are
successful due to industry structural characteristics such as h igh market share (Conner, 1 99 1 ;
Wiggins & Ruefli, 2002). Furthermore, firms of simi lar size are predicted to possess equivalent
advantages, therefore providing the incentive to col lude or mutually refrain from competition
(Hi l l & Deeds, 1 996).
Different industries are thought to be characterised by different average profit levels that persist
over time. The inherent attractiveness of an industry reflects its relative potential for profitabi lity
(refer to Figure 2.2). SCP predicts that successful firms exist in h igh performing industries
characterised by auspicious structural characteristics (Spanos et aI, 2004) or alternatively, poor
performing firms exist in lower performing industries. Porter' s ( 1 980) model of competition
offers a contrasting view whereby he recognises that businesses choose competitive positioning
(via competitive strategy) altering the nature of competition or/and industry structure and thus,
industry attractiveness.
1 7
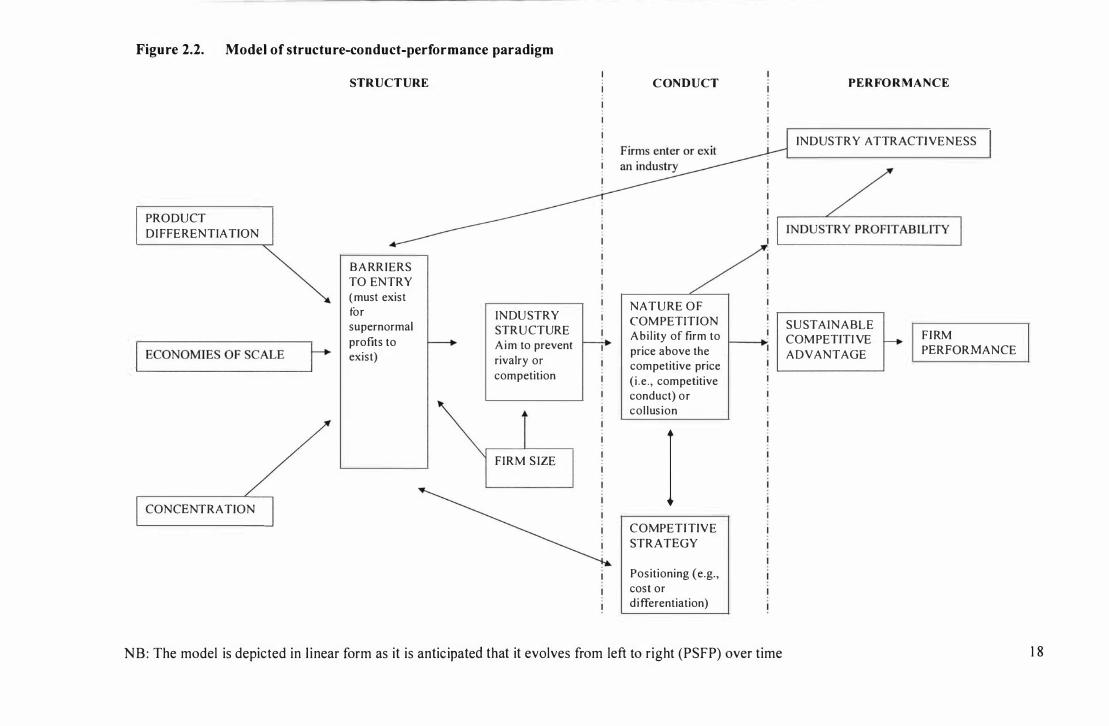
Figure 2.2. Model of structure-conduct-performance paradigm
PRODUCT
DI FFERENTIATION
,--
E
_
C
_
O
_
N
_
O
_
M
_
'
_
E
_
S
_
O
_
F
_
S
_
C
_
A
_
L
_
E
_-,r
CONCENTRATION
STRUCTURE
BARRIERS TO ENTRY
( must exist for supernormal
profits to _ exist)
INDUSTRY STRUCTURE Aim to prevent r-----;. rivalry or
competition
FIRM S IZE
C ONDUCT
NATURE O F
COM PETITION Abil ity of firm to
price above the competitive price
(i .e. , competitive conduct) or collusion
I COMPETITIVE
STRATEGY
Positioning (e.g., cost or differentiation)
NB: The model is depicted in l inear form as it is anticipated that it evolves from left to right (PSFP) over time
PERFO R MANCE
INDUSTRY ATIRACTl VENESS
SUSTAINABLE COM PETITI VE f-ADVANTAGE
FIRM PERFORMANCE
1 8
Various interpretations on the time span of SCA are evident within SCP. One view proposes that
variations due to firm heterogeneity are either insignificant or temporary (Kessides, 1 990). For
example, Chang and S ingh (2000) contended that "any competitive advantage held by a specific
firm is transient because competitors will eventually imitate it" (p. 74 1 ). However, it has been
postulated that firms can achieve medium-term to long-term SCA (Wiggins & Ruefli, 2002).
Explanatory variables of interest to SCP are located exogenously to the firm and include:
Industry concentration as a proxy for barriers to entry or low rivalry� asset, capital or advertising
intensity, as indicators of entry or exit barriers� and industry growth, as a control for unspecified
industry effects (Robins & Wiersema, 1 995 ; Spanos et ai, 2004). A fundamental aspect of SCP
analysis involves using average industry performance heterogeneity to distinguish structural
obstructions to competition (Hansen & Wernerfelt, 1 989; Robins & Wiersema, 1 995).
The influence of SCP's economic theories resulted in the introduction of deductive
methodologies to strategic management to empirically test hypotheses, namely, quantitative
analysis techniques and the use of large datasets collected from secondary sources (Hoskisson et
aI, 1 999). These empirical studies have provided evidence of a positive relationship between
industry effects and firm performance (discussed further in Section 2.9).
d) The role of strategy in the structure-conduct-performance paradigm
As SCP assumes that management is located at the business level (Montgomery 1 994), strategy
is also assumed to be at the business level, that is, competitive strategy. Three predom inant
v iews on strategy exist within SCP: Firstly, strategy has a l imited or nonexistent influence on
SCA as SCP predicts that industry structure controls firm conduct. Thus strategy's role on SCA
is seldom considered (Spanos et aI, 2004). Secondly, strategy is perceived as congruency or "fit"
to the firm ' s environment whereby the firm should appropriately fit its competitive strategy, by
selecting one of a number of predetermined strategies, to the structural characteristics of the
industry (Scarbrough, 1 998). Addleson (200 I , p. 1 78) noted that fit "implies that strategy i s
concerned with items, l ike pieces of a j igsaw, which should interlock when they are properly
coordinated."
C losely aligned to the fit model of strategy, and the most influential, is the third perspective on
strategy as competitive positioning whereby the firm can protect its SCA from competition or
alternatively influence the nature of competition in its favour (Porter, 1 980). For example,
strategy is viewed as the decision of selecting to operate in attractive industries and erecting
1 9
barriers to entry. Each industry is evaluated on the basis of imperfections in structural elements
as a measure of attractiveness (Jaril lo, 2003 ; Porter, 1 980, 1 985 ; Venkatraman & Subramaniam,
2002). Thus the nature of competition can be altered or restricted by the manipulation of
competitive forces via strategy. Theoretical ly, if done successful ly, firms can impose h igher
costs or inferior product qual ity onto customers.
Positioning involves employing the most effective strategy in line with industry imperfections,
for example, Porter's ( 1 980) Five Forces Model . Industry structure should be assessed and the
identified constraints of the industry directs firms to position their products as per specific
competitive strategies (e.g., Porter' s [ 1 980] generic competitive strategies of cost or
differentiation). Addleson (200 1 ) asserted that the view of strategy as positioning is aligned to
the view of strategy as an incremental tactical "battle" of moves to overcome a rival ' s current
position. Therefore, strategy is prescriptive and "exists as a theoretical ly validated set of
prescriptions waiting to be discovered by particular firms" (Tsoukas & Knudsen, 2002, p. 430),
whereby industry structure dictates the selection of strategies. Creativ ity is l imited and
uniqueness is not sought. Managers operating in the same industry are then assumed to make
identical decisions (Mauri & Michaels, 1 998). Therefore, strategies that create competitive
advantage are duplicated by the other firms operating in that industry. Consequently, fi rm
performance is predicted to converge towards the industry average over time.
The rationales underlying the last two perspectives of strategy possess simi lar characterist ics .
Perfect markets are perceived as unattractive. Disequil ibrium al lows the creation of advantage
through the effective identification and management of imperfect industry structural
characteristics which impede and prevent equi librium (Porter, 1 980; Venkatraman &
Subramaniam, 2002). Based on equi l ibrium theory, the market or industry the firm operates in
can be divided up between the current competition. These perspectives advocate that the firm
should influence industry structural characteristics even though other firms may also benefit.
The firm should then employ strategies to get into attractive industries and out of unattractive
ones (Miller & Freisen, 1 986; Smith, Guthrie & Chen, 1 989). Strategy is, therefore, either
situationally determined or externally enforced (Porter, 1 980) .
The fit and positioning perspectives view strategy as rational, uncompl icated and static, for
example, the al location of existing resources rather than resource creation. Viewing strategy as
allocation decisions between product or market opportunities is appropriate for firms operating
under environments characterised by certainty and stabi lity (Scarbrough, 1 998). Resource
20
allocation efficiency is achieved through market selection. This static model suggests that the
best predictor of future performance is past experiences: in other words, strategy that was
appropriate in the past wi l l work in the future.
Strategy is perceived as one of mapping, namely, identifying pieces and arranging the pieces into
appropriate positions for future success (Addleson, 200 1 ) . The focus of strategy is on the firm's
existing rivals. Both views of strategy advocate in-depth analysis of industry structure and
planning under a rational framework where the information gathered from the large scale
environmental analysis is entered into various "standard" models and frameworks (e.g., The
Boston Consulting Group Growth-Share Matrix) .
The fit and competitive positioning perspectives concentrate on competitive strategy rather than
corporate strategy. Due to the overwhelm ing focus on competitive strategy and the l imited
theoretical discussion on corporate strategy questions remain within SCP on the validity and role
of corporate strategy on firm performance: for example, there is an "absence of a persuasive
logic for managing multiple businesses" (Venkatraman & Subramaniam, 2002, p. 463). SCP
perceives corporate strategy as the aggregation or consolidation of the competitive strategies of
SBUs. Synergy between SBUs is not considered. In summary, SCP predicts that the influence
of corporate strategy on firm performance is negl igible or nonexistent.
e) Issues with the structure-conduct-perjormance paradigm
A number of issues regarding the SCP paradigm have been highlighted in the l iterature leading
to such statements as, "SCP logic has . . . been abandoned outright" (Barney, 200 1 a, p. 648). A
number of issues wi l l be discussed in this section including: first, the assumptions inherent
w ithin SCP theory; second, the apparent l im ited predictive power of SCP theory, that is, SCP' s
apparent fai lure to explain heterogeneous firm performance; third, the l imitations due to the
concentration on industry level analysis; fourth, tautological issues; fifth, the focus of SCP
theory on competitive strategy.
Assumptions
Pandian and Robertson (2003, p. 326) observed that SCP "require[s] a number of assumptions
that are unacceptable to strategists because of their lack of real ism." For example, McWilliams
and Smart ( 1 993, p. 68) observed that "most business environments are not in a state of
equi l ibrium. Rather, they are characterised by some degree of change." The changing nature of
competition from stable ol igopolies to hyper-competition leads to uncertainty, complexity,
2 1
dynamism (D'Aveni & Gunther, 1 994; I 1 in itch, D' Aveni & Lewin, 1 996; Rumelt et aI, 1 99 1 ) and
are dramatically different to the assumptions evident in SCP, further l imiting the applicabi lity of
the model . For example, Jacobson ( 1 992) contended that the assumption of perfect knowledge
impl ies innovation has ended.
Another example includes the assumption of clearly defined identifiable industry boundaries
from which analysis is performed to identify industry structural elements (Addleson, 200 1 ) .
However, this assumption does not account for the blurring convergence as observed in the
telecommunications, entertainment and computing industries. A point acknowledged by Porter
( 1 980) although he stated that the subjective definition "has l ittle to do w ith the choice of
strategy" (p. 32). SCP only considers operating within existing industry structures. Young,
Charns and Heeren (2004) found that firm performance can increase due to intense firm-level
competitive behaviour, in contrast with SCP's assumption that competitive rivalry is detrimental
to SCA (I1 initch, et aI, 1 996; Thomas, 1 996).
SCP has produced inaccurate predictions and explanations due to its assumption that the total
industry demand can be calculated as per equi l ibrium theory and what occurred in the past wil l
be repeatable in the future. Assumptions concerning the nature of competition also l imit the
application of SCP. Equi librium theory narrows the range of possibi l ities considered by firms,
for example, the positive relationship between concentration and collusion views innovation as
disturbing the competitive balance (Hi l l & Deeds, 1 996). Furthermore, in reality, the nature of
competition is not solely controlled by concentration or barriers to entry, for example, innovation
can overcome the SCP assumption of static barriers to entry.
Barney ( 1 99 1 ) noted that SCA arising from barriers to entry can only occur if firms are
heterogeneous. Firm resources protected by barriers to entry must be, by definition, imperfectly
mobile and different to those firms excluded by the barriers to entry. The costs associated with
higher barriers to entry potential ly raise a number of issues for firms in that the investment may
not result in SCA or that it may actually result in competitive disadvantage. For example, the
firm util ises its resources to protect the entire industry, including its competitors. I n other words,
SCP supposedly focuses on the use of strategy to manipulate and control industry structural
characteristics "even though their firm wil l not uniquely benefit from the changes" (Black &
Boal, 1 994, p. 1 3 1 ) . The concentration on industry structural characteri stics also deflects
attention from other influences on SCA such as, endogenous factors.
22
Inability to account/or firm heterogeneity (including strategic decisions)
There are deficiencies w ithin the SCP paradigm with respect to its predictive power. The logic
of SCP appears to be ineffective when applied to the "real" environment, as the empirical
evidence obtained has not supported the theoretical models. The goal of developing law-like
certainties has not material i sed such that industry effects have been found to be of minor
significance in relation to firm effects (discussed further in Section 2.9) . Although some
researchers found that concentration is positively related to profitabil ity (e.g., Ravenscraft, 1 983;
Scherer & Ross, 1 990), contrasting empirical evidence has also been presented. For example,
Jacobsen ( 1 988) observed an insignificant relationship between firm performance and industry
concentration. The anticipated one-way causal relationship between industry structure and firm
performance seems to be inaccurate as empirical evidence suggests that firm conduct can affect
industry structure (Spanos et ai, 2004). For example, industry structure appears to exert a smal l
impact on industry attractiveness (Hil l & Deeds, 1 996). In doing so, industry structure can result
from firm decisions (including corporate strategy) and competitive interaction, raising entry
barriers, through such strategies as extending market power beyond SBUs or single industries
and cross-subsidising businesses.
As Hi l l and Deeds ( 1 996) noted, the proxies uti l ised to represent the relationship between SCA
and barriers to entry and concentration may also incorporate firm attributes (such as firm
efficiency). Furthermore, if a standard set of strategies to achieving SCA were uncovered, over
time their widespread use would render SCA unachievable. The SCP model does not attempt to
fully capture the nature of the industry phenomena on performance, that is, performance is only
tested on a l imited number of dimensions assuming al l other th ings remain equal .
SCP has not captured the complexity of performance and, therefore, has not significantly
advanced knowledge. Spulber (2003, p. 254) asserted that "these highly stylised models of the
firm have not lent themselves easily to addressing management questions nor have sufficient
efforts been made to adapt them to pressing business problems." SCP theory has not provided an
explanation for the fundamental strategic management question of why firms operating under the
same industry structure experience different profits (Hawawini et ai, 2003 ; Roquebert, Phi ll ips &
Westfall, 1 996). Furthermore, some firms operating in "unattractive" industries appear to
possess SCA over rivals. Empirical evidence has confirmed the persistence of profit
heterogeneity in contrast to what is predicted by SCP. Empirical evidence has also been
presented that fals ifies SCP; in other words, firm specific influences on BUP have been found to
be greater than industry effects (discussed further in Section 2 .9).
23
Tsoukas and Knudsen (2002) observed that the focus of SCP on cross-sectional analysis instead
of longitudinal research designs has led to the theory being unable to conceive of SCA resulting
from firms. Human elements are not incorporated into the SCP model such as the influence of
power, incomplete perceptions, relationsh ips or uncertainty (Jacobson, 1 992). Addleson (200 1 ,
p . 1 7 1 ) asserted that "an equi l ibrium theory precludes an understanding of firms as social
institutions, del imits our view of what managers do as well as why and how they do things, and
prevents a meaningful explanation of the nature of decision-making." He also noted that such
concepts as clearly identifiable industry boundaries limited the applicabi lity of SCP.
SCP theory assumes that firms exhibit the same behaviour in identical circumstances fol lowing
the rules of maximisation (Tsoukas & Knudsen, 2002). F irms are then perceived as being
homogeneous. However, alternatives to the status quo occur and in real ity firms decide whether
to change or not. A more appropriate assumption to explain firm behaviour may be incorporated
in the notion of "profit seeking" rather than "profit maximising". Alternatively, firms are v iewed
as only altering their conduct in alignment to environmental changes, not in l ine with firm
attributes. SCP does not incorporate an assessment of the strategic decision making processes
managers undertake as the equil ibrium theory assumptions deems that firms have exploited the
opportunities they face, rul ing out the possibil ity of strategic decisions. Moreover, SCP theory
does not account for the abi l ity of firms to shape the environment through their decisions and
actions, such as through innovation (Addleson, 200 1 ; Hamel & Prahalad, 1 994).
In reality, strategy is a manifestation of the perceptions, understandings and decisions of people
rather than fol lowing the "correct" strategic position (Addleson, 200 I ) . Porter ( 1 980, 1 99 1 )
acknowledged the role of managerial decision making when h e advocated the use o f his generic
competitive strategies. Thus, Porter appears to take an intermediate view whereby SCA is
affected by both exogenous and endogenous characteristics. The assumptions inherent in SCP,
therefore, restrict its ability to explain and accurately predict why some firms are able to
consistently outperform others.
Industry unit of analysis
The third issue within SCP theory concerns the concentration on an industry unit of analysis.
While the concept of strategic groups has modified SCP to account for intraindustry performance
heterogeneity, its focus remains at the industry level . Whi le Caves and Porter ( 1 977) contended
that intraindustry performance heterogeneity can be attributed to mobility barriers preventing
firms from moving between strategic groups, the empirical evidence does not appear to support
24
the existence of such strategic groups. Even if strategic groups exist, the evidence suggests that
instead of collusion between strategic group members intense competition may occur (see
Gimeno & Woo, 1 996). The application of strategic group theory has also been l imited by the
determination of these subjective groups.
Util ising industry unit of analyses may be inappropriate when investigating firm performance
phenomenon and may lead to spurious results and incorrect interpretations (Spender, 1 993). As
McWil l iams and Smart ( 1 993, p. 67) noted, "using the wrong level of analysis i s problematic
because it wil l not lead to useful predictions/prescriptions of individual firm performance." F irm
strategy that is concentrated on industry structure only or on currently attractive industries,
neglects other potential sources of advantage and these firms may be "surprised" by
unconventional competitors (Hamel & Prahalad, 1 994) .
Tautological issues
Some scholars have raised tautological issues, for example, "industries with characteristics more
d istant from the hypothetical perfectly competitive extreme . . . are by definition more l ikely to
offer attractive returns" (Arend, 2003, p. 28 1 ) . Powel l (200 1 , p. 883) also noted that "many
industry level phenomena are causally and ontologically ambiguous (e.g., is product
differentiabil ity a firm-specific or industry level phenomena? Exogenous or endogenous?)."
Competitive strategy focus
The last i ssue with SCP's approach to strategy relates to its concentration on the achievement of
SCA via the mechanism of competitive strategy. According to Venkatraman and Subramaniam
(2002), SCP primarily possesses a business level focus which has led to explaining corporate
strategy as simply an accumulation of the strategy of SBUs rather than considering the
possibi lity of intraorganisational synergies. Consequently, corporate strategy is viewed as an
amalgamation of competitive strategy util i sed at the business level . Therefore, SCP theories
appear to be of l ittle relevance to corporate strategy.
2.5 THE END OGENOUS PERSPECTIVE OF
SUSTAINABLE COMPETITIVE ADVANTAGE
Hoskisson et al ( 1 999) observed that the research in strategic management performed during the
1 950s and the 1 960s centred on identifying SCA in terms of endogenous aspects, for example,
managerial capabilities, organ isational structure and systems (e.g., Ansoff, 1 968; Chandler,
25
1 962; Penrose, 1 959). For instance, Penrose ( 1 959) noted that firm growth can be attributed to
the deployment of a range of ski l ls, knowledge and capabil ities that are accumulated by the firm.
Over the last 15 years, the analysis has swung from the industry to the firm whereby, the focus
has changed from the external environment as the generator of unusual returns (Langlois, 2003) .
Through the util isation of the resources available to the firm, "strategic management provides a
more valuable guide to profit maximising behaviour than neoclassical economics can" (Pandian
& Robertson, 2003, p. 330).
The endogenous perspective suggests that both the firm's internal, idiosyncratic characteristics
and conduct are the main source of PS FP (Barney, 1 99 1 ; Das & Teng, 2000; Hamel & Prahalad,
1 994; Hawawini et aI, 2003 ; Peteraf, 1 993 ; Powell, 1 996; Prahalad & Hamel, 1 990; Rumelt,
1 99 1 ) . In contrast to the exogenous perspective of SCA, the fundamental assumption of the
endogenous perspective is that firms are actually heterogeneous. As noted by Coff (2003), the
key assumptions of management l iterature rest on the notions of opportunism and bounded
rational ity, that is, decision makers do not possess perfect knowledge, symmetric information or
cognitive capabi l ity. The endogenous perspective seeks to explain performance heterogeneity
displayed by firms evident both within and across industries.
2.5 . 1 Resource based theory
The significant theory within the endogenous perspective is RBT. Hoopes, Madsen and Walker
(2003) observed that RBT is a combination of economics, organisational theory, and business
policy. In contrast to structure-conduct-performance paradigm, RBT is a theory of growth rather
than one of equi l ibrium. Harrison (2003) postulated that RBT is theoretically based on Ricardo's
early assertion that possessing and uti l ising superordinate resources can lead to SCA. The source
of profitabi lity can then be attributed to firm resources that are costly to imitate (Conner, 1 99 1 ;
Mahoney, 200 1 ). Mahoney (200 1 ) noted that RBT encompasses a variety of subtheories:
resource based view (e.g., Barney, 1 99 1 ; Wernerfelt, 1 984), competence based theory (e.g.,
Eisenhardt & Martin, 2000; Hamel & Prahalad, 1 994; Henderson & Cockburn, 1 994; Prahalad &
Hamel, 1 990), first mover advantage (e.g., Dean & Brown, 1 995 ; Lieberman & Montgomery,
1 988 ; Nehrt, 1 998), and knowledge based theory (e.g., Grant, 1 996b; Madhok, 1 996; Nonaka,
1 99 1 , 1 994; Spender, 1 989).
26
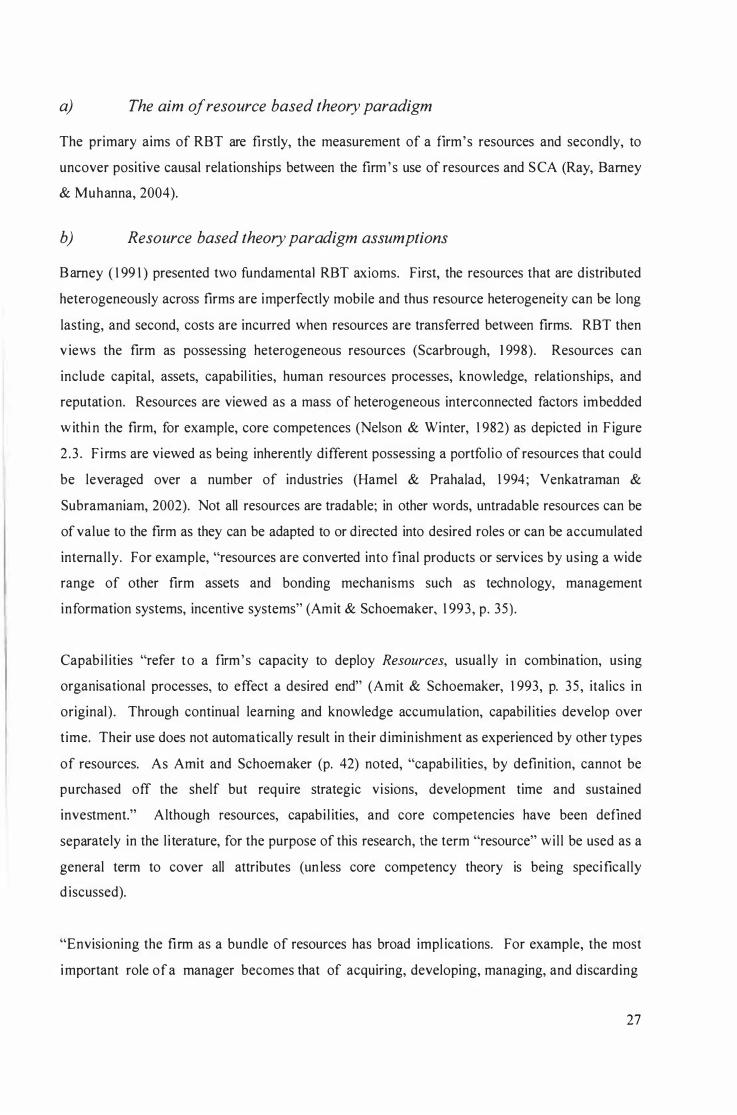
a) The aim of resource based theory paradigm
The primary aims of RBT are firstly, the measurement of a firm's resources and secondly, to
uncover positive causal relationships between the firm ' s use of resources and SCA (Ray, Barney
& Muhanna, 2004).
b) Resource based theory paradigm assumptions
Barney ( 1 99 1 ) presented two fundamental RBT axioms. First, the resources that are distributed
heterogeneously across firms are imperfectly mobile and thus resource heterogeneity can be long
lasting, and second, costs are incurred when resources are transferred between firms. RBT then
v iews the firm as possessing heterogeneous resources (Scarbrough, 1 998). Resources can
include capital, assets, capabil ities, human resources processes, knowledge, relationships, and
reputation. Resources are viewed as a mass of heterogeneous interconnected factors imbedded
withi n the firm, for example, core competences (Nelson & Winter, 1 982) as depicted in F igure
2 .3 . F i rms are viewed as being inherently different possessing a portfolio of resources that could
be leveraged over a number of industries (Hamel & Prahalad, 1 994; Venkatraman &
Subramaniam, 2002). Not all resources are tradable; in other words, untradable resources can be
of value to the firm as they can be adapted to or directed into desired roles or can be accumulated
internally. For example, "resources are converted into final products or services by using a wide
range of other firm assets and bonding mechanisms such as technology, management
information systems, incentive systems" (Am it & Schoemaker, 1 993 , p. 35) .
Capabi l ities "refer to a firm 's capacity to deploy Resources, usual ly in combination, using
organisational processes, to effect a desired end" (Amit & Schoemaker, 1 993, p. 35 , italics in
original). Through continual learning and knowledge accumulation, capabil ities develop over
time. Their use does not automatically result in their d iminishment as experienced by other types
of resources. As Amit and Schoemaker (p. 42) noted, "capabi lities, by definition, cannot be
purchased off the shelf but require strategic visions, development time and sustained
investment." Although resources, capabi l ities, and core competencies have been defined
separately in the l iterature, for the purpose of this research, the term "resource" wil l be used as a
general term to cover all attributes (un less core competency theory is being specifically
d iscussed).
"Envisioning the firm as a bundle of resources has broad impl ications. For example, the most
important role of a manager becomes that of acquiring, developing, managing, and discarding
27
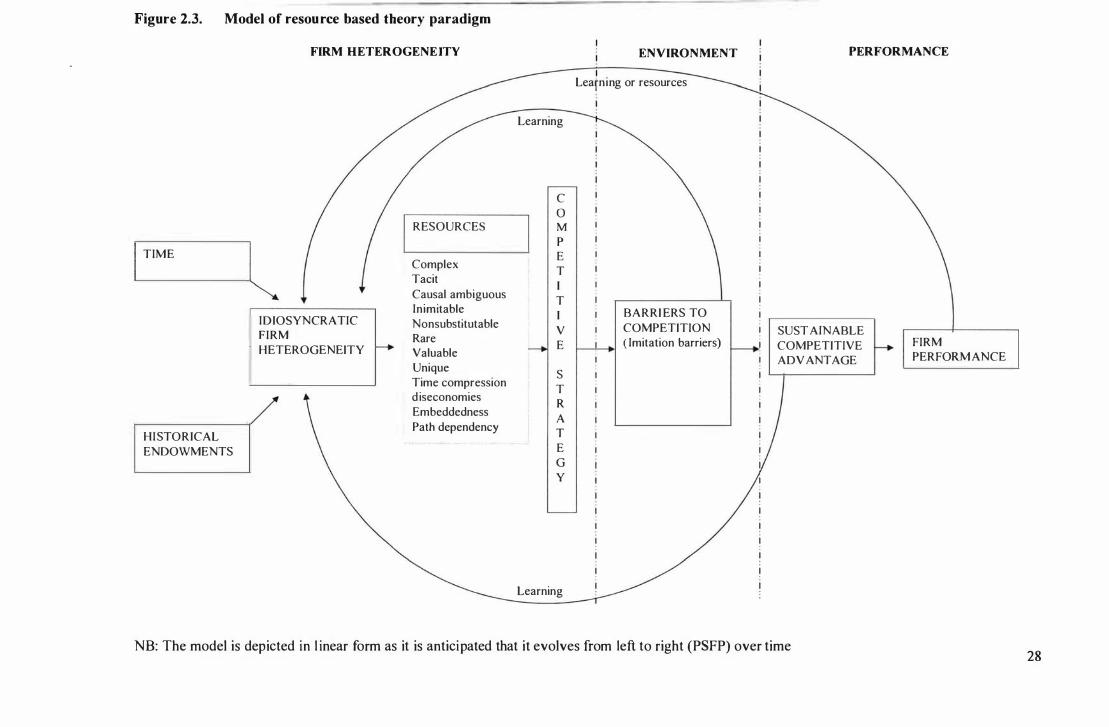
Figure 2.3. Model of resou rce based theory paradigm
TIME
HI STORICAL
ENDOWMENTS
I
FIRM HETEROGENE ITY
RESOURCES
Complex
� Tacit
Causal ambiguous Inimitable
IDIOSYNCRATIC Nonsubstitutable FIRM Rare HETEROGENEITY Valuable
Unique
Time compression d iseconomies
Embeddedness
Path dependency
Learning
C
0
M
P E
T
I
T
I
V
E
S
T R
A T
E G
Y
Learning
ENVIRONMENT
I
Learning or resources
BARRI ERS TO
COMPETITION
( Imitation barriers)
PERFORMANCE
SUST AfNABLE
COMPETITIVE ADV ANTAGE
FIRM PERFORM ANCE
NB: The model is depicted in l inear form as it is anticipated that it evolves from left to right (PSFP) over time 28
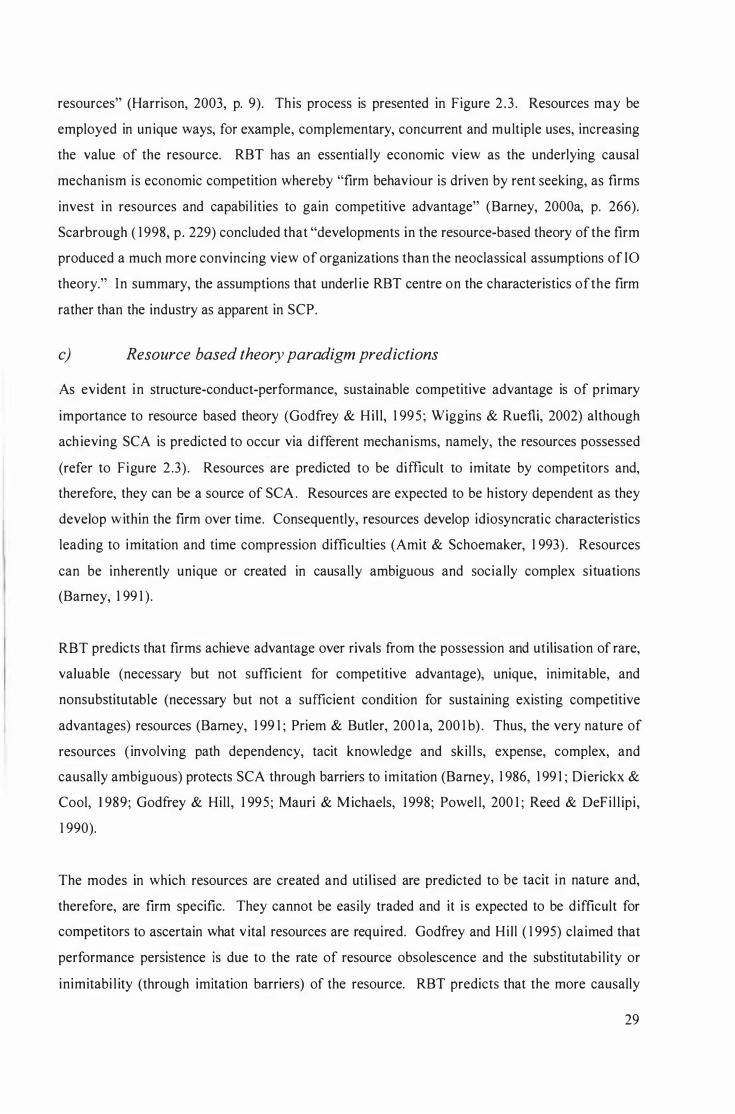
resources" (Harrison, 2003, p. 9). This process is presented in Figure 2 .3 . Resources may be
employed in unique ways, for example, complementary, concurrent and multiple uses, increasing
the value of the resource. RBT has an essential ly economic v iew as the underlying causal
mechanism is economic competition whereby "firm behaviour is driven by rent seeking, as firms
invest in resources and capabi l ities to gain competitive advantage" (Barney, 2000a, p. 266).
Scarbrough ( 1 998, p . 229) concluded that "developments in the resource-based theory of the firm
produced a much more convincing view of organizations than the neoclassical assumptions of IO
theory." In summary, the assumptions that underl ie RBT centre on the characteristics of the firm
rather than the industry as apparent in SCP.
c) Resource based theory paradigm predictions
As evident in structure-conduct-performance, sustainable competitive advantage is of primary
importance to resource based theory (Godfrey & Hil l, 1 995 ; Wiggins & Ruefli, 2002) although
ach ieving SCA is predicted to occur via different mechanisms, namely, the resources possessed
(refer to Figure 2 .3) . Resources are predicted to be difficult to imitate by competitors and,
therefore, they can be a source of SCA. Resources are expected to be history dependent as they
develop w ithin the firm over time. Consequently, resources develop idiosyncratic characteristics
leading to imitation and time compression difficulties (Amit & Schoemaker, 1 993) . Resources
can be inherently unique or created in causally ambiguous and social ly complex situations
(Barney, 1 99 1 ).
RBT predicts that firms achieve advantage over rivals from the possession and utilisation of rare,
valuable (necessary but not sufficient for competitive advantage), unique, inimitable, and
nonsubstitutable (necessary but not a sufficient condition for sustaining existing competitive
advantages) resources (Barney, 1 99 1 ; Priem & Butler, 200 1 a, 200 1 b) . Thus, the very nature of
resources ( involving path dependency, tacit knowledge and skil l s, expense, complex, and
causally ambiguous) protects SCA through barriers to imitation (Barney, 1 986, 1 99 1 ; Dierickx &
Cool, 1 989; Godfrey & Hill , 1 995 ; Mauri & Michaels, 1 998; Powel l, 200 1 ; Reed & DeFi l l ipi,
1 990).
The modes in which resources are created and uti l ised are predicted to be tacit in nature and,
therefore, are firm specific. They cannot be easily traded and it is expected to be difficult for
competitors to ascertain what v ital resources are required. Godfrey and Hi l l ( 1 995) claimed that
performance persistence is due to the rate of resource obsolescence and the substitutabi lity or
inimitabi l ity (through imitation barriers) of the resource. RBT predicts that the more causally
29
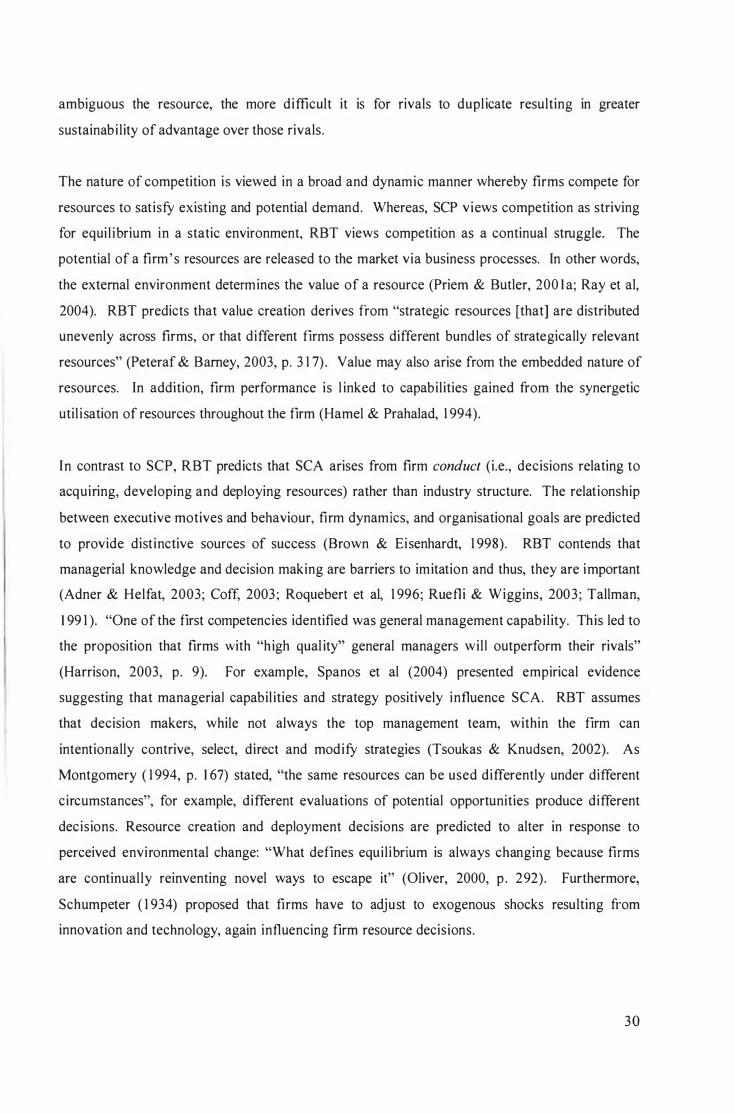
ambiguous the resource, the more difficult it is for rivals to dupl icate resulting in greater
sustainabi lity of advantage over those rivals.
The nature of competition is viewed in a broad and dynamic manner whereby firms compete for
resources to satisfy existing and potential demand. Whereas, SCP views competition as striving
for equi l ibrium in a static environment, RBT views competition as a continual struggle. The
potential of a firm ' s resources are released to the market via business processes. In other words,
the external environment determines the value of a resource (Priem & Butler, 200 1 a; Ray et aI,
2004). RBT predicts that value creation derives from "strategic resources [that] are distributed
unevenly across firms, or that different firms possess different bundles of strategically relevant
resources" (Peteraf & Barney, 2003, p. 3 1 7) . Value may also arise from the embedded nature of
resources. In addition, firm performance is l inked to capabilities gained from the synergetic
util i sation of resources throughout the firm (Hamel & Prahalad, 1 994).
In contrast to SCP, RBT predicts that SCA arises from firm conduct (i.e., decisions relating to
acquiring, developing and deploying resources) rather than industry structure. The relationship
between executive motives and behaviour, firm dynamics, and organisational goals are predicted
to provide dist inctive sources of success (Brown & Eisenhardt, 1 998). RBT contends that
managerial knowledge and decision making are barriers to imitation and thus, they are important
(Adner & Helfat, 2003; Coff, 2003 ; Roquebert et aI, 1 996; Ruefli & Wiggins, 2003 ; Tallman,
1 99 1 ). "One of the first competencies identified was general management capabi lity. This led to
the proposition that firms with "high qual ity" general managers wil l outperform their rivals"
(Harrison, 2003, p. 9). For example, Spanos et al (2004) presented empirical evidence
suggesting that managerial capabil ities and strategy positively influence SCA. RBT assumes
that decision makers, while not always the top management team, within the firm can
intentionally contrive, select, direct and modify strategies (Tsoukas & Knudsen, 2002). As
Montgomery ( 1 994, p. 1 67) stated, "the same resources can be used differently under different
circumstances", for example, different evaluations of potential opportunities produce different
decisions. Resource creation and deployment decisions are predicted to alter in response to
perceived environmental change: "What defines equil ibrium is always changing because firms
are continual ly reinventing novel ways to escape it" (Oliver, 2000, p . 292). Furthermore,
Schumpeter ( 1 934) proposed that firms have to adjust to exogenous shocks resulting from
innovation and technology, again influencing firm resource decisions.
30
RBT suggests that, in contrast to SCP, SCA is not defined at the industry level. Bamey ( 1 99 1 ,
200 1 b) advanced two reasons for the fai lure of SCP to account for SCA, namely, the
arbitrariness of defining industry boundaries, and the instabil ity of industry boundaries due to
technology and competition. Instead, Bamey ( 1 986, 1 99 1 ) suggested that SCA can be
characterised in two ways, namely, an efficiency or effectiveness advantage relative to existing
or future competitors, or economic rents that is, in terms of advantage generated through the
management of resources resulting in consistently h igher firm returns over time (assuming risk is
constant) than anticipated by stockholders. Explanatory variables of interest to RBT include
relative market share as a proxy for performance, and firm size as an indicator of economies of
scale and market power (Robins & Wiersema, 1 995) . The methodologies deemed most
appropriate to analysing endogenous phenomena centre on inductive methods such as historical
analysis and comparative case studies (e.g., Chandler, 1 962). Longitudinal analysis is more
appropriate because RBT assumes that the mechanism for SCA (e.g., strategy) develops over
time.
d) The role of strategy in resource based theory paradigm
An ontological model of performance IS employed with RBT whereby it seeks to locate the
determinants of performance, specifically resources (Scarbrough, 1 998). RBT aims to prove
heterogeneous firm specific resources are a source of SCA rather than the competitive
positioning of the SCP paradigm (Das & Teng, 2000). Market and industry characteristics are
not a given because RBT views them as being able to be altered by firm decisions (Hamel &
Prahalad, 1 994; Scarbrough, 1 998). Instead of viewing strategy as competitive positioning
decisions, RBT considers strategy, itself, as being unique to individual firms. Resource
heterogeneity entails different resource endowments and firm history, each leading to
heterogeneous strategic decisions . A firm' s core competencies are considered to have developed
over long periods of time as the result of decisions made within the firm. As Jacobson ( 1 992, p .
796) noted, "given a firm's invisible assets, some strategy choices wil l prove more effective than
others. Strategies developed in the absence of an appreciation of these invisible assets are
unlikely to prove successful." RBT contends that managers are expected to purposeful ly seek to
differentiate their firms (Carroll, 1 993) .
I n contrast to SCP, RBT predicts that the actions of firms can dramatically alter the environment
(Scarbrough, 1 998). RBT views strategy as a more constantly evolving phenomenon whereby
barriers to imitation can be overcome by competitors through such strategies as continuous
improvement and innovation. The dynamic nature of competition in RBT is also reflected in the
3 1
emphasis not only on resource deployment but also in the importance of resource creation. It is a
v iew of strategy that is creative, adaptable and dynamic. The nature of competition i s viewed as
an ongoing process where advantages due to scale are viewed as less important than innovation
and flexibi l ity. Consequently, RBT attempts to explain why smal l firms can often compete
successfully against much larger firms.
The majority of RBT views on strategy have regrettably centred on achieving SCA in other
words, competitive strategy. Concentration on SBU competition primari ly involves a short-term,
narrowly defined focus on brand share, often at the expense of cross-business synergetic
cooperation. Hamel and Prahalad ( 1 994) contended that much strategy research has primarily
focused on market (or product based) competition rather than premarket competition ( i .e., the
competition in the development and shaping of new markets and industries) . They argued that
gaining advantage or winning the battle for premarket competition (e.g., the competition for core
competencies and foresight) is the most s ignificant competition a firm faces. Thus, fai lure at the
premarket stage means a firm has no advantage relative to rivals, and ultimately firm fai lure.
While Hamel and Prahalad ( 1 994) presented a number of "essential" competitive strategies, they
also advocated corporate strategy was of primary importance to firms whereby "corporate
strategy must be more than an amalgamation of individual unit strategies" (p. 242).
Additionally, Peteraf and Bamey (2003) considered that RBT may be applied to the corporate
unit of analysis as firms use this level of strategy to accumulate, direct and uti l ise their resources
to achieve SCA. Therefore, RBTs view on corporate strategy can be divided into two areas. The
first is environment manipulation and control due to a firm-wide focus. Hamel and Prahalad
( 1 994) asserted that successful compan ies transform and reinvent industries by altering the rules
of engagement, redrawing industry boundaries, discovering "white spaces," and creating new
industries: all corporate strategy initiatives. They recognised that advantage can only arise from
prolonged, firm-wide commitment. Therefore, corporate strategy should direct competitive
strategy.
RBT's second v iew of corporate strategy centres on synergy, encompassing core competencies
and leverage whereby RBT predicts "strategic interrelationships among businesses have a direct
positive effect on firm performance" (Robins & Wiersema, 1 995, p. 2 79). The synergy between
the firm ' s SBUs can lead to higher firm performance (Hamel & Prahalad, 1 994) because "shared
strategic assets or resources are critical to firm performance, and corporate strategy rel ies upon
scope economies . . . among businesses" (Robins & Wiersema, 1 995, p . 277). The nature of
32
strategy changes if it is conceptualised in terms of developing and deploying core competencies.
However, focusing on one core competency may result in the lack of core competencies in other
areas. Therefore, appropriate core competency selection is of paramount importance to firm
performance (SubbaN arasimha, 200 1 ). SCA can be gained through leveraging firm resources
across industries and SBUs via the use of corporate strategy. Although RBT v iews on strategy
are more in accordance with those experienced by firms ( i .e., dynamic in nature), to date this
paradigm has focused on competitive strategy not strategy at the corporate level (with the
exception of Hamel & Prahalad, 1 989, 1 993, 1 994).
e) Issues with the resource based theory paradigm
Some scholars have identified a number of issues with RBT. These are assumptions on the
nature of resources; the analytic and tautological nature of RBT; empirical verification issues,
namely, immeasurabi l ity of unobservable resources and the causally ambiguous nature of
resources; and lastly, the focus on competitive strategy. Each of these l imitations are now
discussed.
Assumption about the nature of resources
The assumptions in RBT related to the nature of resources introduce a l imitation as despite the
fact that RBT recognises the importance of the firm 's resources, the theory does not specifY how
or from where they are obtained. Drawing from evolutionary theory, resources originate from
unexpected idiosyncratic opportunities or from searches for solutions to conundrums or
boundary conditions when existing resource combinations or innovation are exhausted (Ahuja &
Katila, 2004; Nelson & Winter, 1 982). Furthermore, the sources of SCA arising from unique
resources are often difficult to identify.
RBT possesses a l im iting assumption about the nature of resources in that resources can only
generate value if they are heterogeneous, imperfectly mobi le, valuable, rare, imperfectly
imitable, and imperfectly substitutable (Bamey, 1 99 1 ; Cool, Costa & Dierickx, 2002). However,
Teng and Cummings (2002) argued that resource inimitabi l ity may lead to competitive
disadvantage rather than advantage as predicted by RBT whereby "imitabi l ity seems particularly
advantageous with new technologies, where their wide[spread] adoption provides the basis for
value creation" (p. 8 1 ). They also observed that RBT does not account for competitive
advantage in one part of the firm causing competitive disadvantage in another part or for the firm
as a whole. For example, airl ine frequent flyer programmes can provide an advantage in terms
of customer numbers (loyalty) but may create a disadvantage in terms of administrative control .
3 3
Hoopes et al (2003, p. 89 1 ) stated that RBT "seems to assume what it seeks to explain" in that
RBT defines performance in terms of heterogeneous resources. RBT provides only a partial
explanation of competitive heterogeneity as other sources distinct from resources can influence
SCA such as barriers to entry (Hoopes et ai, 2003 ; Powell, 200 1 ) . Whereas, the assumptions of
the SCP paradigm focus on the resource side, the implicit assumptions of RBT are on the
demand side that is, homogeneous and immobile product markets (Priem & Butler, 200 1 a) .
RBT does not define what, where, and how resource decisions are made. Although RBT predicts
that capabi l ities are distributed throughout the firm, the theory appears to assume resources are
created and deployed via managerial direction (Scarbrough, 1 998). In addition, RBT does not
consider resources beyond a single firm such as those resources arising from networks, al l iances
or relationships (e.g., suppliers) through which resources are combined to create advantage (Dyer
& S ingh, 1 998).
Analytic statements and tautological reservations
It has been argued that RBT possesses analytic issues for instance, "different firms are
heterogeneous by nature" (Arend, 2003, p. 28 1 ) . In fact, Powel l (200 1 , p. 882) contended that
"virtual ly all resource based propositions are analytic." These analytic propositions cannot be
empirically tested. Priem and Butler (200 I a; 200 I b) argued that RBT appears tautological as
resources are defined as those that generate rents and, therefore, the theory is true by definition.
For example, "resources that are valuable by definition create value" (Arend, 2003, p. 28 1 ) .
S im ilarly, a firm which has a capabil ity in producing capabil ities will outperform firms that only
possess capabilities (Scarbrough, 1 998). However, Barney (200 I b) argued that any tautological
criticisms of RBT are flawed as the theory operates at different levels of analysis whereby the
explanatory variables are located at the functional level whereas the dependent variable (i .e. ,
performance) i s measured at the level of strategy formulation that i s, business or corporate
levels. Barney (200 1 b) also suggested that any tautological aspects of RBT can be overcome by
envisaging RBT as an extension of the equil ibrium theories of zero economic profit (such as
neoclassical microeconomics) whereby the market determines the value of resources.
Alternatively, Conner ( 1 99 1 ) noted that the tautological aspects of RBT could be eliminated by
analysing the dissimi lar levels of resources that may contribute differently to SCA.
Empirical verification
The third issue with RBT concerns the difficulties associated with empirical verification of its
hypotheses and predictions. These issues can be classified into two categories, namely, resource
34
immeasurabi lity and the causal ambiguous nature of SCA-producing resources. Unobservable
resources or particularly SCA-producing capabi l ities are either by their very nature hidden, or are
unclear to researchers' resulting in immeasurabil ity (Hoopes et aI, 2003 ; Teece, 1 984; Winter,
1 987 as cited in Robins & Wiersema, 1 995). As Jacobson ( \ 992) noted, "it is reasonable to
conclude . . . that important strategic factors influencing business performance will never be
measured completely or without error. Such important factors as corporate culture are fuzzy and
i l l-defined" (p. 80 1 ) .
Although it may be difficult to identifY and measure advantage producing resources, Mahoney
(200 1 , p. 657, ital ics in original) noted that "unobservable constructs can be useful in making
predictions." However, Scarbrough ( \ 998) argued that RBT employs an ontological model of
performance whereby the firm should uncover the resources within the firm that lead to
competitiveness. The ontological model employed produces "attribution of ultimate causes to
nonempirical factors negates attempts at the careful dissection of cause and effect" (Scarbrough,
1 998, p. 223). Consequently, researchers have inductively identified resources on the basis of
outputs resulting in assumptions on cause and effect. Scarbrough ( 1 998) contended that this has
then led to difficulties establ ishing definitions and concepts.
The second issue of empirical verification concerns the causally ambiguous nature of some
resources which cannot be empirically verified. Powell (200 1 ) argued that these propositions
should be classed as metaphysical statements. Causal ambiguity indicates that firms are unable
to fully understand the relationship between resources and SCA, and therefore, cannot leverage
the advantage (King & Zeithaml, 200 1 ). S imi larly, Prahalad and Hamel ( 1 990) argued that the
value of competitive advantages can recede if such resources are not identified, used or
transferred. Theoretically the identification of causally ambiguous resources as sources of SCA
and their uti l isation throughout a firm may then render them imitable by competitors
(Scarbrough, 1 998). In other words, "causal ly ambiguous resources cannot be measured without
making them causally unambiguous" (Arend, 2003, p. 28 1 ). Therefore, the act of identifYing
those advantage producing resources will alter the processes that originally created them
(Scarbrough, 1 998), a process that appears to be singularly destructive ofthe theoretical aims.
As outlined above, d ifficulties exist in the empirical measurement of RBT hypotheses, that is,
identifYing specific mechanisms l inking resources to SCA. The identification of resources that
produce SeA have usually been determined ex post (not a priori), l imiting analysis of how these
resources were created (Levinthal & Myatt, 1 994). Hoopes et al (2003) contended that empirical
3 5
evidence presented disconfinning the importance of resources on SCA was viewed by the
proponents of RBT as indicating "only that the resources or capabi lities examined lack value" (p.
89 1 ). However, Bamey ( 1 995) argued that the VRIO model provides the framework for
assessing of resources in finn perfonnance in terms of Value (the fit of the resource to strategy
and external environment), Rareness (value in terms of perception or determined by the market),
In imitabi l ity (cost of recreating synergy or imperfect factor markets), and organisational
Orientation to use resources.
Godfrey and Hil l ( 1 995) suggested two ways in which RBT can be falsified. Firstly, by relying
on either the application of the correspondence theory of truth, that is, that RBT is found to
represent reality or secondly, by relying on abduction . Proxies have been used to operational ise
RBT concepts of interest but issues arise from the possibil ity that inval id measures have been
employed (Hoskisson et ai, 1 999). Powell (200 1 ) suggested the adoption of a pragmatic
epistemological justification whereby acknowledging RBT's v iews of SCA add value as they
explain and assist in creating SCA, until RBT can be replaced by synthetic propositions. RBT
appears to provide valuable propositions regarding possible sources of SCA and should not then
be set aside without replacement by a superior theoretical framework, which to date, has not,
arguably, been presented.
Competitive strategy focus
Lastly, and as with SCP, the focus of RBT has been on achieving SCA through the mechanisms
of competitive strategy. Focus has been on advantage created by SBUs not advantage created by
the firm as a whole. Common to RBT empirical research, the explanatory variables have been
correlated to BUP rather than finn performance measurements. This principle contrasts with
much of the theoretical work whereby resources are considered to be a firm�wide phenomena.
Again, corporate strategy has received l imited attention, both theoretically and empirically, with
the exception of a few contributions that incorporated corporate strategy, for example, the work
of Hamel and Prahalad relating to foresight, strategic architecture, core competencies, and
strategic intent.
j) Aspects of the resource based theory paradigm that incorporate corporate strategy
Two aspects of RBT that do feature the concept of corporate strategy are now discussed. One
centres on corporate strategy, namely, core competency theory, and the other on the skills of the
corporate strategy decision makers.
36
Core competency theory
While most aspects of RBT focus on the achievement of SCA, the group of theories presented by
Prahalad and Hamel ( 1 990) and Hamel and Prahalad ( 1 989, 1 993, 1 994) advocated a firm level
unit of analysis, in other words, the role of corporate strategy on PSFP or as they term its "inter
firm competition". They recognised that future opportunities should not be the domain of a
single business unit, industry, or market. PSFP is thought to be achieved via the util isation of
core competencies that are located across the firm in addition to the management of business
portfolios. Core competency theory suggests that firms must acquire the foresight to recognise
future markets wil l occur outside existing industries or neatly defined business units. For
example, various researchers have suggested that a relationship exists between core
competencies and subsequent product innovation (Dougherty, 1 992; Henderson & Cockburn,
1 994; Leonard-Barton, 1 992).
Core competencies are an intertwining collection of abil ities, learning and technologies which
may reside in more than one SBU. Hamel and Prahalad advocated that core competencies
(including sometimes disparate technologies) will need to be assessed, integrated and applied
throughout the firm. Therefore, core competencies if they are to be leveraged over a number of
industries, require a corporate v iew of the firm . However, deciding to concentrate on core
competencies requires del iberate and sustained decisions over long periods of time. This is
inherently difficult to achieve in SBUs as firstly, the time frames required for competitive
strategy usual ly encompass a maximum of a few years and secondly, the investment resources
required are usually beyond those available to a SBU. Thirdly, the size, scope, complexity
required to build new core competencies extend beyond the capacity of a SBU, and lastly, SBUs
are narrowly focused on a small number of industries or markets and thus, may not recognise the
opportunities for leveraging resources across the firm . Moreover, SBUs may imprison firm core
competencies. Therefore, the synergistic governance of the entire firm is a corporate
responsibility .
However, researchers have experienced difficulty in operational ising the concept of core
competencies. Some examples of operational isation include those by Henderson and Cockburn
( 1 994) who divided core competencies into component competencies (day-to-day skil ls and
knowledge) and architectural competencies (the use of component competencies through
integration and development of new competencies). Their analysis suggests that core
competencies could be represented by the identification of firm promotion of knowledge and
information flows, for example, close relationships between firms and universities, and joint
37
research projects. They uncovered evidence that firms are heterogeneous in terms of expertise.
Alternatively, Mascarenhas, Baveja and Jamil ( 1 998) suggested that there are three sources of
core competencies. Superior technical know-how (as evidence of deep understanding) and latest
product developments; secondly, rel iable processes ( i .e. , decomposition, relinking and
transferring skil ls) and lastly, c lose relationships with external parties. Douglas and Ryman
(2003) uti l i sed external experts to evaluate potential core competencies, a process that appears
flawed from the outset as external experts are unl ikely to be privy to the unique knowledge and
skil l s embedded in these core competencies. Another method of assessing core competencies
involved researchers employing surveys and interviews with internal respondents asking them to
nominate the firm's core competencies (e.g., King & Zeithaml, 200 1 ) . Attempts have been made
to l ink core competencies to synergy and thus, diversification. For example, Markides and
Wil liamson ( 1 996) noted that the successful performance of related diversification firms was due
to the transferring and sharing of core competencies across SBUs.
In summary, core competency theory proposed that the creation and use of them throughout the
firm can result in PSFP. Firms must first decide to use the core competency approach as a means
of achieving firm success. However, the embedded nature of core competencies may make it
difficult to identify the core competencies that exist with in the firm . Understanding the nature of
core competencies further enhances their protection and deployment in the competition for future
markets and industries. Industry foresight to focus on the correct core competencies wil l be
required for success. This process must then be followed by consistent and effective decision
making over time. Furthermore, the core competency plans formulated should be implemented
to account for the integration of disparate ski l ls and technologies required to release the core
competency's potential. Information and learning at all stages of the core competency
formulation and implementation process are fed back into the cycle. The core competency
approach, therefore, requires a deep and comprehensive understanding of the often path
dependent, complex, and obscure nature of both existing and future core competencies. But thi s
understanding further enhances core competency creation and deployment, an iterative and
embedded process that would appear to result in sustained rates of improved performance
(PSFP).
Corporate level decision making skill
As previously presented in the RBT section, it is expected that heterogeneous managerial abi l ity,
as an example of an endogenous resource, could account for heterogeneity observed in firm
performance. Therefore, it fol lows that corporate level decision making skil l could also be
3 8
heterogeneous. Managerial ski ll has been recognised as a contributor to PSFP since the
foundations of RBT were laid. As early as 1 955 , Drucker argued that managers have to possess
the skil l to lead their firms towards PS FP. Additional ly, Penrose ( 1 959) noted that each firm
creates subjective opportunities given its resources. The realisation of opportunity fulfilment can
be achieved by what the firm does with resources in addition to what resources the firm
possesses (Johnson, Merlin & Whittington, 2003).
Corporate level decision makers included the top management team (e.g. , Chief Executive
Officer [CEO]) and the board of directors. For the purposes of this research, both groups are
considered together, in other words, representing the level of corporate strategy decision making.
Corporate strategy decision making skill can provide an explanation of heterogeneous corporate
strategy decisions. As corporate strategy is expected to provide the basis for all organisational
actions, the impl ic it assumption is that poorly constructed or inappropriate corporate strategy can
greatly impact PSFP. Corporate strategy decision makers are inherently different as each
decision maker possesses heterogeneous knowledge and experience. These characteristics are
thought to shape the perceptions and values of a decision maker (Ebert & Mitchell, 1 975 ; Streib,
1 992). Although beyond the scope of the current research, associations between specific
managerial characteristics have been investigated, for example, longer tenured managers are less
l iable to implement change (Finkelstein & Hambrick, 1 996), while more recent research suggests
that optimal tenure for a CEO is between 1 0 and 1 5 years (Henderson, Mi l ler & Hambrick,
2006).
Adner and Helfat (2003) ident ified three factors which comprise managerial skil ls . These are
firstly, managerial human capital or the ski l ls a manager acquires through "on the job" learning.
They noted that "managers may differ in both the mix of their skills and in the level of abi lity for
each type of skill" (p. 1 020) which leads to heterogeneous decisions. Hamel and Prahalad
( 1 994) advocated that decision making skil l incorporates such concepts as foresight and
leadership. They further suggested that these aspects of decision making ski l l have a profound
impact on firm performance whereby these ski l l s wil l be employed within superior firms. The
heterogeneity in the search for alternatives and selection of decision, implementation, and
evaluation of decisions also produces heterogeneous corporate decisions (Ham brick, 1 982;
Mi l liken, 1 990). Decision making ski l ls are incorporated into the frames of references which
shape decis ions.
The second managerial ski l ls factor is the social capital incorporating the manager' s internal and
39
external relationships. These relationships have been found to impact on firm performance due
to information and knowledge flows, and communication, again resulting in heterogeneous
decis ions (Burt, 1 992; Gelatkanycz & Hambrick, 1 997). The last factor underlying managerial
ski l l is managerial cognition which relates to the decision makers' frames of reference. The
complexity and uncertainty of the environment in which decision makers make decis ions means
that they rely on previous successful experiences (Cyert & March, 1 963; Hitt & Tyler, 1 99 1 ).
These experiences are incorporated into the frames of reference employed during the decision
making process. This dominant logic employed by decision makers, whether by perceptions or
recognition of potential issues, has been found to influence firm performance (Holbrook, Cohen,
Hounshell & Klepper, 2000; Prahalad & Bettis, 1 986, 1 995 ; Tripsas & Gavetti, 2000).
Decisions are not made in a vacuum; instead decisions are made under conditions characterised
by uncertainty, asymmetrical information, complexity, and constrained by path dependencies
(Baird & Thomas, 1 985 ; Trull, 1 966). Therefore, l imitations on cognitive power are encountered
and, consequently, accommodations are made (Simon, 1 977; Wi lson & Alexis, 1 962). Janis
( 1 989) suggested that to reduce complexity, decision makers employ satisficing, rules, make
small adjustments to previous decisions and lastly, break down issues into components.
Corporate strategy decision makers wil l respond to the conditions facing their firm in line with
how they deal with these restrictions to "ideal" decision making. These four factors then impact
on the quality of the decision making as superior decision makers are able to make the right
decisions, at the right time whereas inferior decision makers make inferior decisions. Reasons
for inferior decisions have been offered and inc lude, for example, ambiguity of a garbage-can
decision making model (March & Weissinger-Babylon, 1 986) or from groupthink (Janis, 1 989).
Corporate strategy decision making cannot be encompassed into a single event: It can be
conceptual ised as a process. Research has indicated that qual ity decisions arise from decision
making processes (Jones, Jacobs & van't Spijker, 1 992; Jones, Jones & Deckro, 1 994; Nutt,
1 992; Rodrigues & H ickson, 1 995) . Bourgeois and Eisenhardt ( 1 988) established that h igher
levels of comprehensiveness in the decision making process lead to h igher firm performance
suggesting that the background decisions (which were beyond the scope of this research) assist in
the comprehensiveness of decision making. Decision making has been conceptualised as a
process involving setting objectives, searching for alternatives, evaluating alternatives, making
the decision, implementation of decision and lastly, evaluation of the success of the decision
(Harrison, 1 999) . Failure at any stage of the process could render the decision as ineffective or
40
inefficient. Fredrickson and Mitchell ( 1 984) noted that logical consistency throughout the
decision making process should exist.
Corporate level decision making skill, through the efficacy of decisions, could account for the
heterogeneity in resource governance which shapes firm performance. Some firms are more
qualified to take advantage of these corporate level opportunities through the skil l and
knowledge of the managerial pool available to a firm . Even if constrained by internal and
external influences, corporate strategy decision makers formulate discretionary corporate level
decisions. As Penrose ( 1 959, p. 68) noted, "the same resources can be used differently in
different circumstances." The accumulation and deployment of finite resources means these
vital decisions require trade-offs between opportunities. Furthermore, Coli ins (200 1 , p. 1 1 )
argued that "greatness, it turns out, is largely a matter of conscious choice."
2.6 DIFFERENCES BETWEEN THE EXOGENOUS
AND ENDOGENOUS PERSPECTIVES OF
SUSTAINABLE COMPETITIVE ADV ANTAGE1
Exogenous and endogenous perspectives represent different theoretical frameworks for
predicting sustainable competitive advantage. Whereas economists focus on the performance of
industries or economies (thereby only considering the impact of firms on industry in a broad
sense), strategic management is concerned with the performance of individual firms. The
distinguishing difference between industrial organisation economics and strategic management is
each School ' s view of firm heterogeneity. A summary is presented in Table 2 . 1 .
The structure-conduct-performance and resource based theory paradigms predict that sustainable
competitive advantage arises from isolating mechanisms (industry structure and resources
respectively) as depicted in Figures 2.2 and 2 .3 . The two sources of isolating mechanisms drive
different notions of strategy. The structure-conduct-performance paradigm posits that firms have
only a l imited role in strategy whereby industry structural characteristics (e.g., concentration and
barriers to entry) influence the competitive "rules" and the generation of generic sets of strategy
applicable to certain industry structures. The structure-conduct-performance view of sustainable
competitive advantage predicts that firms select market positions from a certain number of
appropriate strategies as determined by industry structure. Therefore, "given the same
conditions, al l firms wil l do the same thing" (Nelson, 1 99 1 , p. 65) and thus, firm heterogeneity is
I Given the frequent use of abbreviations and to assist the reader, abbreviations are not used in the summary sections and conclusion chapter.
4 1
not significant when explaining sustainable competitive advantage. Whereas the logic of the
structure-conduct-performance paradigm suggests that industry effects on business unit
performance are of greater magnitude and persistency comparative to business and corporate
effects, the endogenous view predicts business and corporate effects ( including strategy) are the
greater determinants of sustainable competitive advantage.
Resource based theory views the role of the endogenous characteristics of the firm as having
wider implications in the strategy available to the firm. Resources are viewed as a mass of
heterogeneous interconnected capital, assets, capabil ities, processes and knowledge imbedded
within the firm. Firms are viewed as inherently different and that they possess a portfolio of
resources that could be leveraged over a number of industries. The endogenous perspective
predicts that sustainable competitive advantage heterogeneity results from the discretionary
behaviour and actions of firms in relation to their environment. As decision making ski I I is a
capabi lity, different firms implement heterogeneous strategies resulting in performance
heterogeneity. Exogenous factors may influence sustainable competitive advantage but they are
not the only aspects that do. If the endogenous aspects of a firm have a greater impact on firm
performance, this suggests that strategic decisions about the creation and deployment of firm
attributes matters.
2.7 THEORETICAL SUMMARY: PART I
One of the aims of strategic management is to develop an understanding of the endogenous
deci sions w ith a v iew to formulating explanations as to why some firms outperform others.
Persistent superior firm performance is thought to arise from sustainable competitive advantage
created from the use of strategy to develop and manipulate certain elements. Determining the
characteristics of the "certain elements" is dependent on the theoretical lens appl ied. The focus
of these theoretical perspectives has been at the business unit of analysis ( i .e., sustainable
competitive advantage) rather than a firm unit of analysis ( i .e . , persistent superior firm
performance) which is applicable to corporate strategy. Two theoretical perspectives on the
source of sustainable competitive advantage were presented.
Although industrial organisation economics is concerned with intraindustry heterogeneity, the
structure-conduct-performance paradigm has had a major impact on strategic management.
F irms within industries are regarded col lectively and are considered heterogeneous only in size.
Furthermore, firm decisions which are made at the business level are determined by external
42
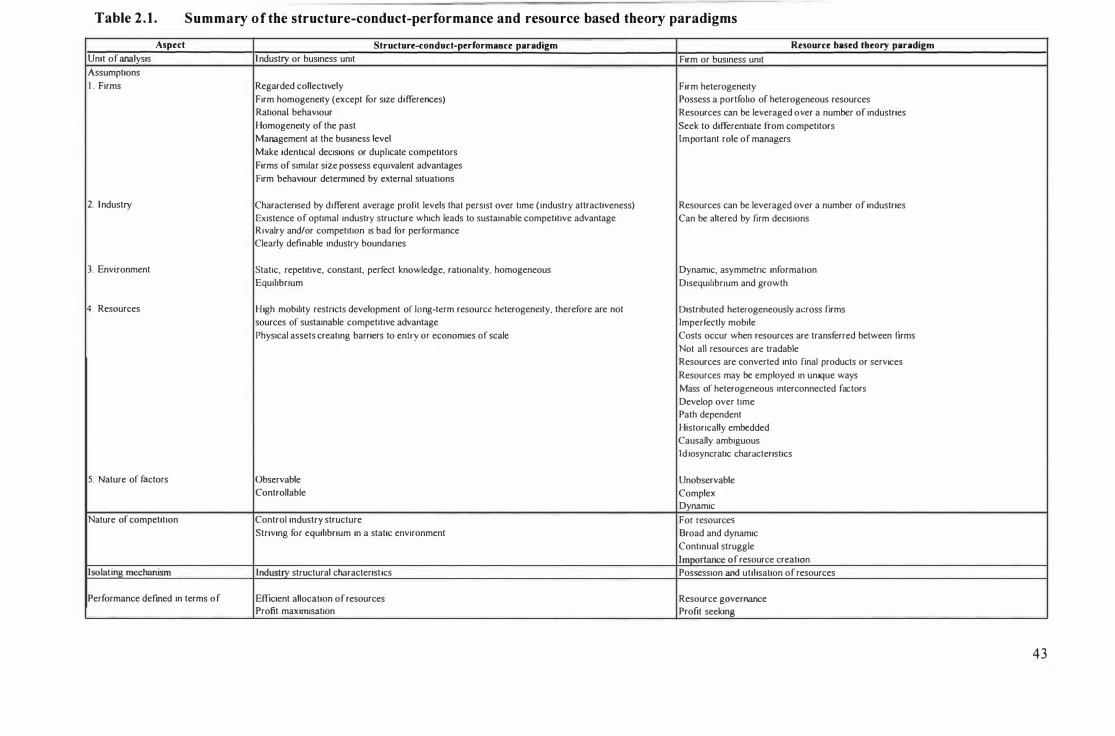
Table 2 . 1 . Summary of the structure-conduct-performance and resource based theory paradigms
Aspect Structure-conduct-performance paradigm Resource based theory paradigm
Unit of analysis I ndustry or business unit Firm or business unit Assumptions I . Firms Regarded collectively Firm heterogeneity
Firm homogeneity (except for size differences) Possess a portfolio of heterogeneous resources Rational behaviour Resources can be leveraged over a number of industries Homogeneity of the past Seek to differentiate from competitors Management at the business level Important role of managers Make identical decisions or duplicate competitors Firms of similar size possess equivalent advantages Firm behaviour determined by external situations
2. I ndustry Characterised by different average profit levels that persist over time (industry attractiveness) Resources can be leveraged over a number of industries Existence of optimal industry structure which leads to sustainable competitive advantage Can be altered by firm decisions Rivalry and/or competition is bad for performance Clearly defmable industry boundaries
3. Environment Static, repetitive, constant, perfect knowledge, rationality, homogeneous Dynamic, asymmetric information Equilibrium Disequilibrium and growth
4 . Resources High mobility restricts development of long-term resource heterogeneity, therefore are not Distributed heterogeneously across firms sources of sustainable competitive advantage Imperfectly mobile Physical assets creating barriers to entry or economies of scale Costs occur when resources are transferred between firms
Not all resources are tradable Resources are converted into final products or services Resources may be employed in unique ways Mass of heterogeneous interconnected factors Develop over time Path dependent Historically embedded Causally ambiguous Id iosyncratic characteristics
5. Nature of filctors Observable Unobservable Controllable Complex
Dynamic Nature of competition Control industry structure For resources
Striving for equilibrium in a static environment Broad and dynamic Continual struggle I mportance 0 f resource creation
Isolat ing_mechanism I ndustry structural characterist ics Possession and utilisation of resources
Performance defmed in terms o f Efficient allocation of resources Resource governance Profit maxirnisation Profit seeking
43
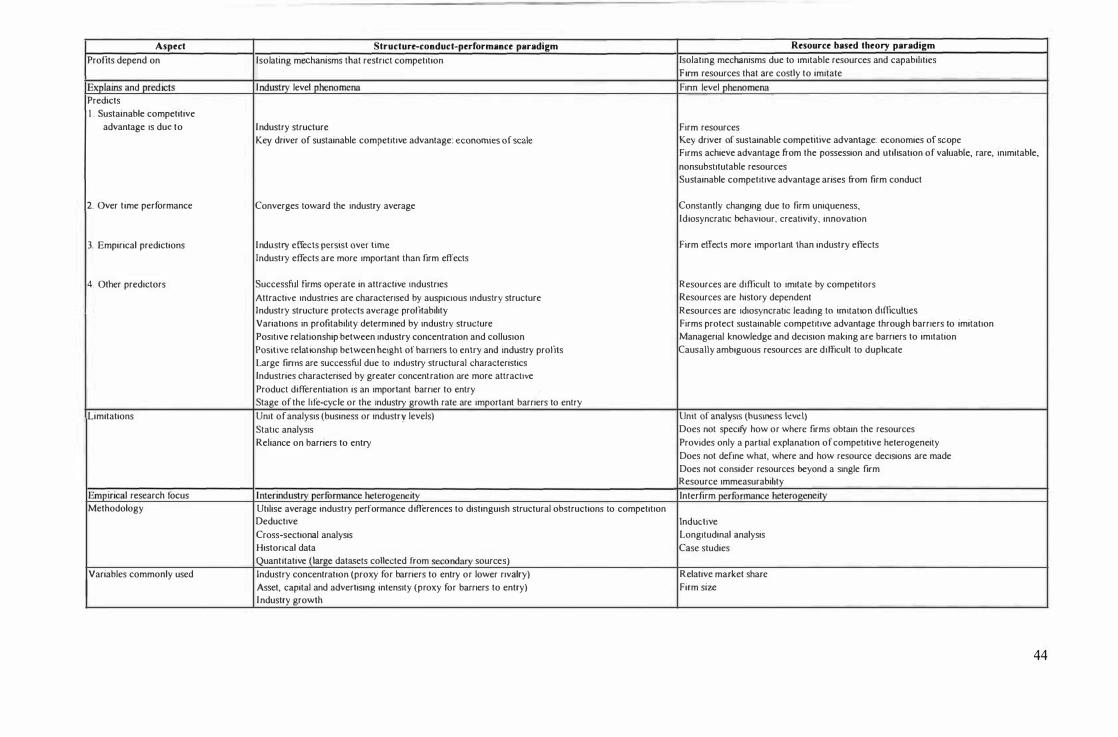
Aspect Structure-conduct-perrormance paradigm Resource based theory paradigm
Profits depend on Isolating mechanisms that restrict competition Isolating mechanisms due to imitable resources and capabilities F inn resources that are costly to imitate
Explains and predicts I ndustry level phenomena Finn level phenomena Predicts I . Sustainable competitive
advantage is due to Industry structure Firm resources Key driver of sustainable competitive advantage: economies of scale Key driver of sustainable competitive advantage: economies of scope
Firms achieve advantage from the possession and utilisation of valuable, rare, inimitable, nonsubstitutable resources Sustainable competitive advantage arises from firm conduct
2. Over t irne performance Converges toward the industry average Constantly changing due to firm uniqueness, Idiosyncratic behaviour. creativity, innovation
3. Empirical predictions Industry effects persist over time Firm effects more important than industry effects Industry effects are more important than firm effects
4. Other predictors Successful firms operate in attractive Industries Resources are diflicult to imitate by competitors Attractive industries are characterised by auspicious industry structure Resources are history dependent Industry structure protects average profitability Resources are idiosyncratic leading to imitation difficulties
Variations in profitability determined by industry structure Firms protect sustainable competitive advantage through barriers to imitation Positive relationship between industry concentration and collusion Managerial knowledge and decision making are barriers to imitation Positive relat ionship between height of barriers to entry and industry profits Causally ambiguous resources are difficult to duplicate Large finns are successful due to industry structural characteristics Industries characterised by greater concentration are more attracllve Product differentiation is an important barrier to entry Stage of the life-cycle or the industry growth rate are important barriers to entry
Limitations Unit of analysis (business or industry levels) Unit of analysis (business level)
Static analysis Does not specity how or where firms obtain the resources Reliance on barriers to entry Provides only a partial explanation of competitive heterogeneity
Does not define what, where and how resource decisions are made Does not consider resources beyond a single firm Resource immeasurability
Empirical research focus Interindustry"'performance heterogeneity Interfirm performance heterogeneity Methodology Utilise average industry performance differences to distinguish structural obstructions to competition
Deductive Inductive Cross-sectional analysis Longitudinal analysis Historical data Case studies Quantitative (large datasets collected from secondary sources)
Variables commonly used Industry concentration (proxy for barriers to entry or lower rivalry) Relative market share Asset, capital and advertising intensity (proxy for barriers to entry) Firm size I ndustry growth
44
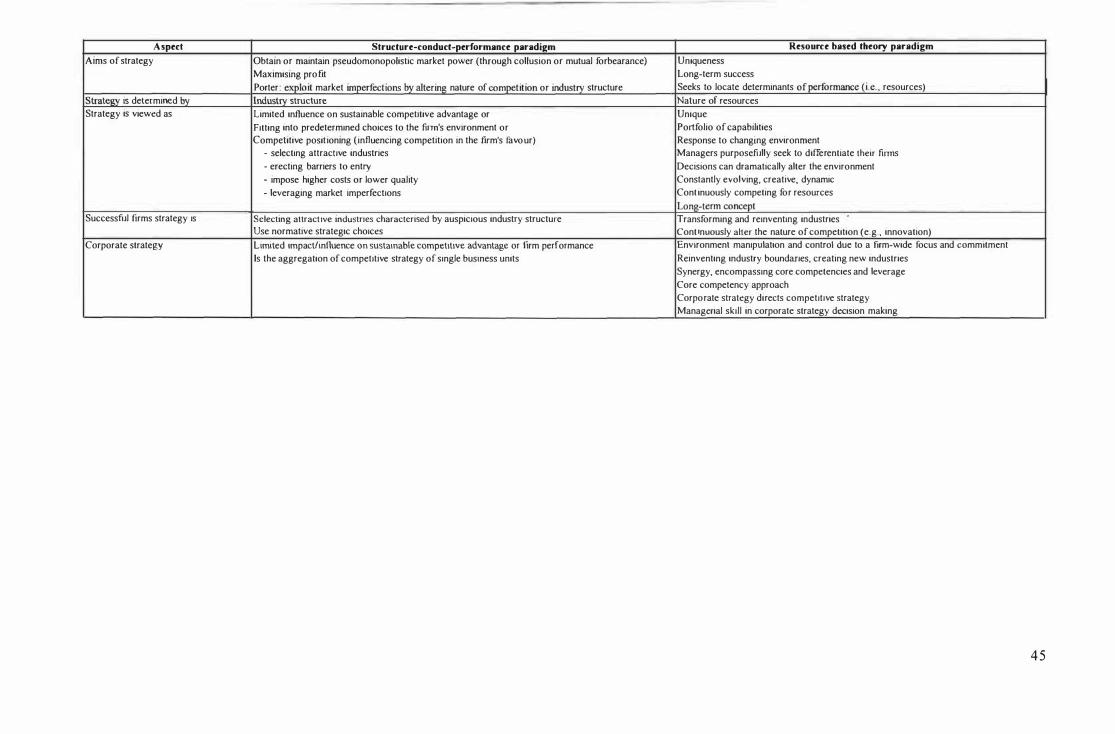
A spect Structure-conduct-performance paradigm Resource based theory paradigm
Aims of strategy Obtain or maintain pseudomonopolistic market power (through collusion or mutual forbearance) Uniqueness Maximising pro fit Long-term success Porter exploit market imperfections by altering nature of competition or industry structure Seeks to locate determinants ofperformanceJi.e., resources)
Strategy is determined by Industry structure Nature of resources Strategy is viewed as Limited influence on sustainable competitive advantage or Unique
Fitting into predetermined choices to the firm's environment or Portfolio of capabilities Competitive positioning (influencing competition in the firm's tavour) Response to changing environment
- selecting attractive industries Managers purposefully seek to differentiate their flfms - erecting barriers to entry Decisions can dramatically alter the environment - impose higher costs or lower quality Constantly evolving, creative, dynamic - leveraging market imperfections Cont inuously competing for resources
Long-term concept Successful firms strategy is Selecting attractive industries characterised by auspicious industry structure Transforming and reinventing industries
Use normative strategic choices Cont inuously alter the nature of competition (e.g., innovation) Corporate strategy Limited impactlinfluence on sustainable competitive advantage or firm performance Environment manipUlation and control due to a firm-wide focus and commitment
Is the aggregation of competitive strategy of single business units Reinventing industry boundaries, creating new industries Synergy, encompassing core competencies and leverage Core competency approach Corporate strategy directs competItive strategy Managerial skill in corporate strategy decision making
45
factors, in other words, industry structure. Strategy i s viewed as either, having l imited influence
on sustainable competitive advantage, or fitting predetermined strategic choices to the firm's
environment, or competitive positioning. Strategy aims to obtain and protect
pseudomonopolistic market power (e.g., deciding to erect barriers to entry) thereby lowering
competition and increasing profit. Successful firms' strategy selects attractive industries which
are characterised by auspicious structural characteristics. In other words, strategy can be util ised
to alter or manipulate the nature of competition whereby sustainable competitive advantage is
achieved for the correct positioning of products via specific competitive strategies through
business units. Creativity and uniqueness is not sought as managers operating in the same
industry are thought to make identical decisions or duplicate competitors' strategies.
Consequently, the structure-conduct-performance paradigm does not theorise on corporate
strategy beyond the supposed accumulation of the competitive strategy of s ingle business units.
The second theoretical lens applied has been that of the endogenous perspective whereby firm
performance results from the heterogeneity of internal, idiosyncratic fi rm characteristics and
conduct. Resource based theory is the dominant paradigm within this v iew. Rather than the
assumption of equi l ibrium as evident within the structure-conduct-performance paradigm,
resource based theory is a theory of growth whereby possessing and util is ing resources leads to
sustainable competitive advantage. Resources are historically embedded as they develop over
time, developing idiosyncratic characteristics which are unique, difficult to imitate and substitute
( i .e., the nature of the resource leads to the inabi l ity to imitate) and thus, resulting in sustainable
competitive advantage over rivals. The nature of competition is viewed as broad and dynamic
whereby firms continuously compete for resources to satisfy existing and potential demand.
Resource based theory concentrates on competitive strategy apart from two aspects, namely, core
competency theory and corporate strategy decis ion making ski ll . These two aspects of the
resource based theory provide a theoretical framework at the corporate level that is, corporate
strategy. The possession and uti l isation of core competencies theoretically influences fi rm
performance. F irms must possess the understanding of these complex core competencies so that
they can be leveraged firm-wide. Furthermore, due to the expense, complexity and long-term
nature of core competencies, their management simply cannot be performed successfully at the
business level.
Resource based theory recognises that ski l l in decision making at the corporate level is
heterogeneous and can be a barrier to imitation and hence success. In other words, superior
decision makers wi l l outperform inferior decision makers. Decision makers control, select,
46
direct, and modify strategy in response to the dynamic competitive environment and, therefore,
strategy is unique. Resource shortages can be overcome by decisions regarding innovation and
other mechanisms that firms seek to continuously alter the nature of competition. Overall,
strategy i s viewed as a long-term concept. Firms create and uti l ise strategy with the aim of
ensuring persistent superior firm performance.
A predominant assumption within the strategic management literature focuses on the positive
contribution of executives on persistent superior firm performance (Bai ley & Helfat, 2003).
Corporate strategy is formulated and chosen by corporate level decision makers. It is reasonable
to suggest then that h igher qual ity decision makers create and implement superior decis ions and
thus, achieve h igher firm performance. This v iew contrasts with the main assumption evident
within the empirical l iterature that wil l be presented in the remainder of thi s chapter, namely,
decisions made at the corporate level have a l imited impact on both business unit and firm
performance. This assumption is unwarranted when one considers the influence of corporate
strategy evident in all firms in reality (i .e., the selection of industry or industries in which the
firm operates, the selection of businesses, and decisions relating to the selection of internal
governance structures such as, organisational design and control and compl iance mechanisms)
which may significantly . influence business unit performance and the firm as a whole. These
decisions are corporate strategy decisions (discussed in Chapter Three). Consequently, persistent
superior firm performance may result from more than just products, markets, or industries.
PART II : EMPI RICAL LITERATU RE REVIEW
2.8 EMPIRICAL OVERVIEW
Researchers in the field of strategic management have proposed that the delivery of persistent
superior firm performance can be achieved v ia the mechanism of corporate strategy. Bowman
and Faulkner ( 1 997, pp. 207-208) for example, noted that "the major concerns of corporate
strategy are to add value to the direction of the corporation by selecting the right markets to be
in, resourcing them appropriately, and controll ing the resources efficiently ." The firm can
influence performance outcomes through the mechanism of corporate strategy, in other words,
strategy is util ised to create and deploy firm resources and to influence the nature of competition
(Reed & OeFil l ippi, 1 990). Although the majority of strategic research focuses on competitive
strategy, some research has been purported to investigate the influence of corporate strategy on
PSFP.
47
Part 11 presents a review of the empirical evidence of corporate strategy being a source of firm
performance. The empirical evidence of corporate effects is outlined first, including the
methodologies employed, the main conclusions, and the validity issues evident in the statistical
models employed to estimate corporate effects. Secondly, additional empirical research into the
corporate strategy-performance association is explored and has been divided into specific
corporate strategies and their relationship to firm performance, then the relationship between
normative models of the centre, corporate advantage and firm performance and lastly, implicit
assumptions of a corporate strategy-performance association.
2.9 THE EMPIRICAL EVIDENCE OF CORPORATE
EFFECTS
The two competing exogenous and endogenous perspectives evident within strategic
management have driven researchers in their attempt to uncover empirically which factors
(industry or firm) are the sources of performance. As the majority of research has measured the
influence of various effects on BUP, it is more accurate to review this research in terms of BUP
rather than PS FP (only two studies of those reviewed in Table 2 .2 uti l ised firm performance
measures when estimating corporate effects). A large body of research has provided empirical
support for the hypothesis that endogenous constituents (i .e. , firm effects) account for a larger
proportion of BUP in comparison to exogenous characteristics (i .e. , industry effects) . F irm
effects supposedly account for a range of between 0.8% and 1 1 4% of the variance in BUP, in
comparison to industry effects which account for a more modest - 1 .6% to 62.8% of the variance
in BUP (refer to Table 2.2). Rather than uncovering the nature of profitabil ity heterogeneity
between firms, this empirical research has focused on developing statistical models that sought to
establish the existence of a number of variables (e.g., industry, business, and corporate effects)
that influence BUP. These empirical studies have built on the previously published 10 research
which investigated the persistence of above average returns (e.g., Cubbin & Geroski, 1 987;
Mueller, 1 977, 1 986; Waring, 1 996). A small body of economic researchers have also presented
empirical evidence of industry effects in comparison to firm effects (e.g., Liebenson &
O'Connor, 1 972).
As the topic of th is research centres on corporate strategy, the focus of the fol lowing overview of
the extant l iterature concentrates on the phenomena of corporate effects. Within this research
stream, a number of scholars have specifically sought to identify the impact of corporate effects
48
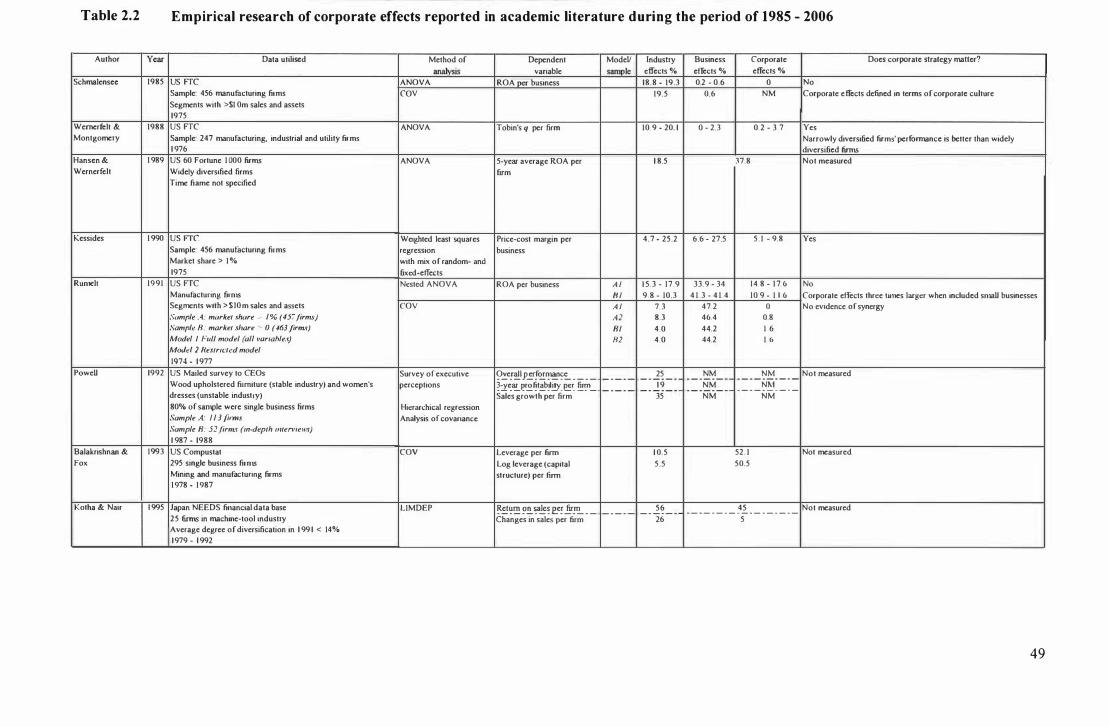
Table 2.2
Author Year
Schmalensee 1985
Wernerfelt & 1988 Montgomery
Hansen & 1 989 Wernerfelt
Kessides 1 990
Rumell 1991
PoweU 1992
Balakrishnan & 1993 Fox
Kotha & Nair 1 995
Empirical research of corporate effects reported in academic literature during the period of 1985 - 2006
Data utilised Method of Dependent ModeV analysis variable sample
US FTC ANOVA ROA per business Sample: 456 manufucturing firms COY Segments with >$1 Om sales and assets 1975 US FTC ANOVA Tobin's q per firm Sample: 247 manufacturing. industrial and ut�ity firms 1 976 US 60 Fortune 1 000 firms ANOVA 5-year average ROA per Widely diversified firms firm Time frame not specified
US FTC Weighted least squares Price-cost margin per Sample: 456 manufucturing firms regression business Market share > 1 % with mix of random- and 1975 fixed·effects US FTC Nested ANOVA ROA per business A I Manufacturing firms 81 Segments with >$ I Om sales and assets COY A I Sample .4: market share ./ 1% (457 firm.!)� Al Sample B: market silare ' 0 (463 firms) BI Model I FilII model (all variable .• ) Bl
Mood 2 Restricted model 1974 - 1 977 US Mailed survey to CEOs Survey of executive 9�e!� _p.!r!�!��_ .. _ .. _ - - - - -Wood upholstered furniture (stable industry) and women's perceptions �:r<:".!:..���t�b!Ii!Y.�� ��_ - - - - -dresses (unstable industry) SaJes growth per firm 80% of sample were single business firms Hierarchical regression Sample A: 1 1 3 fi,ms Analysis of covarianc.e Sample. B: 52 firms (in-deplh mlerVlews) 1 987 - 1988 US Compustat COY Leverage per firm
295 single business firms Log leverage (capital Mining and manufacturing firms st ructure) per firm 1 978 - 1 987
Japan NEEDS financial data base L1MDEP ���� ?!!. ?'�� .e.e! .!!r!'.!... ._ - - - - -25 firms in machine·tool industry Changes in sales per frrm Average degree of diversification in 1 99 1 < 14% 1979 - 1 992
Industry effects %
18.8 - 19.3 19.5
10.9 - 20. 1
1 8.5
4.7 - 25.2
1 5 .3 - 17.9 9.8 - 10.3
7.3 8.3 4.0 4.0
25 - - - .. - -
1 9 - - - - - -
35
1 0.5 5.5
56 - - - - - -
26
Business Corporate Does corporate strategy matter? effects % effects % 0.2 - 0.6 0 No
0.6 NM Corporate effects defined in terms of corporate culture
0 - 2.3 0.2 - 3.7 Ves Narrowly diversified firms' performance is better than widely diversified 6rnlS
37.8 Not measured
6.6 - 27.5 5 . 1 - 9.8 Ves
33.9 - 34 14. 8 - 1 7 6 No 4 1 .3 - 4 1 .4 10.9 - 1 1. 6 Corporate effects three limes larger when included smaU businesses
47.2 0 No evidence 0 f synergy 46.4 0.8 44.2 1 .6 44.2 1 6
NM NM Not measured - - - - - - - - - - - - - - - - -NM NM - - - - - - - - - - - - - - - - -NM NM
52. 1 Not measured 50.5
45 Not measured - - - - - - - - - - - - - - - - - -5
49
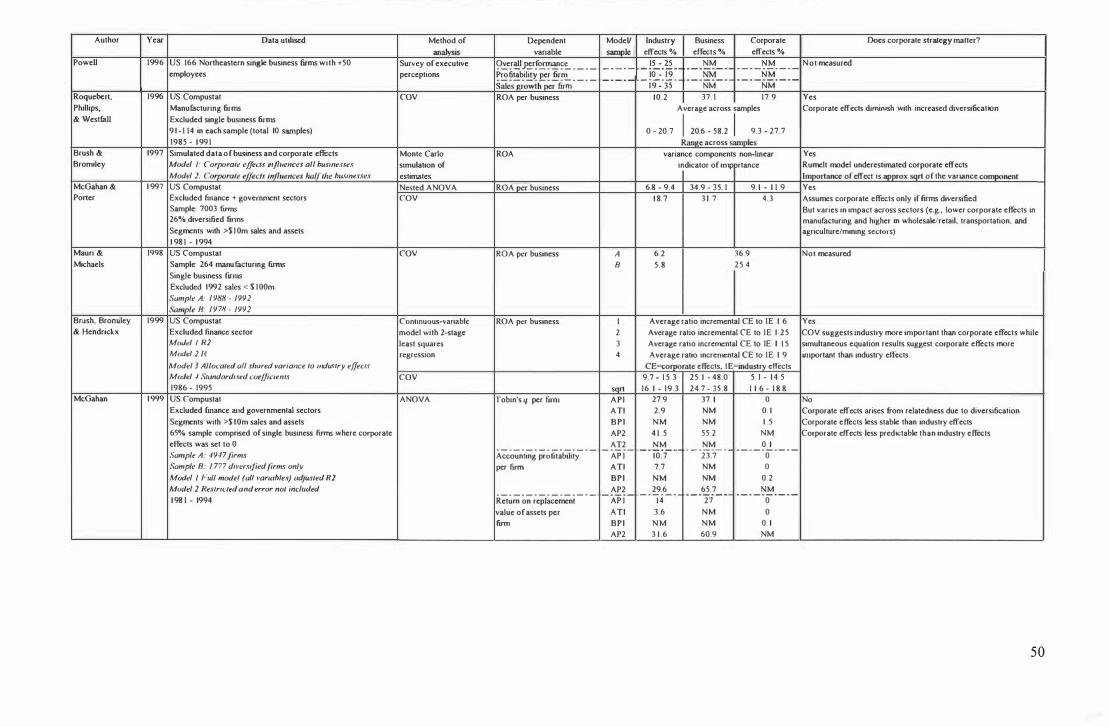
Author Vear Data utilised Method of Dependent ModeV Industry Business Corporate Ooes corporate strategy matter? analysis variable sample effects % effects % effects %
PoweD 1996 US 166 Northeastern single business firms with +50 Survey of executive 9�e!� 'p�r[�"!��c:... _ _ _ _ 15 - 25 NM NM Not measured -- - - - - - - - - - - - -r:.1M- - - - - - - - - - _ . -employees perceptions Pro fitability per firm 10 - 19 NM
s;;i'-sg;o-;ihp�;:-fir;;; - - - - - - - - - - i9--jj - - _ . - - - - - - - - - - - - - -NM NM Roquebert, 19% US Compustat COY ROA per business 10.2 37. 1 17.9 Ves PhilIips, Manufucturing firms Average across samples Corporate effecls diminish with increased diversification & Westfull Excluded single business firms 1 20.6 - 58.2 1 9 1 - 1 14 in each sample (total 10 samples) 0 - 20.7 9.3 - 27.7
1985 - 1 99 1 Range across samples Brush & 1997 Simulated data of business and corporate effects Monte Carlo ROA variance components non-linear Ves Bromiley Model J: Corporall! elJecls influences all busine,ue.� simulation of indicator of importance Rumelt model underestimated corporate effects
Model }: Corporate effects influences half/he bUfmesses estimates Importance of effect is approx sqrt of the variance component McGahan & 1 997 US Compustat Nested ANOVA ROA per business 6.8 - 9.4 34.9 - 35. 1 9. 1 - 1 1 .9 Ves Porter Excluded finance + government sectors COY 1 8.7 3 1. 7 4.3 Assumes corporate effects only if firms diversified
Sample: 7003 firms Bul varies in impact across sectors (c.g., lower corporate effects in 26% diversified firms manufacturing and higher in wholesalclretail. transportation. and Segments with >$ I Om sales and assets agriculture/mining sectors) 1 98 1 - 1 994
Mauri & 1998 US Compustat COY R 0 A per business A 6.2 36.9 Not measured Michaels Sample: 264 manufacturing firms B 5.8 25 .4
Single business ftrms Excluded 1992 sales < $ lOOm Sample A: 1 988 - 1992
Sample B: 1978 - 1992
Brush, Brorniley 1999 US Compustat Continuous·variable ROA per business I Average ratio incremental CE 10 lE 1 .6 Ves & Hendrickx Excluded finance sector model with 2·stage 2 Average ratio incremental CE to lE 1. 25 COY suggests industry more important than corporate effects while
Model I 112 least squares 3 Average ratio incremental CE to lE I . I S simultaneous equation results suggest corporale effects more Model 2 11 regression 4 Average ratio incremental CE to lE 1 . 9 important than industry effects Model 3 AI/ocaleel all shared var;ance 10 mdu.ury effecl.'i CE=corporate effects, I E=industry effects Model .J Slandardi.roed coefficients COY 9.7 - 1 5.3 25. 1 - 48.0 5 I - 1 4. 5 1986 - 1995 sqrt 16. 1 - 19.3 24.7 - 35.8 1 1 6 - 1 8.8
McGahan 1 999 US Compuslat ANOYA Tobin's q per firm API 27.9 37. 1 0 No Excluded fmance and governmental sectors ATI 2.9 NM 0. 1 Corporate effects arises from relatedness due to diversification Segments wilh >$ 1 Om sales and assels B P I NM NM 1 . 5 Corporate effects less stable than industry effects 65% sample comprised of single business firms where corporate AP2 4 1 . 5 55.2 NM Corporate effects less predictable than industry effects effects was set to 0 AT2 NM NM 0. 1
- - - - - _ . _ - - - - - _ . - - - - -- - - - - - - . _ - - - - - - - - - - _ . _ - -Sample A: 4947 firms Accounting profitability AP I 10.7 23.7 0 Sample B: 1 777 divct:'ified firms on(v per firm ATI 7.7 NM 0 Model I FilII model (all variables) "djusled 112 BPI NM NM 0. 2 Model 2 Reslr;cled and error nol included AP2 29.6 65.7 NM
- - - - - _ . _ . _ - - - _ . - - - -- - - - - - _ . . _ - - - - - - _ . _ - - - - - -1 98 1 - 1994 Return on replacement AP I 14 27 0
value of assets per ATI 3.6 NM 0 firm BPI N M NM 0. 1
AP2 3 1 .6 60.9 NM
50
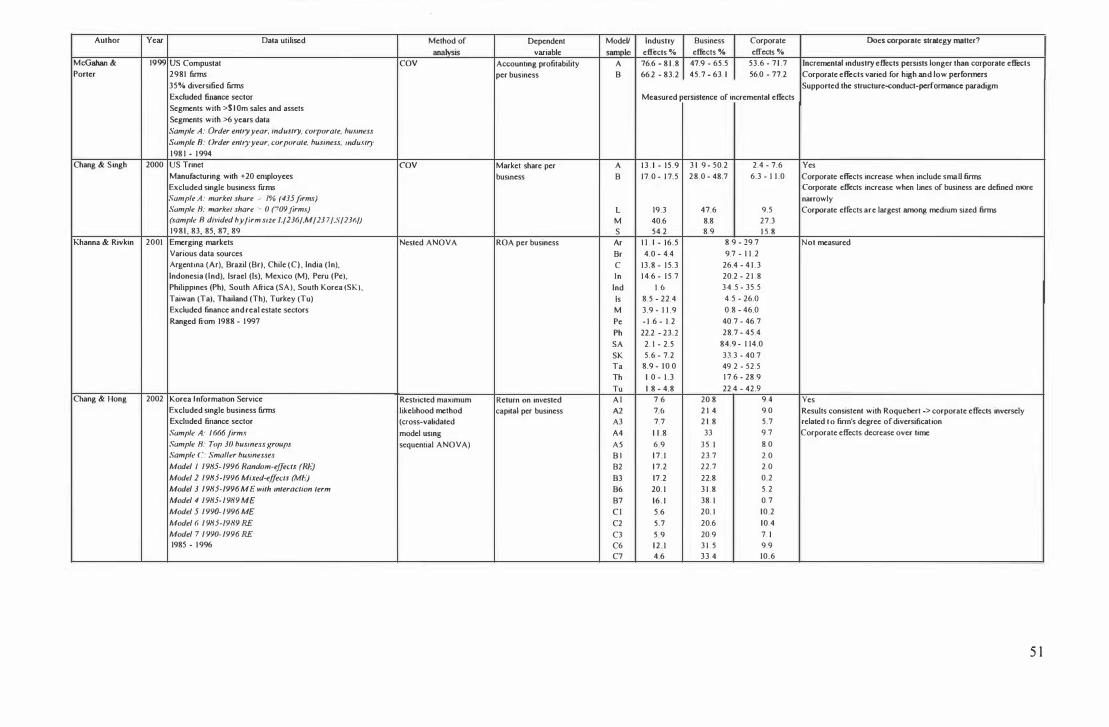
Author Vear Data utilised Method of Dependent ModeV Industry Business Corporate Does corporate stralegy matter?
analysis variable sample effects % eflCcts 0/0 effects %
McGahan & 1999 US Compustat COY Accounting profitability A 76.6 - 8 1 .8 47.9 - 65.5 53.6 - 7 1 .7 Incremental industry effects persists longer than corporate effi:cts
Porter 2981 firms per business B 66.2 - 83.2 45.7 - 63. 1 56.0 - 77.2 Corporate effects varied for high and low perfonners
35% diversified firms Supported the structure-<:anduct-performance paradigm
Excluded finance sector Measured persistence of incremental effects
Segments with >$ 1 Om sales and assets
Segments with >6 years data
Sample A: Order entry year, industry, corporate, hWilness
Sample B: Order entl)' year, corporafe, hu.finess. mdu,ury
1 98 1 - 1 994
Chang & S ingh 2000 US Trinet COY Market share per A 1 3 . 1 - 1 5 . 9 3 1 . 9 - 50.2 2.4 - 7.6 Ves
Manufacturing with +20 employees busmess B 17 .0 - 1 7.5 28.0 - 48.7 6.3 - 1 1 .0 Corporate effects increase when include smaU firms Excluded single business firms Corporate effects increase when lines of business are defined morc
Sample A: markel share � 1% (435 firms) narrowly Sample B: market share ...... 0 (709 firms) L 19.3 47.6 9.5 Corporate effects are largest among medium sized firms (sample R d"'ided by firm size LI2361,MI23 71,SI23�/) M 40.6 8.8 27.3 1981 , 83, 85, 87, 89 S 54.2 8.9 1 5.8
Khanna & Rivkin 2001 Emerging markets Nested ANOVA ROA per business Ar I l . l - 16.5 8.9 - 29.7 Not measured
Various data sources Br 4.0 - 4.4 9.7 - 1 1 .2
Argentina (Ar), Brazil (Br), Chile (C), India (In), C 13.8 - 1 5.3 26.4 - 4 1 .3
Indonesia (Ind), Israel (Is), Mexico (M), Peru (Pe), In 1 4.6 - 1 5.7 20.2 - 2 1 .8
Philippines (Ph), South Africa (SA), South Korea (SI(), Ind 1 . 6 3 4 . 5 - 35.5
Taiwan (Ta), Thailand (Th), Turkey (Tu) Is 8.5 - 22.4 4.5 - 26.0
Excluded finance and real estate sectors M 3.9 - 1 1 .9 0.8 - 46.0
Ranged from 1988 - 1 997 Pe - 1 .6 - 1 . 2 40.7 - 46.7
Ph 22.2 - 23.2 28.7 - 45.4
SA 2. 1 - 2.5 84.9 - 1 14.0
SK 5.6 - 7.2 33.3 - 40.7
Ta 8.9 - 1 0.0 49.2 - 52.5
Th 1 .0 - 1 . 3 1 7.6 - 28.9
Tu 1 . 8 - 4.8 22.4 - 42.9 Chang & Hong 2002 Korea Information Service Restricted maximum Return on invested A l 7.6 20.8 9 .4 Ves
Excluded single business firms likelihood method capital per business A2 7.6 2 1 .4 9.0 Results consistent with Roquebert �> corporate effects inversely Excluded finance sector (cross-validated A3 7.7 2 1 .8 5.7 related 10 firm's degree of diversification
Sample A: I 666 firm .. model using A4 1 1 .8 33 9.7 Corporate effects decrease over time
Sample B: Top 30 business groups sequential ANOVA) AS 6.9 3 5. 1 8.0 Sample c: Small�r businesses B I 1 7 . 1 23.7 2.0
Madel I 1 9155- 1996 Random-effects (Rl:.] B2 1 7.2 22.7 2.0
Made1 1 1 9155-1996 Mixed-effecls (ME) B3 17.2 22.8 0.2
Madel 3 1 985-1996 ME with Interaclion lerm B6 20. 1 3 1 .8 5. 2
Model 4 1 985- 1 989 ME B7 16. 1 38. 1 0. 7
Model 5 1 990- 1 996 ME C l 5.6 20. 1 10.2
Model 6 1 985-1989 RE C2 5.7 20.6 10.4
Model 7 1 990- 1996 RE C3 5.9 20.9 7. 1 1985 - 1 996 C6 1 2 . 1 3 1 . 5 9.9
C7 4.6 33.4 10.6
5 1
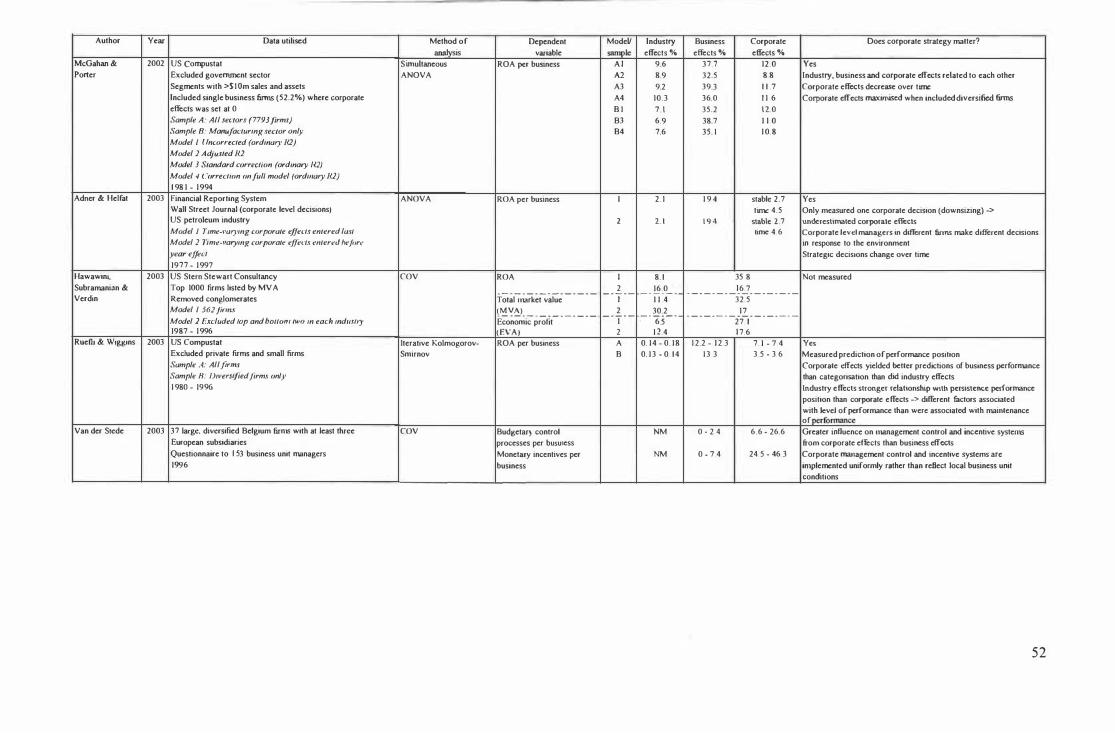
Author Vear Data utilised Method of Dependent ModeV Industry Business Corporate Ooes corporate strategy maller? analysis variable sample effects % effects % effects %
McGahan & 2002 US Compustat S imuJtaneous ROA per business A I 9.6 37.7 12 .0 Ves Porter Excluded government sector ANOVA A2 8.9 32.5 8.8 Industry, business and corporate effects related to each other
Segments with >$ I Om sales and assets A3 9.2 39.3 1 1 .7 Corporate effects decrease over time Included single business finns (52.2%) where corporate A4 10.3 36.0 1 1 .6 Corporate effects maximised when included diversified finns effects was set at 0 B I 7 . 1 35.2 1 2.0 Sample A: All sectors (7793 firms) B3 6.9 38.7 1 1 .0 Sample 8: Manufacturing sector only B4 7.6 35. 1 1 0.8 Model I Uncorrected (ordinary Rl)
Model 1 Adjusted Rl
Model 3 Standard correction (ordinary 112) Model 4 Correction on full model (ordinary Rl)
1 98 1 - 1 994 Adoer & Helfat 2003 Financial Reporting System ANOVA ROA per business I 2. 1 1 9 .4 stable 2.7 Ves
Wall Street Journal (corporate level decisions) t ime 4.5 Only measured onc corporate decision (downsizing) -> US petroleum industry 2 2. 1 1 9 4 stable 2.7 underestimated corporate effects Model J Time-varying corporate ejJecls entered lasl lime 4.6 Corporate Jevel managers in different firms make different decisions Model 2 1ime-" arying ('orporalt! effects entered hefiJre in response to the environment [year effect Strategic decisions change over time
1977 - 1 997 Hawawin� 2003 US Stem Stewart Consultancy COY ROA I 8. 1 35 8 Not measured Subramanian & Top 1000 firms listed by MV A 2 16.0 1 6.7 . - - - - - - - - - - - - - - - - - - - - - - - - - - - - - - - - -- - - - -Verdin Removed conglomerates Total tnarket value I 1 1 .4 32.5
Model I 562 firms (�\I�- - - - - - - - - - - - 2 30.2 1 7 - - - - - - - - - - - - - - - - - - - - - - - - - - - - -Model 2 l�xcluded lOp and hOllon1 two In each mdllSIIJ' Economic profit I 6.5 27. 1 1987 - 1 996 (EVA) 2 1 2 .4 1 7.6
Rueflj & Wigglns 2003 US Compustat Iterative Kolmogorov- ROA per business A 0. 1 4 - 0. 1 8 1 2.2 - 1 2.3 7. 1 - 7.4 Ves Excluded private firms and small firms Smirnov B 0. 1 3 - 0 14 1 3 3 3 5 - 3. 6 Measured prediction of performance position Sample A: All firms Corporale effects yielded beller predictions of business performance Sample B: Diversified firms only than categorisation than did industry effects 1 980 - 19% Industry effccts stronger relationship with pers\stence performance
position than corporate effects -> different factors associated with level of performance than were associated with mainlenance of performance
Van der Slede 2003 37 large, diversified Belgium firms with at least three COY Budgetary control NM 0 - 2 .4 6 .6 - 26.6 Greater inOuence on management control and incentive systems European subsidiaries processes per bUSUlCSS from corporate effects than business effects Questionnaire to I S3 business unit managers Monetary incentives per NM 0 - 7.4 24. 5 - 46.3 Corporate management control and incentive systems are 1996 business inlJllemented uniformly rather than reflect local business unit
conditions
52
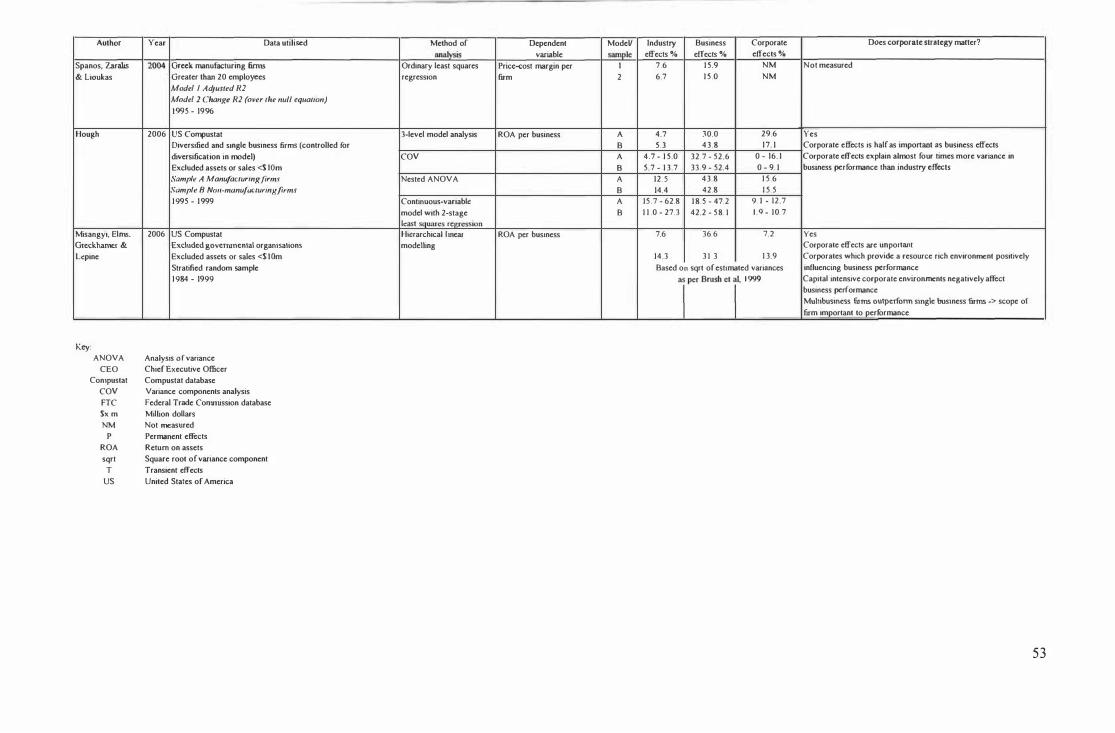
Author
Spanos, ZaraIis & Lioukas
Hough
M isangyi. Elms. Gteckhamer & Lepine
Key: ANOVA
CEO Con1pustat
COY FfC $x m NM
P ROA sqrt
T US
Year Data utilised
2004 Greek maoufacturing firms Greater than 20 employees Model J Adjusted R2
Model 2 Change R2 (over the null equation)
1995 - 19%
2006 US Compustat Diversified and Single business firms (controlled for diversification in model) Excluded assets or sales <$ IOm Sample A Manufacturing firms
Sample B NOll-manu!oc:luringjirms
1 995 - 1 999
2006 US Compustat Excluded goverrunental organisations Excluded assets or sales <$ I Om Stratified random sample 1 984 - 1999
Analysis 0 f variance Chief Executive Officer Compustat database Variance components analysis Federal Trade Conurussion database Mimon dollars Not measured Permanent effects Return on assets Square root ofvariance component Transient effects United States of America
Method of Dependent ModeV analysis variable sample
Ordinary least squares Pricc-<:ost margin per I regression firm 2
3-level model analysis ROA per business A B
COY A B
Nested ANOV A A B
Continuous-variable A model with 2-stage B least squares re 'cession Hierarchical linear ROA per business modelling
Industry Business Corporate Does corporate strategy maner? effects % effects % effects %
7.6 1 5.9 NM Not measured 6.7 1 5 .0 NM
4.7 30.0 29.6 Ves 5 .3 43.8 1 7. 1 Corporate effects is half as important as business effects
4.7 - 1 5.0 32. 7 - 52.6 0 - 16. 1 Corporate effects explain almost four times more variance in 5.7 - 1 3.7 33.9 - 52.4 0 - 9. 1 business performance than industry effects
12.5 43.8 1 5 .6 14.4 42.8 1 5 .5
1 5 . 7 - 62.8 1 8.5 - 47.2 9. 1 - 12.7 1 1 .0 - 27.3 42.2 - 58. 1 I .Q - 10. 7
7.6 36.6 7.2 Ves Corporate effects are unportant
14.3 3 1 . 3 1 3.9 Corporates which provide a resource rich environment positively Based on sqrt of estimated variances influencing business performance
r'·· 'T "" Capital intensive corporate environments negatively affect business performance Muhibusiness firms out'perfonn single business firms -> scope of firm important to performance
53
(as one aspect of firm specific constituents) on the variance in BUP. Theoretically, one aspect of
the corporate effects measured i s corporate strategy, that is :
Corporate effects = f(Corporate strategy. Among other things). ( 1 )
Other factors which may influence corporate effects include weather, decisions by governmental
bodies, or competitors. Estimates of corporate effects were usually determined from the
comparison of the d ifferences in average returns of mUltiple business firms and the individual
businesses within those firms. A high percentage of variation in the BUP has been interpreted as
equivalent to a greater importance of the effect measured (Adner & Helfat, 2003 ; Bowman &
Helfat, 200 I ) .
2.9. 1 Methodologies employed
Most of these studies uti l ised various calculations (e.g., ROA, Tobin ' s q) to measure B UP as the
dependent variable. Accounting measures of performance calculate historical accompl ishment
whereas, "Tobin's q is the ratio of the market value of financial claims on a corporation to the
replacement value of the corporation' s assets" (McGahan, 1 999, p. 374) and provides an
indication of future profitabil ity. McGahan ( 1 999) also contended that Tobin ' s q is more
sensitive to industry effects. Some authors, notably Chang and Singh (2000) and Hawawini et al
(2003) employed economic measures of performance such as market share and total market
value. In addition, Powell ( 1 992, 1 996) uti l ised measures based on managerial perception .
Nevertheless, Hawawini et al (2003) observed that the selection of the performance measurement
did not affect the estimation of corporate effects.
A variety of methodologies have been uti lised to estimate corporate effects. The majority of
these have employed inferential statistical analysis techn iques (e.g., analysis of variance
[ANOV A] and variance components analysis [COY]) to decompose the variance of performance
from large scale, cross-sectional databases (e.g., Federal Trade Commission database [FTC],
Standard and Poor' s Compustat Business-Segment Reports database [Compustat]). Note that the
ANOV A methods outl ined in this Chapter are dissimi lar to the one-way independent ANOVA
(ANOVA l ) employed in Chapters Four and F ive. ANOVA "partitions the total variation in a
dataset according to the sources of variation that are present" (John son & Bhattacharyya, 200 I ,
p. 5 87). ANOVA tests for significance (employing a fixed-effects assumption). In other words,
it examines the incremental explanatory power of a specific set of effects whereby, "ANOV A
basically estimates an ordinary l inear regression model using dummy variables [e.g., industry,
54
business or corporate effects] for different qual itative treatments and, sometimes, continuous
variables . . . . Researchers assess the importance of an effect by the amount of variance explained
by a given set of dummy variables" (Brush, Bromiley & Hendrickx, 1 999, p. 520).
Another common statistical analysis technique employed in empirical estimation of corporate
effects i s COV. COY evaluates the relative importance of each effect employing a random
effects assumption, in other words, the effects are independent of each other. COY "estimates a
model similar to ANOV A, but instead of actual estimates of each dummy variable's parameter, it
reports the variance of a set of implicit dummy variables. This variance corresponds to the
amount of variance in the dependent variable explained by that set of implicit dummy variables"
(Brush et aI, 1 999, p. 520). Thus for COY, "the unique firm characteristics are model led as
latent factors, captured using individual latent variables for each firm; while industry attributes
are captured using a common latent variable shared by members of the same industry" (Mauri &
M ichaels, 1 998, p. 2 1 4) .
2.9.2 Measurements of corporate effects
A number of significant empirical studies are l isted in Table 2.2. The most influential studies are
discussed in further depth below starting with a comparison of industry effects to firm effects
and thereafter, estimation of the influence of corporate effects on both BUP and firm
performance measures.
a) Firm effects versus industry effects
This research has generally concluded that firm effects were more substantial than industry
effects supporting the relative importance of the endogenous approach. In their 1 989 study,
Hansen and Wemerfelt established that organisational factors accounted for almost twice the
impact on variance in ROA than those resulting from economic factors (which included
industry). Later evidence supported their findings, for instance, Balakrishnan and Fox ( 1 993)
sampled single business firms and found that industry effects accounted for between 5 . 5 and
1 0 .5% of the total variance in capital structure and firm effects explained between 50.5 and
52 . 1 %. These authors concluded that "if one expects to find industry effects to be important, it
should have been evident in a sample of single business firms" (p. 1 1 ) as these firms confront
homogeneous environments when raising capital. Furthermore, Balakrishnan and Fox ( 1 993)
suggested that their results h ighlighted the importance of the impact of unique characteristics of
the firm . S imilarly, Mauri and Michaels ( 1 998) found in their sample of nondiversified
manufacturing firms that firm effects reduced as they increased the length of the period under
5 5
examination (from 36.9% in 1988 - 1 992 to 25 .4% in 1 978 - 1 992) and measured industry effects
of between 5 . 8 and 6 .2%. However, Hawawini et al (2003) concluded that industry effects
explained more variance in performance of "averagely" performing firms (the majority), in
comparison to firm effects which influenced both industry leaders and poorly performing
companies.
b) Measurement of corporate effects on business unit performance
In 1 985 Schmalensee presented the first empirical evidence from research involving corporate
effects. He analysed a single year 's data from 456 manufacturing firms and reported that the
greatest variance in BUP resulted from industry effects ( 1 8 .8 - 1 9.5%). The corporate effects
Schmalensee measured were interpreted to be of minor significance. The high level of
unexplained variance (80%) in BUP evident in Schmalensee's ( 1 985) study led to additional
research . These studies extended Schmalensee' s work by applying different stati stical methods,
time periods, datasets and variables.
The second significant addition to the l iterature on corporate effects was the Rumelt ( 1 99 1 )
study. Rumelt ( 1 99 1 ) utilised dummy variables to measure the importance of the variables ( i .e.,
industry, business and corporate effects) on the performance of manufacturing firms from
1 974 - 1 977. Although his ANOVA analysis provided s ignificantly higher estimates of
corporate effects ( 1 0.9 - 1 7.6%), in his conclusion, Rumelt ( 1 99 1 ) focused on justifying the COY
results (0 - 1 .6%). He concluded that firstly, firm effects ( i .e., corporate effects plus business
effects) were more important than industry effects and secondly, that when explaining B UP,
corporate strategy was inconsequential. Furthermore, he argued that variances in ROA due to
corporate effects were negligible when compared to the other effects.
However, five years later Roquebert et al ( 1 996) postulated that corporate effects were more
important than those identified by Rumelt ( 1 99 1 ) . Roquebert and colleagues uti l ised a wider,
more recent dataset ( 1 985 - 1 99 1 ) of manufacturing firms from which they excluded single
business firms. They found that on average, corporate effects explained 1 7.9% of the variance in
B UP. This conclus ion has been supported (to varying degrees) by other studies. For example,
Brush et al ( 1 999) appl ied a continuous-variable model estimated with two-stage least squares.
They argued that their approach was superior to those employed in previous models as it firstly,
allowed for fewer assumptions, secondly, it explicitly removed simultaneous effects that might
cause inconsistent results, and lastly, it could more accurately measure lower estimates as the
model used fewer degrees of freedom. Their results indicated that the average ratio of
56
incremental corporate effects to industry effects ranged from l . I S to l . 9. They then concluded
that corporate effects were more important than industry effects. Furthermore, they found that
the choice of the statistical analysis tool employed influenced the results that is, the COV "results
suggest industry is somewhat more important than corporation while the simultaneous equation
results suggest the opposite" (p. 54 1 ). This finding supports those in Chapter Two concerning
the v iew that firm performance heterogeneity within an industry is greater than the relative
performance of individual industries.
Chang and Singh (2000) utilised a different dataset (i .e., Trinet) of manufacturing firms. They
also employed an alternative measurement of performance (Le., market share per business unit)
and established that corporate effects accounted for between 2.4 and I I % variance in BUP. In
addition, they divided their dataset into large, medium and small firms and found that medium
sized firms possessed the greatest magnitude of corporate effects (27.3% in comparison to 9.5 %
evident in large firms and 1 5 .8% in small firms) suggesting "business units within medium-sized
companies may depend on corporate level resources, such as transferring skil ls and sharing
activities with other business units" (p. 750) . A result that is intuitively appealing, namely, that
the contribution from corporate effects, whi le important, declines as firms get larger and more
diverse.
Various studies have been publ ished by McGahan and Porter. McGahan and Porter ( 1 997)
found that 4.3% (COV) and 9. 1 to 1 1 .9% (nested ANOV A) variance in BUP can be attributed to
corporate effects. Their results also indicated that corporate effects varied across sectors. For
example, lower corporate effects were displayed in the manufacturing sector whereas, higher
corporate effects were evident in the wholesale/retail, transportation, and agricUlture/mining
sectors. In an alternative piece of research ( 1 999), they further tested the two competing theories
by hypothesising that either industry or firm effects on BUP are more persistent (as a measure of
importance). McGahan and Porter reported that "incremental industry effects persist longer than
the incremental business-segment and corporate-parent effects" (p. 1 52) and that corporate
effects were more significant than business effects.
I n yet later research, McGahan and Porter (2002) uti l i sed an alternative method of analysis ( i .e . ,
simultaneous ANOVA) and measured corporate effects on variance in BUP of between
8 .8 and 1 2%. They concluded that firstly, corporate effects were maximised when the sample
included diversified firms and secondly, that corporate effects decreased over time. McGahan
and Porter (2002) observed that industry, corporate, and business effects are related in complex
5 7
ways. They contended that their results confirmed the failure of SCP due to the "evidence of
feedback and coevolution between the industry, corporate-parent, and business-specific effects"
(McGahan & Porter, 2002, p. 848).
Different approaches to estimating corporate effects have also been employed. Chang and Hong
(2002) uti l i sed a mixed-effects modelling methodological approach which simultaneously
estimated both random (e.g., industry effects, corporate effects) and fixed-effects (i .e., top 30
group effects and period effects) . They estimated that corporate effects ranged from 0.2 to 10 .6%
variance in BUP. Their findings supported Roquebert et ai ' s ( 1 996) conclusion that corporate
effects are inversely related to the degree of diversification. They also concluded that corporate
effects decreased over time. Ruefli and Wiggins (2003) employed the Iterative Kolmogorov
Smimov technique to measure the prediction of performance position and estimated corporate
effects of between 3 .5 and 7.4%. Their results indicated that corporate effects yielded better
predictions of BUP than industry effects. They concluded that industry effects were
characterised by a stronger relationship with persi stence performance position than corporate
effects, suggesting different elements are affil iated with the level of performance than were
associated with the maintenance of performance.
Adner and Helfat (2003) divided corporate effects into stable corporate effects and time-varying
corporate effects on variance in BUP. These authors analysed the petroleum industry with the
aim of reducing possible ramifications of different accounting standards and business definitions.
The methodology util i sed corporate announcements of downsizing (as a representative of
corporate level strategic decisions made by managers, and thus not attributable to time-varying
business effects) to estimate corporate effects. Even though they only measured one corporate
decision (thus, underestimating corporate effects), their results estimated the proportional
contribution of stable corporate effect and time-varying corporate effects on total variance in
B UP was 2 .7% and 4 .5 to 4.6% respectively. They concluded that corporate level managers
make dissimilar decisions in response to the environment and that corporate strategy changes
over time.
Van der Stede (2003) examined the impact of corporate management control and incentive
processes (as a measure corporate effects), and business unit culture (as a measure of business
effects), on the variance in BUP of 37 Belgium-based m ultinational firms. He found that
corporate effects ranged from 6.6 to 46.3% of variance in BUP. I n comparison, business effects
were found to be of a more m inor influence on BUP (less than 7.5%). Corporate effects may be
5 8
implemented across the firm's business units in a consistent manner rather than mirroring the
more specific influences of business units.
Two recent pieces of research, namely, those by Hough (2006) and Misangyi, Elms, Greckhamer
and Lepine (2006) have uti l ised multi level approaches to measure corporate effects which sought
to overcome a number of l imitations inherent in the previously employed statistical techniques.
For example, error terms can be applied to each level of analysis, el iminating the collinearity that
exists between corporate and industry, eliminating artificial classification (alternative models
require conformation to a set number of segments), increasing statistical power, and lastly,
testing causal relationships. Hough (2006) found that corporate effects ranging from 1 7. 1 to
29 .6% of variance in BUP. Misangyi et al (2006) reported similar corporate effect results as the
previous research ( 1 3 .9%).
S ingh, Ang and Leong (2003) argued that research extensions provide confidence in the
rel iab i l ity of the various methodologies employed and their findings and consequently, further
developing theory. Overal l, the robustness of the results indicated that firm effects account for a
greater influence than industry effects, supporting the underlying theory of the endogenous
approach. In addition, the empirical research suggested corporate effects explained between
o and 46.3% of the variance in BUP. Therefore, it can be concluded that both corporate effects
exist and they are important to BUP.
c) Measurement of corporate effects on corporate performance
Two studies measured the influence of corporate effects on corporate performance (refer to
Table 2.2). These are by Wernerfelt and Montgomery ( 1 988) and McGahan ( 1 999). Firstly, and
extend ing on Schmalensee's ( 1 985) work, Wernerfelt and Montgomery ( 1 988) uti l ised Tobin' s q per firm to measure the relative importance of corporate effects (as an indicator of firm focus i .e. ,
the level of diversification) on variance in firm performance. The sample represented 247
manufacturing, industrial and util ity firms from FTC during 1 976. Their findings indicated that
corporate effects existed but were minor in nature accounting for only 0.2 to 3 .7% variance in
firm performance. They concluded that narrowly diversified firms performed better than widely
diversified firms, implying that there may be some deadweight cost (corporate) among more
diversified firms.
Secondly, McGahan ( 1 999) performed an extensive measurement of corporate effects (again
assuming corporate effects arose from relatedness due to diversification) on three different
59
indicators of firm performance, namely, Tobin's q, accounting profitabi l ity, and return on
replacement value of assets. The McGahan sample consisted of businesses in Compustat from
1 98 1 to 1 994, excluding the financial sector. Two samples were constructed incorporating 4,947
firms (where corporate effects was set at zero for 65% of this sample as they were single
business firms) and 1 ,777 diversified firms only. The concept of corporate effects (corporate
effects were deemed to be measured by the relatedness between the industries in which the firm
operates) was divided into permanent and transient effects. The findings indicated that
permanent corporate effects for the first sample were zero across all three measures and ranged
from 0. 1 to 1 .5% for the diversified sample. The transient corporate effects for the first sample
ranged from 0 to 0 . 1 % variance in firm performance. McGahan noted that corporate effects
were less stable and less predictable than industry effects and, therefore, concluded that
corporate effects did not have an important impact on firm performance.
In contrast to the measurement of corporate effects on the variance in BUP, it would appear that
corporate effects had a minor role on the variance in firm performance. This would suggest that
corporate strategy had a greater impact on BUP than the firm as a whole, contrary to both SCP
and RBT. Therefore, this limited empirical evidence of corporate strategy suggests that concepts
such as foresight, core competencies and synergy, are not supported.
2.9 .3 Validity issues with models employed to estimate corporate
effects
A number of authors have challenged the interpretation of the results obtained, particularly
various statements referring to corporate strategy as being irrelevant. These issues have been
divided into three categories: methodological, assumptions, and l imitations in generalising
results.
a) Methodological issues
I mportant methodological concerns evolving from this paradigm are outlined below. These
include the influence of order of entry into the mode, the rel iability of findings, and difficulties in
estimating corporate effects (Adner & Helfat, 2003 ; Bowman & Helfat, 200 1 ; Brush &
B romiley, 1 997; Brush et ai, 1 999; Chang & Hong, 2002; Chang & S ingh, 2000; Khanna &
Rivkin, 200 I ; Ruefli & Wiggins, 2003). First, the variances in BUP derived may be imprecise as
the results depended upon the order of entry into the model (especially ANOVA) as "the first of
the correlated effects entered into the analysis may pick up some of the increment actual ly
associated with effects entered later" (Adner & Helfat, 2003, p . 1 0 1 8) . For example, Rumelt
60
( 1 99 1 ) found higher corporate effects when he entered the corporation (representing corporate
effects) before business unit (representing business effects) as the model "assigns all shared
variance between the business units and corporation to the corporation" (Brush et ai, 1 999, p.
52 1 ).
Second, the robustness and reliabil ity of the results of these studies appears limited due firstly to
the range of estimates. Brush and Bromiley ' s ( 1 997) model produced a wide range of values
when they performed multiple simulation runs. The Roquebert et al ( 1 996) study found
corporate effects derived from 1 0 samples ranged from 9.3 to 27.7%. Secondly, the use of
dummy variables in the models does not adequately reflect reality and are thus, unreliable.
F inally, the tools uti l ised to measure corporate effects may not accurately reflect the effect of
corporate strategy on performance when they do exist, especially COY as COY cannot reliably
uncover smaller but significant effects. In addition, Adner and Helfat (2003) observed that most
of the antecedent research models provided an incomplete reflection of corporate effects as they
did not incorporate corporate effects derived from fluctuations in profitabi l ity over time resulting
from changes in corporate strategy (rather the research estimated primarily "stable" corporate
effects) . They concluded that the dynamic nature of strategic decisions should be measured as
"time-varying corporate effects may reflect an important element of corporate strategy" (Adner
& Helfat, 2003, p. 1 0 1 4). Their research estimated time-varying corporate effects of between
4.5 and 4.6% variance on BUP, in addition to stable corporate effects of 2 .7%.
b) Issues with the assumptions employed
Assumptions are inherent in al l models and the assumptions included affect the way the results
of a piece of research may be interpreted whereby, "findings by refining methods are for naught
if the results of those methods are constrained in their interpretation by the deeper contextual
assumptions inherent in the methodology" (Ruefli & Wiggins, 2003, p. 864). The fol lowing
assumptions have been questioned. These are first, ceteris paribus; second, uniformity of
corporate strategy over the entire firm; third, no multicol l inearity; fourth, inclusion of single
business firms in samples yet defining corporate strategy as referring to only diversified firms;
fifth, random samples of businesses; and lastly, the magnitude of estimated effects equates to its
importance.
F irst, Ruefl i and Wiggins (2003) argued that much of the prior research "presupposes a ceteris
paribus worldview in regard to firm performance, [whereas] strategic management theory
6 1
presumes a mutatis mutandis model" (p. 864, italics in original). The mutatis mutandis model
suggests greater managerial influence at the corporate level in comparison to industry effects.
However, McGahan and Porter (2005) contended that the aim of the variance composition
research was not investigating the underlying associations between the effects on BUP, but rather
accounting for the variance in BUP.
Second, another common assumption employed is that corporate strategy is evenly distributed
over the range of business units, in other words, corporate strategy affects BUP in a uniform
manner. Consequently, the models employed have underestimated the importance of corporate
effects (as demonstrated by Brush & Bromiley, 1 997), especial ly for larger firms with more
business units (Chang & S ingh, 2000).
Third, the COY method assumes that the effects are uncorrelated, that is, no multicoll inearity.
For example, Ruefli and Wiggins (2003, p. 863) observed that "the assumption of independence
of effects on a particular business that is inherent in the COY method and the omission of
covariance between effects [is] inherent in the nested ANOVA approach." Adner and Helfat
(2003, p . 1 0 1 8) suggested that "the business level dummy variables are completely collinear with
the corporate level dummy variables, since each corporation has a dummy variable for every
business within the firm ." An assumption that underlies Rumelt's ( 1 99 1 ) research is that
corporate and business effects are not correlated, in other words, firms do not actually select the
businesses within which they operate. This assumption raises some issues in terms of the
definition of corporate strategy (refer to Chapter Three).
Fourth, contrary to the definition of corporate strategy employed in these studies that corporate
strategy only relates to diversified firms, these influential studies (with the exception of Chang &
Hong, 2002; Chang & S ingh, 2000; Hansen & Wemerfelt, 1 989; Roquebert et ai, 1 996 who only
analysed diversified companies) uti lised datasets of diversified and single business firms (e.g.,
Hough, 2006; McGahan, 1 999; McGahan & Porter, 1 997, 2002; Rumelt, 1 99 1 ; Schmalansee,
1 985) . Bowman and Helfat (200 1 ) argued that corporate effects were reduced by the addition of
single business firms in the samples, an outcome you would expect. McGahan and Porter (2002)
observed diversified firms accounted for 48% of corporations within Compustat and justified the
inclusion of s ingle business firms by suggesting that corporate and business effects cannot be
separated in single business firms, thus "for undiversified firms, the corporate-parent effect is
assumed to be zero" (p. 839). And yet, McGahan ( 1 999) attributed the low measurement of
permanent corporate effects to the decision to set corporate effects for the single businesses at
62
zero, which accounted for 65% of her dataset. When she e l iminated single business firms from
the sample, a h igher estimated corporate effect was, unsurprisingly, reported for diversified firms
only.
F ifth, the assumption that the businesses are randomly drawn from the population of businesses
may underestimate the magnitude of corporate effect. Again, th is assumption contradicts the
commonly held definition of corporate strategy. A covariance term is often included in the
model for corporate and industry, but due to the nested nature of the data, it is impossible to add
a covariance term for corporate and business (RumeIt, 1 99 1 ) . Furthermore, these models do not
account for the effects of corporate strategy across industries (e.g., leveraging across many
industries) resulting in the blurring of the distinction between corporate and industry effects.
Therefore, it is difficult to argue whether industry effects pertain to the industry or to firms
within the industry.
F inally, thi s research stream possesses the assumption that the magnitude of estimated corporate
effect equates to its importance. It appears common practice to conclude, that if corporate
effects are one sixth of business effects, then business effects are six times more important than
corporate effects. Brush and Bromiley 's ( 1 997) study highl ighted that this interpretation of the
findings is incorrect. They argue that the correct view should be that if the ratio of corporate
effects to business effects is one sixth, then corporate effects are 40% as important as business
effects. When Brush and Bromiley ( 1 997) ran a Monte Carlo simulation, they noted that a more
accurate representation of the importance of an effect was reflected when the variance
components are square-rooted, overcoming the nonlinearity expressed in their data that is, when
squaring, small estimates produces smaller effects.
c) Limitations of the corporate effects research
Some authors have highl ighted the limitations inherent in this research including differences
between business performance, external validity of the databases used, generalisabi lity of
samples, and lastly, inappropriate level of analysis. First, the techniques employed do "not
provide information about the effects of these [corporate level] decisions on the level of business
performance. Rather, the analysis shows whether the decisions account for a portion of the
variance in performance, indicative of differences between businesses in the level of
performance" (Adner & Helfat, 2003, p. 1 0 1 7, italics in original) . However, alternative
statistical techniques have been used. For example, Ruefli and Wiggins (2003) employed a
distribution-free technique which measured relative rather than absolute differences and found
63
that the performance relationships between inferior, modal or superior performing firms altered
over time. Corporate effects were more significant than industry factors.
Second, issues also surround the datasets analysed, especially concerning external val idity
(Powel l , 1 996). "Given the constraints that Rumelt and Schmalesee placed on their samples, the
results they derived should be interpreted strictly within the context of their samples of large
business units of large and well-diversified corporations" (Chang & S ingh, 2000, p. 745) . For
example, Federal Trade Commission database comprises SBUs of large diversified firms, thus
excluding the majority of firms in the population, in other words, nearly al l service firms, small,
private or single business firms (Powell, 1 996) . Generalising results based on FTC may then be
inappropriate as these samples do not reflect the population. Chang and Hong (2002) remarked
that the difference in results across the various studies may be due to the use of heterogeneous
data sources, that is, "the Compustat database includes many small companies, while FTC
database consists mainly of large diversified corporations" (p. 265). FTC and Compustat are
also biased in regards to business unit categorisation due to self reporting and the restrictions on
the number of businesses on which a firm is able to report. For example, Compustat restricts a
firm to a maximum of 1 0 business units. Chang and S ingh (2000) util ised the Trinet database
which in their view elim inated these issues. Powell ( 1 996) and Adner and Helfat (2003 ) argued
that the studies that uti l ised datasets which combine industries raised generalisation issues :
differences due to industry specific accounting methods or what constitutes an "industry".
McGahan ( 1 999) also observed that the US datasets uti l ised may possess accounting anomalies
which influence any findings.
Third, Chang and Singh (2000) analysed varying firm sizes and found that, for example,
corporate effects are stronger for medium and smaller firms (equivalent to the Fortune 500 l isting
of companies ranked 3 60 to 500). They also argued that the findings of this research stream
should be interpreted with regards to the sample selected. In addition, Wiggins and Ruefli
(2002) found that large numbers of firms in some industries (between 47 and 90%) could be
classed as average. They suggested that the empirical support for many 10 theories arose due to
"this large number of average firms, coupled with the relative symmetry of the sizes of the
above-average and below-average strata" (p. 1 00) and the use of regression techniques.
F inally, the unit of analysis employed in the empirical l iterature centres on both the industry and
the business unit level of the firm. Peteraf and Barney (2003) contended that these studies have
demonstrated that when explaining BUP heterogeneity, multiple levels of analysis m ay add to
64
the understanding of firm performance, in other words, industry, corporate and business effects
all influence BUP. An important l imitation to the reviewed research involves the corporate level
of analysis. Theoretically, if one seeks to estimate corporate effects the most appropriate
methodology would be to analyse those effects in terms of proxies for corporate performance, for
example, share market price (SMP). Instead much of the research l isted in Table 2.2 ( i .e., only
3 1 % of research specified a corporate unit of analysis) estimated the importance of corporate
effects against a dependent variable calculated at the business level, in other words, th is research
estimated the importance of corporate effects on business performance. If the purpose of
corporate strategy is to deliver corporate-wide advantage and PSFP, it would be more
appropriate to util ise a proxy for firm performance. Thus, the majority of this research has not
measured the effect of corporate decisions ( including corporate strategy) onfirm performance or
for that matter, industry or business effects onfirm performance.
2.9.4 C orporate effects research summary
Research that has sought to estimate the effect of corporate strategy on variance in BUP, has
employed statistical models that have made a contribution to our understanding of what factors
(corporate, business, industry, or year) impact on BUP. Generally, firm effects (business and
corporate) have been estimated to have a larger influence on BUP supporting the endogenous
perspective. Overall, the identified corporate effects ranged from 0 to 46.3% (refer to Table 2.2).
According to Adner and Helfat (2003, p. 1 0 1 1 ), "a nontrivial and statistically significant
corporate effects impl ies that firms differ in the impact that their corporate level resources have
on profitabi l ity." It has been suggested that the methodologies employed in these empirical
studies may consistently underestimate the importance of corporate strategy on BUP (Adner &
Helfat, 2003). The underestimation of corporate strategy on BUP in the reviewed empirical
research may have led to the implicit assumption that corporate level decision makers do not
make decisions that influence BUP, namely, those relating to industry selection and control ling
business unit direction . Some authors have focused on the absence of corporate effects
suggesting that BUP can be achieved without corporate offices or theoretically corporate strategy
(e.g., Bowman & Faulkner, 1 997). The two studies that did measure the influence of corporate
effects on firm performance found small measurements of corporate effects ranging from
o to 3 .7%. The corporate effects measured in these studies were an indicator of diversification
not corporate strategy per se (unless diversification is the only corporate strategy).
65
2. 1 0 OTHER EMPIRICAL CORPORATE STRATEGY
PERFORMANCE RESEARCH
Dess, Gupta, Hennart and Hil l ( 1 995) suggested that research on the strategy-performance
relationship has been characterised by ambiguity with weak results. Empirical research in
corporate strategy, as distinct from the empirical studies presented in Section 2 .9, has been
divided into three topics. The three topics are first, investigations into the relationship between
specific corporate strategies and firm performance; second, normative models of the parent,
corporate advantage and firm performance; and lastly, empirical research that appears to make
implic it assumptions of the relationship between corporate strategy and firm performance. Each
of these topics of research are now discussed.
2. 1 0 . 1 Specific corporate strategies and their effect on performance
A large proportion of corporate strategy literature has focused on specific corporate strategies,
for example, acquisition, divestment, merger, alliances and restructuring. This research has
concentrated on comparing the "before and after" effects of a specific corporate strategy on
performance. Empirical evidence presented has been equivocal and mixed. Generally, the
l iterature supports the view that specific corporate strategies have a poor record of performance
(e.g., Franks & Harris, 1 989; Porter, 1 987). As Porter ( 1 99 1 , p. 225) advocated, "the corporate
strategies of most companies have dissipated instead of created shareholder value." Empirical
research has indicated the acquisition target' s SMP increased whereas the acquiring firm ' s SMP
decreased upon announcement of an acquisition (Bradley, Desai & Kim, 1 988) . Mueller ( 1 985)
reported that horizontal and conglomerate mergers also resulted in market share losses.
Diversification strategy has received significant research attention since Rumelt's ( 1 974) seminal
article. Dess et al ( 1 995, p. 364) observed that "there have probably been more empirical studies
of d iversification strategy and corporate performance than of any other phenomenon of interest
to strategic management researchers." Examples include: Gary, 2005; Helfat and Eisenhardt,
2004; Herrmann and Datta, 2005 ; Lu and Beamish, 2004; Markides and WilIiamson, 1 994;
RumeIt, 1 974; Varadarajan and Ramanujam, 1 987. Theoretically, similarities in products and
markets should create synergies in terms of economies of scope, and the transference of core
competencies. In support, Davis and Thomas ( J 993, p. 1 334, ital ics in original) noted that "if
diversification strategy is to succeed it is imperative that synergy, or super-addivity in valuation
of business combinations, be achieved." They suggested that diversification has often fai led to
result in h igher firm performance due to the inabil ity of firms to gain this much anticipated
66
synergy. In contrast, Dess et al ( 1 995) noted that the inconclusive and conflicting empirical
evidence of the diversification strategy-firm performance relationship presented is due to either
the existence of weak and ambiguous results (e.g., Palepu, 1 985), or to the fact that the
conclusions drawn from the results are dependent on methodologies employed. The w idely cited
article by Rumelt ( 1 974) found that related constrained diversification (i .e., d iversification on the
basis of a single core competency) led to higher performance. However, his later 1 982 study
questioned the validity of the earlier study as he realised that the 1 974 results were characterised
by a serious omitted variable ( i .e . , industry effects). Grant (2002b) observed that the empirical
evidence has generally failed to establish whether related diversification outperforms unrelated
diversification.
Overall, the diversification literature has concluded that firstly, lower levels of diversification
result in higher performance and that secondly, firms should diversify into closely related areas.
Conversely, Porter ( 1 99 1 ) stated that corporate strategy research (he defines as equivalent to
d iversification strategy) has not supplied evidence of the importance of these strategies. He
argued that corporate strategy does not add value due to the three reasons of business level
competition, addition of costs and constraints to business units as a result of diversi fication, and
lastly, the ease of shareholder diversification. Levinthal and Myatt ( 1 994) observed that the
fai lure to provide overwhelming empirical evidence on the success of diversification "provides
some indirect evidence that the choice of industry may be less critical to firm performance than
the presence of distinctive capabil ities to operate within a given industry" (p. 45) .
A number of theories have been advanced seeking to explain why diversification has not resulted
in empirical evidence of higher performance. Agency theory proposes that managers may
employ firm resources for reasons other than profit maximisation, fol lowing their own interests
at the expense of shareholders (e.g., empire building for reasons such as increasing demand for
managerial skil l and lowering employment risk) and consequently, exceeding the level of
efficient d iversification or mergers (Amihud & Lev, 1 98 1 ; Jensen, 1 986; Montgomery, 1 994;
M uel ler, 1 969). In addition to agency theory, RBT provides an alternative explanation for the
fai lure of diversification to positively influence performance that is, "firms with more specific
and valuable resources find it optimal to diversify less than firms with less specific and less
valuable resources" (Montgomery, 1 994, p. 1 70). Montgomery suggested that RBT accounted
for the direction of diversification (i .e., into related diversification) as it proposes that firms
should diversify on the basis of core competencies and firm capabilities (Col lis, 1 988; Hamel &
67
Prahalad, 1 994; Prahalad & Hamel, 1 990). Contextual e lements may also provide reasons for
the fai lure of diversification to result in h igher firm performance.
2. 1 0.2 Normative models of the parent, corporate advantage and
performance
A number of normative models relating to corporate strategy have been presented in the
l iterature. Many of these are based on case studies (e.g., Ackerman, 1 970; Chandler, 1 962, 1 99 1 ;
Ghoshal & Bartlett, 1 995 ; Halal, Geranmayeh & Pourdehnad, 1 993; Hi l l & Hoskisson, 1 987;
Lorsch & Al ien, 1 973; Pitts, 1 977; Vancil, 1 980). These normative models have provided l ists
of the functions a corporate parent should perform. Chandler ( 1 99 1 ) proposed that the corporate
function is to create strategy to protect the long-term use of resources and to monitor firm
performance. Coll is and Montgomery ( 1 997) l isted four activities of the parent as to create
strategy, protect resources, establ ishing administrative requirements, and, to perform overhead
tasks. CampbeIl, Goold and Alexander ( 1 995) specified that the role included exploiting
synergistic linkages between divisions, managing external relations, specifying firm domain, and
creating organisational structure. Recent literature has now moved towards flexibi lity, and
learning and empowerment rather than command and control by the corporate parent.
Regrettably, these normative models suggest that firms should conform to the conclusions of the
respective author. These frameworks neither encourage creativ ity or uniqueness. Consequently,
any advantage gained from employing a normative model would be eroded if all firms duplicated
the same advice. Best practice would become the norm for competition instead of generating
advantage over rivals . It is d ifficult to ascertain whether normative models provide effective
frameworks to achieving advantage in new industries or dynamic environments. To date,
timeless principles as to the sources of PSFP (even if they do exist) have not been uncovered.
Markides (2002) argued that many of these models are based on common sense. He proposed
that answering the question of "what should the parent do?" should be grounded in theory of why
multiple business firms exist. For example, transaction cost theory suggests that excess
resources leads to diversification and that the parent performs the function of an internal capital
market whereby it allocates resources to SBUs. The role of the parent also depends on firm strategy that is, different goals require different internal governance structures.
A number of researchers have concentrated on the role that the corporate centre or parent has
played on firm performance. In addition to SCA, it has been suggested that firms can also
achieve corporate advantage (Bowman & Faulkner, 1 997; Campbell, 1 995, 2003 ; Collis &
68
Montgomery, 1 997). For example, corporate advantage should be util i sed to develop and assess
corporate strategy, providing the basis for portfolio management, and design of the organ isation
(Campbell, 2003). These authors advocate that the criterion for corporate strategy should be
corporate or parenting advantage (Campbell , 1 995, 2003 ) . The corporate advantage research,
usually based on case studies, contends that activities relating to corporate strategy should add
value to the firm. Corporate strategies should add value by matching corporate skil ls and the
individual business ' s needs (Campbell et ai, 1 995) . Goold and Campbell ( 1 99 1 ) stressed that if
corporate strategy does not add value, the firm will become a take-over target. Moreover,
Campbel l et al ( 1 995, p. 1 32) argued that "companies without sound corporate-level strategies
gradually lose strength and fal l prey to hostile predators or become emaciated from periodic
downsizing and cost cutting." Firm competitiveness should be augmented by corporate strategy:
"Corporate strategy needs to identity clearly how and where the corporate centre will add value,
both by what it does well, and by how it is able to assist the business units to achieve a higher
performance" (Bowman & Faulkner, 1 997, p. 1 79-1 80).
Two main corporate advantage concepts exist within the l iterature. The first concept is more
narrowly defined as being one that corporate advantage is created from the management of the
bundle of business units, commonly termed portfolio management. The second concept
encompasses the view that corporate advantage arises from the management of the entire firm.
Collis and Montgomery's ( 1 998) concept of corporate advantage impl ies that the corporate
headquarters of a firm should be able to create an advantage ( or value) from the management of
SBUs. The corporate advantage view is based on the definition of corporate strategy from the
perspective of the multiple business firms and thus, does not consider single business firms can
create advantages over their competitors through the uti l i sation of corporate strategy that is
d istinct from competitive strategy. Coll is and Montgomery ' s view of corporate strategy has
contributed to the lack of a universal definition (refer to Chapter Three). Some authors have
investigated the relationship between performance and portfolio management, for example,
"portfolio interrelationships have a positive effect on performance" (Robins & Wiersema, 1 995,
p . 293) . Campbel l ( 1 995) agreed that the multiple business firms' success or fai lure i s dependent
on the influence and role of the corporate parent. However, Goold and Luchs (2003) inferred
that the application of portfolio planning in the 1 970s did not add value and resulted in a number
of firms divesting businesses during the 1 980s.
The second approach to corporate advantage advocates conceptual ising corporate advantage
more holistically, usually focusing on synergy and core competencies. Bowman and Faulkner
69
( 1 997), for instance, suggested that core competencies are not only at the business level, in other
words, advantage can be achieved by the firm as a whole. Hamel and Prahalad ( 1 994, p. 25,
ital ics in original) advocated that "competition for core competency leadership precedes
competition for product leadership, and that conceives of the corporation as a portfolio of
competencies as well as a portfolio of businesses." They also observed that competition for the
future exists on a larger scale than just between products or SBUs, for example, interfirm or
coalitions of firms. They advocated that interfirm competition is of primary importance for three
reasons. Firstly, because future markets wil l occur outside existing industries or neatly defined
SBUs, and secondly, firm-wide core competencies (including sometimes disparate technologies)
wi l l need to be assessed, integrated and applied throughout the firm, and lastly, the size, scope,
complexity, investment and time frames required to build new core competencies extend beyond
the capacity of SBUs. Consequently, SBUs are unable to effectively develop and leverage core
competencies. Instead, SBUs may actual ly imprison firm core competencies. Thus, the
synergistic governance of the entire firm and its attributes becomes a corporate responsibi l ity.
The publ ications on corporate advantage also possess a normative aspect. However, as is often
evident with normative models, the first approach to corporate advantage that is, portfolio
management, does not encourage creativity or uniqueness. Consequently, any advantage gained
from employing a normative model would be eroded if all firms duplicated the same advice.
Although empirical evidence has been l imited, the second approach to corporate advantage may
suggest a positive relationship between corporate advantage and PSFP. To date,
operational isation has been difficult due to the causally ambiguous, tacit nature of the concepts
such as, synergy and core competencies.
2. 1 0.3 Implicit assumptions of the relationship between corporate
strategy and performance
A common, often impl icit assumption evident in corporate strategy research is that corporate
strategy positively influences PSFP (e.g., Bower, 1 982; Hitt, Ireland & Palia, 1 982). Dragun
and Knight (200 1 , p. 44) stated that "successful corporate strategies strengthen market power,
augment sales, align the interests of stakeholders, and contribute to shaping the superior financial
performance." Bowman and Helfat (200 1 , p. 3) perceived that "many corporate level factors . . .
theoretically affect profitabil ity", for example, the scope and range of the firm, core
competencies (e.g., Hamel & Prahalad, 1 994; Hitt & Ireland, 1 985, Prahalad & Hamel, 1 990),
organisational structure (e.g., Chandler, 1 962; Mintzberg, 1 979), fi rm culture (e.g., Collins &
Porras, 1 99 1 ; Hansen & Wernerfelt, 1 989; Peters & Waterman, 1 982), and internal governance
70
(e.g., Campbel l et aI, 1 995; Hamermesh, 1 986; Nelson, 1 99 1 ) . Corporate strategy and firm
architecture are claimed by Prahalad and Hamel ( 1 990) to positively influence PSFP, as
demonstrated by GTE's fragmented corporate strategy emphasising competitive strategy and
thus weakening its competitiveness relative to its rival NEC. Adner and Helfat (2003) proposed
that corporate level capabil ities, especial ly capabi l ities within corporate management, greatly
affect PSFP. Markides and WiIliamson ( 1 996) noted that successful performance of related
diversification firms was due to the transferring and sharing of core competencies across the
firm ' s SBUs.
As corporate strategy is expected to provide the basis for al l firm actions, the implicit assumption
is that poorly constructed or inappropriate corporate strategy should greatly impact on PSFP.
Goold and Campbel l ( 1 987a) concurred with the view that "poor" corporate strategy can
negatively impact on PSFP. They argued that the efficiency of SBUs within firms can be
constrained by corporate involvement in their strategic planning. Furthermore, Finlay (2000)
remarked that most parent organisations do not add value as firstly, those involved with
corporate strategy do not possess adequate knowledge of their firm's SBUs, secondly, the parent
unnecessarily constrains and controls SBUs, and thirdly, the same corporate strategies are
inappropriately appl ied across the portfolio of businesses .
Corporate management research (e.g., leadership, executive group and decision making
processes literatures) appears to contribute to the understanding of corporate strategy (e.g.,
Thomas, 1 988; Weiner & Mahoney, 1 98 1 ). For example, research conducted by Ambrosini and
Bowman (2003) concentrated on the content of corporate strategy in terms of the perceptions of
SBU managers. Powell ( 1 996) util ised the perceptions of executives, rather than numerical
sources in determining the impact of the industry on firm performance "because executives'
perceptions influence organisational behaviour, they are an important organisational variable"
(p. 326). RBT research at the corporate unit of analysis includes investigations into the
relationship between corporate assets and firm performance (Farjoun, 1 998; Markides &
Wil l iamson, 1 994). However, some scholars have noted the l imitations evident in corporate
strategy research . Lynch (2003) suggested that there i s s ignificant disagreement in corporate
strategy research due largely to the presence of two schools of thought on the formulation
process of corporate strategy: the deliberate framework versus the emergent model .
Alternatively, Dess et a l ( 1 995) argued that corporate strategy has focused on formulation rather
than implementation. They also contended that "most of the research in the corporate level
strategy area has attempted to examine the relationship between strategy and performance
7 1
without considering the role played by corporate strategy in creating and sustaining competitive
advantage at the business level" (p. 358) .
A large portion of publ ished accounts investigating corporate strategy appear to be based on
either anecdotal evidence derived from either l im ited numbers of case studies by researchers
acting as consultants, or by large scale statistical analysis. Dess et al ( 1 995) observed that the
results and conclusions drawn from cross-sectional analysis poses two issues. Firstly, the
inabi l ity to distinguish cause from effect does not account for a possible performance-strategy
causal relationship, only the strategy-performance relationship. Secondly, cross-sectional studies
are unable to control the impact of unobservables on PSFP, for example, RBT predicts
managerial ski l ls and tacit knowledge are a source of SCA. Furthermore, 10hnson et al (2003)
suggested that managerial activities are marginalised by the concentration of statistical
techn iques: "The value of a resource depends not on its existence but on its uti l isation" (p. 7) .
They argued that methodology should focus on a microperspective delving deeper into the
mechanisms of firms through small sample in-depth case studies.
Much research has been undertaken in areas "outside" the broad area of corporate strategy that
has, to date, not been incorporated in an overal l theoretical framework on corporate strategy.
While the body of work on strategic intent has indicated a relationship with PSFP, this research
has not yet been fully incorporated into the concept of corporate strategy. Some authors when
writing on corporate strategy do not include organisational direction as a component of corporate
strategy (this l imitation is discussed further in Chapter Three).
2. 1 1 EMPIRICAL SUMMARY : PART 11
Research focus on competitive strategy (at the business unit level) has resulted in l ittle empirical
research specifically being conducted on corporate strategy. This is compounded by the
inappropriate use of business unit performance being an inadequate proxy for firm-wide
performance. Due to the lack of empirical evidence of the relationship between corporate
strategy and persistent superior firm performance, it has been necessary to exhibit empirical
research undertaken in an alternative construct, namely, sustainable competitive advantage. This
then raises the question of whether strategic management is only concerned w ith uncovering
sources of sustainable competitive advantage as an explanation for heterogeneous persistent
superior firm performance. The bulk of antecedent l iterature, both theoretical and empirical,
appears to suggest that only competitive advantage leads to persistent superior firm performance.
72
The major l imitation of the extant empirical l iterature involves the focus on inappropriate units
of analysis when estimating the effect of corporate strategy. Any segmentation in thi$ manner is
artificial as firms decide to operate in particular industries, or to structure their firms in terms of
single business units. However, these decisions are made by the firm at the corporate level
through the mechanisms of corporate strategy.
The aim of both the structure-conduct-performance and the resource based theory paradigms
regarding the creation of law-l ike generalisations has not eventuated, for example, industry
business-corporate effects on business unit performance, diversification strategy-performance
l inkage, and the structure-performance relationship. However, the various normative models
presented assume law-like generalisations are able to be reproduced universally. Contextual
issues also exist, for example, the generalisabi lity of usually cross-sectional studies on large
United States-based firms. In summary, the empirical relationship between corporate strategy
and persistent superior firm performance remains largely unresolved. Competitive strategy and
corporate strategy may be correlated but they are not the same phenomenon.
The fol lowing questions remain unanswered: Why do some firms continually outperform others
and what role, if any, does corporate strategy have on the performance of firms? Much of the
empirical research reviewed in this chapter did not estimate the influence of corporate, business,
industry or year effects on the performance of the entire firm. Theoretically, corporate strategy
influences not just the performance of a single business, corporate strategy should also influence
all business units and the firm as a whole through such mechanisms as core competencies,
synergy and unified direction. Furthermore, although the empirical l iterature reviewed supplied
evidence that decisions made at the corporate level have a positive influence on business unit
performance, they did not seek to provide an explanation of how or why.
There has been l imited l iterature on developing specific theoretical models of corporate strategy
and analysis at the firm level . A universal ly accepted definition of corporate strategy has not
been agreed upon. Therefore, the prevai ling misconception of what is corporate strategy
suggests that the impact of corporate strategy could be greater than that estimated in the
empirical l iterature. The lack of research into corporate strategy is surprising considering
amount of time and effort invested in firms (Ambrosini & Bowman, 2003) . Often corporate
strategy reflects the firm ' s future direction and decisions and these are the strategies
communicated to the business community. Therefore, the primary aim of this research i s to
determine if heterogeneous firm performance is a result of heterogeneity of corporate strategy
73

evident across firms, that is, does corporate strategy contribute to persistent superior firm
performance? Consequently, this question initiates two additional avenues of research: a focus
on corporate strategy rather than competitive strategy, and a focus on persistent superior firm
performance rather than sustainable competitive advantage. Persistent superior firm
performance has been introduced as an alternative measure of firm performance.
There has been a concentration of strategic management research on the concept of sustainable
competitive advantage and business level competitive strategy. Consequently, corporate strategy
has often been considered extraneous to the achievement of firm performance. Those aspects of
corporate strategy that have been advanced appear to have been placed on the periphery of
strategic management.
74
3.0 CONCEPTUAL FRAMEWORK AND
OPERA TIONALISATION
This Chapter is divided into two sequential parts: Part I presents a conceptual framework of
corporate strategy whi le Part 11 outl ines the potential operationalisation of the conceptual
framework. The discussion presented in Chapter Two concluded with the observation that
corporate strategy has not been well incorporated into the prevai l ing strategic management
theoretical frameworks. The incompleteness of these frameworks has encouraged additional
conceptualisations of corporate strategy. Framing corporate strategy decisions as a resource, as
suggested by RBT, may provide an explanation as to why and how corporate strategy impacts on
firm performance. The conceptual framework presented provides a tentative theory, in other
words, it is a system of theorised concepts, assumptions and relationships which explains if
corporate strategy contributes to firm performance.
PART I : A CONCEPTUAL FRAM EWORK OF CORPORATE
STRATEGY
3. 1 CONCEPTUAL OVERVIEW
Part I is structured as follows. The common definitions of corporate strategy are reported on and
an appropriate definition of corporate strategy employed in this research is presented. A concise
conceptual model is provided in which the components of corporate strategy are categorised into
the four corporate strategy attributes first introduced in Chapter One. The propositions and
research statements used in this study are then developed. This part of the Chapter concludes
with a critical review of the four attributes of corporate strategy.
3.2 WHAT IS CORPORATE STRATEGY?
F i rm performance is a multidimensional construct which can be influenced by numerous
variables. It is often assumed that firm performance is relatively stable, predictable,
determinable, and controllable (March & Sutton, 1 997). Both exogenous and endogenous
factors are thought to influence corporate strategy decisions and, therefore, PSFP. The empirical
evidence outlined in Chapter Two suggests, however, that endogenous factors could account for
the largest contribution to PSFP. The focus here is on the aggregate appraisal of firm
75
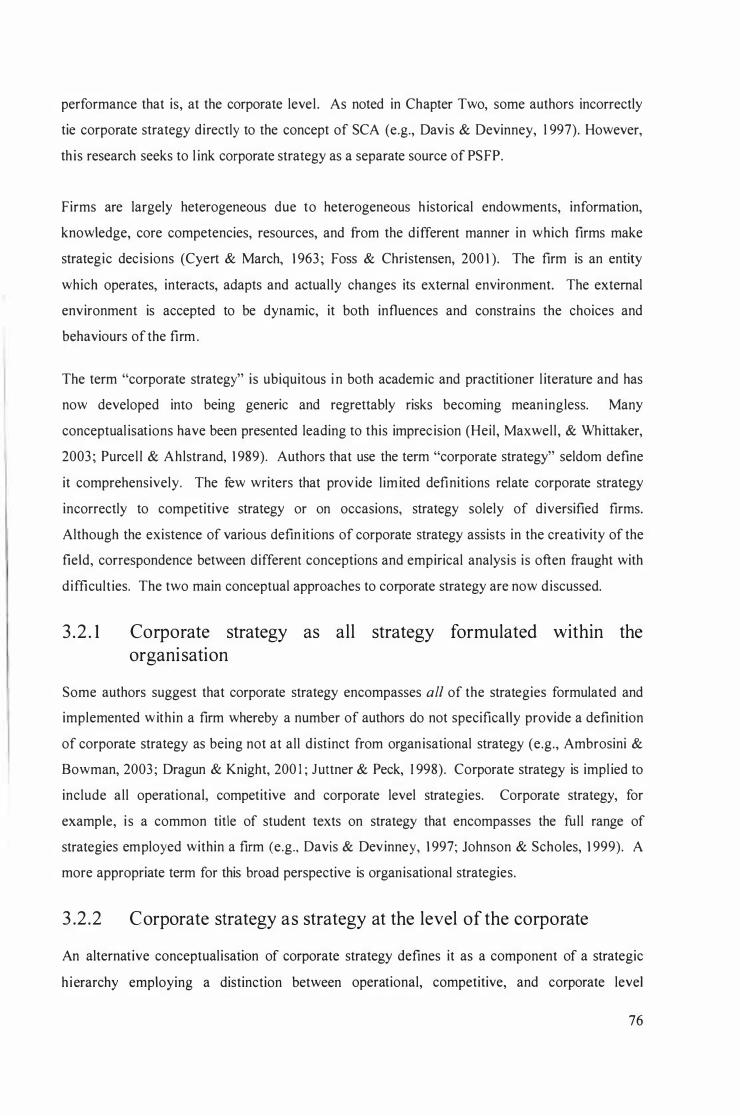
performance that is, at the corporate level . As noted in Chapter Two, some authors incorrectly
tie corporate strategy directly to the concept of SCA (e.g., Davis & Devinney, 1 997). However,
th is research seeks to l ink corporate strategy as a separate source of PS FP.
Firms are largely heterogeneous due to heterogeneous historical endowments, information,
knowledge, core competencies, resources, and from the different manner in which firms make
strategic decisions (Cyert & March, 1 963 � Foss & Christensen, 200 1 ). The firm is an entity
which operates, interacts, adapts and actually changes its external environment. The external
environment is accepted to be dynamic, it both influences and constrains the choices and
behaviours of the firm .
The term "corporate strategy" is ubiquitous i n both academic and practitioner l iterature and has
now developed into being generic and regrettably risks becoming meaningless. Many
conceptual isations have been presented leading to this imprecision (Heil, Maxwell, & Whittaker,
2003 � Purcel l & Ahlstrand, 1 989). Authors that use the term "corporate strategy" seldom define
it comprehensively. The few writers that prov ide lim ited definitions relate corporate strategy
incorrectly to competitive strategy or on occasions, strategy solely of diversified firms.
Although the existence of various defin it ions of corporate strategy assists in the creativity of the
field, correspondence between different conceptions and empirical analysis is often fraught with
difficulties. The two main conceptual approaches to corporate strategy are now discussed.
3 . 2 . 1 Corporate strategy as all strategy formulated within the
organisation
Some authors suggest that corporate strategy encompasses all of the strategies formulated and
implemented within a firm whereby a number of authors do not specifically provide a definition
of corporate strategy as being not at all distinct from organisational strategy (e.g., Ambrosini &
Bowman, 2003 � Dragun & Knight, 200 I ; Juttner & Peck, 1 998). Corporate strategy is impl ied to
include all operational, competitive and corporate level strategies. Corporate strategy, for
example, i s a common title of student texts on strategy that encompasses the full range of
strategies employed within a firm (e.g., Davis & Devinney, 1 997� Johnson & Scholes, 1 999). A
more appropriate term for this broad perspective is organisational strategies.
3 .2 .2 C orporate strategy as strategy at the level of the corporate
An alternative conceptualisation of corporate strategy defines it as a component of a strategic
h ierarchy employing a distinction between operational, competitive, and corporate level
76
strategies (e.g., Beard & Dess, 1 98 1 ; Campbel \ & Faulkner, 2003) . Bourgeois ( 1 980) cites
Vanci l and Lorange ( 1 975) as the first to divide strategy into a corporate and competitive
strategy hierarchy. Various alternative firm strategy hierarchies have been proposed and include
those by Andrews ( 1 97 1 ) and Hamermesh ( 1 986) who suggested that three levels of strategy
exist: competitive, corporate, and, institutional strategy. Grunig and Kuhn (200 1 ) also contended
that organisational strategy should be div ided into three constituents, but of a different hierarchy:
mission statement, corporate strategy and, competitive strategy. The strategic h ierarchy util ised
for thi s research separates strategy into three levels (refer to F igure 3 . 1 ), namely, corporate
strategy, competitive strategy, and operational strategy (Beard & Dess, 1 98 1 ; Harrison, 2003) .
Figure 3.1 Strategy hierarchy
STRATEGY AT THE :
Corporate level
Corporate strategy
Business level
DOMAIN AND FIRM DEFINITION ( Where to compete? What are the characteristics of the ftrm?)
Competitive strategy
DOMAIN NAVIGATION (How to compete?)
Functional level Operational strategy
I MPLEMENTATION AND EXECUTION (How resources w ill be managed so that competitive strategies w i l l be achieved?)
Adapted from Harrison, J. S. (2003, p. 1 9) . Strategic management of resources and relationships: Concepts and cases. New York: John Wi ley & Sons, Inc.
Competitive strategy is defined as those strategies employed to determine how the firm wil l
compete in its markets, aiming to secure SCA. In other words, strategies that operate at the
business level of the firm (Bowman & Faulkner, 1 997; Col ley, Doyle & Hardie, 2002; Grant,
2002a; Porter, 1 980, 1 985) . Examples of competitive strategies include the discovery of new
market opportunities, and the development of new products and services to satisfY customer
demand. The most influential competitive strategy typologies include those of M iles and Snow's
( 1 978) reactor, prospector, analyser and defender model, and Porter' s ( 1 980) generic competitive
strategies. However, competitive strategy translates corporate strategy into that ofthe SBU.
Operational strategy is defined as those functional level strategies created to implement and
execute competitive strategy. Short-term operational strategies direct individual departments
within the firm. Johnson and Scholes ( 1 999) defined operational strategies as those "concerned
77
with how the component parts of the organisation in terms of resources, processes, people and
their ski l ls effectively deliver the corporate- and business-level strategic direction" (p. 1 3) .
3 .2 .3 Strategy at the corporate level
If the term corporate strategy has been misconceived and misunderstood, strategy evident in the
corporate level of the strategic h ierarchy i s even more ambiguous. The proliferation of
definitions has resulted in unclear and distorted boundaries between what is and what may not be
corporate strategy. Ambrosini and Bowman (2003) observed that due to the different definitions
of corporate strategy, it has been difficult to empirically quantify and measure. The disparate
nature of corporate strategy is demonstrated by the fol lowing three perspectives evident within
the l iterature.
a) Corporate strategy is only appropriate for multiple business firms
Coordination and control issues resulting from the diversification strategies of the early twentieth
century led to the design of firms changing from functional structures (V-form) to business unit
configurations, that is, multidivisional structure (M-form) (Chandler, 1 962; Hoskisson, H il l &
Kim, 1 993a). Consequently, operational decisions were decentrali sed to the SBVs with the aim
of allowing the corporate headquarters to focus on the overal l coordination, control and strategic
direction of the organisation (Chandler, 1 962 ; Hoskisson et ai, 1 993a). The unit of analysis
focused on the business level and firm performance was perceived as an aggregation or
consol idation of business performance.
A number of authors have subsequently impl ied that corporate strategy is only applicable to
firms with more than one SBV. The "multiple business firms only" definition of corporate
strategy rests on the premise that corporate strategy i s only domain orientated that i s, concerns
the selection of products, markets and industries, and al locating resources among them (e.g.,
Bergh, 200 I ; Bourgeois, 1 980; Campbel\ & Faulkner, 2003 ; Chaffee, 1 985 ; Ghemawat & Ricart
I Costa, 1 993 ; Grant, 2002a; Hitt & Ireland, 1 985 ; Stalk, Evans & Shulman, 1 992). For
example, Grant (2002a) argued that corporate strategy involves decisions on the scope of the
firm' s operations within particular selected industries and markets. Therefore, corporate strategy
should answer the following questions: Where should a firm compete? and, what business/es
should a firm be in? (Beard & Oess, 1 98 1 ; Porter, 1 99 1 ).
Furthermore, because most of the l iterature assumes that multiple business firms are d iversified,
corporate strategy is assumed to be related to diversified firms only. Such examples include the
78
view that "because corporate strategy is fundamental ly concerned with the selection of which
businesses a firm will be in, it basically involves decisions about the nature of diversification"
(Barton & Gordon, 1 987, p. 73) . Both Bowman and Helfat (200 1 ) and McGahan and Porter
(2002) argued that corporate effects cannot be separated from business effects in single firms (as
discussed in Chapter Two). An example of the rationale employed to justify defining corporate
strategy in terms of diversified firms includes that by Hamermesh ( 1 986) who suggested that
s ingle business firms do not uti l ise corporate strategy as they only compete in one industry and
al locate resources to the one business.
As previously discussed in Section 2 . 1 0.2, some authors have uti l i sed the concept of "parenting"
to define corporate strategy (e.g., Campbel l & Faulkner, 2003 ; Campbell et aI, 1 995 ; Coll is &
Montgomery, 1 998; Finlay, 2000) . This v iew of corporate strategy classifies the parent as the
remaining organisational structure once the SBUs have been subtracted. For Campbel l et al
( 1 995, p. 1 2 1 ), "the parenting framework is grounded in the economics of competitive strategy"
whereby the parent should add value to the SBUs through the fit of the ski l ls of the parent. The
skil l s of the parent include enhancing SBU strategy, organisational legitimacy, and the
management of firm portfolios, financial institutions, governmental agencies, publ ic relations
(Beard & Dess, 1 98 1 ) . Campbell and Faulkner (2003) conceptualised corporate or parenting
advantage as an integration of two paradigms, namely, the synergy school ( i .e., RBT) and the
portfolio school ( i .e., diversification). As a result of this merging, they defined corporate
strategy as the fit between the following three factors: value creation through the management of
mUltiple businesses by one team, the selection of appropriate businesses for the firm's portfolio,
and lastly, the successful management of the portfolio. Defining corporate strategy as the
management of the firm ' s portfolio through the management of synergies across the firm's
businesses has also been advanced by Thompson (200 1 ) . However, Mintzberg ( 1 988) suggested
that this v iew of corporate strategy is false as portfolio management merely extends competitive
strategy.
b) Specific corporate strategies
A significant body of research has defined corporate strategy in terms of specific corporate
strategies such as restructuring, acquisitions, mergers, divestment and diversification. Dess et al
( 1 995) defined corporate strategy as "the study of diversification strategy, acquisitions, new
ventures, and vertical integration can all be grouped into the rubric of corporate strategy"
79
(p. 3 64) for example. The content of this research concentrates on an in-depth analysis of the
specific corporate strategy and its possible impact on firm performance. Consequently, these
articles seldom provide a definition of corporate strategy.
c) Corporate strategy as competitive strategy
The third argument suggests that either corporate strategy is equivalent to competitive strategy or
corporate strategy i s an extension of competitive strategy. The first view defining corporate
strategy as being equivalent to competitive strategy includes contributions from Hula ( 1 989) who
util i sed the term "corporate strategy" in his paper but the research actually addresses competitive
strategy (i .e., advertising and R&D strategies within a business unit). Simi larly, Mi l ler and
Toulouse ( 1 986) titled their article, "Chief executive personality and corporate strategy and
structure in small firms" and yet the strategies investigated were business level rather than
corporate strategies. Furthermore, Tsoukas and Knudsen (2002, p. 422) stated that "most
researchers agree that the chief purpose of corporate strategy is the creation of sustainable
competitive advantage." However, the creation of SCA is the chief purpose of competitive
strategy, not corporate strategy, and remains a concept relevant only to BUP, not firm
performance.
Secondly, corporate strategy is often defined as an extension of competitive strategy but on a
mUltiple-product scale (Bowman & Faulkner, 1 997) . Grunig and Kuhn (200 1 ) extended the
definition of competitive strategy making it less specific and broader in context, transferring it to
a h igher level and termed it "corporate strategy". For example, they argued that corporate
strategy involves determining target market positions (as measured by market share) for the
businesses within the firm. The focus of the strategic management l iterature on competitive
strategy has been justified by the assumption that the key to a firm 's success is achieving SCA
(Campbell et ai, 1 995; Finlay, 2000; Grant, 2002a). For example, Bowman and Faulkner ( 1 997)
proposed that a firm may be profitable even if its corporate strategy is defective whereas, the
firm wi l l fai l if the competitive strategy it employs is inappropriate. In single business firms, this
approach to corporate strategy treats competitive strategy and corporate strategy as being largely
synonymous (Bowman & Helfat, 200 1 ; Hamermesh, 1 986; H itt & I reland, 1 985 ; McGahan &
Porter, 2002; Sadler, 2003; Thompson, 200 1 ) .
3 .2.4 The definition of corporate strategy employed in this research
This research regards corporate strategy as a separate and distinct category of strategy uti l ised by
firms, as graphically represented in Figure 3 . 1 . Corporate strategy is applicable to all firms, not
80
just multiple business firms. Corporate strategy then arises from the discretionary and deliberate
decisions made at the corporate level that is, corporate strategy is created from managerial intent.
The competitive strategy of SBUs is subsequently "aligned" to the firm ' s corporate strategy.
If corporate strategy results from various firm decisions, dissimilar corporate strategies are l ikely
to be developed and employed, eventually leading to heterogeneous firm performance. As
Bower ( 1 982, p . 63 1 ) observed, "the way Polaroid carries out research is fundamental to the
strategy of the firm and to why it is different from Kodak". It is assumed that corporate strategy
involves largely a top-down process because if strategy was created solely from a bottom-up
process, firms would most likely operate only as SBUs. There must be some advantages for the
corporate form, and hence the need for corporate strategy for these advantages to exist.
Although strategy can be viewed as an emergent process, this research focuses on a firm's stated
intended or realised strategy (resultant from deliberate formulation) as it is easier to identify and
measure. Thi s research then does not seek to make a distinction between deliberate and
emergent strategy. Creating broad theoretical and conceptual frameworks of what corporate
strategy is wil l assist in the ongoing development of empirical findings and this wi l l be discussed
below.
3.3 THE ENDS AND MEANS OF CORPORATE
STRATEGY
Purcell and Ahlstrand ( 1 989) argued that l imiting corporate strategy to future objectives and
business portfol ios i s simplistic. Separating corporate strategy into the components of "ends and
means" has precedence in the l iterature (e.g., Bower, 1 982; Lynch, 2003 ; Nelson, 1 99 1 ) . For
example, strategy encompasses ''the determination of the basic long-term goals and objectives of
an enterprise, and the adoption of courses of action and the al location of resources necessary for
carrying out these goals" (Chandler, 1 962, p. 1 3) .
Various components of corporate strategy have been proposed in the l iterature (e.g., Bowman &
Faulkner, 1 997; Col l i s & Montgomery, 1 998; Porter, 1 987). For example, Goold and Campbell
( 1 9 87b) suggested that corporate strategy encompasses corporate identity and internal
governance. Corporate strategy has also been viewed as involving firm legitimacy, directing
what businesses the organisation should be in, and establishing long-term strategic intent (Pearce
& Randel, 2004). Andrews ( 1 97 1 ) considered that market opportunities, core competenc ies and
resources, values and aspirations, and societal obl igations are the four components of corporate
8 1
strategy. Therefore, the construct of corporate strategy is primarily concerned with determining
organisational direction and formulating how the company will achieve their stated strategic
intent. As was noted in Section 3 .2.4, these strategic decisions are made at the corporate level of
the firm.
3 .3 . 1 Organisational direction
The fol lowing section outlines the rationale within the l iterature of why organisational direction
should be selected as a component of corporate strategy. This is followed by a definition of
strategic intent, reasons for selecting strategic intent, and lastly the relationship between strategic
intent and PSFP.
There i s disagreement as to whether organisational direction should be included as part of
corporate strategy. Although some scholars have elected to establ ish organisational direction as
a d istinct construct (e.g., Hamermesh, 1 986; Hofer & Schendel, 1 978), thi s research fol lows the
preponderance of views that incorporates organisational direction as a component of corporate
strategy. For example, "corporate strategy is the pattern of major objectives, purposes, or goals
and essential policies and plans for achieving those goals" (Andrews, 1 97 1 , p. 28).
Various lines of research within organisational direction have included identifYing the
composition of organisational d irection and suggesting preferred or desirable elements (e.g.,
Ireland & Hitt, 1 992; Klemm, Sanderson & Luffman, 1 99 1 ). Organisational direction research
has also been uti lised to justifY the initiation of the organisational direction process within firms
(e.g., O'Gorman & Ooran, 1 999), and to formulate "how to create" models (e.g., A lien, 1 995) .
Other research streams include h ighl ighting emerging trends in management initiatives and
spec ifYing what objectives firms should aspire to (e.g., qual ity, customer service), and revealing
the relationships between organisational direction and other aspects (e.g., human intellectual
capital, Bart, Bontis & Taggar, 200 1 ).
The establ ishment of a centralised organisational direction should provide the basis for all firm
decision making processes, thus h ighl ighting and guiding potential opportunities, innovation and
contributions that are acceptable to the particular firm (Ackerman, 1 970; Hamel & Prahalad,
1 989, 1 994). It has been noted that organisational d irection was a prerequis ite for firm
leadership, especially long-term effectiveness and success (Chakravarthy, 1 997; Fahy, 2000;
lohnson & Scholes, 1 999; Thompson, 1 997). Matejka, Kurke and Gregory ( 1 993) in support of
this approach, argued that "organisations are underachieving because they are directionally
82
impaired" (p. 35 ) . Organisational d irection establishes communication through tools such as
vision, mission, business definition, and values (Harrison, 2003) . Organisational direction also
creates firm identity with stakeholders both internally whereby providing guidance for decision
making, and external ly whereby providing an understanding of the firm' s motives and
relationships (Thomas & Pruett, 1 993).
Hamel and Prahalad ( 1 989, 1 994) argued that organisational direction should be based on
resources and core competencies. Both Lawler ( 1 994), and Bartlett and Ghoshal (2002) argued
that skil led people (their knowledge and expertise) are vital and scarce resources in most firms
and the effective uti l i sation of people does not entail the traditional management mechanisms
associated with compliance, but rather includes practices affiliated with self-discipline and
emotional connection. Castanias and Helfat (200 1 ) noted that managers are able to potentially
influence PSFP through the appropriate util isation of their human capital ( i .e., leading,
organising, d irecting and decision making ski lls). S imi larly, Bennis (2002) in a contribution to
leadership, argued that employees sought direction from their leaders. Obtaining employee
motivation and commitment can lead to the attainment of strategic intent (Hansen & Wernerfelt,
1 989; Monroe, 2002 ; Powell, 1 996; Vecchio & Appelbaum, 1 995; Wilson, 1 992).
Several constructs have been presented as mechanisms of organisational direction, for example,
m ission, vision and objectives. For the purposes of th is research, strategic intent has been
selected as the mechanism for del ivering organisational direction and wi l l be comprehens ively
defined in the remainder of this Section . Although strategic intent could have been placed at the
"ends" level rather than using the term "organisational direction", for simpl ic ity for the reader,
strategic intent has been placed at the same level of analysis as the "means" components, so that
the level of the attributes in the model and subsequent data collection and analysis i s equivalent.
a) Strategic intent
Numerous researchers have published research on a variety of conceptions of organisational
direction, whether termed purpose, vision, mission, or strategic intent (e.g., Avison, Eardley &
Powell , 1 998; Bart et ai, 200 1 ; Brown & Eisenhardt, 1 998; Campbell , Devine, & Young, 1 990;
Coll ins & Porras, 1 99 1 , 1 994; Covin & Slevin, 1 994; De Kluyver, 2000; Hamel & Prahalad,
1 989, 1 994; I reland & Hitt, 1 992; Kirkpatrick & Locke, 1 996; Mi l ler & Dess, 1 996; Pearce &
David, 1 987; Proctor, 1 997; Rampersad, 200 1 ). The proliferation of definitions has resulted in
unclear and distorted boundaries between the concepts of organisational direction, leading to
confusion within both academic and practitioner fields. From the mission (which is often
83
defined as a statement of firm purpose) and vision l iterature, it is apparent that these concepts are
both somewhat incompatible and incomplete . Skat-Rordam ( 1 999) argued that v ision and
mission have been misused and are vague. He suggested that the reason for the fai lure of these
concepts has been due to the inabil ity to define and implement desired change that l inks the
future with the present.
Defining strategic intent
Strategic intent was defined by Hamel and Prahalad ( 1 989, 1 994). Strategic intent is framed
within the principle of strategy as "stretch" (ambition beyond the firm's current resources) and is
the "spirit" of a company's strategic architecture (Hamel & Prahalad, 1 994). Hamel and
Prahalad defined strategic intent as a unique view of leadership in a future market or position
shared by all employees. It is a stretch target that can be described by all employees. Hamel and
Prahalad v iewed strategic intent as critical to the long-term surv ival of the firm, especially for
those wishing to obtain global leadership . Strategic intent is fundamentally concerned with
reaching the future first and changing industry rules, boundaries and standards. In other words,
challenging the status quo by ensuring that firm activities are contributing to the core
competencies required (Day, 1 994), and by overcoming the constraints of l imited resources
(Babbar & Rai, 1 993) . Thus, these firms are in the best position to challenge existing positions
and to take advantage of emerging opportunities (Mark ides, 1 999). Strategic intent encompasses
future threats and opportunities thereby increasing the range of strategic choices available to the
firm (Heugens & van Oosterhout, 200 1 ) . Furthermore, "strategic intent broadly constrains the
'where' , but not the 'how' " (Hamel & Prahalad, 1 994, p. 1 45). It is concerned with economies
of scope, in addition to economies of scale (Przybylowicz & Faulkner, 1 993).
Strategic intent is the "heart" of strategy: It is a positive and ambitious aspiration that suppl ies
the emotional and intellectual vital ity for reaching the future (Hamel & Prahalad, 1 989, 1 994).
The strategic intent should create an internal firm-wide tension, inspiring and compel l ing al l
employees to be dedicated to the specified future direction. Strategic intent generates creativity,
motivation, flexibi l ity, stabi lity, directional focus, enthusiasm and commitment to achieving the
stated goal (Monroe, 2002). For the Coca-Cola Company, strategic intent has been to put a Coke
within "arm's reach" of every consumer in the world. This clearly defined, transformational
intent is in contrast to the commonly uti l i sed goals based on financial measures (Pearson &
Proctor, 1 994; Proctor, 1 997) .
84
Bamel and Prahalad divided the strategic intent construct into three elements, namely, a sense of
direction, a sense of discovery, and a sense of destiny. A sense of direction is expressed as the
strategic intent articulates a long-term position that the firm seeks to achieve over time. Strategic
intent should shape the structure of future industries. Strategic intent encompasses a sense of
discovery as it provides a unique picture of the future distinct from other firms. Therefore,
employees must release their creativ ity and discover new possibil ities and opportunities to reach
the stated future. Strategic intent should also be perceived as worthwhile by employees whereby
employees possess an emotional connection to the firm, and thus, achieving a sense of destiny .
Creating firm aspirations i s a key role of corporate strategy (Bryan, Lyons & Rosenthal, 1 998) .
The three strategic intent elements are closely related and combine to create energy, passion,
motivation, purpose and direction (Monroe, 2002) .
Reasons for selecting strategic intent as an attribute of corporate strategy
Bamel and Prahalad ( 1 989, 1 994) proposed that the concepts of mission or v ision are deficient as
these mechanisms do not focus on the firm's destiny therefore, this research uti l ises strategic
intent as the attribute of organisational direction. Vision and mission appear to constrain how to
achieve the stated organisational direction and restrict the appl ication of the core competency
approach. Strategic intent involves both direction creation and a process to achieve the direction.
In addition, strategic intent encapsulates elements of the other concepts and it is a "total"
construct rather than part of a hierarchy (as evident with mission and vision). Furthermore, one
target, rather than a hierarchy of various missions and visions, is easily communicated and serves
as a unifying theme for the numerous, competing stakeholders (Hannon, 1 997).
Strategic intent moves beyond the other organisational d irection concepts as it advocates
continued improvement, in other words, the aim of strategic intent is to persuade employees that
current performance is inadequate (Hamel & Prahalad, 1 989, 1 994; Markides, 1 999). A
significant constituent of strategic intent is the creation of an obsession for winning at all levels
within the firm with a long-term quest for global leadership. Strategic intent demands resources
and capabi lities are stretched, and thus, challenging and increasing inventiveness, creativity and
momentum. Strategic intent does not require a charismatic or transformational leader to
communicate strategic direction and obtain employee commitment. Strategic intent demands the
involvement of all employees, not just the corporate level decision makers. The corporate level
decision makers must create and sustain the additional components of strategic intent,
specifically, the emotional connection and chal lenge of strategic intent (Hamel & Prahalad,
1 994). Employees are fully integrated into the process and move beyond rational acceptance,
85
i nstead becoming personal ly and emotionally committed to achieving the firm ' s strategic intent
(Markides, 1 999; Monroe, 2002). Therefore, strategic intent becomes the energising force
behind the firm's success.
Proposition I . Strategic intent is an attribute of corporate strategy.
Empirical research on the association between strategic intent and persistent superior firm performance
Various scholars have provided anecdotal statements of how and why strategic intent leads to
PS FP, for example, as a mechanism for control l ing firm-wide decision making (Ambrosini &
Bowman, 2003 ; Fawcett, Smith & Cooper, 1 997; Love, Priem & Lumpkin, 2002). S imilarly,
Bontis and Dragonetti ( 1 999) noted that organisational commitment is critical to h igher firm
performance. The firm should be managed in terms of the specified strategic intent as it
"represents the framework for the entire business, the values that drives the company and the
belief that the company has in itself and what it can achieve" (Colin Marshall, Chief Executive
Officer British Airlines, 1 985 as cited in Sadler, 2003 , p. 58) .
Corporate strategy encompasses the strategic perspective of the firm (Thompson, 200 1 ). It is the
corporate level decision makers' job to develop a core competence building plan, creating
corporate chal lenges which are stepping stones to the strategic intent, to continually focus the
firm on the stated corporate challenge, and ensure the alignment of employee performance
measurement and the stated corporate chal lenge (Hamel & Prahalad, 1 994). An important aspect
of corporate strategy is provided by strategic intent as it imparts a unified firm-wide ideology or
interpretation system (Westley, 1 990). Strategic intent is also util ised in establ ishing firm
culture, ethics, leadership, stakeholder relationship management, portfolio management of
individual businesses and core competencies (Finlay, 2000).
Whether or not firms require all aspects of strategic intent has not been resolved. Possessing
one, or all, of the characteristics of strategic intent should cause PSFP. The three components of
strategic intent may be achieved in different time frames although they should be initiated at the
same time. For example, the aspects of personal commitment and obsession with winning may
take longer to embed in the organisation.
Regrettably, l imited empirical evidence investigating strategic intent has been presented.
Imprecise definitions enveloping the mechanisms of strategic intent have reinforced the
86
uncertainty and indistinctness surrounding the relationship between strategic intent and PSFP.
Four empirical studies of strategic intent are outl ined. Fawcett et al ( 1 997) surveyed executives
to determine whether there was a relationship between strategic intent and firm performance.
They examined the al ignment between strategic direction, measurement systems and operational
performance by utilising a mailed survey to 1 3 1 senior executives. They found that "the greatest
obstacle to competitive success seems to be maintaining focus and consistency among strategic
goals and value-added capabilities" (Fawcett et ai, 1 997, p. 4 1 1 ) . They concluded that what is
measured is more important to employees than the stated strategic intent. Therefore, when the
corporate level decision makers aligned both strategic intent and measurement systems, PSFP
resulted. The careful selection ofthe strategic intent and the process undertaken when seeking to
achieve it, also contributes to PSFP.
Przybylowicz and Faulkner's ( 1 993) article on Kodak outlined the implementation of strategic
intent in a firm . They suggested that strategic intent provided focus, energy and long-term
direction. Kodak also benefited from the building and leveraging of capabilities across
departments, and forging closer interdepartmental relationships. The third major gain centred on
highlighting horizontal market opportunities: opportunities that the firm would not have been
taking advantage of during the normal course of events.
Monroe (2002) empirically investigated strategic intent in New Zealand firms and found a
relationship between the possession and util isation of strategic i ntent and PSFP. Successfu l
firms were characterised to hold strategic intent by varying degrees. Those with high levels of
strategic intent also possessed high of levels of emotional connection to their employees.
Monroe (2002) concluded the three strategic intent components are closely related, mutually
reinforcing, and interdependent.
Johnson and Sohi (200 1 ) uti l ised strategic intent as a measure of a firm's strategic ambition or
aggressiveness, and measured strategic intent to the success of interfirm relationships. This
research was based on data collected from 3 1 9 questionnaires. They concluded that the more
strategically aggressive the company, the greater the effectiveness of these relationships, due to
increases in reciprocity, information transfer and cooperation.
As the empirical research on strategic intent offered is l imited, it is necessary to outline research
which has been presented on the relationship between PSFP and additional concepts of
organisational d irection, namely, mission and vision . Some research appears to implicitly
87
assume that statements of organisational direction are a determinant of success (e.g., Falsey
1 989; Germain & Cooper, 1 990; Klemm et ai, 1 99 1 ; Martin, 1 999; Rarick & Vitton, 1 995). As
Mazza ( 1 999, p. 86) noted, "the success of mission statements as a fashionable management tool
is mainly taken for granted, without further explanations on the reasons of this success and on its
nature." O'Gorman and Ooran ( 1 999) and Sexton and Van Auken ( 1 985) observed that some
researchers automatically related PSFP to the possession of a mission instead of considering that
success may be attributed to the processes a firm undergoes when formulating that mission.
A number of researchers could not l ink PSFP to mission (e.g., Oavid, 1 989; Mone, McKinley &
Barker, 1 998; Muel ler, McKinley, Mone & Barker, 200 I ; O'Gorman & Doran, 1 999). Other
studies have attempted to link mission to PSFP without conclusive results (e.g ., Calfee, 1 993 ;
Campbell, 1 992 ; Oavid, 1 989; I reland & Hitt, 1 992; Matejka & Brooks, 1 993 ; Wilson, 1 992).
Thi s v iew was reinforced by Bart and Baetz ( 1 998, p. 848) who concluded that "most of the
previous writings extol l ing the virtues of having a mission statement appear to be wrong or
incomplete." The l inkage between mission and PSFP was also questioned by P iercy and Morgan
( 1 994) as they observed that there is a "remarkable lack of empirical evidence for the claimed
and assumed positive effects of mission" (p. I ) . For example, Bart and Baetz ( 1 998) studied the
mission statement-PSFP relationship and found that "the presence of mission statements were
not automatically associated with superior firm performance" (p. 848). Furthermore, Quigley
( 1 993) proposed that the empirical linkage between vision and PSFP appeared l imited.
However, some researchers have provided empirical evidence l inking the existence of a mission
or v i sion to PSFP. Pearce and David ( 1 987) presented the first empirical research l inking
mission statements and PSFP. They concluded that successful companies have "comprehensive"
missions. By contrast, Appelbaum, St-Pierre and Glavas ( 1 998) noted that firms may create
unclear, inappropriate visions which impact negatively on PSFP. Rarick and Vitton ( 1 995)
showed that firms possessing a mission had a higher average return on equity than those without
miss ions. A number of researchers proposed that a positive relationship to PSFP resulted from a
more intensive effort to monitor firm performance or by improvements in employee motivation
and al ignment. For example, Collins and Porras ( 1 99 1 ) demonstrated that m issions motivated
employees, and thus increased performance in comparison to "nonmission" firms. Bart and
Baetz ( 1 998) argued that PSFP originates from the adjoining development of inclusive mission
creation processes and al ignment with performance evaluation systems. In later research, Bart et
al (200 1 ) advocated that the success of the mission was dependent upon "post-development
realignment" with employee behaviour. They observed that the success of a mission is
88
dependent on the emotional connection, l inkage to values and commitment of the firm ' s
employees. The impact o f vision on P S FP has been related to culture (Kotter & Heskett, 1 992).
Kirkpatrick and Locke ( 1 996) suggested that a relationship between vis ion and PSFP existed
whereby vision provided intellectual stimulation and inspiration. Vision was also found to
impact positively on the fi rm Clark and Morgan (200 1 ) studied by instil l ing a sense of focus and
discipl ine, especially given the dynamic environment experienced. Wilson ( 1 992) and Testa
( 1 999) also concluded that PSFP is positively correlated to vision by increases in sales, employee
commitment and shareholder value.
Research statement 1 . Strategic intent does contribute to persistent firm performance.
3 .3 .2 Means of achieving organisational direction
Several researchers have argued that corporate strategy involves those decisions relating to how
the firm is to be managed (e.g., Harrison, 2003 ; Porter, 1 987; Thompson & Strickland, 1 996).
These corporate level decisions encompass defining the boundaries of the firm, namely, what the
firm does and does not do (Baron, 1 995), and al locating resources among competing businesses
and activities (Hamermesh, 1 986). In addition, internal governance and management processes
have been viewed as being important aspects of corporate strategy (Campbell et aI, 1 995;
Pettinger, 1 996). Spender ( 1 993) advocated that strategy can be viewed as "the pursuit of
efficiency through market selection, resource allocation and the administration of work" (p. 1 4).
Three means of achieving organisational d irection, namely, organisational domain, internal
governance, and resource governance are now discussed. For each, a definition is outlined,
including the reasons for its selection, and the relationship between it and PSFP.
a) Organisational domain
Defining organisational domain
Organisational theorists have recognised that the complex and dynamic nature of the
environment means that managers cannot effectively comprehend and react with the entire
environment. Consequently, the corporate level decision makers decide to restrict the interaction
between the firm and its environment to selected parts. The definition of the operating
environment of the firm is termed organisational domain. Organi sational domain has been
defined as the "domain of activity through selection of business areas in which the company wil l
compete" (Harrison, 2003, p . 1 9). It encompasses decisions relating to the boundaries of the
firm including what it does not do therefore, guiding the characteristics of the firm (Baron,
1 995). Organisational domain then involves decisions on whether to enter or leave an industry
89
as that industry evolves (Duncan & Weiss, 1 979). As Helfat and L ieberman (2002, p. 727)
noted, "every time the technology or state of business practice shifts, firms must decide whether
to participate in this next phase of the industry."
Reasonfor selecting organisational domain as an attribute of corporate strategy
Corporate strategy has been defined as encompassing the range, scope and diversity of firm
activities and includes deciding what industries firms should be in and withdraw from (Harrison,
2003; Thompson, 200 1 ; Vi ljoen & Dann, 2003). Other researchers provide simi lar inferences of
the importance of organisational domain as a key component of corporate strategy. For example,
"a fundamental part of any firm ' s corporate strategy is its choice of what portfolio of businesses
to compete in" (Markides & Wil l iamson, 1 994, p. 1 49). Another approach to organisational
domain is on the basis of core competencies (Hamel & Prahalad, 1 994; Prahalad & Hamel,
1 990), whereby corporate strategy should identify, nurture and leverage core competencies (or
core competency portfol ios) across the firm rather than solely building portfol ios based on
product offerings.
Organisational domain has been viewed as encompassing three dimensions, namely, product
diversification, geographical diversification, and vertical integration (Grant, 2002a).
Diversification enables firms to achieve market power whereby profits can be transferred among
the various SBUs, reciprocal buying whereby larger firms are in a more advantageous position to
exert superior buying power than a SBU and, lastly, a near monopol istic situation can arise from
mutual forbearance whereby firms competing in numerous markets restrict competition due to
fear of retaliation (Bernheim & Whinston, 1 990; Korn & Baum, 1 999). Vertical integration
promotes market power by forcing competitors to also verticaIly integrate or by creating a
pseudomonopol istic position.
Various management tools have been formulated as a means of managing organisational domain.
For example, portfolio management has been suggested as an important tool for use in corporate
strategy (Hamermesh, 1 986; Porter, 1 99 1 ) . Bowman and Faulkner ( 1 997) stated that prescriptive
tools, such as portfolio matrices, were created to assist in decision making and the management
of the scope and range of firm activities (e.g., The Boston Consulting Group Growth-share
Matrix, and The General ElectriclMcKinsey Directional Policy Matrix). These tools suggest that
company resources should be al located to the appropriate (Le., in terms of attractiveness or fit)
products, markets or businesses. However, these tool s are the antithesis of the core competency
approach as they predominantly relate to unrelated diversification. The effectiveness of these
90
models then appears l imited as they do not incorporate synergies or core competencies among
the various SBUs (Bowman & Faulkner, 1 997; Hamel & Prahalad, 1 994). Instead, they focus on
products, markets or businesses, that is, competitive strategy, rather than the overall scope and
range of the firm. Many firms that uti l ised these models during the 1 970s to 1 980s to diversify
into more attractive businesses found the expected PSFP did not occur. Alternative models have
been advanced such as the core competency approach and the parenting framework (i .e. ,
parenting opportunity analysis and the parenting-fit matrix), whereby firms should use these
models as the basis for successful organisational domain decisions (Campbel l et ai, 1 995; Hamel
& Prahalad, 1 994).
Organisational domain includes economies of scope which develop from resource sharing across
several markets (Grant, 2002a) . Organisation domain also encompasses the degree of
relatedness of firm activities (e.g., product, market, technology, and core competency) which
creates synergies and assists in the creation and deployment of firm-wide core competencies
(Hamel & Prahalad, 1 994). Synergy encompasses util ising connections and combinations
between different businesses, industries, resources and capabil ities (Foss & Christensen, 200 1 ;
Grant, 2002a).
Proposition 2 . Organisational domain is an attribute of corporate strategy.
Empirical research on the association between organisational domain and persistent superior firm performance
While definitive empirical evidence between organisational domain decisions as a whole and
PS FP has not been presented, many scholars have suggested a positive relationship between
PSFP and two of the three organisational domain dimensions, namely, product and geographical
diversi fication. The diversification research has sought to answer why it is efficient for some
firms to diversify and not others, and what makes diversification successful . For example,
related diversification impacts positively on PSFP (e.g., Christensen & Montgomery, 1 98 1 ;
Lecraw, 1 984; Rumelt, 1 974, 1 982). However, diversification occurs not solely across
businesses and industries as commonly measured by the empirical research, but also within
businesses and industries, that is , existing product line extension and new product explorations
(Stem & Henderson, 2004). Furthermore, as Foss and Christensen (200 1 , p. 2 1 6, italics in
original) noted,
a fundamental problem in most of the empirical (if not necessarily theoretical) work on
diversi fication and relatedness is that traditional measures of relatedness only focus on the
9 1
industry or product-market level - not on the level of capabil ities and other finn assets.
Diversification has also been found to be beneficial to a point before complexity and
coordination costs are too high (Grant & Jammine, 1 988; Misangyi et ai, 2006; Palich, Cardinal
& Mi ller, 2000).
Research has noted that diversification altered during the 1 980s which led to the reduction of
conglomerate firms and a trend towards divestment (e .g., Davis, Diekmann & Tinsley, 1 994) .
Davis et a l ( 1 994) concluded that diversification became inefficient; that is, investors were more
efficient at diversifying their portfol ios than firms. I n addition, they noted that in the US
regulatory changes reduced the attractiveness of diversification. Likewise, the stock market
valued conglomerates lower than other organisational structures and, correspondingly, research
found that announcements of refocusing, regardless of the outcome, led to h igher stock market
valuations (Markides, 1 992).
Simi larly, economies of scope and synergies are thought to arise from geographic d iversification
as firms are able to leverage existing resources into new locations, further enhancing those
resources through new learning opportunities (Delios & Henisz, 2000). In addition, risk (e.g.,
from environmental shifts that may result in revenue changes) can be spread over different
geographic markets. New markets may provide additional growth opportunities that may not be
present in current markets. Other researchers have focused on the role of global expansion on
PSFP and have generally concluded multinational firms outperfonn locally or national ly focused
firms (e.g., Grant & Jammine, 1 988; Hitt, Hoskisson & Kim, 1 997). However, Lu and Beamish
(2004, p. 606) found that "at h igh and low levels of internationalisation, the extent of geographic
diversification was negatively associated with firm performance, while at moderate levels of
international isation, greater geographic diversity was accompanied by higher performance."
More consistent empirical findings have been presented in vertical integration research whereby
vertical i ntegration has been observed to underperform both diversified and focused firms (e.g.,
Rumelt, 1 974). A negative correlation was observed between within-stage (e.g., product
extension) vertical integration and return on investment whereas a statistically nonsignificant
association was found for between-stage (e.g., manufacturing and d i stribution) vertical
integration (Peyrefitte & Golden, 2004). However, Delmas and Tokat (2005 ) found a curvi l inear
association between vertical integration and efficiency whereby lowly and highly vertically
integrated firms are more efficient than moderately vertical ly integrated firms .
92
Further organisational domain decisions include organisational domain restructuring, for
example, acquisition and divestment. Col ley et al (2002, p. 5) suggested that the sole corporate
level decision mechanism for making noteworthy adjustments to BUP "is to make changes in the
portfolio of businesses. That is, it can choose to acquire new, more desirable businesses and/or it
can choose to divest less attractive businesses". Bowman, Singh, Useem and Bhadury ( 1 999)
performed a meta-analysis of 2 1 empirical studies that l inked performance to portfolio
restructuring and concluded that decisions to spin-off parts of firms y ielded the greatest
performance reward, with 5% gains on average by the parent company. Sell-offs attributed 2%,
whereas acquisitions and divestments with refocusing saw no improvement on the average.
Research statement 2. Organisational domain does contribute to persistent firm
performance.
b) Internal governance
Defining internal governance
I nternal governance represents the mechan ism by which strategic decisions are implemented
(Duncan & Weiss, 1 979). Barney ( 1 995) proposed that valuable, rare and inimitable resources
can be exploited by appropriate internal governance mechanisms such as reporting, control and
compensation systems. Internal governance then represents decisions regarding how the firm
should be managed, organised and control led. Contingency theory has influenced the internal
governance l iterature due to its central theme that internal governance mechanisms should have
been developed in response to the particular environment experienced by the individual firm
(Lawrence, 1 993). The uniqueness of firms is also upheld through various cultural
characteristics (e.g., Peters & Waterman, 1 982).
Several typologies for classi fying internal governance have been advanced. Prahalad and Doz
(2003) suggested that internal governance comprises four aspects, namely, structural clarity,
administrative processes, basic premises, and the values, beliefs and behaviours for al l
employees. However, Ghoshal and Bartlett ( 1 995) identified the three key management
processes of entrepreneurial, integration, and renewal. In 1 994, Hamel and Prahalad proposed
that strategic architecture was the correct means of internal governance. Strategic architecture i s
an overarching, loosely defined plan "for the deployment of new functionalities, the acquisition
of new competencies or the migration of existing competencies, and the reconfiguring of the
interface with customers" (Hamel & Prahalad, 1 994, p. 1 1 8) .
93
Internal governance may be characterised by three aspects, namely, organisational design,
organisational structure, and control and compliance. Organisational design is the configuration
of coordinating mechanisms and l ines of authority and responsibil ity, for example, centralisation
or decentralisation of decision making. Organisational structure refers to the levels of hierarchy,
such as the establ ishment of functional or divisional reporting l ines. Control and compliance
includes the various performance measurements and incentive systems (Bowman & Faulkner,
1 997; Hoskisson et aI, 1 993a). Through these three aspects, firms are able to influence culture,
values, and communication channels through which flow knowledge and information (Daft &
Weick, 1 984; Westley, 1 990).
Reasons for selecting internal governance as an attribute of corporate strategy
Internal governance mechanisms also assist in directing individual behaviour in line with
strategic intent (Kerr, 2004). How a firm is organised shapes the structure of the work
employees undertake and consequently influences employee emotions, thoughts, learning and
behaviour (De Jong & van Witteloostuijn, 2004). Some firms, for example, Southwest Airlines
(Kerr, 2004), uti l ise cultural controls (e.g., social norms and expectations) rather than relying
solely on bureaucratic controls (e.g., procedures and pol icies). But while SubbaNarasimha
(200 1 ) noted that individuals possess knowledge, PSFP results from col lective action.
Therefore, individual knowledge needs to be transferred within the firm and can be released
through the mechanisms of internal governance. Evolutionary theory suggests that knowledge
resides in the routines that are created and maintained by the mechanisms of internal governance
(Cyert & March, 1 963 ; Nelson & Winter, 1 982).
Organisational design is the mechanism for the management of the firm aligning its goals,
resource allocation and employee roles (Duncan & Weiss, 1 979). A number of typologies have
been developed on organisational design, for example, Mintzberg ( 1 983) proposed the now well
known five configurations of simple, machine bureaucracy, professional bureaucracy, divis ional,
and adhocracy. However, Child and McGrath (200 1 ) observed that organisational design faces a
number of paradoxes, notably, alignment versus flexibil ity, efficiency versus creativity, control
versus responsiveness, and centralisation versus empowerment. Contingency theorists suggest
that internal governance mechanisms should achieve "fit" with the external environment.
Internal governance decisions also include the creation of coordination and cooperation
strategies regarding external relationships, such as, suppl ier all iances (Juttner & Peck, 1 998).
94
Organisational structure "involves how a firm is organized and governed, and how decisions
actually are made and carried out" (Nelson, 1 99 1 , p . 67). Organisational "structure reduces the
task uncertainty by setting up the division of labour (amount of role differentiation), the
departmental structure, the shape (the number of levels, spans of control), and the distribution of
power" (Habib & Victor, 1 99 1 , p. 590). Hamel and Prahalad ( 1 994) suggested that firms should,
in contrast to the portfolio tools as outl ined in Section 3 .3 .2a, structure themselves around core
competencies rather than SBUs, products, or markets. Organisational structure impacts the
control and coordination of employees via an administration system (Kerr, 2004; M intzberg,
1 979; Young et aI, 2004). Three categories of organisational structure were provided by Robbins
and Barnwel l ( 1 994), namely, complexity, formalisation, and centralisation. However,
trad itionally, organi sational structure has been divided along holding (H-form), U-form and
M-form structures. For example, Alexander ( 1 99 1 ) suggested that the M-form enables the
separation of corporate strategy from competitive strategy due to the physical separation of the
corporate from the SBU. In doing so the value of the corporate is further reduced.
Internal governance can also impose control and compliance arrangements that influence how
the firm and employee behaviour are managed. Examples include performance appraisal
processes, financial reporting systems, and monitoring and feedback systems for departmental
targets. According to Alexander ( 1 99 1 ), most research has focused on assessing the control and
compliance practices at the SBU level as it is assumed that firms decentralise decision making in
response to environmental uncertainty . The outcomes of organisational design and structure
include control, connections and interfaces; the encouragement of creativity and innovation;
employee commitment; coordination; and, lastly, core competence and capabi l ity transfer
(Sad1er, 2003). Internal governance then supplies the systems in which knowledge is transferred
among businesses (Szulanski, 1 996).
Proposition 3 . Internal governance i s an attribute o f corporate strategy.
Empirical research on the association between internal governance and persistent superior firm performance
Internal governance is viewed as being heterogeneous across firms, and, therefore, could provide
a mechanism for del ivering PSFP. Robins ( 1 993) suggests that for the American film industry,
as did Lorenzoni and Baden-Fuller ( 1 995) for Benetton, distinctive modes of internal governance
are intrinsic to PS FP. Transferring core competencies, capabi l ities and knowledge across the
entire firm can be l imited by poor internal governance decisions. I nternal governance
95
mechanisms can be created or adjusted to accommodate the generation and transference
(exploration and exploitation) of knowledge throughout the firm (Venkatraman & Subramaniam,
2002). For example, informal and lateral linkages, rich social context, and personal interaction
aim to reduce the stickabi l ity of knowledge transference (Almeida, Song & Grant, 2002; Jaffe,
Trajtenberg & Henderson, 1 993 ; Kogut & Zander, 1 992, 1 996; Szulanski, 1 996). Knowledge
recombination, from both endogenous and exogenous sources, can lead to higher rates of
innovation (Galunic & Rodan, 1 998; Grant, 1 996a; Kogut & Zander, 1 992). However,
inconsistent organisational systems appear to l imit synergy and knowledge sharing (Harrison,
Hall, & Nargundkar, 1 993).
Chi ld and McGrath (200 1 ) contended that a universal organisational design does not exist, as it
should be contingent on, for example, strategic intent, existing organisational design, and the
nature of resources. Contingency theory hypothesises that optimal organisational structure varies
according to contingency factors such as firm size, technology, task uncertainty, and strategy
(Burns & Stalker, 1 96 1 ; Lawrence & Lorsch, 1 967; Pugh, Hickson, Hinings, & Turner, 1 969;
Woodward, 1 965) whereby the extent of the fit of the firm's internal structure with the
environment correlates to performance outcomes (Duncan & Weiss, 1 979). This approach
advocates environmental selection rather than recognising the abil ity of a firm to select the
environment it operates in (Child, 1 997). However, DeSanctis, Glass & Ensing (2002) indicated
that although organisation design does not directly influence PSFP it does determine whether
firms can transform resources into value.
Whittington (2002, p. 1 1 6) argued that "the staying power of large organizations in general, and
some in particular, argues for structure's more positive role in the creation of value."
Organisational structure can lead to competitiveness such as providing innovation, speed and
flexibi lity as it represents how employees are organised, for example, via decentralised or
modul i sed companies (Harrison, 2003). Foss and Christensen (200 1 ) observed that the
organisation design evident in Philips (e.g., rewarding local managers for innovative problem
solving) encourages "local experimentation and learning by giving significant autonomy to local
managers, and to have the results of such experimentation made accessible to other parts of the
organization through personnel transfers" (p. 224) . However, bureaucratic organisational
designs have been thought to restrict innovation and encourage rigidity through routinisation,
conformity and stabil ity leading to less than optimum performance (Child & McGrath, 200 1 ;
El l ig, 200 I ) .
96
As organisational structure has received the majority of the research focus, it wi l l provide the
primary empirical evidence of the relationship between internal governance and PSFP. One
v iew of the role of organisational structure on firm performance suggests that it should be
aligned to or fit the corporate strategy employed by the firm (Chandler, 1 962; Grinyer, Yasai
Ardekani & AI-Bazzaz, 1 980; Habib & Victor, 1 99 1 ; Hami lton & Shergi l l , 1 992, 1 993) or
should be taken into account when formulating corporate strategy (Col1 is & Montgomery, 1 998)
as theoretically "structure provides the necessary systems and processes essential for successful
strategy implementation" (Habib & Victor, 1 99 1 , p. 5 89-590).
However, Chandler ( 1 962) presented a strategy-structure-performance model whereby strategy
precedes structure, specifical ly, divisional isation fol lows diversification as firms engaging in
growth strategies alter their organisational structure in response to the increased complexity ( i .e.,
from the U-form to the M-form). Tushman and O'Rei l ly ( 1 996) and WiIl iamson ( 1 975) argued
that alignment between strategy, structure and culture leads to PSFP. Empirical validation of the
strategy-structure-performance model includes, for instance, Hamilton and Shergil l ( 1 992) who
found that the move from U-form to M-form was caused by strategy and that strategy-structure
fit accounted for between 16 . 1 and 23 .2% of financial performance in the New Zealand firms
they sampled. Moreover, it has been found that the impact of strategy on performance can be
limited by organ isational structure (Chandler, 1 962 ; Vanci l, 1 980). For example, H i l l , Hitt and
Hoskisson ( 1 992) attributed the success of diversified strategies to constrained organisational
structures and that prosperous firms altered their structure to best deliver their strategies.
Amburgey and Dacin ( 1 994) argued that strategy directs structure and that changes in
organisational structure do not necessari ly alter strategy. Nevertheless, some empirical research
has noted a reverse causality: that is, structure can influence strategy (Peters, 1 984; Tsoukas &
Knudsen, 2002; Yin & Zajac, 2004) . For example, Rumelt ( 1 974) found that decentralisation
resulted in greater diversification due to SBU managers' procliv ity for incorporating additional
opportunities into their areas of responsibil ity . Some scholars suggested the relationship
between strategy and structure is one based on reciprocal causality; for example, Mintzberg
( 1 990) stated that strategy and structure move together as the firm changes. In contrast, Habib
and V ictor ( 1 99 1 ) found that although multinational companies align structure to the strategy
pursued, firm performance was not influenced by this strategy-structure fit. The strategy
structure view derives from the deliberate strategy school of thought which proposes strategy is
controlled by the actions of primarily management (Mintzberg & Waters, 1 985) . The other
school, namely, emergent strategy suggests that strategy can be unintended and that over time
97
can form a consistent pattern of strategic choices by management and sometimes other than
management (Mintzberg & Waters, 1 985 ; Quinn, 1 980).
Various authors have proposed the following relationship: Organisational structure influences
organisational culture which then leads to PSFP (Miles & Snow, 1 978; Schein, 1 984; Wi lkins &
Ouchi, 1 983) . For instance, Cadbury 's culture was altered by the implementation of M-form
organisational structure during the 1 960s which indirectly undermined the existing culture
(Rowlinson, 1 995) . Bowman et al ( 1 999) performed a meta-analysis of organisational
restructuring literature and found the impact of performance was mixed. They concluded that
positive but smal l influences on performance occurred from organisational restructuring, and
downsizing in conjunction with organisational restructuring. They also found negative
influences on performance arose from layoffs unaccompanied by other firm alterations. In
contrast, Lewin and 10hnston (2000) noted that restructuring rarely produced the expected gains
in productivity and profitabi l ity, as employees are removed without restructuring roles and
processes.
The M-form hypothesis presented by Wi l l iamson ( 1 970, 1 985) theoretically predicts that PSFP
can be attributed to the possession of M-form organisational structure as it is more efficient in
aJlocating scarce resources via the firm's internal capital market (i .e., separating structure and
allocation decision making from fi rm operations), and in monitoring SBU performance to ensure
maximum effic iency. Wil l iamson ( 1 970) suggested that firms may choose to retain tasks within
the internal environment of the firm due to higher transaction costs. The M-form hypothesis
assumes profit maximising behaviour of management ( i .e., no agency issues). However, more
recent empirical evidence suggests the M-form can lead to inefficient diversification (Porter,
1 987; Russo, 1 99 1 ).
B arney, Wright and Ketchen (200 1 ) contended that PSFP results from heterogeneity in the
ability of firms to implement mechanisms of internal governance and that "while governance, per
se, may not be a source of competitive advantage, fai lure to implement the correct governance in
a situation can lead firms to not ful ly realise the benefits of the resources they control" (p. 632).
Thus, successful strategic implementation and, therefore, PSFP, can be achieved via internal
governance, specifically resulting from the establ ishment of systems, processes and information
uti l isation mechanisms (Habib & Victor, 1 99 1 ; Sadler, 2003) . In summary, the relationship
between organisational structure and persistent firm performance appears to be complex. A
universal view of th is association that contributes to the l iterature has not yet developed.
98
However, it can be suggested that research has found that organisational structure does not
ensure PSFP but that it can be impeded by the selection of an inappropriate form.
Research statement 3 . Internal governance does contribute to persistent firm
performance.
c) Resource governance
Defining resource governance
Evolutionary theory describes firms as a resource governance mechanism, that is, explaining
why firms exist (Nelson & Winter, 1 982). However, the l iterature focuses on resource allocation
rather than resource governance whereby resource al location consists of the deployment of
existing resources between competing projects, tasks, activities and areas. For example, Sharpe
and Keelin ( 1 998) suggested that SmithKline Beecham' s resource al location decision making
processes involved generating a full range of investment alternatives for each project, assessing
value, uncertainty and risk in terms of specific requirements, variables and measures and, l astly,
ranking the projects in terms of highest return on investment and developing a value portfol io
along specific strategic dimensions by a neutral team .
The concept of resource governance involves more than resource allocation i mplies. In addition
to resource al location, resource governance encompasses the deliberate intent to capture,
accumulate, reconfigure, protect and leverage renewable, existing, potential and unrealised
resources (Hamel & Prahalad, 1 993, 1 994). They also noted that additional value can be created
when firms leverage their resources, thus increasing the effectiveness of the resource. Resource
leverage encompasses maximising the return from resources, further developing resources
through learning, exploitation, and spreading resources into additional arenas, that is, resource
widening (Doz, 1 997; Hamel & Prahalad, 1 993, 1 994). Resource l everage can be achieved by
concentrating resources on strategic targets, resource accumulation, increasing value by
complementing resources, resource conservation, and the rapid recovery of resource expenditure
to payoff (Hamel & Prahalad, 1 993, 1 994).
Reasons for selecting resource governance as an attribute of corporate strategy
Adner and Helfat (2003) argued that managerial capabi l ities are uti l ised by firms to "build,
integrate, and reconfigure organizational resources and competences" (p. 1 0 1 2) . To create value,
resources need to be "released", that is, transferred or deployed. The main mode of delivery of
99
these decisions is via corporate strategy: "The corporate centre can act as an internal capital
market - that is, as an alternative to the outside capital market - in allocating resources to the
divisions." (Markides, 2002, p. 1 00). Corporate strategy accumulates, leverages and al locates
the firm ' s resource base. For example, specific corporate strategies, such as mergers,
acquisitions, all iances and joint ventures, are often employed to accumulate additional resources.
Various typologies for classifying firm resources have been advanced in the l iterature; for
example, Grant ( 1 99 1 ) categorised resources into tangible and intangible resources, whereas
Barney ( 1 99 1 ) identified categories of physical, human, and organisational resources. In
contrast, Mi l ler and Shamsie in their 1 996 study on Hol lywood film studios divided resources
into property-based resources (e.g., physical assets and human capital) and knowledge based
resources (e.g., organisational culture and managerial resources).
Various management tools have been devised to evaluate resources and include The Make-Buy
Ally Matrix, The Scope, Scale and Synergy Matrix, core competency profil ing, and resource
aud its. For example, "in an analogy to the growth-share matrix, a resource-product matrix was
used as a way to examine the balance between the exploitation of existing resources and the
development of new ones" (Hoskisson et ai, 1 999, p. 438). One speci fic technique for the
allocation of resources among the various businesses is portfolio management (Campbel l et aI,
1 995; Goold & Luchs, 2003 ; Hamermesh, 1 986). As noted in the organisational domain section,
many of these tools focus on competitive strategy, and thus provide l imited application to
company-wide resources, especially core competencies.
Interfirm competition involves the competition for the core competencies of the future (Hamel &
Prahalad, 1 994; Prahalad & Hamel, 1 990) . The characteristics of core competencies, that is,
long-term, investment heavy, firm-wide, and their importance to firm survival, mean that core
competency management ecl ipses viewing resource governance simply as an allocation
programme between SBUs (Hamel & Prahalad, 1 994). Hitt and Ireland ( 1 985) suggested that
the transference of core competencies throughout the company can lead to synergy.
Consequently, core competency governance should be managed centrally (via corporate strategy
decisions) so that the core competencies are integrated and repeatedly used firm-wide, rather
than in a decentral ised, fragmented manner. In other words, "because core competencies are the
h ighest level, longest-lasting units for strategy making, they must be the central subject of
corporate strategy" (Hamel & Prahalad, 1 994, p. 242).
1 00
Proposition 4. Resource governance is an attribute of corporate strategy.
The influence of resource governance on persistent superior firm performance
There has been l imited empirical research on resource governance. Subsequently this discussion
of the association between resource governance and PSFP wi l l be presented in terms of
expectations. In addition to the individual and col lective value of resources, the managerial skill
in resource governance decision making may alter (enhance or diminish) resource value (Teng &
Cummings, 2002). Some researchers have actually found that the use of management tools can
mislead decision making (e.g., Armstrong, 1 996). Resources can be allowed to atrophy, are
eroded or squandered by inappropriate resource governance decisions, for example, poor
adaptabi l ity, poor understanding of sources of advantages ( i .e., causal ambiguous nature), l imited
investment, poor foresight or understanding of the firm's environment (Hamel & Prahalad, 1 994;
Hunt & Morgan, 1 995).
RBT predicts that the possession and uti lisation of valuable resources leads to PSFP, for
example, "only accumulated competences that enable the firm to build new strategic assets more
quickly and efficiently than its competitors will allow it to sustain supernormal profits"
(Markides, 2002, p . 1 0 1 - 1 02, italics in original). The means of achieving PSFP is by the
proficient exploitation and renewal of resources and capabi l ities relative to competitors (Coff,
2003; Davis & Devinney, 1 997). L ikewise, Hamel and Prahalad ( 1 993, 1 994) suggested that
industry leadership will be determined by the abil ity of firms to leverage their resources. Collis
and Montgomery ( 1 998) advocated that the successful management of firm resources leads to the
creation of corporate advantage. Furthermore, it has been argued that PS FP can be attributed to
the creation of synergy from the possession of simi lar resources amongst various SBUs although
synergy occurs from the successful integration and administration of resources (Harrison et ai,
1 993).
Dyer and S ingh ( 1 998) also noted that resources held within and across firm relationship
networks (e.g., suppl iers) can lead to PSFP through such mechanisms as investing in relationship
specific assets, knowledge exchange (organisational learning), creating new products and
technologies through combining complementary resources and lastly, the effective governance
mechanisms which lower transaction costs. Lorenzoni and Lipparini ( 1 999) found that interfirm
relationships improved firm performance due to resource leverage resulting from access to
additional core competencies and capabil ities, expansion and improvement in existing core
1 0 1
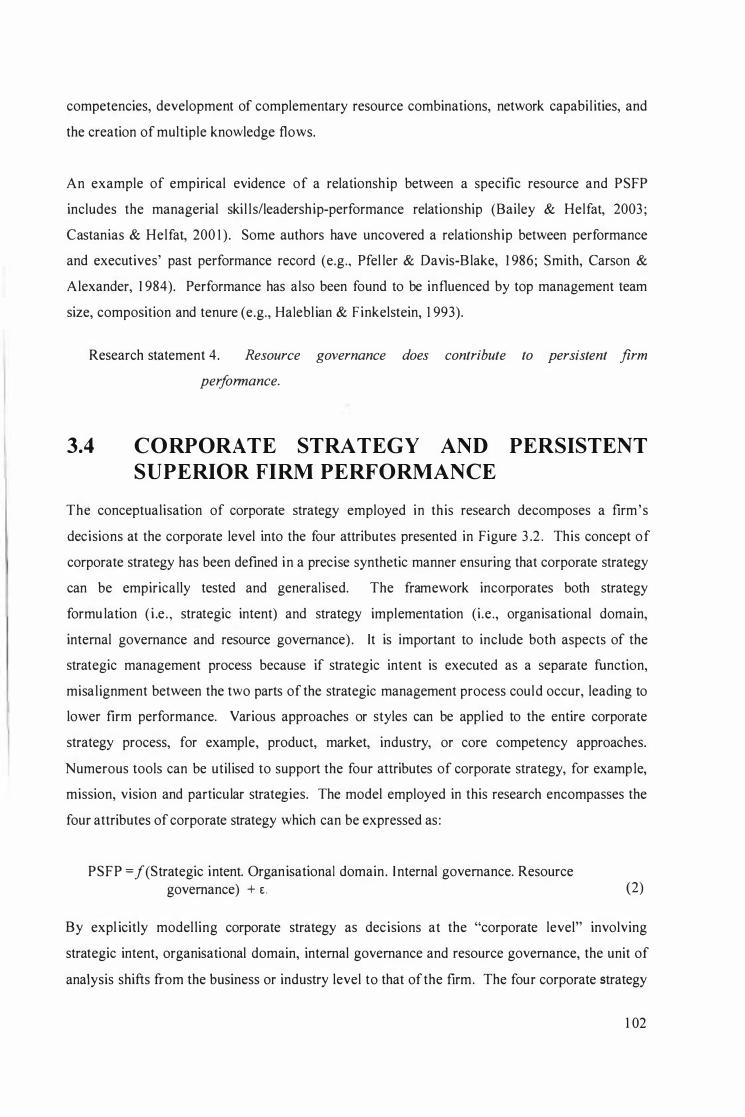
competencies, development of complementary resource combinations, network capabi l ities, and
the creation of multiple knowledge flows.
An example of empirical evidence of a relationship between a specific resource and PS FP
includes the managerial ski l l s/leadership-performance relationship (Bailey & Helfat, 2003 ;
Castanias & Helfat, 200 1 ) . Some authors have uncovered a relationship between performance
and executives' past performance record (e.g., Pfel ler & Davis-Blake, 1 986; Smith, Carson &
Alexander, 1 984). Performance has also been found to be influenced by top management team
size, composition and tenure (e.g., Halebl ian & F inkelstein, 1 993).
Research statement 4. Resource governance does contribute to persistent firm
performance.
3.4 CORPORATE STRATEGY AND PERSISTENT
SUPERIOR FIRM PERFORMANCE
The conceptualisation of corporate strategy employed in th is research decomposes a firm's
decisions at the corporate level into the four attributes presented in Figure 3 .2 . This concept of
corporate strategy has been defined in a precise synthetic manner ensuring that corporate strategy
can be empirically tested and general ised. The framework incorporates both strategy
formu lation ( i .e . , strategic intent) and strategy implementation (i .e. , organisational domain,
internal governance and resource governance) . It is important to include both aspects of the
strategic management process because if strategic intent is executed as a separate function,
misal ignment between the two parts of the strategic management process could occur, leading to
lower firm performance. Various approaches or styles can be appl ied to the entire corporate
strategy process, for example, product, market, industry, or core competency approaches.
Numerous tools can be utilised to support the four attributes of corporate strategy, for example,
mission, vision and particular strategies. The model employed in this research encompasses the
four attributes of corporate strategy which can be expressed as :
PSFP = f{Strategic intent. Organisational domain . I nternal governance. Resource governance) + E . (2)
By expl icitly model ling corporate strategy as decisions at the "corporate level" involving
strategic intent, organisational domain, internal governance and resource governance, the unit of
analysis shifts from the business or industry level to that of the firm. The four corporate strategy
1 02
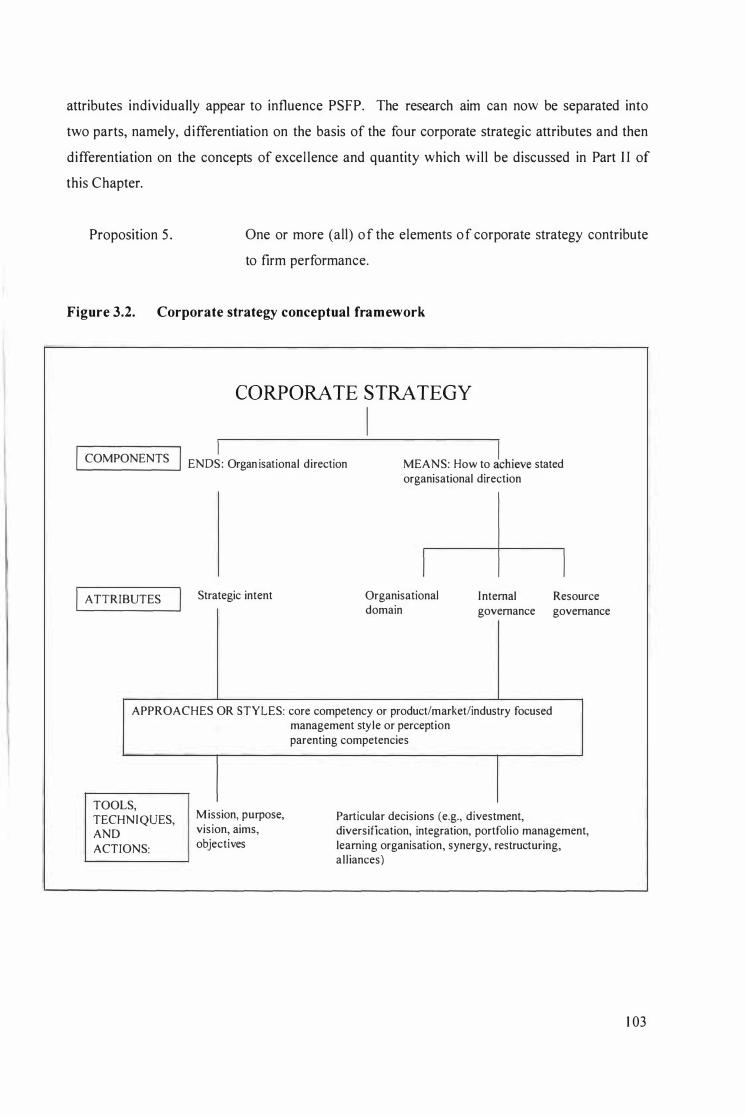
attributes individually appear to influence PSFP. The research aim can now be separated into
two parts, namely, differentiation on the basis of the four corporate strategic attributes and then
differentiation on the concepts of excel lence and quantity which wil l be discussed in Part 11 of
this Chapter.
Proposition 5 . One or more (all) of the elements of corporate strategy contribute
to firm performance.
Figure 3.2. Corporate strategy conceptual framework
CORPORATE STRATEGY I
I I COMPONENTS I ENDS : Organ isational direction MEANS: How to Lhieve stated organisational direction
I I I
ATTRIBUTES I Strategic intent Organisational Internal Resource domain governance governance
APPROACHES OR STYLES: core competency or product/market/industry focused management style or perception
TOOLS, TECHNIQUES, AND ACTIONS:
M ission, purpose, vision, aims, objectives
parenting competencies
Particular decisions (e.g., divestment, diversification, integration, portfol io management, learning organisation, synergy, restructuring, al l iances)
1 03
3 .4. 1 The proposed relationship between corporate strategy and
persistent superior firm performance
A theoretical l ink between corporate effects and corporate strategy has been identified.
Corporate strategy is seen to be a component of the corporate effect measured empirically in the
l iterature (refer to Equation I ) . The empirical research reviewed has established that corporate
strategy does influence B UP; however only limited empirical evidence has been presented on the
influence of corporate strategy on corporate performance. Consequently, the effect of corporate
strategy on BUP may actually be larger than that previously measured. To date, this l iterature
has not provided evidence of the drivers underlying the linkage between corporate strategy and
PSFP (either theoretically or empirically) . Is corporate strategy a multid imensional construct? I f
so, do any ofthe corporate strategy attributes contribute to persistent firm performance?
Corporate strategy may have a significant impact on the firm; for instance, corporate strategy
involves selecting the industries within which the firm operates. Firms can also influence the
development of industry evolution (Hamel & Prahalad, 1 994). L ikewise, Spulber (2003, p. 257)
observed that "the manager chooses whether or not to enter new markets. The manager further
chooses whether or not to develop new resources and competencies and to change the firm ' s
organizational structure." The actions and behaviour o f a fi rm and the way the firm is organised
are essentially connected to its corporate strategy.
Research statement 5 . Corporate strategy does contribute to persistent firm performance.
3.5 CONCEPTUAL
PART I
FRAMEWORK SUMMARY :
It has been argued that in trying to understand the source of persistent superior firm performance,
the fol lowing question can be advanced: Does corporate strategy contribute to persistent superior
firm performance? This research proposes that corporate strategy is an i mportant mechanism for
creating, harnessing and delivering persistent superior firm performance. Corporate strategy
should align and drive firm performance towards a stated target . Corporate strategy is a separate
concept, distinct from competitive and operational strategy and should be defined in terms of
strategy created and implemented from the corporate level . A conceptualisation of corporate
strategy has been presented which encompasses the four attributes of strategic intent,
organisational domain, internal governance, and resource governance. Corporate strategy i s
observed to reduce uncertainty and complexity by providing clear organisational direction to
1 04
employees, and determining the boundaries of the external environment in which the firm
operates ( i .e., organisational domain decisions). Corporate strategy also establishes the resource
governance and internal governance mechanisms required to achieve the organisational
direction. A number of propositions were presented and each discussion was concluded with a
research statement (refer to Table 3 . 1 ) theorising that corporate strategy and the corporate
strategy attribute do contribute to firm performance.
Table 3 . 1 . Summary of research statements
Research statement 1 Strategic intent does contribute to persistent firm performance 2 Organisational domain does contribute to persistent firm performance 3 Internal governance does contribute to persistent firm performance 4 Resource governance does contribute to persistent firm performance 5 Corporate strategy does contribute to persistent fIrm performance
PART II : OPERATIO NALISATION OF CORPORATE STRATEGY
ATTRIBUTES
Chapter Two and the previous sections of this Chapter have sequentially provided theoretical,
empirical, conceptual frameworks for corporate strategy and its role on firm performance.
Corporate strategy is a firm-wide, multidimensional construct that may be divided into the
critical four attributes of strategic intent, organisational domain, internal governance and
resource governance. The purpose of Part I I is to outline the operational isation of these four
attributes into observable and, therefore, measurable variables. The last part of th is Chapter
begins w ith a discussion of the operational isation of firm performance. Each corporate strategy
attribute is reduced to a number of essential contributory variables. The research statements
presented in Part I are redefined to reflect the expected distinction between each of the firm
performance categories, including subhypotheses related to excellence and quantity. The
inferential statistics employed uti l ise both median (Med) and mean (M), but for the purposes of
defining the hypotheses, M is used. Various potential influences on persistent firm performance
are discussed. Thereafter, three potential confounds, namely, corporate level commitment to the
status quo in organisations, historical endowments arising from pre- 1 980 corporate strategy
decisions, and firm size (scale) are then discussed. A simple mathematical model proposing the
effect of corporate strategy on PSFP incorporating all of these indices and each of the variables is
then presented.
1 05
3.6 INTRODUCTION TO OPERATIONALISATION
Perfect measurement of corporate strategy does not exist. Therefore, indicators and proxies have
been created to represent each of the various concepts involved. As noted in Chapter Two,
l imited empirical research has been presented on how corporate strategy may actually influence
firm performance. Consequently, guidance is l im ited.
Managers possess incomplete information so cannot predict exactly which particular corporate
strategy decisions wi l l be successful (March & Simon, 1 958) . Furthermore, the common
economic assumption of rational actors is also inaccurate as managers are constrained by
bounded rational ity (March & Simon, 1 958 ; Quinn, 1 980; S imon, 1 976). It is assumed that firm
decision makers assess the outcomes of their decisions with in their cognitive l imits (Child, 1 997)
and that they believe their decisions are of a high quality and thus, wil l positively contribute to
PSFP. Therefore, when a decision is made, it is a "good" one, based on the "information" and
"knowledge" possessed at the time. It can, therefore, be acknowledged that decision makers do
not knowingly make inferior corporate strategy decisions.
The direct measurement of each of the four attributes of corporate strategy appears difficult as
they are largely immeasurable and unobservable. Consequently, observable and measurable
indicators and proxies need to be selected that reflect each of the phenomena under investigation.
Godfrey and Hi l l ( 1 995) stated that researchers need to "identify what the observable
consequences of unobservable resources are l ikely to be, and then go out see whether such
predictions have a correspondence in the empirical world" (p. 530) . Therefore, testing the five
research statements outlined in Part I of this Chapter involves accurately translating the
conceptual framework presented into essential empirical variables and testable hypotheses.
Popper ( 1 959) suggested that it is important to rigorously ensure construct validity and, thus,
l imit any misinterpretations of the results and eliminate spurious findings. Measurements should
then be selected on the basis of cogency to the attribute it is attempting to represent rather than
on ease of use (Godfrey & Hil l, 1 995) . It would appear that much of the prior research suffers
from this "ease of use" syndrome.
I deal ly, this research would have employed variables that directly measure corporate strategy
decisions in a fine-grained and rich manner. However, the l imitations imposed by data
avai lability highl ighted an alternative. The construct of corporate strategy was operationalised
so that the hypotheses that fol low could be tested in terms of their correspondence to observed
1 06
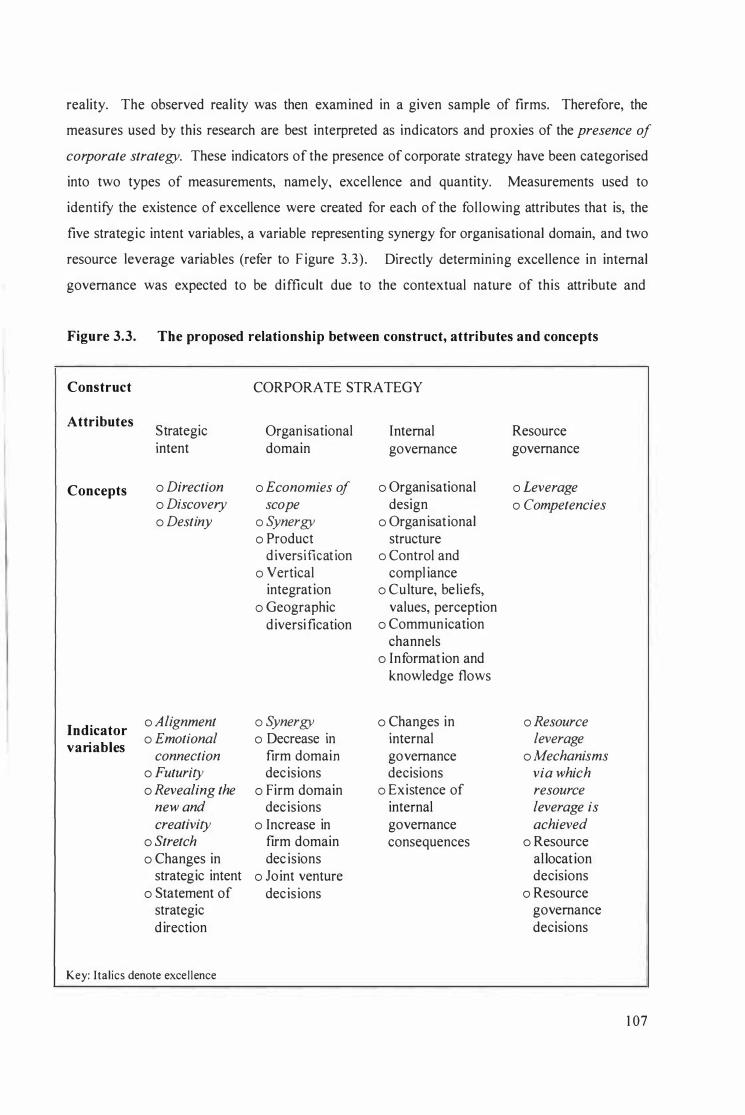
reality. The observed reality was then examined in a given sample of firms. Therefore, the
measures used by this research are best interpreted as indicators and proxies of the presence of
corporate strategy. These indicators of the presence of corporate strategy have been categorised
into two types of measurements, namely, excel lence and quantity. Measurements used to
identify the existence of excellence were created for each of the fol lowing attributes that is, the
five strategic intent variables, a variable representing synergy for organisational domain, and two
resource leverage variables (refer to F igure 3 .3) . Directly determining excellence in internal
governance was expected to be difficult due to the contextual nature of this attribute and
Figure 3.3. The proposed relationship between construct, attributes and concepts
Construct CORPORATE STRATEGY
Attributes Strategic Organisational Internal Resource intent domain governance governance
Concepts o Direction o Economies of o Organisational o Leverage o Discovery scope design o Competencies o Destiny o Synergy o Organisat ional
o Product structure d iversificat ion o Control and
o Vertical compl iance integrat ion o Culture, beliefs,
o Geographic values, perception diversification o Communication
channels o Informat ion and
knowledge flows
Indicator o Alignment o Synergy o Changes in o Resource
variables o Emotional o Decrease in internal leverage
connection flfm domain governance o Mechanisms o Futurity decisions decisions via which o Revealing the o Firm domain o Existence of resource
new and decisions internal leverage is creativity o Increase in governance achieved
o Stretch flfm domain consequences o Resource o Changes in dec isions al locat ion
strategic intent o Joint venture decisions o Statement of decis ions o Resource
strategic governance direction decisions
Key: Italics denote excellence
1 07

therefore, was not measured. I n addition to positive indicators of excellence, firms may also
display negative aspects of excel lence whereby corporate decisions can be observed to reduce
the overall measurement of excel lence. To give a true reflection of the total dimension of
excellence displayed within a firm, variables must be created to provide measurement of
negative excel lence. For example, statements that indicate a fai lure to ach ieve the expected
synergies arising from a merger wil l be recorded as negative synergy (NSYN). The code book
l ists various corporate decisions and the appropriate codes, including examples of both positive
and negative excel lence (refer to Appendix I ). The negative observations may then be
subtracted from the positive observations to produce a net measurement of each excellence
variable. A second set of indicators representing the rate of corporate strategy decisions must be
created. These are termed quantity variables.
Table 3.2. Levels of data analysis and the associated variables and indices
LEVEL NAME QUANTITY
1 Variables 1 8 7 strategic intent variables 5 organisational domain variables 2 internal governance variables 4 resource _governance variables
2 Excellence indices 4 Strategic intent excellence Organisational domain excellence Resource governance excellence Corporate strategy excellence
3 Quantity indices 5 Strategic intent quantity Organisational domain quantity Internal governance quantity Resource governance quant ity Corporate strategy quantity
4 Attribute indices 4 Strategic intent Organisational domain Internal governance Resource �govemance
5 Corporate strategy index 1
Multidimensional indices (excel lence and quantity) of the four corporate strategy attributes may
then be created from the various indicator variables. The four attribute indices are combined to
present a multidimensional index of corporate strategy evident within each firm. Al l of the five
indices (four contributory, plus the corporate strategy index) measure each attribute or construct
as a continuum that is, it is expected that all firms show some degree of the presence of corporate
strategy decision making.
1 08
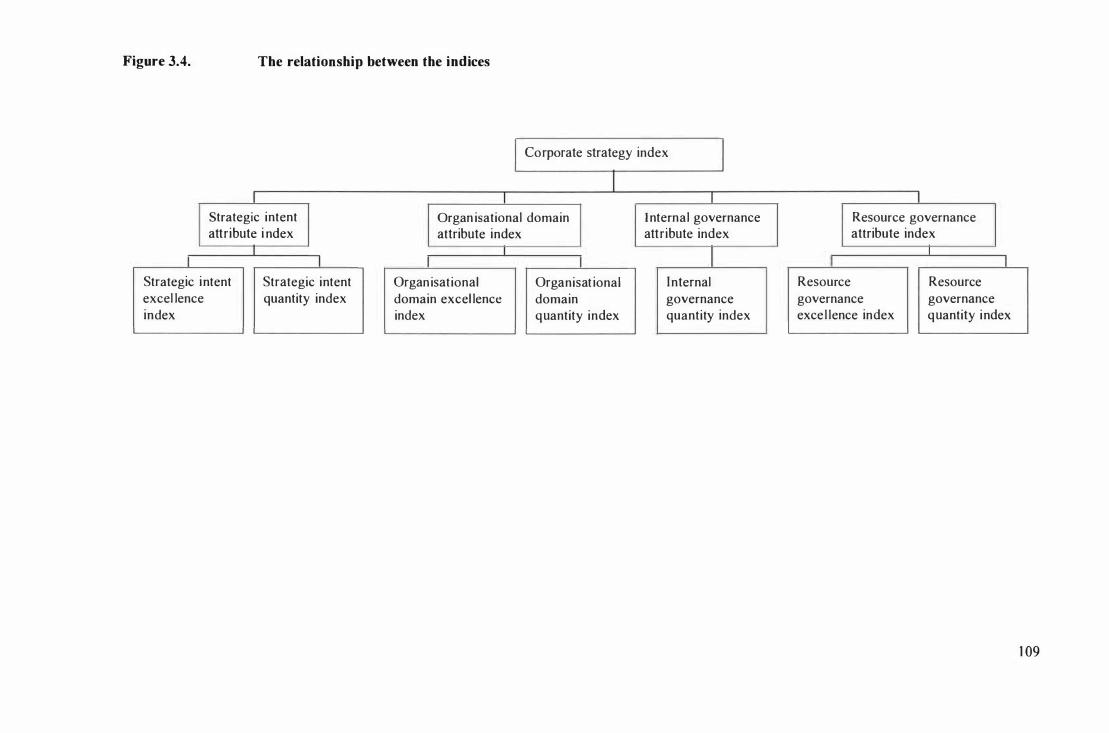
Figure 3.4. The relationship between the indices
r-�---
Strategic intent attribute i ndex
I I
Strategic i ntent Strategic intent excel lence quantity index index
Corporate strategy index
Organ isational domain I nternal governance attribute index attribute index
I
Organ isational
domain excel lence index
I
Organisat ional domain q uantity index
I nternal
governance quantity index
Resource governance attribute index
I I
Resource Resource
governance governance exce l lence index q uantity i ndex
1 09
The 1 8 variables representing corporate strategy are outlined below and are combined into the
indices for the corporate strategy index, the four corporate strategy attributes and the nine
quantity and excellence indices as per the formulae outl ined in Section 3 . 1 2 (refer to Table 3 .2
and F igure 3 .4) . I ndex creation was comprised of three stages firstly, nine multiple-item quantity
and excellence indices secondly, five multiple-item indices representing the corporate strategy
attributes and lastly, the corporate strategy index. Low coding scores represented low levels of
an index, conversely, high coding scores represent high levels of a particular index.
3.7 OPERATIONALISING FIRM PERFORMANCE
It i s often assumed that performance is relatively stable, predictable, determinable, and
control lable (March & Sutton, 1 997). Performance is a complicated and multidimensional
construct. For example, as observed firm performance can be affected by both endogenous and
exogenous factors, often influencing firm performance simultaneously. Consequently, the causal
relationships between variables may obscure the individual influence of each variable. March
and Sutton ( 1 997) highl ighted a number of difficulties evident in the measurement of firm
performance. F irstly, that future performance may be a reflection of past performance, secondly,
that firm performance can be reversed over time due to feedback mechanisms, and thirdly, that
differences exist between short-term and long-term influences on firm performance. Despite
these difficulties, firm performance can be defined in a number of ways. The universally
employed definition in the l iterature is SCA whereby it is assumed that achieving SCA
automatically results in firm performance . Commonly uti l i sed proxies for SCA are BUP
measures.
A lthough the majority of this research uti l ised an inappropriate dependent variable (BUP) to
measure the i mpact of corporate effects, empirical evidence supports the existence of corporate
effects. Furthermore, Godfrey and Hi l l ( 1 995) noted that RBT refers to firms, rather than
businesses in firms, possessing unique resources and thus, the unit of analysis should be at the
firm level.
Table 3.3. Performance variable
Description Calculation Data source
Share market price Daily closing SMP as at 3 1 December Centre for Research in Security Prices
Any investigation into corporate strategy requires a firm-wide proxy for PSFP. This research
util i sed share market price (refer to Table 3 .3). Other empirical research into aspects of
1 1 0
corporate strategy has also util ised SMP (e.g., Byerly, Lamont & Keasler, 2003). SMP was used
to categorise the Fortune 1 000 firms into one of three firm performance categories (refer to
Section 4.3) . SMP, simply, but importantly, represents the share market's valuation of the firm's
future expected value. The share market evaluates present and future profitabi l ity and risk, and
values the stock according to the firm's long-term performance potential (Hitt & Ireland, 1 985) .
For example, "if capital markets are reasonably efficient, one would expect that a firm's share
price on any given day would fully reflect the expansion value inherent in its resource base"
(Montgomery, 1 994, p. 1 73) .
However, as with any proxy, lim itations exist. First, "it can be affected by extraneous factors.
Economic factors affect most stock prices in a systematic manner" (Hitt & Ireland, 1 985, p. 280).
The share market crash experienced in October 1 987, where al l SMPs fel l, h ighlights the
interconnectedness of global share price markets. From this global event, it can be observed that
industries are also interconnected as the crash impacted all industries. Second, Porter (when
interviewed by Argyres & McGahan, 2002, p. 47) stated that "it is interesting that we lost sight
of profitabi l ity as the goal and substituted shareholder value measured by stock price. This has
not only destroyed many companies but gave credence to a number of management ideas that are
not robust." Third, it is assumed that the capital markets integrate all information available at a
given point in time, and thus, SMP does not totally represent the true value of the firm, for
instance, undisclosed developmental projects are not reflected by SMP. Fourth, SMP does not
totally account for the value created by corporate strategy (e.g., when firms split shares). Fifth,
the adoption of SMP assumes that firms cannot manipulate the SMP over the long-term, that is,
the SMP is unbiased and a true reflection of the value of the firm over that period. S ixth, in an
efficient market, the SMP reflects only anticipated changes in firm performance; in other words,
unanticipated changes in firm performance are demonstrated in dramatic changes in SMP
(Brickley & van Drunen, 1 990) . Seventh, movement in SMP may be determined by
psychological factors rather than objective economic indicators or by the way economic
indicators are interpreted by people. Lastly, there are difficulties in l inking SMP changes to
superior firm performance, for example, if the market accurately predicts poor firm performance,
the SMP wil l not be dramatically affected (Brickley & van Drunen, 1 990).
Despite each and all of these misgivings, SMP remains the only proxy for PSFP. SMP is a
measure that encompasses the entire firm's performance. Traditional h istorical accounting
measures are often used as a proxy for firm performance. Unfortunately, these measures are
typically created at the business level and they do not necessari ly reflect the entire resource base
I I I

of a firm. Primarily, S MP is a corporate level measure of firm performance. Furthermore, SMP
reflects both historical and future based assessment of firm performance.
3.8 HYPOTHESIS FIVE : CORPORATE STRATEGY
Corporate strategy (CS) has been viewed as a factor that can be used to distingu ish between the
PSFP category and the other two firm performance categories, namely, persistent inferior firm
performance (PI FP) and persistent average firm performance (PAFP). The research statement
presented in Section 3 .4 . 1 can be converted into a hypothesis:
Hypothesis 5 . Corporate strategy can be uti l i sed to distinguish between categories of
firm performance that is, H5: M(PIFP CS) of M(PAFP CS) of M(PSFP
CS).
The null hypothesis states that a sign ificant difference in corporate strategy does not exist
between the three firm performance categories that is, Ho: M(PIFP CS) = M(PAFP CS) = M(PSFP CS).
To incorporate the notions of quantity (CSQ) and excel lence (CSX) into corporate strategy, the
primary hypothesis H5 can be divided into the following two subhypotheses :
Hypothesis 5a. The rate of corporate strategy decis ions can be uti l ised to distinguish
between categories of firm performance that is, HSa: M(PIFP CSQ) 1-M(PAFP CSQ) of M(PSFP CSQ).
Hypothesis 5b. Excellence in corporate strategy can be utilised to distinguish between
categories of firm performance that i s, HSb: M(PIFP C SX) of M(PAFP
CSX) of M(PSFP CSX).
To empirically test Hs and the two subhypotheses, the four corporate strategy attribute scores
were combined to create an index of corporate strategy for each firm. These are outlined below.
1 1 2
3.9 INDICATORS OF THE CORPORATE STRATEGY
ATTRIBUTES
Empirical research has centred on measuring corporate strategy as a one-dimensional construct.
In this sense, corporate strategy has been operationalised in terms of specific corporate strategies.
The underdevelopment of the empirical verification of the construct of corporate strategy means
that it has rarely been explicitly operationalised into its attributes. This section presents a brief
discussion of the operationalisation of the four corporate strategy attributes into variables.
3 .9 . 1 Strategic intent
This section presents the variables selected to test the strategic intent (SI) research statement
presented in Section 3 .3 . 1 a.
Hypothesis 1 . Strategic intent can be uti l ised to distinguish between categories of firm
performance that is, H I : M(PIFP S I ) t M(P AFP SI) t M(PSFP SI) .
The nul l hypothesis states that a significant difference in strategic intent did not exist between
the three firm performance categories that is, Ho: M(PIFP SI) = M(P AFP SI) = M(PSFP SI).
To empirical ly test HI , the evidence of the presence of strategic intent decisions was measured
by statements of strategic direction, modifications in strategic intent (as a proxy for the quantity
of strategic intent decisions), and lastly, evidence of the existence of strategic intent (as proxies
for excellence in strategic intent decisions). To incorporate the notions of quantity (S IQ) and
excellence (SIX) into strategic intent, the primary hypothesis HI can be divided into the
fol lowing two subhypotheses:
Hypothesis 1 a. The rate of strategic intent decisions can be uti lised to distinguish between
categories of firm performance that is, H l a: M(PIFP SIQ) t M(PAFP SIQ)
t M(PSFP SIQ).
Hypothesis 1 b. Excellence in strategic intent can be uti l ised to distinguish between
categories of firm performance that is, H I b: M(PIFP S IX) t M(P AFP SIX)
t M(PSFP S IX).
1 1 3
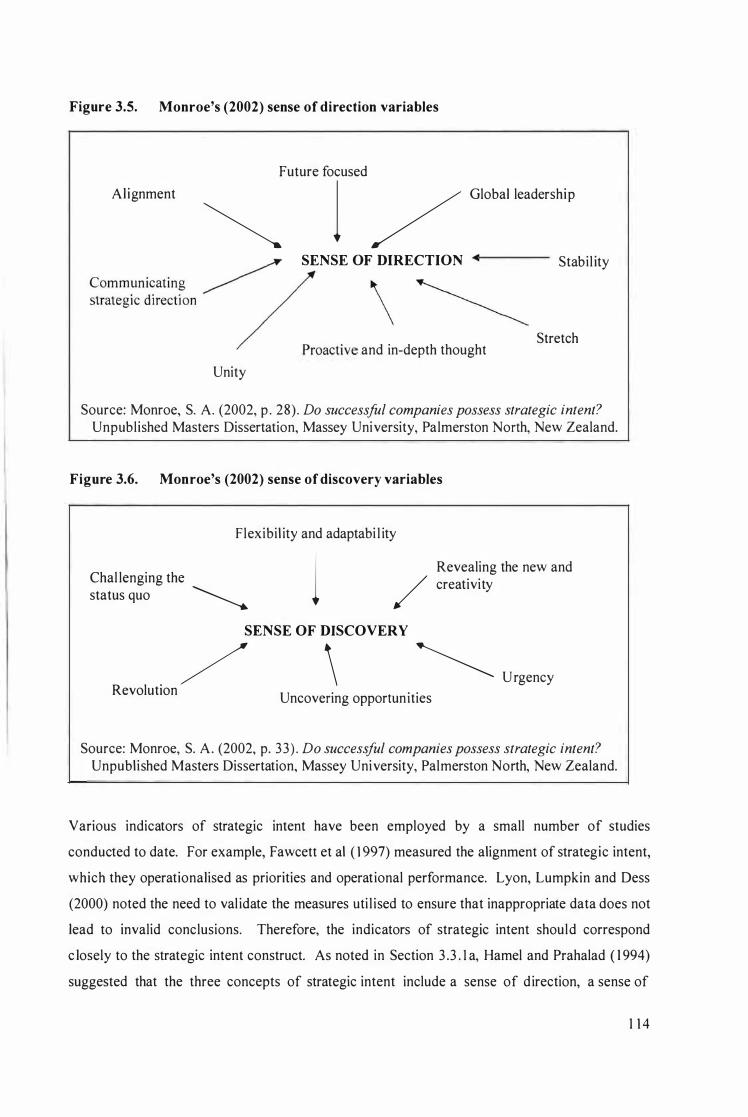
Figure 3.5. Monroe's (2002) sense of direction variables
Future focused
Alignment � 1 / Global leadership
� SENSE OF DIRECTION • Communicating � / \ � strategic direction /
D
_ �
Proactive and in-depth thought
Unity
Stabil ity
Stretch
Source: Monroe, S. A. (2002, p . 28) . Do successful companies possess strategic intent? Unpublished Masters Dissertation, Massey University, Palmerston North, New Zealand.
Figure 3.6. Monroe's (2002) sense of discovery variables
Flexibil ity and adaptabi l ity
1 Chal lenging the status quo � /
Revealing the new and creativity
SENSE OF DISCOVERY
\ � Revolution / Urgency
Uncovering opportunities
Source: Monroe, S. A. (2002, p. 33 ) . Do successful companies possess strategic intent? Unpublished Masters Dissertation, Massey University, Palmerston North, New Zealand.
Various indicators of strategic intent have been employed by a small number of studies
conducted to date. For example, Fawcett et al ( 1 997) measured the alignment of strategic intent,
which they operationalised as priorities and operational performance. Lyon, Lumpkin and Dess
(2000) noted the need to val idate the measures uti l ised to ensure that inappropriate data does not
lead to invalid conclusions. Therefore, the indicators of strategic intent should correspond
c losely to the strategic intent construct. As noted in Section 3 .3 . 1 a, Hamel and Prahalad ( 1 994)
suggested that the three concepts of strategic intent include a sense of direction, a sense of
1 1 4
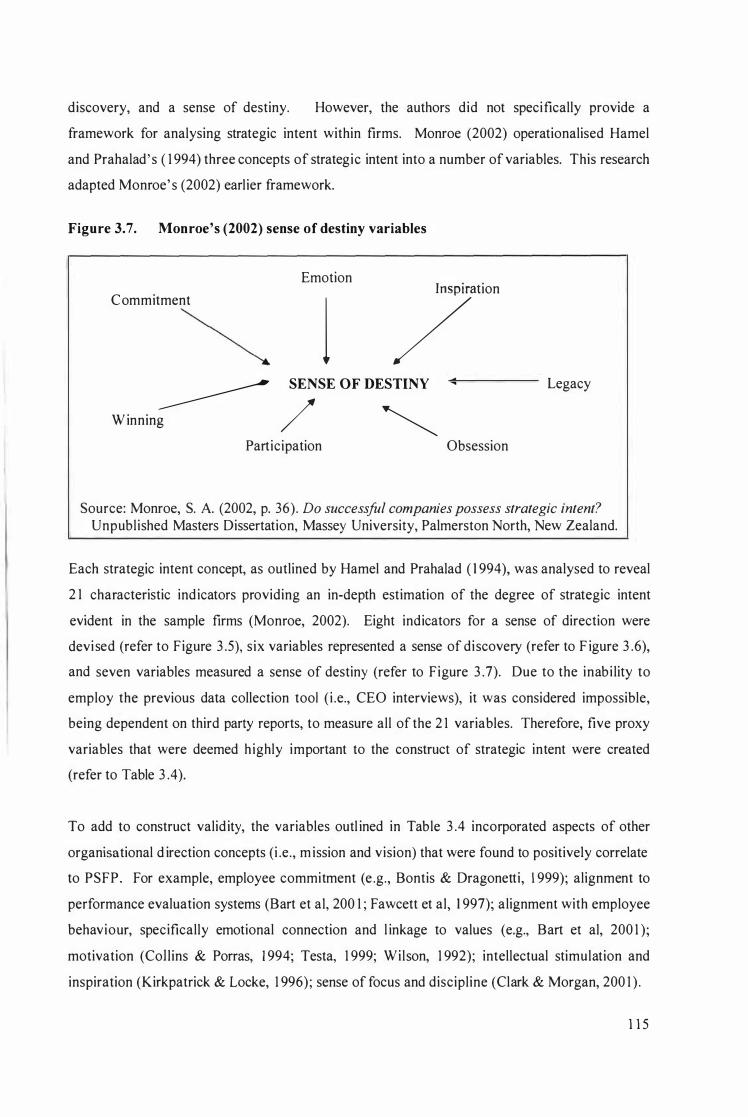
discovery, and a sense of destiny. However, the authors did not specifically provide a
framework for analysing strategic intent within firms. Monroe (2002) operationalised Hamel
and Prahalad' s ( 1 994) three concepts of strategic intent into a number of variables. This research
adapted Monroe' s (2002) earlier framework.
Figure 3.7. Monroe's (2002) sense of destiny variables
Emotion
Commitment
~ 1 7ation
� SENSE OF DESTINY
Winning / � Participation
..
Obsession
Legacy
Source: Monroe, S. A. (2002, p. 36). Do successful companies possess strategic intent? Unpublished Masters Dissertation, Massey University, Palmerston North, New Zealand.
Each strategic intent concept, as outlined by Hamel and Prahalad ( 1 994), was analysed to reveal
2 1 characteristic indicators providing an in-depth estimation of the degree of strategic intent
evident in the sample firms (Monroe, 2002). Eight indicators for a sense of direction were
devised (refer to Figure 3 .5), six variables represented a sense of discovery (refer to F igure 3 .6),
and seven variables measured a sense of destiny (refer to Figure 3 .7). Due to the inabi lity to
employ the previous data collection tool ( i .e., CEO interviews), it was considered impossible,
being dependent on third party reports, to measure all of the 2 1 variables. Therefore, five proxy
variables that were deemed highly important to the construct of strategic intent were created
(refer to Table 3 .4).
To add to construct valid ity, the variables outl ined in Table 3 .4 incorporated aspects of other
organisational d irection concepts (i .e., m ission and vision) that were found to positively correlate
to PSFP. For example, employee commitment (e .g., Bontis & Dragonetti, 1 999); alignment to
performance evaluation systems (Bart et aI, 200 1 ; Fawcett et aI, 1 997); alignment with employee
behaviour, specifically emotional connection and l inkage to values (e.g., Bart et aI, 200 1 );
motivation (CoHins & Porras, 1 994; Testa, 1 999; Wilson, 1 992); intellectual stimulation and
inspiration (Kirkpatrick & Locke, 1 996) ; sense of focus and discipline (Clark & Morgan, 200 1 ) .
1 1 5
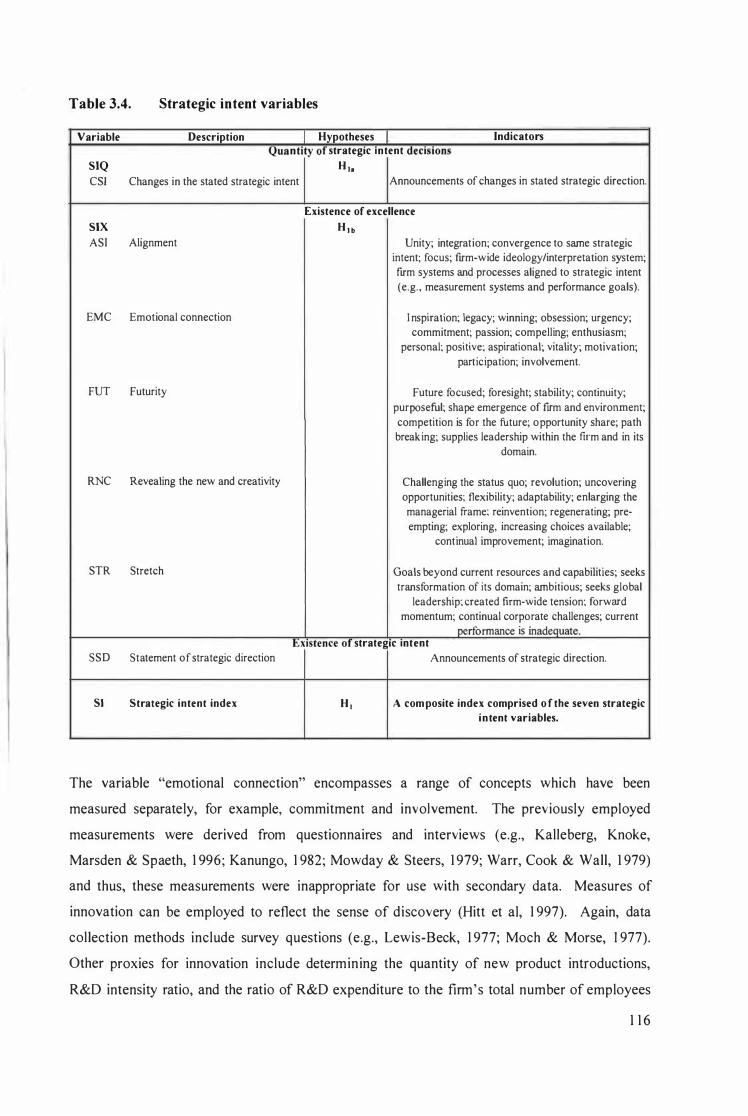
Table 3.4. Strategic intent variables
Variable Description Hypotheses Indicators Quantity of strategic Intent decIsions
SIQ H .. CS! Changes in the stated strategic intent Announcements of changes in stated strategic direction.
Existence of excellence SIX H l b AS! Alignment Unity; integration; convergence to same strategic
intent; focus; firm-wide ideology/interpretation system; firm systems and processes aligned to strategic intent (e.g., measurement systems and performance goals).
EMC Emotional connection I nspiration; legacy; winning; obsession; urgency; commitment; passion; compelling; enthusiasm;
personal; positive; aspirational; vitality; motivation; participation; involvement.
FUT Futurity Future focused; foresight; stability; continuity; purposeful; shape emergence of firm and environment; competition is for the future; opportunity share; path breaking; supplies leadership within the firm and in its
domain.
RNC Revealing the new and creativity Challenging the status quo; revolution; uncovering opportunities; flexibility; adaptability; enlarging the managerial frame; reinvention; regenerating; pre-empting; exploring, increasing choices available;
continual improvement; imagination.
STR Stretch Goals beyond current resources and capabilities; seeks transformation of its domain; ambitious; seeks global
leadership; created firm-wide tension; forward momentum; continual corporate challenges; current
j>erformance is inade�uate. t;xlstence of" strategic Intent
SSD Statement of strategic direction Announcements of strategic direction.
SI Strategic intent index H I A com posite index comprised o f the seven strategic intent variables.
The variable "emotional connection" encompasses a range of concepts which have been
measured separately, for example, commitment and involvement. The previously employed
measurements were derived from questionnaires and interviews (e.g., Kalleberg, Knoke,
Marsden & Spaeth, 1 996; Kanungo, 1 982; Mowday & Steers, 1 979; Warr, Cook & Wall, 1 979)
and thus, these measurements were inappropriate for use with secondary data. Measures of
innovation can be employed to reflect the sense of discovery (Hitt et aI, 1 997). Again, data
collection methods include survey questions (e.g., Lewis-Beck, 1 977; Moch & Morse, 1 977).
Other proxies for innovation include determining the quantity of new product introductions,
R&D intensity ratio, and the ratio of R&D expenditure to the firm's total number of employees
1 1 6
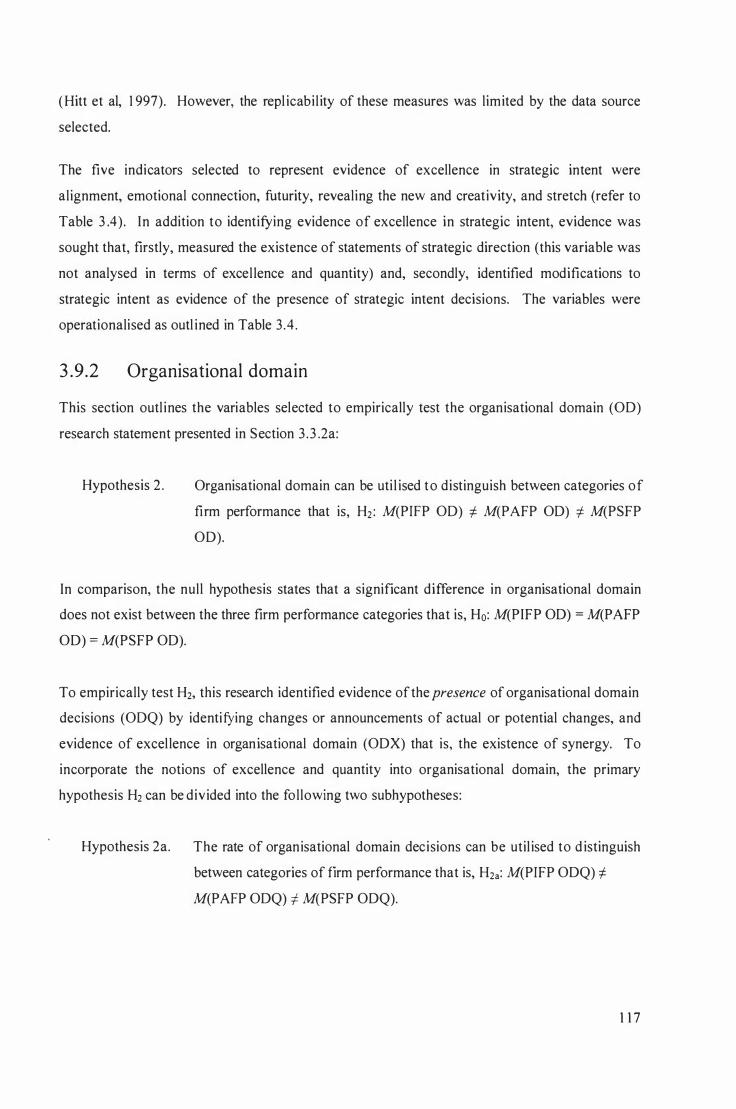
(Hitt et ai, 1 997). However, the repl icabil ity of these measures was limited by the data source
selected.
The five indicators selected to represent evidence of excellence in strategic intent were
alignment, emotional connection, futurity, revealing the new and creativity, and stretch (refer to
Table 3 .4) . In addition to identifying evidence of excellence in strategic intent, evidence was
sought that, firstly, measured the existence of statements of strategic direction (this variable was
not analysed in terms of excel lence and quantity) and, secondly, identified modifications to
strategic intent as evidence of the presence of strategic intent decisions. The variables were
operationalised as outl ined in Table 3 .4 .
3 .9 .2 Organisational domain
This section outl ines the variables selected to empirically test the organisational domain (OD)
research statement presented in Section 3 .3 .2a:
Hypothesis 2 . Organisational domain can be uti l ised to distinguish between categories of
firm performance that is, H2 : M(PIFP OD) =I M(PAFP OD) =I M(PSFP
OD).
In comparison, the null hypothesis states that a significant difference in organisational domain
does not exist between the three firm performance categories that is, Ho: M(PIFP OD) = M(P AFP
OD) = M(PSFP OD).
To empirically test H2, this research identified evidence of the presence of organisational domain
decisions (ODQ) by identifying changes or announcements of actual or potential changes, and
evidence of excel lence in organisational domain (ODX) that is, the existence of synergy. To
incorporate the notions of excellence and quantity into organisational domain, the primary
hypothesis H2 can be divided into the following two subhypotheses:
Hypothesis 2a. The rate of organisational domain decisions can be util ised to d istinguish
between categories of firm performance that is, H2a: M(PIFP ODQ) =I
M(PAFP ODQ) =I M(PSFP ODQ).
1 1 7
Hypothesis 2b. Excellence in organisational domain can be uti l i sed to distinguish between
categories of firm performance that is, H2b: M(PIFP ODX) i: M(PAFP
ODX) i: M(PSFP ODX).
The fol lowing discussion outlines how the five organisational domain variables were selected.
Organisational domain involves decisions regarding the expansion or decl ine in firm scope,
range and diversity. As noted in Section 3 .3 .2a, organisational domain can be categorised into
the implementation of three types of decisions, namely, product diversification, geographic
diversification, and vertical integration. Data was collected that provided evidence that
organisational domain decisions had been made, for example, announcements of acquisitions.
These indicators contrast significantly to previous attempts to measure organisational domain. A
discussion of previously employed measurements of organisational domain fol lows (also refer to
Section 3 .3 .2a) .
Product diversification changes have been evaluated quantitatively. Examples include changes
in the number of segments served (e.g., FoIta & Janney, 2004; Tallman, 1 99 1 ), or the product
count measures (e.g., the Herfindahl index) . However, these counting measures possesses a
number of l imitations such as, no weighting is employed which exaggerates the total
diversification of a firm as usually the majority of firm sales are concentrated into a small
number of product l ines or segments (Mahoney, 1 992) . These measures are discussed further in
the relatedness paragraphs.
A number of quantitative proxies have been uti l ised to represent changes of geographic
diversification over time, namely, alterations in the number of country subsidiaries, ratio of
foreign sales to total sales, and ratio of foreign assets to total assets (Geringer, Beamish &
DaCosta, 1 989; Mahoney, 1 992; Tallman & Li, 1 996). Hitt et al ( 1 997) adjusted the entropy
measure util ised for product diversification to geographical diversification. However, this proxy
only measured geographic diversification in terms of four subjectively defined regions and these
proxies did not reflect geographical movements within a single country.
Vertical integration has been a difficult concept to empirically measure without an in-depth
knowledge of the sample firms. However, Davis and Duhaime ( 1 992) measured vertical
integration using Standard Industrial C lassification (SIC) codes to c lassify each business into
between-stage and within-stage types of vertical integration. Their measurement system has also
been used, for example, by Peyrefitte and Golden (2004). Nevertheless, measurements based on
1 1 8
the commonly uti l ised SIC codes cannot capture internal relatedness such as those aris ing from
vertical integration.
The excellence variables encompass the consequences of related diversification whereby related
diversification is thought to create economies of scope and synergy (Hoskisson et ai, 1 993a).
Economies of scope are a more static reflection of relatedness whereas synergy represents a
dynamic v iew (Foss & Christensen, 200 1 ). Economies of scope are thought to exist i f
relatedness i s measured. Nevertheless, the concepts of production diversification, vertical
integration and geographic diversification relate to industry, market, and product relatedness
rather than measuring dynamic, longer term relatedness such as those aris ing from core
competencies (Markides & Wil liamson, 1 994).
Relatedness has also been assessed by a number of SIC-based measures and some are outlined
below. A number of diversification proxies have been introduced based on the evaluation of
firm activities in terms of researcher defined subjective classification categories usually of types
of product diversification (e.g., Rumelt, 1 974). In contrast, Farjoun ( 1 998) devised a ski l l based
approach whereby industries were grouped according to an assessment of underlying skil ls and
expertise and concluded measures of relatedness were dependent on how it was measured ( i .e.,
production based or knowledge based). However, the accuracy and replicability of these
categorical measures is dependent on the researcher' s in-depth knowledge of the sample firms
and industries ( i .e., introducing interrater error), for example, Rumelt' s ( 1 974) schema requires
knowledge of the relatedness at all points in the value chain (Davis & Thomas, 1 993) .
Various quantitative continuous diversification measures based on SIC codes have been created
such as the Herfindahl index (Montgomery, 1 982), the concentric index (which is an adaptation
of the Herfindahl index, Robins & Wiersema, 1 995), and, lastly, other SIC-based assessment of
product diversification. An example of these latter measures is the entropy measure (e.g.,
Farjoun, 1 998; H itt et ai, 1 997; Palepu, 1 985 ; Robins & Wiersema, 1 995 ; Stem & Henderson,
2004) which is calculated as the number of segments the firm operates in and weighs each
segment according to its contribution to total sales ( i .e., a weighted-average product count
measure). Sambharya (2000) observed that a high correspondence existed between the
continuous and categorical measures. These examples of SIC-based measures are easy to
calculate, replicable, and possess a h igh degree of construct validity (Mahoney, 1 992; Hoskisson,
H itt, Johnson & Moesel, 1 993b; Farjoun, 1 998) .
1 1 9
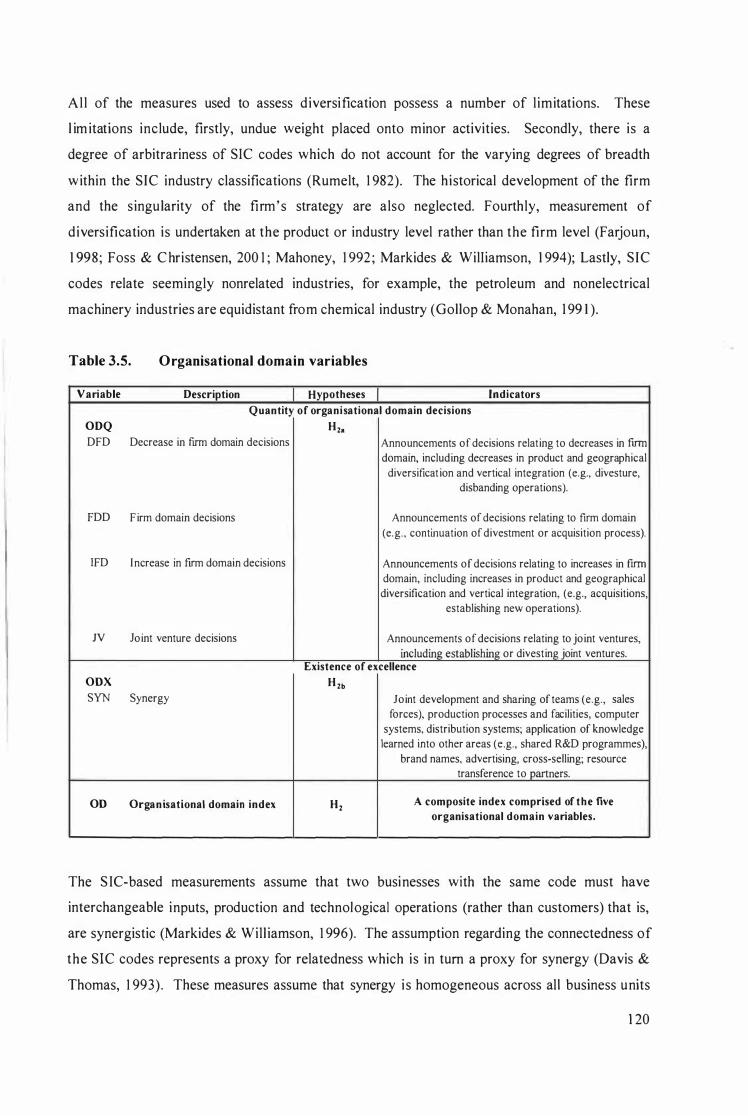
All of the measures used to assess diversification possess a number of l imitations. These
l im itations include, firstly, undue weight placed onto minor activities. Secondly, there is a
degree of arbitrariness of SIC codes which do not account for the varying degrees of breadth
within the SIC industry classifications (Rumelt, 1 982). The historical development of the firm
and the singularity of the firm's strategy are also neglected. Fourthly, measurement of
diversification is undertaken at the product or industry level rather than the firm level (Farjoun,
1 998; Foss & C hristensen, 200 1 ; Mahoney, 1 992 ; Markides & WilIiamson, 1 994); Lastly, SIC
codes relate seemingly nonrelated industries, for example, the petroleum and nonelectrical
machinery industries are equidistant from chemical industry (Gollop & Monahan, 1 99 1 ).
Table 3.5. Organisational domain variables
Variable Description Hypotheses Indicators Quantity of organisational domain decisions
ODQ H2a DFD Decrease in firm domain decisions Announcements of decisions relating to decreases in fIrm
domain, including decreases in product and geographical
diversificat ion and vertical integration (e.g., divesture,
disbanding operations).
FDD Firm domain decisions Announcements of decisions relating to firm domain
(e.g. , continuation of divestment or acquisition process).
IFD Increase in f!Tm domain decisions Announcements of decisions relating to increases in frrm domain, including increases in product and geographical
diversification and vertical integration, (e.g., acquisitions,
establishing new operations).
N Joint venture decisions Announcements of decisions relating to joint ventures,
including establishing or divesting joint ventures. Existence of excellence
ODX H 2b SYN Synergy loint development and sharing of teams (e.g., sales
forces), production processes and facilities, computer
systems, distribution systems; application of knowledge
learned into other areas (e.g., shared R&D programmes),
brand names, advertising, cross-selling; resource
transference to partners.
OD Organisational domain index H2 A composite index comprised of the five organisational domain variables.
The S IC-based measurements assume that two businesses with the same code must have
interchangeable inputs, production and technological operations (rather than customers) that is,
are synergistic (Markides & Will iamson, 1 996). The assumption regarding the connectedness of
the SIC codes represents a proxy for relatedness which is in turn a proxy for synergy (Davis &
Thomas, 1 993) . These measures assume that synergy i s homogeneous across all business units
1 20
(arising from the assumption that industries are homogeneous within the SIC code levels).
D issynergies and core competencies are not measured, for example, the transference of learning
into often vastly different products. Furt�ermore, these measures do not measure variations over
time (Davis & Thomas, 1 993; Hitt et al, 1 997; Markides & Wil liamson, 1 996; Robins &
Wiersema, 1 995) . Both types of proxies for relatedness assume they are capturing strategic
sources of competitive advantage.
The SIC-based proxies for organisational domain decisions are inappropriate for this research as
they do not provide an indication of the quantity of organisational domain decisions. Therefore,
four indicators of actual organisational domain decisions were created, namely, firm domain
decisions, decreases and increases in firm domain decisions, and joint venture decisions. Due to
the lack of access to Compustat, which provides the S IC-based data, the proxies of synergy as
outl ined above were unable to be uti l ised. Table 3 . 5 outl ines how these indicators were
measured. This research sought to evaluate whether the sample firms possessed and util ised
synergy (note: for the purposes of th is research, economies of scope were incorporated into the
notion of synergy) . Synergy was measured by identifying firstly, connections between different
businesses, industries, resources and capabilities, and secondly, combinations of these
connections to integrate various disparate resources so that they can be deployed throughout the
firm (Dyer, Kale & Singh, 2004). Examples include shared R&D programmes and the
transference of common branding values across various product ranges.
3 .9 .3 Internal governance
This section outl ines the variables selected to empirically test the internal governance (lG)
research statement presented in Section 3 .3 .2b:
Hypothesis 3 . Internal governance can be uti l ised to dist inguish between categories of
firm performance that is, H3 : M(PIFP IG) * M(PAFP IG) * M(PSFP JG).
The nul l hypothesis states that a significant difference in internal governance does not exist
between the three firm performance categories, that is, Ho: M(PIFP I G) = M(PAFP IG) = M(PSFP IG) . However, as noted previously, the notion of excel lence in internal governance is
contextual. Therefore, excel lence in internal governance will not be measured. To incorporate
the notion of quantity into internal governance (IGQ), the fol lowing subhypothesis can be stated:
1 2 1
Hypothesis 3a. The rate of internal governance decisions can be uti l ised to distinguish
between categories of firm performance that is, H3a: M(PIFP IGQ) # M(PAFP IGQ) # M(PSFP IGQ).
To empirically test H3, evidence of the presence of internal governance decisions was identified
by measuring modifications in organisational design, organisational structure, control and
compl iance mechanisms, and culture, value, belief, perceptions, and communication information
and knowledge patterns. Internal governance involves decisions regarding the mechanisms by
which corporate strategy is implemented. Internal governance also represents a variety of
decisions at the corporate level regarding how the firm should be managed, organised and
control led.
Whittington (2002) argued that organisational structure has been marginalised as either a proxy
variable or a peripheral variable to such factors as culture, control and change. Organisational
structure has been operationalised in terms of assessing degrees of differentiation; for example,
the number of levels within the hierarchy, and degrees of div ision of labour. Central i sation of
authority for decision making has been assessed uti l ising such measures as the Aston Group
Scale. Formalisation has been operational ised by measuring the degree of formal rules, policies
and procedures used to guide employee behaviour (Alexander, 1 99 1 ; Ettl ie, Bridges & O'Keefe,
1 984; Ezzamel & Watson, 1 993; Habib & Victor, 1 99 1 ; Love et ai, 2002; Miller & Friesen,
1 980; Weber, 1 958) . Measures for these concepts were collected from questionnaires and
surveys, for example, Kal leberg et al ( 1 996) interviewed managers to assess the level at which
certain decisions were made. The individual measures of organisational structure as outlined
above cannot be directly observed without access to the firm.
Organisational design has been assessed by prior empirical research in terms of typologies such
as, Mintzberg's ( 1 983) five configurations. Alternative methods of data col lection available to
this research meant that these previously employed indicators were unavailable. Instead,
evidence of organisational design decis ions included announcements of changes to the existing
configuration of coordinating mechanisms, and l ines of authority and responsibility (refer to
Table 3 .6).
Organisational structure has also been operational ised as broad classes, for example, M-form, H
form, and U-form. However, researchers have found that organisational structure is more
complex as these pure forms are often difficult to uncover. In addition, as the majority of the
1 22
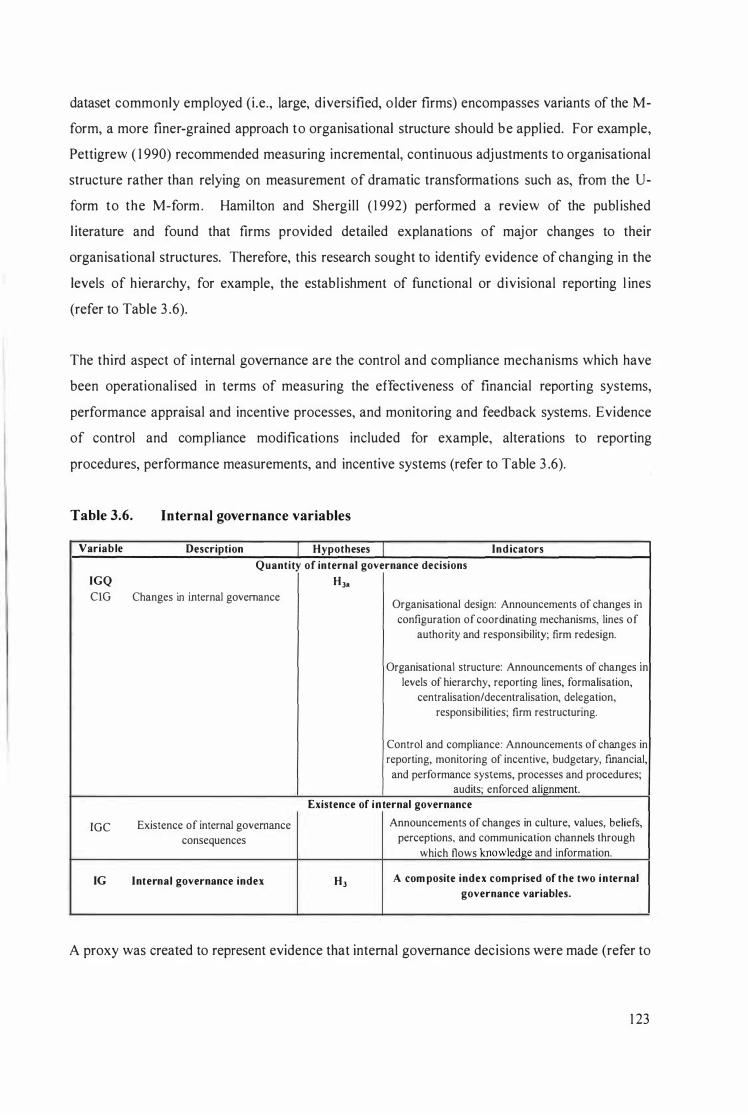
dataset commonly employed (i.e., large, diversified, o lder firms) encompasses variants of the M
form, a more finer-grained approach to organisational structure should be appl ied. For example,
Pettigrew ( 1 990) recommended measuring incremental, continuous adjustments to organisational
structure rather than relying on measurement of dramatic transformations such as, from the U
form to the M-form . Hamilton and Shergil l ( 1 992) performed a review of the publ ished
l iterature and found that firms provided detailed explanations of major changes to their
organisational structures. Therefore, this research sought to identify evidence of changing in the
levels of hierarchy, for example, the establ ishment of functional or divisional reporting l ines
(refer to Table 3 .6).
The third aspect of internal governance are the control and compliance mechanisms which have
been operational ised in terms of measuring the effectiveness of financial reporting systems,
performance appraisal and incentive processes, and monitoring and feedback systems. Evidence
of control and compl iance modifications included for example, alterations to reporting
procedures, performance measurements, and incentive systems (refer to Table 3 .6).
Table 3.6. Internal governance variables
Variable Description Hypotheses Ind icators Quantity of internal governance decisions
IGQ HJa CIO Changes in internal governance
Organisational design: Announcements of changes in
configuration of coordinating mechanisms, lines of
authority and responsibility; firm redesign.
Organisational structure: Announcements of changes in
levels of hierarchy, reporting lines, formalisation,
centralisation/decentralisation, delegation,
responsibilities; firm restructuring.
Control and compliance: Announcements of changes in
reporting, monitoring of incentive, budgetary, fmancial,
and performance systems, processes and procedures;
audits; enforced alignment.
Existence of internal governance
IOC Existence of internal governance Announcements of changes in culture, values, beliefs,
consequences perceptions, and communication channels through
which flows knowledge and information.
IG Internal governance index HJ A com posite index com prised of the two internal governance variables.
A proxy was created to represent evidence that internal governance decisions were made (refer to
1 23
Table 3 .6). This proxy encompassed the consequences of the above three concepts, that is, firms
are able to use organisational design, organisational structure, and control and compliance
mechanisms to influence culture, values, beliefs, perceptions, and communication channels
through which flows knowledge and information. Knowledge codification processes and
systems have been operational ised in terms of employee cohesiveness, proximity to external
knowledge sources, access to experienced employees, access to supportive investments and
resources, low interbusiness and intrabusiness unit rivalry, and the degree of experimentation
allowed (Jaffee et aI, 1 993 ; Stuart & Podolny, 1 996; Teece, Pisano & Shuen, 1 997; Woodman,
Sawyer & Griffin, 1 993). Evidence was sought that identified modifications to firm culture,
values, beliefs and perceptions, for example, changes in the firm's culture from an individualistic
to a more team based culture. This variable was not analysed in terms of excellence and
quantity.
3 .9.4 Resource governance
This section outl ines the variables selected to empirical ly test the resource governance (RG)
research statement presented in Section 3 .3 .2c:
Hypothesis 4. Resource governance can be uti lised to distinguish between categories of
firm performance that is , �: M(PIFP RG) i- M(PAFP RG) i- M(PSFP
RG).
In comparison, the nul l hypothesis states that a significant difference in resource governance
does not exist between the three firm performance categories that is, Ho: M(PIFP RG) = M(PAFP
RG) = M(PSFP RG).
To empirically test H4, this research identified evidence of the presence of resource governance
decisions by measuring firstly, identifying changes or announcements of actual, prospective or
potential future changes (RGQ) and secondly, evidence of excel lence in resource governance
(RGX) that is, the existence of resource leverage and resource leverage mechanisms. To
incorporate the notions of excellence and quantity into resource governance, the primary
hypothesis � can be divided into the fol lowing two subhypotheses:
Hypothesis 4a. The rate of resource governance decisions can be util ised to distinguish
between categories of firm performance that is, �a: M(PIFP RGQ) iM(PAFP RGQ) i- M(PSFP RGQ).
1 24
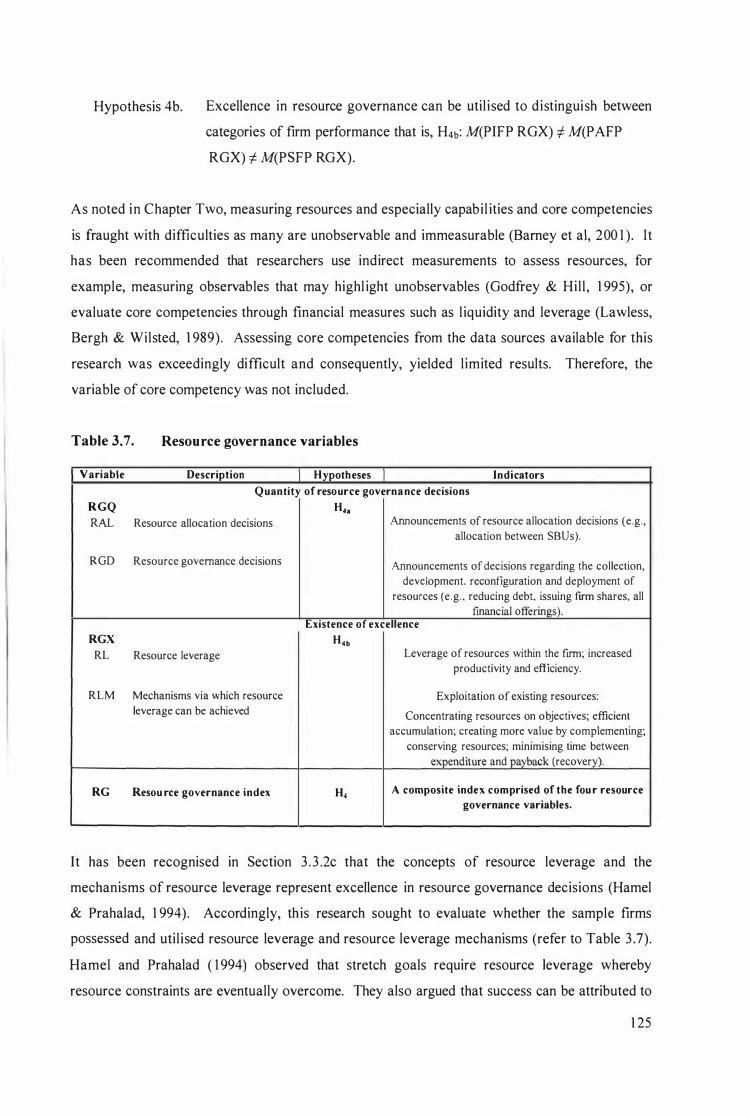
Hypothesis 4b. Excellence in resource governance can be util ised to distinguish between
categories of firm performance that is, H4b: M(PIFP RGX) i M(PAFP
RGX) of M(PSFP RGX).
As noted in Chapter Two, measuring resources and especially capabi l ities and core competencies
is fraught with difficulties as many are unobservable and immeasurable (Bamey et ai, 200 1 ). It
has been recommended that researchers use indirect measurements to assess resources, for
example, measuring observables that may highl ight unobservables (Godfrey & Hil l , 1 995), or
evaluate core competencies through financial measures such as l iquidity and leverage (Lawless,
Bergh & Wilsted, 1 989). Assessing core competencies from the data sources available for this
research was exceedingly difficult and consequently, yielded l imited results. Therefore, the
variable of core competency was not included.
Table 3.7. Resource governance variables
Variable Description Hypotheses Indicators Quantity of resource governa nce decisions
RGQ H4a RAL Resource allocation decisions Announcements of resource allocation decisions (e.g.,
allocation between SBUs).
RGD Resource governance decisions Announcements of decisions regarding the collection,
development. reconfiguration and deployment of
resources (e .g . , reducing debt, issuing firm shares, all
fmancial offerings). Existence of excellence
RGX H4b RL Resource leverage Leverage of resources within the fU1l1; increased
productivity and efficiency.
RLM Mechanisms via which resource Exploitation of existing resources:
leverage can be achieved Concentrating resources on objectives; efficient
accumulation; creating more value by complementing;
conserving resources; minimising time between
expenditure and payback (recovery).
RG Resou rce governance index H4 A composite index comprised of the fou r resource governance variables.
It has been recognised in Section 3 . 3 .2c that the concepts of resource leverage and the
mechanisms of resource leverage represent excellence in resource governance decisions (Hamel
& Prahalad, 1 994). Accordingly, th is research sought to evaluate whether the sample firms
possessed and util ised resource leverage and resource leverage mechanisms (refer to Table 3 .7).
Hamel and Prahalad ( 1 994) observed that stretch goals require resource leverage whereby
resource constraints are eventually overcome. They also argued that success can be attributed to
1 25
arriving at the future first, for less. However, Hamel and Prahalad ( 1 994) noted that
conventional accounting measures of performance such as, return on investment and ROA have
been util ised to measure "excel lence" in resource allocation and consequently, these measures
do not provide a total reflection of resource governance. Furthermore, h istorical measures are
calculated at the business level and do not incorporate a total assessment of the firm's abi lity to
leverage their resources.
The concept of resource governance is an even more abstract idea whereby firms should be
concerned with accumulating, reconfiguring and deploying portfol ios of resources rather than
solely allocational efficiency. Leverage based efficiency gains should result from raising the
numerator that is, productivity ratios (revenue and net profits) rather than from lowering the
denominator (investment, net assets, capital employed and headcount), which indicates resource
cutting (Hamel & Prahalad, 1 994). Hamel and Prahalad ( 1 994) suggested that excellence in
resource governance occurs in firms if there is h igher revenue over time and/or h igher net profits
over time with the same or higher investment over time and/or same or h igher headcount over
time. These four variables were not uti l ised as measures of resource governance as a relationship
between them and PSFP exists independently from the construct of corporate strategy.
S imilarly, another proxy for excel lent resource leverage advocated by Hamel and Prahalad
( 1 994) is the ratio of a firm' s relative market share gain (or loss) to its relative share of
investment or resources. This proxy was also considered inappropriate as it is a business level
measurement. Instead, resource leverage was assessed by the measurement of indications of
leveraging resources throughout the firm (refer to Table 3 .7) .
Ramel and Prahalad ( 1 994) also identified five ways in which resource leverage could be
achieved by firms through concentrating, accumulating, complementing, conserving, and
resource recovery. These five mechanisms have been incorporated into the second resource
governance excellence variable (refer to Table 3 . 7). In addition to identifying evidence of the
existence of excel lence in resource governance, evidence was sought that identified resource
allocation and resource governance decisions as evidence of the presence of resource governance
decisions (refer to Table 3 .7).
1 26
3 . 1 0 THE NATURE
BETWEEN THE
CATEGORIES
OF THE
FIRM
ASSOCIATION
PERFORMANCE
The nature of the association between the firm performance categories and the various indices is
predicted to be curvi l inear, that is, the PIFP and PSFP categories were expected to possess lower
scores in the index than the PAFP category. The exceptions to th is prediction are the strategic
intent attribute index and the four excel lence ind ices. The nature of the relationship between the
firm performance categories and these indices is predicted to be l inear whereby the index
i ncreases as firm performance increases .
3.1 1 POTENTIAL CONFOUNDS
Firm performance is a multidimensional phenomenon. Many factors have been found to
influence it, for example, Capon, Farley and Hoen ig ( 1 990) performed a meta-analysis on
performance research and found that industry concentration, growth (assets and sales), market
share, advertising intensity, R&D spending, and firm social responsibil ity all exhibited a positive
relationship with firm performance. Incorporating all the variables which have found to
influence PSFP may firstly, overshadow the effect of corporate strategy on PSFP (as previous
research indicated corporate effects of between 0 and 46.3% of variance in BUP) and secondly,
produced an unwieldy model. Consequently, it was decided to exclude measuring variables
other than those included in the conceptualisation of corporate strategy as presented in F igure
3 .3 , and three potential confound variables (refer to Section 3 . 1 1 .2). These potential confounds
that were not selected are assumed to be captured by the error ' E ' . The various potential
confounds that were considered but eliminated from the model are now briefly discussed. The
five variables representing three potential confounds are then identified.
3 . 1 1 . 1 The potential confounds considered
The eight potential confounds that were considered as part of the model are discussed below.
a) Luck
F irms cannot adjust the amount of luck they experience. The notion of corporate strategy
assumes that decision making is a deliberate process rather than one relying solely on luck or
chance. As Barney (2000b, p. 299) noted, "even if the in itial source of a firm's competitive
1 27
advantage is luck, a firm must sti l l recognise and exploit that luck to gain competitive advantages
. . . there are sti l l managerial implications of any ' luck' arguments." Consequently, luck is
institutionalised by management and, therefore, embedded into the concept of corporate strategy.
Porter ( 1 985) treated luck in a s imi lar manner in his definition of SCA. Furthermore, luck is
accounted for in the use of "persistent" as if firm performance is persistent, any performance
resulting from luck can be assumed to have been embedded in firm performance over time.
Additionally, the four attributes of corporate strategy involve the measurement of a stream of
consistent, deliberate decision making over a 2S-year period. Therefore, in employing a long
time frame for this research, it is expected that any event of luck ( if it was actually luck) or the
benefit arising from luck (if it was actually luck) is capitalised upon and subsequently embedded
in the firm. In other words, as Coli ins (200 I , p. 6) who investigated firms that displayed superior
performance for at least 1 S years noted "you can't just be lucky for 1 5 years."
b) Organisational learning
Knowledge and learning are important firm resources as they are thought to erode only slowly.
Holbrook et al (2000, p. 1 03 1 ) noted that "the critical role of top management in identifying what
knowledge was critical to firm success, creating structures in which that knowledge could be
secured, and then coordinating the flow of that knowledge across functions." Therefore, the
major concepts of organisational learning have been incorporated into the attribute of strategic
intent whereby the stated strategic intent creates the environment from which the firm can learn
from both its members and the market. Furthermore, aspects of organisational learning are also
captured by resource governance that is, recognition that employees and firm knowledge are
resources that require governance, and internal governance that is, the mechanisms for
institutionalising organisational learning are included in these attributes.
c) Corporate governance
Prior research has suggested that corporate governance may have an impact on PSFP. Corporate
governance i s comprised of two main components, namely, statutory compliance and strategic
governance. Statutory compliance has not been incorporated into the model as a l l firms are
legally required to conform to these regulations despite evidence of contrary behaviour.
Therefore, corporate decisions regarding compl iance cannot be a source of P SFP as they do not
provide the basis for advantage over rivals (although one can argue that compliance can become
a source of advantage if it is capabi l ity based) .
1 28
Strategic governance i s a separate issue. It i s assumed for the purposes of this research that the
major concepts of strategic governance have been incorporated into the attributes of strategic
intent and to a lesser extent, organisational domain. In doing so, it is recognised that the board' s
primary role is in determining organisational direction (strategic intent) and selecting the best
strategies to achieve that outcome. Moreover, sustained negligence with regards to strategic
governance results in firm fai lure and consequently, these firms have been eliminated from the
dataset. Although theoretically, some aspects of strategic governance should drive corporate
strategy, it i s important to note that corporate strategy is a separate construct to strategic
governance.
d) Industry effects
Empirical evidence suggested that industry effects accounted for up to 62.8% variance in BUP
and up to 56.0% of variance in firm performance (refer to Table 2 .2). Industry effects on PSFP
wi l l not be controlled for in this research due to interdependence, in other words, although some
strategic decisions can be dependent on the industries in which the firm operates, the firm
decides via organisational domain decisions whether to enter, remain or exit a particular
industry. Furthermore, to minim ise the effect of industry, the PAFP and PIFP firms were
selected from the same industry as the PSFP firms (refer to Section 4.4).
e) Government effects
S im i larly, the effects of governmental changes (such as, regulatory controls) were not controlled
for in this model as firms possess the abil ity (via organisational domain) to move in or out of a
particular industry or market, if it i s perceived that the governmental changes influenced the firm
negatively.
1) Business effects
The empirical research outlined in Chapter Two has indicated that business effects exert a
significant influence for up to 58 .2% on variance in BUP and up to 65 .7% of variance in firm
performance (refer to Table 2 .2). In the strategic h ierarchy model employed in this research
(refer to F igure 3 . 1 ), business effects are incorporated into competitive strategy and corporate
strategy directs competitive strategy. Furthermore, corporate strategy, through its four attributes,
provides the framework for SBU managers to manage their businesses. For example,
organisational domain includes the decis ions used to move in or out of businesses if the impact
on the firm is perceived as negative.
1 29
g) Year
Year is often control led for ensuring findings have not been determined by unspecified, time
specific influences, for example, much of the corporate effects research presented in Section 2.9.
These findings indicate that time has been estimated to exert a relatively small influence on both
BUP and firm performance (0 to 4.6%, and 1 .7 to 4.7% respectively). The influence of time on
PSFP may be incorporated into all four attributes of corporate strategy. In other words,
corporate strategy is a long-term concept whereby it represents an accumulation of patterns of
decisions over t ime (Chakravarthy & White, 2002). Successful ly altering organisational domain
and internal governance decisions cannot be achieved in the short-term, due to the historical
development, path dependency and fixed and embedded nature of resources. To overcome the
effects of short-term annual variability, a 25-year time horizon was used.
h) Historical performance
Various authors (Levitt & March, 1 988 ; March, 1 99 1 ; Miller, 1 993) contended that h istorical
performance may influence future performance, for example, "successful firms generally lack
the motivation to pursue new and more complex strategies" (Vera & Crossan, 2004, p. 234) .
Alternatively, in l ine with the conceptualisation of corporate strategy employed in this research,
h istorical firm performance, theoretically, should have a small influence on PSFP as strategic
intent, for example, advocates continual ly reinventing the status quo and creating continual
temporary visions and advantages. Furthermore, strategic intent contends historical firm
performance is an insufficient condition for future success - whether poor or successful firm
performance. Hence, it was decided not to incorporate historical performance into the model
developed for this research.
3 . 1 1 .2 The potential confounds selected
Delaney and Huselid ( 1 996, p. 965) noted that "it was not possible to gauge the potential impact
of . . . omitted variables on the results, we relied on the use of control variables to capture any
relevant unmeasured organizational characteri stics." Therefore, five variables representing three
potential confounds were added to the model employed (refer to Table 3 .8).
1 30
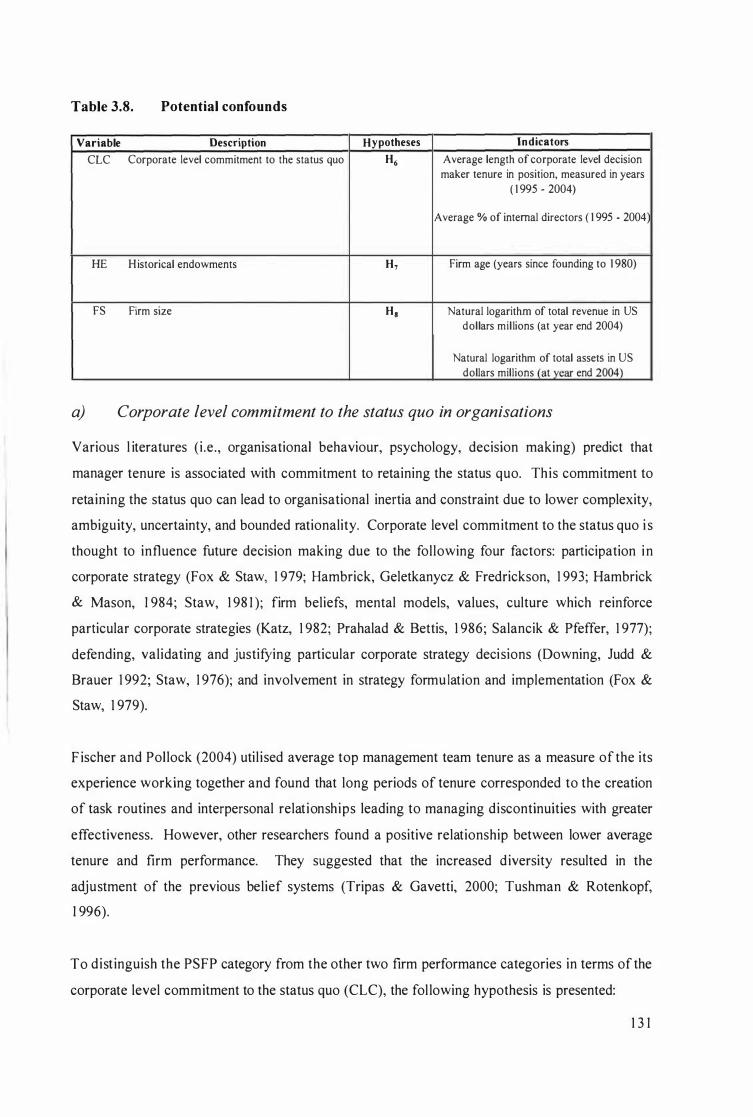
Table 3.8. Potential confounds
Variable Description Hypotheses Indicators
CLC Corporate level commitment to the status quo H6 Average length of corporate level decision maker tenure in position, measured in years
( 1 995 - 2004)
Average % of internal directors ( 1 995 - 2004
HE Historical endowments H, Firm age (years since founding to 1 980)
FS Firm size H8 Natural logarithm of total revenue in US
dollars millions (at year end 2004)
Natural logarithm of total assets in US dollars millions (at year end 2004)
a) Corporate level commitment to the status quo in organisations
Various l iteratures (i .e. , organisational behaviour, psychology, decision making) predict that
manager tenure is associated with commitment to retaining the status quo. This commitment to
retaining the status quo can lead to organisational inertia and constraint due to lower complexity,
ambiguity, uncertainty, and bounded rationality. Corporate level commitment to the status quo i s
thought to influence future decision making due to the following four factors: participation in
corporate strategy (Fox & Staw, 1 979; Hambrick, Geletkanycz & Fredrickson, 1 993; Hambrick
& Mason, 1 984; Staw, 1 98 1 ); firm beliefs, mental models, values, culture which reinforce
particular corporate strategies (Katz, 1 982; Prahalad & Bettis, 1 986; Salancik & Pfeffer, 1 977);
defending, validating and justifying particular corporate strategy decisions (Downing, Judd &
Brauer 1 992; Staw, 1 976); and involvement in strategy formulation and implementation (Fox &
Staw, 1 979).
F ischer and Pollock (2004) util ised average top management team tenure as a measure of the its
experience working together and found that long periods of tenure corresponded to the creation
of task routines and interpersonal relationships leading to managing discontinuities with greater
effectiveness. However, other researchers found a positive relationship between lower average
tenure and firm performance. They suggested that the increased diversity resulted in the
adjustment of the previous belief systems (Tripas & Gavetti, 2000; Tushman & Rotenkopf,
1 996).
To distinguish the PSFP category from the other two firm performance categories in terms of the
corporate level commitment to the status quo (CLC), the fol lowing hypothesis is presented:
1 3 1
Hypothesis 6 . Corporate level commitment to the status quo can be util ised to d istinguish
the PSFP category from other firm performance categories that is, H6:
M(PIFP CLC) i- M(PAFP CLC) i- M(PSFP CLC).
The null hypothesis states a significant difference in the corporate level commitment to status
quo does not exist between the three firm performance categories that is, Ho: M(PIFP CLC) =
M(PAFP CLC) = M(PSFP CLC).
This potential confound has been operationalised by two proxies, namely, the average length of
corporate level decision makers tenure in position during the 1 995 to 2004 period, and the
percentage of internal directors during the 1 995 to 2004 period (refer to Table 3 .8).
b) Historical endowments arising from pre-1980 corporate strategy decisions
F irms do not "appear" with a full assemblage of structures, resources and knowledge. The
results of historical corporate strategy decisions may be influential in terms of their impact
(whether negatively or positively) on future corporate strategy decisions due to their fixedness,
embeddedness, core rigidity and path dependency. According to RBT, "conditions under which
resources are developed or acquired in one period have impl ications for the strategic advantages
of firms in subsequent periods" (Barney, 200 I b, p. 5 1 ) . Furthermore, evolutionary theory
suggests that organisational routines are history dependent (Nelson & Winter, 1 982) in that if a
firm chooses product diversification, different routines are created than if the firm chose
geographic diversification.
Holbrook et al (2000) suggested that different firm backgrounds led to different decisions, for
example, pursing dissimilar goals. Maritan and Brush (2003) presented evidence that
heterogeneous h istorical endowments (e.g., culture, beliefs and physical assets) influenced the
success of the implementation of new processes and knowledge across the firm. Helfat and
L ieberman (2002) found that prior firm experience influences both current and future core
competency creation. Therefore, historical endowments can be assumed to affect PSFP, either
negatively or positively.
As noted in Section 2 .5 , firms obtain resources via sharing, acquisition, accumulation or
endowment. However, the importance of historical endowments on PS FP has been challenged
by Hamel and Prahalad ( 1 994). Their view is that the possession of inferior historical
endowments should not be a l imiting factor. They suggested that with the appropriate strategic
1 32
intent and strategic architecture, seemingly insignificant resources can be leveraged to achieve
PSFP. They offered the perspective "that a firm must unlearn much of its past before it can find
the future" (p. 25) . Although Dosi, Nelson and Winter (2000) recognised the role of historical
knowledge and experience in the development of existing core competencies, they argued that
new core competencies are created through managerial intent. Moreover, Holbrook et al (2000)
found that firms possessed capabi l ities (especial ly pre-existing knowledge and experience) that
al lowed them to adapt to change, which is consistent with dynamic capabil ities perceptive
presented by Teece et al ( 1 997) and evolutionary learning approach proposed by Fuj imoto
( 1 999) . Consequently, to distinguish the PS FP category from the other two firm performance
categories in terms of h istorical endowments (HE), the fol lowing hypothesis is presented:
Hypothesis 7. Historical endowments can be uti l ised to distinguish the PSFP category
from other firm performance categories that is, H7: M(PIFP HE) t
M(P AFP HE) t- M(PSFP HE).
The null hypothesis states that a significant difference in historical endowments did not exist
between the three firm performance categories that is, Ho: M(PIFP HE) = M(P AFP HE) = M(PSFP HE).
F irm age was selected to reflect historical endowments because general ly "by virtue of s ize and
longevity, established firms may hold larger and more developed stocks of individual resources
and capabi lities" (Helfat & Lieberman, 2002, p.734). A number of associations between firm
age (refer to Table 3 .8) and the four corporate strategy attributes are predicted to exist, for
example, Chandler ( J 962) noted that firms undergo a standardised evolutionary path (e.g., U
form to M-form). F irms are thought to gain resources (whether appropriate or inappropriate) as
they age, as expected by all of the strategic management paradigms. However, the older the
firm, the greater is the l ikelihood of fixed mechanisms of internal governance. Age was also
used by Alexander, 1 99 1 ; Delaney and Husel id, 1 996; Denis, Denis and Sarin, 1 997; Folta and
Janney, 2004; Gulati and Higgins, 2003 ; Stern and Henderson, 2004.
c) Firm size
Empirical evidence has suggested that firm s ize has a positive relationship with firm
performance (Robins & Wiersema, 1 995; Wernerfelt & Montgomery, 1 988) ; simply put, large
firms have more resources than smaller firms (Coll ins & Clark, 2003). Firm size is often uti l ised
as an indicator of economies and diseconomies of scale and market power (Hitt et aI, 1 997).
1 3 3
Consequently, firm s ize is used as a control variable in order to remove whatever effects firm
size may have on profitability (Spanos et aI, 2004). Although, to some extent firm s ize is
control led because corporate strategy decisions alter firm size, this variable was included in the
model . To distinguish the PS FP category from the other two firm performance categories in
terms of firm size (FS), the fol lowing hypothesis is presented :
Hypothesis 8 . Firm size can be uti l ised to distinguish the PSFP category from other firm
performance categories that is, Hs: M(PIFP FS) i- M(PAFP FS) i- M(PSFP
FS).
In comparison, the null hypothesis states that a significant difference in firm size does not exist
between the three firm performance categories that is, Ho: M(PIFP FS) = M(PAFP FS) =
M(PSFP FS) .
Following previous research (e.g., Ahuja, Coff & Lee, 2005; Bowen & Wiersema, 2005; Spanos
et ai, 2004), firm size was operationalised as two variables: the natural logarithm of total assets
and the natural logarithm of total revenue (measured in US dollar mi l l ions); refer to Table 3 .8 .
3. 1 2 A MODEL MEASURING THE
CORPORATE STRATEGY ON
SUPERIOR FIRM PERFORMANCE
EFFECT OF
PERSISTEN T
The conceptual model of corporate strategy, displayed i n Figure 3 .2, has been translated into a
more refined model that succinctly exhibits the relationship between the variables and indices
presented in the preceding Sections of this Chapter. Table 3 .9 provides the abbreviations that
have been used in the equations.
Equation 1 was formulated during the presentation of the corporate effects research in Chapter
Two. Corporate strategy is predicted to contribute to PSFP and was represented as:
PSFP = f(Corporate strategy. Among other th ings). ( 1 )
I n addition to corporate strategy, the three potential confound variables of the corporate level
commitment to the status quo, historical endowments, and firm s ize are also expected to
contribute to PSFP.
1 34
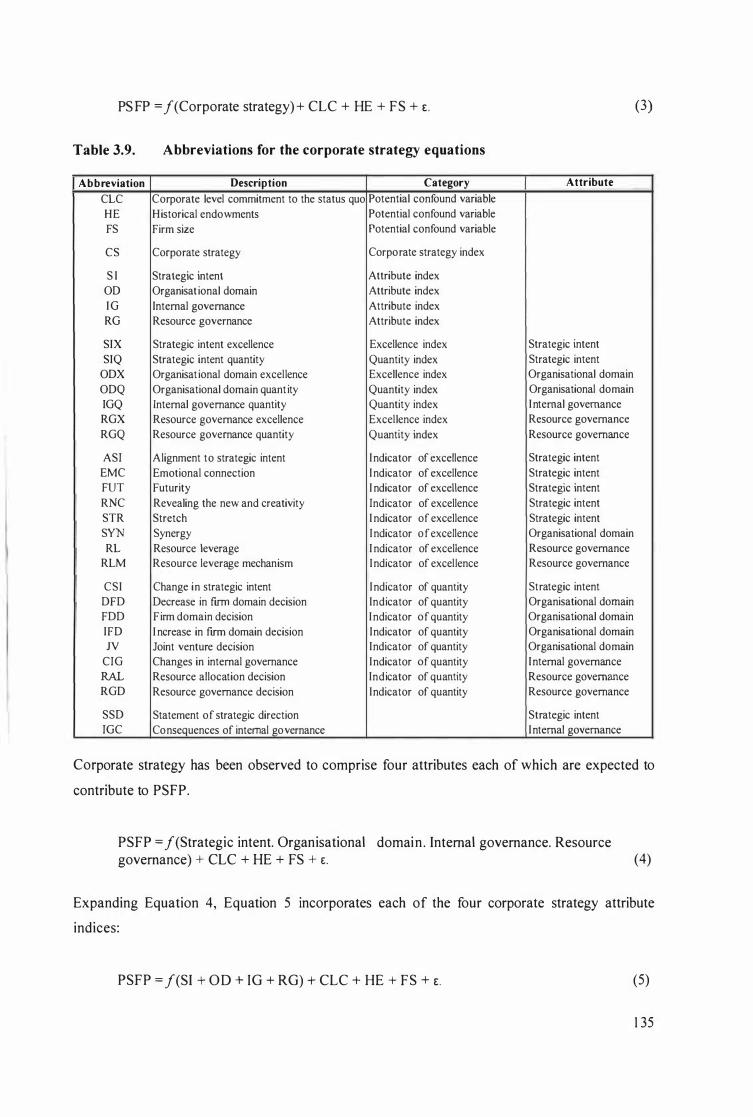
PS FP = f(Corporate strategy) + CLC + HE + FS + E. (3)
Table 3.9. Abbreviations for the corporate strategy equations
Abbreviation Description Category Attribute
CLC Corporate level commitment to the status quo Potential confound variable
HE Historical endowments Potential confound variable
FS Firm size Potential confound variable
CS Corporate strategy Corporate strategy index
S I Strategic intent Attribute index
OD Organisational domain Attribute index
I G Internal governance Attribute index
RG Resource governance Attribute index
SIX Strategic intent excellence Excellence index Strategic intent
SIQ Strategic intent quantity Quantity index Strategic intent
ODX Organisational domain excellence Excellence index Organisational domain
ODO Organisational domain quantity Quantity index Organisational domain
IGQ Internal governance quantity Quantity index Internal governance
RGX Resource governance excellence Excellence index Resource governance
RGO Resource governance quantity Quantity index Resource governance
ASI Alignment to strategic intent Indicator of excellence Strategic intent
EMC Emotional connection Indicator of excellence Strategic intent
FUT Futurity I ndicator of excellence Strategic intent
RNC Revealing the new and creativity Indicator of excellence Strategic intent
STR Stretch I ndicator of excellence Strategic intent
SYN Synergy Indicator o fexcellence Organisational domain
RL Resource leverage I ndicator of excellence Resource governance
RLM Resource leverage mechanism Indicator of excellence Resource governance
CSI Change in strategic intent Indicator of quantity Strategic intent
DFD Decrease in fmn domain decision Indicator of quantity Organisational domain
FDD Firm domain decision Indicator 0 f quantity Organisational domain
IFD I ncrease in firm domain decision Indicator of quantity Organisational domain
N Joint venture decision Indicator of quantity Organisational domain
CIG Changes in internal governance Indicator 0 f quantity Internal governance
RAL Resource allocation decision Indicator of quantity Resource governance
RGD Resource governance decision Indicator of quantity Resource governance
SSD Statement of strategic direction Strategic intent
IGC Consequences of internal governance Internal governance
Corporate strategy has been observed to comprise four attributes each of which are expected to
contribute to PSFP.
PSFP = f(Strategic intent. Organisational domain . Internal governance. Resource governance) + CLC + HE + FS + E. (4)
Expanding Equation 4, Equation 5 incorporates each of the four corporate strategy attribute
indices:
PSFP = f(SI + OD + IG + RG) + CLC + HE + FS + E. (5)
1 35
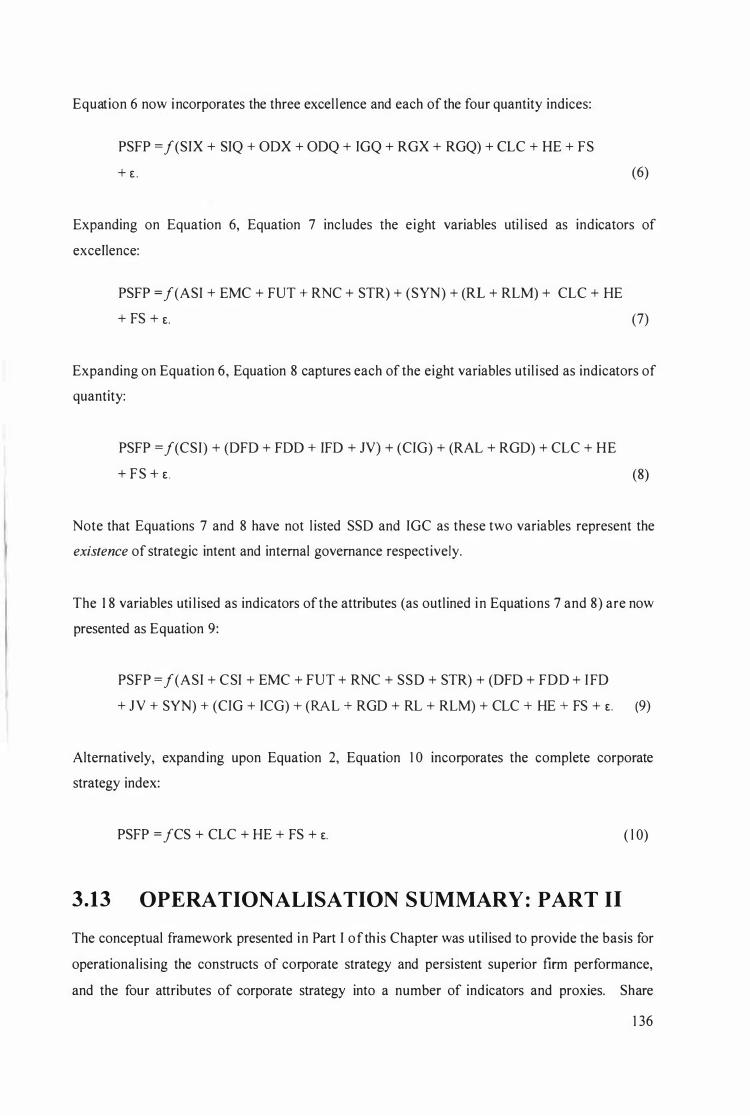
Equation 6 now incorporates the three excel lence and each of the four quantity indices:
PSFP = f(SIX + SIQ + ODX + ODQ + IGQ + RGX + RGQ) + CLC + HE + FS
+ E . (6)
Expanding on Equation 6, Equation 7 includes the eight variables uti l ised as indicators of
exceIlence:
PSFP =f(ASI + EMC + FUT + RNC + STR) + (SYN) + (RL + RLM) + CLC + HE
+ FS + E. (7)
Expanding on Equation 6, Equation 8 captures each of the eight variables util i sed as indicators of
quantity:
PSFP = f(CSI) + (DFD + FDD + IFD + IV) + (CIG) + (RAL + RGD) + CLC + HE
+ F S + E . (8)
Note that Equations 7 and 8 have not l isted SSD and IGC as these two variables represent the
existence of strategic intent and internal governance respectively.
The 1 8 variables uti l ised as indicators of the attributes (as outlined in Equations 7 and 8) are now
presented as Equation 9:
PSFP =f(ASI + CSI + EMC + FUT + RNC + SSD + STR) + (DFD + FDD + I FD
+ IV + SYN) + (CIG + ICG) + (RAL + RGD + RL + RLM) + CLC + HE + FS + E. (9)
Alternatively, expanding upon Equation 2, Equation 1 0 incorporates the complete corporate
strategy index:
PSFP = jCS + CLC + HE + FS + E. ( l 0)
3.13 OPERATIONALISATION SUMMARY : PART 11 The conceptual framework presented in Part I of th is Chapter was utilised to provide the basis for
operationalising the constructs of corporate strategy and persistent superior firm performance,
and the four attributes of corporate strategy into a number of indicators and proxies. Share
1 36
market price was selected as a proxy of persistent superior firm performance as it was a firm
wide measure and was a reflection of both historical and future firm performance. Furthermore,
the research sought to measure the rate of corporate strategy decision making which has not been
conducted previously. Therefore, many of the previous employed indicators were inappropriate.
It was necessary that the variables selected were closely aligned to the concepts of interest. The
five research statements presented in Part I of th is Chapter were transformed into five primary
hypotheses which expressed that corporate strategy (and its attributes and firm performance)
could be used to distinguish between the three firm performance categories. Corporate strategy
has been observed to be a multidimensional concept representing both excellence and quantity.
Consequently, the five hypotheses were redefined into sub hypotheses which incorporated the
notions of excellence and quantity in the corporate strategy attributes. Therefore, the measures
used by this research are best interpreted as indicators of the presence of corporate strategy.
Measurements were used to identify the existence of excel lence in the attributes, that is, five
strategic i ntent variables, synergy, and two resource leverage variables (refer to F igure 3 .3 ) . In
addition to positive indicators of excel lence, firms may also display negative aspects of
excellence whereby corporate decisions can reduce excel lence. Accordingly, variables were
created to provide measurement of negative excellence. The negative observations may then be
subtracted from the positive observations to produce a net measurement of each excel lence
variable.
The second concept measuring corporate strategy involved the quantity of corporate strategy
deci sions made and was represented by one strategic intent, four organisational domain, one
internal governance, and two resource governance variables. Therefore, in total, seven variables
were selected to represent strategic intent, five variables for organisational domain, two internal
governance variables, and four variables for resource governance. Consequently, corporate
strategy can be measured through 1 8 variables. The 1 4 indices measure each attribute or
construct as a continuum that is, it was expected that all firms showed some degree of the
presence of corporate strategy decision making.
A number of potential confounds were considered and five variables representing three potential
confounds were selected. The variables selected have been employed by other researchers.
Lastly, a simple mathematical representation of the model measuring the effect of corporate
strategy on firm performance was presented.
1 37
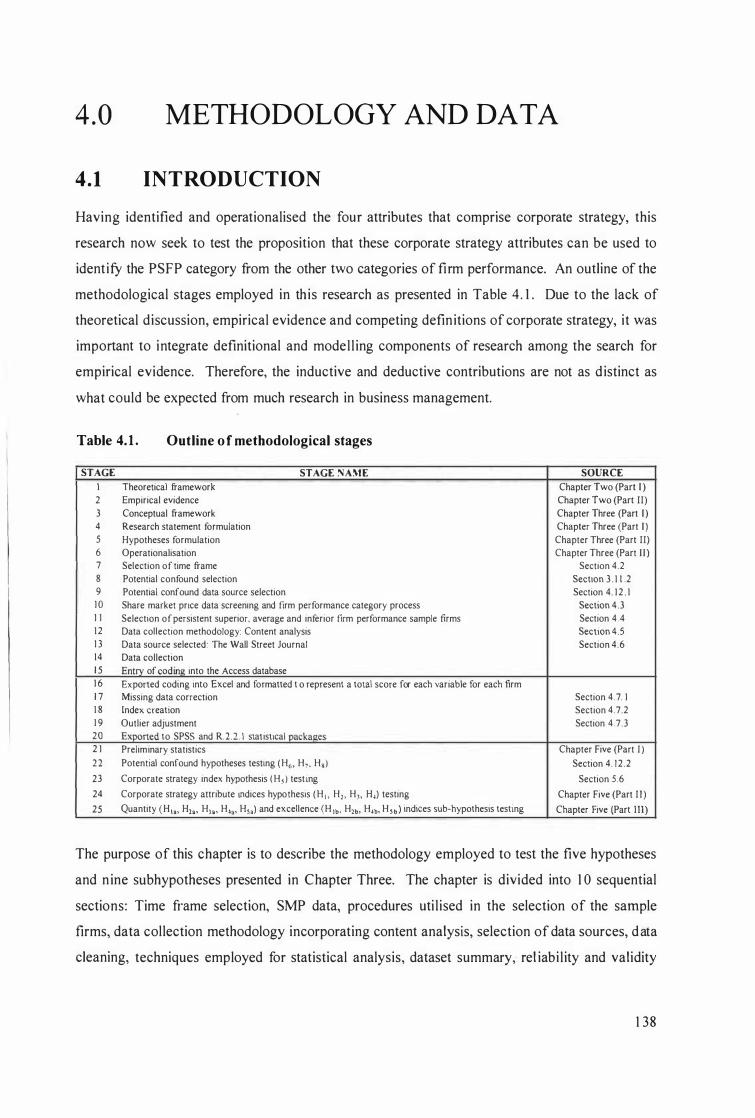
4.0 METHODOLOGY AND DATA
4.1 INTRODUCTION
Having identified and operationalised the four attributes that comprise corporate strategy, this
research now seek to test the proposition that these corporate strategy attributes can be used to
identify the PSFP category from the other two categories of firm performance. An outline of the
methodological stages employed in th is research as presented in Table 4. 1 . Due to the lack of
theoretical discussion, empirical evidence and competing definitions of corporate strategy, it was
important to integrate definitional and model l ing components of research among the search for
empirical evidence. Therefore, the inductive and deductive contributions are not as distinct as
what could be expected from much research in business management.
Table 4. 1 . Outline of methodological stages
STAGE STAGE NAME SOURCE
1 Theoretical framework Chapter Two (Part J ) 2 Empirical evidence Chapter Two (Part 11) 3 Conceptual framework Chapter Three (Part J) 4 Research statement formulation Chapter Three (Part J) 5 Hypotheses formulation Chapter Three (Part 11) 6 Operationalisation Chapter Three (Part 1 1 ) 7 Selection of time frame Section 4.2
8 Potential confound selection Section 3 . 1 1 .2
9 Potential confound data source selection Section 4. 1 2 . 1
1 0 Share market price data screening and firm performance category process Section 4.3
I I Selection of persistent superior. average and inferior firm performance sample firms Section 4 . 4
1 2 Data collection methodology: Content analysis Section 4.5
1 3 Data source selected : The Wall Street Journal Section 4.6
14 Data collection 1 5 Entry of coding into the Access database 1 6 Exported coding into Excel and formatted t o represent a total score for each variable for each firm 1 7 Missing data correction Section 4.7. 1
1 8 Index creation Section 4.7.2
1 9 Outlier adjustment Section 4.7.3
20 Exported to SPSS and R .2 .2. I statistical �ackages 2 1 Preliminary statistics Chapter Five (Part J ) 2 2 Potential confound hypotheses testing ( H6• H" H,) Section 4. 1 2 . 2
23 Corporate strategy index hypothesis (H,) test ing Section 5.6
24 Corporate strategy attribute mdices hypothesis ( H I > H2• H). H,) testing Chapter Five (Part 1 1 ) 25 Quantity ( H I •• H2o• H3a• H" . H,.) and excellence (H lb• H'b. H'b. H'b) indices SUb-hypothesis testing Chapter Five (Part Ill)
The purpose of this chapter is to describe the methodology employed to test the five hypotheses
and n ine sUbhypotheses presented in Chapter Three. The chapter is divided into 1 0 sequential
sections: Time frame selection, SMP data, procedures uti l ised in the selection of the sample
firms, data collection methodology incorporating content analysis, selection of data sources, data
cleaning, techniques employed for statistical analysis, dataset summary,· rel iabi lity and validity
1 38
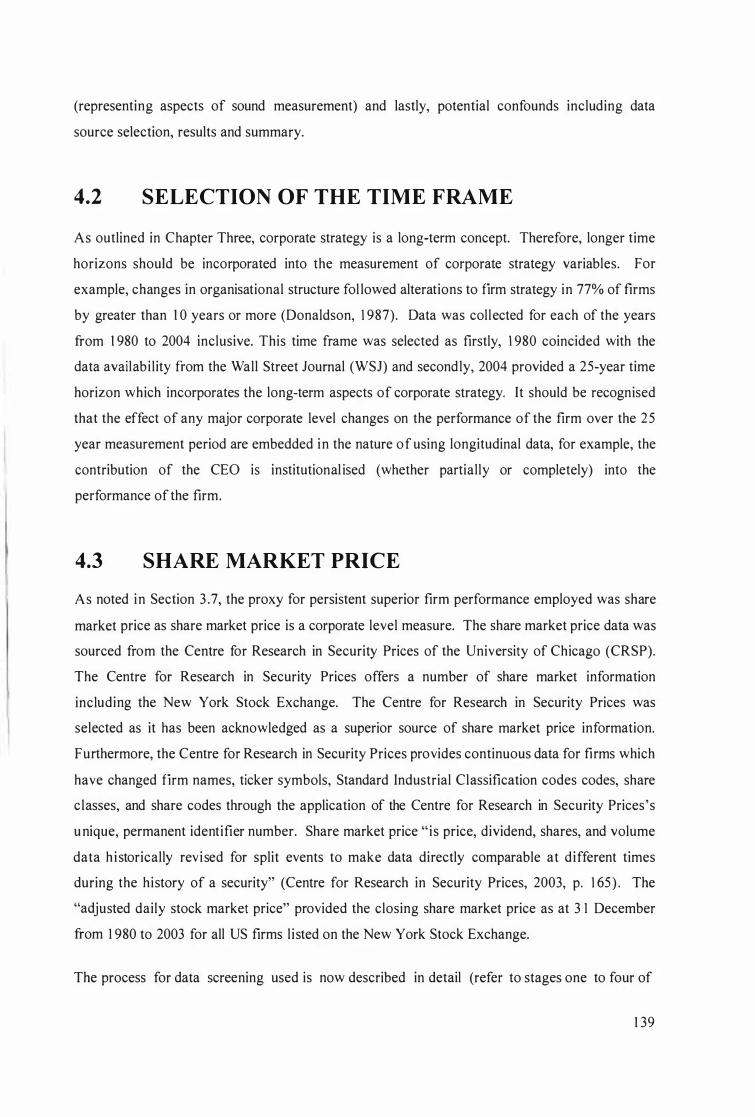
(representing aspects of sound measurement) and lastly, potential confounds including data
source selection, results and summary.
4.2 SELECTION OF THE TIME FRAME
As outlined in Chapter Three, corporate strategy is a long-term concept. Therefore, longer time
horizons should be incorporated into the measurement of corporate strategy variables. For
example, changes in organisational structure fol lowed alterations to firm strategy in 77% of firms
by greater than 1 0 years or more (Donaldson, 1 987). Data was collected for each of the years
from 1 980 to 2004 inclusive. This time frame was selected as firstly, 1 980 coincided with the
data availabi lity from the Wall Street Journal (WSJ) and secondly, 2004 provided a 25-year time
horizon which incorporates the long-term aspects of corporate strategy. It should be recognised
that the effect of any major corporate level changes on the performance of the firm over the 25
year measurement period are embedded in the nature of using longitudinal data, for example, the
contribution of the CEO is institutional ised (whether partially or completely) into the
performance of the firm.
4.3 SHARE MARKET PRICE
As noted in Section 3 .7, the proxy for persistent superior firm performance employed was share
market price as share market price is a corporate level measure. The share market price data was
sourced from the Centre for Research in Security Prices of the University of Chicago (CRSP).
The Centre for Research in Security Prices offers a number of share market information
including the New York Stock Exchange. The Centre for Research in Security Prices was
selected as it has been acknowledged as a superior source of share market price information.
Furthermore, the Centre for Research in Security Prices provides continuous data for firms which
have changed firm names, ticker symbols, Standard Industrial Classification codes codes, share
classes, and share codes through the application of the Centre for Research in Security Prices 's
unique, permanent identifier number. Share market price " is price, dividend, shares, and volume
data h i storically revised for split events to make data directly comparable at different times
during the history of a security" (Centre for Research in Security Prices, 2003, p. 1 65 ) . The
"adjusted daily stock market price" provided the closing share market price as at 3 1 December
from 1 980 to 2003 for all US firms l isted on the New York Stock Exchange.
The process for data screening used is now described in detail (refer to stages one to four of
1 39
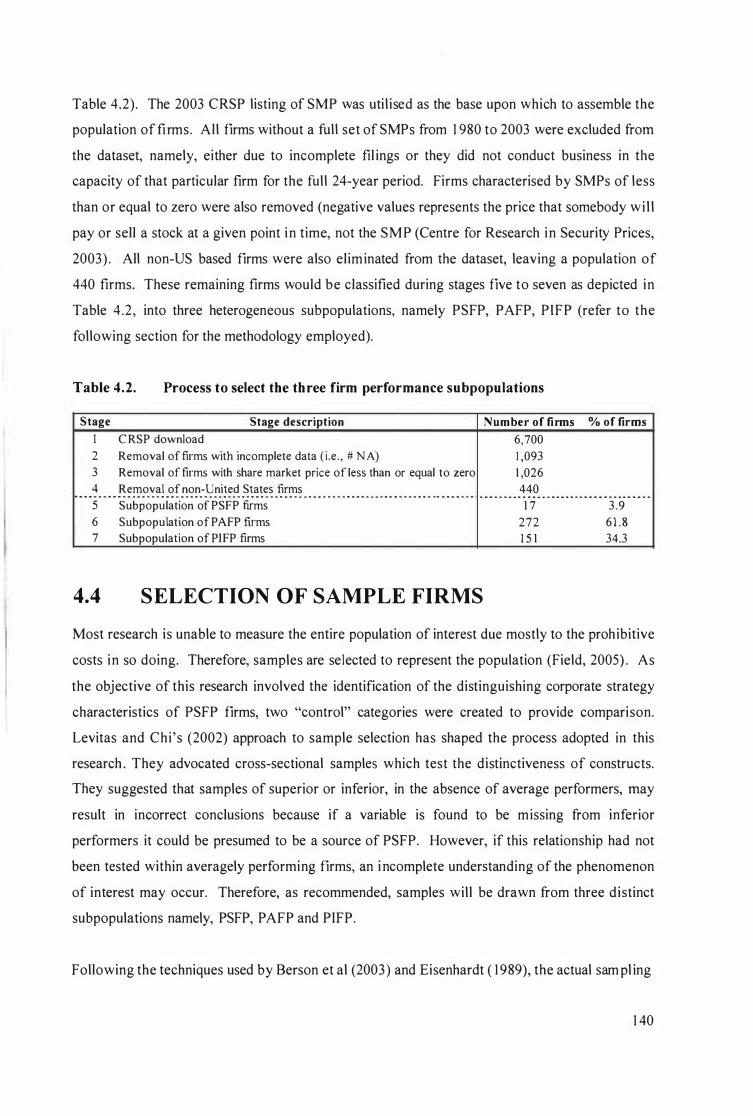
Table 4.2). The 2003 CRSP listing of SMP was uti l ised as the base upon which to assemble the
population of firms. All firms without a full set of SMPs from 1 980 to 2003 were excluded from
the dataset, namely, either due to incomplete fil ings or they did not conduct business in the
capacity of that particular firm for the full 24-year period. Firms characterised by SMPs of less
than or equal to zero were also removed (negative values represents the price that somebody wi l l
pay or sell a stock at a given point in time, not the SMP (Centre for Research in Security Prices,
2003) . All non-US based firms were also elim inated from the dataset, leaving a population of
440 firms. These remaining firms would be classified during stages five to seven as depicted in
Table 4.2, into three heterogeneous subpopulations, namely PSFP, PAFP, PIFP (refer to the
following section for the methodology employed).
Table 4.2. Process to select the three firm performance subpopulations
Stage Stage description Number of firms
I C RSP download 6, 700 2 Removal of firms with incomplete data ( i.e. , # N A) 1 ,093 3 Removal of firms with share market price of less than or equal to zero 1 ,026 4 Removal of non-United States firms 440
% of firms
. . . _ - - . - - - .. .. . .. - - - - _ .. .. .. .. . . .. - .. .. .. . .. _ - . - - _ .. _ - .. . .. . .. _ - . . . - - - - - - _ .. .. .. _ - - . . .. .. .. .. .. . . .. - - .. . .. _ - - - . .. _ - - - .. .. . . .. _ - .. .. .. . .. . . .. - - - - - - - - - . .. _ - - -
S Subpopulation of PS FP firms
6 Subpopulation of PAFP firms
7 Subpopulation of PI FP firms
4.4 SELECTION OF SAMPLE FIRMS
1 7 3 .9 272 6 1 . 8 I S I 34.3
Most research is unable to measure the entire population of interest due mostly to the prohibitive
costs in so doing. Therefore, samples are selected to represent the population (Field, 2005) . As
the objective of this research involved the identification of the distinguishing corporate strategy
characteristics of PSFP firms, two "control" categories were created to provide comparison.
Levitas and Chi 's (2002) approach to sample selection has shaped the process adopted in this
research . They advocated cross-sectional samples which test the distinctiveness of constructs.
They suggested that samples of superior or inferior, in the absence of average performers, may
result in incorrect conclusions because if a variable is found to be missing from inferior
performers it could be presumed to be a source of PSFP. However, if this relationship had not
been tested within averagely performing firms, an i ncomplete understanding of the phenomenon
of interest may occur. Therefore, as recommended, samples will be drawn from three distinct
subpopulations namely, PSFP, PAFP and PIFP.
Following the techniques used by Berson et al (2003) and Eisenhardt ( 1 989), the actual sam pl ing
1 40
procedure was: First, based on theoretical grounds, three heterogeneous subpopulations of firms
( i .e., superior, average and inferior performers) were identified which were consistent with the
conceptualisation of corporate strategy and its attributes. Samples were then randomly selected
(where possible) from each of the three subpopulations.
The subpopulation of PSFP firms represents superior performance relative to averagely and
inferior performing firms. The selection of the sample representing persistent performance over
time was based on the Dow Jones Industrial Average (DJIA) . DJIA was util ised as the reference
standard as firstly, this index is commonly referred to and secondly, it covers a range of
industries (23 as at Apri l 2004). DJIA is a weighted index based on the SMP of 30 firms l isted
on the New York Stock Exchange and NASDAQ.
The DJ lA reference standard value for each year was obtained from a l ist of the firms that
comprised the DJIA from 3 July 1 884 to 8 Apri l 2004 ( i .e . , Pierce, 2004). A listing of the DJIA
firms for each year from 1 980 to 2003 as at 3 1 December was then reconstructed from that
record. The SMPs for the 30 firms were obtained from CRSP for each year of the 24-year
period. Lastly, the 30 SMPs were averaged representing the reference standard for each year.
Of the 50 firms l i sted on the DJIA from 1 980 to 2005 (adjusted for firm name changes), 1 8 firms
were not l isted in any of the three firm performance categories (as outl ined in Section 4.3) , n ine
firms (28%) were l isted as PIFP, 2 1 firms (66%) were l isted in the PAFP category and two firms
(6%) were categorised as PS FP firms. Thus, the DJIA reference standard was not heavily
weighted in terms of persistent, superior performing firms.
Superior firms were classified as firms possessing between 20 and 24 time periods above the
reference standard ( i .e . , 1 7 firms representing 3 .9% of the population of firms). Firms whose
SMP never surpassed the reference standard were c lassified as inferior ( i .e . , 1 5 1 firms
representing 34.3% of the population of firms). Those classified as PAFP equalled
(approximately) the remainder of firms (i .e., 272 firms representing 6 1 .8% of the popUlation of
firms) refer to Table 4.2.
Random sampling i s considered ideal whereby all units in each subpopulation have an equal
chance of being selected. Sampling variability is more predictable and results are typically
considered more reliable with inferences possible (Short, Ketchen & Palmer, 2002). Sample size
was restricted to five firms from each subpopulation due to the time involved in performing
content analysis on the WSJ articles (on average, 1 20 hours per firm, equating to a total of 1 ,800
1 4 1
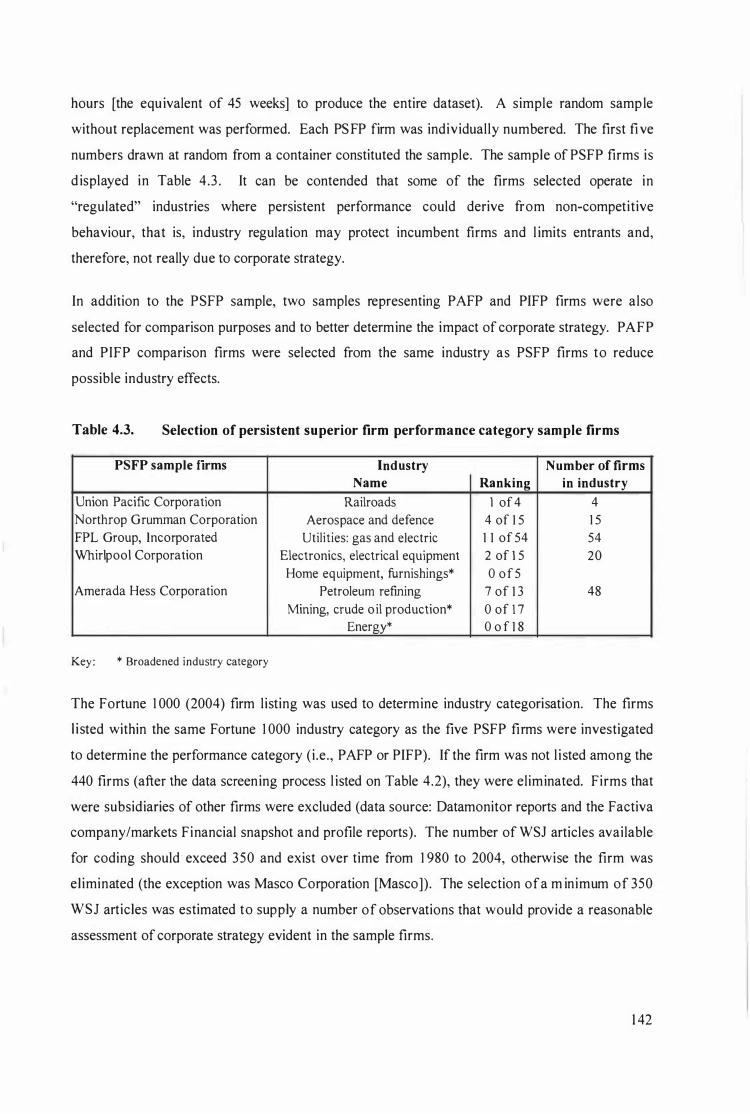
hours [the equivalent of 45 weeks] to produce the entire dataset). A simple random samp le
without replacement was performed. Each PS FP firm was individually numbered. The first fi ve
numbers drawn at random from a container constituted the sample. The sample of PSFP firms is
d isplayed in Table 4.3 . It can be contended that some of the firms selected operate in
"regulated" industries where persistent performance could derive from non-competitive
behaviour, that is, industry regulation may protect incumbent firms and l imits entrants and,
therefore, not really due to corporate strategy.
In addition to the PS FP sample, two samples representing PAFP and PIFP firms were also
selected for comparison purposes and to better determine the impact of corporate strategy. P AFP
and PIFP comparison firms were selected from the same industry as PSFP firms to reduce
possible industry effects.
Table 4.3. Selection of persistent superior firm performance category sample firms
PS FP sample firms
Union Pacific Corporation
Northrop Grumman Corporation
FPL Group, Incorporated
Whirlpool Corporation
Amerada Hess Corporation
Key : * Broadened industry category
Industry Name
Railroads
Aerospace and defence
Utilities: gas and electric
Electronics, electrical equipment
Home equipment, furnishings*
Petroleum refining
Mining, crude o il production*
Energy*
Number of firms Ranking in industry
l of 4 4
4 of 1 5 1 5
1 1 of 54 54
2 of 1 5 20
o o f 5
7 of 1 3 48
o of 1 7 o o f 1 8
The Fortune 1 000 (2004) firm listing was used to determine industry categorisation. The firms
l i sted within the same Fortune 1 000 industry category as the five PSFP firms were investigated
to determine the performance category (i .e. , PAFP or PIFP). If the firm was not l i sted among the
440 firms (after the data screening process l isted on Table 4.2), they were eliminated. Firms that
were subsidiaries of other firms were excluded (data source: Datamonitor reports and the Factiva
company/markets Financial snapshot and profile reports). The number of WSJ articles available
for coding should exceed 350 and exist over time from 1 980 to 2004, otherwise the firm was
el iminated (the exception was Masco Corporation (Masco]). The selection ofa m inimum of 350
WSJ articles was estimated to supply a number of observations that would provide a reasonable
assessment of corporate strategy evident in the sample firms.
1 42
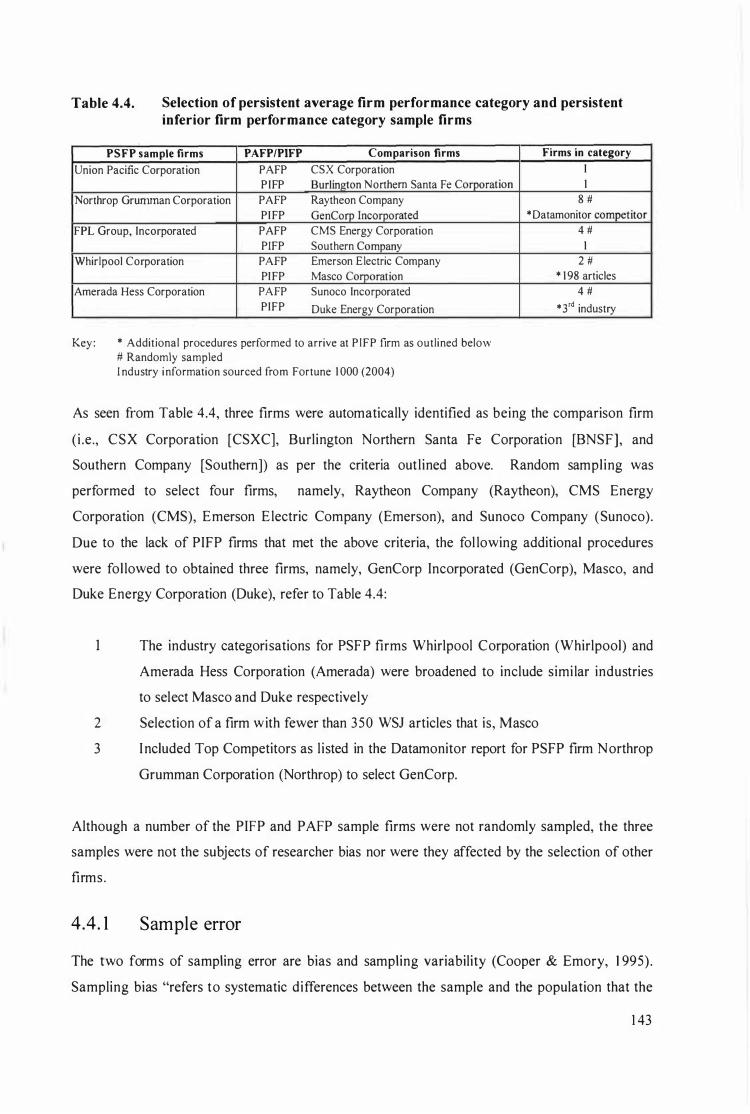
Table 4.4. Selection of persistent average firm performance category and persistent inferior firm performance category sample firms
PSFP sample firms PAFP/PIFP Comparison firms Firms in category
Union Pacific Corporation PAFP CSX Corporation I PIFP Burlington Northern Santa Fe Corporation 1
Northrop Grununan Corporation PAFP Raytheon Company 8 # PI FP GenCorp Incorporated * Datamonitor competitor
FPL Group, Incorporated PAFP CMS Energy Corporation PIFP Southern Company
Whirlpool Corporation PAFP Emerson Electric Company PI FP Masco Corporation
Amerada Hess Corporation PAFP Sunoco Incorporated PI FP Duke Energy Corporation
Key : * Additional procedures performed to arrive at P l F P firm as outlined below # Randomly sampled I ndustry i nformation sourced from Fortune 1 000 (2004)
4 # 1
2 # * 1 98 articles
4 #
* 3 rd industry
As seen from Table 4.4, three firms were automatically identified as being the comparison firm
(i .e., CSX Corporation [CSXC], Burlington Northern Santa Fe Corporation [BNSF], and
Southern Company [Southern]) as per the criteria out lined above. Random sampling was
performed to select four firms, namely, Raytheon Company (Raytheon), CMS Energy
Corporation (CMS), Emerson E lectric Company (Emerson), and Sunoco Company (Sunoco).
Due to the lack of PIFP firms that met the above criteria, the fol lowing additional procedures
were fol lowed to obtained three firms, namely, GenCorp Incorporated (GenCorp), Masco, and
Duke Energy Corporation (Duke), refer to Table 4.4:
The industry categorisations for PS FP firms Whirlpool Corporation (Whirlpool) and
Amerada Hess Corporation (Amerada) were broadened to include simi lar industries
to select Masco and Duke respectively
2 Selection of a firm with fewer than 350 WSJ articles that is, Masco
3 Included Top Competitors as l isted in the Datamonitor report for PSFP firm Northrop
Grumman Corporation (Northrop) to select GenCorp.
Although a number of the PIFP and PAFP sample firms were not randomly sampled, the three
samples were not the subjects of researcher bias nor were they affected by the selection of other
firms.
4.4. 1 Sample error
The two forms of sampling error are bias and sampling variability (Cooper & Emory, 1 995) .
Sampling bias "refers to systematic differences between the sample and the population that the
1 43
sample represents" (Henry, 1 998, p. 1 07). Sampling bias may exist due to nonobservation bias
as the population of firms only included US firms l isted on New York Stock Exchange.
Secondly, a size bias may be evident as the population consists of large firms. Lastly, survivor
bias is present as the population only contains firms that survived from 1 980 to 2004. The
reason for excluding firms that had delisted from the New York Stock Exchange was because
PSFP incorporates the concept of persistence and, secondly, the information on other fi rms
would have been incomplete and only provided a partial representation of corporate strategy.
Therefore, firms possessing all of these characteristics are overrepresented in the sample and
external validity could be reduced. For example, every PIFP firm survived the 25-year time
horizon and arguably, a set of even worse performing firms may exist, who because they
decl ined or were acquired, ceased to be el igible of inclusion in the study.
Sampl ing variabi l ity refers to how well the sample estimates the population. It can be measured
by the standard error whereby a large standard error relative to the sample mean indicates the
sample may not be representative of the population. Furthermore, a large confidence interval
suggests the sample does not estimate the population. Statistical Package for Social Science 1 3 .0
for Windows (SPSS) provides analysis of the appropriate results from calculations on both bias
and precision.
4.5 DATA COLLECTION
ANALYSIS
TOOL : C ONTENT
The presence or absence of corporate strategy was assessed by measuring the incidence of each
of the 1 8 variables (outlined in Equation 9, Chapter Three) evident in WSJ articles. The method
used for determining incidence was content analysis. Content analysis is an empirically
grounded method involving the systematic analysis of usual ly rich and flexible text via
c lassification and evaluation (Krippendorff, 2004) . Content analysis is a perceptual assessment
by the researcher of the text. The text was assumed to provide a representation of corporate
strategy in each of the sample firms. This component of the research fol lowed the sociological
tradition whereby text is considered a proxy for human experience, rather than the l inguistic
tradition whereby text is regarded as the object of analysis, for example, grammatical structures
(Tesch, 1 990). Of the two texts that are thought to exist in the sociological tradition, free
flowing text was applicable for this research . The text is reduced, via researcher interpretation,
according to codes (Ryan & Bernard, 2003). The text was analysed in terms of what was stated
rather than the various meanings that may be applied as "the most informative content analyses,
1 44
therefore, wil l be produced by analysts who choose their content categories with reference to an
explicit theoretical framework" (Ounter, 2002. p. 222).
Content analysis was selected as the data reduction tool because direct observation was
impossible. Hypotheses were then evaluated through inferences gained from the textual data
rather than from direct observation (Krippendorff, 2004) . Secondly, content analysis could be
util i sed to analyse actions not yet taken. Thirdly, content analysis could assess and reduce large
quantities of freely available unstructured secondary data. Lastly, the act of measurement did not
influence or distort the phenomena under investigation. Therefore, any sources of error or b ias
in comparison to alternative data collection methodologies were reduced (Krippendorff, 2004).
Some l imitations of content analysis should be noted. Coding was based on the perceptions of
the researcher and consequently, these interpretations may suffer from various distortions.
Misinterpretation may also be compounded as a single data collection source was uti l ised ( i .e. ,
Wal l Street Journal) . However, a comparison sample of BusinessWeek and Dow lones Business
News articles was analysed and found to be analogous. The research sought to l imit
misinterpretation by using previous coding schema. Unfortunately, content analysis has only
been previously employed on a limited scale in corporate strategy research. Thus, alterative
coding schemas could not be utilised or compared. The strategic intent questionnaire employed
in the interviews by Monroe (2002) was altered to provide the basis for a coding book. The
coding book outlined a description of each code (identifiers of variables), including the
boundaries of exclusion and inclusion (i .e., the codes did not overlap). The coding book used in
this study is presented in Appendix 1 . Second ly, the a priori creation of the coding book as the
frame of reference, although reducing bias and inconsistent coding may have excluded some
evidence of corporate strategy. This process then may result in the loss of some information
from the analysis (Atkinson, 1 992, p. 459 as c ited in Si lverman, 2003).
4.6 SELECTION OF THE DATA
EXPLANATORY VARIABLES:
STREET JOURNAL
SOURCE FOR
THE WALL
The data col lection process focused on deriving the main elements of corporate strategy that
emerged from the sample firms. Employing a historical methodology has been deemed
advantageous when seeking to uncover firm strategic decisions (Helfat, 2000). Finkelstein and
Hambrick ( 1 996) noted that archival data sources are commonly uti l ised in strategic leadership
1 45
research as they are considered h ighly reliable. This research fol lowed the technique used by
Adner and Helfat (2003), and Brickley and van Drunen ( 1 990) who uti lised content analysis of
WSJ to provide an evaluation of corporate strategy. A number of secondary data sources
exhibiting the corporate strategy evident within major US firms were considered. Ideally all
articles published on each firm should be analysed. But due to the laborious process this would
involve, one principal data source was selected by these researchers in which to uncover the
presence of corporate strategy (Le., the WSJ). In both cases, the WSJ provided an accurate
proxy for the record of corporate strategy decisions.
A search was performed within Factiva database (Dow Jones and Reuters) to identify all WSJ
articles l i sted by firm name. All articles from 1 980 to 2004 were collected for each of the 1 5
firms. Content analysis was performed on the 9,970 WSJ articles collected (examples of coding
are presented in Appendix 2). The possible limitations and benefits of secondary data sources
are now described.
4.6 . 1 The benefits of the Wall Street Journal
The WSJ was considered a more reliable data source than firm publ ished reports as firstly, it is
assumed that the reporters and editors in maintaining the reputation of WSJ as a leading business
news source, would perform information triangulation to reduce potential bias and distortion.
Secondly, WSJ is independent of the sample firms and, therefore, it is assumed would not be
biased.
The use of secondary data sources was expected to provide a fair measurement of corporate
strategy as firms often pUblicise their goals whereby firms uti l ise publ icly disclosed data sources
"presenting a preferred image of institutions and managing the impressions of external publics
upon whom they depend for their existence" (Taylor & Bogdan, 1 998, p. 1 30). Levitas and Chi
(2002) noted that firms may also uti l ise publicly disclosed data sources to provide an indication
of advantage to their competitors which may alter their competitors' decisions in their favour.
The data collected from secondary data sources is less l ikely to be contaminated as the original
author is unaware of how the text wil l be analysed in comparison to other data collection
methods such as interviews (Krippendorff, 2004).
The WSJ provided data on all the sample firms at the required unit of analysis that i s, the firm
level . Data obtained from one source could be coded in an identical manner. An initial
assessment of the WSJ provided evidence that corporate strategy decisions were represented and
1 46
the quality of the information was of a high standard. The researcher managed inappropriate
data by excluding it from analysis, that is, only relevant data was coded. The data management
process also sought to exclude flawed data as any data that was revised or corrected by the WSJ
was reflected in the recoding of the original article in l ight of these corrections.
4.6 .2 Limitations of the data source
This data source may incorrectly estimate the level of corporate strategy evident in the sample
firms. However, it is l ikely to represent a minimum level of corporate strategy. I t should be
noted that without access to principal agents within firms, it would be difficult to ascertain
firstly, whether these decisions were carried out and secondly, the success of corporate strategy
implementation. Text is a social construction which may represent different aspects of what is
being measured. In other words, interpretat ion difficulties due to writer bias may exist as the
publ ished accounts may be inaccurate or distorted (i .e. , firm information may be publ ished with
the aim of enhancing firm legitimacy and reputation). For example, firms knowingly make
announcements either to explain, justify or instil confidence in their decisions ( including those
encompassing corporate strategy). Therefore, "the l ikely perspectives and motives of author and
recipient need to be borne in mind" (Jeremy, 2002, p. 447) . An additional l imitation is that the
text is interpreted, possibly creating new meanings beyond the context of which it was originally
created. The articles are not necessarily coded from the viewpoint of the anticipated audience
(Krippendorff, 2004). Despite these concerns, the WSJ articles were taken at face value in a
process to similar to that used by Adner and Helfat (2003).
4.7 DATA CLEANING
The collected data went through three stages before it was analysed, namely, missing data due to
an incomplete Factiva database, creation of the corporate strategy, attribute, excellence and
quantity indices, and the presence of outliers in the dataset. Each coding was entered into the
coding database in Microsoft Access, including article date, annual article number, the firm SBU
the coding applied to, the description of the coding and, lastly, the code. A second review of the
data was then performed to ensure the consistency of the coding. The coding of negative
observations of excellence variables were also performed, and were subtracted from the positive
measurement of excellence to calculate the overall score for each excel lence variable.
Frequencies were calculated for all 1 8 variables.
1 47
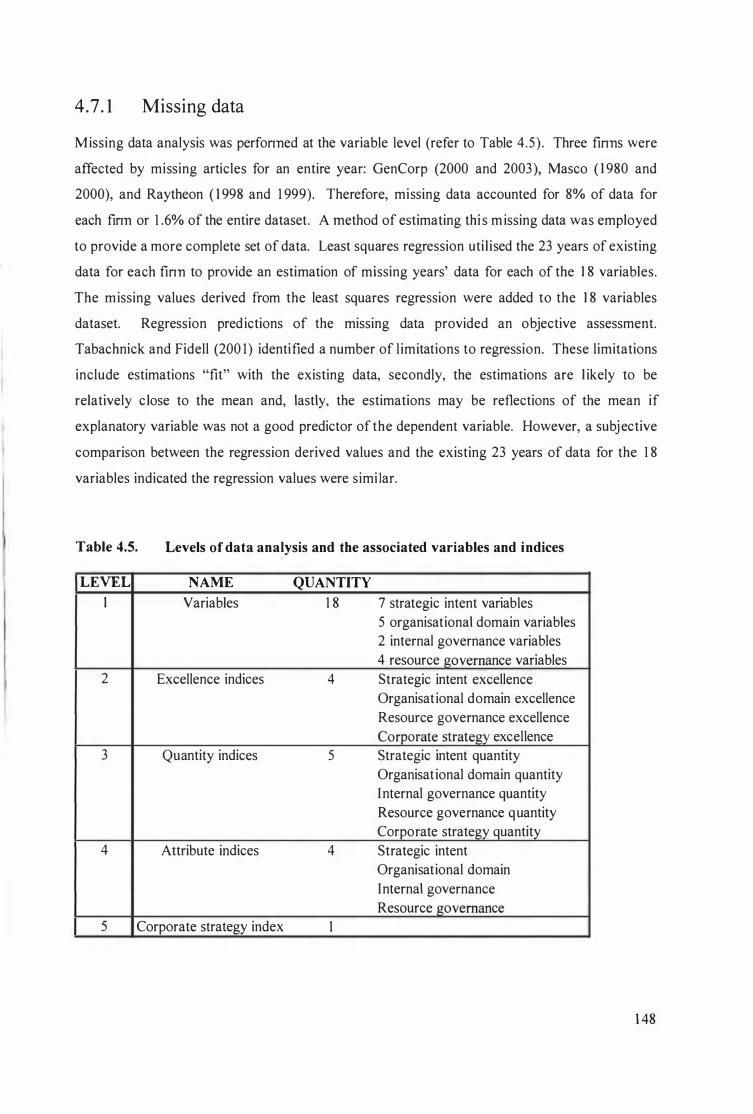
4.7 . 1 Missing data
Missing data analysis was perfonned at the variable level (refer to Table 4.5) . Three finns were
affected by missing articles for an entire year: GenCorp (2000 and 2003), Masco ( 1 980 and
2000), and Raytheon ( 1 998 and 1 999). Therefore, missing data accounted for 8% of data for
each finn or 1 .6% of the entire dataset. A method of estimating thi s m issing data was employed
to provide a more complete set of data. Least squares regression uti l ised the 23 years of existing
data for each finn to provide an estimation of missing years' data for each of the 1 8 variables.
The missing values derived from the least squares regression were added to the 1 8 variables
dataset. Regression predictions of the missing data provided an objective assessment.
Tabachnick and Fidell (200 1 ) identified a number of l imitations to regression. These limitations
include estimations "fit" with the existing data, secondly, the estimations are l ikely to be
relatively c lose to the mean and, lastly, the estimations may be reflections of the mean if
explanatory variable was not a good predictor of the dependent variable. However, a subjective
comparison between the regression derived values and the existing 23 years of data for the 1 8
variables indicated the regression values were simi lar.
Table 4.5. Levels of data analysis and the associated variables and indices
LEVEL NAME QUANTITY
1 Variables 1 8 7 strategic intent variables 5 organisational domain variables 2 internal governance variables 4 resource governance variables
2 Excellence indices 4 Strategic intent excellence Organisat ional domain excellence Resource governance excellence Corporate strategy excellence
3 Quantity indices 5 Strategic intent quantity Organisat ional domain quantity Internal governance quantity Resource governance quantity Corporate strategy quantity
4 Attribute indices 4 Strategic intent Organisational domain Internal governance Resource governance
5 Corporate strategy index 1
1 48
4.7 .2 Index creation
To reduce possible measurement error, a series of indices were created. Index creation was
comprised of three stages: firstly, nine multiple-item quantity and excellence indices ( levels 2
and 3 of Table 4.5 and outlined in Equation 6, Chapter Three). Second ly, four multiple-item
indices representing each corporate strategy attribute were determined (level 4 of Table 4 .5 and
presented in Equation 5, Chapter Three). Thirdly, the calculation of the multiple-item corporate
strategy index (level 5 of Table 4 .5 and outlined in Equation 1 0, Chapter Three). The use of
indices sought to incorporate the complex nature of corporate strategy and the need to accurately
reflect this . I ndices also assist in l imiting distortion and misc\assification, and increasing validity
(Cooper & Emory, 1 995).
The coding database was exported into Microsoft Excel spreadsheets. A number of stages were
employed to create the various indices that would be used in the statistical analysis. F irstly, a
comparison was made between the Access coding database and the Excel spreadsheet to ensure
the data was exported accurately . Secondly, the coding results were aggregated into the 1 8
variables. The 1 8 variables were then combined into the various indices as per the formulae
outl ined in Chapter Three (refer to Figure 4 . 1 for presentation of the relationship between the
three levels of indices). Low coding scores represented low amounts of an index; conversely
h igh coding scores reflect high incidences of a particular index.
4.7.3 Outliers
A number of outliers were present in the indices which may distort statistical analysis resulting
in Type I and II errors or reducing the generalisabil ity of the sample (Tabachnick & F idell,
200 1 ) . Outliers can also inflate the standard deviation and bias the mean (Field, 2005) .
Tabachnick and Fidel l (200 1 ) noted that outliers should be identified in terms of their grouping,
that is, within each firm performance category. Outliers were defined as cases with values
greater than 1 .5 interquartile ranges as identified by the box plots derived from SPSS . The
outl ier analysis was conducted on the index levels for each firm. Due to the greater range of
values evident at the variable level which produced distorted data, th is level was not adjusted for
outliers.
1 49
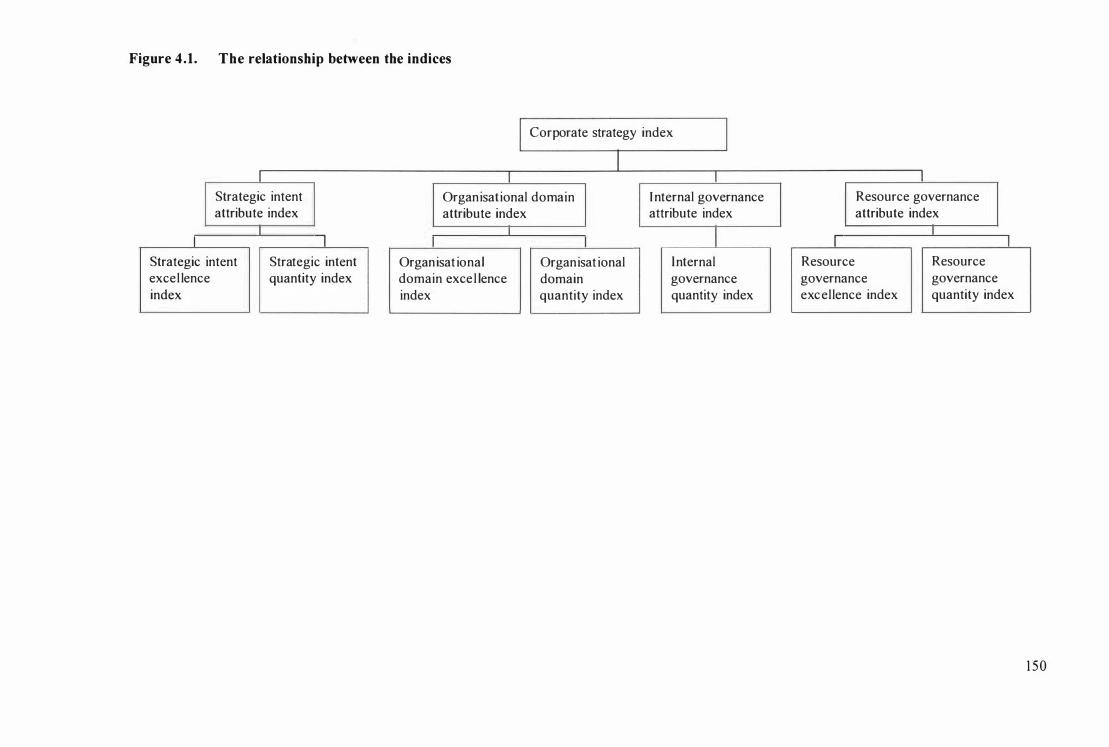
Figure 4.1. The relationship between the indices
Strategic intent attribute index
I I Strategic intent Strategic intent excel lence quantity index index - �------
Corporate strategy index
Organisat ional domain Internal governance attribute index attribute index
I Organisat ional domain exce l lence index
Organisat ional domain quantity index
Internal governance quantity index
Resource governance attribute index
I I Resource Resource governance governance excel lence index quantity index
1 50
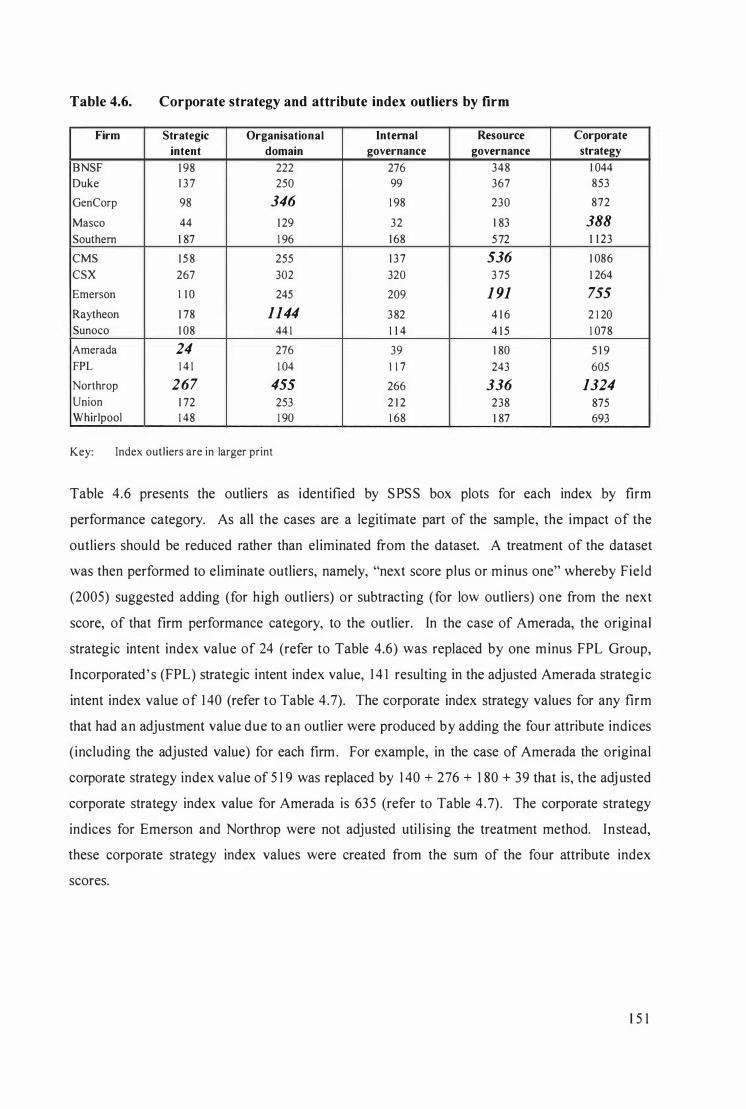
Table 4.6. Corporate strategy and attribute index outliers by firm
Firm Strategic Organisational intent domain
BNSF 1 98 222 Duke 1 37 250
GenCorp 98 346 Masco 44 1 29
Southern 1 87 1 96
CMS 1 5 8 255 CSX 267 302
Emerson 1 1 0 245
Raytheon 1 78 1144 Sunoco 1 08 44 1
Amerada 24 276 FPL 1 4 1 1 04
Northrop 267 455 Union 1 72 253 Whirlpool 1 48 1 90
Key: Index outl iers are in larger print
Internal Resource
governance governance
276 348 99 367
1 98 230
32 1 83
1 68 572
1 3 7 536 320 3 75
209 1 91 382 4 1 6
1 1 4 4 1 5
39 1 80
I 1 7 243
266 336 2 1 2 238 1 68 1 87
Corporate strategy
1 044 853
872
388 1 1 23
1 086
1 264
755 2 1 20
1 078
5 1 9
605
1324 875 693
Table 4.6 presents the outliers as identified by SPSS box plots for each index by firm
performance category. As all the cases are a legitimate part of the sample, the impact of the
outliers should be reduced rather than eliminated from the dataset. A treatment of the dataset
was then performed to eliminate outliers, namely, "next score plus or minus one" whereby Field
(2005) suggested adding (for h igh outl iers) or subtracting (for low outliers) one from the next
score, of that firm performance category, to the outlier. In the case of Amerada, the original
strategic intent index value of 24 (refer to Table 4.6) was replaced by one minus FPL Group,
Incorporated ' s (FPL) strategic intent index value, 1 4 1 resulting in the adjusted Amerada strategic
intent index value of 1 40 (refer to Table 4.7). The corporate index strategy values for any firm
that had an adjustment value due to an outlier were produced by adding the four attribute indices
(including the adjusted value) for each firm . For example, in the case of Amerada the original
corporate strategy index value of 5 1 9 was replaced by 1 40 + 276 + 1 80 + 39 that is, the adj usted
corporate strategy index value for Amerada is 635 (refer to Table 4.7). The corporate strategy
indices for Emerson and Northrop were not adjusted uti l i sing the treatment method. Instead,
these corporate strategy index values were created from the sum of the four attribute index
scores.
1 5 1
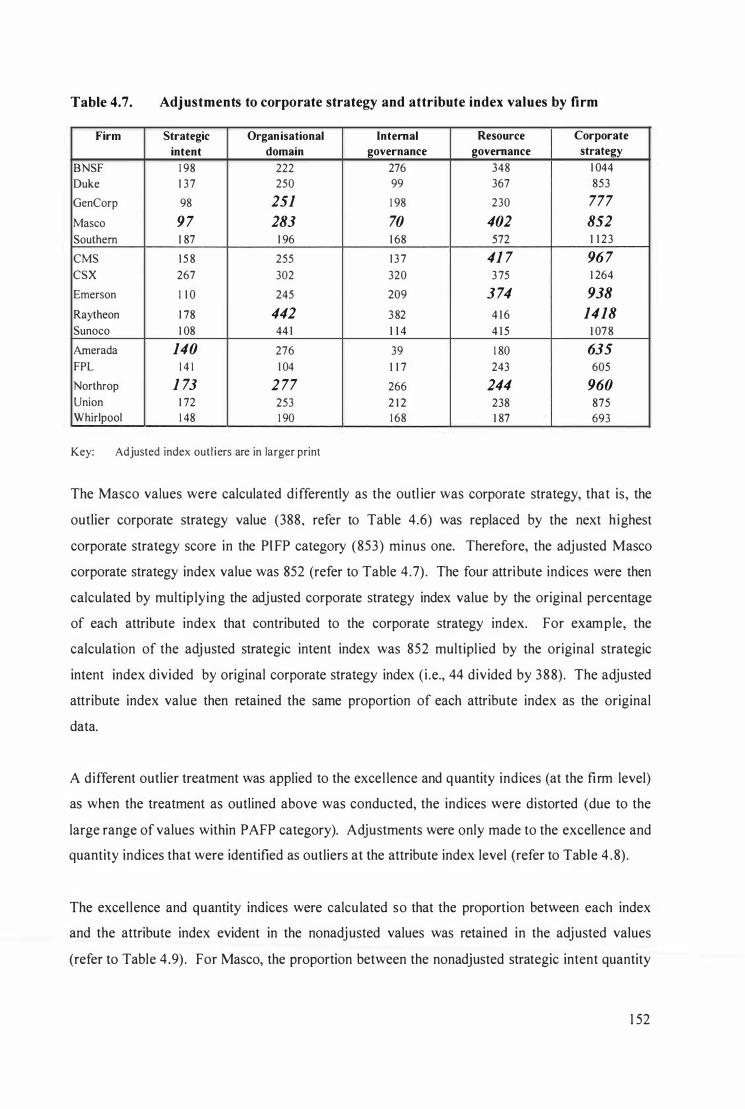
Table 4.7. Adjustments to corporate strategy and attribute index values by firm
Firm Strategic Organisational
intent domain
BNSF 1 98 222 Duke 1 37 250
GenCorp 98 251 Masco 9 7 283 Southern 1 87 1 96
CMS 1 5 8 255
CSX 267 302
Emerson 1 1 0 245
Raytheon 1 78 442 Sunoco 1 08 44 1
Amerada 140 276 FPL 1 4 1 1 04
Northrop 1 73 2 77 Union 1 72 253 Whirlpool 1 48 1 90
Key: Adjusted index outl iers are in larger print
Internal Resource Corporate
governance governance strategy
276 348 1 044 99 367 853
1 98 230 777 70 402 852 1 68 572 1 1 23
1 3 7 41 7 96 7 320 3 75 1 264
209 3 74 938 382 4 1 6 1418 1 1 4 4 1 5 1 078
39 1 80 635 1 1 7 243 605
266 244 960 2 1 2 238 875 1 68 1 87 693
The Masco values were calculated differently as the outl ier was corporate strategy, that is, the
outlier corporate strategy value (388, refer to Table 4.6) was replaced by the next highest
corporate strategy score in the PI FP category (853) minus one. Therefore, the adjusted Masco
corporate strategy index value was 852 (refer to Table 4 .7) . The four attribute indices were then
calculated by mUltip lying the adjusted corporate strategy index value by the original percentage
of each attribute index that contributed to the corporate strategy index. For example, the
calculation of the adjusted strategic intent index was 852 multipl ied by the original strategic
intent index divided by original corporate strategy index (i .e., 44 divided by 388) . The adjusted
attribute index value then retained the same proportion of each attribute index as the original
data.
A different outlier treatment was applied to the excel lence and quantity indices (at the firm level)
as when the treatment as outlined above was conducted, the indices were distorted (due to the
large range of values within PAFP category). Adjustments were only made to the excellence and
quantity indices that were identified as outliers at the attribute index level (refer to Table 4 . 8) .
The excellence and quantity indices were calculated so that the proportion between each index
and the attribute index evident in the nonadjusted values was retained in the adjusted values
(refer to Table 4 .9) . For Masco, the proportion between the nonadjusted strategic intent quantity
1 52
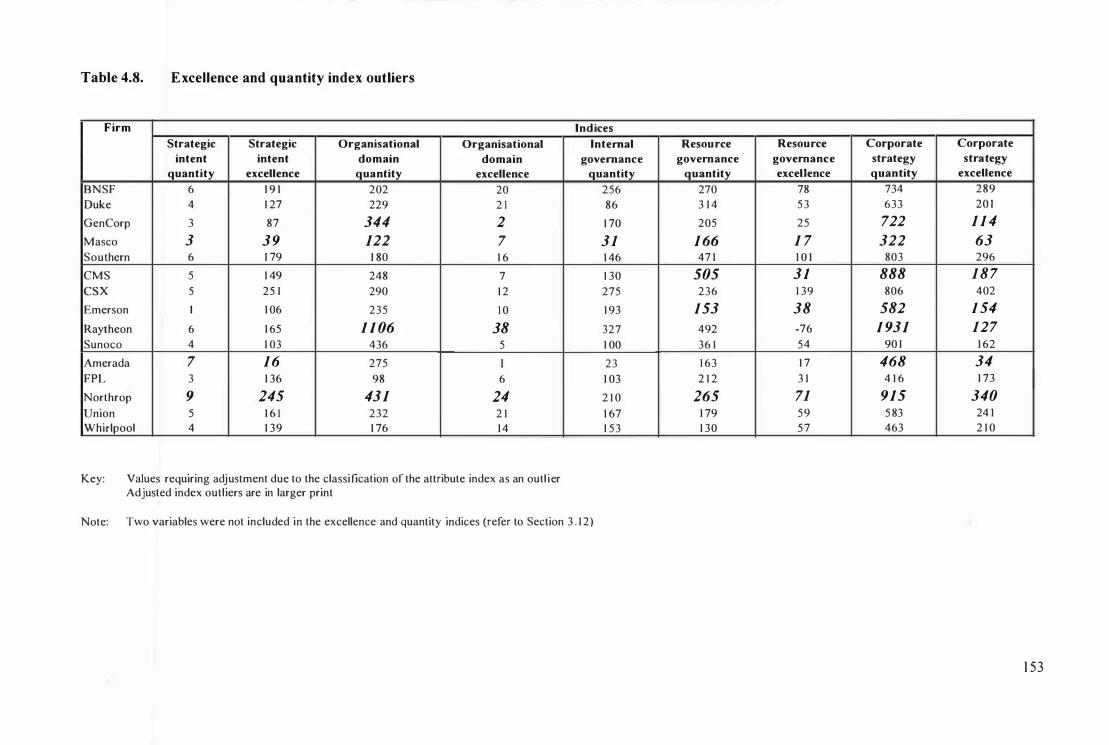
Table 4.8. Excellence and quantity index outliers
Firm
Strategic Strategic Organisational Organisational
intent intent domain domain
quantity excellence quantity excellence
BNSF 6 1 9 1 202 20
Duke 4 1 27 229 2 1
GenCorp 3 87 344 2 Masco 3 3 9 122 7 Southern 6 1 79 1 80 1 6
CMS 5 1 49 248 7
csx 5 25 1 290 1 2
Emerson I 1 06 235 1 0
Raytheon 6 1 65 1 1 06 38 Sunoco 4 1 03 436 5
Amerada 7 1 6 275 I FPL 3 1 36 98 6
Northrop 9 245 431 24 Union 5 1 6 1 232 2 1
Whirlpool 4 1 39 1 76 1 4
Key: Values requiring adjustment due to the classi fication of the attribute index as an outl i er Adjusted index outl iers are in larger print
Indices
Internal
governance
quantity
256
86
1 70
3 1 1 46
1 30
275
1 93
327
1 00
23
1 03
2 1 0
1 67
1 5 3
Note: Two variables were not included in the excellence and quantity indices (refer to Section 3 . 1 2)
Resou rce Resource Corporate Corporate
governance governance strategy strategy
quantity excellence quantity excellence
270 78 734 289
3 1 4 5 3 633 20 1
205 25 722 1 1 4 1 66 1 7 322 63 47 1 1 0 1 803 296
505 3 1 888 1 8 7 236 1 39 806 402
153 38 582 1 54 492 -76 1 931 127 36 1 54 90 1 1 62
1 63 1 7 468 34 2 1 2 3 1 4 1 6 1 73
265 71 915 340 1 79 5 9 5 83 24 1
1 30 5 7 463 2 1 0
1 53
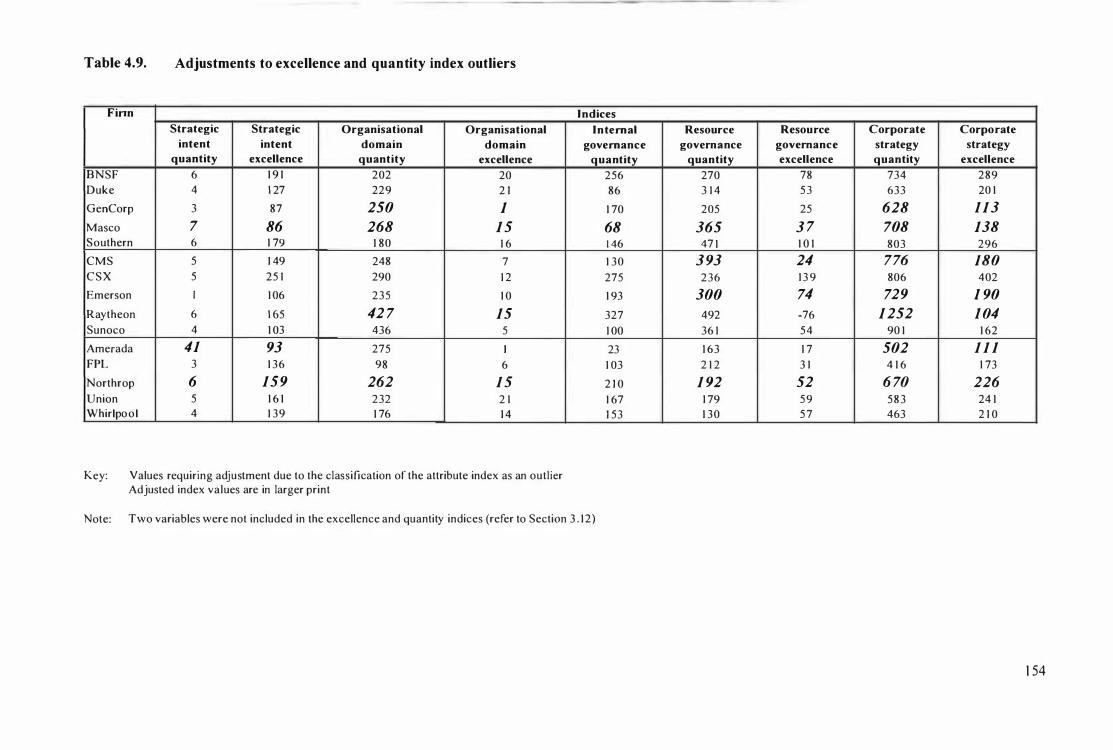
Table 4.9. Adjustments to excellence and quantity index outliers
Finn
Strategic Strategic Organisational Organisational
intent intent domain domain quantity excellence quantity excellence
BNSF 6 1 9 1 202 20
Duke 4 1 27 229 2 1
GenCorp 3 87 250 1 Masco 7 86 268 1 5 Southern 6 1 79 1 80 1 6
CMS 5 1 49 248 7
CSX 5 25 1 290 1 2
Emerson I 1 06 235 1 0
Raytheon 6 1 65 42 7 15 Sunoco 4 1 03 436 5
Amerada 41 93 275 I FPL 3 1 36 98 6
Northrop 6 159 262 1 5 Union 5 1 6 1 232 2 1 Whirlpo o l 4 1 39 1 76 1 4
Key: Values requiring adjustment due to the classification of the attribute index as an outlier Adjusted index values are in larger print
Indices
Internal
governance
quantity
256
86
1 70
68 1 46
1 30
275
1 93
327
1 00
23
1 03
2 1 0
1 67
1 53
Note: Two variables were not included in the excellence and quantity indices (refer to Section 3 . 1 2)
Resource Resource Corporate Corporate
governance governance strategy strategy
quantity excellence quantity excellence
270 78 734 289
3 1 4 5 3 633 20 1
205 25 628 113 365 3 7 708 138
47 1 1 0 1 803 296
3 93 24 776 180 236 1 3 9 806 402
300 74 729 1 90 492 -76 1 252 1 04 36 1 54 90 1 1 62
1 63 1 7 502 1 1 1 2 1 2 3 1 4 1 6 1 73
1 92 52 6 70 226 1 79 5 9 5 8 3 24 1
1 30 5 7 463 2 1 0
1 54
index and the nonadjusted strategic intent index is 6.8%. The proportion between the adjusted
strategic intent quantity index and the adjusted strategic intent index is 7 .2%, rounded to a whole
number.
4.7.4 Data transfonnation
Due to the potential nonnorrnality and heterogeneous variances issues (refer to the fol lowing
section), data transformation methods were appl ied to the dataset. The fol lowing data
transformations were attempted (square-root, log 1 0, reciprocal); however, they did not correct
the data in any meaningful manner.
4.8 STATISTICAL ANALYSIS
Statistical analyses were selected on the basis of the best method to test each of the various
hypotheses, using techniques that provided a comparison between the PSFP category and the
other two firm performance categories. Statistical analysis of the dataset was primarily
performed on SPSS. The Excel files were imported into SPSS and a comparison was then
performed between the Excel and SPSS datasets to ensure accuracy. SPSS provides a series of
statistical techniques which can test Ho and alternative hypotheses via p-values. The excellence
subhypotheses and the strategic intent attribute hypothesis (H2) were expected to be directional
and, thus, employ a one-tailed test.
Two interpretation errors may occur. A Type I error transpires if Ho is incorrectly rejected,
whereas, fai lure to reject Ho when in fact the effect does not exist is termed a Type 11 error. To
restrict the probabi l ity of committing a Type I error, the Ho wi l l be rejected if p is greater than or
equal to 0.05. A Type 11 error is related to statistical power of the test performed and may exist
due to the small sample size. The literature review in conj unction with the in-depth conceptual
framework provided the basis for practical significance of any statistical significant distinction
between the PSFP category from PAFP and PIFP categories in terms of levels two to five (refer
to Table 4.5) .
4.8 . 1 Descriptive statistics
Descriptive statistics were calculated for levels two to five, namely, the excellence, quantity,
attribute, and corporate strategy indices (refer to Table 4.5) to provide a subjective indication of
whether the three firm performance categories differed. Measurements of central tendency
1 55
(mean [M], 5% trimmed mean and median) and measurements of dispersal (standard deviation
[s] and interquartile range) were calculated. Minimum and maximum values were also
displayed. Lastly, skewness and kurtosis were calculated providing an estimation of whether the
firm performance categories displayed normal distributions. Box plots provide a graphical
representation of the distribution of the firm performance categories. They show the median,
bottom and top quartiles, and the interquartile range.
4.8 .2 Inferential statistics : Tests of heterogeneity for three samples
The hypotheses seek to determine whether the three firm performance subpopulations are
distinct. If so, are the differences uncovered actual or due to chance. It should be noted that
alternative inferential statistical techniques were not util ised in the data analysis (e.g., analysing
the control variables with the corporate strategy and firm performance variables) as these
techniques were considered to be inappropriate. For instance, longitudinal analysis was not
conducted on thi s dataset for two reasons, namely, the difficulties in estab lishing when a
corporate level decision began and finished, and secondly, determining a standard time
measurement period (e.g., one year) would difficult due to the long time periods involved in
corporate level decisions. In addition, the financial year period of the sample firms varied . This
factor is thought to have an impact on the tim ing of the rate of corporate level decision making
that is, firms may make more decisions in the quarter before their year-end in preparation for
both the preparation and presentation of year end accounts and the new financial year. The
selected inferential statistical techniques then were selected as they could answer the research
aim, that is, can corporate strategy be used to distinguish between the three firm performance
categories.
The main assumptions for many statistical tests are now discussed. The results of the normal
distribution and homogeneity of variance assumptions directed which statistical tests would be
more appropriate for the data ( in conjunction with the sample size) . The statistical techniques
used in this research are then reported.
a) Assumptions of tests
Assumption of independent observations
Observations should be independent of one another. Possible multicol linearity and
heteroscedasticity issues can impact on commonly uti lised statistical tests such as, ANOVA.
Due to the method of data collection employed in this study, the behaviour of one firm cannot
1 56
influence other firms. The whole strategic management paradigm makes the assumption that
firms are independent and yet in reality, some interaction i s expected. However, as the variables
were measured over 25 years, there is I ikely to be some aspect of nonindependence across the
observations reported within each firm . Therefore, a violation of this assumption is not expected
to greatly influence the results.
Testing for the assumption of normality
The six parametric tests employed in this study ( i .e . , discriminant analysi s, one-way independent
analysis of variance [ANOYA l ], planned contrasts, Games-Howell [GH], Tamhane' s T2 [T2] ,
Dunnett' s T3 [T3] ) are rel iant on the assumption of a normal distribution. A s ignificant
Kolmogorov-Smirnov test at the p < .05 level identified deviations from normality. The
Kolmogorov-Smirnov test contrasts the sample to normally distributed scores with the same
mean and standard deviation (Field, 2005). As the hypotheses for this research involves
comparisons between the three firm performance categories, the statistics related to the
distribution of the categories is of interest, rather than the overall distribution (Field, 2005).
Testing for assumption of homogene ity of variance
The assumption of homogeneity of variance underlies a number of the statistical tests employed
in this study (except Brunner, Detter and Munk heteroscedastic rank-based ANOYA test [BDM],
ANOYA 1 as reporting Welch 's F, planned contrasts, GH, T2 and T3). Violation of this
assumption could lead to increased Type I error. The smal l sample size means that util ising box
plots as a means of assessing homogeneous variances is inappropriate (Freud & Wilson, 2003) .
Instead, the test util i sed was Levene's test (th is test is also robust to large nonnormality). Ho for
the Levene's test states that the difference between the variances within a category is zero.
Therefore, a significant result at the p < .05 level indicates the variances are s ignificantly
different. Another test employed is the variance ratio which is calculated by dividing the largest
variance in firm performance category by the smal lest variance in firm performance category for
each index. A violation of this assumption is recognised as occurring when the variance ratio is
greater than two.
b) Is there a difference between the three firm performance categories?
Due to the possible v iolation of the last two assumptions discussed above, a number of
inferential tests were performed to determine if the various results supported each other,
providing confidence that the results to be interpreted are in fact valid. Discriminant analysis
was util ised to determine whether the attribute indices could correctly classifY the 1 5 firms into
1 57
the three firm performance categories. The fol lowing five tests were used to determine if the
various indices differed between the three firm performance categories: Kruskal-Wall i s one-way
analysis of variance by ranks test (KW), Jonckheere-Terpstra test (JT) which is applicable only
to directional hypotheses ( i .e., the strategic intent attribute index and the excellence indices),
BDM, and ANOV A I .
In addition, due to the small sample size, the dataset collected was inappropriate for the more
restrictive assumptions (regarding the nature of the population) that many parametric statistical
inferential tests possess (Pal lant, 2005) . In comparison, distribution-free statistics offered more
general assumptions regarding the distribution of the population. However, as Gibbons and
Chakraborti ( 1 992, p. 5) noted, "in many cases the assumptions are sufficient, but not necessary,
for the test 's validity." Six parametric tests were performed, namely, discriminant analysis,
ANOV A I , planned contrasts, GH, T2 and T3 .
Gibbons and Chakraborti ( 1 992, p. 6) also stated that "non parametric tests are frequently almost
as powerful, especially for small samples." The five distribution-free tests employed were KW,
BDM, JT, Mann-Whitney (MW) and Siegel-Castellan critical difference test (SC). KW and MW
have two assumptions namely random sampled scores are mutually independent, except the
medians, and the two population ' s distributions are homogeneous (Hol lander & Wolfe, 1 999).
However, authors appear to disagree on the second assumption, for example, Green and Salkind
(2005, p . 385) noted that "if population distributions differ on characteristics other than their
medians, the Mann-Whitney test does not evaluate whether the medians differ among
populations, but whether the distributions themselves differ". In contrast, Pall ant (2005, p. 29 1 )
argued that for M W "as the scores are converted to ranks, the actual d istribution of the scores
does not matter."
A number of l im itations exist that may affect interpretation of the results. Uti l ising ranking
rather than the magnitude of scores lowers the power to detect associations whereby a
statistically insignificant result may occur even if a relationship was present that is, a Type I I
error (Pallant, 2005). However, i t has been argued that "the information embodied in these
actual magnitudes . . . really relates to the underlying distribution, information which is not
relevant for distribution-free tests" (Gibbons & Chakraborti, 1 992, p. 5) . I n summary, the
d istribution-free techniques selected offer the abil ity to provide appropriate statistical analysis of
the small sample; these techniques are also used to answer the hypotheses tested in this research.
1 58
Discriminant analysis
Discriminant analysis was performed on the attribute indices. The discriminant analysis model
created d iscriminant functions (i .e., weightings) based on l inear combinations of the predictor
variables (i .e. , two indices) from a sample of known group members (i .e., PIFP, PAFP, and
PSFP). Discriminant analysis seeks to maximise the d iscriminating power by calculating
d iscriminant functions which separates the firm performance categories.
Assumptions of independent, randomly selected cases, and mutually exclusive and collectively
exhaustive group membership were fulfi l led by this dataset. The power of discriminant analysis
may be reduced if the data is heavi ly skewed. Violation of the assumption of l inear relationships
among pairs of predictors within each group "leads to reduced power rather than increased Type
I error" (Tabachnick & Fidell, 200 1 , p . 463). The small sample size was acceptable
(Tabachnick & Fidel l, 200 1 ) as five (the sample size of each group) is greater than two (the
number of predictor variables entered into the model) .
A number of models were performed to encompass the various combinations within the indices.
Six models were conducted for the attribute indices (i.e., strategic intent versus organisational
domain, strategic intent versus internal governance, strategic intent versus resource governance,
organisational domain versus internal governance, organisational domain versus resource and
internal governance versus resource). The independents together method, where all predictor
variables are entered simultaneously, was selected as the appropriate method for entering the
predictor variables. The model was appraised by how accurately it classified the 1 5 firms into
the three firm performance categories, seeking to correctly classify the firms to better than
chance that i s, 33%. Cross-val idation analyses which calculated the accuracy of predictions with
a new sample, were also performed for each model . This analysis classified 1 4 firms, then the
remaining firm, repeating the cycle until all the firms had been left out once.
Kruskal- Wallis one-way analysis o/variance by ranks test
KW is an appropriate for testing the hypotheses ( i .e. , comparing between three samples) due to
the small sample size (the parametric alternative is the one-way independent ANOV A). In
addition, as the test uti l ises ranking, i t retained the magnitude of the data, and therefore, was
more powerful than parametric techniques which have been applied to nonparametric data.
However, the power of this test may have been reduced due to the violations in the assumption of
homogeneity of variance (Wilcox, 2003) . KW was performed on the corporate strategy index,
1 59
the attribute indices (except strategic intent), the quantity indices, and the potential confound
variables.
KW detects location differences (median) between the three firm performance categories. Ho
states that the samples from the three firm performance categories came "from the same
population or from identical populations with the same median" (Siegel & Castellan, 1 988, p.
206). An example of the hypotheses for the corporate strategy index is as fol lows:
Ho: Mdn(PIFP CS) = Mdn(PAFP CS) = Mdn(PSFP CS)
Hs : Mdn(PIFP CS) =f. Mdn(PAFP CS) =f. Mdn(PSFP CS).
An adjustment is often made for tied observations. The dataset had one tied observation, that of
internal governance ( 1 68) by Southern and Whirlpool . Unfortunately, SPSS does not have a
function where an adjustment can be made for tied observations. However, S iegel and Castel lan
( 1 988, p. 2 1 0, italics in original) noted that "frequently, the effect of the correction is negligible.
If no more than about 25 percent of the observations are involved in ties, the probabil ity
associated a KW computed without the correction for ties . . . is rarely changed by more than 20
percent when the correction is made." Therefore, as only 1 3 percent of observations are ties, the
results were not expected to be significantly affected.
KW places all observations into a single array and ranks them. H is calculated from a formula
sourced from Hol lander and Wolfe (\ 999, p. 1 9 1 ) . Ho cannot be rejected if the medians for the
three firm performance categories did not display a pattern. Ho is tested against:
Reject Ho if H ? 5 .660 (p = .059 and n l = 5, n2 = 5, n3 = 5) .
The critical value of 5 .660 was derived from the KW H statistic table which was located in
Hollander and Wolfe ( 1 999, p. 64 1 ). A small value of H suggests that the ranks were distributed
evenly between the three firm performance categories whereas a large H value provides evidence
against Ho.
In addition to applying the exact signi ficance test (applicable due to the small sample size,
Krauth, 1 988), KW was also run uti l ising the Monte Carlo estimate of significance. If the
confidence interval does not exceed p = 0.05 "it means that assuming this confidence interval i s
one of the 99 out of 1 00 that contains the true value of the sign i ficance of the test statistics, the
1 60
true value i s less than .05 . This gives us a lot of confidence that the significant effect i s genuine"
(Field, 2005, p. 548) .
In addition to the limitation of distribution-free tests expressed previously, a significant KW does
not indicate which firm performance category was different. KW only identifies that at least one
of the firm performance categories was different from at least one ofthe other categories.
Jonckheere-Terpstra test: Test/or ordered alternatives
The distribution-free JT test is simi lar to KW but determines whether a trend exists. JT can be
util ised when hypothesising a priori an increasing or decreasing effect, that is, the five excel lence
subhypotheses and H I , for example,
Ho: Mdn(PIFP SI) = Mdn(PAFP SI) = Mdn(PSFP SI)
H I : Mdn(PIFP SI) < Mdn(P AFP SI) < Mdn(PSFP SI) .
Ho is tested against:
Reject Ho if J ? 54 (p = .05 and n l = 5, n2 = 5, n3 = 5).
The critical value of 54 was derived from the critical value for the J statistic table in Siegel and
Castel lan ( 1 988, p. 359).
Brunner, Detter and Munk heteroscedastic rank-based ANO VA test
The heteroscedastic equivalent of KW, BDM was employed to account for the possible violation
of homogeneity of variance assumption (Wilcox, 2003). The results of BDM can then be
compared to the KW results in case the KW test suffered from lower power due to the possible
v iolation of homogeneity of variance assumption (Wilcox, 2003). BDM was performed on the
corporate strategy index, the attribute indices (except strategic intent), the quantity indices and
lastly, the potential confound variables. In addition, BDM adjusts for tied values of which there
is one (the internal governance attribute index). The statistical package, R.2.2. 1 was util i sed to
calculate BDM. As with KW, Ho states that the three firm performance categories did not differ
for example,
Ho : Mdn(PIFP CS) = Mdn(P AFP CS) = Mdn(PSFP CS)
Hs: Mdn(PIFP CS) t Mdn(PAFP CS) t Mdn(PSFP CS).
1 6 1
One-way independent ANOVA
ANOV A I involves comparison of variance among the means of the three firm performance
categories to variances within the firm performance categories (the equivalent distribution-free
test is the KW test). The ANOV A I results can then be compared to the KW results in case the
KW test suffered from lower power due to the poss ible violation of homogeneity of variance
assumption. ANOV A I was performed on the corporate strategy index, the attribute indices
(except strategic intent), the quantity indices and, lastly, the potential confound variables.
ANOV A I determines if the means were derived from different populations that is, Ho states that
the mean of the three firm performance categories are equal. The ratio of these variances is
represented by F. ANOV A I offers a test for trends and this is relevant as it is expected that
curvi l inear associations exist for the H2, H), H4, Hs hypotheses and the quantity indices
subhypotheses. An example of two hypotheses that were tested by ANOVA 1 includes:
Ho: M(PIFP CS) = M(PAFP CS) = M(PSFP CS)
Hs: M(PIFP CS) t M(PAFP CS) t M(PSFP CS).
The assumptions of ANOV A I include first, independent observations ( i .e. , not correlated);
second, normally distributed data (although ANOVA is robust to small violations of the
normality assumption, Freund & Wi lson, 2003); and, lastly, homogeneous variances (although
ANOV A 1 is robust to violations of homogeneity of variance when the samples sizes are equal,
Field, 2005). ANOV A I was appropriate to this dataset as adjustments inherent in the model
account for possible violation of the homogeneity of variance assumption. In other words,
reporting the Welch 's F incorporates an alternative F statistic that accounts for the possible
violation. A difference in sample means is reflected in a statistical ly significant Welch's F test.
Moreover, the various post-hoc tests as discussed below also accommodate a violation in this
assumption.
c) Where does the difference between the three firm performance categories lie?
If the KW and ANOVA I tests were significant, further analysis using six inferential statistical
techniques sought to answer the appropriate hypothesis, how did the s ignificant index differ
between the firm performance categories that is, could the PS FP category be distinguished from
the non-PS FP categories. Post-hoc tests for KW namely, MW, and SC; and four post-hoc tests
for ANOVA 1 , namely, planned contrasts, GH, T2, and T3 were performed. The fol lowing is an
introduction into the six statistical tests.
1 62
Mann-Whitney tests: A post-hoc test/or Kruskal- Wallis test
M W was performed on the corporate strategy index, the attribute indices (except strategic
intent), the quantity indices and lastly, the potential confound variables if a significant result was
obtained from KW (the equivalent parametric test is the independent I-test). MW was util ised to
conduct pairwise comparisons between the three firm performance categories. MW calculates
the ranked positions in scores of the two groups (Field, 2005). Three tests for each statistically
significant index were performed: PI FP and PSFP; PIFP and PAFP; PAFP and PSFP. MW has
two assumptions, namely, the two popu lation ' s d istributions are homogeneous, except the
medians, and the random samples' scores are mutually independent.
As the alternative hypotheses are directional, for example, PIFP < PAFP, the one-tai led
probabi l ity was reported. In addition, because the sample size is small the exact significance
method wi l l be reported . Note that a Bonferroni correction was employed to compensate for the
effect of Type I errors to p < .05 that is, as three tests were performed, .05 was divided by three
yielding a .0 1 67 critical level of significance.
Siegel-Castellan critical difference test: A post-hoc test/or Kruskal- Wallis test
SC was performed on the corporate strategy index, the attribute indices (except strategic intent),
the quantity indices and lastly, the potential confound variables if a significant result was
obtained from KW. The difference between the mean ranks of the three firm performance
categories is compared to the critical difference (refer to the formula sourced from Siegel &
Castellan, 1 988, p. 2 1 3) . If the difference between the mean ranks is equal to or larger than the
critical d ifference value of 6.79, the difference is significant (Field, 2005).
Planned contrasts: A post-hoc test/or ANOVA I
The planned contrasts were performed on the corporate strategy index, the attribute indices
(except strategic intent), the quantity indices and lastly, the potential confound variables if a
significant result was obtained from ANOV A I . The planned contrasts provide an indication of
where the difference in means rests. These tests are more powerful than the post-hoc tests
outlined below due to their need to make a rejection area adjustment. Due to the possible
violation of the assumption of homogeneous variance, the ANOV A l pairwise contrasts were
appl icable to this dataset as they did not assume equal variances. Planned contrasts compared
a priori predictions that a significant difference existed between the firm performance categories.
The fol lowing contrasts were performed : PSFP and PIFP, PSFP and PAFP, PI FP and PAFP.
1 63
Games-Howell, Tamhane 's T2 and Dunnett 's T3 tests: Post-hoc tests/or ANOVA l
The three post-hoc tests for ANOV A 1 were perfonned on the corporate strategy index, the
attribute indices (except strategic intent), the quantity indices and lastly, the potential confound
variables if a significant result was obtained from ANOV A I . These post-hoc tests are pairwise
comparisons which provide comparisons between the three firm perfonnance categories
(compensating for inflated Type I errors by employing the Bonferroni correction). Due to
possible violation of the homogeneity of variance assumption, three post-hoc pairwise
comparison tests were selected that made adjustments for this violation (Field, 2005; Wilcox,
2003): GH, T2, and T3 . The tests "compare every group (as if conducting several t-tests) but to
use a stricter acceptance criterion such that the family-wise error rate does not rise above .05"
(Field, 2005, p. 325). T3 and GH control for fami ly-wise error rate by uti l ising adjusted critical
values. GH can be generous for small samples, T2 is conservative and a Type I error can be
reduced by T3 (Field, 2005). These tests were perfonned so that comparison could provide
evidence of consistency with the post-hoc KW test results.
d) Effect size
Calculating the effect size provides a standardised measure which allows to a more accurate
detennination of whether the results were important. An effect size of . 1 (small) relates to
explaining I % of the total variance, .3 (moderate) corresponds to 9% of the total variance, and . 5
(strong), representing 25% of the total variance (Cohen 1 988, 1 992 as cited in F ield, 2005, p .
32) .
The KW effect sizes (TJ2) were calculated utilising a fonnula sourced from Green and Salkind
(2005, p. 3 86). The effect sizes for MW (r) were calculated from an equation derived from
Rosenthal ( 1 99 1 , p. 1 9 as cited in Field, 2005, p. 5 32). Field (2005, p. 556) also suppl ied the
fonnula for calculating the JT effect size (r). In d iscriminant analysis, the canonical correlation
can be uti l ised as a measure of the effect size (Green & Salkind, 2005, p. 300). The effect size
for ANOVA 1 (0)) and the planned contrasts (r) were calculated from fonnulae presented in Field
(2005, pp. 357 - 3 5 8).
4.9 DATASET SUMMARY
The 9,970 WSJ articles collected from 1 980 to 2004 were reviewed for content and categorised
in tenns of the nature of corporate strategy characteristics (i .e., the four attributes). Examples of
1 64
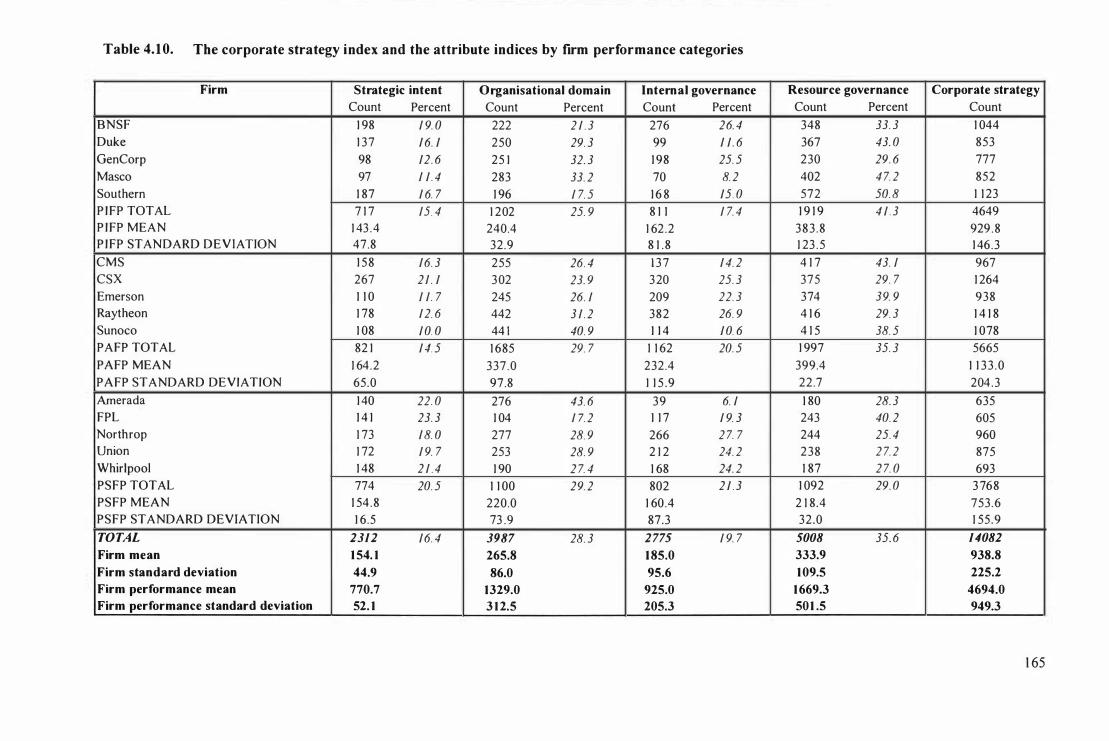
Table 4.1 0. The corporate strategy index and the attribute indices by firm performance categories
Firm Strategic intent O rganisational domain Internal governance
Count Percent Count Percent Count Percent BNSF 1 98 1 9. 0 222 2 1 . 3 276 26. 4 Duke 1 37 1 6. 1 250 29. 3 99 1 1 . 6 GenCorp 98 12. 6 25 1 32. 3 1 98 25. 5 Masco 97 1 1 . 4 283 33. 2 70 8. 2 Southern 1 87 1 6. 7 1 96 1 7. 5 1 6 8 15. 0 P I FP TOTAL 7 1 7 15. 4 1 202 25. 9 8 1 1 1 7. 4 P I FP MEAN 1 43 .4 240.4 1 62 .2 P I FP STANDARD DEVIA nON 47.8 32.9 8 1 . 8
CMS 1 58 16. 3 255 26. 4 1 3 7 1 4. 2 CSX 267 2 1 . 1 302 23. 9 320 25. 3 Emerson 1 1 0 1 1. 7 245 26. 1 209 22. 3 Raytheon 1 78 12. 6 442 3 1. 2 382 26. 9 Sunoco 1 08 1 0. 0 44 1 40. 9 1 1 4 1 0. 6 PAFP TOTAL 82 1 1 4. 5 1 685 29. 7 1 1 62 20. 5 PAFP MEAN 1 64.2 337.0 232.4 PAFP STANDARD DEVIATION 65.0 97.8 1 1 5 .9
Amerada 1 40 22. 0 276 43. 6 39 6. 1 FPL 1 4 1 23. 3 1 04 1 7. 2 1 1 7 1 9. 3 Northrop 1 73 1 8. 0 277 28. 9 266 2 7. 7 Union 1 72 1 9. 7 253 28. 9 2 1 2 24. 2 Whirlpool 1 48 2 1 . 4 1 90 2 7. 4 1 68 24. 2 PSFP TOTAL 774 20. 5 1 1 00 29. 2 802 2 1 . 3 PSFP MEAN 1 54.8 220.0 1 60.4 PSFP STANDARD DEVIA nON 1 6 .5 73 .9 87.3
TOTAL 2312 16. 4 3987 28. 3 2775 1 9. 7 Firm mean 1 54. 1 265.8 1 85.0 Firm standard deviation 44.9 86.0 95.6 Firm performance mean 770.7 1329.0 925.0 Firm performance standard deviation 52. 1 3 1 2.5 205.3
Resource governance Corporate strategy
Count Percent Count
348 33. 3 1 044
367 43. 0 853
230 29. 6 777
402 4 7. 2 852
572 50. 8 1 1 23
1 9 1 9 4 1 . 3 4649
383 .8 929 .8 1 23 . 5 1 46 .3
4 1 7 43. 1 967
375 29. 7 1 264
374 3 9. 9 938
4 1 6 29. 3 1 4 1 8
4 1 5 38. 5 1 078
1 997 35. 3 5665
399.4 1 1 33 .0
22.7 204 .3
1 80 28. 3 635
243 40. 2 605
244 25. 4 960
238 2 7. 2 875 1 87 2 7. 0 693
1 092 29. 0 3 768
2 1 8.4 753.6
32.0 1 55.9
5008 35. 6 14082 333.9 938.8 1 09.5 225.2
1 669.3 4694.0 501 .5 949.3
1 65
coding have been provided in Appendix 2. The results are summarised in Table 4. 1 0. The final
sample incorporated 1 4,082 codings of corporate level strategy by 1 5 firms ranging from 605
(FPL) to 1 ,4 1 8 (Raytheon) . The corporate strategy index was characterised by a firm M of 938.8
(s = 225 .2) and a firm performance M of 4,694.0 (s = 949.3) . The greatest measurement of the
corporate strategy index was evident in the PAFP category with 5 ,665 observations (40.2%),
fol lowed by the PIFP category (4,649, 33 .0%), and, lastly, the PS FP category (3,768, 26.8%).
The PSFP category possessed the greatest range of 355 whereby the minimum was 605 (FPL)
and the maximum 960 (Northrop). The corporate strategy index observed in the PAFP firms
ranged from 938 (Emerson) to 1 ,4 1 8 (Raytheon), and the PIFP category ranged from 777
(GenCorp) to 1 , 1 23 (Southern).
Overall, the strategic intent attribute index was measured 2,3 1 2 times with a firm M of 1 54 . 1 (s =
44.9) and a firm performance M of 770.7 (s = 52. 1 ) . The strategic intent index accounted for
1 6.4% of all corporate strategy observations. The PAFP category had the h ighest measurement
of the strategic intent index evident within the three firm performance categories (82 1 , 3 5 .5%),
fol lowed by the PS FP category (774, 33 .5%), and, lastly, the PIFP category (7 1 7, 3 1 .0%). The
PAFP category had the greatest range of 1 59 whereby the minimum was 1 08 (Sunoco) and the
maximum was 267 (CSXC). The strategic intent attribute index measured in PIFP firms ranged
from 97 (Masco) to 1 98 (BNSF), and PSFP firms ranged from 1 40 (Amerada) to 1 73 (Northrop).
The organisational domain attribute index was measured 3 ,987 times with a firm M of 265 . 8 (s = 86.0) and a firm performance M of 1 ,329.0 (s = 3 1 2 .5) . The organisational domain index
accounted for 28.3% of all corporate strategy measurements. The most observations of the
organisational domain attribute index was recorded by the PAFP category ( 1 ,685, 42.3%),
fol lowed by the PIFP category ( 1 ,202, 30 .2%), and, final ly, the PSFP category ( 1 , 1 00, 27.6%).
The PAFP category was characterised by the greatest range of 1 97. The lowest observation of
the organisational domain index displayed by a PAFP firm was Emerson (245) and Raytheon
recorded the highest score (442) . The organisational domain index measured in PIFP firms
ranged from 1 96 (Southern) to 283 (Masco), whereas the PSFP category ranged from 1 04 (FPL)
to 277 (Northrop).
The internal governance attribute index was measured 2,775 times with a M of 1 85 .0 (s = 95 .6)
and a firm performance M of 925 .0 (s = 205 .3). The internal governance index accounted for
1 9.7% of all corporate strategy observations. The P AFP category was characterised by the
h ighest measurement of the internal governance attribute index ( I , 1 62, 4 1 .9%), fol lowed by the
1 66
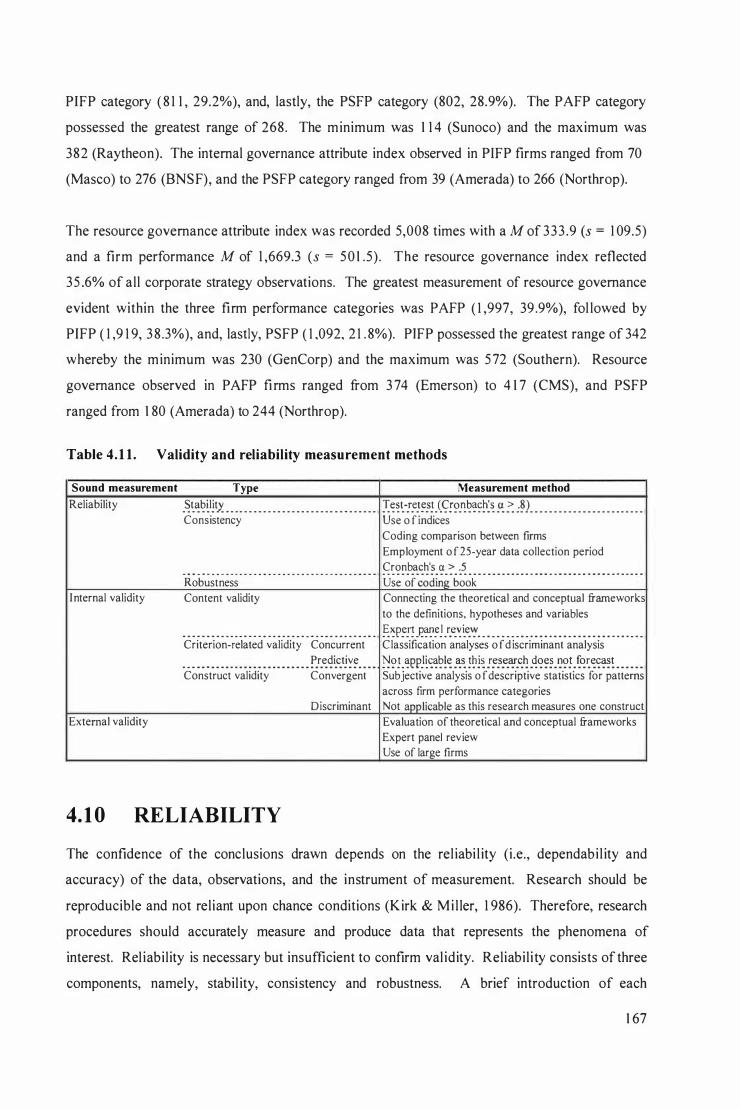
PIFP category ( 8 1 1 , 29.2%), and, lastly, the PSFP category (802, 28.9%). The PAFP category
possessed the greatest range of 268. The minimum was 1 1 4 (Sunoco) and the maximum was
382 (Raytheon). The internal governance attribute index observed in PIFP firms ranged from 70
(Masco) to 276 (BNSF), and the PSFP category ranged from 39 (Amerada) to 266 (Northrop).
The resource governance attribute index was recorded 5,008 times with a M of 333 .9 (s = 1 09.5)
and a firm performance M of 1 ,669.3 (s = 50 1 .5) . The resource governance index reflected
35 .6% of all corporate strategy observations. The greatest measurement of resource governance
evident within the three firm performance categories was PAFP ( 1 ,997, 39 .9%), fol lowed by
PIFP ( 1 ,9 1 9, 3 8 .3%), and, lastly, PSFP ( 1 ,092, 2 1 . 8%). PIFP possessed the greatest range of 342
whereby the minimum was 230 (GenCorp) and the maximum was 5 72 (Southern). Resource
governance observed in PAFP fi rms ranged from 3 74 (Emerson) to 4 1 7 (CMS), and PSFP
ranged from 1 80 (Amerada) to 244 (Northrop).
Table 4. 1 1 . Validity and reliability measurement methods
Sound measurement
Reliability
I nternal validity
External validity
Type
_�����l!t_� _ _ _ _ _ _ _ _ _ _ _ _ _ _ _ _ _ _ _ _ _ _ _ _ _ _ _ _ _ _ _ _
Consistency
- . . . .. .. .. .. . .. .. . . - .. . .. .. .. .. . .. .. .. . .. . . . .. - . .. .. . .. .. .. _ - -
Robustness Content validity
- - - - - - - - _ .. .. .. .. . - - - .. - .. .. .. .. .. .. .. _ - - - .. .. .. .. .. _ . .. _ _ ..
Criterion-related validity Concurrent Predictive
.. - .. .. _ - - _ ... . .. . . . . . .. _ - _ . .. _ . .. _ _ . . . . . . . . .. _ .. . .. -
Construct validity Convergent
Discriminant
4. 1 0 RELIABILITY
Measurement method
!���-!�_
t��! _(�!9_�����:� !,: ? :�) _ _ _ _ _ _ _ _ _ _ _ _ _ _ _ _ _ _ _ _ _ _ _ _
Use o f indices Coding comparison between firms Employment o f 25-year data collection period Cronbach's a > .5 .. .. _ - - - - - - - - - - - - - - - - - - - - - - - - - - - - _ .. .. _ _ .. .. .. . .. - . .. .. ... .. - - - - - - - ..
Use of coding book Connecting the theoretical and conceptual frameworks to the definitions, hypotheses and variables
��P�!! J?'!l:�� _r_��i_e_'.� _ _ _ _ _ _ _ _ _ _ _ _ _ _ _ _ _ _ _ _ _ _ _ _ _ _ _ _ _ _ _ _ _ _ _
Classification analyses o f d iscriminant analysis
�?! _�\?P}����!� _ll:s_ !�!� !�_s::_�_c.� _�<?��_l}?! _������! _ _ _ _ _ _
Subjective analysis o f descriptive statistics for patterns across firm performance categories Not applicable as this research measures one construct Evaluation of theoretical and conceptual frameworks Expert panel review Use of large firms
The confidence of the conclusions drawn depends on the rel iabi l ity (i.e., dependabi l ity and
accuracy) of the data, observations, and the instrument of measurement. Research should be
reproducible and not reliant upon chance conditions (Kirk & Mi l ler, 1 986). Therefore, research
procedures should accurately measure and produce data that represents the phenomena of
interest. Rel iability is necessary but insufficient to confirm val idity. Reliabil ity consists of three
components, namely, stabil ity, consistency and robustness. A brief introduction of each
1 67
component of rel iabi l ity is now outlined. The measurement methods employed for each are
outlined in Table 4 . 1 1 .
4. 1 0. 1 Stabil ity
Stabi lity measures the variabil ity of the measuring instrument; in other words, repeated
observations of the same phenomena should give identical results (Koka & Prescott, 2002).
Stabi lity can be difficult to assess in content analysis due to the fact that coders are interpreting
the text, that is, coders may misinterpret the text and the measuring instrument. Therefore,
stabi lity was assessed by a test-retest approach whereby once all the coding was completed, 5%
of articles (producing 1 , 1 73 corporate strategy codings) were recoded and compared to the
original coding. Cronbach 's a should be above .80 . The re liabil ity statistics of Cronbach' s a was .998, indicating a high level of consistency between the original coding and the recoding ( 1 2
errors or 1 .05% error rate). In conclusion, the corporate strategy model measured produced
relatively stable results, thus enhancing confidence in stabi l ity.
4. 1 0.2 Consistency
Instrument rel iabi l ity evaluates the consistency of measurements obtained from different raters,
d ifferent samples, or from different points in time; in other words, the instrument is free of
random error, noise, or bias (Hoskisson et ai, 1 993b). The conditions under which measurement
occurred were standardised as the researcher was the only rater, thus interrater rel iability was not
a concern. The use of indices minimises the effect of incorrect coding. Consistency was
strengthened by the coding process whereby the coding obtained from each firm was compared
to the coding derived from other firms to ensure consistency of coding across the entire sample.
Furthermore, data was col lected from 25 time periods.
The four attribute indices contribute to the corporate strategy index. They measure aspects of the
construct of corporate strategy and, therefore, a level of correlation is expected. Cronbach's a i s
inversely related to the amount of random error and ranges from zero to one. Cronbach's a could be uti l ised to calculate the rel iabil ity of the corporate strategy index and should be greater
than .70. However, as th is research is exploratory in nature, Cronbach 's a needs only to be
greater than .50 (Nunnally, 1 967). The Cronbach 's a for the four corporate strategy attribute
indices was higher than the value of .50 ( i .e., .53 1 ) indicating moderate support for the premise
that the four attributes actual ly captured different dimensions of corporate strategy. Comparison
between the Cronbach's a values obtained in this study with other empirical research could not
1 68
be performed due to the lack of empirical studies publ ished in which the subconstructs of
corporate strategy have been investigated.
4. 1 0 .3 Robustness
Robustness measures the degree to which the methodology produces the same results when
measured at different times or conditions. The use of a coding book (refer to Appendix 1 ) for
content analysis, firstly, standardised the conditions under which measurement occurred and,
secondly, m inimised external sources of variation. This ensured that the same coding
methodology was employed across all of the 1 5 firms, regardless of what they may have
published, or made available in the publ ic domain of the WSJ.
Overall, rel iabil ity was enhanced by a number of measures employed throughout the research
process. Therefore, the conclusions drawn in this study should be viewed with confidence as the
rel iabi l ity (i.e., dependabil ity and accuracy) of the data, observations, and the instrument of
measurement was supported. The research should be reproducible and was not reliant upon
chance conditions
4. 1 1 VALIDITY
The four corporate strategy attributes represented measurements of different aspects of the
corporate strategy construct. Validity assesses, firstly, whether the measurement instrument
employed actually measures corporate strategy and, secondly, whether the results can be
generalised to broader situations. Val idity has two components which wil l now be discussed,
namely, internal and external validity (refer to Table 4. 1 1 ) .
4. 1 1 . 1 Internal validity
I nternal validity reflects whether the measurement instrument employed adequately measures
corporate strategy. I nternal validity is comprised of three aspects: content, criterion-related and
construct validity. Each aspect of internal validity is outl ined below.
a) Content validity
Content validity involves a qual itative assessment of the measurement tool used to capture the
domain of the construct of interest. In other words, it is used to examine whether the 1 8
variables adequately represent corporate strategy (Hoskisson et aI, 1 993b). The unclear and
1 69
contradictory definitions of corporate strategy found in the literature may be a source of potential
error raising the question as to whether an important aspect of corporate strategy may be missing
from the conceptualisation employed by th is research. Content validity was achieved by the
inductive development of the theoretical and conceptual frameworks (outlined in Chapters Two
and Three) and the subsequent deductive development of the defin itions, research statements and
hypotheses employed (outlined in Chapter Three).
The construct of corporate strategy and the four attributes were clearly defined. The variables
were then operationalised directly from the four attributes. These narrow operationalisations
were both fair and reasonable due to the deficiency of wel l-codified theory regarding corporate
strategy. The main advantage of the indicators and proxies selected was that they incorporated
both quantity and excel lence aspects of corporate strategy, further enhancing construct validity.
The excellence and quantity indices assisted in the development of more exact and valid
measures, reducing possible misinterpretation due to coding misc1assifications.
To further enhance content validity, an expert review of the theoretical and conceptual
foundations was obtained. The panel comprised two chief financial officers, one CEO, one
marketing director (all representing New Zealand firms with greater than $ 1 bi l l ion dollars'
annual turnover), a business consultant, a partner at one of the global top four accounting firms, a
banking executive of a leading Australasian bank, a chief financial officer (Austral ia) for a top
1 00 New Zealand firm, and a general manager (South East Asia region) for a global packaging
firm.
A series of unstructured interviews were conducted with each member of the expert panel. The
panel was interviewed to determine how they, as practitioners, firstly, defined corporate strategy
and, secondly, to determine what the attributes of corporate strategy were, both in terms of what
they thought corporate strategy should be and from their employment experience. The results
from the first stage of interviews were compared to and then incorporated into the definition of
corporate strategy as employed by this research.
The second interview stage involved introducing the definition and conceptualisation of
corporate strategy as outlined in Chapter Three. The expert panel reviewed the conceptual isation
of corporate strategy employed in this research and concluded that, from their experience, it
encompassed the complete range of corporate level decisions. Organisational direction, the most
1 70
"controversial" concept as outlined in Chapter Three, was viewed by the entire expert panel, to
varying degrees, as an important component of corporate strategy.
It was not possible to directly measure the concepts due to the lack of direct access to the sample
firms. To overcome this l imitation, where possible, the attributes were operationalised so that
they l inked to extant variables; for instance, a number of the concepts behind the strategic intent
variables have been used in the measurement of vision and mission statements, namely, futurity
and emotional connection to employees. The expert panel then evaluated the above process. To
further enhance content val idity, their comments were incorporated into the conceptualisation
framework and the operationalisation of variables. The expert panel recognised the difference in
measuring aspects of excellence without direct access to firms. The various measures employed
supported content valid ity.
b) Criterion-related validity
Criterion-related validity reflects the success of variables to predict or estimate an outcome.
Criterion-related validity has two components, namely, predictive and concurrent val idity.
Predictive val idity, the measurement of the accuracy of the instrument to forecast, was
inappropriate for this research. Concurrent valid ity incorporates the abi l ity of the measures to
estimate an outcome. The original and cross-validated classification analyses evident within
discriminant analysis provided an assessment of concurrent validity. The three statistically
significant at p < .05 level attribute index models produced original classification results ranging
from 66.7 to 80%. The cross-validated classification results ranged from 60.0 to 66.7%. Both
classification results were substantially higher than the 33 .3% probabil ity of correctly c lassifying
the 1 5 firms due to chance. Furthermore, for all three models and both classifications, 1 00% of
the five PSFP firms were correctly classified. Thus, concurrent validity was supported.
c) Construct validity
Construct validity evaluates the appropriateness of the measurement instrument ( i .e . ,
operationalised variables) to measure corporate strategy and the attributes which they intend to
measure. Thus, h igh construct validity ensures the mechanisms of measurement employed are
sound, grounded or consistent with theory; in other words, the results were consistent with the
conceptual isation of corporate strategy and the hypotheses proposed received empirical support.
The two aspects of construct val id ity, convergent and discriminant val idity, are outlined below.
1 7 1
Convergent val idity involves assessing the construct of corporate strategy by the correlation
between various different attribute indices. The lack of previous empirical research measuring
the various attributes of corporate strategy prevented comparisons being made. If the different
measurements are found to be in accordance with one another, the variables are seen to be
measuring the same phenomenon (Andersson, Forsgren & Holm, 2002; Hoskisson et ai, 1 993b).
However, the attributes represented different aspects of corporate strategy (Le., the four attributes
are not exactly measuring the same phenomenon), consequently factor analysis was
inappropriate. T -tests were also inappropriate to this dataset due to the possible violation of the
assumption of homogeneity of variance. Instead, descriptive statistics were analysed to
determine if the four corporate strategy attribute indices displayed a similar pattern across each
ofthe firm performance categories.
Construct validity was supported as the results were consistent with the conceptualisation of
corporate strategy and the most of the hypotheses proposed received empirical support (although
only four of the 1 4 hypotheses were statistically significant at the p < .05 level) . Convergent
validity was confirmed as the analysis of the descriptive statistics and indicated the corporate
strategy attributes (except strategic intent as predicted) displayed the same curvi l inear trend
across the three firm performance categories (refer to Chapter Five).
Discriminant validity assesses whether the attributes are independent from each other.
Discriminant val idity is established when two constructs that are theoretically unrelated are
found to be uncorrelated. However, it was not appropriate to measure discriminant validity
because the corporate strategy attributes were predicted to be correlated to some extent.
4. 1 1 .2 External val idity
External val idity involves determining whether the results were representative of a larger
population, that is, could the results be generalised across different time periods, contexts or to
broader populations (e.g. , non-US countries). The sample was representative of publicly l isted
firms and represents a large volume of the business activity in the US. Measuring corporate
strategy from large U S firms was a more valid option than measuring corporate strategy in small
to medium enterprises as disagreement exists as to whether corporate strategy is actual ly evident
within smaller firms. Much of the previous empirical research outlined in Chapter Two had
primarily been undertaken on large US firms, therefore, the results obtained are able to be
generalised within these boundaries.
1 72
Util isation of alternative data collection methods (e.g., survey, interviews, in-depth case
observation) would have produced the results derived from this study if they measured quantity
and excellence of corporate strategy decisions over a significant time period. For the corporate
level decision makers to recollect the quantity of corporate strategy decisions the firm made over
this 25-year period would be difficult. A more accurate reflection of the construct of interest
would be to attend board meetings as an observer or to review firm records (e.g., board meeting
minutes). These alternative data collection methods would also need to occur over a significant
period of time. Again, the lack of previous empirical research on the corporate strategy
attributes meant that conducting an extensive assessment of external validity was difficult.
Instead, evaluation of the theoretical and conceptual frameworks was performed. The expert
panel as outlined in Section 4. 1 1 . 1 a was uti l ised for a review of the conceptual i sation of
corporate strategy.
Overall, both internal and external validity were enhanced by a number of measures employed
throughout the research process. Careful attention was paid to the entire conceptual isation and
operationalisation process so that the construct of corporate strategy was, wherever possible,
closely aligned to the previous theoretical and empirical research. The measurement instrument
employed actually measured corporate strategy and could be general ised to the population of
large US firms, and, thus, supported validity.
4. 1 2 POTENTIAL CONFOUND VARIABLES
4. 1 2 . 1 Data source selection
A number of data sources were uti l ised for the five potential confound variables (refer to Table
4. 1 2) . These variables were all measured at the firm level.
a) Corporate level commitment to the status quo
Corporate level commitment to the status quo was operational ised by two variables, namely, the
average length of corporate level decision maker tenure in position and the average percentage of
internal directors, for the period 1 995 to 2004. For the purposes of this research, the corporate
level decision makers were comprised of directors, CEO, chief operating officer, chief financial
officer and president (note that not all positions were fi lled in every year and one person could
occupy more than one role). The average length of corporate level decision maker tenure in
position was calculated by, firstly, determining the names of the individuals who occupied the
1 73
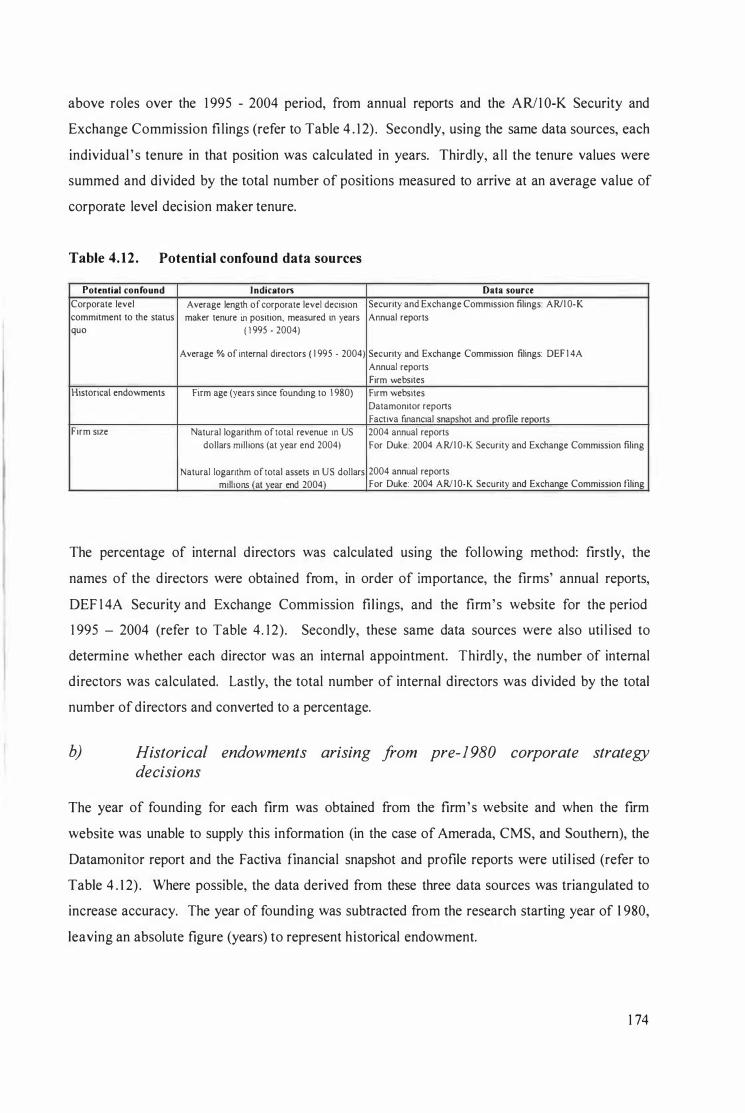
above roles over the 1 995 - 2004 period, from annual reports and the AR/1 0-K Security and
Exchange Commission fi lings (refer to Table 4 . 1 2) . Secondly, using the same data sources, each
individual ' s tenure in that position was calculated in years. Thirdly, al l the tenure values were
summed and divided by the total number of positions measured to arrive at an average value of
corporate level decision maker tenure.
Table 4. 12 . Potential confound data sources
Potential confound I ndicators
Corporate level Average length of corporate level decision commitment to the status maker tenure in position, measured in years quo ( 1 995 - 2004)
Average % of internal directors ( 1 995 - 2004)
Historical endowments Firm age (years since founding to 1 980)
Firm size Natural logarithm of total revenue in US dollars millions (at year end 2004)
Natural logarithm of total assets in US dollars millions (at year end 2004)
Data source
Security and Exchange Commission filings: ARlI 0-K Annual reports
Security and Exchange Commission filings: DEF 1 4A Annual reports Firm websites Firm websites Datamonitor reports Fact iva fmancial snapshot and profile reports 2004 annual reports For Duke: 2004 ARlI O-K Security and Exchange Commission filing
2004 annual reports For Duke: 2004 ARl I O-K Security and Exchange Commission filing
The percentage of internal directors was calculated using the fol lowing method: firstly, the
names of the directors were obtained from, in order of importance, the firms' annual reports,
DEF I 4A Security and Exchange Commission fil ings, and the firm's website for the period
1 995 - 2004 (refer to Table 4. 1 2) . Secondly, these same data sources were also uti l ised to
determine whether each director was an internal appointment. Thirdly, the number of internal
directors was calculated. Lastly, the total number of internal directors was divided by the total
number of directors and converted to a percentage.
b) Historical endowments arising from pre-1980 corporate strategy decisions
The year of founding for each firm was obtained from the firm's website and when the firm
website was unable to supply this information (in the case of Amerada, CMS, and Southern), the
Datamonitor report and the Factiva financial snapshot and profile reports were uti l ised (refer to
Table 4 . 1 2) . Where possible, the data derived from these three data sources was triangulated to
increase accuracy. The year of founding was subtracted from the research starting year of 1 980,
leaving an absolute figure (years) to represent h istorical endowment.
1 74
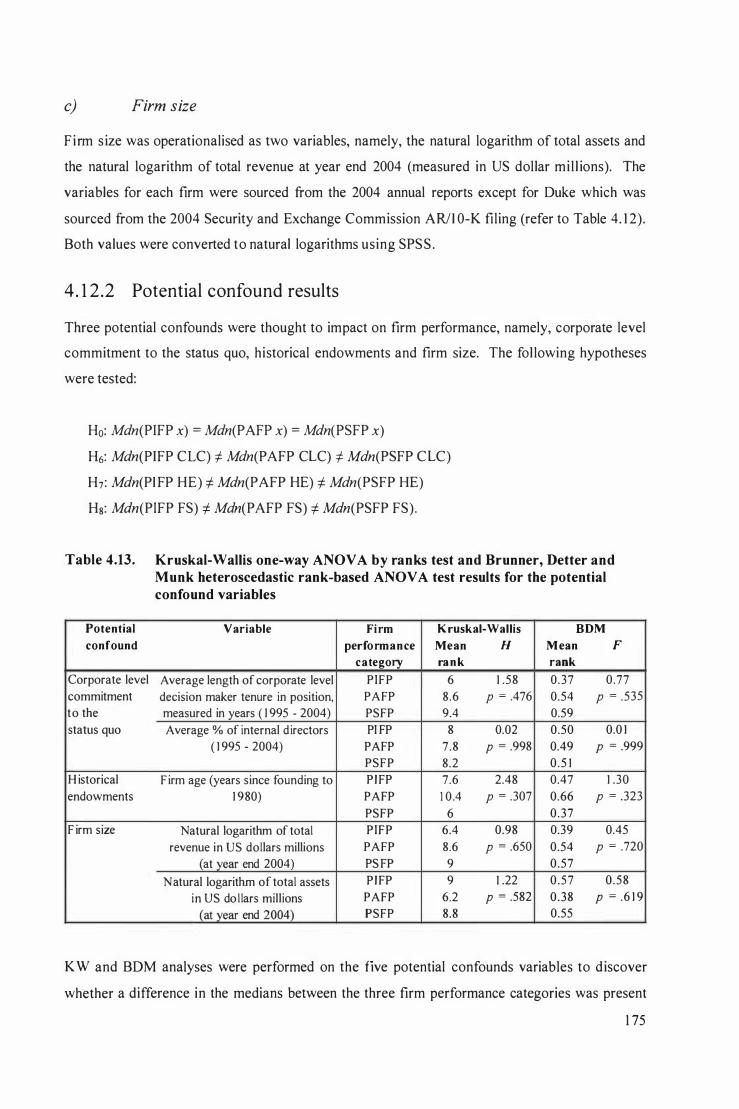
c) Firm size
Firm s ize was operationalised as two variables, namely, the natural logarithm of total assets and
the natural logarithm of total revenue at year end 2004 (measured in US dollar mi l l ions). The
variables for each firm were sourced from the 2004 annual reports except for Duke which was
sourced from the 2004 Security and Exchange Commission ARlI 0-K filing (refer to Table 4. 1 2) .
Both values were converted to natural logarithms using SPSS .
4. 1 2 .2 Potential confound results
Three potential confounds were thought to impact on firm performance, namely, corporate level
commitment to the status quo, historical endowments and firm size. The fol lowing hypotheses
were tested:
Ho: Mdn(PIFP x) = Mdn(PAFP x) = Mdn(PSFP x)
H6: Mdn(PIFP CLC) i- Mdn(PAFP CLC) i- Mdn(PSFP CLC)
H7: Mdn(PI FP HE) i- Mdn(PAFP HE) i- Mdn(PSFP HE)
Hg: Mdn(PIFP FS) i- Mdn(P AFP FS) i- Mdn(PSFP FS).
Table 4.13. Kruskal-Wallis one-way ANOVA by ranks test and Brunner, Detter and Munk heteroscedastic rank-based ANOV A test results for the potential confound variables
Potential Variable Firm Kruskal-Wallis BDM
confound performance Mean H Mean F category rank rank
Corporate level A verage length of corporate level PIFP 6 1 .58 0.37 0.77
commitment decision maker tenure in position, PAFP 8.6 P = .476 0.54 P = .535
to the measured in years ( 1 995 - 2004) PSFP 9.4 0.59 status quo Average % of internal d irectors PI FP 8 0.02 0.50 0.0 1
( 1 995 - 2004) PAFP 7.8 P = .998 0.49 P = .999
PSFP 8.2 0 .5 1 H istorical F irm age (years since founding to P I FP 7.6 2.48 0.47 1 .30
endowments 1 980) PAFP 1 0.4 P = .307 0.66 P = .323
PSFP 6 0.37 F irm size Natural logarithm of total PIFP 6.4 0.98 0.39 0.45
revenue in US dollars millions PAFP 8.6 P = .650 0.54 P = .720
(at year end 2004) PS FP 9 0.57
Natural logarithm of total assets P I FP 9 1 .22 0 .57 0 .58
in US do l lars millions PAFP 6.2 P = .582 0.38 P = .6 1 9
(at year end 2004) PSFP 8.8 0.55
KW and BDM analyses were performed on the five potential confounds variables to discover
whether a difference in the medians between the three firm performance categories was present
1 75
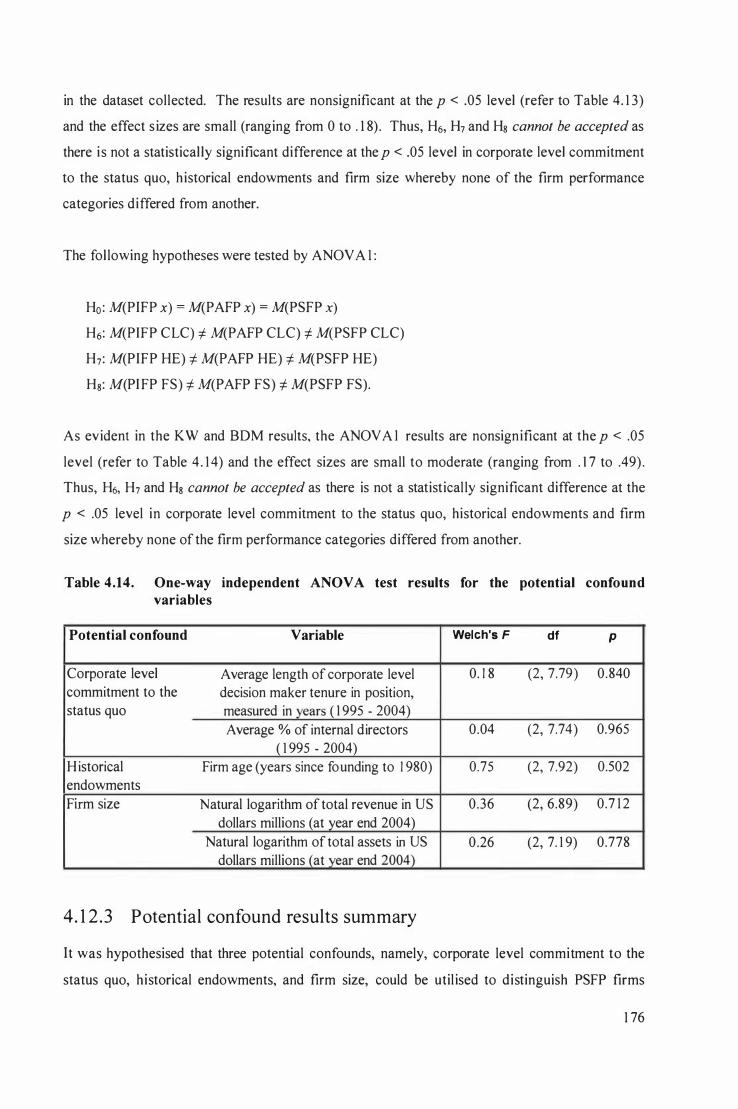
in the dataset collected. The results are nonsignificant at the p < .05 level (refer to Table 4. 1 3)
and the effect s izes are small (ranging from 0 to . 1 8) . Thus, H6, H7 and Hs cannot be accepted as
there i s not a statistical ly significant difference at the p < .05 level in corporate level commitment
to the status quo, h istorical endowments and firm size whereby none of the firm performance
categories differed from another.
The fol lowing hypotheses were tested by ANOV A I :
Ho: M(PIFP x) = M(PAFP x) = M(PSFP x)
H6: M(PIFP CLC) i- M(PAFP CLC) i- M(PSFP CLC)
H7: M(PIFP HE) i- M(PAFP HE) i- M(PSFP HE)
Hs: M(PIFP FS) i- M(PAFP FS) i- M(PSFP FS).
As evident in the KW and BDM results, the ANOV A I results are nonsignificant at the p < .05
level (refer to Table 4 . 1 4) and the effect sizes are small to moderate (ranging from . 1 7 to .49) .
Thus, H6, H7 and Hs cannot be accepted as there is not a statist ical ly significant difference at the
p < .05 level in corporate level commitment to the status quo, historical endowments and firm
size whereby none of the firm performance categories differed from another.
Table 4.14. One-way independent ANOV A test results for the potential confound variables
Potential confound Variable
Corporate level Average length of corporate level commitment to the decision maker tenure in position, status quo measured in years ( 1 995 - 2004)
Average % of internal directors ( 1 995 - 2004)
H istorical Firm age (years since founding to 1 980) endowments Firm size Natural logarithm of total revenue in US
dollars millions (at year end 2004) Natural logarithm oftotal assets in US
dollars millions (at year end 2004)
4. 1 2 .3 Potential confound results summary
Welch's F df P
0. 1 8 (2, 7.79) 0.840
0.04 (2, 7.74) 0.965
0.75 (2, 7.92) 0.502
0.36 (2, 6.89) 0.7 1 2
0.26 (2, 7. 1 9) 0.778
It was hypothesised that three potential confounds, namely, corporate level commitment to the
status quo, historical endowments, and firm size, could be util ised to distinguish PSFP firms
1 76
from other firms. The results found that any difference between the three firm performance
categories is statistically nonsignificant at the p < .05 level . Ho could not be rejected. The
homogeneity found suggests that these confound variables have the same impact on each of the
three firm performance groups. Therefore, they do not appear to influence any of the other
variables or firm performance. The potential confounds, then, wil l not be discussed further.
4. 13 SUMMARY
This chapter presented the research methodology uti l ised for this research . Two factors, namely,
the use of a secondary data source, and the predictions of the hypotheses directed the
methodological approach employed. The approach employed was appropriate: As discussed in
Chapter Three, every effort was made to encompass various conceptual isations of corporate
strategy into an innovative, accumulated definition . The time frame for the study was outlined.
The research population and sampling procedures were outlined whereby share market price was
uti l ised to determine the three firm performance categories. A sample of 1 5 firms was
constructed, comprising five firms per firm performance category. An appropriate secondary
data source was selected to provide evidence of the presence of corporate strategy, namely, the
Wall Street Journal . It was also acknowledged that secondary data may underestimate the level
of corporate strategy evident in the sample firms. Content analysis and the data collection
procedure was discussed. All the data was col lected at the firm level. Data c leaning and outlier
creation procedures were undertaken in the manner outlined in Section 4 .7 .
Lastly, a discussion of the various statistical analysis techniques employed was provided. Five
inferential statistics, namely, discriminant analysis, Kruskal-Wall is one-way analysis of variance
by ranks test, Jonckheere-Terpstra test, Brunner, Detter and Munk heteroscedastic rank-based
ANOV A test, and one-way independent analysis of variance test were employed to assess
whether a difference in the various indices is evident between the three firm performance
categories. S ix inferential statistical techniques, namely, Mann-Whitney test, S iegel-Castel lan
critical difference test, planned contrasts, Games-Howell test, Tamhane's T2 test, and Dunnett' s
T3 test were then conducted to assess where the difference between the three firm performance
categories rested. The use of a variety of inferential statistics provided a profile of results in
doing so, reinforcing the findings. Various statistical techniques, namely, Detter and Munk
heteroscedastic rank-based ANOVA test, one-way independent analysis of variance test Welch' s
F, p lanned contrasts, Games-Howell test, Tamhane' s T2 test, and Dunnett 's T3 test were
selected as they incorporate an adjustment for a possible violation of the assumption of
1 77

homogeneity of variance, and were robust to a possible minor violation in normality.
Furthermore, distribution-free statistics were applicable to the small sample.
A summary of the dataset was presented. Thereafter, rel iability and validity measures were
introduced. Lastly, the data sources for the five potential confounds identified in Chapter Three
were outlined. The results of the potential confound analysi s were presented and indicated that
none of the five potential confound variables could be used to distinguish between the three firm
performance categories.
1 78
5.0 RESULTS
This Chapter is divided into three sequential parts: Part I presents the preliminary analysis results
whi le Part 11 outl ines the hypothesis testing result for the corporate strategy index and the four
corporate strategy attribute indices. Lastly, Part I I I presents results of the tests on the excellence
and quantity indices. To increase readability of the results presented in this Chapter, an explicit
representation of the relationship between the various variables and indices is depicted in Figure
5 . 1 (also Section 4 .7 .2, and Table 4.5) .
PART I : PRELIMINARY DATA ANALYSIS
5. 1 PRELIMINARY DATA ANALYSIS OVERVIEW
The results of the tests for the assumptions of normality and homogeneity of variance are
presented. Thereafter, the preliminary analysis (i .e., descriptive statistics and box plots) of the
five hypotheses are displayed (i .e. , H I , H2, H3, H4 and Hs). These hypotheses predict that the
corporate strategy index and the attribute indices are able to distinguish the PSFP category from
the non-PSFP categories. A curvi l inear relationship between firm performance and the index is
expected for all indices except the strategic intent attribute index.
5.2 TESTS FOR NORMALITY
The Kolmogorov-Smirnov test was used to determine whether the parametric test results should
be interpreted with care. The normality tests for the corporate strategy attribute indices by firm
performance category denotes that the resource governance index for the PAFP category
indicates nonnormality as the result is significant (D(5) = 0.354, p = .040). Two tests of
normality for the quantity and excellence indices by firm performance category are significant,
again indicating nonnormality. Namely, the strategic intent quantity index for the PSFP category
(D(5) = 0.439, p = .002), and the corporate strategy excellence index for the PAFP category
(D(5) = 0.362, p =.03 1 ) . It may, therefore, be considered that the dataset displays minor
nonnormality and that this may influence the results of both discriminant analysis and ANOV A I .
Nevertheless, it has been noted that both the discriminant analysis (Tabachnick & Fidell, 200 1 )
and ANOV A 1 (Field, 2005) techniques are robust to violations of this assumption and, therefore,
the results obtained can sti l l be interpreted with confidence. To provide additional confidence in
1 79
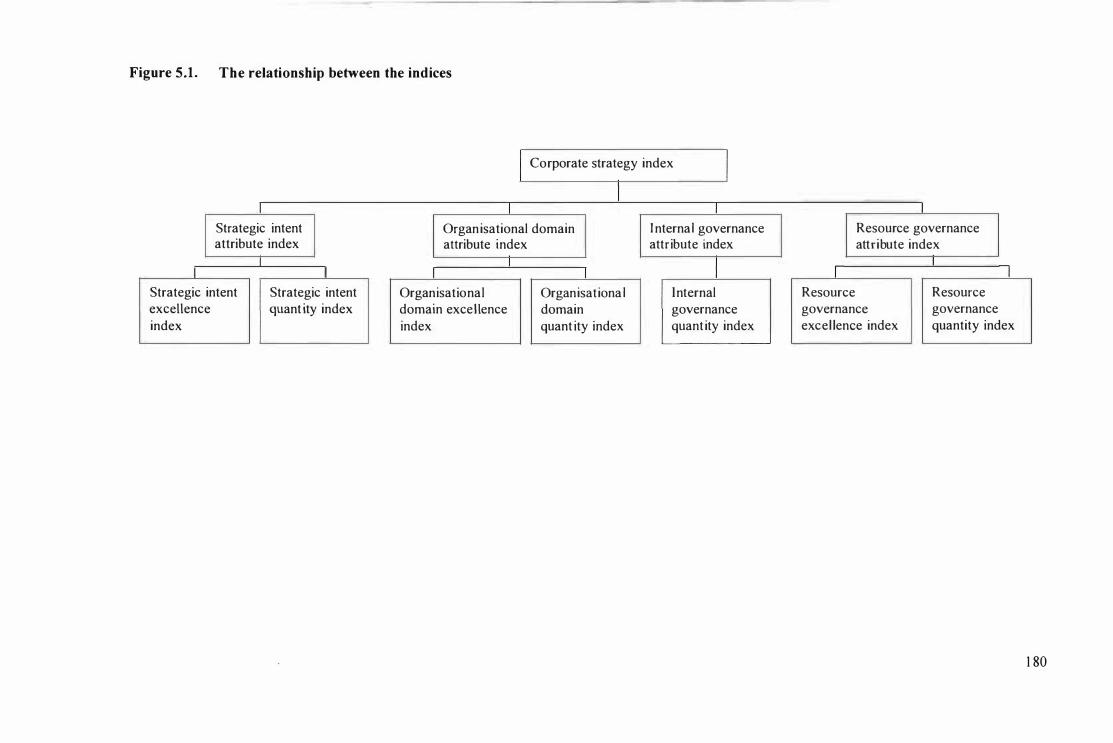
Figure 5.1. The relationship between the indices
Strategic intent attribute index
I I Strategic intent Strategic intent excellence quant ity index index
Corporate strategy index
Organisational domain I nterna I governance attr ibute index attribute index
Organ isat io na I domain excellence index
Organ isat iona I domain quant ity index
Internal governance quant ity index
Resource governance attribute index
I I Resource Resource governance governance excel lence index quantity index
1 80
the findings, d istribution-free statistical inferential techniques were also conducted to provide a
more detailed profile of results.
5.3 TESTS FOR THE ASSUMPTION
HOMOGENEITY OF VARIANCE
OF
The assumption of homogeneity of variance underlies a number of the inferential statistical
techniques employed in this study (except BOM, ANOVA l [when reporting Welch' s FJ,
p lanned contrasts, GH, T2 and T3). The assumption of homogeneity of variance, as measured by
the Levene's test, is violated by the organisational domain index (F(2, 1 2) = 5 .575, p = .0 1 9
based on mean). However, the variance ratio measure indicates all of the indices, except for the
corporate strategy index, v iolate this assumption (i .e., ratio value of greater than two). The
conflicting result h ighlights the difficulty in ascertaining a possible violation of this assumption.
However, it may be concluded that a minor violation of the assumption of homogeneity of
variance in the attribute indices exists.
Contradictory results are also ev ident in the quantity and excellence indices whereby the
Levene' s test reveals violations of the assumption of heterogeneity of variance for the fol lowing
two indices: strategic intent quantity index (F(2, 1 2) = 5 . 382, p = .02 1 based on mean); and
organisational domain quantity index (F(2, 1 2) = 5 . 1 54, P = .024 based on mean). However, the
variance ratio indicates that all indices, but the organisational domain excellence and internal
governance quantity indices, are heterogeneous. It is considered that there is a possible m inor
violation of the assumption of homogeneity of variance in the excellence and quantity indices.
Nevertheless, the reason why the various statistical inferential techniques were selected is that
they could inherently accommodate this possible minor violation. Therefore, any possible
implications of the violation of the assumption of homogeneity of variance have been minimised
and the results of this research remain to be interpreted with confidence.
5.4 EXPLORATORY DATA RESULTS
Various exploratory data analyses were performed (refer to Appendix 3). The exploratory
analysis of the descriptive statistics and box plots for the corporate strategy index as measured by
this research suggest that the PS FP category differs from the other firm performance categories
supporting H5• The curvi linear relationship between firm performance and the corporate strategy
index predicted is observed. The results of the descriptive statistics reveal that the PIFP category
1 8 1
possesses the lowest M strategic intent attribute index while the PAFP category the highest. The
PSFP category then did not display the highest level of strategic intent index as predicted for this
dataset. Instead, a curvi l inear relationship between the strategic intent attribute index and firm
performance is observed. The exploratory analysis of the box plots also suggests that the
medians of the three firm performance categories are minimally different, thus suggesting
l imited support for HI .
The M plus or minus the standard error provide an indication that the firm performance
categories could be distinguished on the basis of each of the other attribute indices . For the
organisational domain and internal governance attribute indices, the PAFP category could be
differentiated from both of the non-PAFP categories. For the resource governance attribute
index, the PSFP category is discriminated from the other two categories. The descriptive
statist ics of the organisational domain, internal and resource governance attribute indices suggest
support for H2, H3 and �. The M of the three firm performance categories are, therefore,
heterogeneous and fol low the curvi l inear relationship hypothesised. The exploratory data
analysis then indicates some support for four of the five hypotheses whereby the corporate
strategy, organisational domain, internal governance and resource governance indices as
measured in this research could be used to distinguish between the three firm performance
categories.
PART II : HYPOTH ESIS TESTING : BETWEEN -FI RM PERFORMANCE
CATEGORIES
5.5 HYPOTHESIS TESTING OVERVIEW
A number of statistical tests were performed to analyse the level of group heterogeneity between
the three firm performance categories for corporate strategy and each of the four corporate
strategy attributes as measured by this research. These tests aim to determine if any of these
indices could be uti l ised to distinguish the PS FP from the other two firm performance categories.
The results for the five hypotheses outlined in Chapter Three wil l now be presented.
The results for each hypothesis are divided into two sections. The first section investigates
whether any of the firm performance categories differ from any of the other firm performance
categories. KW, BDM, and JT (where appropriate) are employed to analyse the difference
between the medians for the firm performance categories. A corresponding parametric test was
1 82
also performed on the dataset, namely, ANOV A 1 (Welch' s F is reported due to possible
violation of assumption of homogeneity of variance) . The profile of results concur with the
distribution-free tests.
The second section examines if the PSFP category could be distinguished from the non-PSFP
category. When a statistically significant result is obtained from the Section 1 analyses, two
distribution-free post-hoc tests were performed for KW: MW and Se. Four post-hoc tests for
ANOV A 1 are also performed: Planned contrasts, GH, T2, and T3 . Discriminant analysis is
uti l ised to differentiate between the three firm performance categories. The only statistically
significant results relate to the resource governance attribute index and thus, are discussed in the
resource governance section.
5.6 HYPOTHESIS TESTING : CORPORATE
STRATEGY
Hs hypothesises that corporate strategy could be used to distinguish the PSFP category from the
non-PSFP categories. A curvil inear relationship between corporate strategy and firm
performance is predicted, that is, the PIFP and PS FP categories are expected to possess lower
corporate strategy than the PAFP category. A number of versions of Hs are tested, depending on
the test employed.
5 .6. 1 Did the corporate strategy index differ between the firm
performance categories?
Three analyses were conducted to examine whether the corporate strategy index differs between
firm performance categories: KW, BDM and ANOV A I . The results are outl ined below.
a) Kruskal- Wallis test
KW identifies if at least one of the firm performance categories differs from at least one of the
other categories in terms of corporate strategy. The following two hypotheses are tested by KW:
Ho: Mdn(PIFP CS) = Mdn(PAFP C S) = Mdn(PSFP CS)
Hs: Mdn(PIFP CS) t Mdn(PAFP CS) t Mdn(PSFP CS).
An inspection of Table 5 . 1 indicates that the PSFP category has the lowest corporate strategy
index mean rank score (4.4), with the PAFP category reporting the h ighest corporate strategy
1 83
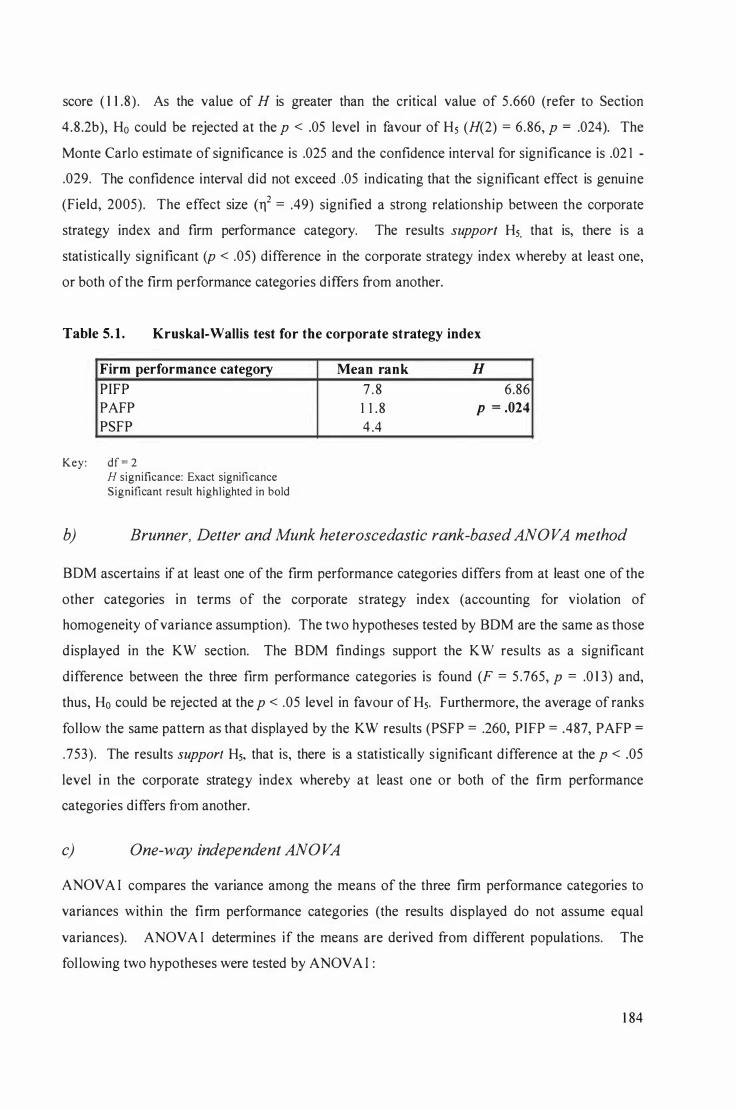
score ( 1 1 .8) . As the value of H is greater than the critical value of 5 .660 (refer to Section
4 .8 .2b), Ho could be rejected at the p < .05 level in favour of Hs (H(2) = 6.86, p = .024). The
Monte Carlo estimate of significance is .025 and the confidence interval for significance is .02 1 -
.029. The confidence interval did not exceed .05 indicating that the significant effect is genuine
(Field, 2005). The effect size (T12 = .49) signified a strong relationship between the corporate
strategy index and firm performance category. The results support Hs, that is, there is a
statistical ly significant (p < .05) difference in the corporate strategy index whereby at least one,
or both of the firm performance categories differs from another.
Table 5. 1 . Kruskal-Wallis test for the corporate strategy index
Firm performance category
PIFP PAFP PSFP
Key: df = 2
H significance: Exact significance Significant result highl ighted in bold
Mean rank H 7 . 8 6.86 1 1 . 8 P = .024
4 .4
b) Brunner, Detter and Munk heteroscedastic rank-based ANOVA method
BDM ascertains if at least one of the firm performance categories differs from at least one of the
other categories in terms of the corporate strategy index (accounting for violation of
homogeneity of variance assumption). The two hypotheses tested by BDM are the same as those
displayed in the KW section. The BDM findings support the KW results as a significant
difference between the three firm performance categories is found (F = 5 .765, p = .0 1 3) and,
thus, Ho could be rejected at the p < .05 level in favour of Hs. Furthermore, the average of ranks
fol low the same pattern as that displayed by the KW results (PSFP = .260, PIFP = .487, PAFP =
.753) . The results support Hs, that is, there is a statistically s ignificant difference at the p < .05
level in the corporate strategy index whereby at least one or both of the firm performance
categories differs from another.
c) One-way independent ANOVA
ANOV A I compares the variance among the means of the three firm performance categories to
variances within the firm performance categories (the results d isplayed do not assume equal
variances). ANOVA I determines if the means are derived from different populations. The
fol lowing two hypotheses were tested by ANOV A I :
1 84
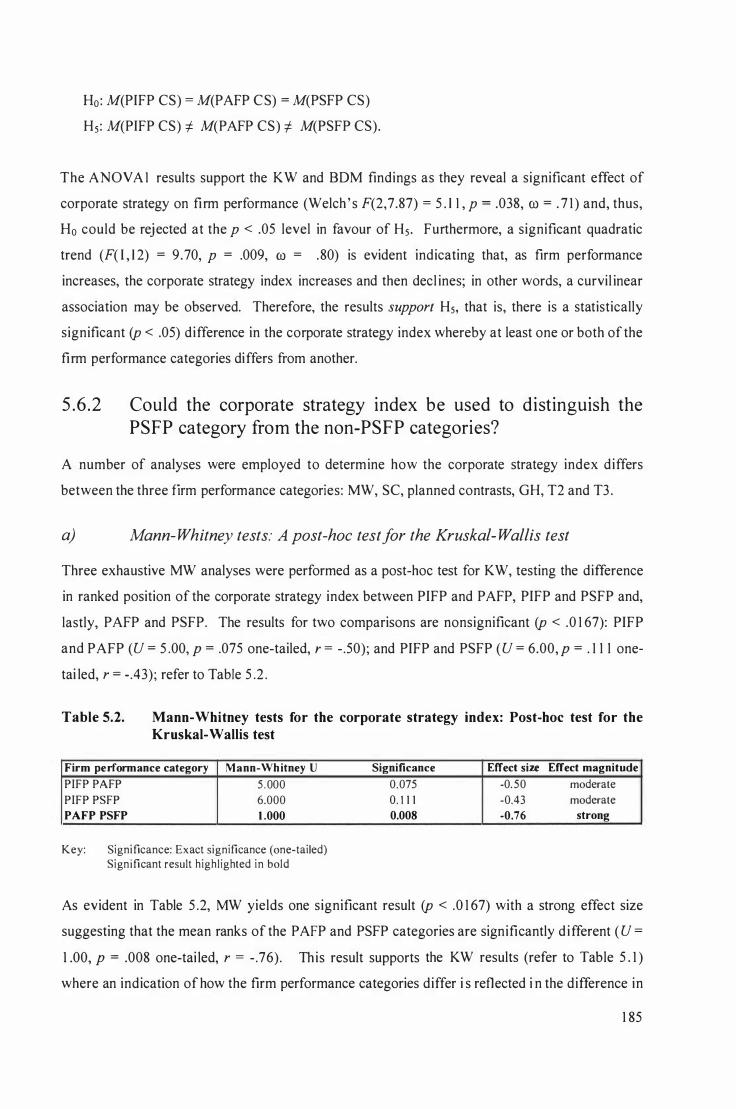
Ho: M(PIFP CS) = M(PAFP CS) = M(PSFP CS)
H5: M(PIFP CS) i- M(PAFP CS) i- M(PSFP CS).
The ANOV A I results support the KW and BDM findings as they reveal a significant effect of
corporate strategy on firm performance (Welch ' s F(2,7.87) = 5 . I I , p = .038, Cl) = . 7 1 ) and, thus,
Ho could be rejected at the p < .05 level in favour of H5• Furthermore, a significant quadratic
trend (F( l , I 2) = 9.70, p = .009, Cl) = . 80) is evident indicating that, as firm performance
increases, the corporate strategy index increases and then decl ines; in other words, a curvil inear
association may be observed. Therefore, the results support H5, that is, there is a statistically
significant (p < .05) difference in the corporate strategy index whereby at least one or both of the
firm performance categories differs from another.
5 .6 .2 Could the corporate strategy index be used to distinguish the PSFP category from the non-PSFP categories?
A number of analyses were employed to determine how the corporate strategy index differs
between the three firm performance categories: MW, se, planned contrasts, GH, T2 and T3 .
a) Mann-Whitney tests: A post-hoc testlor the Kruskal- Wallis test
Three exhaustive MW analyses were performed as a post-hoc test for KW, testing the difference
in ranked position of the corporate strategy index between PIFP and PAFP, PIFP and PSFP and,
lastly, PAFP and PSFP. The results for two comparisons are nonsignificant (p < .0 1 67): PIFP
and PAFP (U = 5 .00, P = .075 one-tailed, r = -.50); and PIFP and PSFP (U = 6.00, P = . 1 1 1 one
tai led, r = -.43); refer to Table 5 .2 .
Table 5.2. Mann-Whitney tests for the corporate strategy index: Post-hoc test for the Kruskal-Wallis test
Firm performance category Mann-Whitney U PIFP PAFP 5 .000 PIFP PSFP 6.000 PAFP PSFP 1 .000
Key: Significance: Exact significance (one-tailed) Significant result highlighted in bold
Significance Effect size Effect magnitude
0.075 -0.50 moderate
0. 1 1 1 -0.43 moderate
0.008 -0.76 strong
As evident in Table 5 .2, MW yields one significant result (p < .0 1 67) with a strong effect size
suggesting that the mean ranks of the PAFP and PSFP categories are significantly d ifferent ( U =
1 .00, P = .008 one-tai led, r = -.76). This result supports the KW results (refer to Table 5 . 1 )
where an indication of how the firm performance categories differ i s reflected i n the difference in
1 85
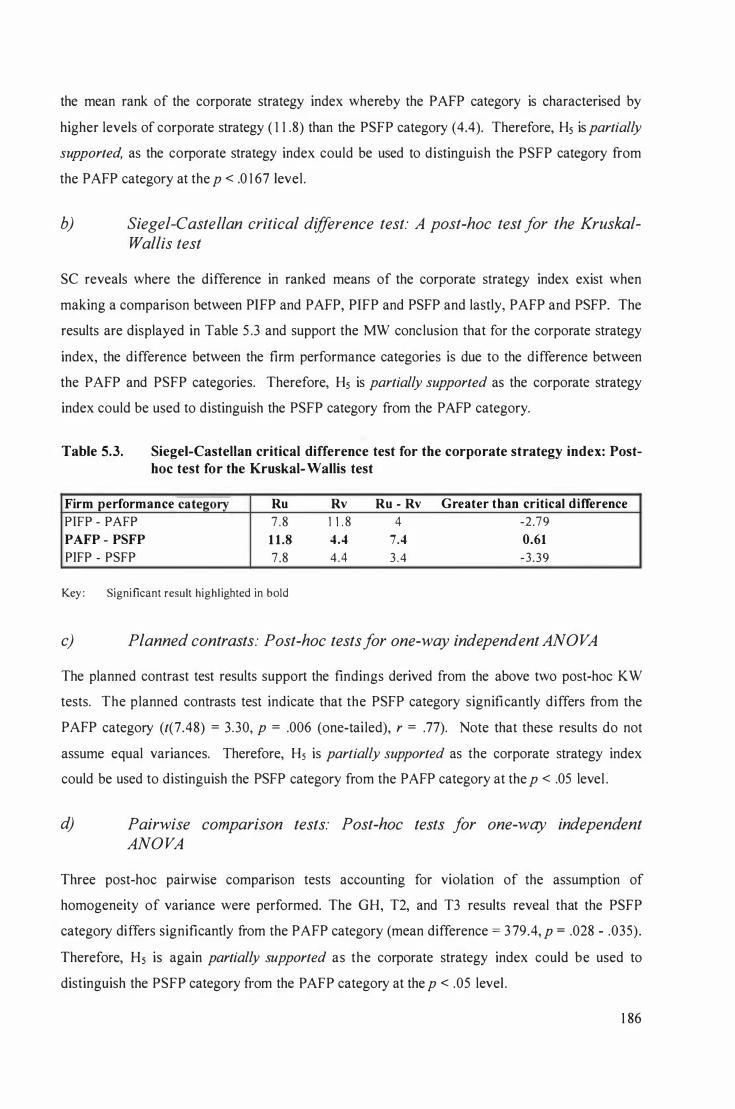
the mean rank of the corporate strategy index whereby the PAFP category is characterised by
higher levels of corporate strategy ( 1 1 .8) than the PSFP category (4.4). Therefore, Hs is partially
supported, as the corporate strategy index could be used to distinguish the PSFP category from
the PAFP category at the p < .0 1 67 level.
b) Siegel-Castellan critical difference test: A post-hoc test for the KruskalWallis test
se reveals where the difference in ranked means of the corporate strategy index exist when
making a comparison between PI FP and PAFP, PIFP and PSFP and lastly, PAFP and PSFP. The
results are displayed in Table 5 .3 and support the MW conclusion that for the corporate strategy
index, the difference between the firm performance categories is due to the difference between
the PAFP and PSFP categories. Therefore, Hs is partially supported as the corporate strategy
index could be used to distinguish the PSFP category from the PAFP category.
Table 5.3. Siegel-Castellan critical difference test for the corporate strategy index: Posthoc test for the Kruskal- Wallis test
Firm performance ca tegory Ru Rv Ru - Rv Greater than critical d ifference PIFP - PAFP 7 . 8
PAFP - PSFP 1 1 .8 PIFP - PSFP 7.8
Key : Significant result highl ighted in bold
1 1 . 8 4 -2.79
4.4 7.4 0.61 4 .4 3 .4 -3 .39
c) Planned contrasts: Post-hoc tests for one-way independent ANOVA
The planned contrast test results support the findings derived from the above two post-hoc KW
tests. The planned contrasts test indicate that the PS FP category significantly differs from the
PAFP category (t(7.48) = 3.30, P = .006 (one-tai led), r = .77). Note that these results do not
assume equal variances. Therefore, Hs is partially supported as the corporate strategy index
could be used to distinguish the PSFP category from the PAFP category at the p < .05 level .
d) Pairwise comparison tests: Post-hoc tests for one-way independent ANOVA
Three post-hoc pairwise comparison tests accounting for violation of the assumption of
homogeneity of variance were performed. The GH, T2, and T3 results reveal that the PSFP
category differs significantly from the PAFP category (mean difference = 3 79.4, p = .028 - .035).
Therefore, Hs is again partially supported as the corporate strategy index could be used to
distinguish the PSFP category from the PAFP category at the p < .05 level .
1 86
5.7 HYPOTHESIS TESTIN G : STRATEGIC INTENT
HI hypothesises that strategic intent could be used to distinguish the PSFP category from the
non-PSFP categories. It is predicted that strategic intent increases as firm performance increases,
that i s, it is expected that the PIFP category possesses a lower level of strategic intent than the
PAFP and PSFP categories. The highest level of strategic intent is expected to occur in the PSFP
category, that is,
Ho: Mdn(PIFP SI) = Mdn(P AFP SI ) = Mdn(PSFP SI)
H I : Mdn(PIFP SI) < Mdn(P AFP SI) < Mdn(PSFP SI) .
The JT results are nonsignificant (J = 42.0, p = . 340, z = 0.475, r = . 1 2) . The positive value for z
indicates that the medians of the strategic intent index increases as firm performance increases.
However, since 42.0 is less than the critical value of 54.0, Ho that the three medians are equal
could not be rejected. Thus, HI cannot be accepted as there is not a statistically significant
difference at the p < .05 level in the strategic intent attribute index in the data col lected, whereby
none of the firm performance categories differ (statistical ly) from another. The implications of
this outcome are explored further in Chapter Six.
5.8 HYPOTHESIS
DOMAIN
TESTING: ORGANISATIONAL
H2 hypothesises that organisational domain could distinguish the PSFP category from the non
PSFP categories. Three analyses were uti l ised to identify whether the organisational domain
attribute index differs between firm performance categories: KW, BDM and ANOVA l . The
fol lowing two hypotheses are tested by KW and BDM:
Ho: Mdn(PIFP OD) = Mdn(P AFP OD) = Mdn(PSFP OD)
H2 : Mdn(PIFP OD) t Mdn(PAFP OD) t Mdn(PSFP OD).
The fol lowing two hypotheses are tested by ANOV A I :
Ho: M(PIFP OD) = M(PAFP OD) = M(PSFP OD)
H2 : M(PIFP OD) t M(PAFP OD) t M(PSFP OD).
1 87
KW identified a statistical ly nonsignificant difference in the organisational domain index across
the three firm performance categories (H(2) = 3 .84, P = . 1 53) ; refer to Appendix 4, Section 1 .0.
The BDM and ANOVA I results are also nonsignificant (F = 2.268, p = . 1 36 and Welch' s
F(2,6.62) = 2.3 1 , P = . 1 73 , 0) = . 59 respectively). Consequently, Ho cannot be rejected in favour
of H2 at the p < .05 level . H2 cannot be accepted as there is again no stat istically sign ificant
difference at p < .05 in the organisational domain attribute index.
5.9 HYPOTHESIS
G OVERNANCE
TESTING : INTERNAL
H3 predicts that internal governance could distinguish the PS FP category from the non-PSFP
categories. Three analyses were uti l ised to determine whether the internal governance attribute
index differs between firm performance categories: KW, BDM and ANOVA I . The fol lowing
two hypotheses are tested by KW and BDM:
Ho: Mdn(PIFP IG) = Mdn(PAFP JG) = Mdn(PSFP IG)
H3: Mdn(PIFP IG) i- Mdn(PAFP JG) i- Mdn(PSFP IG).
The fol lowing two hypotheses are tested by ANOV A I :
Ho: M(PIFP IG) = M(PAFP JG) = M(PSFP JG)
H3 : M(PIFP IG) i- M(PAFP JG) i- M(PSFP JG).
KW found that there is not a statistically significant difference in the internal governance
attribute index across the three firm performance categories (H(2) = 1 .24, P = .565); refer to
Appendix 4, Section 2 .0. The BDM and ANOVA l results are also nonsignificant (F = 0.582, p
= .638 and Welch's F(2,7.86) = 0.68, p = . 532, 0) = . 1 4 respectively). Consequently, Ho again
cannot be rejected in favour of H3 . H3 cannot be accepted as there i s not a statistically
significant difference at the level of p < .05 in the internal governance attribute index.
5. 1 0 HYPOTHESIS
G OVERNANCE
TESTING : RESOURCE
t4 hypothesises that resource governance could dist inguish the PSFP category from the non
PSFP categories. The PIFP and PSFP categories are expected to possess lower resource
governance than the PAFP category, that is, a curvi l inear relationship.
1 88
5 . 1 0 . 1 D id the resource governance attribute index differ between the firm performance categories?
a) Kruskal- Wallis one-way analysis o/variance by ranks, Brunner, Delter and Munk heteroscedastic rank-based ANOVA and One-way independent ANOVA tests
Three analyses were uti l ised to determine whether the resource governance attribute index
differs between firm performance categories: KW, BDM and ANOVA I . The fol lowing two
hypotheses are tested by KW and BDM:
Ho: Mdn(PIFP RG) = Mdn(PAFP RG) = Mdn(PSFP RG)
Ht : Mdn(PIFP RG) * Mdn(PAFP RG) * Mdn(pSFP RG).
The fol lowing two hypotheses are tested by ANOV A I :
Ho: M(PIFP RG) = M(PAFP RG) = M(PSFP RG)
Ht: M(PIFP RG) * M(PAFP RG) * M(PSFP RG).
The KW results identified a statistically significant difference in the resource governance index
across the three firm performance categories (H(2) = 8 .24, P = .08); refer to Appendix 4, Section
3 . 1 . The results suggest that one of the firm performance categories differ from either one of, or
both of, the other categories. The Monte Carlo estimate of significance is .009. The confidence
interval for significance is .007 - .0 1 1 which did not exceed p < 0.05 indicating that the
significant effect is genuine (Field, 2005). The effect size (112 = . 59) s ignified a strong
relationship between the resource governance index and firm performance category. The BDM
results support the KW findings (F = 8 .583, p = . 0 1 0). The mean rank results for both KW and
BDM tests are displayed in Appendix 4, Section 3 . 1 .
ANOVA I also reveals that a significant effect of the resource governance attribute index on firm
performance exists (Welch 's F(2,6.97) = 48.72, p = .000 1 , co = .78). There is a significant l inear
trend (F( l , 1 2) = 1 2 .22, P = .004, co = .83) indicating that as firm performance increases, the
resource governance index increases proportional ly. A significant quadratic trend (F( 1 , 1 2) = 5 .78, p = .034, co = .70) is also evident. Thus, the KW, BDM and ANOVA l results support Ht, that i s, there was a statistically significant difference at p < .05 in the resource governance
attribute index, meaning that at least one, if not two, firm performance categories differ from one
another.
1 89
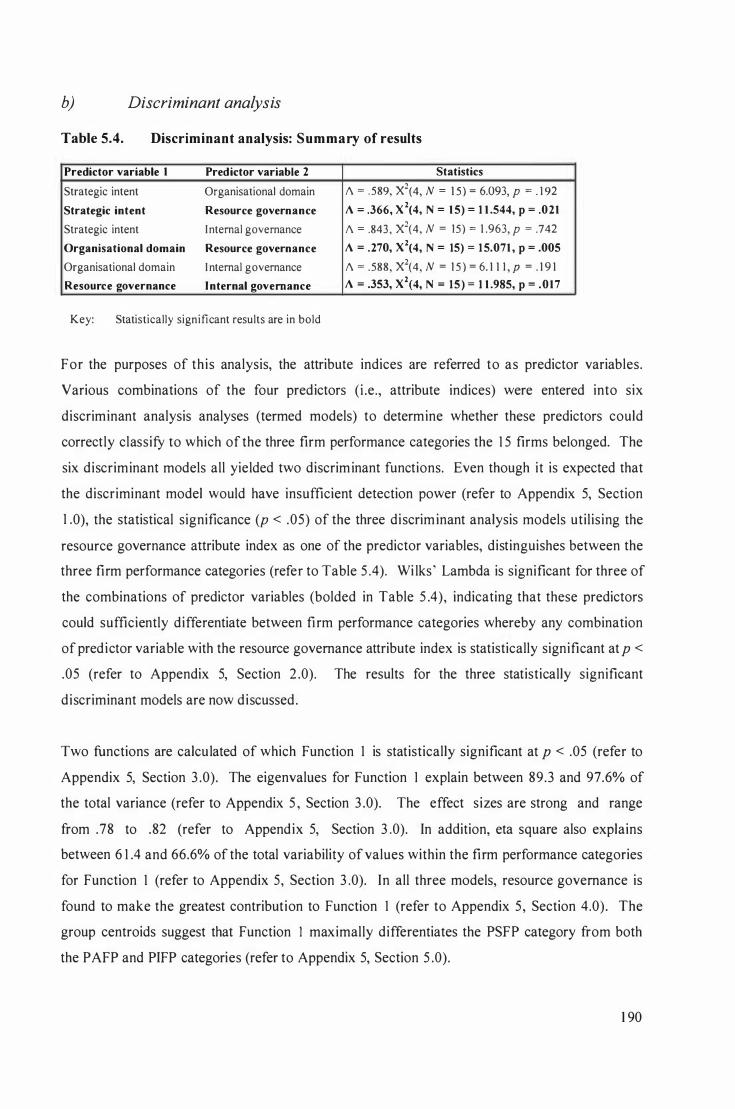
b) Discriminant analysis
Table 5.4. Discriminant analysis: Summary of results
Predictor variable 1 Predictor variable 2
Strategic intent Organisational domain
Strategic intent Resource governance
Strategic intent I nternal governance
Organisational domain Resource governance
Organisational domain I nternal governance
Resource governance I nternal governance
Key: Statistically significant results are in bold
Statistics
/\ = . 589, X2(4, N = 1 5 ) = 6.093, P = . 1 92
A = .366, X2(4, N = 1 5) = 1 1 .544, P = .021
/\ = .843 , X2(4, N = 15) = 1 .963, P = .742
A = .270, X2(4, N = 15) = 1 5.071 , P = .005
/\ = .588, X2(4, N = 1 5 ) = 6. 1 1 1 , p = . 1 9 1
A = .353, X2(4, N = 15) = 1 1 .985, P = .017
For the purposes of this analysis, the attribute indices are referred to as predictor variables.
Various combinations of the four predictors (Le., attribute indices) were entered into six
discriminant analysis analyses (termed models) to determine whether these predictors could
correctly classify to which of the three firm performance categories the 1 5 firms belonged. The
six discriminant models all yielded two discrim inant functions. Even though it is expected that
the discriminant model would have insufficient detection power (refer to Appendix 5, Section
1 .0), the statistical significance (p < .05) of the three discrim inant analysis models utilising the
resource governance attribute index as one of the predictor variables, distinguishes between the
three firm performance categories (refer to Table 5 .4). Wi lks ' Lambda is significant for three of
the combinations of predictor variables (bolded in Table 5 .4), indicating that these predictors
could sufficiently differentiate between firm performance categories whereby any combination
of predictor variable with the resource governance attribute index is statistically significant at p <
.05 (refer to Appendix 5, Section 2 .0). The results for the three statistically significant
discriminant models are now discussed.
Two functions are calculated of which Function 1 is statistically significant at p < .05 (refer to
Appendix 5, Section 3 .0). The eigenvalues for Function I explain between 89.3 and 97.6% of
the total variance (refer to Appendix 5 , Section 3 .0). The effect sizes are strong and range
from .78 to .82 (refer to Appendix 5, Section 3 .0). In addition, eta square also explains
between 6 1 .4 and 66.6% of the total variability of values within the firm performance categories
for Function 1 (refer to Appendix 5, Section 3 .0). In all three models, resource governance is
found to make the greatest contribution to Function 1 (refer to Appendix 5 , Section 4.0). The
group centroids suggest that Function I maximally differentiates the PS FP category from both
the PAFP and PIFP categories (refer to Appendix 5, Section 5 .0).
1 90
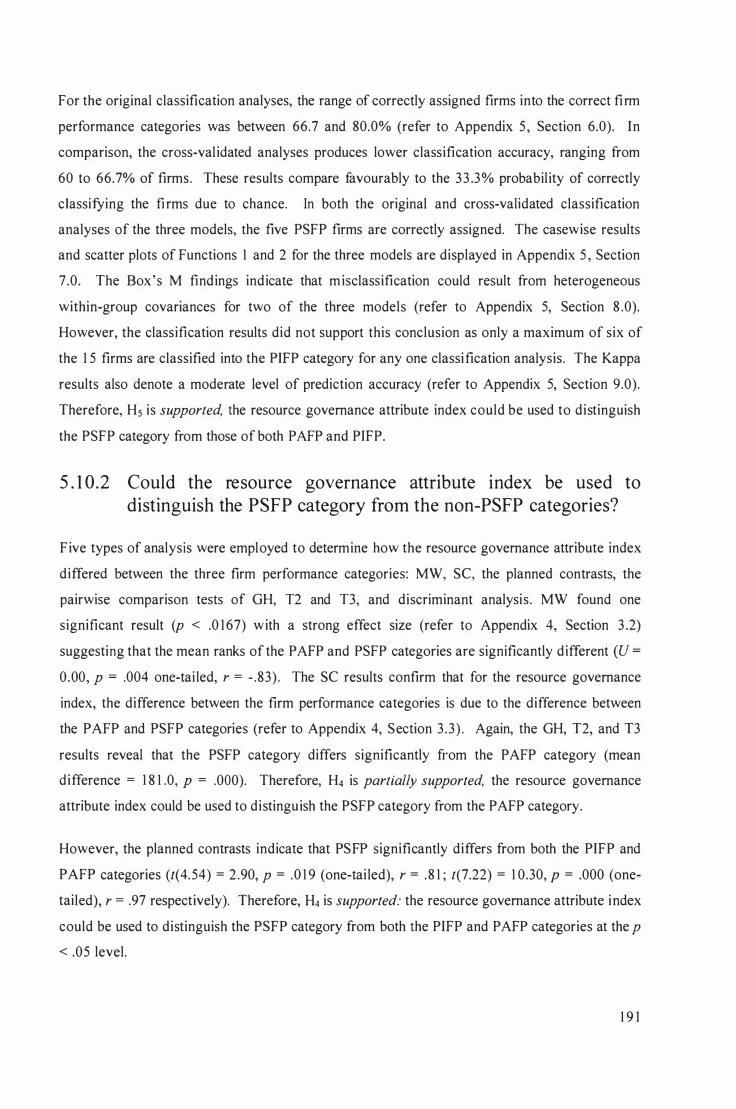
For the original classification analyses, the range of correctly assigned firms into the correct fi rm
performance categories was between 66.7 and 80.0% (refer to Appendix 5 , Section 6.0). In
comparison, the cross-val idated analyses produces lower classification accuracy, ranging from
60 to 66.7% of firms. These results compare favourably to the 33 .3% probabil ity of correctly
c1assitying the firms due to chance. In both the original and cross-validated classification
analyses of the three models, the five PSFP firms are correctly assigned. The casewise results
and scatter plots of Functions 1 and 2 for the three models are displayed in Appendix 5 , Section
7.0. The Box's M findings indicate that m isclassification could result from heterogeneous
within-group covariances for two of the three models (refer to Appendix 5, Section 8 .0).
However, the classification results did not support this conclusion as only a maximum of six of
the 1 5 firms are classified into the PIFP category for any one classification analysis. The Kappa
results also denote a moderate level of prediction accuracy (refer to Appendix 5, Section 9.0).
Therefore, Hs is supported, the resource governance attribute index could be used to distinguish
the PSFP category from those of both PAFP and PIFP.
5 . 1 0 .2 Could the resource governance attribute index be used to distinguish the PSFP category from the non-PSFP categories?
Five types of analysis were employed to determine how the resource governance attribute index
differed between the three firm performance categories: MW, se, the planned contrasts, the
pairwise comparison tests of GH, T2 and T3, and discriminant analysis . MW found one
significant result (p < .0 1 67) with a strong effect size (refer to Appendix 4, Section 3 .2)
suggesting that the mean ranks of the PAFP and PSFP categories are significantly different (u =
0.00, p = .004 one-tai led, r = - .83) . The se results confirm that for the resource governance
index, the difference between the firm performance categories is due to the difference between
the PAFP and PSFP categories (refer to Appendix 4, Section 3 .3) . Again, the GH, T2, and T3
results reveal that the PSFP category differs significantly from the PAFP category (mean
difference = 1 8 1 .0, P = .000). Therefore, H4 is partially supported, the resource governance
attribute index could be used to distinguish the PSFP category from the PAFP category.
However, the planned contrasts indicate that PS FP significantly differs from both the PIFP and
PAFP categories (t(4.54) = 2 .90, p = .0 1 9 (one-tai led), r = . 8 1 ; t(7.22) = 1 0.30, P = .000 (one
tailed), r = .97 respectively). Therefore, � is supported: the resource governance attribute index
could be used to distinguish the PSFP category from both the PIFP and PAFP categories at the p
< .05 level.
1 9 1
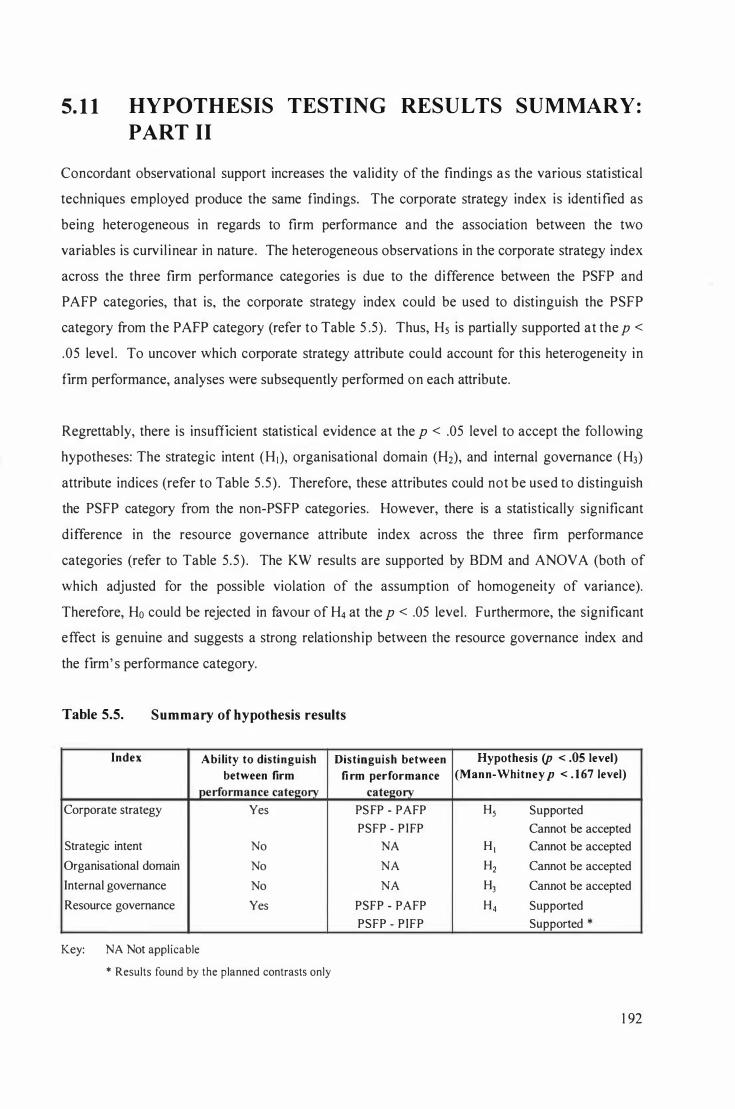
5. 1 1 HYPOTHESIS TESTING RESULTS SUMMARY:
PART 11
Concordant observational support increases the valid ity of the findings as the various statistical
techniques employed produce the same findings. The corporate strategy index is identified as
being heterogeneous in regards to firm performance and the association between the two
variables is curvi l inear in nature. The heterogeneous observations in the corporate strategy index
across the three firm performance categories is due to the difference between the PSFP and
P AFP categories, that is, the corporate strategy index could be used to distinguish the PSFP
category from the PAFP category (refer to Table 5 .5) . Thus, Hs is partially supported at the p <
.05 level . To uncover which corporate strategy attribute could account for this heterogeneity in
firm performance, analyses were subsequently performed on each attribute.
Regrettably, there is insufficient statistical evidence at the p < .05 level to accept the fol lowing
hypotheses: The strategic intent (HI)'
organisational domain (H2), and internal governance (H3)
attribute indices (refer to Table 5 .5) . Therefore, these attributes could not be used to distinguish
the PSFP category from the non-PS FP categories. However, there is a statistically significant
difference in the resource governance attribute index across the three firm performance
categories (refer to Table 5 .5) . The KW results are supported by BDM and ANOV A (both of
which adjusted for the possible violation of the assumption of homogeneity of variance).
Therefore, Ho could be rejected in favour of H4 at the p < .05 level. Furthermore, the significant
effect is genuine and suggests a strong relationship between the resource governance index and
the firm' s performance category.
Table 5.5. Summary of hypothesis results
Index Ability to distinguish Distinguish between Hypothesis (p < .05 level)
between firm fi rm performance (Mann-Whitney p < . 1 67 level)
performance category category
Corporate strategy Yes PS FP - PAFP H5 Supported
PSFP - PIFP Cannot be accepted Strategic intent No NA H I Cannot be accepted
Organisational domain No NA H2 Cannot be accepted
Internal governance No NA H) Cannot be accepted
Resource governance Yes PSFP - PAFP H4 Supported
PSFP - PIFP Supported *
Key: NA Not applicable
* Results found by the planned contrasts only
1 92
F ive of the six post-hoc tests, which provide an indication of how the firm performance
categories differ, yielded one significant result suggesting that the PAFP and PSFP categories are
significantly different (at the p < .05 level except MW where p < .0 1 67 level); refer to Table 5 . 5 .
The planned contrasts also found a difference between the PSFP and PIFP categories. Therefore,
1-4 is partially supported indicating that the heterogeneity observed in the corporate strategy
index could be attributed to the difference in the resource governance attribute index. In other
words, the resource governance index could distinguish the PSFP category from the PAFP
category.
Three statistically significant discriminant analysis models uti l ising the resource governance
attribute index as one of the predictor variables did distinguish between the three firm
performance categories. The resource governance index is a significant predictor itself. The
only statistically significant function explains between 89.3 and 97.6% of the total variance.
Function I explains between 6 1 .4 and 66.6% of the total variabil ity of values within the firm
performance categories. The effect sizes are strong. The group centroids suggest that Function I
maximally differentiates the PS FP category from the PAFP and PIFP categories. For the original
classification analyses, the range of correctly assigned firms was between 66.7 and 80 .0%. In
comparison, the cross-val idated analyses produced lower classification accuracy, ranging from
60 to 66.7% of firms. These results compare favourably to the 33 .3% probabi l ity of correctly
c lassifying the firms due to chance. The Kappa results signify a moderate level of prediction
accuracy. In both the original and cross-validated classifications of the three models, all five
PSFP firms are correctly assigned.
PART Ill : HYPOTH ESIS TESTING : EXCELLENCE AN D QUANTITY
IN DICES
5. 1 2 EXCELLENCE AND QUANTITY OVERVIEW
The corporate strategy attributes are composed of a combination of indicators representing both
excellence and quantity (refer to Chapters Three and Four). A number of statistical tests were
performed to analyse the level of group heterogeneity between the three firm performance
categories for each of the excellence and quantity indices. The results of testing the nine
subhypotheses outl ined in Chapter Three are presented as fol lows: The corporate strategy
excel lence index, the corporate strategy quantity index, and lastly, the tests of the quantity
indices are then reported.
1 93
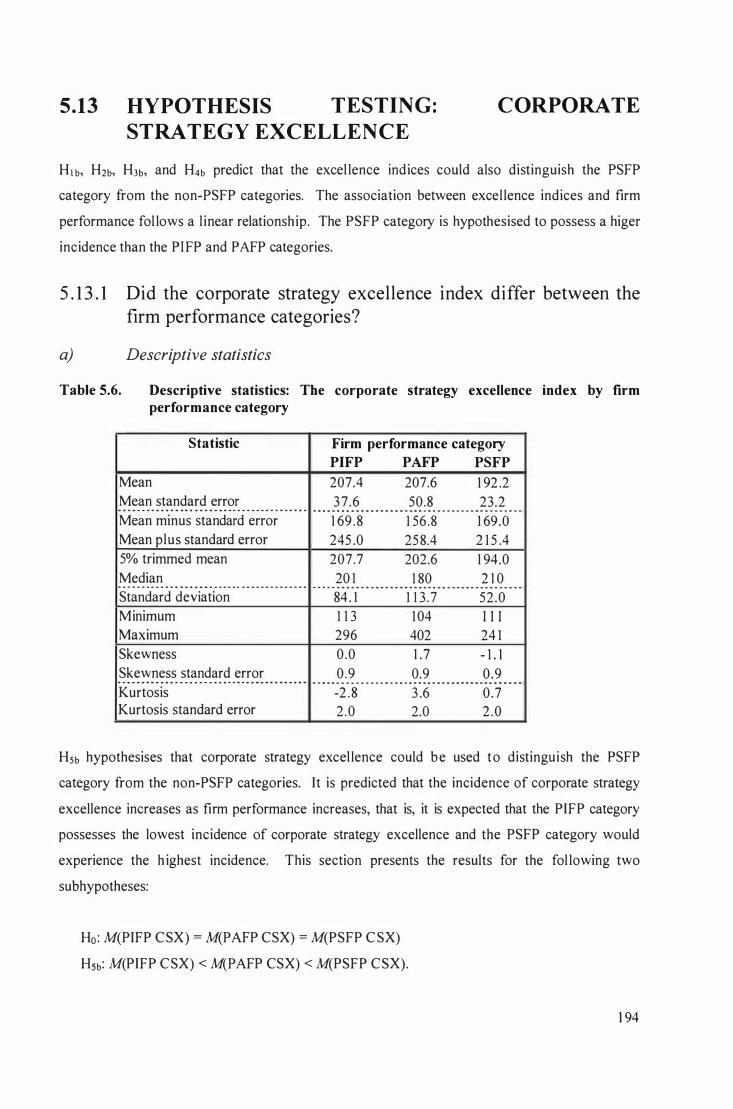
5.13 HYPOTHESIS TESTING: CORPORATE
STRATEGY EXCELLENCE
H1b, H2b, H3b, and H4b predict that the excel lence indices could also distinguish the PSFP
category from the non-PSFP categories. The association between excel lence indices and firm
performance fol lows a l inear relationship. The PSFP category is hypothesised to possess a higer
incidence than the PI FP and PAFP categories.
5 . 1 3 . 1 Did the corporate strategy excel lence index differ between the
firm performance categories?
a) Descriptive statistics
Table 5.6. Descriptive statistics: The corporate strategy excellence index by firm performance category
Statistic Firm performance category
PIFP PAFP PSFP
Mean 207.4 207.6 1 92 .2 Mean standard error 37.6 50.8 23.2
.. .. .. _ - - - .. . . . . .. _ _ . .. .. .. .. .. .. .. _ - - - - - - - .. .. .. .. .. .. .. . - .. .. . .. .. . . . .. . . .. . .. . .. .. . .. .. _ .. .. .. .. .. _ - - - - - - _ .. .. _ - - - - .. - -
Mean minus standard error 1 69 .8 1 56.8 1 69.0 Mean plus standard error 245 .0 258.4 2 1 5 .4 5% trimmed mean 207.7 202.6 1 94.0 Median 20 1 1 80 2 1 0 - - - - - - - .. .. .. . . . .. _ . . .. .. .. _ - - - _ . .. _ - - - - - - - - - - - - - - - - - .. . . .. . . .. . . . . . . .. .. . .. .. .. . .. _ .. .. _ _ . .. _ - - _ .. .. _ - - - -
Standard deviation 84. 1 1 1 3 .7 52.0 Minimum 1 1 3 1 04 I I I Maximum 296 402 24 1 Skewness 0 .0 1 .7 - 1 . 1 Skewness standard error 0.9 0.9 0.9
.. - . .. _ _ . .. _ .. .. .. .. _ - - .. - - .. .. .. .. .. .. . .. .. . .. . . .. _ . .. _ .. . . .. .. _ .. .. _ - - - - - - - - - - - .. . .. . .. . . . .. .. .. .. .. _ . . .. _ . .. _ - - - - - -Kurtosis -2 .8 3 .6 0.7 Kurtosis standard error 2 .0 2.0 2 .0
HSb hypothesises that corporate strategy excel lence could be used to distinguish the PSFP
category from the non-PSFP categories. It is predicted that the incidence of corporate strategy
excellence increases as firm performance increases, that is, it is expected that the PIFP category
possesses the lowest incidence of corporate strategy excellence and the PSFP category would
experience the h ighest incidence. This section presents the results for the fol lowing two
subhypotheses:
Ho: M(PIFP CSX) = M(PAFP CSX) = M(PSFP C SX)
HSb: M(PIFP CSX) < M(PAFP CSX) < M(PSFP CSX).
1 94
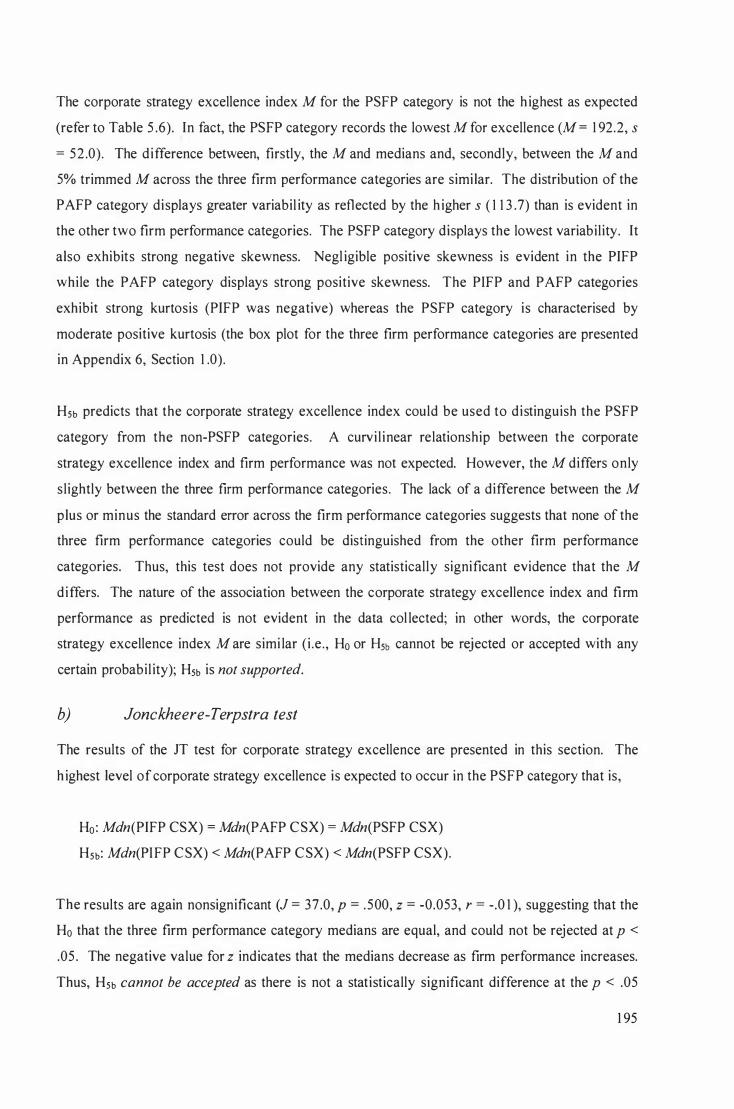
The corporate strategy excellence index M for the PSFP category is not the h ighest as expected
(refer to Table 5 .6). In fact, the PS FP category records the lowest M for excellence (M = 1 92.2, s
= 52 .0). The difference between, firstly, the M and medians and, secondly, between the M and
5% trimmed M across the three firm performance categories are simi lar. The distribution of the
PAFP category displays greater variabil ity as reflected by the h igher s ( 1 1 3 .7) than is evident in
the other two firm performance categories. The PSFP category displays the lowest variabil ity. It
also exhibits strong negative skewness. Negl igible positive skewness is evident in the PIFP
while the PAFP category displays strong positive skewness. The PIFP and PAFP categories
exhibit strong kurtosis (PIFP was negative) whereas the PS FP category is characterised by
moderate positive kurtosis (the box plot for the three firm performance categories are presented
in Appendix 6, Section 1 .0).
HSb predicts that the corporate strategy excellence index could be used to distinguish the PSFP
category from the non-PSFP categories. A curvi l inear relationship between the corporate
strategy excellence index and firm performance was not expected. However, the M differs only
slightly between the three firm performance categories. The lack of a difference between the M
plus or minus the standard error across the firm performance categories suggests that none of the
three firm performance categories could be distinguished from the other firm performance
categories. Thus, this test does not provide any statistically significant evidence that the M
differs. The nature of the association between the corporate strategy excellence index and firm
performance as predicted is not evident in the data col lected; in other words, the corporate
strategy excellence index M are simi lar (i .e . , Ho or HSb cannot be rejected or accepted with any
certain probabil ity); HSb is not supported.
b) Jonckheere-Terpstra test
The results of the JT test for corporate strategy excellence are presented in this section. The
h ighest level of corporate strategy excellence is expected to occur in the PSFP category that is,
Ho: Mdn(PIFP CSX) = Mdn(PAFP CSX) = Mdn(PSFP CSX)
HSb: Mdn(PIFP CSX) < Mdn(PAFP CSX) < Mdn(PSFP CSX).
The results are again nonsignificant (J = 37.0, P = . 500, z = -0.053, r = -.0 1 ), suggesting that the
Ho that the three firm performance category medians are equal, and could not be rejected at p <
.05 . The negative value for z indicates that the medians decrease as firm performance increases.
Thus, HSb cannot be accepted as there is not a statistically significant difference at the p < .05
1 95
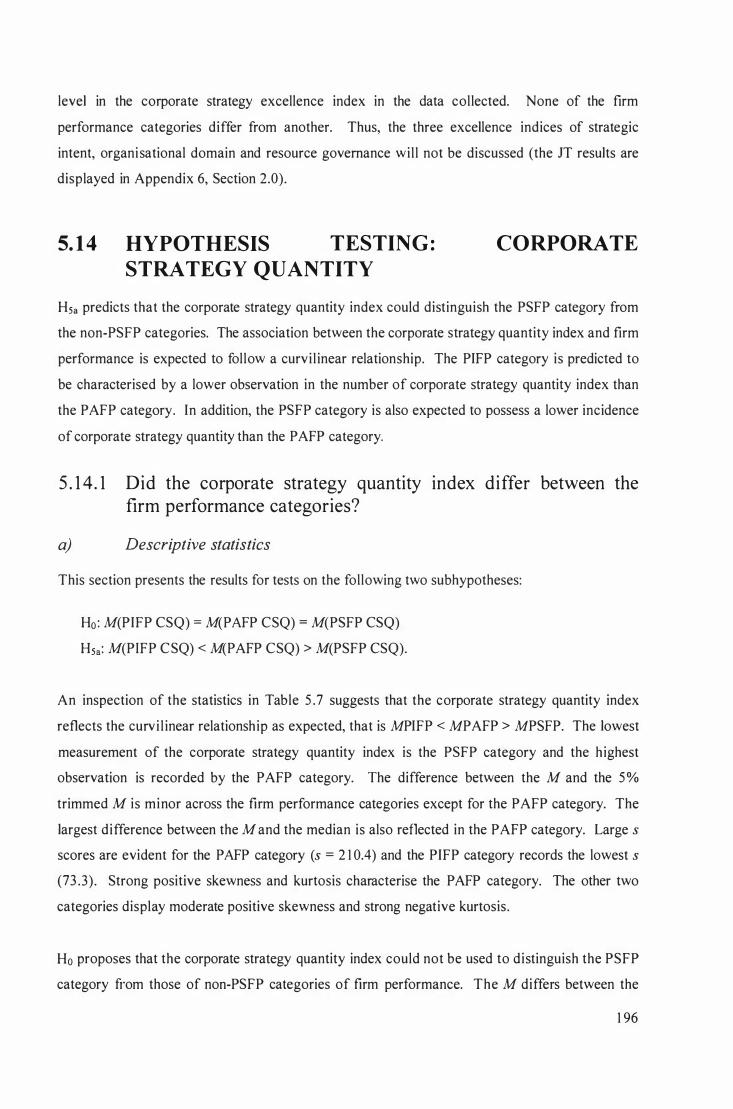
level in the corporate strategy excellence index in the data collected. None of the firm
performance categories differ from another. Thus, the three excellence indices of strategic
intent, organisational domain and resource governance wil l not be discussed (the JT results are
displayed in Appendix 6, Section 2.0).
5. 1 4 HYPOTHESIS TESTING :
STRATEGY QUANTITY
CORPORATE
Hsa predicts that the corporate strategy quantity index could distinguish the PSFP category from
the non-PS FP categories. The association between the corporate strategy quantity index and firm
performance is expected to follow a curvi l inear relationship. The PIFP category is predicted to
be characterised by a lower observation in the number of corporate strategy quantity index than
the PAFP category. In addition, the PS FP category is also expected to possess a lower incidence
of corporate strategy quantity than the P AFP category.
5 . 1 4 . 1 Did the corporate strategy quantity index differ between the firm performance categories?
a) Descriptive statistics
This section presents the results for tests on the following two subhypotheses:
Ho: M(PIFP CSQ) = M(PAFP CSQ) = M(PSFP CSQ)
HSa: M(PIFP CSQ) < M(PAFP CSQ) > M(PSFP CSQ).
An inspection of the statistics in Table 5 .7 suggests that the corporate strategy quantity index
reflects the curv i l inear relationship as expected, that is MPIFP < MPAFP > MPSFP. The lowest
measurement of the corporate strategy quantity index is the PSFP category and the highest
observation is recorded by the PAFP category. The difference between the M and the 5%
trimmed M is minor across the firm performance categories except for the PAFP category. The
largest difference between the M and the median is also reflected in the PAFP category. Large s
scores are evident for the PAFP category (s = 2 1 0.4) and the PIFP category records the lowest s
(73 .3) . Strong positive skewness and kurtosis characterise the PAFP category. The other two
categories display moderate positive skewness and strong negative kurtosis.
Ho proposes that the corporate strategy quantity index could not be used to distinguish the PSFP
category from those of non-PS FP categories of firm performance. The M differs between the
1 96
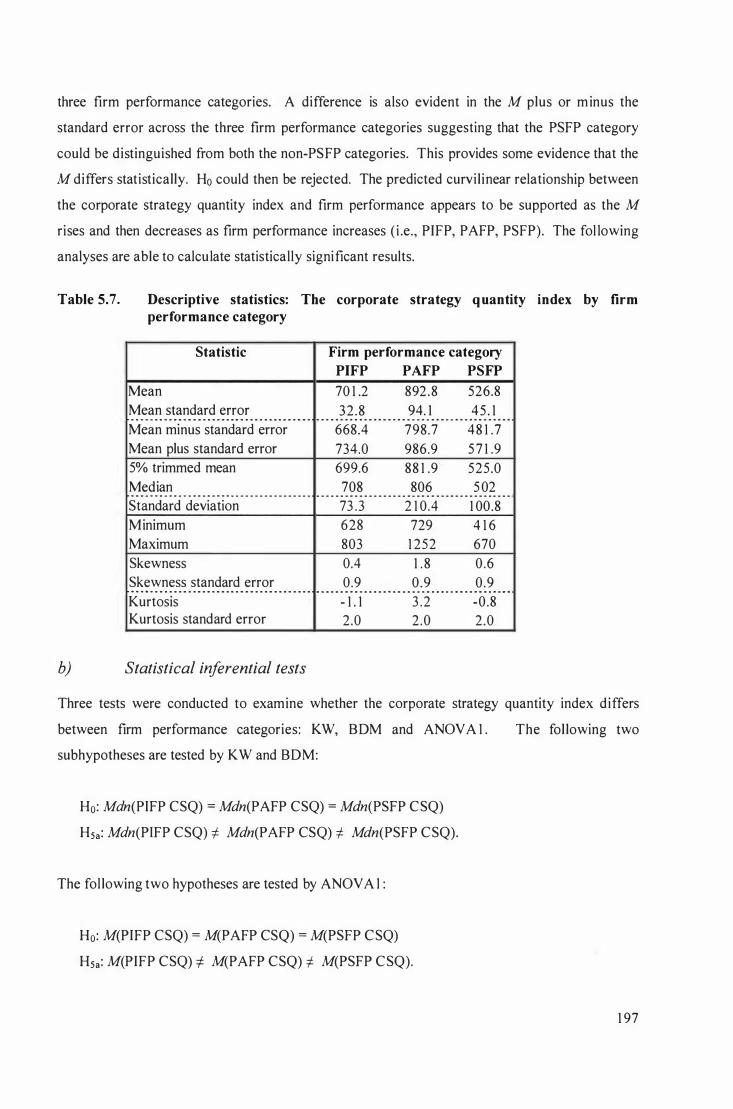
three firm performance categories. A difference is also evident in the M plus or m inus the
standard error across the three firm performance categories suggesting that the PSFP category
could be distinguished from both the non-PS FP categories. This provides some evidence that the
M differs statistically. Ho could then be rejected. The predicted curvi l inear relationship between
the corporate strategy quantity index and firm performance appears to be supported as the M
rises and then decreases as firm performance increases ( i .e., PIFP, PAFP, PSFP). The fol lowing
analyses are able to calculate statistically significant results.
Table 5.7. Descriptive statistics: The corporate strategy q uantity index by firm performance category
Statistic
Mean Mean standard error .. . .. .. - . . .. .. .. .. .. .. .. .. . . . .. .. . .. .. .. . . . .. .. . . . .. .. . .. .. .
Mean minus standard error Mean plus standard error 5% trimmed mean Median .. .. .. - - .. . - . . . .. _ . .. .. _ .. .. .. . . .. _ - - - - - - - - - - - - _ ..
Standard deviation Minimum Maximum Skewness Skewness standard error . .. .. . .. . .. . . . . .. . . .. . .. . .. .. . . . .. .. .. . . . .. . . . .. .. . . .
Kurtosis Kurtosis standard error
b) Statistical inferential tests
Firm performance category
PIFP PAFP PSFP
70 1 .2 892 .8 526.8 32 .8 94. 1 45 . 1
. . . .. . .. .. . .. . .. .. . . .. .. . .. .. .. _ - - _ .. .. .. _ _ .. . .. . . .. .. .. . .. .. .
668.4 798.7 48 1 .7 734.0 986.9 5 7 1 .9 699.6 88 1 .9 525 .0 708 806 5 02
- - - - - - - .. - - - - - - - - - - _ .. _ - .. - .. - - - .. - - - - - - - - - - - -
73 .3 2 1 0.4 1 00.8 628 729 4 1 6 803 1 252 670 0.4 1 . 8 0.6 0.9 0.9 0.9 .. .. - .. .. .. .. . .. _ . .. . .. .. . .. .. .. .. .. .. .. .. . . . .. .. . . .. . . .. .. .. . .. . . - 1 . 1 3 .2 -0.8 2.0 2 .0 2.0
Three tests were conducted to examine whether the corporate strategy quantity index differs
between firm performance categories: KW, BDM and ANOV A 1 .
subhypotheses are tested by KW and BDM:
Ho: Mdn(PIFP CSQ) = Mdn(PAFP CSQ) = Mdn(PSFP CSQ)
HSa: Mdn(PIFP CSQ) -j Mdn(PAFP CSQ) -j Mdn(PSFP CSQ).
The fol lowing two hypotheses are tested by ANOV A I :
Ho: M(PIFP CSQ) = M(PAFP CSQ) = M(PSFP CSQ)
HSa: M(PIFP CSQ) -j M(PAFP CSQ) -t M(PSFP CSQ).
The fol lowing two
1 97
The KW test found that the corporate strategy quantity index is statistical ly significant at the p <
.05 level (H(2) = 1 0 . 1 4, p = .00 1 ); refer to Appendix 6, Section 3 . 1 . The results suggest that one
of the firm performance categories differs from either one of, or both of, the other categories .
Thus, Ho could be rejected in favour of H5a at the p < .05 level . The effect size (112 = .72) is
strong, indicating a large association between the corporate strategy quantity index and related
firm performance category. Statistically significant BDM results at the p < .05 level are also
obtained for the corporate strategy quantity index (F = 1 5 .762, p = .0002).
ANOVA 1 also reveals a statistically significant result (Welch ' s F(2,6.23) = 1 0 .82, P = .009, ill =
.74). The corporate strategy quantity index displays a significant quadratic trend (F( 1 , 1 2) =
1 3 .00, p = .004, ill = . 84) signifying that, as firm performance increases, the corporate strategy
quantity index increases and then decl ines; in other words, its incidence fol lows the expected
curv i l inear pattern. Therefore, the KW, BDM and ANOVA 1 results support H5a. There is a
statistically significant (p < .05) difference in the corporate strategy quantity index as measured
by thi s research whereby at least one of the firm performance categories differs from another.
5 . 1 4.2 Could the corporate strategy quantity index be used to
distinguish the P SFP category from the non-PSFP categories?
The corporate strategy quantity index se test results indicate that a difference in ranked means is
evident between the PAFP - PS FP categories (refer to Appendix 6, Section 3 .2) . Thus, the
difference between the firm performance categories is due to, at least in part, the differences
between the PAFP and PS FP categories. Therefore, H5a is partially supported as the corporate
strategy quantity index could be used to distinguish the PSFP category from the PAFP category.
However, as evident from results presented in Appendix 6, Section 3 .3 , M W found two
statistically significant (p < .0 1 67) results (PIFP - PSFP U = 2.000, P = .0 1 6 one-tai led, r = -.79;
and PAFP - PSFP U = 0.000, p = .004 one-tai led, r = - .83). Thus, the corporate strategy quanti ty
index could be used to distinguish the PSFP category from both the PAFP and PIFP categories.
In addition, both these combinations have strong effects. The planned contrasts also indicate that
the PSFP category significantly differs from both the PIFP and PAFP categories (1(7 .3 1 ) = 3 . 1 3,
p = .008 (one-tailed), r = .76; t(5 . 74) = 3 .5 1 , P = .007 (one-tai led), r = .83 respectively).
However, the PIFP category does not differ from the PAFP category. Again, the three post-hoc
pairwise comparison tests accounting for violation of the assumption of homogeneous variance
reveal that the PSFP category differs significantly from both the PAFP category (mean
difference = 366.0, p ranges from .03 1 to .040) and the PIFP category (mean difference = 1 74 .7,
1 98
p ranges from .037 to .046). Therefore, Hsa is supported as the corporate strategy quantity index
could be used to distinguish the PSFP category from both the non-PSFP categories at the p < .05
level . To uncover if any of the quantity indices could account for thi s distinction between the
PSFP category and both the non-PS FP categories, further analysis was conducted to test four
subhypotheses, namely, H l a, H2a, H3a, and H4a.
5. 1 5 HYPOTHESIS TESTING: QUANTITY INDICES
H1a, H2a, H3a, and H4a predict that the quantity indices could also distinguish the PSFP category
from the non-PSFP categories . The association between quantity indices and firm performance
also fol lows a curvi l inear relationship. The PAFP category is hypothesised to possess a lower
incidence than the PIFP and PSFP categories.
5 . 1 5 . 1 Did the quantity indices differ between the firm performance categories?
a) Descriptive statistics
This section presents the descriptive statistics results for the following two subhypotheses:
Ho: M(PIFP x) = M(PAFP x) = M(PSFP x)
Hxa: M(PIFP x) < M(PAFP x) > M(PSFP x).
An inspection of the statistics in Table 5 .8 suggests that the M for the strategic intent quantity
index did not conform to expectations as the M decreases and then rises as firm performance
increases. The M of the PSFP category is distorted by an outlier (reflected in the larger skewness
and kurtosis). However, the remaining quantity indices reflect the curvi l inear relationship as
expected, that is, MPI FP < MPAFP > MPSFP. The lowest measurement of the quantity indices
is the PSFP category and the highest observation is recorded by the P AFP category (except for
the strategic intent quantity index). The difference between the M and the 5% trimmed M is
minor across the quantity indices. Large differences between the M and the median are evident
in the fol lowing quantity indices: Organisational domain, internal governance and, lastly,
resource governance. Large standard deviation scores are evident across the various quantity
indices especial ly for the PAFP category (except the strategic intent quantity index). The PSFP
category records an especially h igh standard deviation for the strategic intent quantity index.
Strong skewness and kurtosis characterises the strategic intent quantity index for the PAFP and
1 99
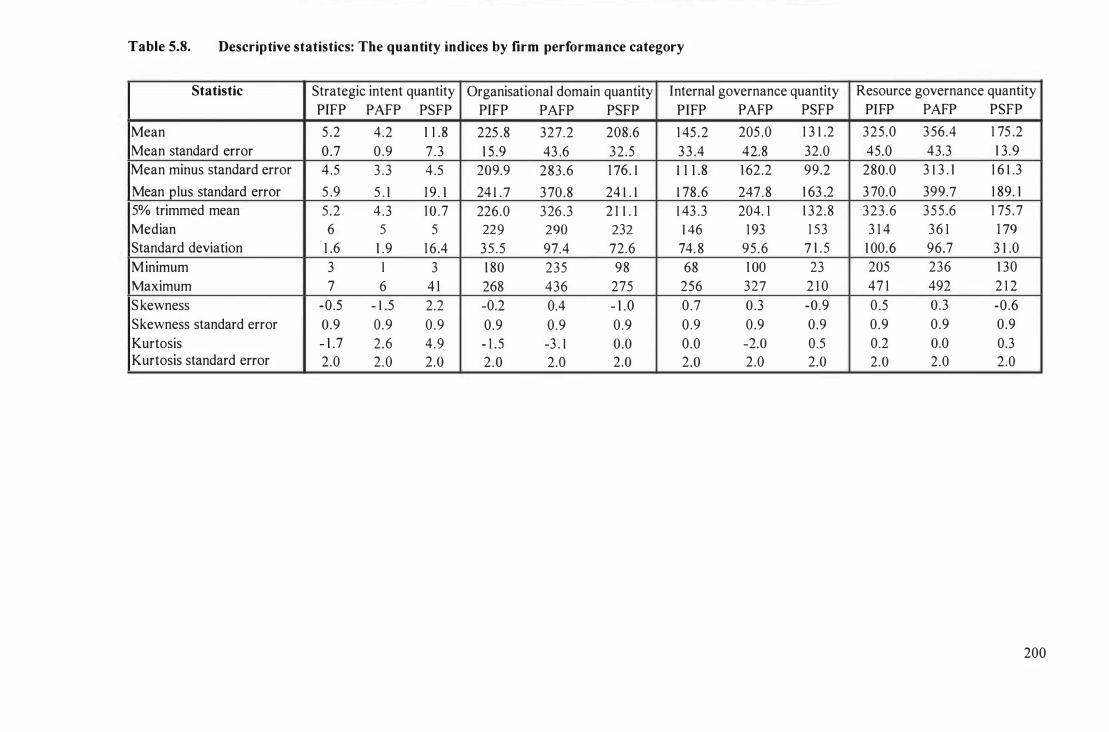
Table 5.8. Descriptive statistics: The quantity indices by firm performance category
Statistic Strategic intent quantity Organisational domain quantity Internal governance quantity Resource governance quantity PIFP PAFP PSFP PIFP PAFP PSFP PIFP PAFP PSFP PI FP PAFP PSFP
Mean 5 .2 4.2 1 1 . 8 225 .8 327.2 208.6 1 45 .2 205 .0 1 3 1 .2 325 .0 3 56.4 1 75 .2 Mean standard error 0 .7 0 .9 7 .3 1 5 .9 43 .6 32.5 3 3 .4 42.8 32.0 45.0 43.3 1 3 .9 Mean minus standard error 4.5 3 . 3 4 .5 209.9 283 .6 1 76. 1 1 1 1 .8 1 62.2 99.2 280.0 3 1 3 . 1 1 6 1 .3
Mean plus standard error 5 .9 5 . 1 1 9 . 1 24 1 . 7 370.8 24 1 . 1 1 78 .6 247.8 1 63 .2 3 70.0 399.7 1 89. 1 5% trimmed mean 5 .2 4 .3 1 0 .7 226.0 326 .3 2 1 1 . 1 1 43 .3 204. 1 1 32 .8 323 .6 355 .6 1 75 .7 Median 6 5 5 229 290 232 1 46 1 93 1 53 3 1 4 36 1 1 79 Standard deviation 1 .6 1 .9 1 6 .4 35 .5 97.4 72.6 74. 8 95 .6 7 1 . 5 1 00.6 96.7 3 1 .0 Minimum 3 I 3 1 80 235 98 68 1 00 23 205 236 1 30 Maximum 7 6 4 1 268 436 275 256 327 2 1 0 47 1 492 2 1 2 Skewness -0.5 - 1 .5 2.2 -0.2 0.4 - 1 .0 0 .7 0 .3 -0 .9 0.5 0.3 -0.6 Skewness standard error 0.9 0.9 0.9 0.9 0.9 0 .9 0.9 0.9 0.9 0.9 0.9 0.9 Kurtosis - 1 .7 2 .6 4.9 - 1 .5 -3 . 1 0.0 0.0 -2.0 0.5 0.2 0.0 0.3 Kurtosis standard error 2.0 2.0 2.0 2.0 2.0 2.0 2.0 2.0 2.0 2.0 2.0 2.0
200
PS FP categories (the PIFP category displayed strong negative kurtosis). The PAFP category
records strong kurtosis for the fol lowing quantity indices: strategic intent, organisational domain,
internal governance (also refer to Appendix 6, Section 4 . 1 for the box plots of the three firm
performance categories).
Ho proposes that the quantity indices could not be used to distinguish the PSFP category from the
non-PSFP categories. The M differs between the three firm performance categories across the
four quantity indices. The lack of a difference between the M plus or minus the standard error
across the firm performance categories for the strategic intent and internal governance quantity
indices suggests that the three firm performance categories could not be distinguished from the
other firm performance categories. For the organisational domain quantity index, the PAFP
category could be distinguished from the other two firm performance categories. The PSFP
category could be distinguished from both the non-PSFP categories in terms of the resource
governance quantity index. These results provide some evidence that the M differs statistically
in terms of the organisational domain and resource governance quantity indices. Ho could then
be rejected. The prediction of a curvi l inear relationship between the quantity indices and firm
performance may be supported as the M rises and then decreases as firm performance increases
(i .e., PIFP, PAFP, PSFP) except for the strategic intent quantity index. This prediction is not
supported here as the relationship between it and firm performance represents a "U-shaped"
association. The following analyses were able to calculate statistically significant results.
b) Statistical inferential tests
Three tests were conducted to examine whether the quantity indices d iffer between firm
performance categories: KW, BDM and ANOVA 1 . The fol lowing two hypotheses are tested by
KW and BDM:
Ho: Mdn(PIFP x) = Mdn(PAFP x) = Mdn(PSFP x)
Hxa: Mdn(PIFP x) i- Mdn(PAFP x) i- Mdn(PSFP x).
The fol lowing two hypotheses are tested by ANOV A I :
Ho: M(PIFP x) = M(PAFP x) = M(PSFP x) Hxa: M(PIFP x) i- M(PAFP x) i- M(PSFP x) .
20 1
The KW tests yielded one statistical ly significant difference for the quantity indices across the
three firm performance categories (refer to Appendix 6, Section 4.2), that is, the resource
governance quantity index (H(2) = 8 . 82, p = .005). The high values for the resource governance
quantity index also suggest that the ranks are not distributed evenly between the three firm
performance categories. Thus, Ho could be rejected in favour of �a at the p < .05 level as one of
the firm performance categories differs from either one of, or both of, the other categories. The
Monte Carlo estimate of significance for the resource governance quantity index is .006. The
confidence interval for significance ranges from .004 to .007 and did not exceed .05, indicating
that the significant effects are genuine (Field, 2005) and not the result of the other factors. The
effect size (1l2 = .63) is strong, ind icating a large association between the resource governance
quantity index and firm performance category. Supporting the KW results, a statistically
significant result (p < .05) for the resource governance index is also obtained from the BDM test
(F = 1 0 .2 1 6, p = .002) . Refer to Appendix 6, Section 4.3 for the rest of the quantity index
results.
ANOV A 1 also identifies a statistically sign ificant result for the resource governance quantity
index (Welch 's F(2,6.23) = 1 0 .82, P = .009, CD = .74); refer to Appendix 6, Section 4.4. The
resource governance quantity index displays a significant quadratic trend (F( l , 1 2) = 5 .53 , p =
.037, CD = .69) signifying that as firm performance increases, the resource governance quantity
index increases and then decl ines, that is, a curvil inear association. A significant l inear trend
(F( l , 1 2) = 8 .24, p = .0 1 4, CD = .77) is also evident. Therefore, the KW, BDM and ANOVAl
results support H4a, that is, that at least one of the firm performance categories differs from
another in terms of the resource governance quantity index at the p < .05 level.
5 . l 5 . 2 Could the resource governance quantity index be used to distinguish the P SFP category from the non-PSFP categories?
Three types of analysis were employed to determine how the quantity indices differ between the
three firm performance categories: MW, se, and post-hoc ANOV A I tests. The se results
indicate that the resource governance quantity index provides a difference in ranked means,
evident between PAFP - PSFP (refer to Appendix 6, Section 4.5), although the difference
between PIFP - PS FP is close to the critical difference. Therefore, the difference between the
firm performance categories is due to the difference between the PAFP and PSFP categories.
Again, the three post-hoc pairwise comparison tests accounting for violation of the assumption of
homogeneous variance reveal that the PSFP category differs significantly from the PAFP
category (mean difference = 1 8 1 .2, P ranges from .025 to .033) . Therefore, H4a is partially
202
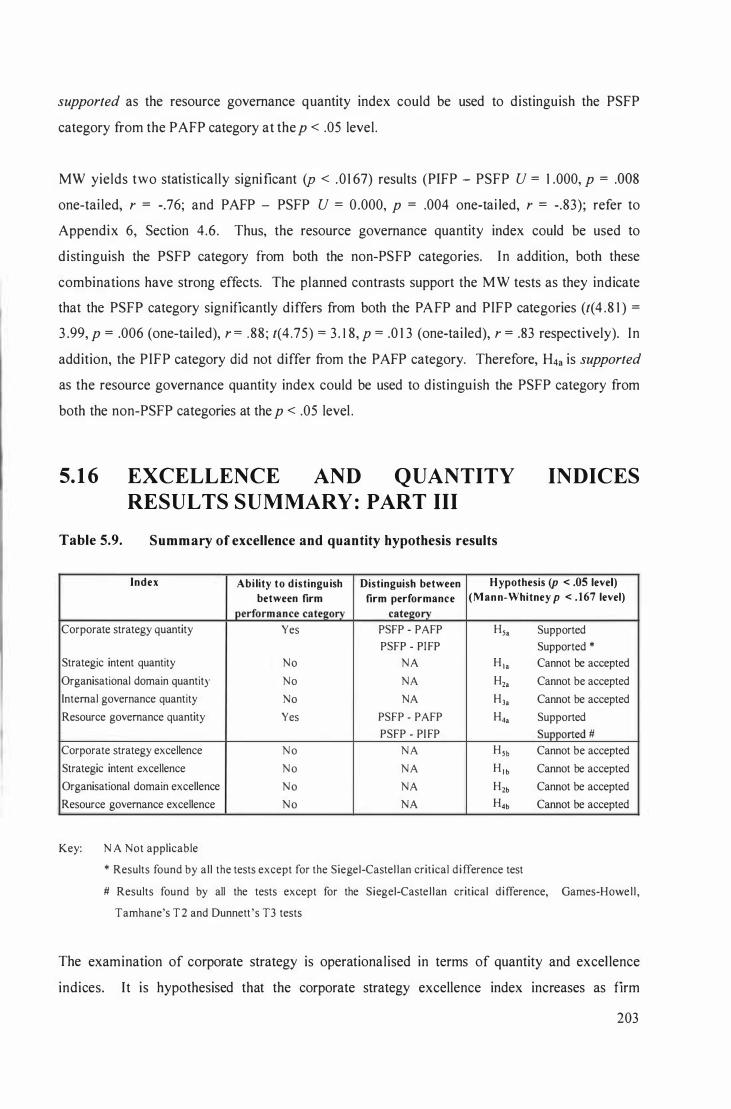
supported as the resource governance quantity index could be used to distinguish the PSFP
category from the PAFP category at the p < .05 level.
MW yields two statistically significant (p < .0 1 67) results (PIFP - PSFP U = 1 .000, p = .OOS
one-tai led, r = -.76; and PAFP - PSFP U = 0 .000, p = .004 one-tai led, r = - .S3); refer to
Appendix 6, Section 4.6. Thus, the resource governance quantity index could be used to
distinguish the PSFP category from both the non-PS FP categories. In addition, both these
combinations have strong effects. The planned contrasts support the M W tests as they indicate
that the PSFP category significantly differs from both the PAFP and PIFP categories (t(4 .S 1 ) =
3 .99, p = .006 (one-tai led), r = .SS; t(4 .75) = 3 . I S, p = .0 1 3 (one-tai led), r = .83 respectively). In
addition, the PIFP category did not differ from the PAFP category. Therefore, H4a is supported
as the resource governance quantity index could be used to distinguish the PSFP category from
both the non-PSFP categories at the p < .05 level .
5. 1 6 EXCELLENCE AND QUANTITY INDICES
RESULTS SUMMARY : PART III
Table 5.9. Summary of excellence and quantity hypothesis results
Index Ability to d istingu ish Distinguish between Hypothesis (p < .05 level) between firm firm performance (Man n-Whitney p < . 167 level)
performance category category Corporate strategy quantity Yes PSFP - PAFP Hsa Supported
PSFP - PI FP Supported *
Strategic intent quantity No N A H la Cannot be accepted
Organisational domain quantity No NA H2a Cannot be accepted
Internal governance quantity No NA H3a Cannot be accepted
Resource governance quantity Yes PS FP - PAFP H4a Supported
PSFP - PI FP Supported # Corporate strategy excellence N o N A HSb Cannot be accepted
Strategic intent excellence N o N A H l b Cannot be accepted
Organisational domain excellence N o NA H2b Cannot be accepted
Resource governance excellence N o NA H4b Cannot be accepted
Key: N A Not applicable
* Results found by al l the tests except for the Siegel-Castel lan critical d i fference test
# Results found by all the tests except for the Siegel-Caste l lan critical difference, Games-Howe l l ,
Tamhane's T 2 and Dunnett's T3 tests
The examination of corporate strategy is operationalised in terms of quantity and excel lence
indices. It is hypothesised that the corporate strategy excellence index increases as firm
203
performance increases. However, the corporate strategy excellence index is not found to
distinguish between the categories. The results from this dataset did not support this proposition
at the p < .05 level ( i .e . , the subhypotheses H I b, H2b, �b, and H5b); refer to Table 5 .9.
By contrast, the KW, BDM and ANOV A 1 results found that the corporate strategy quantity
index is statistically significant at the p < .05 level indicating that one of the firm performance
categories differs from at least one of the other firm performance categories. Ho could then be
rejected in favour of H5a• at p < .05 . The Monte Carlo confidence interval for significance also
indicates that the significant effect is genuine. The effect sizes are strong, suggesting a large
association between the corporate strategy quantity index and firm performance category. A
series of post-hoc tests for KW and ANOV A 1 were conducted with the aim of identifying if the
PSFP category could be distinguished from the non-PSFP categories. The M W tests and the four
post-hoc ANOV A 1 tests suggest that the PSFP category can be distinguished from both the non
PSFP categories. Therefore, further analysis was conducted to determine if any of the quantity
indices could be the source of the difference between the firm performance categories.
The KW, BDM and ANOVA I results produced a statistical ly significant result for the resource
governance quantity index indicating that one of the firm performance categories differs from at
least one of the other categories. The MW tests and the planned contrasts test found statistical ly
significant results suggesting that the PSFP category could be distinguished from both the PIFP
and P AFP firm performance categories. As the parametric tests are more powerful and account
for the possible violation of the homogeneity of variance assumption, they provide the basis of
discussion in the following Chapter. In conclusion, the resource governance quantity index is
found to be the source of corporate strategy heterogeneity and could distinguish between the
PSFP category and both of the other two firm performance categories.
5. 1 7 C HAPTER SUMMARY
Three different results were presented in th is chapter, namely, the prel iminary results; hypothesis
testing for the corporate strategy index and the four corporate strategy attribute indices; and,
lastly, hypothesis testing for the excel lence and quantity indices. The results found that the rate
of resource governance decision making could be used to distinguish the persistent superior firm
performance category from the other two firm performance categories.
204
6.0 DISCUS SION
6. 1 INTRODUCTION
This research focused on the impacts corporate strategy and its attributes have on persistent firm
performance. The primary objective of this research was to determine if there are elements of
corporate strategy that may be used to distinguish the PSFP category from the other two
categories of firm performance. The statistically significant association between the rate of
resource governance decisions and persistent firm performance suggests that the current
predominant theory in strategic management, namely, RBT should be modified to accommodate
the heterogeneity identified. This research extends RBT as it ties the corporate level decision
making ski l l involving resource governance into a valuable, rare, inimitable, nonsubstitutable
resource that firms possess, develop and then deploy. The corporate level decision making skil l
theory presented here i s based on the decision making l iterature which has not, to date, been
significantly incorporated into RBT.
This Chapter provides a discussion of the results presented in the proceeding Chapter and the
l iterature reviewed in Chapters Two and Three. The identifiable pattern evident within the
dataset are identified and discussed. This is followed by a discussion of whether the results
correspond to the conceptual framework presented in Chapter Three. Thereafter, the theoretical
implications of the apparent importance of the incidence of resource governance decisions on
persistent firm performance are examined relative to the endogenous perspectives of firm
performance, namely, core competency theory, and corporate level ski l l in decision making.
Empirical, conceptual and operational impl ications for strategic intent, organisational domain,
internal governance, resource governance and corporate strategy are presented. The impl ications
for the field of strategic management are then discussed. Lastly, implications for practitioners
are presented.
6.2 IDENTIFIABLE PATTERNS IN THE DATASET
Two conclusions may be drawn from the results outl ined in Chapter Five; namely, that the firm
performance categories were heterogeneous in terms of corporate strategy and, secondly, the
distinction between the PSFP category and the lesser categories of firm performance can be, at
least, attributed to the rate of resource governance decisions (refer to Table 6. 1 ) . The profile of
results are equivalent, providing confidence in the findings, that is, the same curvi l inear trend
205
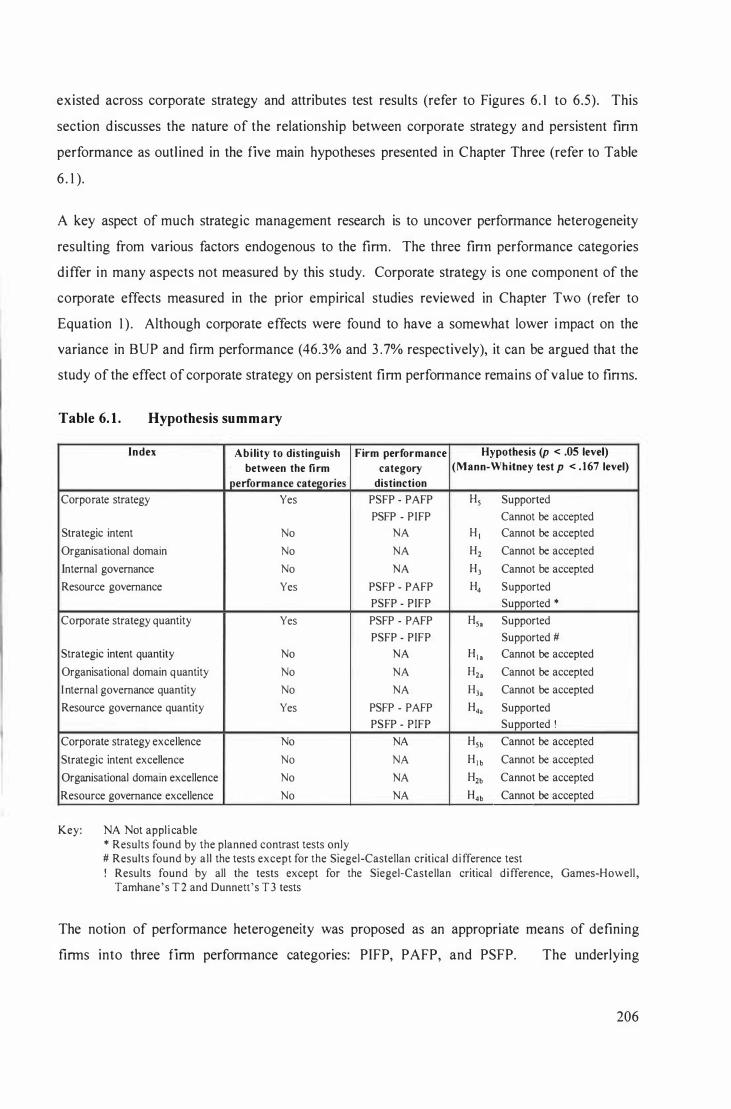
existed across corporate strategy and attributes test results (refer to Figures 6. 1 to 6.5). This
section discusses the nature of the relationship between corporate strategy and persistent finn
performance as outl ined in the five main hypotheses presented in Chapter Three (refer to Table
6 . 1 ) .
A key aspect of much strategic management research is to uncover perfonnance heterogeneity
resulting from various factors endogenous to the finn. The three finn performance categories
differ in many aspects not measured by this study. Corporate strategy is one component of the
corporate effects measured in the prior empirical studies reviewed in Chapter Two (refer to
Equation 1 ) . Although corporate effects were found to have a somewhat lower i mpact on the
variance in BUP and firm performance (46.3% and 3 .7% respectively), it can be argued that the
study of the effect of corporate strategy on persistent finn perfonnance remains of value to finns.
Table 6. 1 . Hypothesis summary
Index Ability to distinguish Firm performance Hypothesis (p < .05 level) between the fi rm category (Mann-Wh itney test p < . 167 level)
performance categories distinction
Corporate strategy Yes PSFP - PAFP H5 Supported
PSFP - PIFP Cannot be accepted
Strategic intent No NA H I Cannot be accepted
Organisational domain No NA H2 Cannot be accepted
Internal governance No NA H3 Cannot be accepted
Resource governance Yes PSFP - PAFP H4 Supported
PSFP - PIFP Supported •
Corporate strategy quantity Yes PSFP - PAFP H5a Supported
PSFP - PIFP Supported # Strategic intent quantity No NA Hla Cannot be accepted
Organisational domain quantity No NA H2a Cannot be accepted
I nternal governance quantity No NA H3a Cannot be accepted
Resource governance quantity Yes PSFP - PAFP H4• Supported
PS FP - PIFP Supported !
Corporate strategy excellence No NA H5b Cannot be accepted
Strategic intent excellence No NA H l b Cannot be accepted
Organisational domain excellence No NA H2b Cannot be accepted
Resource governance excellence No NA H4b Cannot be accepted
Key: NA Not appl i cable • Results found by the planned contrast tests only # Results found by all the tests except for the Siegel-Castellan critical d i fference test ! Results found by all the tests except for the Siegel-Castellan critical d i fference, Games-Howell ,
Tamhane ' s T 2 and Dunnetl's T 3 tests
The notion of performance heterogeneity was proposed as an appropriate means of defining
finns into three finn perfonnance categories: PIFP, PAFP, and PSFP. The underlying
206
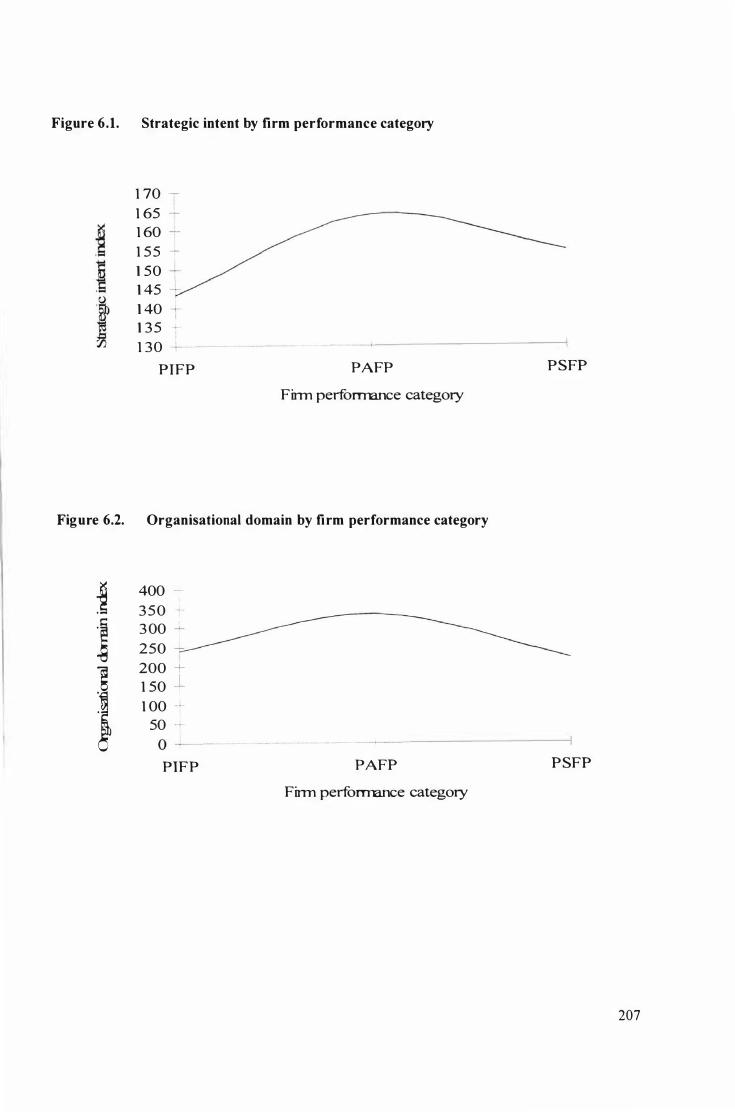
Figure 6.1. Strategic intent by firm performance category
1 70 --1 65 -1 60 � 1 5 5 -1 50 1 45 1 40 T 1 3 5 -I-1 30 ---
PIFP PAFP
Firm perforrnmce category
Figure 6.2. Organisational domain by firm performance category
j 400 -, 3 5 0 -t
J 3 00 -L
250 -
J 200 -+-
1 50 + 1 00 -"-
50 -0 ---
PI FP PAFP
Firm perforrnmce category
PSFP
PSFP
207
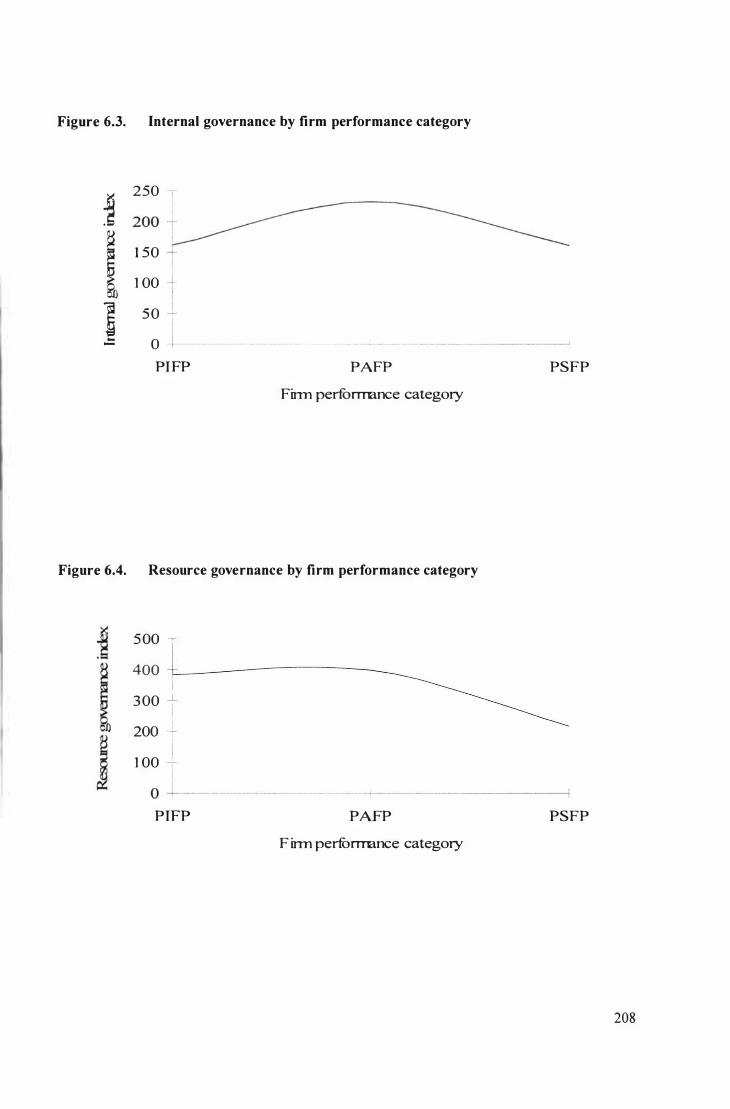
Figure 6.3. Internal governance by firm performance category
250 T � 200 -,-� 1 50 + � 1 00 -1 50 -1 o _, - - - ----------1
PI FP PAFP
Firm perfonTW1Ce category
Figure 6.4. Resource governance by firm performance category
500 � 400 -L------------------
300 + 200 --
I 1 00 --0 -+:--PIFP PAFP
F irm perfonTW1Ce category
PSFP
PSFP
208
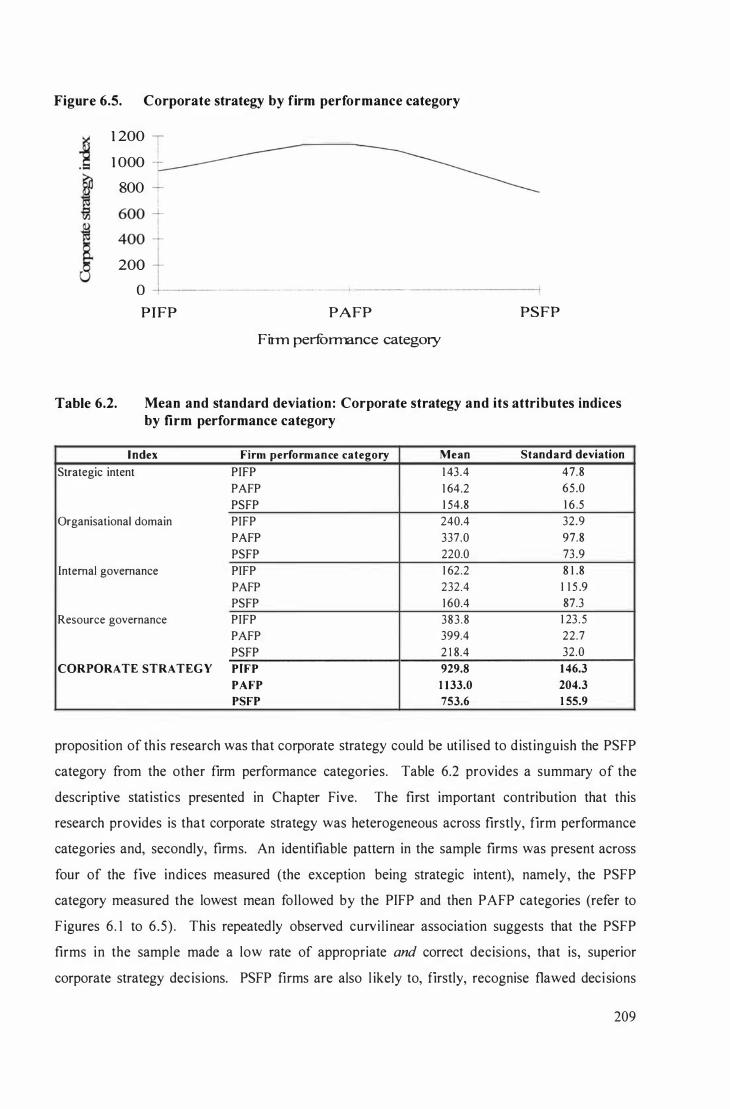
Figure 6.5. Corporate strategy by firm performance category
1 200 1 000
800 -r I
:�� ll 20� __ _ -- - --- ----------,
PIFP PAFP PSFP
Finn perfonnmce category
Table 6.2. Mean and standard deviation: Corporate strategy and its attributes indices by firm performance category
I ndex Firm performance category Mean Standard deviation
Strategic intent PIFP 1 43.4 47.8 PAFP 1 64.2 65.0 PSFP 1 54.8 1 6 .5
Organisational domain PIFP 240.4 32.9 PAFP 337.0 97.8 PSFP 220.0 73 .9
Internal governance PIFP 1 62.2 8 1 .8 PAFP 232.4 1 1 5 .9 PSFP 1 60.4 87.3
Resource governance PIFP 383 .8 1 23 . 5 PAFP 399.4 22.7 PSFP 2 1 8.4 32.0
CORPORATE STRATEG Y PIFP 929.8 1 46.3
PAFP 1 133.0 204.3
PSFP 753.6 1 55.9
proposition of this research was that corporate strategy could be util ised to distinguish the PSFP
category from the other firm performance categories. Table 6.2 provides a summary of the
descriptive statistics presented in Chapter Five. The first important contribution that this
research provides is that corporate strategy was heterogeneous across firstly, firm performance
categories and, secondly, firms. An identifiable pattern in the sample firms was present across
four of the five indices measured (the exception being strategic intent), namely, the PSFP
category measured the lowest mean followed by the PIFP and then PAFP categories (refer to
F igures 6. 1 to 6.5) . This repeatedly observed curvi l inear association suggests that the PSFP
firms in the sample made a low rate of appropriate and correct decisions, that is, superior
corporate strategy decis ions. PSFP firms are also l ikely to, firstly, recognise flawed decisions
209
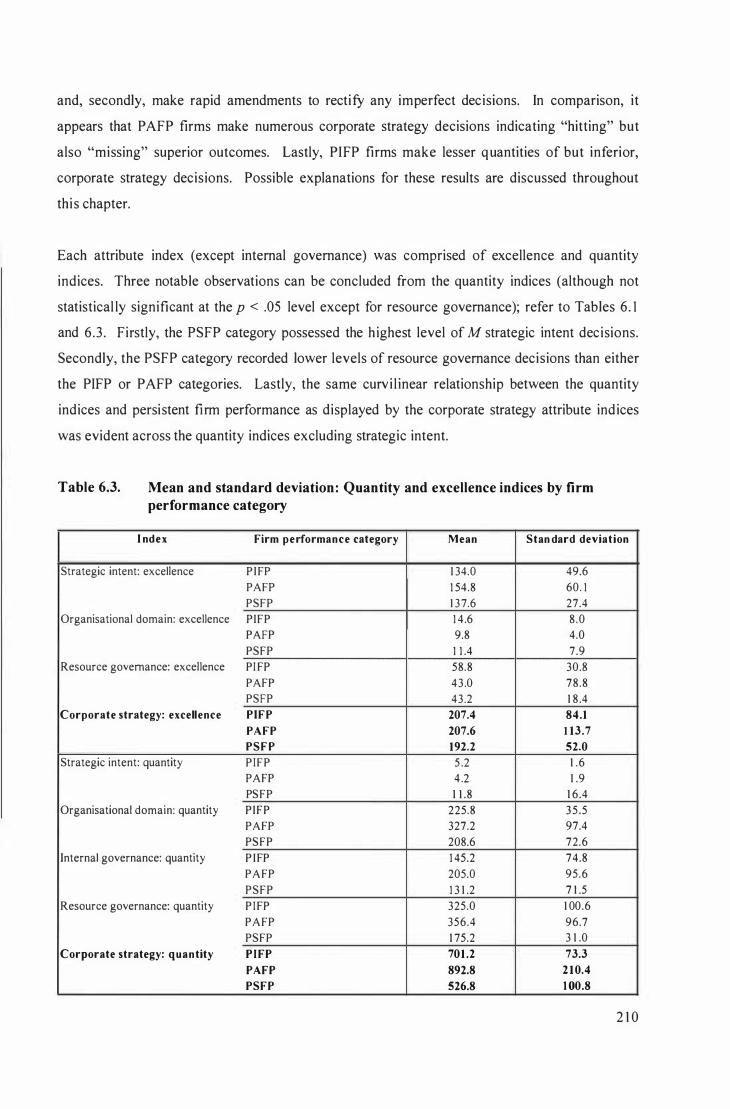
and, secondly, make rapid amendments to rectify any imperfect decisions. In comparison, it
appears that P AFP firms make numerous corporate strategy decisions indicating "hitting" but
also "missing" superior outcomes. Lastly, PI FP firms make lesser quantities of but inferior,
corporate strategy decisions. Possible explanations for these results are discussed throughout
thi s chapter.
Each attribute index (except internal governance) was comprised of excellence and quantity
indices. Three notable observations can be concluded from the quantity indices (although not
statistical ly significant at the p < .05 level except for resource governance); refer to Tables 6. 1
and 6.3 . Firstly, the PSFP category possessed the highest level of M strategic intent decisions.
Secondly, the PSFP category recorded lower levels of resource governance decisions than either
the PIFP or PAFP categories. Lastly, the same curvi l inear relationship between the quantity
indices and persistent firm performance as displayed by the corporate strategy attribute indices
was evident across the quantity indices excluding strategic intent.
Table 6.3. Mean and standard deviation : Quantity and excellence indices by firm performance category
I ndex Firm performance category Mean Stan dard deviation
Strategic intent: excellence P I FP 1 34.0 49.6
PAFP 1 54.8 60. 1
PSFP 1 3 7.6 27.4
Organisational domain: excellence PIFP 1 4 .6 8 . 0
PAFP 9.8 4.0
PSFP 1 1 .4 7.9
Resource governance: excellence PI FP 58.8 30.8
PAFP 4 3 .0 7 8 . 8
PSFP 43.2 1 8 .4
Corporate strategy: excellence PIFP 207.4 84.1
PAFP 207.6 1 13.7
PSFP 192.2 52.0
Strategic intent: quantity P I F P 5 .2 1 .6
PAFP 4 .2 1 .9
PS FP 1 1 .8 1 6.4
Organisational domain: quantity P I F P 225.8 3 5 .5
PAFP 327.2 97.4
PS FP 208.6 72.6
Internal governance: quantity P I FP 1 45.2 74.8
PAFP 205.0 95.6
PSFP 1 3 1 .2 7 1 .5
Resource governance: quantity P I FP 325.0 1 00.6
PAFP 356.4 96.7
PSFP 1 75.2 3 1 .0
Corporate strategy: quantity P I FP 701 .2 73.3
PAFP 892.8 2 1 0.4
PSFP 526.8 1 00.8
2 1 0
S urprisingly, the excellence indices were relatively homogeneous across the three firm
performance categories for this dataset and the expected l inear relationship between each
excellence index and firm performance was not evident (refer to Tables 6. 1 and 6 .3) . For this
dataset, the PSFP category could not be distingu ished from the other two firm categories of
performance. This lack of distinction may be due to the difficulties inherent in measuring
complex internally located variables from secondary data and if so, rendering further discussion
of l ittle value.
I n summary, six valuable findings were observed in th is dataset. Firstly, all four corporate
strategy attributes (also both excellence and quantity indices) as calculated by this research were
measured, in varying degrees, across all 1 5 firms. Secondly, heterogeneity in three of the four
attributes (the exception was for the PIFP and PSFP categories in regards to internal governance)
and the four quantity indices existed across the three firm performance categories. Thirdly, the
PAFP category recorded the highest incidence of all the four attributes and the corporate strategy
index. Fourthly, the same curvi l inear association with persistent firm performance was found to
exist across the four attribute indices. F ifthly, the PSFP category could be distinguished
statistically (at the p < .05 level) from both the other firm performance categories on the basis of
the rate of resource governance decisions. Lastly, the rate of resource governance decision
heterogeneity was not due to the difference between the PAFP and PIFP categories.
6.2 . 1 Factors to consider when interpreting the statistically
nonsignificant results
Speculating on why the attributes of strategic intent, organisational domain and internal
governance were not statistically significant at the p < .05 level and resource governance was
significant (refer to Table 6. 1 ) is difficult without conducting a further in-depth investigation of
each sample firm . There are several reasons to interpret the statistical ly nonsignificant results
with caution. Firstly, the minor violation of the homogeneity of variance assumption for the
indices may have reduced the power of KW to find an effect if one existed (i .e., Type 11 error).
A violation of the assumption of l inear relationships for discriminant analysis may also have
reduced the power of the test rather than increasing Type I error (Tabachnick & F idell, 200 1 ).
One issue possibly involves the inabil ity of the research methodology employed to
comprehensively measure the entire construct of corporate strategy. As the frequency of
organisational domain and resource governance decision observations was similar, it was
expected that organisational domain should have been as measurable as resource governance
2 1 1
(represented by 28.3% and 35 .6% of corporate strategy observations respectively, refer to Table
4. 1 0) . However, the lower measurements recorded by both strategic intent and internal
governance (represented by 16 .4% and 1 9 .7% of corporate strategy measurements respectively,
refer to Table 4. 1 0) may provide an explanation into why these results were nonsignificant at the
p < .05 level.
The nonsignificant findings may be due to the difficulty in accurately assessing any of the e ight
excel lence based variables (especially relevant to strategic intent which possessed five of the
eight variables) inherent in the methodology used in this research. For instance, as evident with
organisational domain, the measurement of synergy was difficult due to its nature ( i .e., lack of
transparency and complexity). The same issue, to a lesser extent, would have arisen from
employing a questionnaire methodology. Accurate measurements of these variables may have
been observed had access been gained to both long-term and al l-levels of decision making in the
firm. A conclusion of a lack of a strategic intent, organisational domain or internal governance
effect on persistent firm performance due to the nonsignificant results cannot be made as
alternative explanations for these findings may exist.
6.3 DISTINCTION BETWEEN THE PSFP VERSUS
THE NON-PSFP FIRM PERFORMANCE
CATEGORIES : THEORETICAL EXPLANATIONS
The rate of resource governance decisions was found to be the source of firm performance
heterogeneity at the p < .05 level and could be used to distinguish the PS FP category from both
the PAFP and PIFP categories (refer to Table 6 . 1 ) . This section outlines four alternative
explanations that may account for this finding. Four alternative theories could be formulated to
explain, firstly, why the PSFP category was characterised by a lower incidence of resource
governance decisions than the PAFP category and, secondly, the frequency of resource
governance decisions observed in both the PIFP and PS FP categories were similar and, yet,
performance d iffers. The four alternative explanations presented are: chance, spuriousness, core
competency theory, and, lastly, corporate level skil l in resource governance decision making
(spuriousness was introduced in Chapter Three and the last two alternatives were introduced in
Chapter Two) .
Both the core competency and corporate level decision making ski l l theories contribute to RBT
as they involve the resources a firm possesses. The significant association between the
2 1 2
frequency of resource governance decisions and persistent firm performance suggested the
theory should be modified to accommodate the heterogeneity found. This research extends and
contributes to the current RBT knowledge as it specifical ly ties the corporate level decision
making ski l l involved in the rate of resource governance decisions into a valuable, rare,
inimitable, nonsubstitutable resource firms can possess, develop and deploy.
6.3 . 1 Alternative explanation 1 : 'Chance
The abil ity of th is dataset to distinguish the PS FP category in terms of the rate of resource
governance dec isions may be due to chance. Denrell (2004, p. 923) suggested that "chance
events can result in sustained interfirm profitabi l ity differences." It should be acknowledged that
the results found may be due to chance as the sample size was smal l . However, the effects of
chance should be l imited as measurements of the impact of corporate strategy and its attributes
on persistent firm performance were determined from data drawn over a 25-year period. In
addition to the subjective analysis of the descriptive statistics and the box plots, a series of
inferential statistical techniques were employed that incorporated the possible rejection of five
hypotheses and the n ine subhypotheses via the use of statistical significance (i .e. , at the p < .05
level ; refer to Table 6 . 1 ) . Therefore, any possible effects of chance are expected to be limited.
6.3 .2 A lternative explanation 2 : Spuriousness
Spuriousness involves the likelihood that a third variable is influencing the association between
the incidence of resource governance decisions and persistent firm performance. To account for
possible spuriousness, five variables were analysed comprising three potential confounds,
namely, corporate level commitment to the status quo, historical endowment and firm size. The
analysis of these variables found that nonsignificant (at the p < .05 level) homogeneity existed
across the firm performance categories. Therefore, and as noted in Section 4. 1 2, these three
potential confounds did not influence the association between the rate of resource governance
decisions and persistent firm performance.
6 . 3 .3 A lternative explanation 3 : Core competencies
I f the assumption is made that resource governance relates to the development and util isation of
core competencies, a view presented by Prahalad and Hamel ( 1 990), and Hamel and Prahalad
( 1 994), then core competency theory can be employed to account for why, firstly, PS FP firms
made lower quantities of resource governance decisions than PAFP firms and, secondly, similar
numbers of resource governance decisions were observed in both PIFP and PSFP firms and, yet,
2 1 3
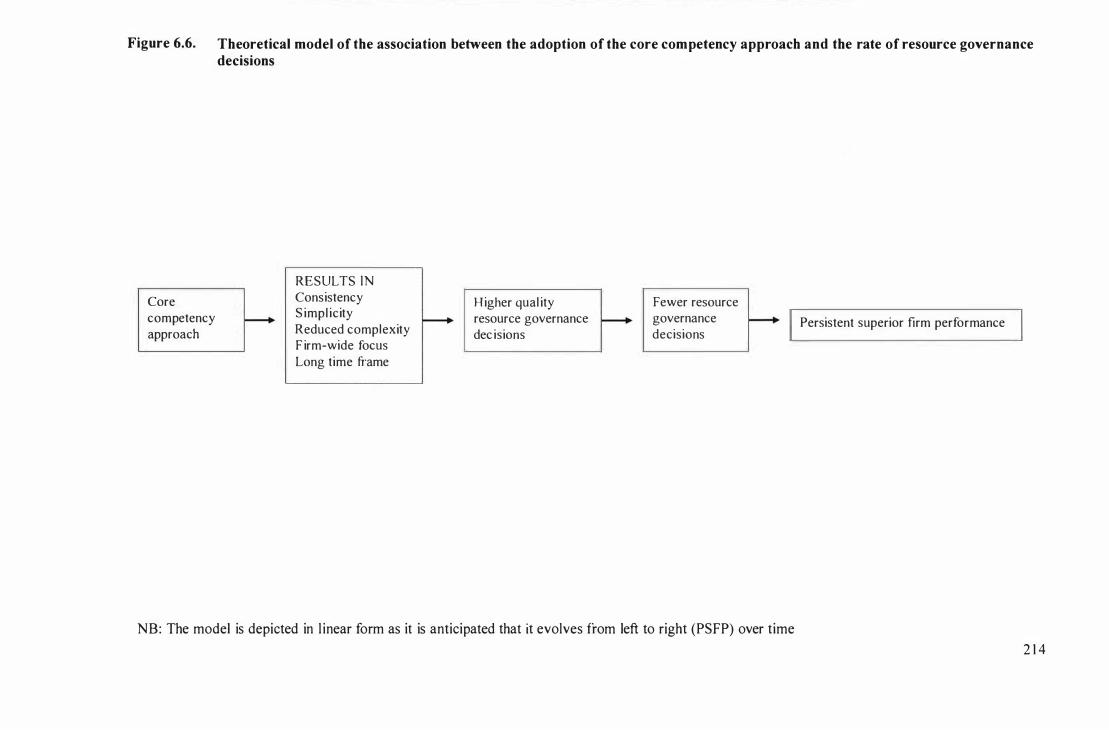
Figure 6.6. Theoretical model of the association between the adoption of the core competency approach and the rate of resource governance decisions
Core competency approach
f---+
RESULTS IN Consistency S impl icity Reduced complexity F irm-wide focus Long time frame
f---+ H igher qual ity resource governance dec isions
f---+ Fewer resource governance decisions
NB: The model is depicted in l inear form as it is anticipated that it evolves from left to right (PSFP) over time
Persistent superior firm performance
2 1 4
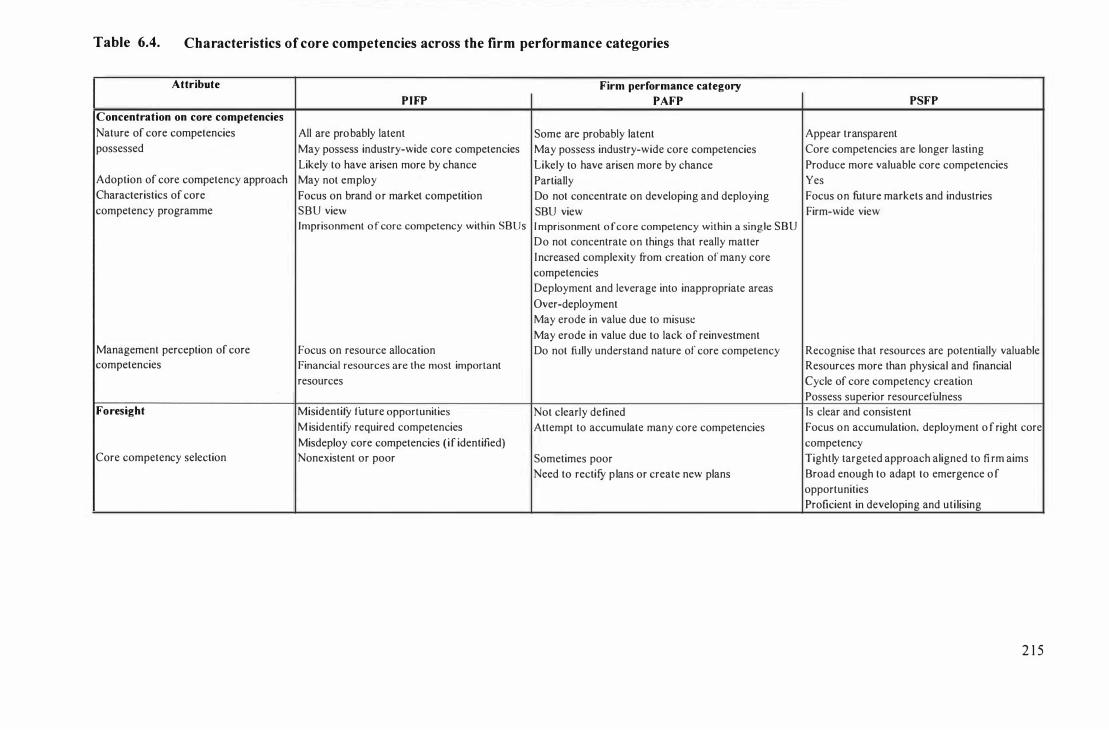
Table 6.4. Characteristics of core competencies across the firm performance categories
Attribute Firm performance category
PIFP PAFP PSFP
Concentration on core competencies
Nature of core competencies All are probably latent Some are probably latent Appear transparent
possessed May possess industry-wide core competencies May possess industry-wide core competencies Core competencies are longer lasting
Likely to have arisen more by chance Likely to have arisen more by chance Produce more valuable core competencies
Adoption of core competency approach May not employ Partially Yes
Characteristics of core Focus on brand or market competition Do not concentrate on developing and deploying Focus on future markets and industries
competency programme SBU view SBU view Firm-wide view Imprisonment ofcore competency within SBUs I mprisonment of core competency within a single SBU
Do not concentrate on things that really matter
Increased complexity /Tom creation of many core
competencies
Deployment and leverage into inappropriate areas
Over-deployment
May erode in value due to misuse
May erode in value due to lack of reinvestment Management perception of core Focus on resource allocation Do not fully understand nature of core competency Recognise that resources are potentially valuable competencies Financial resources are the most important Resources more than physical and fmancial
resources Cycle of core competency creation
Possess superior resourcefulness Foresight MisidentiiY future opportunities Not clearly detined Is clear and consistent
M isidentilY required competencies Attempt to accumulate many core competencies Focus on accumulation. deployment o f right core
Misdeploy core competencies ( if identified) competency Core competency selection Nonexistent or poor Sometimes poor Tightly targeted approach aligned to firm aims
Need to rectiry plans or create new plans Broad enough to adapt to emergence o f
opportunities
Proficient in developing and utilising
2 1 5
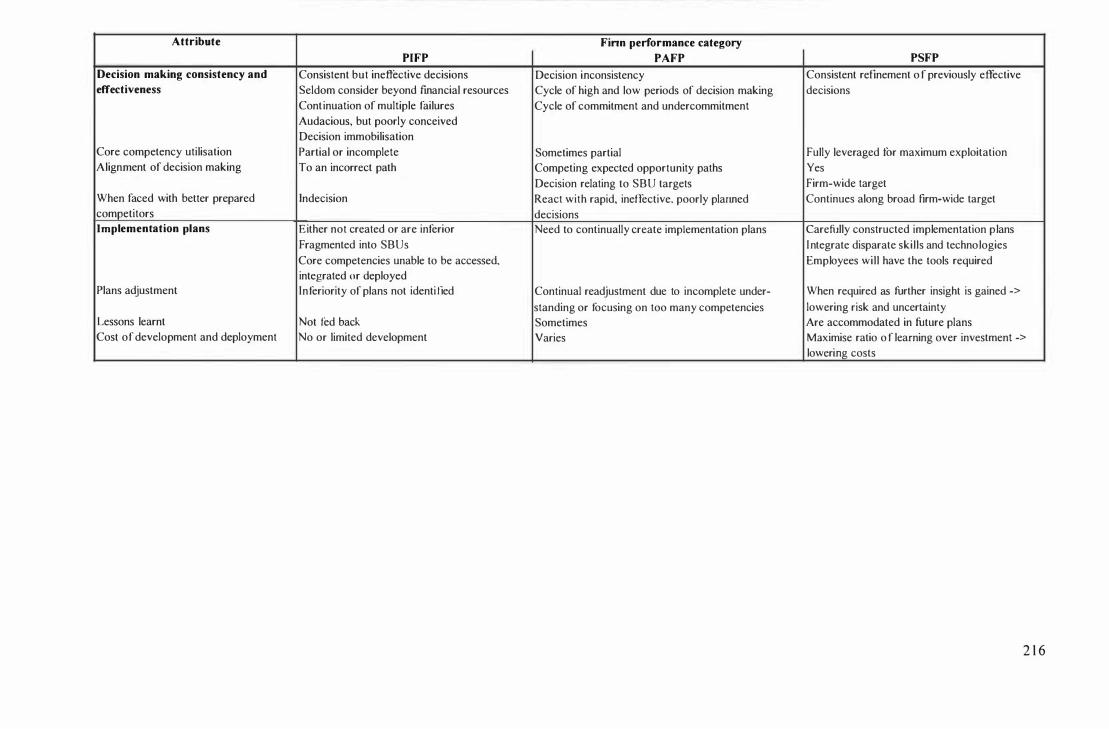
Attribute Finn perfonnance category
P[FP PAFP PSFP
Decision making consistency and Consistent but inefli:ctive decisions Decision inconsistency Consistent refinement o f previously effective
effectiveness Seldom consider beyond fmancial resources Cycle of high and low periods of decision making decisions
Continuation of multiple failures Cycle of commitment and undercommitment
Audacious, but poorly conceived
Decision immobilisation
Core competency utilisation Partial or incomplete Sometimes partial Fully leveraged for maximum exploitation
Alignment of decision making To an incorrect path Competing expected opportunity paths Yes
Decision relating to SBU targets Firm-wide target
When faced with better prepared Indecision React with rapid, ineffective, poorly plarmed Continues along broad firm-wide target
competitors decisions Implementation plans Either not created or are inferior Need to continually create implementation plans Carefully constructed implementation plans
Fragmented into SBUs I ntegrate disparate skills and technologies
Core competencies unable to be accessed, Employees will have the tools required
integrated or deployed
Plans adjustment Inferiority of plans not identi fied Continual readjustment due to incomplete under- When required as further insight is gained ->
standing or focusing on too many competencies lowering risk and uncertainty Lessons learnt Not fed back Sometimes Are accommodated in future plans
Cost of development and deployment No or limited development Varies Maximise ratio o f learning over investment ->
lowering costs
2 1 6
the performance outcomes were vastly different (refer to Figure 6 .6). Hamel and Prahalad
introduced core competency theory as a corporate strategy approach to the management of firms.
The implications of th i s research supports Hamel and Prahalad's v iews that, firstly, resource
governance is an important aspect of firm performance and, secondly, core competency theory
could be uti l ised as a tool or management phi losophy for the management of the resources a firm
develops, possesses and uti l ises. Core competencies are an intertwining col lection of abi l ities,
learning and technologies which may reside in more than one SBU. Core competency theory
argues that core competencies provide the basis for corporate level decisions as they are the
critical to firm survival. The influence of core competencies, via fewer resource governance
decisions, on persistent firm performance has been conceptualised in F igure 6.6 .
Core competency approach, as introduced in Chapter Two, can provide an explanation of the
curvi l inear association between the incidence of resource governance decisions and persistent
firm performance. Four key aspects of the core competency approach wi l l be discussed:
concentration on latent core competencies; foresight to firstly recognise that core competencies
are important and, secondly, to identify the most appropriate core competencies for future
success; decision making consistency and effectiveness; and, lastly, core competency
implementation (refer to Table 6 .4).
a) Concentration on latent core competencies
Core competency theory suggests that PS FP firms concentrate only on the things that really
contribute to PS FP. PS FP firms are observed to make fewer resource governance decisions than
PAFP firms. It is predicted that PS FP firms recognise that resources possess potential value and
that "resources" encompasses more than physical or financ ial resources: Human resources and
embedded, causal ly ambiguous resources are also significant components of core competencies.
Core competencies may then be transparent to PSFP firms whereas other firms may not correctly
identify the core competencies they possess. It is also envisaged that PS FP fi rms produce more
valuable core competencies. These successful core competencies are inherently longer lasting,
further enhancing firm performance. In contrast, non-PS FP firms may not understand the nature
or extent of core competencies, for different reasons, which wil l be outlined below, producing
the observed heterogeneity in the incidence of resource governance decisions.
Rather than relying on the richness of resources, PS FP firms may possess superior
resourcefulness (through creativity). Continual performance outcomes, which may be evident
2 1 7
within PSFP firms, can be created from a cycle of new core competency creation from
leveraging existing core competencies (Danneels, 2002). This cycle ensures the maximum and
most appropriate use of resources PSFP firms possess, which consequently requires fewer
resource governance decisions. It is expected that PAFP and PIFP firms may possess core
competencies, although they may only be industry-wide capabil ities or that their core
competencies are latent at best. Hamel and Prahalad ( 1 994) c laimed that firm success arises
from a shift from the conventional portfolio approach to the management of firm resources, to
one involving core competency development and leverage. This transition of approach does not
appear to have occurred within PIFP firms.
Core competency theory suggests that while PAFP firms may possess core competencies they do
not concentrate on developing and deploying them. In these firms, core competencies are l ikely
to have arisen more by chance than from a sustained effort. It is proposed that P AFP firms pay
attention to many things rather than concentrating on the things that really contribute to PSFP
and in doing so, make more resource governance decisions. Alternatively, if PAFP firms are
util is ing the core competency approach, increased complexity may occur whereby they could
make many resource governance decisions to, firstly, create many core competencies and,
secondly, they attempt to apply the core competency across the entire firm rather than deploying
the core competency into appropriate areas. Instead, PAFP firms may make many attempts to
leverage imprisoned core competencies across the firm as measured by the h igher number of
resource governance decisions. PAFP firms may also seek to gain relatively quick returns on
their core competencies and, therefore, are continually redeploying the core competency from
opportunity to opportunity, thus increasing the rate of resource governance decisions. The
character of these decisions indicates it is l ikely that PAFP firms do not ful ly understand either
the nature of the core competencies or the requirements of the core competency approach.
Consequently, the core competency may erode in value due to its misuse and from the lack of
reinvestment.
Causal ambiguity indicates that firms are unable to fully understand the relationship between
resources and SCA and, therefore, cannot leverage the advantage (King & Zeithaml, 200 1 ) . The
lack of clarity regarding either the core competency approach or the core competencies that may
exist in firms, may be apparent in both PIFP and PAFP firms. Simi larly, Prahalad and Hamel
( 1 990) argued that the value of such advantages recedes if these resources are not identified,
used, or transferred. Their view may indicate that these factors have a negative influence on the
performance outcomes for both PIFP and P AFP firms.
2 1 8
The first aspect of core competency theory that may explain why PIFP firms make fewer
numbers of resource governance decisions centres on the suggestion that PIFP firms may not
employ a core competency approach at al l . It is reasonable to conclude that instead of
recognising the importance of corporate strategy, PIFP firms focus on competitive strategy
(products and markets) rather than core competence building and, thus, makes fewer corporate
level decisions. Core competency theory argues that PIFP firms focus on resource allocation
(i .e. , allocation of resources across business units) and, thus, only one of two aspects of resource
governance were evident in the data set measured resulting in lower rates of resource governance
decisions. Secondly, even if PIFP firms util ise the core competency approach, focus is on
competition for brand share or product share, not the competition for future markets and
industries; in other words, corporate strategy. It is also envisaged that a firm-wide view may be
lacking whereby the core competency is imprisoned within a single SBU. Therefore, resource
governance decisions at the corporate level are not made.
As suggested by Hamel and Prahalad ( 1 994), PIFP firms are l ikely not to possess core
competencies, but if they do, the core competencies wil l be latent. Therefore, these latent core
competencies may have arisen irrespective of any corporate strategy decision that may have been
made by PIFP firms. This supports the view that PIFP fi rm decision making i s often
inappropriate and insufficient and why PIFP were observed to make fewer resource governance
decisions.
b) Foresight
PSFP firms appear to be more proficient in developing and uti lising the foresight required for the
successful accumulation and deployment of the "right" core competencies. It i s expected that
fewer decisions are made as industry foresight is clear, consistent, based on solid foundations
and broad enough to adapt to the final emergence of the opportunities: "How do we learn about
the future faster than competitors, while making fewer and small irrevocable commitments?"
(Hamel & Prahalad, 1 994, p. 1 36). Therefore, PSFP firms may possess a t ightly targeted
approach aligned to the firm's aims.
In comparison to PS FP firms, foresight is not as c learly defined for PAFP firms and, thus, these
firms attempt to accumulate many core competencies to cover all possible opportun ities.
Consequently, many resource governance decisions are made as the firm regularly readjusts its
core competency plans in response to environmental changes. It is proposed that poor selection
of core competencies resulting from inferior foresight may also result in increased resource
2 1 9
governance decision making. An argument can explain this observation as PAFP firms in
responding to the inappropriateness of the current core competency plans will make a large
number of resource governance decisions in an attempt to either rectify the current core
competency plans or alternatively, create new core competency plans.
Core competency theory suggests a lack of foresight exists within PI FP firms whereby the lack
of core competency development reduces the number of resource governance decis ions. It is
expected that PIFP firms are unable to successfully identify and deploy any of the core
competencies, even if they are apparent, that exist within their firms and, consequently, resource
governance decisions are not made.
c) Decision making consistency and effectiveness
Core competency evolution requires consistent decision making over long periods of time
(Leonard-Barton, 1 992). As PSFP firms seem to have correctly identified the scope of the future
opportunities, the resource governance decisions made are only those refining effective decisions
previously made, again resulting in a lower rate of resource governance decision making.
Zucker' s ( 1 977) v iew that repeated decision making can result in the institutionalisation of core
competencies indicates that PSFP firms consistent decision making may further enhance their
core competencies through the routinisation of core competency knowledge. This knowledge
would then assist the gaining of optimal use without having to make numerous resource
governance decisions. The institutionalisation of core competencies can assist in the collection
of knowledge from multiple sources which further increases the understanding of the core
competency (Leonard-Barton, 1 992).
Core competency theory suggests that the h igher rate of resource governance decision making
evident within PAFP firms may be due to decision inconsistency. It is reasonable to conclude
that decision inconsistency can lead to competing expected opportunity paths and, thus,
alterations to resource governance decisions may continually occur as competition for future
paths are contested within PAFP firms. As unclear goals exist, senior managers may be
committed to the goals of their division instead of firm-wide goals. Consequently, it appears
l ikely that more resource governance decisions are then made as the importance or dominance of
one manager wanes and the alternative goals of another manager gains precedence.
If faced with competitors that appear more prepared for the future, it is proposed that PAFP firms
may react with rapid, ineffective and poorly planned decisions. Hamel and Prahalad ( 1 994)
220
noted that many firms initial ly overcommit and start with "a great leap into the unknown and
find themselves hurtling over a cl iff' (p. 1 36). They suggest that undercommitment then
fol lows. This argument serves to explain why the decision making in PAFP firms is l ikely to be
cyclic where a flurry of resource governance decisions are made, fol lowed by a lull, and once
real isation of an error occurs, they are again behind their rivals This is then fol lowed by another
outbreak of intensive decision making.
It is proposed that PIFP firms make consistent, but relatively ineffective, decisions relating to
incorrectly identified future opportunities. The opportunities prepared for are inappropriate, too
late, misdirected, or even irrelevant. As PIFP firms think that they are on the correct path, it is
envisaged that they do not alter the decisions they have previously made. Core competency
theory suggests that PIFP firms are characterised by the continuation of multiple failures
resulting from inappropriate resources and choices. Worse sti ll, PIFP firms may consider that
their financial resources are the only resources of importance. It is expected that PIFP firms,
therefore, make inefficient decisions as they seldom appear to consider aspects beyond their
immediate financial resources. Core competency theory suggests that PIFP may also result from
audacious, but poorly conceived resource governance decisions. "Certainly the reason laggards
end up as laggards i s not because they fai led to make ' strategic investments' " (Hamel &
Prahalad, 1 994, p. 3 1 2) . It is proposed that decision immobilisation may occur when the firm
displays ignorance of the nature of identified core competencies, if in fact analysis got this far.
The absence of core competency integration knowledge could then result in the movement of the
firm away from its core competencies. Consequently, fewer resource governance decisions are
made and core competency uti l isation is at best only partial or incomplete.
d) implementation plans
The implementation of a core competency plan is an important aspect to the success of the core
competency approach . Readjustment of the integration of disparate ski l l s and technologies is
required to release the core competency' s potential. Core competency theory suggests that PSFP
firms' employees, in addition to understanding and being challenged by the goals of the firm,
wil l have the tools required to successfully execute the carefully constructed implementation
plans. PSFP firms then appear to be able to integrate disparate skil ls and technologies acquired
to achieve the stated firm-wide aims. I t is reasonable to conclude that risk and uncertainty is
reduced as further insight is gained, therefore, fewer resource governance decisions are necessary
as the core competency plans are adjusted when required. The lessons learnt throughout the
formulation and implementation phases are expected to be accommodated into future core
22 1
competency plans that exist beyond those currently employed. This again has the effect of
reducing the number of resource governance decisions made. Core competency theory suggests
that PSFP firms are able to maximise the ratio of learning over investment (Hamel & Prahalad,
1 994) and, consequently, these firms are able to develop and deploy their core competencies at a
lower cost than others.
Core competency theory suggests that P AFP firms make additional resource governance
decisions in an attempt to continually readjust their core competency implementation plans. This
may be due to their focus on too many core competencies, or the incomplete understanding of
the core competency. In th is account, core competencies are thought to be partially or wholly
imprisoned within SBUs and that the high incidence of resource governance decisions may be
due to the attempts to develop or leverage them across the firm. However, due to the expected
incomplete understanding of the nature of the core competencies they possess, PAFP firms make
many resource governance decisions. It is anticipated that PAFP firms may realise that the
current implementation plan is ineffective and make yet more decisions to correct it or to create
yet another implementation plan . In addition, new implementation plans are rapidly created in
response to competitors.
However, core competency theory suggests that even if PI FP firms possess core competencies,
they may be fragmented into SBUs and are unable to be accessed, integrated and deployed and
are, therefore, imprisoned within business units. Partial or incomplete uti l i sation may also result
if the core competencies are identified but understanding remains incomplete. The resulting core
competency plan may be inferior. It is proposed that PIFP firms do not appear to create future
core competency implementation plans; rather they concentrate on the current inferior plan,
resulting in lower resource governance decisions.
e) Summary
Core competency theory suggests that the explanation of why the incidence of resource
governance decisions was simi lar for both PIFP and PS FP firms may centre on, firstly, the lack
of foresight evident within PIFP firms to develop core competencies. It is expected that PI FP
firms do not appear to recognise the importance of core competencies; subsequently they may
not seek to apply the core competency approach (refer to Table 6.4 and F igure 6.6). It is
reasonable to conclude that for PIFP firms, the core competency approach i s a difficult concept
to grasp so these firms have not attempted to fully embed the approach into their firms.
However, even if PIFP firms adopt the core competency approach, there appears to be issues
222
with both the incorrectness of the foresight applied whereby the incorrect core competencies are
focused on and, secondly, a lack in understanding of the core competencies may exist w ithin
these firms. Instead, it can be argued that their perception of what is important is more focused
on competitive pressures. There is some indirect evidence that suggests that PIFP firms do not
necessarily have the capacity to adopt the core competency approach .
What was observed for PAFP firms appears to indicate that they may have comprehended the
core competency concept and yet for a number of reasons (e.g., it could be argued that PAFP
firms are somewhat impatient - perhaps they are driven by short-term goals and objectives, or
they could be attempting to respond to competitive pressures), they do not seem to have
persevered with the approach long enough as they are simply making too many decisions. The
core competency concept then has not been embedded into PAFP firms.
Heterogeneity may also exist across the three firm performance categories in terms of the
appropriateness of resource governance decisions made (i.e., decision making consistency and
effectiveness) . It is reasonable to conclude that PAFP firms are characterised by a cycle of
decision making involving some successful decisions but many inferior decisions. In
comparison, PIFP firms are l ikely to possess the opposite characteristics than those evident
within PSFP firms, namely, decision making is both inconsistent and ineffective.
Lastly, it is proposed that heterogeneous qual ity exists In terms of core competency
implementation plans between the three firm performance categories. Again for PSFP firms, it is
proposed that their implementation plans are superior in qual ity in comparison to the other two
firm performance categories. Both PIFP and PAFP firms appear to be characterised by inferior
implementation plans (although some implementation plans evident within PAFP firms may be
appropriate) due to partial or limited understanding of both the core competency approach and
the nature of their core competencies.
Overall, core competency theory suggests that the PSFP category may be the only firm
performance category in which firms ful ly and comprehensively employ Hamel and Prahalad's
( 1 990, 1 994) core competency approach . The findings suggest that PS FP firms conform to
Hamel and Prahalad ' s ( 1 990, 1 994) view of corporate level management; in other words, it is
l ikely that PSFP firms have embedded the core competency approach into their firms which
results in reduced levels of resource governance decision making (as depicted in Figure 6.6) .
223
A relationship was observed between the core competency view of the firm and PSFP.
However, this is a supposition as core competencies were not specifically measured in this
research . This observation can only be confirmed when research into multiple firms is
undertaken to determine the actual existence of core competencies.
Embedding the core competency approach into firms requires viewing the firm as a portfolio of
core competencies. As Hamel and Prahalad ( 1 994) suggested, existing and potential core
competencies need to be, firstly identified and, secondly, acquired or created and developed.
The core competency can then be deployed throughout the entire firm. And, lastly, to ensure
core competencies can be used over time, they must be protected. Therefore, the adoption of the
core competency approach requires a firm-wide change in philosophy, that is, in the way the firm
is v iewed by all its employees.
I n summary, persistent superior performance outcomes can arise from the adoption of the core
competency approach with in firms. It appears that the success of core competencies is due to the
comprehensiveness of the understanding of the nature of the core competencies required and
possessed. This would then impact on the volume of resource governance decisions undertaken
within firms, whereby those that have incorporated the core competency approach ( i .e. , PSFP
firms) are directed by this framework. Therefore, it may be deduced that the resource
governance decisions made are the right ones, at the right time. Successful deployment and
leveraging of core competencies across the entire firm may then result. It is reasonable to
conclude that PS FP firms display this understanding, partial understanding may be evident in
PAFP, and PIFP firms are characterised by a limited or a lack of understanding of the core
competency approach .
6.3 .4 Alternative explanation 4 : The role of corporate level resource governance decision making ski l l
Corporate level ski ll i n resource governance decision making has been advanced a s a fourth
explanation for the distinction between the PSFP category and the other two firm performance
categories. The scope of this discussion is l imited to relevant aspects of corporate level skil l in
resource governance decision making at the corporate level which includes the top management
team and the board of directors. Ski l l in corporate level decision making is a resource which i s
h i storically embedded as i t can increase over t ime, developing idiosyncratic characteristics which
are unique, difficult to imitate and substitute and, thus, could distinguish persistent superior firm
performance. Strategic management predicts that PSFP results from better managed firms.
224
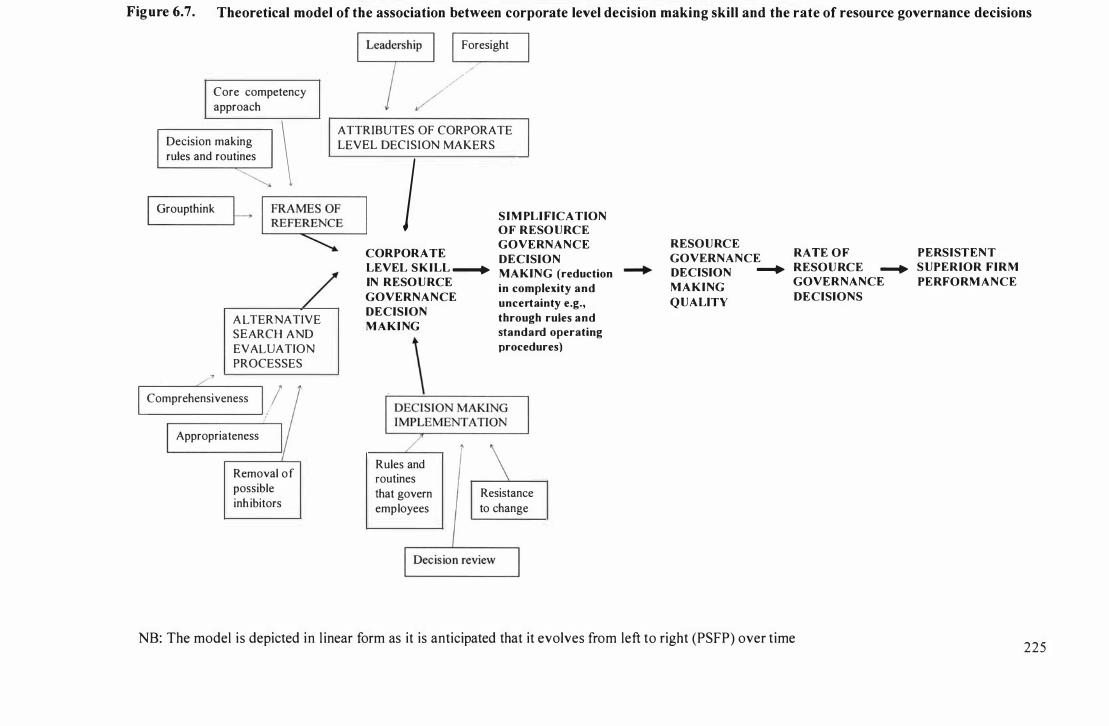
Figure 6.7. Theoretical model of the association between corporate level decision making skill and the rate of resource governance decisions
Core competency approach
Decision making \ rules and routines
Groupthink �
A LTERNATIVE SEARCH AND EVALUATION PROCESSES
Comprehensiveness /1 Appropriateness I
Removal o f possible inh ibitors
I Foresight
/
ATTRIBUTES OF CORPORATE LEVEL DECISION MAKERS
j CORPORATE LEVEL S K I LL ---+ IN RESO U RCE
GOVERNANCE
DECISION M AKI NG
\
S I M PLI FICATION O F RESO U RCE GOVERNANCE
DECISION MAKING (reduction
in complexity and
uncertainty e.g.,
through rules and
standard operating
procedures)
Rules and routines
that govern employees
Resistance
to change
RESOU RCE GOVERNANCE DECISION � M A K ING
QUALITY
RATE O F RESOU RCE � GOVERNANCE
DECISIONS
NB: The model is depicted in l inear form as it is anticipated that it evolves from left to right (PSFP) over time
PERSISTENT S UPERIOR FIRM
PERFORM ANCE
225
"One of the first [core] competencies identified was general management capabil ity. This led to
the proposition that firms with "high qual ity" general managers wi l l outperform their rivals.
Clearly, effective leadership is important to organizational performance" (Harrison, 2003, p . 9).
For example, Spanos et al (2004) presented empirical evidence suggesting that managerial
capabi l ities and strategy positively influence SCA. Corporate level skil l in resource governance
decision making has been conceptualised in Figure 6.7. Strategic choices possess different
characteristics than other firm decisions, namely, they are general ly important to firm survival,
future orientated, complex, highly uncertain, and often nonrecurring (Mintzberg, Raisinghani &
Theoret, 1 976).
Two areas of corporate level decision making ski l l exist which may explain the heterogeneity of
the rate of resource governance decisions. Firstly, the decision making frameworks employed
within firms are heterogeneous. Decision making frameworks are influenced both by the
decision makers' attributes and frames of reference. Secondly, research has indicated that
quality decisions arise from a superior decision making processes (Jones et aI, 1 992 ; Jones et ai,
1 994; Nutt, 1 992; Rodrigues & Hickson, 1 995) . The decision making process involves a number
of steps: setting objectives, searching for alternatives, evaluating alternatives, making the
decision, implementing the decision and, lastly, evaluating of the success of the decision.
Therefore, the second component to be discussed centres on the decision making process
employed within firms, specifical ly, the search and evaluation of alternative processes and
implementation of the decision which may provide an explanation for the heterogeneity in the
incidence of resource governance decision making observed. The four aspects of corporate level
skil l in resource governance decision making are discussed separately below.
a) PSFP versus PIFP and PAFP: Heterogeneous decision maker attributes
A lthough decisions are made throughout the firm, corporate level decision makers are expected
to have a predom inant influence on firm outcomes. It is proposed that heterogeneous abi lity
produces heterogeneous decisions as corporate level decision makers interpret the environment
and make judgements reflecting their different ski l ls and limitations: Superior managerial abi lity
is a rare resource. The two heterogeneous corporate level decision maker attributes that wi l l be
discussed here are superior foresight and leadership (refer to Figure 6 .7) . The different aspects
of fores ight and leadership examined in this section are presented in Table 6 .5 .
Hamel and Prahalad ( 1 994) asserted that successful companies transform and reinvent industries
by altering the rules of engagement, redrawing industry boundaries, discovering "white spaces,"
226
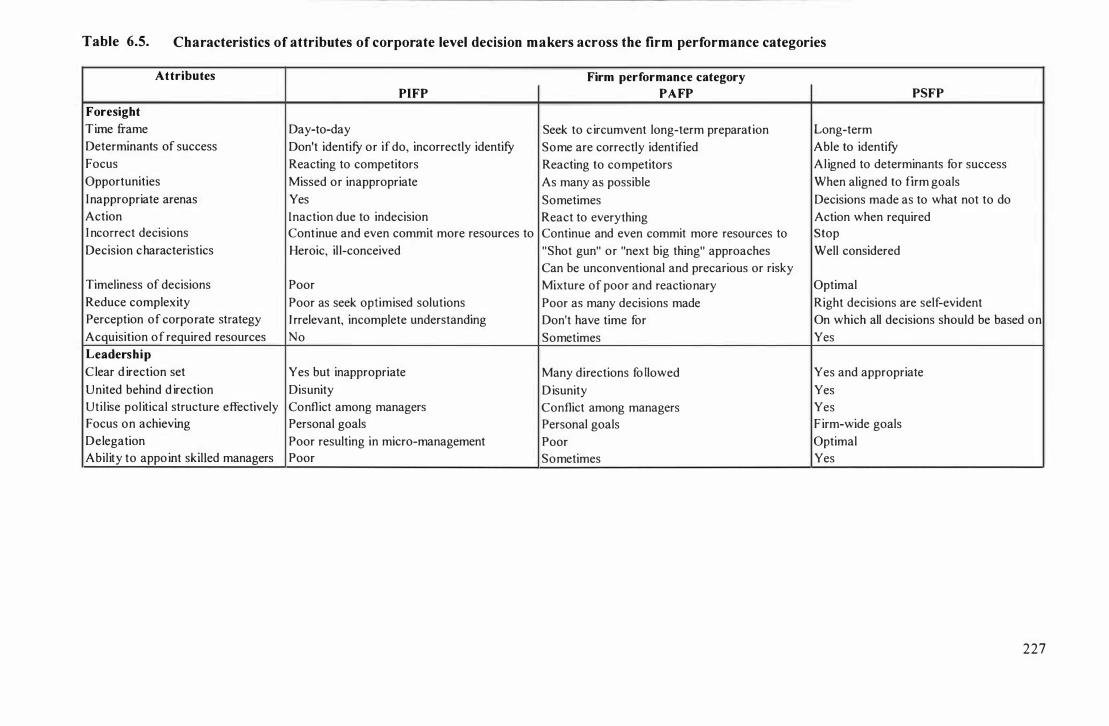
Table 6.5. Characteristics of attributes of corporate level decision makers across the firm performance categories
Attributes Firm performance category
PIFP PAFP PSFP
Foresight
Time frame Day-to-day Seek to c ircumvent long-term preparation Long-term Determinants of success Don't identify or if do, incorrectly identify Some are correctly identified Able to identify Focus Reacting to competitors Reacting to competitors Aligned to determinants for success Opportunities Missed or inappropriate As many as possible When aligned to firm goals I nappropriate arenas Yes Sometimes Decisions made as to what not to do Action Inaction due to indecision React to everything Action when required I ncorrect decisions Continue and even commit more resources to Continue and even commit more resources to Stop Decision c haracteristics Heroic, il l-conceived "Shot gun" or "next big thing" approaches Well considered
Can be unconventional and precarious or risky Timeliness of decisions Poor Mixture of poor and reactionary Optimal Reduce complexity Poor as seek optimised solutions Poor as many decisions made Right decisions are self-evident Perception of corporate strategy I rrelevant, incomplete understanding Don't have time for On which all decisions should be based on Acquisition o f required resources No Sometimes Yes Leadership
C lear d irection set Yes but inappropriate Many directions fo llowed Yes and appropriate U nited behind d irection Disunity D isunity Yes Util ise political structure effectively Conflict among managers Conflict among managers Yes Focus on achieving Personal goals Personal goals F irm-wide goals Delegation Poor resulting in micro-management Poor Optimal Ability to appo int skilled managers Poor Sometimes Yes
227
and creating new industries: all corporate strategy initiatives. A number of examples exist within
the PSFP firms sampled where these firms demonstrated the abi l ity to focus on the long-term and
appear to be able to correctly identify the determinants of success.
In 1 983, Amerada was distinguished from the rest of the oi l industry as it did not focus on oi l
exploration. Instead, Amerada acquired gasoline stations whi le their competitors sold or closed
their operations. Amerada was also observed in 1 983 to be altering the rules of engagement as
they pioneered many now common practices within gasoline marketing. In December 1 990,
FPL was reported to be planning the first US test-burn of orimulsion (a potential fuel source for
electricity generation). Many aspects of Northrop' s B2 Stealth fighter programme created new
industries (e.g., revolutionary advances in design, manufacturing, processes and materials).
Northrop was observed taking pride in transferring techniques from other industries and
successfully applying them, which they then used to alter the rules of engagement. Stealth' s
design d iscarded convention by creating new concepts for the mi l itary aircraft industry. I t was
noted in 1 984 that Northrop was considered a maverick in its industry. Union Pacific
Corporation (Union) broke with its industry in 1 988 when they formal ly endorsed the need for
rail regulation which was expected to have a significant effect on the boundaries of the rail
industry. Lastly, Whirlpool ' s 1 996 global expansion was at contrast to its industry as its
competitors were retrenching back into the US . Their development of a new type of w iring was
also viewed as critical to the creation of futuristic housing in 1 986.
A number of authors have noted that the successful use of resources results not from having
superior resources but from corporate level decision makers. Firstly, superior corporate level
decision makers are thought to possess superior foresight to identify which resources are
required to ach ieve their goals and, secondly, knowing how to use whatever l imited resources are
available (Ahuja et ai, 2005; Alchian & Demsetz, 1 972; Amit & Schoemaker, 1 993; Hamel &
Prahalad, 1 994). The corporate level ski l l decision making perspective argues that corporate
level decision makers of PI FP firms may not possess the correct ski l ls to, firstly, identify the
determinants for success and, secondly, concentrate on those determinants. Opportun ities can,
therefore, be missed, or inappropriate ones are followed. It is proposed instead, that heroic, i l l
conceived resource governance decisions occur whereby PIFP firms erroneously perceive that
they have correctly identified opportunities. In Brockner's ( 1 992) account, inappropriate
persistence and commitment may occur even when the potential fai lure of a decision is known
by the decision maker. In contrast to PSFP firms, PIFP corporate level decision makers then
may commit additional resources to decisions that are fail ing (Kisfalvi, 2000; Staw & Fox,
228
1 977), reinforcing the failure. Previous empirical evidence indicates that success can result in
extremes, either commitment to past decisions (e.g., which l imits the decision making in PIFP
firms) or undertaking new and more risky decisions (e.g., which may explain why PAFP firms
make more decisions) (Mil ler, 1 994).
Fewer resource governance decisions as evident in PI FP firms could also result from the inaction
of corporate level decision makers due to uncertainty, the lack of knowledge, and the fear of the
unknown. But while there is an optimal time of decision making (Bronner, 1 982), the timel iness
of resource governance decisions can be an important determinant of success. It is reasonable to
conclude that decision making in PIFP and PAFP (either poor or reactionary) firms lack
timel iness, whereby decisions are being made too late or too early in comparison to decision
making in PSFP firms. This perspective suggests that the absence of corporate level decisions by
PIFP firm decision makers is due to their lack foresight. For example, in 1 99 1 BNSF was
v iewed as lagging beh ind their competitors in reaching local agreements regarding work rules.
This lack of foresight resulted in employee strikes in the fol lowing years which influenced,
ultimately, persistent firm performance. Corporate strategy could have then been neglected as
they perceived these decisions had a negl igible impact on persistent firm performance in
comparison to the more "vital" and "urgent" competitive strategy decisions - a universal v iew
advanced in the strategic management l iterature. Again, because of BNSF's lack of foresight in
reaching the local agreements, the corporate level decision makers spent a large amount of time
responding to, firstly, employee dissension and, secondly, the need to quickly organise
agreements.
It is expected that PI FP and PAFP corporate level decision makers believe they are facing an
immediate chal lenge with respect to the firm 's inabil ity to compete w ith competitors. The only
way, they bel ieve, that can address this issue is via competitive strategy. PI FP corporate level
decision makers are then focused on "day-to-day" issues and perceive that they do not have the
time to address long-term strategy. This explanation supports Laverty's (2004) findings that
short-term focus can be systematic within firms. The results reported here suggest that these
corporate level decision makers do not appear to understand that the appropriate competitive
strategy should flow from corporate strategy.
The corporate level ski l l perspective also argues that PAFP corporate level decision makers
make many resource governance decisions as they also lack the foresight to, firstly, identify the
determinants for success and, secondly, concentrate on those determinants. PAFP corporate
229
level decision makers are reacting to the environment and are, therefore, continually adj usting
their resource governance decisions. Consequently, the focus of PAFP corporate level decision
makers is predicted to be spread across a wide range of possible opportunities, some of which are
correctly identified, that is, they apply what may be regarded as a "shotgun" approach to decision
making. Alternatively, it is envisaged that PAFP firms are continually looking for the "next big
thing" or a single crucial moment. In other words, they are aiming to circumvent the long-term
preparation required for successful decisions. In this account, P AFP corporate level decision
makers appear to be prepared to either make decisions that involve precarious ventures or make
more unconventional decisions despite the earlier caveat that decision making is expected to be
rational .
The corporate level decision making ski ll perspective proposes that corporate level decision
makers in PS FP firms develop the foresight to acquire the resources necessary for the successful
fulfilment of their goals and are then no longer required to make adjustments to previously made
dec isions. Some firms are then more qual ified to take advantage of these corporate level
opportunities through the ski ll and knowledge of the decision maker pool available to a firm.
Booth and Phi l ips ( 1 996) found that the presence of a clear focus was required for continuous
success. In comparison to the other two firm performance categories, it is expected that PSFP
corporate level decision makers are more al igned in terms of their focus. This view is supported
by B rocklesby and Campbell-Hunt (2004) who argued that successful firms are characterised by
coherence: "a process of mutual co-adjustment that is guided by mutual benefit and support" (p.
1 45 ) . They are able to make better, and a lesser number of decisions as all aspects of the
decision making process are al igned. Therefore, PS FP corporate level decision makers are not
anticipated to be distracted by unimportant and largely irrelevant decis ions, for example,
decisions are made regarding activities that the firm wil l not do. Decisions are also made to
discontinue inappropriate and unsuccessful activities promptly (Col i ins, 200 1 ).
The corporate level ski l l perspective also argues that a deficiency of leadership ski l ls is evident
within PAFP firms. Rather than concentrating on the most appropriate core competency, it is
proposed that this lack of leadership means that the firm follows numerous opportunities and
alternatives, increasing the complexity of the decision making process (Hirokawa, 1 990) and,
consequently, a greater number of resource governance decisions are made. The lack of
leadership skil ls expected from PAFP corporate level decision makers results in a choice to
follow many opportun ities and alternatives, again increasing the frequency of resource
governance decisions.
230
PIFP and PAFP corporate level decision makers may be more focused on achieving personal
goals (e.g., empire bui lding or the predi lection for the excitement of mergers and acquisitions)
rather than concentrating on ambition for the firm . The corporate level ski ll perspective suggests
that a deficiency of leadership ski l ls exists within both PI FP and PAFP firms which affects the
abi lity to unite behind a common purpose. This anticipated disunity can manifest in d ifferent
ways, for example, d isunity between PI FP corporate level decision makers may result in lower
rates of resource governance decisions as the internal "battle" for resources leads to indecision.
Disunity evident from the lack of leadership may also result in many opportunity paths being
fol lowed by PAFP firms, again increasing their rate of resource governance decis ion making.
The lack of leadership ski l ls is expected to be manifest in additional ways, for example, lower
levels of observed resource governance decisions may also result from the inability of PIFP
corporate level decision makers to delegate lower level decisions to appropriate employees, and
consequently, dereliction of corporate strategy decisions may occur. In this account, the
corporate level decision makers, therefore, remain distracted as they micromanage their
employees. Corporate level ski l l also incorporates the abi l ity to select superior nonexecutive
management. This perspective then contends that PIFP corporate level decision makers either do
not have confidence in their employee' s capabil ities to delegate effectively, they lack the skills to
recruit appropriate subordinates, or they seek subordinates who do not challenge their current
decision making abi l ity. Coli ins (200 I ) argued that the most important aspect that enables the
transition from good-to-great fi rms, is the abi l ity to place the right people in the right roles.
PAFP firms, however, seem to employ "skilled" staff only sometimes.
In summary, it is proposed that PIFP corporate level decision makers, when contrasted with
PSFP corporate level decision makers, simplify resource governance decision making In
response to complexity and uncertainty to such an extent that opportunities are m issed or
unsuitable decisions are made. In comparison, PS FP corporate level decision makers are
expected to be able to successfully simpl ify resource governance decision making by providing
clear and universal boundaries for decision making practices through mechanisms such as
leadership and foresight. However, the level of foresight and leadership evident in PAF P firms
results in resource governance decisions of varying qual ity .
23 1
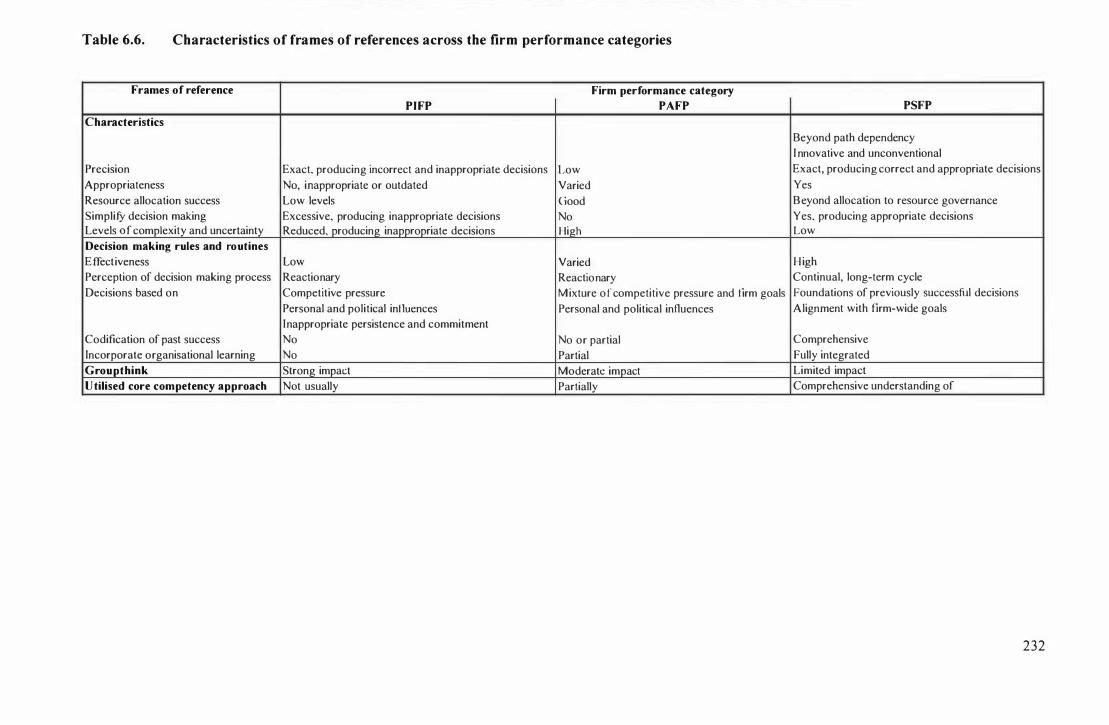
Table 6.6. Characteristics of frames of references across the firm performance categories
Frames of reference Firm performance category
PIFP PAFP PSFP
Characteristics
Beyond path dependency
I nnovative and unconventional
Precision Exact, producing incorrect and inappropriate decisions Low Exact, producing correct and appropriate decisions
Appropriateness No, inappropriate or outdated Varied Yes
Resource allocation success Low levels Good B eyond allocation to resource governance
SimplifY decision making Excessive, producing inappropriate decisions No Yes. producing appropriate decisions Levels 0 f complexity and uncertainty Reduced, producing inappropriate decisions High Low
Decision making rules and routines
E ffectiveness Low Varied H igh
Perception of decision making process Reactionary Reactionary Continual, long-term cycle
Decisions based on Competitive pressure M ixture o f competitive pressure and tirm goals Foundations of previously successful decisions
Personal and political intluences Personal and political influences Alignment with firm-wide goals
Inappropriate persistence and commitment
Codification of past success No No or partial Comprehensive
Incorporate organisational learning No Partial Fully integrated
G rou pthink Strong impact Moderate impact Limited impact
U tilised core competency approach Not usually Partially Comprehensive understanding of
232
b) PSFP versus PIFP and PAFP: Heterageneousframe afreferences
The frames of reference employed by decision makers create distinct boundaries which corporate
level decision makers use to guide decision making (Streib, 1 992). Frames of reference are also
influenced by perceptions, values, and culture, and are, therefore, heterogeneous across firms
(Ebert & Mitchell , 1 975) . A summary of the key aspects of frames of reference considered in
thi s section are displayed in Table 6.6.
Corporate level decision makers have limited cognitive power and consequently make
accommodations when making decisions. Janis ( 1 989) suggested four methods corporate level
decision makers employ to reduce complexity when making decisions: satisficing, rules, making
small adj ustments to previous decisions and, lastly, breaking down issues into components. I n
this account, these methods can be a source of difference between PSFP and the other firm
performance categories; for example, instead of satisficing, PIFP decision makers seek only
maximised outcomes.
Rules and routines provide the basis for knowledge col lection (Szulanski, 1 996). They then can
be uti l ised as frames of reference as a means of increasing reliabi l ity and predictabi l ity and
reducing uncertainty of decision making (Sutcliffe & McNamara, 200 1 ). Sutcliffe and
McNamara (200 1 , p. 485) noted that "different decision procedures lead to different choices.
Moreover, different procedures lead to different outcomes." Their research suggested that PSFP
firms are characterised by superior routines and rules which enable superior decisions and,
conversely, for PIFP firms, their inferior procedures produce inferior performance outcomes.
The varying effectiveness of PAFP firms' decision making suggests that the rules and routines
evident within these firms are also of varying qual ity. Alternatively, PAFP decision makers may
not adhere to these routines and complexity is increased. This suggests that the corporate level
decision making within PSFP firms is based on the foundations of previously successful
decisions which align with firm-wide goals. Decision making is viewed as a continual, long
term cycle. In comparison, the corporate level decision making process within both PIFP and
PAFP firms is perceived as reactionary, focusing on competitive pressures and sometimes in
PAFP firms, political and personal influences are expected to play a major role in decision
making.
The corporate level decision making ski l l perspective suggests that PSFP managers possess more
precise and appropriate frames of reference than corporate level decision makers of the other two
firm performance categories and that this lowers the rate of resource governance decis ion
233
making. PI FP firm decision makers are predicted to possess exact but inappropriate frames of
reference. Inappropriate frames of reference, in conjunction with excessive simplification,
produces lower rates of resource governance decision making. However, for PAFP firms, the
h igh levels of resource governance decision making can be explained by the lack of precision
and varying appropriateness of the frames of reference. Consequently, decision making
simplification is reduced and complexity is h igh. It was observed that decision making by PSFP
corporate level decision makers extended beyond resource allocation to the universal
understanding of the firm's resources: resource governance. It is reasonable, therefore, to
conclude that PSFP corporate level decision makers may see value where others cannot. It is
also l ikely that they are not constrained by past experience whereby these decision makers are
able to move beyond the path dependencies that may restrict the frames of references of lesser
skilled decision makers, for example, through the use of innovative and unconventional frames
of reference.
The corporate level ski l l in resource governance decision making perspective suggests that firms
tend to replicate past decision making processes since they represent the fami l iar and may have
been successful in past. For example, BNSF acquired firms (e.g., in 1 987 they acquired Sante Fe
Corporation and 1 2 trucking firms in 1 994) without fully integrating them into the existing
operations which resulted in major service issues. Various extensive employee reduction
programmes were also implemented prior to and fol lowing the Santa Fe Corporation acquisition
( involving 43,000 employees from 1 980 to 1 987, 7,000 employees from 1 994 to 1 996
respectively). BNSF was also observed to implement an aggressive cost-cutting programme in
1 996. A lthough the lack of integration has been an issue since 1 987, BNSF continued to
el iminate both employees and costs as these actions were perceived as being successful in the
past. These three factors were viewed to be the cause of the widespread service issues the firm
experienced during 1 997. The inferior prior decision making evident in PIFP firms may
intensify the capacity for poor future decision making as suggested by RBTs proposition of path
dependency. In addition, frames of reference can influence inappropriate persistence and
commitment (Whyte, 1 986) where inferior decisions made by PIFP decision makers result in the
perception of choices as being between various losses rather than gains.
Organisational learning is expected to largely be lost in PIFP firms. Previous successful
decisions are not repl icated and inferior decisions are because PIFP firms do not seem to review
and codify their decision making. However, it is proposed that PSFP firms comprehensively
codify both successful and unsuccessful decisions so that these decisions can e ither be duplicated
234
or l imit the chance of repetition respectively. The corporate level ski l l perspective suggests that
PAFP firms do not codify prior decision making, or do partially, due to the complexity of their
decision making processes, treating each uniquely with all of the difficulties in so doing.
In this account, PSFP corporate level decision makers also appear able to l imit the impact of
groupthink (Janis, 1 989) as they actively seek alternatives beyond their current thinking. They
are predicted to col lect and incorporate organisational learning obtained throughout the firm into
firm routines and practices. This information is then available and integrated into the subsequent
decision making processes. Whereas, the corporate level ski ll perspective suggests that PI FP
firm decision making is constrained by conformity to group norms, whereby new ideas or
alternative frames of reference are perceived as nonconformist. It is expected that
communication is structured so that dissidents are "converted" to the group norms. The
perception of the environment is then shaped by these inferior frames of reference.
Consequently, critical thinking within PIFP firms is reduced and blind spots increase eventually,
resulting in inferior decision making.
Brown and Eisenhardt ( 1 998) noted that PI FP may occur when decision makers are unable to
adapt their frames of reference. This provides an interesting insight whereby PIFP corporate
level decision makers may retain outdated frames of reference. As these outdated frames of
reference are used by decision makers to guide decision making, it is proposed that PIFP firms
are l ikely to, firstly, make inferior decisions and, secondly, repeat past inferior deci sions.
Loyalty to a decision and the decision making process is l iable to be unquestioned even if the
decision is fai ling. Simi larly, the corporate level decision making ski ll perspective suggests a
partial form of groupthink can also occur within PAFP firms, but more on the basis of loyalty to
the various independently acting groups which seem to characterise PAFP firms. It is proposed
that as these independent groups compete for ascendancy, they maintain loyalty to their
particular chosen direction even if the decision is inferior. These independent groups do not l ike
to have their underlying assumptions, perceptions and views chal lenged and superseded.
c) PSFP versus PIFP and PAFP: Heterogeneous alternative search and evaluation processes
The second component of corporate level skill perspective involves decision making processes of
which search for alternatives is one aspect. This aspect includes the search for information on
which the firm bases its various alternative opportunities. The other main aspect is decision
making implementation which wi l l be discussed shortly. The aspects of search for alternatives
235
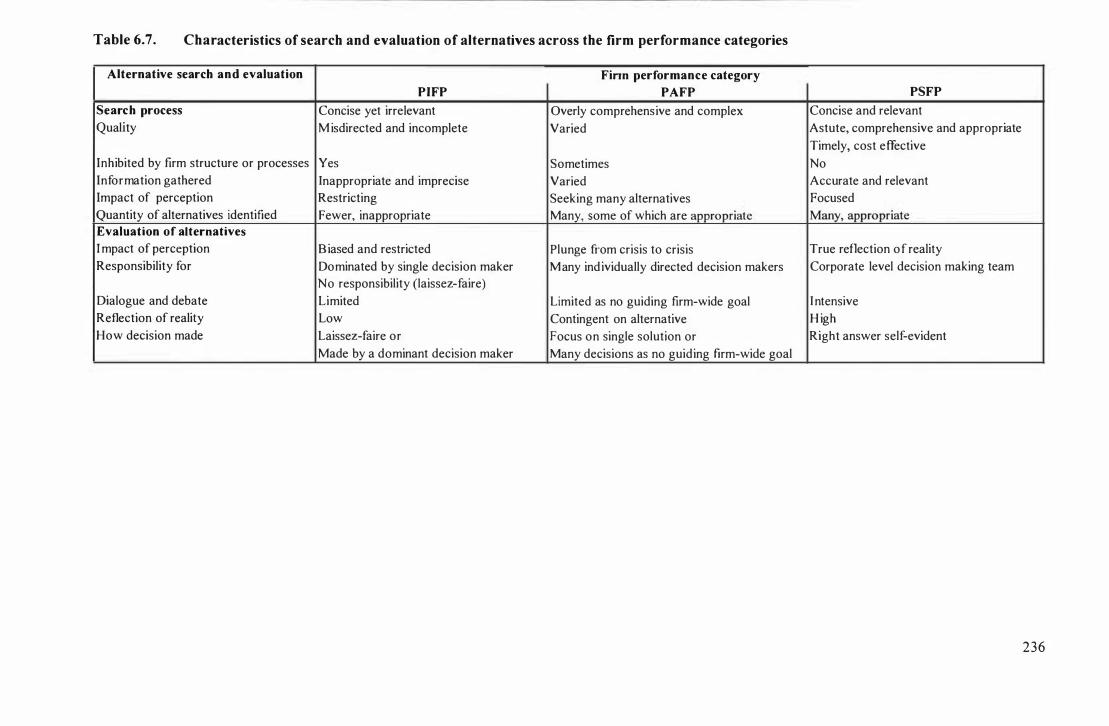
Table 6.7. Characteristics of search and evaluation of alternatives across the firm performance categories
Alternative search and evaluation Finn performance category
PIFP PAFP PSFP
Search process Concise yet irrelevant Overly comprehensive and complex Concise and relevant Quality M isdirected and incomplete Varied Astute, comprehensive and appropriate
Timely, cost effective Inhibited by firm structure or processes Yes Sometimes No Information gathered Inappropriate and imprecise Varied Accurate and relevant Impact of perception Restricting Seeking many alternatives Focused Quantity of alternatives identified Fewer, inappropriate Many, some of which are appropriate Many, appropriate Evaluation of alternatives
I mpact of perception B iased and restricted Plunge from crisis to crisis True reflection o f reality Responsibility for Dominated by single decision maker Many ind ividually directed decision makers Corporate level decision making team
No responsibility (laissez-faire) Dialogue and debate Limited Limited as no guiding firm-wide goal I ntensive Reflection of reality Low Contingent on alternative H igh How decision made Laissez-faire or Focus on single solution or Right answer self-evident
Made by a dominant decision maker Many decisions as no guiding firm-wide goal
236
that are discussed here include the appropriateness and comprehensiveness of the search process,
and the removal of possible inhibitors. A summary of these aspects is presented in Table 6.7.
Corporate level decision making ski l l perspective indicates that PS FP firms' conduct a more
astute search process which is well-structured in comparison to lesser performing firms and
because the search process is appropriate and comprehensive, fewer inaccuracies occur (Janis,
1 989) and therefore, fewer resource governance decisions need to be made. The search for
alternatives by PSFP firms may not be inhibited by firm structure or processes. It is proposed
that PSFP firms may also recognise the importance of the corporate level decis ions to the firm's
performance and accordingly ensure that the search process is comprehensive and valid
(Ham brick, 1 982). Information gathered by PSFP firms from the search process may be more
appropriate, timely and cost effective and the analyses performed on this information appears to
be superior in comparison to lower performing firms. Researchers have noted ski l l factors (such
as cognitive framework, interpretation) influence the search for alternatives (Ham brick, 1 982;
Mi ll iken, 1 990). PSFP firm decision makers are then expected to provide a focused and true
reflection of reality. PSFP corporate level decision makers are envisaged to possess more
effective decision making rules and routines that they util ise to search for and evaluate
alternatives, and implement their decis ions. Fewer resource governance decisions are then made
as the error rate is minimised. PSFP recognise the requirement to make the right decisions and
that this outcome is a continual process. Brocklesby and Campbell-Hunt (2004) also found that
dialogue was an important factor in determining the paths successful firms choose to fol low. It
is reasonable then to conclude that open discussion is encouraged in PSFP firms. As a result of
the higher level of skill in regards to the search for alternatives displayed by PSFP firms, lower
quantities of resource governance deci sions are then required.
In this account, inferior decision making ski l ls may arise from a number of situations, for
example, gathering inappropriate or imprecise information on which to base decisions. If
corporate level decision makers perceive the search process has uncovered all possible
alternatives, it is proposed that they wil l usually only consider those alternatives. Consequently,
it appears that the restricted search processes within PIFP firms may lead to the identification of
fewer opportunities and thus, PIFP corporate level decision makers appear to consider only a
l imited number of alternatives in comparison to PSFP firms. The corporate level skil l
perspective argues that the cognitive limitations of PIFP corporate level decision makers (e.g.,
b iases and information overload) may constrain the search for alternatives. These factors may
also negatively influence the analysis of the information gathered whereby inappropriate or
237
imprecise information is gathered. PIFP firms, in comparison to PSFP firms, appear to simplify
the search for alternatives to such an extent that opportunities are missed or unsuitable decisions
are made. Overall, fewer resource governance decisions may be made as a result of the inferior
search processes evident within PIFP firms. In comparison, the corporate level skil l in decision
making perspective proposes that the search processes evident within PAFP firms are
characterised by varying quality. It is expected that PAFP firms, due to their unfocused
approach to resource governance, may attempt to pursue as many opportunities as possible,
which some are inferior. In conjunction with th is, and because the information gathered is of
varying quality, the search process within PAFP firms appears to be overly comprehensive and
complex.
The evaluation of alternatives is the next step in the decision making process. PIFP firms appear
to be characterised by biased appraisal, or the lack of consideration for possible eventualities.
The lack of resource governance decisions made by PI FP firms suggests that decision evaluation
including dialogue and debate is l imited. For example, decision making may be either
dominated by one decision maker or laissez-faire approach may have been adopted, both of
which lowers the incidence of resource governance decision making. In contrast, PSFP firms
appear to know what is successful as they make the right resource governance decisions at the
right time. It is proposed that the information gathered and the intensive debate that fol lows
produces a truer reflection of the real ity PSFP firms find themselves in. Coli ins (200 1 ) found
that in good-to-great firms, the right decision became obvious. Whereas, the corporate level
decision making skil l perspective suggests that PAFP firms appear to be characterised by
complexity reSUlting from many individuals making numerous resource governance decisions
due to the lack of a guiding firm-wide goal . It is l ikely that l imited evaluation of alternatives
may then occur as the various groups with in PAFP firms are responding to their own agenda and
perceptions of the future. PAFP firms may also seek a single solution to their current problem
and, thus, the evaluation process employed appl ied is tightly confined. One or both situations are
expected to be evident within PAFP firms, therefore leading to h igher rates of resource
governance decisions as they plunge from crisis to crisis.
d) PSFP versus PIFP and PAFP: Heterogeneous implementation
Miller (2002) noted that firms fai l to ach ieve ROI for about 70% of change initiatives. By
extension, this suggests that various corporate strategy decisions formulated are not successfully
implemented and, as such, may provide an explanation of heterogeneous firm performance.
Three aspects of decision implementation wil l be discussed below: the integration of routine and
238
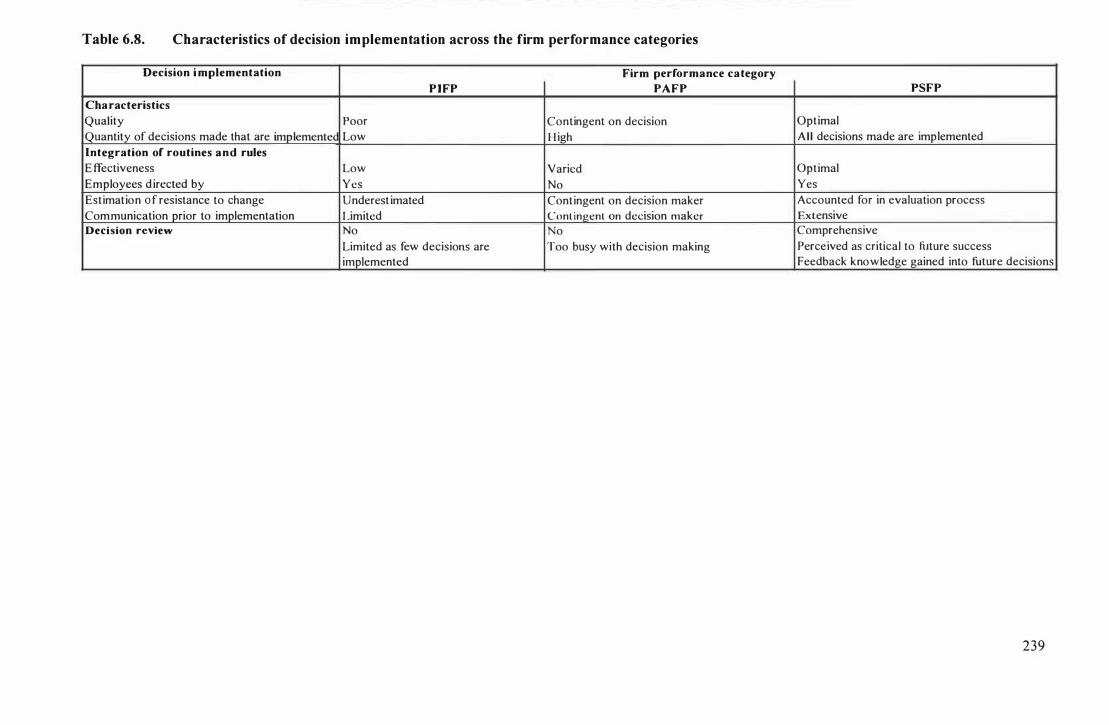
Table 6.8. Characteristics of decision implementation across the firm performance categories
Decision i mplementation Firm performance category
P I FP PAFP PSFP
Cha racteristics
Quality Poor Contingent on decision Optimal
Quantity of decisions made that are implemented Low H igh Al l decisions made are implemented
Integration of routines a n d rules
E ffectiveness Low Varied Optimal
Employees d irected by Yes No Yes
Est imat io n 0 f res istance to change Underest imated Contingent on decision maker Accounted for in evaluation process
Communication prior to implementation Limited Cont ingent on decision maker Extensive
Decision review No No Comprehensive
Limited as few decisions are Too busy with decision making Perceived as critical to future success
implemented Feedback knowledge gained into future decisions
239
rules, estimation of resistance to change and, lastly, decision review, and are presented in Table
6 .8 .
Decision implementation issues can also be a source for lower quantities of resource governance
decisions as nondecision makers appear to control a large part of the outcome. The corporate
level decision making ski ll perspective suggests that PSFP firms appear to be able to l imit
possible negative impacts of their decisions by adequately incorporating knowledge into the
decision making process so that risk is reduced (Hamel & Prahalad, 1 994). The knowledge and
skills acquired across the firm ( i .e . , learning) are then incorporated into the routines of the firm
(Nelson & Winter, 1 982). This appears to reduce the number of decisions required through the
mechanism of corporate strategy. Instead, employee actions seem to be directed by these
effective routines. It is proposed that PS FP firms also ensure that the decision is understood by
the implementers (Trull, 1 966).
The lower incidence of resource governance decisions in PIFP firms may be explained by the
existence of laissez-faire leadership. As decision implementation is usually performed by
noncorporate level employees, it is expected that they are reliant on the framework provided
from the corporate level . If this framework is substandard (a characteristic of laissez-faire
leadership), the effectiveness of decision implementation is inferior. PIFP firms also appear to
be characterised by lower levels of managerial ski ll (resulting from corporate level decision
makers' inabil ity to identify and recruit appropriate managerial skill). Consequently, these
managers appear to be indecisive and wait for direction from corporate level decision makers
which never eventuates . Inferior or nonexistent decision implementation evident in PIFP firms
may result in added indecision at the corporate level, further reducing the number of resource
governance decisions made. On the other hand, it is anticipated that the lack of leadership
evident within PAFP firms leads to the implementation of numerous corporate level decisions
(increasing complexity) and as successful implementation is contingent on the abi l ity of
managers, many decisions are poorly implemented leading to additional resource governance
decisions in an attempt to rectify the failing implementations.
Inferior decisions are argued to result from the apparent underestimation of the effects of change,
due to employee resistance which may characterise PIFP firms and, to some extent, is evident in
P AFP firms (Harrison, 1 999). By way of contrast, in PSFP firms, "effective decision makers
devise plans to carry out their decisions. They anticipate the l ikely setbacks and are ready with
countermeasures" (Wheeler & Janis, 1 980, p. 9). PSFP corporate level decision makers also
240
seem to fully understand that their decisions can l imit any endogenous conflicts of interest that
may reduce the success of implementation . It is proposed that corporate level decision makers
who possess superior ski l ls are then more l ikely to communicate the decision before it is
implemented ensuring less resistance. Research has found that the firm-wide coherence to the
decisions evident within successful firms supports firm-wide action (Brocklesby & Campbell
Hunt, 2004). Again, the application of their superior corporate level skill represents a lower rate
of resource governance decisions made.
The last stage of the decision making process is reviewing the success of the entire decision
(March & Olsen, 1 979). As noted in the previous sections, decision review is critical to
understanding why previous decisions fai l or succeed. The corporate level decision making skill
perspective suggests that PSFP firms appear to conduct a comprehensive review process and
uti lise the knowledge gained in future decisions. In addition, the decisions could be reviewed
against appropriate criteria whereby it is expected that PS FP firms concentrate on other more
future focused measures, for example, core competency development, rather than solely on
profit. In comparison, it is l ikely that as PAFP firms are implementing many resource
governance decisions, they do not conduct decision evaluation. Lastly, as the corporate level
skil l perspective argues that the lower skil l-set of the PIFP decision makers translates to
indecision, many PIFP firms' resource governance decisions do not appear to be implemented
and are, therefore, not reviewed. This may account for the lower frequencies of resource
governance decisions observed in PIFP firms.
e) PSFP versus PIFP and PAFP: Summary
Although this research did not specifical ly investigate the ski l l of corporate level decision
makers of the 1 5 sample firms, the results do suggest that variations in corporate level decision
making ski ll provides a plausible explanation for the heterogeneity observed in the incidence of
resource governance decisions across the different categories of persistent firm performance.
The corporate level decision makers may be regarded as a "black box" but both previous
theoretical thought and empirical evidence have suggested ways in which decision making can
vary and impact on persistent firm performance. The four aspects involving both decision maker
attributes and decision making processes discussed here are reasonably thought to be distributed
heterogeneously across firms.
The corporate level ski l l perspective suggests that both framework and process aspects of
decision making involve asymmetries in corporate level decision making skil l (refer to Figure
24 1
6.7) . I n this account, PSFP firm corporate level decision makers may possess superior decision
making frameworks and processes than the corporate level decision makers in the other two firm
performance categories and consequently will need to make fewer resource governance decis ions
to achieve better outcomes. In other words, "successful [firms] "outdecide" their competitors in
at least three ways: They make better decisions; they make decisions faster; and they implement
decisions more" (McLaughlin, 1 995, p. 443). This perspective also suggests that corporate level
decision makers in PIFP firms make fewer resource governance decisions due to their inferior
decision making skil ls . For example, GenCorp was observed to make a number of decisions to
dispose of their radio and television stations, often at a loss.
A sample firm was selected from each of the three subpopulations that is, from within the same
industry. The PI FP and PS FP firms made simi lar rates of resource governance decision making
and yet achieved different levels of firm performance. Performance failure may occur as a result
of inferior decision making frameworks and processes. This same perspective proposes that
corporate level ski l l in resource governance decision making evident within PAFP firms varies.
Some decisions in PAFP firms are of superior quality whereas many are of inferior quality.
Consequently, revision is required to rectify the inferior resource governance decisions
increasing the number of resource governance decisions made by PAFP firms .
Relative to the PS FP firms, PAFP firms appear to be characterised by some superiorly ski l led
corporate level decision makers but also a large number of corporate level decision makers with
inferior resource governance abi l ities. The apparent lack of leadership within PAFP firms has
profound effects on the formulation of firm-wide direction and ensuring that this d irection is
adhered to throughout the firm. Instead, various PAFP corporate level decision makers possess
competing goals, increasing the complexity of the decision making process (refer to Table 6.9) .
I n contrast, the corporate level decision making ski l l perspective argues that relative to PSFP
firms, P I FP firms are characterised by corporate level decision makers with inferior corporate
level ski l l . In this account, inferior corporate level abi l ities results in poor or laissez-faire
leadership and, consequently, lower quantities of resource governance decisions appear to be
made due to either indecision or the selection of inferior firm goals. These corporate level
decision makers are apparently constrained by their inferior ski l l s and are, thus, unable or
unwil l ing to identify and remove the constraints of inferiority from their decisions.
Lastly, lower rates of resource governance decisions observed within PSFP firms can be
attributed to the superior managerial ski ll evident within this category. In thi s account, superior
242
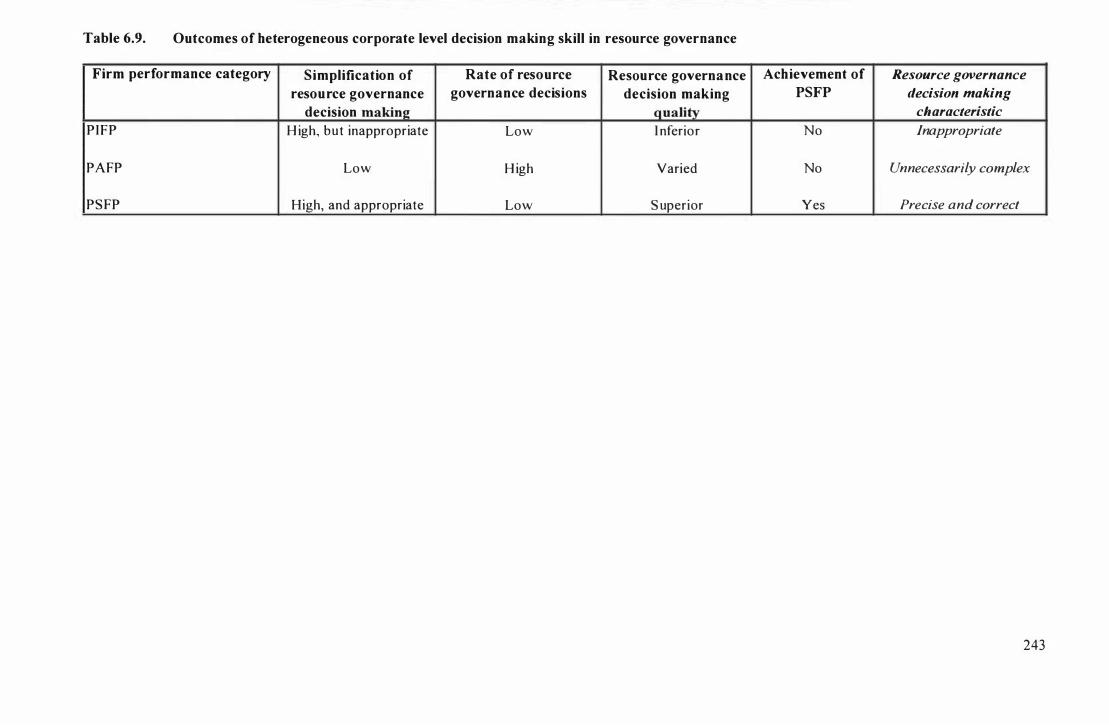
Table 6.9. Outcomes of heterogeneous corporate level decision making skill in resource governance
Firm performance category Simplification of Rate of resource Resource governance Achievement of Resource governance resource governance governance decisions decision making PSFP decision making
decision making quality characteristic PIFP H igh, but inappropriate Low I nferior No Inappropriate
PAFP Low H igh Varied No Unnecessarily complex
PS FP High, and appropriate Low S uperior Yes Precise and correct
243
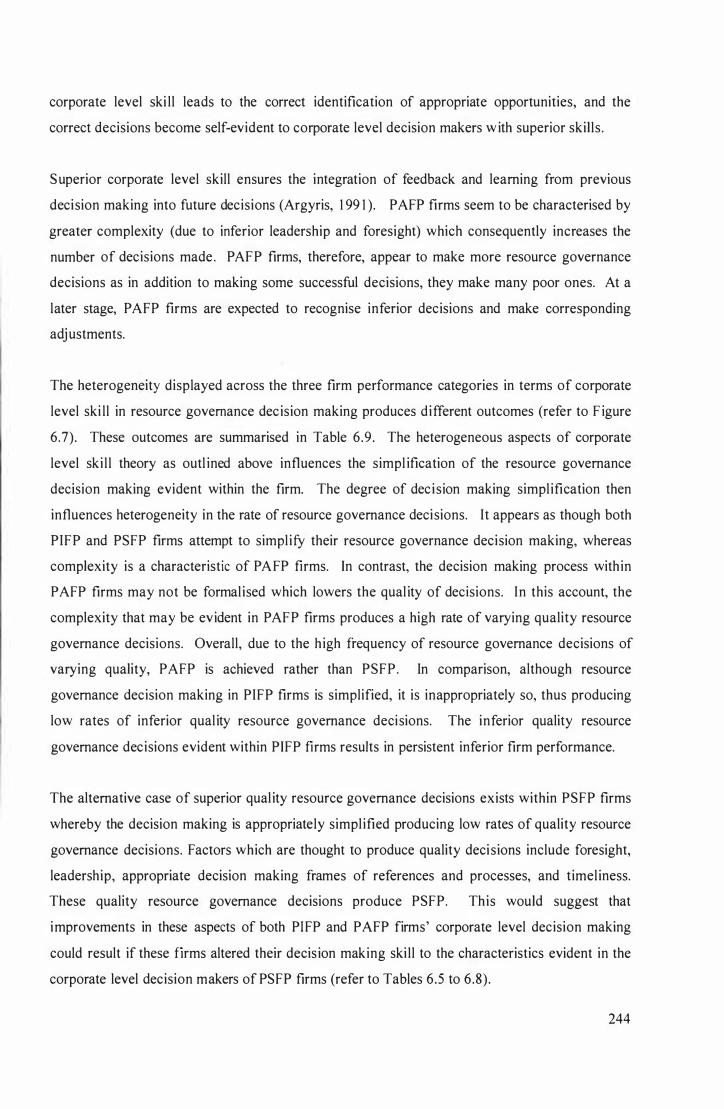
corporate level ski ll leads to the correct identification of appropriate opportunities, and the
correct decisions become self-evident to corporate level decision makers w ith superior skil ls .
Superior corporate level skill ensures the integration of feedback and learning from previous
decision making into future decisions (Argyris, 1 99 1 ). P AFP firms seem to be characterised by
greater complexity (due to inferior leadership and foresight) which consequently increases the
number of decisions made. PAFP firms, therefore, appear to make more resource governance
decisions as in addition to making some successful decisions, they make many poor ones. At a
later stage, P AFP firms are expected to recognise inferior decisions and make corresponding
adjustments.
The heterogeneity displayed across the three firm performance categories in terms of corporate
level ski ll in resource governance decision making produces different outcomes (refer to F igure
6.7). These outcomes are summarised in Table 6.9. The heterogeneous aspects of corporate
level ski l l theory as outl ined above influences the simpl ification of the resource governance
decision making evident within the firm. The degree of decision making simpl ification then
influences heterogeneity in the rate of resource governance decisions. It appears as though both
PIFP and PSFP firms attempt to simpl ify their resource governance decision making, whereas
complexity is a characteristic of PAFP firms. In contrast, the decision making process within
PAFP firms may not be formal ised which lowers the qual ity of decisions. In this account, the
complexity that may be evident in PAFP firms produces a high rate of varying quality resource
governance decisions. Overall, due to the high frequency of resource governance decisions of
varying quality, PAFP is achieved rather than PSFP. In comparison, although resource
governance decision making in PIFP firms is simplified, it is inappropriately so, thus producing
low rates of inferior qual ity resource governance decisions. The inferior quality resource
governance decisions evident within PIFP firms results in persistent inferior firm performance.
The alternative case of superior qual ity resource governance decisions exists within PSFP firms
whereby the decision making is appropriately simpl ified producing low rates of quality resource
governance decisions. Factors which are thought to produce quality decisions include foresight,
leadership, appropriate decision making frames of references and processes, and timel iness.
These quality resource governance decisions produce PSFP. This would suggest that
improvements in these aspects of both PIFP and PAFP firms' corporate level decision making
could result if these firms altered their decis ion making ski ll to the characteristics evident in the
corporate level decision makers of PS FP firms (refer to Tables 6.5 to 6.8) .
244
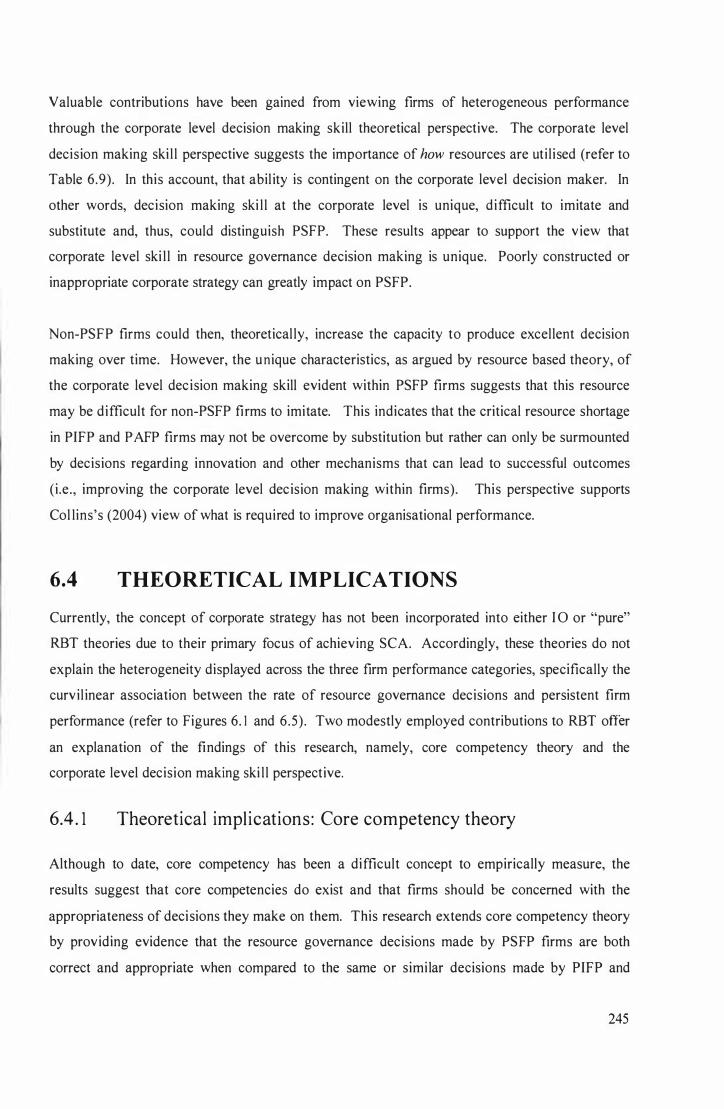
Valuable contributions have been gained from viewing firms of heterogeneous performance
through the corporate level decision making skill theoretical perspective. The corporate level
decision making ski l l perspective suggests the importance of how resources are uti l ised (refer to
Table 6.9). In this account, that abil ity is contingent on the corporate level decision maker. In
other words, decision making ski l l at the corporate level is unique, difficult to imitate and
substitute and, thus, could distinguish PSFP. These results appear to support the v iew that
corporate level ski l l in resource governance decision making is unique. Poorly constructed or
inappropriate corporate strategy can greatly impact on PSFP.
Non-PSFP firms could then, theoretical ly, increase the capacity to produce excellent decision
making over time. However, the unique characteristics, as argued by resource based theory, of
the corporate level decision making skill evident within PSFP firms suggests that this resource
may be difficult for non-PSFP firms to imitate. This indicates that the critical resource shortage
in PIFP and P AFP firms may not be overcome by substitution but rather can only be surmounted
by decisions regarding innovation and other mechanisms that can lead to successful outcomes
(i .e., improving the corporate level decision making within firms). This perspective supports
Col lins's (2004) view of what is required to improve organisational performance.
6.4 THEORETICAL IMPLICATIONS
Currently, the concept of corporate strategy has not been incorporated into either 10 or "pure"
RBT theories due to their primary focus of achieving SCA. Accordingly, these theories do not
explain the heterogeneity displayed across the three firm performance categories, specifically the
curvil inear association between the rate of resource governance decisions and persistent firm
performance (refer to Figures 6. 1 and 6.5) . Two modestly employed contributions to RBT offer
an explanation of the findings of this research, namely, core competency theory and the
corporate level decision making ski l l perspective.
6.4 . 1 Theoretical impl ications : Core competency theory
Although to date, core competency has been a difficult concept to empirically measure, the
results suggest that core competencies do exist and that firms should be concerned with the
appropriateness of decisions they make on them. This research extends core competency theory
by providing evidence that the resource governance decisions made by PS FP firms are both
correct and appropriate when compared to the same or simi lar decisions made by PIFP and
245
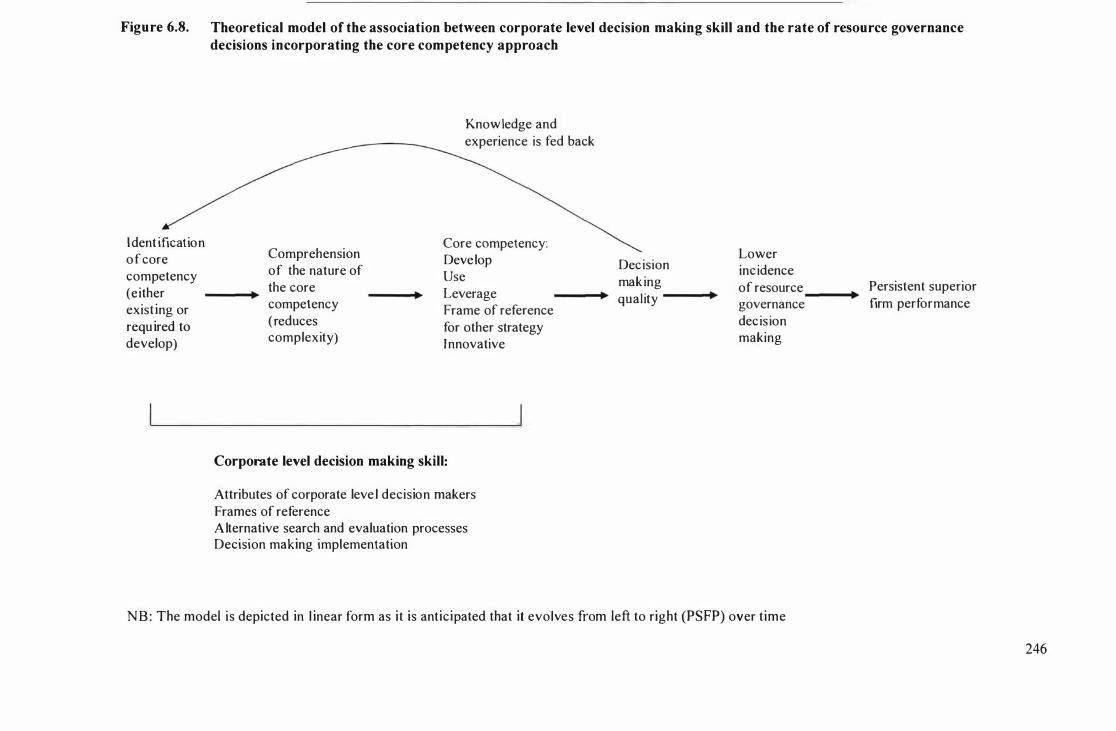
Figure 6.8. Theoretical model of the association between corporate level decision making skill and the rate of resource governance decisions incorporating the core competency approach
Ident ification of core competency (e ither exist ing or requ ired to develop)
Knowledge and
experience is fed back
Core competency: Comprehension Develop of the nature of Use the core Leverage • • competency Frame of reference (reduces for other strategy complexity) Innovative
Corporate level decision making skill:
Attributes of corporate leve l decision makers
Frames of reference Alternative search and evaluation processes Decision making implementation
Lower Decision inc idence mak ing of resource • quality •
governance decis ion making
NB: The model is depicted in l inear form as it is anticipated that it evolves from left to right (PS FP) over time
Persistent superior • firm performance
246
PAFP firms. As suggested by Hamel and Prahalad ( 1 994), for a firm to obtain the full
magnitude of a resource' s value, a governance rather than allocation perspective is required.
The results evident in this dataset suggest that both resource generation, of which the resource
governance variable is a part (in addition to resource leverage and resource leverage mechanisms
variables) and resource deployment (comprised of both resource governance and resource
allocation variables) are important.
Corporate level ski l l in resource governance decisions of which the core competency approach
advocated by core competency theory is an antecedent variable to the relationship between the
rate of resource governance decisions and subsequent persistent firm performance (refer to
F igure 6 .8) . As Penrose ( 1 959, p. 86) noted "no firm ever perceives the complete range of
services available from any resource, because the range of services recognised is for the most
part confirmed by the management 's existing ideas as to possible combinations." Heterogeneity
in resource governance decisions occurs as a result of variation in decision maker behaviour or
responses . The importance of corporate level ski l l is further suggested by the homogeneity
displayed by the potential confound variables across the three firm performance categories. The
homogeneity of corporate level commitment to the status quo variables suggests that the skills
managers bring to firms are more important than extant experience w ithin a firm. Furthermore,
the homogeneity of historical endowments provides an indication of the importance in how
resources are used rather than what resources are possessed by the firm. In other words,
resource governance decisions made regarding the acquisition and deployment of resources may
be a differentiating factor on the basis of corporate level ski l l . Although the in-depth analysis of
the decision making attributes of corporate level decision makers in the sample firms was
beyond the scope ofthis research, it remains an intriguing postulate to explore.
These two components of resource governance reinforce the comprehensiveness of the universal
understanding of the firm 's resources required by corporate level decision makers as specified
by the core competency theory. It can be argued that core competency theory is reliant on
corporate level ski l l in resource governance decisions in identifying, developing and deploying
core competencies. In addition, PIFP and PAFP firms may not fully understand the relationship
between resources and SCA (e.g., due to causal ambiguity). Therefore, they cannot necessarily
leverage the source of advantage (King & Zeithaml, 200 1 ) . Similarly, Prahalad and Hamel
( 1 990) argued that the value of competitive advantages can recede if such resources are not
identified, used or transferred.
247
Linking back to Hamel and Prahalad ' s research, the core competency v iew of the world
defin itely involves a corporate level role. As the core competency approach involves a firm
wide focus, long time frame views and significant investment, it is beyond the capacity of a SBU
to implement successfully. SBUs may actually imprison firm core competencies. Core
competencies are then of strategic importance. Core competencies if they are to be leveraged
over a number of industries, demand a corporate view of the firm. The core competency view i s,
therefore, actually foreign to the SBU view of the world and while there is some linkage
between SCA and the possession of a core competency, the core competency approach is unique
to corporate strategy and not to competitive strategy. The core competency view of the world
then has a role in the value created by corporate strategy because it is foreign to the business unit
view of the world. While there is cross- l inkage between SCA and having a core competency,
the core competency theory advocates a firm-wide view, that is, it is a corporate level concept
not a business unit mechanism. This explains why PIFP and PAFP firms appear to concentrate
on business unit loyalty and focus, rather than a firm-wide focus.
The expected characteristics of both PIFP and PAFP firms outlined above suggest that their
apparent predominant focus on the day-to-day, the perception that competitive strategy is the
mechanism to achieve performance, and the possible loyalty to SBUs, have led to a restricted
firm-wide approach. Therefore, the synergistic governance of the entire firm is a corporate
responsibi l ity. The core competency approach shows how corporate strategy can add value to a
firm. Corporate strategy then plays a critical role in the adoption of such a concept within firms.
Core competency theory is a different way of viewing a firm. Core competency approach may
be a more superior approach to achieving PSFP, although it appears the PIFP firms do not
necessari ly have the capacity to do so.
The relationship between a firm-wide guiding system, namely, the corporate level decision
making skil l approach and persistent firm performance has been established and similarities exist
with CoB ins and Porras's ( 1 994) view of core ideology that they found in visionary companies.
It can then be argued that both PIFP and PAFP firms appear to lack this sustained component of
the firm that does not change. A simi lar concept the Coli ins and Porras' s core ideology is the
construct of strategic intent as advanced by Hamel and Prahalad ( 1 989, 1 994) as a corporate
level mechanism that unifies the firm. In contrast, for PSFP firms, governance is embedded into
the internal structure of the firm . These factors are predicted to have contributed to both the high
level of resource governance decision making and the inabil ity to achieve the expected
performance outcomes.
248
The competency approach increases decision making qual ity as it may provide a common basis
for firm-wide communication and interaction (Orl itzky & Hirokawa, 200 1 ). The implications of
the core competency approach in terms of the corporate level decision making for PIFP and
PAFP firms involves uti l ising the core competency approach to enhance and improve their
decision making in order to achieve better performance outcomes. There are ways in which
decision making can be improved with in firms simply by the introduction and use of the more
appropriate decision making processes (i .e. , the core competency approach) . Hamel and
Prahalad ' s ( 1 994) core competency view of the firm governance should be embedded into PIFP
and PAFP firms which will assist in increasing the production of superior corporate level
decision making and, thus, for PAFP firms, reducing the overal l incidence of resource
governance decision making. Therefore, persistent firm performance is not the rate of decision
making over time; rather it is a function of the excellence in decision making over time.
Some relationship between the core competency view of the firm and PS FP appears to have been
observed. This is a supposition as core competencies were not specifically measured in this
p iece of research. This observation cannot be confirmed unless future research into mUltiple
organisations was undertaken where the researcher was actual ly entrenched into the firms and
determined the existence of core competencies. However, the argument made previously in
Chapter Two contended that this is inherently difficult to achieve due to the embedded and
causal ly ambiguous nature of core competencies at the moment.
Core competency theory, although it employs the appropriate unit of analysis, does not provide a
comprehensive explanation of the curv i l inear relationship between persistent firm performance
and the frequency of resource governance decisions. Instead, core competency theory considers
ski l ls are embedded in the firm rather than at the corporate level decision making level .
Furthermore, th is theory incorporates a number of noncorporate strategy level decisions which
were not measured in this piece of research and, thus, the association observed in this dataset
cannot be attributed solely to core competency theory.
6.4.2 Theoretical implications : Corporate level decision m aking skil l
Persistent firm performance has been found to be distinguished o n the basis of corporate strategy
specifically, the rate of resource governance decisions. This result suggests that an association
between corporate strategy and persistent firm performance exists. It should also be noted that,
although outside the scope of this piece of research, reverse causality (Le., the notion that firm
249
performance can influence corporate strategy) and reciprocal causality (e.g., corporate strategy
and firm performance move together as the firm changes) may provide additional clarity to the
understanding of the corporate strategy-firm performance association. The aim of this research
was to determine whether corporate strategy actually contributes to persistent firm performance,
not to provide an in-depth analysis of the decision making practices of corporate level decision
makers. However, previous evidence has been presented which suggests that decision makers
have a significant role on firm performance (Hrebiniak & Joyce, 1 985) . It is then reasonable to
conclude that corporate level decision making ski l l is a component of resource governance
decision making (particularly in using the core competency approach as a frame of reference) .
Furthermore, it has been noted, in addition to firm core competencies, the notion of personal
competencies may exist; in other words, the ski l l s evident in individuals or small groups (Turner
& Crawford, 1 994). If this view is extended, it would appear that corporate level decision
making skill is not solely embedded into the routines of a firm, which suggests that if the skilled
individual left the firm, the qual ity of corporate level decision making would reduce (unless
replaced by a superior corporate level decision maker). This raises questions for future research:
is the corporate level decision making skill institutional ised into firms or does it represent a
personal competency? And if the qual ity of corporate level decision making is found to be due
to personal competencies, can it be codified? However, as the firm performance of the sample
firms was persistent over time, this indicates that these ski l ls may be more firm specific than
individual specific.
This research went beyond upper echelon theory as although the behavioural aspect of decision
making was deemed important ( i .e., corporate level decision making ski l l), this research
measured one specific set of decisions, namely, corporate strategy, rather than concentrating on
either the demographic or psychometric characteristics of the decision makers. This perspective
then provides insight into why corporate level decision making ski l l may assist in explaining the
association between persistent firm performance and the frequency of resource governance
decisions measured. However, inconsistent empirical evidence has been presented suggesting
that corporate level decision making may not have a significant impact on firm performance
(Hannon & Freeman, 1 977; Lieberson & O'Connor, 1 972) . Empirical evidence appears to
support the phenomenon of corporate level decision making skill as a superior explanation for
the observed heterogeneity in the rate of resource governance decisions than the other alternative
explanations.
250
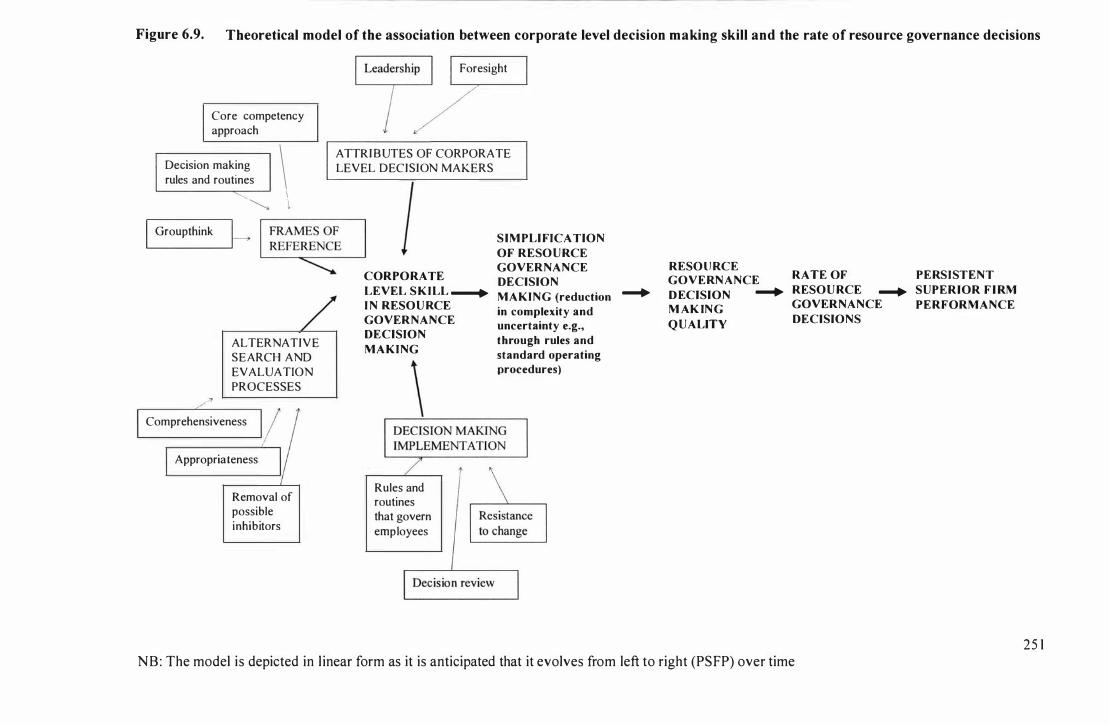
Figure 6.9. Theoretical model of the association between corporate level decision making skill and the rate of resource governance decisions
Core competency approach
Decision making \ rules and routines
� \ Groupthink �
ALTERNATIVE SEARCH AND EVALUATION PROCESSES
Comprehensiveness
Appropriateness
Removal of possible inhibitors
Foresight
ATTRIBUTES OF CORPORATE LEVEL DECISION MAKERS
CORPORATE
LEVEL S K I LL ---+ I N RESOU RCE GOVERNANCE DECISION
MAKING
\ Rules and routines that govern employees
S I M PLI FICATION
OF RESO U RCE GOVERNANCE DECISION
MAKING (reduction -+ in complexity and uncertainty e.g.,
through rules and
standard operating procedures)
RESO U RCE GOVERN ANCE RATE OF PERSISTENT
D ECISION -+ RESOU RCE -+ SUPERIOR F I RM
M AK IN G GOVERNANCE PERFORMANCE
QUALITY DECISIONS
NB: The model is depicted in l inear form as it is anticipated that it evolves from left to right (PS FP) over time 25 1
Corporate level decision makers do control, to a large extent, the corporate strategy decision
making process. Asymmetries in corporate level skil l exist across finns and the reasons
associated with heterogeneous decision making have been explored. Heterogeneous finn
performance can be attributed to the ski l l of the corporate level decision maker in resource
governance decision making within PSFP finns, whereby the skil l corporate level decision
makers uti l ise al lows decision making processes to be simple (but not simpl ifying assumptions)
and, thus, more effective as possible (refer to F igure 6.9) . Simpl icity reduces the complexity and
uncertainty that firms face. Consequently, the quality of decision making within PSFP finns is
higher, which results in a lower rate of resource governance decisions. The relationship between
different types of resource governance decisions and persistent finn perfonnance is an additional
avenue of research that needs to be explored. The premise behind the corporate level decision
making skill perspective model (refer to Figure 6 .9) is that PSFP corporate level decision makers
are parsimonious corporate strategy decision makers who are able to simplify their decision
making in such a manner that fewer, more appropriate decisions are made. There is a certain
parsimony or clarity of thought "driven" by corporate strategy that enables this to occur. Hamel
and Prahalad ( 1 989, 1 994) argued that an important aspect of the value of strategic intent, as a
corporate level construct, is the provision of clarity and alignment. These attributes then provide
the drive to achieve the stated strategic intent. This research supports this notion as it was noted
in Chapter Three, the importance of corporate strategy as a mechanism for providing a
consistent, firm-wide frame of reference or dominant logic for all employee decision making.
For example, competitive strategy should be derived from the stated corporate strategy.
Therefore, in PS FP firms' corporate strategy does matter.
In comparison, PIFP firms, although they make a simi lar rate of decisions to PSFP firms, they
are either not making corporate level dec isions (e.g., adopting a laissez-faire approach to
corporate decision making) or if they are, the decisions made are inappropriate leading to inferior
firm performance. The results suggest that although the level of corporate level decision making
is simi lar, the characteristics of these decisions are l ikely to be different between firm
performance categories, that is, the quality of the corporate level decisions made within P IFP
firms is lower than that evident in PSFP firms. This can provide an explanation into why
although PIFP firms make a simi lar number of resource governance decisions, their perfonnance
is inferior. Therefore, in PIFP firms corporate level decision makers perceive corporate strategy
does not matter.
252
For PAFP firms, it can be proposed that corporate strategy matters, sometimes. The model also
suggests that PAFP firms possess lower corporate level decision making skil ls in resource
governance, meaning that, again l ike PIFP firms, they make higher rates of incorrect decisions.
However, unlike PIFP firms, the corporate level decision makers within PAFP firms may
recognise that they have. made an inferior decision and make additional decisions to correct it.
As corporate strategy is expected to provide the basis for all organisational actions, the impl icit
assumption is that poorly constructed or inappropriate corporate strategy can greatly impact
PSFP.
Overall , the corporate level decision making ski l l perspective indicates that firms may increase
the skil l capacity of decision makers. Perhaps transformation from P IFP to PS FP may be
achieved via an inflection point, in other words, the acquisition of superior corporate level
decision making rather than increasing the rate of corporate level decision making. The
characteri stics of decisions made at the corporate level by both PIFP and PAFP firms, then,
could be altered to increase the qual ity and appropriateness. This perspective also advocates that
performance can shift from PAFP to PSFP through the same mechanism, although the impact of
skil led corporate level decision makers would alter difference aspects of corporate level decision
making. In other words, for PIFP firms, superior corporate level decision making would assist in
the identification of correct goals and opportunities whereas in PAFP firms, skilled corporate
level decision makers could reduce the complexity apparent in these firms by al igning SBU goals
to firm-wide goals. Backward inflection points could also potentially occur whereby PS FP firms
may hire inferior corporate level decision makers which could influence firm performance from
PSFP to PAFP or more drastical ly from PS FP to PIFP.
These results contest arguments that corporate strategy has a l imited impact on PSFP.
I nstead, the findings of this research suggest that corporate strategy, through the corporate level
decision making ski l l evident in resource governance decisions, may provide a firm with the
abi l ity to achieve simplicity in their corporate strategy decision making which leads to successful
performance outcomes. Furthermore, the curvi l inear association between the frequency of
corporate strategy decisions and persistent firm performance may indicate a point where fewer,
but superior decisions result in greater firm performance. The results, therefore, suggest that
PSFP arises from not necessari ly the possession of resources, but how these resources are used.
On the basis of the theoretical, conceptual and empirical observations that have arisen from this
research, the fol lowing propositions can be advanced:
253
Proposition 6.
Proposition 7 .
Proposition 8.
The shift in firm performance from P I FP to PSFP can be largely
achieved through more appropriate corporate level decision
making as opposed to more appropriate resources.
The inflection point hypothesis suggests that PIFP and PAFP firms
can transition to successful performance outcomes on the basis of a
critical change in the capacity of the firm ' s corporate level decision
making.
Corporate level decision making ski l l can be institutionalised and
embedded into firms, that is, it is more firm specific than
individual specific.
Research should be broadened to investigate whether corporate level decision making is an
individual-level or firm-level phenomenon. Work conducted under this research stream could
answer if ski l l is embedded or institutionalised into the firm, or does it reside solely in
individuals? And is this phenomenon of corporate level decision making ski l l heterogeneously
distributed across PIFP, PAFP and PSFP firms?
Overall, this perspective vIews that the quality of corporate level decision making has a
significant impact on persistent firm performance whereby the skil ls these decision makers
employ within their firms can result in superior firm performance. In other words, it is apparent
that there are some aspects of "command" evident and these can explain, at least in part, the
heterogeneity of firm performance that exists. However, this research does not support the
omnipotent leader view of persistent firm performance as this would then suggest that corporate
strategy arises solely from an individual. This research observed that PSFP corporate level
decis ion makers, as a whole, possess superior corporate level decision making ski l l . In addition,
changes in corporate level decision makers were observed in all the sample firms (except Mr
Manoogian who was a director and CEO of Masco for 40 and 1 9 years respectively) suggesting
that the dominance of a single corporate level decision maker did not totally control the
corporate strategy of the firm. The results would also suggest that the dominance of one
individual possessing inferior corporate level decision making ski l ls could have a dramatic effect
on the performance of that firm . However, determining if the ski l l of a dominant corporate level
decision maker is responsible for the performance outcomes of a firm is a question for future
research; in other words, does the ski ll of individual corporate level decision makers matter, and,
254
if so, to what extent (for example, are any of the four influences on corporate level decision
making discussed here more important than the others)?
6.5 EMPIRICAL, CONCEPTUAL AND OPERATIONAL
IMPLICATIONS
This research followed the boundaries of hypothetico-deductive science, which introduced
decision making required by science, namely, precision was controlled by p < .05. However, a
number of impl ications for the conceptual l iterature, in terms of, firstly, both the definition of
corporate strategy and its attributes and the conceptual framework; secondly, the
operationalisation of corporate strategy at its attributes can be advanced and, lastly, empirical
implications, in other words, the association with persistent firm performance.
6. 5 . l Strategic intent
a) Conceptual implications for strategic intent
Although this research did not uncover a statistical ly significant relationship between strategic
intent and firm performance, some impl ications to the conceptualisations of both strategic intent,
and especially the construct of organisational direction, could be advanced. The inclusion of
organisational direction into the conceptual framework of corporate strategy has provided
precision to the conflicting definitions of corporate strategy previously employed.
Organisational direction was recognised as a corporate level decision and consequently, remains
a significant and vital component of corporate strategy.
The use of strategic intent as the mechanism of organisational direction added to the
understanding of the importance of strategic intent and the difficulties inherent in measuring it
without direct access to the firm. Nevertheless, this research was able to clearly articulate the
deconstruction of Hamel and Prahalad 's ( 1 989, 1 994) concept of strategic intent ( i .e., senses of
direction, discovery and destiny) into a concise conceptual model of its components (i .e., five
indicators, refer to Section 3 .9 . 1 ) . These five key indicators provide the most important aspects
that appear foundational to the construct of strategic intent, and possibly to the various
alternative measures of organisational direction. Furthermore, strategic intent, as measured in
thi s research, encompassed both quantity and excel lence aspects of strategic direction which
enhanced construct valid ity.
255
This research also suggests that like the construct of corporate strategy, the construct of
organisational d irection has been fragmented into various separate concepts (e.g., mission,
purpose or v ision) resulting in imperfect cumulative knowledge. Integrating the existing
organisational direction constructs appears to have been limited. It is recommended that the field
should converge towards a common definition of organisational d irection rather than advancing
further, often contradictory concepts. In other words, the use of strategic intent as the most valid
concept of organisational direction may provide a step towards a commonly employed measure
as it appears to incorporate the other concepts. It is proposed that the conceptual model
employed here could provide the basis for further empirical investigations into the measurement
of strategic intent.
b) Implications for the operationalisation of strategic intent
Much research to date has focused on measurements of, firstly, the possession of statements of
organisational d irection and, secondly, the characteristics, actual or ideal, of those statements
(e.g., Ire land & Hitt, 1 992; Klemm et aI, 1 99 1 ) . The organisational d irection literature is
extended as an alternat ive way of measuring organisational direction was uti l ised, namely,
measuring the presence of strategic intent by means of changes in strategic intent and indicators
representing excel lence in strategic intent, in addition to statements of strategic direction.
Secondly, th is research measured firm-wide strategic intent in a general ly more complete and
embedded manner in comparison to the other concepts of organisational direction previously
employed. This research then has enhanced the clarity of the conceptual framework of the
construct of strategic intent. The operational isation of strategic intent into c learly measurable
indicators provides a further foundation for the continued empirical measurement of the to date
lowly measured construct of strategic intent. An avenue for future research has been highlighted
whereby these indicators of strategic intent could be uti l ised when a researcher is able to gain
access into firms.
c) Empirical implications: The relationship between strategic intent and firm performance
Strategic intent was thought to be a prerequisite for superior firm performance due to its impact
on, for example, human capital, communication, firm legitimacy and identity and controll ing
firm-wide decision making, and that if missing, underperformance would result (Ambrosini &
Bowman, 2003 ; Bontis & Dragonetti, 1 999; Fawcett et aI, 1 997; Finlay, 2000; Hamel &
Prahalad, 1 994; Love et aI, 2002; Westley, 1 990). Instead of the expected l inear association, a
curvil inear relationship was found to exist in this dataset, (refer to Figure 6. 1 ). Due to the
256
nonsignificant results, th is dataset could not support or reject the prior empirical research that
concluded strategic intent impacts on persistent firm performance (whether positively or
negatively). While the results did not confirm this conclusion, in a l inear fashion, they did
provide evidence that the level of strategic intent evident within superior firms varied as
identified by Monroe (2002). Strategic intent may be an attribute of corporate strategy but it
appears to have a minor influence on persistent firm performance.
6 . 5 .2 Organisational domain
a) Conceptual implications for organisational domain
To date, organisational domain has either been conceptual ised on the basis of the expected
outcome of organisational domain decisions, namely, synergy or alternatively, in terms of
specific organisational domain decisions (e.g., diversification or downsizing). The
conceptualisation employed in this research attempts to move from the predominant focus on
diversification to a more complete approach to organisational domain decisions. This research
offers a novel approach to the concept of organisational domain as it recognised the importance
of all organisational domain decisions and thus sought to conceptuali se organisational domain in
its entirety. The incorporation of both quantity and excellence aspects of organisational domain
enhanced construct validity. The results (although not statistical ly significant at the p < .05
level) seem to suggest that the rate of organisational domain decisions could distinguish between
categories of persistent firm performance. Further research in the area of organisational domain
would be wel l advised to focus on all organisational domain decisions rather than concentrating
on a specific decision. This avenue of research could uncover underlying aspects of
organisational domain decisions that could be a source of performance heterogeneity.
b) Implications for the operationalisation of organisational domain
Thi s research broke new ground as it operationalised organisational domain decis ions in a
broader manner than that previously employed. In other words, it was possible to observe the
presence of organisational domain decisions by measuring decisions regarding decreases and
increases in organisational domain, and joint venture decisions (refer to Section 3 .9 .2). This
research then measured actual organisational domain decisions, that is, directly measured the
phenomena of interest. Therefore, an alternative, more specific measure of organisational
domain decisions was introduced in comparison to much previous research which relied on
proxies of relatedness which is a proxy for synergy (i .e., measurement of an outcome rather than
organisational domain decisions per se), primarily involving numerical reporting data. The
257
second area of previous organisational domain research has focused on the measurement of
specific organisational domain dec isions. As all organisational domain decisions were
empirical ly measured, irrespective of any specific type of organisational domain decisions, an
extension has been made to the research stream. Again, th is provides a more complete
representation of organisational domain than generally has been previously presented.
c) Empirical implications: The relationship between organisational domain andfirm performance
As noted in Chapters Two and Three, organisational domain was expected to impact on firm
performance due to the effects of synergy and economies of scope that arose from the
management of resources across the firm . To date, the evidence that has been presented appears
contradictory (e.g., Bowman et ai, 1 999; Christensen & Montgomery, 1 98 1 ; Delmas & Tokat,
2005 ; Grant & Jammine, 1 988; Hitt et ai, 1 997; Lecraw, 1 984; Michel & Shaked, 1 984; Rumelt,
1 974, 1 982). However, other research found that both diversification and geographical
expansion experienced a curvi linear relationship with performance (Grant & Jammine, 1 988;
H itt et ai , 1 997; Lu & Beamish, 2004; Misangyi et ai, 2006; Palich et aI , 2000). Therefore, the
curvi l inear relationship between organisational domain and persistent firm performance (refer to
Figure 6.2) found (although statistically nonsign ificant at the p < .05 level) appears to provide
some support for this empirical evidence. Their work is then extended as it was found that the
incidence of organisational domain decisions as measured here reached a point where additional
decisions impacted negatively on performance. However, the nonsignificant result may support
the view that determining where the firm operates has a limited effect on persistent firm
performance. This result then suggests val idation of the main conclusion of the corporate effects
research stream, namely, that industry effects are minor to corporate effects. Organisational
domain may be an attribute of corporate strategy but it appears to have only a m inor influence on
persistent firm performance.
6.5 .3 Internal governance
a) Conceptual implications for internal governance
The conceptualisation of internal governance employed in alternative pieces of research
generally viewed internal governance as representing a number of distinct constructs, that is,
research on organisational design is usually performed separately of organisational structure.
Hamel and Prahalad ( 1 994) introduced the term "strategic architecture" as an entire internal
governance system. However, this concept of internal governance provides a more high level
258
view of internal governance and appears not to have been incorporated into the conceptual
l iterature on internal governance. In addition, the concept of strategic architecture does not focus
on internal governance decisions as such.
Some l iterature has measured the changes in internal governance as did this research (e.g., the
observed movement from the U-form to M-form structures, Chandler, 1 962; Mayer &
Whittington, 1 999), although the previous research did not focus on the presence of internal
governance decisions. Having said that, the findings that the rate of internal governance
decisions may be a source of distinction between firms (although not statistically significant at
the p < .05 level) provide support for the v iew that changes to a firm ' s internal governance
mechanism should be a considered process rather than a reactionary or overmanipulated one. It
is also provides some indirect evidence of the view that successful internal governance involves
aspects of fit and congruency within the firm's environment (Burns & Stalker, 1 96 1 ; Lawrence
& Lorsch, 1 967; Woodward, \ 965) whereby once fit is achieved, more internal governance
decisions are not required, and are, in fact, detrimental to the achievement of successful
performance outcomes. Instead, success can be attributed to the fewer adjustments in internal
governance.
b) Implications for the operationalisation of internal governance
The method of operational ising internal governance here was distinct from much previous
research which focused on determining what the internal governance mechanism of a particular
firm was at a given point in time, for instance, specifically measuring aspects of organisational
design or structure (e.g., Child & McGrath, 200 1 ; Mi ller & Friesen, 1 980). Instead, this research
measured, firstly, changes in internal governance decisions and, secondly, the consequences of
internal governance . Actual internal governance decisions were measured, thereby introducing
an alternative, more specific measure of internal governance decisions in comparison to much
previous research presented. Furthermore, this research extends prior research as it measured
internal governance in its entirety (as currently defined), not just one aspect of internal
governance.
c) Empirical implications: The relationship between internal governance and firm performance
Although, internal governance has been viewed as being heterogeneous across firms, and thus,
could provide a mechanism for delivering PSFP, the prior empirical research suggests that
internal governance is contextual and, thus, successful internal governance is dependent on each
259
firm ' s situation. This has made it difficult to compare the previously presented research findings
to the results obtained from this piece of research . However, this research does reveal that the
frequency of internal governance decisions appears to reach a point where additional decisions
impacted negatively on persistent performance (refer to Figure 6.3) . The curvi l inear
phenomenon does provide some indirect evidence supporting Barney et a i 's (200 1 ) contention
that PSFP results from heterogeneity in the abil ity of firms to implement mechanisms of internal
governance. Internal governance may be an attribute of corporate strategy but it appears to have
a m inor influence on persistent firm performance.
6 . 5 .4 Resource governance
a) Conceptual implications for resource governance
Important conceptual implications have been advanced by this research as, firstly, resource
governance although theoretically defined, has not general ly, to date, been conceptual ly defined
or operationalised. This research provides an exploratory step towards both. Hamel and
Prahalad ( 1 994) view of resource governance was followed as they conceptual ised resource
governance as a construct that was beyond the concept of resource allocation. Resource
allocation has been conceptually viewed as an important aspect of corporate level decisions and
has often been closely connected to organisational domain. Resource allocation usually
perceives of a resource as having only one use: a resource can only be used a l imited number of
times. Resource al location then considers that resources "somehow" exist within firms and that
they should be allocated to the "best" use. However, resource governance views a resource as
having the potential to have multiple uses over time, for example, core competencies and
resource leverage. Resource governance, therefore, encompasses the entire Iifespan of a
resource, namely, resource creation, acquisition, development, review and protection.
The stat istically significant results regarding heterogeneity in resource governance provides
support for the importance of resource governance on persistent firm performance and, secondly,
that resources are governed differently across categories of firm performance. It is reasonable to
conclude that the possession of superior resources may be a lesser factor in persistent firm
performance than how those resources are actual ly governed. Therefore, resource governance
matters.
b) Implications for the operationalisation of resource governance
As noted above, resource governance has only been operationalised on a l imited basis to date.
260
Hamel and Prahalad's ( 1 994) view of resource governance was used as the foundation for the
operationalisation of resource governance. This research then measured actual resource
governance decisions, that is, directly measured the phenomena of interest. Consequently, this
research introduced an alternative, more specific measure of resource governance decisions in
comparison to much previous research which had generally measured resource allocation.
c) Empirical implications: The relationship between resource governance and firm performance
Although the majority of theoretical discussion and empirical research has focused on resource
governance centred on resource al location, it was suggested that resource governance
encompassed more, namely, the creation, accumulation, protection and leverage of resources
(Hamel & Prahalad, 1 994) . PSFP can result from the continual rebui lding and superior
util i sation, exploitation and renewal of resources (Hamel & Prahalad, 1 994; Harrison et aI,
1 993) . The core competency and corporate level decision making ski l l theories, as discussed
above, provide some evidence in support of this research stream. Interestingly, it was revealed
that the PSFP category made significantly fewer resource governance decisions than both the
lower firm performance categories (refer to Figure 6.4).
Of the four corporate strategy attributes, this research advanced a unique contribution whereby it
provided empirical evidence that resource governance had the greatest impact on persistent firm
performance on the dataset collected, indicating that it is the most important underlying attribute
of corporate strategy of those measured and or advanced by theory to date. The other important
contribution to knowledge is that the incidence of resource governance decision making can be
used to distinguish the PSFP category from both the PAFP and PIFP categories. It would be well
advised for future research to further the characteristics of superior resource governance decision
makers and determine whether these specific decision making characteristics impact of firm
performance singularly or as a whole. And are these characteristics embedded into the firm or
are they el iminated if the superior corporate level decision maker is absent?
6 . 5 . 5 Corporate strategy
a) Conceptual implications for corporate strategy
As demonstrated in Chapter Three, corporate strategy has become a ubiquitous concept. The
conceptual model presented in this research views corporate strategy as a series of deliberate
strategic choices made at the corporate level of a firm, encompassing four attributes. A number
26 1
of authors argued that corporate strategy i s only relevant to multiple business or d iversified firms
(e.g., Beard & Dess, 1 98 1 ; Bergh, 200 I ; Bourgeois, 1 980; Campbell & Faulkner, 2003 ; Chaffee,
1 985 ; Ghemawat & Ricart I Costa, 1 993; Grant, 2002a; Hitt & Ireland, 1 985 ; Porter, 1 99 1 ; Stalk
et aI, 1 992). Evidence was found that corporate strategy existed in al l 1 5 of the firms sampled
including those firms operating within one industry (i .e. , Amerada, BNSF, CMS, Masco,
Northrop, Raytheon, Union Pacific and Whirlpool). The definition of corporate strategy
employed in this research, that corporate strategy i s a level of strategy that is important to all
firms, now appears to be supported .
The construct of corporate strategy employed in th is research focused on an appropriate unit of
analysis, namely, corporate strategy is a firm-wide construct. Corporate strategy is beyond
SBUs. It should unite the firm into a firm-wide framework. Corporate strategy considers the
characteristics of the entire firm and the environmental impacts across the entire firm. Clearly,
additional research is required that measures the influence of corporate strategy on firm-wide
performance.
One of the objectives of this research was to identify the attributes of corporate strategy. Every
effort was made to encompass various conceptualisations of corporate strategy into an
innovative, accumulated definition, namely, that corporate strategy was comprised of strategic
intent, organisational domain, internal governance and resource governance. Due to the three
statistical ly nonsignificant at the p < .05 level results for strategic intent, organisational domain
and internal governance, it was difficult to conclusively state whether corporate strategy is a
unidimensional construct (comprising of only the statistical ly significant resource governance) or
a multidimensional construct (comprising all four corporate strategy attributes).
The seeming importance of resource governance decisions may indicate that the construct of
corporate strategy may be more complex than initially contemplated, involving both
microelements and macroelements. Resource governance decisions may correspond to a macro
element within the construct of corporate strategy (i .e. , core competencies) whereas the
statistical ly nonsign ificant attributes might actual ly relate to a more microlevel of corporate
strategy. Th is may provide an explanation for the nonsignificant results obtained for strategic
intent, organisational domain and internal governance.
Alternatively, the complexity of the corporate strategy construct may involve levels of
importance across the four attributes whereby all the attributes are important, but a hierarchy
262
may exist. For example, the results support the importance of resource governance decisions in
comparison to the other attributes. Nevertheless, an ordering of importance may also exist for
strategic intent, organisational domain and internal governance. Unfortunately, relatively l ittle is
known about the relationship between the four attributes. However, theory suggests that they
should be interconnected and al igned. Further research would greatly assist in the understanding
of the construct of corporate strategy and how it impacts on persistent firm performance. The
findings that the rate of resource governance decisions had a significant impact on firm
perfonnance heterogeneity advances the construct defin ition and the conceptual framework of
corporate strategy. Resource governance was then an important mechanism by which corporate
strategy influences persistent firm performance. In addition, all four of the attributes displayed
the same curvi l inear phenomenon which suggests that the same principle may underlie the entire
corporate strategy construct. In other words, success is not about increasing the number of
corporate strategy decisions, rather firm performance can be attributed to the quality of corporate
strategy decisions.
b) Implications for the operationalisation of corporate strategy
As noted in Chapter Two, the prevai l ing theoretical paradigms of 10 and RBT (except for the
core competency and ski ll in corporate level decision making theories) related to SCA did not
incorporate either firm performance or corporate strategy. Corporate strategy has, consequently,
received less attention from empirical researchers in regards to its impact on firm performance.
Although prior research suggested that corporate strategy had a minor effect on BUP, limited
research had been conducted utilising firm-wide measures of firm performance. A starting point
with respect to measuring the actual incidence of corporate strategy within firms has been
provided. As the statistically sign ificant results do indicate support for a relationship between
corporate strategy and persistent firm performance, clearly further empirical research should be
conducted.
c) Empirical implications: The relationship between corporate strategy and firm performance
A predominant assumption with in the strategic management l iterature suggests that PSFP can be
attributed to corporate strategy which is formulated and chosen by the corporate level decision
makers. This view contrasts with the main assumption evident within the empirical l iterature
presented in Chapter Two, namely, decisions made at the corporate level have a l imited impact
on both business unit and firm performance. This assumption is unwarranted when one
considers the influence of corporate strategy evident in all firms in reality which may
263
s ignificantly influence both business unit performance and the firm as a whole. These decisions
are corporate strategy decisions. Consequently, persistent superior firm performance may result
from more than just products, markets, or industries. Corporate strategy has been found to
matter.
6.6 IMPLICATIONS FOR THE
STRATEGIC MANAGEMENT
FIELD OF
The strategic management literature should be revised to recognise the importance of corporate
strategy, in addition to the dominant view that competitive strategy impacts on firm performance.
A clear distinction should then be made regarding the use of the term corporate strategy. As
noted in Chapter Three, clarity in the use of the term "corporate strategy" would assist in the
recognition that it is an important component of organisational strategy. Corporate strategy is
then distinct from all the strategy employed within a firm.
Therefore, it is proposed that the definition of corporate strategy should be a clearly defined
construct like competitive strategy, for example, l ike the definitions outlined in Chapter Three.
The second important contribution of these findings is the apparent support for the inclusion of
the four attributes as representing corporate strategy, that is, all four attributes were observed in
all firms of the sample. Thus, th is research supports the prior theoretical views of, for example,
Andrews, 1 97 1 ; Bower, 1 982; Chandler, 1 962; Lynch, 2003 ; Nelson, 1 99 1 , who argued
organisational direction is also a component of corporate strategy. A universal ly accepted
definition would encourage, firstly, greater theoretical discussion on the role of corporate
strategy in firm performance (e.g., the underlying mechanism, possible universal "laws" of
superior corporate strategy) and, secondly, further empirical research into the construct of
corporate strategy.
Only corporate level decisions were measured in this piece of research. There is then evidence
that important decisions that could be the source of firm performance heterogeneity are made at
the corporate level, not the business level . In other words, the decisions measured here
represented corporate strategy decisions, not dec isions related to competitive strategy.
Corporate strategy has been found to account for some firm performance heterogeneity.
Corporate strategy is, therefore, important and it matters, especial ly to PSFP firms. More
specifical ly, corporate strategy does actual ly contribute to firm performance whereby corporate
264
level resource governance decision making i s critical and does matter to PSFP. Therefore,
corporate strategy should also be more ful ly incorporated into strategic management.
A fresh and unique approach to firm performance, namely, the construct of PSFP has been
presented. PSFP is rare and correspondingly difficult to achieve (e.g., Wiggins & Ruefli, 2002)
suggesting SCP's view is incorrect ( i .e . , competitive positioning which considers strategy as
duplicating competitors' strategy or employing generic strategies). Recognition should also be
made that SCA may be only one mechanism for achieving PSFP. The current view prevalent
with in the strategic management literature is that once a firm achieves SCA, it automatically
ach ieves performance outcomes. This research proposes that, in addition to achieving SCA,
other factors, such as corporate strategy, can also result in PSFP. Clearly, future research could
focus beyond SCA, onto the achievement of PSFP, namely, are there additional ways of
ach ieving PSFP beyond solely SCA? Is there a relationship between functional strategy and
PSFP, separate from the relationship between functional strategy and SCA?
The rareness of PSFP may indicate that superior corporate level decision making ski l l is also
rare. This points the way for future research; for example, investigating the role of corporate
level decision makers. For PSFP firms, corporate level decision makers appear to minimise
uncertainty, conflict, complexity, ambiguity, risk and bias. This suggests that relevant aspects of
the decision making l iterature should be incorporated into the prevailing strategic management
paradigm, namely, resource based theory, to a greater extent than it has been to date.
In summary, strategic management seeks to understand the nature of organisational performance.
The heterogeneity of firm performance has been observed to be caused from a trait which sits
within the firm, namely, the corporate level decision making ski l l . It can then be expected that
the performance of firms can alter over time. The implication for strategic management 's aim of
discovering factors to enhance firm performance is the possible abi l ity of firms to shift the firm
performance, in other words, from PIFP to PSFP or from PAFP to PSFP. However, the PAFP
firms appear to be stuck in a "busy-ness" paradigm and, therefore, it may be more difficult for
these firms to transform to PSFP.
6.7 I MPLICATIONS FOR PRACTITI ONERS
From the perspective of people who create, adopt and use corporate strategy, the statistically
nonsignificant results sti l l provide important and relevant contributions to knowledge. For
265
practitioners, these results suggest that although the incidence of strategic intent, organisational
domain and especial ly, internal governance, was s imi lar for both the PI FP and PSFP categories,
a difference exists in persistent firm performance (refer to Figures 6. 1 - 6.3) . This pattern
suggests that the same underlying principle may exist across the entire corporate strategy
construct, namely, persistent firm performance is dependent on the corporate level decision
making skill evident within firms. If this principle is extended, it is reasonable to conclude that
firms may be able to directly transition from inferior to superior firms.
The phenomenon of the movement of firms from inferior to superior firm performance was also
established by Coli ins (200 I ) . Coli ins analysed annual series data which was gathered using a
large research team. While being relatively weak from a methodological perspective, CoBins
observed that the PIFP firms he studied, over time became better than averagely performing.
The process that was then adopted involved a direct shift from PIFP to PSFP (almost omitting
PAFP as a transitional stage). Therefore, this piece of research can be v iewed as extending
Coll ins's observation as it is reasonable to conclude that th is outcome ought to be ach ieved (refer
to Proposition 7 on page 250). It may not be a matter of fol lowing the curvi l inear phenomenon
observed from PIFP to PAFP and then PSFP, as firms should be able to implement the right ( i .e.,
qual ity) sort of decisions in order to achieve this outcome.
Some commonality of the categories of performance appears to exist between both pieces of
research. Unsurprisingly, considering the selection techniques uti l ised by Coli ins, none of the
firms that comprise the sample of 1 5 firms for this research were identified by Coli ins as good
to-great firms (by the criteria Coli ins employed, it was be expected that these firms would have
been classed as PIFP). Three of the sample firms employed in th is research were considered but
eliminated from his dataset due to either incomplete CRSP data before 1 975 (CSXC) or their rise
in performance was not sustained (Masco and Raytheon). Thi s indicated that Col i ins expected to
find some movement in performance displayed by these three firms. None of Coll in' s 1 1 good
to-great firms were included in the PSFP category. Two were not included in the download of
CRSP data (Fanny Mae and Phi l l ip Morris), three were categorised as PIFP firms (Circuit C ity,
Kroger and Walgreens) and, lastly, six firms were classed as PAFP firms (Abbott Labs, Gil lette,
Nucor, Pitney Bowes and Wel l s Fargo). Of his 1 1 direct comparison and six unsustained firms,
only three (one PIFP and 2 PAFP firms) were inc luded in the population of firms as determined
by this research ( 1 0 were not included in the down load of CRSP data and the remaining four
were characterised by incomplete SMP data).
266
6.7 . 1 Implications for PIFP firms
Some key implications for the PIFP category are now discussed. The PI FP firms may possess
admirable elements as they survived during a period in which (although it outside the scope of
th is research) many other firms were acquired or dissolved. It should then be recognised that the
performance of the PI FP firms is relative to the other two firm performance categories. Al l four
of the attributes displayed the same curvi l inear phenomenon which suggests that the same
principle may underl ie the entire corporate strategy construct, namely, it appears that merely
increasing the incidence of corporate strategy decision making evident within a PIFP firm could
only result in increased firm performance to the PAFP level.
However, the curvi l inear phenomenon observed in this research suggests that a PIFP firm may
choose to achieve the PSFP outcome as it may not be a matter of becoming a P AFP firm before
becoming a PSFP firm. The curvi l inear nature of the phenomena observed appears to involve
inflection points. In other words, it appears as though PIFP firms can transition to PSFP without
having to go through the PAFP stage. This is in contrast to other research which suggests firms
step from stage to stage; for example, Gluck, Kaufrnan and Walleck ( 1 982) observed that firms
move through stages as their strategic management ski ll increases.
Through the concept of inflection points, it can be argued that firms can transition directly from
PIFP to PS FP (i .e. , improvement in firm performance) in a relatively short time frame (i .e . , the
process is not gradual) without the anguish of PAFP stage. An inflection point can be created
when a PIFP firm, for example, can achieve transition to PS FP by increasing the corporate level
decision making skill evident within their firms. This increased corporate level decision making
ski l l for PIFP firms, then broadens the decision making frames of reference and assists in the
identification of appropriate firm-wide aims, thus, producing qual ity resource governance
decision making. An example of an inflection point is the appointment of a new CEO, who then
replaces the top management team with new recruits. This influx of corporate level decision
making skill i ncreases the capacity for precise and correct decision making.
The PIFP firm could then place the right sort of decisions in play in order to achieve that
outcome. First, PI FP firms should recognise the importance of corporate strategy on persistent
firm performance. Second, PIFP firms, instead of increasing the incidence of their corporate
strategy decision making, should focus on making qual ity corporate strategy decisions. In other
words, for PIFP firms, it is about making about the same number of decisions as PSFP firms do,
267
and l ike the PSFP firms, ensuring that these decisions are significantly better in terms of quality.
The corporate level decision making ski l l perspective contends that increasing the capacity of
PIFP firms to make qual ity corporate strategy decisions can influence the movement to the PSFP
category. This can be achieved by either hiring appropriate quality corporate level decision
makers or formulating and implementing qual ity decision making mechanisms (which is a
s lower method). However, PI FP firms should be careful not to introduce complexity into their
corporate level decision making practices.
6.7.2 Implications for P AFP firms
For PAFP firms, the process to achieve PSFP could be viewed as more difficult as the curvi l inear
association observed in this research seems to indicate that PAFP firms should decrease the
incidence of corporate strategy decision making. However, difficulties may exist in separating
inferior decisions from superior decisions due to, firstly, the lack of managerial time available
due to the perceived need to react to the environment and to continue to make decisions.
Secondly, further difficulties may also exist due to the need to rapidly develop a comprehensive
and appropriate decision evaluation and review processes and, lastly, the perceived lack of
priority of corporate level strategy and a firm-wide approach. If PAFP firms attempt to increase
the decision making activ ity at the corporate level, the curvi l inear relationship found suggests
that it wil l not result in improved firm performance. Instead, the higher rate of corporate level
decision making may result in simi lar performance outcomes that they are currently
experiencing.
Again like PI FP firms, PSFP could result if the PAFP firms obtained access to qual ity corporate
strategy decision makers who cou ld then alter the corporate level decision making process so
that, firstly, complexity is reduced, secondly, changing the focus from the SBU to a firm-wide
approach, and, lastly, increasing the qual ity of corporate level decision making. An inflection
point may also be created whereby a P AFP firm can achieve transition to PSFP by means of
increasing the corporate level decision making ski l l evident within their firms. This increased
corporate level decision making ski l l , for PAFP firms, broadens the decision making frames of
reference and assists in the identification of appropriate firm-wide aims, thus, producing qual ity
resource governance decision making. Again, this influx of corporate level decision making skill
increases the capacity for precise and correct decision making.
268
6.7 .3 Implications for P SFP firms
The key impl ications for the PS FP category mainly centre on recognising a key number of
aspects of their corporate level decision making process. Recognition should include ensuring
that decision making simpl icity, not complexity, is an important aspect of their corporate level
decision making success, and that a firm-wide phi losophy or focus is important to PSFP. Any
poor corporate level decisions should continue to be fed back into the review process. PSFP
corporate level decision makers should be aware that a poor recruitment choice may greatly
impact on the quality of corporate level decision making, for example, by creating a backward
inflection point which could result in performance outcomes moving from PSFP to either PAFP
or PIFP.
Alternatively, PSFP firms could establ ish that their corporate level decision making ski l ls are
embedded into the firm so that if these valuable ski l ls are no longer available to the firm (e.g., if
the skil led corporate level decision makerls left the firm), the qual ity of decision making is not
affected. In a similar vein, Coli ins and Porras' s ( 1 994) work also suggests that the core ( i .e.,
philosophies and strategic direction) should be able to exist over a long time period. I nvestment
to increase and develop the decision making ski l l at all levels within the firm should be
encouraged so that the skill level of lower dec ision making levels are producing qual ity
decisions. This talent pool then becomes available for corporate level decision making when
required. Overall, PS FP firms should continue to focus on producing qual ity, not quantity
corporate level decisions.
For practitioners, the curvil inear assoc iation displayed in Figures 6 . 1 to 6.5 suggests that both
PIFP and PAFP firms, instead of increasing the incidence of corporate strategy, should focus on
increasing the quality of corporate strategy evident within their firms. In other words, for a PIFP
or PAFP firm to become a persistent superior performing firm, requires less, but h igher quality
corporate strategy decision making. It is then expected that PIFP firms could successfully
trans ition into the PS FP category without enduring the PAFP stage. This association also
suggests that that it may be relatively easy to shift a firm from the PIFP category to the PSFP
category - providing of course there is a complete change in the top management team - in
comparison to the changes required for PAFP firms to produce PSFP. The curvi l inear
relationship establ ished suggests that a hypothesis for future research could involve investigating
the shift from performance from PIFP to PSFP, largely through use of more appropriate decision
making as opposed to more appropriate resources.
269
6.8 SUMMARY
The aim of thi s research was to investigate the nature of corporate strategy and its role on
persistent firm performance. Even though the methodology employed represented a minimum
level of corporate strategy, the results established the presence of corporate strategy and, further,
suggested corporate strategy was not a rare phenomenon particular to only a certain firm
performance category. In fact, all the 1 5 firms sampled recorded significant levels of corporate
strategy decisions over the 25-year period including those operating in a singular industry
(contradictory to the assumptions underlying the corporate effects research).
The results offered a number of contributions to the understanding of corporate strategy and firm
performance. Firstly, were the three firm performance categories different in terms of corporate
strategy and, if so, its attributes? Corporate strategy does significantly differ across the three
firm performance categories. Secondly, in terms of a corporate strategy, which firm performance
categories differ? The persistent superior firm performance category differed from both the
persistent inferior and persistent average firm performance categories in terms of resource
governance whereas the persistent inferior and persistent average firm performance categories
were found not to differ. Closer examination revealed that the persistent superior firm
performance category differed from both the persistent inferior and persistent average firm
performance categories in terms of the rate of resource governance decisions. As this was the
only significant attribute of corporate strategy (at the p < .05 level), this suggests that the other
three attributes did not have a significant impact on corporate strategy and its relationship to firm
performance.
Support for the two statistically sign ificant hypotheses is suggested by a fit with the theoretical
expectations, namely, heterogeneous corporate level decision making ski l l . Strategic
management predicts that higher firm performance results from better managed companies, that
is, through the mechanisms such as corporate strategy. The statistically significant quantity of
resource governance results indicated support for the resource based theory, in other words, the
successful firms use resources in a superior manner (lower excess or unuti l ised resources). The
c loseness of the inferior and superior firms suggests that the successful firms are consistently
making superior resource based decisions. The lower frequency of resource governance
decisions by the persistent inferior performing firms may be due to poor opportunity
identification, fai lure to respond to opportunities, and indecision. I n comparison, the superior
firms appear to possess the ski ll and abi l ity (through firm systems, processes, programmes) to
270

simpl ify their decision making processes, and, thus in doing so they reduce the number of
corporate strategy decisions actually made. The persistent average firm performance category
was characterised by a larger number of corporate strategy decisions highl ighting a hit-and-miss
approach to the relationship between resource governance decision making and subsequent
performance.
27 1
7 CONCLUSION
7. 1 CHAPTER INTRODUCTION
The seemingly l imited theoretical thought on corporate strategy has resulted in a predominantly
normative literature that lacks a strong theoretical framework. This research attempted to bridge
these gaps by, firstly, focusing on corporate strategy research at the firm level ; secondly, clearly
defining corporate strategy and its attributes; and, thirdly, identifying that the incidence of
resource governance decisions can be used to distinguish persistent superior firm performance
from both the persistent average and persistent inferior categories of firm performance.
A framework that can be uti l i sed to study the complex relationship between firm performance
and each of the four attributes, namely, strategic intent, organisational domain, internal
governance, and resource governance was compi led. This framework included the development
of 1 4 hypotheses (five main hypotheses and nine subhypotheses) and the operationalisation of 1 8
variables for empirical verification. An empirical study of 1 5 United States Fortune 1 000 firms
was conducted to test the hypotheses developed in the research framework. Content analysis of
9,970 Wall Street Journal articles from 1 980 to 2004 was performed. A total of 1 4,082 codings
of corporate strategy were analysed with the use of SPSS and R.2.2 . 1 . A number of inferential
statistical techniques were employed to increase confidence of the findings.
The aim of this research was to determine if corporate strategy could be used to distinguish the
persistent superior firm performance category from the other two firm performance categories.
These tests provided several interesting results from which a number of conclusions may be
drawn. Of the 1 4 hypotheses presented, four were found of be statistically significant at the p <
.05 level for the data collected, namely, Hs and Hsa regarding corporate strategy, and � and �a
regarding resource governance. A discussion of the contribution to theory now fol lows. The
remainder of this chapter presents a number of l imitations to the research and impl ications
including possible future research avenues. Recommendations for practitioners are then
provided.
272
7.2 THE THEORY AND RESULTS
Determining the factors which result in persistent superior firm performance has long been a goal
of the field of strategic management. Previous empirical research has uncovered evidence that
corporate effects resulting from phenomena such as corporate strategy, have accounted for up to
46.3% of business unit performance. However, the continued focus of strategic management
l iterature on sustainable competitive advantage has led to the embeddedness of a number of
weaknesses in terms of corporate strategy. For example, both the conceptual and theoretical
foundations of strategic management are centred on achieving sustainable competitive advantage
from a single business unit. The conceptual framework and theory that was built and tested in
this research makes an important contribution to the field of corporate strategy. Corporate
strategy has been mostly lim ited to research using large multivariate analysis of variance
techniques; the management of mu ltiple business firms; specific corporate strategies; and, lastly,
normative models. This study broadens this extant research and suggests that firms achieving
persistent superior firm performance are characterised by superior corporate level resource
governance decision making. The research also in itiated two uncommon avenues of enquiry:
firstly, a focus on corporate strategy rather than on competitive strategy and, secondly, persistent
superior firm performance rather than focus on the dominant sustainable competitive advantage.
The aim of this research was to make a contribution to the knowledge of corporate strategy by
determining whether corporate strategy actual ly contributes to persistent firm performance. The
first contribution made is a clearly defined conceptual isation of firm performance, that is,
persistent superior firm performance is a corporate level alternative to sustainable competitive
advantage. Secondly, the conceptual framework developed in this study defines, for the first
time, corporate strategy and its attributes, specifically, the four attributes of strategic intent,
organisational domain, internal governance, and resource governance. Thirdly, previous
treatments of corporate strategy have been challenged, in other words, corporate strategy is not
only relevant to multiple business firms. Corporate strategy is also more than a specific strategy.
Fourthly, this research argued and empirical ly demonstrated that corporate strategy is, in fact,
important to persistent firm performance and could be used to distinguish between categories of
firm performance.
Resource governance is the most important attribute of corporate strategy. In other words, the
frequency of resource governance decisions could be used to distinguish the persistent superior
firm performance category from both the other two firm performance categories. Therefore, the
273
results suggest that the aim of strategic management research should be widened to include both
the importance of corporate strategy on the achievement of persistent superior firm performance
and the importance of superior resource governance decisions on the achievement of persistent
superior firm performance.
7.2. 1 The corporate level decis ion making ski l l perspective
Corporate strategy is expected to provide the basis for all organisational actions. Therefore, it
has been assumed that poorly constructed or inappropriate corporate strategy impacts on firm
performance. In other words, corporate strategy is unique, difficult to imitate and substitute, and,
u ltimately, firm specific. The results of this study indicated that corporate level decisions made
by persistent superior performing firms are superior to those made by both persistent average and
inferior performing firms. The asymmetries in corporate level ski l l that exist across firms are
predicted to have a significant impact on the qual ity of the corporate level decisions as corporate
level decision makers do control, to a large extent, the corporate strategy decision making
process. Although the search for theoretical insight has only begun, the corporate level decision
making skil l perspective presented here offers a theory to explain this finding.
Support for the two statistical ly significant hypotheses for corporate strategy and resource
governance is suggested by a fit with the theoretical expectations, namely, heterogeneous
corporate level decis ion making ski l l . Strategic management does predict that persistent superior
firm performance results from better managed companies, that is, through the mechanisms such
as corporate strategy. The statistically significant resource governance results indicates some
support for the resource based theory, in other words, successful firms use resources in a superior
manner (lower excess or unuti l ised resources). The closeness of the sample means for the
persistent inferior and persistent superior firm performance categories suggests that the
successful firms are making superior resource based decisions. The lower frequency of resource
governance decisions made by the inferior firms may be due, for example, to poor opportunity
identification, fai lure to respond to opportunities, and indecision. Decisions, if they are made at
all , appear to be inappropriate leading to inferior firm performance. Therefore, the inferior
fi rms' corporate level decision makers seem to consider that corporate strategy does not actually
matter.
The possession and uti l i sation of superior corporate level decision making ski l l al lows decision
making processes to be simple (but not simplifying assumptions) and more effective. This
simplicity then reduces the complexity and uncertainty the firm faces, which increases the
274
quality of decision making which results in a lower rate of resource governance decisions.
Successful firms may also uti l i se tools, such as the core competency approach, to provide a
consistent firm-wide phi losophy or direction on which, at least, all corporate level decis ions are
then based. Superior firms appear to possess the ski ll and abil ity (either through individual
corporate level decision making ski ll or embedded or institutionalised into firm systems,
processes, programmes) to simpliry their decision making processes and subsequently reduce the
number of corporate strategy decisions made. This then suggests that if the skil led individual left
the firm, the qual ity of corporate level decision making would reduce (unless replaced by an
equally superior corporate level decision maker). Therefore, in successful firms corporate
strategy matters.
The firms in the persistent average firm performance category were characterised by engaging in
a larger number of corporate strategy decis ions highl ighting hit-or-missed opportunities. Some
good opportunities are fu lfilled and some bad opportunities are also undertaken. As these firms
make higher rates of incorrect (e.g., poorly constructed or inappropriate) decisions, average
performing firms appear to possess lower overall corporate level decision making ski l l s relative
to successful firms. However, unl ike inferior firms, they may recognise the inferior decision and
make additional decisions for correction . It can be proposed that for average firms corporate
strategy sometimes matters.
Less successful firms could then increase their capacity to produce excellent decision making
over time. However, resource based theory argues that the unique characteristics of the
corporate level decision making skill evident within excellent firms are difficult to imitate. This
suggests that the critical resource shortage in nonsuccessful firms may not be overcome by
substitution but rather can only be surmounted by decisions regarding innovation or by
improving the ski l l of the current corporate level decision makers within these firms. In these
fi rms corporate strategy does not yet matter.
However, the curvi l inear association found suggests that changes in performance outcomes may
be achieved via an inflection point, in other words, through the acquisition of superior corporate
level decision making ski l l . While there is a difficulty in establishing the point when
unsuccessful firms can become a successful firm, firm performance can, theoretically, transform
from either inferior or average firm performance to successful performance outcomes. This
transformation may occur through an increase in superior corporate level decision making ski l l
(although the impact would alter difference aspects of corporate level decis ion making in inferior
275
and averagely performing firms). Backward inflection points could also potentially occur
whereby successful firms, for example, may hire inferior corporate level decision makers which
could influence firm performance from superior performance to either lower categories of firm
performance.
The arguments that corporate strategy has a l im ited impact on firm performance have been
challenged. Instead, corporate strategy, through the corporate level decision making ski l l evident
in resource governance decisions, may be achieved through appropriate simpl icity in a firm's
corporate strategy decision making which then leads to successful performance outcomes. The
curvi l inear association between persistent firm performance and the incidence of corporate
strategy decisions may also point towards an instant where fewer, but superior decisions result in
greater firm performance. Persistent superior firm performance arises from not necessari ly the
possession of resources, but how these resources are used. This research then endorses Hamel
and Prahalad ' s ( 1 994) view of the world which has not been empirical ly tested. In other words,
corporate strategy does matter to firm performance and can be used to distinguish the persistent
superior firm performance category from the nonpersistent superior firm performance categories
on the basis of the incidence of resource governance decisions.
7.3 LIMITATIONS: EXOGENOUS TO THE RESULTS
This research was constrained by a number of lim itations. Obtaining data from a secondary data
source could have restricted the measurement of corporate strategy actually evident in the sample
collected; for example, unobservable corporate strategy decisions may have been made but not
recorded in Wal l Street Journal . Th is suggests that the phenomenon of corporate strategy may
have been "undermeasured". Furthermore, the Wal l Street Journal articles do not necessarily
represent the phenomenon under study as they were not constructed with the aim of accurately
representing corporate strategy. The capacity to replicate th i s type of research methodology is
l imited to perhaps the United K ingdom as the Financial Times is the only other credible source
of data.
The small sample s ize, in addition to l imiting the type of statistical analysis that could be util ised,
may result in "lower power" to correctly detect the associations hypothesised, that is, a Type 11 error may have been committed. A larger sample may have revealed the phenomenon of
corporate strategy to a greater extent than was observed in this research. Even though the sample
was confined to United States firms, the findings could be generalisable to large corporate firms
276
from other countries as most of the firms sampled were mu ltinational in nature. However, the
results may only have l imited generalisabil ity to medium and smal l firms.
Undoubtedly other important factors may influence the incidence of corporate level decision
making that were not investigated in this study. These factors may play an intervening or
moderating role whereby the nature of corporate level decision making is significantly impacted.
The results of th is research should then be regarded as an important first step in the
understanding of the role of corporate strategy on firm performance.
The final area of concern was the l imited corporate strategy l iterature available which could
provide comparisons with research uti l ising simi lar data sources and research methodologies.
The various constructs, some of which had only been addressed in a l imited manner to date, were
complex, namely, Hamel and Prahalad's ( 1 989, 1 994) strategic intent. Thus, the research
conducted was ambitious in terms of its aim and, while important, should be considered
exploratory in nature given that it has not been undertaken anywhere else.
7.4 DIRECTIONS FOR FUTURE RESEARCH
Each of the l im itations provides important research opportunities. In a perfect world, long-term
and wide-ranging access to the sample firms could provide a more accurate observation of the
corporate strategy attributes evident within the three firm performance categories. Ideally, data
could have been collected in situ via in-depth interviews and long-term (25-year) observation of
the top management team (that is, the people making the corporate strategy decisions). The
scope of future work could be increased whereby additional modes of measurement could be
added to those indicators measured here providing additional construct valid ity. It would be
interesting to compare the data col lected from an expanded sample, in terms of size and beyond
the United States Fortune 1 000 firms. An expanded dataset would also provide some interesting
comparisons and may uncover additional important patterns. For example, are the characteristics
observed in large, publicly listed firms evident within smaller organisations, private firms and
governmental agencies?
This research sought to determine the causal relationship between corporate strategy and firm
performance. But does a reverse causality, however minor, exist whereby successful firm
performance increases the superiority of corporate level decisions (e.g., are successful firms
more able to recruit superior corporate level decision makers)? Accordingly, future research into
277
the uncovering aspects of the relationship between corporate strategy and firm performance
would greatly assist in the understanding of the nature of corporate strategy.
Many intervening variables may alter the relationship between the rate of resource governance
decisions made and persistent firm performance. Some of these were discussed in Chapter Three
(e.g., luck and historical firm performance). These potential sources of covariance would be a
logical area for further research. Any intervening variables found to be statistical ly significant
may also assist in elim inating alternative explanations. Demonstrating cause-effect relationships
as hypothesised may include adding further variables into the model . Such tools of analysis
would include multivariate analysis. The employment of alternative techniques would also
enhance the robustness of these findings.
By considering all four attributes together, add itional insight was gained into the previously
poorly defined notion of corporate strategy. This approach may provide the basis for additional
future research and theoretical discussion whereby the notion of corporate strategy is clarified
within the strategic management community. Bui ld ing on the conceptual isation of corporate
strategy employed in this research would l imit the already fragmented and contradictory concept
of what corporate strategy is and increase the theoretical impact of corporate strategy on
persistent firm performance.
It is notable that resource governance was the statistically significant corporate strategy attribute.
This suggests that aspects of the resource based theory may be a useful source of explanation.
Resource based theory should, therefore, be developed beyond the dominant logic of sustainable
competitive advantage and business level strategy. Secondly, this research highl ighted the
importance of the qual ity of corporate level decision making in successful firms. I mportant
aspects of the decision making l iterature could be further developed and incorporated into
resource based theory. As resource based theory has not specifically developed theoretical
insight into resource governance decision making, the search for theoretical insight may have
only begun. Furthermore, future empirical research could centre on the nature of resource
governance in successful firms, for example, how do these decisions impact positively on firm
performance ( i .e. , involving in-depth qual itative research methods). The specific nature of
resource governance was not directly observed and must remain somewhat speculative. For
example, the relationship between different types of resource governance decisions and firm
performance is an additional avenue of research that needs to be explored. Many important
questions remain unanswered and some include: is heterogeneity due to the resource governance
278
decision fonnulation or resource governance decision implementation? Although aspects of all
the corporate strategy attributes are in both formulation and implementation, resource
governance is currently thought to sit mainly in the strategy implementation arena.
The possibil ity that corporate level decision making skill sole ly rests at the level of the individual
raises a number of questions for future research: does the ski ll of individual corporate level
decision makers matter, or is success due to the ski l l level of a group of corporate level decision
makers? If the group is found to be the main source of corporate level decision making ski l l , do
groups exchange quantity for qual ity as suggested by Orl itzky and Hirokawa (200 1 )? I s
corporate level decision making ski l l institutionalised into finns or does i t represent a personal
competency? Further, if corporate level decision making ski l l is found to signify a personal
competency, can specific aspects of corporate level decision making ski l l be identified? And if
so, what extent (for example, are any of the four influences on corporate level decision making
discussed here more important than the others)? It is also reasonable to ask if these possibly
identifiable ski l ls could be embedded into finns.
7.5 RECOMMENDATIONS FOR PRACTITIONERS
This study offers a number of impl ications for business practice. F irst, academics and tertiary
institutions wil l be wel l advised to include these fol lowing factors in their strategic management
courses. Firstly, conceptual ising corporate strategy as comprising four attributes, namely,
strategic intent, organisational domain, internal governance and resource governance. Secondly,
the concept of persistent superior firm performance should be presented as an important
construct distinct from sustainable competitive advantage. Lastly, the qual ity of resource
governance decisions distinguishes persistent superior finn performance finns from both
persistent average firm perfonnance and persistent inferior finn performance firms.
In order for persistent superior perfonning firms to maintain perfonnance they must continue to
acknowledge the role of quality resource governance decision making. They should also ensure
persistent superior firm perfonnance is regarded as a continual process and long-term concept.
Secondly, successful finns should ensure that their corporate level decision making skil ls are
embedded into the finn so that if these decision makers are no longer available to the firm, the
quality of decision making is not affected. Lastly, the continued recruitment and development of
superior corporate level decision makers (including developing the internal talent pool) would
maintain the capacity of precise and excellence in corporate level decision making. Overall,
279
excellent firms should continue to focus on producing quality, not quantity corporate level
decisions.
If persistent averaging performing firms attempt to increase the decision making activity at the
corporate level, in a vain attempt to increase the rate of superior decisions, the higher rate of
corporate level decision making is l ikely to result in a continuation of the performance outcomes
they are currently experiencing. Instead, it is recommended that average firms should
acknowledge the need to reduce the complexity in the resource governance decision making
processes ( i .e . , Keep It S imple Stupid). Secondly, a unifying firm-wide goal would be created to
el iminate the internal competition, for example, focusing on the core competency approach to
resource development may assist in both a unifying goal and the start of a firm-wide philosophy
that does not change over time. Th is would assist in reducing complexity. Thirdly, the
codification and institutionalisation of decision making processes and rules, that is, capturing
organisational learning, could also reduce complexity and increase the qual ity of resource
governance decision making. It is important for average performing firms to capture both their
successful and inferior corporate level decisions so that, lastly, the recruitment of superior
corporate level decision makers would increase the capacity of precision and excellence in
corporate level decision making.
Persistent inferior performing firms should recognise that increasing performance outcomes is
about making about the same number of decisions as excellent firms do and, l ike the excellent
firms, ensuring that these decisions are substantially better in terms of qual ity. Therefore, for
inferior firms, the most important recommendation involves ensuring the right people are
employed in the right roles throughout the firm, that is, increasing the decision making capacity
of superior ski l led managers will provide the necessary foresight and leadership within the firm.
The correct identification of opportunities and firm-wide goals wil l greatly assist in the
achievement of superior corporate level decision making. Inferior firms could also increase their
quality of decision making by the codification of decision making processes and rules. However,
inferior firms should be vigi lant not to introduce complexity into their corporate level decision
making practices.
280
REFERENCES
Ackerman, R. W. ( 1 970). Influence of integration and diversity on the investment process. Administrative Science Quarterly, 15(3), 34 1 -3 5 1 .
Addleson, M . (200 1 ). Stories about firms: Boundaries, structures, strategies, and processes. Managerial and Decision Economics, 22(4-5), 1 69- 1 82.
Adner, R., & Helfat, C. E. (2003) . Corporate effects and dynamic managerial capabi l ities. Strategic Management Journal, 24( 1 0), 1 0 1 1 - 1 025 .
Ahuja, G. , Coff, R. W. , & Lee, P. M. (2005). Managerial foresight and attempted rent appropriation: Insider trading on knowledge of imminent breakthroughs . Strategic Management Journal, 26(9), 79 1 -808.
Ahuja, G. , & Katila, R. (2004). Where do resources come from? The role of idiosyncratic situations. Strategic Management Journal, 25(8/9), 887-907.
Alchian, A . A., & Demsetz, H. ( 1 972). Production, information costs and economic organization. American Economic Review, 62(5), 777-795 .
Alexander, J . A. ( 1 99 1 ) . Adaptive changes in corporate control practices . Academy of Management Journal, 34( 1 ), 1 62- 1 93 .
Al ien, R ( 1 995). On a clear day you can have a vision: A visioning model for everyone. Leadership & Organization Development Journal, 1 6(4), 39-44.
A lmeida, P., Song, J., & Grant, R. (2002). Are firms superior to markets and al liances? An empirical investigation of cross-boarder knowledge bui lding. Organization Science, 13(2), 1 47- 1 6 1 .
Ambrosini, V., & Bowman, C . (2003). Managerial consensus and corporate strategy: Why do executives agree or disagree about corporate strategy? European Management Journal, 21(2), 2 1 3 -22 1 .
Amburgey, T. L., & Dacin, T. ( 1 994). As the left foot fol lows the right? The dynamics of strategic and structural change. Academy of Management Journal, 3 7(6), 1 427- 1 452.
Amihud, Y., & Lev, B. ( 1 98 1 ). Risk reduction as a managerial motive for conglomerate mergers. Bell Journal of Economics, 12(2), 605-6 1 7 .
Amit, R, & Schoemaker, P . J . H. ( 1 993). Strategic assets and organizational rent. Strategic Management Journal, 14( I ), 33-46.
Andersson, U. , Forsgren, M., & Holm, U. (2002). The strategic impact of external networks: Subsidiary performance and competence development in the multinational corporation. Strategic Management Journal, 23(1 1 ), 979-996.
Andrews, K. P. ( 1 97 1 ) . The concept of corporate strategy. United States of America: Dow Jones-Irwin, Inc.
28 1
Ansoff, H . I . ( 1 968). Corporate strategy: An analytic approach to business policy for growth and expansion. Harmondsworth, United Kingdom: Penguin.
Appelbaum, S. H. , St-Pierre, N ., & Glavas, W. ( 1 998). Strategic organizational change: The role of leadership, learning, motivation and productiv ity. Management Decision, 36(5), 289-30 1 .
Arend, R. J . (2003). Revisiting the logical and research considerations of competitive advantage. Strategic Management Journal, 24(3), 279-284.
Argyres, N . , & McGahan, A. M. (2002). An interview with Michael Porter. Academy of Management Executive, 16(2), 43-52.
Argyris, C. ( 1 99 1 ) . Teaching smart people how to learn. Harvard Business Review, 69(3), 99-1 09 .
Armstrong, J . S . ( 1 996). Management folklore and management science : On portfolio planning, escalation bias, and such. Interfaces, 26(4), 25-5 5 .
Avison, D. E . , Eardley, W . A., & Powell, P. ( 1 998). Suggestions for capturing corporate v ision in strategic information systems. Omega, 26(4), 443-459.
Babbar, S., & Rai, A . ( 1 993). Competitive intell igence for international business. Long Range Planning, 26(3), 1 03 - 1 1 3 .
Bai ley, E . E. , & Helfat, C . E . (2003) . External management succession, human capital, and firm performance: An integrative analysis. Managerial and Decision Economics, 24(4), 347-369.
Bain, J . S . ( 1 954). Economies of scale, concentration, and the condition of entry in twenty manufacturing industries. American Economic Review, 44( 1 ), 1 5-39.
Bain, J . S. ( 1 968). Industrial organization. (2nd ed.) . New York: Wiley.
Baird, I ., & Thomas, H . ( 1 985). Toward a contingency model of strategic risk taking. Academy of Management Review, 10(2), 230-243 .
Balakrishnan, S . , & Fox, I . ( 1 993). Asset specificity, firm heterogeneity and capital structure. Strategic Management Journal, 14( I ), 3 - 1 6.
Barney, 1. B . ( 1 986). Strategic factor markets: Expectations, luck, and business strategy. Management Science, 32( 1 0), 1 23 1 - 1 24 1 .
Barney, J . B . ( 1 99 1 ) . Firm resources and sustained competitive advantage. Journal of Management, J 7( 1 ), 99- 120.
Barney, J . B. ( 1 995) . Looking inside for competitive advantage. Academy of Management Executive, 9(4), 49-6 1 .
Barney, J . B . (2000a) . Context is critical : Commonalities, differences, and subtle differences. I n J . A . C . Baum, & F . Dobbin, (Eds .), Economics meets sociology in strategic management (pp. 26 1 -269). Stamford, eT: JAI Press Inc.
Barney, 1 . B . (2000b). Nothing permanent: The role of sustainabi lity and luck in resource-based
282
logic. In J . A. C . Baum, & F. Dobbin, (Eds.), Economics meets sociology in strategic management (pp. 297-300). Stamford, CT: JAI Press Inc.
Bamey, J . B. (200 1 a) . Resource-based theories of competitive advantage: A ten-year retrospective on the resource-based view. Journal of Management, 2 7(6), 643-650.
Bamey, 1. B. (200 1 b). Is the resource-based "view" a useful perspective for strategic management research? Yes. Academy of Management Review, 26( 1 ), 4 1 -56.
Bamey, J . B. , Wright, M. , & Ketchen, D. 1 . , Jr. (200 1 ) . The resource-based view of the fi rm : Ten years after 1 99 1 . Journal of Management, 2 7(6), 625-64 1 .
Baron, D . P. ( 1 995) . Integrated strategy: Market and nonmarket components. California Management Review, 37(2), 47-65 .
Bart, C . K ., & Baetz, M . C . ( 1 998). The relationship between mission statements and firm performance: An exploratory study. Journal of Management Studies, 35(6), 823-854.
Bart, C . K., Bontis, N. , & Taggar, S . (200 1 ) . A model of the impact of mission statements on firm performance. Management DeCision, 39( 1 ), 1 9-35 .
Bartlett, C . A., & Ghoshal, S . (2002). Building competitive advantage through people. MlT Sloan Management Review, 43(2), 34-4 1 .
Barton, S . L., & Gordon, P. 1 . ( 1 987). Corporate strategy: Useful perspective for the study of capital structure . Academy of Management Review, 1 2( 1 ), 67-75 .
Beard, D . W., & Dess, G. G. ( 1 98 1 ) . Corporate-level strategy, business-level strategy, and firm performance. Academy of Management Journal, 24(4), 663-688.
Bennis, W. (2002). The leadership advantage. In F. Hesselbein & R. Johnston (Eds.), On mission and leadership (pp. 7- 1 7) . San Francisco: Jossey-Bass.
Bergh, D. D. (200 1 ). Diversification strategy research at a crossroads: Established, emerging and anticipated paths. In M . A. Hitt, R. E. Freeman, & 1. S. Harrison, (Eds.), The Blackwell handbook of strategic management (pp. 3 62-3 83). Oxford, United Kingdom: B lackwell Publishers Ltd.
Bemheim, B. D., & Whinston, M. D . ( 1 990) . Multimarket contact and collusive behavior. Journal of Economics, 21( 1 ), 1 -26.
Berson, Y., Avolio, B. J . , & Kahai, S . (2003 ) . Level specification : Using triangulation in a grounded theory approach to construct val idation . In F. Dansereau, & F . J. Yammarino, (Eds.), Multi-level issues in organizational behavior and strategy: Vo!. 2. Research in multilevel issues (pp. 85- 1 1 2) . Oxford, United Kingdom: Elsevier Science Ltd.
B lack, J . A., & Boal, K. B. ( 1 994). Strategic resources: Traits, configurations and paths to sustainable competitive advantage. Strategic Management Journal, 15(Summer Special I ssue), 1 3 1 - 1 48 .
Bontis, N . , & Dragonetti, N . C . ( 1 999). The knowledge toolbox: A review of the tools available
283
to measure and manage intangible resources. European Management Journal, 1 7(4), 3 9 1 -402.
Booth, M. E., & Phi l ips, G. ( 1 996). Technology driven and competency driven approaches to competitiveness: Are they reconci lable? Journal of Information Technology, J J (2), 1 43- 1 59.
Bourgeois, L . J. , I l l . ( 1 980). Strategy and environment: A conceptual integration. Academy of Management Review, 5( 1 ), 25-39.
Bourgeois, L. J., I l l . , & Eisenhardt, K. M. ( 1 988). Strategic decision processes in h igh velocity environments: Four cases in the microcomputer industry. Management Science, 34(7), 8 1 6-835 .
Bowen, H . P . , & Wiersema, M . F. (2005). Foreign-based competition and corporate diversification strategy. Strategic Management Journal, 26( 1 2), 1 1 53 - 1 1 7 1 .
Bower, J . L . ( 1 982). Business policy in the 1 980s. Academy of Management Review, 7(4), 630-638 .
Bowman, c., & Faulkner, D. ( 1 997). Competitive and corporate strategy. London: Richard D. I rwin Books.
Bowman, E. H . , & Helfat, C. E. (200 1 ) . Does corporate strategy matter? Strategic Management Journal, 22( 1 ), 1 -23 .
Bowman, E . H . , S ingh, H ., Useem, M" & Bhadury, R. ( 1 999). When does restructuring improve economic performance? California Management Review, 41(2), 33-54.
Bradley, M. , Desai, A., & Kim, E. H . ( 1 988). Synergistic gains form corporate acquisitions and their division between the stockholders of target and acquiring firms. Journal of Financial Economics, 21( 1 ), 3-40.
B rickley, J . A., & van Drunen, L. ( 1 990). Internal corporate restructuring: An empirical analysis. Journal of Accounting & Economics, 12( 1 -3), 25 1 -280.
Brocklesby, J ., & Campbell-Hunt, C. (2004) . The evolution of competitive capabi l ity: A cognition and complex system perspective. Journal of Organizational Transformation and Social Change, 1(2/3), 1 43- 1 62.
Brockner, J . ( 1 992). The escalation of commitment to a fai l ing course of action: Toward theoretical progress. Academy of Management Review, 1 7( 1 ), 39-6 1 .
Bronner, R. ( 1 982). Decision making under time pressure . Lexington, MA : D. C . Health.
B rown, S . L ., & Eisenhardt, K. M. ( 1 998). Competing on the edge: Strategy as structured chaos. Boston, MA: Harvard Business School Press.
Brush, T. H., & Bromiley, P. ( 1 997). What does a small corporate effect mean? A variance components simulation of corporate and business effects. Strategic Management Journal, 18( 1 0), 825-835 .
B rush, T. H. , Bromiley, P . , & Hendrickx, M. ( 1 999). The relative influence of industry and
284
corporation on business segment performance: An alternative estimate. Strategic Management Journal, 20(6), 5 1 9-547.
Bryan, L. L., Lyons, T. G., & Rosenthal, J . ( 1 998). Corporate strategy in a globalizing world: The market capital ization imperative. McKinsey Quarterly, 3, 6- 1 9 .
Bums, T., & Stalker, G . M. ( 1 96 1 ) . The management of innovation. London: Tavistock.
Burt, R. S. ( 1 992) . Structural holes: The social structure of competition. Cambridge, MA: Harvard University Press.
Byerly, R. T., Lamont, B. T., & Keasler, T. (2003). Business portfol io restructuring, prior diversification posture and investor reactions. Managerial and Decision Economics, 24(8), 535-548.
Calfee, D . L. ( 1 993) . Get your mission statement working. Management Review, 82( 1 ), 54-57.
CampbelJ , A. ( 1 992). Why do companies over-d iversify? Long Range Planning, 25(5), 1 1 4- 1 1 6.
CampbelJ, A. ( 1 995). Vertical integration: Synergy or seduction? Long Range Planning, 28(2), 1 26- 1 28.
Campbel l , A. (2003) . The role of the parent company. In D. O. Faulkner & A. Campbel J (Eds.), The Oxford handbook of strategy: Vol. 2. Corporate strategy (pp. 72-94). Oxford, United Kingdom: Oxford University Press.
Campbel J , A., Devine, M., & Young, D. ( 1 990). A sense of mission. London: Hutchinson Business Books L imited.
Campbel J , A., & Faulkner, D. (2003). Introduction to Volume 2: Corporate and international strategy, change, and flexibil ity. In D. O. Faulkner & A. Campbel l (Eds .), The Oxford handbook of strategy: Vol. 2. Corporate strategy (pp. 1 - 1 6) . Oxford, United Kingdom: Oxford University Press.
Campbel l, A., Goold, M., & Alexander, M. ( 1 995) . Corporate strategy: The quest for parenting advantage. Harvard Business Review, 73(2), 1 20- 1 32 .
Capon, N ., Farley, J . U . , & Hoenig, S . ( 1 990). Determinants of financial performance: A metaanalysis. Management Science, 36( 1 0), 1 1 43 - 1 1 59 .
CarrolJ , G . R. ( 1 993) . A sociological view on why firms differ. Strategic Management Journal, 14(4), 237-249.
Castanias, R. P., & Helfat, C. E. (200 1 ) . The managerial rents model : Theory and empirical analysis. Journal of Management, 27(6), 66 1 -678 .
Caves, R. E. , & Porter, M. E. ( 1 977). From entry barriers to mobility barriers: Conjectural decisions and contrived deterrence to new competition. Quarterly Journal of Economics, 91(3), 42 1 -44 1 .
Centre for Research in Security Prices. (2003). Data description guide for the CRSP US stock
285
database and the CRSP US indices database. Chicago, MI : Centre for Research in Security Prices, The University of Chicago.
Chaffee, E. E. ( 1 985). Three models of strategy. Academy of Management Review, 1 0( 1 ), 89-98.
Chakravarthy, E. S . ( 1 997). A new strategy for coping with turbulence. Sloan Management Review, 38(2), 69-82.
Chakravarthy, B. S., & White, R. E. (2002). Strategy process: Forming, implementing and changing strategies. In A. Pettigrew, H. Thomas, & R. Whittington (Eds.), Handbook of strategy and management (pp. 1 82-205). London: Sage Publications Ltd.
Chandler, A. D., Jr. ( 1 962). Strategy and structure: Chapters in the history of the American industrial enterprise. Cambridge, MA: MIT Press.
Chandler, A. D., Jr. ( 1 99 1 ) . The functions of the HQ unit in the multibusiness firm . Strategic Management Journal, 12(Winter Special Issue), 3 1 -50 .
Chang, S . , & Hong, J . (2002). How much does the business group matter in Korea? Strategic Management Journal, 23(3), 265-274.
Chang, S ., & Singh, H . (2000). Corporate and industry effects on business unit competitive position. Strategic Management Journal, 21 (7), 739-752 .
Chi ld, J . ( 1 997). Strategic choice in the analysis of action, structure, organizations and environment: Retrospect and prospect. Organization Studies, 18( 1 ), 43-76.
Child, J., & McGrath, R. G. (200 1 ) . Organizations unfettered: Organizational form in an information-intensive economy. Academy of Management Journal, 44(6), 1 1 35 - 1 1 48 .
Christensen, H . K. , & Montgomery, C. A. ( 1 98 1 ) . Corporate economic performance: Diversification strategy versus market structure . Strategic Management Journal, 2(4), 327-343 .
Clark, R. E ., & Morgan, B. S . (200 1 ) . Becoming measurement-managed: Strategic focus and business metrics at Monsanto 's IFS. Strategy & Leadership, 29(5), 26-30.
Coff, R. W. (2003). The emergent knowledge-based theory of competitive advantage: An evolutionary approach to integrating econom ics and management. Managerial and Decision Economics, 24(4), 245-25 1 .
Col ley, J . L. , Jr., Doyle, J . L. , & Hardie, R. D. (2002). Corporate strategy. New York: McGrawHi l l .
Col l ins, C . J . , & Cl ark, K . D . (2003) . Strategic human resource practices, top management, team social networks, and firm performance: The role of human resource practices in creating organizational competitive advantage. Academy of Management Journal, 46(6), 740-75 1 .
CoBins, J . C . (200 1 ) . Good to great: Why some companies make the leap, and others don 't. New York: HarperEusiness.
Coll ins, J. c ., & Porras, J . I. ( 1 99 1 ) . Organizational vision and visionary organizations.
286
California Management Review, 34( 1 ), 30-52.
Coli ins, J . c., & Porras, J . l . ( 1 994). Built to last: Successful habits of visionary companies. London: Random House Business Books.
CoI lis, D. J . ( I 988) . The Wait Disney Company: Corporate strategy. Boston, MA: Harvard B usiness School Publishing.
Coli is, D. l., & Montgomery, C. A. ( 1 997). Corporate strategy: Resources and the scope of the firm. Chicago, IL: lrwin.
Coli is, D. 1., & Montgomery, C. A. ( 1 998). Creating corporate advantage. Harvard Business Review, 76(3), 70-83 .
Conner, K . R. ( 1 99 1 ) . A historical comparison of resource-based theory and five schools of thought within industrial organization economics: Do we have a new theory of the firm? Journal of Management, 1 7( 1 ), 1 2 1 - 1 54.
Cool, K. , Costa, L. A., & Dierickx, I . (2002). Constructing competitive advantage. In A. Pettigrew, H. Thomas, & R. Whittington (Eds.), Handbook of strategy and management (pp. 5 5 -7 1 ) . London : Sage Publications Ltd .
Cooper, D. R., & Emory, C. W. ( 1 995) . Business research methods. (5th ed.). United States of America: Richard D. Irwin, I nc .
Covin, J . G. , & S levin, D . P. ( 1 994). Implementing strategic mIssIons: Effective strategic, structural and tactical choices. Journal of Management Studies, 31(4), 4 8 1 -504.
Cramer, D. (2003) . Advanced quantitative data analysis. Berkshire, U nited Kingdom: Open University Press.
Cubbin, l . , & Geroski, P. A. ( 1 987). The convergence of profits in the long run: Inter-firm and inter-industry comparisons. Journal of Industrial Economics, 35(4), 427-442.
Cyert, R. M., & March, 1. G. ( 1 963) . A behavior theory of the firm. Englewood Cliffs, NJ: Prentice Hal l .
Daft, R. L. , & Weick, K . E. ( 1 984). Towards a model of organizations as interpretation systems. Academy of Management Review, 9(2), 284-295 .
Danneels, E. (2002) . The dynamics of product innovation and firm competencies. Strategic Management Journal, 23( 1 2), 1 095- 1 1 2 1 .
Das, T. K. , & Teng, B . (2000). A resource-based theory of strategic all iances. Journal of Management, 26( 1 ), 3 1 -6 1 .
Datamonitor reports were derived from the Business Source Premier database.
D' A veni, R., & Gunther, R. ( 1 994). Hyper-competitive rivalries: Competing in highly dynamic environment. New York: The Free Press.
David, F. R. ( 1 989). How companies define their mission. Long Range Planning, 22( 1 ), 90-97.
287
Davis, G. F., Diekmann, K. A., & Tinsley, C. H . ( 1 994). The decline and fal l of the conglomerate firm in the 1 980s: The deinstitutional ization of an organizational form. American Sociological Review, 59(4), 547-570.
Davis, 1., & Devinney, T. ( 1 997). The essence of corporate strategy: Theory for modern decision making. Austral ia: Alien & Unwin.
Davis, R. , & Duhaime, I. M. ( 1 992) . Diversification, vertical integration, and industry analysis: New perspectives and measurement. Strategic Management Journal, 13(7), 5 1 1 -524.
Davis, R., & Thomas, L . G. ( I 993). Direct estimation of synergy: A new approach to the diversity-performance debate. Management Science, 39( 1 1 ), 1 334- 1 346.
Day, G. S . ( 1 994) . The capabi l ities of market-driven organizations. Journal of Marketing, 58(4), 3 7-53 .
Dean, T. 1. , & Brown, R. L. ( 1 995) . Pol lution regulation as a barrier to new firm entry: In itial evidence and implications for future research. Academy of Management Journal, 38( 1 ), 288-303.
De Jong, G., & Van Witteloostuijn, A. (2004) . Successful corporate democracy: Sustainable cooperation of capital and labour in the Dutch Breman Group. Academy of Management Executive, 18(3), 54-66.
De Kluyver, C. A. (2000). Strategic thinking: An executive perspective . Upper Saddle River, NJ: Prentice-Hall, Inc.
Delaney, 1 . T., & Huselid, M. A. ( 1 996). The impact of human resource management practices on perceptions of organizational performance. Academy of Management Journal, 39(4), 949-969.
Delios, A. , & Henisz, W. J. (2000) . Japanese firms' investment strategies in emerging economics. Academy of Management Journal, 43(3), 305-323.
Delmas, M., & Tokat, Y . (2005). Deregulation, governance structures, and efficiency: The V.S. e lectric util ity sector. Strategic Management Journal, 26(5), 44 1 -460.
Demsetz, H. ( 1 973) . Industry structure, market rivalry, and public policy . Journal of Law & Economics, 1 6( 1 ), 1 -9 .
Denis, D . J . , Denis, D. K. , & Sarin, A. ( 1 997). Agency problems, equity ownership, and corporate diversification . Journal of Finance, 52( 1 ), 1 36- 1 60.
Denrell, J. (2004). Random walks and sustained competitive advantage. Management Science, 50(7), 922-934.
DeSanctis, G., Glass, 1 . T., & Ensing, I . M . (2002). Organizational design for R&D. Academy of Management Executive, 1 6(3), 5 5 -66.
Dess, G. A., Gupta, G., Hennart, J. F., & Hi l l , C. W. L. ( 1 995) . Conducting and integrating strategy research at the international, corporate, and business levels: I ssues and directions. Journal of Management, 21 (3), 3 57-393.
288
Dierickx, I. , & Cool, K . ( 1 989). Asset stock accumulation and sustainabi lity of competitive advantage. Management Science, 35( 1 2), 1 504- 1 5 1 1 .
Donaldson, L . ( 1 987). Strategy and structural al ignment to regain fit and performance: In defense of contingency theory. Journal of Management Studies, 24( 1 ), 1 -24.
Dosi, G., Nelson, R., & Winter, S . (Eds.). (2000). The nature and dynamics of organizational capabilities. Oxford, United Kingdom : Oxford University Press.
Dougherty, D. ( 1 992). A practice-centred model of organizational renewal through product innovation. Strategic Management Journal, 13(Summer Special I ssue), 77-92.
Douglas, T. J ., & Ryman, J. A. (2003). Understanding competitive advantage in the general hospital industry: Evaluating strategic competencies. Strategic Management Journal, 24(4), 333-347.
Downing, J . W., Judd, C . M., & Brauer, M. ( 1 992). Effects of repeated expressions on attitude extremity. Journal of Personality and Social Psychology, 63( 1 ), 1 7-29.
Doz, Y . ( 1 997). Managing a core competence for corporate renewal : Towards a managerial theory of core competencies. In A. Campbell & K. S. Luchs (Eds.), Core competency-based strategy (pp. 53-75) . London: International Thompson Business Press.
Dragun, D., & Knight, R. (200 1 ) . Successful retail strategy: Does the financial performance of leading European retailers reflect the success of their corporate strategies? European Retail Digest, 32, 44-55 .
Drucker, P . F . ( 1 955) . The practice of management. London: Heinemann.
Duncan, R., & Weiss, A. ( 1 979). Organizational learning: Impl ications for organizational design. Research in Organizational Behavior, 1, 75- 1 23 .
Dyer, 1 . H. , Kale, P., & Singh, H. (2004) . When to ally and when to acquire . Harvard Business Review, 82(7/8), 1 08- 1 1 5 .
Dyer, J. H., & Singh, H . ( 1 998). The relational view: Cooperative strategy and sources of interorganizational competitive advantage. Academy of Management Review, 23(4), 660-679.
Ebert, R. J., & M itchell, T. R. ( 1 975). Organizational decision processes. New York: Crane, Russak.
Eisenhardt, K. M. ( 1 989). Building theories from case study research . Academy of Management Review, 1 4(4), 532-550.
Eisenhardt, K . M., & Martin, 1 . A. (2000) . Dynamic capabi lities: What are they? Strategic Management Journal, 21 ( 1 0/1 1 ), 1 1 05- 1 1 2 1 .
E l l ig, J . (200 1 ) . Internal markets and the theory of the firm. Managerial and Decision Economics, 22(4-5), 227-237.
Ettlie, 1 . E., Bridges, W. P. , & O'Keefe, R. D. ( 1 984). Organization strategy and structural differences for radical versus incremental innovation. Management Science, 30(6), 682-695 .
289
Ezzamel, M., & Watson, R. ( 1 993 ) . Organizational form, ownership structure and corporate performance: A contextual empirical analysis of UK companies. British Journal of Management, 4(3 ), 1 6 1 - 1 76 .
Factiva company/markets Financial snapshot and profi le reports were sourced from the Factiva database.
Fahy, 1. (2000). The development and impact of marketing capabi l ities in Central Europe. Journal of International Business Studies, 31( 1 ), 63-82.
Falsey, T. ( 1 989). Corporate philosophies and mission statements. New York: Quorum Books.
Farjoun, M. ( 1 998). The independent and joint effect of the ski ll and physical bases of relatedness in diversification. Strategic Management Journal, 1 9(7), 6 1 1 -630.
Fawcett, S . E . , Smith, S . R. , & Cooper, M. B. ( 1 997). Strategic intent, measurement capabi l ity, and operational success: Making the connection. International Journal of Physical Distribution & Logistics Management. 27(7), 4 1 0-422.
F ield, A. (2005) . Discovering statistics using SPSS. (2nd ed.) . London: Sage Publications Ltd.
Finkelstein, S ., & Hambrick, D. C. ( 1 996). Strategic leadership: Top executives and their effects on organizations. St Paul, MN: West Publ i shing Company.
F inlay, P. (2000). Strategic management: An introduction to business and corporate strategy. Essex, United Kingdom: Pearson Education Ltd.
Fischer, H. M., & Pol lock, T. G. (2004). Effects of social capital and power on survlvmg transformational change: The case of in itial publ ic offerings. Academy of Management Journal, 47(4), 463-48 1 .
Folta, T. B ., & Janney, J . 1 . (2004). Strategic benefits to firms issuing private equity placements. Strategic Management Journal, 25(3), 223-242.
Fortune. (2004). Fortune 1 000: Ranked within industries. Fortune, 149(7), F-44-F67.
Foss, N. l., & Christensen, 1 . F. (200 1 ). A market-process approach to corporate coherence. Managerial and Decision Economics, 22(4-5), 2 1 3-226.
Fottler, M. D. ( 1 977). Employee acceptance of a four-day workweek. Academy of Management Journal, 20(4), 656-668.
Fox, F . V., & Staw, B . M. ( 1 979). The trapped administrator: Effects of job security and pol icy resistance upon commitment to a course of action . Administrative Science Quarterly, 23(3), 449-47 1 .
Franks, 1 . R., & Harris, R. S . ( 1 989). Shareholder wealth effects of corporate takeovers: The U.K. experience 1 95 5- 1 985 . Journal of Financial Economics, 23(2), 225-249.
Fredrickson, J. W., & Mitchel l, T. R. ( 1 984). Strategic decision processes: Comprehensiveness and performance in an industry with an unstable environment. Academy of Management Journal, 2 7(2), 3 99-423 .
290
Freund, R. J . , & Wilson, W. J. (2003 ). Statistical methods (2nd ed.). San Diego, CA: Academic Press.
Fuj imoto, T. ( 1 999). The evolution of a manufacturing system at Toyota. New York: Oxford University Press, Inc.
Galunic, D., & Rodan, S . ( 1 998). Resource recombinations in the firm: Knowledge structure and the potential for Schumpeterian innovation. Strategic Management Journal, 1 9( 1 2), 1 1 93-1 20 1 .
Gary, M . S . (2005). Implementation strategy and performance outcomes In related diversification. Strategic Management Journal, 26(7), 643-664.
Gelatkanycz, M. A., & Hambrick, D. C. ( 1 997). The external ties to top executives: Implications for strategic choice and performance. Administrative Science Quarterly, 42(4), 654-68 1 .
Geringer, J . M., Beamish, P. W., & DaCosta, R. C. ( 1 989). Diversification strategy and internationalization: Impl ications for MNE performance. Strategic Management Journal, 1 0(2), 1 09- 1 1 9.
Germain, R., & Cooper, M. B. ( 1 990). How a customer mission statement affects company performance. Industrial Marketing Management, 19, 47-54.
Ghemawat, P . , & Ricart I Costa, J . E . ( 1 993). The organizational tension between static and dynamic efficiency. Strategic Management Journal, 14(Winter Special Issue), 59-73 .
Ghoshal, S. , & Bartlett, C. ( 1 995). Building the entrepreneurial corporation. European Management Journal, 13(2), 1 39- 1 55 .
Gibbons, 1 . D., & Chakraborti, S . ( 1 992). Nonparametric statistical inference. (3rd ed.) . New York: Marcel Dekker, Inc
G imeno, J., & Woo, C. Y. ( 1 996). Hypercompetition in a multimarket environment: The role of strategy similarity and multi market contact on competitive de-escalation. Organization Science, 7(3), 323-34 1 .
Gluck, F. , Kaufman, S . , & Walleck, A. S . ( 1 982). The four phases of strategic management. Journal of Business Strategy, 2(3), 9-2 1 .
Godfrey, P. c., & Hil l , C. W. ( 1 995 ). The problem of unobservables in strategic management research. Strategic Management Journal, 16(7), 5 1 9-533 .
Gollop, F . M., & Monahan, J . L . ( 1 99 1 ). A generalized index of diversification : Trends in U.S . manufacturing. The Review of Economics and Statistics, 73(2), 3 1 8-330.
Goold, M., & Campbell, A. ( 1 987a). Many best ways to make strategy. Harvard Business Review, 65(6), 70-76.
Goo1d, M., & Campbell , A. ( 1 987b). Strategies and styles: The role of the centre in managing diversified corporations. Oxford, United Kingdom: Blackwell Publishers.
Goold, M., & Campbell, A. ( 1 99 I ). Brief case: From corporate strategy to parenting advantage.
29 1
Long Range Planning, 24( 1 ), 1 1 5 - 1 1 7.
Goold, M ., & Luchs, K . (2003). Why Divers ify? Four decades of management th inking. In D. O. Faulkner & A. Campbell (Eds.), The Oxford handbook of strategy: Vo!. 2. Corporate strategy (pp. 1 7-42). Oxford, United Kingdom: Oxford University Press.
Grant, R. M. ( 1 99 1 ). The resource-based theory of competitive advantage: Impl ications for strategy formulation. California Management Review, 33(3), 1 1 4- 1 35 .
Grant, R . M . ( 1 996a). Prospering i n dynamically-competitive environments: Organizational capability as knowledge integration. Organization Science, 7(4), 3 75-387.
Grant, R. M. ( 1 996b) . Towards a knowledge-based theory of the firm. Strategic Management Journal, 1 7(Winter Special I ssue), 1 09- 1 22.
Grant, R. M . (2002a) . Contemporary strategy analysis: Concepts, techniques, applications. (4th ed.). Oxford, United Kingdom: B lackwell Publishers Inc.
Grant, R. M. (2002b) . Corporate strategy: Managing scope and strategy content. In A. Pettigrew, H . Thomas, & R. Whittington (Eds.), Handbook of strategy and management (pp. 72-97). London: Sage Publications Ltd .
Grant, R. M., & Jammine, A. P. ( 1 988). Performance differences between the WrigleylRumelt strategic categories. Strategic Management Journal, 9(4), 333-346.
Green, S . B ., & Salkind, N. J . (2005). Using SPSS for Windows and Macintosh: A nalyzing and understanding data. (4th ed.). Upper Saddle River, NJ : Pearson Education, Inc.
Grinyer, P. H., Yasai-Ardekani, M., & AI-Bazzaz, S. ( 1 980). Strategy, structure, the environment, and financial performance in 48 United Kingdom companies. Academy of Management Journal, 23(2), 1 93-220.
Grunig, R., & Kuhn, R. (200 1 ) . Process-based strategic planning. (A. Clark, Trans.) . Berli n, Germany: Springer-Verlag.
Gulati, R., & Higgins, M. C. (2003). Which ties matter when? The contingent effects of interorganizational partnerships on IPO success. Strategic Management Journal, 24(2), 1 27-1 44.
Gunter, B . (2002). Basic concepts in quantitative research. In K. B. Jensen (Ed.). A handbook of media and communication research: Qualitative and quantitative methodologies (pp. 209-234). London: Routledge.
Habib, M . M., & Victor, B. ( 1 99 1 ) . Strategy, structure and performance of U .S . manufacturing and service MNCs: A comparative analysis. Strategic Management Journal, 12(8), 5 89-606.
Halal, W. E., Geranmayeh, A., & Pourdehnad, J . ( 1 993). Internal markets: Bringing the power of free enterprise inside your organization. New York: Wi1ey.
Haleblian, J. , & Finikelstein, S. ( 1 993). Top management team size, CEO dominance, and firm performance: The moderating roles of environmental turbulence and discretion. Academy of Management Journal, 36(4), 844-863 .
292
Hambrick, D. C . ( 1 982). Environmental scanning and organizational strategy. Strategic Management Journal, 3(2), 1 59- 1 74.
Hambrick, D. c., Geletkanycz, M. A., & Fredrickson, J . W. ( 1 993). Top executive commitment to the status quo: Some tests of its determinants. Strategic Management Journal, 14(6), 40 1 -4 1 8 .
Hambrick, D . C. , & Mason, P. ( 1 984). Upper echelons: The organization as a reflection of its top managers. Academy of Management Review, 9(2), 1 93-206.
Hambrick, D. c., & Snow, C. C. ( 1 977). A conceptual model of strategic decision making in organizations. Proceedings Academy of Management, 3 7, 1 09- 1 1 2 .
Hamel, G., & Prahalad, C. K. ( 1 989). Strategic intent. Harvard Business Review, 67(3), 63� 76 .
Hamel, G., & Prahalad, C . K. ( 1 993). Strategy as stretch and leverage. Harvard Business Review, 71 (2), 75� 76.
Hamel, G., & Prahalad, C. K. ( 1 994) . Competing for the future. Boston, MA: Harvard Business School Press.
Hamermesh, R. G. ( 1 986). Making strategy work: How senior managers produce results. New York: John Wiley.
Hami lton, R. T., & Shergill, G. S. ( 1 992) . The relationship between strategy-structure fit and financial performance in New Zealand : Evidence of general ity and valid ity with enhanced controls. Journal of Management Studies, 29( 1 ), 95- 1 1 3 .
Hamilton, R. T., & Shergill, G . S . ( 1 993). The logic of New Zealand business: Strategy, structure, and performance. Auckland, New Zealand : Oxford University Press.
Hannon, J . M. ( 1 997). Leveraging HRM to enrich competitive intel ligence. Human Resource Management, 36(4), 409-422 .
Hannon, M . T., & Freeman, J . H . ( 1 977). The population ecology o f organizations. American Journal of Sociology, 82(5), 929-964.
Hansen, G . S ., & Wemerfelt, B. ( 1 989). Determinants of firm performance: The relative importance of economic and organizational factors. Strategic Management Journal, 1 0(5), 399-4 1 2 .
Harrison, E . F . ( 1 999). The managerial decision-making process. (5th ed.). Boston, MA: Houghton Miffiin Company.
Harrison, 1 . S. (2003). Strategic management of resources and relationships: Concepts and cases. New York: John WiJey & Sons, Inc.
Harrison, J. S., Hal l, E. H ., & Nargundkar, R. ( 1 993). Resource allocation as an outcropping of strategic consistency: Performance impl ications. Academy of Management Journal, 36(5), 1 026- 1 05 1 .
H awawini, G. , Subramanian, V., & Verdin, P. (2003). Is performance driven by industry� or
293
firm-specific factors? A new look at the evidence. Strategic Management Journal, 24( 1 ), 1 -1 6.
Heil, D. , Maxwe 11 , T., & Whittaker, L. (2003). Towards the very nature of corporate strategy. South African Journal of Business Management, 34( 1 ). 1 - 1 1 .
Helfat, C. E . (2000). Guest Editor' s introduction to the special issue: The evolution of firm capabi l ities. Strategic Management Journal, 21( 1 0- 1 1 ), 955-959.
Helfat, C . E., & Eisenhardt, K . M . (2004). Inter-temporal economies of scope, organizational modularity, and the dynamics of diversification . Strategic Management Journal, 25( 1 3), 1 2 1 7- 1 232.
Helfat, C . E. , & Lieberman, M. B. (2002). The birth of capabil ities: Market entry and the importance of pre-history. lndustrial and Corporate Change, 1 1 (4), 725 -760.
Henderson, A. D., Mi ller, D., & Hambrick, D. C. (2006) . How quickly do CEOs become obsolete? Industry dynamism, CEO tenure, and company performance. Strategic Management Journal, 27(5), 447-460.
Henderson, R. M. , & Cockburn, I. ( 1 994). Measuring competence? Exploring firm effects in pharmaceutical research. Strategic Management Journal, 15(Winter Special Issue), 63-84.
Henry, G . T. ( 1 998). Practical sampl ing. In L . Bickman, & D. 1 . Rog, (Eds.), Handbook of applied social research methods (pp. 1 0 1 - 1 26). Thousand Oaks, CA: Sage Publications, Inc .
Herrmann, P., & Datta, D. K. (2005). Relationships between top management team characteristics and internal diversification : An empirical investigation . British Journal of Management, 16( 1 ), 69-78.
Heugens, P. P. M. A. R., & van Oosterhout, 1. (200 1 ) . To boldly go where no man has gone before: Integrating cognitive and physical features in scenario studies. Futures, 33( 1 0), 86 1 -872
H i l l, C . W. L . , & Deeds, D. L. ( 1 996). The importance of industry structure for the determination of firm profitabil ity : A neo-Austrian perspective. Journal of Management Studies, 33(4), 429-452.
H il l , C. W. L. , H itt, M . A. , & Hoskisson, R. E . ( 1 992). Cooperative versus competitive structure in related and unrelated diversified firms. Organization Science, 3(4), 50 1 -52 1 .
H il l , C . W. L., & Hoskisson, R. E. ( 1 987). Strategy and structure in the multi product firm. Academy of Management Review, 12(2), 3 3 1 -342.
Hirokawa, R. Y. ( 1 990). The role of communication in group decision-making efficacy. Small Group Research, 21(2), 1 90-204.
Hitt, M . A. , Hoskisson, R. E., & Kim, H. ( 1 997). I nternational d iversification: Effects on innovation and firm performance in product-diversified firms. Academy of Management Journal, 40(4), 767-798.
294
H itt, M. A., & I reland, R. D. ( 1 985) . Corporate distinctive competence, strategy, industry and performance. Strategic Management Journal, 6(3), 273-293 .
H itt, M . A. , I reland, R. D. , & Palia, K. A . ( 1 982). Industrial firms' grand strategy and functional importance: Moderating effects of technology and uncertainty. Academy of Management Journal, 25(2), 265-298.
H itt, M . A. , & Tyler, B . B . ( 1 99 1 ) . Strategic decision models: Integrating different perspectives. Strategic Management Journal, 12(5), 327-35 1 .
Hofer, C . W., & Schendel, D. E . ( 1 978) . Strategy formulation: Analytical concepts. St. Paul, MN: West Publi shing Company.
Holbrook, D., Cohen, W. M., Hounshell , D. A., & Klepper, S. (2000) . The nature, sources, and consequences of firm differences in the early history of the semiconductor industry. Strategic Management Journal, 21( 1 0- 1 1 ), 1 0 1 7- 1 04 1 .
Hollander, M., & Wolfe, D. A. ( 1 999). Nonparametric statistical methods. (2nd ed.). New York: John WiJey & Sons, Inc.
Hoopes, D . G., Madsen, T. L. , & Walker, S . (2003). Guest editors' introduction to the special issue: Why is there a resource-based view? Toward a theory of competitive heterogeneity. Strategic Management Journal, 24( 1 0), 889-902.
Hoskisson, R. E., Hi l l , C. W. L., & Kim, H. ( 1 993a). The multidivisional structure: Organizational fossil or source of value? Journal of Management, 1 9(2), 269-298.
Hoskisson, R. E . , H itt, M . A., Johnson, R. A., & Moesel, D. D. ( 1 993b). Construct validity of an objective (entropy) categorical measure of diversification strategy. Strategic Management Journal, 14(3), 2 1 5-235 .
Hoskisson, R. E. , H itt, M. A., Wan, W. P., & Yiu, D. ( 1 999). Theory and research in strategic management: Swings of a pendulum. Journal of Management, 25(3), 4 1 7-456.
Hough, J. R. (2006) . Business segment performance redux: A multi level approach. Strategic Management Journal, 2 7( I ), 45-6 1 .
Hrebiniak, L . G ., & Joyce, W. F . ( 1 985). Organizational adaptation: Strategic choice and environmental determinism. Administrative Science Quarterly, 30(3), 336-349.
Hula, D. G. ( 1 989). Intangible capital, market share and corporate strategy. Applied Economics, 21( 1 1 ), 1 535 - 1 547.
Hunt, S . D., & Morgan, R. M. ( 1 995) . The comparative advantage theory of competition. 10urnal ofMarketing, 59(2), 1 - 1 5 .
I 1 initch, A . Y., D 'Aveni, R. A., & Lewin, A. Y. ( 1 996). New organizational forms and strategies for managing in hypercompetitive environments. Organization Science, 7(3), 2 1 1 -220.
Ireland, D . R., & Hitt, M. A . ( 1 992). Mission statements: Importance, challenge, and recommendations for development. Business Horizon, 35(3), 34-42.
295
Jacobsen, R. ( 1 988). The persistence of abnormal returns . Strategic Management Journal, 9(5), 4 1 5-430.
Jacobson, R. ( 1 992) . The "Austrian" school of strategy. Academy of Management Review, 1 7(4), 782-807.
Jaffe, A., Trajtenberg, M., & Henderson, R. ( 1 993). Geographic localization of knowledge spillovers as evidenced by patent citations. Quarterly Journal of Economics, 1 08(3), 577-598 .
Janis, I . L . ( 1 989) . Crucial decisions: Leadership in policy making and crisis management. New York: Free Press.
Jari l lo, 1 . C. (2003). Strategic logic. Hampsh ire, Un ited Kingdom: Palgrave Macmillan Ltd.
Jensen, M . C. ( 1 986). Agency costs of free cash flow, corporate finance, and takeovers. American Economic Review, 76(2), 323-329.
Jeremy, D . J. (2002). Business h istory and strategy. In A. Pettigrew, H . Thomas, & R. Whittington (Eds.), Handbook of strategy and management (pp. 436-460). London: Sage Publ ications Ltd.
Johnson, G ., Merlin, L ., & Whittington, R. (2003). Micro strategy and strategizing: Towards an activity-based v iew - Guest editors' introduction. Journal of Management Studies, 40( 1 ), 3-22.
Johnson, G., & Scholes, K. ( 1 999) . Exploring corporate strategy: Text and cases. (5th ed.). Essex, United Kingdom: Pearson Education Limited.
Johnson, 1. L . , & Sohi, R. S. (200 1 ). The influence of firm predispositions on inter-firm relationship formation in business markets. International Journal of Research in Marketing, 18(4), 299-3 1 8 .
Johnson, R. A ., & Bhattacharyya, G. K. (200 1 ) . Statistics: Principles and methods. New York: John Wiley .
Jones, R. E . , Jacobs, L. W., & van't Spijker, W. ( 1 992). Strategic decision processes in international firms. Management International Review, 32(3), 2 1 9-236.
Jones, R. E., Jones, K. M., & Deckro, R. F. ( 1 994). Strategic decision processes in matrix organizations. European Journal of Operational Research, 78(2), 1 92-203 .
Juttner, U. , & Peck, H . ( 1 998). I nvestigating corporate strategies for supplier management in retail ing companies: A framework for analysis. Journal of Strategic Marketing, 6(3), 223-239.
Kalleberg, A . L . , Knoke, D., Marsden, P. V., & Spaeth, J . L. ( 1 996). Organizations in America. Thousand Oaks, CA: Sage Publications Inc.
Kanungo, R. N. ( 1 982). Measurement of job and work involvement. Journal of Applied Psychology, 67(3), 341 -349.
296
Katz, R. ( 1 982). The effects of group longevity on project communication and performance. Administrative Science Quarterly, 29( 1 ), 8 1 - 1 04 .
Kerr, l . L . (2004). The l imits of organizational democracy. Academy of Management Executive, 18(3), 8 1 -9S .
Kessides, 1 . N. ( 1 990). Internal versus external market conditions and firm profitabil ity: An exploratory model . The Economic Journal, I 00(402), 773-792.
Khanna, T., & Rivkin, l . W. (200 1 ) . Estimating the performance effects of business groups in emerging markets. Strategic Management Journal, 22( 1 ), 4S-74.
K ing, A. W., & Zeithaml, C. P. (200 I ) . Competencies and firm performance: Examining the causal ambiguity paradox. Strategic Management Journal, 22( 1 ), 7S-99.
K irk, 1. , & Miller, M. L . ( 1 986). Reliability and validity in qualitative research. Beverly H i lls, CA: Sage Publications, Inc .
Kirkpatrick, S . A., & Locke, E. A. ( 1 996). Direct and indirect effects of three core charismatic leadership components on performance and attitudes. Journal of Applied Psychology, 81( 1 ), 36-S 1 .
Kisfalvi, V . (2000). The threat of fai lure, the peril s of success and CEO character: Sources of strategic persistence. Organization Studies, 21(3), 6 1 1 -639.
Klemm, M., Sanderson, S ., & Luffman, G. ( 1 99 1 ). Mission statements: Sell ing corporate values to employees. Long Range Planning, 24(3), 73-78 .
Kogut, B ., & Zander, U. ( 1 992). Knowledge of the firm, combinative capabi l ities and the replication of technology. Organization Science, 3(3), 383-396.
Kogut, B ., & Zander, U . ( 1 996). What firms do: Coordination, identity, and learning. Organization Science, 7(5), S02-S I 8 .
Koka, B . R., & Prescott, l. E. (2002). Strategic al l iances as social capital : A multidimensional v iew. Strategic Management Journal, 23(9), 79S-8 1 6 .
Korn, H . l ., & Baum, 1 . A. C. ( 1 999). Change, imitative, and strategic antecedents to multimarket contact. Academy of Management Journal, 42(2), 1 7 1 - 1 93 .
Kotter, l . P . , & Heskett, 1 . L. ( 1 992). Corporate culture and performance. New York: The Free Press.
Krauth, l. ( 1 988) . Distribution-free statistics: An application-orientated approach. New York: Elsevier Science Publishers B. V.
Krippendorff, K. (2004). Content analysis: An introduction to its methodology (2nd ed.) . Thousand Oaks, CA: Sage Publications, Inc.
Langlois, R. N . (2003). Strategy as economics versus economics as strategy. Managerial and Decision Economics, 24(4), 283-290.
297
Laverty, K . J . (2004). Managerial myopia or systemic short-termism? The importance of managerial systems in valuing the long term. Management Decision, 42(8), 949-962.
Lawler, E. E. ( 1 994). From job-based to competency-based organizations. Journal of Organizational Behavior, 15( 1 ), 3 - 1 5 .
Lawless, M. W., Bergh, D. D., & Wilsted, W. D. ( 1 989). Performance variations among strategic group members: An examination of individual firm capabil ity . Journal of Management, 1 5(4), 649-664.
Lawrence, P. R. ( 1 993). The contingency approach to organizational design. In R . T. Golembiewski, (Ed.), Handbook of organizational behavior (pp. 9- 1 8). New York: Marcel Dekker, Inc.
Lawrence, P. R., & Lorsch, J . W. ( 1 967). Differentiation and integration in complex organizations. Administrative Science Quarterly, 12( 1 ), 1 -47.
Lecraw, D. J. ( 1 984). Diversification strategy and performance. Journal of Industrial Economics, 33(2), 1 79- 1 98.
Lee, J. (2004). Discriminant analysis of technology adoption behavior: A case of internet technologies in small businesses. Journal of Computer Information Systems, 45(4), 57-66.
Leonard-Barton, D. ( 1 992). Core capabi l ities and core rigidities: A paradox in managing new product development. Strategic Management Journal, 13(Summer Special I ssue), 1 1 1 - 1 25 .
Levinthal, D., & Myatt, J . ( 1 994). Co-evolution o f capabilities and industry : The evolution of mutual fund processing. Strategic Management Journal, 15(Winter Special Issue), 45-62.
Levitas, E., & Chi, T. (2002). Rethinking Rouse and Daellenbach's rethinking: I solating vs. testing for sources of sustainable competitive advantage. Strategic Management Journal, 23( 1 0), 957-962 .
Levitt, B . , & March, J . ( 1 988). Organizational learning. Annual Review of SOCiology, 14, 3 1 9-340.
Lewin, J. E., & Johnston, W. J . (2000). The impact of down sizing and restructuring on organizational competitiveness. Competitiveness Review, 1 0( 1 ), 45-55 .
Lewis-Beck, M . ( 1 977). Influence equal ity and organizational innovation in a third-world nation: An additive-nonadditive model . American Journal of Political Science, 21( 1 ), 1 - 1 1 .
Lieberman, M . B., & Montgomery, D. B . ( 1 988) . First-mover advantages. Strategic Management Journal, 9(Summer Special Issue), 4 1 -58 .
L ieberson, S . , & O'Connor, J . F . ( 1 972). Leadership and organizational performance: A study of large corporations. American Sociological Review, 3 7(2) , 1 1 7- 1 30.
Lorenzoni, G., & Baden-Fuller, C . ( 1 995). Creating a strategic centre to manage a web of partners. California Management Review, 3 7(3), 1 46- 1 63 .
Lorenzoni, G., & Lipparini, A. ( 1 999). The leveraging of interfirm relationships as a distinctive
298
organizational capabil ity: A longitudinal study. Strategic Management Journal, 20(4), 3 1 7-338 .
Lorsch, J . W., & AlIen, S . A. ( 1 973). Managing diversity and interdependence. Boston, MA: Harvard Business School.
Love, L . G., Priem, R. L. , & Lumpkin, G. T. (2002). Explicitly articulated strategy and firm performance under alternative levels of central ization. Journal of Management, 28(5), 6 1 1 -627.
Lu, J. W., & Beamish, P . W. (2004). I nternational diversification and firm performance: The Scurve hypothesis. Academy of Management Journal, 4 7(4), 598-609.
Lynch, R. (2003). Corporate strategy. (3rd ed.). Essex, United Kingdom: Pearson Education Ltd.
Lyon, D. W., Lumpkin, G. T., & Dess, G. G. (2000). Enhancing entrepreneurial orientation research: Operational izing and measuring a key strategic decision making process. Journal of Management, 26(5), 1 055- 1 086.
Madhok, A . ( 1 996). The organization of economic activity : Transaction costs, fi rm capabi l ities, and the nature of governance. Organization Science, 7(5), 577-590.
Mahoney, J . T. ( 1 992). The adoption of the multidivisional form of organization: A contingency model . Journal of Management Studies, 29( 1 ), 49-7 1 .
Mahoney, J . T. (200 1 ). A resource-based theory of sustainable rents. Journal of Management, 2 7(6), 65 1 -660.
March, J. ( 1 99 1 ) . Exploration and exploitation in organizational learning. Organization Science, 2( 1 ), 7 1 -87.
March, J . G ., & Simon, H . A. ( 1 95 8). Organizations. New York: Wiley.
March, J. G., & Sutton, R. I. ( 1 997). Organizational performance as a dependent variable. Organization Science, 8(6), 698-706.
March, J. G., & Weissinger-Babylon, R. ( 1 986). Ambiguity and command. Marshfield, MA: Pitman.
Maritan, C. A., & Brush, T. H . (2003). Heterogeneity and transferring practices: Implementing flow manufacturing in multiple plants. Strategic Management Journal, 24( 1 0), 945 -959.
Markides, C . ( 1 992). Consequences of corporate refocusing: Ex ante evidence. Academy of Management Journal, 35(2), 398-4 1 2 .
Markides, C . ( 1 999). A dynamic view of strategy. Sloan Management Review, 40(3), 55 -64.
Markides, C. (2002). Corporate strategy: The role of the centre. In A. Pettigrew, H. Thomas, & R. Whittington (Eds.), Handbook of strategy and management (pp. 98- 1 1 2) . London: Sage Publ ications Ltd.
Markides, c ., & WilIiamson, P. J . ( 1 994). Related diversification, core competences and
299
corporate perfonnance. Strategic Management Journal, 15(Summer Special I ssue), 1 49- 1 65 .
Markides, c., & Wi l liamson, P. J . ( 1 996). Corporate diversification and organizational structure: A resource-based v iew. Academy of Management Journal, 39(2), 340-367.
Martin, J. ( 1 999). Leadership in local government reform: Strategic direction v administrative compliance. Australian Journal of Public Administration, 58(3), 24-37.
Mascarenhas, B. , Baveja, A., & Jamil, M. ( 1 998). Dynamic of core competencies in leading multinational companies. California Management Review, 40(4), 1 1 7- 1 32 .
Mason, E . C. ( 1 939). Price and production pol icies of large-scale enterprise. American Economic Review, 29( 1 ), 6 1 -74.
Matejka, K., & Brooks, L. ( 1 993) . The total qual ity journey: By invitation only? Management Decision, 31(5), 60-64.
Matejka, K., Kurke, L. B., & Gregory, B. ( 1 993). Mission impossible? Designing a great miss ion statement to ignite your plans. Management Decision, 31(4), 34-37.
Mauri, A . 1 . , & Michaels, M. P. ( 1 998). Firm and industry effects within strategic management: An empirical examination. Strategic Management Journal, 1 9(3), 2 1 1 -2 1 9.
Mayer, M . C. 1 . , & Whittington, R. ( 1 999). Strategy, structure and "systemness": National institutions and corporate change in France, Germany and the UK, 1 950- 1 993 . Organization Studies, 20(6), 933-959.
Mazza, C. ( 1 999). Claim, intent and persuasion: Organizational legitimacy and the rhetoric of corporate mission statements. Norwell, MA: Kluwer Academic Publishers.
McGahan, A. M. ( 1 999) The performance of US corporations: 1 98 1 - 1 994. The Journal of Industrial Economics, 47(4), 373-398.
McGahan, A. M. , & Porter, M. E. ( 1 997). How much does industry matter, really? Strategic Management Journal, 18(Summer Special Issue), 1 5-30.
McGahan, A. M ., & Porter, M. E. ( 1 999). The persistence of shocks to profitabil ity. The Review of Economics and Statistics, 81( 1 ), 1 43- 1 53 .
McGahan, A . M ., & Porter, M . E . (2002). What do we know about variance in accounting profitabi l ity? Management Science, 48(7), 834-85 1 .
McGahan, A. M. , & Porter, M. E. (2005). Comment on ' Industry, corporate and businesssegment effects and business performance: A non-parametric approach ' by Ruetli and Wiggins. Strategic Management Journal, 26(9), 873-880.
McLaughlin, D. 1 . ( 1 995). Strengthening executive decision making. Human Resource Management, 34(3), 443-462.
McNamara, G., Deephouse, D. L ., & Luce, R. A. (2003) . Competitive positioning within and across a strategic group structure: The performance of core, secondary, and solitary firms. Strategic Management Journal, 24(2), 1 6 1 - 1 8 1 .
300
McNulty, P. J . ( 1 968). Economic theory and the meaning of competition. Quarterly Journal of Economics, 82(4), 639-656.
McWilliams, A., & Smart, D. L . ( 1 993). Efficiency v . structure-conduct-performance: Implications for strategy research and practice. Journal of Management, 1 9( 1 ), 63-78.
Michel, A. , & Shaked, I . ( 1 984). Does business diversification affect performance? Financial Management, 13(4), 1 8-25 .
Miles, R. E., & Snow, C . C. ( 1 978). Organizational strategy, structure, and process. Stanford, CA: Stanford University Press.
Mi ller, A. , & Dess, G. G. ( 1 996). Strategic Management (2nd ed.). New York: The McGraw H ill Companies.
Mi ller, D. ( 1 993). The architecture of simpl icity . Academy of Management Review, 18( 1 ), 1 1 6-1 38.
M il ler, D . ( 1 994). What happens after success: The peri l s of excel lence. Journal of Management Studies, 31(3), 325-358 .
Mi ller, D. (2002). Successful change leaders: What makes them? What do they do that i s different? Journal of Change Management, 2(4), 359-368.
Mi ller, D., & Friesen, P . H. ( 1 980). Archetypes of organizational transition . Administrative Science Quarterly, 25(2), 268-299.
Mi ller, D., & Friesen, P. H. ( 1 986). Porter' s ( 1 980) generic strategies and performance: An empirical examination with American data. Part I : Testing Porter. Organization Science, 7( 1 ), 37-55 .
M iller, D., & Shamsie, J . ( 1 996). The resource-based view of the firm i n two environments : The Hollywood film studios from 1 936 to 1 965 . Academy of Management Journal, 39(3), 5 1 9-5 43 .
Mi ller, D. , & Toulouse, J . ( 1 986). Chief executive personal ity and corporate strategy and structure in small firms. Management Science, 32( 1 1 ), 1 3 89- 1 409.
M il liken, F. J. ( 1 990). Perceiving and interpreting environmental change: An examination of college administrators ' interpretation of changing demographics. Academy of Management Journal, 33( 1 ), 42-63 .
M intzberg, H . ( 1 979). The structuring of organizations. Englewood Cliffs, NJ: Prentice-Hal l .
M intzberg, H . ( 1 983) . Structure in fives: Designing effective organizations. Englewood Cliffs, NJ : Prentice-Hall.
M intzberg, H. ( 1 988). Generic strategy: Towards a comprehensive framework. Advances in Strategic Management, 5, 1 -67.
Mintzberg, H. ( 1 990). The design school: Reconsidering the basic premises of strategic management. Strategic Management Journal, 1 1 (3), 1 7 1 - 1 95 .
3 0 1
Mintzberg, H. , Raisinghani, D., & Theoret, A. ( 1 976). The structure of "unstructured" decision processes. Administrative Science Quarterly, 21(2), 246-275 .
Mintzberg, H. , & Waters, J . A. ( 1 985) . Of strategies, deliberate and emergent. Strategic Management Journal, 6(3), 257-272.
M isangyi , V. F., E lms, H., Greckhamer, T., & Lepine, J . A . (2006). A new perspective on a fundamental debate: A multi level approach to industry, corporate and business unit effects. Strategic Management Journal, 2 7(6), 57 1 -590.
Moch, M . K., & Morse, E. V. ( 1 977). Size, central ization and organizational adoption of innovations. American Sociological Review, 42(5), 7 1 6-725 .
Mone, M . A., McKinley, W., & Barker, V . L. ( 1 998). Organizational decline and innovation: A contingency framework. Academy of Management Review, 23( I ) , 1 1 5- 1 32 .
Monroe, S . A. (2002). Do successful companies possess strategic intent? Unpublished Masters Dissertation, Massey University, Palmerston North, New Zealand.
.
Montgomery, C . A. ( 1 982). The measurement of firm diversification : Some new empirical evidence. Academy of Management Journal, 25(2), 299-307.
Montgomery, C . A. ( 1 994). Corporate diversification. Journal of Economic Perspectives, 8(3), 1 63 - 1 78 .
Mowday, R, & Steers, R. M. ( 1 979) . The measurement of organizational commitment. Journal of Vocational Behavior, 14(2), 224-247.
Mueller, D. C. ( 1 969). A theory of conglomerate mergers. Quarterly Journal of Economics, 83(4), 643-659.
Mueller, D. C. ( 1 977). The persistence of profits above the norm. Economica, 44( 1 76), 369-380.
Mueller, D . C . ( 1 985) . Mergers and market share. The Review of Economics and Statistics, 67(2), 259-67.
Mueller, D. C. ( 1 986). Profits in the long run. Cambridge, United Kingdom: Cambridge University Press.
Mueller, G . C. , McKinley, W., Mone, M. A., & Barker, V. L., I ll . (200 1 ) . Organizational dec l ine: A stimulus for innovation? Business Horizons, 44(6), 25-34.
Nehrt, C. ( 1 998). Maintainabil ity of first mover advantages when environmental regulations differ between countries. Academy of Management Review, 23( 1 ), 77-97.
Nelson, R ( 1 99 1 ). Why do firms differ, and how does it matter? Strategic Management Journal, 12(Winter Special I ssue), 6 1 -74.
Nelson, R R., & Winter, S. G. ( 1 982) . An evolutionary theory of economic change. Cambridge, MA: The Belknap Press of Harvard University Press.
Nonaka, I . ( 1 99 1 ) . The knowledge creating company. Harvard Business Review, 69(6), 96- 1 04 .
3 02
Nonaka, I . ( 1 994). A dynamic theory of organizational knowledge creation . Organization Science, 5( 1 ), 1 4-37.
Norusis, M . (2005) . SPSS 13.0 Advanced Statistical Procedures Companion. Upper SaddleRiver, N.1 . : Prentice Hall, Inc.
Nunnal ly, J . C. ( 1 967). Psychometric theory. New York: McGraw-Hil l .
Nutt, P. C . ( 1 992). Formulat ion tactics and the success of organizational decision making. Decision Sciences, 23(3), 5 1 9-540.
O'Gorman, C., & Doran, R. ( 1 999) . Mission statements in smal l and medium-sized businesses. Journal of Small Business Management, 3 7(4), 59-67.
Oliver, C. (2000). Cause for optimism. In J . A . C. Baum, & F. Dobbin, (Eds.), Economics meets sociology in strategic management (pp. 291 -295) . Stamford, CT: JAI Press Inc.
Orlitzky, M., & Hirokawa, R. Y. (200 1 ) . To err is human; to correct for it divine: A metaanalysis of the functional theory of group decision-making effectiveness. Small Group Research, 32(3 ), 3 1 3-34 1 .
Palepu, K. ( 1 985) . Diversification strategies, profit performance and the entropy measure. Strategic Management Journal, 6(3), 239-255 .
Palich, L . E., Cardinal, L . B., & Mil ler, C . C . (2000). Curvil inearity in the diversificationperformance l inkage: An examination of over three decades of research. Strategic Management Journal, 21(2), 1 55- 1 74.
Pall ant, J . (2005). SPSS survival manual: A step by step guide to data analysis using SPSS for Windows (Version 12). (2nd ed. ) . NSW, Australia: Al ien & Unwin.
Pandian, J. R., & Robertson, P. L. (2003). Why look for a mirage when you already have an oasis? Managerial and Decision Economics, 24(4), 325-334.
Pearce, 1., & David, F . ( 1 987). Corporate mission statements: The bottom l ine. Academy of Management Executive, 1(2), 1 09- 1 1 6 .
Pearce, 1. L., & Rande1, A . E. (2004). Expectations of organizational mobil ity, workplace social inclusion, and employee job performance. Journal of Organizational Behavior, 25( 1 ), 8 1 -98.
Pearson, G., & Proctor, T. ( 1 994). The modern framework for marketing planning. Marketing Intelligence & Planning, 1 2( 4), 22-26.
Penrose, E. ( 1 959). The theory of the growth of the firm. (3rd ed.). New York: Oxford University Press Inc. Reprint edition 1 995 .
Peteraf, M . A . ( 1 993) . The cornerstones of competitive advantage: A resource-based v iew. Strategic Management Journal, 1 4(3), 1 79- 1 9 1 .
Peteraf, M . A. , & Barney, J . B . (2003). Unravel ing the resource-based tangle. Managerial and Decision Economics, 24(4), 309-323.
303
Peters, T. J. ( 1 984). Strategy follows structure: Developing distinctive skil ls . California Management Review, 26(3), 1 1 1 - 1 25 .
Peters, T . J. , & Waterman, R . H. ( 1 982). In search of excellence. New York: Free Press.
Pettigrew, A. M. ( 1 990). Longitudinal field research on change: Theory and practice. Organization Science, 1 (3), 267-292 .
Pettinger, R. ( 1 996). Introduction to corporate strategy. London: Macmi l lan Press Ltd.
Peyrefitte, J. , & Golden, P. A. (2004) . Vertical integration and performance in the United States computer hardware industry . International Journal of Management, 2 1 (2), 246-25 1 .
Pfeffer, J . , & Davis-Blake, A. ( 1 986). Administrative succession and organizational performance: How administrator experience mediates the succession effect. Academy of Management Journal, 29( 1 ), 72-83.
Pierce, P . S . (Ed.). (2004). The Dow Jones Averages 1885 - 1995. Retrieved 1 2 October, 2004, from http://dj indexes.com/mdsidxldownloadslDlIA _ H ist_ Comp. pdf.
Piercy, F. N ., & Morgan, N. A. ( 1 994). Mission analysis : An operational approach. Journal of General Management, 19(3), 1 - 1 9 .
Pitts, R. A. ( 1 977) . Strategies and structures for diversification. Academy of Management Journal, 20(2), 1 97-208.
Popper, K . ( 1 959). The logic of scientific discovery. London: Routledge.
Porter, M . E. ( 1 980). Competitive strategies: Techniques for analyzing industries and competitors. New York: The Free Press.
Porter, M. E. ( 1 985) . Competitive advantage: Creating and sustaining superior performance. New York: The Free Press.
Porter, M . E. ( 1 987). From competitive advantage to corporate strategy. Harvard Business Review, 65(3), 43-60.
Porter, M. E. ( 1 99 1 ). From competitive advantage to corporate strategy. In C. A. Montgomery & M. E . Porter (Eds.), Strategy: Seeking and securing competitive advantage (pp. 225-255). Boston, MA: Harvard Business School Publishing Division.
Powell, T. C. ( 1 992). Organizational alignment as competitive advantage. Strategic Management Journal, 13(2), 1 1 9- 1 34.
Powell, T. C . ( 1 996). How much does industry matter? An alternative empirical test. Strategic Management Journal, 1 7(4), 323-334.
Powel l, T. C . (200 1 ) . Competitive advantage: Logical and philosophical considerations. Strategic Management Journal, 22(9), 875-888 .
Prahalad, C. K. , & Bettis, R. A. ( 1 986). The dominant logic: A new l inkage between d iversity and performance. Strategic Management Journal, 7(6), 485-50 1 .
304
Prahalad, C. K., & Bettis, R. A. ( 1 995) . The dominant logic : Retrospective and extension. Strategic Management Journal, 16( 1 ), 5 - 1 4 .
Prahalad, C. K., & Doz, Y . L. (2003). The rationale for multi-SBU companies. In D. O. Faulkner & A. Campbell (Eds.), The Oxford handbook of strategy: Vol. 2. Corporate strategy (pp. 43-7 1 ). Oxford, United Kingdom: Oxford University Press.
Prahalad, C. K., & Hamel, G. ( 1 990). The core competence of the corporation. Harvard Business Review, 68(3), 79-9 ] .
Priem, R. L., & Butler, J . L. (200 1 a). I s the resource-based "view" a useful perspective for strategic management research? Academy of Management Review, 2 6( 1 ), 22-40.
Priem, R. L ., & Butler, J. L. (200 1 b). Tautology in the resource-based v iew and the implications of external ly determined resource value: Further comments. Academy of Management Review, 26( 1 ), 5 7-65.
Proctor, T. ( 1 997). Establishing a strategic direction : A review. Management Decision, 35( 1 /2), 1 43 - 1 55 .
Przybylowicz, E . P., & Faulkner, T. W. ( 1 993). Kodak appl ies strategic intent to the management of technology . Research Technology Management, 36( I ), 3 1 -38 .
Pugh, D. S ., H ickson, D. J . , Hinings, C. R. , & Turner, C. ( 1 969). The context of organizational structures. Administrative Science Quarterly, 14( 1 ), 9 1 - 1 1 4 .
Purcell , J . , & Ahlstrand, B. ( 1 989). Corporate strategy and the management of employee relations in the multi-divisional company. British Journal of Industrial Relations, 2 7(3), 396-4 1 7.
Quigley, 1. V. ( 1 993) . Vision: How leaders develop it, share it, and sustain it. New York: McGraw-Hil l .
Quinn, J . B. ( 1 980). Strategies for change: Logical incrementalism. Homewood, IL : Irwin.
Quinn, J . B. , Mintzberg, H., & James, R. M. ( 1 988) . The strategy process: Concepts, contexts and cases. Englewood Cliffs, NJ: Prentice-Hal l .
Rampersad, H . K. (200 1 ) . A visionary management model . The TQM Magazine, 13(4), 2 1 1 -223 .
Rarick, C . A., & Vitton, J . ( 1 995) . Mission statements make cents. Journal of Business Strategy, 1 6( 1 ), 1 1 - 1 2 .
Ravenscraft, D. J . ( 1 983) . Structure-profit relationships at the I ine of business and industry level . The Review of Economics and Statistics, 65( 1 ), 22-3 1 .
Ray, G. , Barney, J . B. , & Muhanna, W. A. (2004). Capabil ities, business processes, and competitive advantage: Choosing the dependent variable in empirical tests of the resourcebased view. Strategic Management Journal, 25( 1 ), 23-37.
Reed, R., & DeFil l ippi, R. J. ( 1 990) . Causal ambiguity, barriers to imitation, and sustainable competitive advantage. Academy of Management Review, 1 5( 1 ), 88- 1 02.
305
Robbins, S. P., & Bamwell, N . ( 1 994) . Organisational theory in Australia. Austral ia: Prentice Hal l of Australia Pty Ltd.
Robins, 1. ( 1 993). Organization as strategy: Restructuring production in the film industry. Strategic Management Journal, 14(Summer Special Issue), 1 03- 1 1 8 .
Robins, l., & Wiersema, M. F . ( 1 995). A resource-based approach to the multi business firm: Empirical analysis of portfolio interrelationships and corporate financial performance. Strategic Management Journal, 1 6(4), 277-299.
Rodrigues, S . B., & H ickson, D. J . ( 1 995). Success in decision making: Different organizations, differing reasons for success. Journal of Management Studies, 32(5), 655-678.
Roquebert, l. A., Phi l l ips, R. L., & Westfall, P. A . ( 1 996). Markets vs. management: What 'drives' profitabi l ity? Strategic Management Journal, 1 7(8), 653-664.
Rowl inson, M. ( 1 995). Strategy, structure and culture: Cadbury, divisional ization and merger in the 1 960's. Journal of Management Studies, 32(2), 1 2 1 - 1 40.
Ruefli, T. W., & Wiggins, R . R. (2003). Industry, corporate, and segment effects and business performance: A non-parametric approach. Strategic Management Journal, 24(9), 86 1 -879.
Rumelt, R. P. ( 1 974). Strategy, structure and economic performance. Boston, MA: Harvard Business School .
Rumelt, R. P. ( 1 982). Diversification strategy and profitabi lity. Strategic Management Journal, 3(4), 359-369.
Rumelt, R. P. ( 1 99 1 ) . How much does industry matter? Strategic Management Journal, 12(3), 1 67- 1 85 .
Rumelt, R. P., Schendel, D., & Teece, D . J . ( 1 99 1 ) . Strategic management and economics. Strategic Management Journal, 12( 1 ), 5-29.
Russo, M. V. ( 1 99 1 ). The multidivisional structure as an enabl ing device: A longitudinal study of discretionary cash as a strategic resource. Academy of Management Journal, 34(3), 7 1 8-733 .
Ryan, G . W., & Bernard, H. R. (2003). Data management and analysis methods. I n N . K . Denzin & Y. S. L incoln (Eds.). Collecting and interpreting qualitative materials (2nd ed.) (pp. 259-309). Thousand Oaks, CA: Sage Publ ications Ltd.
Sadler, P. (2003). Strategic management. (2nd ed.). London: Kogan Page Ltd.
Salancik, G. R., & Pfeffer, J. ( 1 977) . A social information processing approach to job attitudes and task design. Administrative Science Quarterly, 23(2), 224-253 .
Sambharya, R. B . (2000). Assessing the construct val idity of strategic and SIC-based measures of corporate diversification. British Journal of Management, 1 1 (2), 1 63- 1 73 .
Scarbrough, H. ( 1 998). Path(ological) dependency? Core competencies from an organizational perspective. British Journal of Management, 9(3), 2 1 9-232.
3 06
Schein, E . H. ( 1 984). Coming to a new awareness of organizational culture. Sloan Management Review, 25(2), 3 - 1 6.
Scherer, F . M ., & Ross, D. ( 1 990). Industrial market structure and economic performance. (3rd ed.). Boston, MA: Houghton Mifflin Company.
Schmalensee, R. ( 1 985) . Do markets differ much? American Economic Review, 75(3), 34 1 -35 1 .
Schumpeter, 1 . A. ( 1 934). Theory of economic development: A n inquiry into profits, capital, credit, interest, and the business cycle. Cambridge, MA : Harvard University Press.
Schumpeter, 1. A. ( 1 950). Capitalism, socialism and democracy. (3rd ed.). New York: Harper & Row.
Sexton, D. D. , & Van Auken, P. M. ( 1 985). A longitudinal study of small business strategic plann ing. Journal of Small Business Management, 23( 1 ), 7- 1 5 .
Sharpe, P., & Keelin, T. ( J 998). How SmithKl ine Beecham makes better resource-al location decisions. Harvard Business Review, 76(2), 45-57.
Short, J . c. , Ketchen, D. J . , Jr., & Palmer, T. B . (2002). The role of sampl ing in strategic management research on performance: A two-study analysis. Journal of Management, 28(3), 363-3 85 .
S iegel, S . , & Castellan, N. J . , Jr. ( 1 988). Nonparametric statistics for the behavioral sciences. (2nd ed.). United States of America: McGraw-Hi l l, Inc.
S i lverman, D. (2003) . Analysing talk and text. In N. K. Denzin & Y. S . Lincoln (Eds.), Collecting and interpreting qualitative materials (2nd ed.) (pp. 340-362). Thousand Oaks, CA: Sage Publications Ltd.
S imon, H . A. ( 1 976). Administrative behavior. New York: Macmi l lan.
Simon, H. A. ( 1 977). The new science of management decision. Englewood, NJ: Prentice-Hall .
S ingh, K ., Ang, S . H., & Leong, S. M. (2003). Increasing repl ication for knowledge accumulation in strategy research. Journal of Management, 29(4), 533-549.
Skat-Rordam, P. ( 1 999). Changing strategic direction: Practical insights into opportunity driven business development. Copenhagen: Copenhagen Business School Press.
Smith, 1. E., Carson, K. P., & Alexander, R. A. ( 1 984). Leadership: It can make a difference. Academy of Management Journal, 2 7( 4), 765-776.
Smith, K. G., Guthrie, J. P., & Chen, M. ( 1 989). Strategy, size and performance. Organization Studies, 1 0( 1 ), 63-8 1 .
Spanos, Y . E. , Zaralis, G. , & Lioukas. S . (2004). Strategy and industry effects on profitability: Evidence from Greece. Strategic Management Journal, 25(2), 1 39- 1 65 .
Spender, 1 . C . ( 1 989) . Industrial recipes: The nature and sources of managerial judgement. Oxford, United Kingdom: Basi l Blackwell .
307
Spender, J. C . ( 1 993). Some frontier activities around strategy theorizing. Journal of Management Studies, 30( 1 ), 1 1 -30.
Spulber, D . F. (2003). The intermediation theory of the firm: Integrating economic and management approaches to strategy. Managerial and Decision Economics, 24(4), 253-266.
Stalk, G., Evans, P., & Shulman, L. E. ( 1 992). Competing on capabi l ities: The new rules of corporate strategy. Harvard Business Review, 70(2), 57-69 .
Staw, B . M. ( 1 976). Knee-deep in the big muddy: A study of escalation commitment to a chosen course of action. Organizational Behavior and Human Performance, 1 6( 1 ), 27-44.
Staw, B . M. ( 1 98 1 ). The escalation of commitment to a course of action. Academy of Management Review, 6(4), 577-587.
Staw, B. M., & Fox, F . V. ( 1 977). Escalation: The determinants of commitment to a chosen course of action. Human Relations, 30(5), 43 1 -450.
Stem, 1 . , & Henderson, A. D. (2004). Within-business diversification in technology-intensive industries. Strategic Management Journal, 25(5), 487-505 .
Streib, G . ( 1 992). Applying strategic decision making in local government. Public Productivity & Management Review, 15(3), 34 1 -353 .
Stuart, T. E. , & Podolny, J . M. ( 1 996). Local search and the evolution of technological capabi l ities. Strategic Management Journal, 1 7(Summer Special I ssue), 2 1 -38 .
SubbaNarasimha, P. N . (200 1 ) . Strategy in turbulent environments: The role of dynamic competence. Managerial and Decision Economics, 22(4-5), 20 1 -2 1 2 .
Sueyoshi, T., & Hwang, S . (2004). A use of nonparametric tests for DEA-Discriminant analysis: A methodological comparison. ASia-Pacific Journal of Operational Research, 21(2), 1 79-1 95 .
Sutc1iffe, K . M . , & McNamara, G . (200 1 ). ControIl ing decision making practice i n organizations. Organization Science, 12(4), 484-5 0 1 .
Szulanski, G . ( 1 996). Exploring internal stickiness: Impediments to the transfer of best practice within the firm. Strategic Management Journal, 1 7(Winter Special I ssue), 27-43 .
Tabachnick, B . G. , & Fidell, L. S . (200 1 ) . Using multivariate statistics. (4th ed.). Needharn Heights, MA: AI Iyn & Bacon.
TaIlman, S . ( 1 99 1 ) . Strategic management models and resource-based strategies among MNEs in a host market. Strategic Management Journal, 12(Summer Special I ssue), 69-82.
Tallman, S., & Li, J . ( 1 996). Effects of international diversity and product diversity on the performance of multinational firms. Academy of Management Journal, 39( 1 ), 1 79- 1 96.
Taylor, S. J . , & Bogdan, R. ( 1 998). Introduction to qualitative methods: A guidebook and resource. (3rd ed.). New York: John Wiley & Sons, I nc.
308
Teece, D. J. ( 1 984). Economic analysis and strategic management. California Management Review, 26(3), 87- 1 1 0.
Teece, D. 1., Pisano, G. , & Shuen, A. ( 1 997). Dynamic capabil ities and strategic management. Strategic Management Journal, 18(7), 509-533 .
Teng, B ., & Cummings, J . L . (2002). Trade-offs in managing resources and capabil ities. Academy of Management Executive, 16(2), 8 1 -9 1 .
Tesch, R. ( 1 990). Qualitative research: Analysis types and software tools. New York: Falmer.
Testa, M. R. ( 1 999). Satisfaction with organizational v ision, job satisfaction and service efforts: An empirical investigation. Leadership & Organization Development Journal, 20(3), 1 54-1 6 1 .
Thomas, A . B . ( 1 988). Does leadership make a difference to organizational performance? Administrative Science Quarterly, 33(3), 3 88-400.
Thomas, H., & Pruett, M. ( 1 993). Introduction to the special issue: Perspectives on theory building in strategic management. Journal of Management Studies, 30( 1 ), 3- 1 0.
Thomas, L . G., I l l . ( 1 996). The two faces of competition. Organization Science, 7(3), 22 1 -242.
Thompson, A. A. , & Strickland, A. J . ( 1 996). Strategic management: Concept and cases (9th ed.). I l l inois: I rwin Publishing.
Thompson, J . L. ( 1 997). Lead with VlSlon: Manage the strategic challenge. Cornwall : International Thomson Business Press.
Thompson, J. L. (200 1 ) . Understanding corporate strategy. London: Thomson Learning.
Tripsas, M., & Gavetti , G. (2000). Capabil ities, cognition, and inertia: Evidence from digital imaging. Strategic Management Journal, 21 ( 1 0/1 1 ), 1 1 47- 1 1 6 1 .
Trul l , S . G . ( 1 966). Some factors involved i n determining total decision success. Management Science, 12(6), 270-280.
Tsoukas, H., & Knudsen, C. (2002). The conduct of strategy research. In A. Pettigrew, H . Thomas, & R. Whittington (Eds.), Handbook of strategy and management (pp. 4 1 1 -435) . London: Sage Publ ications Ltd.
Turner, D., & Crawford, M. ( 1 994). Managing current and future competitive performance: The role of competency. In G. Hamel & A. Heene (Eds.), Competency-based competition (pp. 24 1 -264). Chichester, United Kingdom: Wiley.
Tushman, M. L., & O'Reil ly, C. A., I l l . ( 1 996) . Ambidextrous organizations: Managing evolutionary and revolutionary change. California Management Review, 38(4) , 9-30.
Tushman, M. L. , & Rosenkopf, L. ( 1 996). Executive succession, strategic reorientation and performance growth: A longitudinal study in the U .S . cement industry. Management Science, 42(7), 939-953 .
309
Vancil, R . ( 1 980). Decentralization: Managerial ambiguity by design. Homewood, IL : DowJones I rwin.
Van der Stede, W. A. (2003). The effect of national culture on management culture on management control and incentive system design in multi-business firms: Evidence of intracorporate isomorphism. European Accounting Review, 12(2), 263-285 .
Varadaraj an, P . , & Ramanujam, V . ( 1 987). Diversification and performance: A reexamination using a new two-dimensional conceptualization of d iversity in firms. Academy of Management Journal, 30(2), 3 80-393.
Vecchio, R. P., & Appe\baum, S . H. ( 1 995). Managing organizational behavior. Toronto: Dryden.
Venkatraman, N. , & Subramaniam, M. (2002). Theorizing the future of strategy: Questions for shaping strategy. In A. Pettigrew, H. Thomas, & R. Whittington (Eds.), Handbook of strategy and management (pp. 461 -474). London: Sage Publ ications Ltd.
Vera, D. , & Crossan, M. (2004). Strategic leadership and organizational learning. Academy of Management Review, 29(2), 222-240.
Viljoen, J., & Dann, S. (2003) . Strategic management. (4th ed.). Frenchs Forest, NSW: Pearson Education Australia.
Waring, G. F. ( 1 996). Industry differences in the persistence of firm-specific returns. American Economic Review, 86(5), 1 253- 1 265.
WaIT, P. , Cook, J ., & Wall, T. ( 1 979). Scales for the measurement of some work attitudes and aspects of psychological well-being. Journal of Occupational Psychology, 52(2), 1 29- 1 48 .
Weber, M . ( 1 958) . Bureaucracy. In H . H. Gerth, & C . W. Mi l l s (Eds.), From Max Weber: Essays in SOciology (pp. 1 96-244). New York: Oxford University Press.
Weiner, N ., & Mahoney, T. A. ( 1 98 1 ) . A model of corporate performance as a function of environmental, organizational, and leadership influences. Academy of Management Journal, 24(3), 453-470.
Wernerfelt, B . ( 1 984). A resource-based view of the firm. Strategic Management Journal, 5(2), 1 7 1 - 1 80 .
Wernerfelt, B. , & Montgomery, C. A. ( 1 988) . Tobin's q and the importance of focus in firm performance. American Economic Review, 78( 1 ), 246-250.
Westley, F . R. ( 1 990). Middle managers and strategy: Microdynamics of inclusion. Strategic Management Journal, 1 1(5), 337-35 1 .
Wheeler, D. D., & Janis, I . L. ( 1 980) . A practical guide for making decisions. New York: Free Press.
Whittington, R. (2002). Corporate structure: From policy to practice. In A. Pettigrew, H. Thomas, & R. Whittington (Eds.), Handbook of strategy and management (pp. 1 l 3- l 3 8) . London: Sage Publ ications Ltd.
3 1 0
Whyte, G. ( 1 986). Escalating commitment to a course of action: A reinterpretation. Academy of Management Review, 1 1(2), 3 1 1 -32 1 .
Wiggins, R. R. , & Ruetl i , T. W. (2002) . Sustained competitive advantage: Temporal dynamics and the incidence and persistence of superior economic performance. Organization Science, 13( 1 ), 8 1 - 1 05 .
Wilcox, R . R . (2003). Applying contemporary statistical techniques. San Diego, CA: Elsevier Science (USA).
Wilkins, A. L ., & Ouchi, W. G. ( 1 983). Efficient cultures: Exploring the relationship between culture and organizational performance. Administrative Science Quarterly, 28(3), 468-48 1 .
Will iamson, O. ( I 970). Corporate control and business behavior. Englewood C liffs, NJ: Prentice-Hal l .
Wil l iamson, O . ( I 975). Markets and hierarchies: Analysis and antitrust implications. New York: Free Press.
Wil liamson, O. ( 1 980). The organization of work: A comparative institutional assessment. Journal of Economic Behavior and Organization, 1 ( 1 ), 5-38 .
Williamson, O. ( 1 985) . The economic institutions of capitalism: Firms, markets and relational contracting. New York: Free Press.
Wilson, C. Z ., & Alexis, M. ( 1 962) . Basic frameworks for decisions. Academy of Management Journal, 5(2), 1 50- 1 64 .
Wilson, I . ( 1 992) . Realizing the power of strategic vision. Long Range Planning, 25(5 ), 1 8-28 .
Woodman, R. W., Sawyer, J. E . , & Griffin, R. W. ( 1 993). Toward a theory of organizational creativity. Academy of Management Review, 18(2), 293-32 1 .
Woodward, J . ( 1 965). Industrial organization: Theory and practice. London: Oxford University Press.
Y in, X., & Zajac, E. J. (2004). The strategy/governance structure fit relationship: Theory and evidence in franchizing arrangements. Strategic Management Journal, 25(4), 3 65-3 83 .
Young, G . J . , Chams, M . P., & Heeren, T . C . (2004). Product-l ine management i n professional organizations: An empirical test of competing theoretical perspectives. Academy of Management Journal, 47(5), 723-734 .
Zucker, L. G . ( 1 977) . The role of institutionalization i n cultural persi stence. American Sociological Review, 42(5), 726-743 .
3 1 1
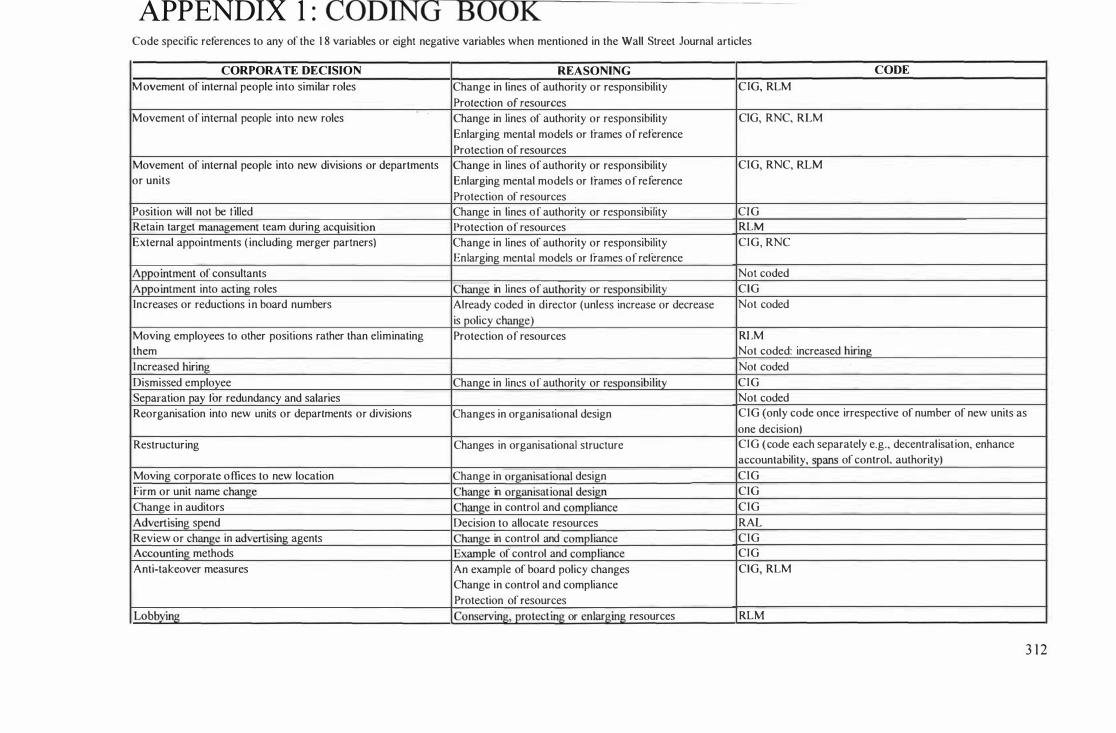
APPENDIX 1 : CODING BOOK Code specific references to any of the 1 8 variables or eight negative variables when mentioned in the Wall Street Journal articles
CORPORATE DECISION REASONING CODE
M ovement of internal people into similar roles Change in lines of authority or responsibility C rG, RLM Protection of resources
Movement of intern'al people into new roles Change in lines of authority or responsibility CIG, RNC, RLM Enlarging mental models or frames of reterence Protection 0 f resources
Movement of internal people into new divisions or departments Change in lines of authority or responsibility CIG, RNC, RLM
or units Enlarging mental models or frames o f reference Protection of resources
Position will not be tilled Change in lines 0 f authority or responsibility C1G Retain target management team during acquisition Protection of resources RLM External appointments ( including merger partners) Change in lines of authority or responsibility CrG, RNC
Enlarging mental models or frames of reterence Appointment of consultants Not coded Appointment into acting roles Change in lines of authority or responsibility CIG Increases or reductions in board numbers Already coded in director (unless increase or decrease Not coded
is policy change) Moving employees to other positions rather than eliminating Protection of resources RLM them Not coded: increased hiring Increased hiring Not coded Dismissed employee Change in lines 0 r authority or responsibility CrG Separation pay tor redundancy and salaries Not coded Reorganisation into new units or departments or divisions Changes in organisational design CIG (only code once irrespective of number of new units as
one decision) Restructuring Changes in organisational structure CrG (code each separately e.g., decentralisation, enhance
accountability, spans of control, authority) Moving corporate o ffices to new location Change in organisational design CIG Firm or unit name chan....&e Change in organisational design CIG Change in auditors Change in control and compliance CIG Advertising spend Decision to allocate resources RAL Review or change in advertising agents Change in control and compliance CIG Accounting methods Example of control and compliance CrG Anti-takeover measures An example of board policy changes CrG, RLM
Change in control and compliance Protection of resources
Lobbying Conserving, protect ing or enlarging resources RLM
3 1 2
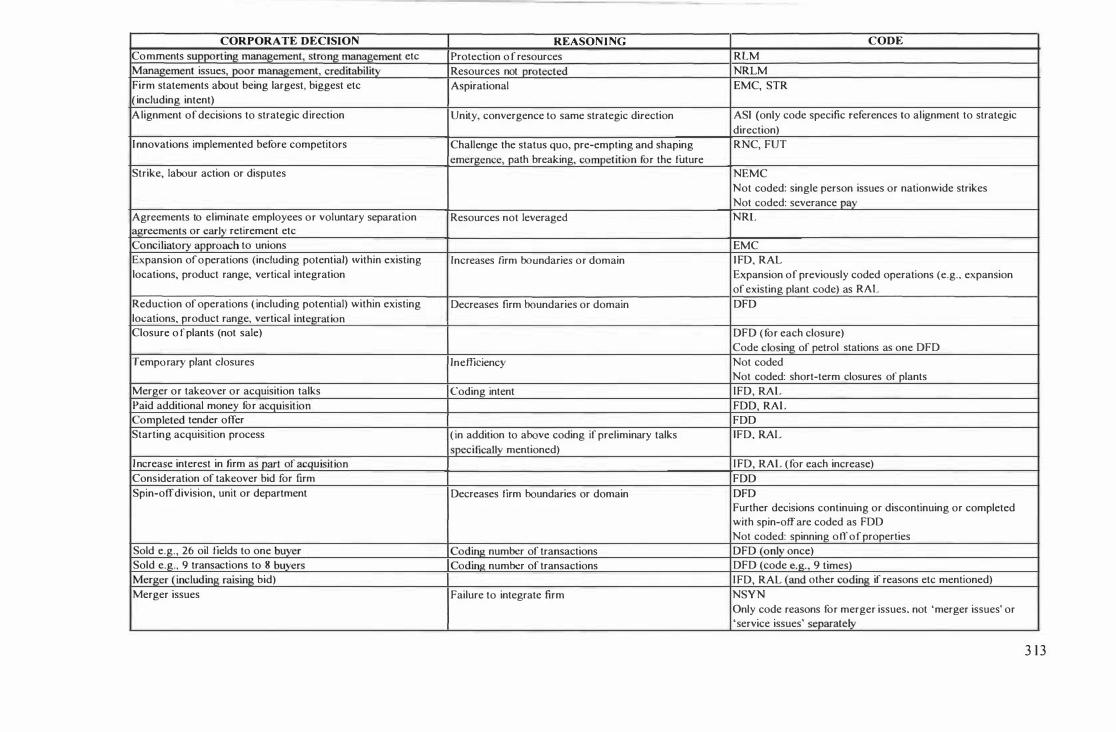
CORPORATE DECISION REASON I NG CODE Comments supporting management, strong management etc Protection o f resources RLM Management issues, poor management, creditability Resources not protected NRLM Firm statements about being largest, biggest etc Aspirational EMC, STR ( including intent) Alignment of decisions to strategic direction Unity, convergence to same strategic direction ASI (only code specific references to alignment to strategic
direction) I nnovations implemented before competitors Challenge the status quo, pre-empting and shaping RNC, FUT
emergence, path breaking, competition for the future Strike, labour action or disputes NEMC
Not coded: single person issues or nationwide strikes Not coded: severance pay
Agreements to eliminate employees or voluntary separation Resources not leveraged NRL agreements or early retirement etc Conciliatory_ aggroach to unions EMC Expansion of operations (including potential) within existing Increases firm boundaries or domain I FD, RAL locations, product range, vertical integration Expansion of previously coded operations (e.g., expansion
of existing plant code) as RAL Reduction of operations ( including potential) within existing Decreases ftrm boundaries or domain DFD locations, product range, vertical integrat ion Closure o f plants (not sale) DFD (for each closure)
Code closing of petrol stations as one DFD Temporary plant closures Inefficiency Not coded
Not coded: short-term closures of plants Merger or takeover or acquisition talks Coding intent [FD, RAL Paid additional money for acquisition FDD, RAL COll1jJleted tender offer FDD Starting acquisition process ( in addition to above coding if preliminary talks [FD. RAL
specifically mentioned) Increase interest in tirm as part of acquisition [ FD, RAL (for each increase) Consideration of takeover bid for firm FDD Spin-off division, unit or department Decreases firm boundaries or domain DFD
Further decisions continuing or discontinuing or completed with spin-off are coded as FDD Not coded: spinning offof properties
Sold e.g., 26 oil fields to one buyer Coding number of transactions DFD (only once) Sold e.g., 9 transactions to 8 buyers Coding_ number of transactions DFD (code e.g., 9 times) Me�er (including raising bid) [ FD, RAL l.and other coding if reasons etc mentioned) Merger issues Failure to integrate firm NSYN
Only code reasons for merger issues, not 'merger issues' or 'service issues' seflarately
3 1 3
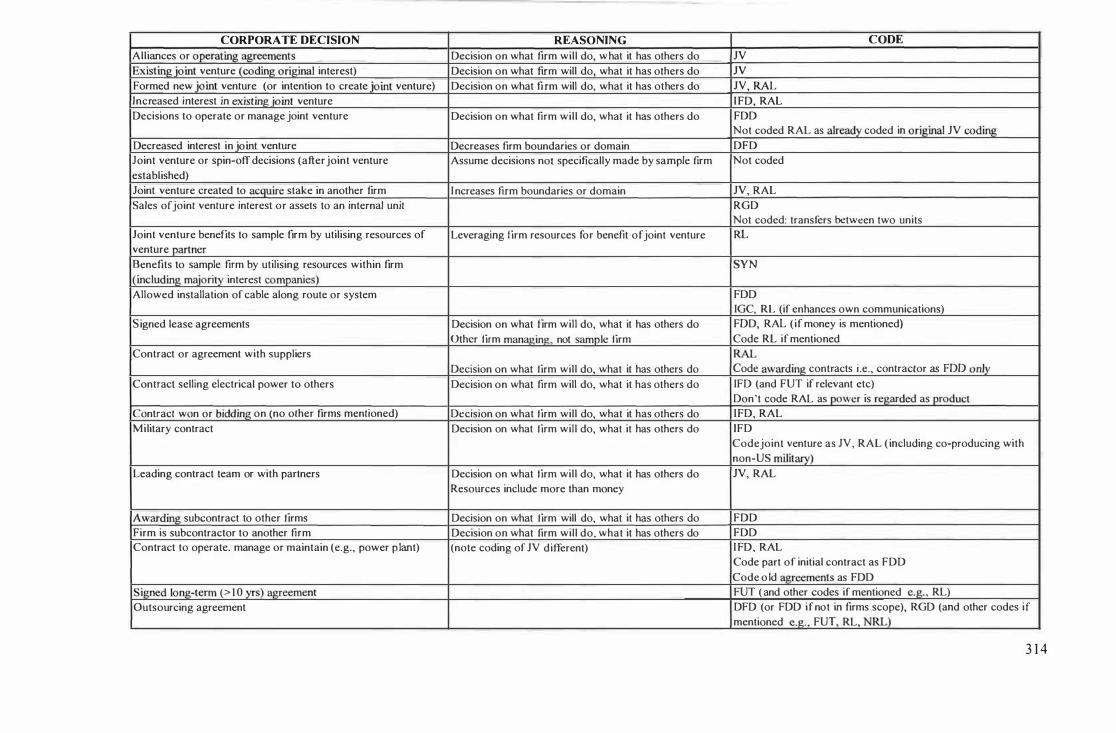
CORPORATE DECISION REASONING CODE
Alliances or o�erating agreements Decision on what firm will do, what it has others do N Existingjoint venture (coding original interest) Decision on what firm will do, what it has others do N Formed new joint venture (or intention to create joint venture) Decision on what firm will do, what it has others do N, RAL Increased interest in existing joint venture I FD, RAL Decisions to operate or manage joint venture Decision on what firm will do, what it has others do FDD
Not coded RAL as already coded in original N coding Decreased interest in joint venture Decreases firm boundaries or domain DFD Joint venture or spin-off decisions (after joint venture Assume decisions not specifically made by sample firm Not coded established) Joint venture created to acquire stake in another firm I ncreases firm boundaries or domain N, RAL Sales of joint venture interest or assets to an internal unit RGD
Not coded: transfers between two units Joint venture benefits to sample firm by utilising resources of Leveraging firm resources for benefit of joint venture RL venture partner Benefits to sample firm by utilising resources within firm SYN
( including majority interest companies) Allowed installation of cable along route or system FDD
IGC, RL (if enhances own communications) S igned lease agreements Decision on what firm will do, what it has others do FDD, RAL (if money is mentioned)
Other tirm man�ing, not sample tirm Code RL if mentioned Contract or agreement with suppliers RAL
Decision on what tirm will do, what it has others do Code awarding contracts i.e., contractor as FDD only Contract selling electrical power to others Decision on what firm will do, what it has others do IFD (and FUT if relevant etc)
Don't code RAL as power is regarded as product Contract won or bidding on (no other firms mentioned) Decision on what firm will do, what it has others do IFD, RAL Military contract Decision on what firm will do, what it has others do IFD
Code joint venture as N, RAL ( including co-producing with non-US military)
Leading contract team or with partners Decision on what firm will do, what it has others do N, RAL Resources include more than money
Awarding subcontract to other firms Decision on what firm will do, what it has others do FDD Firm is subcontractor to another firm Decision on what firm will do, what it has others do FDD Contract to operate. manage or maintain (e.g., power p lant) (note coding of N different) I FD, RAL
Code part of initial contract as FDD Code o ld agreements as FDD
Signed long-term (> \ 0 yrs) agreement FUT (and other codes if mentioned e.g., RL) Outsourcing agreement DFD (or FDD ifnot in firms scope), RGD (and other codes if
mentioned e.g. FUT RL, NRL)
3 1 4
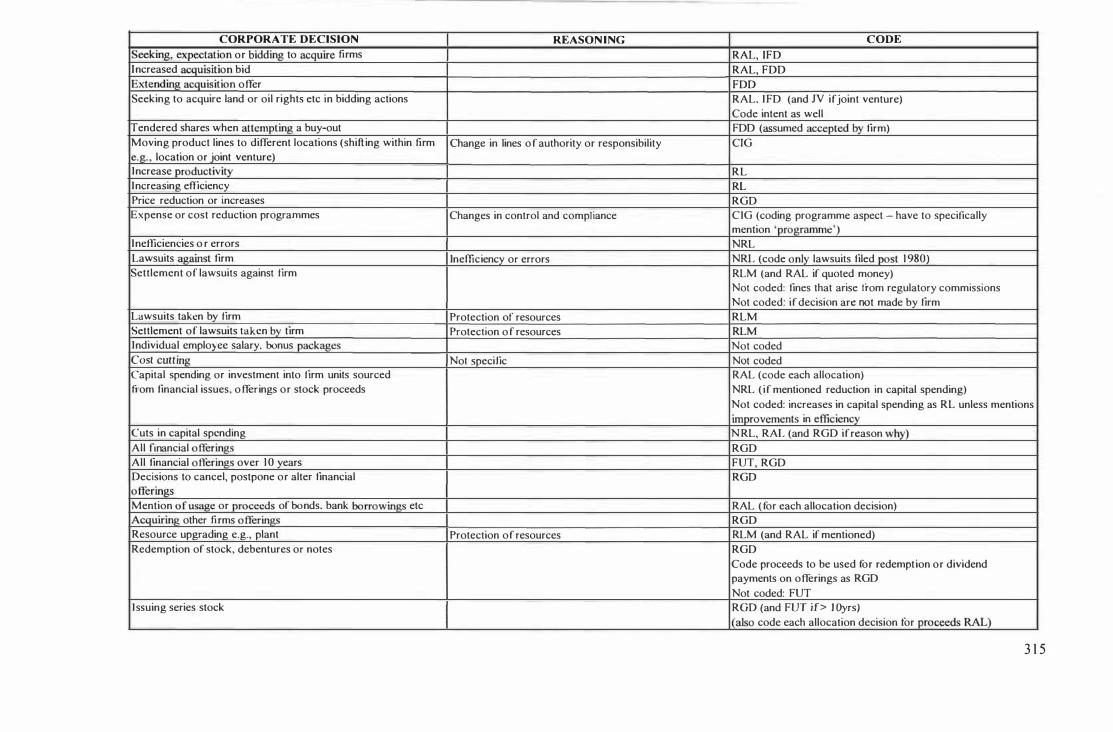
CORPORATE DECISION REASON ING CODE Seeking, expectation or bidding to acquire firms RAL, IFD Increased acquisition bid RAL, FDD Extending acquisition offer FDD Seeking to acquire land or oil rights etc in bidding actions RAL, I FD (and N if joint venture)
Code intent as well Tendered shares when attempting a buy-out FDD (assumed accepted by firm) Moving product lines to different locations (shifting within firm Change in lines o f authority or responsibility ClG e.g., location or joint venture) Increase productivity RL I ncreasing efficiency RL Price reduction or increases RGD Expense or cost reduction programmes Changes in control and compl iance CIG (coding programme aspect - have to specifically
mention 'programme' ) I nefficiencies o r errors NRL Lawsuits against firm Inefficiency or errors NRL (code only lawsuits filed post 1 980)
Settlement of lawsuits against firm RLM (and RAL if quoted money) Not coded: fines that arise ITom regulatory commissions Not coded: if decision are not made by firm
Lawsuits taken by firm Protection of resources RLM Settlement of lawsuits taken by tirm Protection o f resources RLM Individual employee salary. bonus packages Not coded Cost cutt ing Not specific Not coded Capital spending or investment into tirm units sourced RAL (code each allocation) from financial issues, o fferings or stock proceeds NRL (if mentioned reduction in capital spending)
Not coded: increases in capital spending as RL unless mentions improvements in efficiency
Cuts in capital spending N RL, RAL (and RGD if reason why) All fmancial offerings RGD All financial o fii::rings over 1 0 years FUT, RGD Decisions to cancel, postpone or alter financial RGD o fferings Mention ofusage or proceeds of bonds. bank borrowings etc RAL (for each allocation decision) Acquiring other firms offerings RGD Resource upgrading e.g., plant Protection of resources RLM (and RAL if mentioned) Redemption of stock, debentures or notes RGD
Code proceeds to be used for redemption or dividend payments on offerings as RGD Not coded: FUT
I ssuing series stock RGD (and FUT if> 1 0yrs) {also code each allocation decision tor proceeds RAL)
3 1 5

CORPORA TE DECISION REASONING
Sold tax credits Issuing firm shares Repurchasing firm shares
Intent to repurchase firm shares Protection of resources Adjusted purchase price for acquisitions Quarterly dividend (including suspension decisions)
Firm stock split Listing or delisting on stock exchange Requested, raised prices or rates ( including belonging to price-setting agreements or organisations)
Reducing debt Debt retirement or retinancin&�rogrammes Debt rates
Restating earnings External financial downNades or tlpgrades
ASSUMPTIONS: All appointment announcements have been made at the corporate level All resource allocation announcements have been made by at the corporate level All project allocation announcements have been made by at the corporate level
FURTHER CODING RULES: All joint ventures are FDD and RL (Ieveraging from external relat ionships) although not coded unless specifically mentioned Every acquisition, divestment, or joint venture involves CIG but is not coded Prior contracts (that may have been created, existed during sample period) are not coded Decisions in which the sample firm does not have majority (controlling) interest are not coded Speculation by other parties on what decisions will or will not be made by the sample firms are not coded Researcher assumptions or deductions are not coded that is, only code those decisions mentioned specifically in the articles
CODE
RGD RGD (and RAL for each allocation of proceeds mentioned) RGD (and RAL for each proceeds of decisions to repurchase shares and RLM is specifically mentions protection) Not coded: interest rate shares e.g., series shares RLM RGD RGD (if specified why reduced code RAL) Do not retro-code unless specifically stated that quarterly dividend has been maintained or paid since X
RGD RGD RGD ( if specitied allocation decisions code RAL) (if appealing government decisions or responding to competitors code RLM) RGD RGD RGD (only code debt announcements by firm) Not coded: mentions by other firms e.g., rating firms RGD Code only reasons for downgrade
3 1 6
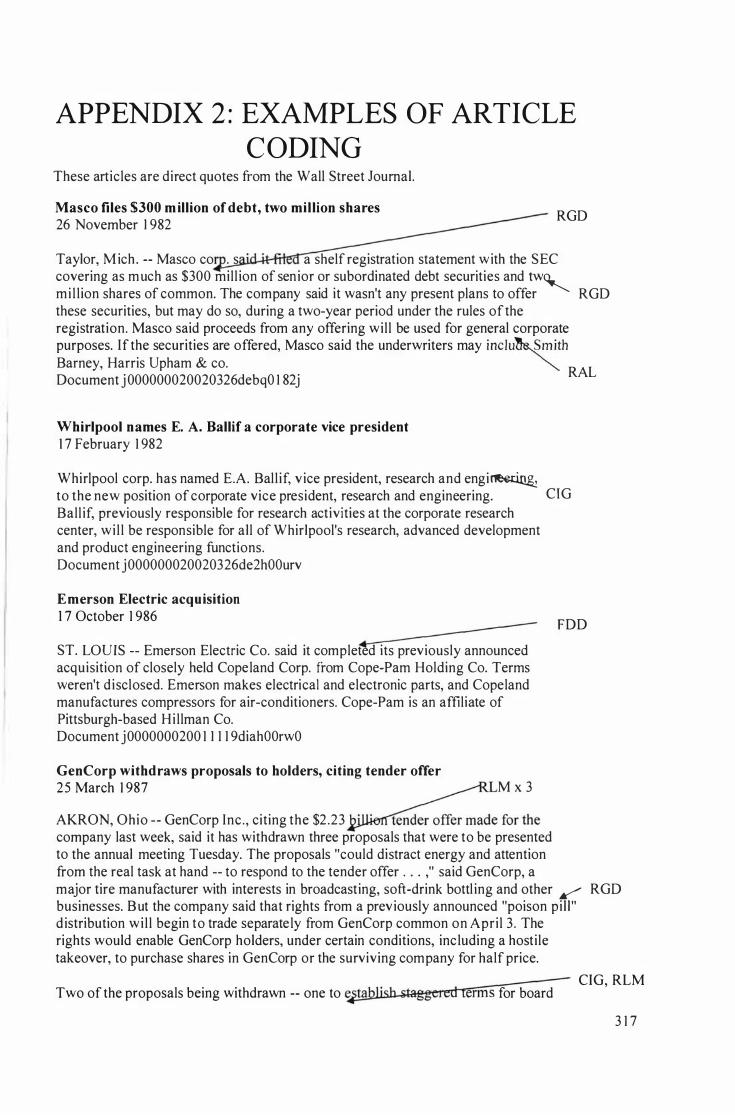
APPENDIX 2 : EXAMPLES OF ARTICLE
CODING These articles are direct quotes from the Wall Street Journal.
Masco files $300 million of debt, two million shares 26 November 1 982
RGD
Taylor, M ich. -- Masco co . s a shelf registration statement with the SEC covering as much as $300 mill ion of senior or subordinated debt securities and tw, mil lion shares of common. The company said it wasn't any present plans to offer RGD these securities, but may do so, during a two-year period under the rules of the registration. Masco said proceeds from any offering wil l be used for general corporate purposes. If the securities are offered, Masco said the underwriters may inclu�mith Barney, Harris Upham & co. � Document j 000000020020326debqO 1 82j RAL
Whirlpool names E. A. Ballif a corporate vice president 1 7 February 1 982
Whirlpool corp. has named E.A. Ball if, v ice president, research and engi� to the new position of corporate vice president, research and engineering. Ball if, previously responsible for research activities at the corporate research center, wi l l be responsible for all of Whirlpool's research, advanced development and product engineering functions. Document j000000020020326de2hOOurv
Emerson Electric acquisition 1 7 October 1 986
ST. LOUIS -- Emerson Electric Co. said it completed its previously announced acquisition of closely held Cope land Corp. from Cope-Pam Holding Co. Terms weren't disclosed. Emerson makes electrical and electronic parts, and Cope land manufactures compressors for air-conditioners. Cope-Pam is an affiliate of Pittsburgh-based Hi llman Co. Document j0000000200 1 1 1 1 9diahOOrwO
GenCorp withdraws proposals to holders, citing tender offer 25 March 1 987
AKRON, Ohio -- GenCorp Inc. , citing the $2 .23
M x 3
CTG
FDD
company last week, said it has withdrawn three proposals that were to be presented to the annual meeting Tuesday. The proposals "could distract energy and attention from the real task at hand -- to respond to the tender offer . . . ," said GenCorp, a major tire manufacturer with interests in broadcasting, soft-drink bottl ing and other / RGD businesses. But the company said that rights from a previously announced "poison pi l l" d istribution wi l l begin to trade separate ly from GenCorp common on Apri l 3 . The rights would enable GenCorp holders, under certain conditions, including a hostile takeover, to purchase shares in GenCorp or the surviving company for half price.
Two of the proposals being withdrawn -- one to $abJish £taggeled terms for board CIG, RLM
3 1 7
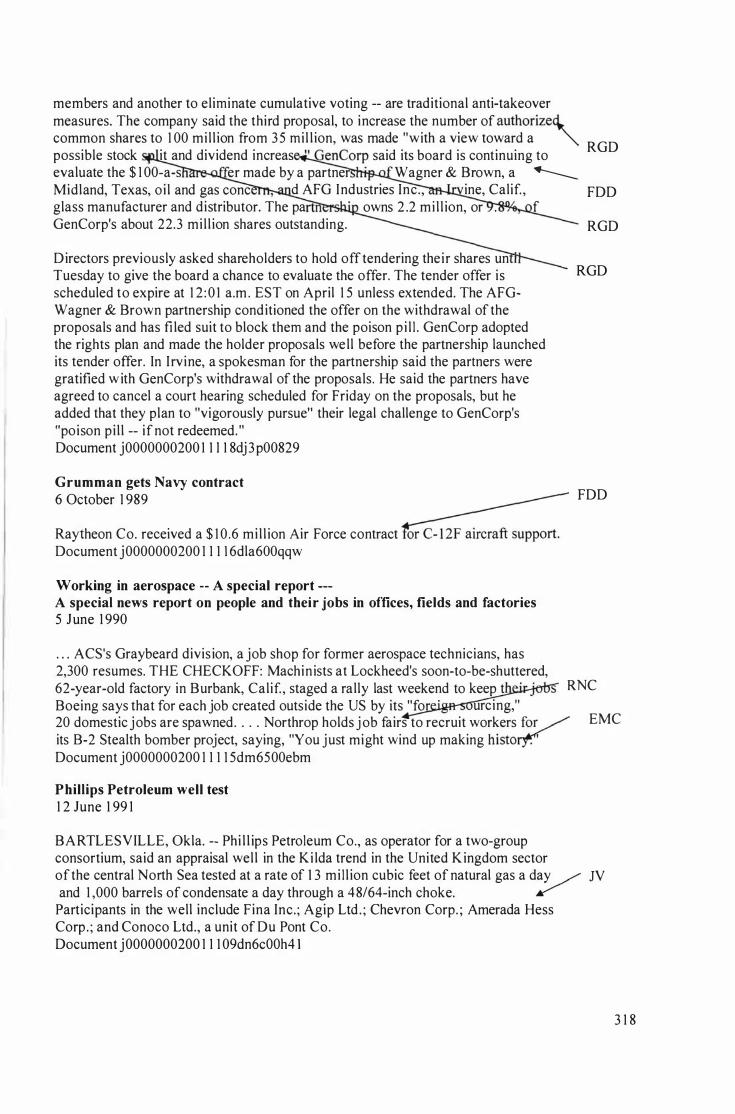
members and another to eliminate cumulative voting -- are traditional anti-takeover measures. The company said the third proposal, to increase the number of authorize� common shares to 1 00 mi l l ion from 3 5 mil l ion, was made "with a view toward a
. '" possible stock it and dividend increas " GenCorp said its board is continuing to evaluate the $ 1 00-a-s er made by a partner ' Wagner & Brown, a � Midland, Texas, oi l and gas conc d AFG Industries Inc. , ine, Calif. , glass manufacturer and distributor. The pa owns 2 .2 mi l l ion, or . f GenCorp's about 22.3 mi l l ion shares outstanding.
RGD
FDD
RGD
Directors previously asked shareholders to hold off tendering their shares un Tuesday to give the board a chance to evaluate the offer. The tender offer is scheduled to expire at 1 2 : 0 1 a.m . EST on April 1 5 unless extended. The AFGWagner & Brown partnership conditioned the offer on the withdrawal of the proposals and has fi led suit to block them and the poison p i l l . GenCorp adopted the rights plan and made the holder proposals well before the partnership launched its tender offer. In Irvine, a spokesman for the partnership said the partners were gratified with GenCorp's withdrawal of the proposals. He said the partners have agreed to cancel a court hearing scheduled for Friday on the proposals, but he added that they plan to "vigorously pursue" their legal challenge to GenCorp's "poison pi l l -- ifnot redeemed. "
RGD
Document j0000000200 1 1 I 1 8dj3p00829
Grumman gets Navy contract 6 October 1 989
Raytheon Co. received a $ 1 0 .6 mi l l ion Air Force contract Document j0000000200 1 1 1 1 6dla600qqw
Working in aerospace -- A special report ---A special news report on people and their jobs in offices, fields and factories 5 June 1 990
. . . ACS's Graybeard divis ion, a job shop for former aerospace technicians, has 2,300 resumes. THE CHECKOFF: Machinists at Lockheed's soon-to-be-shuttered, 62-year-old factory in Burbank, Calif. , staged a rally last weekend to keep t
. .
FDD
RNC
Boeing says that for each job created outside the US by its "for .
urcing," 20 domestic jobs are spawned . . . . Northrop holds j ob fairs to recruit workers for ./ its B-2 Stealth bomber project, saying, "You just might wind up making historr Document j0000000200 1 1 1 1 5dm6500ebm
EMC
Phillips Petroleum well test 1 2 June 1 99 1
BARTLESVILLE, Okla. -- Phi l l ips Petroleum Co., as operator for a two-group consortium, said an appraisal wel l in the Ki lda trend in the United K ingdom sector ofthe central North Sea tested at a rate of 1 3 mi l l ion cubic feet of natural gas a day ../ JV and 1 ,000 barrels of condensate a day through a 48/64-inch choke. /
Participants in the well include Fina Inc.; Agip Ltd . ; Chevron Corp. ; Amerada Hess Corp. ; and Conoco Ltd., a unit of Du Pont Co. Document j0000000200 1 1 1 09dn6cOOh4 1
3 1 8
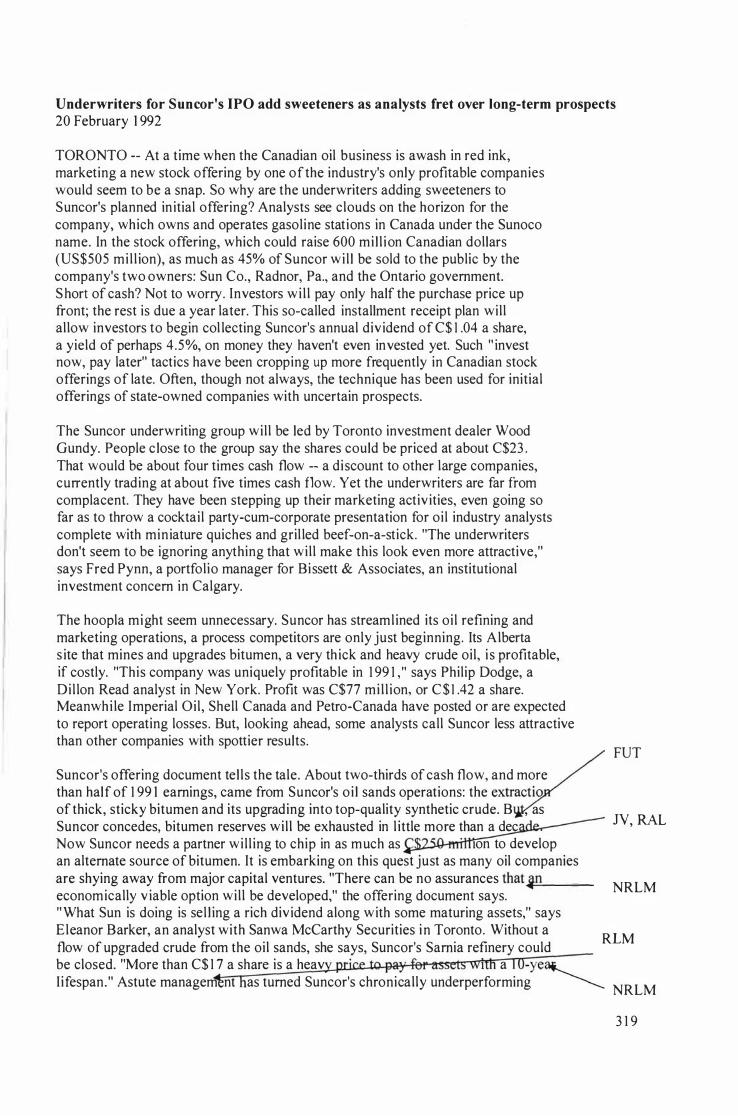
Underwriters for Suncor's IPO add sweeteners as analysts fret over long-term prospects 20 February 1 992
TORONTO -- At a time when the Canadian oil business is awash in red ink, marketing a new stock offering by one of the industry's only profitable companies would seem to be a snap. So why are the underwriters adding sweeteners to Suncor's planned in itial offering? Analysts see clouds on the horizon for the company, which owns and operates gasoline stations in Canada under the Sunoco name. In the stock offering, which could raise 600 mi l l ion Canadian dollars (US$505 mi l l ion), as much as 45% of Sun cor wi l l be sold to the public by the company's two owners: Sun Co., Radnor, Pa., and the Ontario government. Short of cash? Not to worry. Investors wi l l pay only half the purchase price up front; the rest is due a year later. This so-called installment receipt plan will allow investors to begin col lecting Suncor's annual div idend of C$ I .04 a share, a yield of perhaps 4.5%, on money they haven't even invested yet. Such " invest now, pay later" tactics have been cropping up more frequently in Canadian stock offerings of late. Often, though not always, the technique has been used for initial offerings of state-owned companies with uncertain prospects.
The Suncor underwriting group wil l be led by Toronto investment dealer Wood Gundy. People c lose to the group say the shares could be priced at about C$23 . That would be about four times cash flow -- a discount to other large companies, currently trading at about five times cash flow. Yet the underwriters are far from complacent. They have been stepping up their marketing activ ities, even going so far as to throw a cocktail party-cum-corporate presentation for oil industry analysts complete with miniature quiches and gril led beef-on-a-stick. "The underwriters don't seem to be ignoring anything that wil l make this look even more attractive," says Fred Pynn, a portfolio manager for Bissett & Associates, an institutional investment concern in Calgary.
The hoopla might seem unnecessary. Suncor has streamlined its oil refining and marketing operations, a process competitors are only just beginning. Its Alberta s ite that mines and upgrades bitumen, a very th ick and heavy crude oil, i s profitable, if costly. "This company was uniquely profitable in 1 99 1 ," says Philip Dodge, a Dil lon Read analyst in New York. Profit was C$77 mi l l ion, or C$ I .42 a share. Meanwhi le Imperial Oil, Shell Canada and Petro-Canada have posted or are expected to report operating losses. But, looking ahead, some analysts call Suncor less attractive than other companies with spottier results.
Suncor's offering document tel ls the tale. About two-thirds of cash flow, and more than half of 1 99 1 earnings, came from Suncor's o i l sands operations: the extractio of thick, sticky bitumen and its upgrading into top-quality synthetic crude. B , as Suncor concedes, bitumen reserves wil l be exhausted in l ittle more than a dec Now Suncor needs a partner wil l ing to chip in as much as
. Ion to develop
an alternate source of bitumen. It is embarking on this quest just as many oil companies are shying away from major capital ventures. "There can be no assurances that�i:..:.n __ _ economically v iable option wil l be developed," the offering document says. "What Sun is doing is sel l ing a rich dividend along with some maturing assets," says
FUT
N, RAL
NRLM
Eleanor Barker, an analyst with Sanwa McCarthy Securities in Toronto. Without a flow of upgraded crude from the oil sands, she says, Suncor's Sarnia refinery could
RLM
be closed. "More than C$ 1 7 a share is a heav . I a -ye�
I ifespan." Astute managem nt as turned Suncor's chronically underperforming _____ NRLM
3 1 9
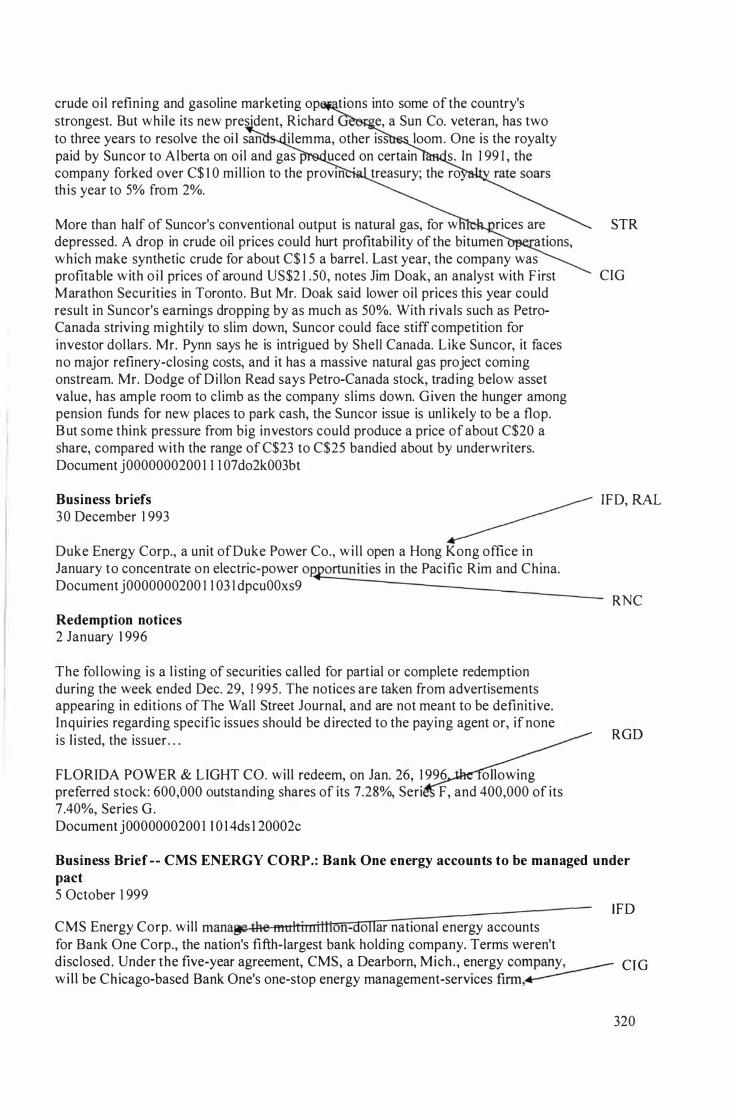
crude oi l refining and gasoline marketing op tions into some ofthe country's strongest. But while its new president, Richard e, a Sun Co. veteran, has two to three years to resolve the oi l san ilemma, other iss loom. One is the royalty paid by Suncor to Alberta on oil and gas uced on certain s. In 1 99 1 , the company forked over C$ 1 0 mil l ion to the provin ' treasury; the ro th is year to 5% from 2%.
More than half of Suncor's conventional output is natural gas, for w rices are depressed. A drop in crude oil prices could hurt profitabil ity of the bitumen ations, which make synthetic crude for about C$ 1 5 a barrel . Last year, the company was profitable with o i l prices of around US$2 1 .50, notes Jim Doak, an analyst with F irst Marathon Securities in Toronto. But Mr. Doak said lower oil prices this year could result in Suncor's earnings dropping by as much as 50%. With rivals such as PetroCanada striving mightily to slim down, Suncor could face stiff competition for investor dol lars. Mr. Pynn says he is intrigued by Shell Canada. Like Suncor, it faces no major refinery-closing costs, and it has a massive natural gas project coming onstream. Mr. Dodge of Dil l on Read says Petro-Canada stock, trading below asset value, has ample room to climb as the company slims down. Given the hunger among pension funds for new places to park cash, the Suncor issue is unl ikely to be a flop. But some think pressure from big investors could produce a price of about C$20 a share, compared with the range of C$23 to C$25 bandied about by underwriters. Document j0000000200 1 1 1 07d02k003bt
Business briefs 30 December 1 993
Duke Energy Corp., a unit of Duke Power Co., wi l l open a Hong Kong office in January to concentrate on electric-power o�ortunities in the Pacific Rim and China. Document j 0000000200 1 1 03 1 dpcuOOxs9
Redemption notices 2 January 1 996
The fol lowing is a l i sting of securities cal led for partial or complete redemption during the week ended Dec. 29, 1 995. The notices are taken from advertisements appearing in editions of The Wall Street Journal, and are not meant to be definitive. Inquiries regarding specific issues should be directed to the paying agent or, if none is l isted, the issuer . . .
FLORIDA POWER & L IGHT CO. will redeem, on Jan. 26, 1 996 ollowing preferred stock: 600,000 outstanding shares of its 7.28%, Seri F, and 400,000 of its 7 .40%, Series G . Document j0000000200 1 1 0 1 4ds 1 20002c
STR
CIG
IFD, RAL
RNC
RGD
Business Brief -- CMS ENERGY CORP.: Bank One energy accounts to be managed under pact 5 October 1 999
CMS Energy Corp. will mana� the mttltiillillion-dollar national energy accounts for Bank One Corp., the nation's fifth-largest bank holding company. Terms weren't
IFD
disclosed. Under the five-year agreement, CMS, a Dearborn, Mich., energy company:--- CrG wil l be Chicago-based Bank One's one-stop energy management-services firm,'----
320
providing electricity and natural gas and consolidating bi l ls for electric, gas, water and sewer for Bank One's 3 ,200 faci l ities in 34 states and the District of Columbia. Bank One said the deal is expected to lower the bank's energy costs. CMS said Bank One wil l pay CMS management and bill-processing transaction fees and other fees b incentives for CMS to cut the bank's energy costs. T ea is CMS's largest energy-marketing deal to date. It is the latest In a series of pacts being forged between large power and natural gas companies and industrial customers. Document j0000000200 I 0828dva500rve
Georgia Power hit with bias suit 28 July 2000
Southern Co.'s Georgia Power Co. unit, a big Atlant - I I , was h it with a race-discrimination s
. 0 e legal team that brought a simi lar bias suit against Coca-Cola Co. The new suit, fi led in Superior Court in Fulton County, Ga., al leges that Georgia Power discriminates against African-Americans in hiring and promotions. The suit, which seeks class-action status for about 2,000 workers, was fi led on behalf of three Georgia Power employees by lawyers from the law firm Bondurant, Mixson & El lmore LLP, one of two firms involved in the class action against Coca-Cola. Parties in that suit have reached a tentative settlement.
A major contention of the Georgia Power lawsuit is that blacks are underrepresented
NRNC
NRL
at senior levels of management. For example, the complaint alleges that although NEMC African-Americans accounted for about 1 9% of Georgia Power's work fore December 1 998, only 22 ofthe company's top 408 employees we c ; and only 83 of 1 ,602 African-American workers held manageria pervisory level pGsitiefl3. NEMC The suit also says black workers were subjected to insults, hostirtty and harassment on the job. � NEMC David M. Ratcl iffe, Georgia Power's president and CEO, said in an interview that he was disappointed by the legal action but promised to probe the allegations. " I intend to thoroughly investigate every single one of the al legations," he said . "To the extent that I can val idate there is any wrongdoing, we wil l deal with that and the individuals involved. " Mr. Ratcl iffe said he learned two weeks ago a group of African-America CIG
workers were considering a suit. He said he hadn't read it and couldn' ent on any of its allegations, but said the company is committed t and promoting minorities. He added that three of the company's 2 executives were black, and that three 0 CIG its 1 1 board members a r. Ratcliffe also said the corn pan Itted to sensitivity trai g and that he created a diversity adviso ounci l two days ago made up of senior Georgia Power executives and board members. " If these activities are occurring, we've got to do a better job of train ing and teaching our folks how to deal w ith different kinds of people," Mr. Ratcliffe said. ..............
IGC Document j0000000200 1 0807dw7s0018c
U nion Pacific blames 35% drop in net on economy, high fuel costs, weather 1 9 January 200 I
Union Pacific Corp. said fourth-quarter net income fel l 3 5%, reflecting a slowing economy, h igher fuel costs, severe winter weather and a one-time charge. The nation's largest rai lroad company reported fourth-quarter net income of $ 1 57 mi l l ion, or 63 cents a di luted share, compared with $242 mi l l ion, or 95 cents a share, a year earlier. Excluding a charge of $72 mi l l ion for reducing the work force, earnings
32 1
in the latest fourth quarter were $229 mil l ion, or 90 cents a share.
That was in l ine with the First Callffhomson Financ ial analysts' consensus estimate. Last month, Union Pacific, Omaha, Neb., said it planned to cut about 2,000 jobs from its work force of 50,000 and expected fourth-quarter earnings, excluding the one-time charge, to range between 87 cents and 90 cents a di luted share . Fourth-quarter revenue rose 3 .4% to $2.95 bi l l ion from $2.86 bi l l ion. As of 4 p.m. in New York Stock Exchange composite trading, Union Pacific fell six cents to $52.56.
Richard Davidson, Union Pacific's chairman, president and chief executive, said fourth-quarter results were hurt by snow in Chicago and ice storms that damaged signal systems in Texas and Arkansas. Shipments of automobi les, lumber, chemicals and steel slowed. But demand for coal remained strong, and there was a pickup in export grain. Fuel prices "remained high and have become more volati le, " he said.
Union Pacific's trucking unit, Overnite Transportation Co., had operating income of $ 1 6 .5 mi l l ion in the fourth quarter compared with an operating loss of $ 1 3 .7 mi l l ion a year earlier. Overnite cited new service offerings, delivery re liability a g t growth for the improved results, despite a continued strike eamsters union. Mr. Davidson said Union Pacific plans to boost productivity by retirin�older freight cars and locomotives and replacing steel coal cars with l ighter aluminium mo at can haul extra coal. Union Pacific plans to reduce capital expenditure IS year to between $ 1 .6 bi l l ion and $ 1 .9 b i l l ion from about $2 bi l l ion last year.
Mr. Davidson said he is optimistic that first-quarter results wil l "come close to where we were in the first quarter last year. " Union Pacific reported first-quarter 2000 net income 0[ $ 1 85 mi l l ion, or 74 cents a share, on revenue of$2 .9 1 bi l l ion. Ike Evans, president of Union Pacific Railroad Co., said new freight services wil l help the company offset the economic slowdown. Document j 0000000200 1 07 1 1 dx 1 j002ky
Stocks Ex-Dividend Aug. 21
20 August 2002
RL
NRL
Company Amoun�t ____ ---------------------------------- RGD
CSX Corp . 1 0 .-
Document j000000020020820dy8k00009
Transportation brief -- Burlington Northern Santa Fe Corp.: Net rises 25% on higher prices and record freight volume 28 July 2004
Record freight volume and higher average prices pushed net income at Burlington RL Northern Santa Fe Corp. up 25% to $249 mil l ion in the second quarter. The Fort Worth, Texas, railroad operator earned 67 cents a share, compared with net i me in the year-earlier period of$200 mi l l ion, or 54 cents a share. Strong d nd from the construction and bui lding industries and the petroleum and c Ical sectors helped increase revenue 1 7% to $2.69 bil l ion from $2.29 bi
. n. The company said RL
its operating ratio, a measure of performance in the r ' ad sector . 0 rom 8 1 .8% a year earlier. A lower ratio means re
. cy at generating profit.
Burlington Northe . .
I S experiencing the strongest demand in years, i s
322

h iring about 2,300 people this year to meet anticipated 2004 and 2005 activity. Chief Executive Matt Rose said the company wil l experience tough comparisons in the fourth quarter due to the increase in demand that began in the last quarter of 2003 . Document J000000020040728e07s0000e
323
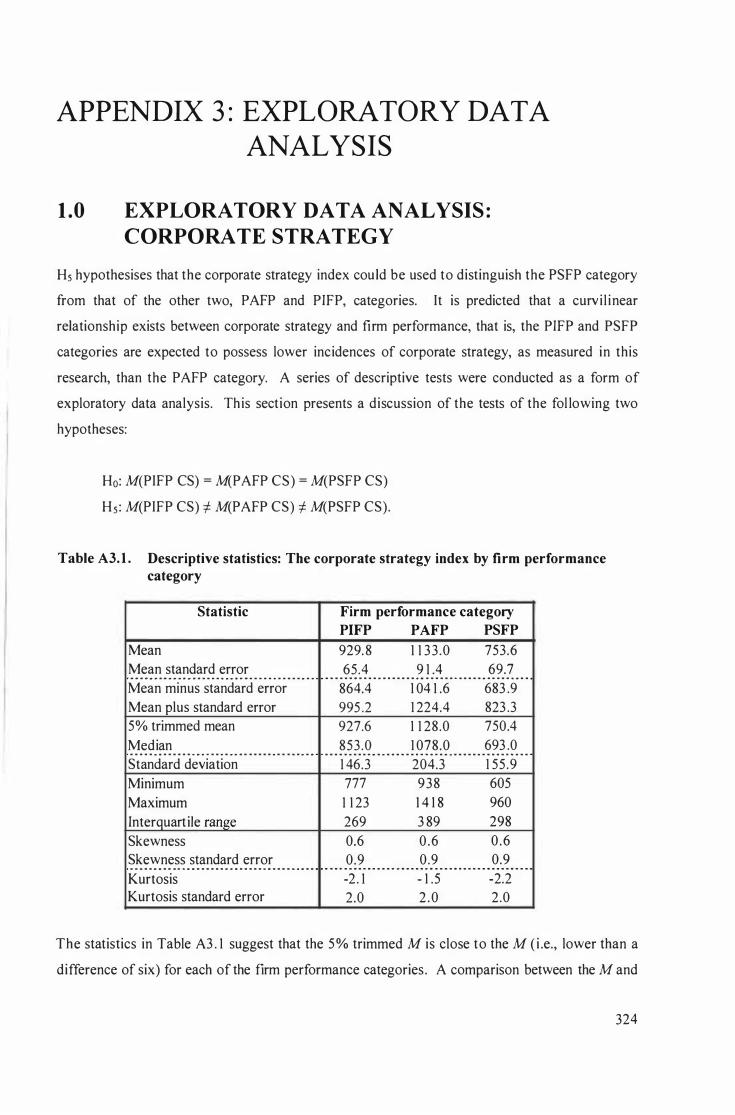
APPENDIX 3 : EXPLORATORY DATA
ANALYSIS
1 .0 EXPLORATORY DATA ANALYSIS :
CORPORATE STRATEGY
H5 hypothesises that the corporate strategy index could be used to distinguish the PSFP category
from that of the other two, PAFP and PIFP, categories. It is predicted that a curvi l inear
relationship exists between corporate strategy and firm performance, that is, the PIFP and PSFP
categories are expected to possess lower incidences of corporate strategy, as measured in this
research, than the PAFP category. A series of descriptive tests were conducted as a form of
exploratory data analysis. This section presents a discussion of the tests of the fol lowing two
hypotheses:
Ho: M(PIFP CS) = M(PAFP CS) = M(PSFP CS)
H5: M(PIFP CS) :f. M(PAFP CS) :f. M(PSFP CS).
Table A3. 1 . Descriptive statistics: The corporate strategy index by firm performance category
Statistic Firm performance category
PIFP PAFP PSFP
Mean 929. 8 1 1 33.0 753.6 Mean standard error 65.4 9 1 .4 69.7 ... .. . .. .. . .. ... _ - _ .. .. .. .. .. .. .. .. .. ... ... .. .. ... .. .. .. .. .. .. .. .. .. .. .. ... .. .. .. .. . . . . . . . . . . . . . . . . . . .. .. . . . . . . .. . . . . .. . .. . . . .. .. . .
Mean minus standard error 864.4 1 04 1 .6 683 .9 Mean plus standard error 995 .2 1 224.4 823 .3 5 % trimmed mean 927.6 1 1 28.0 750.4 Median 853 .0 1 078.0 693 .0
. . . . . .. . . . . . . . . .. .. .. . . .. . . .. . .. . . . . . . . .. . .. . . .. .. . . . . . .. . . . .. .. . .. . . . .. . . . .. .. _ - . . . . . . . . .. .. . . . . .. .. . . .
Standard deviation 1 46.3 204.3 1 55 .9 Minimum 777 938 605 Maximum 1 1 23 1 4 1 8 960 Interquart ile range 269 3 89 298 Skewness 0.6 0 .6 0 .6 Skewness standard error 0.9 0.9 0.9
- - _ . . .. .. . .. _ - .. .. .. .. . . . . . . . .. . . . . . .. . . . .. . .. . .. . .. - . . . - _ . . .. . .. _ - - _ . . . . . . . . - - _ . . . . . .. .. . . . . . . . .. .. .
Kurtosis -2 . 1 - 1 .5 -2.2 Kurtosis standard error 2.0 2 .0 2.0
The statistics in Table A3 . 1 suggest that the 5% trimmed M is close to the M ( i .e., lower than a
difference of six) for each of the firm performance categories . A comparison between the M and
324
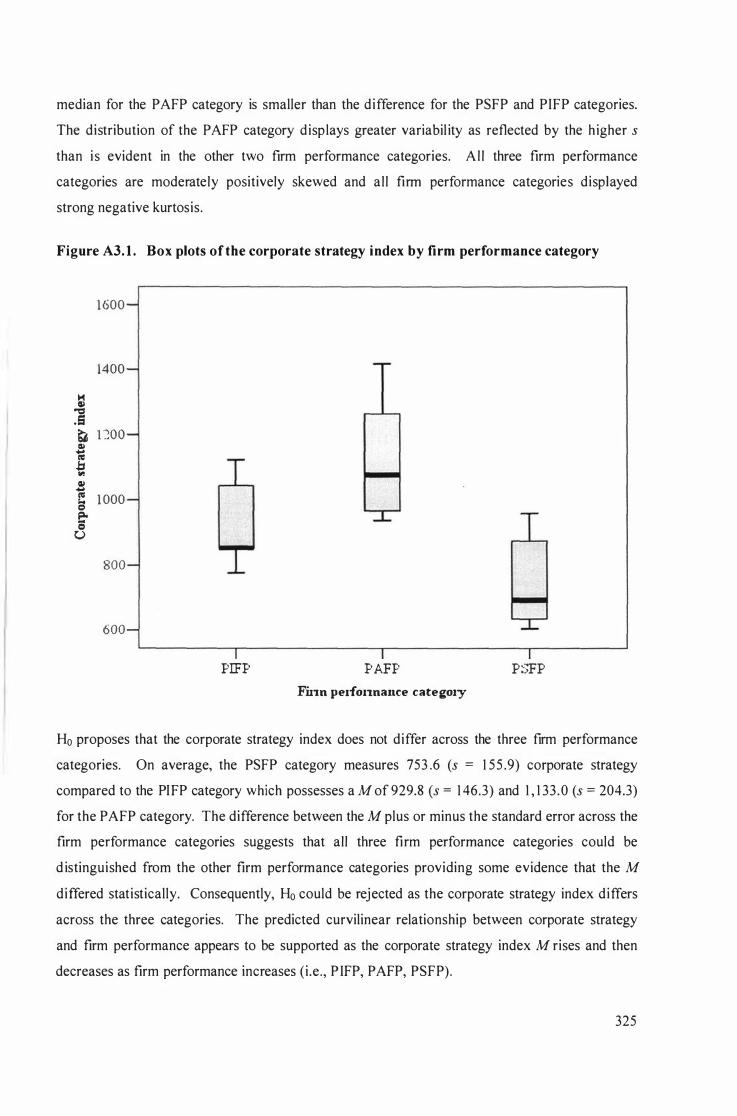
median for the PAFP category is smaller than the difference for the PSFP and PIFP categories.
The distribution of the PAFP category displays greater variabil ity as reflected by the higher s
than i s evident in the other two firm performance categories. Al l three firm performance
categories are moderately positively skewed and al l firm performance categories displayed
strong negative kurtosis.
Figure A3. 1 . Box plots of the corporate strategy index by firm performance category
1600
1400
10< Q) "Cl .$ b l �OO Q) � ce .b ... Q) � 1 000 ;.. 0 e-o u
800
600
PIFP PAFP PSFP Finn pelfonnance category
Ho proposes that the corporate strategy index does not differ across the three firm performance
categories. On average, the PS FP category measures 753 .6 (s = 1 5 5 .9) corporate strategy
compared to the PI FP category which possesses a M of 929.8 (s = 1 46.3) and 1 , 1 33 .0 (s = 204.3)
for the P AFP category. The difference between the M plus or minus the standard error across the
firm performance categories suggests that all three firm performance categories could be
d istinguished from the other firm performance categories providing some evidence that the M
differed statistically. Consequently, Ho could be rejected as the corporate strategy index differs
across the three categories. The predicted curvilinear relationship between corporate strategy
and firm performance appears to be supported as the corporate strategy index M rises and then
decreases as firm performance increases (i .e., P IFP, PAFP, PSFP).
325
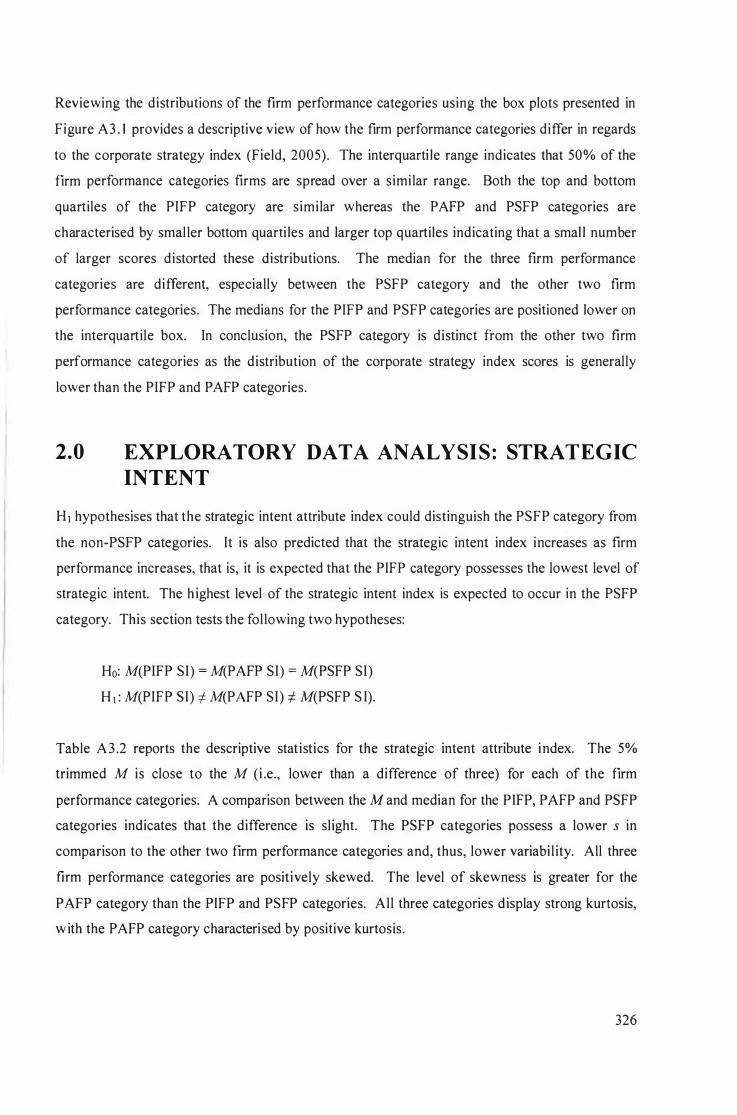
Reviewing the distributions of the firm performance categories using the box plots presented in
Figure A3 . 1 provides a descriptive view of how the firm performance categories differ in regards
to the corporate strategy index (Field, 2005). The interquarti le range indicates that 50% of the
firm performance categories firms are spread over a simi lar range. Both the top and bottom
quartiles of the PIFP category are simi lar whereas the PAFP and PSFP categories are
characterised by smal ler bottom quarti les and larger top quartiles indicating that a smal l number
of larger scores distorted these distributions. The median for the three firm performance
categories are different, especially between the PS FP category and the other two firm
performance categories. The medians for the PIFP and PSFP categories are positioned lower on
the interquartile box. In conclusion, the PS FP category is distinct from the other two firm
performance categories as the distribution of the corporate strategy index scores is generally
lower than the PIFP and P AFP categories.
2.0 EXPLORATORY DATA ANALYSI S : STRATEGIC
INTENT
HI hypothesises that the strategic intent attribute index could distinguish the PSFP category from
the non-PSFP categories. It is also predicted that the strategic intent index increases as firm
performance increases, that is, it is expected that the PI FP category possesses the lowest level of
strategic intent. The h ighest level of the strategic intent index is expected to occur in the PSFP
category. This section tests the fol lowing two hypotheses:
Ho: M(PIFP SI) = M(PAFP SI) = M(PSFP SI)
H I : M(PIFP SI) i- M(PAFP SI) i- M(PSFP S I).
Table A3 .2 reports the descriptive statistics for the strategic intent attribute index. The 5%
trimmed M is close to the M (i .e., lower than a difference of three) for each of the firm
performance categories. A comparison between the M and median for the PIFP, PAFP and PSFP
categories indicates that the difference is slight. The PS FP categories possess a lower s in
comparison to the other two firm performance categories and, thus, lower variabi l ity. All three
firm performance categories are positively skewed. The level of skewness is greater for the
PAFP category than the PIFP and PS FP categories. Al l three categories display strong kurtosis,
w ith the PAFP category characteri sed by positive kurtosis.
326
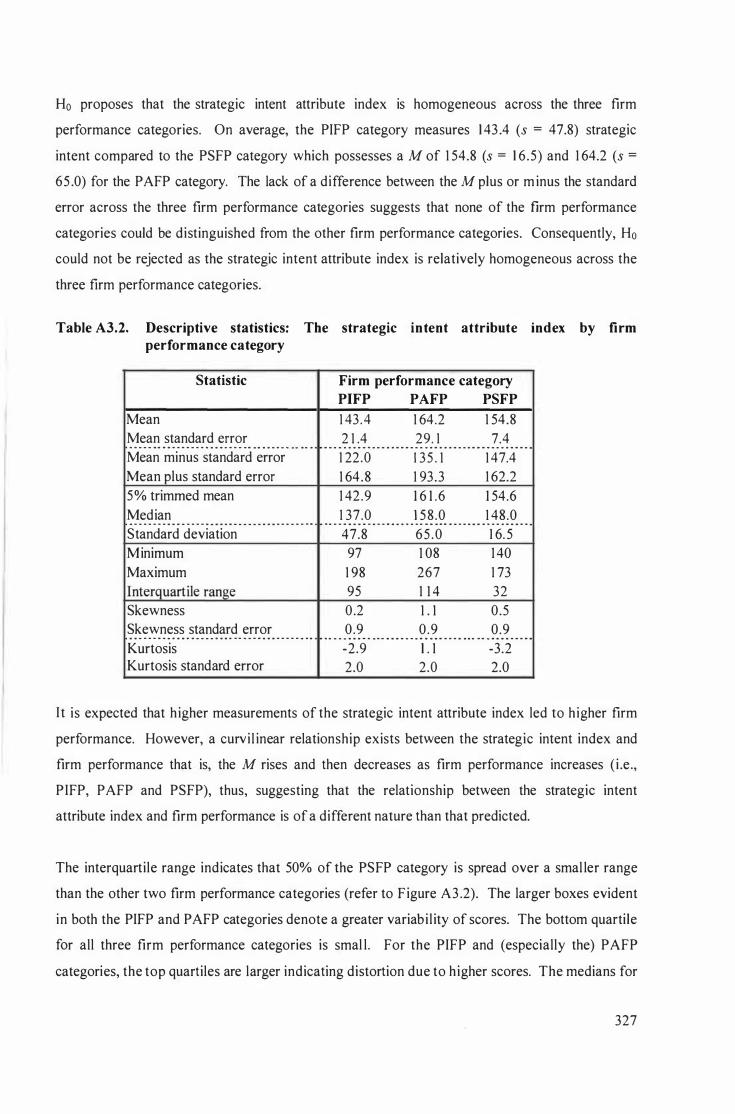
Ho proposes that the strategic intent attribute index is homogeneous across the three firm
performance categories. On average, the PIFP category measures 1 43 .4 (s = 47.8) strategic
intent compared to the PSFP category which possesses a M of 1 54.8 (s = 1 6 .5) and 1 64.2 (s =
65 .0) for the PAFP category. The lack of a difference between the M plus or m inus the standard
error across the three firm performance categories suggests that none of the firm performance
categories could be distinguished from the other firm performance categories. Consequently, Ho
could not be rejected as the strategic intent attribute index is relatively homogeneous across the
three firm performance categories.
Table A3.2. Descriptive statistics: The strategic intent attribute index by firm performance category
Statistic Firm performance category
PIFP PAFP PSFP
Mean 1 43 .4 1 64.2 1 54.8 Mean standard error 2 1 .4 29. 1 7.4
- - - - _ .. .. - .. - - - - - - - .. . . .. - - - _ .. .. _ _ . . .. .. - .. _ _ . .. - .. .. .. .. .. .. .. .. .. .. .. .. .. .. .. .. .. .. .. .. .. .. .. .. .. .. .. .. .. .. .. .. .. .. ... .. .. .. .. .. .. .. ..
Mean minus standard error 1 22.0 1 35 . 1 1 47.4 Mean plus standard error 1 64 .8 1 93 .3 1 62.2 5% trimmed mean 1 42.9 1 6 1 .6 1 54.6 Median 1 37.0 1 58 .0 1 48.0
.. - - - - - - - . . .. .. - - - - . _ _ . .. .. .. - - - _ . . .. . .. - .. _ - _ .. . . .. - - - _ . . .. - . - - - _ . .. .. .. - _ .. .. _ - - .. .. - _ . .. _ .. .. .. _ .. .. _ _ .. ..
Standard deviation 47.8 65 .0 1 6. 5 Minimum 97 1 08 1 40 Maximum 1 98 267 1 73 Interquart ile range 95 1 1 4 32 Skewness 0.2 1 . 1 0.5 Skewness standard error 0.9 0 .9 0.9
. . .. - - - - .. .. .. . . .. .. - - - _ .. . . .. - - .. _ - - _ . . - - - - - _ .. . .. .. - - _ . . . .. .. _ - _ . . . .. .. _ _ .. . . . .. - - - _ . . .. - - .. .. . . . - - - -
Kurtosis -2.9 1 . 1 -3.2 Kurtosis standard error 2.0 2.0 2.0
I t is expected that h igher measurements of the strategic intent attribute index led to higher firm
performance. However, a curvi l inear relationship exists between the strategic intent index and
firm performance that is, the M rises and then decreases as firm performance increases ( i .e.,
PIFP, PAFP and PSFP), thus, suggesting that the relationship between the strategic intent
attribute index and firm performance is of a different nature than that predicted.
The interquartile range indicates that 50% of the PS FP category is spread over a smal ler range
than the other two firm performance categories (refer to F igure A3 .2). The larger boxes evident
in both the PIFP and PAFP categories denote a greater variabi l ity of scores. The bottom quartile
for all three firm performance categories is smal l . For the PIFP and (especially the) PAFP
categories, the top quartiles are larger indicating distortion due to higher scores. The medians for
327
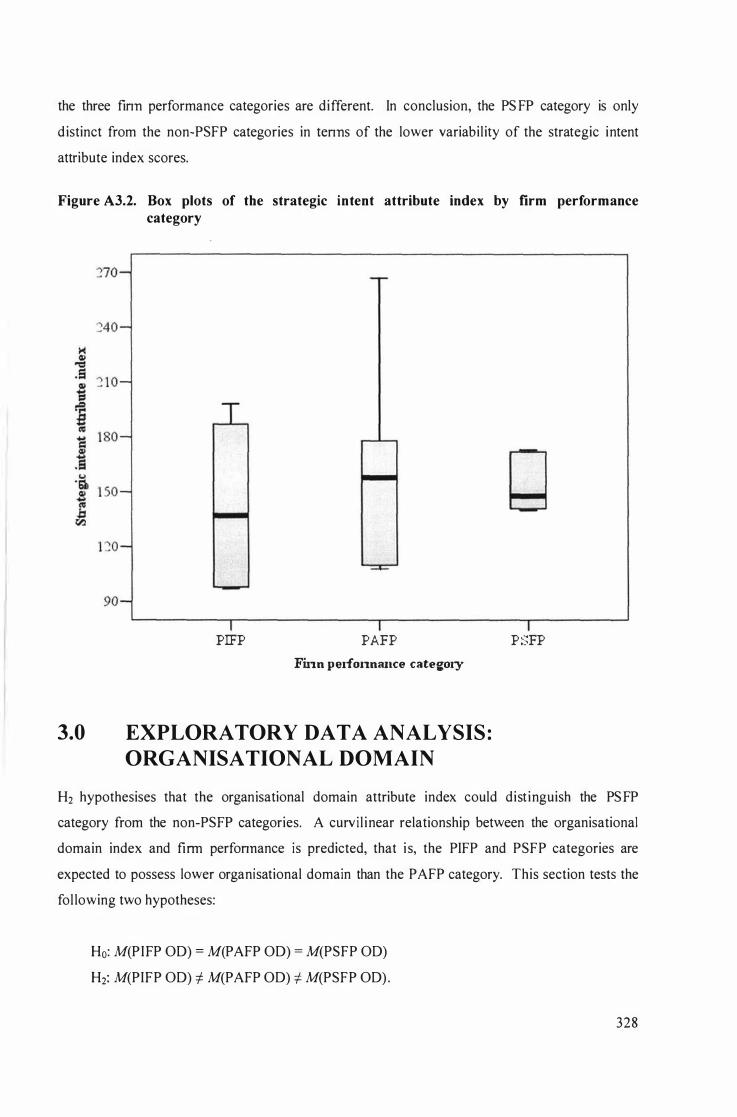
the three finn performance categories are different. In conclusion, the PS FP category is only
distinct from the non�PSFP categories in tenns of the lower variability of the strategic intent
attribute index scores.
Figure A3.2. Box plots of the strategic intent attribute index by firm performance category
PIFP PAFP Finn pelfonnance cate,OJY
3.0 EXPLORATORY DATA ANALYSIS :
ORGANISATIONAL DOMAIN
PSFP
H2 hypothesises that the organisational domain attribute index could dist inguish the PS FP
category from the non-PS FP categories. A curvi l inear relationship between the organisational
domain index and finn perfonnance is predicted, that i s, the PIFP and PSFP categories are
expected to possess lower organisational domain than the PAFP category. This section tests the
fol lowing two hypotheses:
Ho: M(PIFP OD) = M(P AFP OD) = M(PSFP OD)
H2: M(PIFP OD) 1- M(PAFP OD) 1- M(PSFP OD) .
328
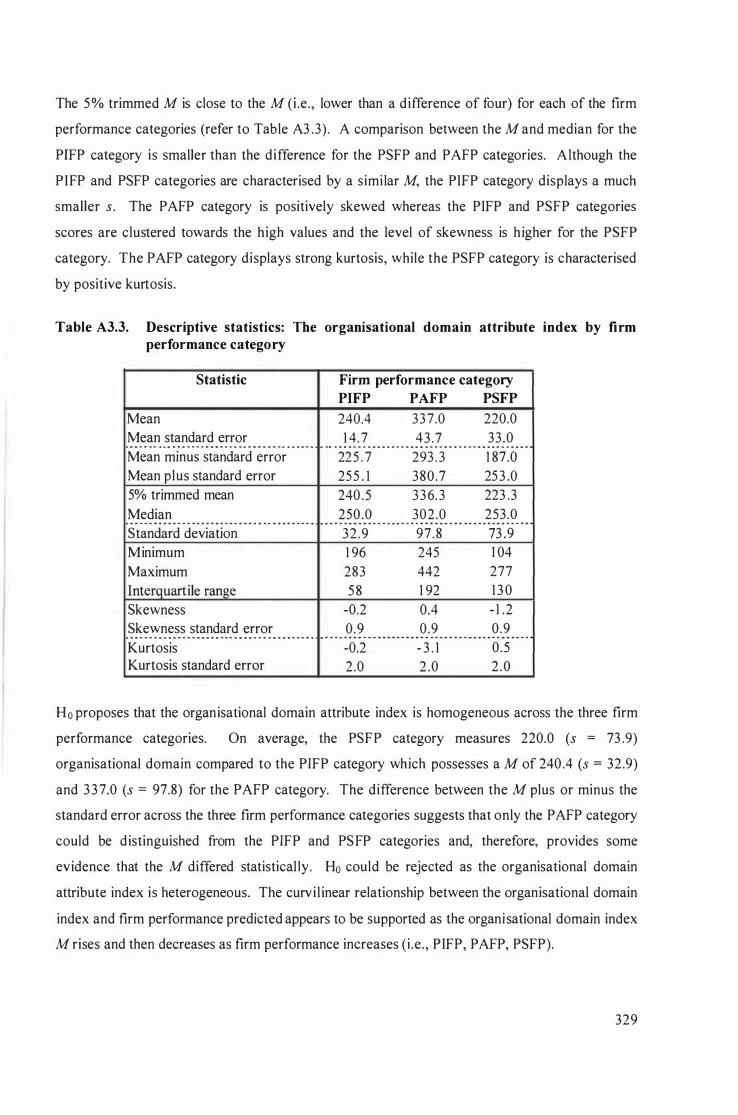
The 5% trimmed M is close to the M (i .e . , lower than a difference of four) for each of the firm
performance categories (refer to Table A3 .3) . A comparison between the M and median for the
PIFP category is smaller than the difference for the PSFP and PAFP categories. Although the
PIFP and PSFP categories are characterised by a simi lar M, the PIFP category displays a much
smaller s. The PAFP category is positively skewed whereas the PI FP and PSFP categories
scores are clustered towards the high values and the level of skewness is h igher for the PSFP
category. The PAFP category displays strong kurtosis, while the PSFP category is characterised
by positive kurtosis.
Table A3.3. Descriptive statistics: The organisational domain attribute index by firm performance category
Statistic Firm performance category
PIFP PAFP PSFP
Mean 240.4 337.0 220.0 Mean standard error 1 4. 7 43 .7 33.0 . .. - .. - - .. .. .. _ _ .. - - - - _ .. .. .. .. .. .. _ _ .. .. _ . .. .. - _ .. .. . . - - -_ .. . . .. - - - - _ . . .. .. .. .. .. . . .. .. - - - _ . . .. .. - - _ . . .. .. .. _ _ . .. -Mean minus standard error 225 . 7 293 . 3 1 87.0 Mean plus standard error 255 . 1 380 .7 253 .0 5% trimmed mean 240 .5 336.3 223 .3 Median 250.0 302.0 253.0
.. .. - - - - .. . . .. - - - - .. . . .. _ .. - - - _ . .. . . - - .. . . .. .. - - - . . . .. - - .. . .. .. .. - - - .. . . .. - .. - - - - _ .. .. .. .. . . .. .. - _ .. . . . - - - - -Standard deviation 32 .9 97.8 73 .9 Minimum 1 96 245 1 04 Maximum 283 442 277 Interquartile range 58 1 92 1 3 0 Skewness -0.2 0.4 - 1 .2 Skewness standard error 0.9 0.9 0.9
. .. - - - - .. .. . . .. - - - .. .. . .. .. - - - .. .. . . .. .. .. .. .. . . . - - - - . - - - _ . . .. _ - - _ . .. . . .. - - _ . .. .. - - _ .. .. . - .. .. .. . .. . - - .. .. .. .. - -Kurtosis -0.2 - 3 . 1 0.5 Kurtosis standard error 2.0 2 .0 2 .0
Ho proposes that the organisational domain attribute index is homogeneous across the three firm
performance categories. On average, the PS FP category measures 220.0 (s = 73 .9)
organisational domain compared to the PIFP category which possesses a M of 240.4 (s = 32.9)
and 3 3 7.0 (s = 97.8) for the PAFP category. The difference between the M plus or minus the
standard error across the three firm performance categories suggests that only the PAFP category
could be distinguished from the PIFP and PS FP categories and, therefore, provides some
evidence that the M differed statistical ly. Ho could be rejected as the organisational domain
attribute index is heterogeneous. The curvi l inear relationship between the organisational domain
index and firm performance predicted appears to be supported as the organi sational domain index
M rises and then decreases as firm performance increases (i .e., PIFP, PAFP, PSFP).
329
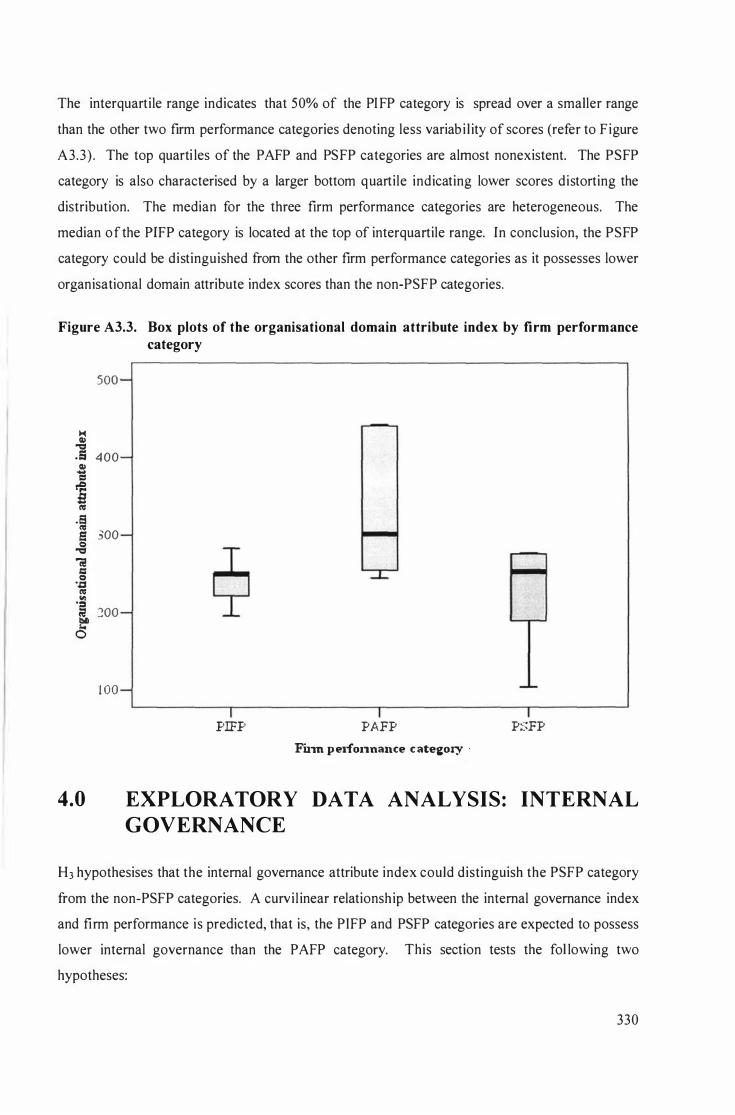
The interquartile range indicates that 50% of the PI FP category is spread over a smaller range
than the other two firm performance categories denoting less variabi l ity of scores (refer to F igure
A3.3) . The top quarti les of the PAFP and PS FP categories are almost nonexistent. The PSFP
category is also characterised by a larger bottom quartile indicating lower scores distorting the
distribution. The median for the three firm performance categories are heterogeneous. The
median ofthe PIFP category is located at the top of interquartile range. In conclusion, the PSFP
category could be distinguished from the other firm performance categories as it possesses lower
organisational domain attribute index scores than the non-PSFP categories.
Figure A3.3. Box plots of the organisational domain attribute index by firm performance category
500
H Ql � .1$ 400 Ql .... =
i � ,� 300 � � -; g '.z:I � �
.� till
::!OO ... 0
1 00
PIFP PAFP PSFP Finn pelfonnance cate&ory .
4.0 EXPLORATORY DATA ANALYSIS: INTERNAL
GOVERNANCE
H3 hypothesises that the internal governance attribute index could distinguish the PSFP category
from the non-PSFP categories. A curvi l inear relationship between the internal governance index
and firm performance is predicted, that is, the PIFP and PSFP categories are expected to possess
lower internal governance than the PAFP category. This section tests the fol lowing two
hypotheses:
330
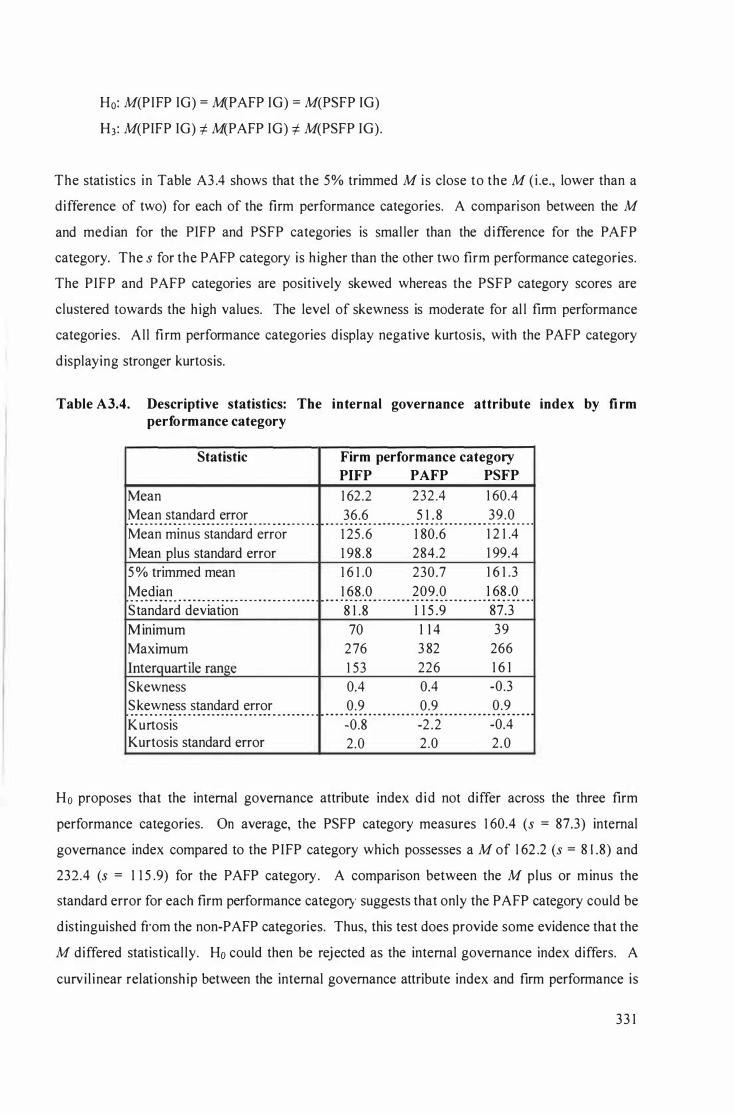
Ho: M(PIFP IG) = M(PAFP IG) = M(PSFP IG)
H3: M(PIFP IG) -:I M(PAFP IG) -:I M(PSFP IG).
The statistics in Table A3 .4 shows that the 5% trimmed M is close to the M (i .e., lower than a
difference of two) for each of the firm performance categories. A comparison between the M
and median for the PIFP and PSFP categories is smal ler than the d ifference for the P AFP
category. The s for the P AFP category is h igher than the other two firm performance categories.
The PIFP and P AFP categories are positively skewed whereas the PSFP category scores are
clustered towards the high values. The level of skewness is moderate for al l firm performance
categories. Al l firm performance categories display negative kurtosis, with the P AFP category
displaying stronger kurtosis.
Table A3.4. Descriptive statistics: The internal governance attribute index by fi rm performance category
Statistic Firm performance category
PIFP PAFP PSFP
Mean 1 62.2 232.4 1 60.4 Mean standard error 36.6 5 1 . 8 39 .0 . .. .. .. - - .. .. . . .. . .. .. .. .. .. .. .. . . . .. .. . .. .. - - - .. . . .. - - - - . - .. - _ .. . . . . .. _ _ . . .. .. - _ .. . . .. .. .. . .. . .. .. .. .. .. _ - - - - .. . .. .. .. .. Mean minus standard error 1 25 .6 1 80.6 1 2 1 .4 Mean plus standard error 1 98 .8 284.2 1 99.4 5 % trimmed mean 1 6 1 .0 230.7 1 6 1 .3 Median 1 68.0 209.0 1 68 .0
- - - - - - - .. - _ . . .. . .. - .. - - _ . . .. - .. .. .. . . .. .. .. .. .. .. . .. - .. - _ . .. . .. _ .. . .. _ - - .. .. . .. _ - - - - _ .. .. .. .. .. - .. - _ .. .. . .. . .. - _ . . . Standard deviation 8 1 .8 1 1 5 .9 87.3 Minimum 70 1 1 4 39 Maximum 276 3 82 266 Interquart ile range 1 53 226 1 6 1 Skewness 0.4 0.4 -0.3 Skewness standard error 0.9 0.9 0.9 .. .. _ . . .. . . . .. . .. . .. .. . .. .. . . . . . .. .. . .. _ - - .. .. .. . .. _ .. . .. - _ .. .. . . .. . .. . .. . . . . . . .. . . . .. _ . . .. .. .. - .. - . .. _ .. .. .. _ - _ .. - -Kurtosis -0.8 -2 .2 -0.4 Kurtosis standard error 2.0 2.0 2 .0
Ho proposes that the internal governance attribute index did not differ across the three firm
performance categories. On average, the PSFP category measures 1 60.4 (s = 87.3) internal
governance index compared to the PIFP category which possesses a M of 1 62 .2 (s = 8 1 .8) and
232.4 (s = 1 1 5 .9) for the PAFP category . A comparison between the M plus or minus the
standard error for each firm performance category suggests that only the PAFP category could be
distinguished from the non-PAFP categories. Thus, this test does provide some evidence that the
M differed statistical ly. Ho could then be rejected as the internal governance index differs. A
curvi l inear relationship between the internal governance attribute index and firm performance is
33 1
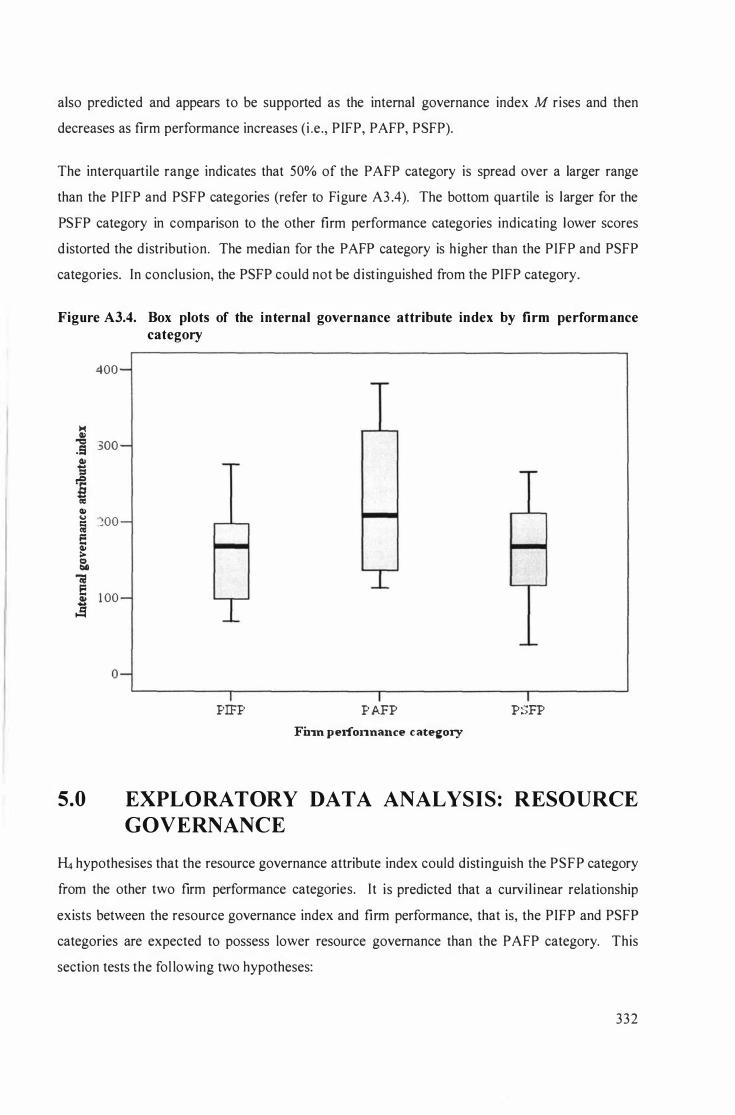
also predicted and appears to be supported as the internal governance index M rises and then
decreases as firm performance increases (i .e., PIFP, PAFP, PSFP).
The interquartile range indicates that 50% of the PAFP category is spread over a larger range
than the PIFP and PSFP categories (refer to Figure A3 .4). The bottom quartile is larger for the
PS FP category in comparison to the other firm performance categories indicating lower scores
distorted the distribution. The median for the PAFP category is h igher than the PIFP and PSFP
categories. In conclusion, the PSFP could not be dist inguished from the PIFP category.
Figure A3.4. Box plots of the internal governance attribute index by firm performance category
400
.i 300 .El � i 1'1:
Q) ... _00 � � ;.. �
"i;! e 1 00 j
o
PIFP P AFP PSFP FU"ln pel"fonnance cate&ory
5.0 EXPLORATORY DATA ANALYSIS: RESOURCE
GOVERNANCE
� hypothesises that the resource governance attribute index could distinguish the PSFP category
from the other two firm performance categories. It is predicted that a curvi l inear relationship
exists between the resource governance index and firm performance, that is, the PIFP and PSFP
categories are expected to possess lower resource governance than the PAFP category. This
section tests the fol lowing two hypotheses:
332
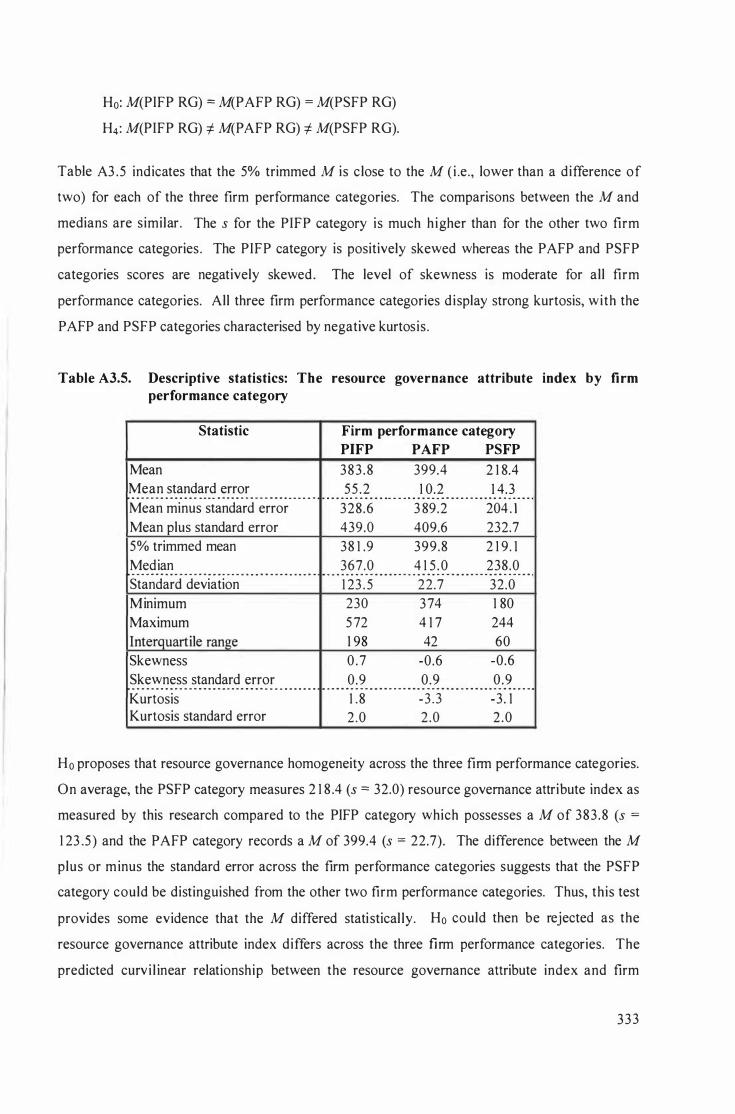
Ho: M(PIFP RG) == M(PAFP RG) == M(PSFP RG)
Ht: M(PIFP RG) f. M(P AFP RG) f. M(PSFP RG).
Table A3 .5 indicates that the 5% trimmed M is close to the M ( i .e., lower than a difference of
two) for each of the three firm performance categories. The comparisons between the M and
medians are similar . The s for the PIFP category is much higher than for the other two firm
performance categories. The PIFP category is positively skewed whereas the PAFP and PSFP
categories scores are negatively skewed. The level of skewness is moderate for all firm
performance categories. All three firm performance categories display strong kurtosis, with the
PAFP and PSFP categories characterised by negative kurtosis .
Table A3.5. Descriptive statistics: The resource governance attribute index by firm performance category
Statistic Firm performance category
PIFP PAFP PSFP
Mean 383 .8 399.4 2 1 8.4 Mean standard error 55 .2 1 0.2 1 4.3
. ... - - - _ .. . . . . .. . .. - - - _ .. . . . . .. - . - - _ .. _ _ . _ - - - - - . . .. .. - .. . .. . . . . . - - - - .. . . . .. - _ .. - . . .. .. .. . . . .. . _ - _ .. .. . .
Mean minus standard error 328.6 3 89.2 204 . 1 Mean plus standard error 439.0 409.6 232.7 5% trimmed mean 38 1 .9 399.8 2 1 9 . 1 Median 367.0 4 1 5 . 0 238.0 ... ... ... - - - - _ ..... ... ... ... ... .. - - - _ ... ... ... ... ... .. ... ... .. .. ... ... ... ... .. ... ... ... .. ... .. . . . . . . . - - _ . . . .. - - .. . .. _ _ . - - - .. . . . .. - - - . _ - - - - - - -
Standard deviation 1 23 . 5 22.7 32.0 Minimum 230 374 1 80 Maximum 5 72 4 1 7 244 Interquartile range 1 98 42 60 Skewness 0 .7 -0.6 -0.6 Skewness standard error 0.9 0.9 0 .9 .. - - - - _ . . . .. .. - _ .. _ - . . .. .. .. - - - - - _ .. - - - _ .. .. . . .. .. .. . .. _ - - _ .. - - . . _ _ .. - - - - _ . .. - - - - .. . . . .. _ _ . . . - - - _ . .. .. ..
Kurtosis 1 .8 -3 .3 -3 . 1 Kurtosis standard error 2.0 2 .0 2 .0
Ho proposes that resource governance homogeneity across the three firm performance categories.
On average, the PSFP category measures 2 1 8 .4 (s == 32.0) resource governance attribute index as
measured by this research compared to the PIFP category which possesses a M of 383 .8 (s ==
1 23 .5 ) and the PAFP category records a M of 399.4 (s == 22.7). The difference between the M
plus or minus the standard error across the firm performance categories suggests that the PSFP
category could be distinguished from the other two firm performance categories. Thus, this test
provides some evidence that the M differed statistical ly. Ho could then be rejected as the
resource governance attribute index differs across the three firm performance categories. The
predicted curvi l inear relationship between the resource governance attribute index and firm
333
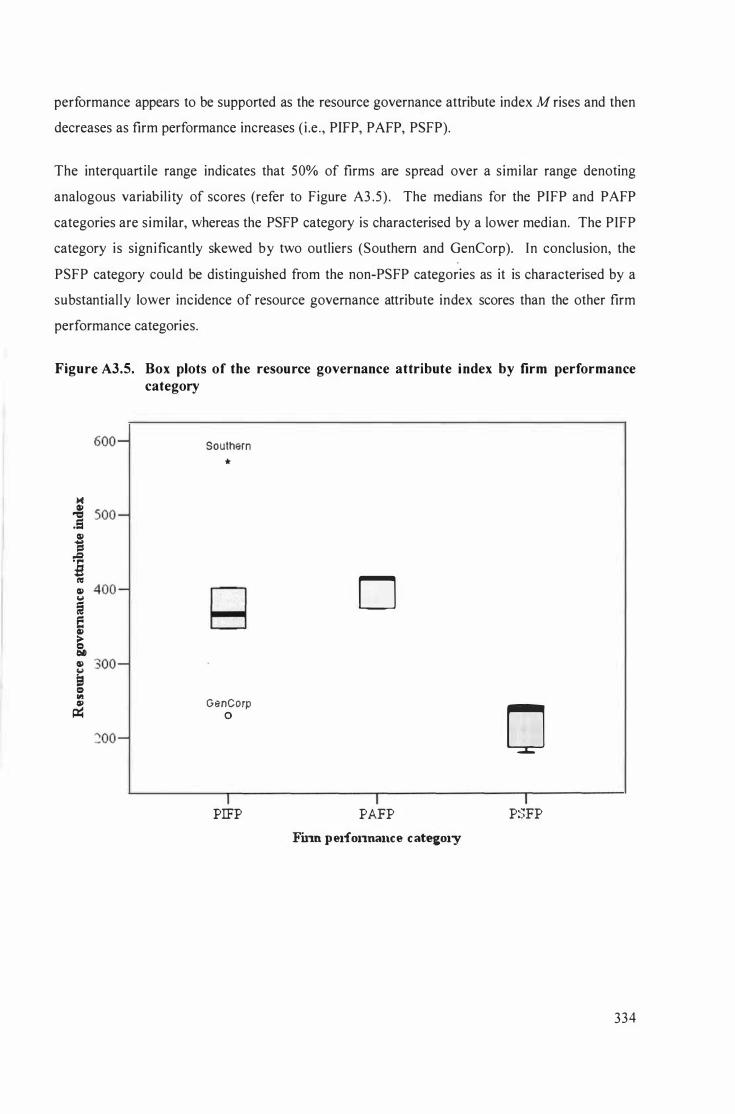
performance appears to be supported as the resource governance attribute index M rises and then
decreases as firm performance increases ( i .e . , PIFP, PAFP, PSFP).
The interquartile range indicates that 50% of firms are spread over a simi lar range denoting
analogous variabil ity of scores (refer to Figure A3 .5) . The medians for the PIFP and PAFP
categories are similar, whereas the PSFP category is characterised by a lower median. The PIFP
category is significantly skewed by two outliers (Southern and GenCorp). In conclusion, the
PSFP category could be distinguished from the non-PS FP categories as it is characterised by a
substantial ly lower incidence of resource governance attribute index scores than the other firm
performance categories.
Figure A3.5. Box plots of the resource governance attribute index by firm performance category
600 - Southern *
� GI 500 -� .5 Q) � j
D � Q) 400 -... !i i > C> till Q) 300 -�
� 1/1 GenCorp Q)
0 � 0 �oo -
I I I PIFP PAFP PSFP
FU:ln pelfonnal\ce categol'Y
334
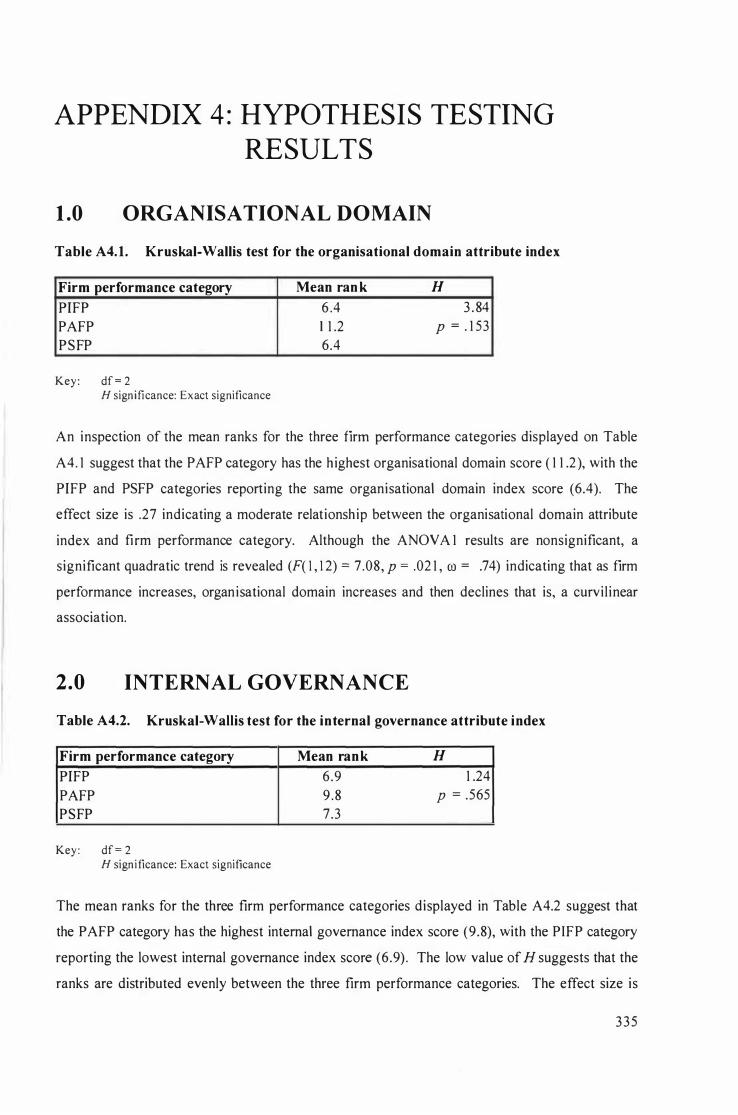
APPENDIX 4 : HYPOTHESIS TESTING
RESULTS
1 .0 ORGANISATIONAL DOMAIN
Table A4. 1 . Kruskal-Wallis test for the organisational domain attribute index
Firm performance category Mean ran k H prFP 6 .4 3 . 84 PAFP 1 1 .2 P = . 1 53 PSFP 6.4
Key : df = 2 H significance: Exact significance
An inspection of the mean ranks for the three firm performance categories displayed on Table
A4. 1 suggest that the PAFP category has the highest organisational domain score ( 1 1 .2 ), with the
prFP and PSFP categories reporting the same organisational domain index score (6.4). The
effect size is .27 indicating a moderate relationship between the organisational domain attribute
index and firm performance category. Although the ANOV A 1 results are nonsignificant, a
significant quadratic trend is revealed (F( 1 , 1 2) =: 7.08, p =: .02 1 , co = .74) indicating that as firm
performance increases, organisational domain increases and then declines that is, a curvi l inear
association.
2.0 INTERNAL GOVERNANCE
Table A4.2. Kruskal-Wallis test for the internal governance attribute index
Firm performance category Mean rank H prFP 6.9 1 .24 PAFP 9 .8 p = . 565 PSFP 7.3
Key : df = 2 H significance: Exact significance
The mean ranks for the three firm performance categories displayed in Table A4.2 suggest that
the PAFP category has the highest internal governance index score (9.8), with the PIFP category
reporting the lowest internal governance index score (6.9) . The low value of H suggests that the
ranks are distributed evenly between the three firm performance categories. The effect size is
3 35
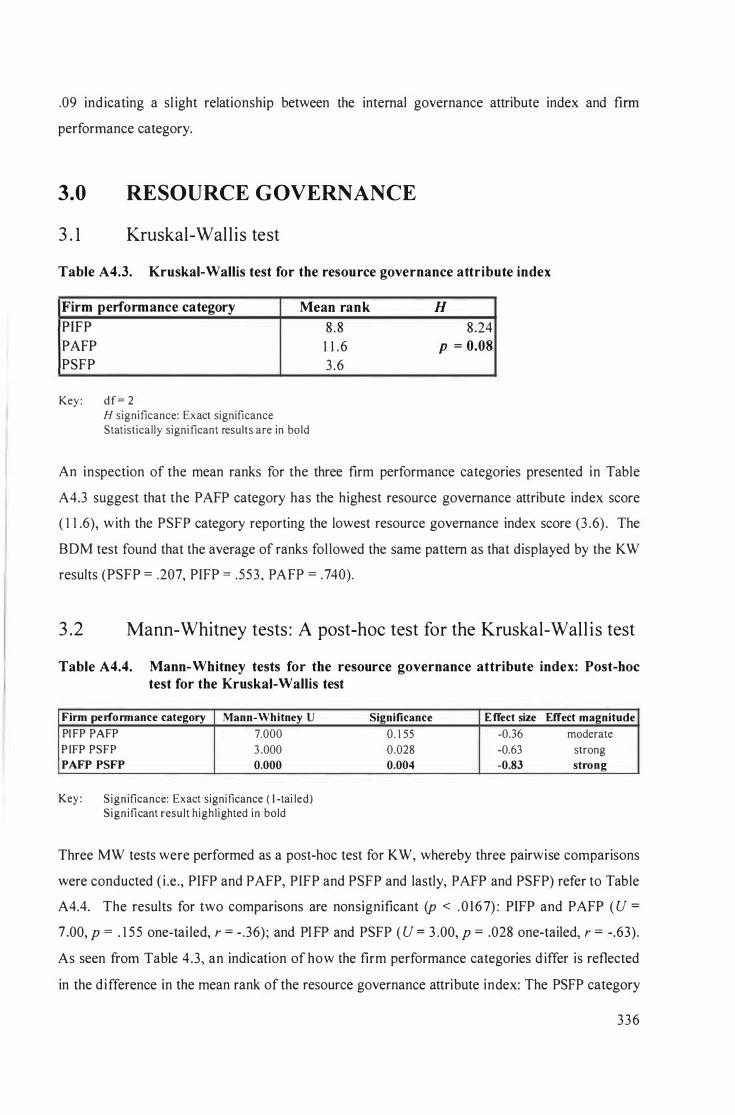
.09 indicating a sl ight relationship between the internal governance attribute index and firm
performance category.
3.0 RESOURCE GOVERNANCE
3 . l Kruskal-Wall is test
Table A4.3. Kruskal-Wallis test for the resource governance attribute index
Firm performance category Mean rank
PIFP PAFP PSFP
Key : df= 2 H significance: Exact significance Statistically signi ficant results are in bold
8 .8 1 1 .6 3 .6
H 8 .24
P = 0.08
An inspection of the mean ranks for the three firm performance categories presented in Table
A4.3 suggest that the PAFP category has the highest resource governance attribute index score
( 1 1 .6), with the PSFP category reporting the lowest resource governance index score (3 .6) . The
BDM test found that the average of ranks fol lowed the same pattern as that displayed by the KW
results (PSFP = .207, PIFP = . 553 , PAFP = .740).
3 .2 Mann-Whitney tests : A post-hoc test for the Kruskal-Wall i s test
Table A4.4. Mann-Whitney tests for the resource governance attribute index: Post-hoc test for the Kruskal-Wallis test
Firm performance category Mann-Whitney U PI FP PAFP 7.000
P IFP PSFP 3 .000 PAFP PSFP 0.000
Key : Significance: Exact significance ( I -tai led) Significant result highlighted in bold
Significance
0. 1 55
0.028
0.004
E ffect size Effect magnitude
-0.36 moderate
-0.63 strong
-0.83 strong
Three MW tests were performed as a post-hoc test for KW, whereby three pairwise comparisons
were conducted ( i .e., PIFP and PAFP, PIFP and PSFP and lastly, PAFP and PSFP) refer to Table
A4.4. The results for two comparisons are nonsignificant (p < . 0 1 6 7) : PIFP and PAFP ( U =
7.00, p = . 1 5 5 one-tai led, r = - .36); and PI FP and PSFP ( U = 3 .00, p = .028 one-tailed, r = -.63).
As seen from Table 4.3, an indication of how the firm performance categories d iffer is reflected
in the d ifference in the mean rank of the resource governance attribute index: The PSFP category
336
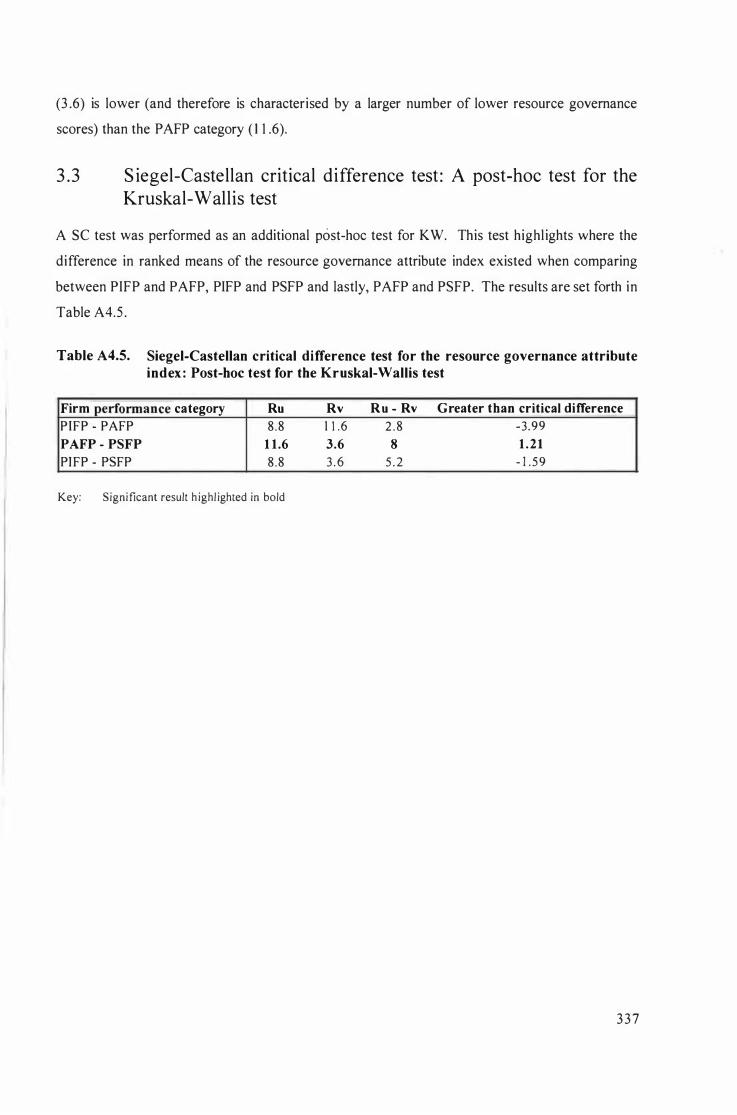
(3 .6) is lower (and therefore is characterised by a larger number of lower resource governance
scores) than the PAFP category ( 1 1 .6).
3 .3 S iegel-Castellan critical difference test : A post-hoc test for the Kruskal-Wallis test
A se test was performed as an additional post-hoc test for KW. This test highl ights where the
difference in ranked means of the resource governance attribute index existed when comparing
between PIFP and PAFP, PIFP and PSFP and lastly, PAFP and PSFP. The results are set forth in
Table A4.S .
Table A4.S. Siegel-Castellan critical difference test for the resource governance attribute index : Post-hoc test for the Kruskal-Wallis test
Firm performance category Ru
PIFP - PAFP 8 .8
PAFP - PSFP 1 1 .6 PI FP - PSFP 8 .8
Key: Signi ficant result h ighl ighted in bold
Rv
1 1 .6
3.6 3 .6
R u - Rv G reater than critical difference 2 . 8 -3 .99
8 1 . 2 1 5 . 2 - 1 . 59
3 3 7
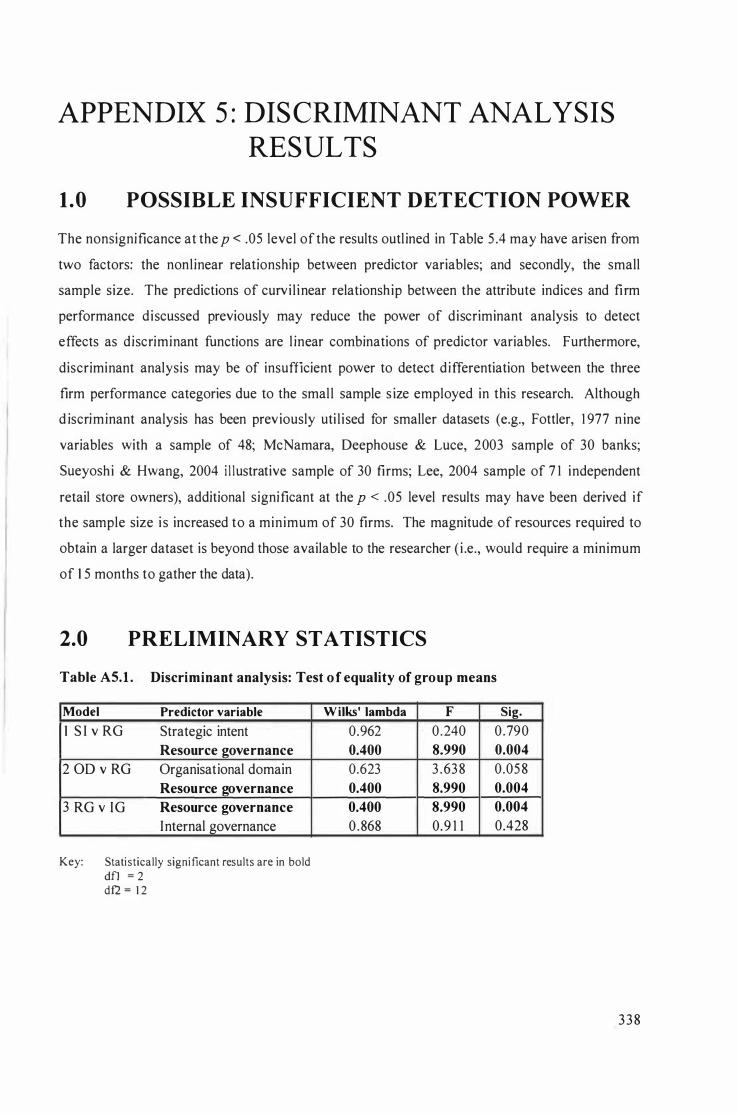
APPENDIX 5 : DISCRIMINANT ANALYSIS
RESULTS
1 . 0 POSSIBLE INSUFFICIENT DETECTION POWER
The nonsignificance at the p < .05 level of the results outl ined in Table 5 .4 may have arisen from
two factors: the nonlinear relationship between predictor variables; and secondly, the small
sample size. The predictions of curvi l inear relationship between the attribute indices and firm
performance discussed previously may reduce the power of discriminant analysis to detect
effects as discriminant functions are l inear combinations of predictor variables. Furthermore,
discriminant analysis may be of insufficient power to detect differentiation between the three
firm performance categories due to the smal l sample s ize employed in this research. Although
d iscriminant analysis has been previously uti l ised for smaller datasets (e.g., Fottler, 1 977 n ine
variables with a sample of 48; McNamara, Oeephouse & Luce, 2003 sample of 30 banks;
Sueyoshi & Hwang, 2004 i l lustrative sample of 30 firms; Lee, 2004 sample of 7 1 independent
retail store owners), additional significant at the p < .05 level results may have been derived if
the sample size i s increased to a minimum of 30 firms. The magnitude of resources required to
obtain a larger dataset is beyond those available to the researcher ( i .e., would require a minimum
of 1 5 months to gather the data).
2.0 PRELIMINARY STATISTICS
Table AS.I . Discriminant analysis: Test of equality of group means
Model Predictor variable
1 S I v RG Strategic intent Resource governance
2 0D v RG Organisational domain Resource governance
3 RG v IG Resource governance
Internal governance
Key: Statistically signi ficant results are in bold dfl = 2 df2 = 1 2
W ilks' lambda F Sig.
0.962 0.240 0.790 0.400 8.990 0.004
0.623 3 .638 0.058 0.400 8.990 0.004
0.400 8.990 0.004
0.868 0.9 1 1 0.428
338
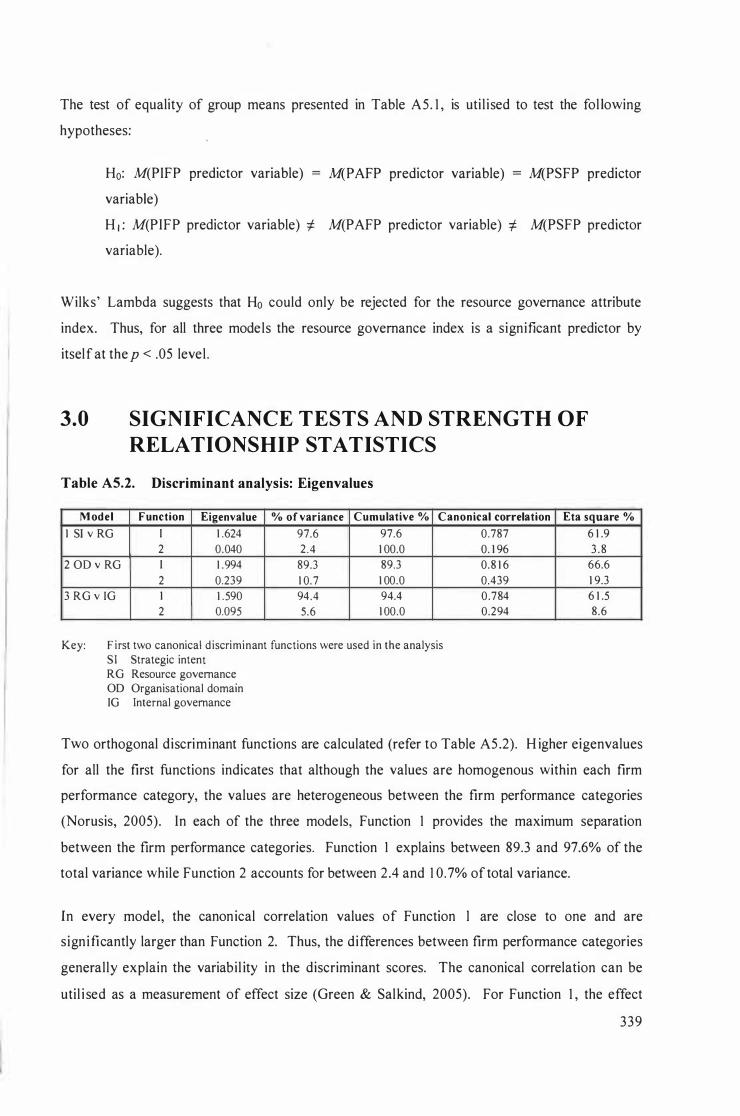
The test of equality of group means presented in Table A5. 1 , is uti l ised to test the fol lowing
hypotheses:
Ho: M(PIFP predictor variable)
variable)
M(PAFP predictor variable) M(PSFP predictor
H I : M(PIFP predictor variable) :f:. M(PAFP predictor variable) :f:. M(PSFP predictor
variable).
Wilks' Lambda suggests that Ho could only be rejected for the resource governance attribute
index. Thus, for all three models the resource governance index is a significant predictor by
itself at the p < .05 level .
3.0 SIGNIFICANCE TESTS AND STRENGTH OF
RELATIONSHIP STATISTICS
Table AS.2. Discriminant analysis: Eigenvalues
M odel Function Eigenvalue % of variance Cumulative % Canonical correlation Eta square % 1 SI v RG I 1 .624 97.6 97.6
2 0.040 2 .4 1 00.0
2 OD v RG I 1 .994 89.3 89.3
2 0.239 1 0. 7 1 00.0
3 RG v IG 1 1 .590 94.4 94.4
2 0.095 5.6 1 00.0
Key: F irst two canonical d iscriminant functions were used in the analysis SI Strategic intent RG Resource governance OD Organisational domain IG Internal governance
0.787 6 1 .9
0. 1 96 3 . 8
0. 8 1 6 66.6
0.439 1 9.3
0 .784 6 1 .5
0.294 8.6
Two orthogonal discriminant functions are calculated (refer to Table A5 .2). H igher eigenvalues
for all the first functions indicates that although the values are homogenous within each firm
performance category, the values are heterogeneous between the firm performance categories
(Norusis, 2005). In each of the three models, Function 1 provides the maximum separation
between the firm performance categories. Function 1 explains between 89.3 and 97.6% of the
total variance while Function 2 accounts for between 2.4 and 1 0.7% of total variance.
In every model, the canonical correlation values of Function I are close to one and are
significantly larger than Function 2. Thus, the differences between firm performance categories
generally explain the variabil ity in the discriminant scores. The canonical correlation can be
util i sed as a measurement of effect size (Green & Sal kind, 2005). For Function 1 , the effect
339
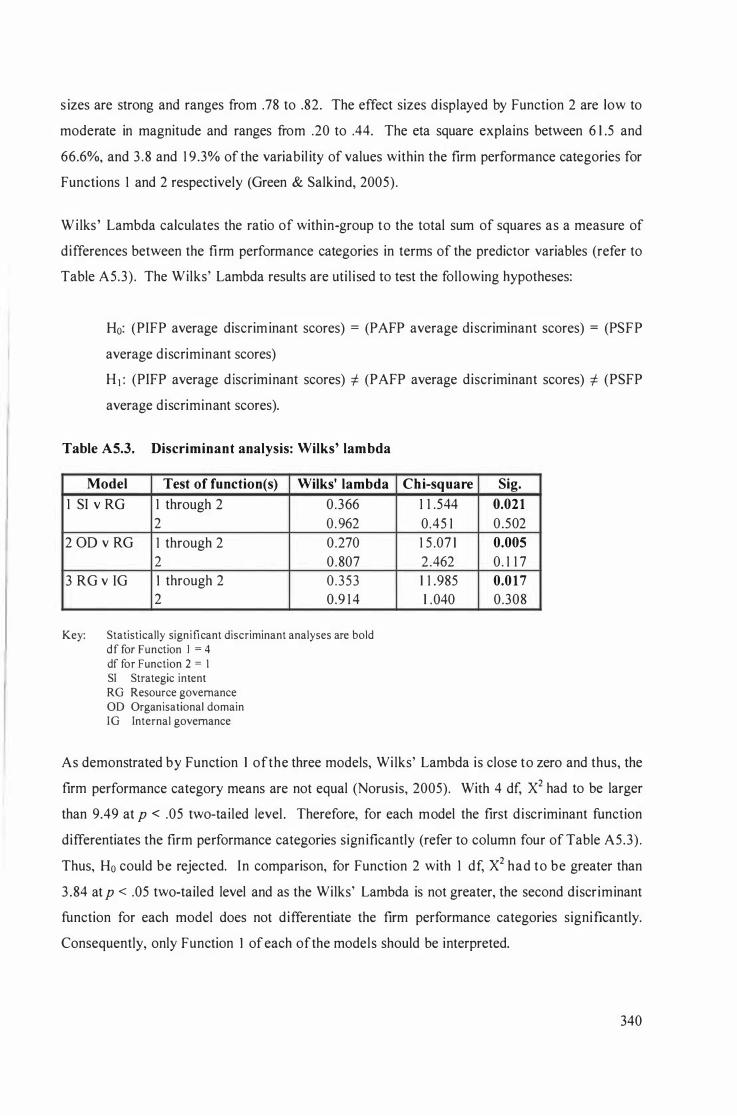
s izes are strong and ranges from .78 to .82. The effect sizes displayed by Function 2 are low to
moderate in magnitude and ranges from .20 to .44. The eta square explains between 6 1 .5 and
66.6%, and 3 .8 and 1 9 .3% of the variabil ity of values within the firm performance categories for
Functions 1 and 2 respectively (Green & Salkind, 2005).
Wilks ' Lambda calculates the ratio of within-group to the total sum of squares as a measure of
differences between the firm performance categories in terms of the predictor variables (refer to
Table A5.3) . The Wilks' Lambda results are uti l ised to test the following hypotheses:
Ho: (PIFP average discrim inant scores) = (PAFP average discriminant scores) = (PS FP
average discriminant scores)
H I : (PIFP average discriminant scores) =F (PAFP average discriminant scores) =F (PSFP
average discriminant scores).
Table A5.3. Discriminant analysis: Wilks' lambda
Model Test of function(s) Wilks' lambda
1 SI v RG 1 through 2 0.366 2 0.962
2 0D v RG 1 through 2 0.270 2 0 .807
3 RG v IG I through 2 0 .353 2 0.9 1 4
Key: Statistically significant discriminant analyses are bold df for Function I = 4 df for Function 2 = I SI Strategic intent RG Resource governance OD Organisational domain I G Internal governance
Chi-square Sig.
1 1 .544 0.02 1
0.45 1 0.502 1 5 .07 1 0.005
2 .462 0. 1 1 7 1 1 .985 0.0 1 7
1 .040 0.308
As demonstrated by Function 1 of the three models, Wilks' Lambda is close to zero and thus, the
firm performance category means are not equal (Norusis, 2005). With 4 df, X2 had to be larger
than 9.49 at p < .05 two-tailed level . Therefore, for each model the first discriminant function
differentiates the firm performance categories significantly (refer to column four of Table A5.3) .
Thus, Ho could be rejected. In comparison, for Function 2 with 1 df, X2 had to be greater than
3 .84 at p < .05 two-tailed level and as the Wilks' Lambda is not greater, the second discriminant
function for each model does not differentiate the firm performance categories significantly.
Consequently, only Function I of each ofthe models should be interpreted.
340
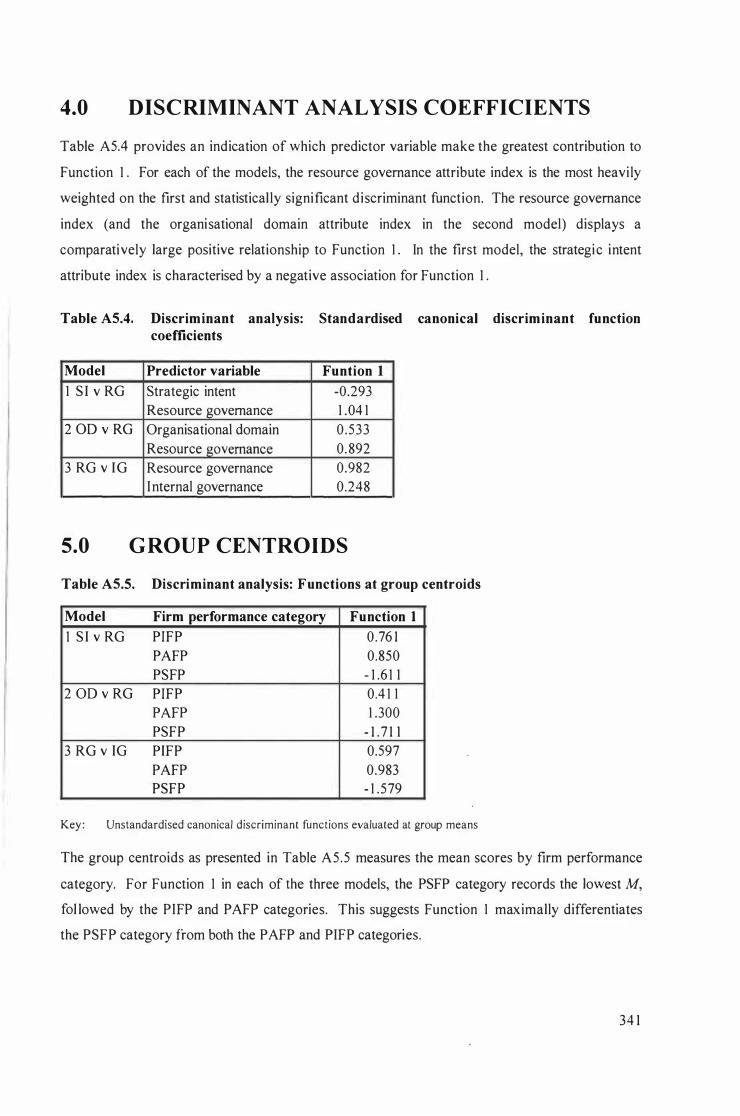
4.0 DISCRIMINANT ANALYSIS COEFFICIENTS
Table ASA provides an indication of which predictor variable make the greatest contribution to
Function 1 . For each of the models, the resource governance attribute index is the most heavi ly
weighted on the first and statistical ly significant discriminant function. The resource governance
index (and the organisational domain attribute index in the second model) displays a
comparatively large positive relationship to Function 1 . In the first model, the strategic intent
attribute index is characterised by a negative association for Function 1 .
Table AS.4. Discriminant analysis: Standardised canonical discriminant function coefficients
Model Predictor variable Funtion 1
1 S I v RG Strategic intent -0.293 Resource governance 1 .04 1
2 0D v RG Organisational domain 0 .S33 Resource governance 0. 892
3 RG v IG Resource governance 0.982 Internal governance 0.248
5.0 G ROUP CENTROIDS
Table AS.5. Discriminant analysis: Functions at group centroids
Model Firm performance category Function 1
1 S I v RG PIFP 0.76 1 PAPP 0.850 PS FP - 1 .6 1 1
2 OD v RG PIFP 004 1 1 PAPP 1 .300 PSFP - 1 . 7 1 1
3 RG v IG PIFP 0.597 PAPP 0.983 PSFP - 1 .579
Key : Unstandardised canonical discriminant functions evaluated at group means
The group centroids as presented in Table AS.S measures the mean scores by firm performance
category. For Function 1 in each of the three models, the PSFP category records the lowest M,
fol lowed by the PIFP and PAFP categories. This suggests Function 1 maximally differentiates
the PSFP category from both the P AFP and PI FP categories.
34 1
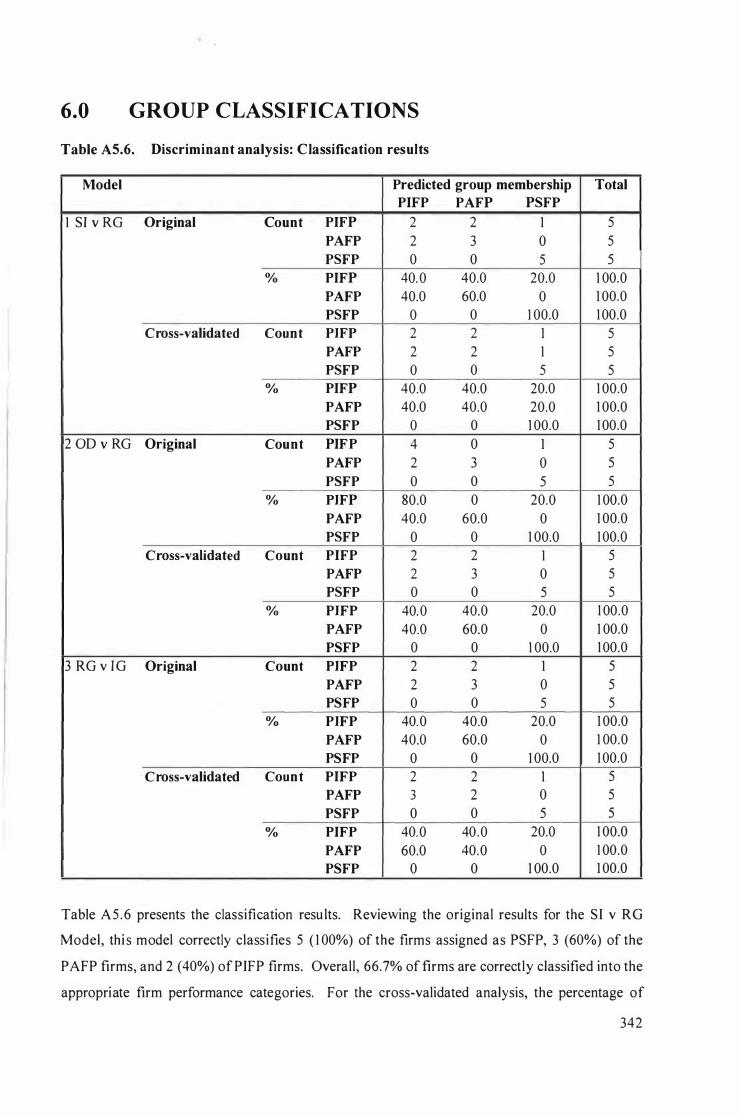
6.0 GROUP CLASSIFICATIONS
Table A5.6. Discriminant analysis: Classification results
Model Predicted group membership PIFP PAFP PSFP
1 SI v RG Original Count PIFP 2 2 1 PAFP 2 3 0 PSFP 0 0 5
0/0 PIFP 40.0 40.0 20.0 PAFP 40.0 60.0 0 PSFP 0 0 1 00.0
Cross-validated Count PIFP 2 2 1 PAFP 2 2 1 PSFP 0 0 5
0/0 PIFP 40.0 40.0 20.0 PAFP 40.0 40.0 20.0 PS FP 0 0 1 00.0
2 0D v RG Original Count PI FP 4 0 1 PAFP 2 3 0 PSFP 0 0 5
0/0 PIFP 80.0 0 20.0 PAFP 40.0 60.0 0 PSFP 0 0 1 00.0
Cross-validated Count PIFP 2 2 1 PAFP 2 3 0 PSFP 0 0 5
0/0 PIFP 40.0 40.0 20.0 PAFP 40.0 60.0 0 PSFP 0 0 1 00.0
3 RG v I G Original Count PI FP 2 2 1 PAFP 2 3 0 PS FP 0 0 5
0/0 PI FP 40.0 40.0 20.0 PAFP 40.0 60.0 0 PS FP 0 0 1 00.0
Cross-validated Count PIFP 2 2 1 PAFP 3 2 0 PSFP 0 0 5
0/0 PIFP 40.0 40 .0 20.0 PAFP 60.0 40.0 0 PSFP 0 0 1 00.0
Total
5 5 5
1 00.0 1 00.0 1 00.0
5 5 5
1 00.0 1 00.0 1 00.0
5 5 5
1 00.0 1 00.0 1 00.0
5 5 5
1 00.0 1 00.0 1 00.0
5 5 5
1 00.0 1 00.0 1 00.0
5 5 5
1 00.0 1 00.0 1 00.0
Table A5 .6 presents the classification resu lts. Reviewing the original results for the S I v RG
Model, thi s model correctly classifies 5 ( 1 00%) of the firms assigned as PSFP, 3 (60%) of the
PAFP firms, and 2 (40%) of PI FP firms. Overall, 66.7% of firms are correctly classified into the
appropriate firm performance categories. For the cross-validated analysis, the percentage of
342
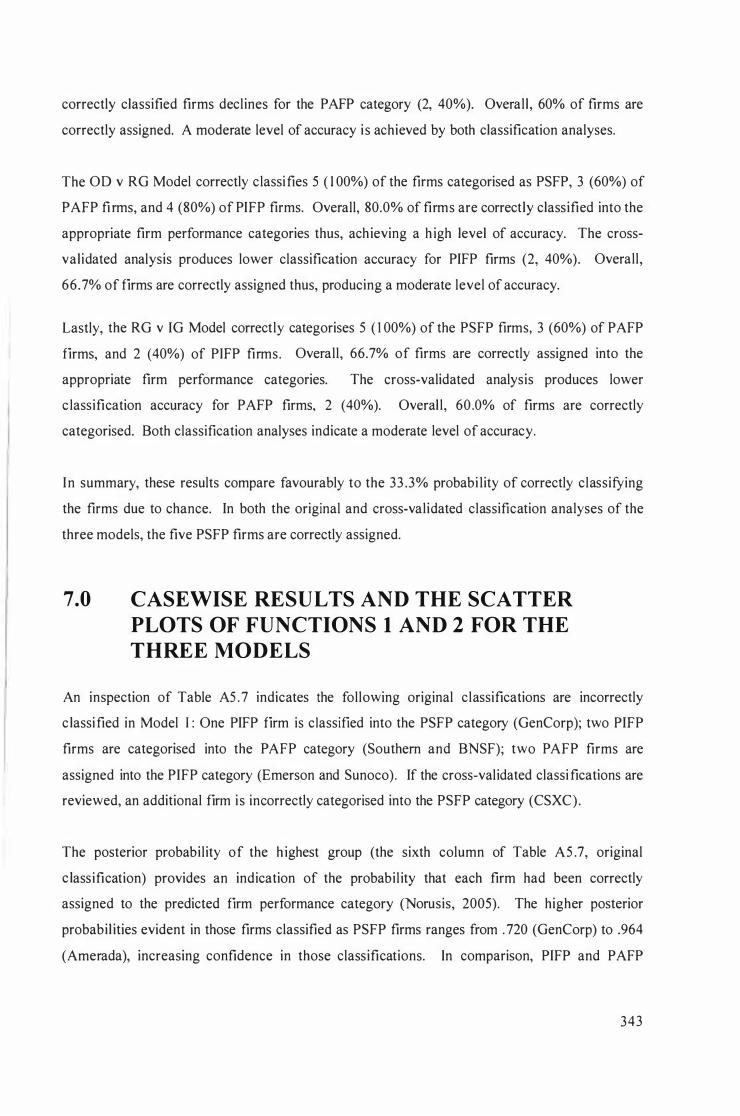
correctly classified firms declines for the PAFP category (2, 40%). Overall, 60% of firms are
correctly assigned. A moderate level of accuracy i s achieved by both classification analyses.
The OD v RG Model correctly classifies 5 ( 1 00%) of the firms categorised as PSFP, 3 (60%) of
PAFP fi rms, and 4 (80%) of PI FP firms. Overall, 80.0% of firms are correctly classified into the
appropriate firm performance categories thus, achieving a h igh level of accuracy. The cross
validated analysis produces lower classification accuracy for PIFP firms (2, 40%). Overall,
66.7% of firms are correctly assigned thus, producing a moderate level of accuracy.
Lastly, the RG v IG Model correctly categorises 5 ( 1 00%) of the PSFP firms, 3 (60%) of PAFP
firms, and 2 (40%) of PIFP firms. Overall, 66.7% of firms are correctly assigned into the
appropriate firm performance categories. The cross-validated analysis produces lower
c lassification accuracy for PAFP firms, 2 (40%). Overal l, 60 .0% of firms are correctly
categorised. Both classification analyses indicate a moderate level of accuracy.
In summary, these results compare favourably to the 33 .3% probabi lity of correctly classifying
the firms due to chance. In both the original and cross-validated classification analyses of the
three models, the five PSFP firms are correctly assigned.
7.0 CASEWISE RESULTS AND THE SCATTER
PLOTS OF FUNCTIONS 1 AND 2 FOR THE
THREE MODELS
An inspection of Table AS .7 indicates the following original classifications are incorrectly
c lassified in Model I : One PIFP firm is classified into the PSFP category (GenCorp); two PIFP
firms are categorised into the PAFP category (Southern and BNSF); two P AFP firms are
assigned into the PIFP category (Emerson and Sunoco). If the cross-validated classi fications are
reviewed, an additional firm i s incorrectly categorised into the PSFP category (CSXC) .
The posterior probability of the h ighest group (the sixth column of Table AS .7, original
c lassification) provides an indication of the probabil ity that each firm had been correctly
assigned to the predicted firm performance category (Norusis, 2005). The higher posterior
probabil ities evident in those firms classified as PSFP firms ranges from . 720 (GenCorp) to .964
(Amerada), increasing confidence in those classifications. In comparison, PIFP and PAFP
343
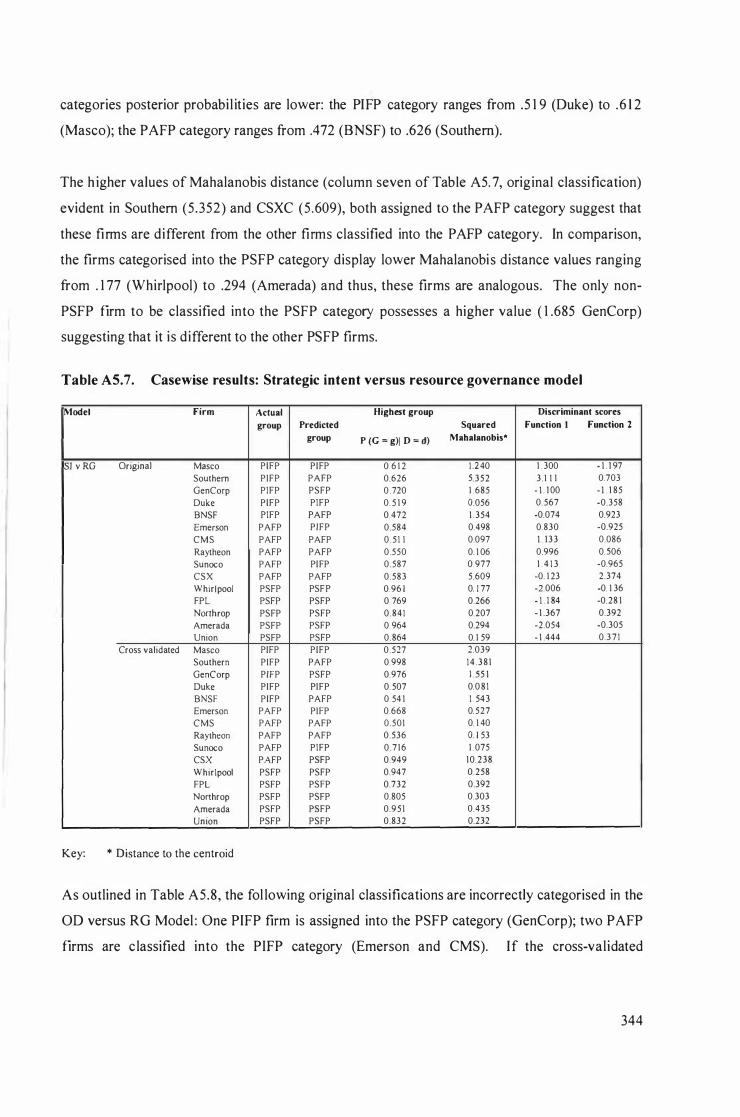
categories posterior probabi l ities are lower: the PI FP category ranges from .5 1 9 (Duke) to .6 1 2
(Masco); the PAFP category ranges from .472 (BNSF) to .626 (Southern).
The h igher values of Mahalanobis distance (column seven of Table A5. 7, original classification)
evident in Southern (5.352) and CSXC (5 .609), both assigned to the PAFP category suggest that
these firms are different from the other firms classified into the PAFP category. In comparison,
the firms categorised into the PS FP category display lower Mahalanobis distance values ranging
from . 1 77 (Whirlpool) to .294 (Amerada) and thus, these firms are analogous. The only non
PSFP firm to be classified into the PS FP category possesses a higher value ( 1 .685 GenCorp)
suggesting that it is different to the other PS FP firms.
Table AS.7. Casewise results: Strategic intent versus resource governance model
Model Firm Actual Highest group Discriminant scores
51 v RG Original Masco
Southern
GenCorp
Duke
BNSF
Emerson
CMS
Raytheon
Sunoco
CSX
Whirlpool
FPL
Nonhrop Amerada Union
Cross validated Masco
Southern
GenCorp
Duke
BNSF
Emerson
CMS
Raytheon
Sunoco
CSX
Whirlpool
FPL
Nonhrop
Amerada
Union
Key: * Distance to the centroid
group Predicted
group
PIFP PI FP
PIFP PAFP
PIFP PSFP
PIFP PIFP
PIFP PAFP
PAFP PIFP
PAFP PAFP
PAFP PAFP
PAFP PI FP
PAFP PAFP
PSFP PS F P
PSFP PSFP
PSFP PSFP
PSFP PSFP
PSFP PSFP
PIFP PIFP
PIFP PAFP
PIFP PSFP
PIFP PI FP
PIFP PAFP
PAFP PIFP
PAFP PAFP
PAFP PAFP
PAFP PIFP
PAFP PSFP
PSFP PSFP
PSFP PSFP
PSFP PSFP
PSFP PSFP
PSFP PSFP
Squared Function 1 Function 2 P (G = g)/ D = d) Mahalanobis'
0. 6 1 2 1 2 40 1 . 300 - ! . l 97
0.626 5.352 3. 1 I 1 0.703
0 . 720 1 .685 - ! . l OO - ! . l 85
0. 5 1 9 0.056 0. 567 -0.358
0.472 1 . 354 -0.074 0.923
0.584 0.498 0.830 -0.925
0 . 5 1 I 0.097 ! . l33 0.086
0.550 0. 1 06 0.996 0506
0.587 0.977 1 . 4 1 3 -0.965
0.583 5.609 -0. 1 23 2.374
0.96 1 0. 1 77 -2.006 -0. 1 36
0 769 0.266 - ! . l 84 -0.28 1
0 .841 0.207 - 1 .367 0.392
0. 964 0.294 -2.054 -0.305
0. 864 0. 1 59 - 1 .444 0.3 7 1
0.527 2.039
0.998 1 4 . 3 8 1
0.976 1 55 1
0. 507 0.0 8 1
0 . 54 1 1 . 543
0.668 0. 527
0.501 0. 1 40
0.536 0. 1 53
0 . 7 1 6 1 .075
0.949 1 0.238
0.947 0.258
0.732 0.392
0.805 0.303
0.9 5 1 0.435
0.832 0.232
As outlined in Table AS.8, the fol lowing original classifications are incorrectly categorised in the
OD versus RG Model : One PIFP firm is assigned into the PSFP category (GenCorp); two PAFP
firms are c lassified into the PIFP category (Emerson and CMS). If the cross-validated
344
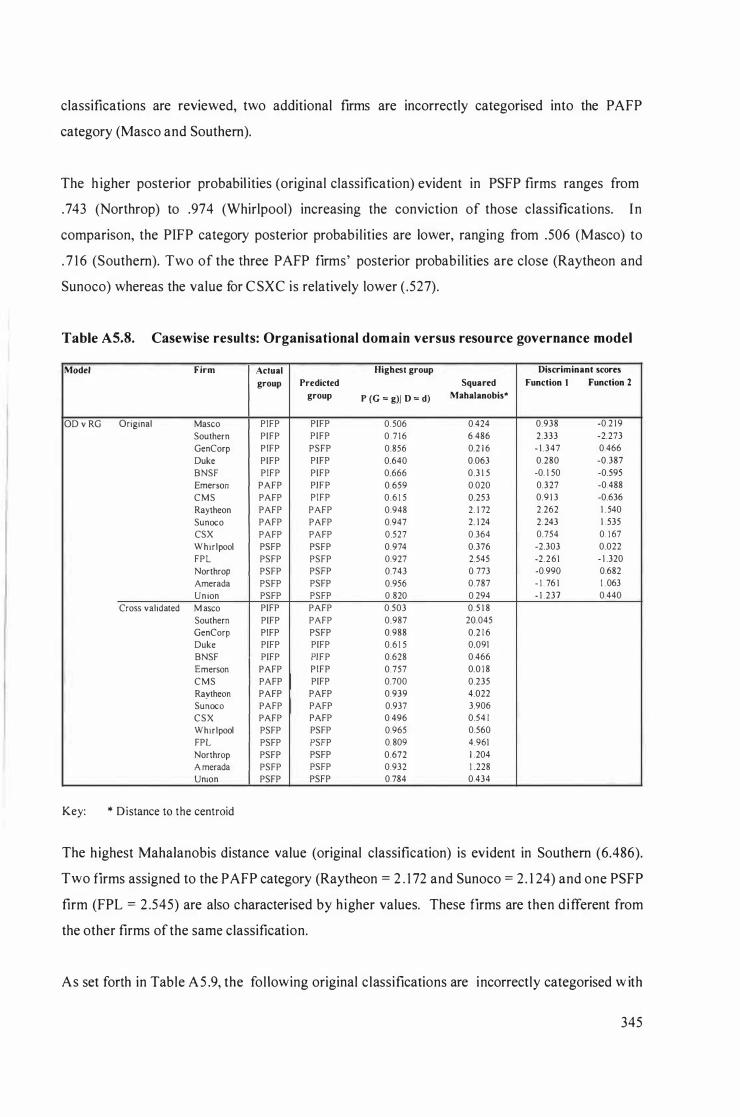
classifications are reviewed, two additional firms are incorrectly categorised into the P AFP
category (Masco and Southern).
The h igher posterior probabil ities (original classification) evident in PSFP firms ranges from
.743 (Northrop) to .974 (Whirlpool) increasing the conviction of those classifications. I n
comparison, the PIFP category posterior probabilities are lower, ranging from .506 (Masco) to
. 7 1 6 (Southern). Two of the three PAFP firms' posterior probabilities are close (Raytheon and
Sunoco) whereas the value for C SXC is relatively lower ( .527).
Table AS.S. Casewise results: Organisational domain versus resource governance model
Model Firm
OD v RG Original Masco
Southern
GenCorp
Duke
BNSF
Emerson
C M S
Raytheon
Sunoco
CSX
Whir lpool
FPL
Northrop
Amerada
Un ion
Cross validated M asco
Southern
GenCorp
Duke
BNSF
Emerson
C M S
Raytheon
Sunoco
CSX
Whirlpool
FPL
Northrop
A merada
Union
Key: * Distance to the centroid
Actual
group Predicted
group
PIFP PIFP
PIFP PIFP
PI FP PSFP
PIFP PIFP
PIFP PI FP
PAFP PI F P
PAFP PIFP
PAFP PAFP
PAFP PAFP
PAFP PAFP
PSFP PSFP
PSFP PSFP
PSFP PSFP
PSFP PSFP
PSFP PSFP
PIFP PAFP
PIFP PAFP
PIFP PSFP
PIFP PIFP
PIFP PI F P
PAFP PIFP
PAFP PIFP
PAFP PAFP
PAFP PAFP
PAFP PAFP
PSFP PSFP
PSFP PSFP
PSFP PSFP
PSFP PSFP
PSFP PSFP
Highest group Discriminant scores
Squared Function 1 Function 2 P (G = g)1 D = d) Mahalanobis'
0. 506 0.424 0.938 -0.2 1 9
0 . 7 1 6 6.486 2.333 -2.273
0.856 0.2 1 6 - 1 .347 0.466
0.640 0.063 0.280 -0.387
0.666 0.3 1 5 -0. 1 50 -0.595
0.659 0.020 0.327 -0.488
0.6 1 5 0.253 0.9 1 3 -0.636
0.948 2 . 1 72 2.262 1 . 540
0.947 2. 1 24 2 .243 1 . 535
0.527 0.364 0.754 0. 1 67
0.974 0.376 -2.303 0.022
0.927 2.545 -2. 2 6 1 - 1 .320
0.743 0 773 -0.990 0.682
0.956 0.787 - 1 . 76 1 1 .063
0 .820 0.294 - 1 .237 0.440
0.503 0. 5 1 8
0.987 20.045
0.988 0.2 1 6
0.6 1 5 0.091
0.628 0.466
0.757 0.0 1 8
0.700 0.235
0.939 4.022
0.937 3.906
0.496 0.54 1
0.965 0.560
0. 809 4.961
0.672 1 .204
0.932 1 .228
0.784 0.434
The highest Mahalanobis distance value (original classification) is evident in Southern (6.486).
Two firms assigned to the PAFP category (Raytheon = 2 . 1 72 and Sunoco = 2 . 1 24) and one PSFP
firm (FPL = 2 .545) are also characterised by higher values. These firms are then different from
the other firms of the same classification.
As set forth in Table A5 .9, the following original classifications are incorrectly categorised w ith
345
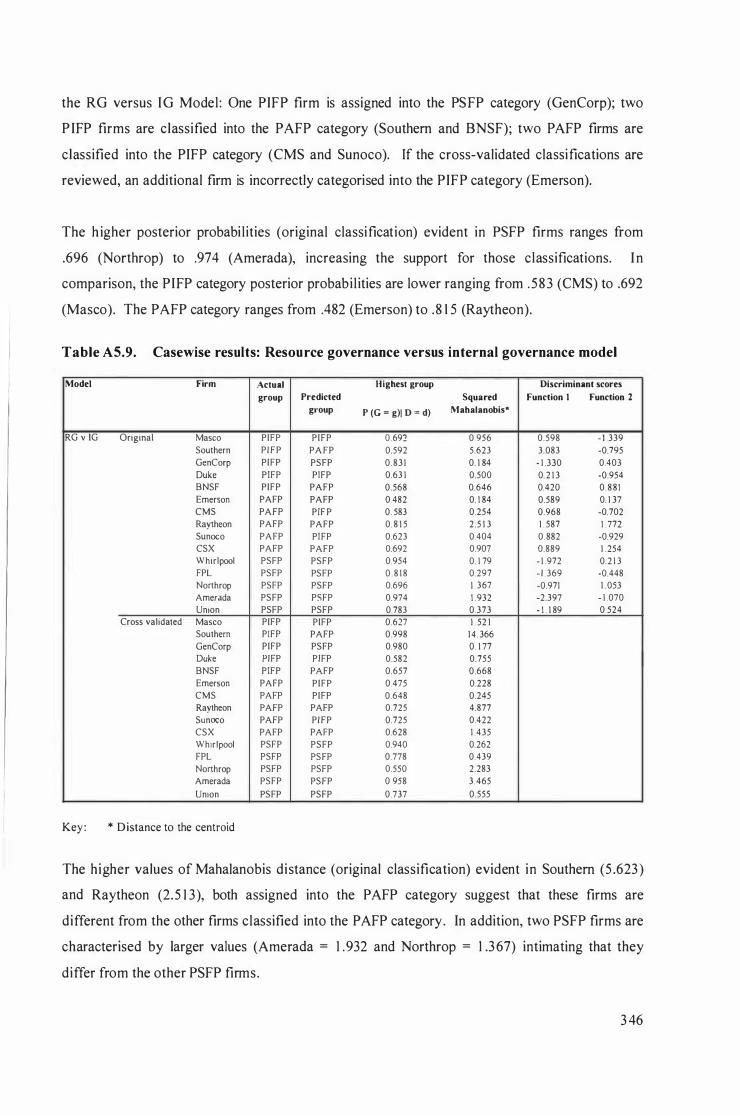
the RG versus IG Model : One PIFP firm is assigned into the PS FP category (GenCorp); two
P I FP firms are classified into the PAFP category (Southern and BNSF); two P AFP firms are
classified into the PIFP category (CMS and Sunoco). If the cross-validated classifications are
reviewed, an additional firm is incorrectly categorised into the PIFP category (Emerson).
The h igher posterior probabi lities (original classification) evident in PSFP firms ranges from
.696 (Northrop) to .974 (Amerada), increasing the support for those classifications. I n
comparison, the PIFP category posterior probabil ities are lower ranging from . 583 (eMS) to .692
(Masco). The PAFP category ranges from .482 (Emerson) to .8 1 5 (Raytheon).
Table A5.9. Casewise results: Resource governance versus internal governance model
Model Firm
RG v lG Original Masco
Southern
GenCorp
Duke
BNSF
Emerson
CMS
Raytheon
Sunoco
CSX
Whirlpool
FPL
Nonhrop
Amerada
Union
Cross validated Masco
Southern
GenCorp
Duke
BNSF
Emerson
CMS
Raytheon
Sunoco
CSX
Whirlpool
FPL
Nonhrop
Amerada
Union
Key : * D istance to the centroid
Actual
group Predicted
group
PIFP PIFP
PIFP PAFP
PIFP PSFP
PIFP PIFP
PIFP PAFP
PAFP PAFP
PAFP PI F P PAFP PAFP
PAFP PI FP
PAFP PAFP
PSFP PSFP
PSFP PS FP
PSFP PSFP
PSFP PSFP
PSFP PSFP
PIFP PIFP PIFP PAFP
PIFP PSFP
PIFP PIFP
PIFP PAFP
PAFP PIFP
PAFP PIFP
PAFP PAFP
PAFP PIFP
PAFP PAFP
PS FP PSFP
PSFP PS FP
PSFP PSFP
PSFP PSFP
PS FP PSFP
Highest group Discriminant scores
Squared Function I Function 2 P (G = g)1 D = d) Mahalanobis*
0.692 0.956 0.598 - 1 .339
0.592 5.623 3.083 -0.795
0 .831 0. 1 84 - 1 .330 0.403
0.63 1 0.500 0. 2 1 3 -0.954
0.568 0.646 0.420 0 . 8 8 1
0.482 0. 1 84 0.589 0. 1 37
0. 583 0.254 0.968 -0.702
0. 8 1 5 2.5 1 3 1 . 587 1 . 772
0.623 0.404 0. 882 -0.929
0.692 0.907 0.889 1 .254
0.954 0. 1 79 - 1 .972 0.2 1 3
0 . 8 1 8 0.297 - 1 .369 -0.448
0.696 1 . 367 -0.971 1 .053
0.974 1 .932 -2.397 - 1 .070
0.783 0.373 - 1 . 1 89 0.524
0.627 1 . 52 1
0.998 1 4 . 366
0.980 0. 1 77
0.582 0.755
0.657 0.668
0.475 0.228
0.648 0.245
0.725 4.877
0.725 0.422
0.628 1 .435
0.940 0.262
0.778 0.439
0.550 2.283
0 958 3. 465
0.737 0.555
The higher values of Mahalanobis distance (original classification) evident in Southern (5 .623 )
and Raytheon (2.5 1 3), both assigned into the PAFP category suggest that these firms are
different from the other firms classified into the PAFP category. In addition, two PSFP firms are
characterised by larger values (Amerada = 1 .932 and Northrop = 1 .3 67) intimating that they
differ from the other PSFP firms.
3 46
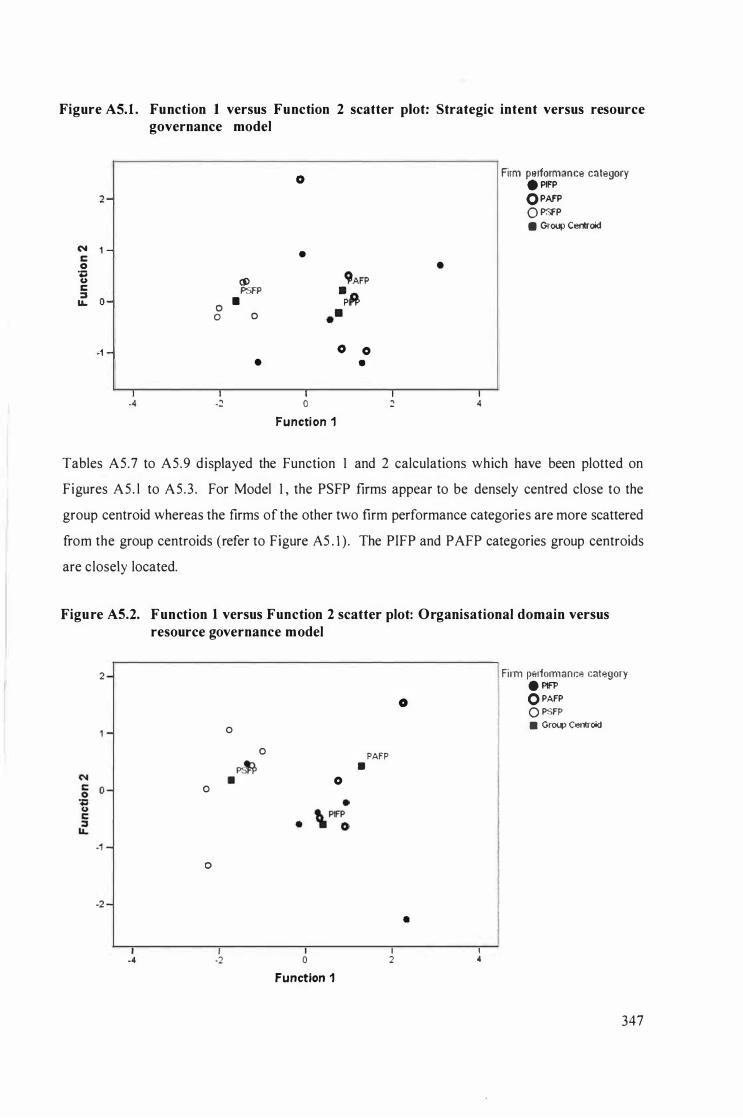
Figure AS.I . Function 1 versus Function 2 scatter plot: Strategic intent versus resource governance model
2 -
C'I 1 -C o .::; u C
� 0 -
-1 -I -4
� PSfP 0 • 0 0
•
I -2
o
•
I o Functi on 1
o 0 •
I 2
•
I 4
Firm pelformance category e PlFP OPAFP O PSfP • Group Centroid
Tables AS.7 to AS.9 displayed the Function 1 and 2 calculations which have been plotted on
Figures AS . l to AS .3 . For Model 1 , the PS FP firms appear to be densely centred close to the
group centroid whereas the firms of the other two firm performance categories are more scattered
from the group centroids (refer to Figure AS . l ) . The PIFP and PAFP categories group centroids
are closely located.
Figure AS.2. Function 1 versus Function 2 scatter plot: Organisational domain versus resource governance model
2
o
-1 o
-2
-4
o o
-2
o
o Function 1
PAFP •
2
o
•
4
Film pelfOlmanCI3 cat>.!9Qry e PIFP O PAFP O PSFP • GrOl4) Cet�roid
347
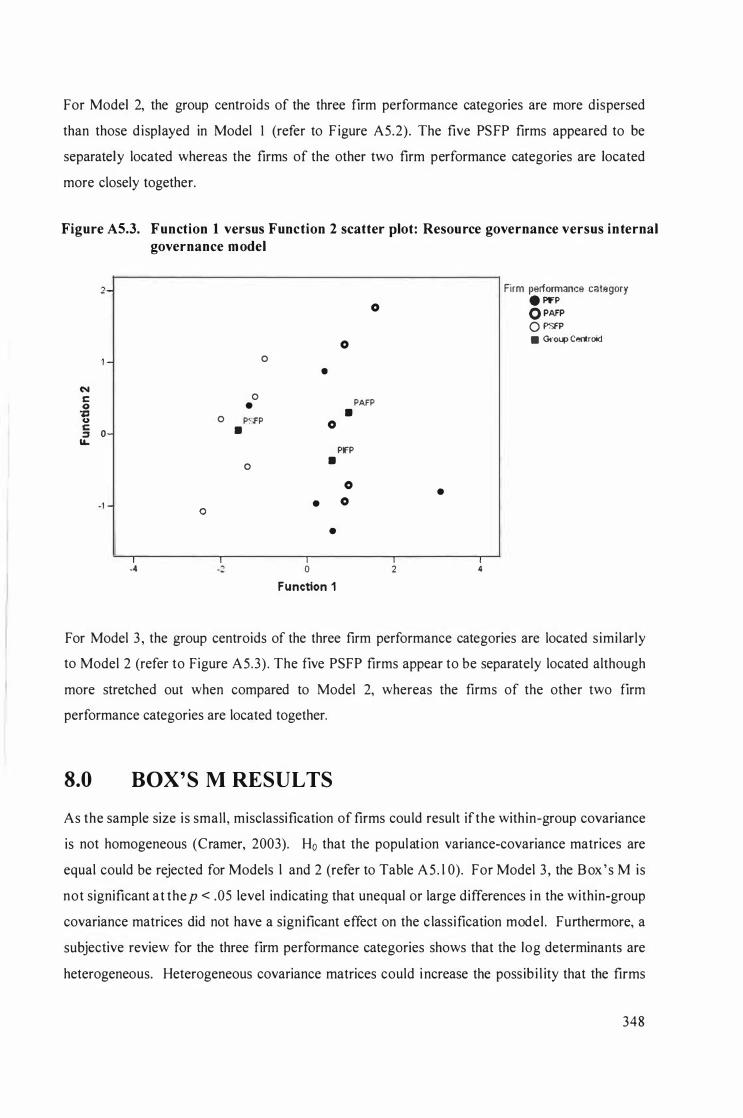
For Model 2, the group centroids of the three firm performance categories are more dispersed
than those displayed in Model 1 (refer to F igure AS.2). The five PS FP firms appeared to be
separately located whereas the firms of the other two firm performance categories are located
more closely together.
Figure A5.3. Function 1 versus Function 2 scatter plot: Resource governance versus internal governance model
C'I s:: o ., Q
2-
1 -
§ 0 u...
·1
I -4
o
o •
o
o PSFP
I -:2
•
o
•
0
•
•
•
I o Function 1
o
•
PIFP
0 0
o
PAfP
I :2
•
I 4
Firm performance category • PFP O PAFP O PSfP • Group Ceriroid
For Model 3 , the group centroids of the three firm performance categories are located similarly
to Model 2 (refer to Figure AS.3) . The five PSFP firms appear to be separately located although
more stretched out when compared to Model 2, whereas the firms of the other two firm
performance categories are located together.
8.0 BOX' S M RESULTS
As the sample size is small , misclassification of firms could result if the within-group covariance
is not homogeneous (Cramer, 2003). Ho that the population variance-covariance matrices are
equal could be rejected for Models l and 2 (refer to Table AS . l 0). For Model 3 , the Box ' s M is
not significant at the p < .05 level indicating that unequal or large differences in the within-group
covariance matrices did not have a significant effect on the c lassification model . Furthermore, a
subjective review for the three firm performance categories shows that the log determinants are
heterogeneous. Heterogeneous covariance matrices could increase the possib i l ity that the firms
348
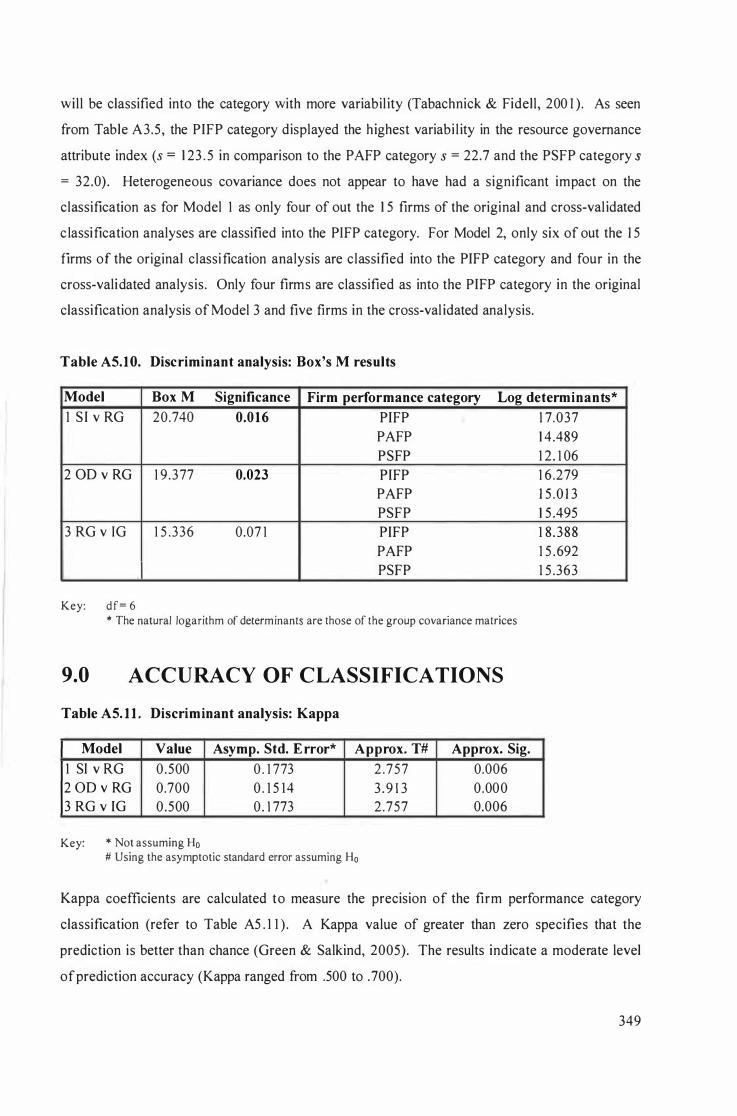
will be classified into the category with more variabil ity (Tabachnick & Fidell, 200 1 ). As seen
from Table A3.5, the PIFP category displayed the highest variabi l ity in the resource governance
attribute index (s = 1 23 . 5 in comparison to the PAFP category s = 22.7 and the PSFP category s = 32.0). Heterogeneous covariance does not appear to have had a significant impact on the
classification as for Model 1 as only four of out the 1 5 firms of the original and cross-val idated
c lassification analyses are classified into the PI FP category. For Model 2, only six of out the 1 5
firms of the original classi fication analysis are classified into the PIFP category and four in the
cross-validated analysis. Only four firms are classified as into the PIFP category in the original
classification analysis of Model 3 and five firms in the cross-val idated analysis.
Table AS.lO. Discriminant analysis: Box's M results
Model Box M Significance Firm performance category Log determinants*
1 S I v RG 20.740 0.0 16 PIFP PAFP PS FP
2 0D v RG 1 9 .377 0.023 PIFP PAFP PSFP
3 RG v IG 1 5 .336 0.07 1 PIFP PAFP PSFP
Key: d f = 6 * The natural logarithm of determinants are those of the group covariance matrices
9.0 ACCURACY OF CLASSIFICATIONS
Table AS. l l . Discriminant analysis: Kappa
Model Value
1 SI v RG 0.500 2 OD v RG 0.700 3 RG v IG 0.500
Key: * Not assuming Ho
Asymp. Std. E rror*
0 . 1 773 0 . 1 5 14 0 . 1 773
Approx. T#
2.757 3 .9 1 3 2 .757
# Using the asymptotic standard error assuming Ho
Approx. Sig.
0.006 0.000 0.006
1 7.037 1 4 .489 1 2 . 1 06 1 6 .279 1 5 .0 1 3 1 5 .495 1 8 .388 1 5 .692 1 5 .363
Kappa coefficients are calculated to measure the precision of the firm performance category
classification (refer to Table A5 . 1 1 ) . A Kappa value of greater than zero specifies that the
prediction is better than chance (Green & Salkind, 2005). The results indicate a moderate level
of prediction accuracy (Kappa ranged from .500 to .700).
349
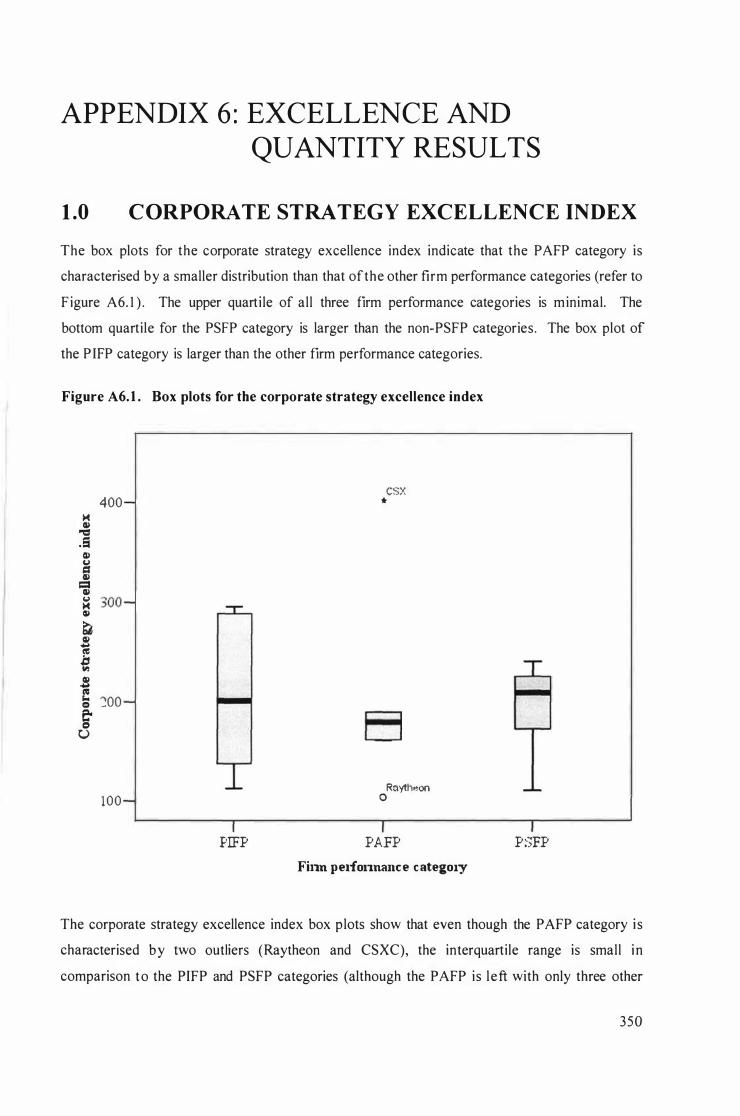
APPENDIX 6 : EXCELLENCE AND
QUANTITY RESULTS
1 .0 C ORPORATE STRATEGY EXCELLENCE INDEX
The box plots for the corporate strategy excellence index indicate that the PAFP category is
characterised by a smaller distribution than that of the other firm performance categories (refer to
F igure A6. 1 ) . The upper quarti le of all three firm performance categories is minimal. The
bottom quartile for the PSFP category is larger than the non-PSFP categories. The box plot of
the P I FP category is larger than the other firm performance categories.
Figure A6. 1 . Box plots for the corporate strategy excellence index
M Q) "Cl .S
Cl)
if = Q) Co> M Q) � � � Q) .... 1'$ ; � U
400
,,00
�OO
100
PIFP
csx •
Raytheon o
PAFP Finn pelfonnance category
PSFP
The corporate strategy excellence index box plots show that even though the PAFP category i s
characterised by two outliers (Raytheon and CSXC), the interquartile range is small in
comparison to the PIFP and PSFP categories (although the PAFP is left with only three other
350
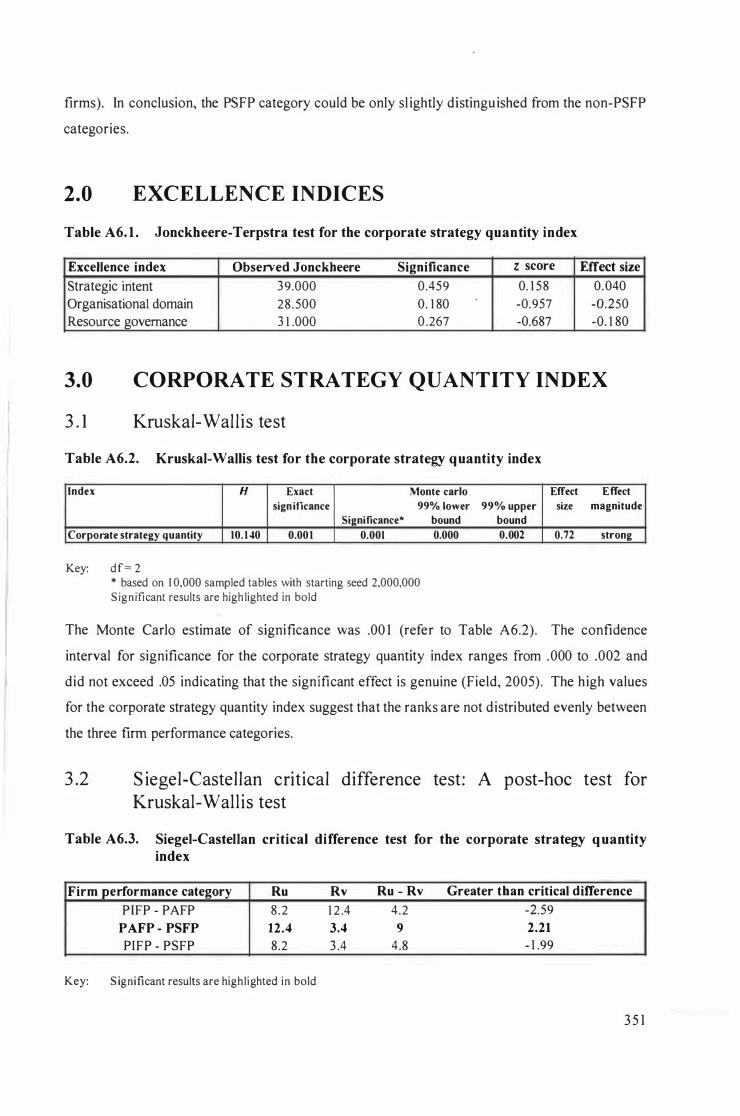
firms). In conclusion, the PSFP category could be only sl ightly distingu ished from the non-PSFP
categories.
2.0 EXCELLENCE INDICES
Table A6. 1 . Jonckheere-Terpstra test for the corporate strategy quantity index
Excellence index Observed Jonckbeere Significance z score
Strategic intent 39.000 0.459 0. 1 58
Organisational domain 28.500 0. 1 80 -0.957
Resource governance 3 1 .000 0 .267 -0.687
Effect size
0.040
-0.250
-0. 1 80
3.0 CORPORATE STRATEGY QUANTITY INDEX
3 . 1 Kruskal-Wal l is test
Table A6.2. Kruskal-Wallis test for the corporate strategy quantity index
Index H Exact Monte carlo sign ificance 99% lower
Significance'" bound Corporate strategy quantity 10. 1 40 0.00 1 0.001 0.000
Key: d f == 2 * based on 1 0,000 sampled tables with starting seed 2,000,000 S ignificant results are high lighted in bold
99% upper bound 0.002
Effect Effect size magnitude
0.72 strong
The Monte Carlo estimate of significance was .00 1 (refer to Table A6.2). The confidence
interval for significance for the corporate strategy quantity index ranges from .000 to .002 and
did not exceed .05 indicating that the significant effect is genuine (Field, 2005). The high values
for the corporate strategy quantity index suggest that the ranks are not distributed evenly between
the three firm performance categories.
3 .2 S iegel-Castellan critical difference test: A post-hoc test for Kruskal-Wall is test
Table A6.3. Siegel-Castellan critical difference test for the corporate strategy q uantity index
Firm performance category Ru
PIFP - PAFP 8 .2
PAFP - PSFP 12.4 PI FP - PSFP 8.2
Key: S ignificant results are highlighted in bold
Rv
1 2 .4
3.4 3 .4
Ru - Rv Greater than critical difference
4.2 -2.59
9 2.21 4.8 - 1 .99
3 5 1
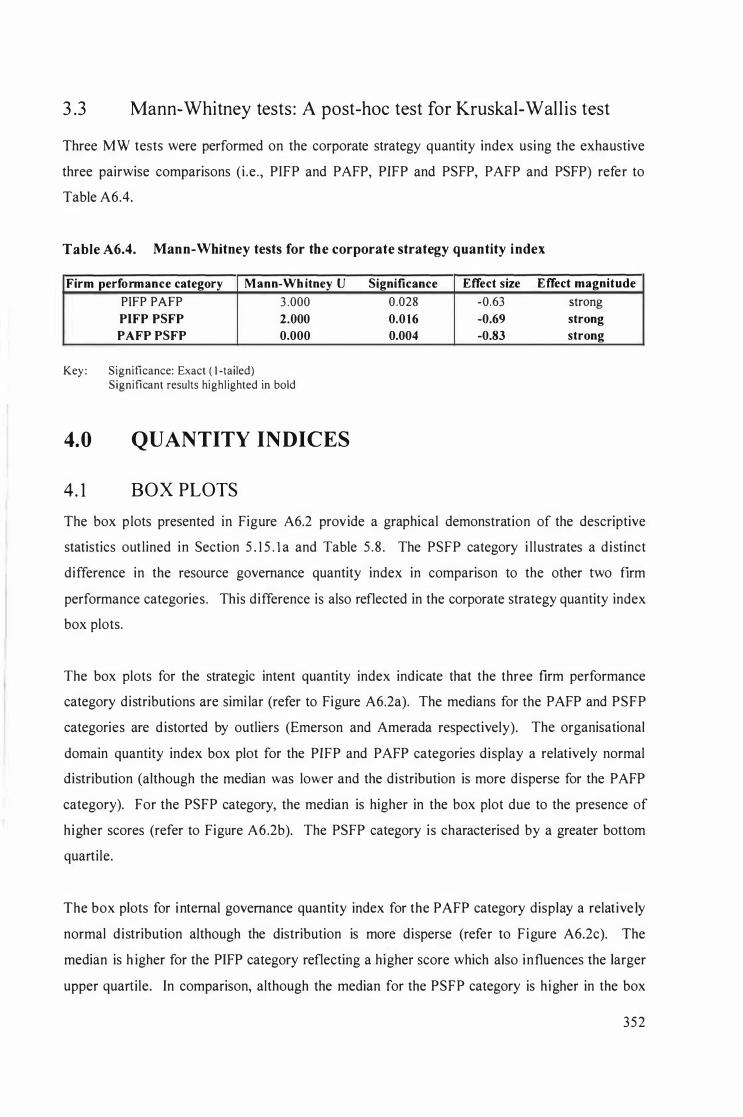
3 .3 Mann-Whitney tests : A post-hoc test for Kruskal-Wallis test
Three MW tests were performed on the corporate strategy quantity index using the exhaustive
three pairwise comparisons (i .e . , PIFP and PAFP, PI FP and PSFP, PAFP and PSFP) refer to
Table A6.4.
Table A6.4. Mann-Whitney tests for the corporate strategy quantity index
Firm perfo rmance category Mann-Wh itney V Significance Effect size Effect magnitude
PIFP PAFP 3 .000
PIFP PSFP 2.000 PAFP PSFP 0.000
Key : Significance: Exact ( I -tailed) Significant results highl ighted in bold
4.0 QUANTITY INDICES
4. 1 BOX PLOTS
0.028 -0.63 strong
0.0 16 -0.69 strong
0.004 -0.83 strong
The box plots presented in Figure A6.2 provide a graphical demonstration of the descriptive
statistics outlined in Section 5 . 1 5 . l a and Table 5 .8 . The PSFP category i l lustrates a distinct
difference in the resource governance quantity index in comparison to the other two firm
performance categories. This difference is also reflected in the corporate strategy quantity index
box plots.
The box plots for the strategic intent quantity index indicate that the three firm performance
category distributions are simi lar (refer to Figure A6.2a). The medians for the PAFP and PSFP
categories are distorted by outliers (Emerson and Amerada respectively). The organisational
domain quantity index box plot for the PI FP and PAFP categories display a relatively normal
distribution (although the median was lower and the distribution is more disperse for the PAFP
category). For the PSFP category, the median is higher in the box plot due to the presence of
higher scores (refer to Figure A6.2b). The PS FP category is characterised by a greater bottom
quartile.
The box plots for internal governance quantity index for the PAFP category display a relative ly
normal distribution although the distribution is more disperse (refer to Figure A6.2c). The
median is h igher for the PI FP category reflecting a higher score which also influences the larger
upper quartile. In comparison, although the median for the PSFP category is higher in the box
352
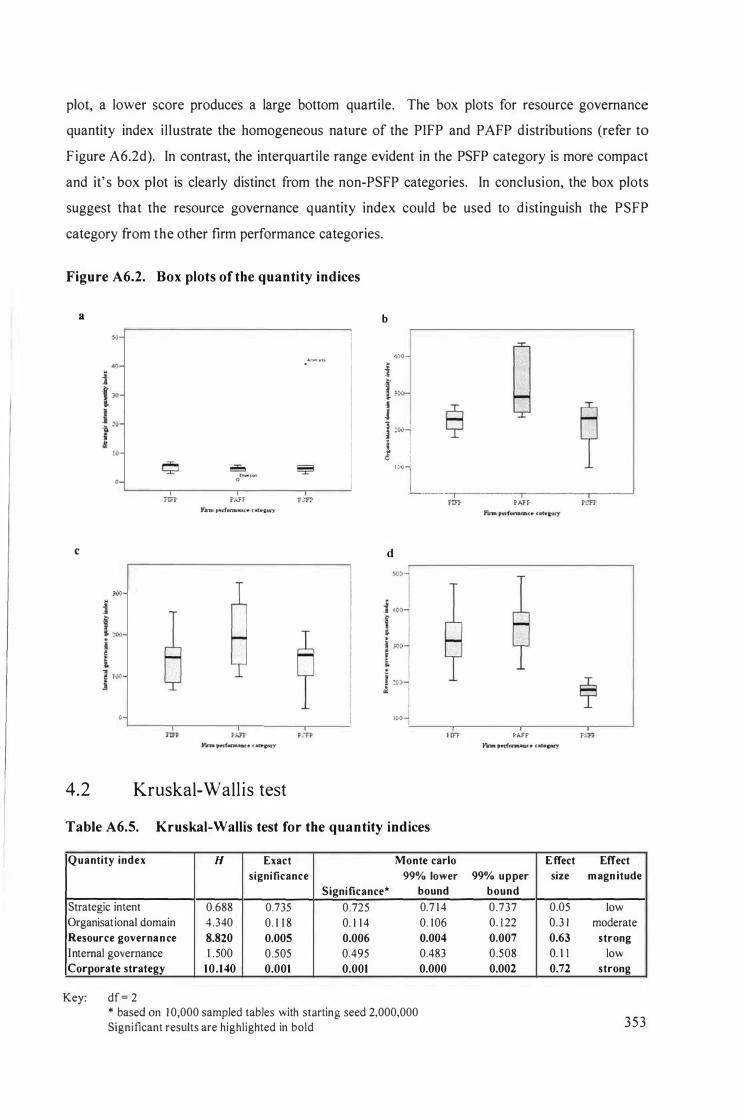
plot, a lower score produces a large bottom quartile. The box plots for resource governance
quantity index i l lustrate the homogeneous nature of the PIFP and PAFP distributions (refer to
F igure A6.2d). In contrast, the interquartile range evident in the PSFP category is more compact
and it' s box plot is clearly distinct from the non-PSFP categories. In conclusion, the box plots
suggest that the resource governance quantity index could be used to distinguish the PSFP
category from the other firm performance categories.
Figure A6.2. Box plots of the quantity indices
a
4Q
'0
b
1 j 400
! 3W ·1 J l ........ ! i .� ..,
i i e I " ",J . L _ ___ .-.-------r---,------PAFt-
c
T
4.2 Kruskal-Wall is test
d
,eo
Table A6.5. Kruskal-Wallis test for the quantity indices
rIFF
PIFF
Quantity index H Exact Monte carlo significance 99% lower
Significance· Strategic intent 0.688 0.735 0.725 Organisational domain 4.340 0. 1 1 8 0. 1 1 4 Resource governa n ce 8.820 0.005 0.006
Internal governance 1 .500 0.505 0.495 Corporate strategy 10 .140 0.001 0.001
Key: df = 2 * based on J 0,000 sampled tables with starting seed 2,000,000 Significant results are highlighted in bold
bound
0.7 1 4
0. 1 06
0.004
0.483
0.000
PAFP
PAFP
E ffect Effect 99% upper size m agn itude
bound
0.737 0.05 low
0. 1 22 0.3 1 moderate
0.007 0.63 strong 0.508 0. 1 1 low
0.002 0.72 strong
353
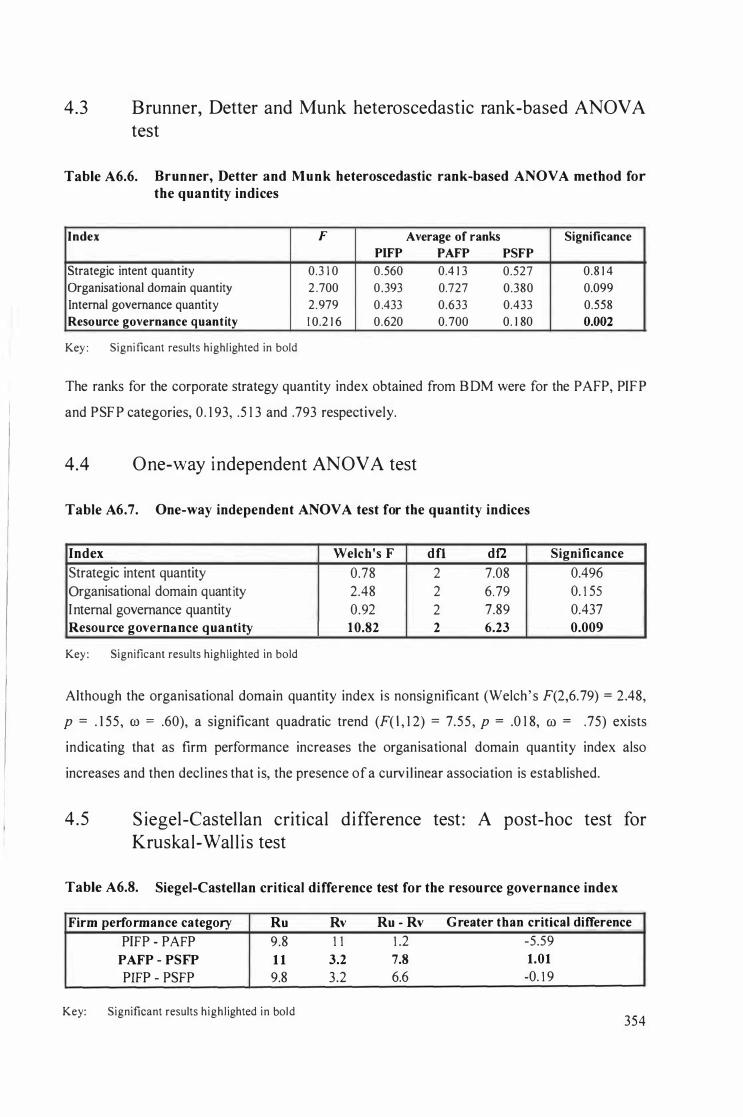
4.3 Brunner, Detter and Munk heteroscedastic rank-based ANOVA test
Table A6.6. Brunner, Detter and Munk heteroscedastic rank-based ANOV A method for the quantity indices
I ndex F Average of ranks Significance
Strategic intent quantity
Organisational domain quantity
Internal governance quantity
Resource governance quantity
Key : Significant results highl ighted in bold
PIFP
0.3 1 0 0 .560
2 .700 0.393
2.979 0 .433
1 0.2 1 6 0.620
PAFP PSFP
0.4 1 3 0.527 0.8 1 4
0.727 0.380 0.099
0.633 0.433 0.558
0.700 0 . 1 80 0.002
The ranks for the corporate strategy quantity index obtained from BDM were for the PAFP, PI F P
and PS F P categories, 0 . 1 93, .5 1 3 and .793 respectively.
4.4 One-way independent ANOVA test
Table A6.7. One-way independent ANOVA test for the quantity indices
Index
Strategic intent quantity Organisational domain quantity Internal governance quantity Resou rce governance quantity
Key : Significant results highlighted in bold
Welch's F
0.78 2.48 0.92 1 0.82
dfl df2
2 7.08 2 6 .79 2 7.89 2 6.23
Significance
0.496 0. 1 55 0.437 0.009
Although the organisational domain quantity index is nonsignificant (Welch' s F(2,6.79) = 2.48,
P = . 1 55 , ill = .60), a significant quadratic trend (F( l , 1 2) = 7.55 , P = .0 1 8, ill = .75) exists
indicating that as firm performance increases the organisational domain quantity index also
increases and then decl ines that is, the presence of a curvi l inear association is established.
4.5 S iegel-Castel lan critical difference test : A post-hoc test for Kruskal-Wal l i s test
Table A6.8. Siegel-Castellan critical difference test for the resource governance index
Firm performance category Ru Rv Ru - Rv G reater than critical difference
PI FP - PAPP 9.8 PAFP - PSFP 1 1 PIFP - PSFP 9.8
Key: Significant results highl ighted in bol d
1 1 1 .2 -5.59 3.2 7.8 1.01 3.2 6.6 -0. 1 9
354
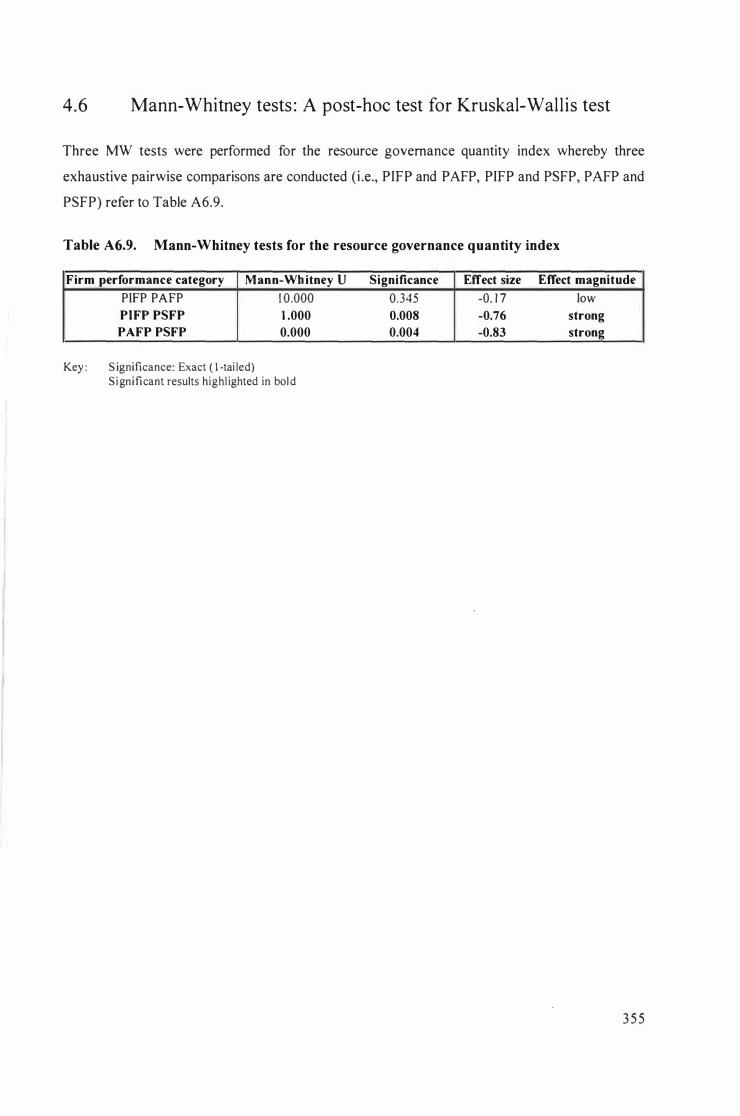
4.6 Mann-Whitney tests : A post-hoc test for Kruskal-Wall is test
Three MW tests were performed for the resource governance quantity index whereby three
exhaustive pairwise comparisons are conducted (i .e., PIFP and PAFP, PIFP and PSFP, PAFP and
PSFP) refer to Table A6.9.
Table A6.9. Mann-Whitney tests for the resource governance quantity index
Firm performance category Man n-Wb itney U Significance Effect size Effect magnitude
PIFP PAFP 1 0.000
PIFP PSFP 1 .000 PAFP PSFP 0.000
Key : S ignificance: Exact ( I -tai led) Significant results highl ighted in bol d
0.345 -0. 1 7 low
0.008 -0.76 strong
0.004 -0.83 strong
3 5 5


