Embed Size (px)
Citation preview

vol. 182, no. 6 the american naturalist december 2013
How Life History Influences Population Dynamics in
Fluctuating Environments
Bernt-Erik Sæther,1,* Tim Coulson,2 Vidar Grøtan,1 Steinar Engen,3 Res Altwegg,4
Kenneth B. Armitage,5 Christophe Barbraud,6 Peter H. Becker,7 Daniel T. Blumstein,8
F. Stephen Dobson,9,10 Marco Festa-Bianchet,11 Jean-Michel Gaillard,12 Andrew Jenkins,13
Carl Jones,14,15 Malcolm A. C. Nicoll,16 Ken Norris,16 Madan K. Oli,17 Arpat Ozgul,17,18 andHenri Weimerskirch6
1. Department of Biology, Centre for Biodiversity Dynamics, Norwegian University of Science and Technology, Trondheim, NO-7491Norway; 2. Department of Zoology, University of Oxford, South Parks Road, Oxford OX1 3PS, United Kingdom;3. Department of Mathematical Sciences, Centre for Biodiversity Dynamics, Norwegian University of Science and Technology,Trondheim, NO-7491 Norway; 4. South African National Biodiversity Institute, Kirstenbosch Research Centre, Claremont 7735, andDepartment of Biological Sciences and Department of Statistical Sciences, Animal Demography Unit, University of Cape Town,Rondebosch 7701, South Africa; 5. Department of Ecology and Evolutionary Biology, University of Kansas, Lawrence, Kansas 66045;6. Centre d’Etudes Biologiques de Chize, CNRS, Unites Propres de Recherche 1934, 79360 Villiers en Bois, France; 7. Institute of AvianResearch “Vogelwarte Helgoland,” Wilhelmshaven 26386, Germany; 8. Department of Ecology and Evolutionary Biology, University ofCalifornia, Los Angeles, California 90095; 9. Centre d’Ecologie Fonctionnelle et Evolutive, Unites Mixtes de Recherche 5175 du CNRS,1919 route de Mende, F-34293 Montpellier, Cedex 5, France; 10. Department of Biological Sciences, Auburn University, Auburn,Alabama 36849; 11. Departement de Biologie, Universite de Sherbrooke, Quebec J1K 2R1, Canada; 12. Biometrie et BiologieEvolutive, Unites Mixtes de Recherche, CNRS, 5558 Laboratoire de Biometrie et Biologie Evolutive, Universite Claude Bernard Lyon 1,Batiment Gregor Mendel, 43 boulevard du 11 novembre 1918, 69622 Villeurbanne Cedex, France; 13. Percy FitzPatrick Institute ofAfrican Ornithology, Department of Science and Technology, National Research Foundation Centre of Excellence, University of CapeTown, Rondebosch 7701, South Africa; 14. Mauritian Wildlife Foundation, Grannum Road, Vacoas, Mauritius; 15. Durrell WildlifeConservation Trust, Les Augres Manor, Trinity, Jersey JE3 5BP, Channel Island; 16. Centre for Agro-Environmental Research, School ofAgriculture-Environmental Research, School of Agriculture, Policy, and Development, University of Reading, Reading RG6 6AR, UnitedKingdom; 17. Department of Wildlife Ecology and Conservation, University of Florida, Gainesville, Florida 32611; 18. Institute ofEvolutionary Biology and Environmental Studies, University of Zurich, Zurich, Switzerland
Submitted December 17, 2012; Accepted June 19, 2013; Electronically published October 25, 2013
abstract: A major question in ecology is how age-specific variationin demographic parameters influences population dynamics. Basedon long-term studies of growing populations of birds and mammals,we analyze population dynamics by using fluctuations in the totalreproductive value of the population. This enables us to account forrandom fluctuations in age distribution. The influence of demo-graphic and environmental stochasticity on the population dynamicsof a species decreased with generation time. Variation in age-specificcontributions to total reproductive value and to stochastic compo-nents of population dynamics was correlated with the position ofthe species along the slow-fast continuum of life-history variation.Younger age classes relative to the generation time accounted forlarger contributions to the total reproductive value and to demo-graphic stochasticity in “slow” than in “fast” species, in which manyage classes contributed more equally. In contrast, fluctuations inpopulation growth rate attributable to stochastic environmental var-iation involved a larger proportion of all age classes independent of
* Corresponding author; e-mail: [email protected].
Am. Nat. 2013. Vol. 182, pp. 743–759. � 2013 by The University of Chicago.
0003-0147/2013/18206-54347$15.00. All rights reserved.
DOI: 10.1086/673497
life history. Thus, changes in population growth rates can be sur-prisingly well explained by basic species-specific life-historycharacteristics.
Keywords: demographic stochasticity, environmental stochasticity,life history, reproductive value, stochastic demography.
Introduction
Species display a wide array of life histories (Stearns 1992;Roff 2002) with a pattern of covariation among traits thatpositions the species along a slow-fast continuum of life-history variation (Stearns 1983; Gaillard et al. 1989; Prom-islow and Harvey 1990; Sæther and Bakke 2000). Speciesat the fast end of this continuum mature early in life,produce many offspring at each reproductive event, buthave short life expectancy. The slow end includes long-lived species with delayed maturity and small litter orbrood sizes that are often restricted to a single offspring.The position of the species along this continuum is closelycorrelated to its generation time (Gaillard et al. 2005). In
This content downloaded from 193.54.110.32 on Mon, 9 Dec 2013 04:22:30 AMAll use subject to JSTOR Terms and Conditions

744 The American Naturalist
some taxa, such as mammals, it is also linked to variationin body mass and development time (Millar and Zammuto1983; Dobson and Oli 2007).
Patterns of life-history covariation are also associatedwith differences in age-specific vital rates. For instance,early comparative analyses suggested that interspecific dif-ferences in age-specific survival could be classified intosome distinct types (Pearl and Miner 1935), constrainingthe structure of life tables (Deevey 1947). These early ad-vances led to a new research field in evolutionary ecologythat focuses on how age-specific variation in vital ratesaffects evolution of life history (see reviews in Charles-worth 1994, Caswell 2001, and Rauser et al. 2009). How-ever, the implications of life history for population dy-namics are much less well understood.
Patterns of age-specific variation in vital rates affect pop-ulation dynamics. Comparative studies have revealed largeinterspecific differences in both the magnitude of vari-ability and patterns of population fluctuations (Pimm andRedfearn 1988; Arino and Pimm 1995; Sæther and Engen2002; Sæther et al. 2002; Lande et al. 2003). However, ourunderstanding of how basic species-specific life-historycharacteristics affect this variation is limited, because itrequires models that include both deterministic changesover long periods and stochastic influences on fluctuationsin population size. An important advance in modeling age-structured populations was provided by Leslie’s (1945,1948) introduction of matrix models. Temporal variationin expected values of population size and age distributionin subsequent generations can be calculated from a pro-jection matrix whose elements are age-specific values ofreproduction and survival. The original formulation of theLeslie model did not include stochasticity. Later, Pollard(1966) and Goodman (1967) introduced demographic sto-chasticity in age-structured models, in which each indi-vidual’s contribution to future generations is a randomindependent variable with an identical distribution foreach year and every age class. Lewontin and Cohen (1969)and Cohen (1977, 1979) developed another class of sto-chastic age-structured models that included environmentalstochasticity (temporal variation in the environment af-fecting the whole or parts of the population in a similarway) based on the theory of stochastic matrices, in whichthe projection matrices are some temporal sequence ofrandom matrices with distributions independent of thepopulation vector. This approach was further extended byTuljapurkar (1982b, 1990), who derived an important first-order approximation for how environmental stochasticityreduces the long-term growth rate of the population. Theinfluences of both demographic and environmental sto-chasticity were included in models by Engen et al. (2005)of the dynamics of age-structured populations using a dif-fusion approximation that generalized the previous ap-
proach of Lande and Orzack (1988). Unfortunately, all ofthese models require estimates of a large number of pa-rameters, seriously restricting their practical applicability.
In addition to model complexity, the relationship be-tween life history and fluctuations in population size iscomplicated by age dependence in life histories, leadingto multiple time delays in the population dynamics andtransient fluctuations in age structure even with a constantenvironment (Haridas and Tuljapurkar 2007). Further-more, demographic and environmental stochasticity willalso cause random variation in age distribution (Caswell2001; Lande et al. 2003). In populations in which survivaland fertility rates vary with age, these two types of sto-chasticity generate a correlation between populationgrowth at time and t, because the number of indi-t � 1viduals of age at time is dependent upon thea � 1 t � 1number of individuals of age a at time t (Coulson et al.2001). The strength of this temporal autocorrelation variesacross species to an unknown extent (Caswell 2001), whichcomplicates cross-species comparative analyses of the roleof environmental and demographic stochasticity on pop-ulation dynamics.
Here, we aim to identify general patterns that link life-history variation and population dynamics in fluctuatingenvironments by removing temporal autocorrelations inpopulation fluctuations using parameters that can be es-timated from individual-based demographic data. Recenttheoretical advances have shown how this can be achievedby calculating the long-run stochastic growth rate usingthe total reproductive value of the population, V, ratherthan time series of population size, N (Engen et al. 2007,2009b). The reproductive value of an age class a is thecontribution of individuals aged a to future populationsizes, relative to the contributions from individuals in theother age classes (Roughgarden 1979). The total repro-ductive value of the population is the sum of reproductivevalues of all individuals within the population (Engen etal. 2009b) and consequently depends on the age structure.Fisher (1930) showed that V grows exactly exponentiallyin deterministic density-independent models of popula-tion growth, which is the case for N only when the pop-ulation is at the stable age distribution (e.g., fig. 3.1 inLande et al. 2003). Engen et al. (2007, 2009b) extendedthis approach to stochastic models, defining individual re-productive value as the stochastic contribution of an in-dividual to the total reproductive value of the populationat the next time step. Although fluctuations in age struc-ture can generate temporal autocorrelations in annualchanges in population size, the total reproductive valueexhibits little or no autocorrelation (Engen et al. 2007,2009b).
Here, we use long-term individual-based studies to in-vestigate how age-specific variation in demographic char-
This content downloaded from 193.54.110.32 on Mon, 9 Dec 2013 04:22:30 AMAll use subject to JSTOR Terms and Conditions

Life History and Population Dynamics 745
acteristics contributes to growth of populations of birdsand mammals with different life histories after accountingfor generation time. We then examine whether these pat-terns are correlated with the position of the species alongthe slow-fast continuum of life-history variation (Stearns1983; Gaillard et al. 1989; Promislow and Harvey 1990;Sæther and Bakke 2000; Dobson and Oli 2007). Our aimis to identify critical stages of the life history (Charlesworth1972) most strongly influencing stochastic variation inpopulation growth rates and examine whether these aredifferent from those affecting the long-term changes inmean population size.
The Model
The long-run population growth rate from time step 1 toT (Tuljapurkar and Orzack 1980; Tuljapurkar et al. 2003)can, according to Sæther et al. (2007), be written as
T�1 21 jds p ln (V(t � 1)) � ln (V(t)) �� [ ]T � 1 2N(t)tp1 (1)2je≈ r � ,
2
where r is the mean population growth rate on the log-arithmic scale, N(t) is the population size in year t, 2j /2e
describes how environmental stochasticity contributes tothe long-run stochastic growth rate, and quan-2j /2N(t)d
tifies how the influence of demographic stochasticity de-creases with increasing population size. This ignores anyeffect of density dependence. Much as the total repro-ductive value, V, is dependent on age-specific patterns ofsurvival and fertility, so too are the demographic and en-vironmental variances, and (Engen et al. 2009b).2 2j jd e
Both these variance components and the total reproductivevalue can be partitioned further, assuming no density de-pendence, into age class–specific survival and fertility con-tributions and a covariance between them (Tuljapurkar1990; Benton et al. 1995; Caswell 2001; Gaillard and Yoccoz2003; Engen et al. 2005; Morris et al. 2006).
Let be a column vector of the num-Tn p (n , n , … n )1 2 k
ber of individuals in the different age classes, where Tdenotes the transpose of a vector, and let the populationvector the next year be , where L is a sto-n � Dn p Lnchastic projection matrix (Caswell 2001). We consider onlythe female segment of the population and assume pre-breeding census so that the subdiagonal defines the sur-vivals of age classes 1 to , and the first row of Lk � 1defines their age-specific fecundity (i.e., the number ofoffspring recruited by females of different age classes intothe population). The last age class k may be a terminalclass so that individuals in this class survive with proba-
bility to remain in the same class. The expected pro-Lkk
jection matrix has the real dominant eigenvaluel p ELof and right and left eigenvectors u (column vector)l
defined by and (row vector) defined bylu p lu v vl p. These eigenvectors are commonly scaled (Engen et al.lv
2009b) so that and . Then u is� u p 1 vu p � u v p 1i i i
the stable age distribution for the deterministic model de-fined by l, and the components of are the reproductivevvalues for the different age classes (Caswell 1978). Thesum of reproductive values of all individuals V p vn p
is called the total reproductive value of the popu-� n vi i
lation. This equals the total population size N if the pop-ulation is exactly at its stable age distribution, and generally
fluctuates around zero. The Fisherian stable ageN � Vdistribution (Engen et al. 2011) is simply , expressingu vi i
how the total reproductive value is distributed amongVage classes if the population is at the stable age distributionu.
For a finite population, the first row of the projectionmatrix is the mean number of female offspring recruitedinto the breeding population by females in different ageclasses, whereas the lower subdiagonal elements are thefraction of surviving individuals. Writing for the numberBi
of female offspring recruited into the breeding population(i.e., recorded in the population at the age at maturity orlater) by an individual in age class i and for its survival,Ji
defined as 1 if it survives and otherwise 0, the individualreproductive value for a given female is defined (Engen etal. 2009b) as
W p B v � J v , (2)i i 1 i i�1
where by definition equals . This is the contributionv vi�1 i
from a single female to the total reproductive value thenext year. The values are random variables, and theirWi
distribution within and among years defines the demo-graphic and environmental variance required to describethe dynamics of the population (Engen et al. 2009b). Writ-ing Z for the environment in a given year, possibly alarge vector, we define the demographic variance com-ponents , , andf p E Var (BFZ) s p E Var (JFZ) c pdi i di i di
, where the expectations are temporalE Cov (B , JFZ)i i
means, and the variances and the covariance refer to thedistribution within a year. The demographic variance isthen given (Engen et al. 2009b) by
2 2 2 2j p u (f v � s v � 2c v v ) p u j , (3)� �d i di 1 di i�1 di 1 i�1 i di
where the age-specific demographic variance componentis defined by the i th term of the sums. The three ad-2jdi
ditive components of then become2jdi
This content downloaded from 193.54.110.32 on Mon, 9 Dec 2013 04:22:30 AMAll use subject to JSTOR Terms and Conditions

746 The American Naturalist
2 2j p f v , (4a)dif di 1
2 2j p s v , (4b)dis di i�1
and
2j p 2c v v . (4c)difs di 1 i�1
Thus, the components of the demographic variance dueto fecundity and survival alone are and , respectively.2 2j jdf ds
Environmental stochasticity acts on all individuals ofthe population (Lewontin and Cohen 1969; May 1973;Cohen 1977; Turelli 1977). In a given year, the mean fe-cundity of age class i, will generally differ fromE(BFZ)i
the overall mean , and the deviationsE(B ) E(BFZ) �i i
will undergo temporal fluctuations with zero mean.E(B )iBy these types of environmental deviations, we define
, where thef p Cov [(E(BFZ) � E(B )),(E(BFZ) � E(B ))]eij i i j j
covariance refers to temporal variation. Similarly, by re-placing by we define . Finally, there will be temporalB J si i eij
environmental covariance components between fecundityand survival, defined as c p Cov [(E(JFZ) � E(J )),eij i i
. Using these definitions, the environ-(E(BFZ) � E(B ))]j j
mental variance can be written as
2 2j p u u [s v v � f v � c (v � v )v ]�e i j eij i�1 j�1 eij 1 eij i�1 j�1 1ij (5)
p u u t ,� i j eijij
where the age-specific component is defined by the ijteij
term of the equation. From this, we define the environ-mental component for a single age class as the sum overthe covariances with all the age classes, that is, t pei
. Then, the total environmental variance takes the� u tj eij
same form as the total demographic variance,
2j p u t , (6)�e i eii
which can be partitioned (Engen et al. 2009b) into additivecomponents from fecundity and survival as well as2 2j jef es
the covariance between them.
Estimation Procedures
We employ the estimation procedure detailed by Engen etal. (2009b). To estimate the variance components of sto-chasticity, we estimate the mean projection matrix l byestimating each element as the mean of all observed vitalrates within and among years. The eigenvectors of theestimated matrix then serve as estimates of the actual ei-genvectors u and . The complete data set is records ofvsurvival and reproduction, , for ages(J , B ) i pimt imt
, in years , and individuals1, 2, ... , k t p 1, 2, ... T m p, where is the number of individuals in age1, 2, ... n nit it
class i recorded at year t. The corresponding individual
reproductive values are . One ad-W p J v � B vimt imt 1 imt i�1
vantage by our approach is that it requires only data of asample of individuals from the population (Engen et al.2009b). We assume that individuals were present in allyears between the first and last year but did not reproducein the years not recorded in the population. However, ourestimates of mortality still exclude some individuals thatare alive but do not reproduce. We assume that thoseindividuals have a negligible influence on the populationdynamics because of high recapture rates of individuals inmost of the studies included in our analyses (sometimeseven close to 1; Barbraud et al. 1999; Catchpole et al. 2004).Furthermore, the pattern of variation in the survival es-timates included as elements in the projection matrix lwas, in several of the populations, similar to the age-dependent differences in survival rates revealed by capture-recapture analyses (e.g., Weimerskirch 1992; Catchpole etal. 2004; Gaillard et al. 2004; Pardo et al. 2013).
We then consider a given year t with environment Zand estimate the demographic variance component con-ditioned on Z, that is,
nit12 2j (Z) p Var (WFZ) p (W � W ) , (7)�di i imt itn � 1 mp1it
where . The estimate of is thennit�1 2 2ˆW p n � W j jit it imt di dimp1
simply given by the weighted mean of the above estimatesover years with at least two records from individuals inthe actual age class with weights . Finally, the es-n � 1ti
timate of the total demographic variance is
2 2ˆ ˆj p u j . (8)�d i di
Engen et al. (2009b) showed that each product of the typehas expectation . Here,1/2(W � W )(W � W ) t′ ′ ′ ′imt im t jqt jq t eij
and and may refer to any age classes. If ,′t ( t i j i p jwe must require that and , whereas the′ ′q ( m q ( mlast subscript otherwise may refer to any observed indi-vidual in the class. An efficient unbiased estimator for
is obtained as the mean value of these products overteij
all possible combinations of and all combinations′t ( tof the second subscript. Finally, the environmental vari-ance is estimated using
2j p u u t . (9)�e i j eijij
Generation time is defined as the mean age of mothers ofnewborn female offspring when the population is at thestable age distribution (Leslie 1966; Caswell 2001; Gaillardet al. 2005). In this study, data on long-lived bird speciesdo not include information about survival prior to onsetof reproduction. Hence, we estimate generation time as
This content downloaded from 193.54.110.32 on Mon, 9 Dec 2013 04:22:30 AMAll use subject to JSTOR Terms and Conditions

Life History and Population Dynamics 747
Table 1: Data and estimates of key parameters included in the study
Species Locality Period l 2jd2je G
Bighorn sheep Ram Mountain, Alberta,
Canada
1981–1992 1.10 (1.08–1.12) .153 (.138–.168) .0027 (.0005–.0068) 13
Black-browed
albatross
Kerguelen, Southern Ocean 1986–1999 .94 (.91–.96) .177 (.143–.210) .0028 (0–.0063) 14
Colombian
ground squirrel
Sheep River Wildlife Sanc-
tuary, Alberta, Canada
1992–2001 1.17 (1.12–1.22) .347 (.300–.399) .0162 (.0049–.0495) 3.5
Common tern Wilhelmshaven, Germany 1993–2001 1.05 (1.03–1.07) .163 (.147–.179) .0001 (0–.0011) 10
Mauritius kestrel Mauritius, Indian Ocean 1990–2001 1.03 (.97–1.08) .337 (.266–.410) .0033 (0–.0351) 6
Peregrine falcon Cape Town, South Africa 1992–2006 .98 (.94–1.04) .169 (.107–.231) .0034 (.0007–.0070) 9
Red deer Rum, United Kingdom 1970–1982 1.05 (1.04–1.07) .131 (.119–.144) .0036 (.0009–.0075) 12
Roe deer Trois-Fontaines, France 1977–2000 1.28 (1.25–1.31) .232 (.211–.253) .0034 (.0019–.0093) 6
Southern fulmar Terre Adelie, Antarctica 1981–1997 .98 (.95–1.00) .093 (.068–.117) 17
Yellow-bellied
marmot
Upper East River Valley,
Colorado
1962–2007 1.10 (1.07–1.14) .994 (.904–1.085) .0351 (.0243–.0611) 3
Wandering
albatross
Possession Island, Indian
Ocean
1981–2007 1.00 (.99–1.00) .096 (.089–.103) .00117 (.00003–.00296) 20
White stork Charente-Maritime, France 1990–1998 .92 (.84–.97) .45 (.30–.58) .0196 (.0009–.0541) 8
Note: The l is the population growth rate; and are the demographic and environmental variance, respectively; and G is the generation time2 2j jd e
(years).
pG p a � (10)
1 � p
(Lande et al. 2003), where is the modal age at firsta
reproduction and p is the mean adult survival rate,weighted by the stable age distribution and assuming aconstant population size.
Data
To parameterize the model described above, we neededindividual-based age-specific survival and fecundity rec-ords across multiple years as well as time series of pop-ulation size for natural populations thought to be wellbelow carrying capacity. We sourced suitable demographicdata from 12 studies (table 1) during periods with nodetectable density dependence in the population dynamics,as revealed by simply regressing change in population size
on N (Royama 1992).DNThe bighorn sheep (Ovis canadensis) population was
located at Ram Mountain (52�N, 115�W), Alberta, Canada.We included only data from a period of exponential growthafter removal of individuals for translocation to other areaswas stopped, and total population size increased from 116to 244 (Festa-Bianchet et al. 1998; Engen et al. 2007). Later,the population stabilized, then declined, partly because ofintense cougar (Puma concolor) predation (Festa-Bianchetet al. 2006).
Black-browed albatross (Thalassarche melanophrys) is alarge (3–4-kg) Procellariiforme, which was studied in thesouthern colony of Canon des Sourcils Noirs (49�41′S,70�14′E) at Kerguelen Island in the Southern Ocean, where
it has been intensively monitored by capture-recapturetechniques since 1980 (Rolland et al. 2009). During thestudy period, the estimated breeding population size fluc-tuated around 1,100 breeding pairs (see fig. 2 in Rollandet al. 2009). It starts to breed at 5–14 years of age, althoughno bird in the current data set bred before the age of 8years. Pairs breed every year, laying a single egg in lateOctober (Weimerskirch and Jouventin 1998). For a com-plete life cycle graph, see Rolland et al. (2009).
Demographic data on Columbian ground squirrel(Spermophilus columbianus) were obtained at 1,500 m el-evation at the Sheep River Wildlife Sanctuary in the RockyMountains of southwestern Alberta, Canada (50�N,110�W). All adults older than 1 year were removed in 1990,ensuring that, when the study started in 1992, the pop-ulation was likely far below carrying capacity, with only 4individuals present; the population reached 57 individualsin 2001 (Engen et al. 2009b). The active season is short,because families start to prepare for the 8–9-month periodof hibernation soon after young are weaned in early sum-mer (Dobson et al. 1999). Mean litter size increases from2.6 offspring among primiparous yearlings to 3.0 offspringamong experienced females (Broussard et al. 2008). Co-lumbian ground squirrels are quite long lived for such asmall mammal (Dobson and Oli 2001).
Data on the common tern (Sterna hirundo) were col-lected in a colony on six artificial islands in the BanterSee in Wilhelmshaven (58�27′N, 08�07′E) on the GermanNorth Sea coast during a period of steady increase in pop-ulation size (see fig. 1 in Szostek and Becker 2012). Allfledged chicks were marked with subcutaneously im-
This content downloaded from 193.54.110.32 on Mon, 9 Dec 2013 04:22:30 AMAll use subject to JSTOR Terms and Conditions

748 The American Naturalist
planted transponders (Becker et al. 2008). The probabilityof resighting of breeders and nonbreeders is close to 1(Szostek and Becker 2012). Breeding starts at the age ofthree years. Most females produce only one clutch perbreeding season, with a maximum of three eggs (Beckeret al. 2001). For a description of the life cycle, see Szostekand Becker (2012).
Mauritius kestrels (Falco punctatus) became extinct inthe Bambous mountain range in eastern Mauritius, IndianOcean, by the late 1950s. A successful reintroduction pro-gram that started at the end of the 1980s caused a rapidincrease in population during the 1990s until an equilib-rium population size was reached of approximately 40breeding pairs (Sutherland and Norris 2002). Since theonset of the introduction program, almost all individualsin the population have been color-ringed, enabling thecollection of detailed individual-based demographic data(Nicoll et al. 2003, 2004; Burgess et al. 2008). In our study,we used data from the period 1990–2001.
Peregrine falcons (Falco peregrinus) were studied in anarea covering Cape Town, Table Mountain, and the CapePeninsula (34�0′S, 18�25′E) between 1989 and 2008, duringwhich period the number of breeding pairs increased from16 to 78. The birds were ringed either as nestlings or aftercapture as newly established breeders and received aunique combination of color metal rings and a numberedSouth African Bird Ringing Unit (University of CapeTown) ring. Peregrines breed between September and De-cember, and all known territories were visited at least onceduring this period to establish whether the resident breed-ing pair was still present or whether one of the old birdshad been replaced by a new breeder. The resighting prob-ability of breeding birds was close to 1.
Red deer (Cervus elaphus) have been studied at the Is-land of Rum, Scotland (57�01′N, 6�17′W) for several de-cades. We included data only from the period 1970–1982.During most of this period, the population was recoveringfrom the cessation of harvesting in 1972 (see fig. 1 inCoulson et al. 2004). Red deer females on Rum give birthto a single calf from 3 years of age onward (Clutton-Brocket al. 1982).
Roe deer (Capreolus capreolus) were studied in the forestof Trois-Fontaines in northeastern France (48�43′N,2�61′W), where an enclosed population has been inten-sively monitored by capture-recapture techniques since1976 (Gaillard et al. 1993, 1998). Roe deer is a small cervidespecies with a litter size of up to 3 offspring. The popu-lation in Trois-Fontaines is productive, with all 2-year-oldfemales breeding in most years and almost all femalesproducing twins every year (Gaillard et al. 1998). Duringthe study period, the population fluctuated between 154and 433 individuals (Gaillard et al. 2003) and was likely
to be kept below the carrying capacity through harvesting(Gaillard et al. 1993).
Southern fulmars (Fulmarus glaicialoides), a medium-sized (700–1,200-g) cliff-nesting fulmarine petrel, werestudied using capture-recapture techniques on Ile des Pe-trels, Pointe Geologie Archipelago (66�40′S, 140�01′E),Terre Adelie, Antarctica, from 1963 onwards by means ofindividually ringed birds (Berman et al. 2009). Southernfulmars are highly philopatric, and if a bird was not ob-served between two breeding seasons, it was assumed thatit did not reproduce. We included the period 1981–1997in our analyses to ensure reasonable numbers of known-aged birds as well as to allow sufficient time for recruitsto return. During that period, the population showed anincrease but with relatively large annual fluctuations in thenumber of breeding pairs (see fig. 1a in Jenouvrier et al.2003).
Yellow-bellied marmots (Marmota flaviventris) are largediurnal burrow-dwelling rodents that live in mountainregions of western North America and hibernate fromSeptember or October to April or May. The critical factordetermining winter survival and subsequent reproductivesuccess is the amount of fat accumulated before hiber-nation (Melcher et al. 1989). Survival and reproductionare affected by the length of the active season, which showssubstantial annual variation associated with changes inonset and termination of snow cover (Armitage andDownhower 1974; Schwartz et al. 1998; Ozgul et al. 2010).We included data collected during the period 1962–2007from a population living in a subalpine habitat in theUpper East River Valley (38�57′N 106�59′W), Colorado (fortime series of population fluctuations, see fig. 1c in Ozgulet al. 2010).
Wandering albatrosses (Diomedea exulans) have beenstudied using capture-recapture techniques on PossessionIsland, Crozet Archipelago, (46�S, 52�E) in the southeast-ern part of the Indian Ocean since 1960. The wanderingalbatross is a large Procellariforme (9–12 kg), matures late(8–10 years of age), and produces a maximum of a singleoffspring per breeding attempt every 2 years (Weimer-skirch et al. 1987, 1997; Jouventin and Dobson 2002; Le-comte et al. 2010). In our analyses, we used data from1981–1997 during a period with increasing population size(see fig. 5 in Engen et al. 2005) to ensure reasonable num-bers of known-aged birds as well as allowing sufficienttime for recruits to return.
White stork (Ciconia ciconia) is a large wading birdspecies that has been studied using capture-recapture tech-niques in Charente-Maritime in western France (45�N,1�W). This population was reestablished in 1978 and sub-sequently showed a rapid increase in population size (Bar-braud et al. 1999), which was influenced by immigrantsfrom surrounding areas. During winter, individuals from
This content downloaded from 193.54.110.32 on Mon, 9 Dec 2013 04:22:30 AMAll use subject to JSTOR Terms and Conditions

Life History and Population Dynamics 749
this population migrate to the western part of Sahel inAfrica. The white stork builds large, perennial nests eitherin natural nest sites or at artificial platforms that are mostcommonly located close to human settlements and there-fore are relatively easy to find and to observe during thebreeding period. Most white stork start breeding when theyare 3 or 4 years old (Nevoux et al. 2007) and produce, onaverage, 3.4 fledglings per nest (Barbraud et al. 1999).Adult survival is high (mean, 0.78). Temporal variation insurvival is dependent on rainfall at the wintering grounds(Nevoux et al. 2008), which may also influence annualvariation in numbers of breeding pairs (Sæther et al. 2006).
Results
First, we examined how individuals of different ages con-tribute to the total reproductive value of the population.In all cases, the age-specific component of total repro-ductive value decreased with increasing age (fig. 1). Incontrast, there were large interspecific differences in howindividual reproductive value decreased with age (fig. 2),with a significant curvilinear relationship in six species.Therefore, age classes consisting of individuals with largecontributions to future generations were not necessarilythose that contributed most to the total reproductive value,because the latter was more strongly dependent on thestable age distribution of the population.
The stochastic components of population dynamicswere related to the position of the species along the slow-fast life-history continuum. Both demographic (fig. 3a)and environmental (fig. 3b) variance decreased with gen-eration time, resulting in smaller total variance (eq. [1])in population growth rates in long-lived species. The ratioof demographic to environmental variance at N p 1ranged from 18.89 in white stork to 1,658.30 in commonterns. Because the effect of demographic stochasticity isdensity dependent (eq. [1]), its contribution to the vari-ance in population fluctuations decreases with increasingpopulation size. However, the population size at which thecontribution of demographic and environmental stochas-ticity to the variance in population growth rate was equal
differed strongly among species, independent2 2j p j /Ne d
of the position along the slow-fast life-history continuum.In four bird species (common tern, Mauritius kestrel,southern fulmar, and wandering albatross) the major con-tribution to the population fluctuations was caused bydemographic stochasticity even at population sizes greaterthan 250 individuals.
Stochastic factors were then partitioned into contri-butions from different vital rates. In all but one species,the contribution from fecundity (fig. 3d, 3g) to the sto-chastic components was larger than the contribution fromsurvival (fig. 3c, 3f ); the exceptions were the demographic
variance of the common tern and the environmental var-iance of red deer. The stochastic variation in fecundity andsurvival as well as the covariation between them, causedeither by demographic or environmental stochasticity, alldecreased with generation time (fig. 3c–3h).
We then analyzed whether the pattern of age-specificvariation in stochastic influences on population growthwas related to life history. The influence of demographicstochasticity in age class i on the variance in population2jdi
growth (eq. [7]) decreased with increasing age, althoughthe rate of decrease differed substantially across species,being nonlinear in four cases (table 2). Age-specific esti-mates of demographic variance, reflecting the between-individual variation in age-dependent fecundity and sur-vival, decreased linearly with age in all species (statisticallysignificant in 5 of 6 mammals, with the Colombian groundsquirrel as an exception, and in 2 bird species [southernfulmar, ; wandering albatross, ]; the de-P p .02 P p .001crease was close to statistical significance [ ].05 ! P ! .06in the black-browed albatross and white stork). In contrast,there was no consistent age-specific pattern in the con-tribution of environmental variance (eq. [9]) to fluc-2tei
tuations in population size (although there was a decreasein with age in 6 species; table 2), in the between-2tei
individual variation in production of new recruits (P 1
), or in survival ( ) caused by environmental.12 P 1 .12stochasticity.
Age-specific variation in the contribution to populationgrowth was affected by large differences among species inthe pattern of age-dependent survival. To account for thesedifferences, we scaled age classes relative to generation timeG, following Hamilton (1966). This facilitates a compar-ison of age-specific patterns between species with differentlife-history characteristics. There were large interspecificdifferences in the stage of the life cycle relative to gener-ation time that had the strongest influence on populationdynamics (fig. 4). For the contribution to total reproduc-tive value (fig. 4a) and to demographic variance (fig. 4b),the larger variation among species was found in the youn-ger age classes (relative to generation time). In contrast,there were large interspecific differences in the contribu-tion from the different stages of the life cycle to environ-mental stochasticity in population dynamics (fig. 4c).
Finally, we analyzed how the stage of the life cycle thatmost strongly affected variation in population growth de-pended on the position of the species along the slow-fastcontinuum of life-history variation, measured by gener-ation time G. We calculated for each species the age relativeto G at which 50% of the total reproductive value and ofthe two stochastic components of the variance in popu-lation growth rate were reached and related these quan-tities to generation time. If the slope of this regression lineis less than 1, the relative contribution of younger age
This content downloaded from 193.54.110.32 on Mon, 9 Dec 2013 04:22:30 AMAll use subject to JSTOR Terms and Conditions

750
0.00
0.05
0.10
0.15
Age
Fish
eria
n ag
e di
strib
utio
nBighorn sheep
0.01
0.02
0.03
0.04
0.05
0.06
Age
Fish
eria
n ag
e di
strib
utio
n
Blackbrowed albatross
0.00
0.05
0.10
0.15
0.20
0.25
Age
Fish
eria
n ag
e di
strib
utio
n
Colombian ground squirrel
0.00
0.02
0.04
0.06
0.08
0.10
Age
Fish
eria
n ag
e di
strib
utio
n
Common tern
0.05
0.10
0.15
0.20
Age
Fish
eria
n ag
e di
strib
utio
nMauritius kestrel
0.02
0.04
0.06
0.08
0.10
0.12
0.14
AgeFi
sher
ian
age
dist
ribut
ion
Peregrine falcon
0.00
0.02
0.04
0.06
0.08
0.10
0.12
Age
Fish
eria
n ag
e di
strib
utio
n
Red deer
0.00
0.05
0.10
0.15
0.20
0.25
0.30
Age
Fish
eria
n ag
e di
strib
utio
n
Roe deer
25 300.00
0.01
0.02
0.03
0.04
0.05
0.06
Age
Fish
eria
n ag
e di
strib
utio
n
Southern fulmar
0.01
0.02
0.03
0.04
0.05
0.06
Age
Fish
eria
n ag
e di
strib
utio
n
Wandering albatross
0.00
0.05
0.10
0.15
Age
Fish
eria
n ag
e di
strib
utio
n
White stork
10 12
0.00
0.05
0.10
0.15
0.20
0.25
0.30
Age
Fish
eria
n ag
e di
strib
utio
n
Yellow−bellied marmot
5 10 15 20
5 10 15 205 10 15
5 10 15 5 10 15 200
25 305 10 15 200 2 4 6 8 2 4 6 8
10 122 4 6 8
10 122 4 6 82 4 6 8
102 4 6 8
Figure 1: Interspecific differences in age-specific variation in the contribution to the total reproductive value of the population. The Fisherianage distribution refers to the reproductive value in age class i scaled so that and , where u is the stable agev �u p 1 vu p �u v p 1i i i i
distribution for the deterministic model. This shows the relative contribution of the different age classes to the total reproductive value ofthe population.
This content downloaded from 193.54.110.32 on Mon, 9 Dec 2013 04:22:30 AMAll use subject to JSTOR Terms and Conditions

751
0.0
0.2
0.4
0.6
0.8
1.0
1.2
Age
Indi
vidu
al re
prod
uctiv
e va
lue
Bighorn sheep
0.5
1.0
1.5
2.0
AgeIn
divi
dual
repr
oduc
tive
valu
e
Blackbrowed albatross
10
0.2
0.4
0.6
0.8
1.0
1.2
Age
Indi
vidu
al re
prod
uctiv
e va
lue
Colombian ground squirrel
0.4
0.6
0.8
1.0
1.2
1.4
Age
Indi
vidu
al re
prod
uctiv
e va
lue
Common tern
0.85
0.90
0.95
1.00
1.05
1.10
1.15
Age
Indi
vidu
al re
prod
uctiv
e va
lue
Mauritius kestrel
10 12
0.5
1.0
1.5
AgeIn
divi
dual
repr
oduc
tive
valu
e
Peregrine falcon
0.0
0.2
0.4
0.6
0.8
1.0
1.2
Age
Indi
vidu
al re
prod
uctiv
e va
lue
Red deer
10 12
0.5
0.6
0.7
0.8
0.9
1.0
1.1
Age
Indi
vidu
al re
prod
uctiv
e va
lue
Roe deer
25 30
0.2
0.4
0.6
0.8
1.0
1.2
Age
Indi
vidu
al re
prod
uctiv
e va
lue
Southern fulmar
0.4
0.6
0.8
1.0
1.2
Age
Indi
vidu
al re
prod
uctiv
e va
lue
Wandering albatross
0.0
0.5
1.0
1.5
Age
Indi
vidu
al re
prod
uctiv
e va
lue
White stork
10 120.2
0.4
0.6
0.8
1.0
1.2
1.4
Age
Indi
vidu
al re
prod
uctiv
e va
lue
Yellow−bellied marmot
5 10 15 20
5 10 15 5 10 15 200
25 305 10 15 200
5 10 15 205 10 15 2 4 6 8
2 4 6 82 4 6 8
2 4 6 8
2 4 6 8 2 4 6 8
Figure 2: Interspecific differences in age-specific individual reproductive value.
This content downloaded from 193.54.110.32 on Mon, 9 Dec 2013 04:22:30 AMAll use subject to JSTOR Terms and Conditions

752 The American Naturalist
5 10 15 20
0.0
0.2
0.4
0.6
0.8
1.0
Generation time
Dem
ogra
phic
var
ianc
e a
5 10 15 20
0.00
0.01
0.02
0.03
0.04
Generation time
Env
ironm
enta
l var
ianc
e b
5 10 15 20
0.00
0.05
0.10
0.15
0.20
0.25
0.30
Generation time
Dem
ogra
phic
sur
viva
l com
pone
nt
c
5 10 15 20
0.0
0.1
0.2
0.3
0.4
0.5
Generation time
Dem
ogra
phic
fecu
ndity
com
pone
nt
d
5 10 15 20
0.000.020.040.060.080.100.120.14
Generation time
Dem
ogra
phic
cov
aria
nce
com
pone
nt
e
5 10 15 20
0.000
0.002
0.004
0.006
0.008
0.010
Generation time
Env
ironm
enta
l sur
viva
l com
pone
nt
f
5 10 15 20
0.000
0.005
0.010
0.015
0.020
Generation time
Env
ironm
enta
l fec
undi
ty c
ompo
nent
g
5 10 15 20
0.000
0.002
0.004
0.006
Generation time
Env
ironm
enta
l cov
aria
nce
com
pone
nt
h
Figure 3: Interspecific variation in demographic (a) and environmental variance (b) as well as the contributions to (c–e) and2 2 2 2j j j jd e d e
(f–h) from survival, fecundity, and the covariance between them in relation to generation time G. The triangles represent mammals, andthe circles represent birds.
classes increases with generation time. In contrast, if theslope is larger than 1, the relative contribution of the youn-ger age classes decreases toward the slow end of the life-history continuum. The slopes for the total reproductivevalue of the population (fig. 5a) and for the total de-mographic variance (fig. 5b) were less than 1, revealingthat the contribution of earlier stages within the life cycleto stochastic population growth rate was greater in long-lived than in short-lived species. In contrast, the slope for
the environmental variance (fig. 5c) did not differ fromunity, indicating that environmental stochasticity at dif-ferent life-history stages has similar effects on populationfluctuations per generation.
Discussion
Our study has shown that, after accounting for fluctuationsin the age distribution by analyzing fluctuations in the
This content downloaded from 193.54.110.32 on Mon, 9 Dec 2013 04:22:30 AMAll use subject to JSTOR Terms and Conditions

Life History and Population Dynamics 753
Table 2: Interspecific variation in age-specific individual contributions to demographic and environmental variance, as2 2j jd e
well as components due to variation in adult survival and fecundity (y), modeled as a linear ( ) or curvilineary p a � b x1
( ) function of age x2y p a � b x � b x1 2
Species, stochasticity
Total
Components
due to survival
Components
due to fecundity
a b1 b2 a b1 b2 a b1 b2
Bighorn sheep:2jd .0201 �.0011∗∗∗ .0066 �.0004∗∗∗ .0014 �.0007∗∗
2je .0004 �.00002 �.00003 .000001 .0005 �.00003∗∗∗
Black-browed albatross:2jd �.010 �.0033∗∗ �.0001∗∗ �.0037 .0015∗ .00001∗∗ �.0060 �.0018∗ �.000062je �.00005 .0002∗ .000006∗ .00001 .0000 .00000 .0000
Columbian ground squirrel:2jd .090 �.0088∗∗∗ .0859 �.0201∗∗ .0011∗∗ .0379 �.00302je .005 �.0005∗∗ .0021 �.00056∗ .00004∗ .0020 �.0002
Common tern:2jd .0146 �.0006∗∗∗ .0101 �.0005∗∗ �.0005 .0009∗∗ �.00004∗∗
2je .00005 .00000 .00007 �.000004∗ .0002 �.00008∗
Mauritius kestrel:2jd .065 �.0045 .0113 �.0004 .0498 �.00372je .0003 �.0001 .00005 �.00003 .00001 .0000
Red deer:2jd .0132 �.0006∗∗∗ .0062 �.0003∗∗ �.0028 .0021∗∗∗ �.00017∗∗∗
2je .0004 �.00002 .0002 �.000005∗ .00004 �.00003∗∗ �.000001∗∗
Roe deer:2jd .057 �.0051∗ .0188 �.0017∗ .0376 �.0033∗
2je .0007 �.00005 .0003 .00003∗ .0009 �.00008∗
Peregrine falcon:2jd .0257 �.0001 .0057 �.0001 .0209 �.000162je �.0012 .0002 �.0001 .000002 .0005 .00000
Southern fulmar:2jd �.0036 �.0014∗∗ �.00004∗∗ .0249 �.00009 �.0026 .00094∗ �.00003∗∗
2je �.0001 .00000 �.00009 .00000 �.00016 .00004∗∗ �.000001∗∗
Wandering albatross:2jd .0040 �.00003 .0018 �.00003 �.0004 .0005∗ .00002∗
2je .00000 .000000 .00000 .0000 .00000 .00000
White stork:2jd �.1200 .0668∗∗ �.0055∗∗ .0249 �.0023 �.1013 .0506∗∗ �.0039∗∗
2je .0029 .0001 .0044 .00005 .0010 .00018
Yellow-bellied marmot:2jd .4375 �.0869∗∗∗ .0042∗∗ .1897 �.0415∗∗∗ .00215∗∗ .1883 �.0339∗∗∗ .0015∗∗∗
2je .0183 �.0038∗∗∗ .0002∗∗ .0046 �.00097∗∗∗ .00005∗∗ .0078 �.0016∗∗∗ .00008∗∗∗
∗ .P ! .05∗∗ .P ! .01∗∗∗ .P ! .001
total reproductive value, the relative contributions to sto-chastic population growth of age-specific variation in re-cruitment and survival varied predictably with life historyin birds and mammals (figs. 3, 5). Stochastic influenceson annual changes in population size decreased towardthe slow end of the slow-fast life-history continuum (fig.3). Early age classes contributed relatively more to the totalreproductive value and demographic variance in slow spe-cies than in fast species, whereas environmental stochas-
ticity affected a larger proportion of the life stages in allspecies, independent of life history (figs. 4, 5).
Reproductive value tended to increase with age to a peakbefore decreasing (fig. 2), similar to the pattern found inmost birds and mammals (Caughley 1967; Newton andRothery 1997; Haridas and Tuljapurkar 2007; Sæther etal. 2007; Bouwhuis et al. 2011), including man (Hamilton1966; Keyfitz and Caswell 2005). In contrast, the Fisherianage distribution that describes the relative contribution of
This content downloaded from 193.54.110.32 on Mon, 9 Dec 2013 04:22:30 AMAll use subject to JSTOR Terms and Conditions

754 The American Naturalist
0.0 0.5 1.0 1.5 2.0 2.5 3.0
0.2
0.4
0.6
0.8
1.0
Relative age
Con
tribu
tion
to to
tal r
epro
duct
ive
valu
e a
0.0 0.5 1.0 1.5 2.0 2.5 3.0
0.0
0.2
0.4
0.6
0.8
1.0
Relative age
Con
tribu
tion
to d
emog
raph
ic v
aria
nce b
0.0 0.5 1.0 1.5 2.0 2.5 3.0
0.0
0.2
0.4
0.6
0.8
1.0
Relative age
Con
tribu
tion
to e
nviro
nmen
tal v
aria
nce c
Figure 4: Age-specific variation in the cumulative contribution tothe total reproductive value (a) and the stochastic components causedby demographic (b) and environmental stochasticity (c) after cor-recting for generation time G. For each species, the cumulative pro-portion of the total reproductive value as well as demographic andenvironmental stochasticity accumulated at different age classes,scaled by generation time G, is plotted.
different age classes to the total reproductive value of thepopulation showed a strict decrease with age (fig. 1), re-flecting the influence of the stable age distribution. Afteraccounting for the effects of generation time, a larger pro-portion of the total reproductive value of the populationwas located at earlier life-history stages in long-lived spe-cies than in short-lived species (fig. 5a). Therefore, de-mographic variation in early age classes (relative to gen-eration time) has a particularly strong influence on thetotal reproductive value of populations of slow species.
Stochastic influences on population dynamics dependedon life history. Both demographic and environmental var-iance decreased with generation time (fig. 3) and resultedin decreased total stochasticity in population dynamicstoward the slow end of the life-history continuum. Fordemographic stochasticity, this is in accordance with pre-vious results for birds (Sæther et al. 2004, 2005), althoughin density-dependent bird populations, environmentalvariance was independent of life history (Sæther et al.2005). This difference may be attributable to a larger in-fluence of environmental stochasticity on populations nearcarrying capacity. Alternatively, environmental variancemay have been overestimated in density-regulated popu-lations by Sæther et al. (2005), because stochastic variationin population size due to fluctuations in age structure wasonly partly taken into account. Accordingly, in several pop-ulations in this study, estimates of environmental variancewere small (fig. 3b). As a consequence, demographic sto-chasticity was the major stochastic factor affecting pop-ulation dynamics even at relatively large population sizes.In particular, when annual adult survival approaches 50%,the contribution of random variation in survival to thedemographic variance will be particularly large, becausethe variance in adult survival peaks at mean sur-P(1 � P)vival (Gaillard and Yoccoz 2003; Morris and DoakP p .52004). Thus, lower random variation in survival amongindividuals is an important contributor to the reductionof demographic stochasticity in long-lived species, reduc-ing stochastic influences on population dynamics at theslow end of the life-history continuum.
The pattern of variation in the contribution of differentage classes to the stochastic effects on population dynamics(table 2; fig. 4b, 4c) also showed life-history correlates. Thelarger contributions from demographic stochasticity (fig.
This content downloaded from 193.54.110.32 on Mon, 9 Dec 2013 04:22:30 AMAll use subject to JSTOR Terms and Conditions
Life History and Population Dynamics 755
5 10 15 20
5
10
15
20A
ge fo
r 50
% o
f tot
al re
prod
uctiv
e va
lue
Generation time
a
5 10 15 20
5
10
15
20
Age
for 5
0 %
of σ
d2
Generation time
b
5 10 15 20
5
10
15
20
Age
for 5
0 %
of σ
e2
Generation time
c
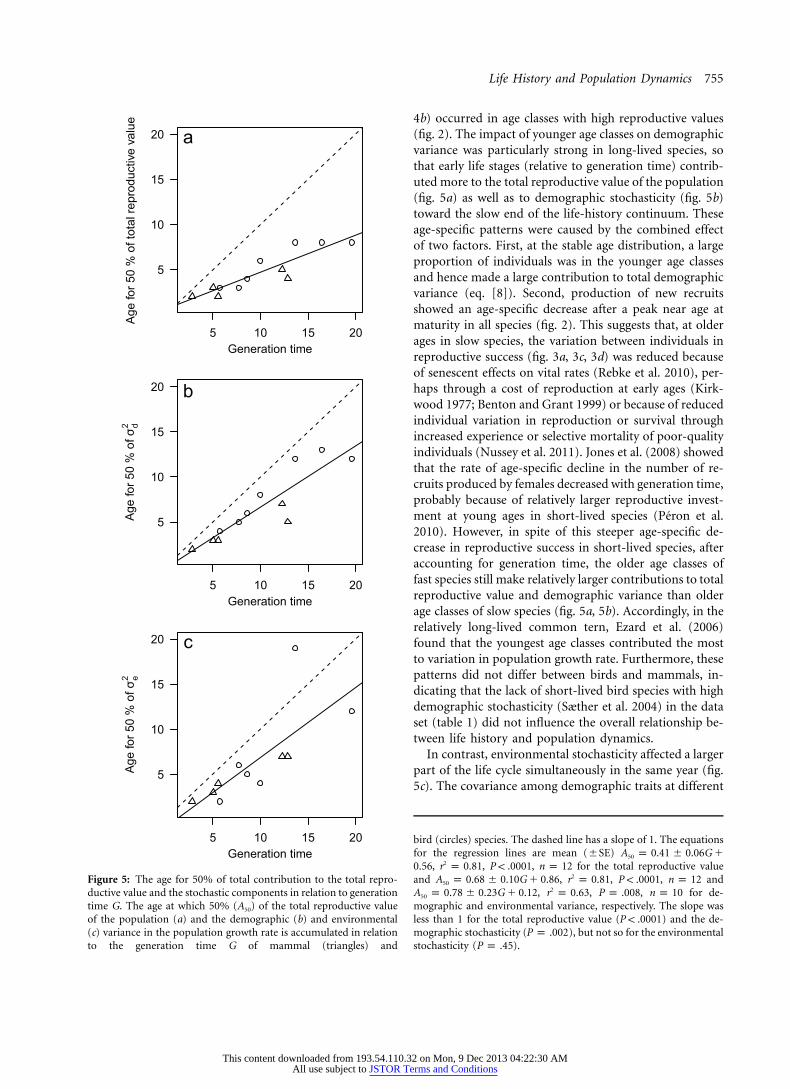
Figure 5: The age for 50% of total contribution to the total repro-ductive value and the stochastic components in relation to generationtime G. The age at which 50% (A50) of the total reproductive valueof the population (a) and the demographic (b) and environmental(c) variance in the population growth rate is accumulated in relationto the generation time G of mammal (triangles) and
bird (circles) species. The dashed line has a slope of 1. The equationsfor the regression lines are mean (�SE) A p 0.41 � 0.06G �50
, , , for the total reproductive value20.56 r p 0.81 P ! .0001 n p 12and , , , and2A p 0.68 � 0.10G � 0.86 r p 0.81 P ! .0001 n p 1250
, , , for de-2A p 0.78 � 0.23G � 0.12 r p 0.63 P p .008 n p 1050
mographic and environmental variance, respectively. The slope wasless than 1 for the total reproductive value ( ) and the de-P ! .0001mographic stochasticity ( ), but not so for the environmentalP p .002stochasticity ( ).P p .45
4b) occurred in age classes with high reproductive values(fig. 2). The impact of younger age classes on demographicvariance was particularly strong in long-lived species, sothat early life stages (relative to generation time) contrib-uted more to the total reproductive value of the population(fig. 5a) as well as to demographic stochasticity (fig. 5b)toward the slow end of the life-history continuum. Theseage-specific patterns were caused by the combined effectof two factors. First, at the stable age distribution, a largeproportion of individuals was in the younger age classesand hence made a large contribution to total demographicvariance (eq. [8]). Second, production of new recruitsshowed an age-specific decrease after a peak near age atmaturity in all species (fig. 2). This suggests that, at olderages in slow species, the variation between individuals inreproductive success (fig. 3a, 3c, 3d) was reduced becauseof senescent effects on vital rates (Rebke et al. 2010), per-haps through a cost of reproduction at early ages (Kirk-wood 1977; Benton and Grant 1999) or because of reducedindividual variation in reproduction or survival throughincreased experience or selective mortality of poor-qualityindividuals (Nussey et al. 2011). Jones et al. (2008) showedthat the rate of age-specific decline in the number of re-cruits produced by females decreased with generation time,probably because of relatively larger reproductive invest-ment at young ages in short-lived species (Peron et al.2010). However, in spite of this steeper age-specific de-crease in reproductive success in short-lived species, afteraccounting for generation time, the older age classes offast species still make relatively larger contributions to totalreproductive value and demographic variance than olderage classes of slow species (fig. 5a, 5b). Accordingly, in therelatively long-lived common tern, Ezard et al. (2006)found that the youngest age classes contributed the mostto variation in population growth rate. Furthermore, thesepatterns did not differ between birds and mammals, in-dicating that the lack of short-lived bird species with highdemographic stochasticity (Sæther et al. 2004) in the dataset (table 1) did not influence the overall relationship be-tween life history and population dynamics.
In contrast, environmental stochasticity affected a largerpart of the life cycle simultaneously in the same year (fig.5c). The covariance among demographic traits at different
This content downloaded from 193.54.110.32 on Mon, 9 Dec 2013 04:22:30 AMAll use subject to JSTOR Terms and Conditions

756 The American Naturalist
ages may then represent an important component of thestochastic contributions to environmental variance in l
(Tuljapurkar 1982a, 1990; Benton et al. 1995; Tuljapurkaret al. 2003; Morris et al. 2006, 2008). This environmentalcovariance spreads the demographic effects of environ-mental fluctuations across more age classes (fig. 4c). As aconsequence, the effects of environmentally induced fluc-tuations in different age classes (scaled to generation time)are independent of life history (fig. 5c). Consequently, theeffects of stochastic variation in the environment on pop-ulation growth of species with long generation times arenot reduced by negative environmental covariances amongdifferent stages of the life cycle (e.g., Morris and Doak2004 and Morris et al. 2008). Accordingly, analyses of age-dependent influences on demography of environmentalcovariates in two long-lived seabirds revealed similar ef-fects in the youngest and in the oldest age classes (Oro etal. 2010; Pardo et al. 2013). Analyses of the dynamics offour of the mammals included in this study (bighornsheep, Columbian ground squirrel, roe deer, and yellow-bellied marmot) also revealed only minor influences oftemporal autocorrelation in the environmental noise onfluctuations in the sizes of these populations (Engen et al.2013). This indicates that the autocorrelations among lifestages in the effects of environmental stochasticity on pop-ulation growth (figs. 4c, 5c) were little influenced by tem-poral trends in key environmental covariates.
Elasticity analyses of matrix projection models measurethe effects of proportional changes in demographic tran-sitions on the population growth rate (Caswell 2001).Comparative analyses of responses of populations to per-turbations of different vital rates based on variation inelasticities within the life cycle have revealed that elasticityvalues may differ widely among age or stage classes, de-pendent on the structure of the life cycle (Caswell 1996;de Kroon et al. 2000). In mammals, perturbations of re-productive rates around age at maturity have a stronginfluence on population growth rate (Heppell et al. 2000;Oli and Dobson 2003). Furthermore, temporal variabilityand elasticity tend to be negatively related (Pfister 1998;Sæther and Bakke 2000; Gaillard and Yoccoz 2003). Ourapproach to analysis of the contribution of different ageclasses to the total reproductive value of the population issimilar to elasticity analyses, because the elasticity of fe-cundity and survival at age are and , respectively.i v u v u1 i i�1 i
Although these elasticity analyses can also be extended toage-specific influences of environmental stochasticity onthe stochastic growth rate (Haridas and Tuljapurkar 2005),the use of individual reproductive values enables us toseparate demographic and environmental stochasticity.Our results reveal that these two stochastic factors havedifferent age-specific effects on the temporal variation inpopulation growth rates (figs. 4, 5). Whereas the effect of
demographic stochasticity tends to arise from age classeswith high reproductive values (figs. 1, 2) and hence largeelasticities, the influence of environmental stochasticity ismore affected by correlated environmental effects spreadmore evenly across the life cycle (figs. 4c, 5c). Thus, thesensitivity of population growth rate to environmental sto-chasticity will be less influenced by variability in a few lifestages and is less likely to be related to age-specific vari-ation in elasticity than the demographic variance.
Our findings substantially improve our ability to iden-tify critical stages of the life cycle that need to be mon-itored closely to predict future population trends whenlong time series are not available. Our results suggest thatrecovery of declining populations of long-lived speciesshould be especially affected by demographic changes atearly life-history stages (figs. 4a, 5a). These analyses alsoshow that effects of environmental fluctuations on thepopulation dynamics arise over larger parts of the lifecycle than those affecting the long-term changes in meanpopulation size, as revealed by the Fisherian age distri-bution (fig. 1). This implies that some critical age classesare particularly vulnerable to demographic perturbations,such as those due to human activities. In long-lived spe-cies, these perturbations will affect many age classes (figs.4c, 5c), which is likely to result in delayed responses inthe dynamics because of covariation in environmentalstochasticity producing fluctuations in age structure. Incontrast, short-lived species will show far more imme-diate responses to environmental perturbations, becausechanges in population size will be caused by demographicvariations across most parts of the life cycle (fig. 5c).Finally, age-specific variation in reproductive values isalso likely to influence the rate of evolutionary changein age-structured populations (Hamilton 1966; Charles-worth 1972, 1994; Engen et al. 2009a). Thus, analyses offluctuations in the reproductive value of the populationmay provide a common framework for analyses of de-mographic responses to environmental changes at bothecological and evolutionary time scales (Engen et al.2011).
Acknowledgments
We are extremely to grateful to B. Sheldon for criticaldiscussion and to two reviewers for comments that greatlyimproved the presentation of the results. This study wasfinanced by a grant from the European Research Council(268562-STOCHPOP).
This content downloaded from 193.54.110.32 on Mon, 9 Dec 2013 04:22:30 AMAll use subject to JSTOR Terms and Conditions

Life History and Population Dynamics 757
Literature Cited
Arino, A., and S. L. Pimm. 1995. On the nature of population ex-tremes. Evolutionary Ecology 9:429–443.
Armitage, K. B., and J. F. Downhower. 1974. Demography of yellow-bellied marmot populations. Ecology 55:1233–1245.
Barbraud, C., J. C. Barbraud, and M. Barbraud. 1999. Populationdynamics of the white stork Ciconia ciconia in western France. Ibis141:469–479.
Becker, P. H., T. H. G. Ezard, J. D. Ludwigs, H. Sauer-Gurth, andM. Wink. 2008. Population sex ratio shift from fledging to re-cruitment: consequences for demography in a philopatric seabird.Oikos 117:60–68.
Becker, P. H., H. Wendeln, and J. Gonzalez-Solis. 2001. Populationdynamics, recruitment, individual quality and reproductive strat-egies in common terns Sterna hirundo marked with transponders.Ardea 89:241–252.
Benton, T. G., and A. Grant. 1999. Optimal reproductive effort instochastic, density-dependent environments. Evolution 53:677–688.
Benton, T. G., A. Grant, and T. H. Clutton-Brock. 1995. Does en-vironmental stochasticity matter? analysis of red deer life-historieson Rum. Evolutionary Ecology 9:559–574.
Berman, M., J.-M. Gaillard, and H. Weimerskirch. 2009. Contrastedpatterns of age-specific reproduction in long-lived seabirds. Pro-ceedings of the Royal Society B: Biological Sciences 276:375–382.
Bouwhuis, S., R. Choquet, B. C. Sheldon, and S. Verhulst. 2011. Theforms and fitness cost of senescence: age-specific recapture, sur-vival, reproduction, and reproductive value in a wild bird popu-lation. American Naturalist 179:E15–E27.
Broussard, D. R., F. S. Dobson, and J. O. Murie. 2008. Previousexperience and reproductive investment of female Columbianground squirrels. Journal of Mammalogy 89:145–152.
Burgess, M. D., M. A. C. Nicoll, C. G. Jones, and K. Norris. 2008.Restricted dispersal reduces the strength of spatial density depen-dence in a tropical bird population. Proceedings of the Royal So-ciety B: Biological Sciences 275:1209–1216.
Caswell, H. 1978. A general formula for the sensitivity of populationgrowth rate to changes in life history parameters. Theoretical Pop-ulation Biology 14:215–230.
———. 1996. Second derivatives of population growth rate: calcu-lation and applications. Ecology 77:870–879.
———. 2001. Matrix population models. 2nd ed. Sinauer, Sunder-land, MA,
Catchpole, E. A., Y. Fan, B. J. T. Morgan, T. H. Clutton-Brock, andT. Coulson. 2004. Sexual dimorphism, survival and dispersal inred deer. Journal of Agricultural Biological and EnvironmentalStatistics 9:1–26.
Caughley, G. 1967. Parameters for seasonally breeding populations.Ecology 48:834–839.
Charlesworth, B. 1972. Selection in populations with overlappinggenerations. III. Conditions for genetic equilibrium. TheoreticalPopulation Biology 3:377–395.
———. 1994. Evolution in age-structured populations. CambridgeUniversity Press, Cambridge.
Clutton-Brock, T. H., F. E. Guinness, and S. D. Albon. 1982. Reddeer: behaviour and ecology of two sexes. University of ChicagoPress, Chicago.
Cohen, J. 1977. Ergodicity of age structure in populations with Mar-
kovian vital rates. III. Finite-state moments and growth rate: anillustration. Advances in Applied Probability 9:462–475.
Cohen, J. E. 1979. Ergodic theorems in demography. Bulletin of theAmerican Mathematical Society 1:275–295.
Coulson, T., E. A. Catchpole, S. D. Albon, B. J. T. Morgan, J. M.Pemberton, T. H. Clutton-Brock, M. J. Crawley, et al. 2001. Age,sex, density, winter weather, and population crashes in Soay sheep.Science 292:1528–1531.
Coulson, T., F. Guinness, J. Pemberton, and T. Clutton-Brock. 2004.The demographic consequences of releasing a population of reddeer from culling. Ecology 85:411–422.
Deevey, E. S., Jr. 1947. Life tables for natural populations of animals.Quarterly Review of Biology 22:283–314.
de Kroon, H., J. van Groenendael, and J. Ehrlen. 2000. Elasticities:a review of methods and model limitations. Ecology 81:607–618.
Dobson, F. S., and M. K. Oli. 2001. The demographic basis of pop-ulation regulation in Columbian ground squirrels. American Nat-uralist 158:236–247.
———. 2007. Fast and slow life histories of mammals. Ecoscience14:292–299.
Dobson, F. S., T. S. Risch, and J. O. Murie. 1999. Increasing returnsin the life history of Columbian ground squirrels. Journal of An-imal Ecology 68:73–86.
Engen, S., R. Lande, and B.-E. Sæther. 2009a. Reproductive valueand fluctuating selection in an age-structured population. Genetics183:629–637.
———. 2011. Evolution of a plastic quantitative trait in an age-structured population in a fluctuating environment. Evolution 65:2893–2906.
Engen, S., R. Lande, B.-E. Sæther, and F. S. Dobson. 2009b. Repro-ductive value and the stochastic demography of age-structuredpopulations. American Naturalist 174:795–804.
Engen, S., R. Lande, B.-E. Sæther, and M. Festa-Bianchet. 2007. Usingreproductive value to estimate key parameters in density-inde-pendent age-structured populations. Journal of Theoretical Biology244:208–317.
Engen, S., R. Lande, B.-E. Sæther, and H. Weimerskirch. 2005. Ex-tinction in relation to demographic and environmental stochas-ticity in age-structured models. Mathematical Biosciences 195:210–227.
Engen, S., B.-E. Sæther, K. B. Armitage, D. T. Blumstein, T. H. Clut-ton-Brock, F. S. Dobson, M. Festa-Bianchet, et al. 2013. Estimatingthe effect of temporally autoccorrelated environments on the de-mography of density-independent age-structured populations.Methods in Ecology and Evolution 4:573–584.
Ezard, T. H. G., P. H. Becker, and T. Coulson. 2006. The contributionsof age and sex to variation in common tern population growthrate. Journal of Animal Ecology 75:1379–1386.
Festa-Bianchet, M., T. Coulson, J.-M. Gaillard, J. T. Hogg, and F.Pelletier. 2006. Stochastic predation events and population per-sistence in bighorn sheep. Proceedings of the Royal Society B:Biological Sciences 273:1537–1543.
Festa-Bianchet, M., J.-M. Gaillard, and J. T. Jorgenson. 1998. Mass-and density-dependent reproductive success and reproductivecosts in a capital breeder. American Naturalist 152:367–379.
Fisher, R. A. 1930. The genetical theory of natural selection. Clar-endon, Oxford.
Gaillard, J.-M., R. Andersen, D. Delorme, and J. D. C. Linnell. 1998.Family effects on growth and survival of juvenile roe deer. Ecology79:2878–2889.
This content downloaded from 193.54.110.32 on Mon, 9 Dec 2013 04:22:30 AMAll use subject to JSTOR Terms and Conditions

758 The American Naturalist
Gaillard, J. M., D. Delorme, J. M. Boutin, G. Vanlaere, B. Boisaubert,and R. Pradel. 1993. Roe deer survival patterns: a comparativeanalysis of contrasting populations. Journal of Animal Ecology 62:778–791.
Gaillard, J. M., P. Duncan, D. Delorme, G. van Laere, N. Pettorelli,D. Maillard, and G. Renaud. 2003. Effects of hurricane Lothar onthe population dynamics of European roe deer. Journal of WildlifeManagement 67:767–773.
Gaillard, J.-M., D. Pontier, D. Allaine, J.-D. Lebreton, J. Trouvilliez,and J. Clobert. 1989. An analysis of demographic tactics in birdsand mammals. Oikos 56:59–76.
Gaillard, J. M., A. Viallefont, A. Loison, and M. Festa-Bianchet. 2004.Assessing senescence patterns in populations of large mammals.Animal Biodiversity and Conservation 27:47–58.
Gaillard, J. M., and N. G. Yoccoz. 2003. Temporal variation in survivalof mammals: a case of environmental canalization? Ecology 84:3294–3306.
Gaillard, J. M., N. G. Yoccoz, J. D. Lebreton, C. Bonenfant, S. Dev-illard, A. Loison, D. Pontier, et al. 2005. Generation time: a reliablemetric to measure life-history variation among mammalian pop-ulations. American Naturalist 166:119–123.
Goodman, L. A. 1967. Probabilities of extinction for birth-and-deathprocesses that are age-dependent or phase-dependent. Biometrika54:579–596.
Hamilton, W. D. 1966. The moulding of senescence by natural se-lection. Journal of Theoretical Biology 12:12–45.
Haridas, C. V., and S. Tuljapurkar. 2005. Elasticities in variable en-vironments: properties and implications. American Naturalist 166:481–495.
———. 2007. Time, transients and elasticity. Ecology Letters 10:1143–1153.
Heppell, S. S., H. Caswell, and L. B. Crowder. 2000. Life historiesand elasticity patterns: perturbation analysis for species with min-imal demographic data. Ecology 81:654–665.
Jenouvrier, S., C. Barbraud, and H. Weimerskirch. 2003. Effects ofclimate on the temporal population dynamics of southern fulmars.Journal of Animal Ecology 72:576–587.
Jones, O. R., J. M. Gaillard, S. Tuljapurkar, J. S. Alho, K. B. Armitage,P. H. Becker, P. Bize, et al. 2008. Senescence rates are determinedby ranking on the fast-slow life-history continuum. Ecology Letters11:664–673.
Jouventin, P., and F. S. Dobson. 2002. Why breed every other year?the case of albatrosses. Proceedings of the Royal Society B: Bio-logical Sciences 269:1955–1961.
Keyfitz, N., and H. Caswell. 2005. Applied mathematical demography.3rd ed. Springer, New York.
Kirkwood, T. B. L. 1977. Evolution of aging. Nature 270:301–304.Lande, R., S. Engen, and B.-E. Sæther. 2003. Stochastic population
dynamics in ecology and conservation. Oxford University Press,Oxford.
Lande, R., and S. H. Orzack. 1988. Extinction dynamics of age-structured populations in a fluctuating environment. Proceedingsof the National Academy of Sciences of the USA 85:7418–7421.
Lecomte, V. J., G. Sorci, S. Cornet, A. Jaeger, B. Faivre, E. Arnoux,M. Gaillard, et al. 2010. Patterns of aging in the long-lived wan-dering albatross. Proceedings of the National Academy of Sciencesof the USA 107:6370–6375.
Leslie, P. H. 1945. On the use of matrices in certain populationmathematics. Biometrika 33:183–212.
———. 1948. Some further notes on the use of matrices in popu-lation mathematics. Biometrika 35:213–245.
———. 1966. The intrinsic rate of increase and overlap of successivegenerations in a population of guillemots (Uria aalge Pont). Jour-nal of Animal Ecology 35:291–301.
Lewontin, R. C., and D. Cohen. 1969. On population growth in arandomly varying environment. Proceedings of the National Acad-emy of Sciences of the USA 62:1056–1060.
May, R. M. 1973. Stability in randomly fluctuating versus determin-istic environments. American Naturalist 107:621–650.
Melcher, J. C., K. B. Armitage, and W. P. Porter. 1989. Energy al-location by yellow-bellied marmots. Physiological Zoology 62:429–448.
Millar, J. S., and R. M. Zammuto. 1983. Life histories of mammals:an analysis of life tables. Ecology 64:631–635.
Morris, W. F., and D. F. Doak. 2004. Buffering of life histories againstenvironmental stochasticity: accounting for a spurious correlationbetween the variabilities of vital rates and their contributions tofitness. American Naturalist 163:579–590.
Morris, W. F., C. A. Pfister, S. Tuljapurkar, C. V. Haridas, C. L. Boggs,M. S. Boyce, E. M. Bruna, et al. 2008. Longevity can buffer plantand animal populations against changing climate variability. Ecol-ogy 89:19–25.
Morris, W. F., S. Tuljapurkar, C. V. Haridas, E. S. Menges, C. C.Horvitz, and C. A. Pfister. 2006. Sensitivity of the populationgrowth rate to demographic variability within and between phasesof the disturbance cycle. Ecology Letters 9:1331–1341.
Nevoux, M., J.-C. Barbraud, and C. Barbraud. 2008. Nonlinear im-pact of climate on survival in a migratory white stork population.Journal of Animal Ecology 77:1143–1152.
Nevoux, M., H. Weimerskirch, and C. Barbraud. 2007. Environ-mental variation and experience-related differences in the de-mography of the long-lived black-browed albatross. Journal ofAnimal Ecology 76:159–167.
Newton, I., and P. Rothery. 1997. Senescence and reproductive valuein sparrowhawks. Ecology 78:1000–1008.
Nicoll, M. A. C., C. G. Jones, and K. Norris. 2003. Declining survivalrates in a reintroduced population of the Mauritius kestrel: evi-dence for non-linear density dependence and environmental sto-chasticity. Journal of Animal Ecology 72:917–926.
———. 2004. Comparison of survival rates of captive-reared andwild-bred Mauritius kestrels (Falco punctatus) in a re-introducedpopulation. Biological Conservation 118:539–548.
Nussey, D. H., T. Coulson, D. Delorme, T. H. Clutton-Brock, J. M.Pemberton, M. Festa-Bianchet, and J. M. Gaillard. 2011. Patternsof body mass senescence and selective disappearance differ amongthree species of free-living ungulates. Ecology 92:1936–1947.
Oli, M. K., and F. S. Dobson. 2003. The relative importance of life-history variables to population growth rate in mammals: Cole’sprediction revisited. American Naturalist 161:422–440.
Oro, D., R. Torres, C. Rodriguez, and H. Drummond. 2010. Climaticinfluence on demographic parameters of a seabird varies with ageand sex. Ecology 91:1205–1214.
Ozgul, A., D. Z. Childs, M. K. Oli, K. B. Armitage, D. T. Blumstein,L. E. Olson, S. Tuljapurkar, et al. 2010. Coupled dynamics of bodymass and population growth in response to environmental change.Nature 466:482–485.
Pardo, D., C. Barbraud, M. Authier, and H. Weimerskirch. 2013.Evidence for an age-dependent influence of environmental vari-
This content downloaded from 193.54.110.32 on Mon, 9 Dec 2013 04:22:30 AMAll use subject to JSTOR Terms and Conditions

Life History and Population Dynamics 759
ations on a long-lived seabird’s life history traits. Ecology 94:208–220.
Pearl, R., and J. R. Miner. 1935. Experimental studies on the durationof life. XIV. The comparative mortality of certain lower organisms.Quarterly Review of Biology 10:60–79.
Peron, G., O. Gimenez, A. Charmantier, J.-M. Gaillard, and P. A.Crochet. 2010. Age at the onset of senescence in birds and mam-mals is predicted by early-life performance. Proceedings of theRoyal Society B: Biological Sciences 277:2849–2856.
Pfister, C. M. 1998. Patterns of variance in stage-structured popu-lations: evolutionary predictions and ecological implications. Pro-ceedings of the National Academy of Sciences of the USA 95:213–218.
Pimm, S. L., and A. Redfearn. 1988. The variability of animal pop-ulations. Nature 334:613–614.
Pollard, E. H. 1966. On the use of the direct matrix product inanalysing certain stochastic population models. Biometrika 53:397–415.
Promislow, D. E. L., and P. H. Harvey. 1990. Living fast and dyingyoung: a comparative analysis of life-history variation amongmammals. Journal of Zoology 220:417–437.
Rauser, C. L., L. D. Mueller, M. Travisano, and M. R. Rose. 2009.Evolution of aging and late life. Pages 551–584 in T. Garland Jr.and M. R. Rose, eds. Experimental evolution: concepts, methods,and applications of selection experiments. University of CaliforniaPress, Berkeley.
Rebke, M., T. Coulson, P. H. Becker, and J. W. Vaupel. 2010. Re-productive improvement and senescence in a long-lived bird. Pro-ceedings of the National Academy of Sciences of the USA 107:7841–7846.
Roff, D. A. 2002. The evolution of life histories. Chapman & Hall,New York.
Rolland, V., M. Nevoux, C. Barbraud, and H. Weimerskirch. 2009.Respective impact of climate and fisheries on the growth of analbatross population. Ecological Applications 19:1336–1346.
Roughgarden, J. 1979. Theory of population genetics and evolution-ary ecology: an introduction. Macmillan, New York.
Royama, T. 1992. Analytical population dynamics. Chapman & Hall,London.
Schwartz, O. A., K. B. Armitage, and D. Van Vuren. 1998. A 32-yeardemography of yellow-bellied marmots (Marmota flaviventris).Journal of Zoology 246:337–346.
Stearns, S. C. 1983. The influence of size and phylogeny on patternsof covariation among life-history traits in mammals. Oikos 41:173–187.
———. 1992. The evolution of life histories. Oxford University Press,Oxford.
Sutherland, W. J., and K. Norris. 2002. Behavioural models of pop-ulation growth rates: implications for conservation and prediction.Philosophical Transactions of the Royal Society B: Biological Sci-ences 357:1273–1284.
Szostek, K. L., and P. H. Becker. 2012. Terns in trouble: demographicconsequences of low breeding success and recruitment on a com-mon tern population in the German Wadden Sea. Journal of Or-nithology 153:313–326.
Sæther, B.-E., and Ø. Bakke. 2000. Avian life history variation and
contribution of demographic traits to the population growth rate.Ecology 81:642–653.
Sæther, B.-E., and S. Engen. 2002. Pattern of variation in avian pop-ulation growth rates. Philosophical Transactions of the Royal So-ciety B: Biological Sciences 357:1185–1195.
Sæther, B.-E., S. Engen, and E. Matthysen. 2002. Demographic char-acteristics and population dynamical patterns of solitary birds.Science 295:2070–2073.
Sæther, B.-E., S. Engen, A. P. Møller, H. Weimerskirch, M. E. Visser,W. Fiedler, E. Matthysen, et al. 2004. Life-history variation predictsthe effects of demographic stochasticity on avian population dy-namics. American Naturalist 164:793–802.
Sæther, B.-E., S. Engen, E. J. Solberg, and M. Heim. 2007. Estimatingthe growth of a newly established moose population using repro-ductive value. Ecography 30:417–421.
Sæther, B.-E., V. Grøtan, P. Tryjanowski, C. Barbraud, S. Engen, andM. Fulin. 2006. Climate and spatio-temporal variation in the pop-ulation dynamics of a long-distance migrant, the white stork. Jour-nal of Animal Ecology 75:80–90.
Sæther, B.-E., R. Lande, S. Engen, H. Weimerskirch, M. Lillegard, R.Altwegg, P. H. Becker, et al. 2005. Generation time and temporalscaling of bird population dynamics. Nature 436:99–102.
Tuljapurkar, S., C. C. Horvitz, and J. B. Pascarella. 2003. The manygrowth rates and elasticities of populations in random environ-ments. American Naturalist 162:489–502.
Tuljapurkar, S. D. 1982a. Population dynamics in variable environ-ments. II. Correlated environments, sensitivity analysis and dy-namics. Theoretical Population Biology 21:114–140.
———. 1982b. Population dynamics in variable environments. III.Evolutionary dynamics of r-selection. Theoretical Population Bi-ology 21:141–165.
———. 1990. Population dynamics in variable environments.Springer, New York.
Tuljapurkar, S. D., and S. H. Orzack. 1980. Population dynamics invariable environments. I. Long-run growth rates and extinction.Theoretical Population Biology 18:314–342.
Turelli, M. 1977. Random environments and stochastic calculus. The-oretical Population Biology 12:140–178.
Weimerskirch, H. 1992. Reproductive effort in long-lived birds: age-specific patterns of condition, reproduction and survival in thewandering albatross. Oikos 64:464–473.
Weimerskirch, H., N. Brothers, and P. Jouventin. 1997. Populationdynamics of wandering albatross Diomedea exulans and Amster-dam albatross D. amsterdamensis in the Indian Ocean and theirrelationships with long-line fisheries: conservation implications.Biological Conservation 79:257–270.
Weimerskirch, H., J. Clobert, and P. Jouventin. 1987. Survival in fivesouthern Albatrosses and its relationship with their life history.Journal of Animal Ecology 56:1043–1055.
Weimerskirch, H., and P. Jouventin. 1998. Changes in populationsizes and demographic parameters of six albatross species breedingon the French sub-Antarctic islands. Pages 84–91 in G. Robertsonand R. Gales, eds. Albatross Biology and Conservation. SurreyBeatty, Sydney, Australia.
Associate Editor: Uta BergerEditor: Troy Day
This content downloaded from 193.54.110.32 on Mon, 9 Dec 2013 04:22:30 AMAll use subject to JSTOR Terms and Conditions


