Embed Size (px)
Citation preview

How probabilistic electricity demand forecasts can expedite universal access toclean and reliable electricity
Stephen J. Lee1,2, Dhruv Suri3, Priyanshi Somani4, Christopher L. Dean2, Jason Pacheco5, Robert Stoner1, Ignacio J.Perez-Arriaga1, John W. Fisher III2, Jay Taneja6
1MIT Energy Initiative, Massachusetts Institute of Technology2Computer Science and Artificial Intelligence Laboratory, Massachusetts Institute of Technology
3Department of Aeronautical and Automobile Engineering, Manipal Institute of Technology4Department of Computer Science and Engineering, Manipal Institute of Technology
5Department of Computer Science, University of Arizona6Department of Electrical and Computer Engineering, University of Massachusetts Amherst
Abstract
The global community is projected to fail in achieving the United Nation’s goal of universal access to affordable,reliable, sustainable and modern electricity by 2030. This is ultimately due to inadequate levels of investment. Effortsto right-size infrastructure investments promise improved efficiency: right-sized infrastructure yields more connec-tions with better reliability for every dollar invested. Because of this, geographic information systems, electrificationplanning models, and methods for characterizing electricity supply and demand have received growing attention asways to support improved investment decision-making at scale.
In this paper, we highlight an underrepresented and complementary area of research that promises significant valuefor infrastructure investment decision-making: probabilistic electricity demand forecasting. This paper is organized inthree main parts. In the first, we discuss ways in which probabilistic electricity demand forecasts can provide uniquevalue by elucidating economically viable investments that would otherwise be foregone due to misperceptions of theirrisk. By doing so, probabilistic forecasts have the potential to bolster private investment and expand the resource poolavailable for electrification and energy for growth. We also discuss how probabilistic forecasts can aid in efforts toefficiently incentivize low-carbon electricity supplies in support of climate goals.
In the second part of this paper, we highlight the fact that probabilistic forecasting models are underrepresented inthe literature when it comes to low-access countries. The most prominent forecasts reflect point forecasting methodsand demonstrate high variability when compared to historical electricity consumption. There is significant need forprobabilistic methods to be applied in this space; probabilistic methods allow for a more informative and transparentway to communicate the expected quality of individual electricity demand forecasts.
In the third and final part of this paper, we highlight a specific model used for probabilistic electricity demandforecasting in the literature: the LDF model. We qualitatively describe useful attributes and limitations of the LDFmodel and similar probabilistic methods for probabilistic forecasting. We do this with the hope of outlining keymodeling concepts that decision-makers should know before employing probabilistic forecasts.
Keywords: energy for growth, electricity access, electricity demand, demand forecasting, probabilistic loadforecasting, electrification planning, sustainable development goals, decarbonization, machine learning
1. Introduction
There is general consensus that the global communityis off-track from realizing the United Nation’s Sustain-able Development Goal #7 (SDG7) target of “univer-
Email address: [email protected] (Stephen J. Lee)
sal access to affordable, reliable and modern energy ser-vices” by the year 2030 [1]. Under the International En-ergy Agency’s (IEA) central “Stated Policies Scenario,”660 million people are expected to be without electric-ity access in 2030 [2]. Rates of improvement are ex-pected to be modest on net, considering that 840 millionwere estimated without access in 2019 [3]. If we are to
Energy for Economic Growth July 27, 2021

achieve SDG7, the IEA estimates that $35 billion mustbe spent annually from 2021 to 2030 on generation andnetwork infrastructure towards these ends [2].
Given investment deficits with regards to SDG7,stretching the value of every dollar spent and eliminat-ing inefficiencies is imperative. Right-sizing infrastruc-ture investments to adequately meet electricity demandis central to this endeavor. We can appreciate the valueof right-sizing infrastructure by highlighting the risks ofover-sizing and under-sizing.
If infrastructure is over-sized relative to demand, cus-tomers will be penalized by indirectly paying the costsof generation and network capacity that is never usedor will not be used for years. This results in highercosts and disincentivizes consumption. Addition-ally, because low-access regions experience resource-constraints, overbuilding in some areas means that re-sources are diverted from underserved areas that wouldotherwise yield significant benefit from them. In thisway, overbuilding makes it so that those without ac-cess will remain without electricity for longer periodsof time.
If infrastructure is under-sized relative to demand,consumers will experience power outages and industrywill suffer. While subsequent upgrades can be made,these investments will miss out on attractive opportuni-ties for exploiting economies of scale in generation andstorage, in addition to opportunities for improved net-work utilization efficiency [4].
Cases of poorly-sized energy infrastructure pervadethe sector globally. In 2018, Pakistan paid $4.7 billionin idle capacity charges due to over-sizing [5]. Con-versely, from 2003-2006, infrastructure under-sizing ledto severe power shortages in China [6, 7]. Even U.S.consumers are affected: generating capacity in the U.S.exceeds required reserve margins by 30%, costing bil-lions per year [8]. In each of these cases, inaccurateelectricity demand (i.e. load) forecasts are known tohave played a central role [5, 6, 7, 8]. Over-sizing is thedirect result of over-forecasting demand, while under-sizing stems from under-forecasting. As such, electric-ity demand forecasts are key to right-sizing infrastruc-ture.
Empirical evidence for the importance of accurateforecasting is supported by techno-economic modelsrun at multiple spatial and temporal scales [9, 10, 11, 12,13, 14, 15]. A study employing a building-level electri-fication model for 366 thousand customers in Ugandademonstrates how electricity unit costs in low-demandscenarios may be nearly three times those in high-demand scenarios resulting from economies of scaleand network utilization improvements [16]. Better fore-
casts allow planners to pursue such economies whileminimizing the risk of over-sizing.
While forecast accuracy is critical, forecasting for thepower sector and other sociotechnical systems is gener-ally difficult. There are limits to how accurate electric-ity demand forecasts can be in the face of intrinsicallyunknown drivers of the power sector, including techno-logical advancements, public policy, a changing popu-lation, and climate variability. The future is inherentlyuncertain.
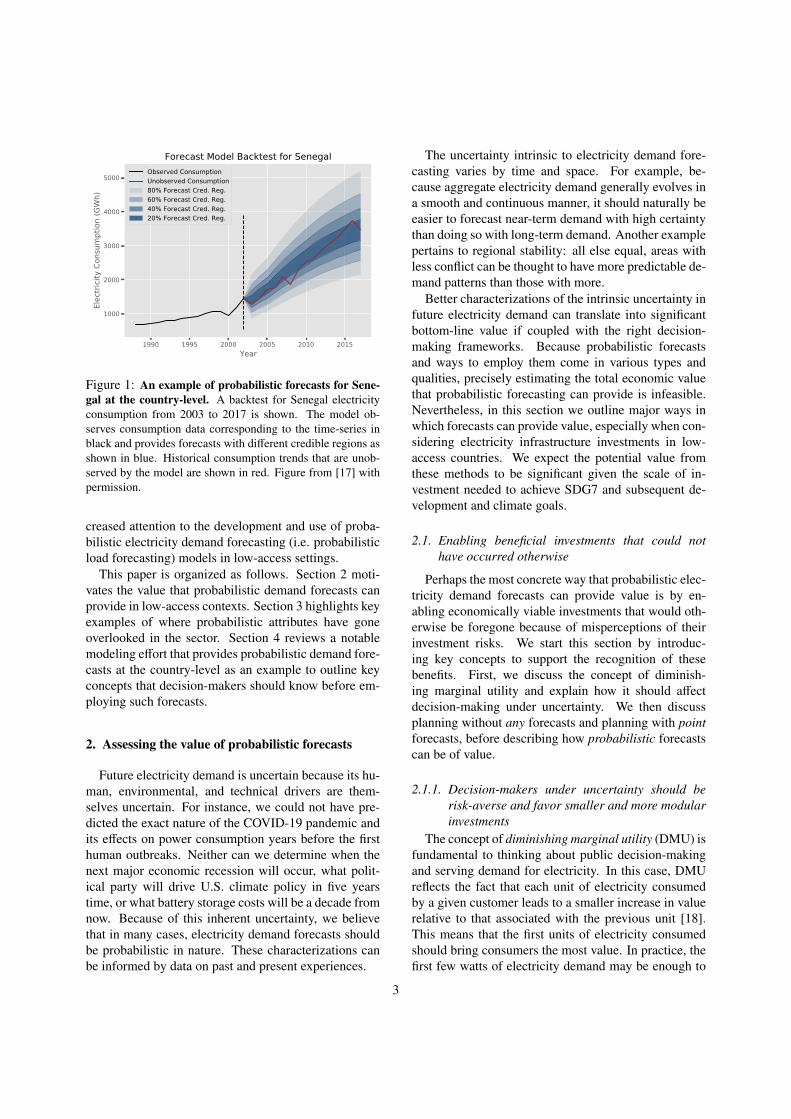
In this paper, we seek to elucidate the importance ofquantifying a forecasting attribute other than accuracy:forecast uncertainty. In addition to providing point fore-casts that describe what a model perceives to be the mostlikely future outcome, models can also be used to pro-vide a characterization of its uncertainty (or conversely,its certainty) pertaining to a forecast by way of present-ing probability distributions. Specialized techniquesfrom statistics and machine learning are well-suited toproviding such output as they may learn to characterizeuncertainty by evaluating how well historical consump-tion data fits candidate distributions. Distributions thatunderestimate uncertainty are penalized as are those thatoverestimate uncertainty. Fig. 1 illustrates an exampleof what a probabilistic forecast may look like.
From a power sector decision-maker’s perspective, anestimate with high uncertainty (low certainty) could ul-timately mean something very different than one withlow uncertainty (high certainty), even if the distributionsprovided center around the same mean forecast. All elseequal, decision-makers should make more conservativeinvestments when presented with more uncertain fore-casts due to risk-aversion. This may mean investing insmaller generation, storage, and network assets, or in-vesting in grid-compatible mini-grid assets so the option(or “real option”) is available to connect to the grid ata later date. In other cases, this may mean delaying in-vestments until better information or more resources areavailable. Conversely, these decision-makers should bemore bold when presented with higher-certainty fore-casts. They may wish to build larger, sooner, to takeadvantage of economies of scale that are more likely tobear fruit. Analogous considerations affect infrastruc-ture decision-making around ways to most efficientlymeet climate goals under demand uncertainty.
In our view, forecast uncertainty is wrongly under-represented in electricity forecasting and planning com-munities, especially when considering low-electricity-access (low-access) regions with poor data availability.If forecasts are made, they are too often representedby point-estimates that are likely to engender overcon-fidence. In this paper, we contextualize the need for in-
2
1990 1995 2000 2005 2010 2015Year
1000
2000
3000
4000
5000
Elec
tricit
y Co
nsum
ptio
n (G
Wh)
Forecast Model Backtest for SenegalObserved ConsumptionUnobserved Consumption80% Forecast Cred. Reg.60% Forecast Cred. Reg.40% Forecast Cred. Reg.20% Forecast Cred. Reg.
Figure 1: An example of probabilistic forecasts for Sene-gal at the country-level. A backtest for Senegal electricityconsumption from 2003 to 2017 is shown. The model ob-serves consumption data corresponding to the time-series inblack and provides forecasts with different credible regions asshown in blue. Historical consumption trends that are unob-served by the model are shown in red. Figure from [17] withpermission.
creased attention to the development and use of proba-bilistic electricity demand forecasting (i.e. probabilisticload forecasting) models in low-access settings.
This paper is organized as follows. Section 2 moti-vates the value that probabilistic demand forecasts canprovide in low-access contexts. Section 3 highlights keyexamples of where probabilistic attributes have goneoverlooked in the sector. Section 4 reviews a notablemodeling effort that provides probabilistic demand fore-casts at the country-level as an example to outline keyconcepts that decision-makers should know before em-ploying such forecasts.
2. Assessing the value of probabilistic forecasts
Future electricity demand is uncertain because its hu-man, environmental, and technical drivers are them-selves uncertain. For instance, we could not have pre-dicted the exact nature of the COVID-19 pandemic andits effects on power consumption years before the firsthuman outbreaks. Neither can we determine when thenext major economic recession will occur, what polit-ical party will drive U.S. climate policy in five yearstime, or what battery storage costs will be a decade fromnow. Because of this inherent uncertainty, we believethat in many cases, electricity demand forecasts shouldbe probabilistic in nature. These characterizations canbe informed by data on past and present experiences.
The uncertainty intrinsic to electricity demand fore-casting varies by time and space. For example, be-cause aggregate electricity demand generally evolves ina smooth and continuous manner, it should naturally beeasier to forecast near-term demand with high certaintythan doing so with long-term demand. Another examplepertains to regional stability: all else equal, areas withless conflict can be thought to have more predictable de-mand patterns than those with more.
Better characterizations of the intrinsic uncertainty infuture electricity demand can translate into significantbottom-line value if coupled with the right decision-making frameworks. Because probabilistic forecastsand ways to employ them come in various types andqualities, precisely estimating the total economic valuethat probabilistic forecasting can provide is infeasible.Nevertheless, in this section we outline major ways inwhich forecasts can provide value, especially when con-sidering electricity infrastructure investments in low-access countries. We expect the potential value fromthese methods to be significant given the scale of in-vestment needed to achieve SDG7 and subsequent de-velopment and climate goals.
2.1. Enabling beneficial investments that could nothave occurred otherwise
Perhaps the most concrete way that probabilistic elec-tricity demand forecasts can provide value is by en-abling economically viable investments that would oth-erwise be foregone because of misperceptions of theirinvestment risks. We start this section by introduc-ing key concepts to support the recognition of thesebenefits. First, we discuss the concept of diminish-ing marginal utility and explain how it should affectdecision-making under uncertainty. We then discussplanning without any forecasts and planning with pointforecasts, before describing how probabilistic forecastscan be of value.
2.1.1. Decision-makers under uncertainty should berisk-averse and favor smaller and more modularinvestments
The concept of diminishing marginal utility (DMU) isfundamental to thinking about public decision-makingand serving demand for electricity. In this case, DMUreflects the fact that each unit of electricity consumedby a given customer leads to a smaller increase in valuerelative to that associated with the previous unit [18].This means that the first units of electricity consumedshould bring consumers the most value. In practice, thefirst few watts of electricity demand may be enough to
3

power basic but critical activities: lighting so that com-merce and studies can continue at night, or phone charg-ing so that important communications can be made.Additional electricity consumption is still valuable, butless so on a per-unit basis: consumers with improvedsupplies may choose to watch television or use elec-tric cookstoves. While economically productive uses ofelectricity such as irrigating farmland and refrigerationare also valuable, they are highly energy intensive andare only prioritized once adequate electricity supply isavailable.
Because of DMU, a decision-maker in low-accesssettings should be more risk-averse when facing de-mand uncertainty. A risk-averse decision-maker shouldpursue smaller and more modular investments, all elseequal. This is because over-forecasting and over-building entails high opportunity-costs: wasted expen-ditures could otherwise have gone to electrify or rein-force supplies in other, underserved areas. The net re-sult creates a situation where consumers in some areasare afforded extra capacity that goes unused while con-sumers in other areas are compelled to live without elec-tricity. Because of DMU, the expected costs from thisarrangement outweigh their benefits as high-utility de-mand is not met. The strategy of making smaller andmore modular investments is prudent because, while itmay entail the potential for missing out on economies ofscale, it decreases the chances of over-building. Whilechances of under-building are increased, the use of mod-ular supply technologies allow subsequent upgrades andcan mitigate potential ramifications pertaining to inade-quate supply reliability.
2.1.2. Planning without forecastsIn the absence of any forecast whatsoever, investors
are left with only their prior expectations about demandto plan investment decisions. This translates to signif-icant decision-making uncertainty. Given the fact thatrisk-averse decision-makers with demand uncertaintyshould favor smaller and more modular investments,only very small investments with economic viabilityare likely to be made, entailing high per-unit electricitycosts. In practice, this may mean an over-reliance on so-lar kits when underlying demand may instead be able tosubstantiate much larger minigrid systems or grid con-nections which derive greater benefit from economies ofscale.
Planners can still work to find suitable sites by sur-veying and collecting better data; however, site-by-sitesurveys can be both costly and slow, keeping it such thateconomically viable but unknown investment opportu-nities remain hidden for undue periods of time.
2.1.3. Planning with point forecastsIt as an improvement for decision-makers to at least
be equipped with point forecasts; nevertheless, pointforecasts still have notable weaknesses.
Even if point forecasts are accurate on average, theuncertainty inherent in sociotechnical systems and lim-ited input information mean that individual point fore-casts will necessarily exemplify error. If decision-makers wrongly interpret individual forecasts to behighly certain, they will treat the forecasts with overcon-fidence when making decisions and will be more likelyto overbuild, yielding inefficiencies that prevent otherbeneficial investments from taking place. As describedbefore, the expected social costs from overbuilding inlow-access regions can be pernicious as it means unusedsupplies are availed in one place at the expense of for-going higher-value electricity consumption elsewhere.On a society-wide level, these costs are likely to signif-icantly outweigh expected benefits because of DMU.
The situation can be similarly damaging if decision-makers do not know how trustworthy the forecast islikely to be. They may remain too weary to make oth-erwise sound investments without first still incurringthe financial and temporal costs of surveying and datagathering. Economies of scale will be harder to realizeif risk-averse decision-makers are too uncertain aboutforecasts. As in the “planning without forecasts” case,significant value will be left on the table.
Without communicating uncertainty, inaccuraciesfrom outliers in point-forecasts can additionally engen-der the development of human stigmas that underminewhat value point forecasts have the potential to bring.
2.1.4. Planning with probabilistic forecastsProbabilistic forecasts allow decision-makers to
make better decisions in the face of future uncertainty.They can implicitly or explicitly combine these prob-abilistic characterizations with functions of social util-ity and attempt to maximize the expected utility fromtheir investments [19]. Probabilistic characterizationsallow decision-makers to better tune their infrastruc-ture investment strategies, fully accounting for the ef-fects of DMU and economies of scale. All else equal,this should equate to targeting investment projects thatprovide higher value while also being characterized bylower demand uncertainty. Such projects would be over-looked for less beneficial projects in the absence ofprobabilistic descriptions. Only when low-risk high-value opportunities are realized should decision-makerschoose to make investments with lower value or higheruncertainty.
4

The value of improved information via probabilisticforecasts also has major implications when consideringthe importance of ‘unlocking’ private sector investmentin electricity infrastructure for most low-access coun-tries. In these countries, public funding is at all timesstretched as far as it can go. In contrast, the private sec-tor represents a comparably boundless source that couldmanifest reliable electricity connections if viable busi-ness cases can be made [20, 21]. Probabilistic forecastshave the promise to illuminate such viable cases andmake progress that would not be realized otherwise.
2.2. Valuing flexibility via real options analysisIn the previous section, we abstractly introduce
how probabilistic demand forecasts can yield improveddecision-making considering uncertainty and the effectsof DMU and economies of scale. These decisions canbe made more concrete by assessing the value of flex-ibility afforded by some infrastructure classes and notothers.
The value of flexibility can be assessed using meth-ods for real options analysis. Real options analysiscommonly models the present value of the right to maketangible future investments assuming uncertainties inbusiness factors. Part of doing so may entail the defi-nition of strategies to exercise these rights with MonteCarlo simulations drawn from probability distributionsover input variables [22].
In the case of electricity demand uncertainty and fore-casting, a real options analysis could focus on valuingthe flexibility provided by grid-compatible minigrids. Inthis example, we consider the comparison of two typesof investment: grid-incompatible minigrids and grid-compatible minigrids. Grid-incompatible minigrids in-volve investment in comparatively cheaper generation,storage, and network components that bring electric-ity to consumers but do not meet the specifications ofthe main grid. They entail lower fixed costs relativeto grid-compatible minigrids and higher variable costsrelative to the main grid. On the other hand, grid-compatible minigrids are more expensive: they ensurethat generation, storage, and network components meetgrid specifications. All else equal, they entail higherfixed costs relative to grid-incompatible minigrids andthe same higher variable costs relative to the grid. In aworld without the potential for centralized grid connec-tions, it would only make sense to build simple mini-grids because of their lower fixed costs; however, grid-compatible minigrids can be advantageous if demandreaches levels that justify connection from the maingrid. The main grid can provide reliable electricity withcomparatively lower variable costs by taking advantage
of much larger economies of scale. If this occurs, as-sets from a grid-compatible minigrid can be subsumedby the main grid, while those from simple minigrids be-come obsolete and expenditures in redundant grid-specassets become necessary. The decision on whether tospend more upfront on a minigrid with the ‘real op-tion’ to connect to the main grid depends fully on theperceived probability that high demand will eventuallywarrant connection to the main grid. Better probabilis-tic characterizations of this demand can support rationaldecision-making pertaining to such investments in flex-ibility.
Considerations of flexibility extend beyond the grid-compatible minigrid case. They also apply to possibleinvestments in extensible and modular mini-grid com-ponents and solar kits, and more flexible generation andstorage assets. Flexibility is also apparent when sim-ply considering the value of doing nothing and wait-ing for the future when improved information arisesabout demand, new storage technologies, and other un-certain factors. Understanding the context behind whenthese technologies should be employed ultimately restson characterizing probability distributions surroundingbusiness factors including demand. Better forecastspromise to inform strategies for exploiting flexibilityand realizing the value of flexible technologies.
In their 2011 book, de Neufville and Scholtes presenta simple, contrived example of how uncertainty regard-ing electricity demand can provide value when buildinga thermal power plant. Considering variability in de-mand can help plant managers avoid over-forecastingexpected profitability through the probabilistic consid-eration of potential downside losses associated withnon-linear plant operations costs [22]. Agaton and Karlpresent a more applied example in a 2018 study thatuses the real options analysis framework to accountfor electricity price, oil price, and oil tax externalitywhen making renewable energy investment decisions onPalawan island in the Philippines. Though uncertaintiesstem from more than just electricity price, and demanduncertainty is not a perfect proxy for electricity priceuncertainty, the study is notable because it calculatesthat the value of the option to invest in renewables canexceed $150 million on Palawan Island alone [23].
2.3. Adaptive approaches and the value of informationWith probabilistic electricity demand forecasts,
decision-makers can exercise information planningalong with infrastructure planning. Information plan-ning stems from the fact that data provides value, andfrom the propensity for model-characterized uncertaintyto decrease as more and better information is collected
5

and used. Users can assess model-based value of in-formation (VoI) metrics and other information theoreticterms associated with different input features of interest[24]. If a piece of information’s expected VoI exceedsthe practical costs of obtaining it, a modeler woulddo well to expend resources to procure it. Probabilis-tic modeling frameworks can rationally direct the cal-culation of VoI and investments in information along-side physical infrastructure. Moreover, these invest-ments can occur over rolling time frames and continueto adapt as new information is gained, new infrastruc-ture is built, and new revenue is collected. Though weare not aware of empirical examples for which suchadaptive approaches to electricity infrastructure plan-ning have been exercised at scale, the concept of Adap-tive Electricity Access Planning has been proposed in[25].
2.4. Climate goals and low-carbon infrastructure plan-ning
Global climate efforts, goals, and agreements add anadditional layer of complexity to electricity infrastruc-ture planning. Researchers are projecting that achievingthe Paris climate goals will be unlikely given currentrates of progress [26, 27]. The electric power sectoris central to these goals. In 2014, electricity and heataccounted for 25% of global greenhouse gas emissionsworldwide [28]; however, decarbonizing broader sec-tors of the economy will very likely necessitate expand-ing the scope of electrification and meeting new demandwith renewable supply [29, 30].
Probabilistic characterizations of future demand inlow-access regions can be used to efficiently achievelow-carbon electricity supplies in much the same waythey can improve infrastructure right-sizing efforts. Twokey concepts are useful to define before supporting thisclaim: energy system momentum and committed emis-sions. Energy system momentum reflects the fact thatlong-lived generation, distribution, and transmission as-sets, in addition to the regulatory frameworks that gov-ern them, yield significant systems-level inertia. In thecontext of climate, energy system momentum yieldscommitted emissions. Already-purchased physical as-sets reflect sunk fixed costs and are thus advantaged rel-ative to assets that are yet to be bought. Fossil fuel-firedgenerators can be thought to have future emissions ef-fectively embedded within them [31]. Because of this,decisions made now affect the future carbon intensity ofthe sector for decades by way of committed emissions.
These effects inform the planning problem for low-carbon energy systems in low-access contexts. Consider
a situation in which a low-access country with electric-ity demand uncertainty is committed to reaching somepredefined level of emissions by a future year, such asfrom a Nationally Determined Contribution (NDC). Iffuture demand is uncertain, the target shares of renew-able and carbon-emitting electricity generation will alsobe uncertain. Too much upfront investment in fossil-derived generation capacity and too little investment inrenewable capacity can result in futures for which itis overwhelmingly costly and inefficient to achieve cli-mate commitments. Too little upfront investment infossil-derived sources and too much investment in re-newables can yield electricity supplies that, in the short-term, are overly costly and unreliable due to the inter-mittency of renewables. Understanding demand uncer-tainty can help risk-averse decision-makers target bal-anced levels of renewable and fossil-derived genera-tion investment over time; this allows for improved riskmanagement in meeting emissions targets while seekingto maximize economic efficiency and growth.
Characterizations of demand uncertainty can also aidin the process of defining emissions targets such asNDCs. If future demand is uncertain, then there arehigher chances that without uncertainty characteriza-tion, risk-averse decision-makers will define overly-restrictive targets that can stymie growth in the powersector and in the economy. If future demand is morecertain, appropriate emissions targets can be used tomore effectively and equitably reduce carbon emissionsworldwide.
3. Probabilistic forecasting is underrepresented inthe literature
Despite the potential value conferred by probabilisticelectricity demand forecasts, these models are seldomemployed in low-access contexts.
A 2020 review paper focusing on electricity demandforecasting in “low and middle income countries” byMir et al. exemplifies this point: while the review de-tails the importance of accurate forecasts, surveys all ofthe major model classes used to forecast electricity de-mand, and cites over 130 articles, the authors provideno description of the difference between a probabilisticforecast and a point forecast, nor of the former’s relativemerits [5].
In contrast, a 2016 review paper focused exclusivelyon probabilistic electricity demand forecasting by Hongand Fan review common methods, describe notablestudies, and characterize the frontier of research in thissubfield (i.e. the need to apply probabilistic forecasting
6

1990 2000 2010 2020 2030 2040200
400
600
800
1000
1200
1400
1600
1800
Tota
l Ele
ctric
ity C
onsu
mpt
ion
(TW
h)
Historical and IEA Forecasted Total Electricity Consumption in Africa
Forecast from WEO 1998Forecast from WEO 2000Forecast from WEO 2002Forecast from WEO 2004Forecast from WEO 2006 Forecast from WEO 2008 Forecast from WEO 2009Forecast from WEO 2010 Forecast from WEO 2011Forecast from WEO 2012Forecast from WEO 2013Forecast from WEO 2014Forecast from WEO 2015Forecast from WEO 2016Forecast from WEO 2017Forecast from WEO 2018Forecast from WEO 2019Historical Consumption
1990 2000 2010 2020 2030 2040
400
600
800
1000
1200
1400
Tota
l Ele
ctric
ity C
onsu
mpt
ion
(TW
h)
Historical and EIA Forecasted Total Electricity Consumption in Africa
Forecast from IEO 1995Forecast from IEO 1996Forecast from IEO 1997Forecast from IEO 1998Forecast from IEO 1999Forecast from IEO 2000Forecast from IEO 2001Forecast from IEO 2002Forecast from IEO 2003Forecast from IEO 2004Forecast from IEO 2005Forecast from IEO 2006Forecast from IEO 2007Forecast from IEO 2008Forecast from IEO 2009Forecast from IEO 2010Forecast from IEO 2011Forecast from IEO 2013Forecast from IEO 2016Forecast from IEO 2017Forecast from IEO 2019Historical Consumption
Figure 2: Historical and forecasted electricity consumption are shown from the IEA’s WEO series (top) and theEIA’s IEO series (bottom).
7

models to account for climate variability, electric vehi-cles, demand response, energy efficiency, and wind andsolar power generation) but fails to mention the specificapplicability and need for probabilistic demand fore-casting in low-access contexts [32].
3.1. A mini-review
We share a table detailing our own, non-exhaustiveliterature review in Table 1 in the supplement of thispaper. We searched for electricity demand forecastingpapers in Africa, specifically. Critically, there are veryfew studies that provide probabilistic outputs; the vastmajority of forecasts published reflect point-estimates.With one notable exception, all of the studies provid-ing probabilistic outputs exclusively focus on the coun-try of South Africa. The fact that South Africa is of-ten considered a high-electricity-consumption outlier onthe African continent underscores the modeling gap thatexists regarding probabilistic forecasting for low-accesscountries.
We highlight the one notable exception to this trendin the first row of Table 1. It is actually a paper we wroteas a technical companion to this specific paper [17].
Section 4 shows how [17] uses the lightweight datafusion (LDF) methodology [33], along with long short-term memory (LSTM) models, to provide and validateprobabilistic forecasts. We speculate that one of the rea-sons that probabilistic electricity demand forecasts havebeen slow to provide answers pertaining to low-accesscountries and SDG7 is because of general data availabil-ity issues. Even aggregated country-level forecastingwas made challenging by inconsistent data ranges anddata availabilities across key features of interest [17].
3.2. A deep dive into prominent demand scenarios
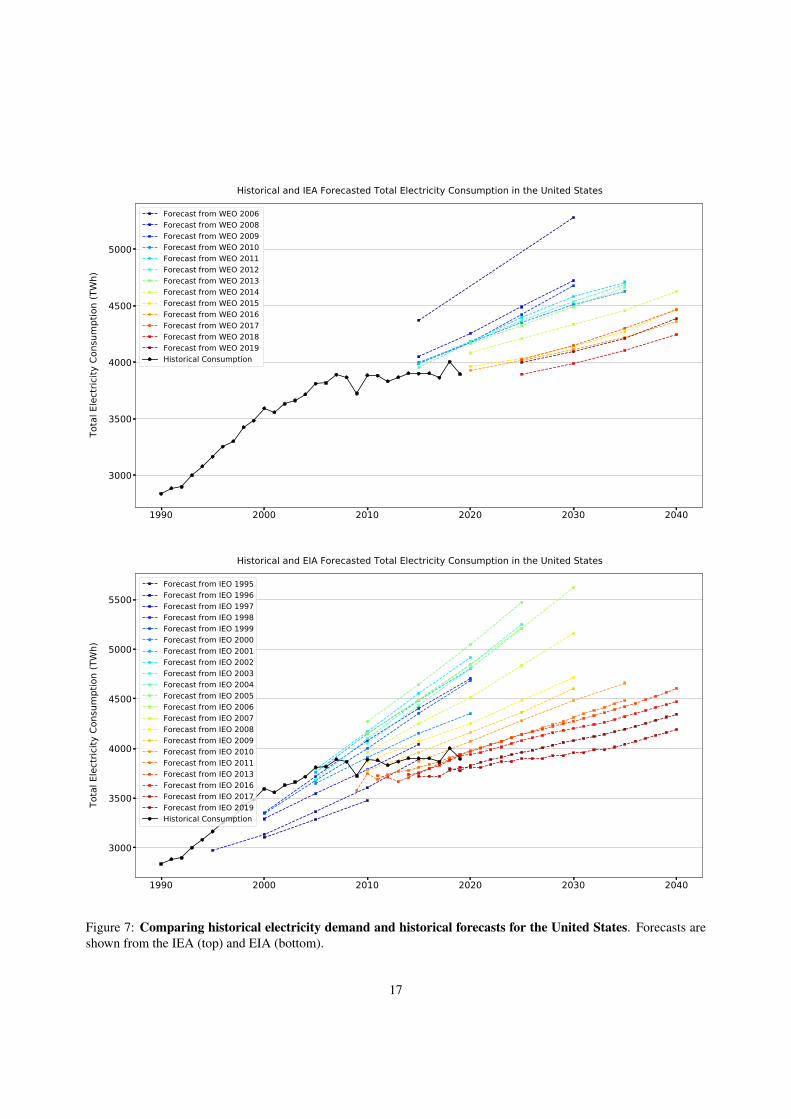
In this subsection, we review electricity demand sce-narios provided by the IEA’s World Energy Outlook(WEO) [34, 35, 36, 37, 38, 39, 40, 41, 42, 43, 44,45, 46, 47, 48, 49, 50] and the U.S. Energy Informa-tion Administration’s (EIA) International Energy Out-look (IEO) [51, 52, 53, 54, 55, 56, 57, 58, 59, 60,61, 62, 63, 64, 65, 66, 67, 68, 69, 70, 71] series andwe compare projections by previous editions to actualhistorical demand for Africa.1 Data series used from
1While neither the IEA or EIA claim that their scenarios aremeant to be directly interpreted as “forecasts,” the “outlooks,” “fu-tures,” or “scenarios” they share are commonly interpreted and usedas such [72]
the WEO specifically corresponds to the “Stated Poli-cies Scenario” (or equivalently, the “New Policies Sce-nario”) which reflects both existing and announced pol-icy frameworks and intentions. Data from the IEO cor-responds to the EIA’s “reference case,” reflecting cur-rent and anticipated trends. The IEA’s scenarios resultfrom the World Energy Model (WEM) [73], while theEIA’s forecasts are driven by the World Energy Projec-tion System (WEPS) model [74].
Both the IEA and EIA provide data and documenta-tion associated with their modeling frameworks. TheWEM is a simulation model that links supply and de-mand across different sectors of the economy to outlinescenarios of future energy flows, CO2 emissions, andinvestments. In determining electricity demand, it useseconometric methods to relate historical data and ex-ogenous assumptions on socioeconomic drivers to de-termine demand-side drivers (e.g. steel production inindustry, household size, etc.). It then uses a least-cost approach to determine fuel and technology typeallocations and accounts for efficiency levels to deter-mine final demand levels [73]. The WEPS system iscomprised of a set of models that simulate the interna-tional energy system, including models for global out-put, residential demand, commercial demand, industrialdemand, and transportation demand. These models usedynamic econometric equations, ordinary least squaresand least absolute difference regression, model selectionalgorithms, and bottom-up approaches to determine de-mand from different segments [74]. Despite the multi-faceted and complicated nature of these systems, whenconsidering Africa, neither the IEA nor EIA providehistorical scenarios with country-level resolution andinstead only provide electricity consumption figures forthe whole continent.2
To get a sense of the success of their scenarios, wechoose to investigate the accuracy of the IEA and EIA’selectricity scenarios at the continent-level via backtest-ing. Similar backtesting analyses pertaining to total pri-mary energy consumption was previously published byWolfram [75]. Here, we compile data from IEA’s WEObetween 1998 and 2019, and U.S. EIA’s InternationalEnergy Outlook between 1995 and 2019. Fig. 2 showsdeviation between the forecasts and historical electricitydemand. Colored dashed line segments depict historicalforecasts, while the solid black line depicts actual con-sumption values on the continent.
From Fig. 2 it is apparent that both the IEA and EIA
2Recent editions of the WEO and associated documents by theIEA have started to share country-level scenarios, but only for selectcountries. These scenarios are also too recent to enable backtesting.
8
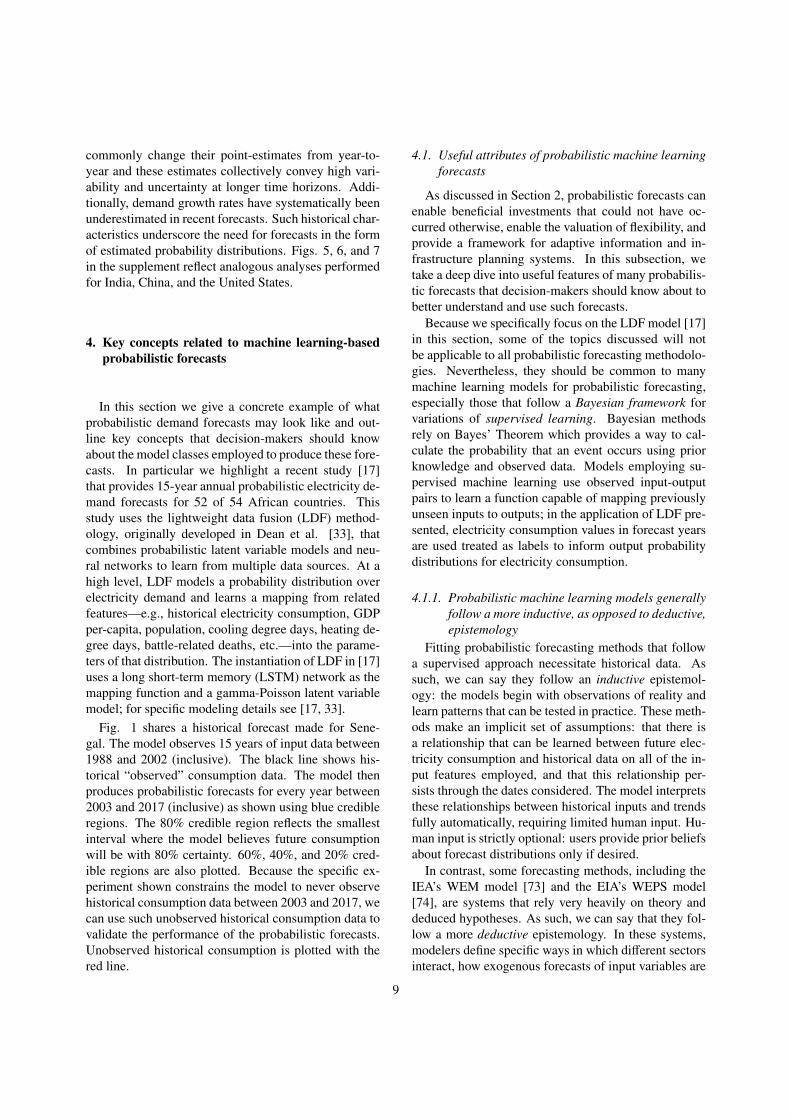
commonly change their point-estimates from year-to-year and these estimates collectively convey high vari-ability and uncertainty at longer time horizons. Addi-tionally, demand growth rates have systematically beenunderestimated in recent forecasts. Such historical char-acteristics underscore the need for forecasts in the formof estimated probability distributions. Figs. 5, 6, and 7in the supplement reflect analogous analyses performedfor India, China, and the United States.
4. Key concepts related to machine learning-basedprobabilistic forecasts
In this section we give a concrete example of whatprobabilistic demand forecasts may look like and out-line key concepts that decision-makers should knowabout the model classes employed to produce these fore-casts. In particular we highlight a recent study [17]that provides 15-year annual probabilistic electricity de-mand forecasts for 52 of 54 African countries. Thisstudy uses the lightweight data fusion (LDF) method-ology, originally developed in Dean et al. [33], thatcombines probabilistic latent variable models and neu-ral networks to learn from multiple data sources. At ahigh level, LDF models a probability distribution overelectricity demand and learns a mapping from relatedfeatures—e.g., historical electricity consumption, GDPper-capita, population, cooling degree days, heating de-gree days, battle-related deaths, etc.—into the parame-ters of that distribution. The instantiation of LDF in [17]uses a long short-term memory (LSTM) network as themapping function and a gamma-Poisson latent variablemodel; for specific modeling details see [17, 33].
Fig. 1 shares a historical forecast made for Sene-gal. The model observes 15 years of input data between1988 and 2002 (inclusive). The black line shows his-torical “observed” consumption data. The model thenproduces probabilistic forecasts for every year between2003 and 2017 (inclusive) as shown using blue credibleregions. The 80% credible region reflects the smallestinterval where the model believes future consumptionwill be with 80% certainty. 60%, 40%, and 20% cred-ible regions are also plotted. Because the specific ex-periment shown constrains the model to never observehistorical consumption data between 2003 and 2017, wecan use such unobserved historical consumption data tovalidate the performance of the probabilistic forecasts.Unobserved historical consumption is plotted with thered line.
4.1. Useful attributes of probabilistic machine learningforecasts
As discussed in Section 2, probabilistic forecasts canenable beneficial investments that could not have oc-curred otherwise, enable the valuation of flexibility, andprovide a framework for adaptive information and in-frastructure planning systems. In this subsection, wetake a deep dive into useful features of many probabilis-tic forecasts that decision-makers should know about tobetter understand and use such forecasts.
Because we specifically focus on the LDF model [17]in this section, some of the topics discussed will notbe applicable to all probabilistic forecasting methodolo-gies. Nevertheless, they should be common to manymachine learning models for probabilistic forecasting,especially those that follow a Bayesian framework forvariations of supervised learning. Bayesian methodsrely on Bayes’ Theorem which provides a way to cal-culate the probability that an event occurs using priorknowledge and observed data. Models employing su-pervised machine learning use observed input-outputpairs to learn a function capable of mapping previouslyunseen inputs to outputs; in the application of LDF pre-sented, electricity consumption values in forecast yearsare used treated as labels to inform output probabilitydistributions for electricity consumption.
4.1.1. Probabilistic machine learning models generallyfollow a more inductive, as opposed to deductive,epistemology
Fitting probabilistic forecasting methods that followa supervised approach necessitate historical data. Assuch, we can say they follow an inductive epistemol-ogy: the models begin with observations of reality andlearn patterns that can be tested in practice. These meth-ods make an implicit set of assumptions: that there isa relationship that can be learned between future elec-tricity consumption and historical data on all of the in-put features employed, and that this relationship per-sists through the dates considered. The model interpretsthese relationships between historical inputs and trendsfully automatically, requiring limited human input. Hu-man input is strictly optional: users provide prior beliefsabout forecast distributions only if desired.
In contrast, some forecasting methods, including theIEA’s WEM model [73] and the EIA’s WEPS model[74], are systems that rely very heavily on theory anddeduced hypotheses. As such, we can say that they fol-low a more deductive epistemology. In these systems,modelers define specific ways in which different sectorsinteract, how exogenous forecasts of input variables are
9

0.0 0.2 0.4 0.6 0.8 1.0Cumulative Distribution Function Evaluations
at Observed Consumption Values
0
50
100
150
200
250
300
Freq
uenc
y
Model Calibration Histogram Across All Validation Countries
Figure 3: Model calibration plot showing fit to data. The50-bin histogram represents the empirical frequency that aspecific 2% probability interval was observed in a held-outset. Figure from [17] with permission.
used, and how specific outputs must be constrained tobe consistent with other components of broader energysystems being modeled.
While we do not argue that inductive supervised ma-chine learning methods should be seen as substitutivefor deductive simulation models such as the WEM orWEPS, we believe that they offer decision-makers avaluable alternative and are made even more useful be-cause they employ a complementary, data-driven ap-proach to forecasting. They are reproducible and mayengender additional trust, they have setups that aretransparent and simple to explain, and are largely im-mune to negative aspects of human bias.
4.1.2. Model calibrationAnother useful attribute of probabilistic demand fore-
casts is their ability to facilitate model calibration anal-yses. These analyses show how well forecasts made onheld-out (unseen) data performed historically, and givean indication for how well one may expect the model toperform in the future.
Fig. 3 represents a model calibration histogram with50 bins that shows the frequency that empirical electric-ity consumption fell into a 2% cumulative distributionfunction (CDF) intervals within predicted (posterior)probability distributions. These CDF intervals shouldhave equal probability of occurrence. Because the prob-abilistic forecast follows the (non-uniform) negative bi-nomial distribution, the intervals will generally corre-spond to different ranges in units of consumption. Oneway to think about these intervals is to consider eachas representing one side of a 50-sided dice. Ideally, the
dice should be fair: all sides are ideally equally prob-able, and with enough rolls, they should have more-or-less equal frequencies of occurrence. This is anal-ogous to our histogram: a perfectly calibrated modelwould show a more-or-less uniform histogram. Thenon-uniform histogram in Fig. 3 suggests that theLDF model described in [17] is not perfectly calibrated.Analogously, the dice is not perfectly fair. Histogramscloser to uniform distributions show evidence of bettermodel calibration than those that are further away.
4.1.3. Determining feature importance and enablingimproved interpretability
Some methods used for probabilistic electricity de-mand forecasting, including the LDF framework used in[17], facilitate the assessment of feature importance andprovide insight into model behavior. These attributescan constitute novel domain-specific insight, in additionto comprise Value of Information (VoI) metrics that canbe used to inform information investments, as discussedin Section 2.
In the LDF model, one way to describe feature im-portance is by determining the gradients of interpretablequantities such as the forecast mean and forecast stan-dard deviation with respect to input features. A positiveforecast mean gradient with respect to a given featuremeans that, as that feature is increased, forecasted con-sumption will increase on net. A positive forecast stan-dard deviation gradient with respect to a given featureimplies that as that feature is increased, forecast uncer-tainty will increase. A feature is more important for an
Elec. C
ons.
Cool D
eg. D
ays
Bat. Dea
ths
Heat D
eg. D
ays
Oil Prod
.Po
p.
GDP p.c.
Renew
. Prod
.
Nat. Gas
Prod.
Elec. P
rod.
Nat. Gas
Net Ex
p.
Oil Net
Exp.
Coal Pr
od.
Coal N
et Ex
p.
Feature
10 8
10 6
10 4
10 2
100
102
104
106
Fore
cast
Mea
n El
ec. C
ons.
Grad
ient
with
R
espe
ct to
Z-S
core
Nor
mal
ized
Inpu
t Fea
ture Forecast Mean Elec. Cons.
Gradient for each Input Feature
Figure 4: Feature importance shown as the absolute valueof forecast mean (top) and standard deviation gradient(bottom) across features. Features are ranked in descendingorder of median importance. Figure from [17] with permis-sion.
10

inference if model output is more sensitive to its value:this corresponds to a higher absolute value of normal-ized forecast mean or absolute value of forecast stan-dard deviation gradient.
Fig. 4 depicts a box plot for the absolute value offorecast mean gradients relative to each input feature.From this analysis, it is evident that expected futureelectricity consumption is most affected by historicalelectricity consumption, followed in descending orderby cooling degree days, battle-related deaths, heatingdegree days, oil production, population, GDP per capita,renewable energy production, natural gas production,electricity production, natural gas net exports, oil netexports, coal production, and coal net exports.
4.2. Limitations of machine learning-based probabilis-tic forecasts
Three notable limitations exist when using inductiveprobabilistic forecasting models: they can only be fitwhen sufficient training data is available, they are not ro-bust to unexpected changes in the relationship betweenhistorical inputs and forecasts, and they may not be in-terpretable in ways that more deductive models can be.
4.2.1. More training data may be requiredAs described earlier, supervised machine learning
models and their variations are inductive: patterns areidentified from numerous observations of input-outputdata pairs. In the case of the LDF probabilistic forecast-ing models introduced earlier, algorithms are used tolearn ground-up relationships between future consump-tion values and inputs including historical consumption,GDP per capita, population, cooling degree days, heat-ing degree days, and other features to define calibratedoutput probability distributions. Because of the poten-tial complexity of the relationships between time seriesinput and output, hundreds of input-output pairings ormore are likely required to learn a reliable model us-ing available information. In contrast, deductive models(or models that are at least more deductive) often re-quire less training data; relationships between historicaldata and input features can be defined by modelers usingexisting economic, social, or technical theory. Whilesupervised machine learning models are optimized toexplicitly fit historical data, they have comparativelyhigher data costs.
4.2.2. Models are not robust to unexpected changes inrelationships between historical data and fore-casts
The act of forecasting is inherently extrapolative;general relationships are learned from historical data to
extrapolate into the future. Challengingly, relationshipsbewteen past and future may change over time. For in-stance, improvements to air conditioning efficiency maybe thought to decrease the influence that cooling degreedays (a measure of how much cooling is needed over aparticular time span) has on electricity consumption.
Probabilistic forecasting models can capture expectedchanges to relationships between historical data andforecasts through characterizations of forecast uncer-tainty. If historical trends in these relationships arefound to be unstable, the model will be rewarded if itincreases forecast uncertainty. This is related to the as-sumption that future forecasting uncertainty should besimilar to past forecasting uncertainty. This assump-tion falls apart, however, if sudden shifts in historicaldata-forecast relationships occur in ways and with mag-nitudes that are not observed in historical training data.
Following our previous example, a sudden and un-expected improvement in electric appliance efficiencywould likely yield over-estimations of future electric-ity demand. Similar effects may be observed withchanges to electricity prices, shifts in economic ac-tivities, consumer preferences, and other phenomena.While these limitations are common to all inductiveforecasting models, other, more deductive frameworksmay deal with them better. For instance, it may beeasy for an expert to know that electricity prices willdecrease at some point in the future given the construc-tion of new local generating capacity. Incorporating thisknowledge in deductive simulation-based models maybe more straightforward than in models following in-ductive frameworks.
4.2.3. Models are still not fully interpretableIn Section 4.1.3 we describe how probabilistic fore-
casting models may lend themselves to analyses that af-ford improved levels of model interpretability. Specifi-cally, feature-specific gradients from the LDF model aredescribed that can inform analysts about how mean con-sumption values and forecast uncertainty change withinput perturbations. Nevertheless, important aspects ofmodels based on artificial neural networks such as theLSTM used in this application of the LDF model, re-main difficult to interpret due to their complexity. Incontrast, simpler models and models based on moredeductive principles may be easier to interpret, and insome ways better garner human trust.
5. Conclusion
In this paper, we discuss ways in which probabilis-tic electricity demand forecasts can provide value to in-
11
frastructure planning endeavors in low-access countries.Among other things, they can enable investments thatcould not occur otherwise. By doing so, they have thepotential to expand the resource pool available for elec-trification efforts by incentivizing private investment.
We also show evidence that such probabilistic meth-ods are underrepresented in the literature when it comesto low-access countries. Additionally, even the mostprominent point forecasts demonstrate high variabilitywhen compared to historical electricity consumption.We use these observations to highlight the need forprobabilistic methods to be applied in this space.
Finally, we highlight a specific model used for proba-bilistic electricity demand forecasting: the LDF model.This model is based on methods for Bayesian infer-ence and artificial neural networks and follows an in-ductive epistemology. We qualitatively describe usefulattributes and limitations of the LDF model and simi-lar promising methods for probabilistic forecasting. Wedo this with the hope of outlining key modeling con-cepts that decision-makers should know before employ-ing such probabilistic forecasts.
6. Acknowledgements
Support for this research was provided by the AppliedResearch Programme on Energy and Economic Growth(EEG), the Enel Foundation, and the Energy for GrowthHub. We would specifically like to thank Claudio Pre-gagnoli, Giuseppe Montesano, and Benjamin Klooss fortheir thoughtful comments and reviews of paper drafts.
References
[1] United Nations, “Sustainable Development Goal 7,” 2017.https://sustainabledevelopment.un.org/sdg7.
[2] IEA, World Energy Outlook 2020. 2020.[3] International Energy Agency, “More people have ac-
cess to electricity than ever before, but the world isfalling short of its sustainable energy goals,” 2019.https://www.iea.org/newsroom/news/2019/may/
sustainable-development-goal-7-tracking-report.
html.[4] E. G. Cazalet, C. E. Clark, and T. W. Keelin, “Costs and benefits
of over/under capacity in electric power system planning. finalreport, october 1978,” tech. rep., Decision Focus, Inc., Palo Alto,CA (USA), 1978.
[5] A. A. Mir, M. Alghassab, K. Ullah, Z. A. Khan, Y. Lu, and M. Im-ran, “A review of electricity demand forecasting in low and mid-dle income countries: The demand determinants and horizons,”Sustainability, vol. 12, no. 15, p. 5931, 2020.
[6] E. Thomson, “Power shortages in china: why?,” China: An Inter-national Journal, vol. 3, no. 1, pp. 155–171, 2005.
[7] S. Yu, L. Zhou, and C. Li, “China wrestles with power shortages,”POWER Magazine, 2013.
[8] M. Dyson and A. Engel, “The billion-dollar costs of forecastingelectricity demand,” Rocky Mountain Institute, 2017.
[9] R. T. Kivaisi, “Installation and use of a 3 kwp pv plant at umbujivillage in zanzibar,” Renewable energy, vol. 19, no. 3, pp. 457–472, 2000.
[10] H. Louie and P. Dauenhauer, “Effects of load estimation erroron small-scale off-grid photovoltaic system design, cost and reli-ability,” Energy for Sustainable Development, vol. 34, pp. 30–43,2016.
[11] S. Mandelli, C. Brivio, E. Colombo, and M. Merlo, “Effect ofload profile uncertainty on the optimum sizing of off-grid pv sys-tems for rural electrification,” Sustainable Energy Technologiesand Assessments, vol. 18, pp. 34–47, 2016.
[12] N. Moksnes, A. Korkovelos, D. Mentis, and M. Howells, “Elec-trification pathways for kenya–linking spatial electrification anal-ysis and medium to long term energy planning,” EnvironmentalResearch Letters, vol. 12, no. 9, p. 095008, 2017.
[13] F. Riva, F. Gardumi, A. Tognollo, and E. Colombo, “Soft-linking energy demand and optimisation models for local long-term electricity planning: An application to rural india,” Energy,vol. 166, pp. 32–46, 2019.
[14] R. Amatya, M. Barbar, Y. Borofsky, M. Brusnahan, P. Ciller,T. Cotterman, F. de Cuadra, C. Drouin, P. Duenas, D. Ellman,A. Gonzalez-Garcıa, S. J. Lee, V. Li, C. Mateo, O. Oladeji,R. Palacios, I. Perez-Arriaga, R. Stoner, and C. Vergara,“Computer-aided electrification planning in developing coun-tries: The Reference Electrification Model (REM),” IIT WorkingPaper, 2018.
[15] P. Ciller, D. Ellman, C. Vergara, A. Gonzalez-Garcıa, S. J. Lee,C. Drouin, M. Brusnahan, Y. Borofsky, C. Mateo, R. Amatya,et al., “Optimal electrification planning incorporating on-and off-grid technologies: the reference electrification model (rem),” Pro-ceedings of the IEEE, vol. 107, no. 9, pp. 1872–1905, 2019.
[16] S. J. Lee, E. Sanchez Jacob, A. Gonzalez Garcıa, P. Ciller Cu-tillas, P. Duenas Martınez, J. Taneja, F. Cuadra Garcıa, J. Lum-breras Martın, H. Daly, R. J. Stoner, and I. J. Perez-Arriaga, “In-vestigating the necessity of demand characterization and stimula-tion for geospatial electrification planning in developing coun-tries,” MIT Center for Energy and Environmental Policy Re-search, 2019.
[17] S. J. Lee, C. L. Dean, D. Suri, P. Somani, J. Pacheco, R. Stoner,I. Perez-Arriaga, J. W. Fisher III, and J. Taneja, “Probabilisticforecasts of country-level electricity demand in Africa,” arxiv,2021.
[18] H. H. Gossen, The laws of human relations and the rules of hu-man action derived therefrom. MIT Press (MA), 1983.
[19] M. J. Kochenderfer, Decision making under uncertainty: theoryand application. MIT press, 2015.
[20] I. J. Perez-Arriaga, R. Stoner, R. Rahnama, S. J. Lee, G. Jacquot,E. Protzer, A. Gonzalez, R. Amatya, M. Brusnahan, P. Duenas,et al., “A utility approach to accelerate universal electricity accessin less developed countries: A regulatory proposal,”
[21] I. J. Perez-Arriaga, R. J. Stoner, D. Nagpal, and G. Jacquot,“Global commission to end energy poverty: Inception report,”MIT Energy Initiative, 2019.
[22] R. De Neufville and S. Scholtes, Flexibility in engineering de-sign. MIT Press, 2011.
[23] C. B. Agaton and H. Karl, “A real options approach to renewableelectricity generation in the philippines,” Energy, Sustainabilityand Society, vol. 8, no. 1, p. 1, 2018.
[24] T. M. Cover and J. A. Thomas, Elements of Information Theory,Second Edition. 2006.
[25] S. J. Lee, “Adaptive electricity access planning,” 2018.[26] C. Brown, P. Alexander, A. Arneth, I. Holman, and M. Roun-
sevell, “Achievement of paris climate goals unlikely due to time
12

lags in the land system,” Nature Climate Change, vol. 9, no. 3,pp. 203–208, 2019.
[27] O. Hoegh-Guldberg, D. Jacob, M. Taylor, T. G. Bolanos,M. Bindi, S. Brown, I. A. Camilloni, A. Diedhiou, R. Djalante,K. Ebi, et al., “The human imperative of stabilizing global cli-mate change at 1.5 c,” Science, vol. 365, no. 6459, 2019.
[28] IPCC, “Mitigation of climate change,” Contribution of WorkingGroup III to the Fifth Assessment Report of the IntergovernmentalPanel on Climate Change, vol. 1454, 2014.
[29] C. E. Casillas and D. M. Kammen, “The energy-poverty-climatenexus,” Science, vol. 330, no. 6008, pp. 1181–1182, 2010.
[30] J. D. Jenkins, M. Luke, and S. Thernstrom, “Getting to zero car-bon emissions in the electric power sector,” Joule, vol. 2, no. 12,pp. 2498–2510, 2018.
[31] W. Boyd, “Public utility and the low-carbon future,” UCLA L.Rev., vol. 61, p. 1614, 2013.
[32] T. Hong, P. Pinson, S. Fan, H. Zareipour, A. Troccoli, and R. J.Hyndman, “Probabilistic energy forecasting: Global energy fore-casting competition 2014 and beyond,” 2016.
[33] C. L. Dean, S. J. Lee, J. Pacheco, and J. W. Fisher III,“Lightweight data fusion via conjugate mappings,” arXiv preprintarXiv:2011.10607, 2020.
[34] IEA, World Energy Outlook 1998. 1998.[35] IEA, World Energy Outlook 2000. 2000.[36] IEA, World Energy Outlook 2002. 2002.[37] IEA, World Energy Outlook 2004. 2004.[38] IEA, World Energy Outlook 2006. 2006.[39] IEA, World Energy Outlook 2008. 2008.[40] IEA, World Energy Outlook 2009. 2009.[41] IEA, World Energy Outlook 2010. 2010.[42] IEA, World Energy Outlook 2011. 2011.[43] IEA, World Energy Outlook 2012. 2012.[44] IEA, World Energy Outlook 2013. 2013.[45] IEA, World Energy Outlook 2014. 2014.[46] IEA, World Energy Outlook 2015. 2015.[47] IEA, World Energy Outlook 2016. 2016.[48] IEA, World Energy Outlook 2017. 2017.[49] IEA, World Energy Outlook 2018. 2018.[50] IEA, World Energy Outlook 2019. 2019.[51] US EIA, International Energy Outlook 1995. 1995.[52] US EIA, International Energy Outlook 1996. 1996.[53] US EIA, International Energy Outlook 1997. 1997.[54] US EIA, International Energy Outlook 1998. 1998.[55] US EIA, International Energy Outlook 1999. 1999.[56] US EIA, International Energy Outlook 2000. 2000.[57] US EIA, International Energy Outlook 2001. 2001.[58] US EIA, International Energy Outlook 2002. 2002.[59] US EIA, International Energy Outlook 2003. 2003.[60] US EIA, International Energy Outlook 2004. 2004.[61] US EIA, International Energy Outlook 2005. 2005.[62] US EIA, International Energy Outlook 2006. 2006.[63] US EIA, International Energy Outlook 2007. 2007.[64] US EIA, International Energy Outlook 2008. 2008.[65] US EIA, International Energy Outlook 2009. 2009.[66] US EIA, International Energy Outlook 2010. 2010.[67] US EIA, International Energy Outlook 2011. 2011.[68] US EIA, International Energy Outlook 2013. 2013.[69] US EIA, International Energy Outlook 2016. 2016.[70] US EIA, International Energy Outlook 2017. 2017.[71] US EIA, International Energy Outlook 2019. 2019.[72] H. Liao, J.-W. Cai, D.-W. Yang, and Y.-M. Wei, “Why did the
historical energy forecasting succeed or fail? a case study oniea’s projection,” Technological Forecasting and Social Change,vol. 107, pp. 90–96, 2016.
[73] IEA, “World energy model documentation, 2020 version,” 2020.
[74] O. of Energy Analysis, “World energy projection system modeldocumentation,” tech. rep., U.S. Energy Information Administra-tion, 2011.
[75] C. Wolfram, “What the heck is happening in the developingworld?,” Energy Institute Blog, 2016.
[76] L. Borjeson, M. Hojer, K.-H. Dreborg, T. Ekvall, and G. Finnve-den, “Scenario types and techniques: towards a user’s guide,” Fu-tures, vol. 38, no. 7, pp. 723–739, 2006.
[77] S. S. Adebola, “Electricity consumption and economic growth:Trivariate investigation in botswana with capital formation,” In-ternational Journal of Energy Economics and Policy, vol. 1, no. 2,pp. 32–46, 2011.
[78] A. Adedokun, “Nigeria electricity forecast and vision 20: 2020:Evidence from arima model,” Energy Sources, Part B: Eco-nomics, Planning, and Policy, vol. 11, no. 11, pp. 1027–1034,2016.
[79] O. Adeoye and C. Spataru, “Modelling and forecasting hourlyelectricity demand in west african countries,” Applied Energy,vol. 242, pp. 311–333, 2019.
[80] P. K. Adom and W. Bekoe, “Conditional dynamic forecast ofelectrical energy consumption requirements in ghana by 2020: Acomparison of ardl and pam,” Energy, vol. 44, no. 1, pp. 367–380,2012.
[81] M. Bazilian, P. Nussbaumer, H.-H. Rogner, A. Brew-Hammond,V. Foster, S. Pachauri, E. Williams, M. Howells, P. Niyongabo,L. Musaba, et al., “Energy access scenarios to 2030 for the powersector in sub-saharan africa,” Utilities Policy, vol. 20, no. 1, pp. 1–16, 2012.
[82] BP, Energy Outlook 2020. 2020.[83] R. Van Buskirk, “Analysis of long-range clean energy invest-
ment scenarios for eritrea, east africa,” Energy policy, vol. 34,no. 14, pp. 1807–1817, 2006.
[84] D. Chikobvu and C. Sigauke, “Regression-sarima modelling ofdaily peak electricity demand in south africa,” Journal of Energyin Southern Africa, vol. 23, no. 3, pp. 23–30, 2012.
[85] ExxonMobil, Outlook for Energy: A perspective to 2040. 2019.[86] O. Ezennaya, O. Isaac, U. Okolie, and O. Ezeanyim, “Analysis
of nigerias national electricity demand forecast (2013–2030),” In-ternational Journal of Science and Technology Research, vol. 3,no. 3, pp. 333–340, 2014.
[87] I. A. Ezenugu, S. C. Nwokonko, and I. Markson, “Modellingand forecasting of residential electricity consumption in nige-ria using multiple and quadratic regression models,” AmericanJournal of Software Engineering and Applications, vol. 6, no. 3,pp. 99–104, 2017.
[88] S. Guefano, J. G. TAMBA, T. E. W. Azong, and L. Monkam,“Forecast of electricity consumption in the cameroonian residen-tial sector by grey and vector autoregressive models,” Energy,p. 118791, 2020.
[89] R. Inglesi, “Aggregate electricity demand in south africa: Con-ditional forecasts to 2030,” Applied energy, vol. 87, no. 1,pp. 197–204, 2010.
[90] IEA, World Energy Outlook 2019. 2019.[91] A. Miketa and B. Merven, “West african power pool: Planning
and prospects for renewable energy,” IRENA, Abu Dhabi, 2013.[92] IRENA, “Global renewables outlook: energy transformation
2050 (edition: 2020),” 2020.[93] M. E. Lebotsa, C. Sigauke, A. Bere, R. Fildes, and J. E. Boylan,
“Short term electricity demand forecasting using partially linearadditive quantile regression with an application to the unit com-mitment problem,” Applied Energy, vol. 222, pp. 104–118, 2018.
[94] L. Marwala and B. Twala, “Forecasting electricity consumptionin south africa: Arma, neural networks and neuro-fuzzy sys-tems,” in 2014 International Joint Conference on Neural Net-works (IJCNN), pp. 3049–3055, IEEE, 2014.
13

[95] P. Mokilane, J. Galpin, V. Sarma Yadavalli, P. Debba, R. Koen,and S. Sibiya, “Density forecasting for long-term electricity de-mand in south africa using quantile regression,” South AfricanJournal of Economic and Management Sciences, vol. 21, no. 1,pp. 1–14, 2018.
[96] A. S. Momodu, A. Addo, J.-F. K. Akinbami, and Y. Mulugetta,“Low-carbon development strategy for the west african electric-ity system: preliminary assessment using system dynamics ap-proach,” Energy, Sustainability and Society, vol. 7, no. 1, p. 11,2017.
[97] G. Okoboi and J. Mawejje, “Electricity peak demand in uganda:insights and foresight,” Energy, Sustainability and Society, vol. 6,no. 1, p. 29, 2016.
[98] N. S. Ouedraogo, “Africa energy future: Alternative scenariosand their implications for sustainable development strategies,”Energy Policy, vol. 106, pp. 457–471, 2017.
[99] N. S. Ouedraogo, “Modeling sustainable long-term electricitysupply-demand in africa,” Applied energy, vol. 190, pp. 1047–1067, 2017.
[100] E. Panos, H. Turton, M. Densing, and K. Volkart, “Poweringthe growth of sub-saharan africa: the jazz and symphony scenar-ios of world energy council,” Energy for Sustainable Develop-ment, vol. 26, pp. 14–33, 2015.
[101] E. Panos, M. Densing, and K. Volkart, “Access to electricityin the world energy council’s global energy scenarios: An out-look for developing regions until 2030,” Energy Strategy Reviews,vol. 9, pp. 28–49, 2016.
[102] S. A. Sarkodie, “Estimating ghanas electricity consumption by2030: An arima forecast,” Energy Sources, Part B: Economics,Planning, and Policy, vol. 12, no. 10, pp. 936–944, 2017.
[103] K. Shibano and G. Mogi, “Electricity consumption forecastmodel using household income: Case study in tanzania,” Ener-gies, vol. 13, no. 10, p. 2497, 2020.
[104] C. Sigauke, “Forecasting medium-term electricity demand in asouth african electric power supply system,” Journal of Energy inSouthern Africa, vol. 28, no. 4, pp. 54–67, 2017.
[105] C. Sigauke and A. Bere, “Modelling non-stationary time se-ries using a peaks over threshold distribution with time varyingcovariates and threshold: An application to peak electricity de-mand,” Energy, vol. 119, pp. 152–166, 2017.
[106] C. Sigauke and D. Chikobvu, “Daily peak electricity load fore-casting in south africa using a multivariate non-parametric regres-sion approach,” ORiON, vol. 26, no. 2, 2010.
[107] R. Spalding-Fecher, M. Senatla, F. Yamba, B. Lukwesa,G. Himunzowa, C. Heaps, A. Chapman, G. Mahumane,B. Tembo, and I. Nyambe, “Electricity supply and demandscenarios for the southern african power pool,” Energy Policy,vol. 101, pp. 403–414, 2017.
[108] C. Taliotis, A. Shivakumar, E. Ramos, M. Howells, D. Men-tis, V. Sridharan, O. Broad, and L. Mofor, “An indicative analysisof investment opportunities in the african electricity supply sec-torusing temba (the electricity model base for africa),” Energy forSustainable Development, vol. 31, pp. 50–66, 2016.
[109] L. Tartibu and K. Kabengele, “Forecasting net energy con-sumption of south africa using artificial neural network,” in 2018International Conference on the Industrial and Commercial Useof Energy (ICUE), pp. 1–7, IEEE, 2018.
[110] United States Energy Information Administration, Interna-tional Energy Outlook 2020. 2020.
[111] World Energy Council, World Energy Scenarios: composingenergy futures to 2050. 2013.
Supplemental Information
6.1. IEA and EIA Historical Forecasts for India, China,and the U.S.
Fig. 5, 6, and 7 show historical electricity demandand historical forecasts from the IEA and EIA for India,China, and the U.S., respectively.
6.2. Predictive, Explorative, and Normative Models
Future energy scenarios can be classified accordingto the types of questions they seek to answer. Predictivescenarios answer the question “what will happen in thefuture?” Predictive scenarios are often informed by dataon the historical and current states of a system being an-alyzed. Explorative scenatios seek to answer the ques-tion, “what can happen in the future?”, and generallyoutline points along a range of possible conditional out-comes. Lastly, normative scenarios answer the question“how can a specific target be reached?” These scenariosare often constructed by modeling some future state of asystem, and then working backwards to understand howthose outcomes could be realized [76].
Each of these three modeling types have applicationsthat they are well-suited for; however, predictive scenar-ios are most useful for planning concrete investments inelectricity infrastructure in low-access countries. Plan-ners need to consider forecasts of what is actually likelyto occur in the future to right-size network, generation,and storage investments.
Table 1 shows a non-exhaustive review of existingelectricity forecasting studies for countries and regionsin Africa. In these tables, we classify models by predic-tive, explorative, and normative model types; whether ornot the model is probabilistic; the number of national-level forecasts presented; whether or not forecasts areprovided at the region- or continent-level; whether ornot forecasts are global in scope; and the forecast timehorizon. The LDF model [17] described in Section 4 ishighlighted in the table.
14

1990 2000 2010 2020 2030 2040
500
1000
1500
2000
2500
3000
3500
Tota
l Ele
ctric
ity C
onsu
mpt
ion
(TW
h)
Historical and IEA Forecasted Total Electricity Consumption in India
Forecast from WEO 2000Forecast from WEO 2002Forecast from WEO 2004Forecast from WEO 2008 Forecast from WEO 2009Forecast from WEO 2010 Forecast from WEO 2011Forecast from WEO 2012Forecast from WEO 2013Forecast from WEO 2014Forecast from WEO 2015Forecast from WEO 2016Forecast from WEO 2017Forecast from WEO 2018Forecast from WEO 2019Historical Consumption
1990 2000 2010 2020 2030 2040
500
1000
1500
2000
2500
3000
3500
Tota
l Ele
ctric
ity C
onsu
mpt
ion
(TW
h)
Historical and EIA Forecasted Total Electricity Consumption in India
Forecast from IEO 1996Forecast from IEO 1997Forecast from IEO 1998Forecast from IEO 1999Forecast from IEO 2000Forecast from IEO 2001Forecast from IEO 2002Forecast from IEO 2003Forecast from IEO 2004Forecast from IEO 2005Forecast from IEO 2006Forecast from IEO 2007Forecast from IEO 2008Forecast from IEO 2009Forecast from IEO 2010Forecast from IEO 2011Forecast from IEO 2013Forecast from IEO 2016Forecast from IEO 2017Forecast from IEO 2019Historical Consumption
Figure 5: Comparing historical electricity demand and historical forecasts for India. Forecasts are shown fromthe IEA (top) and EIA (bottom).
15

1990 2000 2010 2020 2030 2040
2000
4000
6000
8000
10000
Tota
l Ele
ctric
ity C
onsu
mpt
ion
(TW
h)
Historical and IEA Forecasted Total Electricity Consumption in China
Forecast from WEO 1998Forecast from WEO 2000Forecast from WEO 2002Forecast from WEO 2004Forecast from WEO 2006 Forecast from WEO 2008 Forecast from WEO 2009Forecast from WEO 2010 Forecast from WEO 2011Forecast from WEO 2012Forecast from WEO 2013Forecast from WEO 2014Forecast from WEO 2015Forecast from WEO 2016Forecast from WEO 2017Forecast from WEO 2018Forecast from WEO 2019Historical Consumption
1990 2000 2010 2020 2030 2040
2000
4000
6000
8000
10000
Tota
l Ele
ctric
ity C
onsu
mpt
ion
(TW
h)
Historical and EIA Forecasted Total Electricity Consumption in China
Forecast from IEO 1995Forecast from IEO 1996Forecast from IEO 1997Forecast from IEO 1998Forecast from IEO 1999Forecast from IEO 2000Forecast from IEO 2001Forecast from IEO 2002Forecast from IEO 2003Forecast from IEO 2004Forecast from IEO 2005Forecast from IEO 2006Forecast from IEO 2007Forecast from IEO 2008Forecast from IEO 2009Forecast from IEO 2010Forecast from IEO 2011Forecast from IEO 2013Forecast from IEO 2016Forecast from IEO 2017Forecast from IEO 2019Historical Consumption
Figure 6: Comparing historical electricity demand and historical forecasts for China. Forecasts are shown fromthe IEA (top) and EIA (bottom).
16
1990 2000 2010 2020 2030 2040
3000
3500
4000
4500
5000
Tota
l Ele
ctric
ity C
onsu
mpt
ion
(TW
h)
Historical and IEA Forecasted Total Electricity Consumption in the United States
Forecast from WEO 2006 Forecast from WEO 2008 Forecast from WEO 2009Forecast from WEO 2010 Forecast from WEO 2011Forecast from WEO 2012Forecast from WEO 2013Forecast from WEO 2014Forecast from WEO 2015Forecast from WEO 2016Forecast from WEO 2017Forecast from WEO 2018Forecast from WEO 2019Historical Consumption
1990 2000 2010 2020 2030 2040
3000
3500
4000
4500
5000
5500
Tota
l Ele
ctric
ity C
onsu
mpt
ion
(TW
h)
Historical and EIA Forecasted Total Electricity Consumption in the United States
Forecast from IEO 1995Forecast from IEO 1996Forecast from IEO 1997Forecast from IEO 1998Forecast from IEO 1999Forecast from IEO 2000Forecast from IEO 2001Forecast from IEO 2002Forecast from IEO 2003Forecast from IEO 2004Forecast from IEO 2005Forecast from IEO 2006Forecast from IEO 2007Forecast from IEO 2008Forecast from IEO 2009Forecast from IEO 2010Forecast from IEO 2011Forecast from IEO 2013Forecast from IEO 2016Forecast from IEO 2017Forecast from IEO 2019Historical Consumption
Figure 7: Comparing historical electricity demand and historical forecasts for the United States. Forecasts areshown from the IEA (top) and EIA (bottom).
17

Table 1: Table with attributes of electricity demand forecasting studies in Africa.
Model Type Geographic Scope
Author Year Title Methodology
Pred
ictiv
e
Exp
lora
tive
Nor
mat
ive
Prob
abili
stic
Nat
iona
l-le
vel
Reg
.orC
ont.-
leve
l
Glo
bal
Forecast Time Horizon Ref.
1 Lee et al. 2020 Probabilistic forecasts of country-levelelectricity demand in Africa
LDF, LSTM X X 52 X 2016-2031 [17]
2 Adebola 2011 Electricity consumption and economicgrowth: Trivariate investigation in Botswanawith capital formation
ARIMA X 1 2009-2016 [77]
3 Adedokun 2016 Nigeria electricity forecast and vision 2020:Evidence from ARIMA model
ARIMA X X X 1 2012-2050 [78]
4 Adeoye andSpataru
2019 Modelling and forecasting hourly electricitydemand in West African countries
Bottom-up;Linear Model-Based
X 14 2017-2030 [79]
5 Adom and Bekoe 2012 Conditional dynamic forecast of electricalenergy consumption requirements in Ghanaby 2020: A comparison of ARDL and PAM
ARDL; PAM X 1 2009-2020 [80]
6 Bazilian et al. 2012 Energy access scenarios to 2030 for the powersector in sub-Saharan Africa
Heuristic X X X 2010-2030 [81]
7 BP 2020 Energy Outlook 2020 Proprietary X X X 2018-2050 [82]
8 Van Buskirk 2006 Analysis of long-range clean energyinvestment scenarios for Eritrea, East Africa
Economic, De-ductive
X X 1 2000-2100 [83]
9 Chikobvu andSigauke
2012 Regression-SARIMA modelling of daily peakelectricity demand in South Africa
SARIMA;Regression-SARIMA
X X 12009
(14 days)[84]
10 ExxonMobil 2019 Outlook for Energy: A perspective to 2040 Proprietary X X X X 2017-2040 [85]
11 Ezennaya 2014 Analysis of Nigeria’s national electricitydemand forecast (2013-2030)
Linear Model-Based
X 1 2013-2030 [86]
12 Ezenugu et al. 2017 Modelling and Forecasting of residentialelectricity consumption in Nigeria usingMultiple and Quadratic regression models
Multiple andQuadraticRegression
X 1 2015-2029 [87]
13 Guefano et al. 2020 Forecast of electricity consumption in theCameroonian residential sector by Grey andvector autoregressive models
Grey and Vec-tor Autoregres-sive Models
X 1 2018-2025 [88]
14 Inglesi 2010 Aggregate electricity demand in South Africa:Conditional forecasts to 2030
Linear Model-Based
X 1 2006-2030 [89]
18

Model Type Geographic Scope
Author Year Title Methodology
Pred
ictiv
e
Exp
lora
tive
Nor
mat
ive
Prob
abili
stic
Nat
iona
l-le
vel
Reg
.orC
ont.-
leve
l
Glo
bal
Forecast Time Horizon Ref.
15 InternationalEnergy Agency
2020 World Energy Outlook EconometricMethods;Simulation-Based Model
X X X 1 X X 2025-2040 [90]
16 InternationalRenewableEnergy Agency
2013 West African power pool: Planning andprospects for renewable energy
Extrapolation X 13 2010-2050 [91]
17 InternationalRenewableEnergy Agency
2020 Global Renewables Outlook: Energytransformation 2050
Bottom-up X X X X 2016-2050 [92]
18 Lebotsa et al. 2018 Short term electricity demand forecastingusing partially linear additive quantileregression with an application to the unitcommitment problem
Partially LinearAdditive Quan-tile Regression
X X 12012
(hourly)[93]
19 Marwala andTwala
2014 Forecasting electricity consumption in SouthAfrica: ARMA, neural networks andneuro-fuzzy systems
ANNs; ARMA X 1 2012-2023 [94]
20 Mokilane et al. 2018 Density forecasting for long-term electricitydemand in South Africa using quantileregression
Quantile Re-gression
X X 1 2013-2023 [95]
21 Momodu et al. 2017 Low-carbon development strategy for theWest African electricity system: preliminaryassessment using System dynamics approach
Systems Dy-namics
X X 2015-2060 [96]
22 Okoboi andMawejje
2016 Electricity peak demand in Uganda: insightsand foresight
Linear Model-Based (DoubleExponentialForecastingModel)
X 1 2014-2021 [97]
23 Ouedraogo 2017 Africa energy future: Alternative scenariosand their implications for sustainabledevelopment strategies
Bottom-up(LEAP)
X X 2010-2040 [98]
24 Ouedraogo 2017 Modeling sustainable long-term electricitysupply-demand in Africa
Bottom-up(LEAP)
X X 2015-2040 [99]
25 Panos et al. 2015 Powering the growth of Sub-Saharan Africa:the jazz and symphony scenarios of WorldEnergy Council
Bottom-up(MARKAL)
X X 2050 [100]
19
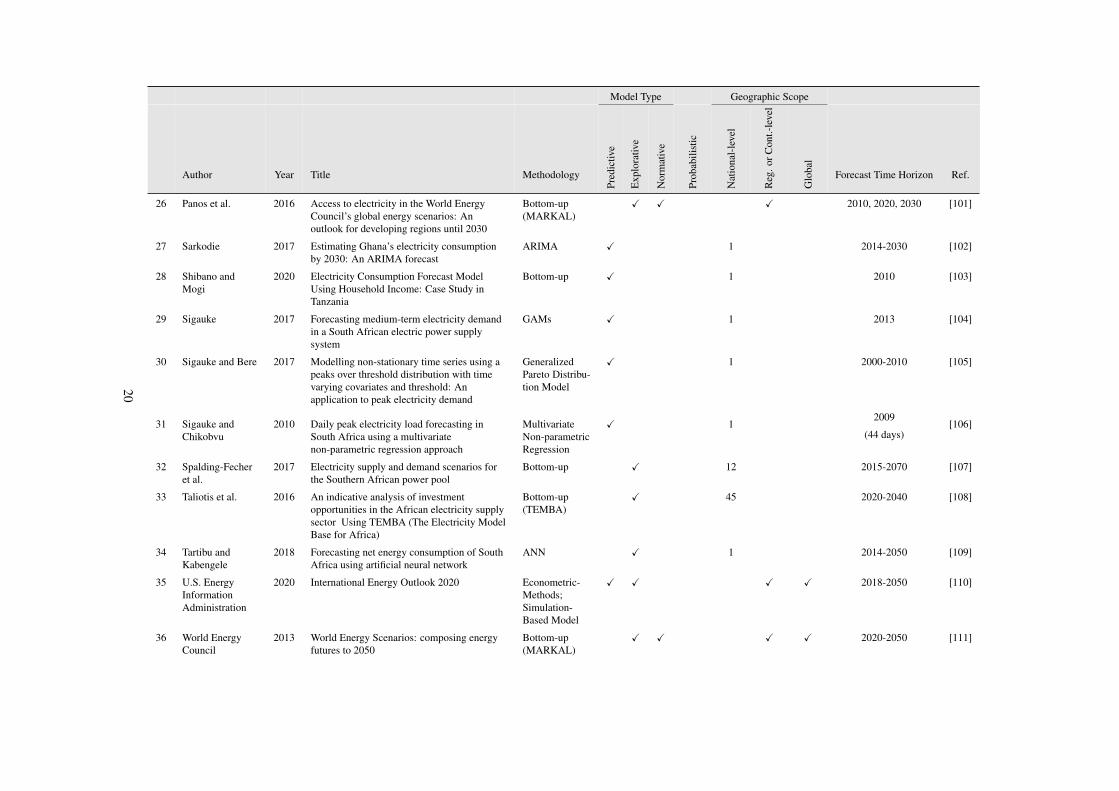
Model Type Geographic Scope
Author Year Title Methodology
Pred
ictiv
e
Exp
lora
tive
Nor
mat
ive
Prob
abili
stic
Nat
iona
l-le
vel
Reg
.orC
ont.-
leve
l
Glo
bal
Forecast Time Horizon Ref.
26 Panos et al. 2016 Access to electricity in the World EnergyCouncil’s global energy scenarios: Anoutlook for developing regions until 2030
Bottom-up(MARKAL)
X X X 2010, 2020, 2030 [101]
27 Sarkodie 2017 Estimating Ghana’s electricity consumptionby 2030: An ARIMA forecast
ARIMA X 1 2014-2030 [102]
28 Shibano andMogi
2020 Electricity Consumption Forecast ModelUsing Household Income: Case Study inTanzania
Bottom-up X 1 2010 [103]
29 Sigauke 2017 Forecasting medium-term electricity demandin a South African electric power supplysystem
GAMs X 1 2013 [104]
30 Sigauke and Bere 2017 Modelling non-stationary time series using apeaks over threshold distribution with timevarying covariates and threshold: Anapplication to peak electricity demand
GeneralizedPareto Distribu-tion Model
X 1 2000-2010 [105]
31 Sigauke andChikobvu
2010 Daily peak electricity load forecasting inSouth Africa using a multivariatenon-parametric regression approach
MultivariateNon-parametricRegression
X 12009
(44 days)[106]
32 Spalding-Fecheret al.
2017 Electricity supply and demand scenarios forthe Southern African power pool
Bottom-up X 12 2015-2070 [107]
33 Taliotis et al. 2016 An indicative analysis of investmentopportunities in the African electricity supplysector Using TEMBA (The Electricity ModelBase for Africa)
Bottom-up(TEMBA)
X 45 2020-2040 [108]
34 Tartibu andKabengele
2018 Forecasting net energy consumption of SouthAfrica using artificial neural network
ANN X 1 2014-2050 [109]
35 U.S. EnergyInformationAdministration
2020 International Energy Outlook 2020 Econometric-Methods;Simulation-Based Model
X X X X 2018-2050 [110]
36 World EnergyCouncil
2013 World Energy Scenarios: composing energyfutures to 2050
Bottom-up(MARKAL)
X X X X 2020-2050 [111]
20


