Embed Size (px)
Citation preview
Journal of Accounting ResearchVol. 41 No. 2 May 2003
Printed in U.S.A.
How Representative Are FirmsThat Are Cross-Listed in theUnited States? An Analysis of
Accounting Quality
M A R K L A N G , ∗ J A N A S M I T H R A E D Y , ∗A N D M I C H E L L E H I G G I N S Y E T M A N †
Received 20 December 2001; accepted 13 November 2002
ABSTRACT
We provide evidence on the characteristics of local generally accepted ac-counting principles (GAAP) earnings for firms cross-listing on U.S. exchangesrelative to a matched sample of foreign firms currently not cross-listing in theUnited States to investigate whether U.S. listing is associated with differencesin accounting data reported in local markets. We find that cross-listed firmsdiffer in terms of the time-series properties of earnings and accruals, and thedegree of association between accounting data and share prices. Cross-listedfirms appear to be less aggressive in terms of earnings management and re-port accounting data that are more conservative, take account of bad newsin a more timely manner, and are more strongly associated with share price.Furthermore, the differences appear to result partially from changes aroundcross-listing and partially from differences in accounting quality before listing.We do not observe a similar pattern for firms cross-listed on other non-U.S.exchanges or on the U.S. over-the-counter market, suggesting a unique qualityto cross-listing on U.S. exchanges.
∗University of North Carolina, Chapel Hill; †University of Iowa. We appreciate helpfulsuggestions from Ray Ball (editor); Peter Joos (referee); workshop participants at the Jour-nal of Accounting Research conference, the University of North Carolina, the University ofPennsylvania, the University of California-Berkeley, the University of Queensland, MonashUniversity, Queensland Institute of Technology, the American Accounting Association annualmeetings; Allison Evans; Irene Karamanou; Maria Nondorf; Kevin Raedy; Brian Rountree;Steve Salter; and Bob Yetman.
363
Copyright C©, University of Chicago on behalf of the Institute of Professional Accounting, 2003
364 M. LANG, J. S. RAEDY, AND M. H. YETMAN
1. Introduction
We provide descriptive evidence on the characteristics of accounting datafor foreign firms that cross-list in U.S. markets relative to matched samplesof foreign firms currently not cross-listing in the United States. In particu-lar, our interest is in investigating whether a firm’s decision to cross-list intothe relatively demanding U.S. cross-listing environment is associated withsystematic differences in the quality of earnings reported in their homemarket. Although the decision to cross-list is not directly linked to domes-tic reporting choices, a body of literature summarized in Coffee [2002]suggests that cross-listing may serve a bonding role, causing systematic dif-ferences in terms of transparency between firms that opt into cross-listingon U.S. markets and others in their local markets. In particular, cross-listingfirms face (1) increased enforcement by the Securities and Exchange Com-mission(SEC), (2) a more demanding litigation environment, and (3) en-hanced disclosure and reconciliations to U.S. generally accepted accountingprinciples (GAAP), all of which may affect the kinds of firms attracted toU.S. cross-listing and the characteristics of their accounting data.
In our primary analysis, we compare firms currently cross-listed (CL)on U.S. exchanges with a sample of non-cross-listed (NCL) firms that arematched based on country, year, industry, and growth and that satisfy thelisting criteria for the exchange on which the CL firm is traded. Where possi-ble, we also control for differences in size, leverage, growth, equity issuances,debt issuances, and capital intensity.1 Our evidence suggests that CL firmshave higher quality accounting information as measured by various mea-sures of income smoothing and earnings management, by various measuresof timely loss recognition, and by associations of accounting informationwith returns and prices.2
In addition to examining the differences between CL and NCL firms, wealso consider two potential causes for these differences: changes aroundcross-listing and pre-listing differences. In terms of pre-listing differences,firms that self-select into U.S. listing are likely to be willing to subjectthemselves to the scrutiny attached to cross-listing. Doidge, Karolyi, and
1 A potential concern is that it is inherently impossible to adequately match CL firms toNCL firms on all dimensions related to cross-listing because NCL firms chose not to cross-listand, therefore, must be different. However, research such as Doidge, Karolyi, and Stulz [2001]differentiates between motivations based on maximizing firm value and those on maximizingthe utility of those in positions of power. For example, two firms may be very similar in termsof underlying economics, but one may chose not to cross-list because managers’ incentivesare poorly aligned with shareholders and managers fear the reduced flexibility associated withgreater transparency. In that case, two firms could have very similar economic incentives tocross-list (growth, equity issuance, etc.), but one would not because of poor incentive alignment.
2 We use the term “accounting quality” for parsimony and do not intend to imply optimality.Consistent with the prior literature (e.g., Leuz, Nanda, and Wysocki [Forthcoming], Ball,Kothari, and Robin [2000]), we view earnings to be of higher quality if they are characterizedby less evidence of earnings management, more timely recognition of bad news, and a higherassociation with share price.
HOW REPRESENTATIVE ARE FIRMS CROSS-LISTED IN THE U.S.? 365
Stulz [2001], for example, envision a situation in which managers trade offfirmwide gains from access to U.S. capital markets against reduced personalflexibility to expropriate shareholder wealth. They argue that one will ob-serve differences in cross-listing decisions across firms with similar firmwideeconomic motivations for cross-listing based on differences in managerialincentive alignment. In that scenario, cross-listing firms will tend to be thosethat have historically been more transparent to the market by, for example,providing more informative accounting data, because the incremental costto providing additional transparency will tend to be lower.
Second, cross-listing may cause firms to change their local GAAP report-ing. In particular, even if the firm has relatively transparent reporting beforecross-listing, the added regulatory requirements and litigation exposure as-sociated with cross-listing may cause firms to change local reporting. Reeseand Weisbach [2001], for example, show that firms cross-listing on U.S.markets tend to raise more capital in local markets following cross-listing,suggesting that firms cross-list to bond themselves to more transparencyeven in their home market. Furthermore, having reconciliations and disclo-sures in the United States that are in the public domain likely reduces thecosts of moving local reporting toward greater transparency.
Our results provide evidence of both changes around cross-listing andpre-listing differences. Although it is difficult to draw causality, the overallpicture is generally consistent with the idea that CL firms have better man-agerial incentive alignment and, hence, a stronger predisposition towardtransparency preceding listing, and are more willing to bond themselves togreater transparency and to further improvements in reporting after listing.
In an attempt to assess whether the results reflect features unique to cross-listing on U.S. exchanges, we conduct a variety of robustness tests. First, wecompare CL firms with non-U.S. firms trading on other types of U.S. mar-kets such as the over-the-counter (OTC) market. Because OTC firms tradein the United States but face a different regulatory environment, they pro-vide a potentially interesting comparison sample. Second, we replicate ourprimary analysis for a subset of NCL firms with a high probability of cross-listing based on a cross-listing prediction model. Our goal is to focus on thesubset of NCL firms that appears to have the strongest economic incentiveto cross-list. Finally, we compare a subsample of the NCL firms that cross-listin non-U.S. markets with their CL counterparts. These firms are interestingbecause they have chosen to cross-list, but not in the U.S. market. Althougheach of the robustness tests has limitations, we find evidence consistent withour primary analysis in the sense that the comparison sample remains signif-icantly different from the CL sample across our earnings quality measures.
Our results relate to several literatures. First, they relate to the substan-tial body of accounting research literature, summarized in studies such asPownall and Schipper [1999], that examines the nature and informationcontent of reconciliations to U.S. GAAP required under Form 20-F. Despitethe potentially large differences between U.S. and non-U.S. GAAP, a generalfinding of that literature is that reconciling items are often relatively small
366 M. LANG, J. S. RAEDY, AND M. H. YETMAN
and do not appear to provide much incremental information to the market.Our results suggest a potential explanation for the Form 20-F findings; CLfirms are a fairly unique group in the sense that they report higher qualitylocal GAAP earnings than do other firms in the local market. As a result, itfollows that differences between local and U.S. GAAP would likely be lowerfor CL firms, but they may not be representative of other firms in the localmarket.
Our results also suggest the importance of considering a firm’s listing sta-tus in understanding its accounting choices, even in its local market. Ouranalysis suggests that a U.S. cross-listed firm’s local accounting choices arelikely different from those of other firms in the local jurisdiction. Althoughmuch of the accounting research literature categorizes firms based on coun-try of domicile, our results imply that factors such as listing choice may be asimportant as domicile. Similarly, they suggest the mitigating effect of incen-tives relative to requirements in accounting choice. As Ball [2001] discusses,changing accounting standards without changing enforcement and litiga-tion may have little effect on actual behavior. With cross-listing, we observethat the added scrutiny and legal exposure may have substantial implicationsfor accounting choice, even absent changes in local requirements.
Finally, our results relate indirectly to the literature in finance, law, andeconomics on the potential for cross-listing to serve as a “bonding” device.For example, Coffee [2002] synthesizes the existing research and survey ev-idence in an attempt to infer why firms cross-list and, hence, what featuresare likely to characterize exchanges that will be able to compete successfully.He concludes that the evidence is most consistent with the notion that firmscross-list in the United States to bond themselves to improved investor pro-tection and disclosure. Similarly, Doidge, Karolyi, and Stulz [2001] arguethat if firms in a given market differ in the extent to which managementincentives are well aligned with minority shareholder interests, managersof firms with better aligned incentives will choose greater transparency ingeneral, and U.S. cross-listing in particular, because the managers are lessconcerned about their ability to expropriate wealth and more concernedabout maximizing shareholder value. Again, our results suggest that firmswith more transparent reporting are more likely to list on U.S. markets.Furthermore, they tend to improve their reporting in their home marketsfollowing cross-listing.
In the next section, we provide a background discussion of the incentivesfaced by cross-listing firms and their implications for the regulatory debate.Section 3 contains a description of the data, followed by empirical analysisand results in section 4. Section 5 concludes.
2. Background
The United States has a reputation as a particularly challenging regula-tory and legal environment for cross-listed firms. Although non-U.S. firmsare not required to comply with all aspects of U.S. listing to the same extent
HOW REPRESENTATIVE ARE FIRMS CROSS-LISTED IN THE U.S.? 367
as domestic firms, they face more requirements than are typical in other en-vironments. Most notably, non-U.S. registrants fall under the jurisdiction ofthe SEC, which is known to be a particularly demanding regulator. In addi-tion, cross-listed firms must comply with additional disclosure requirementsin the U.S. market, including a reconciliation of net income and sharehold-ers’ equity to U.S. GAAP. Furthermore, the U.S. environment is viewed asparticularly litigious. Although there have not been many successful suitsagainst cross-listed firms to date, firms often cite perceived litigation risk asa factor in choosing U.S. listing.
On the other hand, U.S. requirements for cross-listing firms are less oner-ous than for domestic firms. In particular, the SEC is willing to work withpotential cross-listing firms to ease listing difficulties including, for exam-ple, allowing exceptions from U.S. GAAP reconciliations in cases in whichcomputing reconciling items are too onerous. Furthermore, firms may filefinancial statements and footnotes in accordance with local GAAP, with rec-onciling items for bottom-line net income and shareholders’ equity at a fairlysummary level. In addition, cross-listing firms face relaxed requirements onother dimensions relative to U.S. firms, as discussed in Coffee [2002]. Forexample, these requirements relax disclosure regarding compensation andinterested director transactions, do not require quarterly reporting unlessthe firm files quarterly in its local jurisdiction, and provide the firm with sixmonths after year-end to file Form 20-F versus 90 days for U.S. firms.
The consequences of the current level of regulation remain a matter fordebate. Although some argue that the added costs may keep some firmsfrom listing (e.g., Cochrane, Shapiro, and Tobin [1996]), others note thatthey may serve as a screening mechanism, attracting firms that are willingto comply with the more demanding environment (see Coffee [2002] for asummary).
3. Data
We obtain our sample of CL firms for 1990 through 2001 from the Bankof New York Global Equity Investing Depositary Receipt Services (BNY) asof July 2002. We exclude Canadian firms because their local reporting ismore similar to U.S. GAAP, and in some cases, they face different regu-latory requirements. Our sample of CL firms includes sponsored Level IIor III depository receipts, which trade on the New York Stock Exchange(NYSE), American Stock Exchange (AMEX), or Nasdaq and require SECregistration. We gather accounting and market data from Datastream Inter-national. To be included in the analysis, CL firms must have data availableboth before and after cross-listing to enhance comparability across pre- andpost-cross-listing periods.
We construct our sample of NCL firm-years by matching them with CLfirms-years. For an NCL firm to be considered a match, it must be in thesame industry group (based on the FTSEglobal classification system), homecountry, and year, and meet the listing requirements for the same exchange
368 M. LANG, J. S. RAEDY, AND M. H. YETMAN
and year as the CL firm. In addition, we exclude firms that trade Level I ADRs(OTC) and privately placed and offshore ADRs (SEC Rule 144A/RegulationS), and consider those firms separately in our OTC analysis. We then chosethe NCL firm-year that is closest in growth (measured as percentage changein sales) to the CL firm-year. We chose to match on growth because of itspotential effect on the accruals component of earnings, and we includedcontrols for size, leverage, capital intensity, and debt and equity issuances.In a previous version we matched on size, with similar results.
Share prices and returns for the CL and NCL firms are from the firms’domestic markets and accounting data are as reported under local GAAPstandards. We adjust foreign financial data to U.S. dollars based on year-endexchange rates for balance-sheet data and average annual exchange ratesfor income statement data to enhance comparability across countries.
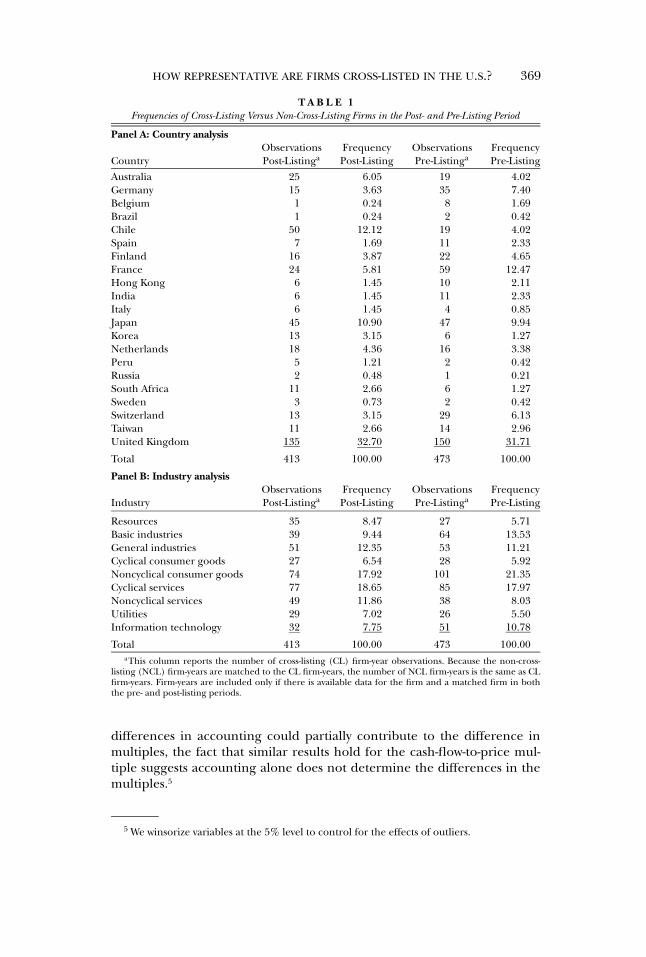
Table 1 provides a breakdown of our sample by country and industry forthe CL versus NCL comparison for the post-listing period (our main analy-sis), as well as for the pre-listing period (our supplementary analysis). Thesample contains observations from 21 countries, with the United Kingdom,Chile, and Japan most heavily represented. However, a broad range of coun-tries is represented, including both developed and emerging markets as wellas code and common law legal systems. Fifty-six percent of sample firms arefrom code law countries, consistent with the notion in studies such as Reeseand Weisbach [2001] that code law firms are more attracted to full U.S. list-ing because they benefit more from the bonding effect given the relativelyweak investor protection in their home markets. The observations are fairlyevenly spread among the industries, with cyclical services being the mostrepresented.
4. Empirical Analysis and Results
4.1 CL VERSUS NCL COMPARISON
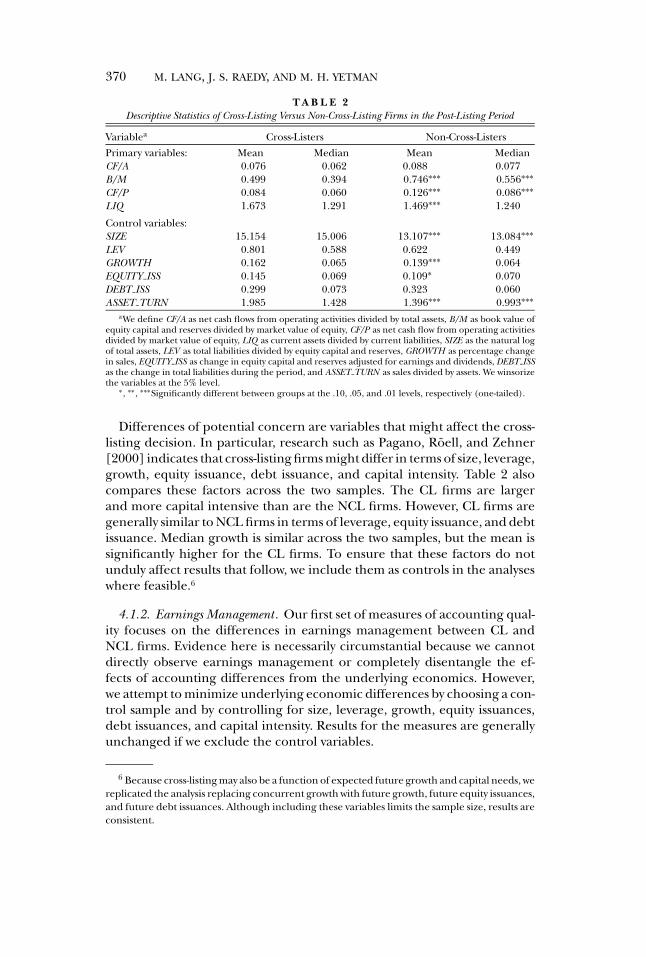
4.1.1. Descriptive Statistics. For our initial analysis, we compare our CL andNCL firms. Table 2 provides descriptive data. The CL firms are not moreprofitable than the NCL sample, as measured by operating cash flows scaledby assets.3 In large part, this reflects the fact that we match on growth, whichis correlated with profitability.4 However, the CL firms typically enjoy highervaluation multiples, consistent with findings in the finance literature (e.g.,Doidge, Karolyi, and Stulz [2001]), and perhaps reflecting lower cost ofcapital, lower risk of expropriation, or higher expected growth. Although
3 We use cash flows as a measure of profitability to reduce the effects of accounting differ-ences, although accounting differences might still affect the denominator. Throughout thepaper we define operating cash flows as “cash inflows-operating activities” as defined by Datas-tream (operating profit plus total depreciation, amortization, special provisions, other adjust-ments [e.g., gains/losses on sale of PPE], exceptional items, and other funds from operatingactivities minus changes in working capital and payments from provisions).
4 In a previous version, we matched on size instead of growth and found that CL firms weresignificantly more profitable than were NCL firms.
HOW REPRESENTATIVE ARE FIRMS CROSS-LISTED IN THE U.S.? 369
T A B L E 1Frequencies of Cross-Listing Versus Non-Cross-Listing Firms in the Post- and Pre-Listing Period
Panel A: Country analysisObservations Frequency Observations Frequency
Country Post-Listinga Post-Listing Pre-Listinga Pre-Listing
Australia 25 6.05 19 4.02Germany 15 3.63 35 7.40Belgium 1 0.24 8 1.69Brazil 1 0.24 2 0.42Chile 50 12.12 19 4.02Spain 7 1.69 11 2.33Finland 16 3.87 22 4.65France 24 5.81 59 12.47Hong Kong 6 1.45 10 2.11India 6 1.45 11 2.33Italy 6 1.45 4 0.85Japan 45 10.90 47 9.94Korea 13 3.15 6 1.27Netherlands 18 4.36 16 3.38Peru 5 1.21 2 0.42Russia 2 0.48 1 0.21South Africa 11 2.66 6 1.27Sweden 3 0.73 2 0.42Switzerland 13 3.15 29 6.13Taiwan 11 2.66 14 2.96United Kingdom 135 32.70 150 31.71
Total 413 100.00 473 100.00
Panel B: Industry analysisObservations Frequency Observations Frequency
Industry Post-Listinga Post-Listing Pre-Listinga Pre-Listing
Resources 35 8.47 27 5.71Basic industries 39 9.44 64 13.53General industries 51 12.35 53 11.21Cyclical consumer goods 27 6.54 28 5.92Noncyclical consumer goods 74 17.92 101 21.35Cyclical services 77 18.65 85 17.97Noncyclical services 49 11.86 38 8.03Utilities 29 7.02 26 5.50Information technology 32 7.75 51 10.78
Total 413 100.00 473 100.00aThis column reports the number of cross-listing (CL) firm-year observations. Because the non-cross-
listing (NCL) firm-years are matched to the CL firm-years, the number of NCL firm-years is the same as CLfirm-years. Firm-years are included only if there is available data for the firm and a matched firm in boththe pre- and post-listing periods.
differences in accounting could partially contribute to the difference inmultiples, the fact that similar results hold for the cash-flow-to-price mul-tiple suggests accounting alone does not determine the differences in themultiples.5
5 We winsorize variables at the 5% level to control for the effects of outliers.
370 M. LANG, J. S. RAEDY, AND M. H. YETMAN
T A B L E 2Descriptive Statistics of Cross-Listing Versus Non-Cross-Listing Firms in the Post-Listing Period
Variablea Cross-Listers Non-Cross-Listers
Primary variables: Mean Median Mean MedianCF/A 0.076 0.062 0.088 0.077B/M 0.499 0.394 0.746∗∗∗ 0.556∗∗∗CF/P 0.084 0.060 0.126∗∗∗ 0.086∗∗∗LIQ 1.673 1.291 1.469∗∗∗ 1.240
Control variables:SIZE 15.154 15.006 13.107∗∗∗ 13.084∗∗∗LEV 0.801 0.588 0.622 0.449GROWTH 0.162 0.065 0.139∗∗∗ 0.064EQUITY ISS 0.145 0.069 0.109∗ 0.070DEBT ISS 0.299 0.073 0.323 0.060ASSET TURN 1.985 1.428 1.396∗∗∗ 0.993∗∗∗
aWe define CF/A as net cash flows from operating activities divided by total assets, B/M as book value ofequity capital and reserves divided by market value of equity, CF/P as net cash flow from operating activitiesdivided by market value of equity, LIQ as current assets divided by current liabilities, SIZE as the natural logof total assets, LEV as total liabilities divided by equity capital and reserves, GROWTH as percentage changein sales, EQUITY ISS as change in equity capital and reserves adjusted for earnings and dividends, DEBT ISSas the change in total liabilities during the period, and ASSET TURN as sales divided by assets. We winsorizethe variables at the 5% level.
∗, ∗∗, ∗∗∗Significantly different between groups at the .10, .05, and .01 levels, respectively (one-tailed).
Differences of potential concern are variables that might affect the cross-listing decision. In particular, research such as Pagano, Roell, and Zehner[2000] indicates that cross-listing firms might differ in terms of size, leverage,growth, equity issuance, debt issuance, and capital intensity. Table 2 alsocompares these factors across the two samples. The CL firms are largerand more capital intensive than are the NCL firms. However, CL firms aregenerally similar to NCL firms in terms of leverage, equity issuance, and debtissuance. Median growth is similar across the two samples, but the mean issignificantly higher for the CL firms. To ensure that these factors do notunduly affect results that follow, we include them as controls in the analyseswhere feasible.6
4.1.2. Earnings Management. Our first set of measures of accounting qual-ity focuses on the differences in earnings management between CL andNCL firms. Evidence here is necessarily circumstantial because we cannotdirectly observe earnings management or completely disentangle the ef-fects of accounting differences from the underlying economics. However,we attempt to minimize underlying economic differences by choosing a con-trol sample and by controlling for size, leverage, growth, equity issuances,debt issuances, and capital intensity. Results for the measures are generallyunchanged if we exclude the control variables.
6 Because cross-listing may also be a function of expected future growth and capital needs, wereplicated the analysis replacing concurrent growth with future growth, future equity issuances,and future debt issuances. Although including these variables limits the sample size, results areconsistent.
HOW REPRESENTATIVE ARE FIRMS CROSS-LISTED IN THE U.S.? 371
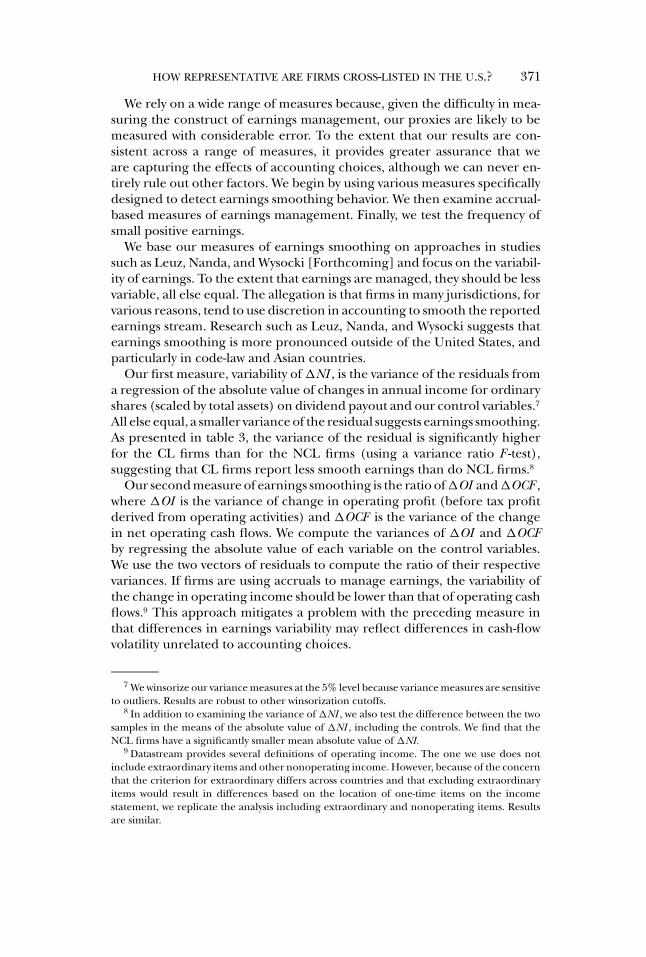
We rely on a wide range of measures because, given the difficulty in mea-suring the construct of earnings management, our proxies are likely to bemeasured with considerable error. To the extent that our results are con-sistent across a range of measures, it provides greater assurance that weare capturing the effects of accounting choices, although we can never en-tirely rule out other factors. We begin by using various measures specificallydesigned to detect earnings smoothing behavior. We then examine accrual-based measures of earnings management. Finally, we test the frequency ofsmall positive earnings.
We base our measures of earnings smoothing on approaches in studiessuch as Leuz, Nanda, and Wysocki [Forthcoming] and focus on the variabil-ity of earnings. To the extent that earnings are managed, they should be lessvariable, all else equal. The allegation is that firms in many jurisdictions, forvarious reasons, tend to use discretion in accounting to smooth the reportedearnings stream. Research such as Leuz, Nanda, and Wysocki suggests thatearnings smoothing is more pronounced outside of the United States, andparticularly in code-law and Asian countries.
Our first measure, variability of �NI , is the variance of the residuals froma regression of the absolute value of changes in annual income for ordinaryshares (scaled by total assets) on dividend payout and our control variables.7
All else equal, a smaller variance of the residual suggests earnings smoothing.As presented in table 3, the variance of the residual is significantly higherfor the CL firms than for the NCL firms (using a variance ratio F -test),suggesting that CL firms report less smooth earnings than do NCL firms.8
Our second measure of earnings smoothing is the ratio of �OI and �OCF ,where �OI is the variance of change in operating profit (before tax profitderived from operating activities) and �OCF is the variance of the changein net operating cash flows. We compute the variances of �OI and �OCFby regressing the absolute value of each variable on the control variables.We use the two vectors of residuals to compute the ratio of their respectivevariances. If firms are using accruals to manage earnings, the variability ofthe change in operating income should be lower than that of operating cashflows.9 This approach mitigates a problem with the preceding measure inthat differences in earnings variability may reflect differences in cash-flowvolatility unrelated to accounting choices.
7 We winsorize our variance measures at the 5% level because variance measures are sensitiveto outliers. Results are robust to other winsorization cutoffs.
8 In addition to examining the variance of �NI , we also test the difference between the twosamples in the means of the absolute value of �NI , including the controls. We find that theNCL firms have a significantly smaller mean absolute value of �NI.
9 Datastream provides several definitions of operating income. The one we use does notinclude extraordinary items and other nonoperating income. However, because of the concernthat the criterion for extraordinary differs across countries and that excluding extraordinaryitems would result in differences based on the location of one-time items on the incomestatement, we replicate the analysis including extraordinary and nonoperating items. Resultsare similar.
372 M. LANG, J. S. RAEDY, AND M. H. YETMAN
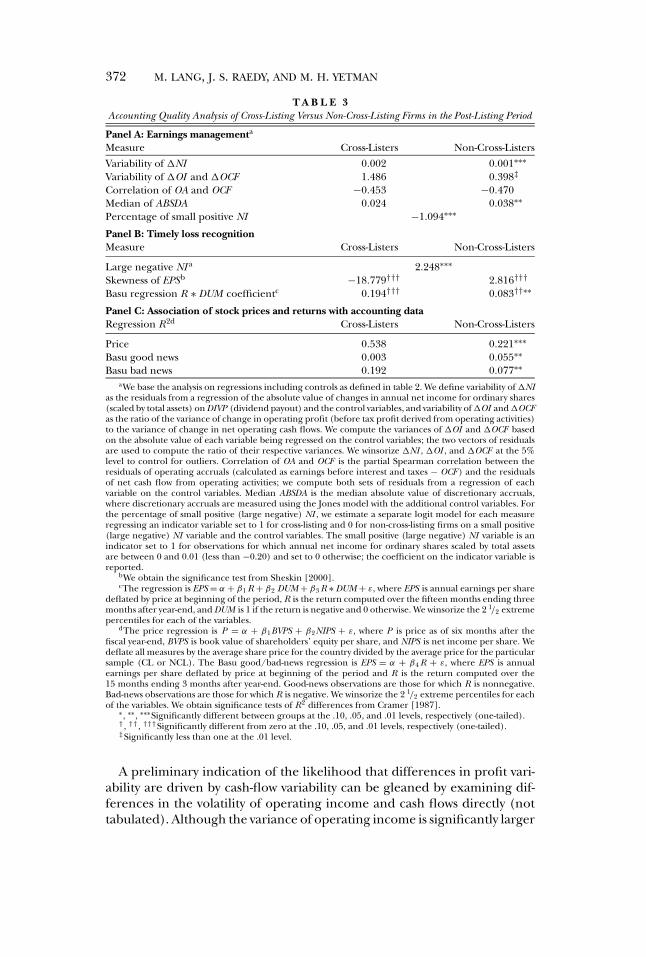
T A B L E 3Accounting Quality Analysis of Cross-Listing Versus Non-Cross-Listing Firms in the Post-Listing Period
Panel A: Earnings managementa
Measure Cross-Listers Non-Cross-Listers
Variability of �NI 0.002 0.001∗∗∗Variability of �OI and �OCF 1.486 0.398‡
Correlation of OA and OCF −0.453 −0.470Median of ABSDA 0.024 0.038∗∗Percentage of small positive NI −1.094∗∗∗
Panel B: Timely loss recognitionMeasure Cross-Listers Non-Cross-Listers
Large negative NI a 2.248∗∗∗Skewness of EPSb −18.779††† 2.816†††
Basu regression R ∗ DUM coefficientc 0.194††† 0.083††∗∗
Panel C: Association of stock prices and returns with accounting dataRegression R2d Cross-Listers Non-Cross-Listers
Price 0.538 0.221∗∗∗Basu good news 0.003 0.055∗∗Basu bad news 0.192 0.077∗∗
aWe base the analysis on regressions including controls as defined in table 2. We define variability of �NIas the residuals from a regression of the absolute value of changes in annual net income for ordinary shares(scaled by total assets) on DIVP (dividend payout) and the control variables, and variability of �OI and �OCFas the ratio of the variance of change in operating profit (before tax profit derived from operating activities)to the variance of change in net operating cash flows. We compute the variances of �OI and �OCF basedon the absolute value of each variable being regressed on the control variables; the two vectors of residualsare used to compute the ratio of their respective variances. We winsorize �NI , �OI , and �OCF at the 5%level to control for outliers. Correlation of OA and OCF is the partial Spearman correlation between theresiduals of operating accruals (calculated as earnings before interest and taxes − OCF ) and the residualsof net cash flow from operating activities; we compute both sets of residuals from a regression of eachvariable on the control variables. Median ABSDA is the median absolute value of discretionary accruals,where discretionary accruals are measured using the Jones model with the additional control variables. Forthe percentage of small positive (large negative) NI , we estimate a separate logit model for each measureregressing an indicator variable set to 1 for cross-listing and 0 for non-cross-listing firms on a small positive(large negative) NI variable and the control variables. The small positive (large negative) NI variable is anindicator set to 1 for observations for which annual net income for ordinary shares scaled by total assetsare between 0 and 0.01 (less than −0.20) and set to 0 otherwise; the coefficient on the indicator variable isreported.
bWe obtain the significance test from Sheskin [2000].cThe regression is EPS = α + β1 R + β2 DUM + β3 R ∗ DUM + ε, where EPS is annual earnings per share
deflated by price at beginning of the period, R is the return computed over the fifteen months ending threemonths after year-end, and DUM is 1 if the return is negative and 0 otherwise. We winsorize the 2 1/2 extremepercentiles for each of the variables.
dThe price regression is P = α + β1BVPS + β2NIPS + ε, where P is price as of six months after thefiscal year-end, BVPS is book value of shareholders’ equity per share, and NIPS is net income per share. Wedeflate all measures by the average share price for the country divided by the average price for the particularsample (CL or NCL). The Basu good/bad-news regression is EPS = α + β4 R + ε, where EPS is annualearnings per share deflated by price at beginning of the period and R is the return computed over the15 months ending 3 months after year-end. Good-news observations are those for which R is nonnegative.Bad-news observations are those for which R is negative. We winsorize the 2 1/2 extreme percentiles for eachof the variables. We obtain significance tests of R2 differences from Cramer [1987].
∗, ∗∗, ∗∗∗Significantly different between groups at the .10, .05, and .01 levels, respectively (one-tailed).†, ††, †††Significantly different from zero at the .10, .05, and .01 levels, respectively (one-tailed).‡Significantly less than one at the .01 level.
A preliminary indication of the likelihood that differences in profit vari-ability are driven by cash-flow variability can be gleaned by examining dif-ferences in the volatility of operating income and cash flows directly (nottabulated). Although the variance of operating income is significantly larger
HOW REPRESENTATIVE ARE FIRMS CROSS-LISTED IN THE U.S.? 373
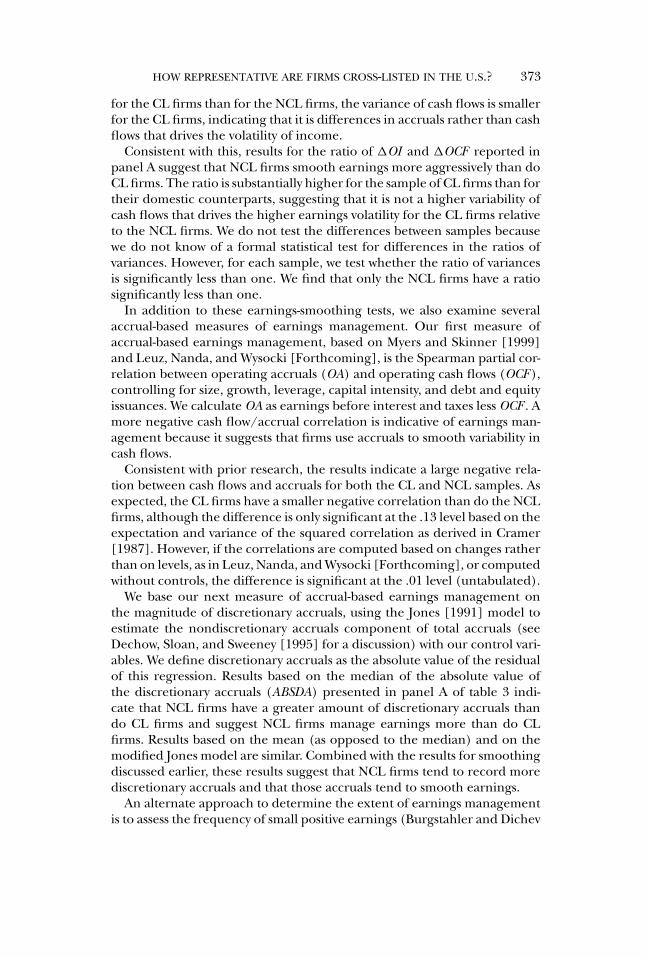
for the CL firms than for the NCL firms, the variance of cash flows is smallerfor the CL firms, indicating that it is differences in accruals rather than cashflows that drives the volatility of income.
Consistent with this, results for the ratio of �OI and �OCF reported inpanel A suggest that NCL firms smooth earnings more aggressively than doCL firms. The ratio is substantially higher for the sample of CL firms than fortheir domestic counterparts, suggesting that it is not a higher variability ofcash flows that drives the higher earnings volatility for the CL firms relativeto the NCL firms. We do not test the differences between samples becausewe do not know of a formal statistical test for differences in the ratios ofvariances. However, for each sample, we test whether the ratio of variancesis significantly less than one. We find that only the NCL firms have a ratiosignificantly less than one.
In addition to these earnings-smoothing tests, we also examine severalaccrual-based measures of earnings management. Our first measure ofaccrual-based earnings management, based on Myers and Skinner [1999]and Leuz, Nanda, and Wysocki [Forthcoming], is the Spearman partial cor-relation between operating accruals (OA) and operating cash flows (OCF ),controlling for size, growth, leverage, capital intensity, and debt and equityissuances. We calculate OA as earnings before interest and taxes less OCF . Amore negative cash flow/accrual correlation is indicative of earnings man-agement because it suggests that firms use accruals to smooth variability incash flows.
Consistent with prior research, the results indicate a large negative rela-tion between cash flows and accruals for both the CL and NCL samples. Asexpected, the CL firms have a smaller negative correlation than do the NCLfirms, although the difference is only significant at the .13 level based on theexpectation and variance of the squared correlation as derived in Cramer[1987]. However, if the correlations are computed based on changes ratherthan on levels, as in Leuz, Nanda, and Wysocki [Forthcoming], or computedwithout controls, the difference is significant at the .01 level (untabulated).
We base our next measure of accrual-based earnings management onthe magnitude of discretionary accruals, using the Jones [1991] model toestimate the nondiscretionary accruals component of total accruals (seeDechow, Sloan, and Sweeney [1995] for a discussion) with our control vari-ables. We define discretionary accruals as the absolute value of the residualof this regression. Results based on the median of the absolute value ofthe discretionary accruals (ABSDA) presented in panel A of table 3 indi-cate that NCL firms have a greater amount of discretionary accruals thando CL firms and suggest NCL firms manage earnings more than do CLfirms. Results based on the mean (as opposed to the median) and on themodified Jones model are similar. Combined with the results for smoothingdiscussed earlier, these results suggest that NCL firms tend to record morediscretionary accruals and that those accruals tend to smooth earnings.
An alternate approach to determine the extent of earnings managementis to assess the frequency of small positive earnings (Burgstahler and Dichev
374 M. LANG, J. S. RAEDY, AND M. H. YETMAN
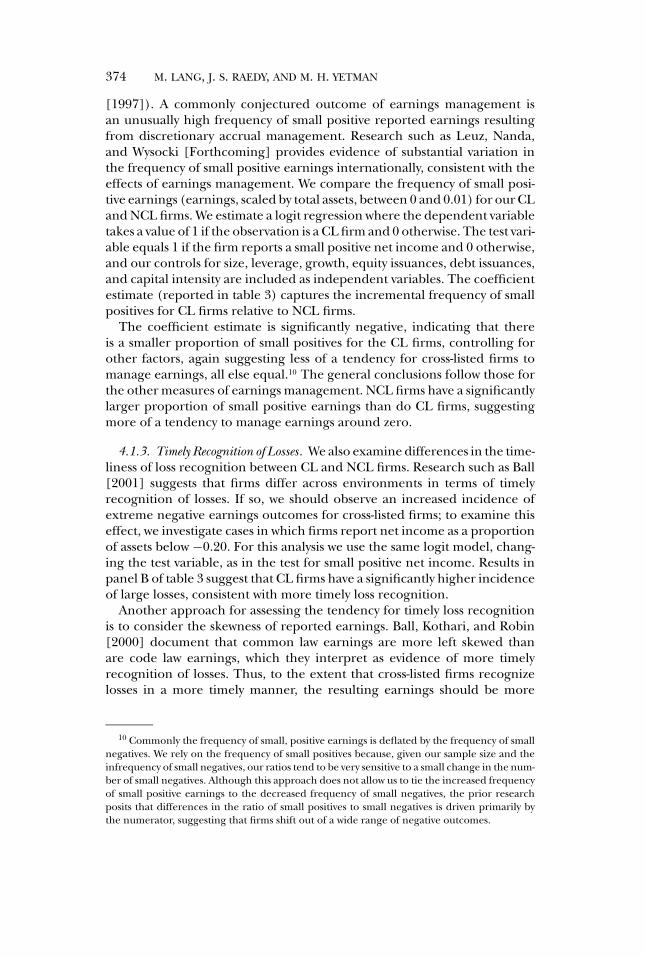
[1997]). A commonly conjectured outcome of earnings management isan unusually high frequency of small positive reported earnings resultingfrom discretionary accrual management. Research such as Leuz, Nanda,and Wysocki [Forthcoming] provides evidence of substantial variation inthe frequency of small positive earnings internationally, consistent with theeffects of earnings management. We compare the frequency of small posi-tive earnings (earnings, scaled by total assets, between 0 and 0.01) for our CLand NCL firms. We estimate a logit regression where the dependent variabletakes a value of 1 if the observation is a CL firm and 0 otherwise. The test vari-able equals 1 if the firm reports a small positive net income and 0 otherwise,and our controls for size, leverage, growth, equity issuances, debt issuances,and capital intensity are included as independent variables. The coefficientestimate (reported in table 3) captures the incremental frequency of smallpositives for CL firms relative to NCL firms.
The coefficient estimate is significantly negative, indicating that thereis a smaller proportion of small positives for the CL firms, controlling forother factors, again suggesting less of a tendency for cross-listed firms tomanage earnings, all else equal.10 The general conclusions follow those forthe other measures of earnings management. NCL firms have a significantlylarger proportion of small positive earnings than do CL firms, suggestingmore of a tendency to manage earnings around zero.
4.1.3. Timely Recognition of Losses. We also examine differences in the time-liness of loss recognition between CL and NCL firms. Research such as Ball[2001] suggests that firms differ across environments in terms of timelyrecognition of losses. If so, we should observe an increased incidence ofextreme negative earnings outcomes for cross-listed firms; to examine thiseffect, we investigate cases in which firms report net income as a proportionof assets below −0.20. For this analysis we use the same logit model, chang-ing the test variable, as in the test for small positive net income. Results inpanel B of table 3 suggest that CL firms have a significantly higher incidenceof large losses, consistent with more timely loss recognition.
Another approach for assessing the tendency for timely loss recognitionis to consider the skewness of reported earnings. Ball, Kothari, and Robin[2000] document that common law earnings are more left skewed thanare code law earnings, which they interpret as evidence of more timelyrecognition of losses. Thus, to the extent that cross-listed firms recognizelosses in a more timely manner, the resulting earnings should be more
10 Commonly the frequency of small, positive earnings is deflated by the frequency of smallnegatives. We rely on the frequency of small positives because, given our sample size and theinfrequency of small negatives, our ratios tend to be very sensitive to a small change in the num-ber of small negatives. Although this approach does not allow us to tie the increased frequencyof small positive earnings to the decreased frequency of small negatives, the prior researchposits that differences in the ratio of small positives to small negatives is driven primarily bythe numerator, suggesting that firms shift out of a wide range of negative outcomes.
HOW REPRESENTATIVE ARE FIRMS CROSS-LISTED IN THE U.S.? 375
negatively skewed. Panel B of table 3 reports skewness measures for earningsper share. CL firms report negatively skewed earnings; whereas NCL firmsreport positively skewed earnings. Although we do not know of a directtest to compare skewness across samples, the fact that NCL earnings aresignificantly and positively skewed and CL earnings are significantly andnegatively skewed (based on the test in Sheskin [2000]) suggests that thedifference in skewness is likely significant.
A final test we perform to examine the timeliness of loss recognition isalso based on Ball, Kothari, and Robin [2000], as well as Basu [1997]. Theyestimate the earnings/returns regression with earnings per share as the de-pendent variable and returns, a dummy if return is negative, and the dummyinteracted with returns as dependent variables. A positive coefficient on re-turn interacted with the dummy variable indicates conservatism. Consistentwith prior research, we find that both CL and NCL firms are conservative,but that CL firms demonstrate a significantly higher level of conservatismas measured by this coefficient.
4.1.4. Accounting Quality: Association of Stock Prices and Returns withAccounting Data. Finally, to examine differences in accounting quality, weexamine the relation of stock prices with accounting data. We consider thesetests to be supplemental subject to the caveat that the pricing mechanismmay have changed around cross-listing. In particular, it may be that evenlocal investors now rely on the U.S. GAAP reconciliations in setting price,which may change the relation between local-GAAP-reported data and shareprice. Although that change may confound the analysis, we do not believeit should cause the association between share price and domestic GAAPdata to increase. In particular, one could argue that if local GAAP report-ing has not changed, the association with share price may decrease as in-vestors shift their attention from the local GAAP statements to the U.S. GAAPreconciliations.
We consider two sets of analyses from the literature. First, we investigatethe relation among price, earnings, and book value by regressing price onearnings per share and book value per share. Because of concerns overscale issues caused by differences in average share prices across countries,we deflate all measures by the average share price for the country dividedby the average price for the particular sample (CL or NCL). Our interestis in whether accounting data for CL firms are more highly associated withshare price than for NCL firms. Results in panel C of table 3 indicate thatthe regression R2 is 0.538 for the CL firms versus 0.221 for the NCL firms,a difference that is significant at the .001 level based on a Cramer [1987]test. We also examine the coefficients on earnings and book values. Thecoefficients on both variables are significantly greater in the CL samplethan in the NCL sample (results untabulated).
In addition to the price regressions, we perform analyses like those inBall, Kothari, and Robin [2000] and Basu [1997]. We regress earningsper share on returns separately for good news and bad news firms, with
376 M. LANG, J. S. RAEDY, AND M. H. YETMAN
observations classified as bad news if returns are negative and good newsotherwise. Ball, Kothari, and Robin find that the greater timeliness of com-mon law accounting income is entirely due to the reporting of losses. Ourresults are consistent with theirs. We find that for bad-news firms the R2 issignificantly greater for CL firms than for NCL firms. However, this findingis not the case for good-news firms, again consistent with the results in Ball,Kothari, and Robin, who find that the good-news R2 is significantly higherfor code law companies than for common law companies.
Overall, results across tests of earnings management, timely loss recogni-tion, and price association suggest CL firms report higher quality earningsthan do NCL firms.
4.2 CHANGES AROUND CROSS-LISTING
As discussed earlier, pre-existing differences, changes around cross-listing,or both could drive the differences documented between CL and NCL firms.One way to investigate the two explanations is to compare CL and NCLfirms before cross-listing and CL firms around cross-listing. If the differencesreflect changes around cross-listing, they should be evident in a comparisonof CL firms pre- and post-cross-listing; if self-selection drives the differences,they should be apparent in CL and NCL differences before cross-listing.11
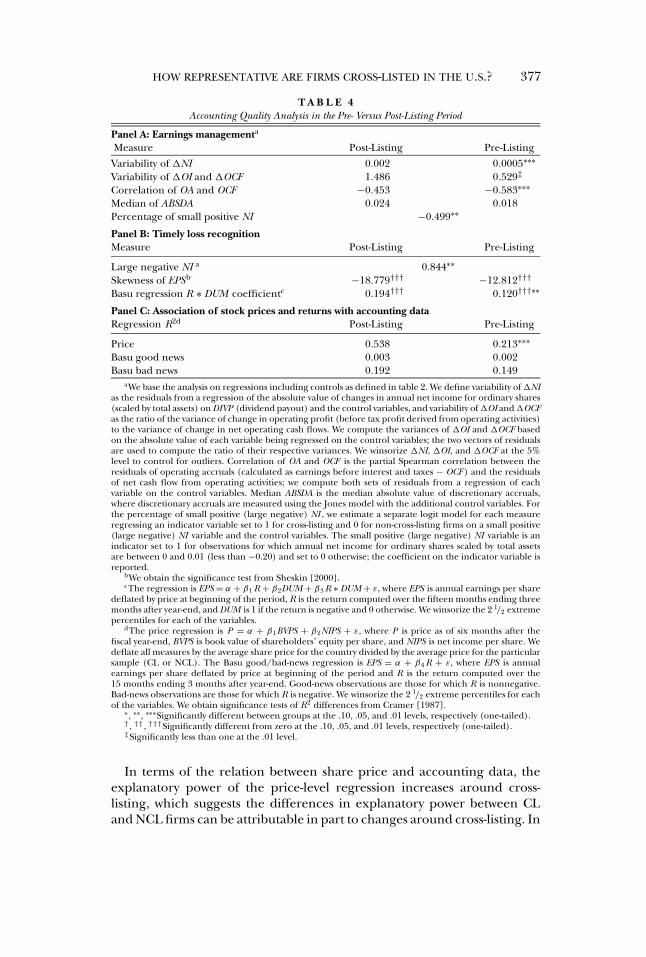
We examine differences in the accounting quality for CL firms betweenthe pre-listing and post-listing periods, using the same measures as used inthe previous section. The sample of CL firms in the pre- and post-listingperiods is summarized in table 1 and the results are reported in table 4.Although we require a firm to appear in both the pre- and post-listing sam-ples to be included, the two samples have different numbers of observations(413 vs. 473) because some firms appear more often in one sample than inthe other. With respect to the earnings management measures (see panel Aof table 4), all change significantly around cross-listing in a direction consis-tent with CL firms’ decreasing their earnings-management activity aroundcross-listing, with the exception of the absolute value of accruals measure,which is insignificant.
We also find evidence that firms report losses on a more timely basis afterlisting. Panel B of table 4 presents evidence that firms report a significantlyhigher incidence of large losses and are significantly more conservative aftercross-listing than before. In addition, earnings are more negatively skewedafter cross-listing.
11 A problem with drawing strong conclusions from this approach is that it is difficult tobe sure that the pre-listing comparison is not contaminated by firms’ changing their behaviorshortly before cross-listing. To address this issue, we replicate the pre-listing analysis both ex-cluding firm-years that are within two years before cross-listing and excluding firm-years that arewithin four years before cross-listing. Although the sample size drops substantially (especiallyfor the four-year analysis), results are consistent. In addition, for the subset of observations forwhich we have data available, we examined changes over the two years before listing. Differ-ences in our measures of accounting quality are not significant between the two years. However,conclusions should still be drawn with caution.
HOW REPRESENTATIVE ARE FIRMS CROSS-LISTED IN THE U.S.? 377
T A B L E 4Accounting Quality Analysis in the Pre- Versus Post-Listing Period
Panel A: Earnings managementa
Measure Post-Listing Pre-Listing
Variability of �NI 0.002 0.0005∗∗∗Variability of �OI and �OCF 1.486 0.529‡
Correlation of OA and OCF −0.453 −0.583∗∗∗Median of ABSDA 0.024 0.018Percentage of small positive NI −0.499∗∗
Panel B: Timely loss recognitionMeasure Post-Listing Pre-Listing
Large negative NI a 0.844∗∗Skewness of EPSb −18.779††† −12.812†††
Basu regression R ∗ DUM coefficientc 0.194††† 0.120†††∗∗
Panel C: Association of stock prices and returns with accounting dataRegression R2d Post-Listing Pre-Listing
Price 0.538 0.213∗∗∗Basu good news 0.003 0.002Basu bad news 0.192 0.149
aWe base the analysis on regressions including controls as defined in table 2. We define variability of �NIas the residuals from a regression of the absolute value of changes in annual net income for ordinary shares(scaled by total assets) on DIVP (dividend payout) and the control variables, and variability of �OI and �OCFas the ratio of the variance of change in operating profit (before tax profit derived from operating activities)to the variance of change in net operating cash flows. We compute the variances of �OI and �OCF basedon the absolute value of each variable being regressed on the control variables; the two vectors of residualsare used to compute the ratio of their respective variances. We winsorize �NI, �OI, and �OCF at the 5%level to control for outliers. Correlation of OA and OCF is the partial Spearman correlation between theresiduals of operating accruals (calculated as earnings before interest and taxes − OCF ) and the residualsof net cash flow from operating activities; we compute both sets of residuals from a regression of eachvariable on the control variables. Median ABSDA is the median absolute value of discretionary accruals,where discretionary accruals are measured using the Jones model with the additional control variables. Forthe percentage of small positive (large negative) NI , we estimate a separate logit model for each measureregressing an indicator variable set to 1 for cross-listing and 0 for non-cross-listing firms on a small positive(large negative) NI variable and the control variables. The small positive (large negative) NI variable is anindicator set to 1 for observations for which annual net income for ordinary shares scaled by total assetsare between 0 and 0.01 (less than −0.20) and set to 0 otherwise; the coefficient on the indicator variable isreported.
bWe obtain the significance test from Sheskin [2000].cThe regression is EPS = α + β1 R + β2DUM + β3 R ∗ DUM + ε, where EPS is annual earnings per share
deflated by price at beginning of the period, R is the return computed over the fifteen months ending threemonths after year-end, and DUM is 1 if the return is negative and 0 otherwise. We winsorize the 2 1/2 extremepercentiles for each of the variables.
dThe price regression is P = α + β1BVPS + β2NIPS + ε, where P is price as of six months after thefiscal year-end, BVPS is book value of shareholders’ equity per share, and NIPS is net income per share. Wedeflate all measures by the average share price for the country divided by the average price for the particularsample (CL or NCL). The Basu good/bad-news regression is EPS = α + β4 R + ε, where EPS is annualearnings per share deflated by price at beginning of the period and R is the return computed over the15 months ending 3 months after year-end. Good-news observations are those for which R is nonnegative.Bad-news observations are those for which R is negative. We winsorize the 2 1/2 extreme percentiles for eachof the variables. We obtain significance tests of R2 differences from Cramer [1987].
∗, ∗∗, ∗∗∗Significantly different between groups at the .10, .05, and .01 levels, respectively (one-tailed).†, ††, †††Significantly different from zero at the .10, .05, and .01 levels, respectively (one-tailed).‡Significantly less than one at the .01 level.
In terms of the relation between share price and accounting data, theexplanatory power of the price-level regression increases around cross-listing, which suggests the differences in explanatory power between CLand NCL firms can be attributable in part to changes around cross-listing. In
378 M. LANG, J. S. RAEDY, AND M. H. YETMAN
addition, the coefficients on both earnings and book value increase signifi-cantly around cross-listing (results untabulated). The explanatory power ofthe Basu [1997] regressions also increases for the bad news firms. In sum-mary, the time-series results around the listing date are consistent with firms’improving the quality of their local GAAP accounting around cross-listing.
4.3 PRE-LISTING DIFFERENCES
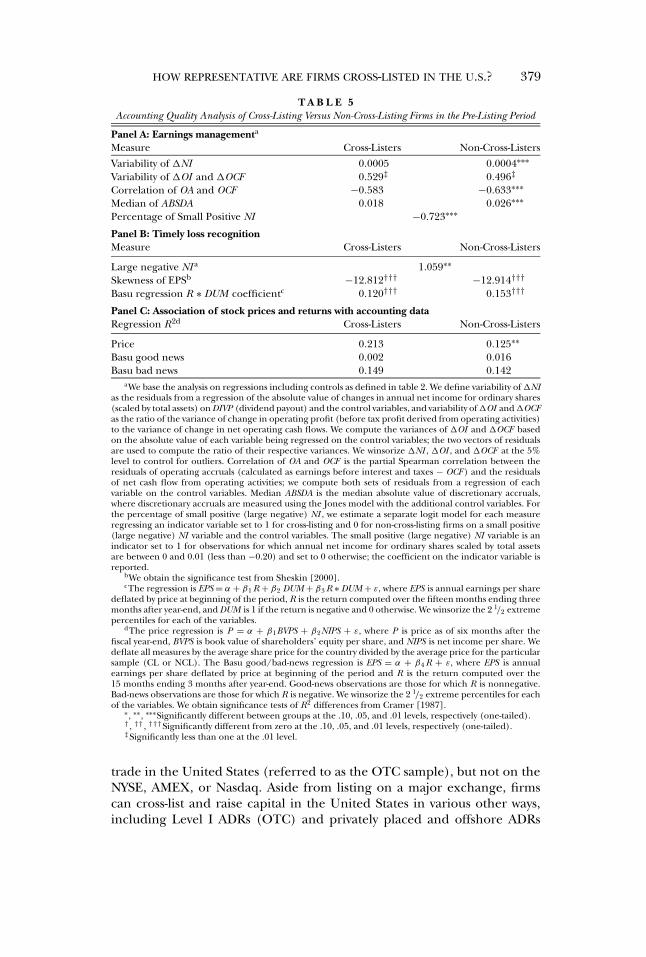
It may be that firms that are attracted to cross-listing tend to be thosethat already have higher quality reporting systems and therefore perceivethe cost of added transparency attached to U.S. listing to be less onerous.To examine that possibility, we compare our sample of CL firms with NCLfirms in the pre-listing period. We find evidence that there is a differencein terms of earnings management behavior in future CL firms and NCLfirms. Results reported in panel A of table 5 indicate that the variability ofnet income and the variability of operating income to operating cash flowsare both greater for the CL firms than for the NCL firms. Additionally, thecorrelation between operating accruals and operating cash flows is morenegative for the NCL firms in the pre-listing period, and the incidenceof discretionary accruals is more positive. Finally, the percentage of firmsreporting small positive net income is significantly lower for the CL than forthe NCL firms.
Evidence on the timely recognition of losses (panel B of table 5) is moremixed. Although CL firms do exhibit a higher frequency of large losses, theydo not exhibit more skewness nor do they seem to report more conservativelyin the pre-listing period.
Evidence for the association between price and accounting data (panelC of table 5) is consistent with higher quality data for the CL firms in thepre-listing period. Although, the R2 on the Basu [1997] regression for bad-news firms is higher for the CL firms than for the NCL firms, the differenceis not significant.
In general, the evidence indicates that our CL sample of firms differsfrom our NCL sample in the post-cross-listing period across various dimen-sions, suggesting higher quality local GAAP reporting. Furthermore, thereis some evidence that the differences are due both to changes around cross-listing and to self-selection, although the evidence is stronger for the changesthan for the pre-listing period. Although the results are generally consistentacross a range of approaches and with various controls, it is possible thatwe have excluded potentially important factors in our analysis. To examinethat possibility, we turn now to other robustness tests.
4.4 OTHER ANALYSES
4.4.1. CL Versus Firms Trading on Other U.S. Markets. We perform severalsensitivity analyses on the CL versus NCL results reported in table 3. Inparticular, one concern is that the CL firms may differ from the NCL firmsin other ways because of, for example, other costs and benefits of cross-listing. First, we employ an additional sample, namely a group of firms that
HOW REPRESENTATIVE ARE FIRMS CROSS-LISTED IN THE U.S.? 379
T A B L E 5Accounting Quality Analysis of Cross-Listing Versus Non-Cross-Listing Firms in the Pre-Listing Period
Panel A: Earnings managementa
Measure Cross-Listers Non-Cross-Listers
Variability of �NI 0.0005 0.0004∗∗∗Variability of �OI and �OCF 0.529‡ 0.496‡
Correlation of OA and OCF −0.583 −0.633∗∗∗Median of ABSDA 0.018 0.026∗∗∗Percentage of Small Positive NI −0.723∗∗∗
Panel B: Timely loss recognitionMeasure Cross-Listers Non-Cross-Listers
Large negative NI a 1.059∗∗Skewness of EPSb −12.812††† −12.914†††
Basu regression R ∗ DUM coefficientc 0.120††† 0.153†††
Panel C: Association of stock prices and returns with accounting dataRegression R2d Cross-Listers Non-Cross-Listers
Price 0.213 0.125∗∗Basu good news 0.002 0.016Basu bad news 0.149 0.142
aWe base the analysis on regressions including controls as defined in table 2. We define variability of �NIas the residuals from a regression of the absolute value of changes in annual net income for ordinary shares(scaled by total assets) on DIVP (dividend payout) and the control variables, and variability of �OI and �OCFas the ratio of the variance of change in operating profit (before tax profit derived from operating activities)to the variance of change in net operating cash flows. We compute the variances of �OI and �OCF basedon the absolute value of each variable being regressed on the control variables; the two vectors of residualsare used to compute the ratio of their respective variances. We winsorize �NI , �OI , and �OCF at the 5%level to control for outliers. Correlation of OA and OCF is the partial Spearman correlation between theresiduals of operating accruals (calculated as earnings before interest and taxes − OCF ) and the residualsof net cash flow from operating activities; we compute both sets of residuals from a regression of eachvariable on the control variables. Median ABSDA is the median absolute value of discretionary accruals,where discretionary accruals are measured using the Jones model with the additional control variables. Forthe percentage of small positive (large negative) NI , we estimate a separate logit model for each measureregressing an indicator variable set to 1 for cross-listing and 0 for non-cross-listing firms on a small positive(large negative) NI variable and the control variables. The small positive (large negative) NI variable is anindicator set to 1 for observations for which annual net income for ordinary shares scaled by total assetsare between 0 and 0.01 (less than −0.20) and set to 0 otherwise; the coefficient on the indicator variable isreported.
bWe obtain the significance test from Sheskin [2000].cThe regression is EPS = α + β1 R + β2 DUM + β3 R ∗ DUM + ε, where EPS is annual earnings per share
deflated by price at beginning of the period, R is the return computed over the fifteen months ending threemonths after year-end, and DUM is 1 if the return is negative and 0 otherwise. We winsorize the 2 1/2 extremepercentiles for each of the variables.
dThe price regression is P = α + β1BVPS + β2NIPS + ε, where P is price as of six months after thefiscal year-end, BVPS is book value of shareholders’ equity per share, and NIPS is net income per share. Wedeflate all measures by the average share price for the country divided by the average price for the particularsample (CL or NCL). The Basu good/bad-news regression is EPS = α + β4 R + ε, where EPS is annualearnings per share deflated by price at beginning of the period and R is the return computed over the15 months ending 3 months after year-end. Good-news observations are those for which R is nonnegative.Bad-news observations are those for which R is negative. We winsorize the 2 1/2 extreme percentiles for eachof the variables. We obtain significance tests of R2 differences from Cramer [1987].
∗, ∗∗, ∗∗∗Significantly different between groups at the .10, .05, and .01 levels, respectively (one-tailed).†, ††, †††Significantly different from zero at the .10, .05, and .01 levels, respectively (one-tailed).‡Significantly less than one at the .01 level.
trade in the United States (referred to as the OTC sample), but not on theNYSE, AMEX, or Nasdaq. Aside from listing on a major exchange, firmscan cross-list and raise capital in the United States in various other ways,including Level I ADRs (OTC) and privately placed and offshore ADRs
380 M. LANG, J. S. RAEDY, AND M. H. YETMAN
(SEC Rule 144A/Regulation S). Firms cross-listing in these ways and in-cluded on the BNY ADR file are included in our OTC sample. We restrictthe OTC analysis (for both OTC and CL firms) to 1990 through 1999 be-cause the SEC approved a new rule during 1999 that required that firmstraded on the OTC Bulletin Board to file the same documents as firms onthe major exchanges (see Bushee and Leuz [2002] for a summary).
The OTC firms make an interesting control sample because they capturesome of the benefits of trading in the United States but are not subject tothe same level of regulation. Specifically, before 1999 an OTC firm was notconsidered a “reporting company” under U.S. securities law and could sim-ply file the same documents as in their home market. The effect on legalexposure of Level I, Rule 144A, and Regulation S listing versus major ex-change listing is less clear. All firms trading in the United States (includingOTC firms) are subject to antifraud liability under Rule 10b-5. Registeringwith the SEC also subjects a firm to potential exposure under Section 18of the Securities Act of 1934, but exposure is limited because a plaintiffmust demonstrate reliance on the filed document and not simply on theinformation contained in the document (sometimes referred to as the “eye-ball” requirement). Thus, if there was a material misstatement in the 20-Fthat also appears in the annual report (which is not a “filed” document forSection 18 purposes), a shareholder would have to demonstrate that he orshe obtained the information from the form 20-F and not simply from theannual report, a requirement that is not present under Rule 10b-5 (Hazen[1996]). As a result, a plaintiff would typically choose to litigate under Rule10b-5 rather than under Section 18.12 Therefore, it is not clear to what ex-tent cross-listing increases a firm’s potential legal exposure relative to OTCtrading.13
Consistent with cross-listing providing more effective bonding, Miller[1999] shows that firms accessing U.S. markets through the OTC marketexperience a smaller positive stock price response. Coffee [2002] arguesthat firms may view OTC trading as means of having a presence in the U.S.markets without some of the regulatory exposure and interprets the Millerresult as consistent with the notion that the OTC listing provides a morelimited bonding role.14 As a result, we predict that, despite trading on U.S.markets, accounting data for firms trading on the OTC will differ from thatfor CL firms.
12 Cross-listing firms choosing to issue securities (Level III ADRs) are also subject to the“strict liability” provisions of Section 11 of the 1933 Act. However, our results are robust toexcluding Level III ADRs, suggesting that results are not driven by Section 11 exposure.
13 Closely related, Seigel [2002, p. 1] investigates the incidence of SEC action against cross-listed firms and argues that “SEC action against any U.S.-listed foreign firm has been rare andmostly ineffective throughout the history of the federal securities laws.”
14 Although OTC listing and Rule 144A/Regulation S security issuance offer some of theadvantages of U.S. listing, they are not perfect substitutes for trading on exchanges becauseliquidity and security issuance is more limited.
HOW REPRESENTATIVE ARE FIRMS CROSS-LISTED IN THE U.S.? 381
Our basic comparison between the CL and OTC samples is the same as forthe CL and NCL samples.15 The primary problem with this sample is that weare no longer able to match individual CL firms to OTC firms, because bothsamples are sufficiently limited that imposing matching constraints wouldreduce sample size to the point where meaningful comparison would nolonger be feasible. In terms of our control variables, although the OTCfirms are comparable in terms of growth, equity issuances, and capital in-tensity, they are more highly levered, issue more debt, and are smaller thanthe CL firms.16 To mitigate the effects of these differences, we include ourcontrol variables. The spread of the 684 OTC observations across countriesand industries is generally consistent with that for the 288 CL observations,with OTC firms representing 34 countries and all of the major industrygroupings.17 However, the OTC sample contains a slightly higher propor-tion (48%) of common law firms than does the CL sample, consistent withevidence in Reese and Weisbach [2001] that code law companies in generalprefer full listing because of the added investor protection.
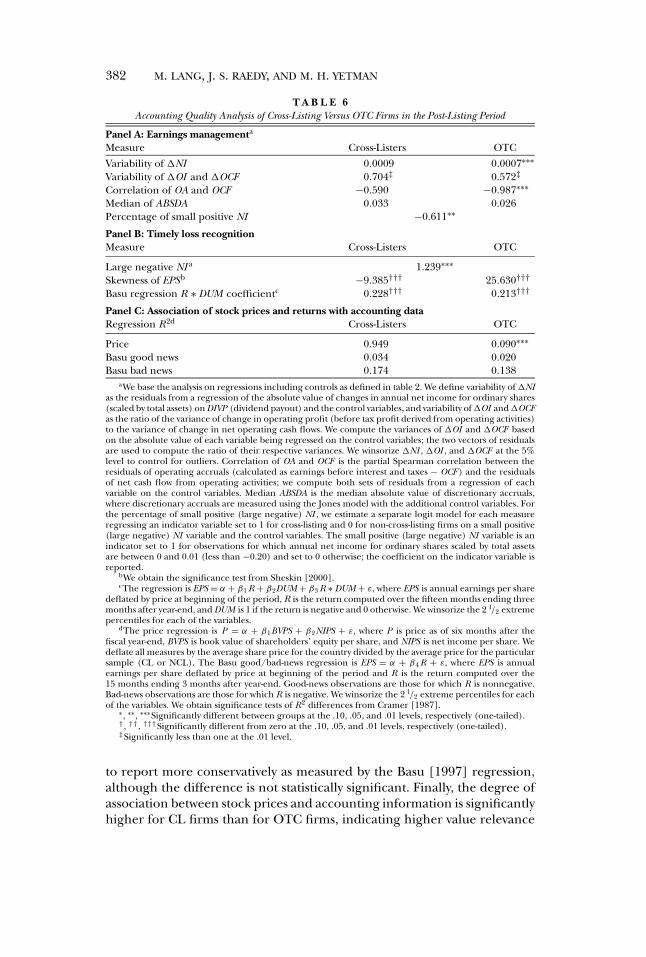
Results for the OTC firms are similar to those for the NCL sample, sug-gesting that the act of trading in the United States alone does not drivethe earlier results. Descriptively, CL firms are more profitable and tradeat higher multiples than do OTC firms (not tabulated). In addition, OTCfirms show more evidence of earnings smoothing than do CL firms, as re-ported in table 6. OTC firms have lower variability of net income and ofoperating income relative to operating cash flows. In addition, their cor-relation between operating accruals and operating income is significantlylower. OTC firms also have a significantly higher proportion of small prof-its than do CL firms, suggesting more of a tendency to use discretion toavoid losses. Only the Jones model accruals measure is not consistent withpredictions.
In terms of timely loss recognition, the results again suggest that CL firmsrecognize losses in a more timely manner than do OTC firms. In particular,OTC firms report fewer instances of large negative earnings. Additionally,CL firms report earnings that are significantly skewed to the left, whereasOTC firms’ earnings are skewed to the right. Furthermore, CL firms appear
15 It would be potentially interesting to examine cases in which OTC firms switch to CLfirms during our sample period. However, we do not have historical OTC listing data for ourCL switching firms to indicate whether they were previously OTC. Given the relatively smallnumber of switching firms on which we have historical data to start with, it seems unlikely thatwe would be able to draw a large enough sample of firms switching from the OTC to CL todraw inference.
16 One way to assess the quality of the match is to estimate the probability of U.S. cross-listing for the OTC and CL samples. As discussed later, we apply the Pagano, Roell, and Zehner[2002] model and find that CL firms have a significantly higher probability of cross-listing thando OTC firms (25% vs. 14%). Inclusion of the control variables may mitigate some of thisdifference, but conclusions should still be drawn with caution.
17 Our sample size for CL observations decreases because we exclude observations after 1999for consistency with the OTC sample.
382 M. LANG, J. S. RAEDY, AND M. H. YETMAN
T A B L E 6Accounting Quality Analysis of Cross-Listing Versus OTC Firms in the Post-Listing Period
Panel A: Earnings managementa
Measure Cross-Listers OTC
Variability of �NI 0.0009 0.0007∗∗∗Variability of �OI and �OCF 0.704‡ 0.572‡
Correlation of OA and OCF −0.590 −0.987∗∗∗Median of ABSDA 0.033 0.026Percentage of small positive NI −0.611∗∗
Panel B: Timely loss recognitionMeasure Cross-Listers OTC
Large negative NI a 1.239∗∗∗Skewness of EPSb −9.385††† 25.630†††
Basu regression R ∗ DUM coefficientc 0.228††† 0.213†††
Panel C: Association of stock prices and returns with accounting dataRegression R2d Cross-Listers OTC
Price 0.949 0.090∗∗∗Basu good news 0.034 0.020Basu bad news 0.174 0.138
aWe base the analysis on regressions including controls as defined in table 2. We define variability of �NIas the residuals from a regression of the absolute value of changes in annual net income for ordinary shares(scaled by total assets) on DIVP (dividend payout) and the control variables, and variability of �OI and �OCFas the ratio of the variance of change in operating profit (before tax profit derived from operating activities)to the variance of change in net operating cash flows. We compute the variances of �OI and �OCF basedon the absolute value of each variable being regressed on the control variables; the two vectors of residualsare used to compute the ratio of their respective variances. We winsorize �NI , �OI , and �OCF at the 5%level to control for outliers. Correlation of OA and OCF is the partial Spearman correlation between theresiduals of operating accruals (calculated as earnings before interest and taxes − OCF ) and the residualsof net cash flow from operating activities; we compute both sets of residuals from a regression of eachvariable on the control variables. Median ABSDA is the median absolute value of discretionary accruals,where discretionary accruals are measured using the Jones model with the additional control variables. Forthe percentage of small positive (large negative) NI , we estimate a separate logit model for each measureregressing an indicator variable set to 1 for cross-listing and 0 for non-cross-listing firms on a small positive(large negative) NI variable and the control variables. The small positive (large negative) NI variable is anindicator set to 1 for observations for which annual net income for ordinary shares scaled by total assetsare between 0 and 0.01 (less than −0.20) and set to 0 otherwise; the coefficient on the indicator variable isreported.
bWe obtain the significance test from Sheskin [2000].cThe regression is EPS = α + β1 R + β2DUM + β3 R ∗ DUM + ε, where EPS is annual earnings per share
deflated by price at beginning of the period, R is the return computed over the fifteen months ending threemonths after year-end, and DUM is 1 if the return is negative and 0 otherwise. We winsorize the 2 1/2 extremepercentiles for each of the variables.
dThe price regression is P = α + β1BVPS + β2NIPS + ε, where P is price as of six months after thefiscal year-end, BVPS is book value of shareholders’ equity per share, and NIPS is net income per share. Wedeflate all measures by the average share price for the country divided by the average price for the particularsample (CL or NCL). The Basu good/bad-news regression is EPS = α + β4 R + ε, where EPS is annualearnings per share deflated by price at beginning of the period and R is the return computed over the15 months ending 3 months after year-end. Good-news observations are those for which R is nonnegative.Bad-news observations are those for which R is negative. We winsorize the 2 1/2 extreme percentiles for eachof the variables. We obtain significance tests of R2 differences from Cramer [1987].
∗, ∗∗, ∗∗∗Significantly different between groups at the .10, .05, and .01 levels, respectively (one-tailed).†, ††, †††Significantly different from zero at the .10, .05, and .01 levels, respectively (one-tailed).‡Significantly less than one at the .01 level.
to report more conservatively as measured by the Basu [1997] regression,although the difference is not statistically significant. Finally, the degree ofassociation between stock prices and accounting information is significantlyhigher for CL firms than for OTC firms, indicating higher value relevance
HOW REPRESENTATIVE ARE FIRMS CROSS-LISTED IN THE U.S.? 383
of reported results for CL firms as compared with OTC firms.18 In addition,the explanatory power in the bad-news Basu [1997] regressions is higher forCL firms than for OTC firms. Although not definitive, results from the OTCanalysis suggest there is more at work here than simply the act of trading inthe United States. Subject to the inherent limitations of the data, the resultis consistent with the notion in Miller [1999] and Coffee [2002] that themarket views a decision to trade on the OTC differently from listing on aU.S. exchange. In particular, consistent with the bonding explanation inCoffee, CL firms appear to report higher quality results in the home marketthan do OTC firms.
4.4.2. Subset of CL Versus NCL: Cross-Listing on Non-U.S. Markets. We alsoinvestigate the subset of our NCL firms that are cross-listed, but not in theUnited States. Research such as Coffee [2002 p. 17] suggests that firms donot appear to view cross-listing in non-U.S. markets as a close substitute forU.S. cross-listing, which he attributes to differences in regulatory environ-ments. Coffee, for example, states, “For the foreign issuer, the NYSE stilloffers a critical advantage: its reputation as the leading repository of highdisclosure standards and market transparency. Here it clearly outranks itsnearest competitor for listings, the LSE.” Because these firms have reasonsto cross-list but did not choose the U.S. market, they provide a potentiallyinteresting comparison sample. The comparison is not perfect because, asnoted by Pagano, Roell, and Zehner [2002], firms cross-listing onto U.S.markets differ from firms listing on European markets in terms of factorssuch as industry, growth, and capital structure.19 Matching on growth andindustry and including our controls for growth, leverage, size, capital in-tensity, and debt and equity issuance should at least partially control forthose types of factors, although we cannot entirely eliminate the possibilityof omitted factors.
We find evidence that 46% of our NCL firms are cross-listed on other non-U.S. markets, 48% of these on code law markets. To the extent that cross-listing on other markets causes our NCL firms to be more similar to our CLfirms (i.e., cross-listing on other markets has similar effects to cross-listingin the United States), it should bias against our finding results. However,except for the small positive net income measure that is not significant,results (not tabulated) are robust to restricting the NCL sample to firmscross-listed on major non-U.S. markets, suggesting that it is not cross-listingper se that drives the results.
18 The large spread in R2s for these price regressions reflects the effect of a few influentialobservations. If we winsorize all variables at the 2.5 and 97.5 level, the CL R2 is 0.512 andthe OTC is 0.329, still significantly different. All of the price regression results are robust toapplying these cutoffs.
19 Applying the Pagano, Roell, and Zehner [2002] model, the NCL firms that are cross-listedelsewhere have a very similar probability of cross-listing in the United States to the CL firms(24% vs. 25%).
384 M. LANG, J. S. RAEDY, AND M. H. YETMAN
4.4.3. Subset of CL Versus NCL: High Probability of Cross-Listing . The preced-ing two subsections suggest it is not simply the fact that a firm trades in theUnited States or cross-lists in general that drives the differences in account-ing quality across CL and NCL firms. However, the motivations for tradingon the OTC or cross-listing on non-U.S. markets may differ from U.S. list-ing on dimensions other than regulation that might affect our results. Thefact that our conclusions are robust to a variety of measures makes it moredifficult to imagine omitted variables that would explain all of the results.Another approach, however, is to explicitly attempt to model the cross-listingdecision. Following Pagano, Roell, and Zehner [2002], we include laggedleverage, total assets, return on assets, total asset growth, market-to-bookratio, percentage of foreign sales, industry, and country in the model. Wefind that cross-listing is correlated with all of these variables except market-to-book ratio. We compute the probability of cross-listing for both our CLsample and our NCL sample. The medians for the two samples are both13.7%. The mean for the CL (NCL) sample is 25.5% (20.4%).20 Althoughthe mean probability of cross-listing is significantly greater for the CL sam-ple than for the NCL sample, the difference becomes insignificant whenthe controls (i.e., size, leverage, growth, equity issuances, debt issuances,and capital intensity) are included. Even though our two samples do notexhibit significantly different probabilities of cross-listing in the presenceof our controls, we perform an additional analysis based on this model. Weselect, from all available firms that are not cross-listing in the United States,a sample of firms with the highest probability of cross-listing (top 20%), andcompare them with our CL sample. For that sample of firms the probabilityof cross-listing is comparable to our CL firms (mean and median of 25% and16% versus 25% and 14% for our CL firms). Conclusions for this sample(not reported) are similar as those reported in the paper.
4.4.4. Subset of CL Versus NCL: Excluding Firms Following U.S. GAAP or IAS.Also, it is possible that our results for the CL firms reflect that some firmsadopt U.S. GAAP or international accounting standards (IAS) outright forlocal reporting. If so, that would not affect our conclusions but might suggestmore directly what drives the differences between CL and NCL firms. Forour sample, more CL than NCL firms claim to report under U.S. GAAP ormodified U.S. GAAP (8.2% vs. 1.0%), although the proportions for IAS arecomparable (2.2% vs. 1.9%). However, the great majority of CL firms stillindicate that they report under local GAAP. To assess whether the decision toreport under U.S. GAAP or IAS drives our results, we replicate the CL versusNCL analysis excluding the U.S. GAAP, modified U.S. GAAP, and IAS firms(there were not enough observations to examine the subsample separately).Results (not reported) are consistent with those reported earlier, indicatingthat the firms reporting under U.S. GAAP and IAS do not drive the results.
20 The probability of cross-listing for the NCL sample that is (is not) cross-listed elsewhereis 24.0% (15.4%).
HOW REPRESENTATIVE ARE FIRMS CROSS-LISTED IN THE U.S.? 385
5. Conclusions
The preceding analyses suggest that CL firms have higher quality localGAAP accounting information as measured by various measures of incomesmoothing and earnings management, by various measures of the timelinessof loss recognition, and by associations of accounting information with shareprices. In addition, we find evidence suggesting that these differences aredue to both changes around cross-listing and pre-listing differences.
We view our analysis as a first step and subject to numerous caveats. First,our conclusions are only as good as our methods. Although we use ap-proaches from the existing literature, constructs such as earnings manage-ment are notoriously difficult to measure. In addition, because many factorsplay a part in cross-listing decisions, we are not able to establish definitivelythe extent to which regulation and litigation play a role. In particular, al-though we attempt to control for other factors, we cannot be sure that ourcontrols are adequate. As research such as Doidge, Karolyi, and Stulz [2001]points out, even if firms are drawn to cross-listing by other factors, regulatorycosts may be the determining factor in whether they proceed. Our goal issimply to provide a body of descriptive evidence that is generally consistentwith existing research in the area in suggesting that firms cross-listing onU.S. markets differ systematically from other firms.
Finally, because there are many dimensions to cross-listing, it is not pos-sible to establish what aspects of U.S. listing drive the empirical results. Ata minimum, however, we view our results as complementing existing cross-listing research and documenting some potentially interesting empiricalregularities that may merit additional analysis.
REFERENCES
BALL, R. “Infrastructure Requirements for an Economically Efficient System of Public FinancialReporting and Disclosure.” Brookings-Wharton Papers on Financial Services (2001): 127–82.
BALL, R.; S. P. KOTHARI; AND A. ROBIN. “The Effect of International Institutional Factors onProperties of Accounting Earnings.” Journal of Accounting and Economics 29 (February 2000):1–51.
BASU, S. “The Conservatism Principle and the Asymmetric Timeliness of Earnings.” Journal ofAccounting and Economics 24 (December 1997): 3–37.
BURGSTAHLER, D., AND I. DICHEV. “Earnings Management to Avoid Earnings Decreases andLosses.” Journal of Accounting and Economics 24 (December 1997): 99–126.
BUSHEE, B., AND C. LEUZ. “Economic Consequences of SEC Disclosure Regulation: Evidencefrom the OTC Bulletin Board.” Working paper, University of Pennsylvania, 2002.
COCHRANE, J.; J. SHAPIRO; AND J. TOBIN. “Foreign Equities and U.S. Investors: BreakingDown the Barriers Separating Supply and Demand.” Stanford Journal of Law, Business andFinance 2 (Summer 1996): 19–32.
COFFEE, J. “Racing Towards the Top?: The Impact of Cross-Listing and Stock Market Compe-tition on International Corporate Governance.” Working paper, Columbia University LawSchool, 2002.
CRAMER, J. S. “Mean and Variance of R2 in Small and Moderate Samples.” Journal of Econometrics35 (July 1987): 253–66.
DECHOW, P.; R. SLOAN; AND A. SWEENEY. “Detecting Earnings Management.” The AccountingReview 70 (April 1995): 193–225.

386 M. LANG, J. S. RAEDY, AND M. H. YETMAN
DOIDGE, C.; G. A. KAROLYI; AND R. STULZ. “Why Are Foreign Firms Listed in the U.S. WorthMore?” National Bureau of Economic Research Working paper No. w8538, Cambridge, 2001.
HAZEN, T. L. The Law of Securities Regulation, Third edition. St. Paul, MN: West Publishing, 1996.JONES, J. “Earnings Management During Import Relief Investigations.” Journal of Accounting
Research 29 (Autumn 1991): 193–228.LEUZ, C.; D. NANDA; AND P. WYSOCKI. “Investor Protection and Earnings Management: An
International Comparison.” Journal of Financial Economics (Forthcoming).MILLER, D. P. “The Market Reaction to International Cross-Listings: Evidence from Depositary
Receipts.” Journal of Financial Economics 51 (January 1999): 103–23.MYERS, L. A., AND D. J. SKINNER. “Earnings Momentum and Earnings Management.” Working
paper, University of Michigan, 1999.PAGANO, M.; A. ROELL; AND J. ZEHNER. “The Geography of Equity Listings: Why Do Companies
List Abroad?” Journal of Finance 57 (December 2002): 2651–94.POWNALL, G., AND K. SCHIPPER. “Implications of Accounting Research for the SEC’s Considera-
tion of International Accounting Standards for U.S. Securities Offerings.” Accounting Horizons13 (September 1999): 259–80.
REESE, W., AND M. WEISBACH. “Protection of Minority Shareholder Interests, Cross-Listing in theUnited States and Subsequent Equity Offerings.” National Bureau of Economics ResearchWorking paper No. w8164, Cambridge, 2001.
SEIGEL, J. “Can Foreign Firms Bond Themselves Effectively by Renting U.S. Securities Laws?”Working paper, MIT Sloan School of Management, 2002.
SHESKIN, D. The Handbook of Parametric and Nonparametric Statistical Procedures, Second edition.Boca Raton, FL: Chapman and Hall/CRC, 2000.


