Embed Size (px)
Citation preview

Philippine Journal of DevelopmentNumber 62, First Semester 2007
Volume XXXIV, Number 1
ABSTRACTThis paper investigates the Philippine government's price stabilizationpolicy for rice. Seemingly unrelated regressions are used to examinethe effectiveness of the program at regional and national levels over a21-year period (January 1983 to December 2003). Results of the re-gional analysis indicate some National Food Authority (NFA)-inducedspatial and temporal differences in terms of producer prices. TheNFA successfully increased producer prices in 5 of 13 regions throughstock accumulation and paddy rice purchase at floor prices. NFAstock releases do not correlate strongly with retail prices at the na-tional level, although results from the regional model indicate NFAstock releases reduced retail prices in five regions. We argue that the
How Successful Are GovernmentInterventions in Food Markets?Insights from the Philippine Rice Market
RICHARD T. YAO, GERALD E. SHIVELY,AND WILLIAM A. MASTERS*
*Richard T. Yao is a PhD Candidate at the Department of Economics, Waikato School of Management,University of Waikato, Hamilton 3240, New Zealand (Tel +64 7 838-4758, Fax +64 7 838-4331, [email protected]). Gerald E. Shively and William A. Masters are Professors at the Department ofAgricultural Economics, Purdue University, 403 West State Street, West Lafayette, Indiana 47907, USA(Shively: Tel +1 765 494-4218, Fax +1 765 494-9176, Email [email protected]; Masters: Tel +1 765494-4235, Fax +1 765 494-9176, Email [email protected]). The authors gratefully thank an anony-mous reviewer for invaluable suggestions that significantly improved this paper. Thanks are also due toconference participants at the American Agricultural Economic Association (AAEA) meeting in Provi-dence, Rhode Island in 2005 where an earlier version of this paper was first presented. They also thankthe staff of the Philippine Bureau of Agricultural Statistics for assistance in obtaining data. The authorsassume responsibility for any errors. Please address all correspondence to Gerald Shively.
PHILIPPINE JOURNAL OF DEVELOPMENT 200736
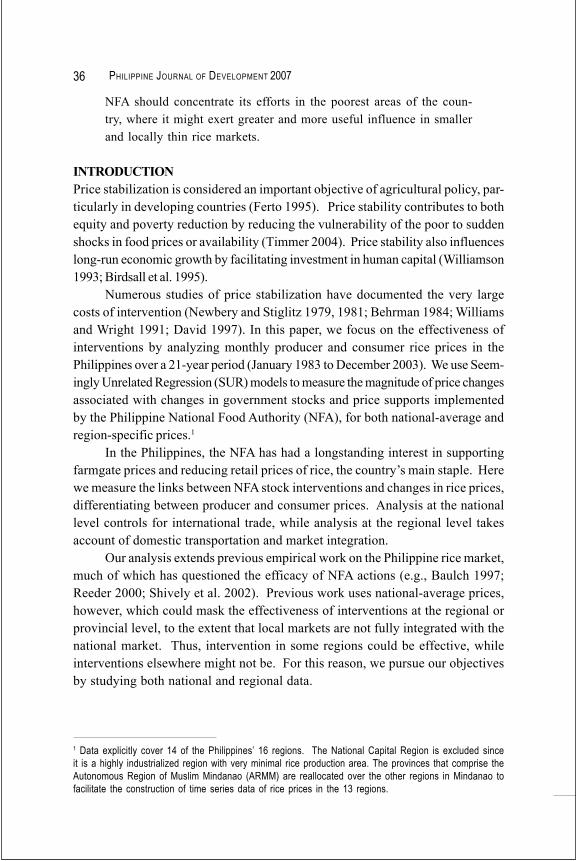
NFA should concentrate its efforts in the poorest areas of the coun-try, where it might exert greater and more useful influence in smallerand locally thin rice markets.
INTRODUCTIONPrice stabilization is considered an important objective of agricultural policy, par-ticularly in developing countries (Ferto 1995). Price stability contributes to bothequity and poverty reduction by reducing the vulnerability of the poor to suddenshocks in food prices or availability (Timmer 2004). Price stability also influenceslong-run economic growth by facilitating investment in human capital (Williamson1993; Birdsall et al. 1995).
Numerous studies of price stabilization have documented the very largecosts of intervention (Newbery and Stiglitz 1979, 1981; Behrman 1984; Williamsand Wright 1991; David 1997). In this paper, we focus on the effectiveness ofinterventions by analyzing monthly producer and consumer rice prices in thePhilippines over a 21-year period (January 1983 to December 2003). We use Seem-ingly Unrelated Regression (SUR) models to measure the magnitude of price changesassociated with changes in government stocks and price supports implementedby the Philippine National Food Authority (NFA), for both national-average andregion-specific prices.1
In the Philippines, the NFA has had a longstanding interest in supportingfarmgate prices and reducing retail prices of rice, the country�s main staple. Herewe measure the links between NFA stock interventions and changes in rice prices,differentiating between producer and consumer prices. Analysis at the nationallevel controls for international trade, while analysis at the regional level takesaccount of domestic transportation and market integration.
Our analysis extends previous empirical work on the Philippine rice market,much of which has questioned the efficacy of NFA actions (e.g., Baulch 1997;Reeder 2000; Shively et al. 2002). Previous work uses national-average prices,however, which could mask the effectiveness of interventions at the regional orprovincial level, to the extent that local markets are not fully integrated with thenational market. Thus, intervention in some regions could be effective, whileinterventions elsewhere might not be. For this reason, we pursue our objectivesby studying both national and regional data.
1 Data explicitly cover 14 of the Philippines� 16 regions. The National Capital Region is excluded sinceit is a highly industrialized region with very minimal rice production area. The provinces that comprise theAutonomous Region of Muslim Mindanao (ARMM) are reallocated over the other regions in Mindanao tofacilitate the construction of time series data of rice prices in the 13 regions.

YAO, SHIVELY AND MASTERS 37
THE PHILIPPINE NATIONAL FOOD AUTHORITYIn the Philippines, rice is the staple food for 85 percent of the population. The pricestabilization program implemented by the NFA aims to keep farmgate prices of riceat levels that provide farmers with a reasonable income and retail prices at levelsthat confer affordability for low-income consumers. To influence both the pro-ducer and the consumer prices, the NFA buys paddy rice from farmers during peakharvest periods, stores this rice in state-owned warehouses, processes this rice instate-owned rice mills, and then sells the milled rice to poor consumers duringperiods in which prices are at their seasonal highs. The NFA�s regional and pro-vincial offices manage approximately 296 warehouses with a combined storagecapacity of more than one million metric tons of grains. The NFA focuses almostexclusively on rice.
During the past three decades, the Philippines was occasionally self-suffi-cient in rice (i.e., 1978-1983, 1987, 1991, 1992, 1994), but during import years, theimported quantities can be very significant. In 2001, imported rice constitutedabout 10 percent of the total rice consumed in the country.2 Historically, the NFAhas controlled the importation of rice through quantitative restrictions. Prior to1996, the NFA was the country�s sole rice importer. In 1996, with the enactment ofthe Agricultural Tariffication Act, private enterprises gained the rights to importminimal quantities of rice. It was only in 2003 that the private sector importedsubstantial quantities,3 but NFA imports still accounted for 75 percent of total riceimportation (NFA 2005), and therefore rice importation still remains a potentiallyimportant public food market intervention.
OBJECTIVESThis study aims to measure the impacts of NFA activities on rice prices. Weaddress three key questions. One, are NFA interventions associated with pricestabilization? Two, are NFA interventions associated with higher producer prices?And three, are NFA interventions associated with lower consumer prices?
We answer these questions from both regional and national perspectives.At the regional level, the analysis aims to determine if the NFA successfully achievedits objectives for each of the 13 rice-producing regions. The regional analysis alsoaims to capture the spatial and temporal diversity of the Philippine rice market.The extent of market diversity can be attributed to the country�s geographic con-ditions as an archipelago consisting of 7,107 islands and islets. This situation
2 This is computed based on the figures reported by PhilRice (2003), where about 7.6 million metric tonsof rice were supplied by local farms while about 0.8 million metric tons of the deficit were imported fromother countries (mainly from Vietnam, Thailand, and USA).3 This is to be compared to the 2002 private importation of 100 metric tons.


YAO, SHIVELY AND MASTERS 39
set consists of a pair of time series (farmgate and retail) each with 252 observa-tions. The regional data set consists of two balanced panels, each with 13 regionalcross-sections and 252 observations (n=3276).
To illustrate the trends in real rice prices, Figure 1 presents a graph of farmgate,retail, and international rice prices from 1983 to 2003. From 1983 to 1992, policyappears to have favored consumers over producers as exhibited by the compara-tively higher average world price and a more stabile (and falling) average retailprice. This pattern is consistent with that reported by Umali (1990) which arguesthat, from 1974 to 1986, the NFA favored consumers over producers. In contrast,beginning in 1994, policy appears to have shifted toward protecting producersfrom the decline in world prices as exhibited by the convergence of domesticfarmgate prices and world prices. The spike in the retail price in 1995 marks a foodprice �crisis� induced by policy failure (David 1997). 4 One explanation is that thegovernment did not have the right information when making decisions regardingthe timing of rice importation.
Figure 2 shows that the abrupt increase in the retail price coincided with avery low NFA rice stock in that year. After the record high retail price in 1995, theNFA responded by building up its stock to record levels both by buying more ricelocally and by increasing imports. In 1998, local rice production was very low dueto El Niño. This triggered a record high importation of about 2.1 million tons of
Figure 1. Retail, farmgate, and world prices (January 1983 to December 2003)
4 In the popular press, this incident is often attributed to an �artificial rice shortage� emanating from ricemiddlemen. It appears that there was no true rice shortage in 1995 based on evidence regarding domesticmilled rice production and expected consumption graph (see Figure 2).

PHILIPPINE JOURNAL OF DEVELOPMENT 200740
rice. In 1999, the NFA had accumulated an all-time high stock of about 12 millionmetric tons of rice. One might posit that the higher NFA stock levels from 1996 to2003 contributed to more stable rice prices. Indeed, retail prices were relativelystable in these years. But it is clear from Figure 1 that consumers were paying veryhigh retail prices for this stability; at the same time, they were protecting produc-ers from the slide in the world price.
Domestic retail prices appear to have been less variable than the world priceas exhibited in Figures 3 and 4. Figure 3 shows monthly percentage changes inlocal rice prices from 1983 to 2003. This measure of price variability suggests twostages: one ranging from 1983 to 1996, characterized by relatively higher pricevariability, and another in 1997 onwards in which the magnitude of price fluctua-tions decreased. The latter pattern can be attributed to the higher amount ofpurchases of local paddy rice and greater volume of rice importation.
Figure 5 presents percentage changes in the volume of monthly rice stocksof the NFA from 1983 to 2003. The graph illustrates sharp increases and decreasesin stock volumes, but from 1999 to 2003, there appears to have been a decrease inthe variability of NFA stock levels. This can be traced to the higher rice inventory(as shown in Figure 2). The higher inventory levels were made possible by higherNFA budget allocations in those years.
As mentioned earlier, the NFA provides the low-income segment of themarket with relatively cheaper milled rice while it buys paddy rice from producersat a relatively higher farmgate price. This scenario is exhibited in Figure 6, whichpresents average monthly prices over the 21-year period, along with NFA sup-port prices. Average domestic retail prices are the highest among the five price
Figure 2. Local rice production, consumption, stocks, and imports (1983�2003)

YAO, SHIVELY AND MASTERS 41Figure 3. First difference in monthly retail prices (January 1983 to December 2003)
Figure 4. First difference in monthly price, FOB Bangkok (January 1983 to December 2003)
series, with an average of P13.53 per kg of milled rice. On average, the retail priceis 21 percent higher than the average NFA consumer support price. The averageworld price is 35 percent lower than the domestic retail price. The fourth line inFigure 6 (ordered from the top to bottom) represents the NFA producer supportprice. This producer support price was, on average, 7 percent higher than theaverage farmgate price.
Figure 7 shows the average monthly NFA injection and the average monthlyprocurement. The NFA injects the greatest volume of its rice stock into the
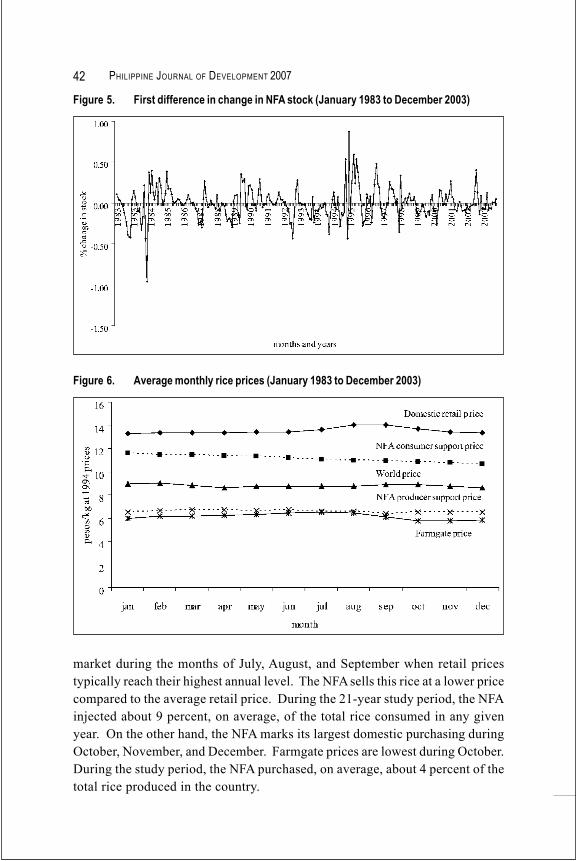
PHILIPPINE JOURNAL OF DEVELOPMENT 200742Figure 5. First difference in change in NFA stock (January 1983 to December 2003)
Figure 6. Average monthly rice prices (January 1983 to December 2003)
market during the months of July, August, and September when retail pricestypically reach their highest annual level. The NFA sells this rice at a lower pricecompared to the average retail price. During the 21-year study period, the NFAinjected about 9 percent, on average, of the total rice consumed in any givenyear. On the other hand, the NFA marks its largest domestic purchasing duringOctober, November, and December. Farmgate prices are lowest during October.During the study period, the NFA purchased, on average, about 4 percent of thetotal rice produced in the country.


PHILIPPINE JO
URNAL OF DEVELO
PMENT 2007
44Table 1. Correlation matrix of the first difference in rice retail prices (natural logs)
Region 1 2 3 4 5 6 7 8 9 10 11 12 13
1 1.002 0.61 1.003 0.62 0.56 1.004 0.30 0.35 0.66 1.005 0.54 0.54 0.52 0.24 1.006 0.44 0.42 0.36 0.27 0.50 1.007 0.42 0.35 0.39 0.17 0.38 0.39 1.008 0.39 0.35 0.39 0.25 0.38 0.35 0.38 1.009 0.41 0.37 0.36 0.17 0.38 0.32 0.33 0.30 1.0010 0.04 0.09 0.05 -0.05 0.10 0.09 0.07 0.13 0.12 1.0011 0.45 0.42 0.40 0.20 0.45 0.45 0.38 0.37 0.40 0.12 1.0012 0.37 0.35 0.32 0.22 0.36 0.48 0.32 0.31 0.37 0.17 0.42 1.0013 0.61 0.52 0.56 0.30 0.54 0.38 0.35 0.34 0.38 -0.06 0.37 0.45 1.00
Note: Correlation coefficients (ñ) in bold are statistically different from zero at 95 percent confidence level (2-tails). The ñ�s in italics are significant at 90 percentlevel.


YAO, SHIVELY AND MASTERS 47Table 3 continued
Item Model 1 Model 2 Model 3Farmgate Retail Farmgate Retail Farmgate Retail
Number of Obs 251 251 251 251 251 251R2 0.4173 0.2764 0.4628 0.2984 0.5052 0.3654P-value 0.0000 0.0000 0.0000 0.0000 0.0000 0.0000
Notes: (1) *** significant at 99 percent confidence level; ** significant at the 95 percent confidence level;* significant at the 90 percent confidence level(2) Standard errors are enclosed in parentheses. (3) Dependent variables are first difference of retail andwholesale prices.
a 0.09 percent increase in the retail price, an increase that was shouldered by theapproximately 85 percent of the Philippine population whose staple food is rice(PhilRice 2003). The negative correlations between NFA stock changes andfarmgate and retail prices is consistent with the fact that NFA does the bulk of itsrice purchasing during the peak harvest months of September and October whenthe farmgate prices are low (see the monthly estimates in Table 3). The negativecoefficient on the NFA stock change indicates that the NFA injects rice mainlyduring the months of July, August, and September, when retail prices are highest(and the supply of rice is at its lowest).
The discussion is illustrated in Figure 8. It shows the monthly patterns ofprices with and without NFA intervention (derived from Models 1 and 2, respec-tively). The graph displays the coefficient estimates for the monthly dummyvariables for each price. The solid lines represent the monthly price changeswithout NFA interventions while the dotted lines represent the monthly pricechanges with NFA intervention variables (NFA stock, producer support prices,and consumer support prices).
Similar to previous findings, we see that, at the national level, the NFAinterventions did achieve the intended effect on the monthly price changes. How-ever, the magnitude of the effect of the NFA interventions is very small. Resultsshow that farmgate prices with NFA intervention are slightly higher than thosewithout NFA intervention. The biggest gap between the with and without NFAintervention occurs in the month of October when the farmgate price, on average,is pulled up by about 1.4 percentage points. With regard to the changes in retailprices, the biggest gap between prices with and without NFA intervention occursin the month of October, although the magnitude of the increase is smaller at only0.6 percentage point.
Model 3, which includes the NFA consumer support prices, reveals no sig-nificant correlation between the price ceiling and the farmgate and consumer prices.

PHILIPPINE JOURNAL OF DEVELOPMENT 200748
One interpretation of this is that while the government tries to sell cheaper rice intothe market to target the very poor, this price ceiling at the national level doesdecrease the average national retail price due to the small volume of NFA ricerelative to the total market. From 1983 to 2003, on average, NFA rice accounted foronly about 8.9 percent of the total rice consumed in the Philippine market. Thispercentage share of NFA rice in the market fluctuates from year to year. Within the21-year period, the lowest share occurred in 1994 (1.5%) and the highest occurredin 1998 (20.8%).
With respect to international trade, the indicator variable for rice importationin Model 3 shows that, at the national level, rice importation is correlated withneither the farmgate nor the retail price. Neither the change in world price nor theinteraction between importation and world price displays a significant correlationwith the national price. These results indicate that international trade has nosignificant direct influence on local prices. Again, this can be attributed to thelimited volume of imported rice relative to the total volume of rice consumed in thecountry. Over the 21-year period, on average, imported rice accounted for only 6.2percent of national consumption. During the 21-year period, there was no riceimportation at all in 10 of the years. The proportion of imported rice to total con-sumption was highest in 1998 when imports accounted for about 27.2 percent (seeFigure 2).7
Turning to the question of variability, Figure 9 illustrates the degree towhich the domestic retail price fluctuates less than the international price. From
7 As mentioned earlier, there was an occurrence of the El Niño phenomenon in 1998 that significantlyreduced the local rice production in that year.
Figure 8. Monthly pattern of national price changes (January 1983 to December 2003)
Retail

YAO, SHIVELY AND MASTERS 49Figure 9. Variability of domestic retail and world prices (January 1983 to December 2003)
1983 to 2003, the domestic retail price had only one major spike (an increase of 20%in 1995), while the international price had roughly four major spikes in prices (all ofthem more than 18%); two occurred in 1984 and one each occurred in 1994 and1998. Figure 10 is a boxplot of these two price series and shows that the interna-tional price had greater variance and more outliers than did the retail price. Thegreater variance in the international price is indicated by a higher average coeffi-cient of variation (13% compared to 3% for the domestic retail price). Results of apaired t-test show that these annual CVs are significantly different at a 1 percenttest level. Despite the lower variability of the domestic retail price, internationalprices were 46 percent lower, on average, than domestic prices.8
Although some of the independent variables in Model 3 are undoubtedlycorrelated, estimates from Model 3 are similar to those of Model 2. In Model 3,interannual variation is captured by the inclusion of year indicator variables. Inthe regression for Model 3, all indicator variables for 1984 to 2003 were included.However, only the point estimates for the years 1991 and 1995 are significant andincluded in Table 3. In 1991, farmgate prices were significantly lower by 2.8 per-cent as compared to the reference year (1983) while retail prices did not show asignificant change in fluctuation. In 1995, due to the occurrence of a rice shortage,farmgate and retail prices were significantly higher by 2.2 and 1.6 percent, respec-tively. There were no significant annual differences in retail and farmgate prices inother years.
8 To better compare the variability of the two price series, future work might analyze the national level dataset using a seasonal generalized autoregressive conditional heteroskedasticity (GARCH) model (Ghyselsand Osborn 2001; Hamilton 1994). The seasonal GARCH model could help determine whether theseasonal variability in international prices is significantly greater or not than that of the local retail prices.

PHILIPPINE JOURNAL OF DEVELOPMENT 200750Figure 10. Boxplot of the local retail and international rice prices
To examine the relationship between the variables in the regression, corre-lation coefficients are presented in Table 4. Changes in farmgate prices arepositively correlated with changes in the NFA stock. This indicates that in-creases in the NFA stock may have contributed to higher farmgate prices. Thepositive correlation between NFA stock changes and the indicator variable onimportation arises because increases in NFA stocks result from rice importation.The negative correlation between the international price change and the NFAstock change indicates that the NFA is less likely to import when internationalprices are high.
The Regional Level AnalysisThe regional analysis covers the 13 rice-producing regions in the country.
The NFA maintains storage facilities in key rice-producing areas that are respon-sible for the implementation of the NFA�s market intervention activities. The re-gional level analysis includes only the NFA�s intervention measures and not inter-national trade since initial regression results did not show significant correlationbetween the international trade variables and the regional rice prices. In addition,we defected what we believed to be spurious correlation between the internationalrice price and the domestic retail price in some regions.

YAO, SHIVELY AND MASTERS 51Ta
ble
4.Co
rrelat
ion
mat
rix o
f the
majo
r reg
ress
ion
varia
bles
Inde
pend
ent
Farm
gate
Reta
ilNF
A St
ock
NFA
prod
ucer
NFA
cons
umer
Impo
rtat
ion
Inte
rnat
iona
l pric
esIM
and
IP
Varia
ble
supp
ort p
rices
supp
ort p
rices
(IM)
(IP)
inte
ract
ion
Farm
gate
1.00
00Re
tail
0.36
671.
0000
NFA
stoc
k0.
1141
-0.0
868
1.00
00NF
A pr
oduc
er p
rices
-0.0
610
-0.0
822
0.08
721.
0000
NFA
cons
umer
pric
es-0
.050
7-0
.070
90.
0958
0.96
701.
0000
Impo
rtatio
n (IM
)0.
0041
0.02
820.
1770
0.32
360.
3982
1.00
00In
tern
ation
al pr
ices
(IP)
0.00
130.
0449
-0.1
284
-0.0
456
-0.0
155
0.01
451.
0000
IM a
nd IP
inte
racti
on0.
0462
0.08
05-0
.119
0-0
.000
20.
0278
-0.0
133
0.82
131.
0000
Note
: Cor
relat
ion c
oeffic
ients
(ñ) i
n bo
ld a
re s
tatis
ticall
y dif
fere
nt fr
om z
ero
at th
e 90
per
cent
con
fiden
ce le
vel (
2-ta
ils).

PHILIPPINE JOURNAL OF DEVELOPMENT 200752
Results for each regional cross-sectional data set show that NFA activitiesare correlated with price changes, although the associations are in nearly all in-stances. Of the 13 regions, Region 4 exhibits the features of the �typical� region.For this reason, coefficients for the monthly dummy variables from this regressionare presented in Figure 11 to illustrate seasonal changes in prices for all the 13regions. The graphs with solid lines represent the price patterns controlling forNFA intervention while the graphs in broken lines take into account the pricechanges with NFA interventions. The effect of NFA intervention on price stabili-zation at the regional level is also similar to that observed at the national level (aspresented in Figure 8).
The model specified in Equation 3 was run for each regional data set. Acondensed summary of the regional results is presented in Table 5. A detailedsummary is presented in Table 6. Only in Region 4 are farmgate prices negativelycorrelated with the change in the NFA stock. This indicates that the NFA regionaloffice in Region 4 buys most of the NFA�s locally purchased rice during the timeswhen farmgate prices are low. On average, over the study period, the NFA pur-chased about 26 percent of its total rice procurement from Region 4, ranging froma low of 10 percent in 1983 to a high of 59 percent in 1998.
In terms of retail prices in five regions (Regions 1, 4, 5, 9, and 12), the retailprice change is negatively correlated with the change in the NFA stock. Thisindicates that a decrease in the NFA stock results in a release of lower-pricedmilled rice into the market in the specific region. Five regions therefore had signifi-cantly lower retail prices resulting from the NFA release, particularly during themonths of July, August, and September (when the supply of rice is relatively lower
Figure 11. Monthly pattern of price changes for Region 4 (January 1983 to December 2003)

YAO, SHIVELY AND MASTERS 53Table 5. Condensed summary of the SUR regional analysis results
Variable Farmgate RetailNo. of regions Percentage No. of regions Percentage
NFA Stock ( � ) 1 8 5 38NFA Prod. Price ( + ) 5 38 10 77NFA Cons. Price ( + ) 2 15 0 0February ( + ) 2 15 2 15March 1 (+), 1 (�) 15 2 (+) 15April 2 (+), 2 (�) 31 2 (+), 1 (�) 23M a y 1 (+), 1 (�) 15 4 (+) 31June 2 (+), 1 (�) 23 3 (+) 23July ( + ) 1 8 8 62August 2 (+), 4 (�) 46 12 (+) 92September 11 (�) 85 3 (+), 1 (�) 31October ( � ) 11 85 6 46November 1 (+), 5 (�) 46 6 (�) 46December 3 (+), 1 (�) 31 2 (�) 15Indicator for 1991 ( � ) 2 15 1 8Indicator for 1993 ( + ) 0 0 1 8Indicator for 1995 ( + ) 1 8 4 31Indicator for 1996 ( � ) 2 15 0 0
Note: (1) �No. of regions� is the number of regions significantly correlated at the 90 percent confidencelevel. (2) Indicator variables shown only for years in which interannual variation in prices is significantlydifferent from zero at the 90 percent confidence level. (3) For regional detail, see Table 6.
and the retail price is relatively higher). On average, the NFA has the highestaccumulation of stock during the months of June and July and then rapidly re-leases these stock into the market during the months of August, September, andOctober (see Figure 12). The NFA starts to accumulate its rice stock in Novemberby purchasing rice during the peak of the harvest season. The NFA usually hastwo major procurement periods in a given year: the first occurs during the monthsof November and December, the peak harvest period for the main (wet) cropping;the second occurs happens during the months of April and May, when harvestedrice for the second (dry) cropping is usually sold.
With regard to the NFA producer support price, rice producers in five re-gions (Regions 4, 6, 10, 12, and 13) benefited from NFA actions as exhibited by thepositive correlation between the farmgate price and the producer support price.However, the producers� price variable is also positively correlated with the retailprice in 10 regions. One interpretation of this pattern is that while rice producers infive regions may be getting a higher income from rice farming, rice consumers in 10regions are buying significantly more expensive rice. For the regions in which the

PHILIPPINE JOURNAL OF DEVELOPMENT 200754Ta
ble
6.De
taile
d su
mm
ary o
f the
SUR
resu
lts b
y reg
ion
Varia
ble
Farm
gate
Reta
ilR1
R2R3
R4R5
R6R7
R8R9
R10
R11
R12
R13
R1R2
R3R4
R5R6
R7R8
R9R1
0R1
1R1
2R1
3
Tim
e tre
ndNF
A st
ock
��
��
��
NFA
prod
ucer
pric
e+
++
++
++
++
++
++
++
NFA
cons
umer
pric
e+
+Fe
brua
ry+
++
+M
arch
�+
++
April
++
��
++
�M
ay+
�+
++
+Ju
ne+
+�
++
+Ju
ly+
++
++
++
++
Augu
st�
�+
+�
�+
++
++
++
++
++
+Se
ptem
ber
��
��
��
��
��
�+
+�
+Oc
tobe
r�
��
��
��
��
��
��
��
��
Nove
mbe
r�
��
+�
��
��
��
�De
cem
ber
++
+�
��
Indic
ator
for 1
990
Indic
ator
for 1
991
��
�In
dicat
or fo
r 199
2In
dicat
or fo
r 199
3+
Indic
ator
for 1
994
Indic
ator
for 1
995
++
++
+In
dicat
or fo
r 199
6�
�
Note
:��� i
ndica
tes
a co
effic
ient w
ith a
neg
ative
sign
sign
ifican
t at t
he 9
0 pe
rcen
t con
fiden
ce le
vel.
�+� in
dicat
es a
coe
fficien
t with
a p
ositiv
e sig
n sig
nifica
nt a
t the
90
perc
ent c
onfid
ence
leve
l.In
the
origi
nal r
egre
ssion
, the
indic
ator
var
iables
are
com
plete
from
198
4 to
200
3 wi
th 1
983
serv
ing a
s th
e ye
ar o
f ref
eren
ce. O
nly th
e ye
ars
from
199
0 to
199
6 ar
epr
esen
ted
here
due
to th
e co
nstra
int in
spa
ce.

YAO, SHIVELY AND MASTERS 55Figure 12. Average monthly NFA rice stock (January 1983 to December 2003)
NFA support price is correlated with both farmgate and retail prices, the percent-age increase in the farmgate price is usually twice as much as the percentageincrease in the retail price. This is consistent with the results in the nationallevel analysis.
While the NFA injects cheaper rice into the market to cater to the poorersegment of the market, the results show that the volume of cheaper rice injected isnot sufficient to significantly bring down the overall average retail prices in any ofthe 13 regions. However, the NFA consumer support price is positively correlatedwith the farmgate prices in Regions 3 and 9. This may indicate that the consumersupport price contributes to higher producer prices in these regions.
Farmgate and retail prices rise and fall from month to month. Using Janu-ary as the base month, the SUR results at the regional level in Table 5 show thatfarmgate prices are at their lowest level during the months of September andOctober in 11 of 13 regions, during the peak harvest season. This is consistentwith the pattern displayed in the national level analysis where September andOctober have a seven percent lower farmgate price compared with January. Re-tail prices reach their peak in 12 of 13 regions during the month of August whenthe supply of rice in the market falls to its lowest level. This is exhibited by thepositive correlation between the domestic retail price and the dummy variablefor August in the regional regressions. These results are also consistent withnational analysis.
Although one might hypothesize that consumer support prices play an im-portant role in poorer regions of the country, we find no significant correlationbetween the consumer support price and the regional retail price in any of the 13regions (Table 5).
PHILIPPINE JOURNAL OF DEVELOPMENT 200756
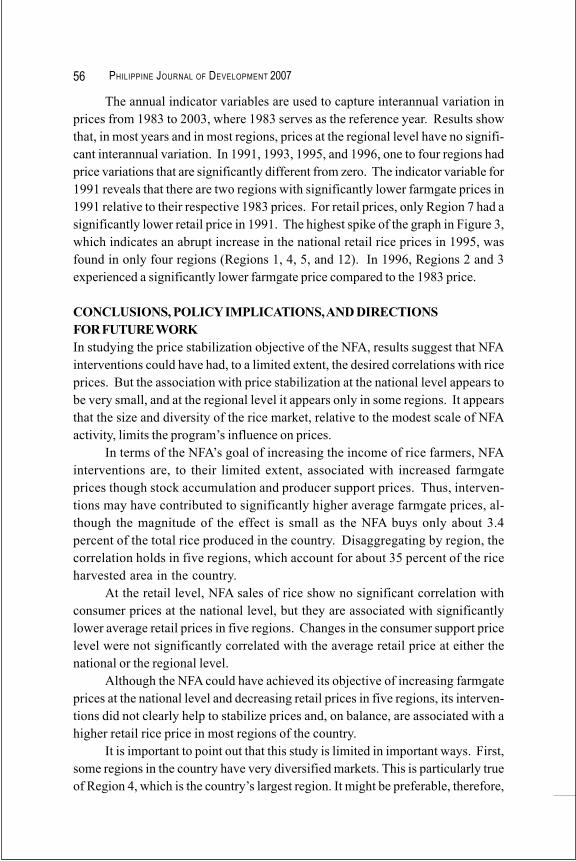
The annual indicator variables are used to capture interannual variation inprices from 1983 to 2003, where 1983 serves as the reference year. Results showthat, in most years and in most regions, prices at the regional level have no signifi-cant interannual variation. In 1991, 1993, 1995, and 1996, one to four regions hadprice variations that are significantly different from zero. The indicator variable for1991 reveals that there are two regions with significantly lower farmgate prices in1991 relative to their respective 1983 prices. For retail prices, only Region 7 had asignificantly lower retail price in 1991. The highest spike of the graph in Figure 3,which indicates an abrupt increase in the national retail rice prices in 1995, wasfound in only four regions (Regions 1, 4, 5, and 12). In 1996, Regions 2 and 3experienced a significantly lower farmgate price compared to the 1983 price.
CONCLUSIONS, POLICY IMPLICATIONS, AND DIRECTIONSFOR FUTURE WORKIn studying the price stabilization objective of the NFA, results suggest that NFAinterventions could have had, to a limited extent, the desired correlations with riceprices. But the association with price stabilization at the national level appears tobe very small, and at the regional level it appears only in some regions. It appearsthat the size and diversity of the rice market, relative to the modest scale of NFAactivity, limits the program�s influence on prices.
In terms of the NFA�s goal of increasing the income of rice farmers, NFAinterventions are, to their limited extent, associated with increased farmgateprices though stock accumulation and producer support prices. Thus, interven-tions may have contributed to significantly higher average farmgate prices, al-though the magnitude of the effect is small as the NFA buys only about 3.4percent of the total rice produced in the country. Disaggregating by region, thecorrelation holds in five regions, which account for about 35 percent of the riceharvested area in the country.
At the retail level, NFA sales of rice show no significant correlation withconsumer prices at the national level, but they are associated with significantlylower average retail prices in five regions. Changes in the consumer support pricelevel were not significantly correlated with the average retail price at either thenational or the regional level.
Although the NFA could have achieved its objective of increasing farmgateprices at the national level and decreasing retail prices in five regions, its interven-tions did not clearly help to stabilize prices and, on balance, are associated with ahigher retail rice price in most regions of the country.
It is important to point out that this study is limited in important ways. First,some regions in the country have very diversified markets. This is particularly trueof Region 4, which is the country�s largest region. It might be preferable, therefore,

YAO, SHIVELY AND MASTERS 57
to conduct this analysis using provincially disaggregated data, perhaps focusingon the poorest provinces where the rural communities have a stronger need forprice stabilization.9 Second, it also seems advisable to conduct statistical andeconomic analyses comparing price variability between domestic and internationalprices. One might, for example, use a seasonal GARCH approach to test for differ-ences in price variability. Third, the use of panel data opens several avenues forinquiry to study the impacts of government interventions. So, for example, theregional level data used here could be used to address regional heterogeneity inmore depth, perhaps using feasible generalized least squares (FGLS) or spatialeconometric methods.
9 For example, Region 4 can be subdivided into two major groups of provinces: CALABARZON andMIMAROPA. The CALABARZON group is composed of relatively more industrialized, and smallerprovinces near Metro Manila. MIMAROPA consists of relatively larger and rural island provinces.

PHILIPPINE JOURNAL OF DEVELOPMENT 200758
REFERENCESBaulch, B. 1997. Transfer costs, spatial arbitrage, and testing for food market
integration. American Journal of Agricultural Economics 79(2):477�487.Berhrman, J.R. 1984. The analytics of international commodity agreements. In
Agricultural development in the Third World, edited by C. Eicher and J.Staatz. Baltimore, MD: John Hopkins University Press.
Birdsall, N., D. Ross, and R. Sabor. 1995. Inequality and growth reconsidered:lessons from East Asia. World Bank Economic Review 9(3):477�508.
Challis, R.E. and R.I. Kitney. 1991. Biomedical signal processing (in four parts).Part 1. Time-domain methods. Medical and Biological Engineering andComputing 28:509�524.
David, C.C. 1997. Food policy: its role in price stability and food security. Journalof Philippine Development 24(43):171�189.
Dickey, D. A. and W.A. Fuller. 1979. Distribution of the estimators for autoregressivetime series with a unit root. Journal of the American Statistical Associa-tion 74(366):427�431.
Economic Reseach Service / U.S. Department of Agriculture (ERS/USDA). 2005.Nominal monthly country exchange rates [online]. Agricultural ExchangeRate Data Set. Economic Research Services of USDA. http://www.ers.usda.gov/data/exchangerates [Accessed August 15, 2005]
Ferto, I. 1995. Methods for stabilizing agricultural prices in developing countries.Acta Oeconomica 47(1-2):155�169.
Ghysels, E. and D.R. Osborn. 2001. The econometric analysis of seasonal timeseries. Cambridge University Press.
Greene, W. 2003. Econometric analysis. Fifth ed. USA: Prentice Hall.Hamilton, J.D. 1994. Time series analysis. Chapter 21, Section 2. Princeton Univer-
sity PressNational Food Authority (NFA). 2005. Memorandum Circular Number AO -2k5-01-
001. General guidelines on the participation of farmers� organizationsand all other sectors in the importation of rice year 2005 [online]. QuezonCity, Philippines: NFA. http://www.nfa.gov.ph/announce.html [AccessedAugust 15, 2005]
Newbery, D. and J.E. Stiglitz. 1979. The theory of commodity price stabilization rules:welfare impacts and supply responses. Economic Journal 89:799�817.
Philippine Rice Research Institute (PhilRice). 2003. The Philippine rice industry[online]. http://www.philrice.gov.ph/prorice/Philippine_rice_industry.htm.[Accessed August 15, 2005]
Reeder, M. 2000. Assymetric prices: implications on trader�s market power inPhilippine rice. Journal of Philippine Development 49(1):49�69.

YAO, SHIVELY AND MASTERS 59
Shively, G.E., E. Martinez and W. Masters. 2002. Testing the link between publicintervention and food price variability: evidence from rice markets in thePhilippines. Pacific Economic Review 7(3):545�554
Timmer, C.P. 2004. Food security and economic growth: an Asian perspective.Working paper No. 51. Washington, DC: Center for Global Development.
Umali, D. 1990. Rice marketing and prices under Philippine government rice stabi-lization. Journal of Agricultural Economics and Development 20:1�43.
Williams, J.C. and B.D. Wright. 1991. Storage and commodity markets. Cam-bridge: Cambridge University Press.
Williamson, J.C. 1993. Human capital deepening, inequality and demographicevents along the Asia-Pacific Rim. In Human resources in developmentalong the Asia-Pacific Rim, edited by N. Ogawa, G. Jones and J. Williamson.Singapore: Oxford University Press.