Embed Size (px)
Citation preview

HSBC Portfolios – World Selection Interim Report 2021

No subscription can be received on the basis of financial reports. Subscriptions are only valid if made on the basis of the current Prospectus
accompanied by the latest annual and the most recent semi-annual report, if published thereafter.
Unaudited report for the period 01 August 2020 to 31 January 2021.
Enfocus Software - Customer Support
Table of Contents General Information 2
Statement of Net Assets as at 31 January 2021 6
Statement of Operations for the period ended 31 January 2021 7
Statement of Changes in Net Assets for the period ended 31 January 2021 8
Statement of Changes in Shares Issued 9
Statistical Information 13
Notes to the Financial Statements 16
Schedules of Investments and Other Net Assets as at 31 January 2021
HSBC Portfolios – World Selection 1 34
HSBC Portfolios – World Selection 2 41
HSBC Portfolios – World Selection 3 46
HSBC Portfolios – World Selection 4 51
HSBC Portfolios – World Selection 5 52
Appendix I (Additional Disclosures) – Taxation of the Company (foreign countries) 53
Appendix II (Additional Disclosures) – UK SORP Disclosure 54
Appendix III (Additional Disclosures) – Fund Holiday Calendar for 2021 57
Appendix IV (Additional Disclosures) – Publication of TER (Total Expense Ratio) 58
Appendix V (Additional Disclosures) – Securities Financing Transactions
Regulation (“SFTR”) 59
Enfocus Software - Customer Support
2
General Information Directors Anthony Jeffs (Chairman), Global Head of Product
HSBC Global Asset Management Limited 8 Canada Square, Canary Wharf, London E14 5HQ, United Kingdom.
Dr. Michael Boehm, Chief Operating Officer HSBC Global Asset Management (Deutschland) GmbH Königsallee 21/23, 40212 Düsseldorf, Germany.
Jean de Courrèges, Independent Director Resident in Grand Duchy of Luxembourg.
Eimear Cowhey, Independent DirectorResident in the Republic of Ireland.
John Li, Independent Director The Directors Office 19 Rue de Bitbourg, L-1273, Luxembourg.
Matteo Pardi, Chief Executive OfficerHSBC Global Asset Management (France) Immeuble “Coeur Défense” - Tour A, 110 Esplanade du Général de Gaulle - La Défense 4, 75419 Paris, Cedex 08, France.
Enfocus Software - Customer Support
General Information (continued)
3
Registered Office 16, boulevard d’Avranches L-1160 Luxembourg, Grand Duchy of Luxembourg.
Administration Agent, Depositary Bank, Paying Agent, Corporate and Domiciliary Agent, Registrar and Transfer Agent
HSBC Continental Europe, Luxembourg (until 30 November 2020 HSBC Continental Europe, Luxembourg was named HSBC France, Luxembourg Branch) 16, boulevard d’Avranches, L-1160 Luxembourg, Grand Duchy of Luxembourg.
Management Company HSBC Investment Funds (Luxembourg) S.A. 16, boulevard d’Avranches, L-1160 Luxembourg, Grand Duchy of Luxembourg.
Auditor PricewaterhouseCoopers, Société coopérative 2, rue Gerhard Mercator, B.P.1443, L-1014 Luxembourg, Grand Duchy of Luxembourg.
Legal Advisers Elvinger Hoss Prussen, Société anonyme 2, Place Winston Churchill, L-1340 Luxembourg, Grand Duchy of Luxembourg.
Investment Advisers HSBC Global Asset Management (UK) Limited 8 Canada Square, London E14 5HQ, United Kingdom.
Distributors and Representatives Global Distributor HSBC Investment Funds (Luxembourg) S.A. 16, boulevard d’Avranches, L-1160 Luxembourg, Grand Duchy of Luxembourg.
Austria and Eastern Europe DistributorHSBC Trinkaus & Burkhardt AG Königsallee 21/23, D-40212 Düsseldorf, Germany.
Enfocus Software - Customer Support
General Information (continued)
4
Distributors and Representatives (continued)
Continental Europe Distributor HSBC Global Asset Management (France) Immeuble “Coeur Défense” - Tour A, 110 Esplanade du Général de Gaulle - La Défense 4, 75419 Paris, Cedex 08, France.
Hong Kong Distributor HSBC Investment Funds (Hong Kong) Limited HSBC Main Building, 1 Queen’s Road Central, Hong Kong.
Singapore Distributor HSBC Global Asset Management (Singapore) Limited 21 Collyer Quay, #06-01 HSBC Building, Singapore 049320, Singapore.
United Kingdom Representative HSBC Global Asset Management (UK) Limited 8 Canada Square, London E14 5HQ, United Kingdom.
Malta Distributor HSBC Global Asset Management (Malta) Ltd 80 Mill Street, Qormi, QRM 3101, Malta.
North America and South America Distributor HSBC Securities (USA) Inc 452 Fifth Avenue, New York, 10018, United States.
Poland Representative ProService Agent Transferowy Sp. Z.o.o. 436 Pulawska Street, Warszawa, Poland.
Enfocus Software - Customer Support
General Information (continued)
5
Note on the risk management
HSBC Investment Funds (Luxembourg) S.A. (the “Management Company”) uses a risk management process that allows monitoring of the risk of
the portfolio positions and their share of the overall risk profile of the portfolios of HSBC Portfolios (the “Company”) at any time. In accordance
with the Law of 17 December 2010 on undertakings for collective investment, as amended (the “2010 Law”), and the applicable regulatory
requirements of the Commission de Surveillance du Secteur Financier (“CSSF”), the Management Company reports to the CSSF on a regular
basis on the risk management process. The Management Company shall monitor, on the basis of appropriate and reasonable methods, that the
Company’s global exposure relating to derivative instruments does not exceed the total net asset value of its portfolio.
For the Company, the Management Company uses the “commitment approach” for the calculation of the global exposure. The “commitment
approach” is based on converting the value of each financial derivative instrument position into the market value of an equivalent position in the
underlying asset of that derivative. Netting and hedging might be considered for derivative financial instruments and their underlying assets. The
sum of these underlying equivalents must not exceed the net asset value of the portfolio.
Statement of changes in the investment portfolio
A list, specifying for each portfolio total purchases and sales transacted during the period under review, may be obtained, upon request, at the
registered office of the Company.
Enfocus Software - Customer Support
6
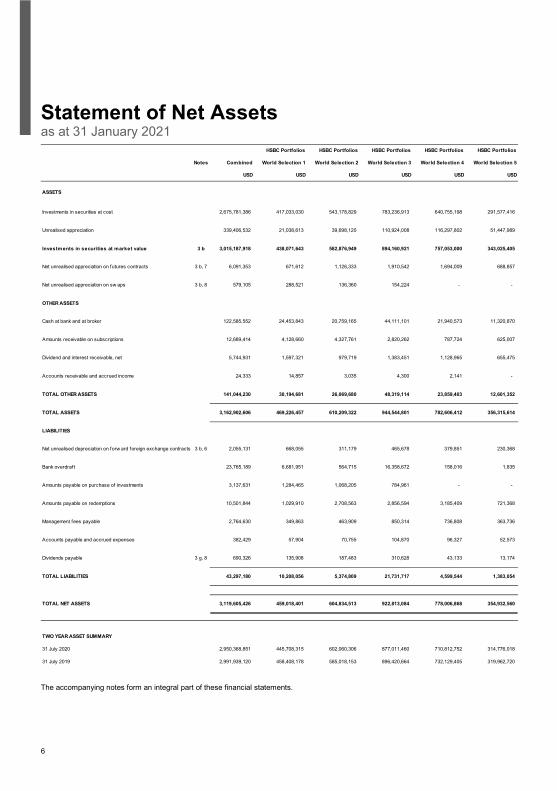
Statement of Net Assets as at 31 January 2021
The accompanying notes form an integral part of these financial statements.
HSBC Portfolios HSBC Portfolios HSBC Portfolios HSBC Portfolios HSBC Portfolios
Notes Combined World Selection 1 World Selection 2 World Selection 3 World Selection 4 World Selection 5
USD USD USD USD USD USD
ASSETS
Investments in securities at cost 2,675,781,386 417,033,030 543,178,829 783,236,913 640,755,198 291,577,416
Unrealised appreciation 339,406,532 21,038,613 39,698,120 110,924,008 116,297,802 51,447,989
Investments in securities at market value 3 b 3,015,187,918 438,071,643 582,876,949 894,160,921 757,053,000 343,025,405
Net unrealised appreciation on futures contracts 3 b, 7 6,091,353 671,612 1,126,333 1,910,542 1,694,009 688,857
Net unrealised appreciation on sw aps 3 b, 8 579,105 288,521 136,360 154,224 - -
OTHER ASSETS
Cash at bank and at broker 122,585,552 24,453,843 20,759,165 44,111,101 21,940,573 11,320,870
Amounts receivable on subscriptions 12,689,414 4,128,660 4,327,761 2,820,262 787,724 625,007
Dividend and interest receivable, net 5,744,931 1,597,321 979,719 1,383,451 1,128,965 655,475
Accounts receivable and accrued income 24,333 14,857 3,035 4,300 2,141 -
TOTAL OTHER ASSETS 141,044,230 30,194,681 26,069,680 48,319,114 23,859,403 12,601,352
TOTAL ASSETS 3,162,902,606 469,226,457 610,209,322 944,544,801 782,606,412 356,315,614
LIABILITIES
Net unrealised depreciation on forw ard foreign exchange contracts 3 b, 6 2,055,131 668,055 311,179 465,678 379,851 230,368
Bank overdraft 23,765,189 6,681,951 564,715 16,358,672 158,016 1,835
Amounts payable on purchase of investments 3,137,631 1,284,465 1,068,205 784,961 - -
Amounts payable on redemptions 10,501,844 1,029,910 2,708,563 2,856,594 3,185,409 721,368
Management fees payable 2,764,630 349,863 463,909 850,314 736,808 363,736
Accounts payable and accrued expenses 382,429 57,904 70,755 104,870 96,327 52,573
Dividends payable 3 g, 8 690,326 135,908 187,483 310,628 43,133 13,174
TOTAL LIABILITIES 43,297,180 10,208,056 5,374,809 21,731,717 4,599,544 1,383,054
TOTAL NET ASSETS 3,119,605,426 459,018,401 604,834,513 922,813,084 778,006,868 354,932,560
TWO YEAR ASSET SUMMARY
31 July 2020 2,950,368,851 445,708,315 602,060,306 877,011,460 710,812,752 314,776,018
31 July 2019 2,991,939,120 458,408,178 585,018,153 896,420,664 732,129,405 319,962,720
Enfocus Software - Customer Support
7
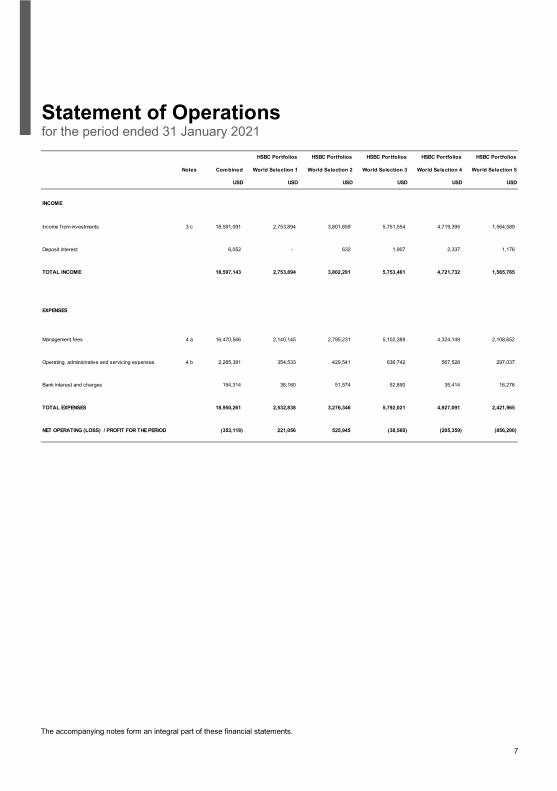
Statement of Operationsfor the period ended 31 January 2021
The accompanying notes form an integral part of these financial statements.
HSBC Portfolios HSBC Portfolios HSBC Portfolios HSBC Portfolios HSBC Portfolios
Notes Combined World Selection 1 World Selection 2 World Selection 3 World Selection 4 World Selection 5
USD USD USD USD USD USD
INCOME
Income from investments 3 c 18,591,091 2,753,894 3,801,659 5,751,554 4,719,395 1,564,589
Deposit interest 6,052 - 632 1,907 2,337 1,176
TOTAL INCOME 18,597,143 2,753,894 3,802,291 5,753,461 4,721,732 1,565,765
EXPENSES
Management fees 4 a 16,470,566 2,140,145 2,795,231 5,102,389 4,324,149 2,108,652
Operating, administrative and servicing expenses 4 b 2,285,381 354,533 429,541 636,742 567,528 297,037
Bank interest and charges 194,314 38,160 51,574 52,890 35,414 16,276
TOTAL EXPENSES 18,950,261 2,532,838 3,276,346 5,792,021 4,927,091 2,421,965
NET OPERATING (LOSS) / PROFIT FOR THE PERIOD (353,118) 221,056 525,945 (38,560) (205,359) (856,200)
Enfocus Software - Customer Support
8
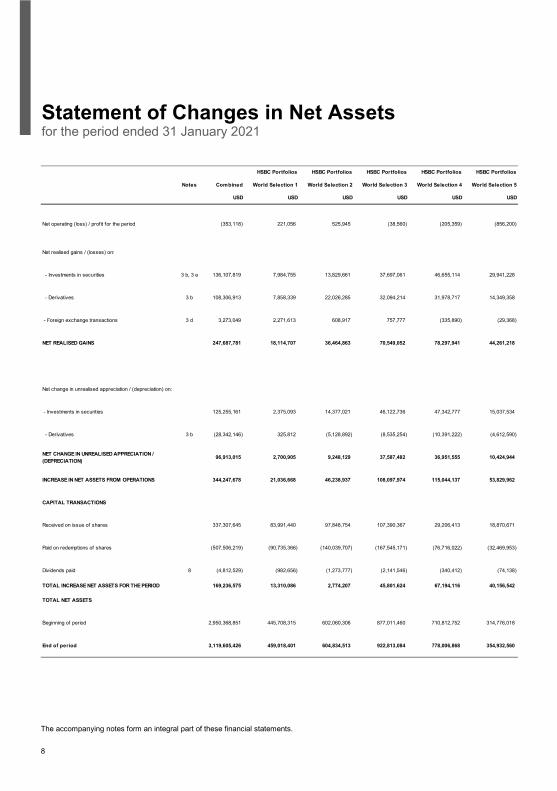
Statement of Changes in Net Assetsfor the period ended 31 January 2021
The accompanying notes form an integral part of these financial statements.
HSBC Portfolios HSBC Portfolios HSBC Portfolios HSBC Portfolios HSBC Portfolios
Notes Combined World Selection 1 World Selection 2 World Selection 3 World Selection 4 World Selection 5
USD USD USD USD USD USD
Net operating (loss) / profit for the period (353,118) 221,056 525,945 (38,560) (205,359) (856,200)
Net realised gains / (losses) on:
- Investments in securities 3 b, 3 e 136,107,819 7,984,755 13,829,661 37,697,061 46,655,114 29,941,228
- Derivatives 3 b 108,306,913 7,858,339 22,026,285 32,094,214 31,978,717 14,349,358
- Foreign exchange transactions 3 d 3,273,049 2,271,613 608,917 757,777 (335,890) (29,368)
NET REALISED GAINS 247,687,781 18,114,707 36,464,863 70,549,052 78,297,941 44,261,218
Net change in unrealised appreciation / (depreciation) on:
- Investments in securities 125,255,161 2,375,093 14,377,021 46,122,736 47,342,777 15,037,534
- Derivatives 3 b (28,342,146) 325,812 (5,128,892) (8,535,254) (10,391,222) (4,612,590)
NET CHANGE IN UNREALISED APPRECIATION / (DEPRECIATION)
96,913,015 2,700,905 9,248,129 37,587,482 36,951,555 10,424,944
INCREASE IN NET ASSETS FROM OPERATIONS 344,247,678 21,036,668 46,238,937 108,097,974 115,044,137 53,829,962
CAPITAL TRANSACTIONS
Received on issue of shares 337,307,645 83,991,440 97,848,754 107,390,367 29,206,413 18,870,671
Paid on redemptions of shares (507,506,219) (90,735,366) (140,039,707) (167,545,171) (76,716,022) (32,469,953)
Dividends paid 8 (4,812,529) (982,656) (1,273,777) (2,141,546) (340,412) (74,138)
TOTAL INCREASE NET ASSETS FOR THE PERIOD 169,236,575 13,310,086 2,774,207 45,801,624 67,194,116 40,156,542
TOTAL NET ASSETS
Beginning of period 2,950,368,851 445,708,315 602,060,306 877,011,460 710,812,752 314,776,018
End of period 3,119,605,426 459,018,401 604,834,513 922,813,084 778,006,868 354,932,560
Enfocus Software - Customer Support
9
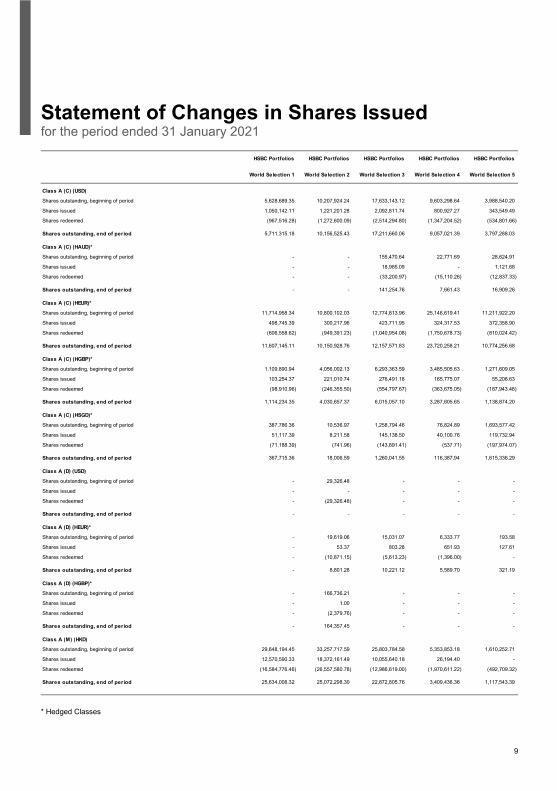
Statement of Changes in Shares Issued for the period ended 31 January 2021
* Hedged Classes
HSBC Portfolios HSBC Portfolios HSBC Portfolios HSBC Portfolios HSBC Portfolios
World Selection 1 World Selection 2 World Selection 3 World Selection 4 World Selection 5
Class A (C) (USD)
Shares outstanding, beginning of period 5,628,689.35 10,207,924.24 17,633,143.12 9,603,298.64 3,988,540.20
Shares issued 1,050,142.11 1,221,201.28 2,092,811.74 800,927.27 343,549.49
Shares redeemed (967,516.28) (1,272,600.09) (2,514,294.80) (1,347,204.52) (534,801.66)
Shares outstanding, end of period 5,711,315.18 10,156,525.43 17,211,660.06 9,057,021.39 3,797,288.03
Class A (C) (HAUD)*
Shares outstanding, beginning of period - - 155,470.64 22,771.69 28,624.91
Shares issued - - 18,985.09 - 1,121.68
Shares redeemed - - (33,200.97) (15,110.26) (12,837.33)
Shares outstanding, end of period - - 141,254.76 7,661.43 16,909.26
Class A (C) (HEUR)*
Shares outstanding, beginning of period 11,714,958.34 10,800,102.03 12,774,813.96 25,146,619.41 11,211,922.20
Shares issued 498,745.39 300,217.96 423,711.95 324,317.53 372,358.90
Shares redeemed (606,558.62) (949,391.23) (1,040,954.08) (1,750,678.73) (810,024.42)
Shares outstanding, end of period 11,607,145.11 10,150,928.76 12,157,571.83 23,720,258.21 10,774,256.68
Class A (C) (HGBP)*
Shares outstanding, beginning of period 1,109,890.94 4,056,002.13 6,293,363.59 3,485,505.63 1,271,609.05
Shares issued 103,254.37 221,010.74 276,491.18 165,775.07 55,208.63
Shares redeemed (98,910.96) (246,355.50) (554,797.67) (363,675.05) (187,943.48)
Shares outstanding, end of period 1,114,234.35 4,030,657.37 6,015,057.10 3,287,605.65 1,138,874.20
Class A (C) (HSGD)*
Shares outstanding, beginning of period 387,786.36 10,536.97 1,258,794.46 76,824.89 1,693,577.42
Shares issued 51,117.39 8,211.58 145,138.50 40,100.76 119,732.94
Shares redeemed (71,188.39) (741.96) (143,891.41) (537.71) (197,974.07)
Shares outstanding, end of period 367,715.36 18,006.59 1,260,041.55 116,387.94 1,615,336.29
Class A (D) (USD)
Shares outstanding, beginning of period - 29,326.48 - - -
Shares issued - - - - -
Shares redeemed - (29,326.48) - - -
Shares outstanding, end of period - - - - -
Class A (D) (HEUR)*
Shares outstanding, beginning of period - 19,619.06 15,031.07 6,333.77 193.58
Shares issued - 53.37 803.28 651.93 127.61
Shares redeemed - (10,871.15) (5,613.23) (1,396.00) -
Shares outstanding, end of period - 8,801.28 10,221.12 5,589.70 321.19
Class A (D) (HGBP)*
Shares outstanding, beginning of period - 166,736.21 - - -
Shares issued - 1.00 - - -
Shares redeemed - (2,379.76) - - -
Shares outstanding, end of period - 164,357.45 - - -
Class A (M) (HKD)
Shares outstanding, beginning of period 29,648,194.45 33,257,717.59 25,803,784.58 5,353,853.18 1,610,252.71
Shares issued 12,570,590.33 18,372,161.49 10,055,640.18 26,194.40 -
Shares redeemed (16,584,776.46) (26,557,580.78) (12,986,619.00) (1,970,611.22) (492,709.32)
Shares outstanding, end of period 25,634,008.32 25,072,298.30 22,872,805.76 3,409,436.36 1,117,543.39
Enfocus Software - Customer Support
10
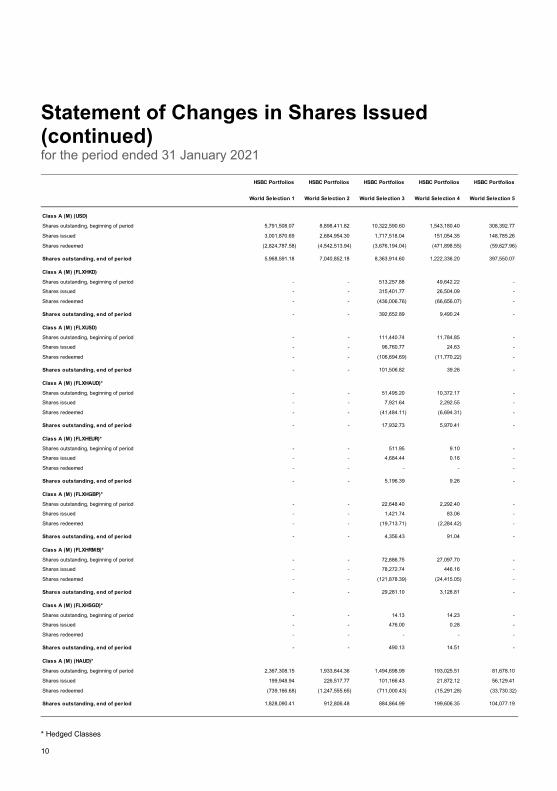
Statement of Changes in Shares Issued(continued)for the period ended 31 January 2021
* Hedged Classes
HSBC Portfolios HSBC Portfolios HSBC Portfolios HSBC Portfolios HSBC Portfolios
World Selection 1 World Selection 2 World Selection 3 World Selection 4 World Selection 5
Class A (M) (USD)
Shares outstanding, beginning of period 5,791,508.07 8,898,411.82 10,322,590.60 1,543,180.40 308,392.77
Shares issued 3,001,870.69 2,684,954.30 1,717,518.04 151,054.35 148,785.26
Shares redeemed (2,824,787.58) (4,542,513.94) (3,676,194.04) (471,898.55) (59,627.96)
Shares outstanding, end of period 5,968,591.18 7,040,852.18 8,363,914.60 1,222,336.20 397,550.07
Class A (M) (FLXHKD)
Shares outstanding, beginning of period - - 513,257.88 49,642.22 -
Shares issued - - 315,401.77 26,504.09 -
Shares redeemed - - (436,006.76) (66,656.07) -
Shares outstanding, end of period - - 392,652.89 9,490.24 -
Class A (M) (FLXUSD)
Shares outstanding, beginning of period - - 111,440.74 11,784.85 -
Shares issued - - 96,760.77 24.63 -
Shares redeemed - - (106,694.69) (11,770.22) -
Shares outstanding, end of period - - 101,506.82 39.26 -
Class A (M) (FLXHAUD)*
Shares outstanding, beginning of period - - 51,495.20 10,372.17 -
Shares issued - - 7,921.64 2,292.55 -
Shares redeemed - - (41,484.11) (6,694.31) -
Shares outstanding, end of period - - 17,932.73 5,970.41 -
Class A (M) (FLXHEUR)*
Shares outstanding, beginning of period - - 511.95 9.10 -
Shares issued - - 4,684.44 0.16 -
Shares redeemed - - - - -
Shares outstanding, end of period - - 5,196.39 9.26 -
Class A (M) (FLXHGBP)*
Shares outstanding, beginning of period - - 22,648.40 2,292.40 -
Shares issued - - 1,421.74 83.06 -
Shares redeemed - - (19,713.71) (2,284.42) -
Shares outstanding, end of period - - 4,356.43 91.04 -
Class A (M) (FLXHRMB)*
Shares outstanding, beginning of period - - 72,886.75 27,097.70 -
Shares issued - - 78,272.74 446.16 -
Shares redeemed - - (121,878.39) (24,415.05) -
Shares outstanding, end of period - - 29,281.10 3,128.81 -
Class A (M) (FLXHSGD)*
Shares outstanding, beginning of period - - 14.13 14.23 -
Shares issued - - 476.00 0.28 -
Shares redeemed - - - - -
Shares outstanding, end of period - - 490.13 14.51 -
Class A (M) (HAUD)*
Shares outstanding, beginning of period 2,367,308.15 1,933,844.36 1,494,698.99 193,025.51 81,678.10
Shares issued 199,948.94 226,517.77 101,166.43 21,872.12 56,129.41
Shares redeemed (739,166.68) (1,247,555.65) (711,000.43) (15,291.28) (33,730.32)
Shares outstanding, end of period 1,828,090.41 912,806.48 884,864.99 199,606.35 104,077.19
Enfocus Software - Customer Support
11
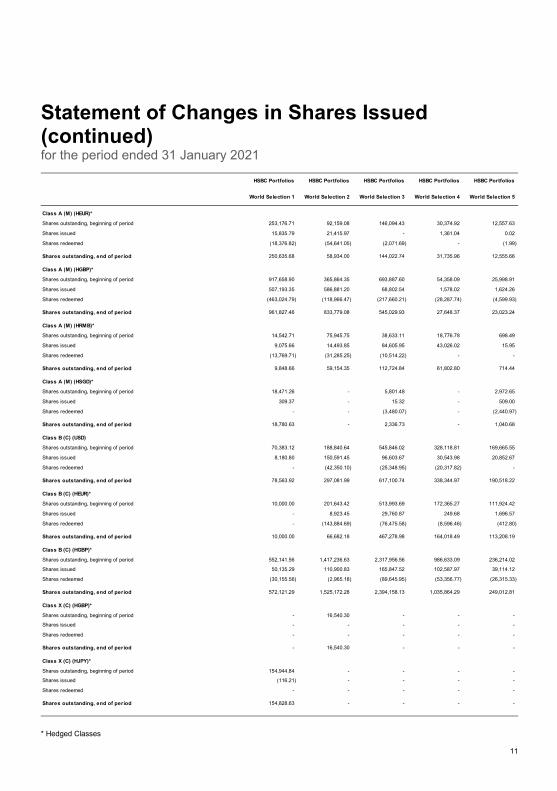
Statement of Changes in Shares Issued(continued)for the period ended 31 January 2021
* Hedged Classes
HSBC Portfolios HSBC Portfolios HSBC Portfolios HSBC Portfolios HSBC Portfolios
World Selection 1 World Selection 2 World Selection 3 World Selection 4 World Selection 5
Class A (M) (HEUR)*
Shares outstanding, beginning of period 253,176.71 92,159.08 146,094.43 30,374.92 12,557.63
Shares issued 15,835.79 21,415.97 - 1,361.04 0.02
Shares redeemed (18,376.82) (54,641.05) (2,071.69) - (1.99)
Shares outstanding, end of period 250,635.68 58,934.00 144,022.74 31,735.96 12,555.66
Class A (M) (HGBP)*
Shares outstanding, beginning of period 917,658.90 365,864.35 693,887.60 54,358.09 25,998.91
Shares issued 507,193.35 586,881.20 68,802.54 1,578.02 1,624.26
Shares redeemed (463,024.79) (118,966.47) (217,660.21) (28,287.74) (4,599.93)
Shares outstanding, end of period 961,827.46 833,779.08 545,029.93 27,648.37 23,023.24
Class A (M) (HRMB)*
Shares outstanding, beginning of period 14,542.71 75,945.75 38,633.11 18,776.78 698.49
Shares issued 9,075.66 14,493.85 84,605.95 43,026.02 15.95
Shares redeemed (13,769.71) (31,285.25) (10,514.22) - -
Shares outstanding, end of period 9,848.66 59,154.35 112,724.84 61,802.80 714.44
Class A (M) (HSGD)*
Shares outstanding, beginning of period 18,471.26 - 5,801.48 - 2,972.65
Shares issued 309.37 - 15.32 - 509.00
Shares redeemed - - (3,480.07) - (2,440.97)
Shares outstanding, end of period 18,780.63 - 2,336.73 - 1,040.68
Class B (C) (USD)
Shares outstanding, beginning of period 70,383.12 188,840.64 545,846.02 328,118.81 169,665.55
Shares issued 8,180.80 150,591.45 96,603.67 30,543.98 20,852.67
Shares redeemed - (42,350.10) (25,348.95) (20,317.82) -
Shares outstanding, end of period 78,563.92 297,081.99 617,100.74 338,344.97 190,518.22
Class B (C) (HEUR)*
Shares outstanding, beginning of period 10,000.00 201,643.42 513,993.69 172,365.27 111,924.42
Shares issued - 8,923.45 29,760.87 249.68 1,696.57
Shares redeemed - (143,884.69) (76,475.58) (8,596.46) (412.80)
Shares outstanding, end of period 10,000.00 66,682.18 467,278.98 164,018.49 113,208.19
Class B (C) (HGBP)*
Shares outstanding, beginning of period 552,141.56 1,417,236.63 2,317,956.56 986,633.09 236,214.02
Shares issued 50,135.29 110,900.83 165,847.52 102,587.97 39,114.12
Shares redeemed (30,155.56) (2,965.18) (89,645.95) (53,356.77) (26,315.33)
Shares outstanding, end of period 572,121.29 1,525,172.28 2,394,158.13 1,035,864.29 249,012.81
Class X (C) (HGBP)*
Shares outstanding, beginning of period - 16,540.30 - - -
Shares issued - - - - -
Shares redeemed - - - - -
Shares outstanding, end of period - 16,540.30 - - -
Class X (C) (HJPY)*
Shares outstanding, beginning of period 154,944.84 - - - -
Shares issued (116.21) - - - -
Shares redeemed - - - - -
Shares outstanding, end of period 154,828.63 - - - -
Enfocus Software - Customer Support
12
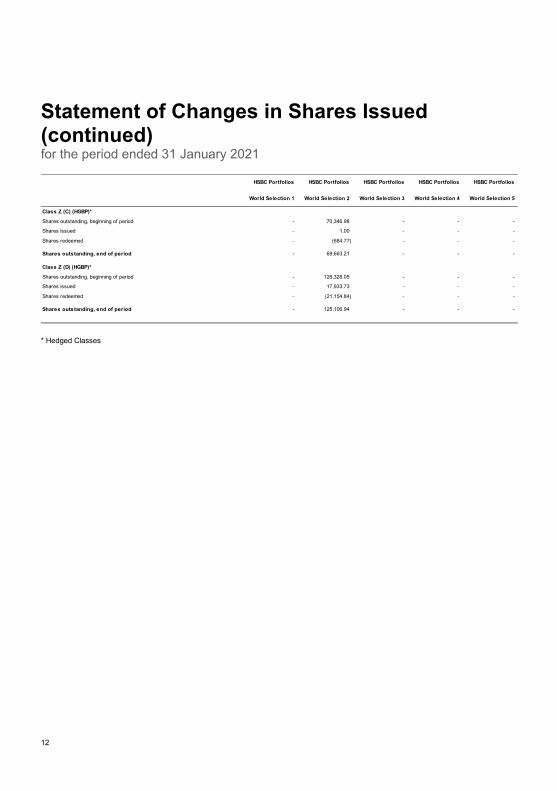
Statement of Changes in Shares Issued (continued) for the period ended 31 January 2021
* Hedged Classes
HSBC Portfolios HSBC Portfolios HSBC Portfolios HSBC Portfolios HSBC Portfolios
World Selection 1 World Selection 2 World Selection 3 World Selection 4 World Selection 5
Class Z (C) (HGBP)*
Shares outstanding, beginning of period - 70,346.98 - - -
Shares issued - 1.00 - - -
Shares redeemed - (684.77) - - -
Shares outstanding, end of period - 69,663.21 - - -
Class Z (D) (HGBP)*
Shares outstanding, beginning of period - 128,328.05 - - -
Shares issued - 17,933.73 - - -
Shares redeemed - (21,154.84) - - -
Shares outstanding, end of period - 125,106.94 - - -
Enfocus Software - Customer Support
13
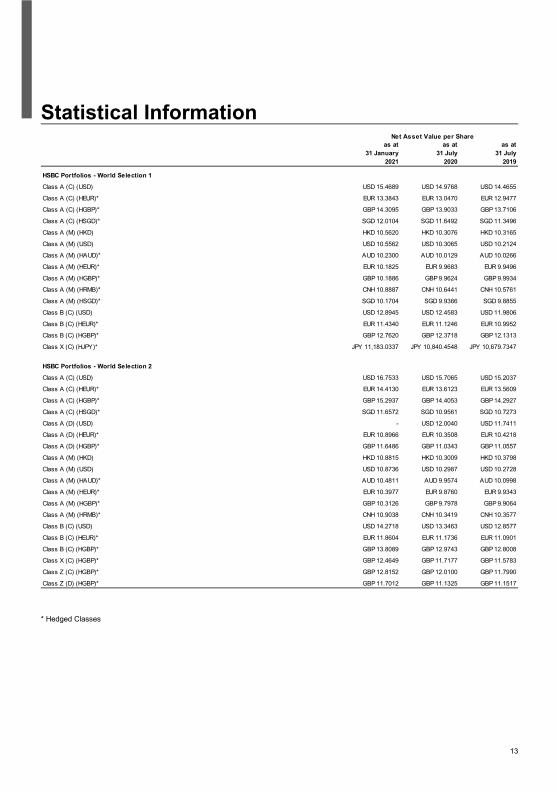
Statistical Information
* Hedged Classes
as at 31 January
2021
as at 31 July
2020
as at 31 July
2019
HSBC Portfolios - World Selection 1
Class A (C) (USD) USD 15.4689 USD 14.9768 USD 14.4655
Class A (C) (HEUR)* EUR 13.3843 EUR 13.0470 EUR 12.9477
Class A (C) (HGBP)* GBP 14.3095 GBP 13.9033 GBP 13.7106
Class A (C) (HSGD)* SGD 12.0104 SGD 11.6492 SGD 11.3496
Class A (M) (HKD) HKD 10.5620 HKD 10.3076 HKD 10.3165
Class A (M) (USD) USD 10.5562 USD 10.3065 USD 10.2124
Class A (M) (HAUD)* AUD 10.2300 AUD 10.0129 AUD 10.0266
Class A (M) (HEUR)* EUR 10.1825 EUR 9.9683 EUR 9.9496
Class A (M) (HGBP)* GBP 10.1886 GBP 9.9624 GBP 9.9934
Class A (M) (HRMB)* CNH 10.8887 CNH 10.6441 CNH 10.5761
Class A (M) (HSGD)* SGD 10.1704 SGD 9.9366 SGD 9.8855
Class B (C) (USD) USD 12.8945 USD 12.4583 USD 11.9806
Class B (C) (HEUR)* EUR 11.4340 EUR 11.1246 EUR 10.9952
Class B (C) (HGBP)* GBP 12.7620 GBP 12.3718 GBP 12.1313
Class X (C) (HJPY)* JPY 11,183.0337 JPY 10,840.4548 JPY 10,679.7347
HSBC Portfolios - World Selection 2
Class A (C) (USD) USD 16.7533 USD 15.7065 USD 15.2037
Class A (C) (HEUR)* EUR 14.4130 EUR 13.6123 EUR 13.5609
Class A (C) (HGBP)* GBP 15.2937 GBP 14.4053 GBP 14.2927
Class A (C) (HSGD)* SGD 11.6572 SGD 10.9561 SGD 10.7273
Class A (D) (USD) - USD 12.0040 USD 11.7411
Class A (D) (HEUR)* EUR 10.8966 EUR 10.3508 EUR 10.4218
Class A (D) (HGBP)* GBP 11.6486 GBP 11.0343 GBP 11.0557
Class A (M) (HKD) HKD 10.8815 HKD 10.3009 HKD 10.3798
Class A (M) (USD) USD 10.8736 USD 10.2987 USD 10.2728
Class A (M) (HAUD)* AUD 10.4811 AUD 9.9574 AUD 10.0998
Class A (M) (HEUR)* EUR 10.3977 EUR 9.8760 EUR 9.9343
Class A (M) (HGBP)* GBP 10.3126 GBP 9.7978 GBP 9.9064
Class A (M) (HRMB)* CNH 10.9038 CNH 10.3419 CNH 10.3577
Class B (C) (USD) USD 14.2718 USD 13.3463 USD 12.8577
Class B (C) (HEUR)* EUR 11.8604 EUR 11.1736 EUR 11.0901
Class B (C) (HGBP)* GBP 13.8089 GBP 12.9743 GBP 12.8008
Class X (C) (HGBP)* GBP 12.4649 GBP 11.7177 GBP 11.5783
Class Z (C) (HGBP)* GBP 12.8152 GBP 12.0100 GBP 11.7990
Class Z (D) (HGBP)* GBP 11.7012 GBP 11.1325 GBP 11.1517
Net Asset Value per Share
Enfocus Software - Customer Support
14
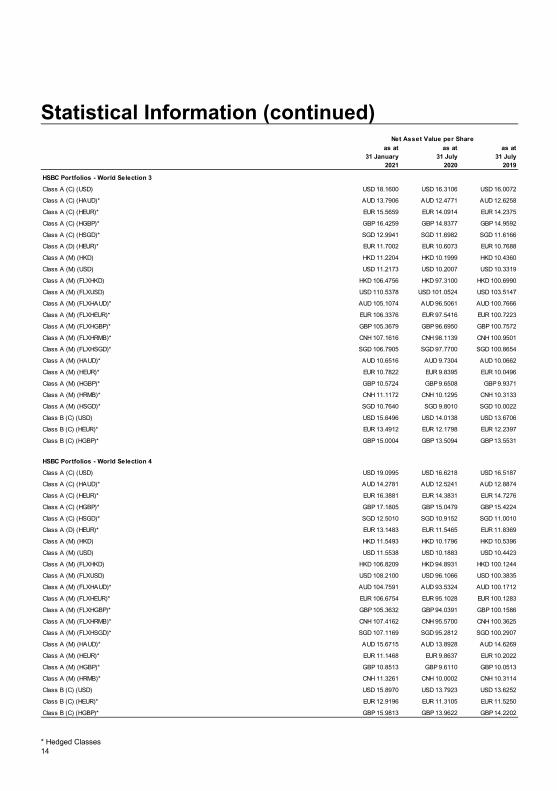
Statistical Information (continued)
* Hedged Classes
as at 31 January
2021
as at 31 July
2020
as at 31 July
2019
HSBC Portfolios - World Selection 3
Class A (C) (USD) USD 18.1600 USD 16.3106 USD 16.0072
Class A (C) (HAUD)* AUD 13.7906 AUD 12.4771 AUD 12.6258
Class A (C) (HEUR)* EUR 15.5659 EUR 14.0914 EUR 14.2375
Class A (C) (HGBP)* GBP 16.4259 GBP 14.8377 GBP 14.9592
Class A (C) (HSGD)* SGD 12.9941 SGD 11.6982 SGD 11.6166
Class A (D) (HEUR)* EUR 11.7002 EUR 10.6073 EUR 10.7688
Class A (M) (HKD) HKD 11.2204 HKD 10.1999 HKD 10.4360
Class A (M) (USD) USD 11.2173 USD 10.2007 USD 10.3319
Class A (M) (FLXHKD) HKD 106.4756 HKD 97.3100 HKD 100.6990
Class A (M) (FLXUSD) USD 110.5378 USD 101.0524 USD 103.5147
Class A (M) (FLXHAUD)* AUD 105.1074 AUD 96.5061 AUD 100.7666
Class A (M) (FLXHEUR)* EUR 106.3376 EUR 97.5416 EUR 100.7223
Class A (M) (FLXHGBP)* GBP 105.3679 GBP 96.6950 GBP 100.7572
Class A (M) (FLXHRMB)* CNH 107.1616 CNH 98.1139 CNH 100.9501
Class A (M) (FLXHSGD)* SGD 106.7905 SGD 97.7700 SGD 100.8654
Class A (M) (HAUD)* AUD 10.6516 AUD 9.7304 AUD 10.0662
Class A (M) (HEUR)* EUR 10.7822 EUR 9.8395 EUR 10.0496
Class A (M) (HGBP)* GBP 10.5724 GBP 9.6508 GBP 9.9371
Class A (M) (HRMB)* CNH 11.1172 CNH 10.1295 CNH 10.3133
Class A (M) (HSGD)* SGD 10.7640 SGD 9.8010 SGD 10.0022
Class B (C) (USD) USD 15.6496 USD 14.0138 USD 13.6706
Class B (C) (HEUR)* EUR 13.4912 EUR 12.1798 EUR 12.2397
Class B (C) (HGBP)* GBP 15.0004 GBP 13.5094 GBP 13.5531
HSBC Portfolios - World Selection 4
Class A (C) (USD) USD 19.0995 USD 16.6218 USD 16.5187
Class A (C) (HAUD)* AUD 14.2781 AUD 12.5241 AUD 12.8874
Class A (C) (HEUR)* EUR 16.3881 EUR 14.3831 EUR 14.7276
Class A (C) (HGBP)* GBP 17.1805 GBP 15.0479 GBP 15.4224
Class A (C) (HSGD)* SGD 12.5010 SGD 10.9152 SGD 11.0010
Class A (D) (HEUR)* EUR 13.1483 EUR 11.5465 EUR 11.8369
Class A (M) (HKD) HKD 11.5493 HKD 10.1796 HKD 10.5396
Class A (M) (USD) USD 11.5538 USD 10.1883 USD 10.4423
Class A (M) (FLXHKD) HKD 106.8209 HKD 94.8931 HKD 100.1244
Class A (M) (FLXUSD) USD 108.2100 USD 96.1066 USD 100.3835
Class A (M) (FLXHAUD)* AUD 104.7591 AUD 93.5324 AUD 100.1712
Class A (M) (FLXHEUR)* EUR 106.6754 EUR 95.1028 EUR 100.1283
Class A (M) (FLXHGBP)* GBP 105.3632 GBP 94.0391 GBP 100.1586
Class A (M) (FLXHRMB)* CNH 107.4162 CNH 95.5700 CNH 100.3625
Class A (M) (FLXHSGD)* SGD 107.1169 SGD 95.2812 SGD 100.2907
Class A (M) (HAUD)* AUD 15.6715 AUD 13.8928 AUD 14.6269
Class A (M) (HEUR)* EUR 11.1468 EUR 9.8637 EUR 10.2022
Class A (M) (HGBP)* GBP 10.8513 GBP 9.6110 GBP 10.0513
Class A (M) (HRMB)* CNH 11.3261 CNH 10.0002 CNH 10.3114
Class B (C) (USD) USD 15.8970 USD 13.7923 USD 13.6252
Class B (C) (HEUR)* EUR 12.9196 EUR 11.3105 EUR 11.5250
Class B (C) (HGBP)* GBP 15.9813 GBP 13.9622 GBP 14.2202
Net Asset Value per Share
Enfocus Software - Customer Support
15
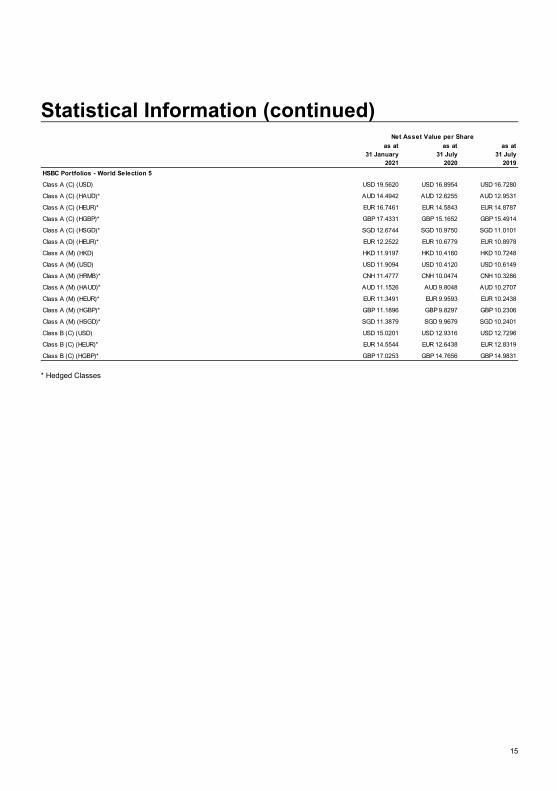
Statistical Information (continued)
* Hedged Classes
as at 31 January
2021
as at 31 July
2020
as at 31 July
2019HSBC Portfolios - World Selection 5
Class A (C) (USD) USD 19.5620 USD 16.8954 USD 16.7280
Class A (C) (HAUD)* AUD 14.4942 AUD 12.6255 AUD 12.9531
Class A (C) (HEUR)* EUR 16.7461 EUR 14.5843 EUR 14.8787
Class A (C) (HGBP)* GBP 17.4331 GBP 15.1652 GBP 15.4914
Class A (C) (HSGD)* SGD 12.6744 SGD 10.9750 SGD 11.0101
Class A (D) (HEUR)* EUR 12.2522 EUR 10.6779 EUR 10.8978
Class A (M) (HKD) HKD 11.9197 HKD 10.4160 HKD 10.7248
Class A (M) (USD) USD 11.9094 USD 10.4120 USD 10.6149
Class A (M) (HRMB)* CNH 11.4777 CNH 10.0474 CNH 10.3286
Class A (M) (HAUD)* AUD 11.1526 AUD 9.8048 AUD 10.2707
Class A (M) (HEUR)* EUR 11.3491 EUR 9.9593 EUR 10.2438
Class A (M) (HGBP)* GBP 11.1896 GBP 9.8297 GBP 10.2306
Class A (M) (HSGD)* SGD 11.3879 SGD 9.9679 SGD 10.2401
Class B (C) (USD) USD 15.0201 USD 12.9316 USD 12.7296
Class B (C) (HEUR)* EUR 14.5544 EUR 12.6438 EUR 12.8319
Class B (C) (HGBP)* GBP 17.0253 GBP 14.7656 GBP 14.9831
Net Asset Value per Share
Enfocus Software - Customer Support
16
Notes to the Financial Statementsfor the period ended 31 January 2021
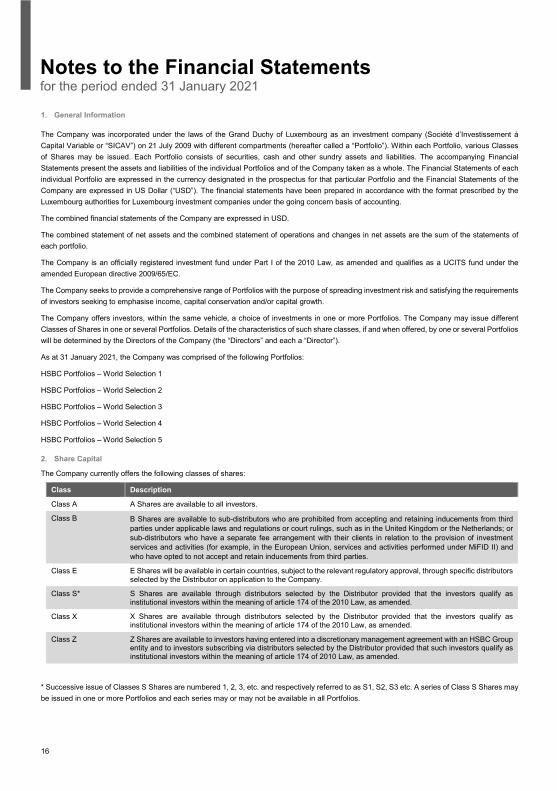
1. General Information
The Company was incorporated under the laws of the Grand Duchy of Luxembourg as an investment company (Société d’Investissement à Capital Variable or “SICAV”) on 21 July 2009 with different compartments (hereafter called a “Portfolio”). Within each Portfolio, various Classes of Shares may be issued. Each Portfolio consists of securities, cash and other sundry assets and liabilities. The accompanying Financial Statements present the assets and liabilities of the individual Portfolios and of the Company taken as a whole. The Financial Statements of each individual Portfolio are expressed in the currency designated in the prospectus for that particular Portfolio and the Financial Statements of the Company are expressed in US Dollar (“USD”). The financial statements have been prepared in accordance with the format prescribed by the Luxembourg authorities for Luxembourg investment companies under the going concern basis of accounting.
The combined financial statements of the Company are expressed in USD.
The combined statement of net assets and the combined statement of operations and changes in net assets are the sum of the statements of each portfolio.
The Company is an officially registered investment fund under Part I of the 2010 Law, as amended and qualifies as a UCITS fund under the amended European directive 2009/65/EC.
The Company seeks to provide a comprehensive range of Portfolios with the purpose of spreading investment risk and satisfying the requirements of investors seeking to emphasise income, capital conservation and/or capital growth.
The Company offers investors, within the same vehicle, a choice of investments in one or more Portfolios. The Company may issue different Classes of Shares in one or several Portfolios. Details of the characteristics of such share classes, if and when offered, by one or several Portfolios will be determined by the Directors of the Company (the “Directors” and each a “Director”).
As at 31 January 2021, the Company was comprised of the following Portfolios:
HSBC Portfolios – World Selection 1
HSBC Portfolios – World Selection 2
HSBC Portfolios – World Selection 3
HSBC Portfolios – World Selection 4
HSBC Portfolios – World Selection 5
2. Share Capital
The Company currently offers the following classes of shares:
Class Description
Class A A Shares are available to all investors.
Class B B Shares are available to sub-distributors who are prohibited from accepting and retaining inducements from third parties under applicable laws and regulations or court rulings, such as in the United Kingdom or the Netherlands; or sub-distributors who have a separate fee arrangement with their clients in relation to the provision of investment services and activities (for example, in the European Union, services and activities performed under MiFID II) and who have opted to not accept and retain inducements from third parties.
Class E E Shares will be available in certain countries, subject to the relevant regulatory approval, through specific distributors selected by the Distributor on application to the Company.
Class S* S Shares are available through distributors selected by the Distributor provided that the investors qualify as institutional investors within the meaning of article 174 of the 2010 Law, as amended.
Class X X Shares are available through distributors selected by the Distributor provided that the investors qualify as institutional investors within the meaning of article 174 of the 2010 Law, as amended.
Class Z Z Shares are available to investors having entered into a discretionary management agreement with an HSBC Group entity and to investors subscribing via distributors selected by the Distributor provided that such investors qualify as institutional investors within the meaning of article 174 of 2010 Law, as amended.
* Successive issue of Classes S Shares are numbered 1, 2, 3, etc. and respectively referred to as S1, S2, S3 etc. A series of Class S Shares may be issued in one or more Portfolios and each series may or may not be available in all Portfolios.
Enfocus Software - Customer Support
17
Notes to the Financial Statementsfor the period ended 31 January 2021 (continued)
2. Share Capital (continued)
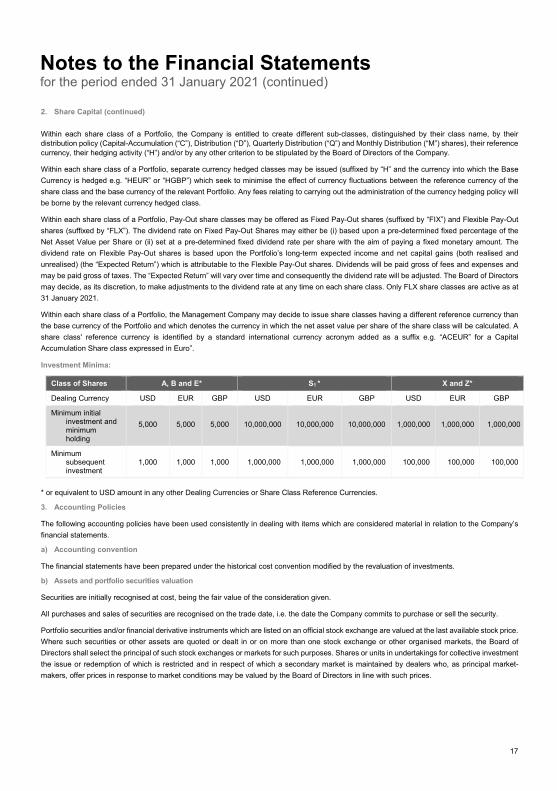
Within each share class of a Portfolio, the Company is entitled to create different sub-classes, distinguished by their class name, by their distribution policy (Capital-Accumulation (“C”), Distribution (“D”), Quarterly Distribution (“Q”) and Monthly Distribution (“M”) shares), their reference currency, their hedging activity (“H”) and/or by any other criterion to be stipulated by the Board of Directors of the Company.
Within each share class of a Portfolio, separate currency hedged classes may be issued (suffixed by “H” and the currency into which the Base Currency is hedged e.g. “HEUR” or “HGBP”) which seek to minimise the effect of currency fluctuations between the reference currency of the share class and the base currency of the relevant Portfolio. Any fees relating to carrying out the administration of the currency hedging policy will be borne by the relevant currency hedged class.
Within each share class of a Portfolio, Pay-Out share classes may be offered as Fixed Pay-Out shares (suffixed by “FIX”) and Flexible Pay-Out shares (suffixed by “FLX”). The dividend rate on Fixed Pay-Out Shares may either be (i) based upon a pre-determined fixed percentage of the Net Asset Value per Share or (ii) set at a pre-determined fixed dividend rate per share with the aim of paying a fixed monetary amount. The dividend rate on Flexible Pay-Out shares is based upon the Portfolio’s long-term expected income and net capital gains (both realised and unrealised) (the “Expected Return”) which is attributable to the Flexible Pay-Out shares. Dividends will be paid gross of fees and expenses and may be paid gross of taxes. The “Expected Return” will vary over time and consequently the dividend rate will be adjusted. The Board of Directors may decide, as its discretion, to make adjustments to the dividend rate at any time on each share class. Only FLX share classes are active as at 31 January 2021.
Within each share class of a Portfolio, the Management Company may decide to issue share classes having a different reference currency than the base currency of the Portfolio and which denotes the currency in which the net asset value per share of the share class will be calculated. A share class' reference currency is identified by a standard international currency acronym added as a suffix e.g. “ACEUR” for a Capital Accumulation Share class expressed in Euro”.
Investment Minima:
* or equivalent to USD amount in any other Dealing Currencies or Share Class Reference Currencies.
3. Accounting Policies
The following accounting policies have been used consistently in dealing with items which are considered material in relation to the Company’s financial statements.
a) Accounting convention
The financial statements have been prepared under the historical cost convention modified by the revaluation of investments.
b) Assets and portfolio securities valuation
Securities are initially recognised at cost, being the fair value of the consideration given.
All purchases and sales of securities are recognised on the trade date, i.e. the date the Company commits to purchase or sell the security.
Portfolio securities and/or financial derivative instruments which are listed on an official stock exchange are valued at the last available stock price. Where such securities or other assets are quoted or dealt in or on more than one stock exchange or other organised markets, the Board of Directors shall select the principal of such stock exchanges or markets for such purposes. Shares or units in undertakings for collective investment the issue or redemption of which is restricted and in respect of which a secondary market is maintained by dealers who, as principal market-makers, offer prices in response to market conditions may be valued by the Board of Directors in line with such prices.
Class of Shares A, B and E* S1 * X and Z*
Dealing Currency USD EUR GBP USD EUR GBP USD EUR GBP
Minimum initial investment and minimum holding
5,000 5,000 5,000 10,000,000 10,000,000 10,000,000 1,000,000 1,000,000 1,000,000
Minimum subsequent investment
1,000 1,000 1,000 1,000,000 1,000,000 1,000,000 100,000 100,000 100,000
Enfocus Software - Customer Support
Notes to the Financial Statementsfor the period ended 31 January 2021 (continued)
18
3. Accounting Policies (continued)
b) Assets and portfolio securities valuation (continued)
Shares or units in open-ended undertakings for collective investment, which do not have a price quotation on a regulated market, will be valued at the actual net asset value for such shares or units as of the relevant dealing day, failing which they shall be valued at the last available net asset value which is calculated prior to such dealing day. In the case where events have occurred which have resulted in a material change in the net asset value of such shares or units since the last net asset value was calculated, the value of such shares or units may be adjusted at their fair value in order to reflect, in the reasonable opinion of the Board of Directors, such change.
The financial derivative instruments which are not listed on any official stock exchange or traded on any other organised market are valued in a reliable and verifiable manner on a daily basis and verified by a competent professional appointed by the Company.
The Financial Statements are presented on the basis of the net asset value calculated on 31 January 2021.
Futures Contracts
Upon entering into a futures contract, the Company is required to deposit with the broker, cash or securities in an amount equal to a certain percentage of the contract amount which is referred to as the initial margin account. Subsequent payments, referred to as variation margin, are made or received by each Portfolio periodically and are based on changes in the market value of open futures contracts.
The unrealised appreciation on future contracts is disclosed in the statement of net assets under “Net unrealised appreciation on futures contracts”. Changes in the market value of open futures contracts are recorded as “Net change in unrealised appreciation/(depreciation) on derivatives” in the statement of changes in net assets. Realised gains or losses, representing the difference between the value of the contract at the time it was opened and the value at the time it was closed, are reported at the closing or expiration of futures contracts in the statement of changes in net assets under “Net realised gains/(losses) on derivatives”. Securities deposited as initial margin account are designated in the statement of investments and cash deposited is recorded under cash at bank and at broker in the statement of net assets. A receivable and/or a payable to brokers for the daily variation margin is also recorded in the statement of net assets.
Forward Foreign Exchange Contracts
The values of the forward foreign currency exchange contracts are adjusted daily based on the applicable exchange rate of the underlying currency. Changes in the value of these contracts are recorded as unrealised appreciation or depreciation until the contract settlement date. When the forward contract is closed, the Portfolio records a realised gain or loss equal to the difference between the value at the time the contract was opened and the value at the time it was closed.
The unrealised depreciation on forward foreign exchange contracts is disclosed in the statement of net assets under “Net unrealised depreciation on forward foreign exchange contracts”. Realised gains/(losses) and change in unrealised appreciation/(depreciation) resulting there from are included in the statement of changes in net assets respectively under “Net realised gains/(losses) on derivatives” and “Net change in unrealised appreciation/(depreciation) on derivatives”.
Credit Default Swaps
A credit default swap is a credit derivative transaction in which two parties enter into an agreement, whereby one party (the protection buyer) pays the other (the protection seller) a fixed periodic coupon for the specified life of the agreement in return for a payment contingent on a credit event related to the underlying reference obligation.
If a credit event occurs, the protection seller would be obliged to make a payment, which may be either: (i) a net cash settlement equal to the notional amount of the swap less the auction value of the reference obligation or (ii) the notional amount of the swap in exchange for the delivery of the reference obligation. Selling protection effectively adds leverage to a Fund’s portfolio up to the notional amount of swap agreements
Credit default swaps are marked to market at each NAV calculation date. The market value is based on the valuation elements laid down in the contracts, and is obtained from third party pricing agents, market makers or internal models.
The unrealised appreciation is disclosed in the statement of net assets under “Net unrealised appreciation on swaps”. Realised gains/(losses) and change in unrealised appreciation/(depreciation) resulting there from are included in the statement of operations and changes in net assets respectively under the heading “Net realised gains/(losses) on derivatives” and “Net change in unrealised appreciation/(depreciation) on derivatives”.
c) Income and Expenses
Interest is accrued on a day-to-day basis. Dividends are accounted for on an ex-dividend basis.
Expenses are recognised on an accrual basis.
Enfocus Software - Customer Support
Notes to the Financial Statementsfor the period ended 31 January 2021 (continued)
19
3. Accounting Policies (continued)
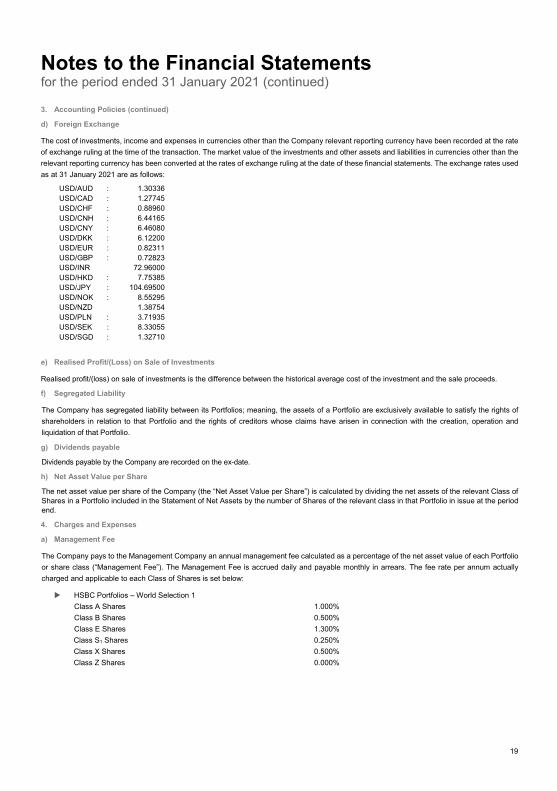
d) Foreign Exchange
The cost of investments, income and expenses in currencies other than the Company relevant reporting currency have been recorded at the rate of exchange ruling at the time of the transaction. The market value of the investments and other assets and liabilities in currencies other than the relevant reporting currency has been converted at the rates of exchange ruling at the date of these financial statements. The exchange rates used as at 31 January 2021 are as follows:
USD/AUD : 1.30336 USD/CAD : 1.27745USD/CHF : 0.88960USD/CNH : 6.44165USD/CNY : 6.46080USD/DKK : 6.12200USD/EUR : 0.82311USD/GBP : 0.72823USD/INR 72.96000 USD/HKD : 7.75385USD/JPY : 104.69500USD/NOK : 8.55295USD/NZD 1.38754 USD/PLN : 3.71935USD/SEK : 8.33055USD/SGD : 1.32710
e) Realised Profit/(Loss) on Sale of Investments
Realised profit/(loss) on sale of investments is the difference between the historical average cost of the investment and the sale proceeds.
f) Segregated Liability
The Company has segregated liability between its Portfolios; meaning, the assets of a Portfolio are exclusively available to satisfy the rights of shareholders in relation to that Portfolio and the rights of creditors whose claims have arisen in connection with the creation, operation and liquidation of that Portfolio.
g) Dividends payable
Dividends payable by the Company are recorded on the ex-date.
h) Net Asset Value per Share
The net asset value per share of the Company (the “Net Asset Value per Share”) is calculated by dividing the net assets of the relevant Class of Shares in a Portfolio included in the Statement of Net Assets by the number of Shares of the relevant class in that Portfolio in issue at the period end.
4. Charges and Expenses
a) Management Fee
The Company pays to the Management Company an annual management fee calculated as a percentage of the net asset value of each Portfolio or share class (“Management Fee”). The Management Fee is accrued daily and payable monthly in arrears. The fee rate per annum actually charged and applicable to each Class of Shares is set below:
HSBC Portfolios – World Selection 1 Class A Shares 1.000% Class B Shares 0.500% Class E Shares 1.300% Class S1 Shares 0.250% Class X Shares 0.500% Class Z Shares 0.000%
Enfocus Software - Customer Support
Notes to the Financial Statements for the period ended 31 January 2021 (continued)
20
4. Charges and Expenses (continued)
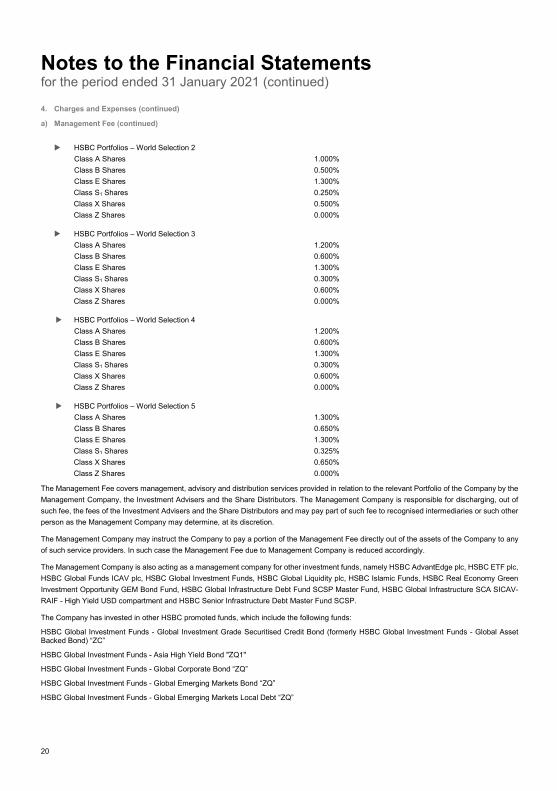
a) Management Fee (continued)
HSBC Portfolios – World Selection 2 Class A Shares 1.000% Class B Shares 0.500% Class E Shares 1.300% Class S1 Shares 0.250% Class X Shares 0.500% Class Z Shares 0.000%
HSBC Portfolios – World Selection 3 Class A Shares 1.200% Class B Shares 0.600% Class E Shares 1.300% Class S1 Shares 0.300% Class X Shares 0.600% Class Z Shares 0.000%
HSBC Portfolios – World Selection 4 Class A Shares 1.200% Class B Shares 0.600% Class E Shares 1.300% Class S1 Shares 0.300% Class X Shares 0.600% Class Z Shares 0.000%
HSBC Portfolios – World Selection 5 Class A Shares 1.300% Class B Shares 0.650% Class E Shares 1.300% Class S1 Shares 0.325% Class X Shares 0.650% Class Z Shares 0.000%
The Management Fee covers management, advisory and distribution services provided in relation to the relevant Portfolio of the Company by the Management Company, the Investment Advisers and the Share Distributors. The Management Company is responsible for discharging, out of such fee, the fees of the Investment Advisers and the Share Distributors and may pay part of such fee to recognised intermediaries or such other person as the Management Company may determine, at its discretion.
The Management Company may instruct the Company to pay a portion of the Management Fee directly out of the assets of the Company to any of such service providers. In such case the Management Fee due to Management Company is reduced accordingly.
The Management Company is also acting as a management company for other investment funds, namely HSBC AdvantEdge plc, HSBC ETF plc, HSBC Global Funds ICAV plc, HSBC Global Investment Funds, HSBC Global Liquidity plc, HSBC Islamic Funds, HSBC Real Economy Green Investment Opportunity GEM Bond Fund, HSBC Global Infrastructure Debt Fund SCSP Master Fund, HSBC Global Infrastructure SCA SICAV-RAIF - High Yield USD compartment and HSBC Senior Infrastructure Debt Master Fund SCSP.
The Company has invested in other HSBC promoted funds, which include the following funds:
HSBC Global Investment Funds - Global Investment Grade Securitised Credit Bond (formerly HSBC Global Investment Funds - Global Asset Backed Bond) “ZC”
HSBC Global Investment Funds - Asia High Yield Bond "ZQ1"
HSBC Global Investment Funds - Global Corporate Bond “ZQ”
HSBC Global Investment Funds - Global Emerging Markets Bond “ZQ”
HSBC Global Investment Funds - Global Emerging Markets Local Debt “ZQ”
Enfocus Software - Customer Support
Notes to the Financial Statementsfor the period ended 31 January 2021 (continued)
21
4. Charges and Expenses (continued)
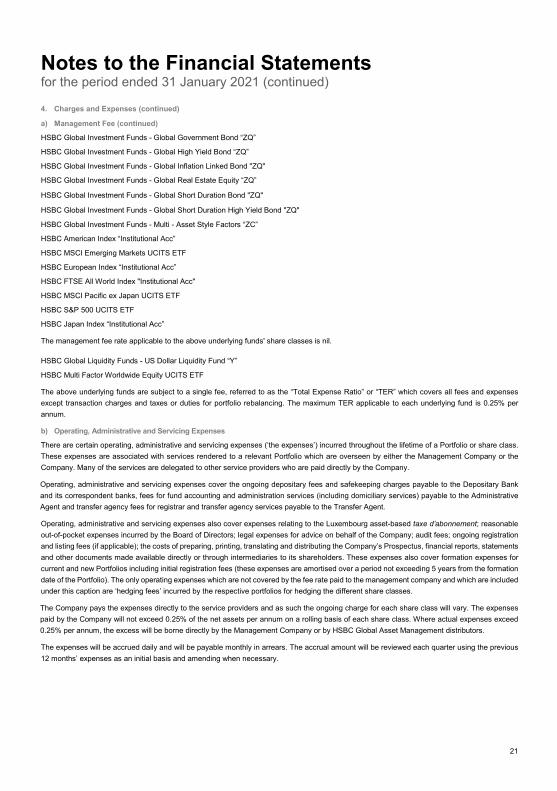
a) Management Fee (continued)
HSBC Global Investment Funds - Global Government Bond “ZQ”
HSBC Global Investment Funds - Global High Yield Bond “ZQ”
HSBC Global Investment Funds - Global Inflation Linked Bond "ZQ"
HSBC Global Investment Funds - Global Real Estate Equity “ZQ”
HSBC Global Investment Funds - Global Short Duration Bond "ZQ"
HSBC Global Investment Funds - Global Short Duration High Yield Bond "ZQ"
HSBC Global Investment Funds - Multi - Asset Style Factors “ZC”
HSBC American Index “Institutional Acc”
HSBC MSCI Emerging Markets UCITS ETF
HSBC European Index “Institutional Acc”
HSBC FTSE All World Index "Institutional Acc"
HSBC MSCI Pacific ex Japan UCITS ETF
HSBC S&P 500 UCITS ETF
HSBC Japan Index “Institutional Acc”
The management fee rate applicable to the above underlying funds' share classes is nil.
HSBC Global Liquidity Funds - US Dollar Liquidity Fund “Y”
HSBC Multi Factor Worldwide Equity UCITS ETF
The above underlying funds are subject to a single fee, referred to as the “Total Expense Ratio” or “TER” which covers all fees and expenses except transaction charges and taxes or duties for portfolio rebalancing. The maximum TER applicable to each underlying fund is 0.25% per annum.
b) Operating, Administrative and Servicing Expenses
There are certain operating, administrative and servicing expenses (‘the expenses’) incurred throughout the lifetime of a Portfolio or share class. These expenses are associated with services rendered to a relevant Portfolio which are overseen by either the Management Company or the Company. Many of the services are delegated to other service providers who are paid directly by the Company.
Operating, administrative and servicing expenses cover the ongoing depositary fees and safekeeping charges payable to the Depositary Bank and its correspondent banks, fees for fund accounting and administration services (including domiciliary services) payable to the Administrative Agent and transfer agency fees for registrar and transfer agency services payable to the Transfer Agent.
Operating, administrative and servicing expenses also cover expenses relating to the Luxembourg asset-based taxe d’abonnement; reasonable out-of-pocket expenses incurred by the Board of Directors; legal expenses for advice on behalf of the Company; audit fees; ongoing registration and listing fees (if applicable); the costs of preparing, printing, translating and distributing the Company’s Prospectus, financial reports, statements and other documents made available directly or through intermediaries to its shareholders. These expenses also cover formation expenses for current and new Portfolios including initial registration fees (these expenses are amortised over a period not exceeding 5 years from the formation date of the Portfolio). The only operating expenses which are not covered by the fee rate paid to the management company and which are included under this caption are ‘hedging fees’ incurred by the respective portfolios for hedging the different share classes.
The Company pays the expenses directly to the service providers and as such the ongoing charge for each share class will vary. The expenses paid by the Company will not exceed 0.25% of the net assets per annum on a rolling basis of each share class. Where actual expenses exceed 0.25% per annum, the excess will be borne directly by the Management Company or by HSBC Global Asset Management distributors.
The expenses will be accrued daily and will be payable monthly in arrears. The accrual amount will be reviewed each quarter using the previous 12 months’ expenses as an initial basis and amending when necessary.
Enfocus Software - Customer Support
Notes to the Financial Statementsfor the period ended 31 January 2021 (continued)
22
4. Charges and Expenses (continued)
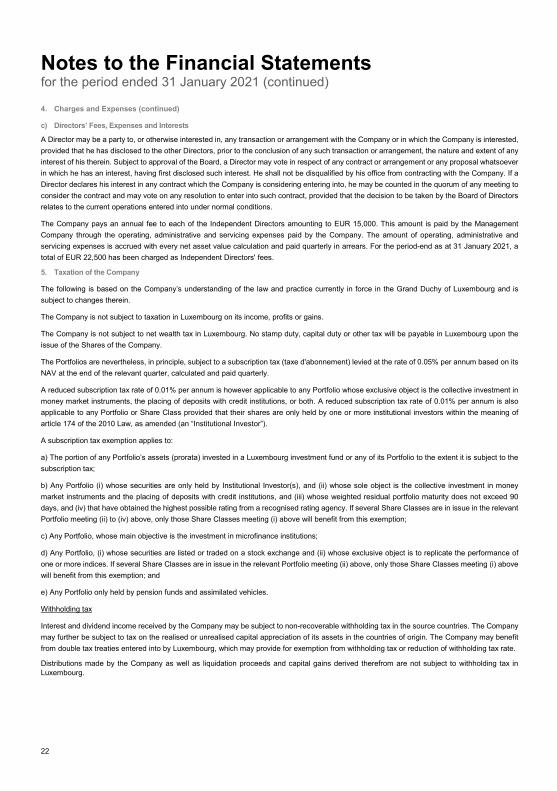
c) Directors’ Fees, Expenses and Interests
A Director may be a party to, or otherwise interested in, any transaction or arrangement with the Company or in which the Company is interested, provided that he has disclosed to the other Directors, prior to the conclusion of any such transaction or arrangement, the nature and extent of any interest of his therein. Subject to approval of the Board, a Director may vote in respect of any contract or arrangement or any proposal whatsoever in which he has an interest, having first disclosed such interest. He shall not be disqualified by his office from contracting with the Company. If a Director declares his interest in any contract which the Company is considering entering into, he may be counted in the quorum of any meeting to consider the contract and may vote on any resolution to enter into such contract, provided that the decision to be taken by the Board of Directors relates to the current operations entered into under normal conditions.
The Company pays an annual fee to each of the Independent Directors amounting to EUR 15,000. This amount is paid by the ManagementCompany through the operating, administrative and servicing expenses paid by the Company. The amount of operating, administrative and servicing expenses is accrued with every net asset value calculation and paid quarterly in arrears. For the period-end as at 31 January 2021, a total of EUR 22,500 has been charged as Independent Directors' fees.
5. Taxation of the Company
The following is based on the Company’s understanding of the law and practice currently in force in the Grand Duchy of Luxembourg and is subject to changes therein.
The Company is not subject to taxation in Luxembourg on its income, profits or gains.
The Company is not subject to net wealth tax in Luxembourg. No stamp duty, capital duty or other tax will be payable in Luxembourg upon the issue of the Shares of the Company.
The Portfolios are nevertheless, in principle, subject to a subscription tax (taxe d'abonnement) levied at the rate of 0.05% per annum based on its NAV at the end of the relevant quarter, calculated and paid quarterly.
A reduced subscription tax rate of 0.01% per annum is however applicable to any Portfolio whose exclusive object is the collective investment in money market instruments, the placing of deposits with credit institutions, or both. A reduced subscription tax rate of 0.01% per annum is also applicable to any Portfolio or Share Class provided that their shares are only held by one or more institutional investors within the meaning of article 174 of the 2010 Law, as amended (an “Institutional Investor”).
A subscription tax exemption applies to:
a) The portion of any Portfolio’s assets (prorata) invested in a Luxembourg investment fund or any of its Portfolio to the extent it is subject to the subscription tax;
b) Any Portfolio (i) whose securities are only held by Institutional Investor(s), and (ii) whose sole object is the collective investment in money market instruments and the placing of deposits with credit institutions, and (iii) whose weighted residual portfolio maturity does not exceed 90 days, and (iv) that have obtained the highest possible rating from a recognised rating agency. If several Share Classes are in issue in the relevant Portfolio meeting (ii) to (iv) above, only those Share Classes meeting (i) above will benefit from this exemption;
c) Any Portfolio, whose main objective is the investment in microfinance institutions;
d) Any Portfolio, (i) whose securities are listed or traded on a stock exchange and (ii) whose exclusive object is to replicate the performance of one or more indices. If several Share Classes are in issue in the relevant Portfolio meeting (ii) above, only those Share Classes meeting (i) above will benefit from this exemption; and
e) Any Portfolio only held by pension funds and assimilated vehicles.
Withholding tax
Interest and dividend income received by the Company may be subject to non-recoverable withholding tax in the source countries. The Company may further be subject to tax on the realised or unrealised capital appreciation of its assets in the countries of origin. The Company may benefit from double tax treaties entered into by Luxembourg, which may provide for exemption from withholding tax or reduction of withholding tax rate.
Distributions made by the Company as well as liquidation proceeds and capital gains derived therefrom are not subject to withholding tax in Luxembourg.
Enfocus Software - Customer Support
Notes to the Financial Statementsfor the period ended 31 January 2021 (continued)
23
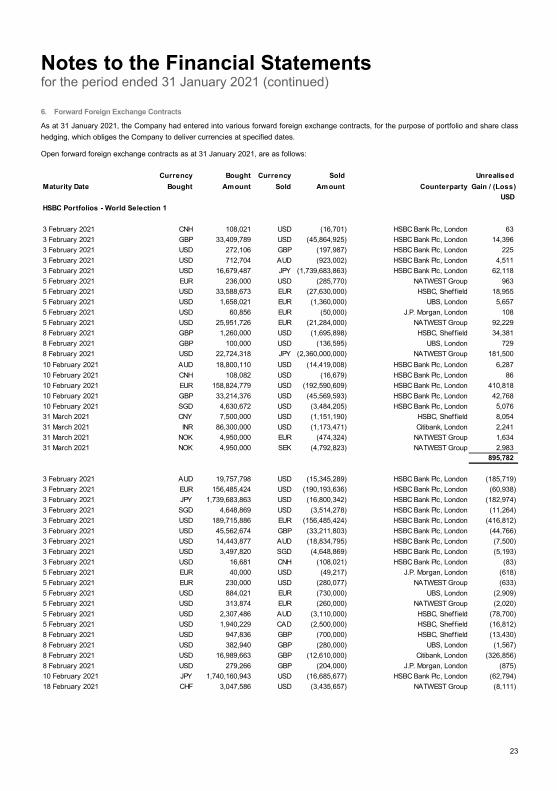
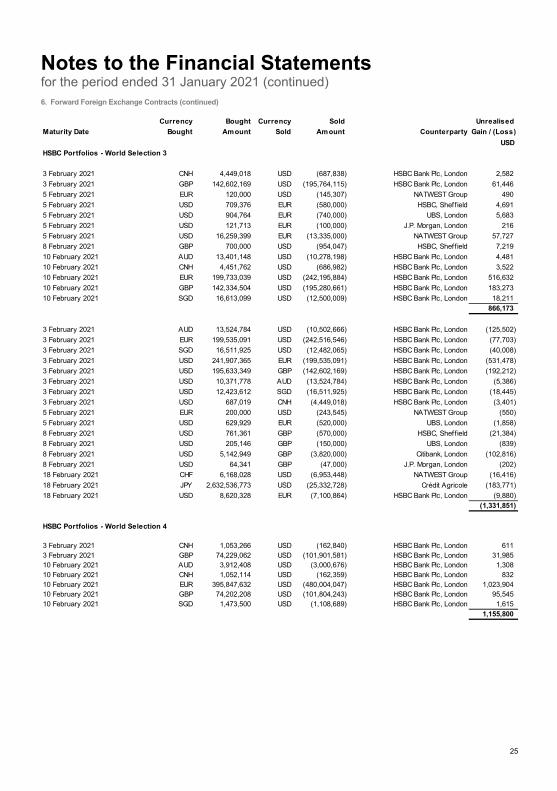
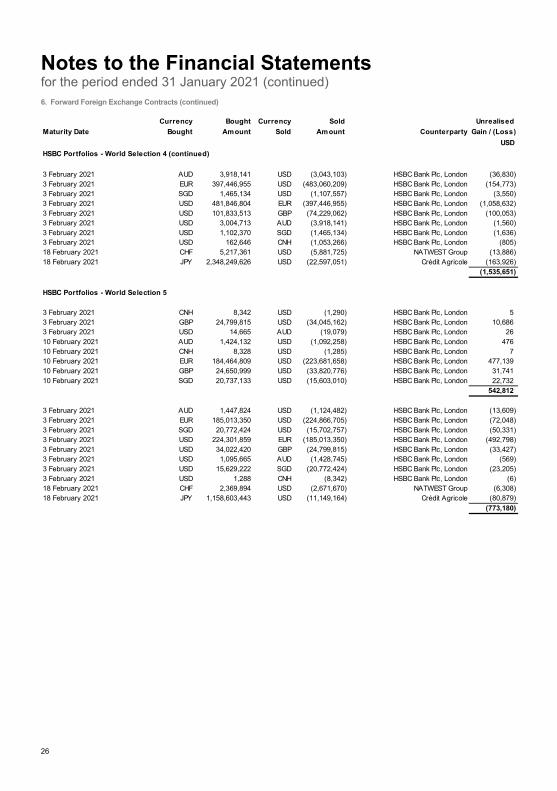
6. Forward Foreign Exchange Contracts
As at 31 January 2021, the Company had entered into various forward foreign exchange contracts, for the purpose of portfolio and share class hedging, which obliges the Company to deliver currencies at specified dates.
Open forward foreign exchange contracts as at 31 January 2021, are as follows:
Currency Bought Currency Sold Unrealised Maturity Date Bought Amount Sold Amount Counterparty Gain / (Loss)
USD HSBC Portfolios - World Selection 1
3 February 2021 CNH 108,021 USD (16,701) HSBC Bank Plc, London 633 February 2021 GBP 33,409,789 USD (45,864,925) HSBC Bank Plc, London 14,3963 February 2021 USD 272,106 GBP (197,987) HSBC Bank Plc, London 2253 February 2021 USD 712,704 AUD (923,002) HSBC Bank Plc, London 4,5113 February 2021 USD 16,679,487 JPY (1,739,683,863) HSBC Bank Plc, London 62,1185 February 2021 EUR 236,000 USD (285,770) NATWEST Group 9635 February 2021 USD 33,588,673 EUR (27,630,000) HSBC, Sheffield 18,9555 February 2021 USD 1,658,021 EUR (1,360,000) UBS, London 5,6575 February 2021 USD 60,856 EUR (50,000) J.P. Morgan, London 1085 February 2021 USD 25,951,726 EUR (21,284,000) NATWEST Group 92,2298 February 2021 GBP 1,260,000 USD (1,695,898) HSBC, Sheffield 34,3818 February 2021 GBP 100,000 USD (136,595) UBS, London 7298 February 2021 USD 22,724,318 JPY (2,360,000,000) NATWEST Group 181,50010 February 2021 AUD 18,800,110 USD (14,419,008) HSBC Bank Plc, London 6,28710 February 2021 CNH 108,082 USD (16,679) HSBC Bank Plc, London 8610 February 2021 EUR 158,824,779 USD (192,590,609) HSBC Bank Plc, London 410,81810 February 2021 GBP 33,214,376 USD (45,569,593) HSBC Bank Plc, London 42,76810 February 2021 SGD 4,630,672 USD (3,484,205) HSBC Bank Plc, London 5,07631 March 2021 CNY 7,500,000 USD (1,151,190) HSBC, Sheffield 8,05431 March 2021 INR 86,300,000 USD (1,173,471) Citibank, London 2,24131 March 2021 NOK 4,950,000 EUR (474,324) NATWEST Group 1,63431 March 2021 NOK 4,950,000 SEK (4,792,823) NATWEST Group 2,983
895,782
3 February 2021 AUD 19,757,798 USD (15,345,289) HSBC Bank Plc, London (185,719)3 February 2021 EUR 156,485,424 USD (190,193,636) HSBC Bank Plc, London (60,938)3 February 2021 JPY 1,739,683,863 USD (16,800,342) HSBC Bank Plc, London (182,974)3 February 2021 SGD 4,648,869 USD (3,514,278) HSBC Bank Plc, London (11,264)3 February 2021 USD 189,715,886 EUR (156,485,424) HSBC Bank Plc, London (416,812)3 February 2021 USD 45,562,674 GBP (33,211,803) HSBC Bank Plc, London (44,766)3 February 2021 USD 14,443,877 AUD (18,834,795) HSBC Bank Plc, London (7,500)3 February 2021 USD 3,497,820 SGD (4,648,869) HSBC Bank Plc, London (5,193)3 February 2021 USD 16,681 CNH (108,021) HSBC Bank Plc, London (83)5 February 2021 EUR 40,000 USD (49,217) J.P. Morgan, London (618)5 February 2021 EUR 230,000 USD (280,077) NATWEST Group (633)5 February 2021 USD 884,021 EUR (730,000) UBS, London (2,909)5 February 2021 USD 313,874 EUR (260,000) NATWEST Group (2,020)5 February 2021 USD 2,307,486 AUD (3,110,000) HSBC, Sheffield (78,700)5 February 2021 USD 1,940,229 CAD (2,500,000) HSBC, Sheffield (16,812)8 February 2021 USD 947,836 GBP (700,000) HSBC, Sheffield (13,430)8 February 2021 USD 382,940 GBP (280,000) UBS, London (1,567)8 February 2021 USD 16,989,663 GBP (12,610,000) Citibank, London (326,856)8 February 2021 USD 279,266 GBP (204,000) J.P. Morgan, London (875)10 February 2021 JPY 1,740,160,943 USD (16,685,677) HSBC Bank Plc, London (62,794)18 February 2021 CHF 3,047,586 USD (3,435,657) NATWEST Group (8,111)
Enfocus Software - Customer Support
Notes to the Financial Statementsfor the period ended 31 January 2021 (continued)
24
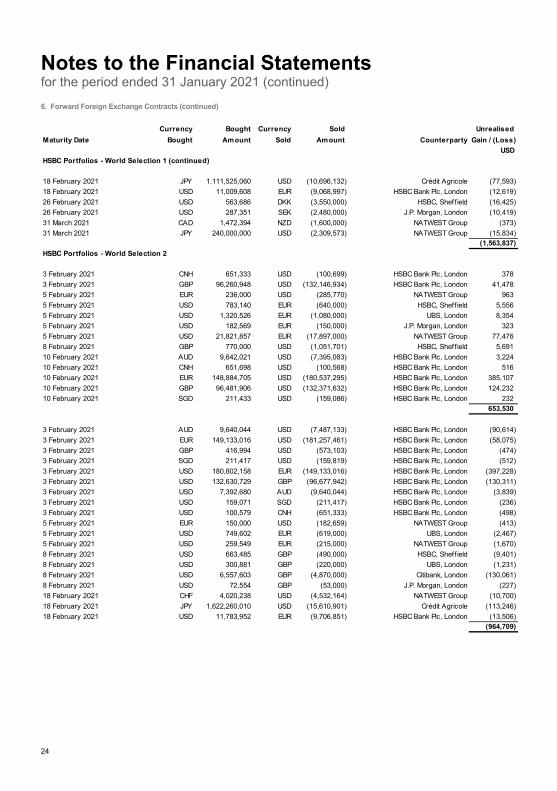
6. Forward Foreign Exchange Contracts (continued)
Currency Bought Currency Sold Unrealised Maturity Date Bought Amount Sold Amount Counterparty Gain / (Loss)
USD HSBC Portfolios - World Selection 1 (continued)
18 February 2021 JPY 1,111,525,060 USD (10,696,132) Crédit Agricole (77,593)18 February 2021 USD 11,009,608 EUR (9,068,997) HSBC Bank Plc, London (12,619)26 February 2021 USD 563,686 DKK (3,550,000) HSBC, Sheffield (16,425)26 February 2021 USD 287,351 SEK (2,480,000) J.P. Morgan, London (10,419)31 March 2021 CAD 1,472,394 NZD (1,600,000) NATWEST Group (373)31 March 2021 JPY 240,000,000 USD (2,309,573) NATWEST Group (15,834)
(1,563,837)HSBC Portfolios - World Selection 2
3 February 2021 CNH 651,333 USD (100,699) HSBC Bank Plc, London 3783 February 2021 GBP 96,260,948 USD (132,146,934) HSBC Bank Plc, London 41,4785 February 2021 EUR 236,000 USD (285,770) NATWEST Group 9635 February 2021 USD 783,140 EUR (640,000) HSBC, Sheffield 5,5565 February 2021 USD 1,320,526 EUR (1,080,000) UBS, London 8,3545 February 2021 USD 182,569 EUR (150,000) J.P. Morgan, London 3235 February 2021 USD 21,821,857 EUR (17,897,000) NATWEST Group 77,4768 February 2021 GBP 770,000 USD (1,051,701) HSBC, Sheffield 5,69110 February 2021 AUD 9,642,021 USD (7,395,083) HSBC Bank Plc, London 3,22410 February 2021 CNH 651,698 USD (100,568) HSBC Bank Plc, London 51610 February 2021 EUR 148,884,705 USD (180,537,295) HSBC Bank Plc, London 385,10710 February 2021 GBP 96,481,906 USD (132,371,632) HSBC Bank Plc, London 124,23210 February 2021 SGD 211,433 USD (159,086) HSBC Bank Plc, London 232
653,530
3 February 2021 AUD 9,640,044 USD (7,487,133) HSBC Bank Plc, London (90,614)3 February 2021 EUR 149,133,016 USD (181,257,461) HSBC Bank Plc, London (58,075)3 February 2021 GBP 416,994 USD (573,103) HSBC Bank Plc, London (474)3 February 2021 SGD 211,417 USD (159,819) HSBC Bank Plc, London (512)3 February 2021 USD 180,802,158 EUR (149,133,016) HSBC Bank Plc, London (397,228)3 February 2021 USD 132,630,729 GBP (96,677,942) HSBC Bank Plc, London (130,311)3 February 2021 USD 7,392,680 AUD (9,640,044) HSBC Bank Plc, London (3,839)3 February 2021 USD 159,071 SGD (211,417) HSBC Bank Plc, London (236)3 February 2021 USD 100,579 CNH (651,333) HSBC Bank Plc, London (498)5 February 2021 EUR 150,000 USD (182,659) NATWEST Group (413)5 February 2021 USD 749,602 EUR (619,000) UBS, London (2,467)5 February 2021 USD 259,549 EUR (215,000) NATWEST Group (1,670)8 February 2021 USD 663,485 GBP (490,000) HSBC, Sheffield (9,401)8 February 2021 USD 300,881 GBP (220,000) UBS, London (1,231)8 February 2021 USD 6,557,603 GBP (4,870,000) Citibank, London (130,061)8 February 2021 USD 72,554 GBP (53,000) J.P. Morgan, London (227)18 February 2021 CHF 4,020,238 USD (4,532,164) NATWEST Group (10,700)18 February 2021 JPY 1,622,260,010 USD (15,610,901) Crédit Agricole (113,246)18 February 2021 USD 11,783,952 EUR (9,706,851) HSBC Bank Plc, London (13,506)
(964,709)
Enfocus Software - Customer Support
Notes to the Financial Statementsfor the period ended 31 January 2021 (continued)
25
6. Forward Foreign Exchange Contracts (continued)
Currency Bought Currency Sold Unrealised Maturity Date Bought Amount Sold Amount Counterparty Gain / (Loss)
USD HSBC Portfolios - World Selection 3
3 February 2021 CNH 4,449,018 USD (687,838) HSBC Bank Plc, London 2,5823 February 2021 GBP 142,602,169 USD (195,764,115) HSBC Bank Plc, London 61,4465 February 2021 EUR 120,000 USD (145,307) NATWEST Group 4905 February 2021 USD 709,376 EUR (580,000) HSBC, Sheffield 4,6915 February 2021 USD 904,764 EUR (740,000) UBS, London 5,6835 February 2021 USD 121,713 EUR (100,000) J.P. Morgan, London 2165 February 2021 USD 16,259,399 EUR (13,335,000) NATWEST Group 57,7278 February 2021 GBP 700,000 USD (954,047) HSBC, Sheffield 7,21910 February 2021 AUD 13,401,148 USD (10,278,198) HSBC Bank Plc, London 4,48110 February 2021 CNH 4,451,762 USD (686,982) HSBC Bank Plc, London 3,52210 February 2021 EUR 199,733,039 USD (242,195,884) HSBC Bank Plc, London 516,63210 February 2021 GBP 142,334,504 USD (195,280,661) HSBC Bank Plc, London 183,27310 February 2021 SGD 16,613,099 USD (12,500,009) HSBC Bank Plc, London 18,211
866,173
3 February 2021 AUD 13,524,784 USD (10,502,666) HSBC Bank Plc, London (125,502)3 February 2021 EUR 199,535,091 USD (242,516,546) HSBC Bank Plc, London (77,703)3 February 2021 SGD 16,511,925 USD (12,482,065) HSBC Bank Plc, London (40,008)3 February 2021 USD 241,907,365 EUR (199,535,091) HSBC Bank Plc, London (531,478)3 February 2021 USD 195,633,349 GBP (142,602,169) HSBC Bank Plc, London (192,212)3 February 2021 USD 10,371,778 AUD (13,524,784) HSBC Bank Plc, London (5,386)3 February 2021 USD 12,423,612 SGD (16,511,925) HSBC Bank Plc, London (18,445)3 February 2021 USD 687,019 CNH (4,449,018) HSBC Bank Plc, London (3,401)5 February 2021 EUR 200,000 USD (243,545) NATWEST Group (550)5 February 2021 USD 629,929 EUR (520,000) UBS, London (1,858)8 February 2021 USD 761,361 GBP (570,000) HSBC, Sheffield (21,384)8 February 2021 USD 205,146 GBP (150,000) UBS, London (839)8 February 2021 USD 5,142,949 GBP (3,820,000) Citibank, London (102,816)8 February 2021 USD 64,341 GBP (47,000) J.P. Morgan, London (202)18 February 2021 CHF 6,168,028 USD (6,953,448) NATWEST Group (16,416)18 February 2021 JPY 2,632,536,773 USD (25,332,728) Crédit Agricole (183,771)18 February 2021 USD 8,620,328 EUR (7,100,864) HSBC Bank Plc, London (9,880)
(1,331,851)
HSBC Portfolios - World Selection 4
3 February 2021 CNH 1,053,266 USD (162,840) HSBC Bank Plc, London 6113 February 2021 GBP 74,229,062 USD (101,901,581) HSBC Bank Plc, London 31,98510 February 2021 AUD 3,912,408 USD (3,000,676) HSBC Bank Plc, London 1,30810 February 2021 CNH 1,052,114 USD (162,359) HSBC Bank Plc, London 83210 February 2021 EUR 395,847,632 USD (480,004,047) HSBC Bank Plc, London 1,023,90410 February 2021 GBP 74,202,208 USD (101,804,243) HSBC Bank Plc, London 95,54510 February 2021 SGD 1,473,500 USD (1,108,689) HSBC Bank Plc, London 1,615
1,155,800
Enfocus Software - Customer Support
Notes to the Financial Statements for the period ended 31 January 2021 (continued)
26
6. Forward Foreign Exchange Contracts (continued)
Currency Bought Currency Sold Unrealised Maturity Date Bought Amount Sold Amount Counterparty Gain / (Loss)
USD HSBC Portfolios - World Selection 4 (continued)
3 February 2021 AUD 3,918,141 USD (3,043,103) HSBC Bank Plc, London (36,830)3 February 2021 EUR 397,446,955 USD (483,060,209) HSBC Bank Plc, London (154,773)3 February 2021 SGD 1,465,134 USD (1,107,557) HSBC Bank Plc, London (3,550)3 February 2021 USD 481,846,804 EUR (397,446,955) HSBC Bank Plc, London (1,058,632)3 February 2021 USD 101,833,513 GBP (74,229,062) HSBC Bank Plc, London (100,053)3 February 2021 USD 3,004,713 AUD (3,918,141) HSBC Bank Plc, London (1,560)3 February 2021 USD 1,102,370 SGD (1,465,134) HSBC Bank Plc, London (1,636)3 February 2021 USD 162,646 CNH (1,053,266) HSBC Bank Plc, London (805)18 February 2021 CHF 5,217,361 USD (5,881,725) NATWEST Group (13,886)18 February 2021 JPY 2,348,249,626 USD (22,597,051) Crédit Agricole (163,926)
(1,535,651)
HSBC Portfolios - World Selection 5
3 February 2021 CNH 8,342 USD (1,290) HSBC Bank Plc, London 53 February 2021 GBP 24,799,815 USD (34,045,162) HSBC Bank Plc, London 10,6863 February 2021 USD 14,665 AUD (19,079) HSBC Bank Plc, London 2610 February 2021 AUD 1,424,132 USD (1,092,258) HSBC Bank Plc, London 47610 February 2021 CNH 8,328 USD (1,285) HSBC Bank Plc, London 710 February 2021 EUR 184,464,809 USD (223,681,658) HSBC Bank Plc, London 477,13910 February 2021 GBP 24,650,999 USD (33,820,776) HSBC Bank Plc, London 31,74110 February 2021 SGD 20,737,133 USD (15,603,010) HSBC Bank Plc, London 22,732
542,812
3 February 2021 AUD 1,447,824 USD (1,124,482) HSBC Bank Plc, London (13,609)3 February 2021 EUR 185,013,350 USD (224,866,705) HSBC Bank Plc, London (72,048)3 February 2021 SGD 20,772,424 USD (15,702,757) HSBC Bank Plc, London (50,331)3 February 2021 USD 224,301,859 EUR (185,013,350) HSBC Bank Plc, London (492,798)3 February 2021 USD 34,022,420 GBP (24,799,815) HSBC Bank Plc, London (33,427)3 February 2021 USD 1,095,665 AUD (1,428,745) HSBC Bank Plc, London (569)3 February 2021 USD 15,629,222 SGD (20,772,424) HSBC Bank Plc, London (23,205)3 February 2021 USD 1,288 CNH (8,342) HSBC Bank Plc, London (6)18 February 2021 CHF 2,369,894 USD (2,671,670) NATWEST Group (6,308)18 February 2021 JPY 1,158,603,443 USD (11,149,164) Crédit Agricole (80,879)
(773,180)
Enfocus Software - Customer Support
Notes to the Financial Statementsfor the period ended 31 January 2021 (continued)
27
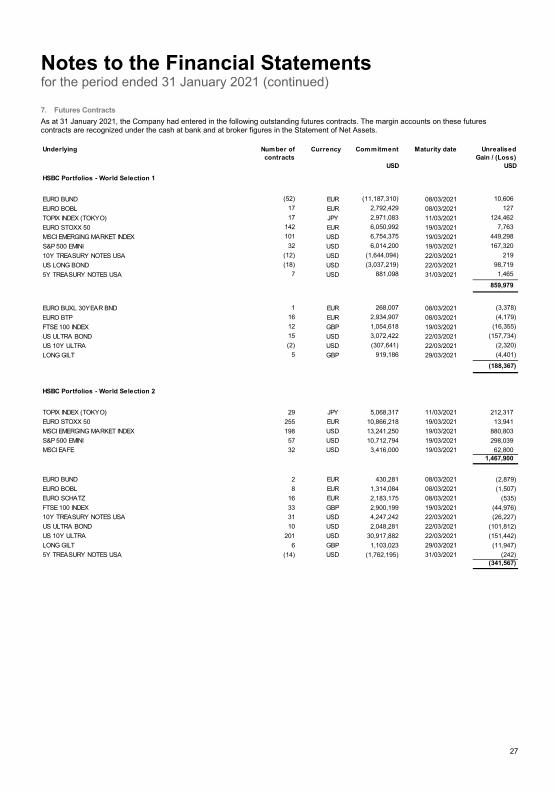
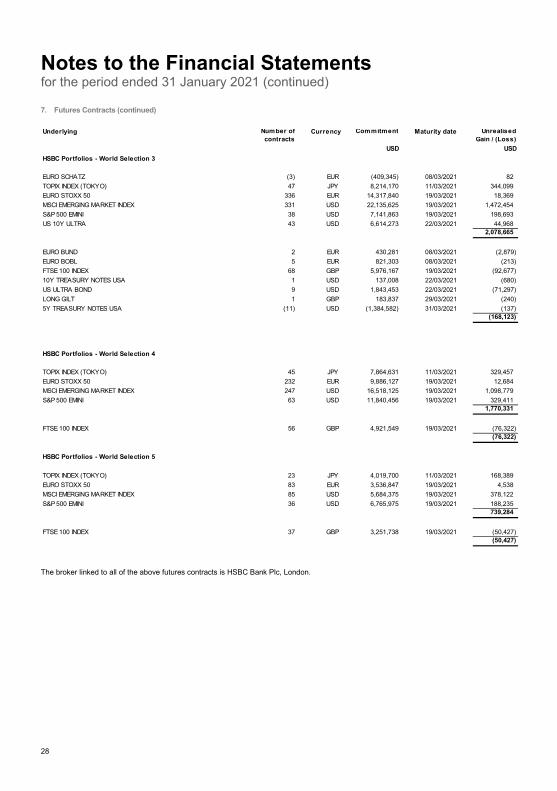
7. Futures Contracts As at 31 January 2021, the Company had entered in the following outstanding futures contracts. The margin accounts on these futures contracts are recognized under the cash at bank and at broker figures in the Statement of Net Assets.
Underlying Number of Currency Commitment Maturity date Unrealised contracts Gain / (Loss)
USD USD
HSBC Portfolios - World Selection 1
EURO BUND (52) EUR (11,187,310) 08/03/2021 10,606 EURO BOBL 17 EUR 2,792,429 08/03/2021 127 TOPIX INDEX (TOKYO) 17 JPY 2,971,083 11/03/2021 124,462 EURO STOXX 50 142 EUR 6,050,992 19/03/2021 7,763 MSCI EMERGING MARKET INDEX 101 USD 6,754,375 19/03/2021 449,298 S&P 500 EMINI 32 USD 6,014,200 19/03/2021 167,320 10Y TREASURY NOTES USA (12) USD (1,644,094) 22/03/2021 219 US LONG BOND (18) USD (3,037,219) 22/03/2021 98,719 5Y TREASURY NOTES USA 7 USD 881,098 31/03/2021 1,465
859,979
EURO BUXL 30YEAR BND 1 EUR 268,007 08/03/2021 (3,378)EURO BTP 16 EUR 2,934,907 08/03/2021 (4,179)FTSE 100 INDEX 12 GBP 1,054,618 19/03/2021 (16,355)US ULTRA BOND 15 USD 3,072,422 22/03/2021 (157,734)US 10Y ULTRA (2) USD (307,641) 22/03/2021 (2,320)LONG GILT 5 GBP 919,186 29/03/2021 (4,401)
(188,367)
HSBC Portfolios - World Selection 2
TOPIX INDEX (TOKYO) 29 JPY 5,068,317 11/03/2021 212,317 EURO STOXX 50 255 EUR 10,866,218 19/03/2021 13,941 MSCI EMERGING MARKET INDEX 198 USD 13,241,250 19/03/2021 880,803 S&P 500 EMINI 57 USD 10,712,794 19/03/2021 298,039 MSCI EAFE 32 USD 3,416,000 19/03/2021 62,800
1,467,900
EURO BUND 2 EUR 430,281 08/03/2021 (2,879)EURO BOBL 8 EUR 1,314,084 08/03/2021 (1,507)EURO SCHATZ 16 EUR 2,183,175 08/03/2021 (535)FTSE 100 INDEX 33 GBP 2,900,199 19/03/2021 (44,976)10Y TREASURY NOTES USA 31 USD 4,247,242 22/03/2021 (26,227)US ULTRA BOND 10 USD 2,048,281 22/03/2021 (101,812)US 10Y ULTRA 201 USD 30,917,882 22/03/2021 (151,442)LONG GILT 6 GBP 1,103,023 29/03/2021 (11,947)5Y TREASURY NOTES USA (14) USD (1,762,195) 31/03/2021 (242)
(341,567)
Enfocus Software - Customer Support
Notes to the Financial Statementsfor the period ended 31 January 2021 (continued)
28
7. Futures Contracts (continued)
The broker linked to all of the above futures contracts is HSBC Bank Plc, London.
Underlying Number of Currency Commitment Maturity date Unrealised contracts Gain / (Loss)
USD USD HSBC Portfolios - World Selection 3
EURO SCHATZ (3) EUR (409,345) 08/03/2021 82 TOPIX INDEX (TOKYO) 47 JPY 8,214,170 11/03/2021 344,099 EURO STOXX 50 336 EUR 14,317,840 19/03/2021 18,369 MSCI EMERGING MARKET INDEX 331 USD 22,135,625 19/03/2021 1,472,454 S&P 500 EMINI 38 USD 7,141,863 19/03/2021 198,693 US 10Y ULTRA 43 USD 6,614,273 22/03/2021 44,968
2,078,665
EURO BUND 2 EUR 430,281 08/03/2021 (2,879)EURO BOBL 5 EUR 821,303 08/03/2021 (213)FTSE 100 INDEX 68 GBP 5,976,167 19/03/2021 (92,677)10Y TREASURY NOTES USA 1 USD 137,008 22/03/2021 (680)US ULTRA BOND 9 USD 1,843,453 22/03/2021 (71,297)LONG GILT 1 GBP 183,837 29/03/2021 (240)5Y TREASURY NOTES USA (11) USD (1,384,582) 31/03/2021 (137)
(168,123)
HSBC Portfolios - World Selection 4
TOPIX INDEX (TOKYO) 45 JPY 7,864,631 11/03/2021 329,457 EURO STOXX 50 232 EUR 9,886,127 19/03/2021 12,684 MSCI EMERGING MARKET INDEX 247 USD 16,518,125 19/03/2021 1,098,779 S&P 500 EMINI 63 USD 11,840,456 19/03/2021 329,411
1,770,331
FTSE 100 INDEX 56 GBP 4,921,549 19/03/2021 (76,322) (76,322)
HSBC Portfolios - World Selection 5
TOPIX INDEX (TOKYO) 23 JPY 4,019,700 11/03/2021 168,389 EURO STOXX 50 83 EUR 3,536,847 19/03/2021 4,538 MSCI EMERGING MARKET INDEX 85 USD 5,684,375 19/03/2021 378,122 S&P 500 EMINI 36 USD 6,765,975 19/03/2021 188,235
739,284
FTSE 100 INDEX 37 GBP 3,251,738 19/03/2021 (50,427) (50,427)
Enfocus Software - Customer Support
Notes to the Financial Statementsfor the period ended 31 January 2021 (continued)
29
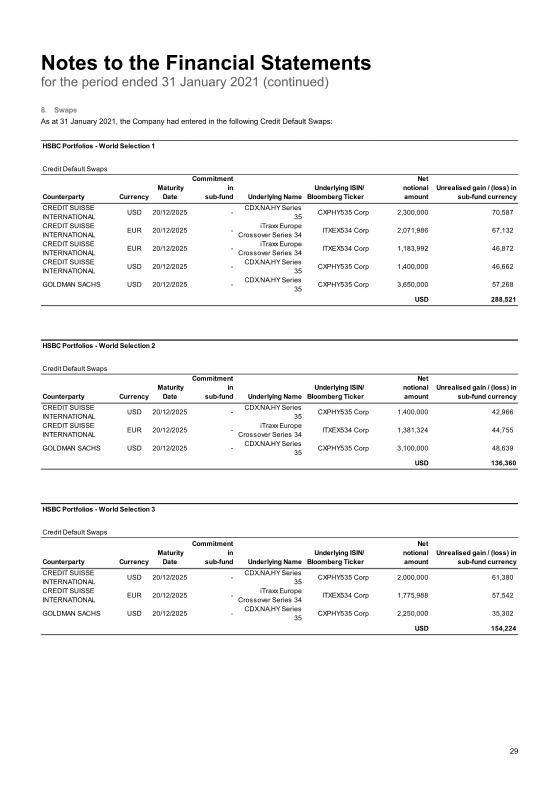
8. Swaps As at 31 January 2021, the Company had entered in the following Credit Default Swaps:
HSBC Portfolios - World Selection 1
Credit Default Swaps
Counterparty Currency Maturity
Date
Commitment in
sub-fund Underlying Name Underlying ISIN/
Bloomberg Ticker
Netnotional amount
Unrealised gain / (loss) in sub-fund currency
CREDIT SUISSE INTERNATIONAL USD 20/12/2025 - CDX.NA.HY Series
35 CXPHY535 Corp 2,300,000 70,587
CREDIT SUISSE INTERNATIONAL EUR 20/12/2025 - iTraxx Europe
Crossover Series 34 ITXEX534 Corp 2,071,986 67,132
CREDIT SUISSE INTERNATIONAL EUR 20/12/2025 - iTraxx Europe
Crossover Series 34 ITXEX534 Corp 1,183,992 46,872
CREDIT SUISSE INTERNATIONAL USD 20/12/2025 - CDX.NA.HY Series
35 CXPHY535 Corp 1,400,000 46,662
GOLDMAN SACHS USD 20/12/2025 - CDX.NA.HY Series 35 CXPHY535 Corp 3,650,000 57,268
USD 288,521
HSBC Portfolios - World Selection 2
Credit Default Swaps
Counterparty Currency Maturity
Date
Commitment in
sub-fund Underlying Name Underlying ISIN/
Bloomberg Ticker
Netnotional amount
Unrealised gain / (loss) in sub-fund currency
CREDIT SUISSE INTERNATIONAL USD 20/12/2025 - CDX.NA.HY Series
35 CXPHY535 Corp 1,400,000 42,966
CREDIT SUISSE INTERNATIONAL EUR 20/12/2025 - iTraxx Europe
Crossover Series 34 ITXEX534 Corp 1,381,324 44,755
GOLDMAN SACHS USD 20/12/2025 - CDX.NA.HY Series 35 CXPHY535 Corp 3,100,000 48,639
USD 136,360
HSBC Portfolios - World Selection 3
Credit Default Swaps
Counterparty Currency Maturity
Date
Commitment in
sub-fund Underlying Name Underlying ISIN/
Bloomberg Ticker
Netnotional amount
Unrealised gain / (loss) in sub-fund currency
CREDIT SUISSE INTERNATIONAL USD 20/12/2025 - CDX.NA.HY Series
35 CXPHY535 Corp 2,000,000 61,380
CREDIT SUISSE INTERNATIONAL EUR 20/12/2025 - iTraxx Europe
Crossover Series 34 ITXEX534 Corp 1,775,988 57,542
GOLDMAN SACHS USD 20/12/2025 - CDX.NA.HY Series 35 CXPHY535 Corp 2,250,000 35,302
USD 154,224
Enfocus Software - Customer Support
Notes to the Financial Statementsfor the period ended 31 January 2021 (continued)
30
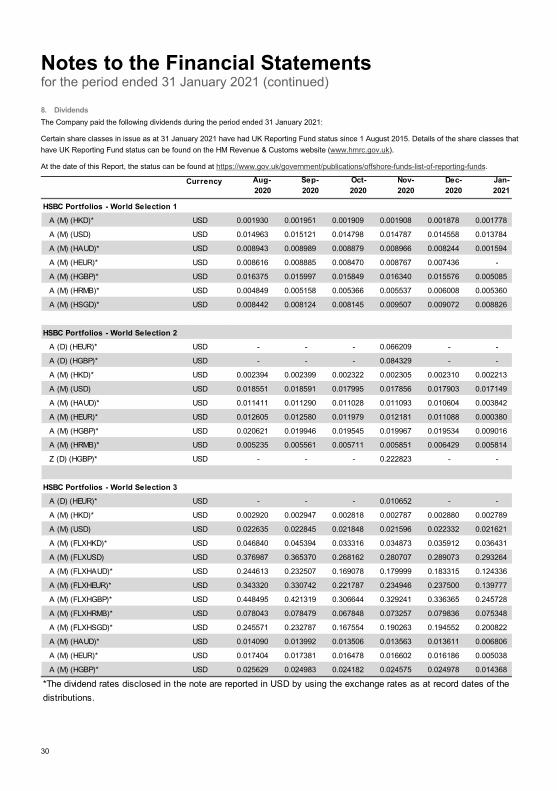
8. Dividends The Company paid the following dividends during the period ended 31 January 2021:
Certain share classes in issue as at 31 January 2021 have had UK Reporting Fund status since 1 August 2015. Details of the share classes that have UK Reporting Fund status can be found on the HM Revenue & Customs website (www.hmrc.gov.uk).
At the date of this Report, the status can be found at https://www.gov.uk/government/publications/offshore-funds-list-of-reporting-funds.
Currency Aug-2020
Sep-2020
Oct-2020
Nov-2020
Dec-2020
Jan-2021
HSBC Portfolios - World Selection 1
A (M) (HKD)* USD 0.001930 0.001951 0.001909 0.001908 0.001878 0.001778
A (M) (USD) USD 0.014963 0.015121 0.014798 0.014787 0.014558 0.013784
A (M) (HAUD)* USD 0.008943 0.008989 0.008879 0.008966 0.008244 0.001594
A (M) (HEUR)* USD 0.008616 0.008885 0.008470 0.008767 0.007436 -
A (M) (HGBP)* USD 0.016375 0.015997 0.015849 0.016340 0.015576 0.005085
A (M) (HRMB)* USD 0.004849 0.005158 0.005366 0.005537 0.006008 0.005360
A (M) (HSGD)* USD 0.008442 0.008124 0.008145 0.009507 0.009072 0.008826
HSBC Portfolios - World Selection 2
A (D) (HEUR)* USD - - - 0.066209 - -
A (D) (HGBP)* USD - - - 0.084329 - -
A (M) (HKD)* USD 0.002394 0.002399 0.002322 0.002305 0.002310 0.002213
A (M) (USD) USD 0.018551 0.018591 0.017995 0.017856 0.017903 0.017149
A (M) (HAUD)* USD 0.011411 0.011290 0.011028 0.011093 0.010604 0.003842
A (M) (HEUR)* USD 0.012605 0.012580 0.011979 0.012181 0.011088 0.000380
A (M) (HGBP)* USD 0.020621 0.019946 0.019545 0.019967 0.019534 0.009016
A (M) (HRMB)* USD 0.005235 0.005561 0.005711 0.005851 0.006429 0.005814
Z (D) (HGBP)* USD - - - 0.222823 - -
HSBC Portfolios - World Selection 3A (D) (HEUR)* USD - - - 0.010652 - -
A (M) (HKD)* USD 0.002920 0.002947 0.002818 0.002787 0.002880 0.002789
A (M) (USD) USD 0.022635 0.022845 0.021848 0.021596 0.022332 0.021621
A (M) (FLXHKD)* USD 0.046840 0.045394 0.033316 0.034873 0.035912 0.036431
A (M) (FLXUSD) USD 0.376987 0.365370 0.268162 0.280707 0.289073 0.293264
A (M) (FLXHAUD)* USD 0.244613 0.232507 0.169078 0.179999 0.183315 0.124336
A (M) (FLXHEUR)* USD 0.343320 0.330742 0.221787 0.234946 0.237500 0.139777
A (M) (FLXHGBP)* USD 0.448495 0.421319 0.306644 0.329241 0.336365 0.245728
A (M) (FLXHRMB)* USD 0.078043 0.078479 0.067848 0.073257 0.079836 0.075348
A (M) (FLXHSGD)* USD 0.245571 0.232787 0.167554 0.190263 0.194552 0.200822
A (M) (HAUD)* USD 0.014090 0.013992 0.013506 0.013563 0.013611 0.006806
A (M) (HEUR)* USD 0.017404 0.017381 0.016478 0.016602 0.016186 0.005038
A (M) (HGBP)* USD 0.025629 0.024983 0.024182 0.024575 0.024978 0.014368
*The dividend rates disclosed in the note are reported in USD by using the exchange rates as at record dates of the distributions.
Enfocus Software - Customer Support
Notes to the Financial Statementsfor the period ended 31 January 2021 (continued)
31
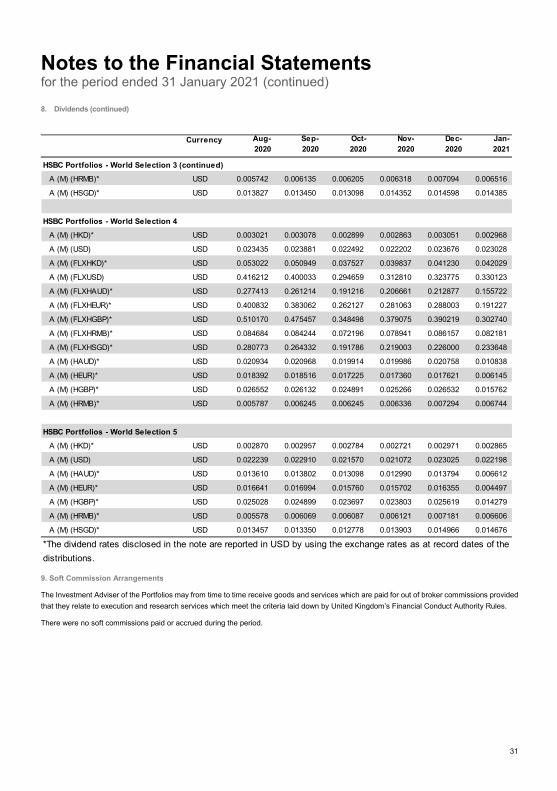
8. Dividends (continued)
9. Soft Commission Arrangements
The Investment Adviser of the Portfolios may from time to time receive goods and services which are paid for out of broker commissions provided that they relate to execution and research services which meet the criteria laid down by United Kingdom’s Financial Conduct Authority Rules.
There were no soft commissions paid or accrued during the period.
Currency Aug-2020
Sep-2020
Oct-2020
Nov-2020
Dec-2020
Jan-2021
HSBC Portfolios - World Selection 3 (continued)A (M) (HRMB)* USD 0.005742 0.006135 0.006205 0.006318 0.007094 0.006516
A (M) (HSGD)* USD 0.013827 0.013450 0.013098 0.014352 0.014598 0.014385
HSBC Portfolios - World Selection 4A (M) (HKD)* USD 0.003021 0.003078 0.002899 0.002863 0.003051 0.002968
A (M) (USD) USD 0.023435 0.023881 0.022492 0.022202 0.023676 0.023028
A (M) (FLXHKD)* USD 0.053022 0.050949 0.037527 0.039837 0.041230 0.042029
A (M) (FLXUSD) USD 0.416212 0.400033 0.294659 0.312810 0.323775 0.330123
A (M) (FLXHAUD)* USD 0.277413 0.261214 0.191216 0.206661 0.212877 0.155722
A (M) (FLXHEUR)* USD 0.400832 0.383062 0.262127 0.281063 0.288003 0.191227
A (M) (FLXHGBP)* USD 0.510170 0.475457 0.348498 0.379075 0.390219 0.302740
A (M) (FLXHRMB)* USD 0.084684 0.084244 0.072196 0.078941 0.086157 0.082181
A (M) (FLXHSGD)* USD 0.280773 0.264332 0.191786 0.219003 0.226000 0.233648
A (M) (HAUD)* USD 0.020934 0.020968 0.019914 0.019986 0.020758 0.010838
A (M) (HEUR)* USD 0.018392 0.018516 0.017225 0.017360 0.017621 0.006145
A (M) (HGBP)* USD 0.026552 0.026132 0.024891 0.025266 0.026532 0.015762
A (M) (HRMB)* USD 0.005787 0.006245 0.006245 0.006336 0.007294 0.006744
HSBC Portfolios - World Selection 5A (M) (HKD)* USD 0.002870 0.002957 0.002784 0.002721 0.002971 0.002865
A (M) (USD) USD 0.022239 0.022910 0.021570 0.021072 0.023025 0.022198
A (M) (HAUD)* USD 0.013610 0.013802 0.013098 0.012990 0.013794 0.006612
A (M) (HEUR)* USD 0.016641 0.016994 0.015760 0.015702 0.016355 0.004497
A (M) (HGBP)* USD 0.025028 0.024899 0.023697 0.023803 0.025619 0.014279
A (M) (HRMB)* USD 0.005578 0.006069 0.006087 0.006121 0.007181 0.006606
A (M) (HSGD)* USD 0.013457 0.013350 0.012778 0.013903 0.014966 0.014676
*The dividend rates disclosed in the note are reported in USD by using the exchange rates as at record dates of the distributions.
Enfocus Software - Customer Support
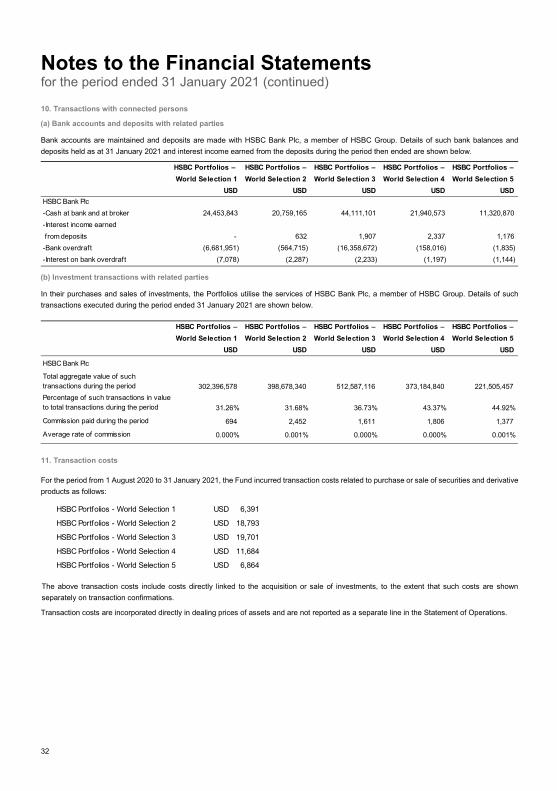
Notes to the Financial Statementsfor the period ended 31 January 2021 (continued)
32
10. Transactions with connected persons
(a) Bank accounts and deposits with related parties
Bank accounts are maintained and deposits are made with HSBC Bank Plc, a member of HSBC Group. Details of such bank balances and deposits held as at 31 January 2021 and interest income earned from the deposits during the period then ended are shown below.
(b) Investment transactions with related parties
In their purchases and sales of investments, the Portfolios utilise the services of HSBC Bank Plc, a member of HSBC Group. Details of such transactions executed during the period ended 31 January 2021 are shown below.
11. Transaction costs
For the period from 1 August 2020 to 31 January 2021, the Fund incurred transaction costs related to purchase or sale of securities and derivative products as follows:
The above transaction costs include costs directly linked to the acquisition or sale of investments, to the extent that such costs are shown separately on transaction confirmations.
Transaction costs are incorporated directly in dealing prices of assets and are not reported as a separate line in the Statement of Operations.
HSBC Portfolios – HSBC Portfolios – HSBC Portfolios – HSBC Portfolios – HSBC Portfolios –World Selection 1 World Selection 2 World Selection 3 World Selection 4 World Selection 5
USD USD USD USD USDHSBC Bank Plc-Cash at bank and at broker 24,453,843 20,759,165 44,111,101 21,940,573 11,320,870 -Interest income earned from deposits - 632 1,907 2,337 1,176 -Bank overdraft (6,681,951) (564,715) (16,358,672) (158,016) (1,835)-Interest on bank overdraft (7,078) (2,287) (2,233) (1,197) (1,144)
HSBC Portfolios – HSBC Portfolios – HSBC Portfolios – HSBC Portfolios – HSBC Portfolios –World Selection 1 World Selection 2 World Selection 3 World Selection 4 World Selection 5
USD USD USD USD USD
HSBC Bank Plc
Total aggregate value of such transactions during the period 302,396,578 398,678,340 512,587,116 373,184,840 221,505,457Percentage of such transactions in value to total transactions during the period 31.26% 31.68% 36.73% 43.37% 44.92%
Commission paid during the period 694 2,452 1,611 1,806 1,377
Average rate of commission 0.000% 0.001% 0.000% 0.000% 0.001%
HSBC Portfolios - World Selection 1 USD 6,391
HSBC Portfolios - World Selection 2 USD 18,793
HSBC Portfolios - World Selection 3 USD 19,701
HSBC Portfolios - World Selection 4 USD 11,684
HSBC Portfolios - World Selection 5 USD 6,864
Enfocus Software - Customer Support

Notes to the Financial Statementsfor the period ended 31 January 2021 (continued)
33
12. Global Exposure
The global risk on derivatives has been determined according to the commitment approach during the financial period ended 31 January 2021.
13. Subsequent Events
Impact of the Coronavirus (COVID-19)
The Board continues to monitor the situation and receives regular updates from the Management Company. As at 17 March 2021, to our knowledge, the impact of COVID-19 has not affected the Investment Manager’s ability to execute the investment strategy of the Company, nor has there been any significant redemption activity or interruption to key service providers engaged by the Company.
Enfocus Software - Customer Support
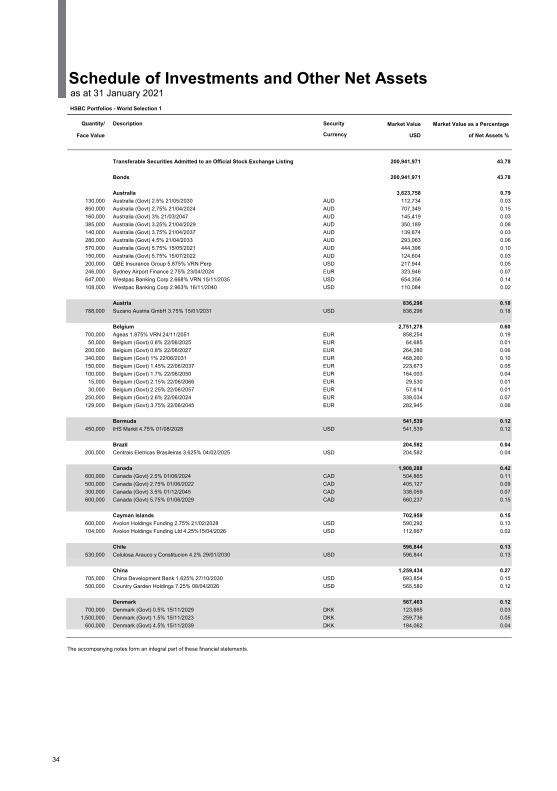
Schedule of Investments and Other Net Assets as at 31 January 2021 HSBC Portfolios - World Selection 1
Quantity/ Description Security Market Value Market Value as a Percentage
Face Value Currency USD of Net Assets %
Transferable Securities Admitted to an Official Stock Exchange Listing 200,941,971 43.78
Bonds 200,941,971 43.78
Australia 3,623,758 0.79 130,000 Australia (Govt) 2.5% 21/05/2030 AUD 112,734 0.03 850,000 Australia (Govt) 2.75% 21/04/2024 AUD 707,349 0.15 160,000 Australia (Govt) 3% 21/03/2047 AUD 145,419 0.03 385,000 Australia (Govt) 3.25% 21/04/2029 AUD 350,189 0.08 140,000 Australia (Govt) 3.75% 21/04/2037 AUD 139,674 0.03 280,000 Australia (Govt) 4.5% 21/04/2033 AUD 293,063 0.06 570,000 Australia (Govt) 5.75% 15/05/2021 AUD 444,396 0.10 150,000 Australia (Govt) 5.75% 15/07/2022 AUD 124,604 0.03 200,000 QBE Insurance Group 5.875% VRN Perp USD 217,944 0.05 246,000 Sydney Airport Finance 2.75% 23/04/2024 EUR 323,946 0.07 647,000 Westpac Banking Corp 2.668% VRN 15/11/2035 USD 654,356 0.14 108,000 Westpac Banking Corp 2.963% 16/11/2040 USD 110,084 0.02
Austria 836,296 0.18788,000 Suzano Austria GmbH 3.75% 15/01/2031 USD 836,296 0.18
Belgium 2,751,278 0.60700,000 Ageas 1.875% VRN 24/11/2051 EUR 858,254 0.19
50,000 Belgium (Govt) 0.8% 22/06/2025 EUR 64,685 0.01200,000 Belgium (Govt) 0.8% 22/06/2027 EUR 264,280 0.06340,000 Belgium (Govt) 1% 22/06/2031 EUR 468,260 0.10150,000 Belgium (Govt) 1.45% 22/06/2037 EUR 223,673 0.05100,000 Belgium (Govt) 1.7% 22/06/2050 EUR 164,003 0.04
15,000 Belgium (Govt) 2.15% 22/06/2066 EUR 29,530 0.0130,000 Belgium (Govt) 2.25% 22/06/2057 EUR 57,614 0.01
250,000 Belgium (Govt) 2.6% 22/06/2024 EUR 338,034 0.07129,000 Belgium (Govt) 3.75% 22/06/2045 EUR 282,945 0.06
Bermuda 541,539 0.12450,000 IHS Markit 4.75% 01/08/2028 USD 541,539 0.12
Brazil 204,582 0.04200,000 Centrais Eletricas Brasileiras 3.625% 04/02/2025 USD 204,582 0.04
Canada 1,908,288 0.42600,000 Canada (Govt) 2.5% 01/06/2024 CAD 504,865 0.11500,000 Canada (Govt) 2.75% 01/06/2022 CAD 405,127 0.09300,000 Canada (Govt) 3.5% 01/12/2045 CAD 338,059 0.07600,000 Canada (Govt) 5.75% 01/06/2029 CAD 660,237 0.15
Cayman Islands 702,959 0.15600,000 Avolon Holdings Funding 2.75% 21/02/2028 USD 590,292 0.13104,000 Avolon Holdings Funding Ltd 4.25%15/04/2026 USD 112,667 0.02
Chile 596,844 0.13530,000 Celulosa Arauco y Constitucion 4.2% 29/01/2030 USD 596,844 0.13
China 1,259,434 0.27705,000 China Development Bank 1.625% 27/10/2030 USD 693,854 0.15500,000 Country Garden Holdings 7.25% 08/04/2026 USD 565,580 0.12
Denmark 567,463 0.12700,000 Denmark (Govt) 0.5% 15/11/2029 DKK 123,665 0.03
1,500,000 Denmark (Govt) 1.5% 15/11/2023 DKK 259,736 0.05600,000 Denmark (Govt) 4.5% 15/11/2039 DKK 184,062 0.04
The accompanying notes form an integral part of these financial statements.
34
Enfocus Software - Customer Support
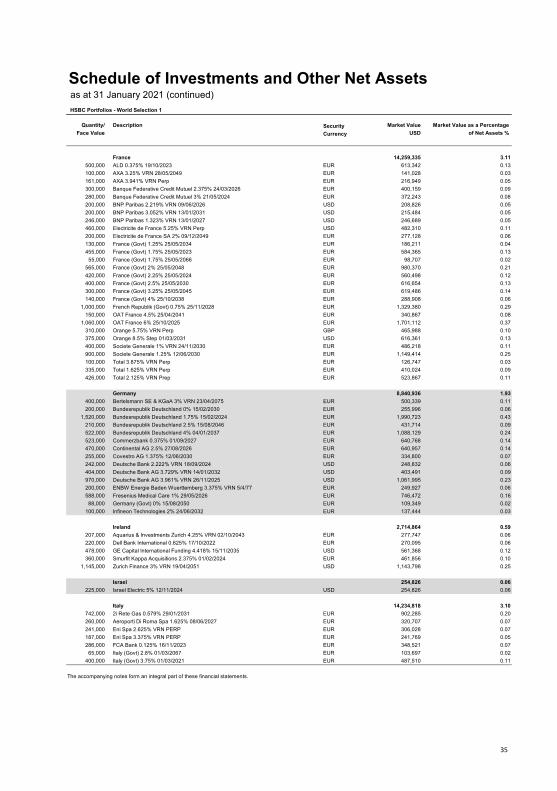
Schedule of Investments and Other Net Assets as at 31 January 2021 (continued) HSBC Portfolios - World Selection 1
Quantity/ Description Security Market Value Market Value as a Percentage Face Value Currency USD of Net Assets %
France 14,259,335 3.11 500,000 ALD 0.375% 19/10/2023 EUR 613,342 0.13 100,000 AXA 3.25% VRN 28/05/2049 EUR 141,028 0.03 161,000 AXA 3.941% VRN Perp EUR 216,949 0.05 300,000 Banque Federative Credit Mutuel 2.375% 24/03/2026 EUR 400,159 0.09 280,000 Banque Federative Credit Mutuel 3% 21/05/2024 EUR 372,243 0.08 200,000 BNP Paribas 2.219% VRN 09/06/2026 USD 208,826 0.05 200,000 BNP Paribas 3.052% VRN 13/01/2031 USD 215,484 0.05 246,000 BNP Paribas 1.323% VRN 13/01/2027 USD 246,689 0.05 460,000 Electricite de France 5.25% VRN Perp USD 482,310 0.11 200,000 Electricite de France SA 2% 09/12/2049 EUR 277,128 0.06 130,000 France (Govt) 1.25% 25/05/2034 EUR 186,211 0.04 455,000 France (Govt) 1.75% 25/05/2023 EUR 584,365 0.13 55,000 France (Govt) 1.75% 25/05/2066 EUR 98,707 0.02 565,000 France (Govt) 2% 25/05/2048 EUR 980,370 0.21 420,000 France (Govt) 2.25% 25/05/2024 EUR 560,498 0.12 400,000 France (Govt) 2.5% 25/05/2030 EUR 616,654 0.13 300,000 France (Govt) 3.25% 25/05/2045 EUR 619,486 0.14 140,000 France (Govt) 4% 25/10/2038 EUR 288,908 0.06 1,000,000 French Republik (Govt) 0.75% 25/11/2028 EUR 1,329,380 0.29 150,000 OAT France 4.5% 25/04/2041 EUR 340,867 0.08 1,060,000 OAT France 6% 25/10/2025 EUR 1,701,112 0.37 310,000 Orange 5.75% VRN Perp GBP 465,988 0.10 375,000 Orange 8.5% Step 01/03/2031 USD 616,361 0.13 400,000 Societe Generale 1% VRN 24/11/2030 EUR 486,218 0.11 900,000 Societe Generale 1.25% 12/06/2030 EUR 1,149,414 0.25 100,000 Total 3.875% VRN Perp EUR 126,747 0.03 335,000 Total 1.625% VRN Perp EUR 410,024 0.09 426,000 Total 2.125% VRN Prep EUR 523,867 0.11
Germany 8,840,936 1.93 400,000 Bertelsmann SE & KGaA 3% VRN 23/04/2075 EUR 500,339 0.11 200,000 Bundesrepublik Deutschland 0% 15/02/2030 EUR 255,996 0.06 1,520,000 Bundesrepublik Deutschland 1.75% 15/02/2024 EUR 1,990,723 0.43 210,000 Bundesrepublik Deutschland 2.5% 15/08/2046 EUR 431,714 0.09 522,000 Bundesrepublik Deutschland 4% 04/01/2037 EUR 1,088,129 0.24 523,000 Commerzbank 0.375% 01/09/2027 EUR 640,768 0.14 470,000 Continental AG 2.5% 27/08/2026 EUR 640,957 0.14 255,000 Covestro AG 1.375% 12/06/2030 EUR 334,800 0.07 242,000 Deutsche Bank 2.222% VRN 18/09/2024 USD 248,832 0.06 404,000 Deutsche Bank AG 3.729% VRN 14/01/2032 USD 403,491 0.09 970,000 Deutsche Bank AG 3.961% VRN 26/11/2025 USD 1,061,995 0.23 200,000 ENBW Energie Baden Wuerttemberg 3.375% VRN 5/4/77 EUR 249,927 0.06 588,000 Fresenius Medical Care 1% 29/05/2026 EUR 746,472 0.16 88,000 Germany (Govt) 0% 15/08/2050 EUR 109,349 0.02 100,000 Infineon Technologies 2% 24/06/2032 EUR 137,444 0.03
Ireland 2,714,864 0.59 207,000 Aquarius & Investments Zurich 4.25% VRN 02/10/2043 EUR 277,747 0.06 220,000 Dell Bank International 0.625% 17/10/2022 EUR 270,095 0.06 478,000 GE Capital International Funding 4.418% 15/11/2035 USD 561,368 0.12 360,000 Smurfit Kappa Acquisitions 2.375% 01/02/2024 EUR 461,856 0.10 1,145,000 Zurich Finance 3% VRN 19/04/2051 USD 1,143,798 0.25
Israel 254,826 0.06 225,000 Israel Electric 5% 12/11/2024 USD 254,826 0.06
Italy 14,234,818 3.10 742,000 2i Rete Gas 0.579% 29/01/2031 EUR 902,285 0.20 260,000 Aeroporti Di Roma Spa 1.625% 08/06/2027 EUR 320,707 0.07 241,000 Eni Spa 2.625% VRN PERP EUR 306,028 0.07 187,000 Eni Spa 3.375% VRN PERP EUR 241,769 0.05 286,000 FCA Bank 0.125% 16/11/2023 EUR 348,521 0.07 65,000 Italy (Govt) 2.8% 01/03/2067 EUR 103,697 0.02 400,000 Italy (Govt) 3.75% 01/03/2021 EUR 487,510 0.11
The accompanying notes form an integral part of these financial statements.
35
Enfocus Software - Customer Support
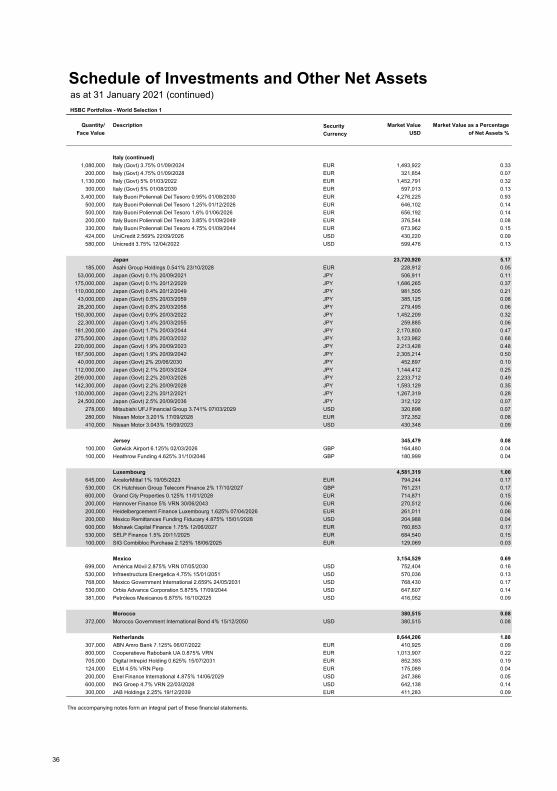
Schedule of Investments and Other Net Assets as at 31 January 2021 (continued) HSBC Portfolios - World Selection 1
Quantity/ Description Security Market Value Market Value as a Percentage Face Value Currency USD of Net Assets %
Italy (continued) 1,080,000 Italy (Govt) 3.75% 01/09/2024 EUR 1,493,922 0.33 200,000 Italy (Govt) 4.75% 01/09/2028 EUR 321,854 0.07 1,130,000 Italy (Govt) 5% 01/03/2022 EUR 1,452,791 0.32 300,000 Italy (Govt) 5% 01/08/2039 EUR 597,013 0.13 3,400,000 Italy Buoni Poliennali Del Tesoro 0.95% 01/08/2030 EUR 4,276,225 0.93 500,000 Italy Buoni Poliennali Del Tesoro 1.25% 01/12/2026 EUR 646,102 0.14 500,000 Italy Buoni Poliennali Del Tesoro 1.6% 01/06/2026 EUR 656,192 0.14 200,000 Italy Buoni Poliennali Del Tesoro 3.85% 01/09/2049 EUR 376,544 0.08 330,000 Italy Buoni Poliennali Del Tesoro 4.75% 01/09/2044 EUR 673,962 0.15 424,000 UniCredit 2.569% 22/09/2026 USD 430,220 0.09 580,000 Unicredit 3.75% 12/04/2022 USD 599,476 0.13
Japan 23,720,920 5.17 185,000 Asahi Group Holdings 0.541% 23/10/2028 EUR 228,912 0.05 53,000,000 Japan (Govt) 0.1% 20/09/2021 JPY 506,911 0.11 175,000,000 Japan (Govt) 0.1% 20/12/2029 JPY 1,686,265 0.37 110,000,000 Japan (Govt) 0.4% 20/12/2049 JPY 981,505 0.21 43,000,000 Japan (Govt) 0.5% 20/03/2059 JPY 385,125 0.08 28,200,000 Japan (Govt) 0.8% 20/03/2058 JPY 279,495 0.06 150,300,000 Japan (Govt) 0.9% 20/03/2022 JPY 1,452,209 0.32 22,300,000 Japan (Govt) 1.4% 20/03/2055 JPY 259,885 0.06 181,200,000 Japan (Govt) 1.7% 20/03/2044 JPY 2,170,800 0.47 275,500,000 Japan (Govt) 1.8% 20/03/2032 JPY 3,123,982 0.68 220,000,000 Japan (Govt) 1.9% 20/09/2023 JPY 2,213,428 0.48 187,500,000 Japan (Govt) 1.9% 20/09/2042 JPY 2,305,214 0.50 40,000,000 Japan (Govt) 2% 20/06/2030 JPY 452,897 0.10 112,000,000 Japan (Govt) 2.1% 20/03/2024 JPY 1,144,412 0.25 209,000,000 Japan (Govt) 2.2% 20/03/2026 JPY 2,233,712 0.49 142,300,000 Japan (Govt) 2.2% 20/09/2028 JPY 1,593,129 0.35 130,000,000 Japan (Govt) 2.2% 20/12/2021 JPY 1,267,319 0.28 24,500,000 Japan (Govt) 2.5% 20/09/2036 JPY 312,122 0.07 278,000 Mitsubishi UFJ Financial Group 3.741% 07/03/2029 USD 320,898 0.07 280,000 Nissan Motor 3.201% 17/09/2028 EUR 372,352 0.08 410,000 Nissan Motor 3.043% 15/09/2023 USD 430,348 0.09
Jersey 345,479 0.08 100,000 Gatwick Airport 6.125% 02/03/2026 GBP 164,480 0.04 100,000 Heathrow Funding 4.625% 31/10/2046 GBP 180,999 0.04
Luxembourg 4,581,319 1.00 645,000 ArcelorMittal 1% 19/05/2023 EUR 794,244 0.17 530,000 CK Hutchison Group Telecom Finance 2% 17/10/2027 GBP 761,231 0.17 600,000 Grand City Properties 0.125% 11/01/2028 EUR 714,871 0.15 200,000 Hannover Finance 5% VRN 30/06/2043 EUR 270,512 0.06 200,000 Heidelbergcement Finance Luxembourg 1.625% 07/04/2026 EUR 261,011 0.06 200,000 Mexico Remittances Funding Fiducary 4.875% 15/01/2028 USD 204,988 0.04 600,000 Mohawk Capital Finance 1.75% 12/06/2027 EUR 760,853 0.17 530,000 SELP Finance 1.5% 20/11/2025 EUR 684,540 0.15 100,000 SIG Combibloc Purchase 2.125% 18/06/2025 EUR 129,069 0.03
Mexico 3,154,529 0.69 699,000 América Móvil 2.875% VRN 07/05/2030 USD 752,404 0.16 530,000 Infraestructura Energetica 4.75% 15/01/2051 USD 570,036 0.13 768,000 Mexico Government International 2.659% 24/05/2031 USD 768,430 0.17 530,000 Orbia Advance Corporation 5.875% 17/09/2044 USD 647,607 0.14 381,000 Petróleos Mexicanos 6.875% 16/10/2025 USD 416,052 0.09
Morocco 380,515 0.08 372,000 Morocco Government International Bond 4% 15/12/2050 USD 380,515 0.08
Netherlands 8,644,206 1.88 307,000 ABN Amro Bank 7.125% 06/07/2022 EUR 410,925 0.09 800,000 Cooperatieve Rabobank UA 0.875% VRN EUR 1,013,907 0.22 705,000 Digital Intrepid Holding 0.625% 15/07/2031 EUR 852,393 0.19 124,000 ELM 4.5% VRN Perp EUR 175,089 0.04 200,000 Enel Finance International 4.875% 14/06/2029 USD 247,386 0.05 600,000 ING Groep 4.7% VRN 22/03/2028 USD 642,138 0.14 300,000 JAB Holdings 2.25% 19/12/2039 EUR 411,283 0.09
The accompanying notes form an integral part of these financial statements.
36
Enfocus Software - Customer Support
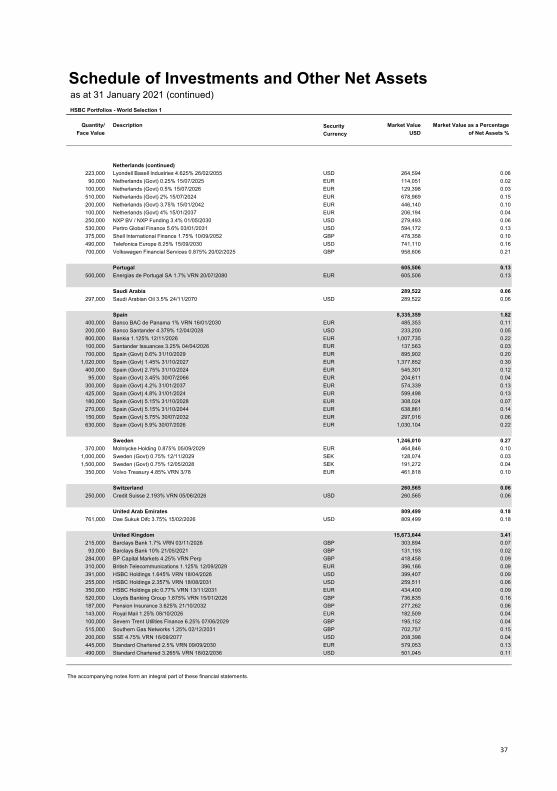
Schedule of Investments and Other Net Assets as at 31 January 2021 (continued) HSBC Portfolios - World Selection 1
Quantity/ Description Security Market Value Market Value as a Percentage Face Value Currency USD of Net Assets %
Netherlands (continued) 223,000 Lyondell Basell Industries 4.625% 26/02/2055 USD 264,594 0.06 90,000 Netherlands (Govt) 0.25% 15/07/2025 EUR 114,051 0.02 100,000 Netherlands (Govt) 0.5% 15/07/2026 EUR 129,398 0.03 510,000 Netherlands (Govt) 2% 15/07/2024 EUR 678,969 0.15 200,000 Netherlands (Govt) 3.75% 15/01/2042 EUR 446,140 0.10 100,000 Netherlands (Govt) 4% 15/01/2037 EUR 206,194 0.04 250,000 NXP BV / NXP Funding 3.4% 01/05/2030 USD 279,493 0.06 530,000 Pertro Global Finance 5.6% 03/01/2031 USD 594,172 0.13 375,000 Shell International Finance 1.75% 10/09/2052 GBP 478,358 0.10 490,000 Telefonica Europe 8.25% 15/09/2030 USD 741,110 0.16 700,000 Volkswagen Financial Services 0.875% 20/02/2025 GBP 958,606 0.21
Portugal 605,506 0.13 500,000 Energias de Portugal SA 1.7% VRN 20/07/2080 EUR 605,506 0.13
Saudi Arabia 289,522 0.06 297,000 Saudi Arabian Oil 3.5% 24/11/2070 USD 289,522 0.06
Spain 8,335,359 1.82 400,000 Banco BAC de Panama 1% VRN 16/01/2030 EUR 485,353 0.11 200,000 Banco Santander 4.379% 12/04/2028 USD 233,200 0.05 800,000 Bankia 1.125% 12/11/2026 EUR 1,007,735 0.22 100,000 Santander Issuances 3.25% 04/04/2026 EUR 137,563 0.03 700,000 Spain (Govt) 0.6% 31/10/2029 EUR 895,902 0.20 1,020,000 Spain (Govt) 1.45% 31/10/2027 EUR 1,377,852 0.30 400,000 Spain (Govt) 2.75% 31/10/2024 EUR 545,301 0.12 95,000 Spain (Govt) 3.45% 30/07/2066 EUR 204,611 0.04 300,000 Spain (Govt) 4.2% 31/01/2037 EUR 574,339 0.13 425,000 Spain (Govt) 4.8% 31/01/2024 EUR 599,498 0.13 180,000 Spain (Govt) 5.15% 31/10/2028 EUR 308,024 0.07 270,000 Spain (Govt) 5.15% 31/10/2044 EUR 638,861 0.14 150,000 Spain (Govt) 5.75% 30/07/2032 EUR 297,016 0.06 630,000 Spain (Govt) 5.9% 30/07/2026 EUR 1,030,104 0.22
Sweden 1,246,010 0.27 370,000 Molnlycke Holding 0.875% 05/09/2029 EUR 464,846 0.10 1,000,000 Sweden (Govt) 0.75% 12/11/2029 SEK 128,074 0.03 1,500,000 Sweden (Govt) 0.75% 12/05/2028 SEK 191,272 0.04 350,000 Volvo Treasury 4.85% VRN 3/78 EUR 461,818 0.10
Switzerland 260,565 0.06 250,000 Credit Suisse 2.193% VRN 05/06/2026 USD 260,565 0.06
United Arab Emirates 809,499 0.18 761,000 Dae Sukuk Difc 3.75% 15/02/2026 USD 809,499 0.18
United Kingdom 15,673,644 3.41 215,000 Barclays Bank 1.7% VRN 03/11/2026 GBP 303,894 0.07 93,000 Barclays Bank 10% 21/05/2021 GBP 131,193 0.02 284,000 BP Capital Markets 4.25% VRN Perp GBP 418,458 0.09 310,000 British Telecommunications 1.125% 12/09/2029 EUR 396,166 0.09 391,000 HSBC Holdings 1.645% VRN 18/04/2026 USD 399,407 0.09 255,000 HSBC Holdings 2.357% VRN 18/08/2031 USD 259,511 0.06 350,000 HSBC Holdings plc 0.77% VRN 13/11/2031 EUR 434,400 0.09 520,000 Lloyds Banking Group 1.875% VRN 15/01/2026 GBP 736,835 0.16 187,000 Pension Insurance 3.625% 21/10/2032 GBP 277,262 0.06 143,000 Royal Mail 1.25% 08/10/2026 EUR 182,509 0.04 100,000 Severn Trent Utilities Finance 6.25% 07/06/2029 GBP 195,152 0.04 515,000 Southern Gas Networks 1.25% 02/12/2031 GBP 702,757 0.15 200,000 SSE 4.75% VRN 16/09/2077 USD 208,398 0.04 445,000 Standard Chartered 2.5% VRN 09/09/2030 EUR 579,053 0.13 490,000 Standard Chartered 3.265% VRN 18/02/2036 USD 501,045 0.11
The accompanying notes form an integral part of these financial statements.
37
Enfocus Software - Customer Support
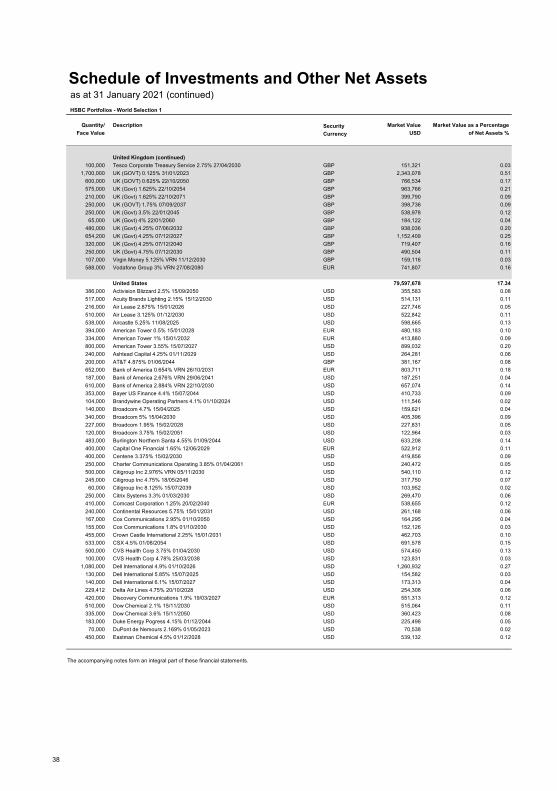
Schedule of Investments and Other Net Assets as at 31 January 2021 (continued) HSBC Portfolios - World Selection 1
Quantity/ Description Security Market Value Market Value as a Percentage Face Value Currency USD of Net Assets %
United Kingdom (continued) 100,000 Tesco Corporate Treasury Service 2.75% 27/04/2030 GBP 151,321 0.03 1,700,000 UK (GOVT) 0.125% 31/01/2023 GBP 2,343,078 0.51 600,000 UK (GOVT) 0.625% 22/10/2050 GBP 766,534 0.17 575,000 UK (Govt) 1.625% 22/10/2054 GBP 963,766 0.21 210,000 UK (Govt) 1.625% 22/10/2071 GBP 399,790 0.09 250,000 UK (GOVT) 1.75% 07/09/2037 GBP 398,736 0.09 250,000 UK (Govt) 3.5% 22/01/2045 GBP 538,978 0.12 65,000 UK (Govt) 4% 22/01/2060 GBP 184,122 0.04 480,000 UK (Govt) 4.25% 07/06/2032 GBP 938,036 0.20 654,200 UK (Govt) 4.25% 07/12/2027 GBP 1,152,409 0.25 320,000 UK (Govt) 4.25% 07/12/2040 GBP 719,407 0.16 250,000 UK (Govt) 4.75% 07/12/2030 GBP 490,504 0.11 107,000 Virgin Money 5.125% VRN 11/12/2030 GBP 159,116 0.03 588,000 Vodafone Group 3% VRN 27/08/2080 EUR 741,807 0.16
United States 79,597,678 17.34 386,000 Activision Blizzard 2.5% 15/09/2050 USD 355,583 0.08 517,000 Acuity Brands Lighting 2.15% 15/12/2030 USD 514,131 0.11 216,000 Air Lease 2.875% 15/01/2026 USD 227,746 0.05 510,000 Air Lease 3.125% 01/12/2030 USD 522,842 0.11 538,000 Aircastle 5.25% 11/08/2025 USD 598,665 0.13 394,000 American Tower 0.5% 15/01/2028 EUR 480,183 0.10 334,000 American Tower 1% 15/01/2032 EUR 413,880 0.09 800,000 American Tower 3.55% 15/07/2027 USD 899,032 0.20 240,000 Ashtead Capital 4.25% 01/11/2029 USD 264,281 0.06 200,000 AT&T 4.875% 01/06/2044 GBP 381,167 0.08 652,000 Bank of America 0.654% VRN 26/10/2031 EUR 803,711 0.18 187,000 Bank of America 2.676% VRN 29/06/2041 USD 187,251 0.04 610,000 Bank of America 2.884% VRN 22/10/2030 USD 657,074 0.14 353,000 Bayer US Finance 4.4% 15/07/2044 USD 410,733 0.09 104,000 Brandywine Operating Partners 4.1% 01/10/2024 USD 111,546 0.02 140,000 Broadcom 4.7% 15/04/2025 USD 159,621 0.04 340,000 Broadcom 5% 15/04/2030 USD 405,396 0.09 227,000 Broadcom 1.95% 15/02/2028 USD 227,831 0.05 120,000 Broadcom 3.75% 15/02/2051 USD 122,964 0.03 483,000 Burlington Northern Santa 4.55% 01/09/2044 USD 633,208 0.14 400,000 Capital One Financial 1.65% 12/06/2029 EUR 522,912 0.11 400,000 Centene 3.375% 15/02/2030 USD 419,856 0.09 250,000 Charter Communications Operating 3.85% 01/04/2061 USD 240,472 0.05 500,000 Citigroup Inc 2.976% VRN 05/11/2030 USD 540,110 0.12 245,000 Citigroup Inc 4.75% 18/05/2046 USD 317,750 0.07 60,000 Citigroup Inc 8.125% 15/07/2039 USD 103,952 0.02 250,000 Citrix Systems 3.3% 01/03/2030 USD 269,470 0.06 410,000 Comcast Corporation 1.25% 20/02/2040 EUR 538,655 0.12 240,000 Continental Resources 5.75% 15/01/2031 USD 261,168 0.06 167,000 Cox Communications 2.95% 01/10/2050 USD 164,295 0.04 155,000 Cox Communications 1.8% 01/10/2030 USD 152,126 0.03 455,000 Crown Castle International 2.25% 15/01/2031 USD 462,703 0.10 533,000 CSX 4.5% 01/08/2054 USD 691,578 0.15 500,000 CVS Health Corp 3.75% 01/04/2030 USD 574,450 0.13 100,000 CVS Health Corp 4.78% 25/03/2038 USD 123,831 0.03 1,080,000 Dell International 4.9% 01/10/2026 USD 1,260,932 0.27 130,000 Dell International 5.85% 15/07/2025 USD 154,582 0.03 140,000 Dell International 6.1% 15/07/2027 USD 173,313 0.04 229,412 Delta Air Lines 4.75% 20/10/2028 USD 254,308 0.06 420,000 Discovery Communications 1.9% 19/03/2027 EUR 551,313 0.12 510,000 Dow Chemical 2.1% 15/11/2030 USD 515,064 0.11 335,000 Dow Chemical 3.6% 15/11/2050 USD 360,423 0.08 183,000 Duke Energy Pogress 4.15% 01/12/2044 USD 225,498 0.05 70,000 DuPont de Nemours 2.169% 01/05/2023 USD 70,538 0.02 450,000 Eastman Chemical 4.5% 01/12/2028 USD 539,132 0.12
The accompanying notes form an integral part of these financial statements.
38
Enfocus Software - Customer Support
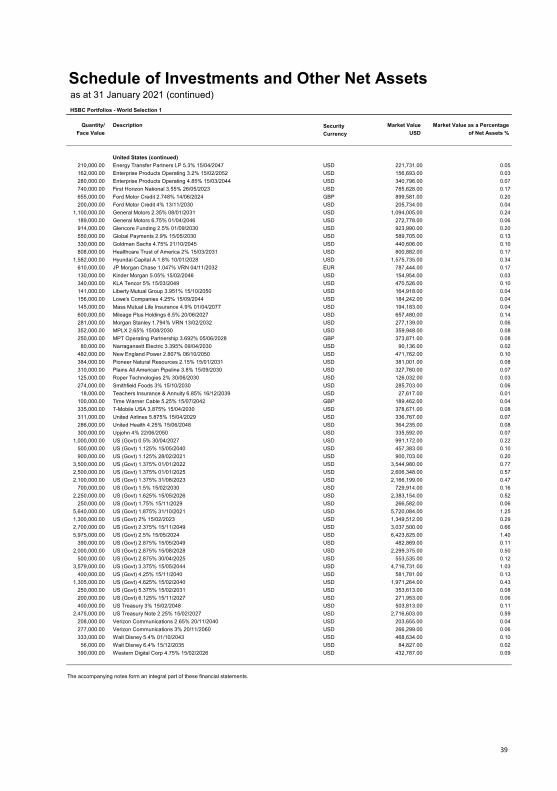
Schedule of Investments and Other Net Assets as at 31 January 2021 (continued) HSBC Portfolios - World Selection 1
Quantity/ Description Security Market Value Market Value as a Percentage Face Value Currency USD of Net Assets %
United States (continued)210,000.00 Energy Transfer Partners LP 5.3% 15/04/2047 USD 221,731.00 0.05162,000.00 Enterprise Products Operating 3.2% 15/02/2052 USD 156,693.00 0.03280,000.00 Enterprise Products Operating 4.85% 15/03/2044 USD 340,796.00 0.07740,000.00 First Horizon National 3.55% 26/05/2023 USD 785,628.00 0.17655,000.00 Ford Motor Credit 2.748% 14/06/2024 GBP 899,581.00 0.20200,000.00 Ford Motor Credit 4% 13/11/2030 USD 205,734.00 0.04
1,100,000.00 General Motors 2.35% 08/01/2031 USD 1,094,005.00 0.24189,000.00 General Motors 6.75% 01/04/2046 USD 272,778.00 0.06914,000.00 Glencore Funding 2.5% 01/09/2030 USD 923,990.00 0.20550,000.00 Global Payments 2.9% 15/05/2030 USD 589,705.00 0.13330,000.00 Goldman Sachs 4.75% 21/10/2045 USD 440,606.00 0.10808,000.00 Healthcare Trust of America 2% 15/03/2031 USD 800,882.00 0.17
1,582,000.00 Hyundai Capital A 1.8% 10/01/2028 USD 1,575,735.00 0.34610,000.00 JP Morgan Chase 1.047% VRN 04/11/2032 EUR 787,444.00 0.17130,000.00 Kinder Morgan 5.05% 15/02/2046 USD 154,954.00 0.03340,000.00 KLA Tencor 5% 15/03/2049 USD 470,526.00 0.10141,000.00 Liberty Mutual Group 3.951% 15/10/2050 USD 164,918.00 0.04156,000.00 Lowe's Companies 4.25% 15/09/2044 USD 184,242.00 0.04145,000.00 Mass Mutual Life Insurance 4.9% 01/04/2077 USD 194,183.00 0.04600,000.00 Mileage Plus Holdings 6.5% 20/06/2027 USD 657,480.00 0.14281,000.00 Morgan Stanley 1.794% VRN 13/02/2032 USD 277,139.00 0.06352,000.00 MPLX 2.65% 15/08/2030 USD 359,948.00 0.08250,000.00 MPT Operating Partnership 3.692% 05/06/2028 GBP 373,871.00 0.08
80,000.00 Narragansett Electric 3.395% 09/04/2030 USD 90,136.00 0.02482,000.00 New England Power 2.807% 06/10/2050 USD 471,762.00 0.10384,000.00 Pioneer Natural Resources 2.15% 15/01/2031 USD 381,001.00 0.08310,000.00 Plains All American Pipeline 3.8% 15/09/2030 USD 327,760.00 0.07125,000.00 Roper Technologies 2% 30/06/2030 USD 126,032.00 0.03274,000.00 Smithfield Foods 3% 15/10/2030 USD 285,703.00 0.06
18,000.00 Teachers Insurance & Annuity 6.85% 16/12/2039 USD 27,617.00 0.01100,000.00 Time Warner Cable 5.25% 15/07/2042 GBP 189,462.00 0.04335,000.00 T-Mobile USA 3.875% 15/04/2030 USD 378,671.00 0.08311,000.00 United Airlines 5.875% 15/04/2029 USD 336,767.00 0.07286,000.00 United Health 4.25% 15/06/2048 USD 364,235.00 0.08300,000.00 Upjohn 4% 22/06/2050 USD 335,592.00 0.07
1,000,000.00 US (Govt) 0.5% 30/04/2027 USD 991,172.00 0.22500,000.00 US (Govt) 1.125% 15/05/2040 USD 457,383.00 0.10900,000.00 US (Govt) 1.125% 28/02/2021 USD 900,703.00 0.20
3,500,000.00 US (Govt) 1.375% 01/01/2022 USD 3,544,980.00 0.772,500,000.00 US (Govt) 1.375% 01/01/2025 USD 2,606,348.00 0.572,100,000.00 US (Govt) 1.375% 31/08/2023 USD 2,166,199.00 0.47
700,000.00 US (Govt) 1.5% 15/02/2030 USD 729,914.00 0.162,250,000.00 US (Govt) 1.625% 15/05/2026 USD 2,383,154.00 0.52
250,000.00 US (Govt) 1.75% 15/11/2029 USD 266,582.00 0.065,640,000.00 US (Govt) 1.875% 31/10/2021 USD 5,720,084.00 1.251,300,000.00 US (Govt) 2% 15/02/2023 USD 1,349,512.00 0.292,700,000.00 US (Govt) 2.375% 15/11/2049 USD 3,037,500.00 0.665,975,000.00 US (Govt) 2.5% 15/05/2024 USD 6,423,825.00 1.40
390,000.00 US (Govt) 2.875% 15/05/2049 USD 482,869.00 0.112,000,000.00 US (Govt) 2.875% 15/08/2028 USD 2,299,375.00 0.50
500,000.00 US (Govt) 2.875% 30/04/2025 USD 553,535.00 0.123,579,000.00 US (Govt) 3.375% 15/05/2044 USD 4,716,731.00 1.03
400,000.00 US (Govt) 4.25% 15/11/2040 USD 581,781.00 0.131,305,000.00 US (Govt) 4.625% 15/02/2040 USD 1,971,264.00 0.43
250,000.00 US (Govt) 5.375% 15/02/2031 USD 353,613.00 0.08200,000.00 US (Govt) 6.125% 15/11/2027 USD 271,953.00 0.06400,000.00 US Treasury 3% 15/02/2048 USD 503,813.00 0.11
2,475,000.00 US Treasury Note 2.25% 15/02/2027 USD 2,716,603.00 0.59208,000.00 Verizon Communications 2.65% 20/11/2040 USD 203,655.00 0.04277,000.00 Verizon Communications 3% 20/11/2060 USD 266,299.00 0.06333,000.00 Walt Disney 5.4% 01/10/2043 USD 468,634.00 0.10
56,000.00 Walt Disney 6.4% 15/12/2035 USD 84,827.00 0.02390,000.00 Western Digital Corp 4.75% 15/02/2026 USD 432,787.00 0.09
The accompanying notes form an integral part of these financial statements.
39
Enfocus Software - Customer Support
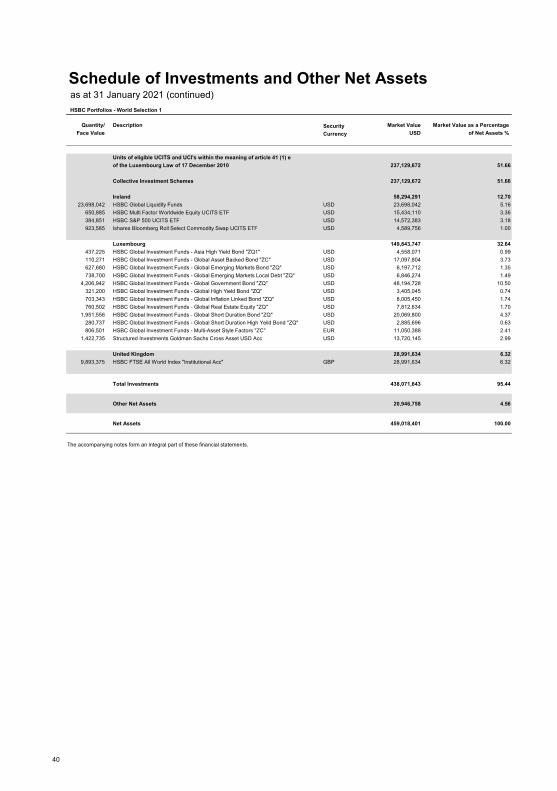
Schedule of Investments and Other Net Assets as at 31 January 2021 (continued) HSBC Portfolios - World Selection 1
Quantity/ Description Security Market Value Market Value as a Percentage Face Value Currency USD of Net Assets %
Units of eligible UCITS and UCI's within the meaning of article 41 (1) eof the Luxembourg Law of 17 December 2010 237,129,672 51.66
Collective Investment Schemes 237,129,672 51.66
Ireland 58,294,291 12.70 23,698,042 HSBC Global Liquidity Funds USD 23,698,042 5.16 650,885 HSBC Multi Factor Worldwide Equity UCITS ETF USD 15,434,110 3.36 384,851 HSBC S&P 500 UCITS ETF USD 14,572,383 3.18 923,585 Ishares Bloomberg Roll Select Commodity Swap UCITS ETF USD 4,589,756 1.00
Luxembourg 149,843,747 32.64 437,225 HSBC Global Investment Funds - Asia High Yield Bond "ZQ1" USD 4,558,071 0.99 110,271 HSBC Global Investment Funds - Global Asset Backed Bond "ZC" USD 17,097,804 3.73 627,680 HSBC Global Investment Funds - Global Emerging Markets Bond "ZQ" USD 6,197,712 1.35 738,700 HSBC Global Investment Funds - Global Emerging Markets Local Debt "ZQ" USD 6,846,274 1.49 4,206,942 HSBC Global Investment Funds - Global Government Bond "ZQ" USD 48,194,728 10.50 321,200 HSBC Global Investment Funds - Global High Yield Bond "ZQ" USD 3,405,045 0.74 703,343 HSBC Global Investment Funds - Global Inflation Linked Bond "ZQ" USD 8,005,450 1.74 760,502 HSBC Global Investment Funds - Global Real Estate Equity "ZQ" USD 7,812,634 1.70 1,951,556 HSBC Global Investment Funds - Global Short Duration Bond "ZQ" USD 20,069,800 4.37 280,737 HSBC Global Investment Funds - Global Short Duration High Yeild Bond "ZQ" USD 2,885,696 0.63 806,501 HSBC Global Investment Funds - Multi-Asset Style Factors "ZC" EUR 11,050,388 2.41 1,422,735 Structured Investments Goldman Sachs Cross Asset USD Acc USD 13,720,145 2.99
United Kingdom 28,991,634 6.32 9,893,375 HSBC FTSE All World Index "Institutional Acc" GBP 28,991,634 6.32
Total Investments 438,071,643 95.44
Other Net Assets 20,946,758 4.56
Net Assets 459,018,401 100.00
The accompanying notes form an integral part of these financial statements.
40
Enfocus Software - Customer Support
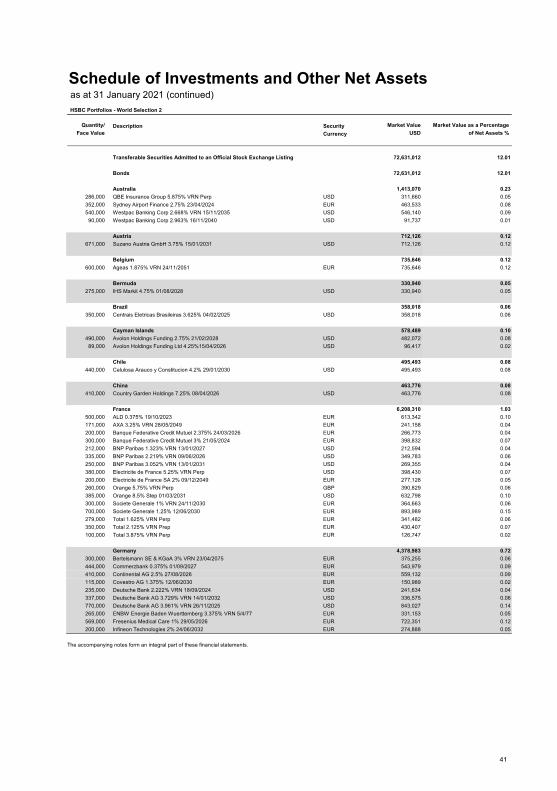
Schedule of Investments and Other Net Assets as at 31 January 2021 (continued) HSBC Portfolios - World Selection 2
Quantity/ Description Security Market Value Market Value as a Percentage Face Value Currency USD of Net Assets %
Transferable Securities Admitted to an Official Stock Exchange Listing 72,631,012 12.01
Bonds 72,631,012 12.01
Australia 1,413,070 0.23 286,000 QBE Insurance Group 5.875% VRN Perp USD 311,660 0.05 352,000 Sydney Airport Finance 2.75% 23/04/2024 EUR 463,533 0.08 540,000 Westpac Banking Corp 2.668% VRN 15/11/2035 USD 546,140 0.09 90,000 Westpac Banking Corp 2.963% 16/11/2040 USD 91,737 0.01
Austria 712,126 0.12 671,000 Suzano Austria GmbH 3.75% 15/01/2031 USD 712,126 0.12
Belgium 735,646 0.12 600,000 Ageas 1.875% VRN 24/11/2051 EUR 735,646 0.12
Bermuda 330,940 0.05 275,000 IHS Markit 4.75% 01/08/2028 USD 330,940 0.05
Brazil 358,018 0.06 350,000 Centrais Eletricas Brasileiras 3.625% 04/02/2025 USD 358,018 0.06
Cayman Islands 578,489 0.10 490,000 Avolon Holdings Funding 2.75% 21/02/2028 USD 482,072 0.08 89,000 Avolon Holdings Funding Ltd 4.25%15/04/2026 USD 96,417 0.02
Chile 495,493 0.08 440,000 Celulosa Arauco y Constitucion 4.2% 29/01/2030 USD 495,493 0.08
China 463,776 0.08 410,000 Country Garden Holdings 7.25% 08/04/2026 USD 463,776 0.08
France 6,208,310 1.03 500,000 ALD 0.375% 19/10/2023 EUR 613,342 0.10 171,000 AXA 3.25% VRN 28/05/2049 EUR 241,158 0.04 200,000 Banque Federative Credit Mutuel 2.375% 24/03/2026 EUR 266,773 0.04 300,000 Banque Federative Credit Mutuel 3% 21/05/2024 EUR 398,832 0.07 212,000 BNP Paribas 1.323% VRN 13/01/2027 USD 212,594 0.04 335,000 BNP Paribas 2.219% VRN 09/06/2026 USD 349,783 0.06 250,000 BNP Paribas 3.052% VRN 13/01/2031 USD 269,355 0.04 380,000 Electricite de France 5.25% VRN Perp USD 398,430 0.07 200,000 Electricite de France SA 2% 09/12/2049 EUR 277,128 0.05 260,000 Orange 5.75% VRN Perp GBP 390,829 0.06 385,000 Orange 8.5% Step 01/03/2031 USD 632,798 0.10 300,000 Societe Generale 1% VRN 24/11/2030 EUR 364,663 0.06 700,000 Societe Generale 1.25% 12/06/2030 EUR 893,989 0.15 279,000 Total 1.625% VRN Perp EUR 341,482 0.06 350,000 Total 2.125% VRN Prep EUR 430,407 0.07 100,000 Total 3.875% VRN Perp EUR 126,747 0.02
Germany 4,378,983 0.72 300,000 Bertelsmann SE & KGaA 3% VRN 23/04/2075 EUR 375,255 0.06 444,000 Commerzbank 0.375% 01/09/2027 EUR 543,979 0.09 410,000 Continental AG 2.5% 27/08/2026 EUR 559,132 0.09 115,000 Covestro AG 1.375% 12/06/2030 EUR 150,989 0.02 235,000 Deutsche Bank 2.222% VRN 18/09/2024 USD 241,634 0.04 337,000 Deutsche Bank AG 3.729% VRN 14/01/2032 USD 336,575 0.06 770,000 Deutsche Bank AG 3.961% VRN 26/11/2025 USD 843,027 0.14 265,000 ENBW Energie Baden Wuerttemberg 3.375% VRN 5/4/77 EUR 331,153 0.05 569,000 Fresenius Medical Care 1% 29/05/2026 EUR 722,351 0.12 200,000 Infineon Technologies 2% 24/06/2032 EUR 274,888 0.05
The accompanying notes form an integral part of these financial statements.
41
Enfocus Software - Customer Support
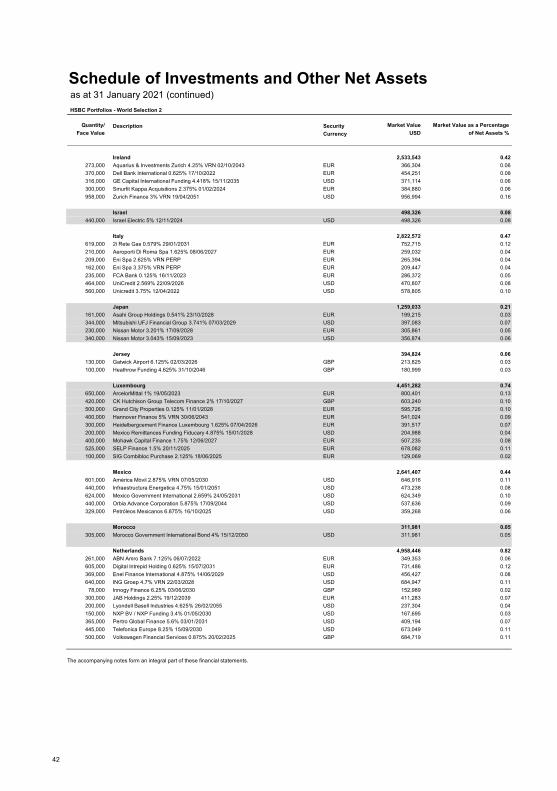
Schedule of Investments and Other Net Assets as at 31 January 2021 (continued) HSBC Portfolios - World Selection 2
Quantity/ Description Security Market Value Market Value as a Percentage Face Value Currency USD of Net Assets %
Ireland 2,533,543 0.42 273,000 Aquarius & Investments Zurich 4.25% VRN 02/10/2043 EUR 366,304 0.06 370,000 Dell Bank International 0.625% 17/10/2022 EUR 454,251 0.08 316,000 GE Capital International Funding 4.418% 15/11/2035 USD 371,114 0.06 300,000 Smurfit Kappa Acquisitions 2.375% 01/02/2024 EUR 384,880 0.06 958,000 Zurich Finance 3% VRN 19/04/2051 USD 956,994 0.16
Israel 498,326 0.08 440,000 Israel Electric 5% 12/11/2024 USD 498,326 0.08
Italy 2,822,572 0.47 619,000 2i Rete Gas 0.579% 29/01/2031 EUR 752,715 0.12 210,000 Aeroporti Di Roma Spa 1.625% 08/06/2027 EUR 259,032 0.04 209,000 Eni Spa 2.625% VRN PERP EUR 265,394 0.04 162,000 Eni Spa 3.375% VRN PERP EUR 209,447 0.04 235,000 FCA Bank 0.125% 16/11/2023 EUR 286,372 0.05 464,000 UniCredit 2.569% 22/09/2026 USD 470,807 0.08 560,000 Unicredit 3.75% 12/04/2022 USD 578,805 0.10
Japan 1,259,033 0.21 161,000 Asahi Group Holdings 0.541% 23/10/2028 EUR 199,215 0.03 344,000 Mitsubishi UFJ Financial Group 3.741% 07/03/2029 USD 397,083 0.07 230,000 Nissan Motor 3.201% 17/09/2028 EUR 305,861 0.05 340,000 Nissan Motor 3.043% 15/09/2023 USD 356,874 0.06
Jersey 394,824 0.06 130,000 Gatwick Airport 6.125% 02/03/2026 GBP 213,825 0.03 100,000 Heathrow Funding 4.625% 31/10/2046 GBP 180,999 0.03
Luxembourg 4,451,282 0.74 650,000 ArcelorMittal 1% 19/05/2023 EUR 800,401 0.13 420,000 CK Hutchison Group Telecom Finance 2% 17/10/2027 GBP 603,240 0.10 500,000 Grand City Properties 0.125% 11/01/2028 EUR 595,726 0.10 400,000 Hannover Finance 5% VRN 30/06/2043 EUR 541,024 0.09 300,000 Heidelbergcement Finance Luxembourg 1.625% 07/04/2026 EUR 391,517 0.07 200,000 Mexico Remittances Funding Fiducary 4.875% 15/01/2028 USD 204,988 0.04 400,000 Mohawk Capital Finance 1.75% 12/06/2027 EUR 507,235 0.08 525,000 SELP Finance 1.5% 20/11/2025 EUR 678,082 0.11 100,000 SIG Combibloc Purchase 2.125% 18/06/2025 EUR 129,069 0.02
Mexico 2,641,407 0.44 601,000 América Móvil 2.875% VRN 07/05/2030 USD 646,916 0.11 440,000 Infraestructura Energetica 4.75% 15/01/2051 USD 473,238 0.08 624,000 Mexico Government International 2.659% 24/05/2031 USD 624,349 0.10 440,000 Orbia Advance Corporation 5.875% 17/09/2044 USD 537,636 0.09 329,000 Petróleos Mexicanos 6.875% 16/10/2025 USD 359,268 0.06
Morocco 311,981 0.05 305,000 Morocco Government International Bond 4% 15/12/2050 USD 311,981 0.05
Netherlands 4,958,446 0.82 261,000 ABN Amro Bank 7.125% 06/07/2022 EUR 349,353 0.06 605,000 Digital Intrepid Holding 0.625% 15/07/2031 EUR 731,486 0.12 369,000 Enel Finance International 4.875% 14/06/2029 USD 456,427 0.08 640,000 ING Groep 4.7% VRN 22/03/2028 USD 684,947 0.11 78,000 Innogy Finance 6.25% 03/06/2030 GBP 152,989 0.02 300,000 JAB Holdings 2.25% 19/12/2039 EUR 411,283 0.07 200,000 Lyondell Basell Industries 4.625% 26/02/2055 USD 237,304 0.04 150,000 NXP BV / NXP Funding 3.4% 01/05/2030 USD 167,695 0.03 365,000 Pertro Global Finance 5.6% 03/01/2031 USD 409,194 0.07 445,000 Telefonica Europe 8.25% 15/09/2030 USD 673,049 0.11 500,000 Volkswagen Financial Services 0.875% 20/02/2025 GBP 684,719 0.11
The accompanying notes form an integral part of these financial statements.
42
Enfocus Software - Customer Support
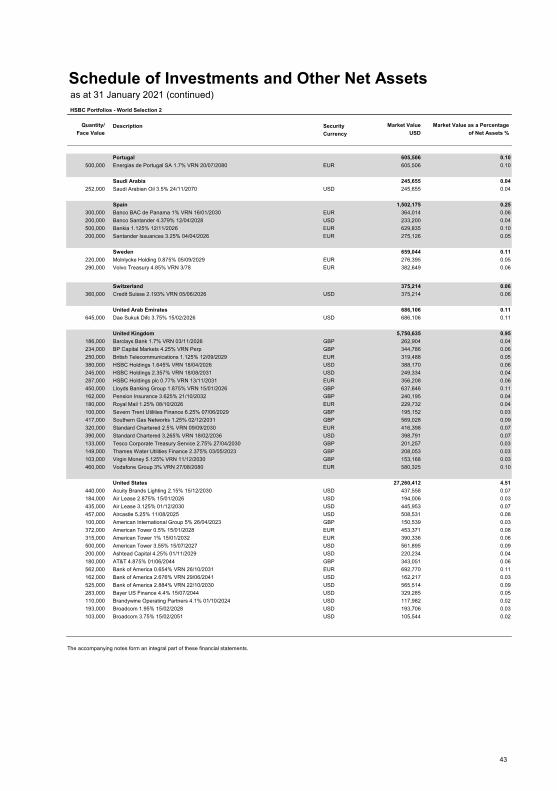
Schedule of Investments and Other Net Assets as at 31 January 2021 (continued) HSBC Portfolios - World Selection 2
Quantity/ Description Security Market Value Market Value as a Percentage Face Value Currency USD of Net Assets %
Portugal 605,506 0.10 500,000 Energias de Portugal SA 1.7% VRN 20/07/2080 EUR 605,506 0.10
Saudi Arabia 245,655 0.04 252,000 Saudi Arabian Oil 3.5% 24/11/2070 USD 245,655 0.04
Spain 1,502,175 0.25 300,000 Banco BAC de Panama 1% VRN 16/01/2030 EUR 364,014 0.06 200,000 Banco Santander 4.379% 12/04/2028 USD 233,200 0.04 500,000 Bankia 1.125% 12/11/2026 EUR 629,835 0.10 200,000 Santander Issuances 3.25% 04/04/2026 EUR 275,126 0.05
Sweden 659,044 0.11 220,000 Molnlycke Holding 0.875% 05/09/2029 EUR 276,395 0.05 290,000 Volvo Treasury 4.85% VRN 3/78 EUR 382,649 0.06
Switzerland 375,214 0.06 360,000 Credit Suisse 2.193% VRN 05/06/2026 USD 375,214 0.06
United Arab Emirates 686,106 0.11 645,000 Dae Sukuk Difc 3.75% 15/02/2026 USD 686,106 0.11
United Kingdom 5,750,635 0.95 186,000 Barclays Bank 1.7% VRN 03/11/2026 GBP 262,904 0.04 234,000 BP Capital Markets 4.25% VRN Perp GBP 344,786 0.06 250,000 British Telecommunications 1.125% 12/09/2029 EUR 319,488 0.05 380,000 HSBC Holdings 1.645% VRN 18/04/2026 USD 388,170 0.06 245,000 HSBC Holdings 2.357% VRN 18/08/2031 USD 249,334 0.04 287,000 HSBC Holdings plc 0.77% VRN 13/11/2031 EUR 356,208 0.06 450,000 Lloyds Banking Group 1.875% VRN 15/01/2026 GBP 637,646 0.11 162,000 Pension Insurance 3.625% 21/10/2032 GBP 240,195 0.04 180,000 Royal Mail 1.25% 08/10/2026 EUR 229,732 0.04 100,000 Severn Trent Utilities Finance 6.25% 07/06/2029 GBP 195,152 0.03 417,000 Southern Gas Networks 1.25% 02/12/2031 GBP 569,028 0.09 320,000 Standard Chartered 2.5% VRN 09/09/2030 EUR 416,398 0.07 390,000 Standard Chartered 3.265% VRN 18/02/2036 USD 398,791 0.07 133,000 Tesco Corporate Treasury Service 2.75% 27/04/2030 GBP 201,257 0.03 149,000 Thames Water Utilities Finance 2.375% 03/05/2023 GBP 208,053 0.03 103,000 Virgin Money 5.125% VRN 11/12/2030 GBP 153,168 0.03 460,000 Vodafone Group 3% VRN 27/08/2080 EUR 580,325 0.10
United States 27,260,412 4.51 440,000 Acuity Brands Lighting 2.15% 15/12/2030 USD 437,558 0.07 184,000 Air Lease 2.875% 15/01/2026 USD 194,006 0.03 435,000 Air Lease 3.125% 01/12/2030 USD 445,953 0.07 457,000 Aircastle 5.25% 11/08/2025 USD 508,531 0.08 100,000 American International Group 5% 26/04/2023 GBP 150,539 0.03 372,000 American Tower 0.5% 15/01/2028 EUR 453,371 0.08 315,000 American Tower 1% 15/01/2032 EUR 390,336 0.06 500,000 American Tower 3.55% 15/07/2027 USD 561,895 0.09 200,000 Ashtead Capital 4.25% 01/11/2029 USD 220,234 0.04 180,000 AT&T 4.875% 01/06/2044 GBP 343,051 0.06 562,000 Bank of America 0.654% VRN 26/10/2031 EUR 692,770 0.11 162,000 Bank of America 2.676% VRN 29/06/2041 USD 162,217 0.03 525,000 Bank of America 2.884% VRN 22/10/2030 USD 565,514 0.09 283,000 Bayer US Finance 4.4% 15/07/2044 USD 329,285 0.05 110,000 Brandywine Operating Partners 4.1% 01/10/2024 USD 117,982 0.02 193,000 Broadcom 1.95% 15/02/2028 USD 193,706 0.03 103,000 Broadcom 3.75% 15/02/2051 USD 105,544 0.02
The accompanying notes form an integral part of these financial statements.
43
Enfocus Software - Customer Support

Schedule of Investments and Other Net Assets as at 31 January 2021 (continued) HSBC Portfolios - World Selection 2
Quantity/ Description Security Market Value Market Value as a Percentage Face Value Currency USD of Net Assets %
United States (continued) 390,000 Broadcom 4.7% 15/04/2025 USD 444,659 0.07 240,000 Broadcom 5% 15/04/2030 USD 286,162 0.05 402,000 Burlington Northern Santa 4.55% 01/09/2044 USD 527,018 0.09 370,000 Capital One Financial 1.65% 12/06/2029 EUR 483,694 0.08 340,000 Centene 3.375% 15/02/2030 USD 356,878 0.06 215,000 Charter Communications Operating 3.85% 01/04/2061 USD 206,806 0.03 560,000 Citigroup Inc 2.976% VRN 05/11/2030 USD 604,923 0.10 135,000 Citigroup Inc 4.75% 18/05/2046 USD 175,087 0.03 66,000 Citigroup Inc 8.125% 15/07/2039 USD 114,347 0.02 200,000 Citrix Systems 3.3% 01/03/2030 USD 215,576 0.04 200,000 Continental Resources 5.75% 15/01/2031 USD 217,640 0.04 164,000 Cox Communications 2.95% 01/10/2050 USD 161,343 0.03 148,000 Cox Communications 1.8% 01/10/2030 USD 145,256 0.02 440,000 Crown Castle International 2.25% 15/01/2031 USD 447,449 0.07 424,000 CSX 4.5% 01/08/2054 USD 550,149 0.09 310,000 CVS Health Corp 3.75% 01/04/2030 USD 356,159 0.06 780,000 Dell International 4.9% 01/10/2026 USD 910,673 0.15 360,000 Dell International 5.85% 15/07/2025 USD 428,072 0.07 196,470 Delta Air Lines 4.75% 20/10/2028 USD 217,791 0.04 390,000 Discovery Communications 1.9% 19/03/2027 EUR 511,934 0.08 390,000 Dow Chemical 2.1% 15/11/2030 USD 393,873 0.07 325,000 Dow Chemical 3.6% 15/11/2050 USD 349,664 0.06 71,000 Duke Energy Pogress 4.15% 01/12/2044 USD 87,488 0.01 300,000 Eastman Chemical 4.5% 01/12/2028 USD 359,421 0.06 200,000 Energy Transfer Partners LP 5.3% 15/04/2047 USD 211,172 0.03 157,000 Enterprise Products Operating 3.2% 15/02/2052 USD 151,857 0.03 170,000 Enterprise Products Operating 4.85% 15/03/2044 USD 206,912 0.03 600,000 First Horizon National 3.55% 26/05/2023 USD 636,996 0.11 540,000 Ford Motor Credit 2.748% 14/06/2024 GBP 741,639 0.12 942,000 General Motors 2.35% 08/01/2031 USD 936,866 0.15 116,000 General Motors 6.75% 01/04/2046 USD 167,419 0.03 782,000 Glencore Funding 2.5% 01/09/2030 USD 790,547 0.13 470,000 Global Payments 2.9% 15/05/2030 USD 503,929 0.08 170,000 Goldman Sachs 4.75% 21/10/2045 USD 226,979 0.04 665,000 Healthcare Trust of America 2% 15/03/2031 USD 659,141 0.11 1,354,000 Hyundai Capital A 1.8% 10/01/2028 USD 1,348,638 0.22 110,000 Kinder Morgan 5.05% 15/02/2046 USD 131,115 0.02 176,000 KLA Tencor 5% 15/03/2049 USD 243,566 0.04 162,000 Liberty Mutual Group 3.951% 15/10/2050 USD 189,480 0.03 117,000 Lowe's Companies 4.25% 15/09/2044 USD 138,182 0.02 109,000 Mass Mutual Life Insurance 4.9% 01/04/2077 USD 145,972 0.02 510,000 Mileage Plus Holdings 6.5% 20/06/2027 USD 558,858 0.09 232,000 Morgan Stanley 1.794% VRN 13/02/2032 USD 228,812 0.04 342,000 MPLX 2.65% 15/08/2030 USD 349,722 0.06 200,000 MPT Operating Partnership 3.692% 05/06/2028 GBP 299,097 0.05 230,000 Narragansett Electric 3.395% 09/04/2030 USD 259,141 0.04 417,000 New England Power 2.807% 06/10/2050 USD 408,143 0.07 317,000 Pioneer Natural Resources 2.15% 15/01/2031 USD 314,524 0.05 320,000 Plains All American Pipeline 3.8% 15/09/2030 USD 338,333 0.06 108,000 Roper Technologies 2% 30/06/2030 USD 108,892 0.02 266,000 Smithfield Foods 3% 15/10/2030 USD 277,361 0.05 34,000 Teachers Insurance & Annuity 6.85% 16/12/2039 USD 52,166 0.01 100,000 Time Warner Cable 5.25% 15/07/2042 GBP 189,462 0.03 250,000 T-Mobile USA 3.875% 15/04/2030 USD 282,590 0.05 264,000 United Airlines 5.875% 15/04/2029 USD 285,873 0.05 280,000 Upjohn 4% 22/06/2050 USD 313,219 0.05 166,000 Verizon Communications 2.65% 20/11/2040 USD 162,532 0.03 221,000 Verizon Communications 3% 20/11/2060 USD 212,463 0.04 224,000 Walt Disney 5.4% 01/10/2043 USD 315,238 0.05 62,000 Walt Disney 6.4% 15/12/2035 USD 93,915 0.02 320,000 Western Digital Corp 4.75% 15/02/2026 USD 355,107 0.06
The accompanying notes form an integral part of these financial statements.
44
Enfocus Software - Customer Support
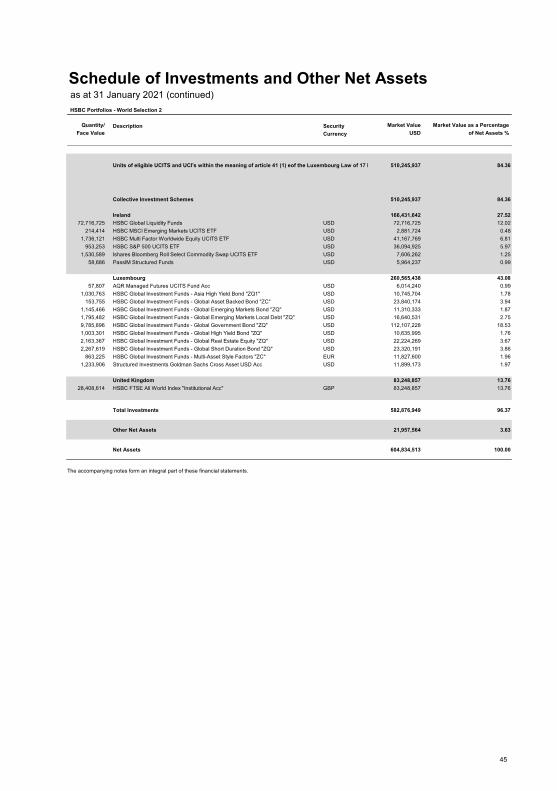
Schedule of Investments and Other Net Assets as at 31 January 2021 (continued) HSBC Portfolios - World Selection 2
Quantity/ Description Security Market Value Market Value as a Percentage Face Value Currency USD of Net Assets %
Units of eligible UCITS and UCI's within the meaning of article 41 (1) eof the Luxembourg Law of 17 D 510,245,937 84.36
Collective Investment Schemes 510,245,937 84.36
Ireland 166,431,642 27.52 72,716,725 HSBC Global Liquidity Funds USD 72,716,725 12.02 214,414 HSBC MSCI Emerging Markets UCITS ETF USD 2,881,724 0.48 1,736,121 HSBC Multi Factor Worldwide Equity UCITS ETF USD 41,167,769 6.81 953,253 HSBC S&P 500 UCITS ETF USD 36,094,925 5.97 1,530,589 Ishares Bloomberg Roll Select Commodity Swap UCITS ETF USD 7,606,262 1.25 58,686 PassIM Structured Funds USD 5,964,237 0.99
Luxembourg 260,565,438 43.08 57,807 AQR Managed Futures UCITS Fund Acc USD 6,014,240 0.99 1,030,763 HSBC Global Investment Funds - Asia High Yield Bond "ZQ1" USD 10,745,704 1.78 153,755 HSBC Global Investment Funds - Global Asset Backed Bond "ZC" USD 23,840,174 3.94 1,145,466 HSBC Global Investment Funds - Global Emerging Markets Bond "ZQ" USD 11,310,333 1.87 1,795,482 HSBC Global Investment Funds - Global Emerging Markets Local Debt "ZQ" USD 16,640,531 2.75 9,785,896 HSBC Global Investment Funds - Global Government Bond "ZQ" USD 112,107,228 18.53 1,003,301 HSBC Global Investment Funds - Global High Yield Bond "ZQ" USD 10,635,995 1.76 2,163,367 HSBC Global Investment Funds - Global Real Estate Equity "ZQ" USD 22,224,269 3.67 2,267,619 HSBC Global Investment Funds - Global Short Duration Bond "ZQ" USD 23,320,191 3.86 863,225 HSBC Global Investment Funds - Multi-Asset Style Factors "ZC" EUR 11,827,600 1.96 1,233,906 Structured Investments Goldman Sachs Cross Asset USD Acc USD 11,899,173 1.97
United Kingdom 83,248,857 13.76 28,408,614 HSBC FTSE All World Index "Institutional Acc" GBP 83,248,857 13.76
Total Investments 582,876,949 96.37
Other Net Assets 21,957,564 3.63
Net Assets 604,834,513 100.00
The accompanying notes form an integral part of these financial statements.
45
Enfocus Software - Customer Support
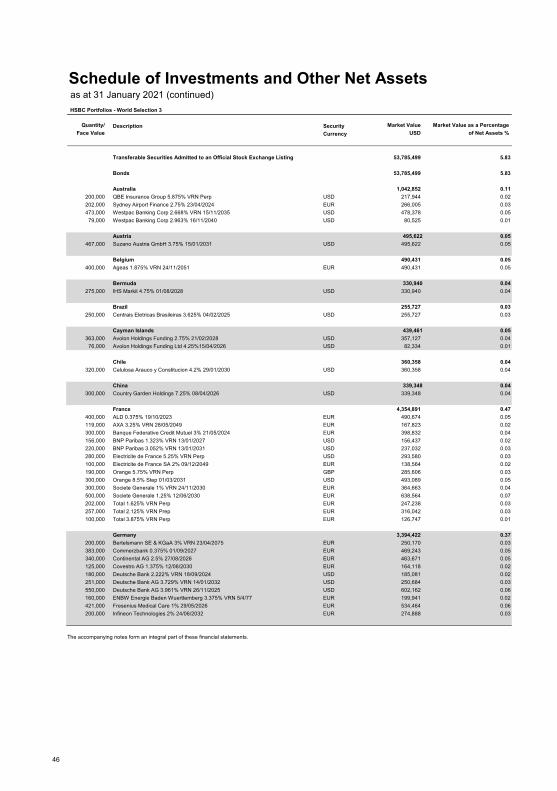
Schedule of Investments and Other Net Assets as at 31 January 2021 (continued) HSBC Portfolios - World Selection 3
Quantity/ Description Security Market Value Market Value as a Percentage Face Value Currency USD of Net Assets %
Transferable Securities Admitted to an Official Stock Exchange Listing 53,785,499 5.83
Bonds 53,785,499 5.83
Australia 1,042,852 0.11 200,000 QBE Insurance Group 5.875% VRN Perp USD 217,944 0.02 202,000 Sydney Airport Finance 2.75% 23/04/2024 EUR 266,005 0.03 473,000 Westpac Banking Corp 2.668% VRN 15/11/2035 USD 478,378 0.05 79,000 Westpac Banking Corp 2.963% 16/11/2040 USD 80,525 0.01
Austria 495,622 0.05 467,000 Suzano Austria GmbH 3.75% 15/01/2031 USD 495,622 0.05
Belgium 490,431 0.05 400,000 Ageas 1.875% VRN 24/11/2051 EUR 490,431 0.05
Bermuda 330,940 0.04 275,000 IHS Markit 4.75% 01/08/2028 USD 330,940 0.04
Brazil 255,727 0.03 250,000 Centrais Eletricas Brasileiras 3.625% 04/02/2025 USD 255,727 0.03
Cayman Islands 439,461 0.05 363,000 Avolon Holdings Funding 2.75% 21/02/2028 USD 357,127 0.04 76,000 Avolon Holdings Funding Ltd 4.25%15/04/2026 USD 82,334 0.01
Chile 360,358 0.04 320,000 Celulosa Arauco y Constitucion 4.2% 29/01/2030 USD 360,358 0.04
China 339,348 0.04 300,000 Country Garden Holdings 7.25% 08/04/2026 USD 339,348 0.04
France 4,354,891 0.47 400,000 ALD 0.375% 19/10/2023 EUR 490,674 0.05 119,000 AXA 3.25% VRN 28/05/2049 EUR 167,823 0.02 300,000 Banque Federative Credit Mutuel 3% 21/05/2024 EUR 398,832 0.04 156,000 BNP Paribas 1.323% VRN 13/01/2027 USD 156,437 0.02 220,000 BNP Paribas 3.052% VRN 13/01/2031 USD 237,032 0.03 280,000 Electricite de France 5.25% VRN Perp USD 293,580 0.03 100,000 Electricite de France SA 2% 09/12/2049 EUR 138,564 0.02 190,000 Orange 5.75% VRN Perp GBP 285,606 0.03 300,000 Orange 8.5% Step 01/03/2031 USD 493,089 0.05 300,000 Societe Generale 1% VRN 24/11/2030 EUR 364,663 0.04 500,000 Societe Generale 1.25% 12/06/2030 EUR 638,564 0.07 202,000 Total 1.625% VRN Perp EUR 247,238 0.03 257,000 Total 2.125% VRN Prep EUR 316,042 0.03 100,000 Total 3.875% VRN Perp EUR 126,747 0.01
Germany 3,394,422 0.37 200,000 Bertelsmann SE & KGaA 3% VRN 23/04/2075 EUR 250,170 0.03 383,000 Commerzbank 0.375% 01/09/2027 EUR 469,243 0.05 340,000 Continental AG 2.5% 27/08/2026 EUR 463,671 0.05 125,000 Covestro AG 1.375% 12/06/2030 EUR 164,118 0.02 180,000 Deutsche Bank 2.222% VRN 18/09/2024 USD 185,081 0.02 251,000 Deutsche Bank AG 3.729% VRN 14/01/2032 USD 250,684 0.03 550,000 Deutsche Bank AG 3.961% VRN 26/11/2025 USD 602,162 0.06 160,000 ENBW Energie Baden Wuerttemberg 3.375% VRN 5/4/77 EUR 199,941 0.02 421,000 Fresenius Medical Care 1% 29/05/2026 EUR 534,464 0.06 200,000 Infineon Technologies 2% 24/06/2032 EUR 274,888 0.03
The accompanying notes form an integral part of these financial statements.
46#
Enfocus Software - Customer Support
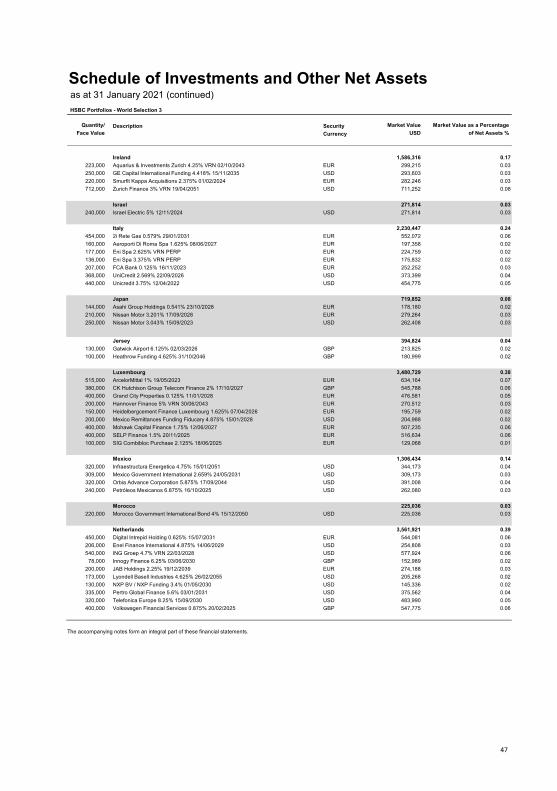
Schedule of Investments and Other Net Assets as at 31 January 2021 (continued) HSBC Portfolios - World Selection 3
Quantity/ Description Security Market Value Market Value as a Percentage Face Value Currency USD of Net Assets %
Ireland 1,586,316 0.17 223,000 Aquarius & Investments Zurich 4.25% VRN 02/10/2043 EUR 299,215 0.03 250,000 GE Capital International Funding 4.418% 15/11/2035 USD 293,603 0.03 220,000 Smurfit Kappa Acquisitions 2.375% 01/02/2024 EUR 282,246 0.03 712,000 Zurich Finance 3% VRN 19/04/2051 USD 711,252 0.08
Israel 271,814 0.03 240,000 Israel Electric 5% 12/11/2024 USD 271,814 0.03
Italy 2,230,447 0.24 454,000 2i Rete Gas 0.579% 29/01/2031 EUR 552,072 0.06 160,000 Aeroporti Di Roma Spa 1.625% 08/06/2027 EUR 197,358 0.02 177,000 Eni Spa 2.625% VRN PERP EUR 224,759 0.02 136,000 Eni Spa 3.375% VRN PERP EUR 175,832 0.02 207,000 FCA Bank 0.125% 16/11/2023 EUR 252,252 0.03 368,000 UniCredit 2.569% 22/09/2026 USD 373,399 0.04 440,000 Unicredit 3.75% 12/04/2022 USD 454,775 0.05
Japan 719,852 0.08 144,000 Asahi Group Holdings 0.541% 23/10/2028 EUR 178,180 0.02 210,000 Nissan Motor 3.201% 17/09/2028 EUR 279,264 0.03 250,000 Nissan Motor 3.043% 15/09/2023 USD 262,408 0.03
Jersey 394,824 0.04 130,000 Gatwick Airport 6.125% 02/03/2026 GBP 213,825 0.02 100,000 Heathrow Funding 4.625% 31/10/2046 GBP 180,999 0.02
Luxembourg 3,480,729 0.38 515,000 ArcelorMittal 1% 19/05/2023 EUR 634,164 0.07 380,000 CK Hutchison Group Telecom Finance 2% 17/10/2027 GBP 545,788 0.06 400,000 Grand City Properties 0.125% 11/01/2028 EUR 476,581 0.05 200,000 Hannover Finance 5% VRN 30/06/2043 EUR 270,512 0.03 150,000 Heidelbergcement Finance Luxembourg 1.625% 07/04/2026 EUR 195,759 0.02 200,000 Mexico Remittances Funding Fiducary 4.875% 15/01/2028 USD 204,988 0.02 400,000 Mohawk Capital Finance 1.75% 12/06/2027 EUR 507,235 0.06 400,000 SELP Finance 1.5% 20/11/2025 EUR 516,634 0.06 100,000 SIG Combibloc Purchase 2.125% 18/06/2025 EUR 129,068 0.01
Mexico 1,306,434 0.14 320,000 Infraestructura Energetica 4.75% 15/01/2051 USD 344,173 0.04 309,000 Mexico Government International 2.659% 24/05/2031 USD 309,173 0.03 320,000 Orbia Advance Corporation 5.875% 17/09/2044 USD 391,008 0.04 240,000 Petróleos Mexicanos 6.875% 16/10/2025 USD 262,080 0.03
Morocco 225,036 0.03 220,000 Morocco Government International Bond 4% 15/12/2050 USD 225,036 0.03
Netherlands 3,561,921 0.39 450,000 Digital Intrepid Holding 0.625% 15/07/2031 EUR 544,081 0.06 206,000 Enel Finance International 4.875% 14/06/2029 USD 254,808 0.03 540,000 ING Groep 4.7% VRN 22/03/2028 USD 577,924 0.06 78,000 Innogy Finance 6.25% 03/06/2030 GBP 152,989 0.02 200,000 JAB Holdings 2.25% 19/12/2039 EUR 274,188 0.03 173,000 Lyondell Basell Industries 4.625% 26/02/2055 USD 205,268 0.02 130,000 NXP BV / NXP Funding 3.4% 01/05/2030 USD 145,336 0.02 335,000 Pertro Global Finance 5.6% 03/01/2031 USD 375,562 0.04 320,000 Telefonica Europe 8.25% 15/09/2030 USD 483,990 0.05 400,000 Volkswagen Financial Services 0.875% 20/02/2025 GBP 547,775 0.06
The accompanying notes form an integral part of these financial statements.
47
Enfocus Software - Customer Support
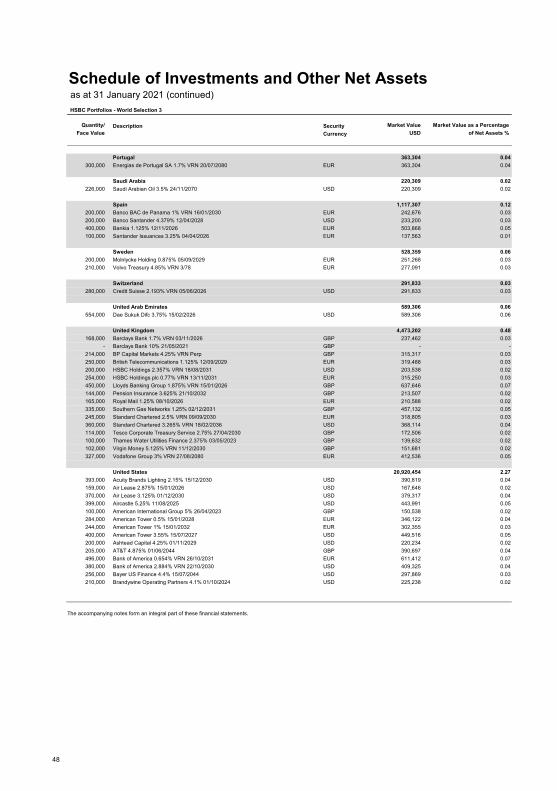
Schedule of Investments and Other Net Assets as at 31 January 2021 (continued) HSBC Portfolios - World Selection 3
Quantity/ Description Security Market Value Market Value as a Percentage Face Value Currency USD of Net Assets %
Portugal 363,304 0.04 300,000 Energias de Portugal SA 1.7% VRN 20/07/2080 EUR 363,304 0.04
Saudi Arabia 220,309 0.02 226,000 Saudi Arabian Oil 3.5% 24/11/2070 USD 220,309 0.02
Spain 1,117,307 0.12 200,000 Banco BAC de Panama 1% VRN 16/01/2030 EUR 242,676 0.03 200,000 Banco Santander 4.379% 12/04/2028 USD 233,200 0.03 400,000 Bankia 1.125% 12/11/2026 EUR 503,868 0.05 100,000 Santander Issuances 3.25% 04/04/2026 EUR 137,563 0.01
Sweden 528,359 0.06 200,000 Molnlycke Holding 0.875% 05/09/2029 EUR 251,268 0.03 210,000 Volvo Treasury 4.85% VRN 3/78 EUR 277,091 0.03
Switzerland 291,833 0.03 280,000 Credit Suisse 2.193% VRN 05/06/2026 USD 291,833 0.03
United Arab Emirates 589,306 0.06 554,000 Dae Sukuk Difc 3.75% 15/02/2026 USD 589,306 0.06
United Kingdom 4,473,202 0.48 168,000 Barclays Bank 1.7% VRN 03/11/2026 GBP 237,462 0.03 - Barclays Bank 10% 21/05/2021 GBP - - 214,000 BP Capital Markets 4.25% VRN Perp GBP 315,317 0.03 250,000 British Telecommunications 1.125% 12/09/2029 EUR 319,488 0.03 200,000 HSBC Holdings 2.357% VRN 18/08/2031 USD 203,538 0.02 254,000 HSBC Holdings plc 0.77% VRN 13/11/2031 EUR 315,250 0.03 450,000 Lloyds Banking Group 1.875% VRN 15/01/2026 GBP 637,646 0.07 144,000 Pension Insurance 3.625% 21/10/2032 GBP 213,507 0.02 165,000 Royal Mail 1.25% 08/10/2026 EUR 210,588 0.02 335,000 Southern Gas Networks 1.25% 02/12/2031 GBP 457,132 0.05 245,000 Standard Chartered 2.5% VRN 09/09/2030 EUR 318,805 0.03 360,000 Standard Chartered 3.265% VRN 18/02/2036 USD 368,114 0.04 114,000 Tesco Corporate Treasury Service 2.75% 27/04/2030 GBP 172,506 0.02 100,000 Thames Water Utilities Finance 2.375% 03/05/2023 GBP 139,632 0.02 102,000 Virgin Money 5.125% VRN 11/12/2030 GBP 151,681 0.02 327,000 Vodafone Group 3% VRN 27/08/2080 EUR 412,536 0.05
United States 20,920,454 2.27 393,000 Acuity Brands Lighting 2.15% 15/12/2030 USD 390,819 0.04 159,000 Air Lease 2.875% 15/01/2026 USD 167,646 0.02 370,000 Air Lease 3.125% 01/12/2030 USD 379,317 0.04 399,000 Aircastle 5.25% 11/08/2025 USD 443,991 0.05 100,000 American International Group 5% 26/04/2023 GBP 150,538 0.02 284,000 American Tower 0.5% 15/01/2028 EUR 346,122 0.04 244,000 American Tower 1% 15/01/2032 EUR 302,355 0.03 400,000 American Tower 3.55% 15/07/2027 USD 449,516 0.05 200,000 Ashtead Capital 4.25% 01/11/2029 USD 220,234 0.02 205,000 AT&T 4.875% 01/06/2044 GBP 390,697 0.04 496,000 Bank of America 0.654% VRN 26/10/2031 EUR 611,412 0.07 380,000 Bank of America 2.884% VRN 22/10/2030 USD 409,325 0.04 256,000 Bayer US Finance 4.4% 15/07/2044 USD 297,869 0.03 210,000 Brandywine Operating Partners 4.1% 01/10/2024 USD 225,238 0.02
The accompanying notes form an integral part of these financial statements.
48#
Enfocus Software - Customer Support

Schedule of Investments and Other Net Assets as at 31 January 2021 (continued) HSBC Portfolios - World Selection 3
Quantity/ Description Security Market Value Market Value as a Percentage Face Value Currency USD of Net Assets %
United States (continued) 145,000 Broadcom 1.95% 15/02/2028 USD 145,531 0.02 75,000 Broadcom 3.75% 15/02/2051 USD 76,852 0.01 170,000 Broadcom 4.7% 15/04/2025 USD 193,825 0.02 260,000 Broadcom 5% 15/04/2030 USD 310,008 0.03 290,000 Capital One Financial 1.65% 12/06/2029 EUR 379,111 0.04 310,000 Centene 3.375% 15/02/2030 USD 325,388 0.03 150,000 Charter Communications Operating 3.85% 01/04/2061 USD 144,283 0.02 250,000 Citigroup Inc 2.976% VRN 05/11/2030 USD 270,055 0.03 190,000 Citigroup Inc 4.75% 18/05/2046 USD 246,419 0.03 84,000 Citigroup Inc 8.125% 15/07/2039 USD 145,533 0.02 150,000 Citrix Systems 3.3% 01/03/2030 USD 161,682 0.02 140,000 Continental Resources 5.75% 15/01/2031 USD 152,348 0.02 125,000 Cox Communications 2.95% 01/10/2050 USD 122,975 0.01 114,000 Cox Communications 1.8% 01/10/2030 USD 111,886 0.01 320,000 Crown Castle International 2.25% 15/01/2031 USD 325,418 0.04 308,000 CSX 4.5% 01/08/2054 USD 399,636 0.04 390,000 CVS Health Corp 3.75% 01/04/2030 USD 448,071 0.05 63,000 CVS Health Corp 4.78% 25/03/2038 USD 78,014 0.01 700,000 Dell International 4.9% 01/10/2026 USD 817,271 0.09 150,000 Dell International 5.85% 15/07/2025 USD 178,363 0.02 160,000 Dell International 6.1% 15/07/2027 USD 198,072 0.02 171,765 Delta Air Lines 4.75% 20/10/2028 USD 190,405 0.02 350,000 Discovery Communications 1.9% 19/03/2027 EUR 459,428 0.05 250,000 Dow Chemical 3.6% 15/11/2050 USD 268,973 0.03 71,000 Duke Energy Pogress 4.15% 01/12/2044 USD 87,488 0.01 80,000 DuPont de Nemours 2.169% 01/05/2023 USD 80,614 0.01 250,000 Eastman Chemical 4.5% 01/12/2028 USD 299,518 0.03 110,000 Energy Transfer Partners LP 5.3% 15/04/2047 USD 116,145 0.01 120,000 Enterprise Products Operating 3.2% 15/02/2052 USD 116,069 0.01 100,000 Enterprise Products Operating 4.85% 15/03/2044 USD 121,713 0.01 560,000 First Horizon National 3.55% 26/05/2023 USD 594,530 0.06 395,000 Ford Motor Credit 2.748% 14/06/2024 GBP 542,495 0.06 700,000 General Motors 2.35% 08/01/2031 USD 696,185 0.08 155,000 General Motors 6.25% 02/10/2043 USD 210,819 0.02 547,000 Glencore Funding 2.5% 01/09/2030 USD 552,979 0.06 420,000 Global Payments 2.9% 15/05/2030 USD 450,320 0.05 190,000 Goldman Sachs 4.75% 21/10/2045 USD 253,682 0.03 515,000 Healthcare Trust of America 2% 15/03/2031 USD 510,463 0.06 1,009,000 Hyundai Capital A 1.8% 10/01/2028 USD 1,005,004 0.11 80,000 Kinder Morgan 5.05% 15/02/2046 USD 95,356 0.01 184,000 KLA Tencor 5% 15/03/2049 USD 254,638 0.03 125,000 Liberty Mutual Group 3.951% 15/10/2050 USD 146,204 0.02 107,000 Lowe's Companies 4.25% 15/09/2044 USD 126,371 0.01 100,000 Mass Mutual Life Insurance 4.9% 01/04/2077 USD 133,919 0.01 450,000 Mileage Plus Holdings 6.5% 20/06/2027 USD 493,110 0.05 262,000 MPLX 2.65% 15/08/2030 USD 267,916 0.03 150,000 MPT Operating Partnership 3.692% 05/06/2028 GBP 224,323 0.02 90,000 Narragansett Electric 3.395% 09/04/2030 USD 101,403 0.01 234,000 Pioneer Natural Resources 2.15% 15/01/2031 USD 232,172 0.02 244,000 Plains All American Pipeline 3.8% 15/09/2030 USD 257,979 0.03 204,000 Smithfield Foods 3% 15/10/2030 USD 212,713 0.02 34,000 Teachers Insurance & Annuity 6.85% 16/12/2039 USD 52,166 0.01 100,000 Time Warner Cable 5.25% 15/07/2042 GBP 189,462 0.02 150,000 T-Mobile USA 3.875% 15/04/2030 USD 169,554 0.02 158,000 United Airlines 5.875% 15/04/2029 USD 171,091 0.02 230,000 Upjohn 4% 22/06/2050 USD 257,287 0.03 152,000 Verizon Communications 2.65% 20/11/2040 USD 148,825 0.02 203,000 Verizon Communications 3% 20/11/2060 USD 195,158 0.02 250,000 Walt Disney 5.4% 01/10/2043 USD 351,827 0.04 240,000 Western Digital Corp 4.75% 15/02/2026 USD 266,330 0.03
The accompanying notes form an integral part of these financial statements.
49
Enfocus Software - Customer Support
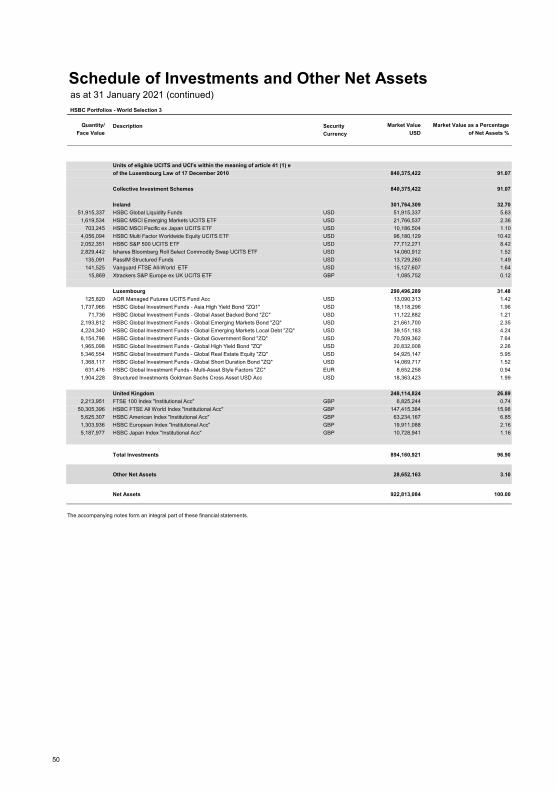
Schedule of Investments and Other Net Assets as at 31 January 2021 (continued) HSBC Portfolios - World Selection 3
Quantity/ Description Security Market Value Market Value as a Percentage Face Value Currency USD of Net Assets %
Units of eligible UCITS and UCI's within the meaning of article 41 (1) eof the Luxembourg Law of 17 December 2010 840,375,422 91.07
Collective Investment Schemes 840,375,422 91.07
Ireland 301,764,309 32.70 51,915,337 HSBC Global Liquidity Funds USD 51,915,337 5.63 1,619,534 HSBC MSCI Emerging Markets UCITS ETF USD 21,766,537 2.36 703,245 HSBC MSCI Pacific ex Japan UCITS ETF USD 10,186,504 1.10 4,056,094 HSBC Multi Factor Worldwide Equity UCITS ETF USD 96,180,129 10.42 2,052,351 HSBC S&P 500 UCITS ETF USD 77,712,271 8.42 2,829,442 Ishares Bloomberg Roll Select Commodity Swap UCITS ETF USD 14,060,912 1.52 135,091 PassIM Structured Funds USD 13,729,260 1.49 141,525 Vanguard FTSE All-World ETF USD 15,127,607 1.64 15,869 Xtrackers S&P Europe ex UK UCITS ETF GBP 1,085,752 0.12
Luxembourg 290,496,289 31.48 125,820 AQR Managed Futures UCITS Fund Acc USD 13,090,313 1.42 1,737,966 HSBC Global Investment Funds - Asia High Yield Bond "ZQ1" USD 18,118,296 1.96 71,736 HSBC Global Investment Funds - Global Asset Backed Bond "ZC" USD 11,122,882 1.21 2,193,812 HSBC Global Investment Funds - Global Emerging Markets Bond "ZQ" USD 21,661,700 2.35 4,224,340 HSBC Global Investment Funds - Global Emerging Markets Local Debt "ZQ" USD 39,151,183 4.24 6,154,798 HSBC Global Investment Funds - Global Government Bond "ZQ" USD 70,509,362 7.64 1,965,098 HSBC Global Investment Funds - Global High Yield Bond "ZQ" USD 20,832,008 2.26 5,346,554 HSBC Global Investment Funds - Global Real Estate Equity "ZQ" USD 54,925,147 5.95 1,368,117 HSBC Global Investment Funds - Global Short Duration Bond "ZQ" USD 14,069,717 1.52 631,476 HSBC Global Investment Funds - Multi-Asset Style Factors "ZC" EUR 8,652,258 0.94 1,904,228 Structured Investments Goldman Sachs Cross Asset USD Acc USD 18,363,423 1.99
United Kingdom 248,114,824 26.89 2,213,951 FTSE 100 Index "Institutional Acc" GBP 6,825,244 0.74 50,305,396 HSBC FTSE All World Index "Institutional Acc" GBP 147,415,384 15.98 5,625,307 HSBC American Index "Institutional Acc" GBP 63,234,167 6.85 1,303,936 HSBC European Index "Institutional Acc" GBP 19,911,088 2.16 5,187,977 HSBC Japan Index "Institutional Acc" GBP 10,728,941 1.16
Total Investments 894,160,921 96.90
Other Net Assets 28,652,163 3.10
Net Assets 922,813,084 100.00
The accompanying notes form an integral part of these financial statements.
50#
Enfocus Software - Customer Support
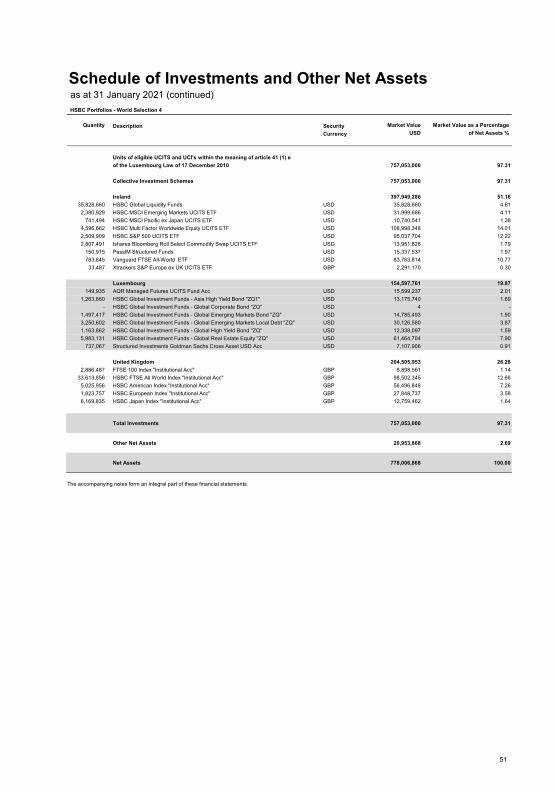
Schedule of Investments and Other Net Assets as at 31 January 2021 (continued) HSBC Portfolios - World Selection 4
Quantity Description Security Market Value Market Value as a Percentage Currency USD of Net Assets %
Units of eligible UCITS and UCI's within the meaning of article 41 (1) eof the Luxembourg Law of 17 December 2010 757,053,000 97.31
Collective Investment Schemes 757,053,000 97.31
Ireland 397,949,286 51.16 35,828,660 HSBC Global Liquidity Funds USD 35,828,660 4.61 2,380,929 HSBC MSCI Emerging Markets UCITS ETF USD 31,999,686 4.11 741,494 HSBC MSCI Pacific ex Japan UCITS ETF USD 10,740,541 1.38 4,596,662 HSBC Multi Factor Worldwide Equity UCITS ETF USD 108,998,348 14.01 2,509,909 HSBC S&P 500 UCITS ETF USD 95,037,704 12.22 2,807,491 Ishares Bloomberg Roll Select Commodity Swap UCITS ETF USD 13,951,826 1.79 150,915 PassIM Structured Funds USD 15,337,537 1.97 783,645 Vanguard FTSE All-World ETF USD 83,763,814 10.77 33,487 Xtrackers S&P Europe ex UK UCITS ETF GBP 2,291,170 0.30
Luxembourg 154,597,761 19.87 149,935 AQR Managed Futures UCITS Fund Acc USD 15,599,237 2.01 1,263,860 HSBC Global Investment Funds - Asia High Yield Bond "ZQ1" USD 13,175,740 1.69 - HSBC Global Investment Funds - Global Corporate Bond "ZQ" USD 4 - 1,497,417 HSBC Global Investment Funds - Global Emerging Markets Bond "ZQ" USD 14,785,493 1.90 3,250,602 HSBC Global Investment Funds - Global Emerging Markets Local Debt "ZQ" USD 30,126,580 3.87 1,163,862 HSBC Global Investment Funds - Global High Yield Bond "ZQ" USD 12,338,097 1.59 5,983,131 HSBC Global Investment Funds - Global Real Estate Equity "ZQ" USD 61,464,704 7.90 737,067 Structured Investments Goldman Sachs Cross Asset USD Acc USD 7,107,906 0.91
United Kingdom 204,505,953 26.28 2,886,487 FTSE 100 Index "Institutional Acc" GBP 8,898,561 1.14 33,613,856 HSBC FTSE All World Index "Institutional Acc" GBP 98,502,345 12.66 5,025,956 HSBC American Index "Institutional Acc" GBP 56,496,848 7.26 1,823,757 HSBC European Index "Institutional Acc" GBP 27,848,737 3.58 6,169,835 HSBC Japan Index "Institutional Acc" GBP 12,759,462 1.64
Total Investments 757,053,000 97.31
Other Net Assets 20,953,868 2.69
Net Assets 778,006,868 100.00
The accompanying notes form an integral part of these financial statements.
51
Enfocus Software - Customer Support
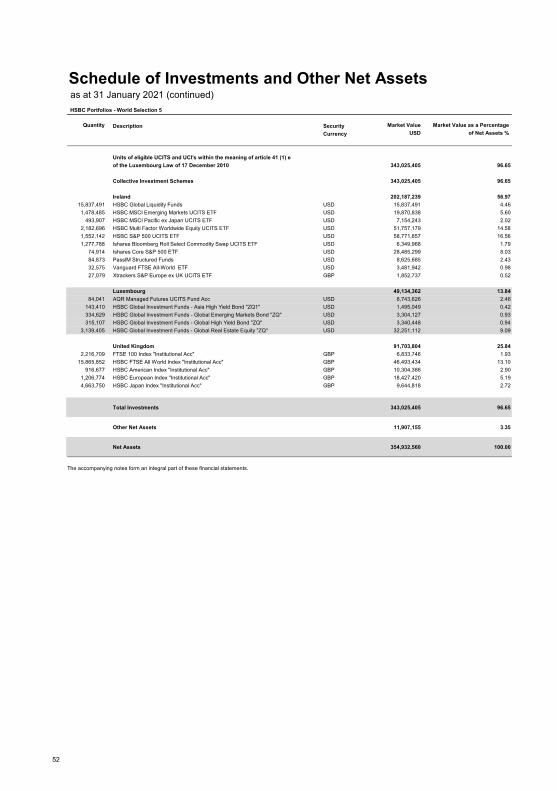
Schedule of Investments and Other Net Assets as at 31 January 2021 (continued) HSBC Portfolios - World Selection 5
Quantity Description Security Market Value Market Value as a Percentage Currency USD of Net Assets %
Units of eligible UCITS and UCI's within the meaning of article 41 (1) eof the Luxembourg Law of 17 December 2010 343,025,405 96.65
Collective Investment Schemes 343,025,405 96.65
Ireland 202,187,239 56.97 15,837,491 HSBC Global Liquidity Funds USD 15,837,491 4.46 1,478,485 HSBC MSCI Emerging Markets UCITS ETF USD 19,870,838 5.60 493,907 HSBC MSCI Pacific ex Japan UCITS ETF USD 7,154,243 2.02 2,182,696 HSBC Multi Factor Worldwide Equity UCITS ETF USD 51,757,179 14.58 1,552,142 HSBC S&P 500 UCITS ETF USD 58,771,857 16.56 1,277,788 Ishares Bloomberg Roll Select Commodity Swap UCITS ETF USD 6,349,968 1.79 74,914 Ishares Core S&P 500 ETF USD 28,485,299 8.03 84,873 PassIM Structured Funds USD 8,625,685 2.43 32,575 Vanguard FTSE All-World ETF USD 3,481,942 0.98 27,079 Xtrackers S&P Europe ex UK UCITS ETF GBP 1,852,737 0.52
Luxembourg 49,134,362 13.84 84,041 AQR Managed Futures UCITS Fund Acc USD 8,743,626 2.46 143,410 HSBC Global Investment Funds - Asia High Yield Bond "ZQ1" USD 1,495,049 0.42 334,629 HSBC Global Investment Funds - Global Emerging Markets Bond "ZQ" USD 3,304,127 0.93 315,107 HSBC Global Investment Funds - Global High Yield Bond "ZQ" USD 3,340,448 0.94 3,139,405 HSBC Global Investment Funds - Global Real Estate Equity "ZQ" USD 32,251,112 9.09
United Kingdom 91,703,804 25.84 2,216,709 FTSE 100 Index "Institutional Acc" GBP 6,833,746 1.93 15,865,852 HSBC FTSE All World Index "Institutional Acc" GBP 46,493,434 13.10 916,677 HSBC American Index "Institutional Acc" GBP 10,304,386 2.90 1,206,774 HSBC European Index "Institutional Acc" GBP 18,427,420 5.19 4,663,750 HSBC Japan Index "Institutional Acc" GBP 9,644,818 2.72
Total Investments 343,025,405 96.65
Other Net Assets 11,907,155 3.35
Net Assets 354,932,560 100.00
The accompanying notes form an integral part of these financial statements.
52
Enfocus Software - Customer Support
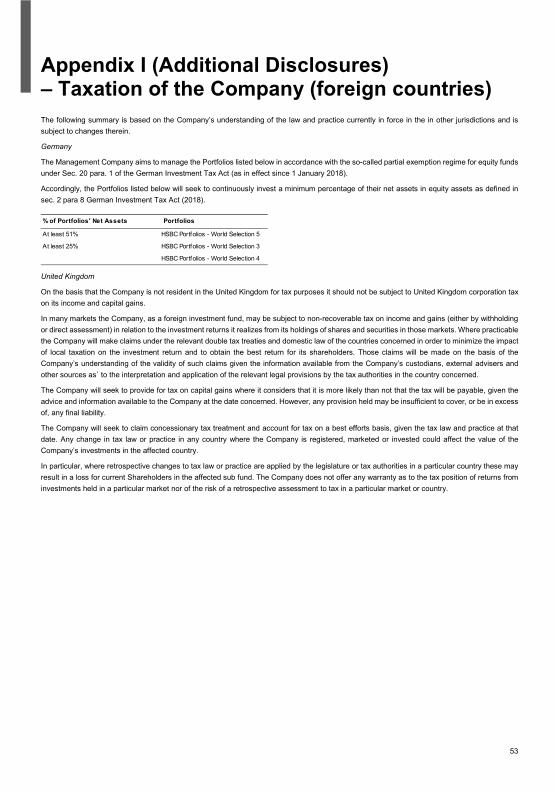
53
Appendix I (Additional Disclosures) – Taxation of the Company (foreign countries) The following summary is based on the Company’s understanding of the law and practice currently in force in the in other jurisdictions and is subject to changes therein.
Germany
The Management Company aims to manage the Portfolios listed below in accordance with the so-called partial exemption regime for equity funds under Sec. 20 para. 1 of the German Investment Tax Act (as in effect since 1 January 2018).
Accordingly, the Portfolios listed below will seek to continuously invest a minimum percentage of their net assets in equity assets as defined in sec. 2 para 8 German Investment Tax Act (2018).
United Kingdom
On the basis that the Company is not resident in the United Kingdom for tax purposes it should not be subject to United Kingdom corporation tax on its income and capital gains.
In many markets the Company, as a foreign investment fund, may be subject to non-recoverable tax on income and gains (either by withholding or direct assessment) in relation to the investment returns it realizes from its holdings of shares and securities in those markets. Where practicable the Company will make claims under the relevant double tax treaties and domestic law of the countries concerned in order to minimize the impact of local taxation on the investment return and to obtain the best return for its shareholders. Those claims will be made on the basis of the Company’s understanding of the validity of such claims given the information available from the Company’s custodians, external advisers and other sources as` to the interpretation and application of the relevant legal provisions by the tax authorities in the country concerned.
The Company will seek to provide for tax on capital gains where it considers that it is more likely than not that the tax will be payable, given the advice and information available to the Company at the date concerned. However, any provision held may be insufficient to cover, or be in excess of, any final liability.
The Company will seek to claim concessionary tax treatment and account for tax on a best efforts basis, given the tax law and practice at that date. Any change in tax law or practice in any country where the Company is registered, marketed or invested could affect the value of the Company’s investments in the affected country.
In particular, where retrospective changes to tax law or practice are applied by the legislature or tax authorities in a particular country these may result in a loss for current Shareholders in the affected sub fund. The Company does not offer any warranty as to the tax position of returns from investments held in a particular market nor of the risk of a retrospective assessment to tax in a particular market or country.
% of Portfolios' Net Assets Portfolios
At least 51% HSBC Portfolios - World Selection 5
At least 25% HSBC Portfolios - World Selection 3
HSBC Portfolios - World Selection 4
Enfocus Software - Customer Support
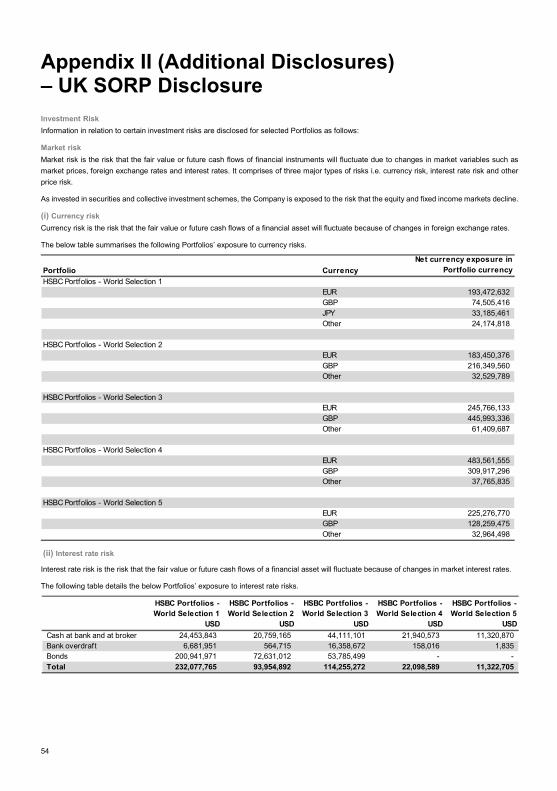
54
Appendix II (Additional Disclosures) – UK SORP Disclosure Investment Risk Information in relation to certain investment risks are disclosed for selected Portfolios as follows:
Market riskMarket risk is the risk that the fair value or future cash flows of financial instruments will fluctuate due to changes in market variables such as market prices, foreign exchange rates and interest rates. It comprises of three major types of risks i.e. currency risk, interest rate risk and other price risk.
As invested in securities and collective investment schemes, the Company is exposed to the risk that the equity and fixed income markets decline.
(i) Currency riskCurrency risk is the risk that the fair value or future cash flows of a financial asset will fluctuate because of changes in foreign exchange rates.
The below table summarises the following Portfolios’ exposure to currency risks.
(ii) Interest rate risk
Interest rate risk is the risk that the fair value or future cash flows of a financial asset will fluctuate because of changes in market interest rates.
The following table details the below Portfolios’ exposure to interest rate risks.
Portfolio CurrencyNet currency exposure in
Portfolio currencyHSBC Portfolios - World Selection 1
EUR 193,472,632GBP 74,505,416JPY 33,185,461Other 24,174,818
HSBC Portfolios - World Selection 2EUR 183,450,376GBP 216,349,560Other 32,529,789
HSBC Portfolios - World Selection 3EUR 245,766,133GBP 445,993,336Other 61,409,687
HSBC Portfolios - World Selection 4EUR 483,561,555GBP 309,917,296Other 37,765,835
HSBC Portfolios - World Selection 5EUR 225,276,770GBP 128,259,475Other 32,964,498
HSBC Portfolios - World Selection 1
USD
HSBC Portfolios - World Selection 2
USD
HSBC Portfolios - World Selection 3
USD
HSBC Portfolios - World Selection 4
USD
HSBC Portfolios - World Selection 5
USD Cash at bank and at broker 24,453,843 20,759,165 44,111,101 21,940,573 11,320,870Bank overdraft 6,681,951 564,715 16,358,672 158,016 1,835Bonds 200,941,971 72,631,012 53,785,499 - -Total 232,077,765 93,954,892 114,255,272 22,098,589 11,322,705
Enfocus Software - Customer Support
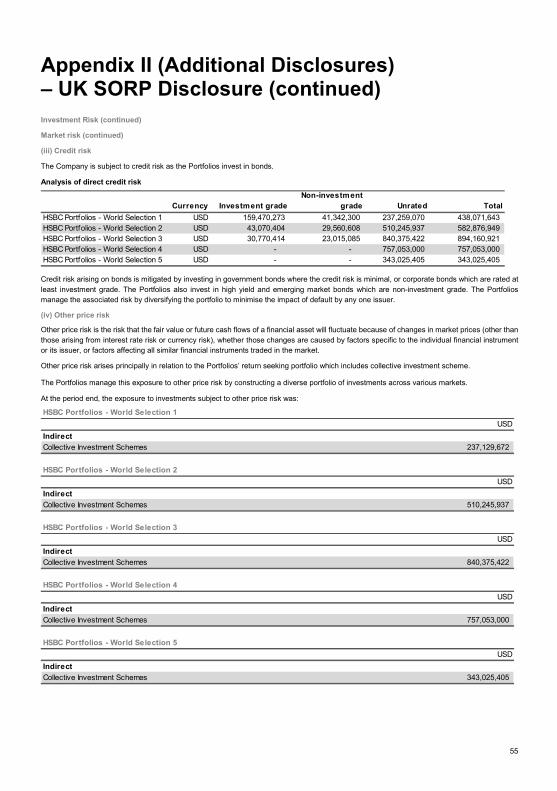
55
Appendix II (Additional Disclosures) – UK SORP Disclosure (continued) Investment Risk (continued)
Market risk (continued)
(iii) Credit risk
The Company is subject to credit risk as the Portfolios invest in bonds.
Analysis of direct credit risk
Credit risk arising on bonds is mitigated by investing in government bonds where the credit risk is minimal, or corporate bonds which are rated at least investment grade. The Portfolios also invest in high yield and emerging market bonds which are non-investment grade. The Portfolios manage the associated risk by diversifying the portfolio to minimise the impact of default by any one issuer.
(iv) Other price risk
Other price risk is the risk that the fair value or future cash flows of a financial asset will fluctuate because of changes in market prices (other than those arising from interest rate risk or currency risk), whether those changes are caused by factors specific to the individual financial instrument or its issuer, or factors affecting all similar financial instruments traded in the market.
Other price risk arises principally in relation to the Portfolios’ return seeking portfolio which includes collective investment scheme.
The Portfolios manage this exposure to other price risk by constructing a diverse portfolio of investments across various markets.
At the period end, the exposure to investments subject to other price risk was:
Currency Investment gradeNon-investment
grade Unrated TotalHSBC Portfolios - World Selection 1 USD 159,470,273 41,342,300 237,259,070 438,071,643HSBC Portfolios - World Selection 2 USD 43,070,404 29,560,608 510,245,937 582,876,949HSBC Portfolios - World Selection 3 USD 30,770,414 23,015,085 840,375,422 894,160,921HSBC Portfolios - World Selection 4 USD - - 757,053,000 757,053,000HSBC Portfolios - World Selection 5 USD - - 343,025,405 343,025,405
HSBC Portfolios - World Selection 1USD
IndirectCollective Investment Schemes 237,129,672
HSBC Portfolios - World Selection 2USD
IndirectCollective Investment Schemes 510,245,937
HSBC Portfolios - World Selection 3USD
IndirectCollective Investment Schemes 840,375,422
HSBC Portfolios - World Selection 4USD
IndirectCollective Investment Schemes 757,053,000
HSBC Portfolios - World Selection 5USD
IndirectCollective Investment Schemes 343,025,405
Enfocus Software - Customer Support
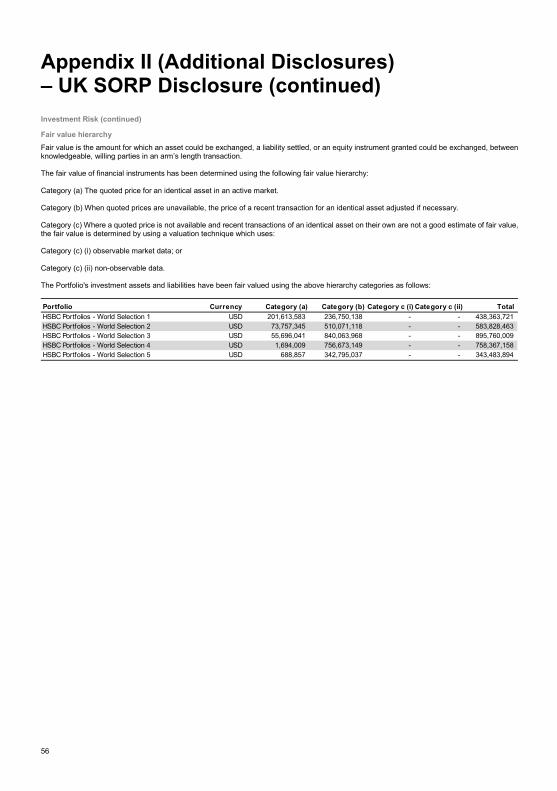
56
Appendix II (Additional Disclosures) – UK SORP Disclosure (continued) Investment Risk (continued)
Fair value hierarchyFair value is the amount for which an asset could be exchanged, a liability settled, or an equity instrument granted could be exchanged, between knowledgeable, willing parties in an arm’s length transaction.
The fair value of financial instruments has been determined using the following fair value hierarchy:
Category (a) The quoted price for an identical asset in an active market.
Category (b) When quoted prices are unavailable, the price of a recent transaction for an identical asset adjusted if necessary.
Category (c) Where a quoted price is not available and recent transactions of an identical asset on their own are not a good estimate of fair value, the fair value is determined by using a valuation technique which uses:
Category (c) (i) observable market data; or
Category (c) (ii) non-observable data.
The Portfolio's investment assets and liabilities have been fair valued using the above hierarchy categories as follows:
Portfolio Currency Category (a) Category (b) Category c (i) Category c (ii) Total HSBC Portfolios - World Selection 1 USD 201,613,583 236,750,138 - - 438,363,721HSBC Portfolios - World Selection 2 USD 73,757,345 510,071,118 - - 583,828,463HSBC Portfolios - World Selection 3 USD 55,696,041 840,063,968 - - 895,760,009HSBC Portfolios - World Selection 4 USD 1,694,009 756,673,149 - - 758,367,158HSBC Portfolios - World Selection 5 USD 688,857 342,795,037 - - 343,483,894
Enfocus Software - Customer Support
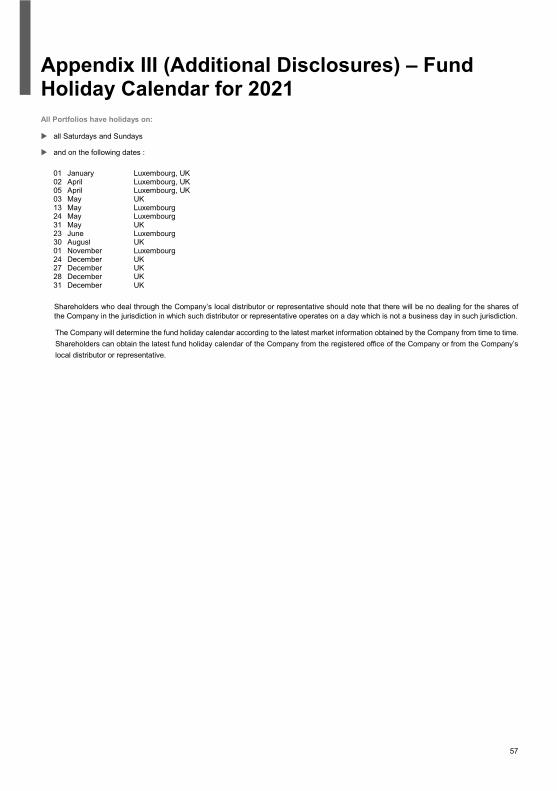
57
Appendix III (Additional Disclosures) – Fund Holiday Calendar for 2021 All Portfolios have holidays on:
all Saturdays and Sundays
and on the following dates :
01 January Luxembourg, UK 02 April Luxembourg, UK 05 April Luxembourg, UK 03 May UK 13 May Luxembourg 24 May Luxembourg 31 May UK 23 June Luxembourg 30 August UK 01 November Luxembourg 24 December UK 27 December UK 28 December UK 31 December UK
Shareholders who deal through the Company’s local distributor or representative should note that there will be no dealing for the shares of the Company in the jurisdiction in which such distributor or representative operates on a day which is not a business day in such jurisdiction.
The Company will determine the fund holiday calendar according to the latest market information obtained by the Company from time to time. Shareholders can obtain the latest fund holiday calendar of the Company from the registered office of the Company or from the Company’s local distributor or representative.
Enfocus Software - Customer Support
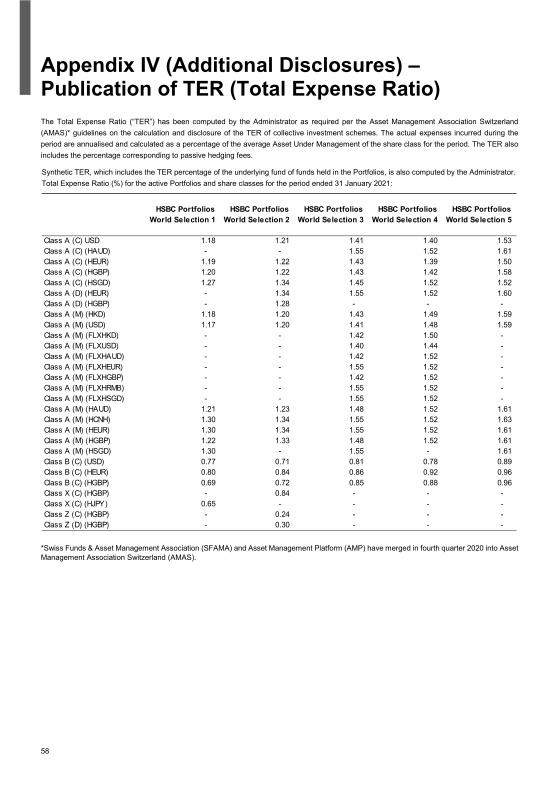
58
Appendix IV (Additional Disclosures) – Publication of TER (Total Expense Ratio) The Total Expense Ratio (“TER”) has been computed by the Administrator as required per the Asset Management Association Switzerland (AMAS)* guidelines on the calculation and disclosure of the TER of collective investment schemes. The actual expenses incurred during the period are annualised and calculated as a percentage of the average Asset Under Management of the share class for the period. The TER also includes the percentage corresponding to passive hedging fees.
Synthetic TER, which includes the TER percentage of the underlying fund of funds held in the Portfolios, is also computed by the Administrator. Total Expense Ratio (%) for the active Portfolios and share classes for the period ended 31 January 2021:
*Swiss Funds & Asset Management Association (SFAMA) and Asset Management Platform (AMP) have merged in fourth quarter 2020 into Asset Management Association Switzerland (AMAS).
HSBC Portfolios HSBC Portfolios HSBC Portfolios HSBC Portfolios HSBC PortfoliosWorld Selection 1 World Selection 2 World Selection 3 World Selection 4 World Selection 5
Class A (C) USD 1.18 1.21 1.41 1.40 1.53Class A (C) (HAUD) - - 1.55 1.52 1.61Class A (C) (HEUR) 1.19 1.22 1.43 1.39 1.50Class A (C) (HGBP) 1.20 1.22 1.43 1.42 1.58Class A (C) (HSGD) 1.27 1.34 1.45 1.52 1.52Class A (D) (HEUR) - 1.34 1.55 1.52 1.60Class A (D) (HGBP) - 1.28 - - -Class A (M) (HKD) 1.18 1.20 1.43 1.49 1.59Class A (M) (USD) 1.17 1.20 1.41 1.48 1.59Class A (M) (FLXHKD) - - 1.42 1.50 -Class A (M) (FLXUSD) - - 1.40 1.44 -Class A (M) (FLXHAUD) - - 1.42 1.52 -Class A (M) (FLXHEUR) - - 1.55 1.52 -Class A (M) (FLXHGBP) - - 1.42 1.52 -Class A (M) (FLXHRMB) - - 1.55 1.52 -Class A (M) (FLXHSGD) - - 1.55 1.52 -Class A (M) (HAUD) 1.21 1.23 1.48 1.52 1.61Class A (M) (HCNH) 1.30 1.34 1.55 1.52 1.63Class A (M) (HEUR) 1.30 1.34 1.55 1.52 1.61Class A (M) (HGBP) 1.22 1.33 1.48 1.52 1.61Class A (M) (HSGD) 1.30 - 1.55 - 1.61Class B (C) (USD) 0.77 0.71 0.81 0.78 0.89Class B (C) (HEUR) 0.80 0.84 0.86 0.92 0.96Class B (C) (HGBP) 0.69 0.72 0.85 0.88 0.96Class X (C) (HGBP) - 0.84 - - -Class X (C) (HJPY) 0.65 - - - -Class Z (C) (HGBP) - 0.24 - - -Class Z (D) (HGBP) - 0.30 - - -
Enfocus Software - Customer Support

59
Appendix V (Additional Disclosures) – Securities Financing Transactions Regulation (“SFTR”) As of the date of this semi-annual report, no Portfolio currently uses any instruments falling into the scope of SFTR.
Enfocus Software - Customer Support

HSBC Global Asset Management, the initiator of HSBC Portfolios, is the asset management specialist of the HSBC Group and operates through HSBC Bank plc and its subsidiaries.
HSBC Global Asset Management is the trading name of HSBC Global Asset Management Limited. HSBC Global Asset Management is established at 8 Canada Square, London E14 5HQ, United Kingdom, which is its registered office.
© Copyright. HSBC Global Asset Management Limited 2021. All Rights Reserved 14846/06088
Enfocus Software - Customer Support

HP
WS
0121
I
Pr
inte
d in
the
Hon
g Ko
ng S
AR
Issued by HSBC Global Asset Management (Hong Kong) Limited


