Embed Size (px)
Citation preview
UvA-DARE is a service provided by the library of the University of Amsterdam (https://dare.uva.nl)
UvA-DARE (Digital Academic Repository)
Existence versus extinctionHuman-hippo conflicts in Lake Victoria Area, KenyaPost, A.W.C.H.M.
Publication date2017Document VersionFinal published versionLicenseOther
Link to publication
Citation for published version (APA):Post, A. W. C. H. M. (2017). Existence versus extinction: Human-hippo conflicts in LakeVictoria Area, Kenya.
General rightsIt is not permitted to download or to forward/distribute the text or part of it without the consent of the author(s)and/or copyright holder(s), other than for strictly personal, individual use, unless the work is under an opencontent license (like Creative Commons).
Disclaimer/Complaints regulationsIf you believe that digital publication of certain material infringes any of your rights or (privacy) interests, pleaselet the Library know, stating your reasons. In case of a legitimate complaint, the Library will make the materialinaccessible and/or remove it from the website. Please Ask the Library: https://uba.uva.nl/en/contact, or a letterto: Library of the University of Amsterdam, Secretariat, Singel 425, 1012 WP Amsterdam, The Netherlands. Youwill be contacted as soon as possible.
Download date:11 Jan 2022
EXISTENCE VERSUS EXTINCTION
Human-hippo confl ictsin Lake Victoria Area, Kenya
Aenne W.C.H.M. Post
This PhD dissertation examines the role different organisations andaffected communities play in human-wildlife governance, with a focus on human-hippo confl icts in Lake Victoria Area, Kenya. The hippo population in this area is under pressure due to human activities that impact on the wetland habitats, and incidents with hippos are common-place. This study investigates ways in which residents of the area protect their assets against hippos and looks at suggestions made by the respective actors to come up with a way to mitigate these confl icts to enable a peaceful coexistence between people and hippos. These solutions are partially political in nature.
Aenne Post studied human geography with a specialisation in developing countries, before pursuing her PhD at the Amsterdam Institute for Social Science Research (AISSR) of the University of Amsterdam.
Print: Drukkerij de Bink
Aenne W.C.H.M
. PostE
XIS
TE
NCE
VE
RS
US
EX
TIN
CT
ION Hum
an-hippo confl icts in Lake Victoria Area, Kenya
9 789082 749014
ISBN 978-90-827490-1-4
Manu_358x240_rug18mm_C.indd 1 05-09-17 08:56
Existence versus Extinction
Human-hippo conflicts in Lake Victoria Area, Kenya
Aenne Post
======================================================
Existence versus Extinction. Human-hippo conflicts in Lake Victoria Area, Kenya
Aenne Post
This doctoral research was partly funded by the Schuring-Beijerinck Popping Fund of The Royal Dutch Geographical Society and a Travel Grant from NWO, the Netherlands Organisation for Scientific Research. The Amsterdam Institute for Social Science Research (AISSR) and the Governance and Inclusive Development (GID) programme group at the University of Amsterdam provided additional support.
© 2017 A. Post, Kisumu, Kenya
All rights reserved. No part of this publication may be reproduced, stored in a retrieval system or transmitted, in any form or by any means, electronic, mechanical, photocopying, recording or otherwise, without prior permission of the author.
Cover: Victor Nyambok, Kenya
Publisher: De Bink BV, Leiden ISBN: 978-90-827490-1-4
Existence versus Extinction
Human-hippo conflicts in Lake Victoria Area, Kenya
ACADEMISCH PROEFSCHRIFT
ter verkrijging van de graad van doctor
aan de Universiteit van Amsterdam
op gezag van de Rector Magnificus
prof. dr. ir. K.I.J. Maex
ten overstaan van een door het College voor Promoties ingestelde
commissie, in het openbaar te verdedigen in de Agnietenkapel
op dinsdag 31 oktober 2017, te 14:00 uur
door
Aenne Wilma Cleo Hermine Maria Post geboren te Gouda
Promotiecommissie:
Promotor: Prof. dr. A.J. Dietz Universiteit Leiden Copromotor: Dr. M.A.F. Ros-Tonen Universiteit van Amsterdam
Overige leden: Prof. dr. W. Admiraal Universiteit van Amsterdam Dr. J.M. Bavinck Universiteit van Amsterdam Prof. dr. B.E. Büscher Wageningen Universiteit Prof. dr. J. Gupta Universiteit van Amsterdam Dr. J.G. Njogu Kenya Wildlife Service, Nairobi
Faculteit: Faculteit der Maatschappij- en Gedragswetenschappen

This dissertation is dedicated to my father

i
Table of contents
Table of contents i List of tables v List of figures vi List of maps vii List of boxes viii List of pictures ix List of acronyms xi Acknowledgements xiii
1. Introduction 1 1.1 Background to the study 2
1.1.1 Intensifying human-wildlife conflicts 2 1.1.2 Conflicts with hippopotamuses 4 1.1.3 The distribution and numbers of hippos in Africa 5 1.1.4 The vulnerability status of hippos in Africa 7
1.2 Justification of the study 8 1.2.1 Poor scientific attention for conflicts with hippos 8 1.2.2 Wide press coverage 9 1.2.3 Focus on conflicts beyond protected areas 10 1.2.4 Hippo conflicts along Winam Gulf 11 1.2.5 Perceiving conflicts differently 12
1.3 Research objectives and research questions 12 1.3.1 Research objectives 12 1.3.2 Research questions 13
1.4 Thesis outline 13
2. Human-Wildlife Conflicts and Wildlife Governance – A Theoretical Orientation 16 2.1 The conceptual deconstruction of wildlife and human-wildlife conflicts 17
2.1.1 Definition of wildlife 17 2.1.2 Definition of human-wildlife conflicts 18
2.2 The human dimension to human-wildlife conflicts 20 2.2.1 Values and attitudes 21 2.2.2 Actual and perceived costs 21 2.2.3 Cultural factors 23 2.2.4 Livelihoods and coping strategies 24
2.3 From human-wildlife conflict mitigation to interactive wildlife governance 24 2.3.1 Interactive governance 25 2.3.2 Orders of governance 26
2.4 Political ecology 29 2.5 Synthesis and conclusions 31
3. Methodology 33 3.1 Project organisation: The Hippo Monitoring Project and field staff 34 3.2 Selection of the study area 34
3.2.1 Site selection 36 3.2.2 Size and location of the study area 37
3.3 Data collection 40 3.3.1 Primary data collection 40 3.3.2 Secondary data collection 46 3.3.3 Update in 2016 47
3.4 Research period 47 3.4.1 Seasonality factors 47 3.4.2 Amidst the post-election violence in Kenya 48
3.5 The shift towards a more action-oriented research 48
ii
3.5.1 Meetings with representatives of the ‘hippo lobby groups’ 48 3.5.2 Awareness creation meetings 48
3.6 Data analysis 49 3.6.1 Type of analysis and data processing 49 3.6.2 Units of observation and analysis 49 3.6.3 Household definitions 50 3.6.4 Validity of the findings 50
3.7 Ethical considerations and limitations to the research 51 3.7.1 Intentions and expectations 51 3.7.2 Logistics 51 3.7.3 Language 52 3.7.4 Power rationing 52
3.8 Conclusions 52
4. Lake Victoria Area and its Inhabitants 53 4.1 The study area 54 4.2 The natural system: wetlands and hippos 55
4.2.1 Wetland ecosystems: their diversity, complexity and dynamics 55 4.2.2 Hippos 57
4.3 The human system: a profile of the inhabitants of Lake Victoria Area 64 4.3.1 The Luo culture and clans 64 4.3.2 Personal characteristics 64 4.3.3 Respondents’ livelihood profile 65 4.3.4 Territorial matters 73
4.4 Conclusions 74
5. The Governing System 75 5.1 Multilateral and Regional Environmental Agreements affecting Kenya’s wildlife
governance 76 5.2 Wildlife laws in Kenya 78 5.3 Actors in the governing system 82
5.3.1 International actors 82 5.3.2 The main actor at national level: The Kenya Wildlife Service 83 5.3.3 Local actors 88
5.4 Illegal actors across multiple levels 91 5.5 Conclusions 91
6. The System-to-be-Governed: Human-Hippo conflicts 93 6.1 Characteristics of human-hippo conflicts in Winam Gulf Area 94
6.1.1 Pre-assessment period 94 6.1.2 Assessment period 96 6.1.3 Post-assessment period 99 6.1.4 Comparisons 102 6.1.5 Examples of human injuries 103
6.2 The KWS reporting chain and data on human-hippo conflicts 104 6.2.1 Reporting of incidents 104 6.2.2 Non-reporting rates 106 6.2.3 Response to reports 108 6.2.4 Data from the KWS Occurrence Books 109 6.2.5 KWS’s country-wide data on conflicts related to hippos 112 6.2.6 KWS and project data compared 113
6.3 Risk factors 113 6.3.1 First-time versus multiple losses 114 6.3.2 The seasonality factor in human-hippo incidents 115 6.3.3 Periodic flooding 118 6.3.4 Risk factors faced by farmers 118 6.3.5 Risk factors faced by fishermen 120
iii
6.4 Conclusions 124
7. Images and Perceptions 125 7.1 Images of human-hippo conflicts 126
7.1.1 Hippo-people interference 126 7.1.2 People-hippo interference 126 7.1.3 Hippo’s image: a problem animal or not? 127 7.1.4 Values ascribed to hippos 129
7.2 Images of local communities 130 7.2.1 Cultural factors: myths and beliefs 130 7.2.2 Opinions about hippo conservation 131 7.2.3 Opinions about the performance of government 133 7.2.4 Suggested roles for KWS and improvement for its performance 137
7.3 Opinions of other actors 139 7.3.1 Opinions of the Kenya Wildlife Service 139 7.3.2 Opinions of the local administration 140 7.3.3 Opinions of non-governmental organisations 141 7.3.4 Opinions of the Beach Management Units 143
7.4 Perceptions of communal action and co-management 143 7.4.1 Changing the mindset 143 7.4.2 Community-based conservation / co-management 144
7.5 Conclusions 146
8. Conflict Mitigation in Practice 148 8.1 Conflict mitigation and risk reduction by local farmers 149
8.1.1 Farmers’ risk reduction strategies 149 8.1.2 Livestock protection methods 151 8.1.3 No crop protection 153
8.2 Conflict mitigation and risk reduction by local fishermen 153 8.3 Coping strategies by farmers and fishers 159
8.3.1 Ancient methods to deal with hippos 159 8.3.2 Changes in economic activities 159 8.3.3 Farmers’ coping strategies 160 8.3.4 Fishers’ coping strategies 161 8.3.5 Coping strategies according to the focus groups 161
8.4 Changes in incident occurrences 163 8.5 Conclusions 165
9. The Prospects of Local Wildlife Governance 167 9.1 Discussing community action 168
9.1.1 Results of focus groups and awareness creating meetings 168 9.1.2 Update from the field 169
9.2 Ideas about community-based hippo conservation 170 9.2.1 Results of focus groups and awareness creating meetings 170 9.2.2 Update from the field 172
9.3 Community action in practice 172 9.3.1 Local groups in Kadibo 172 9.3.2 Local groups in Nyando 174 9.3.3 Local groups in the Nyakach Divisions 174 9.3.4 New developments 174
9.4 Hindrances to co- and self- governance 174 9.4.1 A lack of knowledge on the (legal) aspects of wildlife and wetlands conservation 175 9.4.2 Financial constraints to the reporting of hippo incidents 175 9.4.3. Distrust between KWS and communities 175 9.4.4 A lack of local leadership 176 9.4.5 A lack of compensation 177
9.5 Compensation as an incentive to local wildlife governance 177
iv
9.5.1 Background to monetary compensation 177 9.5.2 Challenges facing compensation schemes 180 9.5.3 Alternatives to compensation 180 9.5.4 Update from the field 181
9.6 Conclusions 181
10. Conclusions and Recommendations 183 10.1 Introduction 184 10.2 Recapitulating the research questions and results 184 10.3 Contribution to science 188 10.4 Suggestions for further research 190 10.5 Recommendations for policy and practice 190
10.5.1 Recommendations for KWS 190 10.5.2 Recommendations for civil society organisations 195 10.5.3 Recommendations for concerted action by KWS and CSOs 195 10.5.4 Recommendation for the private sector 195 10.5.5 Recommendations for communities 196
References 198 Summary 218 Samenvatting 223 Annex 1 – Hippo’s physical characteristics 229 Annex 2 – International trade in hippo ivory 230 Annex 3 – The significance of hippos in wetland ecosystems 231 Annex 4 – Characteristics and task description of the field staff 232 Annex 5 – Hippo Monitoring Project: Occurrence Book of hippo incidents 234 Annex 6 – Composite questionnaire of the Hippo Monitoring Project 236 Annex 7 – Overview of characteristics of interviewed respondents 247 Annex 8 – Interviews with key informants 252 Annex 9 – The influence of the post-election violence on the project 253 Annex 10 – Clarification of household composition and numbers - as seen by the inheritor and
the widow 255 Annex 11 – Human population figures per sublocation in 2009 population and housing census 256 Annex 12 − Number of farms and acreage per location and division (N=430) 257 Annex 13 − Land demarcation in Nyando wetland 258 Annex 14 – Development in wildlife law since 1975 260 Annex 15 − Reporting during the pre-assessment period (N=378) 266 Annex 16 − Reporting during the assessment period (Ni=724) 267 Annex 17 − From incident to report to assessment: time taken in days (N=724) 268 Annex 18 − Reporting during the post-assessment period (N=357) 269 Annex 19 – Crop calendars per location 270 About the author 275
v
List of tables
Table 1.1 – Reasons for intensifying human-wildlife conflicts in Africa ..................................... 2 Table 2.1 – Overview of wildlife definitions .............................................................................. 17 Table 2.2 – Types of wildlife interactions and impacts ............................................................... 19 Table 2.3 − Direct, indirect and hidden costs at micro-level due to a wildlife-related event ...... 22 Table 2.4 – Predictors of tolerance for conflicts with hippos ...................................................... 24 Table 3.1 – Study sites and their classification in administrative units ....................................... 37 Table 3.2 – Venues of the first and second round of focus group discussions ............................ 45 Table 3.3 – Time table of the fieldwork activities ....................................................................... 47 Table 3.4 – Venues of the awareness raising meetings and for whom they were intended ........ 49 Table 4.1 – Average rainfall per month in mm (Kisumu station) during 5 decades ................... 54 Table 4.2 – Hippo habitat requirements ...................................................................................... 58 Table 4.3 – Behaviour of hippopotamuses .................................................................................. 59 Table 4.4 – Relative educational level by sex and age (N=430) ................................................. 65 Table 4.5 – Activities of respondents and their households (N=430) ......................................... 67 Table 5.1 – Multilateral agreements and their importance to Kenya’s wildlife governance....... 77 Table 6.1 – Loss assessment fisheries incidents during the assessment period (Ni=124)........... 99 Table 6.2 – Repeated incidents with hippos during the assessment period (N=724) ................ 115 Table 6.3 – Proportion of hippo-invaded farms in flooded and non-flooded farms .................. 118 Table 6.4 – Risk factor of different fishing methods according to fishers (N=164) ................. 120 Table 6.5 – High risk fishing methods according to BMUs ...................................................... 121 Table 6.6 – Risk factors related to common fishing methods practised by BMU-members
in the study area ...................................................................................................... 122 Table 7.1 – Ranking of key problem animals in the project area (N=6) ................................... 129 Table 7.2 – Hippo conflict prevention/resolution (based on six focus groups, N=6)................ 144 Table 8.1 – Approaches to reduce human-hippo conflicts ........................................................ 150 Table 8.2 – Protective methods in detail* ................................................................................. 152 Table 8.3 – Actions taken by fishermen (N=114) ..................................................................... 153 Table 8.4 − Responses to hippo-induced damage (N=430) ....................................................... 160 Table 8.5 – Change in the number of hippo incidents ............................................................... 163
vi
List of figures
Figure 1.1 − Distribution of hippos (1959 vs 1990) ...................................................................... 6 Figure 1.2 – Hippo population and population trend estimates (Source: HSG 2004 a and b).......7Figure 2.1 – Conceptual scheme ................................................................................................. 32 Figure 3.1 – Time periods used in thequestionnaires(source:author)...........................................42 Figure 4.1 – Composition of fish species in catch (N=140) ........................................................ 70 Figure 4.2 – Common fishing techniques used (N=140) ............................................................ 71 Figure 4.3 – Classification of other activities .............................................................................. 72 Figure 4.4 – Average annual income per activity type in KSh (N=427) ..................................... 73 Figure 5.1 – Organisational setup of KWS ................................................................................. 85 Figure 6.1 − Crop losses (Ni=326) .............................................................................................. 94 Figure 6.2 − Incident nos. in the pre-assessment period(Ni=376)................................................95 Figure 6.3 − Fisheries losses in the pre-assessment period (Ni=50) ........................................... 95 Figure 6.4 – Crop losses during assessment period (Ni=592) ..................................................... 96 Figure 6.5 – Maize as part of all crop raids (Ni=592) ................................................................. 97 Figure 6.6 – Incident nos. during the assessment period(Ni=716)..............................................98Figure 6.7 – Post-assessment incident numbers (Ni=357) ........................................................ 102 Figure 6.8 – Non-reporting rates during the pre-assessment period ......................................... 107 Figure 6.9 – Non-reporting rates during the post-assessment period ........................................ 107 Figure 6.10 – Share of hippo incidents between 1998-2010 (N=1081) .................................... 109 Figure 6.11 – Hippo reports in the project area (N=219) .......................................................... 110 Figure 6.12 – Response of KWS to hippo reports at Kisumu Station (N=614) ........................ 110 Figure 6.13 – Attended reports of PAC Kisumu from 1998-2010 (N=556) ............................. 111 Figure 6.14 – Hippo report categories at KWS Kisumu from 1998-2010 (N=694) ................. 111 Figure 6.15 – Country-wide hippo reports from 1997-2007 (N=3188) .................................... 112 Figure 6.16 – Hippo report categories per month from 1997-2007 (N=3188).......................... 113 Figure 6.17 – Monthly farming incidents during assessment (Ni=592) .................................... 115 Figure 6.18 – Monthly fisheries incidents during assessment (Ni=124) ................................... 116 Figure 6.19 – Monthly farming incidents during pre-assessment (Ni=326) ............................. 117 Figure 6.20 – Monthly fisheries incidents during pre-assessment (Ni=50) .............................. 117 Figure 6.21 – Risk percentage of hippo invasion by distance to water body ............................ 119 Figure 6.22 – Crop incidents per distance from a water body (in m) Ni=592 .......................... 119 Figure 7.1 – Ways in which hippos interfere with people (N=430) .......................................... 126 Figure 7.2 – Ways in which people interfere with hippos (N=359) .......................................... 127 Figure 7.3 – Reasons for labelling hippo as problem animal (N=410) ..................................... 128 Figure 7.4 – Reasons given for negative values ........................................................................ 129 Figure 7.5 – Responsibilities of KWS (N=430) ........................................................................ 134 Figure 7.6 – Reasons for the ‘bad’ performance (N=373) ........................................................ 134 Figure 7.7 – Reasons for ‘sufficient’ performance (N=35) ....................................................... 136 Figure 7.8 – Reasons for ‘good’ performance (N=19) .............................................................. 136 Figure 7.9 – Involvement of government agents and NGOs (N=430) ...................................... 137 Figure 7.10 – Ways to enhance KWS’s performance (N=430).................................................138 Figure 7.11 – Involvement of farmers in conflict mitigation (N=430) .....................................145

vii
List of maps
Map 1.1 – Study area along Winam Gulf, Lake Victoria, Kenya ............................................... 11 Map 3.1 – Kadibo Division (excluding Kanyagwal Location) ................................................... 39 Map 3.2 – Nyando Division (plus Kanyagwal Location) ............................................................ 39 Map 3.3 – Upper and Lower Nyakach Divisions ........................................................................ 40 Map 4.1 – The study area (indicated in red) bordering Winam Gulf .......................................... 55 Map 4.2 – Flood map Kadibo Division ....................................................................................... 61 Map 4.3 – Hippo migration map Kadibo Division ...................................................................... 61 Map 4.4 – Flood map Nyando Division ...................................................................................... 62 Map 4.5 – Hippo migration map Nyando Division ..................................................................... 62 Map 4.6 – Flood map Upper and Lower Nyakach Divisions ...................................................... 63 Map 4.7 – Hippo migration map Upper and Lower Nyakach Divisions ..................................... 63 Map 6.1 – Incident sites in Kadibo (excluding Kanyagwal) ..................................................... 101 Map 6.2 – Incident sites in Nyando (plus Kanyagwal) ............................................................. 101 Map 6.3 – Incident sites in Upper and Lower Nyakach ............................................................ 102
viii
List of boxes
Box 1.1 – Hippos in the national news......................................................................................... 10 Box 2.1 – Metagovernance: changing conservation narratives .................................................... 28 Box 2.2 – The development of political ecology ......................................................................... 30 Box 3.1 – Kenya’s administrative organisation at the time of the project ................................... 38 Box 3.2 – Data collected regarding crop raids by wildlife species .............................................. 43 Box 5.1 – Wildlife projects of USAID ......................................................................................... 83 Box 5.2 – Trajectory from report to action .................................................................................. 87 Box 6.1 – Injured by a hippo …………………………………………………………………..104 Box 8.1 – Ancient methods to deal with hippo issues (from the daily record books) ............... 159
ix
List of pictures
Picture 1.1 – Elevated orbits ........................................................................................................ 4 Picture 1.2 – Hippo’s jaws ............................................................................................................ 4 Picture 3.1 – Project bicycle ........................................................................................................ 35 Picture 3.2 – The project team .................................................................................................... 35 Picture 3.3 – Text at the back of the T-shirt ................................................................................ 35 Picture 3.4 – Project outfit (raincoat) .......................................................................................... 35 Picture 4.1 – Hippo exit/entry point ............................................................................................ 60 Picture 4.2 – Hippo foot print ..................................................................................................... 60 Picture 4.3 – Watering sukuma wiki ............................................................................................ 66 Picture 4.4 – Rice cultivation ...................................................................................................... 66 Picture 4.5 – Farmer using the hoe .............................................................................................. 66 Picture 4.6 – Ploughing with oxen (Nyando) .............................................................................. 66 Picture 4.7 – Livestock in the boma ............................................................................................ 66 Picture 4.8 – Farmhouse in Kadibo ............................................................................................. 66 Picture 4.9 – With the canoe through the papyrus ...................................................................... 68 Picture 4.10 – A fisher and his catch ........................................................................................... 68 Picture 4.11 – Fishing along the shore ........................................................................................ 68 Picture 4.12 – Fish species caught .............................................................................................. 68 Picture 4.13 – Fishers standing in the water ............................................................................... 68 Picture 4.14 – Blocked by the water hyacinth ............................................................................. 68 Picture 4.15 – After harvesting the papyrus ................................................................................ 69 Picture 4.16 – Women walking back with papyrus harvest ........................................................ 69 Picture 4.17 – Beekeeping in a wetland area .............................................................................. 69 Picture 4.18 – Going home with firewood .................................................................................. 69 Picture 4.19 – Papyrus harvesting site ........................................................................................ 69 Picture 4.20 – Fish traps (papyrus/reeds) .................................................................................... 69 Picture 6.1 – Hippo foot prints in the farm ............................................................................... 100 Picture 6.2 – Damaged maize .................................................................................................... 100 Picture 6.3 – A cow killed by a hippo ....................................................................................... 100 Picture 6.4 – A cow injured by a hippo ..................................................................................... 100 Picture 6.5 – Destroyed fishing nets ......................................................................................... 100 Picture 6.6 – Repaired boat after hippo incident ....................................................................... 100 Picture 6.7 – Stitches put on the arm ......................................................................................... 103 Picture 6.8 – Bitten in the leg .................................................................................................... 103 Picture 6.9 – Surviving a hippo attack ...................................................................................... 104 Picture 6.10 – Receiving treatment ........................................................................................... 104 Picture 7.1 – Hippo meat ........................................................................................................... 130 Picture 8.1 – Fence made with locally available material ......................................................... 154 Picture 8.2 – Fence made from reeds ........................................................................................ 154 Picture 8.3 – Fence made from reeds ........................................................................................ 154 Picture 8.4 – Fence made from poles ........................................................................................ 154 Picture 8.5 – Fence: strong poles and barbed wire .................................................................... 154 Picture 8.6 – Fence with bamboo and wire ............................................................................... 154 Picture 8.7 – Need for maintenance .......................................................................................... 155 Picture 8.8 – Deepening the trench ........................................................................................... 155 Picture 8.9 – Trench filled with water ....................................................................................... 155 Picture 8.10 – The construction of a trench .............................................................................. 155 Picture 8.11 – Communal digging of a trench .......................................................................... 155 Picture 8.12 – A functional trench ............................................................................................ 155
x
Picture 8.13 – Simple watch house ........................................................................................... 156 Picture 8.14 – Watch house of reeds and papyrus .................................................................... 156 Picture 8.15 – It also protects from the sun ............................................................................... 156 Picture 8.16 – Staying overnight at the farm ............................................................................. 156 Picture 8.17 – Hut made of papyrus .......................................................................................... 156 Picture 8.18 – A bed in a watch house ...................................................................................... 156 Picture 8.19 – Remains of a nightly bonfire ............................................................................. 157 Picture 8.20 – A ‘sound machine’ ............................................................................................. 157 Picture 8.21 – A scarecrow put in the farm ............................................................................... 157 Picture 8.22 – A sling + stone used to scare hippos .................................................................. 157 Picture 8.23 – Strips of metal on a rope .................................................................................... 157 Picture 8.24 – Sharp thorns to be put in between crops ............................................................ 157 Picture 9.1 – Office building of a group ................................................................................... 173 Picture 9.2 – Strands of barbed wire ......................................................................................... 173
xi
List of acronyms
ACC African Conservation Centre AMCEN African Ministerial Conference on Environment AWF African Wildlife Foundation BMU Beach Management Unit CBC Community-based conservation CBO Community-based organisation CBD Convention on Biological Diversity CBNRM Community-based natural resource management CDF Constituency Development Fund CEO County Executive Officer CFA Comprehensive Framework Agreement (Nile Treaty) CITES Convention on International Trade in Endangered Species of Wild
Fauna and Flora CMS Convention on the Conservation of Migratory Species of Wild Animals COBRA Conservation of Biodiverse Resource Areas CORE Conservation of Resources through Enterprise CSO Civil Society Organisation CWCCC County Wildlife Conservation and Compensation Committee CWA Community Wildlife Association CWS Community Wildlife Service DAO District Agricultural Officer DC District Commissioner DO District Officer EAC East African Community EAWLS East African Wildlife Society ECK Electoral Commission of Kenya ELCI Environment Liaison Centre International EMCA Environmental Management and Coordination Act FAO Food and Agriculture Organisation (of the UN) GIS Geographical Information Systems GoK Government of Kenya GPS Global Positioning System HMP Hippo Monitoring Project HSG Hippo Specialist Group ICCA Indigenous Peoples’ and Community Conserved Areas ICDP Integrated Conservation and Development Program IDP Internally Displaced Person IEBC Independent Electoral and Boundaries Commission IFAW International Fund for Animal Welfare IUCN International Union for the Conservation of Nature KARI Kenya Agricultural Research Institute KLA Kenya Land Alliance KMFRI Kenya Marine Fisheries Research Institute KWCA Kenya Wildlife Conservancies Association KWS Kenya Wildlife Service LATF Local Administration Transfer Fund LBDA Lake Basin Development Authority LVFO Lake Victoria Fisheries Organisation MA Millennium Ecosystem Assessment
xii
MCA Members of the County Assembly MEA Multilateral Environmental Agreement MP Member of Parliament NEMA National Environment Management Authority NEPAD New Partnership for Africa’s Development NGO Non-Governmental Organisation ODM Orange Democratic Movement OSIENALA Friends of Lake Victoria PAC Problem Animal Control PAMU Problem Animal Management Unit PAWS Protected Area Wildlife Service PES Payments for Environmental Services PNU Party of National Unity RAMSAR Convention on Wetlands of International Importance Especially as
Waterfowl Habitat REDD Reducing Emissions from Deforestation and Forest Degradation RoK Republic of Kenya RSIS Ramsar Sites Information Services SSC Species Survival Commission TRAFFIC Trade Records Analysis of Flora and Fauna in Commerce UNDP United Nations Development Programme UNESCO United Nations Educational, Scientific and Cultural Organisation USAID US Agency for International Development VIRED Victoria Institute for Research on Environment and Development WCMC World Conservation Monitoring Centre WCMD Wildlife Conservation and Management Department WHC World Heritage Convention WRMA Water Resource Management Authority WWF World Wildlife Fund
xiii
Acknowledgements
“I have no special talent. I am only passionately curious”.
Albert Einstein— scientist (1879-1955)
Einstein’s quote got to me because of the words “passionately curious”. When I think about the topic of my study, conflicts between humans and hippos in an area that I have come to call home now, these words are somehow applicable. I am passionately curious about the topic of this study, about the roots and potential solutions to these conflicts, which have existed for many years. The lake region has so much potential and yet so many residents along the shores are living in poverty. To what extent are conflicts with hippos contributing to this situation and why is there so little change in local people’s livelihoods? What can be done?
Ton Dietz knew about my curiosity and he encouraged me to pursue a PhD to find some answers. I quit my job and went back to the university, and back to Africa, initially to supervise students in Kenya and later to carry out my own research. In Kenya, I noticed that ‘nothing’ had changed in my previous fieldwork area. What farmers told me reminded me of the stories I heard a decade earlier during my masters’ study. I got intrigued and, to use Einstein’s words once more, ‘passionately curious’ about Lake Victoria and the struggle between humans and hippos in a context of wildlife governance. My former field supervisor, Prof. J.B. Okeyo-Owuor, really welcomed this move and offered me the facilities of VIRED, the Victoria Institute of Research on Environment & Development, an NGO of which he is one of the directors.
I arranged for a small project team consisting of five field staff and one project coordinator. Three of them, Peter Omulo, Denis Odhiambo, and Daniel Ouma, covered Kadibo, Nyando and Nyakach Divisions respectively; two others (Calistas Okatch and Raphael Odhiambo) carried out assessments in Suba District. Due to flaws in the Suba questionnaires, these were excluded from the study. The coordinator’s employment was terminated late July 2008 due to his poor performance. From then on, I coordinated the activities myself, assisted by Becky Aloo, who did the secretarial tasks. In 2009, I employed a data analyst, Kennedy Ouma, to assist me with the data entry in SPSS, while Denis assisted with the collection of secondary data from the KWS field stations. We built up a strong project team and held weekly meetings, first at VIRED and later at the ‘Rao (Hippo) House’. The field staff even started calling our team the ‘Rao Family’. Serena Nasongo, who assisted with the focus group discussions, became the latest addition to the family. This research could not have been done without any of you.
A word of thanks also goes to all the participants in this study, whose contribution has been of great value. This also includes the local administration, all the chiefs, assistant chiefs, BMU officials, and all other officers.
A special word of thanks goes to Prof. Ton Dietz, my promotor, who remained confident that one day I would finish this dissertation, and Dr. Mirjam Ros-Tonen, my co-promotor. Her comments have been very helpful in structuring this book and her enthusiasm has helped me a lot in finalising it, for which I am very grateful. She came to see me in Kisumu – which I really enjoyed – and all along, she has been a great support and a wonderful co-promotor. She kept on motivating me, for which I cannot thank her enough.
I would also like to thank Prof. J.B. Okeyo-Owuor, Dr. Philip Raburu and Tom Otieno (VIRED International), Prof. Bob Wishitemi (Moi University), Dr. Philip Muruthi and Nyokabi Gitahi (AWF), Hadley Becha (EAWLS). From NEMA, Dr. Kennedy Ondimu and
xiv
Geoffrey Mwangi; from WWF, Mohamed Awer and Robert Ndetei; James Ndungo (ACC), Morgan Siloma (SNV), Farouk Sherman (Kipini Wildlife and Botanical Conservancy), Violet Matiru (ELCI), and John Gichuki (KMFRI). From the KWS Headquarters, Joachim Kagiri, Dr. James Njogu, Erustus Kanga, Anderson Koyo, George Muriuki, Dr. Patrick Omondi, Dr. Samuel Kasiki; from KWS Kisumu, Mr. William Sang, Nancy Akinyi, Amos Otieno; from KWS Homa Bay, Mr. Cheruiyot. Thanks also to Dr. Adano Wario, with whom I had good discussions at Moi University.
A word of thanks goes to the staff and colleagues at the University of Amsterdam, especially Dr. Joos Droogleever-Fortuyn and Prof. Len de Klerk, for still believing in me, Prof. Isa Baud and Dr. Fred Zaal, for teaching me a valuable lesson, and Prof. Dr. Maarten Bavinck for arousing my interest in interactive governance processes. Then all my colleagues, especially Dr. Magali Chelpi, Dr. Edith van Ewijk, Dr. Marloes Kraan, Dr. Koen Kusters, Dr. Anna Laven, Dr. Iris Monnereau, Dr. Benson Mulemi, Dr. Emmanuel Nyankweli, Dr. Lothar Smith, Dr. Hebe Verrest, Dr. Kees van der Geest, and Dr. Karen Witsenburg. Then still affiliated with VU Amsterdam, I would like to thank Prof. Dr. Marja Spierenburg, Dr. Harry Wells and Prof. Dr. Bram Büscher for their support. Many thanks go to Marcel Heemskerk and Dr. Karin Pfeffer who helped me in formatting the maps with incident sites. I would also like to express my gratitude to PhD committee members for taking time to read and comment on my work.
I sincerely appreciate the financial assistance I got from the Schuring-Beijerinck Popping Fonds (KNAG), the NWO Travel Grant, and support from the University of Amsterdam. I would also like to thank In-10, a Rotterdam-based agency, for developing the website about my research, http://www.postinafrica.com, and Trital Safety BV in Hoogvliet for assisting with the project clothing.
I would also like to commemorate my father and grandmother, who would have loved to be present during my PhD defense. During this long PhD process, I did not spend as much time with family and friends as I would have liked. Their love and support helped me to develop this dissertation, both in the Netherlands, but mostly in Kenya. I would like to thank Willem Lunshof, for enabling me to start this study. Special thanks go to Stefanie, my daughter, for her unconditional love and support for my work.
Last, but not least, a huge thank you goes to Vipul Amin, my partner, for his support, patience and guidance. I am fully aware that it has not been easy.
1
Chapter 1 Introduction
“The greatness of a nation and its moral progress can be judged by the way its animals are treated…. I hold that, the more helpless a creature, the more entitled it is to protection by man from the cruelty of man”.
Mahatma Gandhi Hindu spiritual leader (1869-1948)
Kenya Wildlife Officer briefing community members
This chapter presents a background to human-wildlife conflicts, of which the increase in the annual frequency and severity has generated a mounting concern among conservationists (1.1). It furthermore justifies the reasons for this study (1.2) and presents the objectives and research questions (1.3), as well as the thesis outline (1.4).
2
1.1 Background to the study
1.1.1 Intensifying human-wildlife conflicts Conflicts between humans and wildlife have existed since time immemorial. The annual frequency and severity of these conflicts are increasing1 worldwide (Madden 2004; Treves 2008; Vitousek et al. 1997). We live in an era of anthropogenic dominance in which humans have increasingly altered the Earth, by transforming between 30 to 50 percent of its land surface through agriculture, forestry and urbanisation – hence the suggestion to label the current geological epoch ‘the Anthropocene’ (Crutzen 2002; Steffen et al. 2007). Human population growth and the drive for further economic expansion ensure a persistently growing human dominance (Vitousek et al. 1997) with people moving into previously uninhabited areas (Dickman 2008; Woodroffe et al. 2005b). Possible reasons for the intensification of human-wildlife conflicts in Africa mostly relate to changes in land use, wildlife behaviour/ecology, and human socio-political systems (Naughton-Treves & Treves 2005), as well as climate change (FAO 2016). These conflicts are subject to mounting concern.
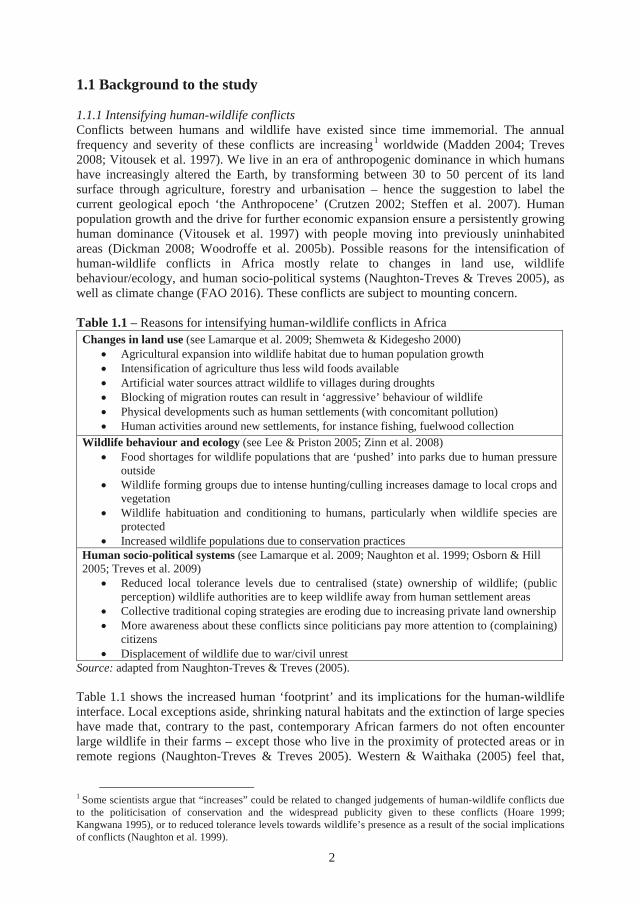
Table 1.1 – Reasons for intensifying human-wildlife conflicts in Africa Changes in land use (see Lamarque et al. 2009; Shemweta & Kidegesho 2000)
• Agricultural expansion into wildlife habitat due to human population growth• Intensification of agriculture thus less wild foods available• Artificial water sources attract wildlife to villages during droughts• Blocking of migration routes can result in ‘aggressive’ behaviour of wildlife• Physical developments such as human settlements (with concomitant pollution)• Human activities around new settlements, for instance fishing, fuelwood collection
Wildlife behaviour and ecology (see Lee & Priston 2005; Zinn et al. 2008) • Food shortages for wildlife populations that are ‘pushed’ into parks due to human pressure
outside• Wildlife forming groups due to intense hunting/culling increases damage to local crops and
vegetation• Wildlife habituation and conditioning to humans, particularly when wildlife species are
protected• Increased wildlife populations due to conservation practices
Human socio-political systems (see Lamarque et al. 2009; Naughton et al. 1999; Osborn & Hill 2005; Treves et al. 2009)
• Reduced local tolerance levels due to centralised (state) ownership of wildlife; (publicperception) wildlife authorities are to keep wildlife away from human settlement areas
• Collective traditional coping strategies are eroding due to increasing private land ownership• More awareness about these conflicts since politicians pay more attention to (complaining)
citizens• Displacement of wildlife due to war/civil unrest
Source: adapted from Naughton-Treves & Treves (2005).
Table 1.1 shows the increased human ‘footprint’ and its implications for the human-wildlife interface. Local exceptions aside, shrinking natural habitats and the extinction of large species have made that, contrary to the past, contemporary African farmers do not often encounter large wildlife in their farms – except those who live in the proximity of protected areas or in remote regions (Naughton-Treves & Treves 2005). Western & Waithaka (2005) feel that,
1 Some scientists argue that “increases” could be related to changed judgements of human-wildlife conflicts due to the politicisation of conservation and the widespread publicity given to these conflicts (Hoare 1999; Kangwana 1995), or to reduced tolerance levels towards wildlife’s presence as a result of the social implications of conflicts (Naughton et al. 1999).
3
whereas fewer people may encounter wildlife, the opposite is true for animals as more of them compete with humans and survive only due to conservation measures.
Habitat loss is one of the factors that contributed to the confinement of large mammal species in protected areas (Osborn & Hill 2005). Because of human settlement, expansion and changing land-use patterns, the pressure on protected areas is mounting, thereby leading to ever more fragmented and isolated spaces in human-dominated landscapes (Madden 2004). Many conservationists consider human-wildlife conflicts as one of the key threats to conservation in Africa (Decker & Chase 1997; Madden 2004), predominantly because of their severe consequences for people and wildlife species (Naughton-Treves & Treves 2005), especially in the case of megaherbivores and predators (Western & Waithaka 2005). These anthropogenic threats coincide with the effects of natural disturbances like rainfall variability (Lewison 2007). Some wildlife species seem to be able to cope with habitat loss and land-use changes2, yet others are – due to particular biological characteristics – less able to do so and thus more vulnerable to extinction (Dickman 2008).
Human-wildlife conflicts, together with habitat destruction and hunting, have attributed to the rapid depletion of wildlife numbers worldwide. Kenya, for example, has experienced a significant reduction in its wildlife numbers between 1977 and 1997. In the rangelands, which cover 75% of the country’s 440,000 km² land surface, the decline is 38% compared to 41% in the most populous protected areas (Western et al. 2009). Since 1977, Kenya has lost 60%-70% of all its large wildlife (Norton-Griffiths 2007). Human-wildlife conflicts have become a huge obstacle to conservation efforts (Adams 2004; Dickman 2010; Ogra 2008; Redpath et al. 2013; Treves et al. 2009; Woodroffe et al. 2005b). Case studies (see Distefano 2005) show that human-wildlife conflicts are not restricted to specific geographical locations or climatic zones, but are manifest wherever humans and wildlife species share space and resources like land and water. Human-wildlife conflicts involve a wide range of species (see Lamarque et al. 2009 for a global overview). In Africa, the main culprits are considered to be primates (McGuinness & Taylor 2014; Sillero-Zubiri & Switzer 2001; Wallace & Hill 2012), crocodiles (Dunham et al. 2010), carnivores such as lions, leopards, cheetahs, hyenas, wild dogs (Hazzah et al. 2009; Hemson et al. 2009; Marker et al. 2003), and herbivores like bush pigs, antelopes, buffaloes, elephants, and hippos (Hoare 1995,1999; Naughton-Treves & Treves 2005; Nelson et al. 2003; Osborn & Parker 2002). Whereas hippos are not mentioned in Distefano’s (2005) worldwide overview of human-wildlife conflicts, Lamarque et al. (2009) denote them as ‘main aggressors in human-wildlife conflicts’ together with crocodiles, elephants, lions and baboons.
The nature and magnitude of human-wildlife conflicts differ from country to country and are most rampant on the fringes of protected areas (Obunde et al. 2005). The distribution of conflicts can be rather patchy (Woodroffe et al. 2005c), with some sites being more prone to crop-raiding by wildlife or wildlife attacks than others, resulting in different patterns and levels of damage (Weladji & Tchamba 2003). The existence of a global partnership like the Human-Wildlife Conflict Collaboration, which aims to prevent and mitigate conflicts, indicates the global range of human-wildlife conflicts (Madden 2006). The need for this international network was expressed at the 5th IUCN3 World Parks Congress, held in 2003 in Durban, South Africa, at which human-wildlife conflicts were brought to the fore in a workshop called ‘Creating Coexistence between Humans and Wildlife: Global Perspectives on Local Efforts to Address Human-Wildlife Conflict’ (Madden 2004).
2 There are several reports of reintroductions of wildlife species in their former range like the wild dog in South Africa (Gusset et al. 2008), the brown bear, wolf and lynx in the Alps (Breitenmoser 1998) and of animal species recolonising parts of their habitat (Dickman 2008; Treves 2008; Woodroffe et al. 2005b), which can intensify conflicts with residents. 3 The IUCN is the International Union for the Conservation of Nature.
4
Human-wildlife conflicts touch upon fundamental issues in wildlife conservation, one of them being coexistence of people and wildlife (see Woodroffe et al. 2005a). Can local people carry the burden of sharing the land with wildlife given the economic losses and safety threats that they incur or can the presence of wildlife help communities in fighting poverty via income-generating activities? (Muruthi 2005) Over the years, conservation strategies have changed from having a biological focus to a more holistic perspective with an eye for the socio-economic dimension (Makombe 1993). This reflects in the development of conservation paradigms from strict protection like ‘fortress conservation’ or the ‘fences and fines approach’ (Adams 2004; Wells et al. 1992) to ‘community conservation strategies’ or ‘integrated conservation and development projects’ (Adams & Hulme 2001; Western 2009), subsequently followed by the revival of more protectionist (Wilshusen et al. 2002) and neoliberal, market-oriented strategies (Büscher 2011). Each paradigm has its own underlying assumptions (see Chapter 2), which determine how conservation and human-wildlife conflict mitigation are looked upon and dealt with, and how actors are involved in wildlife matters.
1.1.2 Conflicts with hippopotamuses Human-hippo conflicts are at the core of this study, especially those that occur along Winam Gulf, Kenya. Being wetland inhabitants, these megaherbivores are confronted with significant habitat loss due to wetland conversion and human encroachment. In her study on hippo population projection models, Lewison (2007) concluded that habitat loss had the strongest effect on the model population, particularly when combined with environmental fluctuations, which increased the risk of substantial population declines within decades (notwithstanding locally abundant populations). The ongoing human population growth and grassland conversion could ‘spell disaster’ for hippos (Eltringham 1999:129) as human activities and hippos’ requirements are at odds.
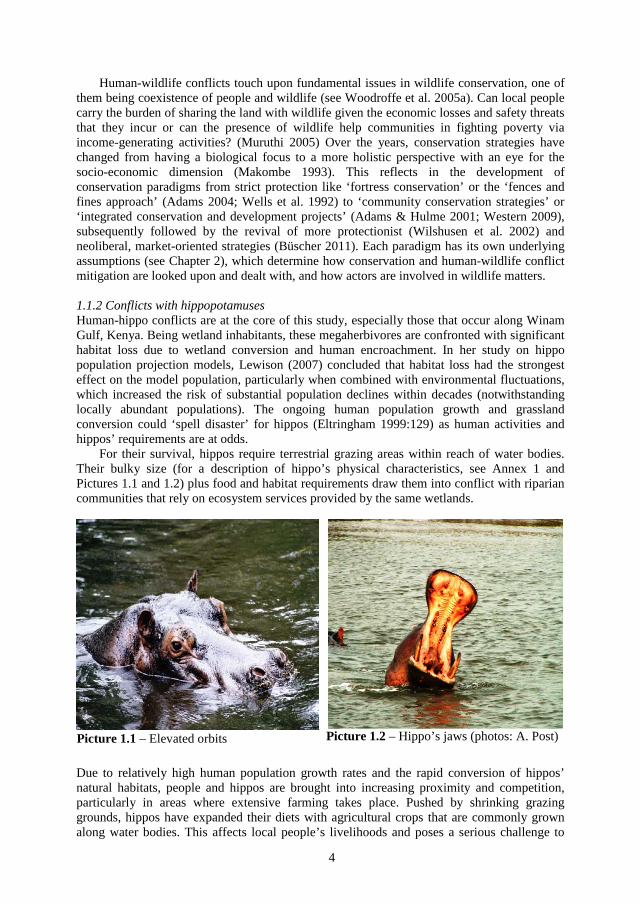
For their survival, hippos require terrestrial grazing areas within reach of water bodies. Their bulky size (for a description of hippo’s physical characteristics, see Annex 1 and Pictures 1.1 and 1.2) plus food and habitat requirements draw them into conflict with riparian communities that rely on ecosystem services provided by the same wetlands.
Due to relatively high human population growth rates and the rapid conversion of hippos’ natural habitats, people and hippos are brought into increasing proximity and competition, particularly in areas where extensive farming takes place. Pushed by shrinking grazing grounds, hippos have expanded their diets with agricultural crops that are commonly grown along water bodies. This affects local people’s livelihoods and poses a serious challenge to
Picture 1.1 – Elevated orbits Picture 1.2 – Hippo’s jaws (photos: A. Post)
5
hippo conservation. Nevertheless, deliberate attacks on humans are rare; most deadly incidents occur when farmers are protecting their farms against crop raiding hippos, or when people accidentally encounter a hippo on its pathways, or meet an injured hippo with an impaired sense of caution (Lamarque et al. 2009). Eltringham (1999:129) calls hippo crop raids an ‘unsolved problem’ and argues that hippo conservation requires an active approach and research on human-hippo conflicts. He underlines the significance of assessing the cost of such crop raids to agriculture for individual farmers (Ibid.). In line with Michalski et al. (2006), who looked into conflicts with predators, I argue that sound conservation strategies for hippos need to properly address human-hippo conflicts so that impact levels become tolerable to the riparian communities and hippo populations will remain at viable levels. This involves identifying the characteristics of conflict ‘hotspots’ and conservation attitudes of the local communities affected by these conflicts.
1.1.3 The distribution and numbers of hippos in Africa The river hippopotamus (common hippo) inhabits wetlands. It is the third largest land animal after elephant and rhinoceros. Its scientific4 name is Hippopotamus amphibius. Its current distribution is restricted to mainland Africa; it is only a fraction of its original range (Kingdon 1979). Hippos predominantly inhabit lakes, rivers and marshy ponds (Dolan 1991; Simon 1993). Africa. All other hippo species are said to have gone extinct (Honders & Klerks 1993), although Okello et al. (2005) support the recognition of three hippopotamus subspecies: the Hippopotamus amphibius amphibius, the H.a. capensis, and the H.a. kiboko.
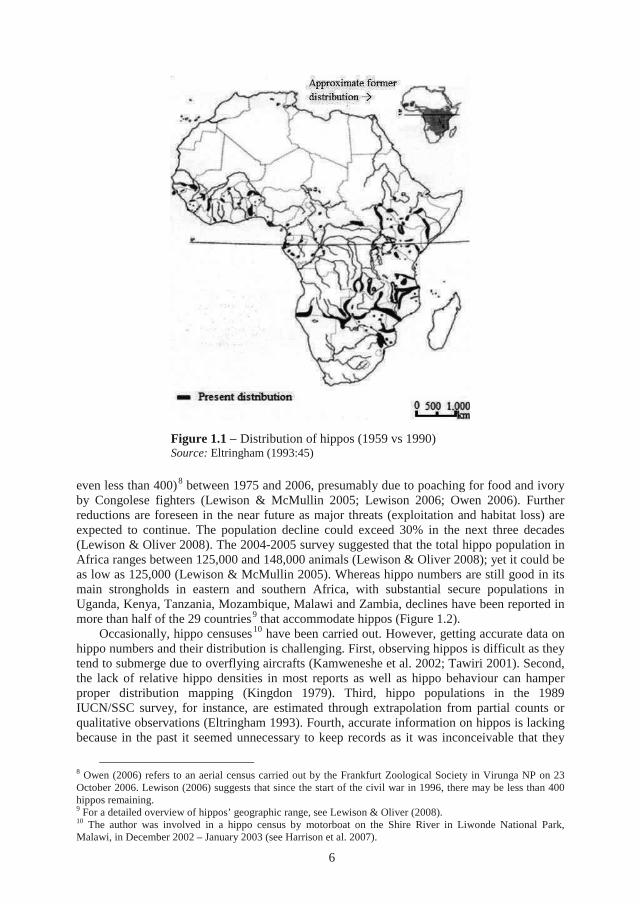
Figure 1.1 shows the reduction of hippos’ range (Eltringham 1993, 1999; Stuart & Stuart 1996). A questionnaire survey, conducted in 1989 by the IUCN/SSC5 Hippo Specialist Group (HSG), confirmed hippos’ wide distribution and their declining numbers in many areas (Eltringham 1993). Estimated hippo numbers range from 150,000 (Klingel 1995) to 157,000, covering western (7,000), southern (80,000) and eastern (70,000) Africa (Eltringham 1993). There are obvious regional differences in distribution and population size. Tanzania probably has the largest number of hippos in East Africa; they are estimated at 25,000 and considered stable (Eltringham 1999). The 2001 census mentioned 20,079 hippos, with 80% in protected areas in Tanzania (Tawiri 2001). The Group’s country-by-country assessment of 1993-1994 estimated roughly 160,000 hippos, which seems to be an overestimation (Lewison & Oliver 2008). However, after having analysed the same data, Eltringham (1999) adjusted the number to 173,6906 hippos, by pointing at the inaccuracy of the techniques used which did not allow for a determination of a degree of error. Earlier observations confirmed hippos’ uneven distribution notwithstanding their impressive range through most of sub-Saharan Africa (Klingel 1995) and overall declining numbers (Honders & Klerks 1993; Lewison 2006). Hippos have been eradicated in many African rivers and virtually everywhere, local hippo populations have either disappeared or declined (Ibid.).
The DRC (former Zaïre) has witnessed one of the most striking reductions in Virunga National Park, where hippo populations are believed to have reduced from 30,0007 to 629 (or
4 Taxonomy, the scientific classification of animals, is done according to body characteristics. Hippos belong to the phylum Chordata, mammalian class, order Artiodactyla (even-toed ungulates), suborder Suiformes. The family Hippopotamidae is divided into two genera, Hexaprotodon (=Choeropsis) and Hippopotamus, each with one surviving species: the Choeropsis liberiensis (the pygmy hippo, a forest inhabitant mainly in West Africa) and the Hippopotamus amphibius (Groves & Grub 1993), which hereafter will be referred to as hippo. 5 The IUCN has Species Specialist Groups (SSC); one of them is the Wild Pig, Peccary and Hippo Specialist Group. 6 The adjusted estimate includes 79,550 (East Africa), 7,590 (West Africa) and 86,400 (South Africa) hippos. 7 Kujirakwinja (2010) presents different hippo population estimates for Virunga NP. In 1974, estimations were 29,178 hippos, after which they declined to 10,489 in 1994 and 887 in 2005. The latest census in 2009 showed an estimated 1,209 hippos but the increase can most likely be attributed to a greater count effort in 2009.
6
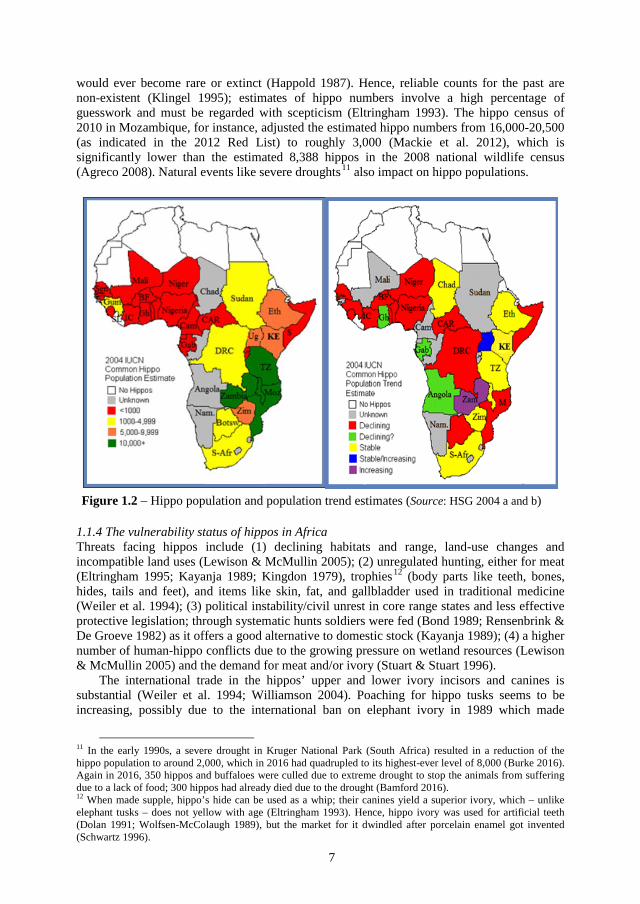
even less than 400)8 between 1975 and 2006, presumably due to poaching for food and ivory by Congolese fighters (Lewison & McMullin 2005; Lewison 2006; Owen 2006). Further reductions are foreseen in the near future as major threats (exploitation and habitat loss) are expected to continue. The population decline could exceed 30% in the next three decades (Lewison & Oliver 2008). The 2004-2005 survey suggested that the total hippo population in Africa ranges between 125,000 and 148,000 animals (Lewison & Oliver 2008); yet it could be as low as 125,000 (Lewison & McMullin 2005). Whereas hippo numbers are still good in its main strongholds in eastern and southern Africa, with substantial secure populations in Uganda, Kenya, Tanzania, Mozambique, Malawi and Zambia, declines have been reported in more than half of the 29 countries9 that accommodate hippos (Figure 1.2).
Occasionally, hippo censuses10 have been carried out. However, getting accurate data on hippo numbers and their distribution is challenging. First, observing hippos is difficult as they tend to submerge due to overflying aircrafts (Kamweneshe et al. 2002; Tawiri 2001). Second, the lack of relative hippo densities in most reports as well as hippo behaviour can hamper proper distribution mapping (Kingdon 1979). Third, hippo populations in the 1989 IUCN/SSC survey, for instance, are estimated through extrapolation from partial counts or qualitative observations (Eltringham 1993). Fourth, accurate information on hippos is lacking because in the past it seemed unnecessary to keep records as it was inconceivable that they
8 Owen (2006) refers to an aerial census carried out by the Frankfurt Zoological Society in Virunga NP on 23 October 2006. Lewison (2006) suggests that since the start of the civil war in 1996, there may be less than 400 hippos remaining. 9 For a detailed overview of hippos’ geographic range, see Lewison & Oliver (2008). 10 The author was involved in a hippo census by motorboat on the Shire River in Liwonde National Park, Malawi, in December 2002 – January 2003 (see Harrison et al. 2007).
Figure 1.1 − Distribution of hippos (1959 vs 1990) Source: Eltringham (1993:45)
7
would ever become rare or extinct (Happold 1987). Hence, reliable counts for the past are non-existent (Klingel 1995); estimates of hippo numbers involve a high percentage of guesswork and must be regarded with scepticism (Eltringham 1993). The hippo census of 2010 in Mozambique, for instance, adjusted the estimated hippo numbers from 16,000-20,500 (as indicated in the 2012 Red List) to roughly 3,000 (Mackie et al. 2012), which is significantly lower than the estimated 8,388 hippos in the 2008 national wildlife census (Agreco 2008). Natural events like severe droughts11 also impact on hippo populations.
1.1.4 The vulnerability status of hippos in Africa Threats facing hippos include (1) declining habitats and range, land-use changes and incompatible land uses (Lewison & McMullin 2005); (2) unregulated hunting, either for meat (Eltringham 1995; Kayanja 1989; Kingdon 1979), trophies12 (body parts like teeth, bones, hides, tails and feet), and items like skin, fat, and gallbladder used in traditional medicine (Weiler et al. 1994); (3) political instability/civil unrest in core range states and less effective protective legislation; through systematic hunts soldiers were fed (Bond 1989; Rensenbrink & De Groeve 1982) as it offers a good alternative to domestic stock (Kayanja 1989); (4) a higher number of human-hippo conflicts due to the growing pressure on wetland resources (Lewison & McMullin 2005) and the demand for meat and/or ivory (Stuart & Stuart 1996).
The international trade in the hippos’ upper and lower ivory incisors and canines is substantial (Weiler et al. 1994; Williamson 2004). Poaching for hippo tusks seems to be increasing, possibly due to the international ban on elephant ivory in 1989 which made
11 In the early 1990s, a severe drought in Kruger National Park (South Africa) resulted in a reduction of the hippo population to around 2,000, which in 2016 had quadrupled to its highest-ever level of 8,000 (Burke 2016). Again in 2016, 350 hippos and buffaloes were culled due to extreme drought to stop the animals from suffering due to a lack of food; 300 hippos had already died due to the drought (Bamford 2016). 12 When made supple, hippo’s hide can be used as a whip; their canines yield a superior ivory, which – unlike elephant tusks – does not yellow with age (Eltringham 1993). Hence, hippo ivory was used for artificial teeth (Dolan 1991; Wolfsen-McColaugh 1989), but the market for it dwindled after porcelain enamel got invented (Schwartz 1996).
Figure 1.2 – Hippo population and population trend estimates (Source: HSG 2004 a and b)
8
dealers and ivory carvers look for substitutes (Annex 2). From 1988 until 1991, African exports of raw hippo ivory more than quintupled (Schwartz 1996) from 5,640 to 30,100 pounds (Eltringham 1995). Intensified efforts to prevent trade in elephant ivory could thus trigger the onslaught of hippos (Nowak 1991) and a ‘substitute-trade’ could put hippos at serious risk (Eltringham 1993). Since 1989, estimated quantities of illegally exported hippo ivory have risen significantly (Lewison & McMullin 2005). Many tusks (especially bulls’ lower canines) have entered the market: their size matches elephant tusks and the resemblance is stunning, particularly when carved (Eltringham 1993). The legal side of trade in hippo ivory is discussed in Chapter 5.
Threatened species lists are drawn up for three key reasons: (1) to assess possible negative impacts on species; (2) to help notify conservation priorities; and (3) as part of the State of the Environment Reports (Possingham et al. 2002). On the 1996 IUCN Red List of Threatened Species, the hippo status was set at ‘lower risk/least concern’ (Baillie & Groombridge 1996). It is due to reports of widespread poaching13 and increasing numbers of human-hippo conflicts in core hippo countries that, in 2004, the Hippo Specialist Group pushed for a population and conservation status re-assessment of the hippo using categories and criteria (A4cd) of the Red List to upgrade the hippo to a ‘vulnerable’ status14, which it got in 2006 (Lewison & Oliver 2008). The overall falling population trend (IUCN 2013) raises concern over its existence in the wild (IUCN 2012). Population estimates point at a decline of 7-20% between 1995-2005 (Lewison 2004; Lewison & McMullin 2005), while over a periodof 30 years, the hippo population decline is likely to exceed 30% (Lewison & Oliver 2005).
Over thirty years ago, national parks and reserves were already deemed critical to the hippo’s survival because they have the highest hippo densities (RoK 1980). Whereas it is likely that most hippos are confined to some type of protected area, others are still found beyond parks (Lewison & Oliver 2008) where habitat destruction and hunting put them at a higher risk. Even though the official level of protection in most countries is good, the enforcement of regulations is often weak (Ibid.). Hunting is mostly related to hippo’s meat and/or ivory. The Convention on International Trade in Endangered Species of Wild Fauna and Flora (CITES) regulates trade in species through a listing system that represents an increasing degree of protection. The hippo is listed on CITES-Appendix II, which means it may become extinct unless trade is closely controlled (CITES 2012) (see Chapter 5).
Since 2008 however, population estimates suggest that common hippo populations have stabilised, with an estimated number of 115,000-130,000 hippos in the wild. Nevertheless, reduced hippo populations are prevalent, and their conservation status remains tricky given the ever-growing threats of “habitat loss and unregulated hunting” (Lewison 2017:52).
1.2 Justification of the study
1.2.1 Poor scientific attention for conflicts with hippos Whereas human-wildlife conflicts are not restricted to particular animal species, conflicts with some species have received more scientific attention than others. An internet search15 clearly shows that conflicts with elephants (Loxodonta africana) have been the focus of most research on African wildlife (Chartier et al. 2011; Gupta 2013; Hoare 1995, 1999; Lee &
13 Poaching, which essentially means nothing more than ‘illegal hunting’, has a criminal connotation. It is often linked to the fight against obtaining ivory of elepants and rhino horns. 14 Other categories on The Red List indicating a threatened status are Endangered (EN) and Critically Endangered (CR) (IUCN 2012). 15 A Google search on 30/11/2016 generated the following results. Conflicts between people and wildlife generated 7,490,000 hits, whereas the same for elephants and hippopotamuses led to respectively 5,530,000 and 4,410,000 hits.
9
Graham 2006; Naughton-Treves & Treves 2005; Nelson et al. 2003; Osborn & Parker 2002; Sitati & Walpole 2006; Sitienei et al. 2014; Smith & Kasiki 2000; Zoë Warner 2008). Conflicts with elephants have grown since the mid-1980s in rural, agricultural areas16, with an increasing conflict interface – even with thinning elephant ranges (Hoare 1995). The African Elephant Database is said to be the ‘most comprehensive one on the conservation status of any single species of mammal in the wild’ (Blanc et al. 2007:1). The situation is different for hippos. Despite their significance – hippos play a vital role as ‘keystone species’ and ‘ecosystem engineers’ in maintaining wetland ecosystems (Annex 3) – and their reputation as notorious ‘crop raiders’, these herbivores have received relatively scant attention from the scientific community (see Mkanda 1994; Post 2000). In Kenya, research on hippos is rare (Kanga 2011). Human-hippo conflicts have seldom been studied even though hippos are often cited as killing more people than any other animal in Africa (Raffaele 2006).
There are several possible explanations for this apparent lack of attention. First, hippo issues may have been ‘overshadowed’ by the publicity for elephant matters in recent years, particularly regarding the fight against poaching. The elephant is one of Africa’s ‘flagship species’17 that attracted ample public attention in the global crusade against ivory trade for instance through the “Ivory belongs to elephants” campaign18 that was launched in 2013. Much less is mentioned about hippo ivory, although it is said to be of superior quality: people feared that the ban on elephant ivory would surge the trade in hippo ivory, with possible detrimental effects (see Williamson 2004; Eltringham 1999). Species conservation is generally biased towards charismatic mammalian species seen as intelligent (elephants), aesthetically pleasing (penguins), and ‘similar’ to humans (chimpanzees), contrary to hippos which are fear-inducing, dangerous mammals, dissimilar to people (Batt 2009). Second, hippo’s nocturnal lifestyle and semi-aquatic environment could play a role in the lack of interest for the species, as these factors may well complicate research activities. The hippo is not listed among the so-called ‘Big Five’ (elephant, buffalo, lion, leopard and rhino) although its presence attracts numerous tourists going on safari trips in Africa. Travel and tourism contributed 13.7% (KSh 403.7bn)19 of Kenya’s GDP in 2011, a figure that is expected to rise by 3.7% per year to Ksh 603.1bn in 2022 (WTTC 2012). Wildlife is a leading forex earner, generating up to roughly KSh 75.2 billion per year (Mwaura 2016). Third, hippo conservation could be affected by an uneven distribution: the existence of localised dense, large populations may inflate notions of the animal’s population status throughout its range (Snyder 2015). Fourth, human-hippo conflicts also impair conservation efforts (Ibid.).
In recent years however, there have been a few publications on human-hippo conflicts in Kenya (e.g. Kanga et al. 2012), Tanzania (Kendall 2011) and other African countries like Cameroon (Scholte et al. 2016, 2017; Scholte & Iyah 2016), Guinea-Bissau (Gonzalez et al. 2016; Kujirakwinja 2010), Mozambique (Mackie et al. 2012), Namibia (Kahler & Gore 2015) and Zambia (Chomba et al. 2012). Maybe the alerting reports on its ‘vulnerable’ population status (Lewison 2004; Lewison & McMullin 2005; Lewison & Oliver 2008) made scientists aware of the need to address hippo conservation and human-hippo conflicts (see Chapter 4).
1.2.2 Wide press coverage In Kenya, articles on human-wildlife conflicts are published almost on a daily basis in The Daily Nation and The Standard, the country’s leading newspapers. This shows that such
16 Conflict ‘hotspots’ are predominantly located in areas with burgeoning human populations and widespread farming activities (Kangwana 1995). 17 Flagship species play a strategic role: they are “chosen to raise public awareness or financial support for conservation action” (Leader-Williams & Dublin 2000:58). 18 See: http://www.kws.co.ke. This campaign was supported by conservation organisations like Elephant Voices, Save the Elephants, the World Wildlife Fund (WWF) and the International Fund for Animal Welfare (IFAW). 19 In 2011, the exchange rate of Ksh: USD was 1:0.01175 (www.exchange-rates.org/Rate/KES/USD/1-1-2011).
10
conflicts are common, nationwide occurrences and contrary to the meagre scientific attention, incidents with hippos are regularly covered in the national press (see examples in Box 1.1).
1.2.3 Focus on conflicts beyond protected areas Many studies on human-wildlife conflicts have been carried out near protected areas, as incidents between people and wildlife often occur in the buffer zones surrounding national parks and game reserves (Gandiwa et al. 2013; Gillingham & Lee 1999, 2003; Naughton-Treves 1997; Newmark & Hough 2000; Ogra 2008), with the frequency of (reported) conflict being inversely related to human densities in the areas bordering protected sites (Newmark et al. 1994). Conflicts are particularly common among communities that live near protected areas that accommodate large herbivores (e.g. elephant, buffalo, rhino and hippo) and carnivores (Ibid; Hemson et al. 2009). However, many wildlife species are found outside protected areas. In Kenya, average figures for the 1990s showed that roughly 35% reside in nationally protected areas (Western et al. 2009a), which is approximately 7.5% of the country’s land area (Gitahi & Fitzgerald 2010), while privately protected areas accommodate 40% of all wildlife (Western et al. 2006). They are considered as ‘parks outside parks’ which account for roughly 12.6% of Kenya’s total area (Mwaura 2016). Contrary to the downward wildlife trend in nationally protected areas, their numbers remain constant in privately protected areas20 – which might be attributed to the behaviour of landowners because, first, wildlife revenue is a strong incentive to conserve; second, they dislike poachers who threaten the revenue; and, third, they invest in community scouts and other methods to protect wildlife and clients (Ibid.). Animals outside protected areas are safeguarded by law but their habitats
20 Except for areas where pastoral lands got subdivided and sedentarised (Western et al. 2009b).
Box 1.1 – Hippos in the national news
MAN MIRACULOUSLY ESCAPES HIPPO ONSLAUGHT (M. Kamande, Standard, August 1, 2012) The survivor was attacked at 6.45 pm and spent over two months in hospital. The next day, another victim was found dead near the incident site in Thika East District. Local people blamed the increased attacks on expanding hippo populations due to translocation by the Kenya Wildlife Service (KWS), which denied this. Villagers complained about the reluctance of KWS to compensate victims of hippo attacks, whereas KWS pointed at procedures that should be followed to start the compensation process.
VILLAGERS VOW TO KILL HIPPOS OVER INVASION (Saturday Nation, July 7, 2012) Residents in Siaya threatened to kill hippos and warthogs that destroyed over 200 acres of cassava, maize and potatoes. Without government assistance, they would deal with the wild animals themselves.
HIPPO VICTORIOUS IN BATTLE WITH VILLAGERS (B. Yonga, Daily Nation, January 6, 2012) Residents of Kisumu were pleading with KWS to shoot a hippo whose calf got stuck in the mud. The rangers had a hard time controlling the crowd demanding for its meat. One of the residents armed with a knife said, “This is a New Year gift from above. The prices of food are high because of inflation and now we have free meat here”. The KWS Warden said that they are bound by law to conserve the hippo. He urged residents to learn how to coexist with hippos, promising that KWS would ‘embark on a campaign to conserve animals’.
11
are not. When humans encroach into (former) wildlife habitats, conflicts are inevitable as people and animals are competing over the same space (Lamarque et al. 2009).
Conflicts over land use have become more intense due to relatively high human population growth rates and the limited availability of naturally arable land. Such conflicts manifest themselves in diverse ways: people are suffering from wildlife-induced damage and animal numbers are dwindling. Kanga (2011), for instance, found that from 1997 to 2008, not only the number of human-hippo conflicts in Kenya had increased but also hippos’ mortality rate, which indicates that hippos living outside protected areas could face a bleak future predominantly due to land-use changes in wetlands. Working towards mitigation of wildlife-induced crop and livestock losses is thus essential to conservation efforts in landscapes beyond protected areas where humans and wildlife co-occur (Karanth et al. 2012).
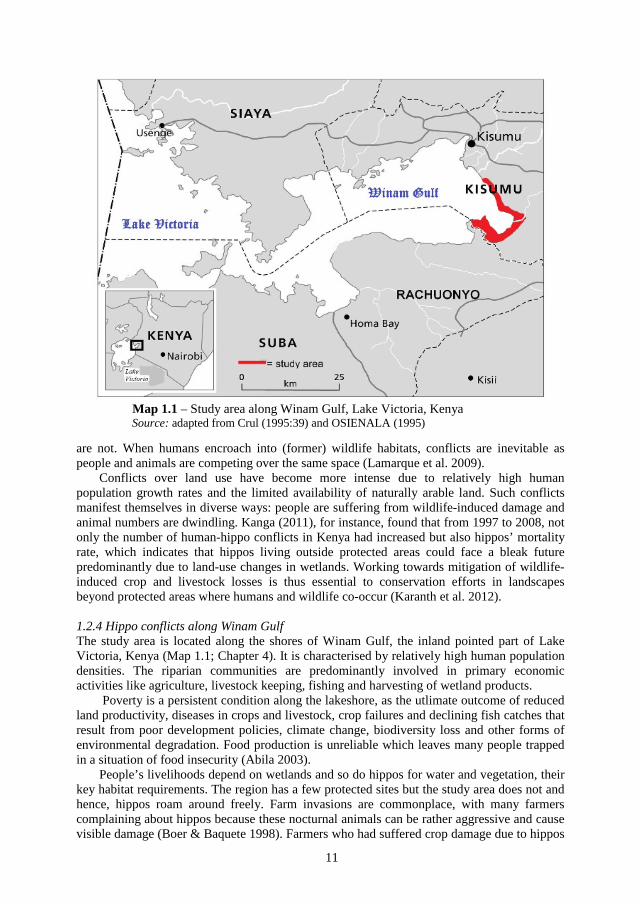
1.2.4 Hippo conflicts along Winam Gulf The study area is located along the shores of Winam Gulf, the inland pointed part of Lake Victoria, Kenya (Map 1.1; Chapter 4). It is characterised by relatively high human population densities. The riparian communities are predominantly involved in primary economic activities like agriculture, livestock keeping, fishing and harvesting of wetland products.
Poverty is a persistent condition along the lakeshore, as the utlimate outcome of reduced land productivity, diseases in crops and livestock, crop failures and declining fish catches that result from poor development policies, climate change, biodiversity loss and other forms of environmental degradation. Food production is unreliable which leaves many people trapped in a situation of food insecurity (Abila 2003).
People’s livelihoods depend on wetlands and so do hippos for water and vegetation, their key habitat requirements. The region has a few protected sites but the study area does not and hence, hippos roam around freely. Farm invasions are commonplace, with many farmers complaining about hippos because these nocturnal animals can be rather aggressive and cause visible damage (Boer & Baquete 1998). Farmers who had suffered crop damage due to hippos
Map 1.1 – Study area along Winam Gulf, Lake Victoria, Kenya Source: adapted from Crul (1995:39) and OSIENALA (1995)
12
were more negative than those who did not suffer any losses (Ibid.). In an exploratory study on human-hippo conflicts in several districts bordering Winam Gulf, carried out in the late 1990s, I found that riparian communities did not have any say in wildlife matters. Evidently, many people had low tolerance levels and a hostile attitude towards hippos, which they felt were causing damage to their properties and life support systems, and particularly towards the authorities responsible for wildlife conservation since these had failed to take care of ‘their animals’ (Post 2000). This may have added to the general perception of increasing conflicts with hippos (Ibid.). Little seems to have changed since then. The public outcry about the hippo menace is ongoing (including retaliation attacks) while many people still claim that the wildlife authorities have not adequately addressed this issue.
1.2.5 Perceiving conflicts differently At present, human-wildlife conflicts constitute one of the most challenging issues facing conservationists (Dickman 2010; Redpath et al. 2013). Solving them requires the development of a clear understanding of the causes21 of such conflicts (Marker & Dickman 2004). Competition between increasing human populations and wildlife over living space and resources is often cited as the main cause of human-wildlife conflicts (Lamarque et al. 2009; Mosimane et al. 2013). Naughton-Treves & Treves (2005) argue that a more detailed look at the roots of human-wildlife conflicts is needed to reveal the variable and complex interactions between wildlife and rural populations in Africa. There are many studies that have looked into technique-oriented approaches directed at damage limitation but, as Dickman (2010) rightfully argues, they do not provide a lasting solution. They can diminish the scale of wildlife damage inflicted, but rarely seem to halt the animosity towards the relevant animal species, thus making long-term conflict resolution a rare occasion. This suggests that the causes of conflicts may be more complex and deep-seated, with social factors possibly playing a bigger role than hitherto has been thought as they strongly impact on how people perceive human-wildlife conflicts (Ibid.). This is most definitely the case for human-hippo conflicts. The next section outlines how these knowledge gaps translate into research objectives and questions that guide the rest of this thesis.
1.3 Research objectives and research questions
1.3.1 Research objectives This study aims to shed light on the societal problem related to human-wildlife conflicts and societal opportunities inherent in wildlife governance strategies in Kenya. As such, it intends to gain insight into the roots of conflicts – particularly those between people and hippos – and possible solutions suggested by different actors. Human-wildlife conflicts take place in a complex, diverse and dynamic environment. They pose a serious threat not only to the communities that share the land with wildlife, but also to the conservation of wildlife and their habitats. Human-wildlife conflicts are multi-faceted in nature with a multitude of interactions taking place between actors who operate at different levels of scale. Interactions between actors are crucial in the interactive governance approach as developed by Kooiman and Bavinck (2005) which theoretically guides this study. I use this theory to clarify in what
21 Mosimane et al. (2013) used mind maps through which local people identified what they considered as key factors contributing to human-wildlife conflicts. Poor land-use planning and increased competition for natural resources were mentioned most, followed by population increase of humans and/or wildlife, poor management and management policies.
13
environmental and socio-political context22 actors operate and how they interact in their quest for solutions to human-wildlife conflicts, including the creation of new opportunities. This study aims to:
• Generate a deeper understanding of the causes of human-wildlife conflicts involvinghippos in non-protected areas;
• Clarify the time-space character of human-hippo conflicts in terms of location,frequency and seasonality;
• Identify the key actors and their respective roles and perceptions in wildlife matters inKenya and analyse how they perceive conflicts with hippos and what they see asviable and effective mitigation strategies;
• Determine how the existing wildlife governance regime accommodates human-natureinteractions and conflicts in Kenyan wetlands, particularly in the Lake Victoria Area,and the way in which it shapes wildlife governance;
• Contribute evidence-based knowledge for designing wildlife governance andconservation strategies in non-protected areas.
1.3.2 Research questions The main research question is, “How can human-hippo conflicts in the Lake Victoria Area, Kenya, best be understood and dealt with?” The following sub-questions are addressed:
• What are the natural and socioeconomic features of wetlands in the Lake VictoriaArea and how do they interact? (Chapter 4);
• What legal arrangements guide wildlife governance in Kenya and the management ofhuman-hippo conflicts? Who are the key actors and what is their role regardinghuman-hippo conflicts? (Chapter 5);
• What types of conflicts occur between people and hippos in Winam Gulf Area andwhat is their magnitude? What does the reporting chain entail? Which risk factors arerelated to hippo presence? (Chapter 6);
• What ‘images’ exist of human-hippo conflicts and how do these images affect actors’attitude towards hippo conservation and human-hippo conflicts? (Chapter 7);
• How do local communities work towards human-hippo conflict mitigation in practice?What coping strategies are used to handle the outcome of such conflicts? (Chapter 8);
• How can local communities become more actively involved in conflict mitigation andhow can they acquire a more prominent role in hippo conservation? (Chapter 9).
1.4 Thesis outline
This dissertation is divided into four parts and consists of nine chapters. A brief overview of the content of each chapter is presented below:
Part I covers Chapters 1-3. It presents the background to the study by introducing the topic, presenting the theoretical framework and the research methodology.
Chapter 1 introduces the study. It presents background information on human-wildlife conflicts and their main causes of conflict, followed by a justification of the study, its objectives and research questions.
22 In resilience thinking, this is referred to as ‘social-ecological system’ (SES). Anderies et al. (2004:3) define a SES as “an ecological system intricately linked with and affected by one or more social systems”. Ostrom (2007) links SES to rapidly changing human and biophysical processes like population increase, overharvesting and pollution, which contribute to the loss of species. She argues that both social and biophyscial processes need thorough analysis in order to handle this myriad of diverse and complex processes effectively. Essentially, resilience is about how ecosystems absorb the human impact on them (Gunderson 2000; Holling 1973; Walker et al. 2002, 2004).
14
Chapter 2 presents the theoretical debates on which this study is grounded. It comprises three strands of scholarly literature related to, first, wildlife conservation, human-wildlife conflicts and wildlife damage management. Second, this study embarks on interactive governance theory, including the norms and principles (meta-governance or third order governance) and institutions (second order governance) that guide and shape day-to-day management (first order governance). Third, this study takes a political ecology approach to analyse the construction of ideas and discourses about human-wildlife conflicts and wildlife conservation and the underlying power structures that determine access to natural resources and the relative influence of different actors in wildlife governance. The idea is that, once the underlying governance principles and values have come to the fore and are made explicit, a more realistic notion will arise of the constraints and opportunities related to dealing with human-wildlife conflicts, hence facilitating conflict resolution.
Chapter 3 describes the research design, data collection methods and analysis, and introduces the study area. It further highlights how the study paved the way for a more ‘action-oriented’ study in collaboration with the Kenya Wildlife Service (KWS) and the local communities.
Part II consists of Chapters 4 and 5 and provides the contextual analysis of the Lake Victoria Area, its inhabitants (both people and hippos) and the governing system.
Chapter 4 looks at the system-to-be-governed from two angles: the natural and the human system. Whereas the first shows the characteristics of the study area and wetland ecosytems, it also presents a hippo profile covering its distribution, numbers and conservation status, at the same time underlining the ecological side in terms of habitat, behaviour, and the species’ significance. The human system is about the socio-economic features of the inhabitants of the study area. It also covers local knowledge about wetlands and hippos.
Chapter 5 deals with the governing system. It describes the legal arrangements that guide wildlife governance in contemporary Kenya and the management of human-hippo conflicts, followed by an overview of the key actors and their roles in the wildlife sector, particularly their positions regarding human-hippo conflicts. It shows the values and guiding principles that underlie the governance system.
Part III, covering Chapters 6-9, presents the fieldwork results.
Chapter 6 focuses on human-wildlife conflicts as a key aspect of the system-to-be-governed; it describes them in terms of conflict type, occurrence and time-space elements. Losses experienced by farmers and fishers are looked into and related to income, followed by the reporting chain of incidents to KWS and its response to them as part of its ‘problem animal’ control strategy. Data from the KWS Occurrence Books is compared with the project data. Finally, risks related to hippo incidents are introduced.
Chapter 7 is about images and perceptions (meta-governance). It not only shows what principles, values and criteria guide governance interactions, but also gives insight into the roles and responsibilities of different actors involved in wildlife governance. Perceptions are significant to this chapter: they show how actors perceive human-hippo conflicts – closely linked to their tolerance levels for the inflicted damage – and how this leads them to take position towards human-wildlife conflict mitigation.
Chapter 8 addresses how local communities work towards human-hippo conflict mitigation in practice. It gives an overview of the methods applied by farmers and fishers, describes risk reduction methods to prevent hippo encounters, and the coping strategies to which residents adhere when they experience damage inflicted by hippos.
Chapter 9 deals with the prospects of local wildlife governance. It addresses the question of what role local communities can play in human-wildlife conflict mitigation. Through focus group discussions and awareness creation meetings with KWS, local inhabitants got more
15
actively involved in curbing human-wildlife conflicts and how to acquire a more prominent role in hippo conservation. This generated the creation of ‘hippo lobby groups’ in the study area.
Part IV: includes the concluding Chapter 10, which syntheses the research, reflects on the problem statement and research objectives, and answers the main research question. It further elaborates on the theoretical and policy implications of this study and gives recommendations for future research.
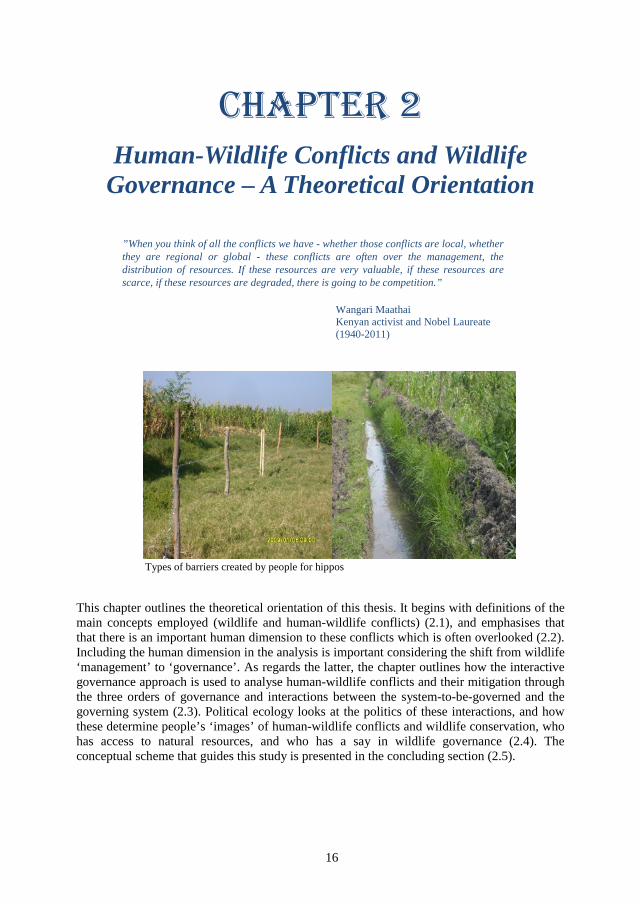
16
Chapter 2 Human-Wildlife Conflicts and Wildlife
Governance – A Theoretical Orientation
”When you think of all the conflicts we have - whether those conflicts are local, whether they are regional or global - these conflicts are often over the management, the distribution of resources. If these resources are very valuable, if these resources are scarce, if these resources are degraded, there is going to be competition.”
Wangari Maathai Kenyan activist and Nobel Laureate (1940-2011)
Types of barriers created by people for hippos
This chapter outlines the theoretical orientation of this thesis. It begins with definitions of the main concepts employed (wildlife and human-wildlife conflicts) (2.1), and emphasises that that there is an important human dimension to these conflicts which is often overlooked (2.2). Including the human dimension in the analysis is important considering the shift from wildlife ‘management’ to ‘governance’. As regards the latter, the chapter outlines how the interactive governance approach is used to analyse human-wildlife conflicts and their mitigation through the three orders of governance and interactions between the system-to-be-governed and the governing system (2.3). Political ecology looks at the politics of these interactions, and how these determine people’s ‘images’ of human-wildlife conflicts and wildlife conservation, who has access to natural resources, and who has a say in wildlife governance (2.4). The conceptual scheme that guides this study is presented in the concluding section (2.5).
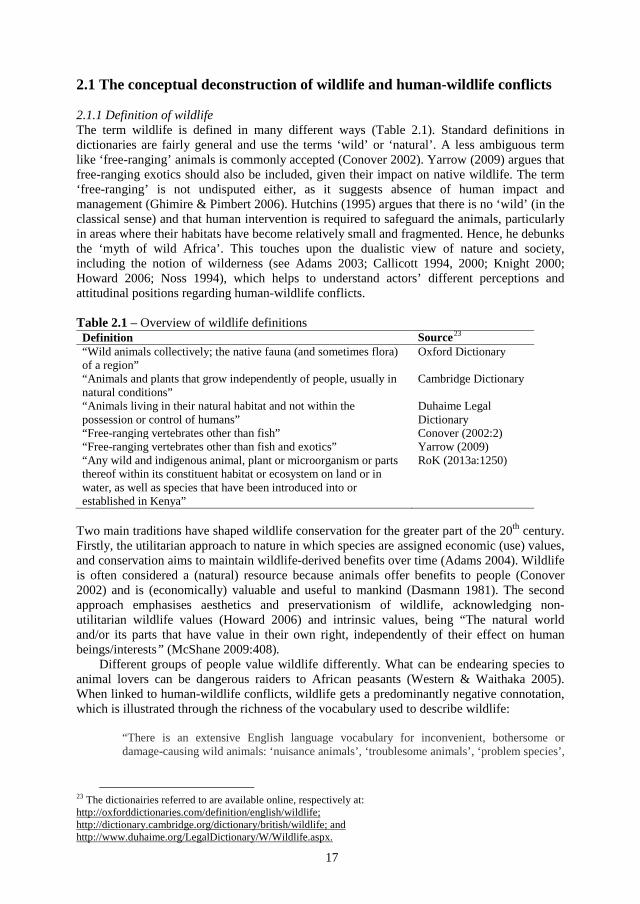
17
2.1 The conceptual deconstruction of wildlife and human-wildlife conflicts
2.1.1 Definition of wildlife The term wildlife is defined in many different ways (Table 2.1). Standard definitions in dictionaries are fairly general and use the terms ‘wild’ or ‘natural’. A less ambiguous term like ‘free-ranging’ animals is commonly accepted (Conover 2002). Yarrow (2009) argues that free-ranging exotics should also be included, given their impact on native wildlife. The term ‘free-ranging’ is not undisputed either, as it suggests absence of human impact and management (Ghimire & Pimbert 2006). Hutchins (1995) argues that there is no ‘wild’ (in the classical sense) and that human intervention is required to safeguard the animals, particularly in areas where their habitats have become relatively small and fragmented. Hence, he debunks the ‘myth of wild Africa’. This touches upon the dualistic view of nature and society, including the notion of wilderness (see Adams 2003; Callicott 1994, 2000; Knight 2000; Howard 2006; Noss 1994), which helps to understand actors’ different perceptions and attitudinal positions regarding human-wildlife conflicts.
Table 2.1 – Overview of wildlife definitions Definition Source23 “Wild animals collectively; the native fauna (and sometimes flora) of a region”
Oxford Dictionary
“Animals and plants that grow independently of people, usually in natural conditions”
Cambridge Dictionary
“Animals living in their natural habitat and not within the possession or control of humans”
Duhaime Legal Dictionary
“Free-ranging vertebrates other than fish” Conover (2002:2) “Free-ranging vertebrates other than fish and exotics” Yarrow (2009) “Any wild and indigenous animal, plant or microorganism or parts thereof within its constituent habitat or ecosystem on land or in water, as well as species that have been introduced into or established in Kenya”
RoK (2013a:1250)
Two main traditions have shaped wildlife conservation for the greater part of the 20th century. Firstly, the utilitarian approach to nature in which species are assigned economic (use) values, and conservation aims to maintain wildlife-derived benefits over time (Adams 2004). Wildlife is often considered a (natural) resource because animals offer benefits to people (Conover 2002) and is (economically) valuable and useful to mankind (Dasmann 1981). The second approach emphasises aesthetics and preservationism of wildlife, acknowledging non-utilitarian wildlife values (Howard 2006) and intrinsic values, being “The natural world and/or its parts that have value in their own right, independently of their effect on human beings/interests” (McShane 2009:408).
Different groups of people value wildlife differently. What can be endearing species to animal lovers can be dangerous raiders to African peasants (Western & Waithaka 2005). When linked to human-wildlife conflicts, wildlife gets a predominantly negative connotation, which is illustrated through the richness of the vocabulary used to describe wildlife:
“There is an extensive English language vocabulary for inconvenient, bothersome or damage-causing wild animals: ‘nuisance animals’, ‘troublesome animals’, ‘problem species’,
23 The dictionairies referred to are available online, respectively at: http://oxforddictionaries.com/definition/english/wildlife; http://dictionary.cambridge.org/dictionary/british/wildlife; and http://www.duhaime.org/LegalDictionary/W/Wildlife.aspx.
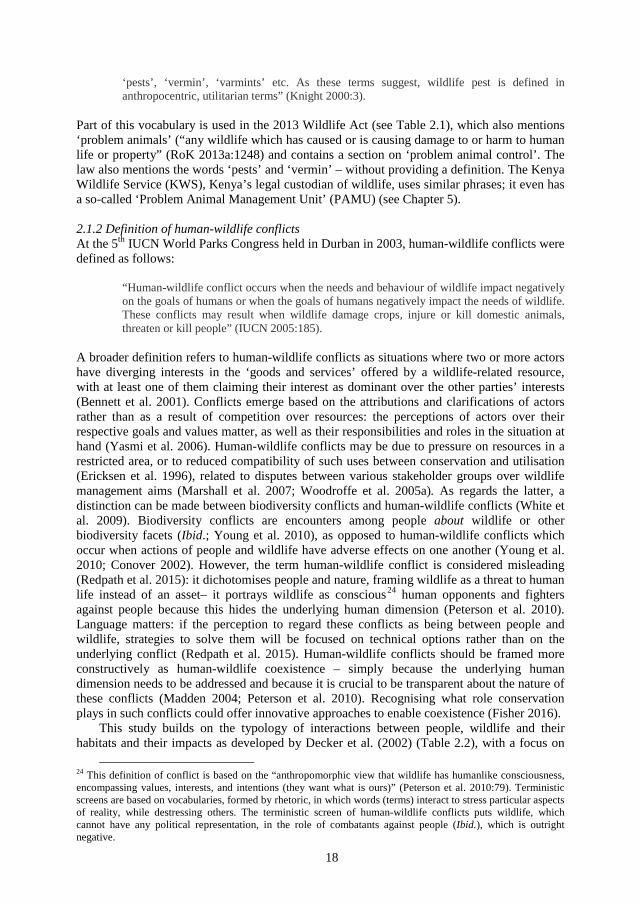
18
‘pests’, ‘vermin’, ‘varmints’ etc. As these terms suggest, wildlife pest is defined in anthropocentric, utilitarian terms” (Knight 2000:3).
Part of this vocabulary is used in the 2013 Wildlife Act (see Table 2.1), which also mentions ‘problem animals’ (“any wildlife which has caused or is causing damage to or harm to human life or property” (RoK 2013a:1248) and contains a section on ‘problem animal control’. The law also mentions the words ‘pests’ and ‘vermin’ – without providing a definition. The Kenya Wildlife Service (KWS), Kenya’s legal custodian of wildlife, uses similar phrases; it even has a so-called ‘Problem Animal Management Unit’ (PAMU) (see Chapter 5).
2.1.2 Definition of human-wildlife conflicts At the 5th IUCN World Parks Congress held in Durban in 2003, human-wildlife conflicts were defined as follows:
“Human-wildlife conflict occurs when the needs and behaviour of wildlife impact negatively on the goals of humans or when the goals of humans negatively impact the needs of wildlife. These conflicts may result when wildlife damage crops, injure or kill domestic animals, threaten or kill people” (IUCN 2005:185).
A broader definition refers to human-wildlife conflicts as situations where two or more actors have diverging interests in the ‘goods and services’ offered by a wildlife-related resource, with at least one of them claiming their interest as dominant over the other parties’ interests (Bennett et al. 2001). Conflicts emerge based on the attributions and clarifications of actors rather than as a result of competition over resources: the perceptions of actors over their respective goals and values matter, as well as their responsibilities and roles in the situation at hand (Yasmi et al. 2006). Human-wildlife conflicts may be due to pressure on resources in a restricted area, or to reduced compatibility of such uses between conservation and utilisation (Ericksen et al. 1996), related to disputes between various stakeholder groups over wildlife management aims (Marshall et al. 2007; Woodroffe et al. 2005a). As regards the latter, a distinction can be made between biodiversity conflicts and human-wildlife conflicts (White et al. 2009). Biodiversity conflicts are encounters among people about wildlife or other biodiversity facets (Ibid.; Young et al. 2010), as opposed to human-wildlife conflicts which occur when actions of people and wildlife have adverse effects on one another (Young et al. 2010; Conover 2002). However, the term human-wildlife conflict is considered misleading (Redpath et al. 2015): it dichotomises people and nature, framing wildlife as a threat to human life instead of an asset– it portrays wildlife as conscious24 human opponents and fighters against people because this hides the underlying human dimension (Peterson et al. 2010). Language matters: if the perception to regard these conflicts as being between people and wildlife, strategies to solve them will be focused on technical options rather than on the underlying conflict (Redpath et al. 2015). Human-wildlife conflicts should be framed more constructively as human-wildlife coexistence – simply because the underlying human dimension needs to be addressed and because it is crucial to be transparent about the nature of these conflicts (Madden 2004; Peterson et al. 2010). Recognising what role conservation plays in such conflicts could offer innovative approaches to enable coexistence (Fisher 2016).
This study builds on the typology of interactions between people, wildlife and their habitats and their impacts as developed by Decker et al. (2002) (Table 2.2), with a focus on
24 This definition of conflict is based on the “anthropomorphic view that wildlife has humanlike consciousness, encompassing values, interests, and intentions (they want what is ours)” (Peterson et al. 2010:79). Terministic screens are based on vocabularies, formed by rhetoric, in which words (terms) interact to stress particular aspects of reality, while destressing others. The terministic screen of human-wildlife conflicts puts wildlife, which cannot have any political representation, in the role of combatants against people (Ibid.), which is outright negative.
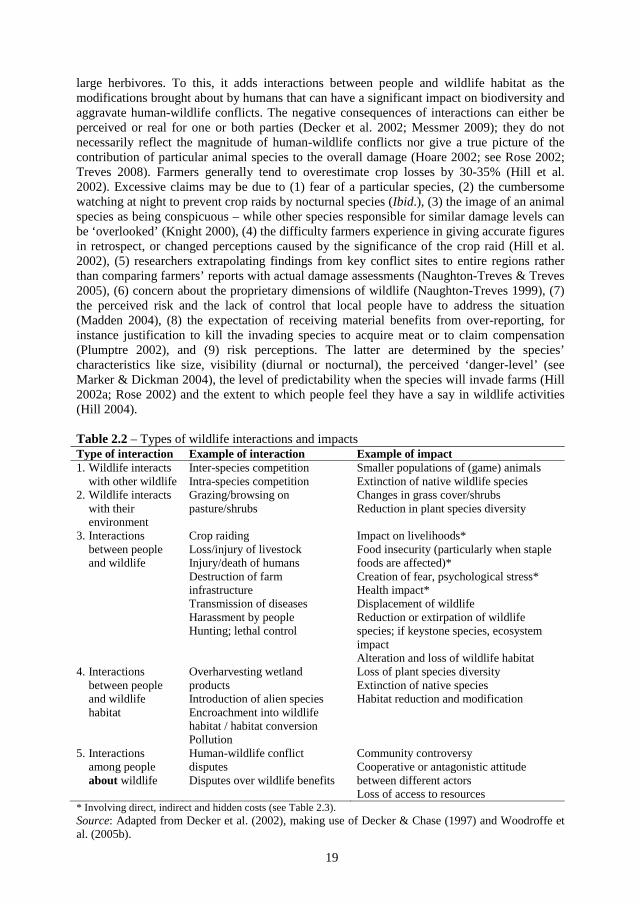
19
large herbivores. To this, it adds interactions between people and wildlife habitat as the modifications brought about by humans that can have a significant impact on biodiversity and aggravate human-wildlife conflicts. The negative consequences of interactions can either be perceived or real for one or both parties (Decker et al. 2002; Messmer 2009); they do not necessarily reflect the magnitude of human-wildlife conflicts nor give a true picture of the contribution of particular animal species to the overall damage (Hoare 2002; see Rose 2002; Treves 2008). Farmers generally tend to overestimate crop losses by 30-35% (Hill et al. 2002). Excessive claims may be due to (1) fear of a particular species, (2) the cumbersome watching at night to prevent crop raids by nocturnal species (Ibid.), (3) the image of an animal species as being conspicuous – while other species responsible for similar damage levels can be ‘overlooked’ (Knight 2000), (4) the difficulty farmers experience in giving accurate figures in retrospect, or changed perceptions caused by the significance of the crop raid (Hill et al. 2002), (5) researchers extrapolating findings from key conflict sites to entire regions rather than comparing farmers’ reports with actual damage assessments (Naughton-Treves & Treves 2005), (6) concern about the proprietary dimensions of wildlife (Naughton-Treves 1999), (7) the perceived risk and the lack of control that local people have to address the situation (Madden 2004), (8) the expectation of receiving material benefits from over-reporting, for instance justification to kill the invading species to acquire meat or to claim compensation (Plumptre 2002), and (9) risk perceptions. The latter are determined by the species’ characteristics like size, visibility (diurnal or nocturnal), the perceived ‘danger-level’ (see Marker & Dickman 2004), the level of predictability when the species will invade farms (Hill 2002a; Rose 2002) and the extent to which people feel they have a say in wildlife activities (Hill 2004).
Table 2.2 – Types of wildlife interactions and impacts Type of interaction Example of interaction Example of impact 1. Wildlife interacts
with other wildlife Inter-species competition Intra-species competition
Smaller populations of (game) animals Extinction of native wildlife species
2. Wildlife interacts with their environment
Grazing/browsing on pasture/shrubs
Changes in grass cover/shrubs Reduction in plant species diversity
3. Interactions between people and wildlife
Crop raiding Loss/injury of livestock Injury/death of humans Destruction of farm infrastructure Transmission of diseases Harassment by people Hunting; lethal control
Impact on livelihoods* Food insecurity (particularly when staple foods are affected)* Creation of fear, psychological stress* Health impact* Displacement of wildlife Reduction or extirpation of wildlife species; if keystone species, ecosystem impact Alteration and loss of wildlife habitat
4. Interactions between people and wildlife habitat
Overharvesting wetland products Introduction of alien species Encroachment into wildlife habitat / habitat conversion Pollution
Loss of plant species diversity Extinction of native species Habitat reduction and modification
5. Interactions among people about wildlife
Human-wildlife conflict disputes Disputes over wildlife benefits
Community controversy Cooperative or antagonistic attitude between different actors Loss of access to resources
* Involving direct, indirect and hidden costs (see Table 2.3). Source: Adapted from Decker et al. (2002), making use of Decker & Chase (1997) and Woodroffe et al. (2005b).
20
The impacts listed in Table 2.2 may be linked to health and safety issues or have an ecological, cultural, psychological, social or economic dimension (Woodroffe et al. 2005b). Studies of human-wildlife conflicts often emphasise negative impacts. Over 95% of publications and presentations that use the phrase human-wildlife conflict or a species-specific alternative (like human-hippo conflict) referred for instance to damage by animals to human food resources (like crops, livestock and fisheries – with the charismatic mega-herbivores cited most), human safety (creating fear, injury or death, and disease transfer), non-agricultural property, and transportation means (vehicles, airplanes) (Peterson et al. 2010). Only in a few publications, human-wildlife conflicts referred to human-human conflicts in which people disagreed over wildlife ‘management’ decisions (Ibid.).
The phrase ‘human-wildlife conflicts’ needs further deconstruction as suggested in Table 2.2, discerning between direct interactions between humans and wildlife (“conflicts with wildlife and conflicts attributed to wildlife”, Knight 2000:3) (3-4 in Table 2.2) and people-people interactions (“conflicts over wildlife”, Knight 2000:3-4) (5 in Table 2.2). Conflicts over wildlife can be about wildlife use and access to wildlife (as a resource) or be due to differing value orientations (Decker & Chase 1997; Knight 2000); involve clashes between people with different levels of empowerment and wealth (Madden 2004), or disputes between stakeholder groups over how to best manage wildlife (Marshall et al. 2007; Redpath et al. 2013; Woodroffe et al. 2005c). People can have opposite views of a particular animal species and its land-use requirements (Knight 2000). Different positions on human-wildlife conflict issues can easily turn into political clashes due to the human tendency to ignore or discount the opinions of people with different values and attitudes (Treves 2008).
Studies of human-wildlife conflicts often fail to address human disagreements. However, underlying values and perceptions of the context of human-wildlife conflicts (like livelihoods and conservation) can influence people’s position on a particular topic, what they see fit to conflict management and the types of management measures to be taken, thus pointing at the significance of the human side of human-wildlife conflicts in order to reach management goals (Marshall et al. 2007). Human-wildlife conflicts arise from a ‘deeper cognitive level’, are related to power arrangements and adjusted attitudes and values which are socially and culturally embedded in history. They can also originate when actors are either kept out of conservation planning or blocked in the negotiation process (Redpath et al. 2013). The underlying values regarding human-wildlife conflicts receive further attention in Section 2.2.1 and Chapter 7.
2.2 The human dimension to human-wildlife conflicts
Human-wildlife conflicts cover a broad field characterised by a variety of situations and species, with humans as the denominator – our thoughts and actions are decisive for the course and outcome of conflicts. This implies that knowledge of human behaviour is critical in dealing with human-wildlife conflicts (Manfredo & Dayer 2004). Confrontations between people call for an approach that looks into the social elements of conflicts viz. relationships and interactions (White et al. 2009). Much research has focused on particular animal species, their characteristics and (habitat) requirements, but much less attention has gone to the human dimension, which is crucial to (long-term) conservation (Marker & Dickman 2004). Key is to strike a balance between wildlife concerns and human interests, thereby weighing multiple wildlife interests within society while taking society’s changing interest in wildlife into account (Manfredo et al. 1998). Hence the need to combine social science and ecological approaches in order to include both perspectives: those of farmers and animals (Decker & Richmond 1995; Hill 2004, 2002b; Nelson 2006). This is preferably done at micro and macro levels due to the global nature of human-wildlife conflicts (Manfredo & Dayer 2004). The
21
human dimensions on which this thesis focuses are values and attitudes (Chapters 6 and 7), actual and perceived costs (Chapter 6), cultural factors (Chapter 7), livelihoods and coping strategies (Chapter 8), and governance (Chapter 9). The ecological dimensions of human-wildlife conflicts are addressed in Chapter 4.
2.2.1 Values and attitudes Crucial to the analysis of the human dimension are the perspectives, values and value orientations that guide attitudes, which in turn influence human behaviour (Cline et al. 2007). Attitudes thus reflect people’s perceptions and values. An extensive typology of values towards wildlife (and nature) was developed by Kellert (1991) and further refined by Howard (2006). This thesis builds on the basic distinction between two main value categories (Burgman & Lindenmayer 1998, in Howard 2006). The first is anthropocentric in nature and based on utilitarian principles, which implies that economic values are assigned to wildlife and their allocation/regulation is predominantly politically determined. The intrinsic values refer to a more holistic ecocentric ethic (people are inseparable from nature and all nature is to be valued in itself) and the biocentric ethic (which attributes inherent value to all living beings thereby stressing the value and rights of individual organisms) (Ibid.).
Understanding local attitudes towards human-wildlife conflicts is essential in the development of conflict mitigation strategies (Ogra 2009) and a major focus of this thesis (Chapter 7). Knowledge of the different wildlife values and attitudes to which (sub)groups in society may adhere (why do they value/dislike wildlife?) and the resulting intractable conflicts cannot only help explain how these groups perceive animal damage control, but also assist in the development of conflict resolution strategies (Kellert 1991). Besides the basic wildlife values mentioned above, there are other factors that influence how people perceive wildlife and wildlife conservation. These include personal characteristics (age, gender), socio-economic status (education, income), people’s dependency on land and natural resources, their knowledge of wildlife species, habitats and conservation matters, and human-wildlife relationships (linked to conservation status, human-wildlife conflicts, utilisation and land-use options) (Kellert 1994).
Yet, the relationship between values, attitude, and behaviour is not straightforward (Dickman 2010). There are significant differences in human responses to conflicts depending on (1) people’s awareness and perceptions of the risk, (2) the visibility of a species, (3) whether people have single or composed livelihoods, which determines their vulnerability to wildlife encounters, (4) the accuracy of the damage assessment, which influences the perceived level of conflict; (5) the intensity of people’s response to that conflict, and (6) whether the management of the ‘problem’ species is correlated with the reported conflict (Ibid.). Rhetoric also plays a role in attitude: the way in which human-hippo incidents are framed in the media may influence the readers to think in a certain way – it may enhance their opinion of wildlife being antagonistic towards people. In this respect, cultural leaders like priests, teachers, and village elders also play a role: residents esteem their opinions and tend to follow them. If they call the hippo a ‘bad’ animal that causes destruction, that framing will penetrate local people’s minds. This implies that they could be a good starting point to changing the mindset of local people. The images and perceptions local people have regarding hippos and conflicts, as well as their attitude towards the wildlife authorities and wildlife, are analysed in Chapter 7.
2.2.2 Actual and perceived costs The impacts addressed in Section 2.1.2 bring costs to the stakeholders25 that may be direct, indirect or hidden (Table 2.3). Direct costs relate to human casualties or property loss; the
25 ‘Stakeholders’ are defined as “individuals and groups who may be affected by or can affect wildlife management decisions and programs” (Decker et al. 2002:5).
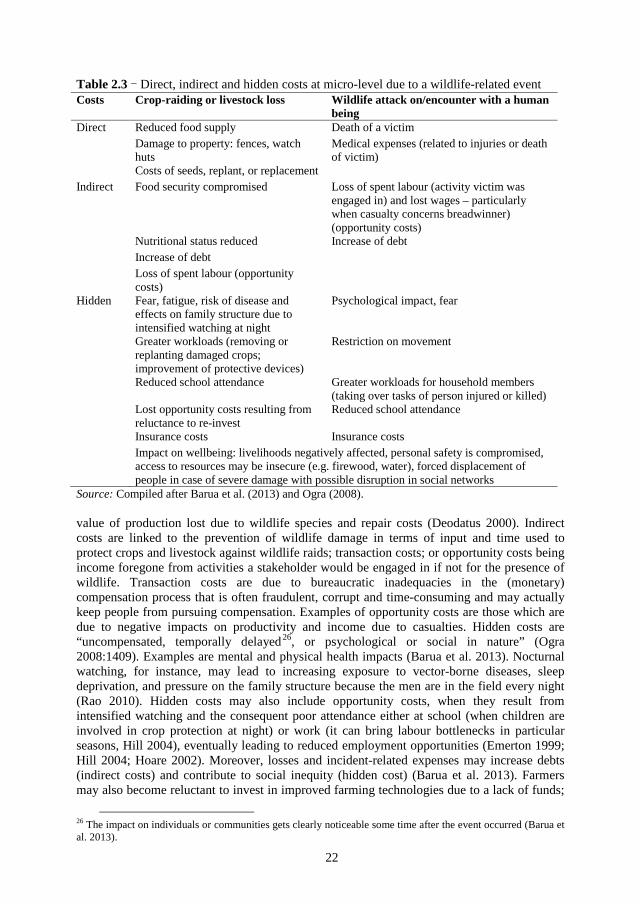
22
Table 2.3 - Direct, indirect and hidden costs at micro-level due to a wildlife-related event Costs Crop-raiding or livestock loss Wildlife attack on/encounter with a human
being Direct Reduced food supply Death of a victim
Damage to property: fences, watch huts
Medical expenses (related to injuries or death of victim)
Costs of seeds, replant, or replacement Indirect Food security compromised Loss of spent labour (activity victim was
engaged in) and lost wages – particularly when casualty concerns breadwinner) (opportunity costs)
Nutritional status reduced Increase of debt Increase of debt Loss of spent labour (opportunity costs)
Hidden Fear, fatigue, risk of disease and effects on family structure due to intensified watching at night
Psychological impact, fear
Greater workloads (removing or replanting damaged crops; improvement of protective devices)
Restriction on movement
Reduced school attendance Greater workloads for household members (taking over tasks of person injured or killed)
Lost opportunity costs resulting from reluctance to re-invest
Reduced school attendance
Insurance costs Insurance costs Impact on wellbeing: livelihoods negatively affected, personal safety is compromised, access to resources may be insecure (e.g. firewood, water), forced displacement of people in case of severe damage with possible disruption in social networks
Source: Compiled after Barua et al. (2013) and Ogra (2008).
value of production lost due to wildlife species and repair costs (Deodatus 2000). Indirect costs are linked to the prevention of wildlife damage in terms of input and time used to protect crops and livestock against wildlife raids; transaction costs; or opportunity costs being income foregone from activities a stakeholder would be engaged in if not for the presence of wildlife. Transaction costs are due to bureaucratic inadequacies in the (monetary) compensation process that is often fraudulent, corrupt and time-consuming and may actually keep people from pursuing compensation. Examples of opportunity costs are those which are due to negative impacts on productivity and income due to casualties. Hidden costs are “uncompensated, temporally delayed26, or psychological or social in nature” (Ogra 2008:1409). Examples are mental and physical health impacts (Barua et al. 2013). Nocturnal watching, for instance, may lead to increasing exposure to vector-borne diseases, sleep deprivation, and pressure on the family structure because the men are in the field every night (Rao 2010). Hidden costs may also include opportunity costs, when they result from intensified watching and the consequent poor attendance either at school (when children are involved in crop protection at night) or work (it can bring labour bottlenecks in particular seasons, Hill 2004), eventually leading to reduced employment opportunities (Emerton 1999; Hill 2004; Hoare 2002). Moreover, losses and incident-related expenses may increase debts (indirect costs) and contribute to social inequity (hidden cost) (Barua et al. 2013). Farmers may also become reluctant to invest in improved farming technologies due to a lack of funds;
26 The impact on individuals or communities gets clearly noticeable some time after the event occurred (Barua et al. 2013).
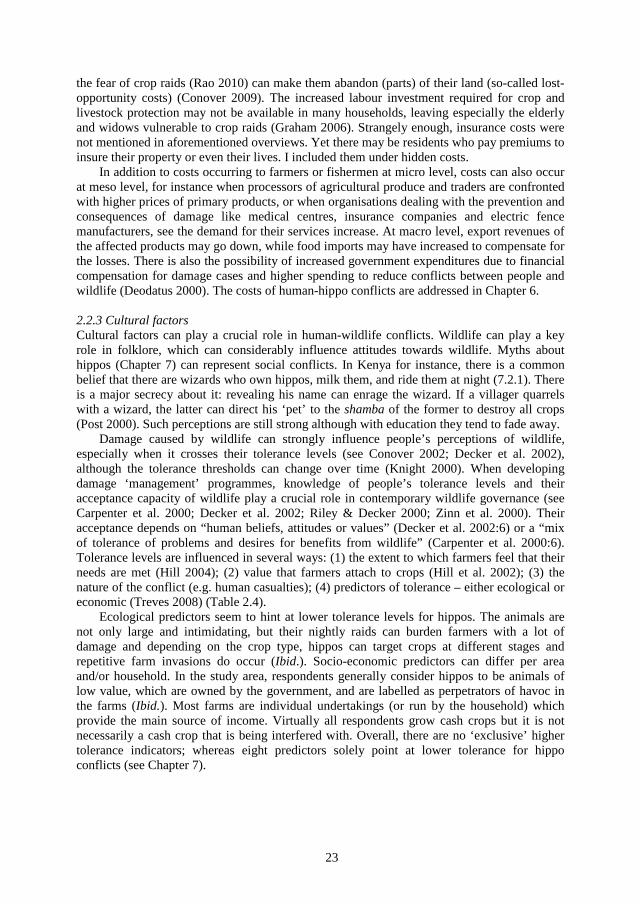
23
the fear of crop raids (Rao 2010) can make them abandon (parts) of their land (so-called lost-opportunity costs) (Conover 2009). The increased labour investment required for crop and livestock protection may not be available in many households, leaving especially the elderly and widows vulnerable to crop raids (Graham 2006). Strangely enough, insurance costs were not mentioned in aforementioned overviews. Yet there may be residents who pay premiums to insure their property or even their lives. I included them under hidden costs.
In addition to costs occurring to farmers or fishermen at micro level, costs can also occur at meso level, for instance when processors of agricultural produce and traders are confronted with higher prices of primary products, or when organisations dealing with the prevention and consequences of damage like medical centres, insurance companies and electric fence manufacturers, see the demand for their services increase. At macro level, export revenues of the affected products may go down, while food imports may have increased to compensate for the losses. There is also the possibility of increased government expenditures due to financial compensation for damage cases and higher spending to reduce conflicts between people and wildlife (Deodatus 2000). The costs of human-hippo conflicts are addressed in Chapter 6.
2.2.3 Cultural factors Cultural factors can play a crucial role in human-wildlife conflicts. Wildlife can play a key role in folklore, which can considerably influence attitudes towards wildlife. Myths about hippos (Chapter 7) can represent social conflicts. In Kenya for instance, there is a common belief that there are wizards who own hippos, milk them, and ride them at night (7.2.1). There is a major secrecy about it: revealing his name can enrage the wizard. If a villager quarrels with a wizard, the latter can direct his ‘pet’ to the shamba of the former to destroy all crops (Post 2000). Such perceptions are still strong although with education they tend to fade away.
Damage caused by wildlife can strongly influence people’s perceptions of wildlife, especially when it crosses their tolerance levels (see Conover 2002; Decker et al. 2002), although the tolerance thresholds can change over time (Knight 2000). When developing damage ‘management’ programmes, knowledge of people’s tolerance levels and their acceptance capacity of wildlife play a crucial role in contemporary wildlife governance (see Carpenter et al. 2000; Decker et al. 2002; Riley & Decker 2000; Zinn et al. 2000). Their acceptance depends on “human beliefs, attitudes or values” (Decker et al. 2002:6) or a “mix of tolerance of problems and desires for benefits from wildlife” (Carpenter et al. 2000:6). Tolerance levels are influenced in several ways: (1) the extent to which farmers feel that their needs are met (Hill 2004); (2) value that farmers attach to crops (Hill et al. 2002); (3) the nature of the conflict (e.g. human casualties); (4) predictors of tolerance – either ecological or economic (Treves 2008) (Table 2.4).
Ecological predictors seem to hint at lower tolerance levels for hippos. The animals are not only large and intimidating, but their nightly raids can burden farmers with a lot of damage and depending on the crop type, hippos can target crops at different stages and repetitive farm invasions do occur (Ibid.). Socio-economic predictors can differ per area and/or household. In the study area, respondents generally consider hippos to be animals of low value, which are owned by the government, and are labelled as perpetrators of havoc in the farms (Ibid.). Most farms are individual undertakings (or run by the household) which provide the main source of income. Virtually all respondents grow cash crops but it is not necessarily a cash crop that is being interfered with. Overall, there are no ‘exclusive’ higher tolerance indicators; whereas eight predictors solely point at lower tolerance for hippo conflicts (see Chapter 7).
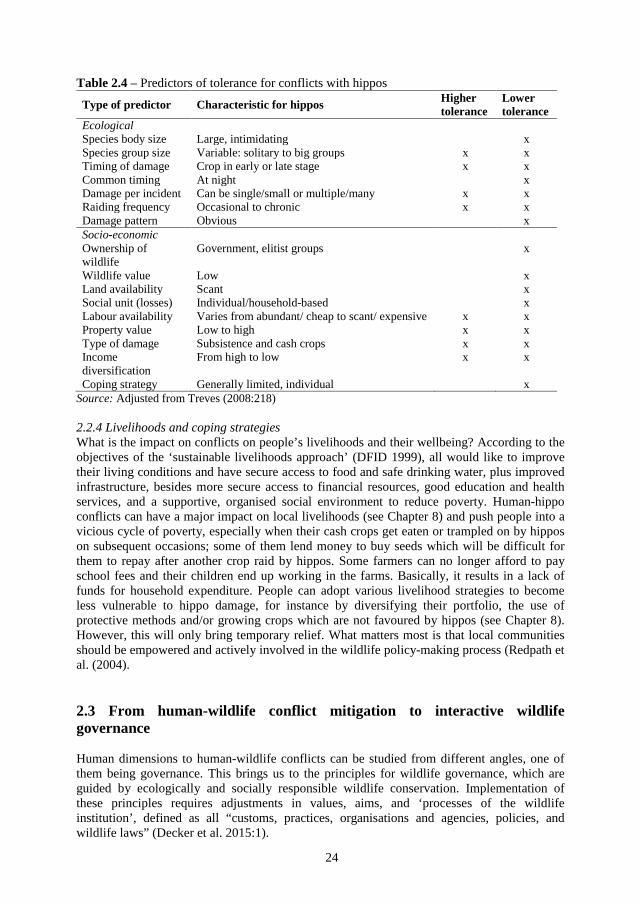
24
Table 2.4 – Predictors of tolerance for conflicts with hippos
Type of predictor Characteristic for hippos Higher tolerance
Lower tolerance
Ecological Species body size Large, intimidating x Species group size Variable: solitary to big groups x x Timing of damage Crop in early or late stage x x Common timing At night x Damage per incident Can be single/small or multiple/many x x Raiding frequency Occasional to chronic x x Damage pattern Obvious x Socio-economic Ownership of wildlife
Government, elitist groups x
Wildlife value Low x Land availability Scant x Social unit (losses) Individual/household-based x Labour availability Varies from abundant/ cheap to scant/ expensive x x Property value Low to high x x Type of damage Subsistence and cash crops x x Income diversification
From high to low x x
Coping strategy Generally limited, individual x Source: Adjusted from Treves (2008:218)
2.2.4 Livelihoods and coping strategies What is the impact on conflicts on people’s livelihoods and their wellbeing? According to the objectives of the ‘sustainable livelihoods approach’ (DFID 1999), all would like to improve their living conditions and have secure access to food and safe drinking water, plus improved infrastructure, besides more secure access to financial resources, good education and health services, and a supportive, organised social environment to reduce poverty. Human-hippo conflicts can have a major impact on local livelihoods (see Chapter 8) and push people into a vicious cycle of poverty, especially when their cash crops get eaten or trampled on by hippos on subsequent occasions; some of them lend money to buy seeds which will be difficult for them to repay after another crop raid by hippos. Some farmers can no longer afford to pay school fees and their children end up working in the farms. Basically, it results in a lack of funds for household expenditure. People can adopt various livelihood strategies to become less vulnerable to hippo damage, for instance by diversifying their portfolio, the use of protective methods and/or growing crops which are not favoured by hippos (see Chapter 8). However, this will only bring temporary relief. What matters most is that local communities should be empowered and actively involved in the wildlife policy-making process (Redpath et al. (2004).
2.3 From human-wildlife conflict mitigation to interactive wildlife governance Human dimensions to human-wildlife conflicts can be studied from different angles, one of them being governance. This brings us to the principles for wildlife governance, which are guided by ecologically and socially responsible wildlife conservation. Implementation of these principles requires adjustments in values, aims, and ‘processes of the wildlife institution’, defined as all “customs, practices, organisations and agencies, policies, and wildlife laws” (Decker et al. 2015:1).
25
The term governance is commonly related to multiple actors and can refer to governance by, with and without the state (Arts & Visseren-Hamakers 2012). Hence governance goes beyond the state and acknowledges the significance of other actors (e.g. market actors and civil society27) in governing at different levels of scale (Chuenpagdee 2011; Lemos & Agrawal 2006). Governance by the state deals with activities undertaken by state bodies, especially those that “operate at the level of the nation state to maintain public order and facilitate collective action”, while governance with the state refers to the rise of new styles of governing with blurred boundaries between “public and private sectors” (Stoker 1998:17). Wildlife-related actors are, for instance, government agencies, local communities, conservation organisations, Beach Management Units, NGOs, fishers, farmers, business enterprises and scientists; they all address wildlife issues through the identification of related problems and implementation of possible solutions (see Chapter 8). Wildlife governance used to be hierarchical (top-down oriented, with steering and control as its main concepts), but that is changing, although state actors are still dominating the governing interactions (Löf 2014). Globalisation and decentralisation resulted in a reconfiguration of the state, with new hybrid governance forms between the conventionally acknowledged social roles that states, markets, and communities play (Lemos & Agrawal 2006). This led to various forms of governing with the state, such as co-management (between state agencies and communities), public-private partnerships (between state agencies and market actors), and social-private partnerships (between market actors and communities) (Ibid.). In interactive governance theory, these modes are labelled as co-governance (Kooiman and Bavinck 2005). Besides hierarchical governance (governing by the state) and co-governance (governing with the state), there is also self-governance (governing without the state), in which the authority and decision-making power lie with the resource ‘users’ (Chuenpagdee 2011) or, as in the case of forest or fisheries certification, with the private sector (Arts & Visseren-Hamakers 2012).
2.3.1 Interactive governance Interaction is the central concept in the definition of interactive governance,
“Governance is the whole of public as well as private interactions taken to solve societal problems and create societal opportunities. It includes the formulation and application of principles guiding those interactions and care for institutions that enable them” (Kooiman & Bavinck 2005:17).
Interactions can be seen as a form of action taken to remove obstacles28 and create new tracks. Whereas institutions structure or organise human relations to create a situation in which people know about interactions and expectations (theirs and others), principles relate to fundamental suppositions, world visions and ethical norms (Bavinck et al. 2005; Kooiman & Bavinck 2013). Interactive governance is an intricate process, through which a multitude of social and political actors with deviating interests interact to articulate, support and reach joint goals through organising, trading, and arranging a series of “ideas, rules and resources” (Torfing et al. 2012:14). Notwithstanding the myriad of interpretations of interactive governance, three key features can be discerned (Kooiman & Bavinck 2005).
First, public and private actors are involved in governing and addressing societal issues, which enable interorganisational policymaking founded on active exchange (Torfing et al. 2012). Second, the shifted government roles point at changes in the tasks of the government
27 Civil society is defined as “The arena in which people come together to pursue the interests they hold in common – not for profit or political power, but because they care enough about something to take collective action” (Edwards 1998, in TACSO 2010:4). CSOs (civil society organisations) include “any organisation, formal or informal, within civil society”, like CBOs (community-based organisations) and NGOs (TACSO 2010:4). 28 What is defined as an obstacle or opportunity is related to the issue in question plus the position and comprehension of the observer (Kooiman et al. 2008).
26
and other social actors, as interests are often shared (Kooiman & Bavinck 2005); there is a collective ambition to strive after joint solutions to problems throughout the process (Torfing et al. 2012). Third, governance is founded on and reflects societal developments. These elements indicate that both the governing system and the system-to-be-governed are varied, intricate and dynamic in nature – they interact with each other (Kooiman & Bavinck 2005, 2013). This is a decentred process, consisting of various competing actors/arenas that add key resources, practices and concepts (Torfing et al. 2012).
Interactive governance theory locates wildlife conflicts in the system-to-be-governed, the governing system and governing interactions. In Kenya’s wildlife governance, the governing system consists of state agencies like KWS, market and civil society organisations that are involved in wildlife governance (Chapter 5), while the system-to-be-governed includes hippos (in their wetland habitats) and local communities (Chapter 4) and the conflicts between them (Chapter 6), whereas the governing interactions incorporate all relations between the actors concerned (Chapter 7, 8). The governing system consists of arenas where actors from the state, market or civil society interact in an effort to address (and solve) societal problems and as such, it acts in the context of the system-to-be-governed. Hence, interactive governance is an approach to analyse how governing objects and governing subjects relate to each other (Kooiman et al. 2008). In the end, it is about governability as “the overall capacity for governance of any societal entity or system” (Kooiman 2008:173), which is determined by the nature of the system-to-be-governed (in terms of diversity, complexity, dynamics, and resilience29) coupled with interactions with the governing system. Governability is a key concept in the interactive governance framework and a measuring rod for its quality (in terms of its problem-solving capacity) and of what is governable (Kooiman et al. 2008).
At the core of the interactive governance model are different interactions, within and between systems. These interactions partially determine the governability of the system, with conflicts arising from them (Bavinck et al. 2014b). They determine the success or failure of whatever governance occurs (Kooiman & Bavinck 2013). People interact in ways which are often unpredictable, with consequences that are not easily understood, particularly when external factors play a role. Interactive governance suggests ‘governability’ (the overall quality and capacity of governance systems), which depends mainly on the system’s properties like diversity, complexity, dynamics, and the spatial and temporal scales (Chuenpagdee 2011; Kooiman & Bavinck 2013). It is commonly assumed that the more diverse, complex, dynamic and large scale a system-to-be-governed is, the more challenging its governance is. The larger the capability of the governing system, the more likely it will be able to tackle the challenges (Chuenpagdee 2011).
2.3.2 Orders of governance Interactive governance advances an operationalisation of the three governing orders. The first order deals with day-to-day management, of people interacting to solve societal issues and break fresh ground – it is operational in nature (see Chapter 9). Governors steer conservation and development, they solve problems and establish alternative options. Hence governors need to know the current state of wildlife affairs (identify and formulate problems), the desired situation, and how to reach there. To this end, they need instruments which, depending on the political support, can be operationalised (Kooiman et al. 2008). All governing activities can be marked by three governance elements: images, instruments and actions (Kooiman & Jentoft 2009).
Images in wildlife governance come in various forms like knowledge, aims, facts, and presuppositions, hypotheses, models. They relate to particular issues at hand, and fundamental questions in the social, political and ethical realm (Ibid.) – e.g. to conservation, utilisation, but
29 To this, Jentoft (2007) adds vulnerability (both physical and social).
27
also to the relationship between people and wildlife. For example, the Government of Kenya restricts consumptive wildlife utilisation like game farming30, game ranching, cropping and culling, while sport hunting and even subsistence hunting are illegal activities. What is driving their stand and why?
There is a wide range of instruments in wildlife governance and natural resource governance in general, from ‘soft’ (like information or peer pressure), legally or financially grounded ones like permits, taxes or fines (Bavinck et al. 2005), technical instruments (like licensing or quota systems), to ‘hard’ instruments like physical force. Wildlife management plans are powerful instruments to bind actors to a particular system like wildlife protected areas. However, to be effective, all actors need access to and involvement in the development of such plans. Whereas instruments link images to action, they are not neutral and often generate friction: their choice is not free, but determined by what is available (type, range) related to one’s position in society (Kooiman & Jentoft 2009).
Actions cover the implementation of policies and/or the mobilisation of actors in another (new) direction. There are three types of enabling actions: “leadership, mobilisation and coordination” (Ibid.:36), which are poorly advanced in wildlife governance. There are several conventions at the international level that Kenya ratified like the Convention on Biological Diversity and the Convention on International Trade in Endangered Species, but so far there has been meagre commitment to their implementation – although Kenya has become one of the front runners when it comes to banning elephant poaching. At the national level, the state fails to serve as a coordinator, particularly when it comes to dealing with human-wildlife conflicts, while at local level, leadership is often poor (see Chapters 5 and 7).
The second order (see Chapter 5) is institutional: it is about designing, maintaining and changing governing institutions needed for problem solving. It provides frameworks within which first order governance takes place, and also deals with the facilitation or control of processes that solve societal problems or generate opportunities. Institutions represent “agreements, rules, rights, laws, norms, beliefs, roles, procedures and organisations” that first-order governors use when making decisions (Kooiman et al. 2008:7). The definition of institutions is multi-faceted and prone to debate. There are formal and informal institutions, as identified by North (1990, in Bennett et al. 2001). Formal ones like the “State, the judiciary, and the political system (i.e. a set of de jure rules, enshrined in regulations and constitutions that govern behaviour and shape society)” and informal ones, like “markets, communities and social capital (i.e. a set of de facto rules or norms, that govern behaviour and shape society)” (Bennett et al. 2001:5). Visions result in frameworks via the use of rules. Over time, governors realised that institutional arrangements left many issues uncovered, for instance due to fast changing circumstances to which institutions cannot adjust in time, or fail to respond to problems due to poor communication and feedback. Building governing institutions requires a certain degree of legitimacy according to its users for the management system to succeed in achieving its goals (Bavinck et al. 2005).
In the third order (meta-order), normative guidelines and values are formulated which guide how governing participants perceive and perform their roles (Ibid.). Meta-governance or “the governance of governance” (Jessop 2003:107, cited in Kooiman & Jentoft 2009:822) deals with the principles, values, and norms, which are debated, phrased and applied in governance interactions (Kooiman & Jentoft 2009). These ‘guidelines’ should be made explicit and clear to all actors involved (Ibid.). Discourses set the tone: the ambiguity of local communities in wildlife conservation, for instance, shows on the one hand, the depiction of ‘the local’ as an intruder in nature, with conflicting interests, while on the other ‘the local’ is constituted as a caretaker who manages natural resources (Wittmayer & Büscher 2010). Wildlife governors should clarify the political or ethical basis of their ideas and bring their
30 Wildlife species for which game farming is allowed are captured in the 2013 Act, Tenth Schedule. These are e.g. crocodiles, lizards, reptiles, tortoises, snakes and some bird species (RoK 2013a).
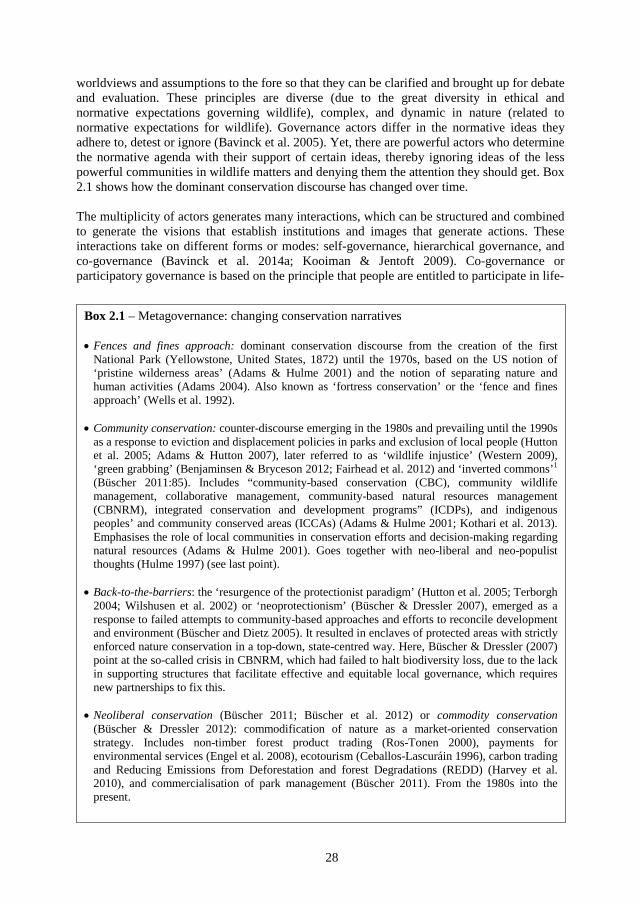
28
worldviews and assumptions to the fore so that they can be clarified and brought up for debate and evaluation. These principles are diverse (due to the great diversity in ethical and normative expectations governing wildlife), complex, and dynamic in nature (related to normative expectations for wildlife). Governance actors differ in the normative ideas they adhere to, detest or ignore (Bavinck et al. 2005). Yet, there are powerful actors who determine the normative agenda with their support of certain ideas, thereby ignoring ideas of the less powerful communities in wildlife matters and denying them the attention they should get. Box 2.1 shows how the dominant conservation discourse has changed over time.
The multiplicity of actors generates many interactions, which can be structured and combined to generate the visions that establish institutions and images that generate actions. These interactions take on different forms or modes: self-governance, hierarchical governance, and co-governance (Bavinck et al. 2014a; Kooiman & Jentoft 2009). Co-governance or participatory governance is based on the principle that people are entitled to participate in life-
Box 2.1 – Metagovernance: changing conservation narratives
• Fences and fines approach: dominant conservation discourse from the creation of the first National Park (Yellowstone, United States, 1872) until the 1970s, based on the US notion of ‘pristine wilderness areas’ (Adams & Hulme 2001) and the notion of separating nature and human activities (Adams 2004). Also known as ‘fortress conservation’ or the ‘fence and fines approach’ (Wells et al. 1992).
• Community conservation: counter-discourse emerging in the 1980s and prevailing until the 1990s
as a response to eviction and displacement policies in parks and exclusion of local people (Hutton et al. 2005; Adams & Hutton 2007), later referred to as ‘wildlife injustice’ (Western 2009), ‘green grabbing’ (Benjaminsen & Bryceson 2012; Fairhead et al. 2012) and ‘inverted commons’1 (Büscher 2011:85). Includes “community-based conservation (CBC), community wildlife management, collaborative management, community-based natural resources management (CBNRM), integrated conservation and development programs” (ICDPs), and indigenous peoples’ and community conserved areas (ICCAs) (Adams & Hulme 2001; Kothari et al. 2013). Emphasises the role of local communities in conservation efforts and decision-making regarding natural resources (Adams & Hulme 2001). Goes together with neo-liberal and neo-populist thoughts (Hulme 1997) (see last point).
• Back-to-the-barriers: the ‘resurgence of the protectionist paradigm’ (Hutton et al. 2005; Terborgh
2004; Wilshusen et al. 2002) or ‘neoprotectionism’ (Büscher & Dressler 2007), emerged as a response to failed attempts to community-based approaches and efforts to reconcile development and environment (Büscher and Dietz 2005). It resulted in enclaves of protected areas with strictly enforced nature conservation in a top-down, state-centred way. Here, Büscher & Dressler (2007) point at the so-called crisis in CBNRM, which had failed to halt biodiversity loss, due to the lack in supporting structures that facilitate effective and equitable local governance, which requires new partnerships to fix this.
• Neoliberal conservation (Büscher 2011; Büscher et al. 2012) or commodity conservation
(Büscher & Dressler 2012): commodification of nature as a market-oriented conservation strategy. Includes non-timber forest product trading (Ros-Tonen 2000), payments for environmental services (Engel et al. 2008), ecotourism (Ceballos-Lascuráin 1996), carbon trading and Reducing Emissions from Deforestation and forest Degradations (REDD) (Harvey et al. 2010), and commercialisation of park management (Büscher 2011). From the 1980s into the present.
29
affecting decisions, as exemplified in the 1992 Convention on Biodiversity (Bavinck and Gupta 2014). In wildlife literature, there is a tendency to work towards co-governance, in which the locus of power shifts from the governing body to an equitably shared power-relationship.
Many authors argue that local communities should be involved in wildlife conservation for it to succeed. To date, there is a lot of discontent among the communities in wildlife areas: they feel side-lined and left out in the decision-making process of wildlife policies and laws, while they experience ‘discomfort’ from human-wildlife conflicts, which can have a major impact on their livelihoods. Hence, involving them directly in the governance process can generate a positive feedback (Kooiman & Bavinck 2013). Governance decisions should be embedded in moral convictions; governors should be morally responsible for the well-being of all life (people and animals) within their jurisdictions (Bavinck et al. 2005) (see Chapter 5).
2.4 Political ecology
Political ecology deals with interactions between humans and the biophysical environment and how these are shaped over time by their political and socio-economic setting (Schubert 2005). Box 2.2 gives an overview of the different phases through which political ecology went since its inception in the 1970s, inspired by peasant studies and Marxist theory (Watts 2000). Political ecology can be defined as:
“an approach that combines the concerns of ecology and political economy to represent the ever-changing dynamic tension between ecological and human change, and between diverse groups within society at scales from the local individual to the Earth as a whole” (Adger et al. 2006:324).
Attempts have been made to involve local communities in conservation and align
conservation efforts with development projects. Under the global neoliberalisation of natural resources, the conservation focus shifted to market strategies in order to enable local and global communities to benefit from sustainable wildlife conservation (Büscher 2011; Prins et al. 2000). However, social benefits and costs are unevenly distributed across conservation strategies (Springer 2009). Particularly the creation of protected areas is inherently political in nature: it interferes with rights of indigenous people, affects access to natural resources, and excludes local people (Adams & Hutton 2007), thereby depriving local people from sustaining their livelihoods. This puts conservation in a bad light, and hampers the image (and fund-raising activities) of big conservation organisations (Brockington & Igoe 2006). Displacement has fuelled the growing public and policy debate about the social consequences of conservation (Adams & Hutton 2007).
Disagreements over resource access and species protection are often at the basis of environmental and public policy conflicts, especially when individuals or groups are not involved in decision-making about resources (Birkhoff & Burgess 2013). This is linked to the framing concept, which when coupled with conflict resolution, can be used to describe how people comprehend, typify, and act upon their understandings of a specific social dispute (Kaufman et al. 2013). Addressing such conflicts requires a clear understanding of the fundamental reasons as to why they occur ‒ something which is commonly overlooked in policy formulation: actors need to have knowledge of “the empirical context, laws and institutions, as well as beliefs, myths and ideas” (Adams et al. 2003:1915). Ideas and ideologies can strongly influence people’s perceptions of wildlife-related problems, while policy narratives can strongly affect decision-makers’ views on wildlife governance (see Adams et al. 2003) ‒ including ways to solve human-wildlife conflicts.
30
In summary, political ecology analyses the construction of ideas about nature, environmental problems and conflicts and how they determine institutional dynamics and social action. It thereby reveals various environmental discourses, underlying power structures that determine unequal access to natural resources, the politics of the relations between humans and nature and between different groups of people, and the interactions between multiple levels of scale. Environmental conservation is a social and political process and since the 1990s, scholars have paid more attention to the social side of conservation (Little 2001). This coincides with the growing importance of neoliberal trends in global environmental governance, with more attention for private sector involvement, participatory approaches, and ‘payment’ for conservation (Adams & Hutton 2007). Whereas partnerships in environmental governance, which have grown significantly since 2005 (Glasbergen et al. 2007; Lemos and Agrawal 2006; Ros-Tonen et al. 2008; Visseren-Hamakers et al. 2007) can enhance the effectiveness of conservation, the power relations and dealing with internal differences determine to what extent they fulfil governance functions. This is particularly important in developing countries, where civil society can be relatively weak and intersectoral relations between state and market actors vis-à-vis civil society actors are a fairly new concept that may restrict the influence of the last mentioned (Visseren-Hamakers 2013).
Box 2.2 – The development of political ecology • Origins of political ecology: fusion of cultural and human ecology in the 1970s with political
economy (Escobar 1999; Greenberg & Park 1994), to discover the causes of human and environmental crises and how the activities of social actors influence social and environmental changes (Stonich 1994). This was a depart from the prior rationale of technology, the Malthusian belief that population pressure on the resource base, and poor land-use practices are the causes of environmental degradation (Bryant & Bailey 2005; Neumann 1992; Stonich 2001).
• First generation political ecology: emerged in developing countries as a research agenda that
aimed to address the “political sources, conditions and ramifications of environmental change” (Bryant 1992:13). It covered: (1) the contextual origins of environmental change, (2) location-specific conflicts over access to environmental resources, and (3) the political ramifications of environmental change. This phase is also known as the ‘structuralist phase’ of political ecology, based on a detailed ecological analysis (Bryant & Bailey 2005; Walker 2005). It was criticised for its lack of attention for discourses and social constructions of environmental issues (Watts 2000), the little concern for politics, class interest and social struggle (Peet & Watts 1996).
• Second generation political ecology: in the 1990s, post-structuralist debates emerged, reflecting
the increased attention for the social setup of the environment and the role of politics of knowledge and discourses in political ecology (Escobar 1996; Fairhead & Leach 1998, 2003; Gray & Mosely 2005), and institutional politics (Dietz 1999; Leach et al. 1999; Ribot & Peluso 2003). Leach et al. (1997) set the foundations for the dynamics and pluralism in institutions, which led to the development of ‘institutional bricolage’ i.e. the amalgamation and utilisation of different institutional regimes (Cleaver 2001; De Koning 2011). This is also referred to as ‘legal pluralism’ (Bavinck & Gupta 2014) or ‘hybrid’ – multilevel – governance (Ros-Tonen et al. 2014). Mainstream institutional approaches suggest that strengthening of local governance requires policy reform and a redesign of community level institutions (Wiersum 1997).
• Third generation political ecology: scientists in the 21st century, as Ros-Tonen (2012) stated,
have become more concerned with resilience thinking (Folke 2006; Walker et al. 2004), adaptation to global change (Neumann 2009), and cross-scale interactions to grasp the human-ecological dynamics (Adger et al. 2006; Peterson 2000).
31
2.5 Synthesis and conclusions
This chapter presented the theoretical framework that guides the analysis of human-wildlife conflicts and governance in the remaining chapters. Interactive governance theory was chosen as the theoretical lens to study the interactions, perceptions, and responses regarding human-hippo conflicts. Interactive governance encompasses the entirety of public and private interactions aimed at solving societal problems (in this study: human-hippo conflicts) and creating societal opportunities (Kooiman & Bavinck 2005). Interactions refer to the organisation of humans to create situations in which people know about relationships and mutual expectations, with principles relating to their fundamental assumptions about conservation and human-wildlife coexistence. These interactions are seen through a political-ecological lens, acknowledging the politics of human-environmental relations and the discursive construction of human-wildlife conflicts and wildlife conservation.
This chapter concludes that human-wildlife conflicts are partly about conflicts with wildlife (‘true’ human-hippo conflicts) and partly between people about wildlife (human-human conflicts). True human-hippo conflicts lead to direct impacts, either on people, hippos, or ecosystems/wildlife habitats, with sometimes dire consequences for both (Chapter 6). Basically, it is a conflict about land use, with people and hippos claiming the same space, which is under increasing pressure due to wetland degradation. Hippos have their intrinsic demands for food, water and living space, while human population pressure and the concomitant demand for farmland make them adversaries. Hippos are harassed by people and hunted for their meat, with a possible imminent elimination outside of protected areas. On the other hand, humans also suffer from these ‘interactions’, which lead to damage to crops or farm infrastructure, loss/injury of livestock, and human casualties, with sometimes significant impacts on their livelihoods as they bear direct, indirect and hidden costs (see Section 2.2.2). People’s perceptions, values and attitudes (addressed in Chapter 7) play a crucial role in these conflicts and determine how they perceive the level of conflict, how they respond (Chapters 8 and 9) and what this implies for the conservation outcomes (Chapter 10).
Figure 2.1 brings the various strands together in a conceptual scheme that guides the analysis in subsequent chapters. It shows the interactions as conflicts between people over wildlife, whereas human-hippo conflicts are partly incorporated in the system-to-be-governed, where they occur (Chapters 4 and 6), and partly in the governing system, where decisions are taken about access of people to natural resources like hippos and wetlands and compensation mechanisms (Chapter 5). Human-hippo conflicts are also part of governance interactions as response strategies (Chapters 8 and 9). These response strategies can be ignorance or avoidance of the situation (which means that the conflicts will continue), look for conflict mitigation methods in an attempt to resolve conflict situations (consensual approach with third parties), or use a non-consensual approach like arbitration, adjudication or coercion – in which a decision is made on how to settle a conflict, which means that the conflict is resolved (Derkyi 2012).
The governance system is a multi-layered system, with actors from the market, communities, NGOs, the scientific realm and, of course, the state. Elements – images, instruments, and actions – play a crucial role here as they strongly influence the governing system. It is the third order that generates the conservation discourses (world views and narratives) that steer actor’s perceptions and values. Political ecology looks at unequal access to natural resources, power imbalances in resource governance and the use of knowledge and discourses to maintain these imbalances. Images of human-wildlife conflicts and their solutions are based on differences of opinions between people, which can be attributed to human attitude, values, power relations, and the inclusion or exclusion of actors in the planning and decision-making process regarding wildlife policy and wildlife conservation.
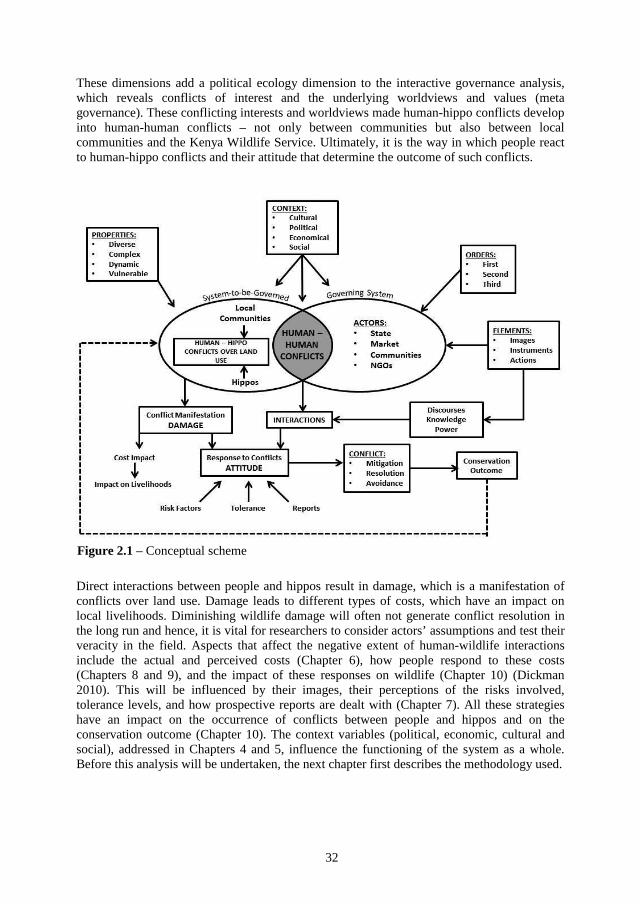
32
These dimensions add a political ecology dimension to the interactive governance analysis, which reveals conflicts of interest and the underlying worldviews and values (meta governance). These conflicting interests and worldviews made human-hippo conflicts develop into human-human conflicts – not only between communities but also between local communities and the Kenya Wildlife Service. Ultimately, it is the way in which people react to human-hippo conflicts and their attitude that determine the outcome of such conflicts.
Direct interactions between people and hippos result in damage, which is a manifestation of conflicts over land use. Damage leads to different types of costs, which have an impact on local livelihoods. Diminishing wildlife damage will often not generate conflict resolution in the long run and hence, it is vital for researchers to consider actors’ assumptions and test their veracity in the field. Aspects that affect the negative extent of human-wildlife interactions include the actual and perceived costs (Chapter 6), how people respond to these costs (Chapters 8 and 9), and the impact of these responses on wildlife (Chapter 10) (Dickman 2010). This will be influenced by their images, their perceptions of the risks involved, tolerance levels, and how prospective reports are dealt with (Chapter 7). All these strategies have an impact on the occurrence of conflicts between people and hippos and on the conservation outcome (Chapter 10). The context variables (political, economic, cultural and social), addressed in Chapters 4 and 5, influence the functioning of the system as a whole. Before this analysis will be undertaken, the next chapter first describes the methodology used.
Figure 2.1 – Conceptual scheme
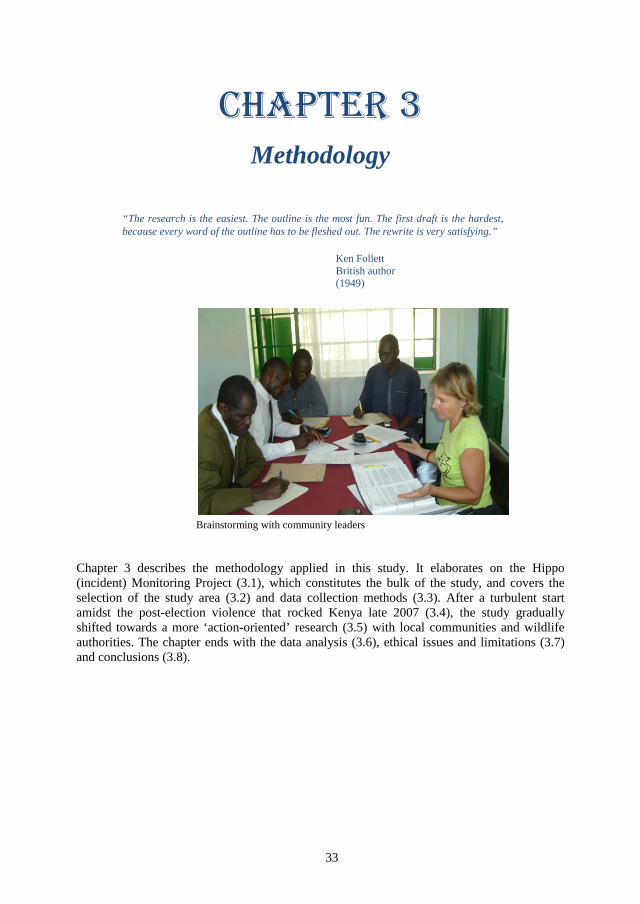
33
Chapter 3 Methodology
“The research is the easiest. The outline is the most fun. The first draft is the hardest, because every word of the outline has to be fleshed out. The rewrite is very satisfying.”
Ken Follett British author (1949)
Brainstorming with community leaders
Chapter 3 describes the methodology applied in this study. It elaborates on the Hippo (incident) Monitoring Project (3.1), which constitutes the bulk of the study, and covers the selection of the study area (3.2) and data collection methods (3.3). After a turbulent start amidst the post-election violence that rocked Kenya late 2007 (3.4), the study gradually shifted towards a more ‘action-oriented’ research (3.5) with local communities and wildlife authorities. The chapter ends with the data analysis (3.6), ethical issues and limitations (3.7) and conclusions (3.8).
34
3.1 Project organisation: The Hippo Monitoring Project and field staff
The Hippo Monitoring Project, the key component of this study, was carried out in close collaboration with the local administration in four divisions bordering Lake Victoria, Kenya, namely Kadibo, Nyando, and Lower- and Upper Nyakach.31 It used data collection techniques like incident monitoring, which involved acquiring hippo incident data in terms of types, sites, dates, damage assessment and coping strategies of the victims. The fieldwork was conducted by three field staff (see Pictures 3.1-3.4 and Annex 4 for their characteristics and task descriptions). Their core tasks consisted of ‘hippo incident monitoring’, i.e. assessing the damage inflicted by hippos and recording the victim’s story, followed by a questionnaire interview with each victim. They regularly visited the local administration, updated ‘contact sheets’32, checked on arrangements related to hippo incidents, studied hippo movements, created awareness, and stimulated local communities to perceive hippo issues differently and explore ways to become actively involved in the design and development of conflict mitigation strategies. They used a measuring tape to calculate the size of the damaged crop area, a camera to visualise the damage and capture proof of hippo’s involvement, and a Global Positioning System (GPS) to take coordinates of the incident sites. They also kept a fieldwork diary to record data.
There were weekly staff meetings, either at my house in Kisumu or at the office of the Victoria Institute for Research on Environment & Development (VIRED), the local partner in this project. These meetings mainly dealt with field experiences and provided a platform to explore issues that arose during the project.
The areas bordering Lake Victoria are mainly inhabited by members of the Luo culture. All staff members are Luos; they are familiar with the study area and know their way around. Most respondents had confidence and trust in the field staff, which enabled the latter to develop their own network of informants in the field – people who contacted them in case they heard about a hippo incident. Employing local people had another advantage because they are native speakers of Dholuo (language spoken by Luos) and conversant with Kiswahili and English. Nearly all interviews were conducted in Dholuo; incidentally Kiswahili was used in case of a non-Luo respondent. Their language skills enabled the staff to address barazas (public meetings)33 to create awareness about the project and request villagers to report hippo-incidents, which contributed to the relatively high report numbers in the project period.
3.2 Selection of the study area
This study focuses on human-hippo conflicts in non-protected areas and thus Kenya’s Lake Victoria Area was an obvious choice. Apart from a few protected sites like Kisumu’s Impala Sanctuary, Ndere Island National Park, Lake Kanyaboli and Ruma National Park, the Lake Area is predominantly a non-protected area which has received little attention in terms of human-wildlife conflicts, neither from academics nor policymakers. Yet, human-hippo conflicts are commonplace as made clear in my 1997 study on the nature of conflicts between people and hippos along the shores of Lake Victoria (Post 2000). In the course of this research, Kenya adopted a devolved governance system where 47 County Governments replaced
31 During the creation of new districts early 2009, Nyando District was subdivided into Nyando and Nyakach Divisions. In this dissertation, the names are in line with the 2009 nomenclature. 32 These sheets showed the locations, sublocations, beaches and BMUs (beach leadership) and contact details of the relevant officials. 33 During the barazas, bilingual documents (Dholuo and English) were handed out. They introduced the team, underlined the role of the field staff and the project aim, thereby stressing the role of local communities.
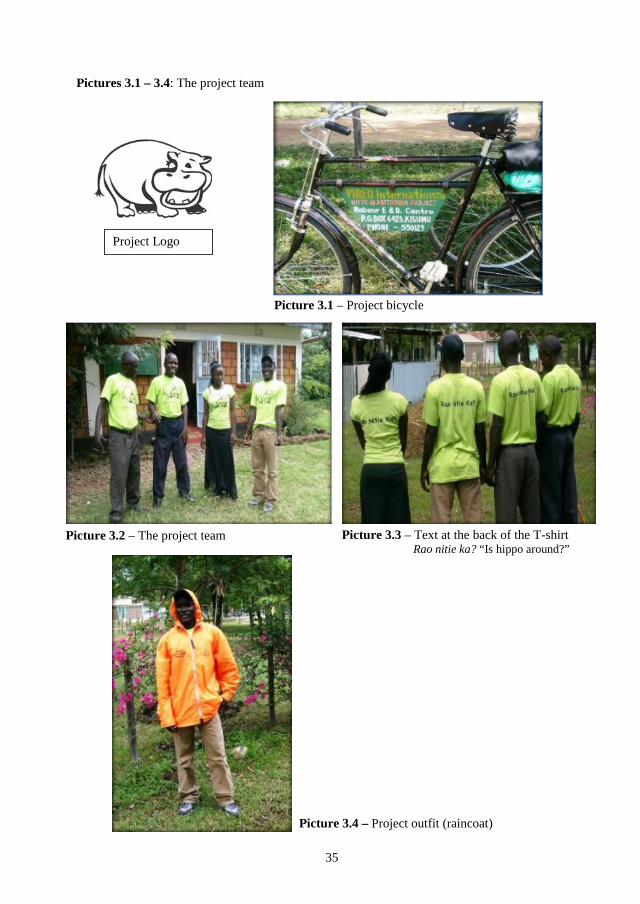
35
Pictures 3.1 – 3.4: The project team
Project Logo
Picture 3.1 – Project bicycle
Picture 3.2 – The project team Picture 3.3 – Text at the back of the T-shirt Rao nitie ka? “Is hippo around?”
Picture 3.4 – Project outfit (raincoat)
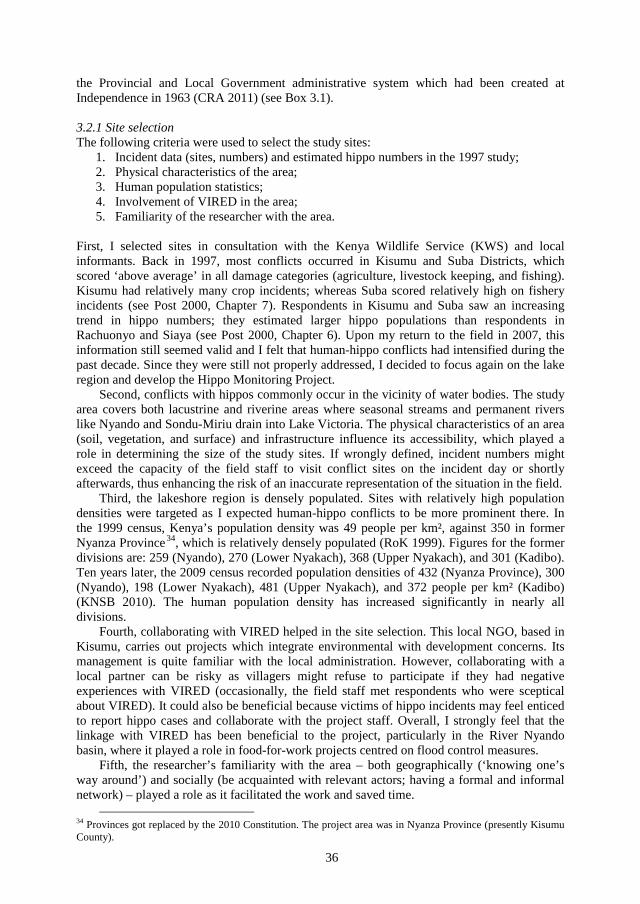
36
the Provincial and Local Government administrative system which had been created at Independence in 1963 (CRA 2011) (see Box 3.1).
3.2.1 Site selection The following criteria were used to select the study sites:
1. Incident data (sites, numbers) and estimated hippo numbers in the 1997 study; 2. Physical characteristics of the area; 3. Human population statistics; 4. Involvement of VIRED in the area; 5. Familiarity of the researcher with the area.
First, I selected sites in consultation with the Kenya Wildlife Service (KWS) and local informants. Back in 1997, most conflicts occurred in Kisumu and Suba Districts, which scored ‘above average’ in all damage categories (agriculture, livestock keeping, and fishing). Kisumu had relatively many crop incidents; whereas Suba scored relatively high on fishery incidents (see Post 2000, Chapter 7). Respondents in Kisumu and Suba saw an increasing trend in hippo numbers; they estimated larger hippo populations than respondents in Rachuonyo and Siaya (see Post 2000, Chapter 6). Upon my return to the field in 2007, this information still seemed valid and I felt that human-hippo conflicts had intensified during the past decade. Since they were still not properly addressed, I decided to focus again on the lake region and develop the Hippo Monitoring Project.
Second, conflicts with hippos commonly occur in the vicinity of water bodies. The study area covers both lacustrine and riverine areas where seasonal streams and permanent rivers like Nyando and Sondu-Miriu drain into Lake Victoria. The physical characteristics of an area (soil, vegetation, and surface) and infrastructure influence its accessibility, which played a role in determining the size of the study sites. If wrongly defined, incident numbers might exceed the capacity of the field staff to visit conflict sites on the incident day or shortly afterwards, thus enhancing the risk of an inaccurate representation of the situation in the field.
Third, the lakeshore region is densely populated. Sites with relatively high population densities were targeted as I expected human-hippo conflicts to be more prominent there. In the 1999 census, Kenya’s population density was 49 people per km², against 350 in former Nyanza Province34, which is relatively densely populated (RoK 1999). Figures for the former divisions are: 259 (Nyando), 270 (Lower Nyakach), 368 (Upper Nyakach), and 301 (Kadibo). Ten years later, the 2009 census recorded population densities of 432 (Nyanza Province), 300 (Nyando), 198 (Lower Nyakach), 481 (Upper Nyakach), and 372 people per km² (Kadibo) (KNSB 2010). The human population density has increased significantly in nearly all divisions.
Fourth, collaborating with VIRED helped in the site selection. This local NGO, based in Kisumu, carries out projects which integrate environmental with development concerns. Its management is quite familiar with the local administration. However, collaborating with a local partner can be risky as villagers might refuse to participate if they had negative experiences with VIRED (occasionally, the field staff met respondents who were sceptical about VIRED). It could also be beneficial because victims of hippo incidents may feel enticed to report hippo cases and collaborate with the project staff. Overall, I strongly feel that the linkage with VIRED has been beneficial to the project, particularly in the River Nyando basin, where it played a role in food-for-work projects centred on flood control measures.
Fifth, the researcher’s familiarity with the area – both geographically (‘knowing one’s way around’) and socially (be acquainted with relevant actors; having a formal and informal network) – played a role as it facilitated the work and saved time.
34 Provinces got replaced by the 2010 Constitution. The project area was in Nyanza Province (presently Kisumu County).
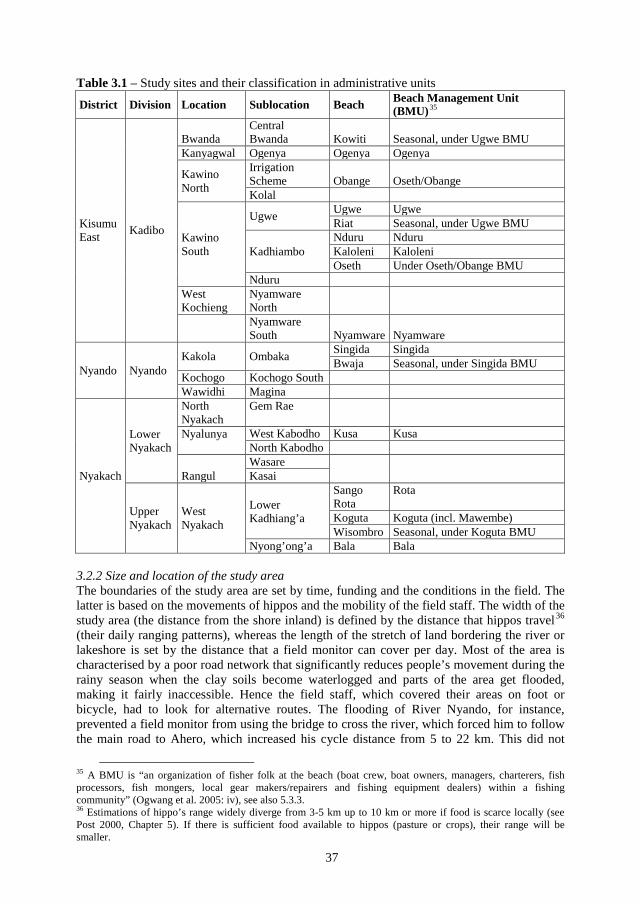
37
Table 3.1 – Study sites and their classification in administrative units
District Division Location Sublocation Beach Beach Management Unit (BMU)35
Kisumu East Kadibo
Bwanda Central Bwanda Kowiti Seasonal, under Ugwe BMU
Kanyagwal Ogenya Ogenya Ogenya
Kawino North
Irrigation Scheme Obange Oseth/Obange Kolal
Kawino South
Ugwe Ugwe Ugwe Riat Seasonal, under Ugwe BMU
Kadhiambo Nduru Nduru Kaloleni Kaloleni Oseth Under Oseth/Obange BMU
Nduru West Kochieng
Nyamware North
Nyamware South Nyamware Nyamware
Nyando Nyando Kakola Ombaka Singida Singida
Bwaja Seasonal, under Singida BMU Kochogo Kochogo South Wawidhi Magina
Nyakach
Lower Nyakach
North Nyakach
Gem Rae
Nyalunya
West Kabodho Kusa Kusa North Kabodho
Rangul Wasare
Kasai
Upper Nyakach
West Nyakach
Lower Kadhiang’a
Sango Rota
Rota
Koguta Koguta (incl. Mawembe) Wisombro Seasonal, under Koguta BMU
Nyong’ong’a Bala Bala
3.2.2 Size and location of the study area The boundaries of the study area are set by time, funding and the conditions in the field. The latter is based on the movements of hippos and the mobility of the field staff. The width of the study area (the distance from the shore inland) is defined by the distance that hippos travel36 (their daily ranging patterns), whereas the length of the stretch of land bordering the river or lakeshore is set by the distance that a field monitor can cover per day. Most of the area is characterised by a poor road network that significantly reduces people’s movement during the rainy season when the clay soils become waterlogged and parts of the area get flooded, making it fairly inaccessible. Hence the field staff, which covered their areas on foot or bicycle, had to look for alternative routes. The flooding of River Nyando, for instance, prevented a field monitor from using the bridge to cross the river, which forced him to follow the main road to Ahero, which increased his cycle distance from 5 to 22 km. This did not
35 A BMU is “an organization of fisher folk at the beach (boat crew, boat owners, managers, charterers, fish processors, fish mongers, local gear makers/repairers and fishing equipment dealers) within a fishing community” (Ogwang et al. 2005: iv), see also 5.3.3. 36 Estimations of hippo’s range widely diverge from 3-5 km up to 10 km or more if food is scarce locally (see Post 2000, Chapter 5). If there is sufficient food available to hippos (pasture or crops), their range will be smaller.
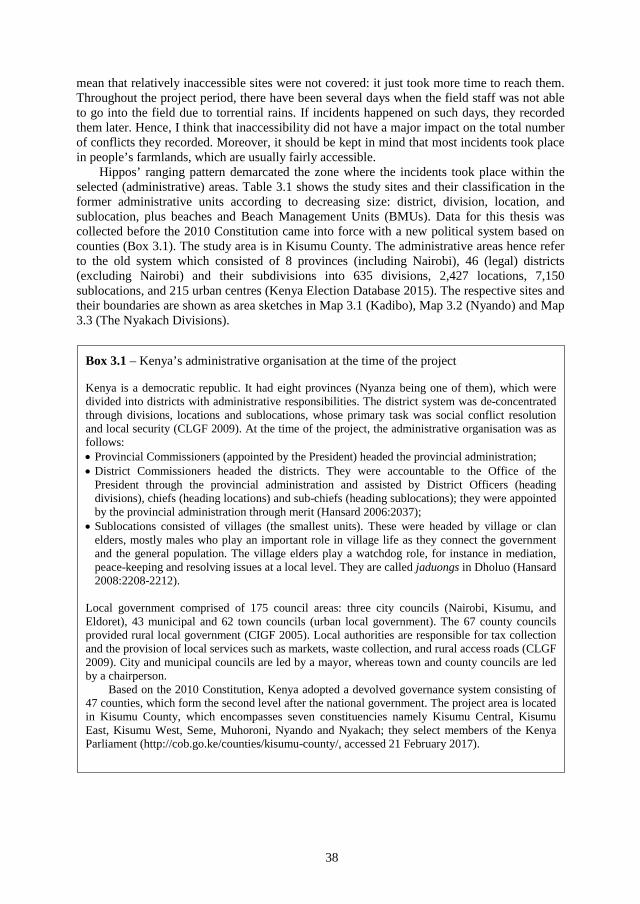
38
mean that relatively inaccessible sites were not covered: it just took more time to reach them. Throughout the project period, there have been several days when the field staff was not able to go into the field due to torrential rains. If incidents happened on such days, they recorded them later. Hence, I think that inaccessibility did not have a major impact on the total number of conflicts they recorded. Moreover, it should be kept in mind that most incidents took place in people’s farmlands, which are usually fairly accessible.
Hippos’ ranging pattern demarcated the zone where the incidents took place within the selected (administrative) areas. Table 3.1 shows the study sites and their classification in the former administrative units according to decreasing size: district, division, location, and sublocation, plus beaches and Beach Management Units (BMUs). Data for this thesis was collected before the 2010 Constitution came into force with a new political system based on counties (Box 3.1). The study area is in Kisumu County. The administrative areas hence refer to the old system which consisted of 8 provinces (including Nairobi), 46 (legal) districts (excluding Nairobi) and their subdivisions into 635 divisions, 2,427 locations, 7,150 sublocations, and 215 urban centres (Kenya Election Database 2015). The respective sites and their boundaries are shown as area sketches in Map 3.1 (Kadibo), Map 3.2 (Nyando) and Map 3.3 (The Nyakach Divisions).
Box 3.1 – Kenya’s administrative organisation at the time of the project
Kenya is a democratic republic. It had eight provinces (Nyanza being one of them), which were divided into districts with administrative responsibilities. The district system was de-concentrated through divisions, locations and sublocations, whose primary task was social conflict resolution and local security (CLGF 2009). At the time of the project, the administrative organisation was as follows: • Provincial Commissioners (appointed by the President) headed the provincial administration; • District Commissioners headed the districts. They were accountable to the Office of the
President through the provincial administration and assisted by District Officers (heading divisions), chiefs (heading locations) and sub-chiefs (heading sublocations); they were appointed by the provincial administration through merit (Hansard 2006:2037);
• Sublocations consisted of villages (the smallest units). These were headed by village or clan elders, mostly males who play an important role in village life as they connect the government and the general population. The village elders play a watchdog role, for instance in mediation, peace-keeping and resolving issues at a local level. They are called jaduongs in Dholuo (Hansard 2008:2208-2212).
Local government comprised of 175 council areas: three city councils (Nairobi, Kisumu, and Eldoret), 43 municipal and 62 town councils (urban local government). The 67 county councils provided rural local government (CIGF 2005). Local authorities are responsible for tax collection and the provision of local services such as markets, waste collection, and rural access roads (CLGF 2009). City and municipal councils are led by a mayor, whereas town and county councils are led by a chairperson.
Based on the 2010 Constitution, Kenya adopted a devolved governance system consisting of 47 counties, which form the second level after the national government. The project area is located in Kisumu County, which encompasses seven constituencies namely Kisumu Central, Kisumu East, Kisumu West, Seme, Muhoroni, Nyando and Nyakach; they select members of the Kenya Parliament (http://cob.go.ke/counties/kisumu-county/, accessed 21 February 2017).
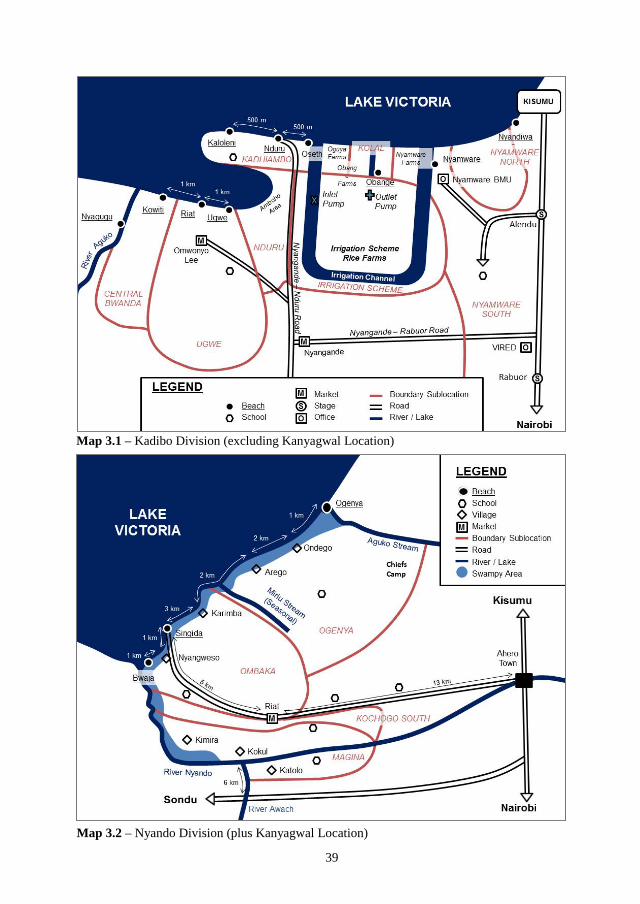
39
Map 3.1 – Kadibo Division (excluding Kanyagwal Location)
Map 3.2 – Nyando Division (plus Kanyagwal Location)
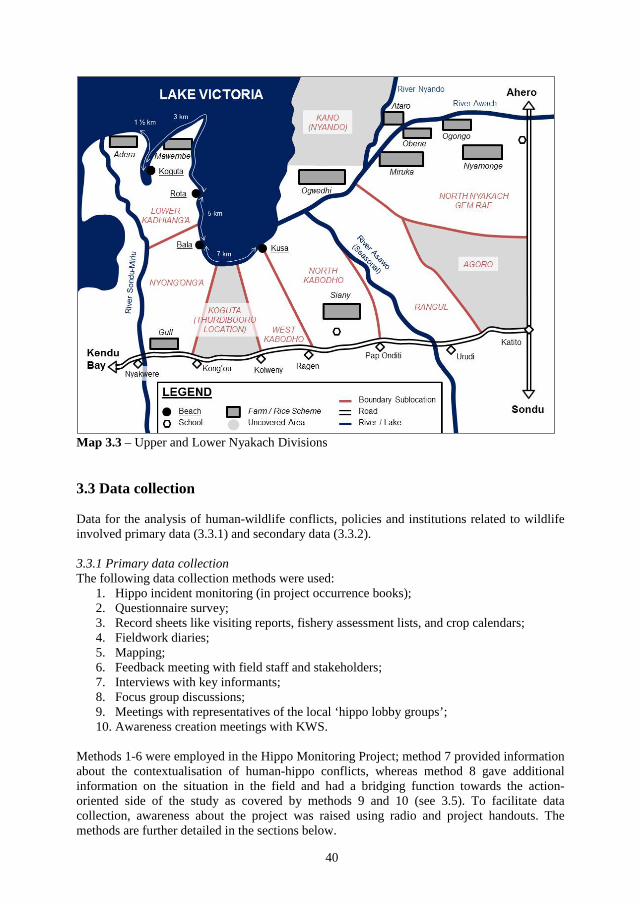
40
Map 3.3 – Upper and Lower Nyakach Divisions
3.3 Data collection
Data for the analysis of human-wildlife conflicts, policies and institutions related to wildlife involved primary data (3.3.1) and secondary data (3.3.2). 3.3.1 Primary data collection The following data collection methods were used:
1. Hippo incident monitoring (in project occurrence books); 2. Questionnaire survey; 3. Record sheets like visiting reports, fishery assessment lists, and crop calendars; 4. Fieldwork diaries; 5. Mapping; 6. Feedback meeting with field staff and stakeholders; 7. Interviews with key informants; 8. Focus group discussions; 9. Meetings with representatives of the local ‘hippo lobby groups’; 10. Awareness creation meetings with KWS.
Methods 1-6 were employed in the Hippo Monitoring Project; method 7 provided information about the contextualisation of human-hippo conflicts, whereas method 8 gave additional information on the situation in the field and had a bridging function towards the action-oriented side of the study as covered by methods 9 and 10 (see 3.5). To facilitate data collection, awareness about the project was raised using radio and project handouts. The methods are further detailed in the sections below.
41
The Hippo Monitoring Project occurrence books During a full year, starting from mid-February 2008, specially trained field staff collected data on crop damage through direct damage assessment. The field staff assessed incidents with hippos thereby covering conflict numbers, types, period, and geographical area. Their project outfit (with a hippo logo) and bicycle with shield (see Pictures 3.1-3.4) made them easily recognisable. Each incident was entered in the ‘Hippo Monitoring Project occurrence book’, a consecutively numbered triplicate copybook that assigned a unique number to each incident (Annex 5). The area chief got the first copy; the second one was for the project administration, while the third one remained with the field monitor for future reference. The staff recorded the victim’s particulars, damage type, quantified loss, and checked subsequent actions to learn about his/her coping strategies. This information was checked with background information from the Ministry of Agriculture37 (see RoK 2008b). Occasionally, agricultural officers came to the field to assess the damages, which gave an opportunity to evaluate differences (if any).
Chiefs, assistant chiefs38 and BMU chairmen39 received (duplicate) occurrence books to record hippo incidents. The field monitor collected the first copy; the second one remained with the official. BMU chairmen noted fishery losses; other officials recorded mostly crop incidents. The field staff carried out most damage assessments except for some fishery incidents, where BMU officials recorded the damage based on the victim’s statement40. When a field monitor could not visualise the damage, take pictures of the losses, or carry out the assessment, he relied on the victim’s statement, for instance when nets that were cast overnight had been swept away by the current or when a fisher had repaired his nets (damaged at night) before he could be visited. Incidentally, lost nets were attributed to theft. BMU officials helped the field staff to recognise theft cases and exclude them from the project database.
Questionnaire surveys This study deals with 430 respondents who together experienced 724 incidents with hippos. The questionnaire survey was conducted in two phases. The first phase consisted of a pilot survey and a survey that took a full year (from February 2008 until March 2009). The second phase, which was additional and explanatory in nature, was carried out between June and December 2009, after having looked into the results of the first phase. This enabled a comparison of the initial figures with the newly acquired data, which shed more light on the dynamic nature of people’s reactions to their coexistence with wildlife. It also gave an idea of the extent to which local people are aware of the local hippo conservation initiatives that had recently started. During the second phase, the field staff kept an eye on changes in respondents’ behaviour and urged residents to continue reporting incidents with hippos.
Annex 6 contains the composite version41 of the questionnaires, containing multiple open-ended and verification (‘routine check’) questions about personal characteristics
37 The field staff used the agricultural guidelines (RoK 2008b) as a reference document to check whether their findings were in line with the expected harvest ranges for different crop types given by the ministry. For fishery incidents, the project relied on background information provided by fisheries officers and BMU officials. 38 Initially, only the field staff used occurrence books. In July 2008, (assistant) chiefs were given occurrence books because their reports were lagging behind notwithstanding their declared commitment to the project. 39 During the Ahero Forum Meeting in July 2008, BMU chairmen got their own occurrence books. Contrary to the findings of the 1997 study (Post 2000), relatively few fishery incidents had been reported so far, which was pointed out to the BMU chairmen. They all promised to note every hippo-related fishery incident in the book, after which the incident number rose significantly. This might partly be attributed to the closed fishing season (April to August), but it seems more likely that the incident numbers in the first five months did not justify the actual fishery incident numbers. 40 Based on the fisherman’s story and knowledge of the situation and area, BMU officials were able to judge the validity of the estimations provided by the victim (in terms of damage to equipment and catch foregone). 41 The second questionnaire partially elaborated on the first one regarding topics that had not come out clearly.
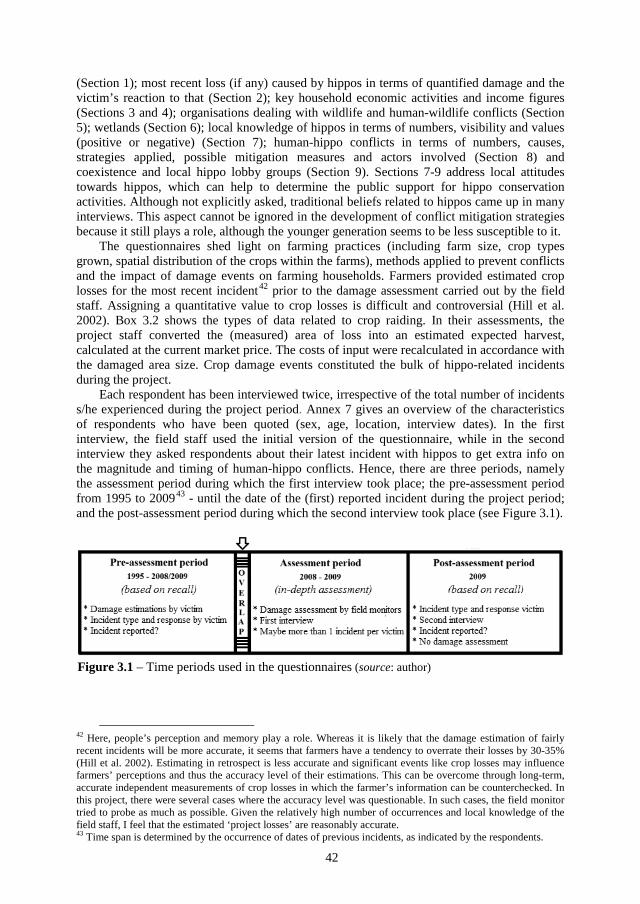
42
(Section 1); most recent loss (if any) caused by hippos in terms of quantified damage and the victim’s reaction to that (Section 2); key household economic activities and income figures (Sections 3 and 4); organisations dealing with wildlife and human-wildlife conflicts (Section 5); wetlands (Section 6); local knowledge of hippos in terms of numbers, visibility and values (positive or negative) (Section 7); human-hippo conflicts in terms of numbers, causes, strategies applied, possible mitigation measures and actors involved (Section 8) and coexistence and local hippo lobby groups (Section 9). Sections 7-9 address local attitudes towards hippos, which can help to determine the public support for hippo conservation activities. Although not explicitly asked, traditional beliefs related to hippos came up in many interviews. This aspect cannot be ignored in the development of conflict mitigation strategies because it still plays a role, although the younger generation seems to be less susceptible to it.
The questionnaires shed light on farming practices (including farm size, crop types grown, spatial distribution of the crops within the farms), methods applied to prevent conflicts and the impact of damage events on farming households. Farmers provided estimated crop losses for the most recent incident42 prior to the damage assessment carried out by the field staff. Assigning a quantitative value to crop losses is difficult and controversial (Hill et al. 2002). Box 3.2 shows the types of data related to crop raiding. In their assessments, the project staff converted the (measured) area of loss into an estimated expected harvest, calculated at the current market price. The costs of input were recalculated in accordance with the damaged area size. Crop damage events constituted the bulk of hippo-related incidents during the project.
Each respondent has been interviewed twice, irrespective of the total number of incidents s/he experienced during the project period. Annex 7 gives an overview of the characteristics of respondents who have been quoted (sex, age, location, interview dates). In the first interview, the field staff used the initial version of the questionnaire, while in the second interview they asked respondents about their latest incident with hippos to get extra info on the magnitude and timing of human-hippo conflicts. Hence, there are three periods, namely the assessment period during which the first interview took place; the pre-assessment period from 1995 to 200943 - until the date of the (first) reported incident during the project period; and the post-assessment period during which the second interview took place (see Figure 3.1).
42 Here, people’s perception and memory play a role. Whereas it is likely that the damage estimation of fairly recent incidents will be more accurate, it seems that farmers have a tendency to overrate their losses by 30-35% (Hill et al. 2002). Estimating in retrospect is less accurate and significant events like crop losses may influence farmers’ perceptions and thus the accuracy level of their estimations. This can be overcome through long-term, accurate independent measurements of crop losses in which the farmer’s information can be counterchecked. In this project, there were several cases where the accuracy level was questionable. In such cases, the field monitor tried to probe as much as possible. Given the relatively high number of occurrences and local knowledge of the field staff, I feel that the estimated ‘project losses’ are reasonably accurate. 43 Time span is determined by the occurrence of dates of previous incidents, as indicated by the respondents.
Figure 3.1 – Time periods used in the questionnaires (source: author)
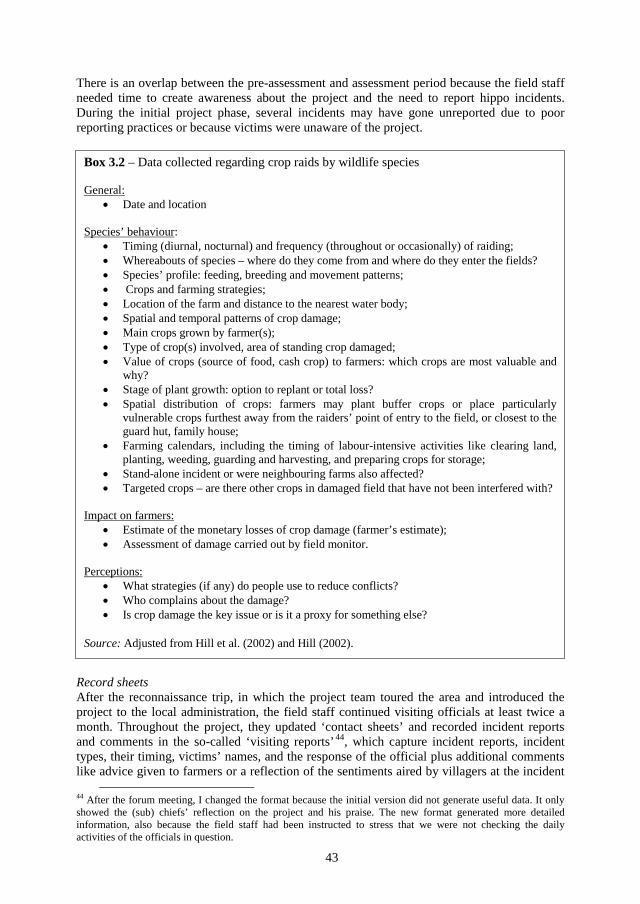
43
There is an overlap between the pre-assessment and assessment period because the field staff needed time to create awareness about the project and the need to report hippo incidents. During the initial project phase, several incidents may have gone unreported due to poor reporting practices or because victims were unaware of the project.
Record sheets After the reconnaissance trip, in which the project team toured the area and introduced the project to the local administration, the field staff continued visiting officials at least twice a month. Throughout the project, they updated ‘contact sheets’ and recorded incident reports and comments in the so-called ‘visiting reports’44, which capture incident reports, incident types, their timing, victims’ names, and the response of the official plus additional comments like advice given to farmers or a reflection of the sentiments aired by villagers at the incident
44 After the forum meeting, I changed the format because the initial version did not generate useful data. It only showed the (sub) chiefs’ reflection on the project and his praise. The new format generated more detailed information, also because the field staff had been instructed to stress that we were not checking the daily activities of the officials in question.
Box 3.2 – Data collected regarding crop raids by wildlife species General:
• Date and location Species’ behaviour:
• Timing (diurnal, nocturnal) and frequency (throughout or occasionally) of raiding; • Whereabouts of species – where do they come from and where do they enter the fields? • Species’ profile: feeding, breeding and movement patterns; • Crops and farming strategies; • Location of the farm and distance to the nearest water body; • Spatial and temporal patterns of crop damage; • Main crops grown by farmer(s); • Type of crop(s) involved, area of standing crop damaged; • Value of crops (source of food, cash crop) to farmers: which crops are most valuable and
why? • Stage of plant growth: option to replant or total loss? • Spatial distribution of crops: farmers may plant buffer crops or place particularly
vulnerable crops furthest away from the raiders’ point of entry to the field, or closest to the guard hut, family house;
• Farming calendars, including the timing of labour-intensive activities like clearing land, planting, weeding, guarding and harvesting, and preparing crops for storage;
• Stand-alone incident or were neighbouring farms also affected? • Targeted crops – are there other crops in damaged field that have not been interfered with?
Impact on farmers:
• Estimate of the monetary losses of crop damage (farmer’s estimate); • Assessment of damage carried out by field monitor.
Perceptions:
• What strategies (if any) do people use to reduce conflicts? • Who complains about the damage? • Is crop damage the key issue or is it a proxy for something else?
Source: Adjusted from Hill et al. (2002) and Hill (2002).
44
site. These reports helped to shed light on the reporting chain: ‘who reports’ and what subsequent actions the administration does take. Visiting reports were compared with the occurrence books of the field staff to get an idea of the rate of incident coverage45 and as a crosscheck of the data flow between officials like assistant chiefs and chiefs.
BMU chairmen gave particulars of their organisation, the types of fishing practised, including gears used, species caught, average catch, time of fishing and landing, and fishing sites (e.g. open water, near the shore, inside vegetation). The project staff recorded everything on the ‘fishery assessment lists’ and used these to crosscheck data provided by victims (like prices of catch and gear). They developed an outline of the fishing methods, including a risk profile for fishermen and fishing gear. Fishery risk profiles signify the chance of an encounter with a hippo, with risks relating to fishing methods, their timing (day or night), and location (distance from the shore, proximity to hippo breeding grounds).
The project staff compiled so-called ‘crop calendars’ that indicate crop stages for crops commonly grown46 in their areas. This covers clearing, ploughing, harrowing, planting, first and second weeding, flowering, maturing and harvesting. The calendars (6.3.4) reflect farming activities per crop type47, their timing (which months) and duration. They are compared with crop damage cases, hippo movements, incident sites and rainfall data in order to check whether a seasonal pattern exists and to define risk profiles for different crop types. I subsequently linked this to risk reduction strategies, taking into account how farmers try to minimise the risk of crop-raiding hippos by using protective methods in their farms. Hill et al. (2002) rightfully point at other benefits of farming calendars: they can be used to avoid possible labour bottlenecks in the development of intervention strategies. The intensification of guarding the farms during peak periods of conflict for instance may not be helpful when people already have many labour-intensive activities that need to be carried out.
The publicity campaign (launched together with KWS), consisted of daily announcements on a regional radio station, Radio Nam Lolwe, and a series of three talk shows, each lasting one hour, in which I introduced the Hippo Monitoring Project in Dholuo and asked listeners to call the field staff when they experienced an incident with a hippo. Those broadcasts reached an audience of 2 million listeners and generated higher awareness of hippo issues. Afterwards, the field staff got many questions and/or comments about the programme.
Fieldwork diaries The field staff kept day-to-day records of their activities and field observations. These diaries were discussed during weekly staff meetings, which acted as a platform for sharing and learning. This generated new ideas and challenged the field staff to look at their ‘own’ areas more critically. It gave me an opportunity to check on issues of interest that arose in the field. The diaries generated substantial information on local attitudes towards conflicts, hippo conservation, and the wildlife authorities. Mapping Existing cartographic maps were used and area sketches, hippo migration maps and area flood maps were developed. These were useful in discussions with KWS about how they address human-hippo incidents near key conflict sites. In human-wildlife conflict studies, GIS is a
45 There could be a mismatch between visiting reports and the field monitor’s occurrence book when the official did not report the incident immediately. If he was notified later on, he visited the victim to get his/her story. If it was a recent incident with visible damage, he carried out the assessment. There were few cases where the staff visited the victim and found the information given by the official to be incorrect. Such cases have been excluded from the project findings. 46 The District Guidelines provided by the Ministry of Agriculture (see RoK 2008b) do not contain crop data at sub-locational level. Hence, the field staff divided their area into sub-areas where similar crop types are grown. 47 In some areas, crops like maize are grown more than once per year (‘maize 1’ and ‘maize 2’).
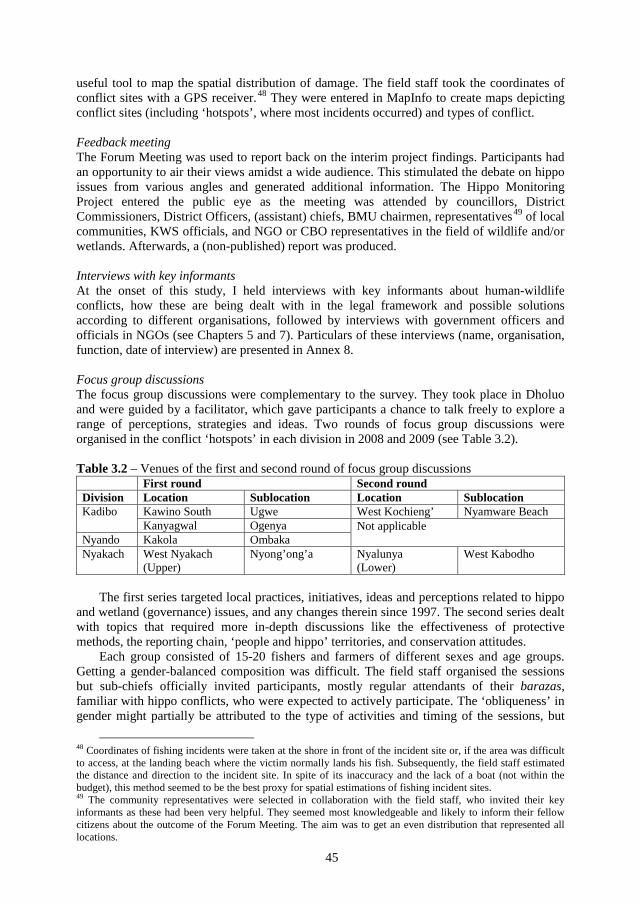
45
useful tool to map the spatial distribution of damage. The field staff took the coordinates of conflict sites with a GPS receiver.48 They were entered in MapInfo to create maps depicting conflict sites (including ‘hotspots’, where most incidents occurred) and types of conflict.
Feedback meeting The Forum Meeting was used to report back on the interim project findings. Participants had an opportunity to air their views amidst a wide audience. This stimulated the debate on hippo issues from various angles and generated additional information. The Hippo Monitoring Project entered the public eye as the meeting was attended by councillors, District Commissioners, District Officers, (assistant) chiefs, BMU chairmen, representatives49 of local communities, KWS officials, and NGO or CBO representatives in the field of wildlife and/or wetlands. Afterwards, a (non-published) report was produced. Interviews with key informants At the onset of this study, I held interviews with key informants about human-wildlife conflicts, how these are being dealt with in the legal framework and possible solutions according to different organisations, followed by interviews with government officers and officials in NGOs (see Chapters 5 and 7). Particulars of these interviews (name, organisation, function, date of interview) are presented in Annex 8. Focus group discussions The focus group discussions were complementary to the survey. They took place in Dholuo and were guided by a facilitator, which gave participants a chance to talk freely to explore a range of perceptions, strategies and ideas. Two rounds of focus group discussions were organised in the conflict ‘hotspots’ in each division in 2008 and 2009 (see Table 3.2). Table 3.2 – Venues of the first and second round of focus group discussions First round Second round Division Location Sublocation Location Sublocation Kadibo Kawino South Ugwe West Kochieng’ Nyamware Beach
Kanyagwal Ogenya Not applicable Nyando Kakola Ombaka
Nyakach West Nyakach (Upper)
Nyong’ong’a Nyalunya (Lower)
West Kabodho
The first series targeted local practices, initiatives, ideas and perceptions related to hippo
and wetland (governance) issues, and any changes therein since 1997. The second series dealt with topics that required more in-depth discussions like the effectiveness of protective methods, the reporting chain, ‘people and hippo’ territories, and conservation attitudes.
Each group consisted of 15-20 fishers and farmers of different sexes and age groups. Getting a gender-balanced composition was difficult. The field staff organised the sessions but sub-chiefs officially invited participants, mostly regular attendants of their barazas, familiar with hippo conflicts, who were expected to actively participate. The ‘obliqueness’ in gender might partially be attributed to the type of activities and timing of the sessions, but
48 Coordinates of fishing incidents were taken at the shore in front of the incident site or, if the area was difficult to access, at the landing beach where the victim normally lands his fish. Subsequently, the field staff estimated the distance and direction to the incident site. In spite of its inaccuracy and the lack of a boat (not within the budget), this method seemed to be the best proxy for spatial estimations of fishing incident sites. 49 The community representatives were selected in collaboration with the field staff, who invited their key informants as these had been very helpful. They seemed most knowledgeable and likely to inform their fellow citizens about the outcome of the Forum Meeting. The aim was to get an even distribution that represented all locations.
46
most likely cultural elements play a bigger role. Men tend to dominate public meetings in the patriarchal Luo society. It is still uncommon for women to actively participate in public meetings that are also attended by men. Interestingly, there were some groups in which young women clearly expressed their views and proposed viable ideas, which might indicate that the male stronghold is slowly eroding. A second cultural element is the traditional division of labour between the sexes. Domestic tasks are entirely a woman’s affair which could keep them from attending public meetings. The group discussions took place in rural areas, where traditional practices are likely more prominent than in cities like Kisumu.
The group discussions had a bridging function towards the more action-oriented side of the study: they encouraged local people to organise themselves in groups to discuss what roles they could play in conflict mitigation. So far, this had not been done in the project area. The communities were interested and willing to discuss the way forward: they also acknowledged the need to involve KWS, whose wardens were keen on talking to the communities. A series of joint meetings was organised, which sparked off the local ‘hippo lobby group’ initiatives (see Chapter 9).
Local hippo lobby groups and awareness meetings The last two methods, meetings with representatives of local ‘hippo lobby groups’ and awareness creation meetings with KWS, are elaborated on in Section 3.5. 3.3.2 Secondary data collection Secondary data was collected from a wide range of government officials and organisations associated with wildlife and wetlands in Kenya, including: 1. Officers within KWS; 2. Government officers dealing with agriculture, fishery, forestry, environment, land issues,
population statistics, cartography, and climate; 3. NGOs/officials dealing with conservation of the Lake Victoria Area such as OSIENALA
(Friends of Lake Victoria), Lake Basin Development Authority (LBDA), Water Resource Management Authority (WRMA) and the National Environment Management Authority (NEMA);
4. NGOs dealing with wildlife conservation, for instance the World Wildlife Fund (WWF), East African Wildlife Society (EAWLS), African Conservation Centre (ACC), and the African Wildlife Foundation (AWF);
5. Local administration; 6. Health officers and hospital staff; 7. Police; 8. Research institutes like the Kenya Agricultural Research Institute (KARI), Kenya Marine
Fisheries Research Institute (KMFRI), and the Kenya Meteorological Institute; 9. Networks like the Kenya Land Alliance (KLA);50 10. Legal officers.
These sources provided documents like (annual) reports, strategic plans, visions and guidelines (e.g. for fishery and agriculture), District Development Plans and maps. Literature reviews, policy briefs, legal documents, annual reports and websites of the above organisations were also used. The number of hippo incident reports covered by the field staff was compared with incident reports received by KWS to get an idea of the conflict reporting rate. I used data from the police records and hospitals, as the police are informed when hippos injure or kill somebody, while hospital data could shed light on the number of patients treated for sustained hippo injuries. The ‘Occurrence Books’ of KWS Kisumu for the period 1998-
50 KLA is a network of civil society organisations and individuals, aimed at law and policy reforms about land.
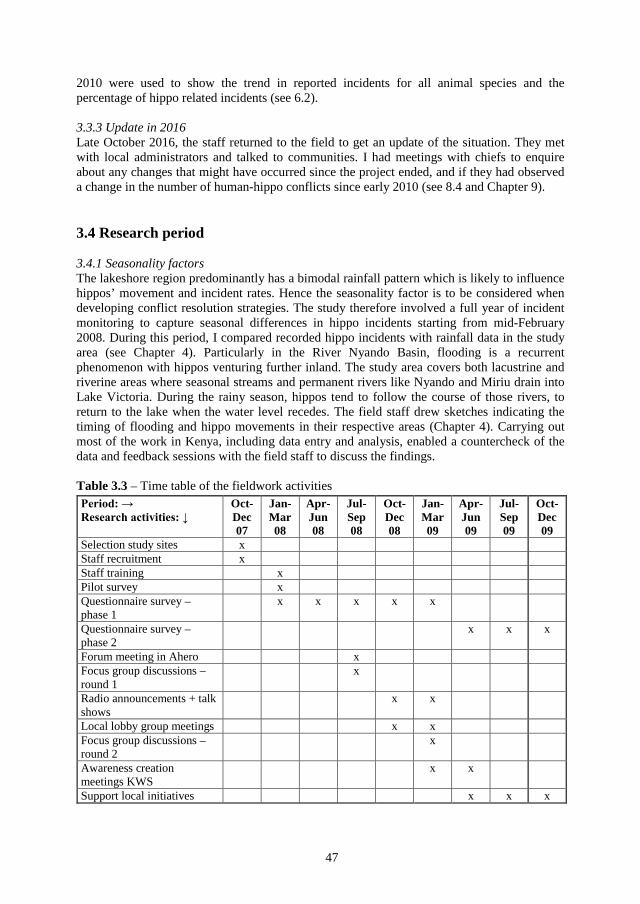
47
2010 were used to show the trend in reported incidents for all animal species and the percentage of hippo related incidents (see 6.2). 3.3.3 Update in 2016 Late October 2016, the staff returned to the field to get an update of the situation. They met with local administrators and talked to communities. I had meetings with chiefs to enquire about any changes that might have occurred since the project ended, and if they had observed a change in the number of human-hippo conflicts since early 2010 (see 8.4 and Chapter 9).
3.4 Research period
3.4.1 Seasonality factors The lakeshore region predominantly has a bimodal rainfall pattern which is likely to influence hippos’ movement and incident rates. Hence the seasonality factor is to be considered when developing conflict resolution strategies. The study therefore involved a full year of incident monitoring to capture seasonal differences in hippo incidents starting from mid-February 2008. During this period, I compared recorded hippo incidents with rainfall data in the study area (see Chapter 4). Particularly in the River Nyando Basin, flooding is a recurrent phenomenon with hippos venturing further inland. The study area covers both lacustrine and riverine areas where seasonal streams and permanent rivers like Nyando and Miriu drain into Lake Victoria. During the rainy season, hippos tend to follow the course of those rivers, to return to the lake when the water level recedes. The field staff drew sketches indicating the timing of flooding and hippo movements in their respective areas (Chapter 4). Carrying out most of the work in Kenya, including data entry and analysis, enabled a countercheck of the data and feedback sessions with the field staff to discuss the findings. Table 3.3 – Time table of the fieldwork activities
Period: → Research activities: ↓
Oct-Dec 07
Jan-Mar 08
Apr-Jun 08
Jul-Sep 08
Oct-Dec 08
Jan-Mar 09
Apr-Jun 09
Jul-Sep 09
Oct-Dec 09
Selection study sites x Staff recruitment x Staff training x Pilot survey x Questionnaire survey – phase 1
x x x x x
Questionnaire survey – phase 2
x x x
Forum meeting in Ahero x Focus group discussions – round 1
x
Radio announcements + talk shows
x x
Local lobby group meetings x x Focus group discussions – round 2
x
Awareness creation meetings KWS
x x
Support local initiatives x x x
48
3.4.2 Amidst the post-election violence in Kenya Fieldwork of the Hippo Monitoring Project started in November 2007 with a reconnaissance tour and the recruitment of the project staff at the VIRED-office in Rabuor. Their training, initially scheduled in December 2007, got rescheduled due to work obligations of the field coordinator. After the highly contested results of the 2007 General Elections were announced, rioting started throughout the country resulting in widespread post-election violence. This significantly delayed the start of the project and influenced its initial stage, although it is difficult to quantify and prove (see Annex 9). Table 3.3 shows the project time table. 3.5 The shift towards a more action-oriented research
Human-nature relationships change through interventions in the social environment. Initially, the project solely focused on human-hippo conflicts and conflict mitigation with an emphasis on local participation. Most participants in the focus group interviews seemed to know little about regulations regarding wildlife: they perceived themselves as ‘ignored victims’. From the onset, it was evident that the level of anger in communities about crop losses was high: it had a severe impact on their livelihoods, and they blamed KWS for not taking appropriate action. They hoped that the project would provide compensation and/or viable solutions to crop raiding – although this was not always expressed. I told residents clearly that such expectations were not realistic and challenged them to consider what role they can play themselves in conflict resolution and how they can put their indigenous knowledge to use. Once people perceive hippos differently, as a resource instead of a nuisance, they can initiate conservation activities and development opportunities in their area. It would be more effective to unite, make their voices heard and start the process of change instead of complaining and waiting for top-down approaches to trickle down, as this might never happen. 3.5.1 Meetings with representatives of the ‘hippo lobby groups’ The way in which the project team addressed hippo issues and pointed out responsibilities and opportunities to the riparian communities seemed to generate space for local initiatives. In several Sublocations, people registered ‘self-help’ groups51 aimed at working towards conflict resolution and finding ways how people can benefit from hippos. Each group received guidelines for proposal writing and a format to write a proposal to KWS, in which they could express their ideas and request the organisation for technical assistance (e.g. a feasibility check and acquisition of funds) so that at a later stage their ideas can be implemented. The field staff was kept informed about the outcome of such group meetings – including the ideas brought forward. The group in North Nyakach picked up the ideas and their driving force went to check on ownership titles of land that could be brought in to create a conservancy (see Chapters 7 and 9). 3.5.2 Awareness creation meetings The team and KWS jointly organised a series of awareness creation meetings in all project divisions (Table 3.4) as KWS wardens had expressed their interest in talking to the communities. They took place in March 2009 and were held in sites where the staff had recorded many incidents and heard numerous complaints and suppositions about KWS. The joint meetings sparked off local ‘hippo lobby group’ initiatives. So far, such forums had been non-existent in the project area. Finding ways to mitigate human-hippo conflicts requires a good working relationship between KWS and local communities, who had a very antagonistic
51 The groups are registered as ‘self-help’ groups within the Department of Social Services. Chapter 9 elaborates on the procedures and requirements for establishing such groups.
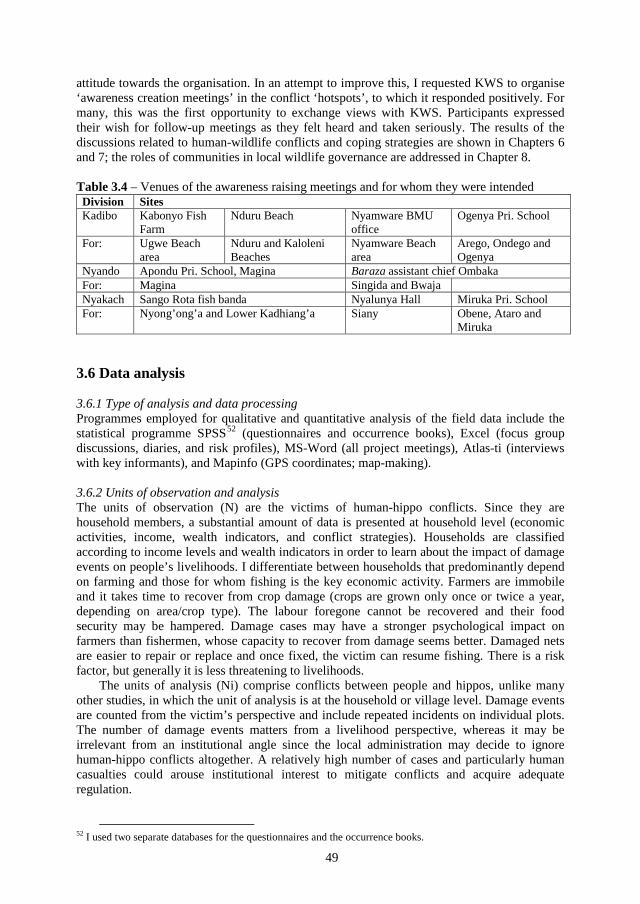
49
attitude towards the organisation. In an attempt to improve this, I requested KWS to organise ‘awareness creation meetings’ in the conflict ‘hotspots’, to which it responded positively. For many, this was the first opportunity to exchange views with KWS. Participants expressed their wish for follow-up meetings as they felt heard and taken seriously. The results of the discussions related to human-wildlife conflicts and coping strategies are shown in Chapters 6 and 7; the roles of communities in local wildlife governance are addressed in Chapter 8. Table 3.4 – Venues of the awareness raising meetings and for whom they were intended Division Sites Kadibo Kabonyo Fish
Farm Nduru Beach Nyamware BMU
office Ogenya Pri. School
For: Ugwe Beach area
Nduru and Kaloleni Beaches
Nyamware Beach area
Arego, Ondego and Ogenya
Nyando Apondu Pri. School, Magina Baraza assistant chief Ombaka For: Magina Singida and Bwaja Nyakach Sango Rota fish banda Nyalunya Hall Miruka Pri. School For: Nyong’ong’a and Lower Kadhiang’a Siany Obene, Ataro and
Miruka
3.6 Data analysis
3.6.1 Type of analysis and data processing Programmes employed for qualitative and quantitative analysis of the field data include the statistical programme SPSS52 (questionnaires and occurrence books), Excel (focus group discussions, diaries, and risk profiles), MS-Word (all project meetings), Atlas-ti (interviews with key informants), and Mapinfo (GPS coordinates; map-making).
3.6.2 Units of observation and analysis The units of observation (N) are the victims of human-hippo conflicts. Since they are household members, a substantial amount of data is presented at household level (economic activities, income, wealth indicators, and conflict strategies). Households are classified according to income levels and wealth indicators in order to learn about the impact of damage events on people’s livelihoods. I differentiate between households that predominantly depend on farming and those for whom fishing is the key economic activity. Farmers are immobile and it takes time to recover from crop damage (crops are grown only once or twice a year, depending on area/crop type). The labour foregone cannot be recovered and their food security may be hampered. Damage cases may have a stronger psychological impact on farmers than fishermen, whose capacity to recover from damage seems better. Damaged nets are easier to repair or replace and once fixed, the victim can resume fishing. There is a risk factor, but generally it is less threatening to livelihoods.
The units of analysis (Ni) comprise conflicts between people and hippos, unlike many other studies, in which the unit of analysis is at the household or village level. Damage events are counted from the victim’s perspective and include repeated incidents on individual plots. The number of damage events matters from a livelihood perspective, whereas it may be irrelevant from an institutional angle since the local administration may decide to ignore human-hippo conflicts altogether. A relatively high number of cases and particularly human casualties could arouse institutional interest to mitigate conflicts and acquire adequate regulation.
52 I used two separate databases for the questionnaires and the occurrence books.
50
Damage events were quantified and triangulated with responses53 of hippo-incident victims. As compensation is likely to influence the opinions of victims on human-hippo conflicts, I distinguish between cases where victims were (financially) compensated for their losses and those where they were not. Victims have expressed their own opinions on hippo issues and conflicts so that personal characteristics like age, sex, educational level, and religion can be correlated with knowledge about hippo issues and attitudes. This can show their willingness to actively participate in conservation initiatives like the local hippo lobby groups (Chapter 9).
Conflicts are also the entry point to the lobby groups, which can only succeed if their members, being community representatives, exchange ideas and jointly decide on the best approach to conflict mitigation. Ultimately, other parties will come in to assist in the development and implementation of the ideas brought forward. Since the groups are at the initial stage and consultation has been limited, the group is seen as a unity and the findings are thus presented per group. The outcome of the group discussions is also presented at group level. While individuals had ample space to vent their ideas, I worked towards a consensus on certain topics as this would allow for a comparison between the groups.
3.6.3 Household definitions There is no universal agreement regarding the definition of a household, although it is considered as an appropriate sample unit for surveys. This study follows the definition given by Casley and Lury (1987:163), who consider a household as, “a person, or group of persons, generally bound by ties of kinship, who live together under a single roof or within a single compound, and who share a community of life in that they are answerable to the same head and share a common source of food”. In the questionnaire survey, the household is defined as “people eating from the same pot / people sharing the same house”. Four types of households were identified: (1) male-headed; (2) female-headed; (3) male-headed, female run (in case of a migrant husband); and (4) other, for instance widows – which turned out to be rare, as women whose husband has passed away still considered themselves as married.
The household definition may seem straightforward but during the course of the study it turned out that the staff members were not unanimous in their interpretation of ‘wife inheritance’, which is a widespread practice among the Luo. When a husband passes away, his widow is inherited by a man (not necessarily a relative of the deceased) so that she and her children will be taken care of. Interestingly, the interviews made clear that the inherited lady (a widow) and the inheritor perceived the concept ‘household’ in a different way (see Annex 10).
3.6.4 Validity of the findings Based on the incident numbers and economic activities in the area, risk profiles were developed for the conflict ‘hotspots’. This does not imply that the project findings can be generalised for the entire Lake Victoria Basin: the local situation is influenced by the physical environment and presence of hippos. Unfortunately, hippo census54 data is lacking and hippo numbers given by respondents are mere estimations. Nevertheless, the project findings give a good idea of human-hippo conflicts in the study area. They were compared with the reports made directly to KWS, both during the project period and the previous years to discern a trend. It seems very likely that the seriousness of human-hippo incidents is underestimated as few people report these incidents to the authorities.
53 The 2009 human population census gives the number of households at sub-locational level. The project data shows the percentage of households that have experienced losses due to hippos, which helps to make an educated guess about the damage proneness of an area. A high damage risk might force residents to relocate and farm elsewhere. 54 I requested KWS to carry out a hippo census, of which it acknowledged the need.
51
3.7 Ethical considerations and limitations to the research
3.7.1 Intentions and expectations Openness about intentions is one of the pillars of fieldwork ethics. The field staff stressed the anonymity55 of the work; respondents’ names were recorded but remained anonymous (unless agreed otherwise). In all meetings, I stressed that the project does neither compensate for any losses brought about by hippos nor had it any funds to finance interventions aimed at reducing crop raids. Notwithstanding that statement and the fact that I worked with local people and all of us rode bicycles in the field (instead of big 4WDs), many people must have secretly hoped for financial support. The field staff was instructed to say that financial assistance was not possible: the team could act as a ‘spokesperson’ but nothing more than that. Our aim was to investigate the situation with hippos from different perspectives and initiate attitudinal change. My attempt to position the project as a neutral ‘third party’ did not convince everybody as some participants in the group meetings kept on trying to involve us and turn us into key agents of change (instead of themselves). I just reminded them of their own responsibilities and assured them that KWS would be informed of our findings.
Communities had many expectations regarding both the project and KWS, like compensation payments and ‘instant’ solutions. I stressed that data acquisition is essential to be able to create viable conflict mitigation strategies and that change requires time. In local communities that suffer from crop losses, the level of anger or hostility is usually high and predominantly directed towards the wildlife authorities, the study area being no exception. Many respondents had an antagonistic attitude towards KWS and blamed the government for not taking care of ‘its animals’. Their tolerance levels were low and they displayed a sense of helplessness towards conflict mitigation options. This attitude was evident in the group meetings, which occasionally turned into heated debates, particularly when an opinion leader ‘feared’ that ideas put forward would impact on the status quo (and possibly his position). Many reactions were rooted in ignorance or a lack of information, but sometimes they could be traced back to one of the key assets: land – more specifically, loss of land. Generally, the project meetings had an open character in which people felt free to express their opinions: they were willing to adopt new ideas and contemplate their own role in conflict mitigation.
3.7.2 Logistics Other challenges concerned logistics. Travelling in the field was troublesome during the rainy season when many dirt roads were inaccessible, particularly the clay ones. I rented a vehicle for the group meetings as we were travelling with a team; on some occasions we got stuck on the way but villagers managed to push us out of the mud. When areas got flooded, the field staff had to look for alternative routes and means to reach the incident sites, which had time and financial implications.
The local sense of time affected the organisation of the meetings, particularly the focus group discussions and awareness creation meetings. The initial aim of two meetings per day in one location did not work as most respondents failed to come at the agreed time. The team either had to wait long until there was a good turnout, or it kept the (next) audience waiting as the previous meeting overran its time – which occasionally made people leave. Hence, I rescheduled to one meeting a day. The time factor can partially be explained by other activities of the attendants: when it had rained the day prior to the meeting, many people spent most of the morning hours in their shambas – but mostly it is linked to a different notion of time and comparative (economic) assessment. Unlike many NGOs in the area, the team did not pay people to attend meetings, but provided sodas and mandazi (a fried dough ball
55 Interview numbers denote the respondents’ identity. The character reflects the division where the respondent comes from: Kadibo (A), Nyando plus Kanyagwal Location (B), and Nyakach (C), and is followed by a number.
52
commonly taken with tea or on its own). There were insufficient funds to pay attendants, but more important, I doubt whether ‘paid attendance’ would generate useful information; it seemed better to talk to people who came out of interest. When the local administration announced a meeting, getting a good turnout proved to be difficult. Hence the team involved headmasters of schools so that the pupils could inform their parents about the meeting in time.
3.7.3 Language Even though the staff members are native speakers of Dholuo, they found it hard to translate particular words from English into Dholuo, while certain words appeared to have a different connotation in the Luo culture. If such issues came up, they were addressed during the weekly staff meetings.
I acquired a working knowledge of Dholuo and was able to introduce the project in Dholuo in the radio announcements mentioned earlier.
3.7.4 Power rationing The data entry and write up were hampered by the power rationing, which started late 2009 and left the work place without power for two days a week. On such days we looked for an alternative space (with a generator) elsewhere. 3.8 Conclusions
This chapter provided an overview of the approach and the methods employed in this study to collect and analyse data in the Hippo Monitoring Project. The conflict analysis, which formed the bulk of the work, was based mainly on the questionnaire survey and damage assessments. Conflicts were chosen as unit of analysis to get a clear notion of the time-space character of hippo-human conflicts and the nature of such conflicts. This will assist in the development of conflict mitigation strategies. The regulatory framework determines what space people have to contribute and what role they can play in conflict reduction, which goes beyond individual measures. Victims and their households were selected as units of observation to get an idea of the impact of damage events on people’s livelihoods in the project area during different seasons.
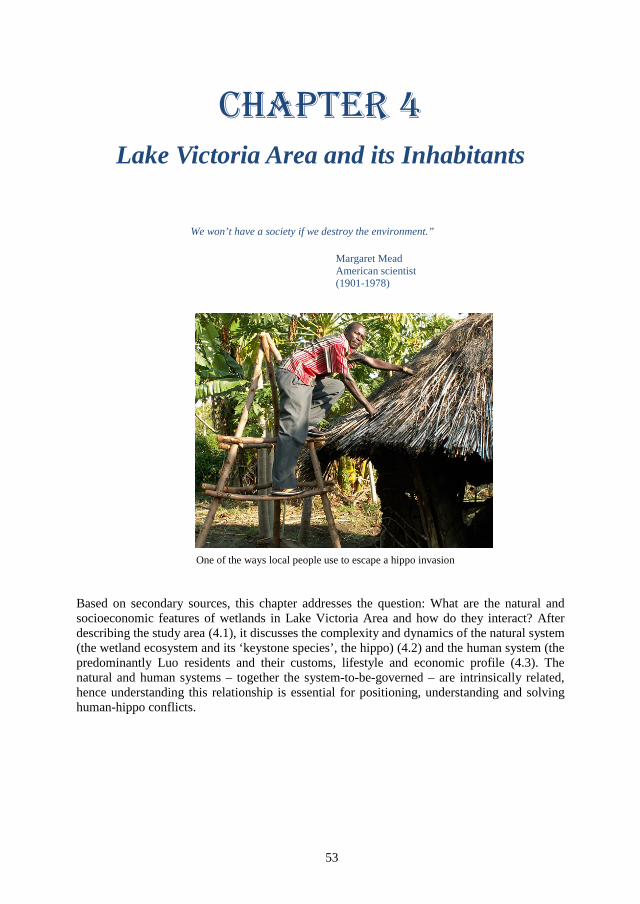
53
Chapter 4 Lake Victoria Area and its Inhabitants
We won’t have a society if we destroy the environment.”
Margaret Mead American scientist (1901-1978)
One of the ways local people use to escape a hippo invasion Based on secondary sources, this chapter addresses the question: What are the natural and socioeconomic features of wetlands in Lake Victoria Area and how do they interact? After describing the study area (4.1), it discusses the complexity and dynamics of the natural system (the wetland ecosystem and its ‘keystone species’, the hippo) (4.2) and the human system (the predominantly Luo residents and their customs, lifestyle and economic profile (4.3). The natural and human systems – together the system-to-be-governed – are intrinsically related, hence understanding this relationship is essential for positioning, understanding and solving human-hippo conflicts.
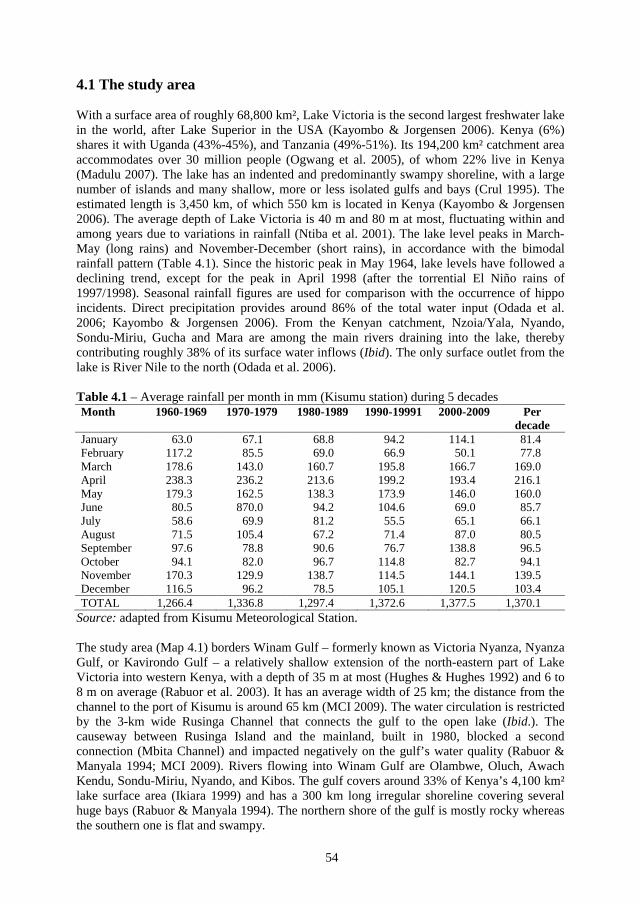
54
4.1 The study area
With a surface area of roughly 68,800 km², Lake Victoria is the second largest freshwater lake in the world, after Lake Superior in the USA (Kayombo & Jorgensen 2006). Kenya (6%) shares it with Uganda (43%-45%), and Tanzania (49%-51%). Its 194,200 km² catchment area accommodates over 30 million people (Ogwang et al. 2005), of whom 22% live in Kenya (Madulu 2007). The lake has an indented and predominantly swampy shoreline, with a large number of islands and many shallow, more or less isolated gulfs and bays (Crul 1995). The estimated length is 3,450 km, of which 550 km is located in Kenya (Kayombo & Jorgensen 2006). The average depth of Lake Victoria is 40 m and 80 m at most, fluctuating within and among years due to variations in rainfall (Ntiba et al. 2001). The lake level peaks in March-May (long rains) and November-December (short rains), in accordance with the bimodal rainfall pattern (Table 4.1). Since the historic peak in May 1964, lake levels have followed a declining trend, except for the peak in April 1998 (after the torrential El Niño rains of 1997/1998). Seasonal rainfall figures are used for comparison with the occurrence of hippo incidents. Direct precipitation provides around 86% of the total water input (Odada et al. 2006; Kayombo & Jorgensen 2006). From the Kenyan catchment, Nzoia/Yala, Nyando, Sondu-Miriu, Gucha and Mara are among the main rivers draining into the lake, thereby contributing roughly 38% of its surface water inflows (Ibid). The only surface outlet from the lake is River Nile to the north (Odada et al. 2006).
Table 4.1 – Average rainfall per month in mm (Kisumu station) during 5 decades Month 1960-1969 1970-1979 1980-1989 1990-19991 2000-2009 Per
decade January 63.0 67.1 68.8 94.2 114.1 81.4 February 117.2 85.5 69.0 66.9 50.1 77.8 March 178.6 143.0 160.7 195.8 166.7 169.0 April 238.3 236.2 213.6 199.2 193.4 216.1 May 179.3 162.5 138.3 173.9 146.0 160.0 June 80.5 870.0 94.2 104.6 69.0 85.7 July 58.6 69.9 81.2 55.5 65.1 66.1 August 71.5 105.4 67.2 71.4 87.0 80.5 September 97.6 78.8 90.6 76.7 138.8 96.5 October 94.1 82.0 96.7 114.8 82.7 94.1 November 170.3 129.9 138.7 114.5 144.1 139.5 December 116.5 96.2 78.5 105.1 120.5 103.4 TOTAL 1,266.4 1,336.8 1,297.4 1,372.6 1,377.5 1,370.1
Source: adapted from Kisumu Meteorological Station.
The study area (Map 4.1) borders Winam Gulf – formerly known as Victoria Nyanza, Nyanza Gulf, or Kavirondo Gulf – a relatively shallow extension of the north-eastern part of Lake Victoria into western Kenya, with a depth of 35 m at most (Hughes & Hughes 1992) and 6 to 8 m on average (Rabuor et al. 2003). It has an average width of 25 km; the distance from the channel to the port of Kisumu is around 65 km (MCI 2009). The water circulation is restricted by the 3-km wide Rusinga Channel that connects the gulf to the open lake (Ibid.). The causeway between Rusinga Island and the mainland, built in 1980, blocked a second connection (Mbita Channel) and impacted negatively on the gulf’s water quality (Rabuor & Manyala 1994; MCI 2009). Rivers flowing into Winam Gulf are Olambwe, Oluch, Awach Kendu, Sondu-Miriu, Nyando, and Kibos. The gulf covers around 33% of Kenya’s 4,100 km² lake surface area (Ikiara 1999) and has a 300 km long irregular shoreline covering several huge bays (Rabuor & Manyala 1994). The northern shore of the gulf is mostly rocky whereas the southern one is flat and swampy.
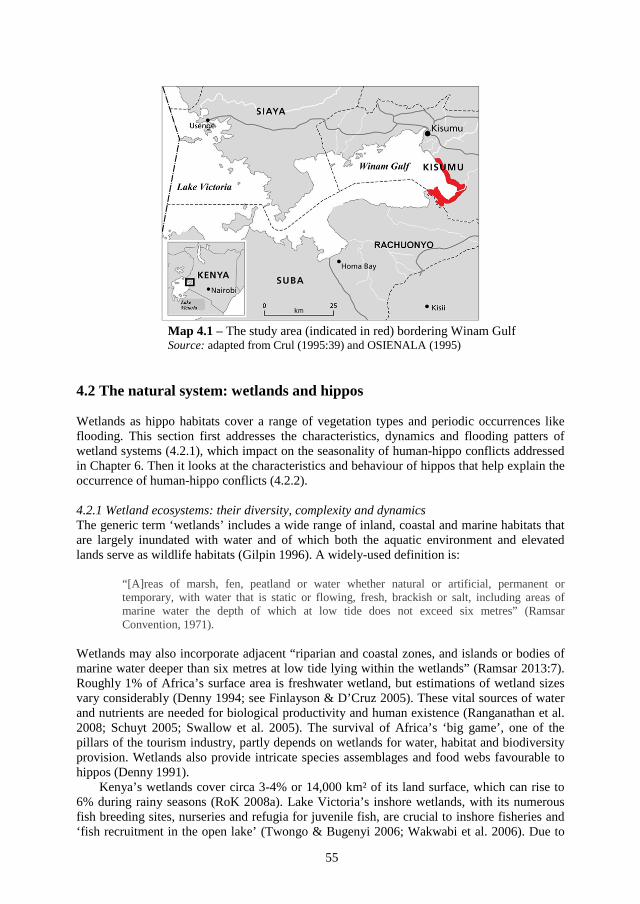
55
Map 4.1 – The study area (indicated in red) bordering Winam Gulf Source: adapted from Crul (1995:39) and OSIENALA (1995)
4.2 The natural system: wetlands and hippos Wetlands as hippo habitats cover a range of vegetation types and periodic occurrences like flooding. This section first addresses the characteristics, dynamics and flooding patters of wetland systems (4.2.1), which impact on the seasonality of human-hippo conflicts addressed in Chapter 6. Then it looks at the characteristics and behaviour of hippos that help explain the occurrence of human-hippo conflicts (4.2.2).
4.2.1 Wetland ecosystems: their diversity, complexity and dynamics The generic term ‘wetlands’ includes a wide range of inland, coastal and marine habitats that are largely inundated with water and of which both the aquatic environment and elevated lands serve as wildlife habitats (Gilpin 1996). A widely-used definition is:
“[A]reas of marsh, fen, peatland or water whether natural or artificial, permanent or temporary, with water that is static or flowing, fresh, brackish or salt, including areas of marine water the depth of which at low tide does not exceed six metres” (Ramsar Convention, 1971).
Wetlands may also incorporate adjacent “riparian and coastal zones, and islands or bodies of marine water deeper than six metres at low tide lying within the wetlands” (Ramsar 2013:7). Roughly 1% of Africa’s surface area is freshwater wetland, but estimations of wetland sizes vary considerably (Denny 1994; see Finlayson & D’Cruz 2005). These vital sources of water and nutrients are needed for biological productivity and human existence (Ranganathan et al. 2008; Schuyt 2005; Swallow et al. 2005). The survival of Africa’s ‘big game’, one of the pillars of the tourism industry, partly depends on wetlands for water, habitat and biodiversity provision. Wetlands also provide intricate species assemblages and food webs favourable to hippos (Denny 1991).
Kenya’s wetlands cover circa 3-4% or 14,000 km² of its land surface, which can rise to 6% during rainy seasons (RoK 2008a). Lake Victoria’s inshore wetlands, with its numerous fish breeding sites, nurseries and refugia for juvenile fish, are crucial to inshore fisheries and ‘fish recruitment in the open lake’ (Twongo & Bugenyi 2006; Wakwabi et al. 2006). Due to
56
the continuous input and cycle of nutrients into the system through nutrient-rich sediments in floodwaters, sedentarisation and decomposition of plant tissue, the lake’s highly dynamic permanent herbaceous swamps are ranked among the most fertile and productive ecosystems in the world (Denny 1991; Kansiime et al. 2007). Hippo faeces (they mainly defecate in the water) and livestock dung deposited ashore increase the ecosystem’s fertility (Denny 1991). Wetlands are highly complex, diverse and dynamic systems, which provide a multitude of ecosystem services and goods (De Groot et al. 2002): (1) provisional services like water for consumptive use, products obtained from farming, fisheries (Stuip et al. 2002); (2) regulating services like flood prevention, pollution control and erosion maintenance (Turner et al. 2000); (3) cultural services like recreation, ecotourism and aesthetic values, and (4) habitat services like primary production, nutrient cycling and soil formation, required for the production of the other three services (Silvis & van der Heide 2013).
The Lake Basin’s key wetlands are categorised as riverine, lacustrine and palustrine systems (Okeyo-Owuor et al. 2012). The riverine system includes rivers and streams with (seasonally or continuously) flowing water, like Nyando and Sondu-Miriu Rivers plus Awach and Aguko Streams (all located in the study area) (Ibid.). Emergent wetland plants are common here, yet the type is related to the source of the runoff and slope of the river (Kairu 2001). Lacustrine systems include freshwater marshes and lakeshores; they cover the entire shoreline swamp and literal zone in Kadibo, Nyando and Lower Nyakach Divisions (Raburu et al. 2012). Wetlands are commonly found where rivers enter the lake due to a reduced flow and sedimentation which favours the growth of vast swampy vegetation along the lake edges, like in the Sondu-Miriu river mouth (part of the Lower Sondu-Miriu wetland, which covers an area of 5.5 km²) (Gichuki et al. 2001). The palustrine system covers non-tidal wetlands dominated by trees, shrubs and persistent emergent plants. Human-made wetlands include Irrigation Scheme Rice Farms (Kadibo Division), small-scale irrigation farms in Gem Rae (Lower Nyakach), plus fish ponds and water pans throughout the study area.
Three dominant macrophytes prevalent in the study area are papyrus (Cyperus papyrus), water hyacinth and hippo grass. Lake Victoria’s shoreline is predominantly fringed with papyrus56 and other tall vegetation extending into swamps (Crul 1995). Besides hippos, there are other species like baboons, bats, a variety of bird species, bush pigs, crocodiles, hyenas, leopards, monitor lizards, vervet monkeys, sitatungas, warthogs, wild cats and -dogs, and different snake species. In the project area, crocodiles and leopards are rarely seen. According to data collected from KWS Kisumu, hippos are ‘causing’ most of the problems.
The past decades have marked significant changes in the lake ecosystem, whose ecological value (like that of wetlands worldwide) has long been ignored (Simon 1993). Colonial governments often instigated the drainage of African wetlands to boost food production and raise living standards (Barbier et al. 1997; Denny 1991) and to reduce the risk for diseases like malaria, yellow fever and bilharzia caused by insects that find their breeding grounds in wetlands (Simon 1993). The growing and more recent pressure on the lake’s ecosystem is mainly due to relatively high human population growth rates and a concomitant expansion of agricultural activities, agro-based industries and urban centres in its catchment area and riparian zone (Crul 1995). Other causes include water withdrawal, land conversion (vegetation clearance, drainage), aquaculture, infrastructural works, pollution, eutrophication, the introduction of invasive exotic species, and overharvesting/exploitation (including destructive fishing practices and overfishing) (Finlayson &D’Cruz 2005; MA 2005; Odada et al. 2004, 2006; WWAP 2006). This resulted in large-scale irrigation and river diversions, roads and flood control infrastructure like dams and river canalization, and wetlands conversion (Ranganathan et al. 2008). Between 1969 and 2000, an estimated 47% and 34% of the papyrus area got cleared at Koguta and Kusa (both Nyakach) due to land conversion and
56 Papyrus is an emergent macrophyte which is rooted in the substrate and produces vegetative shoots above the water surface, used by local people for handicrafts, furniture and building material.
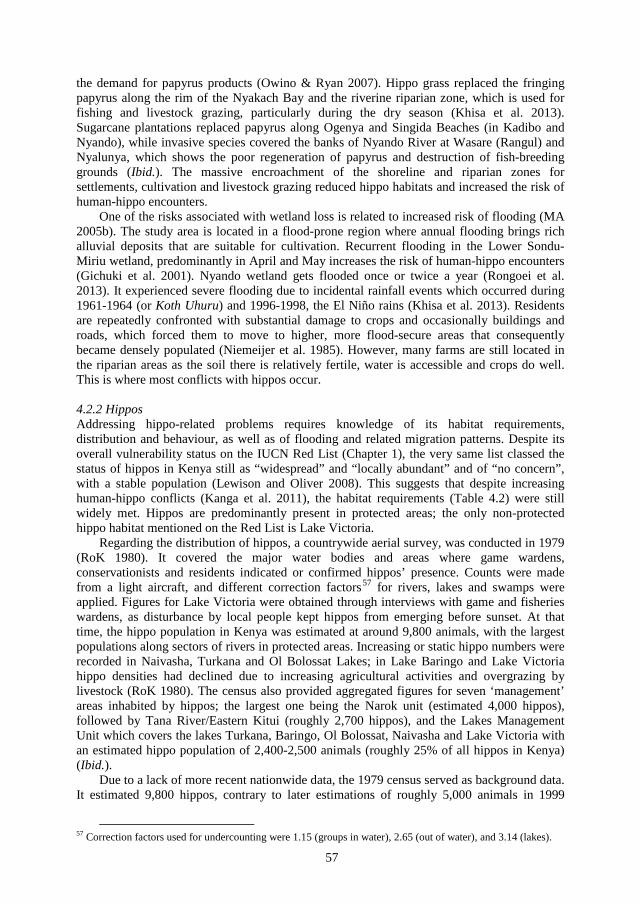
57
the demand for papyrus products (Owino & Ryan 2007). Hippo grass replaced the fringing papyrus along the rim of the Nyakach Bay and the riverine riparian zone, which is used for fishing and livestock grazing, particularly during the dry season (Khisa et al. 2013). Sugarcane plantations replaced papyrus along Ogenya and Singida Beaches (in Kadibo and Nyando), while invasive species covered the banks of Nyando River at Wasare (Rangul) and Nyalunya, which shows the poor regeneration of papyrus and destruction of fish-breeding grounds (Ibid.). The massive encroachment of the shoreline and riparian zones for settlements, cultivation and livestock grazing reduced hippo habitats and increased the risk of human-hippo encounters.
One of the risks associated with wetland loss is related to increased risk of flooding (MA 2005b). The study area is located in a flood-prone region where annual flooding brings rich alluvial deposits that are suitable for cultivation. Recurrent flooding in the Lower Sondu-Miriu wetland, predominantly in April and May increases the risk of human-hippo encounters (Gichuki et al. 2001). Nyando wetland gets flooded once or twice a year (Rongoei et al. 2013). It experienced severe flooding due to incidental rainfall events which occurred during 1961-1964 (or Koth Uhuru) and 1996-1998, the El Niño rains (Khisa et al. 2013). Residents are repeatedly confronted with substantial damage to crops and occasionally buildings and roads, which forced them to move to higher, more flood-secure areas that consequently became densely populated (Niemeijer et al. 1985). However, many farms are still located in the riparian areas as the soil there is relatively fertile, water is accessible and crops do well. This is where most conflicts with hippos occur.
4.2.2 Hippos Addressing hippo-related problems requires knowledge of its habitat requirements, distribution and behaviour, as well as of flooding and related migration patterns. Despite its overall vulnerability status on the IUCN Red List (Chapter 1), the very same list classed the status of hippos in Kenya still as “widespread” and “locally abundant” and of “no concern”, with a stable population (Lewison and Oliver 2008). This suggests that despite increasing human-hippo conflicts (Kanga et al. 2011), the habitat requirements (Table 4.2) were still widely met. Hippos are predominantly present in protected areas; the only non-protected hippo habitat mentioned on the Red List is Lake Victoria.
Regarding the distribution of hippos, a countrywide aerial survey, was conducted in 1979 (RoK 1980). It covered the major water bodies and areas where game wardens, conservationists and residents indicated or confirmed hippos’ presence. Counts were made from a light aircraft, and different correction factors57 for rivers, lakes and swamps were applied. Figures for Lake Victoria were obtained through interviews with game and fisheries wardens, as disturbance by local people kept hippos from emerging before sunset. At that time, the hippo population in Kenya was estimated at around 9,800 animals, with the largest populations along sectors of rivers in protected areas. Increasing or static hippo numbers were recorded in Naivasha, Turkana and Ol Bolossat Lakes; in Lake Baringo and Lake Victoria hippo densities had declined due to increasing agricultural activities and overgrazing by livestock (RoK 1980). The census also provided aggregated figures for seven ‘management’ areas inhabited by hippos; the largest one being the Narok unit (estimated 4,000 hippos), followed by Tana River/Eastern Kitui (roughly 2,700 hippos), and the Lakes Management Unit which covers the lakes Turkana, Baringo, Ol Bolossat, Naivasha and Lake Victoria with an estimated hippo population of 2,400-2,500 animals (roughly 25% of all hippos in Kenya) (Ibid.).
Due to a lack of more recent nationwide data, the 1979 census served as background data. It estimated 9,800 hippos, contrary to later estimations of roughly 5,000 animals in 1999
57 Correction factors used for undercounting were 1.15 (groups in water), 2.65 (out of water), and 3.14 (lakes).
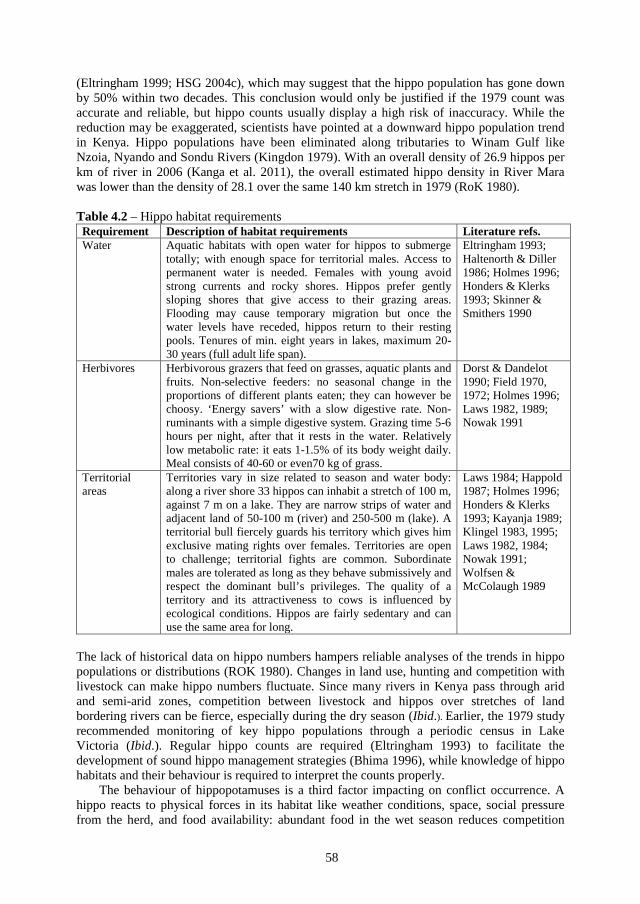
58
(Eltringham 1999; HSG 2004c), which may suggest that the hippo population has gone down by 50% within two decades. This conclusion would only be justified if the 1979 count was accurate and reliable, but hippo counts usually display a high risk of inaccuracy. While the reduction may be exaggerated, scientists have pointed at a downward hippo population trend in Kenya. Hippo populations have been eliminated along tributaries to Winam Gulf like Nzoia, Nyando and Sondu Rivers (Kingdon 1979). With an overall density of 26.9 hippos per km of river in 2006 (Kanga et al. 2011), the overall estimated hippo density in River Mara was lower than the density of 28.1 over the same 140 km stretch in 1979 (RoK 1980).
Table 4.2 – Hippo habitat requirements Requirement Description of habitat requirements Literature refs. Water Aquatic habitats with open water for hippos to submerge
totally; with enough space for territorial males. Access to permanent water is needed. Females with young avoid strong currents and rocky shores. Hippos prefer gently sloping shores that give access to their grazing areas. Flooding may cause temporary migration but once the water levels have receded, hippos return to their resting pools. Tenures of min. eight years in lakes, maximum 20-30 years (full adult life span).
Eltringham 1993; Haltenorth & Diller 1986; Holmes 1996; Honders & Klerks 1993; Skinner & Smithers 1990
Herbivores Herbivorous grazers that feed on grasses, aquatic plants and fruits. Non-selective feeders: no seasonal change in the proportions of different plants eaten; they can however be choosy. ‘Energy savers’ with a slow digestive rate. Non-ruminants with a simple digestive system. Grazing time 5-6 hours per night, after that it rests in the water. Relatively low metabolic rate: it eats 1-1.5% of its body weight daily. Meal consists of 40-60 or even70 kg of grass.
Dorst & Dandelot 1990; Field 1970, 1972; Holmes 1996; Laws 1982, 1989; Nowak 1991
Territorial areas
Territories vary in size related to season and water body: along a river shore 33 hippos can inhabit a stretch of 100 m, against 7 m on a lake. They are narrow strips of water and adjacent land of 50-100 m (river) and 250-500 m (lake). A territorial bull fiercely guards his territory which gives him exclusive mating rights over females. Territories are open to challenge; territorial fights are common. Subordinate males are tolerated as long as they behave submissively and respect the dominant bull’s privileges. The quality of a territory and its attractiveness to cows is influenced by ecological conditions. Hippos are fairly sedentary and can use the same area for long.
Laws 1984; Happold 1987; Holmes 1996; Honders & Klerks 1993; Kayanja 1989; Klingel 1983, 1995; Laws 1982, 1984; Nowak 1991; Wolfsen & McColaugh 1989
The lack of historical data on hippo numbers hampers reliable analyses of the trends in hippo populations or distributions (ROK 1980). Changes in land use, hunting and competition with livestock can make hippo numbers fluctuate. Since many rivers in Kenya pass through arid and semi-arid zones, competition between livestock and hippos over stretches of land bordering rivers can be fierce, especially during the dry season (Ibid.). Earlier, the 1979 study recommended monitoring of key hippo populations through a periodic census in Lake Victoria (Ibid.). Regular hippo counts are required (Eltringham 1993) to facilitate the development of sound hippo management strategies (Bhima 1996), while knowledge of hippo habitats and their behaviour is required to interpret the counts properly.
The behaviour of hippopotamuses is a third factor impacting on conflict occurrence. A hippo reacts to physical forces in its habitat like weather conditions, space, social pressure from the herd, and food availability: abundant food in the wet season reduces competition
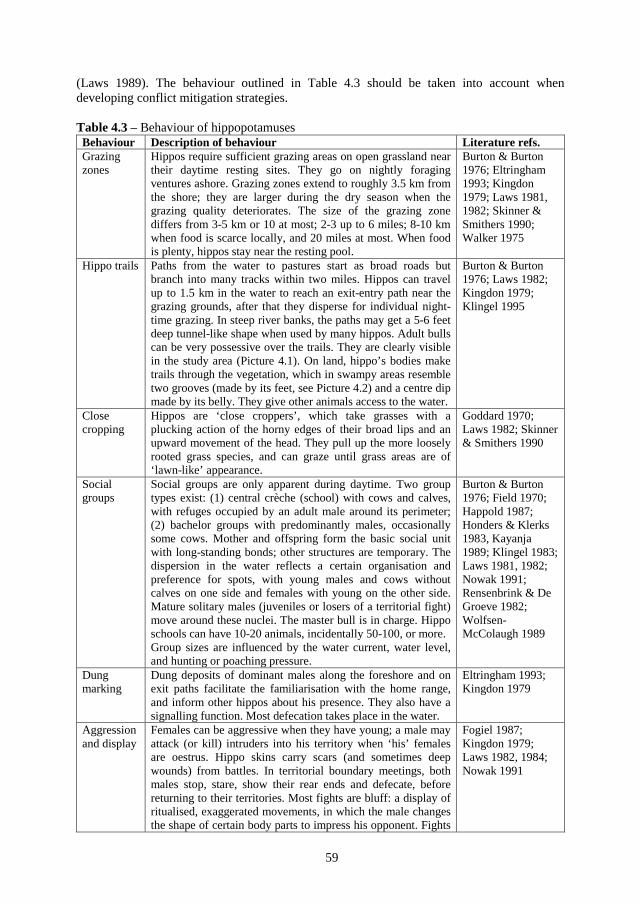
59
(Laws 1989). The behaviour outlined in Table 4.3 should be taken into account when developing conflict mitigation strategies.
Table 4.3 – Behaviour of hippopotamuses Behaviour Description of behaviour Literature refs. Grazing zones
Hippos require sufficient grazing areas on open grassland near their daytime resting sites. They go on nightly foraging ventures ashore. Grazing zones extend to roughly 3.5 km from the shore; they are larger during the dry season when the grazing quality deteriorates. The size of the grazing zone differs from 3-5 km or 10 at most; 2-3 up to 6 miles; 8-10 km when food is scarce locally, and 20 miles at most. When food is plenty, hippos stay near the resting pool.
Burton & Burton 1976; Eltringham 1993; Kingdon 1979; Laws 1981, 1982; Skinner & Smithers 1990; Walker 1975
Hippo trails Paths from the water to pastures start as broad roads but branch into many tracks within two miles. Hippos can travel up to 1.5 km in the water to reach an exit-entry path near the grazing grounds, after that they disperse for individual night-time grazing. In steep river banks, the paths may get a 5-6 feet deep tunnel-like shape when used by many hippos. Adult bulls can be very possessive over the trails. They are clearly visible in the study area (Picture 4.1). On land, hippo’s bodies make trails through the vegetation, which in swampy areas resemble two grooves (made by its feet, see Picture 4.2) and a centre dip made by its belly. They give other animals access to the water.
Burton & Burton 1976; Laws 1982; Kingdon 1979; Klingel 1995
Close cropping
Hippos are ‘close croppers’, which take grasses with a plucking action of the horny edges of their broad lips and an upward movement of the head. They pull up the more loosely rooted grass species, and can graze until grass areas are of ‘lawn-like’ appearance.
Goddard 1970; Laws 1982; Skinner & Smithers 1990
Social groups
Social groups are only apparent during daytime. Two group types exist: (1) central crèche (school) with cows and calves, with refuges occupied by an adult male around its perimeter; (2) bachelor groups with predominantly males, occasionallysome cows. Mother and offspring form the basic social unitwith long-standing bonds; other structures are temporary. Thedispersion in the water reflects a certain organisation andpreference for spots, with young males and cows withoutcalves on one side and females with young on the other side.Mature solitary males (juveniles or losers of a territorial fight)move around these nuclei. The master bull is in charge. Hipposchools can have 10-20 animals, incidentally 50-100, or more.Group sizes are influenced by the water current, water level,and hunting or poaching pressure.
Burton & Burton 1976; Field 1970; Happold 1987; Honders & Klerks 1983, Kayanja 1989; Klingel 1983; Laws 1981, 1982; Nowak 1991; Rensenbrink & De Groeve 1982; Wolfsen-McColaugh 1989
Dung marking
Dung deposits of dominant males along the foreshore and on exit paths facilitate the familiarisation with the home range, and inform other hippos about his presence. They also have a signalling function. Most defecation takes place in the water.
Eltringham 1993; Kingdon 1979
Aggression and display
Females can be aggressive when they have young; a male may attack (or kill) intruders into his territory when ‘his’ females are oestrus. Hippo skins carry scars (and sometimes deep wounds) from battles. In territorial boundary meetings, both males stop, stare, show their rear ends and defecate, before returning to their territories. Most fights are bluff: a display of ritualised, exaggerated movements, in which the male changes the shape of certain body parts to impress his opponent. Fights
Fogiel 1987; Kingdon 1979; Laws 1982, 1984; Nowak 1991
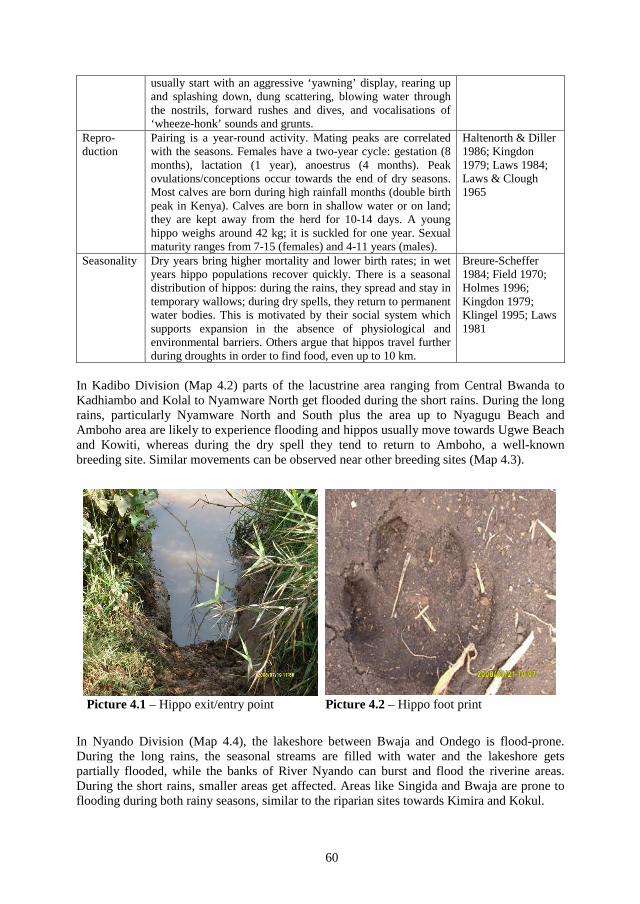
60
usually start with an aggressive ‘yawning’ display, rearing up and splashing down, dung scattering, blowing water through the nostrils, forward rushes and dives, and vocalisations of ‘wheeze-honk’ sounds and grunts.
Repro-duction
Pairing is a year-round activity. Mating peaks are correlated with the seasons. Females have a two-year cycle: gestation (8 months), lactation (1 year), anoestrus (4 months). Peak ovulations/conceptions occur towards the end of dry seasons. Most calves are born during high rainfall months (double birth peak in Kenya). Calves are born in shallow water or on land; they are kept away from the herd for 10-14 days. A young hippo weighs around 42 kg; it is suckled for one year. Sexual maturity ranges from 7-15 (females) and 4-11 years (males).
Haltenorth & Diller 1986; Kingdon 1979; Laws 1984; Laws & Clough 1965
Seasonality Dry years bring higher mortality and lower birth rates; in wet years hippo populations recover quickly. There is a seasonal distribution of hippos: during the rains, they spread and stay in temporary wallows; during dry spells, they return to permanent water bodies. This is motivated by their social system which supports expansion in the absence of physiological and environmental barriers. Others argue that hippos travel further during droughts in order to find food, even up to 10 km.
Breure-Scheffer 1984; Field 1970; Holmes 1996; Kingdon 1979; Klingel 1995; Laws 1981
In Kadibo Division (Map 4.2) parts of the lacustrine area ranging from Central Bwanda to Kadhiambo and Kolal to Nyamware North get flooded during the short rains. During the long rains, particularly Nyamware North and South plus the area up to Nyagugu Beach and Amboho area are likely to experience flooding and hippos usually move towards Ugwe Beach and Kowiti, whereas during the dry spell they tend to return to Amboho, a well-known breeding site. Similar movements can be observed near other breeding sites (Map 4.3). In Nyando Division (Map 4.4), the lakeshore between Bwaja and Ondego is flood-prone. During the long rains, the seasonal streams are filled with water and the lakeshore gets partially flooded, while the banks of River Nyando can burst and flood the riverine areas. During the short rains, smaller areas get affected. Areas like Singida and Bwaja are prone to flooding during both rainy seasons, similar to the riparian sites towards Kimira and Kokul.
Picture 4.1 – Hippo exit/entry point Picture 4.2 – Hippo foot print
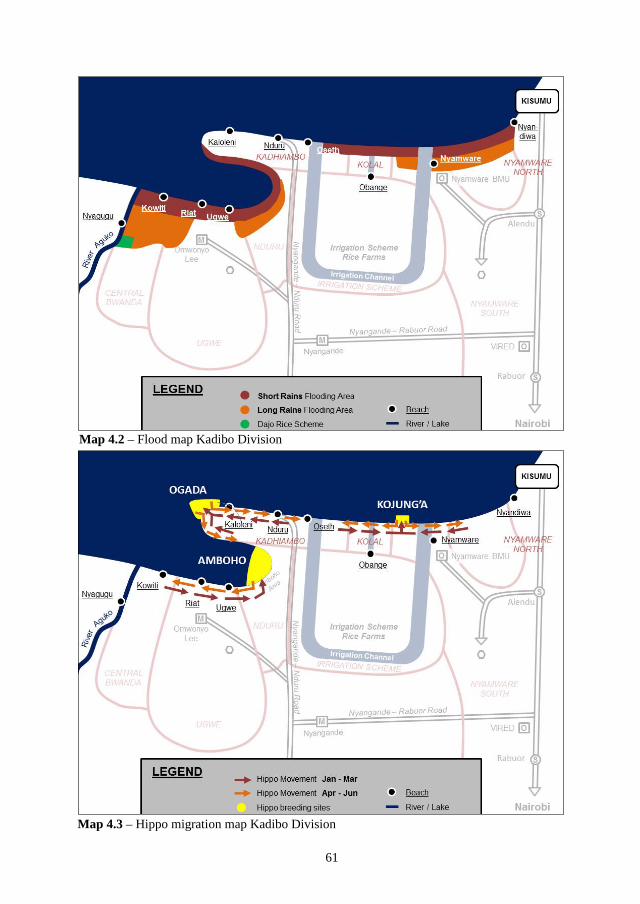
61
Map 4.2 – Flood map Kadibo Division
Map 4.3 – Hippo migration map Kadibo Division
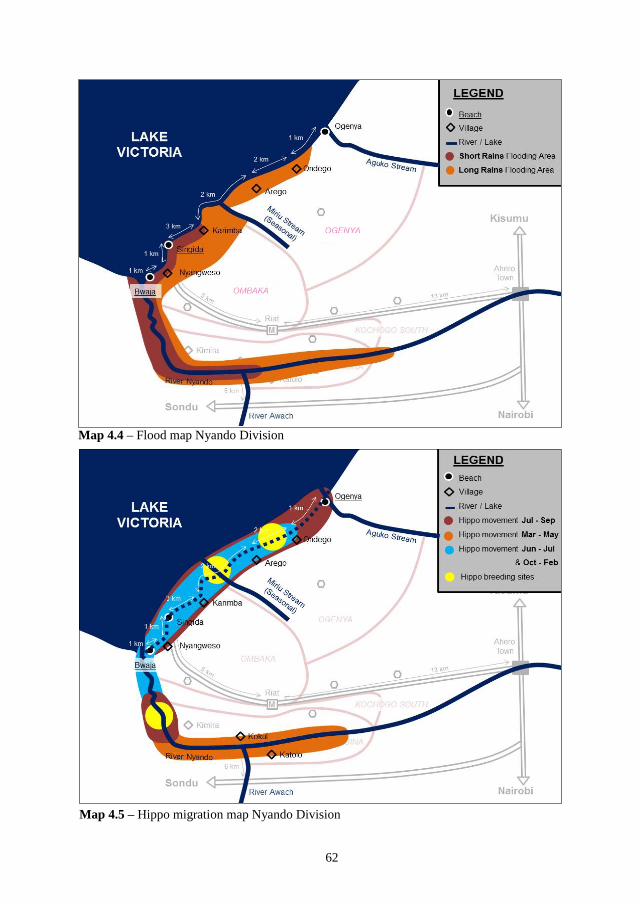
62
Map 4.4 – Flood map Nyando Division
Map 4.5 – Hippo migration map Nyando Division
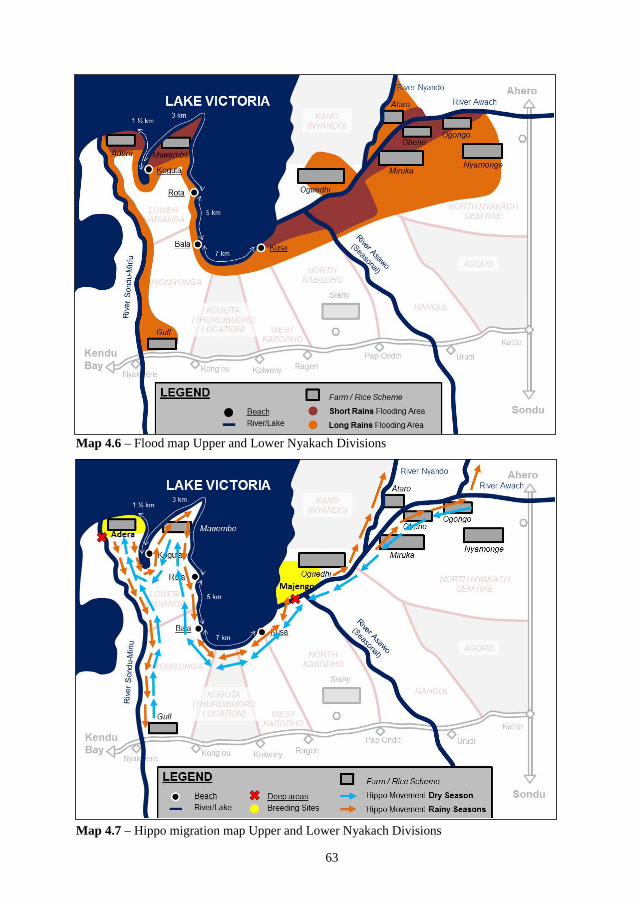
63
Map 4.6 – Flood map Upper and Lower Nyakach Divisions
Map 4.7 – Hippo migration map Upper and Lower Nyakach Divisions
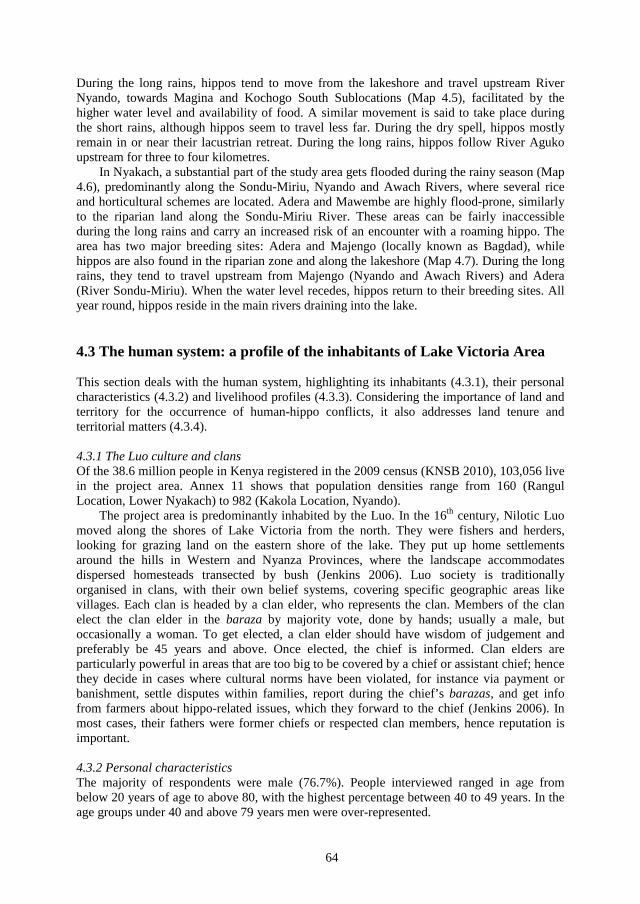
64
During the long rains, hippos tend to move from the lakeshore and travel upstream River Nyando, towards Magina and Kochogo South Sublocations (Map 4.5), facilitated by the higher water level and availability of food. A similar movement is said to take place during the short rains, although hippos seem to travel less far. During the dry spell, hippos mostly remain in or near their lacustrian retreat. During the long rains, hippos follow River Aguko upstream for three to four kilometres.
In Nyakach, a substantial part of the study area gets flooded during the rainy season (Map 4.6), predominantly along the Sondu-Miriu, Nyando and Awach Rivers, where several rice and horticultural schemes are located. Adera and Mawembe are highly flood-prone, similarly to the riparian land along the Sondu-Miriu River. These areas can be fairly inaccessible during the long rains and carry an increased risk of an encounter with a roaming hippo. The area has two major breeding sites: Adera and Majengo (locally known as Bagdad), while hippos are also found in the riparian zone and along the lakeshore (Map 4.7). During the long rains, they tend to travel upstream from Majengo (Nyando and Awach Rivers) and Adera (River Sondu-Miriu). When the water level recedes, hippos return to their breeding sites. All year round, hippos reside in the main rivers draining into the lake.
4.3 The human system: a profile of the inhabitants of Lake Victoria Area
This section deals with the human system, highlighting its inhabitants (4.3.1), their personal characteristics (4.3.2) and livelihood profiles (4.3.3). Considering the importance of land and territory for the occurrence of human-hippo conflicts, it also addresses land tenure and territorial matters (4.3.4).
4.3.1 The Luo culture and clans Of the 38.6 million people in Kenya registered in the 2009 census (KNSB 2010), 103,056 live in the project area. Annex 11 shows that population densities range from 160 (Rangul Location, Lower Nyakach) to 982 (Kakola Location, Nyando).
The project area is predominantly inhabited by the Luo. In the 16th century, Nilotic Luo moved along the shores of Lake Victoria from the north. They were fishers and herders, looking for grazing land on the eastern shore of the lake. They put up home settlements around the hills in Western and Nyanza Provinces, where the landscape accommodates dispersed homesteads transected by bush (Jenkins 2006). Luo society is traditionally organised in clans, with their own belief systems, covering specific geographic areas like villages. Each clan is headed by a clan elder, who represents the clan. Members of the clan elect the clan elder in the baraza by majority vote, done by hands; usually a male, but occasionally a woman. To get elected, a clan elder should have wisdom of judgement and preferably be 45 years and above. Once elected, the chief is informed. Clan elders are particularly powerful in areas that are too big to be covered by a chief or assistant chief; hence they decide in cases where cultural norms have been violated, for instance via payment or banishment, settle disputes within families, report during the chief’s barazas, and get info from farmers about hippo-related issues, which they forward to the chief (Jenkins 2006). In most cases, their fathers were former chiefs or respected clan members, hence reputation is important.
4.3.2 Personal characteristics The majority of respondents were male (76.7%). People interviewed ranged in age from below 20 years of age to above 80, with the highest percentage between 40 to 49 years. In the age groups under 40 and above 79 years men were over-represented.
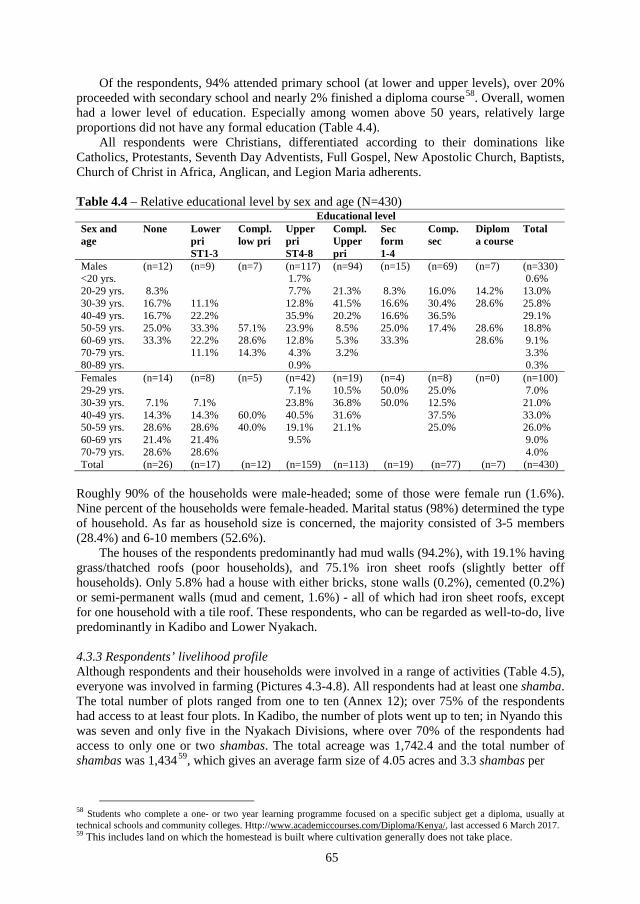
65
Of the respondents, 94% attended primary school (at lower and upper levels), over 20% proceeded with secondary school and nearly 2% finished a diploma course58. Overall, women had a lower level of education. Especially among women above 50 years, relatively large proportions did not have any formal education (Table 4.4).
All respondents were Christians, differentiated according to their dominations like Catholics, Protestants, Seventh Day Adventists, Full Gospel, New Apostolic Church, Baptists, Church of Christ in Africa, Anglican, and Legion Maria adherents.
Table 4.4 – Relative educational level by sex and age (N=430) Educational level
Sex and age
None Lower pri ST1-3
Compl. low pri
Upper pri ST4-8
Compl. Upper pri
Sec form 1-4
Comp. sec
Diploma course
Total
Males (n=12) (n=9) (n=7) (n=117) (n=94) (n=15) (n=69) (n=7) (n=330) <20 yrs. 1.7% 0.6% 20-29 yrs. 8.3% 7.7% 21.3% 8.3% 16.0% 14.2% 13.0% 30-39 yrs. 16.7% 11.1% 12.8% 41.5% 16.6% 30.4% 28.6% 25.8% 40-49 yrs. 16.7% 22.2% 35.9% 20.2% 16.6% 36.5% 29.1% 50-59 yrs. 25.0% 33.3% 57.1% 23.9% 8.5% 25.0% 17.4% 28.6% 18.8% 60-69 yrs. 33.3% 22.2% 28.6% 12.8% 5.3% 33.3% 28.6% 9.1% 70-79 yrs. 11.1% 14.3% 4.3% 3.2% 3.3% 80-89 yrs. 0.9% 0.3% Females (n=14) (n=8) (n=5) (n=42) (n=19) (n=4) (n=8) (n=0) (n=100) 29-29 yrs. 7.1% 10.5% 50.0% 25.0% 7.0% 30-39 yrs. 7.1% 7.1% 23.8% 36.8% 50.0% 12.5% 21.0% 40-49 yrs. 14.3% 14.3% 60.0% 40.5% 31.6% 37.5% 33.0% 50-59 yrs. 28.6% 28.6% 40.0% 19.1% 21.1% 25.0% 26.0% 60-69 yrs 21.4% 21.4% 9.5% 9.0% 70-79 yrs. 28.6% 28.6% 4.0% Total (n=26) (n=17) (n=12) (n=159) (n=113) (n=19) (n=77) (n=7) (n=430)
Roughly 90% of the households were male-headed; some of those were female run (1.6%). Nine percent of the households were female-headed. Marital status (98%) determined the type of household. As far as household size is concerned, the majority consisted of 3-5 members (28.4%) and 6-10 members (52.6%).
The houses of the respondents predominantly had mud walls (94.2%), with 19.1% having grass/thatched roofs (poor households), and 75.1% iron sheet roofs (slightly better off households). Only 5.8% had a house with either bricks, stone walls (0.2%), cemented (0.2%) or semi-permanent walls (mud and cement, 1.6%) - all of which had iron sheet roofs, except for one household with a tile roof. These respondents, who can be regarded as well-to-do, live predominantly in Kadibo and Lower Nyakach.
4.3.3 Respondents’ livelihood profile Although respondents and their households were involved in a range of activities (Table 4.5), everyone was involved in farming (Pictures 4.3-4.8). All respondents had at least one shamba. The total number of plots ranged from one to ten (Annex 12); over 75% of the respondents had access to at least four plots. In Kadibo, the number of plots went up to ten; in Nyando this was seven and only five in the Nyakach Divisions, where over 70% of the respondents had access to only one or two shambas. The total acreage was 1,742.4 and the total number of shambas was 1,43459, which gives an average farm size of 4.05 acres and 3.3 shambas per
58 Students who complete a one- or two year learning programme focused on a specific subject get a diploma, usually at technical schools and community colleges. Http://www.academiccourses.com/Diploma/Kenya/, last accessed 6 March 2017. 59 This includes land on which the homestead is built where cultivation generally does not take place.
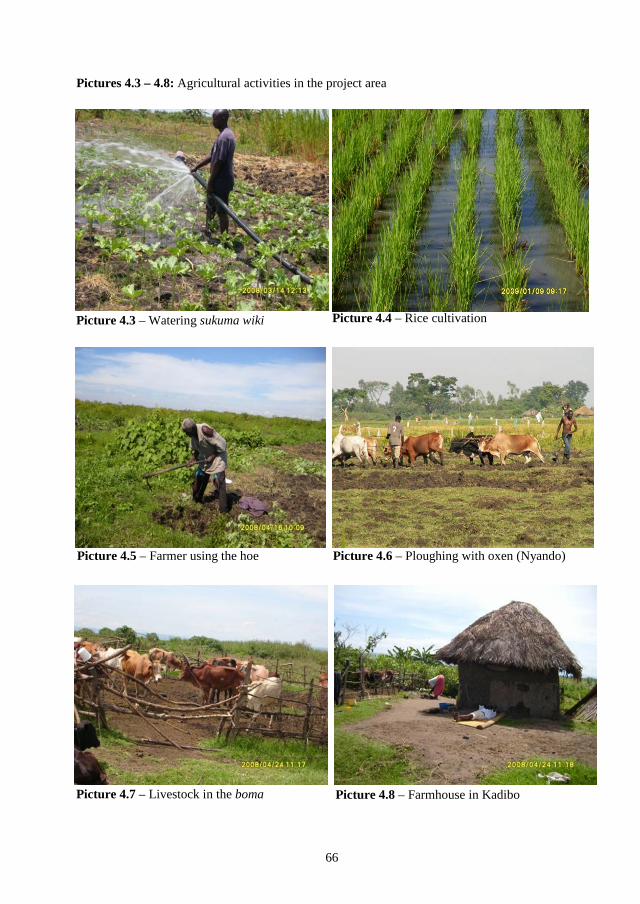
66
Pictures 4.3 – 4.8: Agricultural activities in the project area
.
Picture 4.3 – Watering sukuma wiki Picture 4.4 – Rice cultivation
Picture 4.5 – Farmer using the hoe Picture 4.6 – Ploughing with oxen (Nyando)
Picture 4.7 – Livestock in the boma Picture 4.8 – Farmhouse in Kadibo
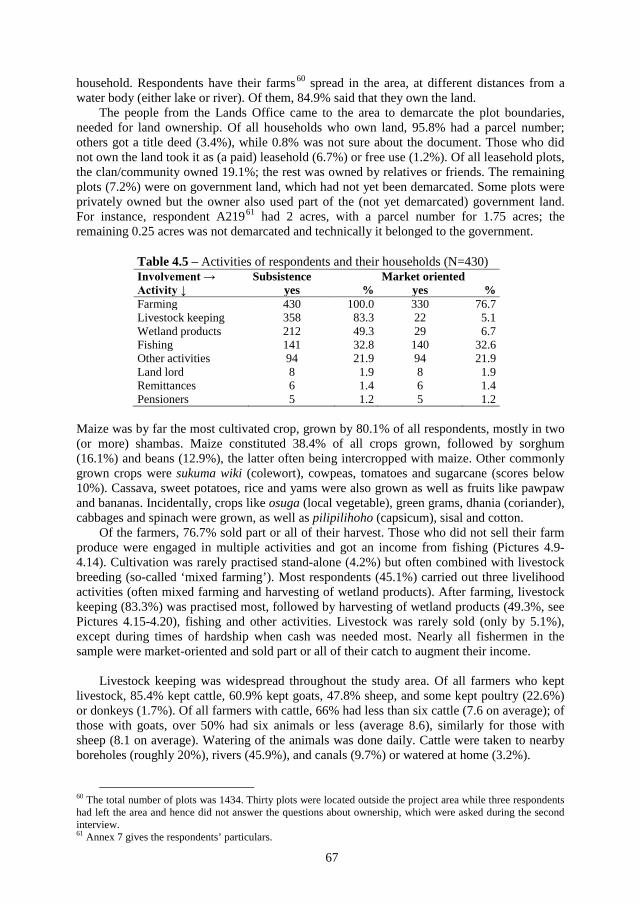
67
household. Respondents have their farms60 spread in the area, at different distances from a water body (either lake or river). Of them, 84.9% said that they own the land.
The people from the Lands Office came to the area to demarcate the plot boundaries, needed for land ownership. Of all households who own land, 95.8% had a parcel number; others got a title deed (3.4%), while 0.8% was not sure about the document. Those who did not own the land took it as (a paid) leasehold (6.7%) or free use (1.2%). Of all leasehold plots, the clan/community owned 19.1%; the rest was owned by relatives or friends. The remaining plots (7.2%) were on government land, which had not yet been demarcated. Some plots were privately owned but the owner also used part of the (not yet demarcated) government land. For instance, respondent A21961 had 2 acres, with a parcel number for 1.75 acres; the remaining 0.25 acres was not demarcated and technically it belonged to the government.
Table 4.5 – Activities of respondents and their households (N=430) Involvement → Subsistence Market oriented Activity ↓ yes % yes % Farming 430 100.0 330 76.7 Livestock keeping 358 83.3 22 5.1 Wetland products 212 49.3 29 6.7 Fishing 141 32.8 140 32.6 Other activities 94 21.9 94 21.9 Land lord 8 1.9 8 1.9 Remittances 6 1.4 6 1.4 Pensioners 5 1.2 5 1.2
Maize was by far the most cultivated crop, grown by 80.1% of all respondents, mostly in two (or more) shambas. Maize constituted 38.4% of all crops grown, followed by sorghum (16.1%) and beans (12.9%), the latter often being intercropped with maize. Other commonly grown crops were sukuma wiki (colewort), cowpeas, tomatoes and sugarcane (scores below 10%). Cassava, sweet potatoes, rice and yams were also grown as well as fruits like pawpaw and bananas. Incidentally, crops like osuga (local vegetable), green grams, dhania (coriander), cabbages and spinach were grown, as well as pilipilihoho (capsicum), sisal and cotton.
Of the farmers, 76.7% sold part or all of their harvest. Those who did not sell their farm produce were engaged in multiple activities and got an income from fishing (Pictures 4.9-4.14). Cultivation was rarely practised stand-alone (4.2%) but often combined with livestock breeding (so-called ‘mixed farming’). Most respondents (45.1%) carried out three livelihood activities (often mixed farming and harvesting of wetland products). After farming, livestock keeping (83.3%) was practised most, followed by harvesting of wetland products (49.3%, see Pictures 4.15-4.20), fishing and other activities. Livestock was rarely sold (only by 5.1%), except during times of hardship when cash was needed most. Nearly all fishermen in the sample were market-oriented and sold part or all of their catch to augment their income.
Livestock keeping was widespread throughout the study area. Of all farmers who kept livestock, 85.4% kept cattle, 60.9% kept goats, 47.8% sheep, and some kept poultry (22.6%) or donkeys (1.7%). Of all farmers with cattle, 66% had less than six cattle (7.6 on average); of those with goats, over 50% had six animals or less (average 8.6), similarly for those with sheep (8.1 on average). Watering of the animals was done daily. Cattle were taken to nearby boreholes (roughly 20%), rivers (45.9%), and canals (9.7%) or watered at home (3.2%).
60 The total number of plots was 1434. Thirty plots were located outside the project area while three respondents had left the area and hence did not answer the questions about ownership, which were asked during the second interview. 61 Annex 7 gives the respondents’ particulars.
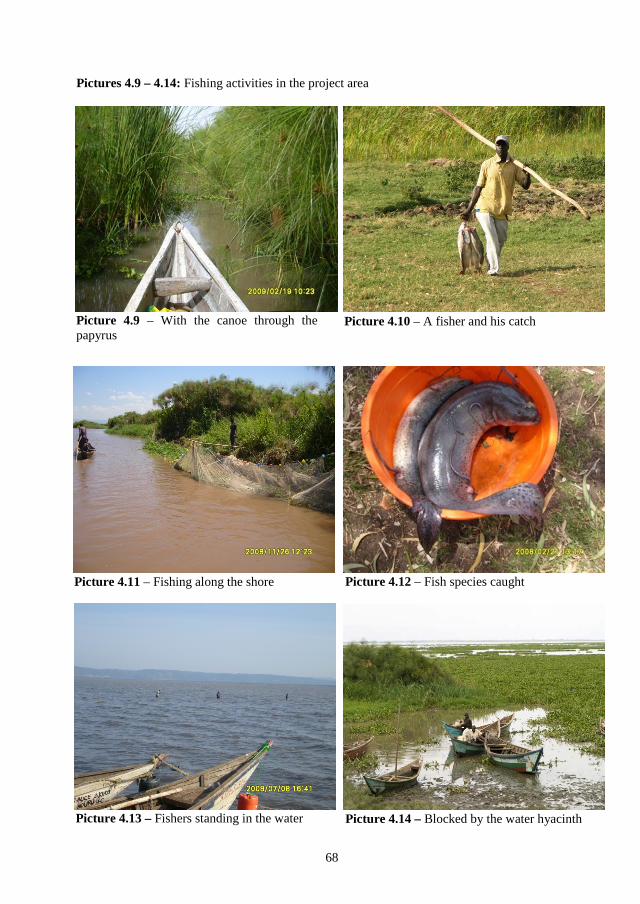
68
Pictures 4.9 – 4.14: Fishing activities in the project area
Picture 4.9 – With the canoe through the papyrus
Picture 4.10 – A fisher and his catch
Picture 4.14 – Blocked by the water hyacinth
Picture 4.11 – Fishing along the shore Picture 4.12 – Fish species caught
Picture 4.13 – Fishers standing in the water
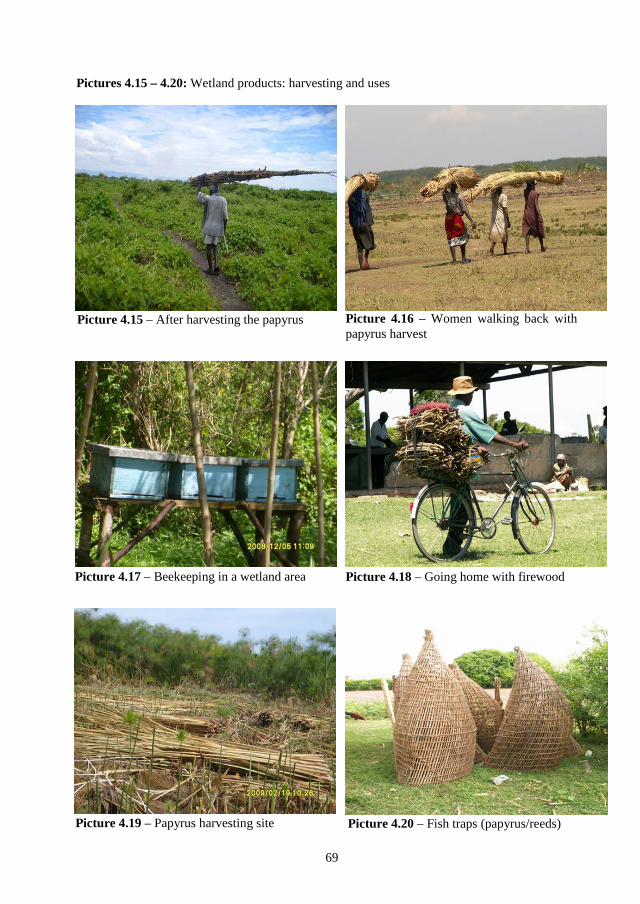
69
Pictures 4.15 – 4.20: Wetland products: harvesting and uses
Picture 4.15 – After harvesting the papyrus Picture 4.16 – Women walking back with papyrus harvest
Picture 4.18 – Going home with firewoodPicture 4.17 – Beekeeping in a wetland area
Picture 4.19 – Papyrus harvesting site Picture 4.20 – Fish traps (papyrus/reeds)
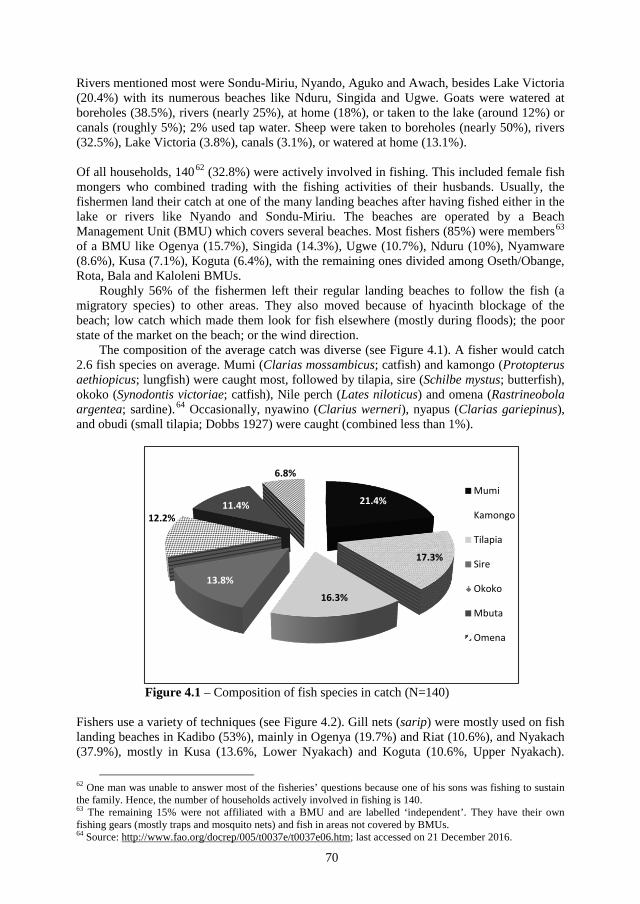
70
Rivers mentioned most were Sondu-Miriu, Nyando, Aguko and Awach, besides Lake Victoria (20.4%) with its numerous beaches like Nduru, Singida and Ugwe. Goats were watered at boreholes (38.5%), rivers (nearly 25%), at home (18%), or taken to the lake (around 12%) or canals (roughly 5%); 2% used tap water. Sheep were taken to boreholes (nearly 50%), rivers (32.5%), Lake Victoria (3.8%), canals (3.1%), or watered at home (13.1%).
Of all households, 14062 (32.8%) were actively involved in fishing. This included female fish mongers who combined trading with the fishing activities of their husbands. Usually, the fishermen land their catch at one of the many landing beaches after having fished either in the lake or rivers like Nyando and Sondu-Miriu. The beaches are operated by a Beach Management Unit (BMU) which covers several beaches. Most fishers (85%) were members63 of a BMU like Ogenya (15.7%), Singida (14.3%), Ugwe (10.7%), Nduru (10%), Nyamware (8.6%), Kusa (7.1%), Koguta (6.4%), with the remaining ones divided among Oseth/Obange, Rota, Bala and Kaloleni BMUs.
Roughly 56% of the fishermen left their regular landing beaches to follow the fish (a migratory species) to other areas. They also moved because of hyacinth blockage of the beach; low catch which made them look for fish elsewhere (mostly during floods); the poor state of the market on the beach; or the wind direction.
The composition of the average catch was diverse (see Figure 4.1). A fisher would catch 2.6 fish species on average. Mumi (Clarias mossambicus; catfish) and kamongo (Protopterus aethiopicus; lungfish) were caught most, followed by tilapia, sire (Schilbe mystus; butterfish), okoko (Synodontis victoriae; catfish), Nile perch (Lates niloticus) and omena (Rastrineobola argentea; sardine).64 Occasionally, nyawino (Clarius werneri), nyapus (Clarias gariepinus), and obudi (small tilapia; Dobbs 1927) were caught (combined less than 1%).
Figure 4.1 – Composition of fish species in catch (N=140)
Fishers use a variety of techniques (see Figure 4.2). Gill nets (sarip) were mostly used on fish landing beaches in Kadibo (53%), mainly in Ogenya (19.7%) and Riat (10.6%), and Nyakach (37.9%), mostly in Kusa (13.6%, Lower Nyakach) and Koguta (10.6%, Upper Nyakach).
62 One man was unable to answer most of the fisheries’ questions because one of his sons was fishing to sustain the family. Hence, the number of households actively involved in fishing is 140. 63 The remaining 15% were not affiliated with a BMU and are labelled ‘independent’. They have their own fishing gears (mostly traps and mosquito nets) and fish in areas not covered by BMUs. 64 Source: http://www.fao.org/docrep/005/t0037e/t0037e06.htm; last accessed on 21 December 2016.
21.4%
17.3%
16.3%
13.8%
12.2% 11.4%
6.8%
Mumi
Kamongo
Tilapia
Sire
Okoko
Mbuta
Omena
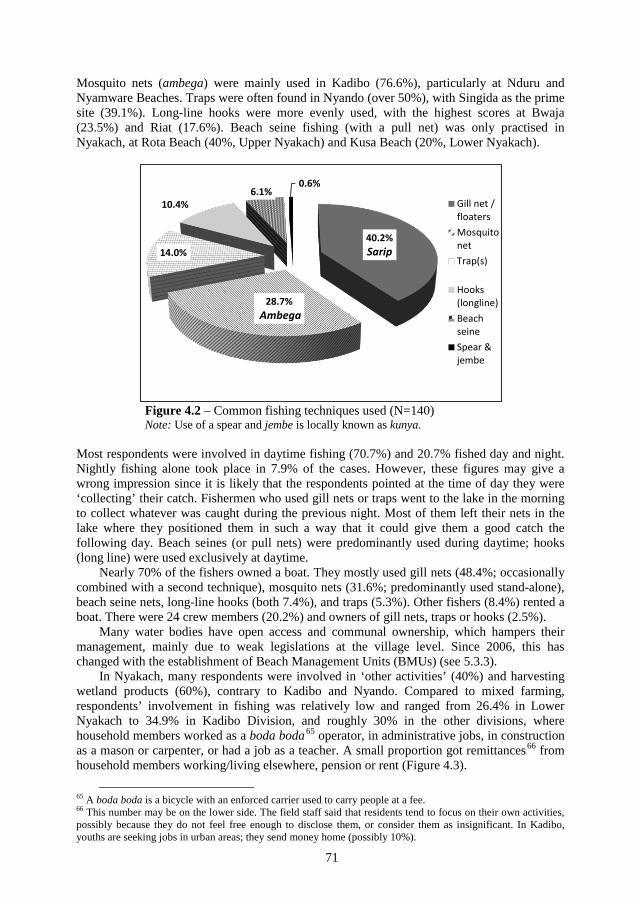
71
Mosquito nets (ambega) were mainly used in Kadibo (76.6%), particularly at Nduru and Nyamware Beaches. Traps were often found in Nyando (over 50%), with Singida as the prime site (39.1%). Long-line hooks were more evenly used, with the highest scores at Bwaja (23.5%) and Riat (17.6%). Beach seine fishing (with a pull net) was only practised in Nyakach, at Rota Beach (40%, Upper Nyakach) and Kusa Beach (20%, Lower Nyakach).
Figure 4.2 – Common fishing techniques used (N=140) Note: Use of a spear and jembe is locally known as kunya.
Most respondents were involved in daytime fishing (70.7%) and 20.7% fished day and night. Nightly fishing alone took place in 7.9% of the cases. However, these figures may give a wrong impression since it is likely that the respondents pointed at the time of day they were ‘collecting’ their catch. Fishermen who used gill nets or traps went to the lake in the morning to collect whatever was caught during the previous night. Most of them left their nets in the lake where they positioned them in such a way that it could give them a good catch the following day. Beach seines (or pull nets) were predominantly used during daytime; hooks (long line) were used exclusively at daytime.
Nearly 70% of the fishers owned a boat. They mostly used gill nets (48.4%; occasionally combined with a second technique), mosquito nets (31.6%; predominantly used stand-alone), beach seine nets, long-line hooks (both 7.4%), and traps (5.3%). Other fishers (8.4%) rented a boat. There were 24 crew members (20.2%) and owners of gill nets, traps or hooks (2.5%).
Many water bodies have open access and communal ownership, which hampers their management, mainly due to weak legislations at the village level. Since 2006, this has changed with the establishment of Beach Management Units (BMUs) (see 5.3.3).
In Nyakach, many respondents were involved in ‘other activities’ (40%) and harvesting wetland products (60%), contrary to Kadibo and Nyando. Compared to mixed farming, respondents’ involvement in fishing was relatively low and ranged from 26.4% in Lower Nyakach to 34.9% in Kadibo Division, and roughly 30% in the other divisions, where household members worked as a boda boda65 operator, in administrative jobs, in construction as a mason or carpenter, or had a job as a teacher. A small proportion got remittances66 from household members working/living elsewhere, pension or rent (Figure 4.3).
65 A boda boda is a bicycle with an enforced carrier used to carry people at a fee. 66 This number may be on the lower side. The field staff said that residents tend to focus on their own activities, possibly because they do not feel free enough to disclose them, or consider them as insignificant. In Kadibo, youths are seeking jobs in urban areas; they send money home (possibly 10%).
40.2% Sarip
28.7% Ambega
14.0%
10.4% 6.1%
0.6%
Gill net /floatersMosquitonetTrap(s)
Hooks(longline)BeachseineSpear &jembe
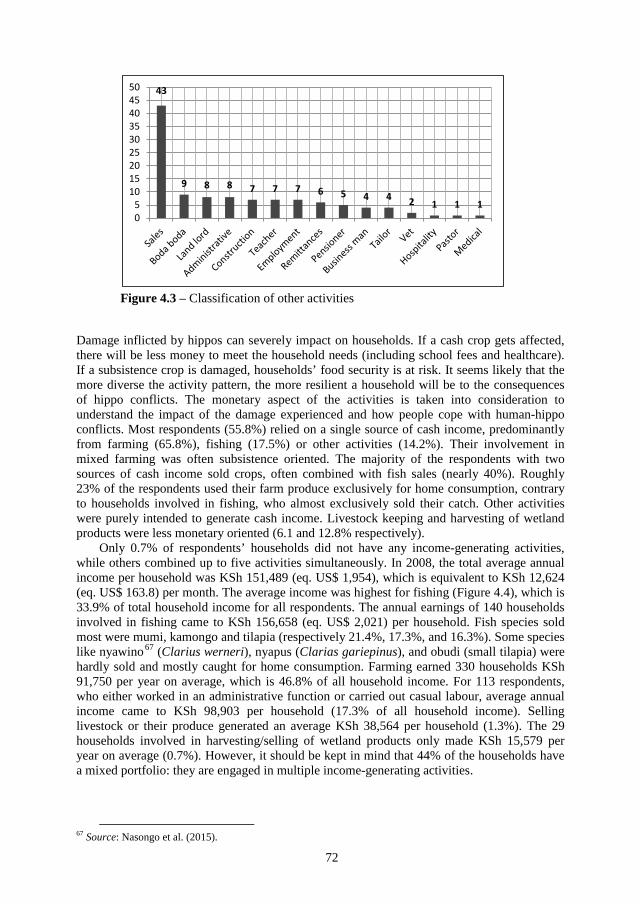
72
Damage inflicted by hippos can severely impact on households. If a cash crop gets affected, there will be less money to meet the household needs (including school fees and healthcare). If a subsistence crop is damaged, households’ food security is at risk. It seems likely that the more diverse the activity pattern, the more resilient a household will be to the consequences of hippo conflicts. The monetary aspect of the activities is taken into consideration to understand the impact of the damage experienced and how people cope with human-hippo conflicts. Most respondents (55.8%) relied on a single source of cash income, predominantly from farming (65.8%), fishing (17.5%) or other activities (14.2%). Their involvement in mixed farming was often subsistence oriented. The majority of the respondents with two sources of cash income sold crops, often combined with fish sales (nearly 40%). Roughly 23% of the respondents used their farm produce exclusively for home consumption, contrary to households involved in fishing, who almost exclusively sold their catch. Other activities were purely intended to generate cash income. Livestock keeping and harvesting of wetland products were less monetary oriented (6.1 and 12.8% respectively).
Only 0.7% of respondents’ households did not have any income-generating activities, while others combined up to five activities simultaneously. In 2008, the total average annual income per household was KSh 151,489 (eq. US$ 1,954), which is equivalent to KSh 12,624 (eq. US$ 163.8) per month. The average income was highest for fishing (Figure 4.4), which is 33.9% of total household income for all respondents. The annual earnings of 140 households involved in fishing came to KSh 156,658 (eq. US$ 2,021) per household. Fish species sold most were mumi, kamongo and tilapia (respectively 21.4%, 17.3%, and 16.3%). Some species like nyawino67 (Clarius werneri), nyapus (Clarias gariepinus), and obudi (small tilapia) were hardly sold and mostly caught for home consumption. Farming earned 330 households KSh 91,750 per year on average, which is 46.8% of all household income. For 113 respondents, who either worked in an administrative function or carried out casual labour, average annual income came to KSh 98,903 per household (17.3% of all household income). Selling livestock or their produce generated an average KSh 38,564 per household (1.3%). The 29 households involved in harvesting/selling of wetland products only made KSh 15,579 per year on average (0.7%). However, it should be kept in mind that 44% of the households have a mixed portfolio: they are engaged in multiple income-generating activities.
67 Source: Nasongo et al. (2015).
43
9 8 8 7 7 7 6 5 4 4 2 1 1 1 05
101520253035404550
Figure 4.3 – Classification of other activities
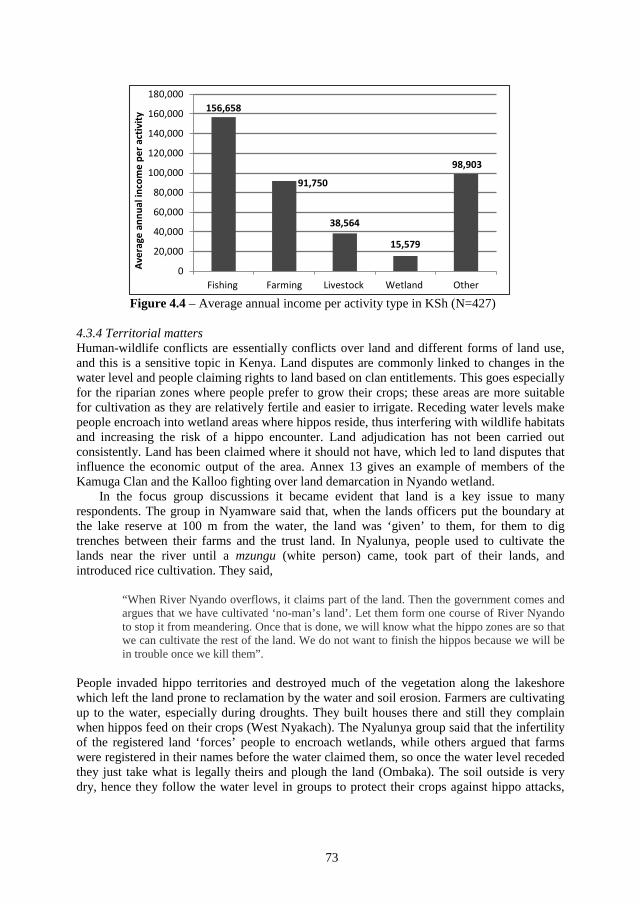
73
4.3.4 Territorial matters Human-wildlife conflicts are essentially conflicts over land and different forms of land use, and this is a sensitive topic in Kenya. Land disputes are commonly linked to changes in the water level and people claiming rights to land based on clan entitlements. This goes especially for the riparian zones where people prefer to grow their crops; these areas are more suitable for cultivation as they are relatively fertile and easier to irrigate. Receding water levels make people encroach into wetland areas where hippos reside, thus interfering with wildlife habitats and increasing the risk of a hippo encounter. Land adjudication has not been carried out consistently. Land has been claimed where it should not have, which led to land disputes that influence the economic output of the area. Annex 13 gives an example of members of the Kamuga Clan and the Kalloo fighting over land demarcation in Nyando wetland.
In the focus group discussions it became evident that land is a key issue to many respondents. The group in Nyamware said that, when the lands officers put the boundary at the lake reserve at 100 m from the water, the land was ‘given’ to them, for them to dig trenches between their farms and the trust land. In Nyalunya, people used to cultivate the lands near the river until a mzungu (white person) came, took part of their lands, and introduced rice cultivation. They said,
“When River Nyando overflows, it claims part of the land. Then the government comes and argues that we have cultivated ‘no-man’s land’. Let them form one course of River Nyando to stop it from meandering. Once that is done, we will know what the hippo zones are so that we can cultivate the rest of the land. We do not want to finish the hippos because we will be in trouble once we kill them”.
People invaded hippo territories and destroyed much of the vegetation along the lakeshore which left the land prone to reclamation by the water and soil erosion. Farmers are cultivating up to the water, especially during droughts. They built houses there and still they complain when hippos feed on their crops (West Nyakach). The Nyalunya group said that the infertility of the registered land ‘forces’ people to encroach wetlands, while others argued that farms were registered in their names before the water claimed them, so once the water level receded they just take what is legally theirs and plough the land (Ombaka). The soil outside is very dry, hence they follow the water level in groups to protect their crops against hippo attacks,
156,658
91,750
38,564
15,579
98,903
0
20,000
40,000
60,000
80,000
100,000
120,000
140,000
160,000
180,000
Fishing Farming Livestock Wetland Other
Aver
age
annu
al in
com
e pe
r act
ivity
Figure 4.4 – Average annual income per activity type in KSh (N=427)
74
similarly to Kanyagwal, where farms were registered68 up to the lake, albeit with ‘flexible’ boundaries due to floods. The receding water level made people struggle over access to farmland. In Ugwe, people said that the water level had risen due to heavy rainfall, due to which a former homestead area got occupied by the lake. Yet the government claims that cultivation is ongoing in the ‘reserve’ areas, which people encroach because they need food. When the water level receded after the Uhuru floods69, the land remained fertile and moist so that is why people cultivate there, due to drought and human population growth. All wetlands are trust lands (reserves), “but people are driven there by hunger so they cultivate their crops there, until the hippo intervenes” (Ugwe group).
Others argue that hippos invaded human space. These notorious crop raiders, who move up to the homesteads during the dry season, oblivious to any boundaries, walk along the shores, invade farms, and even come up to the watch huts. Hippos are invading the lands claimed by the Uhuru floods, thereby encroaching into human territories (Kanyagwal). It is understandable as hippos have to look for food elsewhere since their food has been eliminated from the lakeshore (West Nyakach). They even step on the fish traps and destroy fishing nets, plus they can kill people (Ombaka).
4.4 Conclusions The lakeshore area is a highly diverse area, characterised by a variety of wetland types. Most human-hippo conflicts occur in the riverine and lacustrine wetlands. These wetlands are under threat, mainly due to human encroachment and land conversion for agricultural practices. Both people’s livelihoods and hippos’ existence depend on these wetlands and the ongoing wetland loss impacts on humans and beasts. Fishermen feel the effect of the introduction of alien species like the water hyacinth and Nile perch. A large part of the natural vegetation along the shore has been removed and there is less food available for hippos, whose crop raids into people’s farms result in a huge outcry.
Within a decade, hippo’s conservation status changed from a ‘lower risk/least concern’ to a ‘vulnerable’ status, which raises concern over its existence in the wild. The IUCN pointed at a declining hippo population trend, whereas Lewison (2004) referred to a 7-20% decline based on recent population estimates. Due to habitat loss related to wetland conversion for agricultural purposes, unregulated hunting (poaching), and environmental factors like climate change and the outbreak of diseases like anthrax, hippos are facing a bleak future beyond protected areas. In Kenya, the overall number of hippos is uncertain but it could be as low as 5,000. There have only been localised censuses which were mostly carried out by researchers. Currently, KWS is preparing a nationwide hippo census, presumably to be held in the first half of 2017.
Hippo’s biggest enemy are humans: the species is at risk, particularly outside protected areas, due to anthropogenic impacts on its habitat. People have reclaimed a large part of the shores of Winam Gulf and converted it into farmlands. Local people love hippo meat and since many of them have protein-deficiency, they kill hippos secretly to get meat and to get rid of the nuisance that interferes with their crops or fishing efforts. Is there a possibility for coexistence given hippo’s behaviour and habitat requirements? Chapter 7 presents the views of local communities and other actors on this.
68 It is not clear whether those lands were officially registered or that people feel they own the land because their ancestors lived there before the ‘Koth Uhuru’ rains of 1962/1963, so they are entitled to use it. 69 Around Independence (Uhuru in Kiswahili), Kenya received a huge amount of rainfall and many areas got flooded. The water level in Lake Victoria was exceptionally high.
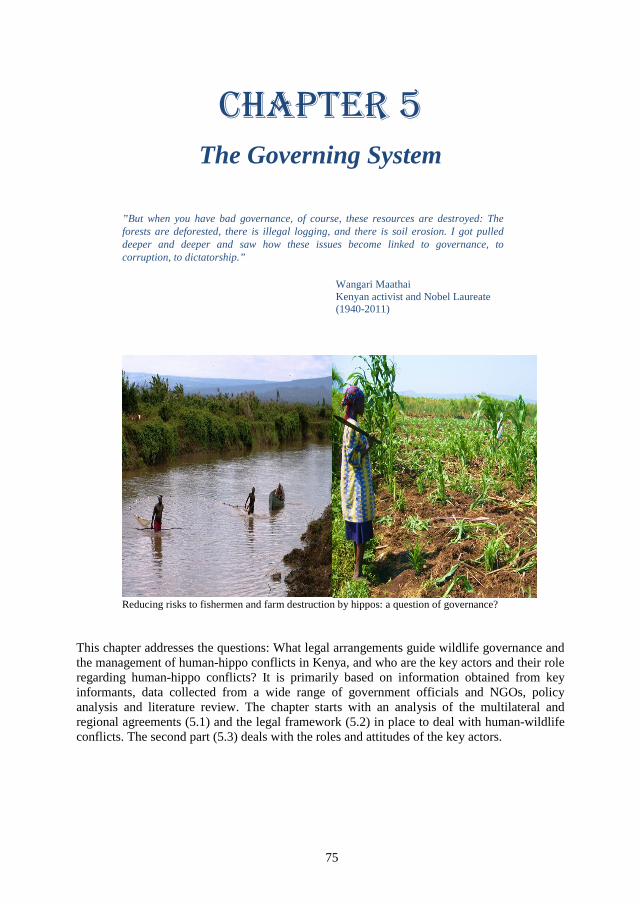
75
Chapter 5 The Governing System
”But when you have bad governance, of course, these resources are destroyed: The forests are deforested, there is illegal logging, and there is soil erosion. I got pulled deeper and deeper and saw how these issues become linked to governance, to corruption, to dictatorship.”
Wangari Maathai Kenyan activist and Nobel Laureate (1940-2011)
Reducing risks to fishermen and farm destruction by hippos: a question of governance?
This chapter addresses the questions: What legal arrangements guide wildlife governance and the management of human-hippo conflicts in Kenya, and who are the key actors and their role regarding human-hippo conflicts? It is primarily based on information obtained from key informants, data collected from a wide range of government officials and NGOs, policy analysis and literature review. The chapter starts with an analysis of the multilateral and regional agreements (5.1) and the legal framework (5.2) in place to deal with human-wildlife conflicts. The second part (5.3) deals with the roles and attitudes of the key actors.
76
5.1 Multilateral and Regional Environmental Agreements affecting Kenya’s wildlife governance
Recent decades have witnessed a significant increase of environmental regulations adopted in international forums. The harmonisation of international environmental law sets a standard for all countries and enables the conservation of species whose range exceeds national boundaries (Cirelli 2002). Multilateral Environmental Agreements (MEAs) centre on environmental issues, international law and multiple nations. They are defined as, “legally binding agreements between two or more countries containing commitments to meet specific environment-related objectives” (Bowling 2008:8). Table 5.1 shows the key wildlife-related MEAs to which Kenya is a party; it excludes less influential agreements.70
Environmental treaties have been instrumental in creating awareness on the significance of environmental conservation and sustainable resource use. However, they generally reflect a managerial approach towards environmental problems which is fundamentally technical in nature and suggests that these problems can be solved by creating laws. In many MEAs, ‘management’ and ‘wise use’ are common words: they reflect the type of rationalism that was rife during the 1970s and 1980s. This so-called ‘administrative rationalism’ (Dryzek 2005) perceives environmental problems as essentially ‘technical issues’ that can be solved through scientific expertise and organisational skills. It is a ‘leave it to the experts’ attitude (Ibid.) that assigns an exclusive role to administrators and bureaucrats. This type of rationalism signifies a top-down model of environmental management, based on a strong belief that nature can be managed through formal hierarchical structures like the state and formal legal systems.
Domestic policy formulation processes remain cumbersome and time-consuming, due to sectoral mandates, widely diverging interests, financial considerations, and the low priority for environmental issues (Bowman 2002). Biodiversity organisations are politically less prominent than those for trade and development, which often conflict with biodiversity aims (Swiderska et al. 2008). There is a biodiversity-related cluster of MEAs that includes the CBD, CMS, CITES, and Ramsar (see Table 5.1 for the meaning of acronyms). Since MEAs simultaneously have a certain level of fragmentation and overlap, a ‘clustering approach’ can create synergies between them to improve the implementation process at different levels (Bowling 2008). Internationally, Ramsar, CITES, the CMS and the CBD made efforts to develop synergies through Joint Work Plans with other treaties (Ramsar 2009). At the national level, similar trends are emerging. KWS, being a National Focal Point for Ramsar, the CMS, and CITES, is involved in their national planning. In 2005, it created the Department of Conventions, Biotechnology and Information Management that coordinates their implementation to streamline collaboration with government agencies and NGOs (KWS 2007; Ramsar 2008). As a focal point, KWS could play a lead role in their domestication and engage different stakeholders in the development of a national wildlife and wetland law. Attempts were made, but public involvement in decision-making remains limited, which is not surprising as most MEAs carry the spirit of administrative rationalism (Dryzek 2005). A democratic pragmatism discourse emerged as a corrective to administrative rationalism, based on the recognition that problem solving requires collaboration and negotiation and explicit involvement of the public (Ibid.). Although it is nowadays more common to use instruments like public consultation, getting access to final policy drafts and having an opportunity to comment on them is still limited to a few people.
70 These are the Lusaka Agreement on Co-operative Enforcement Operations Directed at Illegal Trade in Wild Fauna & Flora (Lusaka Agreement), the Convention Concerning the Protection of the World Cultural and Natural Heritage (WHC), the Protocol Concerning Protected Areas and Wild Fauna and Flora in the Eastern African Region, the Convention for the Establishment of Lake Victoria Fisheries Organisation (LVFO), and the Protocol for the Sustainable Development of the Lake Victoria Basin Nile Water Agreement (CFA).
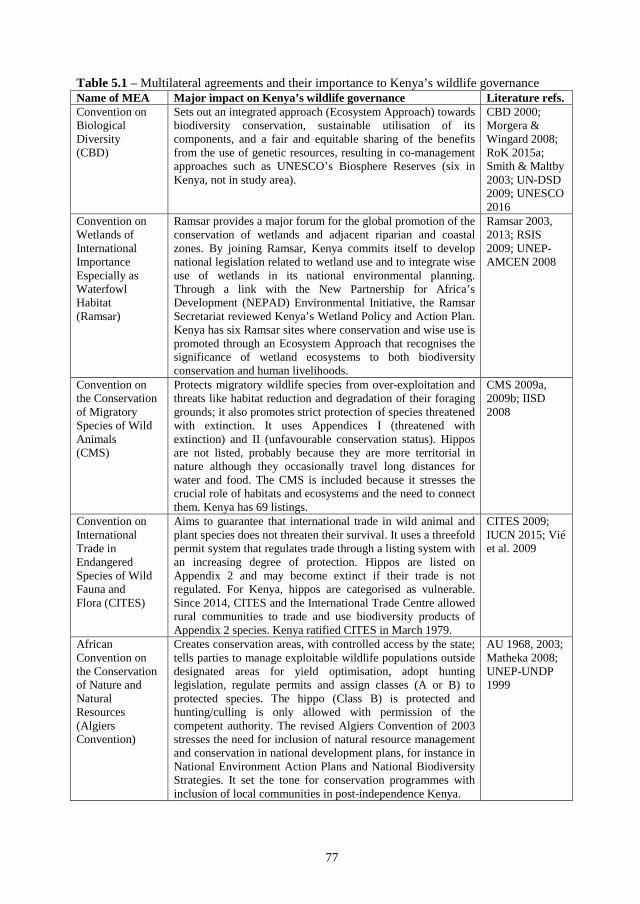
77
Table 5.1 – Multilateral agreements and their importance to Kenya’s wildlife governance Name of MEA Major impact on Kenya’s wildlife governance Literature refs. Convention on Biological Diversity (CBD)
Sets out an integrated approach (Ecosystem Approach) towards biodiversity conservation, sustainable utilisation of its components, and a fair and equitable sharing of the benefits from the use of genetic resources, resulting in co-management approaches such as UNESCO’s Biosphere Reserves (six in Kenya, not in study area).
CBD 2000; Morgera & Wingard 2008; RoK 2015a; Smith & Maltby 2003; UN-DSD 2009; UNESCO 2016
Convention on Wetlands of International Importance Especially as Waterfowl Habitat (Ramsar)
Ramsar provides a major forum for the global promotion of the conservation of wetlands and adjacent riparian and coastal zones. By joining Ramsar, Kenya commits itself to develop national legislation related to wetland use and to integrate wise use of wetlands in its national environmental planning. Through a link with the New Partnership for Africa’s Development (NEPAD) Environmental Initiative, the Ramsar Secretariat reviewed Kenya’s Wetland Policy and Action Plan. Kenya has six Ramsar sites where conservation and wise use is promoted through an Ecosystem Approach that recognises the significance of wetland ecosystems to both biodiversity conservation and human livelihoods.
Ramsar 2003, 2013; RSIS 2009; UNEP-AMCEN 2008
Convention on the Conservation of Migratory Species of Wild Animals (CMS)
Protects migratory wildlife species from over-exploitation and threats like habitat reduction and degradation of their foraging grounds; it also promotes strict protection of species threatened with extinction. It uses Appendices I (threatened with extinction) and II (unfavourable conservation status). Hippos are not listed, probably because they are more territorial in nature although they occasionally travel long distances for water and food. The CMS is included because it stresses the crucial role of habitats and ecosystems and the need to connect them. Kenya has 69 listings.
CMS 2009a, 2009b; IISD 2008
Convention on International Trade in Endangered Species of Wild Fauna and Flora (CITES)
Aims to guarantee that international trade in wild animal and plant species does not threaten their survival. It uses a threefold permit system that regulates trade through a listing system with an increasing degree of protection. Hippos are listed on Appendix 2 and may become extinct if their trade is not regulated. For Kenya, hippos are categorised as vulnerable. Since 2014, CITES and the International Trade Centre allowed rural communities to trade and use biodiversity products of Appendix 2 species. Kenya ratified CITES in March 1979.
CITES 2009; IUCN 2015; Vié et al. 2009
African Convention on the Conservation of Nature and Natural Resources (Algiers Convention)
Creates conservation areas, with controlled access by the state; tells parties to manage exploitable wildlife populations outside designated areas for yield optimisation, adopt hunting legislation, regulate permits and assign classes (A or B) to protected species. The hippo (Class B) is protected and hunting/culling is only allowed with permission of the competent authority. The revised Algiers Convention of 2003 stresses the need for inclusion of natural resource management and conservation in national development plans, for instance in National Environment Action Plans and National Biodiversity Strategies. It set the tone for conservation programmes with inclusion of local communities in post-independence Kenya.
AU 1968, 2003; Matheka 2008; UNEP-UNDP 1999
78
Biodiversity-related MEAs show a tendency to go from sectoral to holistic agreements. CITES-parties, for instance, are more aware of the linkages between local livelihoods, biodiversity and conservation (Bowling 2008).
Even though international legal instruments like the CBD and Algiers Convention have incorporated traditional/customary interests of local communities in environmental conservation, national mechanisms to achieve this seem to be falling short (Kameri-Mbote 2005). International treaties provide for procedural rights like access to information, freedom of association, access to justice and public involvement in the environmental decision-making process, but these concepts remain neglected in domesticated laws and yet, national legislation predominantly borrows from international regulations (Ibid.). Creating community conservation projects through the Algiers Convention could be indicative of a move from a managerial to a governance approach, where mutual interactions of different actors and partnerships play a key role in addressing societal problems. This depends on how local people are involved in such projects and at what stage they become involved. Remarkable is the difference in orientation between Eastern African countries that tend more towards preservationist strategies with state-controlled management activities, and Southern African countries that moved towards communal wildlife management projects in which local communities participate (Lindsey et al. 2006) and hunting71 is regulated through legal instruments (Lindsey et al. 2013).
Global conservation organisations have picked up the debate on how MEAs address poverty issues, thereby underlining the role of the poor. Linking biodiversity and poverty agendas is rooted in a longstanding debate on environment-development linkages. Both agendas can be conflicting: conservation initiatives may increase poverty levels by restricting resource access, while poverty alleviation can undermine conservation through overuse of natural resources. The agendas can also be mutually supportive: when livelihood issues are addressed, conservation activities are more likely to succeed; and proper management of conservation activities may alleviate poverty by creating income opportunities (Swiderska et al. 2008).
5.2 Wildlife laws in Kenya
Wildlife law deals with relationships between wildlife, land and people: it is about the claims people lay on wildlife and the legitimacy thereof by a political entity (the state) or a non-political institution. Property rights in conservation are often related to land, particularly land which is designated as a protected area. Coupled with wildlife property rights, it categorises harvesting, use and ownership. Wildlife law is strongly based on a notion of ‘scarcity and urgency’, irrespective of the threat either being scientifically justified or assumed to be real (Naughton-Treves & Sanderson 1995). This coincided with the rise of the state and an expanding body of law, in line with the administrative rationalism referred to in Section 5.1 (Dryzek 2005). Currently, property regimes governing wildlife make up a patchwork of private, communal and state property with their own rights to wildlife utilisation.
At independence in 1963, Kenya inherited several colonial wildlife ordinances and a number of protected areas and since then the number and acreage of protected areas has grown significantly.72 The National Parks Ordinance (No.9 of 1945) and the Wild Animals Protection Ordinance (No.23 of 1953) remained effective until 1976, when they were both
71 Pack et al. (2013) refer to this divide as the ‘Southern African’ versus the ‘No-Hunting’ wildlife management model, respectively based on private and government wildlife ownership. In the former, there are varying degrees of wildlife ownership or user rights allocated to private landholders. These allow them to hunt for their own use or sell these rights to hunting companies and tourists (Lindsey et al. 2013). 72 For an overview see http://www.parks.it/world/KE/Eindex.html (last accessed 25 February 2017).
79
replaced with the Wildlife (Conservation and Management) Act, Cap.376. (GoK 1976). Protected areas were created after independence, but the largest portion of the National Parks had been gazetted earlier. National Reserves were created predominantly in the 1970s and 1980s, whereas the 1990s showed an increasing number of sanctuaries, conservancies and private reserves, probably due to the activities of KWS (promotion of conservancies) and the growing attention for private and community wildlife conservation initiatives.
Wildlife conservation in Kenya is shaped and dominated by Western environmental and ethical values. The emphasis on law enforcement remained after independence. However, it became clear that enforcement could not prevent a further deterioration of the wildlife base, resulting in a new policy that underlined the principle of wildlife ‘paying its way’ outside parks (Sessional Paper No. 3 of 1975 (GoK 1975); see Annex 14, which gives an overview of the development in wildlife law since 1975). It stressed the need for an integrated approach to wildlife conservation/management to reduce human-wildlife conflict, and a government assuming her responsibility of paying compensation for wildlife-induced damage (Barrow et al. 2000). It also recognised the need for private and/or community participation in wildlife management and economic value maximisation of wildlife. Wildlife management and conservation should be seen within a wider context of economic output linked to different land-use systems; there is need for a clear and flexible wildlife governance regime (UNEP-UNDP 1999). This policy set a road map by identifying the importance of wildlife for the socio-economic development of Kenya, by emphasising the need to manage wildlife for sustainable development and benefit generation, particularly with communities that are hosting wildlife in their areas (KWS wetlands advisor, pers. comm.). 73
The Wildlife (Conservation and Management) Act of 1976 (Cap.376) created the legal provisions for the implementation of the policy. It did not articulate the 1975 policy statement, although many NGOs used it as a guiding principle when implementing community conservation projects (Barrow et al. 2000). The 1976 Act merged the Game Department and Kenya National Parks into the Wildlife Conservation and Management Department (WCMD), a single agency within the Ministry of Tourism and Wildlife (GoK 1976). The Department had a mandate to control poaching/trophy dealing; it cancelled all trophy and curio dealer licences. In 1977, Legal Notice No.120 banned all hunting in Kenya and prohibited consumptive wildlife use plus the associated trade in wildlife products. However, the WCMD was not successful in its mission to combat poaching,74 which was rampant around 1989 (Njogu 2004). Apparently, tighter legal control had neither resulted in fewer human-wildlife conflicts, nor in better protection of wildlife inside protected areas. The aim to have an integrated approach in which communities would participate had not materialised (Barrow et al. 2000).
The rules, regulations and procedures of compensation schemes for wildlife-induced damage were included in the 1976 Act (Nyamwaro et al. 2006). The WCMD had made an effort of compensating victims for wildlife-induced damage, but the procedures were lengthy, chaotic, and prone to corruption.75
“Compensation claims had to pass through several stages of official approval before payments could be made, and at each stage public officers and WCMD officials made certain that ‘a little something’ came their way. For instance, a farmer might have lost the equivalent of three bags of maize to elephant damage. The local wildlife officer would often only agree
73 Annex 8 gives the particulars of all personal communications. 74 The word poaching is used because that term was commonplace in those days. The wildlife service was even known as the ‘Wildlife Poaching Department’ (Butler 1998:2). Late 1980s, the park system was on the edge of collapse because poachers were shooting elephants and robbing park visitors, even killing tourists. Poaching, which essentially means nothing more than ‘illegal hunting’, has a criminal connotation. 75 Political corruption is “the unlawful use of public office for private gain” (Smith et al. 2003:68), which can restrict the achievement of conservation schemes as it lowers funding levels and distort priorities (Ibid.).
80
to forward the claim if it was for six bags. Further up the line, someone else would say that the farmer must claim ten bags. So it went. By the time the claim reached the WCMD, the cost had increased by four or five times. As this happened to almost every claim, WCMD soon ran out of money to pay. Only a fraction of the claims were ever met” (Leakey & Morrell 2001:123).
Clearly, the failure of the system was attributed to ample cheating on claims, exorbitant administration costs and a lack of funds (Thouless 1993). Could this just be attributed to the malfunctioning of the WCMD where corruption was rife, or was it a mere result of legislative inadequacies? In an attempt to address both, the government reviewed the 1976 Act and promulgated the Wildlife (Conservation and Management) (Amendment) Act of 1989. It established the Kenya Wildlife Service (KWS) as a corporate body to replace the WCMD (KWS 2008a) and exempted it from the State Corporations Act, which gave it a greater autonomy and flexibility to meet its obligations. KWS was assigned roles like managing national parks and reserves (including an advisory role towards the government on the establishment), wildlife policy formulation, and education of the public towards conservation and awareness creation plus support for wildlife policies (Ibid.). Apparently, there has been a shift in orientation from ‘parks only’ to ‘community participation’, with its own implications for conservation practices in Kenya. The 1989 Act – which ruled during the fieldwork period – stated that only human casualties were to be compensated76; financial compensation forcrop and property losses due to wildlife was abolished, mainly due to a sharp rise in thenumber of human-wildlife conflicts which made it too costly for the government to operatethe system. However, the impact of corruption77 and false claims should not be ignored(Leakey & Morell 2001; Mshindi 1990). The abolition could result in a faster eradication ofwildlife outside protected areas for farmers would feel that wildlife interests are valued morethan theirs, and they would not remain idle when their crops are destroyed (Marekia 1991).
Due to human population growth (one of the key drivers of biodiversity loss), growth-related challenges and the mounting pressure on natural resources, Kenya needed a new policy framework which would incorporate the need for capacity building, particularly empowerment of, and devolution of wildlife management to local communities, landowners and the private sector (KWS wetlands advisor, pers. comm.). The 1989 Act was clearly outdated and for years, Kenya lacked a comprehensive wildlife policy. There were several attempts to come up with a policy revision. The controversial Wildlife Bill of 2004 (the Kariuki Bill or GG Bill), which allowed sport hunting and killing of wildlife straying on private land, met with strong opposition from conservation organisations78 and ultimately lapsed (Mbaria 2007). Given the push for popular participation in policy formulation, the Ministry pursued a consultative approach in developing the Wildlife Policy, to which end it involved a National Steering Committee which organised regional stakeholder meetings in 2006 (Norton-Griffiths 2007). The results were (supposedly) incorporated in the 2007 Draft Wildlife Bill. Due to political instability and the post-election crisis, it took time before the wildlife law was on the agenda again. The Wildlife (Conservation and Management)
76 They were to be settled from funds that the Parliament had designated and would not burden the KWS budget. 77 Mshindi (1990) argues that most of the compensation was paid to large-scale farmers, many of whom live outside wildlife areas; they by-passed the regular payment system at the expense of local smallholders. Compensation payments were slow and inadequate due to limited resources for field operations (transport, personnel), poor communication and vast distances. 78 President Kibaki was ‘bombarded’ with a worldwide e-mail appeal not to sign the GG Bill. International NGOs supported KWS with funding and they favour retaining of the hunting ban. KWS was compliant out of fear to offend them so that they would hold back the money. The animal rightist lobbies made clear that their true goal is to “control people, not animals”. Silently, UNEP has worked on a new wildlife law for Kenya, with KWS, IFAW, and the Attorney General. Even the Parliament was side-lined; international organisations dominated the scene. They justified this by saying it is about conservation, which they know better than the citizens of Kenya (Parker 2005).
81
(Amendment) Bill 201079 covers only a small part of the proposed amendments in the 2007 Wildlife Bill (GoK 2011), and had some operational deficiencies to which end the Ministry created a technical committee to solve this (EAWLS 2012). Several organisations called for more time for the policy review to allow for proper stakeholder consultation and alignment of the Wildlife Bill and Policy with the Constitution (KLR 2010), which involves environmental sustainability and devolved governance (Kahumbu 2013), leading to the final draft of the National Wildlife Conservation and Management Policy 2012 (RoK 2012). Among its guidelines are devolved wildlife conservation and management, including effective public participation, to be recognised as a form of land use on public, community and private land, with benefits accruing to the land user in line with sustainable use principles. It adheres to an ecosystem approach; it respects the “right of wildlife to live and prosper as a world inheritance” (RoK 2012:5-6). It proposed “to create the requisite institutional, legal and regulatory structures providing for the separation of functions on administration, management, licensing and regulation as distinct entities for appropriate governance within the framework of devolved system and management of wildlife and wildlife resources” (Art. 7.1). This resulted, amongst others, in the creation of the Wildlife Directorate (Ibid.).
Three factors could explain why the policy reviews took so long (KWS wetlands advisor, pers. comm.). First, for their approval, political issues require strong political support and commitment of the Parliament. Second, the political elite had to realise and acknowledge the need for change, which requires sensitisation and education. The Law Reform Commission had to review the entire legal spectrum in Kenya to address pertinent issues and align policies, some of which dated back to the colonial era. Third, directing policies requires a stable institutional framework. Here, KWS’ wetlands advisor pointed at the institutional weakness of KWS: it should work in close collaboration with the ministry that spearheads the policy review.
The revision was justified by several factors: first, a change of tenure and land use in wildlife rangelands; second, the failure of institutional governance to incorporate actors in wildlife conservation/management; third, a rise in human-wildlife conflicts and a lack of compensation; fourth, the increasing pressure on wildlife due to a growing human population, coupled with a marked reduction in wildlife numbers; fifth, the application of unjustified agricultural incentives that adversely impact on wildlife conservation; sixth, the need for decentralised/devolved wildlife management, including the participation of the private sector, NGOs, and CBOs; and seventh, the need to improve research capacity and acquisition of reliable and accurate wildlife data (RoK 2012:4-5).
In 2013, the Cabinet approved a complete overhaul of Kenya’s national wildlife legislation80, most likely as a response to alarming reports of escalating poaching of elephants and rhinos (Kahumbu 2013). Ultimately, the president approved of the 2013 Wildlife Conservation and Management Act.81 The new Wildlife Act covers a wide range of policy instruments, from ‘soft’ to ‘hard’ (see Chapter 2). ‘Soft’ instruments include information or peer pressure82, legal instruments (e.g. people can only undertake wildlife-use activities when
79 This bill was ‘sponsored’ by Hon. Boaz Kaino and gazetted on 16 June 2010 (www.parliament.go.ke; last accessed on 18 March 2017). It was brought forward again in the Senate Bills 2013 by Senator GG Kariuki and gazetted on 11 October 2013. However, it “lapsed pursuant to the then standing orders” (http://kenyalaw.org/kl/index.php?id=4249); last accessed on 18 March 2017. 80 See: National Assembly Bills Tracker 2013, Supp. No. 181 (http://kenyalaw.org/kl/index.php?id=4251). 81 It complements other laws like The Water Act (Cap 372), The Forest Act (Cap 385), EMCA (the Environmental Management and Conservation Act, Cap 387), The Wetland Regulations of 2009, The Tourism Act (Cap 383), and the Fisheries Act (Cap 378), which all aim to guarantee sustainable development as provided for in the Constitution of Kenya (Kaai et al. 2015). 82 The County Wildlife and Compensation Committee, for instance, undertakes education, extension services and public awareness activities (Art. 19). In spite of this, offences do occur, which makes enforcement crucial to
82
they have a permit granted under the 2013 Wildlife Act), financial instruments (for offences committed with respect to the 2013 Act, offenders pay a fine and/or are sentenced to imprisonment) and technical instruments (like licensing83 or quota systems). ‘Hard’ instruments include physical force that KWS can use for instance to prevent the escape of a person who is lawfully arrested; the officer in charge can even use firearms if he cannot prevent the escape otherwise (Art. 112). The 2013 Wildlife Act stipulates that compensation claims for damage (either to crops, livestock, or other property) suffered from wildlife, as specified in the Seventh Schedule84, can be submitted to the County Wildlife Conservation and Compensation Committee (CWCCC), who upon verifying it will submit it to KWS for ‘due consideration’ (RoK 2013a: Art. 25:4). However, no compensation is payable “if the owner of the livestock, crops or other property failed to take reasonable measures to protect such crops, livestock or property from damage by wildlife or his land-use practices are incompatible with the ecosystem-based management plan for the area” (Art. 25:5; RoK 2013a:1267-1268). Compensation is payable for human casualties caused by hippos, and for crop, livestock and property damage caused by the same. It should be noted that these arrangements were not yet in place when the fieldwork for this study was carried out.
5.3 Actors in the governing system This thesis defines actors as “all those who affect, and/or are affected by, the policies, decisions, and actions of the system; they can be individuals, communities, social groups or institutions of any size, aggregation or level in society” (Grimble et al. 1995:3). The term is often used interchangeably with stakeholders85, but the latter term may have a negative connotation in non-western cultures, especially when linked to land appropriation processes (Borrini-Feyerabend et al. 2004). It would be better to use the concept of ‘institutional actor’, which means “the bearer of specific interests (recognised opportunities) and concerns (recognised risks) organised to express them and carry them forward” (Ibid.:40). This section analyses actors in Kenya’s wildlife governance at international (5.3.1), national (5.3.2) and local level (5.3.3).
5.3.1 International actors International actors include branches of multilateral and international organisations, as well as foundations and other philanthropic groups. These organisations allocate funds to conservation projects, wildlife research, park development, and the purchase of equipment for anti-poaching units and wildlife training programmes. Organisational operations throughout
wildlife conservation, for example through anti-poaching activities (Art. 7), or the provision of false information to obtain a license or permit, which is an offence that deserves a fine or imprisonment (Art. 91) (RoK 2013a). 83 Only people or entities can undertake wildlife-use activities in line with the terms and conditions of the license/permit issued under the 2013 Act (Art. 77), particularly for consumptive wildlife utilisation and trophy dealing (Eight Schedule: Part 1 and 2). Offences will be penalised (Part XI), for instance by withdrawing the wildlife user right (Art. 82, RoK 2013a). 84 The Seventh Schedule covers the “National List of Invasive Species” (RoK 2013a: 1342-1343). The Act mistakenly referred to the Third Schedule, which covers “wildlife species in respect of which compensation may be paid” (RoK 2013a: 1328). 85 In some studies, animals are included in the stakeholder concept. This is not the case in this study, where animals are regarded the ‘stake’, and people as the ‘holders’. By defining it in this way, reference is made to the moral issue in wildlife conservation. It raises the question: ‘Do animals have the right to live? Animals cannot speak for themselves; they need human advocacy to cater for their interests in conservation and conflict mitigation programmes, in accordance with the goals of (inter)national organisations concerned with animal welfare. Some of them argue that animals have the right to live per se (intrinsic value) while others derive that right from the ecosystem services that are provided by animals (utilitarian value).
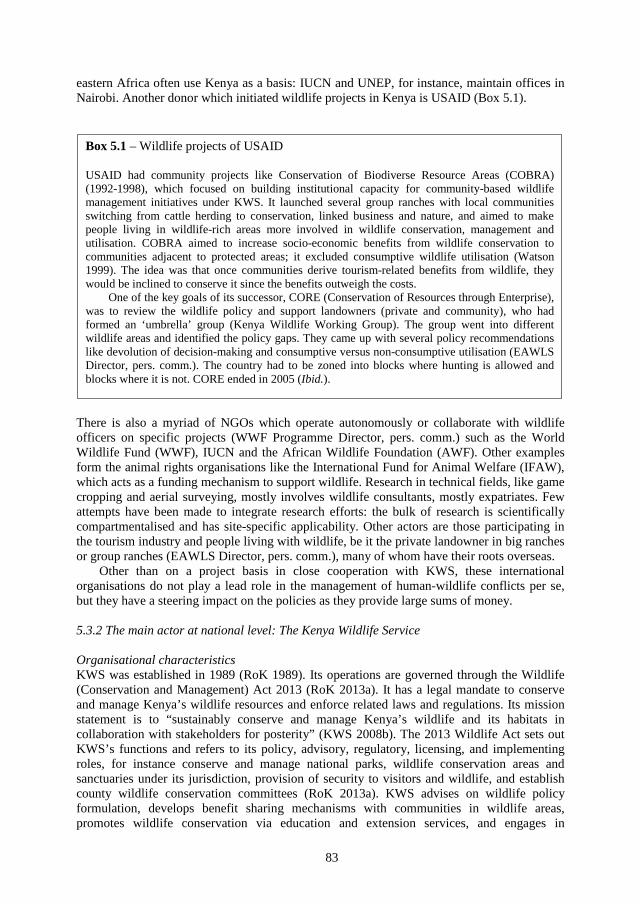
83
eastern Africa often use Kenya as a basis: IUCN and UNEP, for instance, maintain offices in Nairobi. Another donor which initiated wildlife projects in Kenya is USAID (Box 5.1).
There is also a myriad of NGOs which operate autonomously or collaborate with wildlife officers on specific projects (WWF Programme Director, pers. comm.) such as the World Wildlife Fund (WWF), IUCN and the African Wildlife Foundation (AWF). Other examples form the animal rights organisations like the International Fund for Animal Welfare (IFAW), which acts as a funding mechanism to support wildlife. Research in technical fields, like game cropping and aerial surveying, mostly involves wildlife consultants, mostly expatriates. Few attempts have been made to integrate research efforts: the bulk of research is scientifically compartmentalised and has site-specific applicability. Other actors are those participating in the tourism industry and people living with wildlife, be it the private landowner in big ranches or group ranches (EAWLS Director, pers. comm.), many of whom have their roots overseas.
Other than on a project basis in close cooperation with KWS, these international organisations do not play a lead role in the management of human-wildlife conflicts per se, but they have a steering impact on the policies as they provide large sums of money.
5.3.2 The main actor at national level: The Kenya Wildlife Service
Organisational characteristics KWS was established in 1989 (RoK 1989). Its operations are governed through the Wildlife (Conservation and Management) Act 2013 (RoK 2013a). It has a legal mandate to conserve and manage Kenya’s wildlife resources and enforce related laws and regulations. Its mission statement is to “sustainably conserve and manage Kenya’s wildlife and its habitats in collaboration with stakeholders for posterity” (KWS 2008b). The 2013 Wildlife Act sets out KWS’s functions and refers to its policy, advisory, regulatory, licensing, and implementing roles, for instance conserve and manage national parks, wildlife conservation areas and sanctuaries under its jurisdiction, provision of security to visitors and wildlife, and establish county wildlife conservation committees (RoK 2013a). KWS advises on wildlife policy formulation, develops benefit sharing mechanisms with communities in wildlife areas, promotes wildlife conservation via education and extension services, and engages in
Box 5.1 – Wildlife projects of USAID
USAID had community projects like Conservation of Biodiverse Resource Areas (COBRA) (1992-1998), which focused on building institutional capacity for community-based wildlife management initiatives under KWS. It launched several group ranches with local communities switching from cattle herding to conservation, linked business and nature, and aimed to make people living in wildlife-rich areas more involved in wildlife conservation, management and utilisation. COBRA aimed to increase socio-economic benefits from wildlife conservation to communities adjacent to protected areas; it excluded consumptive wildlife utilisation (Watson 1999). The idea was that once communities derive tourism-related benefits from wildlife, they would be inclined to conserve it since the benefits outweigh the costs.
One of the key goals of its successor, CORE (Conservation of Resources through Enterprise), was to review the wildlife policy and support landowners (private and community), who had formed an ‘umbrella’ group (Kenya Wildlife Working Group). The group went into different wildlife areas and identified the policy gaps. They came up with several policy recommendations like devolution of decision-making and consumptive versus non-consumptive utilisation (EAWLS Director, pers. comm.). The country had to be zoned into blocks where hunting is allowed and blocks where it is not. CORE ended in 2005 (Ibid.).
84
enforcement tasks like anti-poaching operations (Ibid.). Figure 5.1 illustrates KWS’ current organisational setup.86 The most relevant divisions for this thesis are ‘Wildlife Conservation’, ‘Devolution & Community Service’, ‘Biodiversity Research & Monitoring’ and ‘Security’.
Due to the nationwide distribution of wildlife and its concomitant multiple jurisdictional responsibilities, KWS centres on protected areas and other sites of biological importance (KWS 2005). It controls around 8% of Kenya’s total land mass, including several protected areas. In 1996, it adopted a structure of eight conservation areas, headed by Area Assistant Directors (KWS 1996). The study area is located in the Western Conservation Area, the second largest in size, which covers an area of 107,426 km² (KWS 2008b). Conservation areas correspond with ecological zones/regions which are critical in the “coordination of wildlife conservation, management, protection and surveillance” (KWS 2014:5).
KWS oversees 154 game stations outside protected areas (KWS 2012). Kisumu is the only game station within the project area, with a responsibility over a vast area covering 12 districts, namely Budalang’i, Bondo, Siaya, Rarieda, Kisumu West, Kisumu East, and Nyando.87 In 2009, Yala, Gem, Ugenya North and Ugenya South were added; the split of Nyando into Nyando and Nyakach made up for 12 districts. Additional stations are located in Bondo and Siaya (outside the project area). These stations deal with the northern side of Lake Victoria, whereas the southern side is under the responsibility of KWS Homa Bay (KWS Senior Warden, pers. comm.). KWS is a paramilitary organisation: every government which comes into power wants to have direct control of KWS. It is important for economic development and in terms of national security, which is why everybody is eying who is running KWS and how it manages its paramilitary resources (including very sophisticated weapons). KWS is vigilant with regard to (military) operations; it can reach bandit areas and border zones fast and come to the rescue of the inhabitants who are being attacked. One of its limitations is how KWS documents and stores data (KWS wetlands advisor, pers. comm.).
Politics take a centre stage in the appointment of directors. Since its creation in 1989, KWS directors have been appointed for political patronage. There have been over 10 people88 who served as directors, some with different (conflicting) management styles in their terms of office. The frequent changes in directorships have led to institutional instability in KWS (Ibid.) for several reasons. First, it resulted in a lack of continuity and consistency, changing priorities and styles of governance, due to which KWS’ conservation vision and goals have been inconsistent. Second, KWS’ entire management has become politicised89 and embedded in political acrimony and intrigues; every new minister appointed a new director. These changes became more frequent as Kenya was heading towards the multiparty90 era and people were either defecting or joining the government. Third, KWS has been under different ministries for security reasons and because of the creation of new ministries (related to nepotism). It went from the Ministry of Tourism and Wildlife to the Office of the President, then to the Ministry of Natural Resources, the Ministry of Forestry and Wildlife, and is currently under the Ministry of Environment, Natural Resources and Regional Development
86 All directors tried to achieve their own optimum organisational structure (EAWLS officer, pers. comm.). 87 Before the administrative reshuffle that took place in February 2009, KWS Kisumu was responsible for the seven first mentioned districts – at that time Nyakach was still part of Nyando District. 88 These were Richard Leakey (1989-March 1994), Dr. David Western (until May 1998), Peter Kubebea (until September 1998), Richard Leakey (until July 1999), Jeremiah Rotich (until December 2001), Joseph Kioko (until November 2002), Michael Wamithi (until May 2003), Joseph Mutie (until September 2003), Evans Mukolwe (until November 2004), John Mukuria (until December 2004), Dr. Kipng’etich (until October 2012), Peter Leitoro (October 2012), William Kiprono (until January 2016), followed by Kitili Mbathi since February. 89 There have been frequent changes of Ministers responsible for wildlife matters. The Minister can appoint the majority of the KWS Board of Trustees; once a new Minister gets appointed, he can just fire part of the Board of Trustees. This made the position of KWS at the international stage fickle (Parker 2005). 90 The instability of the government started from 1992, when the issue of fighting for multi-party and democracy started. The government kept on changing ministers: supporters of the government were appointed, while opponents were thrown out.
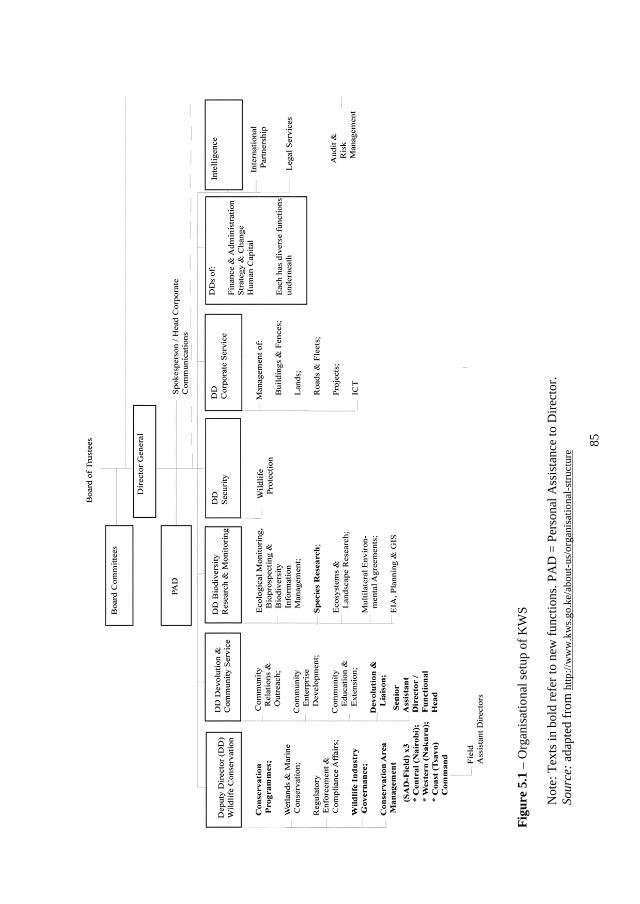
85
Figu
re 5
.1 –
Org
anis
atio
nal s
etup
of K
WS
Not
e: T
exts
in b
old
refe
r to
new
func
tions
. PA
D =
Per
sona
l Ass
ista
nce
to D
irect
or.
Sour
ce: a
dapt
ed fr
om h
ttp://
ww
w.k
ws.g
o.ke
/abo
ut-u
s/or
gani
satio
nal-s
truct
ure
86
Authorities. This also created instability: the changes of ministry stopped the policy reviews, initial ideas were being abandoned altogether, and time has been wasted. Ultimately, the government realised that frequent staff changes were not in the best interest of KWS as its performance went down, donors were becoming more sceptical, communities were getting concerned that KWS was not responding to their needs, and tourists were worried about insecurity issues and the rundown of infrastructure in the protected areas (KWS wetlands advisor, pers. comm.) Management of human-wildlife conflicts In the past, KWS addressed conflicts by maintaining expensive control operations in order to eliminate problem animals when necessary. Yet there is evidence that the wildlife authorities managed wildlife-human conflicts by avoidance and by force. Legal provisions were used to protect animals, while payments of compensation fees for deaths, injuries and damage caused by wildlife were avoided or delayed by using time-consuming bureaucratic tactics (KWS 1996). Problem animal control (PAC) seems to have failed: it is often considered to be ineffective and inefficient. Field data collected by Woodley (1997) indicated that KWS lacks personnel and equipment for PAC work. Rangers’ outposts are sparsely distributed. In a country where public transport coverage is inadequate and travelling time-consuming, a shortage of vehicles really hampers site visits by rangers (KWS 1996).
The mainstream KWS agenda no longer has problem animal management/control; handling PAC is no longer reflected in KWS’s organisational structure (KWS 2016). The Community Wildlife Service (CWS) was established in 1992; at the reorganisation of the KWS late 1995, it was renamed the Partnership Department (Rutten 2004). Its task is to manage wildlife outside protected areas and to this end, it interacts with Members of Parliament, rural communities, NGOs, private ranchers, opinion leaders and relevant ministries at the grassroots level. This department provides technical wildlife-related assistance to private landowners and communities, supports community projects, establishes conflict-reducing mechanisms, and protects people and property against wildlife-induced damage (KWS 2016); it also facilitates wildlife censuses beyond protected areas and wildlife compensation claims. However, CWS faces major challenges like increasing human-wildlife conflicts, bushmeat trade, snaring of wildlife, disappearance of wildlife dispersal areas/corridors, insufficient community benefits and the need to display a ‘positive image for KWS’ (Ibid.). Hence, a new strategic plan is currently being designed (KWS staff, pers. comm.).
The Problem Animal Management Unit91 (PAMU) was established in 1994 as an elite, rapid response unit to support local PAC teams in dealing with human-wildlife conflicts nationwide. The occurrence of crop and other property damage requires a prompt and quick response. However, local people repeatedly complain that KWS does not respond adequately, if at all, to cases with problem animals and they feel a rising resentment of KWS (KWS 2016). Hence in 2008, KWS authorised a procedure to reinforce PAC (through PAMU). Box 5.2 shows how an incident report can lead to action.
KWS implemented a ‘corporate social responsibility programme’ in 2002 aimed at changing community attitudes towards wildlife (KWS 2008a), which further developed in the creation of the Community Enterprise Department in 2009. Its underlying philosophy assumes that when people benefit from wildlife, they are inclined to take care of such resources by using them sustainably (Anyonge-Bashir & Udoto 2012). The transition from the old-style corporate social responsibility notion to a more strategic one was evident.
91 PAMU is a unit within the Partnership Department which aims to hugely reduce the number of conflicts countrywide. It stimulates positive human-wildlife interactions and supports communities to set aside land for conservation through the establishment of beneficial nature based businesses (KWS 2016).
87
Initially, the department faced challenges like governance issues, the lack of community benefits, flawed contracts between communities and investors, and poor management skills. KWS developed a Community Enterprise Strategy (2011-2017), a policy on the creation of conservancies and training of local rangers, and a Corporate Social Citizenship policy (Ibid.). The latter intends to alter attitudes from seeing wildlife as a nuisance to considering it as an economic asset that can enhance livelihoods, generate income, and alleviate poverty (Ibid.).
District Human-Wildlife Conflict Resolution Committees From mid-2008 onwards, District Human-Wildlife Conflict Resolution Committees were formed, one of them in Kisumu. Meetings were held at the District Commissioner’s office in Kisumu Town, attended by district officials like the District Agricultural Officer (DAO), Fisheries Officer, Environmental Officer, representatives from the Police Force, and the Ministry of Health. In the inauguration meetings, compensation for crop damage was high on the agenda. KWS however said that crop damage and livestock injuries or deaths caused by wildlife are not liable for compensation because the ‘privilege’ was abused earlier on, hence the government had ceased from compensating the affected victims. Key items were: sensitisation of farmers and other community members on the importance of wildlife and the handling of wildlife-related complaints, resolving human-wildlife conflicts, ensuring food security in the area, and facilitating community members to establish eco-tourism ventures to generate income. Cases of wildlife menace must be directed to KWS Kisumu. Its rangers should attend community barazas to gain local support to solve conflicts on the ground. The DAO said that the Committee has to address conflicts with hippos and monkeys, as these are the most problematic ones in the area (KWS officer, pers. comm.).
Strategic plan Over time, the KWS management made several attempts to launch a strategic plan, which failed due to internal differences, except for the Zebra Books (1991-1996), which provided a platform for the implementation of the Protected Area Wildlife Service (PAWS) programme. This changed in 2004 when Dr. Kipng’etich became director. A year later, the Strategic Plan 2005-2010 was launched, which stated that KWS had not adequately dealt with its problems:
“The human-wildlife conflict, poaching and the increasing sophistication of security threats, declining wildlife populations, and habitat destruction continue to be the major problems in the operations of KWS” (KWS 2005:15).
Box 5.2 – Trajectory from report to action
After an incident which involves either property damage or human casualty, a community member contacts KWS. The incident is recorded by a KWS officer in the occurrence book. The KWS warden verifies the incident through patrols, assesses the situation, and identifies the problem animal. If the rangers are overburdened, a report will be sent to the Community Wildlife Service (CWS) division at the KWS headquarters, which subsequently informs the PAMU in charge to deploy a section to the affected area.
After having been briefed by the area warden, the PAMU team proceeds to the site to reinforce the ground PAC team and have safety briefs with the local leaders. They use appropriate methods to identify the problem animal(s) and scare or eliminate it/them. The PAMU in charge records the extent of the damage, injury or death in the occurrence book and issue a report to the area warden, who records the operation in the occurrence book and reports it to the KWS headquarters so that it can be entered in the PAC database. If the problem still exists, it is referred back to the CWS headquarters.
Source: KWS (2008c).
88
As wildlife continues to be a key resource, the organisation has to deal with these problems in a more flexible and responsive way and explore innovation opportunities in wildlife conservation and management. The plan marked the start of a professionalization process: it acted as a roadmap to measure KWS’s performance92, which at that time was considered ‘troublesome’ (Ibid.). It also underpinned interlinkages between wildlife conservation and economic development (especially tourism), and emphasised the need to coordinate activities/mandates of all departments dealing with natural and wildlife resources, especially the review of wildlife legislation (Ibid.). The next Strategic Plan (2008-2012) conveyed another phase of the change process (KWS 2008b).
The third phase of the reforms, the so-called ‘KWS 2.0’ Strategy (Strategic Plan 2012-2017), emphasises the need to protect Kenya’s natural heritage from the burgeoning human population, climate change, wildlife crime, and environmental abuse, predominantly through improved wildlife industry governance93, better conservation of species and their habitats, increased collaboration with the stakeholders, and reduced human-wildlife conflicts (KWS 2012). The strategy is aligned with Vision 2030.94 The organisation aims to reduce human-wildlife conflicts through several initiatives like “supporting the establishment of conservancies and linking communities with investors and donors, engaging stakeholders and communities in wildlife management, constructing and maintaining wildlife barriers, training and equipping problem animal management, creating wildlife conservancies forum, building their capacity and carrying out joint patrols and data collection” (Ibid.:24).
5.3.3 Local actors Local actors consist of the local administration, Beach Management Units (BMUs), NGOs and research institutes. There are also Kenya-based NGOs which operate within East Africa. They are engaged in a broad range of activities such as wildlife research and education, management training, the provision of funds for private support of game conservation etc.
Local administration and authorities “Local administration” in this thesis refers to the Provincial Administration and/or the District Administration. At the time of fieldwork, the administration consisted of Provincial Commissioners, District Commissioners, District Officers (heading divisions), chiefs (heading locations) and sub-chiefs (heading sublocations). “Local authorities” or “local government” comprised of three city councils (Nairobi, Kisumu and Eldoret), 43 municipal councils, 62 town councils (urban local government), and 67 county councils (rural local government). The Narok County Council, for instance, is responsible for the Maasai Mara National Reserve, plus communities and private landowners (including group ranches).95
Through devolution in 2010, political structures96 were created at county level (the County Assembly and County Executive), which ranged from the Speaker97, Members of the County Assembly (MCA), and County Assembly Committees to County Executive Officers (CEOs) and finally County Governors, Deputy Governors and the County Executive Committee (Mule 2014). The County Governments Act has created decentralised units for
92 To this end, KWS used a PESTLE (based on political, economic, socio-cultural, technological, legislative and environmental factors) and a SWOT analysis (assessment of strengths, weaknesses, opportunities and threats). 93 This includes e.g. the development and domestication of Wildlife Research and Utilisation Guidelines, and the alignment of wildlife laws and policy to the new constitution, plus the lobby for enactment of a new wildlife bill. 94 Vision 2030 is Kenya’s long-term national planning strategy covering the period 2008-2030, intended to transform Kenya into an “industrialising, middle-income country providing a high quality life to all its citizens by the year 2030” (ROK 2007). 95 To date, there are no group ranches in the project area. 96 Since the 47 counties can enact legislation, Kenya now has a two-tier system of government. 97 The Speaker is the spokesperson and representative of the County Assembly; s/he oversees the administration of the house. http://assembly.laikipiacounty.go.ke/faq/the-role-of-the-speaker-in-the-assembly.
89
service delivery at county level, like sub-county98 administrators, ward administrators, village administrators and village councils. The latter is responsible for coordinating the participation of the village in governance, monitoring the implementation of policies at village level, and advising the ward and sub-county administrator on village matters (Mule 2013). MCAs make appointments with people on the ground: someone who has an issue can contact an MCA, who has a powerful voice. S/he can raise hippo issues when s/he meets with the CEO in charge of a department, for instance environment. Since MCAs do not originate from the local area, they may fail to bring up hippo issues. The implications of devolution for government’s performance in dealing with hippo incidents will be addressed in Chapter 7 (7.2.3).
The Ministry of Interior and Coordination of National Government replaced the Provincial Administration, whose operations have been restructured to address upcoming issues. The County Commissioner replaced the Provincial Commissioner; the Deputy County Commissioner the District Commissioner; and the Assistant County Commissioner the District Officer. The Ministry remained decentralised to the grassroots level to produce an outline for interpreting, propagating and implementing government policies. 99
Beach Management Units Through the Lake Victoria Fisheries Organisation (LVFO), Kenya implemented a regional approach to fisheries co-management via membership of institutions called Beach Management Units (BMUs), against the background of reducing fish stocks and ineffective fisheries legislation. This concept started with the idea to shift management from government institutions to a decentralised style in which resource users are involved in decision-making (MFD 2011). It resulted in the development of National Beach Management Guidelines by the Department of Fisheries in 2006, in an attempt to harmonise and govern the creation and operations of BMUs (Ogwang et al. 2006), followed by the 2007 Fisheries (BMU) Regulations, which apply to both freshwater and marine fisheries, but stress inland fisheries. In 2013, Lake Victoria accounted for 76% of the Kenyan fish harvest (RoK 2013c). Co-management is based on partnerships between government, fisheries communities and others; it is about power sharing and subsidiarity, which means that the management authority is delegated to the lowest organisation (Ogwang et al. 2009).
A BMU unites all people involved in fishing at a local level, like fishers, fish traders, boat owners, crew, fish processors, boat builders, boat and net repairers, and dealers in fisheries equipment. It mostly consists of an assembly and an executive committee. BMUs facilitate co-management of fisheries by linking local communities and the government. They oversee gear regulations and the registration of vessels, and are responsible for promoting sustainable fisheries, capacity building, and increasing the wellbeing of their members (Ngige & Jaeckel 2012). Everyone involved in fisheries at a beach has to register with a BMU (Ogwang et al. 2009). BMU Regulations give them rights to manage fish landing sites; they create horizontal and vertical institutional linkages between participants in fisheries management, but the overall responsibility to monitor and supervise these units retains with the Ministry of Fisheries Development (Ngige & Jaeckel 2012). Devolved government is captured in the Constitution of Kenya: “it gives powers of self-governance to the people and enhance the participation of the people in the exercise of the powers of the State and in making decisions affecting them” and “to recognise the right of communities to manage their own affairs and to further their development” (KLR 2010:107).
BMU members regularly complained about hippos damaging their fishing gears and boats, or about hippos being a threat to the lives of fishermen. Hence BMU leaders advised
98 Sub-counties are comparable to the districts. 99 https://www.kenyans.co.ke/government/ministry-interior-coordination-national-government; last accessed on
2 December 2016.
90
them to avoid fishing in hippo territories and not to put their gears (nets, traps) near hippo grazing areas. Communal watching of hippos is also practised, which involves the collaboration of fishers to keep sight of the whereabouts of hippos. In terms of wildlife utilisation, BMU chairmen underlined non-consumptive use, of tourists coming to see the hippos when they are confined in one place, for which they pay entrance fees and taxes which go straight to the community. They referred to the availability of hippo meat, boats to take the tourists to view the hippos nearby, and hippo trails that give people access to water and wetland products. The connection between hippos and fish was also mentioned (see Annex 3).
Fishermen pay a registration fee to become a member of a BMU, after which an annual renewal fee is payable. Membership can be obtained by fishers from ‘outside’ as well. The BMU checks the character and place of origin of the candidate, who also needs to present a letter of conduct showing he is a good fisher and integrates well. Of every catch, a member has to pay a certain percentage as tax to the BMU. Money received is spent on office rent, office equipment, and allowances of the BMU executives. Tasks of the BMU are: clearing of the beaches, securing of loans in the bank, and providing a welfare system (when a member passes away, every member contributes). Each BMU has its own regulations, which resemble the Fisheries Department Guidelines.
Beach management planning covers resources like fish, vegetables, trees, water hyacinth, and hippos, which all can be seen as a source of income. Sensitisation is required for people to understand that they can turn the Big Five into Big Six (thus including hippos).
Wildlife Clubs of Kenya The Wildlife Clubs of Kenya100 is a non-governmental, non-political, charitable organisation with a mandate to empower the young people of Kenya with conservation knowledge. To this end, it uses schools as an entry point into communities to advance environmental education. It promotes diverse ecosystem awareness creation and conservation empowerment programmes in Lake Victoria Area, and establishes wildlife clubs in schools to make the youth aware of the economic and aesthetic value of wildlife. It collaborates with partners like KWS, National Museums of Kenya, WWF, and the East African Wildlife Society (EAWLS).
Non-governmental organisations Several NGOs that work in Kenya are, for instance, the African Conservation Centre (ACC), the EAWLS, the World Wildlife Fund (WWF), the African Wildlife Foundation (AWF), the International Fund for Animal Welfare (IFAW), and SNV Netherlands Development Organisation.101
ACC works mostly in the ecosystems of Amboseli, the Mara, and the Southern Rift Valley, where it created wildlife- and community associations, land trusts, wildlife sanctuaries and ecotourism lodges. It is involved in research, capacity building of wildlife conservation, and good governance.
The EAWLS, founded in 1961, is involved in community participation programmes, educates them through community initiatives and conservation awareness. It also carries out research to augment wildlife conservation, and runs a wetlands programme, in which it strives after an enabling policy and legislative environment. Advocacy is also on its agenda: it conducts Environmental Impact Assessments to halt environmentally degrading activities.
WWF’s mission is to halt biodiversity degradation and work towards coexistence of people and nature. Its projects are, for instance directed at forests, freshwater, species, and the
100 See www.wildlifeclubsofkenya.org, last accessed on 2 December 2016. 101 See: www.conservationafrica.org; www.eawildlife.org; www.wwfkenya.org; www.awf.org; www.ifaw.org; www.snv.org/country/kenya. Last accessed 22 March 2017.
91
cross-cutting issues of environmental policy and education. Most of the conservation work is carried out in close collaboration with government departments and local communities.
AWF runs several programmes like the ones on ‘Education and African Leadership’ and the ‘Critical Species Research and Conservation’. The latter is directed towards research into conservation management problems and human-wildlife conflict mitigation, whereas the former builds on the conviction that Africans are the ideal stewards of Africa’s natural resources. It does this by promoting awareness of the importance of nature conservation.
IFAW’s mission is protection of animal rights worldwide. It advocates animal conservation in policy, legislation and society, by influencing policy and practices at different levels. IFAW also has a wildlife crime prevention and enforcement unit.
SNV strives to support capacity development of meso-level organisations that contribute to poverty alleviation; hence they focus on processes of organisational and institutional change. All these NGOs are engaged in a broad range of activities, which mainly centre on community involvement in wildlife conservation.
5.4 Illegal actors across multiple levels
In addition to the formal actors in the governing system, there is an informal wildlife circuit as well. Kenya lies at the centre of a thriving regional and international traffic in wildlife products. This trade is partially enacted by poachers, smugglers and illicit traders, but also features white-collar crimes like licensing frauds, funding irregularities and false certification of illegal wildlife products for export (Miller 1986). Corruption also relates to the formal circuit: it is commonplace in developing countries characterised by weak institutions and poor governance, with low levels of accountability and transparency. Corruption can strongly impact on conservation projects – many of which rely on external funding, have lowly paid government officials, and little inspection – for instance through the reduction in available monetary funds, legal enforcement and political backing which influence conservation schemes, while also promoting resource overexploitation (Smith & Walpole 2005). Other interests may prevail over environmental issues, as is often the case in the construction sector or resource extraction, which may be more enticed and capable to bribe politicians at the expense of the environment (Ibid.). It also entails the diversion of wildlife-related income from maintenance of the wildlife base and not sharing it with the communities that bear the local costs of a wildlife-related tourist economy (Kingdon 1990).
5.5 Conclusions
This chapter has shown how post-colonial Kenyan wildlife policy gradually evolved from a top-down conservation and enforcement policy, via a market-oriented approach through which wildlife had ‘to pay its way’ (Barrow et al. 2000) in the 1970s and 1980s, towards an approach that – at least in rhetoric – puts communities at the centre stage. At the local level, community-based conservation approaches have entered the limelight; there is growing attention for the role of communities and traditional knowledge in natural resource conservation, which can be seen as an intermediate phase to ‘interactive governance’. However, such notions have not yet rooted in the domain of the policymakers. The lack of transparency in the consultative policy-making process, which seems to be a common theme in Kenya’s policy development (recent examples being the wildlife, livestock and land policy reviews), may reduce all good intentions to a ‘rhetoric’ exercise. Since policymaking is a political process, the existing power balance is likely to influence the outcome. When the
92
directions that policies take are strongly opposed by wealthy lobby groups, chances are high that the (review) process will be dragging on or that alliances will be created in order to block the process. Nevertheless, the 2013 Wildlife Act was approved, most likely due to pressure related to poaching, which had reached alarming dimensions. It captures devolution, wildlife user rights, and wildlife conservancies, plus it has a CWCCC, which aims to mitigate human-wildlife conflicts in collaboration with community wildlife associations and grants landowners non-consumptive wildlife user rights.
However, KWS remains the most powerful actor in Kenya’s wildlife governance. It has a PAC unit but unfortunately, human-wildlife conflicts are not priority issues on its agenda. Most of the attention goes to the fight against poaching and the (illegal) bushmeat trade. The legal framework to combat poaching has expanded and penalties have increased significantly in the 2013 Wildlife Act (RoK 2013a). KWS seems to be aware that communities have to be involved in wildlife conservation to ensure a future existence for wildlife. This is visible in the devolved structures which allow for community participation and in the new forms of wildlife conservation on private or community land like community conservancies, wildlife sanctuaries, and wildlife conservation areas. Wildlife conservation and management are recognised as forms of land use on public, private and community land. Landowners and communities will need to consult the organisation if they want to become involved in wildlife utilisation, which is primarily non-consumptive in nature. The question is how communities will benefit financially from conserving hippos and other animals on their land. Most of the wildlife policy seems to be directed at protected areas; wetland areas like Lake Victoria Area are hardly mentioned.
Human-hippo conflicts hardly seem to be on the radar of actors in wildlife conservation. The BMUs’ general advice to fishers is to avoid fishing in hippo territories. In case of damage, they did not provide loans to the victims and there was no compensation for the losses incurred. However, there were warnings in case a rogue hippo was sighted.
All NGOs pointed at the need for a new wildlife legislation, which culminated in the 2013 Wildlife Act. Many of them also wanted more community involvement in wildlife matters and give the communities rights of ownership and wildlife utilisation. Whether the increasing role of communities will be enough to bring about a change in the non-protected areas along the lakeshore and whether residents are able to unite and create conservancies from which they can benefit will be addressed in the following chapters.
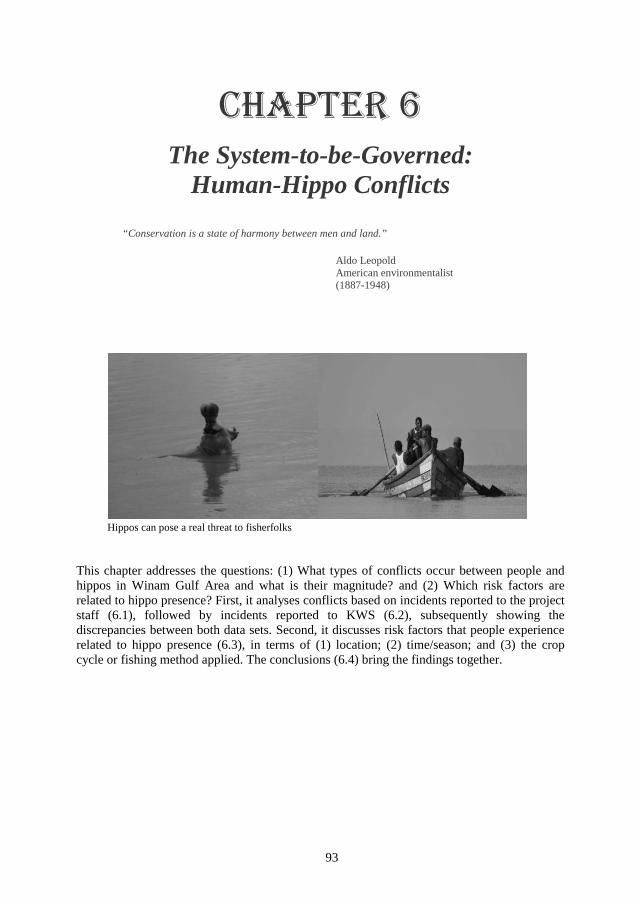
93
Chapter 6 The System-to-be-Governed:
Human-Hippo Conflicts
“Conservation is a state of harmony between men and land.”
Aldo Leopold American environmentalist (1887-1948)
Hippos can pose a real threat to fisherfolks
This chapter addresses the questions: (1) What types of conflicts occur between people and hippos in Winam Gulf Area and what is their magnitude? and (2) Which risk factors are related to hippo presence? First, it analyses conflicts based on incidents reported to the project staff (6.1), followed by incidents reported to KWS (6.2), subsequently showing the discrepancies between both data sets. Second, it discusses risk factors that people experience related to hippo presence (6.3), in terms of (1) location; (2) time/season; and (3) the crop cycle or fishing method applied. The conclusions (6.4) bring the findings together.
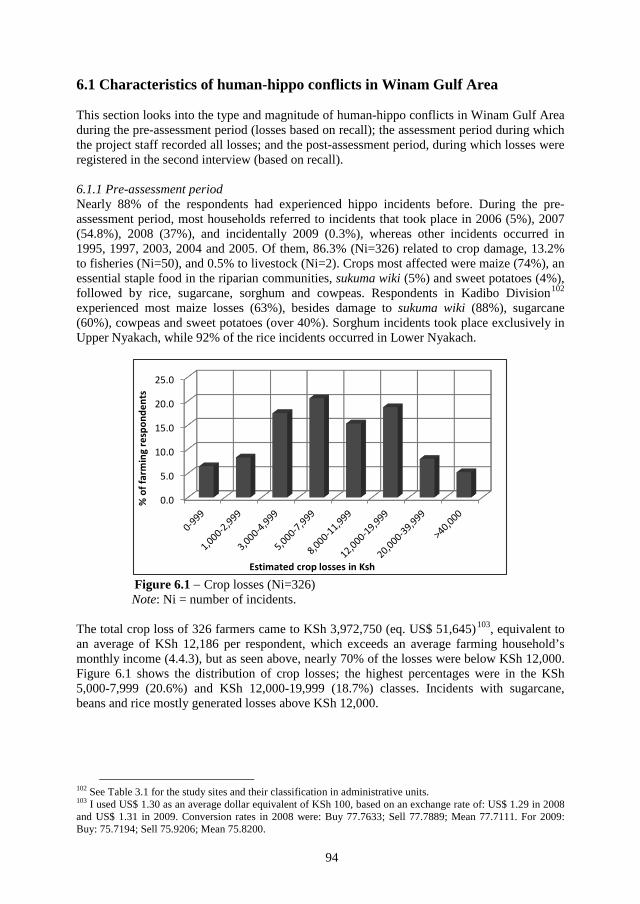
94
6.1 Characteristics of human-hippo conflicts in Winam Gulf Area
This section looks into the type and magnitude of human-hippo conflicts in Winam Gulf Area during the pre-assessment period (losses based on recall); the assessment period during which the project staff recorded all losses; and the post-assessment period, during which losses were registered in the second interview (based on recall).
6.1.1 Pre-assessment period Nearly 88% of the respondents had experienced hippo incidents before. During the pre-assessment period, most households referred to incidents that took place in 2006 (5%), 2007 (54.8%), 2008 (37%), and incidentally 2009 (0.3%), whereas other incidents occurred in 1995, 1997, 2003, 2004 and 2005. Of them, 86.3% (Ni=326) related to crop damage, 13.2% to fisheries (Ni=50), and 0.5% to livestock (Ni=2). Crops most affected were maize (74%), an essential staple food in the riparian communities, sukuma wiki (5%) and sweet potatoes (4%), followed by rice, sugarcane, sorghum and cowpeas. Respondents in Kadibo Division102 experienced most maize losses (63%), besides damage to sukuma wiki (88%), sugarcane (60%), cowpeas and sweet potatoes (over 40%). Sorghum incidents took place exclusively in Upper Nyakach, while 92% of the rice incidents occurred in Lower Nyakach.
Figure 6.1 − Crop losses (Ni=326) Note: Ni = number of incidents.
The total crop loss of 326 farmers came to KSh 3,972,750 (eq. US$ 51,645)103, equivalent to an average of KSh 12,186 per respondent, which exceeds an average farming household’s monthly income (4.4.3), but as seen above, nearly 70% of the losses were below KSh 12,000. Figure 6.1 shows the distribution of crop losses; the highest percentages were in the KSh 5,000-7,999 (20.6%) and KSh 12,000-19,999 (18.7%) classes. Incidents with sugarcane, beans and rice mostly generated losses above KSh 12,000.
102 See Table 3.1 for the study sites and their classification in administrative units. 103 I used US$ 1.30 as an average dollar equivalent of KSh 100, based on an exchange rate of: US$ 1.29 in 2008 and US$ 1.31 in 2009. Conversion rates in 2008 were: Buy 77.7633; Sell 77.7889; Mean 77.7111. For 2009: Buy: 75.7194; Sell 75.9206; Mean 75.8200.
0.0
5.0
10.0
15.0
20.0
25.0
% o
f far
min
g re
spon
dent
s
Estimated crop losses in Ksh
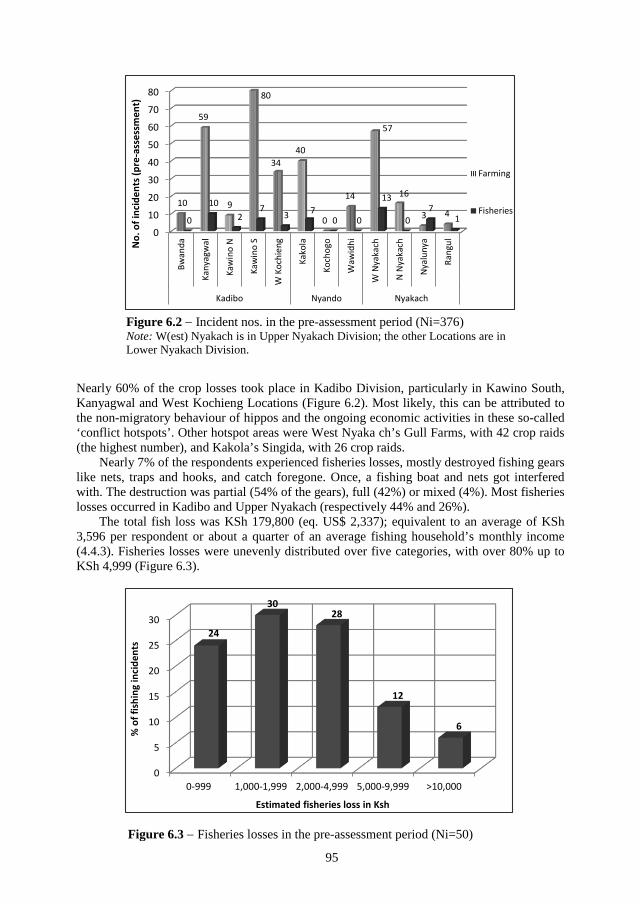
95
Nearly 60% of the crop losses took place in Kadibo Division, particularly in Kawino South, Kanyagwal and West Kochieng Locations (Figure 6.2). Most likely, this can be attributed to the non-migratory behaviour of hippos and the ongoing economic activities in these so-called ‘conflict hotspots’. Other hotspot areas were West Nyaka ch’s Gull Farms, with 42 crop raids (the highest number), and Kakola’s Singida, with 26 crop raids.
Nearly 7% of the respondents experienced fisheries losses, mostly destroyed fishing gears like nets, traps and hooks, and catch foregone. Once, a fishing boat and nets got interfered with. The destruction was partial (54% of the gears), full (42%) or mixed (4%). Most fisheries losses occurred in Kadibo and Upper Nyakach (respectively 44% and 26%).
The total fish loss was KSh 179,800 (eq. US$ 2,337); equivalent to an average of KSh 3,596 per respondent or about a quarter of an average fishing household’s monthly income (4.4.3). Fisheries losses were unevenly distributed over five categories, with over 80% up to KSh 4,999 (Figure 6.3).
0
5
10
15
20
25
30
0-999 1,000-1,999 2,000-4,999 5,000-9,999 >10,000
24
30 28
12
6 % o
f fis
hing
inci
dent
s
Estimated fisheries loss in Ksh
0
10
20
30
40
50
60
70
80
Bwan
da
Kany
agw
al
Kaw
ino
N
Kaw
ino
S
W K
ochi
eng
Kako
la
Koch
ogo
Waw
idhi
W N
yaka
ch
N N
yaka
ch
Nya
luny
a
Rang
ul
Kadibo Nyando Nyakach
10
59
9
80
34 40
0
14
57
16
3 4 0
10 2
7 3 7
0 0
13
0 7
1
No.
of i
ncid
ents
(pre
-ass
essm
ent)
Farming
Fisheries
Figure 6.2 − Incident nos. in the pre-assessment period (Ni=376) Note: W(est) Nyakach is in Upper Nyakach Division; the other Locations are in Lower Nyakach Division.
Figure 6.3 − Fisheries losses in the pre-assessment period (Ni=50)
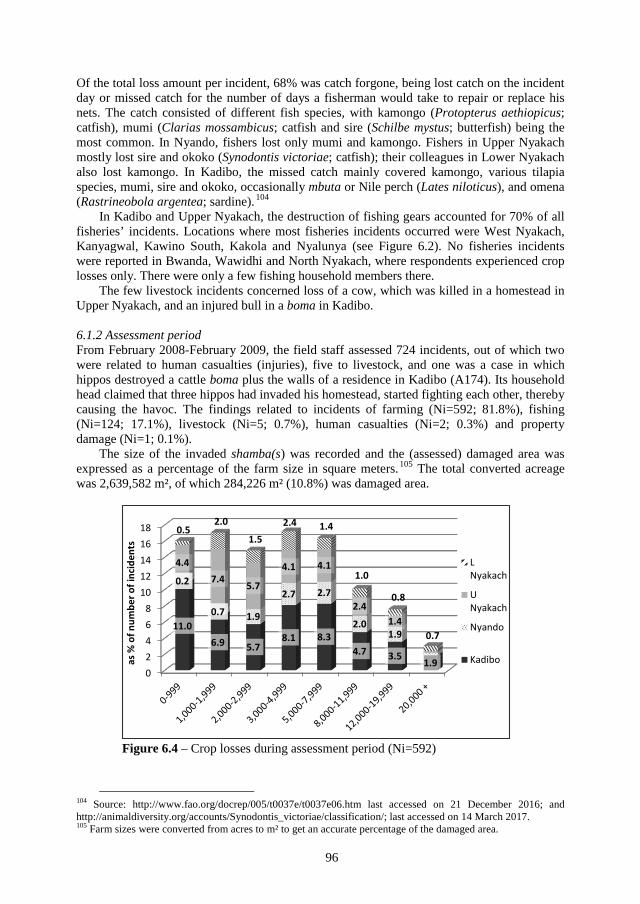
96
Of the total loss amount per incident, 68% was catch forgone, being lost catch on the incident day or missed catch for the number of days a fisherman would take to repair or replace his nets. The catch consisted of different fish species, with kamongo (Protopterus aethiopicus; catfish), mumi (Clarias mossambicus; catfish and sire (Schilbe mystus; butterfish) being the most common. In Nyando, fishers lost only mumi and kamongo. Fishers in Upper Nyakach mostly lost sire and okoko (Synodontis victoriae; catfish); their colleagues in Lower Nyakach also lost kamongo. In Kadibo, the missed catch mainly covered kamongo, various tilapia species, mumi, sire and okoko, occasionally mbuta or Nile perch (Lates niloticus), and omena (Rastrineobola argentea; sardine). 104
In Kadibo and Upper Nyakach, the destruction of fishing gears accounted for 70% of all fisheries’ incidents. Locations where most fisheries incidents occurred were West Nyakach, Kanyagwal, Kawino South, Kakola and Nyalunya (see Figure 6.2). No fisheries incidents were reported in Bwanda, Wawidhi and North Nyakach, where respondents experienced crop losses only. There were only a few fishing household members there.
The few livestock incidents concerned loss of a cow, which was killed in a homestead in Upper Nyakach, and an injured bull in a boma in Kadibo.
6.1.2 Assessment period From February 2008-February 2009, the field staff assessed 724 incidents, out of which two were related to human casualties (injuries), five to livestock, and one was a case in which hippos destroyed a cattle boma plus the walls of a residence in Kadibo (A174). Its household head claimed that three hippos had invaded his homestead, started fighting each other, thereby causing the havoc. The findings related to incidents of farming (Ni=592; 81.8%), fishing (Ni=124; 17.1%), livestock (Ni=5; 0.7%), human casualties (Ni=2; 0.3%) and property damage (Ni=1; 0.1%).
The size of the invaded shamba(s) was recorded and the (assessed) damaged area was expressed as a percentage of the farm size in square meters.105 The total converted acreage was 2,639,582 m², of which 284,226 m² (10.8%) was damaged area.
Figure 6.4 – Crop losses during assessment period (Ni=592)
104 Source: http://www.fao.org/docrep/005/t0037e/t0037e06.htm last accessed on 21 December 2016; and http://animaldiversity.org/accounts/Synodontis_victoriae/classification/; last accessed on 14 March 2017. 105 Farm sizes were converted from acres to m² to get an accurate percentage of the damaged area.
02468
1012141618
11.0 6.9 5.7
8.1 8.3 4.7 3.5
1.9
0.2
0.7 1.9
2.7 2.7
2.0 1.9
4.4 7.4
5.7
4.1 4.1
2.4 1.4
0.5 2.0
1.5 2.4 1.4
1.0
0.8
0.7
as %
of n
umbe
r of i
ncid
ents
LNyakach
UNyakach
Nyando
Kadibo
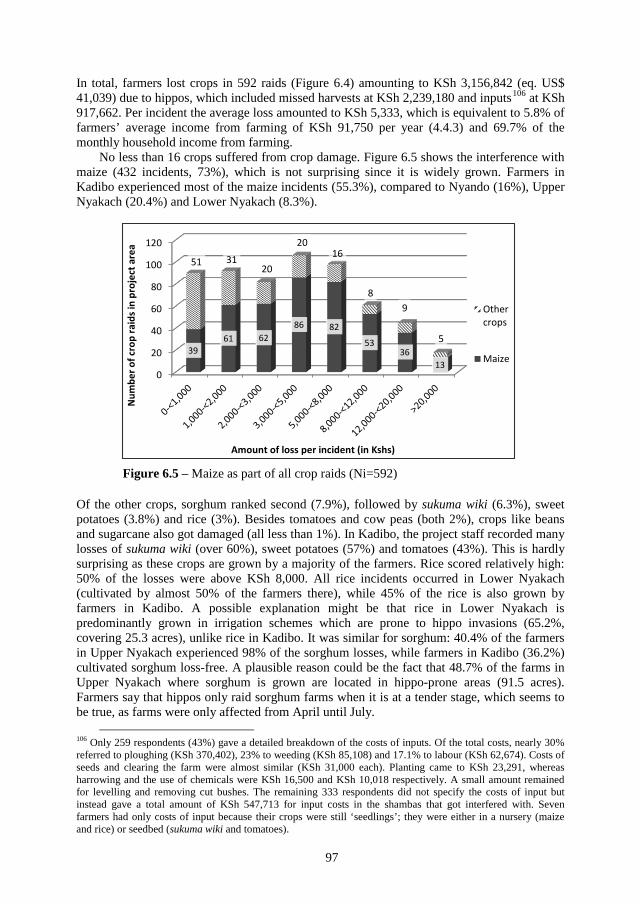
97
In total, farmers lost crops in 592 raids (Figure 6.4) amounting to KSh 3,156,842 (eq. US$ 41,039) due to hippos, which included missed harvests at KSh 2,239,180 and inputs106 at KSh 917,662. Per incident the average loss amounted to KSh 5,333, which is equivalent to 5.8% of farmers’ average income from farming of KSh 91,750 per year (4.4.3) and 69.7% of the monthly household income from farming.
No less than 16 crops suffered from crop damage. Figure 6.5 shows the interference with maize (432 incidents, 73%), which is not surprising since it is widely grown. Farmers in Kadibo experienced most of the maize incidents (55.3%), compared to Nyando (16%), Upper Nyakach (20.4%) and Lower Nyakach (8.3%).
Of the other crops, sorghum ranked second (7.9%), followed by sukuma wiki (6.3%), sweet potatoes (3.8%) and rice (3%). Besides tomatoes and cow peas (both 2%), crops like beans and sugarcane also got damaged (all less than 1%). In Kadibo, the project staff recorded many losses of sukuma wiki (over 60%), sweet potatoes (57%) and tomatoes (43%). This is hardly surprising as these crops are grown by a majority of the farmers. Rice scored relatively high: 50% of the losses were above KSh 8,000. All rice incidents occurred in Lower Nyakach (cultivated by almost 50% of the farmers there), while 45% of the rice is also grown by farmers in Kadibo. A possible explanation might be that rice in Lower Nyakach is predominantly grown in irrigation schemes which are prone to hippo invasions (65.2%, covering 25.3 acres), unlike rice in Kadibo. It was similar for sorghum: 40.4% of the farmers in Upper Nyakach experienced 98% of the sorghum losses, while farmers in Kadibo (36.2%) cultivated sorghum loss-free. A plausible reason could be the fact that 48.7% of the farms in Upper Nyakach where sorghum is grown are located in hippo-prone areas (91.5 acres). Farmers say that hippos only raid sorghum farms when it is at a tender stage, which seems to be true, as farms were only affected from April until July.
106 Only 259 respondents (43%) gave a detailed breakdown of the costs of inputs. Of the total costs, nearly 30% referred to ploughing (KSh 370,402), 23% to weeding (KSh 85,108) and 17.1% to labour (KSh 62,674). Costs of seeds and clearing the farm were almost similar (KSh 31,000 each). Planting came to KSh 23,291, whereas harrowing and the use of chemicals were KSh 16,500 and KSh 10,018 respectively. A small amount remained for levelling and removing cut bushes. The remaining 333 respondents did not specify the costs of input but instead gave a total amount of KSh 547,713 for input costs in the shambas that got interfered with. Seven farmers had only costs of input because their crops were still ‘seedlings’; they were either in a nursery (maize and rice) or seedbed (sukuma wiki and tomatoes).
0
20
40
60
80
100
120
39 61 62
86 82
53 36
13
51 31 20
20 16
8 9
5
Num
ber o
f cro
p ra
ids i
n pr
ojec
t are
a
Amount of loss per incident (in Kshs)
Othercrops
Maize
Figure 6.5 – Maize as part of all crop raids (Ni=592)
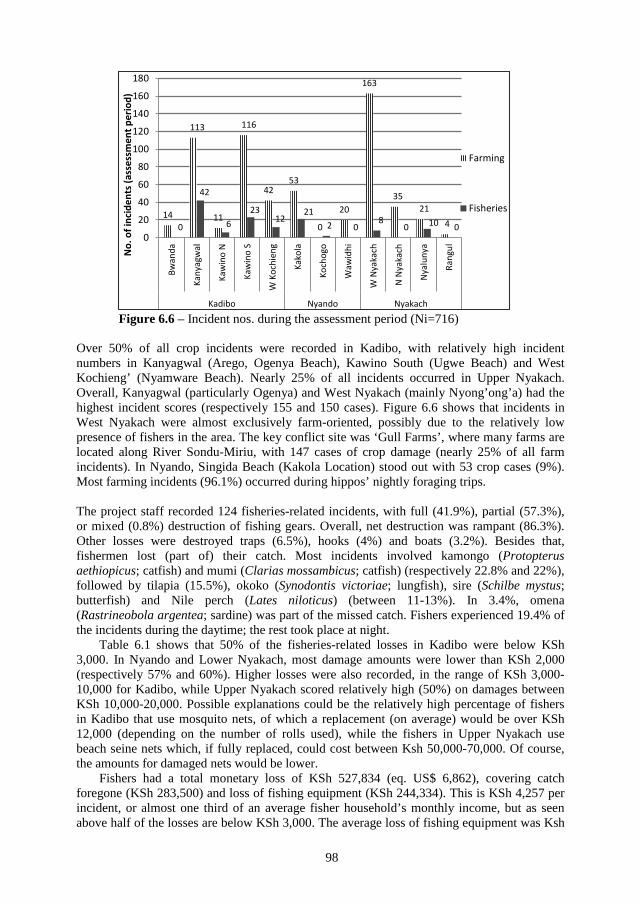
98
Over 50% of all crop incidents were recorded in Kadibo, with relatively high incident numbers in Kanyagwal (Arego, Ogenya Beach), Kawino South (Ugwe Beach) and West Kochieng’ (Nyamware Beach). Nearly 25% of all incidents occurred in Upper Nyakach. Overall, Kanyagwal (particularly Ogenya) and West Nyakach (mainly Nyong’ong’a) had the highest incident scores (respectively 155 and 150 cases). Figure 6.6 shows that incidents in West Nyakach were almost exclusively farm-oriented, possibly due to the relatively low presence of fishers in the area. The key conflict site was ‘Gull Farms’, where many farms are located along River Sondu-Miriu, with 147 cases of crop damage (nearly 25% of all farm incidents). In Nyando, Singida Beach (Kakola Location) stood out with 53 crop cases (9%). Most farming incidents (96.1%) occurred during hippos’ nightly foraging trips.
The project staff recorded 124 fisheries-related incidents, with full (41.9%), partial (57.3%), or mixed (0.8%) destruction of fishing gears. Overall, net destruction was rampant (86.3%). Other losses were destroyed traps (6.5%), hooks (4%) and boats (3.2%). Besides that, fishermen lost (part of) their catch. Most incidents involved kamongo (Protopterus aethiopicus; catfish) and mumi (Clarias mossambicus; catfish) (respectively 22.8% and 22%), followed by tilapia (15.5%), okoko (Synodontis victoriae; lungfish), sire (Schilbe mystus; butterfish) and Nile perch (Lates niloticus) (between 11-13%). In 3.4%, omena (Rastrineobola argentea; sardine) was part of the missed catch. Fishers experienced 19.4% of the incidents during the daytime; the rest took place at night.
Table 6.1 shows that 50% of the fisheries-related losses in Kadibo were below KSh 3,000. In Nyando and Lower Nyakach, most damage amounts were lower than KSh 2,000 (respectively 57% and 60%). Higher losses were also recorded, in the range of KSh 3,000-10,000 for Kadibo, while Upper Nyakach scored relatively high (50%) on damages between KSh 10,000-20,000. Possible explanations could be the relatively high percentage of fishers in Kadibo that use mosquito nets, of which a replacement (on average) would be over KSh 12,000 (depending on the number of rolls used), while the fishers in Upper Nyakach use beach seine nets which, if fully replaced, could cost between Ksh 50,000-70,000. Of course, the amounts for damaged nets would be lower.
Fishers had a total monetary loss of KSh 527,834 (eq. US$ 6,862), covering catch foregone (KSh 283,500) and loss of fishing equipment (KSh 244,334). This is KSh 4,257 per incident, or almost one third of an average fisher household’s monthly income, but as seen above half of the losses are below KSh 3,000. The average loss of fishing equipment was Ksh
14
113
11
116
42 53
0
20
163
35 21
4 0
42
6 23
12 21
2 0 8
0 10 0 0
20
40
60
80
100
120
140
160
180
Bwan
da
Kany
agw
al
Kaw
ino
N
Kaw
ino
S
W K
ochi
eng
Kako
la
Koch
ogo
Waw
idhi
W N
yaka
ch
N N
yaka
ch
Nya
luny
a
Rang
ul
Kadibo Nyando Nyakach
No.
of i
ncid
ents
(ass
essm
ent p
erio
d)
Farming
Fisheries
Figure 6.6 – Incident nos. during the assessment period (Ni=716)
99
1,971; the amount for catch foregone was higher and came to Ksh 2,286 on average. Fisheries damage mostly occurred in Kadibo (66.9%), particularly in Kanyagwal and Kawino South Locations (see Figure 6.6). This is not surprising as Kadibo has relatively many fishing respondents (nearly 60%). Nyando ‘scored’ 18.5% of the fisheries losses (mostly in Kakola), while the Nyakach Divisions recorded 14.5%. No fishing incidents were reported in Bwanda, Wawidhi, North Nyakach and Rangul Locations, since there were few fishers around.
For equipment loss, the highest percentage (17.7%) was in the range of KSh 1,000-1,499 and KSh 2,000-2,999. All fish incidents had catch loss; the highest percentage (21.8%) was in the range of KSh 2,000-2,999, whereas 17.7% referred to KSh 500-999 and KSh 1,000-1,499.
Table 6.1 – Loss assessment fisheries incidents during the assessment period (Ni=124) Division → Kadibo Nyando Upper Nyakach Lower Nyakach Loss assessment in KSh ↓ Freq % Freq % Freq % Freq % 0-999 7 8.4 2 8.7 1 12.5 2 20 1,000-1,499 5 6.0 4 17.4 1 12.5 1 10 1,500-1,999 12 14.5 7 30.4 0 0 3 30 2,000-2,999 18 21.7 4 17.4 0 0 3 30 3,000-4,999 23 27.7 1 4.3 1 12.5 1 10 5,000-9,999 12 14.5 5 21.7 0 0 0 0 10,000-19,999 3 3.6 0 0.0 4 50 0 0 >20,000 3 3.6 0 0.0 1 12.5 0 0 Total incidents 83 100 23 100 8 100 10 100 Note: KSh 100 is equivalent to US$ 1.29 (in 2008) and US$ 1.31 (in 2009).
Livestock incidents were only recorded in Nyakach: four of them in Lower Nyakach, when the cattle were crossing River Nyando; another one occurred in Upper Nyakach when a hippo invaded a cattle boma at night. In all cases, cattle got injured, with costs of treatment ranging from KSh 1,000 for a calf to KSh 8,000 for an injured bull – with a fatal end in three cases. Monetary losses for the cattle that got killed ranged from KSh 6,000 for a cow to KSh 15,000 for a pregnant cow. On average, livestock losses were KSh 8,000 per incident.
Pictures 6.1-6.6 show different types of damage respondents experienced due to hippos. The types of incidents which occurred in the divisions are shown in Maps 6.1 to 6.3. These maps clearly show the conflict ‘hotspots’.
6.1.3 Post-assessment period The post-assessment interviews were held from April to December 2009. Most respondents107 (83%) said they had experienced subsequent108 incidents (N=357) with hippos, of which nearly 80% claimed to have had less than five incidents since the last damage assessment. Of the last incidents, 309 incidents (86.6%) related to crop damage, of which 57% took place in Kadibo, mostly in Kawino South, Kanyagwal, and West Kochieng (Figure 6.7). Of the other crop raids, 24.3% took place in West Nyakach (Upper Nyakach), especially in Gull Farms (in Nyong’ong’a), which had the highest number of farm incidents, and in Nyando (11%) and Lower Nyakach (7.8%).
Forty-eight incidents (13.4%) related to fisheries; over 50% of them took place in Kadibo (mainly in Kanyagwal and Kawino South). Kakola (Nyando) scored 14.6%, while 20.8% occurred in Nyalunya (Lower Nyakach), and 12.5% in West Nyakach (Upper Nyakach). Livestock incidents were not mentioned at all.
107 There were four missing answers and 69 people did not have another incident. 108 The time period per respondent could differ significantly, depending on the date of the first interview (after the first damage assessment) and the last damage assessment, as well as the timing of the second interview.
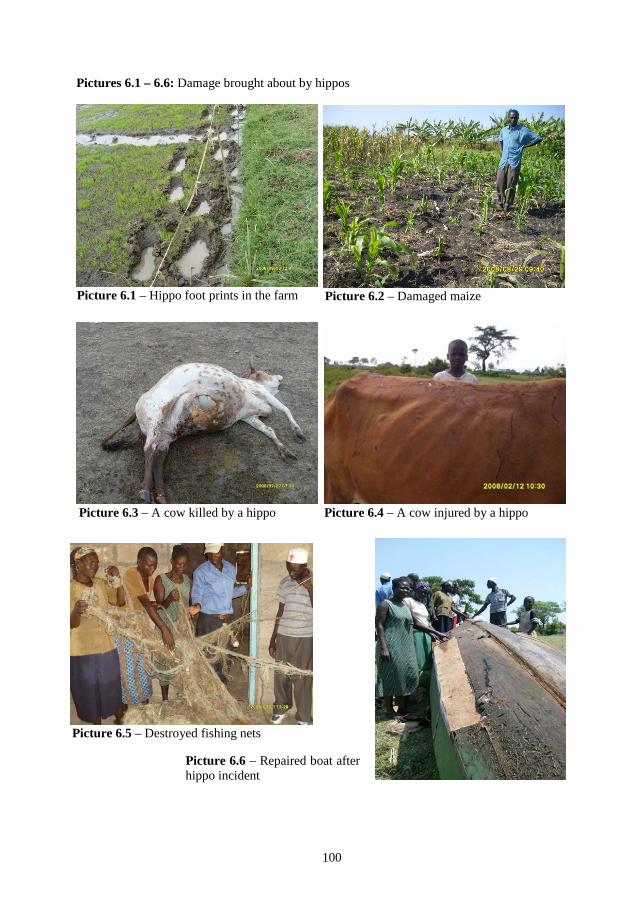
100
Pictures 6.1 – 6.6: Damage brought about by hippos
Picture 6.1 – Hippo foot prints in the farm Picture 6.2 – Damaged maize
Picture 6.4 – A cow injured by a hippo Picture 6.3 – A cow killed by a hippo
Picture 6.6 – Repaired boat after hippo incident
Picture 6.5 – Destroyed fishing nets
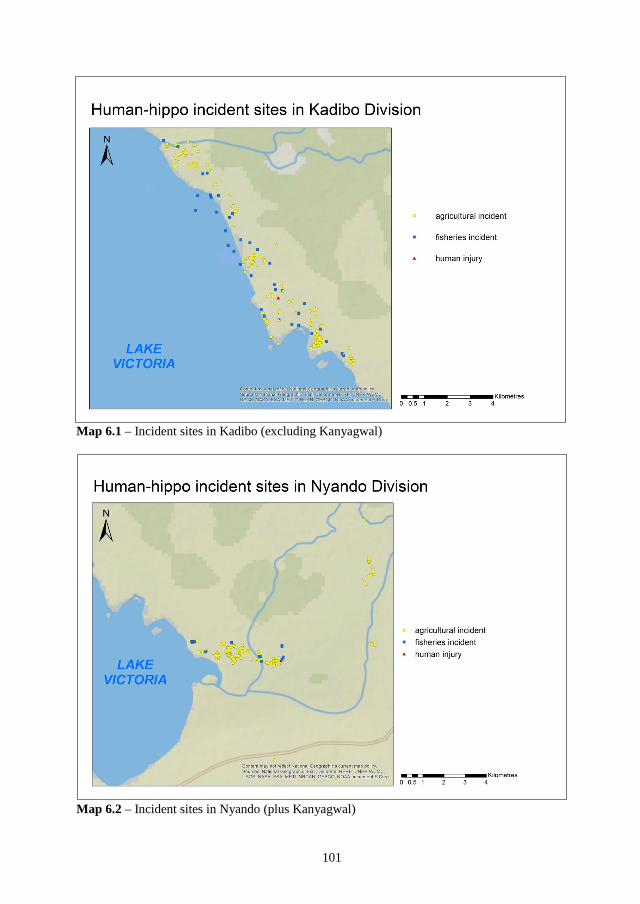
101
Map 6.1 – Incident sites in Kadibo (excluding Kanyagwal)
Map 6.2 – Incident sites in Nyando (plus Kanyagwal)
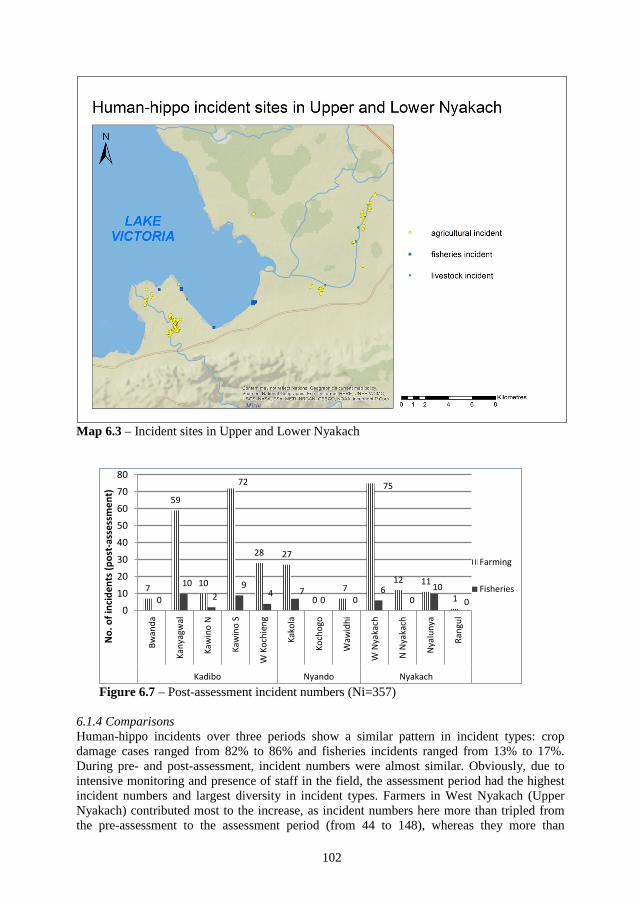
102
Map 6.3 – Incident sites in Upper and Lower Nyakach
Figure 6.7 – Post-assessment incident numbers (Ni=357) 6.1.4 Comparisons Human-hippo incidents over three periods show a similar pattern in incident types: crop damage cases ranged from 82% to 86% and fisheries incidents ranged from 13% to 17%. During pre- and post-assessment, incident numbers were almost similar. Obviously, due to intensive monitoring and presence of staff in the field, the assessment period had the highest incident numbers and largest diversity in incident types. Farmers in West Nyakach (Upper Nyakach) contributed most to the increase, as incident numbers here more than tripled from the pre-assessment to the assessment period (from 44 to 148), whereas they more than
7
59
10
72
28 27
0 7
75
12 11
1 0
10 2
9 4 7
0 0 6
0 10
0 0
10
20
30
40
50
60
70
80
Bwan
da
Kany
agw
al
Kaw
ino
N
Kaw
ino
S
W K
ochi
eng
Kako
la
Koch
ogo
Waw
idhi
W N
yaka
ch
N N
yaka
ch
Nya
luny
a
Rang
ul
Kadibo Nyando Nyakach
No.
of i
ncid
ents
(pos
t-as
sess
men
t)
Farming
Fisheries
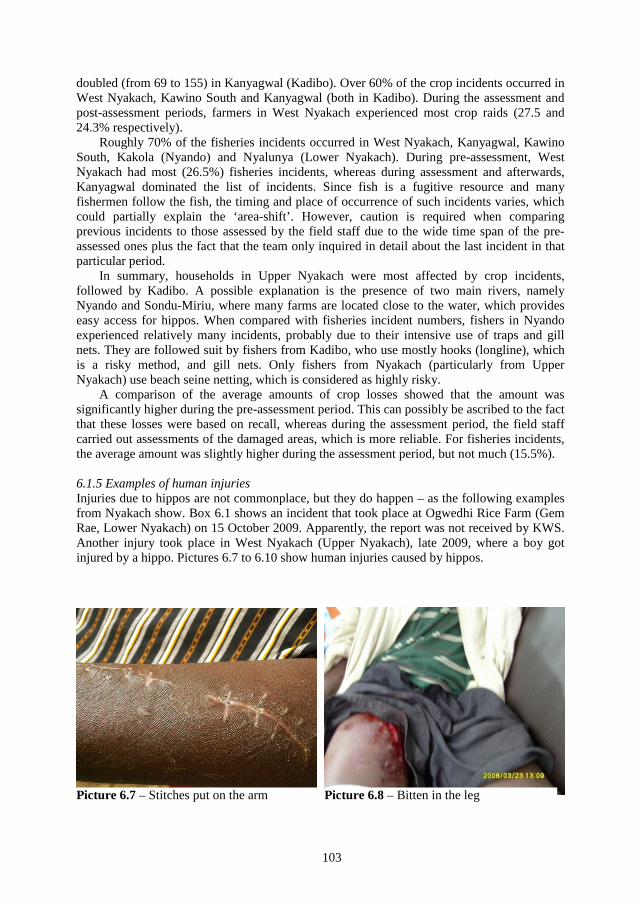
103
doubled (from 69 to 155) in Kanyagwal (Kadibo). Over 60% of the crop incidents occurred in West Nyakach, Kawino South and Kanyagwal (both in Kadibo). During the assessment and post-assessment periods, farmers in West Nyakach experienced most crop raids (27.5 and 24.3% respectively).
Roughly 70% of the fisheries incidents occurred in West Nyakach, Kanyagwal, Kawino South, Kakola (Nyando) and Nyalunya (Lower Nyakach). During pre-assessment, West Nyakach had most (26.5%) fisheries incidents, whereas during assessment and afterwards, Kanyagwal dominated the list of incidents. Since fish is a fugitive resource and many fishermen follow the fish, the timing and place of occurrence of such incidents varies, which could partially explain the ‘area-shift’. However, caution is required when comparing previous incidents to those assessed by the field staff due to the wide time span of the pre-assessed ones plus the fact that the team only inquired in detail about the last incident in that particular period.
In summary, households in Upper Nyakach were most affected by crop incidents, followed by Kadibo. A possible explanation is the presence of two main rivers, namely Nyando and Sondu-Miriu, where many farms are located close to the water, which provides easy access for hippos. When compared with fisheries incident numbers, fishers in Nyando experienced relatively many incidents, probably due to their intensive use of traps and gill nets. They are followed suit by fishers from Kadibo, who use mostly hooks (longline), which is a risky method, and gill nets. Only fishers from Nyakach (particularly from Upper Nyakach) use beach seine netting, which is considered as highly risky.
A comparison of the average amounts of crop losses showed that the amount was significantly higher during the pre-assessment period. This can possibly be ascribed to the fact that these losses were based on recall, whereas during the assessment period, the field staff carried out assessments of the damaged areas, which is more reliable. For fisheries incidents, the average amount was slightly higher during the assessment period, but not much (15.5%).
6.1.5 Examples of human injuries Injuries due to hippos are not commonplace, but they do happen – as the following examples from Nyakach show. Box 6.1 shows an incident that took place at Ogwedhi Rice Farm (Gem Rae, Lower Nyakach) on 15 October 2009. Apparently, the report was not received by KWS. Another injury took place in West Nyakach (Upper Nyakach), late 2009, where a boy got injured by a hippo. Pictures 6.7 to 6.10 show human injuries caused by hippos.
Picture 6.7 – Stitches put on the arm Picture 6.8 – Bitten in the leg
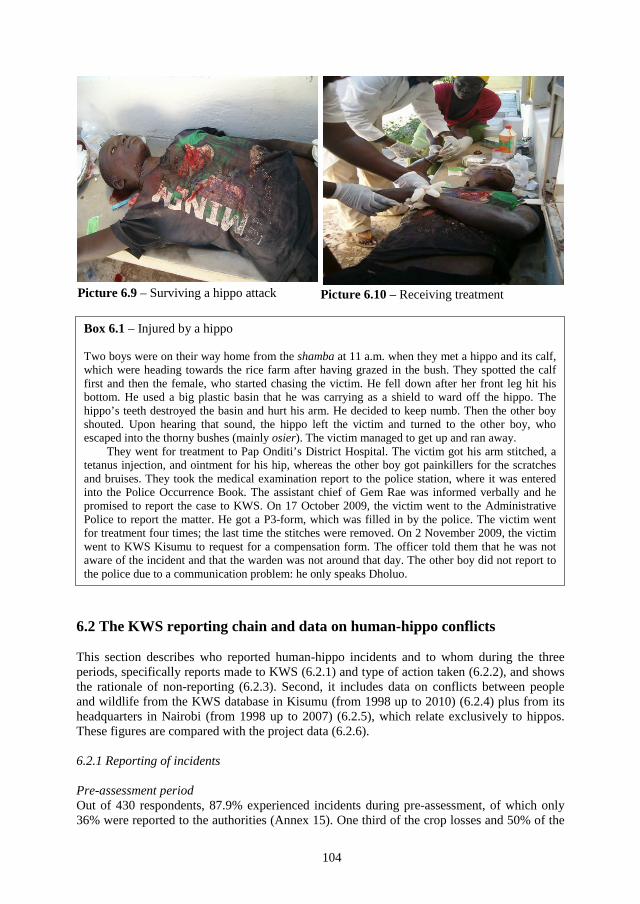
104
6.2 The KWS reporting chain and data on human-hippo conflicts
This section describes who reported human-hippo incidents and to whom during the three periods, specifically reports made to KWS (6.2.1) and type of action taken (6.2.2), and shows the rationale of non-reporting (6.2.3). Second, it includes data on conflicts between people and wildlife from the KWS database in Kisumu (from 1998 up to 2010) (6.2.4) plus from its headquarters in Nairobi (from 1998 up to 2007) (6.2.5), which relate exclusively to hippos. These figures are compared with the project data (6.2.6).
6.2.1 Reporting of incidents
Pre-assessment period Out of 430 respondents, 87.9% experienced incidents during pre-assessment, of which only 36% were reported to the authorities (Annex 15). One third of the crop losses and 50% of the
Picture 6.9 – Surviving a hippo attack Picture 6.10 – Receiving treatment
Box 6.1 – Injured by a hippo
Two boys were on their way home from the shamba at 11 a.m. when they met a hippo and its calf, which were heading towards the rice farm after having grazed in the bush. They spotted the calf first and then the female, who started chasing the victim. He fell down after her front leg hit his bottom. He used a big plastic basin that he was carrying as a shield to ward off the hippo. The hippo’s teeth destroyed the basin and hurt his arm. He decided to keep numb. Then the other boy shouted. Upon hearing that sound, the hippo left the victim and turned to the other boy, who escaped into the thorny bushes (mainly osier). The victim managed to get up and ran away.
They went for treatment to Pap Onditi’s District Hospital. The victim got his arm stitched, a tetanus injection, and ointment for his hip, whereas the other boy got painkillers for the scratches and bruises. They took the medical examination report to the police station, where it was entered into the Police Occurrence Book. The assistant chief of Gem Rae was informed verbally and he promised to report the case to KWS. On 17 October 2009, the victim went to the Administrative Police to report the matter. He got a P3-form, which was filled in by the police. The victim went for treatment four times; the last time the stitches were removed. On 2 November 2009, the victim went to KWS Kisumu to request for a compensation form. The officer told them that he was not aware of the incident and that the warden was not around that day. The other boy did not report to the police due to a communication problem: he only speaks Dholuo.
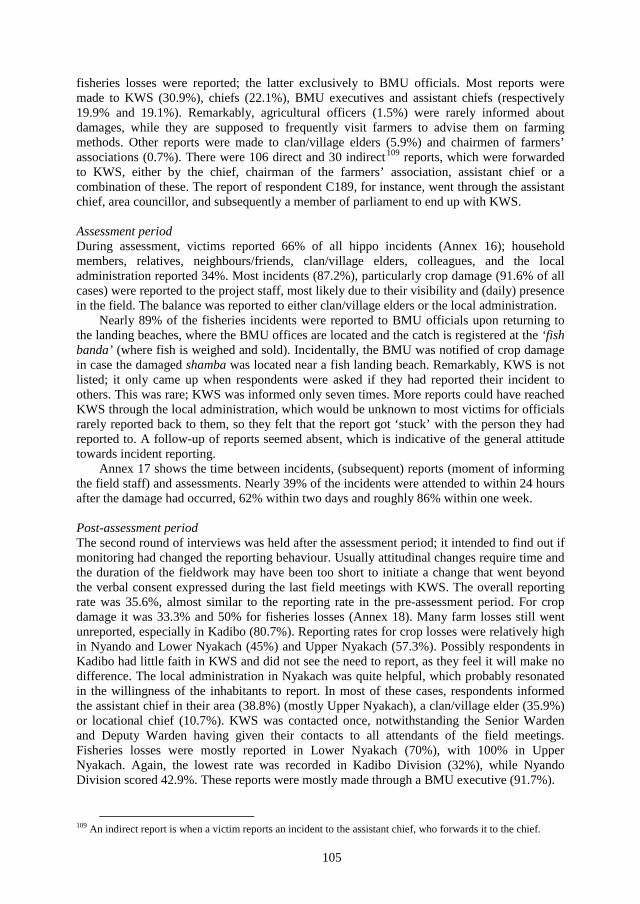
105
fisheries losses were reported; the latter exclusively to BMU officials. Most reports were made to KWS (30.9%), chiefs (22.1%), BMU executives and assistant chiefs (respectively 19.9% and 19.1%). Remarkably, agricultural officers (1.5%) were rarely informed about damages, while they are supposed to frequently visit farmers to advise them on farming methods. Other reports were made to clan/village elders (5.9%) and chairmen of farmers’ associations (0.7%). There were 106 direct and 30 indirect109 reports, which were forwarded to KWS, either by the chief, chairman of the farmers’ association, assistant chief or a combination of these. The report of respondent C189, for instance, went through the assistant chief, area councillor, and subsequently a member of parliament to end up with KWS.
Assessment period During assessment, victims reported 66% of all hippo incidents (Annex 16); household members, relatives, neighbours/friends, clan/village elders, colleagues, and the local administration reported 34%. Most incidents (87.2%), particularly crop damage (91.6% of all cases) were reported to the project staff, most likely due to their visibility and (daily) presence in the field. The balance was reported to either clan/village elders or the local administration.
Nearly 89% of the fisheries incidents were reported to BMU officials upon returning to the landing beaches, where the BMU offices are located and the catch is registered at the ‘fish banda’ (where fish is weighed and sold). Incidentally, the BMU was notified of crop damage in case the damaged shamba was located near a fish landing beach. Remarkably, KWS is not listed; it only came up when respondents were asked if they had reported their incident to others. This was rare; KWS was informed only seven times. More reports could have reached KWS through the local administration, which would be unknown to most victims for officials rarely reported back to them, so they felt that the report got ‘stuck’ with the person they had reported to. A follow-up of reports seemed absent, which is indicative of the general attitude towards incident reporting.
Annex 17 shows the time between incidents, (subsequent) reports (moment of informing the field staff) and assessments. Nearly 39% of the incidents were attended to within 24 hours after the damage had occurred, 62% within two days and roughly 86% within one week.
Post-assessment period The second round of interviews was held after the assessment period; it intended to find out if monitoring had changed the reporting behaviour. Usually attitudinal changes require time and the duration of the fieldwork may have been too short to initiate a change that went beyond the verbal consent expressed during the last field meetings with KWS. The overall reporting rate was 35.6%, almost similar to the reporting rate in the pre-assessment period. For crop damage it was 33.3% and 50% for fisheries losses (Annex 18). Many farm losses still went unreported, especially in Kadibo (80.7%). Reporting rates for crop losses were relatively high in Nyando and Lower Nyakach (45%) and Upper Nyakach (57.3%). Possibly respondents in Kadibo had little faith in KWS and did not see the need to report, as they feel it will make no difference. The local administration in Nyakach was quite helpful, which probably resonated in the willingness of the inhabitants to report. In most of these cases, respondents informed the assistant chief in their area (38.8%) (mostly Upper Nyakach), a clan/village elder (35.9%) or locational chief (10.7%). KWS was contacted once, notwithstanding the Senior Warden and Deputy Warden having given their contacts to all attendants of the field meetings. Fisheries losses were mostly reported in Lower Nyakach (70%), with 100% in Upper Nyakach. Again, the lowest rate was recorded in Kadibo Division (32%), while Nyando Division scored 42.9%. These reports were mostly made through a BMU executive (91.7%).
109 An indirect report is when a victim reports an incident to the assistant chief, who forwards it to the chief.
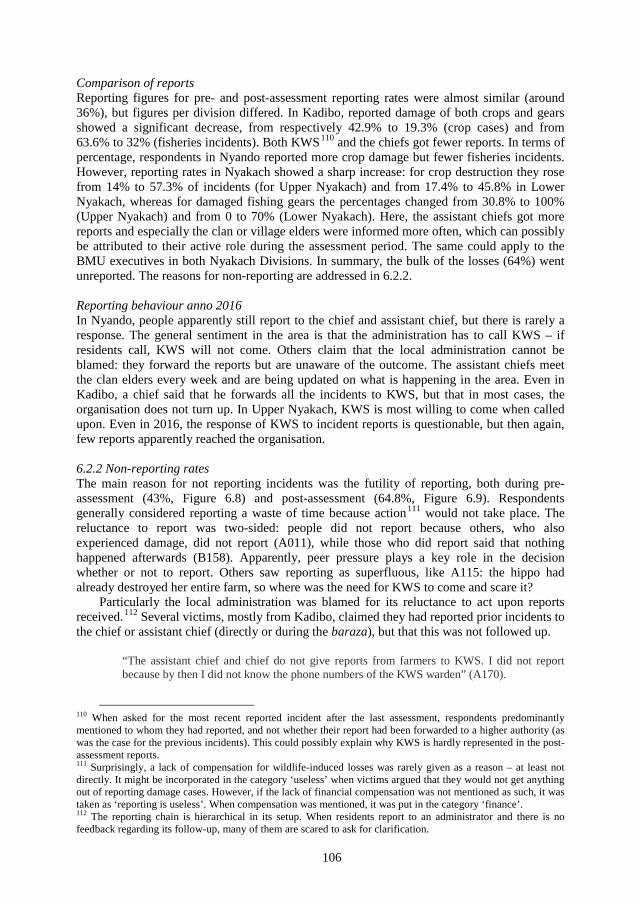
106
Comparison of reports Reporting figures for pre- and post-assessment reporting rates were almost similar (around 36%), but figures per division differed. In Kadibo, reported damage of both crops and gears showed a significant decrease, from respectively 42.9% to 19.3% (crop cases) and from 63.6% to 32% (fisheries incidents). Both KWS110 and the chiefs got fewer reports. In terms of percentage, respondents in Nyando reported more crop damage but fewer fisheries incidents. However, reporting rates in Nyakach showed a sharp increase: for crop destruction they rose from 14% to 57.3% of incidents (for Upper Nyakach) and from 17.4% to 45.8% in Lower Nyakach, whereas for damaged fishing gears the percentages changed from 30.8% to 100% (Upper Nyakach) and from 0 to 70% (Lower Nyakach). Here, the assistant chiefs got more reports and especially the clan or village elders were informed more often, which can possibly be attributed to their active role during the assessment period. The same could apply to the BMU executives in both Nyakach Divisions. In summary, the bulk of the losses (64%) went unreported. The reasons for non-reporting are addressed in 6.2.2.
Reporting behaviour anno 2016 In Nyando, people apparently still report to the chief and assistant chief, but there is rarely a response. The general sentiment in the area is that the administration has to call KWS – if residents call, KWS will not come. Others claim that the local administration cannot be blamed: they forward the reports but are unaware of the outcome. The assistant chiefs meet the clan elders every week and are being updated on what is happening in the area. Even in Kadibo, a chief said that he forwards all the incidents to KWS, but that in most cases, the organisation does not turn up. In Upper Nyakach, KWS is most willing to come when called upon. Even in 2016, the response of KWS to incident reports is questionable, but then again, few reports apparently reached the organisation.
6.2.2 Non-reporting rates The main reason for not reporting incidents was the futility of reporting, both during pre-assessment (43%, Figure 6.8) and post-assessment (64.8%, Figure 6.9). Respondents generally considered reporting a waste of time because action111 would not take place. The reluctance to report was two-sided: people did not report because others, who also experienced damage, did not report (A011), while those who did report said that nothing happened afterwards (B158). Apparently, peer pressure plays a key role in the decision whether or not to report. Others saw reporting as superfluous, like A115: the hippo had already destroyed her entire farm, so where was the need for KWS to come and scare it?
Particularly the local administration was blamed for its reluctance to act upon reports received.112 Several victims, mostly from Kadibo, claimed they had reported prior incidents to the chief or assistant chief (directly or during the baraza), but that this was not followed up.
“The assistant chief and chief do not give reports from farmers to KWS. I did not report because by then I did not know the phone numbers of the KWS warden” (A170).
110 When asked for the most recent reported incident after the last assessment, respondents predominantly mentioned to whom they had reported, and not whether their report had been forwarded to a higher authority (as was the case for the previous incidents). This could possibly explain why KWS is hardly represented in the post-assessment reports. 111 Surprisingly, a lack of compensation for wildlife-induced losses was rarely given as a reason – at least not directly. It might be incorporated in the category ‘useless’ when victims argued that they would not get anything out of reporting damage cases. However, if the lack of financial compensation was not mentioned as such, it was taken as ‘reporting is useless’. When compensation was mentioned, it was put in the category ‘finance’. 112 The reporting chain is hierarchical in its setup. When residents report to an administrator and there is no feedback regarding its follow-up, many of them are scared to ask for clarification.
107
Residents have no faith in the local administration (B076). They blamed KWS for its poor response to reports, which discouraged people from contacting them (A019). Even during post-assessment, KWS was still blamed for being idle and not taking phone calls seriously (B031). While KWS had created some goodwill during the field meetings we had organised, it failed to do a follow-up:
“KWS is not reliable, they promised to come when they held their meeting here but they did not show” (A176).
“There is a lack of trust between the local administration and KWS. I had reported to the chief who said that KWS is not willing to assist” (B250).
Of the pre-assessment answers, 33% referred to the reporting procedure itself. People seemed unfamiliar with the need to report, and if they did, they were oblivious of where or whom to report to. There were numerous complaints about the lengthy, bureaucratic reporting process. During post-assessment, this reason was no longer mentioned, apparently because people got
05
101520253035404550 45.2
0
7.4 4.8 0.4
3.0
7.8 11.7
0.0 2.2
0.0 0.0 0.0 0.0 Perc
enta
ge o
f ans
wer
s giv
en
Post-assessment non-reporting (N=230)
Kadibo
Nyando
UpperNyakach
LowerNyakach
Figure 6.9 – Non-reporting rates during the post-assessment period
Figure 6.8 – Non-reporting rates during the pre-assessment period
0
5
10
15
20
2524.8
8.3
4.5 6.6
0.8 3.7
0.8
8.7
14.0
0.4 0.4 0.4 Perc
enta
ge o
f ans
wer
s giv
en
Pre-assessment non-reporting (N=242)
Kadibo
Nyando
UpperNyakach
LowerNyakach
108
familiarised with the procedures and the ‘permanent’ presence of the project staff, which enabled reporting. However, the change in reporting behaviour was insignificant because once the field staff had left, people seemed to revert to their old habit of non-reporting, possibly due to the limited number of follow-ups, either by the administration or KWS.
Personal circumstances also played a role, with people having neither time nor money to report to KWS, or having other commitments at the time of the incident. Some relied on others and did not see reporting as an individual responsibility. They either claimed that the local administration was aware of the incident or said that other victims had already reported their incidents, so there was no need for them to do the same.
Some people gave location as a reason, referring to cultivation in ‘forbidden areas’:
“People cultivate close to the lake where they have no parcel number, so the land belongs to the Government of Kenya” (B019).
“Farmers have been informed by the district officer, who said that the area where they are farming should be left idle as it was a grazing ground for hippos (A027).
“I fear reporting because I have encroached into hippo habitat, so nothing will be done with my complaint” C137).
These answers show that respondents knew that they should not cultivate areas bordering the water body. Fishers have encroached hippo areas in search of a higher catch, hence going against the advice of the BMU executives. Moreover, some were using illegal gear and could not expose themselves to reporting and getting caught afterwards.
The category ‘other’ had a mixed character, and was occasionally political in nature:
“The mood of the people could not allow for reporting hippo cases since it was during the political campaign and election period” (B183).
Other reasons increased significantly during the post-assessment period, mainly because the field staff were no longer around after the project had ended (B230), local people did not have any faith in the local administration (A121), and BMU officials had stopped taking reports like they used to do during assessment (B169).
6.2.3 Response to reports Over 70% of the reported cases did not lead to a follow-up.113 KWS is the only actor legally allowed to control hippo numbers. Most incidents were reported to the local administration and BMU executives. KWS only got 42 out of 136 reports (30.9%), which mostly came from Kadibo Division, possibly due to the relatively short distance to KWS Kisumu: at the time of the interviews there were no field stations in either Nyando or Nyakach. Of these reports, 61.9% were attended to and 11.9% were not. It is not clear whether KWS took any action for the indirect reports which reached the organisation through the (assistant) chiefs, chairmen of farmers’ associations, area councillors and District Officers. However, the arrival of KWS at the incident site was not a guarantee for ‘success’. In 65.4% of the cases, hippos were not traced, and if spotted, they were either scared by shooting in the air (26.9%) or killed (7.7%).
113 Respondents apparently perceived the word ‘action’ in a particular way: they saw it as being synonymous to scaring and/or killing of hippos by KWS. Whenever KWS followed up the report (irrespective of its outcome), I interpreted this as ‘action taken’. Partial action denotes that KWS was informed but did not show up, or it remained unclear whether it went to the conflict site or not.
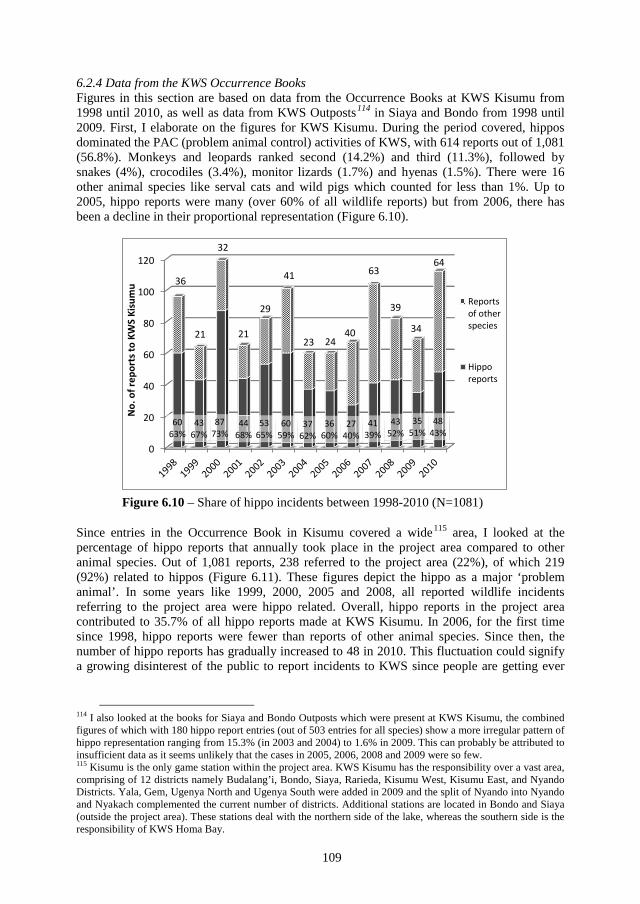
109
6.2.4 Data from the KWS Occurrence Books Figures in this section are based on data from the Occurrence Books at KWS Kisumu from 1998 until 2010, as well as data from KWS Outposts114 in Siaya and Bondo from 1998 until 2009. First, I elaborate on the figures for KWS Kisumu. During the period covered, hippos dominated the PAC (problem animal control) activities of KWS, with 614 reports out of 1,081 (56.8%). Monkeys and leopards ranked second (14.2%) and third (11.3%), followed by snakes (4%), crocodiles (3.4%), monitor lizards (1.7%) and hyenas (1.5%). There were 16 other animal species like serval cats and wild pigs which counted for less than 1%. Up to 2005, hippo reports were many (over 60% of all wildlife reports) but from 2006, there has been a decline in their proportional representation (Figure 6.10).
Since entries in the Occurrence Book in Kisumu covered a wide115 area, I looked at the percentage of hippo reports that annually took place in the project area compared to other animal species. Out of 1,081 reports, 238 referred to the project area (22%), of which 219 (92%) related to hippos (Figure 6.11). These figures depict the hippo as a major ‘problem animal’. In some years like 1999, 2000, 2005 and 2008, all reported wildlife incidents referring to the project area were hippo related. Overall, hippo reports in the project area contributed to 35.7% of all hippo reports made at KWS Kisumu. In 2006, for the first time since 1998, hippo reports were fewer than reports of other animal species. Since then, the number of hippo reports has gradually increased to 48 in 2010. This fluctuation could signify a growing disinterest of the public to report incidents to KWS since people are getting ever
114 I also looked at the books for Siaya and Bondo Outposts which were present at KWS Kisumu, the combined figures of which with 180 hippo report entries (out of 503 entries for all species) show a more irregular pattern of hippo representation ranging from 15.3% (in 2003 and 2004) to 1.6% in 2009. This can probably be attributed to insufficient data as it seems unlikely that the cases in 2005, 2006, 2008 and 2009 were so few. 115 Kisumu is the only game station within the project area. KWS Kisumu has the responsibility over a vast area, comprising of 12 districts namely Budalang’i, Bondo, Siaya, Rarieda, Kisumu West, Kisumu East, and Nyando Districts. Yala, Gem, Ugenya North and Ugenya South were added in 2009 and the split of Nyando into Nyando and Nyakach complemented the current number of districts. Additional stations are located in Bondo and Siaya (outside the project area). These stations deal with the northern side of the lake, whereas the southern side is the responsibility of KWS Homa Bay.
0
20
40
60
80
100
120
60 63%
43 67%
87 73%
44 68%
53 65%
60 59%
37 62%
36 60%
27 40%
41 39%
43 52%
35 51%
48 43%
36
21
32
21
29
41
23 24 40
63
39
34
64
No.
of r
epor
ts to
KW
S Ki
sum
u
Reportsof otherspecies
Hipporeports
Figure 6.10 – Share of hippo incidents between 1998-2010 (N=1081)
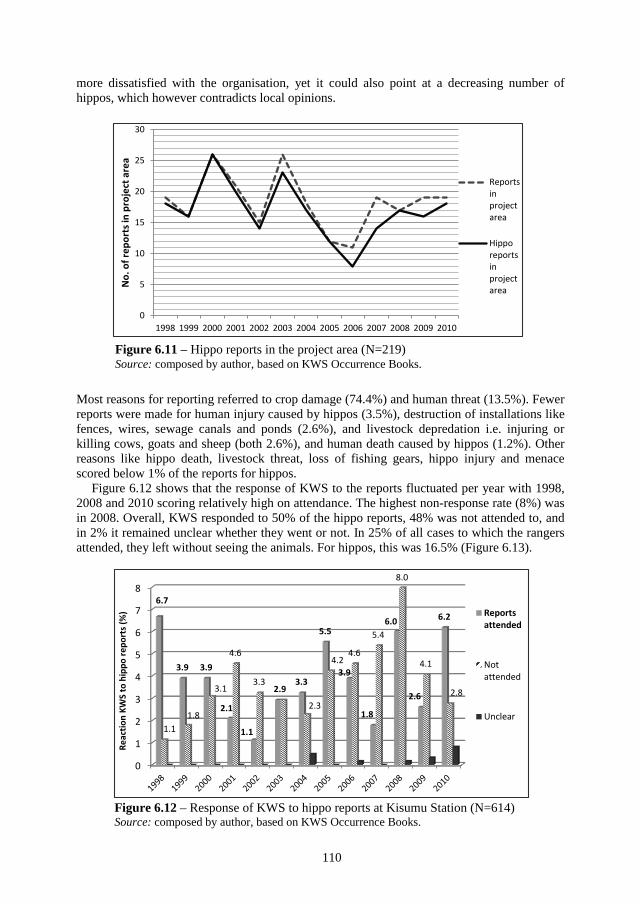
110
more dissatisfied with the organisation, yet it could also point at a decreasing number of hippos, which however contradicts local opinions.
Most reasons for reporting referred to crop damage (74.4%) and human threat (13.5%). Fewer reports were made for human injury caused by hippos (3.5%), destruction of installations like fences, wires, sewage canals and ponds (2.6%), and livestock depredation i.e. injuring or killing cows, goats and sheep (both 2.6%), and human death caused by hippos (1.2%). Other reasons like hippo death, livestock threat, loss of fishing gears, hippo injury and menace scored below 1% of the reports for hippos.
Figure 6.12 shows that the response of KWS to the reports fluctuated per year with 1998, 2008 and 2010 scoring relatively high on attendance. The highest non-response rate (8%) was in 2008. Overall, KWS responded to 50% of the hippo reports, 48% was not attended to, and in 2% it remained unclear whether they went or not. In 25% of all cases to which the rangers attended, they left without seeing the animals. For hippos, this was 16.5% (Figure 6.13).
Figure 6.12 – Response of KWS to hippo reports at Kisumu Station (N=614) Source: composed by author, based on KWS Occurrence Books.
0
1
2
3
4
5
6
7
86.7
3.9 3.9
2.1
1.1
2.9 3.3
5.5
3.9
1.8
6.0
2.6
6.2
1.1 1.8
3.1
4.6
3.3
2.3
4.2 4.6
5.4
8.0
4.1
2.8
Reac
tion
KWS
to h
ippo
repo
rts (
%) Reports
attended
Notattended
Unclear
0
5
10
15
20
25
30
1998 1999 2000 2001 2002 2003 2004 2005 2006 2007 2008 2009 2010
No.
of r
epor
ts in
pro
ject
are
a
Reportsinprojectarea
Hipporeportsinprojectarea
Figure 6.11 – Hippo reports in the project area (N=219) Source: composed by author, based on KWS Occurrence Books.
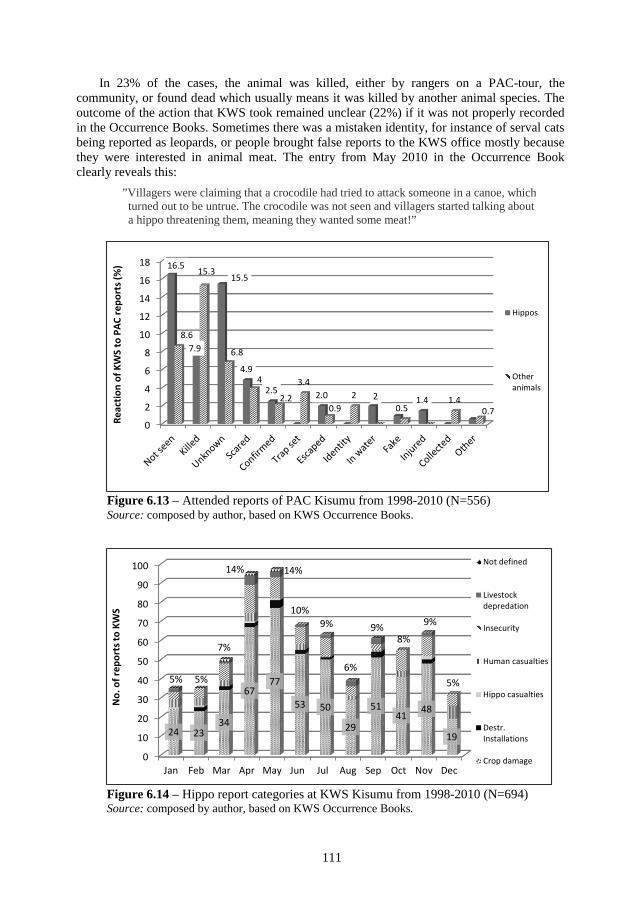
111
In 23% of the cases, the animal was killed, either by rangers on a PAC-tour, the community, or found dead which usually means it was killed by another animal species. The outcome of the action that KWS took remained unclear (22%) if it was not properly recorded in the Occurrence Books. Sometimes there was a mistaken identity, for instance of serval cats being reported as leopards, or people brought false reports to the KWS office mostly because they were interested in animal meat. The entry from May 2010 in the Occurrence Book clearly reveals this:
”Villagers were claiming that a crocodile had tried to attack someone in a canoe, which turned out to be untrue. The crocodile was not seen and villagers started talking about
a hippo threatening them, meaning they wanted some meat!”
Figure 6.14 – Hippo report categories at KWS Kisumu from 1998-2010 (N=694) Source: composed by author, based on KWS Occurrence Books.
0
2
4
6
8
10
12
14
16
18 16.5
7.9
15.5
4.9
2.5 2.0 2 1.4
8.6
15.3
6.8
4
2.2
3.4
0.9 2
0.5 1.4
0.7
Reac
tion
of K
WS
to P
AC re
port
s (%
)
Hippos
Otheranimals
0
10
20
30
40
50
60
70
80
90
100
Jan Feb Mar Apr May Jun Jul Aug Sep Oct Nov Dec
24 23 34
67 77
53 50
29
51 41 48
19
5% 5%
7%
14% 14%
10% 9%
6%
9% 8%
9%
5%
No.
of r
epor
ts to
KW
S
Not defined
Livestockdepredation
Insecurity
Human casualties
Hippo casualties
Destr.Installations
Crop damage
Figure 6.13 – Attended reports of PAC Kisumu from 1998-2010 (N=556) Source: composed by author, based on KWS Occurrence Books.
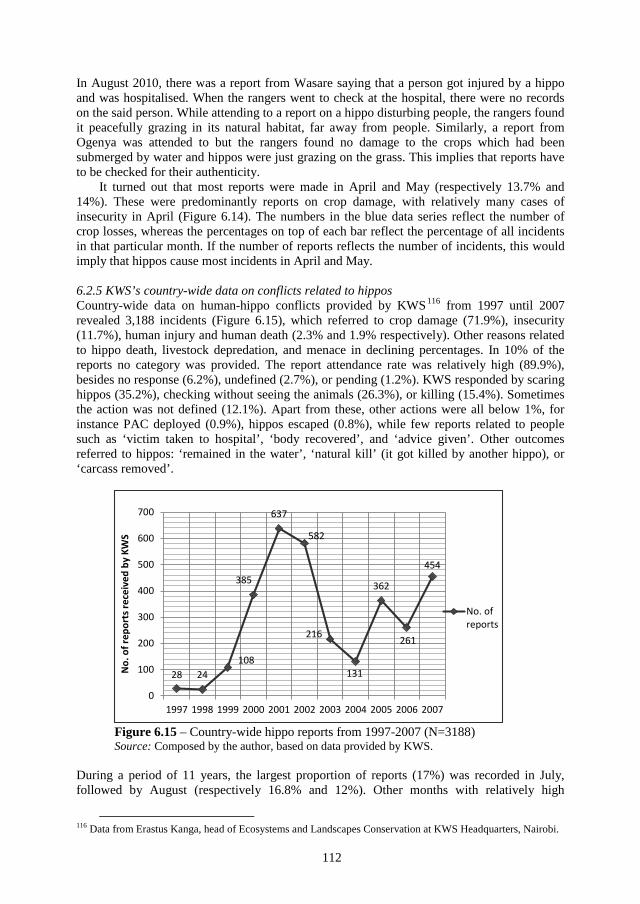
112
In August 2010, there was a report from Wasare saying that a person got injured by a hippo and was hospitalised. When the rangers went to check at the hospital, there were no records on the said person. While attending to a report on a hippo disturbing people, the rangers found it peacefully grazing in its natural habitat, far away from people. Similarly, a report from Ogenya was attended to but the rangers found no damage to the crops which had been submerged by water and hippos were just grazing on the grass. This implies that reports have to be checked for their authenticity.
It turned out that most reports were made in April and May (respectively 13.7% and 14%). These were predominantly reports on crop damage, with relatively many cases of insecurity in April (Figure 6.14). The numbers in the blue data series reflect the number of crop losses, whereas the percentages on top of each bar reflect the percentage of all incidents in that particular month. If the number of reports reflects the number of incidents, this would imply that hippos cause most incidents in April and May.
6.2.5 KWS’s country-wide data on conflicts related to hippos Country-wide data on human-hippo conflicts provided by KWS116 from 1997 until 2007 revealed 3,188 incidents (Figure 6.15), which referred to crop damage (71.9%), insecurity (11.7%), human injury and human death (2.3% and 1.9% respectively). Other reasons related to hippo death, livestock depredation, and menace in declining percentages. In 10% of the reports no category was provided. The report attendance rate was relatively high (89.9%), besides no response (6.2%), undefined (2.7%), or pending (1.2%). KWS responded by scaring hippos (35.2%), checking without seeing the animals (26.3%), or killing (15.4%). Sometimes the action was not defined (12.1%). Apart from these, other actions were all below 1%, for instance PAC deployed (0.9%), hippos escaped (0.8%), while few reports related to people such as ‘victim taken to hospital’, ‘body recovered’, and ‘advice given’. Other outcomes referred to hippos: ‘remained in the water’, ‘natural kill’ (it got killed by another hippo), or ‘carcass removed’.
Figure 6.15 – Country-wide hippo reports from 1997-2007 (N=3188) Source: Composed by the author, based on data provided by KWS.
During a period of 11 years, the largest proportion of reports (17%) was recorded in July, followed by August (respectively 16.8% and 12%). Other months with relatively high
116 Data from Erastus Kanga, head of Ecosystems and Landscapes Conservation at KWS Headquarters, Nairobi.
28 24 108
385
637
582
216
131
362
261
454
0
100
200
300
400
500
600
700
1997 1998 1999 2000 2001 2002 2003 2004 2005 2006 2007
No.
of r
epor
ts re
ceiv
ed b
y KW
S
No. ofreports
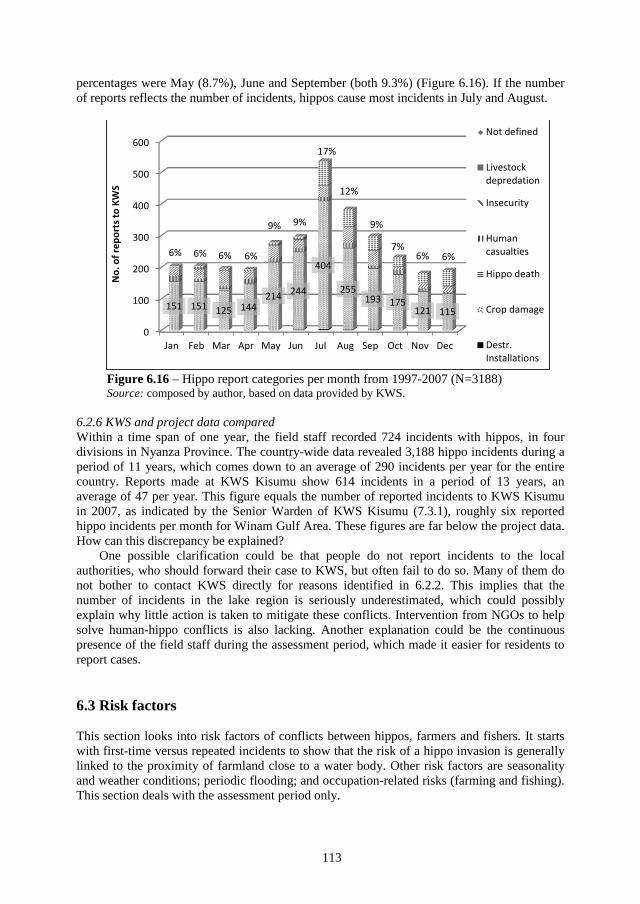
113
percentages were May (8.7%), June and September (both 9.3%) (Figure 6.16). If the number of reports reflects the number of incidents, hippos cause most incidents in July and August.
Figure 6.16 – Hippo report categories per month from 1997-2007 (N=3188) Source: composed by author, based on data provided by KWS.
6.2.6 KWS and project data compared Within a time span of one year, the field staff recorded 724 incidents with hippos, in four divisions in Nyanza Province. The country-wide data revealed 3,188 hippo incidents during a period of 11 years, which comes down to an average of 290 incidents per year for the entire country. Reports made at KWS Kisumu show 614 incidents in a period of 13 years, an average of 47 per year. This figure equals the number of reported incidents to KWS Kisumu in 2007, as indicated by the Senior Warden of KWS Kisumu (7.3.1), roughly six reported hippo incidents per month for Winam Gulf Area. These figures are far below the project data. How can this discrepancy be explained?
One possible clarification could be that people do not report incidents to the local authorities, who should forward their case to KWS, but often fail to do so. Many of them do not bother to contact KWS directly for reasons identified in 6.2.2. This implies that the number of incidents in the lake region is seriously underestimated, which could possibly explain why little action is taken to mitigate these conflicts. Intervention from NGOs to help solve human-hippo conflicts is also lacking. Another explanation could be the continuous presence of the field staff during the assessment period, which made it easier for residents to report cases.
6.3 Risk factors
This section looks into risk factors of conflicts between hippos, farmers and fishers. It starts with first-time versus repeated incidents to show that the risk of a hippo invasion is generally linked to the proximity of farmland close to a water body. Other risk factors are seasonality and weather conditions; periodic flooding; and occupation-related risks (farming and fishing). This section deals with the assessment period only.
0
100
200
300
400
500
600
Jan Feb Mar Apr May Jun Jul Aug Sep Oct Nov Dec
151 151 125 144 214 244
404
255 193 175
121 115
6% 6% 6% 6%
9% 9%
17%
12%
9%
7% 6% 6%
No.
of r
epor
ts to
KW
S Not defined
Livestockdepredation
Insecurity
Humancasualties
Hippo death
Crop damage
Destr.Installations
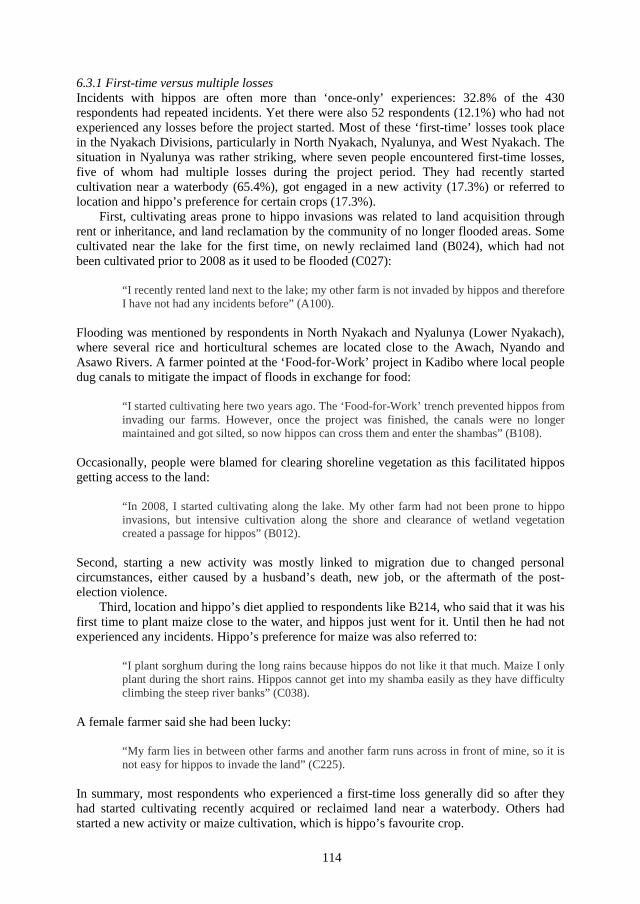
114
6.3.1 First-time versus multiple losses Incidents with hippos are often more than ‘once-only’ experiences: 32.8% of the 430 respondents had repeated incidents. Yet there were also 52 respondents (12.1%) who had not experienced any losses before the project started. Most of these ‘first-time’ losses took place in the Nyakach Divisions, particularly in North Nyakach, Nyalunya, and West Nyakach. The situation in Nyalunya was rather striking, where seven people encountered first-time losses, five of whom had multiple losses during the project period. They had recently started cultivation near a waterbody (65.4%), got engaged in a new activity (17.3%) or referred to location and hippo’s preference for certain crops (17.3%).
First, cultivating areas prone to hippo invasions was related to land acquisition through rent or inheritance, and land reclamation by the community of no longer flooded areas. Some cultivated near the lake for the first time, on newly reclaimed land (B024), which had not been cultivated prior to 2008 as it used to be flooded (C027):
“I recently rented land next to the lake; my other farm is not invaded by hippos and therefore I have not had any incidents before” (A100).
Flooding was mentioned by respondents in North Nyakach and Nyalunya (Lower Nyakach), where several rice and horticultural schemes are located close to the Awach, Nyando and Asawo Rivers. A farmer pointed at the ‘Food-for-Work’ project in Kadibo where local people dug canals to mitigate the impact of floods in exchange for food:
“I started cultivating here two years ago. The ‘Food-for-Work’ trench prevented hippos from invading our farms. However, once the project was finished, the canals were no longer maintained and got silted, so now hippos can cross them and enter the shambas” (B108).
Occasionally, people were blamed for clearing shoreline vegetation as this facilitated hippos getting access to the land:
“In 2008, I started cultivating along the lake. My other farm had not been prone to hippo invasions, but intensive cultivation along the shore and clearance of wetland vegetation created a passage for hippos” (B012).
Second, starting a new activity was mostly linked to migration due to changed personal circumstances, either caused by a husband’s death, new job, or the aftermath of the post-election violence.
Third, location and hippo’s diet applied to respondents like B214, who said that it was his first time to plant maize close to the water, and hippos just went for it. Until then he had not experienced any incidents. Hippo’s preference for maize was also referred to:
“I plant sorghum during the long rains because hippos do not like it that much. Maize I only plant during the short rains. Hippos cannot get into my shamba easily as they have difficulty climbing the steep river banks” (C038).
A female farmer said she had been lucky:
“My farm lies in between other farms and another farm runs across in front of mine, so it is not easy for hippos to invade the land” (C225).
In summary, most respondents who experienced a first-time loss generally did so after they had started cultivating recently acquired or reclaimed land near a waterbody. Others had started a new activity or maize cultivation, which is hippo’s favourite crop.
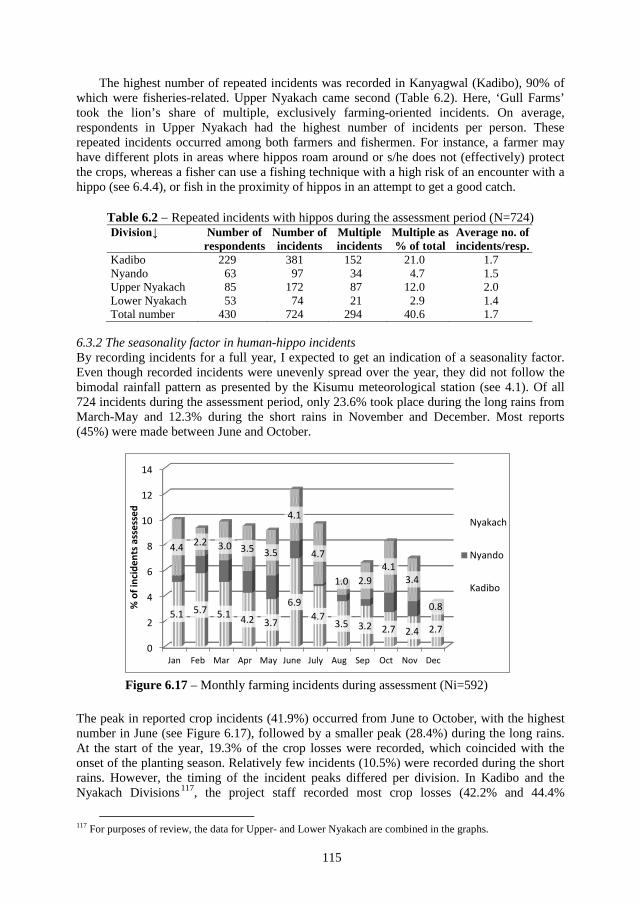
115
The highest number of repeated incidents was recorded in Kanyagwal (Kadibo), 90% of which were fisheries-related. Upper Nyakach came second (Table 6.2). Here, ‘Gull Farms’ took the lion’s share of multiple, exclusively farming-oriented incidents. On average, respondents in Upper Nyakach had the highest number of incidents per person. These repeated incidents occurred among both farmers and fishermen. For instance, a farmer may have different plots in areas where hippos roam around or s/he does not (effectively) protect the crops, whereas a fisher can use a fishing technique with a high risk of an encounter with a hippo (see 6.4.4), or fish in the proximity of hippos in an attempt to get a good catch.
Table 6.2 − Repeated incidents with hippos during the assessment period (N=724) Division↓ Number of
respondents Number of incidents
Multiple incidents
Multiple as % of total
Average no. of incidents/resp.
Kadibo 229 381 152 21.0 1.7 Nyando 63 97 34 4.7 1.5 Upper Nyakach 85 172 87 12.0 2.0 Lower Nyakach 53 74 21 2.9 1.4 Total number 430 724 294 40.6 1.7
6.3.2 The seasonality factor in human-hippo incidents By recording incidents for a full year, I expected to get an indication of a seasonality factor. Even though recorded incidents were unevenly spread over the year, they did not follow the bimodal rainfall pattern as presented by the Kisumu meteorological station (see 4.1). Of all 724 incidents during the assessment period, only 23.6% took place during the long rains from March-May and 12.3% during the short rains in November and December. Most reports (45%) were made between June and October.
The peak in reported crop incidents (41.9%) occurred from June to October, with the highest number in June (see Figure 6.17), followed by a smaller peak (28.4%) during the long rains. At the start of the year, 19.3% of the crop losses were recorded, which coincided with the onset of the planting season. Relatively few incidents (10.5%) were recorded during the short rains. However, the timing of the incident peaks differed per division. In Kadibo and the Nyakach Divisions117, the project staff recorded most crop losses (42.2% and 44.4%
117 For purposes of review, the data for Upper- and Lower Nyakach are combined in the graphs.
0
2
4
6
8
10
12
14
Jan Feb Mar Apr May June July Aug Sep Oct Nov Dec
5.1 5.7 5.1 4.2 3.7
6.9 4.7
3.5 3.2 2.7 2.4 2.7
4.4 2.2 3.0 3.5 3.5
4.1
4.7
1.0 2.9 4.1
3.4
0.8 % o
f inc
iden
ts a
sses
sed
Nyakach
Nyando
Kadibo
Figure 6.17 – Monthly farming incidents during assessment (Ni=592)
116
respectively) during June-October. The fluctuation in the timing of hippo-induced incidents is probably related to the different farming stages and crop types grown. In Nyando, the incident peak was recorded during the long rains (over 40%), with incidents in Wawidhi Location exclusively in March-October. Most likely, this can be attributed to River Nyando which runs through the area. During the rainy season, rising water levels enable hippos to extend their range and travel upstream in search for food, thereby invading people’s farms. As soon as the water level recedes, hippos venture downstream and the number of incidents reduces.
Fisheries-related incidents peaked in August (Figure 6.18); with 58.1% of the reports recorded during June-October. This is probably due to the changed attitude of the BMU officials, who started recording fisheries incidents in the Occurrence Books they were given after the Forum Meeting of late July 2008 (see Section 3.3). This initially resulted in a sharp increase in the number of reports and gradually stabilised. However, the opening of the fishing season118 may also have contributed to the rise, which influenced overall fisheries records, as it was unlikely that previous net destructions were so few.
Figure 6.18 – Monthly fisheries incidents during assessment (Ni=124)
In the focus group discussions, destruction caused by hippos was said to be a year-round issue. Only in Kakola (Nyando), major destruction occurred during the long rains. Most groups said that hippo incidents happened everywhere; three of them gave names of sites where they commonly occur, for instance between Riat and Nduru Beach (in Kadibo, Kawino South), along River Sondu-Miriu (West Nyakach), and in Kuoyo area (in Nyalunya).
Pre-assessment incidents During the pre-assessment period (see 6.1.1), crop losses peaked slightly during June-October (31.3%) as compared to the proportion during the long rains (30.1%) (Figure 6.19). Other seasons had equal scores. The peak in crop incidents was during the dry season (June-October) for both Kadibo (19.6%) and Lower Nyakach (4.9%). In Kadibo, there was another high during the long rains from March-May (18.6%), but in Lower Nyakach only two incidents (0.6%) were recorded in during this period. In Nyando, most crop cases (6.7%) happened during the long rains. In Upper Nyakach, the highest number of crop incidents
118 Each year, the Ministry of Fisheries Development announces the closed fishing season, which is not fixed and can vary per area. During the project period, it lasted from April up to July. The ban does not apply to all techniques: some traditional fishing methods are still allowed (info from Fisheries Assessment Lists, HMP 2009).
0.0
5.0
10.0
15.0
20.0
25.0
30.0
35.0
Jan Feb Mar Apr May June July Aug Sep Oct Nov Dec
11.3
4.0 0.8 1.6
25.0
8.9 3.2 4.8 7.3
0.8 1.6
4.8
4.0 2.4
0.8
2.4
0.8
8.1
% o
f inc
iden
ts a
sses
sed
Nyakach
Nyando
Kadibo
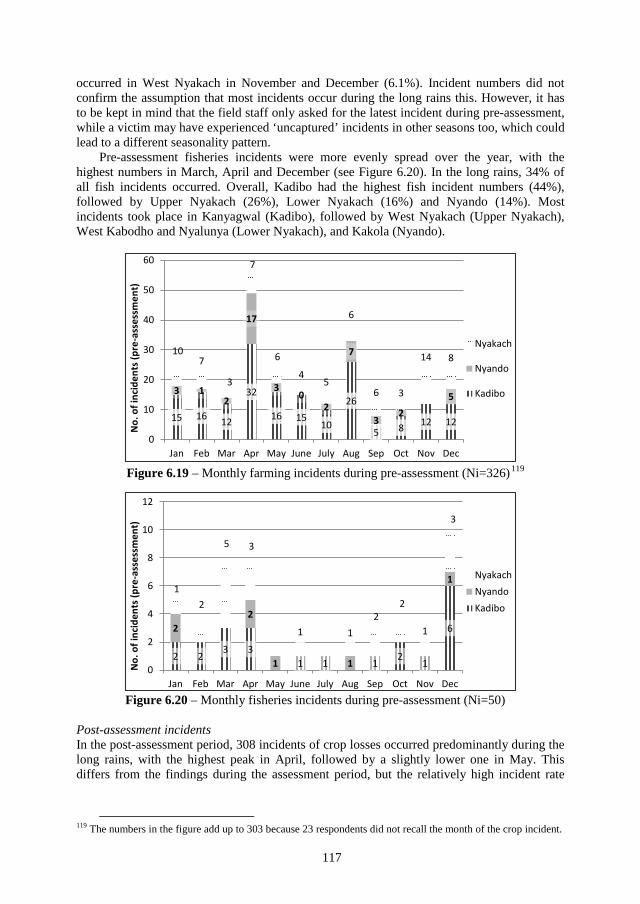
117
occurred in West Nyakach in November and December (6.1%). Incident numbers did not confirm the assumption that most incidents occur during the long rains this. However, it has to be kept in mind that the field staff only asked for the latest incident during pre-assessment, while a victim may have experienced ‘uncaptured’ incidents in other seasons too, which could lead to a different seasonality pattern.
Pre-assessment fisheries incidents were more evenly spread over the year, with the highest numbers in March, April and December (see Figure 6.20). In the long rains, 34% of all fish incidents occurred. Overall, Kadibo had the highest fish incident numbers (44%), followed by Upper Nyakach (26%), Lower Nyakach (16%) and Nyando (14%). Most incidents took place in Kanyagwal (Kadibo), followed by West Nyakach (Upper Nyakach), West Kabodho and Nyalunya (Lower Nyakach), and Kakola (Nyando).
Figure 6.19 – Monthly farming incidents during pre-assessment (Ni=326)119
Figure 6.20 – Monthly fisheries incidents during pre-assessment (Ni=50)
Post-assessment incidents In the post-assessment period, 308 incidents of crop losses occurred predominantly during the long rains, with the highest peak in April, followed by a slightly lower one in May. This differs from the findings during the assessment period, but the relatively high incident rate
119 The numbers in the figure add up to 303 because 23 respondents did not recall the month of the crop incident.
15 16 12
32
16 15 10
26
5 8 12 12
3 1 2
17
3 0
2
7
3 2
5
10 7
3
7
6
4 5
6
6 3
14 8
0
10
20
30
40
50
60
Jan Feb Mar Apr May June July Aug Sep Oct Nov Dec
No.
of i
ncid
ents
(pre
-ass
essm
ent)
Nyakach
Nyando
Kadibo
2 2 3 3
1 1 1 2
1
6 2 2
1 1
1 1
2
5 3
1 1 2
2
1
3
0
2
4
6
8
10
12
Jan Feb Mar Apr May June July Aug Sep Oct Nov Dec
No.
of i
ncid
ents
(pre
-ass
essm
ent)
NyakachNyandoKadibo
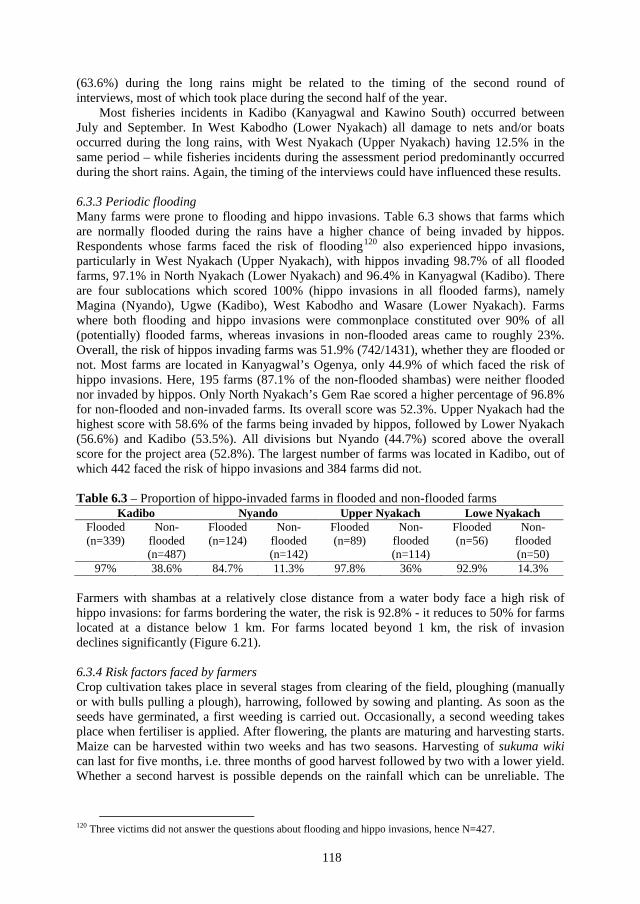
118
(63.6%) during the long rains might be related to the timing of the second round of interviews, most of which took place during the second half of the year.
Most fisheries incidents in Kadibo (Kanyagwal and Kawino South) occurred between July and September. In West Kabodho (Lower Nyakach) all damage to nets and/or boats occurred during the long rains, with West Nyakach (Upper Nyakach) having 12.5% in the same period – while fisheries incidents during the assessment period predominantly occurred during the short rains. Again, the timing of the interviews could have influenced these results.
6.3.3 Periodic flooding Many farms were prone to flooding and hippo invasions. Table 6.3 shows that farms which are normally flooded during the rains have a higher chance of being invaded by hippos. Respondents whose farms faced the risk of flooding120 also experienced hippo invasions, particularly in West Nyakach (Upper Nyakach), with hippos invading 98.7% of all flooded farms, 97.1% in North Nyakach (Lower Nyakach) and 96.4% in Kanyagwal (Kadibo). There are four sublocations which scored 100% (hippo invasions in all flooded farms), namely Magina (Nyando), Ugwe (Kadibo), West Kabodho and Wasare (Lower Nyakach). Farms where both flooding and hippo invasions were commonplace constituted over 90% of all (potentially) flooded farms, whereas invasions in non-flooded areas came to roughly 23%. Overall, the risk of hippos invading farms was 51.9% (742/1431), whether they are flooded or not. Most farms are located in Kanyagwal’s Ogenya, only 44.9% of which faced the risk of hippo invasions. Here, 195 farms (87.1% of the non-flooded shambas) were neither flooded nor invaded by hippos. Only North Nyakach’s Gem Rae scored a higher percentage of 96.8% for non-flooded and non-invaded farms. Its overall score was 52.3%. Upper Nyakach had the highest score with 58.6% of the farms being invaded by hippos, followed by Lower Nyakach (56.6%) and Kadibo (53.5%). All divisions but Nyando (44.7%) scored above the overall score for the project area (52.8%). The largest number of farms was located in Kadibo, out of which 442 faced the risk of hippo invasions and 384 farms did not.
Table 6.3 – Proportion of hippo-invaded farms in flooded and non-flooded farms Kadibo Nyando Upper Nyakach Lowe Nyakach
Flooded (n=339)
Non-flooded (n=487)
Flooded (n=124)
Non-flooded (n=142)
Flooded (n=89)
Non-flooded (n=114)
Flooded (n=56)
Non-flooded (n=50)
97% 38.6% 84.7% 11.3% 97.8% 36% 92.9% 14.3%
Farmers with shambas at a relatively close distance from a water body face a high risk of hippo invasions: for farms bordering the water, the risk is 92.8% - it reduces to 50% for farms located at a distance below 1 km. For farms located beyond 1 km, the risk of invasion declines significantly (Figure 6.21).
6.3.4 Risk factors faced by farmers Crop cultivation takes place in several stages from clearing of the field, ploughing (manually or with bulls pulling a plough), harrowing, followed by sowing and planting. As soon as the seeds have germinated, a first weeding is carried out. Occasionally, a second weeding takes place when fertiliser is applied. After flowering, the plants are maturing and harvesting starts. Maize can be harvested within two weeks and has two seasons. Harvesting of sukuma wiki can last for five months, i.e. three months of good harvest followed by two with a lower yield. Whether a second harvest is possible depends on the rainfall which can be unreliable. The
120 Three victims did not answer the questions about flooding and hippo invasions, hence N=427.
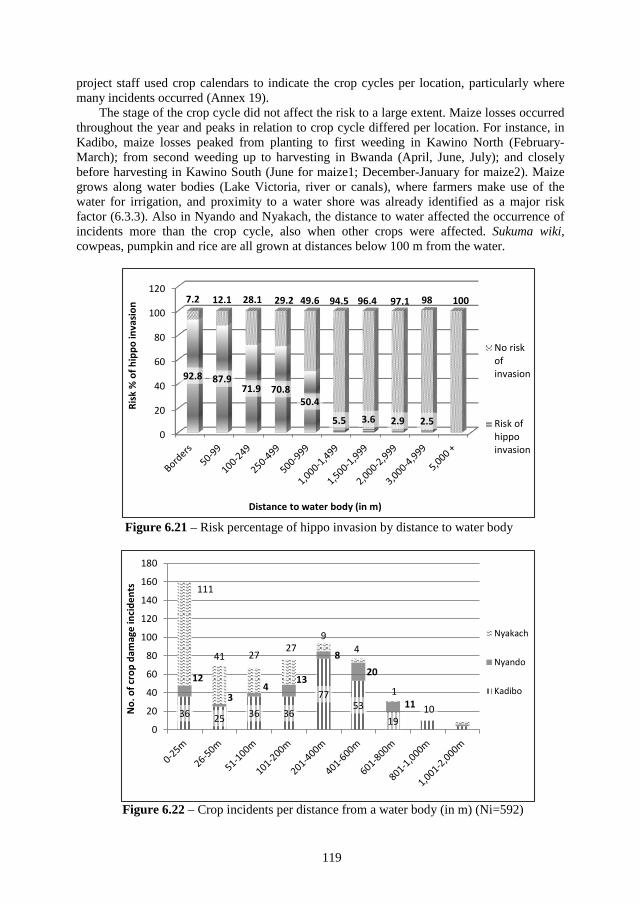
119
project staff used crop calendars to indicate the crop cycles per location, particularly where many incidents occurred (Annex 19).
The stage of the crop cycle did not affect the risk to a large extent. Maize losses occurred throughout the year and peaks in relation to crop cycle differed per location. For instance, in Kadibo, maize losses peaked from planting to first weeding in Kawino North (February-March); from second weeding up to harvesting in Bwanda (April, June, July); and closely before harvesting in Kawino South (June for maize1; December-January for maize2). Maize grows along water bodies (Lake Victoria, river or canals), where farmers make use of the water for irrigation, and proximity to a water shore was already identified as a major risk factor (6.3.3). Also in Nyando and Nyakach, the distance to water affected the occurrence of incidents more than the crop cycle, also when other crops were affected. Sukuma wiki, cowpeas, pumpkin and rice are all grown at distances below 100 m from the water.
Figure 6.21 – Risk percentage of hippo invasion by distance to water body
Figure 6.22 – Crop incidents per distance from a water body (in m) (Ni=592)
0
20
40
60
80
100
120
92.8 87.9 71.9 70.8
50.4
5.5 3.6 2.9 2.5
7.2 12.1 28.1 29.2 49.6 94.5 96.4 97.1 98 100
Risk
% o
f hip
po in
vasi
on
Distance to water body (in m)
No riskofinvasion
Risk ofhippoinvasion
36 25 36 36
77 53
19 10
12
3 4
13
8 20
11
111
41 27 27
9 4
1
0
20
40
60
80
100
120
140
160
180
No.
of c
rop
dam
age
inci
dent
s
Nyakach
Nyando
Kadibo
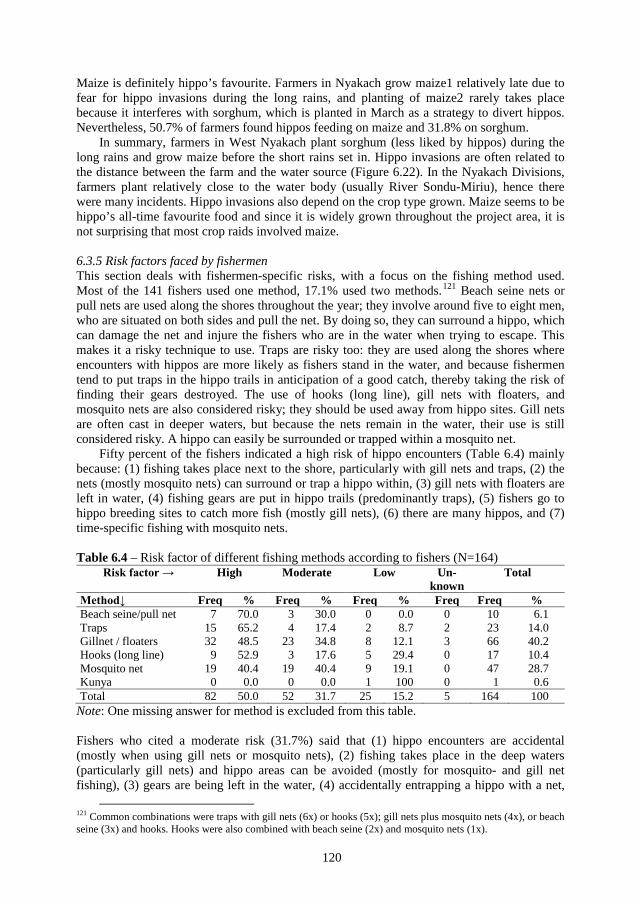
120
Maize is definitely hippo’s favourite. Farmers in Nyakach grow maize1 relatively late due to fear for hippo invasions during the long rains, and planting of maize2 rarely takes place because it interferes with sorghum, which is planted in March as a strategy to divert hippos. Nevertheless, 50.7% of farmers found hippos feeding on maize and 31.8% on sorghum.
In summary, farmers in West Nyakach plant sorghum (less liked by hippos) during the long rains and grow maize before the short rains set in. Hippo invasions are often related to the distance between the farm and the water source (Figure 6.22). In the Nyakach Divisions, farmers plant relatively close to the water body (usually River Sondu-Miriu), hence there were many incidents. Hippo invasions also depend on the crop type grown. Maize seems to be hippo’s all-time favourite food and since it is widely grown throughout the project area, it is not surprising that most crop raids involved maize.
6.3.5 Risk factors faced by fishermen This section deals with fishermen-specific risks, with a focus on the fishing method used. Most of the 141 fishers used one method, 17.1% used two methods.121 Beach seine nets or pull nets are used along the shores throughout the year; they involve around five to eight men, who are situated on both sides and pull the net. By doing so, they can surround a hippo, which can damage the net and injure the fishers who are in the water when trying to escape. This makes it a risky technique to use. Traps are risky too: they are used along the shores where encounters with hippos are more likely as fishers stand in the water, and because fishermen tend to put traps in the hippo trails in anticipation of a good catch, thereby taking the risk of finding their gears destroyed. The use of hooks (long line), gill nets with floaters, and mosquito nets are also considered risky; they should be used away from hippo sites. Gill nets are often cast in deeper waters, but because the nets remain in the water, their use is still considered risky. A hippo can easily be surrounded or trapped within a mosquito net.
Fifty percent of the fishers indicated a high risk of hippo encounters (Table 6.4) mainly because: (1) fishing takes place next to the shore, particularly with gill nets and traps, (2) the nets (mostly mosquito nets) can surround or trap a hippo within, (3) gill nets with floaters are left in water, (4) fishing gears are put in hippo trails (predominantly traps), (5) fishers go to hippo breeding sites to catch more fish (mostly gill nets), (6) there are many hippos, and (7) time-specific fishing with mosquito nets.
Table 6.4 – Risk factor of different fishing methods according to fishers (N=164) Risk factor → High Moderate Low Un-
known Total
Method↓ Freq % Freq % Freq % Freq Freq % Beach seine/pull net 7 70.0 3 30.0 0 0.0 0 10 6.1 Traps 15 65.2 4 17.4 2 8.7 2 23 14.0 Gillnet / floaters 32 48.5 23 34.8 8 12.1 3 66 40.2 Hooks (long line) 9 52.9 3 17.6 5 29.4 0 17 10.4 Mosquito net 19 40.4 19 40.4 9 19.1 0 47 28.7 Kunya 0 0.0 0 0.0 1 100 0 1 0.6 Total 82 50.0 52 31.7 25 15.2 5 164 100
Note: One missing answer for method is excluded from this table.
Fishers who cited a moderate risk (31.7%) said that (1) hippo encounters are accidental (mostly when using gill nets or mosquito nets), (2) fishing takes place in the deep waters (particularly gill nets) and hippo areas can be avoided (mostly for mosquito- and gill net fishing), (3) gears are being left in the water, (4) accidentally entrapping a hippo with a net,
121 Common combinations were traps with gill nets (6x) or hooks (5x); gill nets plus mosquito nets (4x), or beach seine (3x) and hooks. Hooks were also combined with beach seine (2x) and mosquito nets (1x).
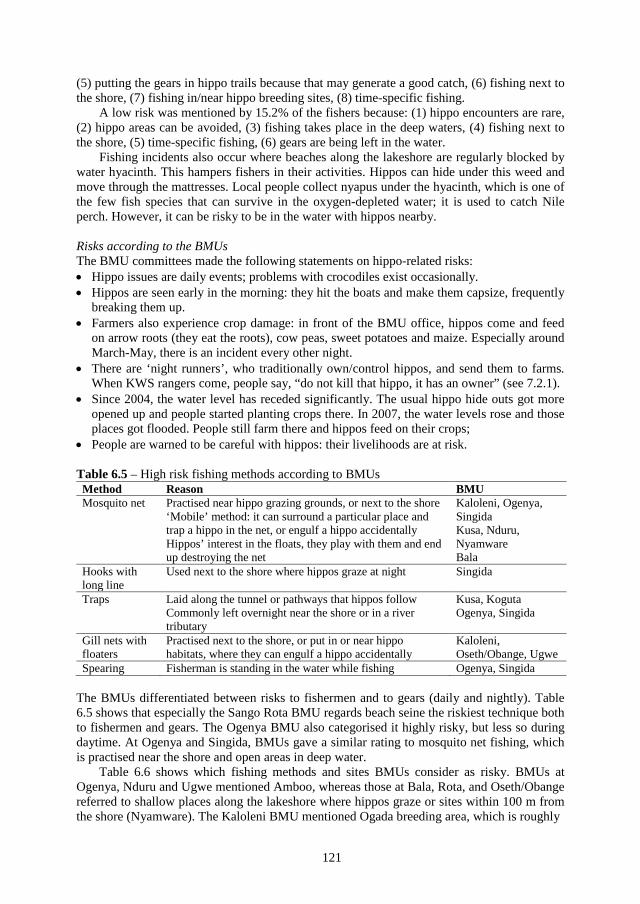
121
(5) putting the gears in hippo trails because that may generate a good catch, (6) fishing next tothe shore, (7) fishing in/near hippo breeding sites, (8) time-specific fishing.
A low risk was mentioned by 15.2% of the fishers because: (1) hippo encounters are rare, (2) hippo areas can be avoided, (3) fishing takes place in the deep waters, (4) fishing next tothe shore, (5) time-specific fishing, (6) gears are being left in the water.
Fishing incidents also occur where beaches along the lakeshore are regularly blocked by water hyacinth. This hampers fishers in their activities. Hippos can hide under this weed and move through the mattresses. Local people collect nyapus under the hyacinth, which is one of the few fish species that can survive in the oxygen-depleted water; it is used to catch Nile perch. However, it can be risky to be in the water with hippos nearby.
Risks according to the BMUs The BMU committees made the following statements on hippo-related risks: • Hippo issues are daily events; problems with crocodiles exist occasionally.• Hippos are seen early in the morning: they hit the boats and make them capsize, frequently
breaking them up.• Farmers also experience crop damage: in front of the BMU office, hippos come and feed
on arrow roots (they eat the roots), cow peas, sweet potatoes and maize. Especially aroundMarch-May, there is an incident every other night.
• There are ‘night runners’, who traditionally own/control hippos, and send them to farms.When KWS rangers come, people say, “do not kill that hippo, it has an owner” (see 7.2.1).
• Since 2004, the water level has receded significantly. The usual hippo hide outs got moreopened up and people started planting crops there. In 2007, the water levels rose and thoseplaces got flooded. People still farm there and hippos feed on their crops;
• People are warned to be careful with hippos: their livelihoods are at risk.
Table 6.5 – High risk fishing methods according to BMUs Method Reason BMU Mosquito net Practised near hippo grazing grounds, or next to the shore
‘Mobile’ method: it can surround a particular place and trap a hippo in the net, or engulf a hippo accidentally Hippos’ interest in the floats, they play with them and end up destroying the net
Kaloleni, Ogenya, Singida Kusa, Nduru, Nyamware Bala
Hooks with long line
Used next to the shore where hippos graze at night Singida
Traps Laid along the tunnel or pathways that hippos follow Commonly left overnight near the shore or in a river tributary
Kusa, Koguta Ogenya, Singida
Gill nets with floaters
Practised next to the shore, or put in or near hippo habitats, where they can engulf a hippo accidentally
Kaloleni, Oseth/Obange, Ugwe
Spearing Fisherman is standing in the water while fishing Ogenya, Singida
The BMUs differentiated between risks to fishermen and to gears (daily and nightly). Table 6.5 shows that especially the Sango Rota BMU regards beach seine the riskiest technique both to fishermen and gears. The Ogenya BMU also categorised it highly risky, but less so during daytime. At Ogenya and Singida, BMUs gave a similar rating to mosquito net fishing, which is practised near the shore and open areas in deep water.
Table 6.6 shows which fishing methods and sites BMUs consider as risky. BMUs at Ogenya, Nduru and Ugwe mentioned Amboo, whereas those at Bala, Rota, and Oseth/Obange referred to shallow places along the lakeshore where hippos graze or sites within 100 m from the shore (Nyamware). The Kaloleni BMU mentioned Ogada breeding area, which is roughly
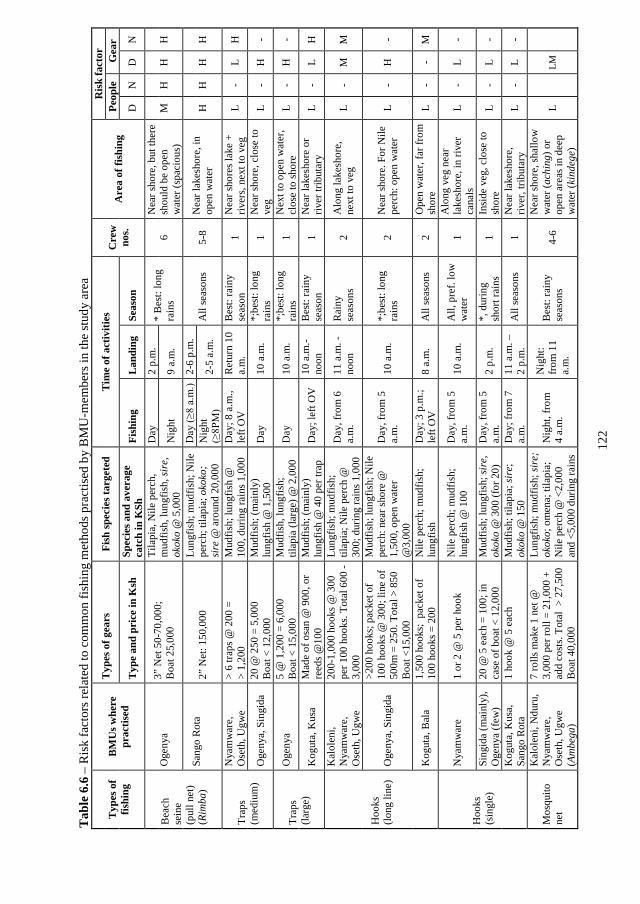
122
Tab
le 6
.6 –
Ris
k fa
ctor
s rel
ated
to c
omm
on fi
shin
g m
etho
ds p
ract
ised
by
BM
U-m
embe
rs in
the
stud
y ar
ea
Type
s of
fishi
ng
BMU
s whe
re
prac
tised
Type
s of g
ears
Fi
sh sp
ecie
s tar
gete
d Ti
me
of a
ctiv
ities
C
rew
no
s. A
rea
of fi
shin
g
Ris
k fa
ctor
Pe
ople
G
ear
Type
and
pri
ce in
Ksh
Sp
ecie
s and
ave
rage
ca
tch
in K
Sh
Fish
ing
Land
ing
Seas
on
D
N
D
N
Bea
ch
sein
e (p
ull n
et)
(Rim
ba)
Oge
nya
3” N
et 5
0-70
,000
; B
oat 2
5,00
0
Tila
pia,
Nile
per
ch,
mud
fish,
lung
fish,
sire
, ok
oko
@ 5
,000
Day
2
p.m
. *
Bes
t: lo
ngra
ins
6 N
ear s
hore
, but
ther
e sh
ould
be
open
w
ater
(spa
ciou
s)
M
H
H
H
Nig
ht
9 a.
m.
Sang
o R
ota
2” N
et: 1
50,0
00
Lung
fish;
mud
fish;
Nile
pe
rch;
tila
pia;
oko
ko;
sire
@ a
roun
d 20
,000
Day
(≥8
a.m
.) 2-
6 p.
m.
All
seas
ons
5-8
Nea
r lak
esho
re, i
n op
en w
ater
H
H
H
H
N
ight
(≥
8PM
) 2-
5 a.
m.
Trap
s (m
ediu
m)
Nya
mw
are,
O
seth
, Ugw
e >
6 tra
ps @
200
=>
1,20
0M
udfis
h; lu
ngfis
h @
10
0, d
urin
g ra
ins 1
,000
D
ay; 8
a.m
., le
ft O
V
Ret
urn
10
a.m
.B
est:
rain
y se
ason
1
Nea
r sho
res l
ake
+ riv
ers,
next
to v
eg
L -
L H
Oge
nya,
Sin
gida
20
@ 2
50 =
5,0
00
Boa
t < 1
2,00
0 M
udfis
h; (m
ainl
y)
lung
fish
@ 1
,500
D
ay
10 a
.m.
*;be
st: l
ong
rain
s 1
Nea
r sho
re, c
lose
to
veg
L -
H
-
Trap
s
(larg
e)
Oge
nya
5 @
1,2
00 =
6,0
00
Boa
t < 1
5,00
0 M
udfis
h, lu
ngfis
h;
tilap
ia (l
arge
) @ 2
,000
D
ay
10 a
.m.
*;be
st: l
ong
rain
s 1
Nex
t to
open
wat
er,
clos
e to
shor
e L
- H
-
Kog
uta,
Kus
a M
ade
of o
san
@ 9
00, o
r re
eds @
100
Mud
fish;
(mai
nly)
lu
ngfis
h @
40
per t
rap
Day
; lef
t OV
10
a.m
.-no
on
Bes
t: ra
iny
seas
on
1 N
ear l
akes
hore
or
river
trib
utar
y L
- L
H
Hoo
ks
(long
line
)
Kal
olen
i, N
yam
war
e,
Ose
th, U
gwe
200-
1,00
0 ho
oks @
300
per 1
00 h
ooks
. Tot
al 6
00 -
3,00
0
Lung
fish;
mud
fish;
til
apia
; Nile
per
ch @
30
0; d
urin
g ra
ins 1
,000
Day
, fro
m 6
a.
m.
11 a
.m. -
noon
R
ainy
se
ason
s 2
Alo
ng la
kesh
ore,
ne
xt to
veg
L
- M
M
Oge
nya,
Sin
gida
>200
hoo
ks; p
acke
t of
100
hook
s @ 3
00; l
ine
of50
0m =
250
. Tot
al >
850
Boa
t <15
,000
Mud
fish;
lung
fish;
Nile
pe
rch:
nea
r sho
re @
1,
500,
ope
n w
ater
@
3,00
0
Day
, fro
m 5
a.
m.
10 a
.m.
*;be
st: l
ong
rain
s 2
Nea
r sho
re. F
or N
ile
perc
h: o
pen
wat
er
L -
H
-
Kog
uta,
Bal
a 1,
500
hook
s; p
acke
t of
100
hook
s = 2
00
Nile
per
ch; m
udfis
h;
lung
fish
Day
; 3 p
.m.;
left
OV
8
a.m
. A
ll se
ason
s 2
Ope
n w
ater
, far
from
sh
ore
L -
- M
Hoo
ks
(s
ingl
e)
Nya
mw
are
1 or
2 @
5 p
er h
ook
Nile
per
ch; m
udfis
h;
lung
fish
@ 1
00
Day
, fro
m 5
a.
m.
10 a
.m.
All,
pre
f. lo
w
wat
er
1 A
long
veg
nea
r la
kesh
ore,
in ri
ver
cana
ls
L -
L -
Sing
ida
(mai
nly)
, O
geny
a (f
ew)
20 @
5 e
ach
= 10
0; in
ca
se o
f boa
t < 1
2,00
0 M
udfis
h; lu
ngfis
h; si
re,
okok
o @
300
(for
20)
D
ay, f
rom
5
a.m
.2
p.m
. *,
dur
ing
shor
t rai
ns
1 In
side
veg
, clo
se to
sh
ore
L -
L -
Kog
uta,
Kus
a,
Sang
o R
ota
1 ho
ok @
5 e
ach
Mud
fish;
tila
pia;
sire
; ok
oko
@ 1
50
Day
; fro
m 7
a.
m.
11 a
.m. –
2
p.m
. A
ll se
ason
s 1
Nea
r lak
esho
re,
river
, trib
utar
y L
- L
-
Mos
quito
ne
t
Kal
olen
i, N
duru
, N
yam
war
e,
Ose
th, U
gwe
(Am
bega
)
7 ro
lls m
ake
1 ne
t @
3,00
0 pe
r rol
l = 2
1,00
0 +
add
cost
s. To
tal
> 27
,500
B
oat 4
0,00
0
Lung
fish;
mud
fish;
sire
; ok
oko;
om
ena;
tila
pia;
N
ile p
erch
@ <
2,00
0 an
d <5
,000
dur
ing
rain
s
Nig
ht, f
rom
4
a.m
.
Nig
ht:
from
11
a.m
.
Bes
t: ra
iny
seas
ons
4-6
Nea
r sho
re, s
hallo
w
wat
er (a
chin
g) o
r op
en a
reas
in d
eep
wat
er (k
inde
ge)
L LM
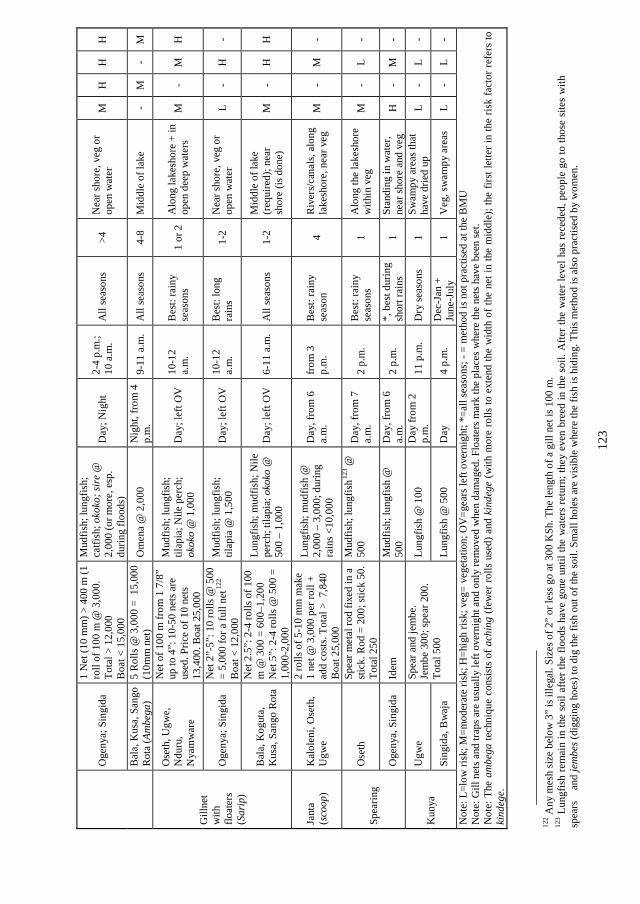
123
Oge
nya;
Sin
gida
1 N
et (1
0 m
m) >
400
m (1
ro
ll of
100
m @
3,0
00.
Tota
l > 1
2,00
0 B
oat <
15,
000
Mud
fish;
lung
fish;
catfi
sh; o
koko
; sire
@
2,00
0 (o
r mor
e, e
sp.
durin
g flo
ods)
Day
; Nig
ht
2-4
p.m
.;10
a.m
. A
ll se
ason
s >4
Nea
r sho
re, v
eg o
r op
en w
ater
M
H
H
H
Bal
a, K
usa,
San
go
Rot
a (A
mbe
ga)
5 R
olls
@ 3
,000
= 1
5,00
0 (1
0mm
net
) O
men
a @
2,0
00
Nig
ht, f
rom
4
p.m
.9-
11 a
.m.
All
seas
ons
4-8
Mid
dle
of la
ke
- M
-
M
Gill
net
with
flo
ater
s
(S
arip
)
Ose
th, U
gwe,
N
duru
, N
yam
war
e
Net
of 1
00 m
from
1 7
/8”
up to
4”:
10-
50 n
ets a
re
used
. Pric
e of
10
nets
13
,400
. Boa
t 25,
000
Mud
fish;
lung
fish;
til
apia
; Nile
per
ch;
okok
o @
1,0
00
Day
; lef
t OV
10
-12
a.m
.B
est:
rain
y se
ason
s 1
or 2
A
long
lake
shor
e +
in
open
dee
p w
ater
s M
-
M
H
Oge
nya;
Sin
gida
N
et 2
”-5”
: 10
rolls
@ 5
00
= 5,
000
for a
full
net12
2 B
oat <
12,
000
Mud
fish;
lung
fish;
til
apia
@ 1
,500
D
ay; l
eft O
V
10-1
2a.
m.
Bes
t: lo
ng
rain
s 1-
2N
ear s
hore
, veg
or
open
wat
er
L -
H
-
Bal
a, K
ogut
a,
Kus
a, S
ango
Rot
a
Net
2.5
”: 2
-4 ro
lls o
f 100
m
@ 3
00 =
600
–1,2
00
Net
5”:
2-4
rolls
@ 5
00 =
1,
000-
2,00
0
Lung
fish;
mud
fish;
Nile
pe
rch;
tila
pia;
oko
ko @
50
0 –
1,00
0 D
ay; l
eft O
V
6-11
a.m
.A
ll se
ason
s 1-
2M
iddl
e of
lake
(r
equi
red)
; nea
r sh
ore
(is d
one)
M
-
H
H
Jant
a (s
coop
) K
alol
eni,
Ose
th,
Ugw
e
2 ro
lls o
f 5-1
0 m
m m
ake
1 ne
t @ 3
,000
per
roll
+ ad
d co
sts.
Tota
l > 7
,840
B
oat 2
5,00
0
Lung
fish;
mud
fish
@
2,00
0 –
3,00
0; d
urin
g ra
ins <
10,0
00
Day
, fro
m 6
a.
m.
from
3
p.m
.B
est:
rain
y se
ason
4
Riv
ers/
cana
ls, a
long
la
kesh
ore,
nea
r veg
M
-
M
-
Spea
ring
Ose
th
Spea
r met
al ro
d fix
ed in
a
stic
k. R
od =
200
; stic
k 50
. To
tal 2
50
Mud
fish;
lung
fish12
3 @
500
Day
, fro
m 7
a.
m.
2 p.
m.
Bes
t: ra
iny
seas
ons
1 A
long
the
lake
shor
e w
ithin
veg
M
-
L -
Oge
nya,
Sin
gida
Id
em
Mud
fish;
lung
fish
@
500
Day
, fro
m 6
a.
m.
2 p.
m.
*, b
est d
urin
g sh
ort r
ains
1
Stan
ding
in w
ater
, ne
ar sh
ore
and
veg
H
- M
-
Kun
ya
Ugw
e Sp
ear a
nd je
mbe
. Je
mbe
300
; spe
ar 2
00.
Tota
l 500
Lung
fish
@ 1
00
Day
from
2
p.m
.11
p.m
. D
ry se
ason
s 1
Swam
py a
reas
that
ha
ve d
ried
up
L -
L -
Sing
ida,
Bw
aja
Lung
fish
@ 5
00
Day
4
p.m
. D
ec-J
an +
Ju
ne-J
uly
1 V
eg, s
wam
py a
reas
L
- L
-
Not
e: L
=low
risk
; M=m
oder
ate
risk;
H=h
igh
risk;
veg
= ve
geta
tion;
OV
=gea
rs le
ft ov
erni
ght;
*=al
l sea
sons
; - =
met
hod
is n
ot p
ract
ised
at t
he B
MU
N
ote:
Gill
net
s and
trap
s are
usu
ally
left
over
nigh
t and
onl
y re
mov
ed w
hen
dam
aged
. Flo
ater
s mar
k th
e pl
aces
whe
re th
e ne
ts h
ave
been
set.
Not
e: T
he a
mbe
ga te
chni
que
cons
ists
of a
chin
g (f
ewer
rolls
use
d) a
nd k
inde
ge (w
ith m
ore
rolls
to e
xten
d th
e w
idth
of t
he n
et in
the
mid
dle)
; the
firs
t let
ter i
n th
e ris
k fa
ctor
refe
rs to
ki
ndeg
e.
122 A
ny m
esh
size
bel
ow 3
” is
ille
gal.
Size
s of 2
” or
less
go
at 3
00 K
Sh. T
he le
ngth
of a
gill
net
is 1
00 m
. 12
3 Lun
gfis
h re
mai
n in
the
soil
afte
r the
floo
ds h
ave
gone
unt
il th
e w
ater
s re
turn
; the
y ev
en b
reed
in th
e so
il. A
fter t
he w
ater
leve
l has
rece
ded,
peo
ple
go to
thos
e si
tes
with
sp
ears
a
nd je
mbe
s (di
ggin
g ho
es) t
o di
g th
e fis
h ou
t of t
he so
il. S
mal
l hol
es a
re v
isib
le w
here
the
fish
is h
idin
g. T
his m
etho
d is
als
o pr
actis
ed b
y w
omen
.
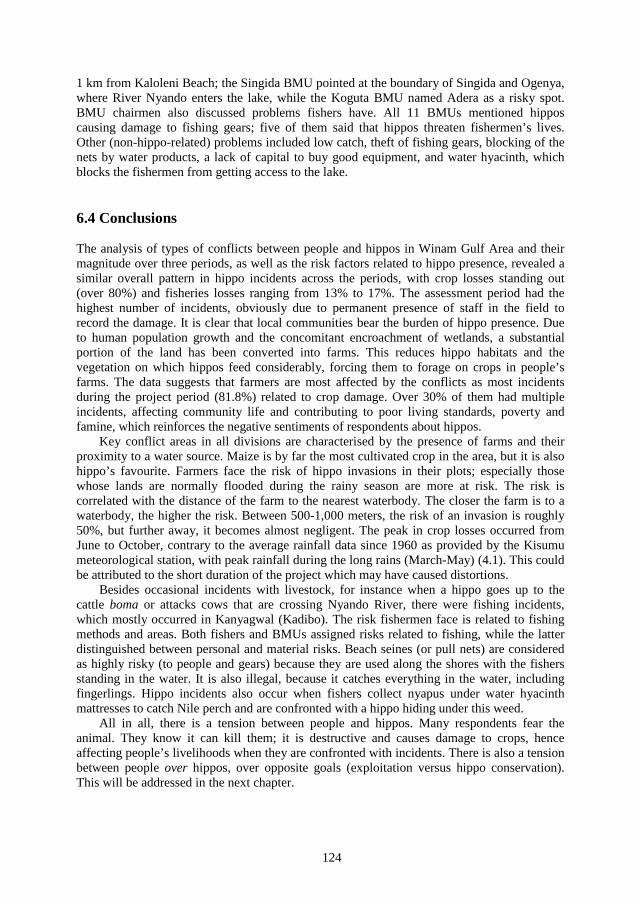
124
1 km from Kaloleni Beach; the Singida BMU pointed at the boundary of Singida and Ogenya, where River Nyando enters the lake, while the Koguta BMU named Adera as a risky spot. BMU chairmen also discussed problems fishers have. All 11 BMUs mentioned hippos causing damage to fishing gears; five of them said that hippos threaten fishermen’s lives. Other (non-hippo-related) problems included low catch, theft of fishing gears, blocking of the nets by water products, a lack of capital to buy good equipment, and water hyacinth, which blocks the fishermen from getting access to the lake.
6.4 Conclusions
The analysis of types of conflicts between people and hippos in Winam Gulf Area and their magnitude over three periods, as well as the risk factors related to hippo presence, revealed a similar overall pattern in hippo incidents across the periods, with crop losses standing out (over 80%) and fisheries losses ranging from 13% to 17%. The assessment period had the highest number of incidents, obviously due to permanent presence of staff in the field to record the damage. It is clear that local communities bear the burden of hippo presence. Due to human population growth and the concomitant encroachment of wetlands, a substantial portion of the land has been converted into farms. This reduces hippo habitats and the vegetation on which hippos feed considerably, forcing them to forage on crops in people’s farms. The data suggests that farmers are most affected by the conflicts as most incidents during the project period (81.8%) related to crop damage. Over 30% of them had multiple incidents, affecting community life and contributing to poor living standards, poverty and famine, which reinforces the negative sentiments of respondents about hippos.
Key conflict areas in all divisions are characterised by the presence of farms and their proximity to a water source. Maize is by far the most cultivated crop in the area, but it is also hippo’s favourite. Farmers face the risk of hippo invasions in their plots; especially those whose lands are normally flooded during the rainy season are more at risk. The risk is correlated with the distance of the farm to the nearest waterbody. The closer the farm is to a waterbody, the higher the risk. Between 500-1,000 meters, the risk of an invasion is roughly 50%, but further away, it becomes almost negligent. The peak in crop losses occurred from June to October, contrary to the average rainfall data since 1960 as provided by the Kisumu meteorological station, with peak rainfall during the long rains (March-May) (4.1). This could be attributed to the short duration of the project which may have caused distortions.
Besides occasional incidents with livestock, for instance when a hippo goes up to the cattle boma or attacks cows that are crossing Nyando River, there were fishing incidents, which mostly occurred in Kanyagwal (Kadibo). The risk fishermen face is related to fishing methods and areas. Both fishers and BMUs assigned risks related to fishing, while the latter distinguished between personal and material risks. Beach seines (or pull nets) are considered as highly risky (to people and gears) because they are used along the shores with the fishers standing in the water. It is also illegal, because it catches everything in the water, including fingerlings. Hippo incidents also occur when fishers collect nyapus under water hyacinth mattresses to catch Nile perch and are confronted with a hippo hiding under this weed.
All in all, there is a tension between people and hippos. Many respondents fear the animal. They know it can kill them; it is destructive and causes damage to crops, hence affecting people’s livelihoods when they are confronted with incidents. There is also a tension between people over hippos, over opposite goals (exploitation versus hippo conservation). This will be addressed in the next chapter.
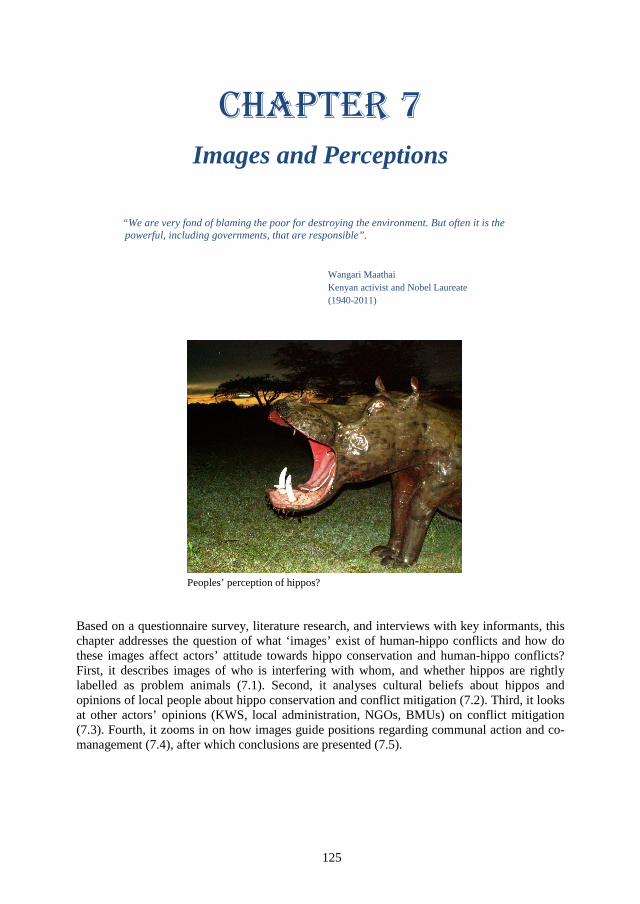
125
Chapter 7 Images and Perceptions
“We are very fond of blaming the poor for destroying the environment. But often it is the powerful, including governments, that are responsible”.
Wangari Maathai Kenyan activist and Nobel Laureate (1940-2011)
Peoples’ perception of hippos?
Based on a questionnaire survey, literature research, and interviews with key informants, this chapter addresses the question of what ‘images’ exist of human-hippo conflicts and how do these images affect actors’ attitude towards hippo conservation and human-hippo conflicts? First, it describes images of who is interfering with whom, and whether hippos are rightly labelled as problem animals (7.1). Second, it analyses cultural beliefs about hippos and opinions of local people about hippo conservation and conflict mitigation (7.2). Third, it looks at other actors’ opinions (KWS, local administration, NGOs, BMUs) on conflict mitigation (7.3). Fourth, it zooms in on how images guide positions regarding communal action and co-management (7.4), after which conclusions are presented (7.5).
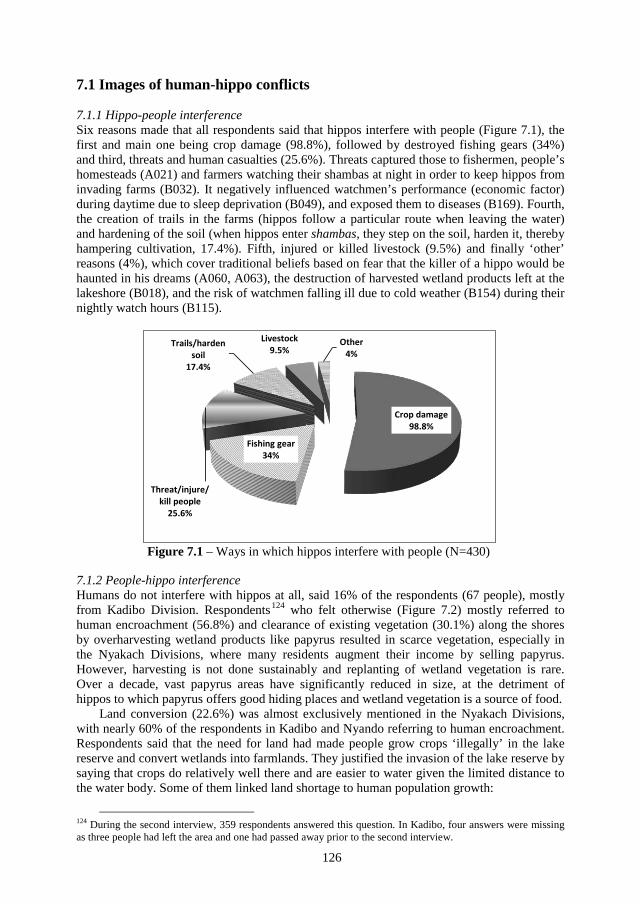
126
7.1 Images of human-hippo conflicts
7.1.1 Hippo-people interference Six reasons made that all respondents said that hippos interfere with people (Figure 7.1), the first and main one being crop damage (98.8%), followed by destroyed fishing gears (34%) and third, threats and human casualties (25.6%). Threats captured those to fishermen, people’s homesteads (A021) and farmers watching their shambas at night in order to keep hippos from invading farms (B032). It negatively influenced watchmen’s performance (economic factor) during daytime due to sleep deprivation (B049), and exposed them to diseases (B169). Fourth, the creation of trails in the farms (hippos follow a particular route when leaving the water) and hardening of the soil (when hippos enter shambas, they step on the soil, harden it, thereby hampering cultivation, 17.4%). Fifth, injured or killed livestock (9.5%) and finally ‘other’ reasons (4%), which cover traditional beliefs based on fear that the killer of a hippo would be haunted in his dreams (A060, A063), the destruction of harvested wetland products left at the lakeshore (B018), and the risk of watchmen falling ill due to cold weather (B154) during their nightly watch hours (B115).
7.1.2 People-hippo interference Humans do not interfere with hippos at all, said 16% of the respondents (67 people), mostly from Kadibo Division. Respondents124 who felt otherwise (Figure 7.2) mostly referred to human encroachment (56.8%) and clearance of existing vegetation (30.1%) along the shores by overharvesting wetland products like papyrus resulted in scarce vegetation, especially in the Nyakach Divisions, where many residents augment their income by selling papyrus. However, harvesting is not done sustainably and replanting of wetland vegetation is rare. Over a decade, vast papyrus areas have significantly reduced in size, at the detriment of hippos to which papyrus offers good hiding places and wetland vegetation is a source of food.
Land conversion (22.6%) was almost exclusively mentioned in the Nyakach Divisions, with nearly 60% of the respondents in Kadibo and Nyando referring to human encroachment. Respondents said that the need for land had made people grow crops ‘illegally’ in the lake reserve and convert wetlands into farmlands. They justified the invasion of the lake reserve by saying that crops do relatively well there and are easier to water given the limited distance to the water body. Some of them linked land shortage to human population growth:
124 During the second interview, 359 respondents answered this question. In Kadibo, four answers were missing as three people had left the area and one had passed away prior to the second interview.
Crop damage 98.8%
Fishing gear 34%
Threat/injure/ kill people
25.6%
Trails/harden soil
17.4%
Livestock 9.5%
Other 4%
Figure 7.1 – Ways in which hippos interfere with people (N=430)
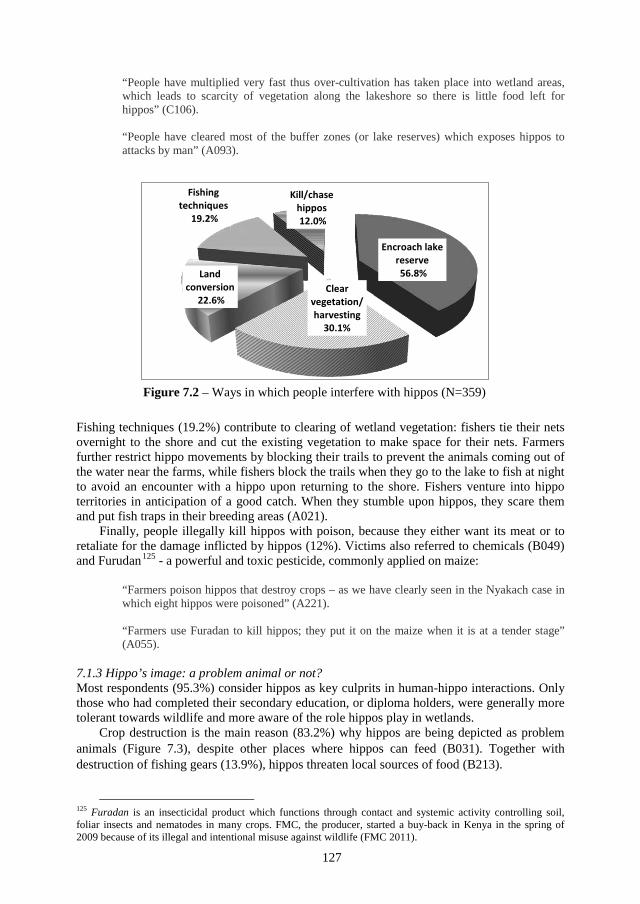
127
“People have multiplied very fast thus over-cultivation has taken place into wetland areas, which leads to scarcity of vegetation along the lakeshore so there is little food left for hippos” (C106).
“People have cleared most of the buffer zones (or lake reserves) which exposes hippos to attacks by man” (A093).
Fishing techniques (19.2%) contribute to clearing of wetland vegetation: fishers tie their nets overnight to the shore and cut the existing vegetation to make space for their nets. Farmers further restrict hippo movements by blocking their trails to prevent the animals coming out of the water near the farms, while fishers block the trails when they go to the lake to fish at night to avoid an encounter with a hippo upon returning to the shore. Fishers venture into hippo territories in anticipation of a good catch. When they stumble upon hippos, they scare them and put fish traps in their breeding areas (A021).
Finally, people illegally kill hippos with poison, because they either want its meat or to retaliate for the damage inflicted by hippos (12%). Victims also referred to chemicals (B049) and Furudan125 - a powerful and toxic pesticide, commonly applied on maize:
“Farmers poison hippos that destroy crops – as we have clearly seen in the Nyakach case in which eight hippos were poisoned” (A221).
“Farmers use Furadan to kill hippos; they put it on the maize when it is at a tender stage” (A055).
7.1.3 Hippo’s image: a problem animal or not? Most respondents (95.3%) consider hippos as key culprits in human-hippo interactions. Only those who had completed their secondary education, or diploma holders, were generally more tolerant towards wildlife and more aware of the role hippos play in wetlands.
Crop destruction is the main reason (83.2%) why hippos are being depicted as problem animals (Figure 7.3), despite other places where hippos can feed (B031). Together with destruction of fishing gears (13.9%), hippos threaten local sources of food (B213).
125 Furadan is an insecticidal product which functions through contact and systemic activity controlling soil, foliar insects and nematodes in many crops. FMC, the producer, started a buy-back in Kenya in the spring of 2009 because of its illegal and intentional misuse against wildlife (FMC 2011).
Encroach lake reserve 56.8%
Clear vegetation/ harvesting
30.1%
Land conversion
22.6%
Fishing techniques
19.2%
Kill/chase hippos 12.0%
Figure 7.2 – Ways in which people interfere with hippos (N=359)
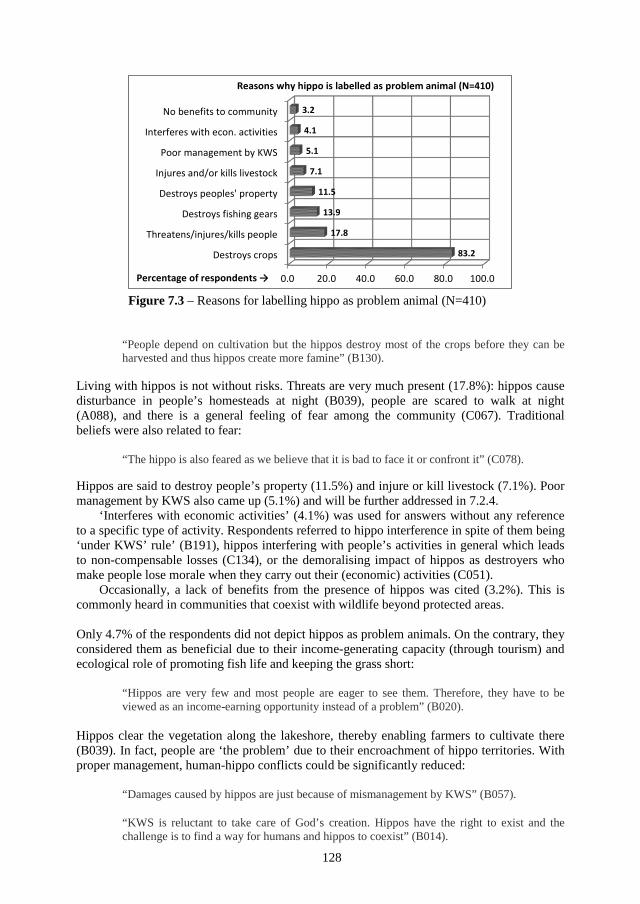
128
“People depend on cultivation but the hippos destroy most of the crops before they can be harvested and thus hippos create more famine” (B130).
Living with hippos is not without risks. Threats are very much present (17.8%): hippos cause disturbance in people’s homesteads at night (B039), people are scared to walk at night (A088), and there is a general feeling of fear among the community (C067). Traditional beliefs were also related to fear:
“The hippo is also feared as we believe that it is bad to face it or confront it” (C078).
Hippos are said to destroy people’s property (11.5%) and injure or kill livestock (7.1%). Poor management by KWS also came up (5.1%) and will be further addressed in 7.2.4.
‘Interferes with economic activities’ (4.1%) was used for answers without any reference to a specific type of activity. Respondents referred to hippo interference in spite of them being ‘under KWS’ rule’ (B191), hippos interfering with people’s activities in general which leads to non-compensable losses (C134), or the demoralising impact of hippos as destroyers who make people lose morale when they carry out their (economic) activities (C051).
Occasionally, a lack of benefits from the presence of hippos was cited (3.2%). This is commonly heard in communities that coexist with wildlife beyond protected areas.
Only 4.7% of the respondents did not depict hippos as problem animals. On the contrary, they considered them as beneficial due to their income-generating capacity (through tourism) and ecological role of promoting fish life and keeping the grass short:
“Hippos are very few and most people are eager to see them. Therefore, they have to be viewed as an income-earning opportunity instead of a problem” (B020).
Hippos clear the vegetation along the lakeshore, thereby enabling farmers to cultivate there (B039). In fact, people are ‘the problem’ due to their encroachment of hippo territories. With proper management, human-hippo conflicts could be significantly reduced:
“Damages caused by hippos are just because of mismanagement by KWS” (B057).
“KWS is reluctant to take care of God’s creation. Hippos have the right to exist and the challenge is to find a way for humans and hippos to coexist” (B014).
0.0 20.0 40.0 60.0 80.0 100.0
Destroys crops
Threatens/injures/kills people
Destroys fishing gears
Destroys peoples' property
Injures and/or kills livestock
Poor management by KWS
Interferes with econ. activities
No benefits to community
83.2
17.8
13.9
11.5
7.1
5.1
4.1
3.2
Percentage of respondents →
Reasons why hippo is labelled as problem animal (N=410)
Figure 7.3 – Reasons for labelling hippo as problem animal (N=410)
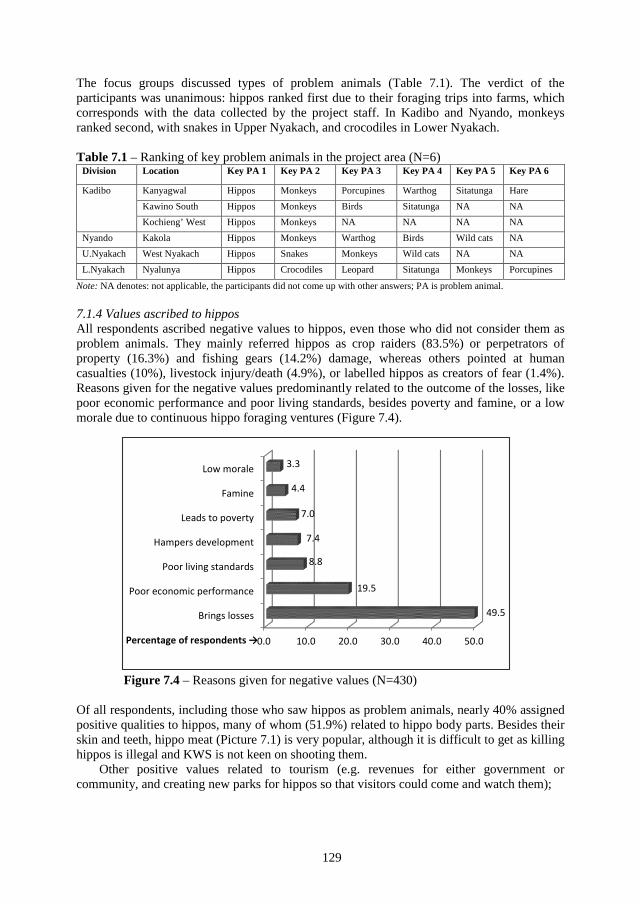
129
The focus groups discussed types of problem animals (Table 7.1). The verdict of the participants was unanimous: hippos ranked first due to their foraging trips into farms, which corresponds with the data collected by the project staff. In Kadibo and Nyando, monkeys ranked second, with snakes in Upper Nyakach, and crocodiles in Lower Nyakach.
Table 7.1 – Ranking of key problem animals in the project area (N=6) Division Location Key PA 1 Key PA 2 Key PA 3 Key PA 4 Key PA 5 Key PA 6
Kadibo Kanyagwal Hippos Monkeys Porcupines Warthog Sitatunga Hare Kawino South Hippos Monkeys Birds Sitatunga NA NA Kochieng’ West Hippos Monkeys NA NA NA NA
Nyando Kakola Hippos Monkeys Warthog Birds Wild cats NA U.Nyakach West Nyakach Hippos Snakes Monkeys Wild cats NA NA L.Nyakach Nyalunya Hippos Crocodiles Leopard Sitatunga Monkeys Porcupines
Note: NA denotes: not applicable, the participants did not come up with other answers; PA is problem animal.
7.1.4 Values ascribed to hippos All respondents ascribed negative values to hippos, even those who did not consider them as problem animals. They mainly referred hippos as crop raiders (83.5%) or perpetrators of property (16.3%) and fishing gears (14.2%) damage, whereas others pointed at human casualties (10%), livestock injury/death (4.9%), or labelled hippos as creators of fear (1.4%). Reasons given for the negative values predominantly related to the outcome of the losses, like poor economic performance and poor living standards, besides poverty and famine, or a low morale due to continuous hippo foraging ventures (Figure 7.4).
Of all respondents, including those who saw hippos as problem animals, nearly 40% assigned positive qualities to hippos, many of whom (51.9%) related to hippo body parts. Besides their skin and teeth, hippo meat (Picture 7.1) is very popular, although it is difficult to get as killing hippos is illegal and KWS is not keen on shooting them.
Other positive values related to tourism (e.g. revenues for either government or community, and creating new parks for hippos so that visitors could come and watch them);
0.0 10.0 20.0 30.0 40.0 50.0
Brings losses
Poor economic performance
Poor living standards
Hampers development
Leads to poverty
Famine
Low morale
49.5
19.5
8.8
7.4
7.0
4.4
3.3
Percentage of respondents →
Figure 7.4 – Reasons given for negative values (N=430)
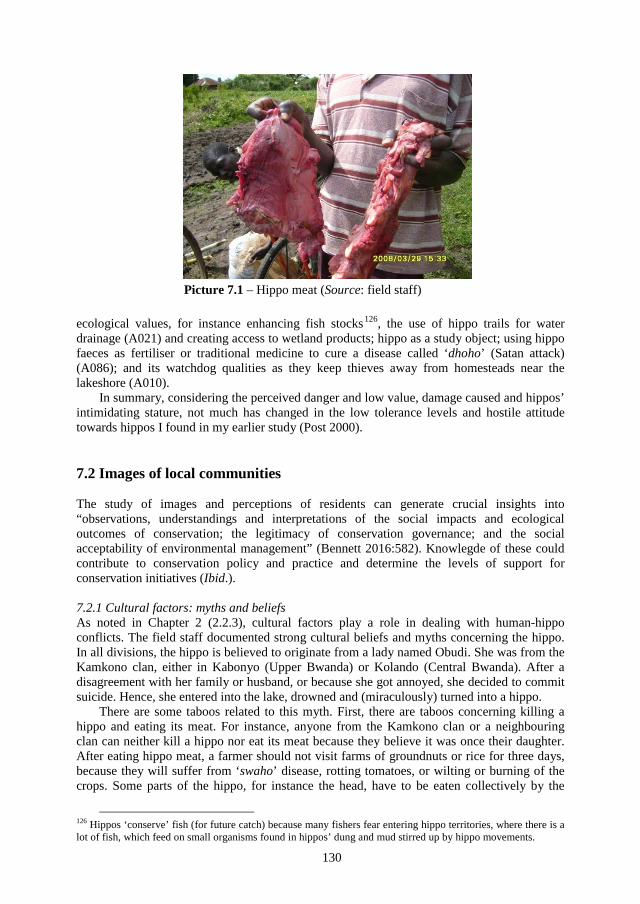
130
ecological values, for instance enhancing fish stocks126, the use of hippo trails for water drainage (A021) and creating access to wetland products; hippo as a study object; using hippo faeces as fertiliser or traditional medicine to cure a disease called ‘dhoho’ (Satan attack) (A086); and its watchdog qualities as they keep thieves away from homesteads near the lakeshore (A010).
In summary, considering the perceived danger and low value, damage caused and hippos’ intimidating stature, not much has changed in the low tolerance levels and hostile attitude towards hippos I found in my earlier study (Post 2000).
7.2 Images of local communities
The study of images and perceptions of residents can generate crucial insights into “observations, understandings and interpretations of the social impacts and ecological outcomes of conservation; the legitimacy of conservation governance; and the social acceptability of environmental management” (Bennett 2016:582). Knowlegde of these could contribute to conservation policy and practice and determine the levels of support for conservation initiatives (Ibid.).
7.2.1 Cultural factors: myths and beliefs As noted in Chapter 2 (2.2.3), cultural factors play a role in dealing with human-hippo conflicts. The field staff documented strong cultural beliefs and myths concerning the hippo. In all divisions, the hippo is believed to originate from a lady named Obudi. She was from the Kamkono clan, either in Kabonyo (Upper Bwanda) or Kolando (Central Bwanda). After a disagreement with her family or husband, or because she got annoyed, she decided to commit suicide. Hence, she entered into the lake, drowned and (miraculously) turned into a hippo.
There are some taboos related to this myth. First, there are taboos concerning killing a hippo and eating its meat. For instance, anyone from the Kamkono clan or a neighbouring clan can neither kill a hippo nor eat its meat because they believe it was once their daughter. After eating hippo meat, a farmer should not visit farms of groundnuts or rice for three days, because they will suffer from ‘swaho’ disease, rotting tomatoes, or wilting or burning of the crops. Some parts of the hippo, for instance the head, have to be eaten collectively by the
126 Hippos ‘conserve’ fish (for future catch) because many fishers fear entering hippo territories, where there is a lot of fish, which feed on small organisms found in hippos’ dung and mud stirred up by hippo movements.
Picture 7.1 – Hippo meat (Source: field staff)
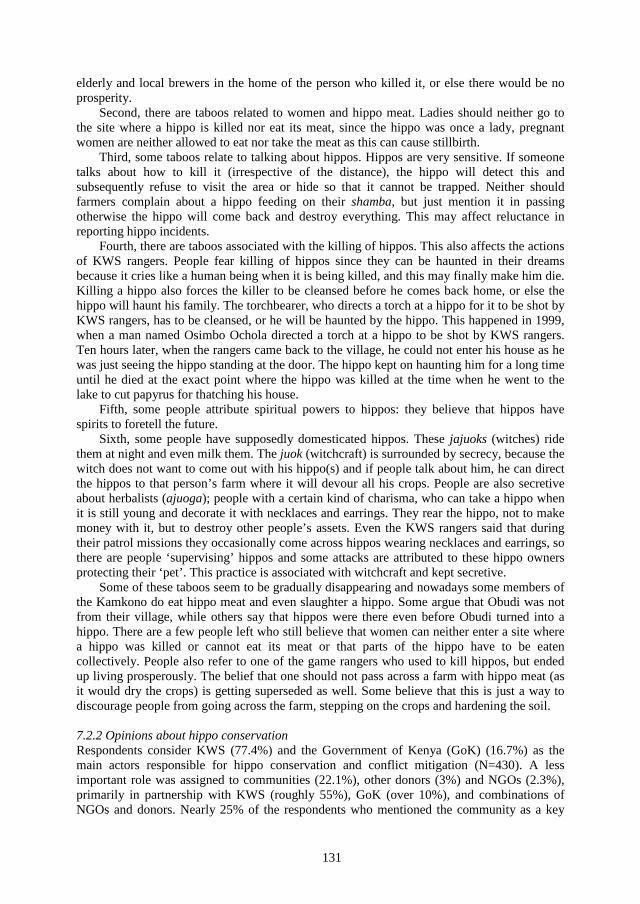
131
elderly and local brewers in the home of the person who killed it, or else there would be no prosperity.
Second, there are taboos related to women and hippo meat. Ladies should neither go to the site where a hippo is killed nor eat its meat, since the hippo was once a lady, pregnant women are neither allowed to eat nor take the meat as this can cause stillbirth.
Third, some taboos relate to talking about hippos. Hippos are very sensitive. If someone talks about how to kill it (irrespective of the distance), the hippo will detect this and subsequently refuse to visit the area or hide so that it cannot be trapped. Neither should farmers complain about a hippo feeding on their shamba, but just mention it in passing otherwise the hippo will come back and destroy everything. This may affect reluctance in reporting hippo incidents.
Fourth, there are taboos associated with the killing of hippos. This also affects the actions of KWS rangers. People fear killing of hippos since they can be haunted in their dreams because it cries like a human being when it is being killed, and this may finally make him die. Killing a hippo also forces the killer to be cleansed before he comes back home, or else the hippo will haunt his family. The torchbearer, who directs a torch at a hippo for it to be shot by KWS rangers, has to be cleansed, or he will be haunted by the hippo. This happened in 1999, when a man named Osimbo Ochola directed a torch at a hippo to be shot by KWS rangers. Ten hours later, when the rangers came back to the village, he could not enter his house as he was just seeing the hippo standing at the door. The hippo kept on haunting him for a long time until he died at the exact point where the hippo was killed at the time when he went to the lake to cut papyrus for thatching his house.
Fifth, some people attribute spiritual powers to hippos: they believe that hippos have spirits to foretell the future.
Sixth, some people have supposedly domesticated hippos. These jajuoks (witches) ride them at night and even milk them. The juok (witchcraft) is surrounded by secrecy, because the witch does not want to come out with his hippo(s) and if people talk about him, he can direct the hippos to that person’s farm where it will devour all his crops. People are also secretive about herbalists (ajuoga); people with a certain kind of charisma, who can take a hippo when it is still young and decorate it with necklaces and earrings. They rear the hippo, not to make money with it, but to destroy other people’s assets. Even the KWS rangers said that during their patrol missions they occasionally come across hippos wearing necklaces and earrings, so there are people ‘supervising’ hippos and some attacks are attributed to these hippo owners protecting their ‘pet’. This practice is associated with witchcraft and kept secretive.
Some of these taboos seem to be gradually disappearing and nowadays some members of the Kamkono do eat hippo meat and even slaughter a hippo. Some argue that Obudi was not from their village, while others say that hippos were there even before Obudi turned into a hippo. There are a few people left who still believe that women can neither enter a site where a hippo was killed or cannot eat its meat or that parts of the hippo have to be eaten collectively. People also refer to one of the game rangers who used to kill hippos, but ended up living prosperously. The belief that one should not pass across a farm with hippo meat (as it would dry the crops) is getting superseded as well. Some believe that this is just a way to discourage people from going across the farm, stepping on the crops and hardening the soil.
7.2.2 Opinions about hippo conservation Respondents consider KWS (77.4%) and the Government of Kenya (GoK) (16.7%) as the main actors responsible for hippo conservation and conflict mitigation (N=430). A less important role was assigned to communities (22.1%), other donors (3%) and NGOs (2.3%), primarily in partnership with KWS (roughly 55%), GoK (over 10%), and combinations of NGOs and donors. Nearly 25% of the respondents who mentioned the community as a key
132
actor said that they were the only actors involved, whereas 2.8% talked about other combinations with KWS and GoK or NGOs, and NGOs with GoK.
Most respondents referred to the use of protective methods (41.2%), parks and conservancies (33.7%), and Problem Animal Control (PAC, 27.2%) as viable ways to conserve hippos. Key actors regarding protective methods would be KWS, community, or government agents, mainly in farming areas to stop hippos from causing damage to their farms (B023). Fences were favourite (81.9%), followed by trenches (12.8%), dikes (4.3%) and others (1.1%). Nearly 60% of the respondents did not specify the type of materials to be used in fencing, but of those who did, the majority opted for barbed wire (65.1%), strong poles (20.6%), and chain-link (3.2%), while 11.1% even talked about an electric fence to keep hippos away from their farms. Fences would ideally be located along the lakeshore, lake reserve, riverbanks or put around the farms. Some people wanted to collect hippos and confine them in a fenced area (A171), whereas others opted for a ‘negotiable’ boundary:
“There should be a (fenced) boundary between people and hippos along the lake but the boundary should be negotiated by people and KWS” (B025).
Second, parks and conservancies could solve hippo problems: 40.2% of the respondents favour a hippo conservancy127 in their area, whereas 33.8% opted for its relocation to parks elsewhere. Nearly 25% only talked about parks but did not specify the location. Third, PAC (27.2%) involves patrol by KWS rangers, who should visit the sites regularly to either scare or kill some hippos to chase away others to reduce farm invasions (A048, B015). Others talked about killing destructive or rogue hippos (A147), or pointed at reducing the hippo population for others to have sufficient food:
“The hippo population should be reduced through killing them so that the few remaining ones have enough grazing space” (A044).
Respondents suggested that KWS would have to eliminate all hippos (A047) to stop the conflict (C046), or properly manage hippos while taking charge to scare them with chemicals, the smell of which they fear (B045). Some also saw a need for KWS to have its offices at a central location (preferably a market, B050), but certainly within the affected areas (B187).
Other suggestions related to dialogue and publicity (7.7%), including a donor agenda to mitigate hippo conflicts (C011), community engagements in talks with the government to find ways to solve conflicts (C008), and continued complaints about hippo damages in the barazas (C116). Respondents arguing for attitudinal change of the community (4.9%) pointed to refraining from cultivation up to the water and clearing the vegetation on which hippos depend (C243) and planting lines of water-resistant trees along the lakeshore (B184). Organisation (1.6%) was mentioned in relation to forming a strong community-based organisation to deal with hippo issues, to be supported by donors (B072); people organising themselves and call KWS to scare the hippos (B069); or jointly protecting the farms (B249). Management and research (1.4%) basically relate to both KWS and government to find a solution to end conflicts:
“The government should take control of the problem hippos cause and look into ways in which this can be prevented; they should control the movement of hippos to avoid crop damage” (B047).
127 The 2013 Wildlife Act defines conservancy as “land set aside by an individual landowner, body corporate, group of owners or a community for purposes of wildlife conservation” (RoK 2013a:1250). This made wildlife conservation a recognised form of land use.
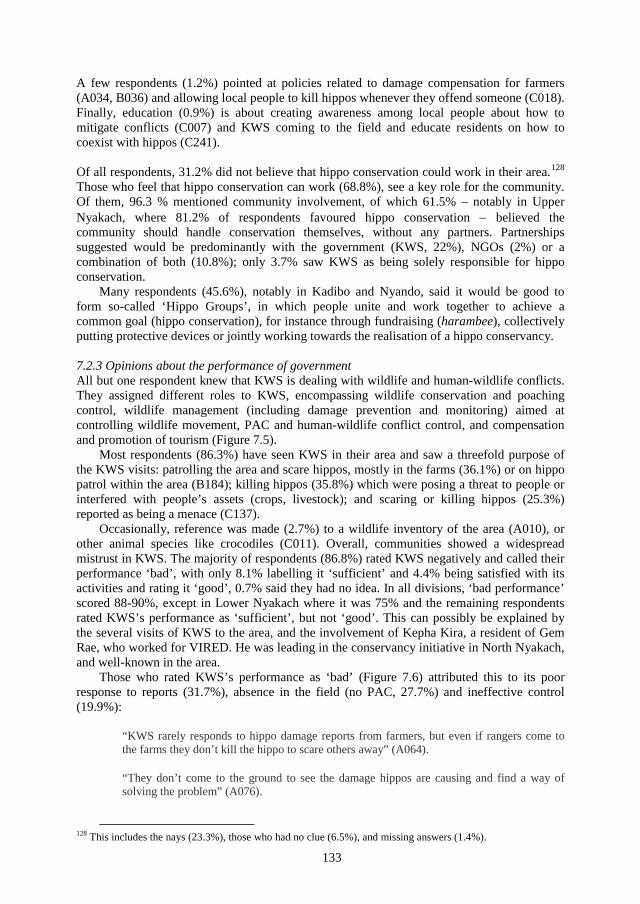
133
A few respondents (1.2%) pointed at policies related to damage compensation for farmers (A034, B036) and allowing local people to kill hippos whenever they offend someone (C018). Finally, education (0.9%) is about creating awareness among local people about how to mitigate conflicts (C007) and KWS coming to the field and educate residents on how to coexist with hippos (C241).
Of all respondents, 31.2% did not believe that hippo conservation could work in their area.128 Those who feel that hippo conservation can work (68.8%), see a key role for the community. Of them, 96.3 % mentioned community involvement, of which 61.5% – notably in Upper Nyakach, where 81.2% of respondents favoured hippo conservation − believed the community should handle conservation themselves, without any partners. Partnerships suggested would be predominantly with the government (KWS, 22%), NGOs (2%) or a combination of both (10.8%); only 3.7% saw KWS as being solely responsible for hippo conservation.
Many respondents (45.6%), notably in Kadibo and Nyando, said it would be good to form so-called ‘Hippo Groups’, in which people unite and work together to achieve a common goal (hippo conservation), for instance through fundraising (harambee), collectively putting protective devices or jointly working towards the realisation of a hippo conservancy.
7.2.3 Opinions about the performance of government All but one respondent knew that KWS is dealing with wildlife and human-wildlife conflicts. They assigned different roles to KWS, encompassing wildlife conservation and poaching control, wildlife management (including damage prevention and monitoring) aimed at controlling wildlife movement, PAC and human-wildlife conflict control, and compensation and promotion of tourism (Figure 7.5).
Most respondents (86.3%) have seen KWS in their area and saw a threefold purpose of the KWS visits: patrolling the area and scare hippos, mostly in the farms (36.1%) or on hippo patrol within the area (B184); killing hippos (35.8%) which were posing a threat to people or interfered with people’s assets (crops, livestock); and scaring or killing hippos (25.3%) reported as being a menace (C137).
Occasionally, reference was made (2.7%) to a wildlife inventory of the area (A010), or other animal species like crocodiles (C011). Overall, communities showed a widespread mistrust in KWS. The majority of respondents (86.8%) rated KWS negatively and called their performance ‘bad’, with only 8.1% labelling it ‘sufficient’ and 4.4% being satisfied with its activities and rating it ‘good’, 0.7% said they had no idea. In all divisions, ‘bad performance’ scored 88-90%, except in Lower Nyakach where it was 75% and the remaining respondents rated KWS’s performance as ‘sufficient’, but not ‘good’. This can possibly be explained by the several visits of KWS to the area, and the involvement of Kepha Kira, a resident of Gem Rae, who worked for VIRED. He was leading in the conservancy initiative in North Nyakach, and well-known in the area.
Those who rated KWS’s performance as ‘bad’ (Figure 7.6) attributed this to its poor response to reports (31.7%), absence in the field (no PAC, 27.7%) and ineffective control (19.9%):
“KWS rarely responds to hippo damage reports from farmers, but even if rangers come to the farms they don’t kill the hippo to scare others away” (A064).
“They don’t come to the ground to see the damage hippos are causing and find a way of solving the problem” (A076).
128 This includes the nays (23.3%), those who had no clue (6.5%), and missing answers (1.4%).
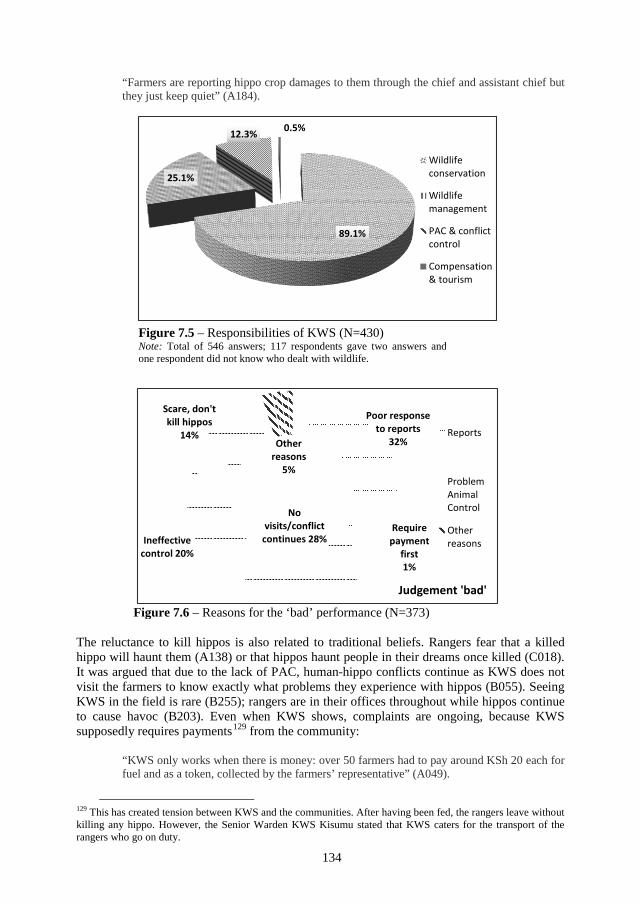
134
“Farmers are reporting hippo crop damages to them through the chief and assistant chief but they just keep quiet” (A184).
The reluctance to kill hippos is also related to traditional beliefs. Rangers fear that a killed hippo will haunt them (A138) or that hippos haunt people in their dreams once killed (C018). It was argued that due to the lack of PAC, human-hippo conflicts continue as KWS does not visit the farmers to know exactly what problems they experience with hippos (B055). Seeing KWS in the field is rare (B255); rangers are in their offices throughout while hippos continue to cause havoc (B203). Even when KWS shows, complaints are ongoing, because KWS supposedly requires payments129 from the community:
“KWS only works when there is money: over 50 farmers had to pay around KSh 20 each for fuel and as a token, collected by the farmers’ representative” (A049).
129 This has created tension between KWS and the communities. After having been fed, the rangers leave without killing any hippo. However, the Senior Warden KWS Kisumu stated that KWS caters for the transport of the rangers who go on duty.
89.1%
25.1%
12.3% 0.5%
Wildlifeconservation
Wildlifemanagement
PAC & conflictcontrol
Compensation& tourism
Poor response to reports
32%
Require payment
first 1%
No visits/conflict
continues 28% Ineffective control 20%
Scare, don't kill hippos
14% Other
reasons 5%
Judgement 'bad'
Reports
ProblemAnimalControl
Otherreasons
Figure 7.6 – Reasons for the ‘bad’ performance (N=373)
Figure 7.5 – Responsibilities of KWS (N=430) Note: Total of 546 answers; 117 respondents gave two answers and one respondent did not know who dealt with wildlife.
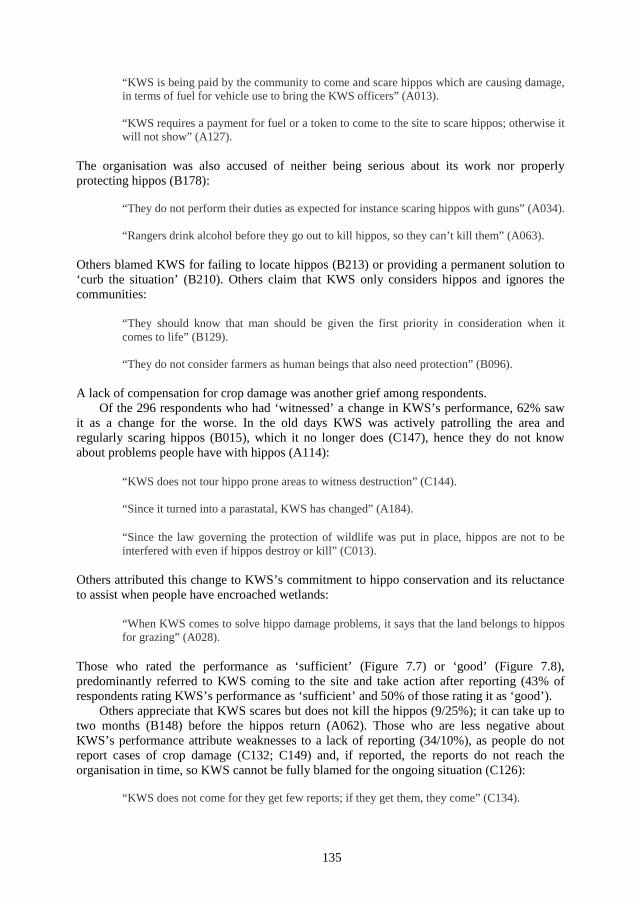
135
“KWS is being paid by the community to come and scare hippos which are causing damage, in terms of fuel for vehicle use to bring the KWS officers” (A013).
“KWS requires a payment for fuel or a token to come to the site to scare hippos; otherwise it will not show” (A127).
The organisation was also accused of neither being serious about its work nor properly protecting hippos (B178):
“They do not perform their duties as expected for instance scaring hippos with guns” (A034).
“Rangers drink alcohol before they go out to kill hippos, so they can’t kill them” (A063).
Others blamed KWS for failing to locate hippos (B213) or providing a permanent solution to ‘curb the situation’ (B210). Others claim that KWS only considers hippos and ignores the communities:
“They should know that man should be given the first priority in consideration when it comes to life” (B129).
“They do not consider farmers as human beings that also need protection” (B096).
A lack of compensation for crop damage was another grief among respondents. Of the 296 respondents who had ‘witnessed’ a change in KWS’s performance, 62% saw
it as a change for the worse. In the old days KWS was actively patrolling the area and regularly scaring hippos (B015), which it no longer does (C147), hence they do not know about problems people have with hippos (A114):
“KWS does not tour hippo prone areas to witness destruction” (C144).
“Since it turned into a parastatal, KWS has changed” (A184).
“Since the law governing the protection of wildlife was put in place, hippos are not to be interfered with even if hippos destroy or kill” (C013).
Others attributed this change to KWS’s commitment to hippo conservation and its reluctance to assist when people have encroached wetlands:
“When KWS comes to solve hippo damage problems, it says that the land belongs to hippos for grazing” (A028).
Those who rated the performance as ‘sufficient’ (Figure 7.7) or ‘good’ (Figure 7.8), predominantly referred to KWS coming to the site and take action after reporting (43% of respondents rating KWS’s performance as ‘sufficient’ and 50% of those rating it as ‘good’).
Others appreciate that KWS scares but does not kill the hippos (9/25%); it can take up to two months (B148) before the hippos return (A062). Those who are less negative about KWS’s performance attribute weaknesses to a lack of reporting (34/10%), as people do not report cases of crop damage (C132; C149) and, if reported, the reports do not reach the organisation in time, so KWS cannot be fully blamed for the ongoing situation (C126):
“KWS does not come for they get few reports; if they get them, they come” (C134).
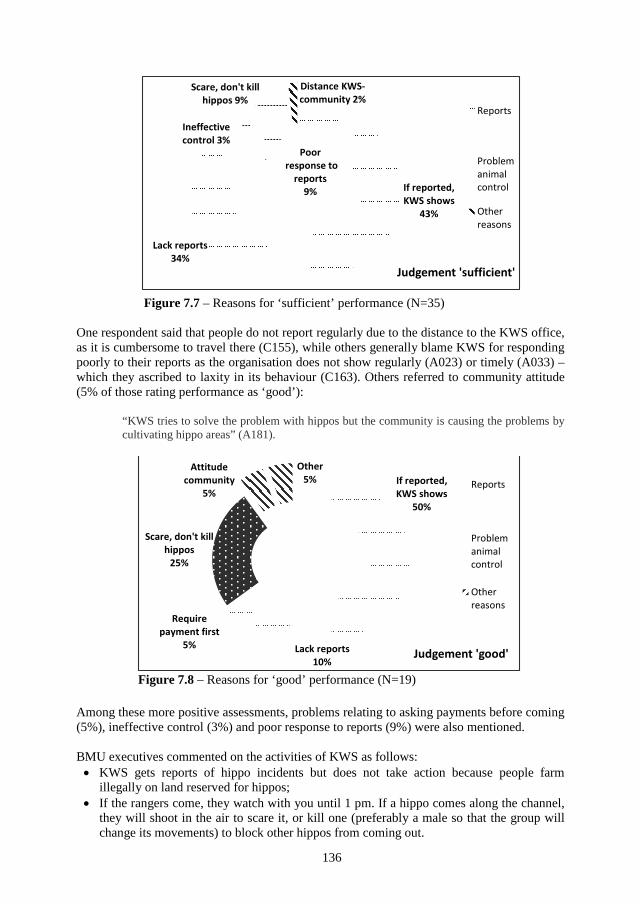
136
One respondent said that people do not report regularly due to the distance to the KWS office, as it is cumbersome to travel there (C155), while others generally blame KWS for responding poorly to their reports as the organisation does not show regularly (A023) or timely (A033) – which they ascribed to laxity in its behaviour (C163). Others referred to community attitude (5% of those rating performance as ‘good’):
“KWS tries to solve the problem with hippos but the community is causing the problems by cultivating hippo areas” (A181).
Among these more positive assessments, problems relating to asking payments before coming (5%), ineffective control (3%) and poor response to reports (9%) were also mentioned.
BMU executives commented on the activities of KWS as follows: • KWS gets reports of hippo incidents but does not take action because people farm
illegally on land reserved for hippos;• If the rangers come, they watch with you until 1 pm. If a hippo comes along the channel,
they will shoot in the air to scare it, or kill one (preferably a male so that the group willchange its movements) to block other hippos from coming out.
If reported, KWS shows
50%
Lack reports 10%
Require payment first
5%
Scare, don't kill hippos
25%
Attitude community
5%
Other 5%
Judgement 'good'
Reports
Problemanimalcontrol
Otherreasons
Figure 7.7 – Reasons for ‘sufficient’ performance (N=35)
Figure 7.8 – Reasons for ‘good’ performance (N=19)
Poor response to
reports 9% If reported,
KWS shows 43%
Lack reports 34%
Ineffective control 3%
Scare, don't kill hippos 9%
Distance KWS- community 2%
Judgement 'sufficient'
Reports
Problemanimalcontrol
Otherreasons
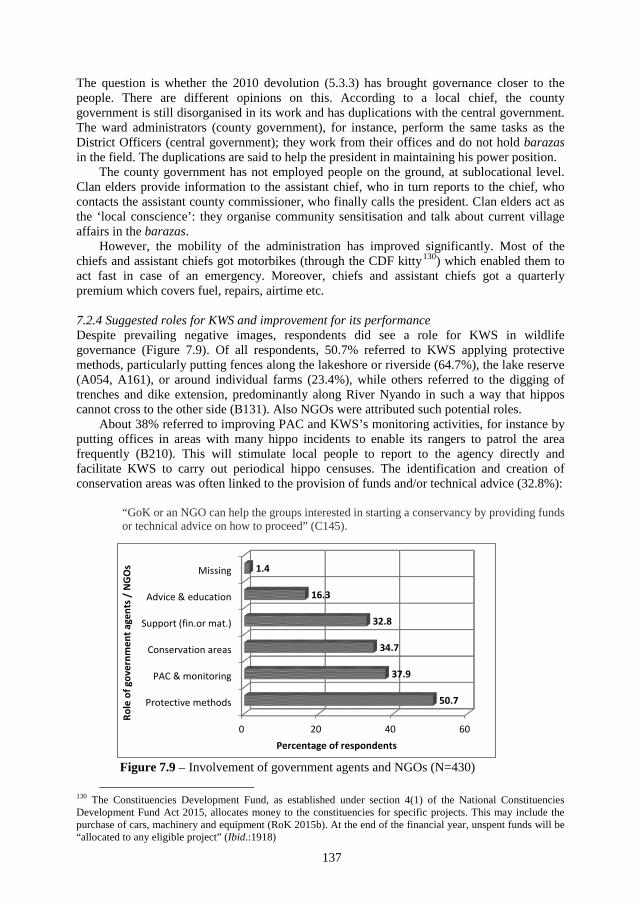
137
The question is whether the 2010 devolution (5.3.3) has brought governance closer to the people. There are different opinions on this. According to a local chief, the county government is still disorganised in its work and has duplications with the central government. The ward administrators (county government), for instance, perform the same tasks as the District Officers (central government); they work from their offices and do not hold barazas in the field. The duplications are said to help the president in maintaining his power position.
The county government has not employed people on the ground, at sublocational level. Clan elders provide information to the assistant chief, who in turn reports to the chief, who contacts the assistant county commissioner, who finally calls the president. Clan elders act as the ‘local conscience’: they organise community sensitisation and talk about current village affairs in the barazas.
However, the mobility of the administration has improved significantly. Most of the chiefs and assistant chiefs got motorbikes (through the CDF kitty130) which enabled them to act fast in case of an emergency. Moreover, chiefs and assistant chiefs got a quarterly premium which covers fuel, repairs, airtime etc.
7.2.4 Suggested roles for KWS and improvement for its performance Despite prevailing negative images, respondents did see a role for KWS in wildlife governance (Figure 7.9). Of all respondents, 50.7% referred to KWS applying protective methods, particularly putting fences along the lakeshore or riverside (64.7%), the lake reserve (A054, A161), or around individual farms (23.4%), while others referred to the digging of trenches and dike extension, predominantly along River Nyando in such a way that hippos cannot cross to the other side (B131). Also NGOs were attributed such potential roles.
About 38% referred to improving PAC and KWS’s monitoring activities, for instance by putting offices in areas with many hippo incidents to enable its rangers to patrol the area frequently (B210). This will stimulate local people to report to the agency directly and facilitate KWS to carry out periodical hippo censuses. The identification and creation of conservation areas was often linked to the provision of funds and/or technical advice (32.8%):
“GoK or an NGO can help the groups interested in starting a conservancy by providing funds or technical advice on how to proceed” (C145).
130 The Constituencies Development Fund, as established under section 4(1) of the National Constituencies Development Fund Act 2015, allocates money to the constituencies for specific projects. This may include the purchase of cars, machinery and equipment (RoK 2015b). At the end of the financial year, unspent funds will be “allocated to any eligible project” (Ibid.:1918)
Figure 7.9 – Involvement of government agents and NGOs (N=430)
0 20 40 60
Protective methods
PAC & monitoring
Conservation areas
Support (fin.or mat.)
Advice & education
Missing
50.7
37.9
34.7
32.8
16.3
1.4
Percentage of respondents
Role
of g
over
nmen
t age
nts /
NG
Os
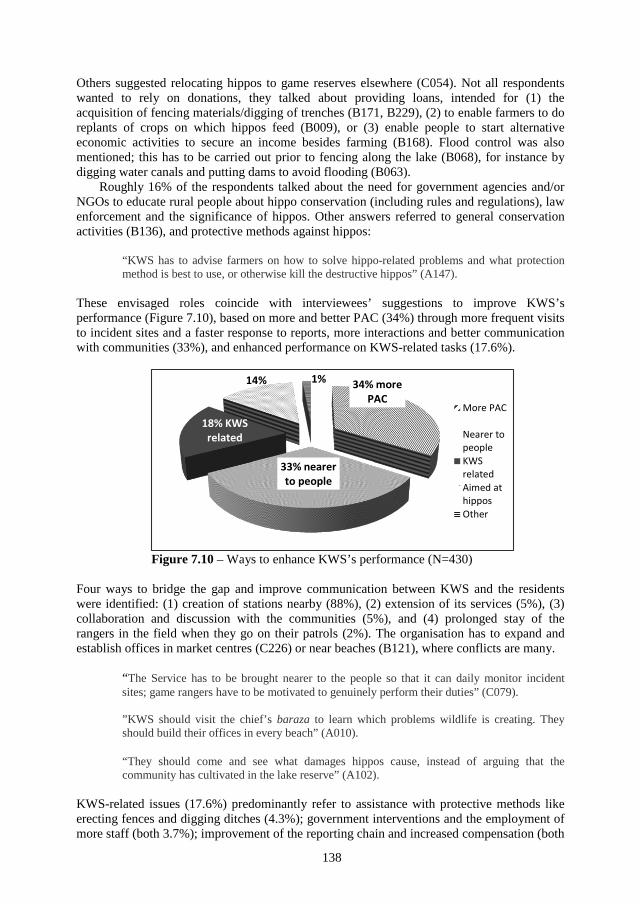
138
Others suggested relocating hippos to game reserves elsewhere (C054). Not all respondents wanted to rely on donations, they talked about providing loans, intended for (1) the acquisition of fencing materials/digging of trenches (B171, B229), (2) to enable farmers to do replants of crops on which hippos feed (B009), or (3) enable people to start alternative economic activities to secure an income besides farming (B168). Flood control was also mentioned; this has to be carried out prior to fencing along the lake (B068), for instance by digging water canals and putting dams to avoid flooding (B063).
Roughly 16% of the respondents talked about the need for government agencies and/or NGOs to educate rural people about hippo conservation (including rules and regulations), law enforcement and the significance of hippos. Other answers referred to general conservation activities (B136), and protective methods against hippos:
“KWS has to advise farmers on how to solve hippo-related problems and what protection method is best to use, or otherwise kill the destructive hippos” (A147).
These envisaged roles coincide with interviewees’ suggestions to improve KWS’s performance (Figure 7.10), based on more and better PAC (34%) through more frequent visits to incident sites and a faster response to reports, more interactions and better communication with communities (33%), and enhanced performance on KWS-related tasks (17.6%).
Figure 7.10 – Ways to enhance KWS’s performance (N=430)
Four ways to bridge the gap and improve communication between KWS and the residents were identified: (1) creation of stations nearby (88%), (2) extension of its services (5%), (3) collaboration and discussion with the communities (5%), and (4) prolonged stay of the rangers in the field when they go on their patrols (2%). The organisation has to expand and establish offices in market centres (C226) or near beaches (B121), where conflicts are many.
“The Service has to be brought nearer to the people so that it can daily monitor incident sites; game rangers have to be motivated to genuinely perform their duties” (C079).
”KWS should visit the chief’s baraza to learn which problems wildlife is creating. They should build their offices in every beach” (A010).
“They should come and see what damages hippos cause, instead of arguing that the community has cultivated in the lake reserve” (A102).
KWS-related issues (17.6%) predominantly refer to assistance with protective methods like erecting fences and digging ditches (4.3%); government interventions and the employment of more staff (both 3.7%); improvement of the reporting chain and increased compensation (both
34% more PAC
33% nearer to people
18% KWS related
14% 1%
More PAC
Nearer topeopleKWSrelatedAimed athipposOther
139
2.6%); and giving an (extra) allowance to KWS field staff (0.9%). Some suggested that the government should appoint a body to supervise KWS’s work and monitor its role (C014, C208, C219) to discover why it is inactive (C023, C019), or create another body that deals with destructive wildlife (C010, C034). Others said that KWS staff needs to be motivated (C083, C038). In general, there should be a follow-up from the ‘higher authority’ to make sure that KWS is acting rightly when in the field (C133). The reporting chain needs improvement so that reports will reach KWS. Now they get lost somewhere within the hierarchy (C108) because the chain is long (A107). Best would be to report to KWS directly (C250). More reports have to reach KWS, but that can only be realised once local people start reporting to their area chiefs, who in turn make sure that they inform KWS about the incident in time (C227, C201). Only in this way KWS can become aware that human-hippo conflicts are a serious problem that needs to be addressed (C020).
Some respondents argue that KWS is understaffed; they need sufficient rangers to carry out proper hippo patrols (B143, B227, C249), scare the hippos (B217) and cover all hippo prone areas (C056, C255, C247), thus enhancing their performance effectively (B134, B169). The current level of compensation is insufficient as people only get compensated for death and/or injury, not for damages caused by hippos. Compensation can be like a ‘wake-up call’.
“If the affected farmers are compensated, KWS will realise what losses they experience and more actively patrol the area to prevent further losses” (B187).
Finally, nearly 14% of the respondents suggested hippo-related ‘improvements’, thereby mentioning reduction of the hippo population to prevent crop damage (10.1%), followed by unspecified ‘innovative solutions’ (1.7%) and relocation of hippos to protected areas or ‘hippo parks’ (1.1%). People also said that locals should be allowed to kill hippos; one person even suggested a change of government so that a new wildlife law can be provided under the KWS (B076). Other improvements (1.5%) were mostly related to KWS putting a stop in asking local people for money for field visits (B088, B229) and a request to visit the area to demarcate the boundary of the lake reserve (A062).
7.3 Opinions of other actors
Actors like KWS, local administration, wildlife-related NGOs and BMUs explained what they think can or should be done to promote wildlife conservation and reduce hippo-conflicts.
7.3.1 Opinions of the Kenya Wildlife Service131 During the past decade, KWS received reports of 565 incidents in the area bordering Winam Gulf. In total, 28 hippos got killed and 28 were injured on patrol missions. In 2007, the number of reported incidents came to 47. All reported cases have been attended to. During their patrols, the rangers killed eight hippos and injured five. In Winam Gulf Area, the average number of hippo incidents reported to KWS comes to six per month.
KWS appreciates the role of non-governmental organizations, which can play a key role in conservation, as they mobilise resources to promote conservation and supplement conservation efforts in Kenya. One of their aims is to create awareness that wildlife should be seen as a resource instead of a menace. KWS attempts to mobilise communities for instance by attending chief’s barazas. It is essential to conserve hippo habitats because without wetlands, there will be no hippos. Land use is another issue: people cultivating up to the water
131 The information in this section is mainly based on interviews with William Sang, Senior Warden at KWS Kisumu held between 2008 and 2010.
140
can be regarded as one of the causes of conflicts with hippos. People are legally obliged to leave a stretch of 100 m from the lakeshore, but this is hardly ever respected.
KWS Headquarters is currently in the process of formulating a national hippo strategy. Its key question is ‘how to contain the hippo in Kenya?’ Hippos will have to be managed in such a way that they are conserved and conflicts are mitigated. Most conflicts with hippos take place along the lakeshore. People should become aware of the potential benefits of wildlife; they can call KWS for technical advice when they intend to create local animal conservancies, either individually or as a group. The main idea is to fence an area where wildlife resides and charge visitors an entrance fee; wildlife is a resource. There are several potential solutions to human-wildlife conflicts. District Commissioners and councillors should provide a forum to discuss all possibilities. The recruitment of rangers in outposts could be a temporary solution.
There is a potential in the project area for ecotourism; the Hippo Monitoring Project is valuable and useful for KWS. It is important to find ways to implement the recommendations and findings of the study, so that people in the project area can benefit from all the activities that are currently being carried out. KWS has to play a crucial role in this.
Generally, KWS takes a stand when it comes to human-hippo conflicts and its performance. All reports, whether they reach KWS by phone or in person, are entered in their Occurrence Books. Everything is noted, including the name of the person who reported and her/his contacts. The organisation normally responds within 12 hours. However, many cases go unreported because they refer to incident sites within the riparian zone, where planting is (illegally) done up to the water body so that hippos coming out of the water instantly enter a shamba. Even reported incidents might signify that residents would like the hippo to be killed because they want meat. The wardens said that local people neither favour hippo conservation nor do they see any benefits of hippos’ presence; hippos are just coming out to destroy their farms. They also pointed at flaws in the chiefs’ reports: they can take money and tell residents it was given to KWS, so residents may think that KWS has to be paid for the rangers to come, which is not the case.
Sometimes Members of Parliament (MPs) assist local communities. The MP of Nyakach, for instance, called KWS on several occasions. When he was told that KWS lacked transport, his personal assistant came to pick the rangers in Kisumu and took them to the incident site.
In one of the meetings of PAC Kisumu East, the District Commissioner, Agricultural Officers and farmers were present to discuss human-hippo conflicts. KWS said that hippos are an issue, but they lack feedback from farmers regarding incidents. Contact details of KWS were given to the people attending, but so far this has not resulted in any phone calls.
This narrative illustrates the following. First, communities are right in assuming that KWS will not act on hippo incidents if these are due to farming in areas destined as hippo habitats. Second, the mistrust is two-sided. However, there is willingness to respond to communities’ genuine wildlife concerns, and to develop initiatives to conserve hippos and create benefits for communities through ecotourism, for instance by establishing hippo conservancies.
7.3.2 Opinions of the local administration In the interviews with District Officers (DOs), four opinions stood out. First, most DOs generally blamed communities for the conflicts as they interfered with hippo habitats:
“People plough up to the lakeshore as the soil is relatively fertile there. By doing so they get into hippo areas, to which the government puts a blind eye. That is why these conflicts occur” (DO Kadibo, pers. comm.). 132
132 See Annex 8 for the particulars of the personal communications.
141
“Conflicts mainly occur because people moved to places where they should not have gone. Once inhabitants have encroached upon the wetlands, it is difficult to tell them to move out. The solution to deal with hippo problems lies with us. When human rights and political activism are involved, people can achieve much through community-based and civil society organisations, so why can this not apply to the hippo issue?” (DO Lower Nyakach, pers. comm.).
“Most people find themselves in a blame game: they have encroached into hippo habitats and are cultivating up to the lake, thereby blocking hippos’ access to food” (DO Nyando, pers. comm.).
Second, in terms of solutions, they acknowledged the need for coexistence:
“No solution is entirely home-grown and can only be effective if adapted to local circumstances; we need to address coping mechanisms to find out how people survive with hippos around” (DO Lower Nyakach, pers. comm.).
Solutions will have to come from the communities though and the question is: can we benefit from wildlife and coexist with hippos? In every challenge there is an opportunity” (DO Nyando, pers. comm.).
Third, they acknowledged that for coexistence community benefits are necessary. One of the options is ecotourism:
“Currently, the government promotes tourism within the Western circuit.133 It would be a good time to establish a place where people come to see hippos. We have to identify what kind of information is needed to initiate this. Many people consider the hippo as a problem animal but we have limited knowledge of its whereabouts and numbers (DO Nyando, pers. comm.).
Fourth, and partly related to the previous point, the DOs acknowledged the need for conservation:
“The government subscribes to the idea of Hippo Parks: it has the mandate to create hippo sanctuaries that are managed by KWS and the local authorities, while the revenues of protected areas flow to the central government and ultimately to local communities (DO Nyando, pers. comm.).
Generally, the DOs stated that communities have encroached into hippo territories; hence they are to blame for the conflicts. However, they also felt that community involvement is essential for coexistence, and subscribed to creating hippo conservancies.
7.3.3 Opinions of non-governmental organisations Several NGOs like the African Wildlife Foundation (AWF), World Wildlife Fund (WWF), East African Wildlife Society (EAWLS), African Conservation Centre (ACC) and SNV Kenya gave their opinions on human-wildlife conflicts (particularly hippos), which can be summarised as follows:
133 Western Kenya has much potential for tourism: it is diverse, with lush highlands, a tropical rainforest, and Lake Victoria. Due to poor marketing and low investor confidence, tourism did not do well, although the election of Barack Obama as president of the USA (his father is of Kenyan origin) caused a revival of tourism in Nyanza. The Lake Victoria Tourism Association was formed, which aims to market tourism and turn the sector into a primary revenue earner (Omolo 2011; Otieno 2011; www.lvtakenya.org; last accessed on 20 March 2017).
142
1. Human-wildlife conflicts are primarily land-use conflicts, due to farmers expanding theiractivities to hippo areas.
2. Proper compensation payments need to be in place; current arrangements like Ksh 30,000for loss of a life are insufficient.
3. Wildlife governance needs to be improved, to which good leadership is key.4. Responsibility for wildlife governance needs to be devolved to communities;
conservation committees need to be recognised by law.5. Human-hippo conflicts need to be addressed in the context of the landscape; wildlife
mostly lives beyond the boundaries of protected areas.6. Communities should create ‘parks outside parks’ and translate the presence of wildlife
into an asset, for instance by benefitting through economies of scale near protected areas.7. Participation of all actors in policy development and wildlife conservation is required.8. The bushmeat trade should be legalised so it can be regulated; the licensing mechanism
and legislation structure is problematic.9. KWS requires more staff and resources to carry out their mandate properly; it has to
provide expertise about (successful) conflict mitigation methods and inform communitiesabout different strategies to which they can adhere.
10. There should be a mechanism that ensures that communities benefit from wildlifeconservation.
11. Zonation is required to ensure coexistence of people and wildlife; it needs a change infocus from wildlife to land (habitat protection), which keeps wildlife alive. One couldintensify agriculture to get a higher yield without expanding the acreage. Areas can be setaside as key wildlife areas, for settlements or livestock grazing, or as farmland.
12. A conflict resolution committee with a multi-actor verification team that verifies andassesses the damage should be created.
One NGO clarified why there are relatively few hippo entries in the KWS Occurrence Books. First, people could have expected crop damage because they are cultivating near areas where hippos are. Second, hippos are not necessarily high-profile animals and people are not heard when they report hippo incidents; it does not raise stakes to report hippos. So there are probably less cases of hippos being reported to KWS, yet this does not mean that hippos are inferior conflict animals. In fact, their impact in a localised area can be huge.
Representatives of NGOs also characterised wildlife governance in terms of wildlife utilisation, community involvement and problem animal strategies. Their opinions are summarised below: 1. Sustainable utilisation of wildlife resources should be allowed, provided that the resource
is managed properly.2. The law should allow the establishment of community-based enterprises with lenient tax
requirements.3. Hunting should be legalised so that it can be regulated.4. People empowerment is a prerequisite for poverty eradication; livelihood issues can be
addressed through conservation.5. Local leadership has to be visionary and knowledgeable in wildlife issues.6. Communities outside protected areas have to be considered as part of a bigger landscape:
they are being affected by wildlife and bear the costs of conservation.7. Communities should inform KWS about local poachers: once they become custodians of
wildlife, poaching and bushmeat hunting will decline.8. Human-wildlife conflicts are based on politics, with people fighting over access to the
resource; by devolving wildlife management to the communities and through capacitybuilding, wildlife can generate income.
143
9. Tragedy of the commons still exists: nobody takes responsibility for conflict mitigation.10. Group ranches are coming up with their own conflict-dealing strategies. These
community-based enterprises are generally formed with the aim being to avert human-wildlife conflicts, predominantly through conservation (Manyara & Jones 2007).
Generally, NGOs134 exert influence in the policy review process, like EAWLS, which takes a lead role in contributing to national policy formulation, and SNV Kenya, which supports policy dialogue at the national level. NGOs like ACC are more geared towards ecological research to generate increased access to biological data. Many NGOs favour a partnership approach with other actors like the private sector, research and government institutions, and CBOs and other NGOs. AWF, for instance, cofounded the Kenya Land Conservation Trust, which supports property-rights based constructions like ‘environmental easements’135 and land acquisition for habitat protection, thereby aiming to guarantee the viability of habitats (outside protected areas) and wildlife populations to ensure the socio-economic interests of landowners and communities (Gitahi & Fitzgerald 2010). NGOs also support community-based programmes to improve local livelihoods, or to address the inequitable governance system that keeps many people affected by environmental change voiceless (WWF).
7.3.4 Opinions of the Beach Management Units BMU officials argued that fishermen can only benefit from hippos in this area once the animals are confined in parks for tourists to come and see them, for which they pay money to the community, while boat operators can also take visitors on a tour on Lake Victoria. BMU officials are helpful in conflict mitigation as they inform their members of hippo issues and advise them accordingly, for instance about the presence of a rogue hippo in the area or a female which has given birth to a calf (the mother can be dangerous); often verbally on the beach or in an impromptu meeting. They also inform their members of incidents with hippos, for instance when hippos destroy nets or damage a fishing boat. BMUs do not assist fishermen financially when their boats or nets get damaged by hippos; owners have to meet the costs themselves. They advise them in (assembly) meetings to fish away from ‘hippo points’ and not to put their nets near hippo grazing areas to avoid damage or getting attacked, at the same time cautioning them to be careful when fishing, avoid hippo territories altogether and leave a wide space when landing their boats ashore.
7.4 Perceptions of communal action and co-management
7.4.1 Changing the mindset Discussing options to deal with human-hippo conflicts at community level and seeing hippos as a resource requires a change of mindset involving the ‘conservation ethic’ (see Buchanan 2016). The discussions sparked off local initiatives to deal with hippo matters, the so-called Hippo Lobby Groups. We advised local people and facilitated the process in collaboration with KWS. As the field staff was close to the communities, they acted as intermediaries and provided information to newly formed groups. For them to feel responsible for any actions taken, local people have to perceive these initiatives as their own. Within the Kenyan context, a good working relationship between KWS and the communities is hereby essential.
Table 7.2 shows the suggestions made by six focus groups to prevent or mitigate human-hippo conflicts, ranging from protective methods, planting of vegetation, management and
134 See following websites: http://www.awf.org; www.accafrica.org; http://www.snv.org/country/kenya; http://wwf.panda.org/who_we_are/wwf_offices/kenya/; www.eawildlife.org; last accessed on 20 March 2017. 135 These are agreements between the easement holder and the landowner; they restrict the use of a property for conservation activities (Gitahi & Fitzgerald 2010).
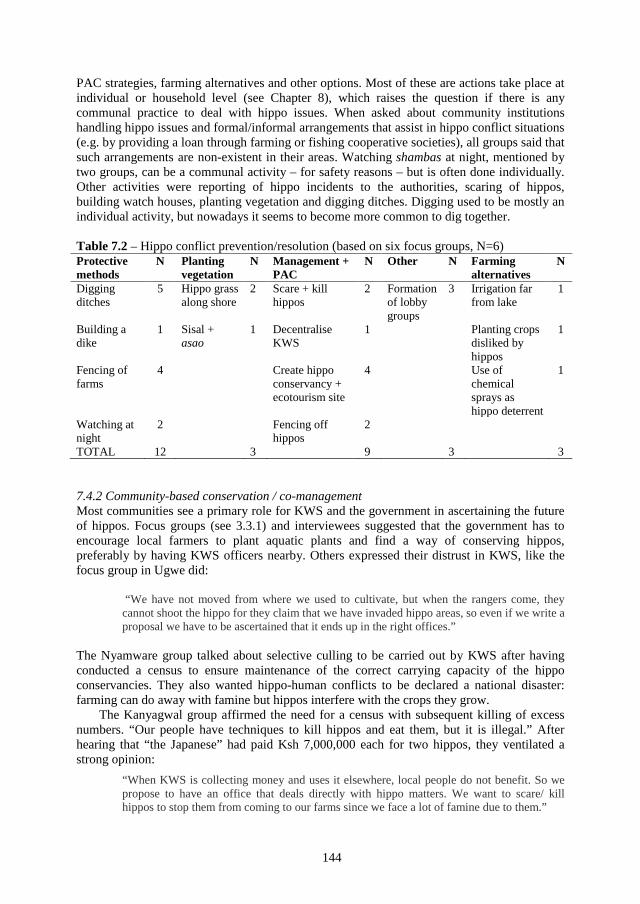
144
PAC strategies, farming alternatives and other options. Most of these are actions take place at individual or household level (see Chapter 8), which raises the question if there is any communal practice to deal with hippo issues. When asked about community institutions handling hippo issues and formal/informal arrangements that assist in hippo conflict situations (e.g. by providing a loan through farming or fishing cooperative societies), all groups said that such arrangements are non-existent in their areas. Watching shambas at night, mentioned by two groups, can be a communal activity – for safety reasons – but is often done individually. Other activities were reporting of hippo incidents to the authorities, scaring of hippos, building watch houses, planting vegetation and digging ditches. Digging used to be mostly an individual activity, but nowadays it seems to become more common to dig together.
Table 7.2 – Hippo conflict prevention/resolution (based on six focus groups, N=6) Protective methods
N Planting vegetation
N Management + PAC
N Other N Farming alternatives
N
Digging ditches
5 Hippo grass along shore
2 Scare + kill hippos
2 Formation of lobby groups
3 Irrigation far from lake
1
Building a dike
1 Sisal + asao
1 Decentralise KWS
1 Planting crops disliked by hippos
1
Fencing of farms
4 Create hippo conservancy + ecotourism site
4 Use of chemical sprays as hippo deterrent
1
Watching at night
2 Fencing off hippos
2
TOTAL 12 3 9 3 3
7.4.2 Community-based conservation / co-management Most communities see a primary role for KWS and the government in ascertaining the future of hippos. Focus groups (see 3.3.1) and interviewees suggested that the government has to encourage local farmers to plant aquatic plants and find a way of conserving hippos, preferably by having KWS officers nearby. Others expressed their distrust in KWS, like the focus group in Ugwe did:
“We have not moved from where we used to cultivate, but when the rangers come, they cannot shoot the hippo for they claim that we have invaded hippo areas, so even if we write a proposal we have to be ascertained that it ends up in the right offices.”
The Nyamware group talked about selective culling to be carried out by KWS after having conducted a census to ensure maintenance of the correct carrying capacity of the hippo conservancies. They also wanted hippo-human conflicts to be declared a national disaster: farming can do away with famine but hippos interfere with the crops they grow.
The Kanyagwal group affirmed the need for a census with subsequent killing of excess numbers. “Our people have techniques to kill hippos and eat them, but it is illegal.” After hearing that “the Japanese” had paid Ksh 7,000,000 each for two hippos, they ventilated a strong opinion:
“When KWS is collecting money and uses it elsewhere, local people do not benefit. So we propose to have an office that deals directly with hippo matters. We want to scare/ kill hippos to stop them from coming to our farms since we face a lot of famine due to them.”
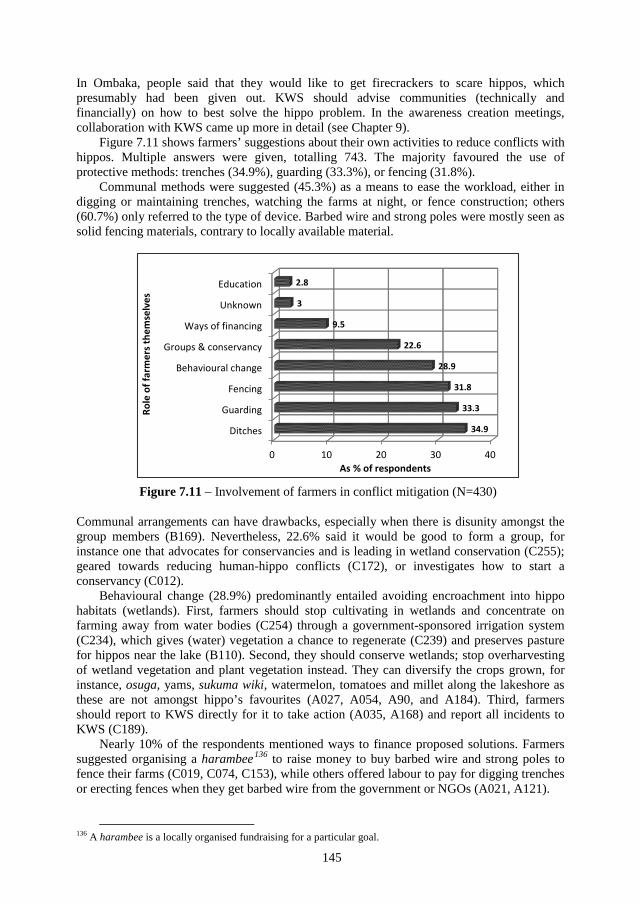
145
In Ombaka, people said that they would like to get firecrackers to scare hippos, which presumably had been given out. KWS should advise communities (technically and financially) on how to best solve the hippo problem. In the awareness creation meetings, collaboration with KWS came up more in detail (see Chapter 9).
Figure 7.11 shows farmers’ suggestions about their own activities to reduce conflicts with hippos. Multiple answers were given, totalling 743. The majority favoured the use of protective methods: trenches (34.9%), guarding (33.3%), or fencing (31.8%).
Communal methods were suggested (45.3%) as a means to ease the workload, either in digging or maintaining trenches, watching the farms at night, or fence construction; others (60.7%) only referred to the type of device. Barbed wire and strong poles were mostly seen as solid fencing materials, contrary to locally available material.
Communal arrangements can have drawbacks, especially when there is disunity amongst the group members (B169). Nevertheless, 22.6% said it would be good to form a group, for instance one that advocates for conservancies and is leading in wetland conservation (C255); geared towards reducing human-hippo conflicts (C172), or investigates how to start a conservancy (C012).
Behavioural change (28.9%) predominantly entailed avoiding encroachment into hippo habitats (wetlands). First, farmers should stop cultivating in wetlands and concentrate on farming away from water bodies (C254) through a government-sponsored irrigation system (C234), which gives (water) vegetation a chance to regenerate (C239) and preserves pasture for hippos near the lake (B110). Second, they should conserve wetlands; stop overharvesting of wetland vegetation and plant vegetation instead. They can diversify the crops grown, for instance, osuga, yams, sukuma wiki, watermelon, tomatoes and millet along the lakeshore as these are not amongst hippo’s favourites (A027, A054, A90, and A184). Third, farmers should report to KWS directly for it to take action (A035, A168) and report all incidents to KWS (C189).
Nearly 10% of the respondents mentioned ways to finance proposed solutions. Farmers suggested organising a harambee136 to raise money to buy barbed wire and strong poles to fence their farms (C019, C074, C153), while others offered labour to pay for digging trenches or erecting fences when they get barbed wire from the government or NGOs (A021, A121).
136 A harambee is a locally organised fundraising for a particular goal.
0 10 20 30 40
Ditches
Guarding
Fencing
Behavioural change
Groups & conservancy
Ways of financing
Unknown
Education
34.9
33.3
31.8
28.9
22.6
9.5
3
2.8
As % of respondents
Role
of f
arm
ers t
hem
selv
es
Figure 7.11 – Involvement of farmers in conflict mitigation (N=430)
146
“We can collect some amount to buy part of fencing materials and offer labour in constructing the dikes, as well as write proposals to NGOs requesting support (funds) to assist us to use effective protective devices like barbed wire in fencing” (A136).
Nearly 3% related to awareness creation and the need for education on wetlands and the significance of hippos. Awareness should be raised in the chiefs’ barazas (C039), while farmers should also be educated on the importance of natural vegetation so that they will stop overharvesting wetland products (A049). Having hippos in the area also generates benefits: farmers should allow that part of their land is used as a conservancy (C161), and enforced to stick to the regulations (A156); otherwise KWS should fine them (A090).
This overview of opinions shows that farmers have an ambiguous relation to both co-management and community-based management. They acknowledge the importance of KWS as an institution in wildlife governance, but negative images and distrust prevail, whereas communal action in human-hippo conflict mitigation is rare (see Chapter 8). This suggests a restricted potential for both co-management with KWS and community-based management based on communal action.
7.5 Conclusions
Negative images of hippos and the agency (KWS) that is supposed to govern the human-hippo conflicts prevail. Generally, respondents feel that hippos interfere with their activities and only rarely they blame themselves for invading hippo habitats. Nearly all consider hippos as problem animals, to which they ascribe predominantly negative values of causing crop and property damage, loss of fishing gears, and human casualties, besides invoking fear. Many inhabitants have low tolerance levels towards hippos. Key actors responsible for hippo conservation and conflict mitigation are KWS, GoK, in addition to the communities, NGOs and other donors. Surprisingly, none of the respondents mentioned the private sector, whereas it could play a crucial role when developing conservancies. A large portion (over 30%) feels that hippo conservation cannot succeed in their area, whereas others favour the creation of ‘lobby groups’ and local conservancies. Residents see a role for GoK and KWS to assist them in erecting fences and dikes, mainly along the lakeshore, to keep hippos away from their farms. They argue that KWS should improve its PAC and hippo-monitoring activities, whereas both GoK and KWS have to identify areas for conservancies and provide financial support and/or technical advice.
KWS has a dominant position but is ‘handicapped’ by a shortage of staff and equipment. The area around Winam Gulf is vast, and there are few protected areas, so hippos roam around freely. KWS seems to blame the communities for having invaded hippo territories (wetland destruction) despite the regulations to keep a ‘buffer zone’ free. Much attention of KWS is directed towards protected areas; the project area seems to be hardly on their radar. They seem to interact with the communities in a distant way; there were some field visits, but information was rarely exchanged. There seems to be a mutual distrust between the two: KWS perceives the communities as intruders of hippo territories, whereas the communities blame KWS for its lax behaviour. According to them, the organisation rarely attends to reports; if the rangers come, they fail to see hippos and just leave. The level of communication is poor; it would be good if both parties would express their expectations and what each can do to curb human-hippo conflicts. This also goes for the local administration, which complains bitterly about the conflicts, but does not seem very keen on changing the situation, with a few exceptions.
147
So far, little has changed in the project area during the past two decades, except for the degradation of wetlands through land conversion, overharvesting and water pollution. However, conflict numbers seemingly have increased, which many respondents attribute to rising hippo numbers. Rather than rising numbers the key issue seems to be that the area where people and hippos come into contact has expanded, often resulting in a higher conflict rate. Literature review shows that one of the bottlenecks in conservation is the lack of benefits local people get from wildlife, while they carry the burden of wildlife invasions. This plays on their conservation ethic; they do not value land set aside for wildlife conservation initiatives. The question is: can residents unite and create conservancies from which they can benefit? Their perspectives on co-management and community-based management suggest limited prospects, but this question will be further explored in the next chapter.
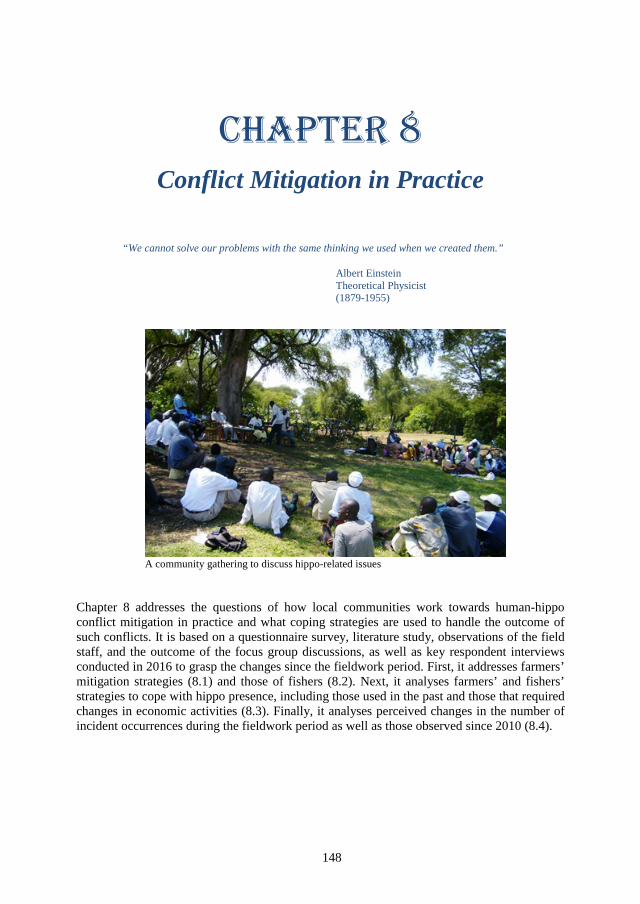
148
Chapter 8 Conflict Mitigation in Practice
“We cannot solve our problems with the same thinking we used when we created them.”
Albert Einstein Theoretical Physicist (1879-1955)
A community gathering to discuss hippo-related issues
Chapter 8 addresses the questions of how local communities work towards human-hippo conflict mitigation in practice and what coping strategies are used to handle the outcome of such conflicts. It is based on a questionnaire survey, literature study, observations of the field staff, and the outcome of the focus group discussions, as well as key respondent interviews conducted in 2016 to grasp the changes since the fieldwork period. First, it addresses farmers’ mitigation strategies (8.1) and those of fishers (8.2). Next, it analyses farmers’ and fishers’ strategies to cope with hippo presence, including those used in the past and those that required changes in economic activities (8.3). Finally, it analyses perceived changes in the number of incident occurrences during the fieldwork period as well as those observed since 2010 (8.4).
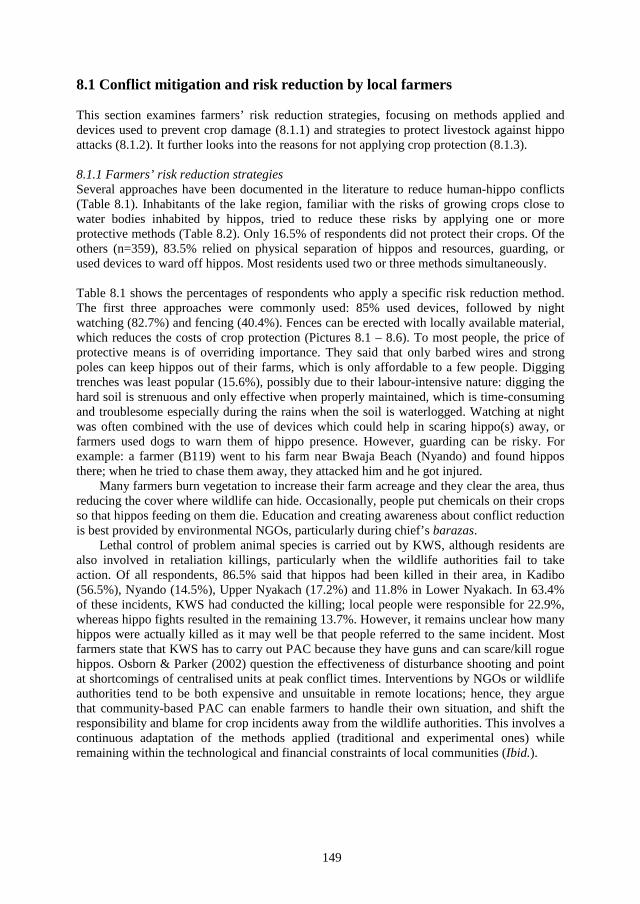
149
8.1 Conflict mitigation and risk reduction by local farmers
This section examines farmers’ risk reduction strategies, focusing on methods applied and devices used to prevent crop damage (8.1.1) and strategies to protect livestock against hippo attacks (8.1.2). It further looks into the reasons for not applying crop protection (8.1.3).
8.1.1 Farmers’ risk reduction strategies Several approaches have been documented in the literature to reduce human-hippo conflicts (Table 8.1). Inhabitants of the lake region, familiar with the risks of growing crops close to water bodies inhabited by hippos, tried to reduce these risks by applying one or more protective methods (Table 8.2). Only 16.5% of respondents did not protect their crops. Of the others (n=359), 83.5% relied on physical separation of hippos and resources, guarding, or used devices to ward off hippos. Most residents used two or three methods simultaneously.
Table 8.1 shows the percentages of respondents who apply a specific risk reduction method. The first three approaches were commonly used: 85% used devices, followed by night watching (82.7%) and fencing (40.4%). Fences can be erected with locally available material, which reduces the costs of crop protection (Pictures 8.1 – 8.6). To most people, the price of protective means is of overriding importance. They said that only barbed wires and strong poles can keep hippos out of their farms, which is only affordable to a few people. Digging trenches was least popular (15.6%), possibly due to their labour-intensive nature: digging the hard soil is strenuous and only effective when properly maintained, which is time-consuming and troublesome especially during the rains when the soil is waterlogged. Watching at night was often combined with the use of devices which could help in scaring hippo(s) away, or farmers used dogs to warn them of hippo presence. However, guarding can be risky. For example: a farmer (B119) went to his farm near Bwaja Beach (Nyando) and found hippos there; when he tried to chase them away, they attacked him and he got injured.
Many farmers burn vegetation to increase their farm acreage and they clear the area, thus reducing the cover where wildlife can hide. Occasionally, people put chemicals on their crops so that hippos feeding on them die. Education and creating awareness about conflict reduction is best provided by environmental NGOs, particularly during chief’s barazas.
Lethal control of problem animal species is carried out by KWS, although residents are also involved in retaliation killings, particularly when the wildlife authorities fail to take action. Of all respondents, 86.5% said that hippos had been killed in their area, in Kadibo (56.5%), Nyando (14.5%), Upper Nyakach (17.2%) and 11.8% in Lower Nyakach. In 63.4% of these incidents, KWS had conducted the killing; local people were responsible for 22.9%, whereas hippo fights resulted in the remaining 13.7%. However, it remains unclear how many hippos were actually killed as it may well be that people referred to the same incident. Most farmers state that KWS has to carry out PAC because they have guns and can scare/kill rogue hippos. Osborn & Parker (2002) question the effectiveness of disturbance shooting and point at shortcomings of centralised units at peak conflict times. Interventions by NGOs or wildlife authorities tend to be both expensive and unsuitable in remote locations; hence, they argue that community-based PAC can enable farmers to handle their own situation, and shift the responsibility and blame for crop incidents away from the wildlife authorities. This involves a continuous adaptation of the methods applied (traditional and experimental ones) while remaining within the technological and financial constraints of local communities (Ibid.).
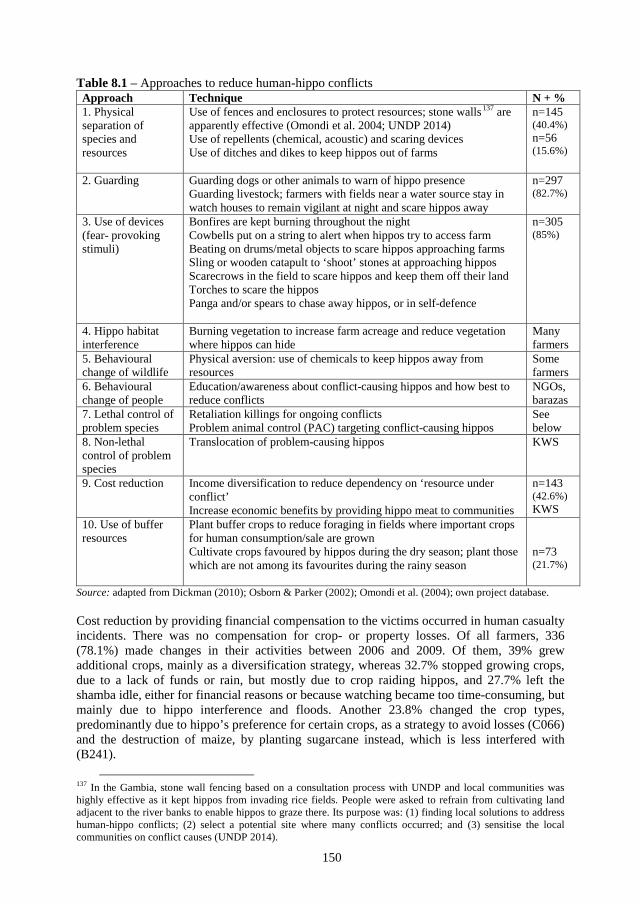
150
Table 8.1 – Approaches to reduce human-hippo conflicts Approach Technique N + % 1. Physicalseparation ofspecies andresources
Use of fences and enclosures to protect resources; stone walls137 are apparently effective (Omondi et al. 2004; UNDP 2014) Use of repellents (chemical, acoustic) and scaring devices Use of ditches and dikes to keep hippos out of farms
n=145 (40.4%) n=56 (15.6%)
2. Guarding Guarding dogs or other animals to warn of hippo presence Guarding livestock; farmers with fields near a water source stay in watch houses to remain vigilant at night and scare hippos away
n=297 (82.7%)
3. Use of devices(fear- provokingstimuli)
Bonfires are kept burning throughout the night Cowbells put on a string to alert when hippos try to access farm Beating on drums/metal objects to scare hippos approaching farms Sling or wooden catapult to ‘shoot’ stones at approaching hippos Scarecrows in the field to scare hippos and keep them off their land Torches to scare the hippos Panga and/or spears to chase away hippos, or in self-defence
n=305 (85%)
4. Hippo habitatinterference
Burning vegetation to increase farm acreage and reduce vegetation where hippos can hide
Many farmers
5. Behaviouralchange of wildlife
Physical aversion: use of chemicals to keep hippos away from resources
Some farmers
6. Behaviouralchange of people
Education/awareness about conflict-causing hippos and how best to reduce conflicts
NGOs, barazas
7. Lethal control ofproblem species
Retaliation killings for ongoing conflicts Problem animal control (PAC) targeting conflict-causing hippos
See below
8. Non-lethalcontrol of problemspecies
Translocation of problem-causing hippos KWS
9. Cost reduction Income diversification to reduce dependency on ‘resource under conflict’ Increase economic benefits by providing hippo meat to communities
n=143 (42.6%) KWS
10. Use of bufferresources
Plant buffer crops to reduce foraging in fields where important crops for human consumption/sale are grown Cultivate crops favoured by hippos during the dry season; plant those which are not among its favourites during the rainy season
n=73 (21.7%)
Source: adapted from Dickman (2010); Osborn & Parker (2002); Omondi et al. (2004); own project database.
Cost reduction by providing financial compensation to the victims occurred in human casualty incidents. There was no compensation for crop- or property losses. Of all farmers, 336 (78.1%) made changes in their activities between 2006 and 2009. Of them, 39% grew additional crops, mainly as a diversification strategy, whereas 32.7% stopped growing crops, due to a lack of funds or rain, but mostly due to crop raiding hippos, and 27.7% left the shamba idle, either for financial reasons or because watching became too time-consuming, but mainly due to hippo interference and floods. Another 23.8% changed the crop types, predominantly due to hippo’s preference for certain crops, as a strategy to avoid losses (C066) and the destruction of maize, by planting sugarcane instead, which is less interfered with (B241).
137 In the Gambia, stone wall fencing based on a consultation process with UNDP and local communities was highly effective as it kept hippos from invading rice fields. People were asked to refrain from cultivating land adjacent to the river banks to enable hippos to graze there. Its purpose was: (1) finding local solutions to address human-hippo conflicts; (2) select a potential site where many conflicts occurred; and (3) sensitise the local communities on conflict causes (UNDP 2014).
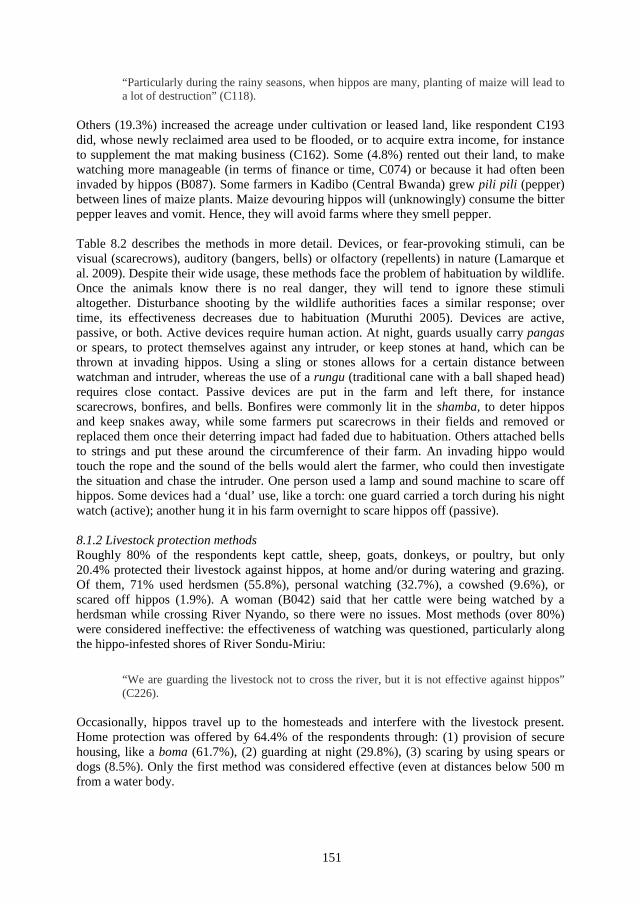
151
“Particularly during the rainy seasons, when hippos are many, planting of maize will lead to a lot of destruction” (C118).
Others (19.3%) increased the acreage under cultivation or leased land, like respondent C193 did, whose newly reclaimed area used to be flooded, or to acquire extra income, for instance to supplement the mat making business (C162). Some (4.8%) rented out their land, to make watching more manageable (in terms of finance or time, C074) or because it had often been invaded by hippos (B087). Some farmers in Kadibo (Central Bwanda) grew pili pili (pepper) between lines of maize plants. Maize devouring hippos will (unknowingly) consume the bitter pepper leaves and vomit. Hence, they will avoid farms where they smell pepper.
Table 8.2 describes the methods in more detail. Devices, or fear-provoking stimuli, can be visual (scarecrows), auditory (bangers, bells) or olfactory (repellents) in nature (Lamarque et al. 2009). Despite their wide usage, these methods face the problem of habituation by wildlife. Once the animals know there is no real danger, they will tend to ignore these stimuli altogether. Disturbance shooting by the wildlife authorities faces a similar response; over time, its effectiveness decreases due to habituation (Muruthi 2005). Devices are active, passive, or both. Active devices require human action. At night, guards usually carry pangas or spears, to protect themselves against any intruder, or keep stones at hand, which can be thrown at invading hippos. Using a sling or stones allows for a certain distance between watchman and intruder, whereas the use of a rungu (traditional cane with a ball shaped head) requires close contact. Passive devices are put in the farm and left there, for instance scarecrows, bonfires, and bells. Bonfires were commonly lit in the shamba, to deter hippos and keep snakes away, while some farmers put scarecrows in their fields and removed or replaced them once their deterring impact had faded due to habituation. Others attached bells to strings and put these around the circumference of their farm. An invading hippo would touch the rope and the sound of the bells would alert the farmer, who could then investigate the situation and chase the intruder. One person used a lamp and sound machine to scare off hippos. Some devices had a ‘dual’ use, like a torch: one guard carried a torch during his night watch (active); another hung it in his farm overnight to scare hippos off (passive).
8.1.2 Livestock protection methods Roughly 80% of the respondents kept cattle, sheep, goats, donkeys, or poultry, but only 20.4% protected their livestock against hippos, at home and/or during watering and grazing. Of them, 71% used herdsmen (55.8%), personal watching (32.7%), a cowshed (9.6%), or scared off hippos (1.9%). A woman (B042) said that her cattle were being watched by a herdsman while crossing River Nyando, so there were no issues. Most methods (over 80%) were considered ineffective: the effectiveness of watching was questioned, particularly along the hippo-infested shores of River Sondu-Miriu:
“We are guarding the livestock not to cross the river, but it is not effective against hippos” (C226).
Occasionally, hippos travel up to the homesteads and interfere with the livestock present. Home protection was offered by 64.4% of the respondents through: (1) provision of secure housing, like a boma (61.7%), (2) guarding at night (29.8%), (3) scaring by using spears or dogs (8.5%). Only the first method was considered effective (even at distances below 500 m from a water body.
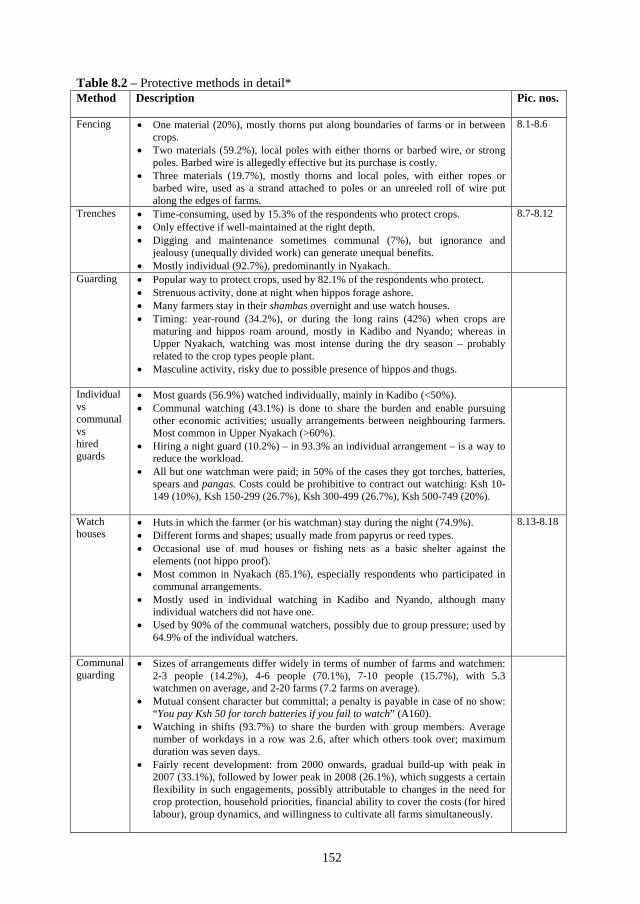
152
Table 8.2 – Protective methods in detail* Method Description Pic. nos.
Fencing • One material (20%), mostly thorns put along boundaries of farms or in betweencrops.
• Two materials (59.2%), local poles with either thorns or barbed wire, or strongpoles. Barbed wire is allegedly effective but its purchase is costly.
• Three materials (19.7%), mostly thorns and local poles, with either ropes orbarbed wire, used as a strand attached to poles or an unreeled roll of wire putalong the edges of farms.
8.1-8.6
Trenches • Time-consuming, used by 15.3% of the respondents who protect crops.• Only effective if well-maintained at the right depth.• Digging and maintenance sometimes communal (7%), but ignorance and
jealousy (unequally divided work) can generate unequal benefits.• Mostly individual (92.7%), predominantly in Nyakach.
8.7-8.12
Guarding • Popular way to protect crops, used by 82.1% of the respondents who protect.• Strenuous activity, done at night when hippos forage ashore.• Many farmers stay in their shambas overnight and use watch houses.• Timing: year-round (34.2%), or during the long rains (42%) when crops are
maturing and hippos roam around, mostly in Kadibo and Nyando; whereas inUpper Nyakach, watching was most intense during the dry season – probablyrelated to the crop types people plant.
• Masculine activity, risky due to possible presence of hippos and thugs.
Individual vs communal vs hired guards
• Most guards (56.9%) watched individually, mainly in Kadibo (<50%).• Communal watching (43.1%) is done to share the burden and enable pursuing
other economic activities; usually arrangements between neighbouring farmers.Most common in Upper Nyakach (>60%).
• Hiring a night guard (10.2%) – in 93.3% an individual arrangement – is a way toreduce the workload.
• All but one watchman were paid; in 50% of the cases they got torches, batteries,spears and pangas. Costs could be prohibitive to contract out watching: Ksh 10-149 (10%), Ksh 150-299 (26.7%), Ksh 300-499 (26.7%), Ksh 500-749 (20%).
Watch houses
• Huts in which the farmer (or his watchman) stay during the night (74.9%).• Different forms and shapes; usually made from papyrus or reed types.• Occasional use of mud houses or fishing nets as a basic shelter against the
elements (not hippo proof).• Most common in Nyakach (85.1%), especially respondents who participated in
communal arrangements.• Mostly used in individual watching in Kadibo and Nyando, although many
individual watchers did not have one.• Used by 90% of the communal watchers, possibly due to group pressure; used by
64.9% of the individual watchers.
8.13-8.18
Communal guarding
• Sizes of arrangements differ widely in terms of number of farms and watchmen:2-3 people (14.2%), 4-6 people (70.1%), 7-10 people (15.7%), with 5.3watchmen on average, and 2-20 farms (7.2 farms on average).
• Mutual consent character but committal; a penalty is payable in case of no show:“You pay Ksh 50 for torch batteries if you fail to watch” (A160).
• Watching in shifts (93.7%) to share the burden with group members. Averagenumber of workdays in a row was 2.6, after which others took over; maximumduration was seven days.
• Fairly recent development: from 2000 onwards, gradual build-up with peak in2007 (33.1%), followed by lower peak in 2008 (26.1%), which suggests a certainflexibility in such engagements, possibly attributable to changes in the need forcrop protection, household priorities, financial ability to cover the costs (for hiredlabour), group dynamics, and willingness to cultivate all farms simultaneously.
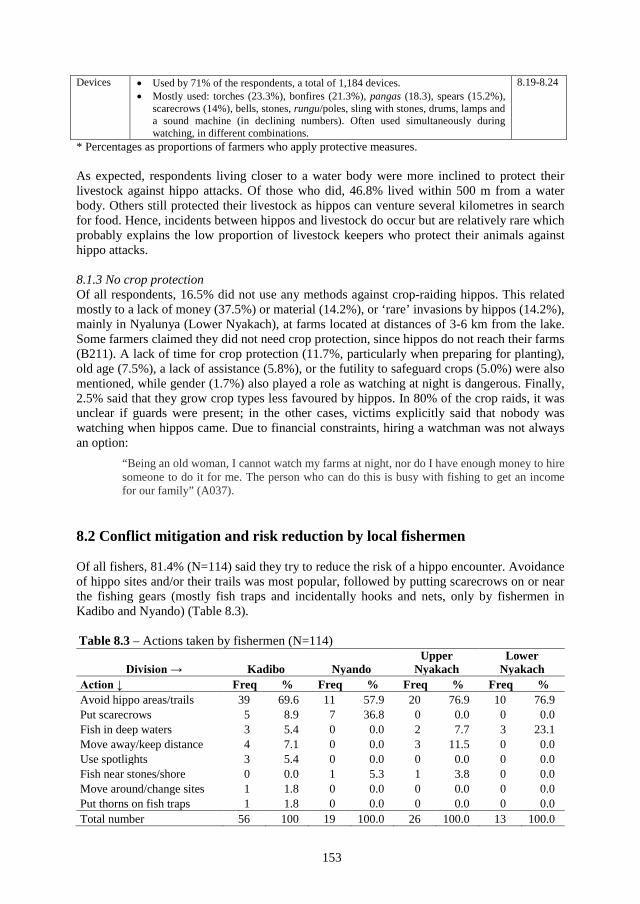
153
Devices • Used by 71% of the respondents, a total of 1,184 devices.• Mostly used: torches (23.3%), bonfires (21.3%), pangas (18.3), spears (15.2%),
scarecrows (14%), bells, stones, rungu/poles, sling with stones, drums, lamps anda sound machine (in declining numbers). Often used simultaneously duringwatching, in different combinations.
8.19-8.24
* Percentages as proportions of farmers who apply protective measures.
As expected, respondents living closer to a water body were more inclined to protect their livestock against hippo attacks. Of those who did, 46.8% lived within 500 m from a water body. Others still protected their livestock as hippos can venture several kilometres in search for food. Hence, incidents between hippos and livestock do occur but are relatively rare which probably explains the low proportion of livestock keepers who protect their animals against hippo attacks.
8.1.3 No crop protection Of all respondents, 16.5% did not use any methods against crop-raiding hippos. This related mostly to a lack of money (37.5%) or material (14.2%), or ‘rare’ invasions by hippos (14.2%), mainly in Nyalunya (Lower Nyakach), at farms located at distances of 3-6 km from the lake. Some farmers claimed they did not need crop protection, since hippos do not reach their farms (B211). A lack of time for crop protection (11.7%, particularly when preparing for planting), old age (7.5%), a lack of assistance (5.8%), or the futility to safeguard crops (5.0%) were also mentioned, while gender (1.7%) also played a role as watching at night is dangerous. Finally, 2.5% said that they grow crop types less favoured by hippos. In 80% of the crop raids, it was unclear if guards were present; in the other cases, victims explicitly said that nobody was watching when hippos came. Due to financial constraints, hiring a watchman was not always an option:
“Being an old woman, I cannot watch my farms at night, nor do I have enough money to hire someone to do it for me. The person who can do this is busy with fishing to get an income for our family” (A037).
8.2 Conflict mitigation and risk reduction by local fishermen
Of all fishers, 81.4% (N=114) said they try to reduce the risk of a hippo encounter. Avoidance of hippo sites and/or their trails was most popular, followed by putting scarecrows on or near the fishing gears (mostly fish traps and incidentally hooks and nets, only by fishermen in Kadibo and Nyando) (Table 8.3).
Table 8.3 – Actions taken by fishermen (N=114)
Division → Kadibo Nyando Upper
Nyakach Lower
Nyakach Action ↓ Freq % Freq % Freq % Freq % Avoid hippo areas/trails 39 69.6 11 57.9 20 76.9 10 76.9 Put scarecrows 5 8.9 7 36.8 0 0.0 0 0.0 Fish in deep waters 3 5.4 0 0.0 2 7.7 3 23.1 Move away/keep distance 4 7.1 0 0.0 3 11.5 0 0.0 Use spotlights 3 5.4 0 0.0 0 0.0 0 0.0 Fish near stones/shore 0 0.0 1 5.3 1 3.8 0 0.0 Move around/change sites 1 1.8 0 0.0 0 0.0 0 0.0 Put thorns on fish traps 1 1.8 0 0.0 0 0.0 0 0.0 Total number 56 100 19 100.0 26 100.0 13 100.0
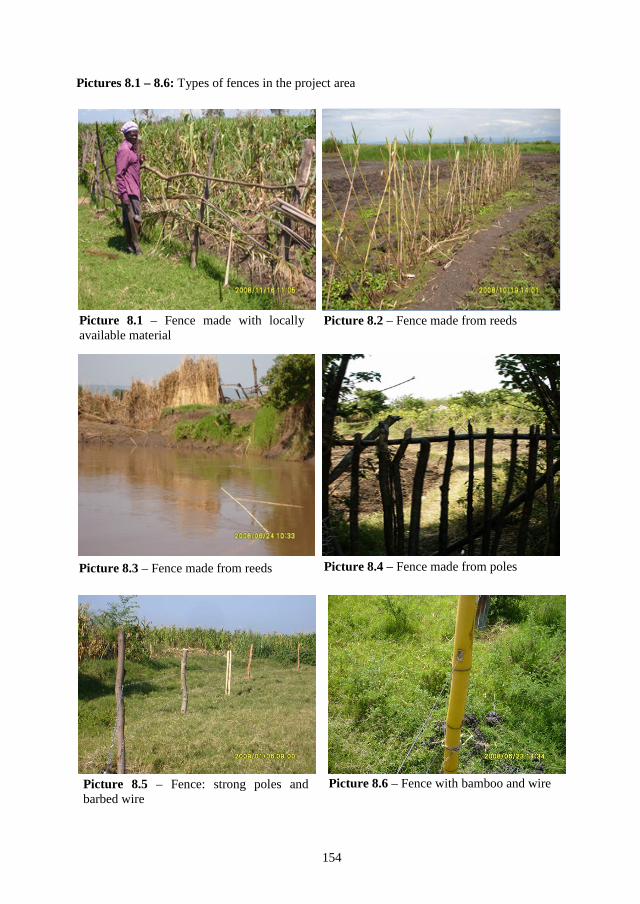
154
Pictures 8.1 – 8.6: Types of fences in the project area
Picture 8.4 – Fence made from poles
Picture 8.1 – Fence made with locally available material
Picture 8.2 – Fence made from reeds
Picture 8.3 – Fence made from reeds
Picture 8.6 – Fence with bamboo and wire Picture 8.5 – Fence: strong poles and barbed wire
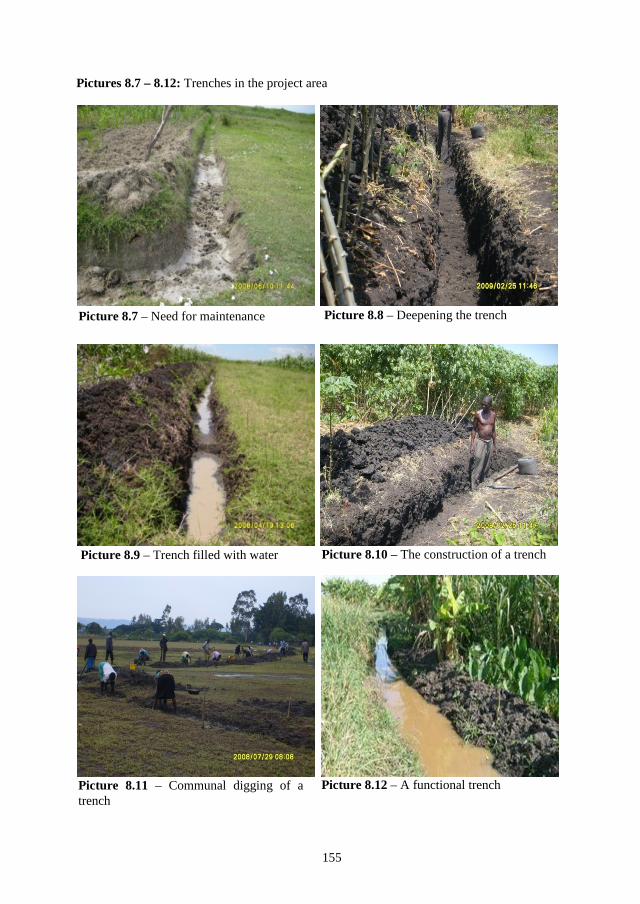
155
Pictures 8.7 – 8.12: Trenches in the project area
Picture 8.7 – Need for maintenance Picture 8.8 – Deepening the trench
Picture 8.9 – Trench filled with water Picture 8.10 – The construction of a trench
Picture 8.11 – Communal digging of a trench
Picture 8.12 – A functional trench
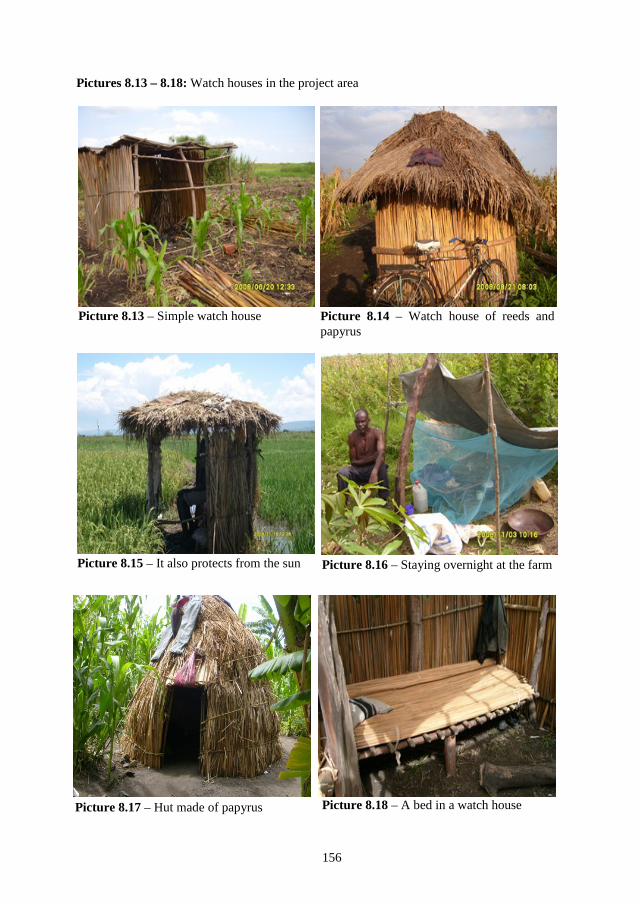
156
Pictures 8.13 – 8.18: Watch houses in the project area
Picture 8.13 – Simple watch house Picture 8.14 – Watch house of reeds and papyrus
Picture 8.15 – It also protects from the sun
Picture 8.17 – Hut made of papyrus Picture 8.18 – A bed in a watch house
Picture 8.16 – Staying overnight at the farm
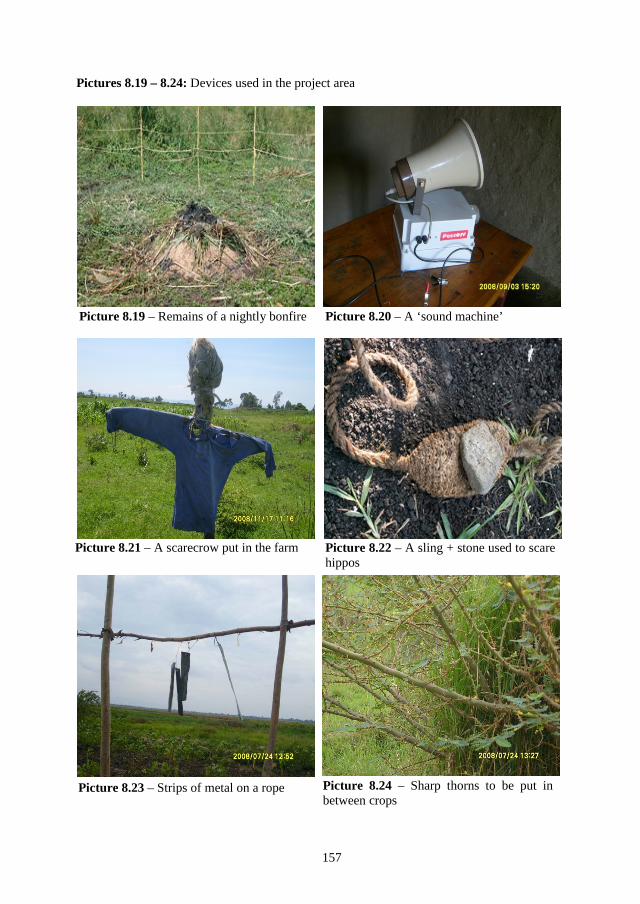
157
Pictures 8.19 – 8.24: Devices used in the project area
Picture 8.19 – Remains of a nightly bonfire Picture 8.20 – A ‘sound machine’
Picture 8.21 – A scarecrow put in the farm Picture 8.22 – A sling + stone used to scare hippos
Picture 8.23 – Strips of metal on a rope Picture 8.24 – Sharp thorns to be put in between crops
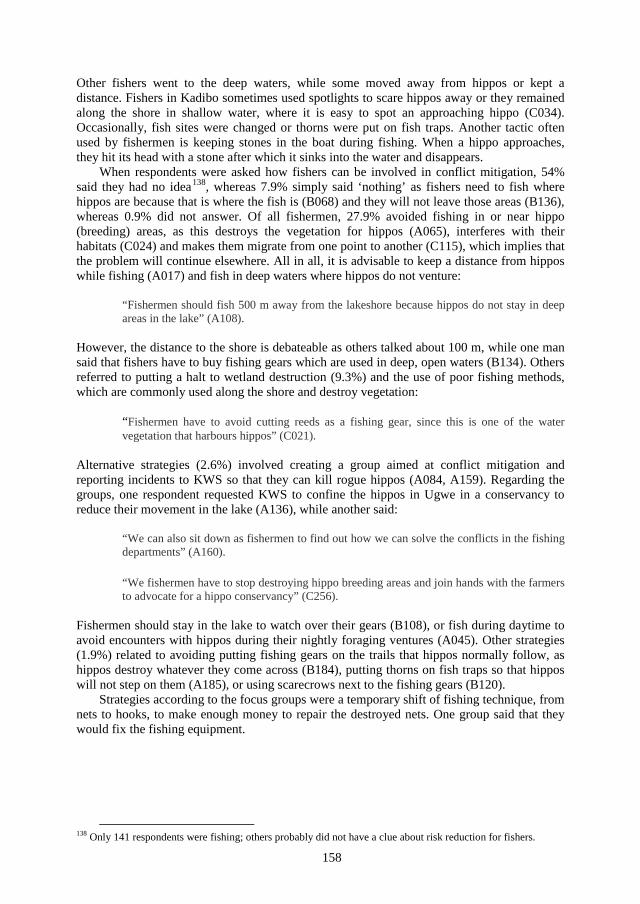
158
Other fishers went to the deep waters, while some moved away from hippos or kept a distance. Fishers in Kadibo sometimes used spotlights to scare hippos away or they remained along the shore in shallow water, where it is easy to spot an approaching hippo (C034). Occasionally, fish sites were changed or thorns were put on fish traps. Another tactic often used by fishermen is keeping stones in the boat during fishing. When a hippo approaches, they hit its head with a stone after which it sinks into the water and disappears.
When respondents were asked how fishers can be involved in conflict mitigation, 54% said they had no idea138, whereas 7.9% simply said ‘nothing’ as fishers need to fish where hippos are because that is where the fish is (B068) and they will not leave those areas (B136), whereas 0.9% did not answer. Of all fishermen, 27.9% avoided fishing in or near hippo (breeding) areas, as this destroys the vegetation for hippos (A065), interferes with their habitats (C024) and makes them migrate from one point to another (C115), which implies that the problem will continue elsewhere. All in all, it is advisable to keep a distance from hippos while fishing (A017) and fish in deep waters where hippos do not venture:
“Fishermen should fish 500 m away from the lakeshore because hippos do not stay in deep areas in the lake” (A108).
However, the distance to the shore is debateable as others talked about 100 m, while one man said that fishers have to buy fishing gears which are used in deep, open waters (B134). Others referred to putting a halt to wetland destruction (9.3%) and the use of poor fishing methods, which are commonly used along the shore and destroy vegetation:
“Fishermen have to avoid cutting reeds as a fishing gear, since this is one of the water vegetation that harbours hippos” (C021).
Alternative strategies (2.6%) involved creating a group aimed at conflict mitigation and reporting incidents to KWS so that they can kill rogue hippos (A084, A159). Regarding the groups, one respondent requested KWS to confine the hippos in Ugwe in a conservancy to reduce their movement in the lake (A136), while another said:
“We can also sit down as fishermen to find out how we can solve the conflicts in the fishing departments” (A160).
“We fishermen have to stop destroying hippo breeding areas and join hands with the farmers to advocate for a hippo conservancy” (C256).
Fishermen should stay in the lake to watch over their gears (B108), or fish during daytime to avoid encounters with hippos during their nightly foraging ventures (A045). Other strategies (1.9%) related to avoiding putting fishing gears on the trails that hippos normally follow, as hippos destroy whatever they come across (B184), putting thorns on fish traps so that hippos will not step on them (A185), or using scarecrows next to the fishing gears (B120).
Strategies according to the focus groups were a temporary shift of fishing technique, from nets to hooks, to make enough money to repair the destroyed nets. One group said that they would fix the fishing equipment.
138 Only 141 respondents were fishing; others probably did not have a clue about risk reduction for fishers.
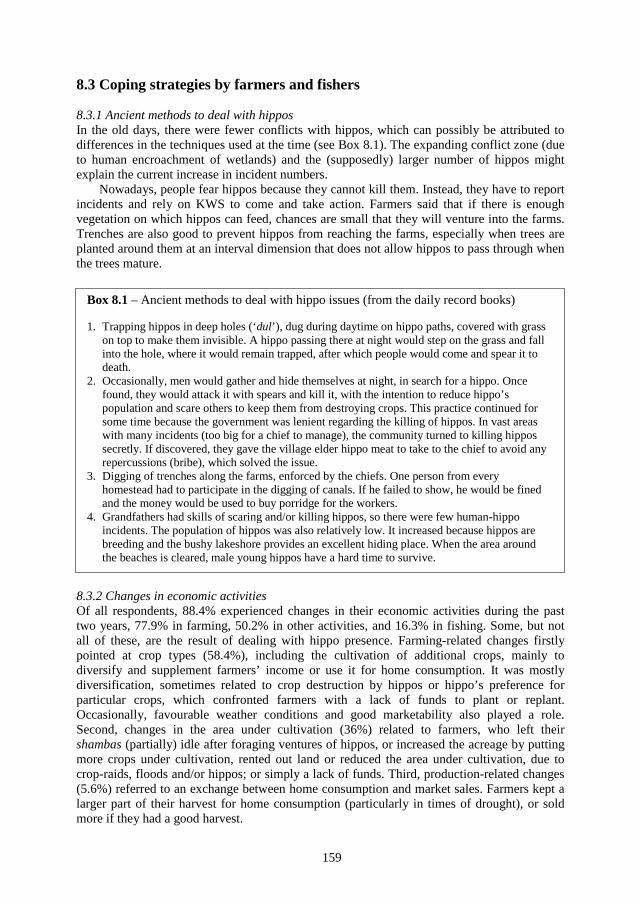
159
8.3 Coping strategies by farmers and fishers
8.3.1 Ancient methods to deal with hippos In the old days, there were fewer conflicts with hippos, which can possibly be attributed to differences in the techniques used at the time (see Box 8.1). The expanding conflict zone (due to human encroachment of wetlands) and the (supposedly) larger number of hippos might explain the current increase in incident numbers.
Nowadays, people fear hippos because they cannot kill them. Instead, they have to report incidents and rely on KWS to come and take action. Farmers said that if there is enough vegetation on which hippos can feed, chances are small that they will venture into the farms. Trenches are also good to prevent hippos from reaching the farms, especially when trees are planted around them at an interval dimension that does not allow hippos to pass through when the trees mature.
8.3.2 Changes in economic activities Of all respondents, 88.4% experienced changes in their economic activities during the past two years, 77.9% in farming, 50.2% in other activities, and 16.3% in fishing. Some, but not all of these, are the result of dealing with hippo presence. Farming-related changes firstly pointed at crop types (58.4%), including the cultivation of additional crops, mainly to diversify and supplement farmers’ income or use it for home consumption. It was mostly diversification, sometimes related to crop destruction by hippos or hippo’s preference for particular crops, which confronted farmers with a lack of funds to plant or replant. Occasionally, favourable weather conditions and good marketability also played a role. Second, changes in the area under cultivation (36%) related to farmers, who left their shambas (partially) idle after foraging ventures of hippos, or increased the acreage by putting more crops under cultivation, rented out land or reduced the area under cultivation, due to crop-raids, floods and/or hippos; or simply a lack of funds. Third, production-related changes (5.6%) referred to an exchange between home consumption and market sales. Farmers kept a larger part of their harvest for home consumption (particularly in times of drought), or sold more if they had a good harvest.
Box 8.1 – Ancient methods to deal with hippo issues (from the daily record books)
1. Trapping hippos in deep holes (‘dul’), dug during daytime on hippo paths, covered with grasson top to make them invisible. A hippo passing there at night would step on the grass and fallinto the hole, where it would remain trapped, after which people would come and spear it todeath.
2. Occasionally, men would gather and hide themselves at night, in search for a hippo. Oncefound, they would attack it with spears and kill it, with the intention to reduce hippo’spopulation and scare others to keep them from destroying crops. This practice continued forsome time because the government was lenient regarding the killing of hippos. In vast areaswith many incidents (too big for a chief to manage), the community turned to killing hippossecretly. If discovered, they gave the village elder hippo meat to take to the chief to avoid anyrepercussions (bribe), which solved the issue.
3. Digging of trenches along the farms, enforced by the chiefs. One person from everyhomestead had to participate in the digging of canals. If he failed to show, he would be finedand the money would be used to buy porridge for the workers.
4. Grandfathers had skills of scaring and/or killing hippos, so there were few human-hippoincidents. The population of hippos was also relatively low. It increased because hippos arebreeding and the bushy lakeshore provides an excellent hiding place. When the area aroundthe beaches is cleared, male young hippos have a hard time to survive.
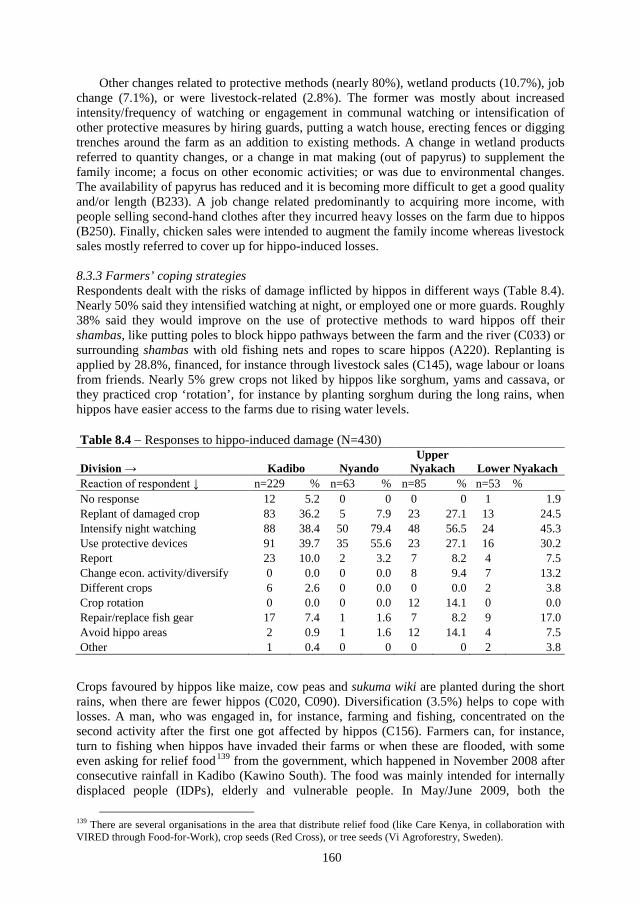
160
Other changes related to protective methods (nearly 80%), wetland products (10.7%), job change (7.1%), or were livestock-related (2.8%). The former was mostly about increased intensity/frequency of watching or engagement in communal watching or intensification of other protective measures by hiring guards, putting a watch house, erecting fences or digging trenches around the farm as an addition to existing methods. A change in wetland products referred to quantity changes, or a change in mat making (out of papyrus) to supplement the family income; a focus on other economic activities; or was due to environmental changes. The availability of papyrus has reduced and it is becoming more difficult to get a good quality and/or length (B233). A job change related predominantly to acquiring more income, with people selling second-hand clothes after they incurred heavy losses on the farm due to hippos (B250). Finally, chicken sales were intended to augment the family income whereas livestock sales mostly referred to cover up for hippo-induced losses.
8.3.3 Farmers’ coping strategies Respondents dealt with the risks of damage inflicted by hippos in different ways (Table 8.4). Nearly 50% said they intensified watching at night, or employed one or more guards. Roughly 38% said they would improve on the use of protective methods to ward hippos off their shambas, like putting poles to block hippo pathways between the farm and the river (C033) or surrounding shambas with old fishing nets and ropes to scare hippos (A220). Replanting is applied by 28.8%, financed, for instance through livestock sales (C145), wage labour or loans from friends. Nearly 5% grew crops not liked by hippos like sorghum, yams and cassava, or they practiced crop ‘rotation’, for instance by planting sorghum during the long rains, when hippos have easier access to the farms due to rising water levels.
Table 8.4 − Responses to hippo-induced damage (N=430)
Division → Kadibo Nyando Upper
Nyakach Lower Nyakach Reaction of respondent ↓ n=229 % n=63 % n=85 % n=53 % No response 12 5.2 0 0 0 0 1 1.9 Replant of damaged crop 83 36.2 5 7.9 23 27.1 13 24.5 Intensify night watching 88 38.4 50 79.4 48 56.5 24 45.3 Use protective devices 91 39.7 35 55.6 23 27.1 16 30.2 Report 23 10.0 2 3.2 7 8.2 4 7.5 Change econ. activity/diversify 0 0.0 0 0.0 8 9.4 7 13.2 Different crops 6 2.6 0 0.0 0 0.0 2 3.8 Crop rotation 0 0.0 0 0.0 12 14.1 0 0.0 Repair/replace fish gear 17 7.4 1 1.6 7 8.2 9 17.0 Avoid hippo areas 2 0.9 1 1.6 12 14.1 4 7.5 Other 1 0.4 0 0 0 0 2 3.8
Crops favoured by hippos like maize, cow peas and sukuma wiki are planted during the short rains, when there are fewer hippos (C020, C090). Diversification (3.5%) helps to cope with losses. A man, who was engaged in, for instance, farming and fishing, concentrated on the second activity after the first one got affected by hippos (C156). Farmers can, for instance, turn to fishing when hippos have invaded their farms or when these are flooded, with some even asking for relief food139 from the government, which happened in November 2008 after consecutive rainfall in Kadibo (Kawino South). The food was mainly intended for internally displaced people (IDPs), elderly and vulnerable people. In May/June 2009, both the
139 There are several organisations in the area that distribute relief food (like Care Kenya, in collaboration with VIRED through Food-for-Work), crop seeds (Red Cross), or tree seeds (Vi Agroforestry, Sweden).
161
government and Red Cross distributed relief food to flood victims in the Nyakach Divisions, especially in Gem Rae, Wasare, Kasai and Lower Kadhiang’a.
Many respondents argued that hippos ‘cause’ famine (7.1; 7.4). In Ugwe (Kadibo), most farming took place along the lakeshore due to land pressure near their homesteads, and this forced them to grow alternative crops like cassavas, sukuma wiki and yams. In the Nyakach Divisions, people had to sell assets like cows, sheep and goats to invest in farming after hippos destroyed their crops: it is a double setback to farmers who simultaneously lose harvest and livestock.
Hippos can be life-threatening and then coping is about survival. Village elders reported about people who got chased by a hippo, like a man who heard something grazing when he was cutting papyrus. He thought it was a cow but when he moved nearer, he saw it was a hippo. The animal started chasing him and he ran real fast; he got away because the hippo decided to return. Another incident took place in Upper Nyakach (Rota Beach), where two hippos invaded a home at night and started fighting. The people in the house were scared and screamed for help; nobody came to their rescue because all neighbours were afraid. The chief called the District Officer, who in turn reported the case to the Member of Parliament of Nyakach constituency. He called the KWS rangers who patrolled the area for three days but failed to see the hippos. So, a brother of the victim said that if the conflict persists, they will find a way of killing the hippos themselves.
Respondents (N=427) gave different reasons as to why they applied specific methods. Most of them (50.4%) said they scared the hippos away, while 28.3% referred to the affordability of a particular method (6.8%) or its efficiency (5.2%) – here reference was made to communal watching. Others talked about avoidance of hippo areas and conflicts (3.7%), the method being risky and/or tiresome (watching is better done communally) or they blamed poor management of KWS (both 1.9%). Some people (1.4%) choose a method because they wanted to generate action, for instance by taking the reports to KWS or the administration (C084) or through fundraising to call the game rangers to come and kill the hippos (C026).
8.3.4 Fishers’ coping strategies Fishing-related changes mostly related to fishing activity itself (65.3%), the equipment (24%) and the area of fishing (10.7%). The first change predominantly referred to a reduction in the number of hours spent on fishing (or quitting altogether), net destruction, a change in the type of fishing, but mainly due to poor catch, which implies more involvement in farming. Second, replacement of nets damaged by hippos represents constant attempts by hippos to destroy the nets while the animals are also life-threatening (B026). Replacement is financed by fish catches (C201) or other businesses (C163). If a fisher lacks the funds for this, he has to sell some assets. Third, area changes ranged from avoiding hippo areas, reducing the risk of hippo attacks, or the availability of a nearby market.
Personal circumstances played a role, for instance sickness or old age, or people who stopped fishing because they were using illegal gears, while those who started fishing wanted to supplement their income. Occasionally, fishers turned to farming, a year-round activity, which requires capital. After destruction by hippos, people have to invest in replanting. The ‘cycle of destruction’ continues and ultimately the output may be less than the costs of input.
8.3.5 Coping strategies according to the focus groups The focus groups (Chapter 3) came up with survival strategies to overcome hippo-induced losses, depending on the diversification in their ‘portfolio’. What means do local people have to sustain themselves in times of adversity? People choose to adhere to different strategies, which can be preventive or evasive in nature (e.g. cultivating crops elsewhere in less hippo
162
prone areas), damage focussed (the aftermath), or future oriented (e.g. thinking about creating a hippo park from which they can benefit).
All groups came up with strategies to prevent or address hippo-induced crop damage: (1) irrigation during dry periods; (2) fencing of farms; and (3) replanting of the farm, provided there is money to buy seeds. In most cases however, there was insufficient money for a replant, which forced people to look for funds. Income-generating strategies were: (1) casual labour (e.g. in rice farms) and the smearing of houses, (2) harvesting of natural resources like wetland products, wood, and felling trees for charcoal burning, (3) setting up businesses, petty trade, hairdressing, or fishing, (4) borrowing, including ‘merry go round associations’; seeking assistance from others, for instance through begging or relief food. The discussions showed the variety in the strategies to which people adhere when confronted with crop losses; acquiring financial means to replant crops was a bottleneck.
Particularly during the rainy season, the effectiveness of ditches was questionable, considering that, given the soil type, they collapse once flooded. Digging ditches is time-consuming and costly; they require correct dimensions, a depth of five feet and width of 4.5 feet (Ugwe). The heap of soil from a ditch can be used to erect a hill unpassable for hippos: their limbs are short and they do not jump. Its maintenance is cumbersome and after a while, hippos may bring it down. Apparently, hippos have a trick of using their ‘cheeks’ to remove the hill soil, flatten it so that they can pass there (Nyalunya), or they lie on their backs and roll over to the other side of the ditch (West Nyakach). Hence, farmers planted sisal on the hill and some plants liked by hippos to prevent them from interfering with it (Ugwe). The Nyalunya group said that their farms are too big; they need support in digging and maintaining before the water starts eroding them. The Kanyagwal group asked for financial support for ditches. Digging canals should be carried out jointly: once dug, people no longer have to watch their farms at night. Watching is cumbersome and watchmen easily fall sick due to mosquitos and the cold air at night.
Some groups favoured a permanent dike along the lakeshore, although the land issue is a problem (Nyamware). In Ombaka, a cement dike was suggested as a barrier against hippos. It needs to have overflow outlets to allow for the use of river water for irrigation of the farms, which should prevent overflowing and stop hippos from getting access to the farms.
Fences with barbed wire are not effective because hippos are clever: they just lean on the poles until they break and then get into the farms (West Nyakach). In Ugwe, people added that barbed wire should have at least five strands. In Nyamware, crops like cassava are grown around the farms. Hippos fear tall vegetation and farmers also fence with thorny plants like omburi which stops hippo invasions, besides putting thorns on the crops to prevent hippos stepping on them. Asao, a thorny plant that grows along the lake, acts as a barrier against hippos, but once a hippo makes a path in the asao, it loses its effectiveness. People also harvest it as firewood and use it to make traditional boats.
Some farmers grew crops like pepper plants or simsim (sesame). Simsim is said to make hippo’s stomach swell; they dislike its smell. Others put tobacco or elephant140 faeces in the bonfire, which apparently keeps hippos far from it (West Nyakach). Sheep faeces were put in water and spread on plant leaves so that hippos do not feed on them. However, its effectiveness is questionable. The group in Ugwe said that people put Furadan on maize leaves; this poison kills the hippo that tries to feed on it. Nevertheless, people still eat its meat, which only shows their desperation.
Other methods included a magician, who bewitched the hippo (Nyamware). The Ombaka group intended to ask KWS to camp close to the lake and put a permanent base near Singida Beach. In Kanyagwal, farmers asked for teargas to scare off hippos, as it has ‘itching’ characteristics. The Nyalunya group said that leaving space for hippos to graze is ineffective:
140 The faeces are to be brought from elsewhere because there are no elephants in the project area.
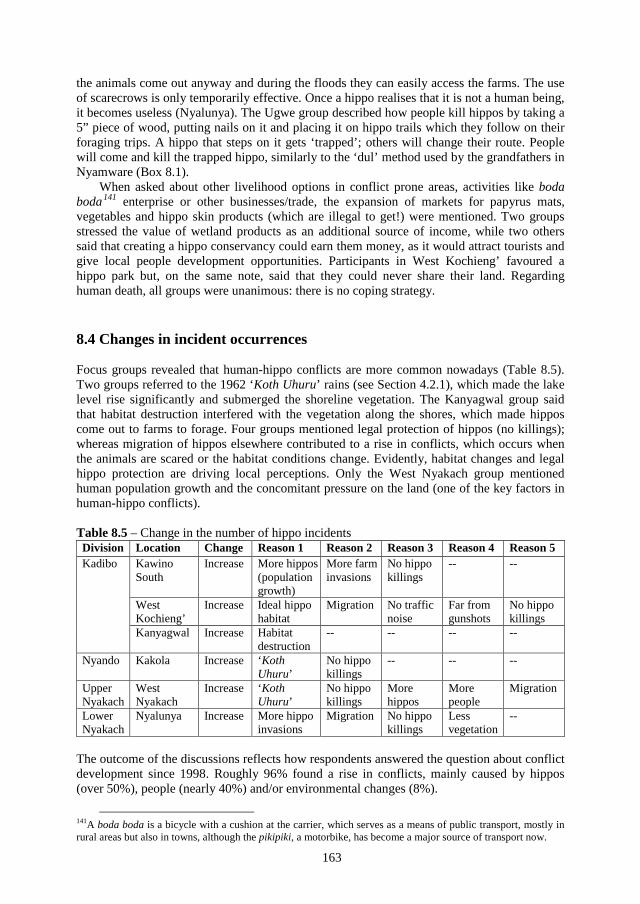
163
the animals come out anyway and during the floods they can easily access the farms. The use of scarecrows is only temporarily effective. Once a hippo realises that it is not a human being, it becomes useless (Nyalunya). The Ugwe group described how people kill hippos by taking a 5” piece of wood, putting nails on it and placing it on hippo trails which they follow on their foraging trips. A hippo that steps on it gets ‘trapped’; others will change their route. People will come and kill the trapped hippo, similarly to the ‘dul’ method used by the grandfathers in Nyamware (Box 8.1).
When asked about other livelihood options in conflict prone areas, activities like boda boda141 enterprise or other businesses/trade, the expansion of markets for papyrus mats, vegetables and hippo skin products (which are illegal to get!) were mentioned. Two groups stressed the value of wetland products as an additional source of income, while two others said that creating a hippo conservancy could earn them money, as it would attract tourists and give local people development opportunities. Participants in West Kochieng’ favoured a hippo park but, on the same note, said that they could never share their land. Regarding human death, all groups were unanimous: there is no coping strategy.
8.4 Changes in incident occurrences
Focus groups revealed that human-hippo conflicts are more common nowadays (Table 8.5). Two groups referred to the 1962 ‘Koth Uhuru’ rains (see Section 4.2.1), which made the lake level rise significantly and submerged the shoreline vegetation. The Kanyagwal group said that habitat destruction interfered with the vegetation along the shores, which made hippos come out to farms to forage. Four groups mentioned legal protection of hippos (no killings); whereas migration of hippos elsewhere contributed to a rise in conflicts, which occurs when the animals are scared or the habitat conditions change. Evidently, habitat changes and legal hippo protection are driving local perceptions. Only the West Nyakach group mentioned human population growth and the concomitant pressure on the land (one of the key factors in human-hippo conflicts).
Table 8.5 – Change in the number of hippo incidents Division Location Change Reason 1 Reason 2 Reason 3 Reason 4 Reason 5 Kadibo Kawino
South Increase More hippos
(population growth)
More farm invasions
No hippo killings
-- --
West Kochieng’
Increase Ideal hippo habitat
Migration No traffic noise
Far from gunshots
No hippo killings
Kanyagwal Increase Habitat destruction
-- -- -- --
Nyando Kakola Increase ‘Koth Uhuru’
No hippo killings
-- -- --
Upper Nyakach
West Nyakach
Increase ‘Koth Uhuru’
No hippo killings
More hippos
More people
Migration
Lower Nyakach
Nyalunya Increase More hippo invasions
Migration No hippo killings
Less vegetation
--
The outcome of the discussions reflects how respondents answered the question about conflict development since 1998. Roughly 96% found a rise in conflicts, mainly caused by hippos (over 50%), people (nearly 40%) and/or environmental changes (8%).
141A boda boda is a bicycle with a cushion at the carrier, which serves as a means of public transport, mostly in rural areas but also in towns, although the pikipiki, a motorbike, has become a major source of transport now.
164
“There are more conflicts because the hippo population has increased. When there is a lot of rain, the lake reserve is being flooded and the plants that hippos eat are submerged, so they just come out to graze on the farms which made the number of conflicts go up” (A099).
“There are more hippos in Ogenya due to their high birth rate: more hippos result in more damage because they lack natural vegetation” (B148).
Respondents pointed at hippos because of the animal’s (perceived) population growth, its reproductive behaviour, migration, and low death rate, which they ascribed to poor PAC techniques.
Human-induced reasons were also given, like extended cultivation along the lakeshore or increased human activity in general. This expansion, which is driven by human population growth, was not accompanied by proper animal control mechanisms, thus leading to a surge in conflicts. Occasionally, the lack of traditional hunting skills was mentioned. In the past, elders used to scare the hippos at night by putting traps to catch and kill them.
Environmental reasons related mostly to a lack of vegetation, either due to drought or the presence of water hyacinth. According to respondent A095, this weed submerged the plants on which hippos feed, which ‘forced’ them to go ashore and graze in the farms. As the reasons that respondents gave still seem to be valid, there is no reason to assume that the number of conflicts has decreased since 2010, although it is closely linked to water levels in the lake.
Updated changes Since 2015, the number of hippo-related incidents has gone down in Kadibo due to non-cultivation of farms in the hippo prone areas, which is caused by frequent flooding of the areas near Kaloleni, Nduru, Oseth, and Nyamware Beaches. This not only resulted in a regrowth of the natural vegetation like orindi, asawo, and papyrus, but also forced many farmers to grow horticultural crops near their homes or plant rice in the irrigation scheme. They use water pumps with water provided by the Irrigation Board through the irrigation canal and alternate rice farming with horticultural crops. As it is located far from the lake, there is less destruction by hippos. Others have concentrated their activities in rice farming along River Aguko (Central Bwanda), and partly in Ugwe. Some people stopped harvesting papyrus, which is difficult to harvest in flooded areas. Instead, they turned to work for people in the rice farms so that they could eke out a living. Generally, people felt there is an increase in human-hippo incidents as the hippo population has grown due to natural reproduction with rare killings by humans. The number of fishing incidents is generally still high, with fishers using mosquito nets to catch nyapus in the swampy areas. Catches haves gone down of late: due to the dry spell, there is little fish.
The seasonal stream between Ogenya Beach and Miriu Stream, 4 m in width, was created by VIRED in its Food-for-Work Programme. It was named ‘Voucher’ and follows the lakeshore. Whatever was dug up was put as a dike on one side, at 1 km from the lake level (during dry spells), hence covering the swampy area in between. During wet spells, all land is flooded. Hippos can walk within the stream but the farms are protected by the dike. The County Government came with an excavator to desilt the stream; it intended to plant bamboo along its shores. The dike has reduced the number of incidents in Ogenya.
Most farmers in Magina (Nyando) said the number of incidents remained the same. They are growing tomatoes, cowpeas, sukuma wiki and maize under irrigation (due to the prolonged drought). However, fewer farmers are cultivating sugarcane. Conflicts occur mostly along River Nyando, which is followed by hippos. Some farms near the lakeshore have been abandoned because of the land conflict between people from Gem Rae and Magina, which forced the government to step in and ban cultivation along the lake until the issue is resolved by the Lands Office. In June-July 2015, residents from Gem Rae attacked farmers and those
165
who were grazing their livestock there; some people got killed. Gem Rae people blocked River Nyando and made it change its course towards Kochogo South, they claimed the land between the newly created distributary and the old river course as theirs. It is said that local politicians paid the people of Nyakach to fight for their land, against the people of Kano.
In Kochogo South, there have been fewer incidents along the lakeshore. This can be attributed to the large number of farms which are abandoned since 2015 due to floods, which made many farmers turn to horticulture near their homesteads. Most of the land next to the lakeshore is not registered; it is government land. However, residents claim it as their land. They get away with it for the government is not implementing the land policy.
In West Kabodho (Lower Nyakach), hippo incidents are said to have increased due to scarcity of pasture and cutting of papyrus (destruction of hippo habitats). Many farmers are practising horticulture: they grow sukuma wiki, cow peas, tomatoes and water melons instead of rice. The latter crop did not do well; it got frequently damaged by hippos.
North Kabodho faced a prolonged drought, due to which the grazing areas for hippos got depleted. Hence, the animals ventured into people’s farms. There has been a change in economic activity: the scarcity of papyrus attracted fewer mat-makers, while since 2014, many people around Ragen turned to sand harvesting.
In Rangul, there have been fewer hippo incidents, mostly due to the decrease in water level in River Nyando. This forced hippos to migrate to deeper areas like Bagdad, which is a breeding area, closer to the lake.
In Gem Rae, there are daily incidents in Obene Rice Scheme during the growing season. In 2014, the County Government constructed a dike along River Awach, which started at the junction of River Nyando with River Awach and continued up to Miruka (no incidents), but did not reach Obene (see Map 3.3). The dike – once maintained – is quite effective in keeping hippos out of the farms. Plans to extend the dike up to Obene have not yet materialised.
The number of hippos has increased in Upper Nyakach and hence, there are more incidents, said an assistant chief. Particularly in Gull farms, groups of 10-20 hippos can be seen. Since 2015, farming activities have gone down. Farmers feel scared when they are watching at night in their watch huts. There is a general reluctance to collective watching: people do not trust one another to be present in the farms and watch out for hippos. The flash floods that occurred in 2015 made the Flood Control Department, in collaboration with local people, put gabions142 along River Sondu-Miriu, between Nyakwere and Konambaya. The gabions were intended to stabilise the river banks against soil erosion but they had another impact: their presence hindered hippos to climb the river banks.
8.5 Conclusions Key issues in this chapter are the way in which local communities work towards human-hippo conflict mitigation in practice, and the coping strategies used to handle the outcome of such conflicts. Local risk reduction strategies are different in nature, depending on the activity concerned (farming, fishing), the area of application (waterlogged soil, hard soil), and amount of money required (fences with locally available material versus strong poles and more costly barbed wire). These elements determine the effectiveness of the measures taken. Most the farmers relied on methods of physical separation of hippos and resources, guarding, or devices to ward off hippos, which are visual, auditory or olfactory in nature. Habituation by wildlife can reduce their effectiveness. Still devices were used most in the project area,
142 A gabion wall is “a large square container made of wire in which rocks are packed (…) used for building structures outdoors, for example to support pieces of ground or control a flow of water.” (http://www.oxfordlearnersdictionaries.com/definition/english/gabion, last accessed 28 February 2017).
166
followed by watching and fencing. Watching is done individually or collectively, with watchmen staying overnight in huts to reduce their exposure to hippos and the elements.
Fishers are more flexible as they can avoid going to hippo sites or putting their gears away from hippo breeding grounds. In the old days, hippo killings were commonplace. Nowadays, it is illegal to kill them (except in cases of self-defence), and residents have to report incidents to the authorities.
Respondents reacted differently to hippo-induced damage. Farmers intensified their nightly watching or used (other) protective methods, while some of them were dealing with ‘damage repair’ like crop replants or crop rotation, whereas fishers replaced or repaired their gears. The focus groups also discussed coping strategies to prevent hippo-induced losses or how to deal with their aftermath. To this end, they suggested income-generating activities like casual labour, harvesting of natural resources, and involvement in businesses or petty trade and so on.
Changes in incident occurrences since 2010 were mainly linked to the apparent increase in hippo numbers and ecological changes, like flooding of the riparian areas, or drought. Many changes can be attributed to changes in land use: farmers vacating their land as ordered by the government, and people fighting over access to land like in Gem Rae. Notwithstanding the general feeling of respondents that hippo incidents have increased, this seems to be different for Kadibo (except for Ogenya) due to flooding, and parts of Nyando, possibly due to the construction of dikes, which made incident numbers go down as hippos are unable to climb the steep slopes. A similar tendency was visible in Upper Nyakach, due to the positioning of gabions along River Sondu-Miriu, and Lower Nyakach, due to the construction of a dike along River Awach. In other areas however, increased hippo interference due to scarcity of pasture and habitat destruction led to changes in economic activities. The question is whether this is a persisting tendency or whether human-hippo conflicts can be controlled by using local governance instruments. This question will be addressed in the next chapter.
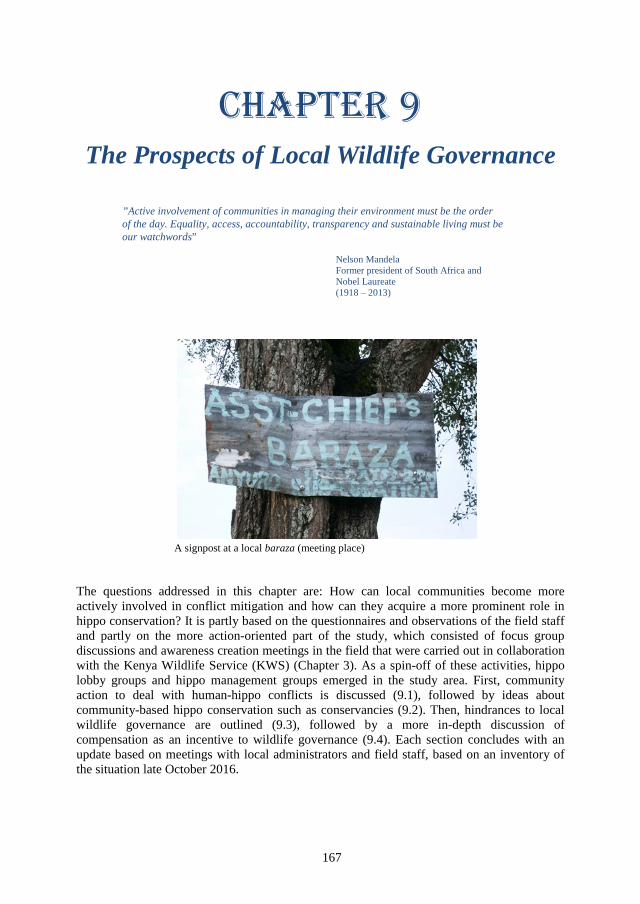
167
Chapter 9 The Prospects of Local Wildlife Governance
”Active involvement of communities in managing their environment must be the order of the day. Equality, access, accountability, transparency and sustainable living must be our watchwords”
Nelson Mandela Former president of South Africa and Nobel Laureate (1918 – 2013)
A signpost at a local baraza (meeting place)
The questions addressed in this chapter are: How can local communities become more actively involved in conflict mitigation and how can they acquire a more prominent role in hippo conservation? It is partly based on the questionnaires and observations of the field staff and partly on the more action-oriented part of the study, which consisted of focus group discussions and awareness creation meetings in the field that were carried out in collaboration with the Kenya Wildlife Service (KWS) (Chapter 3). As a spin-off of these activities, hippo lobby groups and hippo management groups emerged in the study area. First, community action to deal with human-hippo conflicts is discussed (9.1), followed by ideas about community-based hippo conservation such as conservancies (9.2). Then, hindrances to local wildlife governance are outlined (9.3), followed by a more in-depth discussion of compensation as an incentive to wildlife governance (9.4). Each section concludes with an update based on meetings with local administrators and field staff, based on an inventory of the situation late October 2016.
168
9.1 Discussing community action
9.1.1 Results of focus groups and awareness creating meetings The project team and KWS had organised awareness creation meetings in Kadibo, Nyando, Upper and Lower Nyakach Divisions, which acted as a platform to exchange ideas and opinions for both KWS and the communities (Chapter 3). Evidently, many people were unaware of how KWS deals with problem animal control (PAC) and hence did not know what to expect. This had fuelled a negative attitude towards KWS (Chapter 7), specifically in areas where human-wildlife conflicts are commonplace. KWS would like to show residents that it is dedicated to wildlife conservation in Kenya, but with a human face. Hence, it invited them to attend the awareness creation meetings to discuss collaboration with KWS. Councillors, chiefs, assistant chiefs, and BMU officials informed residents in the target areas about the meetings, and contacted headmasters of schools and teachers, who told their pupils to inform their parents. The meetings were open to all residents and attracted many people, possibly because they took place after a series of talk shows on a local radio station, Radio Nam Lolwe, where the Hippo Monitoring Project was discussed, which led to an increased awareness of human-hippo conflicts and mitigation approaches.
The meetings aimed to make local people aware that they can bring about a change in hippo matters, starting where hippo damage is experienced on an almost daily basis. Assuming that they are the ones with thorough knowledge of hippo movements, the idea was to put this knowledge to use by working in unison to reduce human-hippo conflicts. The purpose was to make people’s voices heard at a higher level, so that whatever they proposed would be evaluated and acted upon. Like a former KWS director, Dr. Kipng’etich, had said:
“KWS will have to strengthen relationships with the communities living near wildlife areas and ensure that they benefit from the presence of wildlife in their areas” (Kipng’etich 2012).
Initially, the discussions focussed on short-term solutions like scaring of hippos by KWS. The community suggested putting a KWS office at the Kabonyo Fish Farm (near Ugwe) because of the availability of good houses within reach of community members. Compensation for human casualties was also discussed. The maximum compensation before the 2013 Wildlife Act was enforced was Ksh 50,000, depending on the nature of injury and costs of treatment. An injured person has to report immediately to the chief and then the police, where s/he has to fill in the P3 form. The police would investigate how the incident took place; the victim had to obtain a letter from the doctor. Irrespective of the wildlife species that caused the injury, the compensation amount would be the same. The District Wildlife Compensation Committee assessed what amount is payable. They considered the site and reason of the incident. When KWS found a farmer invading the lake reserve, they would not scare the hippos because it is their area of grazing. When a person was killed by a hippo, s/he should not be buried until the documents for compensation had been approved or else the family might lose the compensation altogether. Deaths were usually not reported because it is expensive to take the body home after a post-mortem.
During the discussions about ways to mitigate human-hippo conflicts, participants were challenged to look at themselves differently, not as helpless victims but as people who know about hippo sites and hippo behaviour, keen on changing situations in which conflicts with hippos are commonplace. They were asked to perceive hippos differently, not as a nuisance, but as a valuable resource from which they can benefit. Despite the novelty of the idea of collective action instead of hierarchical governance with a central role for KWS, the possibility of forming hippo lobby groups and coming up with home-grown solutions was rapidly adopted by three groups. The West Nyakach group welcomed the idea of creating hippo lobby groups for people to make their voices heard. They intended to form groups to
169
discuss hippo matters, register as a community-based organisation (CBO), and write a proposal to KWS or other potential donors to fund a hippo park. In Ugwe (Kadibo), participants were happy about the project and willing to write a proposal. However, they lacked the expertise and were eagerly awaiting assistance from KWS. In Ogenya, organising a lobby group faced difficulties; due to their busy schedule, people could not attend a meeting, hence the lobby group remained at the formation stage. Groups in Ugwe and Nyamware had similar sentiments, to which the Kanyagwal group added that good leadership is a prerequisite for any group to take off and succeed. They talked from experience, as they had formed a (not yet registered) hippo lobby group after the first focus group discussion, which unfortunately collapsed due to failing leadership, and suggested that the members of the ‘hippo lobby group’ should walk from farm to farm to collect reports and forward them to KWS.
In Nyalunya, participants said they intended to register a hippo lobby group, strengthen it and seek assistance from small farming groups around the lake to form one umbrella group. In 2010, they established a Hippo Management Group with 32 members; it was waiting for the floods to stop so that they could start digging ditches along the lakeshore at Majengo, a said hippo breeding area, to conserve hippos and use them as a resource. There were plans to fence the area later. There are many hippos in Gull Yago because, unlike in Kano, papyrus is not burnt there.
In West Nyakach, participants would like to know how to control hippos for the animals to become a resource instead of a problem animal. This definitely involves a change of mindset (see Chapter 7). Moreover, they also wanted to know hippos’ carrying capacity.
In West Kabodho, the lobby group was awaiting the arrival of KWS for them to assess the site where they want to start a conservancy; they had meetings and set aside a piece of land. Many participants wanted the lobby groups to initiate pilot conservation projects in the area. However, this requires commitment of the group and strong, accountable leadership. Due to laxity of the members, the plans did not materialise.
These discussions took place early 2010, and within the framework of these discussions, long-term solutions in the form of conservation activities like ‘creating a hippo conservancy’ or ‘fencing of hippos’ were mentioned too. The latter means confining the hippos to a designated area to restrict hippo interference. The conservancy was linked to ecotourism and seen as a way to make money from hippo conservation. This was promising considering the potential role these groups could play in the development of conflict resolution strategies. This will be further discussed in Section 9.2.
9.1.2 Update from the field The groups in Kadibo have never been registered. A chief143 said that “when people are not being facilitated financially, they do not take action”. The activities undertaken by the field staff stopped once the project was over.
“No one has replaced the field monitor and many residents stopped reporting incidents altogether” (Chief of Kanyagwal Location).
During the project, residents were keen to report, but afterwards they asked the chief why their opinions were taken because nothing had come out of it. They got demotivated to report incidents and questioned the local administration why their opinions had been recorded: their keenness to report seemed to have faded away. Some farmers feared going to KWS: they do not know where to go – some had never even been to Ogenya Beach, let alone Kisumu. Occasionally, the chief took the farmer(s) there. When asked why the local administration did not take it upon itself to motivate residents to continue on the path they had ventured on, the chief said:
143 Interview with chief (rtd.) of Kanyagwal Location, on 19 October 2016.
170
“If I keep on talking about it in every baraza, people will say that I am hammering on the same thing over and over again” (Ibid.).
He urged KWS to come to the area, liaise with the local administration, and hold a baraza to jointly sensitise the local community about hippo issues, which will change their attitude and mindset.
“People just cry over hippo-induced damage and state that they will kill the hippo when it comes” (Ibid.).
In Nyamware, poor leadership prevented the hippo lobby group from registering. There was a lack of collaboration among its members, who also missed clear objectives to steer the group. It was only formed to collectively watch hippos at night and generate financial support from NGOs. Besides collective fencing with barbed wire, a communal trench was dug to prevent hippos from invading the shambas, which became ineffective due to frequent flooding.
Despite its initial progress, the lobby group in Magina (Nyando Division) failed to register due to a lack of coordination among its members, some of whom were unwilling to contribute towards the registration fee. This demoralised the leadership of the group. Hence the group split into several small welfare groups aimed at ‘table banking144‘, directed at receiving instant benefits.
Unfortunately, the hippo lobby group in Upper Nyakach also remained in the initiation stage: it was not registered, mainly due to laxity of the people. “They need to be pushed a bit”, said an assistant chief, who added that he is going to follow it up (after our recent talk). “There is an apparent lack of interest and some people gave up very fast” (Ibid). However, there have been some changes: early 2015, the KWS attended the chief’s baraza at Kong’ou, which covered Thurdibuoro (not in the project area) and West Nyakach Locations. It was then that the community selected a ‘mobiliser’ on the ground, who is – after having been informed by the chief that an incident took place – to go to the incident site and assess the damage (similarly to what the field staff used to do). In Lower Nyakach, a similar laxity prevented the registration of any hippo lobby group.
9.2 Ideas about community-based hippo conservation
9.2.1 Results of focus groups and awareness creating meetings The KWS senior warden said that KWS has the capacity to solve hippo conflicts, depending on the support offered by the community. During the awareness creation meetings, the idea of hippo conservancies was discussed, acknowledging the requirement for collaboration between KWS, the communities and other stakeholders like the private sector. Ogenya (Kadibo) is an attractive place: visitors long to see such places because these are non-existent where they come from. In Gem Rae (Lower Nyakach), there are over 100 different bird species, besides snakes, which enhance the value of a conservancy.
The KWS deputy warden requested the community to register groups and write proposals to them suggesting a campsite in a particular area, digging canals behind the dike along River Nyando so that hippos cannot pass, or constructing a bridge for tourists to see hippos. Funds would be available from CDF (Constituency Development Fund145) and/or LATF (Local
144 Table banking incorporates short term loans, which recipients have to pay back with interest within a week. At the end of the year, all calculated interest paid is equally divided among those who contributed. The money is kept in a metal box with three padlocks, guarded by three signatories with separate keys to access the box (info Denis Odhiambo, 26 October 2016). 145 The Constituency Development Fund (CDF) was introduced in Kenya through the CDF Act 2003. It states that the government puts aside a minimum of 2.5% of its annual revenue for disbursement under the CDF,
171
Authority Transfer Fund146), which could assist them in constructing canals along the lake or river. In collaboration with KWS, communities initiate projects to conserve birds and wild animals in their areas. She also mentioned that hippo conservation can generate money for the youths who work as tour guides, or take tourists on a boat trip to see the hippos: they could go for training offered by KWS to become knowledgeable in tourism. The total contribution of travel and tourism to Kenya’s GDP was 10.5% of GDP in 2014; it was forecasted to rise by 4.2% per annum in 2015 and by 5.1% per annum in 2025 (WTTC 2015). Visitors would come to see the hippos, take pictures, pay for their stay and still the resource remains. The site could be advertised on a website to invite more people, which would uplift the community’s standard of living. The groups needed capable leaders, and support from Members of Parliament to help them achieve their goals.
A conservancy would be a community project, with residents deciding on its location; KWS would only provide technical advice. Residents could also contract cooperative societies or outsiders to do the work. KWS scientists would inspect the area and determine the carrying capacity of the proposed conservancy. In Nyalunya, the senior warden said that once the people would have decided on an area for the conservancy, KWS would fence it, after which bridges could be constructed. This might attract additional investments like dispensaries, technical colleges, secondary schools, and hotels in the vicinity.
All groups acknowledged the importance of animal conservation and favoured a hippo conservancy in their area. Tourists were expected to visit the conservancy, potentially generating revenue and pays for infrastructural improvements like the introduction of electricity in the area (Kanyagwal). Another suggestion was a bridge over the lake from Ogenya to Nyakach, to be used by people to see hippos. There are roughly 100 hippos in the area, which are visible when the lake water level is low. Upon request (though a proposal) by the community, KWS should create a conservancy (Nyamware). People knew that hippo reserves require maintenance: they had to stop harvesting reeds along the shores and plant ‘asao’ (7.4.1) instead, which might stop hippos from invading the farms (West Nyakach). Bamboo can also be planted to prevent soil erosion and be used as a source of construction material and furniture.
In Ombaka, participants pointed at Singida as an excellent spot for a conservancy and the creation of a jetty-bridge (basically a structure on poles which allow water to pass through) from Singida towards the lake to enable visitors to see the hippo breeding sites. Another suggestion was the construction of tree houses, but first KWS had to direct the drainage of River Nyando and secure the boundaries of the river so that the water would go straight to the lake. Another idea was to cement the dikes from Ahero to Ogenya to improve their functioning.
In North Nyakach, plans to start a conservancy in Gem Rae were well-advanced. It was being pulled by Kepha Kira, a resident of Gem Rae, who worked for VIRED. He organised meetings with the community and convinced them to give up part of their land to create a hippo conservancy. Even KWS came with the warden and a few scientists to do an inventory of the area. Kepha Kira had drawn a map with parcel numbers in between the new and original course of River Nyando, and linked the names of residents to parcel numbers. Per August 2009, he had convinced 14 residents to donate their land; of eight parcel numbers he
intended to fight poverty at the grassroots level; it facilitated the creation of water, health and education facilities throughout the country (Gutiérrez Romero 2009). 146 The government of Kenya introduced the Local Authority Transfer Fund (LATF) in 1999, through the LATF Act, No.8 of 1998, in an attempt to devolve funds. It aimed to support local authorities to increase service delivery, improve financial management, and assist in reducing their outstanding debts. LATF forms 5% of the annual national tax income collection. LATF funds are combined with local authority revenues to carry out local priorities (Barasa & Amuono 2013).
172
was trying to locate the owners. Unfortunately, he passed away before the plans were finalised; his successor was posted elsewhere.
9.2.2 Update from the field KWS does not frequently visit Kadibo147: its last visit to Ogenya was in September 2015, around the time the baraza took place in Nyamware Beach, which had been organised by the District Officer and attracted many participants. The KWS warden came and tried to educate residents on how to live with hippos. Notwithstanding the outcry about hippo-induced destruction, he told people not to take revenge on hippos. It was concluded that KWS should come to kill some hippos: one got shot in Nyamware and one at Nduru Beach. In spite of this, the number of hippos supposedly increased as many hippos had given birth. The chief of Kanyagwal Location stressed that communities needed to be sensitised to generate a change of attitude, and called upon KWS to visit the barazas. “When people come together, there is hope” (Ibid.).
In Upper Nyakach148, both KWS wardens had expressed their willingness to assist residents in creating a conservancy at Adera, a wetland. The County Government proposed to bring some tractors to Adera so that people can plough and plant to enhance their food security. However, the supposed increase in the number of hippos may complicate this, as there are groups of 10-20 hippos which can be seen in River Sondu-Miriu. This can be overcome by putting a permanent KWS outpost near the chief’s office in Nyong’ong’a. The offices are ready (including a strong room for valuables and a radio room), the residential areas are not. Realising the outpost will improve the flexibility and mobility of KWS staff in Nyakach as travelling to Kisumu Station is time-consuming. However, ownership of the land is debated: people claim it as their land and feel entitled to the parcels because their ancestors have cultivated it for years, but the government considers it as government land. In 2012, all farms were swept away by the floods and it took a long time before the water level receded, hence people gave up farming at Adera. Now that the water level is down, residents have resumed growing their crops there.
9.3 Community action in practice
The focus groups were somehow reluctant towards collective action and – not surprising considering prevailing ideas about KWS’s performance (Chapter 7) – had a wait-and-see attitude towards KWS; ideas concerning local governance largely remained hypothetical. There were several examples of collective action found in the study area, which are presented in the following sub-sections. They are partly based on the questionnaires, but mostly on the daily reports of the field staff during their year-round field visits and attendance at meetings.
9.3.1 Local groups in Kadibo Some family groups in Kadibo were watching the farms in shifts at night against hippos, like the Katieno, Kochoro, and Koroma, all informal arrangements consisting of 9-10 people. There is also the Obat Family Group, composed of 16 family members who fenced their farms (20 acres of maize) collectively with poles and two strands of barbed wire (A204). Communal watching takes place: it is cumbersome as it keeps people from performing their usual (daytime) duties, which made people say that if hippos cannot be controlled by KWS, they will poison them. There are numerous groups, particularly women’s groups like the
147 Interview: chief of Kanyagwal Location on 19 October 2016. 148 Interview: assistant chief of Lower Kadhiang’a and Nyong’ong’a Sublocations on 17 October 2016.
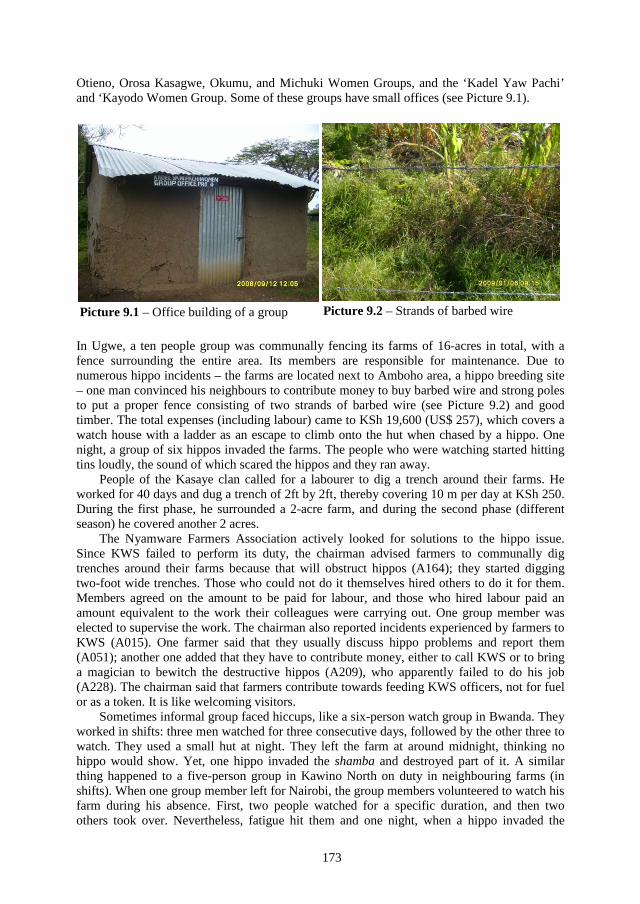
173
Otieno, Orosa Kasagwe, Okumu, and Michuki Women Groups, and the ‘Kadel Yaw Pachi’ and ‘Kayodo Women Group. Some of these groups have small offices (see Picture 9.1).
In Ugwe, a ten people group was communally fencing its farms of 16-acres in total, with a fence surrounding the entire area. Its members are responsible for maintenance. Due to numerous hippo incidents – the farms are located next to Amboho area, a hippo breeding site – one man convinced his neighbours to contribute money to buy barbed wire and strong polesto put a proper fence consisting of two strands of barbed wire (see Picture 9.2) and goodtimber. The total expenses (including labour) came to KSh 19,600 (US$ 257), which covers awatch house with a ladder as an escape to climb onto the hut when chased by a hippo. Onenight, a group of six hippos invaded the farms. The people who were watching started hittingtins loudly, the sound of which scared the hippos and they ran away.
People of the Kasaye clan called for a labourer to dig a trench around their farms. He worked for 40 days and dug a trench of 2ft by 2ft, thereby covering 10 m per day at KSh 250. During the first phase, he surrounded a 2-acre farm, and during the second phase (different season) he covered another 2 acres.
The Nyamware Farmers Association actively looked for solutions to the hippo issue. Since KWS failed to perform its duty, the chairman advised farmers to communally dig trenches around their farms because that will obstruct hippos (A164); they started digging two-foot wide trenches. Those who could not do it themselves hired others to do it for them. Members agreed on the amount to be paid for labour, and those who hired labour paid an amount equivalent to the work their colleagues were carrying out. One group member was elected to supervise the work. The chairman also reported incidents experienced by farmers to KWS (A015). One farmer said that they usually discuss hippo problems and report them (A051); another one added that they have to contribute money, either to call KWS or to bring a magician to bewitch the destructive hippos (A209), who apparently failed to do his job (A228). The chairman said that farmers contribute towards feeding KWS officers, not for fuel or as a token. It is like welcoming visitors.
Sometimes informal group faced hiccups, like a six-person watch group in Bwanda. They worked in shifts: three men watched for three consecutive days, followed by the other three to watch. They used a small hut at night. They left the farm at around midnight, thinking no hippo would show. Yet, one hippo invaded the shamba and destroyed part of it. A similar thing happened to a five-person group in Kawino North on duty in neighbouring farms (in shifts). When one group member left for Nairobi, the group members volunteered to watch his farm during his absence. First, two people watched for a specific duration, and then two others took over. Nevertheless, fatigue hit them and one night, when a hippo invaded the
Picture 9.1 – Office building of a group Picture 9.2 – Strands of barbed wire
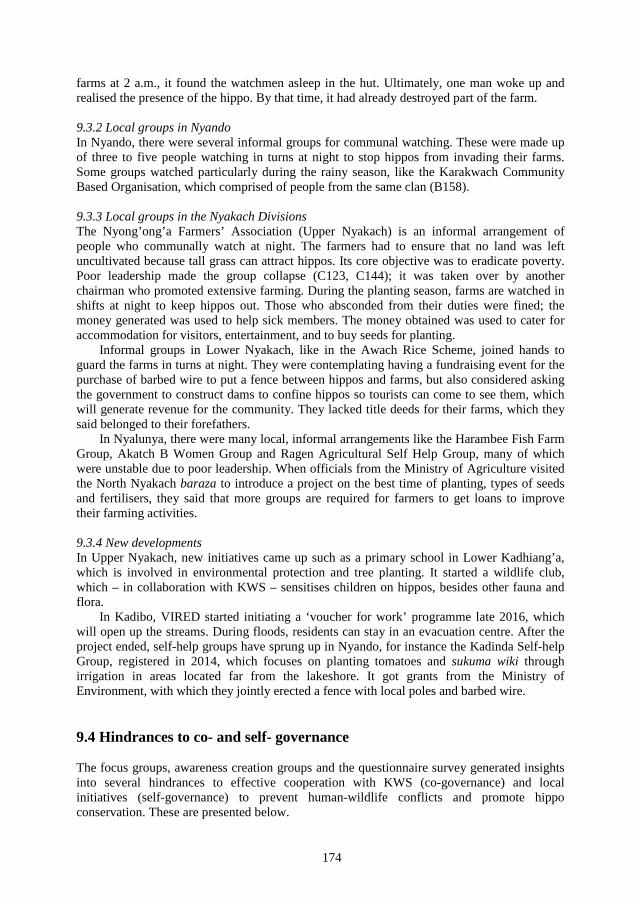
174
farms at 2 a.m., it found the watchmen asleep in the hut. Ultimately, one man woke up and realised the presence of the hippo. By that time, it had already destroyed part of the farm. 9.3.2 Local groups in Nyando In Nyando, there were several informal groups for communal watching. These were made up of three to five people watching in turns at night to stop hippos from invading their farms. Some groups watched particularly during the rainy season, like the Karakwach Community Based Organisation, which comprised of people from the same clan (B158). 9.3.3 Local groups in the Nyakach Divisions The Nyong’ong’a Farmers’ Association (Upper Nyakach) is an informal arrangement of people who communally watch at night. The farmers had to ensure that no land was left uncultivated because tall grass can attract hippos. Its core objective was to eradicate poverty. Poor leadership made the group collapse (C123, C144); it was taken over by another chairman who promoted extensive farming. During the planting season, farms are watched in shifts at night to keep hippos out. Those who absconded from their duties were fined; the money generated was used to help sick members. The money obtained was used to cater for accommodation for visitors, entertainment, and to buy seeds for planting.
Informal groups in Lower Nyakach, like in the Awach Rice Scheme, joined hands to guard the farms in turns at night. They were contemplating having a fundraising event for the purchase of barbed wire to put a fence between hippos and farms, but also considered asking the government to construct dams to confine hippos so tourists can come to see them, which will generate revenue for the community. They lacked title deeds for their farms, which they said belonged to their forefathers.
In Nyalunya, there were many local, informal arrangements like the Harambee Fish Farm Group, Akatch B Women Group and Ragen Agricultural Self Help Group, many of which were unstable due to poor leadership. When officials from the Ministry of Agriculture visited the North Nyakach baraza to introduce a project on the best time of planting, types of seeds and fertilisers, they said that more groups are required for farmers to get loans to improve their farming activities.
9.3.4 New developments In Upper Nyakach, new initiatives came up such as a primary school in Lower Kadhiang’a, which is involved in environmental protection and tree planting. It started a wildlife club, which – in collaboration with KWS – sensitises children on hippos, besides other fauna and flora.
In Kadibo, VIRED started initiating a ‘voucher for work’ programme late 2016, which will open up the streams. During floods, residents can stay in an evacuation centre. After the project ended, self-help groups have sprung up in Nyando, for instance the Kadinda Self-help Group, registered in 2014, which focuses on planting tomatoes and sukuma wiki through irrigation in areas located far from the lakeshore. It got grants from the Ministry of Environment, with which they jointly erected a fence with local poles and barbed wire.
9.4 Hindrances to co- and self- governance The focus groups, awareness creation groups and the questionnaire survey generated insights into several hindrances to effective cooperation with KWS (co-governance) and local initiatives (self-governance) to prevent human-wildlife conflicts and promote hippo conservation. These are presented below.
175
9.4.1 A lack of knowledge on the (legal) aspects of wildlife and wetlands conservation Local communities have little knowledge of legal issues. Only two groups (33.3%) had heard of the 1989 Wildlife (Conservation and Management) Amendment Act. The Kakola group learned this through wildlife officers and newspapers; the West Nyakach group was informed by the chief after he had attended our forum meeting in July 2008. All groups were aware that there is a stretch of land bordering a waterbody that has to be left open, which is commonly referred to as ‘game reserve’, a space left for hippos to graze on. One group called it a space for fish landing beaches, also available to other organisms living around the lake. No group knew the width of the stretch from the river, while for the lake, the general answer was 100 m (only the Kakola group mentioned the legally required 300 m), nor did they know the actual purpose of the zone, which is protection of the water body against erosion (as stipulated in the Agricultural Act). Each group expressed awareness of the regulations prohibiting cultivation along the shore. All were informed by the lands officers; two groups heard it from fisheries officers, one through agricultural officers, and one through KWS. Nevertheless, many people just cultivate up to the lakeshore because the wet soil supports crops that cannot do well away from the water because it is too dry, and because irrigation is easy down at the lake. 9.4.2 Financial constraints to the reporting of hippo incidents The field staff got many reports: not only were they easy to reach but people also felt they could influence KWS to visit incident sites. The Ugwe group said that initially people did not take the field monitor seriously, but had seen the benefits of reporting. Most groups said that after the project, they would like the position of field monitor to remain. However, nobody is willing to pay him/her for that work: KWS should pay a local person to take the reports (Ombaka). Without a field monitor, cases of crop destruction will go unreported because farmers lack time to take reports to KWS. They will just find a way to kill hippos. Finance is an issue: the assistant chief of North Kabodho said that he did not report to KWS Kisumu because he lacks a transport allowance to go there. Occasionally, people report fake incidents to KWS, or exaggerate the damage because they want KWS to come and attend to their needs.
The West Nyakach group requested a representative from the area to participate in the committee for conflict solution, and check what action KWS takes after having been given reports. The assistant chief underlined the need to report incidents and sensitise the community: he argued that only when people are united, they get assisted by the government. Interviewees suggested that there should be a KWS office nearby, for instance at Rota Market (West Nyakach) or Riat Market (Ombaka). KWS could also take one of the fisheries offices at Ugwe (or Rabuor) and convert it into an office. Assumedly, reporting will make wildlife authorities at different levels realise that there is a hippo issue in Winam Gulf area. 9.4.3. Distrust between KWS and communities There is a serious miscommunication between KWS and the communities, who argue that KWS is not willing to help them: they have reported but no action was taken. Participants in Magina complained that they got tired of reporting: KWS took no action and when contacted, they had to pay for their fuel. They lost morale in reporting and even threatened to kill all hippos with Furadan. They say that when the rangers come, they just walk around without seeing any hippo (Chapter 7). When this was discussed in the meetings with KWS, the senior warden said that if the rangers ask for money, he should be contacted. Rangers do not need money from the community because they have salaries and allowances. About non-reporting the deputy warden was brief: “People are not reporting incidents, so obviously there is no response from KWS”. She explained that delays in response were unavoidable, because KWS covers a vast area and has to distribute rangers to different sites. When asked about the discrepancy in the number of reports made to KWS and those made to the field staff, the senior warden blamed the poor relationship between KWS and the communities, which makes
176
people refrain from reporting. Regarding rangers staying in offices near the conflict sites, the senior warden said people should take their reports to KWS Kisumu to get a quick response, because KWS lacks enough personnel to staff other offices. He underlined the need for a hippo census in the area and said that some hippos will be culled.
According to residents, KWS’s claim that it does not get reports is untrue. The Nyamware group had reported through the Nyamware Farmers Group, but KWS denies having received such reports. Hence, the participants put it strongly, “KWS is lying big time”. These sentiments were shared by the Ugwe group, which also said that if people complain too much about the hippo issue, the animals will clear their shambas overnight (7.2.1).
Good communication with KWS is essential to reach a state of coexistence with hippos (7.2.4). In Nyamware, participants were reluctant to report human-wildlife incidences because even the Member of Parliament for Nyakach was told that there is no compensation when he raised the hippo issue in parliament. This was also said in Nyalunya, where people claimed that KWS officers had started going into the field, hence the community will be more positive towards reporting. They had been reluctant to do so because they were ‘threatened’ that they were the ones who were invading hippo territories so they just kept quiet about their losses.
Some of the misunderstandings between KWS and the communities can be easily solved. When the rangers go into the field, they usually ask a local person to carry the torch in order to confuse the hippo so that it will be easier to shoot it. However, local people look at this differently: carrying a torch and aiming at a hippo implies that the torchbearer will be haunted in his dreams to such an extent that he may die (7.2.1). In fact, all of those who held the torch have died since and villagers actually blame KWS for asking them to do this (Nyamware). When the deputy warden heard that, she said that she would instruct the rangers not to give others149 a torch to spot the hippos, but carry it themselves. Another issue that created a lot of misunderstanding is the issue of free meat, after which local people crave. However, the deputy warden said that once the rangers kill a hippo, the meat should be buried in a freshly dug pit. It cannot be eaten because it has not been inspected and hence, people could get sick once eaten. In Gem Rae, KWS said that it is not allowed to grow crops along the lakeshore. There were ambiguities however, due to changes in the river course. KWS promised that it would bring in a scientist who could follow the course of the rivers from the Nandi Hills to the lake to map the changes.
With increasing interaction with KWS, participants in the meetings also said that they would like to conserve hippos since killing them only brings temporary relief and meat for the community (Nyamware). The participants believe that once the ‘hippo lobby groups’ have been strengthened, they should be able to have hippos as a source of income (West Nyakach). Hippos are in River Sondu-Miriu because the lake reserve has been destroyed. Participants also pointed to environmental protection: in the colonial days, people had to plant sisal and other plants along the lakeshore which prevented hippos from coming out. “Now vegetation is destroyed: people are looking for fish in the lake and they are cutting reeds. We request the government to help us in protecting the environment.”
9.4.4 A lack of local leadership Many groups collapsed due to poor leadership, which is common in Kenya. Conservation areas are set up, including community and leadership trust structures, and private investors are brought in to do the marketing and launching. However, benefits do not trickle down once the community starts receiving them; the leaders take everything and community members threaten to discontinue saving wildlife (ACC officer, pers. comm.). Up to today, there are no conservation areas in the project area, but local leaders showed a similar attitude which
149 Predominantly Luos, as they adhere to such traditional beliefs.
177
caused the Fishing Cooperative Societies to collapse (before they were revived into BMUs): by enriching themselves through plundering the Society’s coffers. There is no transparency and no accountability towards its members – in summary: poor governance.
There is mistrust among community members as well. For example, in 2008, a group of farmers were scaring hippos at night in turns: one group on uneven days, the other on even days. It failed because some farmers felt that one group did not perform well and let the team down, so they ended the collaboration. Had there been a local leader who could have united both sides, the group would probably still exist. Therefore, it is so difficult for local people to organise themselves into groups to collectively address hippo issues, or even (at a smaller scale) undertake joint fencing or digging of trenches. The clan organisation could also play a role. The commitment and continuity of individuals to lead and coordinate hippo conservation incentives is essential.
9.4.5 A lack of compensation Compensation for wildlife-induced damage is one of the instruments in the human-wildlife conflict mitigation toolbox. Local people assist wildlife authorities with wildlife conservation despite the economic costs and personal risks involved. To make people tolerate animals on their land, they may be given financial compensation or assistance in applying methods aimed at conflict prevention (Nyhus et al. 2003). Projects like one in Botswana, which gave communities incentives to conserve wildlife through tourism rights to wildlife, were undermined due to the growing central control of community-based natural resource management (CBNRM), notwithstanding the broad local support for the programme and the presence of a labour force that could be paid from the CBNRM revenues (Pienaar et al. 2013).
Compensation can encourage local participation in wildlife conservation by shifting the financial burden away from people living with wildlife, but compensation arrangements have their pitfalls that could contradict conservation aims (Nyhus et al. 2003, 2005; Bulte & Rondeau 2005). Considering the importance attached to this issue in the focus groups and awareness creation meetings, it will be discussed more in-depth in Section 9.5.
9.5 Compensation as an incentive to local wildlife governance
9.5.1 Background to monetary compensation Economic incentives like compensation can be used to offset negative impact of human-wildlife conflicts (Nyhus et al. 2003). Examples of direct incentives are acquisition of (conservation) land, leases and conservation easements and performance payments and tax incentives, whereas indirect incentives to achieve conservation are mainly related to ‘integrated conservation and development projects’ (Svadlenak et al. 2007). Payments for environmental services (PES) are a hybrid form between direct and indirect methods (Ibid.). Occasionally, incentives are paid to villagers to reduce the threats that particular animal species are facing, while maintaining its habitat, and get involved in its conservation. However, measuring its success or cost effectiveness in the long run proved to be difficult. Villagers in Tanzania, for instance, receive communal economic benefits for preserving pastoral activities on grazing areas instead of converting them to agriculture (Redford & Fearn 2007), whereas in Kenya, there are incentives for enhanced community participation and safeguarding space for wildlife conservation due to the inability of wildlife to compete economically with alternative land uses (Kipkeu et al. 2014). However, a non-supportive legal environment and little say for the communities in decision making made these incentives unsuccessful (Ibid.).
There are several types of compensation used in wildlife conservation for wildlife-inflicted damage and loss of land to newly established protected areas. Wildlife imposes costs
178
to landowners in the form of crop damage, livestock depredation, and damage to other property. Strategies address wildlife-induced damage in different ways, for instance through abatement support and compensation, which is mostly monetary in nature. Authors also refer to compensation ‘in kind’, for instance meat from the shooting of some elephants by the Cameroonian wildlife authorities (Tchamba 1995), or live animals (Nyhus et al. 2005). Conventional compensation schemes usually target single species or small groups of species (Ibid.). They are often sponsored by government agencies or environmental organisations (Bulte & Rondeau 2005; Lamarque et al. 2009) and reimburse individuals/household members who have suffered from material or physical wildlife-induced damage. Alternatively, license fees of hunters are used to settle damage compensation claims (Fall & Jackson 2002).
The obligation to compensate for wildlife damage is linked to wildlife ownership, often with restrictions on precautionary measures to prevent such damage. This liability usually rests with the state (as owners), although different approaches exist depending on the way in which wildlife ownership is legally defined. Watve et al. (2016) refer to a community operated compensation scheme for crop damage by wild herbivores. The payable amount is calculated on average losses, but payment is in line with individual yield. Cirelli (2002) points at the difficulties governments face in dealing with increasing pressures for compensation, which often coincide with dissatisfaction, because local people either regard the government as the sole beneficiary of considerable wildlife revenue or they pursue personal consumption, which contributes to increased illegal activities and habitat encroachment. In Kenya, many people assume that KWS is in charge of compensation because it is responsible for wildlife management and conservation. This is not true however: it takes recommendations and verification of the County Wildlife Conservation and Compensation Committees (CWCCCs) into consideration, which ultimately pays compensation valued at the ruling market rates, provided that the owner of the livestock, crops or property has taken adequate protective measures and his/her land-use practices are in line with the ecosystem-based area management plan (RoK 2013a).
Compensation payments are still controversial: advocates claim that it promotes conservation, while opponents argue it does not. Advocates say compensation enhances public tolerance levels for wildlife depredation and creates a more positive attitude towards crop raiding wildlife species (Tchamba 1995). It is widely believed that damage compensation reduces the incentive to kill wildlife species in an act of self-defence or retaliation (Bulte & Rondeau 2005). In cases of livestock damage, victims take up the issue with the owners instead of attacking the animals since financial compensation addresses and redresses the harm done (Sifuna 2005). People seldom complain about livestock damage, probably because communities have developed ‘rules of restitution’ for damage cases (Naughton-Treves 1998). Second, compensation can tone down the loudest and emotional criticasters of human-wildlife conflicts. This is particularly relevant to Kenya, where the media make most of damage reports, especially when it comes to ‘rogue’ elephants that attack people and destroy crops. The political element in addressing such conflicts can actually give politicians in the affected areas substantial political mileage and make them win elections when they incorporate ways to end human-wildlife conflicts in their campaigns (Sifuna 2005). This is mostly related to elephant cases; so far hippo issues have been rarely addressed in the political arena. Third, it stimulates reporting wildlife incidents, as farmers feel they can gain from wildlife damage. Finally, it improves the relationship between local communities and KWS.
Counter-arguments mainly refer to compensation as a ‘flawed’ concept or to practical problems related to its implementation. First, a major criticism is that monetary compensation does not address the root causes of human-wildlife conflicts (Hoare 1995, AfESG 2002). It can even exacerbate them because it maintains an undesired, unsustainable situation (Ibid.).
179
At best, compensation can reduce human-wildlife conflicts but not eradicate them (Sifuna 2005) because it does not address the ‘problem animal’ itself (WWF SARPO 2005).
Second, the effectiveness in preventing retaliation killings by local communities is questionable since there is no quantitative data that suggests otherwise (Nyhus et al. 2005).
Third, compensation reduces incentives for abatement and self-defence methods, especially when local people find incident occurrences more lucrative than their prevention. Yoder (2002) argues that compensation is like a form of damage sharing; the returns may play a decisive role in landowners’ abatement efforts. When a landowner is fully compensated (covering damage and transaction costs), he might be tempted to abstain from abatement because he will not gain from investing in it. A too lucrative compensation package could exacerbate the scale of the problem. Yoder’s assumption may be true for crop damage. When farmers fetch a higher price for their (destroyed) crops than the current market rate, they will be less keen on nurturing it to maturity and use monetary compensation to sustain their livelihoods. Nyhus et al. (2005) call this ‘moral hazard’150. Local people influence the probability of losses by using protective devices to reduce the number of human-wildlife conflicts. When they get compensated for losses, they will be less inclined to improve on existing methods or even develop new ones. The introduction of compensation takes away the impetus to protect farms and livestock, thus reducing the levels of preventive action and contributing to excessive levels of damage. This attitude could create a permanent state of conflict (Bulte & Rondeau 2005). In order to be eligible for compensation payments, farmers have to adopt observable risk-reducing methods (Ibid.); they could also be forced to bear part of the risk by setting a deductible percentage and pay part of the loss (Nyhus et al. 2005) so that it does not work as an incentive to ‘laxity and complacence’ (Sifuna 2005). An alternative form of payment could be more sustainable and socially just (Ogra & Badola 2008).
Fourth, traditional compensation schemes do not address unquantifiable and indirect social costs. These costs should probably be addressed through rural or eco-development style approaches like resettlement schemes, through funds earmarked for integrated conservation and development programmes to improve protective methods, or by establishing economic incentives linked to participation in conflict mitigation (Hoare 2000; Naughton et al 1999; Ogra & Badola 2008).
Fifth, misuse and corruption are probably the most cited criticisms, particularly in countries with a high corruption-index like Kenya (Sifuna 2005). Corruption, bogus claims and deliberate cultivation in areas with a high risk of crop destruction have contributed to the termination of compensation for crop damage (AfESG 2002) and made several countries abandon their experimental compensation schemes altogether (Hoare 1995). In Kenya, compensation for property damage was abolished151 in 1989.
Finally, compensation acts as an agricultural subsidy that makes it more attractive to convert natural habitat into farmland. It makes agriculture more profitable and may thus slow down the exit from farming (where it is non-profitable) and attract people who would not farm if not for the subsidy. This ‘magnet effect’ will ultimately add to the number of farmers exposed to wildlife-induced damage (Nyhus et al. 2005) and may keep the level of human-wildlife conflict ‘artificially high’, plus encourage migration flows towards farmlands where compensation schemes exist (Rondeau & Bulte 2003). People who had left the area might be enticed to return and start cultivating abandoned fields or clear new ones, leading to an increased pressure on remaining habitats, especially when formerly abandoned fields served as animal habitats (Ibid.).
150 Until 2014, compensation in Kenya was only granted for human casualties. Here, the moral hazard criticism is not applicable as it is very unlikely that someone will intentionally seek a hippo attack to get compensation (Sifuna 2005). Some conservation approaches like the predator project in Kenya’s Maasailand incorporated compensation and a behavioural component to avoid the moral hazard dilemma (Bulte & Rondeau 2005). 151 The 2013 Wildlife Act, valid from January 2014, reintroduced compensation.
180
9.5.2 Challenges facing compensation schemes Compensation schemes face a number of challenges which, if not properly addressed, will negatively influence their performance. Critical aspects in determining the effectiveness of (monetary) compensation schemes (Nyhus et al. 2003, 2005) are: • Immediate and accurate damage verification (preferably by experts) to attribute damage
to a particular ‘problem animal’ species. Evidence like a spoor may quickly disappear which enhances the risk of a species being wrongly blamed.
• Timely settlement of compensation claims and fair damage valuation. Farmers and assessors may judge ‘fairness’ differently. Calculations should be based on the current market rate or potential market value, and cover opportunity costs or compensation for the emotional loss or trauma experienced.
• Transparency in compensation for instance through separation of the verification and payment body (thus trying to avoid fraudulent claims).
• Clear rules/guidelines combined with sound management practices that are sensitive to location, species, and cultural characteristics.
• Adequate funding to sustain compensation schemes, most of which rely on external funding which puts their long-term sustainability at risk (Bulte & Rondeau 2005).
9.5.3 Alternatives to compensation Alternative approaches to compensation exist. First, locally-administered relief schemes based on basic foodstuffs, which target people who are most affected by wildlife damage, provided that they can be identified and the damage is assessed fairly, or by replacing damaged assets like livestock, fences and food storage facilities (AfESG 2002). Second, insurance systems can be put in place, through which farmers cover their assets against risks of crop damage or livestock predation by paying insurance152 premiums, either at the market rate or subsidised by conservation organisations (Lamarque et al. 2009; Muruthi 2005). However, the cost-effectiveness of private insurance might be problematic: farmers may find it too costly compared to the likelihood of damage, their small budgets and access to alternative ‘insurance systems’ like the poisoning of animals (Nyhus et al. 2005). A third option is indirect compensation153 in the form of licenses to exploit natural resources like tourism, trophy hunting, or the collection of firewood and fodder (‘settlement of rights’ to use natural resources, Lamarque et al. 2009). Fourth, tangible benefits through conditional performance payments on wildlife populations, which pay landowners or communities a certain amount for every animal that lives on their land – can work where wildlife populations can be monitored, and would encourage local communities to adopt cost-effective mechanisms to minimise wildlife induced damage (Nyhus et al. 2005). There are payments based on predator abundance, not predator-induced damage (Bulte & Rondeau 2005), comparable to payments of environmental services (PES; see Wunder 2015) when communities leave animal habitats intact. Performance payments are increasingly being used as an alternative to traditional regulatory conservation approaches in developing countries, for example the payment of villagers for the protection of sea turtle nests in Watumu, Kenya (Ferraro & Gjertsen 2009). This approach relies on a ‘willing buyer and seller’ model: the sellers deliver conservation outcomes (product) in return for a negotiated payment (Ibid.).
In Kenya, KWS runs a revenue-sharing programme with communities living adjacent to national parks. It started in pilot districts where KWS offered a 25% share of gate revenues to neighbouring communities. Due to requests from other districts, the programme was converted into the Wildlife for Development Fund in 1993 as a way to share benefits while
152 An example is the ‘Human Animal Conflict Self Insurance Scheme’ in Namibia, which covers nine conservancies (Lamarque et al. 2009). 153 Local communities in Zimbabwe collect crocodile eggs in the wild and sell them to private crocodile farms. The financial gain makes them more tolerant towards crocodiles in the wild (WWF SARPO 2005).
181
promoting conservation-related enterprises in key conservation areas. This enabled communities to venture into conservation-related enterprises like wildlife sanctuaries and ecotourism (Barrow et al. 2000), where a proportion of the entrance fee is used to construct classrooms and cattle dips (Muruthi 2005). KWS supports collaboration with communities that accommodate wildlife on their land and carry the costs of conflicts with wildlife; community expectations range from direct economic and social benefits, compensation for damaged property, improved livelihoods through nature-related enterprises, to human-wildlife conflict mitigation and enhanced security (KWS 2010).
The question remains: to what extent will these alternatives be effective in mitigating human-wildlife conflicts? Proponents of compensation argue that programmes will be more effective once communities are actively involved and have a say in decision making regarding compensation. Opponents see the larger community involvement in wildlife-related economic activities as an effective approach to reduce human-wildlife conflicts, but only when local people have access to a significant share of the revenues derived from wildlife conservation (Cirelli 2002). Compensation can be positive once the lack of property rights to land and wildlife are properly addressed (Bulte & Rondeau 2005) and when it is part of an overall approach that incorporates PAC, proactive conflict mitigation methods, and incentives to change land-use practices (Muruthi 2005) to reduce the economic burden of conservation on communities.
9.5.4 Update from the field In all divisions, the introduction of compensation for crop damage seemed not to have made any difference in the reporting behaviour of residents. Many residents were not even aware of this development, except for those in West Kabodho (Lower Nyakach), where they heard about it in the chief’s baraza, but they do not know which procedure to follow. Only in Upper Nyakach, KWS was involved in sensitising the public on how they can live and interact with hippos, while informing them about fines for illegal offtake and compensation rates for human casualty and crop damage. Compensation for crop losses was introduced in January 2014; the forms for compensation, which need to be filled in, were only released in August 2016. People did claim compensation but so far, nobody has received any funds. This can possibly be ascribed to the ignorance of residents regarding the existence of compensation.
9.6 Conclusions
Two questions were central in this chapter: how local communities can get more actively involved in conflict mitigation and play a more prominent role in hippo conservation. It turned out that communities face several difficulties in joining hands for conflict resolution. First, many individual farmers had difficulties to provide for their basic needs. Often, people relied on the government for action and left everything to them. Many residents had an aloof attitude, remained in a ‘dormant’ state and were meeting ‘fatigued’. This made the initial meetings with KWS challenging, particularly in terms of timing and turnout rates, which were low, possibly due to the rain as people were busy getting their daily food. Both KWS and the communities have different images of wildlife (some strongly culturally embedded) and the miscommunication between them is apparent. Communities have low expectations of KWS, it has a negative image. They have lived with hippos for a long time and up to date, no lasting solution has been found and many local people felt that even if KWS visits them, nothing will change.
Nevertheless, some communities had started their own groups to discuss conflict mitigation measures against hippos. These were vivid meetings in which participants eagerly expressed their opinions. They stressed the need to report incidents because it brings KWS to
182
the sites. The senior warden requested all people present to call KWS directly in case of incidents. It added goodwill to the organisation: for many residents it was the first time they actually met KWS staff. Issues of distrust were openly discussed and I felt that these meetings could be a breakthrough in the impasse. There is a lot of hearsay in the communities and the meetings offered a chance to address those issues. Hippo damage is a major issue: it is being addressed at almost every baraza, but nothing is done about it. The ‘hippo lobby groups’ could instigate the change people are waiting for. Nevertheless, it requires active participation of all people: they should not sit and wait in anticipation but instead get actively involved.
The joint meetings with KWS showed that increased interaction with communities generates willingness from both sides to explore options for co-management, but also that poor leadership, financial constraints, a lack of collective spirit and mistrust are significant hindrances. If farmers are not pushed to adopt risk-reducing methods, compensation could reduce the inclination of farmers to protect their crops and livestock, since they will be paid anyway for their losses. Alternatives to compensation, based on payments for animal abundance – which means communities have to leave animals habitats intact – could entice residents to make a joint effort to conserve hippos in the lake region. Since hippos are not migratory animals as such, it should be feasible to come up with a payment schedule. This can work especially when there is a hippo conservancy in the area.
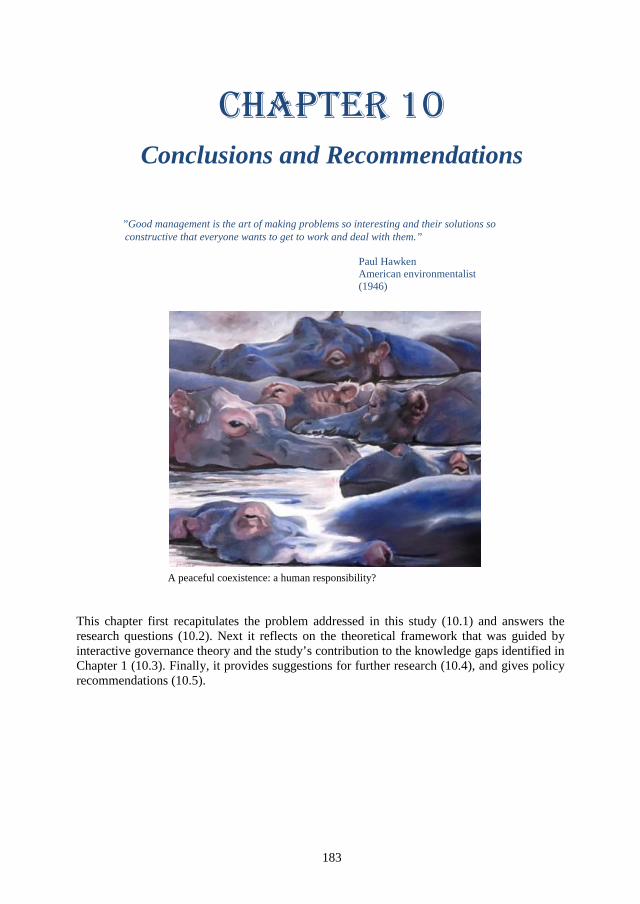
183
Chapter 10 Conclusions and Recommendations
”Good management is the art of making problems so interesting and their solutions so constructive that everyone wants to get to work and deal with them.”
Paul Hawken American environmentalist (1946)
A peaceful coexistence: a human responsibility?
This chapter first recapitulates the problem addressed in this study (10.1) and answers the research questions (10.2). Next it reflects on the theoretical framework that was guided by interactive governance theory and the study’s contribution to the knowledge gaps identified in Chapter 1 (10.3). Finally, it provides suggestions for further research (10.4), and gives policy recommendations (10.5).
184
10.1 Introduction
Worldwide, the frequency and severity of human-wildlife conflicts are increasing, mainly due to human population growth and economic expansion, which contributed to wildlife habitat loss and dwindling wildlife populations, and ultimately to the confinement of large mammal species in protected areas. Human-wildlife conflicts, which are most rampant on the fringes of protected areas, have evoked a mounting concern among conservationists and policymakers, as well as local populations who face these conflicts and associated losses. Much of scholarly work focuses on conflicts on the edges of protected areas, and tends to be biased towards ‘charismatic species’ like elephants and the global crusade against ivory trade. Many studies display a managerial approach directed at damage limitation. However, these approaches rarely provide a long-term solution, nor do they change people’s opinions and/or attitude towards the relevant wildlife species (Chapter 1).
For several reasons (1.2.1), hippos have received relatively scant scientific attention, notwithstanding their reputation as notorious crop raiders and the impact they have on local people’s livelihoods. In this study, the focus is on human-hippo conflicts in Lake Victoria Area, Kenya, which is mainly a non-protected area. It examined the research question: “How can human-hippo conflicts in Lake Victoria Area, Kenya, best be understood and dealt with?” Several sub-questions guided each chapter and help answer this main question. This chapter provides an answer to these questions and addresses the implications for research, policy and practice.
This study used the interactive governance approach (Chapter 2), developed by Bavinck et al. (2005; 2013; see also Kooiman et al. 2008) and subsequently applied to fisheries and aquaculture (e.g. Bavinck et al. 2013; Bavinck & Kooiman 2013; Chuenpagdee 2011; Chuenpagdee & Jentoft 2009; Jentoft 2007). Interactive governance theory focusses on “solving societal problems and creating societal opportunities” (Kooiman & Bavinck 2005:17) and as such is also applicable to other forms of natural resource governance. Beyond the fisheries sector, it has already been applied to analyse the governability of conflicts over forest and tree resources in Ghana (Derkyi 2012), while this study is the first to apply it to wildlife governance and the analysis of the governability of human-wildlife conflicts. This has influenced the framing of human-wildlife conflicts as a societal problem (Chapter 1) and a system-to-be-governed (Chapter 4, 6), and the analysis of the governing system (Chapter 5) and the interaction between the two (Chapters 8 and 9), guided by images and perceptions, or meta-governance (Chapter 7). Using a political ecology approach, which looks at unequal access to natural resources, power differences in conservation matters, and the way in which knowledge and discourses are used to retain inequality, has helped to reveal the conflicting interests, worldviews and power differences.
This analysis was made based on year-round monitoring of human-hippo conflicts and damage assessment in villages bordering Winam Gulf at the North-East of Lake Victoria; a questionnaire survey among 430 fishers and farmers; key respondent interviews with government officials and NGO staff; and action research in focus groups and awareness-raising meetings with local residents and KWS (Chapter 3).
10.2 Recapitulating the research questions and results
Several auxiliary questions were raised to answer the main research question. Chapter 4 (about the system-to-be-governed) asked: What are the natural and socioeconomic features of wetlands in Lake Victoria Area and how do they interact? The chapter concluded that the lakeshore as a natural system (4.2) is characterised by a variety of wetland types, already affected by invaded species like the Nile perch and water hyacinth. The human system (4.3)
185
consists of a predominantly Luo population group, living mainly of farming and fishing. The natural and human system increasingly interact: wetlands are crucial to humans for their ecosystem services (notably provisioning services like water, fish, wetland products, and soil for farming), but also provide a habitat to wildlife species such as hippos. Due to human population growth and economic expansion, many wetlands have been converted to farming land or degraded, which has decimated hippo habitats (4.4.4). According to many residents, hippo populations have increased; this seems unjustified given their overall declining population trend which ‘earned’ them a ‘vulnerable’ status on the IUCN Red List and a listing on CITES-Appendix II (1.1.4). However, human-hippo incidents have increased in number through the clearing of vegetation, which made the animals venture into people’s farms with significant impacts on local livelihoods (Chapter 5, 7).
Chapter 5, the governing system, addressed two questions. First, what legal arrangements guide wildlife governance in Kenya and the management of human-hippo conflicts? Second, who are the key actors and their role regarding human-hippo conflicts? The chapter showed that Kenya’s wildlife governance is embedded in a multilevel governance structure, with the Convention of Biological Diversity, the Ramsar Convention on Wetlands of International Importance Especially as Waterfowl Habitat, the Convention on the Conservation of Migratory Species of Wild Animals (CMS), and the Convention on International Trade in Endangered Species of Wild Fauna and Flora (CITES) being the major multilateral environmental agreements (5.1). At national level, wildlife governance is guided by the 2013 Wildlife Act, which enabled devolution of decision-making in wildlife governance and the creation of wildlife conservancies. It reintroduced compensation for crop damage, through the County Wildlife Conservation and Compensation Committee (CWCCC), which aims to mitigate human-wildlife conflicts in collaboration with Community Wildlife Associations (CWAs) and grants landowners non-consumptive wildlife user rights. It recognises wildlife conservation as a form of land use on public, private and community land. Most of the wildlife policy seems to be directed at protected areas, of which there are few in the Lake Victoria Area (5.2). Despite the devolution rhetoric, KWS remains the most powerful actor in Kenya’s wildlife governance (5.3), but human-wildlife conflicts do not seem to be a priority to the organisation, nor to NGOs. The latter wanted more community involvement in wildlife matters and give them rights of ownership and wildlife utilisation. The project area lacks involvement of the private sector in hippo conservation or human-hippo conflict mitigation.
Chapter 6 looked at human-hippo conflicts as part of the system-to-be-governed. It asked about conflict types and their magnitude in Winam Gulf Area and the risk factors related to hippo’s presence. The field staff collected evidence in terms of incident types, their magnitude (though damage assessment), and location, while they also visualised the damage through pictures. The assessment period – covered by the field staff – showed the largest incident diversity, with over 80% related to crop damage, 17% fisheries-related, 0.7% related to livestock, and 0.3% concerning human injury (6.1). Maize was mostly interfered with, particularly in Upper Nyakach and Kadibo, possibly due to the presence of the Nyando and Sondu-Miriu Rivers, where farms are located close to the water. Generally, crop damage financially outweighed fisheries damage. Loss figures show that many households were severely affected by hippo-induced losses (6.1). During the pre-assessment period, the average crop loss per incident (KSh 12,186; eq. to US$ 158) exceeded the average farming household’s monthly income, whereas the average fisheries loss (KSh 3,596; eq. to US$ 47) took 27,5% of the average fishing household’s monthly income. During the assessment period, farmers lost KSh 5,333 per incident (eq. to US$ 69), which is equivalent to 70% of the average monthly income from farming. Fishers lost KSh 4,257 (eq. to US$ 55) on average per incident, which is 33% of an average fisher household monthly income.
Incident reports are to be made to KWS or the local administration which then forwards the report to KWS (6.2). However, many residents fail to report (see 6.2.2). When comparing
186
KWS data with the project data (6.2.6), a huge discrepancy emerged: the field staff had covered 724 incidents within one year, many more than the KWS country-wide data on hippo incidents revealed (average of 290 incidents per year) or the data provided by KWS Kisumu, which came down to an average of 47 hippo reports per year. The difference can possibly be ascribed to the focus of KWS on protected areas, which may have diverted their attention from the lake region, or the non-reporting attitude of residents, who claim that it is useless to report because ‘no action will be taken’. Risk factors are related to the proximity of farm land close to a water body, seasonality and weather conditions, and periodic flooding. They were also occupation-related, either to farming or fishing. Farmers whose lands are normally flooded during the rainy season have a higher chance of experiencing crop-raiding hippos. The risk is correlated with the distance of the farm to the nearest water body: the closer to the water, the higher the risk. Fishers face risks linked to areas and fishing methods: especially beach seine netting is considered risky because it takes place along the shores, with fishers standing in the water (6.3).
Questions in Chapter 7 (meta-governance) aimed at unravelling what ‘images’ exist of human-hippo conflicts and how these affect actors’ attitude towards hippo conservation and human-hippo conflicts. Residents almost exclusively perceived the hippo as a problem animal and as a provoker of conflicts, which interferes with their livelihoods (farming and fishing). Hence, they attached many negative values to hippos, and only a few positive ones. They also argued that the hippo interferes with them and their livelihoods, although some admitted that it is people who are actually disturbing hippos. Generally, local tolerance levels were very low: many people had a hostile attitude, not only towards hippos but also towards the government/KWS, for failing to take care of its animals (Post 2000) (7.1). Although gradually disappearing, results also revealed persistent beliefs and taboos about hippos that influence how their presence is dealt with, including KWS rangers (7.2.1).
Perceptions of residents towards KWS were mostly negative. Many people felt that human-hippo conflicts had increased in their area because the hippo population has increased, partly due to natural birth and partly due to laxity of KWS, which they perceived to be reluctant to come to the incident sites and kill hippos. Interviews with KWS staff however, made clear that KWS blames people for having encroached into wetlands (hippo territories), hence leaving the animals no option but to invade the shambas to feed on the crops. The organisation claims that its rangers follow up reports, without receiving payment from residents, who fail to report these incidents. It also points at a decrease in hippo populations (7.3.1). There appeared to be major miscommunications between both actors, with conflicting ‘images’ regarding conservation and use of hippo habitats playing a key role. Only if these are addressed, there can be fruitful communication with tangible outcomes (7.2.2; 7.2.3).
Notwithstanding prevailing negative images, communities do see a key role for KWS in hippo conservation, although many respondents also see a role for themselves, but primarily in partnership with KWS (7.2.4). Opinions of the local administration and NGOs favoured local empowerment and legal changes that would allow communities to benefit from conservation (7.3). However, local mindsets will have to change in order to enable community-based conservation initiatives or co-management arrangements, with KWS and/or private investors (7.4). Most actors suggested managerial solutions to human-hippo conflicts that were mostly technical in nature, along with the creation of protected areas and improved problem animal control (PAC) by KWS. The need for an attitudinal change of the community also came up, as well as establishing strong community-based organisations aided financially by donors. Government agents and NGOs should support the communities financially or by providing material to deal with hippo conflicts (7.4).
Chapter 8 (conflict mitigation in practice) addresses the questions of how local communities work towards human-hippo conflict mitigation in practice, and what coping strategies they use to handle the outcome of such conflicts. Both farmers and fishers follow
187
different approaches to reduce these conflicts in practice, with the majority of farmers relying on physical separation (like fencing, digging trenches), guarding (individually or collectively, whether in a watch house or not), or the use of devices to ward off hippos. Most of these approaches are not effective (8.1). Approaches used by fishers related mostly to avoidance of hippo sites and/or their trails, followed by putting scarecrows on or near the fishing gears. However, since fish breed near hippo sites, many fishers still go there to get a good catch (8.2). The analysis further showed changes and adaptation in economic activities occurred partly because of human-hippo conflicts (8.3.2). Once confronted with losses, farmers cope usually cope with the damage by replanting (provided the money is there), adjusting the area under cultivation, planting different crops, or adding income-generating activities to their portfolio in an attempt to diversify (8.3.3). Fishers normally reduce their fishing activity, change their method of fishing (provided they have the required equipment), avoid hippo areas or get more involved in farming (8.3.4). Adaptations to livelihood strategies are related to how people deal with the aftermath of incidents: whether they evade conflict areas or improve on the protective methods and what their future outlook is (8.2, 8.3), resulting in different perceptions of hippos and human-hippo conflicts and ways of dealing with them than in the past (8.4; 8.3.1). Since 2015, however, many residents say that incident numbers have reduced as farmers now cultivate their crops further away from the water shore due to recurrent flooding. The construction of dikes and gabions along the main rivers may have played a role too (8.4).
Chapter 9 (prospects of local wildlife governance) addressed questions related to the action-oriented side of this study, namely how local communities can become more actively involved in conflict mitigation and acquire a more prominent role in hippo conservation. By organising awareness-creation meetings with participation of KWS (Chapter 3), residents were challenged to perceive hippos differently, as a resource from which they can benefit, for instance by establishing a hippo conservancy in their area (9.1). At the time, KWS committed to providing technical assistance, making use of grants through the Community Development Fund (CDF) or Local Authority Trust Fund (LATF) or by seeking sponsors (9.2). The study identified several communal initiatives in the project area, which could act as a stepping stone for the ‘hippo lobby groups’. The research made clear, however, that such initiatives are not sustainable without strong leaders, who are accountable and transparent towards their members, and committed to the key aims: reconciling hippo conservation with income generation, while reducing the number of incidents and increasing residents’ tolerance levels.
Several constraints towards co-governance with KWS and self-governance came up in addition to the lack of local leadership, including a lack of knowledge of the legal aspects of wildlife and wetlands conservation (9.4.1), financial constraints (9.4.2), mistrust between KWS and the communities (9.4.3), and a lack of financial compensation for hippo-induced damage (9.4.5). The 2013 Wildlife Act reintroduced compensation, which is still a highly-debated topic as its effectiveness in conflict mitigation depends on damage verification, timely settlement and transparency in compensation (9.5).
To sum up, answering the main research question “How can human-hippo conflicts in the Lake Victoria Area, Kenya, best be understood and dealt with?” is closely linked to the (potential) roles and positions of wildlife governance actors, namely KWS, communities, NGOs and the private sector. These are coloured by their perceptions and worldviews, which feed the conservation discourse and influence the handling of conflicts. Images of human-wildlife conflicts and how to solve them are based on human disagreements, which can be attributed to human attitude, values, power arrangements, or to the partial inclusion and exclusion of actors in conservation planning and decision-making related to wildlife policies. Power inequality and conflicting interests also play a role. Hence, the framing of governing interactions as ‘human-human’ conflicts over perceptions and practices regarding hippos and hippo habitats (2.1.2), to be looked at separately from human-hippo conflicts, which are
188
essentially conflicts about land use (4.4.4). Human-human conflicts arise when people are contemplating how to handle these conflicts, as this will reveal their different images of hippos and their habitats, and how they relate to hippos. Some people may want to get rid of these problem animals, whereas others feel that hippos are a resource which can either be used or has to be protected. This somehow resembles the different world views of Turner, namely preservationism/ecocentrism (hippos are vulnerable species which require strict protection, for instance in hippo conservancies), exploitationism/technocratism (hippos are a resource which is to be used; market mechanisms will safeguard their existence in the long run), or conservationism (controlled resource use through regulation; PAC) (De Haan 2000).
10.3 Contribution to science
This study contributes to existing literature in several ways. First, studies of human-wildlife conflicts are often restricted to conflicts with wildlife, i.e. direct interactions between people and wildlife. By addressing the governability of these conflicts, this study adds to this the analysis of human-wildlife conflicts as conflicts over wildlife, or people-people interactions, which calls for an approach that looks into the ‘social elements’ of conflicts, namely relationships and interactions between actors (White et al. 2009), with inherent conflicts due to the diversity, complexity and dynamics of the natural and socio-economic settings in which actors operate at various levels (Chuenpagdee & Jentoft 2009; Kooiman 2008).
Second, whereas human-wildlife conflict studies often fail to address human disagreements, they also ignore the underlying values and perceptions of the context of these conflicts, for instance regarding livelihoods and conservation and the trade-offs between them, which can influence people’s position on wildlife conservation and conflict management. This study therefore used the interactive governance approach to address the human and cultural dimension to human-wildlife conflicts, from first order (day-to-day management), designing governing institutions to problem solving (second order) and meta-governance (third order). Although interactive governance theory acknowledges the role of meta-governance and explicitly distinguishes this as a third order of governance, existing studies tend to somewhat ignore this aspect. This study made clear that explicit attention to this governance order enables to address the social factors that play a role in how actors perceive hippos and human-hippo conflicts; it also underlined the crucial role of meta-governance, which reflects the principles, values and norms to which actors in wildlife matters adhere. In line with the suggestion of Adams et al. (2003), this study addressed the beliefs, myths and ideas of actors, which influence people’s perceptions of human-wildlife conflicts, and looked at policy narratives which can strongly influence how decision-makers view wildlife management, including ways to solve human-hippo conflicts. This helps to clarify what exactly the problem is, as actors may have different perceptions about the causes of the problem and about the extent of the damage, something that is commonly overlooked in policy formulation. This not only influences their attitude towards wildlife conservation and conflict mitigation, but also how they respond to conflict occurrences. Ultimately, this led to the evolution of human-hippo conflicts into human-human conflicts, between communities and also between communities and KWS.
Third, adding human and cultural dimensions to the theoretical framework of human-wildlife conflicts gives interactive governance a political ecology angle, thereby revealing conflicting interests and underlying worldviews and values (meta-governance) related to wildlife conservation and conflict mitigation. Notwithstanding devolution, the state is still dominating the wildlife governance scene – it has retained its power position – although newly emerged governance systems are coming to the fore, which leaves opportunities for civil society organisations and the private sector to play a role in wildlife conservation and
189
conflict mitigation. Whereas partnerships can enhance the effectiveness of conservation, power relations and internal differences determine to what extent they fulfil governance functions (Visseren-Hamakers 2013).
Fourth, most studies on human-wildlife conflicts tend to focus on conservation areas and their buffer zones. This study provided insights into human-hippo conflicts in a non-protected setting, revealing the strengths and weaknesses, and the potential and limitations of their governability in such a context. By taking an action-oriented stand, residents were pursued to organise themselves into community groups to discuss hippo-related issues, in order to mitigate or resolve human-hippo conflicts in unison. There are many formal and informal arrangements in the area, which mostly deal with agriculture, for instance family groups that collectively watch farms at night, or farmers’ associations, whose prime target is income generation. In addition, there are fisheries arrangements, targeted at fish marketing, and Beach Management Units, which follow the guidelines as provided by the ministry. Notwithstanding the impact hippos have on local livelihoods, none of the above arrangements deals with hippo-induced damage, and yet they could serve as potential entry points for collective action. However, this study has shown that there are fundamental hindrances to solve human-hippo conflicts through self- and co-governance, including distrust, a lack of leadership and vigour, and conflicting ‘images’. Human-hippo conflicts thus evolve into human-human conflicts – both within the communities (freeriding, power abuse) and between communities and KWS (territorial conflicts, livelihood versus conservation, etc.).
Fifth, the combined methodology of the study, which included year-round monitoring, allowed for detailed measurements and damage assessments. This created an evidence base of the importance and extent of human-hippo conflicts, which have hitherto been underexposed in scholarly literature on human-wildlife conflicts, and made the conflicts visible in terms of cost impact and the impact on local livelihoods. The evidence was also used to show KWS that human-hippo conflicts are a serious issue that needs to be addressed, plus the action-oriented component actually got KWS to organise meetings with communities to discuss hippo issues. These meetings acted as a platform for the exchange of ideas, with residents and KWS expressing their points of view. One of the outcomes was the establishment of ‘hippo lobby groups’, which act as co-governance structures and can assist local communities to work towards local wildlife governance. This showed that co-governance can contribute to conflict mitigation, provided a broker is active to bring actors with conflicting ‘images’ together – although it is far from easy, given the dominance of the State in wildlife governance. During the project, the 2013 Wildlife Act, which gives an official status to conservancies had not yet been drafted. In spite of this, the efforts made towards the creation of a conservancy in Lower Nyakach progressed well until its ‘catalyst’ suddenly passed away. His successor got transferred, leaving the initiative to die. It was another example that showed that, with a broker and committed leader in place, local people can be enthused and are willing to participate actively in finding solutions to human-hippo conflicts.
To sum up, this study has contributed to existing literature by (1) stressing the human and cultural dimension to human-wildlife conflicts, thus disclosing conflicting conservation interests of different actors, which is often overlooked in the existing theoretical frameworks of human-wildlife conflicts; (2) revealing the potential and limitations to the governability of human-hippo conflicts in non-protected areas; (3) revealing the importance of continuous monitoring and damage assessment, as a pathway towards collective action and co-management, and (4) making clear the importance of committed leadership and brokers in solving human-hippo conflicts.
In 2010, Kenya endorsed a new constitution and adopted a devolved governance system with 47 counties (see 3.2). This gave way to the 2013 Wildlife Act (RoK 2013a), which is more geared towards devolution, public participation and community conservation. This leaves opportunities for civil society and the market to play a role in wildlife conservation and
190
conflict mitigation (see Chapter 5). Residents of the project area were not involved in the policy-making process that led to the 2013 Act. All NGOs complained about the absence of a community voice in wildlife matters: wildlife conservation can only work with community involvement. Good governance is essential for successful community-based conservation, which encourages wildlife conservation, while simultaneously improving local livelihoods and people’s incomes. Improved land management, diversified sources of income, better education and strong governance systems are at the basis of the conservancy model, which offers communities resilience to cope with future changes (Pye-Smith 2013). How this translates into recommendations for policy and practice will be addressed in Section 10.5.
10.4 Suggestions for further research
The conclusions and reflections above result in several suggestions for further research. First, although this study examined images of hippos and wildlife governance among actors from different sectors, the analysis did not cover the perceptions of religious and cultural leaders regarding nature, which could have influenced the opinions of residents. There are many denominations in the project area which are of Christian origin. Muslim leaders perceive nature differently, as a source of food for humans, whose bounty is to be equally distributed among all – thus discouraging unnecessary killing of animals – as “man has been placed on earth as God’s representative” (Faruqi 2007:463). Further research could delve deeper into the images and role of religious leaders in wildlife governance in a society where religion plays an important role in daily life.
The Kenyan model of wildlife governance is still top-down oriented, with KWS as the lead actor. It prioritises conservation and excludes consumptive wildlife utilisation (5.3.2; 7.3.1). However, there are changes, with different wildlife initiatives (ranches of private landowners, conservancies) coming to the fore, and several community initiatives. It would be interesting to compare this with the South African model, which incorporates consumptive wildlife utilisation and trophy hunting. What is the impact of both models on wildlife populations? Is the ‘wildlife has to pay its own way’ narrative more effective from a conservation point of view or as a way to involve communities in wildlife governance? This also involves ethical questions regarding the killing of animals and using the proceeds for conservation purposes.
Third, this study revealed a lack of knowledge among communities of legal aspects of wildlife governance and among KWS officers about the actual extent of human-hippo conflicts and their consequences. Schools and barazas were identified as the best ways to disseminate information in an area where infrastructural developments are underway, but far from realised. Further research could explore the role of mobile phones in improving reporting and communication of wildlife-related issues.
Fourth, this study identified a lack of leadership and community involvement as key factors hindering effective wildlife governance. A meta-analysis of case-studies, as well as further research into ‘best cases’ could help identify key factors for successful co-management and community-based wildlife governance.
10.5 Recommendations for policy and practice
10.5.1 Recommendations for KWS
1. Develop into a guiding organisation to increase the governability of human-hippo conflicts KWS has the know-how on wildlife and should be able to advise and guide resident groups,
191
who are carrying the burden of hippo incidents, how to coexist with hippos. This study made clear that creating appropriate institutions at the local level faces several constraints (Chapter 9): people need continuous guidance in the process, which gets easily distorted due to conflicting interests at different levels. The awareness creating meetings had demonstrated that hippos cause major damage in the project area, which ‘pushes’ KWS to go beyond its claim that people have encroached wetlands. The KWS visits during the project period had created much goodwill with the communities: many residents saw it as a first step to solve human-hippo conflicts. However, a follow-up was lacking and promises made by KWS to come and assist residents with proposal writing and sourcing for funding were not kept.
Notwithstanding its limited number of staff and equipment, KWS should work towards conflict mitigation with local communities, educate residents and guide them in group formation so that they will be able to deal with these conflicts in a constructive way. This requires more attention for differences of opinion and interests and underlying values in the communication between KWS (as the governing system), and residents (as the system-to-be-governed). Currently, there is a major mistrust between both actors, with unjustified perceptions. The governability of human-hippo conflicts can be improved by involving local communities in wildlife conservation, for instance through conservancies (see recommendation 7), and by engaging them in the decision-making process regarding wildlife governance. In doing so, it is necessary to (1) resolve the mistrust between KWS and communities, (2) to openly discuss each other’s perceptions, values and value orientations that guide attitudes, (3) to clarify the trade-offs of different options, and (4) to achieve solutions for human-hippo conflicts that are acceptable to all parties involved.
2. KWS has to become a more research-oriented organisation, starting with the developmentof a hippo monitoring databaseThis study revealed a notable lack of information among KWS staff of the extent of hippo-human conflicts and their consequences in the study area (Chapter 6). KWS can improve onits task in two ways. First, I recommend carrying out a hippo census in the Kenyan part ofLake Victoria, aimed at getting the distribution and numbers of hippo populations, and todetermine the carrying capacity. Such data is required to formulate sound hippo conservationand management strategies, which form the basis of a ‘hippo governance and monitoringprogramme’ in the lake region. The census outcome could initiate a hippo monitoringdatabase. Budget, time and staff allowing, a nationwide census can be considered. Keyconsiderations are: (1) timing, preferably from mid-October until mid-November, when thevisibility is relatively good, (2) method and type of equipment used: I recommend aerialcounts combined with land or boat counts to derive a (reliable) correction factor to get goodestimates of the hippo population, (3) required budget: source for sponsors like, for instance,WWF, the IUCN/SSC Hippo Specialist Group (HSG), or Wildlife Direct to cover theestimated survey costs, and (4) determine the survey area. It would be good to start with theWestern Region, but Central Rift, Southern, Tsavo/Coast and Eastern/Mountain Area shouldalso be considered (KWS officer, pers. comm.). Afterwards, the results serve as baselineinformation for a hippo database (to be updated periodically to allow for hippo monitoring).
Second, this study has revealed the impact of continuous presence of monitors in hippo-inflicted areas. In line with this, KWS could consider establishing a network of community-based monitors or scouts154 for a thorough inventory and monitoring of human-hippo conflicts and their effects as a basis for more effective problem animal control (see next point).
154 The idea of ‘community wildlife scouts’ has been picked up, but only for conservancies. It is incorporated in the draft Wildlife Conservation and Management (Conservancy and Sanctuary) Regulations 2015 (KWS 2015). A scout can assist in human-wildlife conflict mitigation and PAC, assist in wildlife monitoring and maintain ‘records of wildlife species and their numbers’ (Ibid.:9). A conservancy has to report incidents to KWS.
192
3. Create rules for people and barriers for hippos KWS is to build barriers to keep hippos in their own areas – and people out. It should patrol the borders of these conservancies and block trespassers, whether hippos or people. The latter can be fined with hefty amounts, whereas the former can be scared by shooting in the air. The organization should also get engaged in creating awareness about the conservancies (see recommendation 7) and educate people on how to avoid conflicts with hippos (see 10.5.3). Generally speaking: people need instructions; hippos need (tangible) barriers. Combined with maps of hippo locations, the results serve as input for the locally recruited scouts or monitors. 4. Improve Problem Animal Control (PAC) There have been numerous complaints about KWS not having enough staff or equipment to carry out its PAC activities, particularly outside protected areas (Chapter 7). KWS has to bridge the gap with local communities by involving them, which will not only (partially) overcome the time and labour constraints that KWS faces, but also enhance the interest of local people in the wildlife species with which they share the land. Ultimately, this may positively influence their conservation attitude. In the lake region, local youths can be involved in each sublocation (gender-balanced selection). After having been trained by KWS, they will be stationed as informants or scouts/monitors within their own communities: they can also monitor the area the presence of hippos or other problem animals. A monitoring system, which includes the use of GIS and remote sensing, has to be developed that incorporates local communities. It needs to be institutionalised so that the data is accessible and transparent. Having monitors on the ground fits into the new KWS policy to increase community involvement in wildlife conservation. It should be announced in the barazas that scouts/monitors are to be informed in case of a significant change in hippo numbers, and they have to provide feedback to the communities. In case of an incident with a hippo, the victim contacts the scout in his area, after which they jointly visit the incident site and investigate the situation. S/he can assist the victim in applying for financial compensation – provided that the conditions as set out in the 2013 Wildlife Act are met – and take care of the follow-up. The scout acts as a direct link between KWS and the communities, which will help to bridge the communication gap between both actors. The data collected will be useful in developing the Hippo Action Plan (see next point).
5. Develop a Hippo Action Plan that goes beyond protected areas Develop a ‘Hippo Action Plan’ that goes beyond the boundaries of protected areas. The type and intensity of human-hippo conflicts may vary locally, depending on the occurrence of natural vegetation, population densities (of people and hippos), and land-use patterns near the waterbody. Key is that these conflicts are human-induced. The Hippo Action Plan gives an overview of methods that can be used to mitigate human-hippo conflicts, for instance by addressing PAC which is carried out by KWS and is reactive in nature. The plan for non-protected areas should include more proactive approaches like strategic positioning of economic activities and reorientation towards other activities. It should be linked to the hippo database (recommendation 1) so that actual monitoring of hippo populations is arranged. 6. Improve dissemination of the 2013 Wildlife Act Knowledge of the legal side of wildlife governance is weak (Chapter 9). There is a need to improve the dissemination of the 2013 Wildlife Act, which has been in place since January 2014, at the local level, for instance in chief’s barazas, meetings of clan elders, and BMU meetings. At present, many residents of the project area – and even the local administration – have little knowledge of the legal framework of wildlife conservation. On paper, local communities have been involved in the decision-making stage of the wildlife policy. In reality
193
however, this does not seem to be the case. Despite the organisation of consultative meetings throughout the country, hardly any (if any) residents of the project area were aware of this. Hence, they did not have a say in the realisation of the 2013 Wildlife Act, and some of the new elements included in this act passed them over in silence. Very few residents did know that compensation for crop damage was reintroduced in this act and that requests for compensation can be made through the CWCCC, on the recommendations and verification of KWS. The CWCCC grants compensation at the ruling market rates, provided that the owner of the livestock, crops or property has taken adequate protective measures155 and his land-use practices are in line with the ecosystem-based area management plan (RoK 2013a). Yet, many residents still assume that KWS is in charge of paying compensation because they know that it is responsible for wildlife management. 7. Create conservancies I recommend promoting the creation of hippo conservancies in the Lake Victoria Area, which is generally a non-protected area. Establishing conservancies, either in co-governance (with KWS/private sector/NGOs) or self-governance, can make residents aware of the benefits of hippo presence. A conservancy creates jobs and income for the communities, provided it is governed well. KWS could stimulate the establishment and registration of local hippo lobby groups (Chapter 9) and provide financial and technical advice on how to proceed. As noted above, communities lack leadership and guidance. Hence, they need assistance in the search for donors which can financially support the proposed activities, for instance through the Community Development Fund (CDF), the Local Authority Transfer Fund (LATF) (see 9.2.1), and the private sector, plus advice on the organisational and institutional setup of the conservancy committee. Getting them actively involved in local arrangements that aim to reduce or mitigate human-hippo conflicts could bring about a change in the mindset of local people, especially when group members see how they can benefit from the presence of hippos, and coexistence can become a reality. One example is the creation of hippo conservancies, in combination with tourism and promotion of the Luo culture. It is crucial that local people are involved from the onset, both in the development and decision-making process. This requires good organisational structures, with strong leadership, which is accountable to its members and transparent when it comes to financial issues.
Together with communities, KWS will have to decide on the location of conservancies156, which can be either on government (predominantly wetland areas), community, or privately owned157. Once the communities have proposed a site, KWS should carry out a ‘biodiversity inventory’ of the area and guide them in developing a conservancy plan, covering aims, management and financial details, including the sourcing of funds from the CDF and/or LATF, or international donors. The following sites were identified in the project area as being suitable for hippo conservancies: Adera (a wetland in Upper Nyakach), Singida (Nyando), Nyamware (Kadibo) and Gem Rae, in Lower Nyakach (9.2). In Gem Rae, one of the residents worked as a catalyst: he mobilized all neighbours and persuaded them to bring in (parts of) their land to create a hippo conservancy. Even KWS checked out the proposed site. Unfortunately, he passed away, and the conservancy plan never materialized. Convincing people to hand over (part of) their land will however be difficult, as land ownership is hotly debated. Key to the establishment of conservancies is therefore the regulation of land ownership (see next point).
155 Payments will be withheld if people cultivate crops in hippo habitats or they fail to protect their crops. This implies that many farmers in the project area will not be eligible for financial compensation. 156 There are several regional associations, like the Northern Rangeland Trust and the Western Wildlife Conservancies Association. The latter started in 2014 but is still in its infancy (KWCA 2017). 157 Conservancies are legally defined in the 2013 Wildlife Act. To date, there are over 140 private and community conservancies, covering a land area of more than 7.5 million acres in 22 counties (KWCA 2017).
194
8. Regulate land ownership This study showed that land ownership is a pressing issue, especially in areas bordering (meandering) rivers and areas with fluctuating water levels (Chapters 4 and 6). There have been violent clashes over land, which can be solved once officers from the Lands Office demarcate the land boundaries. Proper land-use planning can create clarity and provide people with ownership titles, while helping to reduce human-hippo conflicts by restricting the encroachment of human settlements into wetlands and possibly change the location of shambas. For land regulation, the Lands Office will first need to finalise the land adjudication process so that individuals will clearly know which land is theirs. This is particularly relevant given the meandering of River Nyando and the land disputes it generated. Also the receding lake levels have generated land disputes among the communities (4.4.4); the zones commonly referred to as ‘game reserve’ (9.4.1) in the Agricultural Act, which are for hippos to graze on, will have to be demarcated. For areas that are (and remain) government land, strict monitoring and enforcement should take place, specifically for the zones bordering waterbodies, which are protected under the Agricultural Act. In the meantime, the government should step in and ban cultivation along the lake – farmers actually had to abandon their farms – until the land issue is settled and land demarcation has taken place, like what they did in the land conflict between people from Magina and Gem Rae in 2015. Local politicians should respect the outcome of the Lands Office instead of instigating residents to fight the other party (see 8.4).
9. Promote other measures to enhance the coexistence of humans and hippos Accepting coexistence with hippos implies a change of attitude, with higher tolerance levels towards the animals. In addition to the recommendation above, there are several other ways in which this can be realised: 1. Giving financial compensation for losses incurred, with prices at the current market rate,
after properly carried out damage assessment by an ‘independent assessor’. This can offset the loss of harvest, cost of replant and time invested, depending on the crop stage, while insurance schemes guarantee residents reimbursement for crop damage.
2. Ensure funding to improve on protective methods like fences or stone walls, which are effective to keep hippos out of the farms (Omondi et al. 2004). A project in the Gambia successfully kept hippos from invading rice fields, with farmers being asked to refrain from cultivating land adjacent to the river banks to enable hippo grazing (UNDP 2014). My previous study in Lake Victoria Area also suggested walls as an effective method to prevent hippo damage (Post 2000). However, it fell on deaf ears, possibly due to the costs of construction, design, and availability of material. In recent years, dikes have been constructed (with external funding) that keep hippos away from farms.
3. Enable policy changes to allow for consumptive wildlife use. The 2013 Wildlife Act grants wildlife user rights through the CWCCC, either as a permit for non-consumptive use, or as a licence for consumptive wildlife uses like “game farming, game ranching, live capture, research involving off-take, cropping and culling” (RoK 2013a:1298). Game farming is not allowed for hippos. Hence, local communities in the Lake Victoria Area are only entitled to non-consumptive uses of wildlife. This is probably not sufficient to keep a local hippo conservancy viable.
4. Ensure the gazettement of The Wildlife Conservation and Management Act 2013 regulations, for instance the Wildlife Conservation and Management (Conservancy and Sanctuary) Regulations, Compensation Regulations, Licensing and Wildlife User Rights Regulations, and the Community Participation Regulations, which all impact on the management and development of conservancies (KWCA 2017).
195
10.5.2 Recommendations for civil society organisations
1. Get the government moving The government will have to be pushed, as it does not move on its own. Adequate governance of wildlife and human-hippo conflicts requires a catalyst, which can be an NGO or private organisation that supports the creation of hippo zones, and supplies technical know-how and funding. I believe that CBOs should be able to achieve this, but only if properly trained in (financial) management and business skills, and with leaders who are transparent in their activities and accountable to their members. 2. Support collective action Chapter 9 revealed that there are several efforts towards collective action to deal with the presence of hippos, but also that these initiatives face several challenges. Communities require assistance to establish institutions that represent them, as well as training in skills like planning, budgeting, monitoring and financial management to assist them in leading conservation activities. In this respect, NGOs can play a role.
10.5.3 Recommendations for concerted action by KWS and CSOs
Improve education and awareness of wildlife issues Develop and implement an education and awareness programme which focuses on the importance of wetlands as hippo habitats and the need to conserve them. This can be done through a wider approach, which goes beyond a single animal species (hippo) and incorporates the conservation of wetlands and its inhabitants. Initially, an inventory should be made of organisations that can contribute to the development of an educational outreach programme. Awareness creation will be most effective when it is directed at different levels and applies to a variety of techniques, which are suitable for a particular audience. Based on the experiences with the action research component of this research (Chapter 9), I propose to start with a workshop (kick-off meeting) at the county level with county administrators, opinion leaders from within the communities inhabiting the lake region, and chairmen of the BMUs, followed by a series of barazas, coordinated by the local administration, which are instrumental in providing feedback on the educational programme and the monitoring of human-hippo conflicts. It is recommended to include field visits for scouts and representatives of the Hippo Lobby Groups to areas where community conservation is successful so that they get a better notion of conservation activities and success factors.
The educational outreach programme could target students in primary schools and include children interviewing their parents about wetlands and conflicts with wetland animals, so that they learn why these conflicts exist and how they can be mitigated. These interviews would stimulate a discussion on human-wildlife conflicts and wetland conservation, both in the household and at school, which might ultimately lead to a community-wide discussion on locally applied conflict resolution strategies. Other activities could include teaching at schools on the wildlife-related topics as part of the environmental programme; a writing contest for students in primary schools; and the publication of a booklet with the work of the students that can be used a study material in other primary schools. It would be advisable to look for organisations that can assist in the development of the outreach programme, and possibly in the development of a publicity strategy related to ways of coexistence with hippos in a healthy wetland environment.
10.5.4 Recommendation for the private sector The results of this study revealed a notable lack of involvement of the private sector in hippo conservation or human-hippo conflict mitigation in the study area. The private sector could
196
play a greater role in the creation of hippo conservancies and the promotion of ecotourism to enhance the financial sustainability of wildlife governance.
10.5.5 Recommendations for communities
1. Be aware of the risks of encroaching into hippo habitatsIn the past, there was enough land for hippos which inhabited a large part of the lakeshore andthe rivers that discharge into Lake Victoria. High human population growth rates madeincreasing demands on land, for settlements and agriculture, which made residents encroachinto hippo habitats. As a result, hippo numbers have reduced significantly158, in line with thetrend in 1.1.3. This shows the need to: (1) avoid any further reduction in hippo populations,which may otherwise lead to their extinction in the project area (and even beyond that); (2)prevent further deterioration of wetland ecosystems to avoid a total depletion of theenvironment; and (3) adapt livelihoods so that human-hippo conflicts can be reduced.
2. Engage in wildlife governanceResidents should engage themselves in co-governance arrangements with KWS, an NGO, orthe private sector to get funding for their initiatives. Together with these organisations,wildlife conservation ‘that pays its way’ can be achieved. The leadership of the co-governance structure has to be accountable and transparent to its members and manage theresources sustainably. Getting actively involved through local governance structures and byestablishing animal conservancies, communities can become ‘conservation agents’ andbenefit from the presence of wildlife – which discourages illegal activities (Ole Kaelo 2016).Women and youth also have to participate in wildlife governance, and the conservancybenefits should be equally distributed. In order to attract tourists, residents can combine theconservancy with establishing cultural centres where they show their way of life, and displayinformation about the area, wetlands, and hippos, and sell local artefacts and local products tovisitors. It would be good to join in with the expanding tourism in the Western circuit (7.3.2).Community scouts will have to be trained properly in the field (damage assessment,involvement in census and monitoring activities) and feed the data in the hippo monitoringdatabase (KWS recommendation 2) to keep it current. They have to inform residents abouthippo presence and collaborate with residents and KWS, covering the reporting of incidents.
3. Increase joint effortsCollective efforts (shared labour and costs) can help improve protective methods. Joint labourcan also work in watch schemes, with people guarding the farms in turns at night. This willreduce the impact of watching on their physique: residents will be less prone to diseases andgenerally more fit, they will also have more time for other activities. There are horticulturalinitiatives in Nyanza (mostly in Suba), which are properly fenced, where hippos do not enter.Hence, a good harvest is feasible without hippo interference. But then again, people will haveto collaborate, which is often a hindrance to success.
4. Learn from peersThis study has made clear that residents have developed their own risk reduction, conflictmitigation, and coping strategies. These can be discussed and experiences exchanged inbarazas. Strategies that came to the fore included (1) diversification of crop types grown andopt for the ones less palatable to hippos, (2) intensification of agricultural practices, in close
158 According to residents, hippos have increased in number, contrary to KWS which argues that hippo populations outside protected areas have declined. Generally, there is little knowledge of hippo numbers in the lake region. Even the Kisumu County Integrated Development Plan 2013-2017 stated that “hippos are found in the area, but their number is not yet confirmed” (RoK 2013b:224).
197
collaboration with Agricultural Officers, who disseminate this type of information and/or guidance to farmers. This can generate additional income without further land expansion land so as to avoid more pressure on hippo habitats, (3) selecting other new protective methods, for instance the erection of walls which are effective in keeping hippos out of farms, thus reducing the number of crop raids, and if a method is proven to be effective, by disseminating the information with others, (4) work towards capacity building with financial support from conservation payments, which can be in the form of payments for conservation performance (Nyirenda et al. 2013), for instance maintaining a certain number of wildlife in an area.
5. Get involved in wetland conservationAnother way to conserve wetlands (hippo habitats) would be to refrain from harvestingwetland products. However, since this a valuable source of income to many residents, theymight refuse to do so. Hence, as an alternative I suggest planting of wetland vegetation andtrees, and harvesting the products in a sustainable way to guarantee an ‘ongoing’ harvest. Theinitiative in West Nyakach, where a landowner planted fast-growing trees and differentvarieties of wetland vegetation, seemed to be a good local initiative, but it hardly got copied. Ieven arranged for people from the Ministry to visit the site, but a follow-up was lacking.
6. Acquire a change of mindsetResidents need to be educated on wildlife law issues and environmental conservation. Thiscan be done in barazas, but also through primary and secondary education, where teacherscan tell their pupils about the importance of hippos in wetland ecosystems. Once residents seehow they can benefit from hippos, they will safeguard it as a source of income. However, thisrequires a change of mindset. I recommend an open discussion of the motivations of differentactors in conflict mitigation, to get clarity on their rationale for the proposed method andavoid hidden agendas (Evans & Adams 2016).
7. Working towards conflict mitigationCommunity scouts will have to be trained properly in the field (damage assessment,involvement in census and monitoring activities) and feed the data in the hippo monitoringdatabase (KWS recommendation 2) to keep it current. These scouts take on the role of theHippo Monitoring Project field staff. They have to inform residents about hippo presence andcollaborate with residents and KWS, like a broker. In conservancies, scouts can assist in PACactivities and human-wildlife conflict mitigation.
198
References
Abila, R.O. (2003). Fish Trade and Food Security: Are they reconcilable in Lake Victoria? In: FAO Fisheries Report No. 708. Report of the Expert Consultation on International Fish Trade and Food Security, held in Casablanca, Morocco, 27-30 January 2003, pp. 128-155. Rome: Food and Agriculture Organisation of the United Nations.
Adams, W. & D. Hulme (2001). Conservation & Community. Changing Narratives, Policies & Practices in African Conservation. In: Hulme, D. & M. Murphree (2001). African Wildlife & Livelihoods. The Promise & Performance of Community Conservation, pp 9-24. Oxford: James Currey Ltd.
Adams, W.M. (2003). Nature and the colonial mind. In: Adams, W.M. & M. Mulligan (eds) (2003). Decolonizing Nature. Strategies for Conservation in a Post-colonial Era, pp 16-51. London: Earthscan Publications.
Adams, W.M., D. Brockington, J. Dyson & B. Vira (2003). Managing Tragedies: Understanding Conflict over Common Pool Resources. Science Vol. 302, pp 1915-1916.
Adams, W.M. (2004). Against extinction: the story of conservation. London, UK / Sterling, VA: Earthscan. Adams, W.M. & J. Hutton (2007). People, Parks and Poverty: Political Ecology and Biodiversity Conservation.
Conservation and Society, Vol. 5, No.2, pp 147-183. Adger, W.N., K. Brown & E. L. Tompkins (2006). The Political Economy of Cross-Scale Networks in Resource
Co-Management. Ecology and Society, Vol. 10, No. 2, Art.9, pp 14. AfESG (2002), African Elephant Specialist Group. Review of Compensation Schemes for Agricultural and Other
Damage Caused by Elephants, Technical Brief. Gland, Switzerland: IUCN - Human-Elephant Conflict Working Group (AfESG).
Agreco, República de Moçambique, Ministério da Agricultura (2008). National Census of Wildlife in Mozambique, Final Report, December 2008. National Census of Wildlife 2007-2008 – Final Report (Agreco) December 2008.
Anderies, J.M., M.A. Jansen & E. Ostrom (2004). A Framework to Analyze the Robustness Systems from an Institutional Perspective. Ecology and Society, Vol. 9 (1): art18, pp 1-17.
Anyonge-Bashir, M. & P. Udoto (2012). Beyond Philanthropy: Community Nature-based Enterprises as a Basis for Wildlife Conservation. The George Wright Forum, Vol. 29, No.1, pp 67-73.
Arts, B.J.M. & I. Visseren-Hamakers (2012). Forest governance: A state of the art review. In: Arts, B., S. van Bommel, M. Ros-Tonen & G. Verschoor (Eds.). Forest-People Interfaces. Wageningen: Wageningen Academic Publishers, The Netherlands, pp 241-257.
AU, African Union (1968). African Convention on the Conservation of Nature and Natural Resources. Adopted in Algiers, Algeria, on 15/9/1968. Download from: http://www.africa-union.org/root/au/Documents/Treaties/Text/Convention_Nature%20&%20Natural_Resources.pdf
AU, African Union (2003). African Convention on the Conservation of Nature and Natural Resources. Revised version, adopted in Maputo, Mozambique, on 11/7/2003. Download from: http://www.africa-union.org/root/AU/Documents/Treaties/Text/nature%20and%20natural%20recesource.pdf
Baillie, J. & B. Groombridge, B. (Eds) (1996). 1996 IUCN Red List of Threatened Animals. Gland, Switzerland: IUCN.
Bamford, H. (2016). Kruger Park forced to cull its wildlife. Daily News, 10th June 2016. Barasa, J.L. & Amuono, J.I. (2013). The impact of local authority transfer fund on revenue within local
authorities in Kenya. Download on 12/04/2016 from: https://www.uonbi.ac.ke/barasajke/files/the_impact_of_local_authority_transfer_fund_on_revenue_within_local_authorities_in_kenya.pdf
Barbier, E. B., M.C. Acreman & D. Knowler (1997). Economic valuation of wetlands: A guide for policy makers and planners. Gland, Switzerland: Ramsar Convention Bureau.
Barklow, W. (1995). Hippo Talk. Natural History, Vol. 104, issue 5 (p 54). Barrow, E., H. Gichohi & M. Infield (2000). Rhetoric or Reality? A Review of Community Conservation Policy
and Practice in East Africa. Evaluating Eden Series No. 5. London: International Institute for Environment and Development (IIED).
Barua, M., S.A. Bhagwat & S. Jadhav (2013). The hidden dimensions of human-wildlife conflict: Health impacts, opportunity and transaction costs. Biological Conservation 157, pp 309-316.
Batt, S. (2009). Human attitudes towards animals in relation to species similarity to humans: a multivariate approach. Bioscience Horizons, Vol. 2, No. 2, pp 180-190.
Bavinck, M., R. Chuenpagdee, M. Diallo, P. van der Heijden, J. Kooiman, R. Mahon & S. Williams (2005). Interactive fisheries governance. Delft: Eburon Publishers, 72 pp.
Bavinck, M., R. Chuenpagdee, S. Jentoft, & J. Kooiman (Eds.) (2013). Governability of fisheries and aquaculture: theory and applications. (pp 9-30). (MARE Publication Series; No. 7). Dordrecht: Springer.
199
Bavinck, M., & Kooiman, J. (2013). Applying the governability concept in fisheries: explorations from South Asia. In M. Bavinck, R. Chuenpagdee, S. Jentoft, & J. Kooiman (Eds.), Governability of fisheries and aquaculture: theory and applications. (pp 131-153). (MARE Publication Series; No. 7). Dordrecht: Springer.
Bavinck, M. & J. Gupta (2014). Legal pluralism in aquatic regimes: a challenge for governance. Current Opinion in Environmental Sustainability, Vol.11, pp 78-85.
Bavinck, M., L. Pellegrini & E. Mostert (2014a) (Eds.). Conflicts over natural resources in the Global South: conceptual approaches. Leiden: CRC Press/Balkema/Taylor & Francis Group.
Bavinck, M., M. Sowman & A. Menon (2014b). Theorizing participatory governance in contexts of legal pluralism – a conceptual reconnaissance of fishing conflicts and their resolution. In: M. Bavinck et al. (2014a). Conflicts over natural resources in the Global South: conceptual approaches, pp 147-171. Leiden: CRC Press/Balkema/Taylor & Francis Group.
Benjaminsen, T.A. & Bryceson, I. (2012). Conservation, green/blue grabbing and accumulation by dispossession. Tanzania Journal of Peasant Studies. 39( 2): 335-355.
Bennett, N.J. (2016). Using perceptions as evidence to improve conservation and environmental management. Conservation Biology, Vol. 30, No.6, pp 582-592.
Bennett, E., A. Neiland, E. Anang, P. Bannerman, AA Rahman, S. Huq, S. Bhuiya, M. Day, M. Fulford-Gardiner & W. Clerveaux (2001). Towards a better understanding of conflict management in tropical fisheries: evidence from Ghana, Bangladesh and the Caribbean. Marine Policy, Vol. 25, No.5, pp 365-376.
Bhima, R. (1996). Census of hippopotamus (Hippopotamus amphibius (L) in the Upper Shire River, Malawi. Afr. J. Ecol.. 1996, Vol.34, pp 83-85.
Birkhoff, J. & H. Burgess (2013). Public Policy and Environmental Conflicts. Boulder, CO: The Conflict Resolution Information Centre, University of Colorado.
Blanc, J.J., Barnes, R.F.W., Craig, G.C., Dublin, H.T., Thouless, C.R., Douglas-Hamilton, I. & J.A. Hart (2007). African Elephant Status Report: an update from the African Elephant Database. Occasional Paper Series of the IUCN Species Survival Commission, No. 33. Gland, Switzerland: IUCN/SSC African Elephant Specialist Group.
Boer, W.F. de & D.S. Baquete (1998). Natural resource use, crop damage and attitudes of rural people in the vicinity of the Maputo Elephant Reserve, Mozambique. Environmental Conservation, Vol.25, No.3, pp 208-2018.
Bond, C. (1989). Graveyard for hippos. Weekend Telegraph, March 18. Borrini-Feyerabend, G., Pimbert, M., Farvar, M.T., Kothari, A. and Renard, Y (2004). Sharing Power - Learning
by Doing in Co-management of Natural Resources throughout the World. IIED and IUCN/CEESP/CMWG (Ed.) Cenesta, Teheran, Iran.
Bowling, B. (2008). Multilateral Environmental Agreements: A Handbook for Afghan Officials. Kabul, Afghanistan, United Nations Environment Programme, Post-Conflict and Disaster Management Branch.
Bowman, M. (2002). The Ramsar Convention on Wetlands: Has it Made a Difference? In: O.S. Stokke & O.B. Thommessen (Eds). Yearbook of International Cooperation on Environment and Development 2002/2003. London, Earthscan Publications.
Breitenmoser, U. (1998). Large predators in the Alps: the fall and rise of man’s competitors. Biological Conservation Vol. 83, No.3, pp 279-289.
Breure-Scheffer, J.M. (Ed.) (1984). De trek der dieren. Breda: Lekturama. The migration of animals. Breda: Lekturama.
Brockington, D. & J. Igoe (2006). Eviction for Conservation: A Global Overview. Conservation and Society, Volume 4, No. 3, pp 424-470.
Bryant, R.L. (1992). Political ecology. An emerging research agenda in Third-World studies. Political Geography, Vol. 11, No. 1, pp 12-36.
Bryant, R.L. & S. Bailey (2005). Third World Political Ecology. London, UK and New York, USA: Routledge. Buchanan, K. (2016). The Instrumental Effect of Cultural Conservationon Pro-environmental Behaviour in the
Squam Lakes Watershed. Boulder: University of Colorado. Undergraduate Honors Thesis, Paper 1245. Bulte, E.H. & D. Rondeau (2005). Why compensating wildlife damages may be bad for conservation. Journal of
Wildlife Management, Vol. 69, pp 14–19. Burgman, M. & D. Lindenmayer (1998). Conservation Biology for the Australian Environment. Surrey Beatty
and Sons, Chipping Norton. In: Howard, P. (2006). The Beast Within: An exploration of Australian constructions of wildlife. Griffith University, Australia: Australian School of Environmental Studies. D-Phil thesis.
Burke, J. (2016). South African national park to kill animals in response to severe drought. The Guardian, 14th September 2016.
Burton, M. & R. Burton (1976). Hippopotamus. In: Encyclopedia of the Animal Kingdom, pp 448-449. London: Phoebus Publishing Co. & BPC Publishing Ltd.
200
Büscher, B. & T. Dietz (2005). Conjunctions of Governance: The State and the Conservation-development Nexus in Southern Africa. The Journal of Transdisciplinary Environmental Studies, Vol. 4, No. 2, pp 2-15.
Büscher, B. & W. Dressler (2007). Linking Neoprotectionism and Environmental Governance: On the Rapidly Increasing Tensions between Actors in the Environment-Development Nexus. Conservation & Society, Vol. 5, No. 4, pp 586-611.
Büscher, B. (2011). The Neoliberalisation of Nature in Africa. In: T. Dietz, K. Havnevik, M. Kaag & T. Ostigard (eds.). New Topographies of Power? Africa Negotiating an Emerging Multi-polar World, pp 84-109. Leiden: Brill.
Büscher, B. & W. Dressler (2012). Commodity Conservation. The restructuring of community conservation in South Africa and the Philippines. Geoforum 43, 3: 367-376.
Büscher, B., S. Sullivan, K. Neves, J. Igoe & D. Brockington (2012). Towards a Synthesized Critique of Neoliberal Biodiversity Conservation. Capitalism Nature Socialism, Vol. 23, No. 2, pp 4-25.
Butler, V. (1998). Unquiet on the Western Front (head of the Kenya Wildlife Service David Western). International Wildlife, November 1, 1998.
Callicott, J.B. (1994). A Critique of and an Alternative to the Wilderness Idea. Download from: https://envethics.files.wordpress.com/2013/08/callicott_1994.pdf. Last accessed: 14 January 2016.
Callicott, J.B. (2000). Contemporary Criticisms of the Received Wilderness Idea. USDA Forest Service Proceedings RMRS-P-15, Vol 1, pp 24-31.
Carpenter, L.H., D.J. Decker & J.F. Lipscomb (2000). Stakeholder Acceptance Capacity in Wildlife management. Human Dimensions of Wildlife, Vol. 5, No.3, pp 5-19.
Casley, D.J. & A. Lury (1987). Data Collection in Developing Countries. Oxford University Press. CBD, Convention on Biological Diversity (2000). Decision V/6: The Ecosystem Approach. Fifth Ordinary
Meeting of the Conference of the Parties to the CBD, 15 - 26 May 2000 - Nairobi, Kenya. Download from: http://www.cbd.int/decision/cop/?id=7148
Ceballos-Lascurain, H. (1996). Tourism, Ecotourism, and Protected Areas: The State of Nature-Based Tourism around the World and Guidelines for its Development. Gland, Switzerland: IUCN.
Chartier, L., A. Zimmermann & R.J. Ladle (2011). Habitat loss and human-elephant conflict in Assam, India: does a critical threshold exist? Oryx, Vol.45, No.4, pp 528-533.
Chomba, C., R. Senzota, H. Chabwela & V. Nyirenda (2012). Population status of the common hippopotamus (Hippopotamus amphibius) in Luangwa River, Zambia. Journal of Ecology and the Natural Environment, Vol. 40, No. 9, pp 247-257.
Chuenpagdee, R. & S. Jentoft (2009). Governability assessment for fisheries and coastal systems: A reality check. Human Ecology Vol.37, pp 109-120.
Chuenpagdee, R. (2011). An ‘interactive governance’ perspective on human and ocean systems interactions. Article based on the presentation an discussion at the first IMBER HD Working Group in Paris, April 2011.
CIGF (2005). Country Profile: Kenya. The local government system in Kenya. Download from: www.cigf.org.uk; Last accessed 16/09/2005
Cirelli, M.T. (2002). Legal Trends in Wildlife Management. FAO Legislative Study 74. Rome, Food and Agriculture Organisation of the United Nations
CITES (2009). How CITES works. Download from: http://www.cites.org/eng/disc/how.shtml CITES (2012). Appendices I, II and III, valid from 25 September 2012. Geneva, Switzerland: CITES. Download
from: www.cites.org Cleaver, F. (2001), Institutional Bricolage, Conflict and Cooperation in Usangu, Tanzania. IDS Bulletin, Vol. 32,
pp 26–35. CLGF (2009), Commonwealth Local Government Forum. Country profile: Kenya. The local government system
in Kenya. Download from: http://www.clgf.org.uk/default/assets/File/Country_profiles/Kenya.pdf. Last accessed on 20 March 2017.
Cline, R., Sexton, N. & Stewart, S.C. (2007). A human-dimensions review of human-wildlife disturbance: a literature review of impacts, frameworks, and management solutions. U.S. Geological Survey: Open-File Report 2007-1111, 88 p.
CMS, The Convention on Migratory Species (2009a). Official documents: The Convention Text. Appendix I and Appendix II. Download from: http://www.cms.int/documents/index.htm; last accessed on 15/10/2009
CMS, The Convention on Migratory Species (2009b). Parties to the Convention on the Conservation of Migratory Species of Wild Animals and its Agreements, as at 1 October 2009. Download from: http://www.cms.int/about/part_lst.htm; last accessed on 15/10/2009
Colbert, E.H. (1984). Artiodactyls in the modern world. In: Evolution of the vertebrates. A History of Backboned Animals through Time (pp 414-425). Wiley Eastern Ltd.
Conover, M. (2002). Resolving human-wildlife conflicts: the science of wildlife damage management. Boca Raton, Florida, USA: Lewis Publishers, pp 1-418.
Conover, M.R. (2009). The cost of fear. Human–Wildlife Conflicts Vol 3(2), pp 157–158, Fall 2009.
201
CRA, Commission on Revenue Allocation (2011). Kenya. County Fact Sheets. Download from: http://www.crakenya.org/wp-content/uploads/2013/10/Kenya-County-Fact-Sheets_Dec-2011.pdf. Last accessed: 1 August 2015.
Crul, C.M. (1995). Limnology and hydrology of Lake Victoria: comprehensive and comparative study of great lakes. Paris, UNESCO.
Crutzen, P.J. (2002). Geology of mankind: the anthropocene. Nature, Vol. 415, pp 23. Dasmann, R.F. (1981). Wildlife Biology (2nd edition). New York, Chichester, Brisbane, Toronto: John Wiley &
Sons. Decker, D.J. & Richmond, M.E. (1995). Managing people in an urban deer environment: the human dimensions
challenges for managers. Pages 3-10 in J.B. McAninch (Ed.) Urban deer: a manageable resource? Proc. Symposium 55th Midwest Fish and Wildlife Conference, 12-14 December 1993, St. Louis, Mo. North Cent.Sect., The Wildlife Society, West LaFayette, Ind. In: Decker & Chase (1997). Human dimensions of living with wildlife - a management challenge for the 21st century. Wildlife Society Bulletin, 25(4): 788-795.
Decker, D.J. & L. C. Chase (1997). Human dimensions of living with wildlife - a management challenge for the 21st century. Wildlife Society Bulletin, 25(4): 788-795.
Decker, D. J., T. B. Lauber & W. F. Siemer (2002). Human-wildlife conflict management: A practitioner’s guide. Ithaca, New York, USA: The Human Dimensions Research Unit, Cornell University, pp 1-48.
Decker, D.J., A.B. Forstchen, E.F. Pomeranz, C.A. Smith, S.J. Riley, C.A. Jacobson, J.F. Organ, G.R. Batcheller (2015) Stakeholder engagement in wildlife management: Does the public trust doctrine imply limits? The Journal of Wildlife Management, Vol. 79, Issue 2, pp 174–179.
Denny, P. (1994). Benefits and Priorities for Wetland Conservation: The Case for National Wetland Conservation Strategies. In: M. Cox, V. Straker & D. Taylor (Eds.). Wetlands Archeology and Nature Conservation. Proceedings of the International Conference: Wetlands Archeology and Nature Conservation, held at the University of Bristol, pp 249-275. London: HMSO.
Denny, P. (1991). Africa. In: M. Finlayson & M. Moser. Wetlands, pp.115-148. Oxford: Facts on File Ltd. Deodatus, F. (2000). Wildlife Damage in Rural Areas with Emphasis on Malawi. In: Prins, H.T., J.G.
Grootenhuis & T.T. Dolan (2000). Wildlife Conservation by Sustainable Use, pp 115-140. Boston/Dordrecht/London: Kluwer Academic Publishers.
Derkyi, M.A.A. (2012). Fighting over forest. Interactive governance of conflicts over forest and tree resources in Ghana’s high forest zone. Dissertation. Leiden: African Studies Centre.
DFID (Department for International Development) (1999). Sustainable Livelihoods Guidance Sheets. London, United Kingdom.
Dickman, A.J. (2008). Key Determinants of Conflicts between People and Wildlife, particularly large carnivores, around Ruaha National Park, Tanzania. PhD Thesis. London: University College London and Institute of Zoology, Zoological Society of London.
Dickman, A.J. (2010). Complexities of conflict: the importance of considering social factors for effectively resolving human-wildlife conflict. Animal Conservation 13 (2010), pp 458-466. London: The Zoological Society of London.
Dietz, T. (1999). Political Environmental Geography of the Tropics. Development Vol. 42, No. 2. Thematic Section, pp 13-19.
DiStefano, E. (2005). Human-Wildlife Conflict worldwide: collection of case studies, analysis of management strategies and good practices. Rome: The Food and Agriculture Organisation of the United Nations (FAO). Download from: www.fao.org/SARD/common/ecg/1357/en/HCW_final.pdf
Dobbs, C.M. (1927). Fishing in the Kavirondo Gulf, Lake Victoria. Journal of the East Africa and Uganda Natural History Society, Vol. 30, pp 97-109.
Dolan Jr. J.M. (1991). The World Book Encyclopedia, Vol. 9, pp 245-246. Chicago, London, Sydney, Toronto. Dorst, J. & P. Dandelot (1990). Artiodactyla: hippopotamidae. In: A Field Guide to the larger Mammals of
Africa, pp 160, 171-173-203. London: Collins. Dryzek, J. S. (2005). The Politics of the Earth: Environmental Discourses (2nd ed). Oxford, UK: Oxford
University Press. Dugan, P.J. (Ed) (1990). Wetland Conservation. A Review of Current Issues and Required Action. Gland,
Switzerland: IUCN. Dunham, K.M., A. Ghiurghi, R. Cumbi & F. Urbano (2010). Human–wildlife conflict in Mozambique: a
national perspective, with emphasis on wildlife attacks on humans. Oryx, Vol.44, No.2, pp 185-193. EAWLS, East African Wildlife Society (2012). We need a revised Wildlife Policy and Act urgently. Newsletter
October – December 2012, pp 6-7. Edwards, M. (1998). Nailing the Jelly to the Wall: NGOs, Civil Society and International Development. In:
TACS, Technical Assistance for Civil Society Organisations (2010). A Glossary of Terms for Civil Society Organisations. Swedish Institute for Public Administration. Download from: http://tacso.org/doc/TACSO%20Glossary%20for%20CSOs.pdf. Last accessed on 14/04/2017.
202
Eltringham, S.K. (1993). The Common Hippopotamus. In: W.L.R. Oliver (ed.). Pigs, Peccaries and Hippos. A Status Survey and Conservation Action Plan (pp 43-55). Gland, Switzerland, International Union for Conservation of Nature and Natural Resources (IUCN).
Eltringham, S.K. (1995). Hippos Under the Gun? Natural History, vol. 104 (issue 5), p 49. Eltringham, S.K. (1999). The Hippos. Natural History and Conservation. Cambridge: University Press, pp 184. Emerton, L. (1999). Balancing the opportunity costs of wildlife conservation for communities around Lake
Mburo National Park, Uganda. Evaluating Eden Series, Discussion Paper No. 5. Manchester, UK: Institute for Development Policy and Management (IIED).
Engel, S., Pagiola, S., & Wunder, S. (2008). Designing payments for environmental services in theory and practice: An overview of the issues. Ecological economics, Vol.65, Issue 4, pp 663-674.
Eriksen, S. & E. Ouko & N. Marekia (1996). Land tenure and wildlife management. In: C. Juma & J.B. Ojwang (1996). In Land We Trust. Environment, Private Property and Constitutional Change, pp 199-227. Nairobi: African Centre for Technology Studies (ACTS).
Escobar, A. (1996). “Constructing Nature: Elements for a Poststructuralist Political Ecology.” In: R. Peet & M. Watts (eds.), Liberation Ecologies: Environment, Development, Social Movements, pp 46-68. London: Routledge.
Escobar, A. (1999). After Nature. Steps to an Antiessentialist Political Ecology. Current Anthropology, Vol. 49, No. 1, pp 1-16.
Evans, L.A. & W.M. Adams (2016). Fencing elephants: The hidden politics of wildlife fencing in Laikipia, Kenya. Land Use Policy Vol 51, pp 215-228.
Fairhead, J. & M. Leach (eds.) (1998) Reframing Deforestation: Global Analyses and Local Realities: Studies in West Africa. Global Environmental Change Series. Routledge.
Fairhead, J. & M. Leach (2003) Science, Society and Power: Environmental Knowledge and Policy in West Africa and the Caribbean. Cambridge, UK: Cambridge University Press.
Fairhead, J., Leach, M. & Scoones, I. (2012) Green grabbing: A new appropriation of nature? Journal of Peasant Studies 39(2): pp 237-261.
Fall, M.W. & W.B. Jackson (2002). The tools and techniques of wildlife damage management – changing needs: an introduction. International Biodeterioration & Biodegradation, Vol. 49, pp 87-91.
FAO (2016), Food and Agriculture Organization of the United Nations. Climate change and food security: risks and responses. Rome: FAO.
Faruqi, Y.M. (2007). Islamic view of nature and values: Could these be the answer to building bridges between modern science and Islamic science. International Education Journal, Vol. 8, No. 2, pp 461-469.
Ferraro, P.J. & H. Gjertsen (2009). A Global Review of Incentive Payments for Sea Turtle Conservation. Chelonian Conservation and Biology, Vol. 8, No. 1, pp 48-56.
Field, C.R. (1970). A Study of the Feeding Habits of the Hippopotamus (Hippopotamus amphibius Linn.) in the Queen Elizabeth National Park, Uganda, with some Management Implications. Zoologica Africana, Vol. 5, No. 1, pp 71-86.
Finlayson, C.M. & R. D’Cruz (2005). Chapter 20: Inland Water Systems. In: Hassan, R., R. Scholes & N. Ash. Ecosystems and human well-being: current state and trends: findings of the Condition and Trends Working Group of the Millennium Ecosystem Assessment, pp 551-583. Washington DC: Island Press.
Fisher, M. (2016).Whose conflict is it anyway? Mobilizing research to save lives. Oryx, Vol.50, No.3, pp 377-378.
FMC (2011). Furadan Facts. Frequently asked questions. Download from: Http://www.furadanfacts.com/FAQs.aspx Last accessed on: 7 January 2012.
Folke, C. (2006). Resilience: The emergence of a perspective for social-ecological systems analyses. Global Environmental Change, Vol. 16, pp 253-267.
Frädrich, H. (1975). Nijlpaarden (Hippopotamuses). In: B. Grzimek. Het leven der dieren. Encyclopedie van het dierenrijk, deel XIII, zoogdieren 4 (pp 111-133). Animal Life. Encyclopeadia of the animal world, Volume XIII, Mammals 4. Utrecht: Uitgeverij Het Spectrum.
Gandiwa, E., I.M.A. Heitkönig, A.M. Lokhorst, H.H.T. Prins & C. Leeuwis (2013). CAMPFIRE and Human-Wildlife Conflicts in Local Communities Bordering Northern Gonarezhou National Park, Zimbabwe. Ecology and Society, Vol.18, No. 4, Art.7 (pp.15).
Gereta, E. & E. Wolanski (1998). Wildlife-water quality interactions in the Serengeti National Park, Tanzania. African Journal of Ecology, Vol. 36, pp 1-14.
Ghimire, K.B. & M.P. Pimbert (2006). Social Change and Conservation: An Overview of Issues and Concepts. In: Ghimire, K.B. & M.P. Pimbert (eds). Social Change and Conservation. Environmental Politics and Impacts of National Parks and Protected Areas, pp 1-45. South Asian Edition. London, UK: Earthscan Publications Ltd.
Gichuki, J., F. Dahdouh Guebas, J. Mugo, C.O. Rabuor, L. Triest & F. Dehairs (2001). Species inventory and the local uses of the plants and fishes of the Lower Sondu Miriu wetland of Lake Victoria, Kenya. Hydrobiologia 458, pp 99–106.
203
Gillingham, S. & P.C. Lee (1999). The impact of wildlife-related benefits on the conservation attitudes of local people around the Selous Game Reserve, Tanzania. Environmental Conservation Vol.26, Issue 3, pp 218–228.
Gillingham, S. & P.C. Lee (2003). People and protected areas: a study of local perceptions of wildlife crop-damage crop-damage conflict in an area bordering the Selous Game Reserve, Tanzania. Oryx, Vol.37, No.3, pp 316-325.
Gilpin, A. (1996). Dictionary of Environment and Sustainable Development. Chichester: John Wiley & Sons Ltd.
Gitahi, N. & K.H. Fitzgerald (2010). Conserving Wildlife on Private Land: The Legal Framework for Landownership and New Tools for Land Conservation in Kenya. Smithsonian Contributions to Zoology, No. 632, pp 95-103.
Glasbergen, P., F. Biermann, A.P.J. Mol (Eds.) (2007). Partnerships, Governance and Sustainable Development: Reflections on Theory and Practice. Cheltenham: Edward Elgar Publishing.
Goddard, J. (1970). Hippopotamus Populations on the Luangwa River. Report to National Parks & Wildlife Service, Zambia. Mimeo, pp 8-10.
GoK (1975), Government of Kenya. Sessional Paper No. 3 of 1975. Policy on Wildlife Management in Kenya. Nairobi, the Government Printer.
GoK (1976), Government of Kenya. The Wildlife (Conservation and Management) Act, No. 1 of 1976. Nairobi, the Government Printer. Download from: http://kenyalaw.org/kl/fileadmin/pdfdownloads/Acts/WildlifeConservationandManagementActCap376_2_.pdf, last accessed 25 February 2017.
GoK (2011), Government of Kenya. Kenya National Assembly 10th Parliament, 4th Session. Bill Tracker 2011, as at 21st July 2011. Download from: www.parliament.go.ke on 8 August 2011.
Gonzalez, L.M., F.G.D. Montoto, T. Mereck, J.A.J. Pereira, P.F. de Larrinoa, A.M.L. Bolonio & N. El-Kadhir (2016). Preventing crop raiding by the Vulnerable common hippopotamus Hippopotamus amphibius in Guinea-Bissau. Oryx, Vol. 50.
Graham, M. (2006). Coexistence in a land use mosaic? Land use, risk and elephant ecology in Laikipia District, Kenya. Dissertation DPhil, University of Cambridge.
Gray, L. & W.G. Moseley (2005) ‘A geographical perspective on poverty-environment interactions’, The Geographical Journal, Vol. 171, No. 1, pp 9-23.
Greenberg, J.B. & T.K. Park (1994). Political Ecology. Journal of Political Ecology, Vol. 1, pp 1-10. Grimble, R., M. Chan, J. Aglionby & J. Quan (1995). Trees And Trade-Offs: A Stakeholder Approach To
Natural Resource Management. IIED: Sustainable Agriculture and Rural Livelihoods Programme, Gatekeeper Series No. SA52.
Groot, R.S. de, M.A. Wilson & R.M.J. Boumans (2002). A typology for the classification, description and valuation of ecosystem functions, goods and services. Ecological Economics Vol. 41, Issue 3, pp 393-408.
Groves, C.P. & P. Grubb (1993). The Suborder Suiformes. In: W.L.R. Oliver (ed.) Pigs, Peccaries and Hippos. Status Survey and Conservation Action Plan (pp 1-5). Gland, Switzerland, IUCN.
Gunderson, L.H. (2000). Ecological Resilience – in Theory and Application. Annual Review of Ecology and Systematics Vol.31, pp 425-39.
Gupta, A.C. (2013). Elephants, safety nets and agrarian culture: understanding human-wildlife conflict and rural livelihoods around Chobe National Park, Botswana. Journal of Political Ecology, Vol.20, pp 238-254.
Gusset, M., S.J. Ryan, M. Hofmeyr, G. van Dyk, H.T. Davies-Mostert, J.A. Graf, C. Owen, M. Szykman, D.W. Macdonald, S.L. Monfort, D.E. Wildt, A.H. Maddock, M.G.L. Mills, R. Slotow & M.J. Somers (2008). Efforts going to the dogs? Evaluating attempts to re-introduce endangered wild dogs in South Africa. Journal of Applied Ecology Vol. 45, pp 100–108.
Gutiérrez Romero, R. (2009). Decentralization, Accountability and the MPs Elections: The Case of the Constituency Development Fund in Kenya. May 2009. iiG Briefing Paper 02. Improving Institutions for Pro-Poor Growth. University of Oxford. Download on 12/04/2016 from: http://www.iig.ox.ac.uk/output/briefingpapers/pdfs/iiG-briefingpaper-02-kenya-cdf.pdf
Haan, L.J. de (2000). The question of development and environment in geography in the era of globalisation. GeoJournal Vol. 50, No. 4: pp 359-367.
Haltenorth, T. & H. Diller (1986). Hippopotamus. In: A Field Guide to the Mammals of East Africa. London: Collins, pp 32-35.
Hansard (2006), Kenya National Assembly Official Record, Tuesday 12th July 2006. Parliamentary debates. Hansard (2008), Kenya National Assembly Official Record, Wednesday 30th July 2008. Parliamentary debates. Happold, D.C.D. (1987). The Mammals of Nigeria. Oxford, Clarendon Press. Harrison, M.E., M.P. Kalindekafe & B. Banda (2007). The ecology of the hippopotamus in Liwonde National
Park, Malawi: implications for management. African Journal of Ecology, Vol. 46, pp 507-514. Harvey, C.A., Dickson, B., & Kormos, C. (2010). Opportunities for Achieving Biodiversity Conservation
through REDD. Conservation Letters, Volume 3, No. 1, pp 53-61.
204
Hazzah, L., M. Borgerhoff Mulder & L. Frank (2009). Lions and Warriors: Social factors underlying declining African lion populations and the effect of incentive-based management in Kenya. Biological Conservation 142, pp 2428-2437.
Hemson, G., S. Maclennan, G. Mills, P. Johnson & D. Macdonald (2009). Community, lions, livestock and money: A spatial and social analysis of attitudes to wildlife and the conservation value of tourism in a human-carnivore conflict in Botswana. Biological Conservation 142, pp 2718-2725.
Hill, C.M., (2002). Primate Conservation and Local Communities - Ethical Issues and Debates. American Anthropologist, 104(4): pp 1184-1194.
Hill, C.M. (2002a). People, Crops and Wildlife: A Conflict of Interests. In: Hill, C., F. Osborn & A.J. Plumptre (2002). Human-Wildlife Conflict: Identifying the problem and possible solutions. Albertine Rift Technical Report Series, Vol.1, pp 61-68. Wildlife Conservation Society.
Hill, C., F. Osborn & A.J. Plumptre (2002). Human-Wildlife Conflict: Identifying the problem and possible solutions. Albertine Rift Technical Report Series, Vol.1. Wildlife Conservation Society.
Hill, C.M. (2004). Farmers’ Perspectives of Conflict at the Wildlife–Agriculture Boundary: Some Lessons Learned from African Subsistence Farmers. Human Dimensions of Wildlife, Vol.9, Issue 4, pp 279-286.
Hillaby, J. (1962). Harvesting the hippo. New Scientist (pp 588-560), no. 291, June 14th. Hoare, R. (1995). Options for the Control of Elephants in Conflict with People. Pachyderm No.19, pp 54-63. Hoare, R.E. (1999). Determinants of human-elephant conflict in a land-use mosaic. Journal of Applied Ecology,
Vol.36, pp 689-700. Hoare, R. (2000). African elephants and humans in conflict: the outlook for coexistence. Oryx, Vol.34, No.1, pp
34-38. Hoare, R. (2002). Towards a Standardized Data Collection Protocol for Human-Elephant Conflict Situations in
Africa. In: Hill, C., F. Osborn & A.J. Plumptre (2002). Human-Wildlife Conflict: Identifying the problem and possible solutions. Albertine Rift Technical Report Series, Vol.1, pp 98-106. Wildlife Conservation Society.
Holling, C.S. (1973). Resilience and Stability of Ecosystems. Annual Review of Ecology and Systematics Vol.4, pp 1-23.
Holmes, M. (1996). The whole hippo. BBC Wildlife, Vol. 14, no. 4 (pp 26-30). Honders, J. & T. Klerks (Eds.) 1993. Het Nijlpaard. In: Beken en rivieren, dieren in het wild, pp 7-27.
Amsterdam: Uitgeversmij. The Reader’s Digest NV. The hippopotamus. In: Lakes and rivers: animals in the wild, pp 7-27. Amsterdam: The Reader’s Digest NV Publishers.
Howard, P. (2006). The Beast Within: An exploration of Australian constructions of wildlife. Griffith University, Australia: Australian School of Environmental Studies. D-Phil thesis.
HSG (2004a). Map of Current Distribution of Common Hippos (Hippopotamus amphibious) based on the 2004 IUCN Common Hippo Population Assessment. The IUCN Hippo Specialist Group. Download from: www.ml.duke.edu/projects/hippos/CommonMap.html.
HSG (2004b). Map of Population Trends of Common Hippos (Hippopotamus amphibious) based on the 2004 IUCN Hippo SubGroup Assessment. The IUCN Hippo Specialist Group. Download from: www.ml.duke.edu/projects/hippos/Trends.html.
HSG (2004c). Country Assessments. Common Hippos. The IUCN Hippo Specialist Group. Download from: www.ml.duke.edu/projects/hippos/country.html.
Hughes, R.H. & J.S. Hughes (1992). Chapter 2.5 Kenya. In: Hughes, R.H. & J.S. Hughes. A Directory of African Wetlands, pp 171-196. Gland, Switzerland and Cambridge, UK: IUCN; Nairobi, Kenya: UNEP; Cambridge, UK: WCMC.
Hulme, D. (1997). A Framework for the Study of Community Conservation in Africa. Community Conservation Research in Africa. Principles and Comparative Practice. Working Papers pp 1-31. Manchester, UK: Institute for Development Policy and Management (IIED).
Hutchins, M. (1995). What do “wild” and “captive” mean for large ungulates and carnivores now and into the twenty-first century? In: Wildlife Conservation, Zoos and Animal Protection, pp 1-17.
Hutton, J., W.M. Adams & J.C. Murombedzi (2005). Back to the Barriers? Changing Narratives in Biodiversity Conservation. Forum for Development Studies, Vol.32, Issue 2, pp 341-370.
Huxley, J. (Ed.) (1980). Africa. The Swamplands. In: Wildlife. Mitchell Beazly Atlas of the World (pp 72-74). London: Mitchell Beazly.
IISD, International Institute for Sustainable Development (2008). Summary of the ninth conference of the parties to the Convention on Migratory Species of Wild Animals and Related Meetings: 27 November – 5 November 2008. Earth Negotiations Bulletin, Vol. 18, No 38.
Ikiara, M.M. (1999). Sustainability, Livelihoods, Production and Effort Supply in a Declining Fishery. The case of Kenya’s Lake Victoria Fisheries. University of Amsterdam, Faculty of Economics and Econometrics.
IUCN (2005). Benefits Beyond Boundaries. Proceedings of the Vth IUCN World Parks Congress. Gland, Switzerland and Cambridge, UK: IUCN, International Union for the Conservation of Nature and Natural Resources.
205
IUCN (2012). IUCN Red List Categories and Criteria: Version 3.1. Second edition. Gland, Switzerland and Cambridge, UK: IUCN. iv + 32pp.
IUCN (2013). IUCN Red List of Threatened Species. Version 2013.1. IUCN (2015). Numbers of threatened species by major groups of organisms (1996-2015). IUCN Red List
version 2015:4: Table 1. Last updated on 19 November 2015. Jenkins, O.B. (2006). The Suba of Kenya and Tanzania – A Cultural Profile. Downloaded from:
http://orvillejenkins.com/profiles/suba.html on 28 September 2016. Jentoft, S. (2007). Limits of governability: Institutional implications for fisheries and coastal governance.
Marine Policy, Vol. 31, pp 360-370. Jessop, B. (2003). Governance and Meta-governance: On Reflexivity, Requisite Variety and Requisite Irony. In:
H.P. Bang (ed). Governance as Social and Political Communication. Manchester: Manchester University Press, pp 101-66.
Jewell, P.A. & G.M.O. Maloiy (Eds.) (1981). The Biology of Large African Mammals in their Environment, pp 267-298. Zoological Society of London Symposia 61. Oxford: Clarendon Press.
Kaai, R., B. Shah, E. Gitari, P. Kahumbu & B. Kang’ong’oi (2015). A Guide to the Wildlife Act of Kenya (WCMA 2013). Nairobi, Kenya: WildlifeDirect.
Kahler, J.S. & M.L. Gore (2015). Local perceptions of risk associated with poaching of wildlife implicated in human-wildlife conflicts in Namibia. Biological Conservation, Vol. 189, pp 49-58.
Kahumbu, P. (2013). Kenya overhauls wildlife laws following rise in elephant and rhino deaths. The Guardian, 7 June 2013. Download from: Http://www.theguardian.com/environment/africa-wild/2013/jun/07/kenya-wildlife-laws-elephant-rhino-deaths; Last accessed on 4 February 2016.
Kairu, J.K. (2001). Wetland use and impact on Lake Victoria, Kenya region. Lakes & Reservoirs Research and Management, Vol. 6, No. 2, pp 117-125.
Kameri-Mbote, P. (2005). Sustainable Management of Wildlife Resources in East Africa. IELRC Working Paper 2005-5. International Environmental Law Research Centre, Geneva, Switzerland.
Kamweneshe, B., R. Beilfuss & C. Simukonda (2002). Population and distribution of Kafue lechwe and other large mammals on the Kafue flats, Zambia. Working Paper 2, Zambia Crane and Wetland Conservation Project.
Kanga, E.M. (2011). The Kenyan Hippo. Population dynamics, impacts on riparian vegetation and conflicts with humans. Dissertation Rijksuniversiteit Groningen, pp 128.
Kanga, E.M., J.O. Ogutu, H. Olff & P. Santema (2011). Population trend and distribution of the Vulnerable common hippopotamus Hippopotamus amphibius in the Mara Region of Kenya. Oryx, Vol. 45, No.1, pp 20-27.
Kanga, E.M., Ogutu, J.O., Piepho, H.P. & Olff, H. (2012). Human–hippo conflicts in Kenya during 1997–2008: vulnerability of a megaherbivore to anthropogenic land use changes. Journal of Land Use Science, Vol. 7, 4, pp 395-406.
Kangwana, K. (1995). Human-Elephant Conflict: The Challenge Ahead. Pachyderm, Vol. 19, pp 11-14. Kansiime, F., M.J. Saunders & S.A. Loiselle (2007). Functioning and dynamics of wetland vegetation of Lake
Victoria: an overview. Wetlands Ecology and Management 15, pp 443-451. Karanth, K.K., Gopalaswamy, A.M., DeFries, R. & N. Ballal (2012). Assessing Patterns of Human-Wildlife
Conflicts and Compensation around a Central Indian Protected Area. PLoS ONE Vol.7, Issue 12, pp 1-13.
Karume, S. (2014). Kenya: The Independent Electoral and Boundaries Commission. ACE Project: The Electoral Knowledge Network. Download from: http://aceproject.org/ace-en/topics/em/electoral-management-case-studies/kenya-compromised-independence-of-the-emb; last accessed on 25 September 2016.
Kaufman, S., M. Elliott & D. Shmueli (2013). Frames, Framing and Reframing. Beyond Intractability. Download from: http://www.beyondintractability.org/essay/framing. Last accessed: 27 April 2017.
Kayanja, F.I.B. (1989). The reproductive biology of the male hippopotamus. In: Jewell, P.A. & G.M.O. Maloiy (Eds.). The Biology of Large African Mammals in their Environment (pp 181-196). Zoological Society of London Symposia 61. Oxford: Clarendon Press.
Kayombo, S. and S.E. Jorgensen (2006). Lake Victoria. Experience and lessons learned brief. ILEC, International Lake Environment Committee Foundation, pp 431-446. Download from: www.ilec.or.jp/eg/bmi/reports/27_Lake_Victoria_27February 2006.pdf.
Kellert, S.R. (1991). Japanese Perceptions of Wildlife. Conservation Biology Vol. 5, No 3. Sept 1991. Kellert, S.R. (1994). Public Attitudes towards Bears and their Conservation. Int. Conf. Bear Res. and Manage 9:
pp 43-50. Kendall, C.J. (2011). The spatial and agricultural basis of crop raiding by the Vulnerable common hippopotamus
Hippopotamus amphibious around Ruaha National Park, Tanzania. Oryx, Vol.45, Issue 1, pp 28-34. Kenya Election Database (2015). An overview of the Kenya Election Database Ver 2.0.
http://kenyaelectiondatabase.co.ke/
206
Khisa, P.S., S. Uhlenbrook, A.A. van Dam, J. Wenninger, A. van Griensven & M. Abira (2013). Ecohydrological characterization of the Nyando wetland, Lake Victoria, Kenya: A State of System (SoS) analysis. African Journal of Environmental Science and Technology, Vol 7(6), pp 417-434.
Kingdon, J. (1979). Hippopotamids. In: East African Mammals. An Atlas of Evolution in Africa. Vol III, part B (pp 250-277). London/New York/San Francisco: Academic Press.
Kingdon, J. (1990). Island Africa. The Evolution of Africa’s Rare Animals and Plants. London: William Collins Sons & Co. Ltd.
Kipkeu, M. L., Mwangi, S. W., & Njogu, J. A. M. E. S. (2014). Incentives for Enhanced Community Participation in Wildlife Conservation in Amboseli, Kenya. IMPACT: International Journal of Research in Applied, Natural and Social Sciences, Vol 2(5), pp 75-86.
Kipng’etich, J. (2012). Laying the Foundation for Conservation of Kenya’s Natural Resources in the 21st Century. The George Wright Forum, Vol.29, No. 1, pp. 30-38.
Klingel, H. (1983). Life with the gentle giants. SWARA, Vol. 6, No.1, pp 24-27. Klingel, H. (1995). Fluctuating fortunes of the river horse. Natural History, Vol. 104, No. 5, pp 46-57. KLR, the Kenya Law Reports (2010). Laws of Kenya. The Constitution of Kenya. Nairobi, National Council for
Law Reporting with the Authority of the Attorney General, pp 191. Knight, J. (2000). Introduction. In: J. Knight (ed). Natural Enemies. People-Wildlife Conflicts in
Anthropological Perspective, pp 1-35. London: Routledge. KNSB, Kenya National Bureau of Statistics (2010). The 2009 Kenya Population and Housing Census. Volume
1A. Population Distribution by Administrative Units. Koning, J. de (2011). Reshaping Institutions Bricolage Processes in Smallholder Forestry in the Amazon.
Wageningen, the Netherlands: Wageningen University. Thesis. Kooiman, J. & M. Bavinck (2005). The Governance Perspective. In: Kooiman, J., M. Bavinck, S. Jentoft, R.
Pullin (Eds) (2005). Fish for life: Interactive Governance for Fisheries, pp 11-24. Amsterdam University Press, Mare Publication Series No. 3.
Kooiman, J. (2008). Exploring the Concept of Governability. Journal of Comparative Policy Analysis, Vol. 10, No. 2, pp 171-190.
Kooiman, J., M. Bavinck, R. Chuenpagdee, R. Mahon & R. Pullin (2008). Interactive governance and governability: an introduction. The Journal of Transdisciplinary Environmental Studies, Vol. 7, No. 1, pp 1-11.
Kooiman, J. & S. Jentoft (2009). Meta-Governance: Values, Norms and Principles, and The Making of Hard Choices. Public Administration, Vol. 87, No.4, pp 818-836.
Kooiman, J. & M. Bavinck (2013). Theorizing governability – the interactive governance perspective. In: J. Bavinck, R. Chuenpagdee, S. Jentoft & J. Kooiman (2013). Governability of Fisheries and Aquaculture: Theory and Applications. MARE Publication Series; No. 7. Dordrecht: Springer.
Kothari, A., P. Camill & J. Brown (2013). Conservation as if People Also Mattered: Policy and Practice of Community-based Conservation. Conservation and Society, Vol. 11, No. 1, pp 12-15.
Kujirakwinja, D. (2010). The status and conservation of common hippopotamuses in Virunga National Park, Democratic Republic of Congo. MSc. Thesis, University of Cape Town, South Africa.
KWCA (2017), Kenya Wildlife Conservancies Association. Website: http://kwcakenya.com/. Last accessed: 26 March 2017.
KWS (1996), Kenya Wildlife Service. Biodiversity Department. Download from: Http://safariweb.com/kwild/bio96.com. Last accessed on: 14/3/2016.
KWS (2005), Kenya Wildlife Service. Strategic Plan 2005-2010. Preparing for the opportunities ahead. Nairobi, Kenya Wildlife Service.
KWS (2007), Kenya Wildlife Service. Science Bulletin. Vol. 1, issue 1, July 2007. KWS Biodiversity, Research and Monitoring, Nairobi.
KWS (2008a), Kenya Wildlife Service. Annual Report 2008. Nairobi: Kenya Wildlife Service. KWS (2008b), Kenya Wildlife Service. Strategic Plan 2008-2012. Our heritage, our survival, our pride.
Nairobi: Kenya Wildlife Service. KWS (2008c), Kenya Wildlife Service. Procedure for reinforcement of problem animal control. Nairobi: Kenya
Wildlife Service. KWS (2010), Kenya Wildlife Service. Annual Report 2010. Our heritage, our pride. Nairobi: Kenya Wildlife
Service. KWS (2012), Kenya Wildlife Service. Strategic Plan 2012-2017. KWS Strategy 2.0. Nairobi: Kenya Wildlife
Service. KWS, Kenya Wildlife Service (2014). Annual Report 2014. Our heritage, our pride. Nairobi: Kenya Wildlife
Service. KWS (2015), Kenya Wildlife Service. Draft Wildlife Conservation and Management (Conservancy and
Sanctuary) Regulations 2015. Download from: http://www.kws.go.ke/content/wcma-act-2013-regulations. Last accessed: 20 March 2017.
KWS (2016), Kenya Wildlife Service. Community Wildlife Service. Nairobi: Kenya Wildlife Service.
207
Lamarque, F., J. Anderson, R. Fergusson, M. Lagrange, Y. Osei-Owusu & L. Bakker (2009). Human-wildlife conflict in Africa. Causes, consequences and management strategies. FAO Forestry Paper 157. Rome: Food and Agriculture Organisation of the United Nations.
Laws, R.M. & G. Clough (1965). Observations on reproduction in the hippopotamus, Hippopotamus amphibius. J.Reprod.Fertil. 9, pp 369-370.
Laws, R.M. (1981). Large mammal feeding strategies and related overabundance problems. In: Jewel, P.A. & S. Holt & D. Hart (1981). Problems in Management of Locally Abundant Wild Mammals, pp 217-233. New York: Academic Press.
Laws, R.M. (1982). Hippopotamus. In: Encyclopedia of the Animal World, Vol. 10, pp 948-951. Sydney: Bay Books Pty Ltd.
Laws, R.M. (1984). Hippopotamuses. In: D. MacDonald, The Encyclopaedia of Mammals: 2, pp 506-511. London: George Allen & Unwin.
Laws, R.M. (1989). Development of research on large mammals in East Africa. In: Jewell, P.A. & G.M.O. Maloiy (Eds.). The Biology of Large African Mammals in their Environment, pp 267-298. Zoological Society of London Symposia 61. Oxford: Clarendon Press.
Leach, M., R. Mearns & I. Scoones (1997). Environmental Entitlements: A Framework for Understanding the Institutional Dynamics of Environmental Change. IDS Discussion Paper 359. University of Sussex, UK: Institute of Development Studies.
Leach, M., R. Mearns & I. Scoones (1999). Environmental Entitlements: Dynamics and Institutions in Community-Based Natural Resource Management. World Development, Vol. 27, pp 225-247.
Leader-Williams, N. & H. Dublin (2000). Charismatic megafauna as ‘flagship species’. In: A. Entwistle & N. Dunstone (Eds, 2000). Priorities for the Conservation of Mammalian Diversity. Has the Panda Had Its Day? pp 53-82. Cambridge University Press.
Leakey, R. and V. Morell (2001). Wildlife Wars: My Fight to Save Africa’s Natural Treasures. New York, St. Martin’s Press.
Lee, P. C. & N. E. C. Priston (2005). Human Attitudes to Primates: Perceptions of Pests, Conflict and Consequences for Primate Conservation. In Paterson, J.D. & J. Wallis (eds): Commensalism and Conflict: The Human-Primate Interface, pp. 1-23. American Society of Primatologists, Norman.
Lee, P.C. & M.D. Graham (2006). African elephants (Loxodonta africana) and human–elephant interactions: implications for conservation. Int. Zoo Yb. 40: pp 9–19. London, UK; The Zoological Society of London.
Lemos, C.M. & A. Agrawal (2006). Environmental Governance. Annual Reviews Environ. Resour. Vol.31, pp 297–325.
Lewison, R. (2004). Re-assessment of the conservation status of hippo species points to problems. Suiform Soundings. Newsletter of the IUCN/SSC Pigs, Peccaries and Hippos Specialist Group, Vol.4, No.1, pp 23.
Lewison, R. & A. Mc. Mullin (2005). Future of Africa’s Wetland Icons Hangs in the Balance. IUCN, News story 28 February 2005.
Download from: http://www.iucn.org/es/noticias/noticias_por_fecha/anos_anteriores_new_sp/?3482/Future-of-Africas-Wetland-Icons-Hangs-in-the-Balance
Lewison, R. & Oliver, W. (2005). Hippopotamus amphibius. In: 2006 IUCN Red List of Threatened Species. Download from http://www.iucnredlist.org; Last accessed on 9 August 2006.
Lewison, R. (2006). Critical conservation crises: Hippos in Virunga National Park face extirpation. Suiform Soundings. Newsletter of the IUCN/SSC Pigs, Peccaries and Hippos Specialist Group, Vol.6, No.2, pp 2-3.
Lewison, R. (2007). Population responses to natural and human-mediated disturbances: assessing the vulnerability of the common hippopotamus (Hippopotamus amphibius). African Journal of Ecology, Vol 45, pp 407-415.
Lewison, R. & W. Oliver (2008). Hippopotamus amphibius. IUCN/SSC Hippo Specialist Subgroup. In: IUCN 2013. IUCN Red List of Threatened Species. Version 2013.1.
Lewison, R. (2017). The state of common hippo science and conservation. In: K. Brandlová, M. Gloneková, D. Mallon, T. Fedorova, P. Hejcmanová, M. Žáčková, A. Kubátová, P.J. Vymyslická & J. Pluháček (Eds). Antelope, Giraffe, Hippo in the 21st Century: Conservation Action in Africa. Book of Abstracts. Prague: Czech University of Life Sciences Prague, pp 52.
Lindsey, P.A., R. Alexander, L.G. Frank, A. Mathieson & S.S. Romaňach (2006). Potential of trophy hunting to create incentives for wildlife conservation in Africa where alternative wildlife-based land uses may not be available. Animal Conservation, Vol. 9, pp 283-291.
Lindsey, P.A., G. Balme, M. Becker, C. Begg, C. Bento, C. Bocchino, A. Dickman, R.W. Diggle, H. Eves, P. Henschel, D. Lewis, K. Marnewick, J. Mattheus, J.W. McNutt, R. McRobb, N. Midlane, J. Milanzi, R. Morley, M. Murphree, V. Opyene, J. Phadima, G. Purchase, D. Rentsch, C. Roche, J. Shaw, H. van der Westhuizen, N. van Vliet & P. Zisadza-Gandiwa (2013). The bushmeat trade in African savannas: Impacts, drivers, and possible solutions. Biological Conservation, Vol. 160, pp 80-96.
208
Little, P.D. (2001). African Studies: Environment. International Encyclopedia of the Social & Behavioral Sciences. Elsevier Science Ltd., pp 236-240.
Löf, A. (2014). Challenging Adaptability. Analysing the Governance of Reindeer Husbandry in Sweden. Umea University, Sweden: Department of Political Science. Research Report 2014:1.
MA, Millennium Ecosystem Assessment (2005). Ecosystems and Human Well-Being: Synthesis. Washington C: Island Press.
Mackie, C.S., K.M. Dunham & A. Ghiurghi (2012). Current status and distribution of the Vulnerable common hippopotamus Hippopotamus amphibius in Mozambique. Oryx, Vol.47, No.1, pp 70-76.
Madden, F. (2004). Creating Coexistence between Humans and Wildlife: Global Perspectives on Local Efforts to Address Human-Wildlife Conflict. Human Dimensions of Wildlife, Vol. 9, pp 247-257.
Madden, F. (2006). Human-Wildlife Conflict: A Case for Collaboration. In: Nature & Faune Vol 21, Issue 2, pp 8-9.
Madulu, N.F. (2007). The Lake Victoria Region. In: C. King, J. Ramkissoon, M.Clüsener-Godt and Z. Adeel (eds). Water and Ecosystems – Managing Water in Diverse Ecosystems to Ensure Human Well-being. Workshop publication of the Water and Ecosystems Conference, Hamilton, Canada, June 2005. The United Nations University. Download from: www.inweh.unu.edu/inweh/River/Water_Eco_Book/1_OpeningandIntroduction.pdf.
Makombe, K. (1993) (ed). Sharing the land. Wildlife, people and development in Africa. Cambridge: IUCN/ROSA Environmental Issues Series No.1.
Manfredo, M.J., D.J. Decker & M.D. Duda (1998). What is the Future for Human Dimensions of Wildlife? Trans. 63rd No. Am.Wildl.and Natur.Resour.Conf. pp 278-292.
Manfredo, M.J. & A.A. Dayer (2004). Concepts for Exploring the Social Aspects of Human-Wildlife Conflict in a Global Context. Human Dimensions of Wildlife, Vol. 9, pp 317-328.
Manfredo, M.J., J.J. Vaske, P.J. Brown, D.J. Decker & E.A. Duke (2008). Wildlife and Society: The Science of Human Dimensions. Washington DC: Island Press.
Manyara, G. & E. Jones (2007). Community-based Tourism Enterprises Development in Kenya: An Exploration of Their Potential as Avenues of Poverty Reduction. Journal of Sustainable Tourism, Vol 15, Issue 6, pp 628-644.
Marekia, E.N. (1991). Managing wildlife in Kenya. In: A. Kiriro & C. Juma (Eds.), Gaining Ground. Institutional Innovations in Land-use Management in Kenya (pp 105-129). Nairobi, Acts Press/African Centre for Technology Studies.
Marker, L.L., M.G.L. Mills & D.W. MacDonald (2003). Factors Influencing Perceptions of Conflict and Tolerance toward Cheetahs on Namibian Farmlands. Conservation Biology, Vol. 17, No.5, pp 1290-1298.
Marker, L. & A. Dickman (2004). Human Aspects of Cheetah Conservation: Lessons Learned from the Namibian Farmlands. Human Dimensions of Wildlife, Vol. 9: pp 297-305.
Marshall, K., R.White & A. Fischer (2007). Conflicts between humans over wildlife management: on the diversity of stakeholder attitudes and implications for conflict management. Biodiversity Conservation, Vol.16, pp 3129–3146.
Matheka, R.M. (2008). The International Dimension of the Politics of Wildlife Conservation in Kenya, 1958-1968. Journal of Eastern African Studies, Volume 2, Issue 1 March 2008, pp 112 – 133.
Mbaria, J. (2007). Behind-the-Scenes Foreign Efforts to Change Policies. The Nation, February 24. McGuinness, S. & D. Taylor (2014). Farmers’ Perceptions and Actions to Decrease Crop Raiding by Forest-
Dwelling Primates Around a Rwandan Forest Fragment. Human Dimensions of Wildlife, Vol. 19, No.2, pp 179-190.
MCI, Millenium Cities Initiative (2009). An Overview of the Main Environmental Issues Affecting Kisumu and Lake Victoria’s Winam Gulf. Social Sector Working Paper Series No. 02/2009. New York, US: the MDG Centre Nairobi Environmental Team and MCI, Earth Institute at Columbia University. Download from: www.earth.columbia.edu/mci on 7-9-2013.
McShane, K. (2009). Environmental Ethics: An Overview. The Author Philosophy Compass 4/3: pp 407-420. Journal Compilation, Blackwell Publishing Ltd.
Messmer, T.A. (2009). Human-wildlife conflicts: emerging challenges and opportunities. Human-Wildlife Conflicts 3(1), pp 10-17.
MFD, Ministry of Fisheries Development (2011). The Beach Management Units (BMUs). Download from: Http://www.fisheries.go.ke.
Michalski, F., R.L.P. Boulhosa, A. Faria & C.A. Peres (2006). Human–wildlife conflicts in a fragmented Amazonian forest landscape: determinants of large felid depredation on livestock. Animal Conservation Vol. 9, pp 179–188.
Miller, N.N. (1986). Land Use and Wildlife in Modern Kenya. In: R. Yeager & N.N. Miller, Wildlife, Wild Death. Land use and survival in Eastern Africa, pp 68-114. New York: State University of New York Press.
209
Mkanda, F.X. (1994). Conflicts between hippopotamus (Hippopotamus amphibius (L.)) and man in Malawi. Afr.J.Ecol. Vol.32, Issue 1, pp 75-79.
Moore, J.W. (2006). Animal Ecosystem Engineers in Streams. Bioscience, Vol. 56, No. 3, pp 237-246. Morgera, E. & J. Wingard (2008). Principles for Developing Sustainable Wildlife Management Laws. FAO
Legal Papers Online #75. Download from: http://www.fao.org/legal/prs-ol. Mosepele, K., P.B. Moyle, G.S. Merron, D.R. Purkey & B. Mosepele (2009). Fish, Floods, and Ecosystem
Engineers: Aquatic Conservation in the Okavanga Delta, Botswana. BioScience, Vol. 59, No. 1, pp 53-64.
Mosimane, A.W., S. McCool, P. Brown & J. Ingrebretson (2013). Using mental models in the analysis of human-wildlife conflict from the perspective of a social-ecological system in Namibia. Fauna & Flora International, Oryx, pp 1-7.
Mshindi, T. (1990). Why conservation is a serious issue. Daily Nation, November 9, 1990. Mule, J. (2013). Decentralised Units at the County Level. Transparency International Kenya. Download from:
https://tikenya.org/index.php/ti-s-blog/322-decentralised-units-at-the-county-level; last accessed on 20 February 2015.
Mule, J. (2014). The County Government and Its Structures. Transparency International Kenya. Download from: https://www.tikenya.org/index.php/press-releases/327-the-county-government-and-its-structures; last accessed on 20 February 2015.
Muruthi, P. (2005). Human Wildlife Conflict: Lessons Learned From AWF’s African Heartlands. AWF Working Papers. Nairobi, Kenya: African Wildlife Foundation.
Mwaura, F. (2016). Wildlife heritage ownership and utilization in Kenya – the past, present and future. In: A. Deisser & M. Njuguna (2016). Conservation of Natural and Cultural Heritage in Kenya, pp 125-142. London: UCL Press.
Nasongo, S.A.A., F. Zaal, T. Dietz & J.B. Okeyo-Owuor (2015). Institutional pluralism, access and use of wetland resources in the Nyando Papyrus Wetland, Kenya. Journal of Ecology and the Natural Environment, Vol. 7, No. 3, pp 56-71.
Naughton-Treves, L. and S. Sanderson (1995). Property, Politics and Wildlife Conservation. World Development, Vol. 23, No.8. (pp 1265-1275).
Naughton-Treves, L. (1997). Farming the Forest Edge: Vulnerable Places and People around Kibale National Park, Uganda. The Geographical Review, Vol. 87 (1): pp 27-46, January 1997.
Naughton-Treves, L. (1998). Predicting patterns of crop damage by wildlife around Kibale National Park, Uganda. Conservation Biology, Vol.12, pp 156-169.
Naughton-Treves, L. (1999). Whose Animals? A History of Property Rights to Wildlife in Toro, Western Uganda. Land Degradation & Development, Vol.19, pp 311-328.
Naughton, L., R. Rose & A. Treves (1999). The social dimensions of human-elephant in Africa: A literature review and case studies from Uganda and Cameroon. Report to the African Elephant Specialist, Human-Elephant Conflict Task Force of IUCN, Gland, Switzerland, pp 1-82.
Naughton-Treves, L. & A. Treves (2005). Socio-ecological factors shaping local support for wildlife: crop-raiding by elephants and other wildlife in Africa. In: R. Woodroffe, S. Thirgood & A. Rabinowitz (2005). People and Wildlife: Conflict or Coexistence? (pp 252-278). Cambridge: Cambridge University Press.
Nelson, A., P. Bidwell & C. Sillero-Zubiri (2003). A review of humane elephant conflict management strategies. People and Wildlife Initiative. Wildlife Conservation Research Unit, Oxford University. Download from: www.peopleandwildlife.org.uk/crmanuals/HumanElephantConflictP&WManual.
Nelson, F. (2006). People and Wildlife: Conflict or Coexistence? Book Review. Endangered Species Update, Vol.23, No.1. University of Michigan, The School of Natural Resources and Environment.
Neumann, R.P. (1992). Political Ecology of Wildlife Conservation in the Mt. Meru Area of Northeast Tanzania. Land Degradation & Rehabilitation, Vol. 3, pp 85-98.
Neumann, R.P. (2009). Political ecology: theorising scale. Progress in Human Geogaphy, Vol. 33, No.3, pp 398-406.
Newmark, W.D., D.N. Manyanza, D.M. Gamassa & H.I. Sariko (1994). The Conflict between Wildlife and Local People Living Adjacent to Protected Areas in Tanzania: Human Density as a Predictor. Conservation Biology, Vol.8, No.1, pp 249-255.
Newmark, W.D. & J.L. Hough (2000). Conserving Wildlife in Africa: Integrated Conservation and Development Projects and Beyond. Bioscience, Vol.50, No.7, pp 585-592.
Ngige, Z.N. & A. Jaeckel (2012). Legal Aspects of Achieving the Aichi Biodiversity Targets. Case Study Report: Kenya, Fisheries (Beach Management Units) Regulations, 2007. Rome, Italy: International Development Law Organization.
Niemeijer, R., M. Geuns, T. Kliest, V. Ogonda & J. Hoornweg (1985). Nutritional Aspects of Rice Cultivation in Nyanza Province, Kenya. Nairobi, Kenya: Food and Nutrition Planning Unit, Ministry of Planning and National Development, and Leiden, Netherlands: African Studies Centre.
210
Njogu, J.G. (2004). Community-based conservation in an entitlement perspective. Wildlife and forest biodiversity conservation in Taita, Kenya. Leiden, African Studies Centre Research Report 73/2004.
North, D.C. (1990). Institutions, Institutional Change and Economic Performance. Cambridge: Cambridge University Press. In: Bennett et al. (2001). Towards a better understanding of conflict management in tropical fisheries: evidence from Ghana, Bangladesh and the Caribbean. Marine Policy Vol. 25, No.5, pp 365-376.
Norton-Griffiths, M. (2007). How many wildebeest do you need? World Economics, Vol.8, No.2, pp 41-64. April-June 2007
Noss, R.F. (1994). Wilderness – Now More than Ever. A response to Callicott, pp 187-194. Download from: http://www.brontaylor.com/courses/pdf/Noss--Wilderness.pdf. Last accessed: 2 April 2016.
Nowak, R.M. (1991). Artiodactyla; Family Hippopotamidae. In: Walker’s Mammals of the World. Fifth Edition, Vol.II (1347-1350). Baltimore: Johns Hopkins University Press.
Ntiba, M.J., W.M. Kudoja & C.T. Mukasa (2001). Management issues in the Lake Victoria Watershed. Lakes & Reservoirs: Research and Management Vol. 6, pp 211-216.
Nyamwaro, S. O., G. A. Murilla, M. O. K. Mochabo & K. B. Wanjala (2006). Conflict minimising strategies on natural resource management and use: the case for managing and coping with conflicts between wildlife and agro-pastoral production resources in Transmara district, Kenya. Nairobi: Policy Research Conference on Pastoralism and Poverty Reduction in East Africa.
Nyhus, P. J., Fisher, H., Madden, F. & Osofsky, S. (2003). Taking the bite out of wildlife.damage : The.challenges of wildlife compensation schemes. Conservation in Practice, No. 4, pp. 37-40.
Nyhus, P.J., S.A. Osofsky, P. Ferraro, F. Madden & H. Fischer (2005). Bearing the costs of human-wildlife conflict: the challenges of compensation schemes. In: Woodroffe, R., S. Thirgood & A. Rabinowitz (2005). People and Wildlife: Conflict or Coexistence? pp 107-121. Cambridge: Cambridge University Press.
Nyirenda, V.R., W.J.Myburgh, B.K. Reilly, A.I. Phiri & H.N. Chabwela (2013). Wildlife crop damage valuation and conservation: conflicting perception by local farmers in the Luangwa Valley, eastern Zambia. Academic Journals, Vol.5, No.11, pp 741-750.
Obunde, P.O., J.M. Omiti & A.N. Sirengo (2005). Policy Dimensions in Human-wildlife Conflicts in Kenya: Evidence from Laikipia and Nyandarua Districts. Institute of Policy Analysis and Research (IPAR) Discussion Paper No. 065. Nairobi: Kenya.
Odada, E.O., D.O. Olago, K. Kulindwa, M. Ntiba & S. Wandiga (2004). Mitigation of Environmental Problems in Lake Victoria, East Africa: Causal Chain and Policy Options Analyses. AMBIO: A Journal of the Human Environment, Vol. 33(1), pp 13-23. Royal Swedish Academy of Sciences.
Odada, E.O., D. Olago, K.A.A. Kulindwa, F. Bugenyi, K. West, M. Ntiba, S. Wandiga & J. Karimumuryango (2006). J. East African Rift Valley Lakes, GIWA Regional Assessment 47. Kalmar, Sweden: University of Kalmar, on behalf of United Nations Environment Programme (UNEP).
Ogra, M.V. (2008). Human-wildlife conflict and gender in protected area borderlands: A case study of costs, perceptions, and vulnerabilities from Uttarakhand (Uttaranchal), India. Geoforum 39, Issue 3, pp 1408-1422.
Ogra M. & R. Badola (2008). Compensating human–wildlife conflict in protected area communities: ground-level perspectives from Uttarakhand, India. Human Ecology Vol.36: pp 717–729.
Ogra, M. (2009). Attitudes Toward Resolution of Human-Wildlife Conflict Among Forest-Dependent Agriculturalists Near Rajaji National Park, India. Human Ecology, Vol. 37, Issue 2, pp.161-177.
Ogwang, V., M. Medard, E. Kilosa, J.I.Nyeko and A. Bakunda (Eds) (2005). Guidelines for Beach Management Units (BMUs) on Lake Victoria. Version approved by Executive Committee and Policy Steering Committee. East African Community, Lake Victoria Fisheries Organisation. May 2005. Download from: www.lvfo.org/downloads/Harmonized_BMU_Guidelines.pdf. Last accessed: 10-03-2008.
Ogwang, V.O., T. Odende & R. Okwach (2006). National Beach Management Guidelines. Implementation of a Fisheries Management Plan for Lake Victoria, January 2006. Nairobi: Department of Fisheries, pp 40.
Ogwang, V.O., J.I. Nyeko & R. Mbilinyi (2009). Implementing Co-management of Lake Victoria’s Fisheries: Achievements and Challenges. African Journal of Tropical Hydrobiology and Fisheries, Vol.12, pp 52-58.
Okello, J.B.A., S.Nyakaana, C. Masembe, H.R. Siegismund & P. Arctander (2005). Mitochondrial DNA variation of the common hippopotamus: evidence for a recent population expansion. Heredity, Vol.95, pp 206-215.
Okeyo-Owuor, J.B., P.O. Raburu, F.O. Masese & S.N. Omari (2012). Wetlands of Lake Victoria Basin, Kenya: distribution, current status and conservation challenges. In: Raburu, P.O., J.B. Okeyo-Owuor & F. Kwena. Community Based Approach to the Management of Nyando Wetland, Lake Victoria Basin, Kenya, pp 1-14. Nairobi: KDC (Kenya Disaster Concern), VIRED (Victoria Institute for Research on Environment & Development) and UNDP.
Ole Kaelo, D. (2016). Conservancies’ role in wildlife protection. Standard Digital. 18 October. Download from: http://www.standardmedia.co.ke/article/2000220100/conservancies-role-in-wildlife-protection.
211
Last accessed: 15 February 2017. Oliver, W.L.R. (1993). Pigs, Peccaries and Hippos. Status Survey and Conservation Action Plan. Gland,
Switzerland, IUCN. Omolo, L.O. (2011). Kenya: plans are in hand to revive the forty seven year old Western Kenya Tourist Circuit.
Jaluo dot Kom. Download from: http://blog.jaluo.com/?p=12377. Last accessed: 20 March 2017. Omondi, P., E. Bitok & J. Kagiri (2004). Managing human-elephant conflicts: the Kenyan experience.
Pachyderm, No. 36, January-June 2004, pp 80-86. Osborn, F.V. & G.E. Parker (2002). Community-based methods to reduce crop loss to elephants: experiments in
the communal lands of Zimbabwe. Pachyderm No.33, July-December, pp 32-38. Osborn, F.V. & C.M. Hill (2005). Techniques to reduce crop loss: human and technical dimensions in Africa. In:
R. Woodroffe, S. Thirgood & A. Rabinowitz (2005). People and Wildlife: Conflict or Coexistence?, pp 72-85. Cambridge: Cambridge University Press.
OSIENALA (1995). A map of the Riparian Districts of the Lake Victoria Basin, Kenya. Issues and proposals for The Lake Victoria Environment Management Programme.
Ostrom, E. (2007). Sustainable Social-Ecological Systems: An Impossibility? Presented at the 2007 Annual Meetings of the American Association for the Advancement of Science, “Science and Technology for Sustainable Well-Being,” 15–19 February in San Francisco.
Otieno, K. (2011). Tourism marketing for western circuit set to begin. Standard Digital, 23rd December 2011. Download from: http://www.standardmedia.co.ke/article/2000048787/tourism-marketing-for-western-circuit-set-to-begin. Llast accessed 20 March 2017.
Owen, J. (2006). Hippos Butchered by the Hundreds in Congo Wildlife Park. National Geographic News, October 24, 2006. Download from: http://news.nationalgeographic.com/news/2006/10/061024-hippo-congo.html.
Owino, A.O. & P.G. Ryan (2007). Recent papyrus swamp habitat loss and conservation implications in western Kenya. Wetlands Ecology and Management, Vol. 15, pp 1-12.
Pack, S., R. Golden & A. Walker (2013) Comparison of national wildlife management strategies: What works where, and why? Wildlife Consulting Associates, Heinz Center for Science, Economics & Environment & University of Maryland. Download from: https://www.academia.edu/4059587/Comparison_of_national_wildlife_management_strategies_what_works_where_and_why. Last accessed 25 February 2017.
Parker, I. (2005). No Progress in Kenya. African Indaba e-Newsletter Vol. 3, No. 1. Download from: http://www.africanindaba.com/wp-content/uploads/2014/03/AfricanIndabaVol3-1.pdf.
Payton, I.J., M. Fenner & W.G. Lee (2002). Keystone species: the concept and its relevance for conservation management in New Zealand. Science for Conservation 203.Wellington, New Zealand: Department of Conservation.
Peet, R. & M. Watts (1996). Liberation ecology: development, sustainability, and environment in an age of triumphalism. In: R. Peet & M. Watts (eds): Liberation ecologies: environment, development, social movements, pp 1-45. London: Routledge.
Perissinotto, R., D.D. Stretch & R.H. Taylor (Eds) (2013). Ecology and Conservation of Estuarine Ecosystems: Lake St Lucia as a Global Model. New York: Cambridge University Press.
Peterson, G. (2000). Political ecology and ecological resilience: An integration of human and ecological dynamics. Ecological Economics, Vol. 35, pp 323-336.
Peterson, M.N., J.L. Birckhead, K. Leong, M.J. Peterson & T.R. Peterson (2010). Rearticulating the myth of human-wildlife conflict. Conservation Letters XX, pp 1-9. Wiley Periodicals Inc.
Pienaar, E. F., Jarvis, L. S., & Larson, D. M. (2013). Creating direct incentives for wildlife conservation in community-based natural resource management programmes in Botswana. The Journal of Development Studies, 49(3), pp 315-333.
Plumptre, A. (2002). Crop raiding around the Parc National des Volcans, Rwanda: Farmer’s attitudes and possible links with poaching. In: Hill, C., F. Osborn & A.J. Plumptre (2002). Human-Wildlife Conflict: Identifying the problem and possible solutions. Albertine Rift Technical Report Series, Vol.1, pp 79-88. Wildlife Conservation Society.
Possingham, H.P., S.J. Andelman, M.A. Burgman, R.A. Medellín, L.L. Master & D.A. Keith (2002). Limits to the use of threatened species lists. Trends in Ecology & Evolution, Vol. 17, No. 11, pp 503-507.
Post, A.W.C.H.M. (2000). The Hippopotamus: Nothing but a nuisance? Hippo-human conflicts in Lake Victoria Area, Kenya. Doctoral thesis, University of Amsterdam.
Prins, H.T., J.G. Grootenhuis & T.T. Dolan (2000). Wildlife Conservation by Sustainable Use. Boston/Dordrecht/London: Kluwer Academic Publishers.
Pye-Smith, C. (2013). The Story of the Northern Rangelands Trust. Conserving wildlife, transforming lives, bringing peace. Isiolo: Ascent Ltd.
Rabuor, C.O. & J.O. Manyala (1994). Multigear Fishery of Nile perch (Lates niloticus) (L) in the Winam Gulf of Lake Victoria with special reference to Mortality, Selection and Catch-Effort data. In: Okemwa, E., O.
212
Wakwabi & A. Getabu (eds.). Recent trends of research on Lake Victoria fisheries. EEC Regional seminar on Recent trends of research on Lake Victoria fisheries, 25-27 Sep 1991, pp 67-72. ICIPE Science Press.
Rabuor, C.O., J. Gichuki & J. Moreau (2003). Growth, mortality and recruitment of Nile perc Lates niloticus (L. Centropomidae) in the Nyanza Gulf of Lake Victoria: an evaluation update. NAGA World Fish Center Quarterly, Vol. 26, No.4, pp 8-12.
Raburu, P.O., P. Khisa & F.O. Masese (2012). Background information on Nyando Wetland. In: Raburu, P.O., J.B. Okeyo-Owuor & F. Kwena. Community Based Approach to the Management of Nyando Wetland, Lake Victoria Basin, Kenya, pp 15-31. Nairobi: KDC (Kenya Disaster Concern), VIRED (Victoria Institute for Research on Environment & Development) and UNDP.
Ramsar, The Ramsar Convention on Wetlands (2003). The Convention of Wetlands text, as originally adopted in 1971. Final text. Download from: http://www.ramsar.org/cda/en/ramsar-about-bodies-convention-on-20708/main/ramsar/1-36-71^20708_4000_0__ Last accessed: 4 September 2009.
Ramsar, The Ramsar Convention on Wetlands (2008). Kenya National Report on the Implementation of the Ramsar Convention on Wetlands. Report to the 10th Meeting of the Conference of the Contracting Parties, Republic of Korea, 28 October – 4 November 2008. Download from: http://www.ramsar.org/pdf/cop10/cop10_nr_kenya.pdf.
Ramsar, The Ramsar Convention on Wetlands (2009). Synergies with other environment-related conventions and organisations. Download from: http://www.ramsar.org/cda/ramsar/display/main/main.jsp?zn=ramsar&cp=1-36-192_4000_0__Last accessed on 04/09/2009.
Ramsar (2013), Ramsar Convention Secretariat. The Ramsar Convention Manual: a guide to the Convention on Wetlands (Ramsar, Iran, 1971), 6th edition. Gland, Switzerland: Ramsar Convention Secretariat.
Ranganathan, J., C. Raudsepp-Hearne, N. Lucas, F. Irwin, M. Zurek, K. Bennett, N. Ash & P. West (2008). Ecosystem Services. A Guide for Decision Makers, pp 80. World Resources Institute.
Rao, A. (2010). Whose right is it anyway? The farmer-ungulate conflict. Current Conservation, Vol.4, Issue 4, pp 16-21.
Raffaele, P. (2006). Hippo Haven. Smithsonian Magazine, January 2006. Redford, K.H. & E. Fearn (Eds.) (2007). Protected Areas and Human Livelihoods. WCS Working Paper No. 32. Redpath, S.M., B.E. Arroyo, F.M. Leckie, P. Bacon (2004). Using decision modelling with stakeholders to
reduce human-wildlife conflict: a raptor-grouse study. Conservation Biology, Vol. 18, pp 350-359. Redpath, S.M., J. Young, A. Evely, W.M. Adams, W.J. Sutherland, A. Whitehouse, A. Amar, R.A. Lambert,
J.D.C. Linnell, A. Watt & R.J. Gutiérrez (2013). Understanding and managing conservation conflicts. Trends in Ecology & Evolution, Vol. 28, No.2, pp 100-108.
Redpath, S.M., S. Bhatia & J. Young (2015). Tilting at wildlife: reconsidering human-wildlife conflict. Oryx, Vol.49, No.2, pp 222-225.
Rensenbrink, H. & M. De Groeve (1982). Het nijlpaard. In: Fauna, deel 5. Dieren van de hele wereld in eigen omgeving (pp 63-81). Hasselt: Uitgeverij Heideland NV. The hippopotamus. In: Fauna, part 5. Animals of the entire world in their own environment (pp 63-81). Hasselt: Heideland NV.
Ribot, J. C. and Peluso, N. L. (2003), A Theory of Access. Rural Sociology, Vol. 68, pp 153–181. Riley, S.J. & D.J. Decker (2000). Risk perception as a factor in Wildlife Stakeholder Acceptance Capacity for
cougars in Montana. Human Dimensions of Wildlife, Vol. 5, Issue 3, pp 50-62. ROK (1980), Republic of Kenya. A study on the management of very large herbivores in Kenya. Nairobi:
Mwenge International Associates Ltd. RoK (1989), Republic of Kenya. The Wildlife (Conservation and Management) (Amendment) Act, 1989. Kenya
Gazette Supplement No.95, Acts No. 16, 1989. Nairobi: the Government Printer RoK (1999), Republic of Kenya. Kenya Population Census 1999 Volume 1. Government Printer, Nairobi. RoK (2007), Republic of Kenya. Republic of Kenya. Vision 2030. The popular version. Download from:
http://www.vision2030.go.ke/vision-2030-publications/?page=1&com=vision-2030-publications&com=vision-2030-publications. Last accessed: 15 February 2017.
RoK (2008a), Republic of Kenya. Final Draft (revised) Sessional Paper on National Wetlands Conservation and Management. Ministry of Environment and Mineral Resources, Nairobi, April 2008.
RoK (2008b), Republic of Kenya. Kisumu East District Guidelines. Ministry of Agriculture. Compiled by J.K. Kosgei, District Agribusiness Development Officer Kisumu East District.
RoK (2012), Republic of Kenya. The National Wildlife Conservation and Management Policy. http://www.forestpeoples.org/sites/fpp/files/publication/2013/07/draftnationalwildlifeconservation-and-management-policy-2012.pdf. Last accessed on 16 March 2017.
RoK (2013a), Republic of Kenya. The Wildlife Conservation and Management Act, 2013. Kenya Gazette Supplement No. 181 (Acts No. 47). Nairobi, The Government Printer, 27th December 2013.
RoK (2013b), Republic of Kenya. Kisumu County. First County Integrated Development Plan. September 2013.
213
RoK (2013c), Republic of Kenya. Fisheries Annual Statistical Bulletin 2013. Nairobi, Ministry of Agriculture, Livestock and Fisheries, State Department of Fisheries, pp 56.
RoK (2015a), Republic of Kenya. Fifth National Report to the Conference of Parties to the Convention on Biological Diversity. Nairobi.
RoK (2015b), Republic of Kenya. The National Government Constituencies Development Fund Act, 2015. Kenya Gazette Supplement No. 200 (Acts No.30). Nairobi: The Government Printer.
Rondeau, D. & E. Bulte (2003). Compensation for Wildlife Damage: Habitat Conversion, Species Preservation and Local Welfare. Working Papers 2003-01. University of Victoria: Department of Economics, Resource Economics and Policy Analysis Research Group.
Rongoei, P.J., J. Kipkemboi, J.B. Okeyo-Owuor & A.A. van Dam (2013). Ecosystem services and drivers of change in Nyando floodplain wetland, Kenya. African Journal of Environmental Science and Technology, Vol. 7, No. 5, pp 274-291.
Rose, R.A. (2002). A Spatial Analysis of Wildlife Crop Raiding Around the Banyang-Mbo Wildlife Sanctuary, Cameroon. In: Hill, C., F. Osborn & A.J. Plumptre (2002). Human-Wildlife Conflict: Identifying the problem and possible solutions. Albertine Rift Technical Report Series, Vol.1, pp 89-96. Wildlife Conservation Society.
Ros-Tonen, M.A.F. (2000). The role of non-timber forest products in sustainable tropical forest management. Holz als Roh-und Werkstoff, Volume 58, No. 3, pp 196-201.
Ros-Tonen, M.A.F., T. van Andel, C. van Morsello, K. Otsuki, S. Rosendo & I. Scholz (2008). Forest-related partnerships in Brazilian Amazonia: there is more to sustainable forest management than reduced impact logging. Forest Ecology and Management 256: pp 1482-1497.
Ros-Tonen, M.A.F. (2012). Non-timber forest product extraction as a productive bricolage process. Pp. 29-48 in Arts, B., Bommel, S., Ros-Tonen, M.A.F., Verchoor, G. (eds.) (2012). Forest-People Interfaces. Understanding Community Forestry and Bio-Cultural Diversity . Wageningen: Wageningen Academic Publishers.
Ros-Tonen, M.A.F., Derkyi, M, and Insaidoo, T. (2014). From co-management to landscape governance: Whither Ghana’s modified taungya system? Forests 5: 2996-3021
RSIS, Ramsar Sites Information Services (2009). Ramsar Information Sheets for the Ramsar Sites in Kenya. Wetlands International and Ramsar. http://ramsar.wetlands.org.
Rutten, M.E.M. (2004). Partnerships in Community-based Ecotourism Projects: Experiences from the Maasai Region, Kenya. Volume 1. Leiden, African Studies Centre. ASC Working Paper 57/2004.
Scholte, P. & E. Iyah (2016). Declining population of the Vulnerable common hippopotamus Hippopotamus amphibius in Bénoué National Park, Cameroon (1976-2013): the importance of conservation presence. Oryx, Vol.50, No.3, pp 506-513.
Scholte, P., F. Nguimkeng & E. Iyah (2016). Good news from north-central Africa: largest population of Vulnerable common hippopotamus Hippopotamus amphibius is stable. Oryx, August 2016.
Scholte, P., E. Iyah & F. Nguimkeng (2017). Dry season counts (1976-2016) in the Faro-Bénoué protected area complex (North Cameroon) highlight the continued importance of West-Central Africa’s largest population of common hippopotamus. Suiform Soundings, Jan. 2017, Vol. 15, No. 2, pp 42-49.
Schubert, J. (2005). Political Ecology in Development Research. An Introductory Overview and Annotated Bibliography. Bern: NCCR (National Centre for Competence in Research) North-South.
Schuyt, K.D. (2005). Economic consequences of wetland degradation for local populations in Africa. Ecological Economics, Vol.53, No.2, pp 177-190.
Schwartz, D.M. (1996). Snatching scientific secrets from the hippo’s gaping jaws. Smithsonian Vol. 26, No. 12, pp 90-102.
Shemwetta, D.T.K. & J.R. Kidegesho (2000). Human-wildlife conflicts in Tanzania: What Research and Extension could offer to Conflict Resolution. Proceedings of the 1st University Wide Conference, 5th – 7th April 2000, pp 569-577.
Sifuna, N. (2005). Providing compensation for damage caused by wildlife: a case study of Kenya with particular reference to elephants. Journal of Social Development in Africa, Vol. 20, No. 1, pp 7-39.
Sillero-Zubiri, C. & D. Switzer (2001). Crop raiding primates: Searching for alternative, humane ways to resolve conflict with farmers in Africa. People and Wildlife Initiative. Oxford University: Wildlife Conservation Research Unit, pp 1-15.
Silvis, H.J. & C.M. van der Heide (2013). Economic viewpoints on ecosystem services. Wageningen, Statutory Research Tasks Unit for Nature and the Environment (WOT Natuur & Milieu). WOT-rapport 123. Pp 68.
Simon, N. (1993). The Guinness Guide to Nature in Danger, in association with The World Conservation Monitoring Centre, Cambridge. Enfield, Middlesex: Guinness Publishing Ltd.
Sitati, N.W. & M.J. Walpole (2006). Assessing farm-based measures for mitigating human-elephant conflict in Transmara District, Kenya. Oryx, Vol.40, No.3, July 2006, pp 279-286.
214
Sitienei, A.J., G. Jiwen & S.M. Ngene (2014). Assessing the cost of living with elephants (Loxodonta africana) in areas adjacent to Meru National Park, Kenya. Eur J Wildl Res, Vol 60, pp 323-330.
Skinner, J.D. & R.H.N. Smithers (1990). Family Hippopotamidae. In: The Mammals of the Southern African Subregion, pp 599-604. Pretoria: University of Pretoria.
Smith, R.J. & S.M. Kasiki (2000). A spatial analysis of human-elephant conflict in the Tsavo ecosystem, Kenya. A Report to the African Elephant Specialist Group. Gland, Switzerland: Human-Elephant Conflict Task Force, IUCN.
Smith, R.D. and E. Maltby (2003). Using the Ecosystem Approach to Implement the Convention on Biological Diversity. Key Issues and Case Studies. IUCN, Gland, Switzerland and Cambridge, UK. X+ pp 118.
Smith, R.J., R.D. Muir, M.J. Walpole, A. Balmford & N. Leader-Williams (2003). Governance and the loss of biodiversity. Nature, Vol. 426, 6 November 2003, pp 67-70.
Smith, R.J. & M.J. Walpole (2005). Should conservationists pay more attention to corruption? Oryx, Vol. 39, No. 3, pp 251-256.
Snyder, K.D. (2015). The Common Hippopotamus in the Wild and in Captivity: Conservation for Less Charismatic Species. Journal of International Wildlife Law & Policy, Vol. 18, No. 4, pp 337-354.
Springer, J. (2009). Adressing the Social Impacts of Conservation: Lessons from Experience and Future Directions. Conservation and Society Vol.7, No.1, pp 26-29.
Steffen, W., P.J. Crutzen & J.R. McNeill (2007). The Anthropocene: Are Humans Now Overwhelming the Great Forces of Nature? Ambio Vol. 36, No. 8, pp 614-621.
Stoker, G. (1998). Governance as theory: five propositions. International Social Science Journal, Vol.50, pp 17-28.
Stonich, S. C. (1994), Risk and Tenure in Arid Lands: The Political Ecology of Development in the Senegal River Basin. Thomas K. Park. American Anthropologist, Vol.96, pp 770–771.
Stonich, S.C. (2001). Ecology, Political. International Encyclopedia of the Social & Behavioral Sciences. Elsevier Science Ltd. pp 4053-4058.
Stuart, C. & T. Stuart (1996). Africa’s Vanishing Wildlife, pp 130-132. Shrewsbury: Swan Hill Press. Stuip, M.A.M., C.J. Baker & W. Oosterberg (2002). The Socio-economics of Wetlands. Wetlands International
and RIZA, The Netherlands. Svadlenak-Gomez, K., T. Clements, C. Foley, N. Kazakov, D. Miquelle & R. Stenhouse (2007). WCS Cross-
Regional Thematic Perspective. In: Redford, K.H. & E. Fearn (Eds.) (2007). Protected Areas and Human Livelihoods. WCS Working Paper No. 32, pp 117-121.
Swallow, B., L. Onyango & R. Meinzen-Dick (2005). Catchment Property Rights and the Case of Kenya’s Nyando Basin. In: Swallow, B., N. Okono, M. Achouri & L. Tennyson (Eds). Preparing for the next generation of watershed management programmes and projects. Africa. Proceedings of the African Regional Workshop on Watershed Management, Nairobi, Kenya, 8-10 October 2003, pp 123-136. Rome: Food and Agriculture Organization of the United Nations.
Swiderska, K., D. Roe, L. Siegele & M. Grieg-Gran (2008). The Governance of Nature and the Nature of Governance: Policy that works for biodiversity and livelihoods. Biodiversity and Livelihoods Issue Papers 08. London, International Institute for Environment and Development.
TACSO, Technical Assistance for Civil Society Organisations (2010). A Glossary of Terms for Civil Society Organisations. Swedish Institute for Public Administration. Download from: http://tacso.org/doc/TACSO%20Glossary%20for%20CSOs.pdf. Last accessed on 14 April 2017.
Tawiri (2001), Tanzania Wildlife Research Institute. Aerial Census of Hippopotamus in Tanzania Mainland, Dry Seasons, 2001. TAWIRI Aerial Survey Report. Arusha, Tanzania: Tanzania Wildlife Research Institute, Conservation Information and Monitoring Unit, and Frankfurt Zoological Society.
Tchamba, M.N. (1995). The Problem Elephants of Kaélé: a Challenge for Elephant Conservation in Northern Cameroon. Pachyderm, Vol. 19, pp 26-32.
Terborgh, J. (2004). Requiem for nature. Washington DC: Island Press. Thirgood, S., R. Woodroffe & A. Rabinowitz (2005). The impact of human-wildlife conflict on human lives and
livelihoods. In: R. Woodroffe, S. Thirgood & A. Rabinowitz (2005). People and Wildlife: Conflict or Coexistence? pp 13-26. Cambridge: Cambridge University Press.
Thouless C. (1993). The Laikipia Elephant Project. Final Report. Nairobi: KWS and WWF, pp 87. Torfing, J., B. Guy Peters, J. Pierre & E. Sørensen (2012). Interactive Governance. Advancing the Paradigm.
Oxford: Oxford University Press. Treves, A. (2008). The Human Dimensions of Conflicts with Wildlife around Protected Areas. In: M.J.
Manfredo, J.J. Vaske, P.J. Brown, D.J. Decker & E.A. Duke (2008). Wildlife and Society: The Science of Human Dimensions, pp 214-228. Washington DC: Island Press.
Treves, A., R.B. Wallace & S. White (2009). Participatory Planning of Interventions to Mitigate Human-Wildlife Conflicts. Conservation Biology, Volume 23, No.6, pp 1577-1587.
Tripathi, R.S. & P. Law (2006). Keystone species: The Concept, their Ecological Significance and Determining their Keystone Status. Environews, Vol.12, No.3, pp 1-4.
215
Turner, R.K, J.C.J.M. van den Bergh, T. Söderqvist, A. Barendregt, J. van der Straaten, E. Maltby & E.C. van Ierland (2000). Ecological-economic analysis of wetlands: scientific integration for management and policy. Ecological Economics Vol. 35, Issue 1, pp 7-23.
Turner, R. (1988). Sustainable Environmental Management: principles and practice. London: Belhaven Press. In: L.J. de Haan (2000). The question of development and environment in geography in the era of globalisation. GeoJournal Vol. 50, No.4: pp 359-367.
Twongo, T.K. & F.W.B. Bugenyi (2006). Freshwater related issues of Lake Victoria basin. In: Odada, E.O., D.O. Olago & W. Ochola (Eds) (2006b). Environment for Development: An Ecosystems Assessment of Lake Victoria Basin, pp 29-42. Nairobi: UNEP/PASS (Pan African Start Secretariat).
UNDP (2014), United Nations Development Programme. Fencing crops against hippopotamus. UNDP, The Gambia.
UN-DSD (2009), United Nations Division for Sustainable Development. Agenda 21. Download from: http://www.un.org/esa/dsd/agenda21/ Last accessed 17 October 2009.
UNEP-AMCEN, African Ministerial Conference on the Environment (2008). Overview of implementation of the action plan for the environment initiative of the New Partnership for Africa’s Development for the reporting period June 2006–May 2008 and efforts made to mobilize resources. African Ministerial Conference on the Environment, 12th Session, Johannesburg, 7-12 June 2008. Download from: http://www.unon.org/confss/doc/unep/amcen/AMCEN_12/UNEP_AMCEN_12_06/K0840648.pdf.
UNEP-UNDP (1999). Development and Harmonisation of Environmental Laws, Volume 6. Report on legal and institutional issues in the development and harmonisation of laws relating to wildlife management. UNEP/UNDP Joint Project on Environmental Law and Institutions in Africa. The East Africa Sub regional Project. Download from: http://www.unep.org/padelia/publications/Dev._&_harm._Vol.6.pdf.
UNESCO, United Nations Educational, Scientific and Cultural Organisation (2016). Biosphere Reserves. World Network of Biosphere Reserves per January 2016. UNESCO-MAB Secretariat. Download from: http://unesdoc.unesco.org/images/0018/001848/184853M.pdf
Vié, J.C, C. Hilton-Taylor, C.M. Pollock, J. Ragle, J. Smart, S.N. Stuart and R. Tong (2009). The IUCN Red List: a key conservation tool. In: Wildlife in a changing world. Gland, Switzerland, IUCN.
Visseren-Hamakers, I.J., B. Arts & P. Glasbergen (2007). Partnerships as governance mechanism in development cooperation: intersectoral North/South partnerships for marine biodiversity. In: P. Glasbergen, F. Biermann, A.P.J. Mol (Eds.) (2007). Partnerships, Governance and Sustainable Development: Reflections on Theory and Practice. Cheltenham: Edward Elgar Publishing, pp 138-170.
Visseren-Hamakers, I.J. (2013). Partnerships and Sustainable Development: the Lessons Learned from International Biodiversity Governance. Environmental Policy and Governance, Vol. 23, pp 145-160.
Vitousek, P.M., H.A. Mooney, J. Lubchenco & J.M. Melillo (1997). Human Domination of Earth’s Ecosystems. Science, Vol.277, 25 July 1997, pp 494-499.
Wakwabi, E.O., J. Balirwa & M.J. Ntiba (2006). Aquatic biodiversity of Lake Victoria basin. In: Odada, E.O., D.O. Olago & W. Ochola (Eds) (2006b). Environment for Development: An Ecosystems Assessment of Lake Victoria Basin, pp 77-122. Nairobi: UNEP/PASS (Pan African Start Secretariat).
Walker, E.P. (1975). Artiodactyla; family Hippopotamidae. In: Mammals of the World. Third Edition, vol. II (p 1367-1370). Baltimore, Johns Hopkins University Press.
Walker, B., S. Carpenter, J. Anderies, N. Able, G. Cumming, M. Janssen, L. Lebel, J. Norberg, G.D. Peterson & R. Pritchard (2002). Resilience Management in Social-ecological Systems: a Working Hypothesis for a Participatory Approach. Conservation Ecology 6(1): pp 14.
Walker, B., C.S. Holling, S.R. Carpenter & A. Kinzig (2004). Resilience, Adaptability and Transformability in Social-ecological Systems. Ecology and Society 9(2): pp 5.
Walker, P.A. (2005). Political ecology: where is the ecology? Progress in Human Geography Vol.29, No.1, pp 73-82.
Wallace, G.E. & C.M. Hill (2012). Crop Damage by Primates: Identifying the Key Parameters of Crop-Raiding Events. PLoS ONE, Oct 2012, Vol.7, Issue 10, pp 1-13.
Watson, A. (1999). Conservation of Biodiverse Resource Areas (COBRA) Project: Kenya (1992-1998). Summary Report, February 1999. Prepared for USAID. Bethesda, MD, Development Alternatives, pp. 77.
Watts, M. (2000). Political Ecology. In: E. Sheppard & T.J. Barnes (Eds.). A companion to economic geography, pp 257-275. Oxford, UK: Blackwell Publishers.
Watve, M., K. Patel, A. Bayani & P. Patil (2016). A theoretical model of community operated compensation for crop damage caused by wild herbivores. Global Ecology and Conservation, Vol. 5, pp 58-70.
Weiler, P., De-Meulenaer, T. and Vanden-Block, A. (1994). Recent trends in the international trade of hippopotamus ivory. Traffic Bulletin - IUCN Wildlife Trade Monitoring Unit.
Weladji, R.B. & M.N. Tchamba (2003). Conflict between people and protected areas within the Bénoué Wildlife Conservation Area, North Cameroon. Oryx, Vol. 37, No.1, pp 72-79.
216
Wells, M., K. Brandon & L. Hannah (1992 ): People and Parks: Linking Protected Areas With Communities. Washington DC: World Bank.
Western, D. & J. Waithaka (2005). Policies for reducing human-wildlife conflict: a Kenya case study. In: R. Woodroffe, S. Thirgood & A. Rabinowitz (2005). People and Wildlife: Conflict or Coexistence? pp 357-372. Cambridge: Cambridge University Press.
Western, D., S. Russell & K. Mutu (2006). The status of wildlife in Kenya’s protected and non-protected areas. A paper commissioned by Kenya’s wildlife policy review team, presented at the first stakeholders symposium of the wildlife policy and legislation review, 27th to 28th September 2006. Nairobi: African Conservation Centre.
Western, D. (2009). Rethinking wildlife: Bridging the Conservation Divide. In: Meguro, T. (ed). Reconceptualization of Wildlife Conservation. Toward Resonation between Subsistence and Wildlife. Proceedings of a Workshop. Nairobi: ACTS (African Centre for Technology Studies), Chapter 1.
Western, D., S. Russell & I. Cuthill (2009a). The Status of Wildlife in Protected Areas Compared to Non-Protected Areas of Kenya. PLoS ONE 4(7): e6140.
Western, D., R. Groom & J. Worden (2009b). The impact of subdivision and sedentarization of pastoral lands on wildlife in an African savanna ecosystem. Biological Conservation, Vol. 142, pp 2538-2546.
White, R.M., A. Fischer, K. Marshall, J.M.J. Travis, T.J. Webb, S. di Falco, S.M. Redpath & R. van der Wal (2009). Developing an integrated conceptual framework to understand biodiversity conflicts. Land Use Policy, Vol.26, Issue 2, pp 242-253.
Wiersum, K.F. (1997). Indigenous exploitation and management of tropical forest resources: an evolutionary continuum in forest-people interaction. Agriculture, Ecosystems & Environment, Vol. 63, pp 1-16.
Wilshusen, P.R., S.R. Brechin, C.L. Fortwangler & P.C. West (2002). Reinventing a Square Wheel: Critique of a Resurgent “Protection Paradigm” in International Biodiversity Conservation. Society and Natural Resources, Vol. 15, pp 17-40.
Williamson, D.F. (2004). Tackling the Ivories: The Status of the US Trade in Elephant and Hippo Ivory. TRAFFIC North America. Washington DC; World Wildlife Fund.
Wittmayer, J.M. & B. Büscher (2010). Conserving Conflict? Transfrontier Conservation, Development Discourses and Local Conflict Between South Africa and Lesotho. Human Ecology, Vol. 38, pp 763-773.
Wolfsen- McColaugh, D. (1989). Hippopotamus. Kiboko. In: Wild lives, profiles of East African Mammals, pp 48-50. Nairobi: African Wildlife Foundation.
Woodley, D. (1997). A Report on Problem Animal Control. Nairobi: Kenya Wildlife Service. Woodroffe, R., S. Thirgood & A. Rabinowitz (2005a). People and Wildlife: Conflict or Coexistence?
Cambridge: Cambridge University Press. Woodroffe, R., S. Thirgood & A. Rabinowitz (2005b). The impact of human-wildlife conflict on natural
systems. In: R. Woodroffe, S. Thirgood & A. Rabinowitz (2005). People and Wildlife: Conflict or Coexistence? pp 1-12. Cambridge: Cambridge University Press.
Woodroffe, R., S. Thirgood & A. Rabinowitz (2005c). The future of coexistence: resolving human-wildlife conflicts in a changing world. In: R. Woodroffe, S. Thirgood & A. Rabinowitz (2005). People and Wildlife: Conflict or Coexistence? pp 388-405. Cambridge: Cambridge University Press.
WTTC, World Travel & Tourism Council (2012). Travel & Tourism. Economic Impact 2012, Kenya. London, UK: WTTC. WTTC, World Travel & Tourism Council (2015). Travel & Tourism. Economic Impact 2015, Kenya. London, UK: WTTC. Wunder, S. (2015). Payments for environmental services: Some nuts and bolts. Jakarta: Center for International
Forestry Research. WWAP (2006) - World Water Assessment Programme (2006). The United Nations World Water Development
Report 2: ‘Water, a shared responsibility’. Paris: UNESCO, and New York, USA: Berghahn. WWF SARPO (2005). Human wildlife conflict manual. Harare, Zimbabwe: WWF Southern African Regional
Programme Office (SARPO). Yarrow, G. (2009). Wildlife and Wildlife Management. Clemson Extension, Fact Sheet 36. Forestry and Natural
Resources, May 2009, Revised Edition. Yasmi, Y., G.Z. Anshari, H, Komarudin & S. Alqadri (2006). Stakeholder Conflicts and Forest Decentralization
Policies in West Kalimantan: Their Dynamics and Implications for Future Forest Management. Forests, Trees and Livelihoods, Vol. 16, pp 167-180.
Yoder, J.K. (2002). Estimation of Wildlife-Inflicted Property Damage and Abatement Based on Compensation Program Data. Land Econ. Vol.78, No. 1, pp 45-49.
Young, J.C., M. Marzano, R.M. White, D.I. McCracken, S.M. Redpath, D.N. Carss, C.P. Quine & A.D. Watt (2010). The emergence of biodiversity conflicts from biodiversity impacts: characteristics and management strategies. Biodiversity and Conservation, Vol. 19, No. 14, pp 3973-3990.
Zinn, H.C., M.J. Manfredo & J.J.Vaske (2000). Social psychological bases for Stakeholder Acceptance Capacity. Human Dimensions of Wildlife Vol.5, No.3, pp 20-33.
217
Zinn, H.C., M.J. Manfredo & D.J. Decker (2008). Human Conditioning to Wildlife: Steps Toward Theory and Research. Human Dimensions of Wildlife, Vol.13, pp 388-399.
Zoë Warner, M. (2008). Examining Human-Elephant Conflict in Southern Africa: Causes and Options for Coexistence. University of Pennsylvania, Dept. of Earth and Environmental Science. Master of Environmental Studies Capstone Projects.
218
Existence versus Extinction
Summary
Worldwide, the frequency and intensity of human-wildlife conflicts are increasing, mainly due to human population growth and economic expansion, which contributed to wildlife habitat loss and dwindling wildlife populations, and ultimately to the confinement of large mammal species to protected areas. Much of the scholarly work focuses on conflicts on the edges of protected areas, and tends to be biased towards ‘charismatic’ species like elephants. Their policy recommendations focus on managerial approaches directed at damage limitation, but rarely provide a long-term solution, nor do they change people’s opinions and/or attitude towards the relevant wildlife species.
Hippos have received relatively scant scientific attention, notwithstanding their reputation as notorious crop raiders and the impact they have on local people’s livelihoods. Residents are complaining that the hippo is ‘nothing but a nuisance’, from which they gain nothing. Hence their generally negative attitude towards the species and low tolerance levels.
Against this background, this study deals with human-hippo conflicts in Lake Victoria Area, Kenya (mainly a non-protected area). It aims to shed light on the societal problem related to human-wildlife conflicts and societal opportunities inherent in wildlife governance strategies, by looking at the roots of the conflicts and solutions as suggested by different actors, including power differences. Hence it examined the research question: “How can human-hippo conflicts in Lake Victoria Area, Kenya, best be understood and dealt with?” In order to answer this question, the main conclusions per chapter are presented below. Subsequently, the implications for the theoretical debate will be dealt with, and recommendations for further research, policy and practice be given.
Part I covers Chapters 1-3, which present the background to the study. Chapter 1 shows the mounting concern over the rise in human-wildlife conflicts, with human perceptions and actions deciding their course and outcome. Most studies have centred on conflict zones surrounding protected areas, none of which are in the study area. This study addresses the knowledge gap in social sciences regarding human-hippo conflicts in non-protected areas.
Chapter 2 presents the theoretical framework that guides this study. It comprises of three strands of scholarly literature. First, it reviews the literature on wildlife conservation, human-wildlife conflicts, and wildlife damage management. Second, it uses interactive governance theory, including the norms and principles (meta-governance or third order governance) and institutions (second order governance) that guide and shape day-to-day management (first order governance). The idea is that by making the underlying governance principles, values and images explicit, a realistic notion will arise of the constraints and opportunities related to dealing with human-wildlife conflicts, hence facilitating conflict resolution. In addition, the distinction between the system-to-be-governed, governing system and governance interactions is leading in structuring this dissertation and the final appraisal of the governability of human-hippo conflicts. This study is the first to apply the interactive governance theory as developed by Bavinck et al. (2005; 2013; see also Kooiman et al. 2008) to wildlife governance and the analysis of the governability of human-wildlife conflicts. Third, Chapter 2 discusses political ecology, which pays attention to unequal access to natural resources, power differences in wildlife conservation, and the way in which knowledge and discourses are used to retain these power differences and inequalities. The conceptual scheme differentiates between human-hippo conflicts, which are essentially conflicts over land use, and human-human conflicts, between the governing system and the system-to-be-governed, about perceptions and practices related to hippos and hippo habitats. How people respond to conflicts and their attitude (avoidance or oriented towards conflict mitigation/resolution) determines the course of human-hippo conflicts and ultimately their outcome.
219
Chapter 3 presents the methodology. It elaborates on the Hippo Monitoring Project, based on year-round monitoring of human-hippo conflicts and damage assessment in villages bordering Winam Gulf, Lake Victoria. Data collection included a semi-structured questionnaire survey among 430 farmers and fishers. The project gradually got a more action-oriented character, with focus groups and awareness creating meetings with local communities and the Kenya Wildlife Service (KWS), the legal custodian of wildlife. Human-hippo conflicts were chosen as the unit of analysis to get an idea of the time-space character and the nature of such conflicts, which will help in developing conflict mitigation strategies. Victims and their households were selected as units of observation, to learn about the impact of damage events on their livelihoods. The data collection refers to three time periods, namely the pre-assessment, assessment and post-assessment periods.
Part II, consisting of Chapters 4 and 5, provides the contextual analysis of Lake Victoria Area, its inhabitants and the governing system. Chapter 4 concludes that the lakeshore as a natural system is characterised by a variety of wetland types, which are threatened by human encroachment and land conversion for agricultural purposes, while fishers feel the effect of the introduction of alien species like the Nile perch and water hyacinth, which blocks waterways. Hippos are wetland inhabitants, whose habitats are reduced due to anthropogenic influences. Hence, they venture into people’s farms to feed, with at times disastrous impacts on local livelihoods. Most residents belong to the Luo culture, living mainly of farming and fishing. Many of them feel that hippo populations have increased, which seems unjustified given their overall declining trend which ‘earned’ them a ‘vulnerable’ status on the IUCN Red List and a listing on CITES-Appendix II.
Chapter 5 shows a multilevel governance structure, in which national law making is embedded in several multilateral environmental agreements. In Kenya, wildlife governance is guided by the 2013 Wildlife Management and Conservation Act, which not only enabled devolution of decision-making and the creation of wildlife conservancies (wildlife conservation areas), but also reintroduced compensation for crop damage, granted landowners non-consumptive wildlife user rights, and recognised wildlife conservation as a form of land use on public, private and community land. However, most of the 2013 Act still seems to be directed at protected areas, notwithstanding huge wildlife numbers beyond their borders. There is growing attention for the role of communities and traditional knowledge in natural resource conservation, which can be seen as a transition phase towards ‘interactive governance’. Such notions are however not yet deeply rooted in the domain of policymakers and the lack of transparency in the consultative policy-making process may reduce all good intentions to a ‘rhetoric’ exercise. Due to the political nature of policymaking, it is highly likely that the existing power relations influence its outcome. Despite the devolution rhetoric, KWS remains the lead actor in Kenya’s wildlife governance. Yet, it seems that neither KWS nor non-governmental organisations (NGOs) prioritise human-wildlife conflicts, although the latter favour more community involvement and want to give residents rights of ownership and wildlife utilisation.
Part III, comprising Chapters 6-9, presents the fieldwork findings. Chapter 6 addresses human-hippo conflicts as part of the system-to-be-governed. Data collected by the field staff shows the conflict types, their magnitude and location. During the assessment period, over 80% of the incidents related to crop damage, while 17% was fisheries-related. The remainder referred to livestock loss and human injury. These incidents had a huge impact on people’s livelihoods in terms of loss of income and lost opportunity costs. The huge discrepancy in the conflict data of KWS and the project can possibly be explained by the focus of KWS on protected areas and residents’ non-reporting attitude: they see reporting as a futile exercise for no action will be taken. Risk factors are related to the proximity of farm land, seasonality, weather conditions and periodic flooding. Farmers whose lands are usually flooded during the long rains face a higher risk of crop-raiding hippos in their farms. The risk is correlated with
220
the distance between the farm and the nearest water body: the closer to the water, the higher the risk. Fishers involved in beach seine fishing face a higher risk as well, since it takes place along the shores, with fishers standing in the water.
Chapter 7 shows what principles, values and criteria guide governance interactions. It also gives insight into the roles and responsibilities of different actors involved in wildlife governance. Furthermore, this chapter aims to unravel existing conflict ‘images’ and analyses how these affect actors’ attitude towards hippo conservation and human-hippo conflicts. Different opinions exist among residents and between residents and KWS as to who is to blame for the ongoing conflicts. There seemed to be a major miscommunication between them, with conflicting ‘images’ of conservation and the use of hippo habitats playing a major role. Many residents still adhere to traditional beliefs related to hippos, although – with time – this seems to be changing. The local administration and NGOs favour local empowerment and legal changes that would allow communities to benefit from conservation – which is needed as most of them consider the hippo as a problem animal for which they have low tolerance. Support of government agents and NGOs, either financially or by providing material, enables communities to deal with hippo conflicts.
Chapter 8 analyses how communities work towards human-hippo conflict mitigation in practice. It shows what methods farmers and fishers apply to reduce the risk of hippo encounters, and to which coping strategies they adhere to recover from hippo-induced damage. The majority of the farmers relies on physical separation, night watching (either in a watch house or not), or the use of devices. Fishers tend to avoid hippo areas, although some go there deliberately to get a good catch. Others put scarecrows on or near the fish traps. Changes and adaptations in economic activities occurred partly as a result of human-hippo conflicts. Adaptations to livelihood strategies relate to how people deal with the aftermath of incidents: they either avoid conflict areas or improve the protective methods used, which can result in a declining number of conflicts and possibly to changing perceptions of hippos and human-hippo conflicts.
Chapter 9 examines the prospects of local wildlife governance. It looks at ways in which local communities can get more actively involved in conflict mitigation and acquire a more prominent role in hippo conservation. To this end, the focus group discussions and awareness meetings with KWS were instrumental. Several communal initiatives were identified in the area, which could act as a stepping stone for the so-called ‘hippo lobby groups’. These groups collectively try to find solutions for hippo related problems. Such initiatives require strong leaders, who are accountable and transparent towards their members, and committed to the key aims: reconciling hippo conservation with income generation, while reducing the number of incidents and increasing resident’s tolerance levels. This often seems to be missing. Other constraints towards co-governance with KWS and self-governance are a lack of knowledge of the legal aspects of wildlife and wetlands conservation, financial constraints, mutual mistrust between KWS and the communities, and the lack of compensation for hippo-induced damage. Although the latter got reintroduced in the 2013 Wildlife Act, it is still controversial – its effectiveness depends on damage verification, timely settlement and transparency in compensation.
Chapter 10 (Part IV) provides a synthesis of the research, reflects on the problem statement and research objectives, and answers the research questions. It also elaborates on the theoretical and policy implications of this study and gives recommendations for future research. This leads to the following conclusions:
(1) Human-hippo conflicts can largely be understood as ‘human-human’ conflicts over perceptions and practices regarding hippos and hippo habitats, to be separated from human-hippo conflicts, which are essentially conflicts about land use. The roles and positions of wildlife governance actors, being KWS, communities, NGOs and the private sector, are coloured by perceptions and worldviews, which feed the conservation discourse and influence
221
how conflicts are handled. Images of human-wildlife conflicts and their solutions are based on human disagreements, which can be attributed to human attitude, values, power relations, or to the partial inclusion/exclusion of actors in the planning and decision-making related to wildlife governance and conservation. The human and cultural dimension of these conflicts is often overlooked in the existing theoretical frameworks of human-wildlife conflicts. These dimensions add a political ecology lens to interactive governance theory, thereby revealing conflicting interests, underlying worldviews and values (meta-governance). These conflicting interests and worldviews made human-hippo conflicts largely evolve into human-human conflicts – both within the communities and between communities and KWS.
(2) This study also revealed the potential of and limitations to the governability of human-hippo conflicts in non-protected areas and the importance of continuous monitoring and damage assessment. The latter generated an evidence base of the importance and extent of human-hippo conflicts as a pathway towards collective action and co-governance – a foundation for which there is hardly any attention in policymaking. Formal and informal arrangements in the study area can serve as potential entry points for collective action to solve human-hippo conflicts. Committed leaders can be instrumental in creating ‘hippo lobby groups’, which act as co-governance structures and assist local communities to work towards local wildlife governance, provided there is an active broker (‘catalyst’) to bring actors with conflicting ‘images’ together. This is far from easy given the state dominance in wildlife governance. Fundamental hindrances to solve human-hippo conflicts through self- and co-governance cover distrust, a lack of leadership and vigour, and conflicting ‘images’.
(3) Theoretically this study has shown the importance of combining interactive governance theory with a political ecology approach, thereby revealing conflicting interests and worldviews which would have been somewhat neglected with an analysis exclusively focusing on interactive governance theory. Since conflicts with hippos are largely human-human conflicts, it is up to humans to be open about their perceptions and collaborate to mitigate these conflicts. However, this requires a policy setting that enables governance arrangements supportive to the inclusion of local communities.
Further research could elucidate on issues that were not explored in this study, like (i) a research into ‘best practices’ which could help identify key factors for successful collaboration and community-based wildlife governance; (ii) exploring the role of mobile phones in improving reporting and communication of wildlife-related issues; (iii) a comparison of the Kenyan model with the South African model of wildlife governance that permits consumptive wildlife utilisation and trophy hunting, with a view to clarifying the impact of both models on wildlife populations and shedding light on ethical questions like killing animals and using the proceeds thereof for conservation purposes; (iv) ethical issues that have not been discussed with any of the respondents, or the perceptions of religious and cultural leaders regarding nature, which might actually influence the opinions of residents. Their reputation and roles can play a determining role in a society where religion is a key element in daily life.
Finally, several recommendations were formulated on the basis of this research. First, as the lead actor in wildlife governance, KWS can improve the governability of human-hippo conflicts by involving local communities in the decision-making process on wildlife governance and conservation, for example in conservancies. This requires removing the mistrust between KWS and communities, openness in each other’s perceptions, values and value orientations, clarification of the different options, and a willingness to achieve acceptable solutions, thereby taking a strategic positioning of economic activities into account. A hippo census based on GIS and remote sensing is needed to develop a proper Hippo Action Plan.
222
Second, there is a need for a network of community-based monitors or scouts, who carry out an inventory and monitor human-hippo conflicts and their effects and act as a broker between KWS and communities. Their involvement will not only (partially) overcome the time and labour constraints of KWS, but also enhance the interest of residents in the wildlife species with which they share the land, which may positively influence their conservation attitude.
Third, KWS should enable policy changes to allow for consumptive wildlife use, which may enhance the economic viabililty of hippo conservancies.
Fourth, land ownership is a pressing issue, especially in areas bordering (meandering) rivers like the Nyando and lakes with highly fluctuating water levels (Winam Gulf), leading to land disputes. A proper land-use planning by the Lands Ministry can provide residents with ownership titles, restrict the encroachment of human settlements into wetlands and possibly change the location of shambas. Government lands require strict monitoring and enforcement, specifically for zones bordering waterbodies (protected under the Agricultural Act). In the meantime, the government should step in and ban cultivation along the lake until land demarcation has taken place.
Fifth, creating awareness and having an open discussion about the need to protect wetlands and the policies regarding wildlife governance and environmental conservation; generating income through hippo conservation; financial compensation for losses incurred, based on the current market value, after a properly carried out damage assessment by an ‘independent assessor’; and insurance schemes for crop damage may lead to a change of attitude of the residents and create higher tolerance levels towards hippos.
Sixth, NGOs or private actors can act as a catalyst for hippo conservation, for example by providing technical know-how and funding to local communities wanting to start a conservancy or wanting to apply effective protective methods like fences, stone walls, and dikes. Local schools can play a role through awareness creation of their pupils. A framework for concerted action by KWS and CSOs should enhance the effectiveness of these activities.
Seventh, barazas can act as a platform to exchange ideas on how to best tackle human-hippo conflicts, for instance through crop diversification, agricultural intensification in collaboration with agricultural officers (to generate additional income without land expansion to avoid further pressure on hippo habitats), the introduction of alternative protective methods like erecting walls, while working towards capacity building through conservation performance payments (c.f. Nyirenda et al. 2013).
Finally, human tolerance and actions make the difference between hippo existence and extinction.
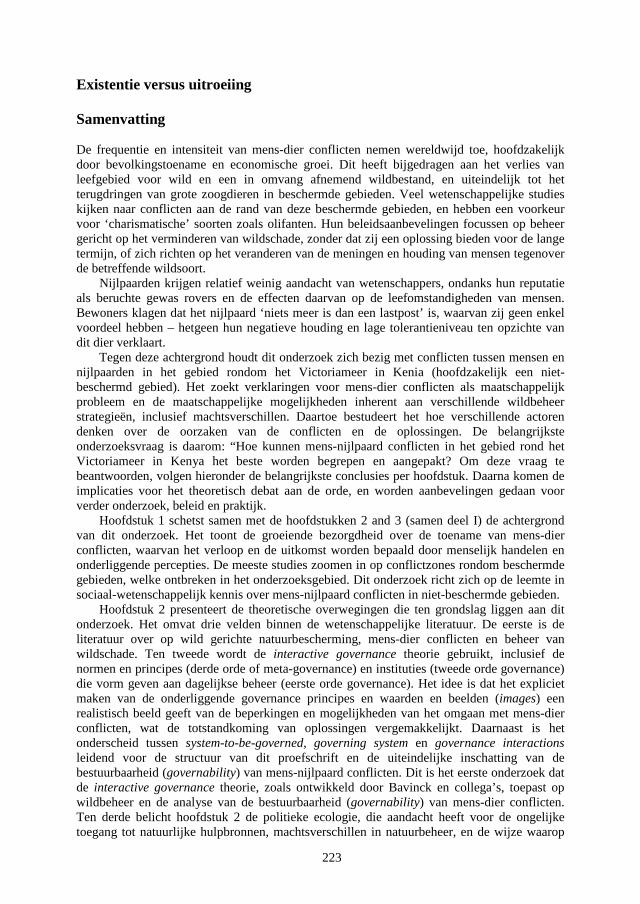
223
Existentie versus uitroeiing
Samenvatting
De frequentie en intensiteit van mens-dier conflicten nemen wereldwijd toe, hoofdzakelijk door bevolkingstoename en economische groei. Dit heeft bijgedragen aan het verlies van leefgebied voor wild en een in omvang afnemend wildbestand, en uiteindelijk tot het terugdringen van grote zoogdieren in beschermde gebieden. Veel wetenschappelijke studies kijken naar conflicten aan de rand van deze beschermde gebieden, en hebben een voorkeur voor ‘charismatische’ soorten zoals olifanten. Hun beleidsaanbevelingen focussen op beheer gericht op het verminderen van wildschade, zonder dat zij een oplossing bieden voor de lange termijn, of zich richten op het veranderen van de meningen en houding van mensen tegenover de betreffende wildsoort.
Nijlpaarden krijgen relatief weinig aandacht van wetenschappers, ondanks hun reputatie als beruchte gewas rovers en de effecten daarvan op de leefomstandigheden van mensen. Bewoners klagen dat het nijlpaard ‘niets meer is dan een lastpost’ is, waarvan zij geen enkel voordeel hebben – hetgeen hun negatieve houding en lage tolerantieniveau ten opzichte van dit dier verklaart.
Tegen deze achtergrond houdt dit onderzoek zich bezig met conflicten tussen mensen en nijlpaarden in het gebied rondom het Victoriameer in Kenia (hoofdzakelijk een niet-beschermd gebied). Het zoekt verklaringen voor mens-dier conflicten als maatschappelijk probleem en de maatschappelijke mogelijkheden inherent aan verschillende wildbeheer strategieën, inclusief machtsverschillen. Daartoe bestudeert het hoe verschillende actoren denken over de oorzaken van de conflicten en de oplossingen. De belangrijkste onderzoeksvraag is daarom: “Hoe kunnen mens-nijlpaard conflicten in het gebied rond het Victoriameer in Kenya het beste worden begrepen en aangepakt? Om deze vraag te beantwoorden, volgen hieronder de belangrijkste conclusies per hoofdstuk. Daarna komen de implicaties voor het theoretisch debat aan de orde, en worden aanbevelingen gedaan voor verder onderzoek, beleid en praktijk.
Hoofdstuk 1 schetst samen met de hoofdstukken 2 and 3 (samen deel I) de achtergrond van dit onderzoek. Het toont de groeiende bezorgdheid over de toename van mens-dier conflicten, waarvan het verloop en de uitkomst worden bepaald door menselijk handelen en onderliggende percepties. De meeste studies zoomen in op conflictzones rondom beschermde gebieden, welke ontbreken in het onderzoeksgebied. Dit onderzoek richt zich op de leemte in sociaal-wetenschappelijk kennis over mens-nijlpaard conflicten in niet-beschermde gebieden.
Hoofdstuk 2 presenteert de theoretische overwegingen die ten grondslag liggen aan dit onderzoek. Het omvat drie velden binnen de wetenschappelijke literatuur. De eerste is de literatuur over op wild gerichte natuurbescherming, mens-dier conflicten en beheer van wildschade. Ten tweede wordt de interactive governance theorie gebruikt, inclusief de normen en principes (derde orde of meta-governance) en instituties (tweede orde governance) die vorm geven aan dagelijkse beheer (eerste orde governance). Het idee is dat het expliciet maken van de onderliggende governance principes en waarden en beelden (images) een realistisch beeld geeft van de beperkingen en mogelijkheden van het omgaan met mens-dier conflicten, wat de totstandkoming van oplossingen vergemakkelijkt. Daarnaast is het onderscheid tussen system-to-be-governed, governing system en governance interactions leidend voor de structuur van dit proefschrift en de uiteindelijke inschatting van de bestuurbaarheid (governability) van mens-nijlpaard conflicten. Dit is het eerste onderzoek dat de interactive governance theorie, zoals ontwikkeld door Bavinck en collega’s, toepast op wildbeheer en de analyse van de bestuurbaarheid (governability) van mens-dier conflicten. Ten derde belicht hoofdstuk 2 de politieke ecologie, die aandacht heeft voor de ongelijke toegang tot natuurlijke hulpbronnen, machtsverschillen in natuurbeheer, en de wijze waarop
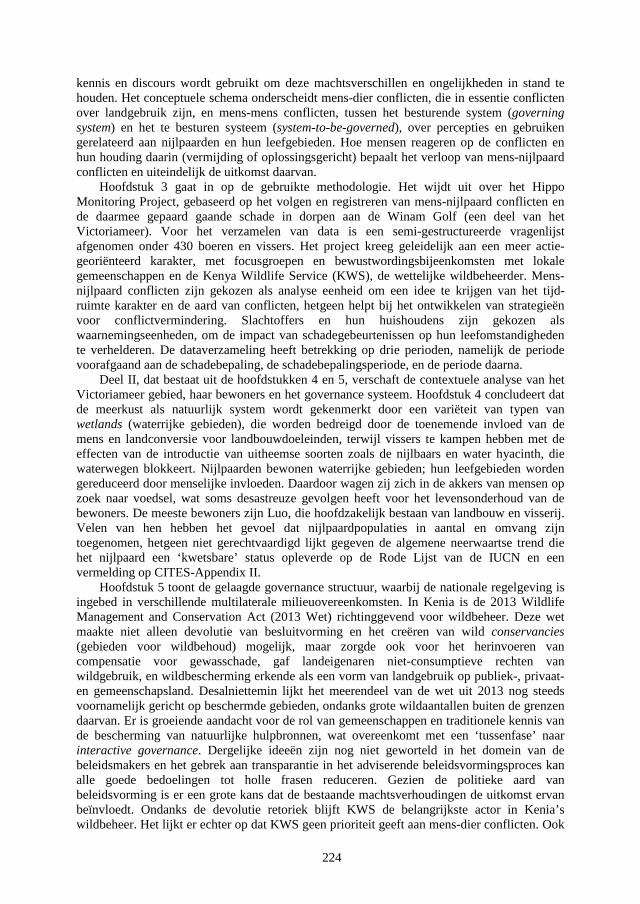
224
kennis en discours wordt gebruikt om deze machtsverschillen en ongelijkheden in stand te houden. Het conceptuele schema onderscheidt mens-dier conflicten, die in essentie conflicten over landgebruik zijn, en mens-mens conflicten, tussen het besturende system (governing system) en het te besturen systeem (system-to-be-governed), over percepties en gebruiken gerelateerd aan nijlpaarden en hun leefgebieden. Hoe mensen reageren op de conflicten en hun houding daarin (vermijding of oplossingsgericht) bepaalt het verloop van mens-nijlpaard conflicten en uiteindelijk de uitkomst daarvan.
Hoofdstuk 3 gaat in op de gebruikte methodologie. Het wijdt uit over het Hippo Monitoring Project, gebaseerd op het volgen en registreren van mens-nijlpaard conflicten en de daarmee gepaard gaande schade in dorpen aan de Winam Golf (een deel van het Victoriameer). Voor het verzamelen van data is een semi-gestructureerde vragenlijst afgenomen onder 430 boeren en vissers. Het project kreeg geleidelijk aan een meer actie-georiënteerd karakter, met focusgroepen en bewustwordingsbijeenkomsten met lokale gemeenschappen en de Kenya Wildlife Service (KWS), de wettelijke wildbeheerder. Mens-nijlpaard conflicten zijn gekozen als analyse eenheid om een idee te krijgen van het tijd-ruimte karakter en de aard van conflicten, hetgeen helpt bij het ontwikkelen van strategieën voor conflictvermindering. Slachtoffers en hun huishoudens zijn gekozen als waarnemingseenheden, om de impact van schadegebeurtenissen op hun leefomstandigheden te verhelderen. De dataverzameling heeft betrekking op drie perioden, namelijk de periode voorafgaand aan de schadebepaling, de schadebepalingsperiode, en de periode daarna.
Deel II, dat bestaat uit de hoofdstukken 4 en 5, verschaft de contextuele analyse van het Victoriameer gebied, haar bewoners en het governance systeem. Hoofdstuk 4 concludeert dat de meerkust als natuurlijk system wordt gekenmerkt door een variëteit van typen van wetlands (waterrijke gebieden), die worden bedreigd door de toenemende invloed van de mens en landconversie voor landbouwdoeleinden, terwijl vissers te kampen hebben met de effecten van de introductie van uitheemse soorten zoals de nijlbaars en water hyacinth, die waterwegen blokkeert. Nijlpaarden bewonen waterrijke gebieden; hun leefgebieden worden gereduceerd door menselijke invloeden. Daardoor wagen zij zich in de akkers van mensen op zoek naar voedsel, wat soms desastreuze gevolgen heeft voor het levensonderhoud van de bewoners. De meeste bewoners zijn Luo, die hoofdzakelijk bestaan van landbouw en visserij. Velen van hen hebben het gevoel dat nijlpaardpopulaties in aantal en omvang zijn toegenomen, hetgeen niet gerechtvaardigd lijkt gegeven de algemene neerwaartse trend die het nijlpaard een ‘kwetsbare’ status opleverde op de Rode Lijst van de IUCN en een vermelding op CITES-Appendix II.
Hoofdstuk 5 toont de gelaagde governance structuur, waarbij de nationale regelgeving is ingebed in verschillende multilaterale milieuovereenkomsten. In Kenia is de 2013 Wildlife Management and Conservation Act (2013 Wet) richtinggevend voor wildbeheer. Deze wet maakte niet alleen devolutie van besluitvorming en het creëren van wild conservancies (gebieden voor wildbehoud) mogelijk, maar zorgde ook voor het herinvoeren van compensatie voor gewasschade, gaf landeigenaren niet-consumptieve rechten van wildgebruik, en wildbescherming erkende als een vorm van landgebruik op publiek-, privaat- en gemeenschapsland. Desalniettemin lijkt het meerendeel van de wet uit 2013 nog steeds voornamelijk gericht op beschermde gebieden, ondanks grote wildaantallen buiten de grenzen daarvan. Er is groeiende aandacht voor de rol van gemeenschappen en traditionele kennis van de bescherming van natuurlijke hulpbronnen, wat overeenkomt met een ‘tussenfase’ naar interactive governance. Dergelijke ideeën zijn nog niet geworteld in het domein van de beleidsmakers en het gebrek aan transparantie in het adviserende beleidsvormingsproces kan alle goede bedoelingen tot holle frasen reduceren. Gezien de politieke aard van beleidsvorming is er een grote kans dat de bestaande machtsverhoudingen de uitkomst ervan beïnvloedt. Ondanks de devolutie retoriek blijft KWS de belangrijkste actor in Kenia’s wildbeheer. Het lijkt er echter op dat KWS geen prioriteit geeft aan mens-dier conflicten. Ook
225
niet-gouvernementele organissaties (NGO’s) doen dit niet, hoewel zij meer betrokkenheid van de gemeenschap voorstaan en bewoners eigendomsrechten en rechten van wildgebruik willen geven.
Deel III, dat de hoofstukken 6-9 omvat, presenteert de resultaten van het veldwerk. Hoofdstuk 6 benoemt mens-nijlpaard conflicten als onderdeel van het system-to-be-governed. Data verzameld door de projectmedewerkers toont het type conflict, de omvang ervan en de locatie. Gedurende de schadebepalingsperiode had meer dan 80% van de incidenten betrekking op gewasschade, 17% was gerelateerd aan visserij. De rest betrof verlies van vee en menselijke verwondingen. Dergelijke incidenten hadden een grote impact op het bestaan van de bewoners in termen van verlies van inkomen en vervangingskosten. Er was een groot verschil tussen de conflictdata van KWS en gegevens verzameld in het kader van dit onderzoek, hetgeen mogelijk kan worden toegeschreven aan de focus van KWS op beschermde gebieden en de houding van respondenten om voorvallen met nijlpaarden niet te rapporteren: zij beschouwen dit als een nutteloze exercitie omdat KWS niet reageert. Risicofactoren zijn gerelateerd aan de nabijheid van akkers, seizoensgebondenheid, weersomstandigheden en periodieke overstromingen. Boeren wiens land normaliter overstroomt gedurende de lange regentijd hebben een verhoogd risico om gewasrovende nijlpaarden aan te treffen op hun akkers. Het risico is gecorreleerd aan de afstand van de akker tot de meest dichtbij gelegen waterpartij: hoe dichter bij het water, des te hoger het risico. Vissers die de ‘beach seine’ methode gebruiken hebben ook een verhoogd risico aangezien dit plaatsvindt nabij de oevers, waarbij de vissers in het water staan.
Hoofdstuk 7 toont de principes, waarden en criteria die leidend zijn in governance interactions. Het geeft ook inzicht in de rollen en verantwoordelijkheden van de verschillende actoren die betrokken zijn bij wildbeheer. Dit hoofdstuk ontleedt tevens bestaande conflict ‘beelden’ en analyseert hoe deze de houding van actoren beïnvloeden ten aanzien van nijlpaardbescherming en mens-nijlpaard conflicten. Er bestaan verschillende opvattingen tussen bewoners onderling en tussen bewoners en de KWS met betrekking tot verantwoordelijkheid voor de voortdurende conflicten. Tussen beide actoren lijkt een groot misverstand te bestaan, waarin conflicterende ‘beelden’ van bescherming en het gebruik van de leefomgeving van nijlpaarden een grote rol spelen. Veel bewoners zijn aanhangers van traditionele overtuigingen over nijlpaarden, alhoewel dit met het verstrijken van de tijd lijkt te veranderen. Lokaal bestuur en NGO’s zijn voorstander van maatregelen die lokale mensen leren voor zichzelf op te komen, en wetswijzigingen die het mogelijk maken dat gemeenschappen voordeel hebben van natuurbescherming – hetgeen noodzakelijk is aangezien de meeste bewoners het nijlpaard als een probleemdier beschouwen en een laag tolerantieniveau hebben ten aanzien ervan. Steun van overheidsinstanties en NGO’s, hetzij financieel of door het verstrekken van materiaal, stelt leefgemeenschappen in staat om conflicten met nijlpaarden hanteerbaar te maken.
Hoofdstuk 8 analyseert hoe gemeenschappen in de praktijk werken aan het verminderen van mens-nijlpaard conflicten. Het toont welke methoden boeren en vissers gebruiken om het risico van een confrontatie met nijlpaarden te verminderen, en welke strategieën zij volgen om de schade te herstellen die door nijlpaarden wordt toegebracht. De meerderheid van de boeren vertrouwt op fysieke scheiding van mens en nijlpaard, de wacht houden in de nachtelijke uren (al dan niet in een hut), of het gebruik van afweermiddelen. Vissers neigen naar het vermijden van gebieden waar nijlpaarden zijn, alhoewel sommigen van hen juist daarheen gaan omdat zij daar een goede vangst krijgen. Anderen plaatsen ‘vogel-verschrikkers’ op of nabij de visfuiken. Mens-nijlpaard conflicten hebben (gedeeltelijk) veranderingen en aanpassingen in de economische activiteiten tot gevolg gehad. Aanpassingen in bestaansverwervingstrategieën houden verband met hoe mensen omgaan met de gevolgen van incidenten: zij vermijden conflictzones of verbeteren de
226
beschermingsmethoden, hetgeen kan resulteren in een afnemend aantal conflicten en mogelijkerwijs een veranderende perceptie over nijlpaarden en mens-nijlpaard conflicten.
Hoofdstuk 9 onderzoekt de mogelijkheden voor lokaal wildbeheer. Het kijkt hoe lokale gemeenschappen meer actief betrokken kunnen worden in conflictvermindering en een meer prominente rol kunnen krijgen in de bescherming van nijlpaarden. In dit opzicht waren de discussies tijdens de focusgroepen en bewustwordingsbijeenkomsten met KWS behulpzaam. Verschillende gezamenlijke initiatieven die in het gebied zijn geïdentificeerd zouden kunnen fungeren als een opstapje voor zogenaamde ‘hippo lobby groups’. Dit zijn lokale groepen die gezamenlijk proberen om oplossingen te vinden voor problemen met nijlpaarden. Dergelijke initiatieven vereisen sterke leiders, die verantwoordelijk en transparent zijn richting hun achterban, en toegewijd zijn aan de belangrijkste doelen: het verenigen van nijlpaardbescherming en inkomensverwerving, en tegelijkertijd het aantal incidenten terugbrengen en het tolerantieniveau van bewoners opschroeven. Daaraan blijkt het vaak te ontbreken. Andere beperkingen richting co-governance met KWS en self-governance zijn het gebrek aan kennis van de wettelijke regelingen met betrekking tot wild en de bescherming van waterrijke gebieden, financiële beperkingen, het geringe wederzijdse wantrouwen tussen KWS en lokale bewoners, en het ontbreken van compensatie voor door nijlpaarden veroorzaakte schade. Dit laatste was weliswaar heringevoerd in de wet van 2013, maar is nog steeds controversieel – de effectiviteit hangt af van de schadebepaling, tijdige afhandeling en transparantie in compensatie.
Hoofdstuk 10 (deel IV) bevat de synthese van het onderzoek; reflecteert op de probleemstelling en onderzoeksdoelen; en beantwoordt de onderzoeksvraag. Tevens belicht het de theoretische en beleidsimplicaties van dit onderzoek en formuleert het aanbevelingen voor toekomstig onderzoek. Dat leidt tot de volgende conclusies:
(1) Mens-nijlpaard conflicten kunnen voor een groot deel worden beschouwd als ‘mens-mens’ conflicten over percepties en praktijken gerelateerd aan nijlpaarden en hun leefomgeving. Dit ter onderscheiding van mens-nijlpaard conflicten, die in essentie over landgebruik gaan. De rol en posities van actoren in wildbeheer, te weten KWS, lokale gemeenschappen, NGO’s en de private sector, zijn gekleurd door percepties en wereldbeelden, die de natuurbeschermingsdialoog voeden en de afhandeling van conflicten beïnvloeden. Beelden van mens-dier conflicten en hun oplossingen zijn gebaseerd op meningsverschillen tussen mensen, en kunnen worden toegeschreven aan attitude, waarden, machtsrelaties, of aan de gedeeltelijke opname of uitsluiting van actoren in de planning en besluitvorming rondom wildbeleid en -bescherming. De menselijke en culturele dimensie van deze conflicten wordt vaak over het hoofd gezien in de bestaande theoritische kaders van mens-dier conflicten. Toevoegen van deze dimensies geeft tevens een politiek-ecologische dimensie aan de interactive governance analyse, waarbij tegenstrijdige belangen en aan governance onderliggende wereldbeelden en waarden (meta-governance) worden blootgelegd. Deze conflicterende belangen en wereldbeelden maken dat mens-nijlpaard conflicten zich grotendeels hebben ontwikkeld tot mens-mens conflicten – zowel tussen gemeenschappen onderling als tussen de lokale bewoners en KWS.
(2) Deze studie heeft ook het potentieel en de beperkingen van de governance mogelijkheden van mens-nijlpaard conflicten in niet-beschermde gebieden laten zien, en het belang van voortdurende monitoring en schadebepaling. Het laatste brengt het belang en de omvang van mens-nijlpaard conflicten in kaart en creëert een onderbouwing voor collectieve actie en governance – een onderbouwing waarvoor in de beleidvorming normaal weinig tot geen aandacht bestaat. Formele en informele arrangementen in het onderzoeksgebied kunnen dienen als een mogelijke ingang voor gezamenlijke actie om conflicten met nijlpaarden op te lossen. Betrokken leiders kunnen instrumenteel zijn in de vorming van ‘hippo lobby’ groepen, die fungeren als een gezamenlijke besturingsstructuur en lokale gemeenschappen ondersteunen om bij te dragen aan lokaal wildbeheer, mits er een actieve tussenpersoon
227
(katalysator) is die de actoren met tegenstrijdige ‘beelden’ bijeen brengt. Dit is verre van gemakkelijk gegeven de staatsdominantie in wildbeheer. Fundamentele belemmeringen hinderen de oplossing van mens-nijlpaard conflicten door middel van self- and co-governance, zoals wantrouwen, een gebrek aan leiderschap en krachtdadigheid, en tegenstrijdige ‘beelden’.
(3) Theoretisch gezien heeft dit onderzoek het belang laten zien van een combinatie vaninteractive governance theorie met een politiek-ecologische benadering. Daardoor komen conflicterende belangen, wereldbeelden en machtsverschillen aan het licht die bij toepassing van interactive governance theorie alleen enigszins onderbelicht blijven. Aangezien conflicten met nijlpaarden grotendeels mens-mens conflicten zijn, kan een oplossing worden gevonden als betrokken actoren hun onderlinge percepties openlijk bespreken en samenwerken om conflicten te verminderen. Dit vraagt echter om aanpassingen in beleid en governance arrangementen die betrokkenheid van gemeenschappen in wildbeheer mogelijk maken.
Verschillende zaken zijn niet aan bod gekomen in dit onderzoek, en kunnen in toekomstig onderzoek worden belicht zoals (i) verder onderzoek naar best practices die zouden kunnen helpen bij het identificeren van de belangrijkste succesfactoren voor samenwerking met en wildbeheer vanuit de gemeenschap; (ii) het onderzoeken van de rol van mobiele telefonie om het rapporteren en de communicatie van wildgerelateerde zaken te verbeteren; (iii) het vergelijken van het Keniase model met het Zuidafrikaanse model van wildbeheer, waar consumptief wildgebruik en de trofeejacht is toegestaan, zodat de impact van beide modellen op de omvang van het wildbestand kan worden onderzocht en ethische kwesties worden belicht zoals het doden van dieren en het gebruik van de opbrengst daarvan voor bescher-mingsdoeleinden; (iv) ethische kwesties die niet zijn besproken met de respondenten, en de percepties van religieuze en culturele leiders over natuur, die de meningen van bewoners zou kunnen beïnvloeden. Hun reputatie en rollen kunnen een bepalende rol spelen in een samenleving waar religie van groot belang is in het dagelijks leven.
Tenslotte zijn op basis van dit onderzoek verschillende aanbevelingen geformuleerd.Ten eerste kan KWS – als de belangrijkste actor in wildbeheer – de governance van mens-nijlpaard conflicten verbeteren door lokale gemeenschappen te betrekken in de besluitvorming over wildbeheer en in wildbescherming, bijvoorbeeld in conservancies. Dat vereist het wegnemen van het wantrouwen tussen KWS en de lokale gemeenschappen; openheid over elkaars percepties, waarden en waardenoriëntaties; afweging van verschillende opties; en bereidheid om voor elke partij acceptabele oplossingen te bereiken, rekening houdend met een strategische positionering van economische activiteiten. Een nijlpaardentelling op basis van GIS en remote sensing is nodig voor een deugdelijk Nijlpaard Actie Plan.
Ten tweede is er behoefte aan een netwerk van getrainde lokale monitoren of scouts, die een inventarisatie uitvoeren, mens-nijlpaard conflicten en de impact daarvan monitoren, en als schakel tussen KWS en de gemeenschappen fungeren. Hun betrokkenheid zal niet alleen de tijds- en personeelsbeperkingen van KWS gedeeltelijk opheffen, maar ook de interesse vergroten van bewoners in het nijlpaard, waarmee zij het land delen – hetgeen hun houding met betrekking tot de instandhouding van deze soort positief kan beïnvloeden.
Ten derde zou KWS door beleidsveranderingen consumptief wildgebruik mogelijk moeten maken, hetgeen nijlpaard conservancies levensvatbaar kan houden.
Ten vierde is landeigendom is een nijpende kwestie, vooral in gebieden die grenzen aan meanderende rivieren en meren met een fluctuerend waterniveau (Winam Golf), hetgeen leidt tot landconflicten. Een goede planning voor landgebruik door het Ministerie van Land kan bewoners eigendomsrechten verlenen, de uitbreiding van nederzettingen in waterrijke
228
gebieden een halt toeroepen, en mogelijk de locaties van de akkers veranderen. Voor staatseigendom zijn strikt toezicht en naleving vereist, met name voor zones die grenzen aan wateroppervlakken (die beschermd zijn via de Landbouwwet). In de tussentijd moet de overheid in actie komen en landbouwactiviteiten bij het meer verbieden totdat de landdemarcatie is uitgevoerd.
Ten vijfde, bewustmaking en een open discussie over de noodzaak tot bescherming van waterrijke gebieden en de regelgeving ten aanzien van wildbeheer en milieubescherming; het creëren van op nijlpaardbehoud gebaseerde inkomenstenbronnen; financiële compensatie van opgedane verliezen, gebaseerd op de huidige marktwaarde, na een zorgvuldig uitgevoerde schadebepaling door een ‘onafhankelijk expert’; en verzekeringsschema’s voor gewasschade, kunnen bijdragen tot een andere houding onder de lokale bevolking ten aanzien van nijlpaarden en een hogere tolerantiegraad jegens deze dieren.
Ten zesde, kunnen NGO’s of private actoren als katalysator fungeren voor nijlpaardbehoud, bijvoorbeeld door het verstrekken van technische know-how en fondsen aan gemeenschappen die een conservancy willen beginnen of effectieve beschermingsmethoden willen toepassen zoals afrasteringen, stenen muren, en dijken. Lokale scholen kunnen een rol spelen bij de bewustmaking van scholieren. Een raamwerk voor gezamenlijke actie door KWS en maatschappelijke organisaties zou de effectiviteit van deze activiteiten kunnen verhogen.
Ten zevende, de barazas kunnen een platform zijn voor de uitwisseling van ideeën over de beste conflictaanpak zoals diversificatie van gewassoorten, landbouwintensivering in samenspraak met landbouw medewerkers (om additioneel inkomen te genereren zonder landuitbreiding, om verdere druk op de leefgebieden van nijlpaarden te voorkomen), de introductie van alternatieve beschermingsmethoden zoals het oprichten van muren, onderwijl werkend aan capaciteitsopbouw door prestatie betalingen voor bescherming (c.f. Nyirenda et al. 2013).
Uiteindelijk maken menselijke tolerantie en acties het verschil tussen voortbestaan of uitroeing van nijlpaarden.
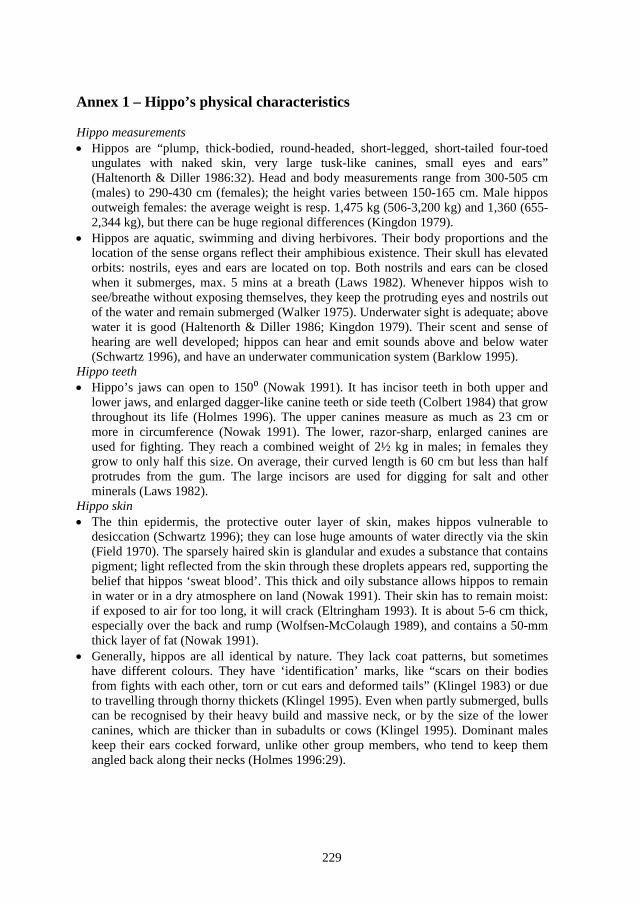
229
Annex 1 – Hippo’s physical characteristics
Hippo measurements • Hippos are “plump, thick-bodied, round-headed, short-legged, short-tailed four-toed
ungulates with naked skin, very large tusk-like canines, small eyes and ears”(Haltenorth & Diller 1986:32). Head and body measurements range from 300-505 cm(males) to 290-430 cm (females); the height varies between 150-165 cm. Male hipposoutweigh females: the average weight is resp. 1,475 kg (506-3,200 kg) and 1,360 (655-2,344 kg), but there can be huge regional differences (Kingdon 1979).
• Hippos are aquatic, swimming and diving herbivores. Their body proportions and thelocation of the sense organs reflect their amphibious existence. Their skull has elevatedorbits: nostrils, eyes and ears are located on top. Both nostrils and ears can be closedwhen it submerges, max. 5 mins at a breath (Laws 1982). Whenever hippos wish tosee/breathe without exposing themselves, they keep the protruding eyes and nostrils outof the water and remain submerged (Walker 1975). Underwater sight is adequate; abovewater it is good (Haltenorth & Diller 1986; Kingdon 1979). Their scent and sense ofhearing are well developed; hippos can hear and emit sounds above and below water(Schwartz 1996), and have an underwater communication system (Barklow 1995).
Hippo teeth • Hippo’s jaws can open to 150⁰ (Nowak 1991). It has incisor teeth in both upper and
lower jaws, and enlarged dagger-like canine teeth or side teeth (Colbert 1984) that growthroughout its life (Holmes 1996). The upper canines measure as much as 23 cm ormore in circumference (Nowak 1991). The lower, razor-sharp, enlarged canines areused for fighting. They reach a combined weight of 2½ kg in males; in females theygrow to only half this size. On average, their curved length is 60 cm but less than halfprotrudes from the gum. The large incisors are used for digging for salt and otherminerals (Laws 1982).
Hippo skin • The thin epidermis, the protective outer layer of skin, makes hippos vulnerable to
desiccation (Schwartz 1996); they can lose huge amounts of water directly via the skin(Field 1970). The sparsely haired skin is glandular and exudes a substance that containspigment; light reflected from the skin through these droplets appears red, supporting thebelief that hippos ‘sweat blood’. This thick and oily substance allows hippos to remainin water or in a dry atmosphere on land (Nowak 1991). Their skin has to remain moist:if exposed to air for too long, it will crack (Eltringham 1993). It is about 5-6 cm thick,especially over the back and rump (Wolfsen-McColaugh 1989), and contains a 50-mmthick layer of fat (Nowak 1991).
• Generally, hippos are all identical by nature. They lack coat patterns, but sometimeshave different colours. They have ‘identification’ marks, like “scars on their bodiesfrom fights with each other, torn or cut ears and deformed tails” (Klingel 1983) or dueto travelling through thorny thickets (Klingel 1995). Even when partly submerged, bullscan be recognised by their heavy build and massive neck, or by the size of the lowercanines, which are thicker than in subadults or cows (Klingel 1995). Dominant maleskeep their ears cocked forward, unlike other group members, who tend to keep themangled back along their necks (Holmes 1996:29).
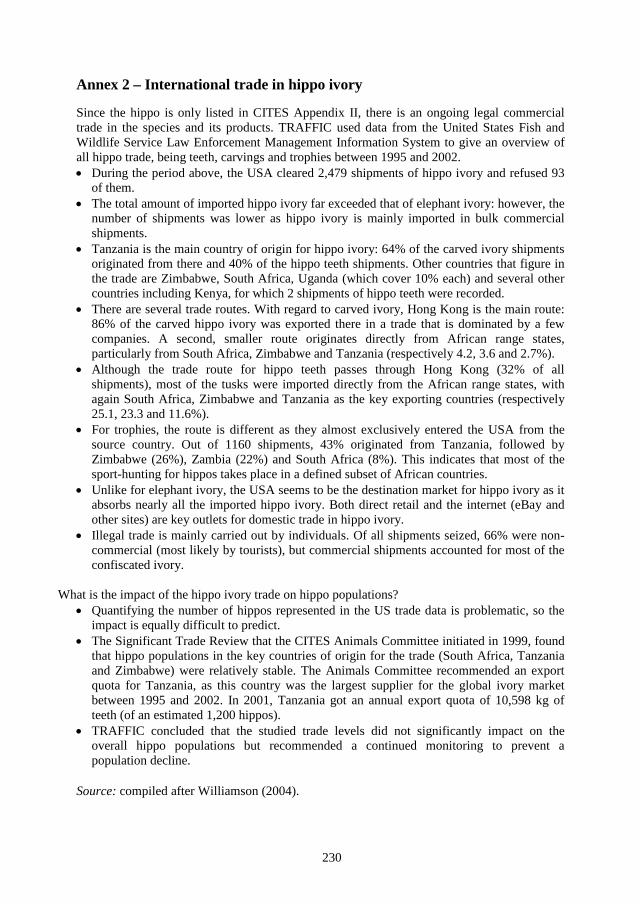
230
Annex 2 – International trade in hippo ivory
Since the hippo is only listed in CITES Appendix II, there is an ongoing legal commercial trade in the species and its products. TRAFFIC used data from the United States Fish and Wildlife Service Law Enforcement Management Information System to give an overview of all hippo trade, being teeth, carvings and trophies between 1995 and 2002. • During the period above, the USA cleared 2,479 shipments of hippo ivory and refused 93
of them.• The total amount of imported hippo ivory far exceeded that of elephant ivory: however, the
number of shipments was lower as hippo ivory is mainly imported in bulk commercialshipments.
• Tanzania is the main country of origin for hippo ivory: 64% of the carved ivory shipmentsoriginated from there and 40% of the hippo teeth shipments. Other countries that figure inthe trade are Zimbabwe, South Africa, Uganda (which cover 10% each) and several othercountries including Kenya, for which 2 shipments of hippo teeth were recorded.
• There are several trade routes. With regard to carved ivory, Hong Kong is the main route:86% of the carved hippo ivory was exported there in a trade that is dominated by a fewcompanies. A second, smaller route originates directly from African range states,particularly from South Africa, Zimbabwe and Tanzania (respectively 4.2, 3.6 and 2.7%).
• Although the trade route for hippo teeth passes through Hong Kong (32% of allshipments), most of the tusks were imported directly from the African range states, withagain South Africa, Zimbabwe and Tanzania as the key exporting countries (respectively25.1, 23.3 and 11.6%).
• For trophies, the route is different as they almost exclusively entered the USA from thesource country. Out of 1160 shipments, 43% originated from Tanzania, followed byZimbabwe (26%), Zambia (22%) and South Africa (8%). This indicates that most of thesport-hunting for hippos takes place in a defined subset of African countries.
• Unlike for elephant ivory, the USA seems to be the destination market for hippo ivory as itabsorbs nearly all the imported hippo ivory. Both direct retail and the internet (eBay andother sites) are key outlets for domestic trade in hippo ivory.
• Illegal trade is mainly carried out by individuals. Of all shipments seized, 66% were non-commercial (most likely by tourists), but commercial shipments accounted for most of theconfiscated ivory.
What is the impact of the hippo ivory trade on hippo populations? • Quantifying the number of hippos represented in the US trade data is problematic, so the
impact is equally difficult to predict.• The Significant Trade Review that the CITES Animals Committee initiated in 1999, found
that hippo populations in the key countries of origin for the trade (South Africa, Tanzaniaand Zimbabwe) were relatively stable. The Animals Committee recommended an exportquota for Tanzania, as this country was the largest supplier for the global ivory marketbetween 1995 and 2002. In 2001, Tanzania got an annual export quota of 10,598 kg ofteeth (of an estimated 1,200 hippos).
• TRAFFIC concluded that the studied trade levels did not significantly impact on theoverall hippo populations but recommended a continued monitoring to prevent apopulation decline.
Source: compiled after Williamson (2004).
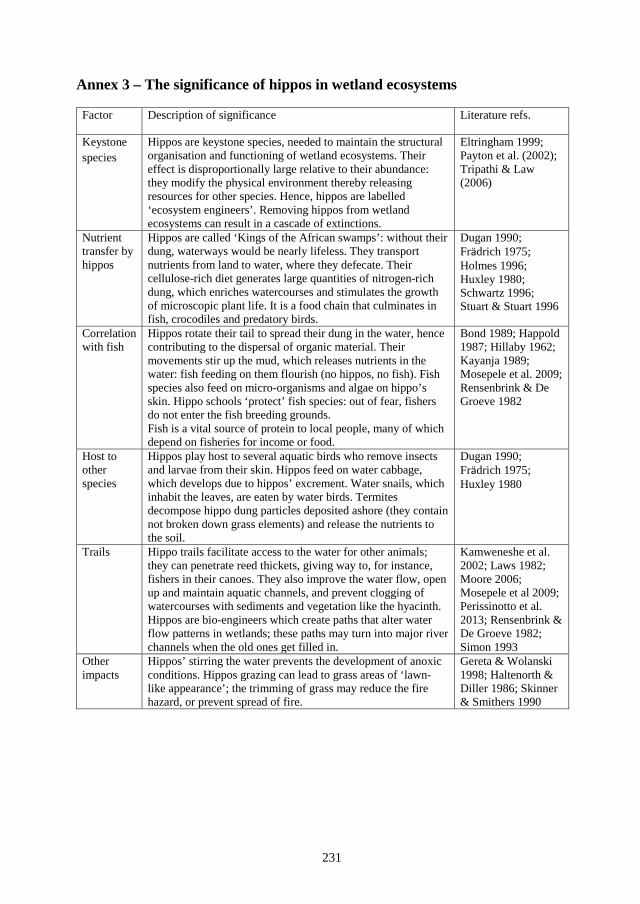
231
Annex 3 – The significance of hippos in wetland ecosystems
Factor Description of significance Literature refs.
Keystone species
Hippos are keystone species, needed to maintain the structural organisation and functioning of wetland ecosystems. Their effect is disproportionally large relative to their abundance: they modify the physical environment thereby releasing resources for other species. Hence, hippos are labelled ‘ecosystem engineers’. Removing hippos from wetland ecosystems can result in a cascade of extinctions.
Eltringham 1999; Payton et al. (2002); Tripathi & Law (2006)
Nutrient transfer by hippos
Hippos are called ‘Kings of the African swamps’: without their dung, waterways would be nearly lifeless. They transport nutrients from land to water, where they defecate. Their cellulose-rich diet generates large quantities of nitrogen-rich dung, which enriches watercourses and stimulates the growth of microscopic plant life. It is a food chain that culminates in fish, crocodiles and predatory birds.
Dugan 1990; Frädrich 1975; Holmes 1996; Huxley 1980; Schwartz 1996; Stuart & Stuart 1996
Correlation with fish
Hippos rotate their tail to spread their dung in the water, hence contributing to the dispersal of organic material. Their movements stir up the mud, which releases nutrients in the water: fish feeding on them flourish (no hippos, no fish). Fish species also feed on micro-organisms and algae on hippo’s skin. Hippo schools ‘protect’ fish species: out of fear, fishers do not enter the fish breeding grounds. Fish is a vital source of protein to local people, many of which depend on fisheries for income or food.
Bond 1989; Happold 1987; Hillaby 1962; Kayanja 1989; Mosepele et al. 2009; Rensenbrink & De Groeve 1982
Host to other species
Hippos play host to several aquatic birds who remove insects and larvae from their skin. Hippos feed on water cabbage, which develops due to hippos’ excrement. Water snails, which inhabit the leaves, are eaten by water birds. Termites decompose hippo dung particles deposited ashore (they contain not broken down grass elements) and release the nutrients to the soil.
Dugan 1990; Frädrich 1975; Huxley 1980
Trails Hippo trails facilitate access to the water for other animals; they can penetrate reed thickets, giving way to, for instance, fishers in their canoes. They also improve the water flow, open up and maintain aquatic channels, and prevent clogging of watercourses with sediments and vegetation like the hyacinth. Hippos are bio-engineers which create paths that alter water flow patterns in wetlands; these paths may turn into major river channels when the old ones get filled in.
Kamweneshe et al. 2002; Laws 1982; Moore 2006; Mosepele et al 2009; Perissinotto et al. 2013; Rensenbrink & De Groeve 1982; Simon 1993
Other impacts
Hippos’ stirring the water prevents the development of anoxic conditions. Hippos grazing can lead to grass areas of ‘lawn-like appearance’; the trimming of grass may reduce the fire hazard, or prevent spread of fire.
Gereta & Wolanski 1998; Haltenorth & Diller 1986; Skinner & Smithers 1990
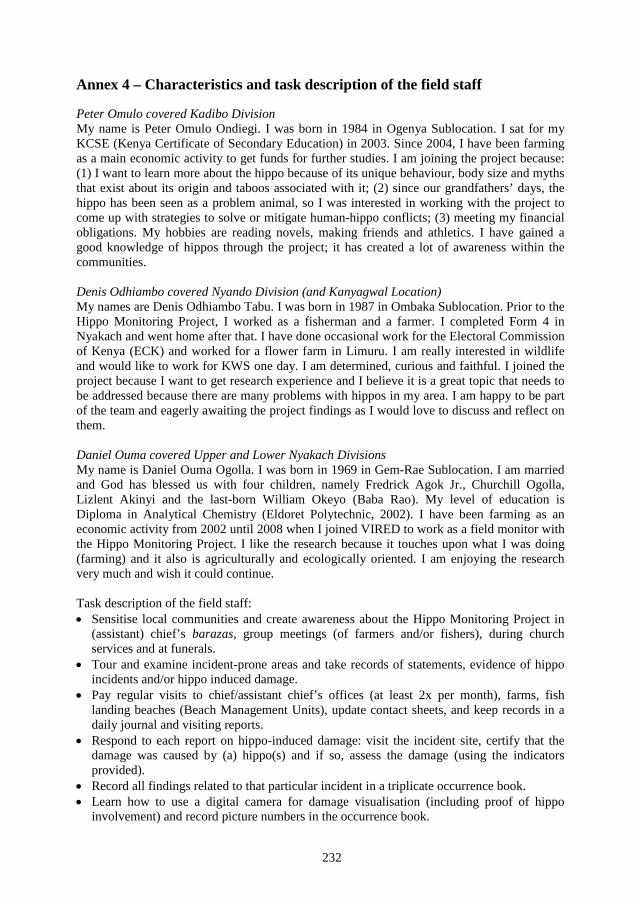
232
Annex 4 – Characteristics and task description of the field staff
Peter Omulo covered Kadibo Division My name is Peter Omulo Ondiegi. I was born in 1984 in Ogenya Sublocation. I sat for my KCSE (Kenya Certificate of Secondary Education) in 2003. Since 2004, I have been farming as a main economic activity to get funds for further studies. I am joining the project because: (1) I want to learn more about the hippo because of its unique behaviour, body size and mythsthat exist about its origin and taboos associated with it; (2) since our grandfathers’ days, thehippo has been seen as a problem animal, so I was interested in working with the project tocome up with strategies to solve or mitigate human-hippo conflicts; (3) meeting my financialobligations. My hobbies are reading novels, making friends and athletics. I have gained agood knowledge of hippos through the project; it has created a lot of awareness within thecommunities.
Denis Odhiambo covered Nyando Division (and Kanyagwal Location) My names are Denis Odhiambo Tabu. I was born in 1987 in Ombaka Sublocation. Prior to the Hippo Monitoring Project, I worked as a fisherman and a farmer. I completed Form 4 in Nyakach and went home after that. I have done occasional work for the Electoral Commission of Kenya (ECK) and worked for a flower farm in Limuru. I am really interested in wildlife and would like to work for KWS one day. I am determined, curious and faithful. I joined the project because I want to get research experience and I believe it is a great topic that needs to be addressed because there are many problems with hippos in my area. I am happy to be part of the team and eagerly awaiting the project findings as I would love to discuss and reflect on them.
Daniel Ouma covered Upper and Lower Nyakach Divisions My name is Daniel Ouma Ogolla. I was born in 1969 in Gem-Rae Sublocation. I am married and God has blessed us with four children, namely Fredrick Agok Jr., Churchill Ogolla, Lizlent Akinyi and the last-born William Okeyo (Baba Rao). My level of education is Diploma in Analytical Chemistry (Eldoret Polytechnic, 2002). I have been farming as an economic activity from 2002 until 2008 when I joined VIRED to work as a field monitor with the Hippo Monitoring Project. I like the research because it touches upon what I was doing (farming) and it also is agriculturally and ecologically oriented. I am enjoying the research very much and wish it could continue.
Task description of the field staff: • Sensitise local communities and create awareness about the Hippo Monitoring Project in
(assistant) chief’s barazas, group meetings (of farmers and/or fishers), during churchservices and at funerals.
• Tour and examine incident-prone areas and take records of statements, evidence of hippoincidents and/or hippo induced damage.
• Pay regular visits to chief/assistant chief’s offices (at least 2x per month), farms, fishlanding beaches (Beach Management Units), update contact sheets, and keep records in adaily journal and visiting reports.
• Respond to each report on hippo-induced damage: visit the incident site, certify that thedamage was caused by (a) hippo(s) and if so, assess the damage (using the indicatorsprovided).
• Record all findings related to that particular incident in a triplicate occurrence book.• Learn how to use a digital camera for damage visualisation (including proof of hippo
involvement) and record picture numbers in the occurrence book.
233
• Indicate the location of the incident site on the questionnaire (sketch using landmarks), and take coordinates of the incident sites with a GPS.
• Interview the victim by using a questionnaire. For repeated incidents, only damage-assessment will take place.
• Later addition: participate in focus group discussions and awareness creation meetings with the Kenya Wildlife Service, Kenya’s legal wildlife custodian.
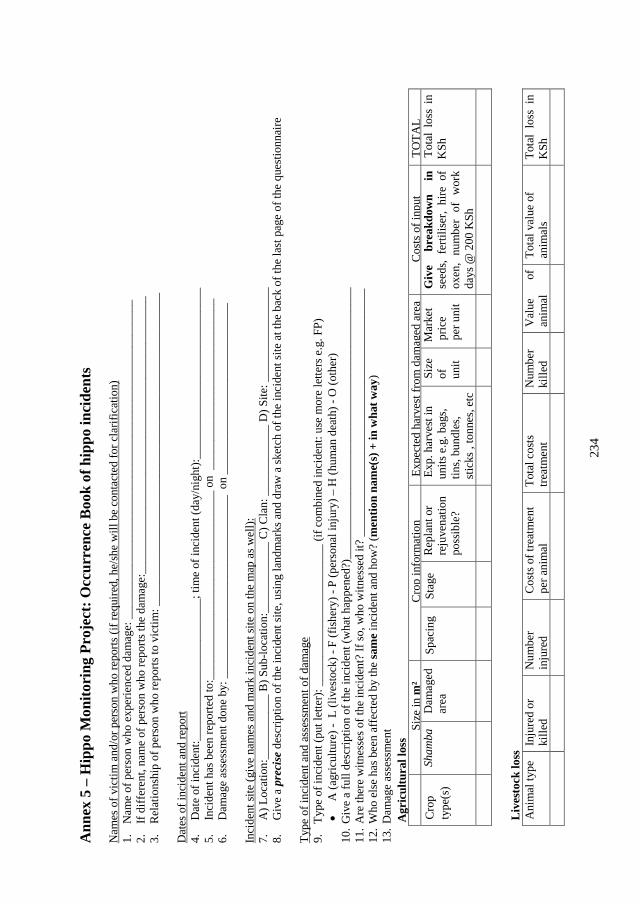
234
Ann
ex 5
– H
ippo
Mon
itori
ng P
roje
ct: O
ccur
renc
e B
ook
of h
ippo
inci
dent
s
Nam
es o
f vic
tim a
nd/o
r per
son
who
repo
rts (i
f req
uire
d, h
e/sh
e w
ill b
e co
ntac
ted
for c
larif
icat
ion)
1.
N
ame
of p
erso
n w
ho e
xper
ienc
ed d
amag
e: _
____
____
____
____
____
____
____
____
____
____
____
____
____
_
2.
If di
ffer
ent,
nam
e of
per
son
who
repo
rts th
e da
mag
e:__
____
____
____
____
____
____
____
____
____
____
____
_ 3.
R
elat
ions
hip
of p
erso
n w
ho re
ports
to v
ictim
: ___
____
____
____
____
____
____
____
____
____
____
____
____
__
D
ates
of i
ncid
ent a
nd re
port
4.
Dat
e of
inci
dent
:___
____
____
____
____
____
_; ti
me
of in
cide
nt (d
ay/n
ight
):___
____
____
____
____
____
____
__
5.
Inci
dent
has
bee
n re
porte
d to
:___
____
____
____
____
____
____
____
_ on
___
____
____
____
____
____
____
__
6.
Dam
age
asse
ssm
ent d
one
by: _
____
____
____
____
____
____
____
__ o
n __
____
____
____
____
____
____
___
Inci
dent
site
(giv
e na
mes
and
mar
k in
cide
nt si
te o
n th
e m
ap a
s wel
l):
7.
A) L
ocat
ion:
____
____
___
B) S
ub-lo
catio
n:__
____
____
__ C
) Cla
n: _
____
____
___
D) S
ite: _
____
____
____
___
8.
Giv
e a
prec
ise d
escr
iptio
n of
the
inci
dent
site
, usi
ng la
ndm
arks
and
dra
w a
sket
ch o
f the
inci
dent
site
at t
he b
ack
of th
e la
st p
age
of th
e qu
estio
nnai
re
Ty
pe o
f inc
iden
t and
ass
essm
ent o
f dam
age
9.
Type
of i
ncid
ent (
put l
ette
r): _
____
____
____
____
____
___
(if c
ombi
ned
inci
dent
: use
mor
e le
tters
e.g
. FP)
•
A (a
gric
ultu
re) -
L (l
ives
tock
) - F
(fis
hery
) - P
(per
sona
l inj
ury)
– H
(hum
an d
eath
) - O
(oth
er)
10. G
ive
a fu
ll de
scrip
tion
of th
e in
cide
nt (w
hat h
appe
ned?
)___
____
____
____
____
____
____
____
____
____
____
___
11. A
re th
ere
witn
esse
s of t
he in
cide
nt?
If so
, who
witn
esse
d it?
___
____
____
____
____
____
____
____
____
____
___
12. W
ho e
lse
has b
een
affe
cted
by
the
sam
e in
cide
nt a
nd h
ow?
(men
tion
nam
e(s)
+ in
wha
t way
) 13
. Dam
age
asse
ssm
ent
Agr
icul
tura
l los
s
Size
in m
²
Cro
p in
form
atio
n Ex
pect
ed h
arve
st fr
om d
amag
ed a
rea
Cos
ts o
f inp
ut
TOTA
L C
rop
type
(s)
Sham
ba
Dam
aged
ar
ea
Spac
ing
Stag
e R
epla
nt o
r re
juve
natio
n po
ssib
le?
Exp.
har
vest
in
units
e.g
. bag
s,
tins,
bund
les,
stic
ks ,
tonn
es, e
tc
Size
of
un
it
Mar
ket
pric
e pe
r uni
t
Giv
e br
eakd
own
in
seed
s, fe
rtilis
er,
hire
of
oxen
, nu
mbe
r of
wor
k da
ys @
200
KSh
Tota
l lo
ss i
n K
Sh
Li
vest
ock
loss
A
nim
al ty
pe
Inju
red
or
kille
d N
umbe
r in
jure
d C
osts
of t
reat
men
t pe
r ani
mal
To
tal c
osts
tre
atm
ent
Num
ber
kille
d V
alue
of
an
imal
To
tal v
alue
of
anim
als
Tota
l lo
ss i
n K
Sh
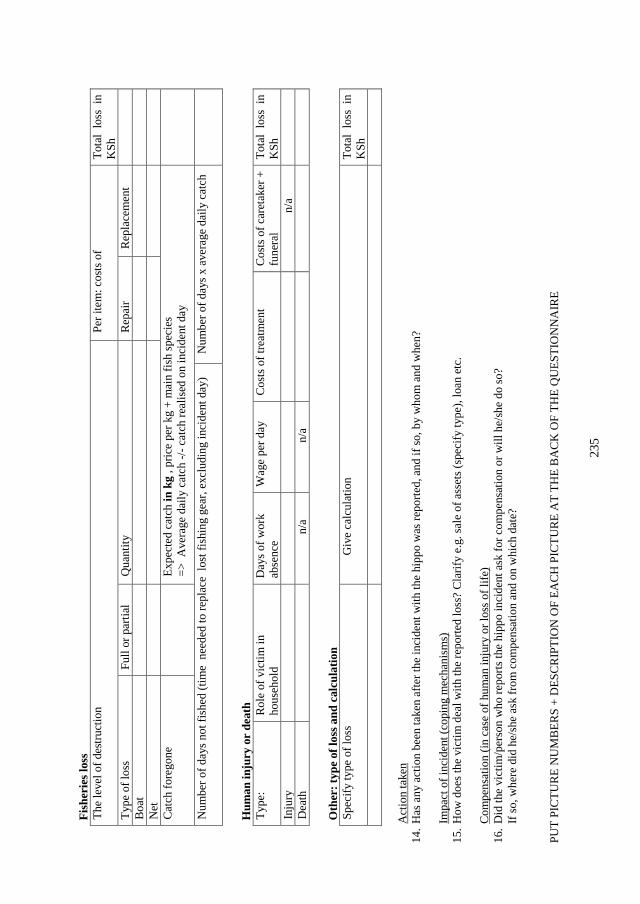
235
Fis
heri
es lo
ss
The
leve
l of d
estru
ctio
n Pe
r ite
m: c
osts
of
Tota
l lo
ss i
n
KSh
Ty
pe o
f los
s Fu
ll or
par
tial
Qua
ntity
R
epai
r R
epla
cem
ent
Boa
t N
et
Cat
ch fo
rego
ne
Expe
cted
cat
ch in
kg
, pric
e pe
r kg
+ m
ain
fish
spec
ies
=> A
vera
ge d
aily
cat
ch -/
- cat
ch re
alis
ed o
n in
cide
nt d
ay
Num
ber o
f day
s not
fish
ed (t
ime
nee
ded
to re
plac
e lo
st fi
shin
g ge
ar, e
xclu
ding
inci
dent
day
) N
umbe
r of d
ays x
ave
rage
dai
ly c
atch
Hum
an in
jury
or
deat
h Ty
pe:
Rol
e of
vic
tim in
ho
useh
old
Day
s of w
ork
abse
nce
Wag
e pe
r day
C
osts
of t
reat
men
t C
osts
of c
aret
aker
+
fune
ral
Tota
l lo
ss i
n
KSh
In
jury
n
/a
Dea
th
n/a
n/a
Oth
er: t
ype
of lo
ss a
nd c
alcu
latio
n Sp
ecify
type
of l
oss
Giv
e ca
lcul
atio
n To
tal
loss
in
K
Sh
Act
ion
take
n 14
.Has
any
act
ion
been
take
n af
ter t
he in
cide
nt w
ith th
e hi
ppo
was
repo
rted,
and
if so
, by
who
m a
nd w
hen?
Impa
ct o
f inc
iden
t (co
ping
mec
hani
sms)
15.H
ow d
oes t
he v
ictim
dea
l with
the
repo
rted
loss
? C
larif
y e.
g. sa
le o
f ass
ets (
spec
ify ty
pe),
loan
etc
.
Com
pens
atio
n (in
cas
e of
hum
an in
jury
or l
oss o
f life
)16
.Did
the
vict
im/p
erso
n w
ho re
ports
the
hipp
o in
cide
nt a
sk fo
r com
pens
atio
n or
will
he/
she
do so
?If
so, w
here
did
he/
she
ask
from
com
pens
atio
n an
d on
whi
ch d
ate?
PUT
PIC
TUR
E N
UM
BER
S +
DES
CR
IPTI
ON
OF
EAC
H P
ICTU
RE
AT
THE
BA
CK
OF
THE
QU
ESTI
ON
NA
IRE
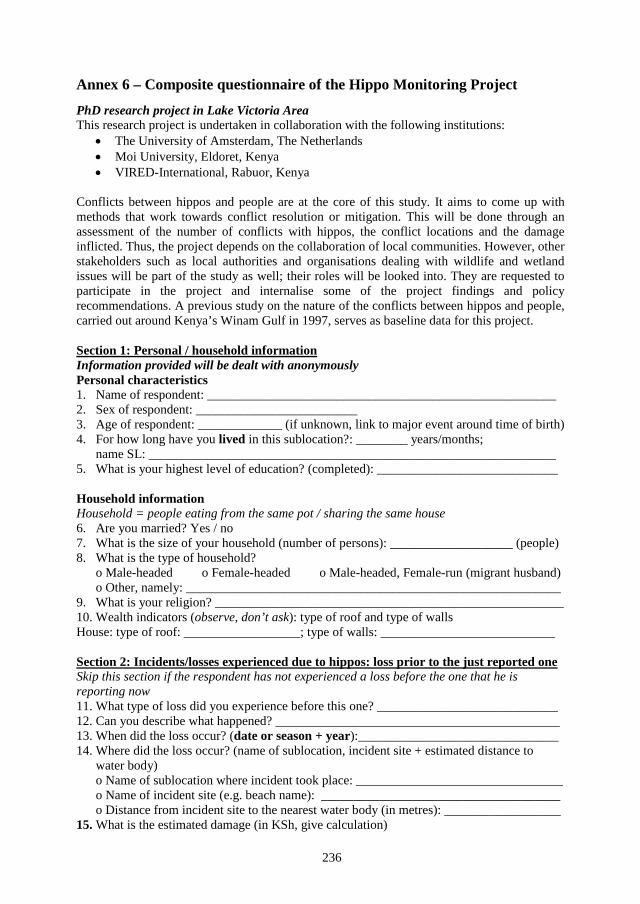
236
Annex 6 – Composite questionnaire of the Hippo Monitoring Project
PhD research project in Lake Victoria Area This research project is undertaken in collaboration with the following institutions:
• The University of Amsterdam, The Netherlands• Moi University, Eldoret, Kenya• VIRED-International, Rabuor, Kenya
Conflicts between hippos and people are at the core of this study. It aims to come up with methods that work towards conflict resolution or mitigation. This will be done through an assessment of the number of conflicts with hippos, the conflict locations and the damage inflicted. Thus, the project depends on the collaboration of local communities. However, other stakeholders such as local authorities and organisations dealing with wildlife and wetland issues will be part of the study as well; their roles will be looked into. They are requested to participate in the project and internalise some of the project findings and policy recommendations. A previous study on the nature of the conflicts between hippos and people, carried out around Kenya’s Winam Gulf in 1997, serves as baseline data for this project.
Section 1: Personal / household information Information provided will be dealt with anonymously Personal characteristics 1. Name of respondent: ______________________________________________________2. Sex of respondent: _________________________3. Age of respondent: _____________ (if unknown, link to major event around time of birth)4. For how long have you lived in this sublocation?: ________ years/months;
name SL: _______________________________________________________________5. What is your highest level of education? (completed): ____________________________
Household information Household = people eating from the same pot / sharing the same house 6. Are you married? Yes / no7. What is the size of your household (number of persons): ___________________ (people)8. What is the type of household?
o Male-headed o Female-headed o Male-headed, Female-run (migrant husband)o Other, namely: __________________________________________________________
9. What is your religion? ______________________________________________________10. Wealth indicators (observe, don’t ask): type of roof and type of wallsHouse: type of roof: __________________; type of walls: ___________________________
Section 2: Incidents/losses experienced due to hippos: loss prior to the just reported one Skip this section if the respondent has not experienced a loss before the one that he is reporting now 11. What type of loss did you experience before this one? ____________________________12. Can you describe what happened? ____________________________________________13. When did the loss occur? (date or season + year):_______________________________14. Where did the loss occur? (name of sublocation, incident site + estimated distance to
water body)o Name of sublocation where incident took place: ________________________________o Name of incident site (e.g. beach name): _____________________________________o Distance from incident site to the nearest water body (in metres): __________________
15. What is the estimated damage (in KSh, give calculation)
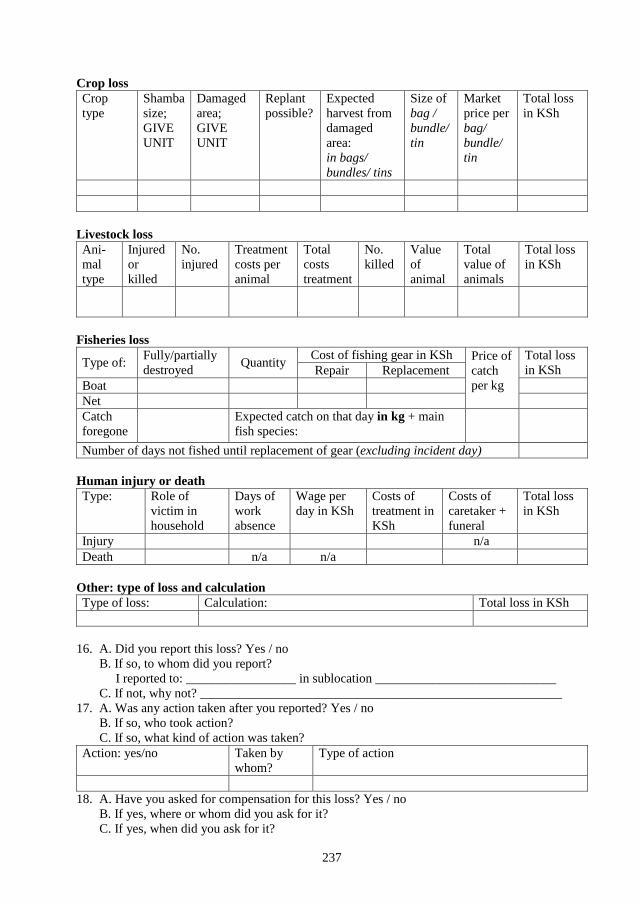
237
Crop loss Crop type
Shamba size; GIVE UNIT
Damaged area; GIVE UNIT
Replant possible?
Expected harvest from damaged area: in bags/ bundles/ tins
Size of bag / bundle/ tin
Market price per bag/ bundle/ tin
Total loss in KSh
Livestock loss Ani-mal type
Injured or killed
No. injured
Treatment costs per animal
Total costs treatment
No. killed
Value of animal
Total value of animals
Total loss in KSh
Fisheries loss
Type of: Fully/partially destroyed Quantity Cost of fishing gear in KSh Price of
catch per kg
Total loss in KSh Repair Replacement
Boat Net Catch foregone
Expected catch on that day in kg + main fish species:
Number of days not fished until replacement of gear (excluding incident day)
Human injury or death Type: Role of
victim in household
Days of work absence
Wage per day in KSh
Costs of treatment in KSh
Costs of caretaker + funeral
Total loss in KSh
Injury n/a Death n/a n/a
Other: type of loss and calculation Type of loss: Calculation: Total loss in KSh
16. A. Did you report this loss? Yes / noB. If so, to whom did you report?
I reported to: _________________ in sublocation ____________________________C. If not, why not? ________________________________________________________
17. A. Was any action taken after you reported? Yes / noB. If so, who took action?C. If so, what kind of action was taken?
Action: yes/no Taken by whom?
Type of action
18. A. Have you asked for compensation for this loss? Yes / noB. If yes, where or whom did you ask for it?C. If yes, when did you ask for it?
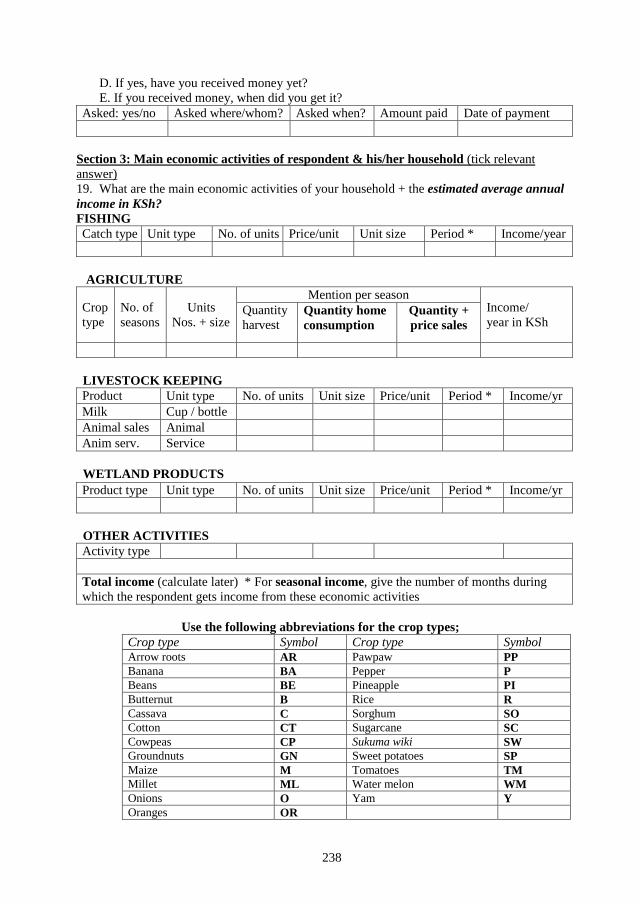
238
D. If yes, have you received money yet? E. If you received money, when did you get it?
Asked: yes/no Asked where/whom? Asked when? Amount paid Date of payment
Section 3: Main economic activities of respondent & his/her household (tick relevant answer) 19. What are the main economic activities of your household + the estimated average annual income in KSh? FISHING Catch type Unit type No. of units Price/unit Unit size Period * Income/year
AGRICULTURE
Crop type
No. of seasons
Units Nos. + size
Mention per season Income/ year in KSh
Quantity harvest
Quantity home consumption
Quantity + price sales
LIVESTOCK KEEPING Product Unit type No. of units Unit size Price/unit Period * Income/yr Milk Cup / bottle Animal sales Animal Anim serv. Service
WETLAND PRODUCTS Product type Unit type No. of units Unit size Price/unit Period * Income/yr
OTHER ACTIVITIES Activity type Total income (calculate later) * For seasonal income, give the number of months during which the respondent gets income from these economic activities
Use the following abbreviations for the crop types;
Crop type Symbol Crop type Symbol Arrow roots AR Pawpaw PP Banana BA Pepper P Beans BE Pineapple PI Butternut B Rice R Cassava C Sorghum SO Cotton CT Sugarcane SC Cowpeas CP Sukuma wiki SW Groundnuts GN Sweet potatoes SP Maize M Tomatoes TM Millet ML Water melon WM Onions O Yam Y Oranges OR
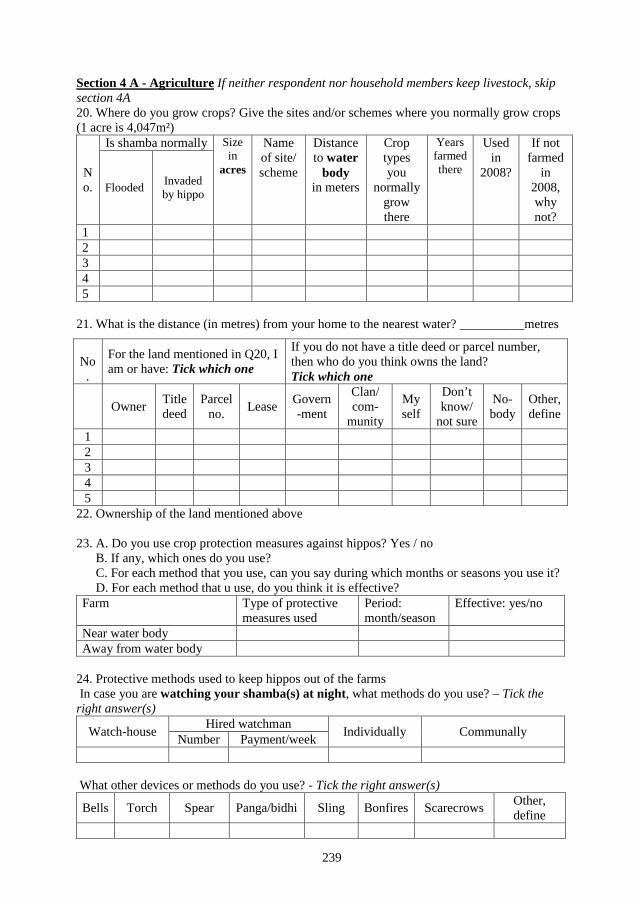
239
Section 4 A - Agriculture If neither respondent nor household members keep livestock, skip section 4A 20. Where do you grow crops? Give the sites and/or schemes where you normally grow crops (1 acre is 4,047m²)
No.
Is shamba normally Size in
acres
Name of site/ scheme
Distance to water
body in meters
Crop types you
normally grow there
Years farmed there
Used in
2008?
If not farmed
in 2008, why not?
Flooded Invaded by hippo
1 2 3 4 5
21. What is the distance (in metres) from your home to the nearest water? __________metres
22. Ownership of the land mentioned above 23. A. Do you use crop protection measures against hippos? Yes / no
B. If any, which ones do you use? C. For each method that you use, can you say during which months or seasons you use it? D. For each method that u use, do you think it is effective?
Farm Type of protective measures used
Period: month/season
Effective: yes/no
Near water body Away from water body
24. Protective methods used to keep hippos out of the farms In case you are watching your shamba(s) at night, what methods do you use? – Tick the right answer(s)
Watch-house Hired watchman Individually Communally Number Payment/week
What other devices or methods do you use? - Tick the right answer(s)
Bells Torch Spear Panga/bidhi Sling Bonfires Scarecrows Other, define
No.
For the land mentioned in Q20, I am or have: Tick which one
If you do not have a title deed or parcel number, then who do you think owns the land? Tick which one
Owner Title
deed Parcel
no. Lease Govern-ment
Clan/ com-
munity
My self
Don’t know/
not sure
No-body
Other, define
1 2 3 4 5
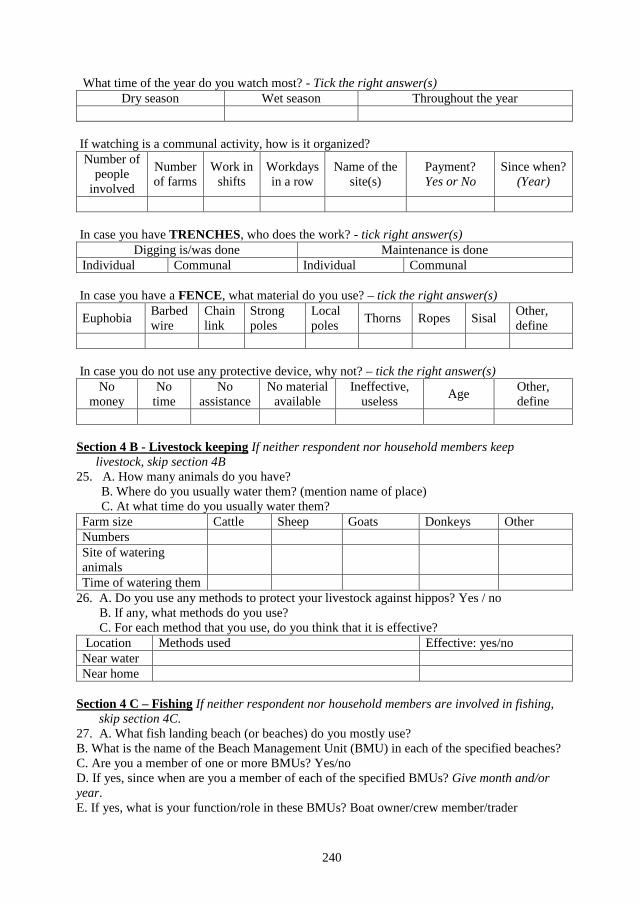
240
What time of the year do you watch most? - Tick the right answer(s) Dry season Wet season Throughout the year
If watching is a communal activity, how is it organized?
Number of people
involved
Number of farms
Work in shifts
Workdays in a row
Name of the site(s)
Payment? Yes or No
Since when? (Year)
In case you have TRENCHES, who does the work? - tick right answer(s)
Digging is/was done Maintenance is done Individual Communal Individual Communal
In case you have a FENCE, what material do you use? – tick the right answer(s)
Euphobia Barbed wire
Chainlink
Strong poles
Local poles Thorns Ropes Sisal Other,
define
In case you do not use any protective device, why not? – tick the right answer(s)
No money
No time
No assistance
No material available
Ineffective, useless Age Other,
define
Section 4 B - Livestock keeping If neither respondent nor household members keep livestock, skip section 4B 25. A. How many animals do you have?
B. Where do you usually water them? (mention name of place) C. At what time do you usually water them?
Farm size Cattle Sheep Goats Donkeys Other Numbers Site of watering animals
Time of watering them 26. A. Do you use any methods to protect your livestock against hippos? Yes / no
B. If any, what methods do you use? C. For each method that you use, do you think that it is effective?
Location Methods used Effective: yes/no Near water Near home
Section 4 C – Fishing If neither respondent nor household members are involved in fishing, skip section 4C. 27. A. What fish landing beach (or beaches) do you mostly use? B. What is the name of the Beach Management Unit (BMU) in each of the specified beaches? C. Are you a member of one or more BMUs? Yes/no D. If yes, since when are you a member of each of the specified BMUs? Give month and/or year. E. If yes, what is your function/role in these BMUs? Boat owner/crew member/trader
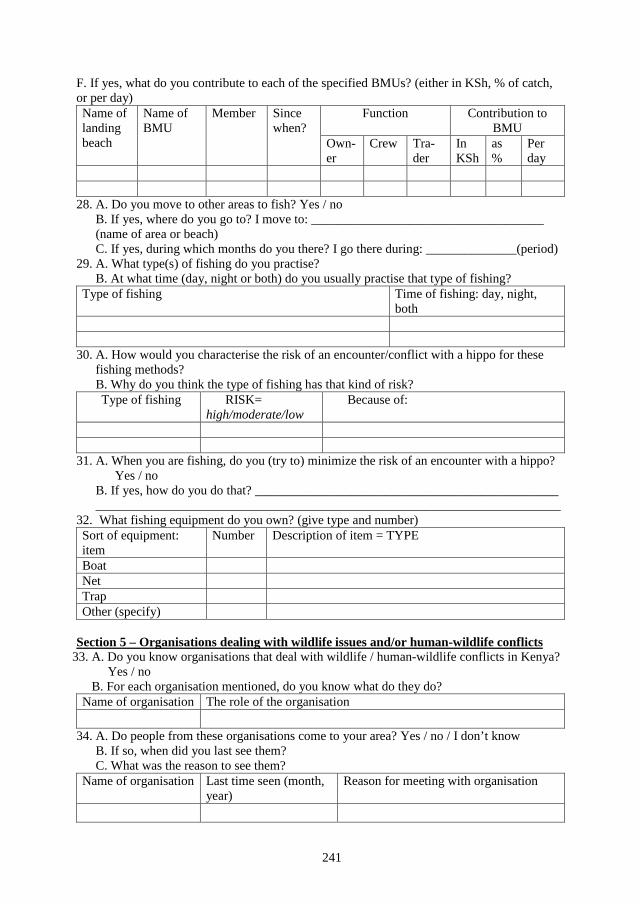
241
F. If yes, what do you contribute to each of the specified BMUs? (either in KSh, % of catch, or per day) Name of landing beach
Name of BMU
Member Since when?
Function Contribution to BMU
Own-er
Crew Tra-der
In KSh
as %
Per day
28. A. Do you move to other areas to fish? Yes / no B. If yes, where do you go to? I move to: ____________________________________ (name of area or beach) C. If yes, during which months do you there? I go there during: ______________(period)
29. A. What type(s) of fishing do you practise? B. At what time (day, night or both) do you usually practise that type of fishing?
Type of fishing Time of fishing: day, night, both
30. A. How would you characterise the risk of an encounter/conflict with a hippo for these fishing methods? B. Why do you think the type of fishing has that kind of risk? Type of fishing RISK=
high/moderate/low Because of:
31. A. When you are fishing, do you (try to) minimize the risk of an encounter with a hippo? Yes / no B. If yes, how do you do that? _______________________________________________ ________________________________________________________________________
32. What fishing equipment do you own? (give type and number) Sort of equipment: item
Number Description of item = TYPE
Boat Net Trap Other (specify)
Section 5 – Organisations dealing with wildlife issues and/or human-wildlife conflicts
33. A. Do you know organisations that deal with wildlife / human-wildlife conflicts in Kenya? Yes / no B. For each organisation mentioned, do you know what do they do?
Name of organisation The role of the organisation
34. A. Do people from these organisations come to your area? Yes / no / I don’t know B. If so, when did you last see them? C. What was the reason to see them?
Name of organisation Last time seen (month, year)
Reason for meeting with organisation
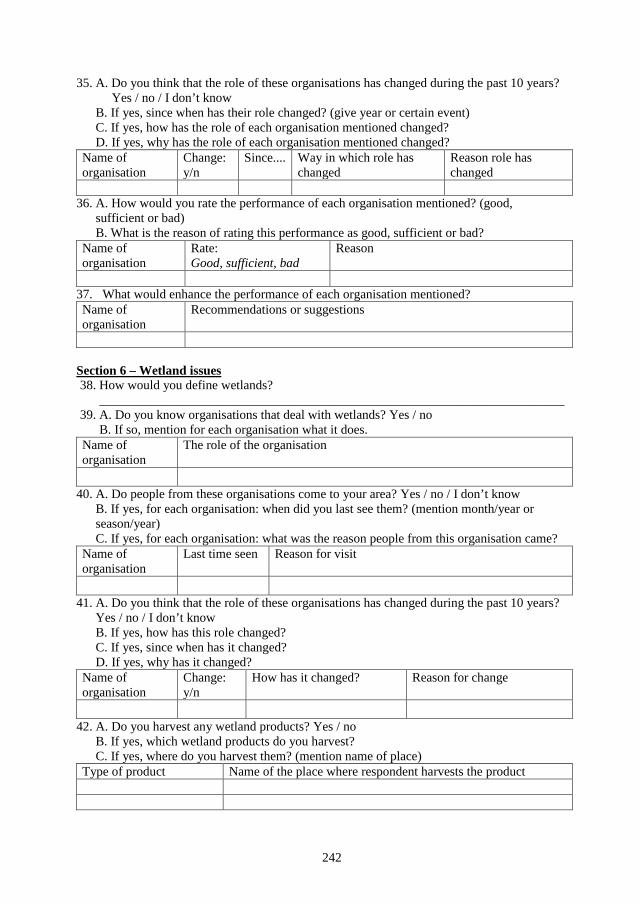
242
35. A. Do you think that the role of these organisations has changed during the past 10 years? Yes / no / I don’t know B. If yes, since when has their role changed? (give year or certain event) C. If yes, how has the role of each organisation mentioned changed? D. If yes, why has the role of each organisation mentioned changed?
Name of organisation
Change: y/n
Since.... Way in which role has changed
Reason role has changed
36. A. How would you rate the performance of each organisation mentioned? (good,
sufficient or bad) B. What is the reason of rating this performance as good, sufficient or bad?
Name of organisation
Rate: Good, sufficient, bad
Reason
37. What would enhance the performance of each organisation mentioned? Name of organisation
Recommendations or suggestions
Section 6 – Wetland issues 38. How would you define wetlands?
________________________________________________________________________ 39. A. Do you know organisations that deal with wetlands? Yes / no
B. If so, mention for each organisation what it does. Name of organisation
The role of the organisation
40. A. Do people from these organisations come to your area? Yes / no / I don’t know
B. If yes, for each organisation: when did you last see them? (mention month/year or season/year) C. If yes, for each organisation: what was the reason people from this organisation came?
Name of organisation
Last time seen Reason for visit
41. A. Do you think that the role of these organisations has changed during the past 10 years?
Yes / no / I don’t know B. If yes, how has this role changed? C. If yes, since when has it changed? D. If yes, why has it changed?
Name of organisation
Change: y/n
How has it changed? Reason for change
42. A. Do you harvest any wetland products? Yes / no
B. If yes, which wetland products do you harvest? C. If yes, where do you harvest them? (mention name of place)
Type of product Name of the place where respondent harvests the product
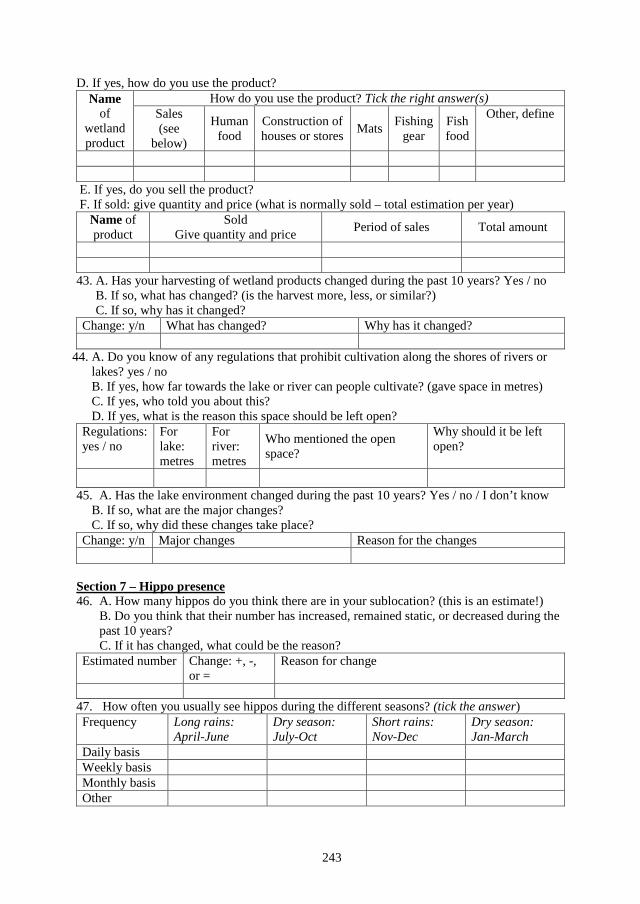
243
D. If yes, how do you use the product?Name
of wetland product
How do you use the product? Tick the right answer(s) Sales (see
below)
Human food
Construction of houses or stores Mats Fishing
gear Fish food
Other, define
E. If yes, do you sell the product?F. If sold: give quantity and price (what is normally sold – total estimation per year)
Name of product
Sold Give quantity and price Period of sales Total amount
43. A. Has your harvesting of wetland products changed during the past 10 years? Yes / noB. If so, what has changed? (is the harvest more, less, or similar?)C. If so, why has it changed?
Change: y/n What has changed? Why has it changed?
44. A. Do you know of any regulations that prohibit cultivation along the shores of rivers orlakes? yes / noB. If yes, how far towards the lake or river can people cultivate? (gave space in metres)C. If yes, who told you about this?D. If yes, what is the reason this space should be left open?
Regulations: yes / no
For lake: metres
For river: metres
Who mentioned the open space?
Why should it be left open?
45. A. Has the lake environment changed during the past 10 years? Yes / no / I don’t knowB. If so, what are the major changes?C. If so, why did these changes take place?
Change: y/n Major changes Reason for the changes
Section 7 – Hippo presence 46. A. How many hippos do you think there are in your sublocation? (this is an estimate!)
B. Do you think that their number has increased, remained static, or decreased during thepast 10 years?C. If it has changed, what could be the reason?
Estimated number Change: +, -, or =
Reason for change
47. How often you usually see hippos during the different seasons? (tick the answer)Frequency Long rains:
April-June Dry season: July-Oct
Short rains: Nov-Dec
Dry season: Jan-March
Daily basis Weekly basis Monthly basis Other
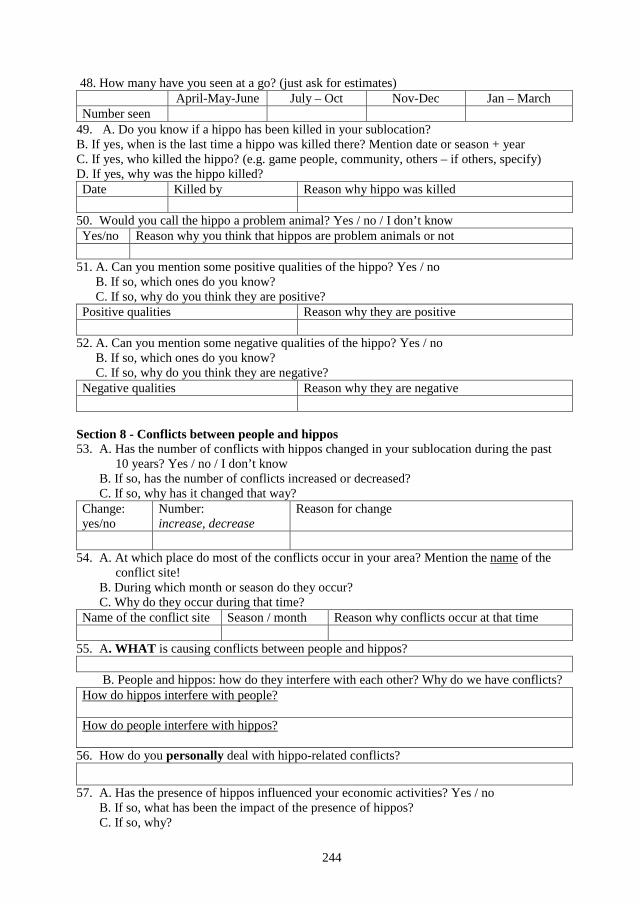
244
48. How many have you seen at a go? (just ask for estimates) April-May-June July – Oct Nov-Dec Jan – March Number seen
49. A. Do you know if a hippo has been killed in your sublocation? B. If yes, when is the last time a hippo was killed there? Mention date or season + year C. If yes, who killed the hippo? (e.g. game people, community, others – if others, specify) D. If yes, why was the hippo killed? Date Killed by Reason why hippo was killed
50. Would you call the hippo a problem animal? Yes / no / I don’t know Yes/no Reason why you think that hippos are problem animals or not
51. A. Can you mention some positive qualities of the hippo? Yes / no B. If so, which ones do you know? C. If so, why do you think they are positive?
Positive qualities Reason why they are positive
52. A. Can you mention some negative qualities of the hippo? Yes / no B. If so, which ones do you know? C. If so, why do you think they are negative?
Negative qualities Reason why they are negative
Section 8 - Conflicts between people and hippos 53. A. Has the number of conflicts with hippos changed in your sublocation during the past
10 years? Yes / no / I don’t know B. If so, has the number of conflicts increased or decreased? C. If so, why has it changed that way?
Change: yes/no
Number: increase, decrease
Reason for change
54. A. At which place do most of the conflicts occur in your area? Mention the name of the
conflict site! B. During which month or season do they occur? C. Why do they occur during that time?
Name of the conflict site Season / month Reason why conflicts occur at that time
55. A. WHAT is causing conflicts between people and hippos?
B. People and hippos: how do they interfere with each other? Why do we have conflicts? How do hippos interfere with people? How do people interfere with hippos?
56. How do you personally deal with hippo-related conflicts?
57. A. Has the presence of hippos influenced your economic activities? Yes / no B. If so, what has been the impact of the presence of hippos? C. If so, why?
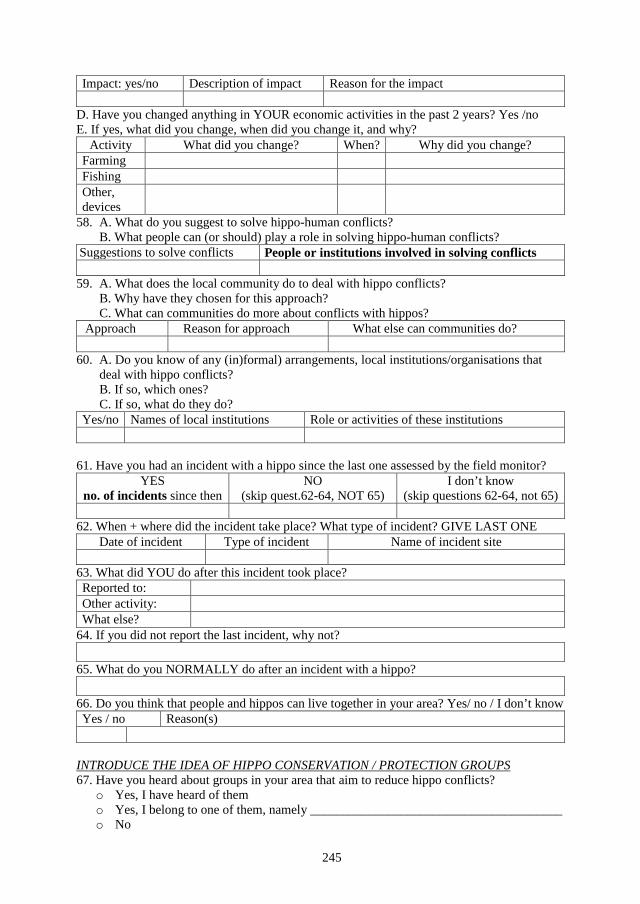
245
Impact: yes/no Description of impact Reason for the impact
D. Have you changed anything in YOUR economic activities in the past 2 years? Yes /no E. If yes, what did you change, when did you change it, and why?
Activity What did you change? When? Why did you change? Farming Fishing Other, devices
58. A. What do you suggest to solve hippo-human conflicts? B. What people can (or should) play a role in solving hippo-human conflicts?
Suggestions to solve conflicts People or institutions involved in solving conflicts
59. A. What does the local community do to deal with hippo conflicts? B. Why have they chosen for this approach? C. What can communities do more about conflicts with hippos?
Approach Reason for approach What else can communities do?
60. A. Do you know of any (in)formal) arrangements, local institutions/organisations that deal with hippo conflicts? B. If so, which ones? C. If so, what do they do?
Yes/no Names of local institutions Role or activities of these institutions
61. Have you had an incident with a hippo since the last one assessed by the field monitor?
YES no. of incidents since then
NO (skip quest.62-64, NOT 65)
I don’t know (skip questions 62-64, not 65)
62. When + where did the incident take place? What type of incident? GIVE LAST ONE
Date of incident Type of incident Name of incident site
63. What did YOU do after this incident took place? Reported to: Other activity: What else?
64. If you did not report the last incident, why not?
65. What do you NORMALLY do after an incident with a hippo?
66. Do you think that people and hippos can live together in your area? Yes/ no / I don’t know Yes / no Reason(s)
INTRODUCE THE IDEA OF HIPPO CONSERVATION / PROTECTION GROUPS 67. Have you heard about groups in your area that aim to reduce hippo conflicts?
o Yes, I have heard of them o Yes, I belong to one of them, namely _______________________________________ o No
246
68. Do you think that hippo conservation / protection activities can succeed in your area? Yes / no / I don’t know Yes / no Reason why you think they can succeed or not
ACTORS IN CONFLICT MITIGATON EFFORTS 69. How can government agents and/or NGOs be involved in reducing hippo problems?
70. How can (local) farmers be involved in reducing hippo problems?
71. How can (local) fishermen be involved in reducing hippo problems?
THANK THE RESPONDENT FOR HIS OR HER COLLABORATION CLARIFY ONCE MORE WHAT WILL BE DONE WITH THE DATA S/HE HAS PROVIDED
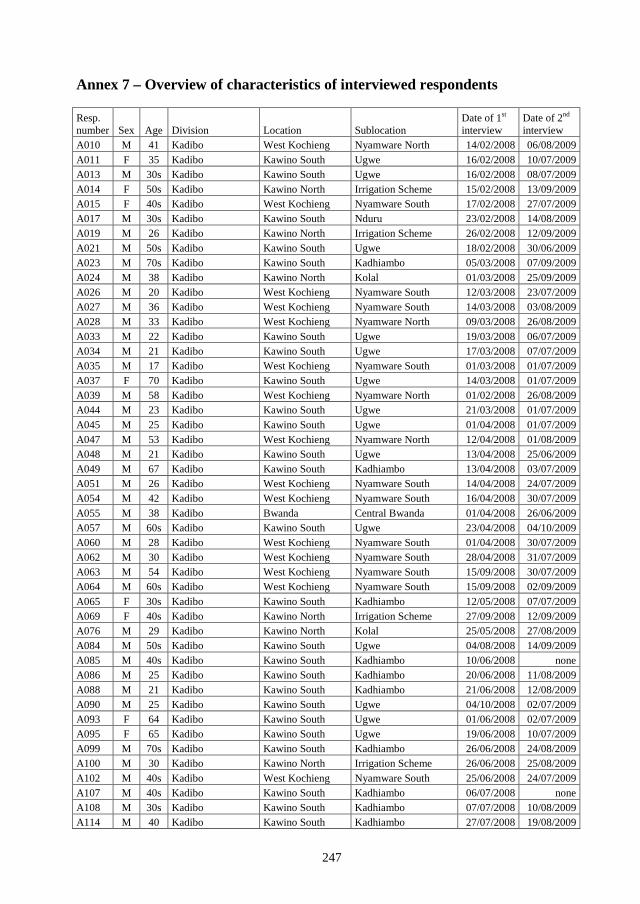
247
Annex 7 – Overview of characteristics of interviewed respondents
Resp. number Sex Age Division Location Sublocation
Date of 1st
interview Date of 2nd
interview A010 M 41 Kadibo West Kochieng Nyamware North 14/02/2008 06/08/2009 A011 F 35 Kadibo Kawino South Ugwe 16/02/2008 10/07/2009 A013 M 30s Kadibo Kawino South Ugwe 16/02/2008 08/07/2009 A014 F 50s Kadibo Kawino North Irrigation Scheme 15/02/2008 13/09/2009 A015 F 40s Kadibo West Kochieng Nyamware South 17/02/2008 27/07/2009 A017 M 30s Kadibo Kawino South Nduru 23/02/2008 14/08/2009 A019 M 26 Kadibo Kawino North Irrigation Scheme 26/02/2008 12/09/2009 A021 M 50s Kadibo Kawino South Ugwe 18/02/2008 30/06/2009 A023 M 70s Kadibo Kawino South Kadhiambo 05/03/2008 07/09/2009 A024 M 38 Kadibo Kawino North Kolal 01/03/2008 25/09/2009 A026 M 20 Kadibo West Kochieng Nyamware South 12/03/2008 23/07/2009 A027 M 36 Kadibo West Kochieng Nyamware South 14/03/2008 03/08/2009 A028 M 33 Kadibo West Kochieng Nyamware North 09/03/2008 26/08/2009 A033 M 22 Kadibo Kawino South Ugwe 19/03/2008 06/07/2009 A034 M 21 Kadibo Kawino South Ugwe 17/03/2008 07/07/2009 A035 M 17 Kadibo West Kochieng Nyamware South 01/03/2008 01/07/2009 A037 F 70 Kadibo Kawino South Ugwe 14/03/2008 01/07/2009 A039 M 58 Kadibo West Kochieng Nyamware North 01/02/2008 26/08/2009 A044 M 23 Kadibo Kawino South Ugwe 21/03/2008 01/07/2009 A045 M 25 Kadibo Kawino South Ugwe 01/04/2008 01/07/2009 A047 M 53 Kadibo West Kochieng Nyamware North 12/04/2008 01/08/2009 A048 M 21 Kadibo Kawino South Ugwe 13/04/2008 25/06/2009 A049 M 67 Kadibo Kawino South Kadhiambo 13/04/2008 03/07/2009 A051 M 26 Kadibo West Kochieng Nyamware South 14/04/2008 24/07/2009 A054 M 42 Kadibo West Kochieng Nyamware South 16/04/2008 30/07/2009 A055 M 38 Kadibo Bwanda Central Bwanda 01/04/2008 26/06/2009 A057 M 60s Kadibo Kawino South Ugwe 23/04/2008 04/10/2009 A060 M 28 Kadibo West Kochieng Nyamware South 01/04/2008 30/07/2009 A062 M 30 Kadibo West Kochieng Nyamware South 28/04/2008 31/07/2009 A063 M 54 Kadibo West Kochieng Nyamware South 15/09/2008 30/07/2009 A064 M 60s Kadibo West Kochieng Nyamware South 15/09/2008 02/09/2009 A065 F 30s Kadibo Kawino South Kadhiambo 12/05/2008 07/07/2009 A069 F 40s Kadibo Kawino North Irrigation Scheme 27/09/2008 12/09/2009 A076 M 29 Kadibo Kawino North Kolal 25/05/2008 27/08/2009 A084 M 50s Kadibo Kawino South Ugwe 04/08/2008 14/09/2009 A085 M 40s Kadibo Kawino South Kadhiambo 10/06/2008 none A086 M 25 Kadibo Kawino South Kadhiambo 20/06/2008 11/08/2009 A088 M 21 Kadibo Kawino South Kadhiambo 21/06/2008 12/08/2009 A090 M 25 Kadibo Kawino South Ugwe 04/10/2008 02/07/2009 A093 F 64 Kadibo Kawino South Ugwe 01/06/2008 02/07/2009 A095 F 65 Kadibo Kawino South Ugwe 19/06/2008 10/07/2009 A099 M 70s Kadibo Kawino South Kadhiambo 26/06/2008 24/08/2009 A100 M 30 Kadibo Kawino North Irrigation Scheme 26/06/2008 25/08/2009 A102 M 40s Kadibo West Kochieng Nyamware South 25/06/2008 24/07/2009 A107 M 40s Kadibo Kawino South Kadhiambo 06/07/2008 none A108 M 30s Kadibo Kawino South Kadhiambo 07/07/2008 10/08/2009 A114 M 40 Kadibo Kawino South Kadhiambo 27/07/2008 19/08/2009
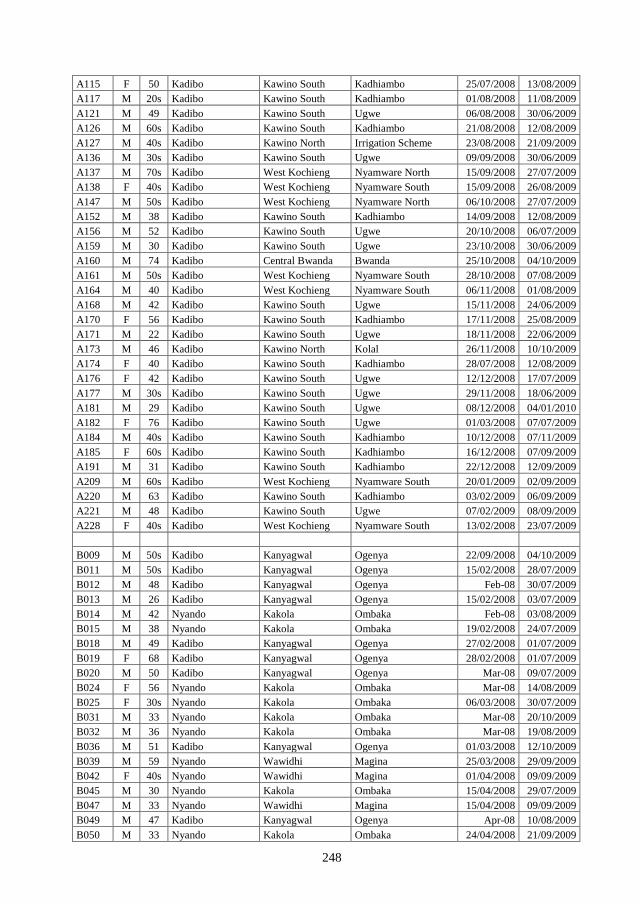
248
A115 F 50 Kadibo Kawino South Kadhiambo 25/07/2008 13/08/2009 A117 M 20s Kadibo Kawino South Kadhiambo 01/08/2008 11/08/2009 A121 M 49 Kadibo Kawino South Ugwe 06/08/2008 30/06/2009 A126 M 60s Kadibo Kawino South Kadhiambo 21/08/2008 12/08/2009 A127 M 40s Kadibo Kawino North Irrigation Scheme 23/08/2008 21/09/2009 A136 M 30s Kadibo Kawino South Ugwe 09/09/2008 30/06/2009 A137 M 70s Kadibo West Kochieng Nyamware North 15/09/2008 27/07/2009 A138 F 40s Kadibo West Kochieng Nyamware South 15/09/2008 26/08/2009 A147 M 50s Kadibo West Kochieng Nyamware North 06/10/2008 27/07/2009 A152 M 38 Kadibo Kawino South Kadhiambo 14/09/2008 12/08/2009 A156 M 52 Kadibo Kawino South Ugwe 20/10/2008 06/07/2009 A159 M 30 Kadibo Kawino South Ugwe 23/10/2008 30/06/2009 A160 M 74 Kadibo Central Bwanda Bwanda 25/10/2008 04/10/2009 A161 M 50s Kadibo West Kochieng Nyamware South 28/10/2008 07/08/2009 A164 M 40 Kadibo West Kochieng Nyamware South 06/11/2008 01/08/2009 A168 M 42 Kadibo Kawino South Ugwe 15/11/2008 24/06/2009 A170 F 56 Kadibo Kawino South Kadhiambo 17/11/2008 25/08/2009 A171 M 22 Kadibo Kawino South Ugwe 18/11/2008 22/06/2009 A173 M 46 Kadibo Kawino North Kolal 26/11/2008 10/10/2009 A174 F 40 Kadibo Kawino South Kadhiambo 28/07/2008 12/08/2009 A176 F 42 Kadibo Kawino South Ugwe 12/12/2008 17/07/2009 A177 M 30s Kadibo Kawino South Ugwe 29/11/2008 18/06/2009 A181 M 29 Kadibo Kawino South Ugwe 08/12/2008 04/01/2010 A182 F 76 Kadibo Kawino South Ugwe 01/03/2008 07/07/2009 A184 M 40s Kadibo Kawino South Kadhiambo 10/12/2008 07/11/2009 A185 F 60s Kadibo Kawino South Kadhiambo 16/12/2008 07/09/2009 A191 M 31 Kadibo Kawino South Kadhiambo 22/12/2008 12/09/2009 A209 M 60s Kadibo West Kochieng Nyamware South 20/01/2009 02/09/2009 A220 M 63 Kadibo Kawino South Kadhiambo 03/02/2009 06/09/2009 A221 M 48 Kadibo Kawino South Ugwe 07/02/2009 08/09/2009 A228 F 40s Kadibo West Kochieng Nyamware South 13/02/2008 23/07/2009 B009 M 50s Kadibo Kanyagwal Ogenya 22/09/2008 04/10/2009 B011 M 50s Kadibo Kanyagwal Ogenya 15/02/2008 28/07/2009 B012 M 48 Kadibo Kanyagwal Ogenya Feb-08 30/07/2009 B013 M 26 Kadibo Kanyagwal Ogenya 15/02/2008 03/07/2009 B014 M 42 Nyando Kakola Ombaka Feb-08 03/08/2009 B015 M 38 Nyando Kakola Ombaka 19/02/2008 24/07/2009 B018 M 49 Kadibo Kanyagwal Ogenya 27/02/2008 01/07/2009 B019 F 68 Kadibo Kanyagwal Ogenya 28/02/2008 01/07/2009 B020 M 50 Kadibo Kanyagwal Ogenya Mar-08 09/07/2009 B024 F 56 Nyando Kakola Ombaka Mar-08 14/08/2009 B025 F 30s Nyando Kakola Ombaka 06/03/2008 30/07/2009 B031 M 33 Nyando Kakola Ombaka Mar-08 20/10/2009 B032 M 36 Nyando Kakola Ombaka Mar-08 19/08/2009 B036 M 51 Kadibo Kanyagwal Ogenya 01/03/2008 12/10/2009 B039 M 59 Nyando Wawidhi Magina 25/03/2008 29/09/2009 B042 F 40s Nyando Wawidhi Magina 01/04/2008 09/09/2009 B045 M 30 Nyando Kakola Ombaka 15/04/2008 29/07/2009 B047 M 33 Nyando Wawidhi Magina 15/04/2008 09/09/2009 B049 M 47 Kadibo Kanyagwal Ogenya Apr-08 10/08/2009 B050 M 33 Nyando Kakola Ombaka 24/04/2008 21/09/2009
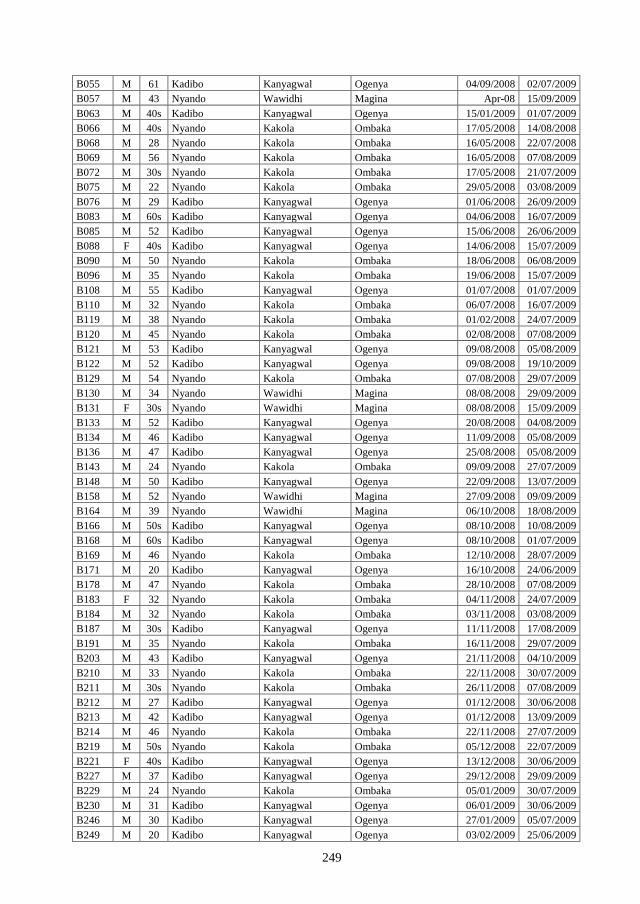
249
B055 M 61 Kadibo Kanyagwal Ogenya 04/09/2008 02/07/2009 B057 M 43 Nyando Wawidhi Magina Apr-08 15/09/2009 B063 M 40s Kadibo Kanyagwal Ogenya 15/01/2009 01/07/2009 B066 M 40s Nyando Kakola Ombaka 17/05/2008 14/08/2008 B068 M 28 Nyando Kakola Ombaka 16/05/2008 22/07/2008 B069 M 56 Nyando Kakola Ombaka 16/05/2008 07/08/2009 B072 M 30s Nyando Kakola Ombaka 17/05/2008 21/07/2009 B075 M 22 Nyando Kakola Ombaka 29/05/2008 03/08/2009 B076 M 29 Kadibo Kanyagwal Ogenya 01/06/2008 26/09/2009 B083 M 60s Kadibo Kanyagwal Ogenya 04/06/2008 16/07/2009 B085 M 52 Kadibo Kanyagwal Ogenya 15/06/2008 26/06/2009 B088 F 40s Kadibo Kanyagwal Ogenya 14/06/2008 15/07/2009 B090 M 50 Nyando Kakola Ombaka 18/06/2008 06/08/2009 B096 M 35 Nyando Kakola Ombaka 19/06/2008 15/07/2009 B108 M 55 Kadibo Kanyagwal Ogenya 01/07/2008 01/07/2009 B110 M 32 Nyando Kakola Ombaka 06/07/2008 16/07/2009 B119 M 38 Nyando Kakola Ombaka 01/02/2008 24/07/2009 B120 M 45 Nyando Kakola Ombaka 02/08/2008 07/08/2009 B121 M 53 Kadibo Kanyagwal Ogenya 09/08/2008 05/08/2009 B122 M 52 Kadibo Kanyagwal Ogenya 09/08/2008 19/10/2009 B129 M 54 Nyando Kakola Ombaka 07/08/2008 29/07/2009 B130 M 34 Nyando Wawidhi Magina 08/08/2008 29/09/2009 B131 F 30s Nyando Wawidhi Magina 08/08/2008 15/09/2009 B133 M 52 Kadibo Kanyagwal Ogenya 20/08/2008 04/08/2009 B134 M 46 Kadibo Kanyagwal Ogenya 11/09/2008 05/08/2009 B136 M 47 Kadibo Kanyagwal Ogenya 25/08/2008 05/08/2009 B143 M 24 Nyando Kakola Ombaka 09/09/2008 27/07/2009 B148 M 50 Kadibo Kanyagwal Ogenya 22/09/2008 13/07/2009 B158 M 52 Nyando Wawidhi Magina 27/09/2008 09/09/2009 B164 M 39 Nyando Wawidhi Magina 06/10/2008 18/08/2009 B166 M 50s Kadibo Kanyagwal Ogenya 08/10/2008 10/08/2009 B168 M 60s Kadibo Kanyagwal Ogenya 08/10/2008 01/07/2009 B169 M 46 Nyando Kakola Ombaka 12/10/2008 28/07/2009 B171 M 20 Kadibo Kanyagwal Ogenya 16/10/2008 24/06/2009 B178 M 47 Nyando Kakola Ombaka 28/10/2008 07/08/2009 B183 F 32 Nyando Kakola Ombaka 04/11/2008 24/07/2009 B184 M 32 Nyando Kakola Ombaka 03/11/2008 03/08/2009 B187 M 30s Kadibo Kanyagwal Ogenya 11/11/2008 17/08/2009 B191 M 35 Nyando Kakola Ombaka 16/11/2008 29/07/2009 B203 M 43 Kadibo Kanyagwal Ogenya 21/11/2008 04/10/2009 B210 M 33 Nyando Kakola Ombaka 22/11/2008 30/07/2009 B211 M 30s Nyando Kakola Ombaka 26/11/2008 07/08/2009 B212 M 27 Kadibo Kanyagwal Ogenya 01/12/2008 30/06/2008 B213 M 42 Kadibo Kanyagwal Ogenya 01/12/2008 13/09/2009 B214 M 46 Nyando Kakola Ombaka 22/11/2008 27/07/2009 B219 M 50s Nyando Kakola Ombaka 05/12/2008 22/07/2009 B221 F 40s Kadibo Kanyagwal Ogenya 13/12/2008 30/06/2009 B227 M 37 Kadibo Kanyagwal Ogenya 29/12/2008 29/09/2009 B229 M 24 Nyando Kakola Ombaka 05/01/2009 30/07/2009 B230 M 31 Kadibo Kanyagwal Ogenya 06/01/2009 30/06/2009 B246 M 30 Kadibo Kanyagwal Ogenya 27/01/2009 05/07/2009 B249 M 20 Kadibo Kanyagwal Ogenya 03/02/2009 25/06/2009
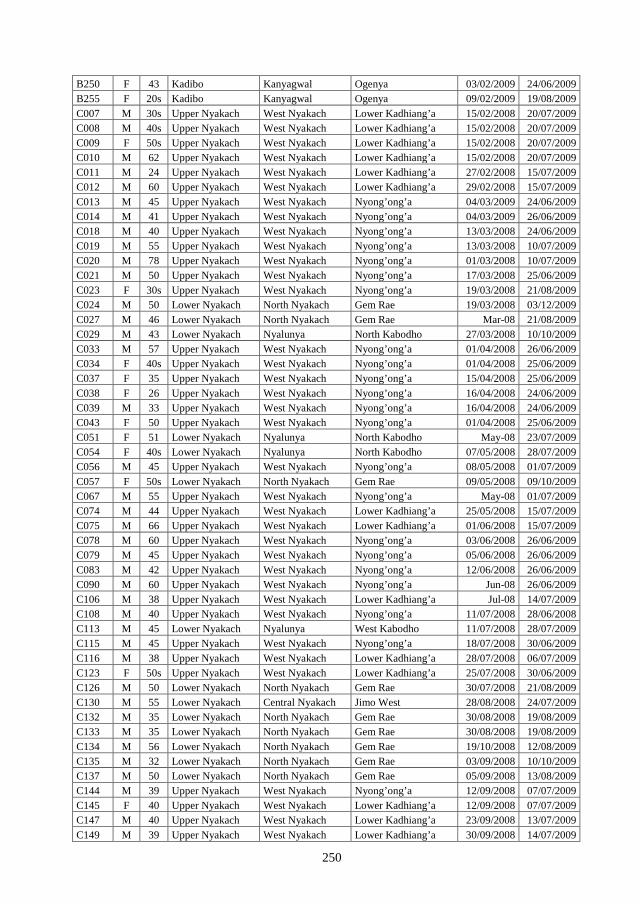
250
B250 F 43 Kadibo Kanyagwal Ogenya 03/02/2009 24/06/2009 B255 F 20s Kadibo Kanyagwal Ogenya 09/02/2009 19/08/2009 C007 M 30s Upper Nyakach West Nyakach Lower Kadhiang’a 15/02/2008 20/07/2009 C008 M 40s Upper Nyakach West Nyakach Lower Kadhiang’a 15/02/2008 20/07/2009 C009 F 50s Upper Nyakach West Nyakach Lower Kadhiang’a 15/02/2008 20/07/2009 C010 M 62 Upper Nyakach West Nyakach Lower Kadhiang’a 15/02/2008 20/07/2009 C011 M 24 Upper Nyakach West Nyakach Lower Kadhiang’a 27/02/2008 15/07/2009 C012 M 60 Upper Nyakach West Nyakach Lower Kadhiang’a 29/02/2008 15/07/2009 C013 M 45 Upper Nyakach West Nyakach Nyong’ong’a 04/03/2009 24/06/2009 C014 M 41 Upper Nyakach West Nyakach Nyong’ong’a 04/03/2009 26/06/2009 C018 M 40 Upper Nyakach West Nyakach Nyong’ong’a 13/03/2008 24/06/2009 C019 M 55 Upper Nyakach West Nyakach Nyong’ong’a 13/03/2008 10/07/2009 C020 M 78 Upper Nyakach West Nyakach Nyong’ong’a 01/03/2008 10/07/2009 C021 M 50 Upper Nyakach West Nyakach Nyong’ong’a 17/03/2008 25/06/2009 C023 F 30s Upper Nyakach West Nyakach Nyong’ong’a 19/03/2008 21/08/2009 C024 M 50 Lower Nyakach North Nyakach Gem Rae 19/03/2008 03/12/2009 C027 M 46 Lower Nyakach North Nyakach Gem Rae Mar-08 21/08/2009 C029 M 43 Lower Nyakach Nyalunya North Kabodho 27/03/2008 10/10/2009 C033 M 57 Upper Nyakach West Nyakach Nyong’ong’a 01/04/2008 26/06/2009 C034 F 40s Upper Nyakach West Nyakach Nyong’ong’a 01/04/2008 25/06/2009 C037 F 35 Upper Nyakach West Nyakach Nyong’ong’a 15/04/2008 25/06/2009 C038 F 26 Upper Nyakach West Nyakach Nyong’ong’a 16/04/2008 24/06/2009 C039 M 33 Upper Nyakach West Nyakach Nyong’ong’a 16/04/2008 24/06/2009 C043 F 50 Upper Nyakach West Nyakach Nyong’ong’a 01/04/2008 25/06/2009 C051 F 51 Lower Nyakach Nyalunya North Kabodho May-08 23/07/2009 C054 F 40s Lower Nyakach Nyalunya North Kabodho 07/05/2008 28/07/2009 C056 M 45 Upper Nyakach West Nyakach Nyong’ong’a 08/05/2008 01/07/2009 C057 F 50s Lower Nyakach North Nyakach Gem Rae 09/05/2008 09/10/2009 C067 M 55 Upper Nyakach West Nyakach Nyong’ong’a May-08 01/07/2009 C074 M 44 Upper Nyakach West Nyakach Lower Kadhiang’a 25/05/2008 15/07/2009 C075 M 66 Upper Nyakach West Nyakach Lower Kadhiang’a 01/06/2008 15/07/2009 C078 M 60 Upper Nyakach West Nyakach Nyong’ong’a 03/06/2008 26/06/2009 C079 M 45 Upper Nyakach West Nyakach Nyong’ong’a 05/06/2008 26/06/2009 C083 M 42 Upper Nyakach West Nyakach Nyong’ong’a 12/06/2008 26/06/2009 C090 M 60 Upper Nyakach West Nyakach Nyong’ong’a Jun-08 26/06/2009 C106 M 38 Upper Nyakach West Nyakach Lower Kadhiang’a Jul-08 14/07/2009 C108 M 40 Upper Nyakach West Nyakach Nyong’ong’a 11/07/2008 28/06/2008 C113 M 45 Lower Nyakach Nyalunya West Kabodho 11/07/2008 28/07/2009 C115 M 45 Upper Nyakach West Nyakach Nyong’ong’a 18/07/2008 30/06/2009 C116 M 38 Upper Nyakach West Nyakach Lower Kadhiang’a 28/07/2008 06/07/2009 C123 F 50s Upper Nyakach West Nyakach Lower Kadhiang’a 25/07/2008 30/06/2009 C126 M 50 Lower Nyakach North Nyakach Gem Rae 30/07/2008 21/08/2009 C130 M 55 Lower Nyakach Central Nyakach Jimo West 28/08/2008 24/07/2009 C132 M 35 Lower Nyakach North Nyakach Gem Rae 30/08/2008 19/08/2009 C133 M 35 Lower Nyakach North Nyakach Gem Rae 30/08/2008 19/08/2009 C134 M 56 Lower Nyakach North Nyakach Gem Rae 19/10/2008 12/08/2009 C135 M 32 Lower Nyakach North Nyakach Gem Rae 03/09/2008 10/10/2009 C137 M 50 Lower Nyakach North Nyakach Gem Rae 05/09/2008 13/08/2009 C144 M 39 Upper Nyakach West Nyakach Nyong’ong’a 12/09/2008 07/07/2009 C145 F 40 Upper Nyakach West Nyakach Lower Kadhiang’a 12/09/2008 07/07/2009 C147 M 40 Upper Nyakach West Nyakach Lower Kadhiang’a 23/09/2008 13/07/2009 C149 M 39 Upper Nyakach West Nyakach Lower Kadhiang’a 30/09/2008 14/07/2009
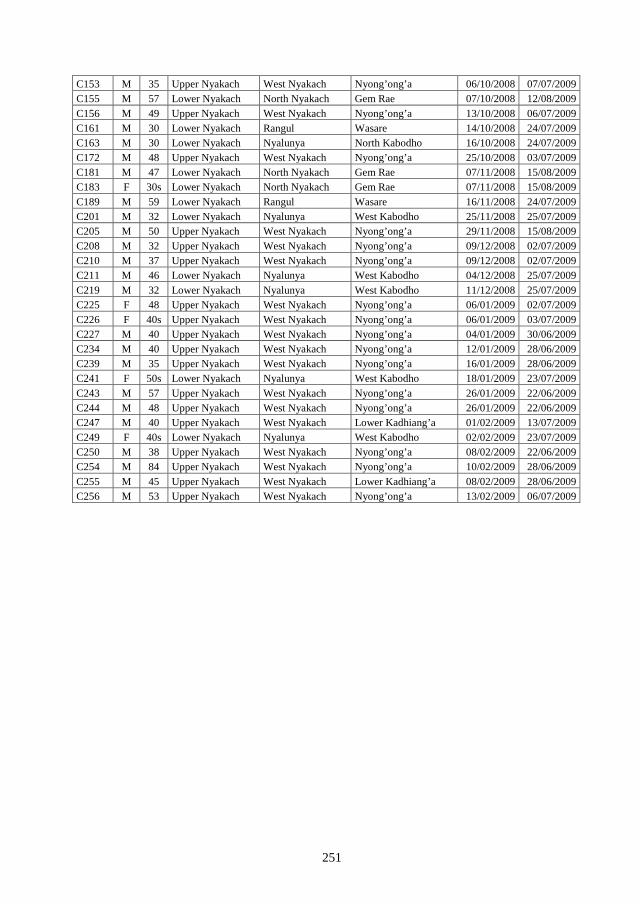
251
C153 M 35 Upper Nyakach West Nyakach Nyong’ong’a 06/10/2008 07/07/2009 C155 M 57 Lower Nyakach North Nyakach Gem Rae 07/10/2008 12/08/2009 C156 M 49 Upper Nyakach West Nyakach Nyong’ong’a 13/10/2008 06/07/2009 C161 M 30 Lower Nyakach Rangul Wasare 14/10/2008 24/07/2009 C163 M 30 Lower Nyakach Nyalunya North Kabodho 16/10/2008 24/07/2009 C172 M 48 Upper Nyakach West Nyakach Nyong’ong’a 25/10/2008 03/07/2009 C181 M 47 Lower Nyakach North Nyakach Gem Rae 07/11/2008 15/08/2009 C183 F 30s Lower Nyakach North Nyakach Gem Rae 07/11/2008 15/08/2009 C189 M 59 Lower Nyakach Rangul Wasare 16/11/2008 24/07/2009 C201 M 32 Lower Nyakach Nyalunya West Kabodho 25/11/2008 25/07/2009 C205 M 50 Upper Nyakach West Nyakach Nyong’ong’a 29/11/2008 15/08/2009 C208 M 32 Upper Nyakach West Nyakach Nyong’ong’a 09/12/2008 02/07/2009 C210 M 37 Upper Nyakach West Nyakach Nyong’ong’a 09/12/2008 02/07/2009 C211 M 46 Lower Nyakach Nyalunya West Kabodho 04/12/2008 25/07/2009 C219 M 32 Lower Nyakach Nyalunya West Kabodho 11/12/2008 25/07/2009 C225 F 48 Upper Nyakach West Nyakach Nyong’ong’a 06/01/2009 02/07/2009 C226 F 40s Upper Nyakach West Nyakach Nyong’ong’a 06/01/2009 03/07/2009 C227 M 40 Upper Nyakach West Nyakach Nyong’ong’a 04/01/2009 30/06/2009 C234 M 40 Upper Nyakach West Nyakach Nyong’ong’a 12/01/2009 28/06/2009 C239 M 35 Upper Nyakach West Nyakach Nyong’ong’a 16/01/2009 28/06/2009 C241 F 50s Lower Nyakach Nyalunya West Kabodho 18/01/2009 23/07/2009 C243 M 57 Upper Nyakach West Nyakach Nyong’ong’a 26/01/2009 22/06/2009 C244 M 48 Upper Nyakach West Nyakach Nyong’ong’a 26/01/2009 22/06/2009 C247 M 40 Upper Nyakach West Nyakach Lower Kadhiang’a 01/02/2009 13/07/2009 C249 F 40s Lower Nyakach Nyalunya West Kabodho 02/02/2009 23/07/2009 C250 M 38 Upper Nyakach West Nyakach Nyong’ong’a 08/02/2009 22/06/2009 C254 M 84 Upper Nyakach West Nyakach Nyong’ong’a 10/02/2009 28/06/2009 C255 M 45 Upper Nyakach West Nyakach Lower Kadhiang’a 08/02/2009 28/06/2009 C256 M 53 Upper Nyakach West Nyakach Nyong’ong’a 13/02/2009 06/07/2009
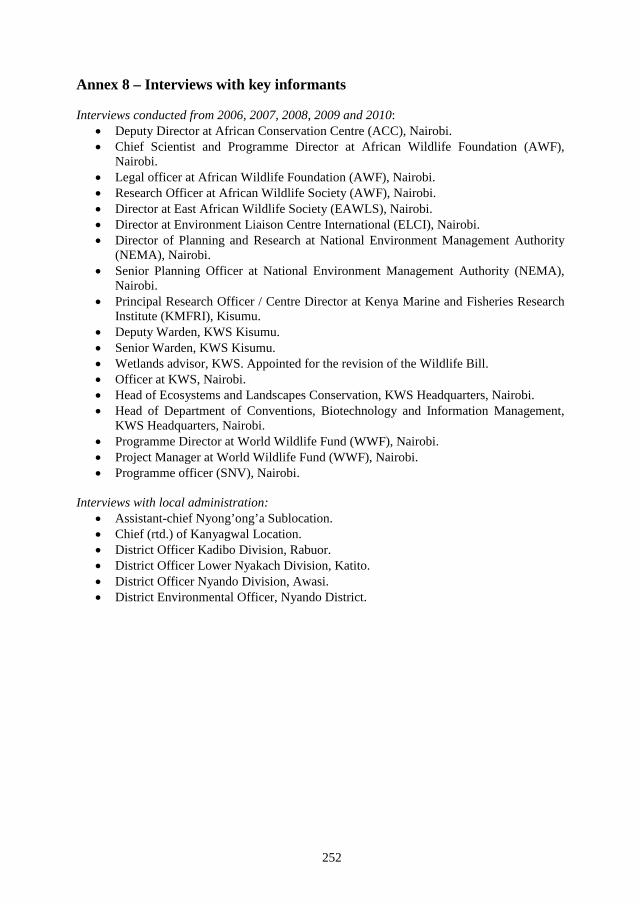
252
Annex 8 – Interviews with key informants Interviews conducted from 2006, 2007, 2008, 2009 and 2010:
• Deputy Director at African Conservation Centre (ACC), Nairobi. • Chief Scientist and Programme Director at African Wildlife Foundation (AWF),
Nairobi. • Legal officer at African Wildlife Foundation (AWF), Nairobi. • Research Officer at African Wildlife Society (AWF), Nairobi. • Director at East African Wildlife Society (EAWLS), Nairobi. • Director at Environment Liaison Centre International (ELCI), Nairobi. • Director of Planning and Research at National Environment Management Authority
(NEMA), Nairobi. • Senior Planning Officer at National Environment Management Authority (NEMA),
Nairobi. • Principal Research Officer / Centre Director at Kenya Marine and Fisheries Research
Institute (KMFRI), Kisumu. • Deputy Warden, KWS Kisumu. • Senior Warden, KWS Kisumu. • Wetlands advisor, KWS. Appointed for the revision of the Wildlife Bill. • Officer at KWS, Nairobi. • Head of Ecosystems and Landscapes Conservation, KWS Headquarters, Nairobi. • Head of Department of Conventions, Biotechnology and Information Management,
KWS Headquarters, Nairobi. • Programme Director at World Wildlife Fund (WWF), Nairobi. • Project Manager at World Wildlife Fund (WWF), Nairobi. • Programme officer (SNV), Nairobi.
Interviews with local administration:
• Assistant-chief Nyong’ong’a Sublocation. • Chief (rtd.) of Kanyagwal Location. • District Officer Kadibo Division, Rabuor. • District Officer Lower Nyakach Division, Katito. • District Officer Nyando Division, Awasi. • District Environmental Officer, Nyando District.
253
Annex 9 – The influence of the post-election violence on the project
Due to work obligations of the field coordinator for the Electoral Commission of Kenya (ECK)159, the staff training was rescheduled to 2 January 2008. However, after the results of the 2007 General Elections were announced on 30 December and Mwai Kibaki, Kenya’s president since 2002 and PNU candidate (Party of National Unity) was swiftly sworn in as Kenya’s president in spite of accusations of rigging – at the expense of Raila Odinga, leader of the Orange Democratic Movement (ODM), who was tipped to win the presidency and had been leading in the polls for months – riots started. Fights broke out in large parts of the country, particularly in the Rift Valley, Nyanza and Western Province, and major cities like Nairobi and Kisumu, later followed by Nakuru and Naivasha. Large parts of Nyanza Province were no-go areas with road-blocks and youths who were mobilized to loot shops and stores; while others used the chaos to settle old scores. The clashes, partly fuelled by ethnicity instigated by several leaders160, led to over 1,000 people dead and displaced 600,000. The political turmoil certainly impacted on the project, which started later as a result. When the clashes161 broke out, I was in Nairobi. Even though many foreigners fled the country, I did not want to leave and remained in Nairobi until I had an opportunity to return to Kisumu.
Upon arrival in Kisumu on 23 January 2008, I found a destroyed city centre. The situation was tense and the Dutch Ministry for Foreign Affairs had not yet lifted her negative travel advice. Still, I proceeded with the 4-day training of the project staff in Rabuor (24-27 January), after which the field staff conducted a pilot survey to test the questionnaire. Because of my imminent departure to the Netherlands, there was insufficient time to re-test the amended questionnaire, so I left that to the field coordinator. However, I strongly recommend others to (re)test questionnaires personally. While the field staff carried out the pilot survey, I remained in Kisumu162 to train the field coordinator and organise the work for it to continue in my absence. The late start had left little time to conduct the pilot, test the questionnaire and streamline the approaches of the individual field staff. Early February 2008, the first interviews were discussed. Ambiguous questions were altered and questions were added, after which the adjusted questionnaire was discussed and given to the project staff. After tons of good advice, I left for Nairobi and left them behind to continue the work.
Even though the field staff was working in rural areas where it was relatively safe and quiet, the general mood in those days was not conducive for scientific research. The minds of the people were set on the turmoil in the country; many of them feared a renewed outburst of violence. It would take another month before Mwai Kibaki and Raila Odinga reached a power-sharing agreement in which Kibaki ‘remained’ president and Raila became Prime Minister. I strongly feel that the post-election violence influenced the project beyond the time implications, particularly in the initial project stage, but it is difficult to quantify and prove it.
159 The ECK was a body empowered by the Constitution of Kenya to conduct and supervise elections. It was ultimately replaced by the Independent Electoral and Boundaries Commission (IEBC) in 2011 (Karume 2014). 160 The Commission of Inquiry into the Post-Election Violence, headed by Justice Philip Waki, investigated the facts and circumstances surrounding the violence. 161 Live broadcasts were forbidden – updates came through ‘live reports’ from friends in Kisumu or phone calls from relatives/friends abroad. 162 The situation seemed calm, but subdued tension could be felt in and around Kisumu town. This erupted in a shoot-out on 28 January amidst roadblocks and burning car tyres. More gunshots were fired when the guesthouse just behind the hotel where I was staying (as the only guest!) was looted. I was prepared for the worst and kept an emergency bag at hand – with laptop and papers. Riots erupted again after two MPs got killed. Given the circumstances, I considered stopping the work and await more peaceful times. However, the project staff reassured me that they could work as their areas were relatively safe. I decided to proceed because it remained unclear if and when a political agreement would be signed, and I did not want to postpone the project for months. It was a bizarre situation that I never hope to experience again.
254
Early June 2008, I returned to Kenya and subsequently joined the project staff to check on the work, organised the Forum Meeting in Ahero (29 July), took up the project coordination and arranged for the first round of focus group discussions. During my next stay in Kenya163, I spent much time in the field as I had noticed that my presence facilitated the work and positively influenced the progress made. From the summer of 2009 onwards, the focus was on data entry and analysis.
163 I had to return to the Netherlands on several occasions (in 2008: from 15/02-09/06 and 11/09-05/10; in 2009 from 6/4-28/4 and 26/08-22/09). Managing a project at a distance of 6,000 km turned out to be quite cumbersome.
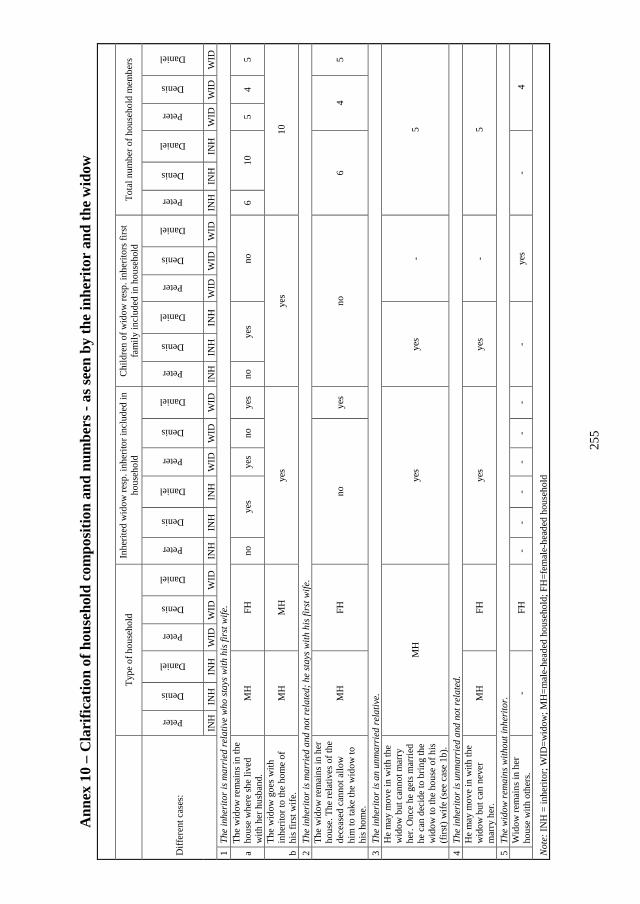
255
Ann
ex 1
0 –
Cla
rific
atio
n of
hou
seho
ld c
ompo
sitio
n an
d nu
mbe
rs -
as se
en b
y th
e in
heri
tor
and
the
wid
ow
Type
of h
ouse
hold
In
herit
ed w
idow
resp
. inh
erito
r inc
lude
d in
ho
useh
old
Chi
ldre
n of
wid
ow re
sp. i
nher
itors
firs
t fa
mily
incl
uded
in h
ouse
hold
To
tal n
umbe
r of h
ouse
hold
mem
bers
Diff
eren
t cas
es:
Peter
Denis
Daniel
Peter
Denis
Daniel
Peter
Denis
Daniel
Peter
Denis
Daniel
Peter
Denis
Daniel
Peter
Denis
Daniel
Peter
Denis
Daniel
Peter
Denis
Daniel
INH
IN
H
INH
W
ID
WID
W
ID
INH
IN
H
INH
W
ID
WID
W
ID
INH
IN
H
INH
W
ID
WID
W
ID
INH
IN
H
INH
W
ID
WID
W
ID
1 Th
e in
heri
tor i
s mar
ried
rela
tive
who
stay
s with
his
firs
t wife
.
a Th
e w
idow
rem
ains
in th
e ho
use
whe
re sh
e liv
ed
with
her
hus
band
. M
H
FH
no
yes
yes
no
yes
no
yes
no
6 10
5
4 5
b
The
wid
ow g
oes w
ith
inhe
ritor
to th
e ho
me
of
his f
irst w
ife.
MH
M
H
yes
yes
10
2 Th
e in
heri
tor i
s mar
ried
and
not
rela
ted;
he
stay
s with
his
firs
t wife
.
The
wid
ow re
mai
ns in
her
ho
use.
The
rela
tives
of t
he
dece
ased
can
not a
llow
hi
m to
take
the
wid
ow to
hi
s hom
e.
MH
FH
no
ye
s no
6
4 5
3 Th
e in
heri
tor i
s an
unm
arri
ed re
lativ
e.
He
may
mov
e in
with
the
wid
ow b
ut c
anno
t mar
ry
her.
Onc
e he
get
s mar
ried
he c
an d
ecid
e to
brin
g th
e w
idow
to th
e ho
use
of h
is
(firs
t) w
ife (s
ee c
ase
1b).
MH
ye
s ye
s -
5
4 Th
e in
heri
tor i
s unm
arri
ed a
nd n
ot re
late
d.
He
may
mov
e in
with
the
wid
ow b
ut c
an n
ever
m
arry
her
. M
H
FH
yes
yes
- 5
5 Th
e w
idow
rem
ains
with
out i
nher
itor.
W
idow
rem
ains
in h
er
hous
e w
ith o
ther
s.
- FH
-
- -
- -
- -
yes
- 4
Not
e: IN
H =
inhe
ritor
; WID
=wid
ow; M
H=m
ale-
head
ed h
ouse
hold
; FH
=fem
ale-
head
ed h
ouse
hold
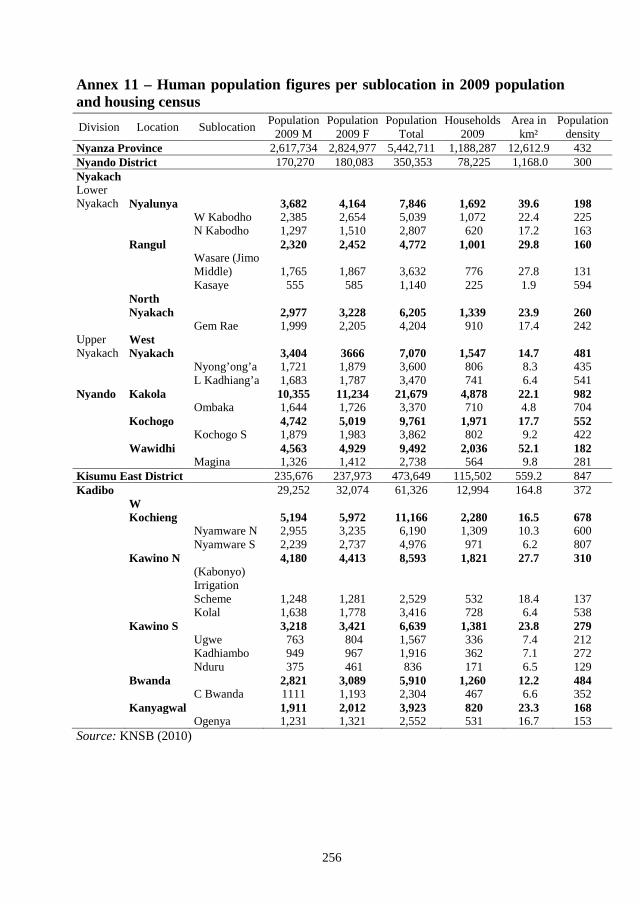
256
Annex 11 – Human population figures per sublocation in 2009 population and housing census
Source: KNSB (2010)
Division Location Sublocation Population 2009 M
Population 2009 F
Population Total
Households 2009
Area in km²
Population density
Nyanza Province 2,617,734 2,824,977 5,442,711 1,188,287 12,612.9 432 Nyando District 170,270 180,083 350,353 78,225 1,168.0 300 Nyakach Lower Nyakach Nyalunya 3,682 4,164 7,846 1,692 39.6 198
W Kabodho 2,385 2,654 5,039 1,072 22.4 225 N Kabodho 1,297 1,510 2,807 620 17.2 163
Rangul 2,320 2,452 4,772 1,001 29.8 160 Wasare (Jimo Middle) 1,765 1,867 3,632 776 27.8 131 Kasaye 555 585 1,140 225 1.9 594
North Nyakach 2,977 3,228 6,205 1,339 23.9 260
Gem Rae 1,999 2,205 4,204 910 17.4 242 Upper Nyakach
West Nyakach 3,404 3666 7,070 1,547 14.7 481
Nyong’ong’a 1,721 1,879 3,600 806 8.3 435 L Kadhiang’a 1,683 1,787 3,470 741 6.4 541
Nyando Kakola 10,355 11,234 21,679 4,878 22.1 982 Ombaka 1,644 1,726 3,370 710 4.8 704
Kochogo 4,742 5,019 9,761 1,971 17.7 552 Kochogo S 1,879 1,983 3,862 802 9.2 422
Wawidhi 4,563 4,929 9,492 2,036 52.1 182 Magina 1,326 1,412 2,738 564 9.8 281
Kisumu East District 235,676 237,973 473,649 115,502 559.2 847 Kadibo 29,252 32,074 61,326 12,994 164.8 372
W Kochieng 5,194 5,972 11,166 2,280 16.5 678
Nyamware N 2,955 3,235 6,190 1,309 10.3 600 Nyamware S 2,239 2,737 4,976 971 6.2 807
Kawino N 4,180 4,413 8,593 1,821 27.7 310 (Kabonyo) Irrigation Scheme 1,248 1,281 2,529 532 18.4 137 Kolal 1,638 1,778 3,416 728 6.4 538
Kawino S 3,218 3,421 6,639 1,381 23.8 279 Ugwe 763 804 1,567 336 7.4 212 Kadhiambo 949 967 1,916 362 7.1 272 Nduru 375 461 836 171 6.5 129
Bwanda 2,821 3,089 5,910 1,260 12.2 484 C Bwanda 1111 1,193 2,304 467 6.6 352
Kanyagwal 1,911 2,012 3,923 820 23.3 168 Ogenya 1,231 1,321 2,552 531 16.7 153
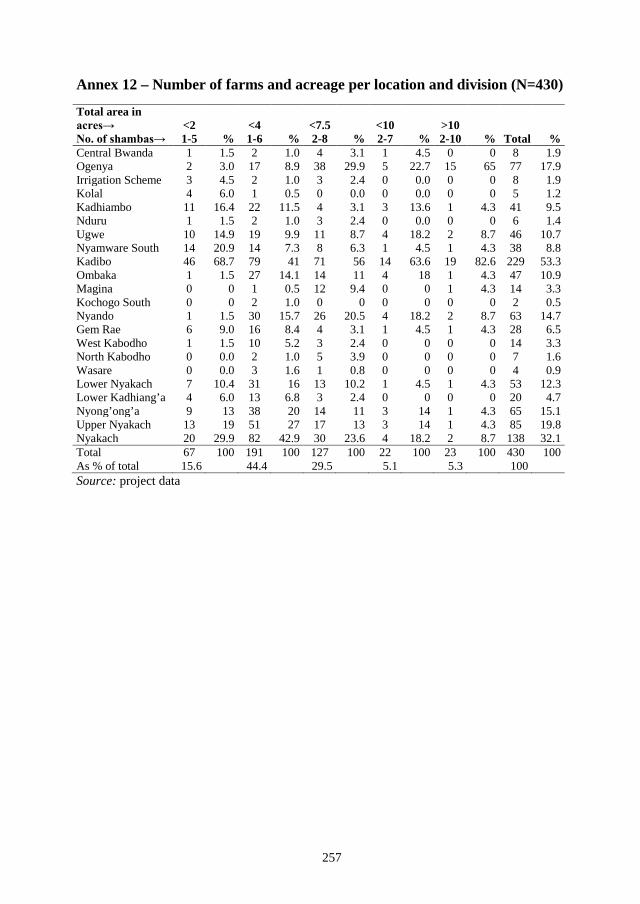
257
Annex 12 – Number of farms and acreage per location and division (N=430)
Source: project data
Total area in acres→ <2
% <4
% <7.5
% <10
% >10
% Total % No. of shambas→ 1-5 1-6 2-8 2-7 2-10 Central Bwanda 1 1.5 2 1.0 4 3.1 1 4.5 0 0 8 1.9 Ogenya 2 3.0 17 8.9 38 29.9 5 22.7 15 65 77 17.9 Irrigation Scheme 3 4.5 2 1.0 3 2.4 0 0.0 0 0 8 1.9 Kolal 4 6.0 1 0.5 0 0.0 0 0.0 0 0 5 1.2 Kadhiambo 11 16.4 22 11.5 4 3.1 3 13.6 1 4.3 41 9.5 Nduru 1 1.5 2 1.0 3 2.4 0 0.0 0 0 6 1.4 Ugwe 10 14.9 19 9.9 11 8.7 4 18.2 2 8.7 46 10.7 Nyamware South 14 20.9 14 7.3 8 6.3 1 4.5 1 4.3 38 8.8 Kadibo 46 68.7 79 41 71 56 14 63.6 19 82.6 229 53.3 Ombaka 1 1.5 27 14.1 14 11 4 18 1 4.3 47 10.9 Magina 0 0 1 0.5 12 9.4 0 0 1 4.3 14 3.3 Kochogo South 0 0 2 1.0 0 0 0 0 0 0 2 0.5 Nyando 1 1.5 30 15.7 26 20.5 4 18.2 2 8.7 63 14.7 Gem Rae 6 9.0 16 8.4 4 3.1 1 4.5 1 4.3 28 6.5 West Kabodho 1 1.5 10 5.2 3 2.4 0 0 0 0 14 3.3 North Kabodho 0 0.0 2 1.0 5 3.9 0 0 0 0 7 1.6 Wasare 0 0.0 3 1.6 1 0.8 0 0 0 0 4 0.9 Lower Nyakach 7 10.4 31 16 13 10.2 1 4.5 1 4.3 53 12.3 Lower Kadhiang’a 4 6.0 13 6.8 3 2.4 0 0 0 0 20 4.7 Nyong’ong’a 9 13 38 20 14 11 3 14 1 4.3 65 15.1 Upper Nyakach 13 19 51 27 17 13 3 14 1 4.3 85 19.8 Nyakach 20 29.9 82 42.9 30 23.6 4 18.2 2 8.7 138 32.1 Total 67 100 191 100 127 100 22 100 23 100 430 100 As % of total 15.6 44.4 29.5 5.1 5.3 100
258
Annex 13 – Land demarcation in Nyando wetland
The Kamuga Clan Ombaka is the last sublocation at the southern border of Kakola Location, Nyando Division. It is located within Nyando wetland, along the shores of Lake Victoria. Ombaka is inhabited by twelve clans, which are headed by clan elders who are subordinate to the assistant (area)chief. The Kalloo, Kanyipola, and Kasiwindi are the main clans; they form the largest part of the population in Ombaka.
Before independence, Kasiwindi was the dominant clan. Its leader Muga, who ruled the entire location, had the freedom to choose where to settle as he controlled the land distribution within Kakola. While his non-relatives remained nearby Ahero Market, Muga and his kinsmen settled along the lakeshore as this is a relatively fertile area that was sparsely populated. Being in charge, Muga simply took over the area. The move to the lake caused the disintegration of the Kasiwindi into two sub-clans namely Kasiwindi North and Kasiwindi South. The latter is now called “Kamuga” Clan after its leader Muga. Since only Muga’s kinsmen followed him, the Kamuga are fewer in number than the Kalloo and Kanyipola. Yet they have a large portion of the land as they grabbed it from other clans during Muga’s reign.
After the ‘Koth Uhuru’ rains in 1963, the water level receded. This made the Kamuga follow the waterline in order to acquire more land. The ‘initial’ inhabitants were offered lease contracts (for cultivation) and they had to pay rent in advance to the Kamuga. After Muga’s demise, the clans that had been forced to accept his authority, wanted to regain the land. Yet there was little they could do as Muga had demarcated the land to render it to his clan. Moreover, the tenants were intimidated and evicted before their terms of lease had come to an end. Since the Kamuga completely ignored the needs of other clans inhabiting the area, a ‘cold war situation’ was created. Land clashes turn into court cases Due to population increase and the resulting pressure on their land, which was relatively small, the majority of the Kalloo decided to invade the land towards the shore that had not been demarcated by the Ministry of Land. In case of any obstruction from the Kamuga, the Kalloo would fight them. This is what happened. Since the Kamuga were much smaller in number, they were defeated and some clan members suffered serious injuries. Ultimately, this situation led to court cases between the Kamuga and Kalloo clan members. Elite and wealthy members of the clans saw the land dispute as a means to acquire land and they used their wealth and network that stretched into the higher government echelons to influence the outcome of the court cases. The Kalloo were more numerous and wealthier than the Kamuga. They won several court cases against the Kamuga through bribes and government support. When government officials came to settle the land dispute, they did not stop cultivation in the disputed area but allowed the farmers to continue cultivating in a peaceful manner. This did not go well with the Kamuga, as they strongly believe that the land bordering the lakeshore is theirs since they were the first settlers towards the lake (in line with Muga’s settlement wishes).
Another reason for the ascendancy of the Kalloo in the land dispute is their internal organisation. Contrary to the Kamuga, who lacked proper leadership and had poor relationships with neighbouring clans, the Kalloo had established ‘land acquisition related’ committees for finance and battle. Both were headed by an appointed chairman, of wealth and well-connected. Other committee members were also educated and relatively well-to-do. This enabled the leaders to raise sufficient funds to cater for the poorer clan members who were not able to pay the fixed contribution to finance the land acquisition (ed: bribing at the DC Lands Office). Since the Kalloo had become the ruling clan, the chief also advised on legal issues. Moreover, the Kalloo convinced several prominent members of the Kanyipola (the
259
second largest clan) to support them in their fight by promising them a portion of the land. Their coalition intended to keep other clans at bay. Current situation In December 2009, members of the Kamuga clan decided to resume cultivation the lakeshore farms that had been appropriated by the Kalloo. They moved there and started planting. When the Kalloo realised what was going on they went to the farms early in the morning, found the Kamuga at work, attacked them, beat them up seriously, captured a few and took them to the police station, claiming that the Kamuga had invaded their land. Upon reaching the station, the Kalloo found out that some Kamuga had gone there earlier to allege them. Their claims not only fell on deaf ears but even backfired on them, as the police released the Kamuga who had been brought in and arrested thirteen Kalloo instead. In order to release them, the Kalloo had to pay a bond of 40,000 KSh per head. Out of revenge, the Kalloo captured several Kamuga who had allegedly invaded their farms and they threatened to attack anyone who would go there. The District Commissioner (DC) Nyando then pleaded with the two rival clans to have a meeting with the administration (chief and assistant chief) in order to settle the dispute. Late December, the administration called for a meeting with the Kamuga and Kalloo plus elders from other clans. The outcome of that meeting was as follows: 1. Both clans have to drop the allegations related to police and court cases in the presence of
the area chief and the District Officer (DO); 2. Both clans have to live in harmony without fearing each other’s attacks; 3. The land issue has to put on hold while they are working on a solution; in the meantime,
the disputed areas should be left idle; 4. A committee, chaired by the Kakola chief, was formed to investigate the land dispute and
solve the issue. The chief and assistant chief were to report back to the DC. After the meeting, the committee had to meet the partisans in the police and court cases. This failed as several Kamuga did not show up at the time when the said cases were supposed to be annulled. It seemed as if they had been pushed into the arrangement and had changed their minds afterwards. This made the Kalloo proceed with the police and court cases. They looked for an advocate to assist them and started collecting money from their members. When asked about the possible outcome, an executive of the Kalloo Group (consisting of the clan members who were involved in the land dispute), said the following: “We are going to win since the disputed land has neither parcel numbers nor title deeds. Thus, we have a right to cultivate that land and we were planting our crops there. The Kamuga created the problem by trying to plant where we had done so already”. The court cases are still ongoing and in the meantime, cultivating the disputed land is banned. The executive sees this differently for he says: “The floods have stopped us from cultivating. We are ready to talk to the DC and DO and request them to allow us to cultivate there since the lands are very fertile and contain enough moisture, even during the dry spell” (ed: he points at their readiness to bribe the government officials). Ed: the crux is that land that has fallen dry is government land, which is not supposed to be claimed by individuals or communities. The buffer zone cannot be demarcated; the rest of the land can be registered. Source: interview with an executive of the Kalloo Group, December 2009
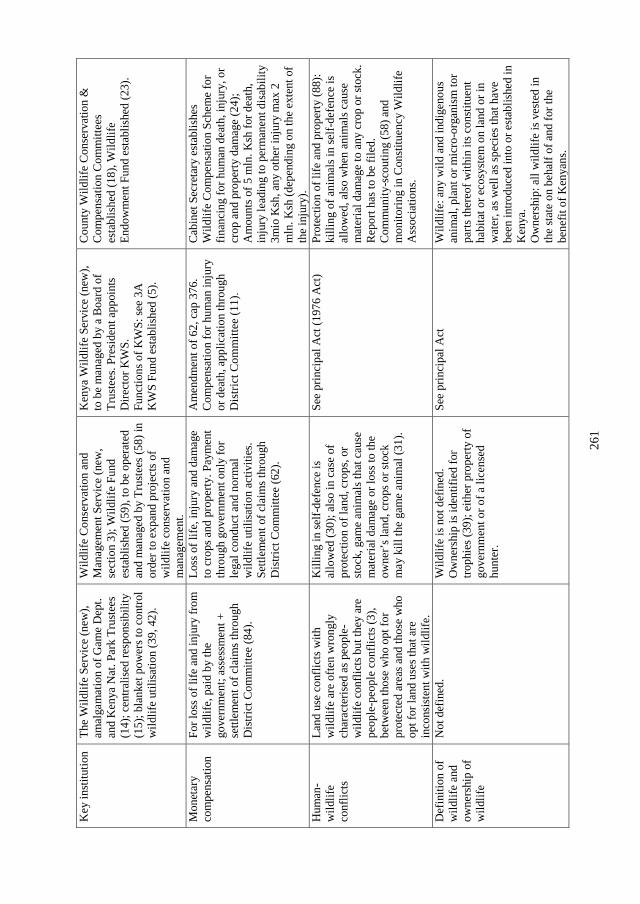
261
Key
inst
itutio
n Th
e W
ildlif
e Se
rvic
e (n
ew),
amal
gam
atio
n of
Gam
e D
ept.
and
Ken
ya N
at. P
ark
Trus
tees
(1
4); c
entra
lised
resp
onsi
bilit
y (1
5); b
lank
et p
ower
s to
cont
rol
wild
life
utili
satio
n (3
9, 4
2).
Wild
life
Con
serv
atio
n an
d M
anag
emen
t Ser
vice
(new
, se
ctio
n 3)
; Wild
life
Fund
es
tabl
ishe
d (5
9), t
o be
ope
rate
d an
d m
anag
ed b
y Tr
uste
es (5
8) in
or
der t
o ex
pand
pro
ject
s of
wild
life
cons
erva
tion
and
man
agem
ent.
Ken
ya W
ildlif
e Se
rvic
e (n
ew),
to b
e m
anag
ed b
y a
Boa
rd o
f Tr
uste
es. P
resi
dent
app
oint
s D
irect
or K
WS.
Fu
nctio
ns o
f KW
S: se
e 3A
K
WS
Fund
est
ablis
hed
(5).
Cou
nty
Wild
life
Con
serv
atio
n &
C
ompe
nsat
ion
Com
mitt
ees
esta
blis
hed
(18)
, Wild
life
Endo
wm
ent F
und
esta
blis
hed
(23)
.
Mon
etar
y co
mpe
nsat
ion
For l
oss o
f life
and
inju
ry fr
om
wild
life,
pai
d by
the
gove
rnm
ent;
asse
ssm
ent +
se
ttlem
ent o
f cla
ims t
hrou
gh
Dis
trict
Com
mitt
ee (8
4).
Loss
of l
ife, i
njur
y an
d da
mag
e to
cro
ps a
nd p
rope
rty. P
aym
ent
thro
ugh
gove
rnm
ent o
nly
for
lega
l con
duct
and
nor
mal
w
ildlif
e ut
ilisa
tion
activ
ities
. Se
ttlem
ent o
f cla
ims t
hrou
gh
Dis
trict
Com
mitt
ee (6
2).
Am
endm
ent o
f 62,
cap
376
. C
ompe
nsat
ion
for h
uman
inju
ry
or d
eath
, app
licat
ion
thro
ugh
Dis
trict
Com
mitt
ee (1
1).
Cab
inet
Sec
reta
ry e
stab
lishe
s W
ildlif
e C
ompe
nsat
ion
Sche
me
for
finan
cing
for h
uman
dea
th, i
njur
y, o
r cr
op a
nd p
rope
rty d
amag
e (2
4);
Am
ount
s of 5
mln
. Ksh
for d
eath
, in
jury
lead
ing
to p
erm
anen
t dis
abili
ty
3mio
Ksh
, any
oth
er in
jury
max
2
mln
. Ksh
(dep
endi
ng o
n th
e ex
tent
of
the
inju
ry).
Hum
an-
wild
life
conf
licts
Land
use
con
flict
s with
w
ildlif
e ar
e of
ten
wro
ngly
ch
arac
teris
ed a
s peo
ple-
wild
life
conf
licts
but
they
are
pe
ople
-peo
ple
conf
licts
(3),
betw
een
thos
e w
ho o
pt fo
r pr
otec
ted
area
s and
thos
e w
ho
opt f
or la
nd u
ses t
hat a
re
inco
nsis
tent
with
wild
life.
Kill
ing
in se
lf-de
fenc
e is
al
low
ed (3
0); a
lso
in c
ase
of
prot
ectio
n of
land
, cro
ps, o
r st
ock,
gam
e an
imal
s tha
t cau
se
mat
eria
l dam
age
or lo
ss to
the
owne
r’s l
and,
cro
ps o
r sto
ck
may
kill
the
gam
e an
imal
(31)
.
See
prin
cipa
l Act
(197
6 A
ct)
Prot
ectio
n of
life
and
pro
perty
(88)
: ki
lling
of a
nim
als i
n se
lf-de
fenc
e is
al
low
ed, a
lso
whe
n an
imal
s cau
se
mat
eria
l dam
age
to a
ny c
rop
or st
ock.
R
epor
t has
to b
e fil
ed.
Com
mun
ity-s
cout
ing
(58)
and
m
onito
ring
in C
onst
ituen
cy W
ildlif
e A
ssoc
iatio
ns.
Def
initi
on o
f w
ildlif
e an
d ow
ners
hip
of
wild
life
Not
def
ined
. W
ildlif
e is
not
def
ined
. O
wne
rshi
p is
iden
tifie
d fo
r tro
phie
s (39
); ei
ther
pro
perty
of
gove
rnm
ent o
r of a
lice
nsed
hu
nter.
See
prin
cipa
l Act
W
ildlif
e: a
ny w
ild a
nd in
dige
nous
an
imal
, pla
nt o
r mic
ro-o
rgan
ism
tor
parts
ther
eof w
ithin
its c
onst
ituen
t ha
bita
t or e
cosy
stem
on
land
or i
n w
ater
, as w
ell a
s spe
cies
that
hav
e be
en in
trodu
ced
into
or e
stab
lishe
d in
K
enya
. O
wne
rshi
p: a
ll w
ildlif
e is
ves
ted
in
the
stat
e on
beh
alf o
f and
for t
he
bene
fit o
f Ken
yans
.
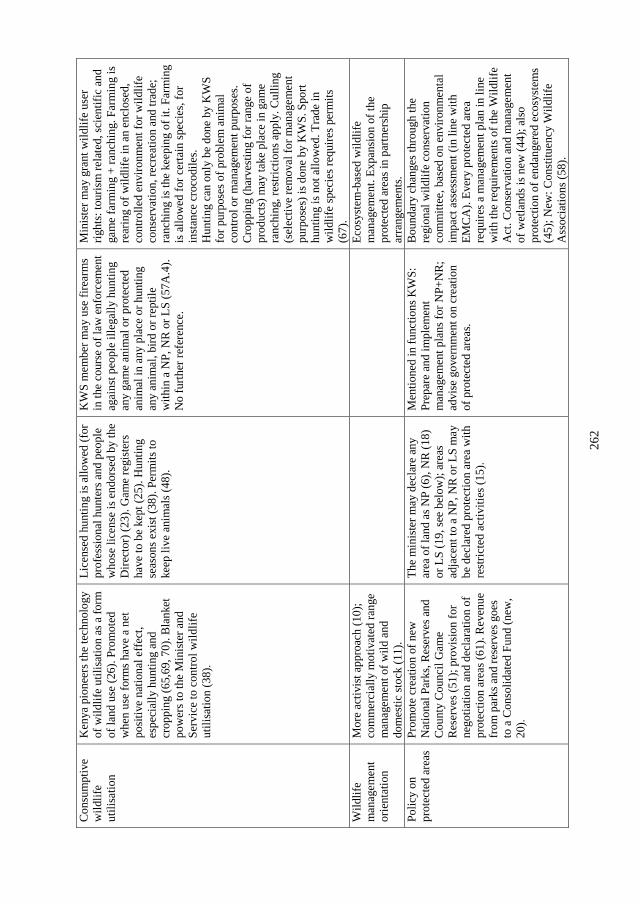
262
Con
sum
ptiv
e w
ildlif
e ut
ilisa
tion
Ken
ya p
ione
ers t
he te
chno
logy
of
wild
life
utili
satio
n as
a fo
rm
of la
nd u
se (2
6). P
rom
oted
w
hen
use
form
s hav
e a
net
posi
tive
natio
nal e
ffec
t, es
peci
ally
hun
ting
and
crop
ping
(65,
69, 7
0). B
lank
et
pow
ers t
o th
e M
inis
ter a
nd
Serv
ice
to c
ontro
l wild
life
utili
satio
n (3
8).
Lice
nsed
hun
ting
is a
llow
ed (f
or
prof
essi
onal
hun
ters
and
peo
ple
who
se li
cens
e is
end
orse
d by
the
Dire
ctor
) (23
). G
ame
regi
ster
s ha
ve to
be
kept
(25)
. Hun
ting
seas
ons e
xist
(38)
. Per
mits
to
keep
live
ani
mal
s (48
).
KW
S m
embe
r may
use
fire
arm
s in
the
cour
se o
f law
enf
orce
men
t ag
ains
t peo
ple
illeg
ally
hun
ting
any
gam
e an
imal
or p
rote
cted
an
imal
in a
ny p
lace
or h
untin
g an
y an
imal
, bird
or r
eptil
e w
ithin
a N
P, N
R o
r LS
(57A
.4).
No
furth
er re
fere
nce.
Min
iste
r may
gra
nt w
ildlif
e us
er
right
s: to
uris
m re
late
d, sc
ient
ific
and
gam
e fa
rmin
g +
ranc
hing
. Far
min
g is
re
arin
g of
wild
life
in a
n en
clos
ed,
cont
rolle
d en
viro
nmen
t for
wild
life
cons
erva
tion,
recr
eatio
n an
d tra
de;
ranc
hing
is th
e ke
epin
g of
it. F
arm
ing
is a
llow
ed fo
r cer
tain
spec
ies,
for
inst
ance
cro
codi
les.
Hun
ting
can
only
be
done
by
KW
S fo
r pur
pose
s of p
robl
em a
nim
al
cont
rol o
r man
agem
ent p
urpo
ses.
C
ropp
ing
(har
vest
ing
for r
ange
of
prod
ucts
) may
take
pla
ce in
gam
e ra
nchi
ng, r
estri
ctio
ns a
pply
. Cul
ling
(sel
ectiv
e re
mov
al fo
r man
agem
ent
purp
oses
) is d
one
by K
WS.
Spo
rt hu
ntin
g is
not
allo
wed
. Tra
de in
w
ildlif
e sp
ecie
s req
uire
s per
mits
(6
7).
Wild
life
man
agem
ent
orie
ntat
ion
Mor
e ac
tivis
t app
roac
h (1
0);
com
mer
cial
ly m
otiv
ated
rang
e m
anag
emen
t of w
ild a
nd
dom
estic
stoc
k (1
1).
Ecos
yste
m-b
ased
wild
life
man
agem
ent.
Expa
nsio
n of
the
prot
ecte
d ar
eas i
n pa
rtner
ship
ar
rang
emen
ts.
Polic
y on
pr
otec
ted
area
s Pr
omot
e cr
eatio
n of
new
N
atio
nal P
arks
, Res
erve
s and
C
ount
y C
ounc
il G
ame
Res
erve
s (51
); pr
ovis
ion
for
nego
tiatio
n an
d de
clar
atio
n of
pr
otec
tion
area
s (61
). R
even
ue
from
par
ks a
nd re
serv
es g
oes
to a
Con
solid
ated
Fun
d (n
ew,
20).
The
mi n
iste
r may
dec
lare
any
ar
ea o
f lan
d as
NP
(6),
NR
(18)
or
LS
(19,
see
belo
w);
area
s ad
jace
nt to
a N
P, N
R o
r LS
may
be
dec
lare
d pr
otec
tion
area
with
re
stric
ted
activ
ities
(15).
Men
tione
d in
func
tions
KW
S:
Prep
are
and
impl
emen
t m
anag
emen
t pla
ns fo
r NP+
NR
; ad
vise
gov
ernm
ent o
n cr
eatio
n of
pro
tect
ed a
reas
.
Bou
ndar
y ch
ange
s thr
ough
the
regi
onal
wild
life
cons
erva
tion
com
mitt
ee, b
ased
on
envi
ronm
enta
l im
pact
ass
essm
ent (
in li
ne w
ith
EMC
A).
Ever
y pr
otec
ted
area
re
quire
s a m
anag
emen
t pla
n in
line
w
ith th
e re
quire
men
ts o
f the
Wild
life
Act
. Con
serv
atio
n an
d m
anag
emen
t of
wet
land
s is n
ew (4
4); a
lso
prot
ectio
n of
end
ange
red
ecos
yste
ms
(45)
; New
: Con
stitu
ency
Wild
life
Ass
ocia
tions
(58)
.
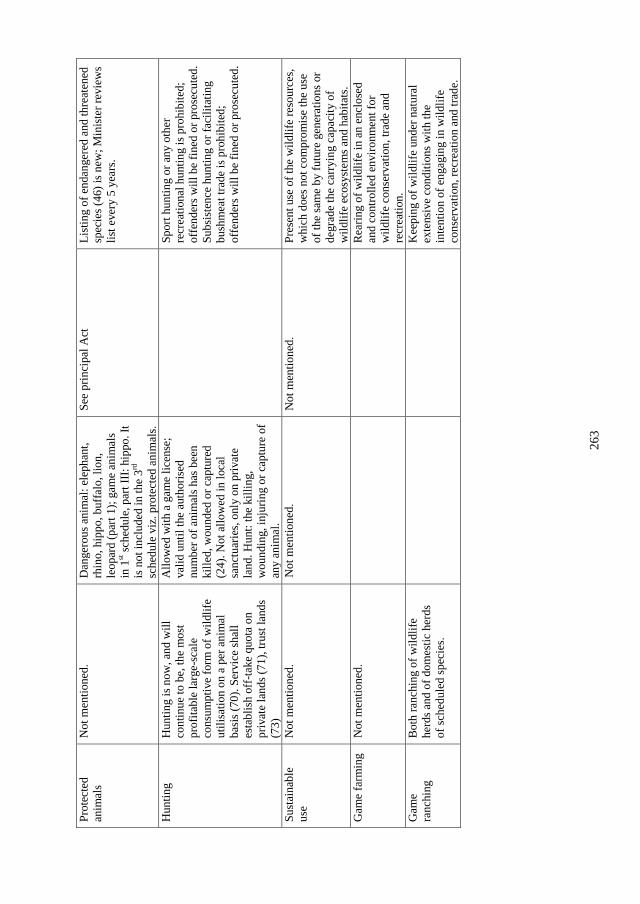
263
Prot
ecte
d an
imal
s N
ot m
entio
ned.
D
ange
rous
ani
mal
: ele
phan
t, rh
ino,
hip
po, b
uffa
lo, l
ion,
l e
opar
d (p
art 1
); ga
me
anim
als
in 1
st sc
hedu
le, p
art I
II: h
ippo
. It
is n
ot in
clud
ed in
the
3rd
sche
dule
viz
. pro
tect
ed a
nim
als.
See
prin
cipa
l Act
Li
stin
g of
end
ange
red
and
thre
aten
ed
spec
ies (
46) i
s new
; Min
iste
r rev
iew
s lis
t eve
ry 5
yea
rs.
Hun
ting
Hun
ting
is n
ow, a
nd w
ill
cont
inue
to b
e, th
e m
ost
prof
itabl
e la
rge-
scal
e co
nsum
ptiv
e fo
rm o
f wild
life
utili
satio
n on
a p
er a
nim
al
basi
s (70
). Se
rvic
e sh
all
esta
blis
h of
f-tak
e qu
ota
on
priv
ate
land
s (71
), tru
st la
nds
(73)
Allo
wed
with
a g
ame
licen
se;
valid
unt
il th
e au
thor
ised
nu
mbe
r of a
nim
als h
as b
een
kille
d, w
ound
ed o
r cap
ture
d (2
4). N
ot a
llow
ed in
loca
l sa
nctu
arie
s, on
ly o
n pr
ivat
e la
nd. H
unt:
the
killi
ng,
wou
ndin
g, in
jurin
g or
cap
ture
of
any
anim
al.
Spor
t hun
ting
or a
ny o
ther
re
crea
tiona
l hun
ting
is p
rohi
bite
d;
offe
nder
s will
be
fined
or p
rose
cute
d.
Subs
iste
nce
hunt
ing
or fa
cilit
atin
g bu
shm
eat t
rade
is p
rohi
bite
d;
offe
nder
s will
be
fined
or p
rose
cute
d.
Sust
aina
ble
use
Not
men
tione
d.
Not
men
tione
d.
Not
men
tione
d.
Pres
ent u
se o
f the
wild
life
reso
urce
s, w
hich
doe
s not
com
prom
ise
the
use
of th
e sa
me
by fu
ture
gen
erat
ions
or
degr
ade
the
carr
ying
cap
acity
of
wild
life
ecos
yste
ms a
nd h
abita
ts.
Gam
e fa
rmin
g N
ot m
entio
ned.
R
earin
g of
wild
life
in a
n en
clos
ed
and
cont
rolle
d en
viro
nmen
t for
w
ildlif
e co
nser
vatio
n, tr
ade
and
recr
eatio
n.
Gam
e ra
nchi
ng
Bot
h ra
nchi
ng o
f wild
life
herd
s and
of d
omes
tic h
erds
of
sche
dule
d sp
ecie
s.
Kee
ping
of w
ildlif
e un
der n
atur
al
exte
nsiv
e co
nditi
ons w
ith th
e in
tent
ion
of e
ngag
ing
in w
ildlif
e co
nser
vatio
n, re
crea
tion
and
trade
.
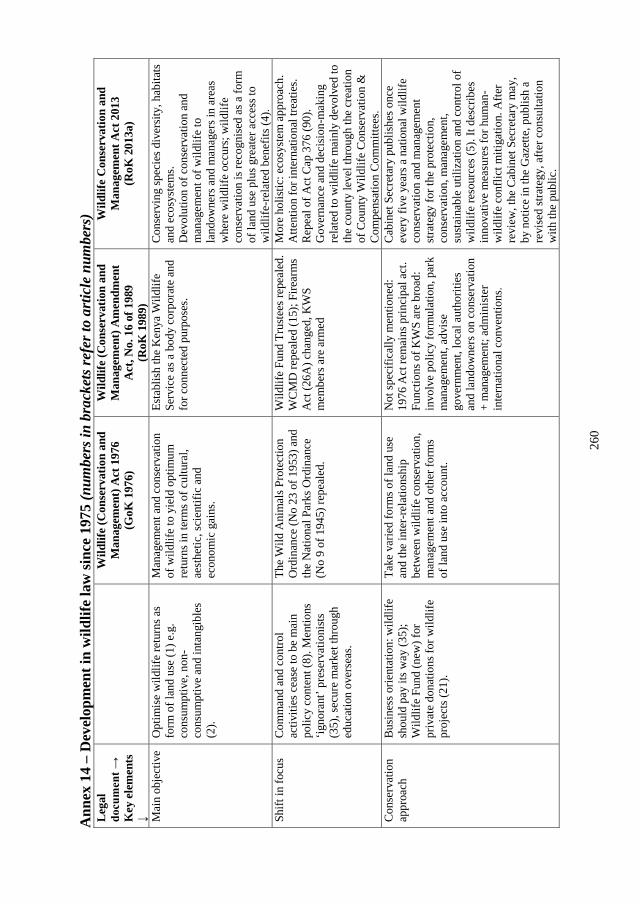
260
Ann
ex 1
4 –
Dev
elop
men
t in
wild
life
law
sinc
e 19
75 (n
umbe
rs in
bra
cket
s ref
er to
art
icle
num
bers
) Le
gal
docu
men
t →
Key
ele
men
ts
↓
Wild
life
(Con
serv
atio
n an
d M
anag
emen
t) A
ct 1
976
(G
oK 1
976)
Wild
life
(Con
serv
atio
n an
d M
anag
emen
t) A
men
dmen
t A
ct, N
o. 1
6 of
198
9
(RoK
198
9)
Wild
life
Con
serv
atio
n an
d M
anag
emen
t Act
201
3 (R
oK 2
013a
)
Mai
n ob
ject
ive
Opt
imis
e w
ildlif
e re
turn
s as
form
of l
and
use
(1) e
.g.
cons
umpt
ive,
non
-co
nsum
ptiv
e an
d in
tang
ible
s (2
).
Man
agem
ent a
nd c
onse
rvat
ion
of w
ildlif
e to
yie
ld o
ptim
um
retu
rns i
n te
rms o
f cul
tura
l, ae
sthe
tic, s
cien
tific
and
ec
onom
ic g
ains
.
Esta
blis
h th
e K
enya
Wild
life
Serv
ice
as a
bod
y co
rpor
ate
and
for c
onne
cted
pur
pose
s.
Con
serv
ing
spec
ies d
iver
sity
, hab
itats
an
d ec
osys
tem
s. D
evol
utio
n of
con
serv
atio
n an
d m
anag
emen
t of w
ildlif
e to
la
ndow
ners
and
man
ager
s in
area
s w
here
wild
life
occu
rs; w
ildlif
e co
nser
vatio
n is
reco
gnis
ed a
s a fo
rm
of la
nd u
se p
lus g
reat
er a
cces
s to
wild
life-
rela
ted
bene
fits (
4).
Shift
in fo
cus
Com
man
d an
d co
ntro
l ac
tiviti
es c
ease
to b
e m
ain
polic
y co
nten
t (8)
. Men
tions
‘ig
nora
nt’ p
rese
rvat
ioni
sts
(35)
, sec
ure
mar
ket t
hrou
gh
educ
atio
n ov
erse
as.
The
Wild
Ani
mal
s Pro
tect
ion
Ord
inan
ce (N
o 23
of 1
953)
and
th
e N
atio
nal P
arks
Ord
inan
ce
(No
9 of
194
5) re
peal
ed.
Wild
life
Fund
Tru
stee
s rep
eale
d.
WC
MD
repe
aled
(15)
; Fire
arm
s A
ct (2
6A) c
hang
ed, K
WS
mem
bers
are
arm
ed
Mor
e ho
listic
: eco
syst
em a
ppro
ach.
A
ttent
ion
for i
nter
natio
nal t
reat
ies.
Rep
eal o
f Act
Cap
376
(90)
. G
over
nanc
e an
d de
cisi
on-m
akin
g re
late
d to
wild
life
mai
nly
devo
lved
to
the
coun
ty le
vel t
hrou
gh th
e cr
eatio
n of
Cou
nty
Wild
life
Con
serv
atio
n &
C
ompe
nsat
ion
Com
mitt
ees.
Con
serv
atio
n ap
proa
ch
Bus
ines
s orie
ntat
ion:
wild
life
shou
ld p
ay it
s way
(35)
; W
ildlif
e Fu
nd (n
ew) f
or
priv
ate
dona
tions
for w
ildlif
e pr
ojec
ts (2
1).
Take
var
ied
form
s of l
and
use
and
the
inte
r-rel
atio
nshi
p be
twee
n w
ildlif
e co
nser
vatio
n,
man
agem
ent a
nd o
ther
form
s of
land
use
into
acc
ount.
Not
spec
i fica
lly m
entio
ned:
19
76 A
ct re
mai
ns p
rinci
pal a
ct.
Func
tions
of K
WS
are
broa
d:
invo
lve
polic
y fo
rmul
atio
n, p
ark
man
agem
ent,
advi
se
gove
rnm
ent,
loca
l aut
horit
ies
and
land
owne
rs o
n co
nser
vatio
n +
man
agem
ent;
adm
inis
ter
inte
rnat
iona
l con
vent
ions.
Cab
inet
Sec
reta
ry p
ublis
hes o
nce
ever
y fiv
e ye
ars a
nat
iona
l wild
life
cons
erva
tion
and
man
agem
ent
stra
tegy
for t
he p
rote
ctio
n,
cons
erva
tion,
man
agem
ent,
sust
aina
ble
utili
zatio
n an
d co
ntro
l of
wild
life
reso
urce
s (5)
. It d
escr
ibes
in
nova
tive
mea
sure
s for
hum
an-
wild
life
conf
lict m
itiga
tion.
Afte
r re
view
, the
Cab
inet
Sec
reta
ry m
ay,
by n
otic
e in
the
Gaz
ette
, pub
lish
a re
vise
d st
rate
gy, a
fter c
onsu
ltatio
n w
ith th
e pu
blic
.
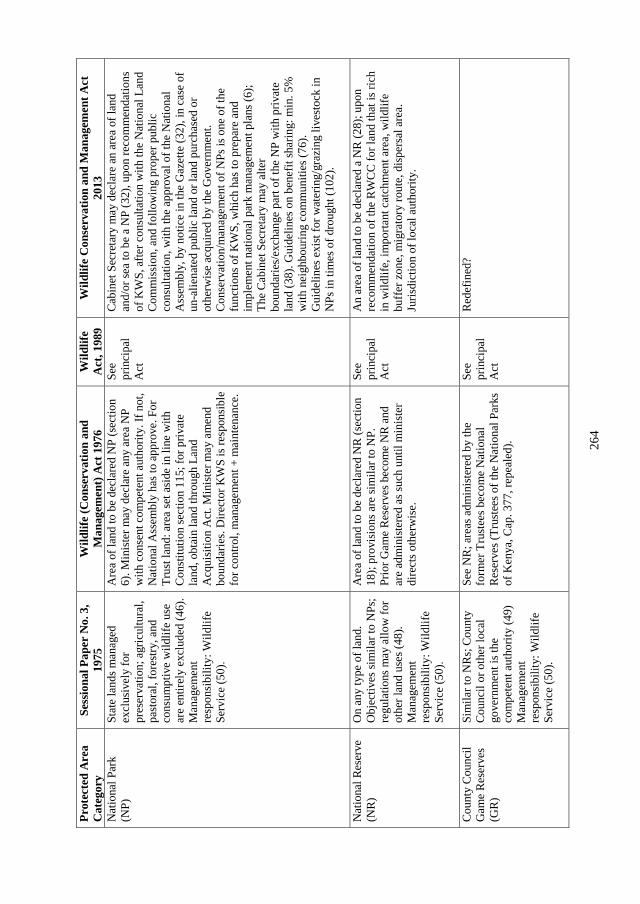
264
Prot
ecte
d A
rea
Cat
egor
y Se
ssio
nal P
aper
No.
3,
1975
W
ildlif
e (C
onse
rvat
ion
and
Man
agem
ent)
Act
197
6 W
ildlif
e A
ct, 1
989
Wild
life
Con
serv
atio
n an
d M
anag
emen
t Act
20
13
Nat
iona
l Par
k (N
P)
Stat
e la
nds m
anag
ed
excl
usiv
ely
for
pres
erva
tion;
agr
icul
tura
l, pa
stor
al, f
ores
try, a
nd
cons
umpt
ive
wild
life
use
are
entir
ely
excl
uded
(46)
. M
ana g
emen
t re
spon
sibi
lity:
Wild
life
Serv
ice
(50).
Are
a of
land
to b
e de
clar
ed N
P (s
ectio
n 6)
. Min
iste
r may
dec
lare
any
are
a N
P w
ith c
onse
nt c
ompe
tent
aut
horit
y. If
not
, N
atio
nal A
ssem
bly
has t
o ap
prov
e. F
or
Trus
t lan
d: a
rea
set a
side
in li
ne w
ith
Con
stitu
tion
sect
ion
115;
for p
rivat
e la
nd, o
btai
n la
nd th
roug
h La
nd
Acq
uisi
tion
Act
. Min
iste
r may
am
end
boun
darie
s. D
irect
or K
WS
is re
spon
sibl
e fo
r con
trol,
man
agem
ent +
mai
nten
ance
.
See
prin
cipa
l A
ct
Cab
inet
Sec
reta
ry m
ay d
ecla
re a
n ar
ea o
f lan
d an
d/or
sea
to b
e a
NP
(32)
, upo
n re
com
men
datio
ns
of K
WS,
afte
r con
sulta
tion
with
the
Nat
iona
l Lan
d C
omm
issi
on, a
nd fo
llow
ing
prop
er p
ublic
co
nsul
tatio
n, w
ith th
e ap
prov
al o
f the
Nat
iona
l A
ssem
bly,
by
notic
e in
the
Gaz
ette
(32)
, in
case
of
un-a
liena
ted
publ
ic la
nd o
r lan
d pu
rcha
sed
or
othe
rwis
e ac
quire
d by
the
Gov
ernm
ent.
C
onse
rvat
ion/
man
agem
ent o
f NPs
is o
ne o
f the
fu
nctio
ns o
f KW
S, w
hich
has
to p
repa
re a
nd
impl
emen
t nat
iona
l par
k m
anag
emen
t pla
ns (6
); Th
e C
abin
et S
ecre
tary
may
alte
r bo
unda
ries/
exch
ange
par
t of t
he N
P w
ith p
rivat
e la
nd (3
8). G
uide
lines
on
bene
fit sh
arin
g: m
in. 5
%
with
nei
ghbo
urin
g co
mm
uniti
es (7
6).
Gui
delin
es e
xist
for w
ater
ing/
graz
ing
lives
tock
in
NPs
in ti
mes
of d
roug
ht (1
02).
Nat
iona
l Res
erve
(N
R)
On
any
type
of l
and.
O
bjec
tives
sim
ilar t
o N
P s;
regu
latio
ns m
ay a
llow
for
othe
r lan
d us
es (4
8).
Man
agem
ent
resp
onsi
bilit
y: W
ildlif
e Se
rvic
e (5
0).
Are
a of
land
to b
e de
clar
ed N
R (s
ectio
n 18
); pr
ovis
ions
are
sim
ilar t
o N
P.
Prio
r Gam
e R
eser
ves b
ecom
e N
R a
nd
are
adm
inis
tere
d as
such
unt
il m
inis
ter
dire
cts o
ther
wis
e.
See
prin
cipa
l A
ct
An
area
of l
and
to b
e de
clar
ed a
NR
(28)
; upo
n re
com
men
datio
n of
the
RW
CC
for l
and
that
is ri
ch
in w
ildlif
e, im
porta
nt c
atch
men
t are
a, w
ildlif
e bu
ffer
zon
e, m
igra
tory
rout
e, d
ispe
rsal
are
a.
Juris
dict
ion
of lo
cal a
utho
rity.
Cou
nty
Cou
ncil
Gam
e R
eser
ves
(GR
)
Sim
ilar t
o N
Rs;
Cou
nty
Cou
ncil
or o
ther
loca
l go
vern
men
t is t
he
com
pete
nt a
utho
rity
(49)
M
anag
emen
t re
spon
sibi
lity:
Wild
life
Serv
ice
(50)
.
See
NR
; are
as a
dmin
iste
red
by th
e fo
rmer
Tru
stee
s bec
ome
Nat
iona
l R
eser
ves (
Trus
tees
of t
he N
atio
nal P
arks
of
Ken
ya, C
ap. 3
77, r
epea
led)
.
See
prin
cipa
l A
ct
Red
efin
ed?
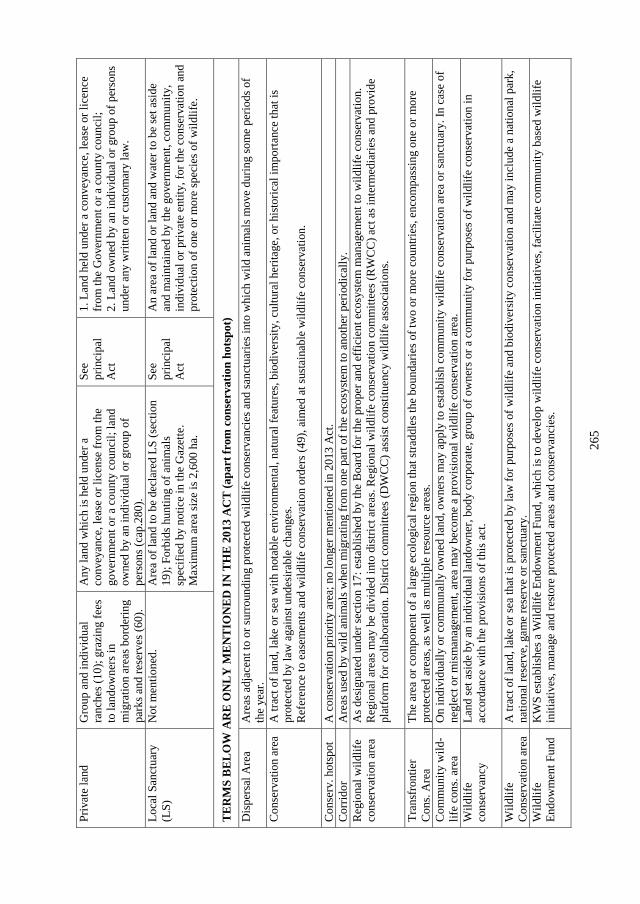
265
Priv
ate
land
G
roup
and
indi
vidu
al
ranc
hes (
10);
graz
ing
fees
to
land
owne
rs in
m
igra
tion
area
s bor
derin
g pa
rks a
nd re
serv
es (6
0).
Any
land
whi
ch is
hel
d un
der a
co
nvey
ance
, lea
se o
r lic
ense
from
the
gove
rnm
ent o
r a c
ount
y co
unci
l; la
nd
owne
d by
an
indi
vidu
al o
r gro
up o
f pe
rson
s (ca
p.28
0).
See
prin
cipa
l A
ct
1.La
nd h
eld
unde
r a c
onve
yanc
e, le
ase
or li
cenc
efr
om th
e G
over
nmen
t or a
cou
nty
coun
cil;
2.La
nd o
wne
d by
an
indi
vidu
al o
r gro
up o
f per
sons
unde
r any
writ
ten
or c
usto
mar
y la
w.
Loca
l San
ctua
ry
(LS)
N
ot m
entio
ned.
A
rea
of la
nd to
be
decl
ared
LS
(sec
tion
19);
Forb
ids h
untin
g of
ani
mal
s sp
ecifi
ed b
y no
tice
in th
e G
azet
te.
Max
imum
are
a si
ze is
2,6
00 h
a.
See
prin
cipa
l A
ct
An
area
of l
and
or la
nd a
nd w
ater
to b
e se
t asi
de
and
mai
ntai
ned
by th
e go
vern
men
t, co
mm
unity
, in
divi
dual
or p
rivat
e en
tity,
for t
he c
onse
rvat
ion
and
prot
ectio
n of
one
or m
ore
spec
ies o
f wild
life.
TER
MS
BEL
OW
AR
E O
NLY
MEN
TIO
NED
IN T
HE
2013
AC
T (a
part
from
con
serv
atio
n ho
tspo
t) D
ispe
rsal
Are
a A
reas
adj
acen
t to
or su
rrou
ndin
g pr
otec
ted
wild
life
cons
erva
ncie
s and
sanc
tuar
ies i
nto
whi
ch w
ild a
nim
als m
ove
durin
g so
me
perio
ds o
f th
e ye
ar.
Con
serv
atio
n ar
ea
A tr
act o
f lan
d, la
ke o
r sea
with
not
able
env
ironm
enta
l, na
tura
l fea
ture
s, bi
odiv
ersi
ty, c
ultu
ral h
erita
ge, o
r his
toric
al im
porta
nce
that
is
prot
ecte
d by
law
aga
inst
und
esira
ble
chan
ges.
Ref
eren
ce to
eas
emen
ts a
nd w
ildlif
e co
nser
vatio
n or
ders
(49)
, aim
ed a
t sus
tain
able
wild
life
cons
erva
tion.
Con
serv
. hot
spot
A
con
serv
atio
n pr
iorit
y ar
ea; n
o lo
nger
men
tione
d in
201
3 A
ct.
Cor
ridor
A
reas
use
d by
wild
ani
mal
s whe
n m
igra
ting
from
one
par
t of t
he e
cosy
stem
to a
noth
er p
erio
dica
lly.
Reg
iona
l wild
life
cons
erva
tion
area
A
s des
igna
ted
unde
r sec
tion
17: e
stab
lishe
d by
the
Boa
rd fo
r the
pro
per a
nd e
ffic
ient
eco
syst
em m
anag
emen
t to
wild
life
cons
erva
tion.
R
egio
nal a
reas
may
be
divi
ded
into
dis
trict
are
as. R
egio
nal w
ildlif
e co
nser
vatio
n co
mm
ittee
s (R
WC
C) a
ct a
s int
erm
edia
ries a
nd p
rovi
de
plat
form
for c
olla
bora
tion.
Dis
trict
com
mitt
ees (
DW
CC) a
ssis
t con
stitu
ency
wild
life
asso
ciat
ions
.
Tran
sfro
ntie
r C
ons.
Are
a Th
e ar
ea o
r com
pone
nt o
f a la
rge
ecol
ogic
al re
gion
that
stra
ddle
s the
bou
ndar
ies o
f tw
o or
mor
e co
untri
es, e
ncom
pass
ing
one
or m
ore
prot
ecte
d ar
eas,
as w
ell a
s mul
tiple
reso
urce
are
as.
Com
mun
ity w
ild-
life
cons
. are
a O
n in
divi
dual
ly o
r com
mun
ally
ow
ned
land
, ow
ners
may
app
ly to
est
ablis
h co
mm
unity
wild
life
cons
erva
tion
area
or s
anct
uary
. In
case
of
negl
ect o
r mis
man
agem
ent,
area
may
bec
ome
a pr
ovis
iona
l wild
life
cons
erva
tion
area
. W
ildlif
e co
nser
vanc
y La
nd se
t asi
de b
y an
indi
vidu
al la
ndow
ner,
body
cor
pora
te, g
roup
of o
wne
rs o
r a c
omm
unity
for p
urpo
ses o
f wild
life
cons
erva
tion
in
acco
rdan
ce w
ith th
e pr
ovis
ions
of t
his a
ct.
Wild
life
Con
serv
atio
n ar
ea
A tr
act o
f lan
d, la
ke o
r sea
that
is p
rote
cted
by
law
for p
urpo
ses o
f wild
life
and
biod
iver
sity
con
serv
atio
n an
d m
ay in
clud
e a
natio
nal p
ark,
na
tiona
l res
erve
, gam
e re
serv
e or
sanc
tuar
y.
Wild
life
Endo
wm
ent F
und
KW
S es
tabl
ishe
s a W
ildlif
e En
dow
men
t Fun
d, w
hich
is to
dev
elop
wild
life
cons
erva
tion
initi
ativ
es, f
acili
tate
com
mun
ity b
ased
wild
life
initi
ativ
es, m
anag
e an
d re
store
pro
tect
ed a
reas
and
con
serv
anci
es.
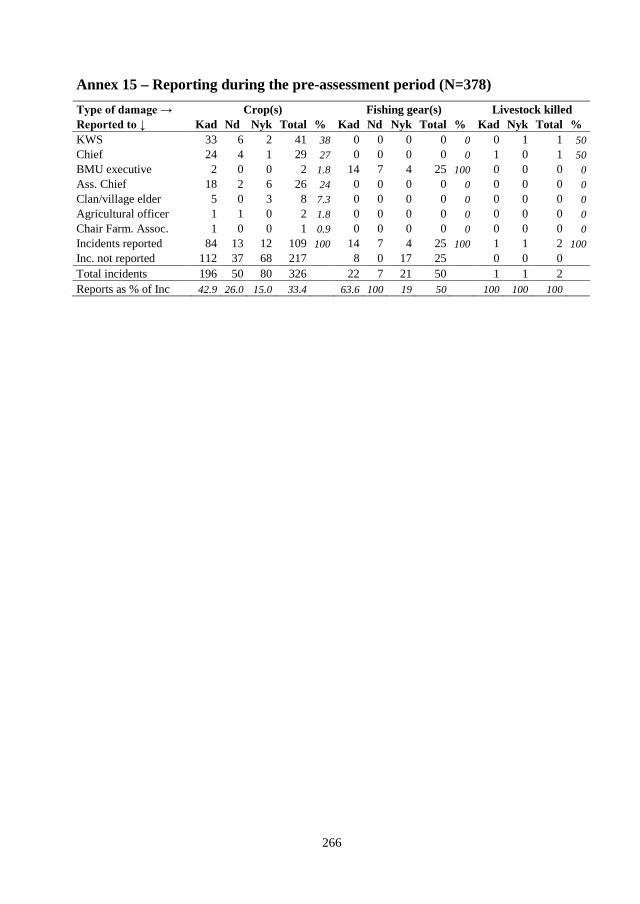
266
Annex 15 – Reporting during the pre-assessment period (N=378)Type of damage → Crop(s) Fishing gear(s) Livestock killed Reported to ↓ Kad Nd Nyk Total % Kad Nd Nyk Total % Kad Nyk Total % KWS 33 6 2 41 38 0 0 0 0 0 0 1 1 50 Chief 24 4 1 29 27 0 0 0 0 0 1 0 1 50 BMU executive 2 0 0 2 1.8 14 7 4 25 100 0 0 0 0 Ass. Chief 18 2 6 26 24 0 0 0 0 0 0 0 0 0 Clan/village elder 5 0 3 8 7.3 0 0 0 0 0 0 0 0 0 Agricultural officer 1 1 0 2 1.8 0 0 0 0 0 0 0 0 0 Chair Farm. Assoc. 1 0 0 1 0.9 0 0 0 0 0 0 0 0 0 Incidents reported 84 13 12 109 100 14 7 4 25 100 1 1 2 100 Inc. not reported 112 37 68 217 8 0 17 25 0 0 0 Total incidents 196 50 80 326 22 7 21 50 1 1 2 Reports as % of Inc 42.9 26.0 15.0 33.4 63.6 100 19 50 100 100 100
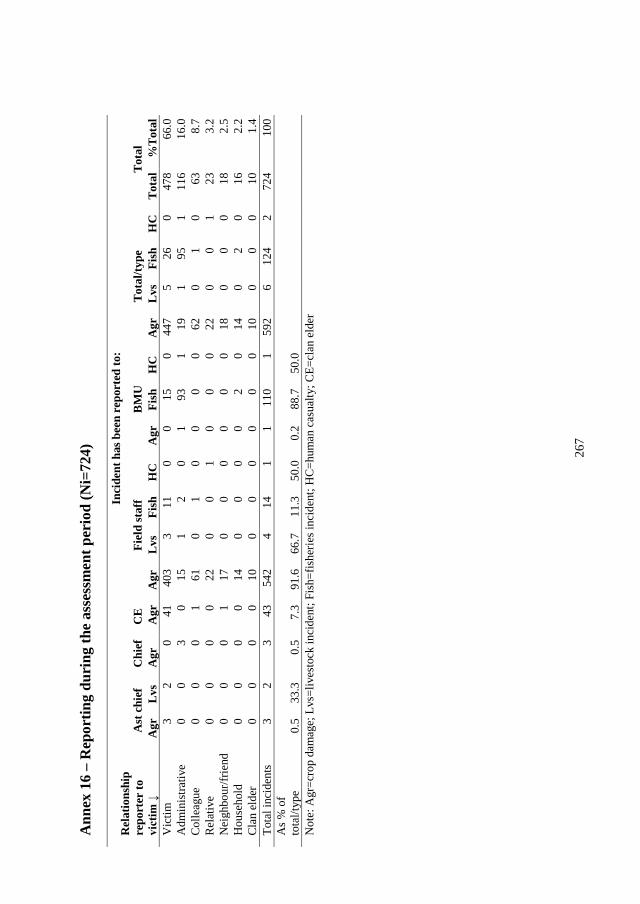
267
Ann
ex 1
6 –
Rep
ortin
g du
ring
the
asse
ssm
ent p
erio
d (N
i=72
4)
Rel
atio
nshi
p re
port
er to
vi
ctim
↓
Inci
dent
has
bee
n re
port
ed to
:
Ast
chi
ef
Chi
ef
CE
Fi
eld
staf
f B
MU
To
tal/t
ype
Tota
l A
gr
Lvs
Agr
A
gr
Agr
Lv
s Fi
sh
HC
A
gr
Fish
H
C
Agr
Lv
s Fi
sh
HC
To
tal
%To
tal
Vic
tim
3 2
0 41
40
3 3
11
0 0
15
0 44
7 5
26
0 47
8 66
.0
Adm
inis
trativ
e 0
0 3
0 15
1
2 0
1 93
1
19
1 95
1
116
16.0
C
olle
ague
0
0 0
1 61
0
1 0
0 0
0 62
0
1 0
63
8.7
Rel
ativ
e 0
0 0
0 22
0
0 1
0 0
0 22
0
0 1
23
3.2
Nei
ghbo
ur/fr
iend
0
0 0
1 17
0
0 0
0 0
0 18
0
0 0
18
2.5
Hou
seho
ld
0 0
0 0
14
0 0
0 0
2 0
14
0 2
0 16
2.
2 C
lan
elde
r 0
0 0
0 10
0
0 0
0 0
0 10
0
0 0
10
1.4
Tota
l inc
iden
ts 3
2 3
43
542
4 14
1
1 11
0 1
592
6 12
4 2
724
100
As %
of
tota
l/typ
e 0.
5 33
.3
0.5
7.3
91.6
66
.7
11.3
50
.0
0.2
88.7
50
.0
Not
e: A
gr=c
rop
dam
age;
Lvs
=liv
esto
ck in
cide
nt; F
ish=
fishe
ries i
ncid
ent;
HC
=hum
an c
asua
lty; C
E=cl
an e
lder
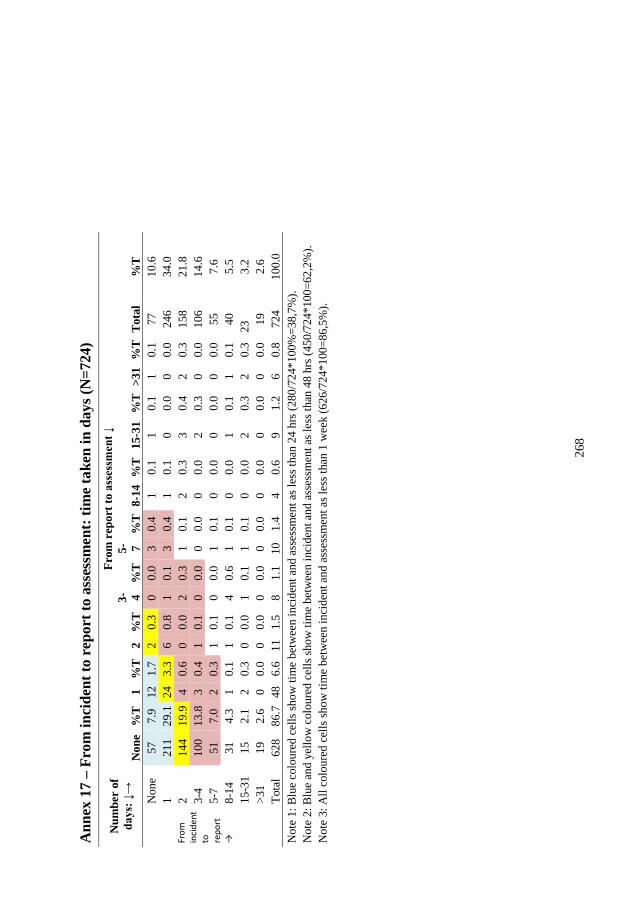
268
Ann
ex 1
7 –
From
inci
dent
to r
epor
t to
asse
ssm
ent:
tim
e ta
ken
in d
ays (
N=7
24)
Num
ber
of
days
: ↓→
From
rep
ort t
o as
sess
men
t ↓
Non
e %
T
1 %
T
2 %
T
3- 4 %
T
5- 7 %
T 8
-14
%T
15
-31
%T
>31
%T
Tot
al
%T
From
in
cide
nt
to
repo
rt
→
Non
e 57
7.
9 12
1.
7 2
0.3
0 0.
0 3
0.4
1 0.
1 1
0.1
1 0.
1 77
10
.6
1 21
1 29
.1 2
4 3.
3 6
0.8
1 0.
1 3
0.4
1 0.
1 0
0.0
0 0.
0 24
6 34
.0
2 14
4 19
.9
4 0.
6 0
0.0
2 0.
3 1
0.1
2 0.
3 3
0.4
2 0.
3 15
8 21
.8
3-4
100
13.8
3
0.4
1 0.
1 0
0.0
0 0.
0 0
0.0
2 0.
3 0
0.0
106
14.6
5-
7 51
7.
0 2
0.3
1 0.
1 0
0.0
1 0.
1 0
0.0
0 0.
0 0
0.0
55
7.6
8-14
31
4.
3 1
0.1
1 0.
1 4
0.6
1 0.
1 0
0.0
1 0.
1 1
0.1
40
5.5
15-3
1 15
2.
1 2
0.3
0 0.
0 1
0.1
1 0.
1 0
0.0
2 0.
3 2
0.3
23
3.2
>31
19
2.6
0 0.
0 0
0.0
0 0.
0 0
0.0
0 0.
0 0
0.0
0 0.
0 19
2.
6 To
tal
628
86.7
48
6.6
11
1.5
8 1.
1 10
1.
4 4
0.6
9 1.
2 6
0.8
724
100.
0 N
ote
1: B
lue
colo
ured
cel
ls sh
ow ti
me
betw
een
inci
dent
and
ass
essm
ent a
s les
s tha
n 24
hrs
(280
/724
*100
%=3
8,7%
). N
ote
2: B
lue
and
yello
w c
olou
red
cells
show
tim
e be
twee
n in
cide
nt a
nd a
sses
smen
t as l
ess t
han
48 h
rs (4
50/7
24*1
00=6
2,2%
). N
ote
3: A
ll co
lour
ed c
ells
show
tim
e be
twee
n in
cide
nt a
nd a
sses
smen
t as l
ess t
han
1 w
eek
(626
/724
*100
=86,
5%).
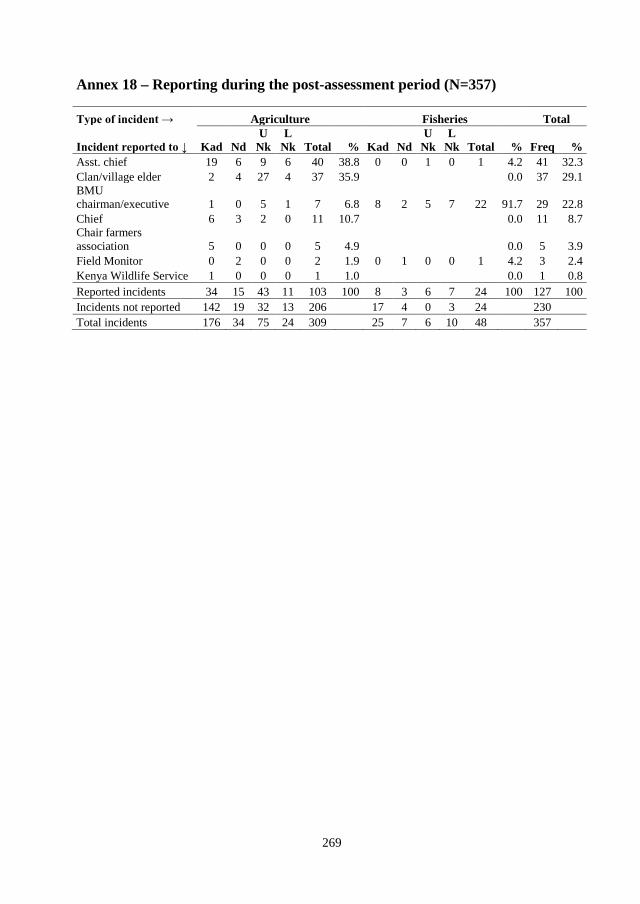
269
Annex 18 – Reporting during the post-assessment period (N=357)
Type of incident → Agriculture Fisheries Total
Incident reported to ↓ Kad Nd U
Nk L
Nk Total % Kad Nd U
Nk L
Nk Total % Freq % Asst. chief 19 6 9 6 40 38.8 0 0 1 0 1 4.2 41 32.3 Clan/village elder 2 4 27 4 37 35.9 0.0 37 29.1 BMU chairman/executive 1 0 5 1 7 6.8 8 2 5 7 22 91.7 29 22.8 Chief 6 3 2 0 11 10.7 0.0 11 8.7 Chair farmers association 5 0 0 0 5 4.9 0.0 5 3.9 Field Monitor 0 2 0 0 2 1.9 0 1 0 0 1 4.2 3 2.4 Kenya Wildlife Service 1 0 0 0 1 1.0 0.0 1 0.8 Reported incidents 34 15 43 11 103 100 8 3 6 7 24 100 127 100 Incidents not reported 142 19 32 13 206 17 4 0 3 24 230 Total incidents 176 34 75 24 309 25 7 6 10 48 357
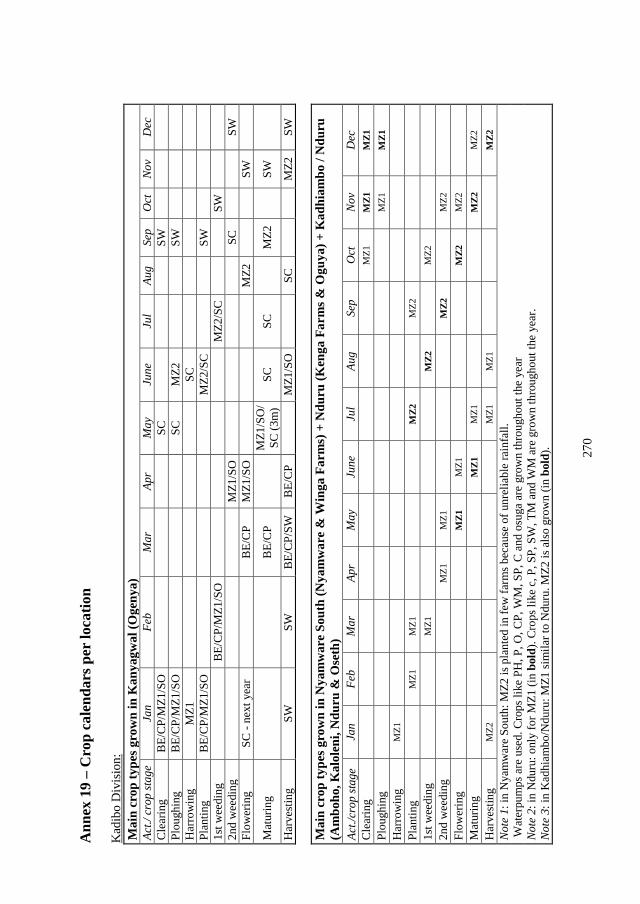
270
Ann
ex 1
9 –
Cro
p ca
lend
ars p
er lo
catio
n K
adib
o D
ivis
ion:
M
ain
crop
type
s gro
wn
in K
anya
gwal
(Oge
nya)
Ac
t./ c
rop
stage
Ja
n Fe
b M
ar
Apr
May
Ju
ne
Jul
Aug
Sep
Oct
No
v D
ec
Cle
arin
g B
E/C
P/M
Z1/S
O
SC
SW
Pl
ough
ing
BE/
CP/
MZ1
/SO
SC
MZ2
SW
Har
row
ing
MZ1
SC
Pl
antin
g B
E/C
P/M
Z1/S
O
MZ2
/SC
SW
1st w
eedi
ng
B
E/C
P/M
Z1/S
O
MZ2
/SC
SW
2n
d w
eedi
ng
M
Z1/S
O
SC
SW
Flow
erin
g SC
- ne
xt y
ear
B
E/C
P M
Z1/S
O
M
Z2
SW
Mat
urin
g
B
E/C
P
MZ1
/SO
/ SC
(3m
) SC
SC
MZ2
SW
Har
vest
ing
SW
SW
BE/
CP/
SW
BE/
CP
M
Z1/S
O
SC
M
Z2
SW
Mai
n cr
op ty
pes g
row
n in
Nya
mw
are
Sout
h (N
yam
war
e &
Win
ga F
arm
s) +
Ndu
ru (K
enga
Far
ms &
Ogu
ya) +
Kad
hiam
bo /
Ndu
ru
(Am
boho
, Kal
olen
i, N
duru
& O
seth
) Ac
t./cr
op st
age
Jan
Feb
Mar
Ap
r M
ay
June
Ju
l Au
g Se
p O
ct
Nov
Dec
C
lear
ing
M
Z1
MZ1
M
Z1
Plou
ghin
g
M
Z1
MZ1
H
arro
win
g M
Z1
Plan
ting
M
Z1
MZ1
MZ2
MZ2
1st w
eedi
ng
MZ1
M
Z2
M
Z2
2nd
wee
ding
MZ1
M
Z1
M
Z2
M
Z2
Flow
erin
g
M
Z1
MZ1
MZ2
M
Z2
Mat
urin
g
MZ1
M
Z1
M
Z2
MZ2
Har
vest
ing
MZ2
MZ1
M
Z1
M
Z2
Note
1: i
n N
yam
war
e So
uth:
MZ2
is p
lant
ed in
few
farm
s bec
ause
of u
nrel
iabl
e ra
infa
ll.
Wat
erpu
mps
are
use
d. C
rops
like
PH
, P, O
, CP,
WM
, SP,
C a
nd o
suga
are
gro
wn
thro
ugho
ut th
e ye
ar
Note
2: i
n N
duru
: onl
y fo
r MZ1
(in
bold
). Cr
ops l
ike
c, P
, SP,
SW
, TM
and
WM
are
gro
wn
thro
ugho
ut th
e ye
ar.
Note
3: i
n K
adhi
ambo
/Ndu
ru: M
Z1 si
mila
r to
Ndu
ru. M
Z2 is
als
o gr
own
(in b
old)
.
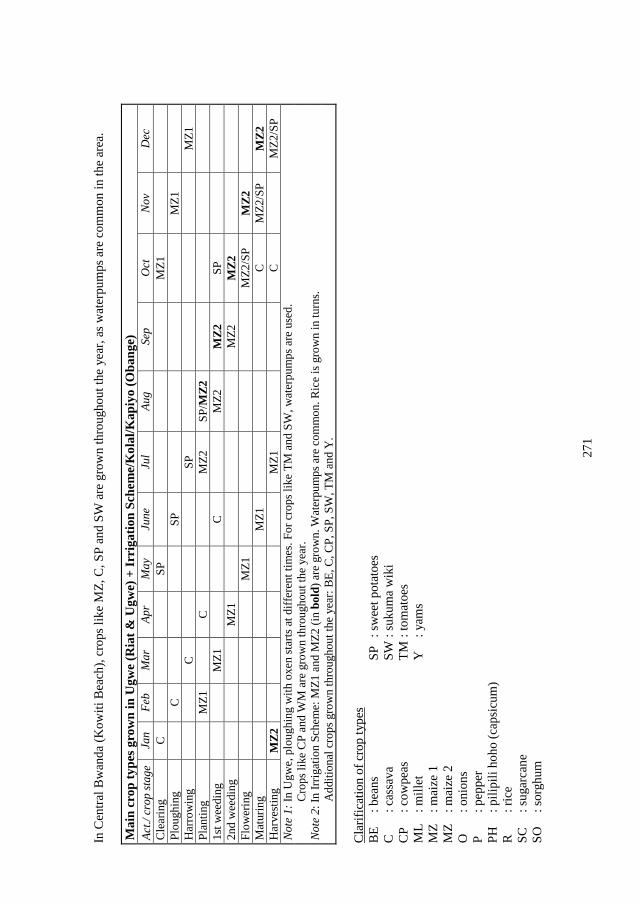
271
In C
entra
l Bw
anda
(Kow
iti B
each
), cr
ops l
ike
MZ,
C, S
P an
d SW
are
gro
wn
thro
ugho
ut th
e ye
ar, a
s wat
erpu
mps
are
com
mon
in th
e ar
ea.
Mai
n cr
op ty
pes g
row
n in
Ugw
e (R
iat &
Ugw
e) +
Irri
gatio
n Sc
hem
e/K
olal
/Kap
iyo
(Oba
nge)
Ac
t./ c
rop
stage
Ja
n Fe
b M
ar
Apr
May
Ju
ne
Jul
Aug
Sep
Oct
No
v D
ec
Cle
arin
g C
SP
M
Z1
Plou
ghin
g C
SP
M
Z1
Har
row
ing
C
SP
MZ1
Pl
antin
g M
Z1
C
MZ2
SP
/MZ2
1s
t wee
ding
M
Z1
C
MZ2
M
Z2
SP
2nd
wee
ding
M
Z1
MZ2
M
Z2
Flow
erin
g M
Z1
MZ2
/SP
MZ2
M
atur
ing
MZ1
C
M
Z2/S
P M
Z2
Har
vest
ing
MZ2
M
Z1
C
MZ2
/SP
Note
1: I
n U
gwe,
plo
ughi
ng w
ith o
xen
star
ts a
t diff
eren
t tim
es. F
or c
rops
like
TM
and
SW
, wat
erpu
mps
are
use
d.
Cro
ps li
ke C
P an
d W
M a
re g
row
n th
roug
hout
the
year
. No
te 2
: In
Irrig
atio
n Sc
hem
e: M
Z1 a
nd M
Z2 (i
n bo
ld) a
re g
row
n. W
ater
pum
ps a
re c
omm
on. R
ice
is g
row
n in
turn
s.
A
dditi
onal
cro
ps g
row
n th
roug
hout
the
year
: BE,
C, C
P, S
P, S
W, T
M a
nd Y
.
Cla
rific
atio
n of
cro
p ty
pes
BE
: bea
ns
SP
: sw
eet p
otat
oes
C
: cas
sava
SW
: su
kum
a w
iki
CP
: cow
peas
TM
: to
mat
oes
ML
: mill
et
Y
: yam
s M
Z : m
aize
1
MZ
: mai
ze 2
O
: o
nion
s P
: pep
per
PH
: pili
pili
hoho
(cap
sicu
m)
R
: ric
e SC
: s
ugar
cane
SO
: s
orgh
um
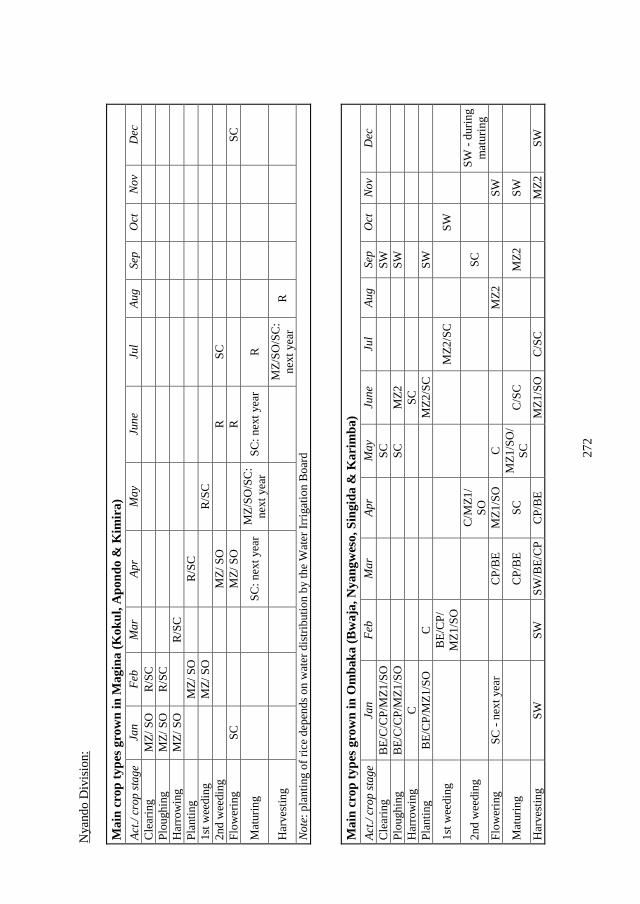
272
Nya
ndo
Div
isio
n:
Mai
n cr
op ty
pes g
row
n in
Mag
ina
(Kok
ul, A
pond
o &
Kim
ira)
Ac
t./ c
rop
stage
Ja
n Fe
b M
ar
Apr
May
Ju
ne
Jul
Aug
Sep
Oct
No
v D
ec
Cle
arin
g M
Z/ S
O
R/S
C
Plou
ghin
g M
Z/ S
O
R/S
C
Har
row
ing
MZ/
SO
R/S
C
Pl
antin
g
MZ/
SO
R/S
C
1st w
eedi
ng
M
Z/ S
O
R/S
C
2n
d w
eedi
ng
M
Z/ S
O
R
SC
Flow
erin
g SC
M
Z/ S
O
R
SC
Mat
urin
g
SC: n
ext y
ear
MZ/
SO/S
C:
next
yea
r SC
: nex
t yea
r R
Har
vest
ing
MZ/
SO/S
C:
next
yea
r R
Note
: pla
ntin
g of
rice
dep
ends
on
wat
er d
istri
butio
n by
the
Wat
er Ir
rigat
ion
Boa
rd
Mai
n cr
op ty
pes g
row
n in
Om
baka
(Bw
aja,
Nya
ngw
eso,
Sin
gida
& K
arim
ba)
Act./
cro
p sta
ge
Jan
Feb
Mar
Ap
r M
ay
June
Ju
l Au
g Se
p O
ct
Nov
Dec
C
lear
ing
BE/
C/C
P/M
Z1/S
O
SC
SW
Pl
ough
ing
BE/
C/C
P/M
Z1/S
O
SC
M
Z2
SW
H
arro
win
g C
SC
Pl
antin
g B
E/C
P/M
Z1/S
O
C
M
Z2/S
C
SW
1st w
eedi
ng
B
E/C
P/
MZ1
/SO
M
Z2/S
C
SW
2nd
wee
ding
C/M
Z1/
SO
SC
SW -
durin
g m
atur
ing
Flow
erin
g SC
- ne
xt y
ear
C
P/B
E M
Z1/S
O
C
MZ2
SW
Mat
urin
g
C
P/B
E SC
M
Z1/S
O/
SC
C/S
C
MZ2
SW
Har
vest
ing
SW
SW
SW/B
E/C
P C
P/B
E
MZ1
/SO
C
/SC
MZ2
SW
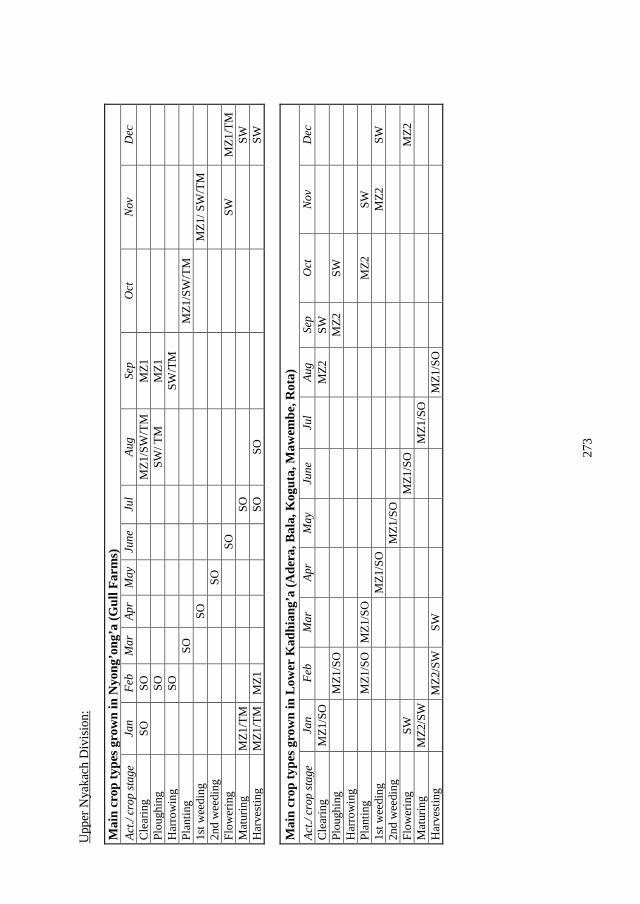
273
Upp
er N
yaka
ch D
ivis
ion:
Mai
n cr
op ty
pes g
row
n in
Nyo
ng’o
ng’a
(Gul
l Far
ms)
Ac
t./ c
rop
stage
Ja
n Fe
b M
ar
Apr
May
Ju
ne
Jul
Aug
Sep
Oct
No
v D
ec
Cle
arin
g SO
SO
MZ1
/SW
/TM
M
Z1
Pl
ough
ing
SO
SW/ T
M
MZ1
Har
row
ing
SO
SW
/TM
Plan
ting
SO
MZ1
/SW
/TM
1s
t wee
ding
SO
MZ1
/ SW
/TM
2nd
wee
ding
SO
Flow
erin
g
SO
SW
MZ1
/TM
M
atur
ing
MZ1
/TM
SO
SW
Har
vest
ing
MZ1
/TM
M
Z1
SO
SO
SW
M
ain
crop
type
s gro
wn
in L
ower
Kad
hian
g’a
(Ade
ra, B
ala,
Kog
uta,
Maw
embe
, Rot
a)
Act./
cro
p sta
ge
Jan
Feb
Mar
Ap
r M
ay
June
Ju
l Au
g Se
p O
ct
Nov
Dec
C
lear
ing
MZ1
/SO
M
Z2
SW
Pl
ough
ing
M
Z1/S
O
MZ2
SW
H
arro
win
g
Pl
antin
g
MZ1
/SO
M
Z1/S
O
MZ2
SW
1st w
eedi
ng
M
Z1/S
O
MZ2
SW
2n
d w
eedi
ng
MZ1
/SO
Flow
erin
g SW
M
Z1/S
O
M
Z2
Mat
urin
g M
Z2/S
W
M
Z1/S
O
H
arve
stin
g
MZ2
/SW
SW
M
Z1/S
O
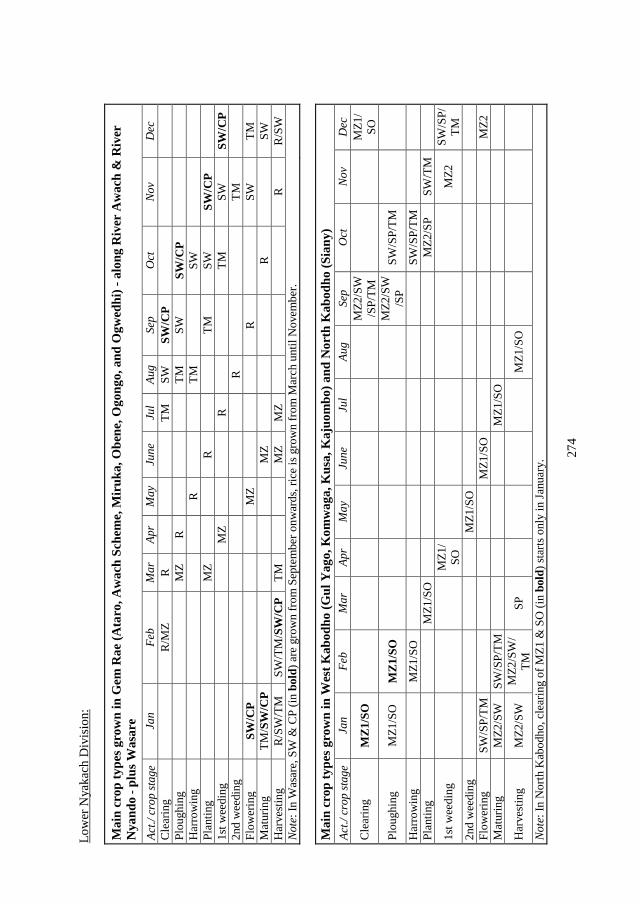
274
Low
er N
yaka
ch D
ivis
ion:
Mai
n cr
op ty
pes g
row
n in
Gem
Rae
(Ata
ro, A
wac
h Sc
hem
e, M
iruk
a, O
bene
, Ogo
ngo,
and
Ogw
edhi
) - a
long
Riv
er A
wac
h &
Riv
er
Nya
ndo
- plu
s Was
are
Act./
cro
p sta
ge
Jan
Feb
Mar
Ap
r M
ay
June
Ju
l Au
g Se
p O
ct
Nov
Dec
C
lear
ing
R/M
Z R
TM
SW
SW
/CP
Plou
ghin
g M
Z R
TM
SW
SW
/CP
Har
row
ing
R
TM
SW
Plan
ting
MZ
R
TM
SW
SW/C
P 1s
t wee
ding
M
Z R
TM
SW
SW
/CP
2nd
wee
ding
R
TM
Fl
ower
ing
SW/C
P M
Z R
SW
TM
M
atur
ing
TM/S
W/C
P M
Z R
SW
H
arve
stin
g R
/SW
/TM
SW
/TM
/SW
/CP
TM
MZ
MZ
R
R/S
W
Note
: In
Was
are,
SW
& C
P (in
bol
d) a
re g
row
n fr
om S
epte
mbe
r onw
ards
, ric
e is
gro
wn
from
Mar
ch u
ntil
Nov
embe
r.
Mai
n cr
op ty
pes g
row
n in
Wes
t Kab
odho
(Gul
Yag
o, K
omw
aga,
Kus
a, K
ajuo
mbo
) and
Nor
th K
abod
ho (S
iany
) Ac
t./ c
rop
stage
Ja
n Fe
b M
ar
Apr
May
Ju
ne
Jul
Aug
Sep
Oct
No
v D
ec
Cle
arin
g M
Z1/S
O
MZ2
/SW
/SP/
TM
MZ1
/ SO
Plou
ghin
g M
Z1/S
O
MZ1
/SO
M
Z2/S
W/S
P SW
/SP/
TM
Har
row
ing
MZ1
/SO
SW
/SP/
TM
Plan
ting
MZ1
/SO
M
Z2/S
P SW
/TM
1st w
eedi
ng
MZ1
/ SO
M
Z2
SW/S
P/
TM
2nd
wee
ding
M
Z1/S
O
Flow
erin
g SW
/SP/
TM
MZ1
/SO
M
Z2
Mat
urin
g M
Z2/S
W
SW/S
P/TM
M
Z1/S
O
Har
vest
ing
MZ2
/SW
M
Z2/S
W/
TM
SP
MZ1
/SO
Note
: In
Nor
th K
abod
ho, c
lear
ing
of M
Z1 &
SO
(in
bold
) sta
rts o
nly
in Ja
nuar
y.
275
About the author
Aenne Post (1962) studied human geography at the University of Amsterdam, the Netherlands. She graduated cum laude in 2000 with a thesis called “The hippo: nothing but a nuisance? Human-hippo conflicts in Lake Victoria Area, Kenya”, which got nominated for the National Thesis Award. After that, she worked at the Project Management Bureau of the municipality of Amsterdam as a project planner. She returned to academics to pursue her PhD at the Amsterdam Institute for Social Science Research (AISSR) of the University of Amsterdam. She was a member of CERES, the national Research School for Resource Studies in the Netherlands. During her fieldwork in Kenya, she was affiliated with the School of Environmental Studies at Moi University, Eldoret, and VIRED, the Victoria Institute for Research on Environment & Development, based in Rabuor. She is a member of the IUCN Hippo Specialist Group. Currently, she lives in Kisumu, Kenya.
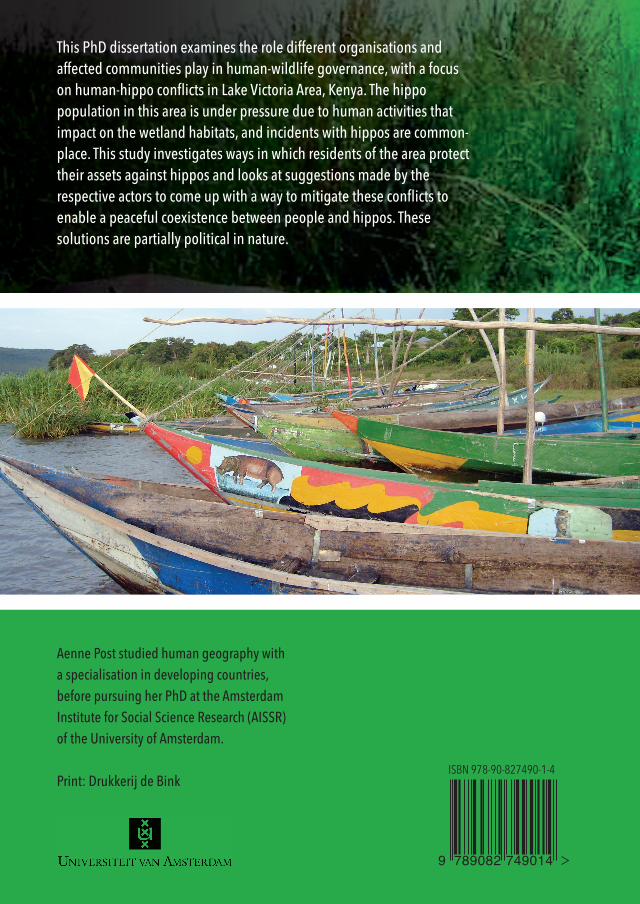
EXISTENCE VERSUS EXTINCTION
Human-hippo confl ictsin Lake Victoria Area, Kenya
Aenne W.C.H.M. Post
This PhD dissertation examines the role different organisations andaffected communities play in human-wildlife governance, with a focus on human-hippo confl icts in Lake Victoria Area, Kenya. The hippo population in this area is under pressure due to human activities that impact on the wetland habitats, and incidents with hippos are common-place. This study investigates ways in which residents of the area protect their assets against hippos and looks at suggestions made by the respective actors to come up with a way to mitigate these confl icts to enable a peaceful coexistence between people and hippos. These solutions are partially political in nature.
Aenne Post studied human geography with a specialisation in developing countries, before pursuing her PhD at the Amsterdam Institute for Social Science Research (AISSR) of the University of Amsterdam.
Print: Drukkerij de Bink
Aenne W.C.H.M
. PostE
XIS
TE
NCE
VE
RS
US
EX
TIN
CT
ION Hum
an-hippo confl icts in Lake Victoria Area, Kenya
9 789082 749014
ISBN 978-90-827490-1-4
Manu_358x240_rug18mm_C.indd 1 05-09-17 08:56