Embed Size (px)
Citation preview

Research Article Open Access
Volume 4 • Issue 6 • 1000168J Phys Chem BiophysISSN: 2161-0398 JPCB, an open access journal
Open AccessResearch Article
Physical Chemistry & Biophysics
Nikolopoulos et al., J Phys Chem Biophys 2014, 4:6http://dx.doi.org/10.4172/2161-0398.1000168
Keywords: Radon (222Rn); Antipersistency; H- values; Hurst exponents
Introduction
Radon (222Rn) is a naturally occurring radioactive gas generated by the decay of the naturally occurring 238U series [1,2]. Radon is directly produced by the decay of radium (226Ra) which is present in soil, rocks, building materials, underground and surface waters [1,3]. Ater generation it may dissolve in soil's pores and luid. hereater, it migrates near or far through difusion or convection and dilutes in atmosphere, surface and groundwater. Radon also dilutes into the atmosphere through release from its aqueous phase [1].
Radon and its progeny are the most signiicant natural sources of radiation exposure to the general population [3] contributing to about half of the total efective dose delivered to humans from all sources of ionizing radiation. he exposure is mainly delivered in domestic environments since the largest period of human lifetime is spent indoors. herefore, the measurement and limitation of radon concentration of buildings are important [4].
Moreover, radon has been considered as an additional factor of radiation burden in stomach mainly due to water consumption [5,6]. Various organizations such as WHO, US-EPA and UNSCEAR [3,5,7] refer to this additional burden which can be estimated by measurements of radon concentrations in waters. Regarding Europe the maximum concentration values for radon are proposed by the European Commission [8]. Human exposure to high concentrations of radon and progeny has been correlated to lung cancer incidence [9,10]. For this reason, radon is considered to be a natural carcinogen of great importance.
he typical radon concentrations outdoors are low [3]. However, indoor radon may accumulate at signiicant levels. Radon accumulation depends on the radioactive properties of the underlying soil and rock, the building structure and the various ways of indoor ventilation and heating [1,3]. Radon in water contributes as well [11,12] and sometimes signiicantly [13].
*Corresponding author: Dimitrios Nikolopoulos, TEI of Piraeus, Department
of Electronic Computer Systems Engineering, Petrou Ralli & Thivon 250, GR-
12244 Aigaleo, Greece, Tel: +0030-210-5381110; Fax: +0030-210-5381436;
E-mail: [email protected]; [email protected]
Received: November 07, 2014; Accepted: December 28, 2014; Published:
December 10, 2014
Citation: Nikolopoulos D, Petraki E, Temenos N, Kottou S, Koulougliotis D, et
al (2014) Hurst Exponent Analysis of Indoor Radon Proiles of Greek Apartment Dwellings. J Phys Chem Biophys 4: 168. doi:10.4172/2161-0398.1000168
Copyright: © 2014 Nikolopoulos D, et al. This is an open-access article distributed
under the terms of the Creative Commons Attribution License, which permits
unrestricted use, distribution, and reproduction in any medium, provided the
original author and source are credited.
During the last few years, several radon time-series were collected
from Greek apartment dwellings. he aim of this work was to estimate
Hurst exponents (H) of some of these radon time-series. One hundred
twenty ive radon signals were collected with Alpha Guard Pro
and included, at least, one day active measurements in ten minutes
cycles. Hurst exponents were calculated by the Rescaled Range (R/S)
method. he scope was to identify whether indoor radon is governed
by long-memory dynamics namely if persistent, anti-persistent traces
can be identiied or if the behavior is random, viz. the signals were
uncorrelated. R/S method was applied through sliding on overlapping
windows and lumping on non-overlapping sequential windows.
Materials and Methods
Hurst exponent
Hurst exponent (H) is a mathematical quantity which can detect
long-range dependencies in time-series [14,15]. It can estimate the
temporal smoothness of time-series and can search if the related
phenomenon is a temporal fractal [16]. Hurst exponent was
conceptualized for hydrology [14,15]. It has been employed however
Hurst Exponent Analysis of Indoor Radon Profiles of Greek Apartment DwellingsDimitrios Nikolopoulos1*, Ermioni Petraki2, Nikolaos Temenos1, Soia Kottou3, Dionysios Koulougliotis4 and Panayotis H Yannakopoulos1
1TEI of Piraeus, Department of Electronic Computer Systems Engineering, Petrou Ralli & Thivon 250, GR-12244 Aigaleo, Greece2Brunel University, Department of Engineering and Design, Kingston Lane, Uxbridge, Middlesex UB8 3PH, London, UK3University of Athens, Medical School, Department of Medical Physics, Mikras Asias 75, GR-11527 Athens, Greece4Technological Educational Institute (TEI) of Ionian Islands, Department of Environmental Technology, Neo Ktirio, Panagoula 29100, Zakynthos, Greece
Abstract
Radon and progeny (218Po, 214Pb, 214Bi and 214Po) are important indoor radioactive air pollutants with impact to
humans. Radon is an inert gas that enters buildings from outdoor air, water and soil, especially via gaps around
pipes and cables and through cracks in loors. Indoors, radon progeny remain free, or attach to indoor aerosols dust and water droplets. Hence, inhalable indoor radioactive mixtures are created which enter human lungs and irradiate
tissues. The radiation exposure depends on several parameters some of which are the building characteristics, local
geology, breathing rate and others.
This work aimed to estimate Hurst exponents (H) of time-evolving radon signals of Greek apartment dwellings.
The signals were collected with Alpha Guard Pro and include at least 24 hours of measurements in each dwelling.
Hurst exponents were calculated by the R/S method through sliding on overlapping windows and lumping on non-
overlapping sequential windows. The scope was to identify whether radon dynamics are governed by persistent, anti-
persistent behavior or if these are uncorrelated.
Most signals presented signiicant long-memory segments with important persistent sub- segments.

J Phys Chem BiophysISSN: 2161-0398 JPCB, an open access journal
Citation: Nikolopoulos D, Petraki E, Temenos N, Kottou S, Koulougliotis D, et al (2014) Hurst Exponent Analysis of Indoor Radon Proiles of Greek Apartment Dwellings. J Phys Chem Biophys 4: 168. doi:10.4172/2161-0398.1000168
Page 2 of 8
Volume 4 • Issue 6 • 1000168
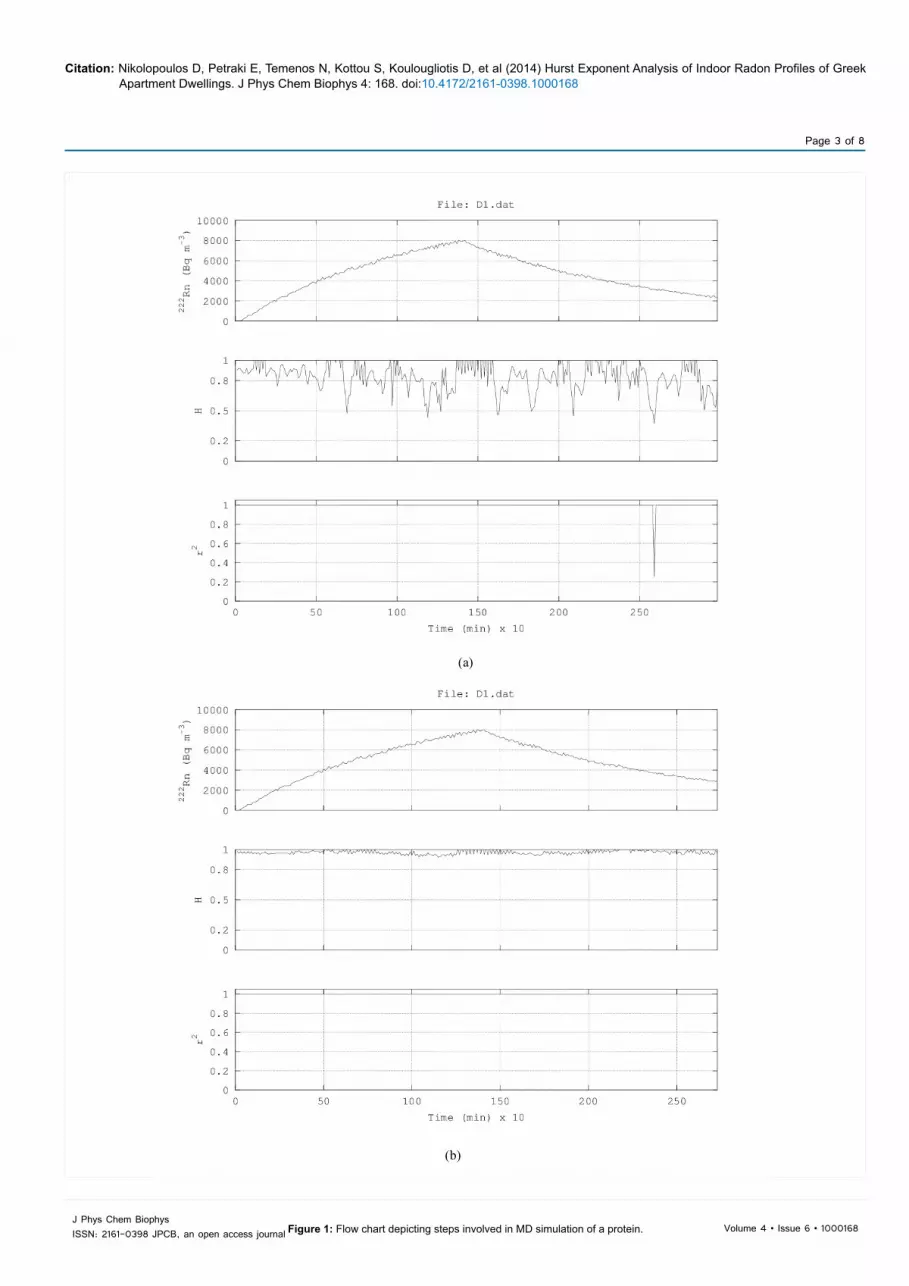
large sliding windows (Figure1b) produced iner-less deviating Hurst exponents which were well concentrated around high H- bands. It is very important that all H - values of Figure1b were well above 0.9. It may be recalled that H - values between 0.5 < H < 1 manifest long-term positive autocorrelation in time-series. his means that high present values will be followed, on the most part, by high future values (persistency) while this tendency will last for numerous future time-periods [24-28]. herefore, the analysis of Figure1b indicates strong-persistent behaviour. Nevertheless, both the analysis of Figure1a (sliding windows) and the one of Figure1c indicate also the persistency of the signal'. Indeed, most of the H- values were above 0.7, viz., they were persistent. It is also very signiicant that almost all values of the Spearman’s correlation coeicients were successive (r2 > 0.95), namely they corresponded to a very linear log-log R/S it.
Figure 2 presents a typical case of radon concentrations oten observed in Greek apartment dwellings [29,30]. Measurements in this dwelling (D2) spanned approximately four days. Recorded radon concentrations ranged between 10 Bqm-3 and 100 Bqm-3. As in Figure 1, most segments exhibited Hurst exponents between 0.5 and 1 with successive square Spearman’s correlation coeicient values above 0.98. his fact indicates that these radon time-series are persistent as well. he H - proiles however, deviate more compared to those of Figure 1. Despite this, only few H - values are below 0.5. he majority of segments are associated with Hurst exponents above 0.7. It is noticeable that in both Figures, the H - proiles do not follow those of radon concentration. Most importantly, this is observable in all sub-Figures, namely the tendency is independent of the selection of the window size. hese observations provide strong indications regarding strong long-memory underlying dynamics which govern and drive the radon generating system. It is also interesting that larger size of sliding windows, produce also less deviating H - values, as in Figure1b. It should be noted however that the analysis should not exceed certain window sizes. For example, the 32 bin window size corresponds to 320 min (32x10min) analysis time. his is the power two window size closest to ive hours. Larger windows would render analysis of larger time-windows and this will tend to smooth the H - values near large-deviating signal areas, such as peaks and downturns. It should be noted as well, that lumping generates H - histograms rather than H - proiles. For certain types of long-memory analysis, lumping is considered favorable [28,29,31] mainly because lumping renders to non-overlapping signal's areas. his fact is advantageous for low-deviating segments of the time-series.
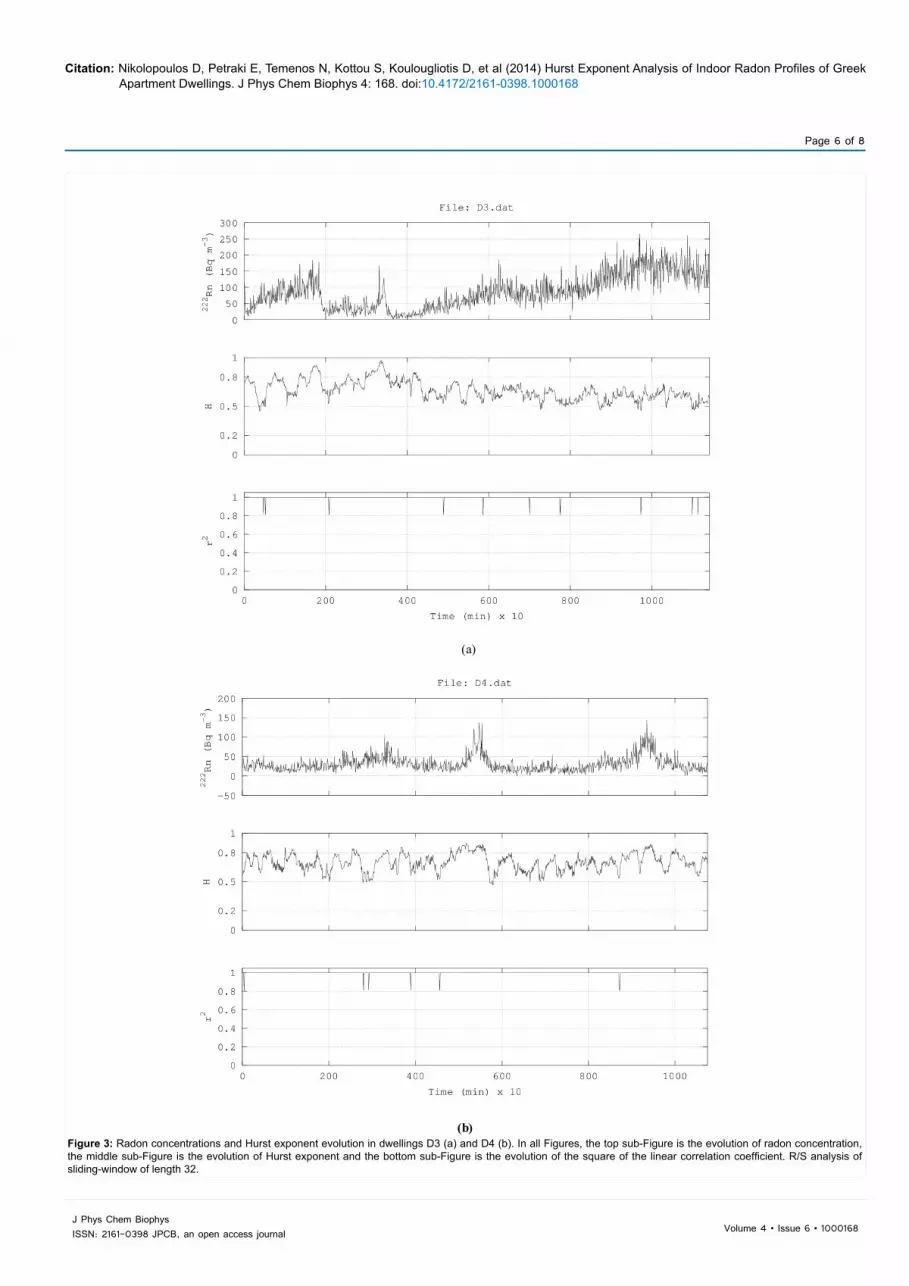
Two more interesting results (dwellings D3 and D4) are shown in Figure 3. All Figures correspond to sliding window R/S analysis of window size 32 and window step 1. Hurst exponent proiles of both sub-Figures show analogous patterns which are similar to those of Figures 1b and 2b under identical conditions (window size 32, window step 1). hese Figures provide further evidence of the underlying long-memory radon dynamics. Once again, the proiles of Hurst exponents are diferent from those of the variation of radon concentration. his is of extreme importance, especially if it is considered that radon concentration variations are afected by various factors and, most importantly, in a multivariate manner [32]. Radon concentrations of Figure3 are below the EU upper action limit for radon concentration, viz. below 400 Bq.m-3. Both radon proiles are also typical for Greek apartment dwellings [30]. Figure 4 presents collectively the results from the R/S analysis of all investigated dwellings. Hurst exponents were calculated through sliding window analysis of window size 8 (Figure 4a), 16 (Figure 4b) and 32 (Figure 4c). As aforementioned, larger size of sliding windows produces less-deviating Hurst exponents. It is important that for all
in other research topics as well, for example, traic traces [17], plasma turbulence [18], ULF geomagnetic ields [19,20], climatic dynamics [21], pre-epileptic seizures [16], astronomy and astrophysics [22] and economy [23]. H-values between 0.5 < H < 1 manifest long-term positive autocorrelation in time-series. his means that a high present value will be, possibly, followed by a high future value and this tendency will last for long future time-periods (persistency) [24-27]. H - values between 0 < H < 0.5 indicate time- series with long-term switching between high and low values. Namely, a high present value will be, possibly, followed by a low future value, whereas the next future value will be high and this switching will last long into the future (antipersistency) [24-27]. H = 0.5 implies completely uncorrelated time-series.
Rescaled Range Analysis (R/S)
Hurst exponents were estimated through the method of Rescaled Range (R/S) [16] or as frequently referred, R/S analysis. he R/S analysis was introduced by Hurst [14] and attempts to ind patterns that might repeat in the future. he method employs two variables, the range, R and the standard deviation, S, of the data. According to the R/S method, a natural record in time, X(N) = x(1), x(2),.., x(N), is transformed into a new variable y(n,N) in a certain time period N(N=1,2,…,N) from the average, ( )nx
N=x
N
=iN ∑
1
1 , over a period of N time units [14]. y(n,N) is called accumulated departure of the natural record in time [14]. he transformation follows the formula:
( ) ( )( )∑ −n
=iN
xix=Nn,y1
(1)
he rescaled range is calculated from (2) [14,16,28] :
( )( )nS nR=SR / (2)
he range R(n) in (2) is deined as the distance between the minimum and maximum value of y(n,N) by :
( ) ( ) ( )Nn,ynimNn,ymax=nRNnlNnl ≤≤−≤≤
(3)
he standard deviation S(n) in (2) is calculated by :
( ) ( )( )21N
xnxN
=nS − (4)
R/S is expected to show a power-law dependence on the bin size n
( )( ) HnC=
nS
nR ⋅ (5)
where H is the Hurst exponent and C is a proportionality constant.
he log transformation of the last equation is a linear relation (6),
( )( ) ( ) ( )nH+c=nS
nRlogloglog ⋅
(6)
from which exponent H can be estimated as the slope of the best line it.
Results
Figure 1 represents a noteworthy case of indoor radon time-series which evolved within approximately two days (47 hours). he corresponding dwelling (D1) was a basement apartment in Athens region. Radon accumulated continuously up to 8kBqm-3 and then decreased down to approximately 3kBqm-3. he recorded concentrations were extremely high and considerably above the upper limit of 400 Bqm-3 recommended by EU [8]. hree diferent conditions were applied for the R/S analysis of this dwelling; namely sliding window analysis of length 8 (Figure1a) and 32 (Figure1b) and lumping analysis of length 32 (Figure1c). It can be observed that
J Phys Chem BiophysISSN: 2161-0398 JPCB, an open access journal
Citation: Nikolopoulos D, Petraki E, Temenos N, Kottou S, Koulougliotis D, et al (2014) Hurst Exponent Analysis of Indoor Radon Proiles of Greek Apartment Dwellings. J Phys Chem Biophys 4: 168. doi:10.4172/2161-0398.1000168
Page 3 of 8
Volume 4 • Issue 6 • 1000168
(a)
(b)
Figure 1: Flow chart depicting steps involved in MD simulation of a protein.

J Phys Chem BiophysISSN: 2161-0398 JPCB, an open access journal
Citation: Nikolopoulos D, Petraki E, Temenos N, Kottou S, Koulougliotis D, et al (2014) Hurst Exponent Analysis of Indoor Radon Proiles of Greek Apartment Dwellings. J Phys Chem Biophys 4: 168. doi:10.4172/2161-0398.1000168
Page 4 of 8
Volume 4 • Issue 6 • 1000168
(b)
(c)
Figure 1: Radon concentration and Hurst exponent evolution in dwelling D1. In all Figureures, the top sub-Figureure is the evolution of radon concentration, the middle
sub-Figureure is the evolution of Hurst exponent and the bottom sub-Figureure is the evolution of the square of the linear correlation coeficient. R/S analysis: (a) sliding-window of length 8, step 1; (b) sliding-window of length 32, step 1; (c) lumping of window-length 32.
(a)

J Phys Chem BiophysISSN: 2161-0398 JPCB, an open access journal
Citation: Nikolopoulos D, Petraki E, Temenos N, Kottou S, Koulougliotis D, et al (2014) Hurst Exponent Analysis of Indoor Radon Proiles of Greek Apartment Dwellings. J Phys Chem Biophys 4: 168. doi:10.4172/2161-0398.1000168
Page 5 of 8
Volume 4 • Issue 6 • 1000168
(b)
(c)
Figure 2: Radon concentrations and Hurst exponent evolution in dwelling D2. In all Figures, the top sub-Figure is the evolution of radon concentration, the middle sub-
Figure is the evolution of Hurst exponent and the bottom sub-Figure is the evolution of the square of the linear correlation coeficient. R/S analysis: (a) sliding-window of length 8,step 1; (b) sliding-window of length 32,step 1; (c) lumping of window-length 32.
J Phys Chem BiophysISSN: 2161-0398 JPCB, an open access journal
Citation: Nikolopoulos D, Petraki E, Temenos N, Kottou S, Koulougliotis D, et al (2014) Hurst Exponent Analysis of Indoor Radon Proiles of Greek Apartment Dwellings. J Phys Chem Biophys 4: 168. doi:10.4172/2161-0398.1000168
Page 6 of 8
Volume 4 • Issue 6 • 1000168
(a)
(b)
Figure 3: Radon concentrations and Hurst exponent evolution in dwellings D3 (a) and D4 (b). In all Figures, the top sub-Figure is the evolution of radon concentration,
the middle sub-Figure is the evolution of Hurst exponent and the bottom sub-Figure is the evolution of the square of the linear correlation coeficient. R/S analysis of sliding-window of length 32.

J Phys Chem BiophysISSN: 2161-0398 JPCB, an open access journal
Citation: Nikolopoulos D, Petraki E, Temenos N, Kottou S, Koulougliotis D, et al (2014) Hurst Exponent Analysis of Indoor Radon Proiles of Greek Apartment Dwellings. J Phys Chem Biophys 4: 168. doi:10.4172/2161-0398.1000168
Page 7 of 8
Volume 4 • Issue 6 • 1000168
(a)
(b)
(c)
Figure 4: Box-whisker plots of Hurst exponent evolution outcomes in all investigated dwellings. Sliding-window R/S of step 1 and window-size (a) 8; (b) 16; (c) 32. The
horizontal axis shows an identiication number for each investigated dwelling.
window sizes, the main percentage of each box-whisker plot is within the region of persistency, i.e. H - values above 0.5. From another perspective, this implies that the majority of Hurst exponents indicate persistency, either with window size 8, 16 or 32. It is more important, that a vast number of segments exhibited H - values above 0.7 or even
0.8. hese segments indicate strong persistency of the corresponding parts of the radon concentration signal. Note, however, that when small window sizes are employed in R/S analysis (size 8 or 16), some antipersistent areas of the signals are identiied. As already implied, a window size of 8 corresponds only to 80 minutes of time-series of

J Phys Chem BiophysISSN: 2161-0398 JPCB, an open access journal
Citation: Nikolopoulos D, Petraki E, Temenos N, Kottou S, Koulougliotis D, et al (2014) Hurst Exponent Analysis of Indoor Radon Proiles of Greek Apartment Dwellings. J Phys Chem Biophys 4: 168. doi:10.4172/2161-0398.1000168
Page 8 of 8
Volume 4 • Issue 6 • 1000168
indoor radon concentrations. his time duration is small enough to be biased by the several radon afecting factors. In this sense, the corresponding results just outline the signals' tendency in presenting persistent long-memory. hey cannot evoke, in this consensus, emergence of any existing long-memory dynamics. hese dynamics are emerged by the larger window size of 32. As also mentioned, this size is a good compromise between bias due to factors and smoothing due to radon peaking or downturn. It should be mentioned though that the 32-sample window-size rendered inconsistencies in some calculated Hurst exponents in twenty ive radon time-series. For this reason, these series were excluded from the box-whisker plots of Figure3c.
Conclusion
Several dwellings were accessed and their indoor radon concentrations were measured with active techniques. Time-series of at-least one day duration were employed in this study. Utilizing R/S analysis through sliding window and lumping, numerous Hurst exponents were calculated for each useful time-series. he majority of exponents were found to be in the range of 0.5 < H < 1 for the majority of the situations. his inding indicated persistency. Several exponents were above 0.8, namely the corresponding time-series parts were very persistent. In almost all cases it was found that indoor-radon dynamics are governed by chaos and long-memory.
Acknowledgements
The authors would like to thank I. Chaldeos, S.Filtisakos and A. Gardikioti for
their assistance in preparatory analysis of some signals through R/S technique.
References
1. Nazaroff W, Nero A (1988) Radon and its decay products in indoor air. Wiley, New York.
2. Appleton JD (2005) Radon in air and water. In: Selinus O, Alloway B, Centero J, Finkelman R, Fuge R, Lindh U, Smedley P (Eds.), Essentials of medical geology, impacts of the natural environment on public health. Elsevier Academic Press 227–262.
3. UNSCEAR (United Nations Scientiic Committee on the Effects of Atomic Radiation) (2008) Sources and effects of ionizing radiation, UNSCEAR, New York.
4. Risica S (1998) Legislation on radon concentration at home and at work. Radiation Protection Dosimetry 78: 15–21.
5. Hu N, Zheng JF, Ding DX, Liu J, Yang LQ, et al. (2009) Metal pollution in Huayuan River in Hunan Province in China by manganese sulphate waste residue. Bull Environ Contam Toxicol 83: 583-590.
6. Ishikawa T, Narazaki Y, Yasuoka Y, Tokonami S, Yamada Y (2003) Bio-kinetics of radon ingested from drinking water. Radiat Prot Dosimetry 105: 65-70.
7. US-EPA (2000) United States-Environmental Protection Agency. Role on radionuclides in drinking water. 65 FR 76707 7 December 2000, EPA, New York.
8. EURATOM, European Commission (1990) Commission recommendation of the 21 Februay 1990 on the protection of the public against indoor exposure to radon. 390HO14390/143/EURATOM, L 080. 26-28.
9. Burkart W, Sohrabi M, Bayer A (2002) High levels of natural radiation and radon areas: radiation dose and health effects. Elsevier Science, Amsterdam 325.
10. Yu KN, Lau BM, Nikezic D (2006) Assessment of environmental radon hazard using human respiratory tract models. J Hazard Mater 132: 98-110.
11. Vogiannis E, Nikolopoulos D, Louizi A, Halvadakis CP (2004) Radon variations during treatment in thermal spas of Lesvos Island (Greece). Journal of Environmental Radioactivity 75:159-170.
12. Nikolopoulos D, Vogiannis E (2007) Modelling radon progeny concentration variations in thermal spas. Sci Total Environ 373: 82-93.
13. Bernhardt GP, Hess CT (1996) Acute exposure from 222Rn and aerosols in drinking water. Environment International 22: S753-S759.
14. Hurst H (1951) Long Term Storage Capacity of Reservoirs. Transactions of the
American Society of Civil Engineers 116: 770-799.
15. Black R, Simaiki Y (1965) Long-term storage: an experimental study. Constable,
London.
16. Lopez T, Martinez-Gonzalez C, Manjarrez J, Plascencia N, Balankin A (2009)
Fractal Analysis of EEG Signals in the Brain of Epileptic Rats, with and without
Biocompatible Implanted Neuroreservoirs. Applied Mechanics and Materials
15:127-136.
17. Dattatreya G (2005) Hurst Parameter Estimation from Noisy Observations
of Data Trafic Traces. 4th WSEAS International Conference on Electronics, Control and Signal Processing, Miami, Florida, USA, 17-19 November, 193–
198.
18. Gilmore M, Yu C, Rhodes T, Peebles W (2002) Investigation of rescaled range
analysis, the Hurst exponent, and long-time correlations in plasma turbulence.
Physics of Plasmas 9: 1312-1317.
19. Smirnova N, Hayakawa M, Gotoh K (2004) Precursory behavior of fractal
characteristics of the ULF electromagnetic ields in seismic active zones before strong earthquakes. Physics and Chemistry of the Earth 29: 445–451.
20. Smirnova N, Hayakawa M (2007) Fractal characteristics of the ground-observed
ULF emissions in relation to geomagnetic and seismic activities. Journal of
Atmospheric and Solar-Terrestrial Physics 69: 1833–1841.
21. Rehman S, Siddiqi A (2009) Wavelet based Hurst exponent and fractal
dimensional analysis of Saudi climatic dynamics. Chaos, Solitons and Fractals
39: 1081-1090.
22. Kilcik A, Anderson C, Rozelot J, Ye H, Sugihara G, Ozguc A (2009) Non linear
prediction of solar cycle 24. The Astrophysical Journal 693: 1173–1177.
23. Granero MS, Segovia JT, Perez JG (2008) Some comments on Hurst exponent
and the long memory processes on capital markets. Physica A 387: 5543–5551.
24. Eftaxias K, Kapiris P, Dologlou E, Kopanas J, Bogris N, et al. (2002) EM
anomalies before the Kozani earthquake: a study of their behavior through
laboratory experiments. Geophysical Research Letters 29: 69-1-69-4.
25. Eftaxias K, Kapiris P, Polygiannakis J, Bogris N, Kopanas J, et al. (2001)
Signature of pending earthquake from electromagnetic anomalies. Geophysical
Research Letters 29: 3321–3324.
26. Kapiris P, Polygiannakis J, Peratzakis A, Nomicos K, Eftaxias K (2002) VHF-
electromagnetic evidence of the underlying pre-seismic critical stage. Earth
Planets Space 54: 1237–1246.
27. Kapiris PG, Eftaxias KA, Nomikos KD, Polygiannakis J, Dologlou E, et al. (2003)
Evolving towards a critical point: A possible electromagnetic way in which the
critical regime is reached as the rupture approaches. Nonlinear Processes in
Geophysics 10: 511–524.
28. Nikolopoulos D, Petraki E,Vogiannis E, Chaldeos Y, Yannakopoulos P, et al.
(2013). Traces of self-organisation and long-range memory in variations of
environmental radon in soil: Comparative results from monitoring in Lesvos
Island and Ileia (Greece). Journal of Radioanaltical and Nuclear Chemistry 299:
203-219.
29. Nikolopoulos D, Louizi A, Koukouliou V, Serefoglou A, Georgiou E, et al. (2002)
Radon survey in Greece--risk assesment. J Environ Radioact 63: 173-186.
30. Nikolopoulos D, Louizi A (2008) Study of indoor radon and radon in drinking
water in Greece and Cyprus: Implications to exposure and dose. Radiation
Measurements 43:1305-1314.
31. Karamanos K, Dakopoulos D, Aloupis K, Peratzakis A, Athanasopoulou L, et al.
(2006) Preseismic electromagnetic signals in terms of complexity. Phys Rev E
Stat Nonlin Soft Matter Phys 74: 016104.
32. Nikolopoulos D, Kottou S, Louizi A, Petraki E, Vogiannis E et al. (2014) Factors
Affecting Indoor Radon Concentrations of Greek Dwellings through Multivariate
Statistics - First Approach. J Phys Chem Biophys 4:145.
Citation: Nikolopoulos D, Petraki E, Temenos N, Kottou S, Koulougliotis D, et
al (2014) Hurst Exponent Analysis of Indoor Radon Proiles of Greek Apartment Dwellings. J Phys Chem Biophys 4: 168. doi:10.4172/2161-0398.1000168


