Embed Size (px)
Citation preview
Hybrid and
Multi-Component
Hydrogels
Daniel Cornwell
Doctor of Philosophy
University of York
Chemistry
July 2016
2
Abstract
Low-molecular-weight gelators (LMWGs) form a network via non-covalent interactions to
immobilise the surrounding bulk solvent and form a gel. Whilst such gels are highly responsive and
dynamic, they are often mechanically weak. In order to enhance the mechanical strength of such
networks, the LMWG network can be supplemented with a second network formed from stronger
polymer gelators (PGs) to yield a multi-component, multi-functional material – a hybrid gel.
By using this multi-functionality, hybrid gels were made that could demonstrate the following:
a) robustness yet responsiveness, b) spatial control over the formation of one network in the
presence of another, and c) temporal control over the formation of one network in the presence of
another.
For the first aim, a pH-responsive LMWG (1,3:2,4-dibenzylidene-D-sorbitol dicarboxylic acid,
DBS-CO2H) was combined with the robust PG agarose. The assembly of DBS-CO2H in the
presence and absence of agarose was investigated by NMR and CD spectroscopies, whilst materials
properties were examined by rheology. DBS-CO2H was found to retain its pH-responsive
character, as was demonstrated by cycling the pH within the gel – whilst the DBS-CO2H network
could be switched “on” or “off”, the robust agarose network remained intact.
Following this, DBS-CO2H was combined with the photo-inducible PG poly(ethylene glycol)
dimethacrylate (PEGDM). Spectroscopic methods and electron microscopy showed that the
kinetics and morphology of DBS-CO2H assembly were impacted by the presence of PEGDM. The
application of a mask during photoirradiation allowed patterning of the PEGDM network to form a
material with two distinct, spatially-resolved regions, defined as a “multidomain gel”, achieving the
second aim. The different domains had different properties with regards to the diffusion and release
of dyes.
DBS-CO2H was then combined with another pH-responsive LMWG (1,3:2,4-dibenzylidene-D-
sorbitol-dicarbonyl-glycine, DBS-Gly). The two gelators showed a good degree of kinetic self-
sorting, their self-assembly being triggered at different pHs. It was possible to use two proton
sources – the slow hydrolysis of glucono-δ-lactone, and the more rapid photoacid generator
diphenyliodonium nitrate – to achieve a two-step process of network formation. As the second step
was UV-initiated, photopatterned multi-component gels were produced; these materials were both
spatially and temporally resolved, achieving the third aim. Finally, the combination of DBS-CO2H,
DBS-Gly and PEGDM into a three-gelator, multi-component hybrid hydrogel was investigated.
3
Table of Contents
Abstract ............................................................................................. 2
Table of Contents ............................................................................. 3
List of Figures ................................................................................. 11
List of Schemes ............................................................................... 24
List of Tables .................................................................................. 25
Acknowledgements ........................................................................ 26
Declaration ...................................................................................... 28
1. Chapter 1: Introduction ....................................................... 29
1.1. Low-molecular-weight-gelators ...................................................... 29
1.2. Multi-component gels of low-molecular-weight gelators.............. 30
1.2.1. Structurally similar self-sorting multi-component gels of two LMWGs ...................... 31
1.2.2. Structurally different self-sorting multi-component gels of two LMWGs.................... 35
1.3. Combinations of low-molecular-weight gelators and polymers .. 36
1.3.1. Polymerisation of LMWG fibres .................................................................................. 37
1.3.2. Capture of LMWG fibres in a polymer matrix ............................................................. 41
1.3.3. Polymerised LMWG fibres within a polymer matrix ................................................... 45
1.3.4. Addition of a non-gelling polymer in solution to supramolecular gels of LMWGs ..... 47
1.3.5. Directed interactions between LMWGs and polymers ................................................. 51
1.3.6. Other combinations of LMWGs and polymers ............................................................. 54
1.4. Hybrid gels of low-molecular-weight gelators and polymer
gelators ......................................................................................................... 54
1.4.1. Semi-hybrid gels ........................................................................................................... 55
1.4.2. Hybrid organogels ......................................................................................................... 56
1.4.3. Hybrid hydrogels........................................................................................................... 57
1.5. Project aims ....................................................................................... 59
1.5.1. Responsive yet robust hybrid hydrogels ....................................................................... 59
1.5.2. Spatial resolution in hybrid hydrogels .......................................................................... 59
1.5.3. Temporal resolution in hybrid hydrogels ...................................................................... 60
2. Chapter 2: Responsive Yet Robust Hybrid Hydrogels ..... 61
2.1. Introduction ...................................................................................... 61
2.2. DBS and derivatives ......................................................................... 61
4
2.3. Synthesis of 1,3:2,4-dibenzylidene-D-sorbitol-p,p’-dicarboxylic
acid (DBS-CO2H) ........................................................................................ 63
2.4. Gelation studies of DBS-CO2H ........................................................ 64
2.4.1. Preparation and Tgel studies of DBS-CO2H hydrogels .................................................. 65
2.4.2. 1H NMR studies of DBS-CO2H hydrogels ................................................................... 66
2.4.3. Circular dichroism studies of DBS-CO2H hydrogels .................................................... 71
2.4.4. SEM imaging of DBS-CO2H hydrogels ....................................................................... 75
2.5. Agarose Hydrogels ............................................................................ 76
2.5.1. Background ................................................................................................................... 76
2.5.2. Preparation and Tgel studies of agarose hydrogels ......................................................... 76
2.5.3. SEM imaging of agarose hydrogels .............................................................................. 77
2.6. Hybrid hydrogels of DBS-CO2H and agarose ............................... 78
2.6.1. Preparation and Tgel studies of hybrid hydrogels of DBS-CO2H and agarose .............. 78
2.6.2. Rheological studies of hybrid hydrogels of DBS-CO2H and agarose ........................... 78
2.6.3. 1H NMR studies of hybrid hydrogels of DBS-CO2H and agarose ................................ 83
2.6.4. CD studies of hybrid hydrogels of DBS-CO2H and agarose ........................................ 85
2.6.5. SEM imaging of hybrid hydrogels of DBS-CO2H and agarose .................................... 88
2.7. Responsive, pH “switchable” hybrid hydrogels of DBS-CO2H and
agarose ......................................................................................................... 89
2.8. Conclusions and Outlook ................................................................. 91
3. Chapter 3: Photopatterned Multidomain Hybrid
Hydrogels ........................................................................................ 94
3.1 Introduction ...................................................................................... 94
3.2 Poly(ethylene glycol) and derivatives ............................................. 94
3.3 Synthesis of PEGDM ........................................................................ 95
3.4 Gelation studies of PEGDM ............................................................ 95
3.4.1 Preparation and Tgel studies of PEGDM hydrogels ....................................................... 96
3.4.2 NMR of PEGDM hydrogels ......................................................................................... 96
3.4.3 SEM imaging of PEGDM hydrogels ............................................................................ 97
3.5 Hybrid hydrogels of DBS-CO2H and PEGDM.............................. 98
3.5.1 Preparation and Tgel studies of hybrid hydrogels of DBS-CO2H and PEGDM ............. 98
3.5.2 Rheological studies of hybrid hydrogels of DBS-CO2H and PEGDM ......................... 99
3.5.3 1H NMR studies of hybrid hydrogels of DBS-CO2H and PEGDM ............................ 102
3.5.4 CD studies of hybrid hydrogels of DBS-CO2H and PEGDM ..................................... 104
3.5.5 SEM imaging of hybrid hydrogels of DBS-CO2H and PEGDM ................................ 107
3.6 Functionality of hybrid hydrogels of DBS-CO2H and PEGDM 108
5
3.6.1 Photopatterning of hybrid hydrogels of DBS-CO2H and PEGDM ............................. 108
3.6.2 Controlled release from hybrid hydrogels of DBS-CO2H and PEGDM ..................... 109
3.7 Conclusions and Outlook ............................................................... 114
4. Chapter 4: DBS-Peptide Gelators and Multi-Gelator Self-
Sorting ........................................................................................... 116
4.1. Introduction .................................................................................... 116
4.2. Synthesis of DBS-peptide LMWGs ............................................... 116
4.3. Gelation studies of DBS-peptide LMWGs ................................... 118
4.3.1. Reproducibility of certain results ................................................................................ 118
4.3.2. Preparation and Tgel studies of hydrogels of DBS-peptide LMWGs ........................... 119
4.3.3. 1H NMR studies of hydrogels of DBS-Gly ................................................................. 122
4.3.4. CD and VT CD studies of hydrogels of DBS-Gly ...................................................... 126
4.3.5. SEM imaging of hydrogels of DBS-Gly ..................................................................... 128
4.4. Multi-component self-assembly and self-sorting ......................... 129
4.4.1. Determination of pKa values for DBS-Gly and DBS-CO2H ....................................... 130
4.4.2. Table-top studies of multi-component hydrogels of DBS-Gly and DBS-CO2H ......... 131
4.4.3. NMR studies of multi-component hydrogels of DBS-Gly and DBS-CO2H ............... 131
4.4.4. CD studies of multi-component hydrogels of DBS-Gly and DBS-CO2H................... 133
4.4.5. SEM imaging of multi-component hydrogels of DBS-Gly and DBS-CO2H .............. 136
4.4.6. Rheological studies of multi-component hydrogels of DBS-Gly and DBS-CO2H ..... 137
4.5. Conclusions and Outlook ............................................................... 139
5. Chapter 5: Photoactivation of DBS-derived low-molecular-
weight gelators .............................................................................. 141
5.1. Introduction .................................................................................... 141
5.1.1. Photoresponsive LMWGs ........................................................................................... 141
5.1.2. LMWGs with photoacid generators ............................................................................ 142
5.1.3. Photo-induced gelation of DBS-derived LMWGs ...................................................... 142
5.2. Photoacid generator diphenyliodonium nitrate .......................... 143
5.3. Initial studies of DBS-CO2H using DPIN as PAG, with low-
intensity UV light ...................................................................................... 144
5.3.1. System optimisation .................................................................................................... 144
5.3.2. Gelation studies of DBS-CO2H using DPIN as PAG, with low-intensity UV light ... 146
5.4. Gelation studies of DBS-CO2H and DBS-Gly using DPIN as PAG,
with high-intensity UV light..................................................................... 147
5.4.1. Formation of gels of DBS-CO2H and DBS-Gly using DPIN as PAG, with high-
intensity UV light ..................................................................................................................... 147
6
5.4.2. 1H NMR studies of DBS-CO2H and DBS-Gly using DPIN as PAG .......................... 149
5.4.3. CD studies of DBS-CO2H and DBS-Gly using DPIN as PAG ................................... 153
5.4.4. SEM imaging of hydrogels of DBS-CO2H and DBS-Gly using DPIN as PAG ......... 156
5.5. Dual activation of DBS-CO2H and DBS-Gly hydrogels using GdL
and DPIN ................................................................................................... 157
5.5.1. 1H NMR studies of multi-component system with dual activation ............................. 158
5.5.2. Rheological studies of multi-component systems with dual activation ...................... 159
5.5.3. SEM images of multi-component systems with dual activation ................................. 159
5.6. Photopatterning to achieve spatial control in multi-component
gels using dual activation methodology .................................................. 160
5.6.1. Preparation of photopatterned multi-component, multidomain gels using dual
activation methodology............................................................................................................. 161
5.7. Conclusions and Outlook ............................................................... 162
6. Chapter 6: Photopatterned Multidomain Multi-
Component Hybrid Hydrogels ................................................... 165
6.1. Introduction .................................................................................... 165
6.2. Photopatterned multidomain hydrogels of PEGDM and a LMWG165
6.2.1. Preparation of hybrid and photopatterned hybrid hydrogels of DBS-CO2H and
PEGDM .................................................................................................................................... 165
6.2.2. Rheological studies of hybrid hydrogels of DBS-CO2H and PEGDM ....................... 167
6.2.3. 1H NMR studies of hybrid hydrogels of DBS-CO2H and PEGDM ............................ 168
6.2.4. CD studies of hybrid hydrogels of DBS-CO2H and PEGDM ..................................... 170
6.2.5. SEM imaging of hybrid hydrogels of DBS-CO2H and PEGDM ................................ 170
6.3. Multi-component hybrid hydrogels of DBS-CO2H, DBS-Gly and
PEGDM with single proton source ......................................................... 171
6.3.1. Preparation and Tgel studies of multi-component hybrid hydrogels with single proton
source ..................................................................................................................................... 171
6.3.2. Rheological studies of multi-component hybrid hydrogels with single proton source172
6.3.3. 1H NMR studies of multi-component hybrid hydrogels with single proton source .... 174
6.3.4. CD studies of multi-component hybrid hydrogels with single proton source ............. 176
6.3.5. SEM imaging of multi-component hybrid hydrogels with single proton source ........ 177
6.4. Multi-component hybrid hydrogels of DBS-CO2H, DBS-Gly and
PEGDM with two proton sources ........................................................... 178
6.4.1. Preparation of multi-component hybrid hydrogels with two proton sources .............. 178
6.4.2. Rheology of multi-component hybrid hydrogels with two proton sources ................. 179
6.4.3. 1H NMR studies of multi-component hybrid hydrogels with two proton sources ...... 180
6.4.4. CD studies of multi-component hybrid hydrogels with two proton sources ............... 181
6.4.5. SEM imaging of multi-component hybrid hydrogels with two proton sources .......... 181
7
6.4.6. Photopatterning of multi-component hybrid hydrogels with two proton sources ....... 183
6.5. Conclusions and Outlook ............................................................... 186
7. Chapter 7: Conclusions and Future Work ....................... 188
7.1. Chapters 2 and 3: Simple hybrid hydrogels ................................ 188
7.2. Chapters 4 and 5: Multi-component hydrogels ........................... 190
7.3. Chapter 6: Complex multi-component hybrid hydrogels .......... 191
7.4. Summary ......................................................................................... 193
8. Chapter 8: Experimental ................................................... 194
8.1. General Experimental Methods .................................................... 194
8.1.1. 1H NMR assignment of sugar CH resonances for DBS-derivative ............................. 194
8.2. Synthesis procedures ...................................................................... 195
8.2.1. Synthesis and characterisation of DBS-CO2Me .......................................................... 195
8.2.2. Synthesis and characterisation of DBS-CO2H ............................................................ 196
8.2.3. Synthesis and characterisation of PEGDM ................................................................. 197
8.2.4. Synthesis and characterisation of DBS-GlyOMe ........................................................ 198
8.2.5. Synthesis and characterisation of DBS-Gly ................................................................ 199
8.2.6. Synthesis and characterisation of DBS-PheOMe ........................................................ 200
8.2.7. Synthesis and characterisation of DBS-Phe ................................................................ 201
8.2.8. Synthesis and characterisation of DBS-TrpOMe ........................................................ 202
8.2.9. Synthesis and characterisation of DBS-Trp ................................................................ 203
8.2.10. Attempted synthesis of DBS-AlaOMe .................................................................... 204
8.2.11. Attempted synthesis of DBS-Asp(OMe)2 ............................................................... 205
8.3. Standard gelation protocols to produce gels in sample vials ..... 205
8.3.1. DBS-CO2H hydrogels ................................................................................................. 205
8.3.2. Agarose hydrogels....................................................................................................... 206
8.3.3. DBS-CO2H and agarose hybrid hydrogels .................................................................. 206
8.3.4. PEGDM hydrogels ...................................................................................................... 206
8.3.5. DBS-CO2H and PEGDM hybrid hydrogels ................................................................ 206
8.3.6. DBS-Gly hydrogels, heat-cool method ....................................................................... 206
8.3.7. DBS-Gly hydrogels, pH-change method .................................................................... 207
8.3.8. DBS-CO2H and DBS-Gly multi-component hydrogels .............................................. 207
8.3.9. DBS-CO2H, DBS-Gly and PEGDM multi-component hybrid hydrogels with single
proton source ............................................................................................................................ 207
8.4. Tgel procedure .................................................................................. 207
8.5. Rheology sample preparation........................................................ 207
8.5.1. DBS-CO2H hydrogels ................................................................................................. 207
8
8.5.2. Agarose hydrogels....................................................................................................... 208
8.5.3. DBS-CO2H and agarose hybrid hydrogels .................................................................. 208
8.5.4. PEGDM hydrogels ...................................................................................................... 208
8.5.5. DBS-CO2H and PEGDM hybrid hydrogels ................................................................ 208
8.5.6. DBS-Gly ..................................................................................................................... 208
8.5.7. DBS-CO2H and DBS-Gly multi-component hydrogels .............................................. 208
8.5.8. DBS-CO2H, DBS-Gly and PEGDM multi-component hybrid hydrogels with single
proton source ............................................................................................................................ 208
8.6. NMR sample preparation .............................................................. 209
8.6.1. DBS-CO2H hydrogels with GdL ................................................................................. 209
8.6.2. DBS-CO2H and agarose hybrid hydrogels .................................................................. 209
8.6.3. PEGDM hydrogels ...................................................................................................... 209
8.6.4. DBS-CO2H and PEGDM hybrid hydrogels ................................................................ 209
8.6.5. DBS-Gly hydrogels, heat cool method ....................................................................... 209
8.6.6. DBS-Gly hydrogels, pH-change method with GdL .................................................... 209
8.6.7. DBS-CO2H and DBS-Gly multi-component hydrogels with GdL ............................. 210
8.6.8. DBS-CO2H hydrogels with DPIN ............................................................................... 210
8.6.9. DBS-Gly hydrogels with DPIN .................................................................................. 210
8.6.10. DBS-CO2H and DBS-Gly multi-component hydrogels with dual proton source ... 210
8.6.11. DBS-CO2H and PEGDM hybrid hydrogel with DPIN ........................................... 210
8.6.12. DBS-CO2H, DBS-Gly and PEGDM multi-component hybrid hydrogel with single
proton source ............................................................................................................................ 211
8.6.13. DBS-CO2H, DBS-Gly and PEGDM multi-component hybrid hydrogel with dual
proton source ............................................................................................................................ 211
8.7. NMR kinetics and VT experiments .............................................. 211
8.7.1. DBS-CO2H hydrogels with GdL ................................................................................. 211
8.7.2. DBS-CO2H and agarose hybrid hydrogels .................................................................. 211
8.7.3. DBS-CO2H and PEGDM hybrid hydrogels ................................................................ 212
8.7.4. DBS-Gly hydrogels, heat-cool method VT experiments ............................................ 212
8.7.5. DBS-Gly hydrogels, pH-change method with GdL .................................................... 212
8.7.6. DBS-CO2H and DBS-Gly multi-component hydrogels, varying amounts of GdL .... 212
8.7.7. DBS-CO2H hydrogels with DPIN ............................................................................... 212
8.7.8. DBS-Gly hydrogels with DPIN .................................................................................. 212
8.7.9. DBS-CO2H and PEGDM hybrid hydrogels with DPIN .............................................. 213
8.7.10. DBS-CO2H, DBS-Gly and PEGDM multi-component hybrid hydrogels with single
proton source ............................................................................................................................ 213
8.8. CD sample preparation .................................................................. 213
8.8.1. DBS-CO2H with GdL ................................................................................................. 213
8.8.2. Agarose ....................................................................................................................... 213
9
8.8.3. DBS-CO2H and agarose hybrid system ...................................................................... 213
8.8.4. PEGDM ....................................................................................................................... 214
8.8.5. DBS-CO2H and PEGDM hybrid system ..................................................................... 214
8.8.6. DBS-Gly, heat-cool method ........................................................................................ 214
8.8.7. DBS-CO2H and DBS-Gly multi-component system with GdL .................................. 214
8.8.8. DBS-CO2H with HCl .................................................................................................. 214
8.8.9. DBS-Gly with HCl ...................................................................................................... 214
8.8.10. DBS-CO2H and DBS-Gly multi-component system with HCl ............................... 215
8.8.11. DBS-CO2H with DPIN ........................................................................................... 215
8.8.12. DBS-Gly with DPIN ............................................................................................... 215
8.8.13. DBS-CO2H, DBS-Gly and PEGDM multi-component hybrid system ................... 215
8.9. CD kinetics and VT experiments .................................................. 215
8.9.1. DBS-CO2H with GdL ................................................................................................. 215
8.9.2. DBS-CO2H and agarose hybrid system ...................................................................... 215
8.9.3. DBS-CO2H and PEGDM hybrid system ..................................................................... 216
8.9.4. DBS-Gly, heat-cool method VT experiment .............................................................. 216
8.10. Responsive yet robust experiment procedures ......................... 216
8.10.1. Table-top method .................................................................................................... 216
8.10.2. NMR method .......................................................................................................... 217
8.11. pKa titrations ................................................................................ 217
8.11.1. DBS-CO2H .............................................................................................................. 217
8.11.2. DBS-Gly ................................................................................................................. 217
8.12. UV curing and photopatterning procedures ............................ 217
8.12.1. General equipment and setup for UV curing .......................................................... 217
8.12.2. Procedure for hybrid hydrogels of DBS-CO2H and PEGDM with GdL as proton
source ................................................................................................................................. 218
8.12.3. Procedure for multi-component hydrogels of DBS-CO2H and DBS-Gly with dual
proton source ............................................................................................................................ 218
8.12.4. Procedure for hybrid hydrogels of DBS-CO2H and PEGDM with DPIN as proton
source ................................................................................................................................. 219
8.12.5. Procedure for multi-component hybrid hydrogels of DBS-CO2H, DBS-Gly and
PEGDM ................................................................................................................................. 219
8.13. SEM sample preparation ............................................................ 220
8.13.1. Freeze-drying method ............................................................................................. 220
8.13.2. Ambient drying method .......................................................................................... 220
8.14. TEM sample preparation ........................................................... 221
8.14.1. DBS-CO2H hydrogels, with or without MB dye..................................................... 221
8.15. UV-vis experiments ..................................................................... 221
10
8.15.1. Controlled release from PEGDM hydrogels and DBS-CO2H and PEGDM hybrid
hydrogels ................................................................................................................................. 221
8.15.2. Adsorption of MB and MG dyes onto DBS-CO2H ................................................. 223
Appendix ....................................................................................... 225
Exemplar assigned 1H NMR spectra ....................................................... 225
DBS-CO2Me: ............................................................................................................................ 225
DBS-CO2H: .............................................................................................................................. 226
PEGDM: ................................................................................................................................... 227
Maldi MS spectra ...................................................................................... 228
PEGDM: ................................................................................................................................... 228
List of Abbreviations ................................................................... 229
References ..................................................................................... 234
11
List of Figures
Figure 1.1: A typical hierarchical process of self-assembly for a supramolecular gel; individual
LMWG molecules (1) assemble into fibrils (2), which assemble into fibres (3), which then entangle
to form the sample-spanning solid-like network (4). ........................................................................ 29
Figure 1.2: Representation of the three main types of multi-component gels of LMWGs. Image
adapted from reference 13................................................................................................................. 30
Figure 1.3: Example structures of alkyl aldonamide gelators with glucose headgroups of differing
chirality and alkyl chains of different lengths, as investigated by Fuhrhop and Boettcher.17 These
two gelators are able to self-sort. ...................................................................................................... 31
Figure 1.4: Structures of lysine-based dendritic gelator and different periphery groups investigated
by Moffat and Smith.19 ...................................................................................................................... 32
Figure 1.5: Structurally similar peptide-derived bis(urea) gelators with differing spacer chain length
and headgroups, as investigated by Steed and co-workers.20 ............................................................ 32
Figure 1.6: Enantiomeric LMWGs capable of self-sorting as used by Cicchi and co-workers.21 .... 33
Figure 1.7: Examples of DAN donors and NDI acceptors used as LWMGs by Ghosh and co-
workers.22–26 ...................................................................................................................................... 34
Figure 1.8: The structures of the pH-controlled self-sorting LMWGs used by Adams and co-
workers; pKa values are given underneath each structure.29 ............................................................. 35
Figure 1.9: Structures of dibenzylidene-D-sorbitol derived gelator (left) and cholesterol-based
gelator (right), used by Smith and Smith and a self-sorting system.31 .............................................. 36
Figure 1.10: Illustrations of four of the main types of LMWG-polymer combinations. .................. 37
Figure 1.11: Photopolymerisable methacrylate derivative of trans-1,2-bis(3-
methylureido)cyclohexane LMWG.35 ............................................................................................... 38
Figure 1.12: Exemplar structures of diactylene containing LMWGs: a) 10,12-pentacosadiyonic acid
derived gelator,37 and b) dendritic gelator.38 ..................................................................................... 38
Figure 1.13: SEM images of the insoluble material produced by metathesis of dendritic LMWG; a)
shows the nanofibres visible through a crack in the polymerised material surface; b) shows the
nanofibre network after re-swelling of the dried material. Images reproduced from reference 48... 39
Figure 1.14: Alkyne and azide derivatives of the undecylamide of trans-1,2-diaminocyclohexane
LMWGs.49 ......................................................................................................................................... 40
12
Figure 1.15: Triethoxysilane bis(urea) LMWG; hydrolysis and subsequent polymerisation occurs at
the SiOEt3 and groups.52 ................................................................................................................... 40
Figure 1.16: Structure of carbazole-protected amino acid LMWG, as used by Adams and co-
workers.53 .......................................................................................................................................... 41
Figure 1.17: a) Structure of a gluconamide gelator used by Nolte and co-workers; b) TEM image of
helical fibre of gluconamide gelators (scale bar = 110 nm); c) pores left in methacrylate polymer
after gelator removed by washing (scale bar = 1.35 µm). Images reproduced from reference 58. ... 42
Figure 1.18: a) BHPB gelator used by Mésini and co-workers; b) TEM image of helical tapes of
BHPB gelators; c) helical pores in polymer matrix after removal of BHPB – black arrows = pore
viewed perpendicular to axis, white arrows = pore viewed along axis. Images reproduced from
reference 62. ...................................................................................................................................... 42
Figure 1.19: Left: pure polystyrene polymer cylinder; middle: hard polymer material containing
both polystyrene and a LMWG network; right rubbery polymer containing both poly(2-ethyl hexyl
methacrylate) and a LMWG network. Image reproduced from reference 64. .................................. 43
Figure 1.20: TEM image of poly(styrene-divinylbenzene) with embedded dendritic LMWG (dark
fibres and spots); the gelator network is visualised through the use of the reactive stain OsO4.
Image reproduced from reference 66. ............................................................................................... 44
Figure 1.21: Photographs (under 365 nm irradiation) of fluorescent thermochromic LMWG
systems prepared by Kim and Chang, a) gelling unpolymerised solvent at increasing temperature
and undergoing gel-sol transition with accompanying thermochromic colour change; b) LMWG
network in polymer film, with thermochromic colour change observed with increasing temperature.
.......................................................................................................................................................... 44
Figure 1.22: a) Hetero-bifunctional LMWG with both acryl and diacetylene polymerisable groups
used by Chang and co-workers; b) fluorescent polymerised gel fibres within poly(HMA) matrix; c)
photo-patterned polymer film – fluorescing areas contain polydiacetylene. Images reproduced from
reference 70. ...................................................................................................................................... 46
Figure 1.23: Illustration of the preparation of molecularly imprinted polymer/polymerised LMWG
materials by Yang and co-workers, and the process of molecular recognition. Image adapted from
reference 72. ...................................................................................................................................... 46
Figure 1.24: SEM images of L/DHL/DIOP systems studied by Liu and co-workers: a) Separate
needle-like fibres of L/DHL in DIOP; b) addition of EVACP caused a network of interconnected
branched fibres to form; c) illustration of crystallographic mismatch branching. Images reproduced
from reference 77. ............................................................................................................................. 48
13
Figure 1.25: a) Image of hydrogel of naphthalene-dipeptide; b) TEM and c) confocal micrograph of
gel (with Nile Blue stain); d) hydrogel of naphthalene-dipeptide with added dextran; e) TEM and f)
confocal microscopy showing that the gel fibres are significantly thinner. Image reproduced from
reference 84. ...................................................................................................................................... 50
Figure 1.26: Structures of a) pyridine-based LMWG and b) poly(acrylic acid), as used by McNeil
and co-workers, and TEM images of gel c) without and d) with PAA, resulting in thinner fibres.
Image reproduced from reference 88. ............................................................................................... 52
Figure 1.27: a) Cholesterol-saccharide LMWG and b) boronic-acid appended poly(L-lysine), as
used by Reinhoudt and co-workers, produce a gel consisting of polymer crosslinked vesicles; c)
varying the concentration of polymer controls crosslinking and the physical properties of the gel.
Image reproduced from reference 89. ............................................................................................... 52
Figure 1.28: Exemplar a) polynucleotide and b) nucleobase-appended gelator, used by Shinkai and
co-workers to form c) templated polymer-LMWG complexes. Image reproduced from reference
91. ..................................................................................................................................................... 53
Figure 1.29: a) Structure of 1,4-bis(phenylalanine-diglycol)-benzene (PDB) LMWG as used by
Feng and co-workers; b) schematic illustration of 3D cell culturing strategy using PDB/HA semi-
hybrid hydrogels: cells are cultured onto a xerogel (step A); swelling of the gel, facilitated by HA
then allows the cells to migrate into the bulk of the gel to form a 3D culture (step B). Image
reproduced from reference 103. ........................................................................................................ 56
Figure 1.30: a) Structure of oligo(p-phenylenevinylene) LMWG OPV16 as used by Guenet and co-
workers; b) AFM image of the hybrid organogel of OPV16 and isotactic polystyrene – two distinct
sizes of fibres can be seen, with the larger fibres being of the LMWG and the smaller of the PG.
Image reproduced from reference 105. ............................................................................................. 57
Figure 1.31: The multi-component peptide-based LMWG system used by Yang and co-workers,
consisting of H-lysine(Fmoc)-OH in combination with one of three Fmoc-amino acids; this multi-
component gel system was combined with the PG agarose to produce hybrid hydrogels. ............... 58
Figure 2.1: Formation of DBS-CO2H hydrogel; clear, basic solution (left) changes to translucent
gel (right) with decrease in pH over time, brought about by hydrolysis of GdL. ............................. 65
Figure 2.2: 1H NMR spectra (400 MHz, D2O) of DBS-CO2H gel (0.2% wt/vol) at (a) start of
gelation and (b) end of gelation; the absence of signals related to DBS-CO2H in (b) indicates that
all of the LMWG has been incorporated into a sample-spanning solid-like network. ...................... 68
Figure 2.3: Plot of average rate of formation of the DBS-CO2H network, as monitored by 1H NMR.
.......................................................................................................................................................... 69
14
Figure 2.4: Avrami plot for formation of DBS-CO2H network, using data from two runs; n =
gradient of line = 1.61. ...................................................................................................................... 71
Figure 2.5: a) CD spectra of GdL/gluconic acid (black) (44.9 mM) and H2O (light blue); b) DBS-
CO2H (0.02% wt/vol, 44.9 mM GdL). .............................................................................................. 72
Figure 2.6: Evolution of CD spectrum of DBS-CO2H (0.02% wt/vol) over a 2-hour period, after
addition of GdL (44.9 mM). ............................................................................................................. 73
Figure 2.7: Evolution of CD spectrum of DBS-CO2H (0.02% wt/vol) over a 2-hour period,
monitoring the ellipticity at 260 nm, after addition of GdL (44.9 mM). .......................................... 74
Figure 2.8: SEM images of freeze-dried DBS-CO2H xerogel. Scale bars = 1 µm ........................... 75
Figure 2.9: Formation of double helix structure with terminal “kinks” from agarose polysaccharide;
the double helices then aggregate into bundles, which are held together physically by the formation
of “junction zones” between the free terminal polysaccharide chains. ............................................. 76
Figure 2.10: Formation of agarose hydrogel from cold suspension of solid agarose(left); heating to
90°C followed by cooling to room temperature results in a robust, transparent gel(right). .............. 77
Figure 2.11: SEM images of xerogels of agarose (0.5 % wt/vol); scale bars = 1 µm ....................... 77
Figure 2.12: Formation of hybrid hydrogel of DBS-CO2H and agarose; GdL is added after heating
of basic solution of DBS-CO2H with agarose suspension(a); clear agarose gel then forms (b),
changing to translucent over time as LMWG network forms (c). .................................................... 78
Figure 2.13: Vials used in the preparation of some hydrogel samples for rheological analysis; left:
disassembled vial; right: reassemble vial, where removable base is held in place with the heat-
shrink seal. ........................................................................................................................................ 80
Figure 2.14: Comparison of results from amplitude sweep rheological analysis of DBS-CO2H,
agarose, and DBS-CO2H and agarose hybrid hydrogels. .................................................................. 81
Figure 2.15: Comparison of results from frequency sweep rheological analysis of DBS-CO2H,
agarose, and DBS-CO2H and agarose hybrid hydrogels. .................................................................. 82
Figure 2.16: 1H NMR spectra (400 MHz, D2O) of hybrid hydrogel of DBS-CO2H (0.2% wt/vol)
and agarose (0.5% wt/vol) at a) start of gelation and b) end of gelation; the absence of signals
related to DBS-CO2H in (b) indicates that all of the LMWG has been incorporated into a sample-
spanning solid-like network. ............................................................................................................. 83
Figure 2.17: Plot of average rate of formation of the DBS-CO2H network in presence (red) and
absence (blue) of agarose. ................................................................................................................. 84
15
Figure 2.18: Avrami plot for formation of DBS-CO2H network in presence of agarose; gradient of
line = n = 1.52. .................................................................................................................................. 85
Figure 2.19: CD spectra of agarose (yellow) and DBS-CO2H/agarose (0.02% and 0.05% wt/vol)
(red) after standing for 5 hours. ........................................................................................................ 86
Figure 2.20: Evolution of CD spectrum of hybrid system of DBS-CO2H (0.02% wt/vol) and
agarose (0.05% wt/vol) over an 80 minute period, after addition of GdL (44.9 mM). ..................... 87
Figure 2.21: Comparison of evolution of CD spectra over time, monitoring ellipticity at 260 nm,
after addition of GdL (44.9 mM); DBS-CO2H (blue); hybrid system of DBS-CO2H and agarose
(red). .................................................................................................................................................. 87
Figure 2.22: SEM images of xerogels of hybrid hydrogels of DBS-CO2H (0.2% wt/vol) and
agarose (0.5 % wt/vol); scale bars = 1 µm (left) and 100 nm (right). In the image on the right the
two different thicknesses of fibres can clearly be seen. .................................................................... 89
Figure 2.23: Progression of pH “switchable” gel; addition of NaOH increases pH and “switches
off” the LMWG network as DBS-CO2H is deprotonated and mobilised; addition of GdL returns the
system to acidic pH and the LMWG network is “switched on” again, as DBS-CO2H becomes re-
protonated and immobilised. ............................................................................................................. 90
Figure 2.24: Progression of “switchable” gel as visualised by 1H NMR spectroscopy; signals
associated with DBS-CO2H become visible or invisible upon addition of base or acid respectively.
.......................................................................................................................................................... 91
Figure 3.1: Formation of PEGDM hydrogel; solution of PEGDM and PI forms a robust, transparent
hydrogel upon exposure to UV light to activate PI. .......................................................................... 96
Figure 3.2: 1H NMR spectra (400 MHz, D2O) of PEGDM hydrogel (5% wt/vol) a) before UV
curing and b) after UV curing. The PEGDM signals are significantly reduced after
photopolymerisation, whilst the PI signals are almost absent after its activation. ............................ 97
Figure 3.3: SEM images of xerogels of PEGDM (5% wt/vol); scale bars = 1 µm. .......................... 98
Figure 3.4: Formation of hybrid hydrogels of DBS-CO2H and PEGDM; photoirradiation of a
solution of both gelators with PI and GdL (a) triggers photopolymerisation to form the crosslinked
PEGDM network and to yield a clear gel (b); the gel goes from clear to translucent (c) as the
LMWG network forms over time with the slow hydrolysis of GdL. ................................................ 98
Figure 3.5: Comparison of results from amplitude sweep rheological analysis of DBS-CO2H,
PEGDM, and DBS-CO2H and PEGDM hybrid hydrogels. ............................................................ 100
16
Figure 3.6: Comparison of results from frequency sweep rheological analysis of DBS-CO2H,
PEGDM, and DBS-CO2H and PEGDM hybrid hydrogels. ............................................................ 101
Figure 3.7: 1H NMR spectra (400 MHz, D2O) of hybrid hydrogel of DBS-CO2H (0.2% wt/vol) and
PEGDM (5% wt/vol) at a) before UV curing and start of DBS-CO2H gelation and b) after UV
curing and end of DBS-CO2H gelation; the absence of signals related to DBS-CO2H in (b) indicates
that all of the LMWG has been incorporated into a sample-spanning solid-like network. ............. 102
Figure 3.8: Plot of average rate of formation of the DBS-CO2H network in presence (purple) and
absence (blue) of PEGDM. ............................................................................................................. 103
Figure 3.9: Avrami plot for formation of DBS-CO2H network in presence of PEGDM; gradient of
line = n = 1.45. ................................................................................................................................ 104
Figure 3.10: CD spectrum of PEGDM (brown) and hybrid system of DBS-CO2H and PEGDM
(0.02% wt/vol and 0.5% wt/vol respectively) (purple) after standing for 5 hours. ......................... 105
Figure 3.11: Evolution of CD spectrum of hybrid system of DBS-CO2H (0.02% wt/vol) and
PEGDM (0.5% wt/vol) over a 2 hour period, after addition of GdL (44.9 mM). ........................... 106
Figure 3.12: Comparison of evolution of CD spectra over time, monitoring ellipticity at 260 nm,
after addition of GdL (44.9 mM); DBS-CO2H (blue); hybrid system of DBS-CO2H and PEGDM
(purple). ........................................................................................................................................... 106
Figure 3.13: SEM images of xerogels of hybrid hydrogels of DBS-CO2H (0.2% wt/vol) and
PEGDM (5 % wt/vol); scale bars = 1 µm. ...................................................................................... 107
Figure 3.14: (A) Patterned multi-domain gel consisting of non-hybrid single-network region (more
translucent) and hybrid dual-network Y-shaped region (less translucent). (B) The non-hybrid
domain is easily deformed, whilst (C) the hybrid region can be removed intact. (D) Diffusion of
DR80 dye from left edge at ca. 60 s. (E) Diffusion of dye at ca. 3 h. (F) Diffusion of dye at ca. 24 h
– non-hybrid region is nearly completely stained, whilst there is only minimal diffusion into hybrid
region. ............................................................................................................................................. 109
Figure 3.15: Structures of dyes: a) Direct Red 80, b) malachite green oxalate, and c) methylene
blue chloride.................................................................................................................................... 110
Figure 3.16: Comparison of the percentages of dye released from both PEGDM and hybrid gels in
pH 7 phosphate buffer solution. ...................................................................................................... 111
Figure 3.17: UV-vis spectrum for the time-dependent adsorption study of methylene blue (MB)
onto DBS-CO2H. ............................................................................................................................. 112
17
Figure 3.18: UV-vis spectrum for the time-dependent adsorption study of malachite green (MG)
onto DBS-CO2H. ............................................................................................................................. 113
Figure 3.19: TEM images of 0.2% wt/vol DBS-CO2H xerogels; left, without MB dye, right, with
MB dye (0.1 mg/mL). Scale bar = 500 nm. The xerogels are negatively stained with uranyl acetate.
The fibres in both samples show similar morphologies (rigid fibres)............................................. 114
Figure 4.1: Successfully synthesised DBS-peptide potential LMWGs DBS-Gly, DBS-Phe, and
DBS-Trp. ......................................................................................................................................... 118
Figure 4.2: a) Formation of DBS-Gly hydrogel by heat-cool method from cold suspension of the
solid LMWG; heating to 95°C followed by cooling to room temperature results in a transparent gel;
b) formation of DBS-Gly hydrogel by pH change; clear, basic solution changes to translucent gel
with decrease in pH over time, brought about by hydrolysis of GdL. ............................................ 120
Figure 4.3: pH change over time after addition of GdL (10 mg mL-1) for a DBS-Gly (0.45% wt/vol)
gel system........................................................................................................................................ 121
Figure 4.4: Plot of Tgel values for DBS-Gly gels made by heat-cool method as a function of %
wt/vol of the LMWG. ..................................................................................................................... 122
Figure 4.5: Plot of concentration of mobile DBS-Gly vs. Temperature, as determined by VT NMR
for a gel produced by heat-cool method. ......................................................................................... 123
Figure 4.6: 1H NMR spectra (500 MHz, D2O) of DBS-Gly gel (0.45% wt/vol) made by pH change
method at (a) start of gelation and (b) end of gelation; the near absence of signals related to DBS-
Gly in (b) indicates that most of the LMWG has been incorporated into a sample-spanning solid-
like network. ................................................................................................................................... 124
Figure 4.7: Plot of average rate of formation of a DBS-Gly network by pH change method......... 125
Figure 4.8: Avrami plot for formation of DBS-Gly network; n = gradient of line = 1.06. ............. 126
Figure 4.9: CD spectra of DBS-Gly (heat-cool method) at 0.01% wt/vol (green) and 0.05% wt/vol
(red). ................................................................................................................................................ 127
Figure 4.10: VT CD spectra for DBS-Gly (heat-cool method, 0.05% wt/vol) over temperature range
20-90°C. .......................................................................................................................................... 128
Figure 4.11: SEM images of DBS-Gly hydrogels, 0.1% wt/vol, prepared by heat/cool method. Left:
25000× magnification, scale bar = 1 µm; right: 75000× magnification, scale bar = 100 nm. ........ 129
Figure 4.12: SEM images of DBS-Gly hydrogels, 0.45% wt/vol, prepared by pH change method.
Left: 25000× magnification, scale bar = 1 µm; right: 75000× magnification, scale bar = 100 nm.129
18
Figure 4.13: Titration curves for a) DBS-Gly, and b) DBS-CO2H ................................................. 130
Figure 4.14: Formation of a multi-component hydrogel of DBS-Gly (0.45% wt/vol) and DBS-
CO2H (0.45% wt.vol); clear, basic solution (left) changes to translucent gel (right) with decrease in
pH over time, brought about by hydrolysis of GdL. ....................................................................... 131
Figure 4.15: % of gelator assembled into a solid-like network for multi-component systems of
DBS-Gly (8.03 mM) and DBS-CO2H (10.08 mM) with a) 22.5 mM, b) 32.0 mM, and c) 80.3 mM
GdL. ................................................................................................................................................ 132
Figure 4.16: CD spectra of DBS-CO2H (0.045% wt/vol) (blue), DBS-Gly (0.045% wt/vol) (green),
and a multi-component mixture of DBS-CO2H and DBS-Gly (0.045% wt/vol each) (orange), all
using GdL (8 mg mL-1) as the acidifying agent. The major band from gluconic acid can be seen to
start to appear below 250 nm. ......................................................................................................... 134
Figure 4.17: CD spectra of DBS-CO2H (0.045% wt/vol) and DBS-Gly (0.045% wt/vol) using HCl
(0.03 mM) as acidifying agent; a number of CD bands are now visible for DBS-Gly (notably at ca.
275 nm and 242 nm). ...................................................................................................................... 135
Figure 4.18: Calculated (purple) and experimental (orange) CD spectra for a multi-component
mixture of DBS-CO2H and DBS-Gly (0.045% wt/vol each), prepared using HCl (0.03 mM) as the
acidifying agent. .............................................................................................................................. 136
Figure 4.19: images of a) DBS-CO2H (0.40% wt/vol); b) DBS-Gly (0.45% wt/vol); c) multi-
component gel of DBS-CO2H and DBS-Gly (0.45% wt/vol each). Scale bars = 100 nm. ............. 137
Figure 4.20: Comparison of results from amplitude sweep rheological analysis of DBS-CO2H,
DBS-Gly, and multi-component DBS-CO2H + DBS-Gly hydrogels. ............................................ 138
Figure 4.21: Comparison of results from frequency sweep rheological analysis of DBS-CO2H,
DBS-Gly, and multi-component DBS-CO2H + DBS-Gly hydrogels. ............................................ 139
Figure 5.1: UV-vis spectrum of PAG diphenyliodonium nitrate (DPIN), 1.5 mM in H2O. From this
spectrum, λmax = 287 nm. ................................................................................................................ 143
Figure 5.2: Change in pH over time as DPIN solution (8 mg mL-1) is exposed to UV light (254
nm). ................................................................................................................................................. 144
Figure 5.3: Change in pH over time as DBS-CO2H/DPIN solutions are exposed to UV light (254
nm). ................................................................................................................................................. 145
Figure 5.4: Change in pH over time for DBS-CO2H/DPIN systems (0.2% wt/vol, 8 mg mL-1) with
varying amounts of HCl (0.5 M) added. ......................................................................................... 146
19
Figure 5.5: DBS-CO2H (varying % wt/vol) and DPIN (8 mg mL-1) systems after 8 hours exposure
to UV (254 nm); the gel-like membranes formed at the surface of the solution prevent flow of the
remaining solution upon tube inversion. ......................................................................................... 146
Figure 5.6: Suspensions of partial gels produced from solutions (1 mL volumes) of DBS-CO2H
(0.4% wt/vol) and DPIN (8 mg mL-1) after exposure to high intensity UV light; the partial gel
nature can been seen when the vial is placed on its side (right)...................................................... 148
Figure 5.7: System of DBS-CO2H (0.4% wt/vol) and DPIN (8 mg mL-1) in a 5 × 5 cm glass mould
before (left) and after (right) exposure to UV light; after exposure, a weak, opaque hydrogel is
formed. ............................................................................................................................................ 148
Figure 5.8: a) and b) suspensions of partial gel of DBS-Gly (0.4% wt/vol) using DPIN (8 mg mL-1)
as acidifying agent made in vials; c) weak, opaque hydrogel of DBS-Gly (0.4% wt/vol) using DPIN
(8 mg/mL) made in glass mould. .................................................................................................... 149
Figure 5.9: 1H NMR of DBS-CO2H system with 8mg mL-1 DPIN as acidifying agent, before and
after UV exposure of 1 hour. The lack of DBS-CO2H Ar-H peaks signifies that all the LMWG has
been reprotonated. Unlabelled peaks correspond to Ar-H protons of DPIN. ................................. 150
Figure 5.10: a) Plot of average rate of formation of the DBS-CO2H network when using DPIN as
the acidifying agent, as monitored by 1H NMR; b) Avrami plot for formation of DBS-CO2H
network, n = gradient of line = 0.99. ............................................................................................... 151
Figure 5.11: 1H NMR of DBS-Gly system with 8mg mL-1 DPIN as acidifying agent, before and
after UV exposure of 1 hour. The significant reduction of DBS-Gly Ar-H peaks signifies that most
of the LMWG has been reprotonated. Unlabelled peaks correspond to Ar-H protons of DPIN. ... 152
Figure 5.12: a) Plot of average rate of formation of the DBS-Gly network when using DPIN as the
acidifying agent, as monitored by 1H NMR; b) Avrami plot for formation of DBS-CO2H network, n
= gradient of line = 1.08. ................................................................................................................. 153
Figure 5.13: CD spectra of DBS-CO2H when prepared using DPIN as then acidifying agent (solid
line) or GdL as the acidifying agent (dashed line). ......................................................................... 154
Figure 5.14: CD spectra of DBS-Gly (0.045% wt/vol) using DPIN (0.8 mg/mL) as the acidifying
agent; the CD bands of DPIN appeared to mask the CD bands of DBS-Gly. ................................ 155
Figure 5.15: SEM images of the xerogels of DBS-CO2H partial gels produced using DPIN as PAG.
Scale bars = 1 μm. ........................................................................................................................... 156
Figure 5.16: SEM images of the xerogels of DBS-Gly partial gels produced using DPIN as PAG.
Scale bars = 1 μm (left) and 100 nm (right). ................................................................................... 157
20
Figure 5.17: 1H NMR spectra (aromatic region) for multicomponent gel of DBS-CO2H and DBS-
Gly (both 0.45% wt/vol), incorporating GdL (32.0 mM) and DPIN (23.3 mM) as proton sources.
Spectra were recorded after initial preparation of the solution (top, red), after GdL hydrolysis
(centre, green) and after UV activation of DPIN (bottom, blue). The highlighted peaks decrease in
intensity after each proton source has been activated, showing incorporation of the LMWGs into
solid-like networks. ......................................................................................................................... 159
Figure 5.18: SEM images of multi-component gels of DBS-CO2H and DBS-Gly (0.45% wt/vol
each), a) after GdL hydrolysis, and b) after both GdL hydrolysis and activation of DPIN. Scale bars
= 1 µm. ............................................................................................................................................ 160
Figure 5.19: Photopatterning of a multi-component gel of DBS-CO2H and DBS-Gly in 5 × 5 cm
mould. After formation of a translucent gel (left) using GdL as the proton source, exposure to UV
through a mask activates DPIN on the exposed regions, visualised by the gel changing from
translucent to opaque as the second network forms (right). ............................................................ 161
Figure 5.20: Photopatterned multi-component gel of DBS-CO2H and DBS-Gly in which one half
has been exposed to UV to activate DPIN (upper, opaque half) whilst one half was left unexposed
(lower, translucent half). Congo Red indicator has been applied, showing that pH > 5 in the
unexposed region, and pH ≈ 4 in the photopatterned region, indicating that the protons generated
during DPIN activation remain in the patterned region (left). A line of Congo Red indicator was
then applied to span the two regions, further showing the distinct difference in pH between the two
regions (right).................................................................................................................................. 162
Figure 6.1: Formation of a hybrid hydrogel of DBS-CO2H and PEGDM through photoactivation of
both networks (PI-initiated for PEGDM, DPIN-initiated for DBS-CO2H); a clear solution (left)
becomes an opaque gel after 1 hour of exposure to high-intensity UV light. ................................. 166
Figure 6.2: Formation of a photopatterned hybrid hydrogel of DBS-CO2H and PEGDM through
photoactivation of both networks; after 10 minutes of UV curing a translucent gel is formed (left);
after application of a mask (centre) and 50 minutes of further UV curing, a pattern is visible in the
gel (right). ....................................................................................................................................... 167
Figure 6.3: Photopatterned hybrid hydrogel of DBS-CO2H and PEGDM through photoactivation of
both networks; after formation of the PEGDM gel, the acetate photomask (left) was placed over the
gel and after 50 minutes of further UV curing, a detailed pattern is visible in the gel (right). Scale
bar = 10 mm. ................................................................................................................................... 167
Figure 6.4: 1H NMR of DBS-CO2H and PEGDM hybrid system with 8mg mL-1 DPIN as acidifying
agent, before and after UV exposure of 1 hour. The significant reduction of DBS-CO2H Ar-H
21
peaks signifies that nearly all the LMWG has been reprotonated. Unlabelled peaks correspond to
Ar-H protons of DPIN. ................................................................................................................... 168
Figure 6.5: a) Plot of average rate of formation of the DBS-CO2H network when using DPIN as the
acidifying agent, in the presence of PEGDM, as monitored by 1H NMR; b) Avrami plot for
formation of DBS-CO2H network, n = gradient of line = 1.05. ...................................................... 169
Figure 6.6: SEM images of the xerogels of hybrid hydrogels of DBS-CO2H and PEGDM, produced
using DPIN as PAG. Scale bars = 1 μm (left) and 100 nm (right). ................................................. 170
Figure 6.7: Formation of multi-component hybrid hydrogels of DBS-CO2H, DBS-Gly and
PEGDM; photoirradiation of a solution of all three gelators with PI and GdL (a) triggers
photopolymerisation to form the crosslinked PEGDM network and to yield a clear gel (b); the gel
goes from clear to translucent (c) as the LMWG networks forms over time with the slow hydrolysis
of GdL. ............................................................................................................................................ 171
Figure 6.8: Comparison of results from amplitude sweep rheological analysis of DBS-CO2H and
DBS-Gly multi-component hydrogel, PEGDM hydrogel, and DBS-CO2H, DBS-Gly and PEGDM
hybrid hydrogel. .............................................................................................................................. 172
Figure 6.9: Comparison of results from frequency sweep rheological analysis of DBS-CO2H and
DBS-Gly multi-component hydrogel, PEGDM hydrogel, and DBS-CO2H, DBS-Gly and PEGDM
hybrid hydrogel. .............................................................................................................................. 173
Figure 6.10: 1H NMR spectra (aromatic region) for multi-component gel of DBS-CO2H and DBS-
Gly (both 0.45% wt/vol) and PEGDM (5% wt/vol), using GdL (101 mM) as proton source. Spectra
were recorded after initial preparation of the PEGDM gel (top, black), and after GdL hydrolysis
(bottom, blue). ................................................................................................................................. 174
Figure 6.11: a) Plot of average rate of formation of the DBS-CO2H (blue) and DBS-Gly (green)
networks in the presence of PEGDM; b) the same plot with the two different periods of assembly
of DBS-Gly highlighted (dark green diamonds and black line, light green diamonds and red line).
........................................................................................................................................................ 175
Figure 6.12: CD spectrum of hybrid system of DBS-CO2H (0.045% wt/vol), DBS-Gly (0.045%
wt/vol) and PEGDM (0.5% wt/vol) after standing for 5 hours. ...................................................... 177
Figure 6.13: SEM images of xerogels of multi-component hybrid hydrogels of DBS-CO2H (0.45%
wt/vol), DBS-Gly (0.45% wt/vol) and PEGDM (5 % wt/vol); scale bars = 1 µm (left) and 100 nm
(right). ............................................................................................................................................. 178
22
Figure 6.14: Stepwise formation of a multi-component hybrid hydrogel of DBS-CO2H, DBS-Gly
and PEGDM. A solution of all three gelators and PI, GdL and DPIN (a) is cured under UV light for
10 minutes to form a complete PEGDM gel (with a small amount of DPIN activation) (b); the gel is
then left overnight for GdL to hydrolyse, and partial formation of the LMWG networks (mostly
DBS-CO2H) takes place (c); further curing under UV for 60 minutes then activates the remaining
DPIN and LMWG network formation is completed, accompanied by production of iodobenzene,
changing the gel from translucent to opaque (d). ............................................................................ 179
Figure 6.15: 1H NMR spectra (aromatic region) for multi-component hybrid hydrogel of DBS-
CO2H, DBS-Gly and PEGDM (0.45% wt/vol of both LMWGs, 5% wt/vol PG), incorporating GdL
(32.0 mM) and DPIN (23.3 mM) as proton sources. Spectra were recorded after initial UV curing
of the solution (top, black), after GdL hydrolysis (centre, blue) and after UV activation of DPIN
(bottom, green). The highlighted peaks in the first two spectra show a decrease in intensity after
GdL has been activated; though the peaks are shifted upfield in the final spectrum, their further
significant decrease indicates further incorporation of the LMWGs into solid-like networks. The
peaks for DBS-CO2H and DBS-Gly overlap; the relevant “side” of each multiplet is assigned to the
Ar-H of each LMWG. Unlabelled peaks correspond to Ar-H protons of DPIN. ........................... 181
Figure 6.16: SEM images of multi-component hybrid hydrogels of DBS-CO2H, DBS-Gly (0.45%
wt/vol each) and PEGDM (5% wt/vol), a) + b) after GdL hydrolysis, and c) + d) after both GdL
hydrolysis and activation of DPIN. Scale bars = 1 µm. .................................................................. 182
Figure 6.17: Photopatterned multidomain, multi-component hybrid hydrogel of DBS-CO2H, DBS-
Gly and PEGDM. Each domain is labelled to show which gel networks are present and which
gelators remain largely free in solution. .......................................................................................... 183
Figure 6.18: Stepwise formation of a four-domain multi-component hybrid hydrogel of DBS-
CO2H, DBS-Gly and PEGDM. A solution of all three gelators and PI, GdL and DPIN (a) is cured
under UV light (with a mask obscuring half of the sample) for 10 minutes to form a complete
PEGDM gel (with a small amount of DPIN activation), after which the remaining solution is
poured away and replaced by one containing DBS-CO2H, DBS-Gly, GdL and DPIN (b); the
sample is then left overnight for GdL to hydrolyse, and partial formation of the LMWG networks
(mostly DBS-CO2H) takes place (c); further curing under UV (with the mask now rotated 90°) for
50 minutes then activates the remaining DPIN and LMWG network formation is completed,
accompanied by production of iodobenzene, changing the gel from translucent to opaque, and
completing formation of the four-domain gel (d); each domain is labelled according to the list
given above. .................................................................................................................................... 185
23
Figure 7.1: Illustration of the principle of the responsive yet robust hybrid hydrogel produced from
the combination of DBS-CO2H and agarose. .................................................................................. 188
Figure 7.2: Illustration of the principle of making a multidomain hybrid hydrogel from the
combination of DBS-CO2H and PEGDM. ...................................................................................... 189
Figure 7.3: Illustration of the principle of gaining temporal resolution in multi-component gels
through the hydrolysis of GdL, followed by activation of DPIN with a combination of the LMWGs
DBS-CO2H and DBS-Gly. .............................................................................................................. 191
Figure 7.4: Illustration of the procedure for producing a multi-component hybrid hydrogel through
activation of PI, followed by hydrolysis of GdL, followed by activation of DPIN, for a combination
of the LMWGs DBS-CO2H and DBS-Gly and the PG PEGDM. ................................................... 192
Figure 8.1: Numbering of sugar CH resonances as used in 1H NMR assignment of DBS-derived
compounds. ..................................................................................................................................... 195
Figure 8.2: Typical setup of a cooling tray used for cooling glass mould and gel during UV curing.
........................................................................................................................................................ 218
Figure 8.3: Calibration plot of methylene blue for controlled release, λmax = 663 nm. ................... 222
Figure 8.4: Calibration plot of malachite green for controlled release, λmax = 617 nm. .................. 222
Figure 8.5: Calibration plot of Direct Red 80 for controlled release, λmax = 541 nm. ..................... 222
Figure 8.6: Calibration plot of methylene blue for adsorption, λmax = 663 nm. .............................. 223
Figure 8.7: Calibration plot of malachite green for adsorption, λmax = 617 nm. ............................. 224
24
List of Schemes
Scheme 2.1: Synthesis of 1,3;2,4-dibenzylidene-D-sorbitol from D-sorbitol and benzaldehyde, and
3D conformational view. .................................................................................................................. 62
Scheme 2.2: Synthesis of DBS-CO2H .............................................................................................. 64
Scheme 2.3: The hydrolysis of glucono-δ-lactone to gluconic acid; this reaction is accompanied by
a decrease in solution pH. ................................................................................................................. 64
Scheme 3.1: Synthesis of PEGDM from PEG and methacrylic anhydride (n ≈ 180). ...................... 95
Scheme 3.2: Photolysis of photoinitiator 2-hydroxy-4′-(2-hydroxyethoxy)-2-methylpropiophenone
under UV light to generate radical species. ...................................................................................... 95
Scheme 3.3: Process of production of a multidomain gel of PEGDM and DBS-CO2H; the patterned
PG network is formed first by selective exposure to UV light, followed by formation of the LMWG
network throughout the bulk sample as a result of GdL hydrolysis. .............................................. 108
Scheme 4.1: Synthesis of a DBS-peptide from DBS-CO2H and a methyl ester-protected L-amino
acid through TBTU coupling followed by NaOH saponification. .................................................. 117
Scheme 5.1: Mechanism for the activation of DPIN in aqueous solution. ..................................... 143
Scheme 5.2: Formation of dual-network gel of DBS-CO2H and DBS-Gly through a two-step
activation process using GdL followed by DPIN. .......................................................................... 157
Scheme 5.3: Fabrication of photopatterned multi-component multidomain gels by two-step
acidification process; in the first step, GdL activates DBS-CO2H network formation, then in the
second step UV activation of DPIN activates DBS-Gly network formation in the exposed regions.
........................................................................................................................................................ 161

25
List of Tables
Table 2.1: Tgel data for DBS-CO2H and hybrid gels. “>100” signifies that the gel remained stable
over the boiling point of the solvent; the collapse of the gel after this point can be attributed to the
boiling of the solvent rather than a breakdown of the gel network. .................................................. 66
26
Acknowledgements
To begin with, a big thank you to my parents for all their support over the years of my studies,
whether it was financial, logistical, or just being a phone call away when times were hard. I may
have thoroughly confused you sometimes when talking about my work (and lots of other things, to
be honest), but you were always willing to listen and be encouraging, and for that I am very
grateful. My thanks to the rest of my family too for all their interest shown in my research –
particularly my grandad for always being excited to receive the latest paper.
I am of course hugely thankful for the support and guidance from my supervisor Professor
David Smith – for all his ideas, encouragement and help throughout the project and in my other
academic activities, and when things really weren’t going so well for me. I am also appreciative of
the input from my IPM, Dr Isabel Saez, particularly her useful comments and questions in TAP
meetings. I must also thank the University of York and the Department of Chemistry for my
funding through a Teaching Studentship.
On the technical side of things, my thanks to Heather Fish (NMR), Karl Heaton (mass
spectrometry) and Abi Storey (glassblowing); and also, over in Biology, Meg Stark (SEM/TEM)
and Dr Andrew Leech (circular dichroism).
Thanks to all members of the DKS group, past and present, for making the lab and offices a
great place to work. Particular acknowledgements must go to Dr Will Edwards and Dr Babatunde
Okesola for their help during the early stages of my project, Dr Ching Wan Chan (Rex) for his help
with NMR, and especially to Dr Stephen Bromfield and Lizzie Wheeldon for being available
whenever a good old moan about research or teaching was needed. I am also indebted to my
MChem project student Oliver Daubney for his work on photoacid generators. Best of luck to
everyone else still researching or writing-up – Buthaina Albanyan, Nicole Whitelaw, Jorge Ruiz
Olles, Vânia Vieira and Phill Chivers.
My life in York has not all been work, and I would not have got through the last few years
without some great friends, practically all of whom I met through the Douglas Adams Society
(DougSoc). There are far too many of you to list here, but really big special thanks must go to Elise
Groves, Chris Reynolds, and Dave Cooper. Thanks for keeping me just the right kind of crazy, and
for making me an Eternal Dougling! I’ll be back to check in on you from time to time – I expect
I’ll find you all in ‘Spoons…
27
28
Declaration
I declare that the work presented within this thesis is entirely my own, except where otherwise
acknowledge. This work has not been submitted in part or fully for examination towards any
degrees or qualifications. Aspects of this work have been published in the following journal
articles: Soft Matter, 2013, 9, 8730–8736; Angew. Chem. Int. Ed., 2014, 53, 12461–12465; Mater.
Horiz., 2015, 2, 279–293; J. Am. Chem. Soc., 2015, 137, 15486–15492.
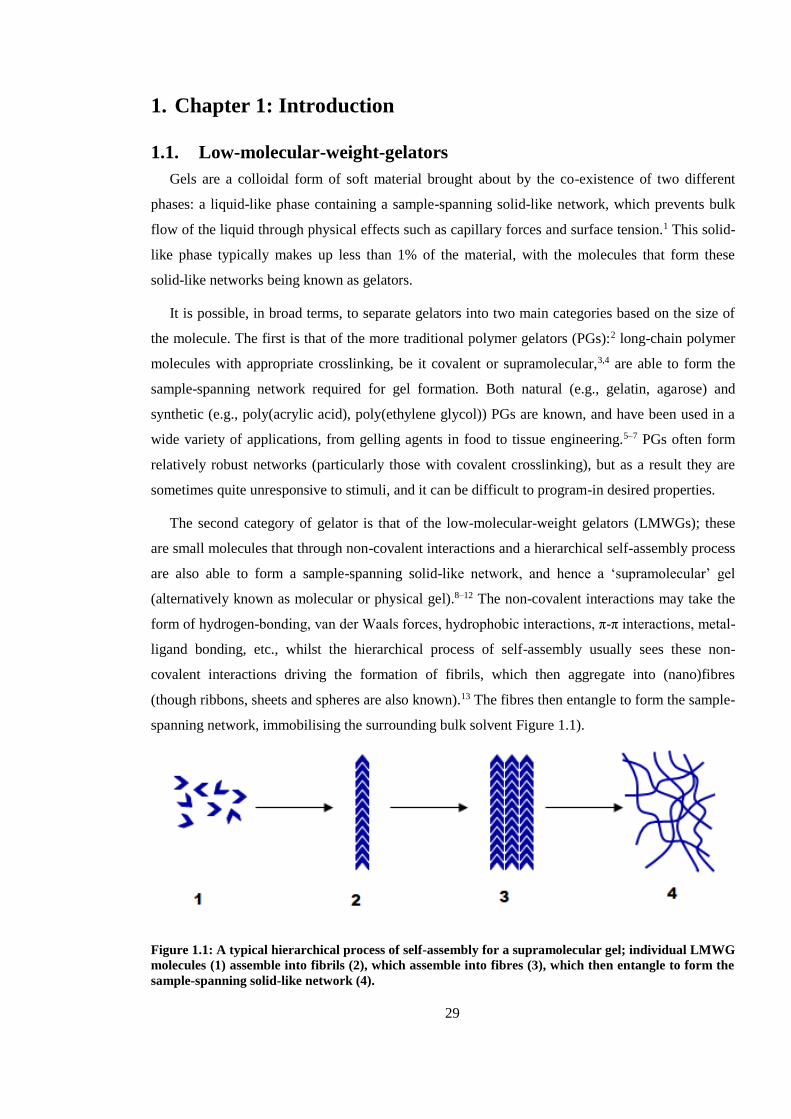
29
1. Chapter 1: Introduction
1.1. Low-molecular-weight-gelators
Gels are a colloidal form of soft material brought about by the co-existence of two different
phases: a liquid-like phase containing a sample-spanning solid-like network, which prevents bulk
flow of the liquid through physical effects such as capillary forces and surface tension.1 This solid-
like phase typically makes up less than 1% of the material, with the molecules that form these
solid-like networks being known as gelators.
It is possible, in broad terms, to separate gelators into two main categories based on the size of
the molecule. The first is that of the more traditional polymer gelators (PGs):2 long-chain polymer
molecules with appropriate crosslinking, be it covalent or supramolecular,3,4 are able to form the
sample-spanning network required for gel formation. Both natural (e.g., gelatin, agarose) and
synthetic (e.g., poly(acrylic acid), poly(ethylene glycol)) PGs are known, and have been used in a
wide variety of applications, from gelling agents in food to tissue engineering.5–7 PGs often form
relatively robust networks (particularly those with covalent crosslinking), but as a result they are
sometimes quite unresponsive to stimuli, and it can be difficult to program-in desired properties.
The second category of gelator is that of the low-molecular-weight gelators (LMWGs); these
are small molecules that through non-covalent interactions and a hierarchical self-assembly process
are also able to form a sample-spanning solid-like network, and hence a ‘supramolecular’ gel
(alternatively known as molecular or physical gel).8–12 The non-covalent interactions may take the
form of hydrogen-bonding, van der Waals forces, hydrophobic interactions, π-π interactions, metal-
ligand bonding, etc., whilst the hierarchical process of self-assembly usually sees these non-
covalent interactions driving the formation of fibrils, which then aggregate into (nano)fibres
(though ribbons, sheets and spheres are also known).13 The fibres then entangle to form the sample-
spanning network, immobilising the surrounding bulk solvent Figure 1.1).
Figure 1.1: A typical hierarchical process of self-assembly for a supramolecular gel; individual LMWG
molecules (1) assemble into fibrils (2), which assemble into fibres (3), which then entangle to form the
sample-spanning solid-like network (4).
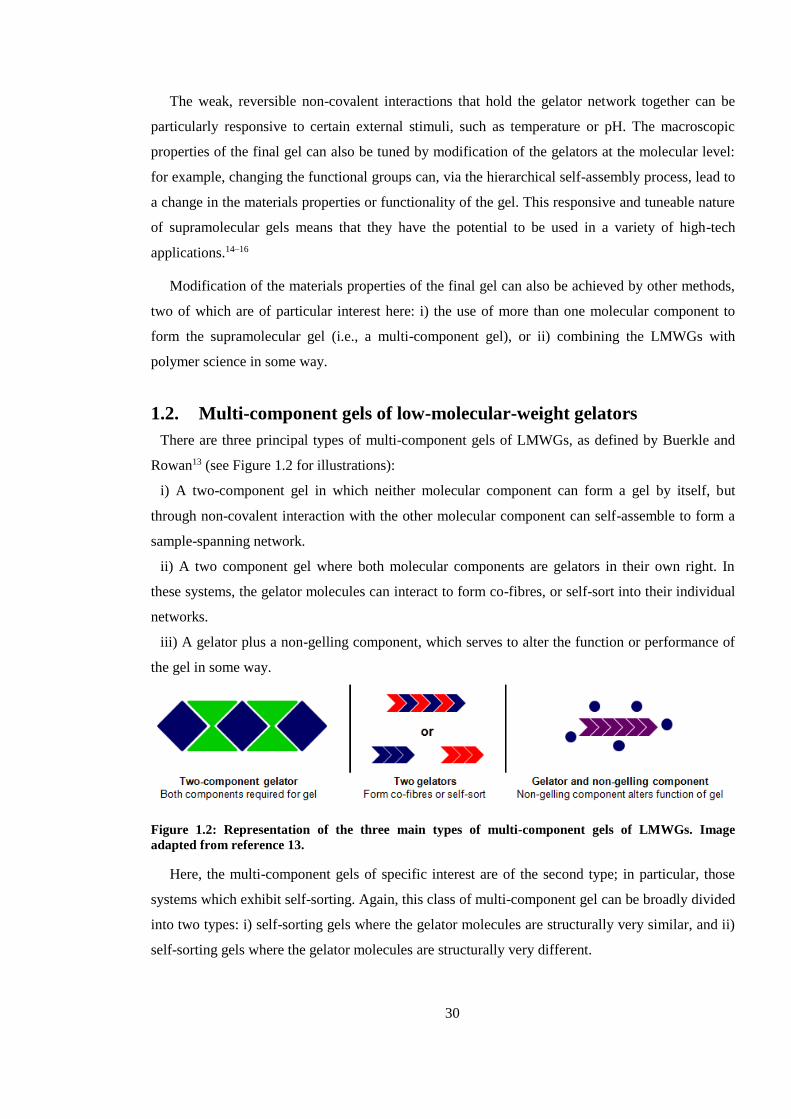
30
The weak, reversible non-covalent interactions that hold the gelator network together can be
particularly responsive to certain external stimuli, such as temperature or pH. The macroscopic
properties of the final gel can also be tuned by modification of the gelators at the molecular level:
for example, changing the functional groups can, via the hierarchical self-assembly process, lead to
a change in the materials properties or functionality of the gel. This responsive and tuneable nature
of supramolecular gels means that they have the potential to be used in a variety of high-tech
applications.14–16
Modification of the materials properties of the final gel can also be achieved by other methods,
two of which are of particular interest here: i) the use of more than one molecular component to
form the supramolecular gel (i.e., a multi-component gel), or ii) combining the LMWGs with
polymer science in some way.
1.2. Multi-component gels of low-molecular-weight gelators
There are three principal types of multi-component gels of LMWGs, as defined by Buerkle and
Rowan13 (see Figure 1.2 for illustrations):
i) A two-component gel in which neither molecular component can form a gel by itself, but
through non-covalent interaction with the other molecular component can self-assemble to form a
sample-spanning network.
ii) A two component gel where both molecular components are gelators in their own right. In
these systems, the gelator molecules can interact to form co-fibres, or self-sort into their individual
networks.
iii) A gelator plus a non-gelling component, which serves to alter the function or performance of
the gel in some way.
Figure 1.2: Representation of the three main types of multi-component gels of LMWGs. Image
adapted from reference 13.
Here, the multi-component gels of specific interest are of the second type; in particular, those
systems which exhibit self-sorting. Again, this class of multi-component gel can be broadly divided
into two types: i) self-sorting gels where the gelator molecules are structurally very similar, and ii)
self-sorting gels where the gelator molecules are structurally very different.

31
1.2.1. Structurally similar self-sorting multi-component gels of two LMWGs
Fuhrhop and Boettcher provided an early example of self-sorting between structurally similar
gelators when investigating mixtures of different alkyl aldonamides.17 These hydrogelators had
different lengths of alkyl tails (8 or 12 carbons) and different chiralities of the sugar head groups (D
or L glucose, galactose or mannose) (Figure 1.3). They summarized their findings with three rules
regarding self-sorting in these systems: i) for two alkyl aldonamides where the chain length is the
only difference, self-sorting does not occur; ii) racemic mixtures crystallise to give platelet- or
tube-like crystals, and iii) self-sorting readily occurs for diastereoisomers if there is the opposite
chirality at C3 and C5.
Figure 1.3: Example structures of alkyl aldonamide gelators with glucose head groups of differing
chirality and alkyl chains of different lengths, as investigated by Fuhrhop and Boettcher.17 These two
gelators are able to self-sort.
Smith and co-workers investigated self-sorting in mixtures of structurally related peptide-based,
bola-amphiphile-like dendritic gelators, examining the effects of size (generation of dendron),
shape (length of central carbon chain) and chirality (D or L-lysine as dendron building blocks).18 It
was found that whilst differences in size and chirality led to self-sorting, differences in shape did
not (similar to the lack of self-sorting observed by Fuhrhop and Boettcher when only chain length
differed);17 it was therefore proposed that interactions between the dendritic groups drove the self-
assembly of the gelator fibres, and that self-sorting is dependent on the nature and location of the
molecular information used in the molecular recognition pathway, which is responsible for gel
formation. In related work, Moffat and Smith expanded on this idea by investigating mixtures of
lysine-based dendritic gelators with different peripheral groups (either carbamate- or amide-based)
(Figure 1.4).19 Whilst a mixture of two gelators with carbamate and amide peripheral groups was
able to self-sort (Figure 4a/4b, 4a/4c), a mixture of two gelators with two different amide groups
(Figure 4b/4c) showed equal interaction with each other; this contrast was likely due to amide-
amide hydrogen bonding being preferable over amide-carbamate hydrogen bonding, again
suggesting that self-sorting is dependent on the nature of the molecular information used in the
molecular recognition pathway.
L-Glu 8
D-Glu 12
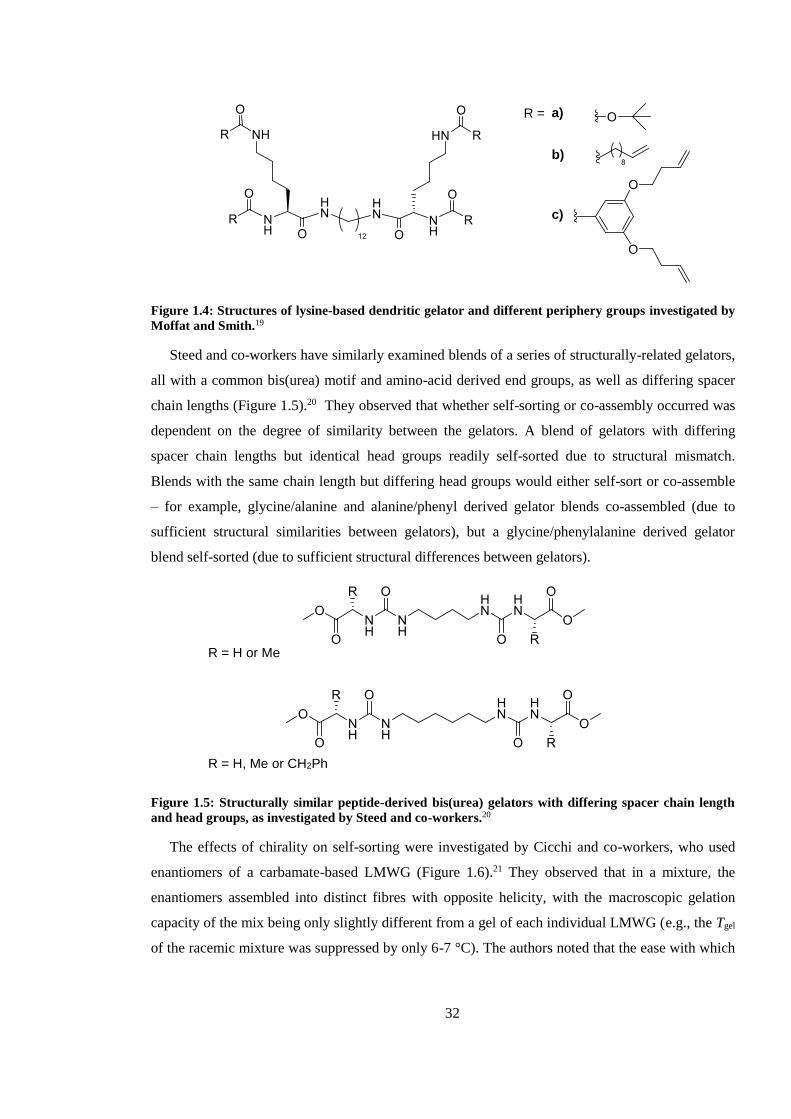
32
Figure 1.4: Structures of lysine-based dendritic gelator and different periphery groups investigated by
Moffat and Smith.19
Steed and co-workers have similarly examined blends of a series of structurally-related gelators,
all with a common bis(urea) motif and amino-acid derived end groups, as well as differing spacer
chain lengths (Figure 1.5).20 They observed that whether self-sorting or co-assembly occurred was
dependent on the degree of similarity between the gelators. A blend of gelators with differing
spacer chain lengths but identical head groups readily self-sorted due to structural mismatch.
Blends with the same chain length but differing head groups would either self-sort or co-assemble
– for example, glycine/alanine and alanine/phenyl derived gelator blends co-assembled (due to
sufficient structural similarities between gelators), but a glycine/phenylalanine derived gelator
blend self-sorted (due to sufficient structural differences between gelators).
Figure 1.5: Structurally similar peptide-derived bis(urea) gelators with differing spacer chain length
and head groups, as investigated by Steed and co-workers.20
The effects of chirality on self-sorting were investigated by Cicchi and co-workers, who used
enantiomers of a carbamate-based LMWG (Figure 1.6).21 They observed that in a mixture, the
enantiomers assembled into distinct fibres with opposite helicity, with the macroscopic gelation
capacity of the mix being only slightly different from a gel of each individual LMWG (e.g., the Tgel
of the racemic mixture was suppressed by only 6-7 °C). The authors noted that the ease with which
R = H or Me
R = H, Me or CH2Ph
R = a)
b)
c)
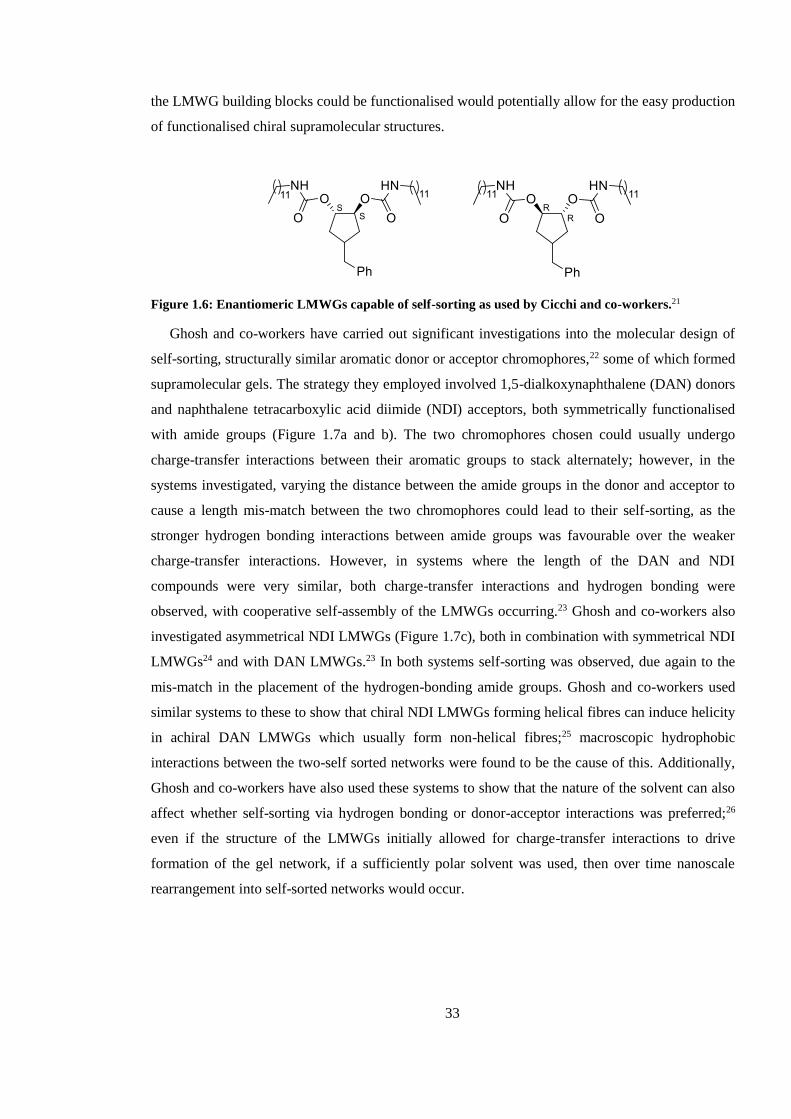
33
the LMWG building blocks could be functionalised would potentially allow for the easy production
of functionalised chiral supramolecular structures.
Figure 1.6: Enantiomeric LMWGs capable of self-sorting as used by Cicchi and co-workers.21
Ghosh and co-workers have carried out significant investigations into the molecular design of
self-sorting, structurally similar aromatic donor or acceptor chromophores,22 some of which formed
supramolecular gels. The strategy they employed involved 1,5-dialkoxynaphthalene (DAN) donors
and naphthalene tetracarboxylic acid diimide (NDI) acceptors, both symmetrically functionalised
with amide groups (Figure 1.7a and b). The two chromophores chosen could usually undergo
charge-transfer interactions between their aromatic groups to stack alternately; however, in the
systems investigated, varying the distance between the amide groups in the donor and acceptor to
cause a length mis-match between the two chromophores could lead to their self-sorting, as the
stronger hydrogen bonding interactions between amide groups was favourable over the weaker
charge-transfer interactions. However, in systems where the length of the DAN and NDI
compounds were very similar, both charge-transfer interactions and hydrogen bonding were
observed, with cooperative self-assembly of the LMWGs occurring.23 Ghosh and co-workers also
investigated asymmetrical NDI LMWGs (Figure 1.7c), both in combination with symmetrical NDI
LMWGs24 and with DAN LMWGs.23 In both systems self-sorting was observed, due again to the
mis-match in the placement of the hydrogen-bonding amide groups. Ghosh and co-workers used
similar systems to these to show that chiral NDI LMWGs forming helical fibres can induce helicity
in achiral DAN LMWGs which usually form non-helical fibres;25 macroscopic hydrophobic
interactions between the two-self sorted networks were found to be the cause of this. Additionally,
Ghosh and co-workers have also used these systems to show that the nature of the solvent can also
affect whether self-sorting via hydrogen bonding or donor-acceptor interactions was preferred;26
even if the structure of the LMWGs initially allowed for charge-transfer interactions to drive
formation of the gel network, if a sufficiently polar solvent was used, then over time nanoscale
rearrangement into self-sorted networks would occur.
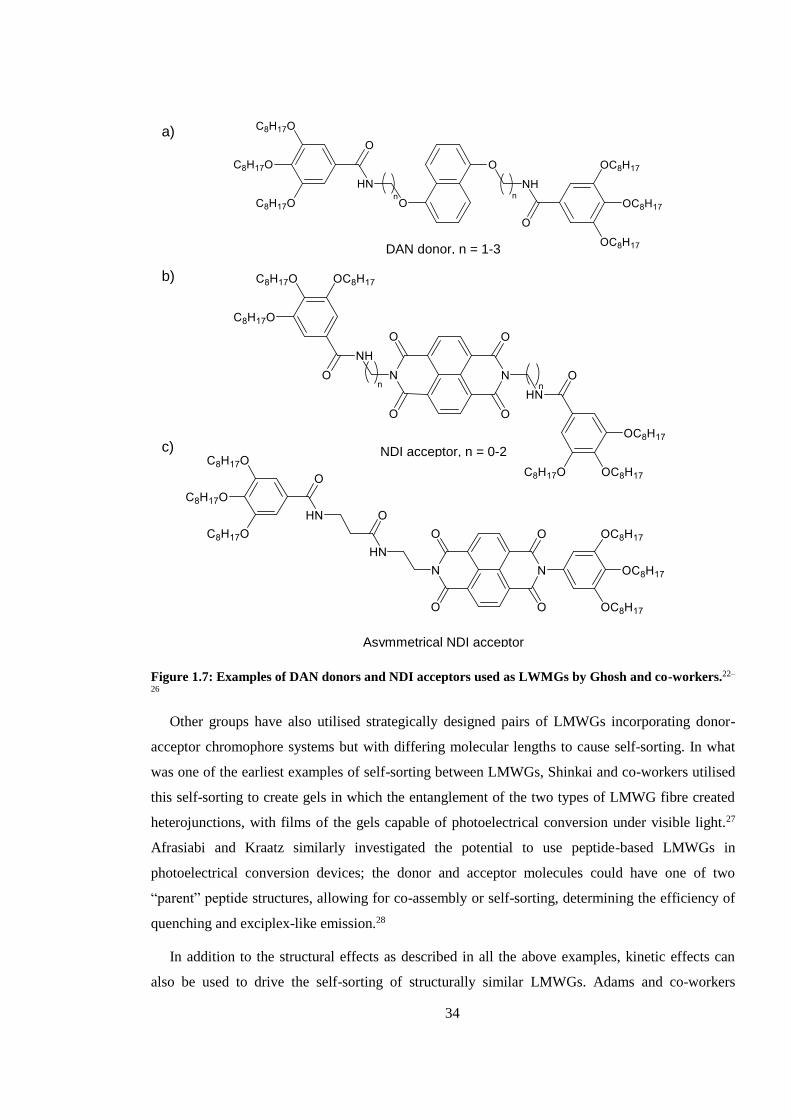
34
Figure 1.7: Examples of DAN donors and NDI acceptors used as LWMGs by Ghosh and co-workers.22–
26
Other groups have also utilised strategically designed pairs of LMWGs incorporating donor-
acceptor chromophore systems but with differing molecular lengths to cause self-sorting. In what
was one of the earliest examples of self-sorting between LMWGs, Shinkai and co-workers utilised
this self-sorting to create gels in which the entanglement of the two types of LMWG fibre created
heterojunctions, with films of the gels capable of photoelectrical conversion under visible light.27
Afrasiabi and Kraatz similarly investigated the potential to use peptide-based LMWGs in
photoelectrical conversion devices; the donor and acceptor molecules could have one of two
“parent” peptide structures, allowing for co-assembly or self-sorting, determining the efficiency of
quenching and exciplex-like emission.28
In addition to the structural effects as described in all the above examples, kinetic effects can
also be used to drive the self-sorting of structurally similar LMWGs. Adams and co-workers
DAN donor, n = 1-3
NDI acceptor, n = 0-2
a)
b)
c)
Asymmetrical NDI acceptor
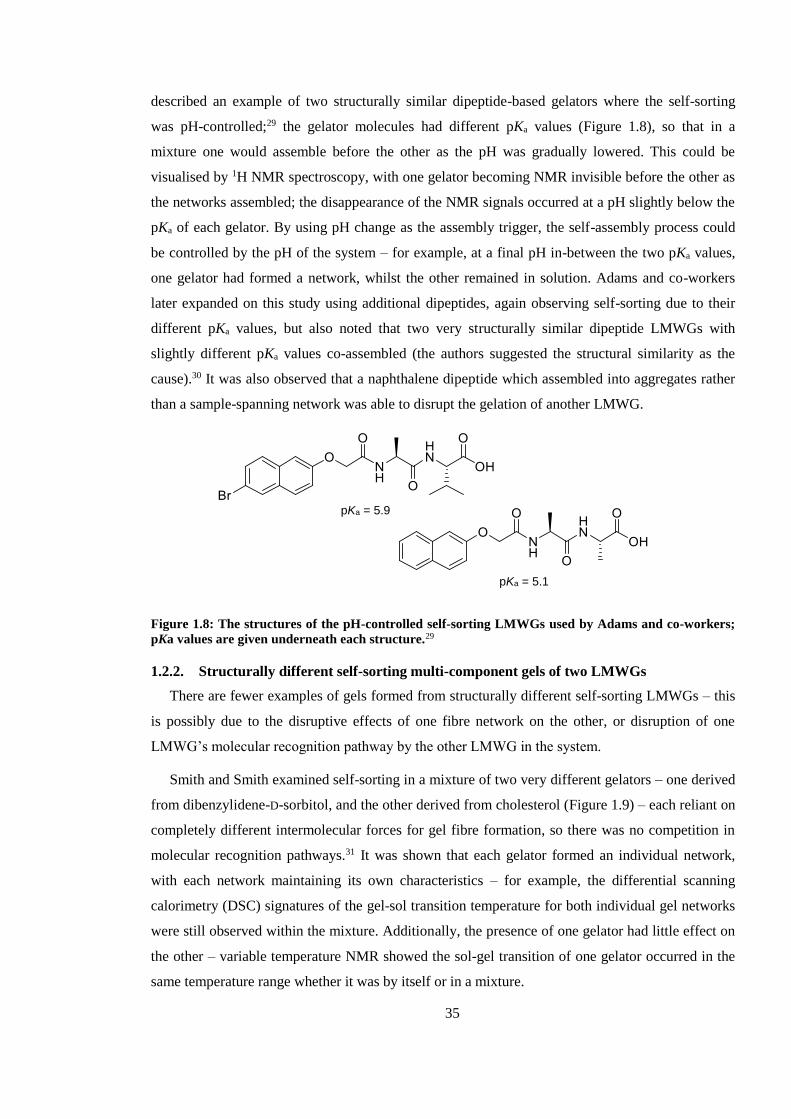
35
described an example of two structurally similar dipeptide-based gelators where the self-sorting
was pH-controlled;29 the gelator molecules had different pKa values (Figure 1.8), so that in a
mixture one would assemble before the other as the pH was gradually lowered. This could be
visualised by 1H NMR spectroscopy, with one gelator becoming NMR invisible before the other as
the networks assembled; the disappearance of the NMR signals occurred at a pH slightly below the
pKa of each gelator. By using pH change as the assembly trigger, the self-assembly process could
be controlled by the pH of the system – for example, at a final pH in-between the two pKa values,
one gelator had formed a network, whilst the other remained in solution. Adams and co-workers
later expanded on this study using additional dipeptides, again observing self-sorting due to their
different pKa values, but also noted that two very structurally similar dipeptide LMWGs with
slightly different pKa values co-assembled (the authors suggested the structural similarity as the
cause).30 It was also observed that a naphthalene dipeptide which assembled into aggregates rather
than a sample-spanning network was able to disrupt the gelation of another LMWG.
Figure 1.8: The structures of the pH-controlled self-sorting LMWGs used by Adams and co-workers;
pKa values are given underneath each structure.29
1.2.2. Structurally different self-sorting multi-component gels of two LMWGs
There are fewer examples of gels formed from structurally different self-sorting LMWGs – this
is possibly due to the disruptive effects of one fibre network on the other, or disruption of one
LMWG’s molecular recognition pathway by the other LMWG in the system.
Smith and Smith examined self-sorting in a mixture of two very different gelators – one derived
from dibenzylidene-D-sorbitol, and the other derived from cholesterol (Figure 1.9) – each reliant on
completely different intermolecular forces for gel fibre formation, so there was no competition in
molecular recognition pathways.31 It was shown that each gelator formed an individual network,
with each network maintaining its own characteristics – for example, the differential scanning
calorimetry (DSC) signatures of the gel-sol transition temperature for both individual gel networks
were still observed within the mixture. Additionally, the presence of one gelator had little effect on
the other – variable temperature NMR showed the sol-gel transition of one gelator occurred in the
same temperature range whether it was by itself or in a mixture.
pKa = 5.9
pKa = 5.1
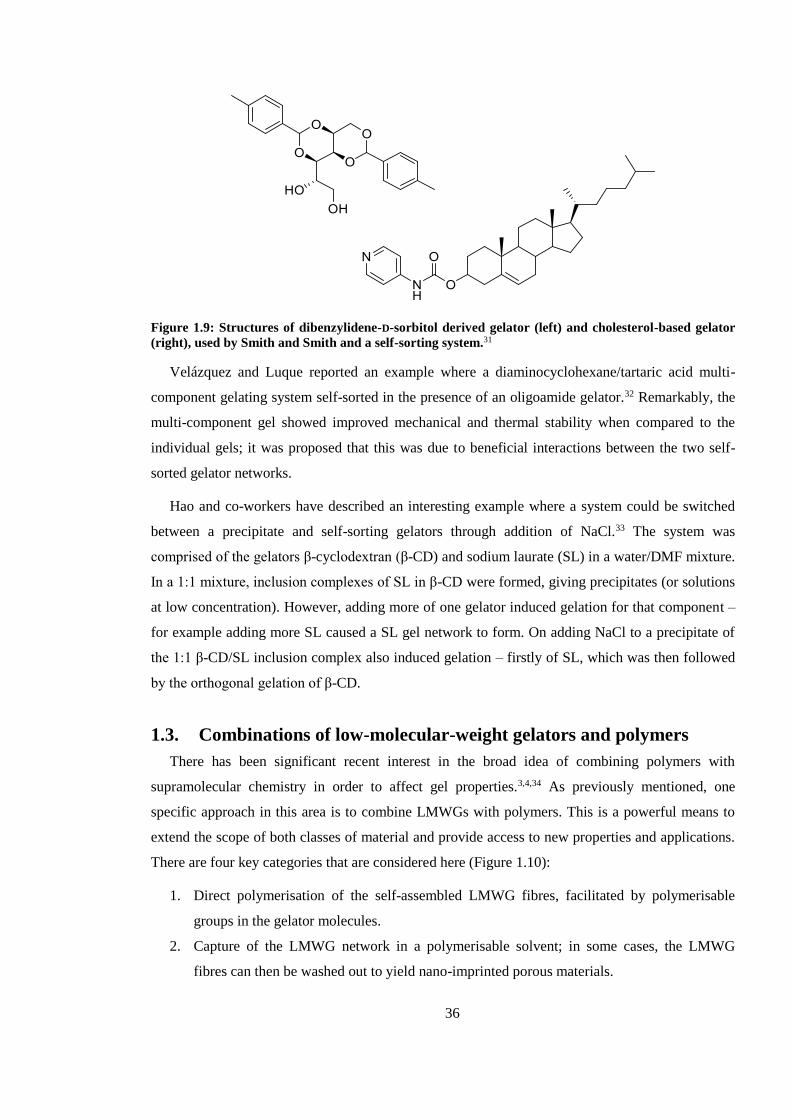
36
Figure 1.9: Structures of dibenzylidene-D-sorbitol derived gelator (left) and cholesterol-based gelator
(right), used by Smith and Smith and a self-sorting system.31
Velázquez and Luque reported an example where a diaminocyclohexane/tartaric acid multi-
component gelating system self-sorted in the presence of an oligoamide gelator.32 Remarkably, the
multi-component gel showed improved mechanical and thermal stability when compared to the
individual gels; it was proposed that this was due to beneficial interactions between the two self-
sorted gelator networks.
Hao and co-workers have described an interesting example where a system could be switched
between a precipitate and self-sorting gelators through addition of NaCl.33 The system was
comprised of the gelators β-cyclodextran (β-CD) and sodium laurate (SL) in a water/DMF mixture.
In a 1:1 mixture, inclusion complexes of SL in β-CD were formed, giving precipitates (or solutions
at low concentration). However, adding more of one gelator induced gelation for that component –
for example adding more SL caused a SL gel network to form. On adding NaCl to a precipitate of
the 1:1 β-CD/SL inclusion complex also induced gelation – firstly of SL, which was then followed
by the orthogonal gelation of β-CD.
1.3. Combinations of low-molecular-weight gelators and polymers
There has been significant recent interest in the broad idea of combining polymers with
supramolecular chemistry in order to affect gel properties.3,4,34 As previously mentioned, one
specific approach in this area is to combine LMWGs with polymers. This is a powerful means to
extend the scope of both classes of material and provide access to new properties and applications.
There are four key categories that are considered here (Figure 1.10):
1. Direct polymerisation of the self-assembled LMWG fibres, facilitated by polymerisable
groups in the gelator molecules.
2. Capture of the LMWG network in a polymerisable solvent; in some cases, the LMWG
fibres can then be washed out to yield nano-imprinted porous materials.
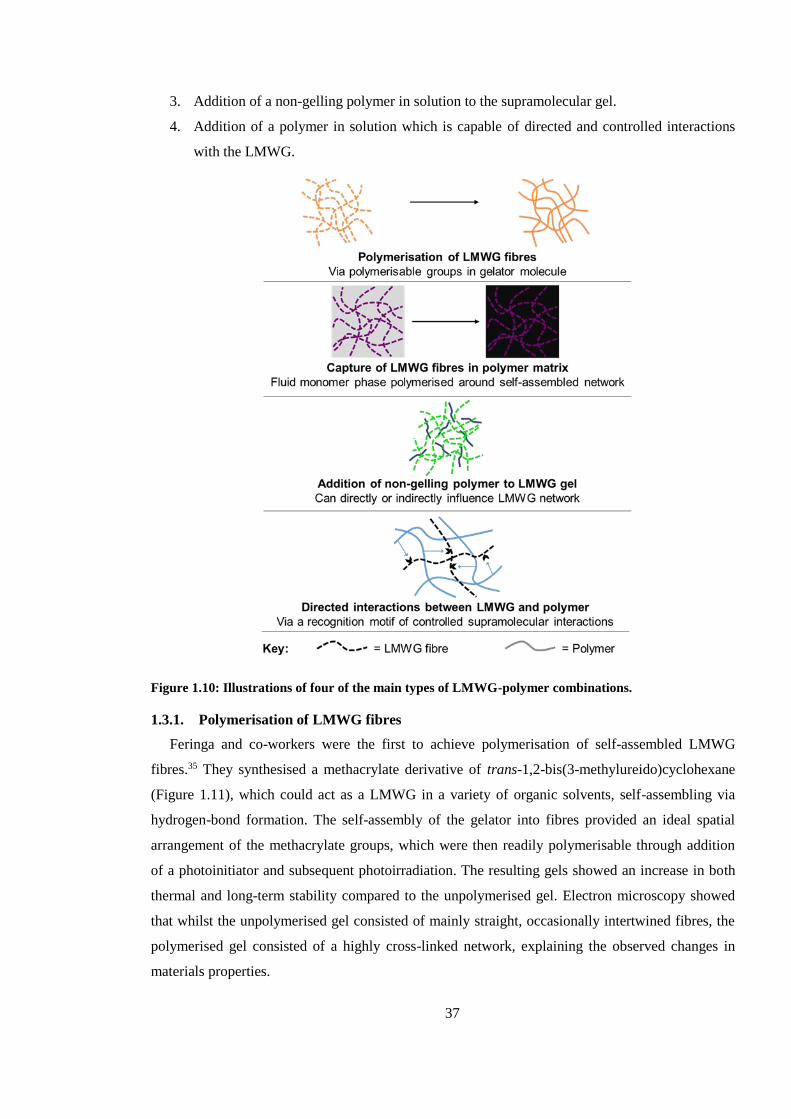
37
3. Addition of a non-gelling polymer in solution to the supramolecular gel.
4. Addition of a polymer in solution which is capable of directed and controlled interactions
with the LMWG.
Figure 1.10: Illustrations of four of the main types of LMWG-polymer combinations.
1.3.1. Polymerisation of LMWG fibres
Feringa and co-workers were the first to achieve polymerisation of self-assembled LMWG
fibres.35 They synthesised a methacrylate derivative of trans-1,2-bis(3-methylureido)cyclohexane
(Figure 1.11), which could act as a LMWG in a variety of organic solvents, self-assembling via
hydrogen-bond formation. The self-assembly of the gelator into fibres provided an ideal spatial
arrangement of the methacrylate groups, which were then readily polymerisable through addition
of a photoinitiator and subsequent photoirradiation. The resulting gels showed an increase in both
thermal and long-term stability compared to the unpolymerised gel. Electron microscopy showed
that whilst the unpolymerised gel consisted of mainly straight, occasionally intertwined fibres, the
polymerised gel consisted of a highly cross-linked network, explaining the observed changes in
materials properties.
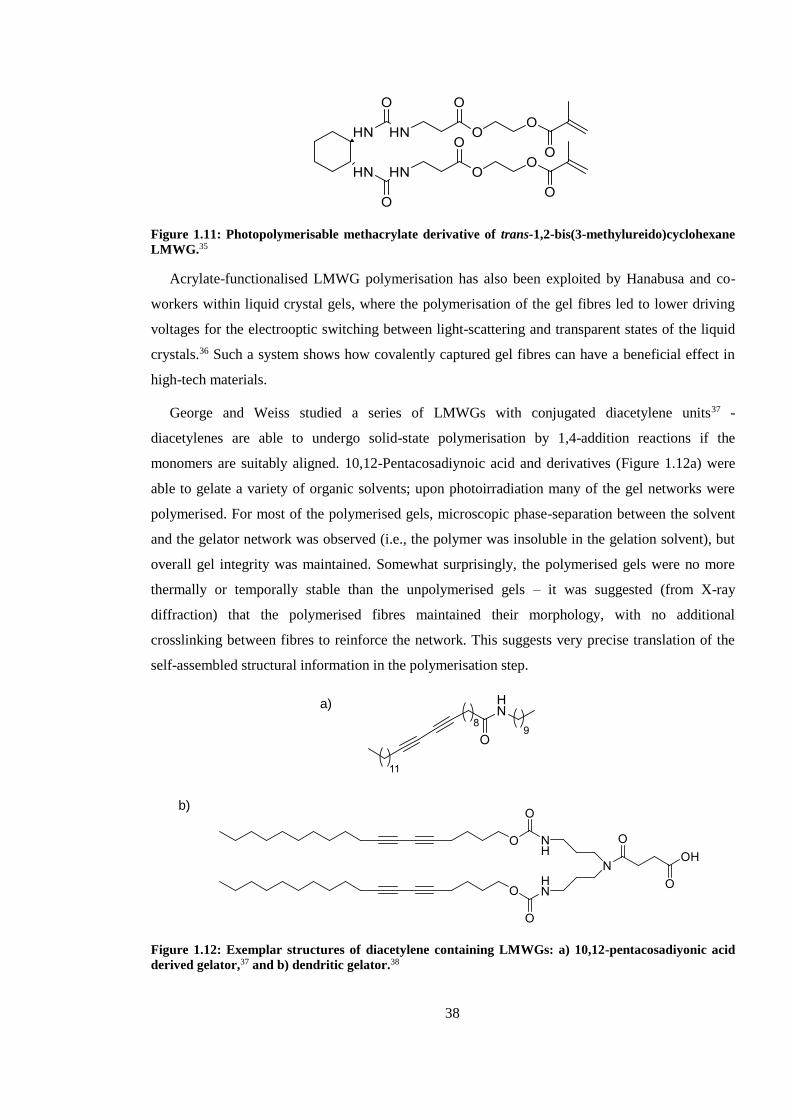
38
Figure 1.11: Photopolymerisable methacrylate derivative of trans-1,2-bis(3-methylureido)cyclohexane
LMWG.35
Acrylate-functionalised LMWG polymerisation has also been exploited by Hanabusa and co-
workers within liquid crystal gels, where the polymerisation of the gel fibres led to lower driving
voltages for the electrooptic switching between light-scattering and transparent states of the liquid
crystals.36 Such a system shows how covalently captured gel fibres can have a beneficial effect in
high-tech materials.
George and Weiss studied a series of LMWGs with conjugated diacetylene units37 -
diacetylenes are able to undergo solid-state polymerisation by 1,4-addition reactions if the
monomers are suitably aligned. 10,12-Pentacosadiynoic acid and derivatives (Figure 1.12a) were
able to gelate a variety of organic solvents; upon photoirradiation many of the gel networks were
polymerised. For most of the polymerised gels, microscopic phase-separation between the solvent
and the gelator network was observed (i.e., the polymer was insoluble in the gelation solvent), but
overall gel integrity was maintained. Somewhat surprisingly, the polymerised gels were no more
thermally or temporally stable than the unpolymerised gels – it was suggested (from X-ray
diffraction) that the polymerised fibres maintained their morphology, with no additional
crosslinking between fibres to reinforce the network. This suggests very precise translation of the
self-assembled structural information in the polymerisation step.
Figure 1.12: Exemplar structures of diacetylene containing LMWGs: a) 10,12-pentacosadiyonic acid
derived gelator,37 and b) dendritic gelator.38
a)
b)
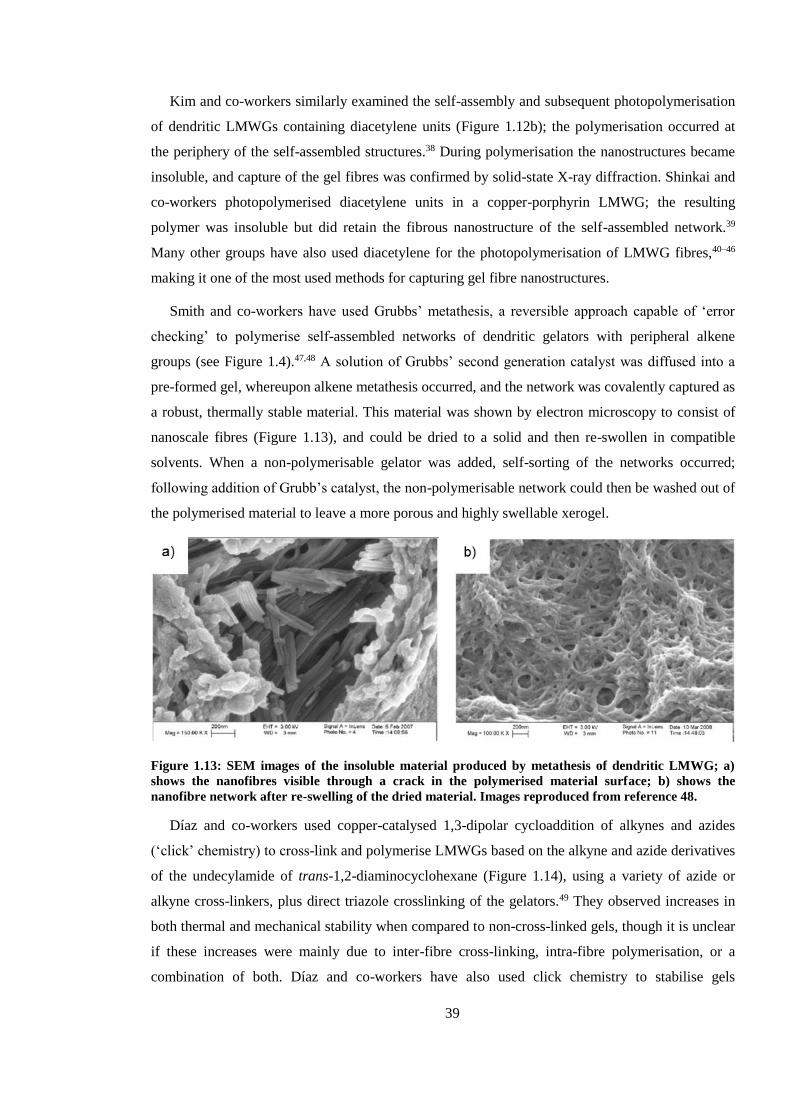
39
Kim and co-workers similarly examined the self-assembly and subsequent photopolymerisation
of dendritic LMWGs containing diacetylene units (Figure 1.12b); the polymerisation occurred at
the periphery of the self-assembled structures.38 During polymerisation the nanostructures became
insoluble, and capture of the gel fibres was confirmed by solid-state X-ray diffraction. Shinkai and
co-workers photopolymerised diacetylene units in a copper-porphyrin LMWG; the resulting
polymer was insoluble but did retain the fibrous nanostructure of the self-assembled network.39
Many other groups have also used diacetylene for the photopolymerisation of LMWG fibres,40–46
making it one of the most used methods for capturing gel fibre nanostructures.
Smith and co-workers have used Grubbs’ metathesis, a reversible approach capable of ‘error
checking’ to polymerise self-assembled networks of dendritic gelators with peripheral alkene
groups (see Figure 1.4).47,48 A solution of Grubbs’ second generation catalyst was diffused into a
pre-formed gel, whereupon alkene metathesis occurred, and the network was covalently captured as
a robust, thermally stable material. This material was shown by electron microscopy to consist of
nanoscale fibres (Figure 1.13), and could be dried to a solid and then re-swollen in compatible
solvents. When a non-polymerisable gelator was added, self-sorting of the networks occurred;
following addition of Grubb’s catalyst, the non-polymerisable network could then be washed out of
the polymerised material to leave a more porous and highly swellable xerogel.
Figure 1.13: SEM images of the insoluble material produced by metathesis of dendritic LMWG; a)
shows the nanofibres visible through a crack in the polymerised material surface; b) shows the
nanofibre network after re-swelling of the dried material. Images reproduced from reference 48.
Díaz and co-workers used copper-catalysed 1,3-dipolar cycloaddition of alkynes and azides
(‘click’ chemistry) to cross-link and polymerise LMWGs based on the alkyne and azide derivatives
of the undecylamide of trans-1,2-diaminocyclohexane (Figure 1.14), using a variety of azide or
alkyne cross-linkers, plus direct triazole crosslinking of the gelators.49 They observed increases in
both thermal and mechanical stability when compared to non-cross-linked gels, though it is unclear
if these increases were mainly due to inter-fibre cross-linking, intra-fibre polymerisation, or a
combination of both. Díaz and co-workers have also used click chemistry to stabilise gels
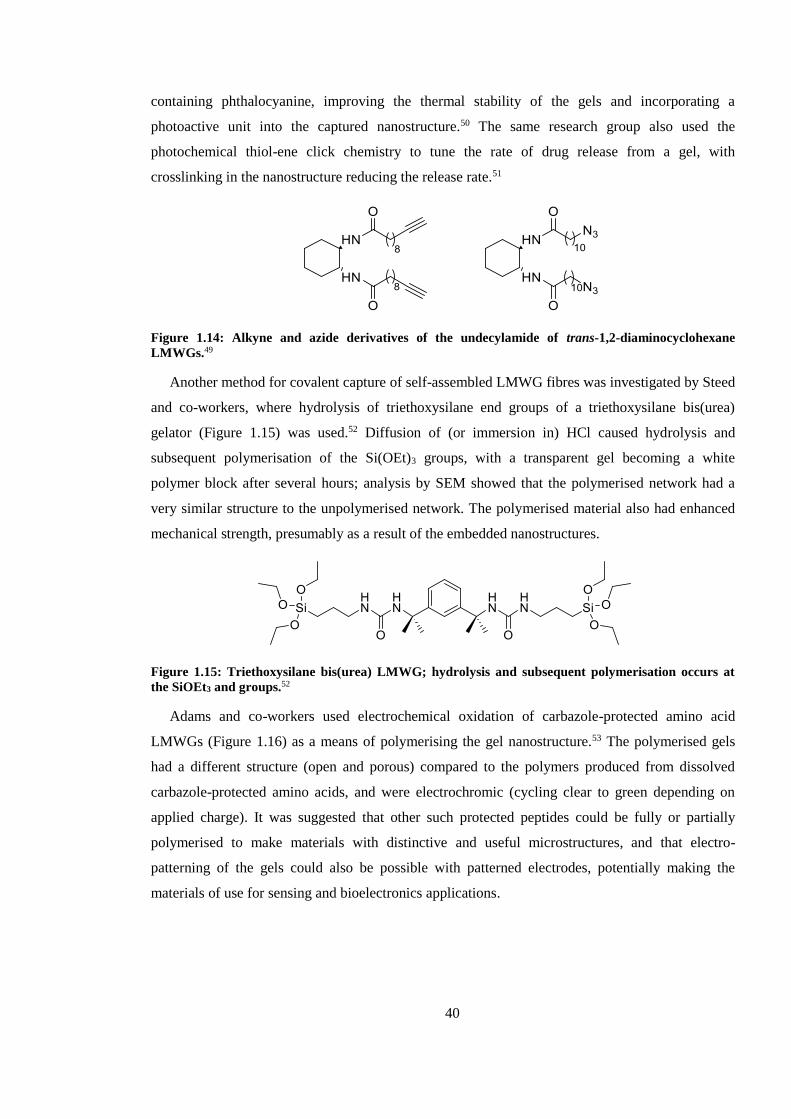
40
containing phthalocyanine, improving the thermal stability of the gels and incorporating a
photoactive unit into the captured nanostructure.50 The same research group also used the
photochemical thiol-ene click chemistry to tune the rate of drug release from a gel, with
crosslinking in the nanostructure reducing the release rate.51
Figure 1.14: Alkyne and azide derivatives of the undecylamide of trans-1,2-diaminocyclohexane
LMWGs.49
Another method for covalent capture of self-assembled LMWG fibres was investigated by Steed
and co-workers, where hydrolysis of triethoxysilane end groups of a triethoxysilane bis(urea)
gelator (Figure 1.15) was used.52 Diffusion of (or immersion in) HCl caused hydrolysis and
subsequent polymerisation of the Si(OEt)3 groups, with a transparent gel becoming a white
polymer block after several hours; analysis by SEM showed that the polymerised network had a
very similar structure to the unpolymerised network. The polymerised material also had enhanced
mechanical strength, presumably as a result of the embedded nanostructures.
Figure 1.15: Triethoxysilane bis(urea) LMWG; hydrolysis and subsequent polymerisation occurs at
the SiOEt3 and groups.52
Adams and co-workers used electrochemical oxidation of carbazole-protected amino acid
LMWGs (Figure 1.16) as a means of polymerising the gel nanostructure.53 The polymerised gels
had a different structure (open and porous) compared to the polymers produced from dissolved
carbazole-protected amino acids, and were electrochromic (cycling clear to green depending on
applied charge). It was suggested that other such protected peptides could be fully or partially
polymerised to make materials with distinctive and useful microstructures, and that electro-
patterning of the gels could also be possible with patterned electrodes, potentially making the
materials of use for sensing and bioelectronics applications.
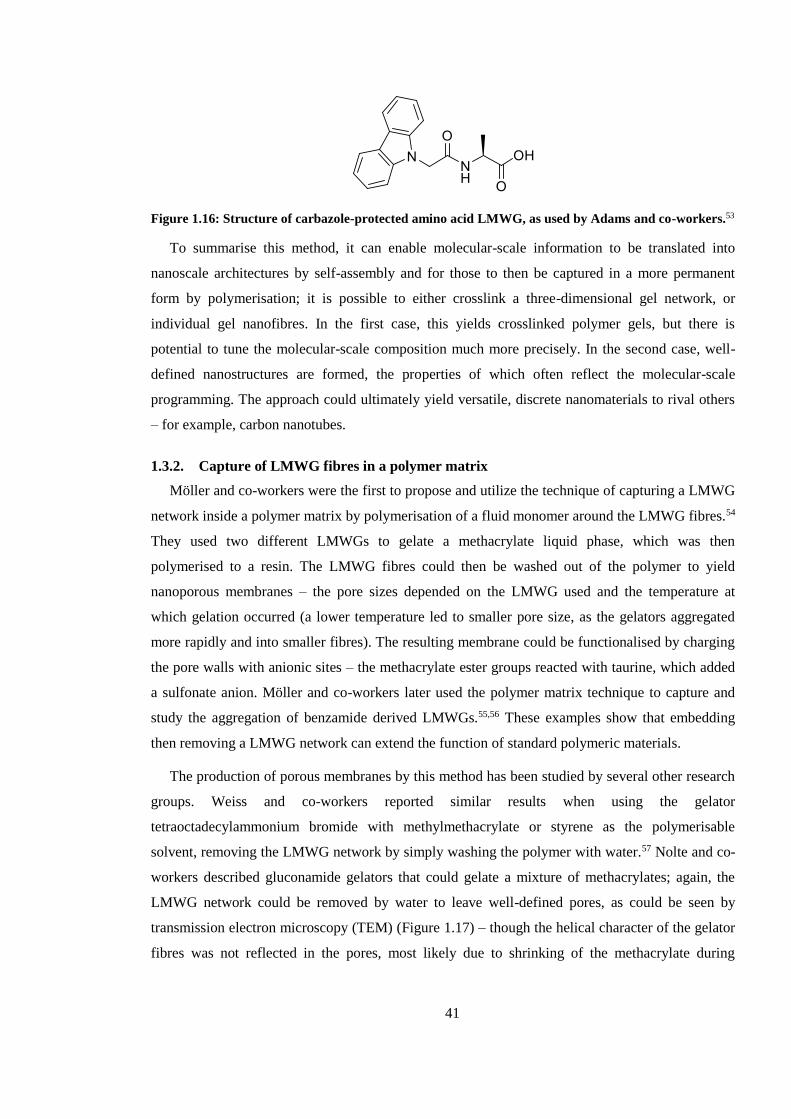
41
Figure 1.16: Structure of carbazole-protected amino acid LMWG, as used by Adams and co-workers.53
To summarise this method, it can enable molecular-scale information to be translated into
nanoscale architectures by self-assembly and for those to then be captured in a more permanent
form by polymerisation; it is possible to either crosslink a three-dimensional gel network, or
individual gel nanofibres. In the first case, this yields crosslinked polymer gels, but there is
potential to tune the molecular-scale composition much more precisely. In the second case, well-
defined nanostructures are formed, the properties of which often reflect the molecular-scale
programming. The approach could ultimately yield versatile, discrete nanomaterials to rival others
– for example, carbon nanotubes.
1.3.2. Capture of LMWG fibres in a polymer matrix
Möller and co-workers were the first to propose and utilize the technique of capturing a LMWG
network inside a polymer matrix by polymerisation of a fluid monomer around the LMWG fibres.54
They used two different LMWGs to gelate a methacrylate liquid phase, which was then
polymerised to a resin. The LMWG fibres could then be washed out of the polymer to yield
nanoporous membranes – the pore sizes depended on the LMWG used and the temperature at
which gelation occurred (a lower temperature led to smaller pore size, as the gelators aggregated
more rapidly and into smaller fibres). The resulting membrane could be functionalised by charging
the pore walls with anionic sites – the methacrylate ester groups reacted with taurine, which added
a sulfonate anion. Möller and co-workers later used the polymer matrix technique to capture and
study the aggregation of benzamide derived LMWGs.55,56 These examples show that embedding
then removing a LMWG network can extend the function of standard polymeric materials.
The production of porous membranes by this method has been studied by several other research
groups. Weiss and co-workers reported similar results when using the gelator
tetraoctadecylammonium bromide with methylmethacrylate or styrene as the polymerisable
solvent, removing the LMWG network by simply washing the polymer with water.57 Nolte and co-
workers described gluconamide gelators that could gelate a mixture of methacrylates; again, the
LMWG network could be removed by water to leave well-defined pores, as could be seen by
transmission electron microscopy (TEM) (Figure 1.17) – though the helical character of the gelator
fibres was not reflected in the pores, most likely due to shrinking of the methacrylate during
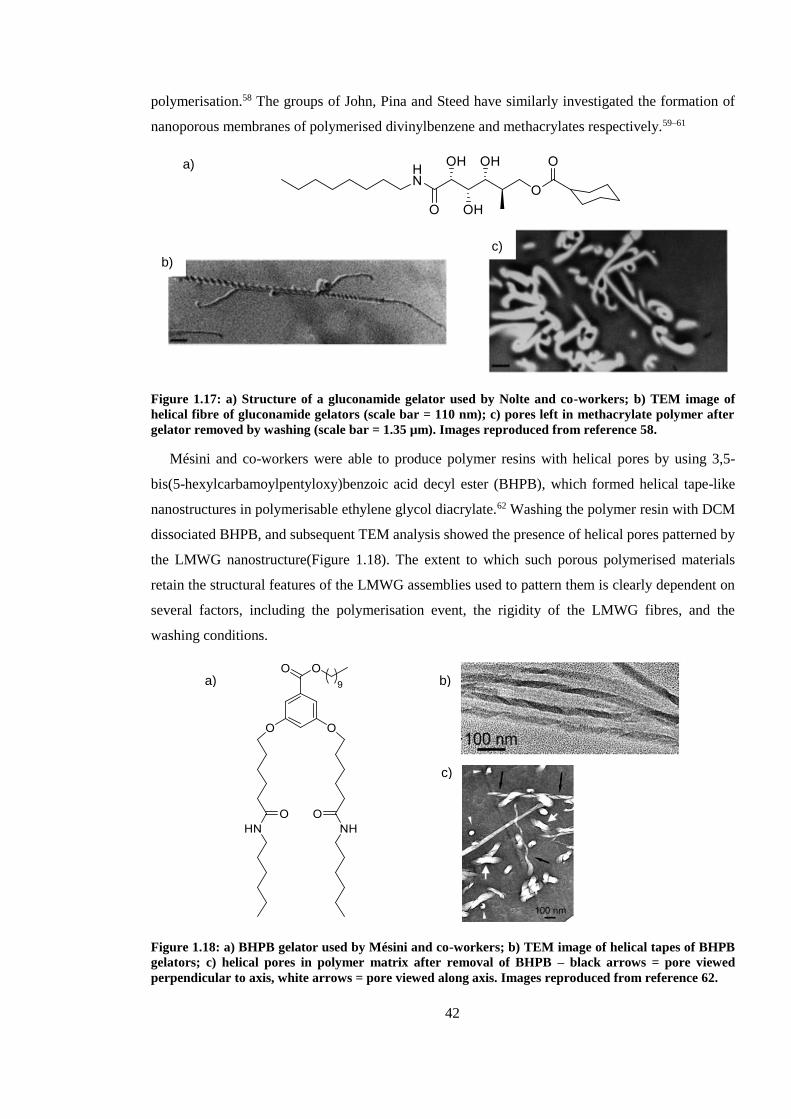
42
polymerisation.58 The groups of John, Pina and Steed have similarly investigated the formation of
nanoporous membranes of polymerised divinylbenzene and methacrylates respectively.59–61
Figure 1.17: a) Structure of a gluconamide gelator used by Nolte and co-workers; b) TEM image of
helical fibre of gluconamide gelators (scale bar = 110 nm); c) pores left in methacrylate polymer after
gelator removed by washing (scale bar = 1.35 µm). Images reproduced from reference 58.
Mésini and co-workers were able to produce polymer resins with helical pores by using 3,5-
bis(5-hexylcarbamoylpentyloxy)benzoic acid decyl ester (BHPB), which formed helical tape-like
nanostructures in polymerisable ethylene glycol diacrylate.62 Washing the polymer resin with DCM
dissociated BHPB, and subsequent TEM analysis showed the presence of helical pores patterned by
the LMWG nanostructure(Figure 1.18). The extent to which such porous polymerised materials
retain the structural features of the LMWG assemblies used to pattern them is clearly dependent on
several factors, including the polymerisation event, the rigidity of the LMWG fibres, and the
washing conditions.
Figure 1.18: a) BHPB gelator used by Mésini and co-workers; b) TEM image of helical tapes of BHPB
gelators; c) helical pores in polymer matrix after removal of BHPB – black arrows = pore viewed
perpendicular to axis, white arrows = pore viewed along axis. Images reproduced from reference 62.
c)
a) b)
a)
c)
b)
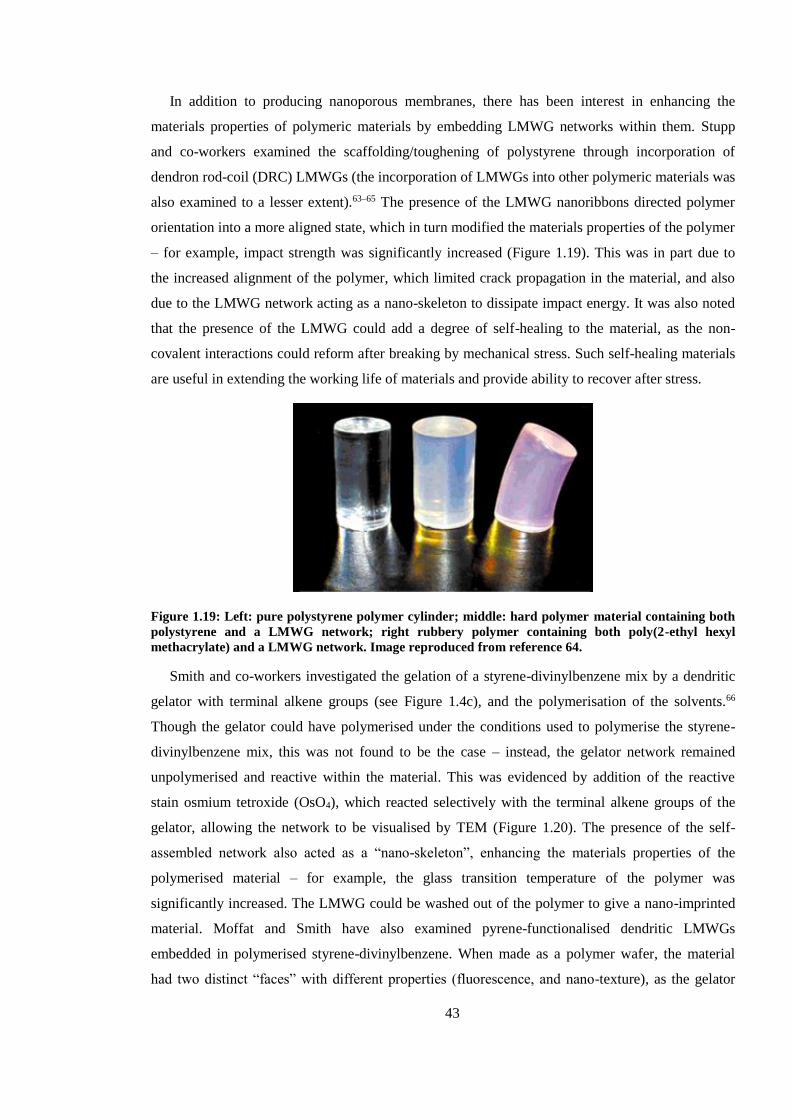
43
In addition to producing nanoporous membranes, there has been interest in enhancing the
materials properties of polymeric materials by embedding LMWG networks within them. Stupp
and co-workers examined the scaffolding/toughening of polystyrene through incorporation of
dendron rod-coil (DRC) LMWGs (the incorporation of LMWGs into other polymeric materials was
also examined to a lesser extent).63–65 The presence of the LMWG nanoribbons directed polymer
orientation into a more aligned state, which in turn modified the materials properties of the polymer
– for example, impact strength was significantly increased (Figure 1.19). This was in part due to
the increased alignment of the polymer, which limited crack propagation in the material, and also
due to the LMWG network acting as a nano-skeleton to dissipate impact energy. It was also noted
that the presence of the LMWG could add a degree of self-healing to the material, as the non-
covalent interactions could reform after breaking by mechanical stress. Such self-healing materials
are useful in extending the working life of materials and provide ability to recover after stress.
Figure 1.19: Left: pure polystyrene polymer cylinder; middle: hard polymer material containing both
polystyrene and a LMWG network; right rubbery polymer containing both poly(2-ethyl hexyl
methacrylate) and a LMWG network. Image reproduced from reference 64.
Smith and co-workers investigated the gelation of a styrene-divinylbenzene mix by a dendritic
gelator with terminal alkene groups (see Figure 1.4c), and the polymerisation of the solvents.66
Though the gelator could have polymerised under the conditions used to polymerise the styrene-
divinylbenzene mix, this was not found to be the case – instead, the gelator network remained
unpolymerised and reactive within the material. This was evidenced by addition of the reactive
stain osmium tetroxide (OsO4), which reacted selectively with the terminal alkene groups of the
gelator, allowing the network to be visualised by TEM (Figure 1.20). The presence of the self-
assembled network also acted as a “nano-skeleton”, enhancing the materials properties of the
polymerised material – for example, the glass transition temperature of the polymer was
significantly increased. The LMWG could be washed out of the polymer to give a nano-imprinted
material. Moffat and Smith have also examined pyrene-functionalised dendritic LMWGs
embedded in polymerised styrene-divinylbenzene. When made as a polymer wafer, the material
had two distinct “faces” with different properties (fluorescence, and nano-texture), as the gelator
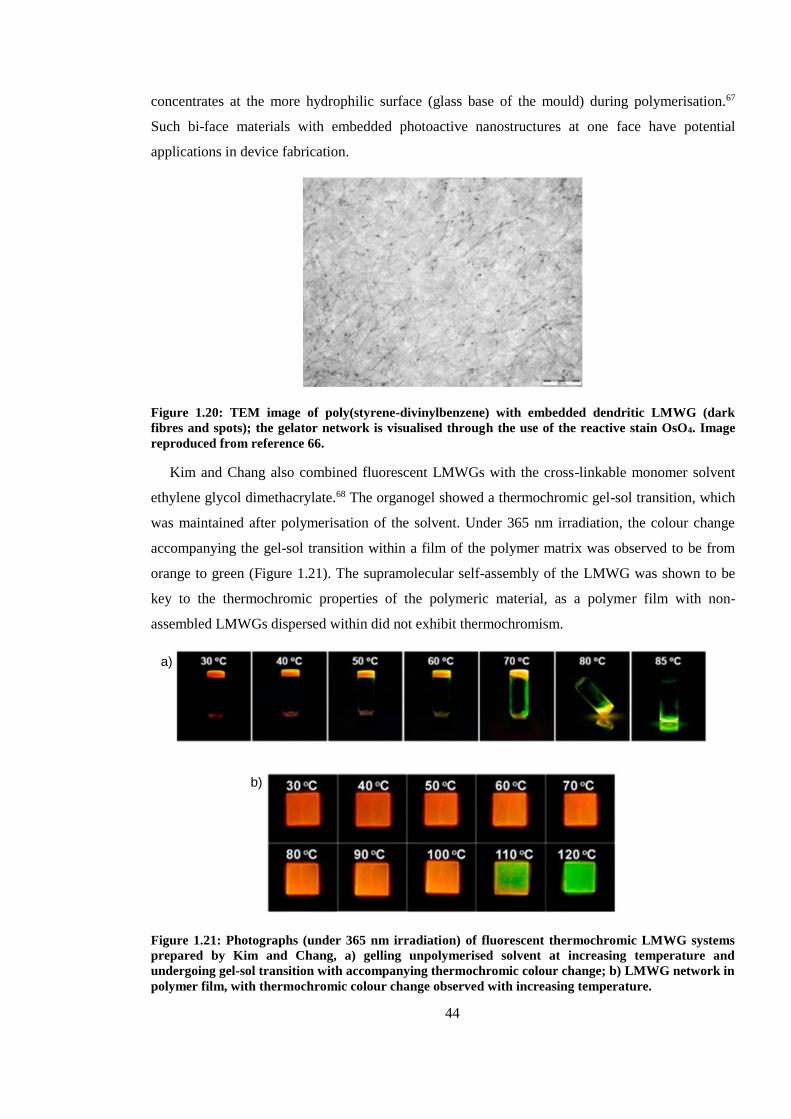
44
concentrates at the more hydrophilic surface (glass base of the mould) during polymerisation.67
Such bi-face materials with embedded photoactive nanostructures at one face have potential
applications in device fabrication.
Figure 1.20: TEM image of poly(styrene-divinylbenzene) with embedded dendritic LMWG (dark
fibres and spots); the gelator network is visualised through the use of the reactive stain OsO4. Image
reproduced from reference 66.
Kim and Chang also combined fluorescent LMWGs with the cross-linkable monomer solvent
ethylene glycol dimethacrylate.68 The organogel showed a thermochromic gel-sol transition, which
was maintained after polymerisation of the solvent. Under 365 nm irradiation, the colour change
accompanying the gel-sol transition within a film of the polymer matrix was observed to be from
orange to green (Figure 1.21). The supramolecular self-assembly of the LMWG was shown to be
key to the thermochromic properties of the polymeric material, as a polymer film with non-
assembled LMWGs dispersed within did not exhibit thermochromism.
Figure 1.21: Photographs (under 365 nm irradiation) of fluorescent thermochromic LMWG systems
prepared by Kim and Chang, a) gelling unpolymerised solvent at increasing temperature and
undergoing gel-sol transition with accompanying thermochromic colour change; b) LMWG network in
polymer film, with thermochromic colour change observed with increasing temperature.
a)
b)
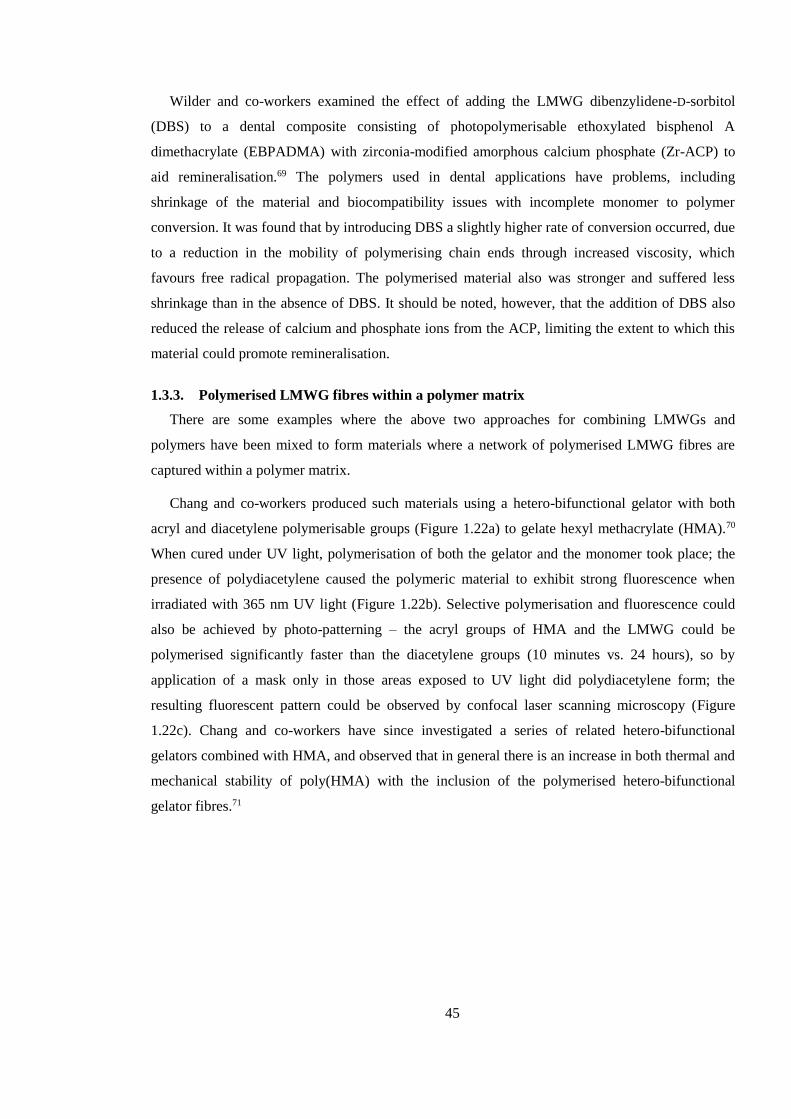
45
Wilder and co-workers examined the effect of adding the LMWG dibenzylidene-D-sorbitol
(DBS) to a dental composite consisting of photopolymerisable ethoxylated bisphenol A
dimethacrylate (EBPADMA) with zirconia-modified amorphous calcium phosphate (Zr-ACP) to
aid remineralisation.69 The polymers used in dental applications have problems, including
shrinkage of the material and biocompatibility issues with incomplete monomer to polymer
conversion. It was found that by introducing DBS a slightly higher rate of conversion occurred, due
to a reduction in the mobility of polymerising chain ends through increased viscosity, which
favours free radical propagation. The polymerised material also was stronger and suffered less
shrinkage than in the absence of DBS. It should be noted, however, that the addition of DBS also
reduced the release of calcium and phosphate ions from the ACP, limiting the extent to which this
material could promote remineralisation.
1.3.3. Polymerised LMWG fibres within a polymer matrix
There are some examples where the above two approaches for combining LMWGs and
polymers have been mixed to form materials where a network of polymerised LMWG fibres are
captured within a polymer matrix.
Chang and co-workers produced such materials using a hetero-bifunctional gelator with both
acryl and diacetylene polymerisable groups (Figure 1.22a) to gelate hexyl methacrylate (HMA).70
When cured under UV light, polymerisation of both the gelator and the monomer took place; the
presence of polydiacetylene caused the polymeric material to exhibit strong fluorescence when
irradiated with 365 nm UV light (Figure 1.22b). Selective polymerisation and fluorescence could
also be achieved by photo-patterning – the acryl groups of HMA and the LMWG could be
polymerised significantly faster than the diacetylene groups (10 minutes vs. 24 hours), so by
application of a mask only in those areas exposed to UV light did polydiacetylene form; the
resulting fluorescent pattern could be observed by confocal laser scanning microscopy (Figure
1.22c). Chang and co-workers have since investigated a series of related hetero-bifunctional
gelators combined with HMA, and observed that in general there is an increase in both thermal and
mechanical stability of poly(HMA) with the inclusion of the polymerised hetero-bifunctional
gelator fibres.71
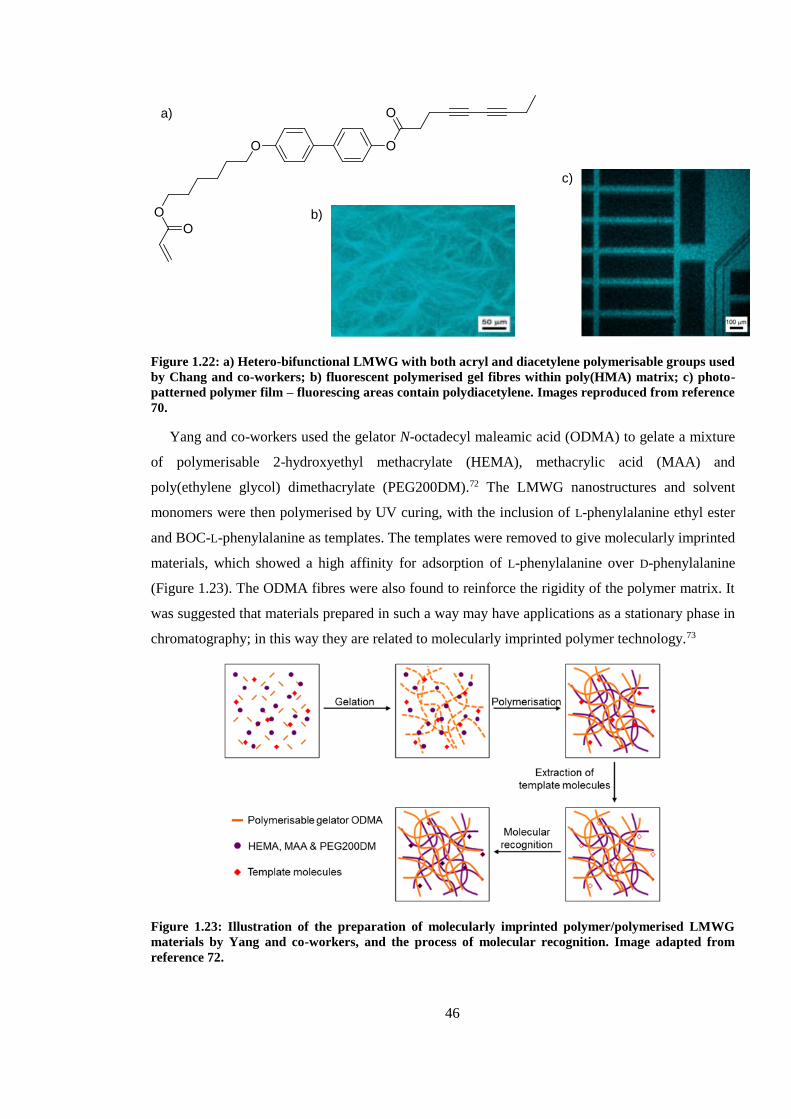
46
Figure 1.22: a) Hetero-bifunctional LMWG with both acryl and diacetylene polymerisable groups used
by Chang and co-workers; b) fluorescent polymerised gel fibres within poly(HMA) matrix; c) photo-
patterned polymer film – fluorescing areas contain polydiacetylene. Images reproduced from reference
70.
Yang and co-workers used the gelator N-octadecyl maleamic acid (ODMA) to gelate a mixture
of polymerisable 2-hydroxyethyl methacrylate (HEMA), methacrylic acid (MAA) and
poly(ethylene glycol) dimethacrylate (PEG200DM).72 The LMWG nanostructures and solvent
monomers were then polymerised by UV curing, with the inclusion of L-phenylalanine ethyl ester
and BOC-L-phenylalanine as templates. The templates were removed to give molecularly imprinted
materials, which showed a high affinity for adsorption of L-phenylalanine over D-phenylalanine
(Figure 1.23). The ODMA fibres were also found to reinforce the rigidity of the polymer matrix. It
was suggested that materials prepared in such a way may have applications as a stationary phase in
chromatography; in this way they are related to molecularly imprinted polymer technology.73
Figure 1.23: Illustration of the preparation of molecularly imprinted polymer/polymerised LMWG
materials by Yang and co-workers, and the process of molecular recognition. Image adapted from
reference 72.
a)
b)
c)
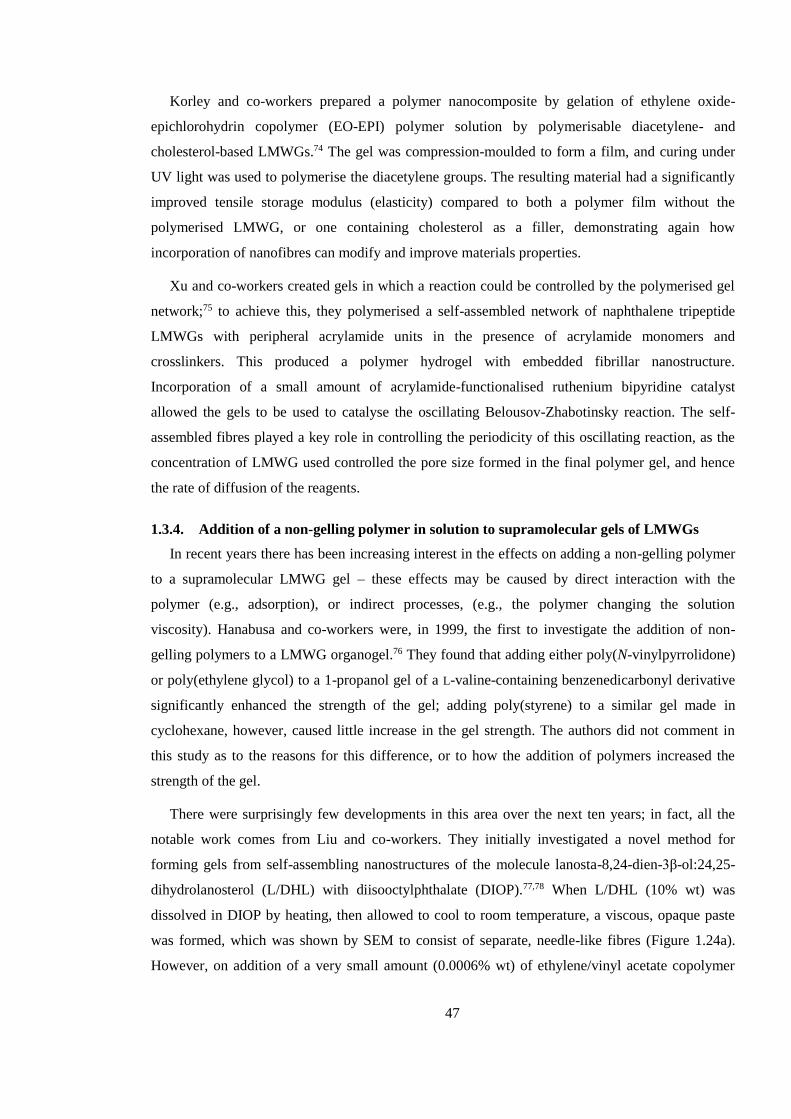
47
Korley and co-workers prepared a polymer nanocomposite by gelation of ethylene oxide-
epichlorohydrin copolymer (EO-EPI) polymer solution by polymerisable diacetylene- and
cholesterol-based LMWGs.74 The gel was compression-moulded to form a film, and curing under
UV light was used to polymerise the diacetylene groups. The resulting material had a significantly
improved tensile storage modulus (elasticity) compared to both a polymer film without the
polymerised LMWG, or one containing cholesterol as a filler, demonstrating again how
incorporation of nanofibres can modify and improve materials properties.
Xu and co-workers created gels in which a reaction could be controlled by the polymerised gel
network;75 to achieve this, they polymerised a self-assembled network of naphthalene tripeptide
LMWGs with peripheral acrylamide units in the presence of acrylamide monomers and
crosslinkers. This produced a polymer hydrogel with embedded fibrillar nanostructure.
Incorporation of a small amount of acrylamide-functionalised ruthenium bipyridine catalyst
allowed the gels to be used to catalyse the oscillating Belousov-Zhabotinsky reaction. The self-
assembled fibres played a key role in controlling the periodicity of this oscillating reaction, as the
concentration of LMWG used controlled the pore size formed in the final polymer gel, and hence
the rate of diffusion of the reagents.
1.3.4. Addition of a non-gelling polymer in solution to supramolecular gels of LMWGs
In recent years there has been increasing interest in the effects on adding a non-gelling polymer
to a supramolecular LMWG gel – these effects may be caused by direct interaction with the
polymer (e.g., adsorption), or indirect processes, (e.g., the polymer changing the solution
viscosity). Hanabusa and co-workers were, in 1999, the first to investigate the addition of non-
gelling polymers to a LMWG organogel.76 They found that adding either poly(N-vinylpyrrolidone)
or poly(ethylene glycol) to a 1-propanol gel of a L-valine-containing benzenedicarbonyl derivative
significantly enhanced the strength of the gel; adding poly(styrene) to a similar gel made in
cyclohexane, however, caused little increase in the gel strength. The authors did not comment in
this study as to the reasons for this difference, or to how the addition of polymers increased the
strength of the gel.
There were surprisingly few developments in this area over the next ten years; in fact, all the
notable work comes from Liu and co-workers. They initially investigated a novel method for
forming gels from self-assembling nanostructures of the molecule lanosta-8,24-dien-3β-ol:24,25-
dihydrolanosterol (L/DHL) with diisooctylphthalate (DIOP).77,78 When L/DHL (10% wt) was
dissolved in DIOP by heating, then allowed to cool to room temperature, a viscous, opaque paste
was formed, which was shown by SEM to consist of separate, needle-like fibres (Figure 1.24a).
However, on addition of a very small amount (0.0006% wt) of ethylene/vinyl acetate copolymer
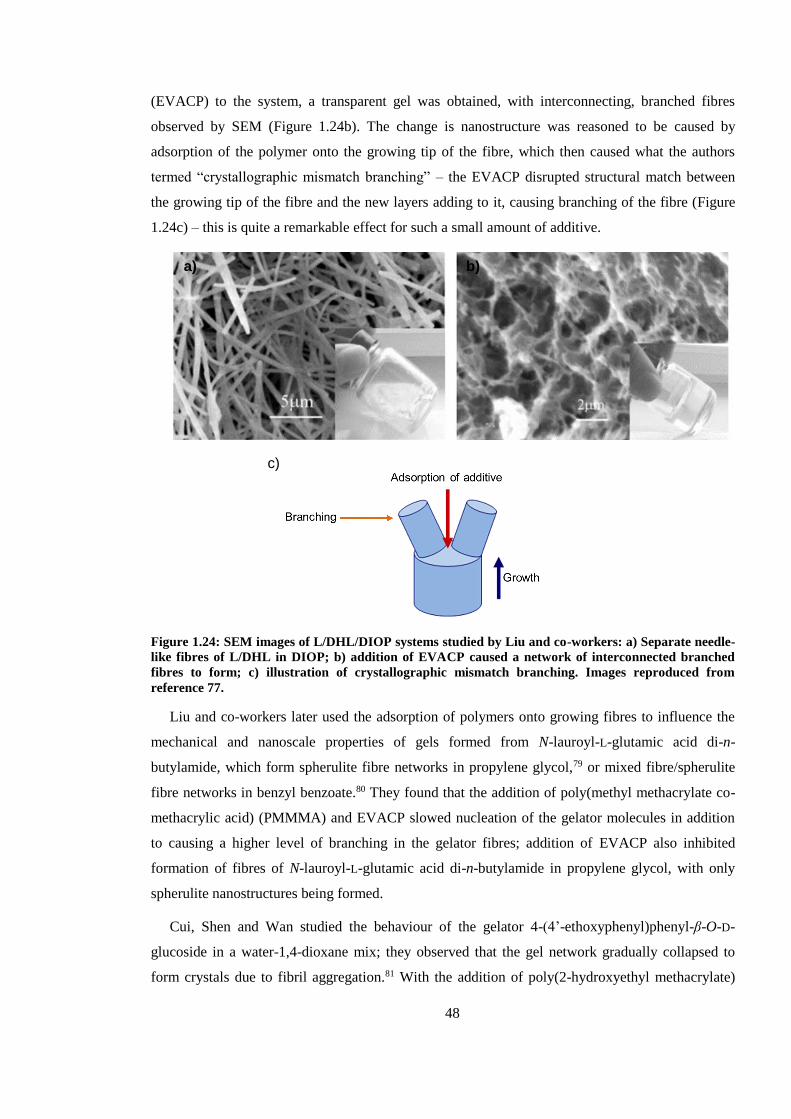
48
(EVACP) to the system, a transparent gel was obtained, with interconnecting, branched fibres
observed by SEM (Figure 1.24b). The change is nanostructure was reasoned to be caused by
adsorption of the polymer onto the growing tip of the fibre, which then caused what the authors
termed “crystallographic mismatch branching” – the EVACP disrupted structural match between
the growing tip of the fibre and the new layers adding to it, causing branching of the fibre (Figure
1.24c) – this is quite a remarkable effect for such a small amount of additive.
Figure 1.24: SEM images of L/DHL/DIOP systems studied by Liu and co-workers: a) Separate needle-
like fibres of L/DHL in DIOP; b) addition of EVACP caused a network of interconnected branched
fibres to form; c) illustration of crystallographic mismatch branching. Images reproduced from
reference 77.
Liu and co-workers later used the adsorption of polymers onto growing fibres to influence the
mechanical and nanoscale properties of gels formed from N-lauroyl-L-glutamic acid di-n-
butylamide, which form spherulite fibre networks in propylene glycol,79 or mixed fibre/spherulite
fibre networks in benzyl benzoate.80 They found that the addition of poly(methyl methacrylate co-
methacrylic acid) (PMMMA) and EVACP slowed nucleation of the gelator molecules in addition
to causing a higher level of branching in the gelator fibres; addition of EVACP also inhibited
formation of fibres of N-lauroyl-L-glutamic acid di-n-butylamide in propylene glycol, with only
spherulite nanostructures being formed.
Cui, Shen and Wan studied the behaviour of the gelator 4-(4’-ethoxyphenyl)phenyl-β-O-D-
glucoside in a water-1,4-dioxane mix; they observed that the gel network gradually collapsed to
form crystals due to fibril aggregation.81 With the addition of poly(2-hydroxyethyl methacrylate)
a) b)
c)
49
(PHEMA), however, the gel was stabilised; it was proposed that PHEMA was adsorbed onto the
growing gel fibres, causing branching, which prevented aggregation of the fibrils, and therefore the
collapse of the gel.
Nandi and co-workers examined the addition of the biopolymer chitosan to a folic acid gel.82
They observed that the gels with chitosan added had fibres that were both thinner and more
branched – suggestive that the polymer was adsorbed onto the growing tip of the gelator fibre to
cause crystallographic mismatch branching, and adsorbed onto the side of the fibre to hinder lateral
growth; in both cases, chitosan interacts with folic acid via hydrogen bonding. The increased
branching led, as in the above examples, to increased mechanical strength when compared to a
folic acid gel without chitosan. The gels were also tested for their abilities to adsorb dyes and heavy
metal ions from water, suggesting that such biomaterial-derived gels may have applications in
water purification. Nandi and co-workers have also studied the addition of poly(4-vinylpyridine-co-
styrene) to folic acid gels, again observing crystallographic mismatch branching, and
improvements in mechanical and thermal stability.83 The gels with poly(4-vinylpyridine-co-
styrene) were also shown to have semi-conductivity, from extended π-conjugation between the
LMWG and polymer.
Adams and co-workers demonstrated how the addition of polymers can have viscosity-induced
effects on the properties of LMWG gels. They added dextran biopolymers to hydrogels of a pH-
dependant naphthalene-dipeptide LMWG;84 They found that by changing the molecular weight or
wt% of the dextrans added, the viscosity of the solution before gelation could be altered. Increased
viscosity lengthened gelation time, whilst decreasing the mechanical strength. When observed by
TEM, the gels with dextran were seen to have thinner fibres in a less well-defined network when
compared to gels without dextran (Figure 1.25). The change in morphology and gelation time with
addition of dextran was attributed to a reduction in diffusion of the LMWG due to increased
viscosity of the solution; this meant that the LMWG self-assembly occurred more slowly and with
less lateral assembly.
50
Figure 1.25: a) Image of hydrogel of naphthalene-dipeptide; b) TEM and c) confocal micrograph of gel
(with Nile Blue stain); d) hydrogel of naphthalene-dipeptide with added dextran; e) TEM and f)
confocal microscopy showing that the gel fibres are significantly thinner. Image reproduced from
reference 84.
Adams and co-workers later studied the effects of dextrans and other polymers – poly(ethylene
glycol), poly(vinylpyrrolidone), poly(ethylene oxide), poly(acrylic acid) – on the rheological
properties of gels of naphthalene- or Fmoc-dipeptide LMWGs.85 Again, in contrast to Liu and co-
workers, they found that the mechanical strength of the gels decreased with the addition of
polymers – here, the LMWGs formed spherulites, which upon addition of the polymers became
smaller and less interconnected – hence the weakening in mechanical strength. They also found
that the identity of the polymer additive also significantly affected the final rheological properties
of the gels. They suggested that for some of the polymers added there might also be adsorption
onto the gel fibres occurring as well as changes in the solution viscosity.
Yang and co-workers reported the addition of hyaluronic acid (HA) polymer to a LMWG
hydrogel based on succinated Taxol.86 They found that in the presence of the polymer the hydrogel
fibres were more likely to bundle, slightly enhancing the mechanical strength of the gel. They also
noted that the addition of more than 30% HA appeared to boost the anticancer activity of the
nanofibres – they suggested this was a result of HA assisting in tumour targeting because it is a
ligand for a protein overexpressed in the cancer cells. This showed how polymeric additives have
the capacity to not only affect gel rheology and nanostructure, but may also introduce their own
functionality to the material.
Ulijn and co-workers observed that peptide-based LMWGs could self-assemble in the presence
of clusters of proteins (i.e., biological polymers) – specifically clusters of bovine serum albumin or
β-lactoglobulin.87 The proteins clustered at much lower concentrations than usual when in the
presence of the LMWGs, whilst the presence of protein clusters also affected the self-assembly of
the LMWGs. The resulting gels had different morphological and rheological properties compared
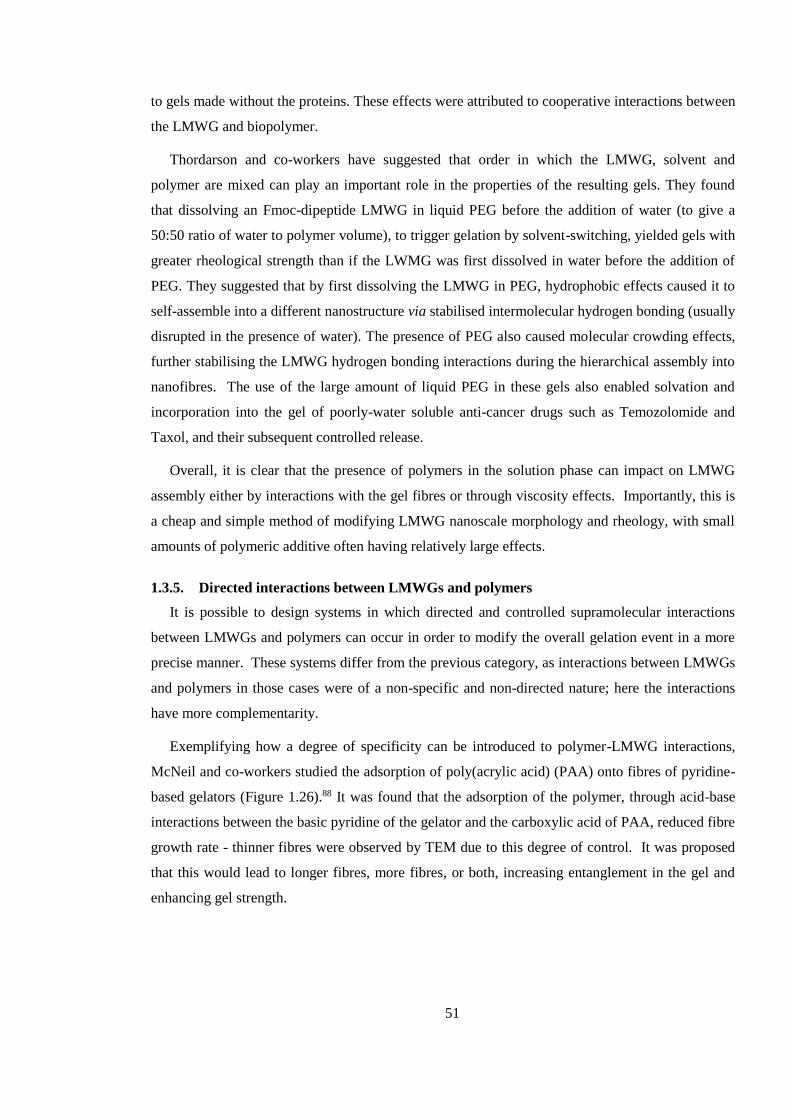
51
to gels made without the proteins. These effects were attributed to cooperative interactions between
the LMWG and biopolymer.
Thordarson and co-workers have suggested that order in which the LMWG, solvent and
polymer are mixed can play an important role in the properties of the resulting gels. They found
that dissolving an Fmoc-dipeptide LMWG in liquid PEG before the addition of water (to give a
50:50 ratio of water to polymer volume), to trigger gelation by solvent-switching, yielded gels with
greater rheological strength than if the LWMG was first dissolved in water before the addition of
PEG. They suggested that by first dissolving the LMWG in PEG, hydrophobic effects caused it to
self-assemble into a different nanostructure via stabilised intermolecular hydrogen bonding (usually
disrupted in the presence of water). The presence of PEG also caused molecular crowding effects,
further stabilising the LMWG hydrogen bonding interactions during the hierarchical assembly into
nanofibres. The use of the large amount of liquid PEG in these gels also enabled solvation and
incorporation into the gel of poorly-water soluble anti-cancer drugs such as Temozolomide and
Taxol, and their subsequent controlled release.
Overall, it is clear that the presence of polymers in the solution phase can impact on LMWG
assembly either by interactions with the gel fibres or through viscosity effects. Importantly, this is
a cheap and simple method of modifying LMWG nanoscale morphology and rheology, with small
amounts of polymeric additive often having relatively large effects.
1.3.5. Directed interactions between LMWGs and polymers
It is possible to design systems in which directed and controlled supramolecular interactions
between LMWGs and polymers can occur in order to modify the overall gelation event in a more
precise manner. These systems differ from the previous category, as interactions between LMWGs
and polymers in those cases were of a non-specific and non-directed nature; here the interactions
have more complementarity.
Exemplifying how a degree of specificity can be introduced to polymer-LMWG interactions,
McNeil and co-workers studied the adsorption of poly(acrylic acid) (PAA) onto fibres of pyridine-
based gelators (Figure 1.26).88 It was found that the adsorption of the polymer, through acid-base
interactions between the basic pyridine of the gelator and the carboxylic acid of PAA, reduced fibre
growth rate - thinner fibres were observed by TEM due to this degree of control. It was proposed
that this would lead to longer fibres, more fibres, or both, increasing entanglement in the gel and
enhancing gel strength.
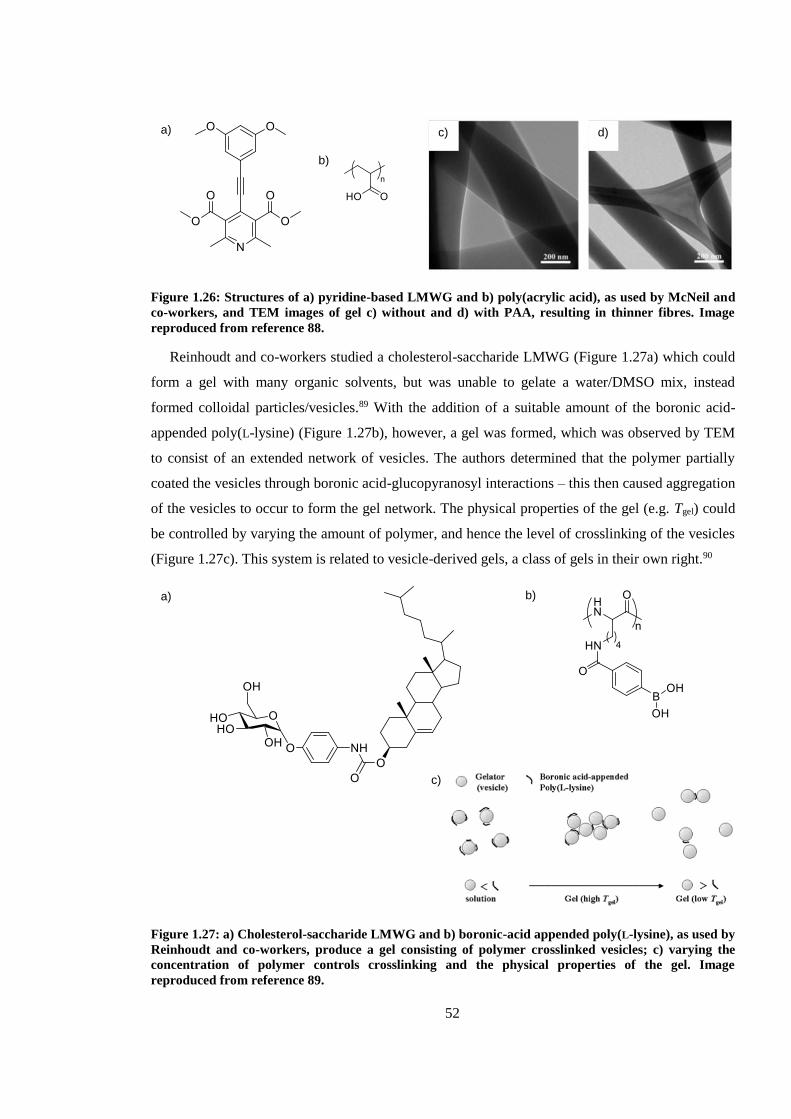
52
Figure 1.26: Structures of a) pyridine-based LMWG and b) poly(acrylic acid), as used by McNeil and
co-workers, and TEM images of gel c) without and d) with PAA, resulting in thinner fibres. Image
reproduced from reference 88.
Reinhoudt and co-workers studied a cholesterol-saccharide LMWG (Figure 1.27a) which could
form a gel with many organic solvents, but was unable to gelate a water/DMSO mix, instead
formed colloidal particles/vesicles.89 With the addition of a suitable amount of the boronic acid-
appended poly(L-lysine) (Figure 1.27b), however, a gel was formed, which was observed by TEM
to consist of an extended network of vesicles. The authors determined that the polymer partially
coated the vesicles through boronic acid-glucopyranosyl interactions – this then caused aggregation
of the vesicles to occur to form the gel network. The physical properties of the gel (e.g. Tgel) could
be controlled by varying the amount of polymer, and hence the level of crosslinking of the vesicles
(Figure 1.27c). This system is related to vesicle-derived gels, a class of gels in their own right.90
Figure 1.27: a) Cholesterol-saccharide LMWG and b) boronic-acid appended poly(L-lysine), as used by
Reinhoudt and co-workers, produce a gel consisting of polymer crosslinked vesicles; c) varying the
concentration of polymer controls crosslinking and the physical properties of the gel. Image
reproduced from reference 89.
a)
c)
b)
a)
b)
c) d)
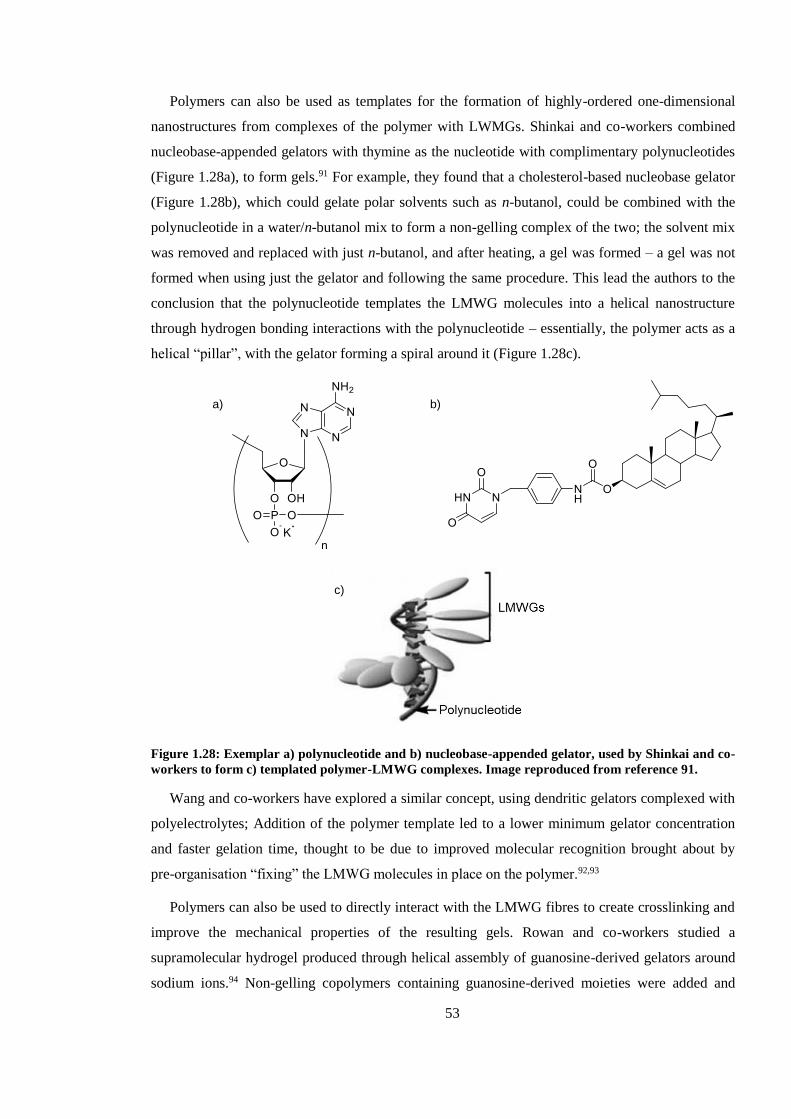
53
Polymers can also be used as templates for the formation of highly-ordered one-dimensional
nanostructures from complexes of the polymer with LWMGs. Shinkai and co-workers combined
nucleobase-appended gelators with thymine as the nucleotide with complimentary polynucleotides
(Figure 1.28a), to form gels.91 For example, they found that a cholesterol-based nucleobase gelator
(Figure 1.28b), which could gelate polar solvents such as n-butanol, could be combined with the
polynucleotide in a water/n-butanol mix to form a non-gelling complex of the two; the solvent mix
was removed and replaced with just n-butanol, and after heating, a gel was formed – a gel was not
formed when using just the gelator and following the same procedure. This lead the authors to the
conclusion that the polynucleotide templates the LMWG molecules into a helical nanostructure
through hydrogen bonding interactions with the polynucleotide – essentially, the polymer acts as a
helical “pillar”, with the gelator forming a spiral around it (Figure 1.28c).
Figure 1.28: Exemplar a) polynucleotide and b) nucleobase-appended gelator, used by Shinkai and co-
workers to form c) templated polymer-LMWG complexes. Image reproduced from reference 91.
Wang and co-workers have explored a similar concept, using dendritic gelators complexed with
polyelectrolytes; Addition of the polymer template led to a lower minimum gelator concentration
and faster gelation time, thought to be due to improved molecular recognition brought about by
pre-organisation “fixing” the LMWG molecules in place on the polymer.92,93
Polymers can also be used to directly interact with the LMWG fibres to create crosslinking and
improve the mechanical properties of the resulting gels. Rowan and co-workers studied a
supramolecular hydrogel produced through helical assembly of guanosine-derived gelators around
sodium ions.94 Non-gelling copolymers containing guanosine-derived moieties were added and
a) b)
c)
54
found to be incorporated into the helical assemblies, forming supramolecular crosslinks in the
system. At suitable concentrations of polymer, the mechanical strength of the gels could be
dramatically improved (up to 40 times stronger) due to the additional crosslinking.
Nandi and co-workers examined a system consisting of the LMWG Fmoc-tryptophan (FT) and
PEG;95 FT formed hydrogels which exhibited thixotropy (regeneration of the gel after mechanical
disruption of the gelator network) due to the strong hydrogen-bonding interactions between
individual gelator molecules and the self-assembled fibres. The addition of PEG increased the rate
of gel regeneration, with the polymer proposed to act as a sort of “molecular adhesive”, forming
hydrogen bonds with the active ends of the fibres after mechanical disruption. After assembly, PEG
continued to act as an additional connecter between the LMWG fibres, reinforcing the overall gel
structure.
1.3.6. Other combinations of LMWGs and polymers
There are some examples of LMWG-polymer combinations which do not fit into any of the
categories described above. For instance, it has been shown that LMWGs can be used to gel liquid
polymers to form novel electrolytes – this is a case of using a LMWG to improve a polymer system
(similar to the those discussed in 1.3.2).96 An interesting example from Nandi and co-workers
involved a folic acid gel in which aniline was bound via non-covalent interactions to the surface of
the self-assembled LMWG fibres;97 the aniline could then be polymerised to form “shells” around
the fibres, resulting in an increase in the mechanical stability and conductivity of the gel. Another
example from Yang and co-workers saw the incorporation of a polymer nanogel into a hydrogel of
LMWGs in order to improve thermal stability and controlled release.98
1.4. Hybrid gels of low-molecular-weight gelators and polymer gelators
Another approach to combining LMWGs with polymers is to mix them with polymer gelators
(PGs); this approach sits between the two general methods discussed above in sections 1.2 and 1.3,
in that the final material is composed of two independent gel networks (a self-sorting multi-
component gel) which combines LMWGs with polymer science. LMWGs and PGs each have their
own different advantages and disadvantages; quite often the weak, reversible interactions that drive
formation of gels from LMWGs mean the final material is mechanically weak, whilst gels formed
from PGs are often much stronger. On the other hand, it is often much easier to introduce
responsiveness into LWMG systems due to the easily tuneable nature of the individual building
blocks and revisable nature of the assembly process.
Here, this combination of LMWGs and PGs is referred to as hybrid gels – note that some
authors use this term to refer to combinations of LMWGs with non-gelling polymers, but here it
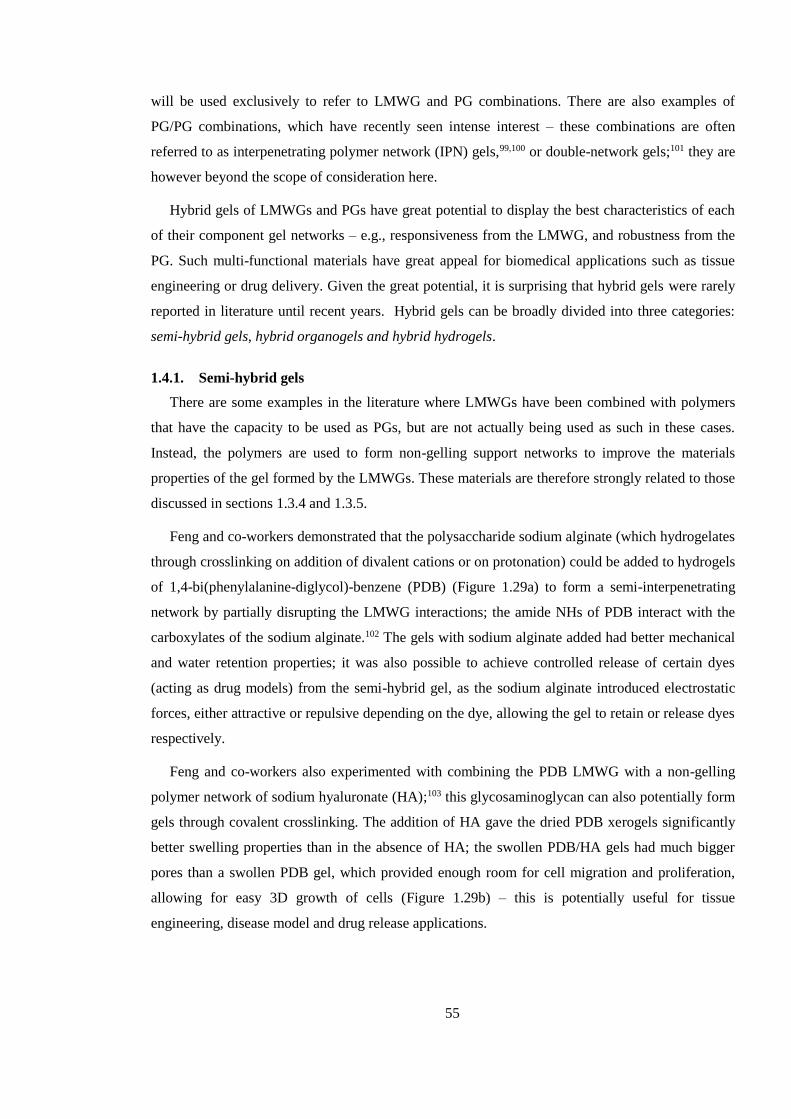
55
will be used exclusively to refer to LMWG and PG combinations. There are also examples of
PG/PG combinations, which have recently seen intense interest – these combinations are often
referred to as interpenetrating polymer network (IPN) gels,99,100 or double-network gels;101 they are
however beyond the scope of consideration here.
Hybrid gels of LMWGs and PGs have great potential to display the best characteristics of each
of their component gel networks – e.g., responsiveness from the LMWG, and robustness from the
PG. Such multi-functional materials have great appeal for biomedical applications such as tissue
engineering or drug delivery. Given the great potential, it is surprising that hybrid gels were rarely
reported in literature until recent years. Hybrid gels can be broadly divided into three categories:
semi-hybrid gels, hybrid organogels and hybrid hydrogels.
1.4.1. Semi-hybrid gels
There are some examples in the literature where LMWGs have been combined with polymers
that have the capacity to be used as PGs, but are not actually being used as such in these cases.
Instead, the polymers are used to form non-gelling support networks to improve the materials
properties of the gel formed by the LMWGs. These materials are therefore strongly related to those
discussed in sections 1.3.4 and 1.3.5.
Feng and co-workers demonstrated that the polysaccharide sodium alginate (which hydrogelates
through crosslinking on addition of divalent cations or on protonation) could be added to hydrogels
of 1,4-bi(phenylalanine-diglycol)-benzene (PDB) (Figure 1.29a) to form a semi-interpenetrating
network by partially disrupting the LMWG interactions; the amide NHs of PDB interact with the
carboxylates of the sodium alginate.102 The gels with sodium alginate added had better mechanical
and water retention properties; it was also possible to achieve controlled release of certain dyes
(acting as drug models) from the semi-hybrid gel, as the sodium alginate introduced electrostatic
forces, either attractive or repulsive depending on the dye, allowing the gel to retain or release dyes
respectively.
Feng and co-workers also experimented with combining the PDB LMWG with a non-gelling
polymer network of sodium hyaluronate (HA);103 this glycosaminoglycan can also potentially form
gels through covalent crosslinking. The addition of HA gave the dried PDB xerogels significantly
better swelling properties than in the absence of HA; the swollen PDB/HA gels had much bigger
pores than a swollen PDB gel, which provided enough room for cell migration and proliferation,
allowing for easy 3D growth of cells (Figure 1.29b) – this is potentially useful for tissue
engineering, disease model and drug release applications.
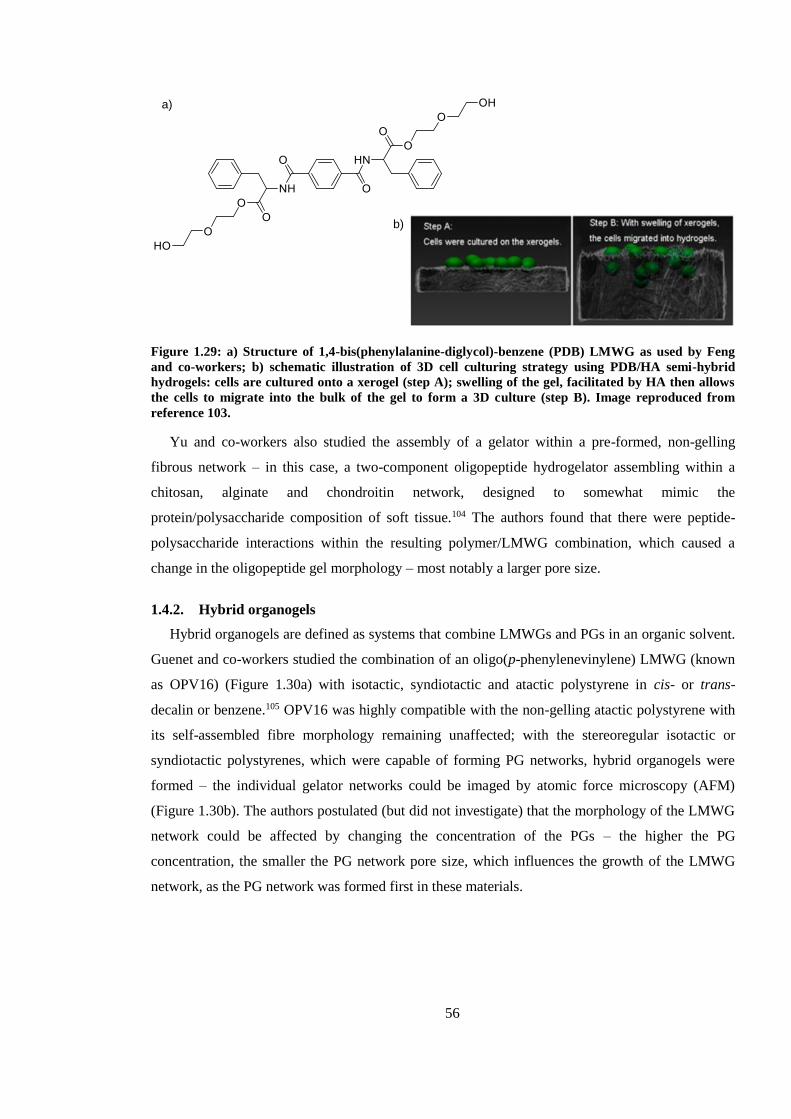
56
Figure 1.29: a) Structure of 1,4-bis(phenylalanine-diglycol)-benzene (PDB) LMWG as used by Feng
and co-workers; b) schematic illustration of 3D cell culturing strategy using PDB/HA semi-hybrid
hydrogels: cells are cultured onto a xerogel (step A); swelling of the gel, facilitated by HA then allows
the cells to migrate into the bulk of the gel to form a 3D culture (step B). Image reproduced from
reference 103.
Yu and co-workers also studied the assembly of a gelator within a pre-formed, non-gelling
fibrous network – in this case, a two-component oligopeptide hydrogelator assembling within a
chitosan, alginate and chondroitin network, designed to somewhat mimic the
protein/polysaccharide composition of soft tissue.104 The authors found that there were peptide-
polysaccharide interactions within the resulting polymer/LMWG combination, which caused a
change in the oligopeptide gel morphology – most notably a larger pore size.
1.4.2. Hybrid organogels
Hybrid organogels are defined as systems that combine LMWGs and PGs in an organic solvent.
Guenet and co-workers studied the combination of an oligo(p-phenylenevinylene) LMWG (known
as OPV16) (Figure 1.30a) with isotactic, syndiotactic and atactic polystyrene in cis- or trans-
decalin or benzene.105 OPV16 was highly compatible with the non-gelling atactic polystyrene with
its self-assembled fibre morphology remaining unaffected; with the stereoregular isotactic or
syndiotactic polystyrenes, which were capable of forming PG networks, hybrid organogels were
formed – the individual gelator networks could be imaged by atomic force microscopy (AFM)
(Figure 1.30b). The authors postulated (but did not investigate) that the morphology of the LMWG
network could be affected by changing the concentration of the PGs – the higher the PG
concentration, the smaller the PG network pore size, which influences the growth of the LMWG
network, as the PG network was formed first in these materials.
b)
a)
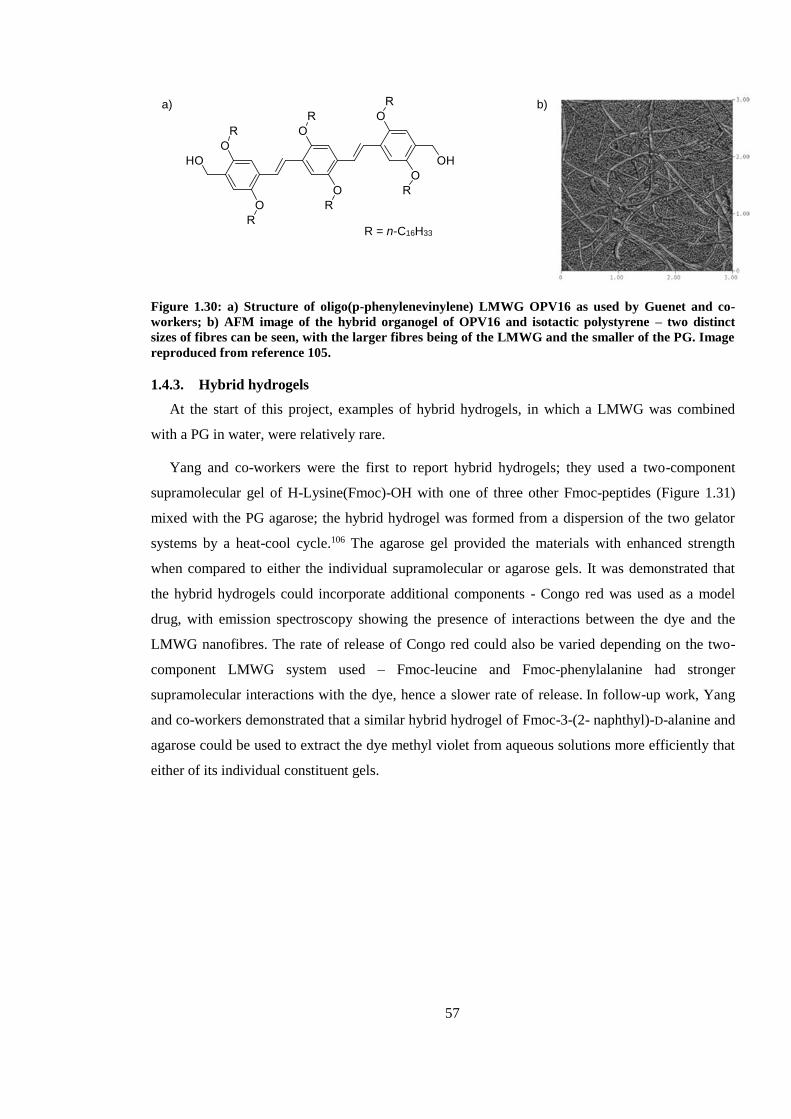
57
Figure 1.30: a) Structure of oligo(p-phenylenevinylene) LMWG OPV16 as used by Guenet and co-
workers; b) AFM image of the hybrid organogel of OPV16 and isotactic polystyrene – two distinct
sizes of fibres can be seen, with the larger fibres being of the LMWG and the smaller of the PG. Image
reproduced from reference 105.
1.4.3. Hybrid hydrogels
At the start of this project, examples of hybrid hydrogels, in which a LMWG was combined
with a PG in water, were relatively rare.
Yang and co-workers were the first to report hybrid hydrogels; they used a two-component
supramolecular gel of H-Lysine(Fmoc)-OH with one of three other Fmoc-peptides (Figure 1.31)
mixed with the PG agarose; the hybrid hydrogel was formed from a dispersion of the two gelator
systems by a heat-cool cycle.106 The agarose gel provided the materials with enhanced strength
when compared to either the individual supramolecular or agarose gels. It was demonstrated that
the hybrid hydrogels could incorporate additional components - Congo red was used as a model
drug, with emission spectroscopy showing the presence of interactions between the dye and the
LMWG nanofibres. The rate of release of Congo red could also be varied depending on the two-
component LMWG system used – Fmoc-leucine and Fmoc-phenylalanine had stronger
supramolecular interactions with the dye, hence a slower rate of release. In follow-up work, Yang
and co-workers demonstrated that a similar hybrid hydrogel of Fmoc-3-(2- naphthyl)-D-alanine and
agarose could be used to extract the dye methyl violet from aqueous solutions more efficiently that
either of its individual constituent gels.
a)
R = n-C16H33
b)
58
Figure 1.31: The multi-component peptide-based LMWG system used by Yang and co-workers,
consisting of H-lysine(Fmoc)-OH in combination with one of three Fmoc-amino acids; this multi-
component gel system was combined with the PG agarose to produce hybrid hydrogels.
Qi and co-workers also investigated drug release from hybrid hydrogels. Their hybrid gel was
composed of the LMWG Fmoc-diphenylalanine (Fmoc-FF) and the polysaccharide PG konjac
glucomannan (KGM).107 In this material, a solvent-switch approach was needed to trigger gelation
of the LMWG, by first dissolving it in a small amount of DMSO before addition of the aqueous PG
solution; the PG network was then formed by slow gelation over several days. Again, the hybrid
hydrogel was found to have a higher mechanical strength than compared to a gel of just Fmoc-FF;
this increase in strength was found to be due to the nanostructure of the hybrid gel, in which the
Fmoc-FF fibres were interpenetrated and interwoven with KGM chains – the authors made an
analogy to the structure of reinforced concrete. The Fmoc-FF fibres in the hybrid hydrogel were
also observed (by electron microscopy) to be thinner than in the Fmoc-FF gel; this was reasoned to
be due to the presence of the KGM, which increased the viscosity of the solution, decreasing the
rate of diffusion of Fmoc-FF, as well as causing more crowded assembly sites. Docetaxel was used
as a drug model for in vitro release studies; it was found that an increase in KGM concentration
lead to a decrease in docetaxel release rate (attributed to a more stable gel structure), though the
rate could be increased by introducing β-mannanase – an enzyme able to degrade KGM – to the
diffusion medium. This demonstrates how responsivity can be built into hybrid gels.
There are further examples of hybrid hydrogels; however, as these were published concurrent
with the research presented in this thesis, they will be discussed at the relevant point.
H-Lysine(Fmoc)-OH Fmoc-alanine
Fmoc-leucine Fmoc-phenylalanine
59
1.5. Project aims
The main theme of this project is the combination of low-molecular-weight and polymer
gelators, especially to expand the fundamental understanding of this as yet very little-explored class
of gels. There was a particular focus on how to control the formation of one network within the
presence of another, and how to install some functionality into the gels produced from these
combinations so they act as proof-of-principle demonstrations to the potential of hybrid gels. There
are three main areas to be examined: (i) the combination of a LMWG with a PG to yield a material
that can be described as responsive yet also robust, to clearly demonstrate the advantages of
combining the two distinct classes of gelators; (ii) controlling the formation of one gel network in
space in the presence of another gel network to yield a material with two or more spatially-resolved
regions; and (iii) controlling the formation of one gel network in time in the presence of another,
i.e., to determine when it forms, with scope to combine the final two aims into one material which
is both spatially and temporally resolved.
1.5.1. Responsive yet robust hybrid hydrogels
The production of responsive yet robust hydrogels rested on the possibility of combining a
LMWG and PG with orthogonal methods of network production to best demonstrate the responsive
of the LMWG component. Previous research in the area had largely focused on combinations of
gels with the same methods of network production, meaning in those cases each network was
responsive to the same stimuli; through using orthogonally assembled networks it was hoped that
each network would respond to a different stimulus. There was a particular aim here to show that
the LMWG network could be repeatedly switched “on” or “off” within the PG matrix through
application of a stimulus, whilst the polymer network would remain intact and unaffected.
It is worth noting that such a responsive yet robust hybrid hydrogel had not been demonstrated
before – the closest example involved the irreversible breakdown of the PG network, which of
course severely affected the robustness of the gel.107
1.5.2. Spatial resolution in hybrid hydrogels
This part of the project aimed to utilise a gelator for which the formation of gel network could
be spatially controlled. To achieve this, it was thought that the best method for spatial control
would be to use a photo-activated gel, potentially one activated by UV light. It was hoped that
these different regions would show distinct diffusion properties, giving such materials potential for
controlled release applications.
60
1.5.3. Temporal resolution in hybrid hydrogels
The control of when a gel network is formed in time could be said to be dependent on one of
two factors, either (i) through careful control of the rate of network formation from a stimulus
already present in the gel (e.g., a slow-releasing proton source to form a pH-responsive network),
or (ii) from application of an external stimulus (e.g., UV light) to activate a gelator to form its
network it the presence of another, pre-formed gel network. It was hoped that temporal control
could be achieved using a variety of methods, including photoacid generation, and also to combine
this approach with spatial control to yield materials with both spatial and temporal resolution.
61
2. Chapter 2: Responsive Yet Robust Hybrid Hydrogels
Results from this chapter were published in D. J. Cornwell, B. O. Okesola and D. K. Smith, Soft
Matter, 2013, 9, 8730–8736.
2.1. Introduction
In order to create hybrid hydrogels which can harness the advantages of the two independent
networks, the first consideration is the selection of appropriate and compatible LMWGs and PGs; a
large factor in this compatibility derives from the methods used to create each gelator network.
Previous studies had chosen to use gelators that were both formed by heat/cool methodology,106,108
or simple mixing of both gelators;107 whilst this enabled quick and/or simple production of robust
hybrid gels, it could be thought to limit the responsiveness of the final material, as both networks
respond to the same stimulus (in those cases, change in temperature). Additionally, the relatively
rapid and simultaneous formation of both networks prevented any detailed study of the kinetics of
formation of one network in the presence of the other.
For the first hybrid hydrogels to be made here, a LMWG and a PG with orthogonal methods of
gel production were chosen: the LMWG component was a pH-responsive 1,3:2,4-dibenzylidene-D-
sorbitol derivative, and the PG component was the thermally responsive agarose. Each of these
gelators will be considered and characterised individually first, before the hybrid hydrogels are
discussed.
2.2. DBS and derivatives
1,3:2,4-Dibenzylidene-D-sorbitol (also known as dibenzylidene-D-sorbitol or DBS) (Scheme
2.1) is a well-known low-molecular-weight gelator. It was first identified as early as 1891 by
Meunier, who obtained a mixture of two compounds, which he stated to be isomeric diacetals, from
acid catalysed condensation of two equivalents of benzaldehyde with D-sorbitol;109 one of these
compounds formed a gel in certain organic solvents, while the other did not.
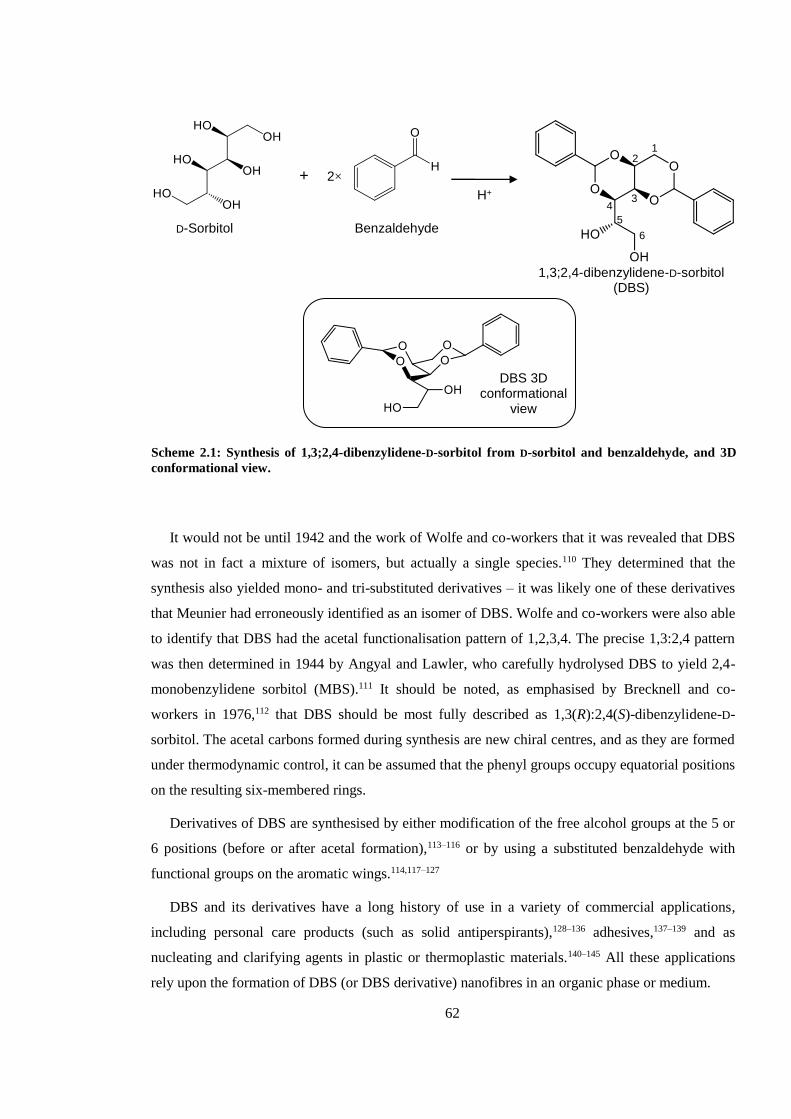
62
It would not be until 1942 and the work of Wolfe and co-workers that it was revealed that DBS
was not in fact a mixture of isomers, but actually a single species.110 They determined that the
synthesis also yielded mono- and tri-substituted derivatives – it was likely one of these derivatives
that Meunier had erroneously identified as an isomer of DBS. Wolfe and co-workers were also able
to identify that DBS had the acetal functionalisation pattern of 1,2,3,4. The precise 1,3:2,4 pattern
was then determined in 1944 by Angyal and Lawler, who carefully hydrolysed DBS to yield 2,4-
monobenzylidene sorbitol (MBS).111 It should be noted, as emphasised by Brecknell and co-
workers in 1976,112 that DBS should be most fully described as 1,3(R):2,4(S)-dibenzylidene-D-
sorbitol. The acetal carbons formed during synthesis are new chiral centres, and as they are formed
under thermodynamic control, it can be assumed that the phenyl groups occupy equatorial positions
on the resulting six-membered rings.
Derivatives of DBS are synthesised by either modification of the free alcohol groups at the 5 or
6 positions (before or after acetal formation),113–116 or by using a substituted benzaldehyde with
functional groups on the aromatic wings.114,117–127
DBS and its derivatives have a long history of use in a variety of commercial applications,
including personal care products (such as solid antiperspirants),128–136 adhesives,137–139 and as
nucleating and clarifying agents in plastic or thermoplastic materials.140–145 All these applications
rely upon the formation of DBS (or DBS derivative) nanofibres in an organic phase or medium.
Scheme 2.1: Synthesis of 1,3;2,4-dibenzylidene-D-sorbitol from D-sorbitol and benzaldehyde, and 3D
conformational view.
1 2
3 4
5
6
+ 2×
D-Sorbitol Benzaldehyde
1,3;2,4-dibenzylidene-D-sorbitol (DBS)
DBS 3D conformational
view
H+
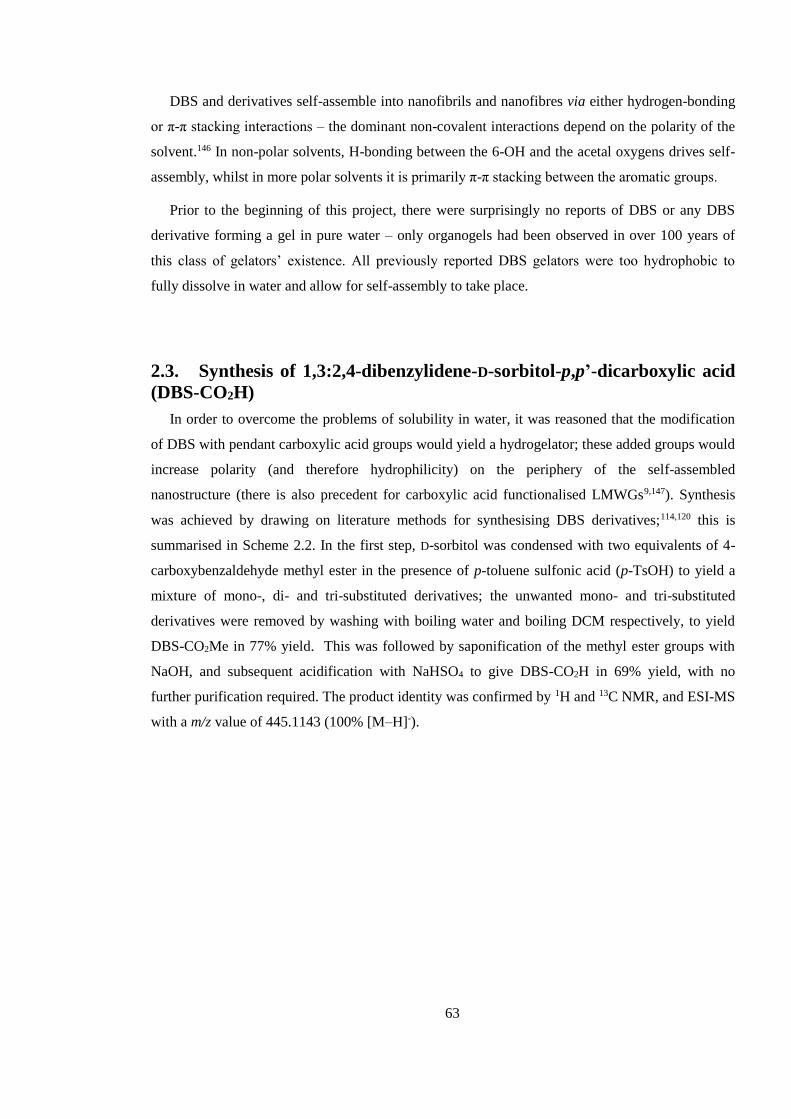
63
DBS and derivatives self-assemble into nanofibrils and nanofibres via either hydrogen-bonding
or π-π stacking interactions – the dominant non-covalent interactions depend on the polarity of the
solvent.146 In non-polar solvents, H-bonding between the 6-OH and the acetal oxygens drives self-
assembly, whilst in more polar solvents it is primarily π-π stacking between the aromatic groups.
Prior to the beginning of this project, there were surprisingly no reports of DBS or any DBS
derivative forming a gel in pure water – only organogels had been observed in over 100 years of
this class of gelators’ existence. All previously reported DBS gelators were too hydrophobic to
fully dissolve in water and allow for self-assembly to take place.
2.3. Synthesis of 1,3:2,4-dibenzylidene-D-sorbitol-p,p’-dicarboxylic acid
(DBS-CO2H)
In order to overcome the problems of solubility in water, it was reasoned that the modification
of DBS with pendant carboxylic acid groups would yield a hydrogelator; these added groups would
increase polarity (and therefore hydrophilicity) on the periphery of the self-assembled
nanostructure (there is also precedent for carboxylic acid functionalised LMWGs9,147). Synthesis
was achieved by drawing on literature methods for synthesising DBS derivatives;114,120 this is
summarised in Scheme 2.2. In the first step, D-sorbitol was condensed with two equivalents of 4-
carboxybenzaldehyde methyl ester in the presence of p-toluene sulfonic acid (p-TsOH) to yield a
mixture of mono-, di- and tri-substituted derivatives; the unwanted mono- and tri-substituted
derivatives were removed by washing with boiling water and boiling DCM respectively, to yield
DBS-CO2Me in 77% yield. This was followed by saponification of the methyl ester groups with
NaOH, and subsequent acidification with NaHSO4 to give DBS-CO2H in 69% yield, with no
further purification required. The product identity was confirmed by 1H and 13C NMR, and ESI-MS
with a m/z value of 445.1143 (100% [M–H]-).
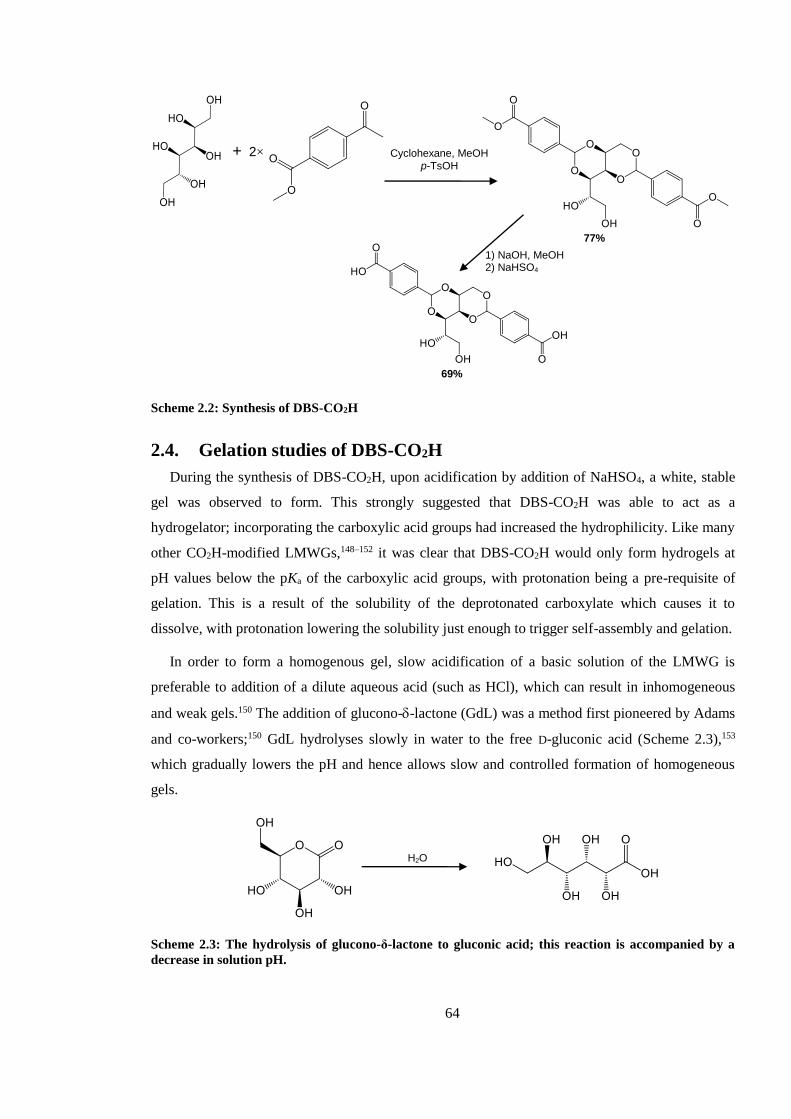
64
Scheme 2.2: Synthesis of DBS-CO2H
2.4. Gelation studies of DBS-CO2H
During the synthesis of DBS-CO2H, upon acidification by addition of NaHSO4, a white, stable
gel was observed to form. This strongly suggested that DBS-CO2H was able to act as a
hydrogelator; incorporating the carboxylic acid groups had increased the hydrophilicity. Like many
other CO2H-modified LMWGs,148–152 it was clear that DBS-CO2H would only form hydrogels at
pH values below the pKa of the carboxylic acid groups, with protonation being a pre-requisite of
gelation. This is a result of the solubility of the deprotonated carboxylate which causes it to
dissolve, with protonation lowering the solubility just enough to trigger self-assembly and gelation.
In order to form a homogenous gel, slow acidification of a basic solution of the LMWG is
preferable to addition of a dilute aqueous acid (such as HCl), which can result in inhomogeneous
and weak gels.150 The addition of glucono--lactone (GdL) was a method first pioneered by Adams
and co-workers;150 GdL hydrolyses slowly in water to the free D-gluconic acid (Scheme 2.3),153
which gradually lowers the pH and hence allows slow and controlled formation of homogeneous
gels.
Scheme 2.3: The hydrolysis of glucono-δ-lactone to gluconic acid; this reaction is accompanied by a
decrease in solution pH.
H2O
Cyclohexane, MeOH
p-TsOH
1) NaOH, MeOH 2) NaHSO4
+ 2×
77%
69%
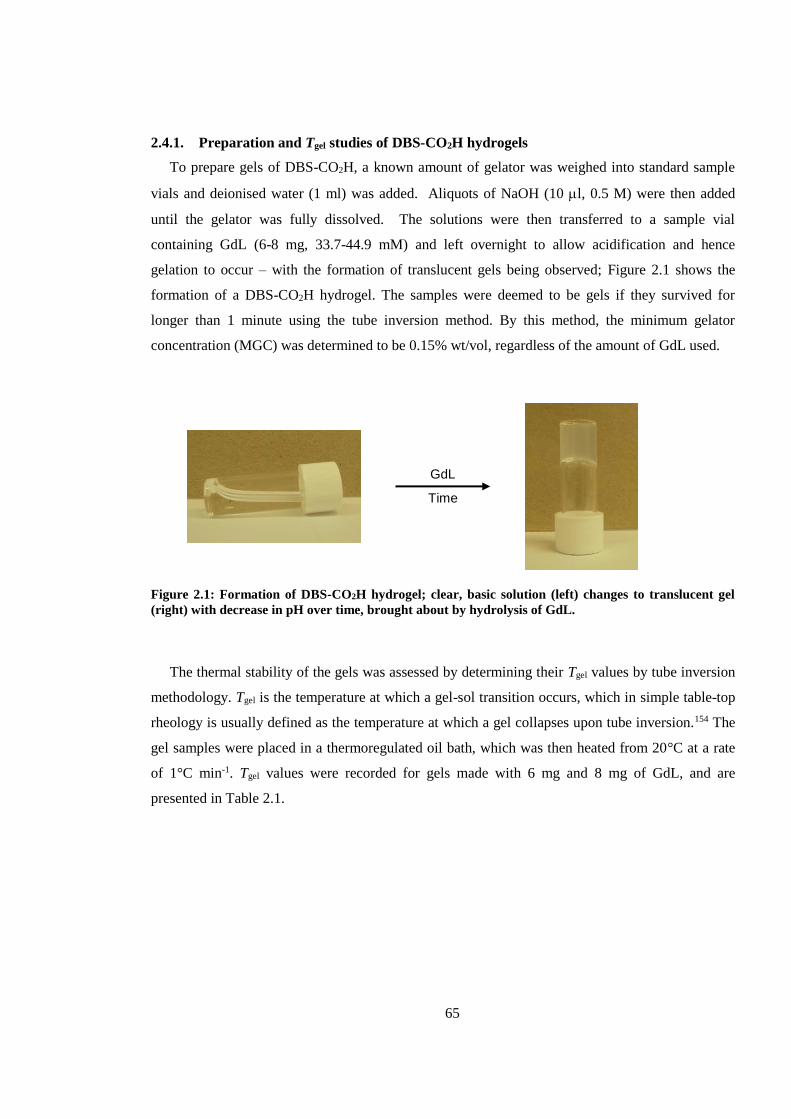
65
2.4.1. Preparation and Tgel studies of DBS-CO2H hydrogels
To prepare gels of DBS-CO2H, a known amount of gelator was weighed into standard sample
vials and deionised water (1 ml) was added. Aliquots of NaOH (10 l, 0.5 M) were then added
until the gelator was fully dissolved. The solutions were then transferred to a sample vial
containing GdL (6-8 mg, 33.7-44.9 mM) and left overnight to allow acidification and hence
gelation to occur – with the formation of translucent gels being observed; Figure 2.1 shows the
formation of a DBS-CO2H hydrogel. The samples were deemed to be gels if they survived for
longer than 1 minute using the tube inversion method. By this method, the minimum gelator
concentration (MGC) was determined to be 0.15% wt/vol, regardless of the amount of GdL used.
Figure 2.1: Formation of DBS-CO2H hydrogel; clear, basic solution (left) changes to translucent gel
(right) with decrease in pH over time, brought about by hydrolysis of GdL.
The thermal stability of the gels was assessed by determining their Tgel values by tube inversion
methodology. Tgel is the temperature at which a gel-sol transition occurs, which in simple table-top
rheology is usually defined as the temperature at which a gel collapses upon tube inversion.154 The
gel samples were placed in a thermoregulated oil bath, which was then heated from 20°C at a rate
of 1°C min-1. Tgel values were recorded for gels made with 6 mg and 8 mg of GdL, and are
presented in Table 2.1.
GdL
Time
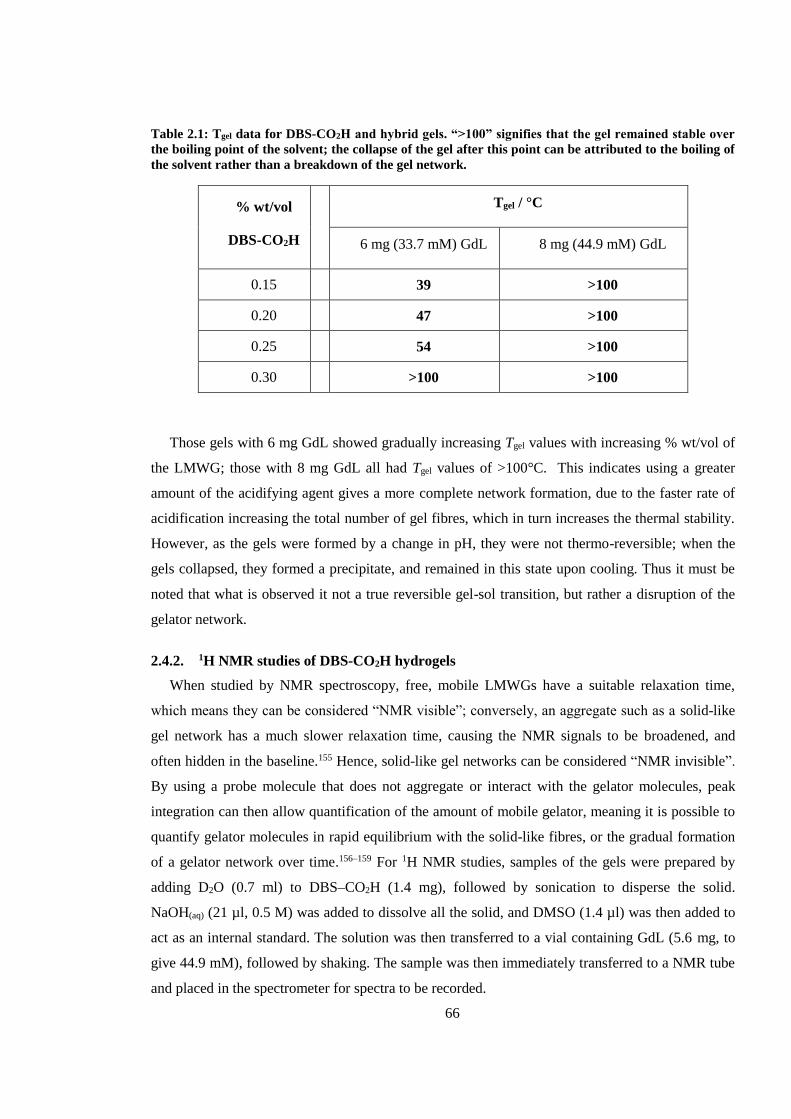
66
Table 2.1: Tgel data for DBS-CO2H and hybrid gels. “>100” signifies that the gel remained stable over
the boiling point of the solvent; the collapse of the gel after this point can be attributed to the boiling of
the solvent rather than a breakdown of the gel network.
% wt/vol
DBS-CO2H
Tgel / °C
6 mg (33.7 mM) GdL 8 mg (44.9 mM) GdL
0.15 39 >100
0.20 47 >100
0.25 54 >100
0.30 >100 >100
Those gels with 6 mg GdL showed gradually increasing Tgel values with increasing % wt/vol of
the LMWG; those with 8 mg GdL all had Tgel values of >100°C. This indicates using a greater
amount of the acidifying agent gives a more complete network formation, due to the faster rate of
acidification increasing the total number of gel fibres, which in turn increases the thermal stability.
However, as the gels were formed by a change in pH, they were not thermo-reversible; when the
gels collapsed, they formed a precipitate, and remained in this state upon cooling. Thus it must be
noted that what is observed it not a true reversible gel-sol transition, but rather a disruption of the
gelator network.
2.4.2. 1H NMR studies of DBS-CO2H hydrogels
When studied by NMR spectroscopy, free, mobile LMWGs have a suitable relaxation time,
which means they can be considered “NMR visible”; conversely, an aggregate such as a solid-like
gel network has a much slower relaxation time, causing the NMR signals to be broadened, and
often hidden in the baseline.155 Hence, solid-like gel networks can be considered “NMR invisible”.
By using a probe molecule that does not aggregate or interact with the gelator molecules, peak
integration can then allow quantification of the amount of mobile gelator, meaning it is possible to
quantify gelator molecules in rapid equilibrium with the solid-like fibres, or the gradual formation
of a gelator network over time.156–159 For 1H NMR studies, samples of the gels were prepared by
adding D2O (0.7 ml) to DBS–CO2H (1.4 mg), followed by sonication to disperse the solid.
NaOH(aq) (21 µl, 0.5 M) was added to dissolve all the solid, and DMSO (1.4 µl) was then added to
act as an internal standard. The solution was then transferred to a vial containing GdL (5.6 mg, to
give 44.9 mM), followed by shaking. The sample was then immediately transferred to a NMR tube
and placed in the spectrometer for spectra to be recorded.
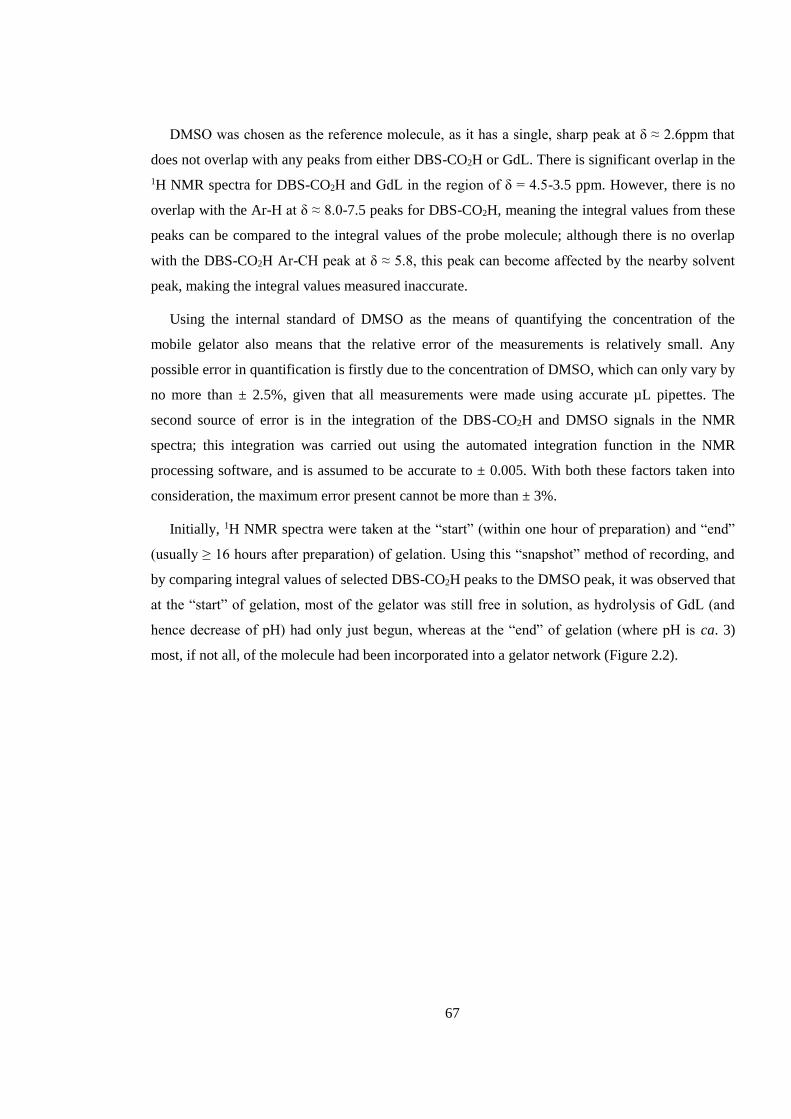
67
DMSO was chosen as the reference molecule, as it has a single, sharp peak at δ ≈ 2.6ppm that
does not overlap with any peaks from either DBS-CO2H or GdL. There is significant overlap in the
1H NMR spectra for DBS-CO2H and GdL in the region of δ = 4.5-3.5 ppm. However, there is no
overlap with the Ar-H at δ ≈ 8.0-7.5 peaks for DBS-CO2H, meaning the integral values from these
peaks can be compared to the integral values of the probe molecule; although there is no overlap
with the DBS-CO2H Ar-CH peak at δ ≈ 5.8, this peak can become affected by the nearby solvent
peak, making the integral values measured inaccurate.
Using the internal standard of DMSO as the means of quantifying the concentration of the
mobile gelator also means that the relative error of the measurements is relatively small. Any
possible error in quantification is firstly due to the concentration of DMSO, which can only vary by
no more than ± 2.5%, given that all measurements were made using accurate µL pipettes. The
second source of error is in the integration of the DBS-CO2H and DMSO signals in the NMR
spectra; this integration was carried out using the automated integration function in the NMR
processing software, and is assumed to be accurate to ± 0.005. With both these factors taken into
consideration, the maximum error present cannot be more than ± 3%.
Initially, 1H NMR spectra were taken at the “start” (within one hour of preparation) and “end”
(usually ≥ 16 hours after preparation) of gelation. Using this “snapshot” method of recording, and
by comparing integral values of selected DBS-CO2H peaks to the DMSO peak, it was observed that
at the “start” of gelation, most of the gelator was still free in solution, as hydrolysis of GdL (and
hence decrease of pH) had only just begun, whereas at the “end” of gelation (where pH is ca. 3)
most, if not all, of the molecule had been incorporated into a gelator network (Figure 2.2).
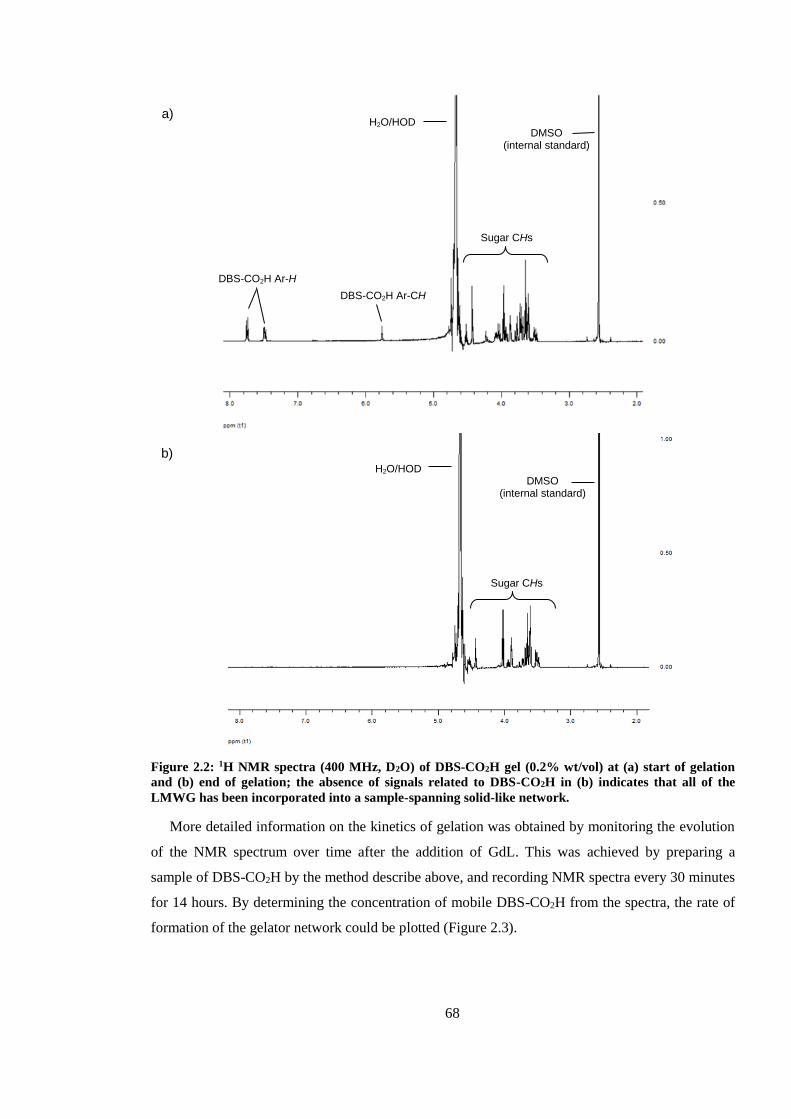
68
Figure 2.2: 1H NMR spectra (400 MHz, D2O) of DBS-CO2H gel (0.2% wt/vol) at (a) start of gelation
and (b) end of gelation; the absence of signals related to DBS-CO2H in (b) indicates that all of the
LMWG has been incorporated into a sample-spanning solid-like network.
More detailed information on the kinetics of gelation was obtained by monitoring the evolution
of the NMR spectrum over time after the addition of GdL. This was achieved by preparing a
sample of DBS-CO2H by the method describe above, and recording NMR spectra every 30 minutes
for 14 hours. By determining the concentration of mobile DBS-CO2H from the spectra, the rate of
formation of the gelator network could be plotted (Figure 2.3).
H2O/HOD DMSO
(internal standard)
Sugar CHs
(from GdL and gluconic acid)
b)
DBS-CO2H Ar-CH
H2O/HOD DMSO
(internal standard)
Sugar CHs
(from DBS-CO2H and GdL)
a)
DBS-CO2H Ar-H
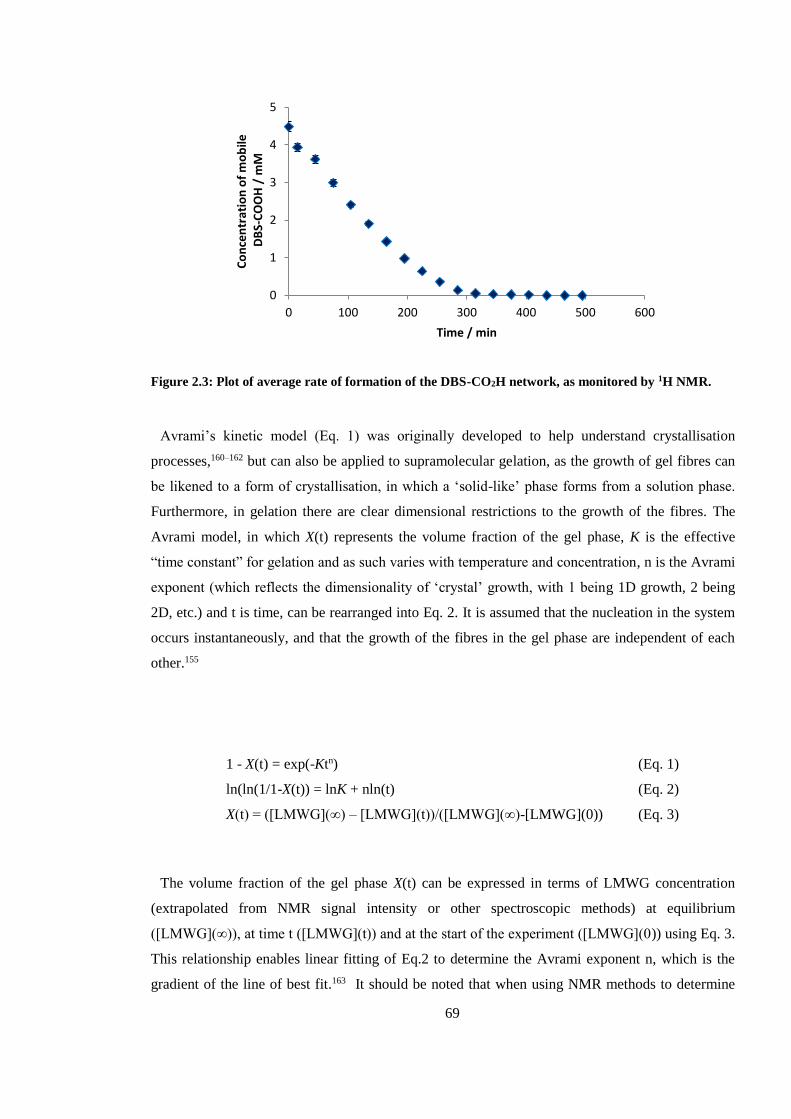
69
Figure 2.3: Plot of average rate of formation of the DBS-CO2H network, as monitored by 1H NMR.
Avrami’s kinetic model (Eq. 1) was originally developed to help understand crystallisation
processes,160–162 but can also be applied to supramolecular gelation, as the growth of gel fibres can
be likened to a form of crystallisation, in which a ‘solid-like’ phase forms from a solution phase.
Furthermore, in gelation there are clear dimensional restrictions to the growth of the fibres. The
Avrami model, in which X(t) represents the volume fraction of the gel phase, K is the effective
“time constant” for gelation and as such varies with temperature and concentration, n is the Avrami
exponent (which reflects the dimensionality of ‘crystal’ growth, with 1 being 1D growth, 2 being
2D, etc.) and t is time, can be rearranged into Eq. 2. It is assumed that the nucleation in the system
occurs instantaneously, and that the growth of the fibres in the gel phase are independent of each
other.155
1 - X(t) = exp(-Ktn) (Eq. 1)
ln(ln(1/1-X(t)) = lnK + nln(t) (Eq. 2)
X(t) = ([LMWG](∞) – [LMWG](t))/([LMWG](∞)-[LMWG](0)) (Eq. 3)
The volume fraction of the gel phase X(t) can be expressed in terms of LMWG concentration
(extrapolated from NMR signal intensity or other spectroscopic methods) at equilibrium
([LMWG](∞)), at time t ([LMWG](t)) and at the start of the experiment ([LMWG](0)) using Eq. 3.
This relationship enables linear fitting of Eq.2 to determine the Avrami exponent n, which is the
gradient of the line of best fit.163 It should be noted that when using NMR methods to determine
0
1
2
3
4
5
0 100 200 300 400 500 600
Co
nce
ntr
atio
n o
f m
ob
ileD
BS-
CO
OH
/ m
M
Time / min
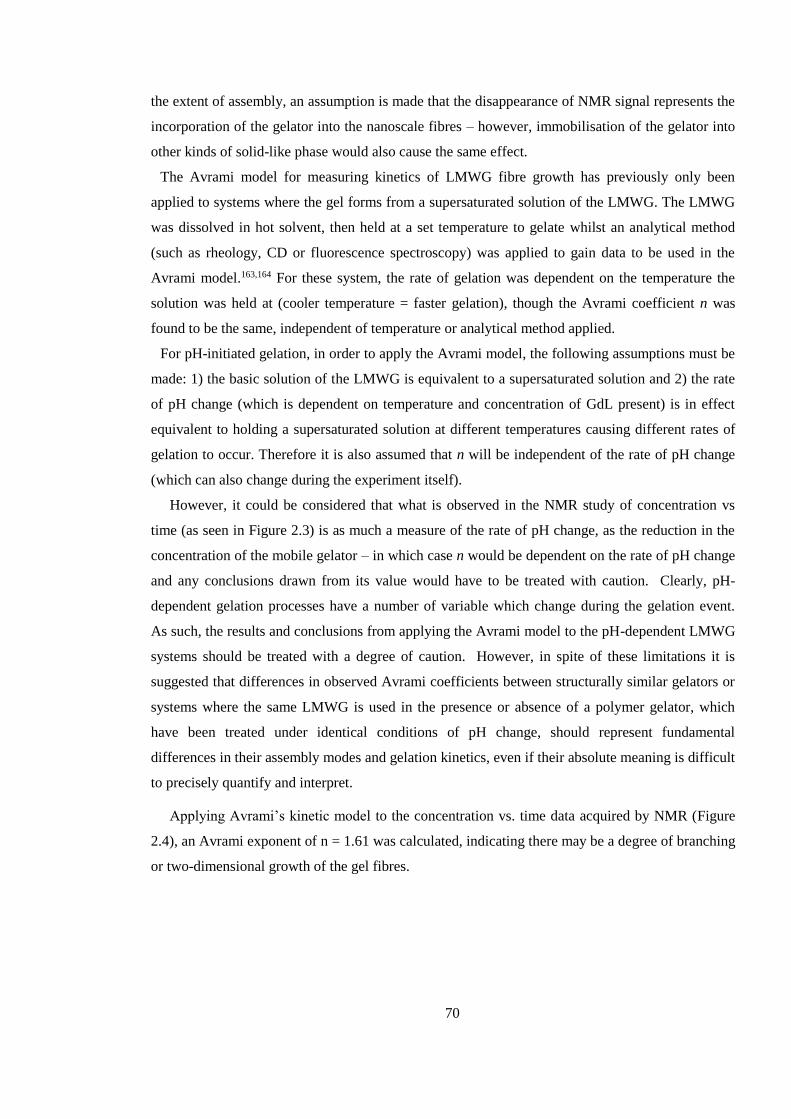
70
the extent of assembly, an assumption is made that the disappearance of NMR signal represents the
incorporation of the gelator into the nanoscale fibres – however, immobilisation of the gelator into
other kinds of solid-like phase would also cause the same effect.
The Avrami model for measuring kinetics of LMWG fibre growth has previously only been
applied to systems where the gel forms from a supersaturated solution of the LMWG. The LMWG
was dissolved in hot solvent, then held at a set temperature to gelate whilst an analytical method
(such as rheology, CD or fluorescence spectroscopy) was applied to gain data to be used in the
Avrami model.163,164 For these system, the rate of gelation was dependent on the temperature the
solution was held at (cooler temperature = faster gelation), though the Avrami coefficient n was
found to be the same, independent of temperature or analytical method applied.
For pH-initiated gelation, in order to apply the Avrami model, the following assumptions must be
made: 1) the basic solution of the LMWG is equivalent to a supersaturated solution and 2) the rate
of pH change (which is dependent on temperature and concentration of GdL present) is in effect
equivalent to holding a supersaturated solution at different temperatures causing different rates of
gelation to occur. Therefore it is also assumed that n will be independent of the rate of pH change
(which can also change during the experiment itself).
However, it could be considered that what is observed in the NMR study of concentration vs
time (as seen in Figure 2.3) is as much a measure of the rate of pH change, as the reduction in the
concentration of the mobile gelator – in which case n would be dependent on the rate of pH change
and any conclusions drawn from its value would have to be treated with caution. Clearly, pH-
dependent gelation processes have a number of variable which change during the gelation event.
As such, the results and conclusions from applying the Avrami model to the pH-dependent LMWG
systems should be treated with a degree of caution. However, in spite of these limitations it is
suggested that differences in observed Avrami coefficients between structurally similar gelators or
systems where the same LMWG is used in the presence or absence of a polymer gelator, which
have been treated under identical conditions of pH change, should represent fundamental
differences in their assembly modes and gelation kinetics, even if their absolute meaning is difficult
to precisely quantify and interpret.
Applying Avrami’s kinetic model to the concentration vs. time data acquired by NMR (Figure
2.4), an Avrami exponent of n = 1.61 was calculated, indicating there may be a degree of branching
or two-dimensional growth of the gel fibres.
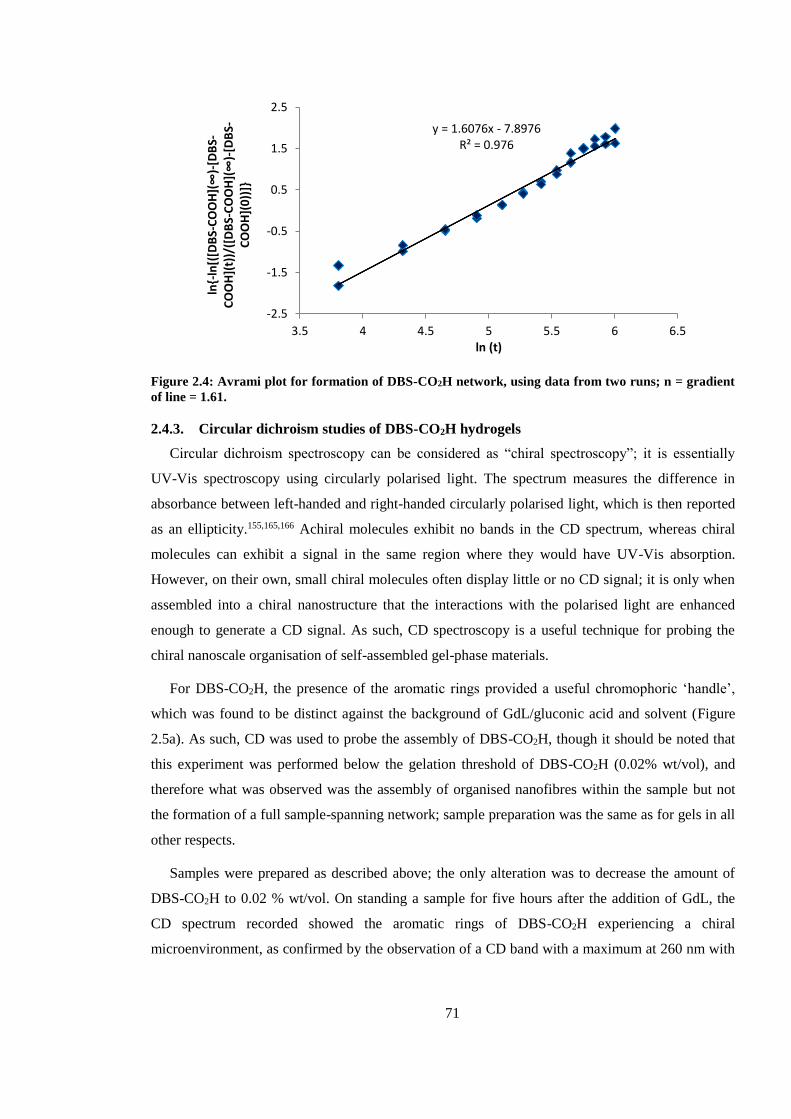
71
Figure 2.4: Avrami plot for formation of DBS-CO2H network, using data from two runs; n = gradient
of line = 1.61.
2.4.3. Circular dichroism studies of DBS-CO2H hydrogels
Circular dichroism spectroscopy can be considered as “chiral spectroscopy”; it is essentially
UV-Vis spectroscopy using circularly polarised light. The spectrum measures the difference in
absorbance between left-handed and right-handed circularly polarised light, which is then reported
as an ellipticity.155,165,166 Achiral molecules exhibit no bands in the CD spectrum, whereas chiral
molecules can exhibit a signal in the same region where they would have UV-Vis absorption.
However, on their own, small chiral molecules often display little or no CD signal; it is only when
assembled into a chiral nanostructure that the interactions with the polarised light are enhanced
enough to generate a CD signal. As such, CD spectroscopy is a useful technique for probing the
chiral nanoscale organisation of self-assembled gel-phase materials.
For DBS-CO2H, the presence of the aromatic rings provided a useful chromophoric ‘handle’,
which was found to be distinct against the background of GdL/gluconic acid and solvent (Figure
2.5a). As such, CD was used to probe the assembly of DBS-CO2H, though it should be noted that
this experiment was performed below the gelation threshold of DBS-CO2H (0.02% wt/vol), and
therefore what was observed was the assembly of organised nanofibres within the sample but not
the formation of a full sample-spanning network; sample preparation was the same as for gels in all
other respects.
Samples were prepared as described above; the only alteration was to decrease the amount of
DBS-CO2H to 0.02 % wt/vol. On standing a sample for five hours after the addition of GdL, the
CD spectrum recorded showed the aromatic rings of DBS-CO2H experiencing a chiral
microenvironment, as confirmed by the observation of a CD band with a maximum at 260 nm with
y = 1.6076x - 7.8976R² = 0.976
-2.5
-1.5
-0.5
0.5
1.5
2.5
3.5 4 4.5 5 5.5 6 6.5
ln{-
ln[(
[DB
S-COOH](∞)-
[DB
S-C
OO
H](
t))/
([D
BS-COOH](∞)-
[DB
S-C
OO
H](
0))
]}
ln (t)
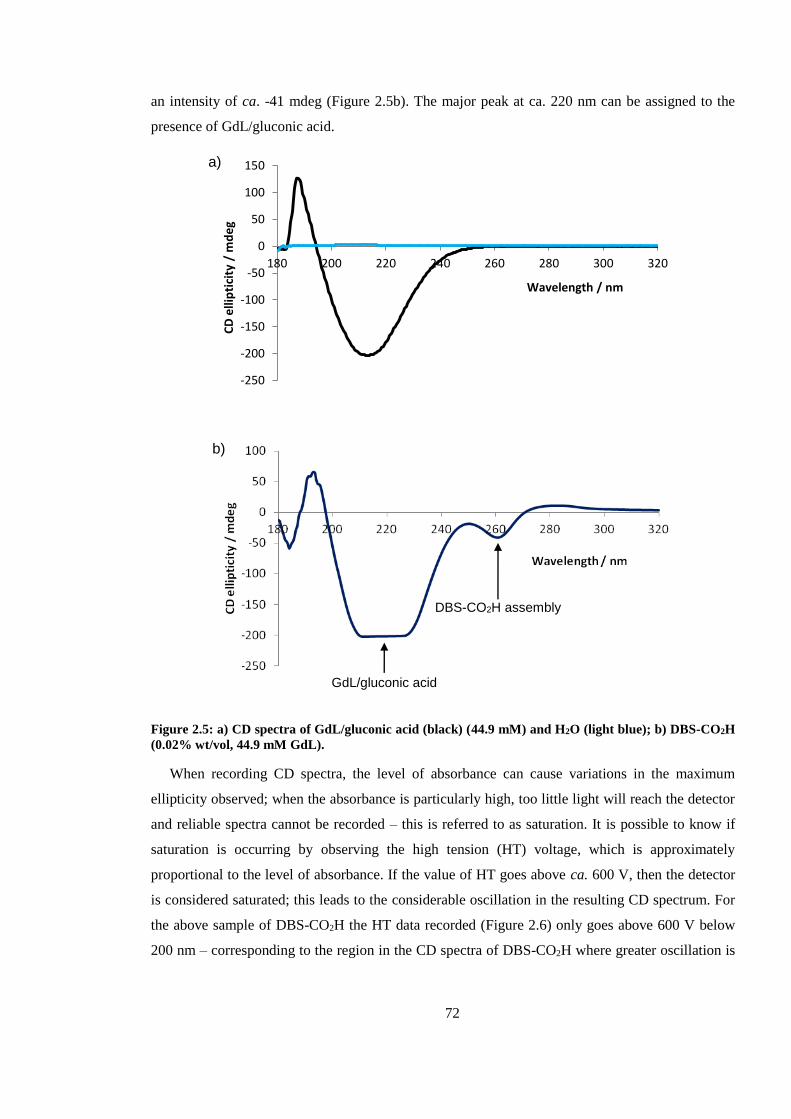
72
an intensity of ca. -41 mdeg (Figure 2.5b). The major peak at ca. 220 nm can be assigned to the
presence of GdL/gluconic acid.
Figure 2.5: a) CD spectra of GdL/gluconic acid (black) (44.9 mM) and H2O (light blue); b) DBS-CO2H
(0.02% wt/vol, 44.9 mM GdL).
When recording CD spectra, the level of absorbance can cause variations in the maximum
ellipticity observed; when the absorbance is particularly high, too little light will reach the detector
and reliable spectra cannot be recorded – this is referred to as saturation. It is possible to know if
saturation is occurring by observing the high tension (HT) voltage, which is approximately
proportional to the level of absorbance. If the value of HT goes above ca. 600 V, then the detector
is considered saturated; this leads to the considerable oscillation in the resulting CD spectrum. For
the above sample of DBS-CO2H the HT data recorded (Figure 2.6) only goes above 600 V below
200 nm – corresponding to the region in the CD spectra of DBS-CO2H where greater oscillation is
-250
-200
-150
-100
-50
0
50
100
150
180 200 220 240 260 280 300 320
CD
elli
pti
city
/ m
de
g
Wavelength / nm
a)
GdL/gluconic acid
DBS-CO2H assembly
b)
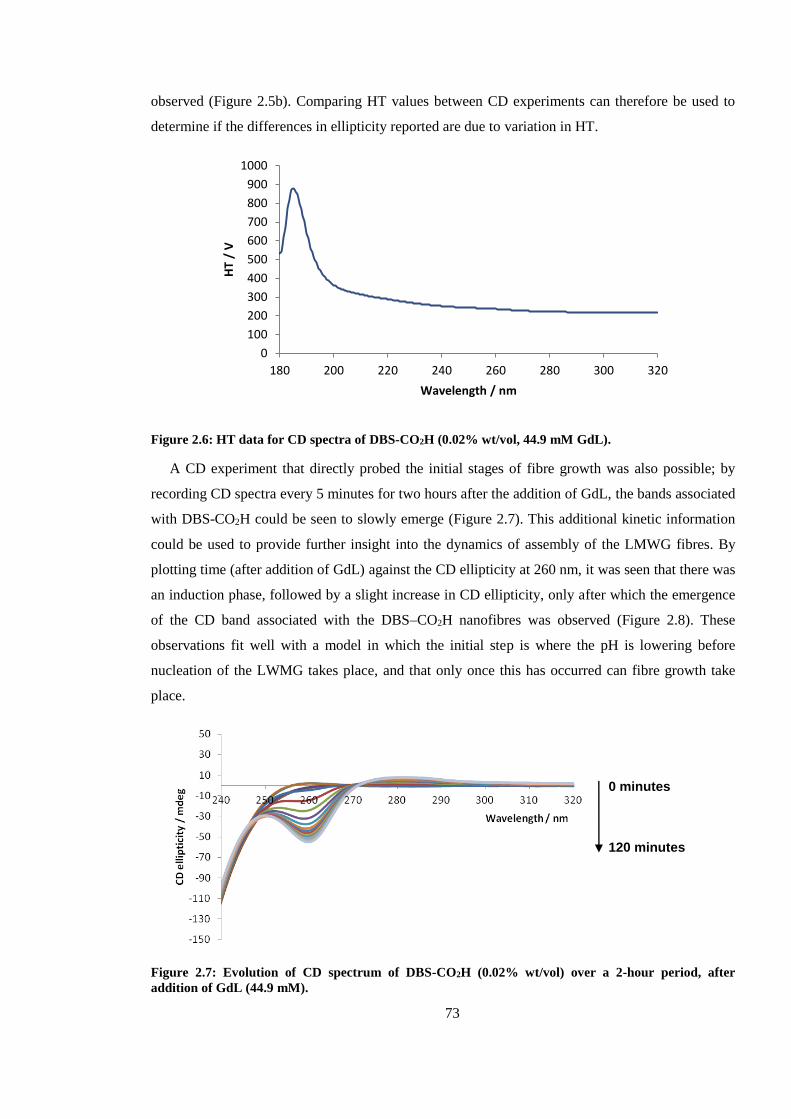
73
observed (Figure 2.5b). Comparing HT values between CD experiments can therefore be used to
determine if the differences in ellipticity reported are due to variation in HT.
Figure 2.6: HT data for CD spectra of DBS-CO2H (0.02% wt/vol, 44.9 mM GdL).
A CD experiment that directly probed the initial stages of fibre growth was also possible; by
recording CD spectra every 5 minutes for two hours after the addition of GdL, the bands associated
with DBS-CO2H could be seen to slowly emerge (Figure 2.7). This additional kinetic information
could be used to provide further insight into the dynamics of assembly of the LMWG fibres. By
plotting time (after addition of GdL) against the CD ellipticity at 260 nm, it was seen that there was
an induction phase, followed by a slight increase in CD ellipticity, only after which the emergence
of the CD band associated with the DBS–CO2H nanofibres was observed (Figure 2.8). These
observations fit well with a model in which the initial step is where the pH is lowering before
nucleation of the LWMG takes place, and that only once this has occurred can fibre growth take
place.
Figure 2.7: Evolution of CD spectrum of DBS-CO2H (0.02% wt/vol) over a 2-hour period, after
addition of GdL (44.9 mM).
0
100
200
300
400
500
600
700
800
900
1000
180 200 220 240 260 280 300 320
HT
/ V
Wavelength / nm
0 minutes
120 minutes
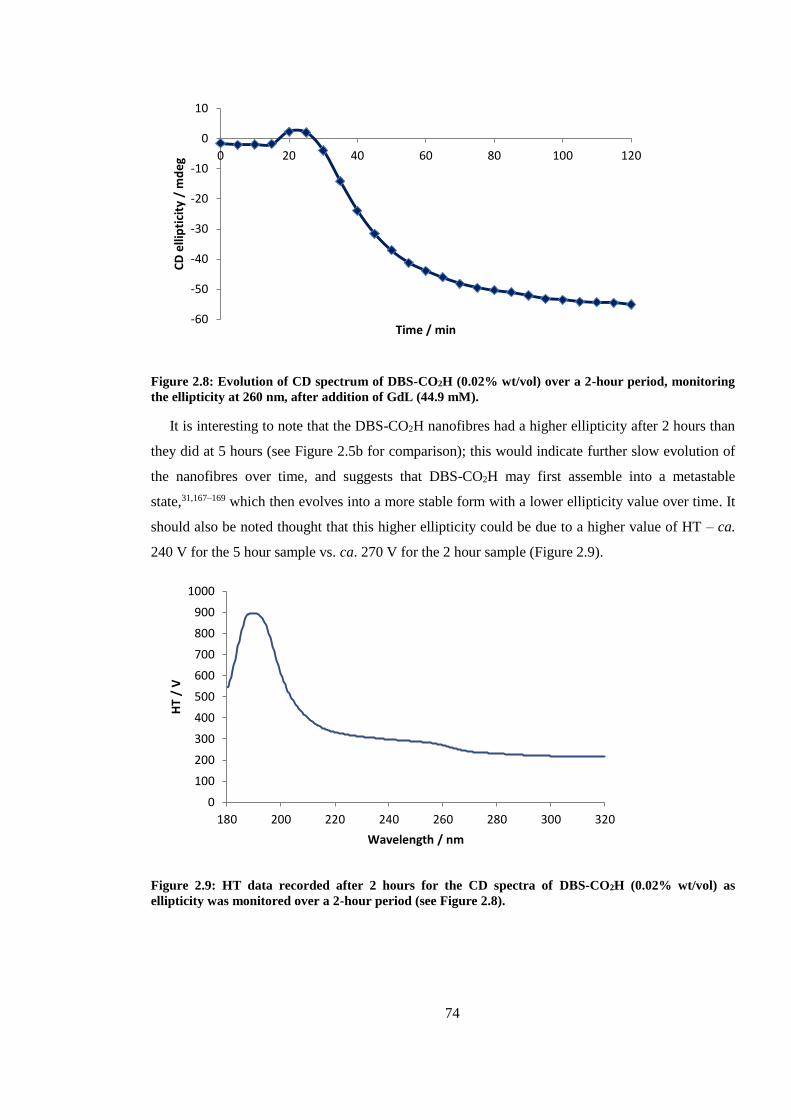
74
Figure 2.8: Evolution of CD spectrum of DBS-CO2H (0.02% wt/vol) over a 2-hour period, monitoring
the ellipticity at 260 nm, after addition of GdL (44.9 mM).
It is interesting to note that the DBS-CO2H nanofibres had a higher ellipticity after 2 hours than
they did at 5 hours (see Figure 2.5b for comparison); this would indicate further slow evolution of
the nanofibres over time, and suggests that DBS-CO2H may first assemble into a metastable
state,31,167–169 which then evolves into a more stable form with a lower ellipticity value over time. It
should also be noted thought that this higher ellipticity could be due to a higher value of HT – ca.
240 V for the 5 hour sample vs. ca. 270 V for the 2 hour sample (Figure 2.9).
Figure 2.9: HT data recorded after 2 hours for the CD spectra of DBS-CO2H (0.02% wt/vol) as
ellipticity was monitored over a 2-hour period (see Figure 2.8).
-60
-50
-40
-30
-20
-10
0
10
0 20 40 60 80 100 120
CD
elli
pti
city
/ m
de
g
Time / min
0
100
200
300
400
500
600
700
800
900
1000
180 200 220 240 260 280 300 320
HT
/ V
Wavelength / nm
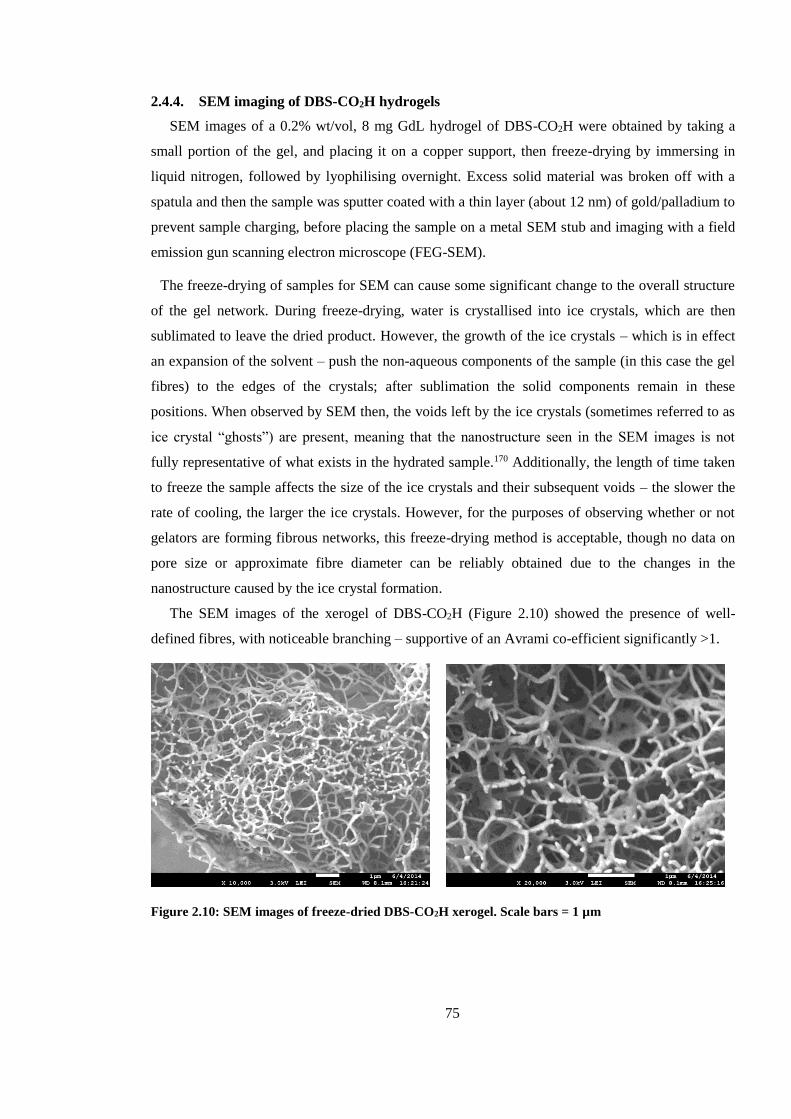
75
2.4.4. SEM imaging of DBS-CO2H hydrogels
SEM images of a 0.2% wt/vol, 8 mg GdL hydrogel of DBS-CO2H were obtained by taking a
small portion of the gel, and placing it on a copper support, then freeze-drying by immersing in
liquid nitrogen, followed by lyophilising overnight. Excess solid material was broken off with a
spatula and then the sample was sputter coated with a thin layer (about 12 nm) of gold/palladium to
prevent sample charging, before placing the sample on a metal SEM stub and imaging with a field
emission gun scanning electron microscope (FEG-SEM).
The freeze-drying of samples for SEM can cause some significant change to the overall structure
of the gel network. During freeze-drying, water is crystallised into ice crystals, which are then
sublimated to leave the dried product. However, the growth of the ice crystals – which is in effect
an expansion of the solvent – push the non-aqueous components of the sample (in this case the gel
fibres) to the edges of the crystals; after sublimation the solid components remain in these
positions. When observed by SEM then, the voids left by the ice crystals (sometimes referred to as
ice crystal “ghosts”) are present, meaning that the nanostructure seen in the SEM images is not
fully representative of what exists in the hydrated sample.170 Additionally, the length of time taken
to freeze the sample affects the size of the ice crystals and their subsequent voids – the slower the
rate of cooling, the larger the ice crystals. However, for the purposes of observing whether or not
gelators are forming fibrous networks, this freeze-drying method is acceptable, though no data on
pore size or approximate fibre diameter can be reliably obtained due to the changes in the
nanostructure caused by the ice crystal formation.
The SEM images of the xerogel of DBS-CO2H (Figure 2.10) showed the presence of well-
defined fibres, with noticeable branching – supportive of an Avrami co-efficient significantly >1.
Figure 2.10: SEM images of freeze-dried DBS-CO2H xerogel. Scale bars = 1 µm
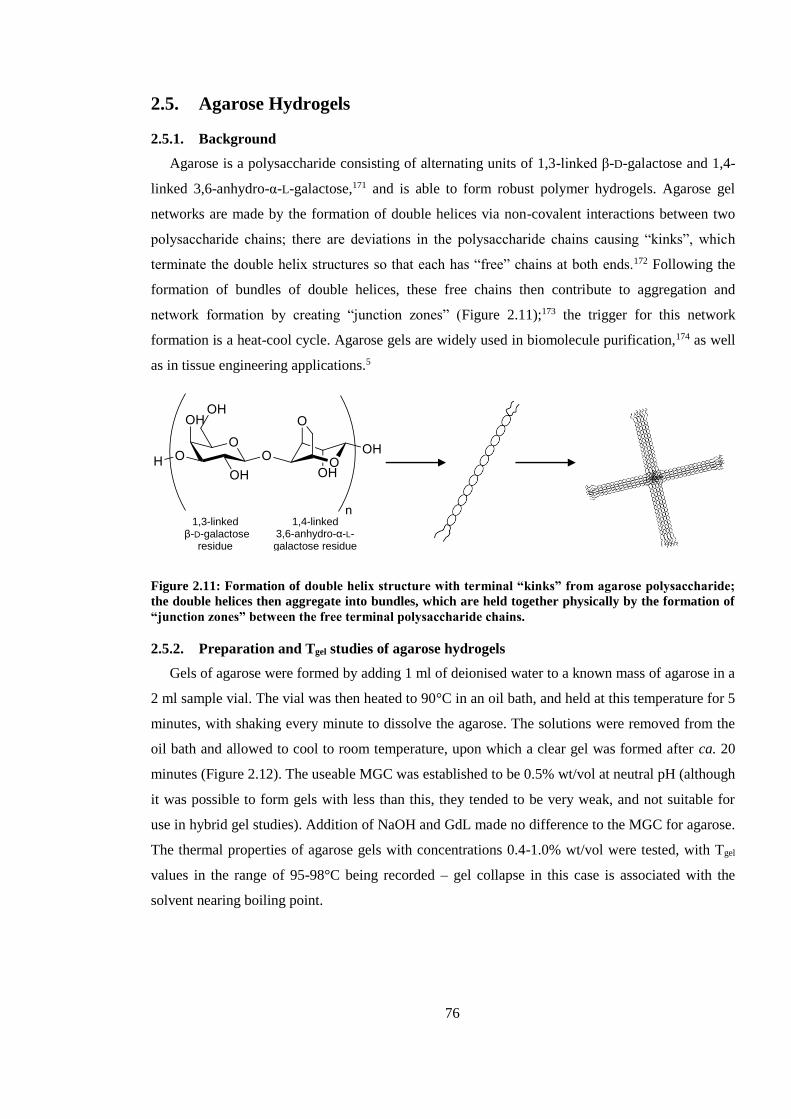
76
2.5. Agarose Hydrogels
2.5.1. Background
Agarose is a polysaccharide consisting of alternating units of 1,3-linked β-D-galactose and 1,4-
linked 3,6-anhydro-α-L-galactose,171 and is able to form robust polymer hydrogels. Agarose gel
networks are made by the formation of double helices via non-covalent interactions between two
polysaccharide chains; there are deviations in the polysaccharide chains causing “kinks”, which
terminate the double helix structures so that each has “free” chains at both ends.172 Following the
formation of bundles of double helices, these free chains then contribute to aggregation and
network formation by creating “junction zones” (Figure 2.11);173 the trigger for this network
formation is a heat-cool cycle. Agarose gels are widely used in biomolecule purification,174 as well
as in tissue engineering applications.5
Figure 2.11: Formation of double helix structure with terminal “kinks” from agarose polysaccharide;
the double helices then aggregate into bundles, which are held together physically by the formation of
“junction zones” between the free terminal polysaccharide chains.
2.5.2. Preparation and Tgel studies of agarose hydrogels
Gels of agarose were formed by adding 1 ml of deionised water to a known mass of agarose in a
2 ml sample vial. The vial was then heated to 90°C in an oil bath, and held at this temperature for 5
minutes, with shaking every minute to dissolve the agarose. The solutions were removed from the
oil bath and allowed to cool to room temperature, upon which a clear gel was formed after ca. 20
minutes (Figure 2.12). The useable MGC was established to be 0.5% wt/vol at neutral pH (although
it was possible to form gels with less than this, they tended to be very weak, and not suitable for
use in hybrid gel studies). Addition of NaOH and GdL made no difference to the MGC for agarose.
The thermal properties of agarose gels with concentrations 0.4-1.0% wt/vol were tested, with Tgel
values in the range of 95-98°C being recorded – gel collapse in this case is associated with the
solvent nearing boiling point.
1,3-linked β-D-galactose
residue
1,4-linked 3,6-anhydro-α-L-galactose residue
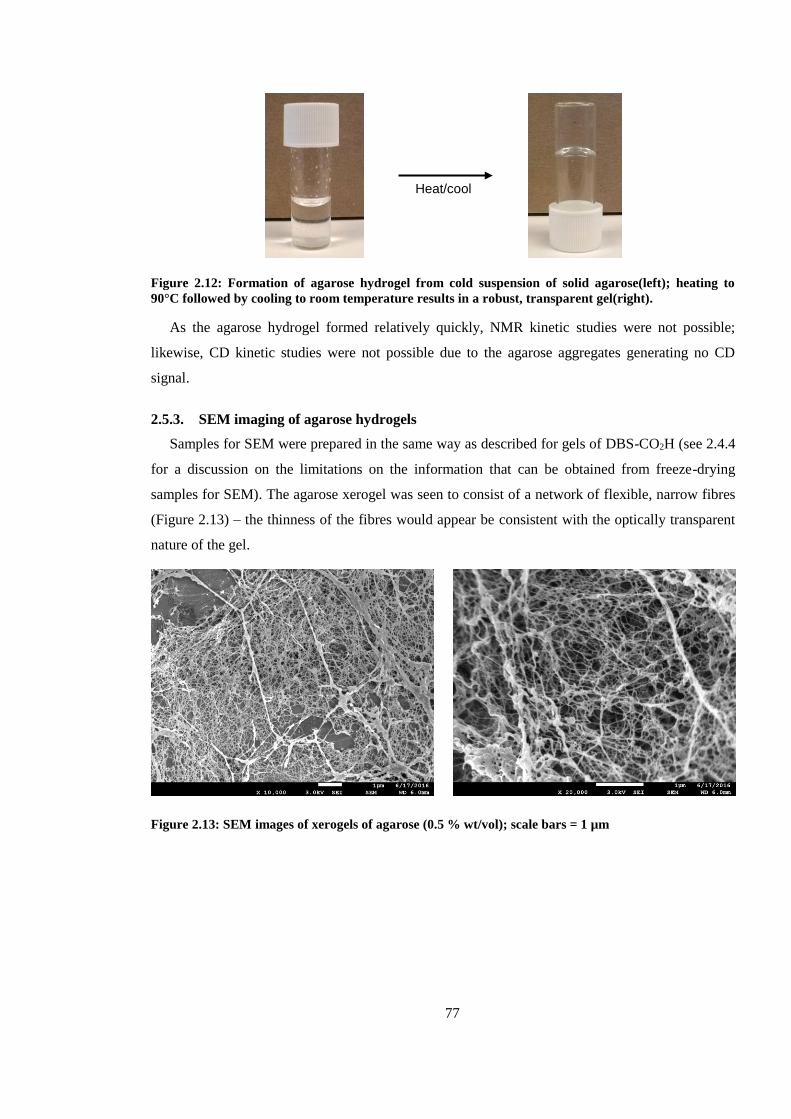
77
Figure 2.12: Formation of agarose hydrogel from cold suspension of solid agarose(left); heating to
90°C followed by cooling to room temperature results in a robust, transparent gel(right).
As the agarose hydrogel formed relatively quickly, NMR kinetic studies were not possible;
likewise, CD kinetic studies were not possible due to the agarose aggregates generating no CD
signal.
2.5.3. SEM imaging of agarose hydrogels
Samples for SEM were prepared in the same way as described for gels of DBS-CO2H (see 2.4.4
for a discussion on the limitations on the information that can be obtained from freeze-drying
samples for SEM). The agarose xerogel was seen to consist of a network of flexible, narrow fibres
(Figure 2.13) – the thinness of the fibres would appear be consistent with the optically transparent
nature of the gel.
Figure 2.13: SEM images of xerogels of agarose (0.5 % wt/vol); scale bars = 1 µm
Heat/cool
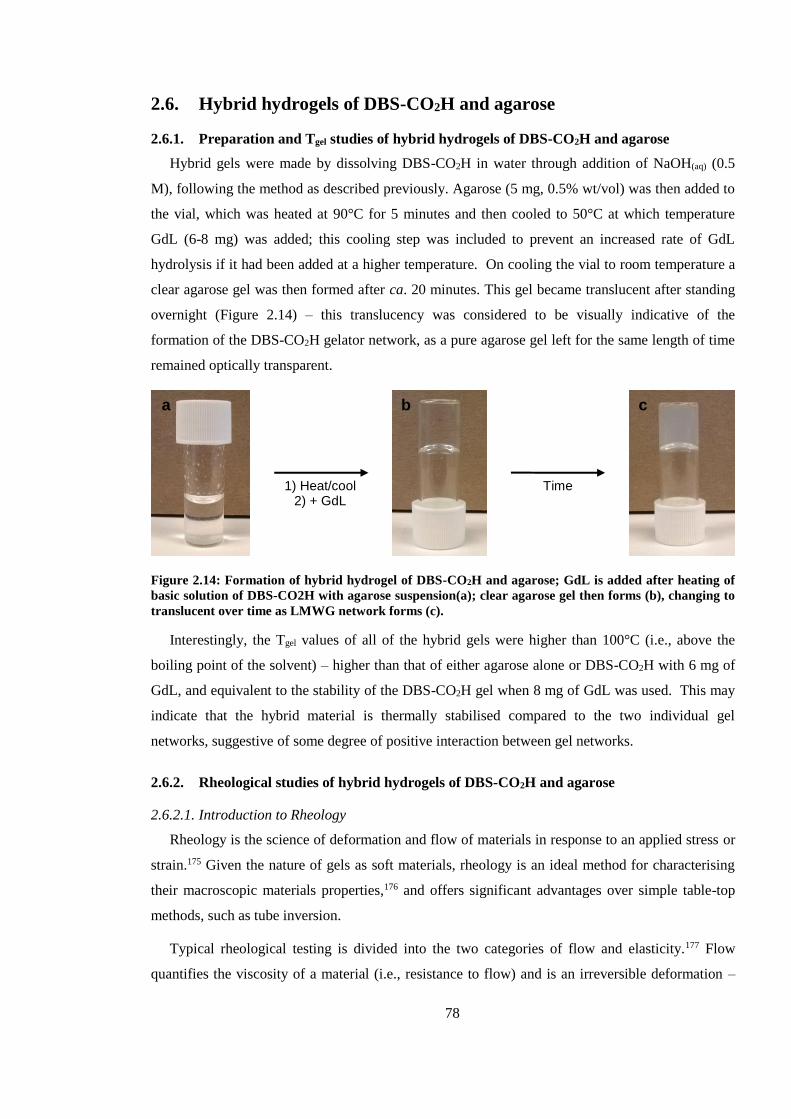
78
2.6. Hybrid hydrogels of DBS-CO2H and agarose
2.6.1. Preparation and Tgel studies of hybrid hydrogels of DBS-CO2H and agarose
Hybrid gels were made by dissolving DBS-CO2H in water through addition of NaOH(aq) (0.5
M), following the method as described previously. Agarose (5 mg, 0.5% wt/vol) was then added to
the vial, which was heated at 90°C for 5 minutes and then cooled to 50°C at which temperature
GdL (6-8 mg) was added; this cooling step was included to prevent an increased rate of GdL
hydrolysis if it had been added at a higher temperature. On cooling the vial to room temperature a
clear agarose gel was then formed after ca. 20 minutes. This gel became translucent after standing
overnight (Figure 2.14) – this translucency was considered to be visually indicative of the
formation of the DBS-CO2H gelator network, as a pure agarose gel left for the same length of time
remained optically transparent.
Figure 2.14: Formation of hybrid hydrogel of DBS-CO2H and agarose; GdL is added after heating of
basic solution of DBS-CO2H with agarose suspension(a); clear agarose gel then forms (b), changing to
translucent over time as LMWG network forms (c).
Interestingly, the Tgel values of all of the hybrid gels were higher than 100°C (i.e., above the
boiling point of the solvent) – higher than that of either agarose alone or DBS-CO2H with 6 mg of
GdL, and equivalent to the stability of the DBS-CO2H gel when 8 mg of GdL was used. This may
indicate that the hybrid material is thermally stabilised compared to the two individual gel
networks, suggestive of some degree of positive interaction between gel networks.
2.6.2. Rheological studies of hybrid hydrogels of DBS-CO2H and agarose
2.6.2.1. Introduction to Rheology
Rheology is the science of deformation and flow of materials in response to an applied stress or
strain.175 Given the nature of gels as soft materials, rheology is an ideal method for characterising
their macroscopic materials properties,176 and offers significant advantages over simple table-top
methods, such as tube inversion.
Typical rheological testing is divided into the two categories of flow and elasticity.177 Flow
quantifies the viscosity of a material (i.e., resistance to flow) and is an irreversible deformation –
1) Heat/cool 2) + GdL
Time
a b c
79
the material will not return to its prior form once the applied stress/strain is removed. Elasticity
quantifies how a material recovers after stress/strain is applied – it is a reversible deformation.
Materials that exhibit both flow and elastic properties (such as gels) are termed viscoelastic. Whilst
in an ordered solid, the elasticity is brought about by bond stretching along crystallographic planes,
in the case of viscoelastic materials, the elastic component is a result of diffusion of the molecules
within the amorphous material.178
The rheological properties of a material are usually measured by sandwiching the material
between two parallel surfaces (geometries)155 – typically a two-plate or a cone-and-plate setup,
depending on the nature of the testing. The material is sheared between the two surfaces, and by
using variable parameters such as strain or frequency, materials properties can be determined.
For viscoelastic materials such as gels, a back and forth oscillatory stress/strain is applied.155 In
a purely elastic material, this sinusoidal stress/strain would produce a strain/stress exactly in phase
with it – there is no lag between the applied and measured signals, and the material is said to have a
phase angle (δ) of 0°. For a purely viscous material, the stress/strain would produce a strain/stress a
quarter of a cycle out of phase with it – so the phase angle would be 90°. For viscoelastic materials,
the phase angle is somewhere between 0° and 90°. From the input stress/strain and the measured
strain/stress, a complex modulus, G*, can be derived.
This complex modulus can then be broken down into its elastic and viscous components, known
as the storage modulus, G’, and the loss modulus, G’’, respectively, such that:
G* = G’ + iG’’ (Eq. 4)
These moduli are related to the amplitudes of stress (σ0) and strain (ε0), as well as the phase
angle, δ, and are obtained from Eq. 5 and 6:
G’ = G*cosδ (Eq. 5)
G’’ = G*sinδ (Eq. 6)
The ratio of G’ to G’’ is the ratio of stored energy to lost energy; for a gel, G’ > G’’, meaning
more energy is stored than lost. At the point when G’ = G’’, the gel loses its viscoelastic properties
and is converted into a sol.
For gels, a variety of properties can be tested through the measurement of G’ and G’’. However,
optimisation of the experimental parameters and sample preparation are key.155 Useful
measurements can only be made within the linear viscoelastic region (LVR), where both moduli
remain independent of the frequency of oscillation and the applied stress/strain; therefore the LVR
is often determined first.
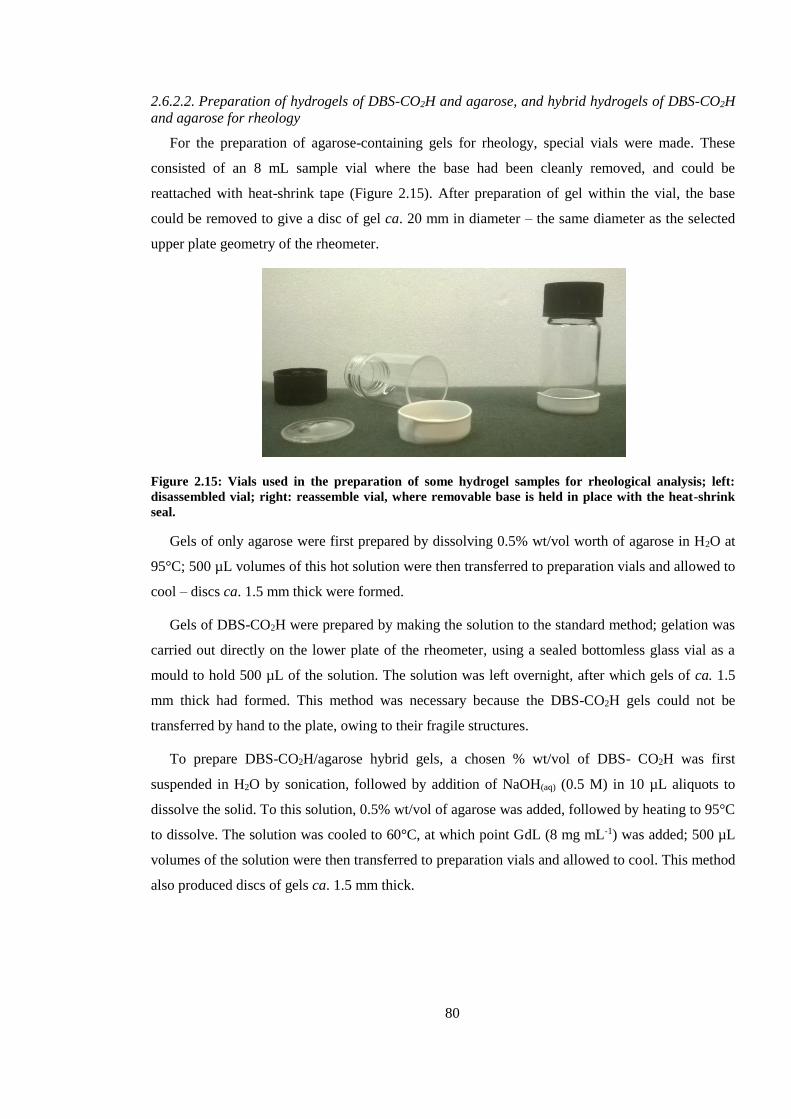
80
2.6.2.2. Preparation of hydrogels of DBS-CO2H and agarose, and hybrid hydrogels of DBS-CO2H
and agarose for rheology
For the preparation of agarose-containing gels for rheology, special vials were made. These
consisted of an 8 mL sample vial where the base had been cleanly removed, and could be
reattached with heat-shrink tape (Figure 2.15). After preparation of gel within the vial, the base
could be removed to give a disc of gel ca. 20 mm in diameter – the same diameter as the selected
upper plate geometry of the rheometer.
Figure 2.15: Vials used in the preparation of some hydrogel samples for rheological analysis; left:
disassembled vial; right: reassemble vial, where removable base is held in place with the heat-shrink
seal.
Gels of only agarose were first prepared by dissolving 0.5% wt/vol worth of agarose in H2O at
95°C; 500 µL volumes of this hot solution were then transferred to preparation vials and allowed to
cool – discs ca. 1.5 mm thick were formed.
Gels of DBS-CO2H were prepared by making the solution to the standard method; gelation was
carried out directly on the lower plate of the rheometer, using a sealed bottomless glass vial as a
mould to hold 500 µL of the solution. The solution was left overnight, after which gels of ca. 1.5
mm thick had formed. This method was necessary because the DBS-CO2H gels could not be
transferred by hand to the plate, owing to their fragile structures.
To prepare DBS-CO2H/agarose hybrid gels, a chosen % wt/vol of DBS- CO2H was first
suspended in H2O by sonication, followed by addition of NaOH(aq) (0.5 M) in 10 µL aliquots to
dissolve the solid. To this solution, 0.5% wt/vol of agarose was added, followed by heating to 95°C
to dissolve. The solution was cooled to 60°C, at which point GdL (8 mg mL-1) was added; 500 µL
volumes of the solution were then transferred to preparation vials and allowed to cool. This method
also produced discs of gels ca. 1.5 mm thick.
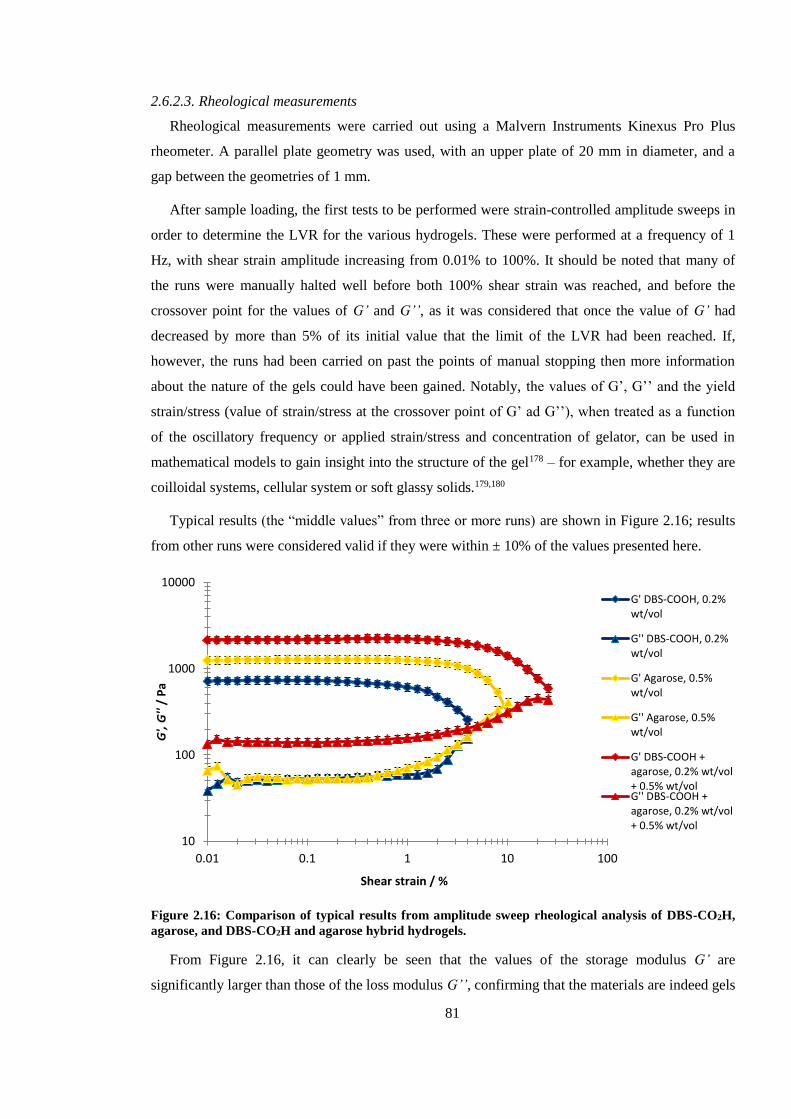
81
2.6.2.3. Rheological measurements
Rheological measurements were carried out using a Malvern Instruments Kinexus Pro Plus
rheometer. A parallel plate geometry was used, with an upper plate of 20 mm in diameter, and a
gap between the geometries of 1 mm.
After sample loading, the first tests to be performed were strain-controlled amplitude sweeps in
order to determine the LVR for the various hydrogels. These were performed at a frequency of 1
Hz, with shear strain amplitude increasing from 0.01% to 100%. It should be noted that many of
the runs were manually halted well before both 100% shear strain was reached, and before the
crossover point for the values of G’ and G’’, as it was considered that once the value of G’ had
decreased by more than 5% of its initial value that the limit of the LVR had been reached. If,
however, the runs had been carried on past the points of manual stopping then more information
about the nature of the gels could have been gained. Notably, the values of G’, G’’ and the yield
strain/stress (value of strain/stress at the crossover point of G’ ad G’’), when treated as a function
of the oscillatory frequency or applied strain/stress and concentration of gelator, can be used in
mathematical models to gain insight into the structure of the gel178 – for example, whether they are
coilloidal systems, cellular system or soft glassy solids.179,180
Typical results (the “middle values” from three or more runs) are shown in Figure 2.16; results
from other runs were considered valid if they were within ± 10% of the values presented here.
Figure 2.16: Comparison of typical results from amplitude sweep rheological analysis of DBS-CO2H,
agarose, and DBS-CO2H and agarose hybrid hydrogels.
From Figure 2.16, it can clearly be seen that the values of the storage modulus G’ are
significantly larger than those of the loss modulus G’’, confirming that the materials are indeed gels
10
100
1000
10000
0.01 0.1 1 10 100
G',
G''
/ P
a
Shear strain / %
G' DBS-COOH, 0.2%wt/vol
G'' DBS-COOH, 0.2%wt/vol
G' Agarose, 0.5%wt/vol
G'' Agarose, 0.5%wt/vol
G' DBS-COOH +agarose, 0.2% wt/vol+ 0.5% wt/volG'' DBS-COOH +agarose, 0.2% wt/vol+ 0.5% wt/vol
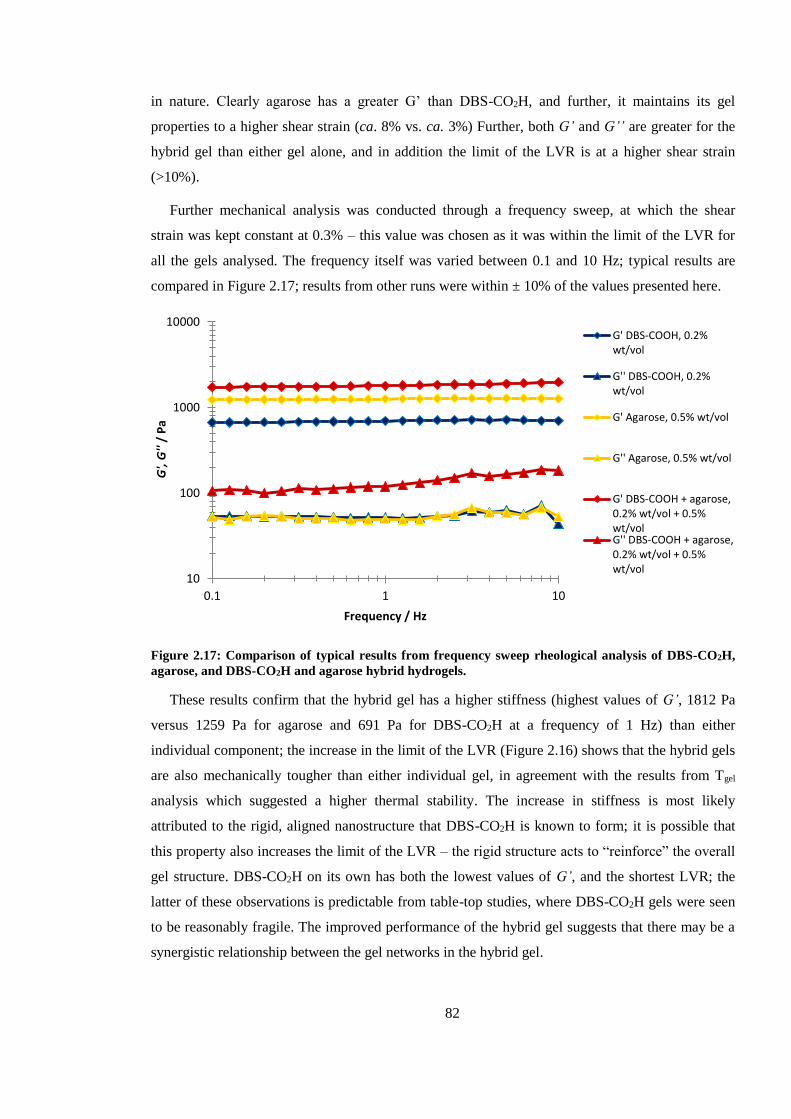
82
in nature. Clearly agarose has a greater G’ than DBS-CO2H, and further, it maintains its gel
properties to a higher shear strain (ca. 8% vs. ca. 3%) Further, both G’ and G’’ are greater for the
hybrid gel than either gel alone, and in addition the limit of the LVR is at a higher shear strain
(>10%).
Further mechanical analysis was conducted through a frequency sweep, at which the shear
strain was kept constant at 0.3% – this value was chosen as it was within the limit of the LVR for
all the gels analysed. The frequency itself was varied between 0.1 and 10 Hz; typical results are
compared in Figure 2.17; results from other runs were within ± 10% of the values presented here.
Figure 2.17: Comparison of typical results from frequency sweep rheological analysis of DBS-CO2H,
agarose, and DBS-CO2H and agarose hybrid hydrogels.
These results confirm that the hybrid gel has a higher stiffness (highest values of G’, 1812 Pa
versus 1259 Pa for agarose and 691 Pa for DBS-CO2H at a frequency of 1 Hz) than either
individual component; the increase in the limit of the LVR (Figure 2.16) shows that the hybrid gels
are also mechanically tougher than either individual gel, in agreement with the results from Tgel
analysis which suggested a higher thermal stability. The increase in stiffness is most likely
attributed to the rigid, aligned nanostructure that DBS-CO2H is known to form; it is possible that
this property also increases the limit of the LVR – the rigid structure acts to “reinforce” the overall
gel structure. DBS-CO2H on its own has both the lowest values of G’, and the shortest LVR; the
latter of these observations is predictable from table-top studies, where DBS-CO2H gels were seen
to be reasonably fragile. The improved performance of the hybrid gel suggests that there may be a
synergistic relationship between the gel networks in the hybrid gel.
10
100
1000
10000
0.1 1 10
G',
G''
/ P
a
Frequency / Hz
G' DBS-COOH, 0.2%wt/vol
G'' DBS-COOH, 0.2%wt/vol
G' Agarose, 0.5% wt/vol
G'' Agarose, 0.5% wt/vol
G' DBS-COOH + agarose,0.2% wt/vol + 0.5%wt/volG'' DBS-COOH + agarose,0.2% wt/vol + 0.5%wt/vol
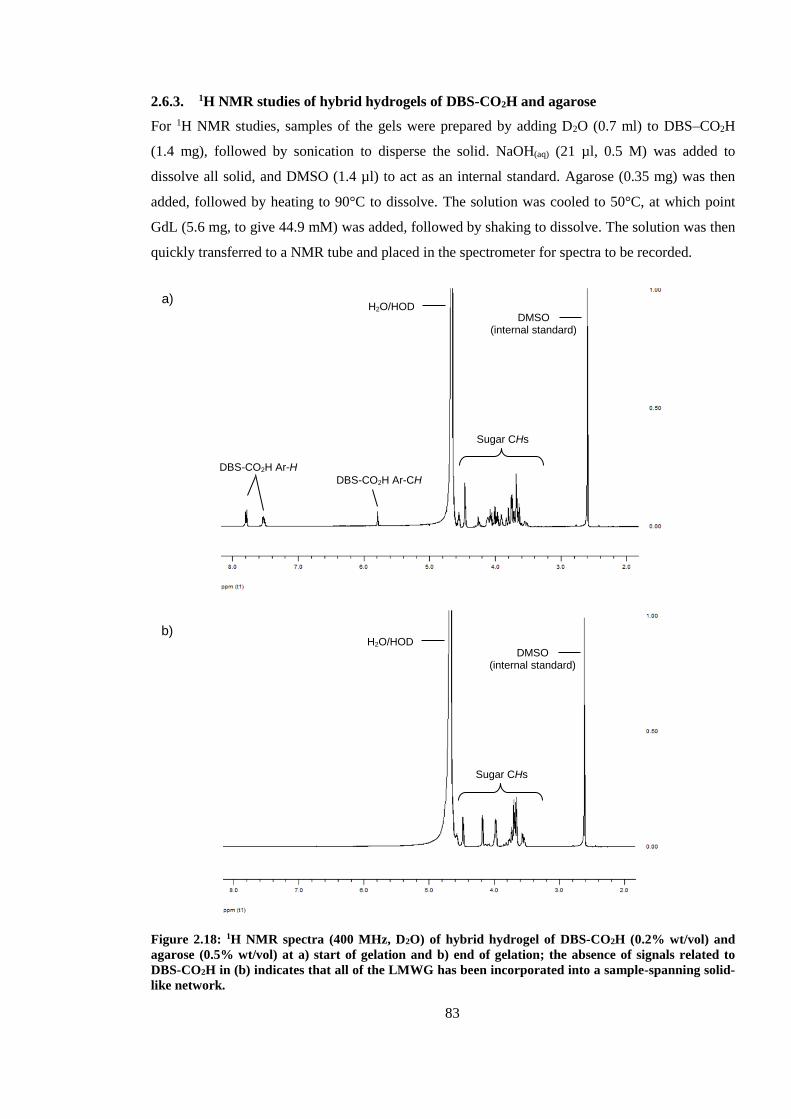
83
2.6.3. 1H NMR studies of hybrid hydrogels of DBS-CO2H and agarose
For 1H NMR studies, samples of the gels were prepared by adding D2O (0.7 ml) to DBS–CO2H
(1.4 mg), followed by sonication to disperse the solid. NaOH(aq) (21 µl, 0.5 M) was added to
dissolve all solid, and DMSO (1.4 µl) to act as an internal standard. Agarose (0.35 mg) was then
added, followed by heating to 90°C to dissolve. The solution was cooled to 50°C, at which point
GdL (5.6 mg, to give 44.9 mM) was added, followed by shaking to dissolve. The solution was then
quickly transferred to a NMR tube and placed in the spectrometer for spectra to be recorded.
Figure 2.18: 1H NMR spectra (400 MHz, D2O) of hybrid hydrogel of DBS-CO2H (0.2% wt/vol) and
agarose (0.5% wt/vol) at a) start of gelation and b) end of gelation; the absence of signals related to
DBS-CO2H in (b) indicates that all of the LMWG has been incorporated into a sample-spanning solid-
like network.
b) H2O/HOD
DMSO (internal standard)
Sugar CHs
(from DBS-CO2H and GdL)
a)
DBS-CO2H Ar-CH
H2O/HOD DMSO
(internal standard)
Sugar CHs
(from DBS-CO2H and GdL) DBS-CO2H Ar-H
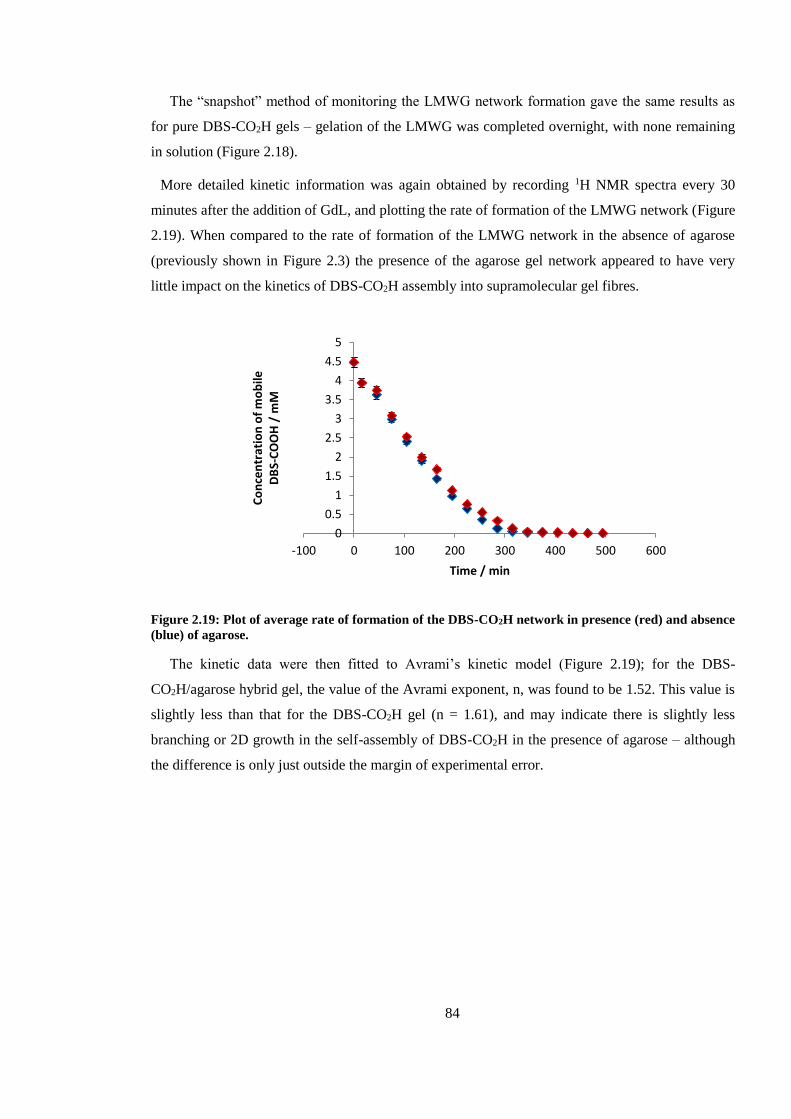
84
The “snapshot” method of monitoring the LMWG network formation gave the same results as
for pure DBS-CO2H gels – gelation of the LMWG was completed overnight, with none remaining
in solution (Figure 2.18).
More detailed kinetic information was again obtained by recording 1H NMR spectra every 30
minutes after the addition of GdL, and plotting the rate of formation of the LMWG network (Figure
2.19). When compared to the rate of formation of the LMWG network in the absence of agarose
(previously shown in Figure 2.3) the presence of the agarose gel network appeared to have very
little impact on the kinetics of DBS-CO2H assembly into supramolecular gel fibres.
Figure 2.19: Plot of average rate of formation of the DBS-CO2H network in presence (red) and absence
(blue) of agarose.
The kinetic data were then fitted to Avrami’s kinetic model (Figure 2.19); for the DBS-
CO2H/agarose hybrid gel, the value of the Avrami exponent, n, was found to be 1.52. This value is
slightly less than that for the DBS-CO2H gel (n = 1.61), and may indicate there is slightly less
branching or 2D growth in the self-assembly of DBS-CO2H in the presence of agarose – although
the difference is only just outside the margin of experimental error.
0
0.5
1
1.5
2
2.5
3
3.5
4
4.5
5
-100 0 100 200 300 400 500 600
Co
nce
ntr
atio
n o
f m
ob
ile
DB
S-C
OO
H /
mM
Time / min
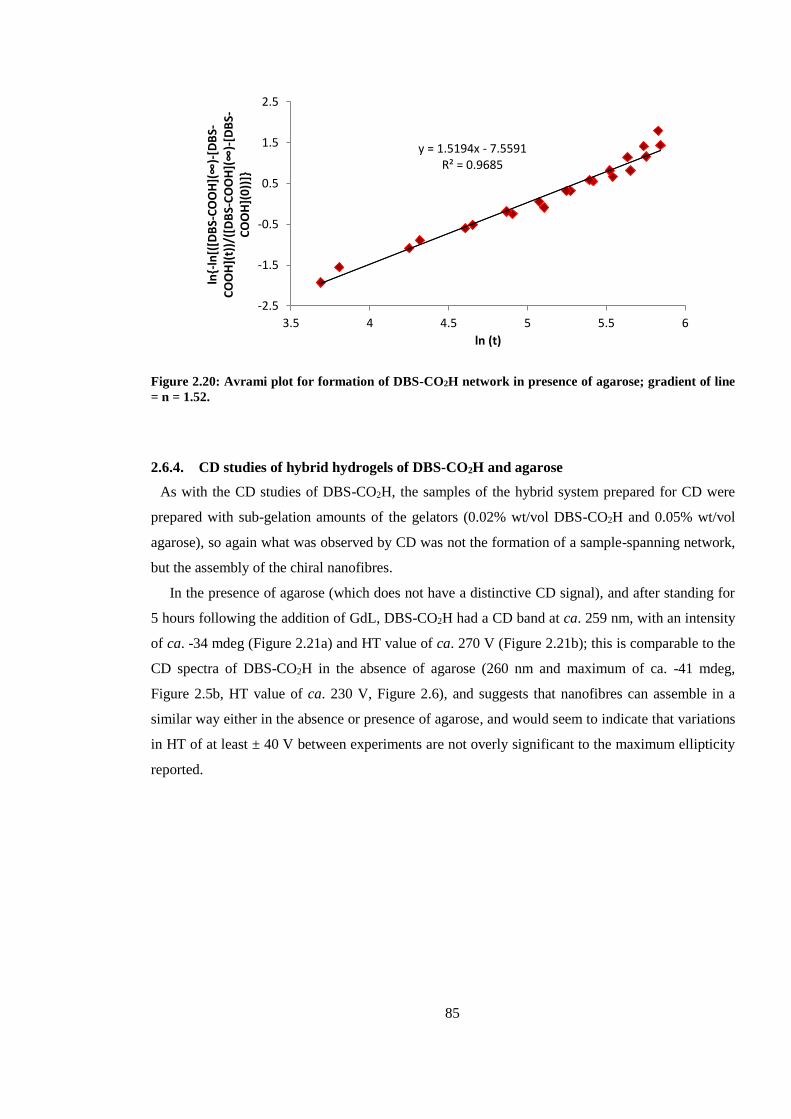
85
Figure 2.20: Avrami plot for formation of DBS-CO2H network in presence of agarose; gradient of line
= n = 1.52.
2.6.4. CD studies of hybrid hydrogels of DBS-CO2H and agarose
As with the CD studies of DBS-CO2H, the samples of the hybrid system prepared for CD were
prepared with sub-gelation amounts of the gelators (0.02% wt/vol DBS-CO2H and 0.05% wt/vol
agarose), so again what was observed by CD was not the formation of a sample-spanning network,
but the assembly of the chiral nanofibres.
In the presence of agarose (which does not have a distinctive CD signal), and after standing for
5 hours following the addition of GdL, DBS-CO2H had a CD band at ca. 259 nm, with an intensity
of ca. -34 mdeg (Figure 2.21a) and HT value of ca. 270 V (Figure 2.21b); this is comparable to the
CD spectra of DBS-CO2H in the absence of agarose (260 nm and maximum of ca. -41 mdeg,
Figure 2.5b, HT value of ca. 230 V, Figure 2.6), and suggests that nanofibres can assemble in a
similar way either in the absence or presence of agarose, and would seem to indicate that variations
in HT of at least ± 40 V between experiments are not overly significant to the maximum ellipticity
reported.
y = 1.5194x - 7.5591R² = 0.9685
-2.5
-1.5
-0.5
0.5
1.5
2.5
3.5 4 4.5 5 5.5 6
ln{-
ln[(
[DB
S-COOH](∞)-
[DB
S-C
OO
H](
t))/
([D
BS-COOH](∞)-
[DB
S-C
OO
H](
0))
]}
ln (t)
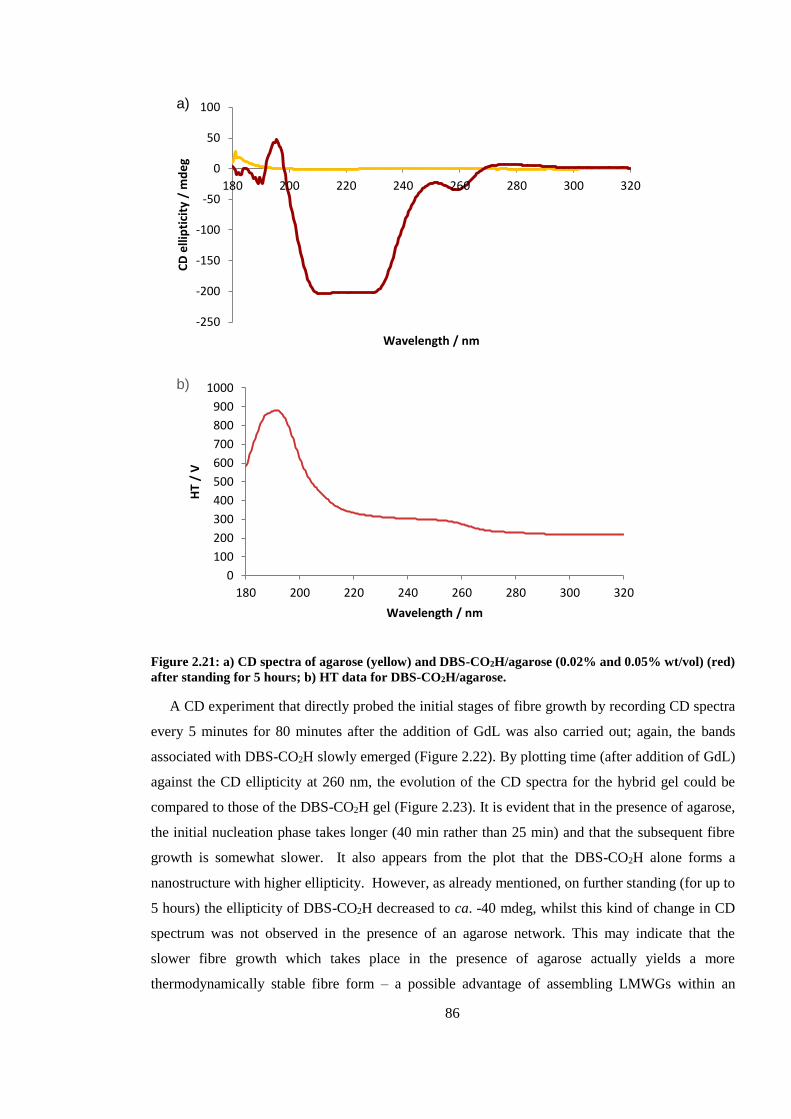
86
Figure 2.21: a) CD spectra of agarose (yellow) and DBS-CO2H/agarose (0.02% and 0.05% wt/vol) (red)
after standing for 5 hours; b) HT data for DBS-CO2H/agarose.
A CD experiment that directly probed the initial stages of fibre growth by recording CD spectra
every 5 minutes for 80 minutes after the addition of GdL was also carried out; again, the bands
associated with DBS-CO2H slowly emerged (Figure 2.22). By plotting time (after addition of GdL)
against the CD ellipticity at 260 nm, the evolution of the CD spectra for the hybrid gel could be
compared to those of the DBS-CO2H gel (Figure 2.23). It is evident that in the presence of agarose,
the initial nucleation phase takes longer (40 min rather than 25 min) and that the subsequent fibre
growth is somewhat slower. It also appears from the plot that the DBS-CO2H alone forms a
nanostructure with higher ellipticity. However, as already mentioned, on further standing (for up to
5 hours) the ellipticity of DBS-CO2H decreased to ca. -40 mdeg, whilst this kind of change in CD
spectrum was not observed in the presence of an agarose network. This may indicate that the
slower fibre growth which takes place in the presence of agarose actually yields a more
thermodynamically stable fibre form – a possible advantage of assembling LMWGs within an
-250
-200
-150
-100
-50
0
50
100
180 200 220 240 260 280 300 320C
D e
llip
tici
ty /
md
eg
Wavelength / nm
a)
0
100
200
300
400
500
600
700
800
900
1000
180 200 220 240 260 280 300 320
HT
/ V
Wavelength / nm
b)
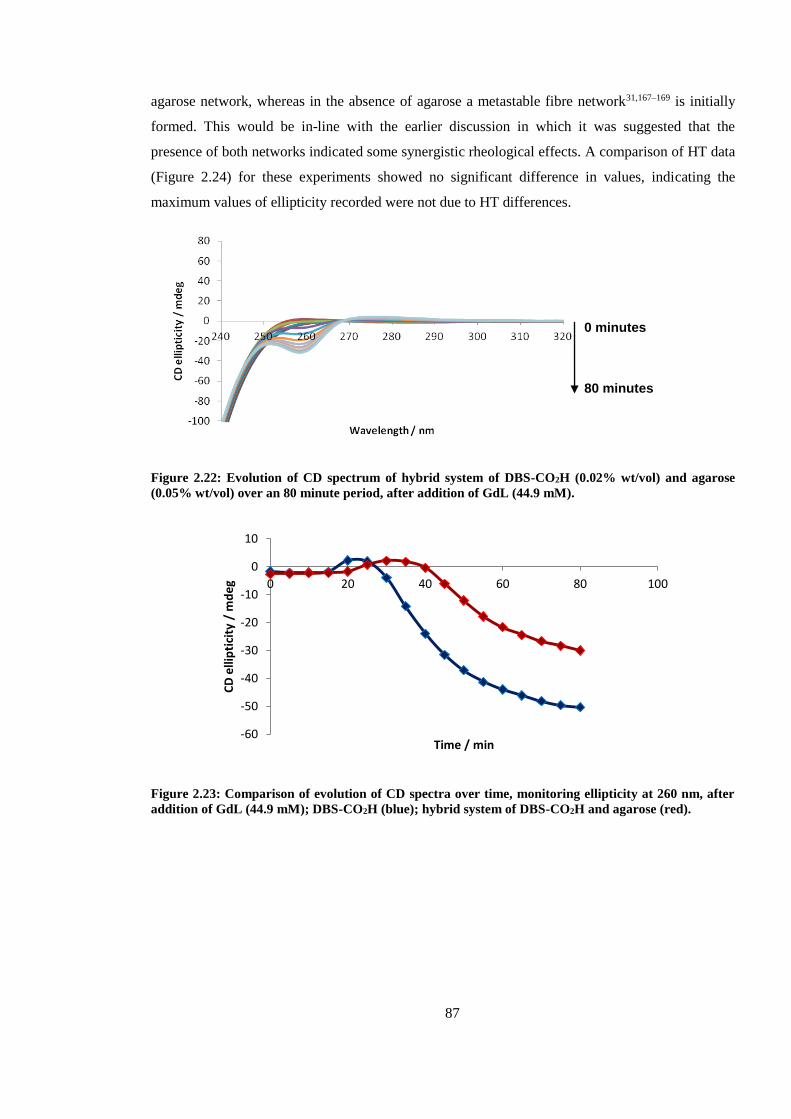
87
agarose network, whereas in the absence of agarose a metastable fibre network31,167–169 is initially
formed. This would be in-line with the earlier discussion in which it was suggested that the
presence of both networks indicated some synergistic rheological effects. A comparison of HT data
(Figure 2.24) for these experiments showed no significant difference in values, indicating the
maximum values of ellipticity recorded were not due to HT differences.
Figure 2.22: Evolution of CD spectrum of hybrid system of DBS-CO2H (0.02% wt/vol) and agarose
(0.05% wt/vol) over an 80 minute period, after addition of GdL (44.9 mM).
Figure 2.23: Comparison of evolution of CD spectra over time, monitoring ellipticity at 260 nm, after
addition of GdL (44.9 mM); DBS-CO2H (blue); hybrid system of DBS-CO2H and agarose (red).
-60
-50
-40
-30
-20
-10
0
10
0 20 40 60 80 100
CD
elli
pti
city
/ m
de
g
Time / min
0 minutes
80 minutes
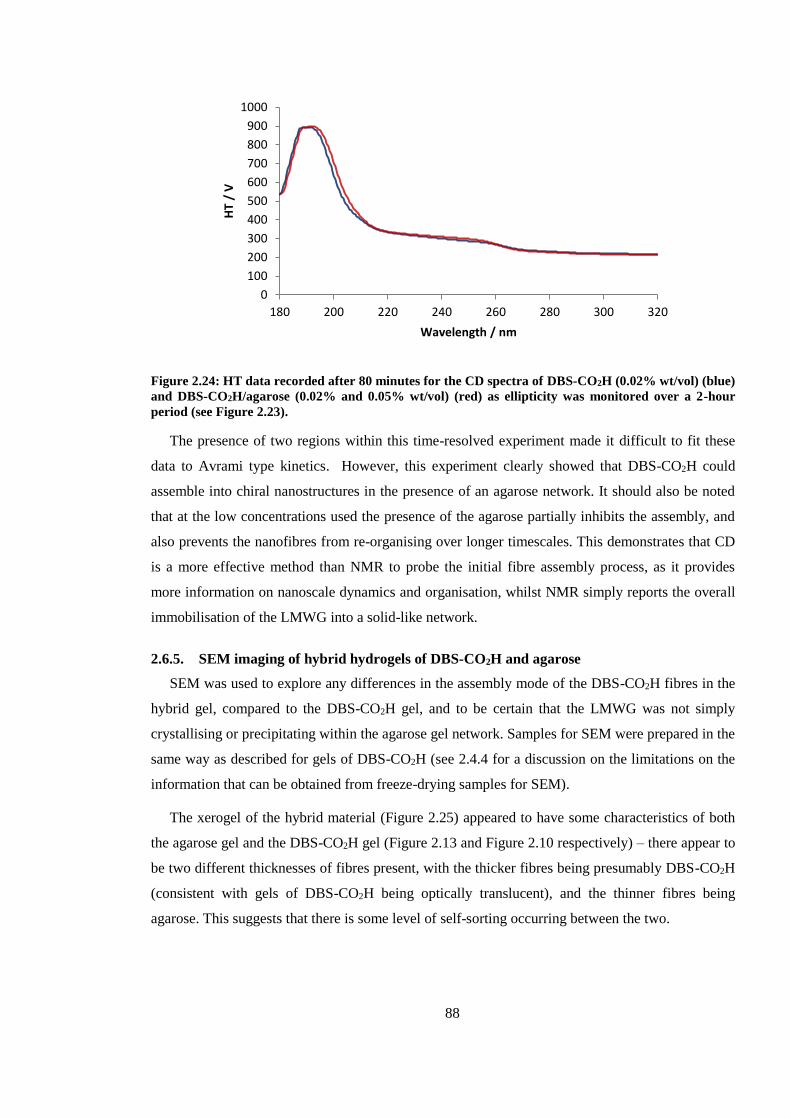
88
Figure 2.24: HT data recorded after 80 minutes for the CD spectra of DBS-CO2H (0.02% wt/vol) (blue)
and DBS-CO2H/agarose (0.02% and 0.05% wt/vol) (red) as ellipticity was monitored over a 2-hour
period (see Figure 2.23).
The presence of two regions within this time-resolved experiment made it difficult to fit these
data to Avrami type kinetics. However, this experiment clearly showed that DBS-CO2H could
assemble into chiral nanostructures in the presence of an agarose network. It should also be noted
that at the low concentrations used the presence of the agarose partially inhibits the assembly, and
also prevents the nanofibres from re-organising over longer timescales. This demonstrates that CD
is a more effective method than NMR to probe the initial fibre assembly process, as it provides
more information on nanoscale dynamics and organisation, whilst NMR simply reports the overall
immobilisation of the LMWG into a solid-like network.
2.6.5. SEM imaging of hybrid hydrogels of DBS-CO2H and agarose
SEM was used to explore any differences in the assembly mode of the DBS-CO2H fibres in the
hybrid gel, compared to the DBS-CO2H gel, and to be certain that the LMWG was not simply
crystallising or precipitating within the agarose gel network. Samples for SEM were prepared in the
same way as described for gels of DBS-CO2H (see 2.4.4 for a discussion on the limitations on the
information that can be obtained from freeze-drying samples for SEM).
The xerogel of the hybrid material (Figure 2.25) appeared to have some characteristics of both
the agarose gel and the DBS-CO2H gel (Figure 2.13 and Figure 2.10 respectively) – there appear to
be two different thicknesses of fibres present, with the thicker fibres being presumably DBS-CO2H
(consistent with gels of DBS-CO2H being optically translucent), and the thinner fibres being
agarose. This suggests that there is some level of self-sorting occurring between the two.
0
100
200
300
400
500
600
700
800
900
1000
180 200 220 240 260 280 300 320
HT
/ V
Wavelength / nm
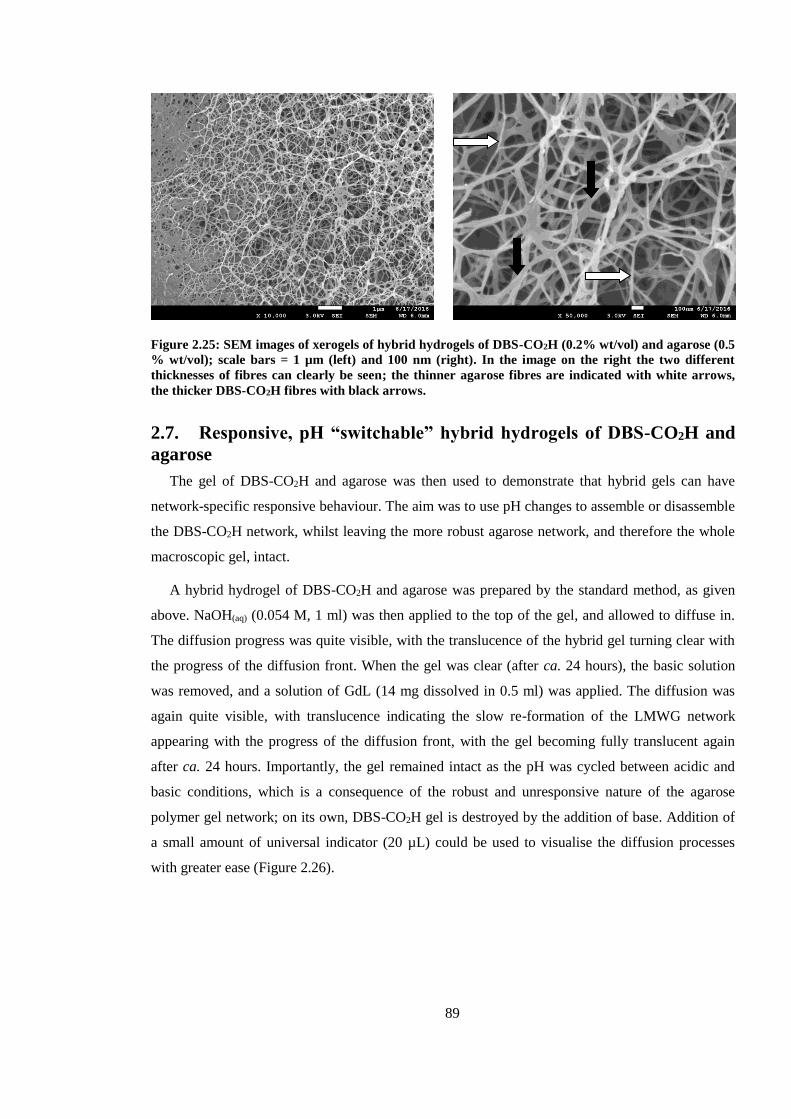
89
Figure 2.25: SEM images of xerogels of hybrid hydrogels of DBS-CO2H (0.2% wt/vol) and agarose (0.5
% wt/vol); scale bars = 1 µm (left) and 100 nm (right). In the image on the right the two different
thicknesses of fibres can clearly be seen; the thinner agarose fibres are indicated with white arrows,
the thicker DBS-CO2H fibres with black arrows.
2.7. Responsive, pH “switchable” hybrid hydrogels of DBS-CO2H and
agarose
The gel of DBS-CO2H and agarose was then used to demonstrate that hybrid gels can have
network-specific responsive behaviour. The aim was to use pH changes to assemble or disassemble
the DBS-CO2H network, whilst leaving the more robust agarose network, and therefore the whole
macroscopic gel, intact.
A hybrid hydrogel of DBS-CO2H and agarose was prepared by the standard method, as given
above. NaOH(aq) (0.054 M, 1 ml) was then applied to the top of the gel, and allowed to diffuse in.
The diffusion progress was quite visible, with the translucence of the hybrid gel turning clear with
the progress of the diffusion front. When the gel was clear (after ca. 24 hours), the basic solution
was removed, and a solution of GdL (14 mg dissolved in 0.5 ml) was applied. The diffusion was
again quite visible, with translucence indicating the slow re-formation of the LMWG network
appearing with the progress of the diffusion front, with the gel becoming fully translucent again
after ca. 24 hours. Importantly, the gel remained intact as the pH was cycled between acidic and
basic conditions, which is a consequence of the robust and unresponsive nature of the agarose
polymer gel network; on its own, DBS-CO2H gel is destroyed by the addition of base. Addition of
a small amount of universal indicator (20 µL) could be used to visualise the diffusion processes
with greater ease (Figure 2.26).
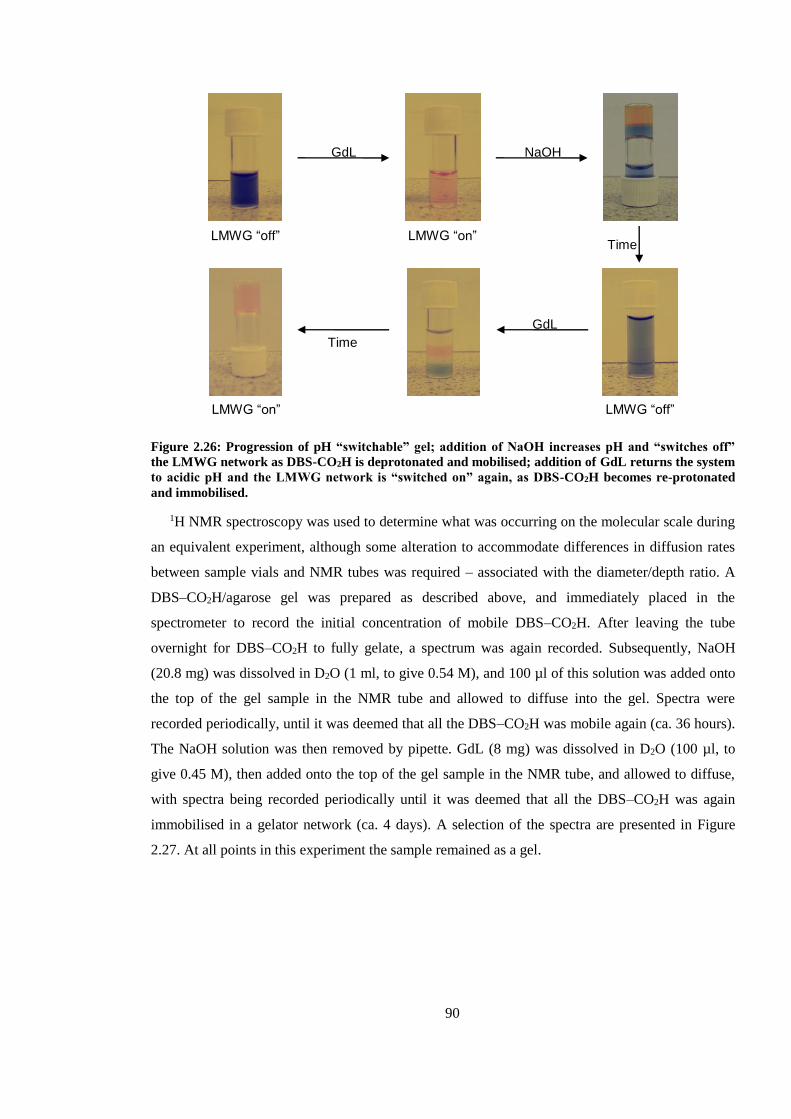
90
Figure 2.26: Progression of pH “switchable” gel; addition of NaOH increases pH and “switches off”
the LMWG network as DBS-CO2H is deprotonated and mobilised; addition of GdL returns the system
to acidic pH and the LMWG network is “switched on” again, as DBS-CO2H becomes re-protonated
and immobilised.
1H NMR spectroscopy was used to determine what was occurring on the molecular scale during
an equivalent experiment, although some alteration to accommodate differences in diffusion rates
between sample vials and NMR tubes was required – associated with the diameter/depth ratio. A
DBS–CO2H/agarose gel was prepared as described above, and immediately placed in the
spectrometer to record the initial concentration of mobile DBS–CO2H. After leaving the tube
overnight for DBS–CO2H to fully gelate, a spectrum was again recorded. Subsequently, NaOH
(20.8 mg) was dissolved in D2O (1 ml, to give 0.54 M), and 100 µl of this solution was added onto
the top of the gel sample in the NMR tube and allowed to diffuse into the gel. Spectra were
recorded periodically, until it was deemed that all the DBS–CO2H was mobile again (ca. 36 hours).
The NaOH solution was then removed by pipette. GdL (8 mg) was dissolved in D2O (100 µl, to
give 0.45 M), then added onto the top of the gel sample in the NMR tube, and allowed to diffuse,
with spectra being recorded periodically until it was deemed that all the DBS–CO2H was again
immobilised in a gelator network (ca. 4 days). A selection of the spectra are presented in Figure
2.27. At all points in this experiment the sample remained as a gel.
LMWG “off” LMWG “on”
LMWG “off” LMWG “on”
GdL
GdL
NaOH
Time
Time
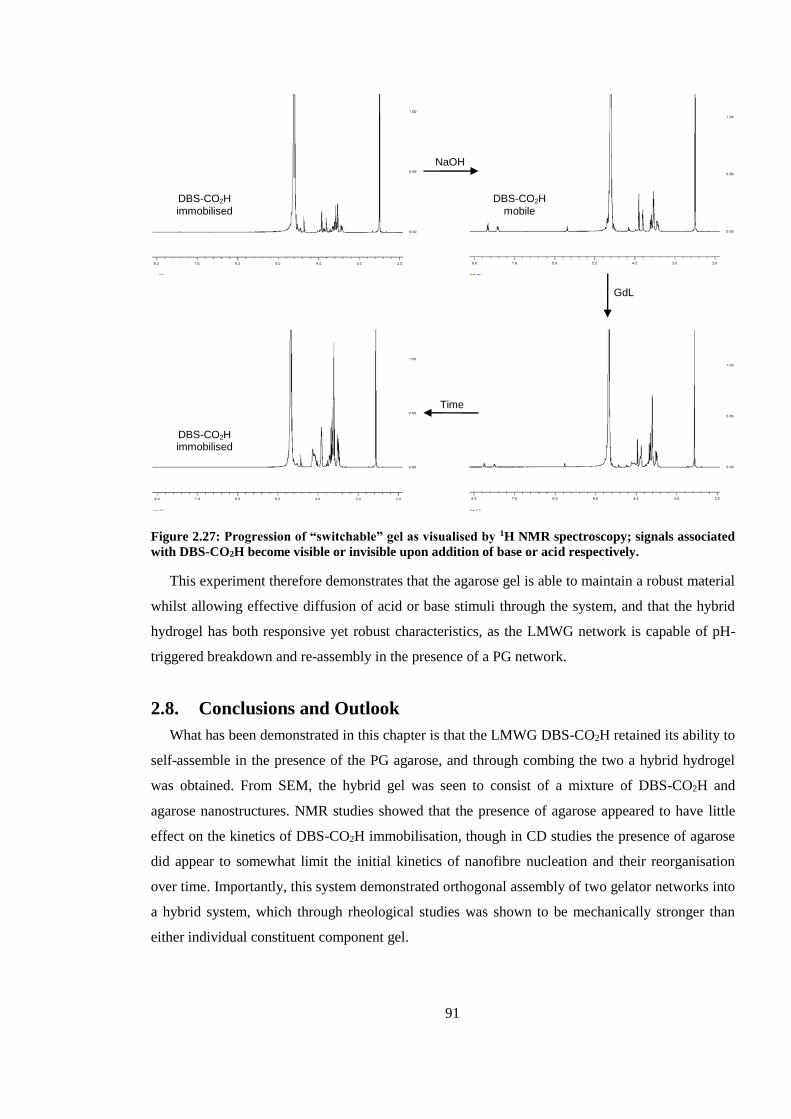
91
Figure 2.27: Progression of “switchable” gel as visualised by 1H NMR spectroscopy; signals associated
with DBS-CO2H become visible or invisible upon addition of base or acid respectively.
This experiment therefore demonstrates that the agarose gel is able to maintain a robust material
whilst allowing effective diffusion of acid or base stimuli through the system, and that the hybrid
hydrogel has both responsive yet robust characteristics, as the LMWG network is capable of pH-
triggered breakdown and re-assembly in the presence of a PG network.
2.8. Conclusions and Outlook
What has been demonstrated in this chapter is that the LMWG DBS-CO2H retained its ability to
self-assemble in the presence of the PG agarose, and through combing the two a hybrid hydrogel
was obtained. From SEM, the hybrid gel was seen to consist of a mixture of DBS-CO2H and
agarose nanostructures. NMR studies showed that the presence of agarose appeared to have little
effect on the kinetics of DBS-CO2H immobilisation, though in CD studies the presence of agarose
did appear to somewhat limit the initial kinetics of nanofibre nucleation and their reorganisation
over time. Importantly, this system demonstrated orthogonal assembly of two gelator networks into
a hybrid system, which through rheological studies was shown to be mechanically stronger than
either individual constituent component gel.
DBS-CO2H immobilised
DBS-CO2H immobilised
DBS-CO2H mobile
NaOH
Time
GdL
92
Concurrent with the publication of this research, two further publications exploring hybrid
hydrogels were released. The first came from Feng and co-workers, who combined the PDB gelator
(previously discussed in Introduction) with a calcium-alginate gelling system.181 This was achieved
by first using PDB to gel (by heat/cool method) a solution of sodium alginate, followed by
diffusion of a CaCl2 solution into the gel, which caused a PG network to form via ionic interactions
between Ca2+ and carboxylate groups of alginate. The addition of the PG network enhanced the
mechanical stability of the supramolecular hydrogel; increasing the concentration of calcium ions
further improved the mechanical stability due to greater crosslinking of the polymer gelator. Cells
seeded onto the hybrid hydrogel showed better viability, adhesion and spreading than compared to
the supramolecular gel. There was potential that changing the concentrations of PDB, sodium
alginate or CaCl2 could be used to tune these hybrid hydrogels to particular cell types. The main
obstacle for using this hybrid hydrogel in biomedical applications is the use of the heat/cool cycle
to form the LMWG network (as seen with previous hybrid hydrogel examples)106,108 – this is not
particularly suitable for encapsulating cells for 3D tissue growth, or indeed for encapsulating most
biomacromolecules, such as enzymes.
To overcome this issue, Yang and co-workers investigated the use of a mild hydrogelation
process (enzyme or reducing agent triggered) on a mixture of naphthalene-peptide LMWGs and
sodium alginate, followed by soaking in a CaCl2 solution to form a calcium alginate network, and
hence a hybrid hydrogel.182 These hybrid hydrogels had significantly increased stabilities and
mechanical strengths. Emission spectroscopy suggested that interactions between the LMWG and
alginate networks contributed towards this, with the authors identifying extensive hydrogen
bonding between the networks. Phosphatase enzymes could be immobilized in some of the hybrid
gels, and used at least 20 times without significant decrease in activity; by comparison
phosphatases immobilized in calcium alginate alone showed a very marked decrease in activity
after just the first use, most likely due to leaching of the enzyme. Whilst these systems allow
production of a hybrid hydrogel at ambient temperature and for the encapsulation of
biomacromolecules (and even potentially 3D cell cultures), their overall complexity may create
limits for their practical applications.
Whilst the use of the heat/cool cycle to produce the DBS-CO2H and agarose hybrid gels would
limit their use for biomedical applications, the unique ability they had over the above181,182 and
previous examples106–108 is the responsiveness of the LMWG network to a stimulus. This made this
system the first example of a responsive yet robust hybrid hydrogel, one which both demonstrated
and utilised to an advantage the better properties of each of its constituent components in the final
hybrid material. Although the combination of DBS-CO2H and agarose might best be described as a
model system for these types of hybrid hydrogels, similar combinations of orthogonally assembling
93
LMWGs and PGs could have great potential in applications such as controlled release or
switchable self-healing systems.
94
3. Chapter 3: Photopatterned Multidomain Hybrid Hydrogels
Results from this chapter were published in D. J. Cornwell, B. O. Okesola and D. K. Smith, Angew.
Chem., 2014, 126, 12669-12673; D. J. Cornwell, B. O. Okesola and D. K. Smith, Angew. Chem.
Int. Ed., 2014, 53, 12461–12465.
3.1 Introduction
Whilst the hybrid hydrogel system of DBS-CO2H and agarose demonstrated the concept of a
responsive yet robust gel, and showed how orthogonally assembling gel networks could be
combined into one material, the main disadvantage of the material was the need for a heat/cool
cycle to form the agarose network. As discussed, the use of heat would be problematic for 3D cell
culturing or encapsulation of biomacromolecules. It therefore seemed that the next logical step in
investigating hybrid hydrogels would be to replace agarose with an alternative PG, one which did
not require a heat/cool cycle to assemble, but would still be formed by an orthogonal method to
DBS-CO2H.
Additionally, prior to this research there existed no examples of any hybrid hydrogel combining
a LMWG with a synthetic, covalently crosslinked PG. This was also taken into consideration in the
choice of PG.
3.2 Poly(ethylene glycol) and derivatives
Poly(ethylene glycol) (PEG) is a water soluble polymer, and commercially available in both
linear and branched structures in a wide range of molecular weights. The polymer consists of repeat
units of the ethylene glycol diol with two hydroxyl end groups, which can be easily converted to
other functional groups.183 PEG is also known as poly(ethylene oxide), PEO, particularly if the
chain length is above 150 repeat monomers.184 PEG and its derivatives are some of the most
widely-used hydrogels in biomedical applications, including drug delivery and tissue engineering5–
7,183 – it is particularly useful for the latter of these as it has good biocompatibility, is non-
immunogenic and has resistance to protein adsorption.185,186
PEG can be covalently crosslinked in order to form a gelator network; crosslinked PEG is not
readily available, but crosslinking can be achieved by several methods, including irradiation,187,188
free radical polymerisation,189 and specific reactions such as Click chemistry190,191 or the use of
enzymes.192–194 UV photopolymerisation is probably the most common method of preparing a
crosslinked network for PEG hydrogels – this method also allows for spatial control by
photopatterning methods. Generally, a PEG acrylate is chosen for UV photopolymerisation –
usually PEG methacrylate (PEGMA), PEG diacrylate (PEGDA) or PEG dimethacrylate (PEGDM),
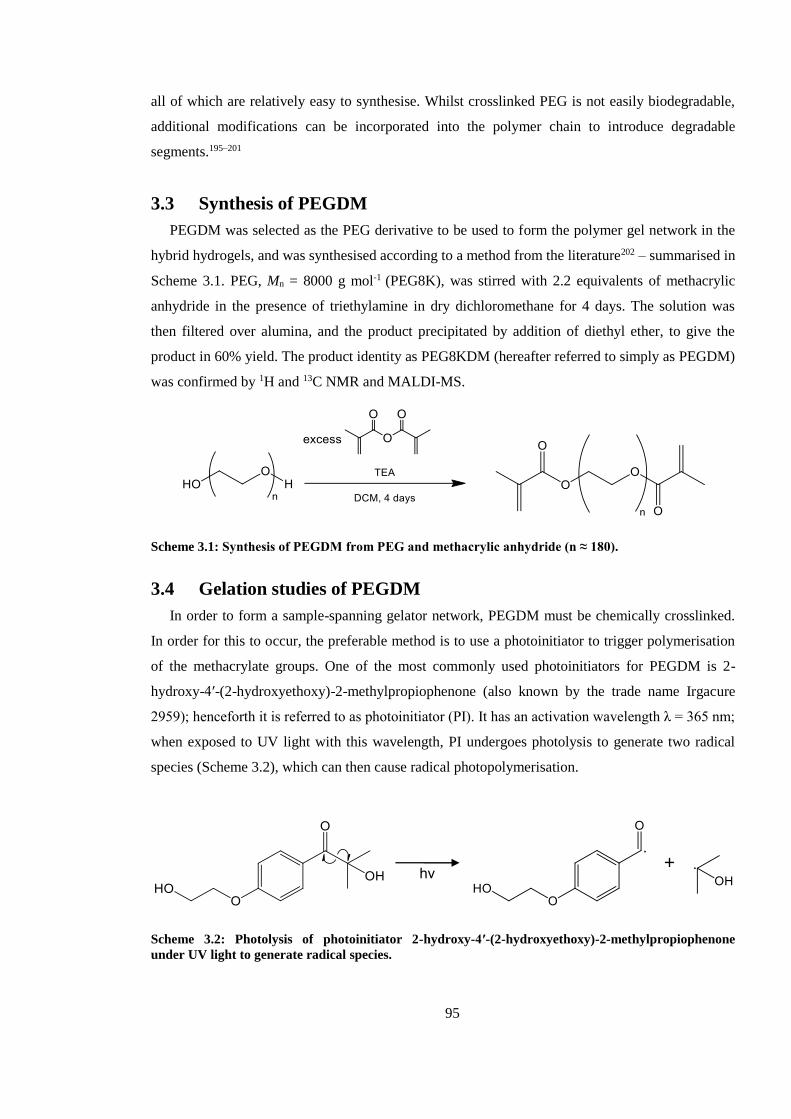
95
all of which are relatively easy to synthesise. Whilst crosslinked PEG is not easily biodegradable,
additional modifications can be incorporated into the polymer chain to introduce degradable
segments.195–201
3.3 Synthesis of PEGDM
PEGDM was selected as the PEG derivative to be used to form the polymer gel network in the
hybrid hydrogels, and was synthesised according to a method from the literature202 – summarised in
Scheme 3.1. PEG, Mn = 8000 g mol-1 (PEG8K), was stirred with 2.2 equivalents of methacrylic
anhydride in the presence of triethylamine in dry dichloromethane for 4 days. The solution was
then filtered over alumina, and the product precipitated by addition of diethyl ether, to give the
product in 60% yield. The product identity as PEG8KDM (hereafter referred to simply as PEGDM)
was confirmed by 1H and 13C NMR and MALDI-MS.
Scheme 3.1: Synthesis of PEGDM from PEG and methacrylic anhydride (n ≈ 180).
3.4 Gelation studies of PEGDM
In order to form a sample-spanning gelator network, PEGDM must be chemically crosslinked.
In order for this to occur, the preferable method is to use a photoinitiator to trigger polymerisation
of the methacrylate groups. One of the most commonly used photoinitiators for PEGDM is 2-
hydroxy-4′-(2-hydroxyethoxy)-2-methylpropiophenone (also known by the trade name Irgacure
2959); henceforth it is referred to as photoinitiator (PI). It has an activation wavelength λ = 365 nm;
when exposed to UV light with this wavelength, PI undergoes photolysis to generate two radical
species (Scheme 3.2), which can then cause radical photopolymerisation.
Scheme 3.2: Photolysis of photoinitiator 2-hydroxy-4′-(2-hydroxyethoxy)-2-methylpropiophenone
under UV light to generate radical species.
hν +

96
3.4.1 Preparation and Tgel studies of PEGDM hydrogels
PEGDM hydrogels were prepared according to an established procedure from the literature;203
PEGDM was dissolved at varying % wt/vol in a 0.05% wt/vol of PI. The solutions were cured with
a long wavelength UV source for 5-10 minutes (dependent on PEGDM concentration) to obtain
very robust, transparent hydrogels (Figure 3.1). The MGC was found to be 4% wt/vol (though 5%
wt/vol was used in further studies as it was found to have greater long-term stability).
Figure 3.1: Formation of PEGDM hydrogel; solution of PEGDM and PI forms a robust, transparent
hydrogel upon exposure to UV light to activate PI.
The PEGDM hydrogels were observed to not have a Tgel value, due to their robust, covalently
crosslinked structure. Furthermore, kinetic studies of PEGDM by NMR or CD were not possible
due to the quick gelation time, and due to PEGDM generating no CD signal owing to its lack of
chirality.
3.4.2 NMR of PEGDM hydrogels
The 1H NMR spectra of a PEGDM gel prepared in D2O (with a DMSO probe molecule) revealed
that not all the methacrylate alkenes were photopolymerised into crosslinks (Figure 3.2); in reality,
for a 5% wt/vol gel, approximately 75% of the alkenes were polymerised, with approximately 25%
remaining unpolymerised – probably as some alkenes become isolated within the gel network and
cannot find a reactive partner. The percentages of polymerised alkenes remained the same for a
10% wt/vol gel.
UV
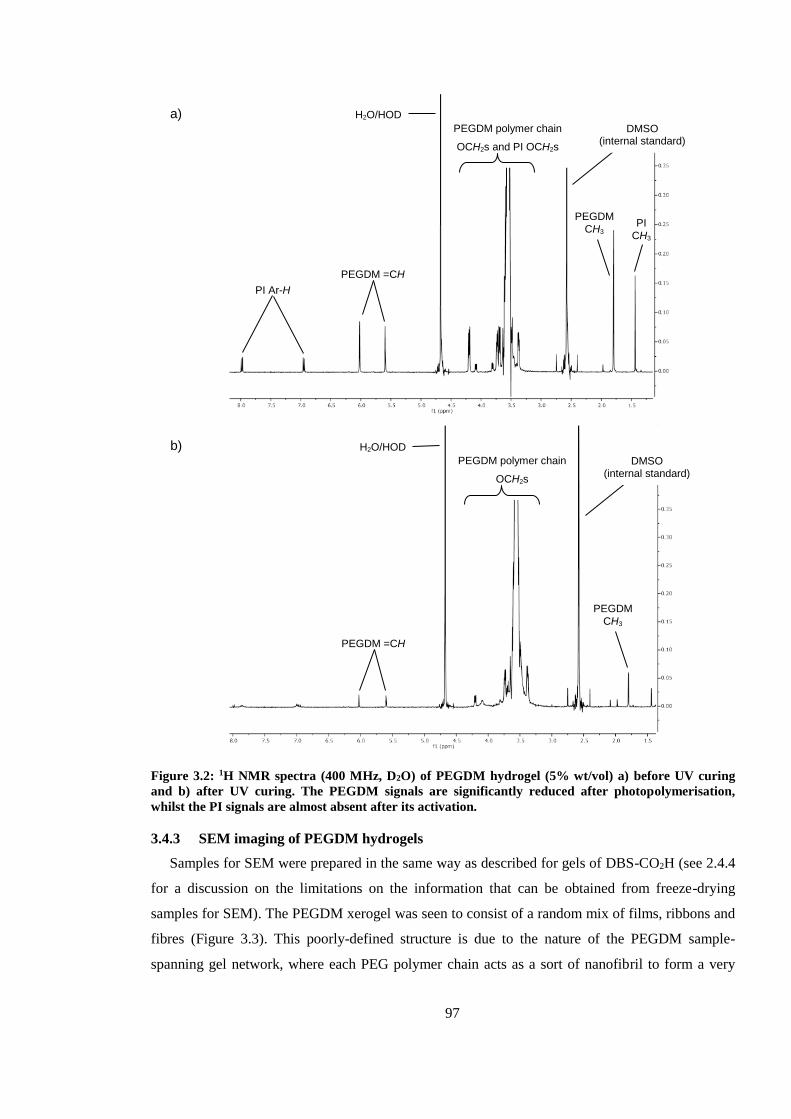
97
Figure 3.2: 1H NMR spectra (400 MHz, D2O) of PEGDM hydrogel (5% wt/vol) a) before UV curing
and b) after UV curing. The PEGDM signals are significantly reduced after photopolymerisation,
whilst the PI signals are almost absent after its activation.
3.4.3 SEM imaging of PEGDM hydrogels
Samples for SEM were prepared in the same way as described for gels of DBS-CO2H (see 2.4.4
for a discussion on the limitations on the information that can be obtained from freeze-drying
samples for SEM). The PEGDM xerogel was seen to consist of a random mix of films, ribbons and
fibres (Figure 3.3). This poorly-defined structure is due to the nature of the PEGDM sample-
spanning gel network, where each PEG polymer chain acts as a sort of nanofibril to form a very
b)
PEGDM =CH
H2O/HOD
DMSO (internal standard)
PEGDM
CH3
PEGDM polymer chain
OCH2s
PEGDM =CH
H2O/HOD
DMSO (internal standard)
PEGDM
CH3
PI Ar-H
PI
CH3
a)
PEGDM polymer chain
OCH2s and PI OCH2s
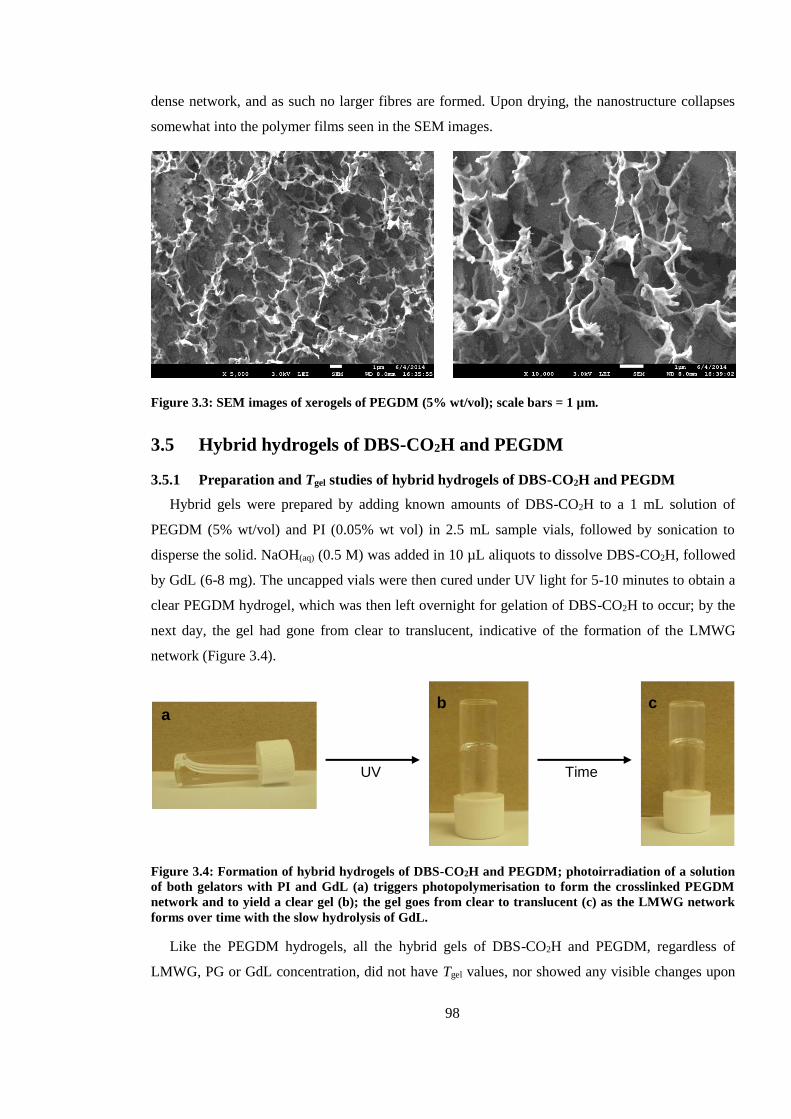
98
dense network, and as such no larger fibres are formed. Upon drying, the nanostructure collapses
somewhat into the polymer films seen in the SEM images.
Figure 3.3: SEM images of xerogels of PEGDM (5% wt/vol); scale bars = 1 µm.
3.5 Hybrid hydrogels of DBS-CO2H and PEGDM
3.5.1 Preparation and Tgel studies of hybrid hydrogels of DBS-CO2H and PEGDM
Hybrid gels were prepared by adding known amounts of DBS-CO2H to a 1 mL solution of
PEGDM (5% wt/vol) and PI (0.05% wt vol) in 2.5 mL sample vials, followed by sonication to
disperse the solid. NaOH(aq) (0.5 M) was added in 10 µL aliquots to dissolve DBS-CO2H, followed
by GdL (6-8 mg). The uncapped vials were then cured under UV light for 5-10 minutes to obtain a
clear PEGDM hydrogel, which was then left overnight for gelation of DBS-CO2H to occur; by the
next day, the gel had gone from clear to translucent, indicative of the formation of the LMWG
network (Figure 3.4).
Figure 3.4: Formation of hybrid hydrogels of DBS-CO2H and PEGDM; photoirradiation of a solution
of both gelators with PI and GdL (a) triggers photopolymerisation to form the crosslinked PEGDM
network and to yield a clear gel (b); the gel goes from clear to translucent (c) as the LMWG network
forms over time with the slow hydrolysis of GdL.
Like the PEGDM hydrogels, all the hybrid gels of DBS-CO2H and PEGDM, regardless of
LMWG, PG or GdL concentration, did not have Tgel values, nor showed any visible changes upon
UV Time
a b c
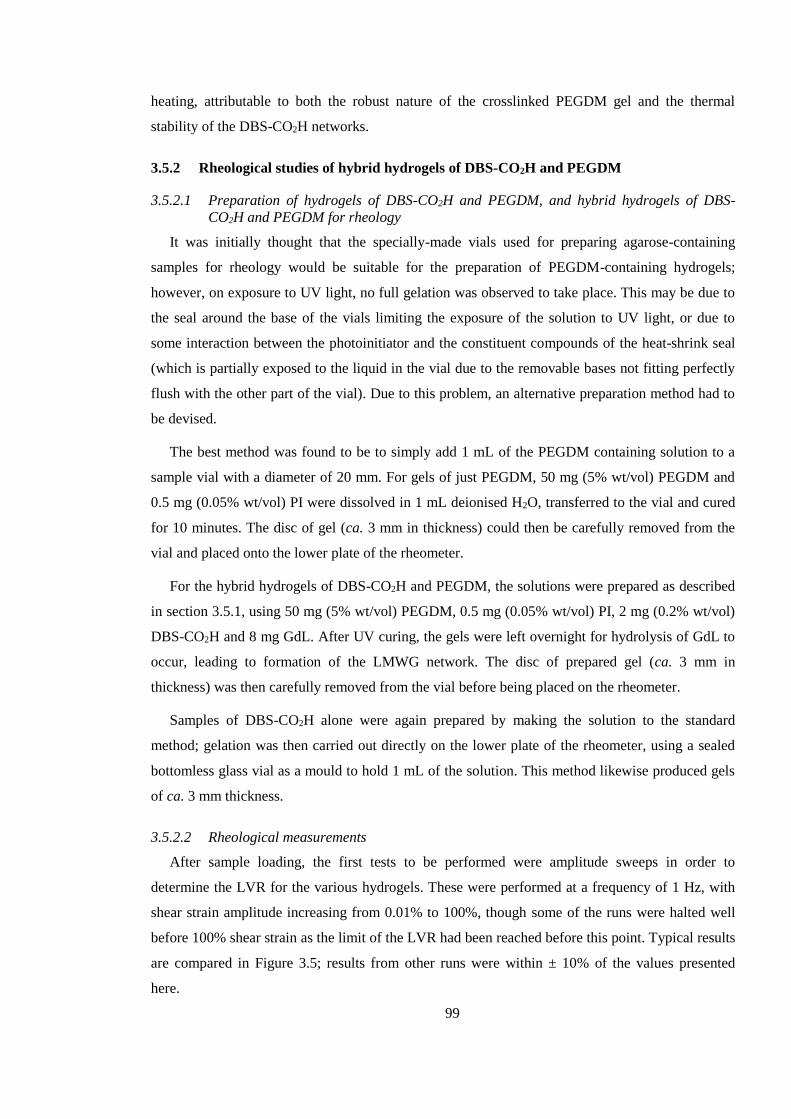
99
heating, attributable to both the robust nature of the crosslinked PEGDM gel and the thermal
stability of the DBS-CO2H networks.
3.5.2 Rheological studies of hybrid hydrogels of DBS-CO2H and PEGDM
3.5.2.1 Preparation of hydrogels of DBS-CO2H and PEGDM, and hybrid hydrogels of DBS-
CO2H and PEGDM for rheology
It was initially thought that the specially-made vials used for preparing agarose-containing
samples for rheology would be suitable for the preparation of PEGDM-containing hydrogels;
however, on exposure to UV light, no full gelation was observed to take place. This may be due to
the seal around the base of the vials limiting the exposure of the solution to UV light, or due to
some interaction between the photoinitiator and the constituent compounds of the heat-shrink seal
(which is partially exposed to the liquid in the vial due to the removable bases not fitting perfectly
flush with the other part of the vial). Due to this problem, an alternative preparation method had to
be devised.
The best method was found to be to simply add 1 mL of the PEGDM containing solution to a
sample vial with a diameter of 20 mm. For gels of just PEGDM, 50 mg (5% wt/vol) PEGDM and
0.5 mg (0.05% wt/vol) PI were dissolved in 1 mL deionised H2O, transferred to the vial and cured
for 10 minutes. The disc of gel (ca. 3 mm in thickness) could then be carefully removed from the
vial and placed onto the lower plate of the rheometer.
For the hybrid hydrogels of DBS-CO2H and PEGDM, the solutions were prepared as described
in section 3.5.1, using 50 mg (5% wt/vol) PEGDM, 0.5 mg (0.05% wt/vol) PI, 2 mg (0.2% wt/vol)
DBS-CO2H and 8 mg GdL. After UV curing, the gels were left overnight for hydrolysis of GdL to
occur, leading to formation of the LMWG network. The disc of prepared gel (ca. 3 mm in
thickness) was then carefully removed from the vial before being placed on the rheometer.
Samples of DBS-CO2H alone were again prepared by making the solution to the standard
method; gelation was then carried out directly on the lower plate of the rheometer, using a sealed
bottomless glass vial as a mould to hold 1 mL of the solution. This method likewise produced gels
of ca. 3 mm thickness.
3.5.2.2 Rheological measurements
After sample loading, the first tests to be performed were amplitude sweeps in order to
determine the LVR for the various hydrogels. These were performed at a frequency of 1 Hz, with
shear strain amplitude increasing from 0.01% to 100%, though some of the runs were halted well
before 100% shear strain as the limit of the LVR had been reached before this point. Typical results
are compared in Figure 3.5; results from other runs were within ± 10% of the values presented
here.
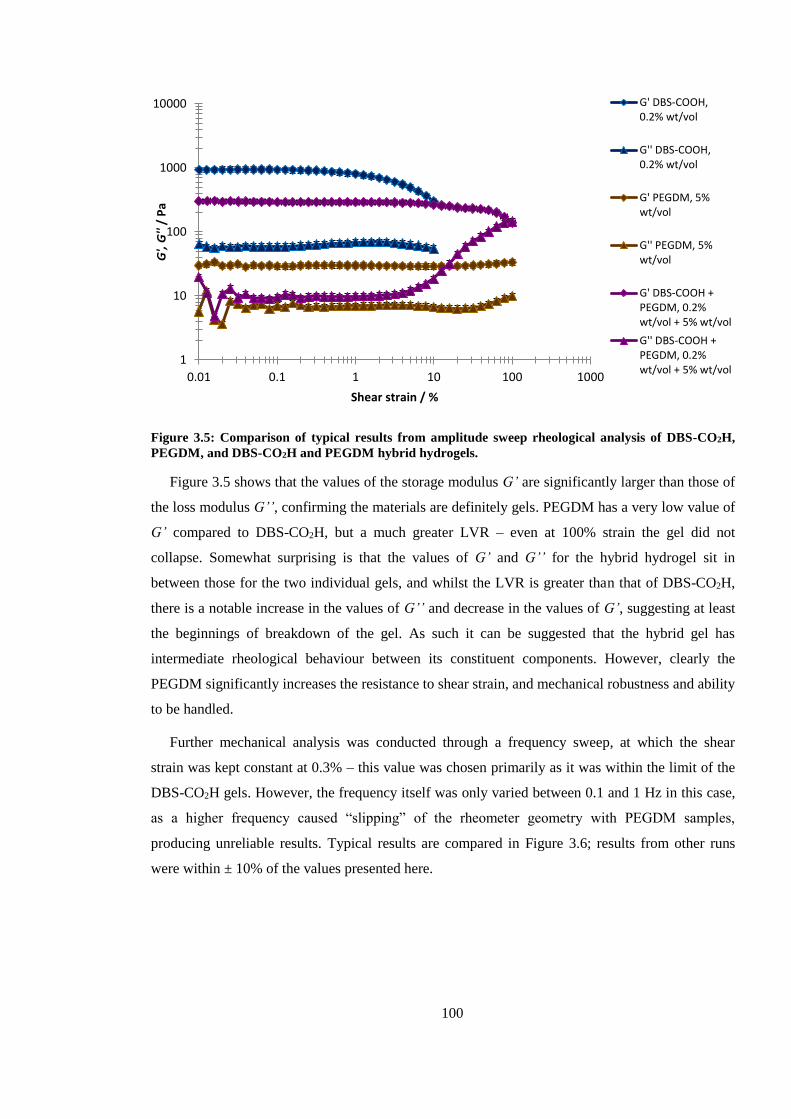
100
Figure 3.5: Comparison of typical results from amplitude sweep rheological analysis of DBS-CO2H,
PEGDM, and DBS-CO2H and PEGDM hybrid hydrogels.
Figure 3.5 shows that the values of the storage modulus G’ are significantly larger than those of
the loss modulus G’’, confirming the materials are definitely gels. PEGDM has a very low value of
G’ compared to DBS-CO2H, but a much greater LVR – even at 100% strain the gel did not
collapse. Somewhat surprising is that the values of G’ and G’’ for the hybrid hydrogel sit in
between those for the two individual gels, and whilst the LVR is greater than that of DBS-CO2H,
there is a notable increase in the values of G’’ and decrease in the values of G’, suggesting at least
the beginnings of breakdown of the gel. As such it can be suggested that the hybrid gel has
intermediate rheological behaviour between its constituent components. However, clearly the
PEGDM significantly increases the resistance to shear strain, and mechanical robustness and ability
to be handled.
Further mechanical analysis was conducted through a frequency sweep, at which the shear
strain was kept constant at 0.3% – this value was chosen primarily as it was within the limit of the
DBS-CO2H gels. However, the frequency itself was only varied between 0.1 and 1 Hz in this case,
as a higher frequency caused “slipping” of the rheometer geometry with PEGDM samples,
producing unreliable results. Typical results are compared in Figure 3.6; results from other runs
were within ± 10% of the values presented here.
1
10
100
1000
10000
0.01 0.1 1 10 100 1000
G',
G''
/ P
a
Shear strain / %
G' DBS-COOH,0.2% wt/vol
G'' DBS-COOH,0.2% wt/vol
G' PEGDM, 5%wt/vol
G'' PEGDM, 5%wt/vol
G' DBS-COOH +PEGDM, 0.2%wt/vol + 5% wt/vol
G'' DBS-COOH +PEGDM, 0.2%wt/vol + 5% wt/vol
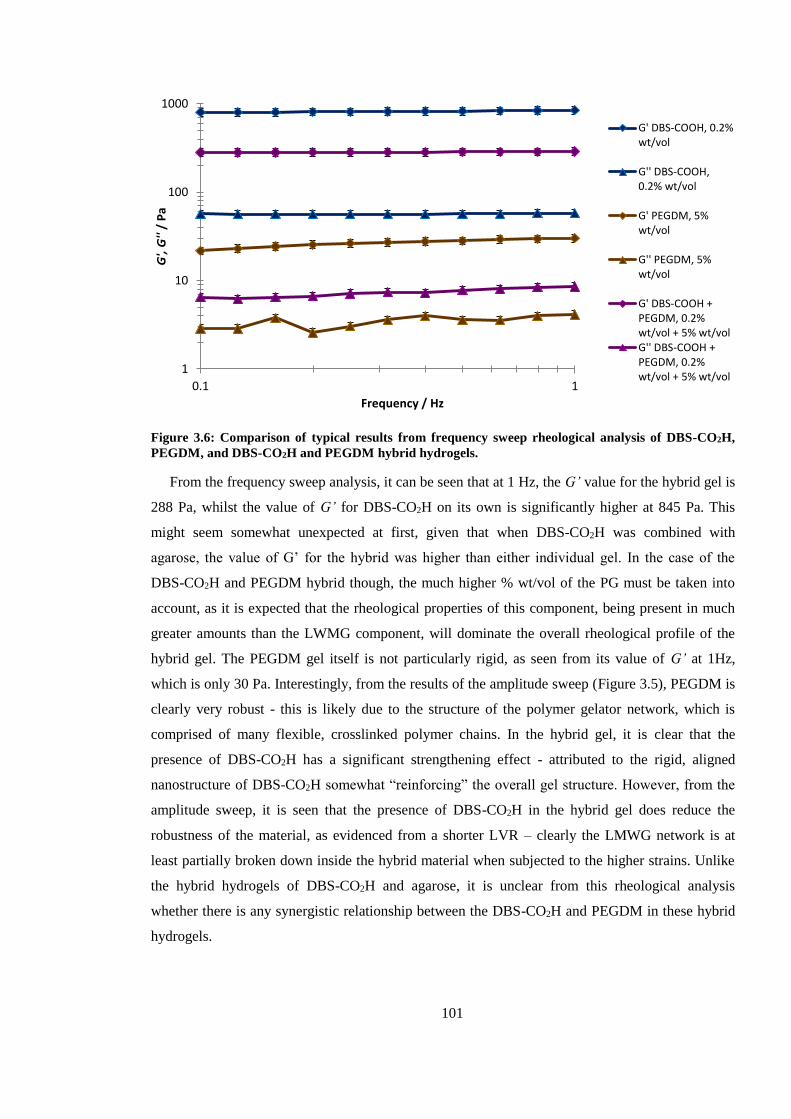
101
Figure 3.6: Comparison of typical results from frequency sweep rheological analysis of DBS-CO2H,
PEGDM, and DBS-CO2H and PEGDM hybrid hydrogels.
From the frequency sweep analysis, it can be seen that at 1 Hz, the G’ value for the hybrid gel is
288 Pa, whilst the value of G’ for DBS-CO2H on its own is significantly higher at 845 Pa. This
might seem somewhat unexpected at first, given that when DBS-CO2H was combined with
agarose, the value of G’ for the hybrid was higher than either individual gel. In the case of the
DBS-CO2H and PEGDM hybrid though, the much higher % wt/vol of the PG must be taken into
account, as it is expected that the rheological properties of this component, being present in much
greater amounts than the LWMG component, will dominate the overall rheological profile of the
hybrid gel. The PEGDM gel itself is not particularly rigid, as seen from its value of G’ at 1Hz,
which is only 30 Pa. Interestingly, from the results of the amplitude sweep (Figure 3.5), PEGDM is
clearly very robust - this is likely due to the structure of the polymer gelator network, which is
comprised of many flexible, crosslinked polymer chains. In the hybrid gel, it is clear that the
presence of DBS-CO2H has a significant strengthening effect - attributed to the rigid, aligned
nanostructure of DBS-CO2H somewhat “reinforcing” the overall gel structure. However, from the
amplitude sweep, it is seen that the presence of DBS-CO2H in the hybrid gel does reduce the
robustness of the material, as evidenced from a shorter LVR – clearly the LMWG network is at
least partially broken down inside the hybrid material when subjected to the higher strains. Unlike
the hybrid hydrogels of DBS-CO2H and agarose, it is unclear from this rheological analysis
whether there is any synergistic relationship between the DBS-CO2H and PEGDM in these hybrid
hydrogels.
1
10
100
1000
0.1 1
G',
G''
/ P
a
Frequency / Hz
G' DBS-COOH, 0.2%wt/vol
G'' DBS-COOH,0.2% wt/vol
G' PEGDM, 5%wt/vol
G'' PEGDM, 5%wt/vol
G' DBS-COOH +PEGDM, 0.2%wt/vol + 5% wt/volG'' DBS-COOH +PEGDM, 0.2%wt/vol + 5% wt/vol
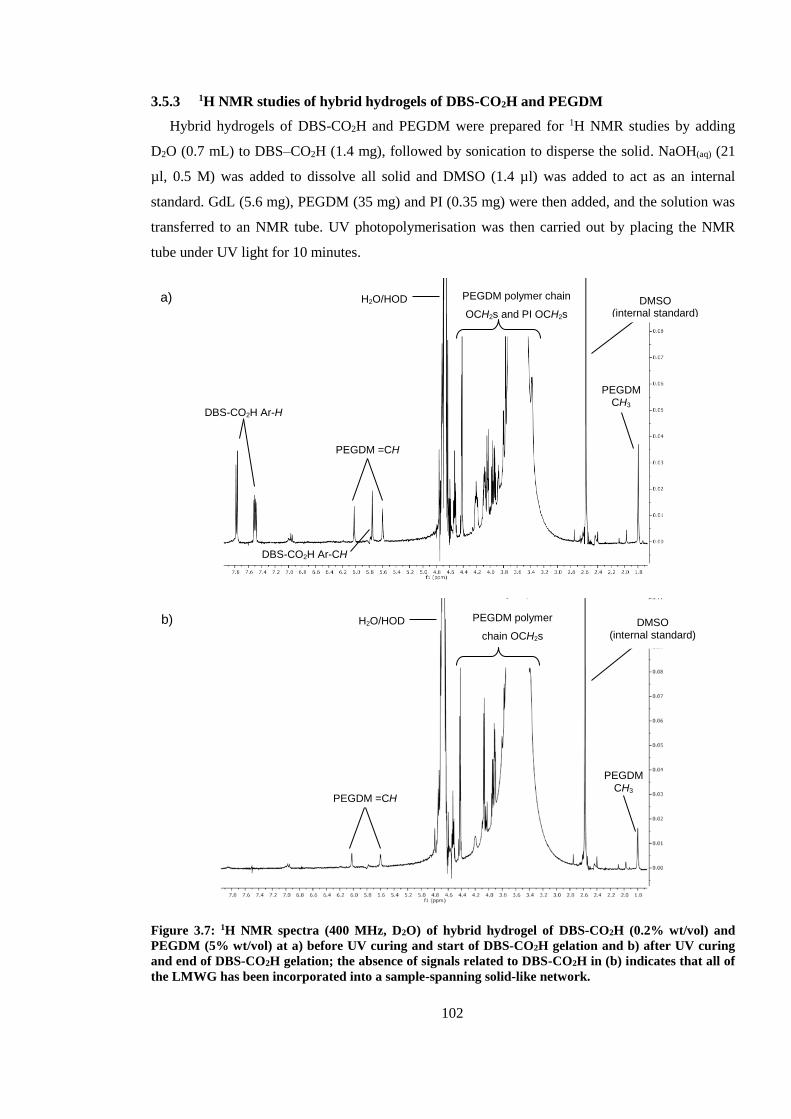
102
3.5.3 1H NMR studies of hybrid hydrogels of DBS-CO2H and PEGDM
Hybrid hydrogels of DBS-CO2H and PEGDM were prepared for 1H NMR studies by adding
D2O (0.7 mL) to DBS–CO2H (1.4 mg), followed by sonication to disperse the solid. NaOH(aq) (21
µl, 0.5 M) was added to dissolve all solid and DMSO (1.4 µl) was added to act as an internal
standard. GdL (5.6 mg), PEGDM (35 mg) and PI (0.35 mg) were then added, and the solution was
transferred to an NMR tube. UV photopolymerisation was then carried out by placing the NMR
tube under UV light for 10 minutes.
Figure 3.7: 1H NMR spectra (400 MHz, D2O) of hybrid hydrogel of DBS-CO2H (0.2% wt/vol) and
PEGDM (5% wt/vol) at a) before UV curing and start of DBS-CO2H gelation and b) after UV curing
and end of DBS-CO2H gelation; the absence of signals related to DBS-CO2H in (b) indicates that all of
the LMWG has been incorporated into a sample-spanning solid-like network.
b)
PEGDM =CH
H2O/HOD
PEGDM
CH3
PEGDM polymer
chain OCH2s
DMSO
(internal standard)
a)
DBS-CO2H Ar-H
PEGDM =CH
H2O/HOD
PEGDM CH3
DBS-CO2H Ar-CH
PEGDM polymer chain
OCH2s and PI OCH2s
DMSO
(internal standard)
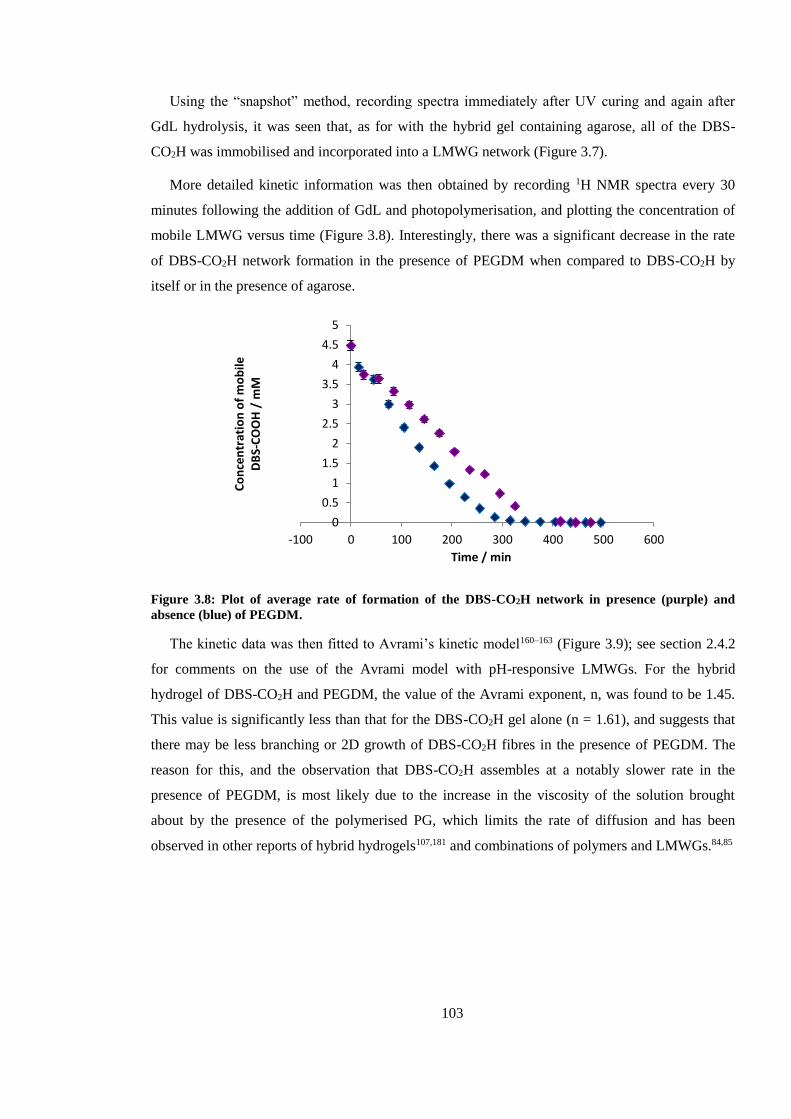
103
Using the “snapshot” method, recording spectra immediately after UV curing and again after
GdL hydrolysis, it was seen that, as for with the hybrid gel containing agarose, all of the DBS-
CO2H was immobilised and incorporated into a LMWG network (Figure 3.7).
More detailed kinetic information was then obtained by recording 1H NMR spectra every 30
minutes following the addition of GdL and photopolymerisation, and plotting the concentration of
mobile LMWG versus time (Figure 3.8). Interestingly, there was a significant decrease in the rate
of DBS-CO2H network formation in the presence of PEGDM when compared to DBS-CO2H by
itself or in the presence of agarose.
Figure 3.8: Plot of average rate of formation of the DBS-CO2H network in presence (purple) and
absence (blue) of PEGDM.
The kinetic data was then fitted to Avrami’s kinetic model160–163 (Figure 3.9); see section 2.4.2
for comments on the use of the Avrami model with pH-responsive LMWGs. For the hybrid
hydrogel of DBS-CO2H and PEGDM, the value of the Avrami exponent, n, was found to be 1.45.
This value is significantly less than that for the DBS-CO2H gel alone (n = 1.61), and suggests that
there may be less branching or 2D growth of DBS-CO2H fibres in the presence of PEGDM. The
reason for this, and the observation that DBS-CO2H assembles at a notably slower rate in the
presence of PEGDM, is most likely due to the increase in the viscosity of the solution brought
about by the presence of the polymerised PG, which limits the rate of diffusion and has been
observed in other reports of hybrid hydrogels107,181 and combinations of polymers and LMWGs.84,85
0
0.5
1
1.5
2
2.5
3
3.5
4
4.5
5
-100 0 100 200 300 400 500 600
Co
nce
ntr
atio
n o
f m
ob
ile
DB
S-C
OO
H /
mM
Time / min
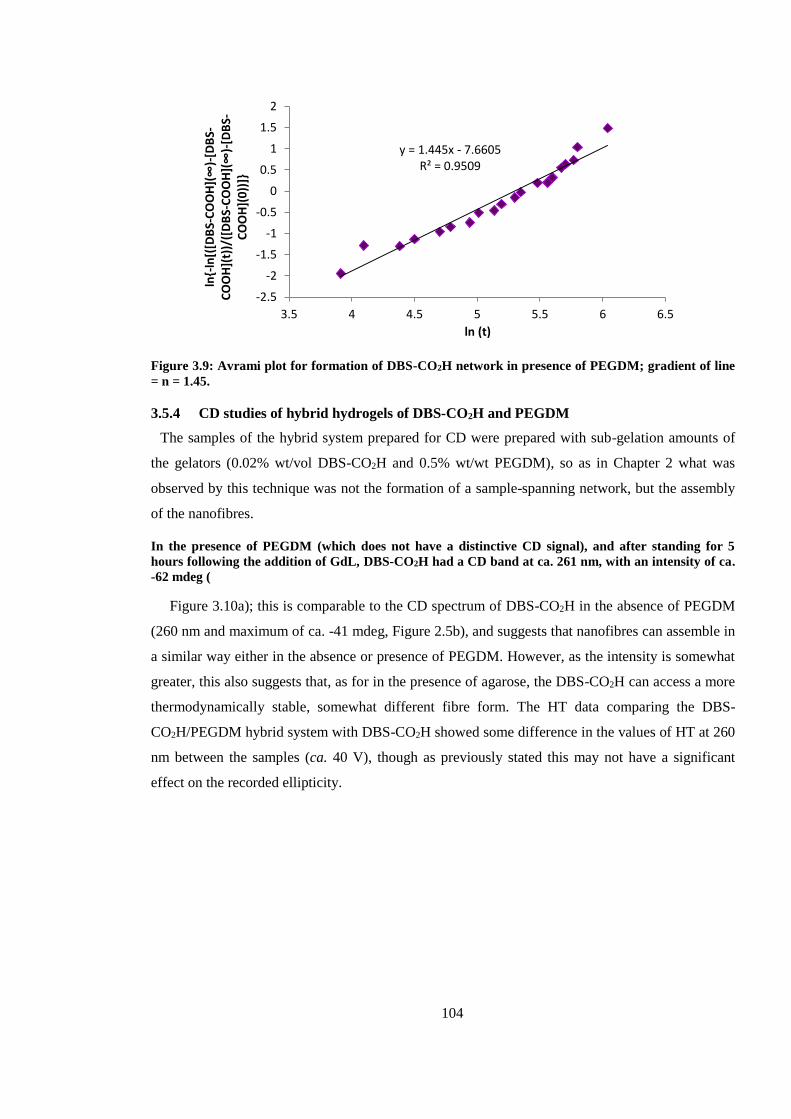
104
Figure 3.9: Avrami plot for formation of DBS-CO2H network in presence of PEGDM; gradient of line
= n = 1.45.
3.5.4 CD studies of hybrid hydrogels of DBS-CO2H and PEGDM
The samples of the hybrid system prepared for CD were prepared with sub-gelation amounts of
the gelators (0.02% wt/vol DBS-CO2H and 0.5% wt/wt PEGDM), so as in Chapter 2 what was
observed by this technique was not the formation of a sample-spanning network, but the assembly
of the nanofibres.
In the presence of PEGDM (which does not have a distinctive CD signal), and after standing for 5
hours following the addition of GdL, DBS-CO2H had a CD band at ca. 261 nm, with an intensity of ca.
-62 mdeg (
Figure 3.10a); this is comparable to the CD spectrum of DBS-CO2H in the absence of PEGDM
(260 nm and maximum of ca. -41 mdeg, Figure 2.5b), and suggests that nanofibres can assemble in
a similar way either in the absence or presence of PEGDM. However, as the intensity is somewhat
greater, this also suggests that, as for in the presence of agarose, the DBS-CO2H can access a more
thermodynamically stable, somewhat different fibre form. The HT data comparing the DBS-
CO2H/PEGDM hybrid system with DBS-CO2H showed some difference in the values of HT at 260
nm between the samples (ca. 40 V), though as previously stated this may not have a significant
effect on the recorded ellipticity.
y = 1.445x - 7.6605R² = 0.9509
-2.5
-2
-1.5
-1
-0.5
0
0.5
1
1.5
2
3.5 4 4.5 5 5.5 6 6.5
ln{-
ln[(
[DB
S-COOH](∞)-
[DB
S-C
OO
H](
t))/
([D
BS-COOH](∞)-
[DB
S-C
OO
H](
0))
]}
ln (t)
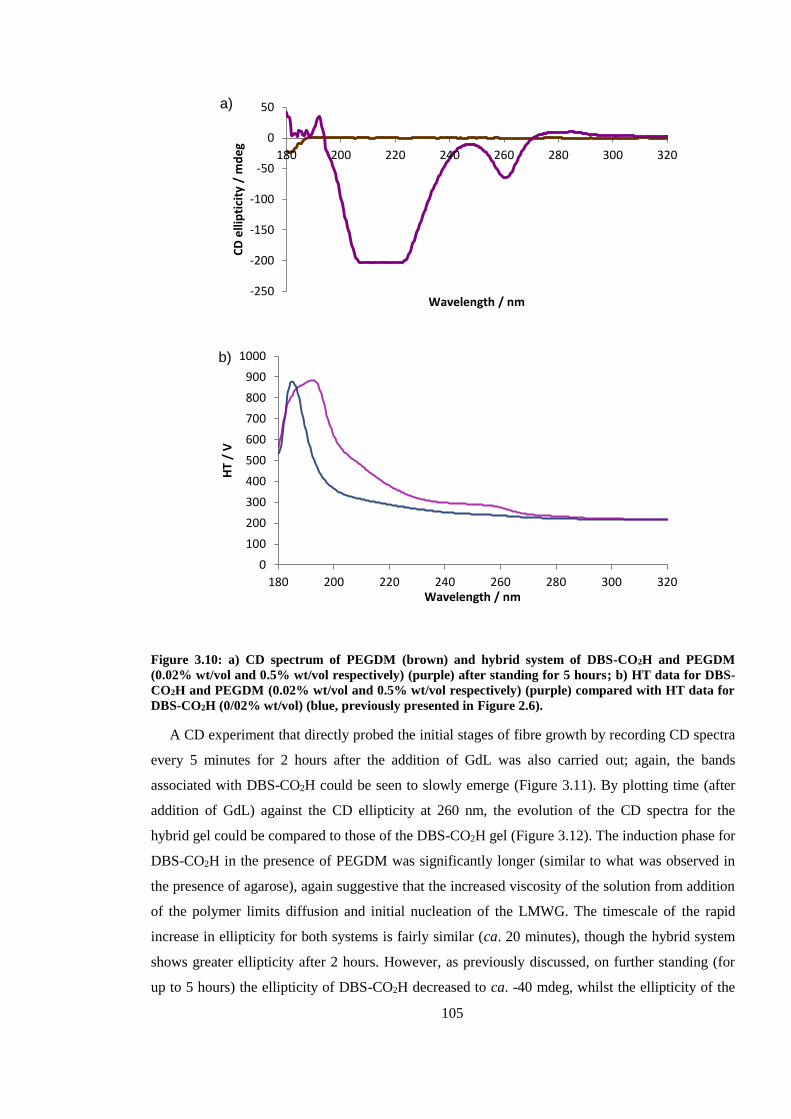
105
Figure 3.10: a) CD spectrum of PEGDM (brown) and hybrid system of DBS-CO2H and PEGDM
(0.02% wt/vol and 0.5% wt/vol respectively) (purple) after standing for 5 hours; b) HT data for DBS-
CO2H and PEGDM (0.02% wt/vol and 0.5% wt/vol respectively) (purple) compared with HT data for
DBS-CO2H (0/02% wt/vol) (blue, previously presented in Figure 2.6).
A CD experiment that directly probed the initial stages of fibre growth by recording CD spectra
every 5 minutes for 2 hours after the addition of GdL was also carried out; again, the bands
associated with DBS-CO2H could be seen to slowly emerge (Figure 3.11). By plotting time (after
addition of GdL) against the CD ellipticity at 260 nm, the evolution of the CD spectra for the
hybrid gel could be compared to those of the DBS-CO2H gel (Figure 3.12). The induction phase for
DBS-CO2H in the presence of PEGDM was significantly longer (similar to what was observed in
the presence of agarose), again suggestive that the increased viscosity of the solution from addition
of the polymer limits diffusion and initial nucleation of the LMWG. The timescale of the rapid
increase in ellipticity for both systems is fairly similar (ca. 20 minutes), though the hybrid system
shows greater ellipticity after 2 hours. However, as previously discussed, on further standing (for
up to 5 hours) the ellipticity of DBS-CO2H decreased to ca. -40 mdeg, whilst the ellipticity of the
-250
-200
-150
-100
-50
0
50
180 200 220 240 260 280 300 320
CD
elli
pti
city
/ m
de
g
Wavelength / nm
a)
0
100
200
300
400
500
600
700
800
900
1000
180 200 220 240 260 280 300 320
HT
/ V
Wavelength / nm
b)
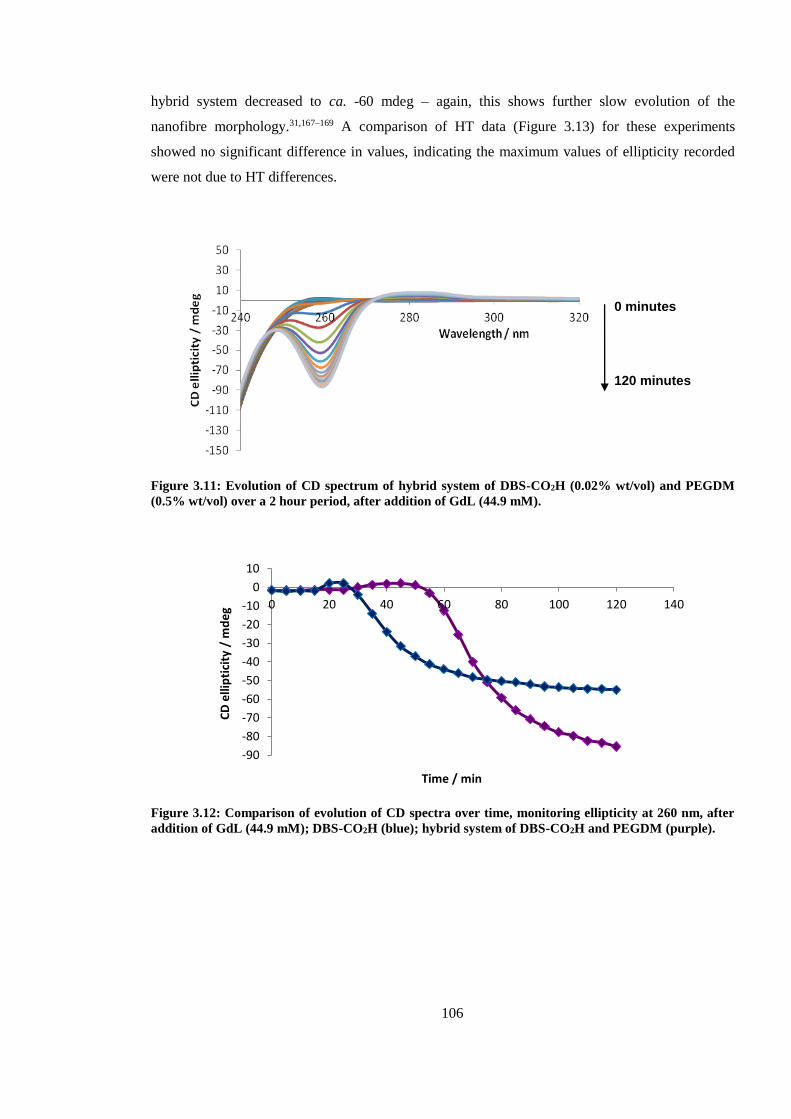
106
hybrid system decreased to ca. -60 mdeg – again, this shows further slow evolution of the
nanofibre morphology.31,167–169 A comparison of HT data (Figure 3.13) for these experiments
showed no significant difference in values, indicating the maximum values of ellipticity recorded
were not due to HT differences.
Figure 3.11: Evolution of CD spectrum of hybrid system of DBS-CO2H (0.02% wt/vol) and PEGDM
(0.5% wt/vol) over a 2 hour period, after addition of GdL (44.9 mM).
Figure 3.12: Comparison of evolution of CD spectra over time, monitoring ellipticity at 260 nm, after
addition of GdL (44.9 mM); DBS-CO2H (blue); hybrid system of DBS-CO2H and PEGDM (purple).
-90
-80
-70
-60
-50
-40
-30
-20
-10
0
10
0 20 40 60 80 100 120 140
CD
elli
pti
city
/ m
de
g
Time / min
0 minutes
120 minutes
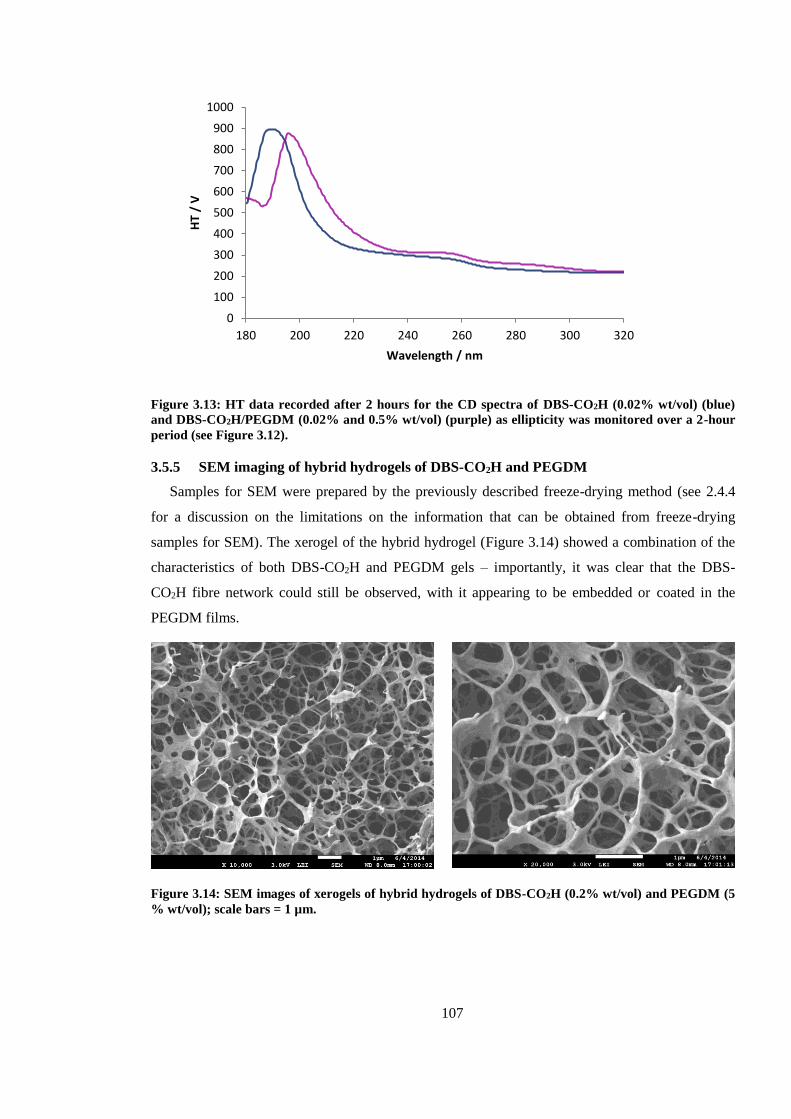
107
Figure 3.13: HT data recorded after 2 hours for the CD spectra of DBS-CO2H (0.02% wt/vol) (blue)
and DBS-CO2H/PEGDM (0.02% and 0.5% wt/vol) (purple) as ellipticity was monitored over a 2-hour
period (see Figure 3.12).
3.5.5 SEM imaging of hybrid hydrogels of DBS-CO2H and PEGDM
Samples for SEM were prepared by the previously described freeze-drying method (see 2.4.4
for a discussion on the limitations on the information that can be obtained from freeze-drying
samples for SEM). The xerogel of the hybrid hydrogel (Figure 3.14) showed a combination of the
characteristics of both DBS-CO2H and PEGDM gels – importantly, it was clear that the DBS-
CO2H fibre network could still be observed, with it appearing to be embedded or coated in the
PEGDM films.
Figure 3.14: SEM images of xerogels of hybrid hydrogels of DBS-CO2H (0.2% wt/vol) and PEGDM (5
% wt/vol); scale bars = 1 µm.
0
100
200
300
400
500
600
700
800
900
1000
180 200 220 240 260 280 300 320
HT
/ V
Wavelength / nm
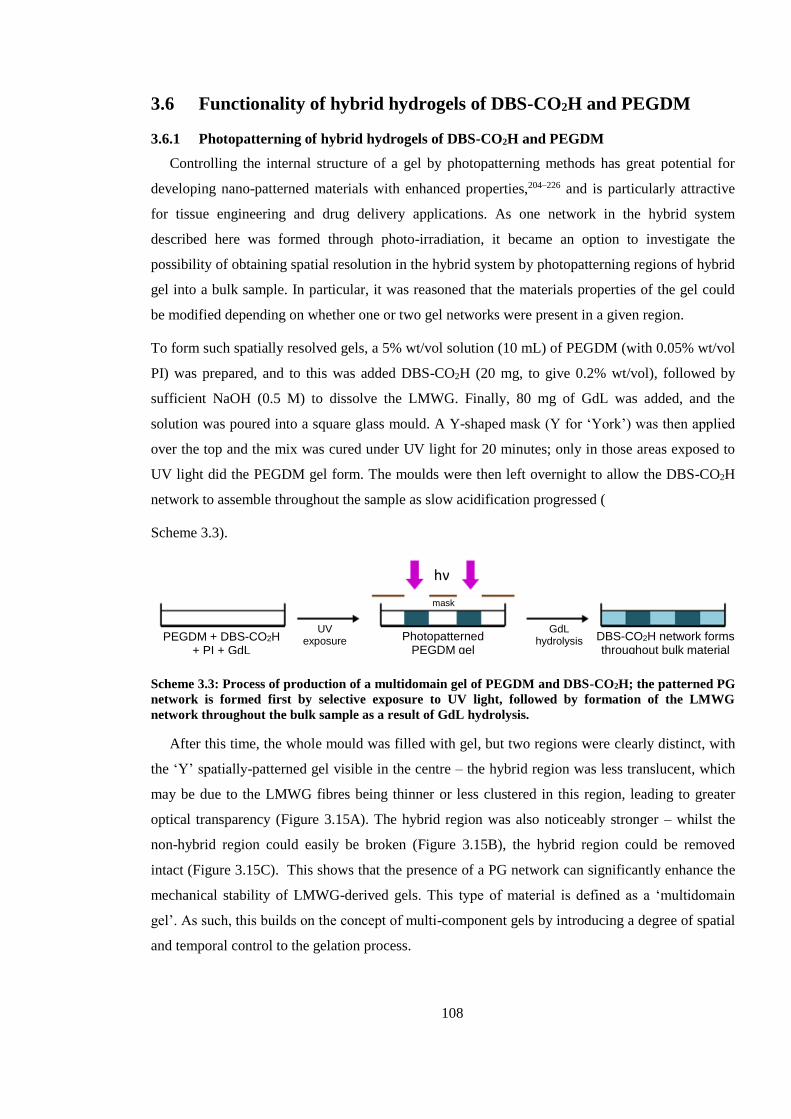
108
3.6 Functionality of hybrid hydrogels of DBS-CO2H and PEGDM
3.6.1 Photopatterning of hybrid hydrogels of DBS-CO2H and PEGDM
Controlling the internal structure of a gel by photopatterning methods has great potential for
developing nano-patterned materials with enhanced properties,204–226 and is particularly attractive
for tissue engineering and drug delivery applications. As one network in the hybrid system
described here was formed through photo-irradiation, it became an option to investigate the
possibility of obtaining spatial resolution in the hybrid system by photopatterning regions of hybrid
gel into a bulk sample. In particular, it was reasoned that the materials properties of the gel could
be modified depending on whether one or two gel networks were present in a given region.
To form such spatially resolved gels, a 5% wt/vol solution (10 mL) of PEGDM (with 0.05% wt/vol
PI) was prepared, and to this was added DBS-CO2H (20 mg, to give 0.2% wt/vol), followed by
sufficient NaOH (0.5 M) to dissolve the LMWG. Finally, 80 mg of GdL was added, and the
solution was poured into a square glass mould. A Y-shaped mask (Y for ‘York’) was then applied
over the top and the mix was cured under UV light for 20 minutes; only in those areas exposed to
UV light did the PEGDM gel form. The moulds were then left overnight to allow the DBS-CO2H
network to assemble throughout the sample as slow acidification progressed (
Scheme 3.3).
Scheme 3.3: Process of production of a multidomain gel of PEGDM and DBS-CO2H; the patterned PG
network is formed first by selective exposure to UV light, followed by formation of the LMWG
network throughout the bulk sample as a result of GdL hydrolysis.
After this time, the whole mould was filled with gel, but two regions were clearly distinct, with
the ‘Y’ spatially-patterned gel visible in the centre – the hybrid region was less translucent, which
may be due to the LMWG fibres being thinner or less clustered in this region, leading to greater
optical transparency (Figure 3.15A). The hybrid region was also noticeably stronger – whilst the
non-hybrid region could easily be broken (Figure 3.15B), the hybrid region could be removed
intact (Figure 3.15C). This shows that the presence of a PG network can significantly enhance the
mechanical stability of LMWG-derived gels. This type of material is defined as a ‘multidomain
gel’. As such, this builds on the concept of multi-component gels by introducing a degree of spatial
and temporal control to the gelation process.
Photopatterned PEGDM gel
GdL hydrolysis
UV exposure
hν
mask
PEGDM + DBS-CO2H + PI + GdL
DBS-CO2H network forms throughout bulk material
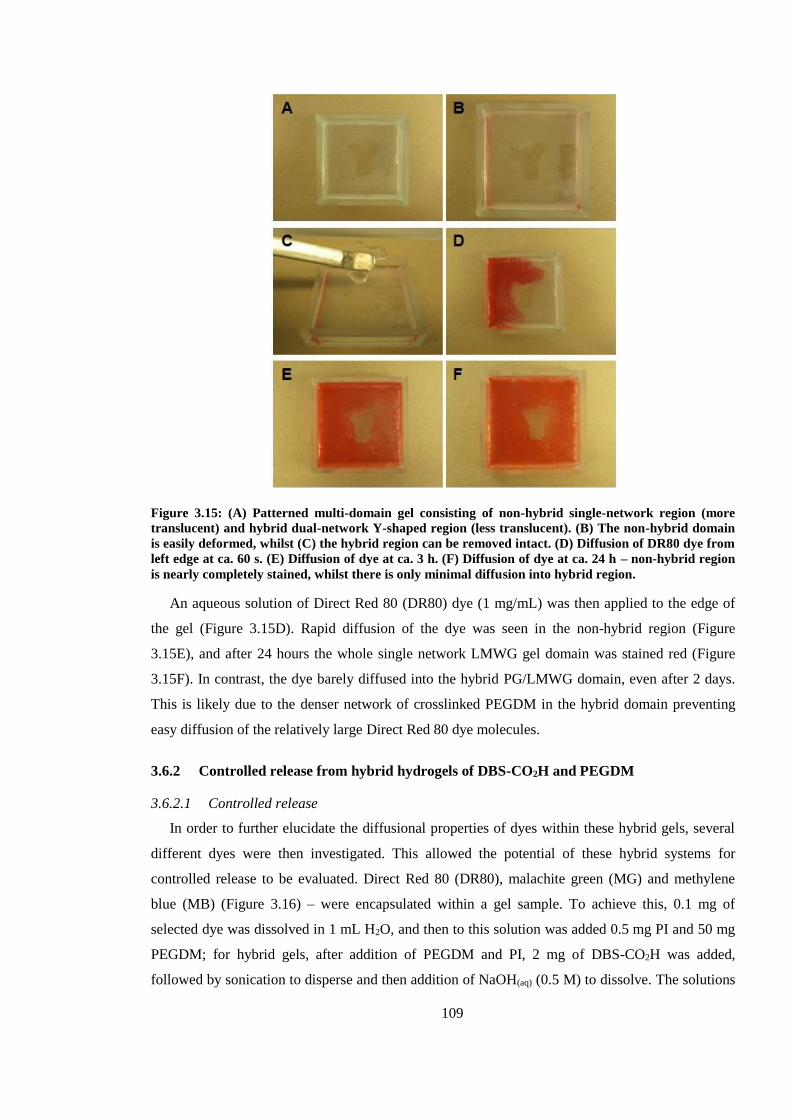
109
Figure 3.15: (A) Patterned multi-domain gel consisting of non-hybrid single-network region (more
translucent) and hybrid dual-network Y-shaped region (less translucent). (B) The non-hybrid domain
is easily deformed, whilst (C) the hybrid region can be removed intact. (D) Diffusion of DR80 dye from
left edge at ca. 60 s. (E) Diffusion of dye at ca. 3 h. (F) Diffusion of dye at ca. 24 h – non-hybrid region
is nearly completely stained, whilst there is only minimal diffusion into hybrid region.
An aqueous solution of Direct Red 80 (DR80) dye (1 mg/mL) was then applied to the edge of
the gel (Figure 3.15D). Rapid diffusion of the dye was seen in the non-hybrid region (Figure
3.15E), and after 24 hours the whole single network LMWG gel domain was stained red (Figure
3.15F). In contrast, the dye barely diffused into the hybrid PG/LMWG domain, even after 2 days.
This is likely due to the denser network of crosslinked PEGDM in the hybrid domain preventing
easy diffusion of the relatively large Direct Red 80 dye molecules.
3.6.2 Controlled release from hybrid hydrogels of DBS-CO2H and PEGDM
3.6.2.1 Controlled release
In order to further elucidate the diffusional properties of dyes within these hybrid gels, several
different dyes were then investigated. This allowed the potential of these hybrid systems for
controlled release to be evaluated. Direct Red 80 (DR80), malachite green (MG) and methylene
blue (MB) (Figure 3.16) – were encapsulated within a gel sample. To achieve this, 0.1 mg of
selected dye was dissolved in 1 mL H2O, and then to this solution was added 0.5 mg PI and 50 mg
PEGDM; for hybrid gels, after addition of PEGDM and PI, 2 mg of DBS-CO2H was added,
followed by sonication to disperse and then addition of NaOH(aq) (0.5 M) to dissolve. The solutions
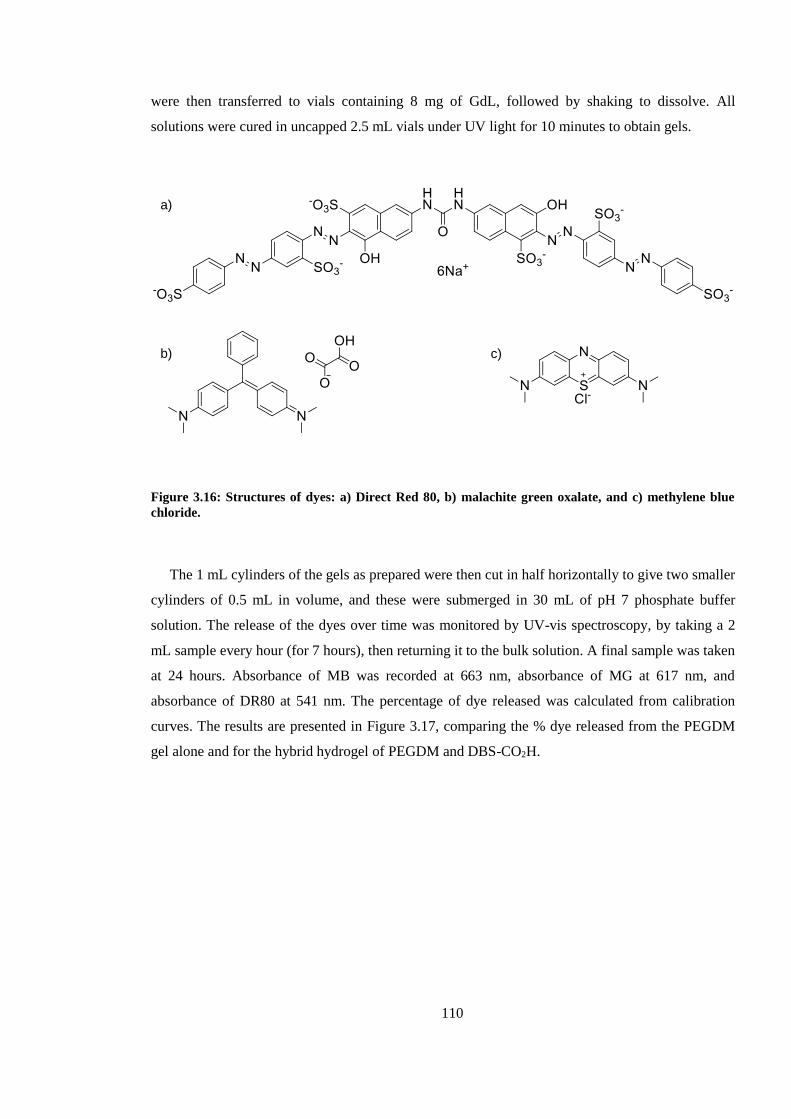
110
were then transferred to vials containing 8 mg of GdL, followed by shaking to dissolve. All
solutions were cured in uncapped 2.5 mL vials under UV light for 10 minutes to obtain gels.
Figure 3.16: Structures of dyes: a) Direct Red 80, b) malachite green oxalate, and c) methylene blue
chloride.
The 1 mL cylinders of the gels as prepared were then cut in half horizontally to give two smaller
cylinders of 0.5 mL in volume, and these were submerged in 30 mL of pH 7 phosphate buffer
solution. The release of the dyes over time was monitored by UV-vis spectroscopy, by taking a 2
mL sample every hour (for 7 hours), then returning it to the bulk solution. A final sample was taken
at 24 hours. Absorbance of MB was recorded at 663 nm, absorbance of MG at 617 nm, and
absorbance of DR80 at 541 nm. The percentage of dye released was calculated from calibration
curves. The results are presented in Figure 3.17, comparing the % dye released from the PEGDM
gel alone and for the hybrid hydrogel of PEGDM and DBS-CO2H.
a)
b) c)
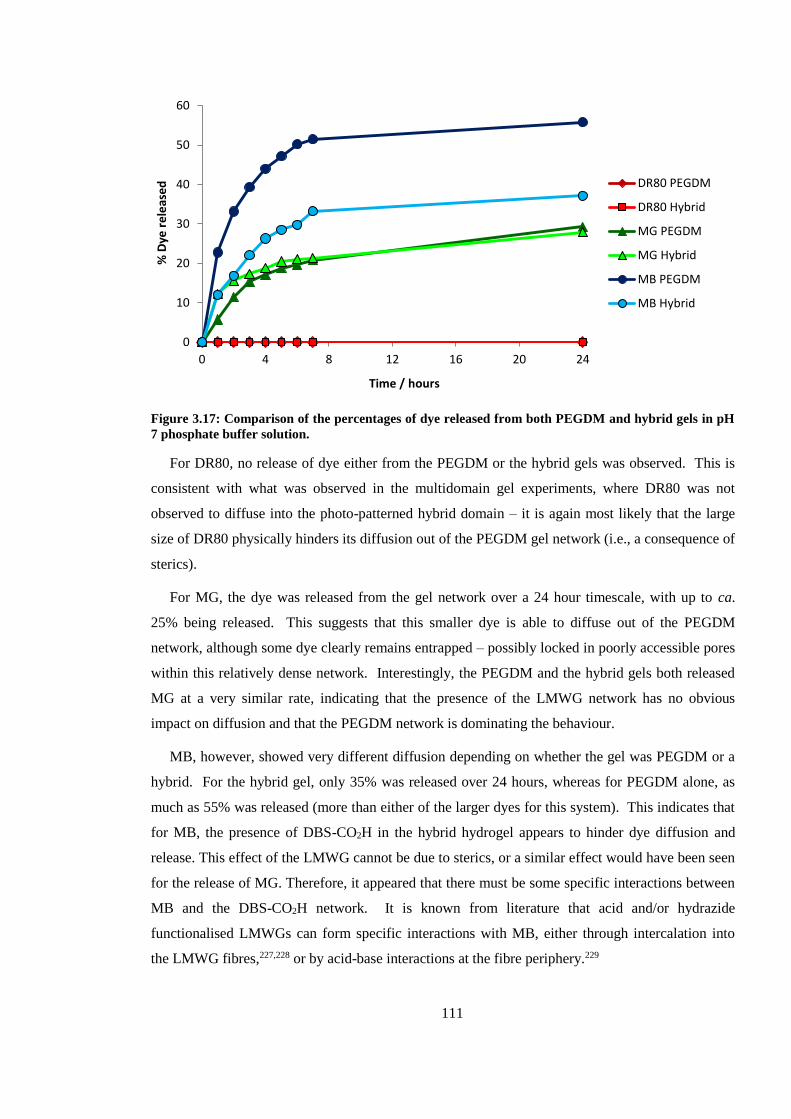
111
Figure 3.17: Comparison of the percentages of dye released from both PEGDM and hybrid gels in pH
7 phosphate buffer solution.
For DR80, no release of dye either from the PEGDM or the hybrid gels was observed. This is
consistent with what was observed in the multidomain gel experiments, where DR80 was not
observed to diffuse into the photo-patterned hybrid domain – it is again most likely that the large
size of DR80 physically hinders its diffusion out of the PEGDM gel network (i.e., a consequence of
sterics).
For MG, the dye was released from the gel network over a 24 hour timescale, with up to ca.
25% being released. This suggests that this smaller dye is able to diffuse out of the PEGDM
network, although some dye clearly remains entrapped – possibly locked in poorly accessible pores
within this relatively dense network. Interestingly, the PEGDM and the hybrid gels both released
MG at a very similar rate, indicating that the presence of the LMWG network has no obvious
impact on diffusion and that the PEGDM network is dominating the behaviour.
MB, however, showed very different diffusion depending on whether the gel was PEGDM or a
hybrid. For the hybrid gel, only 35% was released over 24 hours, whereas for PEGDM alone, as
much as 55% was released (more than either of the larger dyes for this system). This indicates that
for MB, the presence of DBS-CO2H in the hybrid hydrogel appears to hinder dye diffusion and
release. This effect of the LMWG cannot be due to sterics, or a similar effect would have been seen
for the release of MG. Therefore, it appeared that there must be some specific interactions between
MB and the DBS-CO2H network. It is known from literature that acid and/or hydrazide
functionalised LMWGs can form specific interactions with MB, either through intercalation into
the LMWG fibres,227,228 or by acid-base interactions at the fibre periphery.229
0
10
20
30
40
50
60
0 4 8 12 16 20 24
% D
ye r
ele
ase
d
Time / hours
DR80 PEGDM
DR80 Hybrid
MG PEGDM
MG Hybrid
MB PEGDM
MB Hybrid
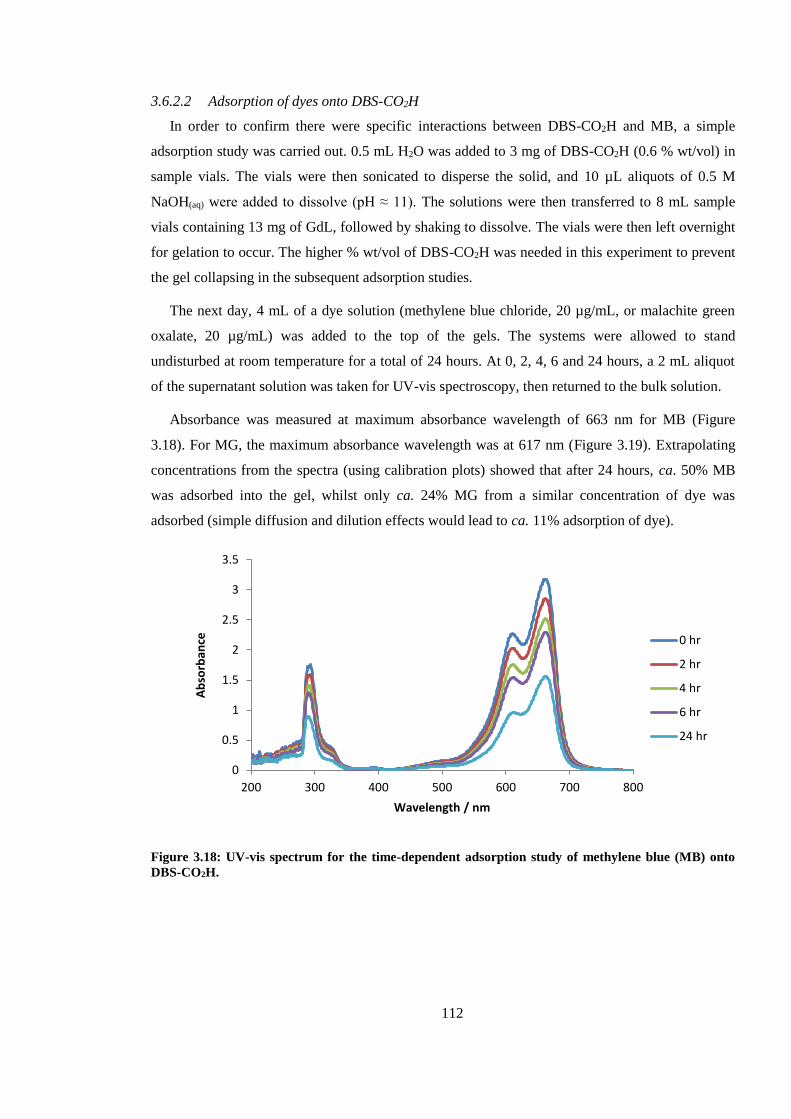
112
3.6.2.2 Adsorption of dyes onto DBS-CO2H
In order to confirm there were specific interactions between DBS-CO2H and MB, a simple
adsorption study was carried out. 0.5 mL H2O was added to 3 mg of DBS-CO2H (0.6 % wt/vol) in
sample vials. The vials were then sonicated to disperse the solid, and 10 µL aliquots of 0.5 M
NaOH(aq) were added to dissolve (pH ≈ 11). The solutions were then transferred to 8 mL sample
vials containing 13 mg of GdL, followed by shaking to dissolve. The vials were then left overnight
for gelation to occur. The higher % wt/vol of DBS-CO2H was needed in this experiment to prevent
the gel collapsing in the subsequent adsorption studies.
The next day, 4 mL of a dye solution (methylene blue chloride, 20 µg/mL, or malachite green
oxalate, 20 µg/mL) was added to the top of the gels. The systems were allowed to stand
undisturbed at room temperature for a total of 24 hours. At 0, 2, 4, 6 and 24 hours, a 2 mL aliquot
of the supernatant solution was taken for UV-vis spectroscopy, then returned to the bulk solution.
Absorbance was measured at maximum absorbance wavelength of 663 nm for MB (Figure
3.18). For MG, the maximum absorbance wavelength was at 617 nm (Figure 3.19). Extrapolating
concentrations from the spectra (using calibration plots) showed that after 24 hours, ca. 50% MB
was adsorbed into the gel, whilst only ca. 24% MG from a similar concentration of dye was
adsorbed (simple diffusion and dilution effects would lead to ca. 11% adsorption of dye).
Figure 3.18: UV-vis spectrum for the time-dependent adsorption study of methylene blue (MB) onto
DBS-CO2H.
0
0.5
1
1.5
2
2.5
3
3.5
200 300 400 500 600 700 800
Ab
sorb
ance
Wavelength / nm
0 hr
2 hr
4 hr
6 hr
24 hr
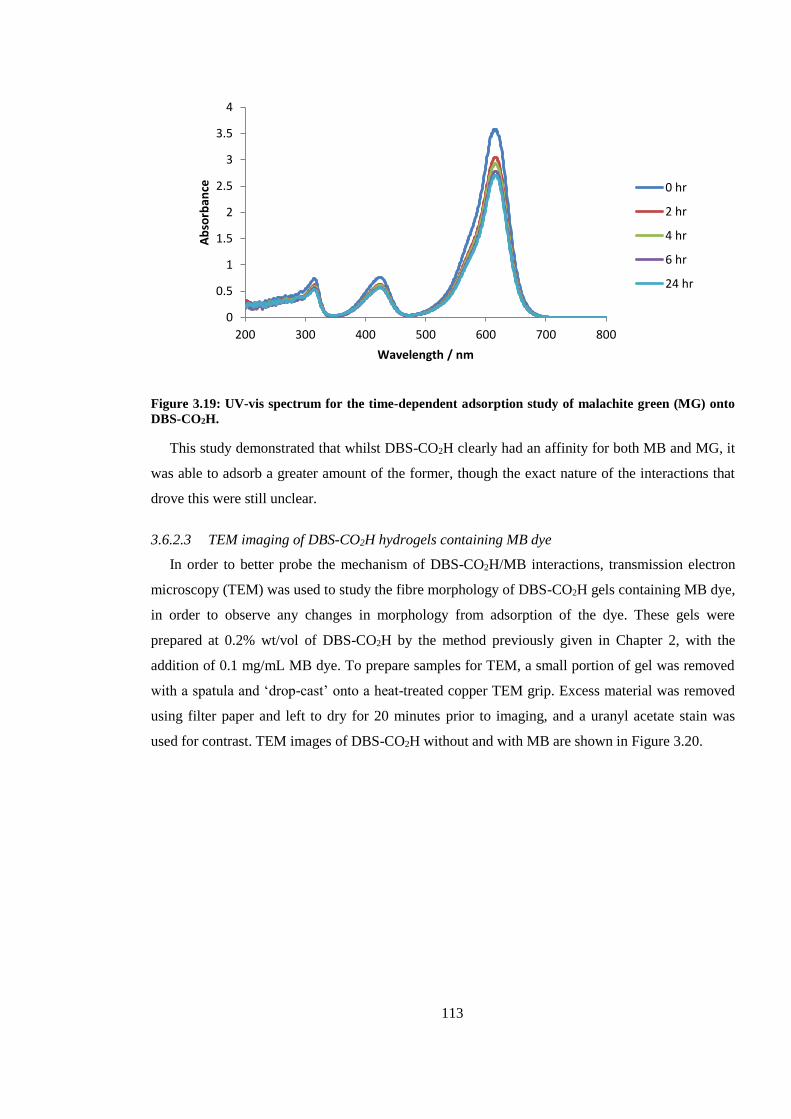
113
Figure 3.19: UV-vis spectrum for the time-dependent adsorption study of malachite green (MG) onto
DBS-CO2H.
This study demonstrated that whilst DBS-CO2H clearly had an affinity for both MB and MG, it
was able to adsorb a greater amount of the former, though the exact nature of the interactions that
drove this were still unclear.
3.6.2.3 TEM imaging of DBS-CO2H hydrogels containing MB dye
In order to better probe the mechanism of DBS-CO2H/MB interactions, transmission electron
microscopy (TEM) was used to study the fibre morphology of DBS-CO2H gels containing MB dye,
in order to observe any changes in morphology from adsorption of the dye. These gels were
prepared at 0.2% wt/vol of DBS-CO2H by the method previously given in Chapter 2, with the
addition of 0.1 mg/mL MB dye. To prepare samples for TEM, a small portion of gel was removed
with a spatula and ‘drop-cast’ onto a heat-treated copper TEM grip. Excess material was removed
using filter paper and left to dry for 20 minutes prior to imaging, and a uranyl acetate stain was
used for contrast. TEM images of DBS-CO2H without and with MB are shown in Figure 3.20.
0
0.5
1
1.5
2
2.5
3
3.5
4
200 300 400 500 600 700 800
Ab
sorb
ance
Wavelength / nm
0 hr
2 hr
4 hr
6 hr
24 hr
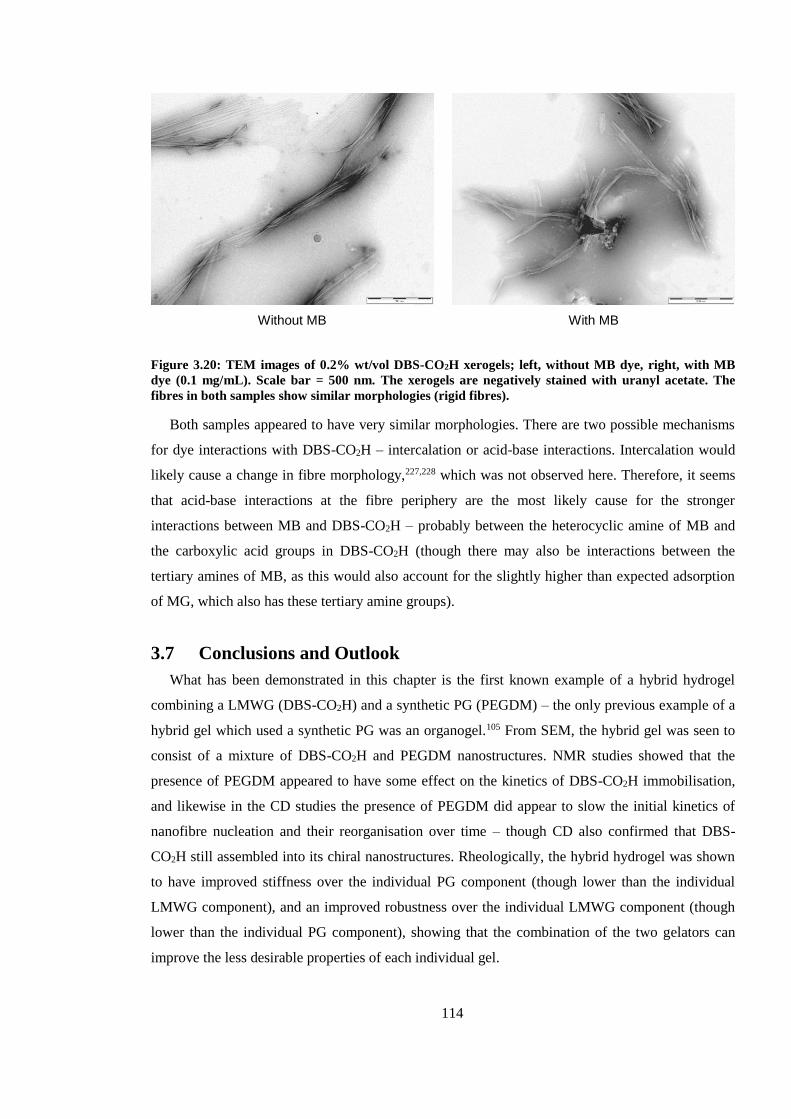
114
Figure 3.20: TEM images of 0.2% wt/vol DBS-CO2H xerogels; left, without MB dye, right, with MB
dye (0.1 mg/mL). Scale bar = 500 nm. The xerogels are negatively stained with uranyl acetate. The
fibres in both samples show similar morphologies (rigid fibres).
Both samples appeared to have very similar morphologies. There are two possible mechanisms
for dye interactions with DBS-CO2H – intercalation or acid-base interactions. Intercalation would
likely cause a change in fibre morphology,227,228 which was not observed here. Therefore, it seems
that acid-base interactions at the fibre periphery are the most likely cause for the stronger
interactions between MB and DBS-CO2H – probably between the heterocyclic amine of MB and
the carboxylic acid groups in DBS-CO2H (though there may also be interactions between the
tertiary amines of MB, as this would also account for the slightly higher than expected adsorption
of MG, which also has these tertiary amine groups).
3.7 Conclusions and Outlook
What has been demonstrated in this chapter is the first known example of a hybrid hydrogel
combining a LMWG (DBS-CO2H) and a synthetic PG (PEGDM) – the only previous example of a
hybrid gel which used a synthetic PG was an organogel.105 From SEM, the hybrid gel was seen to
consist of a mixture of DBS-CO2H and PEGDM nanostructures. NMR studies showed that the
presence of PEGDM appeared to have some effect on the kinetics of DBS-CO2H immobilisation,
and likewise in the CD studies the presence of PEGDM did appear to slow the initial kinetics of
nanofibre nucleation and their reorganisation over time – though CD also confirmed that DBS-
CO2H still assembled into its chiral nanostructures. Rheologically, the hybrid hydrogel was shown
to have improved stiffness over the individual PG component (though lower than the individual
LMWG component), and an improved robustness over the individual LMWG component (though
lower than the individual PG component), showing that the combination of the two gelators can
improve the less desirable properties of each individual gel.
Without MB With MB
115
Most importantly, this hybrid system demonstrated that through controlled exposure to UV
photoirradiation, different regions could be spatially patterned into the material, resulting in a
multidomain hydrogel. This was the first report of multidomain hydrogels to include a LMWG
system. In these multidomain gels, either one or two gelator networks were present in each domain,
which led to differences in materials behaviour and diffusion. Additionally, on examining the
controlled release of dyes from hybrid gels, it was seen that both networks played active roles,
either due to the density of the network (PEGDM) or through specific interactions between the dye
molecules and the gelator network (DBS-CO2H).
Such photopatternable materials with controlled release abilities would have great potential in
several fields of application. Firstly, in microfluidics, where patterns to control diffusion could be
designed. Secondly, in drug delivery, where writing in the different domains would generate gels
with differential kinetics of drug release, depending on the composition of the domain – for
example, burst release from a weak LMWG domain, with sustained controlled release from a
robust hybrid domain. Thirdly, in tissue engineering, where complex microscale patterns with
greater spatial definition (achievable with laser irradiation) could be used to encourage differential
cell growth. This latter application would also benefit from the use of two-photon polymerisation
(2PP),230–232 which would allow for patterning in 3D – the main drawback of the simple masking
method used here it that it only allows for only 2D photopatterning. For these biomedical
applications, whilst PEGDM is reasonably biocompatible (and can be further modified to improve
its biocompatibility195–201), DBS-CO2H, being formed at a relatively acidic pH, is likely to not be –
hence a LMWG which forms a gel at a more biologically-friendly pH would need to be used.
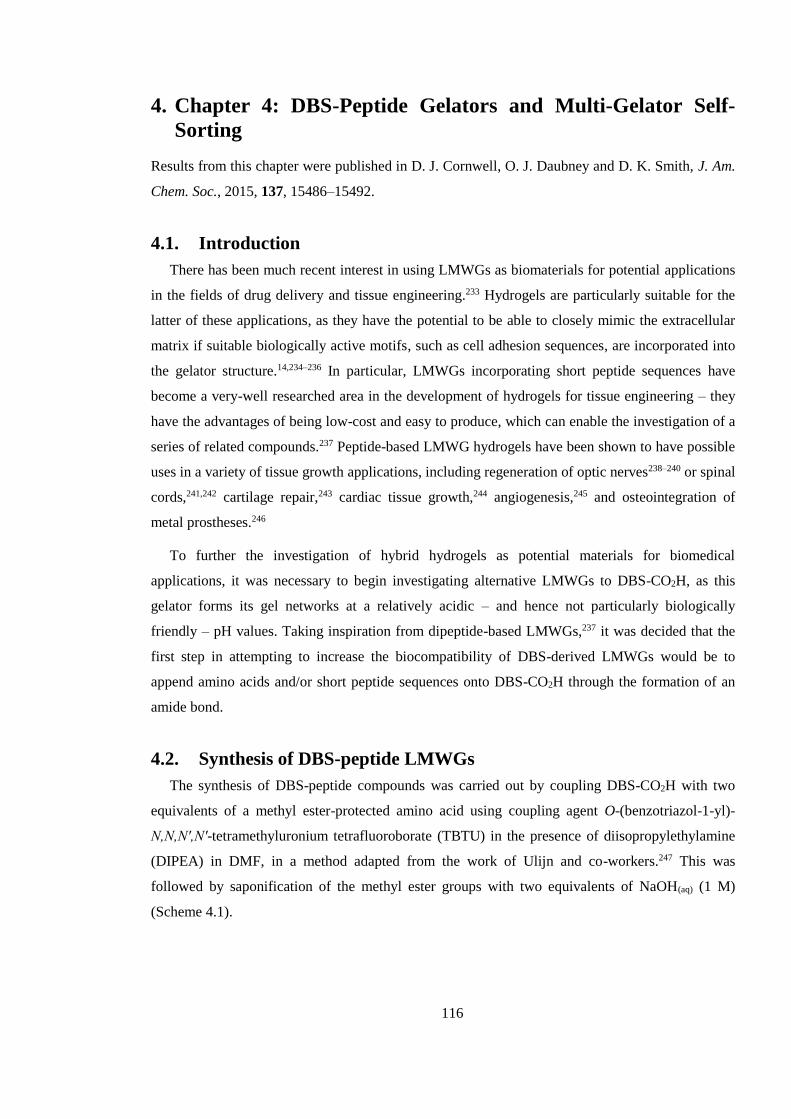
116
4. Chapter 4: DBS-Peptide Gelators and Multi-Gelator Self-
Sorting
Results from this chapter were published in D. J. Cornwell, O. J. Daubney and D. K. Smith, J. Am.
Chem. Soc., 2015, 137, 15486–15492.
4.1. Introduction
There has been much recent interest in using LMWGs as biomaterials for potential applications
in the fields of drug delivery and tissue engineering.233 Hydrogels are particularly suitable for the
latter of these applications, as they have the potential to be able to closely mimic the extracellular
matrix if suitable biologically active motifs, such as cell adhesion sequences, are incorporated into
the gelator structure.14,234–236 In particular, LMWGs incorporating short peptide sequences have
become a very-well researched area in the development of hydrogels for tissue engineering – they
have the advantages of being low-cost and easy to produce, which can enable the investigation of a
series of related compounds.237 Peptide-based LMWG hydrogels have been shown to have possible
uses in a variety of tissue growth applications, including regeneration of optic nerves238–240 or spinal
cords,241,242 cartilage repair,243 cardiac tissue growth,244 angiogenesis,245 and osteointegration of
metal prostheses.246
To further the investigation of hybrid hydrogels as potential materials for biomedical
applications, it was necessary to begin investigating alternative LMWGs to DBS-CO2H, as this
gelator forms its gel networks at a relatively acidic – and hence not particularly biologically
friendly – pH values. Taking inspiration from dipeptide-based LMWGs,237 it was decided that the
first step in attempting to increase the biocompatibility of DBS-derived LMWGs would be to
append amino acids and/or short peptide sequences onto DBS-CO2H through the formation of an
amide bond.
4.2. Synthesis of DBS-peptide LMWGs
The synthesis of DBS-peptide compounds was carried out by coupling DBS-CO2H with two
equivalents of a methyl ester-protected amino acid using coupling agent O-(benzotriazol-1-yl)-
N,N,N′,N′-tetramethyluronium tetrafluoroborate (TBTU) in the presence of diisopropylethylamine
(DIPEA) in DMF, in a method adapted from the work of Ulijn and co-workers.247 This was
followed by saponification of the methyl ester groups with two equivalents of NaOH(aq) (1 M)
(Scheme 4.1).
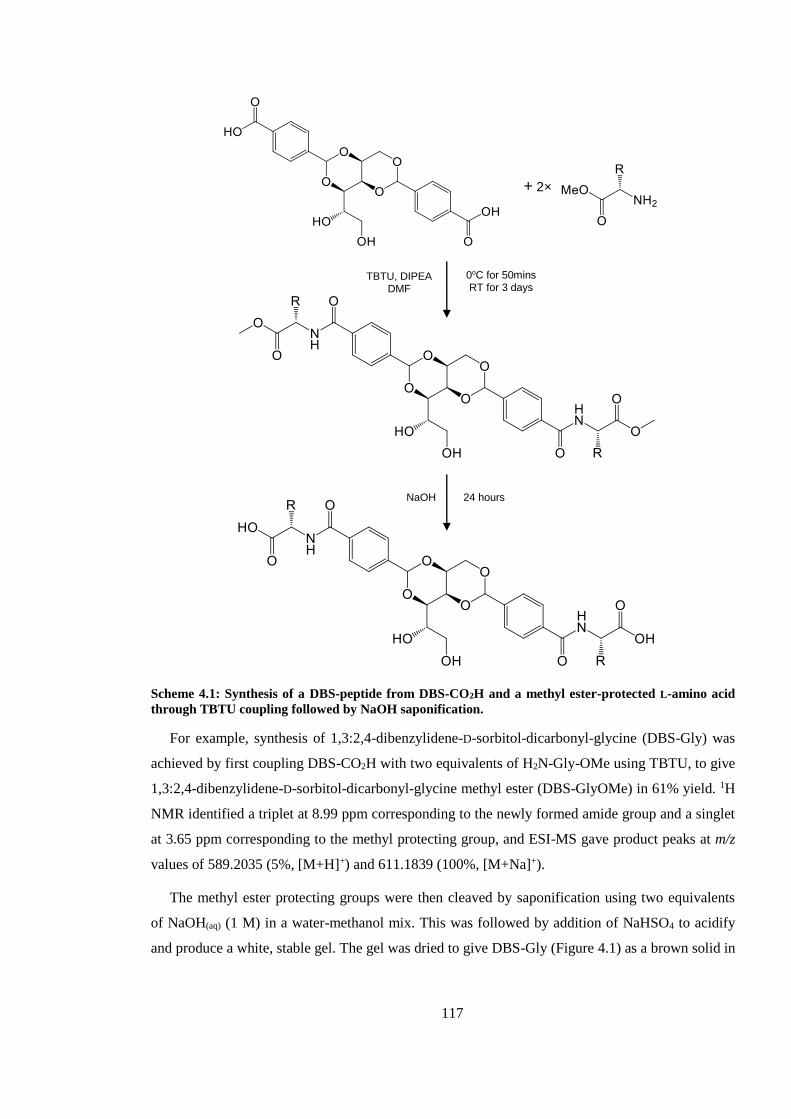
117
Scheme 4.1: Synthesis of a DBS-peptide from DBS-CO2H and a methyl ester-protected L-amino acid
through TBTU coupling followed by NaOH saponification.
For example, synthesis of 1,3:2,4-dibenzylidene-D-sorbitol-dicarbonyl-glycine (DBS-Gly) was
achieved by first coupling DBS-CO2H with two equivalents of H2N-Gly-OMe using TBTU, to give
1,3:2,4-dibenzylidene-D-sorbitol-dicarbonyl-glycine methyl ester (DBS-GlyOMe) in 61% yield. 1H
NMR identified a triplet at 8.99 ppm corresponding to the newly formed amide group and a singlet
at 3.65 ppm corresponding to the methyl protecting group, and ESI-MS gave product peaks at m/z
values of 589.2035 (5%, [M+H]+) and 611.1839 (100%, [M+Na]+).
The methyl ester protecting groups were then cleaved by saponification using two equivalents
of NaOH(aq) (1 M) in a water-methanol mix. This was followed by addition of NaHSO4 to acidify
and produce a white, stable gel. The gel was dried to give DBS-Gly (Figure 4.1) as a brown solid in
TBTU, DIPEA DMF
0oC for 50mins RT for 3 days
NaOH 24 hours
+ 2×
118
59% yield. 1H NMR showed an absence of the methyl ester protecting group, and ESI-MS gave a
product peak at a m/z value of 559.1592 (100%, [M-H]-).
The syntheses of 1,3:2,4-dibenzylidene-D-sorbitol-dicarbonyl-phenylalanine (DBS-Phe, Figure
4.1) and 1,3:2,4-dibenzylidene-D-sorbitol-dicarbonyl-tryptophan (DBS-Trp, Figure 4.1) were
similarly carried out, with yields of 68% (DBS-PheOMe) and 69% (DBS-Phe), and 97% (DBS-
TrpOMe) and 52% (DBS-Trp). Attempts were also made to synthesise both 1,3:2,4-dibenzylidene-
D-sorbitol-dicarbonyl-alanine (DBS-Ala) and 1,3:2,4-dibenzylidene-D-sorbitol-dicarbonyl-aspartic
acid (DBS-Asp), but these were unsuccessful due to the high solubility of the intermediate in DMF.
Figure 4.1: Successfully synthesised DBS-peptide potential LMWGs DBS-Gly, DBS-Phe, and DBS-
Trp.
4.3. Gelation studies of DBS-peptide LMWGs
4.3.1. Reproducibility of certain results
The initial three batches of DBS-Gly successfully synthesised showed great promise as a gelator
that produced a gel by either heat-cool or pH change methods, and as such both approaches are
DBS-Gly
DBS-Phe
DBS-Trp
119
discussed below. However, after the initial batches of DBS-Gly were almost exhausted, it became
apparent that there were issues regarding the solubility of subsequent batches of the gelator. Whilst
these batches of DBS Gly were all able to form gels by applying the pH change methodology, only
certain batches functioned as heat-cool LMWGs, and even then with varying levels of success.
When heated to dissolve the solid, some batches remained insoluble and instead of gelation, only
precipitation, or partial inhomogeneous gelation were observed.
The synthesis was closely examined but no obvious problems were found. The different batches
of DBS-Gly (including the original, fully-functional batches) were compared by 1H NMR to check
for impurities that could either disrupt or promote gelation, but none were observed. The different
batches of DBS-Gly were washed with a variety of hot and cold solvents (to attempt to remove any
impurities not visible by NMR), but these made little difference to the solubility of the compound.
The pKa values of the different batches were determined, and whilst there was some variation, with
values ranging from ca. 4.1 to 4.4, there was no clear divide between those batches that functioned
as heat-cool LMWGs and those that did not, and this variation was within the range of error for the
pH meter used.
It was concluded that the issue of solubility is likely to be due to the packing structure that
DBS-Gly adopts in the solid form produced during the final stages of synthesis. Similar issues were
encountered by Escuder and co-workers, who found that relatively slight changes in environmental
parameters during gel preparation affected the polymorph structure.248 By extension, it can be
assumed that as a gel is formed as part of the synthesis for DBS-Gly, small, and not easily
controllable, changes in the surrounding environment could affect the packing structure for the
LMWG, and hence its solubility when it comes to producing gels by the heat/cool method. The pH
change method remains unaffected as it involves deprotonation to solubilise the gelator, and the
protonated version is formed in the same way each time. As such, the pH change approach is fully
reproducible, while the heat-cool method remains irreproducible until a means of reliably forming
the compound in the desired sold polymorph is found.
4.3.2. Preparation and Tgel studies of hydrogels of DBS-peptide LMWGs
4.3.2.1. DBS-Gly
Gels of DBS-Gly were prepared by first weighing a known amount of the gelator into a 2.5 ml
glass sample vial; 1 ml of H2O was then added and the tube was sealed. One of two methods could
then be used to induce gelation. The first was a heat-cool method, in which the sample was heated
to 95°C in a thermoregulated oil bath to fully dissolve the LMWG, then cooled to room
temperature to induce self-assembly, after which an optically transparent gel was formed (Figure
4.2a).
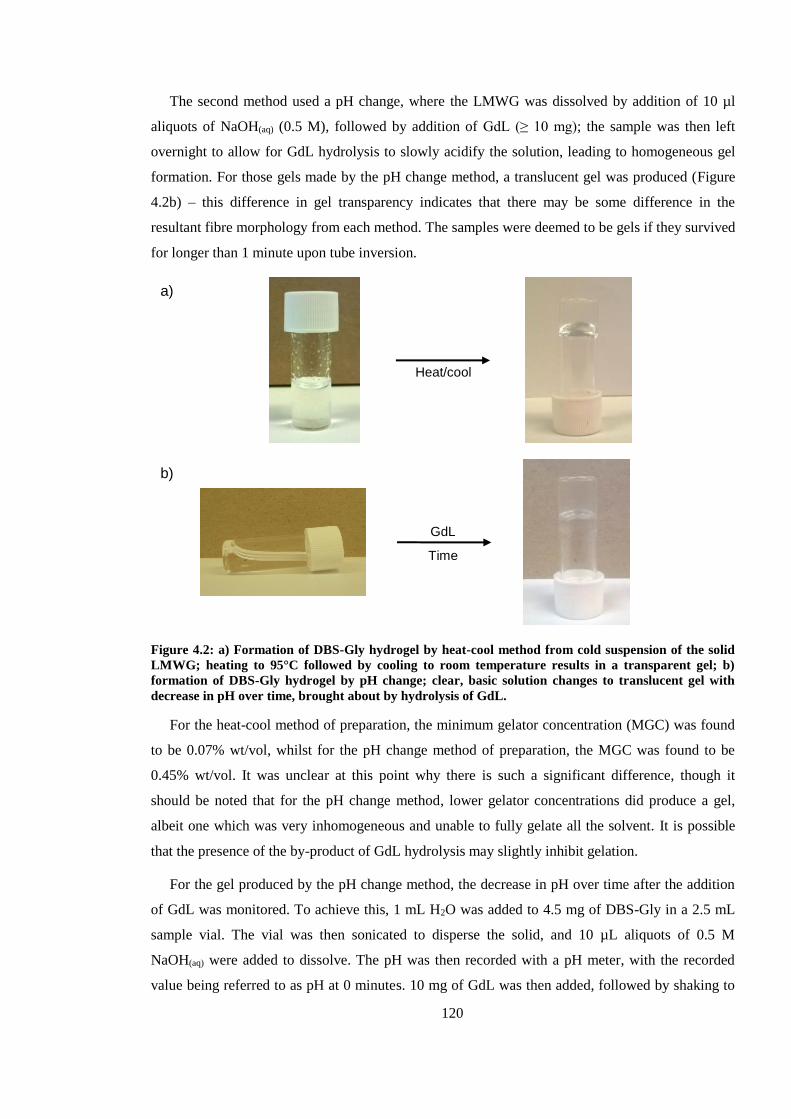
120
The second method used a pH change, where the LMWG was dissolved by addition of 10 µl
aliquots of NaOH(aq) (0.5 M), followed by addition of GdL (≥ 10 mg); the sample was then left
overnight to allow for GdL hydrolysis to slowly acidify the solution, leading to homogeneous gel
formation. For those gels made by the pH change method, a translucent gel was produced (Figure
4.2b) – this difference in gel transparency indicates that there may be some difference in the
resultant fibre morphology from each method. The samples were deemed to be gels if they survived
for longer than 1 minute upon tube inversion.
Figure 4.2: a) Formation of DBS-Gly hydrogel by heat-cool method from cold suspension of the solid
LMWG; heating to 95°C followed by cooling to room temperature results in a transparent gel; b)
formation of DBS-Gly hydrogel by pH change; clear, basic solution changes to translucent gel with
decrease in pH over time, brought about by hydrolysis of GdL.
For the heat-cool method of preparation, the minimum gelator concentration (MGC) was found
to be 0.07% wt/vol, whilst for the pH change method of preparation, the MGC was found to be
0.45% wt/vol. It was unclear at this point why there is such a significant difference, though it
should be noted that for the pH change method, lower gelator concentrations did produce a gel,
albeit one which was very inhomogeneous and unable to fully gelate all the solvent. It is possible
that the presence of the by-product of GdL hydrolysis may slightly inhibit gelation.
For the gel produced by the pH change method, the decrease in pH over time after the addition
of GdL was monitored. To achieve this, 1 mL H2O was added to 4.5 mg of DBS-Gly in a 2.5 mL
sample vial. The vial was then sonicated to disperse the solid, and 10 µL aliquots of 0.5 M
NaOH(aq) were added to dissolve. The pH was then recorded with a pH meter, with the recorded
value being referred to as pH at 0 minutes. 10 mg of GdL was then added, followed by shaking to
b)
GdL
Time
a)
Heat/cool
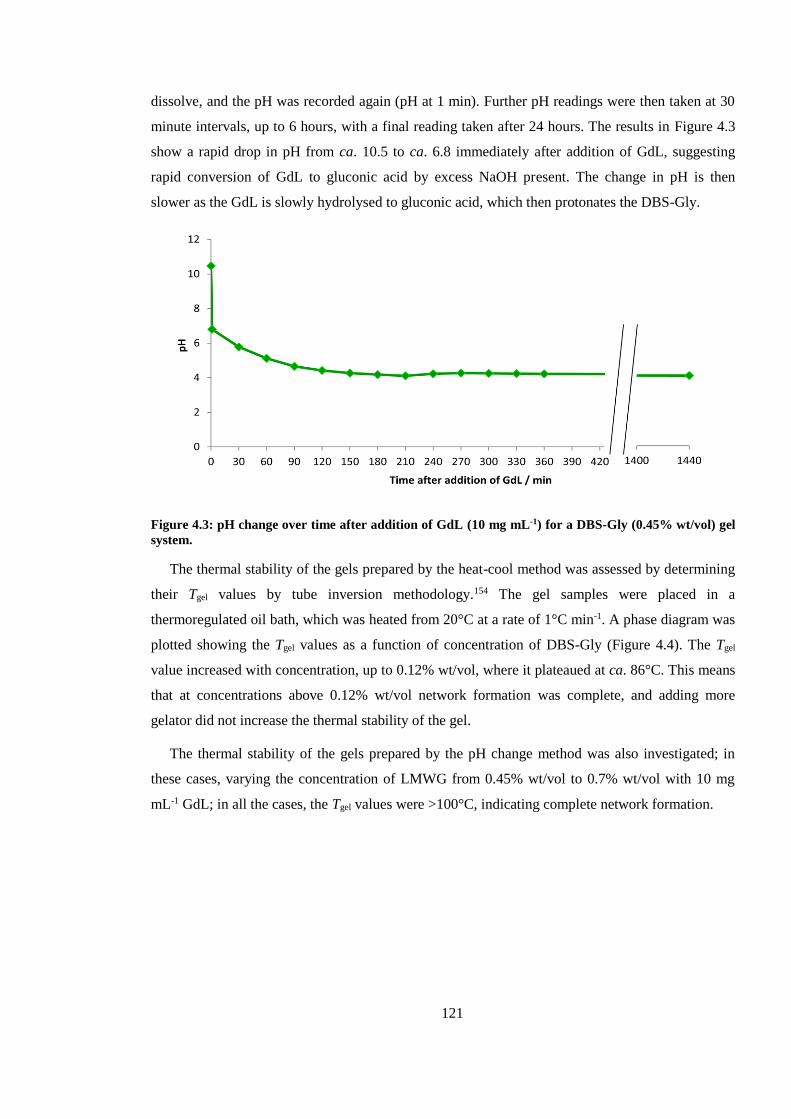
121
dissolve, and the pH was recorded again (pH at 1 min). Further pH readings were then taken at 30
minute intervals, up to 6 hours, with a final reading taken after 24 hours. The results in Figure 4.3
show a rapid drop in pH from ca. 10.5 to ca. 6.8 immediately after addition of GdL, suggesting
rapid conversion of GdL to gluconic acid by excess NaOH present. The change in pH is then
slower as the GdL is slowly hydrolysed to gluconic acid, which then protonates the DBS-Gly.
Figure 4.3: pH change over time after addition of GdL (10 mg mL-1) for a DBS-Gly (0.45% wt/vol) gel
system.
The thermal stability of the gels prepared by the heat-cool method was assessed by determining
their Tgel values by tube inversion methodology.154 The gel samples were placed in a
thermoregulated oil bath, which was heated from 20°C at a rate of 1°C min-1. A phase diagram was
plotted showing the Tgel values as a function of concentration of DBS-Gly (Figure 4.4). The Tgel
value increased with concentration, up to 0.12% wt/vol, where it plateaued at ca. 86°C. This means
that at concentrations above 0.12% wt/vol network formation was complete, and adding more
gelator did not increase the thermal stability of the gel.
The thermal stability of the gels prepared by the pH change method was also investigated; in
these cases, varying the concentration of LMWG from 0.45% wt/vol to 0.7% wt/vol with 10 mg
mL-1 GdL; in all the cases, the Tgel values were >100°C, indicating complete network formation.
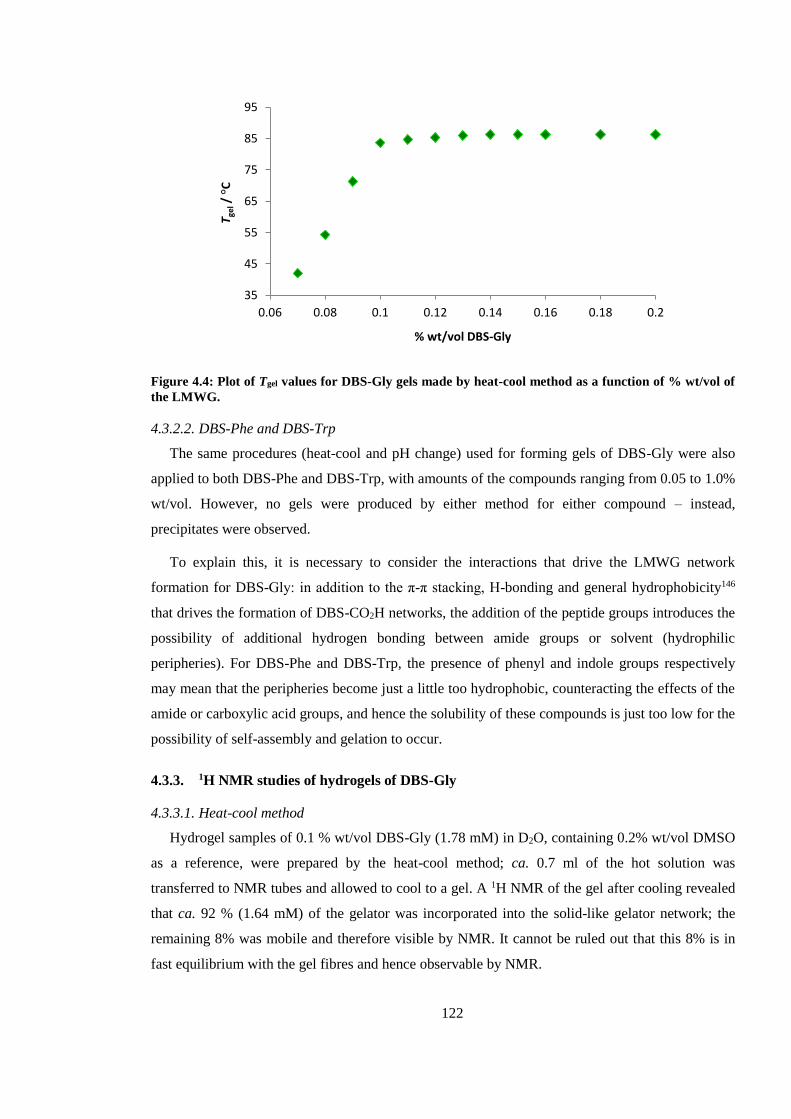
122
Figure 4.4: Plot of Tgel values for DBS-Gly gels made by heat-cool method as a function of % wt/vol of
the LMWG.
4.3.2.2. DBS-Phe and DBS-Trp
The same procedures (heat-cool and pH change) used for forming gels of DBS-Gly were also
applied to both DBS-Phe and DBS-Trp, with amounts of the compounds ranging from 0.05 to 1.0%
wt/vol. However, no gels were produced by either method for either compound – instead,
precipitates were observed.
To explain this, it is necessary to consider the interactions that drive the LMWG network
formation for DBS-Gly: in addition to the π-π stacking, H-bonding and general hydrophobicity146
that drives the formation of DBS-CO2H networks, the addition of the peptide groups introduces the
possibility of additional hydrogen bonding between amide groups or solvent (hydrophilic
peripheries). For DBS-Phe and DBS-Trp, the presence of phenyl and indole groups respectively
may mean that the peripheries become just a little too hydrophobic, counteracting the effects of the
amide or carboxylic acid groups, and hence the solubility of these compounds is just too low for the
possibility of self-assembly and gelation to occur.
4.3.3. 1H NMR studies of hydrogels of DBS-Gly
4.3.3.1. Heat-cool method
Hydrogel samples of 0.1 % wt/vol DBS-Gly (1.78 mM) in D2O, containing 0.2% wt/vol DMSO
as a reference, were prepared by the heat-cool method; ca. 0.7 ml of the hot solution was
transferred to NMR tubes and allowed to cool to a gel. A 1H NMR of the gel after cooling revealed
that ca. 92 % (1.64 mM) of the gelator was incorporated into the solid-like gelator network; the
remaining 8% was mobile and therefore visible by NMR. It cannot be ruled out that this 8% is in
fast equilibrium with the gel fibres and hence observable by NMR.
35
45
55
65
75
85
95
0.06 0.08 0.1 0.12 0.14 0.16 0.18 0.2
T ge
l/
°C
% wt/vol DBS-Gly
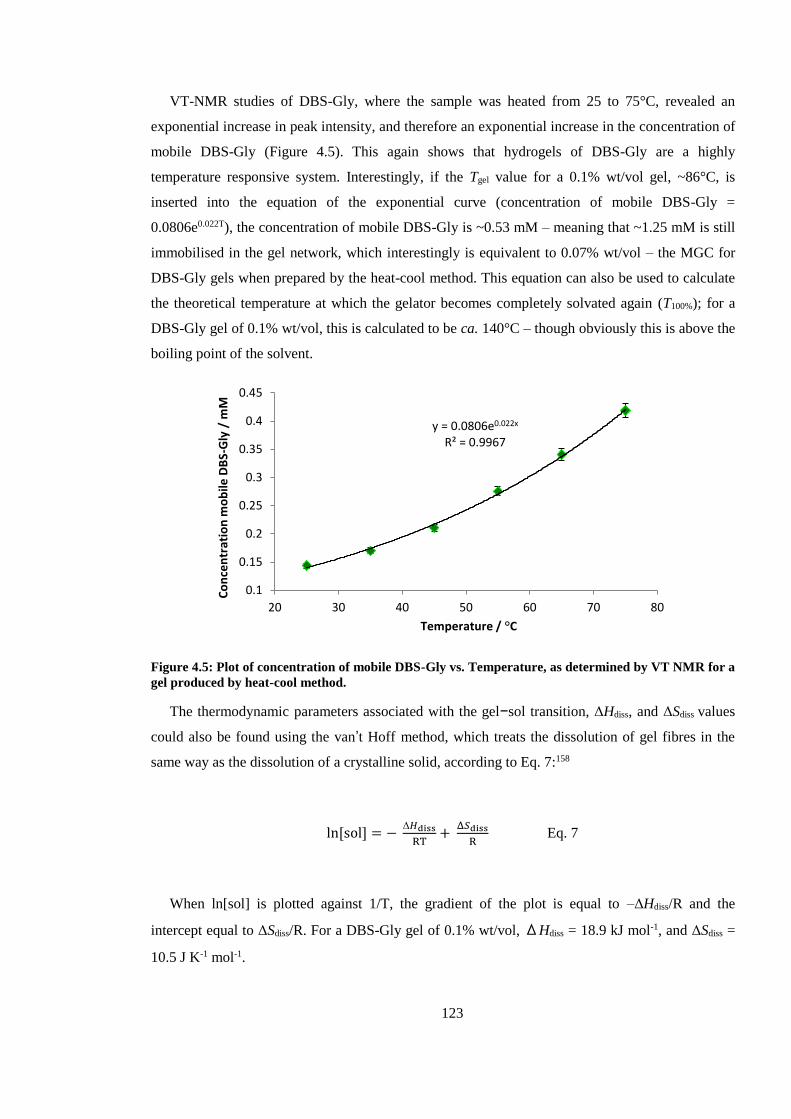
123
VT-NMR studies of DBS-Gly, where the sample was heated from 25 to 75°C, revealed an
exponential increase in peak intensity, and therefore an exponential increase in the concentration of
mobile DBS-Gly (Figure 4.5). This again shows that hydrogels of DBS-Gly are a highly
temperature responsive system. Interestingly, if the Tgel value for a 0.1% wt/vol gel, ~86°C, is
inserted into the equation of the exponential curve (concentration of mobile DBS-Gly =
0.0806e0.022T), the concentration of mobile DBS-Gly is ~0.53 mM – meaning that ~1.25 mM is still
immobilised in the gel network, which interestingly is equivalent to 0.07% wt/vol – the MGC for
DBS-Gly gels when prepared by the heat-cool method. This equation can also be used to calculate
the theoretical temperature at which the gelator becomes completely solvated again (T100%); for a
DBS-Gly gel of 0.1% wt/vol, this is calculated to be ca. 140°C – though obviously this is above the
boiling point of the solvent.
Figure 4.5: Plot of concentration of mobile DBS-Gly vs. Temperature, as determined by VT NMR for a
gel produced by heat-cool method.
The thermodynamic parameters associated with the gel−sol transition, ΔHdiss, and ΔSdiss values
could also be found using the van’t Hoff method, which treats the dissolution of gel fibres in the
same way as the dissolution of a crystalline solid, according to Eq. 7:158
ln[sol] = − Δ𝐻diss
RT+
Δ𝑆diss
R Eq. 7
When ln[sol] is plotted against 1/T, the gradient of the plot is equal to –ΔHdiss/R and the
intercept equal to ΔSdiss/R. For a DBS-Gly gel of 0.1% wt/vol, ΔHdiss = 18.9 kJ mol-1, and ΔSdiss =
10.5 J K-1 mol-1.
y = 0.0806e0.022x
R² = 0.9967
0.1
0.15
0.2
0.25
0.3
0.35
0.4
0.45
20 30 40 50 60 70 80
Co
nce
ntr
atio
n m
ob
ile D
BS-
Gly
/ m
M
Temperature / °C
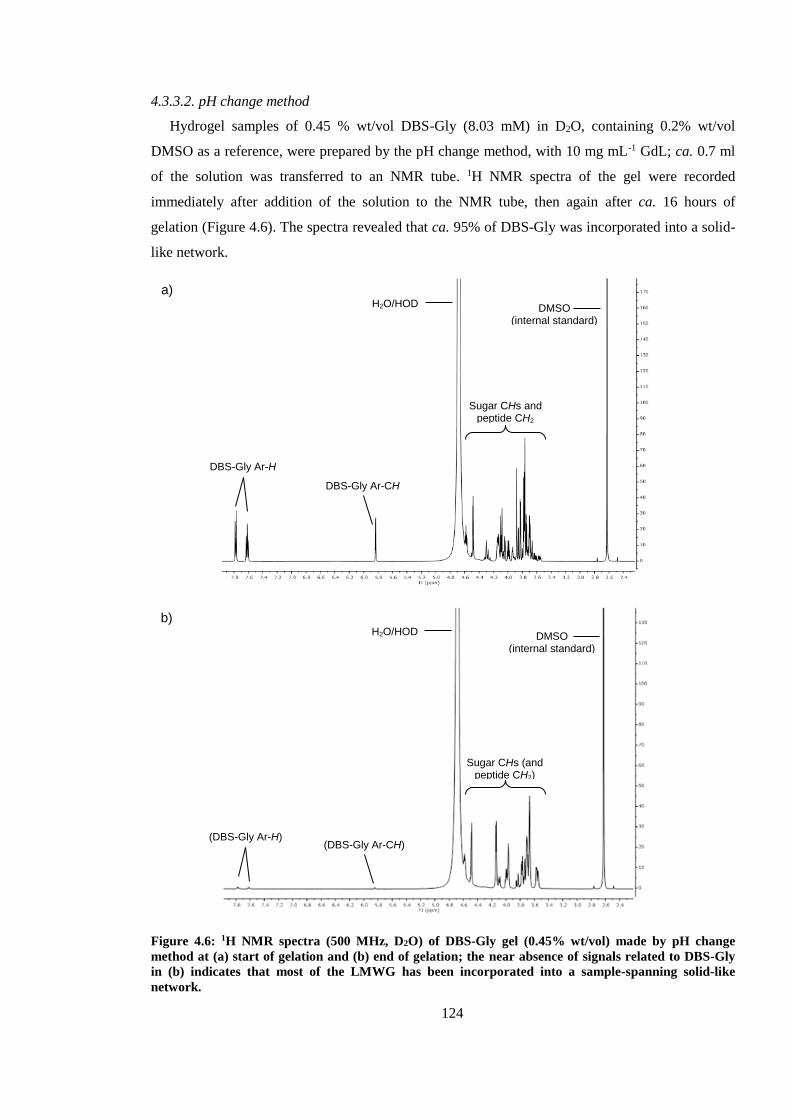
124
4.3.3.2. pH change method
Hydrogel samples of 0.45 % wt/vol DBS-Gly (8.03 mM) in D2O, containing 0.2% wt/vol
DMSO as a reference, were prepared by the pH change method, with 10 mg mL-1 GdL; ca. 0.7 ml
of the solution was transferred to an NMR tube. 1H NMR spectra of the gel were recorded
immediately after addition of the solution to the NMR tube, then again after ca. 16 hours of
gelation (Figure 4.6). The spectra revealed that ca. 95% of DBS-Gly was incorporated into a solid-
like network.
Figure 4.6: 1H NMR spectra (500 MHz, D2O) of DBS-Gly gel (0.45% wt/vol) made by pH change
method at (a) start of gelation and (b) end of gelation; the near absence of signals related to DBS-Gly
in (b) indicates that most of the LMWG has been incorporated into a sample-spanning solid-like
network.
b)
(DBS-Gly Ar-H) (DBS-Gly Ar-CH)
H2O/HOD
DMSO (internal standard)
Sugar CHs (and peptide CH2)
a)
DBS-Gly Ar-H
DBS-Gly Ar-CH
H2O/HOD
DMSO (internal standard)
Sugar CHs and peptide CH2
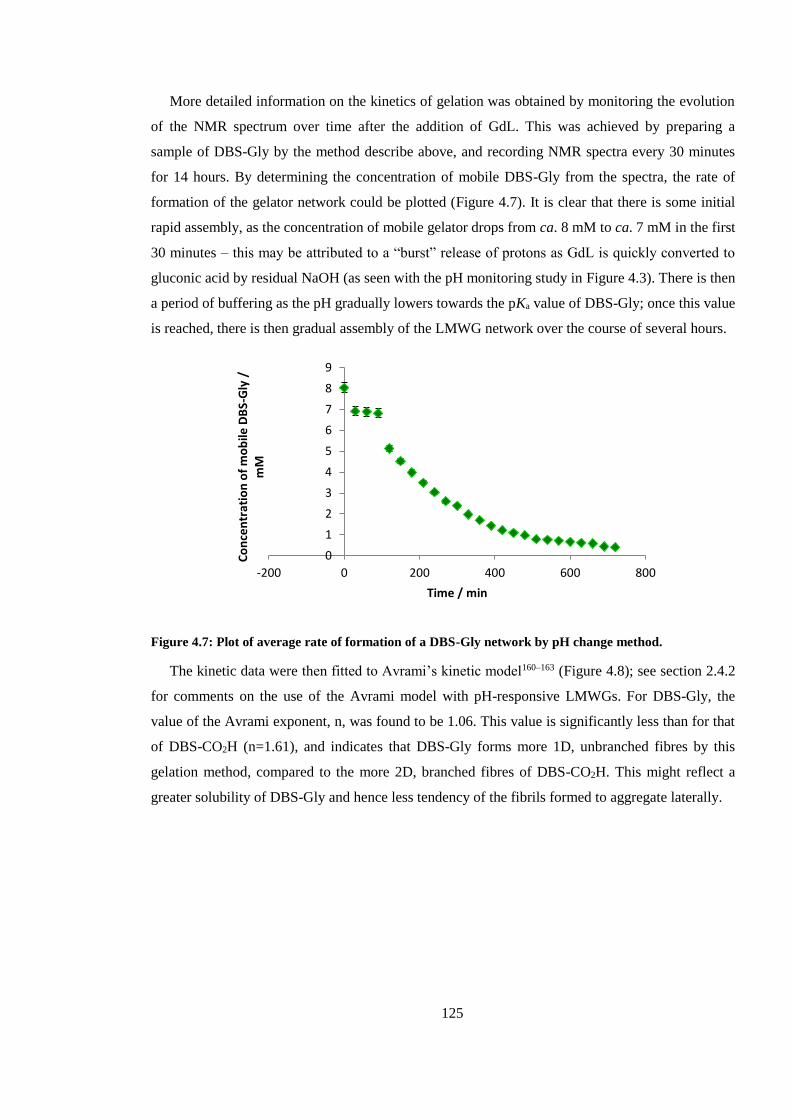
125
More detailed information on the kinetics of gelation was obtained by monitoring the evolution
of the NMR spectrum over time after the addition of GdL. This was achieved by preparing a
sample of DBS-Gly by the method describe above, and recording NMR spectra every 30 minutes
for 14 hours. By determining the concentration of mobile DBS-Gly from the spectra, the rate of
formation of the gelator network could be plotted (Figure 4.7). It is clear that there is some initial
rapid assembly, as the concentration of mobile gelator drops from ca. 8 mM to ca. 7 mM in the first
30 minutes – this may be attributed to a “burst” release of protons as GdL is quickly converted to
gluconic acid by residual NaOH (as seen with the pH monitoring study in Figure 4.3). There is then
a period of buffering as the pH gradually lowers towards the pKa value of DBS-Gly; once this value
is reached, there is then gradual assembly of the LMWG network over the course of several hours.
Figure 4.7: Plot of average rate of formation of a DBS-Gly network by pH change method.
The kinetic data were then fitted to Avrami’s kinetic model160–163 (Figure 4.8); see section 2.4.2
for comments on the use of the Avrami model with pH-responsive LMWGs. For DBS-Gly, the
value of the Avrami exponent, n, was found to be 1.06. This value is significantly less than for that
of DBS-CO2H (n=1.61), and indicates that DBS-Gly forms more 1D, unbranched fibres by this
gelation method, compared to the more 2D, branched fibres of DBS-CO2H. This might reflect a
greater solubility of DBS-Gly and hence less tendency of the fibrils formed to aggregate laterally.
0
1
2
3
4
5
6
7
8
9
-200 0 200 400 600 800
Co
nce
ntr
atio
n o
f m
ob
ile D
BS-
Gly
/
mM
Time / min
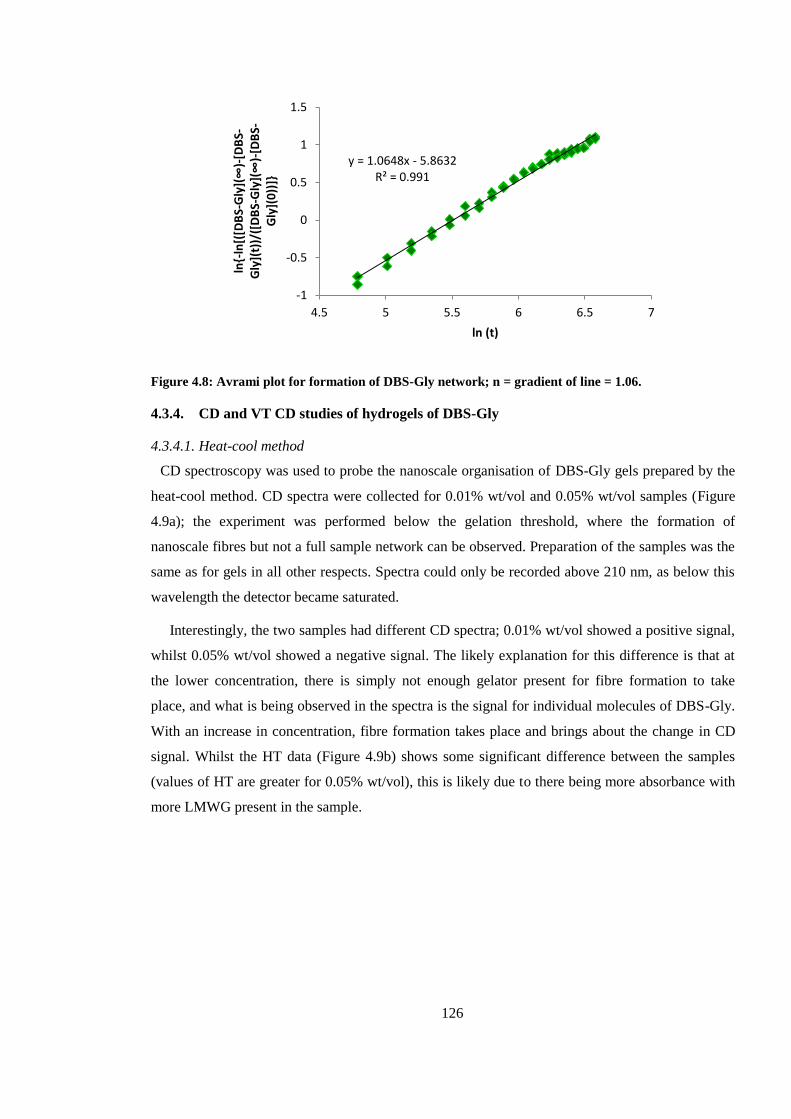
126
Figure 4.8: Avrami plot for formation of DBS-Gly network; n = gradient of line = 1.06.
4.3.4. CD and VT CD studies of hydrogels of DBS-Gly
4.3.4.1. Heat-cool method
CD spectroscopy was used to probe the nanoscale organisation of DBS-Gly gels prepared by the
heat-cool method. CD spectra were collected for 0.01% wt/vol and 0.05% wt/vol samples (Figure
4.9a); the experiment was performed below the gelation threshold, where the formation of
nanoscale fibres but not a full sample network can be observed. Preparation of the samples was the
same as for gels in all other respects. Spectra could only be recorded above 210 nm, as below this
wavelength the detector became saturated.
Interestingly, the two samples had different CD spectra; 0.01% wt/vol showed a positive signal,
whilst 0.05% wt/vol showed a negative signal. The likely explanation for this difference is that at
the lower concentration, there is simply not enough gelator present for fibre formation to take
place, and what is being observed in the spectra is the signal for individual molecules of DBS-Gly.
With an increase in concentration, fibre formation takes place and brings about the change in CD
signal. Whilst the HT data (Figure 4.9b) shows some significant difference between the samples
(values of HT are greater for 0.05% wt/vol), this is likely due to there being more absorbance with
more LMWG present in the sample.
y = 1.0648x - 5.8632R² = 0.991
-1
-0.5
0
0.5
1
1.5
4.5 5 5.5 6 6.5 7
ln{-
ln[(
[DB
S-Gly](∞)-
[DB
S-G
ly](
t))/
([D
BS-Gly](∞)-
[DB
S-G
ly](
0))
]}
ln (t)
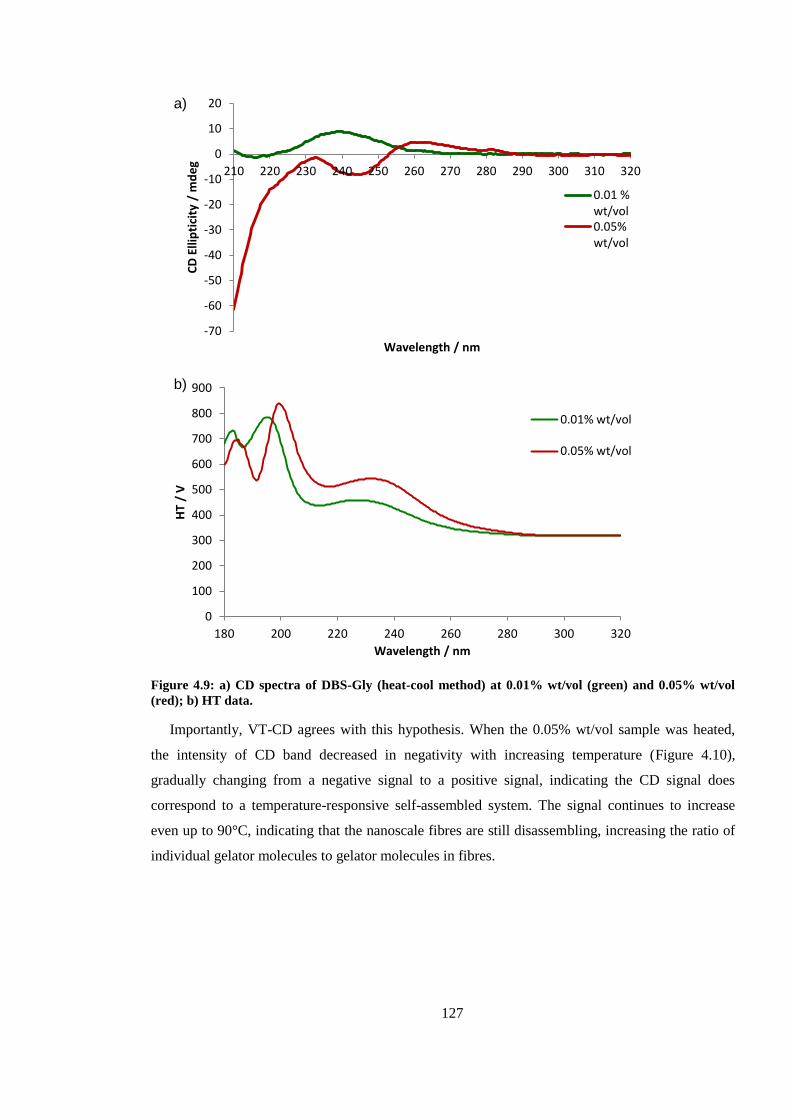
127
Figure 4.9: a) CD spectra of DBS-Gly (heat-cool method) at 0.01% wt/vol (green) and 0.05% wt/vol
(red); b) HT data.
Importantly, VT-CD agrees with this hypothesis. When the 0.05% wt/vol sample was heated,
the intensity of CD band decreased in negativity with increasing temperature (Figure 4.10),
gradually changing from a negative signal to a positive signal, indicating the CD signal does
correspond to a temperature-responsive self-assembled system. The signal continues to increase
even up to 90°C, indicating that the nanoscale fibres are still disassembling, increasing the ratio of
individual gelator molecules to gelator molecules in fibres.
-70
-60
-50
-40
-30
-20
-10
0
10
20
210 220 230 240 250 260 270 280 290 300 310 320
CD
Elli
pti
city
/ m
de
g
Wavelength / nm
a)
0.01 %wt/vol0.05%wt/vol
0
100
200
300
400
500
600
700
800
900
180 200 220 240 260 280 300 320
HT
/ V
Wavelength / nm
b)
0.01% wt/vol
0.05% wt/vol
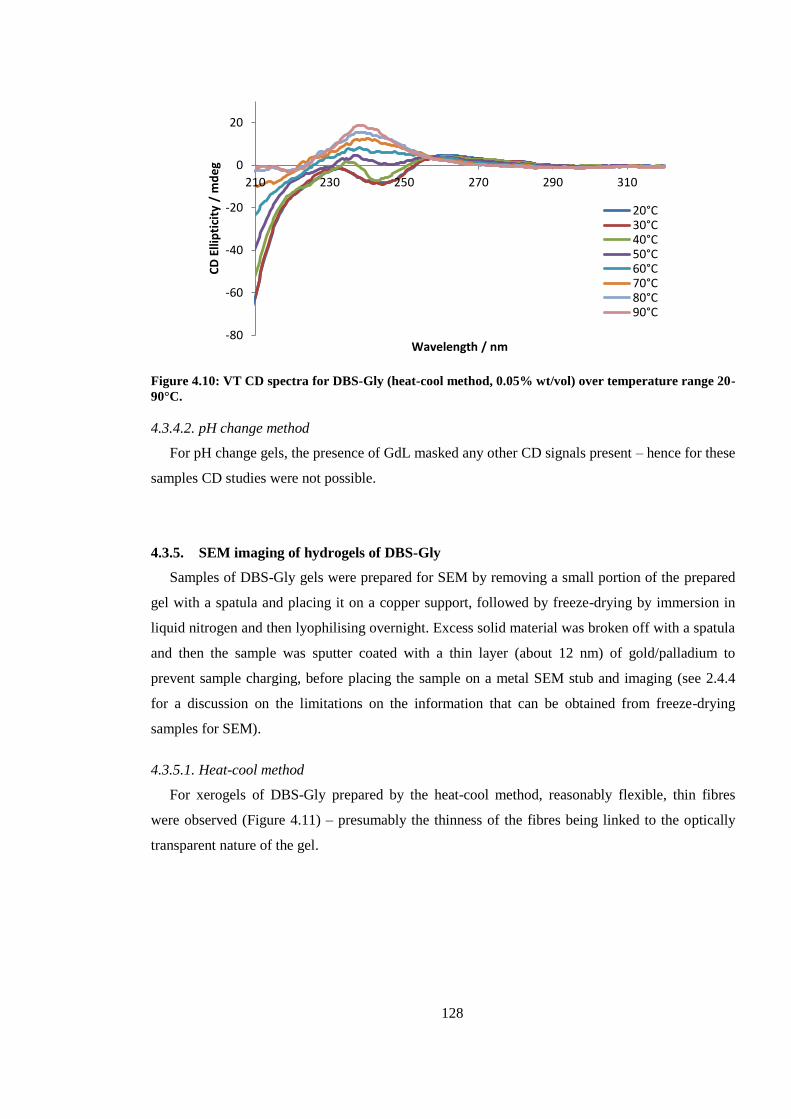
128
Figure 4.10: VT CD spectra for DBS-Gly (heat-cool method, 0.05% wt/vol) over temperature range 20-
90°C.
4.3.4.2. pH change method
For pH change gels, the presence of GdL masked any other CD signals present – hence for these
samples CD studies were not possible.
4.3.5. SEM imaging of hydrogels of DBS-Gly
Samples of DBS-Gly gels were prepared for SEM by removing a small portion of the prepared
gel with a spatula and placing it on a copper support, followed by freeze-drying by immersion in
liquid nitrogen and then lyophilising overnight. Excess solid material was broken off with a spatula
and then the sample was sputter coated with a thin layer (about 12 nm) of gold/palladium to
prevent sample charging, before placing the sample on a metal SEM stub and imaging (see 2.4.4
for a discussion on the limitations on the information that can be obtained from freeze-drying
samples for SEM).
4.3.5.1. Heat-cool method
For xerogels of DBS-Gly prepared by the heat-cool method, reasonably flexible, thin fibres
were observed (Figure 4.11) – presumably the thinness of the fibres being linked to the optically
transparent nature of the gel.
-80
-60
-40
-20
0
20
210 230 250 270 290 310
CD
Elli
pti
city
/ m
de
g
Wavelength / nm
20°C30°C40°C50°C60°C70°C80°C90°C
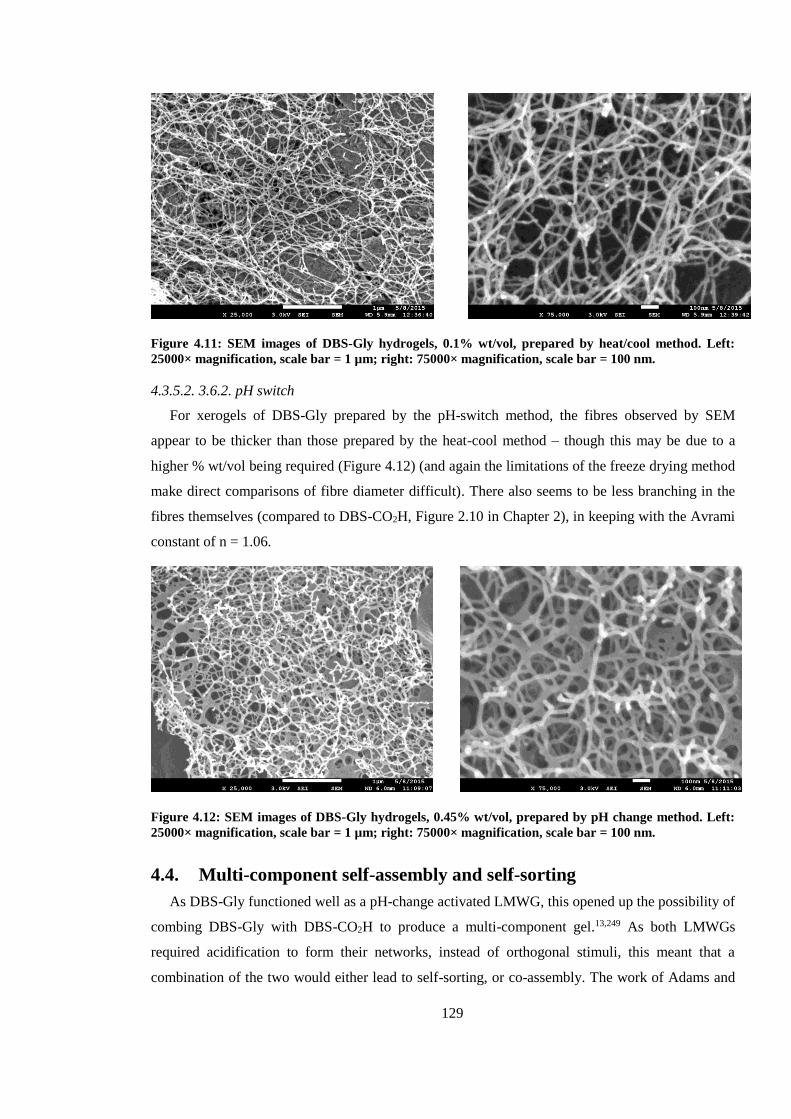
129
Figure 4.11: SEM images of DBS-Gly hydrogels, 0.1% wt/vol, prepared by heat/cool method. Left:
25000× magnification, scale bar = 1 µm; right: 75000× magnification, scale bar = 100 nm.
4.3.5.2. 3.6.2. pH switch
For xerogels of DBS-Gly prepared by the pH-switch method, the fibres observed by SEM
appear to be thicker than those prepared by the heat-cool method – though this may be due to a
higher % wt/vol being required (Figure 4.12) (and again the limitations of the freeze drying method
make direct comparisons of fibre diameter difficult). There also seems to be less branching in the
fibres themselves (compared to DBS-CO2H, Figure 2.10 in Chapter 2), in keeping with the Avrami
constant of n = 1.06.
Figure 4.12: SEM images of DBS-Gly hydrogels, 0.45% wt/vol, prepared by pH change method. Left:
25000× magnification, scale bar = 1 µm; right: 75000× magnification, scale bar = 100 nm.
4.4. Multi-component self-assembly and self-sorting
As DBS-Gly functioned well as a pH-change activated LMWG, this opened up the possibility of
combing DBS-Gly with DBS-CO2H to produce a multi-component gel.13,249 As both LMWGs
required acidification to form their networks, instead of orthogonal stimuli, this meant that a
combination of the two would either lead to self-sorting, or co-assembly. The work of Adams and
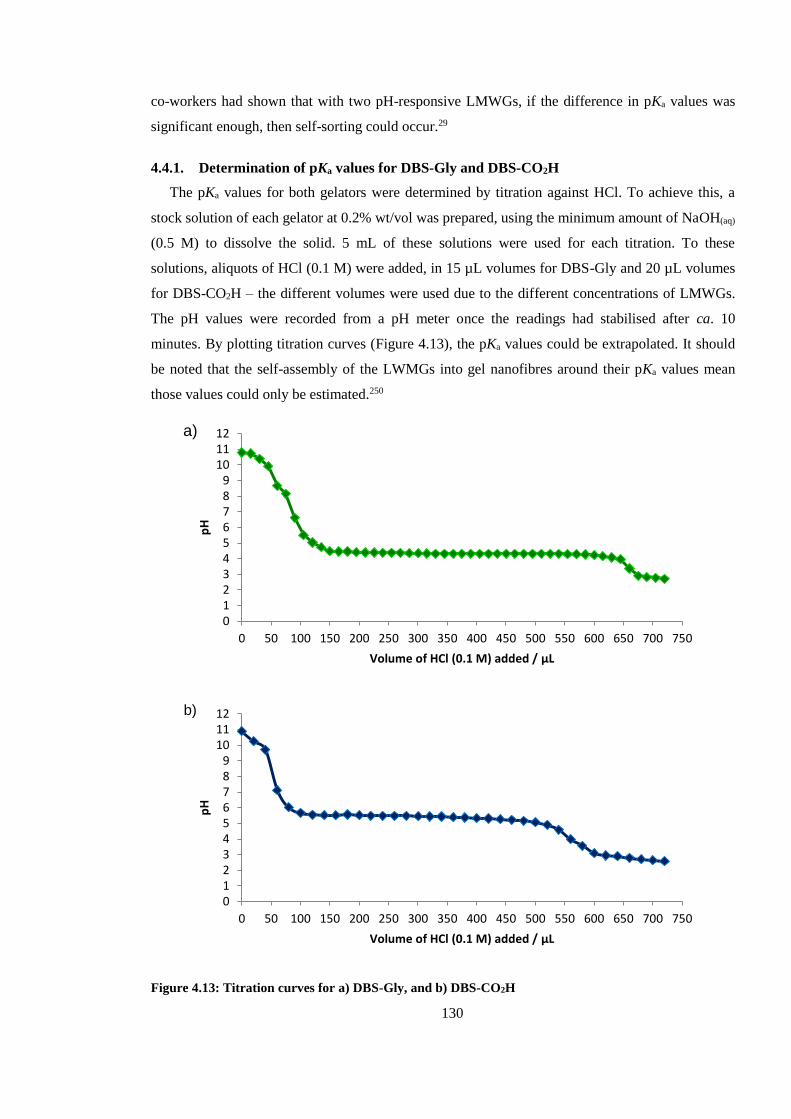
130
co-workers had shown that with two pH-responsive LMWGs, if the difference in pKa values was
significant enough, then self-sorting could occur.29
4.4.1. Determination of pKa values for DBS-Gly and DBS-CO2H
The pKa values for both gelators were determined by titration against HCl. To achieve this, a
stock solution of each gelator at 0.2% wt/vol was prepared, using the minimum amount of NaOH(aq)
(0.5 M) to dissolve the solid. 5 mL of these solutions were used for each titration. To these
solutions, aliquots of HCl (0.1 M) were added, in 15 µL volumes for DBS-Gly and 20 µL volumes
for DBS-CO2H – the different volumes were used due to the different concentrations of LMWGs.
The pH values were recorded from a pH meter once the readings had stabilised after ca. 10
minutes. By plotting titration curves (Figure 4.13), the pKa values could be extrapolated. It should
be noted that the self-assembly of the LWMGs into gel nanofibres around their pKa values mean
those values could only be estimated.250
Figure 4.13: Titration curves for a) DBS-Gly, and b) DBS-CO2H
0123456789
101112
0 50 100 150 200 250 300 350 400 450 500 550 600 650 700 750
pH
Volume of HCl (0.1 M) added / μL
a)
0123456789
101112
0 50 100 150 200 250 300 350 400 450 500 550 600 650 700 750
pH
Volume of HCl (0.1 M) added / μL
b)
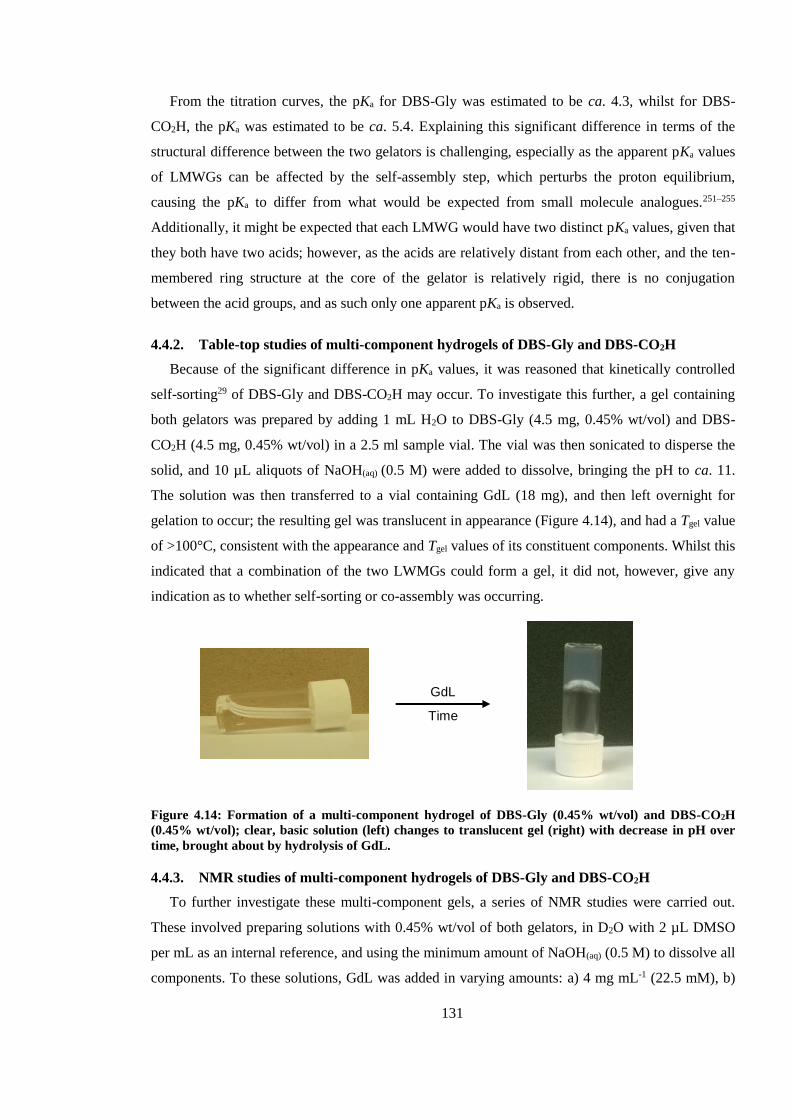
131
From the titration curves, the pKa for DBS-Gly was estimated to be ca. 4.3, whilst for DBS-
CO2H, the pKa was estimated to be ca. 5.4. Explaining this significant difference in terms of the
structural difference between the two gelators is challenging, especially as the apparent pKa values
of LMWGs can be affected by the self-assembly step, which perturbs the proton equilibrium,
causing the pKa to differ from what would be expected from small molecule analogues.251–255
Additionally, it might be expected that each LMWG would have two distinct pKa values, given that
they both have two acids; however, as the acids are relatively distant from each other, and the ten-
membered ring structure at the core of the gelator is relatively rigid, there is no conjugation
between the acid groups, and as such only one apparent pKa is observed.
4.4.2. Table-top studies of multi-component hydrogels of DBS-Gly and DBS-CO2H
Because of the significant difference in pKa values, it was reasoned that kinetically controlled
self-sorting29 of DBS-Gly and DBS-CO2H may occur. To investigate this further, a gel containing
both gelators was prepared by adding 1 mL H2O to DBS-Gly (4.5 mg, 0.45% wt/vol) and DBS-
CO2H (4.5 mg, 0.45% wt/vol) in a 2.5 ml sample vial. The vial was then sonicated to disperse the
solid, and 10 µL aliquots of NaOH(aq) (0.5 M) were added to dissolve, bringing the pH to ca. 11.
The solution was then transferred to a vial containing GdL (18 mg), and then left overnight for
gelation to occur; the resulting gel was translucent in appearance (Figure 4.14), and had a Tgel value
of >100°C, consistent with the appearance and Tgel values of its constituent components. Whilst this
indicated that a combination of the two LWMGs could form a gel, it did not, however, give any
indication as to whether self-sorting or co-assembly was occurring.
Figure 4.14: Formation of a multi-component hydrogel of DBS-Gly (0.45% wt/vol) and DBS-CO2H
(0.45% wt/vol); clear, basic solution (left) changes to translucent gel (right) with decrease in pH over
time, brought about by hydrolysis of GdL.
4.4.3. NMR studies of multi-component hydrogels of DBS-Gly and DBS-CO2H
To further investigate these multi-component gels, a series of NMR studies were carried out.
These involved preparing solutions with 0.45% wt/vol of both gelators, in D2O with 2 µL DMSO
per mL as an internal reference, and using the minimum amount of NaOH(aq) (0.5 M) to dissolve all
components. To these solutions, GdL was added in varying amounts: a) 4 mg mL-1 (22.5 mM), b)
GdL
Time
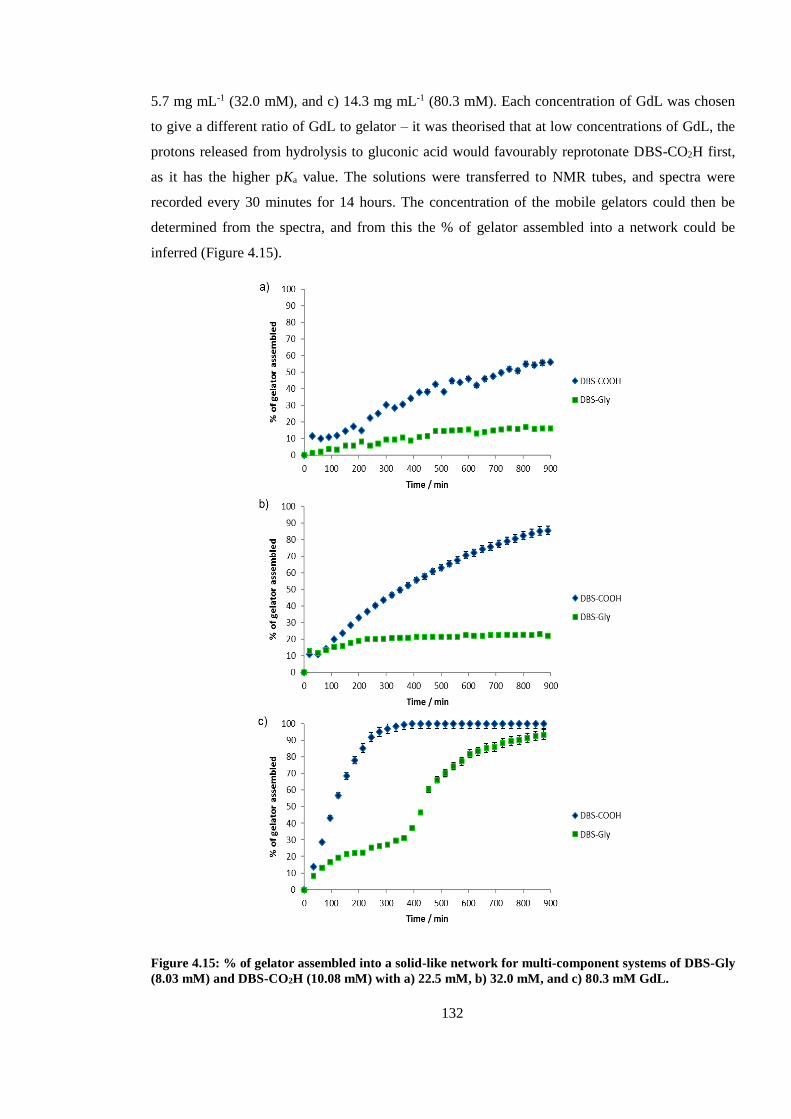
132
5.7 mg mL-1 (32.0 mM), and c) 14.3 mg mL-1 (80.3 mM). Each concentration of GdL was chosen
to give a different ratio of GdL to gelator – it was theorised that at low concentrations of GdL, the
protons released from hydrolysis to gluconic acid would favourably reprotonate DBS-CO2H first,
as it has the higher pKa value. The solutions were transferred to NMR tubes, and spectra were
recorded every 30 minutes for 14 hours. The concentration of the mobile gelators could then be
determined from the spectra, and from this the % of gelator assembled into a network could be
inferred (Figure 4.15).
Figure 4.15: % of gelator assembled into a solid-like network for multi-component systems of DBS-Gly
(8.03 mM) and DBS-CO2H (10.08 mM) with a) 22.5 mM, b) 32.0 mM, and c) 80.3 mM GdL.
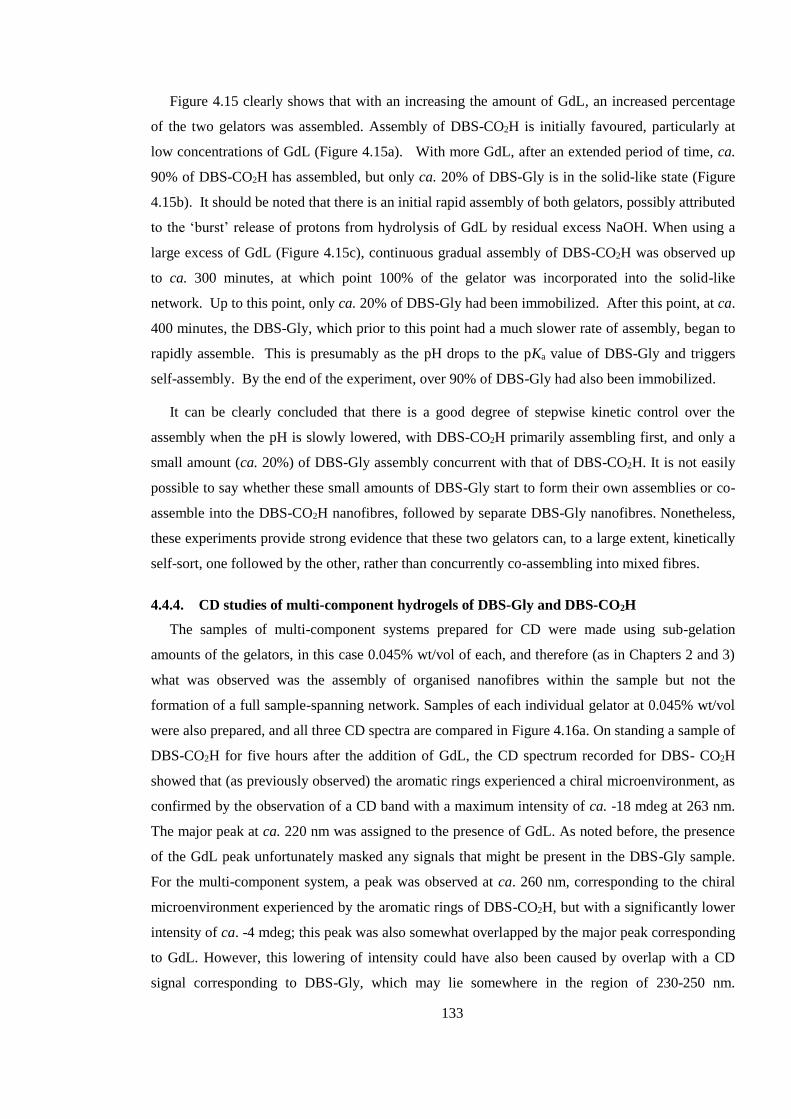
133
Figure 4.15 clearly shows that with an increasing the amount of GdL, an increased percentage
of the two gelators was assembled. Assembly of DBS-CO2H is initially favoured, particularly at
low concentrations of GdL (Figure 4.15a). With more GdL, after an extended period of time, ca.
90% of DBS-CO2H has assembled, but only ca. 20% of DBS-Gly is in the solid-like state (Figure
4.15b). It should be noted that there is an initial rapid assembly of both gelators, possibly attributed
to the ‘burst’ release of protons from hydrolysis of GdL by residual excess NaOH. When using a
large excess of GdL (Figure 4.15c), continuous gradual assembly of DBS-CO2H was observed up
to ca. 300 minutes, at which point 100% of the gelator was incorporated into the solid-like
network. Up to this point, only ca. 20% of DBS-Gly had been immobilized. After this point, at ca.
400 minutes, the DBS-Gly, which prior to this point had a much slower rate of assembly, began to
rapidly assemble. This is presumably as the pH drops to the pKa value of DBS-Gly and triggers
self-assembly. By the end of the experiment, over 90% of DBS-Gly had also been immobilized.
It can be clearly concluded that there is a good degree of stepwise kinetic control over the
assembly when the pH is slowly lowered, with DBS-CO2H primarily assembling first, and only a
small amount (ca. 20%) of DBS-Gly assembly concurrent with that of DBS-CO2H. It is not easily
possible to say whether these small amounts of DBS-Gly start to form their own assemblies or co-
assemble into the DBS-CO2H nanofibres, followed by separate DBS-Gly nanofibres. Nonetheless,
these experiments provide strong evidence that these two gelators can, to a large extent, kinetically
self-sort, one followed by the other, rather than concurrently co-assembling into mixed fibres.
4.4.4. CD studies of multi-component hydrogels of DBS-Gly and DBS-CO2H
The samples of multi-component systems prepared for CD were made using sub-gelation
amounts of the gelators, in this case 0.045% wt/vol of each, and therefore (as in Chapters 2 and 3)
what was observed was the assembly of organised nanofibres within the sample but not the
formation of a full sample-spanning network. Samples of each individual gelator at 0.045% wt/vol
were also prepared, and all three CD spectra are compared in Figure 4.16a. On standing a sample of
DBS-CO2H for five hours after the addition of GdL, the CD spectrum recorded for DBS- CO2H
showed that (as previously observed) the aromatic rings experienced a chiral microenvironment, as
confirmed by the observation of a CD band with a maximum intensity of ca. -18 mdeg at 263 nm.
The major peak at ca. 220 nm was assigned to the presence of GdL. As noted before, the presence
of the GdL peak unfortunately masked any signals that might be present in the DBS-Gly sample.
For the multi-component system, a peak was observed at ca. 260 nm, corresponding to the chiral
microenvironment experienced by the aromatic rings of DBS-CO2H, but with a significantly lower
intensity of ca. -4 mdeg; this peak was also somewhat overlapped by the major peak corresponding
to GdL. However, this lowering of intensity could have also been caused by overlap with a CD
signal corresponding to DBS-Gly, which may lie somewhere in the region of 230-250 nm.
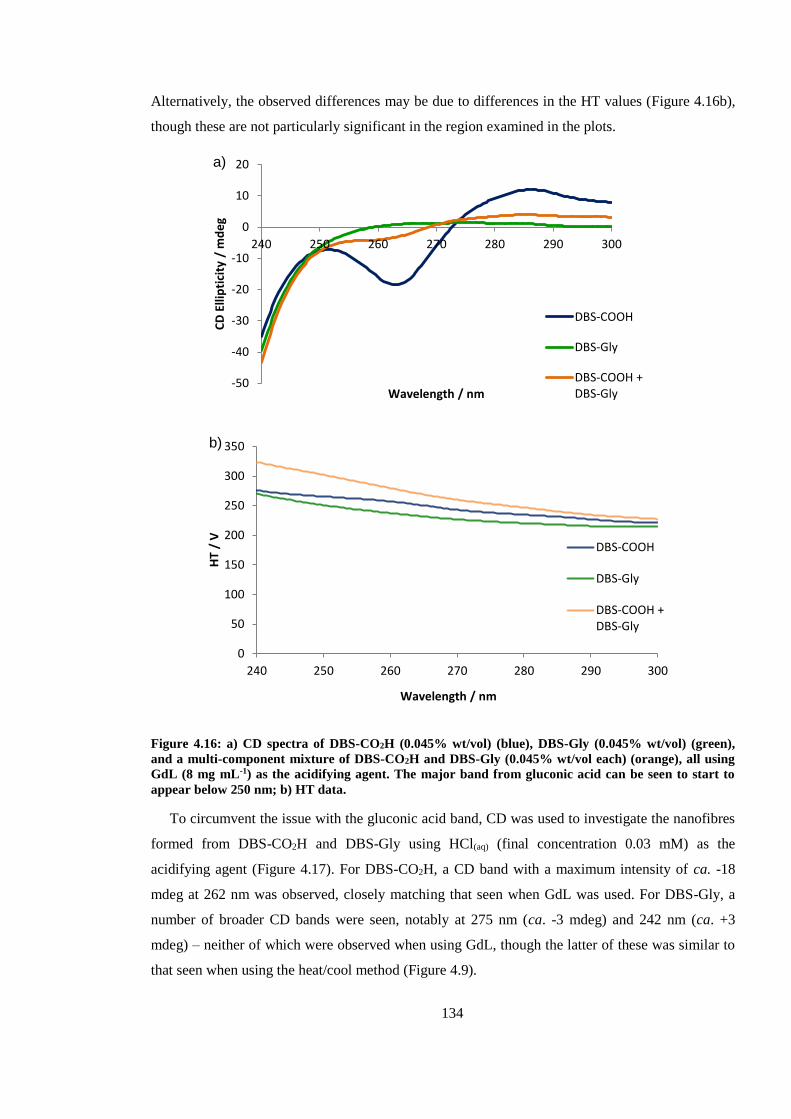
134
Alternatively, the observed differences may be due to differences in the HT values (Figure 4.16b),
though these are not particularly significant in the region examined in the plots.
Figure 4.16: a) CD spectra of DBS-CO2H (0.045% wt/vol) (blue), DBS-Gly (0.045% wt/vol) (green),
and a multi-component mixture of DBS-CO2H and DBS-Gly (0.045% wt/vol each) (orange), all using
GdL (8 mg mL-1) as the acidifying agent. The major band from gluconic acid can be seen to start to
appear below 250 nm; b) HT data.
To circumvent the issue with the gluconic acid band, CD was used to investigate the nanofibres
formed from DBS-CO2H and DBS-Gly using HCl(aq) (final concentration 0.03 mM) as the
acidifying agent (Figure 4.17). For DBS-CO2H, a CD band with a maximum intensity of ca. -18
mdeg at 262 nm was observed, closely matching that seen when GdL was used. For DBS-Gly, a
number of broader CD bands were seen, notably at 275 nm (ca. -3 mdeg) and 242 nm (ca. +3
mdeg) – neither of which were observed when using GdL, though the latter of these was similar to
that seen when using the heat/cool method (Figure 4.9).
-50
-40
-30
-20
-10
0
10
20
240 250 260 270 280 290 300
CD
Elli
pti
city
/ m
de
g
Wavelength / nm
a)
DBS-COOH
DBS-Gly
DBS-COOH +DBS-Gly
0
50
100
150
200
250
300
350
240 250 260 270 280 290 300
HT
/ V
Wavelength / nm
b)
DBS-COOH
DBS-Gly
DBS-COOH +DBS-Gly
135
Figure 4.17: a) CD spectra of DBS-CO2H (0.045% wt/vol) and DBS-Gly (0.045% wt/vol) using HCl
(0.03 mM) as acidifying agent; a number of CD bands are now visible for DBS-Gly (notably at ca. 275
nm and 242 nm); b) HT data.
A CD spectrum of the multi-component system with HCl was also recorded, and compared to a
calculated addition of the two separate CD spectra for DBS-CO2H and DBS-Gly with HCl (Figure
4.18). The calculated spectrum showed two maximum absorbances – one at 262 nm (ca. -10
mdeg), corresponding to the absorbance from DBS-CO2H, and another at 245 nm (ca. +3 mdeg),
corresponding to the absorbance from DBS-Gly. The experimental spectrum resembled the overall
shape of the calculated spectrum, but the values of λmax and CD ellipticity were somewhat different.
It is assumed that the maximum at 259 nm (ca. -16 mdeg) corresponds to DBS-CO2H, whilst the
maximum at 229 nm (ca. +5 mdeg) corresponds to DBS-Gly. Whilst the former value is not too
dissimilar from the calculated values, suggesting that DBS-CO2H still assembles into distinct
nanofibres, the latter is significantly different – it may be the case that the self-assembled
-30
-20
-10
0
10
20
30
40
180 200 220 240 260 280 300 320
CD
Elli
pti
city
/ m
de
g
Wavelength / nm
a)
DBS-COOH
DBS-Gly
0
100
200
300
400
500
600
700
800
900
1000
180 200 220 240 260 280 300 320
HT
/ V
Wavelength / nm
b)
DBS-COOH
DBS-Gly
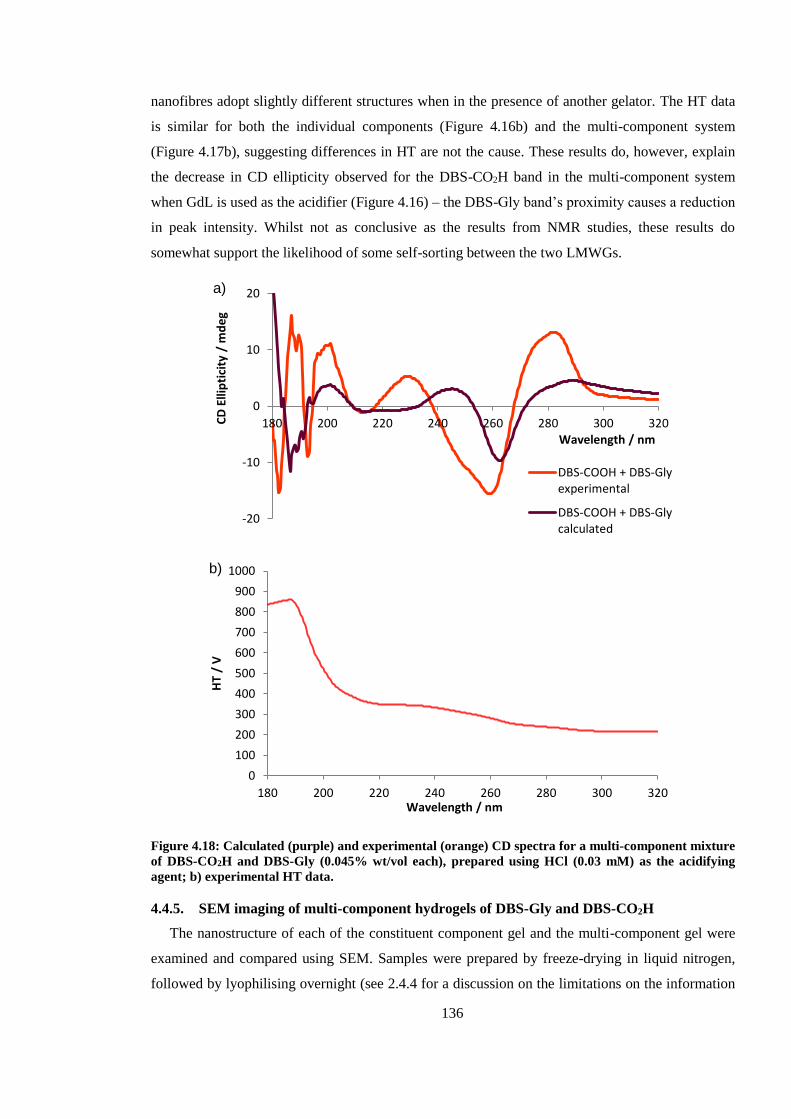
136
nanofibres adopt slightly different structures when in the presence of another gelator. The HT data
is similar for both the individual components (Figure 4.16b) and the multi-component system
(Figure 4.17b), suggesting differences in HT are not the cause. These results do, however, explain
the decrease in CD ellipticity observed for the DBS-CO2H band in the multi-component system
when GdL is used as the acidifier (Figure 4.16) – the DBS-Gly band’s proximity causes a reduction
in peak intensity. Whilst not as conclusive as the results from NMR studies, these results do
somewhat support the likelihood of some self-sorting between the two LMWGs.
Figure 4.18: Calculated (purple) and experimental (orange) CD spectra for a multi-component mixture
of DBS-CO2H and DBS-Gly (0.045% wt/vol each), prepared using HCl (0.03 mM) as the acidifying
agent; b) experimental HT data.
4.4.5. SEM imaging of multi-component hydrogels of DBS-Gly and DBS-CO2H
The nanostructure of each of the constituent component gel and the multi-component gel were
examined and compared using SEM. Samples were prepared by freeze-drying in liquid nitrogen,
followed by lyophilising overnight (see 2.4.4 for a discussion on the limitations on the information
-20
-10
0
10
20
180 200 220 240 260 280 300 320CD
Elli
pti
city
/ m
de
g
Wavelength / nm
a)
DBS-COOH + DBS-Glyexperimental
DBS-COOH + DBS-Glycalculated
0
100
200
300
400
500
600
700
800
900
1000
180 200 220 240 260 280 300 320
HT
/ V
Wavelength / nm
b)
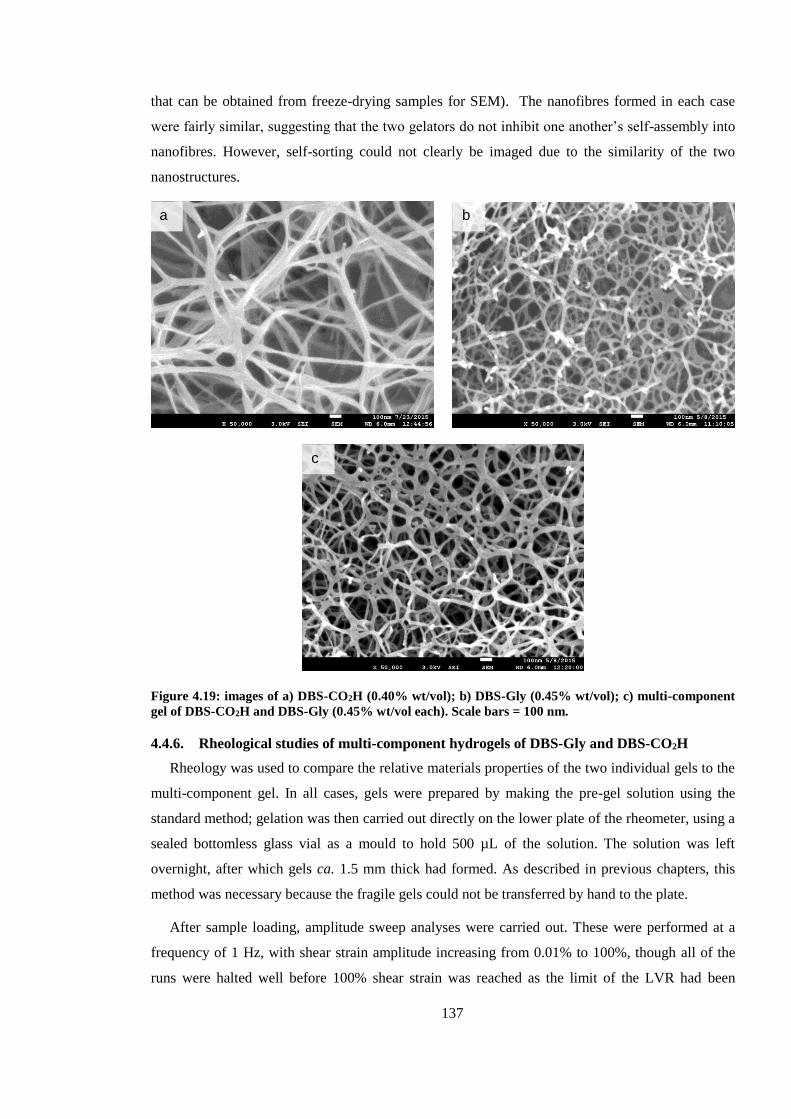
137
that can be obtained from freeze-drying samples for SEM). The nanofibres formed in each case
were fairly similar, suggesting that the two gelators do not inhibit one another’s self-assembly into
nanofibres. However, self-sorting could not clearly be imaged due to the similarity of the two
nanostructures.
Figure 4.19: images of a) DBS-CO2H (0.40% wt/vol); b) DBS-Gly (0.45% wt/vol); c) multi-component
gel of DBS-CO2H and DBS-Gly (0.45% wt/vol each). Scale bars = 100 nm.
4.4.6. Rheological studies of multi-component hydrogels of DBS-Gly and DBS-CO2H
Rheology was used to compare the relative materials properties of the two individual gels to the
multi-component gel. In all cases, gels were prepared by making the pre-gel solution using the
standard method; gelation was then carried out directly on the lower plate of the rheometer, using a
sealed bottomless glass vial as a mould to hold 500 µL of the solution. The solution was left
overnight, after which gels ca. 1.5 mm thick had formed. As described in previous chapters, this
method was necessary because the fragile gels could not be transferred by hand to the plate.
After sample loading, amplitude sweep analyses were carried out. These were performed at a
frequency of 1 Hz, with shear strain amplitude increasing from 0.01% to 100%, though all of the
runs were halted well before 100% shear strain was reached as the limit of the LVR had been
b
c
a
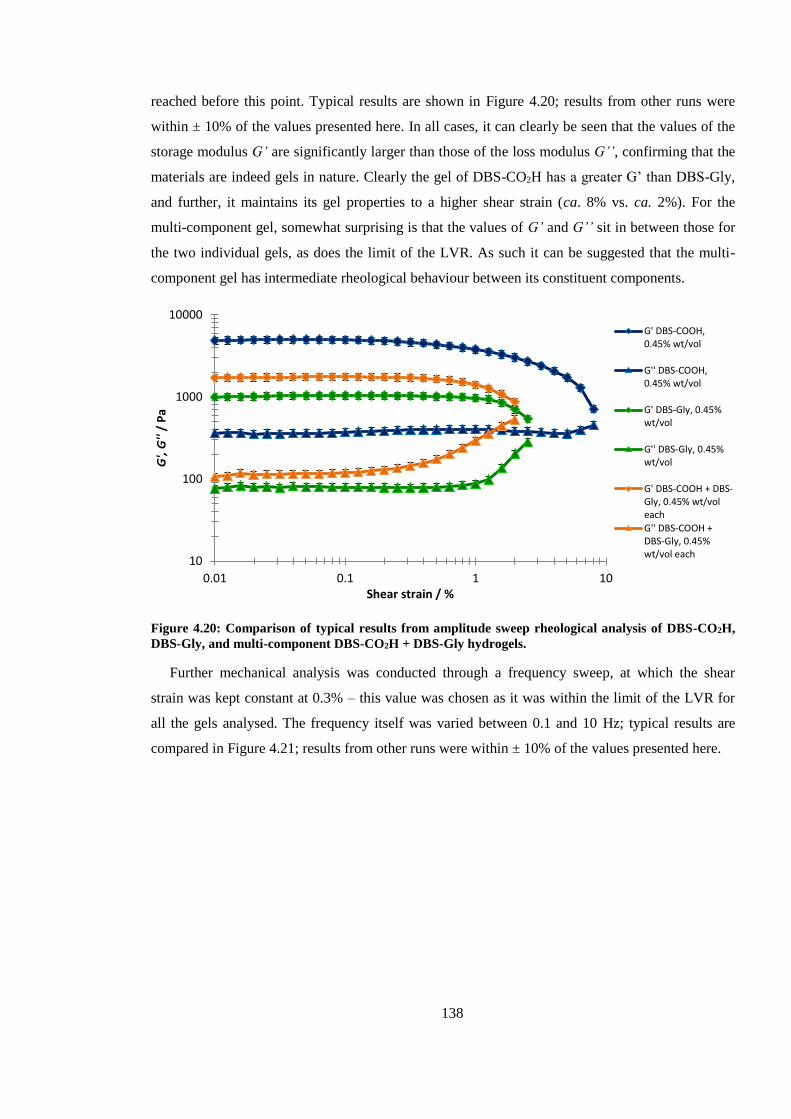
138
reached before this point. Typical results are shown in Figure 4.20; results from other runs were
within ± 10% of the values presented here. In all cases, it can clearly be seen that the values of the
storage modulus G’ are significantly larger than those of the loss modulus G’’, confirming that the
materials are indeed gels in nature. Clearly the gel of DBS-CO2H has a greater G’ than DBS-Gly,
and further, it maintains its gel properties to a higher shear strain (ca. 8% vs. ca. 2%). For the
multi-component gel, somewhat surprising is that the values of G’ and G’’ sit in between those for
the two individual gels, as does the limit of the LVR. As such it can be suggested that the multi-
component gel has intermediate rheological behaviour between its constituent components.
Figure 4.20: Comparison of typical results from amplitude sweep rheological analysis of DBS-CO2H,
DBS-Gly, and multi-component DBS-CO2H + DBS-Gly hydrogels.
Further mechanical analysis was conducted through a frequency sweep, at which the shear
strain was kept constant at 0.3% – this value was chosen as it was within the limit of the LVR for
all the gels analysed. The frequency itself was varied between 0.1 and 10 Hz; typical results are
compared in Figure 4.21; results from other runs were within ± 10% of the values presented here.
10
100
1000
10000
0.01 0.1 1 10
G',
G''
/ P
a
Shear strain / %
G' DBS-COOH,0.45% wt/vol
G'' DBS-COOH,0.45% wt/vol
G' DBS-Gly, 0.45%wt/vol
G'' DBS-Gly, 0.45%wt/vol
G' DBS-COOH + DBS-Gly, 0.45% wt/voleach
G'' DBS-COOH +DBS-Gly, 0.45%wt/vol each
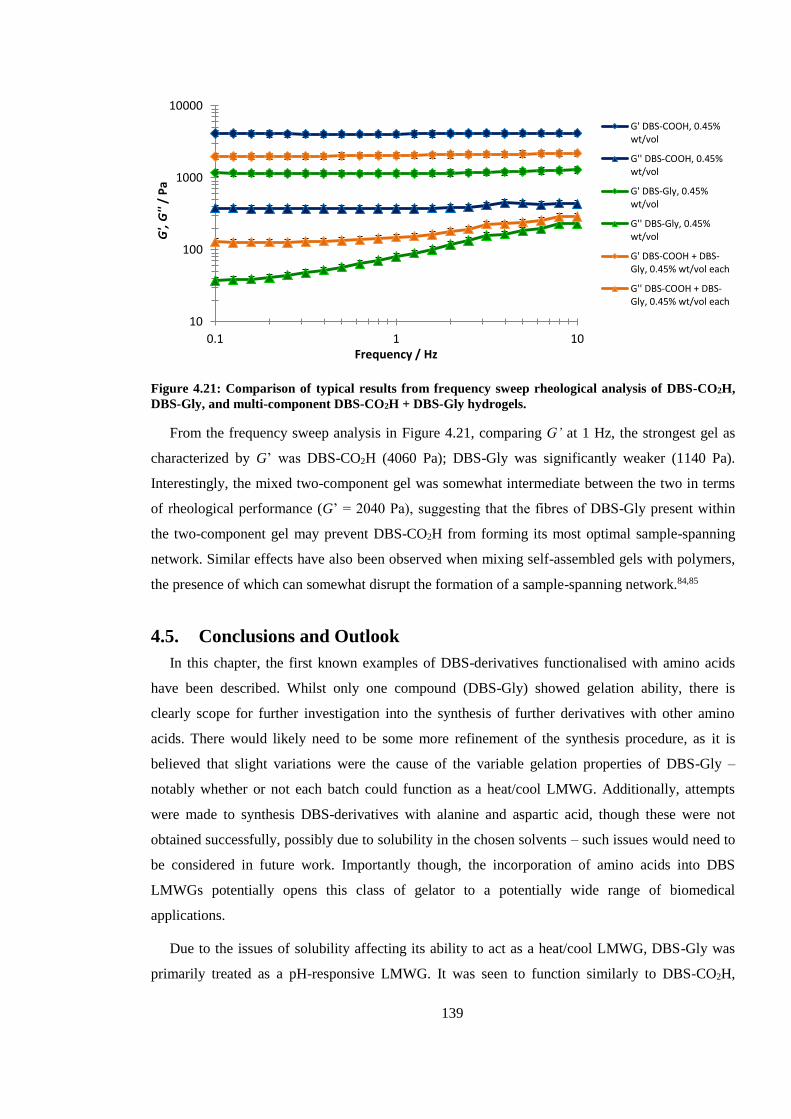
139
Figure 4.21: Comparison of typical results from frequency sweep rheological analysis of DBS-CO2H,
DBS-Gly, and multi-component DBS-CO2H + DBS-Gly hydrogels.
From the frequency sweep analysis in Figure 4.21, comparing G’ at 1 Hz, the strongest gel as
characterized by G’ was DBS-CO2H (4060 Pa); DBS-Gly was significantly weaker (1140 Pa).
Interestingly, the mixed two-component gel was somewhat intermediate between the two in terms
of rheological performance (G’ = 2040 Pa), suggesting that the fibres of DBS-Gly present within
the two-component gel may prevent DBS-CO2H from forming its most optimal sample-spanning
network. Similar effects have also been observed when mixing self-assembled gels with polymers,
the presence of which can somewhat disrupt the formation of a sample-spanning network.84,85
4.5. Conclusions and Outlook
In this chapter, the first known examples of DBS-derivatives functionalised with amino acids
have been described. Whilst only one compound (DBS-Gly) showed gelation ability, there is
clearly scope for further investigation into the synthesis of further derivatives with other amino
acids. There would likely need to be some more refinement of the synthesis procedure, as it is
believed that slight variations were the cause of the variable gelation properties of DBS-Gly –
notably whether or not each batch could function as a heat/cool LMWG. Additionally, attempts
were made to synthesis DBS-derivatives with alanine and aspartic acid, though these were not
obtained successfully, possibly due to solubility in the chosen solvents – such issues would need to
be considered in future work. Importantly though, the incorporation of amino acids into DBS
LMWGs potentially opens this class of gelator to a potentially wide range of biomedical
applications.
Due to the issues of solubility affecting its ability to act as a heat/cool LMWG, DBS-Gly was
primarily treated as a pH-responsive LMWG. It was seen to function similarly to DBS-CO2H,
10
100
1000
10000
0.1 1 10
G',
G''
/ P
a
Frequency / Hz
G' DBS-COOH, 0.45%wt/vol
G'' DBS-COOH, 0.45%wt/vol
G' DBS-Gly, 0.45%wt/vol
G'' DBS-Gly, 0.45%wt/vol
G' DBS-COOH + DBS-Gly, 0.45% wt/vol each
G'' DBS-COOH + DBS-Gly, 0.45% wt/vol each
140
though with some differences in its nanoscale arrangement, as evidenced by differing Avrami
number and CD spectra.
The key difference examined here between DBS-Gly and DBS-CO2H was in the values of pKa,
which were ca. 4.3 and ca. 5.4 respectively. This enabled the two LMWGs to undergo partial
kinetic self-sorting, which was observed by NMR. DBS-CO2H primarily assembled first after
addition of GdL, followed by the assembly of DBS-Gly as the pH neared its pKa. The multi-
component gel was seen to have a similar morphology to each individual gel, and rheological
properties which were intermediate between the two. Future work on these self-sorting systems
could involve the use of another pH-responsive LMWG in place of either of the two used here,
potentially one which would give a greater difference in pKa, and hence possibly distinct instead of
partial self-sorting. It could also be feasible to investigate a combination of three or more pH-
responsive LMWGs with differing pKa values, or to investigate alternative methods of acidification
and how this might affect the rate of assembly or the self-sorting ability of the gelators.
141
5. Chapter 5: Photoactivation of DBS-derived low-molecular-
weight gelators
The work in this chapter was carried out in conjunction with MChem Student Oliver J. Daubney,
and results were published in D. J. Cornwell, O. J. Daubney and D. K. Smith, J. Am. Chem. Soc.,
2015, 137, 15486–15492.
5.1. Introduction
In Chapter 3, the use of UV light to photopattern a PG network was examined; when the
patterned PG network was used in combination with a pH responsive LMWG network, a material
termed a multidomain gel was produced. Photopatterning of PGs is a widely used and reported
method for gaining spatial resolution in gel materials, particularly in the biomedical field;230,232,256–
261 in contrast, photoresponsiveness – let alone photopatterning – of LMWGs has rarely been
reported.
There are two main methods by which LWMGs can be made photoresponsive, and potentially
photopatterned: a) by incorporation of photoresponsive moieties into the structure of the LMWG to
directly trigger gelation, or b) through the use of a light-responsive compound, such as a photoacid
generator (PAG) to trigger the gelation event indirectly.
5.1.1. Photoresponsive LMWGs
A popular mechanism for photoresponsive LMWG gelation is to use photo-induced cis-trans
isomerisation of a double bond with the structure of the gelator to switch gelation “on” or “off”.
Zinić and co-workers investigated an early example of such a LMWG, exploiting the irreversible
UV light (in presence of bromine) induced cis to trans isomerisation to switch non-gelling
microspheres of bis(phenylalanine) maleic acid amides to gelling bis(phenylalanine) fumaric acid
amides.262 Hamachi and co-workers similarly used cis-trans isomerism with glycolipid-based
LMWGs; under visible light in the presence of bromine, the LMWG network was switched on,
whilst under UV irradiation the gel converted to a sol.263 Photopatterning was achieved in these
materials through selective exposure to UV light through a mask to negatively etch out a pattern.
Hamachi et al developed their photoresponsive systems further by designing LMWGs to respond to
light, temperature, Ca2+ ions and pH; in doing so these LMWGs could be used to construct physical
“logic gates” where multiple stimuli (e.g., light and Ca2+) were needed for the gel to form.264
An alternative mechanism for photoresponsiveness was investigated by Zhang and co-workers,
who investigated LMWGs formed from peptides linked to a tetrazole-containing moiety; upon
exposure to UV, the tetrazole moiety underwent intramolecular photoclick ligation to form a
pyrazoline ring.265 This rearrangement resulted in a gel-sol transition; using a photomask during the
142
exposure allowed for etching of microchannels into the gel, which could be used for growing cells
within.
The above systems were limited to 2D photopatterning (where photopatterning was possible);
Hamachi and co-workers, having also developed photoresponsive dipeptide-based LMWGs,266
investigated the possibility of obtaining 3D photopatterned materials through the use of two-photon
polymerisation techniques.267 The LMWG used contained a dimethylaminocoumarin-4-yl-
methoxycarbony, which had suitable responsive absorbance for 2PP. This responsive group was
cleaved from the dipeptide segment of the LMWG when activated at the focal point of the two
lasers used in 2PP, causing a gel-sol transition. The 2PP technique allowed for much more detailed
and higher resolution 3D patterning in the gels, and could be used to selectively mobilise
nanobeads or bacteria.
5.1.2. LMWGs with photoacid generators
PAGS are a type of molecule which upon exposure to light (either visible or UV) undergo
photolysis, with one of the products being an acid. PAGs are therefore of particular use for
promoting gelation in certain pH-responsive LMWG systems. Surprisingly though, very little work
has been carried out in this area. Adams and co-workers used the PAG diphenyliodonium nitrate
(DPIN) in combination with pH-responsive dipeptide LMWGs, and observed formation of gels
after exposure to low-intensity UV light for 14 hours.268 With a higher-intensity UV light, lower
exposure time and a photomask, photopatterning was also shown to be possible.
Van Esch and co-workers investigated a different PAG, derived from spiropyran, which
generated acid upon exposure to visible light.269 With this PAG, the generated protons catalysed the
formation of a trishydrazone LMWG from a trishydrazide and a benzaldehyde derivative, and a gel
was seen to form after 100 minutes of exposure; photopatterning was also possible at reasonable
resolutions (100 µm). A disadvantage of this system, however, is that the PAG still functioned as a
catalyst for the gelation in the absence of visible light, albeit at a slower rate and with a weaker gel
being formed.
5.1.3. Photo-induced gelation of DBS-derived LMWGs
Given that both DBS-CO2H and DBS-Gly are both pH-responsive LMWG, it seemed
reasonable to presume that one or both of them could undergo photo-induced gelation with the use
of a PAG as the proton source. This chapter therefore examines the gelation of both LWMGs using
the PAG DPIN.
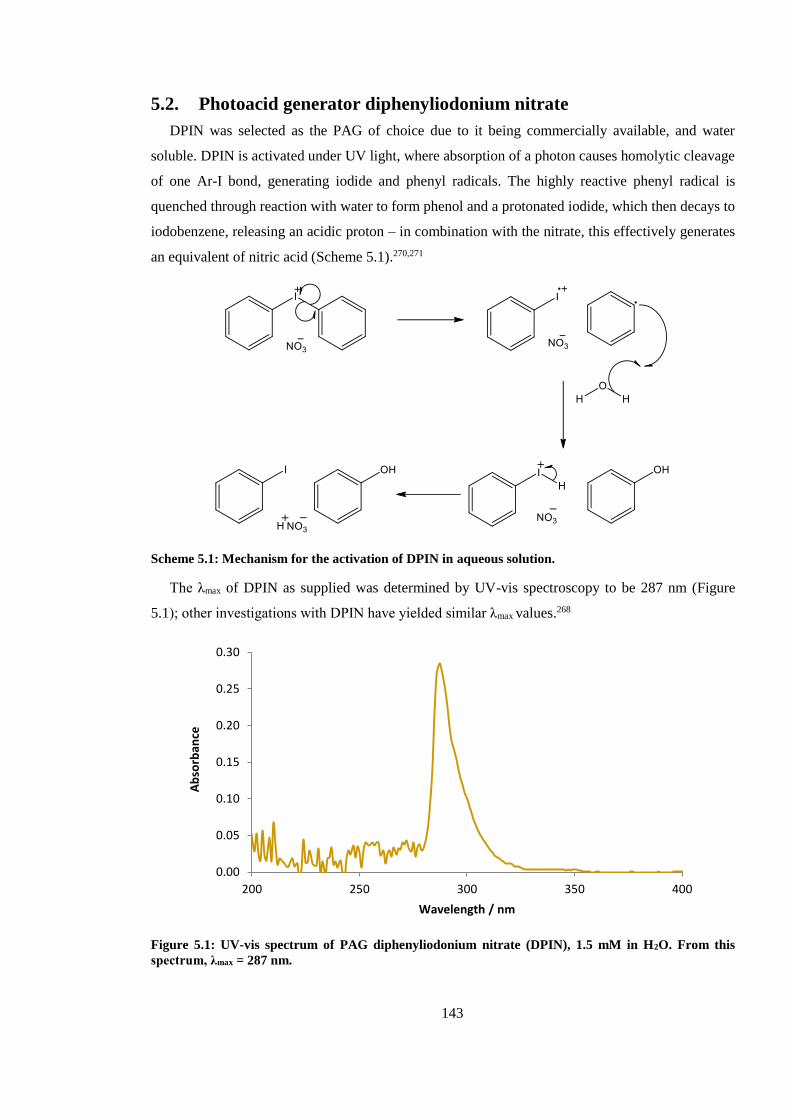
143
5.2. Photoacid generator diphenyliodonium nitrate
DPIN was selected as the PAG of choice due to it being commercially available, and water
soluble. DPIN is activated under UV light, where absorption of a photon causes homolytic cleavage
of one Ar-I bond, generating iodide and phenyl radicals. The highly reactive phenyl radical is
quenched through reaction with water to form phenol and a protonated iodide, which then decays to
iodobenzene, releasing an acidic proton – in combination with the nitrate, this effectively generates
an equivalent of nitric acid (Scheme 5.1).270,271
Scheme 5.1: Mechanism for the activation of DPIN in aqueous solution.
The λmax of DPIN as supplied was determined by UV-vis spectroscopy to be 287 nm (Figure
5.1); other investigations with DPIN have yielded similar λmax values.268
Figure 5.1: UV-vis spectrum of PAG diphenyliodonium nitrate (DPIN), 1.5 mM in H2O. From this
spectrum, λmax = 287 nm.
0.00
0.05
0.10
0.15
0.20
0.25
0.30
200 250 300 350 400
Ab
sorb
ance
Wavelength / nm
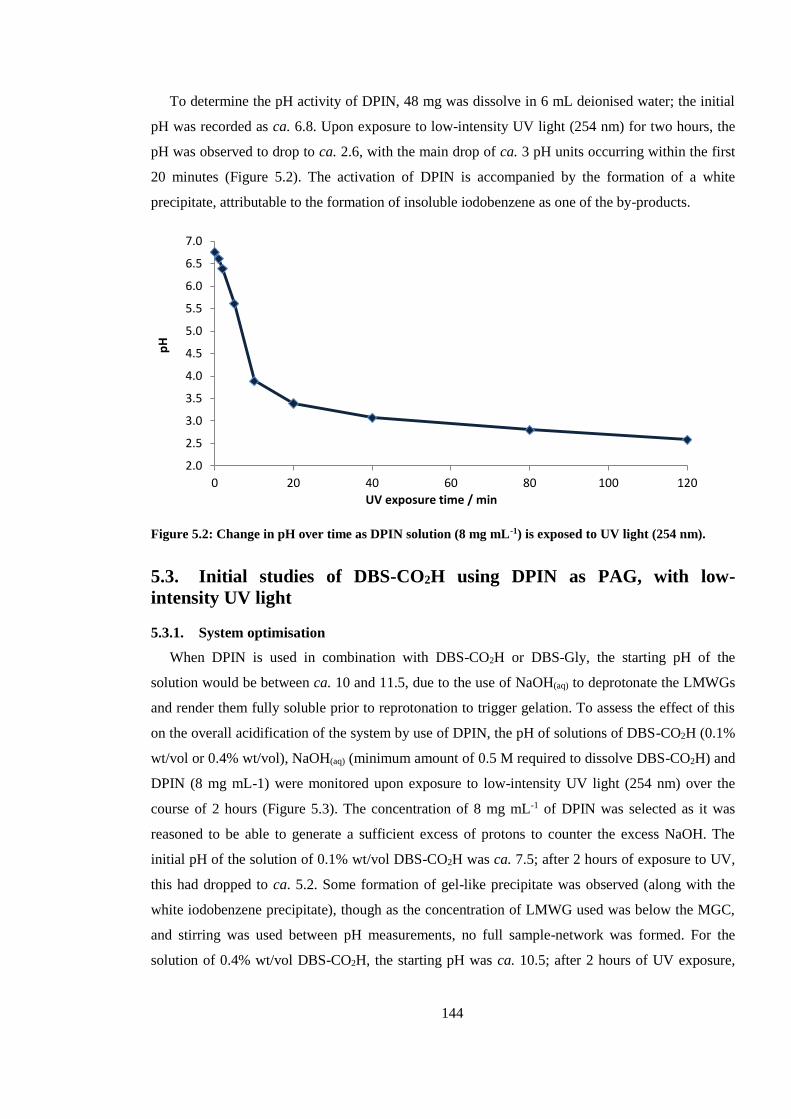
144
To determine the pH activity of DPIN, 48 mg was dissolve in 6 mL deionised water; the initial
pH was recorded as ca. 6.8. Upon exposure to low-intensity UV light (254 nm) for two hours, the
pH was observed to drop to ca. 2.6, with the main drop of ca. 3 pH units occurring within the first
20 minutes (Figure 5.2). The activation of DPIN is accompanied by the formation of a white
precipitate, attributable to the formation of insoluble iodobenzene as one of the by-products.
Figure 5.2: Change in pH over time as DPIN solution (8 mg mL-1) is exposed to UV light (254 nm).
5.3. Initial studies of DBS-CO2H using DPIN as PAG, with low-
intensity UV light
5.3.1. System optimisation
When DPIN is used in combination with DBS-CO2H or DBS-Gly, the starting pH of the
solution would be between ca. 10 and 11.5, due to the use of NaOH(aq) to deprotonate the LMWGs
and render them fully soluble prior to reprotonation to trigger gelation. To assess the effect of this
on the overall acidification of the system by use of DPIN, the pH of solutions of DBS-CO2H (0.1%
wt/vol or 0.4% wt/vol), NaOH(aq) (minimum amount of 0.5 M required to dissolve DBS-CO2H) and
DPIN (8 mg mL-1) were monitored upon exposure to low-intensity UV light (254 nm) over the
course of 2 hours (Figure 5.3). The concentration of 8 mg mL-1 of DPIN was selected as it was
reasoned to be able to generate a sufficient excess of protons to counter the excess NaOH. The
initial pH of the solution of 0.1% wt/vol DBS-CO2H was ca. 7.5; after 2 hours of exposure to UV,
this had dropped to ca. 5.2. Some formation of gel-like precipitate was observed (along with the
white iodobenzene precipitate), though as the concentration of LMWG used was below the MGC,
and stirring was used between pH measurements, no full sample-network was formed. For the
solution of 0.4% wt/vol DBS-CO2H, the starting pH was ca. 10.5; after 2 hours of UV exposure,
2.0
2.5
3.0
3.5
4.0
4.5
5.0
5.5
6.0
6.5
7.0
0 20 40 60 80 100 120
pH
UV exposure time / min
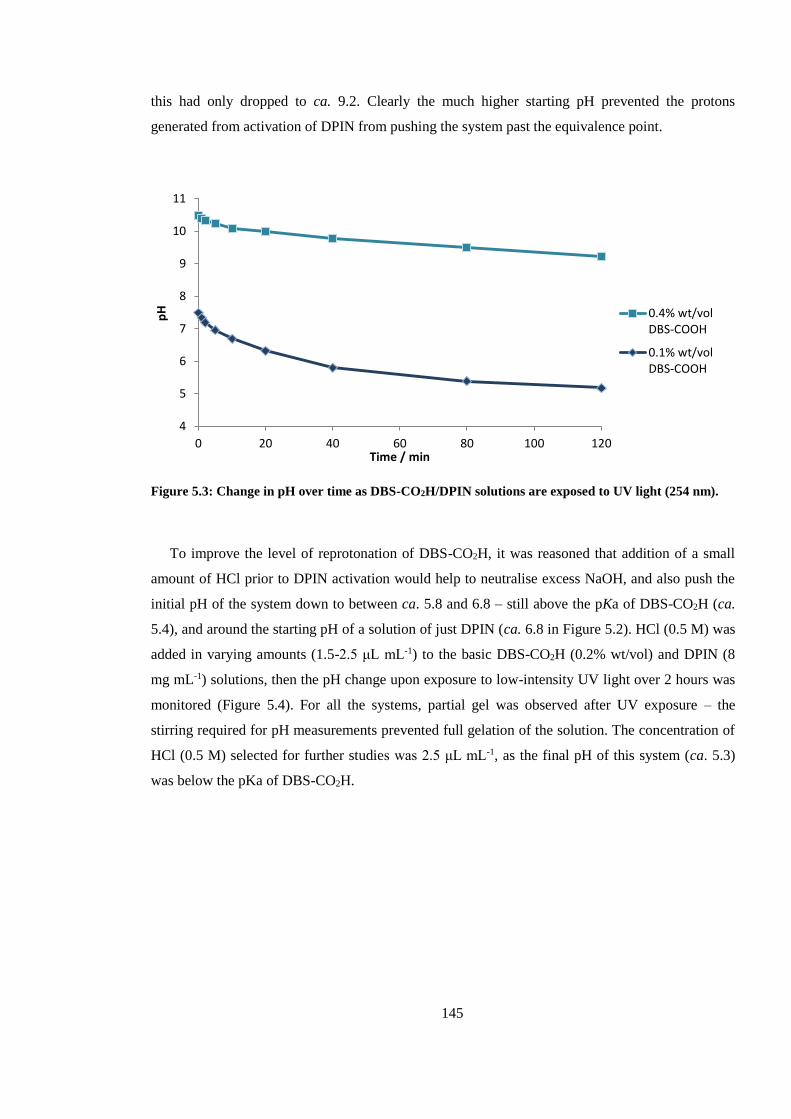
145
this had only dropped to ca. 9.2. Clearly the much higher starting pH prevented the protons
generated from activation of DPIN from pushing the system past the equivalence point.
Figure 5.3: Change in pH over time as DBS-CO2H/DPIN solutions are exposed to UV light (254 nm).
To improve the level of reprotonation of DBS-CO2H, it was reasoned that addition of a small
amount of HCl prior to DPIN activation would help to neutralise excess NaOH, and also push the
initial pH of the system down to between ca. 5.8 and 6.8 – still above the pKa of DBS-CO2H (ca.
5.4), and around the starting pH of a solution of just DPIN (ca. 6.8 in Figure 5.2). HCl (0.5 M) was
added in varying amounts (1.5-2.5 μL mL-1) to the basic DBS-CO2H (0.2% wt/vol) and DPIN (8
mg mL-1) solutions, then the pH change upon exposure to low-intensity UV light over 2 hours was
monitored (Figure 5.4). For all the systems, partial gel was observed after UV exposure – the
stirring required for pH measurements prevented full gelation of the solution. The concentration of
HCl (0.5 M) selected for further studies was 2.5 μL mL-1, as the final pH of this system (ca. 5.3)
was below the pKa of DBS-CO2H.
4
5
6
7
8
9
10
11
0 20 40 60 80 100 120
pH
Time / min
0.4% wt/volDBS-COOH
0.1% wt/volDBS-COOH
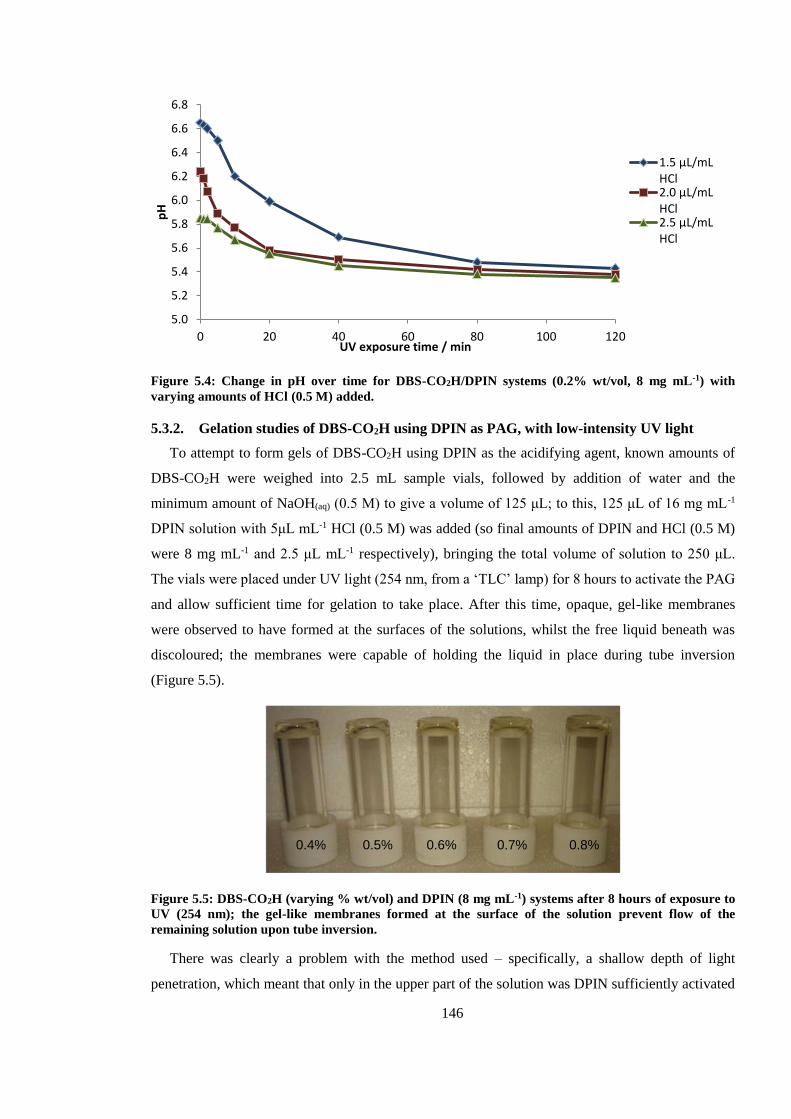
146
Figure 5.4: Change in pH over time for DBS-CO2H/DPIN systems (0.2% wt/vol, 8 mg mL-1) with
varying amounts of HCl (0.5 M) added.
5.3.2. Gelation studies of DBS-CO2H using DPIN as PAG, with low-intensity UV light
To attempt to form gels of DBS-CO2H using DPIN as the acidifying agent, known amounts of
DBS-CO2H were weighed into 2.5 mL sample vials, followed by addition of water and the
minimum amount of NaOH(aq) (0.5 M) to give a volume of 125 μL; to this, 125 μL of 16 mg mL-1
DPIN solution with 5μL mL-1 HCl (0.5 M) was added (so final amounts of DPIN and HCl (0.5 M)
were 8 mg mL-1 and 2.5 μL mL-1 respectively), bringing the total volume of solution to 250 μL.
The vials were placed under UV light (254 nm, from a ‘TLC’ lamp) for 8 hours to activate the PAG
and allow sufficient time for gelation to take place. After this time, opaque, gel-like membranes
were observed to have formed at the surfaces of the solutions, whilst the free liquid beneath was
discoloured; the membranes were capable of holding the liquid in place during tube inversion
(Figure 5.5).
Figure 5.5: DBS-CO2H (varying % wt/vol) and DPIN (8 mg mL-1) systems after 8 hours of exposure to
UV (254 nm); the gel-like membranes formed at the surface of the solution prevent flow of the
remaining solution upon tube inversion.
There was clearly a problem with the method used – specifically, a shallow depth of light
penetration, which meant that only in the upper part of the solution was DPIN sufficiently activated
5.0
5.2
5.4
5.6
5.8
6.0
6.2
6.4
6.6
6.8
0 20 40 60 80 100 120
pH
UV exposure time / min
1.5 μL/mL HCl2.0 μL/mL HCl2.5 μL/mL HCl
0.4% 0.5% 0.6% 0.7% 0.8%
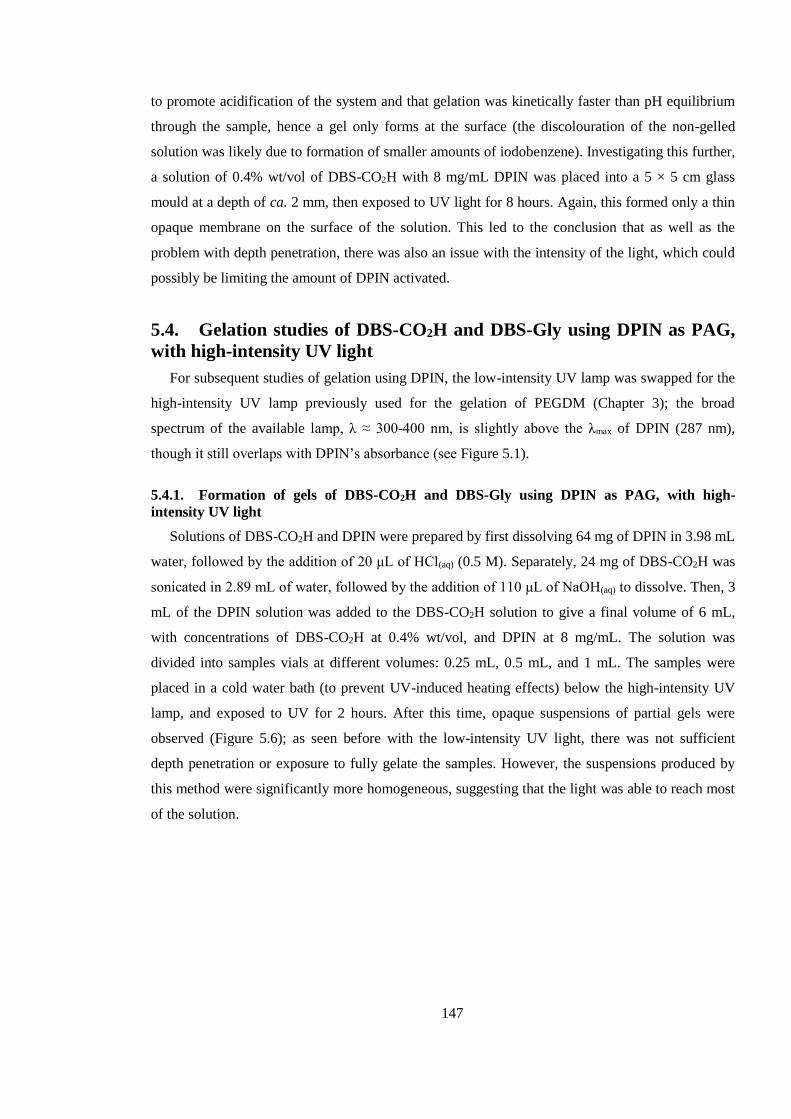
147
to promote acidification of the system and that gelation was kinetically faster than pH equilibrium
through the sample, hence a gel only forms at the surface (the discolouration of the non-gelled
solution was likely due to formation of smaller amounts of iodobenzene). Investigating this further,
a solution of 0.4% wt/vol of DBS-CO2H with 8 mg/mL DPIN was placed into a 5 × 5 cm glass
mould at a depth of ca. 2 mm, then exposed to UV light for 8 hours. Again, this formed only a thin
opaque membrane on the surface of the solution. This led to the conclusion that as well as the
problem with depth penetration, there was also an issue with the intensity of the light, which could
possibly be limiting the amount of DPIN activated.
5.4. Gelation studies of DBS-CO2H and DBS-Gly using DPIN as PAG,
with high-intensity UV light
For subsequent studies of gelation using DPIN, the low-intensity UV lamp was swapped for the
high-intensity UV lamp previously used for the gelation of PEGDM (Chapter 3); the broad
spectrum of the available lamp, λ ≈ 300-400 nm, is slightly above the λmax of DPIN (287 nm),
though it still overlaps with DPIN’s absorbance (see Figure 5.1).
5.4.1. Formation of gels of DBS-CO2H and DBS-Gly using DPIN as PAG, with high-
intensity UV light
Solutions of DBS-CO2H and DPIN were prepared by first dissolving 64 mg of DPIN in 3.98 mL
water, followed by the addition of 20 μL of HCl(aq) (0.5 M). Separately, 24 mg of DBS-CO2H was
sonicated in 2.89 mL of water, followed by the addition of 110 μL of NaOH(aq) to dissolve. Then, 3
mL of the DPIN solution was added to the DBS-CO2H solution to give a final volume of 6 mL,
with concentrations of DBS-CO2H at 0.4% wt/vol, and DPIN at 8 mg/mL. The solution was
divided into samples vials at different volumes: 0.25 mL, 0.5 mL, and 1 mL. The samples were
placed in a cold water bath (to prevent UV-induced heating effects) below the high-intensity UV
lamp, and exposed to UV for 2 hours. After this time, opaque suspensions of partial gels were
observed (Figure 5.6); as seen before with the low-intensity UV light, there was not sufficient
depth penetration or exposure to fully gelate the samples. However, the suspensions produced by
this method were significantly more homogeneous, suggesting that the light was able to reach most
of the solution.
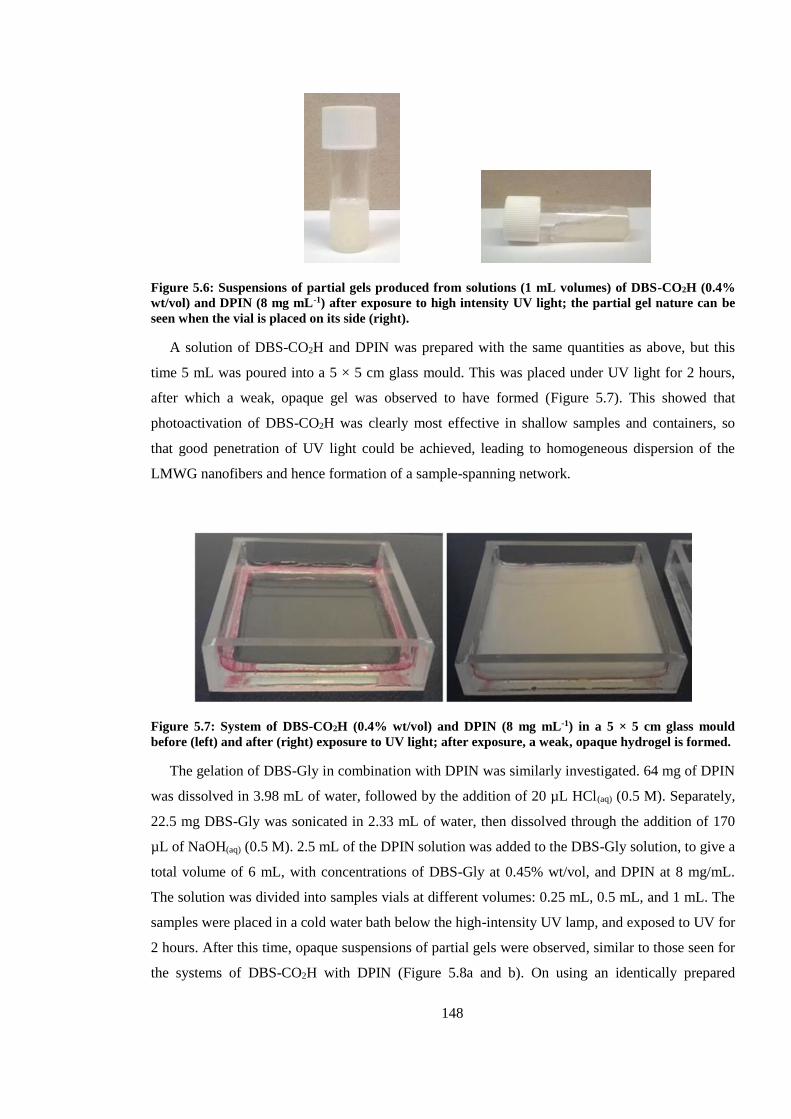
148
Figure 5.6: Suspensions of partial gels produced from solutions (1 mL volumes) of DBS-CO2H (0.4%
wt/vol) and DPIN (8 mg mL-1) after exposure to high intensity UV light; the partial gel nature can be
seen when the vial is placed on its side (right).
A solution of DBS-CO2H and DPIN was prepared with the same quantities as above, but this
time 5 mL was poured into a 5 × 5 cm glass mould. This was placed under UV light for 2 hours,
after which a weak, opaque gel was observed to have formed (Figure 5.7). This showed that
photoactivation of DBS-CO2H was clearly most effective in shallow samples and containers, so
that good penetration of UV light could be achieved, leading to homogeneous dispersion of the
LMWG nanofibers and hence formation of a sample-spanning network.
Figure 5.7: System of DBS-CO2H (0.4% wt/vol) and DPIN (8 mg mL-1) in a 5 × 5 cm glass mould
before (left) and after (right) exposure to UV light; after exposure, a weak, opaque hydrogel is formed.
The gelation of DBS-Gly in combination with DPIN was similarly investigated. 64 mg of DPIN
was dissolved in 3.98 mL of water, followed by the addition of 20 µL HCl(aq) (0.5 M). Separately,
22.5 mg DBS-Gly was sonicated in 2.33 mL of water, then dissolved through the addition of 170
µL of NaOH(aq) (0.5 M). 2.5 mL of the DPIN solution was added to the DBS-Gly solution, to give a
total volume of 6 mL, with concentrations of DBS-Gly at 0.45% wt/vol, and DPIN at 8 mg/mL.
The solution was divided into samples vials at different volumes: 0.25 mL, 0.5 mL, and 1 mL. The
samples were placed in a cold water bath below the high-intensity UV lamp, and exposed to UV for
2 hours. After this time, opaque suspensions of partial gels were observed, similar to those seen for
the systems of DBS-CO2H with DPIN (Figure 5.8a and b). On using an identically prepared
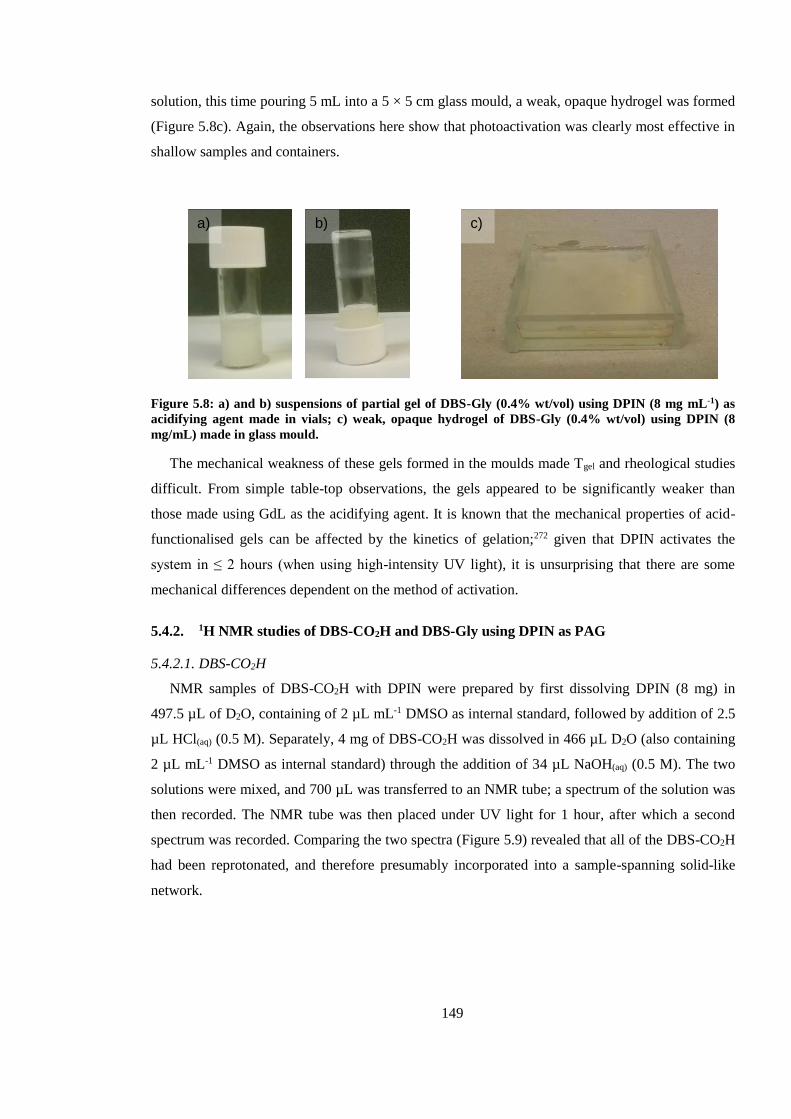
149
solution, this time pouring 5 mL into a 5 × 5 cm glass mould, a weak, opaque hydrogel was formed
(Figure 5.8c). Again, the observations here show that photoactivation was clearly most effective in
shallow samples and containers.
Figure 5.8: a) and b) suspensions of partial gel of DBS-Gly (0.4% wt/vol) using DPIN (8 mg mL-1) as
acidifying agent made in vials; c) weak, opaque hydrogel of DBS-Gly (0.4% wt/vol) using DPIN (8
mg/mL) made in glass mould.
The mechanical weakness of these gels formed in the moulds made Tgel and rheological studies
difficult. From simple table-top observations, the gels appeared to be significantly weaker than
those made using GdL as the acidifying agent. It is known that the mechanical properties of acid-
functionalised gels can be affected by the kinetics of gelation;272 given that DPIN activates the
system in ≤ 2 hours (when using high-intensity UV light), it is unsurprising that there are some
mechanical differences dependent on the method of activation.
5.4.2. 1H NMR studies of DBS-CO2H and DBS-Gly using DPIN as PAG
5.4.2.1. DBS-CO2H
NMR samples of DBS-CO2H with DPIN were prepared by first dissolving DPIN (8 mg) in
497.5 µL of D2O, containing of 2 µL mL-1 DMSO as internal standard, followed by addition of 2.5
µL HCl(aq) (0.5 M). Separately, 4 mg of DBS-CO2H was dissolved in 466 µL D2O (also containing
2 µL mL-1 DMSO as internal standard) through the addition of 34 µL NaOH(aq) (0.5 M). The two
solutions were mixed, and 700 µL was transferred to an NMR tube; a spectrum of the solution was
then recorded. The NMR tube was then placed under UV light for 1 hour, after which a second
spectrum was recorded. Comparing the two spectra (Figure 5.9) revealed that all of the DBS-CO2H
had been reprotonated, and therefore presumably incorporated into a sample-spanning solid-like
network.
a) b) c)
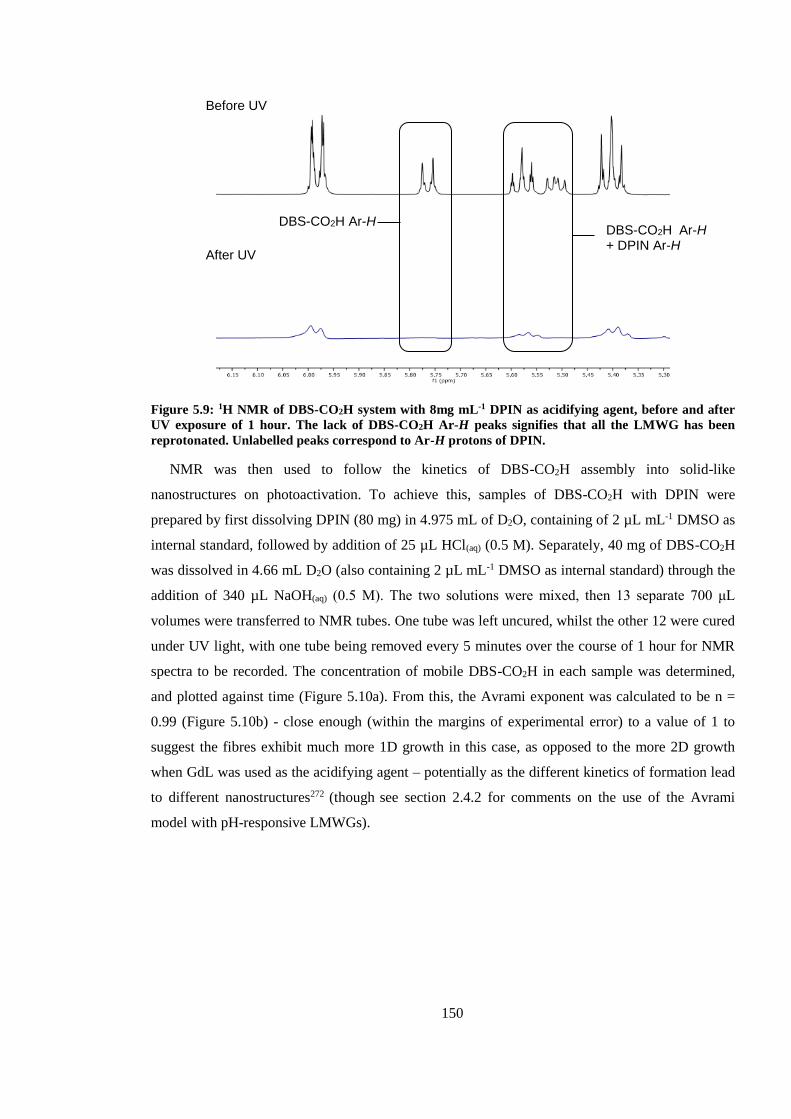
150
Figure 5.9: 1H NMR of DBS-CO2H system with 8mg mL-1 DPIN as acidifying agent, before and after
UV exposure of 1 hour. The lack of DBS-CO2H Ar-H peaks signifies that all the LMWG has been
reprotonated. Unlabelled peaks correspond to Ar-H protons of DPIN.
NMR was then used to follow the kinetics of DBS-CO2H assembly into solid-like
nanostructures on photoactivation. To achieve this, samples of DBS-CO2H with DPIN were
prepared by first dissolving DPIN (80 mg) in 4.975 mL of D2O, containing of 2 µL mL-1 DMSO as
internal standard, followed by addition of 25 µL HCl(aq) (0.5 M). Separately, 40 mg of DBS-CO2H
was dissolved in 4.66 mL D2O (also containing 2 µL mL-1 DMSO as internal standard) through the
addition of 340 µL NaOH(aq) (0.5 M). The two solutions were mixed, then 13 separate 700 μL
volumes were transferred to NMR tubes. One tube was left uncured, whilst the other 12 were cured
under UV light, with one tube being removed every 5 minutes over the course of 1 hour for NMR
spectra to be recorded. The concentration of mobile DBS-CO2H in each sample was determined,
and plotted against time (Figure 5.10a). From this, the Avrami exponent was calculated to be n =
0.99 (Figure 5.10b) - close enough (within the margins of experimental error) to a value of 1 to
suggest the fibres exhibit much more 1D growth in this case, as opposed to the more 2D growth
when GdL was used as the acidifying agent – potentially as the different kinetics of formation lead
to different nanostructures272 (though see section 2.4.2 for comments on the use of the Avrami
model with pH-responsive LMWGs).
After UV
Before UV
DBS-CO2H Ar-H DBS-CO2H Ar-H + DPIN Ar-H
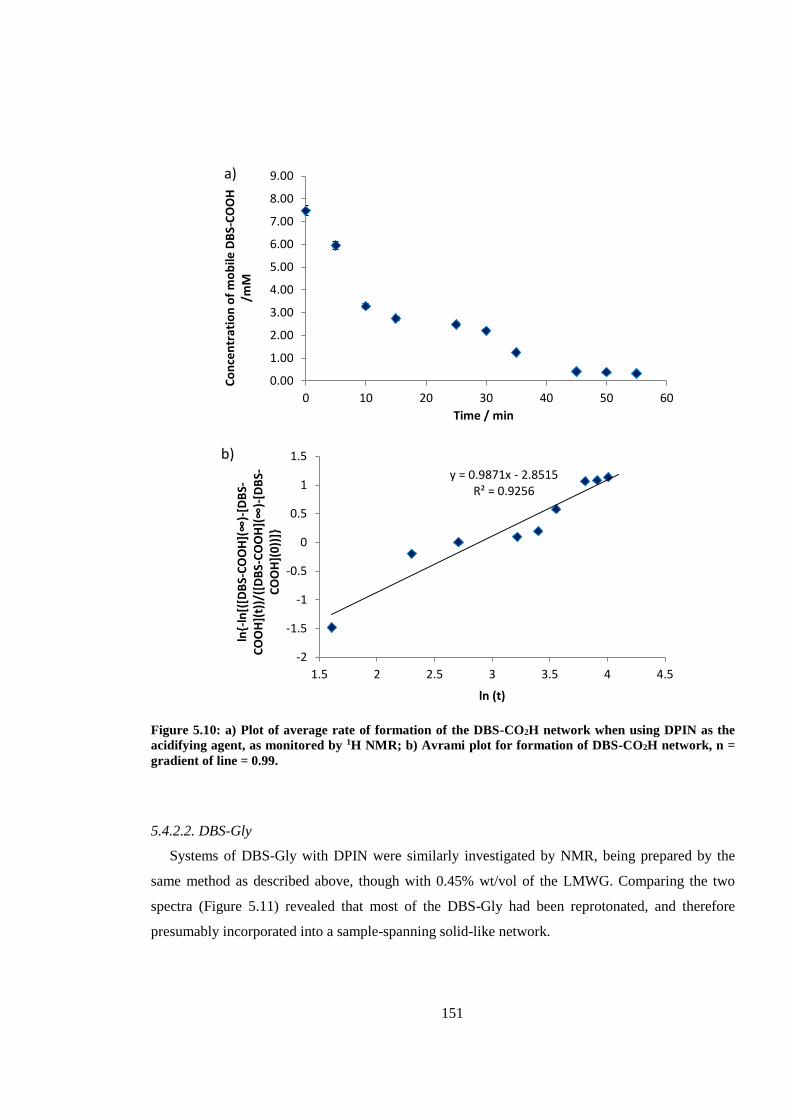
151
Figure 5.10: a) Plot of average rate of formation of the DBS-CO2H network when using DPIN as the
acidifying agent, as monitored by 1H NMR; b) Avrami plot for formation of DBS-CO2H network, n =
gradient of line = 0.99.
5.4.2.2. DBS-Gly
Systems of DBS-Gly with DPIN were similarly investigated by NMR, being prepared by the
same method as described above, though with 0.45% wt/vol of the LMWG. Comparing the two
spectra (Figure 5.11) revealed that most of the DBS-Gly had been reprotonated, and therefore
presumably incorporated into a sample-spanning solid-like network.
0.00
1.00
2.00
3.00
4.00
5.00
6.00
7.00
8.00
9.00
0 10 20 30 40 50 60
Co
nce
ntr
atio
n o
f m
ob
ile D
BS-
CO
OH
/m
M
Time / min
a)
y = 0.9871x - 2.8515R² = 0.9256
-2
-1.5
-1
-0.5
0
0.5
1
1.5
1.5 2 2.5 3 3.5 4 4.5
ln{-
ln[(
[DB
S-COOH](∞)-
[DB
S-C
OO
H](
t))/
([D
BS-COOH](∞)-
[DB
S-C
OO
H](
0))
]}
ln (t)
b)
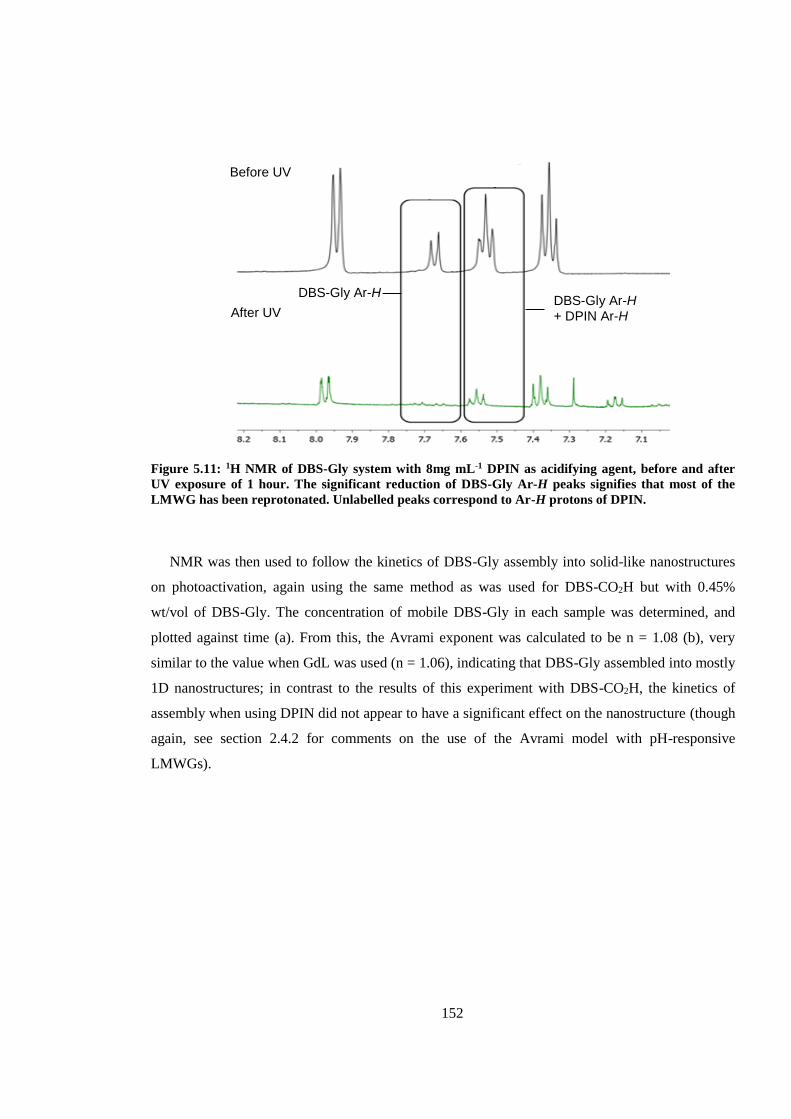
152
Figure 5.11: 1H NMR of DBS-Gly system with 8mg mL-1 DPIN as acidifying agent, before and after
UV exposure of 1 hour. The significant reduction of DBS-Gly Ar-H peaks signifies that most of the
LMWG has been reprotonated. Unlabelled peaks correspond to Ar-H protons of DPIN.
NMR was then used to follow the kinetics of DBS-Gly assembly into solid-like nanostructures
on photoactivation, again using the same method as was used for DBS-CO2H but with 0.45%
wt/vol of DBS-Gly. The concentration of mobile DBS-Gly in each sample was determined, and
plotted against time (a). From this, the Avrami exponent was calculated to be n = 1.08 (b), very
similar to the value when GdL was used (n = 1.06), indicating that DBS-Gly assembled into mostly
1D nanostructures; in contrast to the results of this experiment with DBS-CO2H, the kinetics of
assembly when using DPIN did not appear to have a significant effect on the nanostructure (though
again, see section 2.4.2 for comments on the use of the Avrami model with pH-responsive
LMWGs).
After UV
Before UV
DBS-Gly Ar-H DBS-Gly Ar-H + DPIN Ar-H
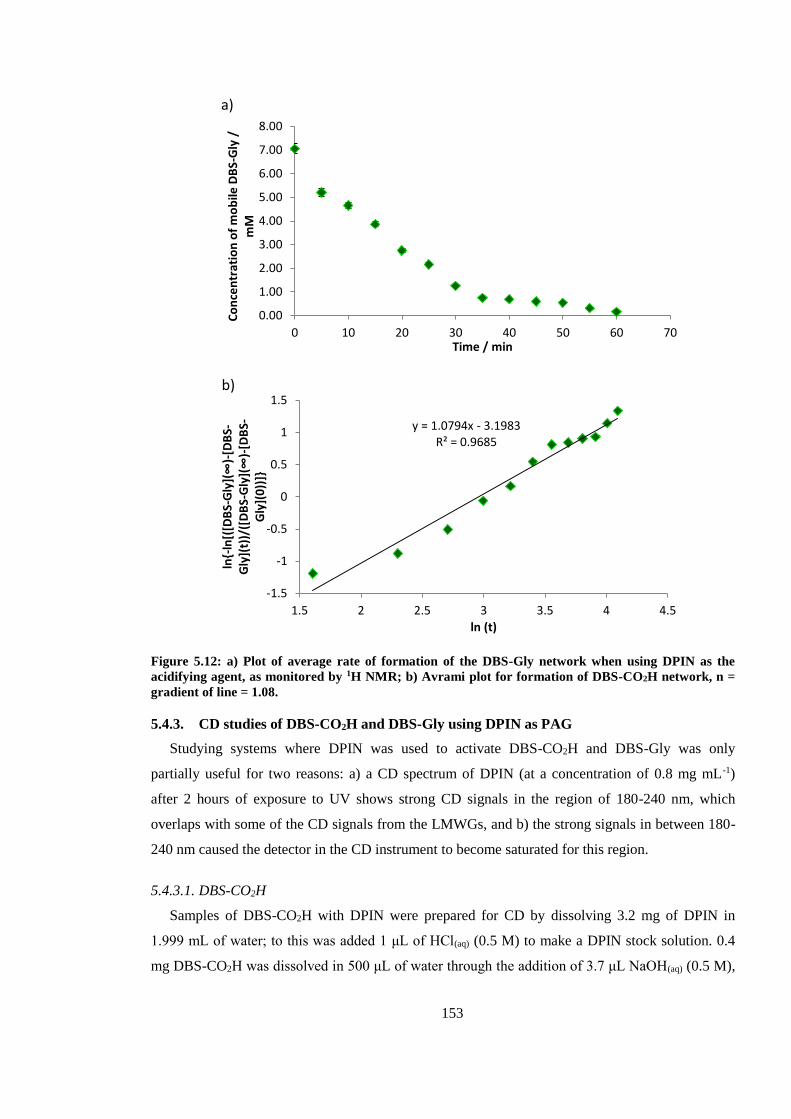
153
Figure 5.12: a) Plot of average rate of formation of the DBS-Gly network when using DPIN as the
acidifying agent, as monitored by 1H NMR; b) Avrami plot for formation of DBS-CO2H network, n =
gradient of line = 1.08.
5.4.3. CD studies of DBS-CO2H and DBS-Gly using DPIN as PAG
Studying systems where DPIN was used to activate DBS-CO2H and DBS-Gly was only
partially useful for two reasons: a) a CD spectrum of DPIN (at a concentration of 0.8 mg mL-1)
after 2 hours of exposure to UV shows strong CD signals in the region of 180-240 nm, which
overlaps with some of the CD signals from the LMWGs, and b) the strong signals in between 180-
240 nm caused the detector in the CD instrument to become saturated for this region.
5.4.3.1. DBS-CO2H
Samples of DBS-CO2H with DPIN were prepared for CD by dissolving 3.2 mg of DPIN in
1.999 mL of water; to this was added 1 μL of HCl(aq) (0.5 M) to make a DPIN stock solution. 0.4
mg DBS-CO2H was dissolved in 500 μL of water through the addition of 3.7 μL NaOH(aq) (0.5 M),
0.00
1.00
2.00
3.00
4.00
5.00
6.00
7.00
8.00
0 10 20 30 40 50 60 70
Co
nce
ntr
atio
n o
f m
ob
ile D
BS-
Gly
/
mM
Time / min
a)
y = 1.0794x - 3.1983R² = 0.9685
-1.5
-1
-0.5
0
0.5
1
1.5
1.5 2 2.5 3 3.5 4 4.5
ln{-
ln[(
[DB
S-Gly](∞)-
[DB
S-G
ly](
t))/
([D
BS-Gly](∞)-
[DB
S-G
ly](
0))
]}
ln (t)
b)
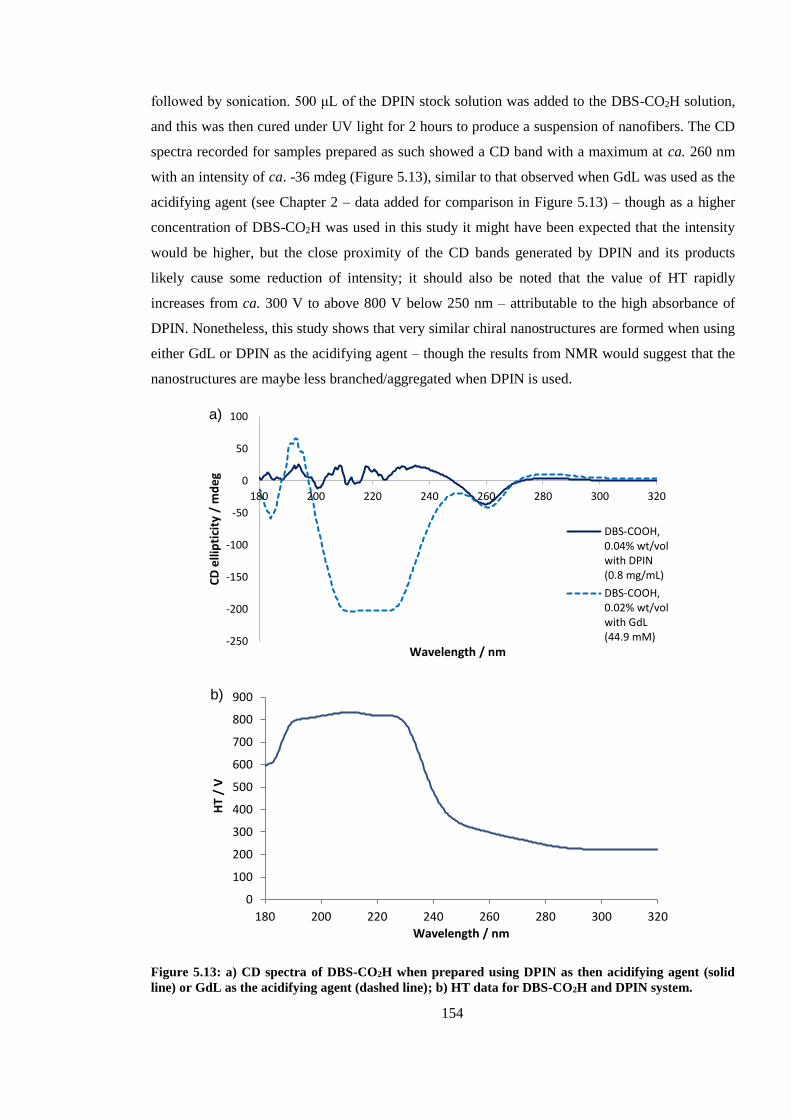
154
followed by sonication. 500 μL of the DPIN stock solution was added to the DBS-CO2H solution,
and this was then cured under UV light for 2 hours to produce a suspension of nanofibers. The CD
spectra recorded for samples prepared as such showed a CD band with a maximum at ca. 260 nm
with an intensity of ca. -36 mdeg (Figure 5.13), similar to that observed when GdL was used as the
acidifying agent (see Chapter 2 – data added for comparison in Figure 5.13) – though as a higher
concentration of DBS-CO2H was used in this study it might have been expected that the intensity
would be higher, but the close proximity of the CD bands generated by DPIN and its products
likely cause some reduction of intensity; it should also be noted that the value of HT rapidly
increases from ca. 300 V to above 800 V below 250 nm – attributable to the high absorbance of
DPIN. Nonetheless, this study shows that very similar chiral nanostructures are formed when using
either GdL or DPIN as the acidifying agent – though the results from NMR would suggest that the
nanostructures are maybe less branched/aggregated when DPIN is used.
Figure 5.13: a) CD spectra of DBS-CO2H when prepared using DPIN as then acidifying agent (solid
line) or GdL as the acidifying agent (dashed line); b) HT data for DBS-CO2H and DPIN system.
-250
-200
-150
-100
-50
0
50
100
180 200 220 240 260 280 300 320
CD
elli
pti
city
/ m
de
g
Wavelength / nm
a)
DBS-COOH,0.04% wt/volwith DPIN(0.8 mg/mL)
DBS-COOH,0.02% wt/volwith GdL(44.9 mM)
0
100
200
300
400
500
600
700
800
900
180 200 220 240 260 280 300 320
HT
/ V
Wavelength / nm
b)
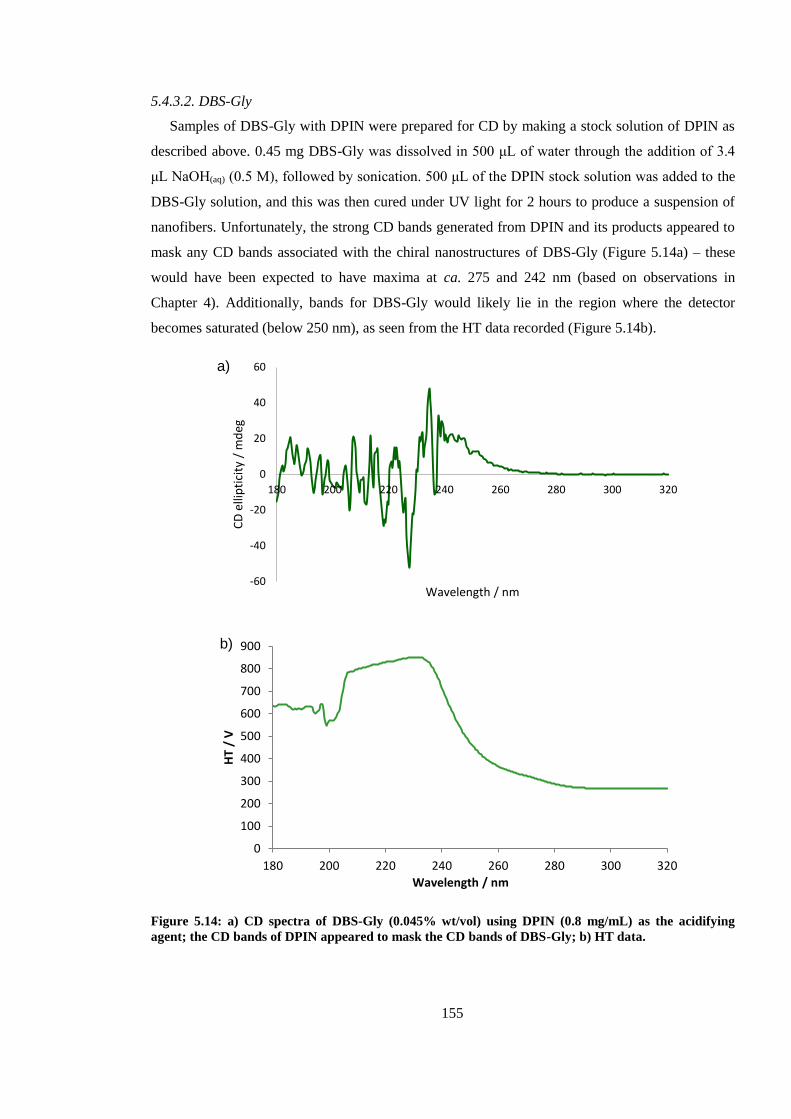
155
5.4.3.2. DBS-Gly
Samples of DBS-Gly with DPIN were prepared for CD by making a stock solution of DPIN as
described above. 0.45 mg DBS-Gly was dissolved in 500 μL of water through the addition of 3.4
μL NaOH(aq) (0.5 M), followed by sonication. 500 μL of the DPIN stock solution was added to the
DBS-Gly solution, and this was then cured under UV light for 2 hours to produce a suspension of
nanofibers. Unfortunately, the strong CD bands generated from DPIN and its products appeared to
mask any CD bands associated with the chiral nanostructures of DBS-Gly (Figure 5.14a) – these
would have been expected to have maxima at ca. 275 and 242 nm (based on observations in
Chapter 4). Additionally, bands for DBS-Gly would likely lie in the region where the detector
becomes saturated (below 250 nm), as seen from the HT data recorded (Figure 5.14b).
Figure 5.14: a) CD spectra of DBS-Gly (0.045% wt/vol) using DPIN (0.8 mg/mL) as the acidifying
agent; the CD bands of DPIN appeared to mask the CD bands of DBS-Gly; b) HT data.
-60
-40
-20
0
20
40
60
180 200 220 240 260 280 300 320
CD
elli
pti
city
/ m
deg
Wavelength / nm
a)
0
100
200
300
400
500
600
700
800
900
180 200 220 240 260 280 300 320
HT
/ V
Wavelength / nm
b)
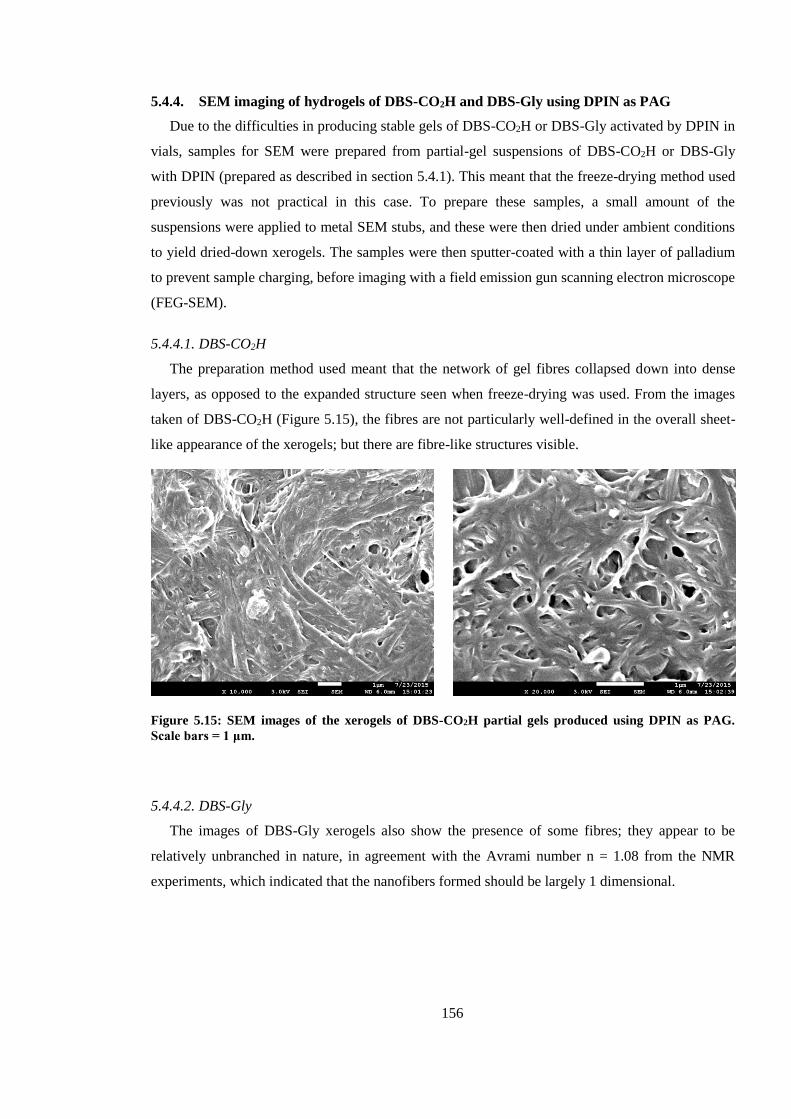
156
5.4.4. SEM imaging of hydrogels of DBS-CO2H and DBS-Gly using DPIN as PAG
Due to the difficulties in producing stable gels of DBS-CO2H or DBS-Gly activated by DPIN in
vials, samples for SEM were prepared from partial-gel suspensions of DBS-CO2H or DBS-Gly
with DPIN (prepared as described in section 5.4.1). This meant that the freeze-drying method used
previously was not practical in this case. To prepare these samples, a small amount of the
suspensions were applied to metal SEM stubs, and these were then dried under ambient conditions
to yield dried-down xerogels. The samples were then sputter-coated with a thin layer of palladium
to prevent sample charging, before imaging with a field emission gun scanning electron microscope
(FEG-SEM).
5.4.4.1. DBS-CO2H
The preparation method used meant that the network of gel fibres collapsed down into dense
layers, as opposed to the expanded structure seen when freeze-drying was used. From the images
taken of DBS-CO2H (Figure 5.15), the fibres are not particularly well-defined in the overall sheet-
like appearance of the xerogels; but there are fibre-like structures visible.
Figure 5.15: SEM images of the xerogels of DBS-CO2H partial gels produced using DPIN as PAG.
Scale bars = 1 μm.
5.4.4.2. DBS-Gly
The images of DBS-Gly xerogels also show the presence of some fibres; they appear to be
relatively unbranched in nature, in agreement with the Avrami number n = 1.08 from the NMR
experiments, which indicated that the nanofibers formed should be largely 1 dimensional.
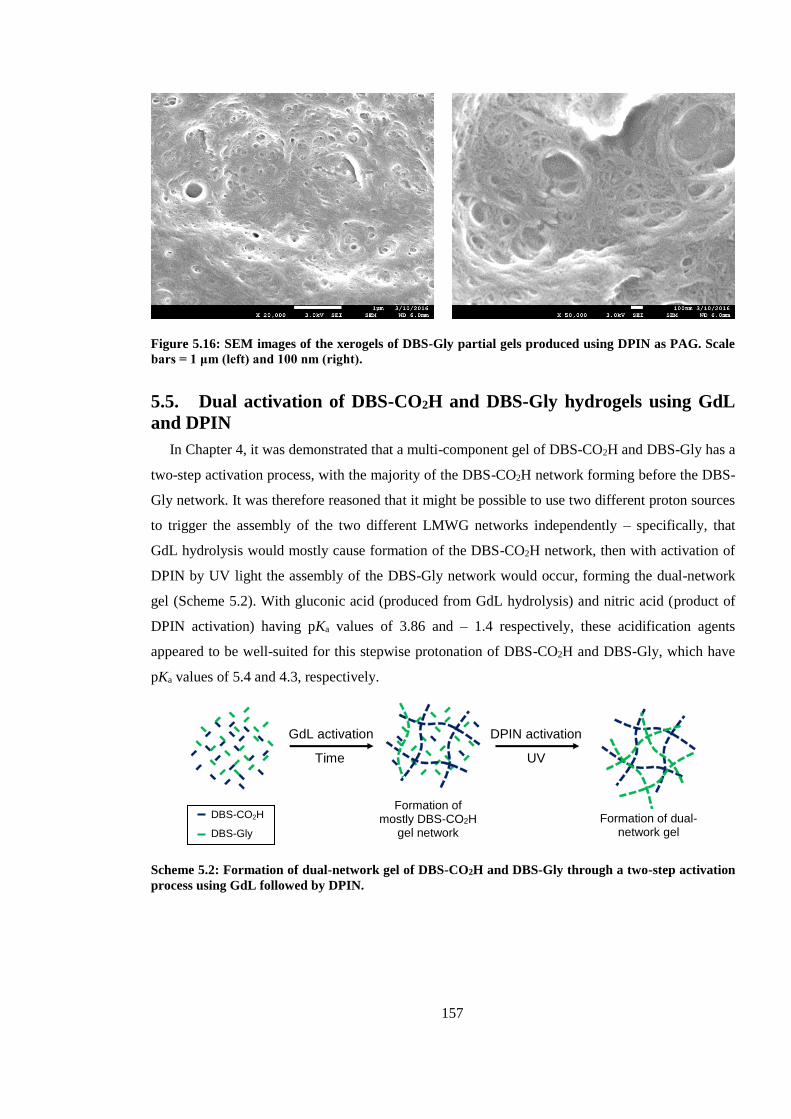
157
Figure 5.16: SEM images of the xerogels of DBS-Gly partial gels produced using DPIN as PAG. Scale
bars = 1 μm (left) and 100 nm (right).
5.5. Dual activation of DBS-CO2H and DBS-Gly hydrogels using GdL
and DPIN
In Chapter 4, it was demonstrated that a multi-component gel of DBS-CO2H and DBS-Gly has a
two-step activation process, with the majority of the DBS-CO2H network forming before the DBS-
Gly network. It was therefore reasoned that it might be possible to use two different proton sources
to trigger the assembly of the two different LMWG networks independently – specifically, that
GdL hydrolysis would mostly cause formation of the DBS-CO2H network, then with activation of
DPIN by UV light the assembly of the DBS-Gly network would occur, forming the dual-network
gel (Scheme 5.2). With gluconic acid (produced from GdL hydrolysis) and nitric acid (product of
DPIN activation) having pKa values of 3.86 and – 1.4 respectively, these acidification agents
appeared to be well-suited for this stepwise protonation of DBS-CO2H and DBS-Gly, which have
pKa values of 5.4 and 4.3, respectively.
Scheme 5.2: Formation of dual-network gel of DBS-CO2H and DBS-Gly through a two-step activation
process using GdL followed by DPIN.
GdL activation DPIN activation
DBS-CO2H
DBS-Gly
Time UV
Formation of dual-network gel
Formation of mostly DBS-CO2H
gel network
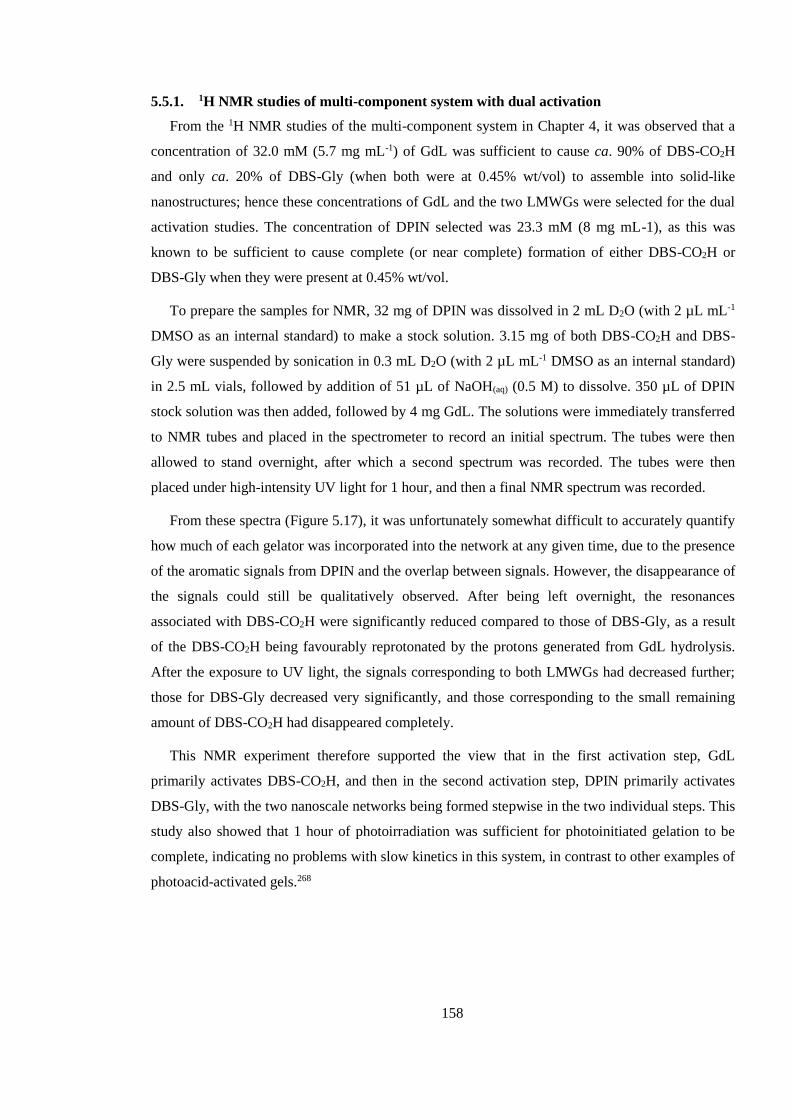
158
5.5.1. 1H NMR studies of multi-component system with dual activation
From the 1H NMR studies of the multi-component system in Chapter 4, it was observed that a
concentration of 32.0 mM (5.7 mg mL-1) of GdL was sufficient to cause ca. 90% of DBS-CO2H
and only ca. 20% of DBS-Gly (when both were at 0.45% wt/vol) to assemble into solid-like
nanostructures; hence these concentrations of GdL and the two LMWGs were selected for the dual
activation studies. The concentration of DPIN selected was 23.3 mM (8 mg mL-1), as this was
known to be sufficient to cause complete (or near complete) formation of either DBS-CO2H or
DBS-Gly when they were present at 0.45% wt/vol.
To prepare the samples for NMR, 32 mg of DPIN was dissolved in 2 mL D2O (with 2 µL mL-1
DMSO as an internal standard) to make a stock solution. 3.15 mg of both DBS-CO2H and DBS-
Gly were suspended by sonication in 0.3 mL D2O (with 2 µL mL-1 DMSO as an internal standard)
in 2.5 mL vials, followed by addition of 51 µL of NaOH(aq) (0.5 M) to dissolve. 350 µL of DPIN
stock solution was then added, followed by 4 mg GdL. The solutions were immediately transferred
to NMR tubes and placed in the spectrometer to record an initial spectrum. The tubes were then
allowed to stand overnight, after which a second spectrum was recorded. The tubes were then
placed under high-intensity UV light for 1 hour, and then a final NMR spectrum was recorded.
From these spectra (Figure 5.17), it was unfortunately somewhat difficult to accurately quantify
how much of each gelator was incorporated into the network at any given time, due to the presence
of the aromatic signals from DPIN and the overlap between signals. However, the disappearance of
the signals could still be qualitatively observed. After being left overnight, the resonances
associated with DBS-CO2H were significantly reduced compared to those of DBS-Gly, as a result
of the DBS-CO2H being favourably reprotonated by the protons generated from GdL hydrolysis.
After the exposure to UV light, the signals corresponding to both LMWGs had decreased further;
those for DBS-Gly decreased very significantly, and those corresponding to the small remaining
amount of DBS-CO2H had disappeared completely.
This NMR experiment therefore supported the view that in the first activation step, GdL
primarily activates DBS-CO2H, and then in the second activation step, DPIN primarily activates
DBS-Gly, with the two nanoscale networks being formed stepwise in the two individual steps. This
study also showed that 1 hour of photoirradiation was sufficient for photoinitiated gelation to be
complete, indicating no problems with slow kinetics in this system, in contrast to other examples of
photoacid-activated gels.268
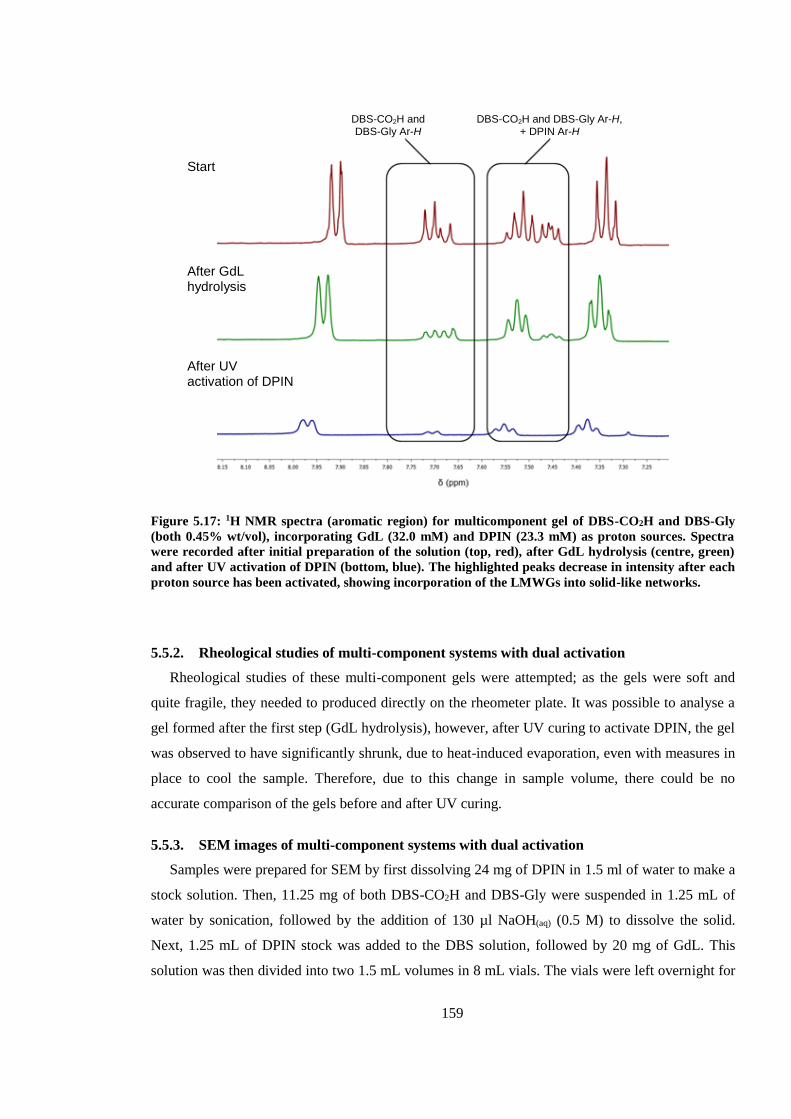
159
Figure 5.17: 1H NMR spectra (aromatic region) for multicomponent gel of DBS-CO2H and DBS-Gly
(both 0.45% wt/vol), incorporating GdL (32.0 mM) and DPIN (23.3 mM) as proton sources. Spectra
were recorded after initial preparation of the solution (top, red), after GdL hydrolysis (centre, green)
and after UV activation of DPIN (bottom, blue). The highlighted peaks decrease in intensity after each
proton source has been activated, showing incorporation of the LMWGs into solid-like networks.
5.5.2. Rheological studies of multi-component systems with dual activation
Rheological studies of these multi-component gels were attempted; as the gels were soft and
quite fragile, they needed to produced directly on the rheometer plate. It was possible to analyse a
gel formed after the first step (GdL hydrolysis), however, after UV curing to activate DPIN, the gel
was observed to have significantly shrunk, due to heat-induced evaporation, even with measures in
place to cool the sample. Therefore, due to this change in sample volume, there could be no
accurate comparison of the gels before and after UV curing.
5.5.3. SEM images of multi-component systems with dual activation
Samples were prepared for SEM by first dissolving 24 mg of DPIN in 1.5 ml of water to make a
stock solution. Then, 11.25 mg of both DBS-CO2H and DBS-Gly were suspended in 1.25 mL of
water by sonication, followed by the addition of 130 µl NaOH(aq) (0.5 M) to dissolve the solid.
Next, 1.25 mL of DPIN stock was added to the DBS solution, followed by 20 mg of GdL. This
solution was then divided into two 1.5 mL volumes in 8 mL vials. The vials were left overnight for
Start
After GdL hydrolysis
After UV activation of DPIN
DBS-CO2H and DBS-Gly Ar-H
DBS-CO2H and DBS-Gly Ar-H, + DPIN Ar-H
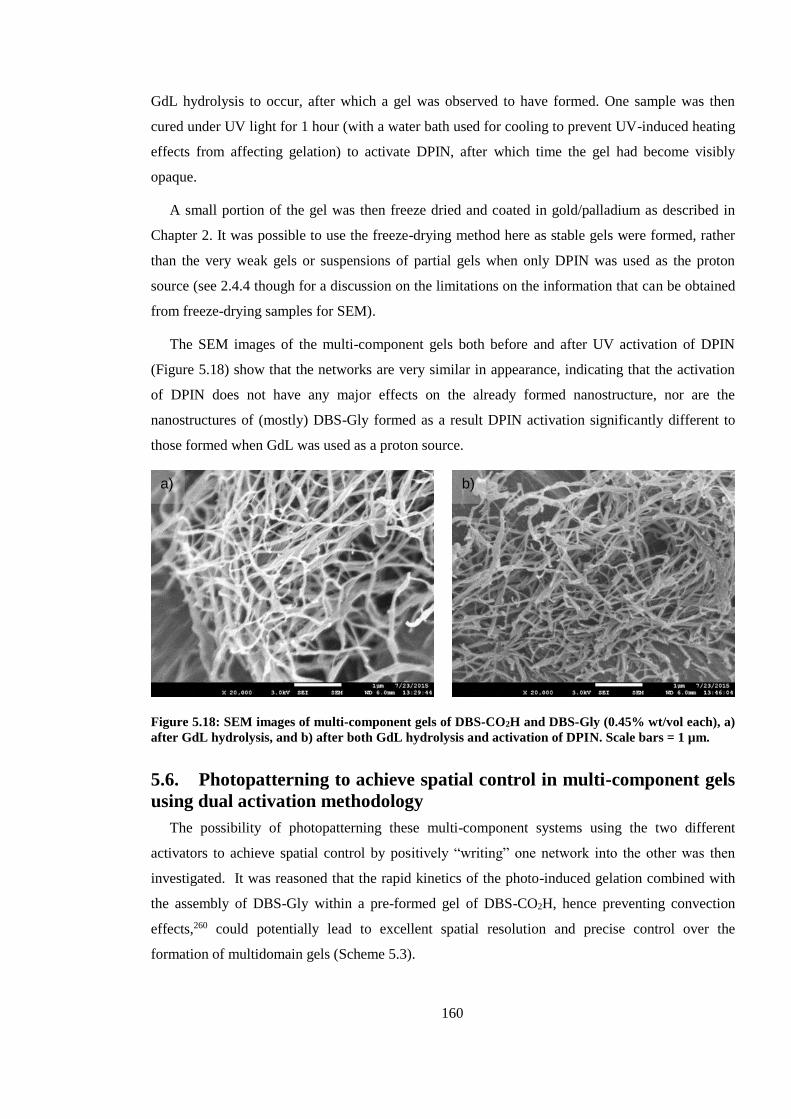
160
GdL hydrolysis to occur, after which a gel was observed to have formed. One sample was then
cured under UV light for 1 hour (with a water bath used for cooling to prevent UV-induced heating
effects from affecting gelation) to activate DPIN, after which time the gel had become visibly
opaque.
A small portion of the gel was then freeze dried and coated in gold/palladium as described in
Chapter 2. It was possible to use the freeze-drying method here as stable gels were formed, rather
than the very weak gels or suspensions of partial gels when only DPIN was used as the proton
source (see 2.4.4 though for a discussion on the limitations on the information that can be obtained
from freeze-drying samples for SEM).
The SEM images of the multi-component gels both before and after UV activation of DPIN
(Figure 5.18) show that the networks are very similar in appearance, indicating that the activation
of DPIN does not have any major effects on the already formed nanostructure, nor are the
nanostructures of (mostly) DBS-Gly formed as a result DPIN activation significantly different to
those formed when GdL was used as a proton source.
Figure 5.18: SEM images of multi-component gels of DBS-CO2H and DBS-Gly (0.45% wt/vol each), a)
after GdL hydrolysis, and b) after both GdL hydrolysis and activation of DPIN. Scale bars = 1 µm.
5.6. Photopatterning to achieve spatial control in multi-component gels
using dual activation methodology
The possibility of photopatterning these multi-component systems using the two different
activators to achieve spatial control by positively “writing” one network into the other was then
investigated. It was reasoned that the rapid kinetics of the photo-induced gelation combined with
the assembly of DBS-Gly within a pre-formed gel of DBS-CO2H, hence preventing convection
effects,260 could potentially lead to excellent spatial resolution and precise control over the
formation of multidomain gels (Scheme 5.3).
a) b)
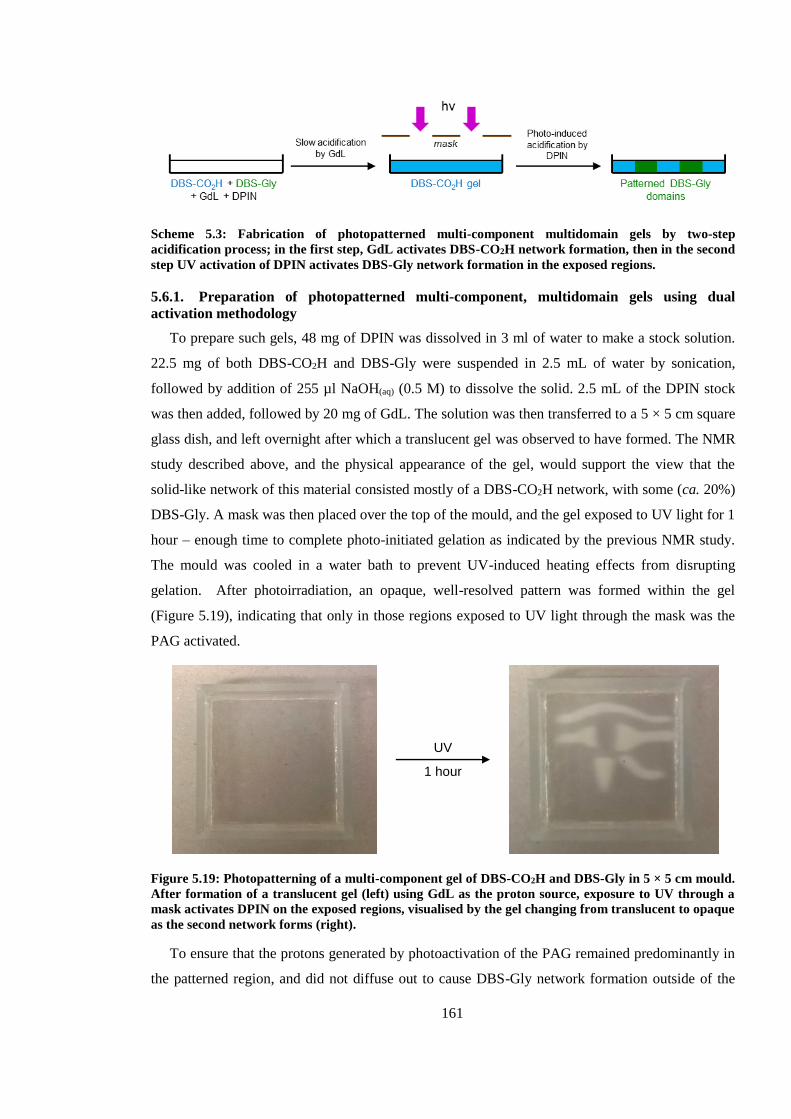
161
Scheme 5.3: Fabrication of photopatterned multi-component multidomain gels by two-step
acidification process; in the first step, GdL activates DBS-CO2H network formation, then in the second
step UV activation of DPIN activates DBS-Gly network formation in the exposed regions.
5.6.1. Preparation of photopatterned multi-component, multidomain gels using dual
activation methodology
To prepare such gels, 48 mg of DPIN was dissolved in 3 ml of water to make a stock solution.
22.5 mg of both DBS-CO2H and DBS-Gly were suspended in 2.5 mL of water by sonication,
followed by addition of 255 µl NaOH(aq) (0.5 M) to dissolve the solid. 2.5 mL of the DPIN stock
was then added, followed by 20 mg of GdL. The solution was then transferred to a 5 × 5 cm square
glass dish, and left overnight after which a translucent gel was observed to have formed. The NMR
study described above, and the physical appearance of the gel, would support the view that the
solid-like network of this material consisted mostly of a DBS-CO2H network, with some (ca. 20%)
DBS-Gly. A mask was then placed over the top of the mould, and the gel exposed to UV light for 1
hour – enough time to complete photo-initiated gelation as indicated by the previous NMR study.
The mould was cooled in a water bath to prevent UV-induced heating effects from disrupting
gelation. After photoirradiation, an opaque, well-resolved pattern was formed within the gel
(Figure 5.19), indicating that only in those regions exposed to UV light through the mask was the
PAG activated.
Figure 5.19: Photopatterning of a multi-component gel of DBS-CO2H and DBS-Gly in 5 × 5 cm mould.
After formation of a translucent gel (left) using GdL as the proton source, exposure to UV through a
mask activates DPIN on the exposed regions, visualised by the gel changing from translucent to opaque
as the second network forms (right).
To ensure that the protons generated by photoactivation of the PAG remained predominantly in
the patterned region, and did not diffuse out to cause DBS-Gly network formation outside of the
UV
1 hour
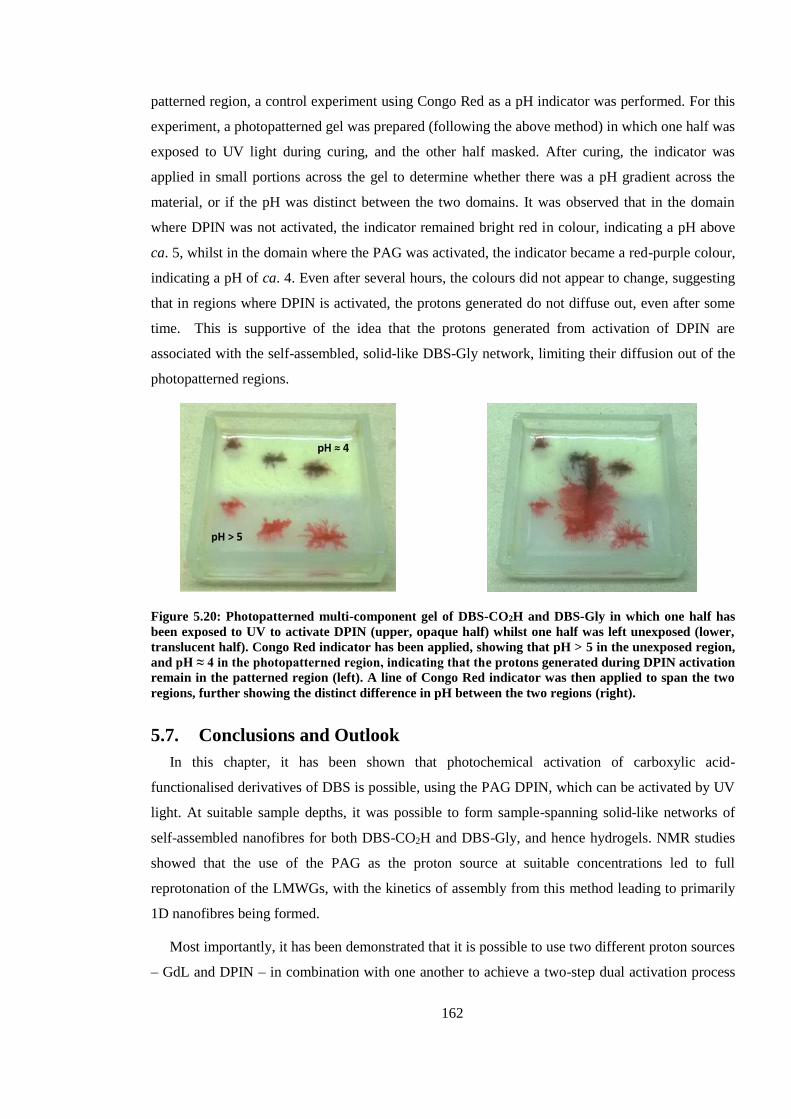
162
patterned region, a control experiment using Congo Red as a pH indicator was performed. For this
experiment, a photopatterned gel was prepared (following the above method) in which one half was
exposed to UV light during curing, and the other half masked. After curing, the indicator was
applied in small portions across the gel to determine whether there was a pH gradient across the
material, or if the pH was distinct between the two domains. It was observed that in the domain
where DPIN was not activated, the indicator remained bright red in colour, indicating a pH above
ca. 5, whilst in the domain where the PAG was activated, the indicator became a red-purple colour,
indicating a pH of ca. 4. Even after several hours, the colours did not appear to change, suggesting
that in regions where DPIN is activated, the protons generated do not diffuse out, even after some
time. This is supportive of the idea that the protons generated from activation of DPIN are
associated with the self-assembled, solid-like DBS-Gly network, limiting their diffusion out of the
photopatterned regions.
Figure 5.20: Photopatterned multi-component gel of DBS-CO2H and DBS-Gly in which one half has
been exposed to UV to activate DPIN (upper, opaque half) whilst one half was left unexposed (lower,
translucent half). Congo Red indicator has been applied, showing that pH > 5 in the unexposed region,
and pH ≈ 4 in the photopatterned region, indicating that the protons generated during DPIN activation
remain in the patterned region (left). A line of Congo Red indicator was then applied to span the two
regions, further showing the distinct difference in pH between the two regions (right).
5.7. Conclusions and Outlook
In this chapter, it has been shown that photochemical activation of carboxylic acid-
functionalised derivatives of DBS is possible, using the PAG DPIN, which can be activated by UV
light. At suitable sample depths, it was possible to form sample-spanning solid-like networks of
self-assembled nanofibres for both DBS-CO2H and DBS-Gly, and hence hydrogels. NMR studies
showed that the use of the PAG as the proton source at suitable concentrations led to full
reprotonation of the LMWGs, with the kinetics of assembly from this method leading to primarily
1D nanofibres being formed.
Most importantly, it has been demonstrated that it is possible to use two different proton sources
– GdL and DPIN – in combination with one another to achieve a two-step dual activation process
163
of a multi-component gel of DBS-CO2H and DPIN, in which the protons generated from GdL in
the first step mainly drive formation of the DBS-CO2H network, whilst the protons generated from
DPIN in the second step drive the formation of the DBS-Gly network. Performing the second step
of this process through a photo mask allowed for positive photopatterning of one LMWG network
within the other, leading to a multidomain, spatially resolved supramolecular gel, in which there is
also a degree of temporal control over when each network is formed (particularly the second
network).
Concurrent with this research, Adams and co-workers published a similar study into spatially-
resolved multi-component gels where the patterning was achieved by exposure to UV light.273
These gels were formed from two structurally different LMWGS, one based on stilbene, the other a
naphthalene dipeptide. Both LMWGs were pH-responsive, and having suitably differing pKa
values, their reprotonation occurred at different pHs; this allowed for production of a self-sorted
multi-component gel. The stilbene-based gelator was also responsive to UV light, under which it
would undergo isomerisation from trans to cis structure; the cis isomer was not an effective
LMWG, and gels of just the stilbene-based gelator would undergo a gel-sol transition on exposure
to UV. Hence, if the multi-component gel was exposed to UV through a mask, only in the exposed
areas was the stilbene-based LMWG network broken down, leading to a gel photopatterned
through a negative etching approach.
Spatial and temporal control over the formation of different networks in multi-component gels
is also potentially achievable by other methods. Adams and co-workers have also investigated the
use of an electrochemical method, in which an electrode was used to oxidise hydroquinone,
releasing protons to trigger the gelation of pH-responsive dipeptide-based gelators, with the gel
forming on the electrode surface.274 Temporal control could be introduced to multi-component gels
by the choice of the current applied to the electrode, determining the pH at a given time and if it
was sufficient to promote gelator of one or both gelators in the multi-component system. Spatial
control could be achieved by forming a layer of a gel of one LMWG on the electrode, then placing
it into a solution of another LMWG and electrochemically triggering gelation.
Whilst both of these above systems achieved spatial resolution in the gels, they are not without
potential problems. In the first example,273 both gel networks needed to be formed before the
“negative etching” patterning could be carried out; this could limit the overall detail possible in the
patterning, particularly if most of the photodegradable network was required to be removed. In the
second example,274 achieving spatial resolution required removal and insertion of the gel-coated
electrode, which disturbs the sample. The system described in this chapter does not have these
associated problems, although the self-sorting of each network is not quite as good; future
development would likely require this issue to be addressed. Additionally, it should be noted that
164
DPIN is not very biocompatible – a more biologically-friendly PAG would need to be
used/developed if these materials were to be used in biomedical applications.
Looking further to the future of these systems, there is considerable potential for them. There is
scope for morphological design using this photopatterning approach, limited only by the
possibilities of photoactivation. This photo-activated approach to gelation could also be very
simply combined with other different hydrogels (both LMWG and PG based) – for example those
activated by heat-cool cycles rather than pH control. Such materials could be viable for controlled
release or tissue engineering applications (if the issue of PAG biocompatibility is addressed).
Furthermore, the use two-photon methods to activate the PAG could give rise to truly three
dimensional multi-domain supramolecular gel architectures.
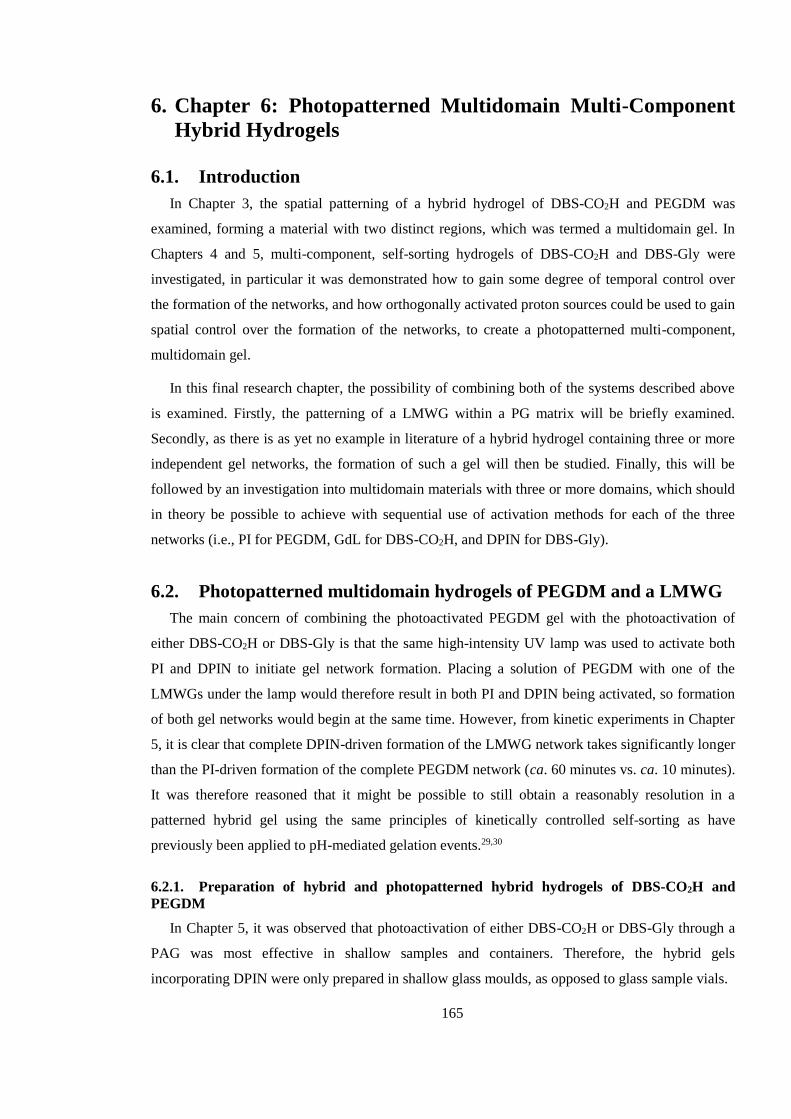
165
6. Chapter 6: Photopatterned Multidomain Multi-Component
Hybrid Hydrogels
6.1. Introduction
In Chapter 3, the spatial patterning of a hybrid hydrogel of DBS-CO2H and PEGDM was
examined, forming a material with two distinct regions, which was termed a multidomain gel. In
Chapters 4 and 5, multi-component, self-sorting hydrogels of DBS-CO2H and DBS-Gly were
investigated, in particular it was demonstrated how to gain some degree of temporal control over
the formation of the networks, and how orthogonally activated proton sources could be used to gain
spatial control over the formation of the networks, to create a photopatterned multi-component,
multidomain gel.
In this final research chapter, the possibility of combining both of the systems described above
is examined. Firstly, the patterning of a LMWG within a PG matrix will be briefly examined.
Secondly, as there is as yet no example in literature of a hybrid hydrogel containing three or more
independent gel networks, the formation of such a gel will then be studied. Finally, this will be
followed by an investigation into multidomain materials with three or more domains, which should
in theory be possible to achieve with sequential use of activation methods for each of the three
networks (i.e., PI for PEGDM, GdL for DBS-CO2H, and DPIN for DBS-Gly).
6.2. Photopatterned multidomain hydrogels of PEGDM and a LMWG
The main concern of combining the photoactivated PEGDM gel with the photoactivation of
either DBS-CO2H or DBS-Gly is that the same high-intensity UV lamp was used to activate both
PI and DPIN to initiate gel network formation. Placing a solution of PEGDM with one of the
LMWGs under the lamp would therefore result in both PI and DPIN being activated, so formation
of both gel networks would begin at the same time. However, from kinetic experiments in Chapter
5, it is clear that complete DPIN-driven formation of the LMWG network takes significantly longer
than the PI-driven formation of the complete PEGDM network (ca. 60 minutes vs. ca. 10 minutes).
It was therefore reasoned that it might be possible to still obtain a reasonably resolution in a
patterned hybrid gel using the same principles of kinetically controlled self-sorting as have
previously been applied to pH-mediated gelation events.29,30
6.2.1. Preparation of hybrid and photopatterned hybrid hydrogels of DBS-CO2H and
PEGDM
In Chapter 5, it was observed that photoactivation of either DBS-CO2H or DBS-Gly through a
PAG was most effective in shallow samples and containers. Therefore, the hybrid gels
incorporating DPIN were only prepared in shallow glass moulds, as opposed to glass sample vials.
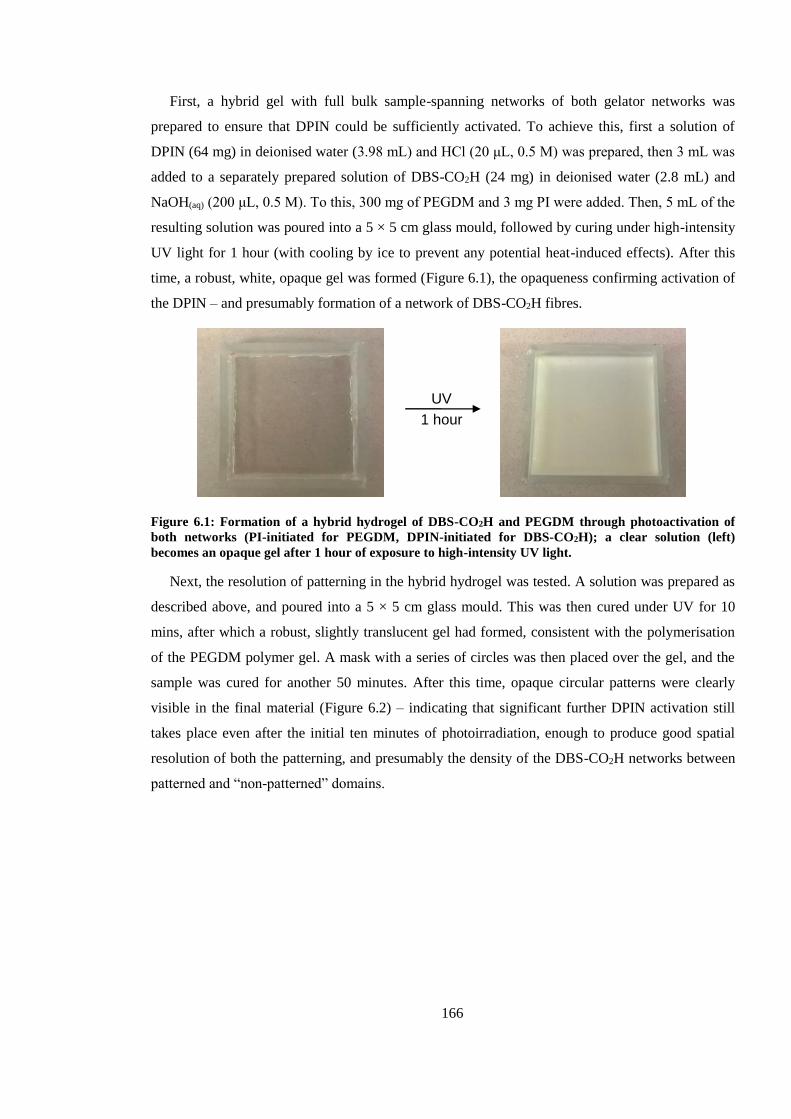
166
First, a hybrid gel with full bulk sample-spanning networks of both gelator networks was
prepared to ensure that DPIN could be sufficiently activated. To achieve this, first a solution of
DPIN (64 mg) in deionised water (3.98 mL) and HCl (20 μL, 0.5 M) was prepared, then 3 mL was
added to a separately prepared solution of DBS-CO2H (24 mg) in deionised water (2.8 mL) and
NaOH(aq) (200 μL, 0.5 M). To this, 300 mg of PEGDM and 3 mg PI were added. Then, 5 mL of the
resulting solution was poured into a 5 × 5 cm glass mould, followed by curing under high-intensity
UV light for 1 hour (with cooling by ice to prevent any potential heat-induced effects). After this
time, a robust, white, opaque gel was formed (Figure 6.1), the opaqueness confirming activation of
the DPIN – and presumably formation of a network of DBS-CO2H fibres.
Figure 6.1: Formation of a hybrid hydrogel of DBS-CO2H and PEGDM through photoactivation of
both networks (PI-initiated for PEGDM, DPIN-initiated for DBS-CO2H); a clear solution (left)
becomes an opaque gel after 1 hour of exposure to high-intensity UV light.
Next, the resolution of patterning in the hybrid hydrogel was tested. A solution was prepared as
described above, and poured into a 5 × 5 cm glass mould. This was then cured under UV for 10
mins, after which a robust, slightly translucent gel had formed, consistent with the polymerisation
of the PEGDM polymer gel. A mask with a series of circles was then placed over the gel, and the
sample was cured for another 50 minutes. After this time, opaque circular patterns were clearly
visible in the final material (Figure 6.2) – indicating that significant further DPIN activation still
takes place even after the initial ten minutes of photoirradiation, enough to produce good spatial
resolution of both the patterning, and presumably the density of the DBS-CO2H networks between
patterned and “non-patterned” domains.
UV
1 hour
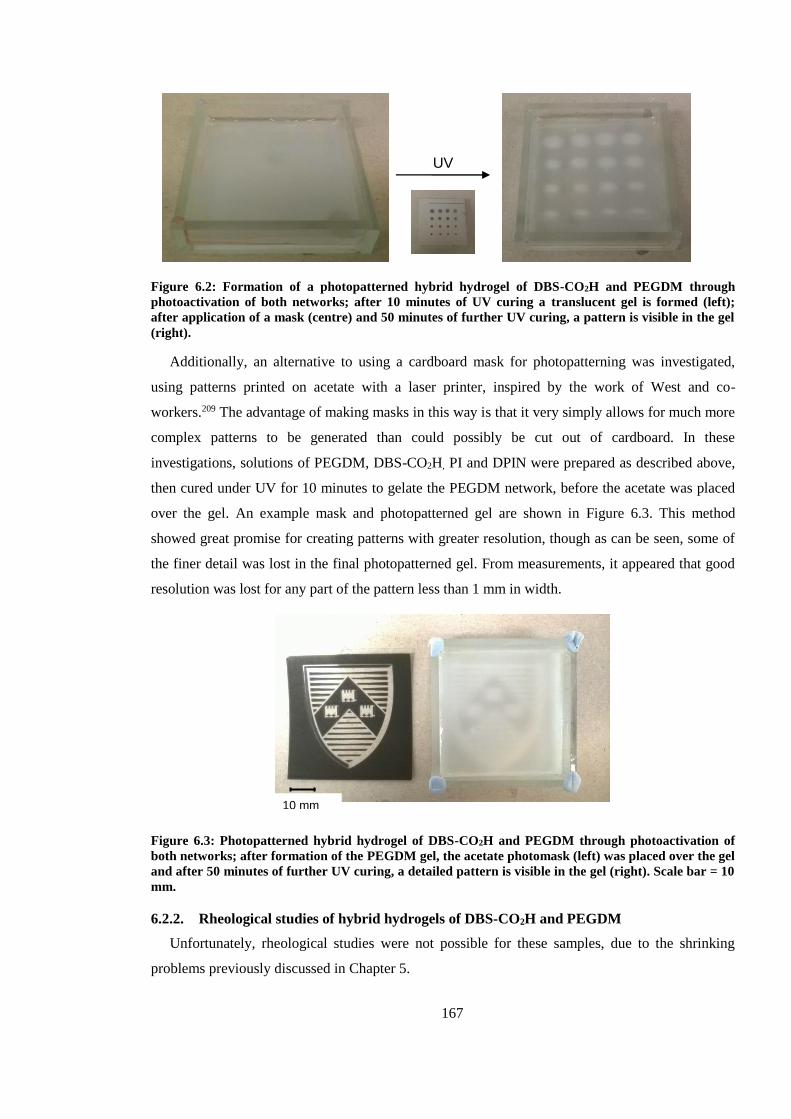
167
Figure 6.2: Formation of a photopatterned hybrid hydrogel of DBS-CO2H and PEGDM through
photoactivation of both networks; after 10 minutes of UV curing a translucent gel is formed (left);
after application of a mask (centre) and 50 minutes of further UV curing, a pattern is visible in the gel
(right).
Additionally, an alternative to using a cardboard mask for photopatterning was investigated,
using patterns printed on acetate with a laser printer, inspired by the work of West and co-
workers.209 The advantage of making masks in this way is that it very simply allows for much more
complex patterns to be generated than could possibly be cut out of cardboard. In these
investigations, solutions of PEGDM, DBS-CO2H, PI and DPIN were prepared as described above,
then cured under UV for 10 minutes to gelate the PEGDM network, before the acetate was placed
over the gel. An example mask and photopatterned gel are shown in Figure 6.3. This method
showed great promise for creating patterns with greater resolution, though as can be seen, some of
the finer detail was lost in the final photopatterned gel. From measurements, it appeared that good
resolution was lost for any part of the pattern less than 1 mm in width.
Figure 6.3: Photopatterned hybrid hydrogel of DBS-CO2H and PEGDM through photoactivation of
both networks; after formation of the PEGDM gel, the acetate photomask (left) was placed over the gel
and after 50 minutes of further UV curing, a detailed pattern is visible in the gel (right). Scale bar = 10
mm.
6.2.2. Rheological studies of hybrid hydrogels of DBS-CO2H and PEGDM
Unfortunately, rheological studies were not possible for these samples, due to the shrinking
problems previously discussed in Chapter 5.
10 mm
UV
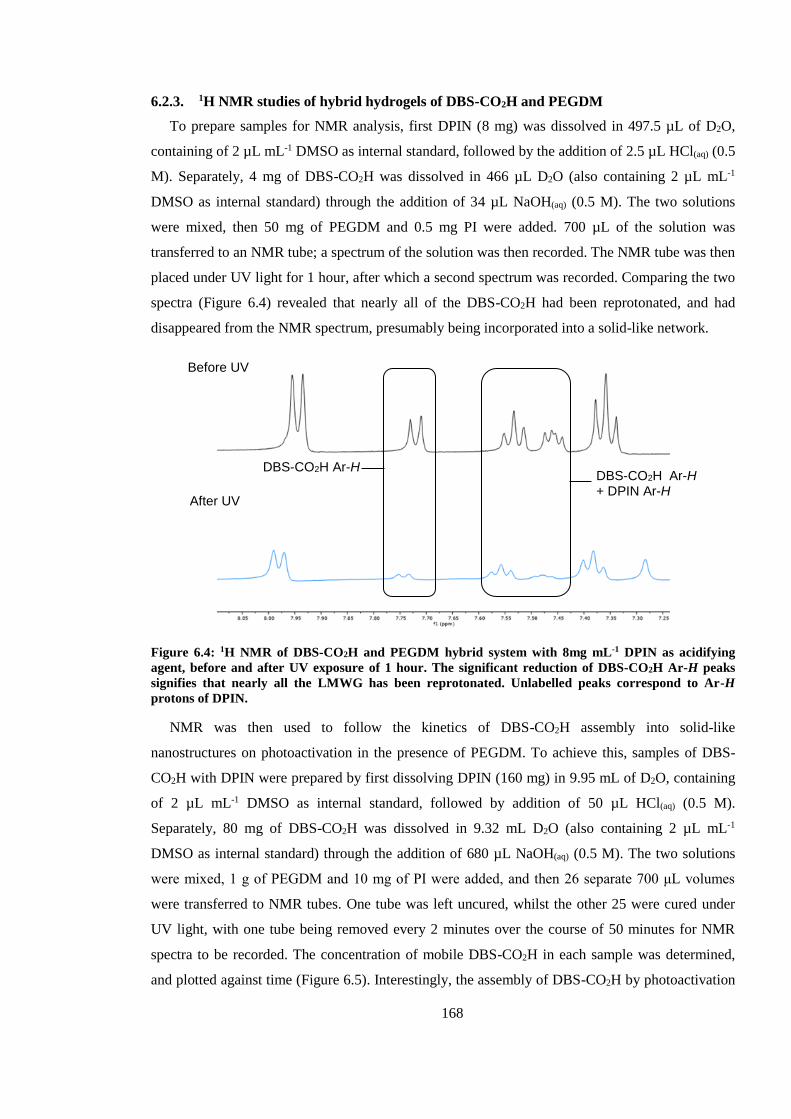
168
6.2.3. 1H NMR studies of hybrid hydrogels of DBS-CO2H and PEGDM
To prepare samples for NMR analysis, first DPIN (8 mg) was dissolved in 497.5 µL of D2O,
containing of 2 µL mL-1 DMSO as internal standard, followed by the addition of 2.5 µL HCl(aq) (0.5
M). Separately, 4 mg of DBS-CO2H was dissolved in 466 µL D2O (also containing 2 µL mL-1
DMSO as internal standard) through the addition of 34 µL NaOH(aq) (0.5 M). The two solutions
were mixed, then 50 mg of PEGDM and 0.5 mg PI were added. 700 µL of the solution was
transferred to an NMR tube; a spectrum of the solution was then recorded. The NMR tube was then
placed under UV light for 1 hour, after which a second spectrum was recorded. Comparing the two
spectra (Figure 6.4) revealed that nearly all of the DBS-CO2H had been reprotonated, and had
disappeared from the NMR spectrum, presumably being incorporated into a solid-like network.
Figure 6.4: 1H NMR of DBS-CO2H and PEGDM hybrid system with 8mg mL-1 DPIN as acidifying
agent, before and after UV exposure of 1 hour. The significant reduction of DBS-CO2H Ar-H peaks
signifies that nearly all the LMWG has been reprotonated. Unlabelled peaks correspond to Ar-H
protons of DPIN.
NMR was then used to follow the kinetics of DBS-CO2H assembly into solid-like
nanostructures on photoactivation in the presence of PEGDM. To achieve this, samples of DBS-
CO2H with DPIN were prepared by first dissolving DPIN (160 mg) in 9.95 mL of D2O, containing
of 2 µL mL-1 DMSO as internal standard, followed by addition of 50 µL HCl(aq) (0.5 M).
Separately, 80 mg of DBS-CO2H was dissolved in 9.32 mL D2O (also containing 2 µL mL-1
DMSO as internal standard) through the addition of 680 µL NaOH(aq) (0.5 M). The two solutions
were mixed, 1 g of PEGDM and 10 mg of PI were added, and then 26 separate 700 μL volumes
were transferred to NMR tubes. One tube was left uncured, whilst the other 25 were cured under
UV light, with one tube being removed every 2 minutes over the course of 50 minutes for NMR
spectra to be recorded. The concentration of mobile DBS-CO2H in each sample was determined,
and plotted against time (Figure 6.5). Interestingly, the assembly of DBS-CO2H by photoactivation
After UV
DBS-CO2H Ar-H DBS-CO2H Ar-H + DPIN Ar-H
Before UV
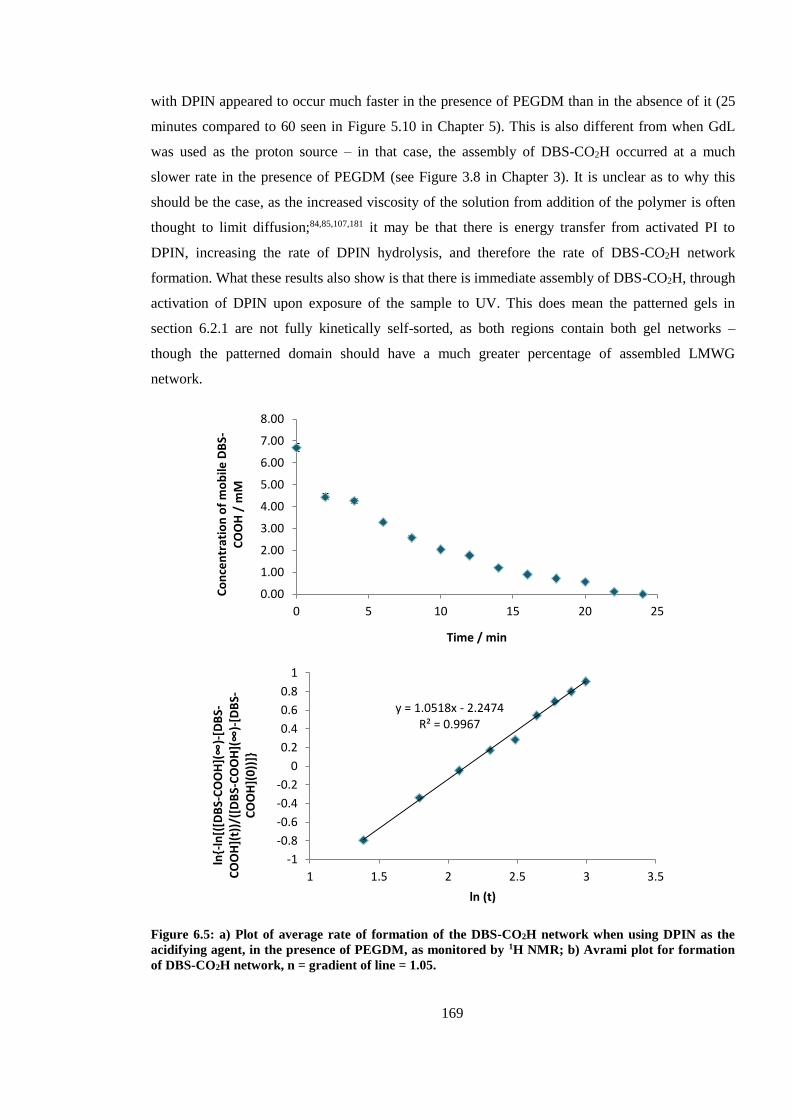
169
with DPIN appeared to occur much faster in the presence of PEGDM than in the absence of it (25
minutes compared to 60 seen in Figure 5.10 in Chapter 5). This is also different from when GdL
was used as the proton source – in that case, the assembly of DBS-CO2H occurred at a much
slower rate in the presence of PEGDM (see Figure 3.8 in Chapter 3). It is unclear as to why this
should be the case, as the increased viscosity of the solution from addition of the polymer is often
thought to limit diffusion;84,85,107,181 it may be that there is energy transfer from activated PI to
DPIN, increasing the rate of DPIN hydrolysis, and therefore the rate of DBS-CO2H network
formation. What these results also show is that there is immediate assembly of DBS-CO2H, through
activation of DPIN upon exposure of the sample to UV. This does mean the patterned gels in
section 6.2.1 are not fully kinetically self-sorted, as both regions contain both gel networks –
though the patterned domain should have a much greater percentage of assembled LMWG
network.
Figure 6.5: a) Plot of average rate of formation of the DBS-CO2H network when using DPIN as the
acidifying agent, in the presence of PEGDM, as monitored by 1H NMR; b) Avrami plot for formation
of DBS-CO2H network, n = gradient of line = 1.05.
0.00
1.00
2.00
3.00
4.00
5.00
6.00
7.00
8.00
0 5 10 15 20 25
Co
nce
ntr
atio
n o
f m
ob
ile D
BS-
CO
OH
/ m
M
Time / min
y = 1.0518x - 2.2474R² = 0.9967
-1
-0.8
-0.6
-0.4
-0.2
0
0.2
0.4
0.6
0.8
1
1 1.5 2 2.5 3 3.5
ln{-
ln[(
[DB
S-COOH](∞)-
[DB
S-C
OO
H](
t))/
([D
BS-COOH](∞)-
[DB
S-C
OO
H](
0))
]}
ln (t)
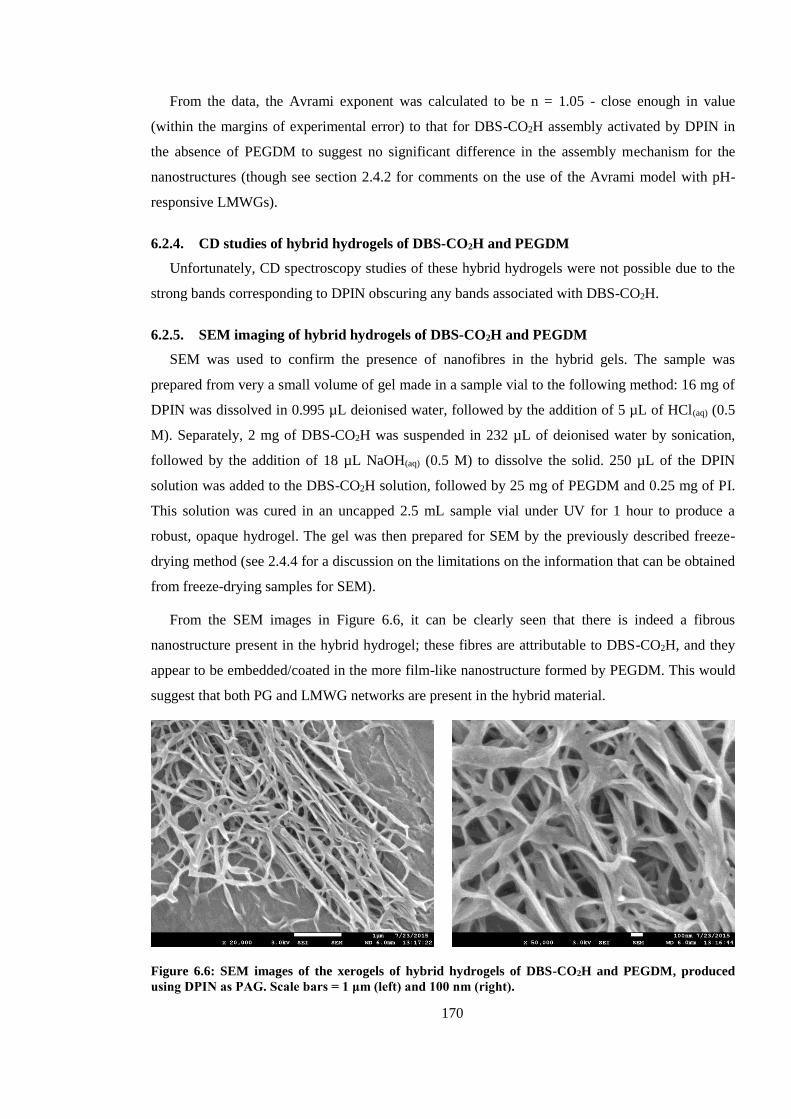
170
From the data, the Avrami exponent was calculated to be n = 1.05 - close enough in value
(within the margins of experimental error) to that for DBS-CO2H assembly activated by DPIN in
the absence of PEGDM to suggest no significant difference in the assembly mechanism for the
nanostructures (though see section 2.4.2 for comments on the use of the Avrami model with pH-
responsive LMWGs).
6.2.4. CD studies of hybrid hydrogels of DBS-CO2H and PEGDM
Unfortunately, CD spectroscopy studies of these hybrid hydrogels were not possible due to the
strong bands corresponding to DPIN obscuring any bands associated with DBS-CO2H.
6.2.5. SEM imaging of hybrid hydrogels of DBS-CO2H and PEGDM
SEM was used to confirm the presence of nanofibres in the hybrid gels. The sample was
prepared from very a small volume of gel made in a sample vial to the following method: 16 mg of
DPIN was dissolved in 0.995 µL deionised water, followed by the addition of 5 µL of HCl(aq) (0.5
M). Separately, 2 mg of DBS-CO2H was suspended in 232 µL of deionised water by sonication,
followed by the addition of 18 µL NaOH(aq) (0.5 M) to dissolve the solid. 250 µL of the DPIN
solution was added to the DBS-CO2H solution, followed by 25 mg of PEGDM and 0.25 mg of PI.
This solution was cured in an uncapped 2.5 mL sample vial under UV for 1 hour to produce a
robust, opaque hydrogel. The gel was then prepared for SEM by the previously described freeze-
drying method (see 2.4.4 for a discussion on the limitations on the information that can be obtained
from freeze-drying samples for SEM).
From the SEM images in Figure 6.6, it can be clearly seen that there is indeed a fibrous
nanostructure present in the hybrid hydrogel; these fibres are attributable to DBS-CO2H, and they
appear to be embedded/coated in the more film-like nanostructure formed by PEGDM. This would
suggest that both PG and LMWG networks are present in the hybrid material.
Figure 6.6: SEM images of the xerogels of hybrid hydrogels of DBS-CO2H and PEGDM, produced
using DPIN as PAG. Scale bars = 1 μm (left) and 100 nm (right).
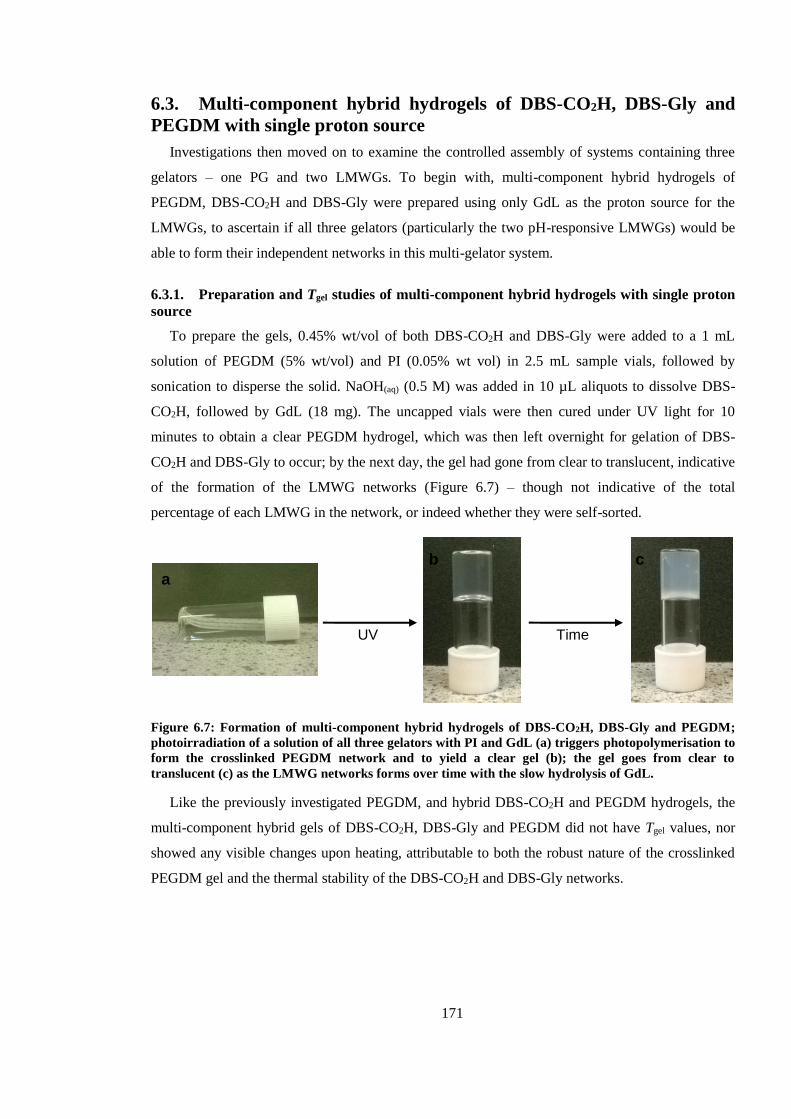
171
6.3. Multi-component hybrid hydrogels of DBS-CO2H, DBS-Gly and
PEGDM with single proton source
Investigations then moved on to examine the controlled assembly of systems containing three
gelators – one PG and two LMWGs. To begin with, multi-component hybrid hydrogels of
PEGDM, DBS-CO2H and DBS-Gly were prepared using only GdL as the proton source for the
LMWGs, to ascertain if all three gelators (particularly the two pH-responsive LMWGs) would be
able to form their independent networks in this multi-gelator system.
6.3.1. Preparation and Tgel studies of multi-component hybrid hydrogels with single proton
source
To prepare the gels, 0.45% wt/vol of both DBS-CO2H and DBS-Gly were added to a 1 mL
solution of PEGDM (5% wt/vol) and PI (0.05% wt vol) in 2.5 mL sample vials, followed by
sonication to disperse the solid. NaOH(aq) (0.5 M) was added in 10 µL aliquots to dissolve DBS-
CO2H, followed by GdL (18 mg). The uncapped vials were then cured under UV light for 10
minutes to obtain a clear PEGDM hydrogel, which was then left overnight for gelation of DBS-
CO2H and DBS-Gly to occur; by the next day, the gel had gone from clear to translucent, indicative
of the formation of the LMWG networks (Figure 6.7) – though not indicative of the total
percentage of each LMWG in the network, or indeed whether they were self-sorted.
Figure 6.7: Formation of multi-component hybrid hydrogels of DBS-CO2H, DBS-Gly and PEGDM;
photoirradiation of a solution of all three gelators with PI and GdL (a) triggers photopolymerisation to
form the crosslinked PEGDM network and to yield a clear gel (b); the gel goes from clear to
translucent (c) as the LMWG networks forms over time with the slow hydrolysis of GdL.
Like the previously investigated PEGDM, and hybrid DBS-CO2H and PEGDM hydrogels, the
multi-component hybrid gels of DBS-CO2H, DBS-Gly and PEGDM did not have Tgel values, nor
showed any visible changes upon heating, attributable to both the robust nature of the crosslinked
PEGDM gel and the thermal stability of the DBS-CO2H and DBS-Gly networks.
UV Time
a
b c
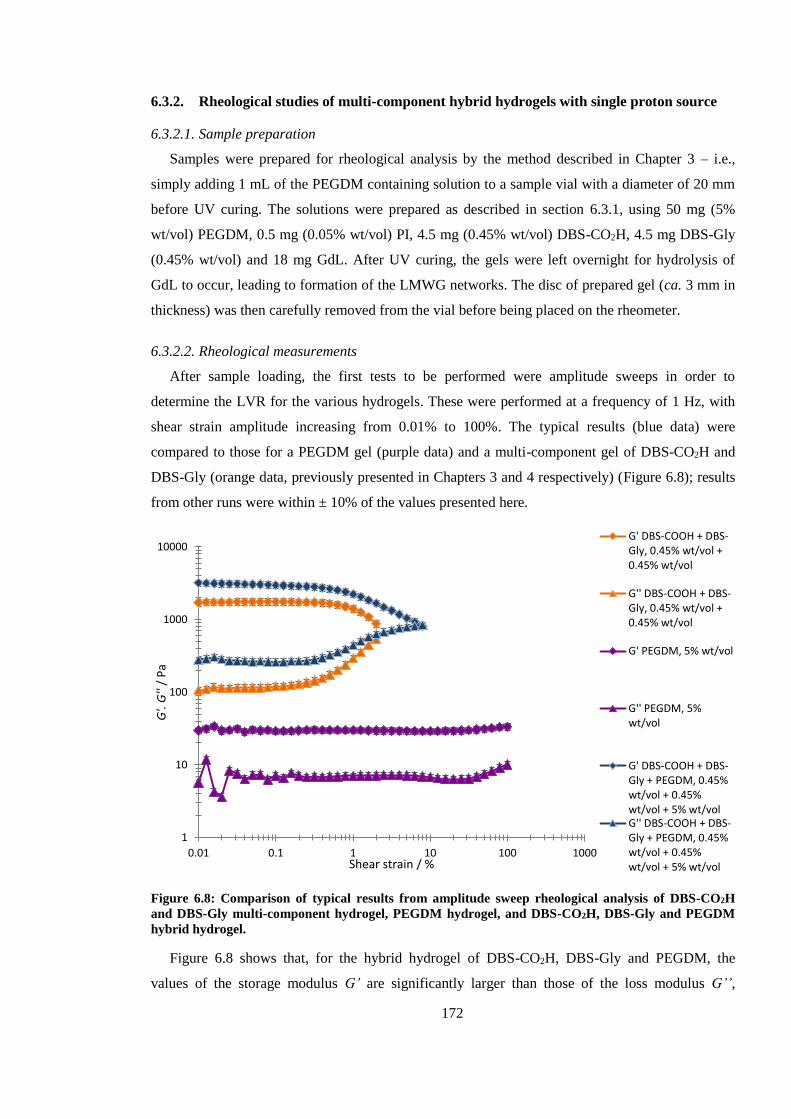
172
6.3.2. Rheological studies of multi-component hybrid hydrogels with single proton source
6.3.2.1. Sample preparation
Samples were prepared for rheological analysis by the method described in Chapter 3 – i.e.,
simply adding 1 mL of the PEGDM containing solution to a sample vial with a diameter of 20 mm
before UV curing. The solutions were prepared as described in section 6.3.1, using 50 mg (5%
wt/vol) PEGDM, 0.5 mg (0.05% wt/vol) PI, 4.5 mg (0.45% wt/vol) DBS-CO2H, 4.5 mg DBS-Gly
(0.45% wt/vol) and 18 mg GdL. After UV curing, the gels were left overnight for hydrolysis of
GdL to occur, leading to formation of the LMWG networks. The disc of prepared gel (ca. 3 mm in
thickness) was then carefully removed from the vial before being placed on the rheometer.
6.3.2.2. Rheological measurements
After sample loading, the first tests to be performed were amplitude sweeps in order to
determine the LVR for the various hydrogels. These were performed at a frequency of 1 Hz, with
shear strain amplitude increasing from 0.01% to 100%. The typical results (blue data) were
compared to those for a PEGDM gel (purple data) and a multi-component gel of DBS-CO2H and
DBS-Gly (orange data, previously presented in Chapters 3 and 4 respectively) (Figure 6.8); results
from other runs were within ± 10% of the values presented here.
Figure 6.8: Comparison of typical results from amplitude sweep rheological analysis of DBS-CO2H
and DBS-Gly multi-component hydrogel, PEGDM hydrogel, and DBS-CO2H, DBS-Gly and PEGDM
hybrid hydrogel.
Figure 6.8 shows that, for the hybrid hydrogel of DBS-CO2H, DBS-Gly and PEGDM, the
values of the storage modulus G’ are significantly larger than those of the loss modulus G’’,
1
10
100
1000
10000
0.01 0.1 1 10 100 1000
G'.
G''
/ P
a
Shear strain / %
G' DBS-COOH + DBS-Gly, 0.45% wt/vol +0.45% wt/vol
G'' DBS-COOH + DBS-Gly, 0.45% wt/vol +0.45% wt/vol
G' PEGDM, 5% wt/vol
G'' PEGDM, 5%wt/vol
G' DBS-COOH + DBS-Gly + PEGDM, 0.45%wt/vol + 0.45%wt/vol + 5% wt/volG'' DBS-COOH + DBS-Gly + PEGDM, 0.45%wt/vol + 0.45%wt/vol + 5% wt/vol
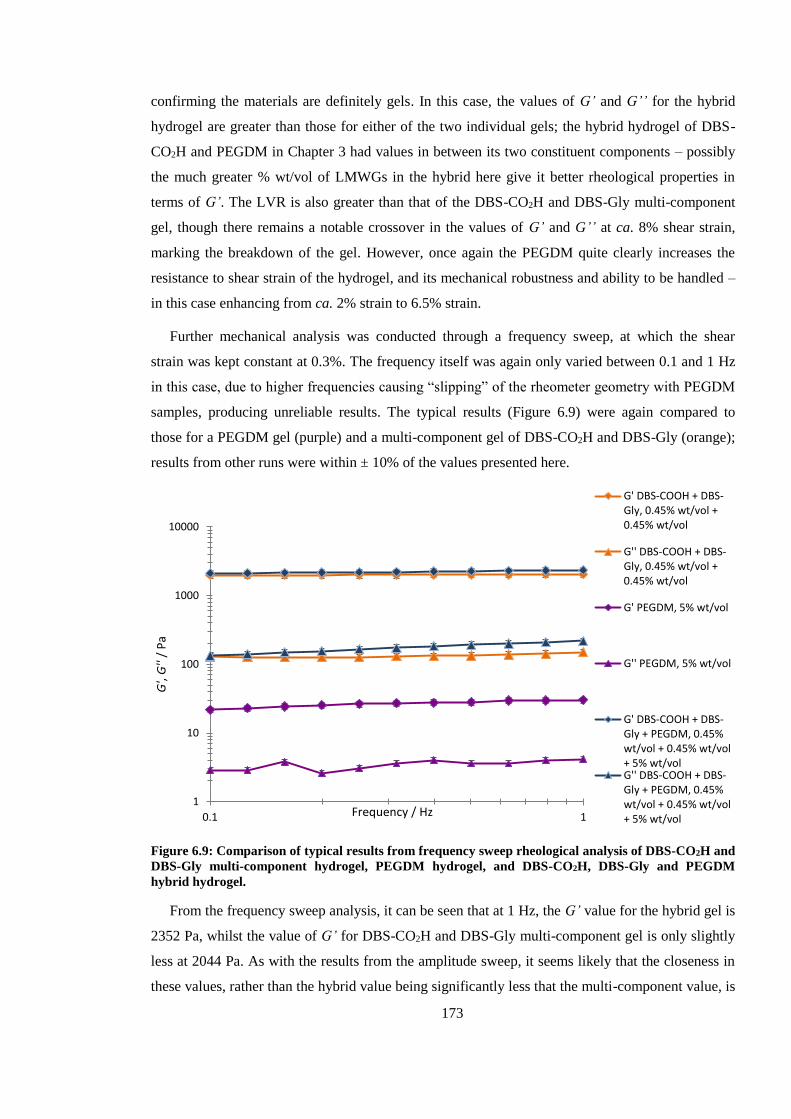
173
confirming the materials are definitely gels. In this case, the values of G’ and G’’ for the hybrid
hydrogel are greater than those for either of the two individual gels; the hybrid hydrogel of DBS-
CO2H and PEGDM in Chapter 3 had values in between its two constituent components – possibly
the much greater % wt/vol of LMWGs in the hybrid here give it better rheological properties in
terms of G’. The LVR is also greater than that of the DBS-CO2H and DBS-Gly multi-component
gel, though there remains a notable crossover in the values of G’ and G’’ at ca. 8% shear strain,
marking the breakdown of the gel. However, once again the PEGDM quite clearly increases the
resistance to shear strain of the hydrogel, and its mechanical robustness and ability to be handled –
in this case enhancing from ca. 2% strain to 6.5% strain.
Further mechanical analysis was conducted through a frequency sweep, at which the shear
strain was kept constant at 0.3%. The frequency itself was again only varied between 0.1 and 1 Hz
in this case, due to higher frequencies causing “slipping” of the rheometer geometry with PEGDM
samples, producing unreliable results. The typical results (Figure 6.9) were again compared to
those for a PEGDM gel (purple) and a multi-component gel of DBS-CO2H and DBS-Gly (orange);
results from other runs were within ± 10% of the values presented here.
Figure 6.9: Comparison of typical results from frequency sweep rheological analysis of DBS-CO2H and
DBS-Gly multi-component hydrogel, PEGDM hydrogel, and DBS-CO2H, DBS-Gly and PEGDM
hybrid hydrogel.
From the frequency sweep analysis, it can be seen that at 1 Hz, the G’ value for the hybrid gel is
2352 Pa, whilst the value of G’ for DBS-CO2H and DBS-Gly multi-component gel is only slightly
less at 2044 Pa. As with the results from the amplitude sweep, it seems likely that the closeness in
these values, rather than the hybrid value being significantly less that the multi-component value, is
1
10
100
1000
10000
0.1 1
G',
G''
/ P
a
Frequency / Hz
G' DBS-COOH + DBS-Gly, 0.45% wt/vol +0.45% wt/vol
G'' DBS-COOH + DBS-Gly, 0.45% wt/vol +0.45% wt/vol
G' PEGDM, 5% wt/vol
G'' PEGDM, 5% wt/vol
G' DBS-COOH + DBS-Gly + PEGDM, 0.45%wt/vol + 0.45% wt/vol+ 5% wt/volG'' DBS-COOH + DBS-Gly + PEGDM, 0.45%wt/vol + 0.45% wt/vol+ 5% wt/vol
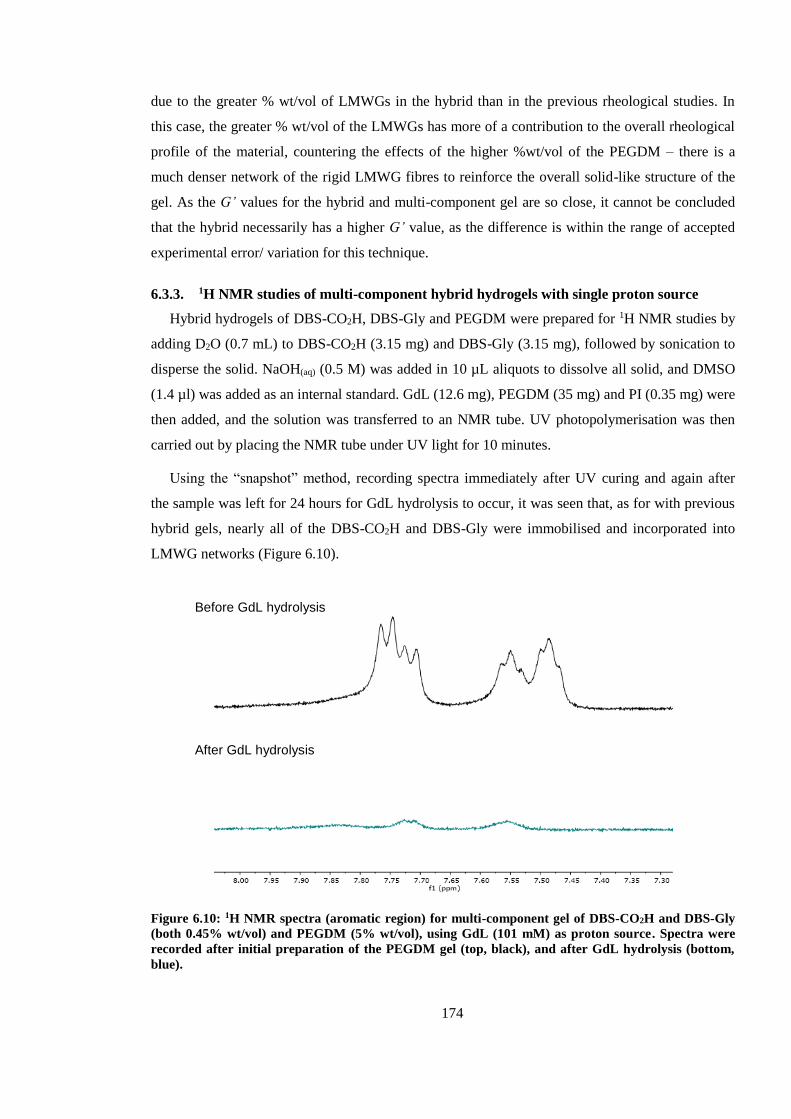
174
due to the greater % wt/vol of LMWGs in the hybrid than in the previous rheological studies. In
this case, the greater % wt/vol of the LMWGs has more of a contribution to the overall rheological
profile of the material, countering the effects of the higher %wt/vol of the PEGDM – there is a
much denser network of the rigid LMWG fibres to reinforce the overall solid-like structure of the
gel. As the G’ values for the hybrid and multi-component gel are so close, it cannot be concluded
that the hybrid necessarily has a higher G’ value, as the difference is within the range of accepted
experimental error/ variation for this technique.
6.3.3. 1H NMR studies of multi-component hybrid hydrogels with single proton source
Hybrid hydrogels of DBS-CO2H, DBS-Gly and PEGDM were prepared for 1H NMR studies by
adding D2O (0.7 mL) to DBS-CO2H (3.15 mg) and DBS-Gly (3.15 mg), followed by sonication to
disperse the solid. NaOH(aq) (0.5 M) was added in 10 µL aliquots to dissolve all solid, and DMSO
(1.4 µl) was added as an internal standard. GdL (12.6 mg), PEGDM (35 mg) and PI (0.35 mg) were
then added, and the solution was transferred to an NMR tube. UV photopolymerisation was then
carried out by placing the NMR tube under UV light for 10 minutes.
Using the “snapshot” method, recording spectra immediately after UV curing and again after
the sample was left for 24 hours for GdL hydrolysis to occur, it was seen that, as for with previous
hybrid gels, nearly all of the DBS-CO2H and DBS-Gly were immobilised and incorporated into
LMWG networks (Figure 6.10).
Figure 6.10: 1H NMR spectra (aromatic region) for multi-component gel of DBS-CO2H and DBS-Gly
(both 0.45% wt/vol) and PEGDM (5% wt/vol), using GdL (101 mM) as proton source. Spectra were
recorded after initial preparation of the PEGDM gel (top, black), and after GdL hydrolysis (bottom,
blue).
Before GdL hydrolysis
After GdL hydrolysis
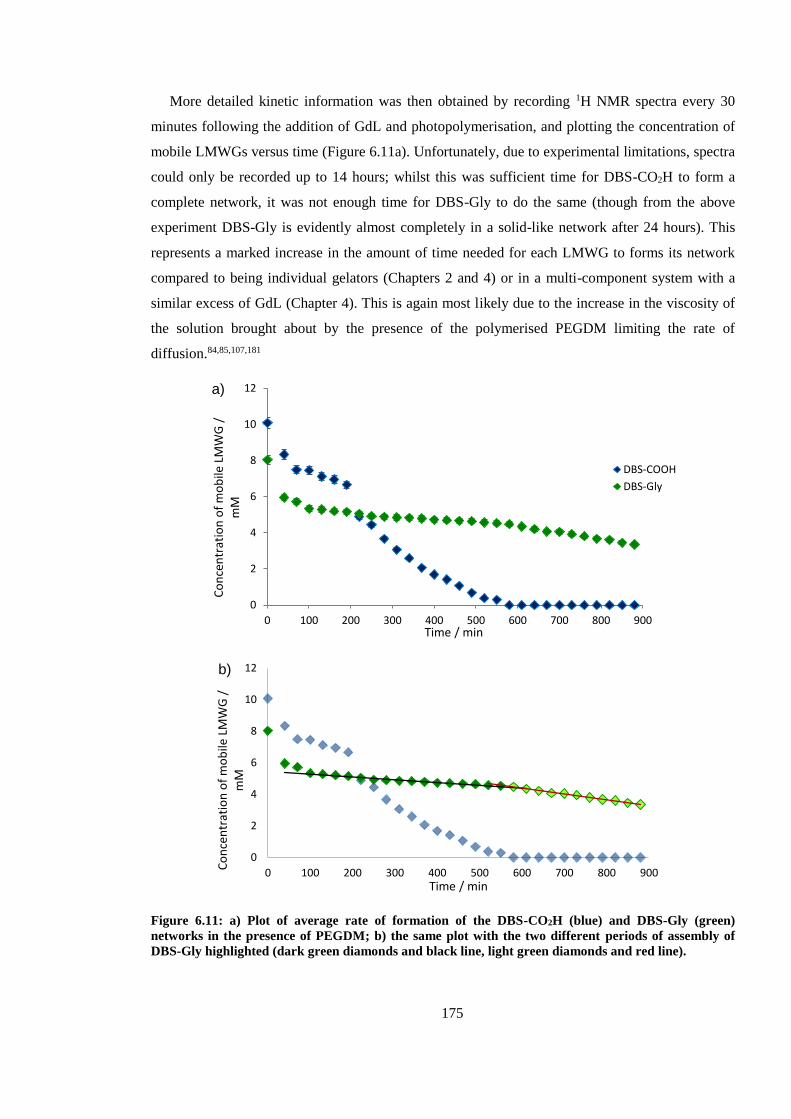
175
More detailed kinetic information was then obtained by recording 1H NMR spectra every 30
minutes following the addition of GdL and photopolymerisation, and plotting the concentration of
mobile LMWGs versus time (Figure 6.11a). Unfortunately, due to experimental limitations, spectra
could only be recorded up to 14 hours; whilst this was sufficient time for DBS-CO2H to form a
complete network, it was not enough time for DBS-Gly to do the same (though from the above
experiment DBS-Gly is evidently almost completely in a solid-like network after 24 hours). This
represents a marked increase in the amount of time needed for each LMWG to forms its network
compared to being individual gelators (Chapters 2 and 4) or in a multi-component system with a
similar excess of GdL (Chapter 4). This is again most likely due to the increase in the viscosity of
the solution brought about by the presence of the polymerised PEGDM limiting the rate of
diffusion.84,85,107,181
Figure 6.11: a) Plot of average rate of formation of the DBS-CO2H (blue) and DBS-Gly (green)
networks in the presence of PEGDM; b) the same plot with the two different periods of assembly of
DBS-Gly highlighted (dark green diamonds and black line, light green diamonds and red line).
0
2
4
6
8
10
12
0 100 200 300 400 500 600 700 800 900
Co
nce
ntr
atio
n o
f m
ob
ile L
MW
G /
m
M
Time / min
a)
DBS-COOH
DBS-Gly
0
2
4
6
8
10
12
0 100 200 300 400 500 600 700 800 900
Co
nce
ntr
atio
n o
f m
ob
ile L
MW
G /
m
M
Time / min
b)
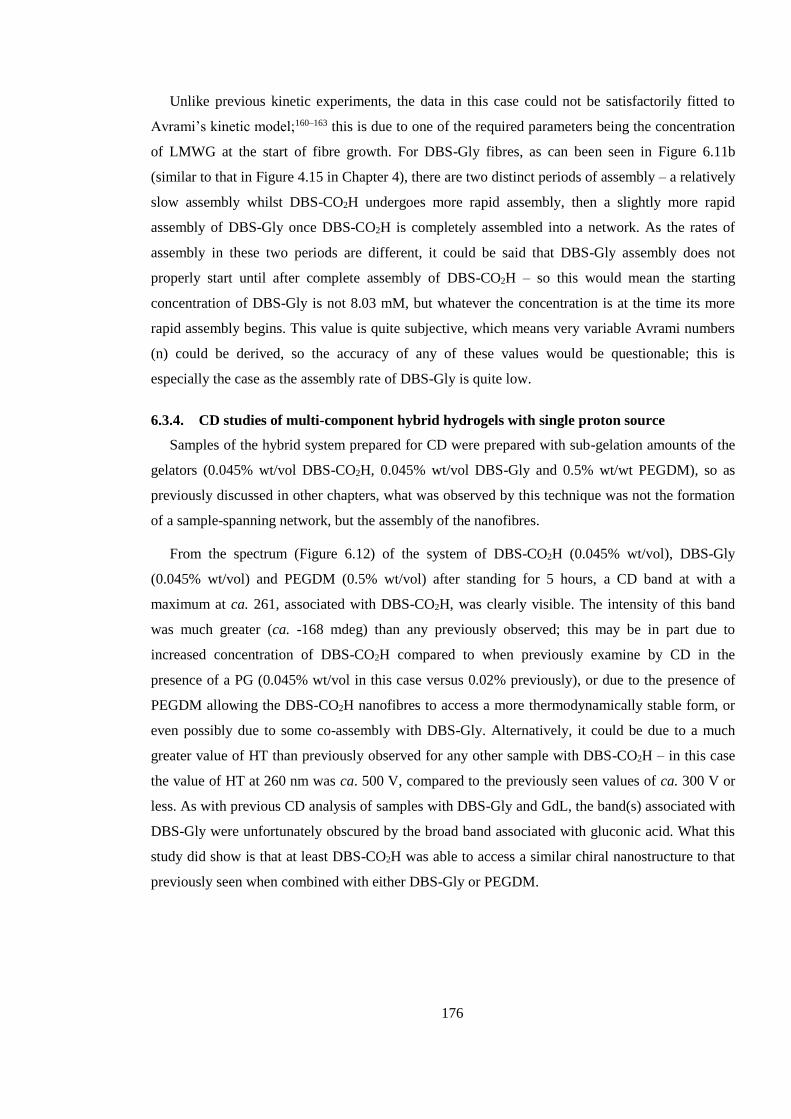
176
Unlike previous kinetic experiments, the data in this case could not be satisfactorily fitted to
Avrami’s kinetic model;160–163 this is due to one of the required parameters being the concentration
of LMWG at the start of fibre growth. For DBS-Gly fibres, as can been seen in Figure 6.11b
(similar to that in Figure 4.15 in Chapter 4), there are two distinct periods of assembly – a relatively
slow assembly whilst DBS-CO2H undergoes more rapid assembly, then a slightly more rapid
assembly of DBS-Gly once DBS-CO2H is completely assembled into a network. As the rates of
assembly in these two periods are different, it could be said that DBS-Gly assembly does not
properly start until after complete assembly of DBS-CO2H – so this would mean the starting
concentration of DBS-Gly is not 8.03 mM, but whatever the concentration is at the time its more
rapid assembly begins. This value is quite subjective, which means very variable Avrami numbers
(n) could be derived, so the accuracy of any of these values would be questionable; this is
especially the case as the assembly rate of DBS-Gly is quite low.
6.3.4. CD studies of multi-component hybrid hydrogels with single proton source
Samples of the hybrid system prepared for CD were prepared with sub-gelation amounts of the
gelators (0.045% wt/vol DBS-CO2H, 0.045% wt/vol DBS-Gly and 0.5% wt/wt PEGDM), so as
previously discussed in other chapters, what was observed by this technique was not the formation
of a sample-spanning network, but the assembly of the nanofibres.
From the spectrum (Figure 6.12) of the system of DBS-CO2H (0.045% wt/vol), DBS-Gly
(0.045% wt/vol) and PEGDM (0.5% wt/vol) after standing for 5 hours, a CD band at with a
maximum at ca. 261, associated with DBS-CO2H, was clearly visible. The intensity of this band
was much greater (ca. -168 mdeg) than any previously observed; this may be in part due to
increased concentration of DBS-CO2H compared to when previously examine by CD in the
presence of a PG (0.045% wt/vol in this case versus 0.02% previously), or due to the presence of
PEGDM allowing the DBS-CO2H nanofibres to access a more thermodynamically stable form, or
even possibly due to some co-assembly with DBS-Gly. Alternatively, it could be due to a much
greater value of HT than previously observed for any other sample with DBS-CO2H – in this case
the value of HT at 260 nm was ca. 500 V, compared to the previously seen values of ca. 300 V or
less. As with previous CD analysis of samples with DBS-Gly and GdL, the band(s) associated with
DBS-Gly were unfortunately obscured by the broad band associated with gluconic acid. What this
study did show is that at least DBS-CO2H was able to access a similar chiral nanostructure to that
previously seen when combined with either DBS-Gly or PEGDM.
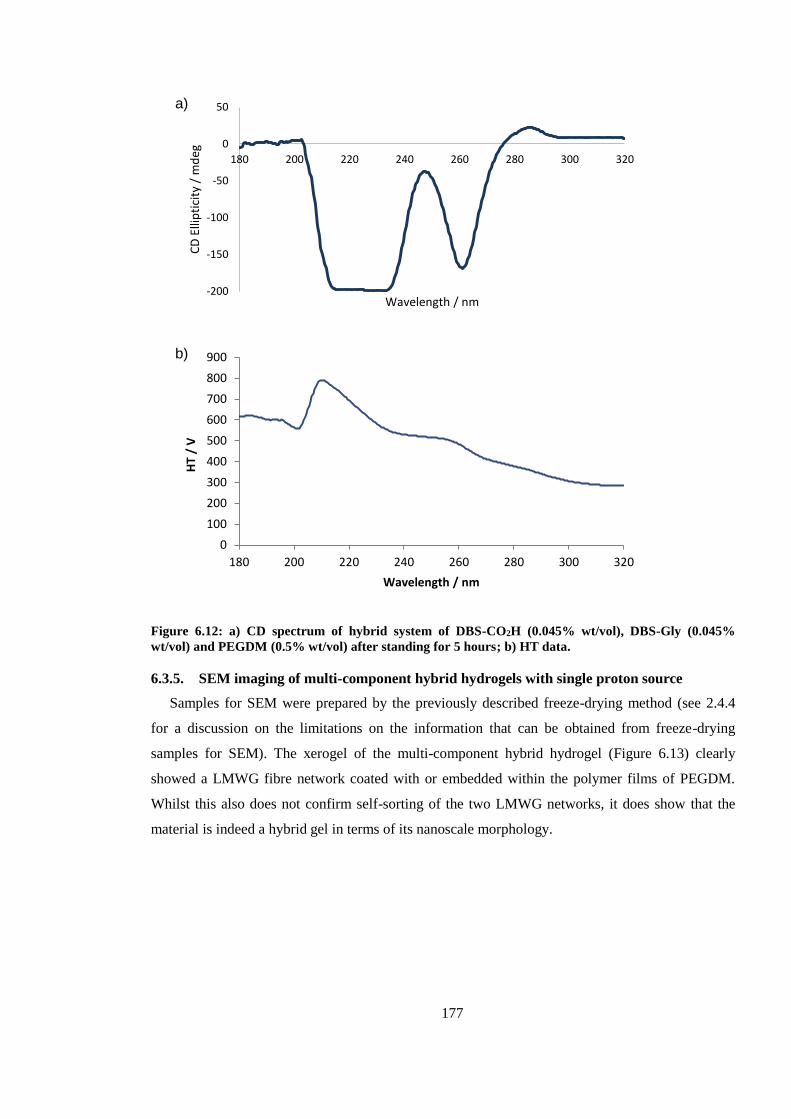
177
Figure 6.12: a) CD spectrum of hybrid system of DBS-CO2H (0.045% wt/vol), DBS-Gly (0.045%
wt/vol) and PEGDM (0.5% wt/vol) after standing for 5 hours; b) HT data.
6.3.5. SEM imaging of multi-component hybrid hydrogels with single proton source
Samples for SEM were prepared by the previously described freeze-drying method (see 2.4.4
for a discussion on the limitations on the information that can be obtained from freeze-drying
samples for SEM). The xerogel of the multi-component hybrid hydrogel (Figure 6.13) clearly
showed a LMWG fibre network coated with or embedded within the polymer films of PEGDM.
Whilst this also does not confirm self-sorting of the two LMWG networks, it does show that the
material is indeed a hybrid gel in terms of its nanoscale morphology.
-200
-150
-100
-50
0
50
180 200 220 240 260 280 300 320
CD
Elli
pti
city
/ m
deg
Wavelength / nm
a)
0
100
200
300
400
500
600
700
800
900
180 200 220 240 260 280 300 320
HT
/ V
Wavelength / nm
b)
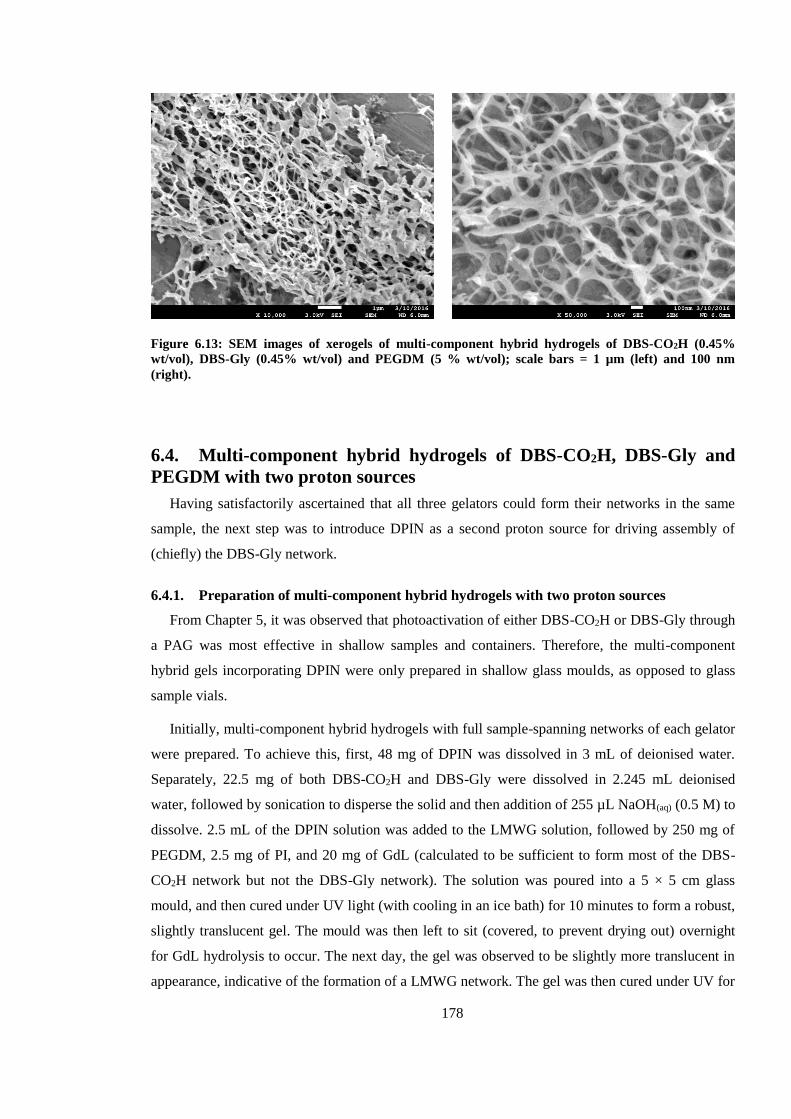
178
Figure 6.13: SEM images of xerogels of multi-component hybrid hydrogels of DBS-CO2H (0.45%
wt/vol), DBS-Gly (0.45% wt/vol) and PEGDM (5 % wt/vol); scale bars = 1 µm (left) and 100 nm
(right).
6.4. Multi-component hybrid hydrogels of DBS-CO2H, DBS-Gly and
PEGDM with two proton sources
Having satisfactorily ascertained that all three gelators could form their networks in the same
sample, the next step was to introduce DPIN as a second proton source for driving assembly of
(chiefly) the DBS-Gly network.
6.4.1. Preparation of multi-component hybrid hydrogels with two proton sources
From Chapter 5, it was observed that photoactivation of either DBS-CO2H or DBS-Gly through
a PAG was most effective in shallow samples and containers. Therefore, the multi-component
hybrid gels incorporating DPIN were only prepared in shallow glass moulds, as opposed to glass
sample vials.
Initially, multi-component hybrid hydrogels with full sample-spanning networks of each gelator
were prepared. To achieve this, first, 48 mg of DPIN was dissolved in 3 mL of deionised water.
Separately, 22.5 mg of both DBS-CO2H and DBS-Gly were dissolved in 2.245 mL deionised
water, followed by sonication to disperse the solid and then addition of 255 µL NaOH(aq) (0.5 M) to
dissolve. 2.5 mL of the DPIN solution was added to the LMWG solution, followed by 250 mg of
PEGDM, 2.5 mg of PI, and 20 mg of GdL (calculated to be sufficient to form most of the DBS-
CO2H network but not the DBS-Gly network). The solution was poured into a 5 × 5 cm glass
mould, and then cured under UV light (with cooling in an ice bath) for 10 minutes to form a robust,
slightly translucent gel. The mould was then left to sit (covered, to prevent drying out) overnight
for GdL hydrolysis to occur. The next day, the gel was observed to be slightly more translucent in
appearance, indicative of the formation of a LMWG network. The gel was then cured under UV for
179
a further 50 minutes (again with cooling) to activate the remaining DPIN, with the final gel being
robust, and opaque in appearance, indicative of the activation of DPIN and presumably further
LMWG network formation (Figure 6.14).
Figure 6.14: Stepwise formation of a multi-component hybrid hydrogel of DBS-CO2H, DBS-Gly and
PEGDM. A solution of all three gelators and PI, GdL and DPIN (a) is cured under UV light for 10
minutes to form a complete PEGDM gel (with a small amount of DPIN activation) (b); the gel is then
left overnight for GdL to hydrolyse, and partial formation of the LMWG networks (mostly DBS-
CO2H) takes place (c); further curing under UV for 60 minutes then activates the remaining DPIN and
LMWG network formation is completed, accompanied by production of iodobenzene, changing the gel
from translucent to opaque (d).
6.4.2. Rheology of multi-component hybrid hydrogels with two proton sources
Unfortunately, rheological studies were not possible for these samples, again due to the
shrinking problems previously mentioned.
UV (10 mins)
UV (50 mins)
GdL hydrolysis
a
c d
b
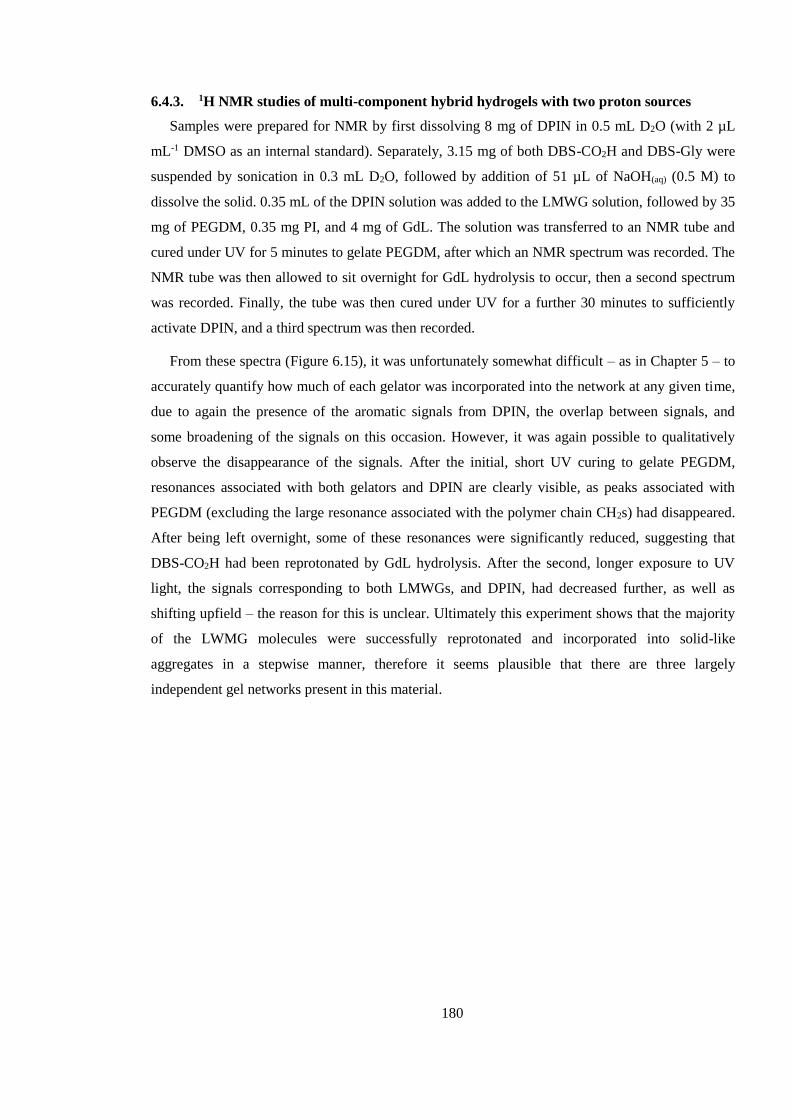
180
6.4.3. 1H NMR studies of multi-component hybrid hydrogels with two proton sources
Samples were prepared for NMR by first dissolving 8 mg of DPIN in 0.5 mL D2O (with 2 µL
mL-1 DMSO as an internal standard). Separately, 3.15 mg of both DBS-CO2H and DBS-Gly were
suspended by sonication in 0.3 mL D2O, followed by addition of 51 µL of NaOH(aq) (0.5 M) to
dissolve the solid. 0.35 mL of the DPIN solution was added to the LMWG solution, followed by 35
mg of PEGDM, 0.35 mg PI, and 4 mg of GdL. The solution was transferred to an NMR tube and
cured under UV for 5 minutes to gelate PEGDM, after which an NMR spectrum was recorded. The
NMR tube was then allowed to sit overnight for GdL hydrolysis to occur, then a second spectrum
was recorded. Finally, the tube was then cured under UV for a further 30 minutes to sufficiently
activate DPIN, and a third spectrum was then recorded.
From these spectra (Figure 6.15), it was unfortunately somewhat difficult – as in Chapter 5 – to
accurately quantify how much of each gelator was incorporated into the network at any given time,
due to again the presence of the aromatic signals from DPIN, the overlap between signals, and
some broadening of the signals on this occasion. However, it was again possible to qualitatively
observe the disappearance of the signals. After the initial, short UV curing to gelate PEGDM,
resonances associated with both gelators and DPIN are clearly visible, as peaks associated with
PEGDM (excluding the large resonance associated with the polymer chain CH2s) had disappeared.
After being left overnight, some of these resonances were significantly reduced, suggesting that
DBS-CO2H had been reprotonated by GdL hydrolysis. After the second, longer exposure to UV
light, the signals corresponding to both LMWGs, and DPIN, had decreased further, as well as
shifting upfield – the reason for this is unclear. Ultimately this experiment shows that the majority
of the LWMG molecules were successfully reprotonated and incorporated into solid-like
aggregates in a stepwise manner, therefore it seems plausible that there are three largely
independent gel networks present in this material.
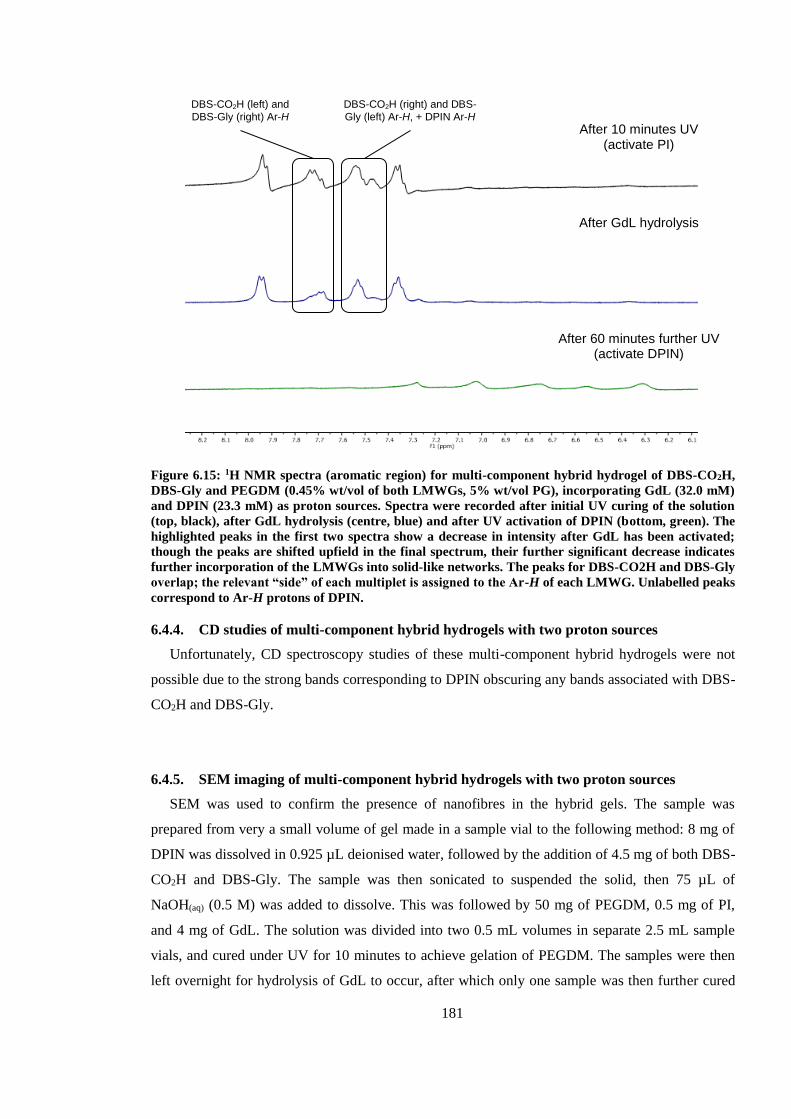
181
Figure 6.15: 1H NMR spectra (aromatic region) for multi-component hybrid hydrogel of DBS-CO2H,
DBS-Gly and PEGDM (0.45% wt/vol of both LMWGs, 5% wt/vol PG), incorporating GdL (32.0 mM)
and DPIN (23.3 mM) as proton sources. Spectra were recorded after initial UV curing of the solution
(top, black), after GdL hydrolysis (centre, blue) and after UV activation of DPIN (bottom, green). The
highlighted peaks in the first two spectra show a decrease in intensity after GdL has been activated;
though the peaks are shifted upfield in the final spectrum, their further significant decrease indicates
further incorporation of the LMWGs into solid-like networks. The peaks for DBS-CO2H and DBS-Gly
overlap; the relevant “side” of each multiplet is assigned to the Ar-H of each LMWG. Unlabelled peaks
correspond to Ar-H protons of DPIN.
6.4.4. CD studies of multi-component hybrid hydrogels with two proton sources
Unfortunately, CD spectroscopy studies of these multi-component hybrid hydrogels were not
possible due to the strong bands corresponding to DPIN obscuring any bands associated with DBS-
CO2H and DBS-Gly.
6.4.5. SEM imaging of multi-component hybrid hydrogels with two proton sources
SEM was used to confirm the presence of nanofibres in the hybrid gels. The sample was
prepared from very a small volume of gel made in a sample vial to the following method: 8 mg of
DPIN was dissolved in 0.925 µL deionised water, followed by the addition of 4.5 mg of both DBS-
CO2H and DBS-Gly. The sample was then sonicated to suspended the solid, then 75 µL of
NaOH(aq) (0.5 M) was added to dissolve. This was followed by 50 mg of PEGDM, 0.5 mg of PI,
and 4 mg of GdL. The solution was divided into two 0.5 mL volumes in separate 2.5 mL sample
vials, and cured under UV for 10 minutes to achieve gelation of PEGDM. The samples were then
left overnight for hydrolysis of GdL to occur, after which only one sample was then further cured
DBS-CO2H (left) and
DBS-Gly (right) Ar-H
DBS-CO2H (right) and DBS-
Gly (left) Ar-H, + DPIN Ar-H
After 10 minutes UV (activate PI)
After GdL hydrolysis
After 60 minutes further UV (activate DPIN)
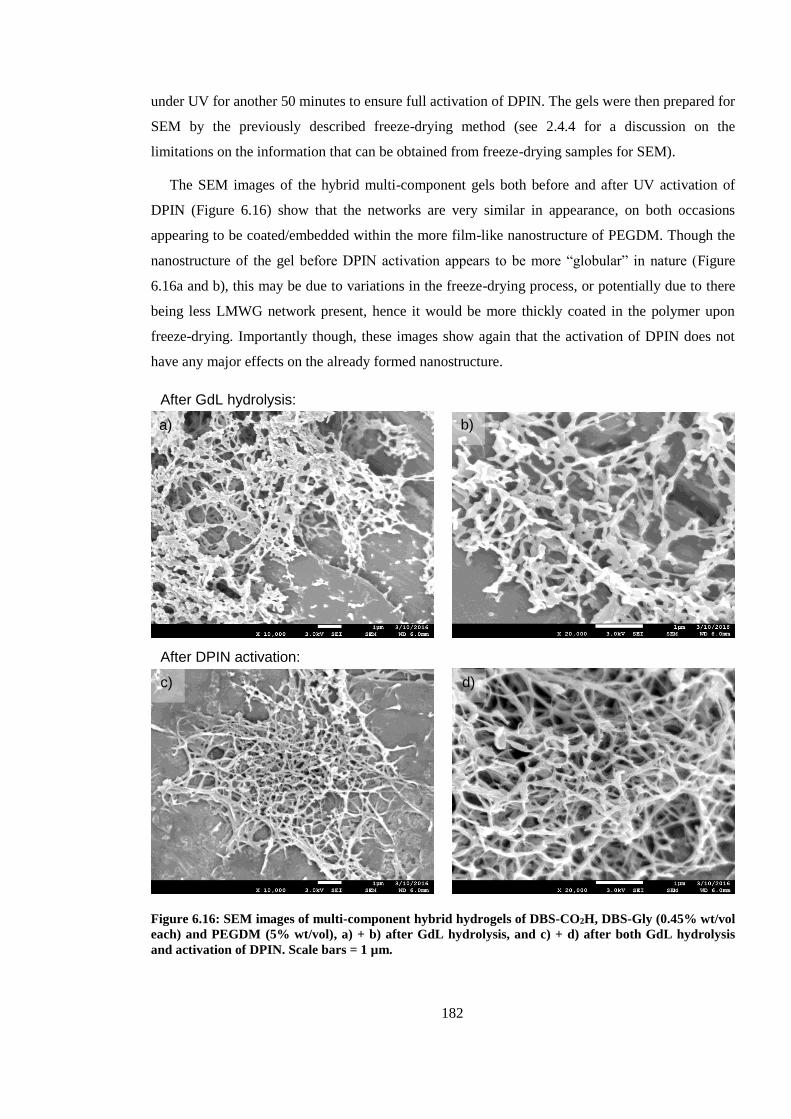
182
under UV for another 50 minutes to ensure full activation of DPIN. The gels were then prepared for
SEM by the previously described freeze-drying method (see 2.4.4 for a discussion on the
limitations on the information that can be obtained from freeze-drying samples for SEM).
The SEM images of the hybrid multi-component gels both before and after UV activation of
DPIN (Figure 6.16) show that the networks are very similar in appearance, on both occasions
appearing to be coated/embedded within the more film-like nanostructure of PEGDM. Though the
nanostructure of the gel before DPIN activation appears to be more “globular” in nature (Figure
6.16a and b), this may be due to variations in the freeze-drying process, or potentially due to there
being less LMWG network present, hence it would be more thickly coated in the polymer upon
freeze-drying. Importantly though, these images show again that the activation of DPIN does not
have any major effects on the already formed nanostructure.
Figure 6.16: SEM images of multi-component hybrid hydrogels of DBS-CO2H, DBS-Gly (0.45% wt/vol
each) and PEGDM (5% wt/vol), a) + b) after GdL hydrolysis, and c) + d) after both GdL hydrolysis
and activation of DPIN. Scale bars = 1 µm.
After DPIN activation:
c) d)
b)
After GdL hydrolysis:
a)
183
6.4.6. Photopatterning of multi-component hybrid hydrogels with two proton sources
6.4.6.1. Three-domain multi-component hybrid hydrogel
For preliminary investigations into photopatterning, a solution of the three gelators (DBS-
CO2H, DBS-Gly and PEGDM), along with the activating agents PI, GdL and DPIN, was prepared
according to the procedure given in section 6.4.1. This solution was then poured into a 5 × 5 cm
glass mould, and a mask obscuring half of the sample was placed over it. The solution was then
cured under UV light for ten minutes to gelate PEGDM, after which it was left overnight for
hydrolysis of GdL to occur. The next day, the mask was rotated 90°, and the sample was cured
under UV again, this time for a further 50 minutes, to fully activate DPIN – this would also activate
PI in the previously masked region and cause further formation of PEGDM networks. The final gel
is shown in Figure 6.17.
It was hoped that by this procedure what would be achieved was a gel with the following three
different domains:
1. A domain consisting of all three gelator networks.
2. A domain consisting of PEGDM and mostly DBS-CO2H networks (activated by GdL
hydrolysis), gelling free DBS-Gly and inactivated DPIN.
3. A domain consisting of just mostly DBS-CO2H gelling a solution of PEGDM, free DBS-
Gly and inactivated DPIN.
Figure 6.17: Photopatterned multidomain, multi-component hybrid hydrogel of DBS-CO2H, DBS-Gly
and PEGDM. Each domain is labelled to show which gel networks are present and which gelators
remain largely free in solution.
“Domain 1”: DBS-CO2H, DBS-Gly and PEGDM networks
“Domain 3”: DBS-CO2H network gelling free
PEGDM and DBS-Gly – this domain was very
fragile
“Domain 2”: DBS-CO2H and PEGDM networks gelling
free DBS-Gly
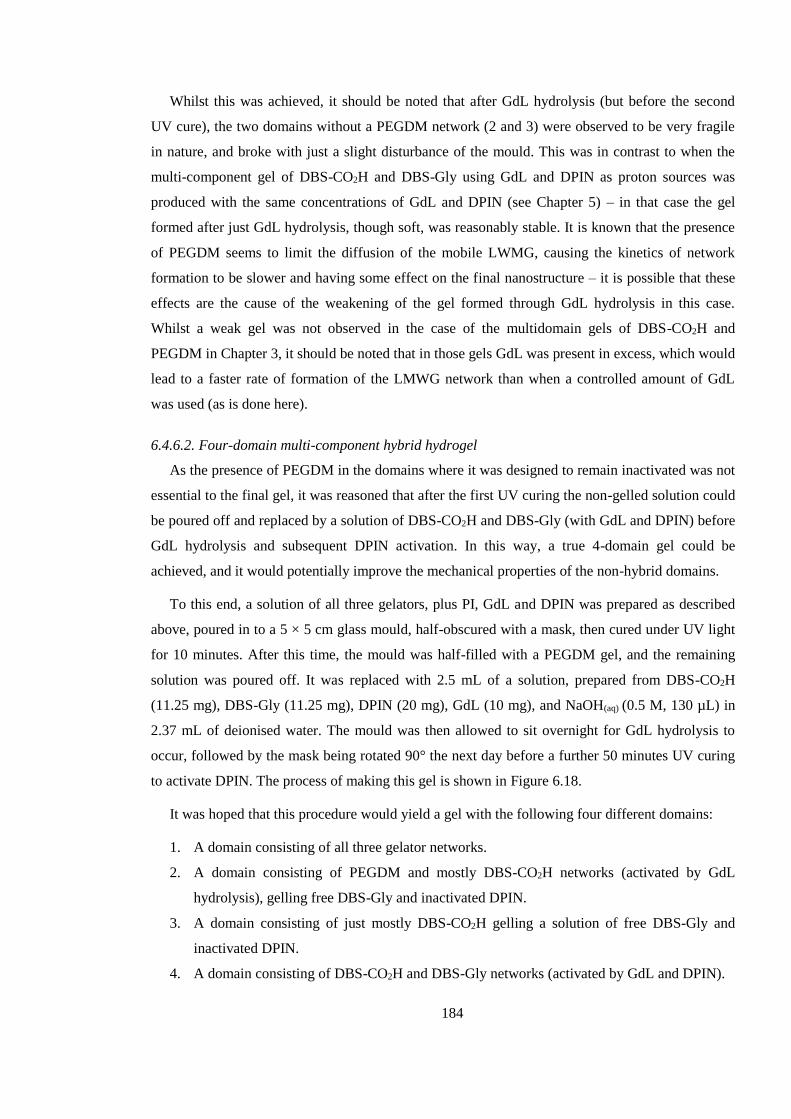
184
Whilst this was achieved, it should be noted that after GdL hydrolysis (but before the second
UV cure), the two domains without a PEGDM network (2 and 3) were observed to be very fragile
in nature, and broke with just a slight disturbance of the mould. This was in contrast to when the
multi-component gel of DBS-CO2H and DBS-Gly using GdL and DPIN as proton sources was
produced with the same concentrations of GdL and DPIN (see Chapter 5) – in that case the gel
formed after just GdL hydrolysis, though soft, was reasonably stable. It is known that the presence
of PEGDM seems to limit the diffusion of the mobile LWMG, causing the kinetics of network
formation to be slower and having some effect on the final nanostructure – it is possible that these
effects are the cause of the weakening of the gel formed through GdL hydrolysis in this case.
Whilst a weak gel was not observed in the case of the multidomain gels of DBS-CO2H and
PEGDM in Chapter 3, it should be noted that in those gels GdL was present in excess, which would
lead to a faster rate of formation of the LMWG network than when a controlled amount of GdL
was used (as is done here).
6.4.6.2. Four-domain multi-component hybrid hydrogel
As the presence of PEGDM in the domains where it was designed to remain inactivated was not
essential to the final gel, it was reasoned that after the first UV curing the non-gelled solution could
be poured off and replaced by a solution of DBS-CO2H and DBS-Gly (with GdL and DPIN) before
GdL hydrolysis and subsequent DPIN activation. In this way, a true 4-domain gel could be
achieved, and it would potentially improve the mechanical properties of the non-hybrid domains.
To this end, a solution of all three gelators, plus PI, GdL and DPIN was prepared as described
above, poured in to a 5 × 5 cm glass mould, half-obscured with a mask, then cured under UV light
for 10 minutes. After this time, the mould was half-filled with a PEGDM gel, and the remaining
solution was poured off. It was replaced with 2.5 mL of a solution, prepared from DBS-CO2H
(11.25 mg), DBS-Gly (11.25 mg), DPIN (20 mg), GdL (10 mg), and NaOH(aq) (0.5 M, 130 µL) in
2.37 mL of deionised water. The mould was then allowed to sit overnight for GdL hydrolysis to
occur, followed by the mask being rotated 90° the next day before a further 50 minutes UV curing
to activate DPIN. The process of making this gel is shown in Figure 6.18.
It was hoped that this procedure would yield a gel with the following four different domains:
1. A domain consisting of all three gelator networks.
2. A domain consisting of PEGDM and mostly DBS-CO2H networks (activated by GdL
hydrolysis), gelling free DBS-Gly and inactivated DPIN.
3. A domain consisting of just mostly DBS-CO2H gelling a solution of free DBS-Gly and
inactivated DPIN.
4. A domain consisting of DBS-CO2H and DBS-Gly networks (activated by GdL and DPIN).
185
Pleasingly, a gel with the appearance of four distinct domains was produced – this is shown in
Figure 6.18d, with each domain labelled as above. Additionally, after GdL hydrolysis, the gel of
DBS-CO2H without PEGDM was on this occasion observed to be significantly less fragile. The
only drawback to this method is that the second solution would often flow a little over the PEGDM
gel before gelation, hence the four domains were not as neatly defined as in the three-domain gel.
Despite this, after the second UV curing, this material could be considered a true four-domain
multi-component hybrid hydrogel.
Figure 6.18: Stepwise formation of a four-domain multi-component hybrid hydrogel of DBS-CO2H,
DBS-Gly and PEGDM. A solution of all three gelators and PI, GdL and DPIN (a) is cured under UV
light (with a mask obscuring half of the sample) for 10 minutes to form a complete PEGDM gel (with a
small amount of DPIN activation), after which the remaining solution is poured away and replaced by
one containing DBS-CO2H, DBS-Gly, GdL and DPIN (b); the sample is then left overnight for GdL to
hydrolyse, and partial formation of the LMWG networks (mostly DBS-CO2H) takes place (c); further
curing under UV (with the mask now rotated 90°) for 50 minutes then activates the remaining DPIN
and LMWG network formation is completed, accompanied by production of iodobenzene, changing
the gel from translucent to opaque, and completing formation of the four-domain gel (d); each domain
is labelled according to the list given above.
a
d c
b
1: UV (10 mins)
UV (50 mins)
GdL hydrolysis
2: replace solution
1 4
2 3
186
6.5. Conclusions and Outlook
The hydrogels studied in this chapter have bridged the gap between the hybrid hydrogels
examined in Chapters 2 and 3, and the multi-component gels in Chapters 4 and 5. To begin with,
the two methods of photoactivating gel networks, DPIN and PI, were combined to yield
multidomain gels of DBS-CO2H and PEGDM. Due to the wavelength of UV used, both PI and
DPIN were activated concurrently, meaning that in a patterned gel, both domains actually
contained some of both networks. However, as DPIN takes much longer to be full activated, this
meant that in photopatterning a good degree of kinetic resolution between domains could be
achieved in the final gel. With these gels, it was also demonstrated that laser-printed acetate masks
could be used in place of cardboard masks, allowing for more complex patterns to be produced –
such complexity would be very useful in gels patterned for use in applications such as tissue
engineering.
In the second main section of this chapter, the first (to current knowledge) example of a multi-
component hybrid hydrogel containing three separate (or at least largely separate) networks was
presented. Whilst not contributing much in the way of any functionality, this is an important
development with regards to showing that three separate gel networks can potentially exist in the
same material – particularly when one of those networks is a PG.
Finally, a multi-component hybrid hydrogel utilising both methods of forming the LMWG
networks within a PG network was studied. The main problem with this material was not that it
was a challenge to produce, but more that it was a challenge to analyse by the methods used for
other gels. This was largely due to there being many components present in the one material, which
led to overlaps between signals observed by spectroscopic methods, meaning a fuller understanding
could not be easily obtained for the interactions (or lack of) between the gelators and their networks
or the kinetics of gelation; rheology was also not possible for these samples as the heat from the
UV lamp during photoactivation of DPIN caused the gels to shrink, preventing accurate
comparisons between gels before and after DPIN activation. In spite of this, qualitative analysis
suggested that all three gelators did indeed form their networks. Knowing this, and by carefully
controlled stepwise activation of PI, GdL and DPIN within different regions, hydrogels with three
and four domains were successfully produced – again, to current knowledge, this has not
previously been achieved. Though the patterns produced were reasonably crude, it is highly likely
that using laser-printed acetate masks would allow for much more complex patterning in these
materials. The other main drawback still to be addressed is that both UV responsive component, PI
and DPIN, activate at the same time – this could be easily rectified by using UV lamps with much
more specific ranges than the high-intensity UV lamp that was available during this work, or by
187
changing one of the photoactivation agents such that it is activated at a significantly different
wavelength.
Though these three- and four-domain hybrid hydrogels are very much “proof of principle
systems”, they are examples of gels in which there is both spatial and temporal resolution – the
location and time of formation of each gel network being controlled. There is much scope for their
future development, which could eventually yield materials very suitable for complex tissue
engineering, where each domain allows for different stem cell differentiation depending on the
materials properties of the domain,275 potentially allowing for growth of replacement organs ex-
vivo. Suggested future work and possible applications for these materials will be discussed in the
next chapter.
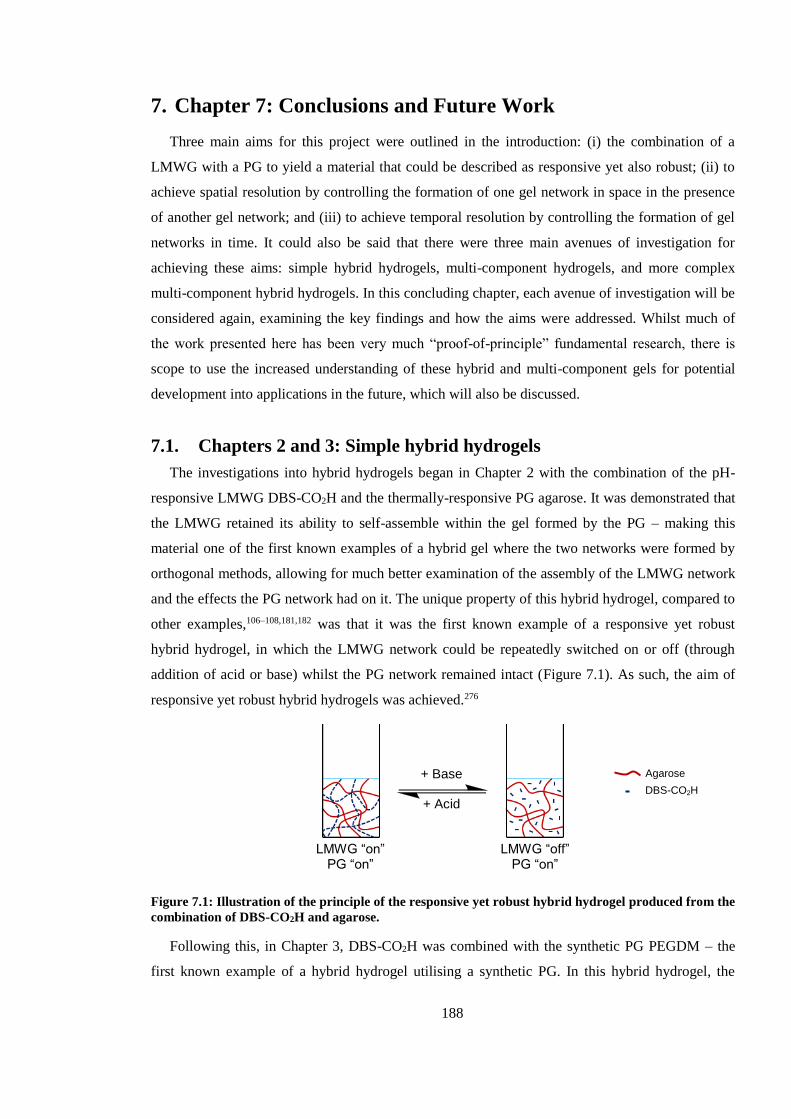
188
7. Chapter 7: Conclusions and Future Work
Three main aims for this project were outlined in the introduction: (i) the combination of a
LMWG with a PG to yield a material that could be described as responsive yet also robust; (ii) to
achieve spatial resolution by controlling the formation of one gel network in space in the presence
of another gel network; and (iii) to achieve temporal resolution by controlling the formation of gel
networks in time. It could also be said that there were three main avenues of investigation for
achieving these aims: simple hybrid hydrogels, multi-component hydrogels, and more complex
multi-component hybrid hydrogels. In this concluding chapter, each avenue of investigation will be
considered again, examining the key findings and how the aims were addressed. Whilst much of
the work presented here has been very much “proof-of-principle” fundamental research, there is
scope to use the increased understanding of these hybrid and multi-component gels for potential
development into applications in the future, which will also be discussed.
7.1. Chapters 2 and 3: Simple hybrid hydrogels
The investigations into hybrid hydrogels began in Chapter 2 with the combination of the pH-
responsive LMWG DBS-CO2H and the thermally-responsive PG agarose. It was demonstrated that
the LMWG retained its ability to self-assemble within the gel formed by the PG – making this
material one of the first known examples of a hybrid gel where the two networks were formed by
orthogonal methods, allowing for much better examination of the assembly of the LMWG network
and the effects the PG network had on it. The unique property of this hybrid hydrogel, compared to
other examples,106–108,181,182 was that it was the first known example of a responsive yet robust
hybrid hydrogel, in which the LMWG network could be repeatedly switched on or off (through
addition of acid or base) whilst the PG network remained intact (Figure 7.1). As such, the aim of
responsive yet robust hybrid hydrogels was achieved.276
Figure 7.1: Illustration of the principle of the responsive yet robust hybrid hydrogel produced from the
combination of DBS-CO2H and agarose.
Following this, in Chapter 3, DBS-CO2H was combined with the synthetic PG PEGDM – the
first known example of a hybrid hydrogel utilising a synthetic PG. In this hybrid hydrogel, the
+ Base
+ Acid
Agarose
DBS-CO2H
LMWG “on” PG “on”
LMWG “off” PG “on”
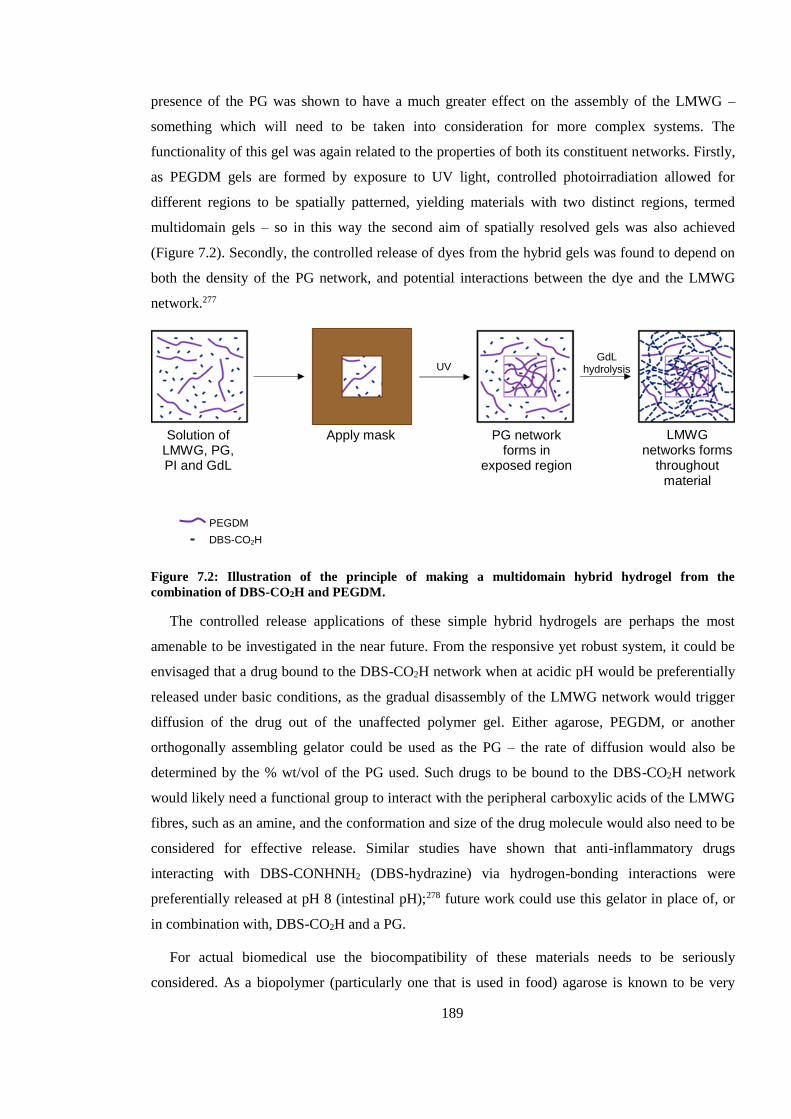
189
presence of the PG was shown to have a much greater effect on the assembly of the LMWG –
something which will need to be taken into consideration for more complex systems. The
functionality of this gel was again related to the properties of both its constituent networks. Firstly,
as PEGDM gels are formed by exposure to UV light, controlled photoirradiation allowed for
different regions to be spatially patterned, yielding materials with two distinct regions, termed
multidomain gels – so in this way the second aim of spatially resolved gels was also achieved
(Figure 7.2). Secondly, the controlled release of dyes from the hybrid gels was found to depend on
both the density of the PG network, and potential interactions between the dye and the LMWG
network.277
Figure 7.2: Illustration of the principle of making a multidomain hybrid hydrogel from the
combination of DBS-CO2H and PEGDM.
The controlled release applications of these simple hybrid hydrogels are perhaps the most
amenable to be investigated in the near future. From the responsive yet robust system, it could be
envisaged that a drug bound to the DBS-CO2H network when at acidic pH would be preferentially
released under basic conditions, as the gradual disassembly of the LMWG network would trigger
diffusion of the drug out of the unaffected polymer gel. Either agarose, PEGDM, or another
orthogonally assembling gelator could be used as the PG – the rate of diffusion would also be
determined by the % wt/vol of the PG used. Such drugs to be bound to the DBS-CO2H network
would likely need a functional group to interact with the peripheral carboxylic acids of the LMWG
fibres, such as an amine, and the conformation and size of the drug molecule would also need to be
considered for effective release. Similar studies have shown that anti-inflammatory drugs
interacting with DBS-CONHNH2 (DBS-hydrazine) via hydrogen-bonding interactions were
preferentially released at pH 8 (intestinal pH);278 future work could use this gelator in place of, or
in combination with, DBS-CO2H and a PG.
For actual biomedical use the biocompatibility of these materials needs to be seriously
considered. As a biopolymer (particularly one that is used in food) agarose is known to be very
UV GdL
hydrolysis
Solution of LMWG, PG, PI and GdL
Apply mask PG network forms in
exposed region
PEGDM
DBS-CO2H
LMWG networks forms
throughout material
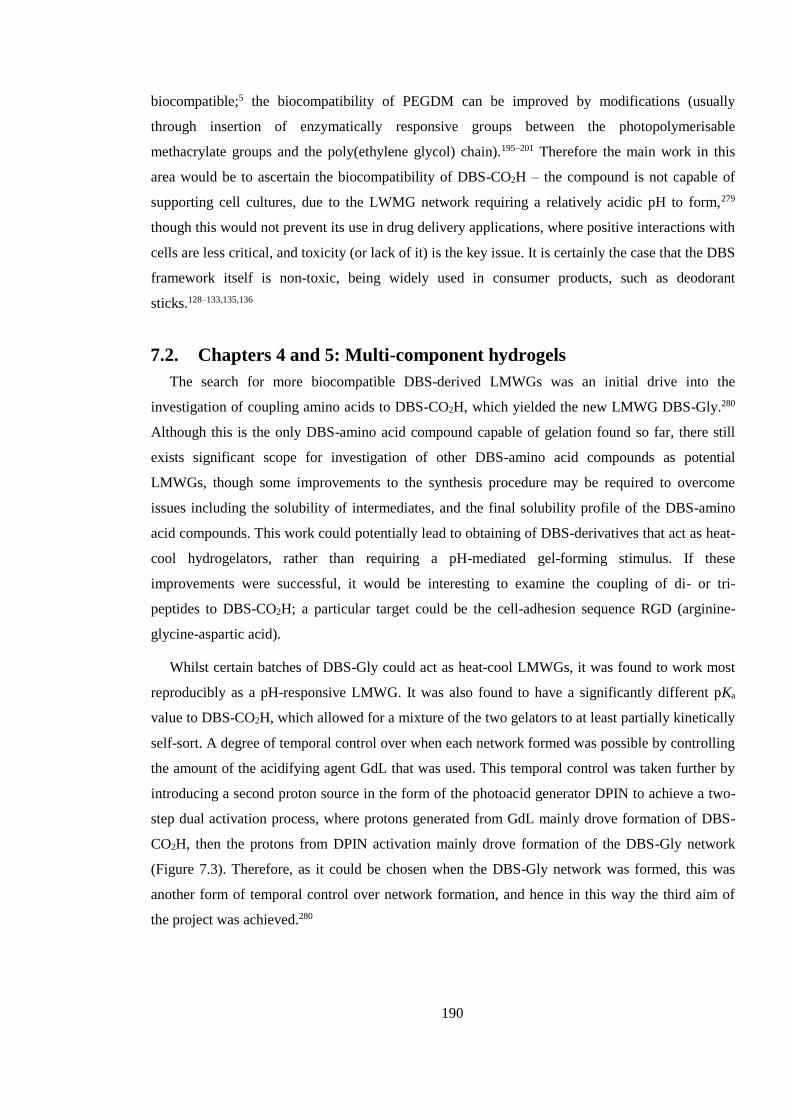
190
biocompatible;5 the biocompatibility of PEGDM can be improved by modifications (usually
through insertion of enzymatically responsive groups between the photopolymerisable
methacrylate groups and the poly(ethylene glycol) chain).195–201 Therefore the main work in this
area would be to ascertain the biocompatibility of DBS-CO2H – the compound is not capable of
supporting cell cultures, due to the LWMG network requiring a relatively acidic pH to form,279
though this would not prevent its use in drug delivery applications, where positive interactions with
cells are less critical, and toxicity (or lack of it) is the key issue. It is certainly the case that the DBS
framework itself is non-toxic, being widely used in consumer products, such as deodorant
sticks.128–133,135,136
7.2. Chapters 4 and 5: Multi-component hydrogels
The search for more biocompatible DBS-derived LMWGs was an initial drive into the
investigation of coupling amino acids to DBS-CO2H, which yielded the new LMWG DBS-Gly.280
Although this is the only DBS-amino acid compound capable of gelation found so far, there still
exists significant scope for investigation of other DBS-amino acid compounds as potential
LMWGs, though some improvements to the synthesis procedure may be required to overcome
issues including the solubility of intermediates, and the final solubility profile of the DBS-amino
acid compounds. This work could potentially lead to obtaining of DBS-derivatives that act as heat-
cool hydrogelators, rather than requiring a pH-mediated gel-forming stimulus. If these
improvements were successful, it would be interesting to examine the coupling of di- or tri-
peptides to DBS-CO2H; a particular target could be the cell-adhesion sequence RGD (arginine-
glycine-aspartic acid).
Whilst certain batches of DBS-Gly could act as heat-cool LMWGs, it was found to work most
reproducibly as a pH-responsive LMWG. It was also found to have a significantly different pKa
value to DBS-CO2H, which allowed for a mixture of the two gelators to at least partially kinetically
self-sort. A degree of temporal control over when each network formed was possible by controlling
the amount of the acidifying agent GdL that was used. This temporal control was taken further by
introducing a second proton source in the form of the photoacid generator DPIN to achieve a two-
step dual activation process, where protons generated from GdL mainly drove formation of DBS-
CO2H, then the protons from DPIN activation mainly drove formation of the DBS-Gly network
(Figure 7.3). Therefore, as it could be chosen when the DBS-Gly network was formed, this was
another form of temporal control over network formation, and hence in this way the third aim of
the project was achieved.280
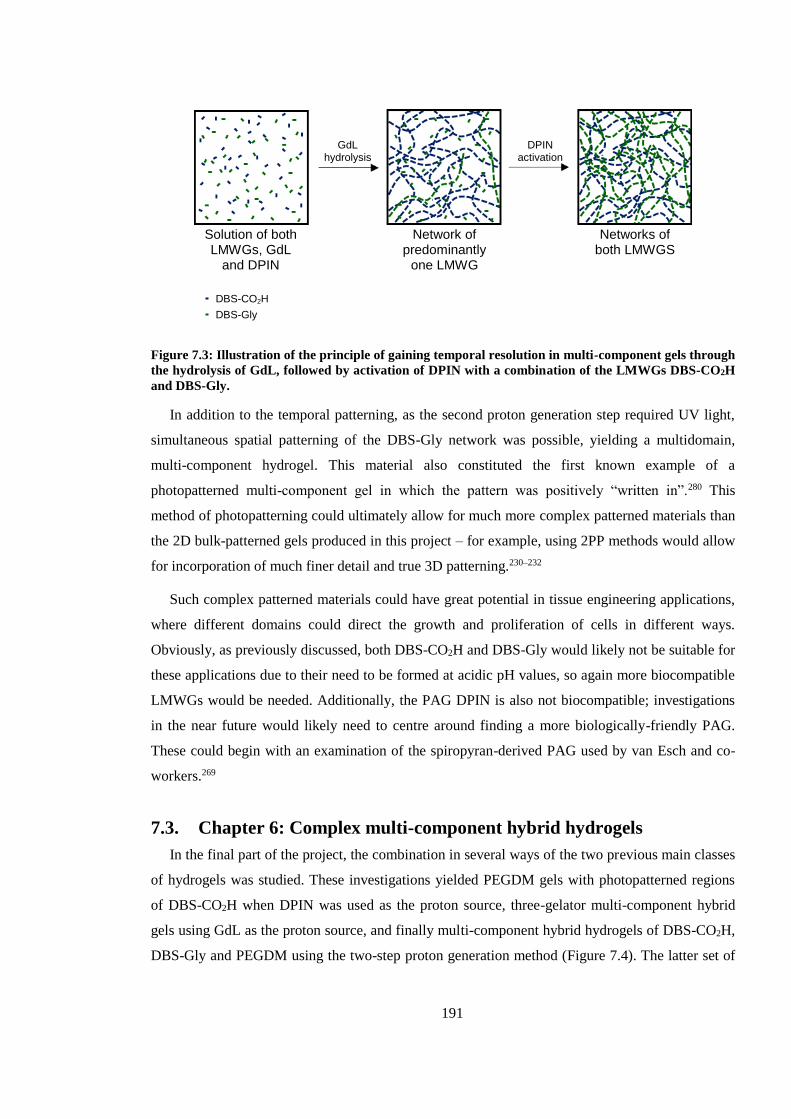
191
Figure 7.3: Illustration of the principle of gaining temporal resolution in multi-component gels through
the hydrolysis of GdL, followed by activation of DPIN with a combination of the LMWGs DBS-CO2H
and DBS-Gly.
In addition to the temporal patterning, as the second proton generation step required UV light,
simultaneous spatial patterning of the DBS-Gly network was possible, yielding a multidomain,
multi-component hydrogel. This material also constituted the first known example of a
photopatterned multi-component gel in which the pattern was positively “written in”.280 This
method of photopatterning could ultimately allow for much more complex patterned materials than
the 2D bulk-patterned gels produced in this project – for example, using 2PP methods would allow
for incorporation of much finer detail and true 3D patterning.230–232
Such complex patterned materials could have great potential in tissue engineering applications,
where different domains could direct the growth and proliferation of cells in different ways.
Obviously, as previously discussed, both DBS-CO2H and DBS-Gly would likely not be suitable for
these applications due to their need to be formed at acidic pH values, so again more biocompatible
LMWGs would be needed. Additionally, the PAG DPIN is also not biocompatible; investigations
in the near future would likely need to centre around finding a more biologically-friendly PAG.
These could begin with an examination of the spiropyran-derived PAG used by van Esch and co-
workers.269
7.3. Chapter 6: Complex multi-component hybrid hydrogels
In the final part of the project, the combination in several ways of the two previous main classes
of hydrogels was studied. These investigations yielded PEGDM gels with photopatterned regions
of DBS-CO2H when DPIN was used as the proton source, three-gelator multi-component hybrid
gels using GdL as the proton source, and finally multi-component hybrid hydrogels of DBS-CO2H,
DBS-Gly and PEGDM using the two-step proton generation method (Figure 7.4). The latter set of
GdL hydrolysis
DPIN activation
Solution of both LMWGs, GdL
and DPIN
Network of predominantly
one LMWG
Networks of both LMWGS
DBS-CO2H
DBS-Gly
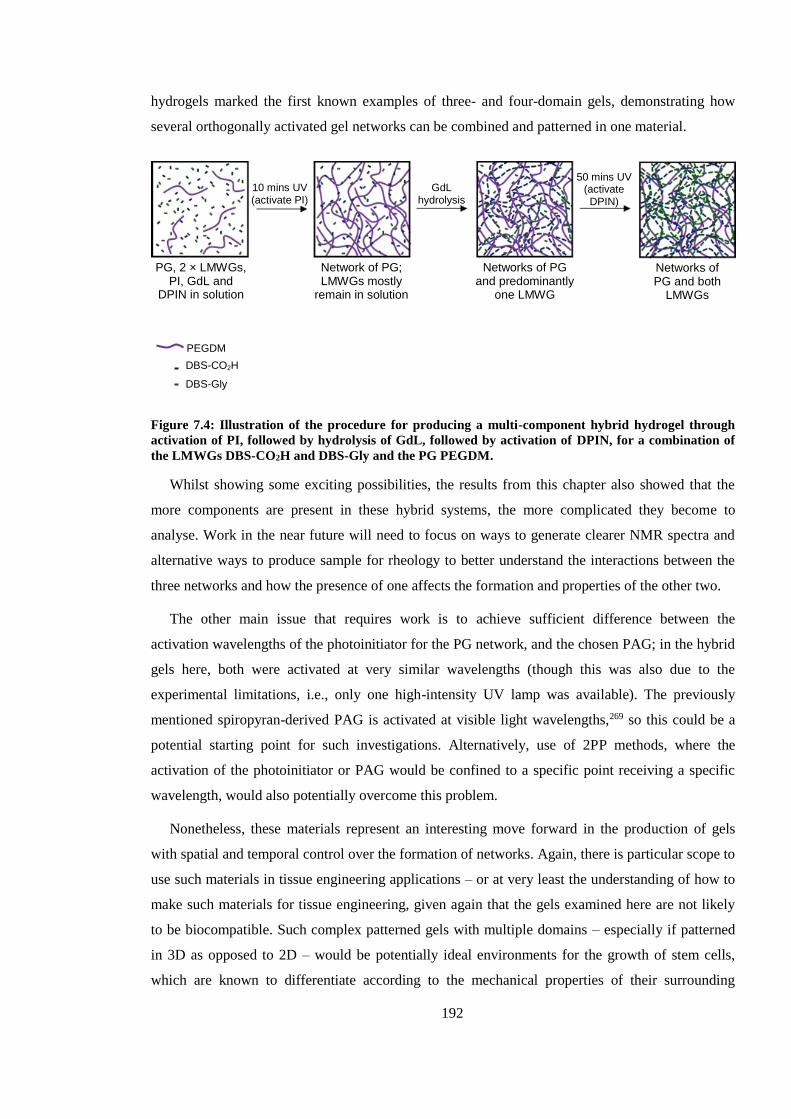
192
hydrogels marked the first known examples of three- and four-domain gels, demonstrating how
several orthogonally activated gel networks can be combined and patterned in one material.
Figure 7.4: Illustration of the procedure for producing a multi-component hybrid hydrogel through
activation of PI, followed by hydrolysis of GdL, followed by activation of DPIN, for a combination of
the LMWGs DBS-CO2H and DBS-Gly and the PG PEGDM.
Whilst showing some exciting possibilities, the results from this chapter also showed that the
more components are present in these hybrid systems, the more complicated they become to
analyse. Work in the near future will need to focus on ways to generate clearer NMR spectra and
alternative ways to produce sample for rheology to better understand the interactions between the
three networks and how the presence of one affects the formation and properties of the other two.
The other main issue that requires work is to achieve sufficient difference between the
activation wavelengths of the photoinitiator for the PG network, and the chosen PAG; in the hybrid
gels here, both were activated at very similar wavelengths (though this was also due to the
experimental limitations, i.e., only one high-intensity UV lamp was available). The previously
mentioned spiropyran-derived PAG is activated at visible light wavelengths,269 so this could be a
potential starting point for such investigations. Alternatively, use of 2PP methods, where the
activation of the photoinitiator or PAG would be confined to a specific point receiving a specific
wavelength, would also potentially overcome this problem.
Nonetheless, these materials represent an interesting move forward in the production of gels
with spatial and temporal control over the formation of networks. Again, there is particular scope to
use such materials in tissue engineering applications – or at very least the understanding of how to
make such materials for tissue engineering, given again that the gels examined here are not likely
to be biocompatible. Such complex patterned gels with multiple domains – especially if patterned
in 3D as opposed to 2D – would be potentially ideal environments for the growth of stem cells,
which are known to differentiate according to the mechanical properties of their surrounding
10 mins UV (activate PI)
GdL hydrolysis
50 mins UV (activate DPIN)
DBS-CO2H
DBS-Gly
PEGDM
Network of PG; LMWGs mostly
remain in solution
Networks of PG and predominantly
one LMWG
PG, 2 × LMWGs, PI, GdL and
DPIN in solution
Networks of PG and both
LMWGs
193
environments,275 so in this way complex tissues could be grown. Again, with patterning in 3D, it
could also be possible to make gels for drug delivery applications in which the multiple domains
have different kinetics of release depending on the networks present in each domain, controlling
release through interactions with the networks, through how easily the drug diffuses though the
networks, and how easily each domain is degraded to release the drug.
7.4. Summary
Altogether, the work in this project has contributed much to the understanding of how hybrid
and multi-component gels can be produced, how the gelators in them interact with or are affected
by each other, and how functionality can be added to the materials, particularly by photopatterning
methods. As such, the experiments described in this thesis have opened up wholly new areas in gel-
phase materials research. It is hoped that the principles elucidated here will go on to open up new
applications of such materials in high-tech biomedical processes, and prompt further investigations
into the understanding of this relatively new class of materials that is hybrid gels.
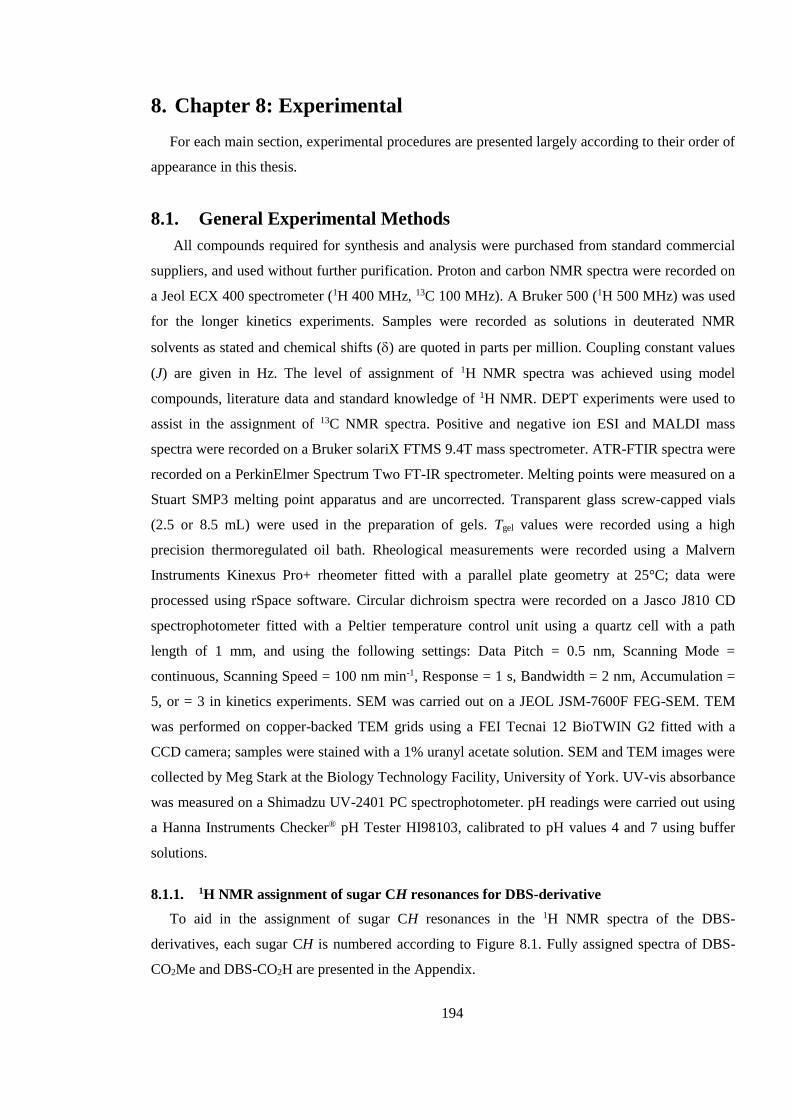
194
8. Chapter 8: Experimental
For each main section, experimental procedures are presented largely according to their order of
appearance in this thesis.
8.1. General Experimental Methods
All compounds required for synthesis and analysis were purchased from standard commercial
suppliers, and used without further purification. Proton and carbon NMR spectra were recorded on
a Jeol ECX 400 spectrometer (1H 400 MHz, 13C 100 MHz). A Bruker 500 (1H 500 MHz) was used
for the longer kinetics experiments. Samples were recorded as solutions in deuterated NMR
solvents as stated and chemical shifts () are quoted in parts per million. Coupling constant values
(J) are given in Hz. The level of assignment of 1H NMR spectra was achieved using model
compounds, literature data and standard knowledge of 1H NMR. DEPT experiments were used to
assist in the assignment of 13C NMR spectra. Positive and negative ion ESI and MALDI mass
spectra were recorded on a Bruker solariX FTMS 9.4T mass spectrometer. ATR-FTIR spectra were
recorded on a PerkinElmer Spectrum Two FT-IR spectrometer. Melting points were measured on a
Stuart SMP3 melting point apparatus and are uncorrected. Transparent glass screw-capped vials
(2.5 or 8.5 mL) were used in the preparation of gels. Tgel values were recorded using a high
precision thermoregulated oil bath. Rheological measurements were recorded using a Malvern
Instruments Kinexus Pro+ rheometer fitted with a parallel plate geometry at 25°C; data were
processed using rSpace software. Circular dichroism spectra were recorded on a Jasco J810 CD
spectrophotometer fitted with a Peltier temperature control unit using a quartz cell with a path
length of 1 mm, and using the following settings: Data Pitch = 0.5 nm, Scanning Mode =
continuous, Scanning Speed = 100 nm min-1, Response = 1 s, Bandwidth = 2 nm, Accumulation =
5, or = 3 in kinetics experiments. SEM was carried out on a JEOL JSM-7600F FEG-SEM. TEM
was performed on copper-backed TEM grids using a FEI Tecnai 12 BioTWIN G2 fitted with a
CCD camera; samples were stained with a 1% uranyl acetate solution. SEM and TEM images were
collected by Meg Stark at the Biology Technology Facility, University of York. UV-vis absorbance
was measured on a Shimadzu UV-2401 PC spectrophotometer. pH readings were carried out using
a Hanna Instruments Checker® pH Tester HI98103, calibrated to pH values 4 and 7 using buffer
solutions.
8.1.1. 1H NMR assignment of sugar CH resonances for DBS-derivative
To aid in the assignment of sugar CH resonances in the 1H NMR spectra of the DBS-
derivatives, each sugar CH is numbered according to Figure 8.1. Fully assigned spectra of DBS-
CO2Me and DBS-CO2H are presented in the Appendix.
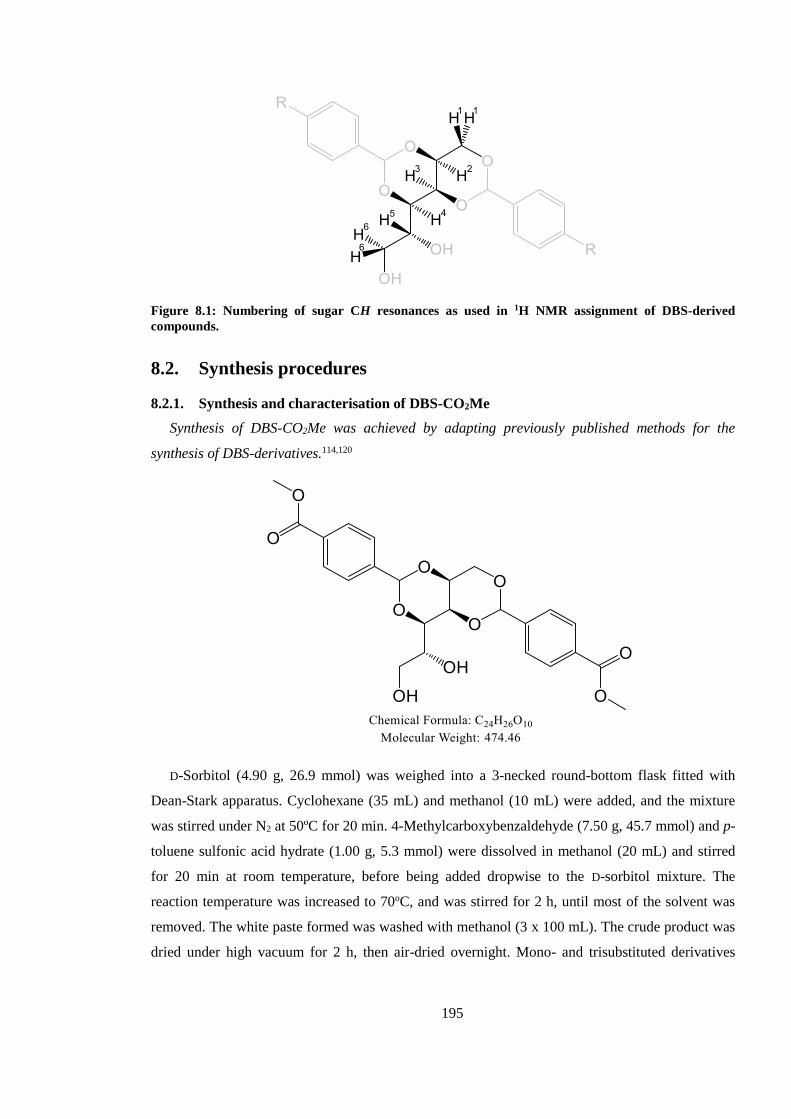
195
Figure 8.1: Numbering of sugar CH resonances as used in 1H NMR assignment of DBS-derived
compounds.
8.2. Synthesis procedures
8.2.1. Synthesis and characterisation of DBS-CO2Me
Synthesis of DBS-CO2Me was achieved by adapting previously published methods for the
synthesis of DBS-derivatives.114,120
D-Sorbitol (4.90 g, 26.9 mmol) was weighed into a 3-necked round-bottom flask fitted with
Dean-Stark apparatus. Cyclohexane (35 mL) and methanol (10 mL) were added, and the mixture
was stirred under N2 at 50ºC for 20 min. 4-Methylcarboxybenzaldehyde (7.50 g, 45.7 mmol) and p-
toluene sulfonic acid hydrate (1.00 g, 5.3 mmol) were dissolved in methanol (20 mL) and stirred
for 20 min at room temperature, before being added dropwise to the D-sorbitol mixture. The
reaction temperature was increased to 70oC, and was stirred for 2 h, until most of the solvent was
removed. The white paste formed was washed with methanol (3 x 100 mL). The crude product was
dried under high vacuum for 2 h, then air-dried overnight. Mono- and trisubstituted derivatives
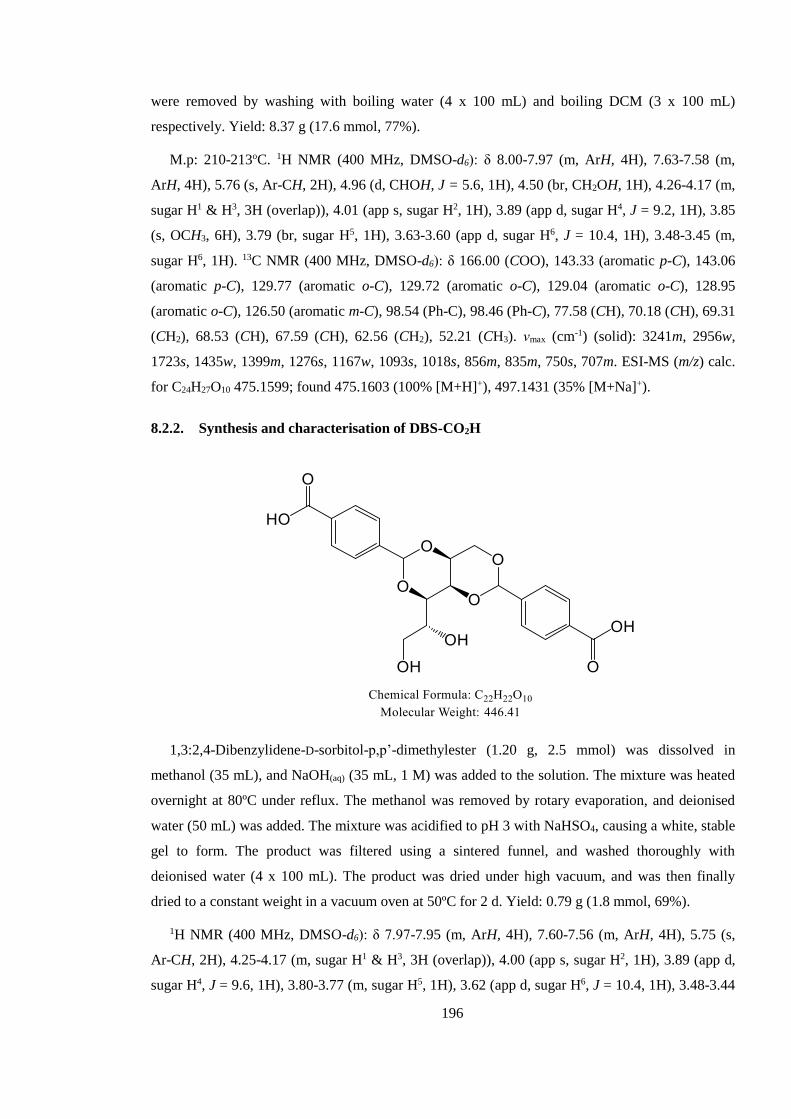
196
were removed by washing with boiling water (4 x 100 mL) and boiling DCM (3 x 100 mL)
respectively. Yield: 8.37 g (17.6 mmol, 77%).
M.p: 210-213oC. 1H NMR (400 MHz, DMSO-d6): δ 8.00-7.97 (m, ArH, 4H), 7.63-7.58 (m,
ArH, 4H), 5.76 (s, Ar-CH, 2H), 4.96 (d, CHOH, J = 5.6, 1H), 4.50 (br, CH2OH, 1H), 4.26-4.17 (m,
sugar H1 & H3, 3H (overlap)), 4.01 (app s, sugar H2, 1H), 3.89 (app d, sugar H4, J = 9.2, 1H), 3.85
(s, OCH3, 6H), 3.79 (br, sugar H5, 1H), 3.63-3.60 (app d, sugar H6, J = 10.4, 1H), 3.48-3.45 (m,
sugar H6, 1H). 13C NMR (400 MHz, DMSO-d6): δ 166.00 (COO), 143.33 (aromatic p-C), 143.06
(aromatic p-C), 129.77 (aromatic o-C), 129.72 (aromatic o-C), 129.04 (aromatic o-C), 128.95
(aromatic o-C), 126.50 (aromatic m-C), 98.54 (Ph-C), 98.46 (Ph-C), 77.58 (CH), 70.18 (CH), 69.31
(CH2), 68.53 (CH), 67.59 (CH), 62.56 (CH2), 52.21 (CH3). νmax (cm-1) (solid): 3241m, 2956w,
1723s, 1435w, 1399m, 1276s, 1167w, 1093s, 1018s, 856m, 835m, 750s, 707m. ESI-MS (m/z) calc.
for C24H27O10 475.1599; found 475.1603 (100% [M+H]+), 497.1431 (35% [M+Na]+).
8.2.2. Synthesis and characterisation of DBS-CO2H
1,3:2,4-Dibenzylidene-D-sorbitol-p,p’-dimethylester (1.20 g, 2.5 mmol) was dissolved in
methanol (35 mL), and NaOH(aq) (35 mL, 1 M) was added to the solution. The mixture was heated
overnight at 80ºC under reflux. The methanol was removed by rotary evaporation, and deionised
water (50 mL) was added. The mixture was acidified to pH 3 with NaHSO4, causing a white, stable
gel to form. The product was filtered using a sintered funnel, and washed thoroughly with
deionised water (4 x 100 mL). The product was dried under high vacuum, and was then finally
dried to a constant weight in a vacuum oven at 50ºC for 2 d. Yield: 0.79 g (1.8 mmol, 69%).
1H NMR (400 MHz, DMSO-d6): δ 7.97-7.95 (m, ArH, 4H), 7.60-7.56 (m, ArH, 4H), 5.75 (s,
Ar-CH, 2H), 4.25-4.17 (m, sugar H1 & H3, 3H (overlap)), 4.00 (app s, sugar H2, 1H), 3.89 (app d,
sugar H4, J = 9.6, 1H), 3.80-3.77 (m, sugar H5, 1H), 3.62 (app d, sugar H6, J = 10.4, 1H), 3.48-3.44
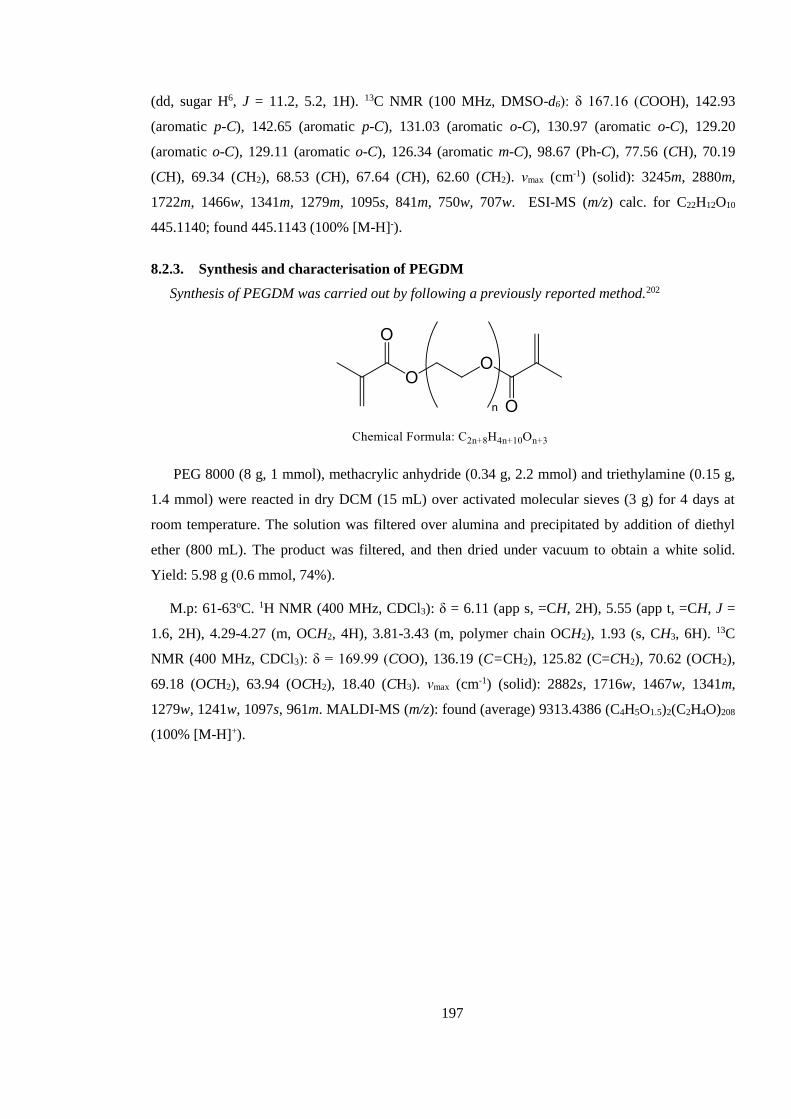
197
(dd, sugar H6, J = 11.2, 5.2, 1H). 13C NMR (100 MHz, DMSO-d6): δ 167.16 (COOH), 142.93
(aromatic p-C), 142.65 (aromatic p-C), 131.03 (aromatic o-C), 130.97 (aromatic o-C), 129.20
(aromatic o-C), 129.11 (aromatic o-C), 126.34 (aromatic m-C), 98.67 (Ph-C), 77.56 (CH), 70.19
(CH), 69.34 (CH2), 68.53 (CH), 67.64 (CH), 62.60 (CH2). νmax (cm-1) (solid): 3245m, 2880m,
1722m, 1466w, 1341m, 1279m, 1095s, 841m, 750w, 707w. ESI-MS (m/z) calc. for C22H12O10
445.1140; found 445.1143 (100% [M-H]-).
8.2.3. Synthesis and characterisation of PEGDM
Synthesis of PEGDM was carried out by following a previously reported method.202
PEG 8000 (8 g, 1 mmol), methacrylic anhydride (0.34 g, 2.2 mmol) and triethylamine (0.15 g,
1.4 mmol) were reacted in dry DCM (15 mL) over activated molecular sieves (3 g) for 4 days at
room temperature. The solution was filtered over alumina and precipitated by addition of diethyl
ether (800 mL). The product was filtered, and then dried under vacuum to obtain a white solid.
Yield: 5.98 g (0.6 mmol, 74%).
M.p: 61-63oC. 1H NMR (400 MHz, CDCl3): δ = 6.11 (app s, =CH, 2H), 5.55 (app t, =CH, J =
1.6, 2H), 4.29-4.27 (m, OCH2, 4H), 3.81-3.43 (m, polymer chain OCH2), 1.93 (s, CH3, 6H). 13C
NMR (400 MHz, CDCl3): δ = 169.99 (COO), 136.19 (C=CH2), 125.82 (C=CH2), 70.62 (OCH2),
69.18 (OCH2), 63.94 (OCH2), 18.40 (CH3). νmax (cm-1) (solid): 2882s, 1716w, 1467w, 1341m,
1279w, 1241w, 1097s, 961m. MALDI-MS (m/z): found (average) 9313.4386 (C4H5O1.5)2(C2H4O)208
(100% [M-H]+).
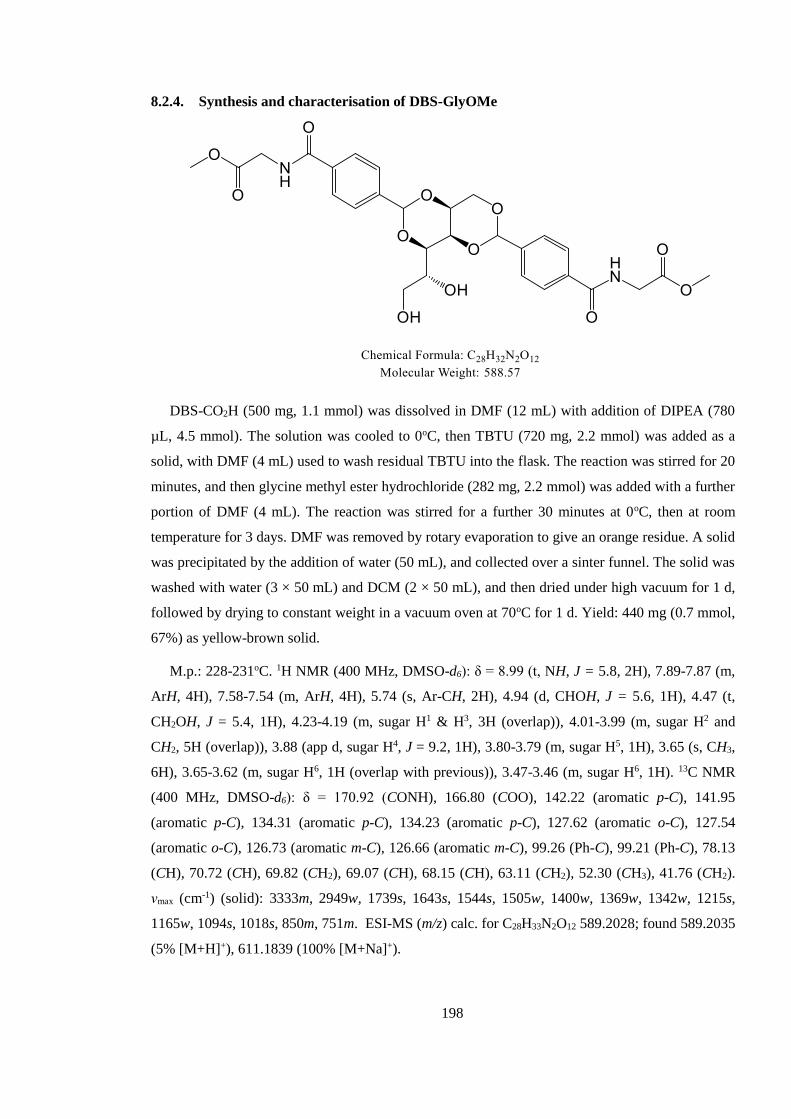
198
8.2.4. Synthesis and characterisation of DBS-GlyOMe
DBS-CO2H (500 mg, 1.1 mmol) was dissolved in DMF (12 mL) with addition of DIPEA (780
µL, 4.5 mmol). The solution was cooled to 0oC, then TBTU (720 mg, 2.2 mmol) was added as a
solid, with DMF (4 mL) used to wash residual TBTU into the flask. The reaction was stirred for 20
minutes, and then glycine methyl ester hydrochloride (282 mg, 2.2 mmol) was added with a further
portion of DMF (4 mL). The reaction was stirred for a further 30 minutes at 0oC, then at room
temperature for 3 days. DMF was removed by rotary evaporation to give an orange residue. A solid
was precipitated by the addition of water (50 mL), and collected over a sinter funnel. The solid was
washed with water (3 × 50 mL) and DCM (2 × 50 mL), and then dried under high vacuum for 1 d,
followed by drying to constant weight in a vacuum oven at 70oC for 1 d. Yield: 440 mg (0.7 mmol,
67%) as yellow-brown solid.
M.p.: 228-231oC. 1H NMR (400 MHz, DMSO-d6): δ = 8.99 (t, NH, J = 5.8, 2H), 7.89-7.87 (m,
ArH, 4H), 7.58-7.54 (m, ArH, 4H), 5.74 (s, Ar-CH, 2H), 4.94 (d, CHOH, J = 5.6, 1H), 4.47 (t,
CH2OH, J = 5.4, 1H), 4.23-4.19 (m, sugar H1 & H3, 3H (overlap)), 4.01-3.99 (m, sugar H2 and
CH2, 5H (overlap)), 3.88 (app d, sugar H4, J = 9.2, 1H), 3.80-3.79 (m, sugar H5, 1H), 3.65 (s, CH3,
6H), 3.65-3.62 (m, sugar H6, 1H (overlap with previous)), 3.47-3.46 (m, sugar H6, 1H). 13C NMR
(400 MHz, DMSO-d6): δ = 170.92 (CONH), 166.80 (COO), 142.22 (aromatic p-C), 141.95
(aromatic p-C), 134.31 (aromatic p-C), 134.23 (aromatic p-C), 127.62 (aromatic o-C), 127.54
(aromatic o-C), 126.73 (aromatic m-C), 126.66 (aromatic m-C), 99.26 (Ph-C), 99.21 (Ph-C), 78.13
(CH), 70.72 (CH), 69.82 (CH2), 69.07 (CH), 68.15 (CH), 63.11 (CH2), 52.30 (CH3), 41.76 (CH2).
νmax (cm-1) (solid): 3333m, 2949w, 1739s, 1643s, 1544s, 1505w, 1400w, 1369w, 1342w, 1215s,
1165w, 1094s, 1018s, 850m, 751m. ESI-MS (m/z) calc. for C28H33N2O12 589.2028; found 589.2035
(5% [M+H]+), 611.1839 (100% [M+Na]+).
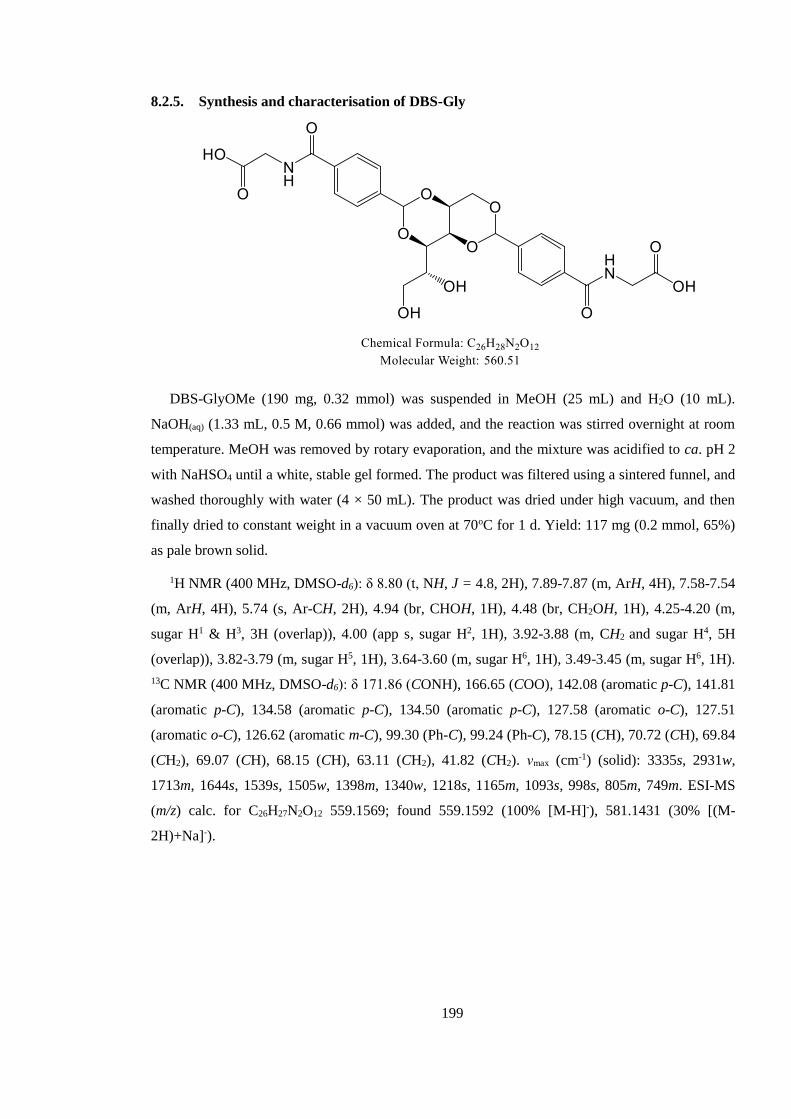
199
8.2.5. Synthesis and characterisation of DBS-Gly
DBS-GlyOMe (190 mg, 0.32 mmol) was suspended in MeOH (25 mL) and H2O (10 mL).
NaOH(aq) (1.33 mL, 0.5 M, 0.66 mmol) was added, and the reaction was stirred overnight at room
temperature. MeOH was removed by rotary evaporation, and the mixture was acidified to ca. pH 2
with NaHSO4 until a white, stable gel formed. The product was filtered using a sintered funnel, and
washed thoroughly with water (4 × 50 mL). The product was dried under high vacuum, and then
finally dried to constant weight in a vacuum oven at 70oC for 1 d. Yield: 117 mg (0.2 mmol, 65%)
as pale brown solid.
1H NMR (400 MHz, DMSO-d6): δ 8.80 (t, NH, J = 4.8, 2H), 7.89-7.87 (m, ArH, 4H), 7.58-7.54
(m, ArH, 4H), 5.74 (s, Ar-CH, 2H), 4.94 (br, CHOH, 1H), 4.48 (br, CH2OH, 1H), 4.25-4.20 (m,
sugar H1 & H3, 3H (overlap)), 4.00 (app s, sugar H2, 1H), 3.92-3.88 (m, CH2 and sugar H4, 5H
(overlap)), 3.82-3.79 (m, sugar H5, 1H), 3.64-3.60 (m, sugar H6, 1H), 3.49-3.45 (m, sugar H6, 1H).
13C NMR (400 MHz, DMSO-d6): δ 171.86 (CONH), 166.65 (COO), 142.08 (aromatic p-C), 141.81
(aromatic p-C), 134.58 (aromatic p-C), 134.50 (aromatic p-C), 127.58 (aromatic o-C), 127.51
(aromatic o-C), 126.62 (aromatic m-C), 99.30 (Ph-C), 99.24 (Ph-C), 78.15 (CH), 70.72 (CH), 69.84
(CH2), 69.07 (CH), 68.15 (CH), 63.11 (CH2), 41.82 (CH2). νmax (cm-1) (solid): 3335s, 2931w,
1713m, 1644s, 1539s, 1505w, 1398m, 1340w, 1218s, 1165m, 1093s, 998s, 805m, 749m. ESI-MS
(m/z) calc. for C26H27N2O12 559.1569; found 559.1592 (100% [M-H]-), 581.1431 (30% [(M-
2H)+Na]-).
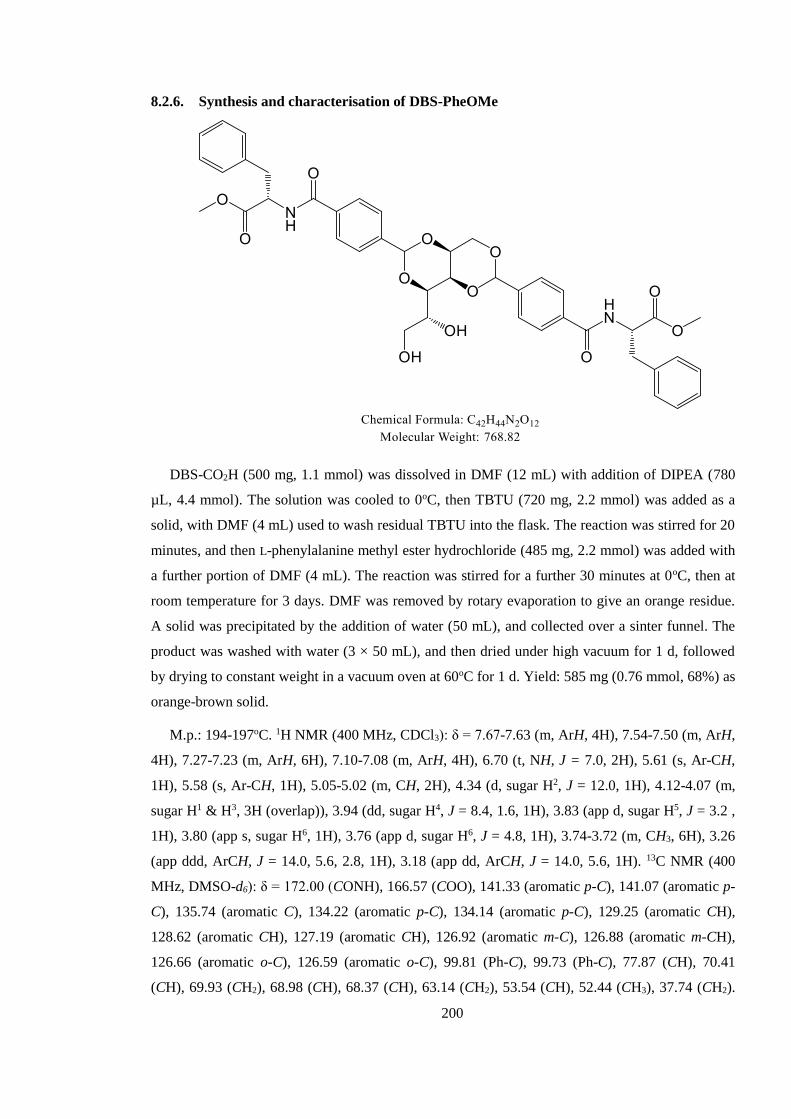
200
8.2.6. Synthesis and characterisation of DBS-PheOMe
DBS-CO2H (500 mg, 1.1 mmol) was dissolved in DMF (12 mL) with addition of DIPEA (780
µL, 4.4 mmol). The solution was cooled to 0oC, then TBTU (720 mg, 2.2 mmol) was added as a
solid, with DMF (4 mL) used to wash residual TBTU into the flask. The reaction was stirred for 20
minutes, and then L-phenylalanine methyl ester hydrochloride (485 mg, 2.2 mmol) was added with
a further portion of DMF (4 mL). The reaction was stirred for a further 30 minutes at 0oC, then at
room temperature for 3 days. DMF was removed by rotary evaporation to give an orange residue.
A solid was precipitated by the addition of water (50 mL), and collected over a sinter funnel. The
product was washed with water (3 × 50 mL), and then dried under high vacuum for 1 d, followed
by drying to constant weight in a vacuum oven at 60oC for 1 d. Yield: 585 mg (0.76 mmol, 68%) as
orange-brown solid.
M.p.: 194-197oC. 1H NMR (400 MHz, CDCl3): δ = 7.67-7.63 (m, ArH, 4H), 7.54-7.50 (m, ArH,
4H), 7.27-7.23 (m, ArH, 6H), 7.10-7.08 (m, ArH, 4H), 6.70 (t, NH, J = 7.0, 2H), 5.61 (s, Ar-CH,
1H), 5.58 (s, Ar-CH, 1H), 5.05-5.02 (m, CH, 2H), 4.34 (d, sugar H2, J = 12.0, 1H), 4.12-4.07 (m,
sugar H1 & H3, 3H (overlap)), 3.94 (dd, sugar H4, J = 8.4, 1.6, 1H), 3.83 (app d, sugar H5, J = 3.2 ,
1H), 3.80 (app s, sugar H6, 1H), 3.76 (app d, sugar H6, J = 4.8, 1H), 3.74-3.72 (m, CH3, 6H), 3.26
(app ddd, ArCH, J = 14.0, 5.6, 2.8, 1H), 3.18 (app dd, ArCH, J = 14.0, 5.6, 1H). 13C NMR (400
MHz, DMSO-d6): δ = 172.00 (CONH), 166.57 (COO), 141.33 (aromatic p-C), 141.07 (aromatic p-
C), 135.74 (aromatic C), 134.22 (aromatic p-C), 134.14 (aromatic p-C), 129.25 (aromatic CH),
128.62 (aromatic CH), 127.19 (aromatic CH), 126.92 (aromatic m-C), 126.88 (aromatic m-CH),
126.66 (aromatic o-C), 126.59 (aromatic o-C), 99.81 (Ph-C), 99.73 (Ph-C), 77.87 (CH), 70.41
(CH), 69.93 (CH2), 68.98 (CH), 68.37 (CH), 63.14 (CH2), 53.54 (CH), 52.44 (CH3), 37.74 (CH2).
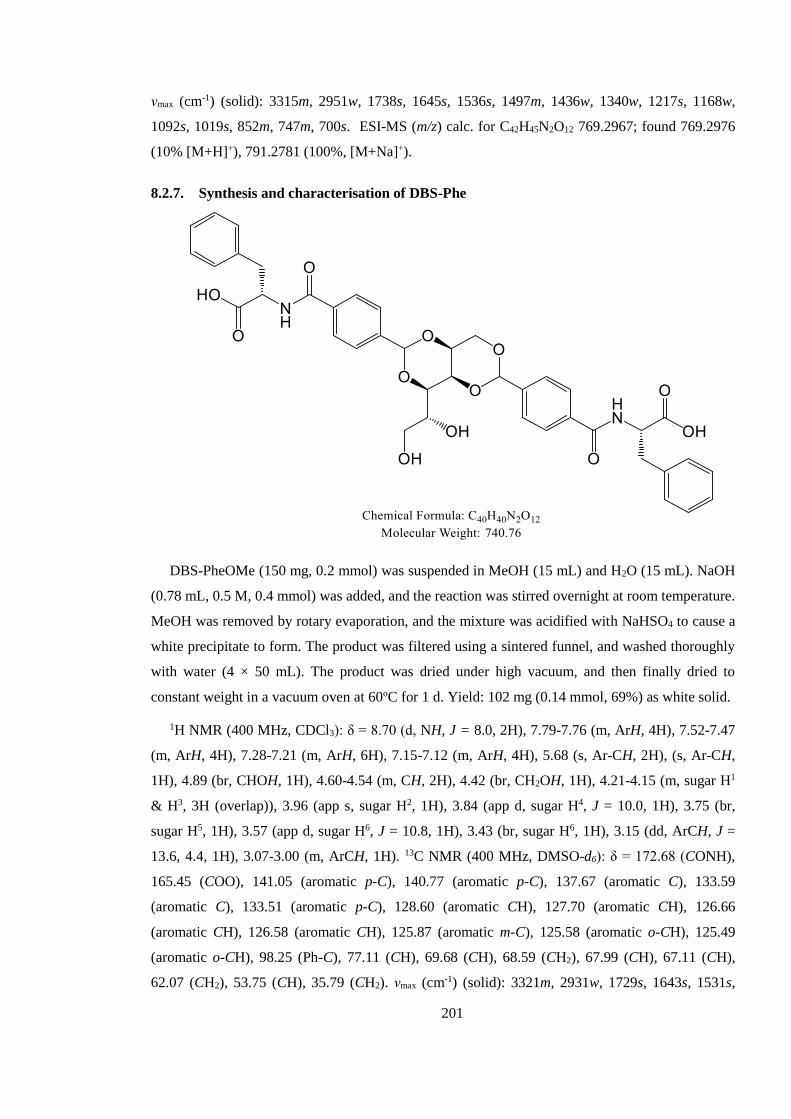
201
νmax (cm-1) (solid): 3315m, 2951w, 1738s, 1645s, 1536s, 1497m, 1436w, 1340w, 1217s, 1168w,
1092s, 1019s, 852m, 747m, 700s. ESI-MS (m/z) calc. for C42H45N2O12 769.2967; found 769.2976
(10% [M+H]+), 791.2781 (100%, [M+Na]+).
8.2.7. Synthesis and characterisation of DBS-Phe
DBS-PheOMe (150 mg, 0.2 mmol) was suspended in MeOH (15 mL) and H2O (15 mL). NaOH
(0.78 mL, 0.5 M, 0.4 mmol) was added, and the reaction was stirred overnight at room temperature.
MeOH was removed by rotary evaporation, and the mixture was acidified with NaHSO4 to cause a
white precipitate to form. The product was filtered using a sintered funnel, and washed thoroughly
with water (4 × 50 mL). The product was dried under high vacuum, and then finally dried to
constant weight in a vacuum oven at 60oC for 1 d. Yield: 102 mg (0.14 mmol, 69%) as white solid.
1H NMR (400 MHz, CDCl3): δ = 8.70 (d, NH, J = 8.0, 2H), 7.79-7.76 (m, ArH, 4H), 7.52-7.47
(m, ArH, 4H), 7.28-7.21 (m, ArH, 6H), 7.15-7.12 (m, ArH, 4H), 5.68 (s, Ar-CH, 2H), (s, Ar-CH,
1H), 4.89 (br, CHOH, 1H), 4.60-4.54 (m, CH, 2H), 4.42 (br, CH2OH, 1H), 4.21-4.15 (m, sugar H1
& H3, 3H (overlap)), 3.96 (app s, sugar H2, 1H), 3.84 (app d, sugar H4, J = 10.0, 1H), 3.75 (br,
sugar H5, 1H), 3.57 (app d, sugar H6, J = 10.8, 1H), 3.43 (br, sugar H6, 1H), 3.15 (dd, ArCH, J =
13.6, 4.4, 1H), 3.07-3.00 (m, ArCH, 1H). 13C NMR (400 MHz, DMSO-d6): δ = 172.68 (CONH),
165.45 (COO), 141.05 (aromatic p-C), 140.77 (aromatic p-C), 137.67 (aromatic C), 133.59
(aromatic C), 133.51 (aromatic p-C), 128.60 (aromatic CH), 127.70 (aromatic CH), 126.66
(aromatic CH), 126.58 (aromatic CH), 125.87 (aromatic m-C), 125.58 (aromatic o-CH), 125.49
(aromatic o-CH), 98.25 (Ph-C), 77.11 (CH), 69.68 (CH), 68.59 (CH2), 67.99 (CH), 67.11 (CH),
62.07 (CH2), 53.75 (CH), 35.79 (CH2). νmax (cm-1) (solid): 3321m, 2931w, 1729s, 1643s, 1531s,
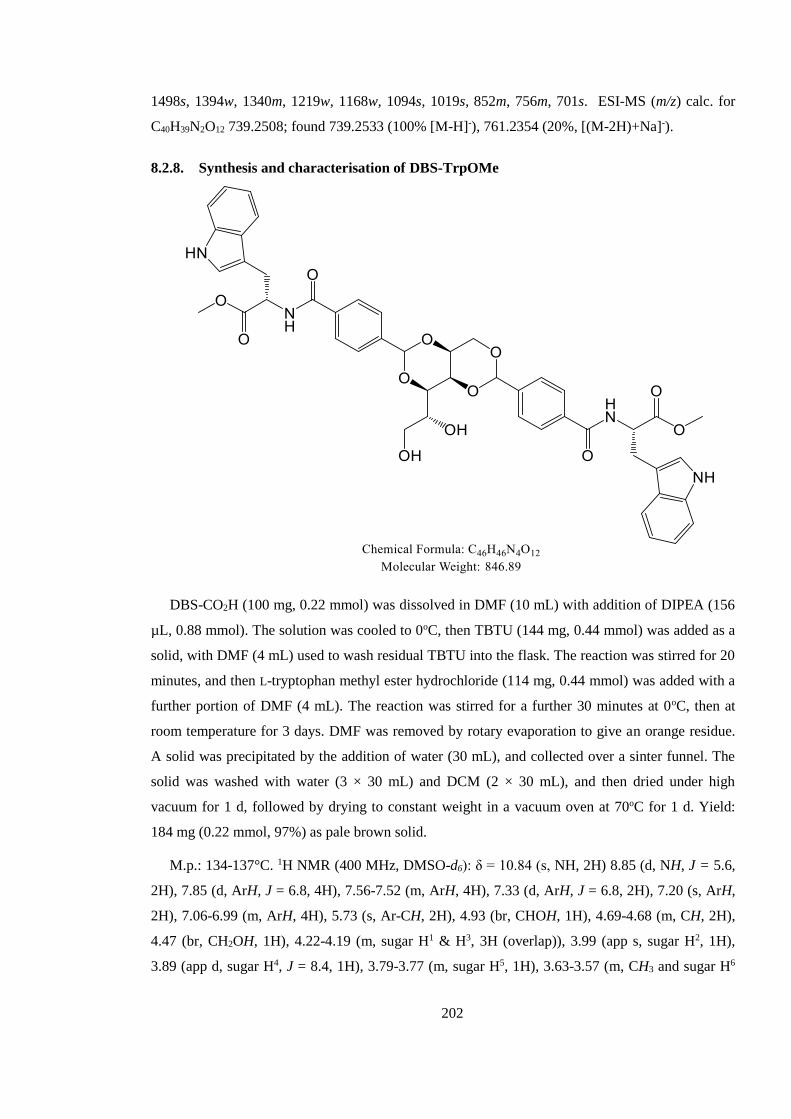
202
1498s, 1394w, 1340m, 1219w, 1168w, 1094s, 1019s, 852m, 756m, 701s. ESI-MS (m/z) calc. for
C40H39N2O12 739.2508; found 739.2533 (100% [M-H]-), 761.2354 (20%, [(M-2H)+Na]-).
8.2.8. Synthesis and characterisation of DBS-TrpOMe
DBS-CO2H (100 mg, 0.22 mmol) was dissolved in DMF (10 mL) with addition of DIPEA (156
µL, 0.88 mmol). The solution was cooled to 0oC, then TBTU (144 mg, 0.44 mmol) was added as a
solid, with DMF (4 mL) used to wash residual TBTU into the flask. The reaction was stirred for 20
minutes, and then L-tryptophan methyl ester hydrochloride (114 mg, 0.44 mmol) was added with a
further portion of DMF (4 mL). The reaction was stirred for a further 30 minutes at 0oC, then at
room temperature for 3 days. DMF was removed by rotary evaporation to give an orange residue.
A solid was precipitated by the addition of water (30 mL), and collected over a sinter funnel. The
solid was washed with water (3 × 30 mL) and DCM (2 × 30 mL), and then dried under high
vacuum for 1 d, followed by drying to constant weight in a vacuum oven at 70oC for 1 d. Yield:
184 mg (0.22 mmol, 97%) as pale brown solid.
M.p.: 134-137°C. 1H NMR (400 MHz, DMSO-d6): δ = 10.84 (s, NH, 2H) 8.85 (d, NH, J = 5.6,
2H), 7.85 (d, ArH, J = 6.8, 4H), 7.56-7.52 (m, ArH, 4H), 7.33 (d, ArH, J = 6.8, 2H), 7.20 (s, ArH,
2H), 7.06-6.99 (m, ArH, 4H), 5.73 (s, Ar-CH, 2H), 4.93 (br, CHOH, 1H), 4.69-4.68 (m, CH, 2H),
4.47 (br, CH2OH, 1H), 4.22-4.19 (m, sugar H1 & H3, 3H (overlap)), 3.99 (app s, sugar H2, 1H),
3.89 (app d, sugar H4, J = 8.4, 1H), 3.79-3.77 (m, sugar H5, 1H), 3.63-3.57 (m, CH3 and sugar H6
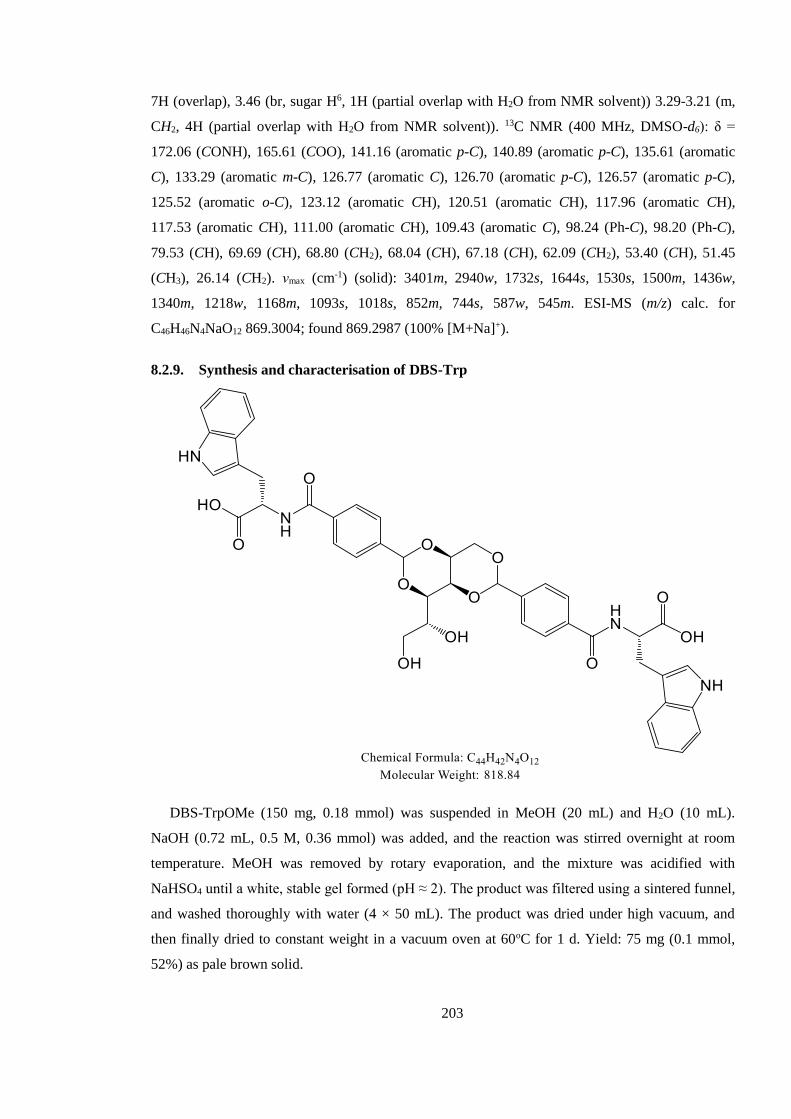
203
7H (overlap), 3.46 (br, sugar H6, 1H (partial overlap with H2O from NMR solvent)) 3.29-3.21 (m,
CH2, 4H (partial overlap with H2O from NMR solvent)). 13C NMR (400 MHz, DMSO-d6): δ =
172.06 (CONH), 165.61 (COO), 141.16 (aromatic p-C), 140.89 (aromatic p-C), 135.61 (aromatic
C), 133.29 (aromatic m-C), 126.77 (aromatic C), 126.70 (aromatic p-C), 126.57 (aromatic p-C),
125.52 (aromatic o-C), 123.12 (aromatic CH), 120.51 (aromatic CH), 117.96 (aromatic CH),
117.53 (aromatic CH), 111.00 (aromatic CH), 109.43 (aromatic C), 98.24 (Ph-C), 98.20 (Ph-C),
79.53 (CH), 69.69 (CH), 68.80 (CH2), 68.04 (CH), 67.18 (CH), 62.09 (CH2), 53.40 (CH), 51.45
(CH3), 26.14 (CH2). νmax (cm-1) (solid): 3401m, 2940w, 1732s, 1644s, 1530s, 1500m, 1436w,
1340m, 1218w, 1168m, 1093s, 1018s, 852m, 744s, 587w, 545m. ESI-MS (m/z) calc. for
C46H46N4NaO12 869.3004; found 869.2987 (100% [M+Na]+).
8.2.9. Synthesis and characterisation of DBS-Trp
DBS-TrpOMe (150 mg, 0.18 mmol) was suspended in MeOH (20 mL) and H2O (10 mL).
NaOH (0.72 mL, 0.5 M, 0.36 mmol) was added, and the reaction was stirred overnight at room
temperature. MeOH was removed by rotary evaporation, and the mixture was acidified with
NaHSO4 until a white, stable gel formed (pH ≈ 2). The product was filtered using a sintered funnel,
and washed thoroughly with water (4 × 50 mL). The product was dried under high vacuum, and
then finally dried to constant weight in a vacuum oven at 60oC for 1 d. Yield: 75 mg (0.1 mmol,
52%) as pale brown solid.
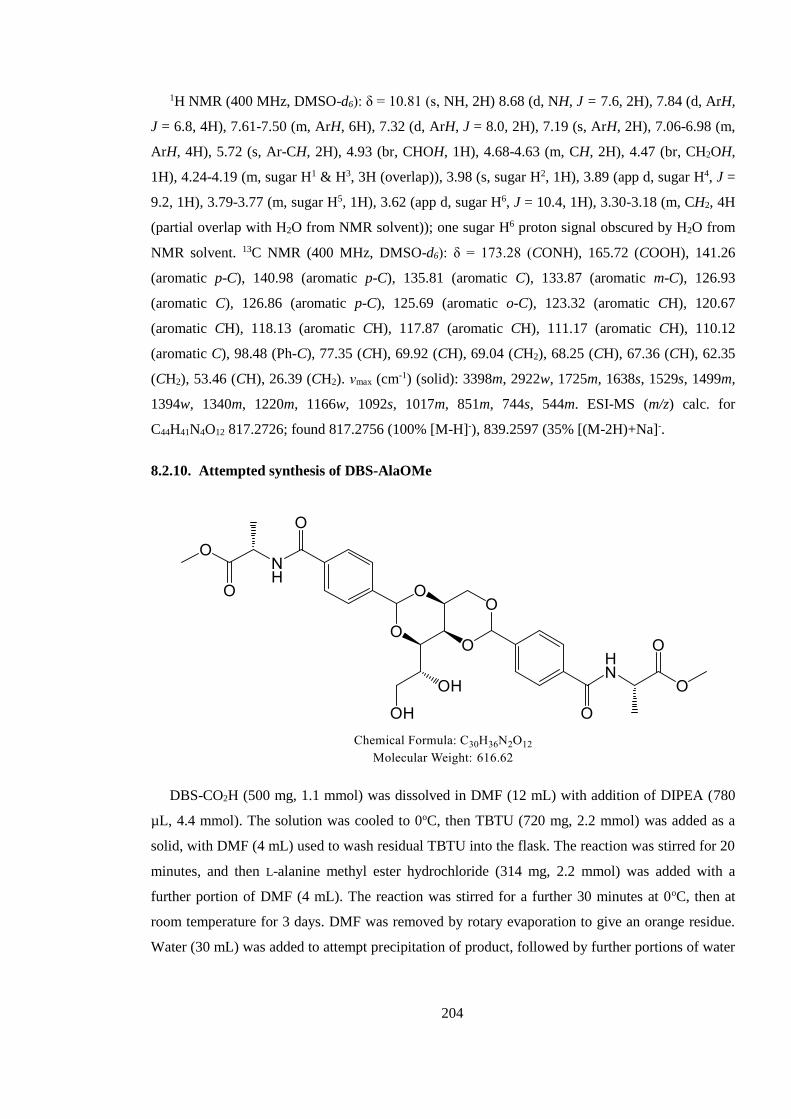
204
1H NMR (400 MHz, DMSO-d6): δ = 10.81 (s, NH, 2H) 8.68 (d, NH, J = 7.6, 2H), 7.84 (d, ArH,
J = 6.8, 4H), 7.61-7.50 (m, ArH, 6H), 7.32 (d, ArH, J = 8.0, 2H), 7.19 (s, ArH, 2H), 7.06-6.98 (m,
ArH, 4H), 5.72 (s, Ar-CH, 2H), 4.93 (br, CHOH, 1H), 4.68-4.63 (m, CH, 2H), 4.47 (br, CH2OH,
1H), 4.24-4.19 (m, sugar H1 & H3, 3H (overlap)), 3.98 (s, sugar H2, 1H), 3.89 (app d, sugar H4, J =
9.2, 1H), 3.79-3.77 (m, sugar H5, 1H), 3.62 (app d, sugar H6, J = 10.4, 1H), 3.30-3.18 (m, CH2, 4H
(partial overlap with H2O from NMR solvent)); one sugar H6 proton signal obscured by H2O from
NMR solvent. 13C NMR (400 MHz, DMSO-d6): δ = 173.28 (CONH), 165.72 (COOH), 141.26
(aromatic p-C), 140.98 (aromatic p-C), 135.81 (aromatic C), 133.87 (aromatic m-C), 126.93
(aromatic C), 126.86 (aromatic p-C), 125.69 (aromatic o-C), 123.32 (aromatic CH), 120.67
(aromatic CH), 118.13 (aromatic CH), 117.87 (aromatic CH), 111.17 (aromatic CH), 110.12
(aromatic C), 98.48 (Ph-C), 77.35 (CH), 69.92 (CH), 69.04 (CH2), 68.25 (CH), 67.36 (CH), 62.35
(CH2), 53.46 (CH), 26.39 (CH2). νmax (cm-1) (solid): 3398m, 2922w, 1725m, 1638s, 1529s, 1499m,
1394w, 1340m, 1220m, 1166w, 1092s, 1017m, 851m, 744s, 544m. ESI-MS (m/z) calc. for
C44H41N4O12 817.2726; found 817.2756 (100% [M-H]-), 839.2597 (35% [(M-2H)+Na]-.
8.2.10. Attempted synthesis of DBS-AlaOMe
DBS-CO2H (500 mg, 1.1 mmol) was dissolved in DMF (12 mL) with addition of DIPEA (780
µL, 4.4 mmol). The solution was cooled to 0oC, then TBTU (720 mg, 2.2 mmol) was added as a
solid, with DMF (4 mL) used to wash residual TBTU into the flask. The reaction was stirred for 20
minutes, and then L-alanine methyl ester hydrochloride (314 mg, 2.2 mmol) was added with a
further portion of DMF (4 mL). The reaction was stirred for a further 30 minutes at 0oC, then at
room temperature for 3 days. DMF was removed by rotary evaporation to give an orange residue.
Water (30 mL) was added to attempt precipitation of product, followed by further portions of water

205
(20 mL) when no precipitate was seen; however, product remained dissolved even after addition of
> 100 mL water. The reaction was not purified further.
8.2.11. Attempted synthesis of DBS-Asp(OMe)2
DBS-CO2H (250 mg, 0.55 mmol) was dissolved in DMF (8 mL) with addition of DIPEA (390
µL, 2.2 mmol). The solution was cooled to 0oC, then TBTU (360 mg, 1.1 mmol) was added as a
solid, with DMF (2 mL) used to wash residual TBTU into the flask. The reaction was stirred for 20
minutes, and then L-aspartic acid dimethyl ester hydrochloride (222 mg, 1.1 mmol) was added with
a further portion of DMF (2 mL). The reaction was stirred for a further 30 minutes at 0oC, then at
room temperature for 3 days. DMF was removed by rotary evaporation to give an orange residue.
Water (20 mL) was added to attempt precipitation of product, followed by further portions of water
(15 mL) when no precipitate was seen; however, product remained dissolved even after addition of
> 100 mL water. The reaction was not purified further.
8.3. Standard gelation protocols to produce gels in sample vials
8.3.1. DBS-CO2H hydrogels
1 mL H2O was added to a known mass of DBS-CO2H in 2.5 mL sample vials. The vials were
then sonicated to disperse the solid, and 10 µL aliquots of 0.5 M NaOH(aq) were added to dissolve
(pH ≈ 11). The solutions were then transferred to vials containing 6 or 8 mg of GdL, followed by
shaking to dissolve. The vials were then left overnight for gelation to occur. Final pH values of the
gels were 3-4, depending on amount of GdL used.
206
8.3.2. Agarose hydrogels
1 mL H2O was added to a known mass of agarose in a 2.5 mL sample vial. The capped vial was
then heated to 90°C in an oil bath, and held at this temperature for 5 minutes, with shaking every
minute to dissolve the agarose. The solutions were removed from the oil bath and allowed to cool
to room temperature, upon which a clear gel was formed after ca. 20 minutes
8.3.3. DBS-CO2H and agarose hybrid hydrogels
1 mL H2O was added to a known mass of DBS-CO2H in 2.5 mL sample vials. The vials were
then sonicated to disperse the solid, and 10 µL aliquots of 0.5 M NaOH(aq) were added to dissolve
(pH ≈ 11). Agarose (5 mg) was then added. The capped vials were then heated to 90°C in an oil
bath, and held at this temperature for 5 minutes, with shaking every minute to dissolve the agarose.
The solutions were then cooled to 50°C, at which temperature they were removed from the oil bath
and GdL (6-8 mg) was added, followed by shaking to dissolve. The vials were left overnight for
gelation to occur. Final pH values of the gels were 3-4, depending on amount of GdL used.
8.3.4. PEGDM hydrogels
PEGDM was dissolved at varying % wt/vols in 1 mL a 0.05% wt/vol aqueous solution of 2-
hydroxy-4′-(2-hydroxyethoxy)-2-methylpropiophenone (photoinitiator, PI) in 2.5 mL sample vials.
The solutions were cured in the uncapped vials under a long wavelength UV lamp for 10 minutes
to obtain hydrogels.
8.3.5. DBS-CO2H and PEGDM hybrid hydrogels
PEGDM (50 mg) was dissolved in 1 mL a 0.05% wt/vol aqueous solution of 2-hydroxy-4′-(2-
hydroxyethoxy)-2-methylpropiophenone (photoinitiator, PI) in 2.5 mL sample vials. Varying
known masses of DBS-CO2H were added, and the vials were then sonicated to disperse the solid;
10 µL aliquots of 0.5 M NaOH(aq) were added to dissolve (pH ≈ 11). The solutions were then
transferred to vials containing 6 or 8 mg of GdL, followed by shaking to dissolve. The solutions
were cured in the uncapped vials under a long wavelength UV source for 10 minutes to obtain
transparent gels. The vials were then capped and left overnight for DBS-CO2H gelation to occur.
Final pH values of the gels were 3-4, depending on amount of GdL used.
8.3.6. DBS-Gly hydrogels, heat-cool method
1 mL of H2O was added to a known mass of DBS-Gly in a 2.5 mL glass sample vial. The sealed
vial was then heated to 95°C in a thermoregulated oil bath, with shaking every few minutes to fully
dissolve the LMWG. The vial was removed from the oil bath and cooled to room temperature with
an optically transparent gel forming after ca. 30 minutes.
207
8.3.7. DBS-Gly hydrogels, pH-change method
1 mL H2O was added to a known mass of DBS-Gly in 2.5 mL sample vials. The vials were then
sonicated to disperse the solid, and 10 µL aliquots of 0.5 M NaOH(aq) were added to dissolve (pH ≈
11). The solutions were then transferred to vials containing ≥10 mg of GdL, followed by shaking to
dissolve. The vials were then left overnight for gelation to occur.
8.3.8. DBS-CO2H and DBS-Gly multi-component hydrogels
1 mL H2O was added DBS-Gly (4.5 mg) and DBS-CO2H (4.5 mg) in a 2.5 mL sample vial. The
vial was then sonicated to disperse the solid, and 10 µL aliquots of 0.5 M NaOH(aq) were added to
dissolve (pH ≈ 11). The solution was then transferred to a vial containing 18 mg of GdL, followed
by shaking to dissolve. The vial was then left overnight for gelation to occur.
8.3.9. DBS-CO2H, DBS-Gly and PEGDM multi-component hybrid hydrogels with single
proton source
DBS-CO2H and DBS-Gly (4.5 mg of both) were added to a 1 mL solution of PEGDM (5%
wt/vol) and PI (0.05% wt vol) in 2.5 mL sample vials, followed by sonication to disperse the solid.
NaOH(aq) (0.5 M) was added in 10 µL aliquots to dissolve DBS-CO2H, followed by GdL (18 mg).
The uncapped vials were then cured under UV light for 10 minutes to obtain a clear PEGDM
hydrogel, which was then left overnight for gelation of DBS-CO2H and DBS-Gly to occur.
8.4. Tgel procedure
To record Tgel values, gel samples were first prepared in 2.5 mL sample vials as described on
section 8.3. The vials were then placed in a thermoregulated oil bath, which was then heated from
20°C at a rate of 1°C min-1. Vials were carefully removed every minute, inverted, and replaced
until a gel-sol transition was observed.
8.5. Rheology sample preparation
Note: For the preparation of agarose-containing gels for rheology, special vials were made.
These consisted of an 8 mL sample vial where the base had been cleanly removed, and could be
reattached with heat-shrink tape. After preparation of gel within the vial, the base could be
removed to give a disc of gel ca. 20 mm in diameter – the same diameter as the selected upper plate
geometry of the rheometer.
8.5.1. DBS-CO2H hydrogels
Solutions were prepared according to the method described in section 8.3.1; gelation was
carried out directly on the lower plate of the rheometer, using a sealed bottomless glass vial as a
mould to hold 0.5 – 1 mL of the solution. This method produced gels ca. 1.5 – 3 mm thick.
208
8.5.2. Agarose hydrogels
0.5% wt/vol worth of agarose was dissolved in H2O at 95°C; 500 µL volumes of this hot
solution were then transferred to preparation vials and allowed to cool; discs ca. 1.5 mm thick were
formed.
8.5.3. DBS-CO2H and agarose hybrid hydrogels
Hot solutions were prepared as described in section 8.3.3; after addition of GdL, 500 µL
volumes of the solution were then transferred to preparation vials and allowed to cool. This method
produced discs of gels ca. 1.5 mm thick.
8.5.4. PEGDM hydrogels
PEGDM (50 mg) and PI (0.5 mg) were dissolved in 1 mL H2O; the solution was transferred to
an 8.5 mL sample vial and cured under UV light for 10 minutes. The disc of gel (ca. 3 mm in
thickness) was then carefully removed from the vial and placed onto the lower plate of the
rheometer.
8.5.5. DBS-CO2H and PEGDM hybrid hydrogels
Solutions were prepared as described in section 8.3.5; 1 mL volumes were transferred to 8.5 mL
sample vials, before being cured under UV light for 10 minutes. The vials were then left overnight.
The disc of prepared gel (ca. 3 mm in thickness) was then carefully removed from the vial before
being placed on the rheometer.
8.5.6. DBS-Gly
Solutions were prepared by the pH-change method as described in section 8.3.7; gelation was
carried out directly on the lower plate of the rheometer, using a sealed bottomless glass vial as a
mould to hold 0.5 – 1 mL of the solution. This method produced gels ca. 1.5 – 3 mm thick.
8.5.7. DBS-CO2H and DBS-Gly multi-component hydrogels
Solutions were prepared as described in section 8.3.8; gelation was carried out directly on the
lower plate of the rheometer, using a sealed bottomless glass vial as a mould to hold 0.5 – 1 mL of
the solution. This method produced gels ca. 1.5 – 3 mm thick.
8.5.8. DBS-CO2H, DBS-Gly and PEGDM multi-component hybrid hydrogels with single
proton source
Solutions were prepared as described in section 8.3.9; 1 mL volumes of the solutions were
transferred to 8.5 mL sample vials before being cured under UV light for 10 minutes. The vials
were then left overnight. The disc of prepared gel (ca. 3 mm in thickness) was then carefully
removed from the vial before being placed on the rheometer.
209
8.6. NMR sample preparation
8.6.1. DBS-CO2H hydrogels with GdL
DBS-CO2H (1.4 mg) was suspended in 0.7 mL D2O with sonication. NaOH(aq) (21 µ, 0.5 M)
was added to dissolve all solid and DMSO (1.4 µl) was added to act as an internal standard. The
solution was then transferred to a vial containing GdL (5.6 mg), followed by shaking. The sample
was then immediately transferred to a NMR tube for spectra to be recorded.
8.6.2. DBS-CO2H and agarose hybrid hydrogels
DBS-CO2H (2.0 mg) was suspended in 1 mL D2O with sonication. NaOH(aq) (30 µl, 0.5 M) was
added to dissolve all solid and DMSO (2 µl) was added to act as an internal standard. The solution
was then transferred to a vial containing agarose (5 mg), which was then heated to 90°C in a
thermoregulated oil bath to dissolve the agarose. The solution was then cooled to 50°C, and
transferred to a vial containing 8 mg of GdL (8 mg), followed by shaking to dissolve. Ca. 0.7 mL
was then immediately transferred to a NMR tube for spectra to be recorded.
8.6.3. PEGDM hydrogels
PEGDM (35 mg) and PI (0.35 mg) were dissolved in 0.7 mL D2O; DMSO (1.4 µl) was added to
act as an internal standard. The solution was transferred to a NMR tube and a spectrum was
recorded. The tube was then cured under UV light for 10 minutes, followed by recording of a
second spectrum.
8.6.4. DBS-CO2H and PEGDM hybrid hydrogels
DBS-CO2H (1.4 mg) was suspended in 0.7 mL D2O with sonication. NaOH(aq) (21 µl, 0.5 M)
was added to dissolve all solid and DMSO (1.4 µl) was added to act as an internal standard.
PEGDM (35 mg), PI (0.35 mg) and GdL (5.6 mg) were then added, followed by shaking to
dissolve. The solution was transferred to a NMR tube and cured under UV light for 10 minutes,
after which NMR spectra were recorded.
8.6.5. DBS-Gly hydrogels, heat cool method
DBS-Gly (1 mg) was suspended in 1 mL D2O by sonication, with 2 µL DMSO added as an
internal standard. The solution was heated to 95°C in a thermoregulated oil bath, with shaking
every few minutes until all solid had dissolved. Ca. 0.7 ml of the hot solution was transferred to a
NMR tube and allowed to cool to a gel, after which NMR spectra were recorded.
8.6.6. DBS-Gly hydrogels, pH-change method with GdL
DBS-Gly (3.15 mg) was suspended in 0.7 mL D2O with sonication. NaOH(aq) (42 µl, 0.5 M) was
added to dissolve all solid and DMSO (1.4 µl) was added to act as an internal standard. The
210
solution was then transferred to a vial containing GdL (7 mg), followed by shaking. The sample
was then immediately transferred to a NMR tube for spectra to be recorded.
8.6.7. DBS-CO2H and DBS-Gly multi-component hydrogels with GdL
DBS-CO2H and DBS-Gly (3.15 mg of both) were suspended by sonication in 0.65 mL D2O,
followed by addition of 51 µL of NaOH(aq) (0.5 M) to dissolve, and DMSO (1.4 µL) to act as an
internal standard. GdL (12.6 mg) was then added with shaking, and the solution was immediately
transferred to a NMR tube, and spectra were recorded.
8.6.8. DBS-CO2H hydrogels with DPIN
DPIN (8 mg) was dissolved in 497.5 µL D2O (with 2 µL mL-1 DMSO added as internal
standard), followed by addition of HCl(aq) (2.5 µL, 0.5 M). Separately, DBS-CO2H (4 mg) was
dissolved in 466 µL D2O (with 2 µL mL-1 DMSO as internal standard) through the addition of
NaOH(aq) (34 µL, 0.5 M). The two solutions were mixed, and 700 µL was transferred to a NMR
tube. An initial 1H NMR spectra was recorded, after which the tube was cured for 30 minutes under
UV light. A second spectra was then recorded.
8.6.9. DBS-Gly hydrogels with DPIN
DPIN (8 mg) was dissolved in 497.5 µL D2O (with 2 µL mL-1 DMSO added as internal
standard), followed by addition of HCl(aq) (2.5 µL, 0.5 M). Separately, DBS-Gly (4.5 mg) was
dissolved in 461 µL D2O (with 2 µL mL-1 DMSO as internal standard) through the addition of
NaOH(aq) (39 µL, 0.5 M). The two solutions were mixed, and 700 µL was transferred to a NMR
tube. An initial 1H NMR spectra was recorded, after which the tube was cured for 30 minutes under
UV light. A second spectra was then recorded.
8.6.10. DBS-CO2H and DBS-Gly multi-component hydrogels with dual proton source
DPIN (32 mg) was dissolved in 2 mL D2O (with 2 µL mL-1 DMSO as an internal standard) to
make a stock solution. DBS-CO2H and DBS-Gly (3.15 mg of both) were suspended by sonication
in 0.3 mL D2O (with 2 µL mL-1 DMSO as an internal standard), followed by addition of 51 µL of
NaOH(aq) (0.5 M) to dissolve. 350 µL of DPIN stock solution was then added, followed by 4 mg
GdL. The solution was immediately transferred to a NMR tube and placed in the spectrometer to
record an initial spectrum. The tube was then allowed to stand overnight, after which a second
spectrum was recorded. The tube was then cured under UV light for 1 hour, and then a third and
final NMR spectrum was recorded.
8.6.11. DBS-CO2H and PEGDM hybrid hydrogel with DPIN
DPIN (8 mg) was dissolved in 497.5 µL of D2O, containing of 2 µL mL-1 DMSO as internal
standard, followed by the addition of HCl(aq) (2.5 µL, 0.5 M). Separately, DBS-CO2H (4 mg) was
211
dissolved in 466 µL D2O (also containing 2 µL mL-1 DMSO as internal standard) through the
addition of 34 µL NaOH(aq) (0.5 M). The two solutions were mixed, then PEGDM (50 mg) and PI
(0.5 mg) were added. 700 µL of the solution was transferred to an NMR tube, and a spectrum of
the solution was then recorded. The NMR tube was then cured under UV light for 1 hour, after
which a second spectrum was recorded.
8.6.12. DBS-CO2H, DBS-Gly and PEGDM multi-component hybrid hydrogel with single
proton source
DBS-CO2H and DBS-Gly (3.15 mg of both) were suspended in 0.7 mL D2O by sonication,
followed by the addition of NaOH(aq) (0.5 M) in 10 µL aliquots to dissolve all solid; DMSO (1.4 µl)
was added as an internal standard. GdL (12.6 mg), PEGDM (35 mg) and PI (0.35 mg) were then
added, and the solution was transferred to an NMR tube. UV photopolymerisation was then carried
out by placing the NMR tube under UV light for 10 minutes.
8.6.13. DBS-CO2H, DBS-Gly and PEGDM multi-component hybrid hydrogel with dual
proton source
DPIN (8 mg) was dissolved in 0.5 mL D2O (with 2 µL mL-1 DMSO as an internal standard).
Separately, DBS-CO2H and DBS-Gly (3.15 mg of both) were suspended by sonication in 0.3 mL
D2O, followed by addition of NaOH(aq) (51 µL, 0.5 M) to dissolve the solid. 0.35 mL of the DPIN
solution was added to the LMWG solution, followed by PEGDM (35 mg), PI (0.35 mg), and GdL
(4 mg). The solution was transferred to an NMR tube and cured under UV for 5 minutes to cause
gelation of PEGDM, after which an NMR spectrum was recorded. The NMR tube was then
allowed to sit overnight for GdL hydrolysis to occur, then a second spectrum was recorded. Finally,
the tube was then cured under UV for a further 30 minutes to sufficiently activate DPIN, and a
third spectrum was then recorded.
8.7. NMR kinetics and VT experiments
8.7.1. DBS-CO2H hydrogels with GdL
Samples were prepared as described in section 8.6.1; spectra were recorded every 30 minutes
for a period of 14 hours in total, with the time of GdL addition being considered the start point of
gelation.
8.7.2. DBS-CO2H and agarose hybrid hydrogels
Samples were prepared as described in section 8.6.2; spectra were recorded every 30 minutes
for a period of 14 hours in total, with the time of GdL addition being considered the start point of
gelation.
212
8.7.3. DBS-CO2H and PEGDM hybrid hydrogels
Samples were prepared as described in section 8.6.4; spectra were recorded every 30 minutes
for a period of 14 hours in total, with the time of GdL addition being considered the start point of
gelation.
8.7.4. DBS-Gly hydrogels, heat-cool method VT experiments
Samples were prepared as described in section 8.6.5; after gelation, the NMR tube was placed in
the spectrometer and spectra were recorded at temperatures from 25 – 75°C (at 10°C intervals).
8.7.5. DBS-Gly hydrogels, pH-change method with GdL
Samples were prepared as described in section 8.6.68.6.4; spectra were recorded every 30
minutes for a period of 14 hours in total, with the time of GdL addition being considered the start
point of gelation.
8.7.6. DBS-CO2H and DBS-Gly multi-component hydrogels, varying amounts of GdL
DBS-Gly and DBS-CO2H (3.15 mg of both) were suspended by sonication in 0.65 mL D2O
(with 2 µL mL-1 DMSO as an internal standard), followed by addition of NaOH(aq) (51 µL, 0.5 M)
to dissolve. GdL was then added in known amounts, and the solutions were immediately
transferred to NMR tubes and placed in the spectrometer. Spectra were recorded every 30 minutes
for a period of 14 hours.
8.7.7. DBS-CO2H hydrogels with DPIN
DPIN (80 mg) was dissolved in 4.975 mL of D2O (with 2 µL mL-1 DMSO as internal standard),
followed by addition of HCl(aq) (25 µL, 0.5 M). Separately, DBS-CO2H (40 mg) was dissolved in
4.66 mL D2O (also containing 2 µL mL-1 DMSO as internal standard) through the addition of
NaOH(aq) (340 µL, 0.5 M). The two solutions were mixed, then 13 separate 700 μL volumes were
transferred to NMR tubes. One tube was left uncured, whilst the other 12 were cured under UV
light, with one tube being removed every 5 minutes over the course of 1 hour for NMR spectra to
be recorded.
8.7.8. DBS-Gly hydrogels with DPIN
DPIN (80 mg) was dissolved in 4.975 mL of D2O (with 2 µL mL-1 DMSO as internal standard),
followed by addition of HCl(aq) (25 µL, 0.5 M). Separately, DBS-Gly (45 mg) was dissolved in 4.61
mL D2O (also containing 2 µL mL-1 DMSO as internal standard) through the addition of NaOH(aq)
(390 µL, 0.5 M). The two solutions were mixed, then 13 separate 700 μL volumes were transferred
to NMR tubes. One tube was left uncured, whilst the other 12 were cured under UV light, with one
tube being removed every 5 minutes over the course of 1 hour for NMR spectra to be recorded.
213
8.7.9. DBS-CO2H and PEGDM hybrid hydrogels with DPIN
DPIN (160 mg) was dissolved in 9.95 mL of D2O, (with 2 µL mL-1 DMSO as internal standard),
followed by addition of HCl(aq) (50 µL, 0.5 M). Separately, DBS-CO2H (80 mg) was dissolved in
9.32 mL D2O (also containing 2 µL mL-1 DMSO as internal standard) through the addition of
NaOH(aq) (680 µL, 0.5 M). The two solutions were mixed, and PEGDM (1 g) and PI (10 mg) were
added, and then 26 separate 700 μL volumes were transferred to NMR tubes. One tube was left
uncured, whilst the other 25 were cured under UV light, with one tube being removed every 2
minutes over the course of 50 minutes for NMR spectra to be recorded.
8.7.10. DBS-CO2H, DBS-Gly and PEGDM multi-component hybrid hydrogels with single
proton source
Samples were prepared as described in section 8.6.12; spectra were recorded every 30 minutes
for a period of 14 hours in total, with the time of GdL addition being considered the start point of
gelation.
8.8. CD sample preparation
8.8.1. DBS-CO2H with GdL
DBS-CO2H (0.2 or 0.45 mg) was dispersed in H2O (1 mL) by sonication. NaOH(aq) (20 µL, 0.5
M) was added to dissolve the solid and bring the pH to ca. 11. GdL (8 mg) was then added,
followed by shaking to dissolve. The solution was allowed to stand for five hours, before 400 µL
was transferred to a CD cuvette for spectra to be recorded.
8.8.2. Agarose
Agarose (0.5 mg) was added to 1 mL H2O in a sample vial. The capped vial was then heated to
90°C in an oil bath, and held at this temperature for 5 minutes, with shaking every minute to
dissolve the agarose. The vial was then removed from the oil bath, and allowed to stand for five
hours, before 400 µL was transferred to a CD cuvette for spectra to be recorded.
8.8.3. DBS-CO2H and agarose hybrid system
DBS-CO2H (0.2 mg) was dispersed in H2O (1 mL) by sonication. NaOH(aq) (20 µL, 0.5 M) was
added to dissolve the solid and bring the pH to ca. 11. Agarose (0.5 mg) was then added. The
capped vial was then heated to 90°C in an oil bath, and held at this temperature for 5 minutes, with
shaking every minute to dissolve the agarose. The solution was then cooled to 50°C, at which
temperature it was removed from the oil bath and GdL (8 mg) was added, followed by shaking to
dissolve. The solution was allowed to stand for five hours, before 400 µL was transferred to a CD
cuvette for spectra to be recorded.
214
8.8.4. PEGDM
PEGDM (5 mg) was dissolved in 1 mL of 0.05% wt/vol aqueous solution of PI in a sample vial.
The uncapped vial was then cured under UV light for 10 minutes. After standing for 5 hours, 400
µL was transferred to a CD cuvette for spectra to be recorded.
8.8.5. DBS-CO2H and PEGDM hybrid system
PEGDM (5 mg) was dissolved in 1 mL of 0.05% wt/vol aqueous solution of PI in a sample vial.
DBS-CO2H (0.2 mg) was added and dispersed by sonication. NaOH(aq) (20 µl 0.5 M) was added to
dissolve the solid and bring the pH to ca. 11. The uncapped vial was then cured under UV light for
10 minutes. The solution then transferred to a vial containing GdL (8 mg), followed by shaking to
dissolve. After standing for 5 hours, 400 µL was transferred to a CD cuvette for spectra to be
recorded.
8.8.6. DBS-Gly, heat-cool method
1 mL of H2O was added to DBS-Gly (0.1 or 0.5 mg) in a 2.5 mL glass sample vial. The sealed
vial was then heated to 95°C in a thermoregulated oil bath, with shaking every few minutes to fully
dissolve the LMWG. The vial was removed from the oil bath and cooled to room temperature, then
allowed to stand for 5 hours, after which 400 µL was transferred to a CD cuvette for spectra to be
recorded.
8.8.7. DBS-CO2H and DBS-Gly multi-component system with GdL
DBS-CO2H and DBS-Gly (0.45 mg of both) were dispersed in 1 mL H2O by sonication.
NaOH(aq) (20 µl 0.5 M) was added to dissolve the solid and bring the pH to ca. 11. The solution
was transferred to a vial containing 8 mg GdL, followed by shaking to dissolve. The solution was
allowed to stand for 5 hours, then 400 µl was transferred to a CD cuvette for spectra to be recorded.
8.8.8. DBS-CO2H with HCl
DBS-CO2H (0.45 mg) was dispersed in 940 µl H2O by sonication. NaOH(aq) (20 µl 0.5 M) was
added to dissolve the solid and bring the pH to ca. 11. HCl(aq) (0.5 M, 60 µl) was then added
dropwise with gentle stirring. 400 µl was transferred to a CD cuvette for spectra to be recorded.
8.8.9. DBS-Gly with HCl
DBS-Gly (0.45 mg) was dispersed in 940 µl H2O by sonication. NaOH(aq) (20 µl 0.5 M) was
added to dissolve the solid and bring the pH to ca. 11. HCl(aq) (0.5 M, 60 µl) was then added
dropwise with gentle stirring. 400 µl was transferred to a CD cuvette for spectra to be recorded.
215
8.8.10. DBS-CO2H and DBS-Gly multi-component system with HCl
DBS-CO2H and DBS-Gly (0.45 mg of both) was dispersed in 940 µl H2O by sonication. 20 µl
0.5 M NaOH(aq) was added to dissolve the solid and bring the pH to ca. 11. HCl(aq) (0.5 M, 60 µl)
was then added dropwise with gentle stirring. 400 µl was transferred to a CD cuvette for spectra to
be recorded.
8.8.11. DBS-CO2H with DPIN
DPIN (3.2 mg) was dissolved in 1.999 mL of water, along with 1 μL of HCl(aq) (0.5 M) to make
a DPIN stock solution. DBS-CO2H (0.4 mg) was dissolved in 500 μL of H2O through the addition
of NaOH(aq) (3.7 μL, 0.5 M), followed by sonication. 500 μL of the DPIN stock solution was added
to the DBS-CO2H solution, and this was then cured under UV light for 2 hours to produce a
suspension of nanofibers. 400 µl was transferred to a CD cuvette for spectra to be recorded.
8.8.12. DBS-Gly with DPIN
DPIN (3.2 mg) was dissolved in 1.999 mL of water, along with 1 μL of HCl(aq) (0.5 M) to make
a DPIN stock solution. DBS-Gly (0.45 mg) was dissolved in 500 μL of H2O through the addition of
NaOH(aq) (3.4 μL, 0.5 M), followed by sonication. 500 μL of the DPIN stock solution was added to
the DBS-Gly solution, and this was then cured under UV light for 2 hours to produce a suspension
of nanofibers. 400 µl was transferred to a CD cuvette for spectra to be recorded.
8.8.13. DBS-CO2H, DBS-Gly and PEGDM multi-component hybrid system
DBS-CO2H and DBS-Gly (0.45 mg of both) were dispersed in 1 mL H2O by sonication.
NaOH(aq) (20 µl 0.5 M) was added to dissolve the solid and bring the pH to ca. 11. PEGDM (5 mg),
PI (0.05 mg) and GdL (8 mg) were then added, followed by shaking to dissolve. The solution was
allowed to stand for 5 hours, then 400 µl was transferred to a CD cuvette for spectra to be recorded.
8.9. CD kinetics and VT experiments
8.9.1. DBS-CO2H with GdL
DBS-CO2H (0.2 mg) was dispersed in H2O (1 mL) by sonication. NaOH(aq) (20 µL, 0.5 M) was
added to dissolve the solid and bring the pH to ca. 11. GdL (8 mg) was then added, followed by
shaking to dissolve. 400 µL of the solution was immediately transferred to a CD cuvette for spectra
to be recorded every 5 minutes for up to 2 hours.
8.9.2. DBS-CO2H and agarose hybrid system
DBS-CO2H (0.2 mg) was dispersed in H2O (1 mL) by sonication. NaOH(aq) (20 µL, 0.5 M) was
added to dissolve the solid and bring the pH to ca. 11. Agarose (0.5 mg) was then added. The
capped vial was then heated to 90°C in an oil bath, and held at this temperature for 5 minutes, with
216
shaking every minute to dissolve the agarose. The solution was then cooled to 50°C, at which
temperature it was removed from the oil bath and GdL (8 mg) was added, followed by shaking to
dissolve. 400 µL of the solution was immediately transferred to a CD cuvette for spectra to be
recorded every 5 minutes for up to 80 minutes.
8.9.3. DBS-CO2H and PEGDM hybrid system
PEGDM (5 mg) was dissolved in 1 mL of 0.05% wt/vol aqueous solution of PI in a sample vial.
DBS-CO2H (0.2 mg) was added and dispersed by sonication. NaOH(aq) (20 µl 0.5 M) was added to
dissolve the solid and bring the pH to ca. 11. The uncapped vial was then cured under UV light for
10 minutes. The solution then transferred to a vial containing GdL (8 mg), followed by shaking to
dissolve. 400 µL of the solution was immediately transferred to a CD cuvette for spectra to be
recorded every 5 minutes for up to 2 hours.
8.9.4. DBS-Gly, heat-cool method VT experiment
1 mL of H2O was added to DBS-Gly (0.1 or 0.5 mg) in a 2.5 mL glass sample vial. The sealed
vial was then heated to 95°C in a thermoregulated oil bath, with shaking every few minutes to fully
dissolve the LMWG. The vial was removed from the oil bath and cooled to room temperature, then
400 µL was transferred to a CD cuvette for spectra to be recorded, starting at 20°C and increasing
temperature in 10°C increments up to 90°C.
8.10. Responsive yet robust experiment procedures
8.10.1. Table-top method
1 mL H2O was added to DBS-CO2H (2 mg) in a 2.5 mL sample vial. The vial was then
sonicated to disperse the solid, and 10 µL aliquots of 0.5 M NaOH(aq) were added to dissolve (pH ≈
11). Agarose (5 mg) was then added. The capped vial was then heated to 90°C in an oil bath, and
held at this temperature for 5 minutes, with shaking every minute to dissolve the agarose. The
solution was then cooled to 50°C, at which temperature they were removed from the oil bath and
GdL (8 mg) and universal indicator (20 µL) were added, followed by shaking to dissolve. The vials
were left overnight for gelation to occur, with the final gel being orange in colour due to the acidic
pH. NaOH(aq) (0.054 M, 1 mL) was then applied to the top of the gel, and allowed to diffuse in.
When the gel was fully blue, indicating basic pH (after ca. 24 hours), the supernatant solution was
removed, and a solution of GdL (14 mg dissolved in 0.5 mL) was applied and allowed to diffuse;
the gel would become orange again (returned to acidic pH) after ca. 24 hours.
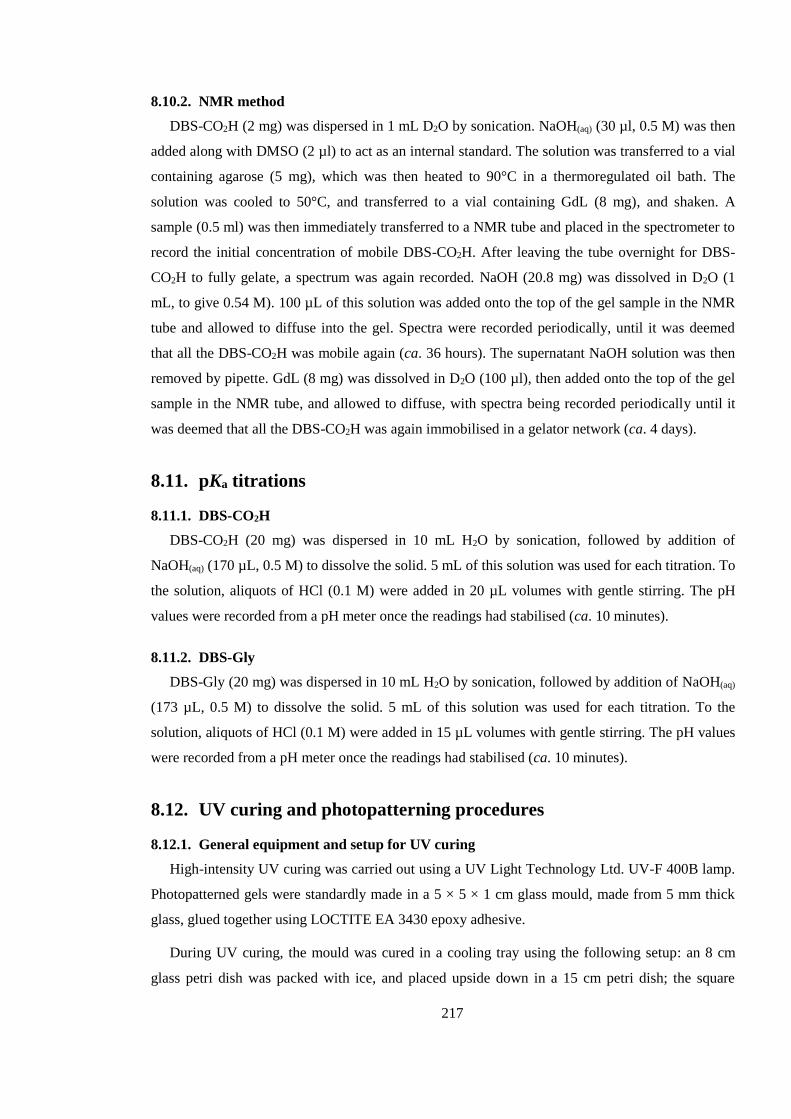
217
8.10.2. NMR method
DBS-CO2H (2 mg) was dispersed in 1 mL D2O by sonication. NaOH(aq) (30 µl, 0.5 M) was then
added along with DMSO (2 µl) to act as an internal standard. The solution was transferred to a vial
containing agarose (5 mg), which was then heated to 90°C in a thermoregulated oil bath. The
solution was cooled to 50°C, and transferred to a vial containing GdL (8 mg), and shaken. A
sample (0.5 ml) was then immediately transferred to a NMR tube and placed in the spectrometer to
record the initial concentration of mobile DBS-CO2H. After leaving the tube overnight for DBS-
CO2H to fully gelate, a spectrum was again recorded. NaOH (20.8 mg) was dissolved in D2O (1
mL, to give 0.54 M). 100 µL of this solution was added onto the top of the gel sample in the NMR
tube and allowed to diffuse into the gel. Spectra were recorded periodically, until it was deemed
that all the DBS-CO2H was mobile again (ca. 36 hours). The supernatant NaOH solution was then
removed by pipette. GdL (8 mg) was dissolved in D2O (100 µl), then added onto the top of the gel
sample in the NMR tube, and allowed to diffuse, with spectra being recorded periodically until it
was deemed that all the DBS-CO2H was again immobilised in a gelator network (ca. 4 days).
8.11. pKa titrations
8.11.1. DBS-CO2H
DBS-CO2H (20 mg) was dispersed in 10 mL H2O by sonication, followed by addition of
NaOH(aq) (170 µL, 0.5 M) to dissolve the solid. 5 mL of this solution was used for each titration. To
the solution, aliquots of HCl (0.1 M) were added in 20 µL volumes with gentle stirring. The pH
values were recorded from a pH meter once the readings had stabilised (ca. 10 minutes).
8.11.2. DBS-Gly
DBS-Gly (20 mg) was dispersed in 10 mL H2O by sonication, followed by addition of NaOH(aq)
(173 µL, 0.5 M) to dissolve the solid. 5 mL of this solution was used for each titration. To the
solution, aliquots of HCl (0.1 M) were added in 15 µL volumes with gentle stirring. The pH values
were recorded from a pH meter once the readings had stabilised (ca. 10 minutes).
8.12. UV curing and photopatterning procedures
8.12.1. General equipment and setup for UV curing
High-intensity UV curing was carried out using a UV Light Technology Ltd. UV-F 400B lamp.
Photopatterned gels were standardly made in a 5 × 5 × 1 cm glass mould, made from 5 mm thick
glass, glued together using LOCTITE EA 3430 epoxy adhesive.
During UV curing, the mould was cured in a cooling tray using the following setup: an 8 cm
glass petri dish was packed with ice, and placed upside down in a 15 cm petri dish; the square
218
mould was sat on top of the 8 cm petri dish, and then more ice was packed around the mould (see
Figure 8.2). In photopatterning experiments, a mask made from either cardboard or laser-printed
acetate was sat across the top of the glass mould.
Figure 8.2: Typical setup of a cooling tray used for cooling glass mould and gel during UV curing.
8.12.2. Procedure for hybrid hydrogels of DBS-CO2H and PEGDM with GdL as proton
source
5 mg of PI was dissolved in 10 mL H2O. 500 mg of PEGDM was added and stirred to dissolve.
20 mg DBS-CO2H was then added, followed by sonication to disperse and addition of 0.3 mL
NaOH(aq) (0.5 M) to dissolve DBS-CO2H. 80 mg of GdL was added with stirring, then the solution
was transferred to a 5 x 5 x 1 cm square glass mould. A cardboard mask was placed over the top so
that only part of the gel was exposed. The mould was then sat in a cooling tray (to minimise
heating) and placed under a long-wavelength UV lamp. The solution was cured for 20 mins, after
which the exposed region of the solution had formed a gel. The mould was then transferred to a
petri dish, covered (to prevent evaporation) and left overnight for DBS-CO2H to gelate the
remaining solution.
8.12.3. Procedure for multi-component hydrogels of DBS-CO2H and DBS-Gly with dual
proton source
48 mg of DPIN was dissolved in 3 mL H2O to make a stock solution. 22.5 mg of both DBS-Gly
and DBS-CO2H were suspended in 2.5 mL H2O by sonication, followed by addition of 255 µl
NaOH(aq) (0.5 M) to dissolve DBS-CO2H and DBS-Gly. 2.5 mL of DPIN stock was then added,
followed by 20 mg of GdL. The solution was then transferred to a 5 x 5 x 1 cm square glass mould;
the mould was then transferred to a petri dish, covered (to prevent evaporation) and left overnight
for GdL hydrolysis to occur. The next day, the mould was removed from the petri dish, and a
cardboard mask was placed over the top so that only part of the gel was exposed. The mould was
then sat in the cooling tray (to minimise heating), and placed under a long-wavelength UV lamp
and cured for 1 hour, after which the exposed region of the solution had become visibly opaque.
15 cm petri dish
8 cm petri dish
5 × 5 × 1 cm glass mould
Ice
219
8.12.4. Procedure for hybrid hydrogels of DBS-CO2H and PEGDM with DPIN as proton
source
64 mg of DPIN was dissolved in 3.98 mL H2O with 20 µL HCl(aq) (0.5 M) to make a stock
solution. 24 mg of DBS-CO2H was suspended by sonication in 2.8 mL H2O, then 0.2 mL of
NaOH(aq) (0.5 M) was added to dissolve DBS-CO2H. 3 mL of DPIN stock was added to the DBS-
CO2H solution, followed by 3 mg of PI and 300 mg of PEGDM, with stirring. The solution was
transferred to a 5 x 5 x 1 cm square glass mould. The dish was then sat in a cooling tray (to
minimise heating) and placed under a long-wavelength UV lamp. The solution was cured for 10
mins to gelate PEGDM, after which a mask (cardboard or acetate) could be applied before a further
50 minutes curing to fully activate DPIN and form a patterned hydrogel.
8.12.5. Procedure for multi-component hybrid hydrogels of DBS-CO2H, DBS-Gly and
PEGDM
8.12.5.1. Multi-component hybrid hydrogels with three domains
48 mg of DPIN was dissolved in 3 mL of H2O to make a stock solution. Separately, 22.5 mg of
both DBS-CO2H and DBS-Gly were dissolved in 2.245 mL H2O, followed by sonication to
disperse the solid, followed by addition of 255 µL NaOH(aq) (0.5 M) to dissolve the solid. 2.5 mL of
the DPIN stock solution was added to the LMWG solution, followed by 250 mg of PEGDM, 2.5
mg of PI, and 20 mg of GdL with stirring. The solution was poured into a 5 x 5 x 1 cm square glass
mould, then sat in a cooling tray (to minimise heating) and cured under UV light for 10 minutes; a
mask could be applied during this step to pattern the formation of the PEGDM network. The mould
was then transferred to a petri dish, covered (to prevent evaporation) and left overnight for GdL
hydrolysis to occur. The next day, the mould was removed from the petri dish, sat in a cooling tray,
and then cured under UV for a further 50 minutes to activate the remaining DPIN; a mask could
also be applied during this step to pattern the formation of the DBS-Gly and further PEGDM
networks.
8.12.5.2. Multi-component hybrid hydrogels with four domains
48 mg of DPIN was dissolved in 3 mL of H2O to make a stock solution. Separately, 22.5 mg of
both DBS-CO2H and DBS-Gly were dissolved in 2.245 mL H2O, followed by sonication to
disperse the solid, followed by addition of 255 µL NaOH(aq) (0.5 M) to dissolve the solid. 2.5 mL of
the DPIN stock solution was added to the LMWG solution, followed by 250 mg of PEGDM, 2.5
mg of PI, and 20 mg of GdL with stirring. The solution was poured into a 5 x 5 x 1 cm glass mould,
and sat in a cooling tray (to minimise heating). A mask was applied over the solution, which was
then cured under UV light for 10 minutes. The non-gelled solution was then poured away. 11.25
mg of both DBS-CO2H and DBS-Gly were suspended in 2.37 mL of H2O by sonication, followed
by addition of 130 µL of NaOH(aq) (0.5 M) to dissolve the solid. 20 mg of DPIN and 10 mg of GdL
220
was then added to this solution with stirring. The solution was then poured into the mould to fill the
voids from removal of the first solution. The mould was then transferred to a petri dish, covered (to
prevent evaporation) and left overnight for GdL hydrolysis to occur. The next day, the mould was
removed from the petri dish, sat in a cooling tray, and then cured under UV for a further 50 minutes
to activate the remaining DPIN; a mask could also be applied during this step to pattern formation
of the DBS-Gly networks.
8.13. SEM sample preparation
8.13.1. Freeze-drying method
Gels were prepared as described in section 8.3, or as described in section 8.10 for gels which
could not be produced in 1 mL volumes in sample vials – in these cases, 0.5 mL of solution was
cured in a 2.5 mL sample vial.
Gels were then prepared for SEM by freeze-drying; this was carried out by Meg Stark at the
Biology Technology Facility, University of York, using the method described below.
The gel was spread using a mounted needle on a thin piece of copper shim (to act as support);
excess liquid was removed with filter paper. The gel was frozen on the copper support by
submersion in nitrogen slush (ca. -210°C); after this water was removed from the gel by
lyophilising on a Peltier stage, with a maximum temperature of -50°C.
Once dry, the gel was knocked off the shim with a mounted needle, and the shim was mounted on
an SEM stub using a carbon sticky tab. The sample was then sputter-coated with a thin layer (< 12
nm) of gold/palladium coating to prevent sample charging, before SEM imaging.
8.13.2. Ambient drying method
Suspensions were prepared as described below. To prepare the sample for SEM a small amount
of the suspensions were applied to metal SEM stubs, and these were then dried under ambient
conditions to yield dried-down xerogels. The samples were then sputter-coated with a thin layer of
palladium to prevent sample charging before SEM imaging.
8.13.2.1. DBS-CO2H with DPIN
DPIN (8 mg) was dissolved in 497.5 µL H2O, followed by addition of HCl(aq) (2.5 µL, 0.5 M).
Separately, DBS-CO2H (4 mg) was dissolved in 466 µL H2O through the addition of NaOH(aq) (34
µL, 0.5 M) and sonication. The two solutions were mixed, then cured under UV light for 2 hours.
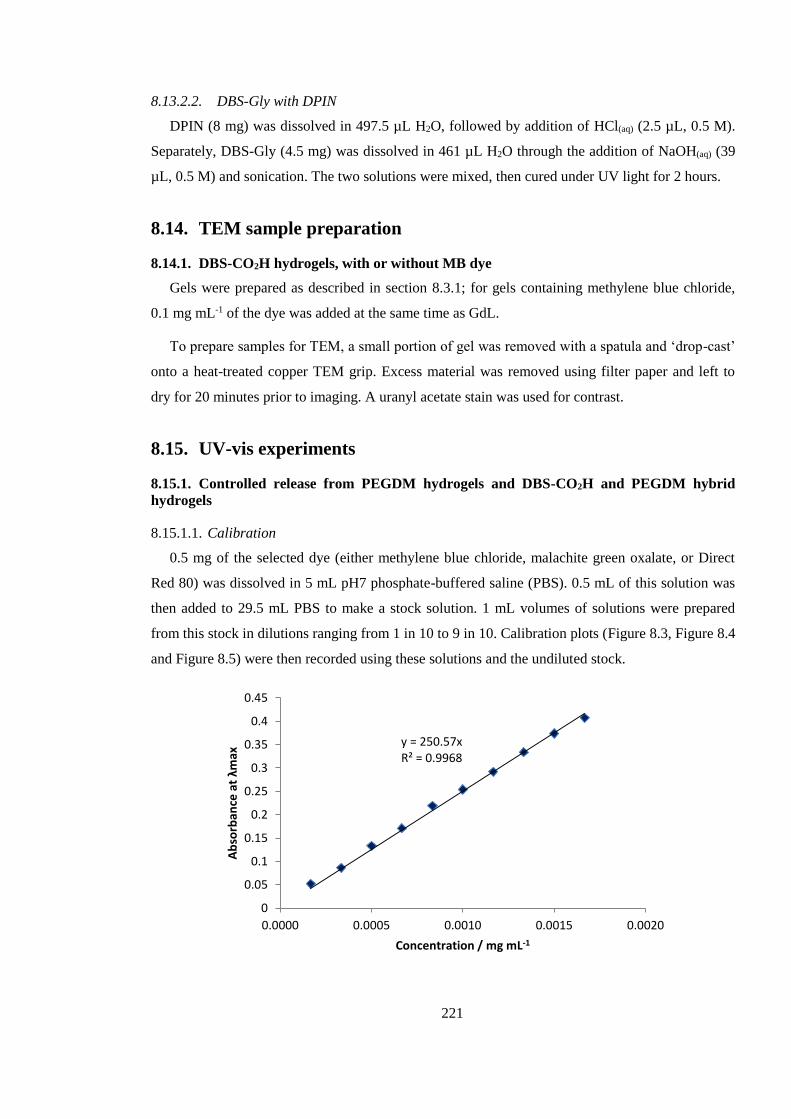
221
8.13.2.2. DBS-Gly with DPIN
DPIN (8 mg) was dissolved in 497.5 µL H2O, followed by addition of HCl(aq) (2.5 µL, 0.5 M).
Separately, DBS-Gly (4.5 mg) was dissolved in 461 µL H2O through the addition of NaOH(aq) (39
µL, 0.5 M) and sonication. The two solutions were mixed, then cured under UV light for 2 hours.
8.14. TEM sample preparation
8.14.1. DBS-CO2H hydrogels, with or without MB dye
Gels were prepared as described in section 8.3.1; for gels containing methylene blue chloride,
0.1 mg mL-1 of the dye was added at the same time as GdL.
To prepare samples for TEM, a small portion of gel was removed with a spatula and ‘drop-cast’
onto a heat-treated copper TEM grip. Excess material was removed using filter paper and left to
dry for 20 minutes prior to imaging. A uranyl acetate stain was used for contrast.
8.15. UV-vis experiments
8.15.1. Controlled release from PEGDM hydrogels and DBS-CO2H and PEGDM hybrid
hydrogels
8.15.1.1. Calibration
0.5 mg of the selected dye (either methylene blue chloride, malachite green oxalate, or Direct
Red 80) was dissolved in 5 mL pH7 phosphate-buffered saline (PBS). 0.5 mL of this solution was
then added to 29.5 mL PBS to make a stock solution. 1 mL volumes of solutions were prepared
from this stock in dilutions ranging from 1 in 10 to 9 in 10. Calibration plots (Figure 8.3, Figure 8.4
and Figure 8.5) were then recorded using these solutions and the undiluted stock.
y = 250.57xR² = 0.9968
0
0.05
0.1
0.15
0.2
0.25
0.3
0.35
0.4
0.45
0.0000 0.0005 0.0010 0.0015 0.0020
Ab
sorb
ance
at λm
ax
Concentration / mg mL-1
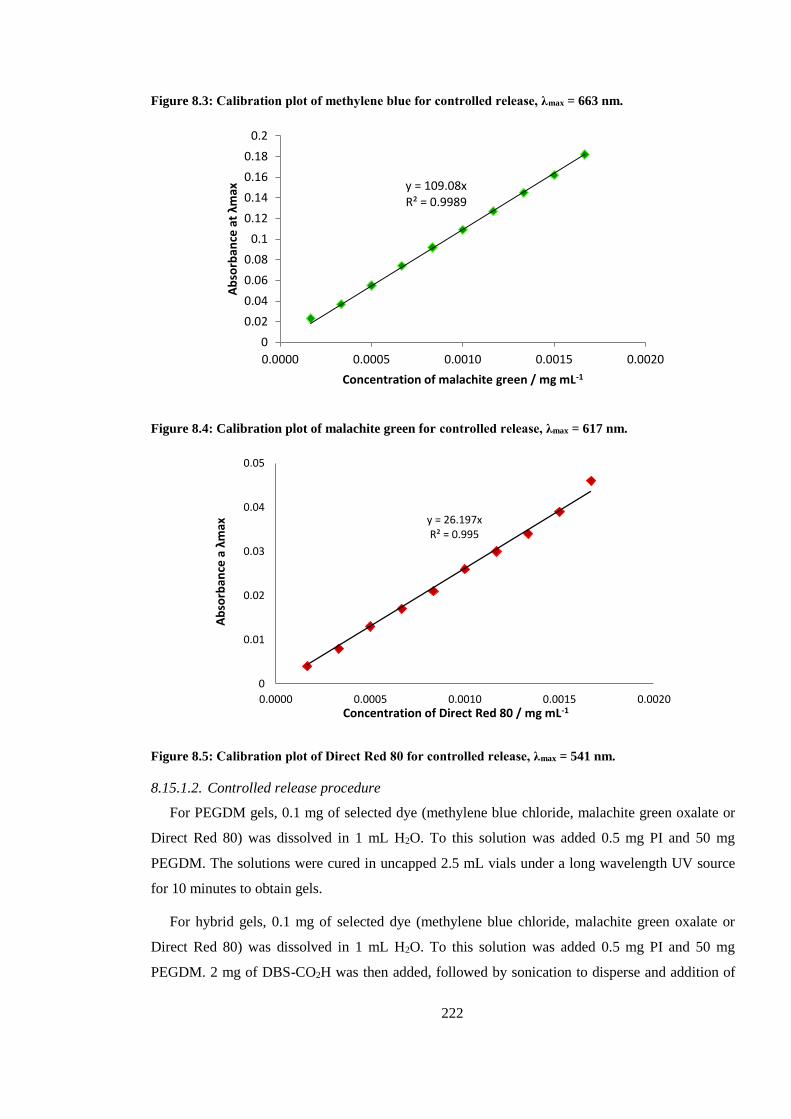
222
Figure 8.3: Calibration plot of methylene blue for controlled release, λmax = 663 nm.
Figure 8.4: Calibration plot of malachite green for controlled release, λmax = 617 nm.
Figure 8.5: Calibration plot of Direct Red 80 for controlled release, λmax = 541 nm.
8.15.1.2. Controlled release procedure
For PEGDM gels, 0.1 mg of selected dye (methylene blue chloride, malachite green oxalate or
Direct Red 80) was dissolved in 1 mL H2O. To this solution was added 0.5 mg PI and 50 mg
PEGDM. The solutions were cured in uncapped 2.5 mL vials under a long wavelength UV source
for 10 minutes to obtain gels.
For hybrid gels, 0.1 mg of selected dye (methylene blue chloride, malachite green oxalate or
Direct Red 80) was dissolved in 1 mL H2O. To this solution was added 0.5 mg PI and 50 mg
PEGDM. 2 mg of DBS-CO2H was then added, followed by sonication to disperse and addition of
y = 109.08xR² = 0.9989
0
0.02
0.04
0.06
0.08
0.1
0.12
0.14
0.16
0.18
0.2
0.0000 0.0005 0.0010 0.0015 0.0020
Ab
sorb
ance
at λm
ax
Concentration of malachite green / mg mL-1
y = 26.197xR² = 0.995
0
0.01
0.02
0.03
0.04
0.05
0.0000 0.0005 0.0010 0.0015 0.0020
Ab
sorb
ance
a λ
max
Concentration of Direct Red 80 / mg mL-1
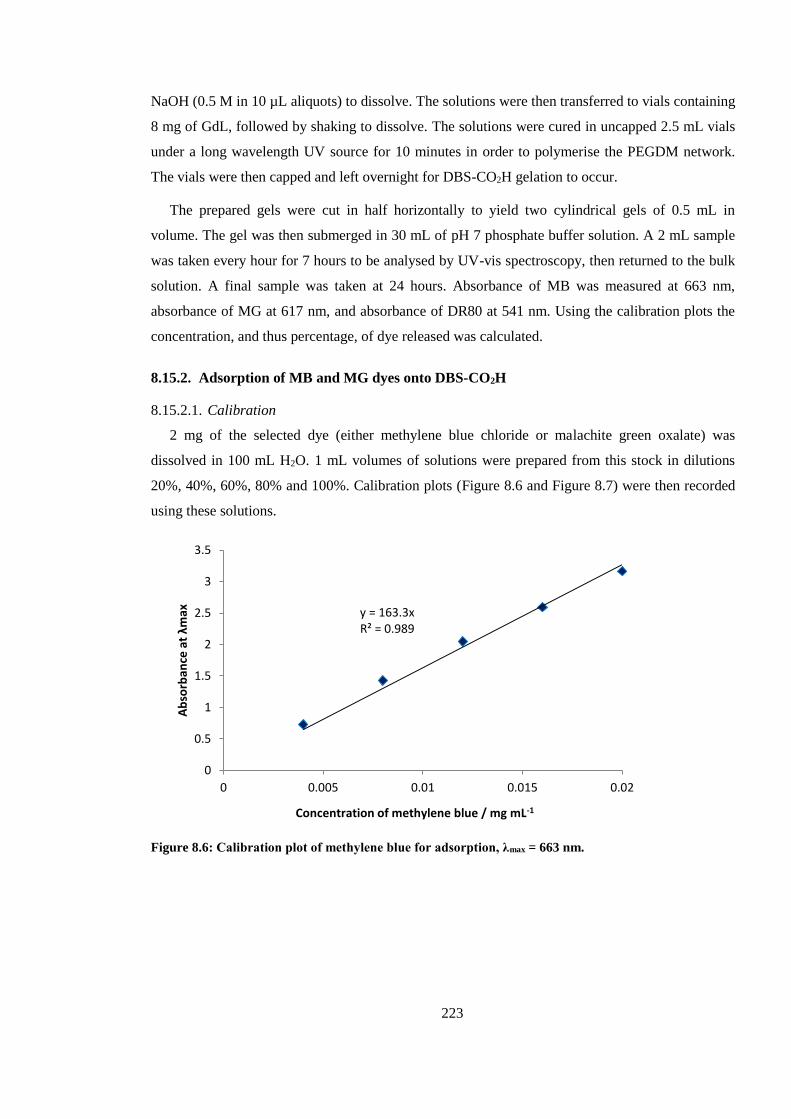
223
NaOH (0.5 M in 10 µL aliquots) to dissolve. The solutions were then transferred to vials containing
8 mg of GdL, followed by shaking to dissolve. The solutions were cured in uncapped 2.5 mL vials
under a long wavelength UV source for 10 minutes in order to polymerise the PEGDM network.
The vials were then capped and left overnight for DBS-CO2H gelation to occur.
The prepared gels were cut in half horizontally to yield two cylindrical gels of 0.5 mL in
volume. The gel was then submerged in 30 mL of pH 7 phosphate buffer solution. A 2 mL sample
was taken every hour for 7 hours to be analysed by UV-vis spectroscopy, then returned to the bulk
solution. A final sample was taken at 24 hours. Absorbance of MB was measured at 663 nm,
absorbance of MG at 617 nm, and absorbance of DR80 at 541 nm. Using the calibration plots the
concentration, and thus percentage, of dye released was calculated.
8.15.2. Adsorption of MB and MG dyes onto DBS-CO2H
8.15.2.1. Calibration
2 mg of the selected dye (either methylene blue chloride or malachite green oxalate) was
dissolved in 100 mL H2O. 1 mL volumes of solutions were prepared from this stock in dilutions
20%, 40%, 60%, 80% and 100%. Calibration plots (Figure 8.6 and Figure 8.7) were then recorded
using these solutions.
Figure 8.6: Calibration plot of methylene blue for adsorption, λmax = 663 nm.
y = 163.3xR² = 0.989
0
0.5
1
1.5
2
2.5
3
3.5
0 0.005 0.01 0.015 0.02
Ab
sorb
ance
at λm
ax
Concentration of methylene blue / mg mL-1
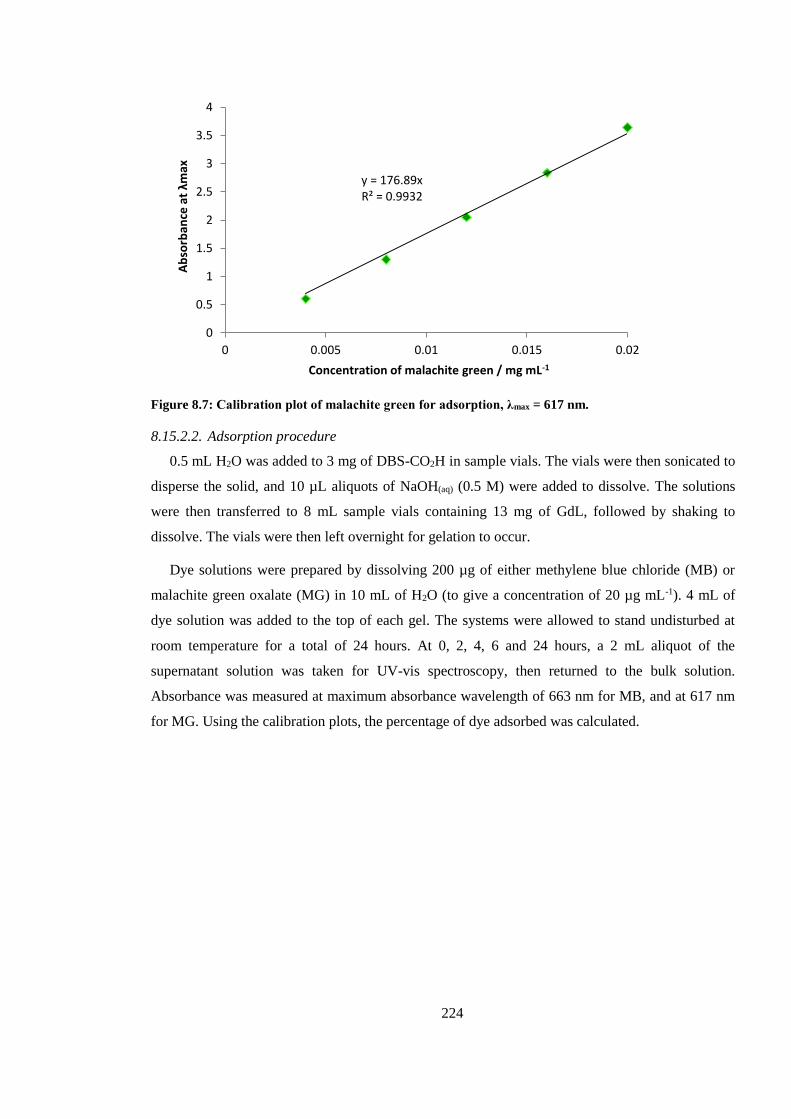
224
Figure 8.7: Calibration plot of malachite green for adsorption, λmax = 617 nm.
8.15.2.2. Adsorption procedure
0.5 mL H2O was added to 3 mg of DBS-CO2H in sample vials. The vials were then sonicated to
disperse the solid, and 10 µL aliquots of NaOH(aq) (0.5 M) were added to dissolve. The solutions
were then transferred to 8 mL sample vials containing 13 mg of GdL, followed by shaking to
dissolve. The vials were then left overnight for gelation to occur.
Dye solutions were prepared by dissolving 200 µg of either methylene blue chloride (MB) or
malachite green oxalate (MG) in 10 mL of H2O (to give a concentration of 20 µg mL-1). 4 mL of
dye solution was added to the top of each gel. The systems were allowed to stand undisturbed at
room temperature for a total of 24 hours. At 0, 2, 4, 6 and 24 hours, a 2 mL aliquot of the
supernatant solution was taken for UV-vis spectroscopy, then returned to the bulk solution.
Absorbance was measured at maximum absorbance wavelength of 663 nm for MB, and at 617 nm
for MG. Using the calibration plots, the percentage of dye adsorbed was calculated.
y = 176.89xR² = 0.9932
0
0.5
1
1.5
2
2.5
3
3.5
4
0 0.005 0.01 0.015 0.02
Ab
sorb
ance
at λm
ax
Concentration of malachite green / mg mL-1
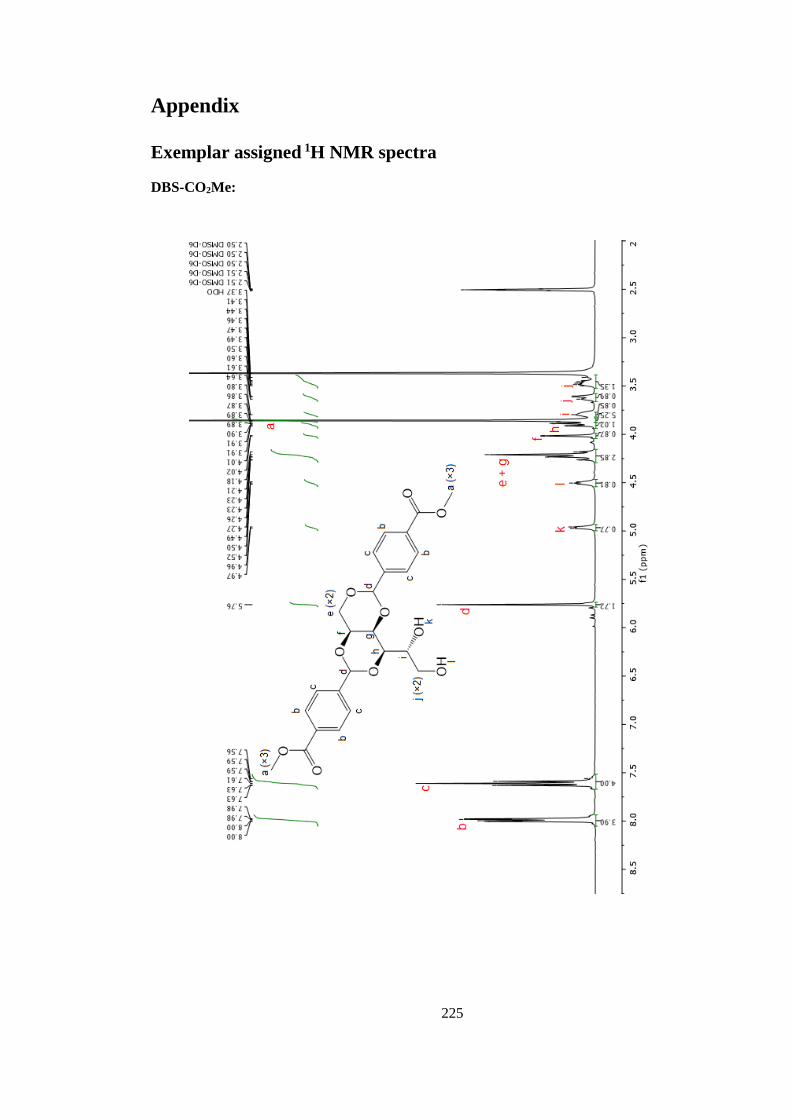
225
Appendix
Exemplar assigned 1H NMR spectra
DBS-CO2Me:
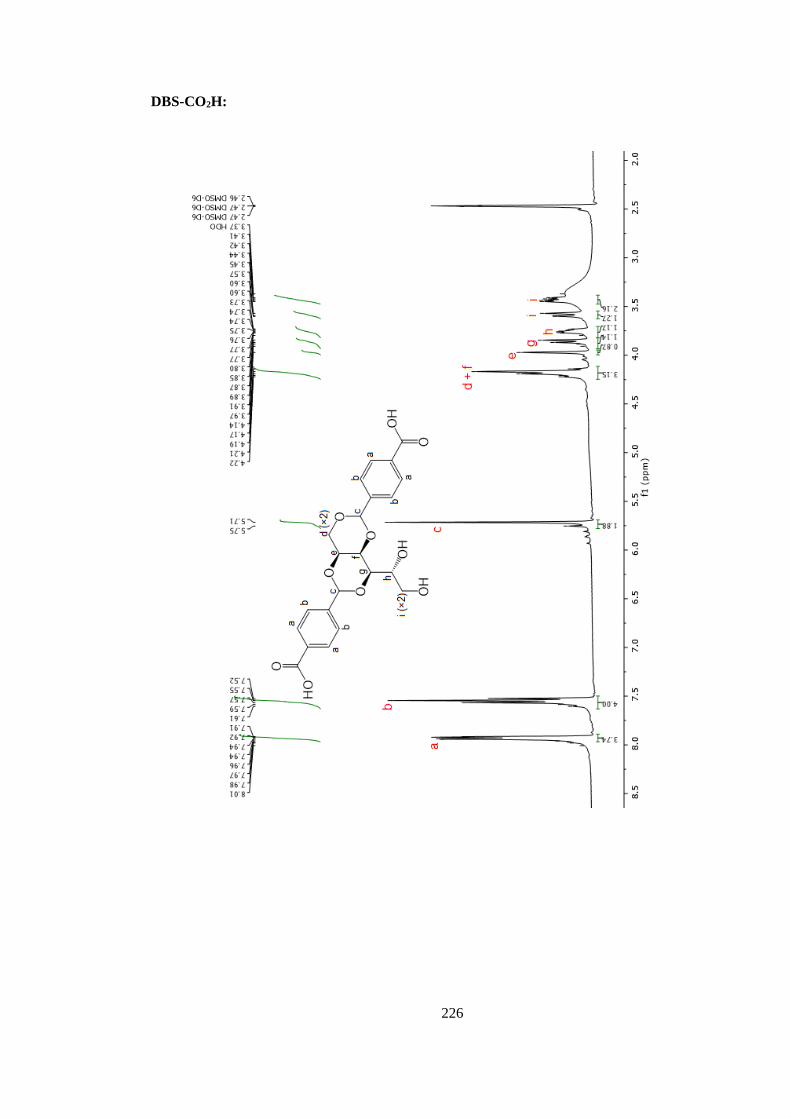
226
DBS-CO2H:
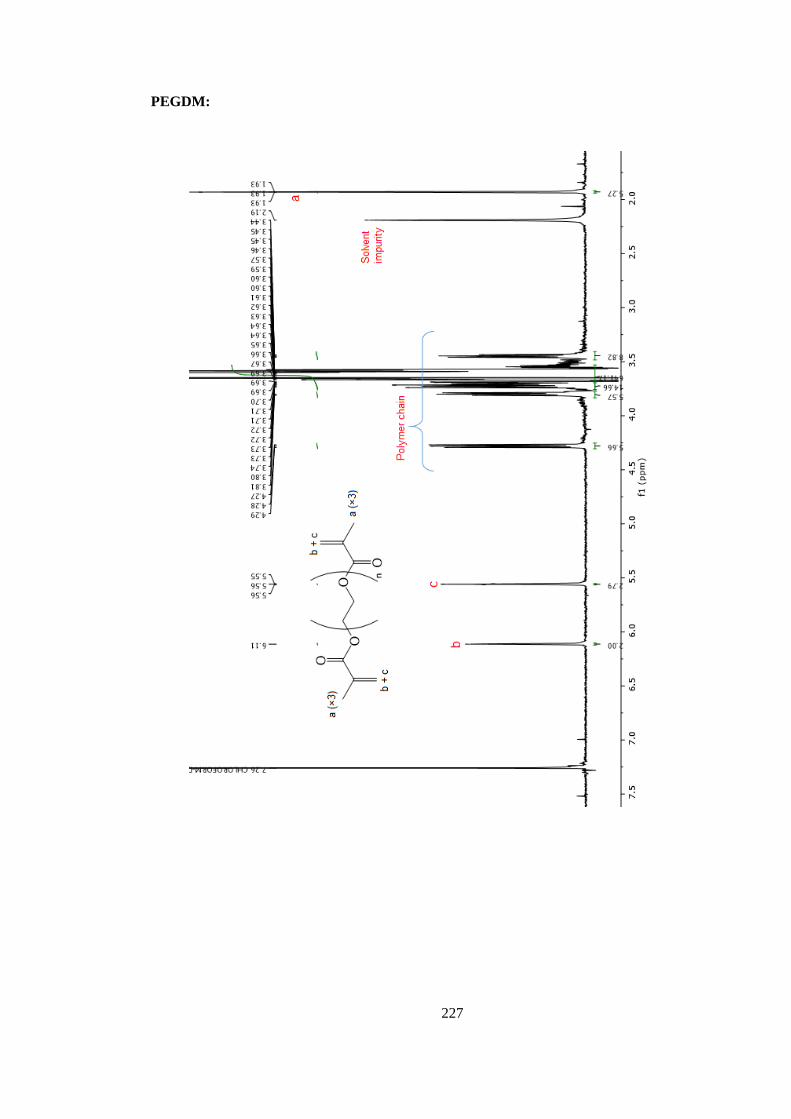
227
PEGDM:
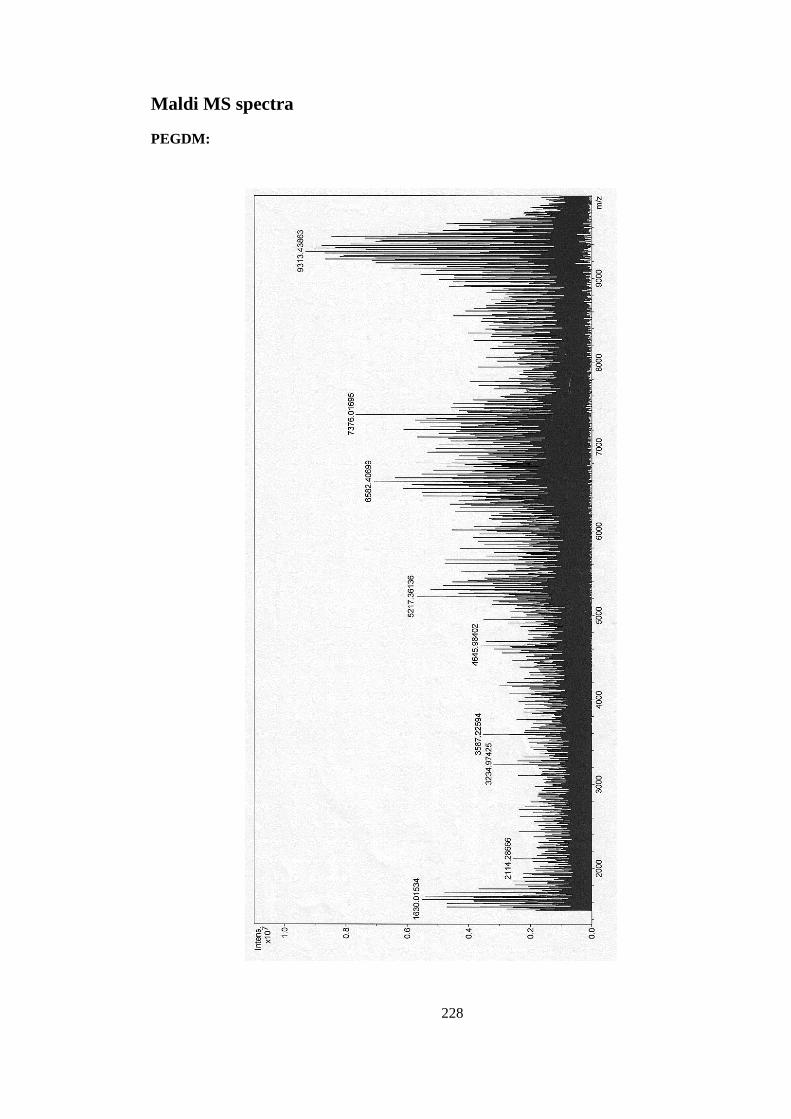
228
Maldi MS spectra
PEGDM:
229
List of Abbreviations
Ar aromatic
app apparent (NMR)
aq aqueous
br broad (NMR)
CD circular dichroism spectroscopy
CDCl3 deuterated chloroform
d doublet (NMR)
dd doublet of doublets (NMR)
ddd double doublet of doublets (NMR)
D2O deuterated water (heavy water)
DBS 1,3:2,4-dibenzylidene-D-sorbitol
DBS-Ala 1,3:2,4-dibenzylidene-D-sorbitol-p,p’-dicarbonyl alanine
DBS-AlaOMe 1,3:2,4-dibenzylidene-D-sorbitol-p,p’-dicarbonyl alanine methyl ester
DBS-Asp 1,3:2,4-dibenzylidene-D-sorbitol-p,p’-dicarbonyl aspartic acid
DBS-Asp(OMe)2 1,3:2,4-dibenzylidene-D-sorbitol-p,p’-dicarbonyl aspartic acid dimethyl ester
DBS-CO2H 1,3:2,4-dibenzylidene-D-sorbitol-p,p’-dicarboxylic acid
DBS-CO2Me 1,3:2,4-dibenzylidene-D-sorbitol-p,p’-dimethyl ester
DBS-Gly 1,3:2,4-dibenzylidene-D-sorbitol-p,p’-dicarbonyl glycine
DBS-GlyOMe 1,3:2,4-dibenzylidene-D-sorbitol-p,p’-dicarbonyl glycine methyl ester
DBS-Phe 1,3:2,4-dibenzylidene-D-sorbitol-p,p’-dicarbonyl phenylalanine
230
DBS-PheOMe 1,3:2,4-dibenzylidene-D-sorbitol-p,p’-dicrbonyl phenylalanine methyl ester
DBS-Trp 1,3:2,4-dibenzylidene-D-sorbitol-p,p’-dicarbonyl tryptophan
DBS-TrpOMe 1,3:2,4-dibenzylidene-D-sorbitol-p,p’-dicarbonyl tryptophan methyl ester
DCM dichloromethane
DEPT distortionless enhancement by polarization transfer
DIPEA diisopropylethylamine
DMSO dimethylsulfoxide
DMSO-d6 deuterated dimethylsulfoxide
DPIN diphenyliodonium nitrate
DR80 Direct Red 80
Eq. equation
eq/equiv equivalent
ESI-MS electrospray ionisation mass spectrometry
FEG-SEM field emission gun scanning electron microscopy
FT-IR Fourier transform infrared spectroscopy
G’ storage modulus
G’’ loss modulus
GdL glucono--lactone
HCl hydrochloric acid
HOD partially deuterated water (one hydrogen atom, one deuterium atom)
HT high tension voltage
231
Hz hertz
IR infrared
J coupling constant (in hertz)
K Kelvin
LMWG low-molecular-weight gelator
LVR linear viscoelastic region
M moles per dm3
m multiplet (NMR)
m medium (IR)
MGC minimum gelator concentration
M.p. melting point
m/z mass to charge ratio
MALDI-MS matrix-assisted laser desorption/ionisation
MB methylene blue (chloride)
mdeg millidegrees
MG malachite green (oxalate)
mg milligrams
min minutes
mL millilitres
mM millimoles per dm3
MS mass spectrometry
232
MW molecular weight
NaHSO4 sodium hydrogen sulfate
NaOH sodium hydroxide
nm nanometre
NMR nuclear magnetic resonance (spectroscopy)
Pa Pascal
PAG photoacid generator
PEG poly(ethylene glycol)
PEGDM poly(ethylene glycol) dimethacrylate, here commonly used to refer to PEGDM
synthesised from PEG 8000
PG polymer gelator
pH negative logarithm of the concentration of hydrogen ions
PI photoinitiator, here used to refer to 2-hydroxy-4′-(2-hydroxyethoxy)-2-
methylpropiophenone
pKa negative logarithm of the acid disassociation constant
ppm parts per million
p-TsOH para-toluene sulfonic acid (monohydrate)
q quartet (NMR)
R gas constant, 8.314 J K-1 mol-1
RGD arginine-glycine-aspartic acid tripeptide
rt room temperature
s singlet (NMR)
233
s strong (IR)
SEM scanning electron microscopy
sol solution
t time or triplet (NMR)
TBTU O-(Benzotriazol-1-yl)-N,N,N′,N′-tetramethyluronium tetrafluoroborate
TEA triethylamine
TEM transmission electron microscopy
Tgel gel-sol transition temperature
UV ultraviolet
UV-vis ultraviolet visible (spectroscopy)
VT variable temperature
w weak (IR)
wt/vol weight to volume ratio
ΔH change in enthalpy
ΔS change in entropy
NMR chemical shift (in ppm)
λmax wavelength at maximum intensity
µg micrograms
µL microlitres
νmax wavenumber at maximum peak intensity
234
References
1 P. Terech and R. G. Weiss, Chem. Rev., 1997, 97, 3133–3160.
2 H. B. Bohidar, P. Dubin and Y. Osada, Eds., Polymer Gels: Fundamentals and
Applications, American Chemical Society, Washington DC, 2002.
3 M. Suzuki and K. Hanabusa, Chem. Soc. Rev., 2010, 39, 455–463.
4 E. A. Appel, J. del Barrio, X. J. Loh and O. A. Scherman, Chem. Soc. Rev., 2012, 41, 6195–
6214.
5 K. Y. Lee and D. J. Mooney, Chem. Rev., 2001, 101, 1869–1880.
6 J. Jagur-Grodzinski, Polym. Adv. Technol., 2010, 21, 27–47.
7 I. Gibas and H. Janik, Chem. Chem. Technol., 2010, 4, 297–304.
8 R. G. Weiss and P. Terech, Eds., Molecular Gels: Materials with Self-Assembled Fibrillar
Networks, Springer, Dordrecht, Netherlands, 2006.
9 L. A. Estroff and A. D. Hamilton, Chem. Rev., 2004, 104, 1201–1218.
10 M. de Loos, B. L. Feringa and J. H. Van Esch, Eur. J. Org. Chem., 2005, 3615–3631.
11 J. H. Van Esch, Langmuir, 2009, 25, 8392–8394.
12 J. W. Steed, Chem. Commun., 2011, 47, 1379–1383.
13 L. E. Buerkle and S. J. Rowan, Chem. Soc. Rev., 2012, 41, 6089–6102.
14 A. R. Hirst, B. Escuder, J. F. Miravet and D. K. Smith, Angew. Chem. Int. Ed., 2008, 47,
8002–8018.
15 N. M. Sangeetha and U. Maitra, Chem. Soc. Rev., 2005, 34, 821–836.
16 S. Banerjee, R. K. Das and U. Maitra, J. Mater. Chem., 2009, 19, 6649–6687.
17 J. H. Fuhrhop and C. Boettcher, J. Am. Chem. Soc., 1990, 112, 1768–1776.
18 A. R. Hirst, B. Huang, V. Castelletto, I. W. Hamley and D. K. Smith, Chem. Eur. J., 2007,
13, 2180–2188.
19 J. R. Moffat and D. K. Smith, Chem. Commun., 2009, 316–318.
20 J. A. Foster, R. M. Edkins, G. J. Cameron, N. Colgin, K. Fucke, S. Ridgeway, A. G.
Crawford, T. B. Marder, A. Beeby, S. L. Cobb and J. W. Steed, Chem. Eur. J, 2014, 20,
279–291.
21 S. Cicchi, G. Ghini, L. Lascialfari, A. Brandi, F. Betti, D. Berti, P. Baglioni, L. Di Bari, G.
235
Pescitelli, M. Mannini and A. Caneschi, Soft Matter, 2010, 6, 1655–1661.
22 M. R. Molla, A. Das and S. Ghosh, Chem. Eur. J., 2010, 16, 10084–10093.
23 A. Das and S. Ghosh, Chem. Commun., 2011, 47, 8922–8924.
24 A. Das, M. R. Molla and S. Ghosh, J. Chem. Sci., 2011, 123, 963–973.
25 M. R. Molla, A. Das and S. Ghosh, Chem. Commun., 2011, 47, 8934–8936.
26 A. Das, M. R. Molla, A. Banerjee, A. Paul and S. Ghosh, Chem. Eur. J., 2011, 17, 6061–
6066.
27 K. Sugiyasu, S. Kawano, N. Fujita and S. Shinkai, Chem. Mater., 2008, 20, 3871–3873.
28 R. Afrasiabi and H. B. Kraatz, Chem. Eur. J., 2013, 19, 15862–15871.
29 K. L. Morris, L. Chen, J. Raeburn, O. R. Sellick, P. Cotanda, A. Paul, P. C. Griffiths, S. M.
King, R. K. O’Reilly, L. C. Serpell and D. J. Adams, Nat. Commun., 2013, 4, 1480.
30 C. Colquhoun, E. R. Draper, E. G. B. Eden, B. N. Cattoz, K. L. Morris, L. Chen, T. O.
McDonald, A. E. Terry, P. C. Griffiths, L. C. Serpell and D. J. Adams, Nanoscale, 2014, 6,
13719–13725.
31 M. M. Smith and D. K. Smith, Soft Matter, 2011, 7, 4856–4860.
32 D. G. Velázquez and R. Luque, Chem. Eur. J., 2011, 17, 3847–3849.
33 P. Xing, X. Chu, S. Li, F. Xin, M. Ma and A. Hao, New J. Chem., 2013, 37, 3949–3955.
34 X. Yan, F. Wang, B. Zheng and F. Huang, Chem. Soc. Rev., 2012, 41, 6042.
35 M. de Loos, J. van Esch, I. Stokroos, R. M. Kellog and B. L. Feringa, J. Am. Chem. Soc.,
1997, 7863, 12675–12676.
36 H. Eimura, M. Yoshio, Y. Shoji, K. Hanabusa and T. Kato, Polym. J., 2012, 44, 594–599.
37 M. George and R. G. Weiss, Chem. Mater., 2003, 15, 2879–2888.
38 C. Kim, S. J. Lee, I. H. Lee and K. T. Kim, Chem. Mater., 2003, 15, 3638–3642.
39 M. Shirakawa, N. Fujita and S. Shinkai, J. Am. Chem. Soc., 2005, 127, 4164–4165.
40 K. Aoki, M. Kudo and N. Tamaoki, Org. Lett., 2004, 6, 429–430.
41 O. J. Dautel, M. Robitzer, J. Le and J. E. Moreau, J. Am. Chem. Soc., 2006, 128, 16213–
16223.
42 N. Fujita, Y. Sakamoto, M. Shirakawa, M. Ojima, A. Fujii, M. Ozaki and S. Shinkai, J. Am.
Chem. Soc., 2007, 129, 4134–4135.
236
43 E. Jahnke, I. Lieberwirth, N. Severin, J. P. Rabe and H. Frauenrath, Angew. Chem. Int. Ed.,
2006, 45, 5383–5386.
44 E. Jahnke, N. Severin, P. Kreutzkamp, J. P. Rabe and H. Frauenrath, Adv. Mater., 2008, 20,
409–414.
45 J. Nagasawa, M. Kudo and S. Hayashi, Langmuir, 2004, 6, 7907–7916.
46 X. Nie and G. Wang, J. Org. Chem., 2006, 71, 4734–4741.
47 C. S. Love, V. Chechik, D. K. Smith, I. Ashworth and C. Brennan, Chem. Commun., 2005,
45, 5647–5649.
48 J. R. Moffat, I. A. Coates, F. J. Leng and D. K. Smith, Langmuir, 2009, 25, 8786–8793.
49 D. D. Díaz, K. Rajagopal, E. Strable, J. Schneider and M. G. Finn, J. Am. Chem. Soc., 2006,
128, 6056–7.
50 D. D. Díaz, J. J. Cid, P. Vázquez and T. Torres, Chem. Eur. J., 2008, 14, 9261–9273.
51 D. D. Díaz, E. Morin, E. M. Schön, G. Budin, A. Wagner and J.-S. Remy, J. Mater. Chem.,
2011, 21, 641–644.
52 M.-O. M. Piepenbrock, N. Clarke, J. A. Foster and J. W. Steed, Chem. Commun., 2011, 47,
2095–2097.
53 P. Kubiak, S. Awhida, C. Hotchen, W. Deng, B. M. Alston, T. O. McDonald, D. J. Adams
and P. J. Cameron, Chem. Commun., 2015, 51, 10427–10430.
54 H. Gankema, M. A. Hempenius, M. Möller, G. Johansson and V. Percec, Macromol. Symp.,
1996, 102, 381–390.
55 U. Beginn, S. Keinath and M. Möller, Macromol. Chem. Phys., 1998, 119, 2379–2384.
56 U. Beginn, S. Sheiko and M. Möller, Macromol. Chem. Phys., 2000, 201, 1008–1015.
57 W. Gu, L. Lu, G. B. Chapman and R. G. Weiss, Chem. Commun., 1997, 1, 543–544.
58 R. J. H. Hafkamp, B. P. A. Kokke, I. M. Danke, H. P. M. Geurts, A. E. Rowan, M. C.
Feiters and R. J. M. Nolte, Microscopy, 1997, 545–546.
59 G. Tan, M. Singh, J. He, V. T. John and G. L. McPherson, Langmuir, 2005, 21, 9322–9326.
60 M. I. Burguete, F. Galindo, R. Gavara, M. A. Izquierdo, J. C. Lima, S. V Luis, A. J. Parola
and F. Pina, Langmuir, 2008, 24, 9795–9803.
61 J. A. Foster, D. W. Johnson, M.-O. M. Pipenbrock and J. W. Steed, New J. Chem., 2014, 38,
927–932.
237
62 F.-X. Simon, N. S. Khelfallah, M. Schmutz, N. Díaz and P. J. Mésini, J. Am. Chem. Soc.,
2007, 129, 3788–3789.
63 J. C. Stendahl, L. Li, E. R. Zubarev, Y.-R. Chen and S. I. Stupp, Adv. Mater., 2002, 14,
1540–1543.
64 E. R. Zubarev, M. U. Pralle, E. D. Stone and S. I. Stupp, Adv. Mater., 2002, 14, 198–203.
65 J. C. Stendahl, E. R. Zubarev, M. S. Arnold, M. C. Hersam, H.-J. Sue and S. I. Stupp, Adv.
Funct. Mater., 2005, 15, 487–493.
66 J. R. Moffat, G. J. Seeley, J. T. Carter, A. Burgess and D. K. Smith, Chem. Commun., 2008,
4601–4603.
67 J. R. Moffat and D. K. Smith, Chem. Commun., 2011, 47, 11864–11866.
68 H. Kim and J. Y. Chang, Langmuir, 2014, 30, 13673–13679.
69 E. A. Wilder, K. S. Wilson, J. B. Quinn, D. Skrtic and J. M. Antonucci, Chem. Mater.,
2005, 17, 2946–2952.
70 S. H. Kang, B. M. Jung and J. Y. Chang, Adv. Mater., 2007, 19, 2780–2784.
71 S. H. Kang, B. M. Jung, W. J. Kim and J. Y. Chang, Chem. Mater., 2008, 20, 5532–5540.
72 S. Zhang, X. Fu, H. Wang and Y. Yang, J. Sep. Sci., 2008, 31, 3782–3787.
73 G. Vasapollo, R. Del Sole, L. Mergola, M. R. Lazzoi, A. Scardino, S. Scorrano and G.
Mele, Int. J. Mol. Sci., 2011, 12, 5908–5945.
74 D. A. Stone, L. Hsu, N. R. Wheeler, E. Wilusz, W. Zukas, G. E. Wnek and L. T. J. Korley,
Soft Matter, 2011, 7, 2449–2455.
75 Y. Zhang, R. Zhou, J. Shi, N. Zhou, I. R. Epstein and B. Xu, J. Phys. Chem. B, 2013, 117,
6566–6573.
76 K. Hanabusa, A. Itoh, M. Kimura and H. Shirai, Chem. Lett., 1999, 767–768.
77 X.-Y. Liu and P. D. Sawant, Angew. Chem. Int. Ed., 2002, 41, 3641–3645.
78 X.-Y. Liu, P. D. Sawant, W.-B. Tan, I. B. M. Noor, C. Pramesti and B.-H. Chen, J. Am.
Chem. Soc., 2002, 124, 15055–15063.
79 J.-L. Li and X.-Y. Liu, J. Phys. Chem. B, 2009, 113, 15467–15472.
80 J.-L. Li, B. Yuan, X.-Y. Liu, X.-G. Wang and R.-Y. Wang, Cryst. Growth Des., 2011, 11,
3227–3234.
81 J. Cui, Z. Shen and X. Wan, Langmuir, 2010, 26, 97–103.
238
82 P. Chakraborty, B. Roy, P. Bairi and A. K. Nandi, J. Mater. Chem., 2012, 22, 20291–20298.
83 P. Chakraborty, S. Das, S. Mondal, P. Bairi and A. K. Nandi, Langmuir, 2016, 32, 1871–
1880.
84 L. Chen, S. Revel, K. Morris, D. G. Spiller, L. C. Serpell and D. J. Adams, Chem.
Commun., 2010, 46, 6738–6740.
85 G. Pont, L. Chen, D. G. Spiller and D. J. Adams, Soft Matter, 2012, 8, 7797–7802.
86 C. Yang, M. Bian and Z. Yang, Biomater. Sci., 2014, 2, 651–654.
87 N. Javid, S. Roy, M. Zelzer, Z. Yang, J. Sefcik and R. V Ulijn, Biomacromolecules, 2013,
14, 4368–4376.
88 Y. J. Adhia, T. H. Schloemer, M. T. Perez and A. J. McNeil, Soft Matter, 2012, 8, 430–434.
89 H. Kobayashi, M. Amaike, J. H. Jung, A. Friggeri, S. Shinkai and D. N. Reinhoudt, Chem.
Commun., 2001, 1038–1039.
90 M. Gradzielski, J. Phys. Condens. Matter, 2003, 15, R655–R697.
91 M. Numata, K. Sugiyasu, T. Kishida, S. Haraguchi, N. Fujita, S. M. Park, Y. J. Yun, B. H.
Kim and S. Shinkai, Org. Biomol. Chem., 2008, 6, 712–718.
92 Z. Zhang, M. Yang, X. Zhang, L. Zhang, B. Liu, P. Zheng and W. Wang, Chem. Eur. J.,
2009, 15, 2352–2361.
93 Z. Zhang, M. Yang, C. Hu, B. Liu, M. Hu, X. Zhang, W. Wang, Y. Zhou and H. Wang,
New J. Chem., 2011, 35, 103–110.
94 A. E. Way, A. B. Korpusik, T. B. Dorsey, L. E. Buerkle, H. A. von Recum and S. J. Rowan,
Macromolecules, 2014, 47, 1810–1818.
95 P. Chakraborty, S. Mondal, S. Khara, P. Bairi and A. K. Nandi, J. Phys. Chem. B, 2015,
119, 5933–5944.
96 W.-C. Lai and C.-C. Chen, Soft Matter, 2014, 10, 312–319.
97 P. Chakraborty, P. Bairi, B. Roy and A. K. Nandi, Appl. Mater. Interfaces, 2014, 6, 3615–
3622.
98 Q. Wang, X. Xiao, Y. Hu, H. Wang and Y. Yang, RSC Adv., 2014, 4, 22380–22386.
99 E. S. Dragan, Chem. Eng. J., 2014, 243, 572–590.
100 M. Shivashankar and B. K. Mandal, Int. J. Pharm. Pharm. Sci., 2012, 4, 1–7.
101 M. A. Haque, T. Kurokawa and J. P. Gong, Polymer, 2012, 53, 1805–1822.
239
102 P. Li, X.-Q. Dou, Y.-T. Tang, S. Zhu, J. Gu, C.-L. Feng and D. Zhang, J. Colloid. Interface
Sci., 2012, 387, 115–122.
103 P. Li, Z. Yin, X.-Q. Dou, G. Zhou and C.-L. Feng, Appl. Mater. Interfaces, 2014, 6, 7948–
7952.
104 L. L. Hyland, M. B. Taraban, Y. Feng, B. Hammouda and Y. B. Yu, Biopolymers, 2012, 97,
177–188.
105 D. Dasgupta, S. Srinivasan, C. Rochas, A. Ajayaghosh and J. M. Guenet, Langmuir, 2009,
25, 8593–8598.
106 J. Wang, Z. Wang, J. Gao, L. Wang, Z. Yang, D. Kong and Z. Yang, J. Mater. Chem., 2009,
19, 7892–7896.
107 R. Huang, W. Qi, L. Feng, R. Su and Z. He, Soft Matter, 2011, 7, 6222–6230.
108 J. Wang, H. Wang, Z. Song, D. Kong, X. Chen and Z. Yang, Colloids Surf. B.
Biointerfaces, 2010, 80, 155–160.
109 M. J. Meunier, Ann. Chim. Phys., 1891, 22, 412–432.
110 J. K. Wolfe, M. Hann and C. S. Hudson, J. Am. Chem. Soc., 1942, 64, 1493–1497.
111 S. J. Angyal and J. V Lawler, J. Am. Chem. Soc., 1944, 66, 837–838.
112 D. Brecknell, R. Carman, J. Kibby and L. Nichola, Aust. J. Chem., 1976, 29, 1859–1863.
113 S. Yamasaki, Y. Ohashi, H. Tsutsumi and K. Tsujii, Bull. Chem. Soc. Jpn., 1995, 68, 146–
151.
114 F. Rongxiu, C. Lingong, H. Zhongke and S. Jian, Trans. Tianjin Univ., 2007, 13, 35–41.
115 R. Stan, C. Ott, N. Sulca, A. Lungu and H. Iovu, Mater. Plast., 2009, 46, 230–235.
116 G. Malle and T. Luukas, 2013, US Patent 20130039862.
117 H. Uchiyama, 1981, US Patent 4267110.
118 K. Murai, T. Kobayashi and K. Fujitani, 1984, US Patent 4429140.
119 G. Machell, 1985, US Patent 4562265.
120 J. M. Gardlik and R. V Burkes, 1992, US Patent 5106999.
121 T. Kobayashi, 1992, US Patent 5120863.
122 W. A. Scrivens and J. M. Salley, 1998, US Patent 5731474.
123 J. G. Lever, D. L. Dotson, J. D. Anderson, J. R. Jones and S. R. Sheppard, 2001, US Patent
240
6500964.
124 R. Stan, S. Roşca, C. Ott, S. Roşca, E. Perez, I. Rico-Lattes and A. Lattes, Rev. Rou. Chem.,
2006, 51, 609–613.
125 R. Stan, N. Chira, C. Ott, C. Todasca and E. Perez, Rev. Chemie, 2008, 59, 273–276.
126 A. Pavankumar and P. V Uppara, 2014, US Patent 8871954.
127 P. V Uppara, P. Aduri, M. Sakhalkar and U. Ratnaparkhi, 2014, US Patent 20130281716.
128 E. L. Roehl and H. B. Tan, 1979, US Patent 4154816.
129 E. L. Roehl, 1982, US Patent 4346079.
130 T. Schamper, M. Jablon, M. H. Randhawa, A. Senatore and J. D. Warren, J. Soc. Cosmet.
Chem., 1986, 37, 225–231.
131 T. J. Schamper, M. M. Perl and J. D. Warren, 1988, US Patent 4720381.
132 R. B. Kasat, W. Lee, M. D. R and N. G. Telyan, 1996, US Patent 5490979.
133 J. P. Luebbe, P. R. Tanner and J. D. Melanson, 1989, US Patent 4816261.
134 M. H. Randhawa and T. J. Schamper, 1988, US Patent 4719102.
135 J. Mattai, C. Ortiz, E. Guenin and J. Afflitto, 2002, US Patent 6338841.
136 A. Esposito, T. Schamper and E. C. Henry, 2010, US Patent 7799318.
137 T. Ando and Y. Yamazaki, 1974, US Patent 3846363.
138 H. Fukuo and S. Tsujio, 2001, US Patent 6203910.
139 R. N. Vachon and H. R. R. Partin, 1981, US Patent 4257928.
140 K. Hamada and H. Uchiyama, 1977, US Patent 4016118.
141 Y. Kawai, K. Sasagawa, M. Maki, H. Ueda and M. Miyamoto, 1982, US Patent 4314039.
142 H. Uchiyama, 1984, US Patent 4483956.
143 J. W. Rekers, 1991, US Patent 5049605.
144 J. Xu, J. Li, B. W. Bolt, K. D. Lake, J. D. Sprinkle, B. M. Burkhart and K. A. Keller, 2011,
US Patent 8022133.
145 T. D. Danielson, J. Rockwood and N. A. Mehl, 2014, US Patent 8653165.
146 J. Li, K. Fan, X. Guan, Y. Yu and J. Song, Langmuir, 2014, 30, 13422–13429.
147 D. K. Smith, in Supramolecular Chemistry; From Molecules to Nanomaterial, eds. P. A.
241
Gale and J. W. Steed, Wiley-VCH, Weinheim, 2012.
148 Y. Zhang, H. Gu, Z. Yang and B. Xu, J. Am. Chem. Soc., 2003, 125, 13680–13681.
149 V. Jayawarna, M. Ali, T. A. Jowitt, A. F. Miller, A. Saiani, J. E. Gough and R. V Ulijn,
Adv. Mater., 2006, 18, 611–614.
150 D. J. Adams, M. F. Butler, W. J. Frith, M. Kirkland, L. Mullen and P. Sanderson, Soft
Matter, 2009, 5, 1856–1862.
151 D. J. Adams, L. M. Mullen, M. Berta, L. Chen and W. J. Frith, Soft Matter, 2010, 6, 1971–
1980.
152 L. Chen, S. Revel, K. Morris, L. C Serpell and D. J. Adams, Langmuir, 2010, 26, 13466–
13471.
153 Y. Pocker and E. Green, J. Am. Chem. Soc., 1972, 95, 113–119.
154 S. R. Raghavan and B. H. Cipriano, in Molecular Gels: Materials with Self-Assembled
Fibrillar Networks, eds. R. G. Weiss and P. Terech, Springer, Dordrecht, Netherlands,
2006.
155 V. J. Nebot and D. K. Smith, in Functional Molecular Gels, eds. B. Escuder and J. F.
Miravet, Royal Society of Chemistry, Cambridge, UK, 2013.
156 J. Makarević, M. Jokić, B. Perić, V. Tomisić, B. Kojić-Prodić and M. Zinić, Chem. Eur. J.,
2001, 7, 3328–3341.
157 B. Escuder, M. LLusar and J. F. Miravet, J. Org. Chem., 2006, 71, 7747–7752.
158 A. R. Hirst, I. A. Coates, T. R. Boucheteau, J. F. Miravet, B. Escuder, V. Castelletto, I. W.
Hamley and D. K. Smith, J. Am. Chem. Soc., 2008, 130, 9113–9121.
159 Y. E. Shapiro, Prog. Polym. Sci., 2011, 36, 1184–1253.
160 M. Avrami, J. Chem. Phys., 1939, 7, 1103–1122.
161 M. Avrami, J. Chem. Phys., 1940, 8, 212–224.
162 M. Avrami, J. Chem. Phys., 1941, 9, 177–184.
163 X. Huang, P. Terech, S. R. Raghavan and R. G. Weiss, J. Am. Chem. Soc., 2005, 127, 4336–
4344.
164 X. Huang, S. R. Raghavan, P. Terech and R. G. Weiss, J. Am. Chem. Soc., 2006, 128,
15341–15352.
165 N. Berova, K. Nakanishi and R. W. Woody, Circular Dichroism: Principles and
242
Applications, Wiley-VCH, Weinheim, 2nd edn., 1994.
166 M. A. Mateos-Timoneda, M. Crego-Calama and D. N. Reinhoudt, Chem. Soc. Rev., 2004,
33, 363–372.
167 J. R. Moffat and D. K. Smith, Chem. Commun., 2008, 2248–2250.
168 J. Cui, A. Liu, Y. Guan, J. Zheng, Z. Shen and X. Wan, Langmuir, 2010, 26, 3615–3622.
169 B. Roy, A. Saha, A. Esterrani and A. K. Nandi, Soft Matter, 2010, 6, 3337–3345.
170 P. Echlin, Handbook of Sample Preparation for Scannin Electron Microscopy, Springer,
New York, 2009.
171 C. Araki, Bull. Chem. Soc. Jpn., 1956, 29, 543–544.
172 E. R. Morris, D. A. Rees, D. Thom and E. J. Welsh, J. Supramol. Struct., 1977, 6, 259–274.
173 S. Arnott, A. Fulmer, W. E. Scott, I. C. Dea, R. Moorhouse and D. A. Rees, J. Mol. Biol.,
1974, 90, 269–284.
174 P. Serwer, Electrophoresis, 1983, 4, 375–382.
175 T. G. Mezger, The Rheology Handbook, Vincentz Network, Hanover, 3rd edn., 2011.
176 P. Sollich, in Molecular Gels: Materials with Self-Assembled Fibrillar Networks, eds. R. G.
Weiss and P. Terech, Springer, Dordrecht, Netherlands, 2006.
177 H. F. Mark, Encyclopedia of Polymer Science and Technology, John Wiley & Sons, New
York, 2004.
178 M.-O. M. Piepenbrock, G. O. Lloyd, N. Clarke and J. W. Steed, Chem. Rev., 2010, 110,
1960–2004.
179 N. M. Sangeetha, S. Bhat, U. Maitra and P. Terech, J. Phys. Chem. B, 2004, 108, 16056–
16063.
180 P. Terech, D. Pasquier, V. Bordas and C. Rossat, Langmuir, 2000, 16, 4485–4494.
181 P. Li, X.-Q. Dou, C.-L. Feng and D. Zhang, Soft Matter, 2013, 9, 3750–3757.
182 J. Wang, X. Miao, Q. Fengzhao, C. Ren, Z. Yang and L. Wang, RSC Adv., 2013, 3, 16739–
16746.
183 J. Zhu, Biomaterials, 2010, 31, 4639–4656.
184 F. E. Bailey and J. V Koleske, Poly(Ethylene Oxide), Academic Press, New York, 1976.
185 J. H. Lee, H. B. Lee and J. D. Andrade, Prog. Polym. Sci., 1995, 20, 1043–1079.
243
186 N. A. Alcantar, E. S. Aydil and J. N. Israelachvili, J. Biomed. Mater. Res., 2000, 51, 343–
351.
187 K. B. Keys, F. M. Andreopoulos and N. a. Peppas, Macromolecules, 1998, 31, 8149–8156.
188 N. A. Peppas, K. B. Keys, M. Torres-Lugo and A. M. Lowman, J. Control. Release, 1999,
62, 81–87.
189 C. Lin and K. S. Anseth, Pharm. Res., 2009, 26, 631–643.
190 M. Malkoch, R. Vestberg, N. Gupta, L. Mespouille, P. Dubois, A. F. Mason, J. L. Hedrick,
Q. Liao, C. W. Frank, K. Kingsbury and C. J. Hawker, Chem. Commun., 2006, 2774–2776.
191 B. D. Polizzotti, B. D. Fairbanks and K. S. Anseth, Biomacromolecules, 2008, 9, 1084–
1087.
192 T. J. Sanborn, P. B. Messersmith and A. E. Barron, Biomaterials, 2002, 23, 2703–2710.
193 M. Ehrbar, S. C. Rizzi, R. Hlushchuk, V. Djonov, A. H. Zisch, J. A. Hubbell, F. E. Weber
and M. P. Lutolf, Biomaterials, 2007, 28, 3856–3866.
194 M. Ehrbar, S. C. Rizzi, R. G. Schoenmakers, B. San Miguel, J. A. Hubbell, F. E. Weber and
M. P. Lutoff, Biomacromolecules, 2007, 8, 3000–3007.
195 A. S. Sawhney, J. A. Pathak and J. A. Hubbell, Macromolecules, 1993, 26, 581–587.
196 J. L. West and J. A. Hubbell, React. Polym., 1995, 25, 139–147.
197 S. Jo, P. S. Engel and A. G. Mikos, Polymer, 2000, 41, 7595–7604.
198 J. D. Clapper, J. M. Skeie, R. F. Mullins and C. A. Guymon, Polymer, 2007, 48, 6554–
6564.
199 Z. Jiang, J. Hao, Y. You, Y. Liu, Z. Wang and X. Deng, J. Biomed. Mater. Res. A, 2008, 87,
45–51.
200 S. Kaihara, S. Matsumura and J. P. Fisher, Eur. J. Pharm. Biopharm., 2008, 68, 67–73.
201 J. Zhang, A. Skardal and G. D. Prestwich, Biomaterials, 2008, 29, 4521–4531.
202 S. Lin-Gibson, S. Bencherif, J. A. Cooper, S. J. Wetzel, J. M. Antonucci, B. M. Vogel, F.
Horkay and N. R. Washburn, Biomacromolecules, 2004, 5, 1280–1287.
203 S. J. Bryant and K. S. Anseth, J. Biomed. Mater. Res., 2002, 59, 63–72.
204 A. Revzin, R. J. Russell, V. K. Yadavalli, W.-G. Koh, C. Deister, D. D. Hile, M. B. Mellott
and M. V. Pishko, Langmuir, 2001, 17, 5440–5447.
205 A. Revzin, R. G. Tompkins and M. Toner, Langmuir, 2003, 19, 9855–9862.
244
206 Y. Luo and M. S. Shoichet, Nat. Mater., 2004, 3, 249–253.
207 Y. Luo and M. S. Shoichet, Biomacromolecules, 2004, 5, 2315–2323.
208 M. S. Hahn, J. S. Miller and J. L. West, Adv. Mater., 2006, 18, 2679–2684.
209 M. S. Hahn, L. J. Taite, J. J. Moon, M. C. Rowland, K. A. Ruffino and J. L. West,
Biomaterials, 2006, 27, 2519–2524.
210 S.-H. Lee, J. J. Moon and J. L. West, Biomaterials, 2008, 29, 2962–2968.
211 J. H. Wosnick and M. S. Shoichet, Chem. Mater., 2008, 20, 55–60.
212 C. A. DeForest, B. D. Polizzotti and K. S. Anseth, Nat. Mater., 2009, 8, 659–664.
213 S. Khetan, J. S. Katz and J. A. Burdick, Soft Matter, 2009, 5, 1601–1606.
214 A. M. Kloxin, A. M. Kasko, C. N. Salinas and K. S. Anseth, Science, 2009, 324, 59–63.
215 H. Aubin, J. W. Nichol, C. B. Hutson, H. Bae, A. L. Sieminski, D. M. Cropek, P. Akhyari
and A. Khademhosseini, Biomaterials, 2010, 31, 6941–6951.
216 J. W. Nichol, S. T. Koshy, H. Bae, C. M. Hwang, S. Yamanlar and A. Khademhosseini,
Biomaterials, 2010, 31, 5536–5544.
217 A. Ovsianikov, M. Gruene, M. Pflaum, L. Koch, F. Maiorana, M. Wilhelmi, A. Haverich
and B. Chichkov, Biofabrication, 2010, 2, 014104.
218 A. Ovsianikov, M. Malinauskas, S. Schlie, B. Chichkov, S. Gittard, R. Narayan, M. Löbler,
K. Sternberg, K.-P. Schmitz and A. Haverich, Acta Biomater., 2011, 7, 967–974.
219 A. Ovsianikov, A. Deiwick, S. Van Vlierberghe, P. Dubruel, L. Möller, G. Drager and B.
Chichkov, Biomacromolecules, 2011, 12, 851–858.
220 T. Weiß, R. Schade, T. Laube, A. Berg, G. Hildebrand, R. Wyrwa, M. Schnabelrauch and
K. Liefeith, Adv. Eng. Mater., 2011, 13, B264–B273.
221 R. G. Wylie, S. Ahsan, Y. Aizawa, K. L. Maxwell, C. M. Morshead and M. S. Shoichet,
Nat. Mater., 2011, 10, 799–806.
222 L. Cai, J. Lu, V. Sheen and S. Wang, Biomacromolecules, 2012, 13, 1663–1674.
223 K. A. Mosiewicz, L. Kolb, A. J. van der Vlies, M. M. Martino, P. S. Lienemann, J. A.
Hubbell, M. Ehrbar and M. P. Lutolf, Nat. Mater., 2013, 12, 1072–1078.
224 T. Vignaud, H. Ennoman, M. Thery and M. Piel, Methods Cell Biol., 2014, 120, 93–116.
225 F. Yanagawa, S. Sugiura, T. Takagi, K. Sumaru, G. Camci-Unal, A. Patel, A.
Khademhosseini and T. Kanamori, Adv. Healthc. Mater., 2014, 4, 246–254.
245
226 K. M. C. Tsang, N. Annabi, F. Ercole, K. Zhou, D. J. Karst, F. Li, J. M. Haynes, R. A.
Evans, H. Thissen, A. Khademhosseini and J. S. Forsythe, Adv. Funct. Mater., 2015, 25,
977–986.
227 F. Rodríguez-Llansola, B. Escuder, J. F. Miravet, D. Hermida-Merino, I. W. Hamley, C. J.
Cardin and W. Hayes, Chem. Commun., 2010, 46, 7960–2.
228 D. M. Wood, B. W. Greenland, A. L. Acton, F. Rodríguez-Llansola, C. A. Murray, C. J.
Cardin, J. F. Miravet, B. Escuder, I. W. Hamley and W. Hayes, Chem. Eur. J., 2012, 18,
2692–2699.
229 B. O. Okesola and D. K. Smith, Chem. Commun., 2013, 49, 11164–11166.
230 I. Tomatsu, K. Peng and A. Kros, Adv. Drug Deliv. Rev., 2011, 63, 1257–1266.
231 A. Ovsianikov, V. Mironov, J. Stampfl and R. Liska, Expert Rev. Med. Devices, 2012, 9,
613–633.
232 J. Torgersen, X. H. Qin, Z. Li, A. Ovsianikov, R. Liska and J. Stampfl, Adv. Funct. Mater.,
2013, 23, 4542–4554.
233 K. J. Skilling, F. Citossi, T. D. Bradshaw, M. Ashford, B. Kellam and M. Marlow, Soft
Matter, 2014, 10, 237–256.
234 H. Cui, M. J. Webber and S. I. Stupp, Polym. Sci., 2009, 94, 1–18.
235 J. B. Matson and S. I. Stupp, Chem. Commun., 2012, 48, 26–33.
236 M. Zhou, A. M. Smith, A. K. Das, N. W. Hodson, R. F. Collins, R. V Ulijn and J. E. Gough,
Biomaterials, 2009, 30, 2523–2530.
237 D. M. Ryan and B. L. Nilsson, Polym. Chem., 2012, 3, 18–33.
238 S. Zhang, T. C. Holmes, C. M. DiPersio, R. O. Hynes, X. Su and A. Rich, Biomaterials,
1995, 16, 1385–1393.
239 T. C. Holmes, S. De Lacalle, X. Su, G. Liu, A. Rich and S. Zhang, Proc. Natl. Acad. Sci.,
2000, 97, 6728–6733.
240 R. G. Ellis-Behnke, Y.-X. Liang, S.-W. You, D. K. C. Tay, S. Zhang, K.-F. So and G. E.
Schneider, Proc. Natl. Acad. Sci., 2006, 103, 5054–5059.
241 G. A. Silva, C. Czeisler, K. L. Niece, E. Beniash, D. A. Harrington, J. A. Kessler and S. I.
Stupp, Science, 2004, 303, 1352–1355.
242 V. M. Tysseling-Mattiace, V. Sahni, K. L. Niece, D. Birch, C. Czeisler, M. G. Fehlings, S.
I. Stupp and J. A. Kessler, J. Neurosci., 2008, 28, 3814–3823.
246
243 J. Kisiday, M. Jin, B. Kurz, H. Hung, C. Semino, S. Zhang and A. J. Grodzinsky, Proc.
Natl. Acad. Sci., 2002, 99, 9996–10001.
244 M. E. Davis, J. P. M. Motion, D. A. Narmoneva, T. Takahashi, D. Hakuno, R. D. Kamm, S.
Zhang and R. T. Lee, Circulation, 2005, 111, 442–450.
245 K. Rajangam, H. A. Behanna, M. J. Hui, X. Han, J. F. Hulvat, J. W. Lomasney and S. I.
Stupp, Nano Lett., 2006, 6, 2086–2090.
246 T. D. Sargeant, M. O. Guler, S. M. Oppenheimer, A. Mata, R. L. Satcher, D. C. Dunand and
S. I. Stupp, Biomaterials, 2008, 29, 161–171.
247 L. S. Birchall, S. Roy, V. Jayawarna, M. Hughes, E. Irvine, G. T. Okorogheye, N. Saudi, E.
De Santis, T. Tuttle, A. A. Edwards and R. V. Ulijn, Chem. Sci., 2011, 2, 1349–1355.
248 S. Díaz-Oltra, C. Berdugo, J. F. Miravet and B. Escuder, New J. Chem., 2015, 39, 3785–
3791.
249 J. Raeburn and D. J. Adams, Chem. Commun., 2015, 51, 5170–5180.
250 J. Raeburn, G. Pont, L. Chen, Y. Cesbron, R. Lévy and D. J. Adams, Soft Matter, 2012, 8,
1168–1174.
251 F. Rodríguez-Llansola, B. Escuder and J. F. Miravet, J. Am. Chem. Soc., 2009, 131, 11478–
11484.
252 C. Tang, A. M. Smith, R. F. Collins, R. V. Ulijn and A. Saiani, Langmuir, 2009, 25, 9447–
9453.
253 L. Chen, K. Morris, A. Laybourn, D. Elias, M. R. Hicks, A. Rodger, L. Serpell and D. J.
Adams, Langmuir, 2010, 26, 5232–5242.
254 A. Reddy, A. Sharma and A. Srivastava, Chem. Eur. J., 2012, 18, 7575–7581.
255 M. Wallace, J. A. Iggo and D. J. Adams, Soft Matter, 2015, 11, 7739–7747.
256 A. Khademhosseini and R. Langer, Biomaterials, 2007, 28, 5087–5092.
257 J. S. Katz and J. A. Burdick, Macromol. Biosci., 2010, 10, 339–48.
258 T. Billiet, M. Vandenhaute, J. Schelfhout, S. Van Vlierberghe and P. Dubruel, Biomaterials,
2012, 33, 6020–6041.
259 A. M. Greiner, B. Richter and M. Bastmeyer, Macromol. Biosci., 2012, 12, 1301–1314.
260 Š. Selimović, J. Oh, H. Bae, M. Dokmeci and A. Khademhosseini, Polymers, 2012, 4,
1554–1579.
247
261 P. Bajaj, R. M. Schweller, A. Khademhosseini, J. L. West and R. Bashir, Annu. Rev.
Biomed. Eng., 2014, 16, 247–276.
262 L. Frkanec, M. Jokić, J. Makarević, K. Wolsperger and M. Žinić, J. Am. Chem. Soc., 2002,
124, 9716–9717.
263 S. Matsumoto, S. Yamaguchi, S. Ueno, H. Komatsu, M. Ikeda, K. Ishizuka, Y. Iko, K. V
Tabata, H. Aoki, S. Ito, H. Noji and I. Hamachi, Chem. Eur. J., 2008, 14, 3977–86.
264 H. Komatsu, S. Matsumoto, S. I. Tamaru, K. Kaneko, M. Ikeda and I. Hamachi, J. Am.
Chem. Soc., 2009, 131, 5580–5585.
265 M. He, J. Li, S. Tan, R. Wang and Y. Zhang, J. Am. Chem. Soc., 2013, 135, 18718–18721.
266 M. Ikeda, T. Tanida, T. Yoshii and I. Hamachi, Adv. Mater., 2011, 23, 2819–2822.
267 T. Yoshii, M. Ikeda and I. Hamachi, Angew. Chem. Int. Ed., 2014, 53, 7264–7267.
268 J. Raeburn, T. O. McDonald and D. J. Adams, Chem. Commun., 2012, 48, 9355–9357.
269 C. Maity, W. E. Hendriksen, J. H. Van Esch and R. Eelkema, Angew. Chem. Int. Ed., 2015,
54, 998–1001.
270 H.-J. Timpe and V. Schikowsky, J. für Prakt. Chemie, 1989, 331, 447–460.
271 W. Behnck and J. Bargon, Synth. Met., 1993, 54, 223–228.
272 E. R. Draper, L. L. E. Mears, A. M. Castilla, S. M. King, T. O. McDonald, R. Akhtar and D.
J. Adams, RSC Adv., 2015, 5, 95369–95378.
273 E. R. Draper, E. G. B. Eden, T. O. McDonald and D. J. Adams, Nat. Chem., 2015, 7, 848–
852.
274 J. Raeburn, B. Alston, J. Kroeger, T. O. McDonald, J. R. Howse, P. J. Cameron and D. J.
Adams, Mater. Horiz., 2014, 1, 241–246.
275 A. J. Engler, S. Sen, H. L. Sweeney and D. E. Discher, Cell, 2006, 126, 677–689.
276 D. J. Cornwell, B. O. Okesola and D. K. Smith, Soft Matter, 2013, 9, 8730–8736.
277 D. J. Cornwell, B. O. Okesola and D. K. Smith, Angew. Chem. Int. Ed., 2014, 53, 12461–
12465.
278 E. J. Howe, B. O. Okesola and D. K. Smith, Chem. Commun., 2015, 51, 7451–7454.
279 V. M. P. Vieira, A. C. Lina, M. de Jong and D. K. Smith, Unpublished results.
280 D. J. Cornwell, O. J. Daubney and D. K. Smith, J. Am. Chem. Soc., 2015, 137, 15486–
15492.


