Embed Size (px)
Citation preview

BioMed CentralBMC Bioinformatics
ss
Open AcceMethodology articleHybrid elementary flux analysis/nonparametric modeling: application for bioprocess controlAna P Teixeira1,2, Carlos Alves2, Paula M Alves1, Manuel JT Carrondo1,3 and Rui Oliveira*2Address: 1IBET/ITQB, Apartado 12, P-2781-901 Oeiras, Portugal, 2REQUIMTE, Laboratório de Engenharia Bioquímica, FCT/UNL P-2829-516 Caparica, Portugal and 3Laboratório de Engenharia Bioquímica, FCT/UNL P-2829-516 Caparica, Portugal
Email: Ana P Teixeira - [email protected]; Carlos Alves - [email protected]; Paula M Alves - [email protected]; Manuel JT Carrondo - [email protected]; Rui Oliveira* - [email protected]
* Corresponding author
AbstractBackground: The progress in the "-omic" sciences has allowed a deeper knowledge on manybiological systems with industrial interest. This knowledge is still rarely used for advancedbioprocess monitoring and control at the bioreactor level. In this work, a bioprocess controlmethod is presented, which is designed on the basis of the metabolic network of the organismunder consideration. The bioprocess dynamics are formulated using hybrid rigorous/data drivensystems and its inherent structure is defined by the metabolism elementary modes.
Results: The metabolic network of the system under study is decomposed into elementary modes(EMs), which are the simplest paths able to operate coherently in steady-state. A reduced reactionmechanism in the form of simplified reactions connecting substrates with end-products is obtained.A dynamical hybrid system integrating material balance equations, EMs reactions stoichiometry andkinetics was formulated. EMs kinetics were defined as the product of two terms: a mechanistic/empirical known term and an unknown term that must be identified from data, in a processoptimisation perspective. This approach allows the quantification of fluxes carried by individualelementary modes which is of great help to identify dominant pathways as a function ofenvironmental conditions. The methodology was employed to analyse experimental data ofrecombinant Baby Hamster Kidney (BHK-21A) cultures producing a recombinant fusionglycoprotein. The identified EMs kinetics demonstrated typical glucose and glutamine metabolicresponses during cell growth and IgG1-IL2 synthesis. Finally, an online optimisation study wasconducted in which the optimal feeding strategies of glucose and glutamine were calculated afterre-estimation of model parameters at each sampling time. An improvement in the final productconcentration was obtained as a result of this online optimisation.
Conclusion: The main contribution of this work is a novel bioreactor optimal control method thatuses detailed information concerning the metabolism of the underlying biological system.Moreover, the method allows the identification of structural modifications in metabolism overbatch time.
Published: 29 January 2007
BMC Bioinformatics 2007, 8:30 doi:10.1186/1471-2105-8-30
Received: 23 October 2006Accepted: 29 January 2007
This article is available from: http://www.biomedcentral.com/1471-2105/8/30
© 2007 Teixeira et al; licensee BioMed Central Ltd. This is an Open Access article distributed under the terms of the Creative Commons Attribution License (http://creativecommons.org/licenses/by/2.0), which permits unrestricted use, distribution, and reproduction in any medium, provided the original work is properly cited.
Page 1 of 15(page number not for citation purposes)

BMC Bioinformatics 2007, 8:30 http://www.biomedcentral.com/1471-2105/8/30
BackgroundKnowledge of intracellular metabolic fluxes is crucial tounderstand how different pathways interact and their rel-ative importance within the overall metabolic processes.Metabolic flux analysis (MFA) is an established method-ology that allows the quantification of such intracellularfluxes. In MFA, intracellular fluxes are calculated by apply-ing steady-state material balances around intracellularmetabolites. In general the number of reactions exceedsthe number of metabolites resulting in undetermined sys-tems of algebraic equations [1]. Such systems can besolved after measurement of the missing fluxes, which aretypically uptake rates of substrates and secretion rates ofmetabolites, and also intracellular fluxes when the formerare not enough.
The determination of metabolic flux distribution in unde-termined systems may also be obtained by flux-balanceanalysis (FBA) [2]. In FBA, unknown fluxes are deter-mined by linear programming (LP), whereby a givenobjective function, related to a given cellular physiologicalstate, is optimised. Typically, the maximisation of thegrowth flux defined in terms of biosynthetic requirementsis used as the objective function [2-5]. In general, FBA pro-vides flux distribution for a desirable physiological state,it is however uncertain that the provided solution isunique [6]. Frequently multiple optima are obtainedwhich are a consequence of the existence of redundantpathways in the metabolic network conferring structuralrobustness to cells [7].
Metabolic Pathway Analysis (MPA) is another flux-basedanalysis method. MPA, unlike FBA, do not look only atthe properties of solutions selected by the statement of anobjective, but study the full range of achievable biochem-ical network states that are provided by the solution space.Network-based MPA has focused on two approaches, ele-mentary modes (EMs) and extreme pathways (EPs) [8-10]. These approaches are very similar being EPs a subsetof EMs. In certain network topologies the sets of EMs andEPs coincide. They are both unique for a given networkand can be considered as nondecomposable steady stateflux distributions using a minimal set of reactions. Thedifference is that EP analysis decouples all internal revers-ible reactions into two separate irreversible reactions (for-ward and backward directions) and EMs analysis accountsfor reaction directionality. In this work we have adoptedthe EMs concept since it has broad application; EPs anal-ysis can exclude important routes of the network givingmisleading results [10]. MFA focuses on single flux distri-butions, but in a complex metabolic network of reactionsthere is a space of admissible flux distributions. The MPAallows the transition from a reaction based perspective toa pathway-oriented view of metabolism because each fea-
sible steady state flux distribution can be represented as anonnegative combination of EPs or EMs [8,11].
Although flux-based analysis methods have been mainlyused for metabolic engineering [1,12], they may also beuseful in other phases of the bioprocess developmentcycle, namely for advanced bioreactor monitoring andcontrol [13,14]. The EMs concept is particularly attractivesince it reduces network complexity to a minimal set ofreactions. Provost and Bastin [13] exemplified the use ofthe EMs concept for dynamic modeling of a CHO culture.The main objective of the present study is to derive anoptimal control method that incorporates the knowledgeof the metabolic network of the biological system understudy using the EMs technique. Model-based off- and on-line control techniques are today well established in boththeoretical and practical terms, and have been widelyapplied for bioprocess optimisation (e.g. [15,16]). Thesuccess of such methods is critically dependent on thequality of the supporting mathematical model. Not onlyaccuracy in describing previously measured data butmainly the capacity to predict behaviour in unexploredstates is the key for success. In previous studies [17,18], aniterative batch-to-batch optimisation scheme was devel-oped and applied to the optimisation of recombinantBHK-21 cultures. The method is based on the premise thatin general the biological system under consideration isonly partially known or even poorly known in a mecha-nistic sense. Following this principle, a flexible hybrid par-ametric/nonparametric representation of the biologicalsystem was adopted to support the batch-to-batch optimi-sation scheme. It was verified that the model generaliza-tion capacity increases as more reliable mechanisticknowledge of cells is incorporated in the hybrid model.The algorithm presented here is essentially an extension tothe previous batch-to-batch optimisation schemewhereby the knowledge concerning the metabolic net-work is incorporated in the optimisation algorithm. Themethods will be exemplified through the application to arecombinant BHK-21 culture expressing the fusion glyco-protein IgG1-IL2.
Results and discussionProposed methodologyThe proposed methodology for bioprocess monitoringand control is represented schematically in Figures 1, 2.The backbone of this methodology is the hybrid semipar-ametric model structure shown in Figure 1. The maindesign principle is flexible integration of knowledge con-cerning the metabolism, transport phenomena andempirical process data. The method contemplates the pos-sibility of missing parts of the metabolism (e.g., the prod-uct metabolism) and of unknown reaction kinetics andunderlying transduction mechanisms. Whenever knowl-edge is missing, empirical data modeling is called to fill
Page 2 of 15(page number not for citation purposes)

BMC Bioinformatics 2007, 8:30 http://www.biomedcentral.com/1471-2105/8/30
the gaps. The starting point is the establishment of themetabolic network of the biological system under study.Firstly, the metabolic network is analyzed using the ele-mentary modes technique. The overall network is decom-posed into structural subunits, the EMs, which are thesimplest paths connecting substrates with end-products.This structural analysis identifies all compounds (sub-strates, metabolites and products) taken up and/orsecreted to the abiotic phase, which essentially define thesystem state space vector. The bioreactor dynamics aresubsequently described by the material balance equationsof each component occurring in the EMs. The EMs kinet-ics are identified with data from exploratory experiments,using chemometric techniques.
Once the model is properly validated, it can be used foron-line intracellular flux distribution monitoring and foron-line process performance optimisation (Figure 2). Sothe next step is the on-line implementation of the newlydeveloped hybrid model for process monitoring and/oroptimisation in the sense of maximizing the process per-formance by manipulating the control inputs, i.e., theoptimal control problem [16,18-20]. The performance
function includes a penalty term that accounts for the riskof model unreliability, i.e., extrapolation outside themodel trust region. The empirical parameters are re-esti-mated, followed by the re-optimisation of the future proc-ess time course whenever new measurements of theprocess state are performed. In the lines below we describein detail the steps involved.
Elementary modes analysisWe consider a generic metabolic network with m metabo-lites and q reactions such as the network represented inFigure 3. Assuming balanced growth and negligible dilu-tion, the fundamental steady state mass balance equationson intracellular metabolites are expressed as follows:
with N = {nij} a m × q stoichiometric matrix and v = {vj}the vector of q metabolic fluxes with vj denoting the netspecific rate of reaction j. Some of the q reactions are irre-versible, thus the respective fluxes must be nonnegative: vk
Nv 0=>
⎧⎨⎩
( )vk 0
1
General hybrid structure for bioprocessesFigure 1General hybrid structure for bioprocesses. This hybrid model structure integrates knowledge concerning the metabo-lism, transport phenomena and empirical process data. The bioreactor dynamics are then described by the material balance equations of each component occurring in the EMs. The EMs kinetics are identified with data from exploratory experiments, using chemometric techniques.
Page 3 of 15(page number not for citation purposes)

BMC Bioinformatics 2007, 8:30 http://www.biomedcentral.com/1471-2105/8/30
Page 4 of 15(page number not for citation purposes)
Proposed model-based optimisation schemeFigure 2Proposed model-based optimisation scheme. On-line optimisation supported by the hybrid model. The process per-formance function includes a penalty term that accounts for the risk of model unreliability, i.e., extrapolation outside the model trust region. The parameter estimation as well as the optimisation of the future process course occurs every time a new meas-urement becomes available.

BMC Bioinformatics 2007, 8:30 http://www.biomedcentral.com/1471-2105/8/30
> 0 with k denoting the irreversible reactions in the meta-bolic network. The universe of solutions of system (1)forms a convex polyhedral cone in the solution space[21,22]. It is a property of this system that the infinite setof solutions forming the convex polyhedral cone may beexpressed as nonnegative linear combinations of a finiteset of n fundamental vectors ei called elementary modes(EMs):
These elementary modes e = {ei} obey to constraints (1)and additionally to the elementarily constraint statingthat there is no other non-null flux vector involvingproper subsets of the reactions participating in that partic-ular EM [22]. In the context of the present work, there are
two most important features of the EMs analysis: it allowsto identify all possible pathways for the conversion of sub-strates into products, and opens the way to the quantifica-tion of the relative importance of pathways at a givenprocess stage. The non-null elements in each elementarymode, ei, define a subset of active reactions of the overallmetabolic network N, which are essentially pathways forthe conversion of substrates into products.
Hybrid dynamical model formulationThe knowledge acquired from the EMs analysis is inte-grated in the hybrid model structure represented in Figure1. This structure allows the introduction of the a prioriknowledge concerning the metabolic reactions and intra-cellular kinetics, but it is also open to the possibility ofexisting missing parts in both cases. The EMs analysis pro-vides a stoichiometric matrix, KEM, that may be aug-
v e vi ii
nq= ∀ ∈ℜ ( )
=∑λ
1
2
BHK cells metabolic networkFigure 3BHK cells metabolic network. The figure shows important pathways in the central metabolism of BHK cells. The dashed arrows indicate lumped pathways towards biomass and desired product synthesis.
Page 5 of 15(page number not for citation purposes)

BMC Bioinformatics 2007, 8:30 http://www.biomedcentral.com/1471-2105/8/30
mented (to a K matrix) if important parts of themetabolism are missing. For instance, the energetic andbiosynthetic metabolism may be known, but productmetabolism may be unknown. In this case the productconcentration or other compounds and respective reac-tions kinetics are included through matrix I independ-ently of the EMs.
Even though information about cellular components isgrowing rapidly, enzymes concentrations and intracellu-lar kinetic data are difficult to obtain. In this work the EMskinetics are defined by the product of two functions of thesystem state: a mechanistic/empirical function (in case itis available) and a nonparametric function that representswhat is extracted from data without mechanistic interpre-tation. This model structure can be formulated mathemat-ically by the following two equations, which may beregarded as a general hybrid model for ideal bioreactorsystems [18]:
r(c, w) = K�ϕj(c) × ρj(c, w)�j = 1,...,m (3b)
with c a vector of n concentrations in the liquid phase, r avector of n volumetric reaction rates, K a n × m coefficientsmatrix obtained from the elementary modes analysis, ϕ(c)are m kinetic functions established from mechanisticknowledge, ρj(c,w) are m unknown kinetic functions, w avector of parameters that must be estimated from data, Dis the dilution rate, and u is a vector of n volumetric inputrates (control inputs).
Identification of EMs kineticsThe reaction rate of elementary mode j is defined by theproduct ϕj(c) × ρj(c, w). The function ϕj(c) represents"known" mechanisms whereas ρj(c, w) representsunknown mechanisms. Redundancy and degeneracy arecommon problems in the determination of fluxes of bio-logical networks [23,24]. It is very important to define apriori the conditions under which metabolic fluxes areidentifiable. A rank of matrix K equal to the number ofunknown EMs and an equivalent number of measuredstates are necessary conditions for the identifiability ofsystem (3). If identifiable, the unknown functions ρj(c, w)can be extracted from data using chemometric techniquessuch as multilinear regression, partial least squares, artifi-cial neural networks and many other. In the frame ofhybrid modeling, neural networks have been the mostwidely used technique for reaction kinetics modeling inbiosystems [17,18,25-28]. We used a backpropagationneural network with a single hidden layer to define ρj(c,w):
ρ(c, w) = ρmaxs(w2s(w1c + b1) + b2) (4a)
with ρ = �ρj(c, w)� a vector of m unknown reaction rates,ρmax a vector of scaling factors with dim(ρmax) = m, w1, b1,w2 and b2 are parameter matrices associated with connec-tions between the nodes of the network, w is a vectoredform of w1, b1, w2, b2, and s(·) the sigmoid activationfunction. A batch neural network training method wasadopted, whereby the parameters w are estimated in thesense of least squares employing a quasi-Newton opti-miser with gradients calculated by the sensitivitiesmethod [25,28,29] as described in the methods section.
Dynamic optimisation of culture operation: optimal control problemIn the dynamic optimisation step the process performanceis optimised with respect to control inputs. This problemmay be formulated mathematically as follows:
with J the performance index, tb the batch time, f(·) a ter-minal performance function and g(·) a time-dependentperformance function. The algorithm used was the micro-genetic algorithm [30] coded by Carroll [31]. For simplic-ity, a piecewise constant approximation of the controlinputs u was adopted. The optimisation (5) is subject tothe constraint defined by the hybrid dynamical model(3)–(4) (and indirectly by the metabolic network (1)) butpossibly also by other equality and inequality constraintsregarding process states, cellular states and control inputs.Due to the use of nonparametric functions, namely of theneural network function (4), it is important to evaluatethe unreliability risk during the optimisation. After theEM identification step, the measured input space is clus-tered by ellipsoidal functions (see the methods section).The clustered input space forms the trust region, whereinthe function (4) is considered to be reliable. Optimisation(5) is then further constrained by the risk of function (4)inputs being outside the trust region. The technique isdescribed in detail in the methods section.
Case study: optimisation of recombinant BHK culturesProcess descriptionTo illustrate the methodology described above it will beapplied to a recombinant Baby Hamster Kidney (BHK-21A) culture expressing a fusion glycoprotein (an anti-body type 1 linked to an interleukin type 2, IgG1-IL2)intended for cancer therapy [32]. The experiments werecarried out in serum free and protein free medium(SMIF6, Life Technology, Glasgow, UK). The batch cul-tures were set up in a 2 1 reactor volume and the fed-batch
d
dtD
cr c w c u= − + ( )( , ) 3a
s xe
bx
( ) =+
( )−1
14
max ( ( )) ( ( ), ( )), ( ), ( )t t
bt
b
bJ f c t g dc u
c u0 0
5= +{ } ( )∫ τ τ τ
Page 6 of 15(page number not for citation purposes)

BMC Bioinformatics 2007, 8:30 http://www.biomedcentral.com/1471-2105/8/30
cultures were set up at 3 different volume scales (2, 8 and24 1). Sparger aeration was employed. Dissolved oxygenconcentration was set at 15% of air saturation. Agitationrate used was 60 rpm; pH was set as 7.2 and controlledthrough the addition of CO2. Experimental data of viablecells concentration and six extracellular species (glucose,glutamine, lactate, ammonia, alanine and desired prod-uct) were collected. Analytical techniques are describedelsewhere [17].
Elementary modesBHK-21A cells use glucose and glutamine as majorsources of carbon and energy, and produce lactate andammonia as toxic by-products. A reduction of this wasteproduction will improve both cellular growth and glyco-protein (IgG1-IL2) synthesis. Figure 3 shows the meta-bolic network adopted in this work [33,34]. As catabolicroutes, the network includes the glucose and glutaminefluxes through glycolysis, glutaminolysis and TCA cycle.The amino acids metabolism was not considered; it wasassumed that all of them are provided by the culturemedium. The elementary modes of the 14 reactions thatcompose the catabolism were calculated using the FluxAn-alyser program [22,35]. This system has five EMs, each oneconsisting of collections of reactions steps (Figure 4). Thehypothesis of balanced growth allows the elimination ofthe intermediate metabolites resulting in a simplified setof reactions (see Table 1) connecting extracellular sub-
strates (glucose and glutamine) with end-products (lac-tate, ammonia, alanine and carbon dioxide). The firstelementary mode corresponds to the glucose flux con-verted into lactate; the second is the complete oxidation ofglucose via TCA cycle (the most energetic pathway involv-ing glucose); the third mode is the complete oxidation ofglutamine (the most energetic pathway involvingglutamine) and the fourth and fifth modes are partial oxi-dations of glutamine in alanine and lactate, respectively.
Biomass and product synthesisIn addition to the catabolism, the anabolism and productsynthesis must also be considered. For the sake of simplic-ity, the anabolism (biomass synthesis) was represented asa lumped equation combining the precursors of the maincellular building blocks (glucose, required for the synthe-sis of carbohydrates, lipids and nucleotides, and aminoacids required for the synthesis of cellular proteins andsome of them also for the synthesis of nucleotides). Thestoichiometry established by Wei-Shou Hu and coworkers[36] for an hybridoma cell line was adopted in this work.
0.0208Glc + 0.0377Gln + 0.0133Ala + 0.0165Gly +0.0096Val + 0.0133Leu + 0.0084Ile + 0.0033Met +0.0081Pro + 0.0055Phe + 0.004Try + 0.0099Ser +0.008Thr + 0.0Asn + 0.0077Tyr + 0.0004Cys + 0.0101Lys+ 0.007Arg + 0.0033His + 0.026Asp + 0.0006Glu → Bio-mass (7)
Elementary modes of the metabolic network consideredFigure 4Elementary modes of the metabolic network considered.
Page 7 of 15(page number not for citation purposes)

BMC Bioinformatics 2007, 8:30 http://www.biomedcentral.com/1471-2105/8/30
The IgG1-IL2 synthesis was also represented as a lumpedequation as follows:
0.0104Gln + 0.0112Ala + 0.0139Gly + 0.0163Val +0.0182Leu + 0.0061Ile + 0.0029Met + 0.0147Pro +0.0072Phe + 0.0037Try + 0.0243Ser + 0.0163Thr +0.0088Asn + 0.0077Tyr + 0.053Cys + 0.0136Lys +0.0061Arg + 0.0043His + 0.0083Asp + 0.0096Glu →IgG1-IL2 (8)
This equation is based on the amino acid composition ofthe antibody IgG1 plus the interleukin IL2 (both aminoacid sequences are available at [37]). The carbohydratecontent of this fusion glycoprotein was neglected since theglucose contribution is extremely small compared to over-all glucose consumption.
Hybrid model structureThe EMs analysis provides a simplified reaction mecha-nism based on which the following hybrid model struc-ture (equivalent to system 3a-b) is formulated:
The state space vector is formed by the concentrations ofcompounds that intervene in the final reactions set (glu-cose, Glc, glutamine, Gln, lactate, Lac, ammonia, Amm,alanine, Ala) and additionally the concentrations of via-ble cells, Xv, and product, IgG:
c = [Xv, Glc, Gln, Lac, Amm, Ala, IgG]T. (10)
Carbon dioxide was excluded because its concentrationwas not measured and because it doesn't interfere with thedynamics of the remaining variables (given that pH iscontrolled). The stoichiometric matrix, K, is establishedfrom the elementary modes of Table 1, but it alsoaccounts for cell growth (5th column) and product forma-tion (6th column) as lumped equations of glucose,glutamine and alanine. It should be noted that the 5th EMwas not included in K because preliminary results showedthat this EM has negligible flux. This observation is inagreement with some published works [38-40], stating
that lactate is mainly produced from glucose, being thepercentage coming from glutamine very low (less than10%). The volumetric reaction rates of the EMs weredefined on the basis of the following assumptions:
(i) all reaction rates are specific (proportional to the con-centration of viable cells),
(ii) the metabolic reactions considered are all irreversible(in this particular problem) and therefore the respectivereaction rates are nonnegative
(iii) uncertainty in relation to kinetic constants and possi-ble unknown saturation and inhibition effects.
(iv) only the concentrations of glucose, glutamine andammonia have a significant impact on the specific reac-tion kinetics [41]. Lactate never reaches inhibitory levelsin our experiments.
In the reaction rates of eq. (9) the term in parenthesis rep-resents the a priori knowledge concerning the kinetics ofthe particular reaction (points (i) and (ii)) whereas the ρi,μ and π terms represent the uncertainty concerning thereaction kinetics (point (iii)) and are functions of threestate variables (point (iv)). With this particular formula-tion, the vector of known kinetic functions is given by:
ϕ(c) = [XvGlc XvGlc XvGln XvGln Xv XvGln]T, (11)
whereas the vector of unknown kinetics is given by:
ρ = [ρ1 ρ2 ρ3 ρ4 μ π]T = ρ(Glc,Gln,Amm,w) (12)
The last term in eq. (9) is the control input vector u thatin our case accounts for the volumetric feeding of glucose,FGlc, and glutamine, FGln.
Identification of the EM kineticsAn important point for the identification of unknown fluxfunctions (12) is that the rank of K is 6, thus the measure-ment of (10) (dim(c) = 7 > rank(K)) is sufficient for theobservability of the EM kinetics. The other relevant pointis the availability of sufficiently "rich" measurements toidentify the "true" fluxes. Preliminary simulation testsshowed that, for the system structure of eq (9), the "true"fluxes can be identified under typical fed-batch conditions(results not shown).
Experimental data of seven experiments (three batch andfour fed-batch cultures) were used for the identification ofthe EM kinetics. Data of 5 experiments were used forparameter calibration whereas data of 2 experiments wereused for model validation. The concentrations in the statespace vector (eq. 10) were analyzed off-line according to
ddt
X
Glc
Gln
Lac
Amm
Ala
IgG
v⎡
⎣
⎢⎢⎢⎢⎢⎢⎢⎢⎢⎢
⎤
⎦
⎥⎥⎥⎥⎥⎥⎥⎥⎥⎥
=
− −0 0 0 0 1 0
1 1 00 0 0 0208 0
0 0 1 1 0 0377 0 0104
2 0 0 0 0 0
0 0 2 1 0 0
0 0 0 1 0 0133 0 0
−− − − −
− −
.
. .
. . 1112
0 0 0 0 0 1
1⎡
⎣
⎢⎢⎢⎢⎢⎢⎢⎢⎢⎢
⎤
⎦
⎥⎥⎥⎥⎥⎥⎥⎥⎥⎥
⋅ρ ( ) (Glc, Gln, Amm X GlcV ))
( ) ( )
( ) ( )
(
ρρρ
2
3
4
Glc, Gln, Amm X Glc
Glc, Gln, Amm X Gln
Glc
V
V
⋅⋅
,, Gln, Amm X Gln
Glc, Gln, Amm X
Glc, Gln, Amm
V
V
) ( )
( ) ( )
( )
⋅⋅
⋅μ
π (( )X Gln
D
X
Glc
Gln
Lac
Amm
Ala
IgGV
v⎡
⎣
⎢⎢⎢⎢⎢⎢⎢⎢
⎤
⎦
⎥⎥⎥⎥⎥⎥⎥⎥
−
⎡
⎣
⎢⎢⎢⎢⎢⎢⎢⎢⎢⎢⎢
⎤
⎦
⎥⎥⎥⎥⎥⎥⎥⎥⎥⎥
+
⎡
⎣
⎢⎢⎢⎢⎢⎢⎢⎢⎢⎢
⎤
⎦
⎥⎥⎥⎥⎥⎥⎥⎥⎥⎥
( )
0
0
0
0
0
9
F
FGlc
Gln
Table 1: Elementary modes of the metabolic network considered.
EM1 : Glucose→ 2 LactateEM2 : Glucose → 6 CO2EM3 : Glutamine → 5 CO2 + 2 AmmoniaEM4 : Glutamine → 2 CO2 + Ammonia + AlanineEM5 : Glutamine → Lactate + 2 CO2 + 2 Ammonia
Page 8 of 15(page number not for citation purposes)

BMC Bioinformatics 2007, 8:30 http://www.biomedcentral.com/1471-2105/8/30
methods published elsewhere [17]. The neural networkhas three inputs, [Glc,Gln,Amm]T and 6 outputs asdefined by eq. (12). The number of hidden nodes wastuned heuristically in the sense of minimizing the error ofthe validation data set. The best result was obtained with5 hidden nodes giving a total number of network param-eters equal to 56. The output scaling factors reflect themaximum kinetic rates and were defined as ρmax = [0.110.30 0.05 0.05 0.09 0.11]T.
The hybrid modeling results in terms of measured andpredicted state variables are presented in Figure 5 for bothtraining and validation data sets. Examples of EM kineticsidentification are provided in Figure 6. The hybrid modelwas able to describe simultaneously all seven experimentswith acceptable accuracy. In particular, the results with thevalidation data set strengthen the predictive potential ofthe model.
Metabolic interpretationFigure 6 illustrates the EM kinetics identified by the hybridmodel for two experiments, one batch and one fed-batchculture. The analysis of the flux distribution over the timecourse of bioreaction provides valuable information con-cerning the evolution of BHK metabolism and how tocontrol the flux distribution through the feeding of glu-cose and glutamine.
In general, the metabolic activity of BHK cells during thecell growth phase is higher in the batch culture than in thefed-batch culture. The EM fluxes in the fed-batch experi-ments seem to be much more controlled than in the batchexperiments. The high levels of glucose and glutamine atthe beginning of the batch culture are mostly directedtoward the overflow metabolism, i.e., waste production oflactate and alanine (EM1 and EM4). The fed-batch culture,which had lower glucose and glutamine concentrationsduring the cell growth phase, started with substantiallylower consumption rates of these nutrients, while main-taining the flux to biomass.
Glucose is consumed for biomass synthesis and is metab-olized through elementary modes EM1 and EM2. The con-sumption of this nutrient differs significantly from batchto fed-batch cultures. Cells use glucose in a more efficientway in fed-batch than in batch cultures particularly at thebeginning of the culture, since the glucose metabolized tolactate (EM1) is much higher in the batch experiment.These results are in agreement with several publishedworks for other mammalian cells [42-44], where it isreported that high glycolytic activity of animal cells resultsfrom high residual glucose.
Glutamine is consumed for product and biomass synthe-sis and is metabolized through elementary modes EM3
Hybrid modeling resultsFigure 5Hybrid modeling results. Modeling results of all seven state variables for both training (I-V) and validation data sets (VI-VII). Experiments I-III are Batch cultures and IV-VII are Fed-batch cultures.
Page 9 of 15(page number not for citation purposes)

BMC Bioinformatics 2007, 8:30 http://www.biomedcentral.com/1471-2105/8/30
Page 10 of 15(page number not for citation purposes)
Kinetic rates identified by the hybrid modelFigure 6Kinetic rates identified by the hybrid model. The kinetic rates over the time course of bioreaction can provide valuable information concerning the evolution of BHK metabolism, (a) Batch culture; (b) Fed-batch culture.

BMC Bioinformatics 2007, 8:30 http://www.biomedcentral.com/1471-2105/8/30
and EM4. The most energetic pathway involvingglutamine, EM3, is practically inactive during the cellgrowth phase of the batch culture, being glutamine pref-erentially converted into alanine. On the opposite, thiselementary flux mode is an important pathway in thecourse of the fed-batch culture, representing 50% of thetotal glutamine consumption. The higher production rateof alanine at high glutamine levels (such as the onespresent at the beginning of batch cultures) is consistentwith observations made by Doverskog et al. [44] andVriezen et al. [45].
Concerning the specific formation rate of glycoprotein,πIgG, the product formation is consistently more stable inthe fed-batch culture than in the batch culture. The prod-uct synthesis rate oscillates between 0,06 and 0,07 mg 10-
9 cells h-1 in the former case whereas in the latter case thereaction is much lower in the beginning. This appears tobe correlated with the overflow metabolism in the batchexperiments, which seems to be detrimental for productsynthesis.
On-line culture optimisationThe hybrid model was further used for on-line optimisa-tion of a fed-batch BHK culture. The model parameterswere re-tuned on-line using the data from the running cul-tivation. A batch training scheme was adopted, wherebythe data of the running cultivation along with the data ofhistorical experiments were used for model adjustment(Figure 2). Some variables, namely glucose, glutamine,lactate and viable cells concentration, can be measuredoff-line, with the results available after a short period oftime (about 10 minutes). Therefore, at sampling times of6 to 12 h, these measurements were stored in the trainingdata set and then used for parameter identification usingthe same strategy previously described in the Identificationof the EM kinetics section. The only difference was that theinitial parameter values were those obtained in the off-line training procedure. The ammonia, alanine and IgGconcentrations were exclude form this model adjustmentstep because they were quantified only at the end of theexperiment.
After the parameters retuning step, the glucose andglutamine feeding rates were re-optimised (u = [FGLC,FGLN]T) in the sense of maximising the total amount ofIgG1-IL2 produced at the end of the experiment (13).
The optimisation (13) is subjected to the constraints ofthe process dynamics (equation 9), upper and lowerbounds for the glucose and glutamine feeding rates, andthe maximum risk of model unreliability, RISKmax (seemethods section). The increase in volume is negligible inthis problem, thus it was not considered in optimisation(13). The risk constraint states that the average risk mustnot exceed a given maximum level defined by the user.This restricts the feasibility domain to low risk regions andis essential for process optimisation supported by hybridmodels since the black-box model (4a,b) predictionsdegrade in regions of the input space with sparse measure-ments.
The micro-genetic algorithm coded by [31] was used tosolve optimisation (13). The population size and numberof generations was 5 and 2000, respectively. A maximumrisk level of 35% (RISKmax = 0.35) was adopted during theon-line optimisation experiment. At each sampling time,the flow rates of the feeding pumps were updated accord-ing to the re-optimised feeding profiles of glucose andglutamine.
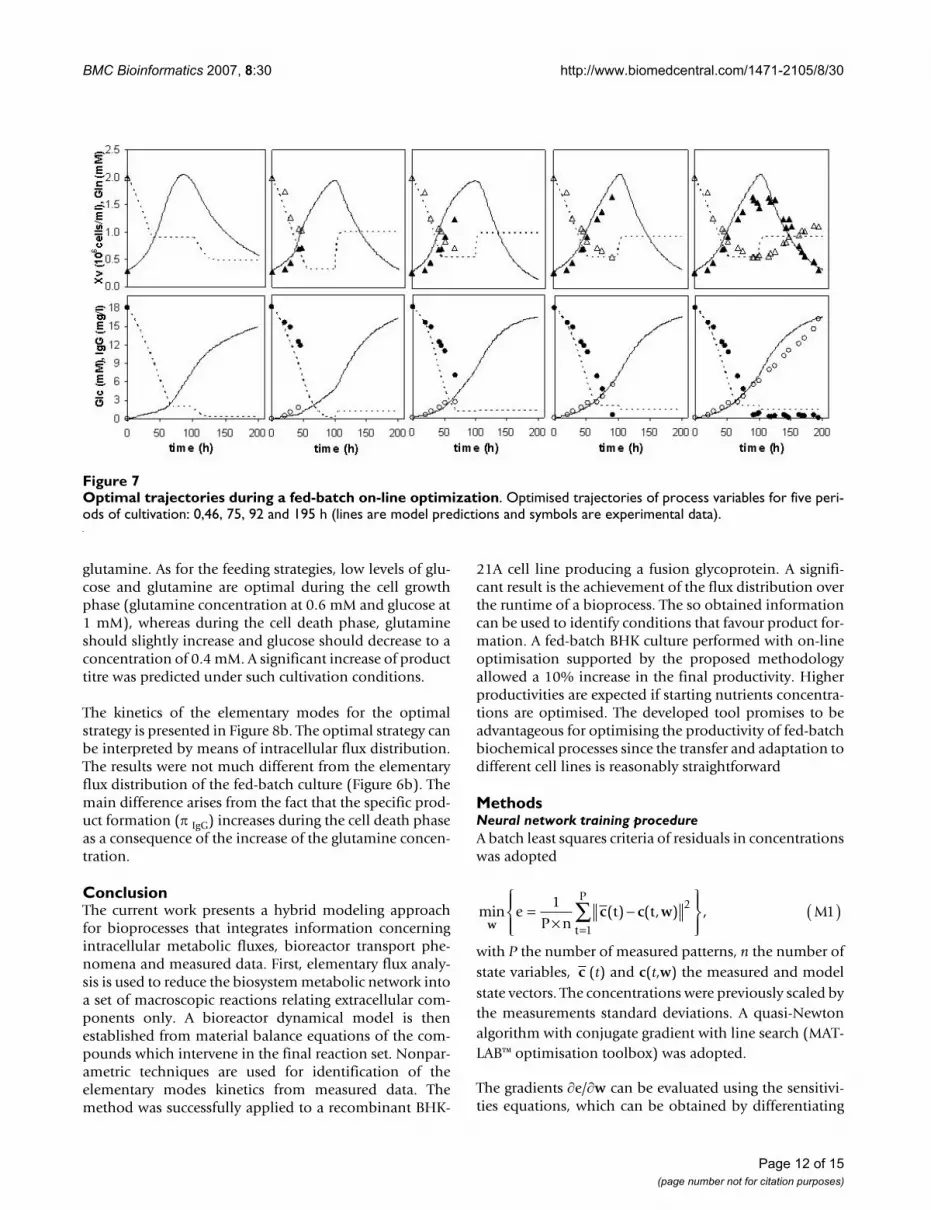
Figure 7 shows the optimised trajectories and correspond-ing measurements for the main state variables (viablecells, glucose, glutamine and product) at cultivation timesof 0 h (i.e., a priori optimised trajectories), 46 h, 75 h, 92h and 195 h. The comparison of predicted and measuredconcentrations shows a very satisfactory performance forthe on-line optimisation. Furthermore, although themeasured product concentration was only available at theend of the experiment, the predicted time course of thisvariable follows closely the product measurements. Thefinal product titre obtained was 16.4 mg/1 correspondingto a 10% increase in relation to previous experiments car-ried out with the same medium (initial glucose andglutamine concentrations) and without on-line optimisa-tion.
Medium optimisationHigher productivities are likely if the initial medium com-position is optimised. The optimisation results of initialglucose and glutamine concentrations along with the cor-responding feeding strategies are shown in Figure 8a. Themedium should have initially low levels of glucose and
max ( ) ( )
,
uIgG IL f f
glu glu
g
J C t V t
F F
F F
=
( )≤ ≤
≤ ≤
− 2
9
0
0
equation
max
ln gg
ft
t
t t RISK d RISKf
ln max,
max( ) ( )− [ ] ≤
( )
− ∫01
0
13
c τ τ
Page 11 of 15(page number not for citation purposes)
BMC Bioinformatics 2007, 8:30 http://www.biomedcentral.com/1471-2105/8/30
glutamine. As for the feeding strategies, low levels of glu-cose and glutamine are optimal during the cell growthphase (glutamine concentration at 0.6 mM and glucose at1 mM), whereas during the cell death phase, glutamineshould slightly increase and glucose should decrease to aconcentration of 0.4 mM. A significant increase of producttitre was predicted under such cultivation conditions.
The kinetics of the elementary modes for the optimalstrategy is presented in Figure 8b. The optimal strategy canbe interpreted by means of intracellular flux distribution.The results were not much different from the elementaryflux distribution of the fed-batch culture (Figure 6b). Themain difference arises from the fact that the specific prod-uct formation (π IgG) increases during the cell death phaseas a consequence of the increase of the glutamine concen-tration.
ConclusionThe current work presents a hybrid modeling approachfor bioprocesses that integrates information concerningintracellular metabolic fluxes, bioreactor transport phe-nomena and measured data. First, elementary flux analy-sis is used to reduce the biosystem metabolic network intoa set of macroscopic reactions relating extracellular com-ponents only. A bioreactor dynamical model is thenestablished from material balance equations of the com-pounds which intervene in the final reaction set. Nonpar-ametric techniques are used for identification of theelementary modes kinetics from measured data. Themethod was successfully applied to a recombinant BHK-
21A cell line producing a fusion glycoprotein. A signifi-cant result is the achievement of the flux distribution overthe runtime of a bioprocess. The so obtained informationcan be used to identify conditions that favour product for-mation. A fed-batch BHK culture performed with on-lineoptimisation supported by the proposed methodologyallowed a 10% increase in the final productivity. Higherproductivities are expected if starting nutrients concentra-tions are optimised. The developed tool promises to beadvantageous for optimising the productivity of fed-batchbiochemical processes since the transfer and adaptation todifferent cell lines is reasonably straightforward
MethodsNeural network training procedureA batch least squares criteria of residuals in concentrationswas adopted
with P the number of measured patterns, n the number ofstate variables, (t) and c(t,w) the measured and modelstate vectors. The concentrations were previously scaled bythe measurements standard deviations. A quasi-Newtonalgorithm with conjugate gradient with line search (MAT-LAB™ optimisation toolbox) was adopted.
The gradients ∂e/∂w can be evaluated using the sensitivi-ties equations, which can be obtained by differentiating
min ( ) ( , ) ,w
c c weP n
t t Mt
P=
×−
⎧⎨⎪
⎩⎪
⎫⎬⎪
⎭⎪( )
=∑1
12
1
c
Optimal trajectories during a fed-batch on-line optimizationFigure 7Optimal trajectories during a fed-batch on-line optimization. Optimised trajectories of process variables for five peri-ods of cultivation: 0,46, 75, 92 and 195 h (lines are model predictions and symbols are experimental data).
Page 12 of 15(page number not for citation purposes)

BMC Bioinformatics 2007, 8:30 http://www.biomedcentral.com/1471-2105/8/30
Page 13 of 15(page number not for citation purposes)
Optimisation results with optimised mediumFigure 8Optimisation results with optimised medium. (a) Predicted optimal trajectories of viable cells, glucose, glutamine and product concentrations starting with low levels of glucose and glutamine. (b) Distribution of intracellular elementary modes over the time course of the process for the optimal strategy.

BMC Bioinformatics 2007, 8:30 http://www.biomedcentral.com/1471-2105/8/30
eq. (3a) in order to w, yielding, after some manipulations,the following linear time-varying system:
with
These equations must be integrated along with hybridmodel eqs. (3)–(4). The initial value is (∂c/∂w)t = 0 = 0because the initial state is independent of parameters w.The evaluation of matrices A and B require the sensitivi-ties ∂ϕj/∂c, ∂ρj/∂w and ∂ρj/∂c. The first term is obtained byanalytical derivation of known functions (in our case, bythe derivation of eq. (9)). The other two matrices areobtained by backpropagating the identity matrix throughthe neural network. The backpropagation of a given iden-tity matrix column 'i' results in the evaluation of vectors∂ρij/∂w and ∂ρij/∂c.
Evaluation of prediction riskThe trust region is the subspace of the input domain,where the model was properly validated with experimen-tal data, showing low modeling error. Model predictions,c*, outside the trust region may have a high risk, RISK(c*),of being unreliable. The use of unreliable model predic-tions for process control should be avoided. For this rea-son, the value of the risk is used as a constraint to theoptimisation (13). Here, the trust region was defined bync ellipsoidal clusters of the form:
with mj the cluster centres and ∑ = diag{σi2} the diagonal
covariance matrix. The choice of the clusters number (nc)is done by trial and error according to the criteria of good-ness of measurement density representation. The rule nc =P/3, with P the number of measured patterns normallyprovides acceptable results. The interpolation tolerances(IT) defines the distance to measured pattern such that yC> 0.5. The clusters width is then given by:
σ = [-2 ln(0.5/n)]-1/2 IT (M6)
The k-means algorithm was used to calculate mj. The finalset of clusters forms a continuous density function f:c→vby applying the maximum operator:
The output v(c) is a scalar between 0 and 1 that can beinterpreted as the degree of membership of c to the dataset used for training the black-box model (4). Low v val-ues (i.e. c vectors out of the interpolation tolerance) are anindication of high risk of the black box model outputsbeing unreliable. Finally, the risk of black box modelunreliability is given by: RISK(c) = 1 - v(c) (M8)
AbbreviationsBHK – Baby Hamster Kidney cells
CHO – Chinese Hamster Ovary cells
EM – Elementary Flux Mode
EP – Extreme Pathway
FBA – Flux Balance Analysis
IgG1-IL2 – Imunoglobulin type one linked to interleukintype two
LP – Linear Programming
MFA – Metabolic Flux Analysis
MPA – Metabolic Pathway Analysis
Authors' contributionsAll authors read and approved the final manuscript. ROdeveloped the software. APT, CA and RO participated inthe model implementation. APT performed experimentalwork. PA, MJTC and RO designed and coordinated thestudy. APT and RO drafted the manuscript.
AcknowledgementsSupport from Sartorius BBI and Merck KGaA is gratefully acknowledged. Financial support for this work was provided by the Portuguese Fundação para a Ciência e Tecnologia through project POCTI/BIO/57927/2004 and PhD grant SFRH/BD/13712/2003.
References1. Stephanopoulos G: Metabolic fluxes and metabolic engineer-
ing. Metab Eng 1999, 1(1):1-11.2. Varma A, Palsson BO: Metabolic Flux Balancing: Basic Con-
cepts, Scientific and Practical Use. Bio-Technology 1994,12(994–998):994-998.
3. Bonarius HPJ, Schmid G, Tramper J: Flux analysis of underdeter-mined metabolic networks: the quest for the missing con-straints. Trends in Biotechnology 1997, 15(8):308-314.
4. Pramanik J, Keasling JD: Stoichiometric model of Escherichiacoli metabolism: Incorporation of growth-rate dependentbiomass. Biotech and Bioeng 1997, 56(4):398-421.
5. Edwards JS, Ibarra RU, Palsson BO: In silico predictions ofEscherichia coli metabolic capabilities are consistent withexperimental data. Nat Biotechnol 2001, 19(2):125-130.
ddt w w
M∂∂
⎛⎝⎜
⎞⎠⎟= ∂
∂+ ( )c
Ac
B 2
A Kc c
I=∂∂
+∂∂
− ( )ρϕ
ϕρ
ij
jj
nD , M3
B Kw
=∂∂
( )ϕρ
jj
, M4
y e MC jj
Tj( , , )
. ( ) ( )c m c m c mΣΣ = ( )− − −−0 5 1
5Σ
v y Mj
C j( ) max ( , , ) .c c m= { } ( )ΣΣ 7
Page 14 of 15(page number not for citation purposes)

BMC Bioinformatics 2007, 8:30 http://www.biomedcentral.com/1471-2105/8/30
Publish with BioMed Central and every scientist can read your work free of charge
"BioMed Central will be the most significant development for disseminating the results of biomedical research in our lifetime."
Sir Paul Nurse, Cancer Research UK
Your research papers will be:
available free of charge to the entire biomedical community
peer reviewed and published immediately upon acceptance
cited in PubMed and archived on PubMed Central
yours — you keep the copyright
Submit your manuscript here:http://www.biomedcentral.com/info/publishing_adv.asp
BioMedcentral
6. Edwards JS, Covert M, Palsson B: Metabolic modelling ofmicrobes: the flux-balance approach. Environ Microbiol 2002,4(3):133-140.
7. Lee DY, Fan LT, Park S, Lee SY, Shafie S, Bertok B, Friedler F: Com-plementary identification of multiple flux distributions andmultiple metabolic pathways. Metab Eng 2005, 7(3):182-200.
8. Schuster S, Dandekar T, Fell DA: Detection of elementary fluxmodes in biochemical networks: a promising tool for path-way analysis and metabolic engineering. Trends Biotechnol 1999,17(2):53-60.
9. Schuster S, Fell DA, Dandekar T: A general definition of meta-bolic pathways useful for systematic organization and analy-sis of complex metabolic networks. Nat Biotechnol 2000,18(3):326-332.
10. Klamt S, Stelling J: Two approaches for metabolic pathwayanalysis? Trends Biotechnol 2003, 21(2):64-69.
11. Schilling CH, Letscher D, Palsson BO: Theory for the SystemicDefinition of Metabolic Pathways and their use in Interpret-ing Metabolic Function from a Pathway-Oriented Perspec-tive. Journal of Theoretical Biology 2000, 203(3):229-248.
12. Edwards JS, Palsson BO: How will bioinformatics influence met-abolic engineering? Biotechnol Bioeng 1998, 58:162-169.
13. Provost A, Bastin G: Dynamic metabolic modeling under bal-anced growth condition. J Process Control 2004, 14:717-728.
14. Mahadevan R, Burgard AP, Famili I, Van Dien S, Schilling CH: Appli-cations of metabolic modeling to drive bioprocess develop-ment for the production of value-added chemicals. Biotechand Bioprocess Eng 2005, 10(5):408-417.
15. Dhir S, Morrow KJ Jr, Rhinehart RR, Wiesner T: Dynamic optimi-zation of hybridoma growth in a fed-batch bioreactor. Bio-technol Bioeng 2000, 67(2):197-205.
16. Mahadevan R, Doyle IF: On-line optimization of recombinantproduct in a fed-batch bioreactor. Biotechnol Prog 2003,19(2):639-646.
17. Teixeira A, Cunha AE, Clemente JJ, Moreira JL, Cruz HJ, Alves PM,Carrondo MJ, Oliveira R: Modelling and optimization of arecombinant BHK-21 cultivation process using hybrid grey-box systems. J Biotechnol 2005, 118(3):290-303.
18. Teixeira AP, Clemente JJ, Cunha AE, Carrondo MJ, Oliveira R: Bio-process iterative batch-to-batch optimization based onhybrid parametric/nonparametric models. Biotechnol Prog2006, 22(1):247-258.
19. Bonvin D: Optimal operation of batch reactors: a personalview. J process Control 1998, 8:355-368.
20. Banga JR, Balsa-canto E, Moles CG, Alonso AA: Dynamic optimiza-tion of bioreactors: a review. Indian Natn Sci Acad 2003,69:359-401.
21. Rockafellar R: Convex analysis. Princeton, Princeton UniversityPress; 1970.
22. Gagneur J, Klamt S: Computation of elementary modes: a uni-fying framework and the new binary approach. BMC Bioinfor-matics 2004, 5:175-196.
23. Gadkar KG, Gunawan R, Doyle FJ 3rd: Iterative approach tomodel identification of biological networks. BMC Bioinformatics2005, 6:155.
24. Stephanopoulos G, Aristidou AA, Nielsen J: Metabolic Engineer-ing:. Elsevier Science 1998.
25. Oliveira R: Combining first principles modelling and artificialneural networks: a general framework. Computers & ChemicalEngineering 2004, 28(5):755-766.
26. Thompson ML, Kramer MA: Modeling chemical processes usingprior knowledge and neural networks. Process Systems Engineer-ing 1994, 40(8):1328-1340.
27. van Can HJ, te Braake HA, Bijman A, Hellinga C, Luyben KC, HeijnenJJ: An efficient model development strategy for bioprocessesbased on neural networks in macroscopic balances: Part II.Biotechnol Bioeng 1999, 62(6):666-680.
28. Psichogios D, Ungar LH: A hybrid neural network-first princi-ples approach to process modeling. AIChE Journal 1992,38(10):1499-1511.
29. Schubert J, Simutis R, Doors M, Havlik I, Lübbert A: Hybrid Model-ling of Yeast Production Processes. Chem Eng Technol 1994,17:10-20.
30. Krishnakumar K: Micro-Genetic Algorithms for Stationary andNon-Stationary Function Optimization. In SPIE: Intelligent Con-trol and Adaptive Systems Philadelphia, PA; 1989:1196.
31. Carroll DL: Chemical Laser Modeling with Genetic Algo-rithms. AIAA J 1996, 34(2):338-346.
32. Cruz HJ, Conradt HS, Dunker R, Peixoto CM, Cunha AE, Thomaz M,Burger C, Dias EM, Clemente J, Moreira JL, et al.: Process develop-ment of a recombinant antibody/interleukin-2 fusion proteinexpressed in protein-free medium by BHK cells. J Biotechnol2002, 96(2):169-183.
33. Follstad BD, Balcarcel RR, Stephanopoulos G, Wang DI: Metabolicflux analysis of hybridoma continuous culture steady statemultiplicity. Biotechnol Bioeng 1999, 63(6):675-683.
34. Gódia F, Cairó JJ: Metabolic engineering of animal cells. Bioproc-esses and Biosystems Engineering 2002, 24:289-298.
35. Klamt S, Stelling J, Ginkel M, Gilles ED: FluxAnalyzer: exploringstructure, pathways, and flux distributions in metabolic net-works on interactive flux maps. Bioinformatics 2003,19(2):261-269.
36. Gambhir A, Korke R, Lee J, Fu PC, Europa A, Hu WS: Analysis ofcellular metabolism of hybridoma cells at distinct physiolog-ical states. J Biosci Bioeng 2003, 95(4):317-327.
37. [http://www.rcsb.org].38. Reitzer L, Wice BM, Kennel D: Evidence that glutamine, not
sugar, is the major energy source for cultured HeLa Cells.The Journal of Biological Chemistry 1979, 254(8):2669-2676.
39. Ozturk SS, Palsson BO: Growth, metabolic, and antibody pro-duction kinetics of hybridoma cell culture: 1. Analysis of datafrom controlled batch reactors. Biotechnol Prog 1991,7(6):471-480.
40. Ozturk SS, Palsson BO: Growth, metabolic, and antibody pro-duction kinetics of hybridoma cell culture: 2. Effects ofserum concentration, dissolved oxygen concentration, andmedium pH in a batch reactor. Biotechnol Prog 1991,7(6):481-494.
41. Cruz HJ, Freitas CM, Alves PM, Moreira JL, Carrondo MJ: Effects ofammonia and lactate on growth, metabolism, and produc-tivity of BHK cells. Enzyme Microb Technol 2000, 27(1–2):43-52.
42. Xie L, Wang DIC: Material balance studies on animal cellmetabolism using a stoichiometrically based reaction net-work. Biotechnology and Bioengineering 1996, 52:579-590.
43. Bonarius HPJ, Hatzimanikatis V, Meesters KPH, Gooijer CD, SchmidG, Tramper J: Metabolic flux analysis of hybridoma cells in dif-ferent culture media using mass balances. Biotechnology and Bio-engineering 1996, 50:299-318.
44. Doverskog M, Ljunggren J, Ohman L, Haggstrom L: Physiology ofcultured animal cells. J Biotechnol 1997, 59(1–2):103-115.
45. Vriezen N, Romein B, Luyben KCAM, van Dijken JP: Effects ofglutamine supply on growth and metabolism of mammaliancells in chemostat culture. Biotech and Bioeng 1997,54(3):272-286.
Page 15 of 15(page number not for citation purposes)


![Elementary algebra [microform]](https://img.pdfslide.net/doc/110x75/63233ca9887d24588e04911d/elementary-algebra-microform.jpg)