Embed Size (px)
Citation preview
Hydraulic performance of drip irrigation
subunits using WWTP effluents
J. Puig-Bargues a,*, G. Arbat a, J. Barragan b,F. Ramırez de Cartagena a
a Department of Chemical and Agricultural Engineering and Technology,
University of Girona, Campus Montilivi s/n, 17071 Girona, Spainb Department of Agricultural and Forestry Engineering, University of Lleida,
Avda. Rovira Roure 191, 25198 Lleida, Spain
Received 1 January 2004; received in revised form 1 June 2004; accepted 1 September 2004
Available online 9 March 2005
Abstract
The hydraulic performance of three drip irrigation subunits using effluents from a WWTP (Waste
Water Treatment Plant) was studied. Each subunit had four laterals, 40 m in length with 1.9 l/h drip
emitters spaced at 0.3 m intervals. Two subunits, one with a 130 mm disk filter and the other with a
130 mm screen filter, were supplied with secondary effluent from an activated sludge treatment. The third
subunit, which had a 130 mm screen filter, was supplied with the effluent that had undergone tertiary
treatment based on filtration with sand cells and disinfection by ultraviolet light and chlorination. All the
subunits operated intermittently for a total of 750 h–10 h per day, 5 days per week. Water was analyzed
periodically at the points of entry and exit of each filter, and at the location of the first and last emitters of a
lateral. The emission and pressure uniformity and the variation coefficients were determined every 50 h.
The laterals and emitters were cut open and analyzed with microscopic techniques once the field
experiment was finished. The action of the filters and emitters did not result in significant changes in the
water composition. However, with secondary effluent, uniformity in the subunit diminished consider-
ably, because the emitters became clogged. The main causes observed regarding the clogging of the
emitters were biological. The subunit with secondary effluent and a disk filter showed the worst values of
uniformity. In contrast, uniformity was stable throughout the trials with tertiary effluent.
# 2005 Elsevier B.V. All rights reserved.
Keywords: Clogging; Effluent; Uniformity; Drip irrigation
www.elsevier.com/locate/agwat
Agricultural Water Management 77 (2005) 249–262
* Corresponding author. Tel.: +34 972 41 84 59; fax: +34 972 41 83 99.
E-mail addresses: [email protected] (J. Puig-Bargues), [email protected] (G. Arbat),
[email protected] (J. Barragan), [email protected] (F. Ramırez de Cartagena).
0378-3774/$ – see front matter # 2005 Elsevier B.V. All rights reserved.
doi:10.1016/j.agwat.2004.09.032
1. Introduction
The use of wastewater for irrigation purposes is being established as a future alternative
in those areas where there is heavy competition for water. In this perspective, the irrigation
system that has more advantages in terms of the environment and public health is drip
irrigation (Bucks et al., 1979; McDonald et al., 1984; Feigin et al., 1991; Oron et al., 1992).
Despite these advantages, drip irrigation has a serious limitation in that the emitters tend to
clog (McDonald et al., 1984; Feigin et al., 1991; Ravina et al., 1997) which affects the
water application uniformity (Oron et al., 1979; Nakayama and Bucks, 1981).
Filtration is a key aspect in drip irrigation with wastewater (Oron et al., 1979; McDonald
et al., 1984), but this does not prevent emitters to clog (Tajrishy et al., 1994). The most
important factors that affect clogging of emitters when using effluents are suspended solids
and micro-organisms, especially algae and bacteria (McDonald et al., 1984; Adin and Sacks,
1991; Tajrishy et al., 1994; Taylor et al., 1995; Ravina et al., 1997; Hills and Brenes, 2001).
Chlorination has been found to be an effective way to reduce clogging caused by
bacteria and algae when wastewater is used (Oron et al., 1979; Tajrishy et al., 1994; Ravina
et al., 1997; Coelho and Resende, 2001); applying other oxidant or flocculant substances is
also effective (Adin and Sacks, 1991) as is a combination of both treatments (Chica et al.,
2000a). The effect at the moment chlorination is applied has also been studied (Gilbert
et al., 1981; Tajrishy et al., 1994).
The aim of this work was, first, to evaluate the influence of different strategies of effluent
treatment on irrigation uniformity at the subunit level; second, to determine the degree and
type of clogging produced, and, third, to study the influence of the types of filters in the
clogging of the emitters.
2. Materials and methods
2.1. Location
The study was carried out between July and October 2001, using the effluents treated in
the wastewater treatment plant (WWTP) of Castell-Platja d’Aro (Girona, Spain).
Secondary treatment at this WWTP is by means of an activated sludge process; tertiary
treatment is by means of filtration in a mono-medium, unstratified sand filter bed and then
disinfection by exposure to ultraviolet light and chlorination with 5 mg NaClO/l. The sand
filter had four filtration cells, each one with a filtration surface of 20 m2 and a depth of
0.25 m. The effective grain size of the sand was 0.45 mm and its uniformity coefficient of
1.6. The maximum filtration velocity was 7.8 m3/(m2 h). Each sand filtration cell had
between two and three backwashings per day.
2.2. Experimental set-up
The experimental set-up consisted in three irrigation subunits. Two of these subunits
were supplied with secondary effluent from the WWTP, while the third was supplied with
tertiary effluent.
J. Puig-Bargues et al. / Agricultural Water Management 77 (2005) 249–262250
Each subunit had a control head with a filter, a manometer at filter inlet and outlet, a
volumetric counter of 38.1 mm (3/2 in.) diameter and a pressure regulator of 19.1 mm (3/
4 in.) diameter. The mean pressure at the pressure regulators outlet was 153 kPa in the
subunit with secondary effluent and disk filter, 155 kPa in the subunit with secondary
effluent and screen filter and 159 kPa in the subunit with tertiary effluent and screen filter.
The average head loss along the different subunits oscillated between 33 kPa and 35 kPa.
Valves were installed, before the volumetric counter and at the exit of the filter, to allow
effluent sampling.
Disk and screen filters of 50.8 mm (2 in.) diameter and a level of filtration of 130 mm,
which is the typical filtration level in the region, were used in the tests. One of the subunits
with secondary effluent had a disk filter and the other had a screen filter. The subunit with
the tertiary effluent used a screen filter.
In each subunit, four laterals of 40 m length, 12 mm nominal diameter and 1 mm wall
thickness were installed. The emitters were of the tortuous-path type, integrated and non-
compensating. The emitters had a nominal flow of 1.9 l/h at 101.2 kPa and were spaced by
0.3 m. According to the manufacturer, the emitter discharge formula is:
q ¼ 0:629H0:48 (1)
where q is the emitter discharge (l/h) and H the operating pressure (m of water column).
The manufacturing coefficient of variation (CVm) was 0.03 maximum. The minimum
water passage dimensions were 0.7 mm wide and 0.7 mm deep.
2.3. Operational procedure
The experimental set-up has been operated for 750 h, i.e. 10 h/day for two 3-hour
periods plus two 2-hour periods, from Monday to Friday. The operation schedule during a
day was from 8:00 to 11:00 h, from 12:00 to 14:00, from 17:00 to 20:00 and from 22:00 to
24:00. No flushing of the laterals was carried out during the experiment. The total amounts
of volume measured by the volumetric meters were 767.6 m3, 771.7 m3 and 882.7 m3 for
the subunits with screen filter and secondary effluent, disk filter and secondary effluent and
screen filter and tertiary effluent, respectively.
The filters were cleaned manually when the head loss across them was higher than
49 kPa. The average time between two filter cleanings was 164 h for both screen filters and
218 h for the disc filter.
Samples of the effluents were taken periodically at filters inlet and outlet and from the
first and last emitters of a lateral of each subunit. The total suspended solids (TSS), the
chemical oxygen demand (COD) and the turbidity of these samples were determined in the
laboratory. The number of particles of the samples was analyzed using a Galai1 Cis1
particle laser analyzer.
2.4. Determination of the irrigation uniformity
Approximately every 50 working hours, the uniformity of the drip irrigation subunits
was determined by means of the methodology described by Merriam and Keller (1978) and
adapted by Vermeiren and Jobling (1986).
J. Puig-Bargues et al. / Agricultural Water Management 77 (2005) 249–262 251
In each of the four laterals of the subunit, two contiguous emitters were selected in
four different positions along the lateral: at the beginning, at 1/3 and 2/3 of the way
along its length and at the end: 16 different locations and 32 emitters. At each location,
the working pressure was measured by means of a manometer placed in the hole of one
of its two emitters. A liquid filled manometer with a precision of 1% (�5.9 kPa) was
used. The manometer was previously calibrated. The manometer had a pressure port
adapter which avoided leaks that could affect pressure measurements. Whenever the
emitter being tested was completely clogged, the pressure was measured in the next
emitter. From each of the 32 emitters, the water delivered during a period of 3 min was
collected and its volume was determined by means of a 1-liter graduated cylinder. This
data was used to calculate the average flow for each pair of emitters, producing 16
average rates of flow.
The data obtained was used to calculate the emission uniformity (EU), the absolute
emission uniformity (EUa) (Keller and Karmeli, 1974), the pressure uniformity (Up)
(Bliesner, 1976), the coefficient of variation of the emitter flow (CVq), the coefficient of
variation of the pressure (CVh) and the coefficient of variation due to the emitters (CVe)
(Bralts and Kesner, 1983). The formulas used for calculating the previous parameters are
shown in Table 1.
2.5. Observation of the material
The laterals of each subunit were cut at the end of the experiment. Observations were
focused on the emitters selected for the determination of uniformity. These emitters were
kept in the same effluent they had been using and refrigerated until they were inspected,
first with a Nikon1 SMZ 1000 8-80x Plan Apo stereo zoom microscope and after that with
a Zeiss1 DSM 960-A scanning electron microscope.
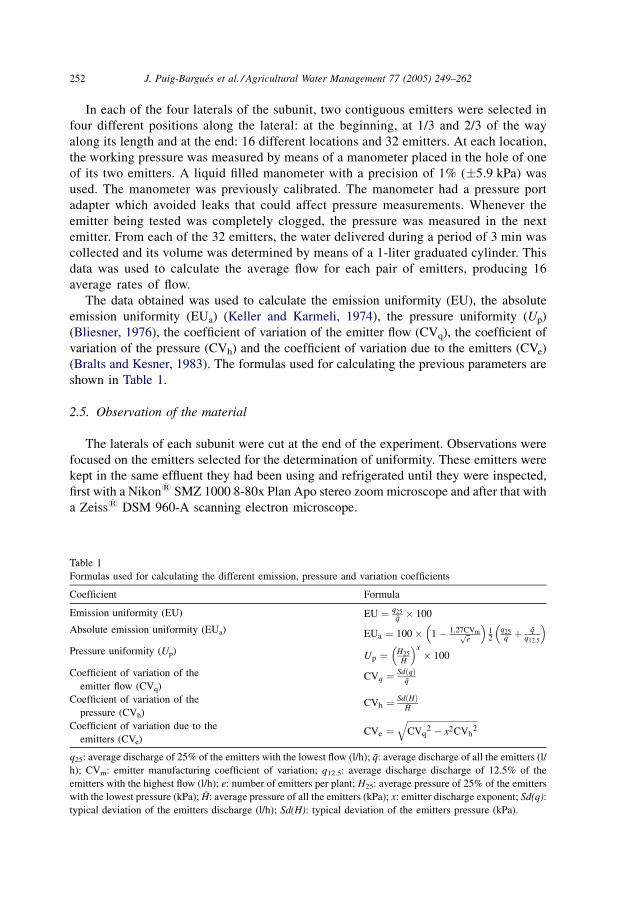
J. Puig-Bargues et al. / Agricultural Water Management 77 (2005) 249–262252
Table 1
Formulas used for calculating the different emission, pressure and variation coefficients
Coefficient Formula
Emission uniformity (EU) EU ¼ q25q � 100
Absolute emission uniformity (EUa) EUa ¼ 100 � 1 � 1:27CVmffiffie
p� �
12
q25q þ q
q12:5
� �
Pressure uniformity (Up) Up ¼ H25
H
� �x� 100
Coefficient of variation of the
emitter flow (CVq)CVq ¼ SdðqÞ
q
Coefficient of variation of the
pressure (CVh)CVh ¼ SdðHÞ
H
Coefficient of variation due to the
emitters (CVe)CVe ¼
ffiffiffiffiffiffiffiffiffiffiffiffiffiffiffiffiffiffiffiffiffiffiffiffiffiffiffiffiffiffiffiffiCVq
2 � x2CVh2
q
q25: average discharge of 25% of the emitters with the lowest flow (l/h); q: average discharge of all the emitters (l/
h); CVm: emitter manufacturing coefficient of variation; q12.5: average discharge discharge of 12.5% of the
emitters with the highest flow (l/h); e: number of emitters per plant; H25: average pressure of 25% of the emitters
with the lowest pressure (kPa); H: average pressure of all the emitters (kPa); x: emitter discharge exponent; Sd(q):
typical deviation of the emitters discharge (l/h); Sd(H): typical deviation of the emitters pressure (kPa).
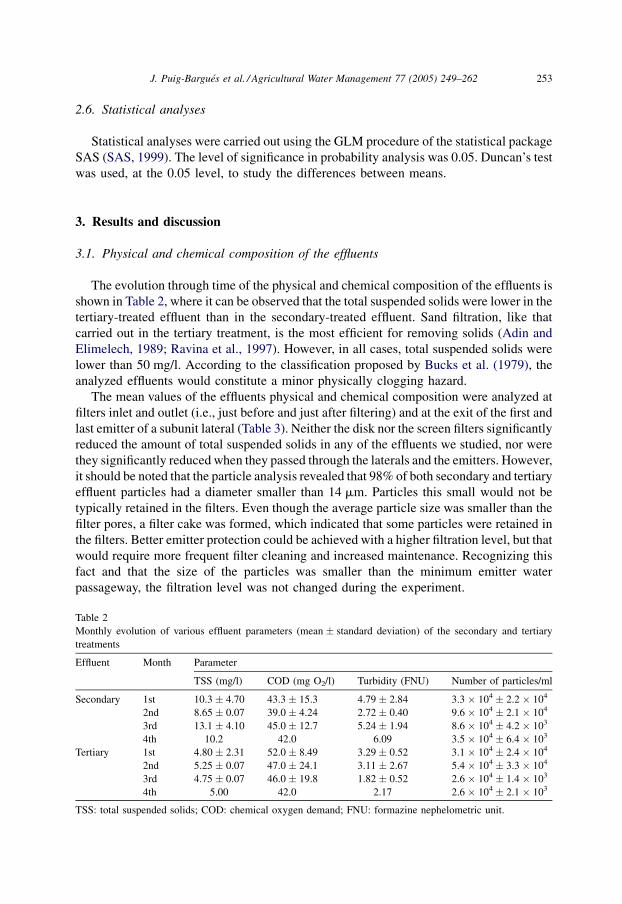
2.6. Statistical analyses
Statistical analyses were carried out using the GLM procedure of the statistical package
SAS (SAS, 1999). The level of significance in probability analysis was 0.05. Duncan’s test
was used, at the 0.05 level, to study the differences between means.
3. Results and discussion
3.1. Physical and chemical composition of the effluents
The evolution through time of the physical and chemical composition of the effluents is
shown in Table 2, where it can be observed that the total suspended solids were lower in the
tertiary-treated effluent than in the secondary-treated effluent. Sand filtration, like that
carried out in the tertiary treatment, is the most efficient for removing solids (Adin and
Elimelech, 1989; Ravina et al., 1997). However, in all cases, total suspended solids were
lower than 50 mg/l. According to the classification proposed by Bucks et al. (1979), the
analyzed effluents would constitute a minor physically clogging hazard.
The mean values of the effluents physical and chemical composition were analyzed at
filters inlet and outlet (i.e., just before and just after filtering) and at the exit of the first and
last emitter of a subunit lateral (Table 3). Neither the disk nor the screen filters significantly
reduced the amount of total suspended solids in any of the effluents we studied, nor were
they significantly reduced when they passed through the laterals and the emitters. However,
it should be noted that the particle analysis revealed that 98% of both secondary and tertiary
effluent particles had a diameter smaller than 14 mm. Particles this small would not be
typically retained in the filters. Even though the average particle size was smaller than the
filter pores, a filter cake was formed, which indicated that some particles were retained in
the filters. Better emitter protection could be achieved with a higher filtration level, but that
would require more frequent filter cleaning and increased maintenance. Recognizing this
fact and that the size of the particles was smaller than the minimum emitter water
passageway, the filtration level was not changed during the experiment.
J. Puig-Bargues et al. / Agricultural Water Management 77 (2005) 249–262 253
Table 2
Monthly evolution of various effluent parameters (mean � standard deviation) of the secondary and tertiary
treatments
Effluent Month Parameter
TSS (mg/l) COD (mg O2/l) Turbidity (FNU) Number of particles/ml
Secondary 1st 10.3 � 4.70 43.3 � 15.3 4.79 � 2.84 3.3 � 104 � 2.2 � 104
2nd 8.65 � 0.07 39.0 � 4.24 2.72 � 0.40 9.6 � 104 � 2.1 � 104
3rd 13.1 � 4.10 45.0 � 12.7 5.24 � 1.94 8.6 � 104 � 4.2 � 103
4th 10.2 42.0 6.09 3.5 � 104 � 6.4 � 103
Tertiary 1st 4.80 � 2.31 52.0 � 8.49 3.29 � 0.52 3.1 � 104 � 2.4 � 104
2nd 5.25 � 0.07 47.0 � 24.1 3.11 � 2.67 5.4 � 104 � 3.3 � 104
3rd 4.75 � 0.07 46.0 � 19.8 1.82 � 0.52 2.6 � 104 � 1.4 � 103
4th 5.00 42.0 2.17 2.6 � 104 � 2.1 � 103
TSS: total suspended solids; COD: chemical oxygen demand; FNU: formazine nephelometric unit.
There were more suspended solids after the screen filter using the tertiary effluent
than there were before it. These higher levels of solids at the filter outlet were probably
due to the detachment of the solids from the filter cake as observed by Adin and Alon
(1986).
There were no significant differences in the chemical oxygen demand between
secondary and tertiary treatment effluents in the inlet and outlet of the disk and screen
filters. In fact, there was a slight increase in chemical oxygen demand at the exit of the
filters with the secondary effluent, which could be caused by the growth of micro-
organisms in the filter cake. The mean values of the chemical oxygen demand of
secondary effluent were lower after the screen filter than after the disk filter, although
Oron et al. (1980) found the opposite. The filter cake was thicker in the screen filter
than for the disk filter and thus, more oxidizable particles were retained in the screen
filter.
Turbidity tended to increase at the exit of the disk filter of the secondary effluent and at
the screen filter of the tertiary effluent. However, turbidity tended to decrease at the exit of
all the emitters, except at the last emitter of the lateral with screen filter and secondary
effluent.
The number of particles was not significantly different between the points of entry and
exit of each filter. However, a tendency to decrease was observed. At the point of exit of all
emitters, the number of particles increased slightly, with the exception of the subunit with
secondary effluent and screen filter.
If the values of the different parameters are analyzed together it can be observed that the
action of the filters and emitters did not originate significant changes in the chemical and
physical parameters of the used effluents.
J. Puig-Bargues et al. / Agricultural Water Management 77 (2005) 249–262254
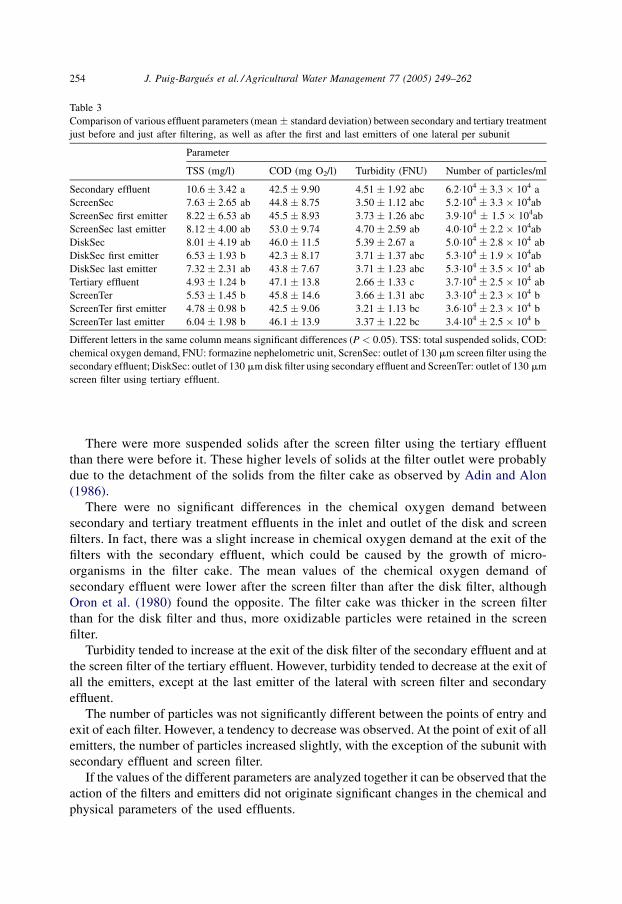
Table 3
Comparison of various effluent parameters (mean � standard deviation) between secondary and tertiary treatment
just before and just after filtering, as well as after the first and last emitters of one lateral per subunit
Parameter
TSS (mg/l) COD (mg O2/l) Turbidity (FNU) Number of particles/ml
Secondary effluent 10.6 � 3.42 a 42.5 � 9.90 4.51 � 1.92 abc 6.2104 � 3.3 � 104 a
ScreenSec 7.63 � 2.65 ab 44.8 � 8.75 3.50 � 1.12 abc 5.2104 � 3.3 � 104ab
ScreenSec first emitter 8.22 � 6.53 ab 45.5 � 8.93 3.73 � 1.26 abc 3.9104 � 1.5 � 104ab
ScreenSec last emitter 8.12 � 4.00 ab 53.0 � 9.74 4.70 � 2.59 ab 4.0104 � 2.2 � 104ab
DiskSec 8.01 � 4.19 ab 46.0 � 11.5 5.39 � 2.67 a 5.0104 � 2.8 � 104 ab
DiskSec first emitter 6.53 � 1.93 b 42.3 � 8.17 3.71 � 1.37 abc 5.3104 � 1.9 � 104ab
DiskSec last emitter 7.32 � 2.31 ab 43.8 � 7.67 3.71 � 1.23 abc 5.3104 � 3.5 � 104 ab
Tertiary effluent 4.93 � 1.24 b 47.1 � 13.8 2.66 � 1.33 c 3.7104 � 2.5 � 104 ab
ScreenTer 5.53 � 1.45 b 45.8 � 14.6 3.66 � 1.31 abc 3.3104 � 2.3 � 104 b
ScreenTer first emitter 4.78 � 0.98 b 42.5 � 9.06 3.21 � 1.13 bc 3.6104 � 2.3 � 104 b
ScreenTer last emitter 6.04 � 1.98 b 46.1 � 13.9 3.37 � 1.22 bc 3.4104 � 2.5 � 104 b
Different letters in the same column means significant differences (P < 0.05). TSS: total suspended solids, COD:
chemical oxygen demand, FNU: formazine nephelometric unit, ScrenSec: outlet of 130 mm screen filter using the
secondary effluent; DiskSec: outlet of 130 mm disk filter using secondary effluent and ScreenTer: outlet of 130 mm
screen filter using tertiary effluent.
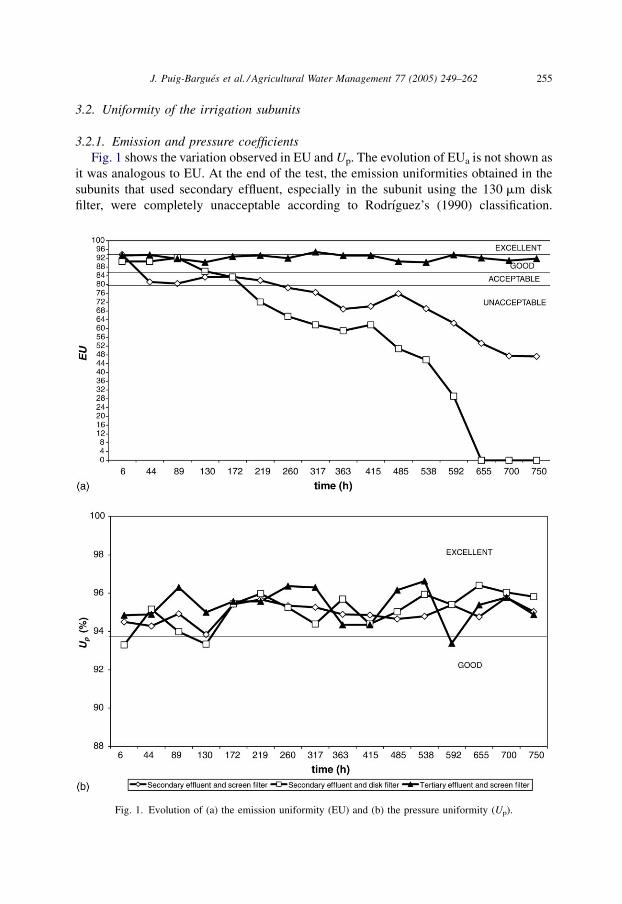
3.2. Uniformity of the irrigation subunits
3.2.1. Emission and pressure coefficients
Fig. 1 shows the variation observed in EU and Up. The evolution of EUa is not shown as
it was analogous to EU. At the end of the test, the emission uniformities obtained in the
subunits that used secondary effluent, especially in the subunit using the 130 mm disk
filter, were completely unacceptable according to Rodrıguez’s (1990) classification.
J. Puig-Bargues et al. / Agricultural Water Management 77 (2005) 249–262 255
Fig. 1. Evolution of (a) the emission uniformity (EU) and (b) the pressure uniformity (Up).
These results were influenced by the complete clogging of some emitters after 650 h of
irrigation. In contrast, with the tertiary effluent the result was always between good and
excellent, and no large decreases in the value of these coefficients were observed.
At the end of the tests, 25% of the control emitters were completely clogged in the
subunit with secondary effluent and disk filter while in the subunit with secondary effluent
and screen filter only 6.25% of the emitters were completely clogged. The number of
clogged emitters was remarkable, despite the working pressure being higher than the
required (101.2 kPa), which may reduce the clogging of the emitters (Chica et al., 2001).
No cases of complete clogging were observed in the emitters of subunits using tertiary
effluent. These results agree with Ravina et al. (1992) who described how partial clogging
is more usual than complete clogging.
The values of Up were good for all the subunits throughout the tests. Thus, as pressure
distribution along the lateral was correct and the emitter manufacturing coefficient of
variation was low, the low uniformities can only be explained by the clogging of the
emitters, in agreement with Rodrıguez (1990).
The lowest uniformity, which occurred in the subunit with the disk filter, is probably due
to the fact that this filter clogged more slowly than the screen filter with the secondary
effluent. The rapid formation of the filtration cake in the screen filter produced an
additional retention of particles that could not be generated in the disk filter. Besides, as the
time between cleanings was greater in the disk filter than in the screen filter, more solids
could have passed through it. Probably, with a lower filter pore this effect could be avoided.
Despite the results obtained with the disk filter in the present work, Puig-Bargues (2003)
and Capra and Scicolone (2004) found that disk filter may assure performance levels
similar to those of the sand filter using secondary effluents.
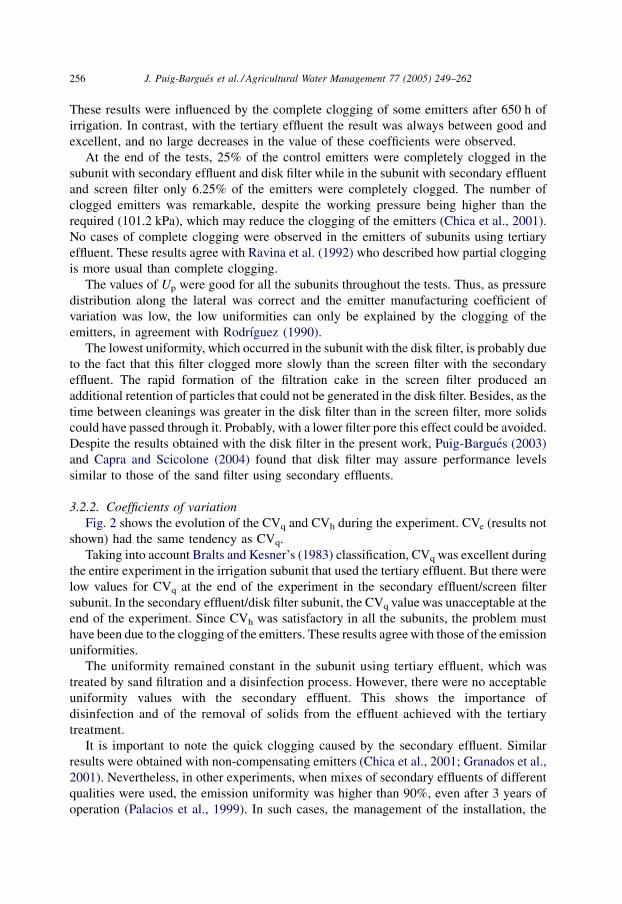
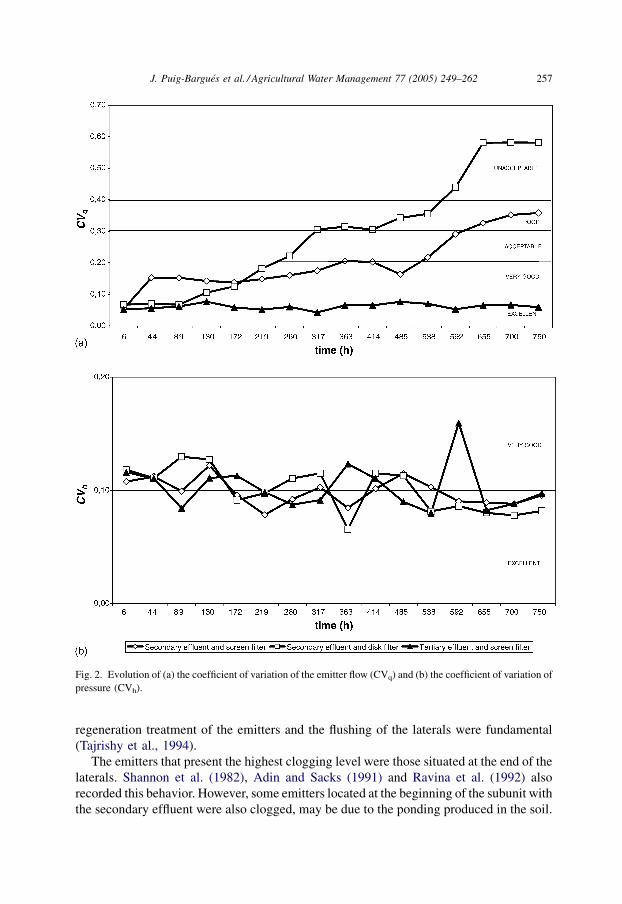
3.2.2. Coefficients of variation
Fig. 2 shows the evolution of the CVq and CVh during the experiment. CVe (results not
shown) had the same tendency as CVq.
Taking into account Bralts and Kesner’s (1983) classification, CVq was excellent during
the entire experiment in the irrigation subunit that used the tertiary effluent. But there were
low values for CVq at the end of the experiment in the secondary effluent/screen filter
subunit. In the secondary effluent/disk filter subunit, the CVq value was unacceptable at the
end of the experiment. Since CVh was satisfactory in all the subunits, the problem must
have been due to the clogging of the emitters. These results agree with those of the emission
uniformities.
The uniformity remained constant in the subunit using tertiary effluent, which was
treated by sand filtration and a disinfection process. However, there were no acceptable
uniformity values with the secondary effluent. This shows the importance of
disinfection and of the removal of solids from the effluent achieved with the tertiary
treatment.
It is important to note the quick clogging caused by the secondary effluent. Similar
results were obtained with non-compensating emitters (Chica et al., 2001; Granados et al.,
2001). Nevertheless, in other experiments, when mixes of secondary effluents of different
qualities were used, the emission uniformity was higher than 90%, even after 3 years of
operation (Palacios et al., 1999). In such cases, the management of the installation, the
J. Puig-Bargues et al. / Agricultural Water Management 77 (2005) 249–262256
regeneration treatment of the emitters and the flushing of the laterals were fundamental
(Tajrishy et al., 1994).
The emitters that present the highest clogging level were those situated at the end of the
laterals. Shannon et al. (1982), Adin and Sacks (1991) and Ravina et al. (1992) also
recorded this behavior. However, some emitters located at the beginning of the subunit with
the secondary effluent were also clogged, may be due to the ponding produced in the soil.
J. Puig-Bargues et al. / Agricultural Water Management 77 (2005) 249–262 257
Fig. 2. Evolution of (a) the coefficient of variation of the emitter flow (CVq) and (b) the coefficient of variation of
pressure (CVh).
J. Puig-Bargues et al. / Agricultural Water Management 77 (2005) 249–262258
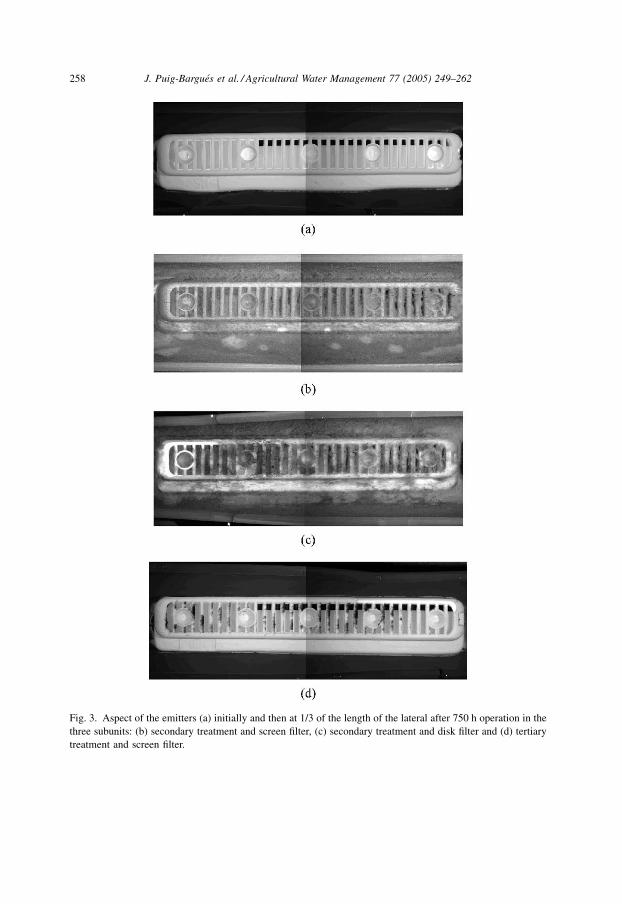
Fig. 3. Aspect of the emitters (a) initially and then at 1/3 of the length of the lateral after 750 h operation in the
three subunits: (b) secondary treatment and screen filter, (c) secondary treatment and disk filter and (d) tertiary
treatment and screen filter.
3.3. Observation of the material
Figs. 3 and 4 show the aspect of different emitters at the end of the tests. Clear
differences between secondary effluent emitters and tertiary effluent emitters can be seen.
The initial aspect of the emitters that worked with tertiary effluent did not change much
during the tests.
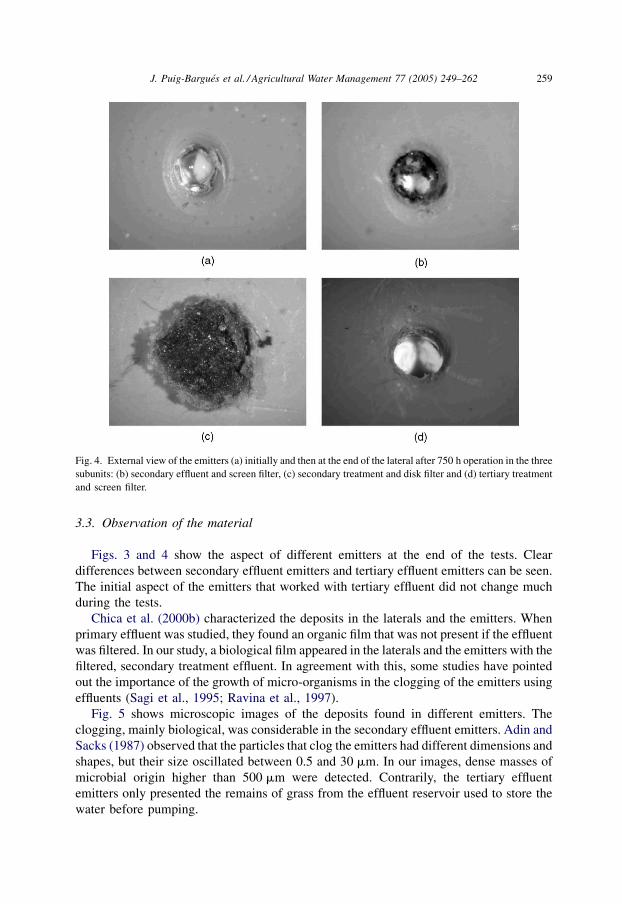
Chica et al. (2000b) characterized the deposits in the laterals and the emitters. When
primary effluent was studied, they found an organic film that was not present if the effluent
was filtered. In our study, a biological film appeared in the laterals and the emitters with the
filtered, secondary treatment effluent. In agreement with this, some studies have pointed
out the importance of the growth of micro-organisms in the clogging of the emitters using
effluents (Sagi et al., 1995; Ravina et al., 1997).
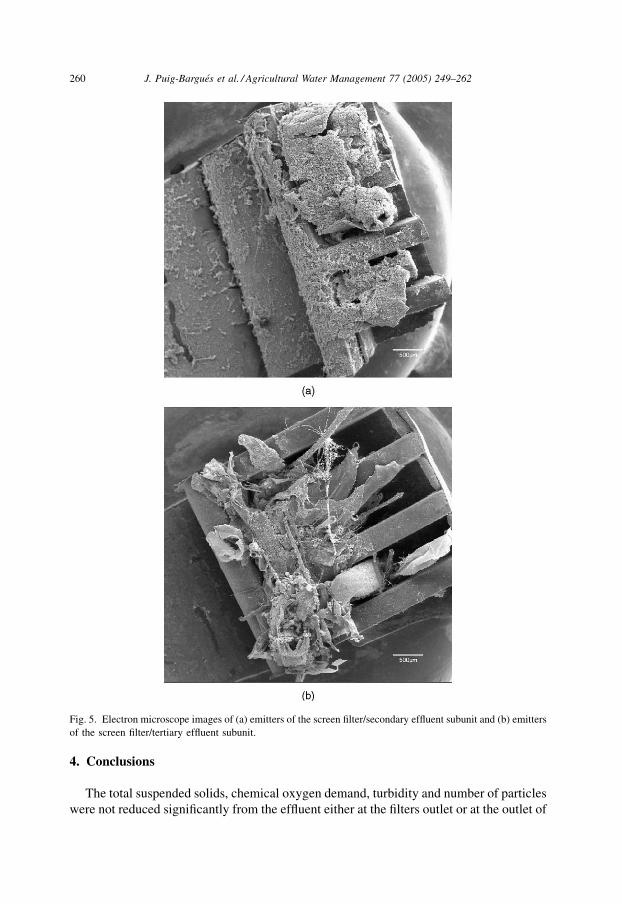
Fig. 5 shows microscopic images of the deposits found in different emitters. The
clogging, mainly biological, was considerable in the secondary effluent emitters. Adin and
Sacks (1987) observed that the particles that clog the emitters had different dimensions and
shapes, but their size oscillated between 0.5 and 30 mm. In our images, dense masses of
microbial origin higher than 500 mm were detected. Contrarily, the tertiary effluent
emitters only presented the remains of grass from the effluent reservoir used to store the
water before pumping.
J. Puig-Bargues et al. / Agricultural Water Management 77 (2005) 249–262 259
Fig. 4. External view of the emitters (a) initially and then at the end of the lateral after 750 h operation in the three
subunits: (b) secondary effluent and screen filter, (c) secondary treatment and disk filter and (d) tertiary treatment
and screen filter.
4. Conclusions
The total suspended solids, chemical oxygen demand, turbidity and number of particles
were not reduced significantly from the effluent either at the filters outlet or at the outlet of
J. Puig-Bargues et al. / Agricultural Water Management 77 (2005) 249–262260
Fig. 5. Electron microscope images of (a) emitters of the screen filter/secondary effluent subunit and (b) emitters
of the screen filter/tertiary effluent subunit.
the first and last emitters, with the exception of the first emitter after the disk filter using
secondary effluent. Despite the filter openings (130 mm) being greater than the mean
particle diameter, the filters showed a general tendency to reduce the number of particles
but the number of particles increased at the outlet of most of the emitters. There was a slight
increase in chemical oxygen demand at the outlet of the disk and screen filters using
secondary effluent. Turbidity tended to increase at the exit of the filters and last emitters,
except in the subunit with the screen filter and secondary effluent.
The clogging caused by the secondary effluent with very low values of total suspended
solids (10.6 mg/l) and with most of the particles having a diameter smaller than 14 mm can
be quite considerable, and it induces a reduction in the uniformity of the water application,
which reaches an emission uniformity (EU) of 55% after 750 working hours. This
clogging, mainly due to biological causes, was higher when a disk filter was used rather
than a screen filter. The filtration cake was thicker for the screen filter and this played an
important role in these results.
When a tertiary effluent obtained by means of sand filtration and disinfection was used,
the emission uniformity of the subunit was maintained constantly at values in excess of
90%, although some small remains of grass from the effluent reservoir were detected in
some emitters. The results obtained with the tertiary effluent showed that it is important to
follow the correct disinfection procedures for the effluents used in drip irrigation.
Acknowledgements
The authors would like to acknowledge their gratitude to the Spanish Ministry of
Science and Technology for their financial support in this experiment, within the projects
REN2000-0642/HID and REN2002-00690/HID. The authors would also like to thank the
Consorci de la Costa Brava and the WWTP of Castell-Platja d’Aro for their help in the
development of this experiment in their installations.
References
Adin, A., Alon, G., 1986. Mechanisms and process parameters of filter screens. J. Irrig. Drain. Eng. 112 (4), 293–
304.
Adin, A., Elimelech, M., 1989. Particle filtration for wastewater irrigation. J. Irrig. Drain. Engrg. 115 (3), 474–487.
Adin, A., Sacks, M., 1987. Water quality and emitter clogging relationship in wastewater irrigation. In:
Proceedings of the Water Reuse Symposium. AWWA Research Foundation, Denver, Colorado, pp. 517–530.
Adin, A., Sacks, M., 1991. Dripper-clogging factors in wastewater irrigation. J. Irrig. Drain. Engrg. 117 (6), 813–
827.
Bliesner, R.D., 1976. Field evaluation of trickle irrigation efficiency. In: Proceedings of Water Management for
Irrigation and Drainage, ASCE, Reston, Virgina, pp. 382–393.
Bralts, V.F., Kesner, D., 1983. Drip irrigation field uniformity estimation. Trans. ASAE 26 (5), 1369–1374.
Bucks, D.A., Nakayama, F.S., Gilbert, R.G., 1979. Trickle irrigation water quality and preventive maintenance.
Agric. Water Manage. 2 (2), 149–162.
Capra, A., Scicolone, B., 2004. Emitter and filter test for wastewater reuse by drip irrigation. Agric. Water
Manage. 68 (2), 135–149.
Chica, R.M., Roldan, J., Alcaide, M., 2000a. Recuperacion de emisores usados con aguas residuales depuradas.
Riegos y Drenajes XXI 113, 44–48.
J. Puig-Bargues et al. / Agricultural Water Management 77 (2005) 249–262 261
Chica, R.M., Roldan, J., Alcaide, M., 2000b. Depositos en instalaciones de riego. Su caracterizacion para aguas
depuradas en ramales y emisores. Riegos y Drenajes XXI 114, 34–36.
Chica, R.M., Roldan, J., Alcaide, M., 2001. Grados de obturacion alcanzados por emisores a lo largo de un tiempo
trabajando con aguas residuales depuradas. Ingenierıa del Agua 8 (3), 351–362.
Coelho, R.D., Resende, R.S., 2001. Biological clogging of Netafim’s drippers and recovering process through
chlorination impact treatment. ASAE Annual International Meeting Paper No. 012231, ASAE, St. Joseph,
Michigan.
Feigin, A., Ravina, I., Shalhevet, J., 1991. Irrigation with treated sewage effluent. Management for environmental
protection. Springer-Verlag, Berlin, 224 pp.
Gilbert, R.G., Nakayama, F.S., Bucks, D.A., French, O.F., Adamsom, K.C., 1981. Trickle irrigation: emitter
clogging and other flow problems. Agric. Water Manage. 3 (3), 159–178.
Granados, G., Alcaide, M., Roldan, J., 2001. Estudio del comportamiento hidraulico de unidades de riego
localizado usando aguas residuales. Proc. 1er Congreso Nacional de Ingenierıa para la Agricultura y el Medio
Rural. Asociacion Espanola de Agroingenierıa, Valencia, Spain, vol. 2, pp. 153–159.
Hills, D.J., Brenes, M.J., 2001. Microirrigation of wastewater effluent using drip tape. Appl. Eng. Agric. 17 (3),
303–308.
Keller, J., Karmeli, D., 1974. Trickle irrigation design parameters. Trans. ASAE 17 (4), 678–684.
McDonald, D.R., Lau, L.S., Wu, I.P., Gee, H.K., Young, S.C.H., 1984. Improved emitter and network system
design for reuse of wastewater in drip irrigation. Technical Report No 163, Water Resources Research Center,
University of Hawaii at Manoa, Honolulu.
Merriam, J.L., Keller, J., 1978. Farm irrigation evaluation: a guide for management. Department of Agricultural
and Irrigation Engineering, Utah State University, Logan, Utah.
Nakayama, F.S., Bucks, D.A., 1981. Emitter clogging effects on trickle irrigation uniformity. Trans. ASAE 24 (1),
77–80.
Oron, G., Shelef, G., Turzynski, B., 1979. Trickle irrigation using treated wastewaters. J. Irrig. Drain. Div. 105
(IR2), 175–186.
Oron, G., Shelef, G., Zur, B., 1980. Stormwater and reclaimed effluent in trickle irrigation. J. Irrig. Drain. Div. 106
(IR4), 299–310.
Oron, G., DeMalach, J., Hoffman, Z., Manor, Y., 1992. Effluent reuse by trickle irrigation. Water. Sci. Tech. 24 (9),
103–108.
Palacios, M.P., Del-Nero, E., Pavon, N., 1999. Influencia del riego con agua depurada municipal de diferentes
calidades sobre los suelos y el cultivo de la platanera. Proc. of the IV Jornadas de Estudio de la Zona No
Saturada del Suelo. ICIA, Valle Guerra, Tenerife, Spain, pp. 131–137.
Puig-Bargues, J., 2003. Utilizacion de aguas residuales en sistemas de riego localizado: embozamiento y
filtracion. Ph.D. Thesis, University of Lleida, Spain.
Ravina, I., Paz, E., Sofer, Z., Marcu, A., Shisha, A., Sagi, G., 1992. Control of emitter clogging in drip irrigation
with reclaimed wastewater. Irrig. Sci. 13, 129–139.
Ravina, I., Paz, E., Sofer, Z., Marcu, A., Shisha, A., Sagi, G., Yechialy, Z., Lev, Y., 1997. Control of clogging in
drip irrigation with stored treated municipal sewage effluent. Agric. Water Manage. 33 (2-3), 127–137.
Rodrıguez, C., 1990. Evaluacion de instalaciones de microirrigacion. IV Curso de Tecnologıa del Riego, ETSIA,
Universidad Politecnica de Cataluna, Lleida, Spain.
Sagi, G., Paz, E., Ravina, I., Schischa, A., Marcu, A., Yechiely, Z., 1995. Clogging of drip irrigation systems by
colonial protozoa and sulfur bacteria.. In: Proceedings of the Fifth International Microirrigation Congress,
ASAE, Orlando, FL, pp. 250–254.
SAS, 1999. SAS/STAT User’s Guide, Version 8. Volumes 1, 2 and 3. SAS Institute Inc., Cary, NC.
Shannon, W.M., James, L.G., Basset, D.L., Mih, W.C., 1982. Sediment transport and deposition in trickle
irrigation laterals. Trans. ASAE 25 (1), 160–164.
Tajrishy, M.A., Hills, D.J., Tchobanoglobus, G., 1994. Pretreatment of secondary effluent for drip irrigation. J.
Irrig. Drain. Engrg. 120 (4), 716–731.
Taylor, H.D., Bastos, R.K.X., Pearson, H.W., Mara, D.D., 1995. Drip irrigation with waste stabilisation pond
effects: solving the problem of emitter fouling. Wat. Sci. Tech. 31 (12), 417–424.
Vermeiren, L., Jobling, G.A., 1986. Localized irrigation. Irrigation and Drainage Paper 36, FAO, Rome.
J. Puig-Bargues et al. / Agricultural Water Management 77 (2005) 249–262262


