Embed Size (px)
Citation preview
Hydrochemistry, isotopes and groundwater modeling to
characterize multi-layered aquifers flow system in the
upper part of Awaj River - Damascus Basin (Syria)
Nazeer Asmael
To cite this version:
Nazeer Asmael. Hydrochemistry, isotopes and groundwater modeling to characterize multi-layered aquifers flow system in the upper part of Awaj River - Damascus Basin (Syria).Earth Sciences. Universite Michel de Montaigne - Bordeaux III, 2015. English. <NNT :2015BOR30009>. <tel-01219132>
HAL Id: tel-01219132
https://tel.archives-ouvertes.fr/tel-01219132
Submitted on 22 Oct 2015
HAL is a multi-disciplinary open accessarchive for the deposit and dissemination of sci-entific research documents, whether they are pub-lished or not. The documents may come fromteaching and research institutions in France orabroad, or from public or private research centers.
L’archive ouverte pluridisciplinaire HAL, estdestinee au depot et a la diffusion de documentsscientifiques de niveau recherche, publies ou non,emanant des etablissements d’enseignement et derecherche francais ou etrangers, des laboratoirespublics ou prives.
THÈSE
Présentée à L'Université Bordeaux Montaigne
Par Nazeer Asmael
École Doctorales des Université de Bordeaux Montaigne (ED 480)
Pour obtenir le grade de:
Docteur en Hydrogéologie
Hydrochimie, isotopie et modélisation hydrodynamique pour la
caractérisation du système aquifère multicouche amont de la rivière
Awaj- Bassin de Damas (Syrie)
Directeur de thèse: M. Alain Dupuy
Co-directeurs de thèse: M. Philippe Le Coustumer, M. Salim Hamid
Soutenue publiquement le 07 juillet 2015
Devant la commission d'examen
M. Frédéric HUNEAU, Professeur, Université de Corse Président
M. Moumtaz RAZACK, Professeur, Université de Poitiers Rapporteur
M. Mikael MOTELICA-HEINO, Professeur, Université d'Orléans Rapporteur
M. Alain DUPUY, MCU HDR, Bordeaux INP Examinateur
M. Philippe LE COUSTUMER, MCU HDR, Université de Bordeaux Examinateur
M. Salim HAMAID, MCU HDR, Université de Damas Examinateur

3
ACKNOWLEDGEMENTS
After a little more than three years of starting this thesis, it is my pleasure to sit down in
front of my computer to thank everyone who has participated directly or indirectly and
contributed in one way or another in developing this work and writing this manuscript.
Before the acknowledgments, I would like to briefly mention how this doctorate research
started. After obtaining my Master’s degree in hydrology and water resources from IHE
Institute (Delft, The Netherlands), the story that brought me to France to carry out this PhD
thesis started when I came here as a visitor to accompany my wife Rim who was also doing
her PhD at Université de Bordeaux 1. This allowed me to communicate with Professor
“Frédéric Huneau” who helped and offered me this valuable opportunity to register and
start my PhD under his supervision. So, thanks a lot due to both of you Rim and Prof.
Huneau.
I would like to start by thanking my supervisors. I deeply express my deepest gratefulness
to Prof Frédéric Huneau, who agreed to initiate this work and supervise it. Under his
effective supervision and huge effort, we have published two articles during this research;
hence working with Prof. HUNEAU has scientifically yielded prosperous result! Once
again, thank you very much for your effort which I highly appreciate. I pursued my work
under the supervision of Mr. Alain Dupuy and Mr. Philippe Le Coustumer. Sincere
thanks go to Mr. Dupuy for his valuable time. He has offered patiently to develop and
discuss the groundwater model which has, in my opinion, given me a good background in
this field. I also would like to thank him for his help, sympathy, and open-mindedness
which were extremely important for achieving my research objectives and overcome other
related difficulties. Many thanks to Mr. Le Coustumer! His unlimited support and
thoughtful guidance have aided me to overcome several problems and continue this work in
the best possible way. Indeed, the support given by all of them made me feel home among
my parents, whom I have not seen in the last four years, and really strengthen me to carry
on this research.
My special thanks go to the other members of the jury, the two rapporteurs Prof. Moumtaz
Razack and Prof. Mikael Motelica-Heino, who accepted to review and to evaluate this
thesis and provided me with valuable comments.
4
I’m grateful to my co-director of thesis from Damascus University Dr. Salim Hamid for
his unlimited and constant support and guidance in providing necessary information and
needed data. Huge thanks are due to him for his support in easing and overcoming all
relevant administrative procedures.
Sincere thanks and appreciation go to Dr. Jan Willem Foppen from UNESCO IHE
Institute, Delft - The Netherlands, who has supervised me during my master project and
developed the spreadsheet which has been extensively used in this research.
I owe special thanks to my sponsor "Campus France" and the Foreign Affairs Ministry
of France, for their financial support (MAE grant n° 779091L and n° 839300A). Without
their gratefully appreciated aid, I would not be able to do this research.
I would like to thank my colleagues with whom I have shared the same office, Jessy
Jaunat, Yohana Stupar and Morgan Le Lous. I can say that I'm so happy to have and
continue preserve their friendship. Special thanks to Yohana for her kindness and help in
linguistic editing and enhancing the published articles. Thanks to Morgan for his help,
friendship and productive discussions.
This study has been done at ENSEGID (Ecole Nationale Supérieure en Environnement
Géoressources et Ingénierie du Développement Durable) so, I would like to express my
appreciation to my fellow doctoral students and to all the ENSEGID’s members,
professors, for their contributions during this work. I specially would like to thank some
teachers who helped me in answering some questions related to my research, Mr. Michel
Franceschi and Mr. Francois Larroque. Special thank goes to Prof. Adrian Cerepi for
his support and guidance.
I also would like to express my gratitude to the University of Bordeaux 3 (Université
Bordeaux Montaigne) which nominated me a member of Bordeaux Alumni program!
Thanks to you Mr. Rigollet who helped in that. I must acknowledge the kindness of my
sponsor in this program Mr. Alain Cougrand and the program coordinator Ms. Caroline
Pedezert.
I would like to express my gratitude to my employer, Damascus University, Faculty of
Sciences, Department of Geology for giving me this opportunity to come to France for
doing my research.

5
My gratitude is also due to my colleagues in Damascus, Mr. Abdallah Al-Kattea and Dr.
Kasem Salih from the General Directorate of Barada and Awaj Basin (GDBAB)-Syria, and
Ms. Taghreed Alsaleh from Arab Center for the Studies of Arid Zones and Dry Lands
(ACSAD) - Damascus for their assistance in providing required data and information for
setting the groundwater model. Very special thanks go to Mrs. Basma Al-Ali for her aid in
editing the final version of this thesis
I'm really very grateful to our friends here in France who were very close to my family
especially Eliane Gonthier and Odile Playoult. Thanks a lot to both of you for your warm
hospitality and care.
Finally I warmly would like to thank my “small family”, thanks to my wife Rim for her
patience and sharing, to some extent, all of suffering, disappointment, worry, and success.
For my lovely son (Yamen!!), who cannot realize that I'm motivated by him and that he is
my reason to live! He really gives me all power and love that I need! My gratitude is to my
“large family” in Syria, my parents, who always supported me even in unimagined or
unseen manner! My sisters and my brothers, all of them illuminate my life.
At the end, this work is dedicated to all of my Syrian fellow countrymen who shed their
precious blood for Syria… We pray for all of those who work honestly for the
reconciliation and peace in Syria!
My apologies go to those whom I have failed to mention.
6
Abstract
In developing countries, such as Syria, the limited budgets as well as the lack of
hydrological data affects the groundwater resources' assessment. The Barada and Awaj
basin (Damascus Basin) is the most important and extensively utilized water basin in Syria.
The upper part of Awaj River catchment occupies the southwestern part of this basin. In
this arid region, groundwater is considered to be a main source of water supply for both
drinking and irrigation purposes. In order to assess the main features characterizing the
hydrogeological system in this area and estimate its groundwater resources potential, a
multi approach methodology using hydrochemistry, environmental stable isotopes and
groundwater modeling were used as integrated tools. The water budget of the upper aquifer
horizon, where the most anthropogenic activities are concentrated, was developed.
The geological formations outcropping in the study area range from the Jurassic to the
Quaternary. The Jurassic carbonate rocks are occupied the western region, while the plain
region is characterized by the exposure of Neogene conglomerates, Quaternary alluvial
proluvial deposits and the basalt of Quaternary and Miocene. The Small exposure of
Cretaceous and Paleogene are found in the south-western part of the study area.
The detailed description of hydrogeochemical conditions, including major ions, physico-
chemical and in situ field parameters, has underlined the very complex variability of the
stratigraphic sequences and hence the numerous hydrogeological units within the study
area. The hydrogeochemical evolution of groundwater reveals the domination of
dissolution/precipitation mechanisms in this complex sequences, not only in the
mountainous part of the area but also in the plain region. This was evidenced by the
saturation indices of calcite and dolomite. However, and to less extent, the silicate
hydrolysis and reverse ion exchange, involving clay minerals, were recognized in playing a
considerable role in groundwater chemical composition. The dissolution of gypsum is
recognized in some places, mainly in the Jurassic aquifer.
It was found that the groundwater's geochemistry at the upper part of the Awaj River is
more controlled by the geogenic processes rather than the effect of anthropogenic activities.
The hydrochemical facies of groundwater show that about 70% of water samples tend to
have Ca-HCO3 water type. This confirms the effect of carbonate rocks and the recent
recharge of groundwater from atmospheric precipitation. The similarity in water type tends
7
to express the existence of a unique hydrochemical system where the individualised
groundwater flow paths are difficult to delineate within the different hyro-stratigraphic
units. However, a remarkable anthropogenic influence on the groundwater quality was
observed through the infiltration of irrigation water and the effect of intensive use of
mineral and organic fertilizers on nitrate level as well as the contamination by sewage
water and animal waste disposal.
Consequently, hydrochemical patterns did not give enough evidences for expecting huge
feeding flow from Jurassic aquifers towards the other aquifers. The hydrochemical
processes are highly irregular in space, especially in the Jurassic aquifer, suggesting active
dissolution/precipitation phenomena. The results indicate that this area is much more
featured by recharge rather than discharge mechanisms. Thus, this area could be considered
as a part of a major intermediate or regional flow system rather than a local one.
The isotope compositions of precipitation were used to construct a local meteoric water line
in the study area as well as interpret the relationship between stable isotope depletion and
altitude. Comparing the isotope composition of groundwater and precipitation implies an
important rapid infiltration of atmospheric precipitation before significant evaporation takes
place prior to or during the infiltration. This data also shows that the infiltrated precipitation
provides the main source of recharge to the aquifers system all over the study area but the
main recharge occurs over the mountainous parts through the karst landscape and fractured
rocks. To a lesser extent, it also contributes to recharge the Neogene conglomerate and
Quaternary alluvial aquifer in the plain region where the mixing of groundwater flow paths
has been recognized. All the groundwater samples are situated to the left of the GMWL
suggesting input of local rainfall that derives from weather front originating from the
Mediterranean Sea.
Nevertheless and based on the hydrochemical and isotopic characteristics of groundwater,
the study area is divided into two main sub-regions A and B. In the sub-region A which
constitutes the western, south-western and north-western parts of the area, mainly the
Jurassic aquifer where karstic features are well developed facilitated by cracks and fissures.
These features increase the permeability coefficient and enhance the infiltration
mechanism; hence this part is characterized by groundwater vulnerability to pollution. This
was evidenced by high rates of nitrates resulting from sewage water infiltration. The
hydrochemical processes are highly irregular in this part which suggests active dissolution
8
phenomena and deep vertical groundwater flow. The sub-region B occupies the south,
central and eastern part of the area, mainly Neogene conglomerates and Quaternary alluvial
aquifers. It is characterized by a shallow horizontal flow component associated with active
interaction between groundwater and hosting rocks, evidenced by water chemistry
evolution. The upward leakage of groundwater from deep aquifers seems to be an
important component to maintain the Neogene/ Quaternary aquifer in this sub-region where
the discharge occurs mainly through the major springs and groundwater withdrawal. The
springs which are located in this sub-region, mainly in the recent basalt, yield significantly
high discharge and cannot be classified under the perched springs but most likely are
draining the deeper regional aquifers.
Developing numerical model simulating the groundwater flow performance in the study
area was a useful alternative tool to evaluate the groundwater resources and understand its
flow patterns in this region. The model's result indicates that the elevated Jurassic and
Cretaceous aquifers became confined as they extend to the east toward the plain region and
are overlain by younger formations. The hydraulic gradient of these aquifers was high
enough to permit hydraulic connections between them and the overlying upper aquifer
horizon through the upward leakage of groundwater. In the upper aquifer horizon, the
groundwater dynamics is affected by different mechanisms in terms of recharge and
discharge. The recharge is originating from different sources such as direct meteoric
infiltration, lateral groundwater recharge along the contacts between Jurassic aquifer and
the conglomerate escarpment of Neogene aquifer. The upward leakages of deep artesian
water as well as the indirect recharge from the irrigation return flow play also a
considerable role in recharging this aquifer. The discharge of this aquifer occurs mainly
through the lateral outflow at the eastern boundary and groundwater withdrawal. The
highland Jurassic aquifer is solely recharged by the infiltration of intensive rainfall and
snowmelt.
Consequently, the simulation result is in good agreement with the result of interpretation of
the hydrochemical and isotopic characteristics of the groundwater in dividing the study area
into two different but linked flow systems. The first one is shallow and is developed in the
unconsolidated or semi-consolidated Neogene/Quaternary aquifer, while the second one is
deep and developed in the Cretaceous and Jurassic carbonate aquifers where the
preferential flow component contributes potentially to the groundwater flow behaviour.
Groundwater flow in the first system seems to be controlled by bedding and
9
lithostratigraphic units with a minor downward component. While in the second system,
groundwater flow pathways constitute two main components. The first one is controlled by
local conduits and active fault zones and discharges either as a preferential flow throughout
a several karstic springs or recharges the upper aquifer horizon through the cavernous
limestone as a lateral groundwater flow. The second one is recognized to be regional and
controlled by the geological structures as deep vertical groundwater flow. The hydraulic
connection between the two systems was observed. Accordingly, the local flow and deep
circulation of groundwater seem to be controlling the flow system in the entire study area.
The most important components of the water budget of the upper aquifer horizon have been
determined. The result indicated that the lateral discharge from the Jurassic karstic aquifer
as well as the meteoric infiltration is the most important recharging component of this
budget. The upward leakage of groundwater from deeper aquifers also plays an important
role in recharging this aquifer. However, the lateral discharge from the eastern boundary of
the model's domain is the largest discharge component which indicates that the study area
can be considered as a main recharge region of the western side of the Barada and Awaj
Basin. The simulated result as well as the hydrochemical characteristics of groundwater in
the study area suggests the extension of the orographic basin boundary toward the west
direction.
Keywords:
Aquifer, hydrochemistry, stable isotopes, FEFLOW, groundwater modeling, water budget,
water resources management, Mt. Hermon, Syria
01
Résumé
Dans les pays en développement, tels que la Syrie, des ressources en eaux limitées
associées au manque de données hydrologiques, se pose le problème de l'évaluation des
ressources en eaux souterraines. Le bassin Barada et Awaj (région de Damas) est le plus
important bassin hydrologique en Syrie et aussi le plus utilisé. La partie amont du bassin
versant de la rivière Awaj occupe la partie sud-ouest du bassin Barada & Awaj, dans
laquelle se développe un système aquifère multicouche. Dans cette région aride, l'eau
souterraine est considérée comme la principale source d'approvisionnement en eau pour des
usages principalement agricoles (irrigation) et alimentation en eau potable (consommation
humaine). En vue d'évaluer les principales caractéristiques hydrogéologique et quantifier
les ressources potentielles en eau souterraine de ce système aquifère, une approche
méthodologique multicritères basée sur l’hydrochimie, les isotopes stables (δ18
O & δ2H) et
une modélisation hydrodynamique ont été utilisés dans un outil intégré. Le bilan
hydrogéologique de la nappe la plus superficielle de l'aquifère, où les activités anthropiques
et les prélèvements sont concentrés, a été déterminé par une approche numérique
quantitative.
L’analyse détaillée des paramètres hydrogéochimiques et physico-chimiques (ions majeurs
et mineurs, conductivité, température, pH etc..) obtenus sur le terrain, a mis en évidence la
très forte interrelation entre l’hétérogénéité des séquences stratigraphiques et
l’hydrogéochimie des eaux, et donc des différentes unités hydrogéologiques de la zone
d'étude. L’évolution hydrogéochimique des eaux souterraines révèle que les mécanismes de
dissolution / précipitation dominent tant dans la zone montagneuse que dans la région de
plaine. Cette tendance a été démontrée par les indices de saturation de calcite et la
dolomite. Dans une moindre mesure, l'hydrolyse des silicates induit, notamment au contact
des minéraux argileux, une composition chimique des eaux souterraines contrastée avec
également des échanges ioniques importants. La dissolution des formations riches en gypse
a été identifiée dans certains endroits, principalement dans les formations formant la nappe
du Jurassique.
Il a également été constaté que la géochimie de l'eau souterraine dans la partie amont du
bassin de la rivière Awaj est contrôlée par des processus géogéniques plutôt
qu’anthropiques. Du point de vue des faciès hydrochimiques, les eaux souterraines du
bassin versant de la rivière Awaj sont de type carbonaté (Ca-HCO3) comme l’indiquent
00
près de 70% des échantillons d'eau analysés. Cela confirme l'interaction avec des roches
carbonatées et la recharge des eaux souterraines par des précipitations atmosphériques
récentes. Ce facies des eaux tend à démontrer l'existence d'un système hydrochimique
unique, où les trajets d'écoulement singuliers des eaux souterraines sont difficiles à
délimiter à l'intérieur des différentes unités hydro-stratigraphiques. A noter, il existe une
influence anthropique remarquable sur la qualité chimique des eaux souterraines via
l'infiltration des eaux d'irrigation, qui sous l’effet de l'utilisation intensive d’engrais
minéraux (nitrates et phosphates) et organiques, conduisent à une contamination en nitrates
ainsi que par les eaux usées (déchets animaux et humains).
Les processus hydrochimiques observés sont irréguliers du point de vue spatial, en
particulier dans l'aquifère du Jurassique, suggérant un phénomène de dissolution /
précipitation assez actif. En général, le résultat de l'évolution hydrochimique indique que
cette zone est beaucoup plus concernée par l’impact des recharges plutôt que par les
exhaures. Les modèles hydrochimiques suggèrent que la zone amont pourrait être
considérée comme dépendant d'un système d'écoulement intermédiaire ou régional plutôt
que local. Ils n’apportent pas d’éléments vis-à-vis des flux nécessaires à l'alimentation des
aquifères Jurassique vers les autres aquifères
Les compositions isotopiques des précipitations ont permis de construire la droite
météorique locale de la zone d'étude. Elles permettent de proposer une interprétation entre
l'appauvrissement des isotopes stables en fonction de l'altitude. En comparant la
composition isotopique des eaux souterraines avec celles des précipitations, il apparaît que
l’infiltration rapide des précipitations atmosphériques se produit avant l'évaporation de ces
dernières.
Ces données montrent également que les eaux de précipitation infiltrées constituent la
principale source de la recharge de l’aquifère et ce dans toute la zone d'étude. Cependant la
recharge principale se produit dans les régions montagneuses carbonatées karstiques et les
formations basaltiques composées de roches fracturées. A noter également, mais dans une
moindre mesure, la contribution à la recharge de l’aquifère alluvial de la zone de plaine, par
des eaux infiltrées au travers des formations conglomératiques du Néogène et du
Quaternaire. Toutes les analyses isotopiques réalisées sur les échantillons d'eau souterraine
sont situés à la gauche de la GMWL suggérant l’entrée de précipitations locales venant du
climat maritime et donc l’influence de la mer Méditerranée. En fonction des
01
caractéristiques hydrochimiques et isotopiques observées pour les eaux souterraines, la
zone d'étude est divisée en deux principales sous-régions A et B.
La sous-région A, constitue la partie occidentale du bassin. Elle est principalement formée
de l’aquifère du Jurassique où les mécanismes karstiques de dissolution des formations
carbonatées et gypseuses sont bien développés et grandement facilitées par le réseau de
fissures et de crevasses. Il favorise la perméabilité des couches et améliore l'infiltration. Il
est possible de conclure que cette sous-région A se caractérise par une vulnérabilité des
eaux souterraines aux intrants de surfaces possiblement contaminés et donc une fragilité à
ce type de pollution de surface. Ceci est attesté par les taux élevés de nitrates résultant de
l'infiltration des eaux usées et d’irrigation. Les processus hydrochimiques sont très
irréguliers dans cette zone suggérant que les mécanismes de dissolution (interaction eaux –
roches) sont actifs. En profondeur des flux verticaux d'eaux souterraines existent pour
maintenir la charge des aquifères supérieurs du Neogone et du Quaternaire. Ces derniers
sont affectés par des flux sortants liés aux nombreuses émergences (sources) et pompages
(forages et puits). Les sources de cette région localisées dans les formations basaltiques,
avec des débits importants ne sont pas classées comme sources perchées mais directement
alimentées par les flux ascendants des aquifères profonds (drainance ascendante).
La sous-région B au sud, occupe la partie centrale et orientale du bassin versant. Elle est
essentiellement géologiquement caractérisée par des conglomérats du Néogène et du
Quaternaire qui forment les aquifères alluviaux. Ils sont caractérisés par des écoulements
horizontaux, peu profonds, et fortement marqués par l’interaction dynamique entre les eaux
souterraines et les roches encaissantes, comme en témoigne l'évolution de la chimie de ces
eaux. Les flux ascendants des aquifères profonds semblent être une composante importante
au maintient de l'équilibre de l'aquifère du Néogène / Quaternaire ;
Nous avons développé un modèle numérique pouvant évaluer les différents écoulements
des eaux souterraines dans la zone d'étude, afin de quantifier les ressources en eaux
souterraines, de préciser les quantités mises en jeux dans les différents aquifères propres à
cette région.
Le résultat du modèle développé, indique que les aquifères du Jurassique et du Crétacé
supérieur sont confinés lors de l'extension vers l'est en direction de la zone de plaine et sont
recouverts par les formations plus récentes. Le gradient hydraulique de ces différents
aquifères est suffisamment élevé pour permettre les connexions hydrauliques entre
03
aquifères. Le modèle confirme l'alimentation de la première nappe libre par une drainance
verticale ascendante. Dans cette nappe, les circulations souterraines sont affectées par
différents mécanismes de réalimentation et de décharge. La recharge est essentiellement
marquée par une dynamique d’infiltration directe et rapide des eaux météoritiques, mais
aussi latéralement le long des contacts entre l’aquifère du Jurassique et ceux des
escarpements conglomératiques du Néogène. Les flux sortants affectant l'aquifère du
Neogene sont principalement dus aux sorties latérales aux limites est du bassin, ainsi que
par les prélèvements directs dans les eaux souterraines. L'aquifère du Jurassique supérieur
est quant à lui uniquement alimenté par l'infiltration des précipitations et lors de la fonte
des neiges.
En conséquence, les résultats obtenus par simulation numériques sont en bon accord avec
les données hydrochimiques et isotopiques des eaux souterraines. Le modèle conforte ainsi
l’hypothèse d’un diviser la zone d'étude en deux systèmes d'écoulement différents, le
premier système de surface (faible profondeur) et se développant dans les formations
géologiques poreuses (basaltes et conglomérats non cimentes) du Néogène et l’aquifère
Quaternaire. Un second système se trouve en profondeur et se développe dans les
carbonates du Jurassique et du Crétacé. Les liaisons hydrauliques entre les deux systèmes
ont été mises en évidence. La balance des eaux souterraines dans le premier système
semble être contrôlée par la lithologie des unités stratigraphiques. En revanche, dans le
second système, les écoulements des eaux souterraines semblent avoir deux composantes
principales. La premièreest contrôlée par des émergences locales situées dans les zones
faillées (actives). Les débits d'exhaure permettent de recharger la première nappe à travers
les calcaires par écoulement latérale. La seconde composante est régionale et contrôlée par
les structures géologiques permettant une composante verticale des eaux souterraines
profondes.
En conséquence et d’une manière générale, les flux mis en jeu dans la nappe profonde
semblent être gérés par un système d'écoulement complexe (descendant pour la partie
amont et la recharge, et ascendant pour la partie aval et la drainance) affectant l'ensemble
de la zone d'étude.
Les plus importantes composantes, pour la gestion des ressources en eau, du premier
horizon de l’aquifère Jurassique de type karstique ont été déterminées. Elles indiquent que:
04
Le flux d’exhaure latéral dans la zone karstique est intense et largement compensé par une
infiltration rapide des eaux pluviales.
La drainance verticale ascendante d’eaux souterraines provenant de l’aquifère profond joue
également un rôle important dans la recharge de la nappe de surface.
La recharge principale s’effectue du côté ouest du bassin versant de Barada et de la rivière
Awaj.
Le résultat simulé de la balance des eaux du bassin hydrogéologique étudié, associé aux
caractéristiques hydrochimiques des eaux souterraines suggère une extension aux limites du
bassin orographiques en direction de l’ouest.
Mots-clés:
aquifère, hydrochimie, isotopes stables, FEFLOW; modélisation des eaux souterraines;
budget de l'eau, la gestion des ressources en eau, Mt. Hermon, la Syrie.

05
الملخص
تؤثر محدودية الموارد المائية والمالية سلبا في إدارة هذه الموارد في دول كثيرة تقع في المناطق الجافة وشبه الجافة،
.والسيما النامية منها مثل سورية
يعد حوض بردى واألعوج واحدا من األحواض المائية المهمة في سورية لجهة حجم االستهالك المائي فيه من أجل
.طية االحتياجات المتزايدة من المياه في قطاعي الشرب والزراعة، والتي تعتمد بشكل أساسي على المياه الجوفيةتغ
والذي يحتل الجزء الجنوبي الغربيالبحث القسم األعلى من حوض نهر األعوج، هذا تشغل منطقة الدراسة التي تناولها
. من هذا الحوض
ى التكامل ما بين الطرائق الهيدروكيميائية، وطريقة النظائر، إضافة للنمذجة اتبع في البحث منهجية اعتمدت عل
الرياضية، وذلك بهدف تقييم الخصائص الهيدروجيولوجية الناظمة لحركة المياه الجوفية في منطقة الدراسة، ودراسة
درت الموازنة المائية للطبقة المائية العالقة الهيدروديناميكية بين مختلف الطبقات الحاملة للمياه الجوفية، وبناء عليه ق
.العليا، والتي يعتمد عليها معظم النشاطات البشرية المستهلكة للمياه
درست الخصائص الهيدروكيميائية للمياه الجوفية من خالل تتبع تغيرات األيونات الرئيسة فيها، ونسبها األيونية، إضافة
بارامترات الحقلية، وقد عكست قيم هذه الخصائص درجة التعقيد العالية لخصائصها الفيزيوكيميائية المتمثلة بقياس ال
لمنطقة الدراسة من الناحية الجيولوجية، والتكتونية، وبالتالي من الناحية الهيدروجيولوجية، وقد تبين من خالل تتبع
وترسيب الصخور الكربوناتية في تغيرات الصفات الهيدروكيميائية للمياه الجوفية الدور الكبير الذي يلعبه كل من انحالل
المياه الجوفية ضمن كافة أنحاء منطقة الدراسة، والذي استدل عليه من خالل قيم معامل التشبع لهذه الصخور، أما
بالنسبة النحالل السيليكات، وخاصية التبادل األيوني العكسي، فقد تبين أنهما يأتيان في المرتبة الثانية من ناحية التأثير
سيما المأخوذة من الطبقة العائدة لجص على تراكيب بعض العينات، والا التركيب، وقد لوحظ أيضا تأثير انحالل افي هذ
.للعصر الجوراسي
يتحكم المنشأ الجيولوجي للطبقات الحاملة للمياه في الخصائص الكيميائية لهذه المياه، بينما يكون تأثير النشاطات البشرية
من العينات المدروسة يغلب عليها الصفة % 70وقد أظهرت هذه الخصائص أن أكثر من ضعيفا على هذه الخصائص،
الكربوناتية الكلسية، والتي تؤكد بدورها على التأثير الكبير للصخور الكربوناتية من جهة، وعلى التغذية الحديثة للحوامل
.المائية من الهطوالت المطرية من جهة أخرى
كيميائية للمياه الجوفية إلى احتمالية سيطرة نظام هيدروكيميائي متماثل الخواص، بحيث يشير التشابه في الصفات ال
يصعب تتبع مسار حركة المياه الجوفية من خالل تتبع تطور هذه الصفات، وقد لوحظ دور واضح لتأثير النشاطات
االستخدام المكثف لألسمدة البشرية على خصائص المياه الجوفية في بعض أجزاء المنطقة المدروسة، وذلك من خالل
رفع مستوى النترات في المياه الجوفية إلىالعضوية والكيميائية في الزراعة، وتأثير الصرف الصحي، األمر الذي أدى
.بمنطقة الدراسة
، وكافية تتبع التغيرات الكيميائية المترافقة مع حركة المياه الجوفية، والتي تتميز بعدم انتظامها لم يعط داللة واضحة إن
عن التغذية الكبيرة المتوقعة من الطبقة الجوراسية الكارستية المتكشفة في القسم الجبلي باتجاه الطبقة النيوجينية الرباعية
في القسم السهلي من منطقة الدراسة، وهو ما يشير إلى سيطرة خاصية التغذية مقارنة مع التصريف، وبالتالي يمكن
.ن منطقة تغذية رئيسية تشمل مناطق أوسع انتشارا اعتبار منطقة الدراسة جزء م
12استخدمت الخصائص النظائرية لألمطار من أجل إنشاء خط األمطار المحلي باالعتماد على البيانات المتوافرة في
أو بجوار المنطقة المدروسة، كما استخدمت هذه الخصائص وتغيراتها مع االرتفاع عن / محطة مناخية يقع معظمها في
.، والديتيريوم18-لكل من األكسجين ( درجة النضوب)سطح البحر لتحديد التدرج النظائري
إن مقارنة الخصائص النظائرية لكل من مياه األمطار والمياه الجوفية في منطقة الدراسة تشير إلى إمكانية التغذية
ث تبخر مهم لمياه الهطوالت، سواء كان ذلك المباشرة للمياه الجوفية من الهطوالت المطرية، والثلجية، وذلك قبل حدو

06
قبل أو إثناء عملية الرشح، من جهة أخرى أشارت دراسة هذه الخصائص أيضا إلى الدور الكبير الذي تلعبه هذه
الهطوالت في تغذية الحوامل المائية الجوفية، والسيما في القسم الجبلي ذي الطبيعة الكارستية المتشققة، ومن المفيد
أن جميع عينات المياه الجوفية تقع إلى الشمال من خط المياه العالمي، مما يؤشر إلى إمكانية تغذية إلىهنا كذلك ةاإلشار
الطبقات الحاملة لهذه المياه بشكل مباشر من األمطار الناتجة عن الجبهة الهوائية المتولدة من تأثير البحر األبيض
.المتوسط
لكيميائية والنظائرية للمياه الجوفية يمكن تقسيم منطقة الدراسة إلى قسمين أساسيين بناء على نتائج دراسة الخصائص ا
هما القسم الجبلي الذي يشمل األجزاء الغربية، والجنوبية الغربية، والشمالية الغربية، حيث تسود التكشفات الجوراسية
فات لشرقية والمتوسطة، حيث تسيطر تكش الكارستية، والقسم السهلي الذي يشمل بشكل رئيس األجزاء الجنوبية، وا
. الكونغلوميرا النيوجينية، واللحقيات الرباعية
يمتاز القسم األول الجبلي بقابلية عالية للتلوث، وبخاصية الجريانات الرأسية فيه، وذلك بسبب طبيعته الكارستية، وبنيته
ات تحت السطحية أفقية، وتترافق مع تفاعل نشط بين المياه الفالقية، أما في القسم الثاني السهلي، فغالبا ما تكون الجريان
الجوفية والصخور الحاملة، كما يبدو أن التبادل المائي الرأسي بين الطبقات العميقة، والطبقة المائية العليا المتمثلة بشكل
دالل على ذلك من خالل رئيس بطبقة الكونغلوميرا النيوجينية يلعب دورا بارزا في تغذية هذه الطبقة، ويمكن االست
.التصاريف العالية نسبيا للينابيع الواقعة في القسم السهلي، وطبيعة التركيب النظائري لمياه هذه الينابيع
تضمن البحث أيضا تطوير نموذج رياضي يحاكي الجريانات الجوفية في مختلف الطبقات الحاملة لمنطقة الدراسة،
افرة، وقد دلت نتائج هذا النموذج على أن الطبقتين الجوراسية والكريتاسية المتكشفتين وذلك باالستناد على البيانات المتو
طبقات مضغوطة عندما تمتدان باتجاه الشرق، وتغطيهما التوضعات الجيولوجية األحدث، إلىفي القسم الجبلي تتحوالن
رجة تسمح بالتبادل المائي مع الطبقة المائية كما بينت هذه النتائج أن التدرج الهيدروليكي لهذه الطبقات يكون كبيرا لد
العليا عبر التسرب الصاعد للمياه الجوفية، وبناء عليه فان عملية تغذية الطبقة المائية العليا تتم من تغذية مباشرة تأتي من
لنيوجين مياه األمطار الراشحة نحو باطن األرض، ومن تغذية جانبية من خالل الطبقة الجوراسية عند توضع طبقة ا
الكونغلوميرية على تماس مباشر مع هذه الطبقة، ومن تغذية رأسية صاعدة تأتي من الطبقات العميقة، وأخيرا من تغذية
غير مباشرة عبر رواجع مياه الري، وفواقد نقل المياه من أجل االستخدامات الزراعية والمنزلية، ومياه الصرف
فهي تتغذي، وبشكل حصري من مياه األمطار، والمياه الناتجة عن ذوبان الصحي، أما فيما يتعلق بالطبقة الجوراسية،
.الثلوج
دلت الدراسة المتكاملة لكل من الخصائص الهيدروكيميائية والنظائرية والهيدروديناميكية للمياه الجوفية في المنطقة
هيدروليكيا ببعضهما البعض، المدروسة على احتمال وجود نظامين هيدوجيولوجيين مختلفين فيها، ولكنهما يتصالن
وعلى أن النظام األول يتميز بأنه ضحل نسبيا، ويتشكل ضمن الصخور النيوجينية والرباعية ضعيفة التماسك مما يسهل
حركة المياه الجوفية فيه، بينما يتميز النظام الثاني المتشكل في الصخور الكريتاسية والجوراسية العميقة، بأنه عميق
لبنية الكارستية المتشققة ونظام القنوات والفوالق، وهو ما يساعد على حركة وتصريف المياه الجوفية فيه وتطغى عليه ا
. من خالل خاصية الجريان المفضل
حددت مركبات الموازنة المائية في الطبقة المائية العليا من منطقة الدراسة باالعتماد على كل من النمذجة الرياضية،
وافرت حول كميات الهطول المطري، وتصاريف الينابيع، وكميات الضخ، وغيرها من العوامل األخرى والبيانات التي ت
المؤثرة في هذه الطبقة، ومن خالل ذلك تبين أن الجريان الجانبي والعمودي من طبقة الجوارسي يشكل المركبة األهم في
رية، أما من ناحية التصريف، فان الجريان الجانبي تغذية هذه الطبقة، يأتي بعدها التغذية الرشحية من الهطوالت المط
من هذه الطبقة باتجاه الشرق خارج منطقة النموذج يشكل المركبة األكبر للتصريف، مما يؤكد أن منطقة الدراسة تشكل
. منطقة تغذية رئيسية في الجزء الغربي من حوض بردى واألعوج
رر النتائج التي تم التوصل إليها سواء لجهة المركبة الكبيرة نسبيا إن توسيع حدود الحوض المذكور باتجاه الغرب قد يب
للتغذية المائية القادمة من طبقة الجوراسي للطبقة المائية العليا، أو لجهة التصاريف العالية نسبيا للينابيع المتدفقة من
.القسم السهلي لمنطقة الدراسة

07
: اآلتيةالبحث بالنقاط األساسية هذا في إليهائج التي تم التوصل باالستناد على كل ما سبق، يمكن تلخيص أهم النتا
وكذلك حيث تتركز معظم األنشطة الزراعيةتأكيد تأثير االستخدام المكثف لألسمدة الكيميائية في القسم السهلي -
ة تلوث الذي يمتاز بقابلي (الخ...قلعة جندل، بقعسم ) سيما في القسم الجبليوالتأثير مياه الصرف الصحي
. ستوى النترات في المياه الجوفية،على زيادة م ،عالية بسبب طبيعته الكارستية
وجود تغذية رأسية صاعدة من الطبقات العميقة المضغوطة باتجاه الحامل األول، وقد بينت ذلك نتائج الدراسة -
السابقة أن معظم الدراسات إلىهنا اإلشارةالكيميائية والنظائرية، وأكدت عليها نتائج النموذج الرياضي، مع
. وجود هذه التغذيةافترضت
في القسم السهليالجريان تحت السطحي األفقي حيث يسود تحديد أنماط الجريان السائدة في منطقة الدراسة، -
.في القسم الجبليعمودي الجوفي شبه الجريان ال يسيطربينما
ما هي منطقة تصريف، وذلك اعتمادا على التغير في يمكن اعتبار منطقة الدراسة منطقة تغذية رئيسية أكثر م -
خصائص التراكيب الكيميائية والنظائرية للمياه الجوفية، ويمكن بالتالي اعتبار هذه المنطقة جزء من منطقة
.تغذية تشغل حدودها مناطق أوسع انتشارا
خالل الصفات ظهرت درجة التعقيد الجيولوجي والليتولوحي في منطقة الدراسة بشكل واضح من -
الهيدروكيميائية في هذه المنطقة، وتغير التراكيب الكيمائية، ونسبها األيونية، ومؤشرات التشبع بالمياه الجوفية
.فيها، والتي لم تسمح بالتتبع الدقيق لمسارات حركة المياه الجوفية ضمنها
ألنها تعطي إشارة واضحة لوجود اتصال بالنمذجة الرياضية مثيرة لالهتمام، إليهاتعد النتائج التي تم التوصل -
هيدوليكي بين الحوامل المائية العميقة والسطحية، والتي لم تكن مؤكدة مسبقا، كما أن تقدير الموازنة المائية
للطبقة المائية العليا، التي تمثل المصدر الرئيس للتزود بالمياه من أجل االستخدام الزراعي يعتبر أيضا من
.ة لهذا البحثالنتائج الهام
أثبتت نتائج النمذجة الرياضية، بأن الظروف الطبيعية، والبنية الجيولوجية والتكتونية تلعب الدور الرئيس في -
هذه تزايد النشاطات المستهلكة للمياه في بغض النظر عن منطقة الدراسةنظام المياه الجوفية السائد في
.منطقةال
سواء الحجم الكبير نسبيا لمركبة الجريان الجوفي والسيما تم التوصل إليهاالتي نتائج يجب اإلشارة بناء على ال -
إلى إمكانية عدم التوافق بين نقاط الفصل الطبقة المائية العليا الطبقات العميقة باتجاهالجانبي أو الرأسي من
اح حدود الحوض في وبالتالي إمكانية انزي لقسم الجبلي من المنطقة المدروسةالمائي السطحي والجوفي في ا
.تلك المنطقة باتجاه الغرب
:الكلمات المفتاحية
، النمذجة الراضية، الموازنة المائية، إدارة الموارد FEFLOWحامل مائي، الهيدروكيمياء، النظائر البيئية،
المائية، جبل الحرمون، سورية
08
Table of Contents
ACKNOWLEDGEMENTS .................................................................................................. 3
Abstract .................................................................................................................................. 6
Résumé ................................................................................................................................. 10
15 .................................................................................................................................... الملخص
Table of Contents ................................................................................................................ 18
List of Figures ...................................................................................................................... 21
List of Tables ....................................................................................................................... 25
Introduction ......................................................................................................................... 26
Chapter 1. General setting of the Study area ................................................................... 31
1.1. General Characteristics of the Study Area .................................................................31
1.2. Geology ......................................................................................................................34
1.2.1. Stratigraphy .........................................................................................................34
1.2.1.1. Jurassic ..........................................................................................................34
1.2.1.2. Cretaceous .....................................................................................................35
1.2.1.3. Paleogene ......................................................................................................35
1.2.1.4. Neogene formations ......................................................................................36
1.2.1.5. Quaternary deposits ......................................................................................37
1.2.1.6. Basaltic rocks ................................................................................................37
1.2.2. Structures .............................................................................................................42
1.3. Hydro-climatology .....................................................................................................46
1.4. Hydrology ...................................................................................................................48
1.4.1. Awaj River ...........................................................................................................49
1.4.2. Major springs .......................................................................................................53
1.4.2.1. Mambej spring ..............................................................................................55
1.4.2.2. Talmasiat spring ............................................................................................56
1.4.2.3. Tabibieh spring .............................................................................................58
1.4.2.4. High Beit Jinn spring ....................................................................................58
1.4.2.5. Beit Jinn spring .............................................................................................60
1.5. Aquifer systems (Hydrogeology) ...............................................................................63
1.5.1. Jurassic Unit ........................................................................................................66
1.5.2. Cretaceous Unit ...................................................................................................67
1.5.3. The sedimentary Miocene–Quaternary aquifer ...................................................67
09
1.5.4. The Middle Miocene volcanic aquifer .................................................................67
Chapter 2. Methodology ..................................................................................................... 73
2.1. Sampling, analysis and database preparation .............................................................73
2.2. Constructing of groundwater model ...........................................................................79
Chapter 3. Hydrochemistry to delineate groundwater flow pattern in the study area 82
Introduction .......................................................................................................................... 82
3.1. Results and discussion ................................................................................................83
3.1.1. Calcite, Dolomite and Gypsum Dissolution ........................................................83
3.1.2. Dedolomitization Process ....................................................................................90
3.1.3. Silicate hydrolysis................................................................................................94
3.1.4. Redox processes ................................................................................................100
3.1.5. Stuyfzand classification .....................................................................................101
3.1.6. Correlation between groundwater flow pattern and hydrochemical behaviour 103
Chapter 4. Hydrochemical facies and isotopes to characterize the origin and recharge
mechanisms of the groundwater in the study area ........................................................ 105
Introduction ........................................................................................................................ 105
4.1. Result and discussion ...............................................................................................106
4.1.1. Water- Rock interaction and salts dissolution ...................................................106
4.1.2. Hydrochemical facies ........................................................................................109
4.1.3. Pollution Index (PI) and fecal contamination ....................................................113
4.1.4. Stable isotope composition of atmospheric precipitation and groundwater ......116
4.1.4.1. Origin of air masses ....................................................................................116
4.1.4.2. Local meteoric water line ............................................................................117
4.1.4.3. Altitude effect and tritium unit changes ......................................................121
4.1.4.4. Groundwater response to input precipitation ..............................................123
4.1.5. Equipotential contour lines and hydrogeological subdivision of the study area
.....................................................................................................................................125
Chapter 5. Groundwater modeling approach to estimate the water budget of the
upper aquifer horizon in the model domain and assess the hydraulic relationship
between multilayered aquifers ......................................................................................... 128
Introduction ........................................................................................................................ 128
5.1. Conceptual model .....................................................................................................129
5.2. Boundary conditions ................................................................................................131
5.3. Input data ..................................................................................................................134
11
5.3.1. Recharge ............................................................................................................134
5.3.2. Net Pumping ......................................................................................................135
5.3.3. Spatial distribution of hydraulic conductivity ...................................................137
5.4. Steady-state calibration ............................................................................................138
5.4.1. The result of simulated hydraulic head in the different aquifers .......................139
5.4.2. Integrated water budget for the upper aquifer horizon ......................................142
Chapter 6. General conclusion and Prospective ............................................................ 146
6.1. General conclusion ...................................................................................................146
6.2. Prospective ...............................................................................................................150
6.3. Conclusion générale .................................................................................................151
6.4. Perspectives ..............................................................................................................156
References .......................................................................................................................... 159
Supplemental data tables ................................................................................................. 173
Appendices ......................................................................................................................... 184
Appendix A Published Article .........................................................................................184
Appendices B Published Article ......................................................................................206
Appendices C Published Article ......................................................................................229
10
List of Figures
Fig.1-1 The location site of the study area and map of Syria divided into 7 hydrogeological
basins. ............................................................................................................................31
Fig. 1- 2 Elevation contour lines of the study area as well as the 3D view of this area. ......33
Fig. 1- 3 Range of the Paleogene thickness in the study area. ..............................................36
Fig. 1- 4 Range of Neogene thickness in the study area .......................................................37
Fig. 1- 5 Shows the soils that derived from the weathering of the basalt of the Neogene age
in the study area. ............................................................................................................38
Fig. 1- 6 Geological map of the study area modified from Selkhozpromexport 1986, as well
as three geological cross sections and one geophysical profile. ....................................39
Fig. 1- 7 Graphical logs of the stratigraphy in the Barada and Awaj Basin (Kattan 2006) ..41
Fig. 1- 8 Bedding and folding phenomena in the carbonate rocks of Jurassic (Arneh valley).
.......................................................................................................................................43
Fig. 1- 9 Majors fault in the study area (updating from Selkhozpromexport 1986) .............44
Fig. 1- 10 Three cross sections: A-B, C-D, and E-F (Fig. 1-6), demonstrate the subsurface
lithology as well as the major structures within the study area. (Modified from
RDWSSA 2006) ............................................................................................................45
Fig. 1-11 Geophysical profile G-H (Fig. 1-6), demonstrates the subsurface structures
(Modified from RDWSSA 2006) ..................................................................................45
Fig. 1-12 Precipitation isopleths map based on the amount of precipitation measured at the
six meteorological stations located in the study area during the hydrological year 2009-
2010. ..............................................................................................................................48
Fig. 1- 13 The Arneh Valley where the Sebarani tributary of Awaj River is generated and
flowing ...........................................................................................................................50
Fig. 1- 14 Kneseh and Rashasheh springs emerge from the upper part of Arneh valley
(Jurassic aquifer). ...........................................................................................................50
Fig. 1- 15 Schematic layout correspond to Sebarani tributary from Arneh toward the plain
area throughout several geological formations ..............................................................51
Fig. 1-16 Hydrograph shows the monthly average discharge of Awaj River from the
hydrological years 1930-1931 until 2009-2010 after the recharge of Tabibieh spring. 52
Fig. 1- 17 Annual discharge of Awaj River from the hydrological years 1930-1931 until
2009-2010 after the recharge of Tabibieh spring ..........................................................52
Fig. 1- 18 Location sites of major springs in the study area .................................................54
Fig. 1- 19 Mambej spring and its probable schematic framework .......................................55
Fig. 1- 20 The variations of the monthly discharge of Mambej spring and the annual
amount of precipitation measured at Arneh station. ......................................................56
Fig. 1- 21 Talmasiat spring which emerges from the Quaternary basalt. .............................57
Fig. 1- 22 The variations of the monthly discharge of Talmasiat spring and the annual
amount of precipitation measured at Arneh station. ......................................................57
Fig. 1- 23 The variations of the monthly discharge of Tabibieh spring and the yearly
amount of precipitation measured at Arneh station. ......................................................58
Fig. 1- 24 High Beit Jinn spring which emerges at the limit between the Jurassic and
Cretaceous formations. ..................................................................................................59
11
Fig. 1-25 The relationship between high Beit Jinn spring and the annual amount of
precipitation measured at Arneh station. .......................................................................60
Fig. 1- 26 Beit Jinn spring which emerges from the exposure of Paleogene southwest of the
study area. ......................................................................................................................61
Fig. 1- 27 The relationship between Beit Jinn spring and the annual amount of precipitation
measured at Arneh station. ............................................................................................61
Fig. 1- 28 The mean annual discharge of 5 major springs in the study area. .......................63
Fig. 1- 29 The hydraulic zones in the karstified aquifer in Syria, after Burdon and Safadi,
1964. ..............................................................................................................................65
Fig. 1- 30 Jurassic limestone demonstrates the karstification and rillenkarren along the
fractures. ........................................................................................................................66
Fig. 1- 31 The hydrogeological map of the study area. ........................................................68
Fig. 1- 32 Different aquifers and aquitards discriminated in the study area. 1, 3 and 5 are
aquifers, 2 and 4 are aquitards. ......................................................................................69
Fig 2 - 1 Location map of sampling sites in the study area. .................................................78
Fig 2 - 2 Framework of super-mesh of the model domain as well as three dimensional (3D)
representation of the 6 layers and 7 slices consisting of this model domain. ................81
Fig. 3 - 1 Opened and closed systems dissolution of carbonate rocks determined with
PHREEQC and pH as a function of PCO2 (atm) calculated values in the water samples.
.......................................................................................................................................84
Fig. 3 - 2 Calcium, magnesium and alkalinity concentration in mmoll-1
as a function of
PCO2 (atm) calculated values; solid lines are the alkalinity, calcium and magnesium
determined with PHREEQC for pure calcite and dolomite dissolution. .......................85
Fig. 3 - 3 Scatter plot of the saturation indices (SI) of calcite and dolomite determined in
the water samples. ..........................................................................................................87
Fig. 3 - 4 Classification and spatial distribution of saturation index of calcite in the water
samples with chart showing the SI of calcite as a function of PCO2 (atm) calculated
values. ............................................................................................................................88
Fig. 3 - 5 The Mg2+/
Ca2+
molar ration as a function of PCO2 (atm) calculated values. ........89
Fig. 3 - 6 Scatter charts of Ca2+
, Mg2+
(mmol.l-1
) and pH as a function of SO42-
(mmol.l-1
).
.......................................................................................................................................91
Fig. 3 - 7 Saturation indices of calcite, dolomite and gypsum as a function of SO4-2
(mmoll-
1). ....................................................................................................................................92
Fig. 3 - 8 Classification and spatial distribution of saturation index of dolomite in the water
samples. .........................................................................................................................94
Fig. 3 - 9 Classification and spatial distribution of SiO2 (mgl-1
) concentration in water
samples. .........................................................................................................................96
Fig. 3 - 10 Stability diagram of both Ca-Plagioclase (anorthite) and Na-Plagioclase (albite)
and their possible weathering products. ........................................................................98
Fig. 3 - 11 Na+/Ca
2+ versus Mg
2+/Ca
2+ molar ratios in the water samples, (after Han and
Liu, 2004). .....................................................................................................................99
13
Fig. 3 - 12 Scattered plots of (Ca2+
+ mg2+
) vs (HCO3- + SO4
2- showing the effect of
carbonate rock dissolution and silicate hydrolysis on groundwater composition. ......100
Fig. 3 - 13 Stability diagram of redox conditions range based on the relationship between
pH and PE and the distribution of water samples. .......................................................101
Fig. 3 - 14 Water types based on Stuyfzand classification. ................................................102
Fig. 3 - 15 Schematic groundwater flow patterns based on major springs discharge and
hydrochemical tracers and the associated hydrogeological subarea based on these
patterns. ........................................................................................................................104
Fig. 4- 1 Contribution of processes, other than evaporation, to the groundwater composition
(cations effect). ............................................................................................................108
Fig. 4- 2 Contribution of processes, other than evaporation, to the groundwater composition
(anions effect) ..............................................................................................................108
Fig. 4 - 3 Scatters plots of Na+/Cl
- vs Ca
2+/(HCO3
-+SO4
2-) and (Ca
2+ + mg
2+) vs (HCO3
- +
SO42-
) ...........................................................................................................................109
Fig. 4 - 4 a) Modified piper diagram depicting hydrochemical facies of groundwater in the
study area (b) spatial distribution and classification of these facies. ...........................111
Fig. 4 - 5 Representative stiff diagrams of selected samples for visual observation of spatial
variation in their water chemistry. The spatial visualization of electrical conductivity
(EC) is also shown in this figure. ................................................................................113
Fig. 4 - 6 Spatial visualization of the pollution index (PI) (a). The total coliform and fecal
coliform (Escherichia coli) measured in 3 spring water samples during March-April
2006 are also shown (b). ..............................................................................................115
Fig. 4 - 7 Scatter plot shows the relationship between NO3- (mmolL
-1) vs Cl
- (mmolL
-1) 116
Fig. 4 - 8 The locations map of sampling sites of atmospheric precipitation in Barada and
Awaj Basin and other basins in Syria. .........................................................................118
Fig. 4 - 9 The locations of groundwater sampling points for environmental isotopes
investigations. ..............................................................................................................119
Fig. 4 - 10 The relationship between δ18
O and δ2H in the atmospheric precipitation
(Weighted Mean) and in the groundwater samples. ....................................................121
Fig. 4 - 11 The relationship between the both δ18
O and δ2H and altitude for precipitation
and groundwater samples. ...........................................................................................122
Fig. 4 - 12 The relationship between tritium unit and the distance from the Syrian shoreline.
.....................................................................................................................................123
Fig. 4 - 13 Change of δ18
O in the Beit Jinn spring during the year of 1994. ......................124
Fig. 4 - 14 Equipotential contours map based on groundwater level measured in 31
monitoring wells during October 2006. The associated hydrogeological sub-regions (A
and B) as well as cross section C-D are depicted. .......................................................126
Fig. 4 - 15 The fluctuations of monthly groundwater level of the well 46RK from 2004 until
2011. ............................................................................................................................127
Fig. 5- 1 Schematic hydrogeological cross section C-D (Fig. 4-14) demonstrates conceptual
hydrogeological model. ...............................................................................................130
14
Fig. 5 - 2 Two dimessional (2D) FEFLOW mesh for the groundwater model and the spatial
distribution of boundary conditions, springs and observation wells as well as the
equipotential contours of measured initial hydraulic head for September 2010. ........132
Fig. 5 - 3 Variogram associated with the performance of kriging interpolation method. ...133
Fig. 5 - 4 Irrigation field location sites and spatial distribution of abstraction wells. ........136
Fig. 5 - 5 The irrigations method applied in the study area (plain region). ........................137
Fig. 5 - 6 Spatial distribution of the hydraulic conductivity in the model domain (upper
aquifer horizon). ..........................................................................................................138
Fig. 5 - 7 The comparison between measured and simulated initial hydraulic head in the
upper aquifer horizon, September 2010. .....................................................................139
Fig. 5 - 8 Scatter plot of measured and simulated initial hydraulic head for September 2010.
.....................................................................................................................................140
Fig. 5 - 9 Simulated equipotential contours lines in the Cretaceous aquifer, September 2010
.....................................................................................................................................142
Fig. 5 - 10 Simulated equipotential contours lines in the Jurassic aquifer, September 2010.
.....................................................................................................................................142
Fig. 5 - 11 Three dimensional (3D) numerical model showing computed water budget in the
upper aquifer horizon applied for steady-state simulation during September 2010. The
positive inflow and negative outflow values are expressed in Mm3y-1. ....................145
15
List of Tables
Table1-1 Average discharge of major springs in the study area during several hydrological
years. ............................................................................................................................. 53
Table 2 - 1 Site locations of the samples collected during the first fieldwork campaign
(2006) as well as other samples from Selkhozpromexport (1986) ............................... 74
Table 2 - 2 Site locations of the samples collected during the second fieldwork campaign
(2012) ............................................................................................................................ 77
Table 3 - 1 List of sampling sites and chemical composition of water samples collected
during November and December 2006 and the historical data based on
Selkhozpromexport study performed on 1986. .......................................................... 173
Table 4 - 1 Major ions concentration in the precipitation samples collected from three
stations located in the study area. ............................................................................... 107
table 4 - 2 List of sampling sites and chemical composition of water samples collected
during August 2012. ................................................................................................... 179
table 4 - 3 Environmental stable isotopic composition measured in groundwater samples
collected from 18 sites in the study area during August 2012 as addition to 3 samples
from Selkhozpromexport 1986. .................................................................................. 180
table 4 - 4 Environmental stable isotopic composition and amount of precipitation
measured in different meteorological stations in Syria. 1989-1990 data from Kattan
(1997a), 1983-1984 data from Selkhozpromexport (1986) and Arneh data from Kattan
(2006). ......................................................................................................................... 181
Table 5 - 1 Possible amounts of water entering and leaving a groundwater system of the
upper aquifer horizon and the primary information used to calculate different
components of the groundwater budget in this horizon. Units are in Mm3.y
-1 ........... 144
16
Introduction
Syria occupies the eastern cost of the Mediterranean Sea. It is a largely arid country
with a land area of about 185,000 km2 of which around one third is arable land or forests
and the remaining is desert and rocky mountain area (Higano and Melhem 2002). Water
has always been an important resource in the Middle East and has had strategic
implications. This area is considered one part of the world where water scarcity is severe
and precarious (Berkoff 1994, Brielmann 2008). It is a common and often-expressed
assumption that "the next war in the Middle East will be about water" contended, for
instance, by former UN general secretary Boutros Boutros-Ghali (Fröhlich 2012). The
struggle for fresh water in this area was a primer cause of the 1967 Arab-Israeli war and has
contributed to other military quarrels in the region.
Over the last few decades, the rapid growth and socio-economic development in most
of the sectors especially agricultural and light industry as well as the effect of climate
changes have severely affected water resources in the whole country and lead to water
quality and quantity degradation. The sufficient availability of water resources are
considered to be the key for prosper economic development in agricultural countries such
as Syria. The agricultural sector consumes more than 80% of total water resources of the
country (Kaisi et al. 2006). The dry continental climate is prevailing in the eastern
Mediterranean Basin, leading to substantial decrease in average precipitation (Al-Charideh
2007). Issar (2008) has concluded that the future increase in global temperature will cause
the dryness and desertification over the Mediterranean regions. The combination of climate
change effects with the increase in population density in these regions will undoubtedly
produce starvation and exacerbate poverty there. The recent drought which began in 2007
in the Middle East has further strained the limited water resources in the region which is
quite alarming. This requires immediate reaction to achieve water resources sustainability
(U.S. Department of Agriculture –USDA 2008, Integrated Regional Information Networks
2010, Voss et al. 2013). Fröhlich (2012) has mentioned that so many Syrian farmers have
lost their livelihood due to an on-going drought which has reduced the amount of arable
land through desertification and put enormous pressure on the previously scarce natural
water resources. According to Abou Zakhem and Hafez (2010) the average decrease of
rainfall in Syria was about 18% over the last 10 years.
17
Syria is characterized by low rainfall with annual and seasonal variations. In Barada
and Awaj Basin (Damascus Basin), the percentage of actual rainfall to average rainfall
during 2000 was 59% while a year earlier it was just 16% (Elhadj 2004). In the Hermon
region and according to joint climate-hydrology simulations result, the decrease in annual
precipitation amount will be about 25% in the coming years (Suppan et al. 2008). Since
streams flow and groundwater renewability are essentially generated by precipitation, in
simple words, one cannot imagine a region scarce in precipitation, will ever enjoy
abundance of surface and groundwater resources. However, the impact of climate changes
on groundwater resources depends upon the change in the volume and distribution of
groundwater recharge (Kumar 2012), but this impact is difficult to assess (Seiler and Gat
2007, Brielmann 2008). Nevertheless, it is well recognized that regional depletion of
groundwater resources is a global-scale problem (Konikow and Kendy 2005, Kløve et al.
2013).
According to Mourad and Berndtsson (2012), the annual available water per capita in
Syria will decrease from 2684 m3 in 1970 to 620 m
3 in 2025. The Syrian government's
development policy has encouraged the expansion of the irrigation area in order to reach
food self-sufficiency, but no consideration was given to the sustainability of groundwater
resources. Groundwater abstraction in Syria exceeds by far its recharge in almost all
regions, and all tapped aquifers are overexploited (Stadler et al. 2012). Hence water
scarcity and its sustainable use in all sectors is becoming a matter of social, economic and
political concern. The challenges of water scarcity are heightened by the increasing costs of
developing new water resources, land degradation in irrigated areas, groundwater depletion,
water pollution, and ecosystem degradation (Rosegrant and Cline 2003, Aw-Hassan et al.
2014). Syria suffers from both water scarcity and misdistribution of its water resources. Its
surface water is typically scarce by nature, and the situation is even made worse by the fact
that most of them are trans-boundary. The rapid growth of population which is considered
to be amongst the highest in the world, 2.9% in 2003 and 2.5% in 2010, (CBS 2010, Aw-
Hassan et al. 2014) leads to redoubling the Syria's population every 22-25 year (Abed
Rabboh 2007). The heterogeneous distribution of water resources over water basins as well
as the unbalanced distribution of population over these basins causes greater pressure on
water resources.
18
The use of groundwater in Syria dates back to centuries ago. Currently, groundwater
provides the necessary supplies for drinking and domestic purposes as well as for
agricultural and industrial purposes. Syria’s local agricultural policy of subsidized inputs
and supported prices for the expansion of cotton, wheat, maize and beetroot areas, is
leading to more demand for groundwater irrigation. Groundwater is estimated to constitute
more than 50% of the total amount of irrigation water in the country. (JICA 1997, Jumaa et
al. 1999, Zhou et al. 2010). In Barada and Awaj basin, the total withdrawal from
groundwater and surface water resources for irrigation purposes amounts to 786 Mm3y
-1
while the withdrawal of 269 and 76 Mm3y
-1 are for the domestic and industrial purposes
respectively (Kaisi et al. 2006). Moreover, Damascus is located in this basin, it
characterized by uncontrolled rural-urban migration and mushrooming illegal settlement.
To overcome the water demand increasing across the city, the policy makers are started
looking to other possibilities in order to adjust the pressure on water demand. More areas in
the basin are being investigated for additional water supply and the study area is one of the
most promised areas.
Sustainable, management and careful use of the scarce groundwater resources is the
most prominent challenge for the country, this requires more knowledge about groundwater
systems, which became a key issue. Such knowledge is especially critical in arid and semi-
arid regions, where natural recharge and discharge rates are often low and groundwater
pumping can rapidly dominate the behavior of the system. Springs are probably the most
widely available means for providing groundwater mainly in the karstic carbonate rocks.
For instance, the Fegih spring, the main source of potable water supply in the capital city of
Damascus, is considered to be the third largest karstic spring in the world (La-moreaux
1989). Groundwater is over-exploited in most of the basins due to the fact that water
extraction rates overcome by far available water recharge rates. This causes water
deficiency in most regions of Syria and declining in spring' discharges.
The Barada and Awaj Basin is considered to be one of the most important seven basins
constituting Syria (Fig.1-1). In spite of the fact that this basin has no significant water
resources, it constitutes an important water supply for the capital city, Damascus. From
historical point of view; the two main rivers in this basin (Barada and Aawaj), after which
the basin is named, are considered to be a vital socioeconomic supply, sustaining the
agricultural activities in this basin (INECO 2009).
19
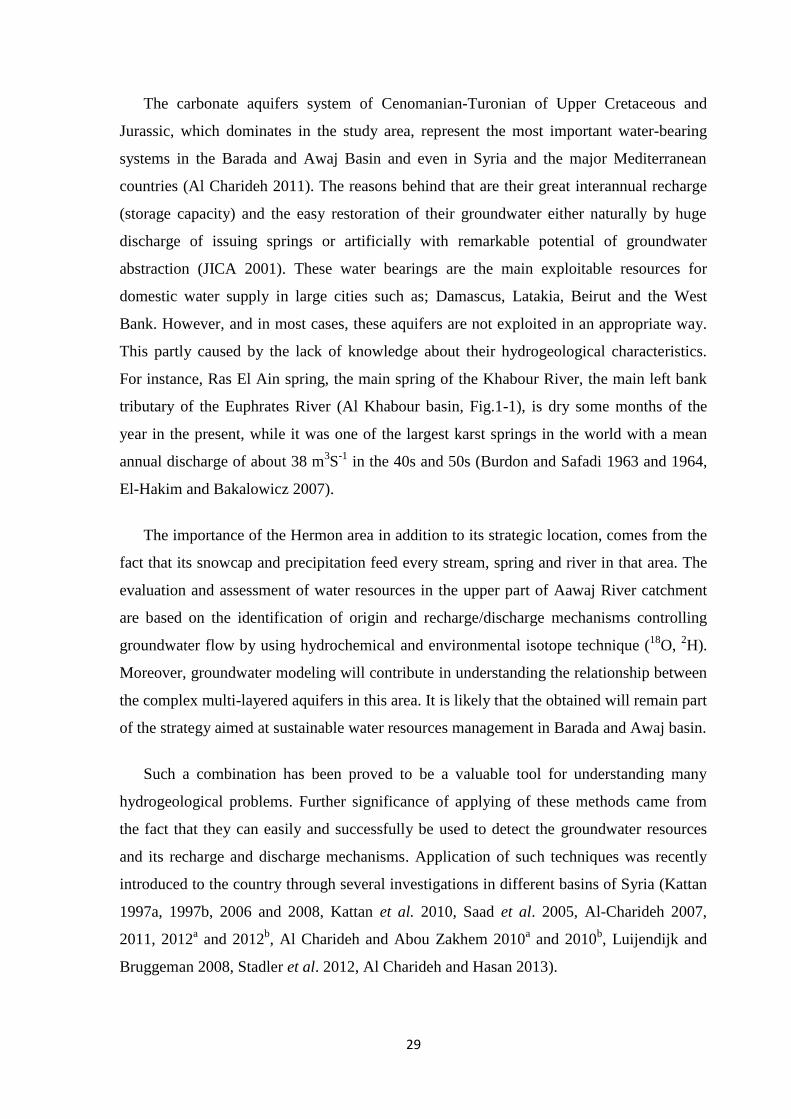
The carbonate aquifers system of Cenomanian-Turonian of Upper Cretaceous and
Jurassic, which dominates in the study area, represent the most important water-bearing
systems in the Barada and Awaj Basin and even in Syria and the major Mediterranean
countries (Al Charideh 2011). The reasons behind that are their great interannual recharge
(storage capacity) and the easy restoration of their groundwater either naturally by huge
discharge of issuing springs or artificially with remarkable potential of groundwater
abstraction (JICA 2001). These water bearings are the main exploitable resources for
domestic water supply in large cities such as; Damascus, Latakia, Beirut and the West
Bank. However, and in most cases, these aquifers are not exploited in an appropriate way.
This partly caused by the lack of knowledge about their hydrogeological characteristics.
For instance, Ras El Ain spring, the main spring of the Khabour River, the main left bank
tributary of the Euphrates River (Al Khabour basin, Fig.1-1), is dry some months of the
year in the present, while it was one of the largest karst springs in the world with a mean
annual discharge of about 38 m3S
-1 in the 40s and 50s (Burdon and Safadi 1963 and 1964,
El-Hakim and Bakalowicz 2007).
The importance of the Hermon area in addition to its strategic location, comes from the
fact that its snowcap and precipitation feed every stream, spring and river in that area. The
evaluation and assessment of water resources in the upper part of Aawaj River catchment
are based on the identification of origin and recharge/discharge mechanisms controlling
groundwater flow by using hydrochemical and environmental isotope technique (18
O, 2H).
Moreover, groundwater modeling will contribute in understanding the relationship between
the complex multi-layered aquifers in this area. It is likely that the obtained will remain part
of the strategy aimed at sustainable water resources management in Barada and Awaj basin.
Such a combination has been proved to be a valuable tool for understanding many
hydrogeological problems. Further significance of applying of these methods came from
the fact that they can easily and successfully be used to detect the groundwater resources
and its recharge and discharge mechanisms. Application of such techniques was recently
introduced to the country through several investigations in different basins of Syria (Kattan
1997a, 1997b, 2006 and 2008, Kattan et al. 2010, Saad et al. 2005, Al-Charideh 2007,
2011, 2012a and 2012
b, Al Charideh and Abou Zakhem 2010
a and 2010
b, Luijendijk and
Bruggeman 2008, Stadler et al. 2012, Al Charideh and Hasan 2013).
31
In the natural circumstances, water availability is a function of recharge effort and
extraction rate. The decreasing water resources in the study area as a result of climate
variability and increasing of water demand is one of the major challenges facing the
habitants over there. The population in the whole study area is about 40,000 who are
distributed in 14 villages and two Palestinian refugees' camps and is strongly depending on
agricultural resources (fruits, olives, beans and vegetables).
This research aims at: (I) Determining the groundwater origin and its geochemical
evaluation based on rock-water interactions within the framework of its complex geology
and morphology. (II) Identifying the major hydro-geochemical processes controlling the
groundwater quality and the dominating water types based on their chemical compositions
and ionic ratios. (III) Interpret the groundwater flow behaviour and assess the recharge and
discharge mechanisms in the study area. (IV) Give a quantitative estimation for
groundwater budget of the upper aquifer horizon, where the majority of habitants and the
agricultural activities are well developed, under steady-state conditions.
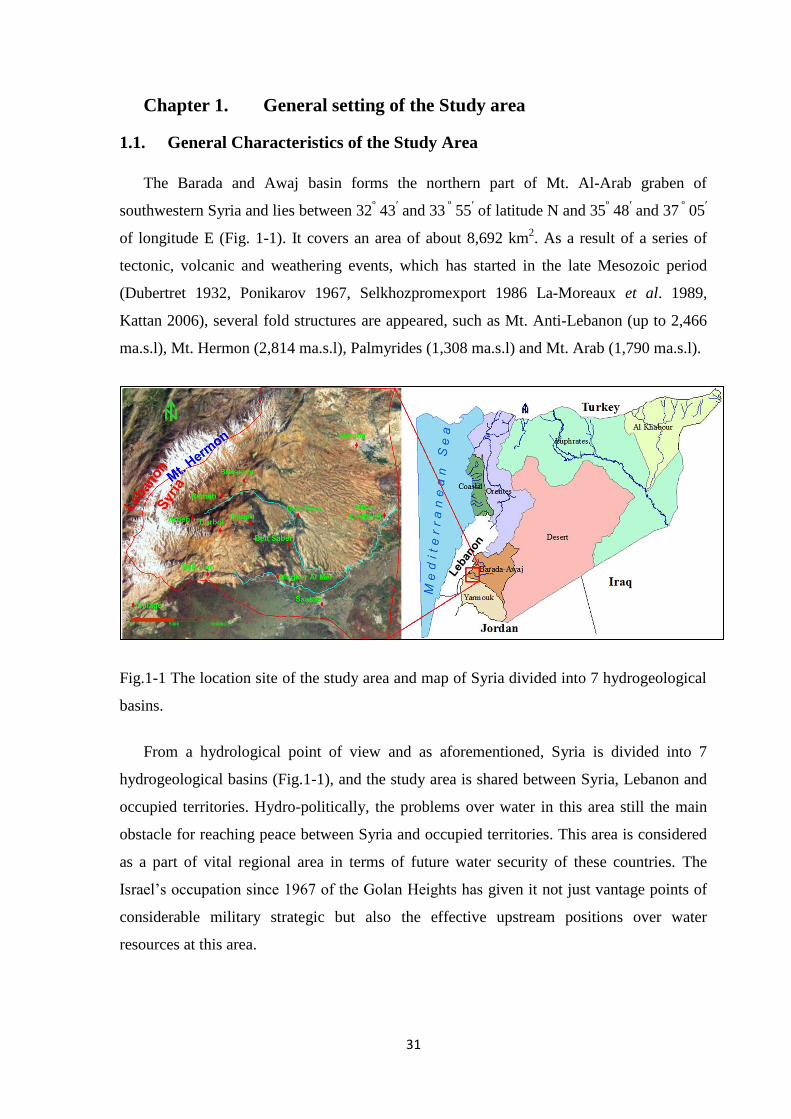
30
Chapter 1. General setting of the Study area
1.1. General Characteristics of the Study Area
The Barada and Awaj basin forms the northern part of Mt. Al-Arab graben of
southwestern Syria and lies between 32º 43
ʹ and 33
º 55
ʹ of latitude N and 35
º 48
ʹ and 37
º 05
ʹ
of longitude E (Fig. 1-1). It covers an area of about 8,692 km2. As a result of a series of
tectonic, volcanic and weathering events, which has started in the late Mesozoic period
(Dubertret 1932, Ponikarov 1967, Selkhozpromexport 1986 La-Moreaux et al. 1989,
Kattan 2006), several fold structures are appeared, such as Mt. Anti-Lebanon (up to 2,466
ma.s.l), Mt. Hermon (2,814 ma.s.l), Palmyrides (1,308 ma.s.l) and Mt. Arab (1,790 ma.s.l).
Fig.1-1 The location site of the study area and map of Syria divided into 7 hydrogeological
basins.
From a hydrological point of view and as aforementioned, Syria is divided into 7
hydrogeological basins (Fig.1-1), and the study area is shared between Syria, Lebanon and
occupied territories. Hydro-politically, the problems over water in this area still the main
obstacle for reaching peace between Syria and occupied territories. This area is considered
as a part of vital regional area in terms of future water security of these countries. The
Israel’s occupation since 1967 of the Golan Heights has given it not just vantage points of
considerable military strategic but also the effective upstream positions over water
resources at this area.
31
The study area (Fig. 1-1) covers an area of approximately 600 km2 and is considered to
be a major recharge area of the Aawaj River which is a main water course in that area and
mostly characterized by a seasonal flow regime. The total long of this river is 91 km and its
supply catchment area estimated to be 1120 km2 (MOI 2005). This stream is formed by the
junction of two main tributaries (Jenani and Sebarani), which are fed from a large number
of karstic springs that are distributed along the slop of Mt. Hermon in the Arneh and Beit
Jinn valleys. The annual average discharge of Aawaj River in the normal circumstances is
4.7 m3S
-1 between the years 1982-2004 (MOI 2005) which has decreased to approximately
2.2 m3S
-1 with a total dry out period during summer in recent years (2004-2014) [ (Melhem
and Higano 2001). In dry year such as the hydrological year 2000-2001, its average
discharge was 0.5m3.S
-1 during winter while it dries out during summer (Elhadj 2004). This
river losses most or all of its resources as it flows towards Damascus depression by the
intensive exploitation along its course for irrigation purposes. In the former days, the river
was terminated in Hijaneh Lake as a final natural drainage system. This lake is located at
the central part of Barada and Awaj basin and is dried out nowadays.
The average discharge of the springs located in the study area ranges between 0 and 0.3
m3S
-1 during summer and between 0.025 and 2.7 m
3S
-1 during winter (RDWSSA 2006).
From the geomorphological point of view, the area can be considered as a result of
Jurassic to recent deposition, tectonic, and volcanic. Sporadic uplift along with
comprehensive folding and faulting at shallow depth has resulted in a variety of surface
forms and geologic structures. This area can be divided into three parts, mountain ridges,
volcanic district and plain area. The mountains occupy the western part with anticlines or
hogbacks shapes which are resulted from the Neogene and Quaternary tectonic structure
(folding and/or faulting). The major sharp deep valleys in-between follow synclinal
structures, occur as strike valleys parallel to hogbacks or are the result of Pleistocene
erosion along normal faults of significant displacement. The karst features are well-
developed in this part at surface and even in deeper parts. The volcanic formations occupy
the southern part as an outcome of effusive rocks during the Neogene and Quaternary
periods. The plain region occupies more than 1/3 of the whole study area in the central and
eastern parts where the exposure of Neogene and Quaternary formations are dominating.
The elevation in the study area varies between 800 and 2800 ma.s.l (Fig. 1-2).
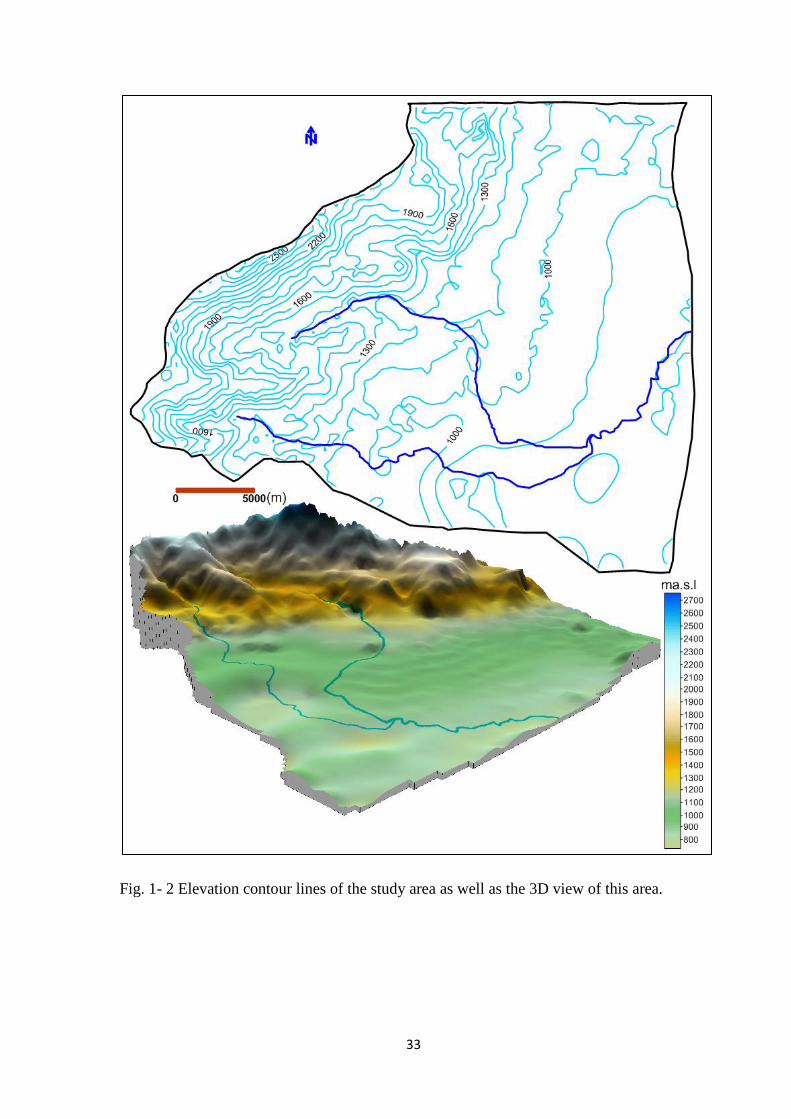
33
Fig. 1- 2 Elevation contour lines of the study area as well as the 3D view of this area.
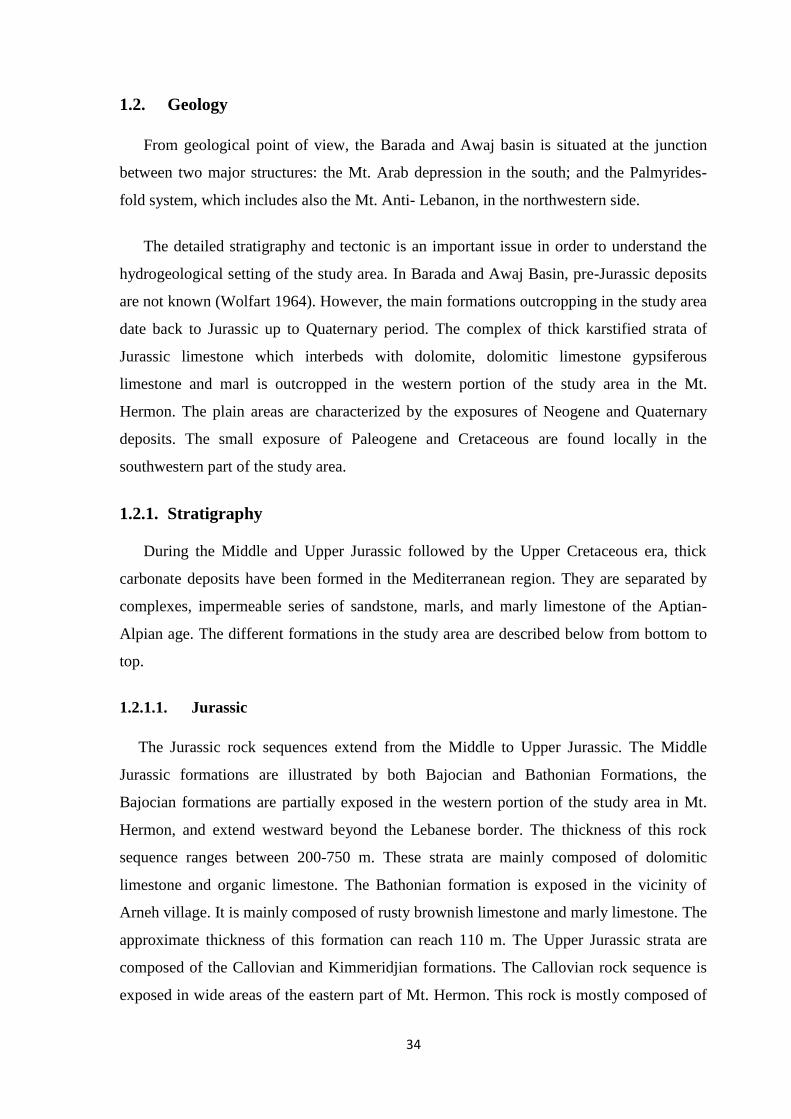
34
1.2. Geology
From geological point of view, the Barada and Awaj basin is situated at the junction
between two major structures: the Mt. Arab depression in the south; and the Palmyrides-
fold system, which includes also the Mt. Anti- Lebanon, in the northwestern side.
The detailed stratigraphy and tectonic is an important issue in order to understand the
hydrogeological setting of the study area. In Barada and Awaj Basin, pre-Jurassic deposits
are not known (Wolfart 1964). However, the main formations outcropping in the study area
date back to Jurassic up to Quaternary period. The complex of thick karstified strata of
Jurassic limestone which interbeds with dolomite, dolomitic limestone gypsiferous
limestone and marl is outcropped in the western portion of the study area in the Mt.
Hermon. The plain areas are characterized by the exposures of Neogene and Quaternary
deposits. The small exposure of Paleogene and Cretaceous are found locally in the
southwestern part of the study area.
1.2.1. Stratigraphy
During the Middle and Upper Jurassic followed by the Upper Cretaceous era, thick
carbonate deposits have been formed in the Mediterranean region. They are separated by
complexes, impermeable series of sandstone, marls, and marly limestone of the Aptian-
Alpian age. The different formations in the study area are described below from bottom to
top.
1.2.1.1. Jurassic
The Jurassic rock sequences extend from the Middle to Upper Jurassic. The Middle
Jurassic formations are illustrated by both Bajocian and Bathonian Formations, the
Bajocian formations are partially exposed in the western portion of the study area in Mt.
Hermon, and extend westward beyond the Lebanese border. The thickness of this rock
sequence ranges between 200-750 m. These strata are mainly composed of dolomitic
limestone and organic limestone. The Bathonian formation is exposed in the vicinity of
Arneh village. It is mainly composed of rusty brownish limestone and marly limestone. The
approximate thickness of this formation can reach 110 m. The Upper Jurassic strata are
composed of the Callovian and Kimmeridjian formations. The Callovian rock sequence is
exposed in wide areas of the eastern part of Mt. Hermon. This rock is mostly composed of
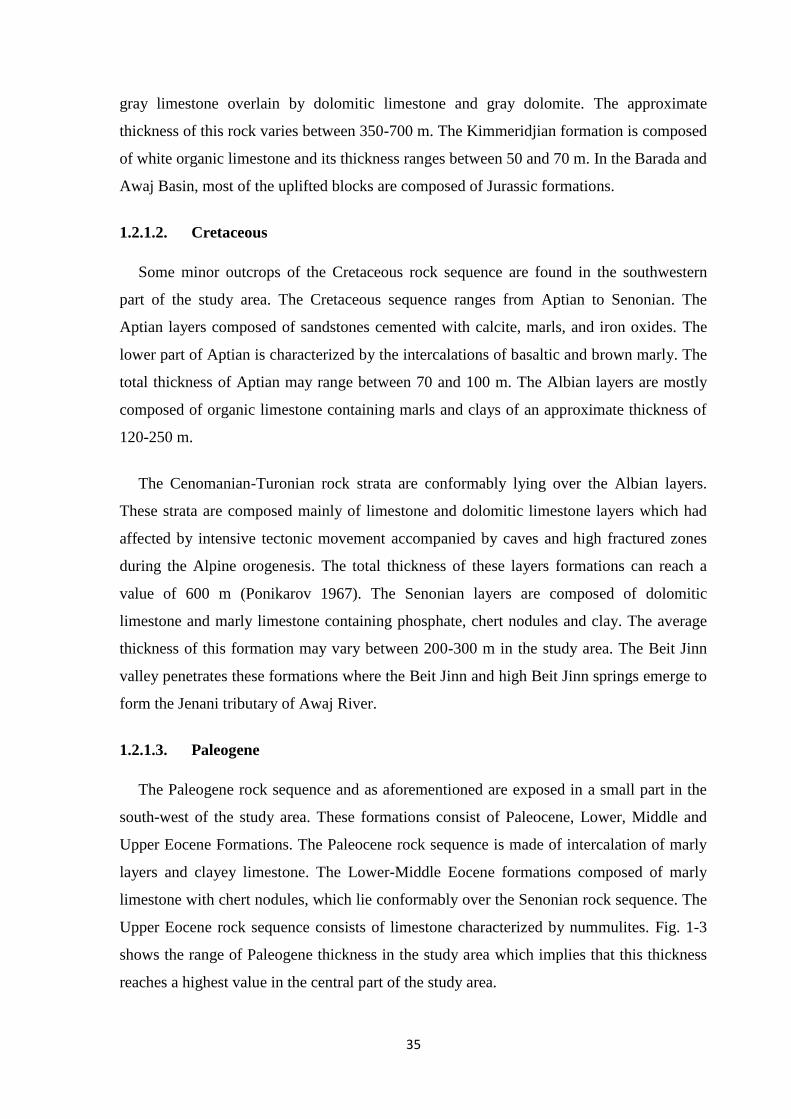
35
gray limestone overlain by dolomitic limestone and gray dolomite. The approximate
thickness of this rock varies between 350-700 m. The Kimmeridjian formation is composed
of white organic limestone and its thickness ranges between 50 and 70 m. In the Barada and
Awaj Basin, most of the uplifted blocks are composed of Jurassic formations.
1.2.1.2. Cretaceous
Some minor outcrops of the Cretaceous rock sequence are found in the southwestern
part of the study area. The Cretaceous sequence ranges from Aptian to Senonian. The
Aptian layers composed of sandstones cemented with calcite, marls, and iron oxides. The
lower part of Aptian is characterized by the intercalations of basaltic and brown marly. The
total thickness of Aptian may range between 70 and 100 m. The Albian layers are mostly
composed of organic limestone containing marls and clays of an approximate thickness of
120-250 m.
The Cenomanian-Turonian rock strata are conformably lying over the Albian layers.
These strata are composed mainly of limestone and dolomitic limestone layers which had
affected by intensive tectonic movement accompanied by caves and high fractured zones
during the Alpine orogenesis. The total thickness of these layers formations can reach a
value of 600 m (Ponikarov 1967). The Senonian layers are composed of dolomitic
limestone and marly limestone containing phosphate, chert nodules and clay. The average
thickness of this formation may vary between 200-300 m in the study area. The Beit Jinn
valley penetrates these formations where the Beit Jinn and high Beit Jinn springs emerge to
form the Jenani tributary of Awaj River.
1.2.1.3. Paleogene
The Paleogene rock sequence and as aforementioned are exposed in a small part in the
south-west of the study area. These formations consist of Paleocene, Lower, Middle and
Upper Eocene Formations. The Paleocene rock sequence is made of intercalation of marly
layers and clayey limestone. The Lower-Middle Eocene formations composed of marly
limestone with chert nodules, which lie conformably over the Senonian rock sequence. The
Upper Eocene rock sequence consists of limestone characterized by nummulites. Fig. 1-3
shows the range of Paleogene thickness in the study area which implies that this thickness
reaches a highest value in the central part of the study area.
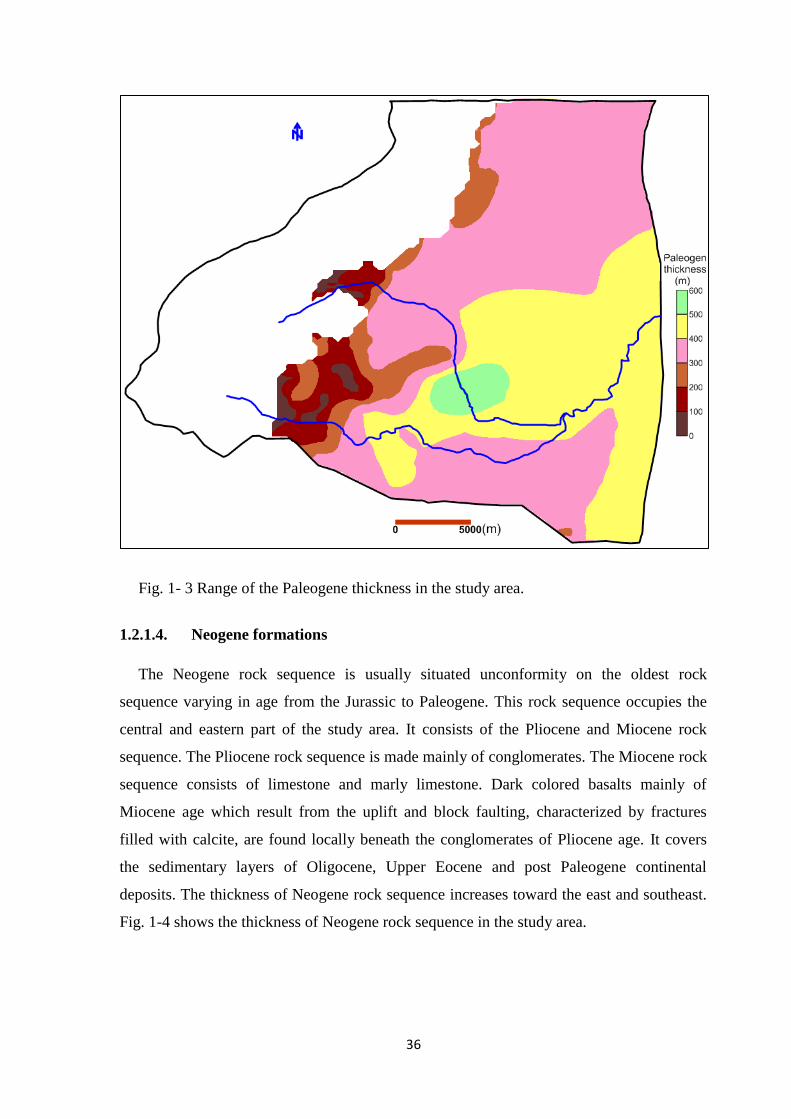
36
Fig. 1- 3 Range of the Paleogene thickness in the study area.
1.2.1.4. Neogene formations
The Neogene rock sequence is usually situated unconformity on the oldest rock
sequence varying in age from the Jurassic to Paleogene. This rock sequence occupies the
central and eastern part of the study area. It consists of the Pliocene and Miocene rock
sequence. The Pliocene rock sequence is made mainly of conglomerates. The Miocene rock
sequence consists of limestone and marly limestone. Dark colored basalts mainly of
Miocene age which result from the uplift and block faulting, characterized by fractures
filled with calcite, are found locally beneath the conglomerates of Pliocene age. It covers
the sedimentary layers of Oligocene, Upper Eocene and post Paleogene continental
deposits. The thickness of Neogene rock sequence increases toward the east and southeast.
Fig. 1-4 shows the thickness of Neogene rock sequence in the study area.
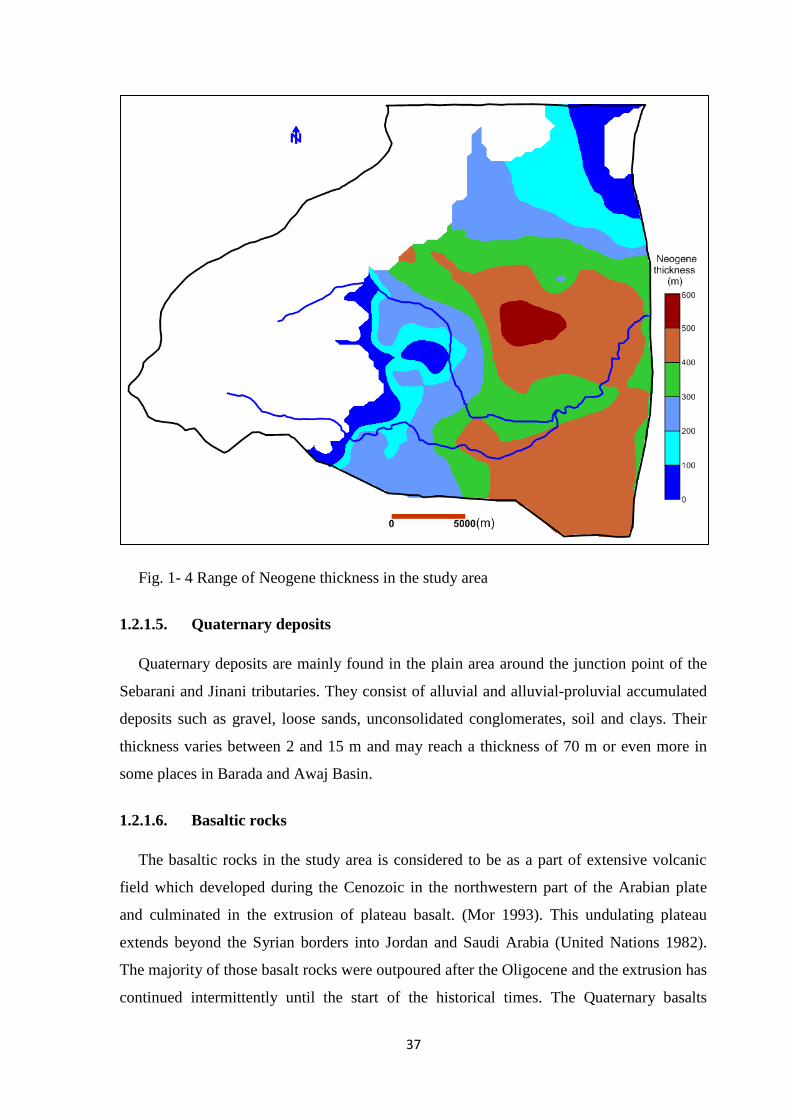
37
Fig. 1- 4 Range of Neogene thickness in the study area
1.2.1.5. Quaternary deposits
Quaternary deposits are mainly found in the plain area around the junction point of the
Sebarani and Jinani tributaries. They consist of alluvial and alluvial-proluvial accumulated
deposits such as gravel, loose sands, unconsolidated conglomerates, soil and clays. Their
thickness varies between 2 and 15 m and may reach a thickness of 70 m or even more in
some places in Barada and Awaj Basin.
1.2.1.6. Basaltic rocks
The basaltic rocks in the study area is considered to be as a part of extensive volcanic
field which developed during the Cenozoic in the northwestern part of the Arabian plate
and culminated in the extrusion of plateau basalt. (Mor 1993). This undulating plateau
extends beyond the Syrian borders into Jordan and Saudi Arabia (United Nations 1982).
The majority of those basalt rocks were outpoured after the Oligocene and the extrusion has
continued intermittently until the start of the historical times. The Quaternary basalts
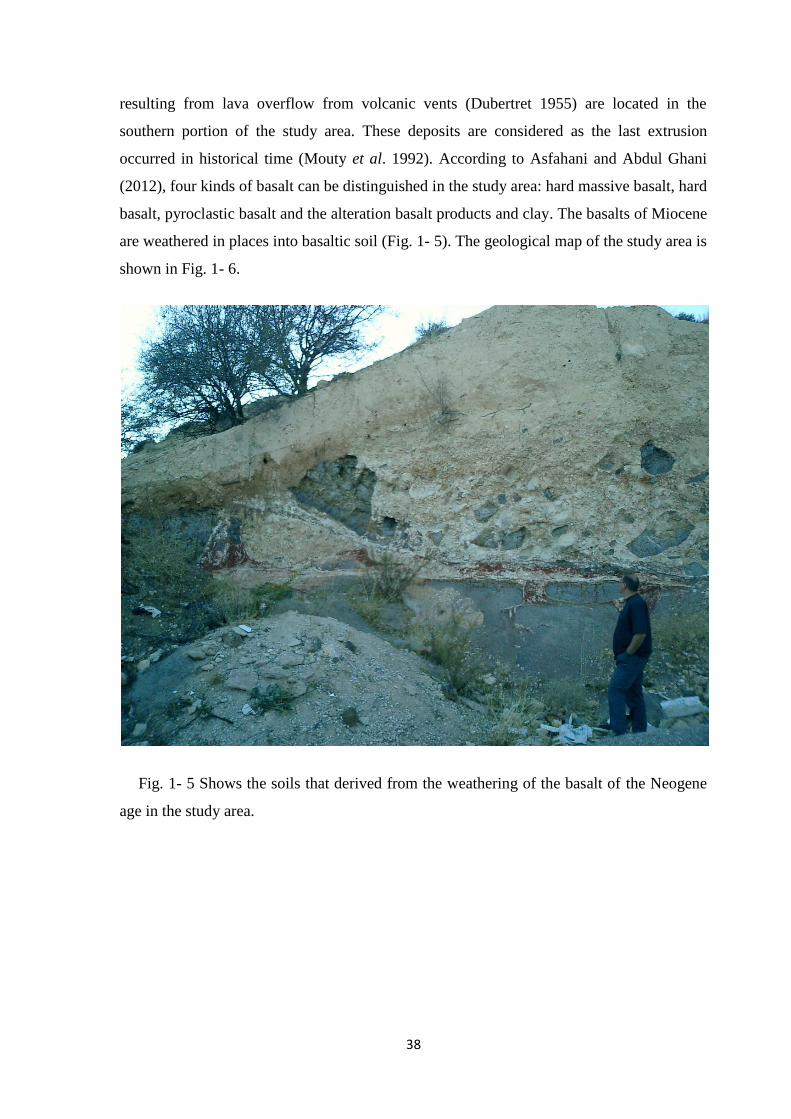
38
resulting from lava overflow from volcanic vents (Dubertret 1955) are located in the
southern portion of the study area. These deposits are considered as the last extrusion
occurred in historical time (Mouty et al. 1992). According to Asfahani and Abdul Ghani
(2012), four kinds of basalt can be distinguished in the study area: hard massive basalt, hard
basalt, pyroclastic basalt and the alteration basalt products and clay. The basalts of Miocene
are weathered in places into basaltic soil (Fig. 1- 5). The geological map of the study area is
shown in Fig. 1- 6.
Fig. 1- 5 Shows the soils that derived from the weathering of the basalt of the Neogene
age in the study area.
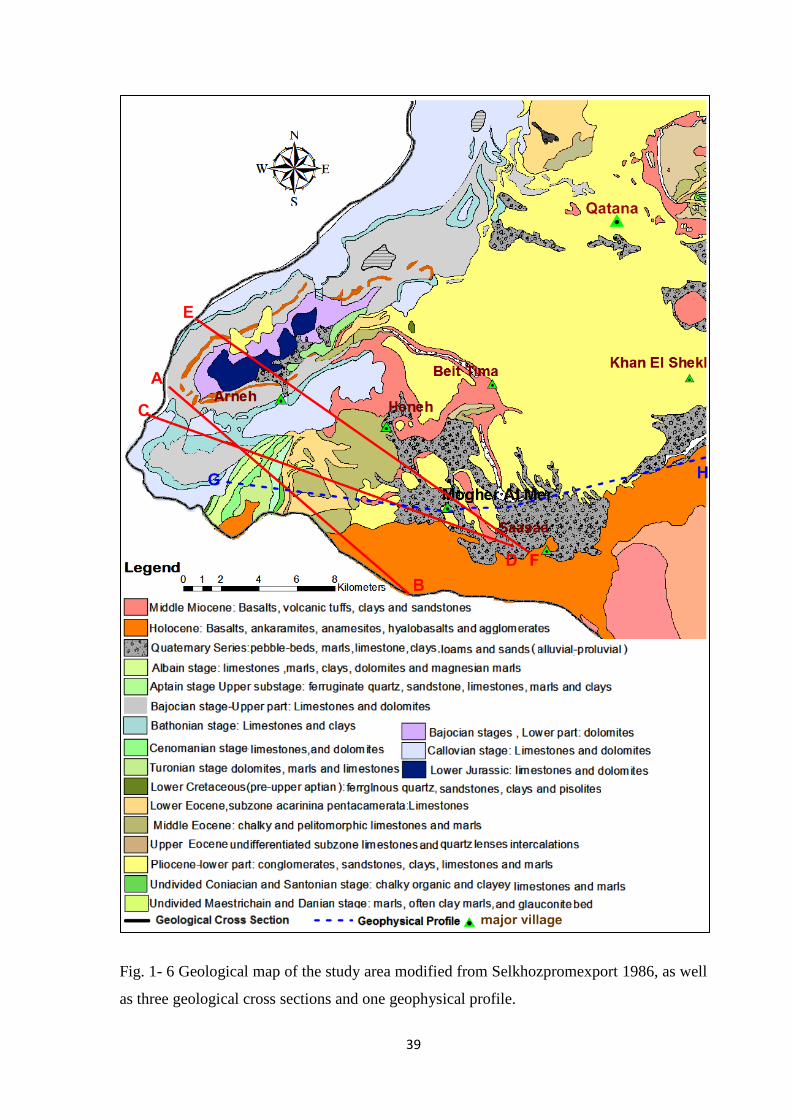
39
Fig. 1- 6 Geological map of the study area modified from Selkhozpromexport 1986, as well
as three geological cross sections and one geophysical profile.

41
The rock sequences of different geological age play major role in terms of the aquifer's
characteristics such as aquifer type, storage capacities and hydrodynamic properties. The
graphic logs of that record the stratigraphy of the Barada and Awaj Basin is shown in Fig.
1-7
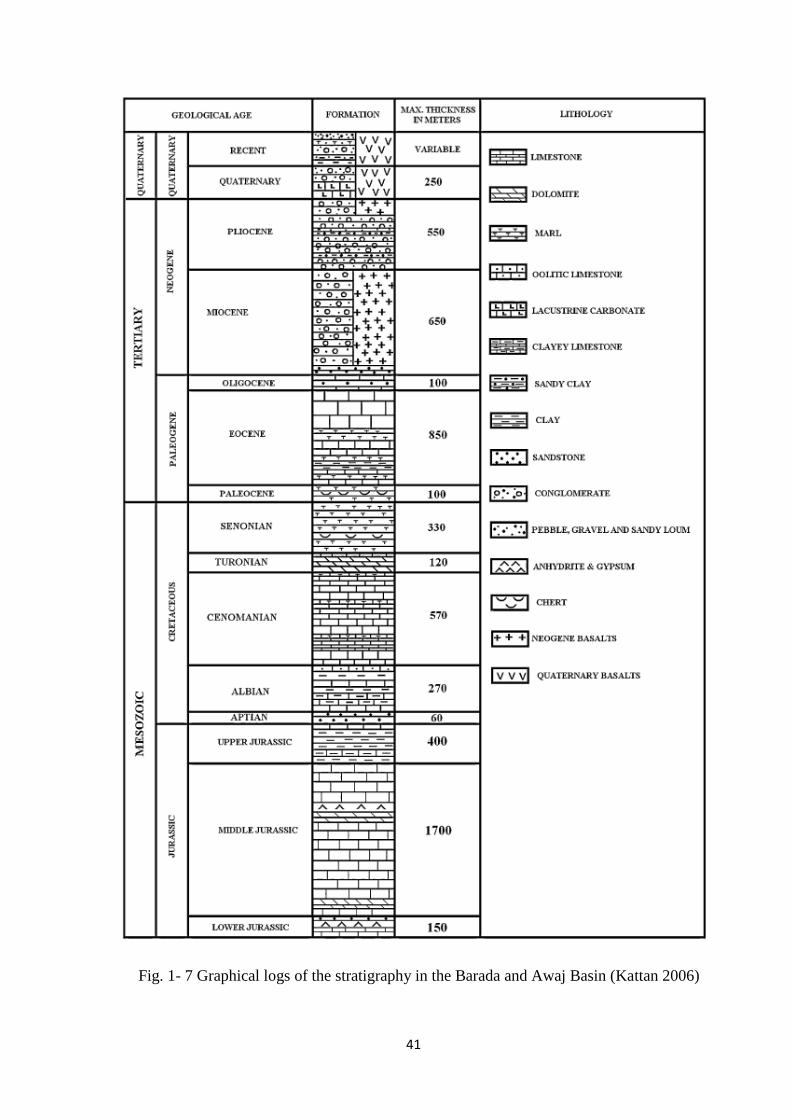
40
Fig. 1- 7 Graphical logs of the stratigraphy in the Barada and Awaj Basin (Kattan 2006)
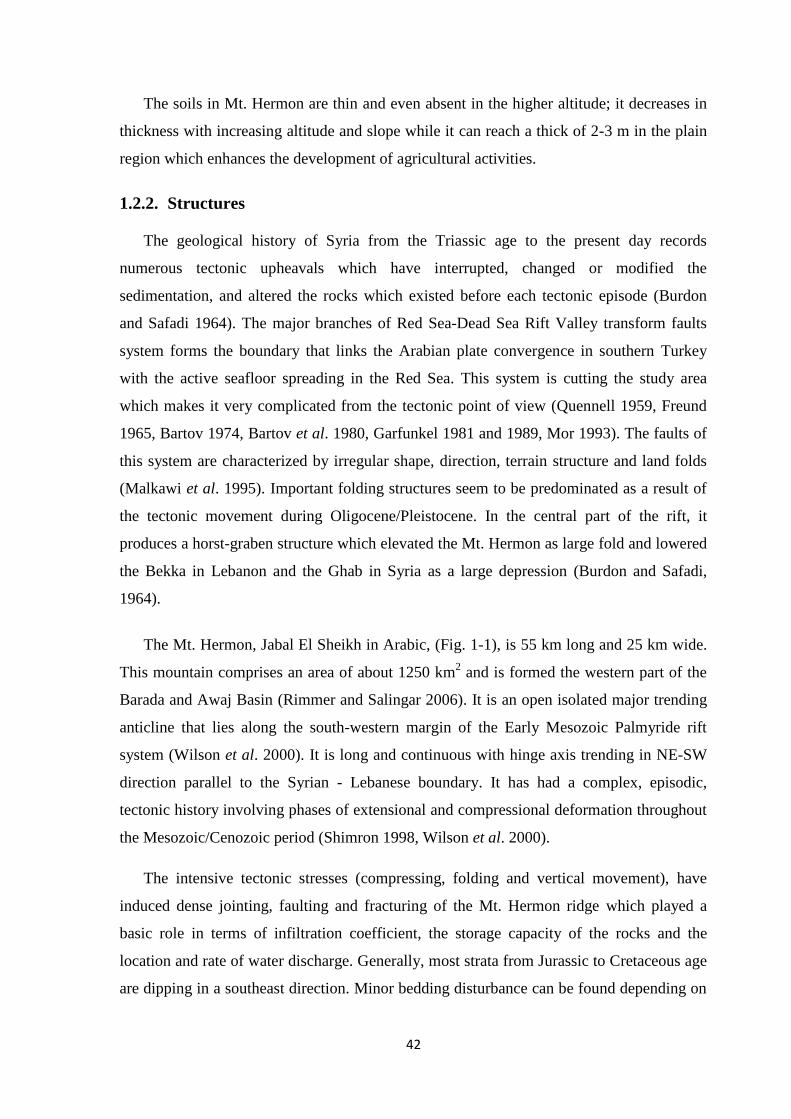
41
The soils in Mt. Hermon are thin and even absent in the higher altitude; it decreases in
thickness with increasing altitude and slope while it can reach a thick of 2-3 m in the plain
region which enhances the development of agricultural activities.
1.2.2. Structures
The geological history of Syria from the Triassic age to the present day records
numerous tectonic upheavals which have interrupted, changed or modified the
sedimentation, and altered the rocks which existed before each tectonic episode (Burdon
and Safadi 1964). The major branches of Red Sea-Dead Sea Rift Valley transform faults
system forms the boundary that links the Arabian plate convergence in southern Turkey
with the active seafloor spreading in the Red Sea. This system is cutting the study area
which makes it very complicated from the tectonic point of view (Quennell 1959, Freund
1965, Bartov 1974, Bartov et al. 1980, Garfunkel 1981 and 1989, Mor 1993). The faults of
this system are characterized by irregular shape, direction, terrain structure and land folds
(Malkawi et al. 1995). Important folding structures seem to be predominated as a result of
the tectonic movement during Oligocene/Pleistocene. In the central part of the rift, it
produces a horst-graben structure which elevated the Mt. Hermon as large fold and lowered
the Bekka in Lebanon and the Ghab in Syria as a large depression (Burdon and Safadi,
1964).
The Mt. Hermon, Jabal El Sheikh in Arabic, (Fig. 1-1), is 55 km long and 25 km wide.
This mountain comprises an area of about 1250 km2 and is formed the western part of the
Barada and Awaj Basin (Rimmer and Salingar 2006). It is an open isolated major trending
anticline that lies along the south-western margin of the Early Mesozoic Palmyride rift
system (Wilson et al. 2000). It is long and continuous with hinge axis trending in NE-SW
direction parallel to the Syrian - Lebanese boundary. It has had a complex, episodic,
tectonic history involving phases of extensional and compressional deformation throughout
the Mesozoic/Cenozoic period (Shimron 1998, Wilson et al. 2000).
The intensive tectonic stresses (compressing, folding and vertical movement), have
induced dense jointing, faulting and fracturing of the Mt. Hermon ridge which played a
basic role in terms of infiltration coefficient, the storage capacity of the rocks and the
location and rate of water discharge. Generally, most strata from Jurassic to Cretaceous age
are dipping in a southeast direction. Minor bedding disturbance can be found depending on
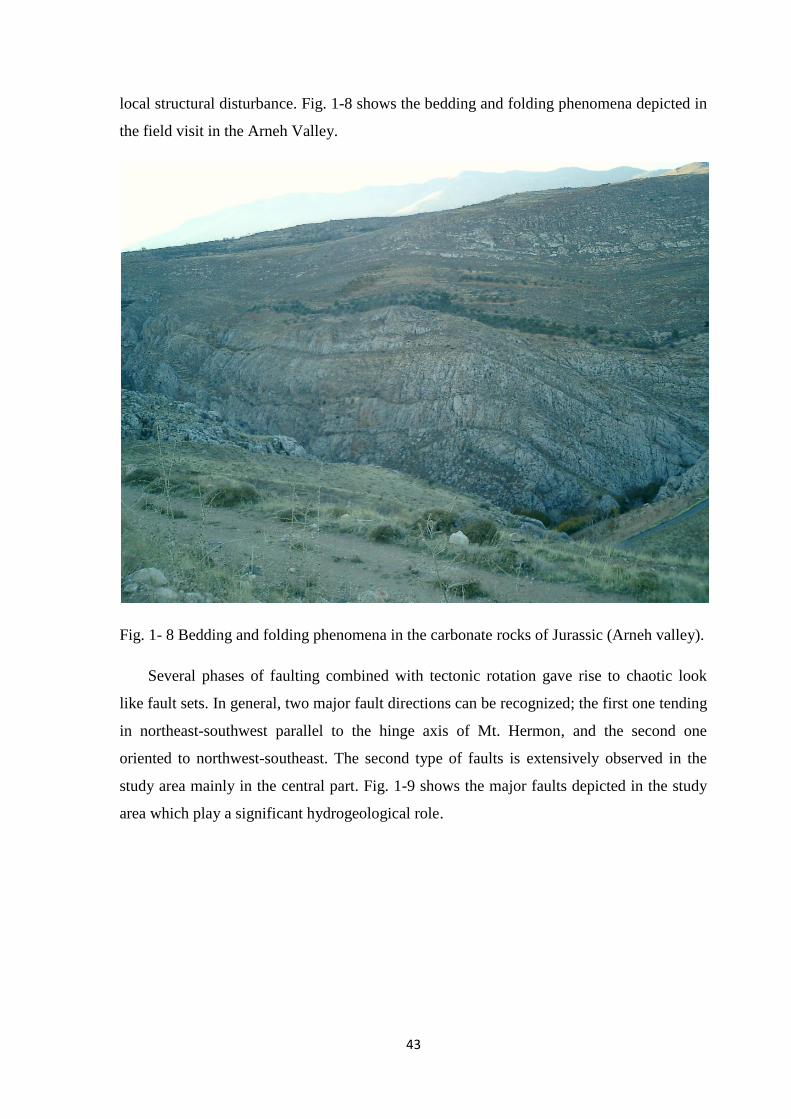
43
local structural disturbance. Fig. 1-8 shows the bedding and folding phenomena depicted in
the field visit in the Arneh Valley.
Fig. 1- 8 Bedding and folding phenomena in the carbonate rocks of Jurassic (Arneh valley).
Several phases of faulting combined with tectonic rotation gave rise to chaotic look
like fault sets. In general, two major fault directions can be recognized; the first one tending
in northeast-southwest parallel to the hinge axis of Mt. Hermon, and the second one
oriented to northwest-southeast. The second type of faults is extensively observed in the
study area mainly in the central part. Fig. 1-9 shows the major faults depicted in the study
area which play a significant hydrogeological role.
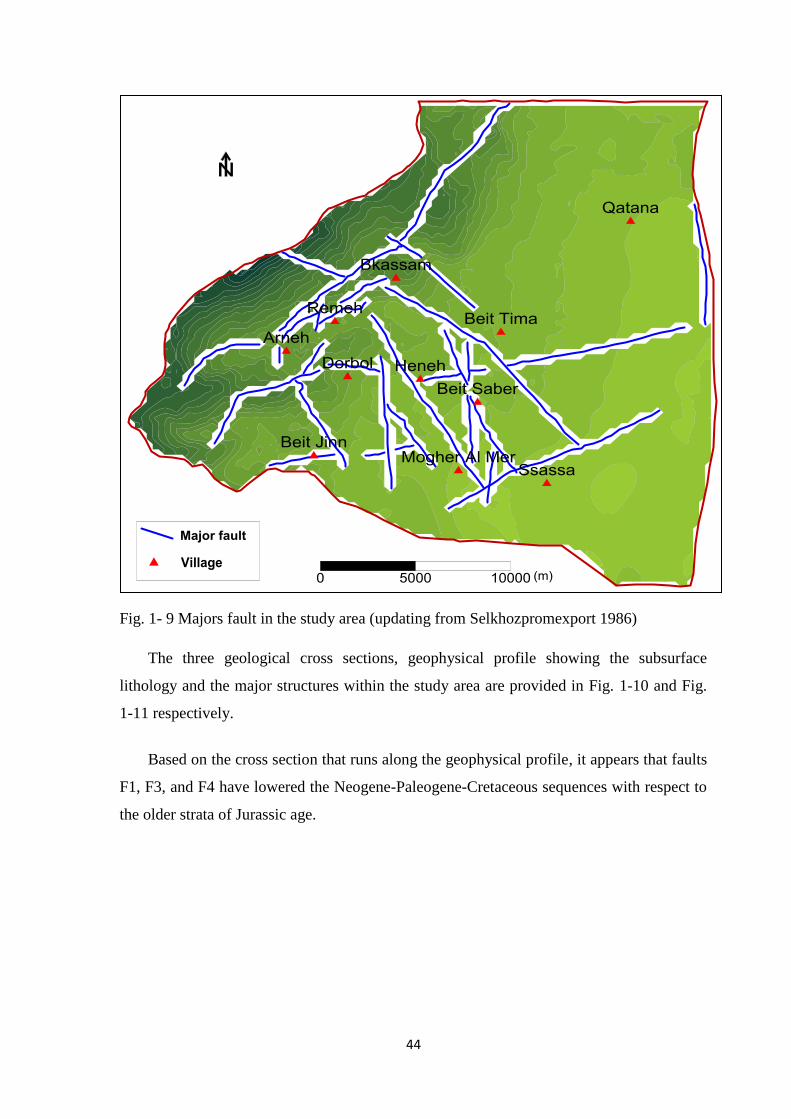
44
Fig. 1- 9 Majors fault in the study area (updating from Selkhozpromexport 1986)
The three geological cross sections, geophysical profile showing the subsurface
lithology and the major structures within the study area are provided in Fig. 1-10 and Fig.
1-11 respectively.
Based on the cross section that runs along the geophysical profile, it appears that faults
F1, F3, and F4 have lowered the Neogene-Paleogene-Cretaceous sequences with respect to
the older strata of Jurassic age.
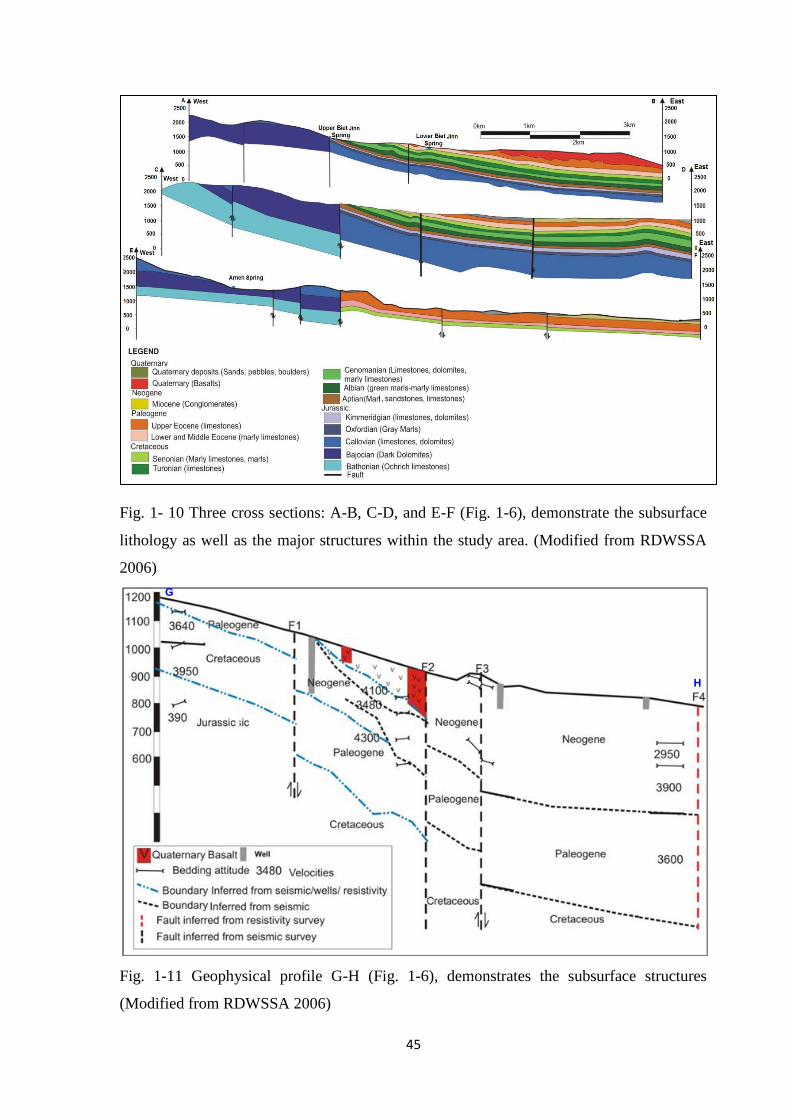
45
Fig. 1- 10 Three cross sections: A-B, C-D, and E-F (Fig. 1-6), demonstrate the subsurface
lithology as well as the major structures within the study area. (Modified from RDWSSA
2006)
Fig. 1-11 Geophysical profile G-H (Fig. 1-6), demonstrates the subsurface structures
(Modified from RDWSSA 2006)
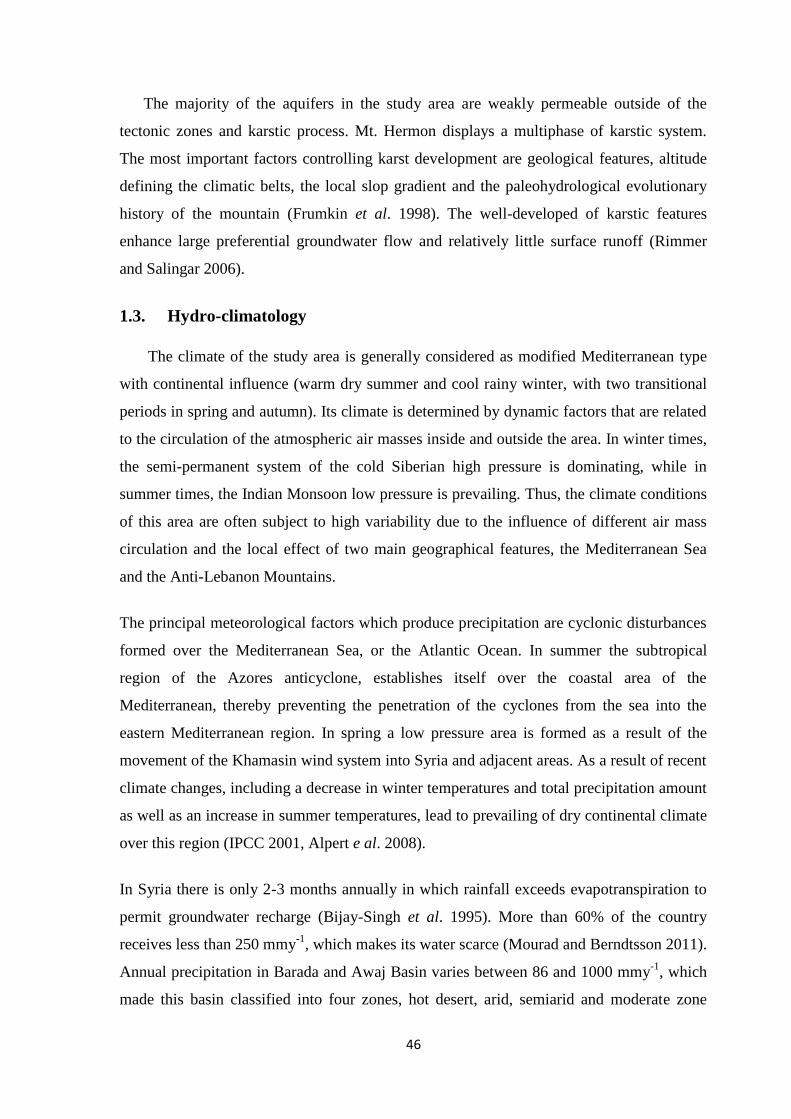
46
The majority of the aquifers in the study area are weakly permeable outside of the
tectonic zones and karstic process. Mt. Hermon displays a multiphase of karstic system.
The most important factors controlling karst development are geological features, altitude
defining the climatic belts, the local slop gradient and the paleohydrological evolutionary
history of the mountain (Frumkin et al. 1998). The well-developed of karstic features
enhance large preferential groundwater flow and relatively little surface runoff (Rimmer
and Salingar 2006).
1.3. Hydro-climatology
The climate of the study area is generally considered as modified Mediterranean type
with continental influence (warm dry summer and cool rainy winter, with two transitional
periods in spring and autumn). Its climate is determined by dynamic factors that are related
to the circulation of the atmospheric air masses inside and outside the area. In winter times,
the semi-permanent system of the cold Siberian high pressure is dominating, while in
summer times, the Indian Monsoon low pressure is prevailing. Thus, the climate conditions
of this area are often subject to high variability due to the influence of different air mass
circulation and the local effect of two main geographical features, the Mediterranean Sea
and the Anti-Lebanon Mountains.
The principal meteorological factors which produce precipitation are cyclonic disturbances
formed over the Mediterranean Sea, or the Atlantic Ocean. In summer the subtropical
region of the Azores anticyclone, establishes itself over the coastal area of the
Mediterranean, thereby preventing the penetration of the cyclones from the sea into the
eastern Mediterranean region. In spring a low pressure area is formed as a result of the
movement of the Khamasin wind system into Syria and adjacent areas. As a result of recent
climate changes, including a decrease in winter temperatures and total precipitation amount
as well as an increase in summer temperatures, lead to prevailing of dry continental climate
over this region (IPCC 2001, Alpert e al. 2008).
In Syria there is only 2-3 months annually in which rainfall exceeds evapotranspiration to
permit groundwater recharge (Bijay-Singh et al. 1995). More than 60% of the country
receives less than 250 mmy-1
, which makes its water scarce (Mourad and Berndtsson 2011).
Annual precipitation in Barada and Awaj Basin varies between 86 and 1000 mmy-1
, which
made this basin classified into four zones, hot desert, arid, semiarid and moderate zone
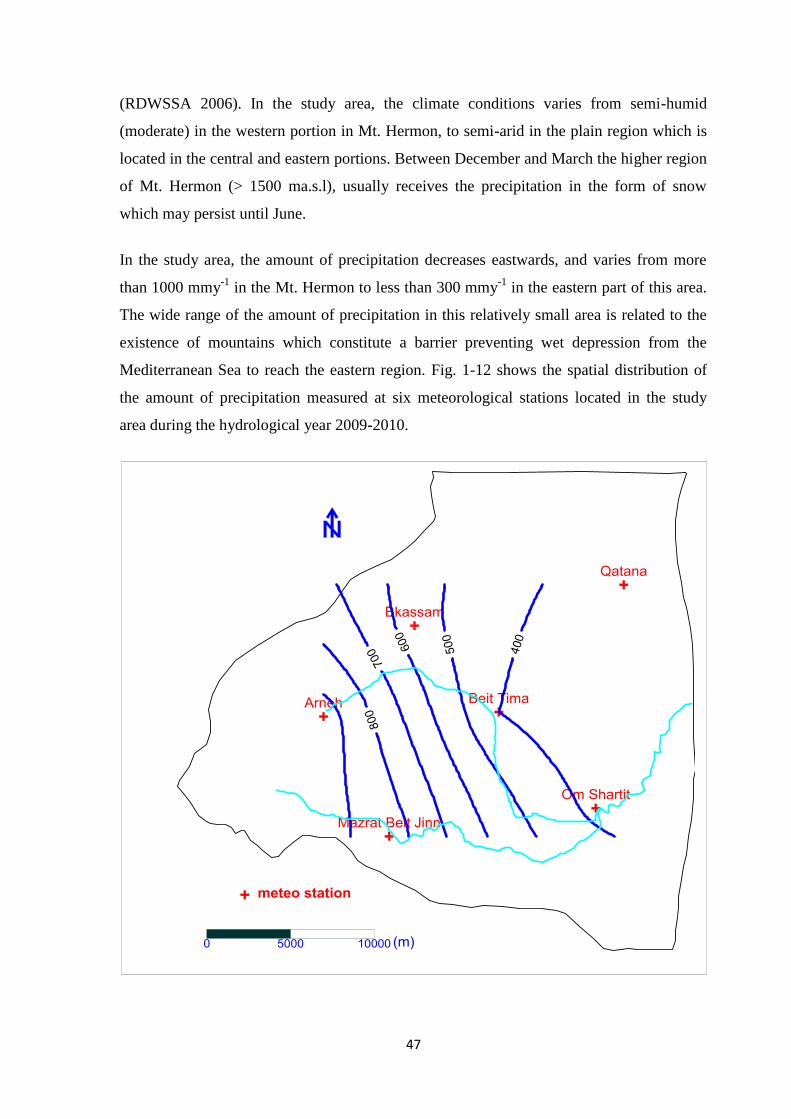
47
(RDWSSA 2006). In the study area, the climate conditions varies from semi-humid
(moderate) in the western portion in Mt. Hermon, to semi-arid in the plain region which is
located in the central and eastern portions. Between December and March the higher region
of Mt. Hermon (> 1500 ma.s.l), usually receives the precipitation in the form of snow
which may persist until June.
In the study area, the amount of precipitation decreases eastwards, and varies from more
than 1000 mmy-1
in the Mt. Hermon to less than 300 mmy-1
in the eastern part of this area.
The wide range of the amount of precipitation in this relatively small area is related to the
existence of mountains which constitute a barrier preventing wet depression from the
Mediterranean Sea to reach the eastern region. Fig. 1-12 shows the spatial distribution of
the amount of precipitation measured at six meteorological stations located in the study
area during the hydrological year 2009-2010.
48
Fig. 1-12 Precipitation isopleths map based on the amount of precipitation measured at the
six meteorological stations located in the study area during the hydrological year 2009-
2010.
The monthly average of air temperature ranges between 25º and 27ºC in summer within the
plain region, while this value is about 19º C in the mountains at elevation above 2000 ms.s.l
during the same period. In winter, the monthly average of air temperature ranges from 10º
to 15ºC within the plain area and decreases to less than 0 ºC above 1500 ma.s.l. According
to Alpert et al. (2008), the average temperature over the Eastern Mediterranean area has
increased by 1.5-4 ºC in the last 100 years
The relative humidity values are essentially related to temperature oscillation (JICA, 2001),
thus low monthly values are usually about 24-50% during summer (July and August) and
may reach up to 60–70% during winter (January and February). The humidity values
generally decrease eastward across the recharge area for any given elevation. The reason
behind that is due to increasing distance from the principal source of water vapor, the
Mediterranean Sea, and the increasing effectiveness of a rain-shadow as the moisture is
carried eastward across the Anti-Lebanon by winter storms. The annual potential
evaporation varies between 1,500 mmy-1
in the flatlands to 1,100 mmy-1
in the mountainous
parts. the lowest values of potential evaporation estimated to be 500 mmy-1
for the altitude
more 2600 ma.s.l. Evapotranspiration in the mountainous area varies between 300-400
mmy-1
while it is about 100 mmy-1
in the flatland area (Selkhozpromexport 1986; Kattan
1997b).
1.4. Hydrology
The drainage network of the study area is influenced by climatic, topographic,
geomorphic, geologic, ecological and anthropogenic conditions prevailing in that area.
From the satellite photo (Fig. 1-1), it is clear that the ancient drainage network plays an
important role in the formation of Neogene conglomerate which occupies the plain region.
In this area, three alluvial fans can be determined of which one is relatively large compared
to the others.
49
1.4.1. Awaj River
The denser drainage network is found along the slopes of the Mt. Hermon ridge at the
altitude of more than 1000 ma.s.l where the two tributaries of Awaj River (Sebarani and
Jenani) are generated. This river is considered as a main form of surface water in the study
area. During summer, it used for irrigation purposes through more than 20 canals branching
out into the plain region. The major factors affecting streams discharge in this area are
precipitation and snowmelt. The amount of snowfall at the altitude between 2200m and
2400m is estimated to be between 1100 and 1700 mm. The snowmelt contributes to about
80% of the total precipitation for the altitude more than 2400 m, and about 60% for the
altitude between 2000 and 2400 m, while this value is about 30% at the altitude of 1500 m
(MOI 1994). Surprisingly, it was observed that snowfall on Mt. Hermon and Anti-Lebanon
had twice the water content as the same volume of snow falling at the same altitude on the
Alps (Aouad-Rizk et al. 2005, Brielmann 2008).
According to Scanlon et al. (2006) and Brielmann (2008), the preferential flow through
fractures rocks in the valleys of semi-arid region is a common phenomenon. The main
tributary of Awaj River (Sebarani) starts beneath the central peak from the exposure of
Jurassic formations in the western side of the study area near Arneh village (Arneh Valley,
Fig. 1-13).
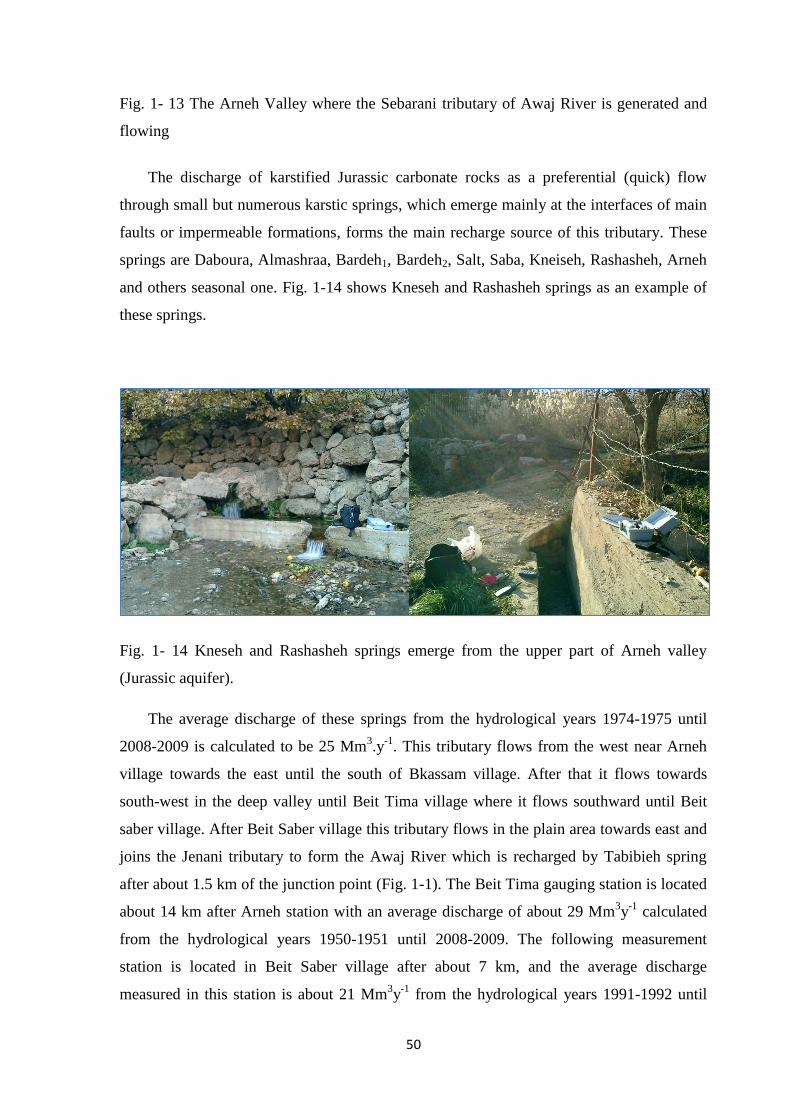
51
Fig. 1- 13 The Arneh Valley where the Sebarani tributary of Awaj River is generated and
flowing
The discharge of karstified Jurassic carbonate rocks as a preferential (quick) flow
through small but numerous karstic springs, which emerge mainly at the interfaces of main
faults or impermeable formations, forms the main recharge source of this tributary. These
springs are Daboura, Almashraa, Bardeh1, Bardeh2, Salt, Saba, Kneiseh, Rashasheh, Arneh
and others seasonal one. Fig. 1-14 shows Kneseh and Rashasheh springs as an example of
these springs.
Fig. 1- 14 Kneseh and Rashasheh springs emerge from the upper part of Arneh valley
(Jurassic aquifer).
The average discharge of these springs from the hydrological years 1974-1975 until
2008-2009 is calculated to be 25 Mm3.y
-1. This tributary flows from the west near Arneh
village towards the east until the south of Bkassam village. After that it flows towards
south-west in the deep valley until Beit Tima village where it flows southward until Beit
saber village. After Beit Saber village this tributary flows in the plain area towards east and
joins the Jenani tributary to form the Awaj River which is recharged by Tabibieh spring
after about 1.5 km of the junction point (Fig. 1-1). The Beit Tima gauging station is located
about 14 km after Arneh station with an average discharge of about 29 Mm3y
-1 calculated
from the hydrological years 1950-1951 until 2008-2009. The following measurement
station is located in Beit Saber village after about 7 km, and the average discharge
measured in this station is about 21 Mm3y
-1 from the hydrological years 1991-1992 until
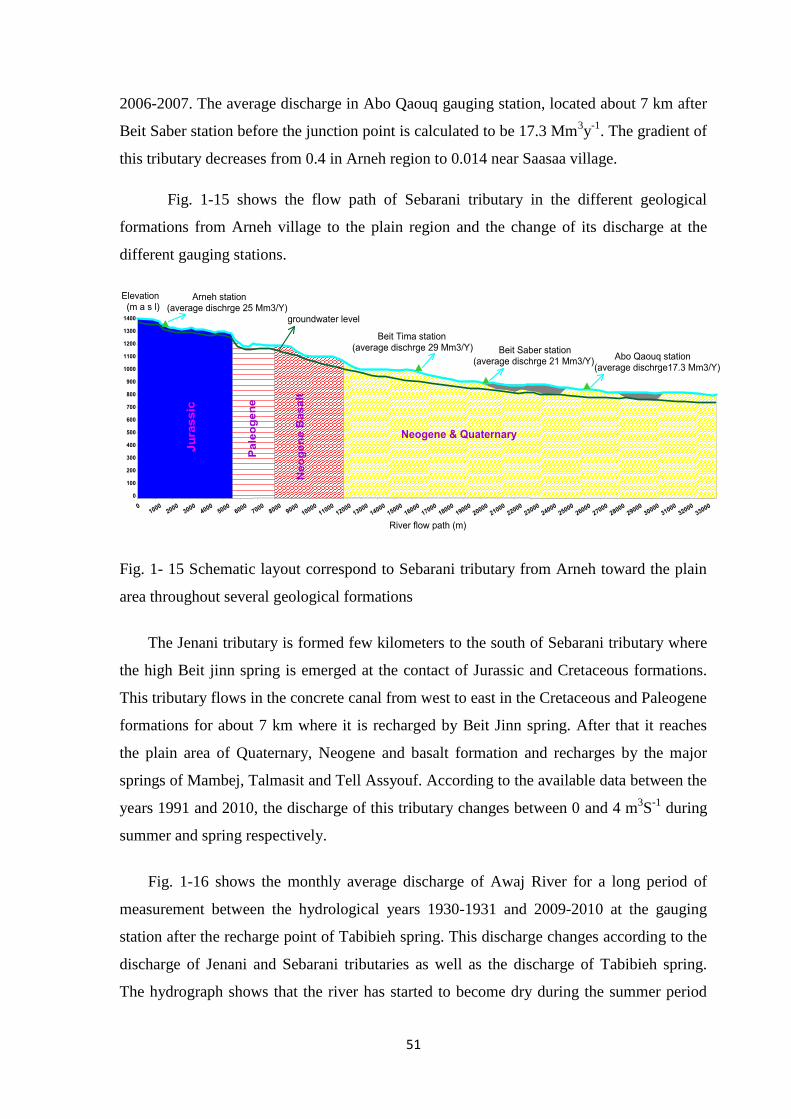
50
2006-2007. The average discharge in Abo Qaouq gauging station, located about 7 km after
Beit Saber station before the junction point is calculated to be 17.3 Mm3y
-1. The gradient of
this tributary decreases from 0.4 in Arneh region to 0.014 near Saasaa village.
Fig. 1-15 shows the flow path of Sebarani tributary in the different geological
formations from Arneh village to the plain region and the change of its discharge at the
different gauging stations.
Fig. 1- 15 Schematic layout correspond to Sebarani tributary from Arneh toward the plain
area throughout several geological formations
The Jenani tributary is formed few kilometers to the south of Sebarani tributary where
the high Beit jinn spring is emerged at the contact of Jurassic and Cretaceous formations.
This tributary flows in the concrete canal from west to east in the Cretaceous and Paleogene
formations for about 7 km where it is recharged by Beit Jinn spring. After that it reaches
the plain area of Quaternary, Neogene and basalt formation and recharges by the major
springs of Mambej, Talmasit and Tell Assyouf. According to the available data between the
years 1991 and 2010, the discharge of this tributary changes between 0 and 4 m3S
-1 during
summer and spring respectively.
Fig. 1-16 shows the monthly average discharge of Awaj River for a long period of
measurement between the hydrological years 1930-1931 and 2009-2010 at the gauging
station after the recharge point of Tabibieh spring. This discharge changes according to the
discharge of Jenani and Sebarani tributaries as well as the discharge of Tabibieh spring.
The hydrograph shows that the river has started to become dry during the summer period
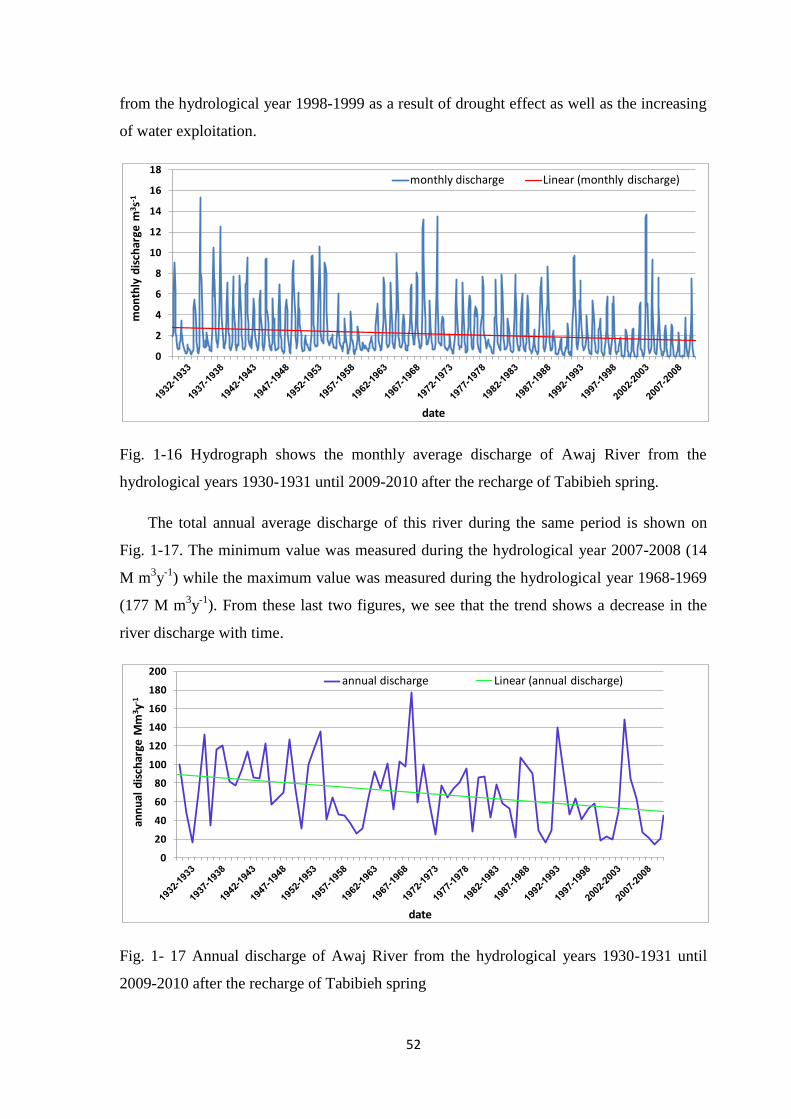
51
from the hydrological year 1998-1999 as a result of drought effect as well as the increasing
of water exploitation.
Fig. 1-16 Hydrograph shows the monthly average discharge of Awaj River from the
hydrological years 1930-1931 until 2009-2010 after the recharge of Tabibieh spring.
The total annual average discharge of this river during the same period is shown on
Fig. 1-17. The minimum value was measured during the hydrological year 2007-2008 (14
M m3y
-1) while the maximum value was measured during the hydrological year 1968-1969
(177 M m3y
-1). From these last two figures, we see that the trend shows a decrease in the
river discharge with time.
Fig. 1- 17 Annual discharge of Awaj River from the hydrological years 1930-1931 until
2009-2010 after the recharge of Tabibieh spring
0
2
4
6
8
10
12
14
16
18
mo
nth
ly d
isch
arge
m3 s
-1
date
monthly discharge Linear (monthly discharge)
0
20
40
60
80
100
120
140
160
180
200
ann
ual
dis
char
ge M
m3 y
-1
date
annual discharge Linear (annual discharge)
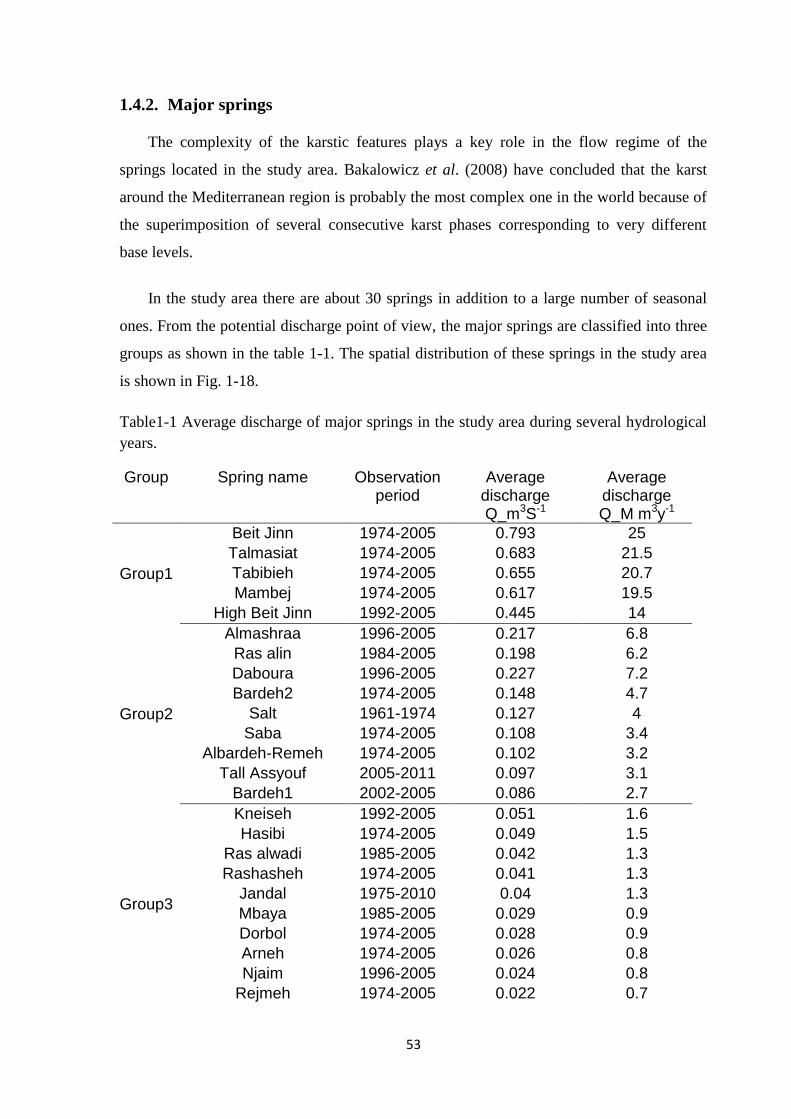
53
1.4.2. Major springs
The complexity of the karstic features plays a key role in the flow regime of the
springs located in the study area. Bakalowicz et al. (2008) have concluded that the karst
around the Mediterranean region is probably the most complex one in the world because of
the superimposition of several consecutive karst phases corresponding to very different
base levels.
In the study area there are about 30 springs in addition to a large number of seasonal
ones. From the potential discharge point of view, the major springs are classified into three
groups as shown in the table 1-1. The spatial distribution of these springs in the study area
is shown in Fig. 1-18.
Table1-1 Average discharge of major springs in the study area during several hydrological
years.
Group Spring name Observation period
Average discharge Q_m3S-1
Average discharge Q_M m3y-1
Group1
Beit Jinn 1974-2005 0.793 25
Talmasiat 1974-2005 0.683 21.5
Tabibieh 1974-2005 0.655 20.7
Mambej 1974-2005 0.617 19.5
High Beit Jinn 1992-2005 0.445 14
Group2
Almashraa 1996-2005 0.217 6.8
Ras alin 1984-2005 0.198 6.2
Daboura 1996-2005 0.227 7.2
Bardeh2 1974-2005 0.148 4.7
Salt 1961-1974 0.127 4
Saba 1974-2005 0.108 3.4
Albardeh-Remeh 1974-2005 0.102 3.2
Tall Assyouf 2005-2011 0.097 3.1
Bardeh1 2002-2005 0.086 2.7
Group3
Kneiseh 1992-2005 0.051 1.6
Hasibi 1974-2005 0.049 1.5
Ras alwadi 1985-2005 0.042 1.3
Rashasheh 1974-2005 0.041 1.3
Jandal 1975-2010 0.04 1.3
Mbaya 1985-2005 0.029 0.9
Dorbol 1974-2005 0.028 0.9
Arneh 1974-2005 0.026 0.8
Njaim 1996-2005 0.024 0.8
Rejmeh 1974-2005 0.022 0.7
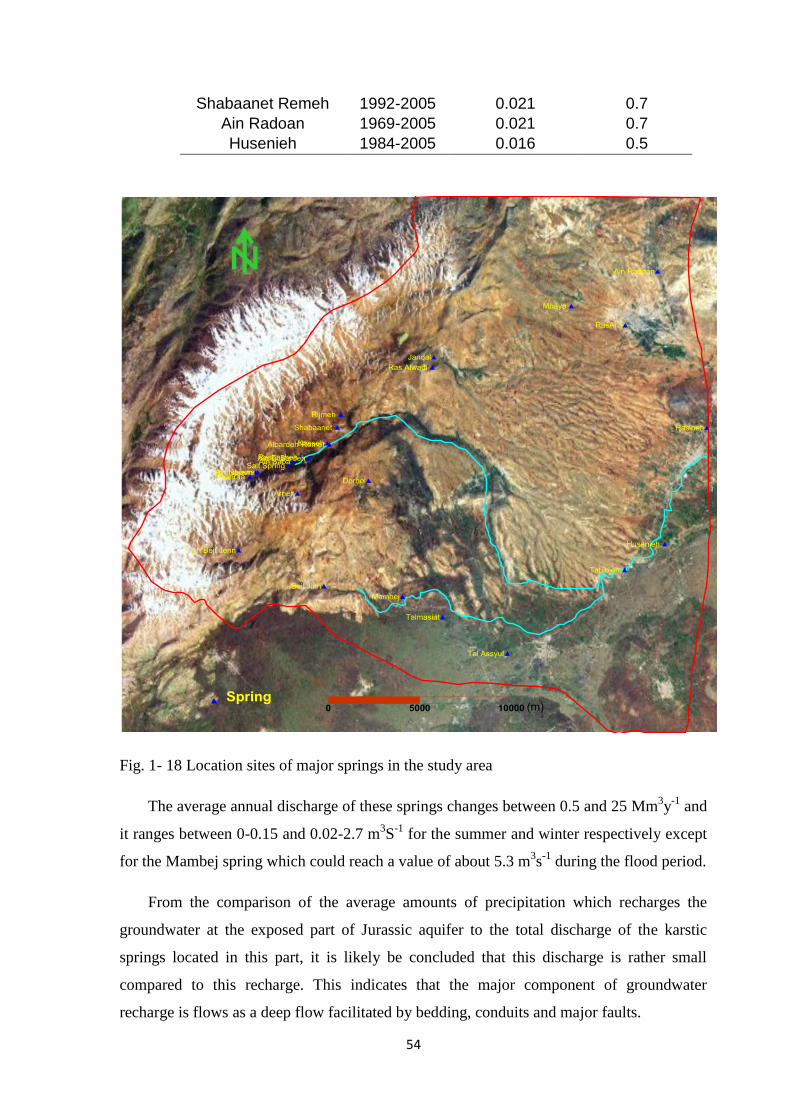
54
Shabaanet Remeh 1992-2005 0.021 0.7
Ain Radoan 1969-2005 0.021 0.7
Husenieh 1984-2005 0.016 0.5
Fig. 1- 18 Location sites of major springs in the study area
The average annual discharge of these springs changes between 0.5 and 25 Mm3y
-1 and
it ranges between 0-0.15 and 0.02-2.7 m3S
-1 for the summer and winter respectively except
for the Mambej spring which could reach a value of about 5.3 m3s
-1 during the flood period.
From the comparison of the average amounts of precipitation which recharges the
groundwater at the exposed part of Jurassic aquifer to the total discharge of the karstic
springs located in this part, it is likely be concluded that this discharge is rather small
compared to this recharge. This indicates that the major component of groundwater
recharge is flows as a deep flow facilitated by bedding, conduits and major faults.
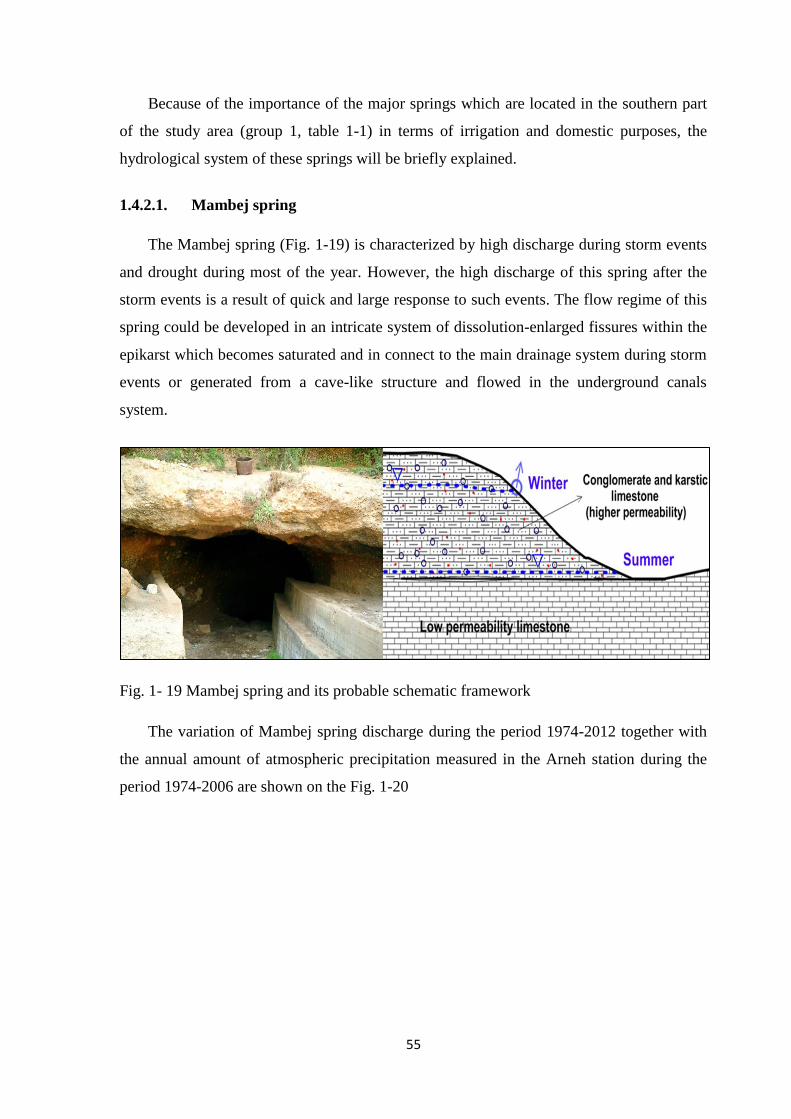
55
Because of the importance of the major springs which are located in the southern part
of the study area (group 1, table 1-1) in terms of irrigation and domestic purposes, the
hydrological system of these springs will be briefly explained.
1.4.2.1. Mambej spring
The Mambej spring (Fig. 1-19) is characterized by high discharge during storm events
and drought during most of the year. However, the high discharge of this spring after the
storm events is a result of quick and large response to such events. The flow regime of this
spring could be developed in an intricate system of dissolution-enlarged fissures within the
epikarst which becomes saturated and in connect to the main drainage system during storm
events or generated from a cave-like structure and flowed in the underground canals
system.
Fig. 1- 19 Mambej spring and its probable schematic framework
The variation of Mambej spring discharge during the period 1974-2012 together with
the annual amount of atmospheric precipitation measured in the Arneh station during the
period 1974-2006 are shown on the Fig. 1-20
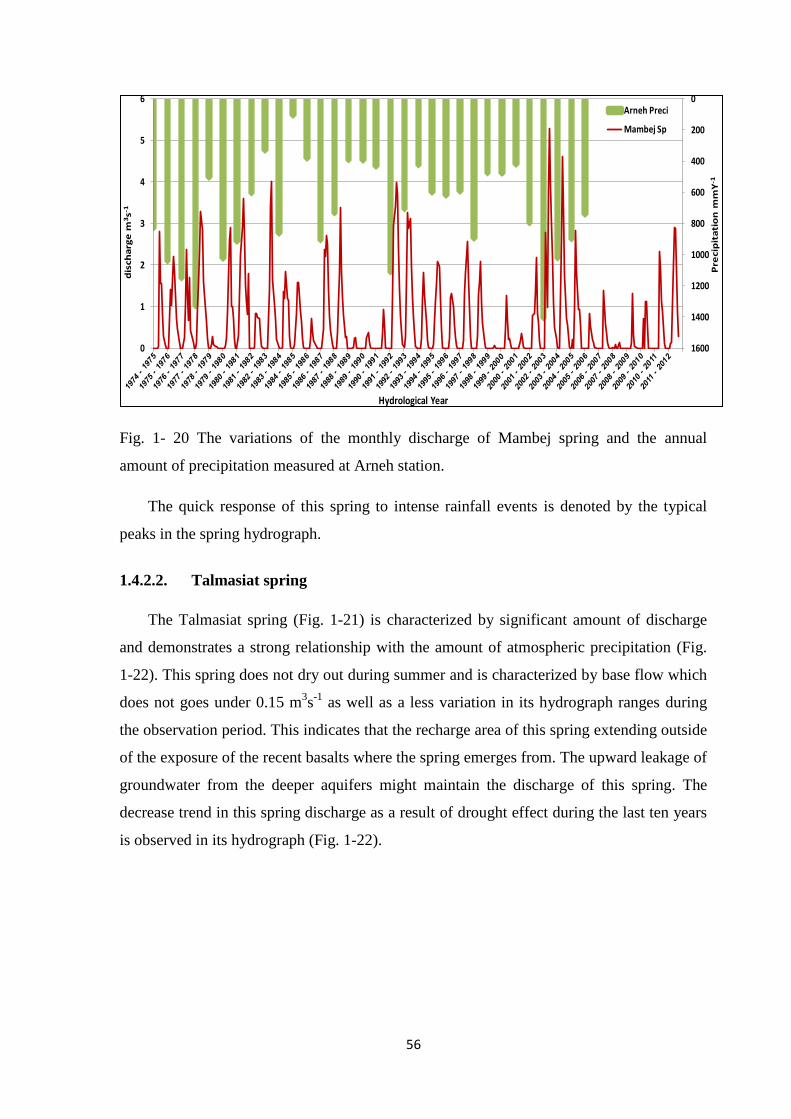
56
Fig. 1- 20 The variations of the monthly discharge of Mambej spring and the annual
amount of precipitation measured at Arneh station.
The quick response of this spring to intense rainfall events is denoted by the typical
peaks in the spring hydrograph.
1.4.2.2. Talmasiat spring
The Talmasiat spring (Fig. 1-21) is characterized by significant amount of discharge
and demonstrates a strong relationship with the amount of atmospheric precipitation (Fig.
1-22). This spring does not dry out during summer and is characterized by base flow which
does not goes under 0.15 m3s
-1 as well as a less variation in its hydrograph ranges during
the observation period. This indicates that the recharge area of this spring extending outside
of the exposure of the recent basalts where the spring emerges from. The upward leakage of
groundwater from the deeper aquifers might maintain the discharge of this spring. The
decrease trend in this spring discharge as a result of drought effect during the last ten years
is observed in its hydrograph (Fig. 1-22).
0
200
400
600
800
1000
1200
1400
16000
1
2
3
4
5
6
Pre
cip
ita
tio
n m
mY
-1
dis
cha
rge
m3s-
1
Hydrological Year
Arneh Preci
Mambej Sp
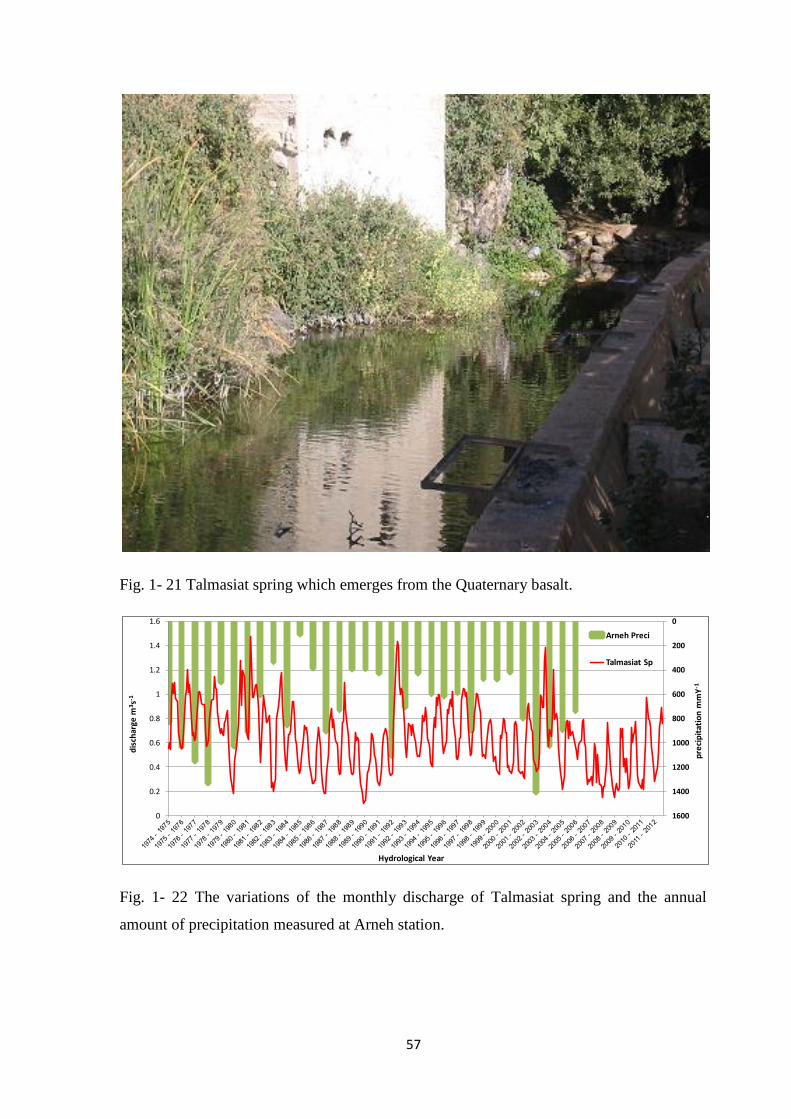
57
Fig. 1- 21 Talmasiat spring which emerges from the Quaternary basalt.
Fig. 1- 22 The variations of the monthly discharge of Talmasiat spring and the annual
amount of precipitation measured at Arneh station.
0
200
400
600
800
1000
1200
1400
16000
0.2
0.4
0.6
0.8
1
1.2
1.4
1.6
pre
cip
itat
ion
mm
Y-1
dis
char
ge m
3s-1
Hydrological Year
Arneh Preci
Talmasiat Sp
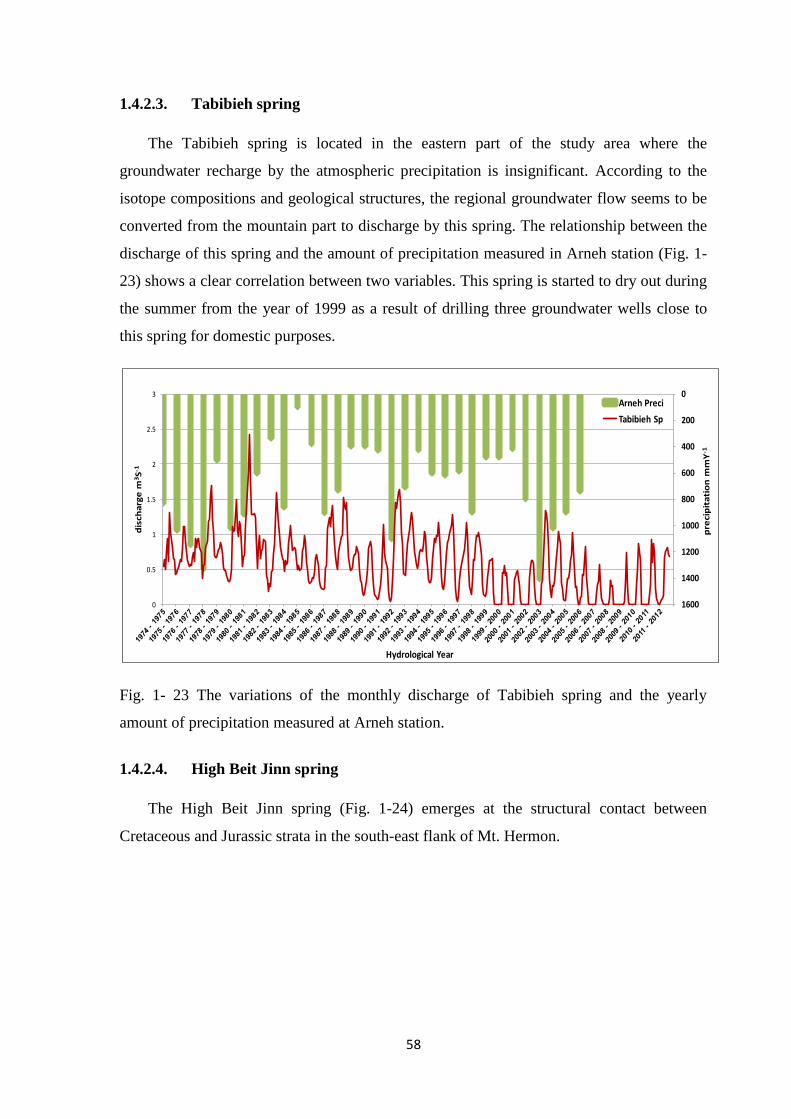
58
1.4.2.3. Tabibieh spring
The Tabibieh spring is located in the eastern part of the study area where the
groundwater recharge by the atmospheric precipitation is insignificant. According to the
isotope compositions and geological structures, the regional groundwater flow seems to be
converted from the mountain part to discharge by this spring. The relationship between the
discharge of this spring and the amount of precipitation measured in Arneh station (Fig. 1-
23) shows a clear correlation between two variables. This spring is started to dry out during
the summer from the year of 1999 as a result of drilling three groundwater wells close to
this spring for domestic purposes.
Fig. 1- 23 The variations of the monthly discharge of Tabibieh spring and the yearly
amount of precipitation measured at Arneh station.
1.4.2.4. High Beit Jinn spring
The High Beit Jinn spring (Fig. 1-24) emerges at the structural contact between
Cretaceous and Jurassic strata in the south-east flank of Mt. Hermon.
0
200
400
600
800
1000
1200
1400
16000
0.5
1
1.5
2
2.5
3
pre
cip
ita
tio
n m
mY
-1
dis
cha
rge
m3S
-1
Hydrological Year
Arneh Preci
Tabibieh Sp
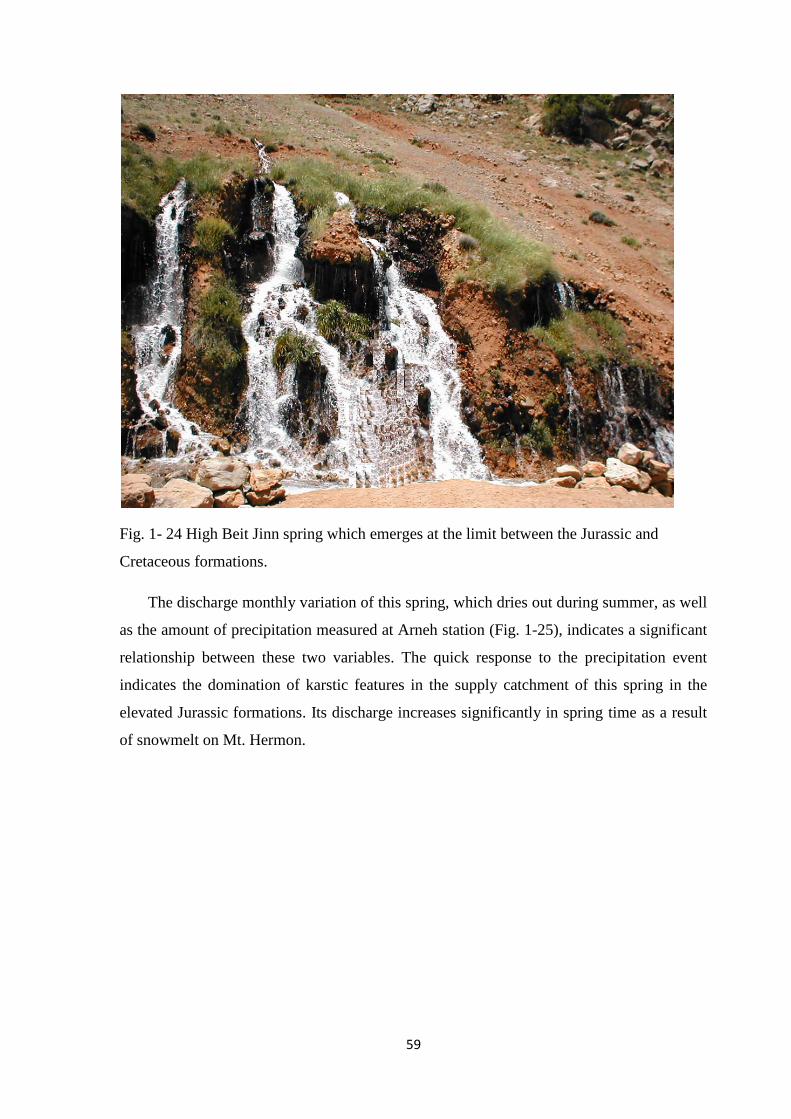
59
Fig. 1- 24 High Beit Jinn spring which emerges at the limit between the Jurassic and
Cretaceous formations.
The discharge monthly variation of this spring, which dries out during summer, as well
as the amount of precipitation measured at Arneh station (Fig. 1-25), indicates a significant
relationship between these two variables. The quick response to the precipitation event
indicates the domination of karstic features in the supply catchment of this spring in the
elevated Jurassic formations. Its discharge increases significantly in spring time as a result
of snowmelt on Mt. Hermon.
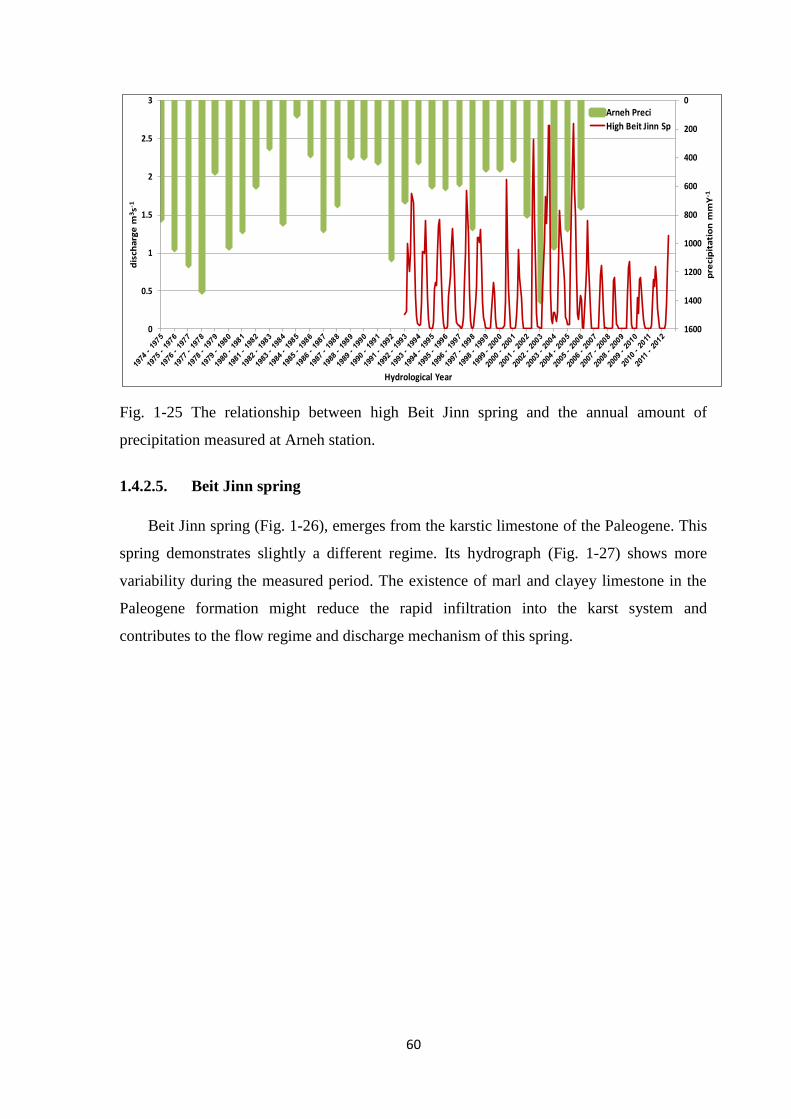
61
Fig. 1-25 The relationship between high Beit Jinn spring and the annual amount of
precipitation measured at Arneh station.
1.4.2.5. Beit Jinn spring
Beit Jinn spring (Fig. 1-26), emerges from the karstic limestone of the Paleogene. This
spring demonstrates slightly a different regime. Its hydrograph (Fig. 1-27) shows more
variability during the measured period. The existence of marl and clayey limestone in the
Paleogene formation might reduce the rapid infiltration into the karst system and
contributes to the flow regime and discharge mechanism of this spring.
0
200
400
600
800
1000
1200
1400
16000
0.5
1
1.5
2
2.5
3
pre
cip
ita
tio
n m
mY
-1
dis
cha
rge
m3s-1
Hydrological Year
Arneh Preci
High Beit Jinn Sp
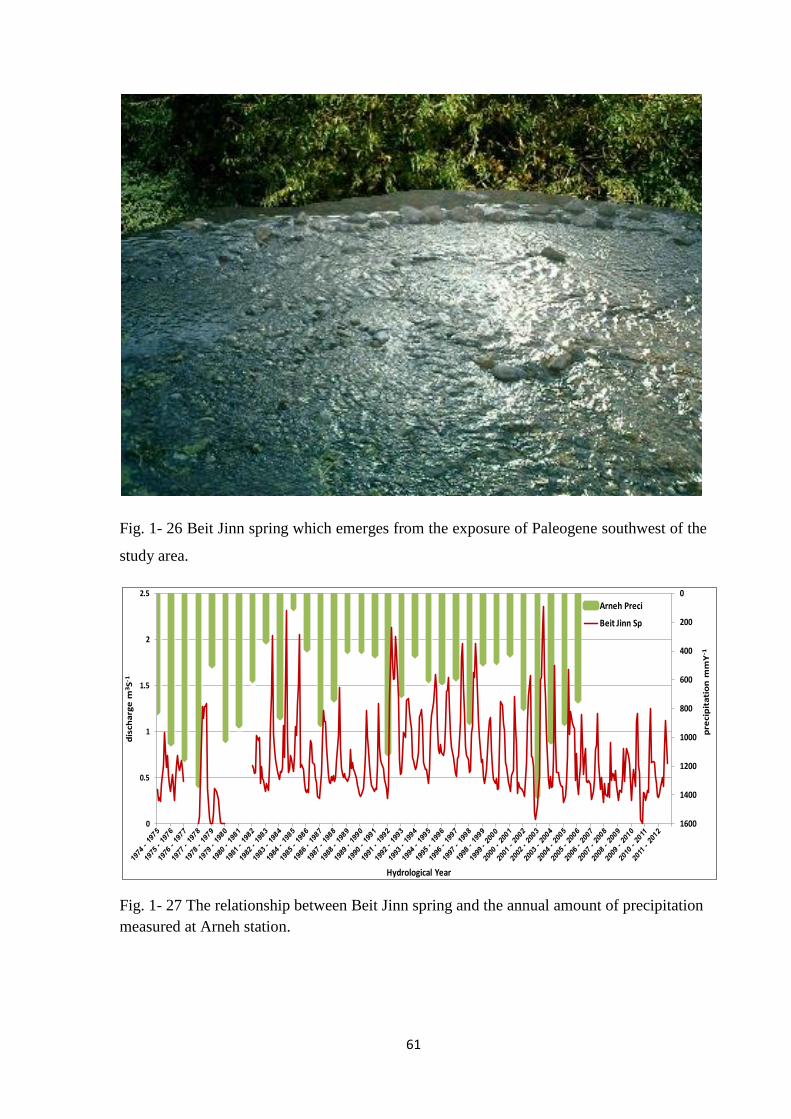
60
Fig. 1- 26 Beit Jinn spring which emerges from the exposure of Paleogene southwest of the
study area.
Fig. 1- 27 The relationship between Beit Jinn spring and the annual amount of precipitation
measured at Arneh station.
0
200
400
600
800
1000
1200
1400
16000
0.5
1
1.5
2
2.5
pre
cip
ita
tio
n m
mY
-1
dis
cha
rge
m3S
-1
Hydrological Year
Arneh Preci
Beit Jinn Sp
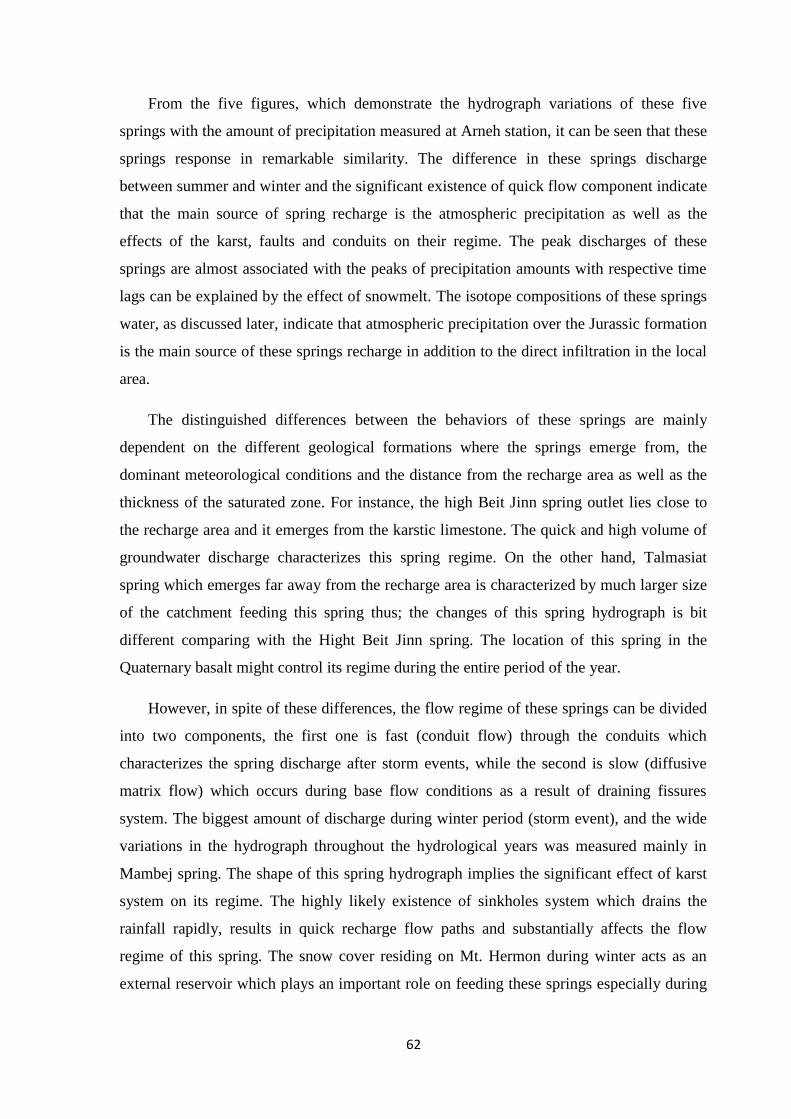
61
From the five figures, which demonstrate the hydrograph variations of these five
springs with the amount of precipitation measured at Arneh station, it can be seen that these
springs response in remarkable similarity. The difference in these springs discharge
between summer and winter and the significant existence of quick flow component indicate
that the main source of spring recharge is the atmospheric precipitation as well as the
effects of the karst, faults and conduits on their regime. The peak discharges of these
springs are almost associated with the peaks of precipitation amounts with respective time
lags can be explained by the effect of snowmelt. The isotope compositions of these springs
water, as discussed later, indicate that atmospheric precipitation over the Jurassic formation
is the main source of these springs recharge in addition to the direct infiltration in the local
area.
The distinguished differences between the behaviors of these springs are mainly
dependent on the different geological formations where the springs emerge from, the
dominant meteorological conditions and the distance from the recharge area as well as the
thickness of the saturated zone. For instance, the high Beit Jinn spring outlet lies close to
the recharge area and it emerges from the karstic limestone. The quick and high volume of
groundwater discharge characterizes this spring regime. On the other hand, Talmasiat
spring which emerges far away from the recharge area is characterized by much larger size
of the catchment feeding this spring thus; the changes of this spring hydrograph is bit
different comparing with the Hight Beit Jinn spring. The location of this spring in the
Quaternary basalt might control its regime during the entire period of the year.
However, in spite of these differences, the flow regime of these springs can be divided
into two components, the first one is fast (conduit flow) through the conduits which
characterizes the spring discharge after storm events, while the second is slow (diffusive
matrix flow) which occurs during base flow conditions as a result of draining fissures
system. The biggest amount of discharge during winter period (storm event), and the wide
variations in the hydrograph throughout the hydrological years was measured mainly in
Mambej spring. The shape of this spring hydrograph implies the significant effect of karst
system on its regime. The highly likely existence of sinkholes system which drains the
rainfall rapidly, results in quick recharge flow paths and substantially affects the flow
regime of this spring. The snow cover residing on Mt. Hermon during winter acts as an
external reservoir which plays an important role on feeding these springs especially during
63
the spring period. Based on the available data, Fig. 1-28 shows the mean annual discharge
of these five springs measured in Mm3y
-1.
Fig. 1- 28 The mean annual discharge of 5 major springs in the study area.
The amount of all springs' discharge in the study area calculated to be 155 Mm3.Y
-1
based on the mentioned period of observations in the table 1-1.
1.5. Aquifer systems (Hydrogeology)
The majority of water flow in the study area is subsurface flow. The aquifers in this
area can be classified into karstic and porous aquifers. The karstic aquifers consist of
fractured soluble rock such as limestones, dolomites and gypsum, which upon dissolution
along faults and prime fractures create a secondary porosity. Such aquifers belong to
Jurassic, Cenomanian-Turonian, and Upper Eocene units (Al-Charideh 2012a). Porous
aquifer consists of unconsolidated or semi-consolidated sediments, such as Pliocene
conglomerate units and Quaternary aquifer. Groundwater flow in karstic aquifers is
controlled by three types of porosities, intergranular matrix porosity, which develops
directly with the genesis of the carbonates, fracture/fissure porosity which develops later on
and conduit porosity which results from the second one (White 1988, Brielmann 2008). In
the karstified limestone aquifers, three zones can be recognized (Fig. 1-29): The upper
carapace zone which forms the upper portion of the limestone formation. This zone has
0
10
20
30
40
50
60
70
dis
char
ge M
m3 Y
-1
Hydrological Year
Mambej Talmasiat Tabibieh High Beit Jinn Beit Jinn
64
either been rendered impermeable by the plugging and resealing of the openings or has
remained unkarstified. The central open karst zone, in which the karst openings are filled
with groundwater in active circulation zones, so that openings enlarge in horizontal and
downward directions. The third one is the lower un-karstified carbonate zone, in which the
joints and openings are filled with groundwater that is saturated with bicarbonate and no
longer aggressive, so that the karsification proceeds slowly.
Highly karstified, tectonically broken rocks and the step-like pattern of the slope create
favorable infiltration conditions for precipitation in the elevated Jurassic aquifers. The
majority of groundwater transport in this system takes place in the conduits and faults,
while the majority of storage occurs in the fissure and rock matrix porosities. Therefore, the
major springs in Syria are found to arise predominantly along fault traces, fault junctions,
and fracture zones developed in the karst aquifer (La-Moreaux et al. 1989). The exposure
of the karstified aquifers in the mountain area shows unfavorable conditions for
exploitation by drilling, however, when they underlie at a reasonable depth in the plain
area, they form a favorable aquifer.
The presence of karstic landscapes such as dolines (sinkholes) and lapiaz renders the
recharge area more than pervious, consequently that makes it characterized by
heterogeneous hydraulic regime. Fig. 1-30 shows the rillenkarren and karsification
processes along the fractures in the Jurassic aquifer of the study area.
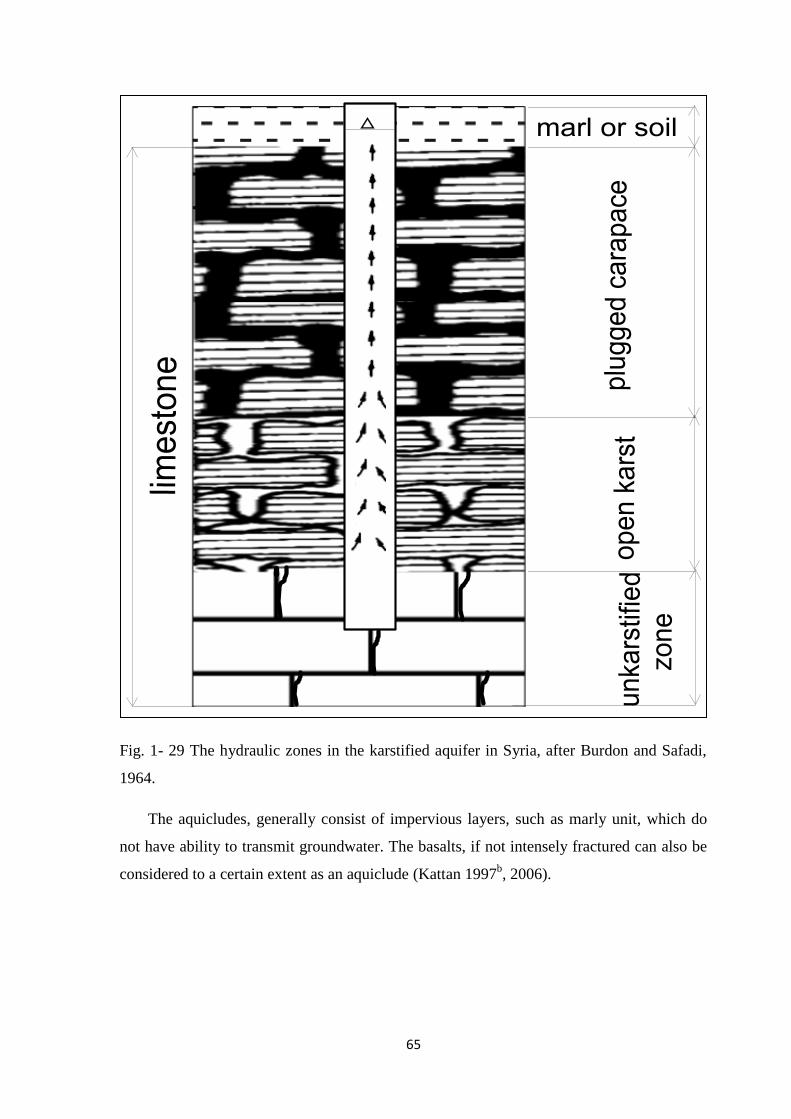
65
Fig. 1- 29 The hydraulic zones in the karstified aquifer in Syria, after Burdon and Safadi,
1964.
The aquicludes, generally consist of impervious layers, such as marly unit, which do
not have ability to transmit groundwater. The basalts, if not intensely fractured can also be
considered to a certain extent as an aquiclude (Kattan 1997b, 2006).
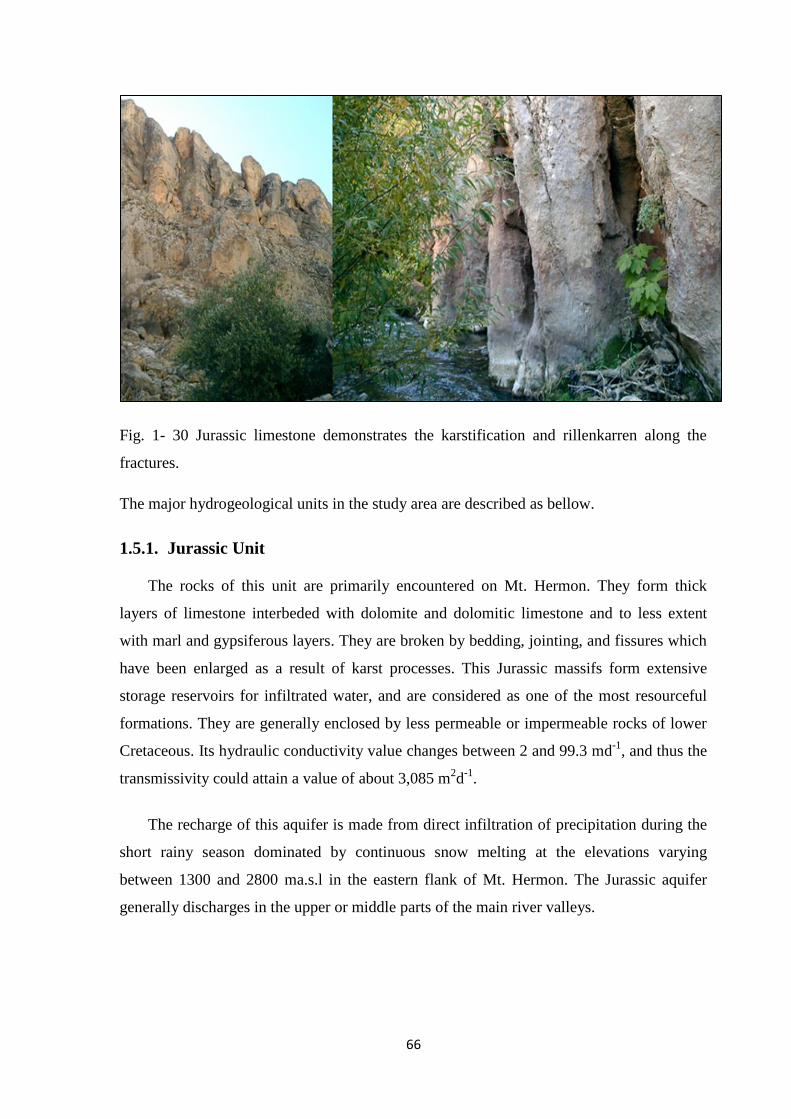
66
Fig. 1- 30 Jurassic limestone demonstrates the karstification and rillenkarren along the
fractures.
The major hydrogeological units in the study area are described as bellow.
1.5.1. Jurassic Unit
The rocks of this unit are primarily encountered on Mt. Hermon. They form thick
layers of limestone interbeded with dolomite and dolomitic limestone and to less extent
with marl and gypsiferous layers. They are broken by bedding, jointing, and fissures which
have been enlarged as a result of karst processes. This Jurassic massifs form extensive
storage reservoirs for infiltrated water, and are considered as one of the most resourceful
formations. They are generally enclosed by less permeable or impermeable rocks of lower
Cretaceous. Its hydraulic conductivity value changes between 2 and 99.3 md-1
, and thus the
transmissivity could attain a value of about 3,085 m2d
-1.
The recharge of this aquifer is made from direct infiltration of precipitation during the
short rainy season dominated by continuous snow melting at the elevations varying
between 1300 and 2800 ma.s.l in the eastern flank of Mt. Hermon. The Jurassic aquifer
generally discharges in the upper or middle parts of the main river valleys.
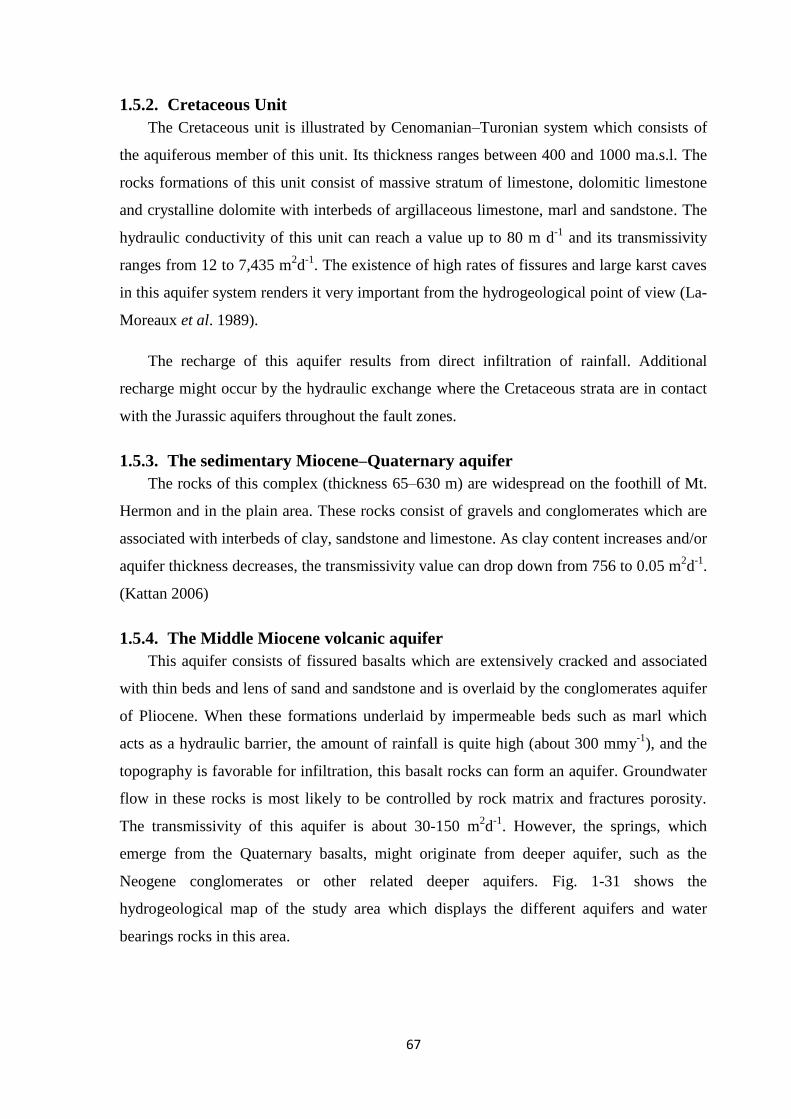
67
1.5.2. Cretaceous Unit
The Cretaceous unit is illustrated by Cenomanian–Turonian system which consists of
the aquiferous member of this unit. Its thickness ranges between 400 and 1000 ma.s.l. The
rocks formations of this unit consist of massive stratum of limestone, dolomitic limestone
and crystalline dolomite with interbeds of argillaceous limestone, marl and sandstone. The
hydraulic conductivity of this unit can reach a value up to 80 m d-1
and its transmissivity
ranges from 12 to 7,435 m2d
-1. The existence of high rates of fissures and large karst caves
in this aquifer system renders it very important from the hydrogeological point of view (La-
Moreaux et al. 1989).
The recharge of this aquifer results from direct infiltration of rainfall. Additional
recharge might occur by the hydraulic exchange where the Cretaceous strata are in contact
with the Jurassic aquifers throughout the fault zones.
1.5.3. The sedimentary Miocene–Quaternary aquifer
The rocks of this complex (thickness 65–630 m) are widespread on the foothill of Mt.
Hermon and in the plain area. These rocks consist of gravels and conglomerates which are
associated with interbeds of clay, sandstone and limestone. As clay content increases and/or
aquifer thickness decreases, the transmissivity value can drop down from 756 to 0.05 m2d
-1.
(Kattan 2006)
1.5.4. The Middle Miocene volcanic aquifer
This aquifer consists of fissured basalts which are extensively cracked and associated
with thin beds and lens of sand and sandstone and is overlaid by the conglomerates aquifer
of Pliocene. When these formations underlaid by impermeable beds such as marl which
acts as a hydraulic barrier, the amount of rainfall is quite high (about 300 mmy-1
), and the
topography is favorable for infiltration, this basalt rocks can form an aquifer. Groundwater
flow in these rocks is most likely to be controlled by rock matrix and fractures porosity.
The transmissivity of this aquifer is about 30-150 m2d
-1. However, the springs, which
emerge from the Quaternary basalts, might originate from deeper aquifer, such as the
Neogene conglomerates or other related deeper aquifers. Fig. 1-31 shows the
hydrogeological map of the study area which displays the different aquifers and water
bearings rocks in this area.
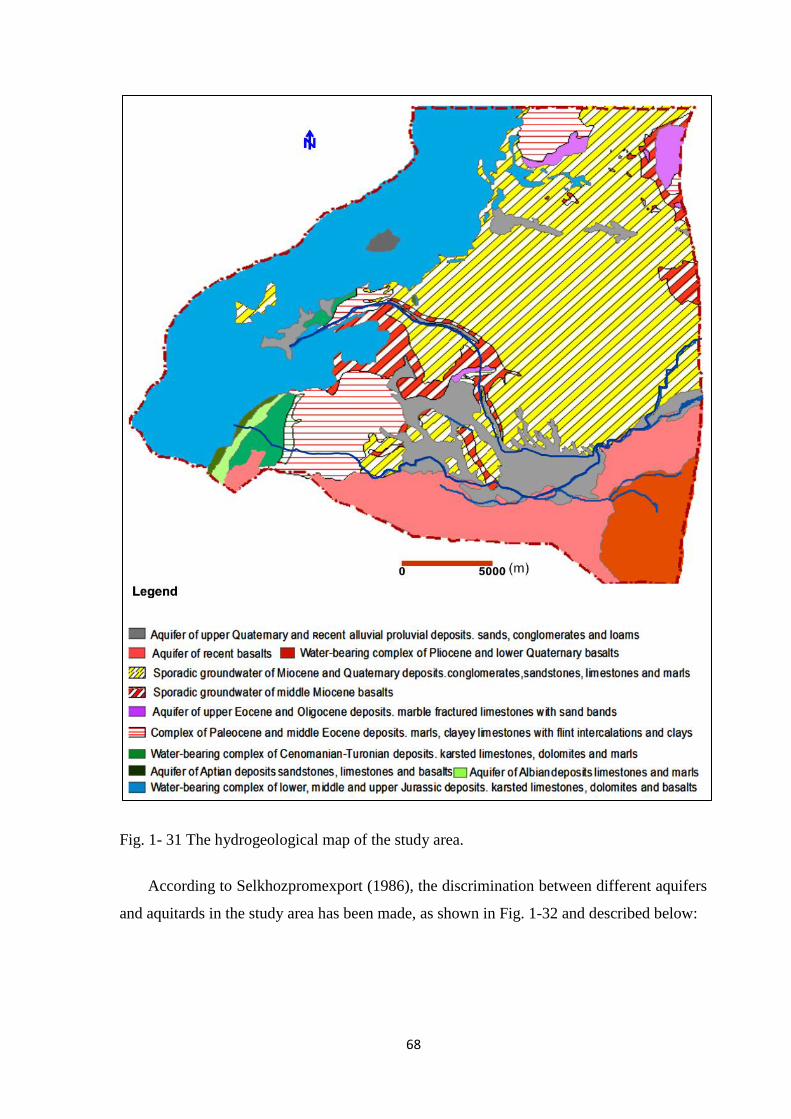
68
Fig. 1- 31 The hydrogeological map of the study area.
According to Selkhozpromexport (1986), the discrimination between different aquifers
and aquitards in the study area has been made, as shown in Fig. 1-32 and described below:
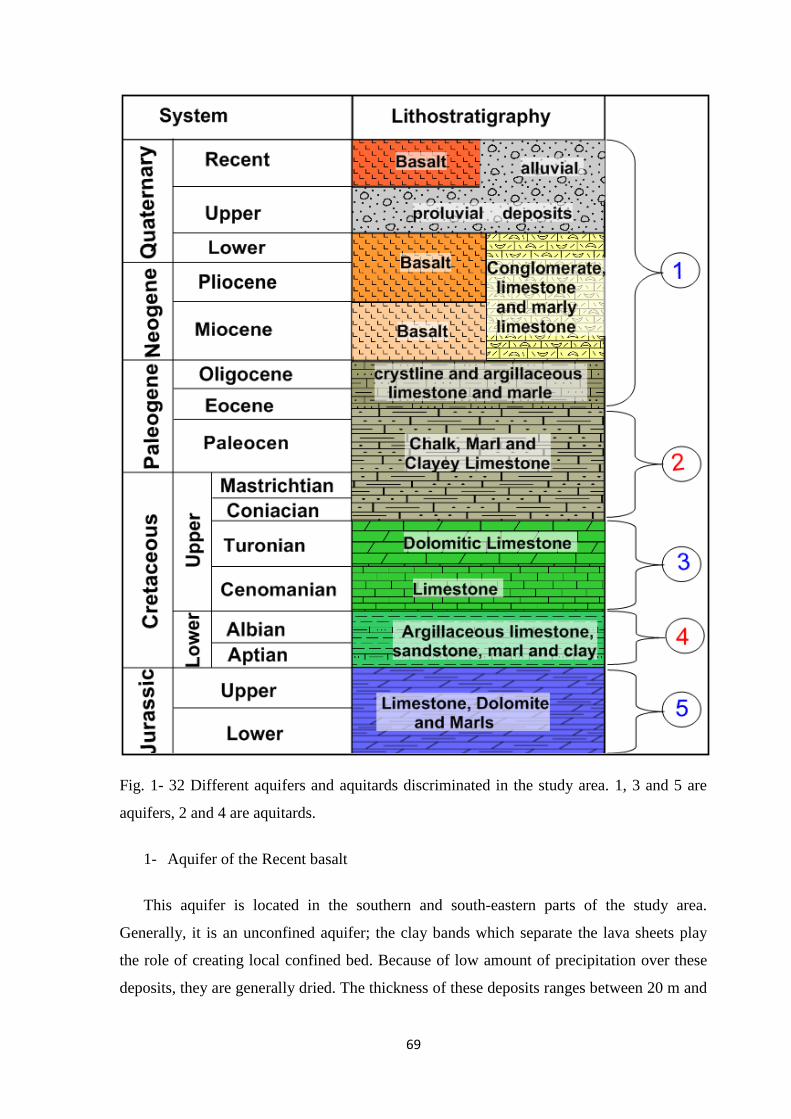
69
Fig. 1- 32 Different aquifers and aquitards discriminated in the study area. 1, 3 and 5 are
aquifers, 2 and 4 are aquitards.
1- Aquifer of the Recent basalt
This aquifer is located in the southern and south-eastern parts of the study area.
Generally, it is an unconfined aquifer; the clay bands which separate the lava sheets play
the role of creating local confined bed. Because of low amount of precipitation over these
deposits, they are generally dried. The thickness of these deposits ranges between 20 m and
71
45 m. they are lying on Pliocene-Lower Quaternary basalt and Pliocene conglomerate. The
transmissivity of this aquifer is estimated to be about 42.6 m2d
-1 and its hydraulic
conductivity varies with wide limits within an average value of about 1 md-1
. The Talmasiat
spring emerges from this aquifer.
2- Unconfined aquifer of Upper and Recent Quaternary alluvial-proluvial deposits
The thickness of this aquifer ranges from 3 m to15 m in the study area. It lies mainly on
Pliocene conglomerates and the basalt of Miocene. Its hydraulic conductivity changes
between 3.7-13 md-1
while its transmissivity ranges between 200 and 900 m2d
-1. This
aquifer is recharged mainly by irrigation return flow and numerous canals that distribute the
surface water of Awaj River for the irrigation purpose. The recharge by the atmospheric
precipitation plays a minor role for this aquifer. The easy exploitation by tapping wells
especially for agricultural purposes has resulted in depletion of this aquifer as a result of
overexploitation.
3- Aquifer of lower Quaternary and Pliocene basalt
It outcrops in a small part at the south-easternmost part of the study area. This
formation is overlaid by the recent basalt and lies either on Middle Miocene basalt or on
Paleocene chalk-like and clayey limestone or marl. The thickness of this aquifer ranges
between 40 m and 85 m and is considered as fissured unconfined aquifer. It contains
interbedded clay layers separating the individual lava and sheets. The fissures of this
aquifer are usually filed-in with clay or calcite. Its hydraulic conductivity ranges between
0.13 and 2 md-1
while its transmissivity changes between 50 and 70m2d
-1.
4- Sporadic groundwater in the Neogene/Quaternary deposits
Generally these deposits are outcropping along the foothill of Mt. Hermon; they occupy
the major part of the study area. They are overlaid by the recent basalt, the alluvial deposits
of Quaternary and the basalt of Pliocene-Lower Quaternary, while they are usually lying on
the Middle Miocene basalt and Upper Eocene limestone in the inter mountain depression.
The thickness of these deposits ranges between 300 m and 550 m. These deposits consist in
pebble and conglomerates interbedded with clay, limestone and sandstones. They contain
sporadic groundwater in the form of individual lenses and inter-layers in the zones of
increasing fractures and/or karstification. The permeability of this water bearing changes
70
between 0.1 and 9.5 md-1
while its transmissivity varies between 15-400 m2d
-1 which
increases significantly in the fractured and dislocated zones to about 1300 m2d
-1. The
recharge amount of this aquifer from the meteoric precipitation decreases eastwards and the
majority of groundwater abstraction wells are located in this aquifer.
5- Sporadic groundwater distribution in the Middle Miocene basalt
The deposits of Middle Miocene basalt crop out along the Sebrani tributary and in the
region of Heneh village. These deposits are overlaid by Pliocene-Quaternary rocks and lie
over the Upper and Middle Eocene carbonates rocks within a thickness changes between 80
m and 200 m. The hydraulic conductivity of this aquifer ranges between 0.3 and 1.4 md-1
and its transmissivity varies between 25 and 140 m2d
-1.
6- Aquifer in the Upper Eocene-Oligocene Deposits
This deposit is overlaid by Miocene basalt and Neogene sediments; it lies over Middle
Eocene chalk-like, argillaceous limestones and marl. Its thickness ranges between 40-95m.
This aquifer is largely fractured and locally made of karstified limestone with interbedded
lenses of quartz and fine grained sands in the upper part. The hydraulic conductivity of this
aquifer varies between 0.2 and 2.4 md-1
and its transmissivity ranges between 15 and 700
m2d
-1. According to reasonable similarity in the hydrogeological characteristics of the
above six layers and for a modeling purpose, we will consider them as one aquifer horizon.
7- Impermeable complex of Coniacian-Mastrichtian and Paleocene- Middle Eocene
strata
The thickness of these formations ranges between 200 and 600 m in the study area, it is
lying on Cenomanian-Turonian strata. Due to the high degree of blockage of fissures by
argillaceous material, these thick strata in general display low permeability and are
assigned to be impermeable bed (aquitard).
8- Water bearing complex of Cenomania-Turonian strata
The average thickness of this complex ranges between 400 and 1000 m. When it crops
out, the dominated water types are of fissure-karstic, fissure-vein and more rarely strata
fissured unconfined aquifer. While, when it is plunging under the younger strata at a
considerable depth, it becomes a confined aquifer. The infiltration coefficient of the
exposed part of these formations estimates to be 70% in the mountain range.
71
The karstification process might affect the entire thickness of this complex. It is
recharged by the infiltration of precipitation in the zone of its exposure as well as by
probable upward leakage of groundwater from the Jurassic strata.
9- Aquifer of the Aptian-Albian stages
This aquifer developed in the limbs of the anticlinal structure. It is overlaid by
Cenomanian-Turonain complex and it lies over Jurassic aquifers. Its thickness varies
between 180-470 m. The hydraulic conductivity of this aquifer is about 0.15 md-1
while its
transmissivity varies between 3 and 75 m2d
-1 and it can be considered as an aquitard.
10- Water bearing complex of Lower-Upper Jurassic strata
The rocks of this complex outcrop in the western part of the study area. They are
intensively karstified at the surface and under surface for several hundred of meters
(Selkhozpromexport 1986). The existence of karst at significant depth promotes the
formation of thick zone of free water exchange in the lower-upper Jurassic complex. The
thickness of this aquifer varies between 1000 m and 2000 m. The water of this unit is of
fracture and fracture karstic type. Its hydraulic conductivity ranges between 2 and 100 and
in average is about 25 md-1
. Its transmissivity varies between 700-3090 m2d
-1. The recharge
of this aquifer is made from the atmospheric precipitation. The infiltration coefficient of
this complex is estimated to be 60-80 %.
However, there are no reliable regionally continuous impermeable beds as a result of
intensive dislocations that are dominated in the study area. It is quite evident that the zones
of tectonic dislocation, when it transecting all of the aquifers of the sequence, it unites them
into a single hydraulic system. According to Wolfart (1964), there is no hydraulic isolation
between the aquifers in the Barada and Awaj basin because there are no beds between these
aquifers can act as real aquicludes. Moreover, the relatively high discharge of some springs,
as has been recognized, indicates that these springs could not be recharged either from a
local infiltration or from the resources of single aquifer where they are emerging from.
73
Chapter 2. Methodology
2.1. Sampling, analysis and database preparation
For major ions and field parameters investigation, a total of 177 water samples from
springs and the irrigation wells were used (Fig. 2-1). A total of 122 water samples were
collected during two fieldwork campaigns. The first one took place in November and
December during 2006 in which 107 samples were collected (table 2-1). While in the
second one, the result of 15 samples collected during August 2012 were used (table 2-2). In
addition, the database was completed with other available related analyzed samples from
Selkhozpromexport (1986) (table 2-1). For groundwater isotopic composition, the results of
18 samples collected during the second field campaign (August 2012), and 3 samples from
Selkhozpromexport (1986) were used (table 4-3). Prior to all groundwater samples
collection, the non-operating pumping wells were pumped for about three to five minutes to
ensure collection of representative samples. The exact wells depths are not available but in
general and according to Ministry of Irrigation in Syria (MOI) and farmers, these depths
range between 35 and 160 m. All the samples were collected in polyethylene bottles, which
were rinsed twice with sample water. Two bottles of each water point were collected; one
bottle was filtered (0.45 µm) and acidified with two drops of nitric acid, (HNO3) for cations
determination. Acidification stops most bacterial growth, inhibits oxidation reactions and
precipitation of cations. The historical data available of the atmospheric precipitation
isotopic content from 12 stations (Kattan 1997a, Selkhozpromexport 1986, Kattan 2006)
were used to determine the local meteoric water line interpret the relationship between
rainfall and groundwater in the study area
Field parameters such as electrical conductivity (EC), pH and alkalinity (HCO3-) were
measured onsite. Within 30 days of sampling, all samples were analysed in the UNESCO-
IHE Institute laboratory in The Netherlands. Cation concentrations were measured using an
Absorption Spectrophotometer (AAS), whereas the anions were measured with Dionex Ion
Chromatograph (DIOEX ICC-1000). Silica (as SiO2) was measured by using HACH
colorimeter. The samples of the second fieldwork campaign were analysed at the
Hydrogeology Department of the University of Corsica (UMR 6134 CNRS) for both major
ions and environmental isotopes of the water molecule (δ18O and δ2
H). In terms of major
ions, ionic chromatography in liquid phase (DIONEX ICS- 1100) technique has been used,
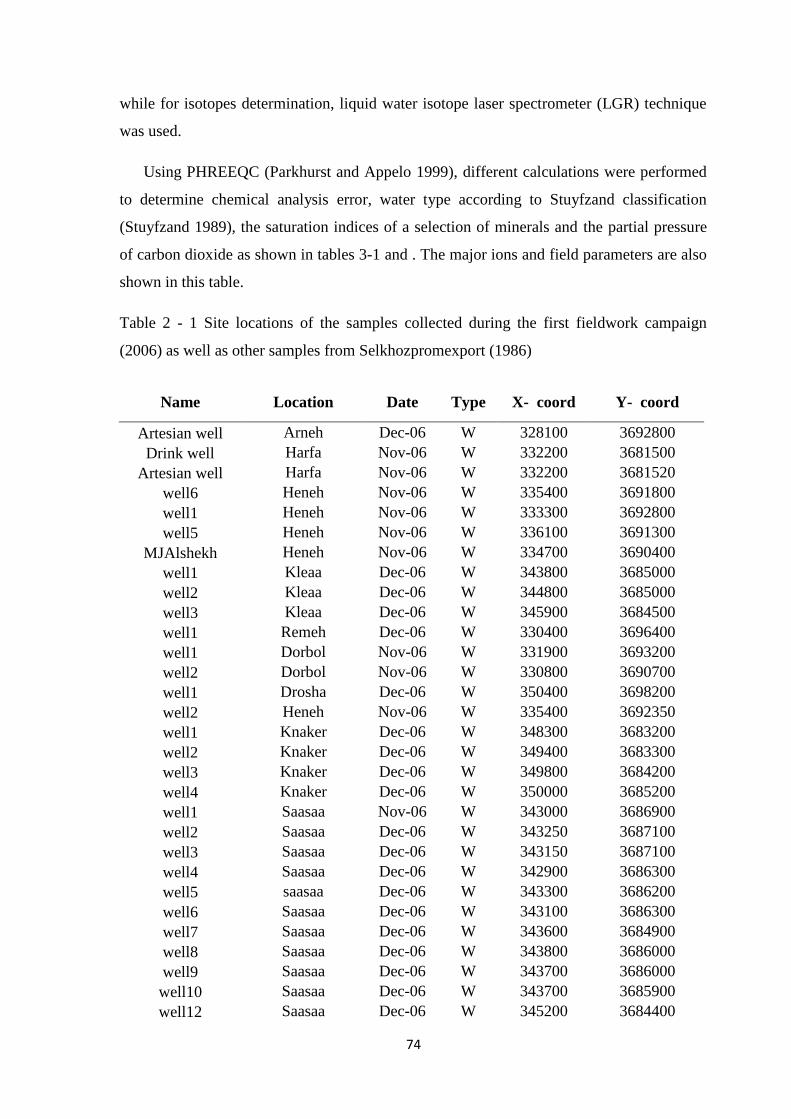
74
while for isotopes determination, liquid water isotope laser spectrometer (LGR) technique
was used.
Using PHREEQC (Parkhurst and Appelo 1999), different calculations were performed
to determine chemical analysis error, water type according to Stuyfzand classification
(Stuyfzand 1989), the saturation indices of a selection of minerals and the partial pressure
of carbon dioxide as shown in tables 3-1 and . The major ions and field parameters are also
shown in this table.
Table 2 - 1 Site locations of the samples collected during the first fieldwork campaign
(2006) as well as other samples from Selkhozpromexport (1986)
Name Location Date Type X- coord Y- coord
Artesian well Arneh Dec-06 W 328100 3692800
Drink well Harfa Nov-06 W 332200 3681500
Artesian well Harfa Nov-06 W 332200 3681520
well6 Heneh Nov-06 W 335400 3691800
well1 Heneh Nov-06 W 333300 3692800
well5 Heneh Nov-06 W 336100 3691300
MJAlshekh Heneh Nov-06 W 334700 3690400
well1 Kleaa Dec-06 W 343800 3685000
well2 Kleaa Dec-06 W 344800 3685000
well3 Kleaa Dec-06 W 345900 3684500
well1 Remeh Dec-06 W 330400 3696400
well1 Dorbol Nov-06 W 331900 3693200
well2 Dorbol Nov-06 W 330800 3690700
well1 Drosha Dec-06 W 350400 3698200
well2 Heneh Nov-06 W 335400 3692350
well1 Knaker Dec-06 W 348300 3683200
well2 Knaker Dec-06 W 349400 3683300
well3 Knaker Dec-06 W 349800 3684200
well4 Knaker Dec-06 W 350000 3685200
well1 Saasaa Nov-06 W 343000 3686900
well2 Saasaa Dec-06 W 343250 3687100
well3 Saasaa Dec-06 W 343150 3687100
well4 Saasaa Dec-06 W 342900 3686300
well5 saasaa Dec-06 W 343300 3686200
well6 Saasaa Dec-06 W 343100 3686300
well7 Saasaa Dec-06 W 343600 3684900
well8 Saasaa Dec-06 W 343800 3686000
well9 Saasaa Dec-06 W 343700 3686000
well10 Saasaa Dec-06 W 343700 3685900
well12 Saasaa Dec-06 W 345200 3684400
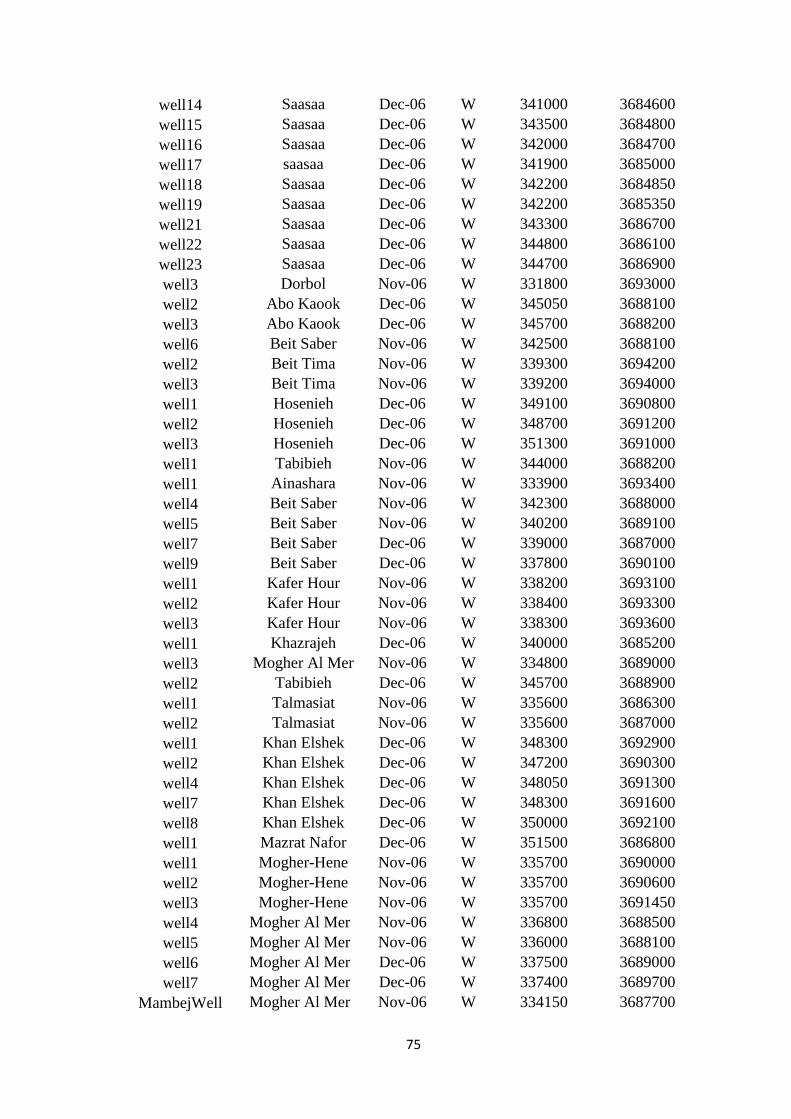
75
well14 Saasaa Dec-06 W 341000 3684600
well15 Saasaa Dec-06 W 343500 3684800
well16 Saasaa Dec-06 W 342000 3684700
well17 saasaa Dec-06 W 341900 3685000
well18 Saasaa Dec-06 W 342200 3684850
well19 Saasaa Dec-06 W 342200 3685350
well21 Saasaa Dec-06 W 343300 3686700
well22 Saasaa Dec-06 W 344800 3686100
well23 Saasaa Dec-06 W 344700 3686900
well3 Dorbol Nov-06 W 331800 3693000
well2 Abo Kaook Dec-06 W 345050 3688100
well3 Abo Kaook Dec-06 W 345700 3688200
well6 Beit Saber Nov-06 W 342500 3688100
well2 Beit Tima Nov-06 W 339300 3694200
well3 Beit Tima Nov-06 W 339200 3694000
well1 Hosenieh Dec-06 W 349100 3690800
well2 Hosenieh Dec-06 W 348700 3691200
well3 Hosenieh Dec-06 W 351300 3691000
well1 Tabibieh Nov-06 W 344000 3688200
well1 Ainashara Nov-06 W 333900 3693400
well4 Beit Saber Nov-06 W 342300 3688000
well5 Beit Saber Nov-06 W 340200 3689100
well7 Beit Saber Dec-06 W 339000 3687000
well9 Beit Saber Dec-06 W 337800 3690100
well1 Kafer Hour Nov-06 W 338200 3693100
well2 Kafer Hour Nov-06 W 338400 3693300
well3 Kafer Hour Nov-06 W 338300 3693600
well1 Khazrajeh Dec-06 W 340000 3685200
well3 Mogher Al Mer Nov-06 W 334800 3689000
well2 Tabibieh Dec-06 W 345700 3688900
well1 Talmasiat Nov-06 W 335600 3686300
well2 Talmasiat Nov-06 W 335600 3687000
well1 Khan Elshek Dec-06 W 348300 3692900
well2 Khan Elshek Dec-06 W 347200 3690300
well4 Khan Elshek Dec-06 W 348050 3691300
well7 Khan Elshek Dec-06 W 348300 3691600
well8 Khan Elshek Dec-06 W 350000 3692100
well1 Mazrat Nafor Dec-06 W 351500 3686800
well1 Mogher-Hene Nov-06 W 335700 3690000
well2 Mogher-Hene Nov-06 W 335700 3690600
well3 Mogher-Hene Nov-06 W 335700 3691450
well4 Mogher Al Mer Nov-06 W 336800 3688500
well5 Mogher Al Mer Nov-06 W 336000 3688100
well6 Mogher Al Mer Dec-06 W 337500 3689000
well7 Mogher Al Mer Dec-06 W 337400 3689700
MambejWell Mogher Al Mer Nov-06 W 334150 3687700
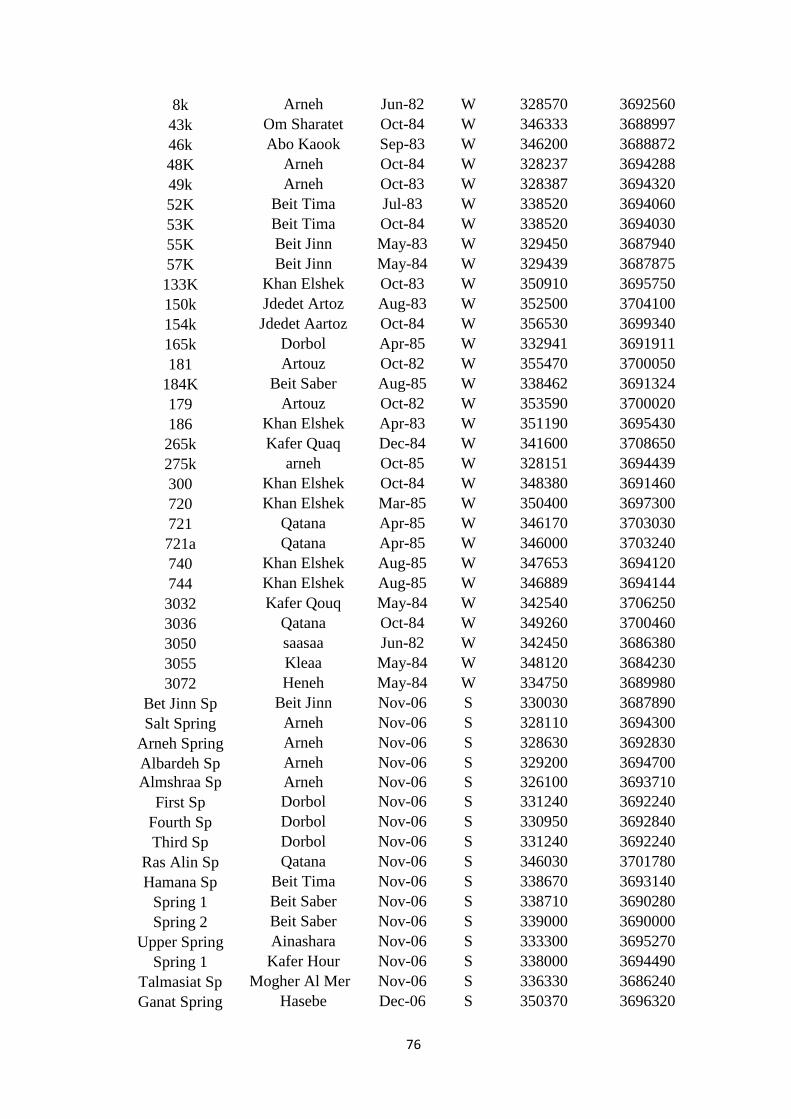
76
8k Arneh Jun-82 W 328570 3692560
43k Om Sharatet Oct-84 W 346333 3688997
46k Abo Kaook Sep-83 W 346200 3688872
48K Arneh Oct-84 W 328237 3694288
49k Arneh Oct-83 W 328387 3694320
52K Beit Tima Jul-83 W 338520 3694060
53K Beit Tima Oct-84 W 338520 3694030
55K Beit Jinn May-83 W 329450 3687940
57K Beit Jinn May-84 W 329439 3687875
133K Khan Elshek Oct-83 W 350910 3695750
150k Jdedet Artoz Aug-83 W 352500 3704100
154k Jdedet Aartoz Oct-84 W 356530 3699340
165k Dorbol Apr-85 W 332941 3691911
181 Artouz Oct-82 W 355470 3700050
184K Beit Saber Aug-85 W 338462 3691324
179 Artouz Oct-82 W 353590 3700020
186 Khan Elshek Apr-83 W 351190 3695430
265k Kafer Quaq Dec-84 W 341600 3708650
275k arneh Oct-85 W 328151 3694439
300 Khan Elshek Oct-84 W 348380 3691460
720 Khan Elshek Mar-85 W 350400 3697300
721 Qatana Apr-85 W 346170 3703030
721a Qatana Apr-85 W 346000 3703240
740 Khan Elshek Aug-85 W 347653 3694120
744 Khan Elshek Aug-85 W 346889 3694144
3032 Kafer Qouq May-84 W 342540 3706250
3036 Qatana Oct-84 W 349260 3700460
3050 saasaa Jun-82 W 342450 3686380
3055 Kleaa May-84 W 348120 3684230
3072 Heneh May-84 W 334750 3689980
Bet Jinn Sp Beit Jinn Nov-06 S 330030 3687890
Salt Spring Arneh Nov-06 S 328110 3694300
Arneh Spring Arneh Nov-06 S 328630 3692830
Albardeh Sp Arneh Nov-06 S 329200 3694700
Almshraa Sp Arneh Nov-06 S 326100 3693710
First Sp Dorbol Nov-06 S 331240 3692240
Fourth Sp Dorbol Nov-06 S 330950 3692840
Third Sp Dorbol Nov-06 S 331240 3692240
Ras Alin Sp Qatana Nov-06 S 346030 3701780
Hamana Sp Beit Tima Nov-06 S 338670 3693140
Spring 1 Beit Saber Nov-06 S 338710 3690280
Spring 2 Beit Saber Nov-06 S 339000 3690000
Upper Spring Ainashara Nov-06 S 333300 3695270
Spring 1 Kafer Hour Nov-06 S 338000 3694490
Talmasiat Sp Mogher Al Mer Nov-06 S 336330 3686240
Ganat Spring Hasebe Dec-06 S 350370 3696320
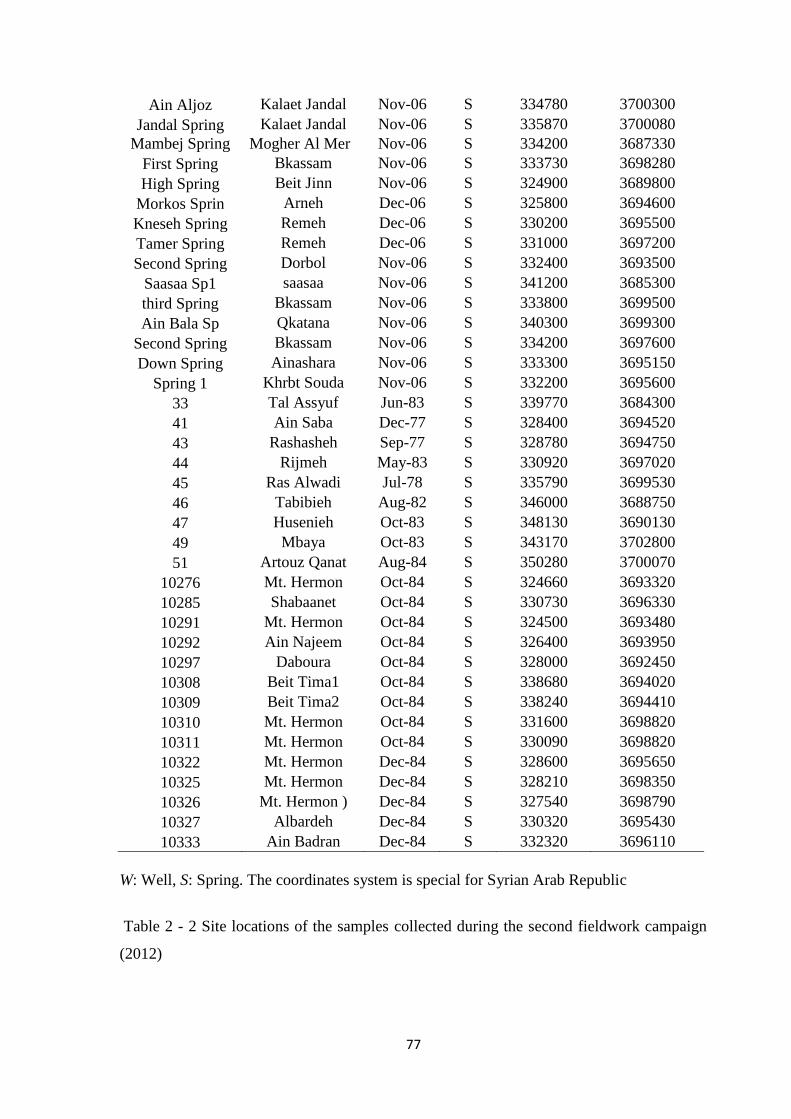
77
Ain Aljoz Kalaet Jandal Nov-06 S 334780 3700300
Jandal Spring Kalaet Jandal Nov-06 S 335870 3700080
Mambej Spring Mogher Al Mer Nov-06 S 334200 3687330
First Spring Bkassam Nov-06 S 333730 3698280
High Spring Beit Jinn Nov-06 S 324900 3689800
Morkos Sprin Arneh Dec-06 S 325800 3694600
Kneseh Spring Remeh Dec-06 S 330200 3695500
Tamer Spring Remeh Dec-06 S 331000 3697200
Second Spring Dorbol Nov-06 S 332400 3693500
Saasaa Sp1 saasaa Nov-06 S 341200 3685300
third Spring Bkassam Nov-06 S 333800 3699500
Ain Bala Sp Qkatana Nov-06 S 340300 3699300
Second Spring Bkassam Nov-06 S 334200 3697600
Down Spring Ainashara Nov-06 S 333300 3695150
Spring 1 Khrbt Souda Nov-06 S 332200 3695600
33 Tal Assyuf Jun-83 S 339770 3684300
41 Ain Saba Dec-77 S 328400 3694520
43 Rashasheh Sep-77 S 328780 3694750
44 Rijmeh May-83 S 330920 3697020
45 Ras Alwadi Jul-78 S 335790 3699530
46 Tabibieh Aug-82 S 346000 3688750
47 Husenieh Oct-83 S 348130 3690130
49 Mbaya Oct-83 S 343170 3702800
51 Artouz Qanat Aug-84 S 350280 3700070
10276 Mt. Hermon Oct-84 S 324660 3693320
10285 Shabaanet Oct-84 S 330730 3696330
10291 Mt. Hermon Oct-84 S 324500 3693480
10292 Ain Najeem Oct-84 S 326400 3693950
10297 Daboura Oct-84 S 328000 3692450
10308 Beit Tima1 Oct-84 S 338680 3694020
10309 Beit Tima2 Oct-84 S 338240 3694410
10310 Mt. Hermon Oct-84 S 331600 3698820
10311 Mt. Hermon Oct-84 S 330090 3698820
10322 Mt. Hermon Dec-84 S 328600 3695650
10325 Mt. Hermon Dec-84 S 328210 3698350
10326 Mt. Hermon ) Dec-84 S 327540 3698790
10327 Albardeh Dec-84 S 330320 3695430
10333 Ain Badran Dec-84 S 332320 3696110
W: Well, S: Spring. The coordinates system is special for Syrian Arab Republic
Table 2 - 2 Site locations of the samples collected during the second fieldwork campaign
(2012)
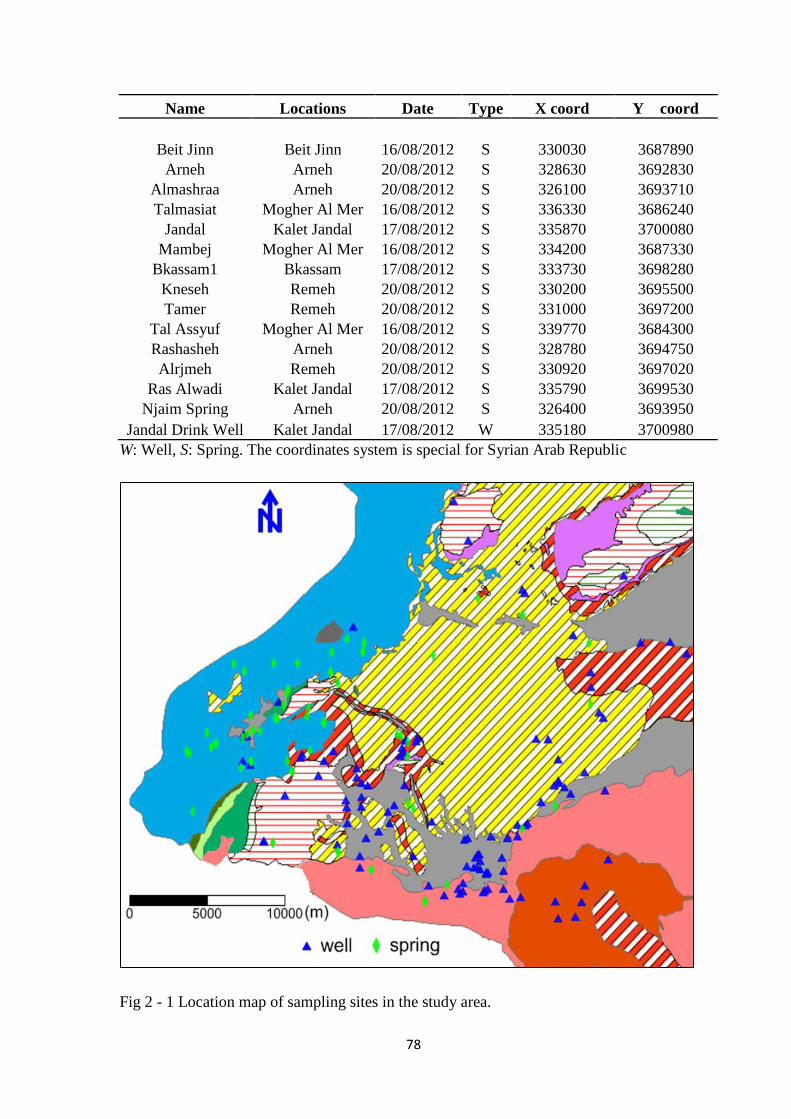
78
Name Locations Date Type X coord Y coord
Beit Jinn 16/08/2012 S 330030 3687890 Beit Jinn
Arneh Arneh 20/08/2012 S 328630 3692830
Almashraa Arneh 20/08/2012 S 326100 3693710
Talmasiat Mogher Al Mer 16/08/2012 S 336330 3686240
Jandal Kalet Jandal 17/08/2012 S 335870 3700080
Mambej Mogher Al Mer 16/08/2012 S 334200 3687330
Bkassam1 Bkassam 17/08/2012 S 333730 3698280
Kneseh Remeh 20/08/2012 S 330200 3695500
Tamer Remeh 20/08/2012 S 331000 3697200
Tal Assyuf Mogher Al Mer 16/08/2012 S 339770 3684300
Rashasheh Arneh 20/08/2012 S 328780 3694750
Alrjmeh Remeh 20/08/2012 S 330920 3697020
Ras Alwadi Kalet Jandal 17/08/2012 S 335790 3699530
Njaim Spring Arneh 20/08/2012 S 326400 3693950
Jandal Drink Well Kalet Jandal 17/08/2012 W 335180 3700980
W: Well, S: Spring. The coordinates system is special for Syrian Arab Republic
Fig 2 - 1 Location map of sampling sites in the study area.
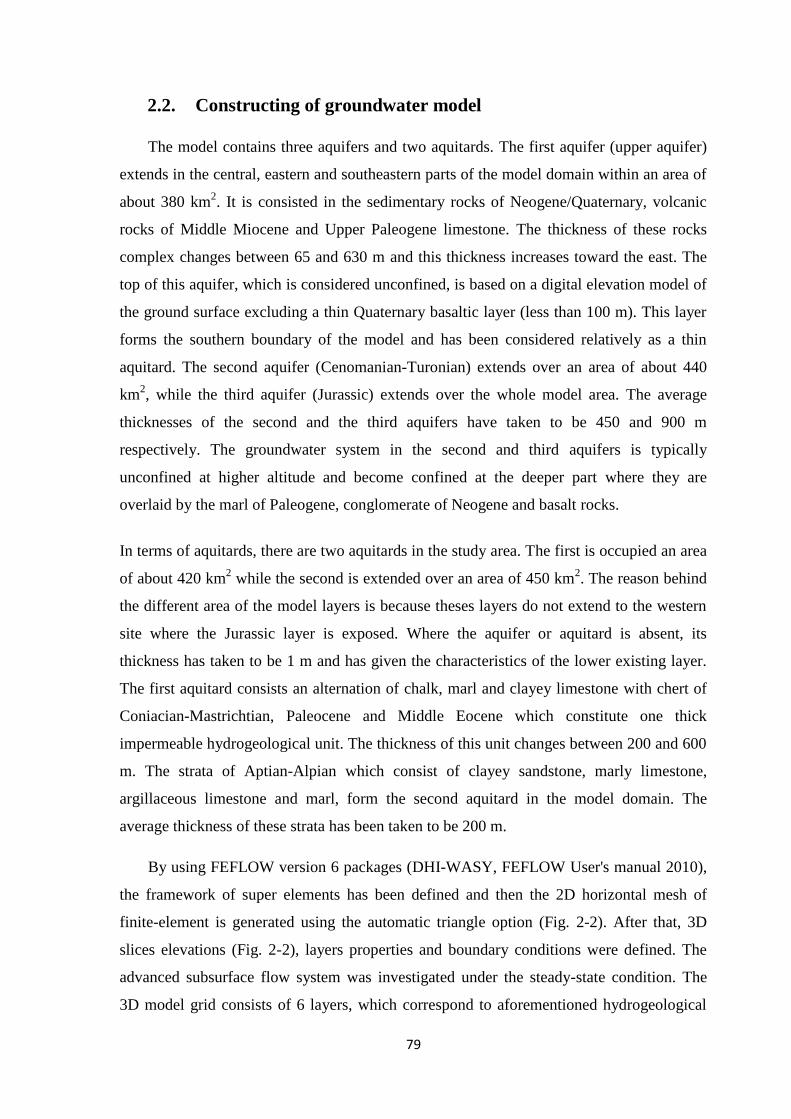
79
2.2. Constructing of groundwater model
The model contains three aquifers and two aquitards. The first aquifer (upper aquifer)
extends in the central, eastern and southeastern parts of the model domain within an area of
about 380 km2. It is consisted in the sedimentary rocks of Neogene/Quaternary, volcanic
rocks of Middle Miocene and Upper Paleogene limestone. The thickness of these rocks
complex changes between 65 and 630 m and this thickness increases toward the east. The
top of this aquifer, which is considered unconfined, is based on a digital elevation model of
the ground surface excluding a thin Quaternary basaltic layer (less than 100 m). This layer
forms the southern boundary of the model and has been considered relatively as a thin
aquitard. The second aquifer (Cenomanian-Turonian) extends over an area of about 440
km2, while the third aquifer (Jurassic) extends over the whole model area. The average
thicknesses of the second and the third aquifers have taken to be 450 and 900 m
respectively. The groundwater system in the second and third aquifers is typically
unconfined at higher altitude and become confined at the deeper part where they are
overlaid by the marl of Paleogene, conglomerate of Neogene and basalt rocks.
In terms of aquitards, there are two aquitards in the study area. The first is occupied an area
of about 420 km2 while the second is extended over an area of 450 km
2. The reason behind
the different area of the model layers is because theses layers do not extend to the western
site where the Jurassic layer is exposed. Where the aquifer or aquitard is absent, its
thickness has taken to be 1 m and has given the characteristics of the lower existing layer.
The first aquitard consists an alternation of chalk, marl and clayey limestone with chert of
Coniacian-Mastrichtian, Paleocene and Middle Eocene which constitute one thick
impermeable hydrogeological unit. The thickness of this unit changes between 200 and 600
m. The strata of Aptian-Alpian which consist of clayey sandstone, marly limestone,
argillaceous limestone and marl, form the second aquitard in the model domain. The
average thickness of these strata has been taken to be 200 m.
By using FEFLOW version 6 packages (DHI-WASY, FEFLOW User's manual 2010),
the framework of super elements has been defined and then the 2D horizontal mesh of
finite-element is generated using the automatic triangle option (Fig. 2-2). After that, 3D
slices elevations (Fig. 2-2), layers properties and boundary conditions were defined. The
advanced subsurface flow system was investigated under the steady-state condition. The
3D model grid consists of 6 layers, which correspond to aforementioned hydrogeological

81
units, and 7 slices. The total number of two dimensional triangular prismatic mesh elements
is 48,702 with 29,162 nodes which have been generated based on all the basic geometrical
information. The finite element method is characterized by its flexibility in generating the
mesh and its capacity to simulate complex geometric forms and to refine the nodal grid
around points and/or single lines. The finite element grid was generated automatically with
reasonable refinement around the points in both plain area and Arneh region. These points
illustrate the abstraction wells which are placed in the grid as fixed nodes at their exact
positions as shown later. The spatial data were prepared by using Arc GIS (10) which can
be totally interfaced with FEFLOW.
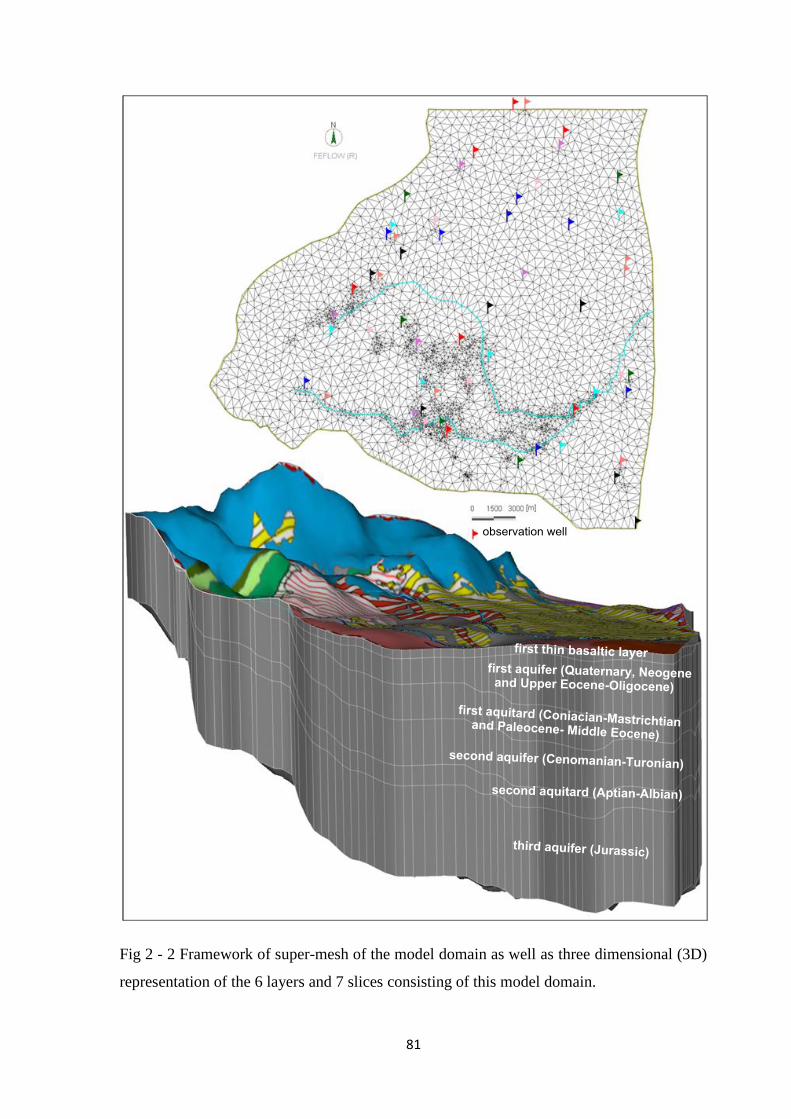
80
Fig 2 - 2 Framework of super-mesh of the model domain as well as three dimensional (3D)
representation of the 6 layers and 7 slices consisting of this model domain.
81
Chapter 3. Hydrochemistry to delineate groundwater flow pattern
in the study area
Introduction
The hydrogeochemical processes of the groundwater system help to obtain an insight
into the contributions of water-rock interaction and anthropogenic influences on
groundwater (Matthess 1982, Kumar et al. 2006, Varol and Davraz 2014). Using of major-
ions as natural tracers has become a significant tool to delineate flow paths and interpret the
spatial variations in water chemistry in the aquifers. However, the majority of these ions in
the groundwater are subject to different processes such as dissolution of calcite and
dolomite, cation exchange with the clay-humus complex and precipitation of calcite with
CO2 degassing at the small spring (Ribolzi et al. 2000). In order to predict any change in
groundwater environments, it is necessary to understand the hydrochemical characteristics
of the groundwater and its evolution under natural water circulation processes (Lawrence et
al. 2000; Edmunds et al. 2002 and 2006; Guendouz et al. 2003; Wen et al. 2005; Ma et al.
2005; Ma and Edmunds 2006; Jianhua et al. 2009). The motion of groundwater along its
flow paths increases the concentration of the chemical species. This depends on the
geological formation, geological structure and determined by the interaction processes
between the water and hosting rock (Domenico and Schwartz 1990; Freeze and Cherry
1979; Kortatsi 2007; Aghazadeh and Mogaddam 2011). Additional controls on
groundwater characteristics are influenced by anthropogenic activities such as the pumping
and pollution of groundwater. In many areas, particularly in the arid and semi-arid zones,
groundwater quality degradation limits the supply of potable fresh water (Rakhmatullaev et
al. 2012). Generally, groundwater is often a mixture of waters from different flow-paths;
this is particularly true in heterogeneous systems such as well-developed karst and
fractured rocks. This chapter has been developed based on the interpretation of dataset in
table 3-1.
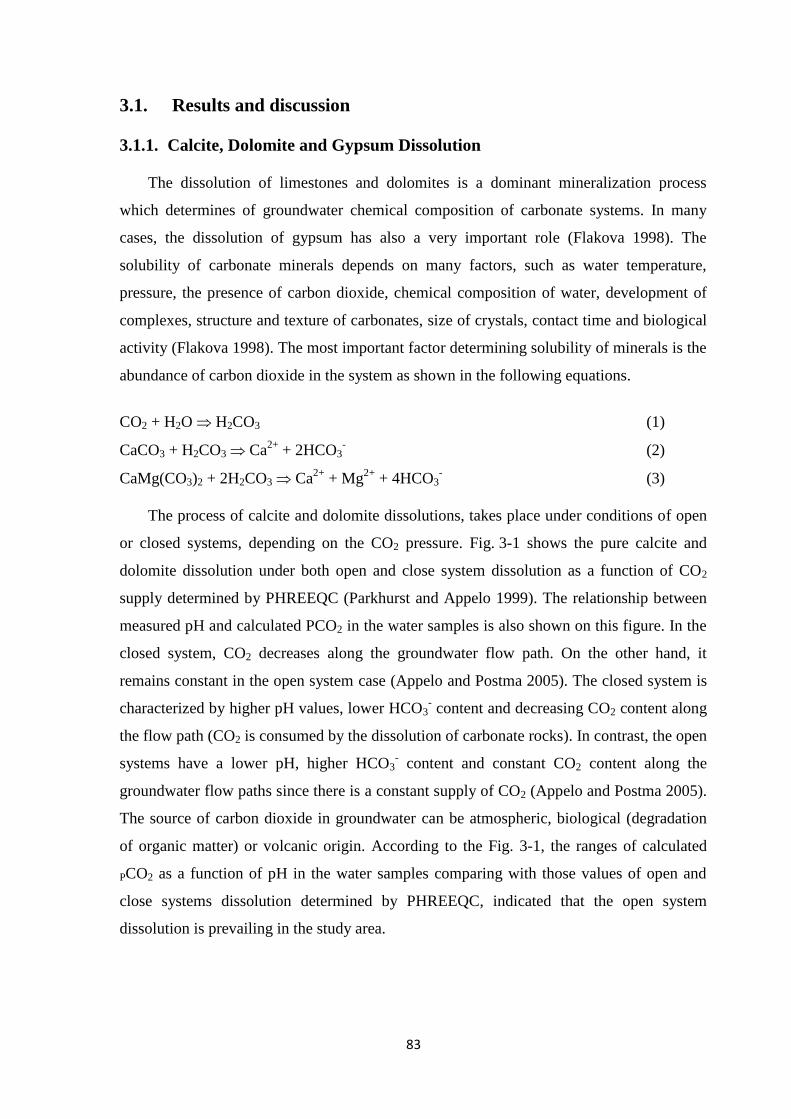
83
3.1. Results and discussion
3.1.1. Calcite, Dolomite and Gypsum Dissolution
The dissolution of limestones and dolomites is a dominant mineralization process
which determines of groundwater chemical composition of carbonate systems. In many
cases, the dissolution of gypsum has also a very important role (Flakova 1998). The
solubility of carbonate minerals depends on many factors, such as water temperature,
pressure, the presence of carbon dioxide, chemical composition of water, development of
complexes, structure and texture of carbonates, size of crystals, contact time and biological
activity (Flakova 1998). The most important factor determining solubility of minerals is the
abundance of carbon dioxide in the system as shown in the following equations.
CO2 + H2O H2CO3 (1)
CaCO3 + H2CO3 Ca2+
+ 2HCO3- (2)
CaMg(CO3)2 + 2H2CO3 Ca2+
+ Mg2+
+ 4HCO3- (3)
The process of calcite and dolomite dissolutions, takes place under conditions of open
or closed systems, depending on the CO2 pressure. Fig. 3-1 shows the pure calcite and
dolomite dissolution under both open and close system dissolution as a function of CO2
supply determined by PHREEQC (Parkhurst and Appelo 1999). The relationship between
measured pH and calculated PCO2 in the water samples is also shown on this figure. In the
closed system, CO2 decreases along the groundwater flow path. On the other hand, it
remains constant in the open system case (Appelo and Postma 2005). The closed system is
characterized by higher pH values, lower HCO3- content and decreasing CO2 content along
the flow path (CO2 is consumed by the dissolution of carbonate rocks). In contrast, the open
systems have a lower pH, higher HCO3- content and constant CO2 content along the
groundwater flow paths since there is a constant supply of CO2 (Appelo and Postma 2005).
The source of carbon dioxide in groundwater can be atmospheric, biological (degradation
of organic matter) or volcanic origin. According to the Fig. 3-1, the ranges of calculated
PCO2 as a function of pH in the water samples comparing with those values of open and
close systems dissolution determined by PHREEQC, indicated that the open system
dissolution is prevailing in the study area.
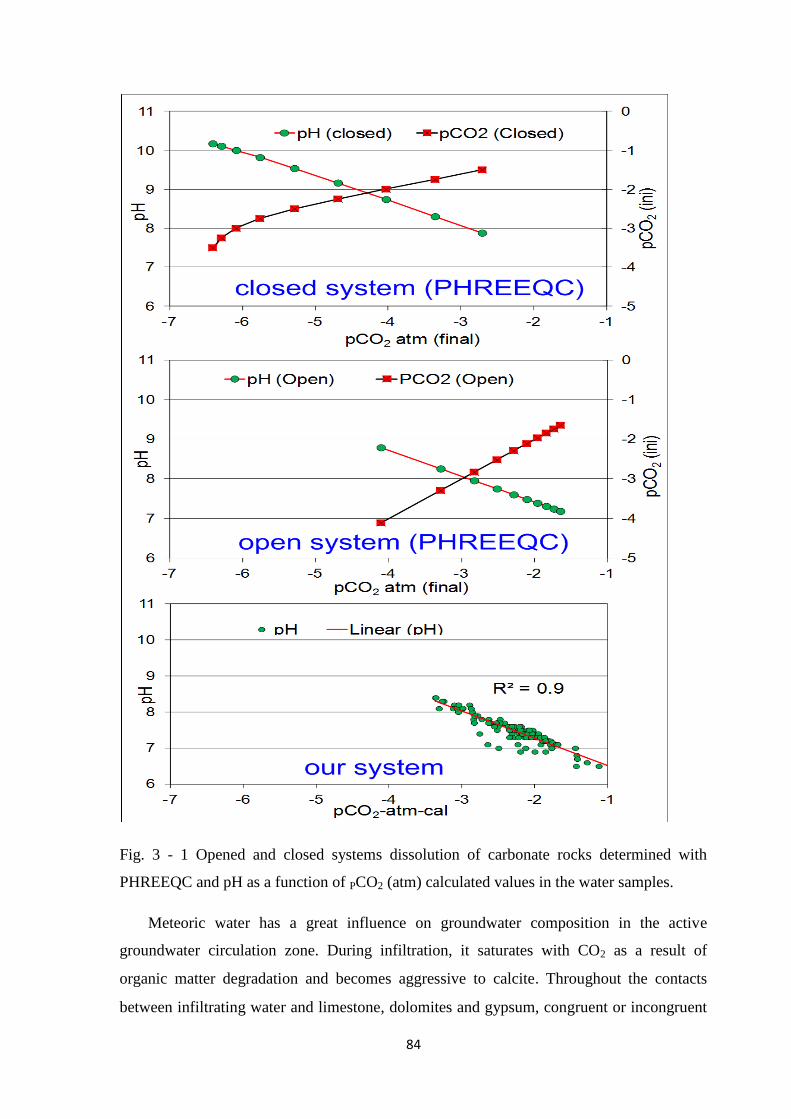
84
Fig. 3 - 1 Opened and closed systems dissolution of carbonate rocks determined with
PHREEQC and pH as a function of PCO2 (atm) calculated values in the water samples.
Meteoric water has a great influence on groundwater composition in the active
groundwater circulation zone. During infiltration, it saturates with CO2 as a result of
organic matter degradation and becomes aggressive to calcite. Throughout the contacts
between infiltrating water and limestone, dolomites and gypsum, congruent or incongruent
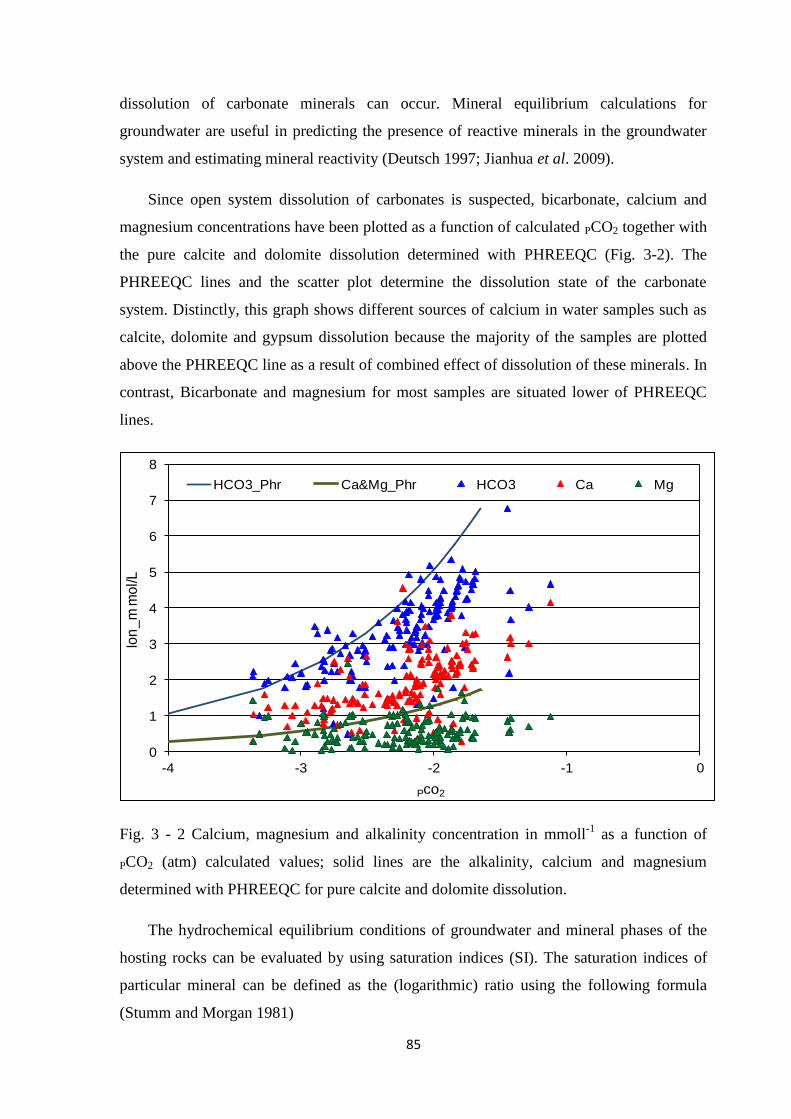
85
dissolution of carbonate minerals can occur. Mineral equilibrium calculations for
groundwater are useful in predicting the presence of reactive minerals in the groundwater
system and estimating mineral reactivity (Deutsch 1997; Jianhua et al. 2009).
Since open system dissolution of carbonates is suspected, bicarbonate, calcium and
magnesium concentrations have been plotted as a function of calculated PCO2 together with
the pure calcite and dolomite dissolution determined with PHREEQC (Fig. 3-2). The
PHREEQC lines and the scatter plot determine the dissolution state of the carbonate
system. Distinctly, this graph shows different sources of calcium in water samples such as
calcite, dolomite and gypsum dissolution because the majority of the samples are plotted
above the PHREEQC line as a result of combined effect of dissolution of these minerals. In
contrast, Bicarbonate and magnesium for most samples are situated lower of PHREEQC
lines.
Fig. 3 - 2 Calcium, magnesium and alkalinity concentration in mmoll-1
as a function of
PCO2 (atm) calculated values; solid lines are the alkalinity, calcium and magnesium
determined with PHREEQC for pure calcite and dolomite dissolution.
The hydrochemical equilibrium conditions of groundwater and mineral phases of the
hosting rocks can be evaluated by using saturation indices (SI). The saturation indices of
particular mineral can be defined as the (logarithmic) ratio using the following formula
(Stumm and Morgan 1981)
0
1
2
3
4
5
6
7
8
-4 -3 -2 -1 0
Ion
_m
mo
l/L
Pco2
HCO3_Phr Ca&Mg_Phr HCO3 Ca Mg
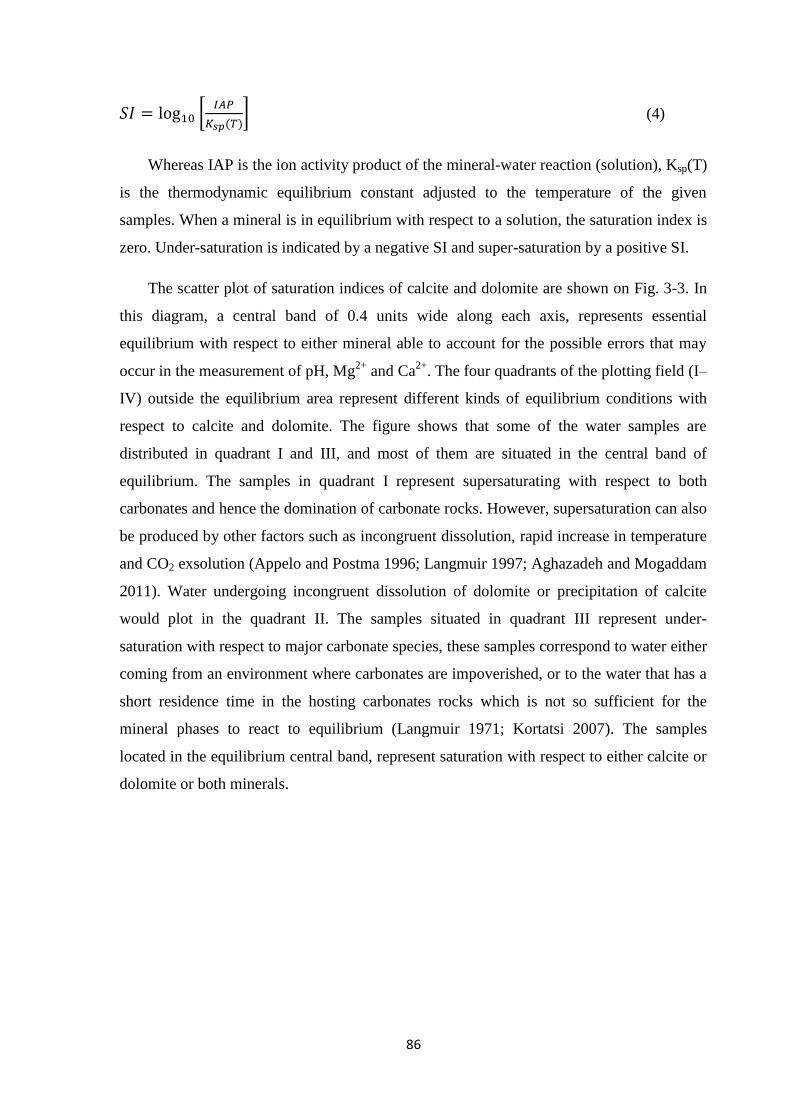
86
(4)
Whereas IAP is the ion activity product of the mineral-water reaction (solution), Ksp(T)
is the thermodynamic equilibrium constant adjusted to the temperature of the given
samples. When a mineral is in equilibrium with respect to a solution, the saturation index is
zero. Under-saturation is indicated by a negative SI and super-saturation by a positive SI.
The scatter plot of saturation indices of calcite and dolomite are shown on Fig. 3-3. In
this diagram, a central band of 0.4 units wide along each axis, represents essential
equilibrium with respect to either mineral able to account for the possible errors that may
occur in the measurement of pH, Mg2+
and Ca2+
. The four quadrants of the plotting field (I–
IV) outside the equilibrium area represent different kinds of equilibrium conditions with
respect to calcite and dolomite. The figure shows that some of the water samples are
distributed in quadrant I and III, and most of them are situated in the central band of
equilibrium. The samples in quadrant I represent supersaturating with respect to both
carbonates and hence the domination of carbonate rocks. However, supersaturation can also
be produced by other factors such as incongruent dissolution, rapid increase in temperature
and CO2 exsolution (Appelo and Postma 1996; Langmuir 1997; Aghazadeh and Mogaddam
2011). Water undergoing incongruent dissolution of dolomite or precipitation of calcite
would plot in the quadrant II. The samples situated in quadrant III represent under-
saturation with respect to major carbonate species, these samples correspond to water either
coming from an environment where carbonates are impoverished, or to the water that has a
short residence time in the hosting carbonates rocks which is not so sufficient for the
mineral phases to react to equilibrium (Langmuir 1971; Kortatsi 2007). The samples
located in the equilibrium central band, represent saturation with respect to either calcite or
dolomite or both minerals.
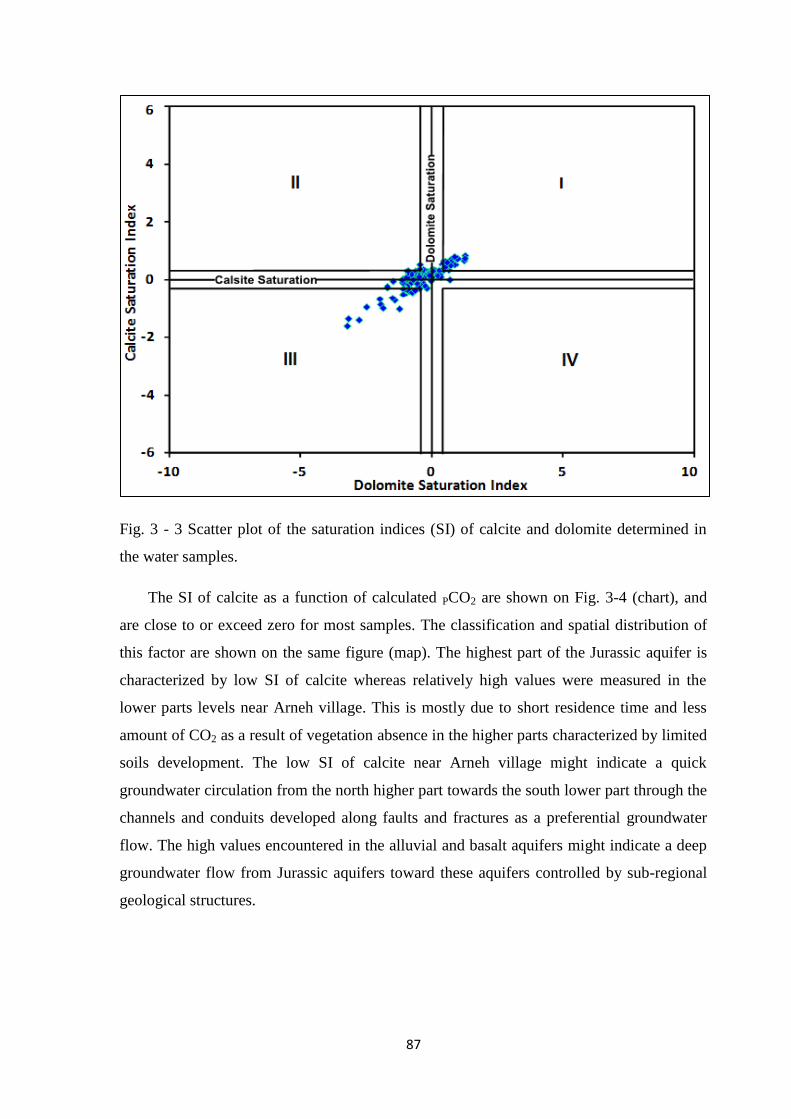
87
Fig. 3 - 3 Scatter plot of the saturation indices (SI) of calcite and dolomite determined in
the water samples.
The SI of calcite as a function of calculated PCO2 are shown on Fig. 3-4 (chart), and
are close to or exceed zero for most samples. The classification and spatial distribution of
this factor are shown on the same figure (map). The highest part of the Jurassic aquifer is
characterized by low SI of calcite whereas relatively high values were measured in the
lower parts levels near Arneh village. This is mostly due to short residence time and less
amount of CO2 as a result of vegetation absence in the higher parts characterized by limited
soils development. The low SI of calcite near Arneh village might indicate a quick
groundwater circulation from the north higher part towards the south lower part through the
channels and conduits developed along faults and fractures as a preferential groundwater
flow. The high values encountered in the alluvial and basalt aquifers might indicate a deep
groundwater flow from Jurassic aquifers toward these aquifers controlled by sub-regional
geological structures.
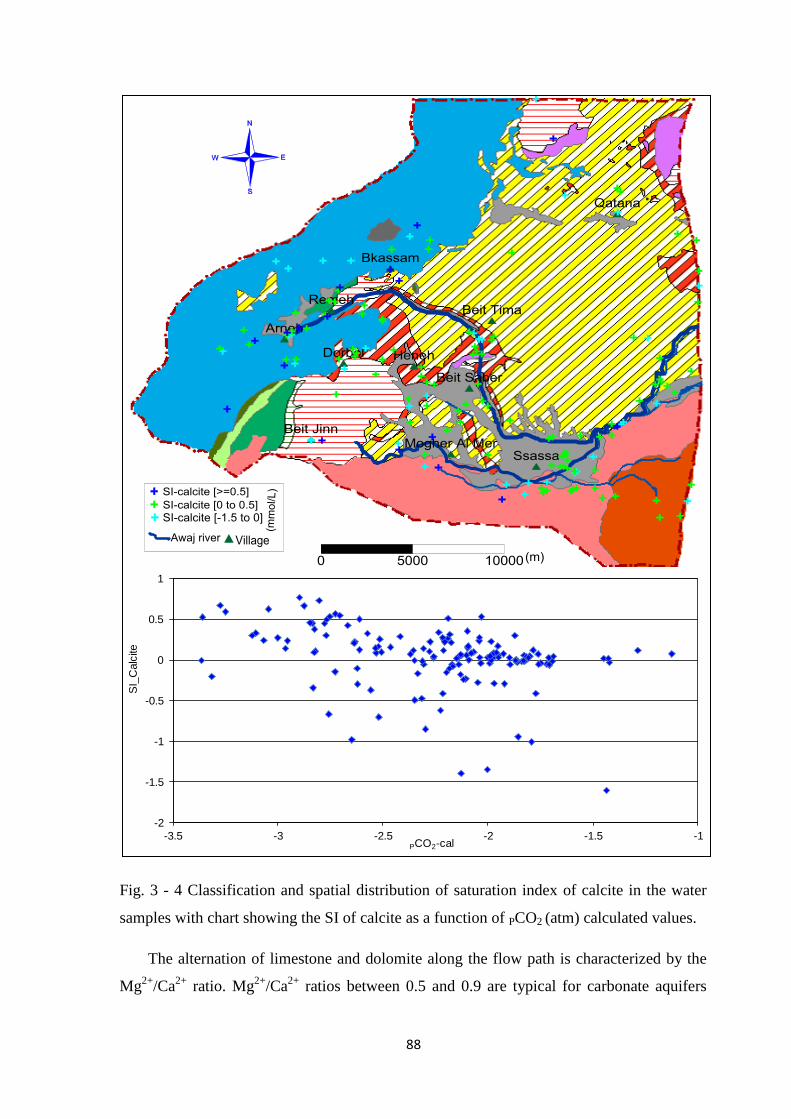
88
Fig. 3 - 4 Classification and spatial distribution of saturation index of calcite in the water
samples with chart showing the SI of calcite as a function of PCO2 (atm) calculated values.
The alternation of limestone and dolomite along the flow path is characterized by the
Mg2+
/Ca2+
ratio. Mg2+
/Ca2+
ratios between 0.5 and 0.9 are typical for carbonate aquifers
-2
-1.5
-1
-0.5
0
0.5
1
-3.5 -3 -2.5 -2 -1.5 -1
SI_
Calc
ite
PCO2-cal
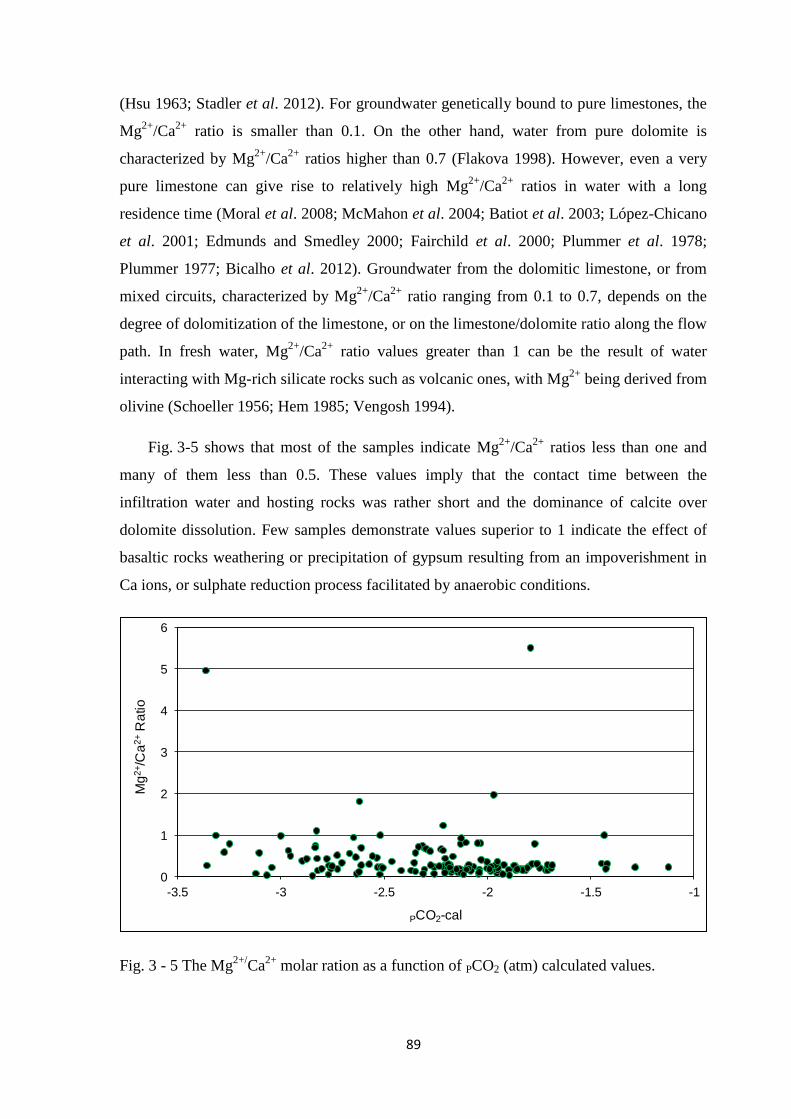
89
(Hsu 1963; Stadler et al. 2012). For groundwater genetically bound to pure limestones, the
Mg2+
/Ca2+
ratio is smaller than 0.1. On the other hand, water from pure dolomite is
characterized by Mg2+
/Ca2+
ratios higher than 0.7 (Flakova 1998). However, even a very
pure limestone can give rise to relatively high Mg2+
/Ca2+
ratios in water with a long
residence time (Moral et al. 2008; McMahon et al. 2004; Batiot et al. 2003; López-Chicano
et al. 2001; Edmunds and Smedley 2000; Fairchild et al. 2000; Plummer et al. 1978;
Plummer 1977; Bicalho et al. 2012). Groundwater from the dolomitic limestone, or from
mixed circuits, characterized by Mg2+
/Ca2+
ratio ranging from 0.1 to 0.7, depends on the
degree of dolomitization of the limestone, or on the limestone/dolomite ratio along the flow
path. In fresh water, Mg2+
/Ca2+
ratio values greater than 1 can be the result of water
interacting with Mg-rich silicate rocks such as volcanic ones, with Mg2+
being derived from
olivine (Schoeller 1956; Hem 1985; Vengosh 1994).
Fig. 3-5 shows that most of the samples indicate Mg2+
/Ca2+
ratios less than one and
many of them less than 0.5. These values imply that the contact time between the
infiltration water and hosting rocks was rather short and the dominance of calcite over
dolomite dissolution. Few samples demonstrate values superior to 1 indicate the effect of
basaltic rocks weathering or precipitation of gypsum resulting from an impoverishment in
Ca ions, or sulphate reduction process facilitated by anaerobic conditions.
Fig. 3 - 5 The Mg2+/
Ca2+
molar ration as a function of PCO2 (atm) calculated values.
0
1
2
3
4
5
6
-3.5 -3 -2.5 -2 -1.5 -1
Mg
2+/C
a2+
Ra
tio
PCO2-cal
91
The dissolution of gypsum leads to increasing sulphate concentration in groundwater
and to enhanced solubility of dolomite; consequently it lowers the solubility of calcite. SI
of gypsum as a function of SO42-
concentration is plotted on Fig. 3-7 The relationship
between two variables shows that the dissolution of gypsum is the main source of sulphate
in these waters and a positive correlation was also found between them (correlation
coefficient r = 0.68). This is associated with an increase in calcium concentration as shown
on Fig. 3-6. This figure shows that there is no correlation between calcium and sulphate in
most samples, only when sulphate concentration becomes greater than 0.5 mmolL-1
, the
trend indicates a positive relationship between the two variables due to gypsum dissolution.
3.1.2. Dedolomitization Process
The contemporary occurrence of Mesozoic limestone and dolomites associated with
gypsiferous layers of evaporitic origin, gives rise to Ca-sulphate- rich water which induces
dissolution-precipitation processes in the dolomite-calcite mineral assemblage (Capaccioni
et al. 2001). Dedolomitization process means, that the calcite precipitation (eq. 6) and
dolomite dissolution (eq. 7) are driven by anhydrite (gypsum) dissolution (eq. 5) (Plummer
et al. 1990). The dedolomitization is controlled by the three following reactions:
CaSO4 → Ca2+
+ SO42-
(5)
Ca2+
+ 2HCO3- → CaCO3 + CO2 + H2O (6)
2CO2 + 2H2O + CaMg(CO3)2 ↔ Ca2+
+ Mg2+
+ 4HCO3- (7)
The increasing concentration of Ca2+
during the dissolution of gypsum leads to the
precipitation of calcite. The loss of Ca2+
and HCO3- subsaturates the water with dolomite
which dissolves and increases the Mg2+
concentrations in water (Fig. 3-6). The increase of
Mg2+
concentrations causes an increase of Ca2+
concentration (Fig. 3-6), until the
equilibrium is reached between water and both minerals. Thus, the gypsum dissolution
brings about a substitution of dolomite by calcite.
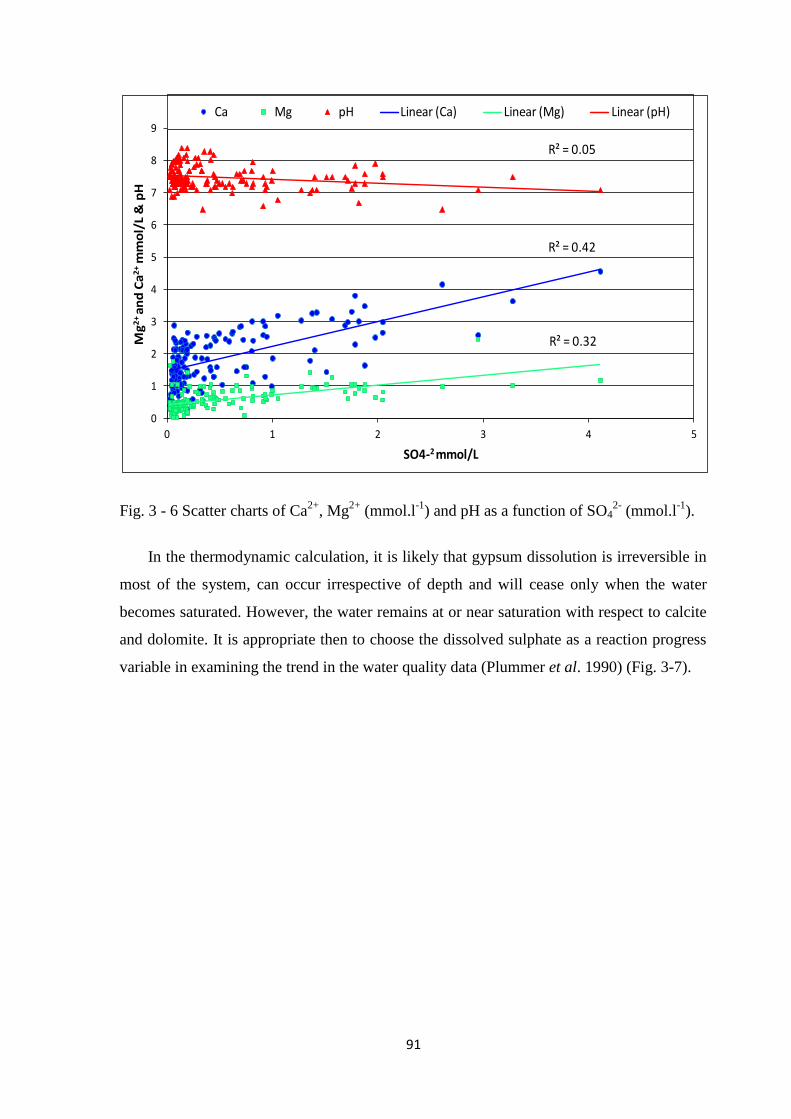
90
Fig. 3 - 6 Scatter charts of Ca2+
, Mg2+
(mmol.l-1
) and pH as a function of SO42-
(mmol.l-1
).
In the thermodynamic calculation, it is likely that gypsum dissolution is irreversible in
most of the system, can occur irrespective of depth and will cease only when the water
becomes saturated. However, the water remains at or near saturation with respect to calcite
and dolomite. It is appropriate then to choose the dissolved sulphate as a reaction progress
variable in examining the trend in the water quality data (Plummer et al. 1990) (Fig. 3-7).
R² = 0.42
R² = 0.32
R² = 0.05
0
1
2
3
4
5
6
7
8
9
0 1 2 3 4 5
Mg
2+
an
d C
a2
+ m
mo
l/L
& p
H
SO4-2 mmol/L
Ca Mg pH Linear (Ca) Linear (Mg) Linear (pH)
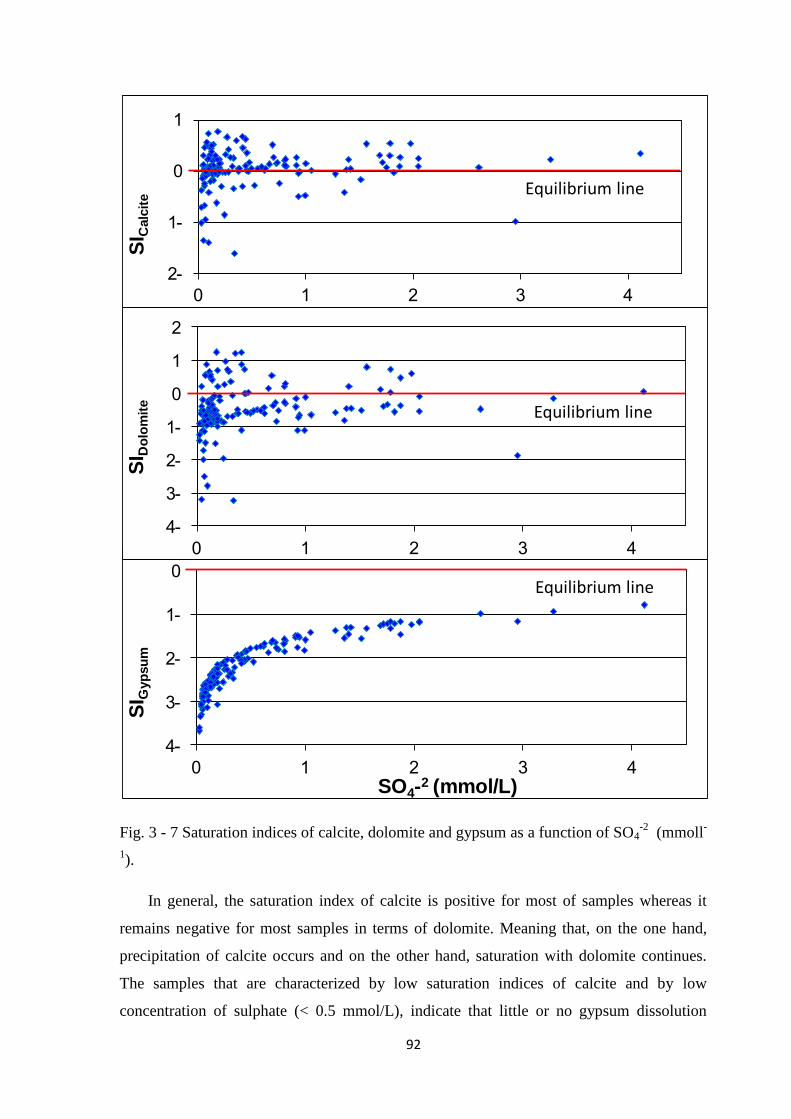
91
Fig. 3 - 7 Saturation indices of calcite, dolomite and gypsum as a function of SO4-2
(mmoll-
1).
In general, the saturation index of calcite is positive for most of samples whereas it
remains negative for most samples in terms of dolomite. Meaning that, on the one hand,
precipitation of calcite occurs and on the other hand, saturation with dolomite continues.
The samples that are characterized by low saturation indices of calcite and by low
concentration of sulphate (< 0.5 mmol/L), indicate that little or no gypsum dissolution
-
-
-
-
SI G
yp
su
m
SO4-2 (mmol/L)
-
-
SI C
alc
ite
Equilibrium line
-
-
-
-
SI D
olo
mit
e
Equilibrium line
Equilibrium line
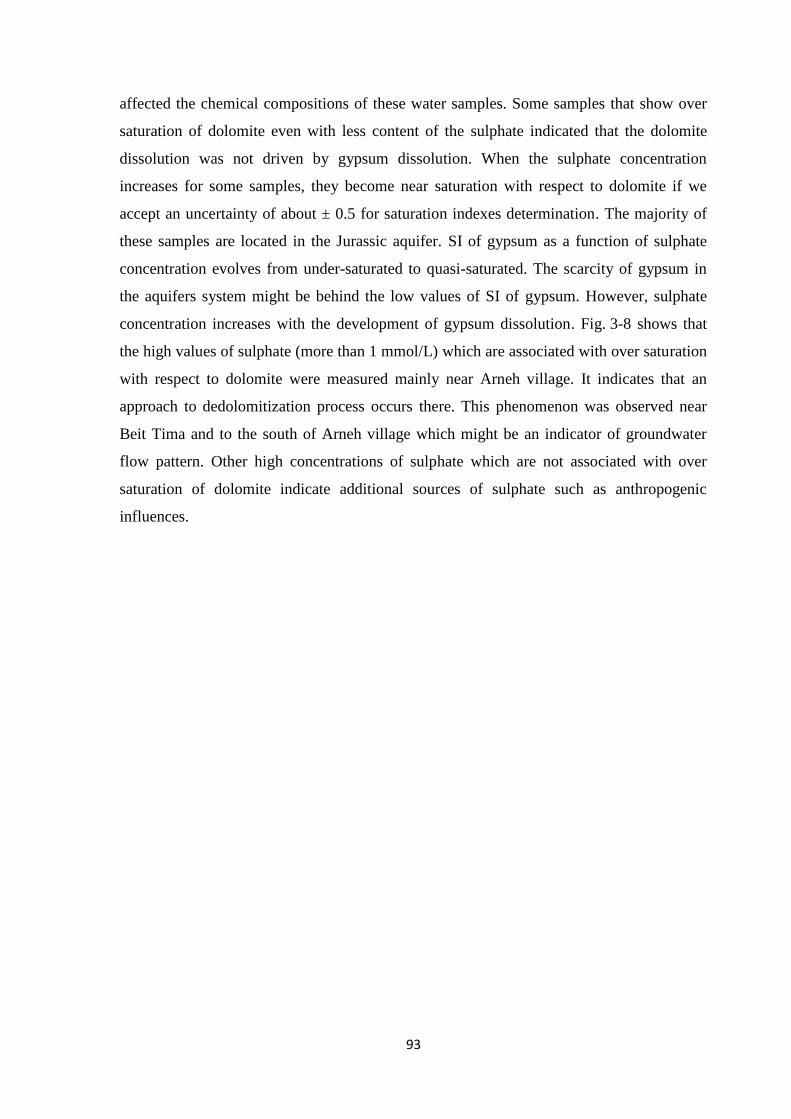
93
affected the chemical compositions of these water samples. Some samples that show over
saturation of dolomite even with less content of the sulphate indicated that the dolomite
dissolution was not driven by gypsum dissolution. When the sulphate concentration
increases for some samples, they become near saturation with respect to dolomite if we
accept an uncertainty of about ± 0.5 for saturation indexes determination. The majority of
these samples are located in the Jurassic aquifer. SI of gypsum as a function of sulphate
concentration evolves from under-saturated to quasi-saturated. The scarcity of gypsum in
the aquifers system might be behind the low values of SI of gypsum. However, sulphate
concentration increases with the development of gypsum dissolution. Fig. 3-8 shows that
the high values of sulphate (more than 1 mmol/L) which are associated with over saturation
with respect to dolomite were measured mainly near Arneh village. It indicates that an
approach to dedolomitization process occurs there. This phenomenon was observed near
Beit Tima and to the south of Arneh village which might be an indicator of groundwater
flow pattern. Other high concentrations of sulphate which are not associated with over
saturation of dolomite indicate additional sources of sulphate such as anthropogenic
influences.
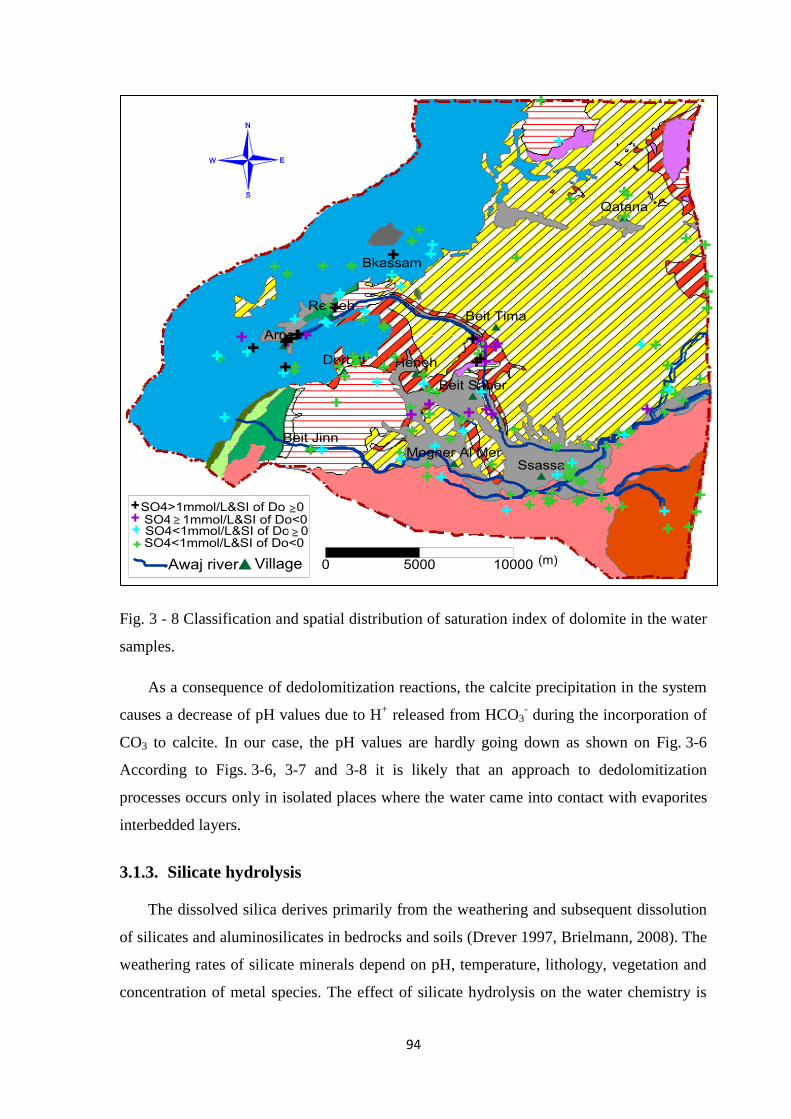
94
Fig. 3 - 8 Classification and spatial distribution of saturation index of dolomite in the water
samples.
As a consequence of dedolomitization reactions, the calcite precipitation in the system
causes a decrease of pH values due to H+ released from HCO3
- during the incorporation of
CO3 to calcite. In our case, the pH values are hardly going down as shown on Fig. 3-6
According to Figs. 3-6, 3-7 and 3-8 it is likely that an approach to dedolomitization
processes occurs only in isolated places where the water came into contact with evaporites
interbedded layers.
3.1.3. Silicate hydrolysis
The dissolved silica derives primarily from the weathering and subsequent dissolution
of silicates and aluminosilicates in bedrocks and soils (Drever 1997, Brielmann, 2008). The
weathering rates of silicate minerals depend on pH, temperature, lithology, vegetation and
concentration of metal species. The effect of silicate hydrolysis on the water chemistry is
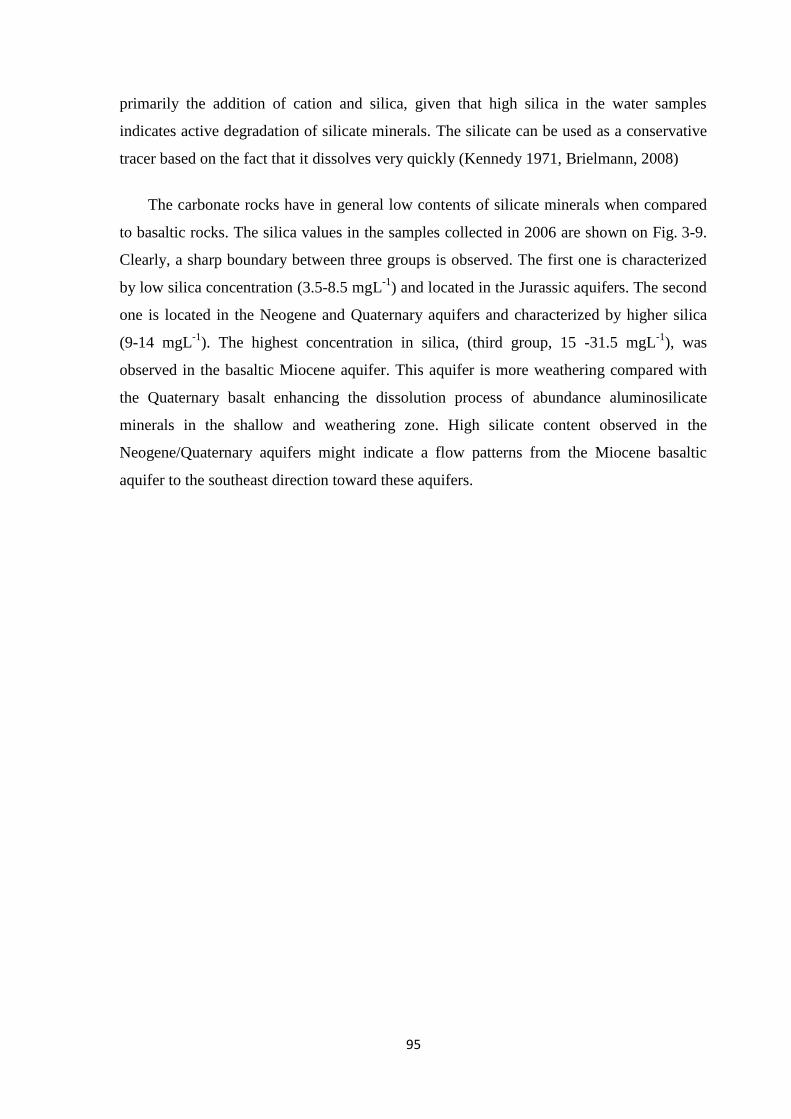
95
primarily the addition of cation and silica, given that high silica in the water samples
indicates active degradation of silicate minerals. The silicate can be used as a conservative
tracer based on the fact that it dissolves very quickly (Kennedy 1971, Brielmann, 2008)
The carbonate rocks have in general low contents of silicate minerals when compared
to basaltic rocks. The silica values in the samples collected in 2006 are shown on Fig. 3-9.
Clearly, a sharp boundary between three groups is observed. The first one is characterized
by low silica concentration (3.5-8.5 mgL-1
) and located in the Jurassic aquifers. The second
one is located in the Neogene and Quaternary aquifers and characterized by higher silica
(9-14 mgL-1
). The highest concentration in silica, (third group, 15 -31.5 mgL-1
), was
observed in the basaltic Miocene aquifer. This aquifer is more weathering compared with
the Quaternary basalt enhancing the dissolution process of abundance aluminosilicate
minerals in the shallow and weathering zone. High silicate content observed in the
Neogene/Quaternary aquifers might indicate a flow patterns from the Miocene basaltic
aquifer to the southeast direction toward these aquifers.
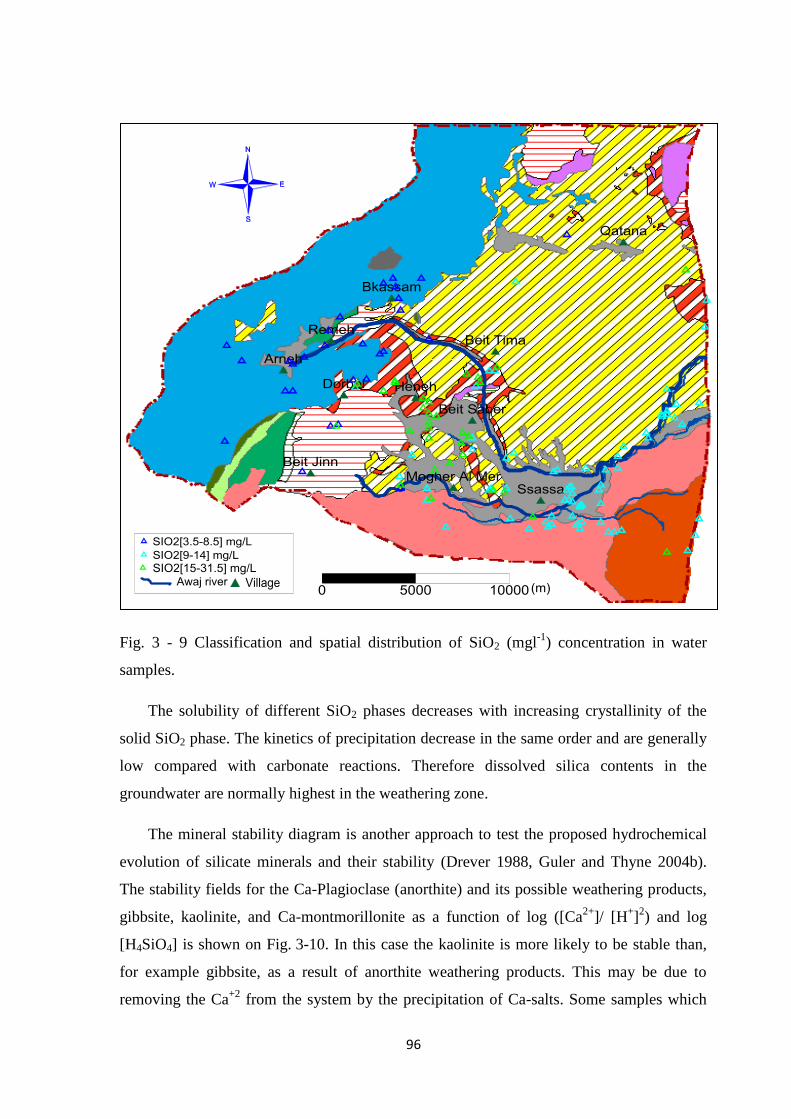
96
Fig. 3 - 9 Classification and spatial distribution of SiO2 (mgl-1
) concentration in water
samples.
The solubility of different SiO2 phases decreases with increasing crystallinity of the
solid SiO2 phase. The kinetics of precipitation decrease in the same order and are generally
low compared with carbonate reactions. Therefore dissolved silica contents in the
groundwater are normally highest in the weathering zone.
The mineral stability diagram is another approach to test the proposed hydrochemical
evolution of silicate minerals and their stability (Drever 1988, Guler and Thyne 2004b).
The stability fields for the Ca-Plagioclase (anorthite) and its possible weathering products,
gibbsite, kaolinite, and Ca-montmorillonite as a function of log ([Ca2+
]/ [H+]
2) and log
[H4SiO4] is shown on Fig. 3-10. In this case the kaolinite is more likely to be stable than,
for example gibbsite, as a result of anorthite weathering products. This may be due to
removing the Ca+2
from the system by the precipitation of Ca-salts. Some samples which
97
are located at or close to the stability field of montmorillonite, indicated that the typical
aquifer of these water samples is most likely a basic rock (like basalts) (Appelo and Postma
2005).
Fig. 3-10 also shows the stability fields for the Na-Plagioclase (albite) and its potential
weathering products, paragonite, gibbsite, kaolinite, and pyrophyllite as a function of log
(Na+]/[H
+]) and log [H4SiO4] . It shows that the main reaction is the conversion of albite to
kaolinite. Meaning that the primary silicate minerals such as plagioclase and clinopyroxene,
can be dissolved and weathered to kaolinite which is more likely to be in equilibrium in the
system. While noting some samples extending into the albite stability field suggesting that
the equilibrium between clay and primary mineral is not likely to be the main process
controlling the water chemistry (Guler and Thyne 2004b).
The two diagrams show that most of the groundwater samples are not in equilibrium
neither with anorthite nor with albite, and they will decompose if they are present in the
aquifers system as shown in the equations 8 and 9.
2NaAlSi3O8 + 2H2CO3 + 9H2O Al2Si2O5(OH)4 + 2Na+ + 4H4SiO4 + 2HCO3
- (8)
CaAl2Si2O8 + 2H2CO3 + H2O Al2Si2O5(OH)4+Ca2+
+ 2CO32-
+ 2H+ (9)
98
Fig. 3 - 10 Stability diagram of both Ca-Plagioclase (anorthite) and Na-Plagioclase (albite)
and their possible weathering products.
According to Han and Liu (2004), the variation in the composition of water (Mg2+
/Ca2+
and Na+/Ca
2+) can be used to distinguish limestone, dolomite and silicate rock sources of
ions. Fig. 3-11 displays the covariation between the two molars ratios. These two ratios are
almost equivalent because both of them vary over three orders of magnitude. Water
samples composition seems to be affected by the mixing trend of three types of rock; most
likely the carbonate rocks have a higher effect. It is noticeable that the Mg2+
/Ca2+
ratios of
most samples are bellowing the Mg2+
/Ca2+
=0.8 line. This is probably due to non-
equilibration of the waters simultaneously with calcite and dolomite as the contact time
between them was rather short. The water equilibrated together with calcite and dolomite
5
7
9
11
13
15
17
19
-5.5 -5 -4.5 -4 -3.5 -3 -2.5 -2
log
([C
a+
2]/
[H+]2 )
log([H4SiO4])
Anorthite(CaAl2Si2O8)
Ca-Montmorillonite
Gibbsite
Kaolinite
2
4
6
8
10
12
14
-5.5 -4.5 -3.5 -2.5
log
([N
a+]/
[H+])
log([H4SiO4])
Albite (NaAlSi3O8)
KaoliniteGibbsite Pyrophyllite
Paragonite
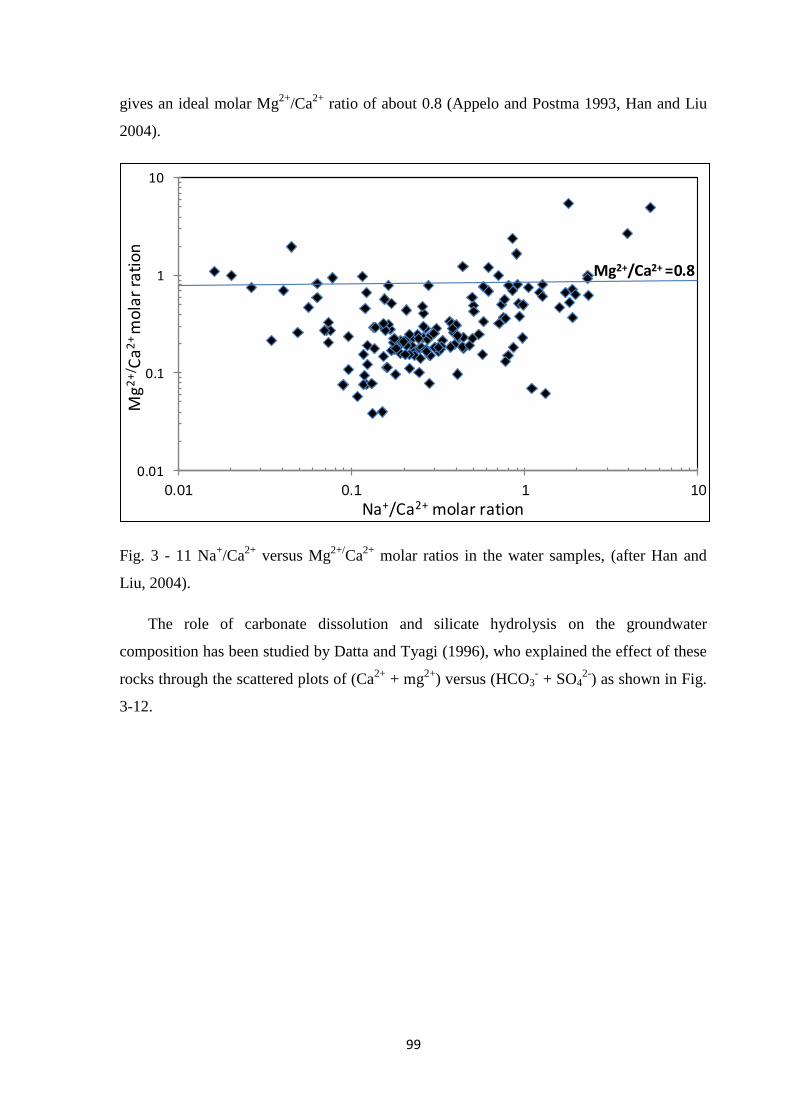
99
gives an ideal molar Mg2+
/Ca2+
ratio of about 0.8 (Appelo and Postma 1993, Han and Liu
2004).
Fig. 3 - 11 Na+/Ca
2+ versus Mg
2+/Ca
2+ molar ratios in the water samples, (after Han and
Liu, 2004).
The role of carbonate dissolution and silicate hydrolysis on the groundwater
composition has been studied by Datta and Tyagi (1996), who explained the effect of these
rocks through the scattered plots of (Ca2+
+ mg2+
) versus (HCO3- + SO4
2-) as shown in Fig.
3-12.
0.01
0.1
1
10
0.01 0.1 1 10
Mg
2+
/ Ca
2+ m
ola
r ra
tio
n
Na+/Ca2+ molar ration
Mg2+/Ca2+ =0.8
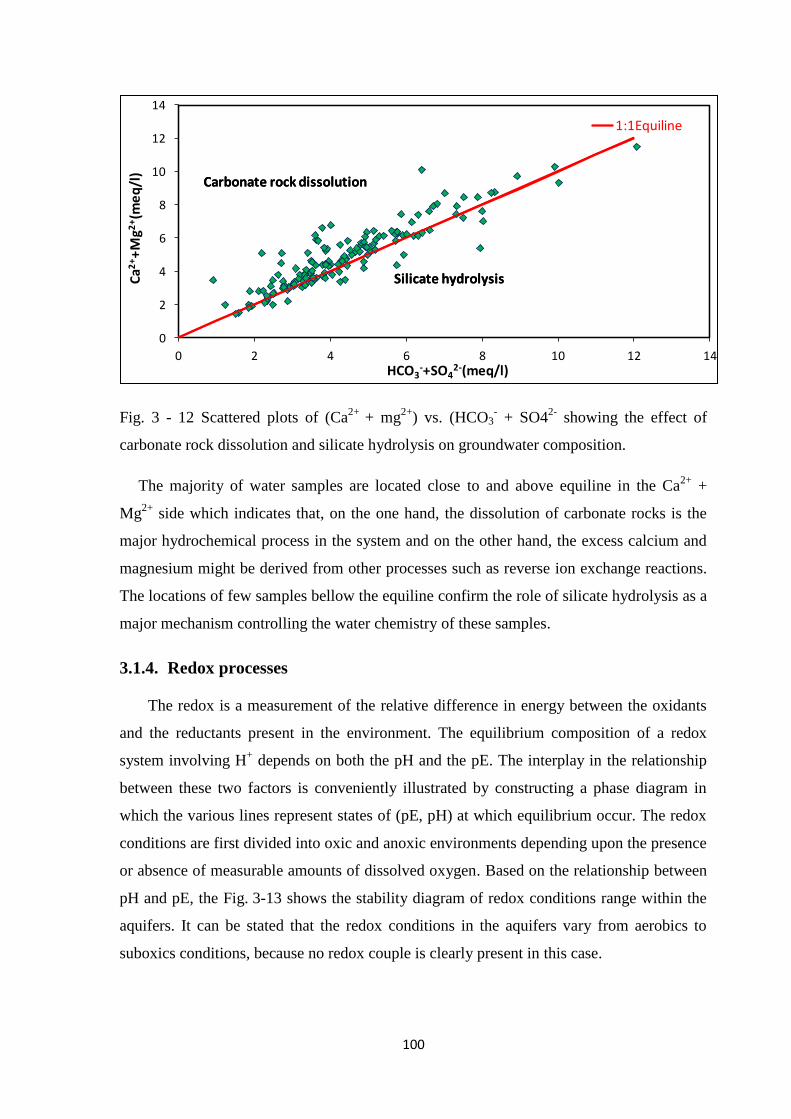
011
Fig. 3 - 12 Scattered plots of (Ca2+
+ mg2+
) vs. (HCO3- + SO4
2- showing the effect of
carbonate rock dissolution and silicate hydrolysis on groundwater composition.
The majority of water samples are located close to and above equiline in the Ca2+
+
Mg2+
side which indicates that, on the one hand, the dissolution of carbonate rocks is the
major hydrochemical process in the system and on the other hand, the excess calcium and
magnesium might be derived from other processes such as reverse ion exchange reactions.
The locations of few samples bellow the equiline confirm the role of silicate hydrolysis as a
major mechanism controlling the water chemistry of these samples.
3.1.4. Redox processes
The redox is a measurement of the relative difference in energy between the oxidants
and the reductants present in the environment. The equilibrium composition of a redox
system involving H+ depends on both the pH and the pE. The interplay in the relationship
between these two factors is conveniently illustrated by constructing a phase diagram in
which the various lines represent states of (pE, pH) at which equilibrium occur. The redox
conditions are first divided into oxic and anoxic environments depending upon the presence
or absence of measurable amounts of dissolved oxygen. Based on the relationship between
pH and pE, the Fig. 3-13 shows the stability diagram of redox conditions range within the
aquifers. It can be stated that the redox conditions in the aquifers vary from aerobics to
suboxics conditions, because no redox couple is clearly present in this case.
0
2
4
6
8
10
12
14
0 2 4 6 8 10 12 14
Ca2
++
Mg2
+(m
eq
/l)
HCO3-+SO4
2-(meq/l)
1:1Equiline
Carbonate rock dissolution
Silicate hydrolysis
Carbonate rock dissolution
Silicate hydrolysis
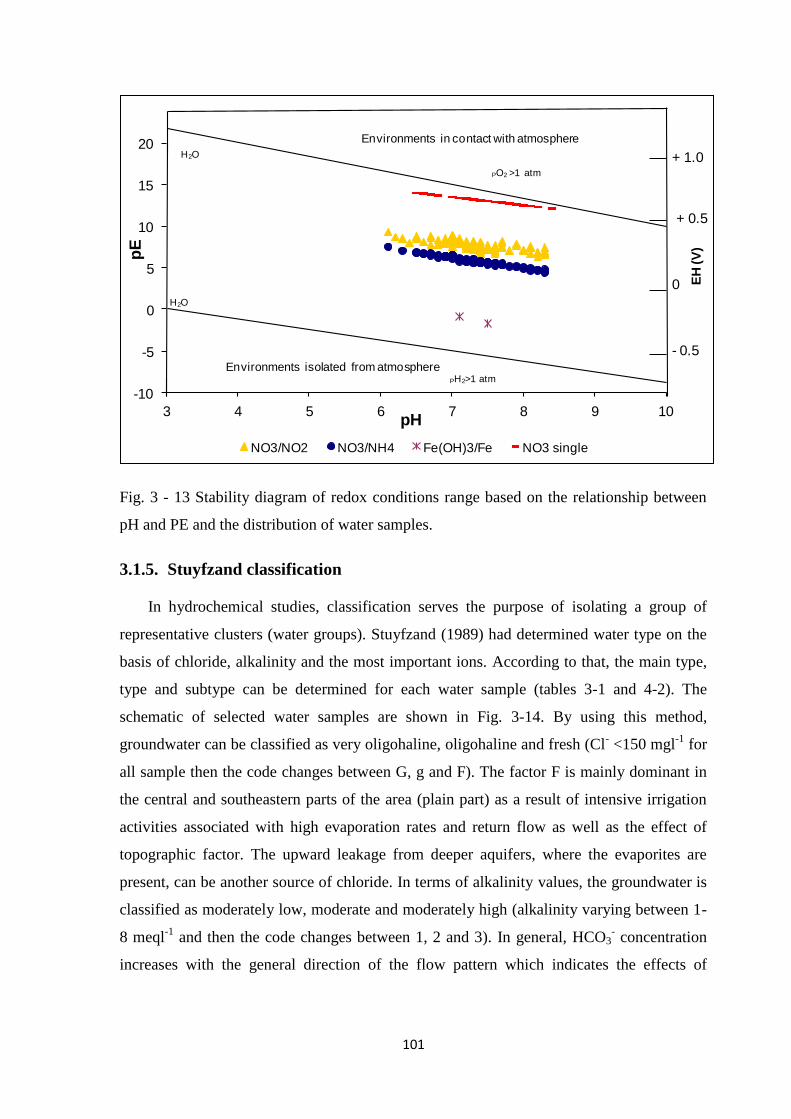
010
Fig. 3 - 13 Stability diagram of redox conditions range based on the relationship between
pH and PE and the distribution of water samples.
3.1.5. Stuyfzand classification
In hydrochemical studies, classification serves the purpose of isolating a group of
representative clusters (water groups). Stuyfzand (1989) had determined water type on the
basis of chloride, alkalinity and the most important ions. According to that, the main type,
type and subtype can be determined for each water sample (tables 3-1 and 4-2). The
schematic of selected water samples are shown in Fig. 3-14. By using this method,
groundwater can be classified as very oligohaline, oligohaline and fresh (Cl- <150 mgl
-1 for
all sample then the code changes between G, g and F). The factor F is mainly dominant in
the central and southeastern parts of the area (plain part) as a result of intensive irrigation
activities associated with high evaporation rates and return flow as well as the effect of
topographic factor. The upward leakage from deeper aquifers, where the evaporites are
present, can be another source of chloride. In terms of alkalinity values, the groundwater is
classified as moderately low, moderate and moderately high (alkalinity varying between 1-
8 meql-1
and then the code changes between 1, 2 and 3). In general, HCO3- concentration
increases with the general direction of the flow pattern which indicates the effects of
-10
-5
0
5
10
15
20
3 4 5 6 7 8 9 10
pE
pH
NO3/NO2 NO3/NH4 Fe(OH)3/Fe NO3 single
- 0.5
0
+ 0.5
+ 1.0
Environments isolated from atmosphere
Environments in contact with atmosphere
PH2>1 atm
H2O
PO2 >1 atm
H2O
EH
(V
)
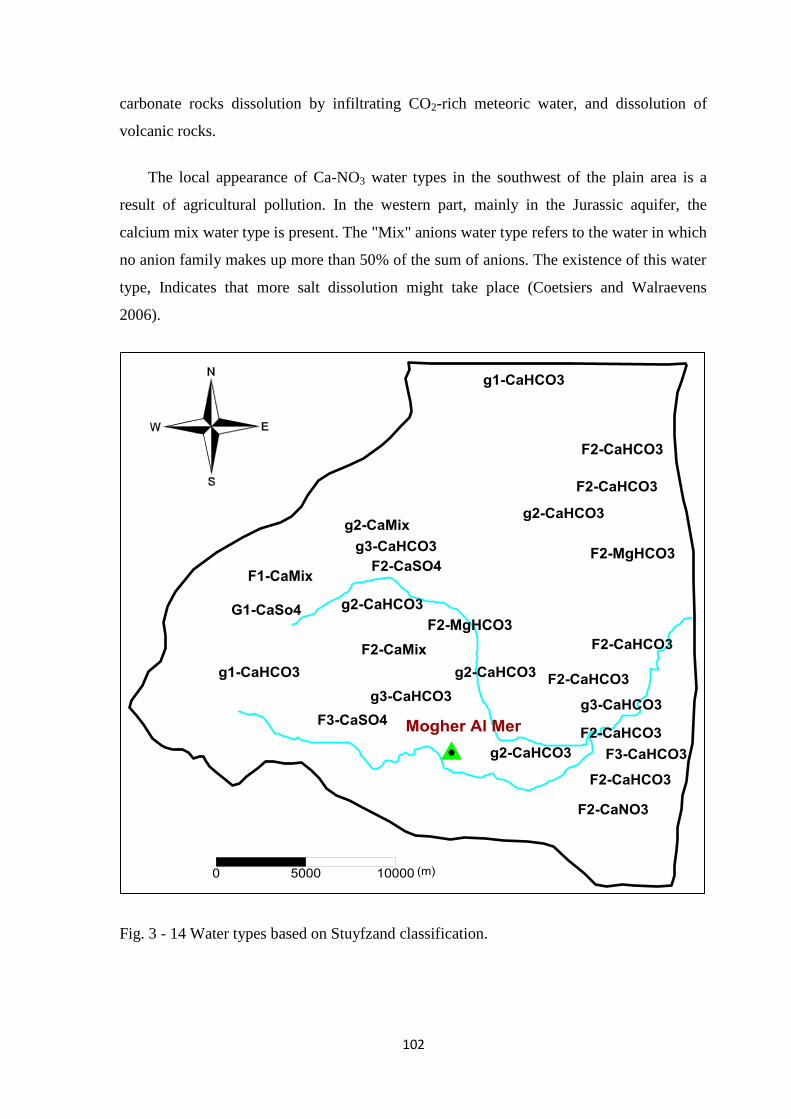
011
carbonate rocks dissolution by infiltrating CO2-rich meteoric water, and dissolution of
volcanic rocks.
The local appearance of Ca-NO3 water types in the southwest of the plain area is a
result of agricultural pollution. In the western part, mainly in the Jurassic aquifer, the
calcium mix water type is present. The "Mix" anions water type refers to the water in which
no anion family makes up more than 50% of the sum of anions. The existence of this water
type, Indicates that more salt dissolution might take place (Coetsiers and Walraevens
2006).
Fig. 3 - 14 Water types based on Stuyfzand classification.
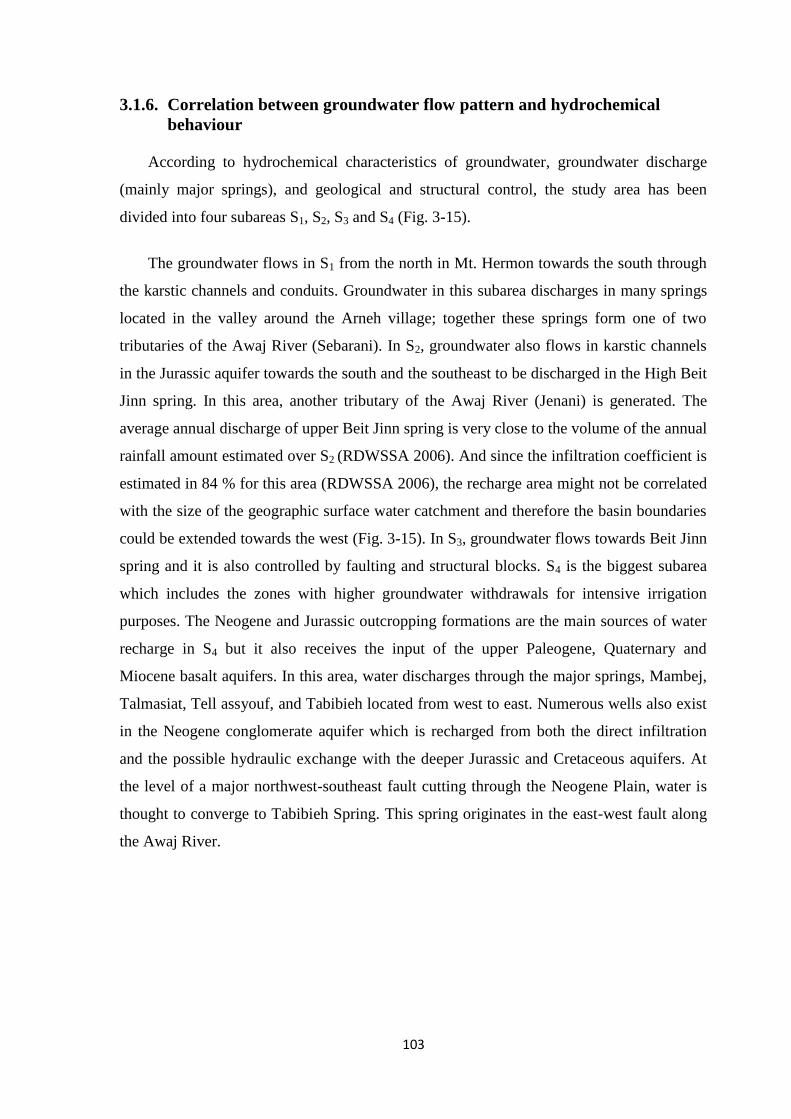
013
3.1.6. Correlation between groundwater flow pattern and hydrochemical
behaviour
According to hydrochemical characteristics of groundwater, groundwater discharge
(mainly major springs), and geological and structural control, the study area has been
divided into four subareas S1, S2, S3 and S4 (Fig. 3-15).
The groundwater flows in S1 from the north in Mt. Hermon towards the south through
the karstic channels and conduits. Groundwater in this subarea discharges in many springs
located in the valley around the Arneh village; together these springs form one of two
tributaries of the Awaj River (Sebarani). In S2, groundwater also flows in karstic channels
in the Jurassic aquifer towards the south and the southeast to be discharged in the High Beit
Jinn spring. In this area, another tributary of the Awaj River (Jenani) is generated. The
average annual discharge of upper Beit Jinn spring is very close to the volume of the annual
rainfall amount estimated over S2 (RDWSSA 2006). And since the infiltration coefficient is
estimated in 84 % for this area (RDWSSA 2006), the recharge area might not be correlated
with the size of the geographic surface water catchment and therefore the basin boundaries
could be extended towards the west (Fig. 3-15). In S3, groundwater flows towards Beit Jinn
spring and it is also controlled by faulting and structural blocks. S4 is the biggest subarea
which includes the zones with higher groundwater withdrawals for intensive irrigation
purposes. The Neogene and Jurassic outcropping formations are the main sources of water
recharge in S4 but it also receives the input of the upper Paleogene, Quaternary and
Miocene basalt aquifers. In this area, water discharges through the major springs, Mambej,
Talmasiat, Tell assyouf, and Tabibieh located from west to east. Numerous wells also exist
in the Neogene conglomerate aquifer which is recharged from both the direct infiltration
and the possible hydraulic exchange with the deeper Jurassic and Cretaceous aquifers. At
the level of a major northwest-southeast fault cutting through the Neogene Plain, water is
thought to converge to Tabibieh Spring. This spring originates in the east-west fault along
the Awaj River.
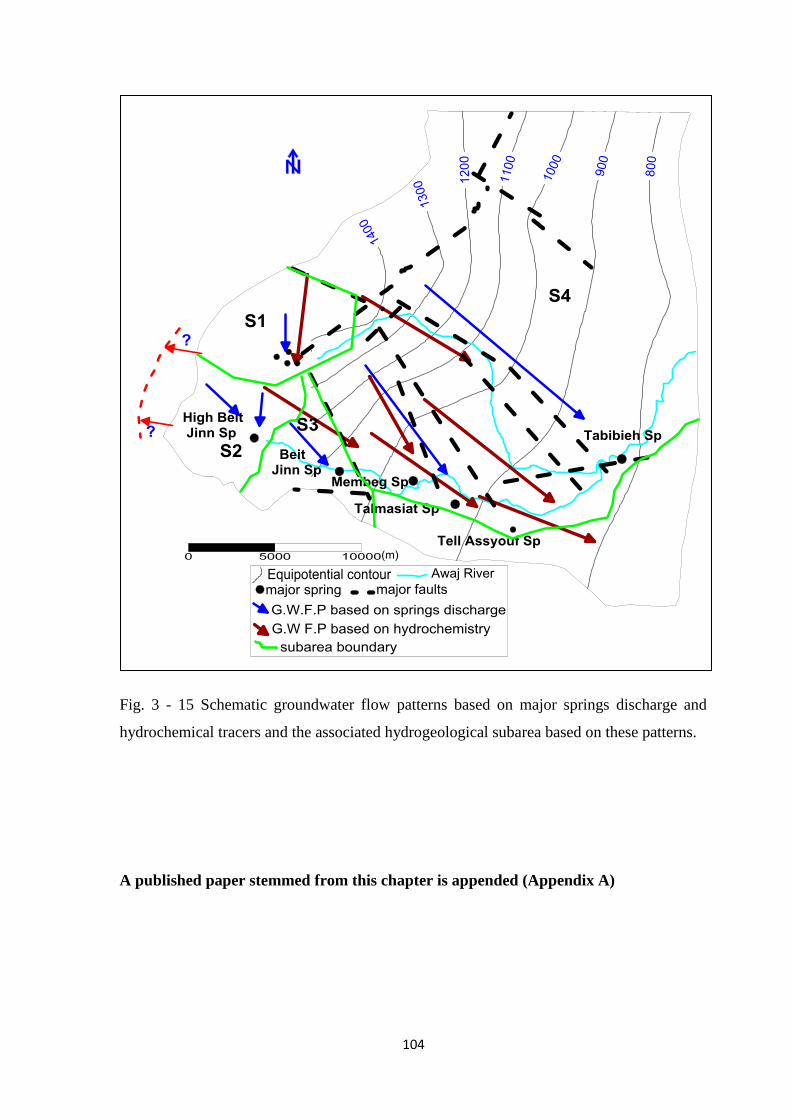
014
Fig. 3 - 15 Schematic groundwater flow patterns based on major springs discharge and
hydrochemical tracers and the associated hydrogeological subarea based on these patterns.
A published paper stemmed from this chapter is appended (Appendix A)
015
Chapter 4. Hydrochemical facies and isotopes to characterize the
origin and recharge mechanisms of the groundwater in the study area
Introduction
The data, which has been used in this chapter, is based on the historical data
(Selkhozpromexport 1986, Asmael et al. 2014) as well as the obtained result from the
samples analysis in the year of 2012.
Hydrochemical facies is another method used to classify groundwater into groups of
samples whose assigned names indicate the most concentrated cations and anions in the
water samples. This can be correlated with location and geology (Suk and Lee 1999,
Barbieri et al. 2001, Guler et al. 2002, Guler and Thyne 2004a). The vertical and horizontal
groundwater flow patterns control the distribution of these facies. Abundance values are
based on equivalents or milliequivalents (meq) rather than mgl-1
or molar concentrations.
Isotopes are atoms of the same element, in which the nuclei of the atoms have the same
number of protons but different numbers of neutrons. The stable and naturally occurring
isotopes of 18
O and δ2H are components of the water molecule and thus they are ideal
tracers to answer several hydrological problems. They have conservative properties and
depend only on atmospheric conditions during recharge; consequently, they provide
information on the recharge processes of groundwater (Bajjali 2008; Bajjali 2006, Fritz et
al. 1981, Gat 1971). As a result, 18
O and δ2H composition of precipitation throughout the
world is linearly correlated and plots along a line known as the meteoric water line (Craig
1961). Differences in the isotopic composition of precipitation occur along this line if water
vapour originated from evaporation of cooler or warmer seawater. This composition is also
controlled by the isotope fractionation which occurs during transition processes such as
evaporation, condensation and mixing. As the moist air masses move across continent, the
heavier isotopes are preferentially removed by precipitation. However, the isotope
compositions can change between storm events and even during the course of a single
event (Heathcote and Lloyd 1986, Nativ and Mazor 1987, Rindsberger et al. 1990, Adar et
al. 1998, Kubota and Tsuboyama 2003, Celle-Jeanton et al. 2004, Brielmann 2008).
016
4.1. Result and discussion
4.1.1. Water- Rock interaction and salts dissolution
Groundwater chemical characteristics change along its flow paths. These changes may
reflect processes such as mixing of groundwater types, mineral dissolution and
precipitation, ion exchange and redox reaction (Dehnavi et al. 2011, Varol and Davraz
2014). Using of binary diagram together with spatial distribution maps of analyzed results
and ionic ratios, may aid in interpretation of the evolution trends.
Hydrochemical indices are commonly used to ascertain the possible chemical reactions
of groundwater along a flow path and to identify groundwater evolution and recharge
mechanisms in the aquifer (Zhu et al. 2007, Jianhua et al. 2009, Litaor et al. 2010).
Evaluation of the groundwater potential to dissolve or precipitate minerals involves mainly
the solubility indices (SI) of minerals under measured conditions of ionic concentrations,
pH, and temperature.
The evaporation process represents the total amount or rate of transfer of liquid or solid
water into atmospheric water vapour at the concerned watershed surface. Since the chloride
is assumed to originate exclusively from precipitation, it is considered as one of the most
conservative parameters once it is in the aqueous phase (Edmunds et al. 1985). The reason
behind this is that it does not interact with constituents in the rock matrix/soil and it is not
taken up by vegetation or removed from the system by evaporation. (Hem 1985, Luijendijk
and Bruggeman 2008). The available average concentration of the major ions in the
rainwater samples collected from three stations, Arneh, Remeh and Qatana (Table 4-1), as
well as the major ions measured in the groundwater samples (tables 3-1,4-2) were used to
determine the effect of evaporation on the groundwater composition by determination of
the evaporation factor (EF) by using the following equation:
(10)
Where Cls is the chloride concentration in the groundwater sample and Clr is the chloride
concentration in the rain sample.
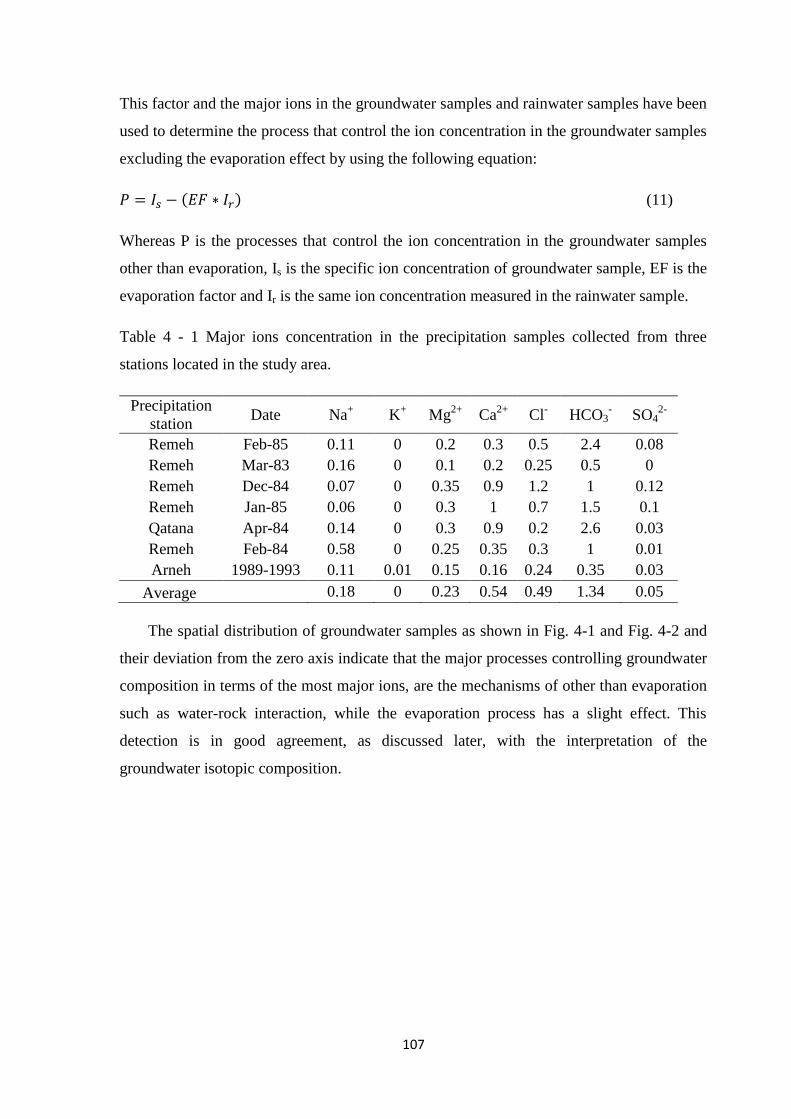
017
This factor and the major ions in the groundwater samples and rainwater samples have been
used to determine the process that control the ion concentration in the groundwater samples
excluding the evaporation effect by using the following equation:
(11)
Whereas P is the processes that control the ion concentration in the groundwater samples
other than evaporation, Is is the specific ion concentration of groundwater sample, EF is the
evaporation factor and Ir is the same ion concentration measured in the rainwater sample.
Table 4 - 1 Major ions concentration in the precipitation samples collected from three
stations located in the study area.
Precipitation
station Date Na
+ K
+ Mg
2+ Ca
2+ Cl
- HCO3
- SO4
2-
Remeh Feb-85 0.11 0 0.2 0.3 0.5 2.4 0.08
Remeh Mar-83 0.16 0 0.1 0.2 0.25 0.5 0
Remeh Dec-84 0.07 0 0.35 0.9 1.2 1 0.12
Remeh Jan-85 0.06 0 0.3 1 0.7 1.5 0.1
Qatana Apr-84 0.14 0 0.3 0.9 0.2 2.6 0.03
Remeh Feb-84 0.58 0 0.25 0.35 0.3 1 0.01
Arneh 1989-1993 0.11 0.01 0.15 0.16 0.24 0.35 0.03
Average 0.18 0 0.23 0.54 0.49 1.34 0.05
The spatial distribution of groundwater samples as shown in Fig. 4-1 and Fig. 4-2 and
their deviation from the zero axis indicate that the major processes controlling groundwater
composition in terms of the most major ions, are the mechanisms of other than evaporation
such as water-rock interaction, while the evaporation process has a slight effect. This
detection is in good agreement, as discussed later, with the interpretation of the
groundwater isotopic composition.
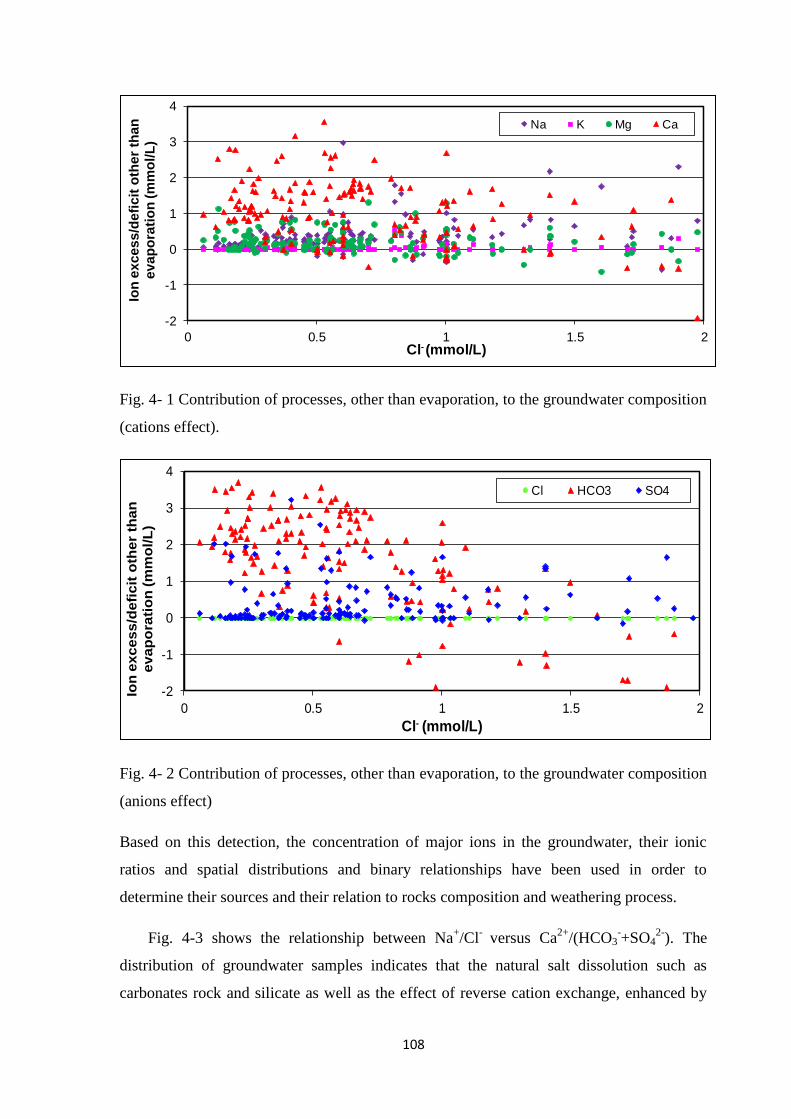
018
Fig. 4- 1 Contribution of processes, other than evaporation, to the groundwater composition
(cations effect).
Fig. 4- 2 Contribution of processes, other than evaporation, to the groundwater composition
(anions effect)
Based on this detection, the concentration of major ions in the groundwater, their ionic
ratios and spatial distributions and binary relationships have been used in order to
determine their sources and their relation to rocks composition and weathering process.
Fig. 4-3 shows the relationship between Na+/Cl
- versus Ca
2+/(HCO3
-+SO4
2-). The
distribution of groundwater samples indicates that the natural salt dissolution such as
carbonates rock and silicate as well as the effect of reverse cation exchange, enhanced by
-2
-1
0
1
2
3
4
0 0.5 1 1.5 2
Ion
excess/d
efi
cit
oth
er
than
e
vap
ora
tio
n (m
mo
l/L
)
Cl- (mmol/L)
Na K Mg Ca
-2
-1
0
1
2
3
4
0 0.5 1 1.5 2
Ion
exc
ess
/defi
cit
oth
er
tha
n
ev
ap
ora
tio
n (
mm
ol/
L)
Cl- (mmol/L)
Cl HCO3 SO4
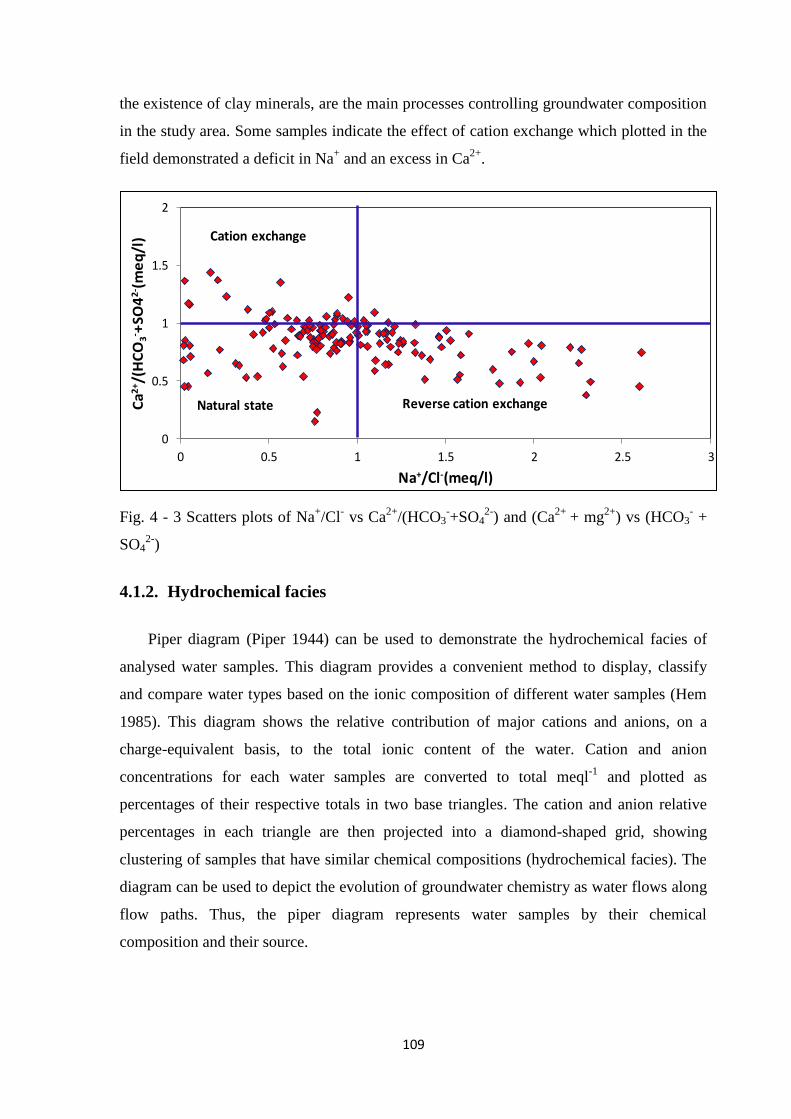
019
the existence of clay minerals, are the main processes controlling groundwater composition
in the study area. Some samples indicate the effect of cation exchange which plotted in the
field demonstrated a deficit in Na+ and an excess in Ca
2+.
Fig. 4 - 3 Scatters plots of Na+/Cl
- vs Ca
2+/(HCO3
-+SO4
2-) and (Ca
2+ + mg
2+) vs (HCO3
- +
SO42-
)
4.1.2. Hydrochemical facies
Piper diagram (Piper 1944) can be used to demonstrate the hydrochemical facies of
analysed water samples. This diagram provides a convenient method to display, classify
and compare water types based on the ionic composition of different water samples (Hem
1985). This diagram shows the relative contribution of major cations and anions, on a
charge-equivalent basis, to the total ionic content of the water. Cation and anion
concentrations for each water samples are converted to total meql-1
and plotted as
percentages of their respective totals in two base triangles. The cation and anion relative
percentages in each triangle are then projected into a diamond-shaped grid, showing
clustering of samples that have similar chemical compositions (hydrochemical facies). The
diagram can be used to depict the evolution of groundwater chemistry as water flows along
flow paths. Thus, the piper diagram represents water samples by their chemical
composition and their source.
0
0.5
1
1.5
2
0 0.5 1 1.5 2 2.5 3
Ca2
+/(
HC
O3
- +SO
42
- (m
eq
/l)
Na+/Cl-(meq/l)
Reverse cation exchangeNatural state
Cation exchange
001
The hydrochemical facies according to the Piper diagram and the spatial distribution of
these facies are shown in Fig. 4-4. From this figure it has been seen that all the water
samples demonstrate an excess in alkaline earth (Ca2+
, Mg2+
) compared to the alkalis metal
(Na+, K
+). The weak acidic anion (HCO3
-) of the majority of these samples exceeded the
strong acidic anions (Cl-, SO4
2-). About 70% of water samples tend to have anion chemistry
dominated by HCO3- and cation composition dominated by Ca
2+ (Ca-HCO3 water type).
This indicates the short duration of water-rock interaction and the effect of
dissolution/precipitation of carbonate rocks as well as recently recharge of groundwater
from atmospheric precipitation. The similarity in water type tends to express the existence
of a unique hydrochemical system notwithstanding the very complex tectonic setting and
stratigraphic sequences. Hence, the waters had the same or similar origins and flow paths,
where individualised groundwater flow paths are difficult to delineate within the different
hydro-stratigraphic unit. The Ca-SO4, Ca-SO4-HCO3, Ca-mixed SO4-HCO3, Ca-mixed
HCO3-SO4 and Ca-HCO3-SO4 water types characterize some springs near Arneh and Beit
Tima villages (11% of all water samples). The local presence of this water type suggests
the dissolution of evaporite minerals. Kattan (2006) had concluded that the water type of
major tributary of Awaj River (Sebarani), which is feed by several karstic springs located in
the uppermost of Arneh valley, is calcium-sulfate type. Few samples (6% of all samples),
demonstrate a water type of Ca-Cl-HCO3, Ca-mixed Cl-HCO3 and Ca-Mixed HCO3-Cl.
The dissolution of evaporite minerals and possible pollution from wastewater, animal
manure and chemical fertilizer may have contributed to the chemical composition of these
samples. A mixed cation-mixed anion water types characterized about of 10% of the water
samples. This water type, and as aforementioned, indicates that more salts dissolution takes
place. The reverse cation exchange as well as the dissolution of silicate mineral might play
a role in this water type. The remaining samples (about 3%) demonstrate a water type of
Mg-HCO3 and Mg-Ca-HCO3.
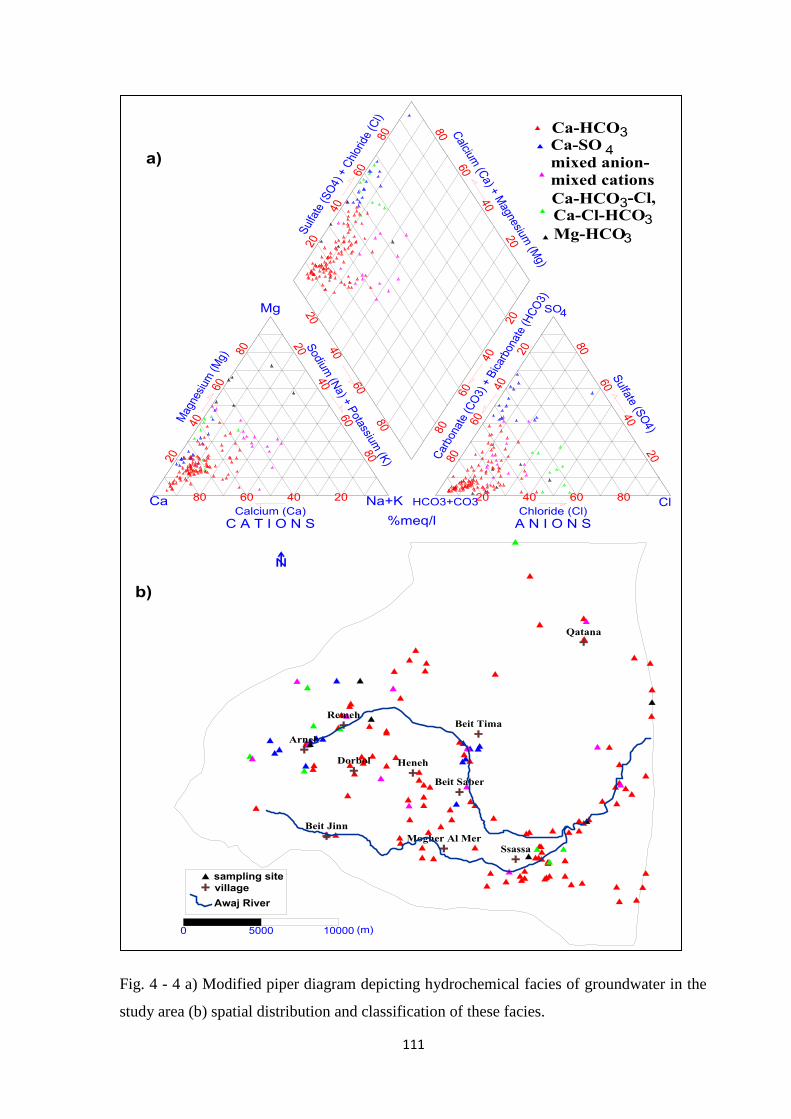
000
Fig. 4 - 4 a) Modified piper diagram depicting hydrochemical facies of groundwater in the
study area (b) spatial distribution and classification of these facies.
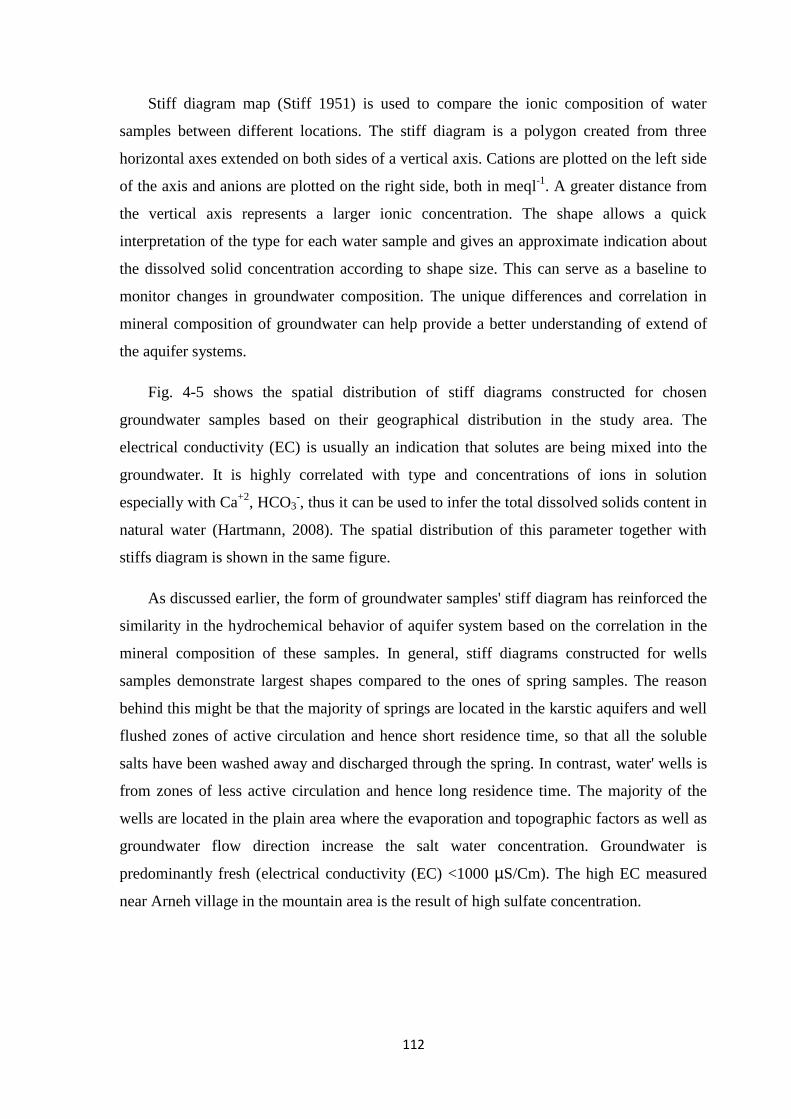
001
Stiff diagram map (Stiff 1951) is used to compare the ionic composition of water
samples between different locations. The stiff diagram is a polygon created from three
horizontal axes extended on both sides of a vertical axis. Cations are plotted on the left side
of the axis and anions are plotted on the right side, both in meql-1
. A greater distance from
the vertical axis represents a larger ionic concentration. The shape allows a quick
interpretation of the type for each water sample and gives an approximate indication about
the dissolved solid concentration according to shape size. This can serve as a baseline to
monitor changes in groundwater composition. The unique differences and correlation in
mineral composition of groundwater can help provide a better understanding of extend of
the aquifer systems.
Fig. 4-5 shows the spatial distribution of stiff diagrams constructed for chosen
groundwater samples based on their geographical distribution in the study area. The
electrical conductivity (EC) is usually an indication that solutes are being mixed into the
groundwater. It is highly correlated with type and concentrations of ions in solution
especially with Ca+2
, HCO3-, thus it can be used to infer the total dissolved solids content in
natural water (Hartmann, 2008). The spatial distribution of this parameter together with
stiffs diagram is shown in the same figure.
As discussed earlier, the form of groundwater samples' stiff diagram has reinforced the
similarity in the hydrochemical behavior of aquifer system based on the correlation in the
mineral composition of these samples. In general, stiff diagrams constructed for wells
samples demonstrate largest shapes compared to the ones of spring samples. The reason
behind this might be that the majority of springs are located in the karstic aquifers and well
flushed zones of active circulation and hence short residence time, so that all the soluble
salts have been washed away and discharged through the spring. In contrast, water' wells is
from zones of less active circulation and hence long residence time. The majority of the
wells are located in the plain area where the evaporation and topographic factors as well as
groundwater flow direction increase the salt water concentration. Groundwater is
predominantly fresh (electrical conductivity (EC) <1000 µS/Cm). The high EC measured
near Arneh village in the mountain area is the result of high sulfate concentration.
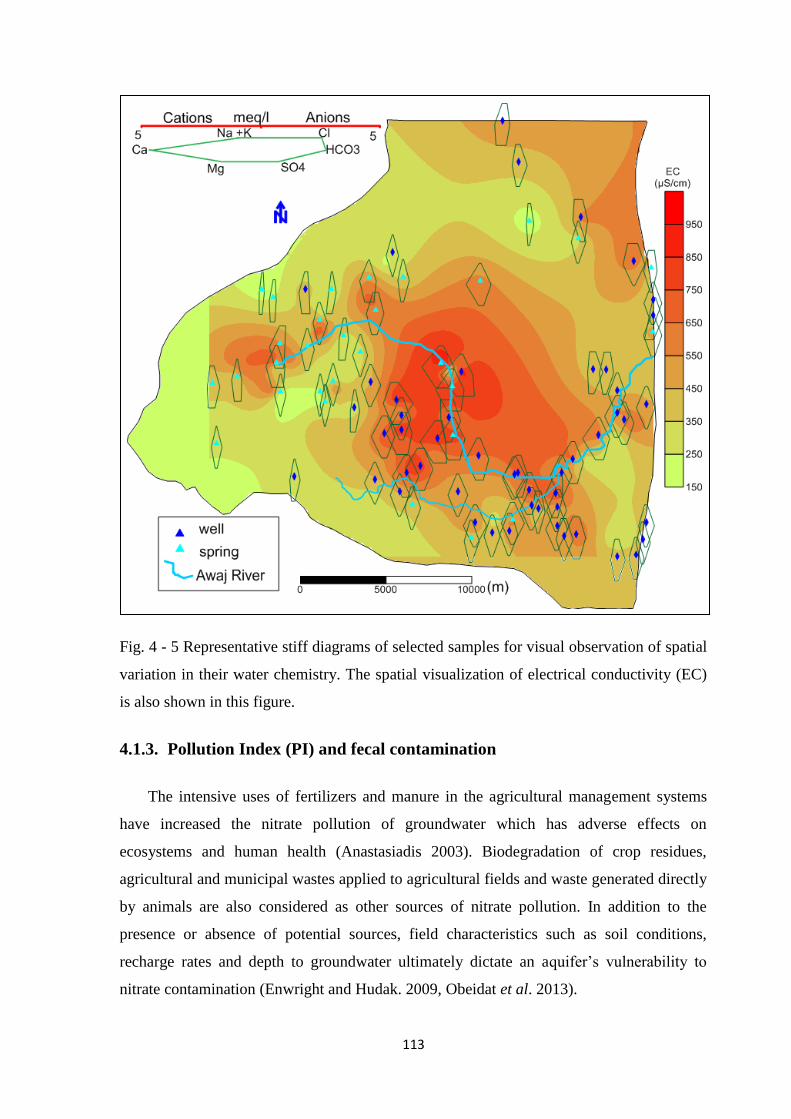
003
Fig. 4 - 5 Representative stiff diagrams of selected samples for visual observation of spatial
variation in their water chemistry. The spatial visualization of electrical conductivity (EC)
is also shown in this figure.
4.1.3. Pollution Index (PI) and fecal contamination
The intensive uses of fertilizers and manure in the agricultural management systems
have increased the nitrate pollution of groundwater which has adverse effects on
ecosystems and human health (Anastasiadis 2003). Biodegradation of crop residues,
agricultural and municipal wastes applied to agricultural fields and waste generated directly
by animals are also considered as other sources of nitrate pollution. In addition to the
presence or absence of potential sources, field characteristics such as soil conditions,
recharge rates and depth to groundwater ultimately dictate an aquifer’s vulnerability to
nitrate contamination (Enwright and Hudak. 2009, Obeidat et al. 2013).
004
The domination of the karstic features in most parts of the study area increases its
sensitivity to pollution, which is considered as a major problem in that area due to rapid
developing of urbanization. There are 14 villages in the study area in whose wastewater is
directly discharging onto sink holes or to the river, without any treatment. Wastewater can
contain high concentration of pathogenic or indicator bacteria, which can act as a potential
reservoir for contamination of groundwater. Pathogenic micro organic can be waterborn or
foodborn, especially when the food crops are watered with contaminated water. The
uninformed and excessive use of chemical fertilizers and organic input, to maintain high
agricultural yields, as well as using of untreated waste water in irrigation lead to water
quality degradation.
The pollution index (PI) calculated based on the concentration of nitrate and sulfate
anions using the following formula (Stuyfzand 1989):
PI= (12)
The spatial distribution of this factor, as shown in Fig. 4-6 (a) demonstrates highest
localized values in Arneh and Bkassam villages. The elevated value found in Arneh is
resulted from high concentration of sulfate driven by gypsum dissolution. Whereas the high
values in Bkassam is resulted from the pollution by nitrate attributed to punctual pollution
source mainly the existence of septic tank. The high vulnerability of karstic limestone in
this region enhances quick infiltration of untreated wastewater and increases the nitrate
concentration in the groundwater. On the other hand, the high value of this factor measured
in the plain area, is caused by high nitrate concentration which results mainly from the
extensive use of fertilizers. This area hosts a considerable number of irrigation wells and
intensive agricultural activities where a massive input of nitrogenous fertilizers and
manures are applied.
The total and fecal coliforms are used as indicators of possible sewage water
contamination because they are commonly found in human and animal feces. Although
they are generally not harmful themselves, they indicate the possible presence of
pathogenic (disease-causing) bacteria, viruses, and protozoans that also live in human and
animal digestive systems. Sources of these bacterial contaminations are mainly wastewater
on-site septic systems and wild animal manure.
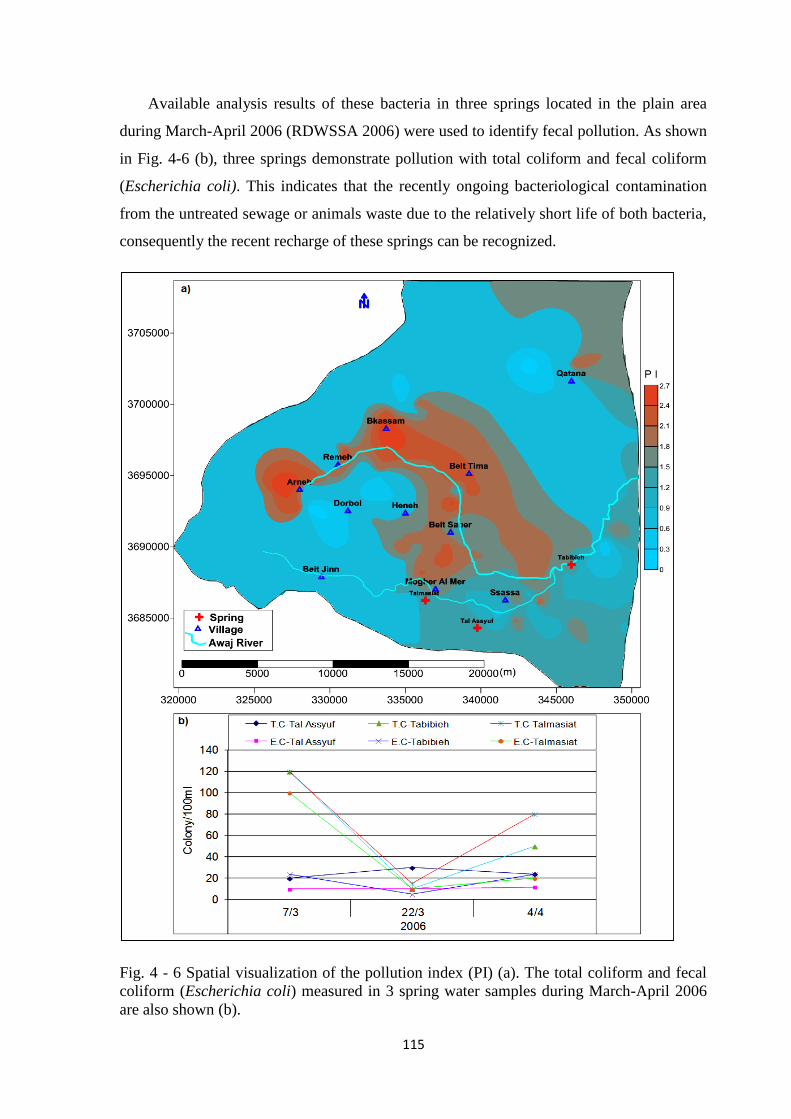
005
Available analysis results of these bacteria in three springs located in the plain area
during March-April 2006 (RDWSSA 2006) were used to identify fecal pollution. As shown
in Fig. 4-6 (b), three springs demonstrate pollution with total coliform and fecal coliform
(Escherichia coli). This indicates that the recently ongoing bacteriological contamination
from the untreated sewage or animals waste due to the relatively short life of both bacteria,
consequently the recent recharge of these springs can be recognized.
Fig. 4 - 6 Spatial visualization of the pollution index (PI) (a). The total coliform and fecal
coliform (Escherichia coli) measured in 3 spring water samples during March-April 2006
are also shown (b).
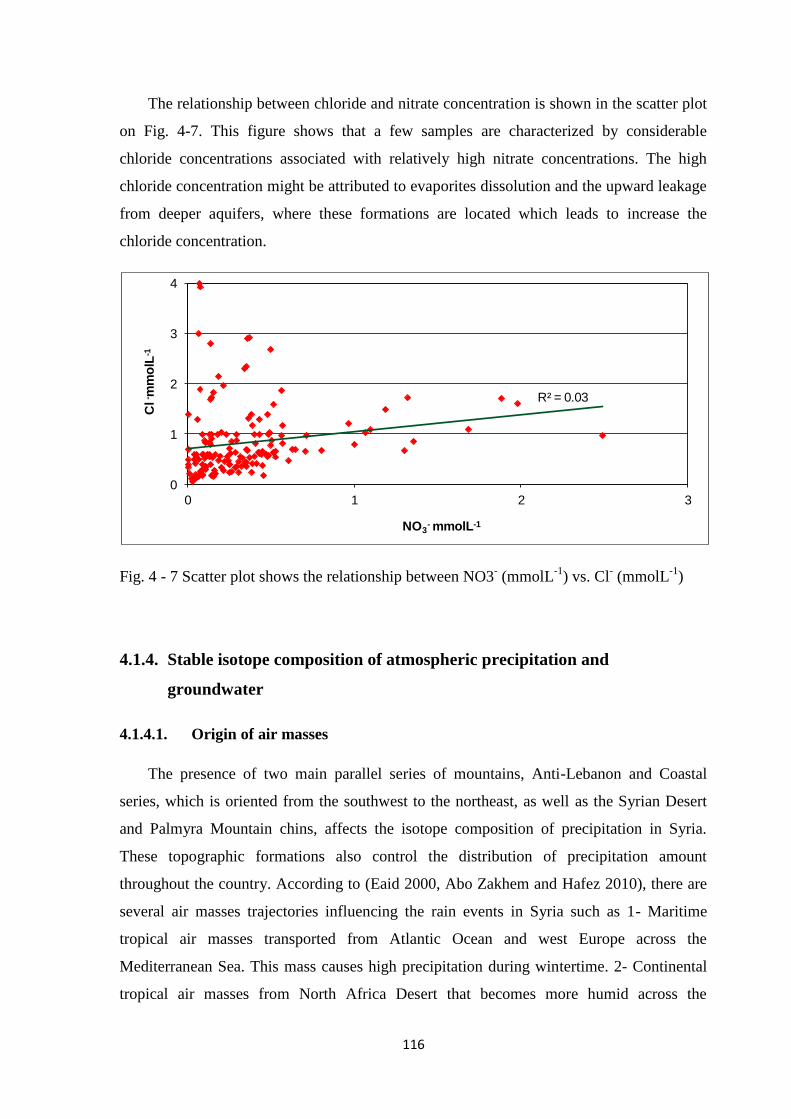
006
The relationship between chloride and nitrate concentration is shown in the scatter plot
on Fig. 4-7. This figure shows that a few samples are characterized by considerable
chloride concentrations associated with relatively high nitrate concentrations. The high
chloride concentration might be attributed to evaporites dissolution and the upward leakage
from deeper aquifers, where these formations are located which leads to increase the
chloride concentration.
Fig. 4 - 7 Scatter plot shows the relationship between NO3- (mmolL
-1) vs. Cl
- (mmolL
-1)
4.1.4. Stable isotope composition of atmospheric precipitation and
groundwater
4.1.4.1. Origin of air masses
The presence of two main parallel series of mountains, Anti-Lebanon and Coastal
series, which is oriented from the southwest to the northeast, as well as the Syrian Desert
and Palmyra Mountain chins, affects the isotope composition of precipitation in Syria.
These topographic formations also control the distribution of precipitation amount
throughout the country. According to (Eaid 2000, Abo Zakhem and Hafez 2010), there are
several air masses trajectories influencing the rain events in Syria such as 1- Maritime
tropical air masses transported from Atlantic Ocean and west Europe across the
Mediterranean Sea. This mass causes high precipitation during wintertime. 2- Continental
tropical air masses from North Africa Desert that becomes more humid across the
R² = 0.03
0
1
2
3
4
0 1 2 3
Cl -
mm
olL
-1
NO3- mmolL-1
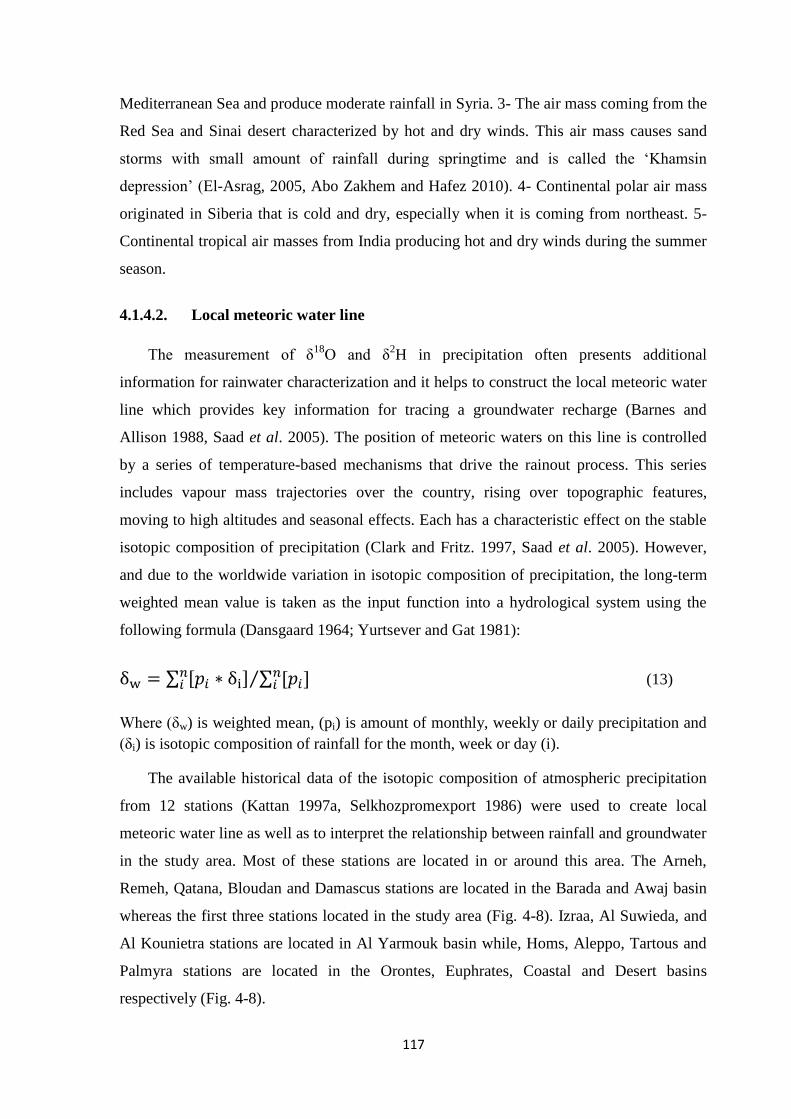
007
Mediterranean Sea and produce moderate rainfall in Syria. 3- The air mass coming from the
Red Sea and Sinai desert characterized by hot and dry winds. This air mass causes sand
storms with small amount of rainfall during springtime and is called the ‘Khamsin
depression’ (El-Asrag, 2005, Abo Zakhem and Hafez 2010). 4- Continental polar air mass
originated in Siberia that is cold and dry, especially when it is coming from northeast. 5-
Continental tropical air masses from India producing hot and dry winds during the summer
season.
4.1.4.2. Local meteoric water line
The measurement of δ18
O and δ2H in precipitation often presents additional
information for rainwater characterization and it helps to construct the local meteoric water
line which provides key information for tracing a groundwater recharge (Barnes and
Allison 1988, Saad et al. 2005). The position of meteoric waters on this line is controlled
by a series of temperature-based mechanisms that drive the rainout process. This series
includes vapour mass trajectories over the country, rising over topographic features,
moving to high altitudes and seasonal effects. Each has a characteristic effect on the stable
isotopic composition of precipitation (Clark and Fritz. 1997, Saad et al. 2005). However,
and due to the worldwide variation in isotopic composition of precipitation, the long-term
weighted mean value is taken as the input function into a hydrological system using the
following formula (Dansgaard 1964; Yurtsever and Gat 1981):
(13)
Where (δw) is weighted mean, (pi) is amount of monthly, weekly or daily precipitation and
(δi) is isotopic composition of rainfall for the month, week or day (i).
The available historical data of the isotopic composition of atmospheric precipitation
from 12 stations (Kattan 1997a, Selkhozpromexport 1986) were used to create local
meteoric water line as well as to interpret the relationship between rainfall and groundwater
in the study area. Most of these stations are located in or around this area. The Arneh,
Remeh, Qatana, Bloudan and Damascus stations are located in the Barada and Awaj basin
whereas the first three stations located in the study area (Fig. 4-8). Izraa, Al Suwieda, and
Al Kounietra stations are located in Al Yarmouk basin while, Homs, Aleppo, Tartous and
Palmyra stations are located in the Orontes, Euphrates, Coastal and Desert basins
respectively (Fig. 4-8).
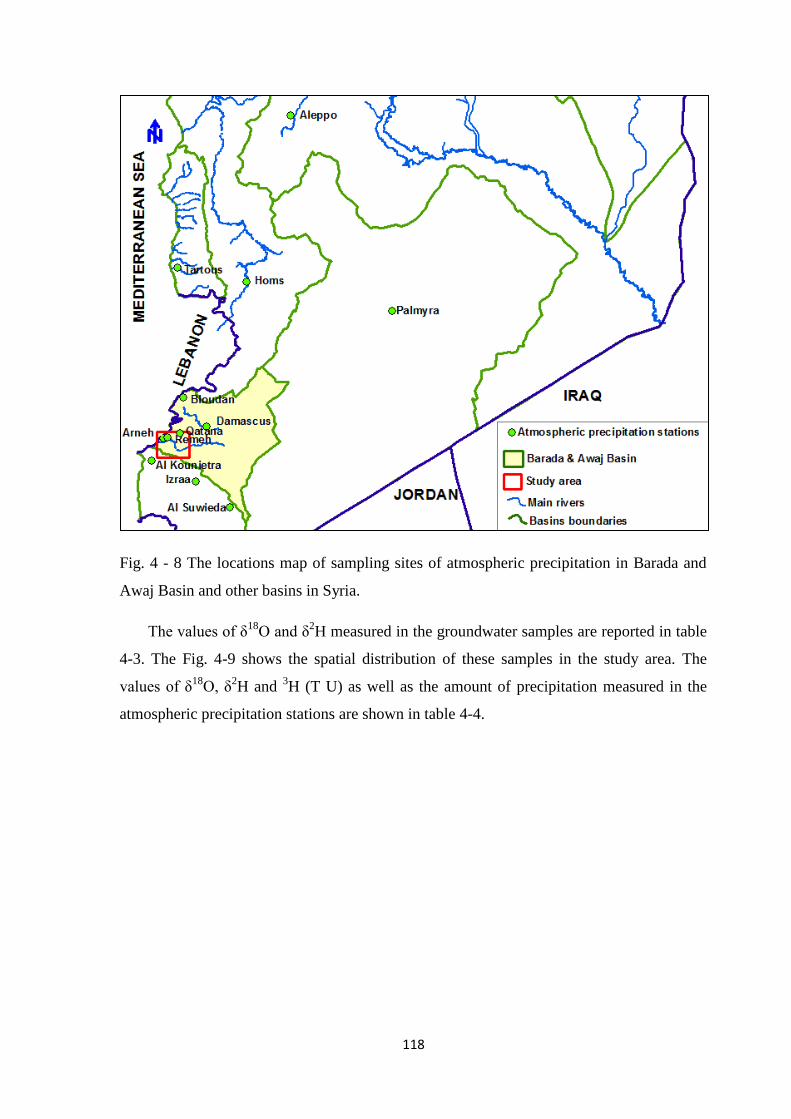
008
Fig. 4 - 8 The locations map of sampling sites of atmospheric precipitation in Barada and
Awaj Basin and other basins in Syria.
The values of δ18
O and δ2H measured in the groundwater samples are reported in table
4-3. The Fig. 4-9 shows the spatial distribution of these samples in the study area. The
values of δ18
O, δ2H and
3H (T U) as well as the amount of precipitation measured in the
atmospheric precipitation stations are shown in table 4-4.
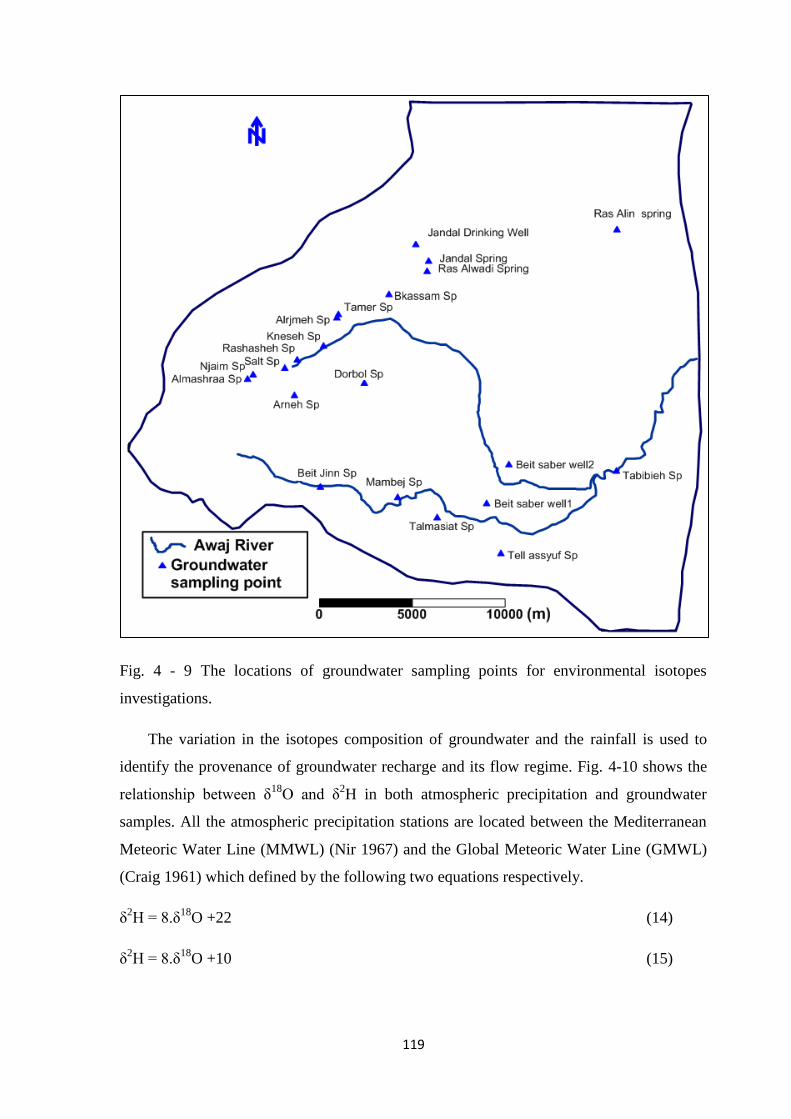
009
Fig. 4 - 9 The locations of groundwater sampling points for environmental isotopes
investigations.
The variation in the isotopes composition of groundwater and the rainfall is used to
identify the provenance of groundwater recharge and its flow regime. Fig. 4-10 shows the
relationship between δ18
O and δ2H in both atmospheric precipitation and groundwater
samples. All the atmospheric precipitation stations are located between the Mediterranean
Meteoric Water Line (MMWL) (Nir 1967) and the Global Meteoric Water Line (GMWL)
(Craig 1961) which defined by the following two equations respectively.
δ2H = 8.δ
18O +22 (14)
δ2H = 8.δ
18O +10 (15)
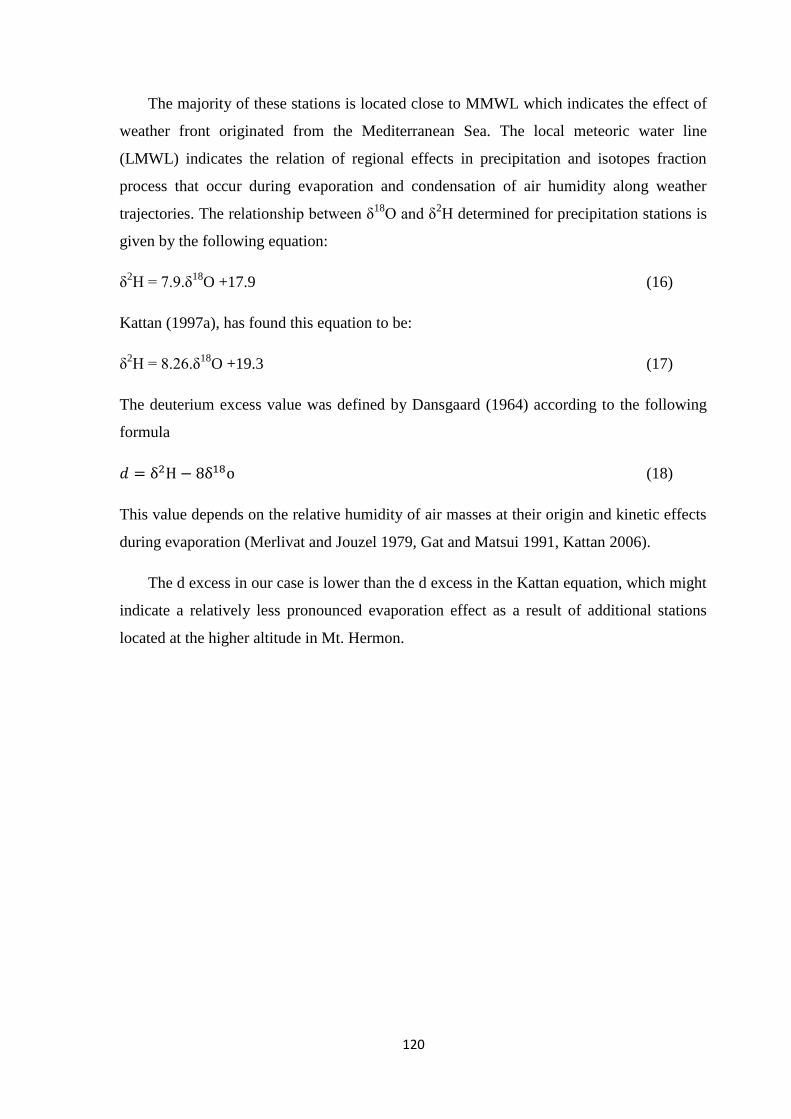
011
The majority of these stations is located close to MMWL which indicates the effect of
weather front originated from the Mediterranean Sea. The local meteoric water line
(LMWL) indicates the relation of regional effects in precipitation and isotopes fraction
process that occur during evaporation and condensation of air humidity along weather
trajectories. The relationship between δ18
O and δ2H determined for precipitation stations is
given by the following equation:
δ2H = 7.9.δ
18O +17.9 (16)
Kattan (1997a), has found this equation to be:
δ2H = 8.26.δ
18O +19.3 (17)
The deuterium excess value was defined by Dansgaard (1964) according to the following
formula
(18)
This value depends on the relative humidity of air masses at their origin and kinetic effects
during evaporation (Merlivat and Jouzel 1979, Gat and Matsui 1991, Kattan 2006).
The d excess in our case is lower than the d excess in the Kattan equation, which might
indicate a relatively less pronounced evaporation effect as a result of additional stations
located at the higher altitude in Mt. Hermon.
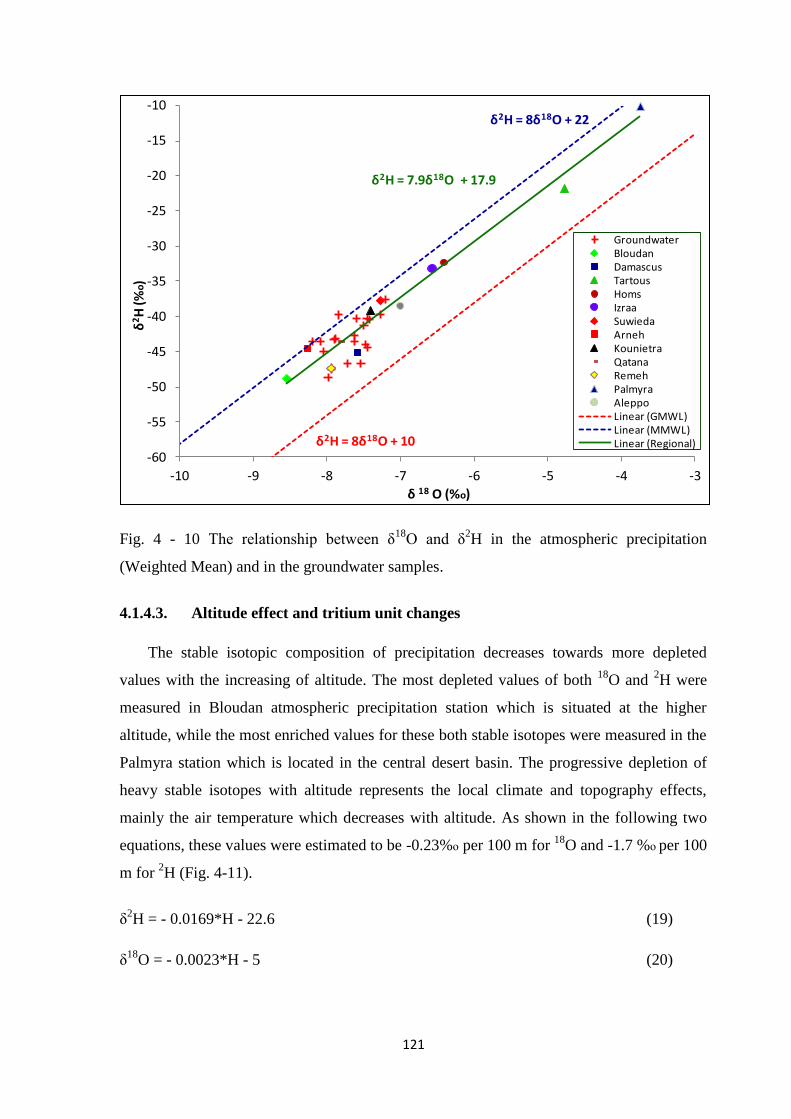
010
Fig. 4 - 10 The relationship between δ18
O and δ2H in the atmospheric precipitation
(Weighted Mean) and in the groundwater samples.
4.1.4.3. Altitude effect and tritium unit changes
The stable isotopic composition of precipitation decreases towards more depleted
values with the increasing of altitude. The most depleted values of both 18
O and 2H were
measured in Bloudan atmospheric precipitation station which is situated at the higher
altitude, while the most enriched values for these both stable isotopes were measured in the
Palmyra station which is located in the central desert basin. The progressive depletion of
heavy stable isotopes with altitude represents the local climate and topography effects,
mainly the air temperature which decreases with altitude. As shown in the following two
equations, these values were estimated to be -0.23%о per 100 m for 18
O and -1.7 %о per 100
m for 2H (Fig. 4-11).
δ2H = - 0.0169*H - 22.6 (19)
δ18
O = - 0.0023*H - 5 (20)
δ2H = 8δ18O + 10
δ2H = 8δ18O + 22
δ2H = 7.9δ18O + 17.9
-60
-55
-50
-45
-40
-35
-30
-25
-20
-15
-10
-10 -9 -8 -7 -6 -5 -4 -3
δ2H
(%о)
δ 18 O (%о)
GroundwaterBloudanDamascusTartousHomsIzraaSuwiedaArnehKounietraQatanaRemehPalmyraAleppoLinear (GMWL)Linear (MMWL)Linear (Regional)
011
Based on this gradient, the mean elevation of recharge zones of groundwater in the
study area is calculated to be between 900 and 1,600 m. The deviation of Damascus,
Aleppo and Palmyra stations from these two regression lines is caused by global, regional
and/or seasonal effects such as the Khamasin rain originated from the North African
dessert, or due to local and particular climatic conditions controlling rainfalls in the region.
Fig. 4 - 11 The relationship between the both δ18
O and δ2H and altitude for precipitation
and groundwater samples.
Tritium (3H) is a naturally occurring radioactive isotope of hydrogen that has a half-life
of 12.43 years and measured in tritium units (TU). 1 tritium unit is equivalent to one tritium
atom in 1018
atoms of hydrogen (Izbicki et al. 2003, Taylor and Roether, 1982). The
relationship between tritium units and distance from the Syrian shoreline (Fig. 4-12) shows
a positive trend with moving inland as a result of increasing stratospheric influence. The
build-up of tritium over land is a result of the cutting off from the supply of low activity
oceanic vapour, while influx from aloft continues.
δ 18O - .H -
0
200
400
600
800
1000
1200
1400
1600
-9 -8 -7 -6 -5 -4 -3
Alt
itu
de
(m
.a.s
.l)
δ 18 O (%о)
Precipitation
Groundwater
Linear (Precipitation)
δ 2H - 0.0169.H - 22.6
0
200
400
600
800
1000
1200
1400
1600
-50 -40 -30 -20 -10
Alt
itu
de
(m
.a.s
.l)
δ2H (%о)
Precipitation
Groundwater
Linear (Precipitation)
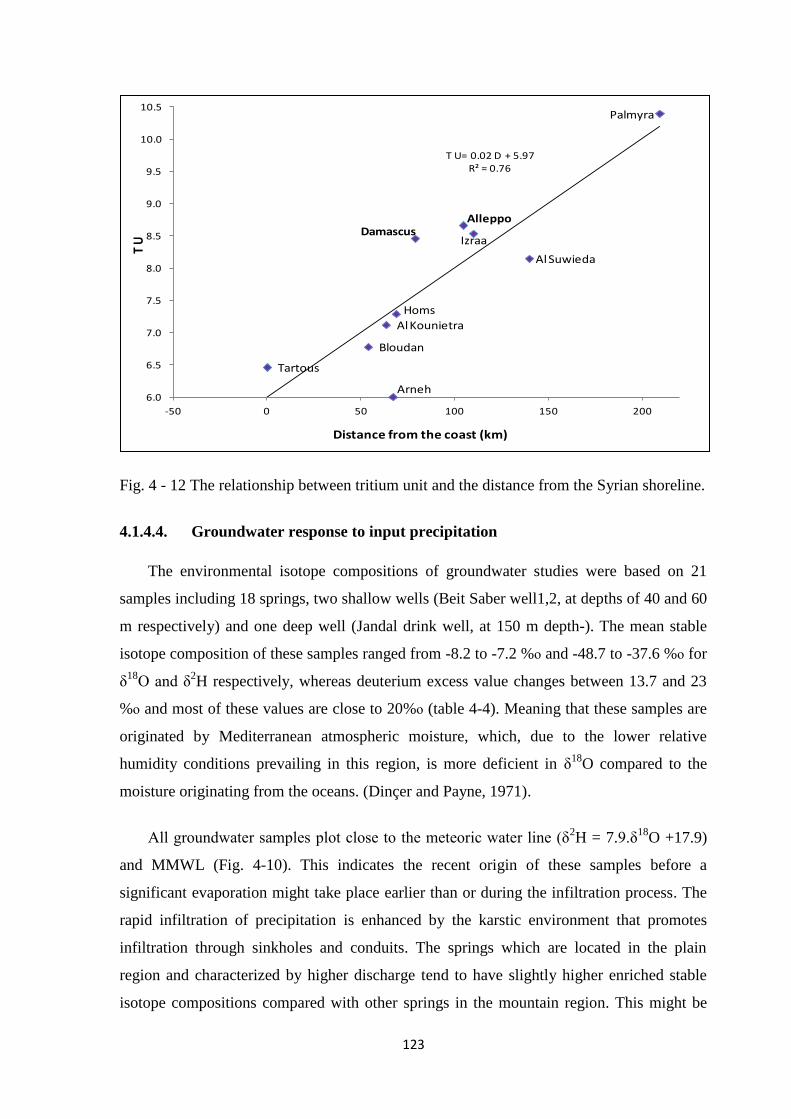
013
Fig. 4 - 12 The relationship between tritium unit and the distance from the Syrian shoreline.
4.1.4.4. Groundwater response to input precipitation
The environmental isotope compositions of groundwater studies were based on 21
samples including 18 springs, two shallow wells (Beit Saber well1,2, at depths of 40 and 60
m respectively) and one deep well (Jandal drink well, at 150 m depth-). The mean stable
isotope composition of these samples ranged from -8.2 to -7.2 %о and -48.7 to -37.6 %о for
δ18
O and δ2H respectively, whereas deuterium excess value changes between 13.7 and 23
%о and most of these values are close to 20%о (table 4-4). Meaning that these samples are
originated by Mediterranean atmospheric moisture, which, due to the lower relative
humidity conditions prevailing in this region, is more deficient in δ18
O compared to the
moisture originating from the oceans. (Dinçer and Payne, 1971).
All groundwater samples plot close to the meteoric water line (δ2H = 7.9.δ
18O +17.9)
and MMWL (Fig. 4-10). This indicates the recent origin of these samples before a
significant evaporation might take place earlier than or during the infiltration process. The
rapid infiltration of precipitation is enhanced by the karstic environment that promotes
infiltration through sinkholes and conduits. The springs which are located in the plain
region and characterized by higher discharge tend to have slightly higher enriched stable
isotope compositions compared with other springs in the mountain region. This might be
Bloudan
Damascus
Al Kounietra
Tartous
Homs
Izraa
Al Suwieda
Arneh
Palmyra
Alleppo
T U= 0.02 D + 5.97R² = 0.76
6.0
6.5
7.0
7.5
8.0
8.5
9.0
9.5
10.0
10.5
-50 0 50 100 150 200
T U
Distance from the coast (km)
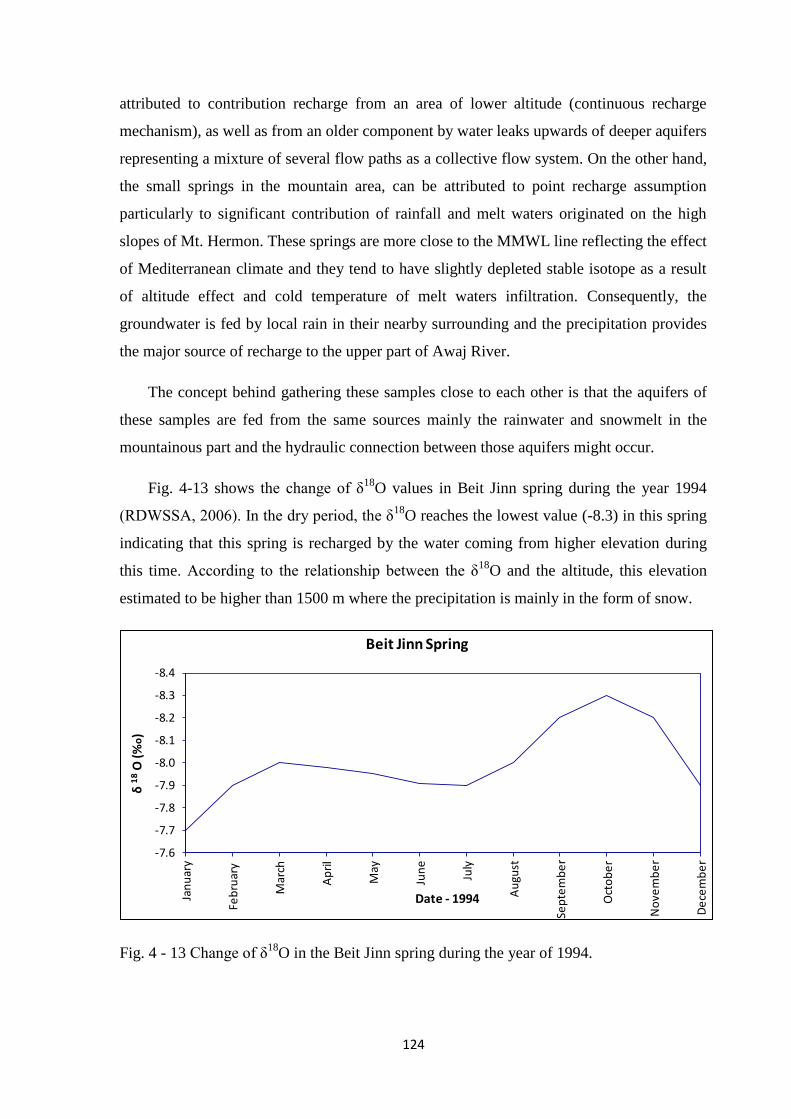
014
attributed to contribution recharge from an area of lower altitude (continuous recharge
mechanism), as well as from an older component by water leaks upwards of deeper aquifers
representing a mixture of several flow paths as a collective flow system. On the other hand,
the small springs in the mountain area, can be attributed to point recharge assumption
particularly to significant contribution of rainfall and melt waters originated on the high
slopes of Mt. Hermon. These springs are more close to the MMWL line reflecting the effect
of Mediterranean climate and they tend to have slightly depleted stable isotope as a result
of altitude effect and cold temperature of melt waters infiltration. Consequently, the
groundwater is fed by local rain in their nearby surrounding and the precipitation provides
the major source of recharge to the upper part of Awaj River.
The concept behind gathering these samples close to each other is that the aquifers of
these samples are fed from the same sources mainly the rainwater and snowmelt in the
mountainous part and the hydraulic connection between those aquifers might occur.
Fig. 4-13 shows the change of δ18
O values in Beit Jinn spring during the year 1994
(RDWSSA, 2006). In the dry period, the δ18
O reaches the lowest value (-8.3) in this spring
indicating that this spring is recharged by the water coming from higher elevation during
this time. According to the relationship between the δ18
O and the altitude, this elevation
estimated to be higher than 1500 m where the precipitation is mainly in the form of snow.
Fig. 4 - 13 Change of δ18
O in the Beit Jinn spring during the year of 1994.
-8.4
-8.3
-8.2
-8.1
-8.0
-7.9
-7.8
-7.7
-7.6
Jan
uar
y
Feb
ruar
y
Mar
ch
Ap
ril
May
Jun
e
July
Au
gust
Sep
tem
be
r
Oct
ob
er
No
vem
be
r
De
cem
be
r
δ 1
8O
(%o)
Date - 1994
Beit Jinn Spring
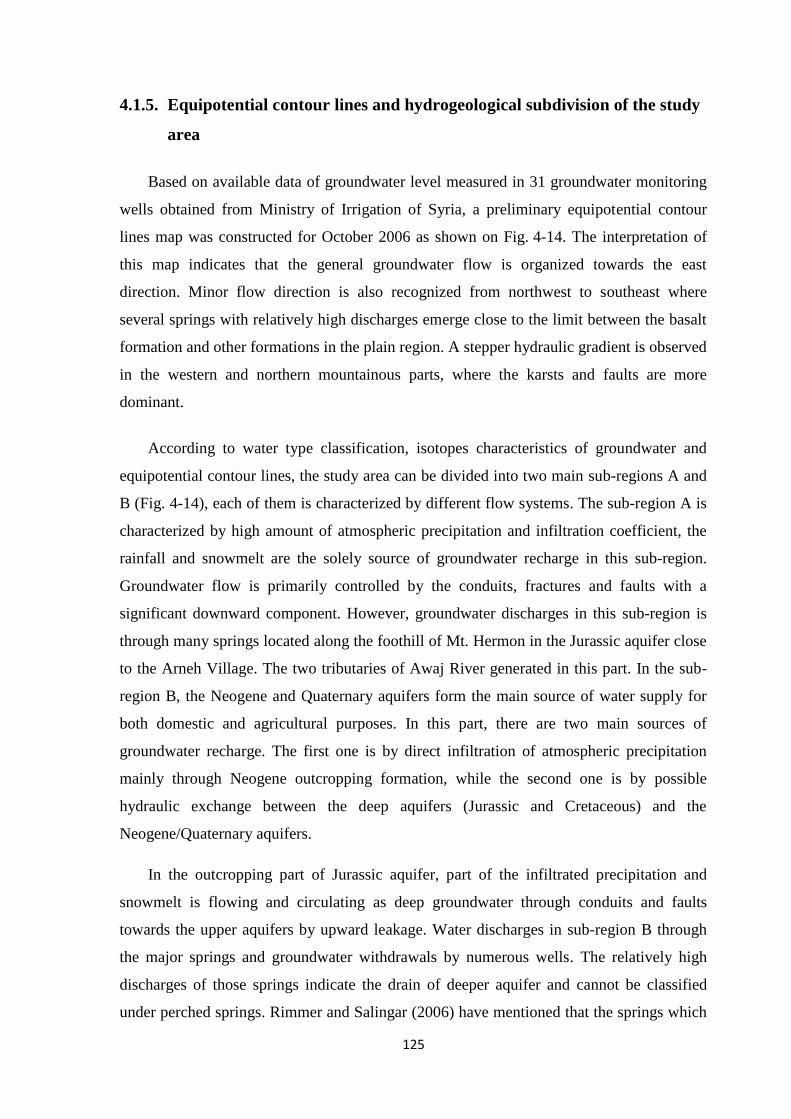
015
4.1.5. Equipotential contour lines and hydrogeological subdivision of the study
area
Based on available data of groundwater level measured in 31 groundwater monitoring
wells obtained from Ministry of Irrigation of Syria, a preliminary equipotential contour
lines map was constructed for October 2006 as shown on Fig. 4-14. The interpretation of
this map indicates that the general groundwater flow is organized towards the east
direction. Minor flow direction is also recognized from northwest to southeast where
several springs with relatively high discharges emerge close to the limit between the basalt
formation and other formations in the plain region. A stepper hydraulic gradient is observed
in the western and northern mountainous parts, where the karsts and faults are more
dominant.
According to water type classification, isotopes characteristics of groundwater and
equipotential contour lines, the study area can be divided into two main sub-regions A and
B (Fig. 4-14), each of them is characterized by different flow systems. The sub-region A is
characterized by high amount of atmospheric precipitation and infiltration coefficient, the
rainfall and snowmelt are the solely source of groundwater recharge in this sub-region.
Groundwater flow is primarily controlled by the conduits, fractures and faults with a
significant downward component. However, groundwater discharges in this sub-region is
through many springs located along the foothill of Mt. Hermon in the Jurassic aquifer close
to the Arneh Village. The two tributaries of Awaj River generated in this part. In the sub-
region B, the Neogene and Quaternary aquifers form the main source of water supply for
both domestic and agricultural purposes. In this part, there are two main sources of
groundwater recharge. The first one is by direct infiltration of atmospheric precipitation
mainly through Neogene outcropping formation, while the second one is by possible
hydraulic exchange between the deep aquifers (Jurassic and Cretaceous) and the
Neogene/Quaternary aquifers.
In the outcropping part of Jurassic aquifer, part of the infiltrated precipitation and
snowmelt is flowing and circulating as deep groundwater through conduits and faults
towards the upper aquifers by upward leakage. Water discharges in sub-region B through
the major springs and groundwater withdrawals by numerous wells. The relatively high
discharges of those springs indicate the drain of deeper aquifer and cannot be classified
under perched springs. Rimmer and Salingar (2006) have mentioned that the springs which
016
emerge from lower topography in Mt. Hermon are characterized by higher discharge than
the springs in higher altitude.
Fig. 4 - 14 Equipotential contours map based on groundwater level measured in 31
monitoring wells during October 2006. The associated hydrogeological sub-regions (A and
B) as well as cross section C-D are depicted.
The fluctuations of monthly groundwater level of the well 46RK which is located in
sub-region B during the period between 2004 and 2011 are shown in Fig. 4-15. The typical
decline during the summer dry period and increase during the rainy winter period depict
seasonal trends in the water level as well as the effect of groundwater withdrawal. The
decreasing trend in groundwater level during the measured period is caused by groundwater
overexploitation.
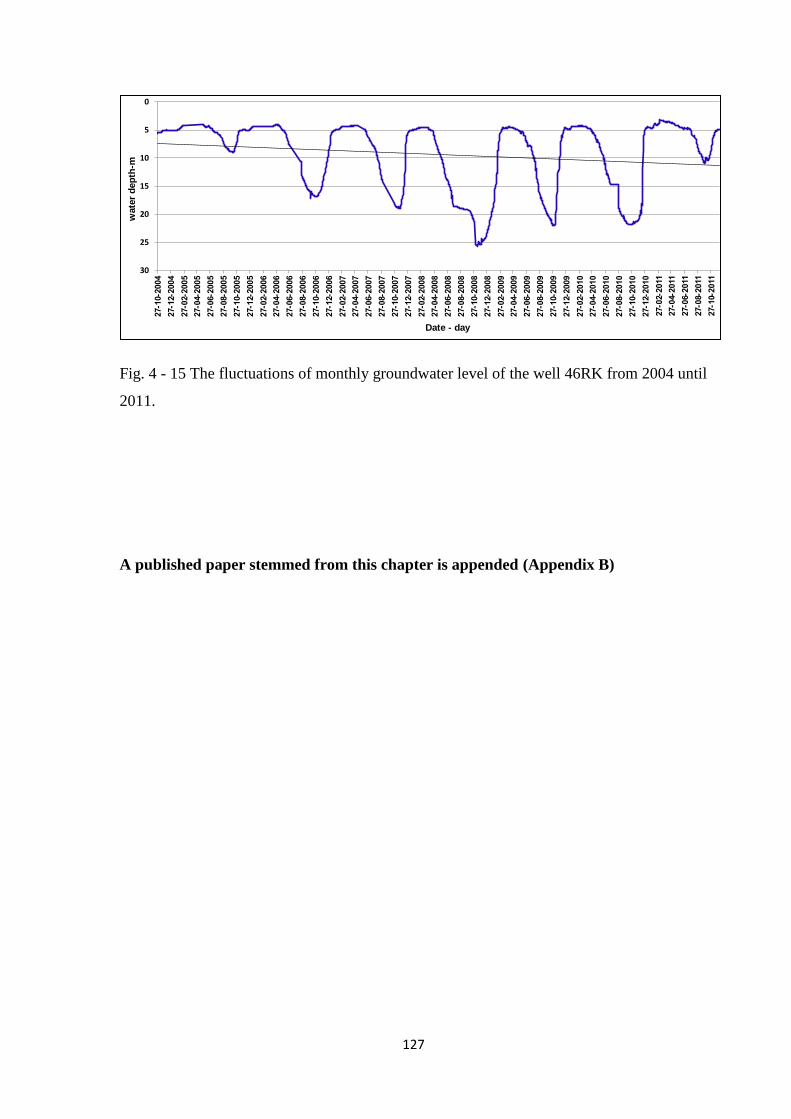
017
Fig. 4 - 15 The fluctuations of monthly groundwater level of the well 46RK from 2004 until
2011.
A published paper stemmed from this chapter is appended (Appendix B)
0
5
10
15
20
25
30
-
-
-
-
-
-
-
-
-
-
-
-
-
-
-
-
-
-
-
-
-
-
-
-
-
-
-
-
-
-
-
-
-
-
-
-
-
-
-
-
-
-
-
-
-
-
-
-
-
-
-
-
-
-
-
-
-
-
-
-
-
-
-
-
-
-
-
-
-
-
-
-
-
-
-
-
-
-
-
-
-
-
-
-
-
-
wate
r d
ep
th-m
Date - day
018
Chapter 5. Groundwater modeling approach to estimate the water
budget of the upper aquifer horizon in the model domain and assess the
hydraulic relationship between multilayered aquifers
Introduction
This chapter describes the development and calibration of the steady-state groundwater
flow model. Among the available data on groundwater recharge and water consumption,
the numerical model was applied for the water budget assessment in the upper aquifer
horizon. This steady-state model was developed in this complex region primarily as a toll to
assess groundwater flow behaviour between different aquifers and water bearing in the
study area. This is significantly important since this relation is poorly understood and the
hydrochemical evolution does not give enough information about the groundwater flow
system in this area. The calculation of water budget of the upper aquifer horizon, which has
a vital role in maintaining a stable agricultural life in this region, is another important
purpose of developing this numerical model. The obtained result might be a valuable tool in
order to select an optimum management scheme and sustainable use of groundwater
resources in this semiarid region.
Groundwater modeling is recognized nowadays as a best tool to support management
of groundwater resources (Lubczynski and Gurwin 2005, Mahmoudzadeh et al. 2012) and
it is also considered to be as a significant alternative approach to overcome the lack of
observational data. Groundwater model has been used as a scientific tool to examine the
response of the aquifer system to an adequate level of details and understanding the flow
patterns (Anderson and Woessner 1992, Chiang et al. 1998). Consequently, it provides a
scientific answer to quantify water balance of the system under specified hydrological
conditions. Bredehoeft (2002) has pointed out that the modeling is generally a preferred
approach when studying a groundwater's system response to pumping. This is because it
can include, explicitly, the spatio-temporal nature of the response of the system to imposed
stresses, as well as the changes in boundary conditions and recharge and discharge rates
that result from this response. Limiting uncertainty in groundwater models requires
accurate determination of the spatial and temporal variations in hydraulic parameters of the
aquifer such as the hydraulic conductivity and permeability (Su et al. 2004, Alkhaier 2011)
The developed model in this case study will be used to calculate the water budget
019
component of the upper aquifer in the model domain which is considered a vital source for
the intensive agricultural activities developed in the study area. However, this steady state
model can be considered as a basis in order to predict the future changes in the groundwater
system under various scenarios.
5.1. Conceptual model
The groundwater modeling is based on two key components which are a conceptual
model and a mathematical model. The conceptual model is an idealised pictorial
representation of our hydrogeological understanding which includes a delineation of system
boundaries, inputs/outputs, hydrogeological units and flow patterns that are dominant in the
system being studied. A mathematical model is a set of equations which, based on certain
assumptions, quantify the active physical processes in the aquifer system(s) being
modelled.
In order to simplify the field conditions of the model domain and based on the
hydrogeological cross section C-D (Fig. 4-14), the design of the conceptual groundwater
model (Fig. 5-1) was developed. The development of this model is based on the available
geological and meteorological information as well as the obtained hydrogeological
information from hydrochemistry and isotopic interpretation. The vertical and horizontal
extent of the subsurface hydrogeological units and their connection is consistent with
available boreholes information (Selkhozpromexport 1986). The recharge and discharge
areas are delineated. The conceptual model assumed that the preferential groundwater flow
occurs mainly in the Jurassic aquifer and discharges as a karstic springs into the upper part
of the Arneh valley.
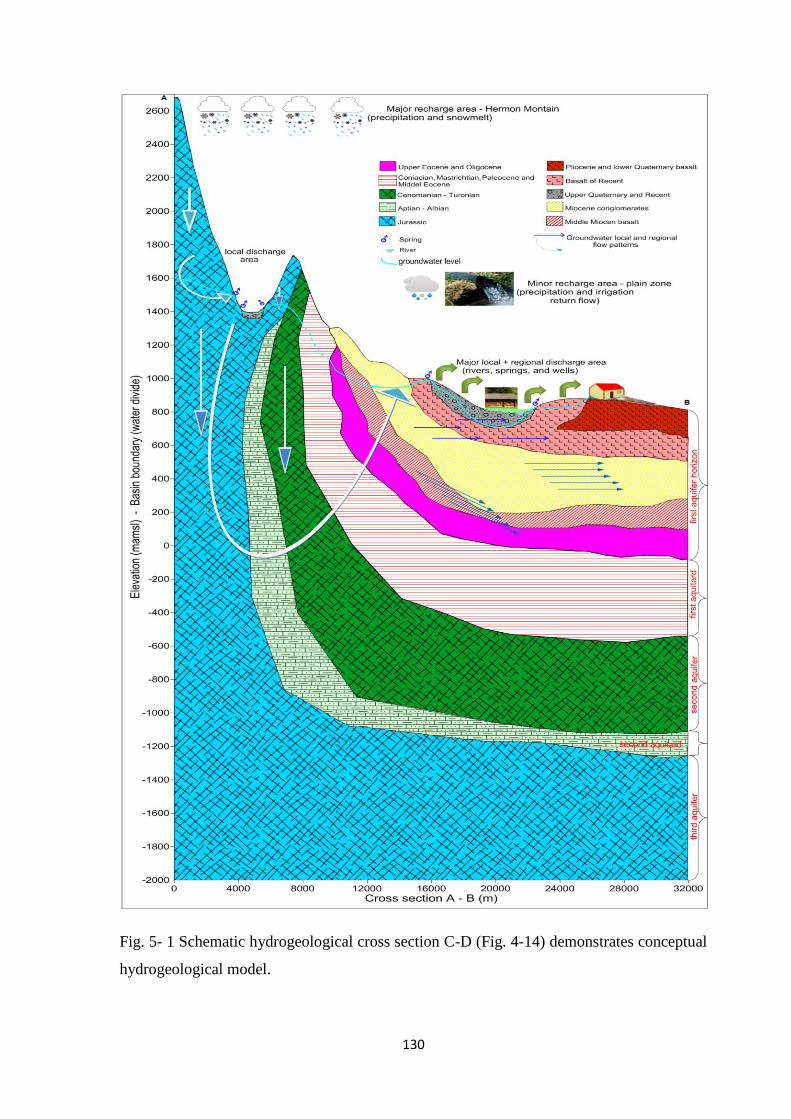
031
Fig. 5- 1 Schematic hydrogeological cross section C-D (Fig. 4-14) demonstrates conceptual
hydrogeological model.
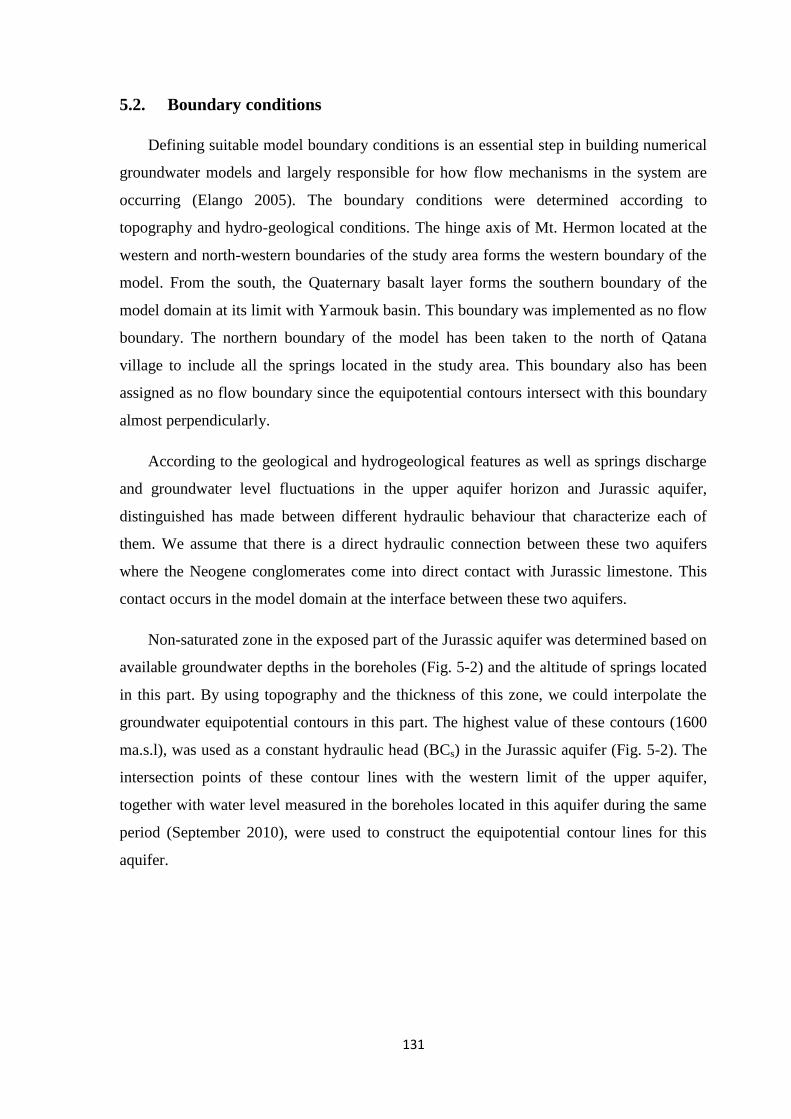
030
5.2. Boundary conditions
Defining suitable model boundary conditions is an essential step in building numerical
groundwater models and largely responsible for how flow mechanisms in the system are
occurring (Elango 2005). The boundary conditions were determined according to
topography and hydro-geological conditions. The hinge axis of Mt. Hermon located at the
western and north-western boundaries of the study area forms the western boundary of the
model. From the south, the Quaternary basalt layer forms the southern boundary of the
model domain at its limit with Yarmouk basin. This boundary was implemented as no flow
boundary. The northern boundary of the model has been taken to the north of Qatana
village to include all the springs located in the study area. This boundary also has been
assigned as no flow boundary since the equipotential contours intersect with this boundary
almost perpendicularly.
According to the geological and hydrogeological features as well as springs discharge
and groundwater level fluctuations in the upper aquifer horizon and Jurassic aquifer,
distinguished has made between different hydraulic behaviour that characterize each of
them. We assume that there is a direct hydraulic connection between these two aquifers
where the Neogene conglomerates come into direct contact with Jurassic limestone. This
contact occurs in the model domain at the interface between these two aquifers.
Non-saturated zone in the exposed part of the Jurassic aquifer was determined based on
available groundwater depths in the boreholes (Fig. 5-2) and the altitude of springs located
in this part. By using topography and the thickness of this zone, we could interpolate the
groundwater equipotential contours in this part. The highest value of these contours (1600
ma.s.l), was used as a constant hydraulic head (BCs) in the Jurassic aquifer (Fig. 5-2). The
intersection points of these contour lines with the western limit of the upper aquifer,
together with water level measured in the boreholes located in this aquifer during the same
period (September 2010), were used to construct the equipotential contour lines for this
aquifer.
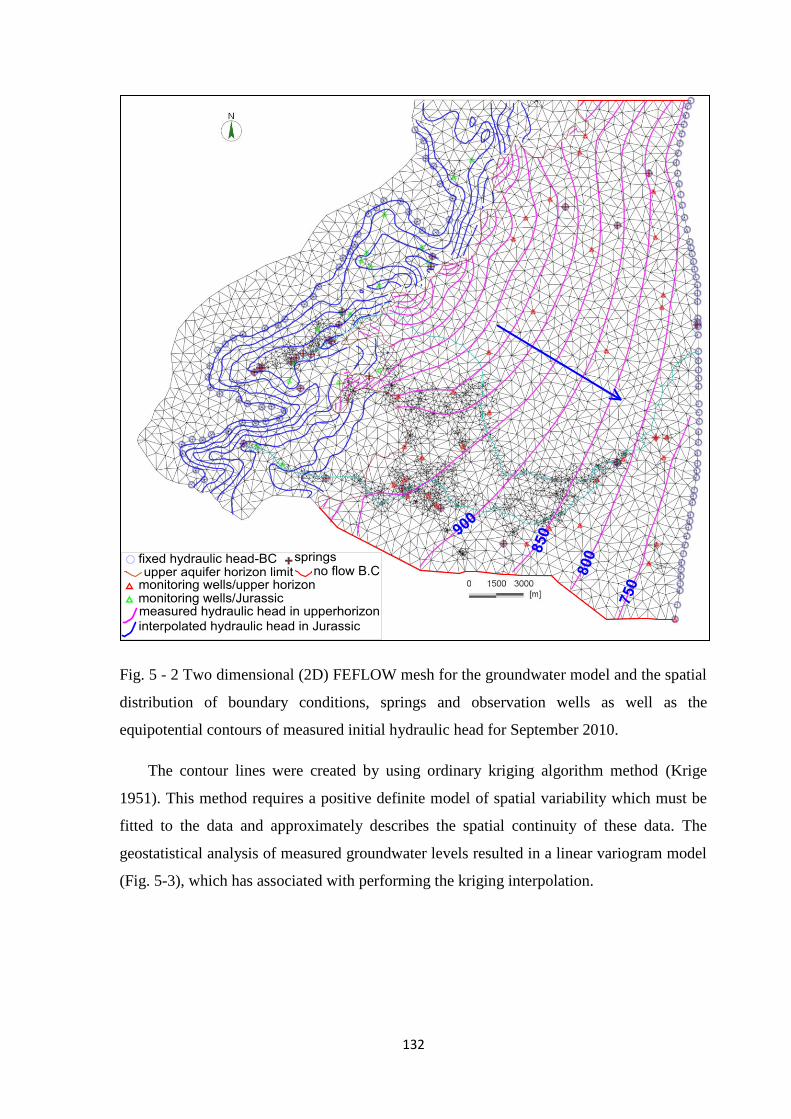
031
Fig. 5 - 2 Two dimensional (2D) FEFLOW mesh for the groundwater model and the spatial
distribution of boundary conditions, springs and observation wells as well as the
equipotential contours of measured initial hydraulic head for September 2010.
The contour lines were created by using ordinary kriging algorithm method (Krige
1951). This method requires a positive definite model of spatial variability which must be
fitted to the data and approximately describes the spatial continuity of these data. The
geostatistical analysis of measured groundwater levels resulted in a linear variogram model
(Fig. 5-3), which has associated with performing the kriging interpolation.
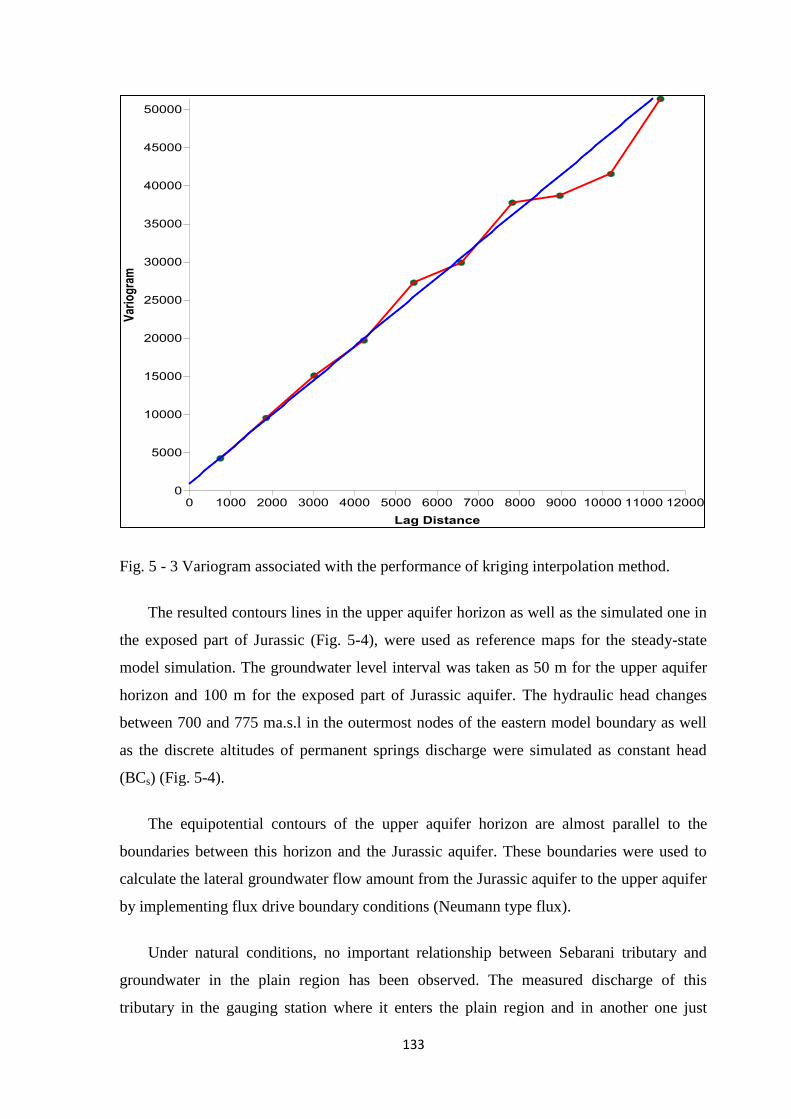
033
Fig. 5 - 3 Variogram associated with the performance of kriging interpolation method.
The resulted contours lines in the upper aquifer horizon as well as the simulated one in
the exposed part of Jurassic (Fig. 5-4), were used as reference maps for the steady-state
model simulation. The groundwater level interval was taken as 50 m for the upper aquifer
horizon and 100 m for the exposed part of Jurassic aquifer. The hydraulic head changes
between 700 and 775 ma.s.l in the outermost nodes of the eastern model boundary as well
as the discrete altitudes of permanent springs discharge were simulated as constant head
(BCs) (Fig. 5-4).
The equipotential contours of the upper aquifer horizon are almost parallel to the
boundaries between this horizon and the Jurassic aquifer. These boundaries were used to
calculate the lateral groundwater flow amount from the Jurassic aquifer to the upper aquifer
by implementing flux drive boundary conditions (Neumann type flux).
Under natural conditions, no important relationship between Sebarani tributary and
groundwater in the plain region has been observed. The measured discharge of this
tributary in the gauging station where it enters the plain region and in another one just
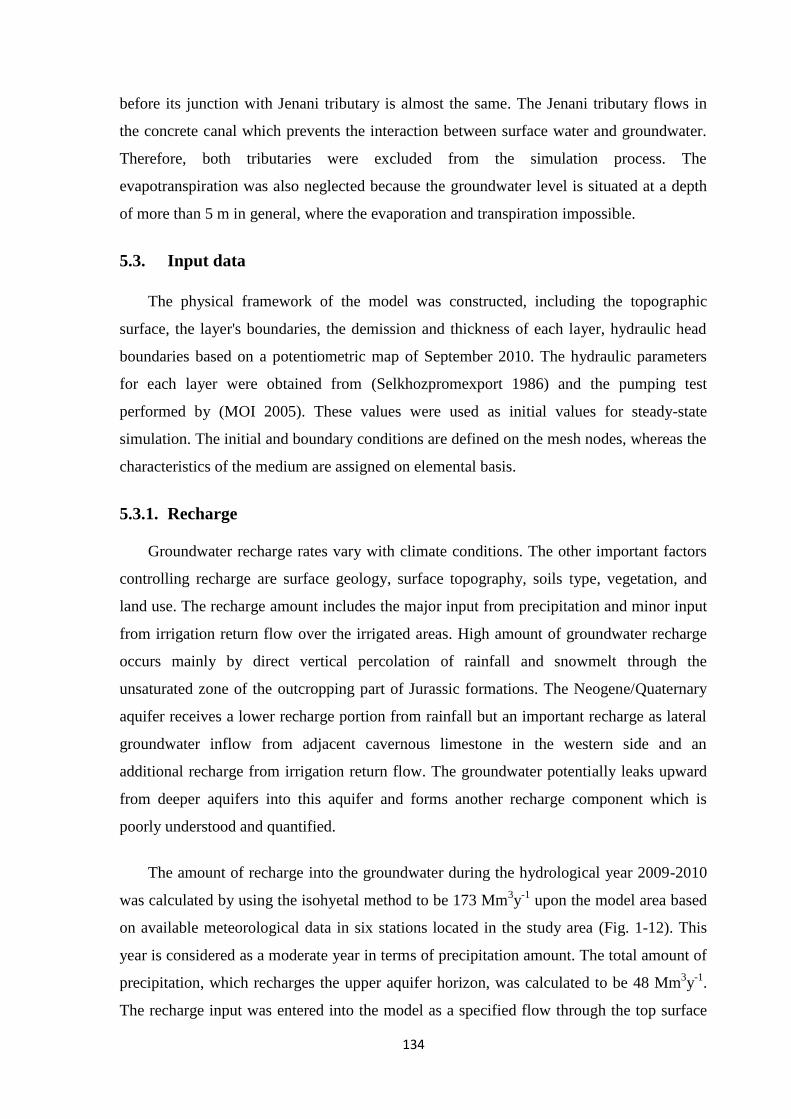
034
before its junction with Jenani tributary is almost the same. The Jenani tributary flows in
the concrete canal which prevents the interaction between surface water and groundwater.
Therefore, both tributaries were excluded from the simulation process. The
evapotranspiration was also neglected because the groundwater level is situated at a depth
of more than 5 m in general, where the evaporation and transpiration impossible.
5.3. Input data
The physical framework of the model was constructed, including the topographic
surface, the layer's boundaries, the demission and thickness of each layer, hydraulic head
boundaries based on a potentiometric map of September 2010. The hydraulic parameters
for each layer were obtained from (Selkhozpromexport 1986) and the pumping test
performed by (MOI 2005). These values were used as initial values for steady-state
simulation. The initial and boundary conditions are defined on the mesh nodes, whereas the
characteristics of the medium are assigned on elemental basis.
5.3.1. Recharge
Groundwater recharge rates vary with climate conditions. The other important factors
controlling recharge are surface geology, surface topography, soils type, vegetation, and
land use. The recharge amount includes the major input from precipitation and minor input
from irrigation return flow over the irrigated areas. High amount of groundwater recharge
occurs mainly by direct vertical percolation of rainfall and snowmelt through the
unsaturated zone of the outcropping part of Jurassic formations. The Neogene/Quaternary
aquifer receives a lower recharge portion from rainfall but an important recharge as lateral
groundwater inflow from adjacent cavernous limestone in the western side and an
additional recharge from irrigation return flow. The groundwater potentially leaks upward
from deeper aquifers into this aquifer and forms another recharge component which is
poorly understood and quantified.
The amount of recharge into the groundwater during the hydrological year 2009-2010
was calculated by using the isohyetal method to be 173 Mm3y
-1 upon the model area based
on available meteorological data in six stations located in the study area (Fig. 1-12). This
year is considered as a moderate year in terms of precipitation amount. The total amount of
precipitation, which recharges the upper aquifer horizon, was calculated to be 48 Mm3y
-1.
The recharge input was entered into the model as a specified flow through the top surface
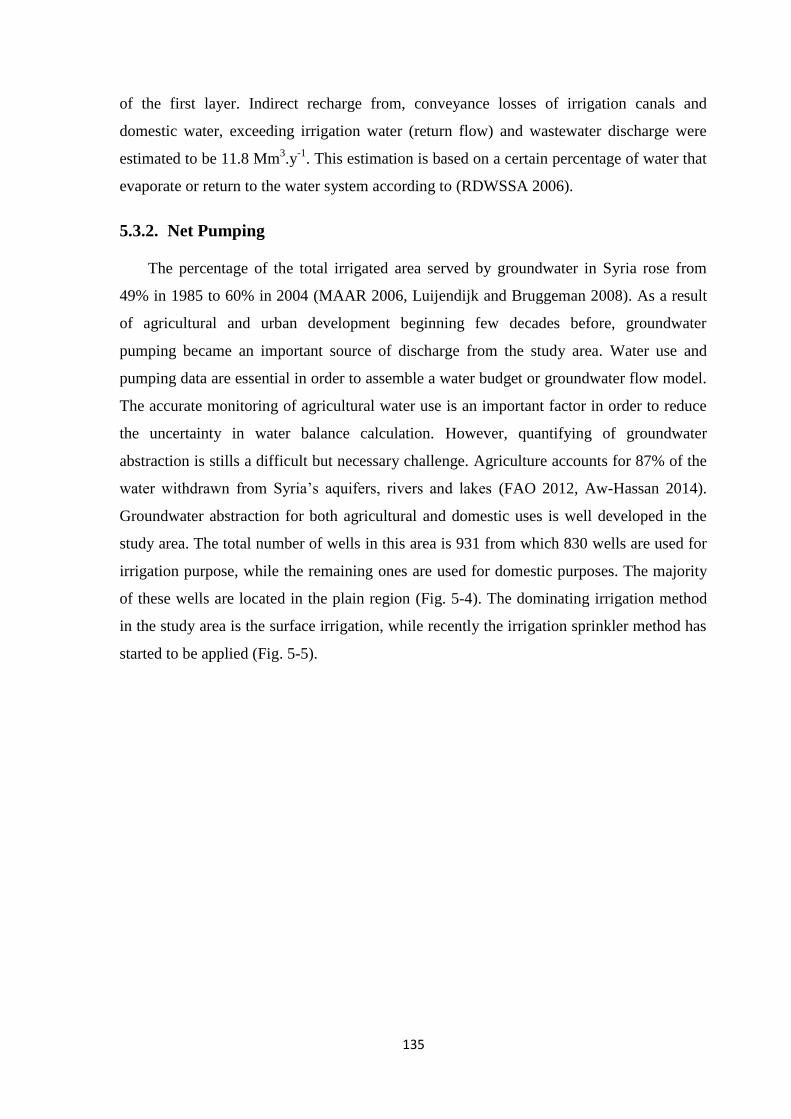
035
of the first layer. Indirect recharge from, conveyance losses of irrigation canals and
domestic water, exceeding irrigation water (return flow) and wastewater discharge were
estimated to be 11.8 Mm3.y
-1. This estimation is based on a certain percentage of water that
evaporate or return to the water system according to (RDWSSA 2006).
5.3.2. Net Pumping
The percentage of the total irrigated area served by groundwater in Syria rose from
49% in 1985 to 60% in 2004 (MAAR 2006, Luijendijk and Bruggeman 2008). As a result
of agricultural and urban development beginning few decades before, groundwater
pumping became an important source of discharge from the study area. Water use and
pumping data are essential in order to assemble a water budget or groundwater flow model.
The accurate monitoring of agricultural water use is an important factor in order to reduce
the uncertainty in water balance calculation. However, quantifying of groundwater
abstraction is stills a difficult but necessary challenge. Agriculture accounts for 87% of the
water withdrawn from Syria’s aquifers, rivers and lakes (FAO 2012, Aw-Hassan 2014).
Groundwater abstraction for both agricultural and domestic uses is well developed in the
study area. The total number of wells in this area is 931 from which 830 wells are used for
irrigation purpose, while the remaining ones are used for domestic purposes. The majority
of these wells are located in the plain region (Fig. 5-4). The dominating irrigation method
in the study area is the surface irrigation, while recently the irrigation sprinkler method has
started to be applied (Fig. 5-5).
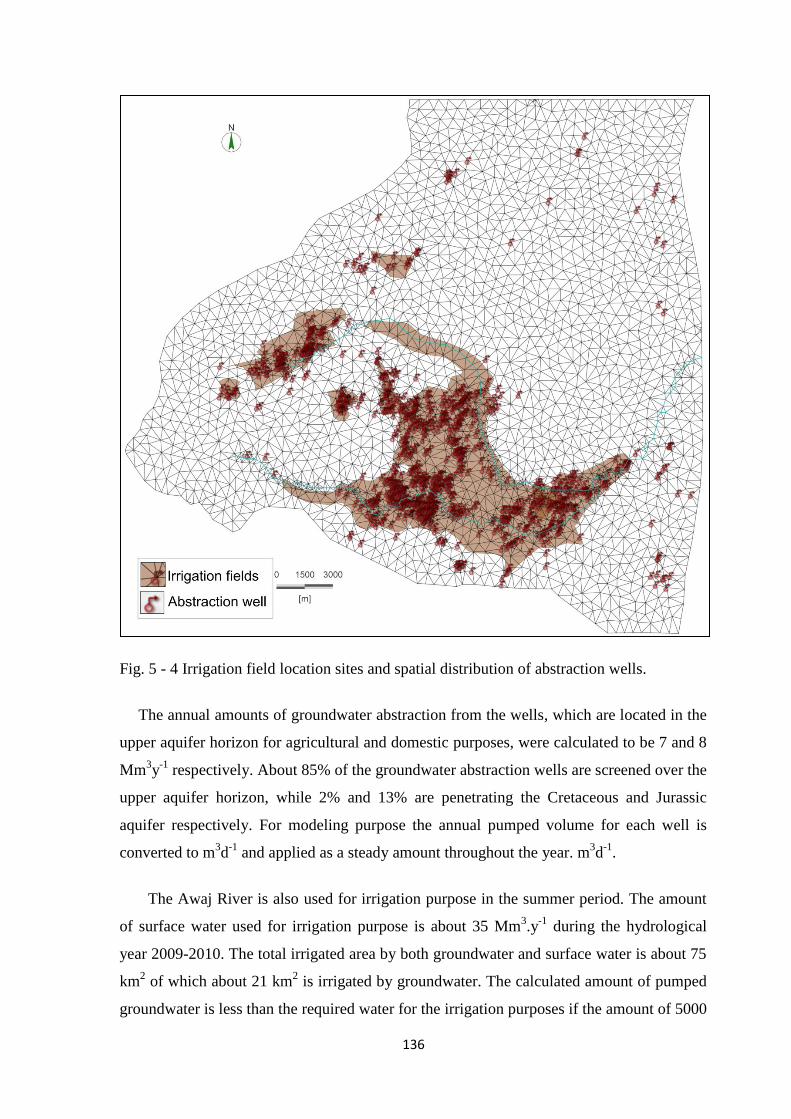
036
Fig. 5 - 4 Irrigation field location sites and spatial distribution of abstraction wells.
The annual amounts of groundwater abstraction from the wells, which are located in the
upper aquifer horizon for agricultural and domestic purposes, were calculated to be 7 and 8
Mm3y
-1 respectively. About 85% of the groundwater abstraction wells are screened over the
upper aquifer horizon, while 2% and 13% are penetrating the Cretaceous and Jurassic
aquifer respectively. For modeling purpose the annual pumped volume for each well is
converted to m3d
-1 and applied as a steady amount throughout the year. m
3d
-1.
The Awaj River is also used for irrigation purpose in the summer period. The amount
of surface water used for irrigation purpose is about 35 Mm3.y
-1 during the hydrological
year 2009-2010. The total irrigated area by both groundwater and surface water is about 75
km2 of which about 21 km
2 is irrigated by groundwater. The calculated amount of pumped
groundwater is less than the required water for the irrigation purposes if the amount of 5000
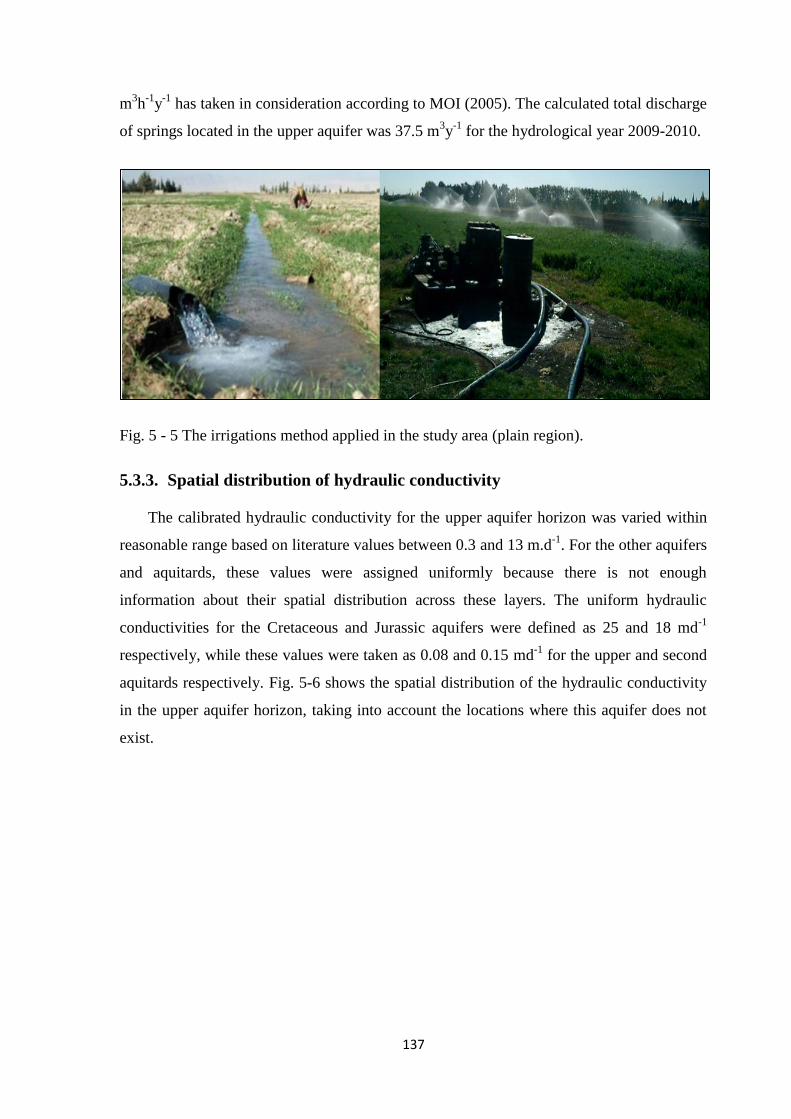
037
m3h
-1y
-1 has taken in consideration according to MOI (2005). The calculated total discharge
of springs located in the upper aquifer was 37.5 m3y
-1 for the hydrological year 2009-2010.
Fig. 5 - 5 The irrigations method applied in the study area (plain region).
5.3.3. Spatial distribution of hydraulic conductivity
The calibrated hydraulic conductivity for the upper aquifer horizon was varied within
reasonable range based on literature values between 0.3 and 13 m.d-1
. For the other aquifers
and aquitards, these values were assigned uniformly because there is not enough
information about their spatial distribution across these layers. The uniform hydraulic
conductivities for the Cretaceous and Jurassic aquifers were defined as 25 and 18 md-1
respectively, while these values were taken as 0.08 and 0.15 md-1
for the upper and second
aquitards respectively. Fig. 5-6 shows the spatial distribution of the hydraulic conductivity
in the upper aquifer horizon, taking into account the locations where this aquifer does not
exist.
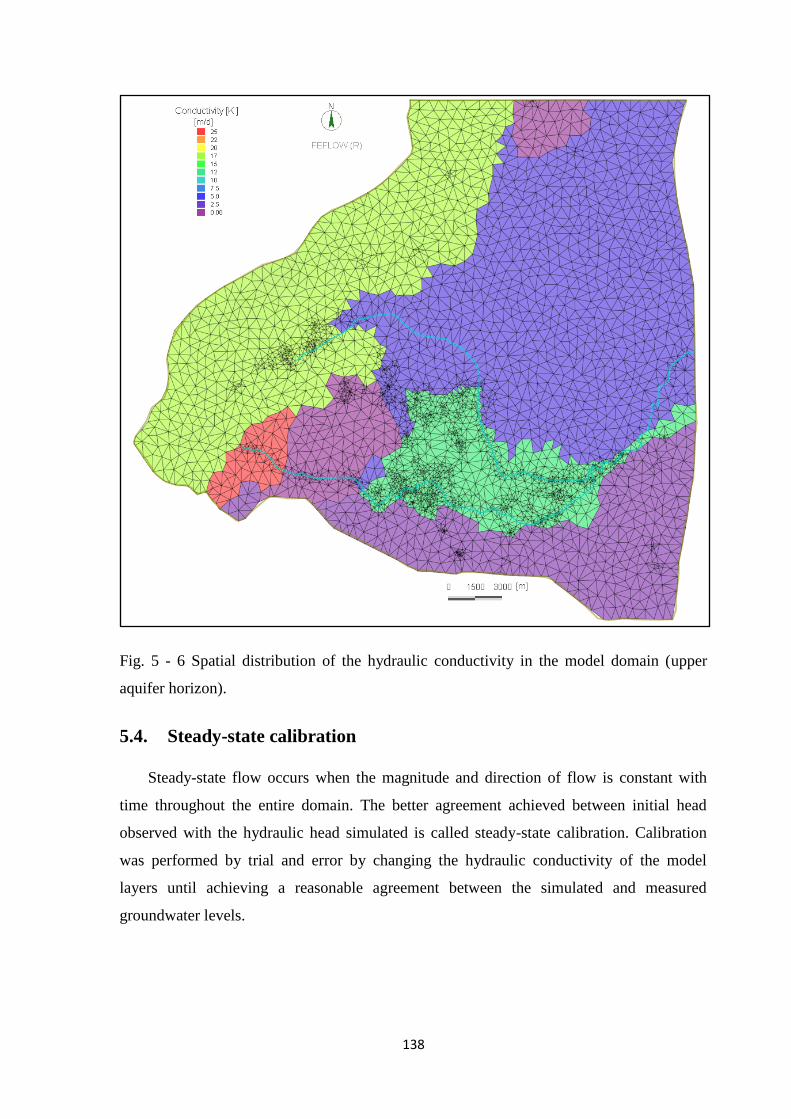
038
Fig. 5 - 6 Spatial distribution of the hydraulic conductivity in the model domain (upper
aquifer horizon).
5.4. Steady-state calibration
Steady-state flow occurs when the magnitude and direction of flow is constant with
time throughout the entire domain. The better agreement achieved between initial head
observed with the hydraulic head simulated is called steady-state calibration. Calibration
was performed by trial and error by changing the hydraulic conductivity of the model
layers until achieving a reasonable agreement between the simulated and measured
groundwater levels.
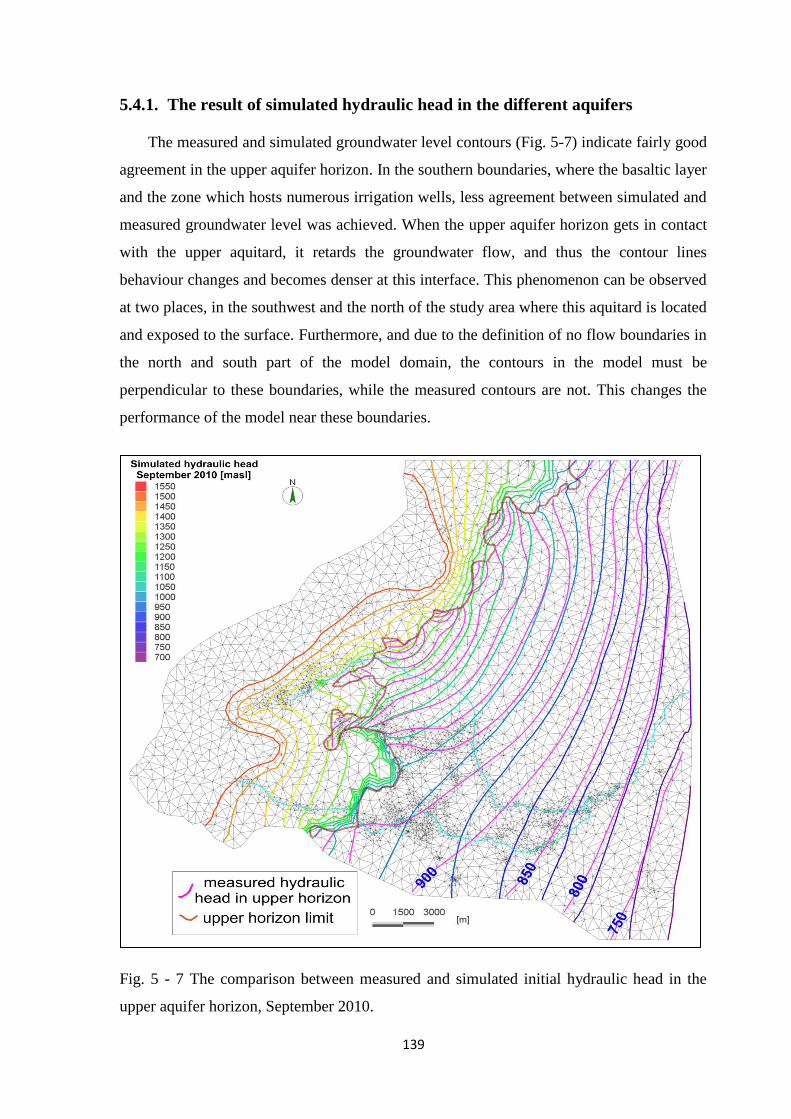
039
5.4.1. The result of simulated hydraulic head in the different aquifers
The measured and simulated groundwater level contours (Fig. 5-7) indicate fairly good
agreement in the upper aquifer horizon. In the southern boundaries, where the basaltic layer
and the zone which hosts numerous irrigation wells, less agreement between simulated and
measured groundwater level was achieved. When the upper aquifer horizon gets in contact
with the upper aquitard, it retards the groundwater flow, and thus the contour lines
behaviour changes and becomes denser at this interface. This phenomenon can be observed
at two places, in the southwest and the north of the study area where this aquitard is located
and exposed to the surface. Furthermore, and due to the definition of no flow boundaries in
the north and south part of the model domain, the contours in the model must be
perpendicular to these boundaries, while the measured contours are not. This changes the
performance of the model near these boundaries.
Fig. 5 - 7 The comparison between measured and simulated initial hydraulic head in the
upper aquifer horizon, September 2010.
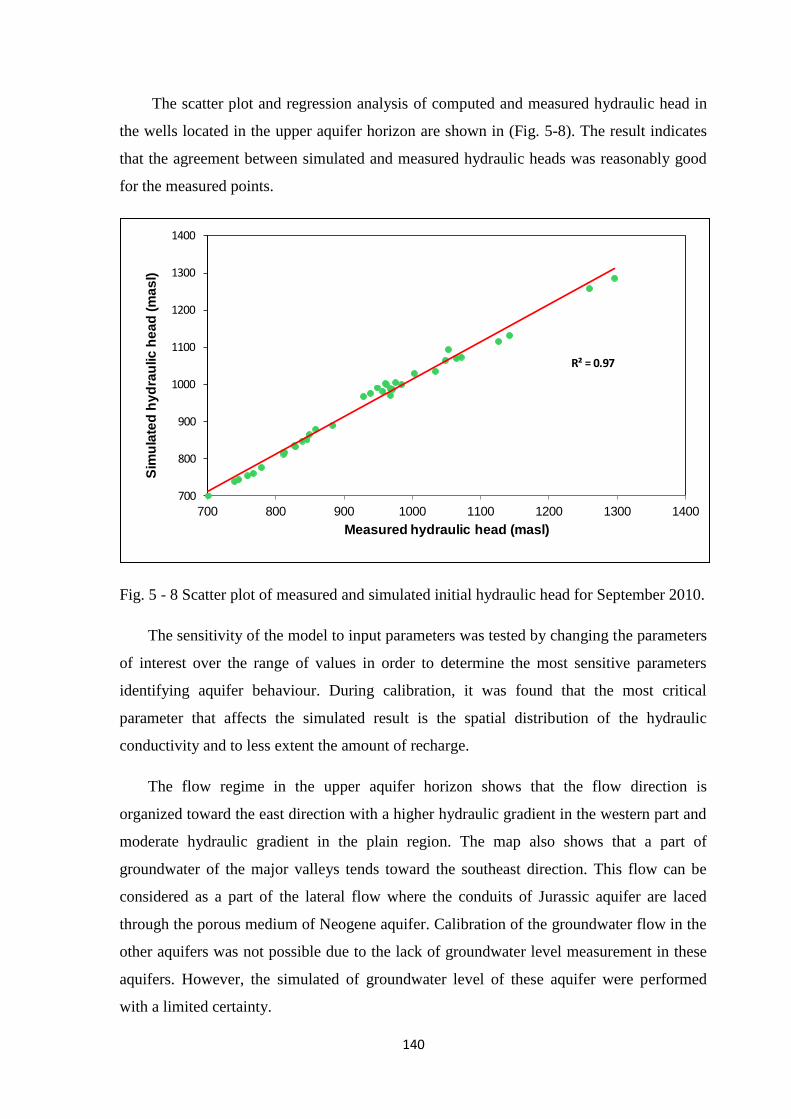
041
The scatter plot and regression analysis of computed and measured hydraulic head in
the wells located in the upper aquifer horizon are shown in (Fig. 5-8). The result indicates
that the agreement between simulated and measured hydraulic heads was reasonably good
for the measured points.
Fig. 5 - 8 Scatter plot of measured and simulated initial hydraulic head for September 2010.
The sensitivity of the model to input parameters was tested by changing the parameters
of interest over the range of values in order to determine the most sensitive parameters
identifying aquifer behaviour. During calibration, it was found that the most critical
parameter that affects the simulated result is the spatial distribution of the hydraulic
conductivity and to less extent the amount of recharge.
The flow regime in the upper aquifer horizon shows that the flow direction is
organized toward the east direction with a higher hydraulic gradient in the western part and
moderate hydraulic gradient in the plain region. The map also shows that a part of
groundwater of the major valleys tends toward the southeast direction. This flow can be
considered as a part of the lateral flow where the conduits of Jurassic aquifer are laced
through the porous medium of Neogene aquifer. Calibration of the groundwater flow in the
other aquifers was not possible due to the lack of groundwater level measurement in these
aquifers. However, the simulated of groundwater level of these aquifer were performed
with a limited certainty.
R² = 0.97
700
800
900
1000
1100
1200
1300
1400
700 800 900 1000 1100 1200 1300 1400
Sim
ula
ted
hy
dra
ulic
he
ad
(m
as
l)
Measured hydraulic head (masl)
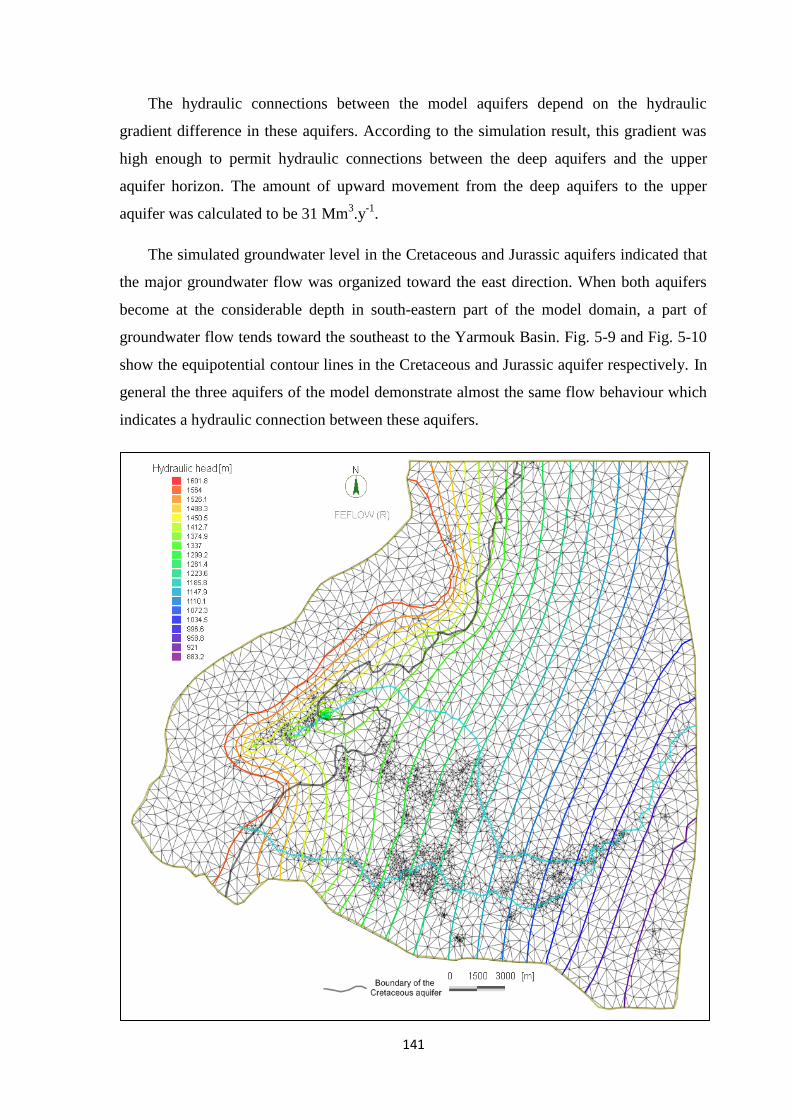
040
The hydraulic connections between the model aquifers depend on the hydraulic
gradient difference in these aquifers. According to the simulation result, this gradient was
high enough to permit hydraulic connections between the deep aquifers and the upper
aquifer horizon. The amount of upward movement from the deep aquifers to the upper
aquifer was calculated to be 31 Mm3.y
-1.
The simulated groundwater level in the Cretaceous and Jurassic aquifers indicated that
the major groundwater flow was organized toward the east direction. When both aquifers
become at the considerable depth in south-eastern part of the model domain, a part of
groundwater flow tends toward the southeast to the Yarmouk Basin. Fig. 5-9 and Fig. 5-10
show the equipotential contour lines in the Cretaceous and Jurassic aquifer respectively. In
general the three aquifers of the model demonstrate almost the same flow behaviour which
indicates a hydraulic connection between these aquifers.
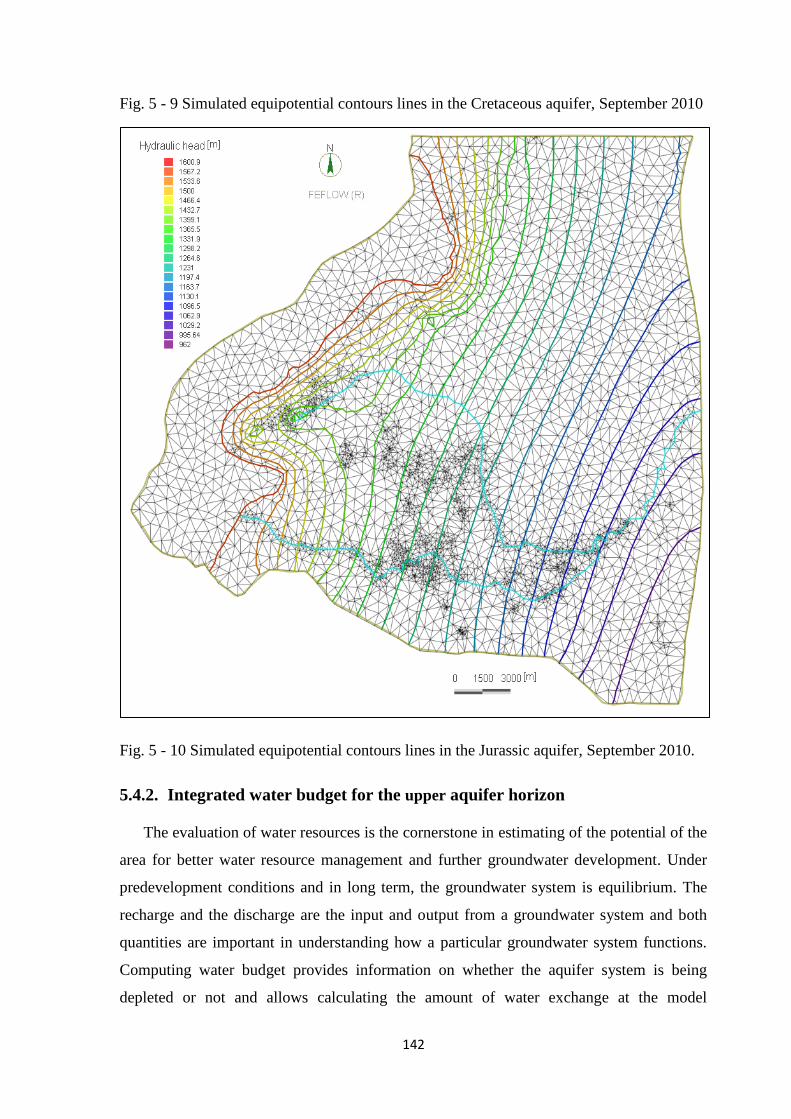
041
Fig. 5 - 9 Simulated equipotential contours lines in the Cretaceous aquifer, September 2010
Fig. 5 - 10 Simulated equipotential contours lines in the Jurassic aquifer, September 2010.
5.4.2. Integrated water budget for the upper aquifer horizon
The evaluation of water resources is the cornerstone in estimating of the potential of the
area for better water resource management and further groundwater development. Under
predevelopment conditions and in long term, the groundwater system is equilibrium. The
recharge and the discharge are the input and output from a groundwater system and both
quantities are important in understanding how a particular groundwater system functions.
Computing water budget provides information on whether the aquifer system is being
depleted or not and allows calculating the amount of water exchange at the model
043
boundaries. This helps to use the available groundwater resources in a sustainable way. The
water budget and flow tools in FEFLOW as well as the FEFLOW classic version can be
used to quantify the volume of water across lines (aquifer boundaries), polygons (model
layers), and boundary conditions (flow in or out of the model). The steady-state calibration
result was used to calculate the preliminary water balance in the upper aquifer horizon. The
change in groundwater storage can be estimated based on the quantity of water entering and
leaving this aquifer during a certain period of time using the following equation:
(21)
Where dV/dT is the change in storage (m3.y
-1), R is the groundwater recharge by
precipitation, lateral inflow, upward leakage, conveyance loss of irrigation and domestic
water, irrigation return flow and wastewater discharge (m3.y
-1). P is the total groundwater
pumping (m3.y
-1), and Q represents the springs discharges and cross-boundary groundwater
outflow from the model area (m3.y
-1). The groundwater balance was calculated based on
available recent data of the hydrological year 2009-2010. The precipitation during this year
is near the long-term average (MOI. 2005). The groundwater used for irrigation does not
depend on the rainfall because there is no rainfall during the summer period.
The indirect recharge component of this budget was developed based on various
assumptions which were drawn upon a hydrogeological and meteorological conditions
dominated in the model area and mainly the fractions that evaporate or recharge the system.
The water budget of the calibrated model domain is balanced. However, the water budget
applied on the upper aquifer horizon indicates an imbalance between the simulated and
estimated components of inflow and outflow (table 5-1) in this aquifer equal to 4.6 Mm3y
-1.
The lateral and upward inflow ensemble is the most important input to this horizon while
the atmospheric precipitation is the second important recharge component. The largest
outflow component is through the eastern boundary. Even with the fact that groundwater
flows across the eastern boundary of the model area, the groundwater system in the
adjacent eastern region is under a great stress than of the model region. Based on the
FEFLOW numerical model and the other primarily information utilized within this study,
the different components of the water budget of the upper aquifer horizon are shown in
table (5-1).
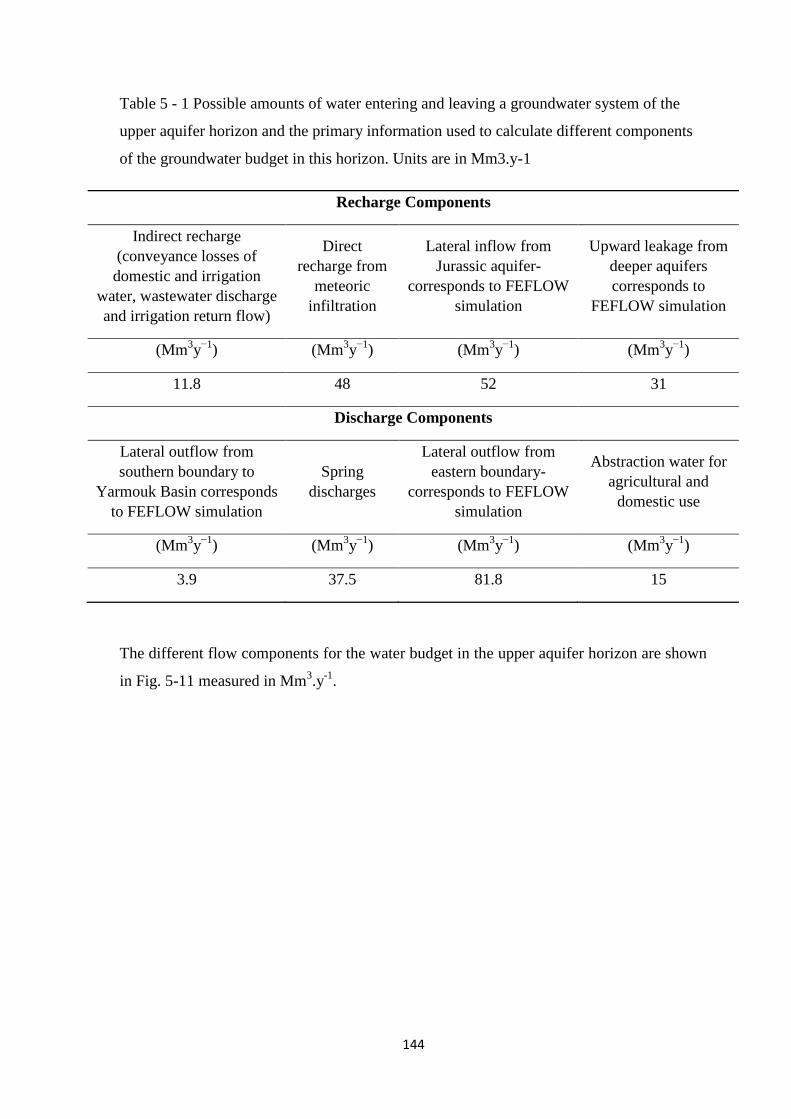
044
Table 5 - 1 Possible amounts of water entering and leaving a groundwater system of the
upper aquifer horizon and the primary information used to calculate different components
of the groundwater budget in this horizon. Units are in Mm3.y-1
Recharge Components
Indirect recharge
(conveyance losses of
domestic and irrigation
water, wastewater discharge
and irrigation return flow)
Direct
recharge from
meteoric
infiltration
Lateral inflow from
Jurassic aquifer-
corresponds to FEFLOW
simulation
Upward leakage from
deeper aquifers
corresponds to
FEFLOW simulation
(Mm3y
−1) (Mm
3y
−1) (Mm
3y
−1) (Mm
3y
−1)
11.8 48 52 31
Discharge Components
Lateral outflow from
southern boundary to
Yarmouk Basin corresponds
to FEFLOW simulation
Spring
discharges
Lateral outflow from
eastern boundary-
corresponds to FEFLOW
simulation
Abstraction water for
agricultural and
domestic use
(Mm3y
−1) (Mm
3y
−1) (Mm
3y
−1) (Mm
3y
−1)
3.9 37.5 81.8 15
The different flow components for the water budget in the upper aquifer horizon are shown
in Fig. 5-11 measured in Mm3.y
-1.
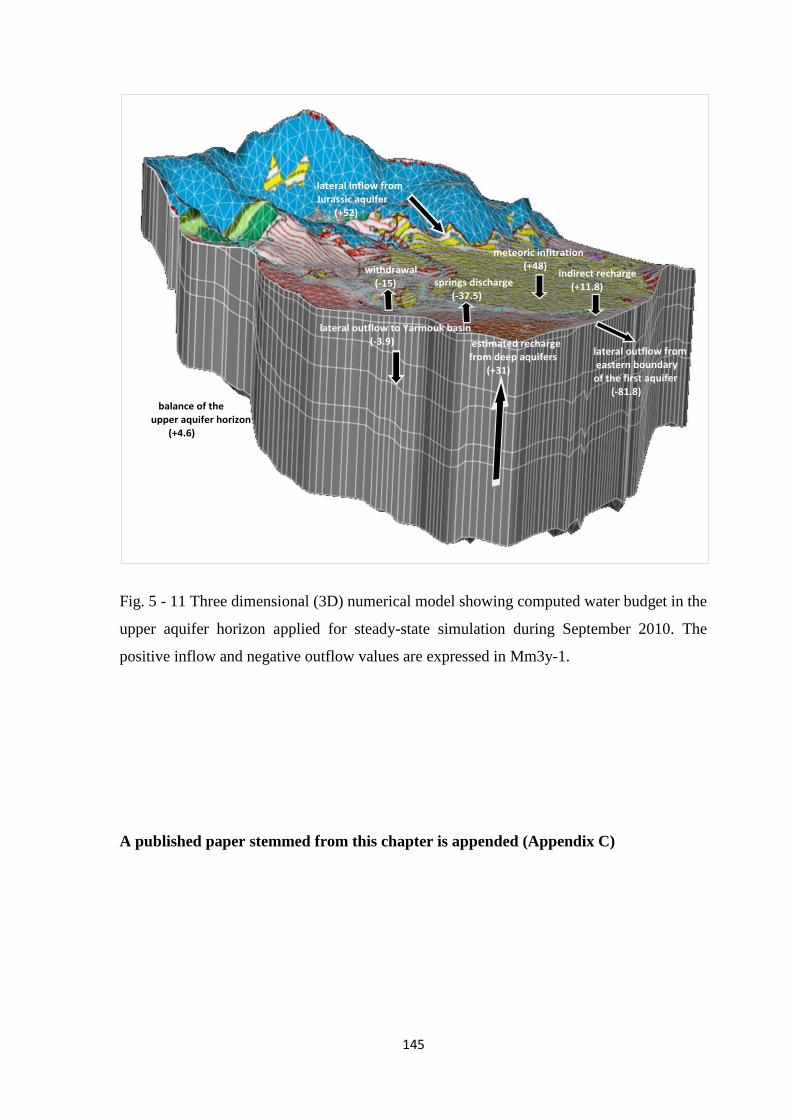
045
Fig. 5 - 11 Three dimensional (3D) numerical model showing computed water budget in the
upper aquifer horizon applied for steady-state simulation during September 2010. The
positive inflow and negative outflow values are expressed in Mm3y-1.
A published paper stemmed from this chapter is appended (Appendix C)
046
Chapter 6. General conclusion and Prospective
6.1. General conclusion
The main objectives of this study were to evaluate groundwater flow behavior and
assess the recharge and discharge mechanisms in the upper part of Awaj River which
occupies the eastern part of Mt. Hermon. The dynamic controlling groundwater flow
system in this area has been investigated. To achieve these objectives, the integration
between hydrochemical, isotopic and hydrodynamic characteristics of groundwater were
used. However, the aquifers system was interpreted based on obtained information on the
flow paths and volumes of groundwater flow. Based on that, the water budget of the upper
aquifer horizon, where the most anthropogenic activities are concentrated, is a considerable
result of this study.
The hydrochemical characteristics of groundwater have provided useful information
about different mechanisms characterising and controlling groundwater flow as a result of
its interaction with the hosting rocks. Based on that and on the discharge of major springs,
the discrimination between different main behavioural trends in groundwater flow pattern
has been distinguished and thus the study area has been divided into four sub-areas. The
dissolution/precipitation of carbonate minerals is the major process dominating water-rocks
interaction and thus controlling groundwater composition not only in the mountainous part
but also in the plain region. This was evidenced by the saturation indices of calcite and
dolomite. However, and to less extent, the silicate hydrolysis and reverse ion exchange,
involving clay minerals, were recognized to play a considerable role in groundwater
composition. The dissolution of gypsum is recognized in some places, mainly in the
Jurassic aquifer.
It is likely that the geochemistry of the groundwater at the upper part of the Awaj River
is controlled by the geogenic process rather than the effect of anthropogenic activities. The
interpretation of hydrogeochemical data reveals a large degree of variability that results
from its marked hydrogeological and lithological complexity. Consequently,
hydrochemical patterns did not give enough evidences for the expecting of huge feeding
flow from Jurassic aquifers towards the other aquifers.
Nevertheless, the hydrochemical facies of groundwater show that about 70% of water
samples, tend to have anion chemistry dominated by HCO3- and cation composition
047
dominated by Ca2+
(Ca-HCO3 water type). This confirms the dissolution/precipitation of
carbonate rocks and the recent recharge of groundwater from atmospheric precipitation.
The similarity in water type tends to express the existence of a unique hydrochemical
system where the individualised groundwater flow paths are difficult to delineate within the
different hydro-stratigraphic units.
A remarkable anthropogenic influence on the groundwater quality was observed
through the infiltration of irrigation water and the effect of fertilizers on nitrate level as well
as the contamination by sewage water and animal waste disposal. This impact has detected
in some villages in the mountainous part as well as in the plain area through the substantial
increases of nitrate and fecal concentrations.
In general, the result of hydrochemical evolution is not clear enough to provide an
effective approach to delineate the flow pattern, indicating that this area is much more
dominated by recharge than discharge processes. Thus, it could be considered as a part of a
main intermediate or regional flow system rather than a local one. The flow pattern is clear
from the potentiometric map but that does not tell the whole story about the groundwater
behaviour.
The isotope compositions of precipitation were used to construct a local meteoric water
line in the study area (δ2H = 7.9.δ
18O +17.9) as well as the relationship between stable
isotope depletion and altitude. This relation indicated that the altitude effect causes a
depletion of -0.23%о per 100 m for 18
O and -1.7 %о per 100 m for 2H. Comparing the
isotope composition of groundwater and precipitation implies an important rapid
infiltration of atmospheric precipitation before significant evaporation takes place prior to
or during the infiltration. These data also show that groundwater recharge takes place all
over the study area but the main recharge occurs over the mountainous parts. The karstic
springs along Arneh valley show similar isotopic composition to the precipitation of that
area. This indicates that these springs issued water is originated from the direct local
recharge of this precipitation. All the groundwater samples are situated to the left of
GMWL suggesting input of local rainfall that derives from weather front originating from
the Mediterranean Sea. The infiltrated precipitation provides the main source of recharge to
the aquifers system through the karst landscape and fractured rocks in the mountainous part
(Jurassic aquifer). It also, but to a less extent, contributes to the recharge of Neogene
048
conglomerate, Quaternary alluvial and basalt formations in the plain region where the
mixing of groundwater flow paths has been recognized.
Nevertheless and based on the hydrochemical and isotopic characteristics of
groundwater, the study area can be divide into two main sub-region A and B. The sub-
region A constitutes the western, south-western, and north-western parts (Jurassic aquifer)
where the main groundwater recharge is occurring. In this part, the karstic features are well
developed in the upper and deeper parts facilitated by cracks and fissures. This leads to
increase the permeability characteristics and enhance the infiltration and dissolution
mechanisms; hence this part is characterized by a high vulnerability of groundwater to
pollution evidenced by high rates of nitrates resulting from sewage water infiltration. The
hydrochemical processes are highly irregular in this part which is suggestive of an active
dissolution phenomenon and a deep vertical groundwater flow.
The sub-region B occupies the south, central and eastern part (Neogene conglomerates
and Quaternary alluvial aquifers). This part is characterized by a shallow horizontal flow
component associated with active interaction between groundwater and hosting rocks,
evidenced by water chemistry evolution. The upward movement from deep aquifers seem
to be an important component to maintain the Neogene/Quaternary aquifer in this sub-
region where the discharge occurs mainly through the major springs and groundwater
abstraction wells. The springs which are distributed in the recent basalt or close to its
border with the other formations in this sub-region, yield significantly high discharge and
cannot be classified under the perched springs. This indicates that these springs are draining
the deeper regional aquifers.
Fluctuation of groundwater level is strongly controlled by atmospheric precipitation
and anthropogenic influence through the increasing of groundwater abstraction.
The development of numerical model which simulated the groundwater system
behavior of the upper part of Awaj River was a useful alternative tool to evaluate
groundwater resources in this region. The result of the calibrated model shows reasonable
agreement between measured and calculated water level in the observed wells. However,
the model has predicted water level in the deep aquifers and the hydraulic connection
between these aquifers and the upper one. Based on the simulation result, the calculation of
the groundwater budget of the upper aquifer horizon was developed.
049
The model result indicates that the elevated Jurassic and Cretaceous aquifers become
confined where they are extended toward the east in the plain region where they are
overlaid by the recent formations. The hydraulic gradient of these aquifers was high enough
to permit hydraulic connections between them and the overlying upper aquifer horizon
through the upward leakage of groundwater. In the upper aquifer horizon, the groundwater
flow system is affected by different mechanisms in terms of recharge and discharge. The
recharge is originated from different sources such as direct meteoric recharge, lateral
recharge along the contacts between Jurassic aquifer and the escarpment conglomerate of
Neogene aquifer and the upward leakage of deep artesian water as well as the indirect
recharge from the irrigation return flow. The discharge is occurred mainly through the
lateral outflow at the eastern and south-eastern boundaries as well as groundwater
withdrawal. The highlands Jurassic aquifer is recharged solely by the infiltration of
intensive rainfall and snowmelt.
Consequently, groundwater flow system in the model domain can be divided into two
different systems. The first is shallow and develops in the unconsolidated or semi-
consolidated Quaternary/Neogene formations in the plain region. The second is deep and
develops in the Cretaceous and Jurassic carbonate strata where the preferential flow
mechanism contributes potentially to the groundwater flow patterns. The hydraulic
connection between the two systems was observed. Groundwater flow in the first system
seems to be controlled by bedding and lithostratigraphic units with a minor downward
component. While in the second system, groundwater flow pathways constitute of two
main components. The first component is controlled by local conduits and an active fault
zones. This component discharges either as a preferential flow throughout several karstic
springs or recharges the upper aquifer horizon through the cavernous limestone as a lateral
groundwater flow. The second component is recognized to be regional which is controlled
by the geological structures as deep vertical groundwater flow. Accordingly, the local flow
and deep circulation of groundwater seem to be dominating and controlling the flow system
in the study area.
Due to the complexity of the geology/hydrogeology and the uncertain accuracy of
hydraulic parameters of deep aquifer (Cretaceous and Jurassic), this groundwater model
was limited in developing a general insight about groundwater system and water budget in
the upper aquifer horizon. However, the most important components of this budget had
been determined. The result indicates that the lateral discharge from the Jurassic karstic
051
aquifer as well as the meteoric infiltration is the most important recharging component of
this budget. The upward movement of groundwater from deeper aquifers plays an
important role in recharging this aquifer. However, the lateral discharge from the eastern
model domain boundary is the most important discharge component which indicates that
the study area can be considered as a main recharge region of the western side in Barada
and Awaj Basin. Nonetheless, the simulated groundwater level in the Cretaceous and
Jurassic aquifer indicated that the major groundwater flow was organized toward the east
direction. In general, the natural characteristics of the hydrogeological dynamic of the study
area seem to play a key role in the groundwater flow system despite of the development of
intensive agricultural/domestic activities in this area.
The obtained result of groundwater modeling is in well agreement with that one
achieved by the interpretation of groundwater hydrochemical characteristics of the study
area. This result clarifies the recharge/discharge mechanisms between two different but
linked hydrogeological systems (shallow and deep), and helps to quantify the different
components of the water budget in the shallow one. The simulated result, which indicates a
relatively high amount of lateral inflow and upward leakage of groundwater into the upper
aquifer horizon, supports the suggestion based on hydrochemical analysis to extend the
orographic basin boundary towards the west. This leads to increase the subsurface recharge
area and justify the considerable quantity (31Mm3.y
-1) of upward leakage from deeper
aquifers to the upper aquifer horizon.
6.2. Prospective
In the dry developing agricultural countries such as Syria, the achieving balance
between short-term productivity growths with the long-term negative impacts of
groundwater depletion is a challenge facing policy makers.
Further additional survey of the aquifer mineralogy, more frequent sampling for
geochemical characterization, isotopes analysis and age-dating techniques as well as
increasing of groundwater model efficiency would help as significant tools for better
understanding of the aquifer system behaviour. However, more accurate geological and
hydrogeological information, in particular the hydraulic and dispersive characteristics of
deep aquifers and karst setting, could give more accurate result in terms of groundwater
050
modeling. Obtaining necessary data during a considerable period will allow running the
model in transient state and applying, probably, different scenarios to predict future
changes in the groundwater system in the study area.
Due to the complexity and lack of hydrodynamic data, the investigations of the
aquifers system in the study area should focus on the isotope techniques that are very useful
to characterize the aquifers system. The accurate information concerning groundwater level
fluctuations, irrigation water losses, crops productivity as well as meteorological data
would help to overcome the policy makers' challenge.
Nonetheless, more accurate results could be obtained by improving the quality of site-
specific information, in particular more accurate information about the hydraulic and
dispersive characteristics of deep aquifers and karst setting (e.g., drilling data, tracer tests,
pumping tests, and additional groundwater level data). However, extending the study area
over the entire Barada and Awaj Basin, and applying regional groundwater flow modeling
might give significant insight about groundwater system in this basin. Immediate reaction
must be taken to reduce water losses throughout the distribution system and the application
of modern irrigation techniques instead of traditional surface ones.
Improving the efficiency of water system data monitoring as well as the
communication between different water authorities will help in accurate determination of
renewable water resources and furthermore in better water resources management strategy.
The co-ordination between the neighboring countries and exchange the experience in terms
of investigations, exploitation, transfer and protection of water resources will give a
significant effort in terms of water management in this semiarid zone.
6.3. Conclusion générale
Les principaux objectifs de cette étude étaient de préciser le fonctionnement
hydrodynamique du système aquifère en utilisant notamment la physico-chimie des
écoulements des eaux souterraines et en précisant l’aspect quantitatif des mécanismes de
recharge et de décharge de la partie supérieure du bassin versant de la rivière Awaj (zone
orientale du Mt. Hermon, Syrie).
051
La dynamique des écoulements des eaux souterraines du système a été précisée en
utilisant à la fois les caractéristiques hydrochimiques (nature et qualification des eaux),
isotopiques (origine et nature) et hydrodynamiques des eaux (balance des eaux et modèle
numérique de quantification).
Un des résultats a été l’identification des directions et sens d’écoulement au sein des
différentes unités hydrogéologiques du bassin versant d’Awaj ainsi que l’estimation des
volumes et stocks de masses d’eau propres à cet aquifère. Ces éléments sont indispensables
pour déterminer les capacités de la ressource en eau de l’aquifère du Quaternaire-Néogène
(aquifère phréatique libre local) à répondre aux besoins humains et agricoles (eau potable et
irrigation). L’étude intègre également l’influence des activités anthropiques concentrées
dans la zone alluviale de la plaine et pouvant affecter la qualité des eaux.
Les caractéristiques hydrochimiques des eaux souterraines ont fourni des informations
essentielles sur les différents mécanismes caractérisant ces eaux. Notamment l’interaction
eau- roche, qui contrôle en grande partie la dissolution-précipitation des ions (majeurs et
mineurs), a permis de préciser la nature des flux d’eaux circulant au sein des différentes
unités géologiques. La dissolution/ précipitation des minéraux carbonatés est le phénomène
dominant et marque la chimie des eaux souterraines tant dans la partie montagneuse que
dans la zone de plaine. Ceci a été démontré par le calcul des indices de saturation de la
calcite et la dolomite. Cependant, et dans une moindre mesure, l'hydrolyse des silicates
(type argiles) peut inverser localement les échanges ioniques et modifier localement
l’hydrochimie des eaux souterraines. Au vue de ces résultats, il est possible de conclure que
les eaux souterraines de la partie supérieure du bassin de la rivière Awaj sont contrôlées par
des processus géogéniques et non anthropiques. Les données hydrogéochimiques révèlent
une grande variabilité, conséquence d’une complexité hydrogéologique et lithologique. De
ce fait, il est difficile de pouvoir clairement identifier les importants flux migrant depuis
l’aquifère du Jurassique vers les autres aquifères surincombants au sein du bassin
sédimentaire.
Les principaux résultats hydrochimiques montrent que plus de 70% des échantillons
d’eau analysés ont une composition anionique de type HCO3- et cationique de type Ca
2+
propre aux eaux carbonatées (Ca-HCO3). Ce résultat confirme d’une part le mécanisme de
dissolution/ précipitation des roches carbonatées et d’autre part une recharge plus récente
de l’ensemble du système aquifère par les précipitations atmosphériques. Les similarités
053
entre les différents types d’eau des aquifères de la zone d’étude tendent à démontrer
l'existence d'un système hydrochimique unique, où la délimitation des chemins
d'écoulement propres aux eaux souterraines sont difficiles à identifier au sein des
différentes unités hydro-stratigraphiques. A noter également, l’influence des activités
anthropiques sur la qualité des eaux du fait de l’infiltration des eaux d’irrigation fortement
chargées en fertilisants (niveau de nitrates élevé) mais également par les eaux usées issues
des décharges de déchets organiques (élevages). Ces impacts ont été identifiés localement
dans certains villages de montagne et de plaine.
Si d’une façon générale, l'évolution de la signature hydrochimique n'est pas suffisante
pour orienter les sens d’écoulement des différentes masses d’eaux considérées le recours
aux cartes piézométriques permettent de préciser clairement les écoulements et de proposer
un modèle de fonctionnement intégrateur. Notre système est à priori caractérisé par un taux
de recharge supérieur la décharge et peut être considéré comme faisant partie d'un système
intermédiaire ou régional plus que local.
La composition isotopique des eaux des précipitations a été utilisée pour construire
localement la ligne d’eau météorique de la zone d'étude (δ2H = 7.9.δ
18O +17.9) ainsi que la
corrélation entre l’appauvrissement en isotopes stables et l'altitude. Cette relation indique
qu’en fonction de l'altitude un appauvrissement de -0,23% par hm pour 18
O et -1,7% par
hm pour 2H. Les résultats de la comparaison entre la composition isotopique des eaux
souterraines à celle des précipitations, impliquent une infiltration rapide des précipitations
atmosphériques avant qu’une évaporation des eaux ne se produise. Ces données montrent
également que la recharge des nappes a lieu dans toute la zone d'étude, mais que la recharge
se produit principalement en zone montagneuse. Cela est démontré par le fait que les
sources karstiques le long de la vallée Arneh montrent une composition isotopique similaire
à celle des eaux de précipitation. Ceci indique que ces émergences sont directement
alimentées par les eaux infiltrées précédemment. Tous les échantillons d'eau souterraine,
ont une composition isotopique située à gauche du GMWL suggérant une contribution des
précipitations locales dérivant des intempéries provenant de la mer Méditerranée.
L’infiltration des précipitations contribue principalement à la recharge de l’aquifères
du Jurassique et plus spécifiquement de sa partie karstique localisée dans les formations de
roches fracturées, en montagne. Elle contribue également, mais dans une moindre mesure, à
la recharge du système des aquifères conglomératiques du Néogène ainsi que des aquifères
054
alluviaux dans les formations basaltiques de la plaine. Dans ce dernier aquifère, un mélange
des flux souterrains a été observé.
Néanmoins, et en fonction des caractéristiques hydrochimiques et isotopiques des eaux
souterraines, la zone d’étude peut être divisée en deux principales sous-région : A et B. La
sous-région A est constituée par la partie occidentale, sud-ouest et nord-ouest, de l’aquifère
jurassique et constitue la principale zone de recharge des nappes souterraines. Dans cette
partie, les caractéristiques karstiques sont bien exprimées aussi bien dans la zone supérieure
qu’en profondeur du fait de l’existence de fissures et de fractures. Cela conduit à augmenter
la conductivité hydraulique de l’aquifère, ce qui induit une prédominance de l'infiltration
ainsi que de la dissolution. D’un autre côté, cette sous-région A est caractérisée par une
forte vulnérabilité des eaux souterraines à la pollution, comme en témoignent les taux
élevés de nitrates issus de l'infiltration des eaux usées. L’irrégularité des processus
hydrochimiques dans cette zone suggère d’actifs phénomènes de dissolution associés à des
écoulements verticaux en profondeur.
La sous-région B occupe le sud, le centre et la zone orientale avec des aquifères dans
les formations conglomératiques du Néogène et alluviales du Quaternaire. Cette partie est
caractérisée par une composante d'écoulement horizontal de sub-surface associée à une
interaction active entre les eaux souterraines et les roches encaissantes, comme en témoigne
l'évolution de la chimie des eaux souterraines. Une circulation de flux ascendant au sein des
aquifères semblent être un élément important pour maintenir le niveau piézométrique de
l'aquifère du Néogène-Quaternaire où la décharge est essentiellement fonction des
émergences (sources) et des prélèvements (puits et forages). Ces sources, présentes dans les
formations basaltiques récentes et aux interfaces avec les autres formations, affichent un
rendement de flux sortants importants et ne peuvent être classées comme des sources
perchées. Ceci indique que ces sources drainent les aquifères régionaux plus importants et
plus profonds.
La fluctuation du niveau piézométrique des eaux souterraines est fortement contrôlée
par les précipitations atmosphériques et l'influence anthropique du fait de l'augmentation
des captages d’eaux souterraines.
Le développement d’un modèle numérique pour simuler le devenir du système d’eaux
souterraines de la partie supérieure du bassin versant de la rivière Awaj est une alternative
055
utile pour évaluer les ressources en eau de la région. Le résultat du modèle calibré montre
un accord raisonnable entre les niveaux observés dans les puits et calculés par simulation.
Le modèle a permis de simuler la hauteur piézométrique dans tous les aquifères profonds
en précisant la nature de la connexion hydraulique avec le premier aquifère de surface du
Quaternaire-Néogène ainsi que ses débits entrants/sortants.
Le résultat du modèle indique que les aquifères Jurassique et du Crétacé supérieur
(Cénomanien-Turonien) sont captifs quand ils s'étendent vers la plaine et surmontés par les
formations plus récentes. Le gradient hydraulique de ces aquifères est suffisamment élevé
pour permettre des connexions hydrauliques entre eux et l’aquifère directement
surincombant par drainance ascendante. Dans l’aquifère superficiel libre du Néogène-
Quaternaire, le système d'écoulement des eaux souterraines est affectée par des mécanismes
différents en termes de réalimentation et de déversement. Le flux de recharge provient de
différentes origines telles que l'infiltration directe par les eaux météoritiques, les recharges
latérales le long des contacts hydrauliques avec l’aquifère du Jurassique et de l’aquifère
conglomératique du Néogène. Cet aquifère libre bénéficie également du flux ascendant par
drainance des eaux profondes mais également indirectement d’une recharge induite par les
flux en retour d'irrigation. L’écoulement sortant se produit principalement par les flux
latéraux aux limites est et sud-est ainsi que par le prélèvement direct des eaux souterraines.
L’aquifère du Jurassique de la partie montagneuse se recharge uniquement par l'infiltration
des importantes précipitations et la fonte des neiges.
Par conséquent, le système d'écoulement des eaux souterraines dans le domaine
modélisé peut être divisé en deux systèmes différents. Le premier est superficiel et se
développe dans les formations non consolidées du Quaternaire et du Néogène de la plaine.
Le second est profond et se développe dans les horizons carbonatés du Crétacé et du
Jurassique. La liaison hydraulique entre les deux systèmes par drainance a été observée.
L’orientation des flux d’eaux souterraines dans le premier système semble être contrôlée
par l’organisation lithologique et les unités stratigraphiques sédimentaires. En revanche,
dans le second système, les écoulements des eaux souterraines ont deux composantes
principales. La première plus locale est contrôlée localement par les chemins au sein des
zones de failles actives, par écoulements préférentiels, et émerges au travers de plusieurs
sources karstiques et par alimentation latérale du premier horizon de l'aquifère au travers
les calcaires caverneux. La seconde plus régionale s’effectue selon un flux ascendant
contrôlé par les structures géologiques. En conséquence, le flux local et la circulation des
056
eaux souterraines en profondeur semblent dominer et contrôler le système d'écoulement
global de la zone d'étude.
En raison de la complexité de la géologie et de l’hydrogéologie et de l'incertitude sur la
précision des paramètres hydrauliques de l'aquifère profond (du Crétacé et du Jurassique),
la finalité du modèle hydrodynamique du système aquifère général est de donné un aperçu
du fonctionnement du système des eaux souterraines et une estimation de la balance des
eaux de la première nappe (aquifère superficiel). Les principales composantes du bilan
volumique des eaux ont été déterminées. Le résultat indique que les flux latéraux de la
partie karstique du Jurassique ainsi que l'infiltration sont les deux principales contributions
du bilan. Le mouvement ascendant des eaux souterraines des aquifères profonds par
drainance joue un rôle important dans la recharge cet aquifère. Pour les sorties, l’exhaure
latéral en limite orientale du domaine est le flux le plus important, qui indique que la zone
d'étude peut être considérée comme la principale zone d’alimentation de la partie ouest du
grand bassin de Barada et Awaj.
Le résultat obtenu par la modélisation des eaux souterraines concorde avec celui
obtenu par l'interprétation des caractéristiques hydrochimiques de la zone d'étude. Ce
résultat clarifie les mécanismes de recharge / décharge entre les deux systèmes
hydrogéologiques différents (profond et superficiel), mais étroitement liés et a permis de
quantifier les différentes composantes de la balance des eaux de l’aquifère superficiel. Le
résultat de la simulation indique une proportion relativement élevée de flux latéraux d’eaux
entrantes avec une drainance ascendante des eaux souterraines profondes vers l’aquifère de
superficiel. Ces observations soutiennent l’hypothèse, issue de l'analyse hydrochimique
d'étendre les limites du bassin orographique vers l'ouest. Cela conduit à augmenter la zone
de recharge de sub-surface et justifie le volume conséquent (31 Mm3.y
-1) du flux ascendant
issu des aquifères plus profonds.
6.4. Perspectives
Dans les pays en développement, tels que la Syrie, l'équilibre - entre l’amélioration de
l’augmentation de la productivité de agriculture en climat aride - à court terme avec les
impacts négatifs à long terme liés à la sur exploitation des eaux souterraines est un défi
pour les décideurs politiques.
057
En complément, une étude de la minéralogie du réservoir, avec une fréquence
d’échantillonnage plus élevée pour l'analyse des isotopes et des techniques de datation
additionnelles permettraient d’améliorer la précision du modèle hydrogéologique et la
compréhension d’un système complexe. Des données géologiques et hydrogéologiques plus
précises en particulier les caractéristiques hydrauliques et de dispersion de l’aquifère
profond permettraient d’affiner le calage du modèle hydrogéologique en zone hétérogène.
L’obtention de ces données sur une période suffisamment longue permettrait d’utiliser le
modèle développé en régime transitoire. Celui-ci pourrait alors être utilisé en déclinant
différents scénarios afin prévoir et évaluer les possibles changements dans le
fonctionnement du système hydrogéologique de la zone d'étude. Ceci tant pour l’aspect
qualitatif que quantitatif.
En raison de la complexité et le manque de données hydrodynamiques, les
performances du modèle hydrogéologique de la zone d'étude ne permettent pas de répondre
à l’ensemble des questionnements. A des fins de calage, le modèle doit intégrer les résultats
issus de l’isotopie qui sont très utiles pour améliorer la compréhension du comportement
des aquifères. Les informations précises concernant les fluctuations piézométriques de la
nappe phréatique, les pertes en eau liées à l'irrigation, l’augmentation de la productivité des
cultures ainsi que les données météorologiques sont un des enjeux majeur en vue de
surmonter le défi d’un développement durable et raisonné de la zone envisagé par les
décideurs et le politique.
L'extension de la zone d'étude à l'ensemble du bassin de Barada et Awaj, en vue de
modéliser régionalement le bilan hydrique, permettrait une meilleure gestion des ressources
en eaux du bassin.
Une des premières mesures à envisager porte sur la réduction des pertes en eau du
système de distribution et l'application de techniques d'irrigation modernes en lieu et place
de l'irrigation de surface traditionnelle.
L'eau domestique est la première priorité en termes de gestion des ressources du bassin du
fait de l'augmentation de cette demande en compensant par une diminution équivalente des
prélèvements pour l’irrigation. Ainsi, les politiques futures doivent tenir compte des
utilisateurs finaux des ressources hydriques. En particulier le domaine agricole, plus grand
consommateur d'eau, a besoin d’un système d’informations précis et optimisé pour tous.
Ceci passe également par une politique de soutiens en action de formations de la main
d’œuvre, des propriétaires et des acteurs régionaux. Ces actions passent par le déploiement
058
de système d'irrigation moderne en accord avec une politique agricole réfléchie. Cela aidera
à réduire la quantité des prélèvements par captage des eaux souterraines à des fins
d'irrigation tout en augmentant l'efficacité des usages de l'eau.
En termes d’eau potable, du fait de ressources limitées dans la zone d'étude, la seule
stratégie adaptée qui devrait être développée, est d'investir dans la protection et
l'amélioration des techniques de prélèvements. L’analyse des coûts et conséquences du
laisser-faire doivent conduire à modifier le modèle économique concernant la ressource
afin de tendre vers une gestion régionale afin d’épargner les eaux à usage domestique.
La coordination entre les pays voisins ainsi que le partage des connaissances et
d’expériences en matière de protection, de transfert et d'exploitation des ressources en eau,
permettraient également d’améliorer significativement une gestion de l'eau concertée en
zone semi-aride.
059
References
- Abed Rabboh, R. Water demand management, progress and policies: Proceedings
of the 3rd
Regional Workshop on Water and Sustainable Development in the
Mediterranean. Zaragoza, Spain, 19 - 21 March 2007.
- Abou Zakhem, B.; Hafez, R. Climatic factors controlling chemical and isotopic
characteristics of precipitation in Syria. Hydrol Process. 2010, 24, 2641-2654.
- Adar, E.M.; Dody, A.; Geyh, M.A.; Yair, A.; Yakirevich, A.; Issar, A.S.
Distribution of stable isotopes in arid storms. I. Relation between the distribution of
isotopic composition in rainfall and in the consequent runoff. Hydrogeol J. 1998, 6,
50-65.
- Aghazadeh, N.; Mogaddam A.A. Investigation of hydrochemical characteristics of
groundwater in the Harzandat aquifer, Northwest of Iran. Environ Monit Assess
2011, 176,183-195.
- Al-Charideh, A. Environmental isotopic and hydrochemical study of water in the
karst aquifer and submarine springs of the Syrian coast. Hydrogeol J. 2007, 15, 351-
364.
- Al-Charideh, A. Environmental isotope study of groundwater discharge from the
large karst springs in West Syria:a case study of Figeh and Al-sin springs. Environ
Earth Sci. 2011, 63,1-10.
- Al-Charideh, A. Geochemical and isotopic characterization of groundwater from
shallow and deep limestone aquifers system of Aleppo basin (north Syria). Environ
Earth Sci. 2012a 65, 1157-1168.
- Al-Charideh, A. Recharge rate estimation in the Mountain karst aquifer system of
Figeh spring, Syria. Environ Earth Sci. 2012b 65, 1169-1178.
- Al-Charideh, A.; Abou Zakhem, B. Distribution of tritium and stable isotopes in
precipitation in Syria. Hydrol Sci J. 2010a, 55, 832-843.
- Al-Charideh, A.; Abou-Zakhem, B. Geochemical and isotopic characterization of
groundwater from the Paleogene limestone aquifer of the Upper Jezireh, Syria.
Environ Earth Sci. 2010b, 59, 1065-1078.
- Al-Charideh, A.; Hasan, A. Use of isotopic tracers to characterize the interaction of
water components and nitrate contamination in the arid Rasafeh area (Syria).
Environ Earth Sci. 2013, 70, 71-82.
061
- Alkhaier, F. Shallow groundwater effect on land surface temperature and surface
energy balance: description, modeling, and remote sensing application. Ph.D.
Thesis, University of Twente. The Netherlands, 2011.
- Alpert, P.; Krichak, D.O.; Sharif, H.; Haim, D.; Osetinsky, I. Climatic trends to
extremes employing regional modeling and statistical interpretation over the E.
Mediterranean. Global planet change. 2008, 63, 163-170.
- Anderson, M.P.; Woessner W.W. Applied groundwater modeling, simulation of
flow and advective transport, Academic press, New York, USA, 1982.
- Anastasiadis, P. Vulnerability of groundwater to agricultural activities Pollution,
Proceedings of the 8th
International Conference on Environmental Science and
Technology Lemnos Island, Greece, 8- 10 September. 2003. Full paper Vol. B, p:
24-30.
- Aouad-Rizk, A.; Job, J.-O.; Khalil, S.; Touma, T.; Bitar, C.; Boqcuillon, C.; Najem,
W. Snow in Lebanon: A preliminary study of snow cover over Mount Lebanon and
simple snowmelt model. Hydrolog Sci J. 2005, 50 (3), 555-569.
- Appelo, C.A J.; Postma, D. Geochemistry, Groundwater and Pollution. A.A.
Balkema, 1993, Rotterdam. The Netherlands.
- Appelo, C.A.J.; Postma, D. Geochemistry, groundwater and pollution. 1996, (p.
536). Rotterdam-Balkema.
- Appelo, C.A.J, Postma, D. Geochemistry, Groundwater and Pollution, 2nd
edition.
2005, Amsterdam, The Netherlands.
- Asfahani, J.; Abdul Ghani, B. Automated interpretation of nuclear and electrical
well loggings for basalt characterization (case study from southern Syria). Appl
Radiat Isot. 2012, 70, 2500-2506.
- Asmael, N.M.; Huneau, F.; Garel, E.; Celle-Jeanton, H.; Le Coustumer, P.; Dupuy,
A. Hydrochemistry to delineate groundwater flow conditions in the Mogher Al Mer
area (Damascus Basin, Southwestern Syria). Environ Earth Sci. 2014, 72, 3205-
3225.
- Aw-Hassan, A.; Rida, F.; Telleria, R.; Bruggeman, A. The impact of food and
agricultural policies on groundwater use in Syria. J. Hydrol. 2014, 513, 204-215.
- Bajjali, W. Evaluation of groundwater in a three-aquifer system in Ramtha area,
Jordan: recharge mechanisms, hydraulic relationship and geochemical evolution.
Hydrogeol J. 2008, 16, 1193-1205.
060
- Bajjali, W. Recharge mechanism and hydrochemistry evaluation of groundwater in
the Nuaimeh Area, Jordan using environmental isotope techniques. Hydrogeol J
2006, 14, 180-191.
- Bakalowicz, M.; El Hakim, M.; El-Hajj, A. Karst groundwater resources in the
countries of eastern Mediterranean: the example of Lebanon. Environ Geol. 2008,
54, 597-604.
- Barbieri, P.; Adami, G.; Favretto, A.; Lutman, A.; Avoscan, W.; Reisenhofer, E.
Robust cluster analysis for detecting physicochemical typologies of freshwater from
wells of the plain of Friuli (north-eastern Italy). Anal Chim Acta 2001, 440, 161-
170.
- Barnes, C.J.; Allison, G.B. Tracing of water movement in the unsaturated zone
using stable isotopes of hydrogen and oxygen. J. Hydrol. 1988, 100, 143-176.
- Bartov, Y.A. structural and paleogeographlcal study of central Sinai faults and
domes, Ph.D. thesis, Hebrew Univ Jerusalem. 1974, 143 p.
- Bartov, Y.; Steinitz, G.; Eyal, Y. Sinistral movement along the Gulf of Aqaba - its
age and relation to the opening of the Red Sea, (letter), Nature 1980, 285, 220-222.
- Batiot, C.; Emblanch, C.; Blavoux, B. Carbone organique total (COT) et
magnésium (Mg+2
): deux traceurs complémentaires du temps de séjour dans
l’aquifère karstique Total Organic Carbon (TOC) and magnesium (Mg+2
): two
complementary tracers of residence time in karstic systems. CR Geosci 2003, 335
(2): 205-214.
- Berkoff, J.A. Strategy for managing water in the Middle East and North Africa.
WORLD BANK, WASHINGTON, D.C. (USA). 1994. 96 pp.
- Bicalho, CC.; Batiot-Guilhe, C.; Seidel, J.L.; Exter, S.V.; Jourde, H. Geochemical
evidence of water source characterization and hydrodynamic responses in a karst
aquifer. J Hydrol. 2012, 450-451: 206-218.
- Bijay-Singh.; Yadvinder-Singh.; Sekhon, G.S. Fertilizer-N use efficiency and
nitrate pollution of groundwater in developing countries. j contam hydrol. 1995, 20,
167-184.
- Bredehoeft, J.D. The water budget myth revisited: why hydrogeologists model.
Groundwater. 2002, 4, 340-345.
- Brielmann, H. Recharge and discharge mechanism and dynamics in the
mountainous northern Upper Jordan River Catchment, Israel. Ph.D. Thesis,
Ludwig-Maximilians-University, Munich, Germany, 2008.
061
- Burdon, D.J.; Safadi, C. Ras-El-Ain: The great karst spring of Mesopotamia, an
hydrogeological study. J Hyrol 1963, 1, 58-95.
- Burdon, D.J.; Safadi, C. The Karst Groundwater of Syria. J Hyrol 1964, 2, 324-347.
- Capaccioni, B.; Didero, M.; Paletta, C.; Salvadori, P. Hydrochemistry of
Groundwater from Carbonate Formation with Basal Gypsiferous Layers. J Hydrol.
2001, 253, 14-26.
- CBS (Central Bureau of Statistics), 2010. Statistical Abstract, 2003–2010. Central
Bureau of Statistics, Damascus, Syria.
- Celle-Jeanton, H.; Gonfiantini, R.; Travi, Y.; Sol, B. Oxygen-18 variations of
rainwater during precipitation: application of the Rayleigh model to selected
rainfalls in Southern France. J Hydrol. 2004, 289, 165-177.
- Chiang, W.H.; Kinzelbach, W.; Rausch, R. Aquifer Simulation Model for Windows
- Groundwater flow and transport modeling, an integrated program. 1998. 137 p.
Berlin, Stuttgart (Borntraeger).
- Clark, I.D.; P. Fritz. Environmental isotopes in hydrogeology. New York, Lewis
Publishers. 1997, 328 p.
- Coetsiers, M.; Walraevens, K. Chemical characterization of the Neogene Aquifer,
Belgium. Hydrogeol J. 2006, 14, 1556-1568
- Craig, H. Isotopic variations in meteoric waters. Science. 1961, 133, 1702-1703.
- Dansgaard,W. Stable isotope in precipitation. Tellus. 1964, 216, 436-468.
- Datta, P.S, Tyagi, S.K. Major Ion Chemistry of Groundwater in Delhi Area:
Chemical Weathering Processes and Groundwater Flow Regime. J Geol Soc India.
1996, 47, 179-188.
- Dehnavi, A.G.; Sarikhani, R.; Nagaraju, D. Hydro geochemical and rock water
interaction studies in East of Kurdistan, N-W of Iran. Int J Environ Sci Res 2011,
1(1), 16-22.
- Deutsch, W.J. Groundwater geochemistry: fundamentals and application to
contamination. 1997 CRC Press, Boca Raton.
- DHI-WASY GmbH. FEFLOW 6. Finite elements subsurface flow and transport
simulation system. User's manual, Berlin. 2010.
- Dinçer, T.; Payne, B.R. An environmental isotope study of the south-western part
karst region of Turkey. J Hydrol. 1971, 14, 233-258.
- Domenico, P.A.; Schwartz, F.W. Physical and chemical hydrogeology. (p. 824).
1990. New York.
063
- Drever, J.I. The Geochemistry of Natural Waters, Prentice-Hall, Upper Saddle
River. 1988.
- Drever, J.I. The Geochemistry of Natural Waters: Surface and Groundwater
Environments. 3rd ed., Prentice-Hall, Upper Saddle River, NJ. 1997, 436pp.
- Dubertret, L. L’Hydrologie et aperçu sur l’Hydrographie de la Syrie et du Liban
dans leurs relations avec la géologie. Rev Géogr Phys Géol Dynamique. 1932, TVI
fas.4.
- Eaid, E. Meteorological Conditions in Mediterranean Basin. General
Meteorological Department. 2000, Damascus, Syria; 41.
- Edmunds, W.M.; Carrillo-Rivera, J.J.; Cardona, A. Geochemical evolution of
groundwater beneath Mexico City. Hydrogeol J. 2002, 258, 1-24.
- Edmunds, W.M.; Ma, J.Z.; Aeschbach-Hertig, W.; Kipfer, R.; Darbyshire, D.P.F.
Groundwater recharge history and hydrogeochemical evolution in the Minqin
Basin, North West China. Appl Geochem. 2006, 21, 2148-2170.
- Edmunds, W.M.; KAY, R.L.F.; McCartney, R.A. Origin of saline groundwater in
the carnmenellis granite (cornwall, england): natural processes and reaction during
hot dry rock reservoir circulation. Chem Geol. 1985, 49, 287-301.
- Edmunds, W.M.; Smedley, P.L. Residence time indicators in groundwater: the East
Midlands Triassic sandstone aquifer. Appl Geochem. 2000 15, (6), 737-752.
- Elango, L. Numerical Simulation of Groundwater Flow and Solute Transport, 1st
ed. 2005. New Delhi, India.
- El-Asrag, A.M. Effect of synoptic and climatic situations on fractionation of stable
isotopes in rainwater over Egypt and east Mediterranean. 2005. IAEA-TECDOC-
1453. 51–73.
- Elhadj, E. The household water crisis in Syria’s Greater Damascus Region. 2004.
School of Oriental & African Studies and King's College London, University of
London.
- El-Hakim, M.; Bakalowicz, M. Significance and origin of very large regulating
power of some karst aquifers in the Middle East. Implication on karst aquifer
classification. J Hyrol. 2007, 333, 329-339.
- Enwright, N.; Hudak, P.F. Spatial distribution of nitrate and related factors in the
High Plains Aquifer, Texas. Environ Geol. 2009, 58, 1541-1548.
- Fairchild, I.J.; Borsato, A.; Tooth, A.F.; Frisia, S.; Hawkesworth, C.J.; Huang, Y.;
McDermott, F.; Spiro, B. Controls on trace element (Sr-Mg) compositions of
064
carbonate cave waters: implications for speleothem climatic records. Chem Geol.
2000, 166 (3–4), 255-269.
- FAO (Food and Agriculture Organization of the United Nations). 2012.
AQUASTAT: http://www.fao.org/nr/water/aquastat/main/index.stm (accessed on 11
February 2013).
- Flakova, R. Formation and changes of groundwater chemical composition of the
Western Carpathian carbonate systems. ACTA Geologica Universitatis Comenianae
Nr. 53, 5 – 25. 1998. Bratislava, Slovakia.
- Freeze, R.A.; Cherry, J.A. Groundwater. Published by: Prentice-Hall, Englewood
Cliffs, N.J. 1979.
- Freund, R.A. Model of the structural development of Israel and adjacent areas since
Upper Cretaceous times. Geol Mag. 1965, 102, 189-205.
- Fritz, P.; Suzuki, O.; Silva, C.; Salati, E. Isotope hydrology of groundwater in the
Pampa del Tamarugal, Chile. J Hydrol. 1981, 53, 161-184.
- Fröhlich, C.J. Water: Reason for Conflict or Catalyst for Peace? The Case of the
Middle East. L'Europe en Formation. 2012, 365, 139-161. DOI: 10.3917/eufor.365.
0139.
- Frumkin, A.; Shimron, A.E.; Miron, Y. Karst morphology across steep climate
gradient southern Mount Hermon. Israel. Z Geomorphol. 1998, 109, 23-40.
- Garfunkel, Z. Internal structureof the Dead Sea leaky transform (Rift) in relation to
plate kinematics. Tectonophysics. 1981, 80, 81-108.
- Garfunkel, Z. Tectonic setting of Phanerozoic magmatismin Israel. Isr. J. Earth Sct.
1989, 38, 51-74.
- Gat, J.R. Comments on the stable isotope method in regional groundwater
investigations. Water Resour Res. 1971, 7, 980-993.
- Gat, J.R.; Matsui, E. Atmospheric water balance in the Amazon Basin. An isotopic
evapo-transpiration model. J Geophys Res. 1991, 96,13179-13188
- Guendouz, A.; Moulla, A. S.; Edmunds, W.M.; Zouari, K.; Shand, P.; Mamou, A.
Hydrogeochemical and isotopic evolution of water in the Complexe Terminal
aquifer in the Algerian Sahara. Hydrogeol J. 2003, 11,483-495.
- Guler, C.; Thyne, G.D. Delineation of hydrochemical facies distribution in a
regional groundwater system by means of fuzzy c-means clustering. Water Resour
Res. 2004a. 40, 1-11.
065
- Guler, C.; Thyne, G.D. Hydrologic and geologic factors controlling surface and
groundwater chemistry in Indian Wells-Owens Valley area, southeastern California,
USA. J Hydrol 2004b 285, 177-198.
- Guler, C.; Thyne. G.D.; McCray, J.E.; Turner, K.A. Evaluation of graphical and
multivariate statistical methods for classification of water chemistry data.
Hydrogeol J 2002, 10, 455-474.
- Han, G.; Liu, C. Water geochemistry controlled by carbonate dissolution: a study of
the river waters draining karst-dominated terrain, Guizhou Province, China. Chem
Geol 2004, 204, 1-21.
- Hartmann, A. Process-based modeling of karst springs in Mt. Hermon, Israel. Ph.D.
Thesis. 2008Albert-Ludwigs-Universität Freiburg im Breisgau, Breisgau, Germany.
- Heathcote, J.A.; Lloyd, J.W. Factors affecting the isotopic composition of daily
rainfall at Driby, Lincolnshire. J Climatol. 1986, 6 (1), 97-106.
- Hem, J.D. Study and interpretation of the chemical characteristics of natural water,
3rd Edn. 1985 U.S. Geol. Surv. Water Supply Paper: 2254.
- Higano, Y.; Melhem, R. Endogenous derivation of the optimal policy measures to
improve the water quality in the Barada Basin, Syria. 2002, In: ERSA conference
papers. RePEc:wiw:wiwrsa:ersa02p249.
- Hsu, K.J. Solubility of dolomite and the composition of Florida groundwater. J
Hydrol. 1963, 1, 288-310.
- INECO. Studies and Integration Consulting (2009) Institutional framework and
decision-making practices for water management in Syria. Towards the
development of strategy for water pollution prevention and control in the Barada
River Basin, Greater Damascus area. Contract No: INCO‐CT‐2006‐517673.
- Integrated Regional Information Networks (IRIN). Syria: Drought pushing millions
into poverty. Damascus 9 September 2010. Available at http://www.irin
news.org/Report/ 90442/SYRIA-Drought-pushing-millions-into-poverty.
- IPCC, Climate Change. The Scientific Basis, Contribution of WG I to the Third
Assessment Report of the Intergovernmental Panel on Climate Change. 2001.
Cambridge Univ. Press.
- Issar, A.S. Climatic Changes and Water Resources in the Middle East and North
Africa 2008. Book, pp: 145-164. DOI: 10.1007/978-3-540-85047-2_12
- Izbicki, J.A.; Borchers, J.W.; Leighton, D.A.; Kulongoski, J.; Fields, L.; Galloway,
D.L.; Michel, R.L. Hydrogeology and Geochemistry of Aquifers Underlying the
066
San Lorenzo and San Leandro Areas of the East Bay Plain, Alameda County,
California. 2003. U.S. Geological Survey, Water-Resources Investigations Report
02-4259.
- Jianhua, S.; Qi, F.; Xiaohu, W.; Yonghong, S.; Haiyang, X.; Zongqiang, C. Major
ion chemistry of groundwater in the extreme arid region northwest China. Environ
Geol 2009, 57 1079-1087.
- JICA (Japan International Cooperation Agency) The study on water resource
development in Northern and Central Basins in the Syrian Arab Republic: final
report. 1997, Nippon Koei, Tokyo.
- JICA (Japan International Cooperation Agency). The study of water resources
development in the western and central basins in Syrian Arab Republic, phase I.
2001, unpublished report, in Arabic.
- Jumaa, V.; Naji, M.; Pala, M. Review paper on optimizing soil water use in Syria.
1999. In: Van Dulmkwden, N.; Pala, M.; Studer, C.; Bieldes, C.L. (eds)
Proceedings of workshop on efficient soil water use. Soil Water Use Consortium,
Niamey, Niger, 26-30 April 1998; Amman, Jordan.
- Kaisi, A.; Al-Chayeb, R.; Al-Zoughbi, S. Water resources in Syria: management,
development and women role. 2006. 3rd
Arab Water Regional Conference: Research
Advancement in Managing Monitoring and Evaluation Limited Water Resources.
- Kattan, Z. Chemical and environmental isotopes study of precipitation in Syria. J
Arid Environ. 1997a 35, 601-615
- Kattan, Z. Environmental isotope study of the major karst springs in Damascus
limestone aquifer systems: case of the Figeh and Barada springs. J Hydrol. 1997b
193, 161-182.
- Kattan, Z. Characterization of surface water and groundwater in the Damascus
Ghotta basin: hydrochemical and environmental isotopes approaches. Environ Geol.
2006 51, 173-201.
- Kattan, z.; Kadkoy, N.; Nasser, S. Effects of artificial recharge via injection wells
on groundwater quality in a shallow alluvial aquifer, central Damascus Basin.
ISMAR, MAR, in Arid Environment. 7th
International Symposium, 9-13 October
2010, Abu Dhabi, UAE.
- Kattan, z. Estimation of evaporation and irrigation return flow in arid zones using
stable isotope ratios and chloride mass-balance analysis: Case of the Euphrates
River, Syria. j. arid environ. 2008, 72, 730-747.
067
- Kennedy, V.C. Silica variations in stream water with time and discharge. In: Hem,
J. D. (Ed.). Nonequilibrium systems in natural water chemistry. Advances in
Chemistry Series American Chemical Society, Washington, DC, 1971, pp. 106-130.
- Kløve, B.; Ala-Aho, P.; Bertrand, G.; Gurdak, J.J.; Kupfersberger, H.; Kvaerner, J.;
Muotka, T.; Mykrä, H.; Preda, E.; Rossi, P.; Uvo, C. B.; Velasco, E.; Pulido-
Velazquez, M. Climate change impacts on groundwater and dependent ecosystems.
J. Hydrol. 2013, 518, 250-266.
- Konikow, L.; Kendy, E. Groundwater depletion: a global problem. Hydrogeol J.
2005, 13, 317-320.
- Kortatsi, B.K. Hydrochemical framework of groundwater in the Ankobra Basin,
Ghana. Aquat Geochem. 2007, 13, 41-74.
- Krige, D.G. A statistical approach to some basic mine valuation problems on the
Witwatersrand. J Chem Metall Min Soc S Afi. 1951, 52,119-139.
- Kubota, T.; Tsuboyama, Y. Estimation of evaporation rate from the forest floor
using oxygen-18 and deuterium composition of throughfall and stream water during
a non-storm runoff period. J Forest Res. 2003, 9(1), 51-59.
- Kumar, C. P. Climate Change and Its Impact on Groundwater Resources. Ent J Eng
Sci. 2012, 1(5), 43-60.
- Kumar, M.; Ramanathan, A.L.R.; Kumar, M.S.B. Identification and evaluation of
hydrogeochemical processes in the groundwater environment of Delhi, India.
Environ Geol. 2006, 50, 1025-1039.
- La-Moreaux, P.E.; Hughes, T.H.; Memon, B.A.; Lineback, N. Hydrogeologic
assessment-Figeh Spring, Damascus, Syria. Environ Geol Water Sci 1989, 13 (2),
73-127.
- Langmuir, D. Aqueous environmental geochemistry (p. 601). Prentice Hall, Inc.
1997
- Langmuir, D. The geochemistry of some carbonates groundwater in central
Pennsylvania. Geochim Cosmochim Ac. 1971, 35, 1023-1045.
- Lawrence, A.R.; Gooddy, D.C.; Kanatharana, P.; Meesilp, M,; Ramnarong, V.
Groundwater evolution beneath Hat Yai, a rapidly developing city in Thailand.
Hydrogeol J. 2000, 8, 564-575.
- Litaor, M. I.; Brielmann, H.; Reichmann, O.; Shenker, M. Hydrochemical analysis
of groundwater using a tree-based model. J Hydrol. 2010, 387, 273-282.
068
- López-Chicano, M.; Bouamama, M.; Vallejos, A.; Pulido-Bosch, A. Factors which
determine the hydrogeochemical behaviour of karstic springs. A case study from the
Betic Cordilleras, Spain. Appl Geochem 2001, 16 (9–10): 1179-1192.
- Luijendijk, E.; Bruggeman, A. Groundwater resources in the Jabal Al Hass region,
northwest Syria: an assessment of past use and future potential. Hydrogeol J 2008,
16, 511-530. doi: 10.1007/s10040-008-0282-5.
- Lubczynski, M. W.; Gurwin, J. Integration of various data sources for transient
groundwater modeling with spatio-temporally variable fluxes - sardon study case,
Spain. J Hydro. 2005, l306, 71–96.
- Ma, J.Z.; Wang, X.S.; Edmunds, W.M. The characteristics of groundwater
resources and their changes under the impacts of human activity in the arid
Northwest China, a case study of the Shiyang River Basin. J Arid Environ. 2005,
61:277-295.
- Ma, J.Z.; Edmunds, W.M. Groundwater and lake evolution in the Badain Jaran
desert ecosystem, Inner Mongolia. Hydrogeol J. 2006, 14, 1231-1243.
- MAAR (Ministry of Agriculture and agrarian reform) syrian agriculture database.
2006. Damascus, Syria.
- Mahmoudzadeh M.R.; Francés, A.P.; Lubczynski. M.; Lambot. S. Using Ground
Penetrating Radar to investigate the water table depth in weathered granites -
Sardon case study, Spain. J Appl Geophys. 2012, 79, 17-26.
- Malkawi, A.H.; Liang, R.Y.; Nusairat, J.H.; Al-Homoud, A.S. Probabilistic Seismic
Hazard Zonation of Syria. Nat Hazards. 1995, 12, 139-151.
- Matthess, G. Properties of groundwater. Wiley, 1982. New York. Translated by
John C. Harvey.
- McMahon, P.B.; Böhlke, J.K.; Christenson, S.C. Geochemistry, radiocarbon
ages,and paleorecharge conditions along a transect in the central High Plains
aquifer, southwestern Kansas, USA. Appl Geochem. 2004, 19 (11), 1655-1686
- Melhem, R.; Higano, Y. Policy measures for river water management in Barada
Basin, Syria. Stud Region Sci. 2001 32, 1-23, DOI:10.2457/srs.32.3_1.
- Merlivat, L.; Jouzel, J. Global climatic interpretation of deuterium-oxygen 18
relationship for precipitation. J Geophys Res. 1979, 84, 5029-5033.
- MOI. Annual Water Resources Report of Barada and Awaj Basin, Damascus, Syria.
2005. (In Arabic), (Unpublished report).
- MOI, Hermon Project Report. 1994. (In Arabic).
069
- Mor, D. A time-table for the Levant Volcanic Province, according to K-Ar dating in
the Golan Heights, Israel. J Afr Earth Sci. 1993, 16, 223-234.
- Moral, F.; Cruz-Sanjulián, J.J.; Olías, M. Geochemical evolution of groundwater in
the carbonate aquifers of Sierra de Segura (Betic Cordillera, southern Spain). J
Hydrol. 2008 360, 281-296.
- Mourad, K.A.; Berndtsson, R. Water Status in the Syrian Water Basins. Open J
Mod Hydrol. 2012, 2, 15-20.
- Mourad, K.A.; Berndtsson, R. Syrian Water Resources between the Present and the
Future. Air, Soil Water Res 2011, 4, 93-100. DOI: 10.4137/ASWR.S8076.
- Mouty, M.; Delalaye, M.; Fontignie, D.; Piskin,O.; Wagner, J.J. The volcanic
activity in Syria and Lebanon between Jurassic and Actual. Schweiz mineral und
petrogr Mitt. 1992, 72, 91-105.
- Nativ, R.; Mazor, E. Rain events in an arid environment-their distribution and ionic
and isotopic composition patterns: Makhtesh Ramon Basin. Israel Journal of
Hydrology. 1987, 89, 205-237.
- Nir, A. Development of isotope methods applied to groundwater hydrology.
Proceedings of a Symposium on Isotope Techniques in the Hydrological Cycle. Am
Geophys Union Monogr Series. 1967 no° 11, pp 1-109.
- Obeidat, M.M.; Awawdeh, M.; Abu Al-Rub, F. Multivariate statistical analysis and
environmental isotopes of Amman/Wadi Sir (B2/A7) groundwater, Yarmouk River
Basin, Jordan. Hydrol Process. 2013, 27, 2449-2461.
- Parkhurst, D.L.; Appelo, C.A.J PHREEQC for windows version 1.4.07. A
hydrogeochemical transport model. 1999. U.S. Geological Survey Software.
- Piper, A.M. A graphic procedure in the geochemical interpretation of water
analyses. Trans Amer Geophys Union. 1944, 25, 914-923.
- Plummer, L.N. Defining reactions and mass transfer in part of the Floridan aquifer.
Water Resour Res 1977, 13 (5), 801-812.
- Plummer, L.N.; Wigley, T.M.L.; Parkhurst, D.L. The kinetics of calcite dissolution
in CO2 water systems at 5–60 C° and 0.0–1.0 atm CO2. Am J Sci 1978, 278 (2)
179-216.
- Plummer, L.N.; Busby, J.F.; Lee. R.W.; Hanshaw, B.B. Geochemical Modeling of
the Madison Aquifer in parts of Montana, Wyoming, and south Dakota. Water
Resour Res. 1990, 26 (9): 1981-2014.
071
- Ponikarov, V.O. The geology of Syria, explanatory notes on the map of Syria, Scale
1:500,000. Part II. Mineral deposits and underground water resources 1967
Technoexport, Moscow.
- Quennell, M. Tectonics of the Dead Sea Rift. 20th InternationaI Geological
Congress. Mexico, Assoc Serv Geol Africa. 1959, pp: 385-405.
- Rakhmatullaev, S.; Huneau, F.; Kazbekov, J.; Celle-Jeanton, H.; Motelica-Heino,
M.; Le Coustumer, P.; Jumanov, J. Groundwater resources of Uzbekistan: an
environmental and operational overview. Cent Eur J Geosci 2012, 4, 67-80.
- RDWSSA (Damascus Rural Water Supply and Sanitation Authority, Damascus,
Syria) Interim Report - Hydrogeological study of Mogher Al Mer area. 2006,
Damascus rural water and sanitation project (Unpublished report, in Arabic),.
- Ribolzi, O.; Andrieux, P.; Valles, V.; Bouzigues, R.; Bariac, T.; Voltz, M.
Contribution of groundwater and overland flows to storm flow generation in a
cultivated Mediterranean catchment. Quantification by natural chemical tracing. J
Hydrol. 2000, 233, 241-257.
- Rimmer, A.; Salingar, Y. Modelling precipitation-streamflow processes in karst
basin: The case of the Jordan River sources, Israel. J Hyrol 2006, 331, 524-542.
- Rindsberger, M.; Jaffe, S.; Rahamim, S.; Gat, J.R. Patterns of the isotopic
composition of precipitation in time and space: data from the Israeli storm water
collection program. Tellus. 1990, 42B, 263-271.
- Rosegrant, M.W.; Cline, S.A. Global food security: challenges and policies. Sci.
2003, 302, 1917-1919. DOI: 10.1126/science.1092958.
- Saad, Z.; Kazpard, V.; El Samrani, A.G, Slim, K. Chemical and isotopic
composition of rainwater in coastal and highland regions in Lebanon. J Environ
Hydrol. 2005, 13.
- Scanlon, B.R.; Keese, K.E.; Flint, A.L.; Flint, L.E.; Gaye, C.B.; Edmunds, W.M.;
Simmers, I. Global synthesis of groundwater recharge in semiarid and arid regions.
Hydrol. Process. 2006, 20, 3335-3370.
- Schoeller, H. Geochemie des eaux souterraines. Application aux eaux des gisements
de petrole. Soc Ed Technip, Paris. 1956, 213 pp.
- Seiler, K.P.; Gat, J.R. Groundwater recharge from run-off and infiltration. 2007,
241pp. Springer Verlag, Dordrecht. DOI: 10.1007/978-1-4020-5306-1
070
- Selkhozpromexport. Water resources use in Barada and Awaj Basins for irrigation
of crops, Syria Arab Republic. 1986. USSR. Ministry of Land Reclamation and
Water Management, Moscow.
- Shimron, A.E. Tectonic evolution of the southern Mount Hermon. Report Geol Surv
Isr Rep GSI. 1998, 10, 98.
- Stadler, S.; Geyh, M.A.; Ploethner, D.; Koeniger, P. The deep Cretaceous aquifer in
the Aleppo and Steppe basins of Syria: assessment of the meteoric origin and
geographic source of the groundwater. Hydrogeol J. 2012, 20 1007-1026.
- Stiff, H.A. The Interpretation of Chemical Water Analysis by Means of Patterns. J
Petrol Technol. 1951 3(10).
- Stumm, W.; Morgan, J.J. Aquatic chemistry; an introduction emphasizing chemical
equilibria in natural waters. 1981, Wiley, New York.
- Stuyfzand, P.J. A new hydrochemical classification of water type. IAHS Red books
1989, 182: 89-98
- Su, G.W.; Jasperse, J.; Seymour, D.; Constantz, J. Estimation of Hydraulic
Conductivity in an Alluvial System Using Temperatures. Groundwater. 2004, 42,
890-901.
- Suk, H.; Lee, K-K. Characterization of a ground water hydrochemical system
through multivariate analysis: Clustering into groundwater zones. Groundwater.
1999, 37, 358-366.
- Suppan, P.; Kunstmann, H.; Heckl, A.; Rimmer, A. Climatic Changes and Water
Resources in the Middle East and North Africa. 2008. Book, pp: 47-58. DOI:
10.1007/978-3-540-85047-2_12.
- Taylor, C.B.; Roether, W. A uniform scale for reporting low-level tritium in water.
Methods of low-level counting and spectrometry. 1982 Vienna, International
Atomic Energy Agency, p: 303-323.
- United Nations Groundwater in the Eastern Mediterranean and Western Asia,
natural resources, water series 1982. no 9, United Nations, New York.
- U.S. Department of Agriculture (USDA), Foreign Agricultural Service Middle East
and Central Asia: Continued drought in 2009/2010 threatens greater food grain
shortages. 2008, available at http://www.pecad.-fas.usda.gov/highlights/2008/
09/mideast_cenasia_drought/, accessed 16 September.
071
- Varol, S.; Davraz, A. Assessment of geochemistry and hydrogeochemical processes
in groundwater of the Tefenni plain (Burdur/Turkey). Environ Earth Sci. 2014, 71,
4657-4673.
- Vengosh. A.; Rosenthal, E. Saline groundwater in Israel: its bearing on the water
crisis in the country. J Hydrol. 1994, 156, 389-430.
- Voss, K. A.; Famiglietti, J.S.; Lo, M.; de Linage, C.; Rodell, M.; Swenson, S.C.
Groundwater depletion in the Middle East from GRACE with implications for
transboundary water management in the Tigris-Euphrates-Western Iran region.
Water Resour Res. 2013, 49, 904-914.
- Wen, X.; Wu, Y.; Zhang, Y.; Liu, F. Hydrochemical characteristics and salinity of
groundwater in the Ejina basin, northwestern China. Environ Geol. 2005, 48, 665-
675.
- White, W. Geomorphology and Hydrology of Karst Terrains. Oxford Univ. Press,
New York. 1988, 464 pp.
- Wilson, M.; Shimron, A.E.; Rosenbaum, J.M.; Preston, J. Early Cretaceous
magmatism of Mount Hermon, Northern Israel. Contributions to Mineralogy and
Petrology. Contrib Mineral Petr. 2000, 139, 54-67.
- Wolfart, R. Hydrogeology of the Damascus Basin (southwest-Syria). Internat,
Assoc. Sci. Hydrology. 1964, 64, 402-413.
- Yurtsever, Y.; Gat, J.R. Atmospheric waters. Stable isotopes hydrology, deuterium
and oxygen-18 in the water cycle. 1981, IAEA, Vienna, Tech Rep Ser no 210.
- Zhou, Y.; Zwahlen, F.; Wang, Y.; Li. Y. Impact of climate change on irrigation
requirements in terms of groundwater resources. Hydrogeol J, 2010, 18, 1571-1582.
- Zhu, G.F.; Li, Z.Z.; Su, Y.H.; Ma, J.Z.; Zhang, Y.Y. Hydrogeochemical and isotope
evidence of groundwater evolution and recharge in Minqin Basin, Northwest China.
J Hydrol. 2007, 333, 239–251.
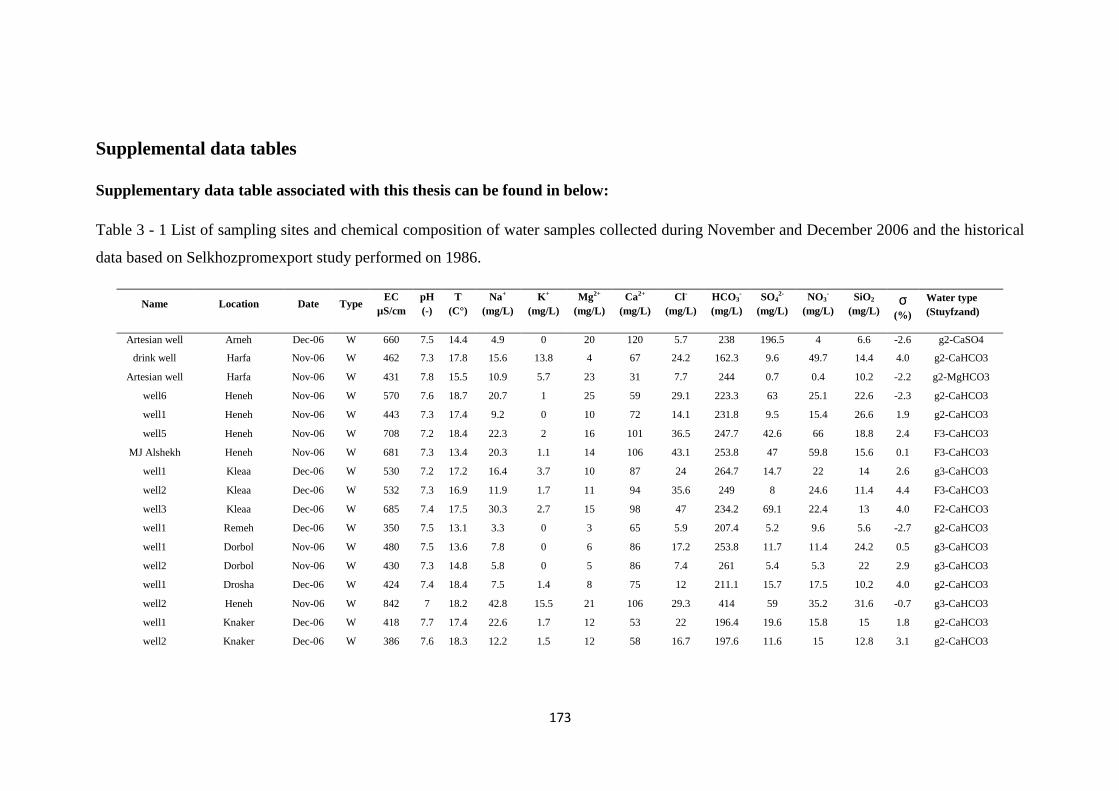
073
Supplemental data tables
Supplementary data table associated with this thesis can be found in below:
Table 3 - 1 List of sampling sites and chemical composition of water samples collected during November and December 2006 and the historical
data based on Selkhozpromexport study performed on 1986.
Name Location Date Type EC
µS/cm
pH
(-)
T
(C°)
Na+
(mg/L)
K+
(mg/L)
Mg2+
(mg/L)
Ca2+
(mg/L)
Cl-
(mg/L)
HCO3-
(mg/L)
SO42-
(mg/L)
NO3-
(mg/L)
SiO2
(mg/L) σ
(%)
Water type
(Stuyfzand)
Artesian well Arneh Dec-06 W 660 7.5 14.4 4.9 0 20 120 5.7 238 196.5 4 6.6 -2.6 g2-CaSO4
drink well Harfa Nov-06 W 462 7.3 17.8 15.6 13.8 4 67 24.2 162.3 9.6 49.7 14.4 4.0 g2-CaHCO3
Artesian well Harfa Nov-06 W 431 7.8 15.5 10.9 5.7 23 31 7.7 244 0.7 0.4 10.2 -2.2 g2-MgHCO3
well6 Heneh Nov-06 W 570 7.6 18.7 20.7 1 25 59 29.1 223.3 63 25.1 22.6 -2.3 g2-CaHCO3
well1 Heneh Nov-06 W 443 7.3 17.4 9.2 0 10 72 14.1 231.8 9.5 15.4 26.6 1.9 g2-CaHCO3
well5 Heneh Nov-06 W 708 7.2 18.4 22.3 2 16 101 36.5 247.7 42.6 66 18.8 2.4 F3-CaHCO3
MJ Alshekh Heneh Nov-06 W 681 7.3 13.4 20.3 1.1 14 106 43.1 253.8 47 59.8 15.6 0.1 F3-CaHCO3
well1 Kleaa Dec-06 W 530 7.2 17.2 16.4 3.7 10 87 24 264.7 14.7 22 14 2.6 g3-CaHCO3
well2 Kleaa Dec-06 W 532 7.3 16.9 11.9 1.7 11 94 35.6 249 8 24.6 11.4 4.4 F3-CaHCO3
well3 Kleaa Dec-06 W 685 7.4 17.5 30.3 2.7 15 98 47 234.2 69.1 22.4 13 4.0 F2-CaHCO3
well1 Remeh Dec-06 W 350 7.5 13.1 3.3 0 3 65 5.9 207.4 5.2 9.6 5.6 -2.7 g2-CaHCO3
well1 Dorbol Nov-06 W 480 7.5 13.6 7.8 0 6 86 17.2 253.8 11.7 11.4 24.2 0.5 g3-CaHCO3
well2 Dorbol Nov-06 W 430 7.3 14.8 5.8 0 5 86 7.4 261 5.4 5.3 22 2.9 g3-CaHCO3
well1 Drosha Dec-06 W 424 7.4 18.4 7.5 1.4 8 75 12 211.1 15.7 17.5 10.2 4.0 g2-CaHCO3
well2 Heneh Nov-06 W 842 7 18.2 42.8 15.5 21 106 29.3 414 59 35.2 31.6 -0.7 g3-CaHCO3
well1 Knaker Dec-06 W 418 7.7 17.4 22.6 1.7 12 53 22 196.4 19.6 15.8 15 1.8 g2-CaHCO3
well2 Knaker Dec-06 W 386 7.6 18.3 12.2 1.5 12 58 16.7 197.6 11.6 15 12.8 3.1 g2-CaHCO3
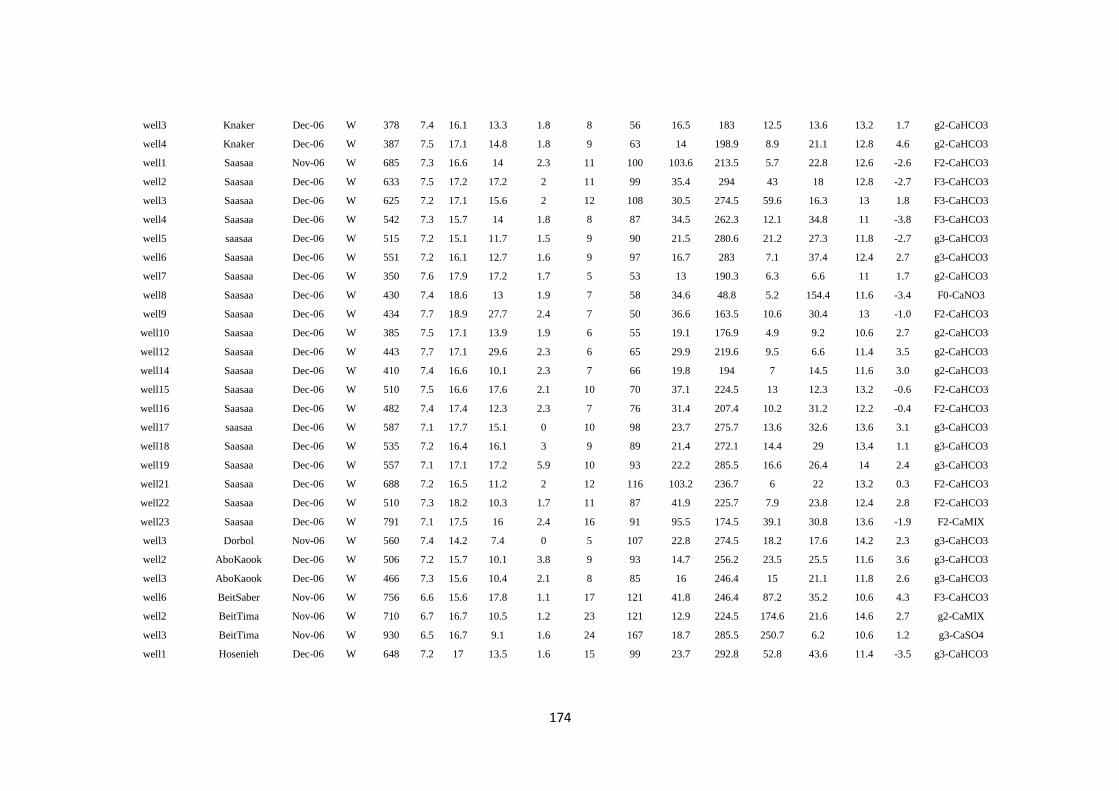
074
well3 Knaker Dec-06 W 378 7.4 16.1 13.3 1.8 8 56 16.5 183 12.5 13.6 13.2 1.7 g2-CaHCO3
well4 Knaker Dec-06 W 387 7.5 17.1 14.8 1.8 9 63 14 198.9 8.9 21.1 12.8 4.6 g2-CaHCO3
well1 Saasaa Nov-06 W 685 7.3 16.6 14 2.3 11 100 103.6 213.5 5.7 22.8 12.6 -2.6 F2-CaHCO3
well2 Saasaa Dec-06 W 633 7.5 17.2 17.2 2 11 99 35.4 294 43 18 12.8 -2.7 F3-CaHCO3
well3 Saasaa Dec-06 W 625 7.2 17.1 15.6 2 12 108 30.5 274.5 59.6 16.3 13 1.8 F3-CaHCO3
well4 Saasaa Dec-06 W 542 7.3 15.7 14 1.8 8 87 34.5 262.3 12.1 34.8 11 -3.8 F3-CaHCO3
well5 saasaa Dec-06 W 515 7.2 15.1 11.7 1.5 9 90 21.5 280.6 21.2 27.3 11.8 -2.7 g3-CaHCO3
well6 Saasaa Dec-06 W 551 7.2 16.1 12.7 1.6 9 97 16.7 283 7.1 37.4 12.4 2.7 g3-CaHCO3
well7 Saasaa Dec-06 W 350 7.6 17.9 17.2 1.7 5 53 13 190.3 6.3 6.6 11 1.7 g2-CaHCO3
well8 Saasaa Dec-06 W 430 7.4 18.6 13 1.9 7 58 34.6 48.8 5.2 154.4 11.6 -3.4 F0-CaNO3
well9 Saasaa Dec-06 W 434 7.7 18.9 27.7 2.4 7 50 36.6 163.5 10.6 30.4 13 -1.0 F2-CaHCO3
well10 Saasaa Dec-06 W 385 7.5 17.1 13.9 1.9 6 55 19.1 176.9 4.9 9.2 10.6 2.7 g2-CaHCO3
well12 Saasaa Dec-06 W 443 7.7 17.1 29.6 2.3 6 65 29.9 219.6 9.5 6.6 11.4 3.5 g2-CaHCO3
well14 Saasaa Dec-06 W 410 7.4 16.6 10.1 2.3 7 66 19.8 194 7 14.5 11.6 3.0 g2-CaHCO3
well15 Saasaa Dec-06 W 510 7.5 16.6 17.6 2.1 10 70 37.1 224.5 13 12.3 13.2 -0.6 F2-CaHCO3
well16 Saasaa Dec-06 W 482 7.4 17.4 12.3 2.3 7 76 31.4 207.4 10.2 31.2 12.2 -0.4 F2-CaHCO3
well17 saasaa Dec-06 W 587 7.1 17.7 15.1 0 10 98 23.7 275.7 13.6 32.6 13.6 3.1 g3-CaHCO3
well18 Saasaa Dec-06 W 535 7.2 16.4 16.1 3 9 89 21.4 272.1 14.4 29 13.4 1.1 g3-CaHCO3
well19 Saasaa Dec-06 W 557 7.1 17.1 17.2 5.9 10 93 22.2 285.5 16.6 26.4 14 2.4 g3-CaHCO3
well21 Saasaa Dec-06 W 688 7.2 16.5 11.2 2 12 116 103.2 236.7 6 22 13.2 0.3 F2-CaHCO3
well22 Saasaa Dec-06 W 510 7.3 18.2 10.3 1.7 11 87 41.9 225.7 7.9 23.8 12.4 2.8 F2-CaHCO3
well23 Saasaa Dec-06 W 791 7.1 17.5 16 2.4 16 91 95.5 174.5 39.1 30.8 13.6 -1.9 F2-CaMIX
well3 Dorbol Nov-06 W 560 7.4 14.2 7.4 0 5 107 22.8 274.5 18.2 17.6 14.2 2.3 g3-CaHCO3
well2 AboKaook Dec-06 W 506 7.2 15.7 10.1 3.8 9 93 14.7 256.2 23.5 25.5 11.6 3.6 g3-CaHCO3
well3 AboKaook Dec-06 W 466 7.3 15.6 10.4 2.1 8 85 16 246.4 15 21.1 11.8 2.6 g3-CaHCO3
well6 BeitSaber Nov-06 W 756 6.6 15.6 17.8 1.1 17 121 41.8 246.4 87.2 35.2 10.6 4.3 F3-CaHCO3
well2 BeitTima Nov-06 W 710 6.7 16.7 10.5 1.2 23 121 12.9 224.5 174.6 21.6 14.6 2.7 g2-CaMIX
well3 BeitTima Nov-06 W 930 6.5 16.7 9.1 1.6 24 167 18.7 285.5 250.7 6.2 10.6 1.2 g3-CaSO4
well1 Hosenieh Dec-06 W 648 7.2 17 13.5 1.6 15 99 23.7 292.8 52.8 43.6 11.4 -3.5 g3-CaHCO3
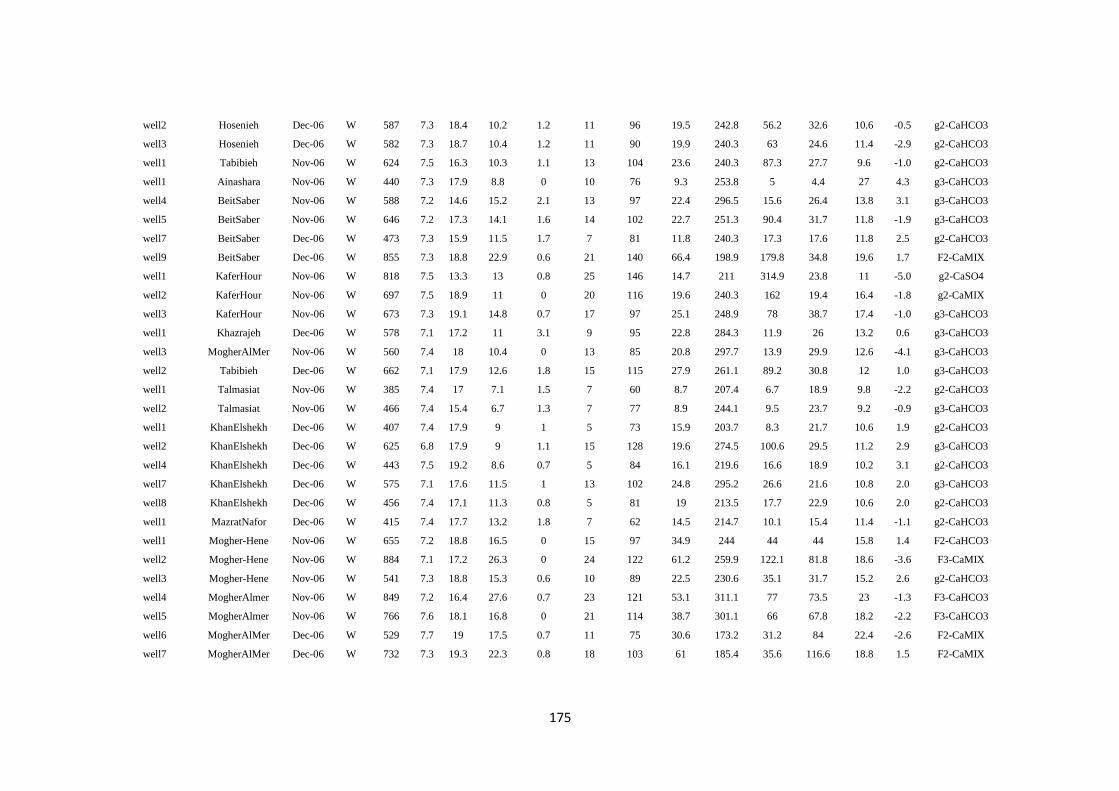
075
well2 Hosenieh Dec-06 W 587 7.3 18.4 10.2 1.2 11 96 19.5 242.8 56.2 32.6 10.6 -0.5 g2-CaHCO3
well3 Hosenieh Dec-06 W 582 7.3 18.7 10.4 1.2 11 90 19.9 240.3 63 24.6 11.4 -2.9 g2-CaHCO3
well1 Tabibieh Nov-06 W 624 7.5 16.3 10.3 1.1 13 104 23.6 240.3 87.3 27.7 9.6 -1.0 g2-CaHCO3
well1 Ainashara Nov-06 W 440 7.3 17.9 8.8 0 10 76 9.3 253.8 5 4.4 27 4.3 g3-CaHCO3
well4 BeitSaber Nov-06 W 588 7.2 14.6 15.2 2.1 13 97 22.4 296.5 15.6 26.4 13.8 3.1 g3-CaHCO3
well5 BeitSaber Nov-06 W 646 7.2 17.3 14.1 1.6 14 102 22.7 251.3 90.4 31.7 11.8 -1.9 g3-CaHCO3
well7 BeitSaber Dec-06 W 473 7.3 15.9 11.5 1.7 7 81 11.8 240.3 17.3 17.6 11.8 2.5 g2-CaHCO3
well9 BeitSaber Dec-06 W 855 7.3 18.8 22.9 0.6 21 140 66.4 198.9 179.8 34.8 19.6 1.7 F2-CaMIX
well1 KaferHour Nov-06 W 818 7.5 13.3 13 0.8 25 146 14.7 211 314.9 23.8 11 -5.0 g2-CaSO4
well2 KaferHour Nov-06 W 697 7.5 18.9 11 0 20 116 19.6 240.3 162 19.4 16.4 -1.8 g2-CaMIX
well3 KaferHour Nov-06 W 673 7.3 19.1 14.8 0.7 17 97 25.1 248.9 78 38.7 17.4 -1.0 g3-CaHCO3
well1 Khazrajeh Dec-06 W 578 7.1 17.2 11 3.1 9 95 22.8 284.3 11.9 26 13.2 0.6 g3-CaHCO3
well3 MogherAlMer Nov-06 W 560 7.4 18 10.4 0 13 85 20.8 297.7 13.9 29.9 12.6 -4.1 g3-CaHCO3
well2 Tabibieh Dec-06 W 662 7.1 17.9 12.6 1.8 15 115 27.9 261.1 89.2 30.8 12 1.0 g3-CaHCO3
well1 Talmasiat Nov-06 W 385 7.4 17 7.1 1.5 7 60 8.7 207.4 6.7 18.9 9.8 -2.2 g2-CaHCO3
well2 Talmasiat Nov-06 W 466 7.4 15.4 6.7 1.3 7 77 8.9 244.1 9.5 23.7 9.2 -0.9 g3-CaHCO3
well1 KhanElshekh Dec-06 W 407 7.4 17.9 9 1 5 73 15.9 203.7 8.3 21.7 10.6 1.9 g2-CaHCO3
well2 KhanElshekh Dec-06 W 625 6.8 17.9 9 1.1 15 128 19.6 274.5 100.6 29.5 11.2 2.9 g3-CaHCO3
well4 KhanElshekh Dec-06 W 443 7.5 19.2 8.6 0.7 5 84 16.1 219.6 16.6 18.9 10.2 3.1 g2-CaHCO3
well7 KhanElshekh Dec-06 W 575 7.1 17.6 11.5 1 13 102 24.8 295.2 26.6 21.6 10.8 2.0 g3-CaHCO3
well8 KhanElshekh Dec-06 W 456 7.4 17.1 11.3 0.8 5 81 19 213.5 17.7 22.9 10.6 2.0 g2-CaHCO3
well1 MazratNafor Dec-06 W 415 7.4 17.7 13.2 1.8 7 62 14.5 214.7 10.1 15.4 11.4 -1.1 g2-CaHCO3
well1 Mogher-Hene Nov-06 W 655 7.2 18.8 16.5 0 15 97 34.9 244 44 44 15.8 1.4 F2-CaHCO3
well2 Mogher-Hene Nov-06 W 884 7.1 17.2 26.3 0 24 122 61.2 259.9 122.1 81.8 18.6 -3.6 F3-CaMIX
well3 Mogher-Hene Nov-06 W 541 7.3 18.8 15.3 0.6 10 89 22.5 230.6 35.1 31.7 15.2 2.6 g2-CaHCO3
well4 MogherAlmer Nov-06 W 849 7.2 16.4 27.6 0.7 23 121 53.1 311.1 77 73.5 23 -1.3 F3-CaHCO3
well5 MogherAlmer Nov-06 W 766 7.6 18.1 16.8 0 21 114 38.7 301.1 66 67.8 18.2 -2.2 F3-CaHCO3
well6 MogherAlMer Dec-06 W 529 7.7 19 17.5 0.7 11 75 30.6 173.2 31.2 84 22.4 -2.6 F2-CaMIX
well7 MogherAlMer Dec-06 W 732 7.3 19.3 22.3 0.8 18 103 61 185.4 35.6 116.6 18.8 1.5 F2-CaMIX
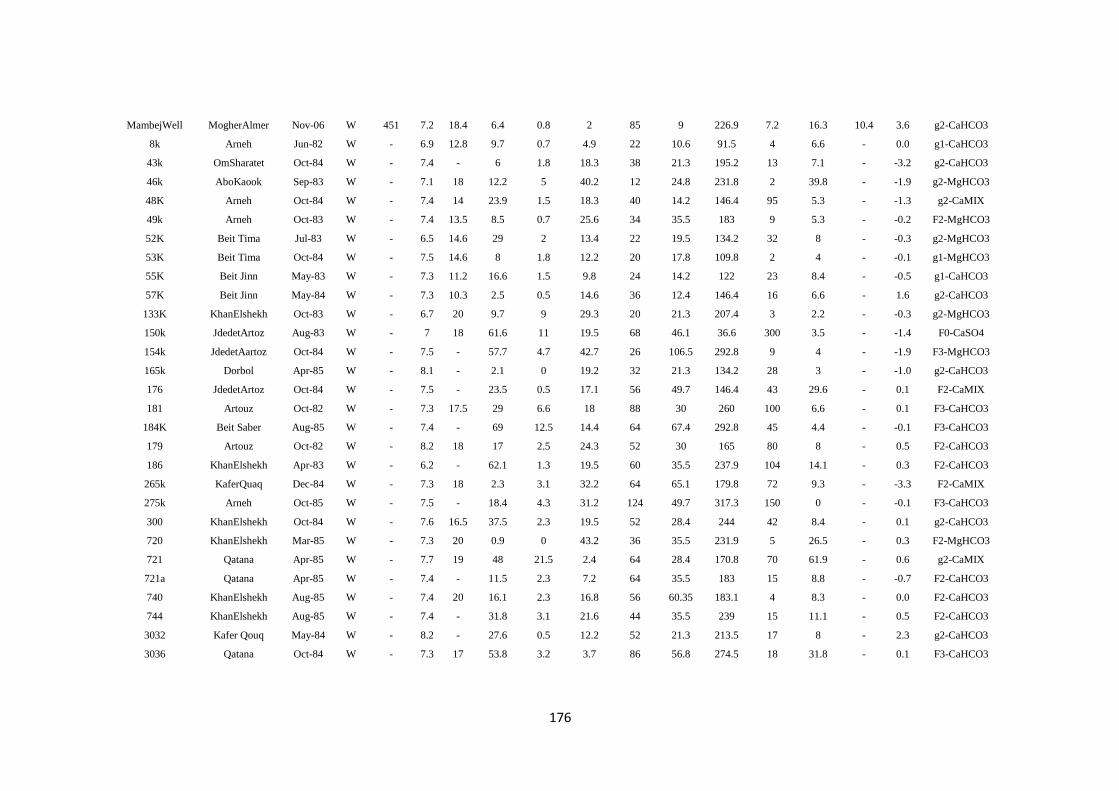
076
MambejWell MogherAlmer Nov-06 W 451 7.2 18.4 6.4 0.8 2 85 9 226.9 7.2 16.3 10.4 3.6 g2-CaHCO3
8k Arneh Jun-82 W - 6.9 12.8 9.7 0.7 4.9 22 10.6 91.5 4 6.6 - 0.0 g1-CaHCO3
43k OmSharatet Oct-84 W - 7.4 - 6 1.8 18.3 38 21.3 195.2 13 7.1 - -3.2 g2-CaHCO3
46k AboKaook Sep-83 W - 7.1 18 12.2 5 40.2 12 24.8 231.8 2 39.8 - -1.9 g2-MgHCO3
48K Arneh Oct-84 W - 7.4 14 23.9 1.5 18.3 40 14.2 146.4 95 5.3 - -1.3 g2-CaMIX
49k Arneh Oct-83 W - 7.4 13.5 8.5 0.7 25.6 34 35.5 183 9 5.3 - -0.2 F2-MgHCO3
52K Beit Tima Jul-83 W - 6.5 14.6 29 2 13.4 22 19.5 134.2 32 8 - -0.3 g2-MgHCO3
53K Beit Tima Oct-84 W - 7.5 14.6 8 1.8 12.2 20 17.8 109.8 2 4 - -0.1 g1-MgHCO3
55K Beit Jinn May-83 W - 7.3 11.2 16.6 1.5 9.8 24 14.2 122 23 8.4 - -0.5 g1-CaHCO3
57K Beit Jinn May-84 W - 7.3 10.3 2.5 0.5 14.6 36 12.4 146.4 16 6.6 - 1.6 g2-CaHCO3
133K KhanElshekh Oct-83 W - 6.7 20 9.7 9 29.3 20 21.3 207.4 3 2.2 - -0.3 g2-MgHCO3
150k JdedetArtoz Aug-83 W - 7 18 61.6 11 19.5 68 46.1 36.6 300 3.5 - -1.4 F0-CaSO4
154k JdedetAartoz Oct-84 W - 7.5 - 57.7 4.7 42.7 26 106.5 292.8 9 4 - -1.9 F3-MgHCO3
165k Dorbol Apr-85 W - 8.1 - 2.1 0 19.2 32 21.3 134.2 28 3 - -1.0 g2-CaHCO3
176 JdedetArtoz Oct-84 W - 7.5 - 23.5 0.5 17.1 56 49.7 146.4 43 29.6 - 0.1 F2-CaMIX
181 Artouz Oct-82 W - 7.3 17.5 29 6.6 18 88 30 260 100 6.6 - 0.1 F3-CaHCO3
184K Beit Saber Aug-85 W - 7.4 - 69 12.5 14.4 64 67.4 292.8 45 4.4 - -0.1 F3-CaHCO3
179 Artouz Oct-82 W - 8.2 18 17 2.5 24.3 52 30 165 80 8 - 0.5 F2-CaHCO3
186 KhanElshekh Apr-83 W - 6.2 - 62.1 1.3 19.5 60 35.5 237.9 104 14.1 - 0.3 F2-CaHCO3
265k KaferQuaq Dec-84 W - 7.3 18 2.3 3.1 32.2 64 65.1 179.8 72 9.3 - -3.3 F2-CaMIX
275k Arneh Oct-85 W - 7.5 - 18.4 4.3 31.2 124 49.7 317.3 150 0 - -0.1 F3-CaHCO3
300 KhanElshekh Oct-84 W - 7.6 16.5 37.5 2.3 19.5 52 28.4 244 42 8.4 - 0.1 g2-CaHCO3
720 KhanElshekh Mar-85 W - 7.3 20 0.9 0 43.2 36 35.5 231.9 5 26.5 - 0.3 F2-MgHCO3
721 Qatana Apr-85 W - 7.7 19 48 21.5 2.4 64 28.4 170.8 70 61.9 - 0.6 g2-CaMIX
721a Qatana Apr-85 W - 7.4 - 11.5 2.3 7.2 64 35.5 183 15 8.8 - -0.7 F2-CaHCO3
740 KhanElshekh Aug-85 W - 7.4 20 16.1 2.3 16.8 56 60.35 183.1 4 8.3 - 0.0 F2-CaHCO3
744 KhanElshekh Aug-85 W - 7.4 - 31.8 3.1 21.6 44 35.5 239 15 11.1 - 0.5 F2-CaHCO3
3032 Kafer Qouq May-84 W - 8.2 - 27.6 0.5 12.2 52 21.3 213.5 17 8 - 2.3 g2-CaHCO3
3036 Qatana Oct-84 W - 7.3 17 53.8 3.2 3.7 86 56.8 274.5 18 31.8 - 0.1 F3-CaHCO3
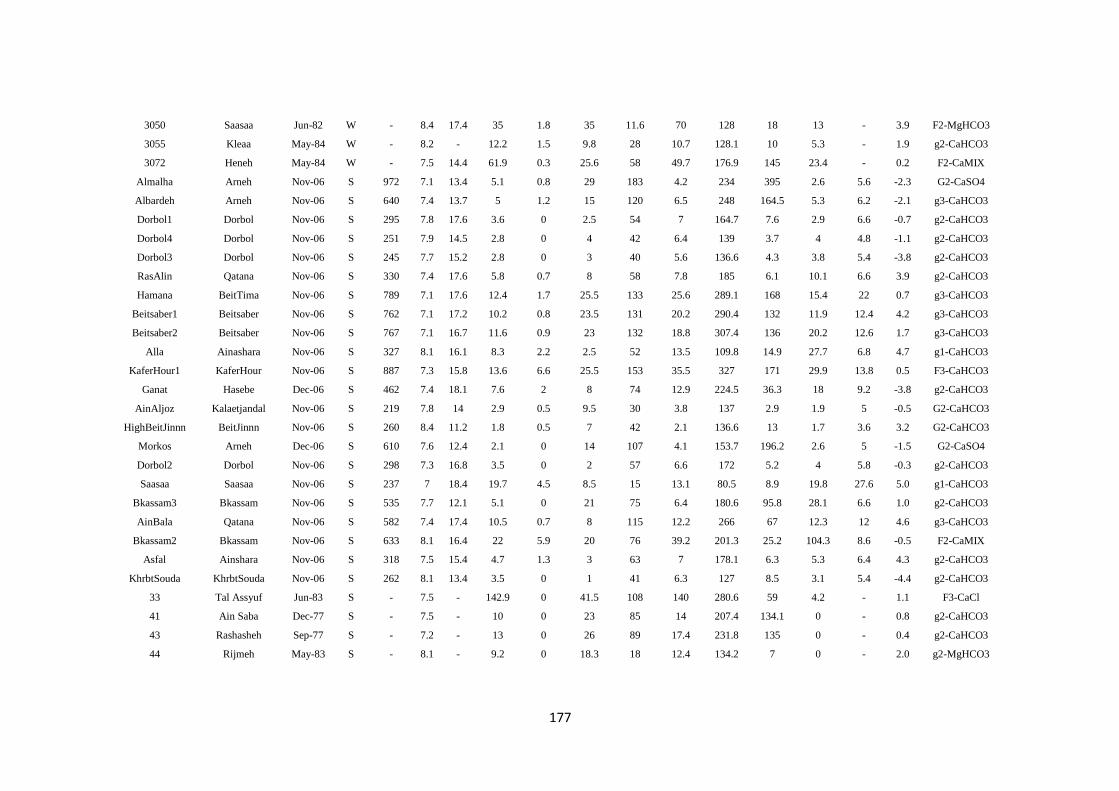
077
3050 Saasaa Jun-82 W - 8.4 17.4 35 1.8 35 11.6 70 128 18 13 - 3.9 F2-MgHCO3
3055 Kleaa May-84 W - 8.2 - 12.2 1.5 9.8 28 10.7 128.1 10 5.3 - 1.9 g2-CaHCO3
3072 Heneh May-84 W - 7.5 14.4 61.9 0.3 25.6 58 49.7 176.9 145 23.4 - 0.2 F2-CaMIX
Almalha Arneh Nov-06 S 972 7.1 13.4 5.1 0.8 29 183 4.2 234 395 2.6 5.6 -2.3 G2-CaSO4
Albardeh Arneh Nov-06 S 640 7.4 13.7 5 1.2 15 120 6.5 248 164.5 5.3 6.2 -2.1 g3-CaHCO3
Dorbol1 Dorbol Nov-06 S 295 7.8 17.6 3.6 0 2.5 54 7 164.7 7.6 2.9 6.6 -0.7 g2-CaHCO3
Dorbol4 Dorbol Nov-06 S 251 7.9 14.5 2.8 0 4 42 6.4 139 3.7 4 4.8 -1.1 g2-CaHCO3
Dorbol3 Dorbol Nov-06 S 245 7.7 15.2 2.8 0 3 40 5.6 136.6 4.3 3.8 5.4 -3.8 g2-CaHCO3
RasAlin Qatana Nov-06 S 330 7.4 17.6 5.8 0.7 8 58 7.8 185 6.1 10.1 6.6 3.9 g2-CaHCO3
Hamana BeitTima Nov-06 S 789 7.1 17.6 12.4 1.7 25.5 133 25.6 289.1 168 15.4 22 0.7 g3-CaHCO3
Beitsaber1 Beitsaber Nov-06 S 762 7.1 17.2 10.2 0.8 23.5 131 20.2 290.4 132 11.9 12.4 4.2 g3-CaHCO3
Beitsaber2 Beitsaber Nov-06 S 767 7.1 16.7 11.6 0.9 23 132 18.8 307.4 136 20.2 12.6 1.7 g3-CaHCO3
Alla Ainashara Nov-06 S 327 8.1 16.1 8.3 2.2 2.5 52 13.5 109.8 14.9 27.7 6.8 4.7 g1-CaHCO3
KaferHour1 KaferHour Nov-06 S 887 7.3 15.8 13.6 6.6 25.5 153 35.5 327 171 29.9 13.8 0.5 F3-CaHCO3
Ganat Hasebe Dec-06 S 462 7.4 18.1 7.6 2 8 74 12.9 224.5 36.3 18 9.2 -3.8 g2-CaHCO3
AinAljoz Kalaetjandal Nov-06 S 219 7.8 14 2.9 0.5 9.5 30 3.8 137 2.9 1.9 5 -0.5 G2-CaHCO3
HighBeitJinnn BeitJinnn Nov-06 S 260 8.4 11.2 1.8 0.5 7 42 2.1 136.6 13 1.7 3.6 3.2 G2-CaHCO3
Morkos Arneh Dec-06 S 610 7.6 12.4 2.1 0 14 107 4.1 153.7 196.2 2.6 5 -1.5 G2-CaSO4
Dorbol2 Dorbol Nov-06 S 298 7.3 16.8 3.5 0 2 57 6.6 172 5.2 4 5.8 -0.3 g2-CaHCO3
Saasaa Saasaa Nov-06 S 237 7 18.4 19.7 4.5 8.5 15 13.1 80.5 8.9 19.8 27.6 5.0 g1-CaHCO3
Bkassam3 Bkassam Nov-06 S 535 7.7 12.1 5.1 0 21 75 6.4 180.6 95.8 28.1 6.6 1.0 g2-CaHCO3
AinBala Qatana Nov-06 S 582 7.4 17.4 10.5 0.7 8 115 12.2 266 67 12.3 12 4.6 g3-CaHCO3
Bkassam2 Bkassam Nov-06 S 633 8.1 16.4 22 5.9 20 76 39.2 201.3 25.2 104.3 8.6 -0.5 F2-CaMIX
Asfal Ainshara Nov-06 S 318 7.5 15.4 4.7 1.3 3 63 7 178.1 6.3 5.3 6.4 4.3 g2-CaHCO3
KhrbtSouda KhrbtSouda Nov-06 S 262 8.1 13.4 3.5 0 1 41 6.3 127 8.5 3.1 5.4 -4.4 g2-CaHCO3
33 Tal Assyuf Jun-83 S - 7.5 - 142.9 0 41.5 108 140 280.6 59 4.2 - 1.1 F3-CaCl
41 Ain Saba Dec-77 S - 7.5 - 10 0 23 85 14 207.4 134.1 0 - 0.8 g2-CaHCO3
43 Rashasheh Sep-77 S - 7.2 - 13 0 26 89 17.4 231.8 135 0 - 0.4 g2-CaHCO3
44 Rijmeh May-83 S - 8.1 - 9.2 0 18.3 18 12.4 134.2 7 0 - 2.0 g2-MgHCO3
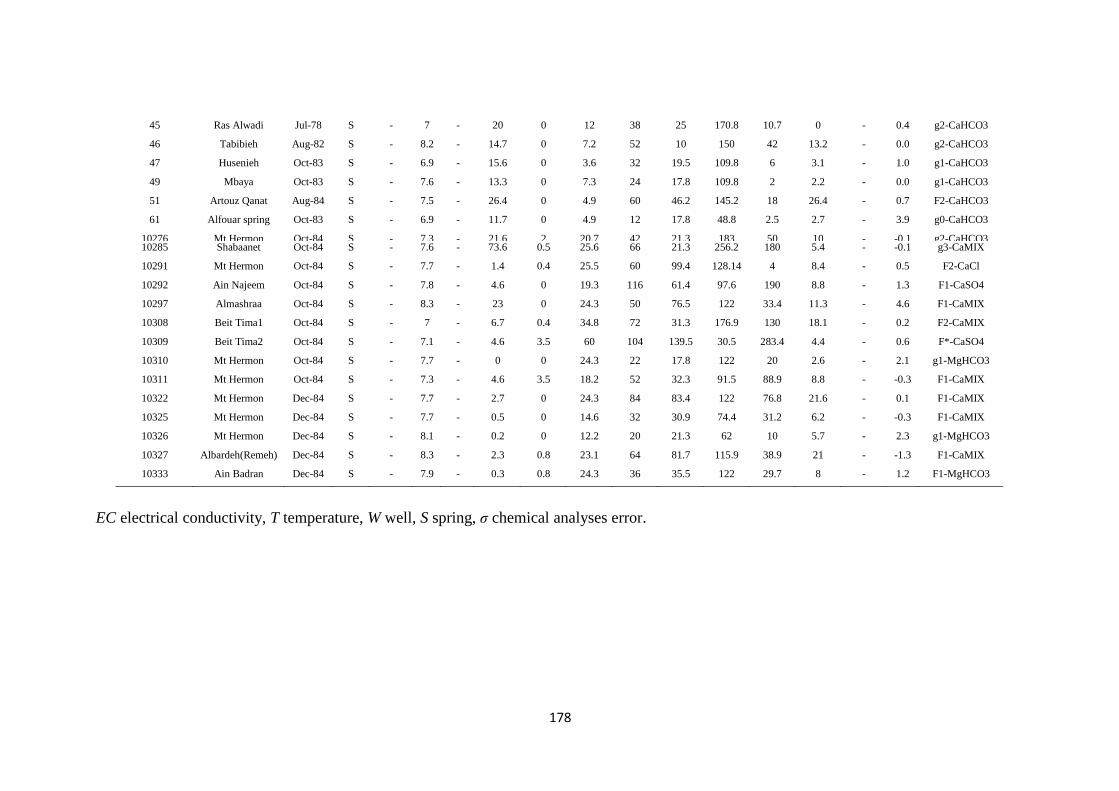
078
45 Ras Alwadi Jul-78 S - 7 - 20 0 12 38 25 170.8 10.7 0 - 0.4 g2-CaHCO3
46 Tabibieh Aug-82 S - 8.2 - 14.7 0 7.2 52 10 150 42 13.2 - 0.0 g2-CaHCO3
47 Husenieh Oct-83 S - 6.9 - 15.6 0 3.6 32 19.5 109.8 6 3.1 - 1.0 g1-CaHCO3
49 Mbaya Oct-83 S - 7.6 - 13.3 0 7.3 24 17.8 109.8 2 2.2 - 0.0 g1-CaHCO3
51 Artouz Qanat Aug-84 S - 7.5 - 26.4 0 4.9 60 46.2 145.2 18 26.4 - 0.7 F2-CaHCO3
61 Alfouar spring Oct-83 S - 6.9 - 11.7 0 4.9 12 17.8 48.8 2.5 2.7 - 3.9 g0-CaHCO3
10276 Mt Hermon Oct-84 S - 7.3 - 21.6 2 20.7 42 21.3 183 50 10 - -0.1 g2-CaHCO3 10285 Shabaanet Oct-84 S - 7.6 - 73.6 0.5 25.6 66 21.3 256.2 180 5.4 - -0.1 g3-CaMIX
10291 Mt Hermon Oct-84 S - 7.7 - 1.4 0.4 25.5 60 99.4 128.14 4 8.4 - 0.5 F2-CaCl
10292 Ain Najeem Oct-84 S - 7.8 - 4.6 0 19.3 116 61.4 97.6 190 8.8 - 1.3 F1-CaSO4
10297 Almashraa Oct-84 S - 8.3 - 23 0 24.3 50 76.5 122 33.4 11.3 - 4.6 F1-CaMIX
10308 Beit Tima1 Oct-84 S - 7 - 6.7 0.4 34.8 72 31.3 176.9 130 18.1 - 0.2 F2-CaMIX
10309 Beit Tima2 Oct-84 S - 7.1 - 4.6 3.5 60 104 139.5 30.5 283.4 4.4 - 0.6 F*-CaSO4
10310 Mt Hermon Oct-84 S - 7.7 - 0 0 24.3 22 17.8 122 20 2.6 - 2.1 g1-MgHCO3
10311 Mt Hermon Oct-84 S - 7.3 - 4.6 3.5 18.2 52 32.3 91.5 88.9 8.8 - -0.3 F1-CaMIX
10322 Mt Hermon Dec-84 S - 7.7 - 2.7 0 24.3 84 83.4 122 76.8 21.6 - 0.1 F1-CaMIX
10325 Mt Hermon Dec-84 S - 7.7 - 0.5 0 14.6 32 30.9 74.4 31.2 6.2 - -0.3 F1-CaMIX
10326 Mt Hermon Dec-84 S - 8.1 - 0.2 0 12.2 20 21.3 62 10 5.7 - 2.3 g1-MgHCO3
10327 Albardeh(Remeh) Dec-84 S - 8.3 - 2.3 0.8 23.1 64 81.7 115.9 38.9 21 - -1.3 F1-CaMIX
10333 Ain Badran Dec-84 S - 7.9 - 0.3 0.8 24.3 36 35.5 122 29.7 8 - 1.2 F1-MgHCO3
EC electrical conductivity, T temperature, W well, S spring, σ chemical analyses error.
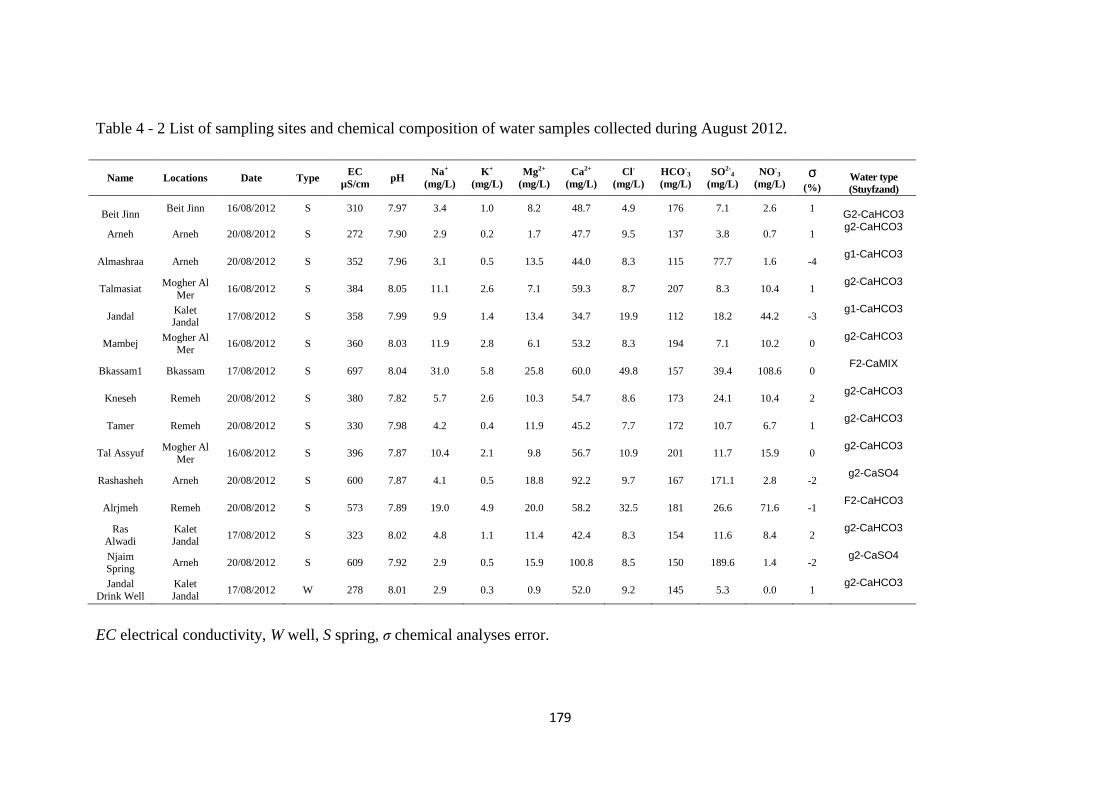
079
Table 4 - 2 List of sampling sites and chemical composition of water samples collected during August 2012.
Name Locations Date Type EC
µS/cm pH
Na+
(mg/L)
K+
(mg/L)
Mg2+
(mg/L)
Ca2+
(mg/L)
Cl-
(mg/L)
HCO-3
(mg/L)
SO2-4
(mg/L)
NO-3
(mg/L) σ
(%) Water type
(Stuyfzand)
Beit Jinn Beit Jinn 16/08/2012 S 310 7.97 3.4 1.0 8.2 48.7 4.9 176 7.1 2.6 1
G2-CaHCO3
Arneh Arneh 20/08/2012 S 272 7.90 2.9 0.2 1.7 47.7 9.5 137 3.8 0.7 1 g2-CaHCO3
Almashraa Arneh 20/08/2012 S 352 7.96 3.1 0.5 13.5 44.0 8.3 115 77.7 1.6 -4 g1-CaHCO3
Talmasiat Mogher Al
Mer 16/08/2012 S 384 8.05 11.1 2.6 7.1 59.3 8.7 207 8.3 10.4 1
g2-CaHCO3
Jandal Kalet Jandal
17/08/2012 S 358 7.99 9.9 1.4 13.4 34.7 19.9 112 18.2 44.2 -3 g1-CaHCO3
Mambej Mogher Al
Mer 16/08/2012 S 360 8.03 11.9 2.8 6.1 53.2 8.3 194 7.1 10.2 0
g2-CaHCO3
Bkassam1 Bkassam 17/08/2012 S 697 8.04 31.0 5.8 25.8 60.0 49.8 157 39.4 108.6 0 F2-CaMIX
Kneseh Remeh 20/08/2012 S 380 7.82 5.7 2.6 10.3 54.7 8.6 173 24.1 10.4 2 g2-CaHCO3
Tamer Remeh 20/08/2012 S 330 7.98 4.2 0.4 11.9 45.2 7.7 172 10.7 6.7 1 g2-CaHCO3
Tal Assyuf Mogher Al
Mer 16/08/2012 S 396 7.87 10.4 2.1 9.8 56.7 10.9 201 11.7 15.9 0
g2-CaHCO3
Rashasheh Arneh 20/08/2012 S 600 7.87 4.1 0.5 18.8 92.2 9.7 167 171.1 2.8 -2 g2-CaSO4
Alrjmeh Remeh 20/08/2012 S 573 7.89 19.0 4.9 20.0 58.2 32.5 181 26.6 71.6 -1 F2-CaHCO3
Ras
Alwadi
Kalet
Jandal 17/08/2012 S 323 8.02 4.8 1.1 11.4 42.4 8.3 154 11.6 8.4 2
g2-CaHCO3
Njaim
Spring Arneh 20/08/2012 S 609 7.92 2.9 0.5 15.9 100.8 8.5 150 189.6 1.4 -2
g2-CaSO4
Jandal
Drink Well
Kalet
Jandal 17/08/2012 W 278 8.01 2.9 0.3 0.9 52.0 9.2 145 5.3 0.0 1
g2-CaHCO3
EC electrical conductivity, W well, S spring, σ chemical analyses error.
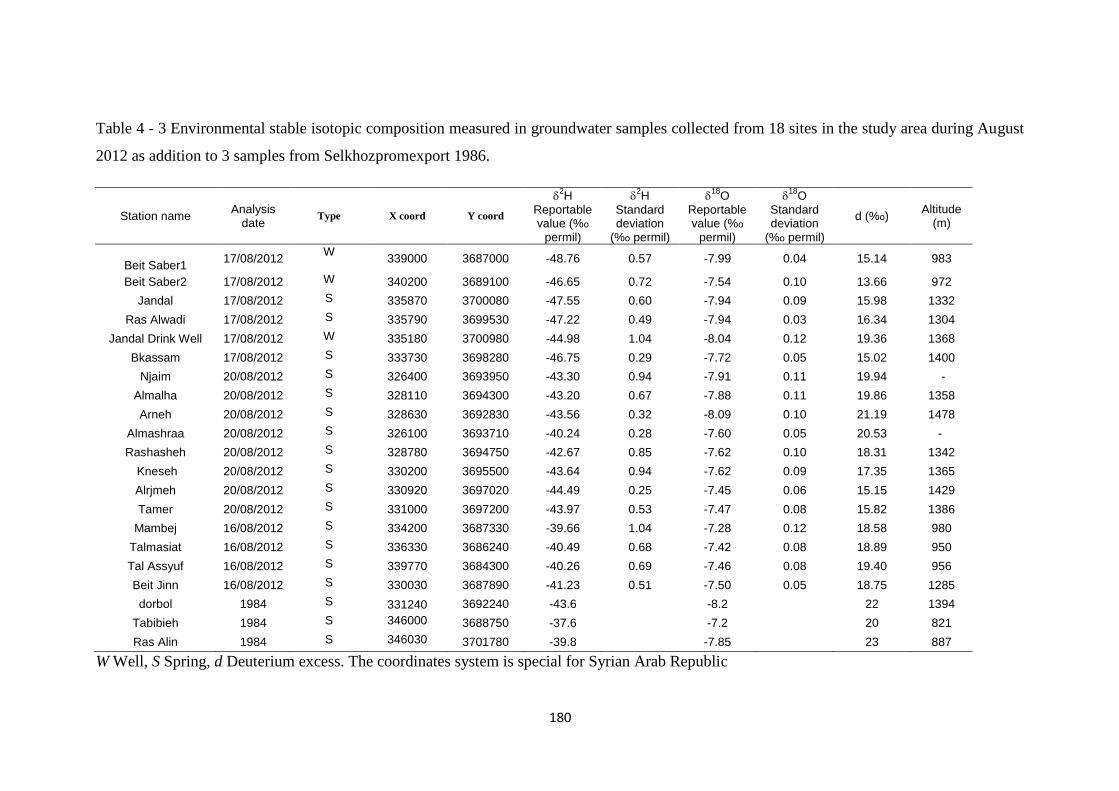
081
Table 4 - 3 Environmental stable isotopic composition measured in groundwater samples collected from 18 sites in the study area during August
2012 as addition to 3 samples from Selkhozpromexport 1986.
Station name Analysis
date Type X coord Y coord
2H
Reportable value (%о
permil)
2H
Standard deviation
(%о permil)
18
O Reportable value (%о
permil)
18
O Standard deviation
(%о permil)
d (%о) Altitude
(m)
Beit Saber1
17/08/2012 W
339000 3687000 -48.76 0.57 -7.99 0.04 15.14 983
Beit Saber2 17/08/2012 W 340200 3689100 -46.65 0.72 -7.54 0.10 13.66 972
Jandal 17/08/2012 S 335870 3700080 -47.55 0.60 -7.94 0.09 15.98 1332
Ras Alwadi 17/08/2012 S 335790 3699530 -47.22 0.49 -7.94 0.03 16.34 1304
Jandal Drink Well 17/08/2012 W 335180 3700980 -44.98 1.04 -8.04 0.12 19.36 1368
Bkassam 17/08/2012 S 333730 3698280 -46.75 0.29 -7.72 0.05 15.02 1400
Njaim 20/08/2012 S 326400 3693950 -43.30 0.94 -7.91 0.11 19.94 -
Almalha 20/08/2012 S 328110 3694300 -43.20 0.67 -7.88 0.11 19.86 1358
Arneh 20/08/2012 S 328630 3692830 -43.56 0.32 -8.09 0.10 21.19 1478
Almashraa 20/08/2012 S 326100 3693710 -40.24 0.28 -7.60 0.05 20.53 -
Rashasheh 20/08/2012 S 328780 3694750 -42.67 0.85 -7.62 0.10 18.31 1342
Kneseh 20/08/2012 S 330200 3695500 -43.64 0.94 -7.62 0.09 17.35 1365
Alrjmeh 20/08/2012 S 330920 3697020 -44.49 0.25 -7.45 0.06 15.15 1429
Tamer 20/08/2012 S 331000 3697200 -43.97 0.53 -7.47 0.08 15.82 1386
Mambej 16/08/2012 S 334200 3687330 -39.66 1.04 -7.28 0.12 18.58 980
Talmasiat 16/08/2012 S 336330 3686240 -40.49 0.68 -7.42 0.08 18.89 950
Tal Assyuf 16/08/2012 S 339770 3684300 -40.26 0.69 -7.46 0.08 19.40 956
Beit Jinn 16/08/2012 S 330030 3687890 -41.23 0.51 -7.50 0.05 18.75 1285
dorbol 1984 S 331240
3692240 -43.6 -8.2 22 1394
Tabibieh 1984 S 346000 3688750 -37.6 -7.2 20 821
Ras Alin 1984 S 346030 3701780 -39.8 -7.85 23 887
W Well, S Spring, d Deuterium excess. The coordinates system is special for Syrian Arab Republic
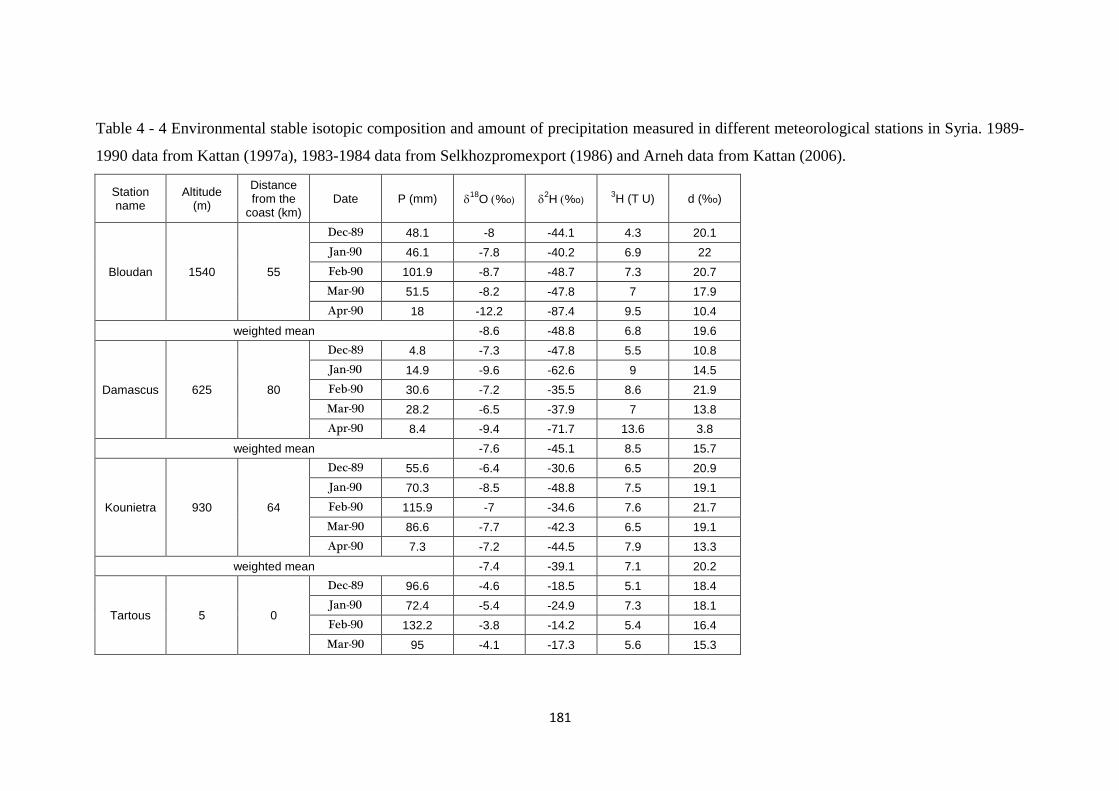
080
Table 4 - 4 Environmental stable isotopic composition and amount of precipitation measured in different meteorological stations in Syria. 1989-
1990 data from Kattan (1997a), 1983-1984 data from Selkhozpromexport (1986) and Arneh data from Kattan (2006).
Station name
Altitude (m)
Distance from the
coast (km) Date P (mm)
18O %о)
2H %о)
3H (T U) d (%о)
Bloudan 1540 55
Dec-89 48.1 -8 -44.1 4.3 20.1
Jan-90 46.1 -7.8 -40.2 6.9 22
Feb-90 101.9 -8.7 -48.7 7.3 20.7
Mar-90 51.5 -8.2 -47.8 7 17.9
Apr-90 18 -12.2 -87.4 9.5 10.4
weighted mean -8.6 -48.8 6.8 19.6
Damascus 625 80
Dec-89 4.8 -7.3 -47.8 5.5 10.8
Jan-90 14.9 -9.6 -62.6 9 14.5
Feb-90 30.6 -7.2 -35.5 8.6 21.9
Mar-90 28.2 -6.5 -37.9 7 13.8
Apr-90 8.4 -9.4 -71.7 13.6 3.8
weighted mean -7.6 -45.1 8.5 15.7
Kounietra 930 64
Dec-89 55.6 -6.4 -30.6 6.5 20.9
Jan-90 70.3 -8.5 -48.8 7.5 19.1
Feb-90 115.9 -7 -34.6 7.6 21.7
Mar-90 86.6 -7.7 -42.3 6.5 19.1
Apr-90 7.3 -7.2 -44.5 7.9 13.3
weighted mean -7.4 -39.1 7.1 20.2
Tartous 5 0
Dec-89 96.6 -4.6 -18.5 5.1 18.4
Jan-90 72.4 -5.4 -24.9 7.3 18.1
Feb-90 132.2 -3.8 -14.2 5.4 16.4
Mar-90 95 -4.1 -17.3 5.6 15.3
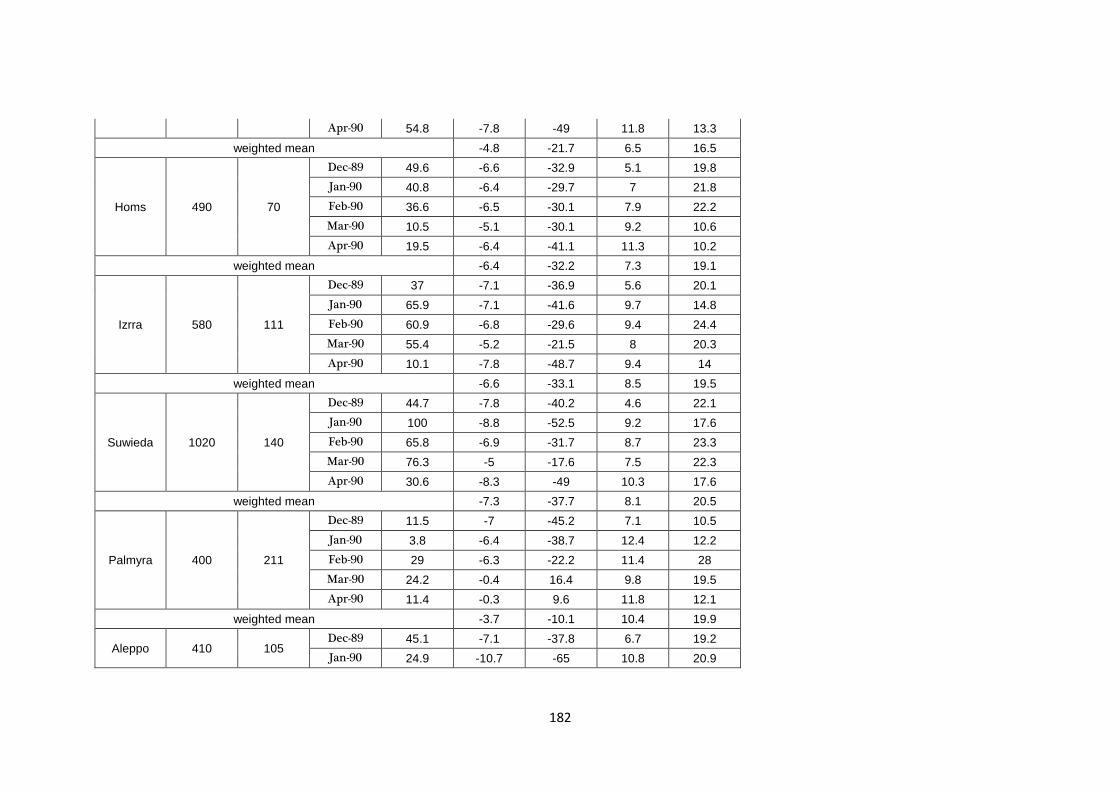
081
Apr-90 54.8 -7.8 -49 11.8 13.3
weighted mean -4.8 -21.7 6.5 16.5
Homs 490 70
Dec-89 49.6 -6.6 -32.9 5.1 19.8
Jan-90 40.8 -6.4 -29.7 7 21.8
Feb-90 36.6 -6.5 -30.1 7.9 22.2
Mar-90 10.5 -5.1 -30.1 9.2 10.6
Apr-90 19.5 -6.4 -41.1 11.3 10.2
weighted mean -6.4 -32.2 7.3 19.1
Izrra 580 111
Dec-89 37 -7.1 -36.9 5.6 20.1
Jan-90 65.9 -7.1 -41.6 9.7 14.8
Feb-90 60.9 -6.8 -29.6 9.4 24.4
Mar-90 55.4 -5.2 -21.5 8 20.3
Apr-90 10.1 -7.8 -48.7 9.4 14
weighted mean -6.6 -33.1 8.5 19.5
Suwieda 1020 140
Dec-89 44.7 -7.8 -40.2 4.6 22.1
Jan-90 100 -8.8 -52.5 9.2 17.6
Feb-90 65.8 -6.9 -31.7 8.7 23.3
Mar-90 76.3 -5 -17.6 7.5 22.3
Apr-90 30.6 -8.3 -49 10.3 17.6
weighted mean -7.3 -37.7 8.1 20.5
Palmyra 400 211
Dec-89 11.5 -7 -45.2 7.1 10.5
Jan-90 3.8 -6.4 -38.7 12.4 12.2
Feb-90 29 -6.3 -22.2 11.4 28
Mar-90 24.2 -0.4 16.4 9.8 19.5
Apr-90 11.4 -0.3 9.6 11.8 12.1
weighted mean -3.7 -10.1 10.4 19.9
Aleppo 410 105 Dec-89 45.1 -7.1 -37.8 6.7 19.2
Jan-90 24.9 -10.7 -65 10.8 20.9
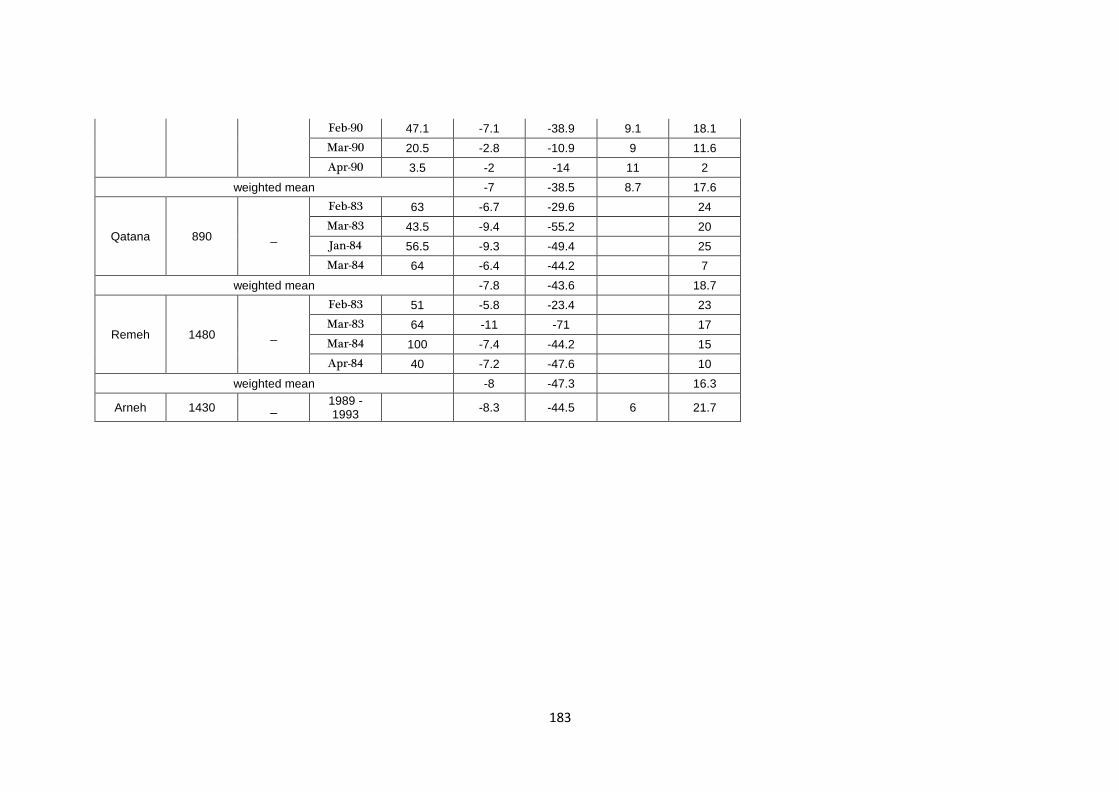
083
Feb-90 47.1 -7.1 -38.9 9.1 18.1
Mar-90 20.5 -2.8 -10.9 9 11.6
Apr-90 3.5 -2 -14 11 2
weighted mean -7 -38.5 8.7 17.6
Qatana 890 _
Feb-83 63 -6.7 -29.6 24
Mar-83 43.5 -9.4 -55.2 20
Jan-84 56.5 -9.3 -49.4 25
Mar-84 64 -6.4 -44.2 7
weighted mean -7.8 -43.6 18.7
Remeh 1480 _
Feb-83 51 -5.8 -23.4 23
Mar-83 64 -11 -71 17
Mar-84 100 -7.4 -44.2 15
Apr-84 40 -7.2 -47.6 10
weighted mean -8 -47.3 16.3
Arneh 1430 _ 1989 -1993
-8.3 -44.5 6 21.7
084
Appendices
Appendix A Published Article
Article published in the journal of Environmental Earth Sciences
Hydrochemistry to delineate groundwater flow conditions in the
Mogher Al Mer area (Damascus Basin, Southwestern Syria)
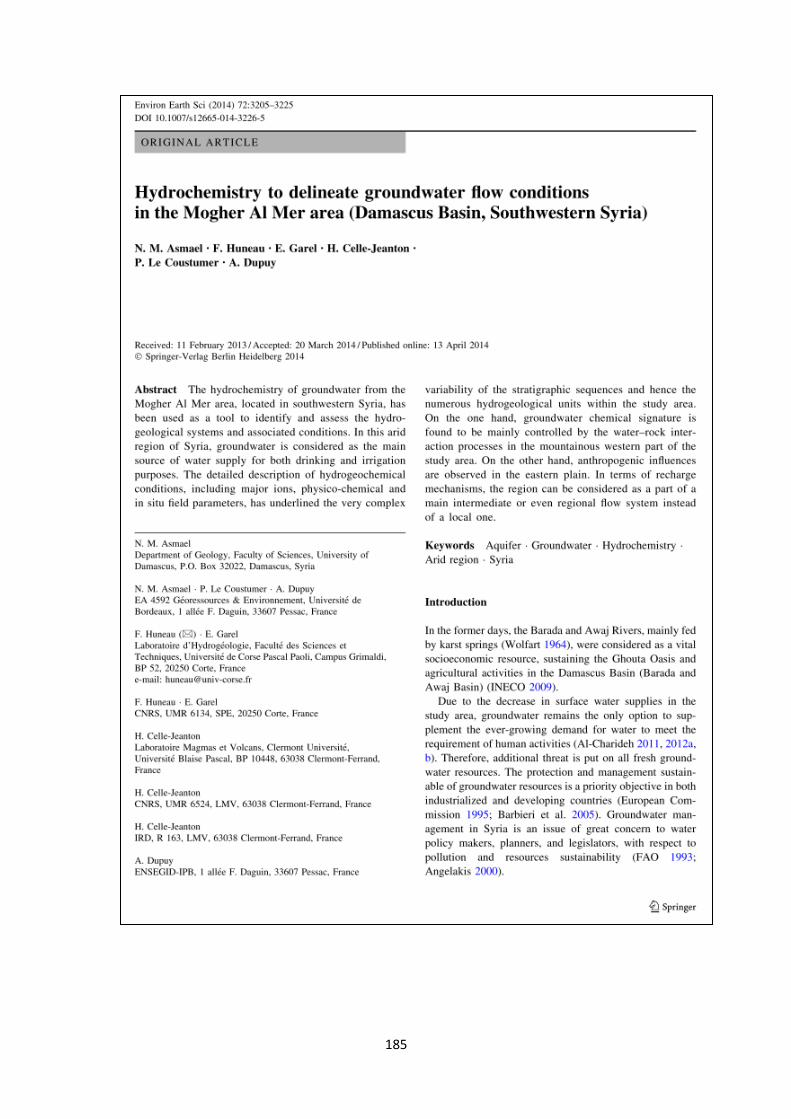
085
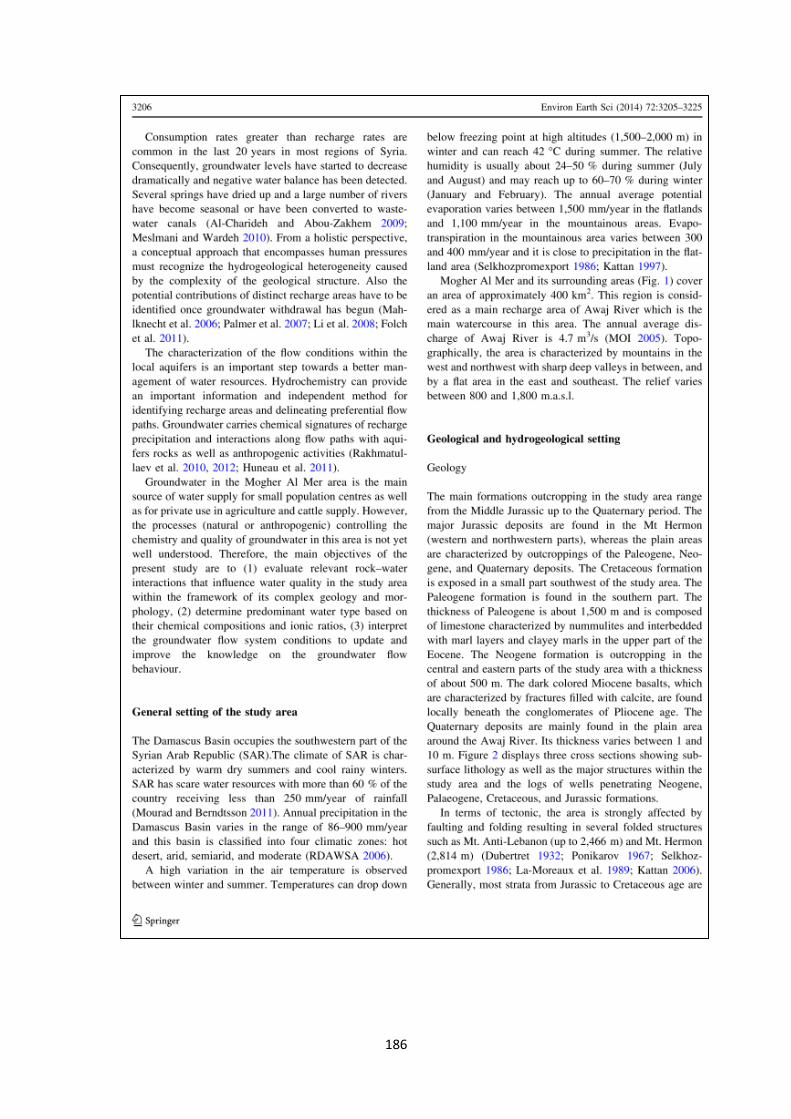
086
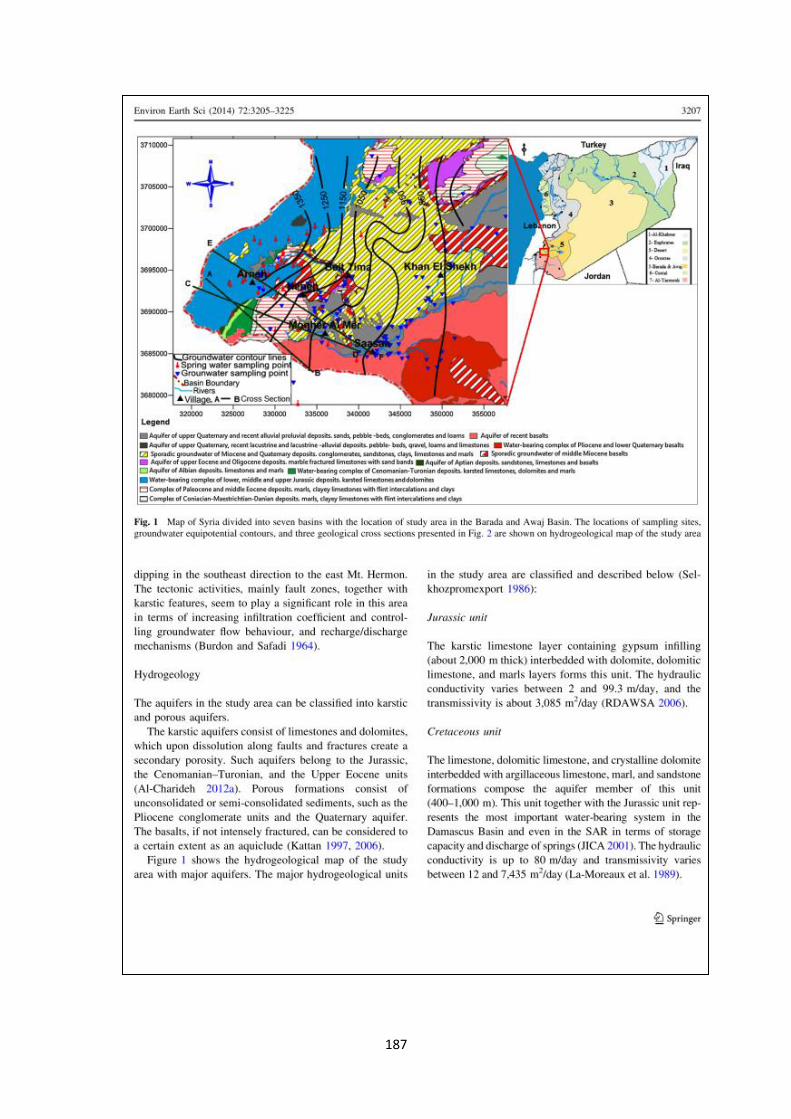
087
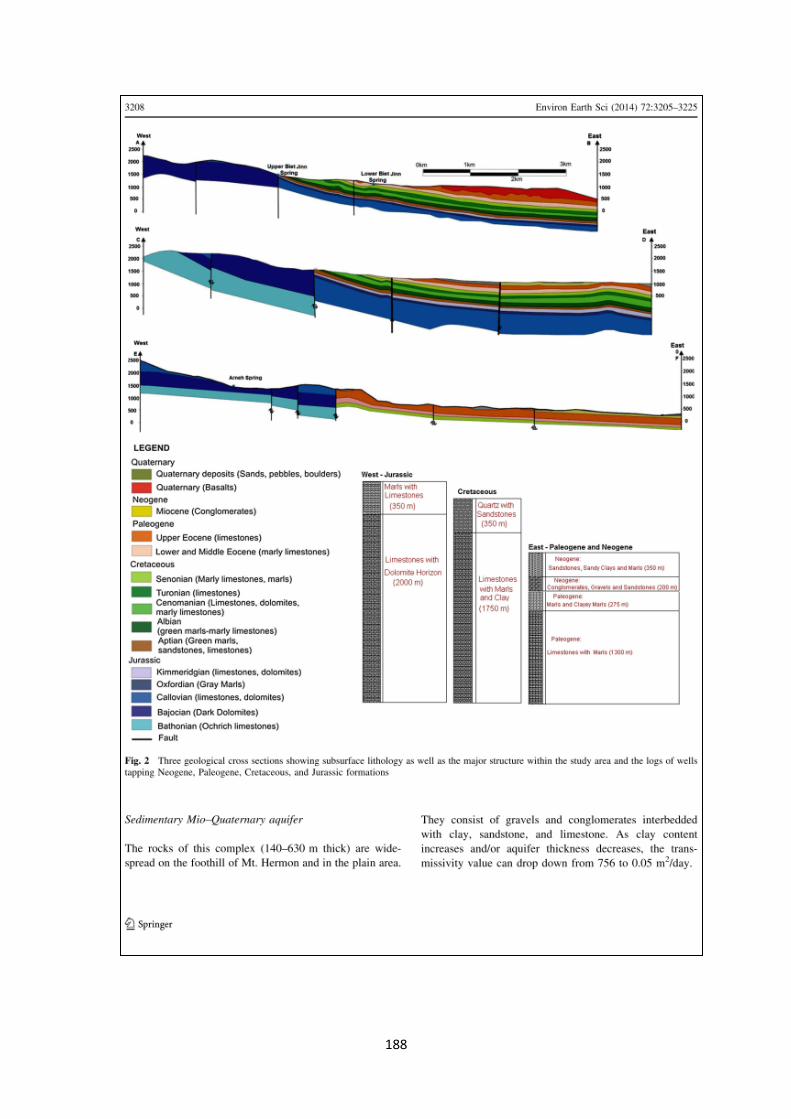
088
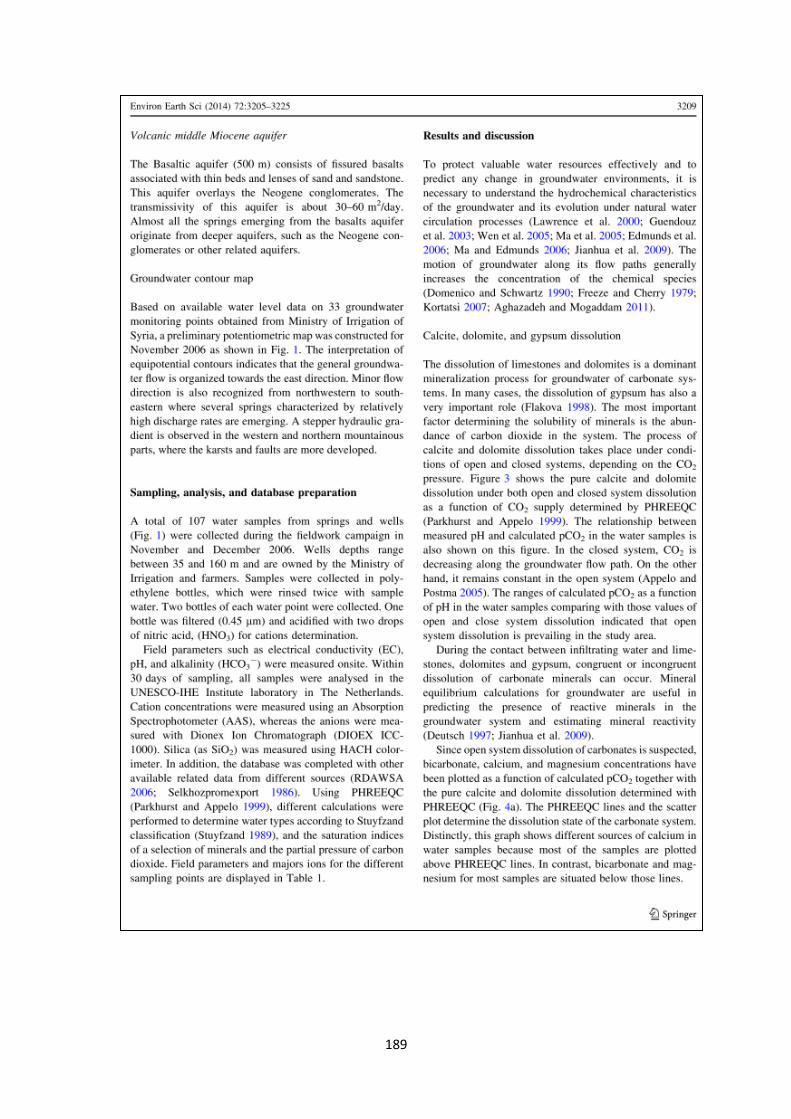
089
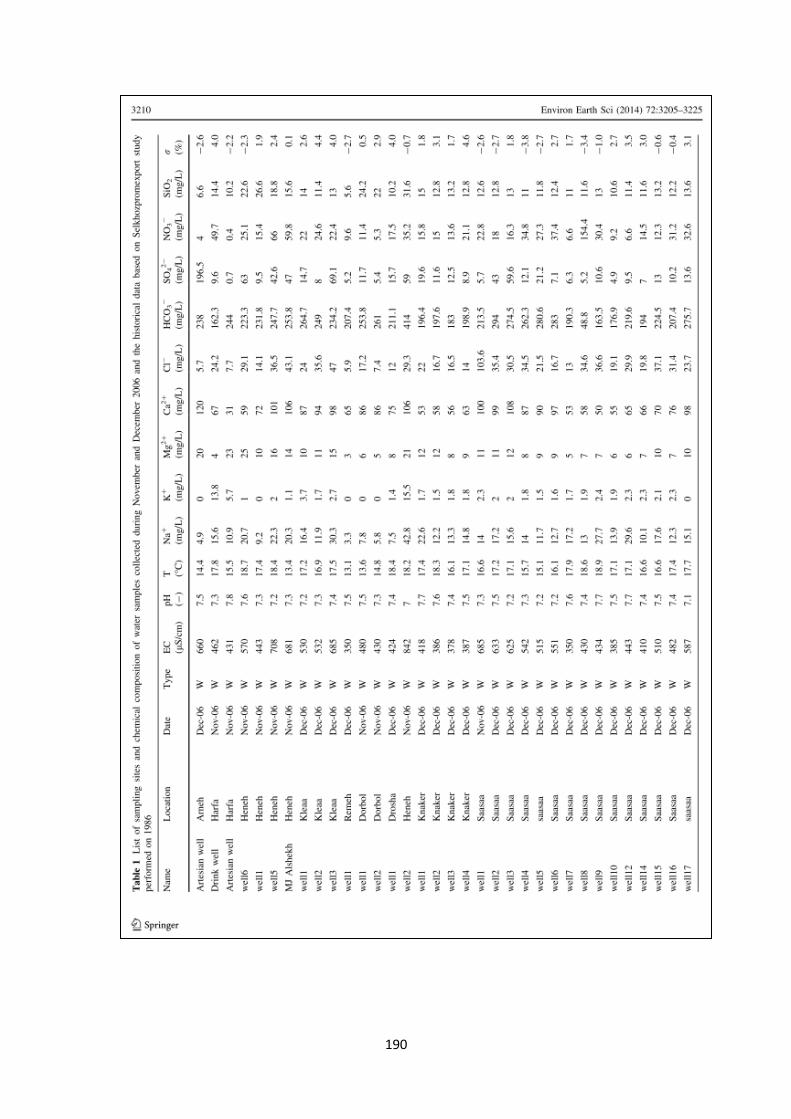
091
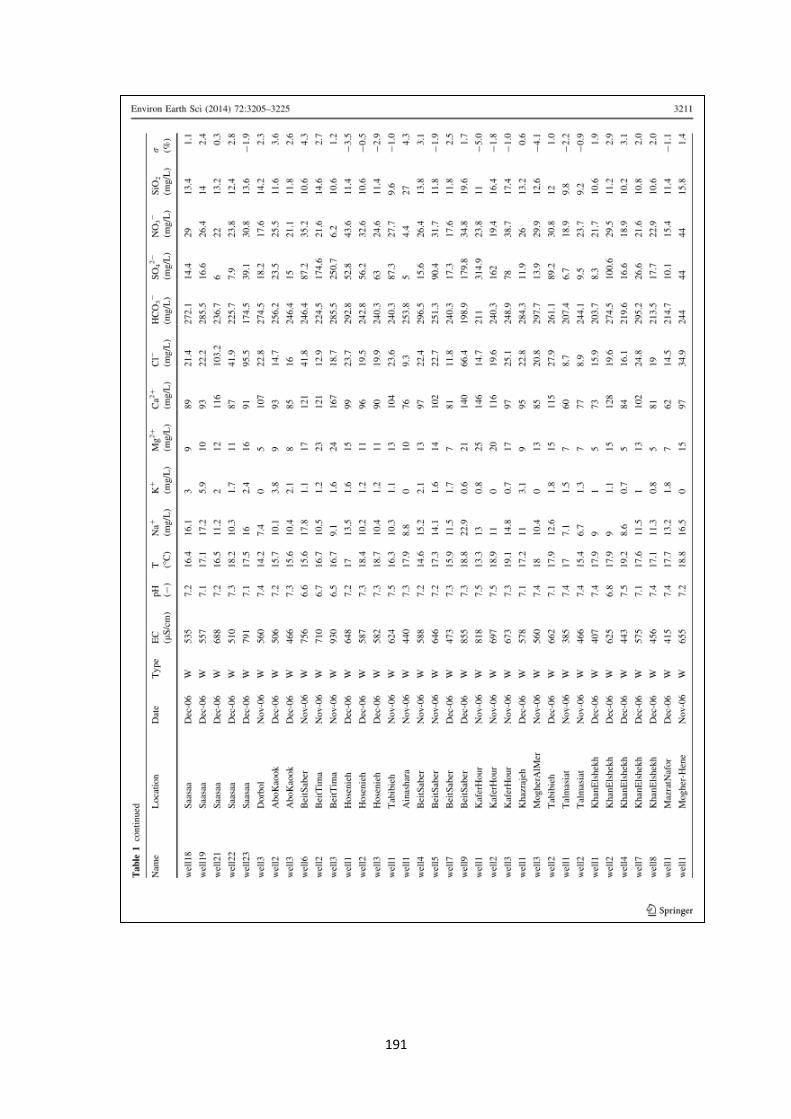
090
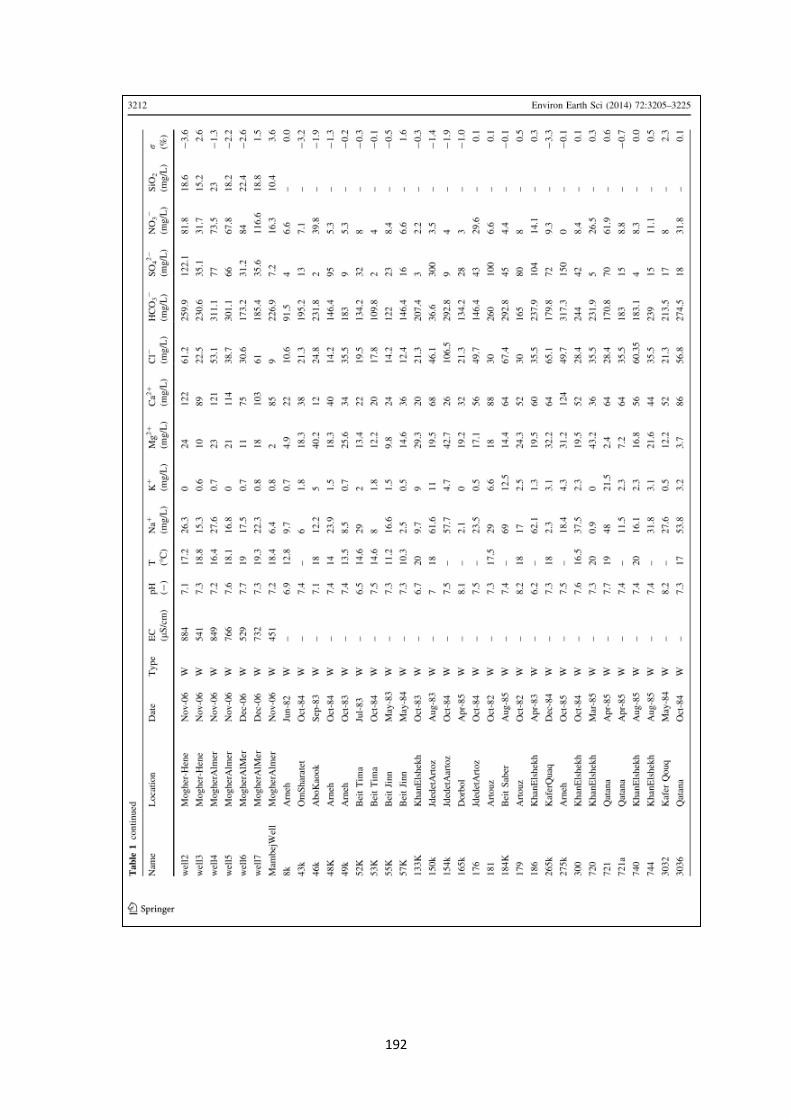
091
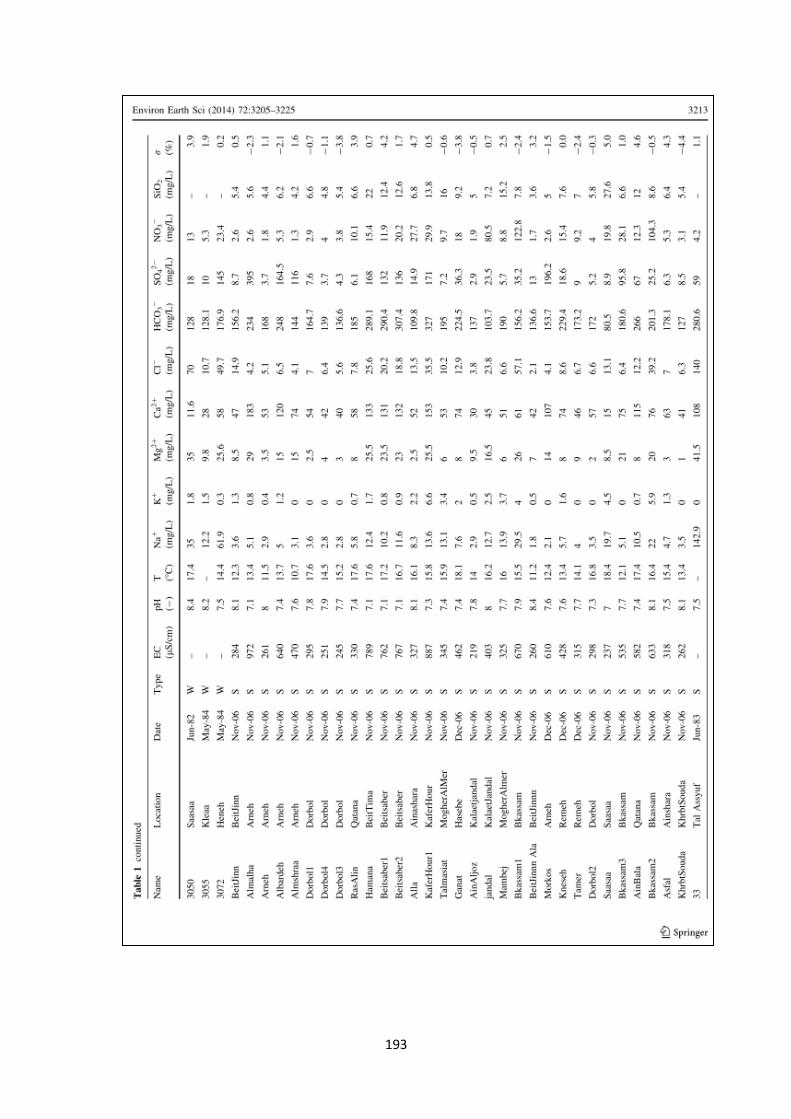
093
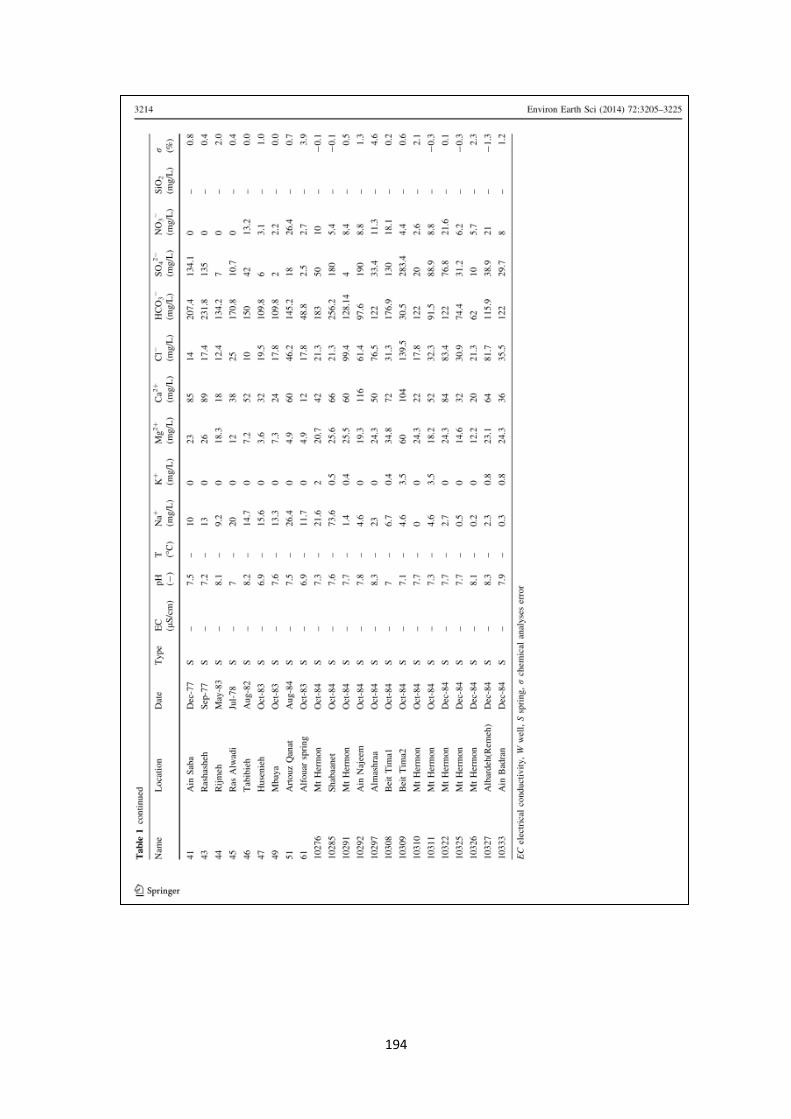
094
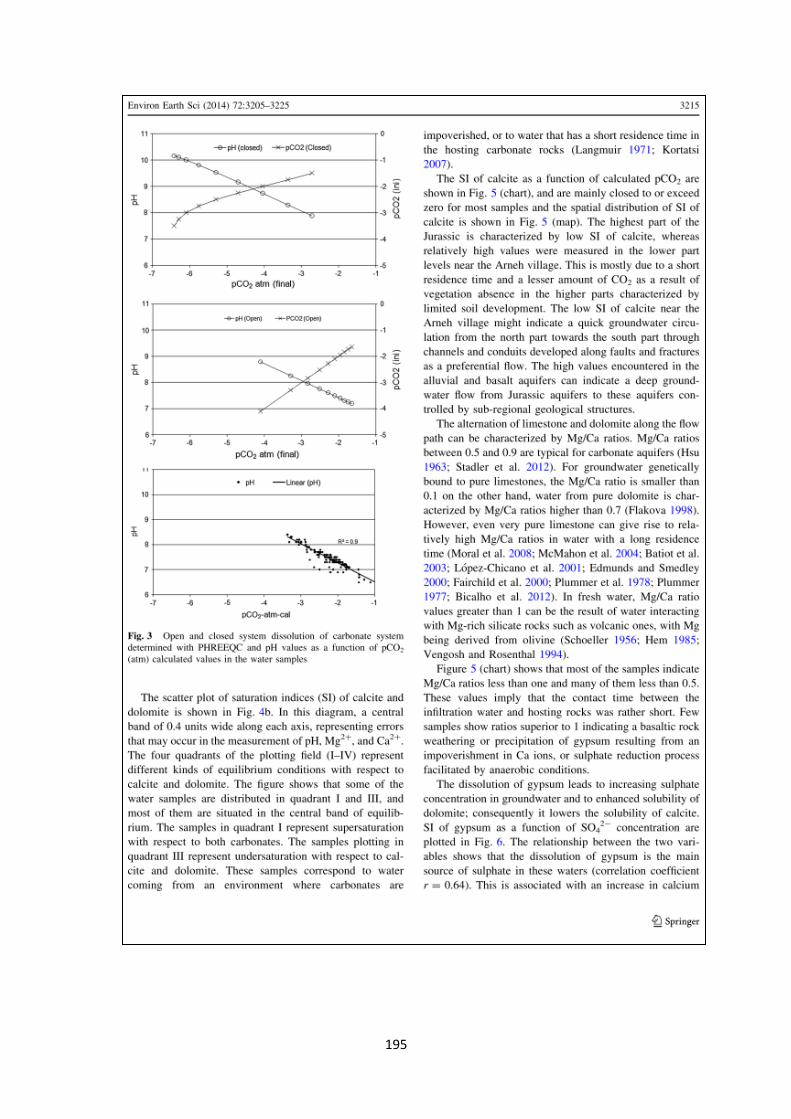
095
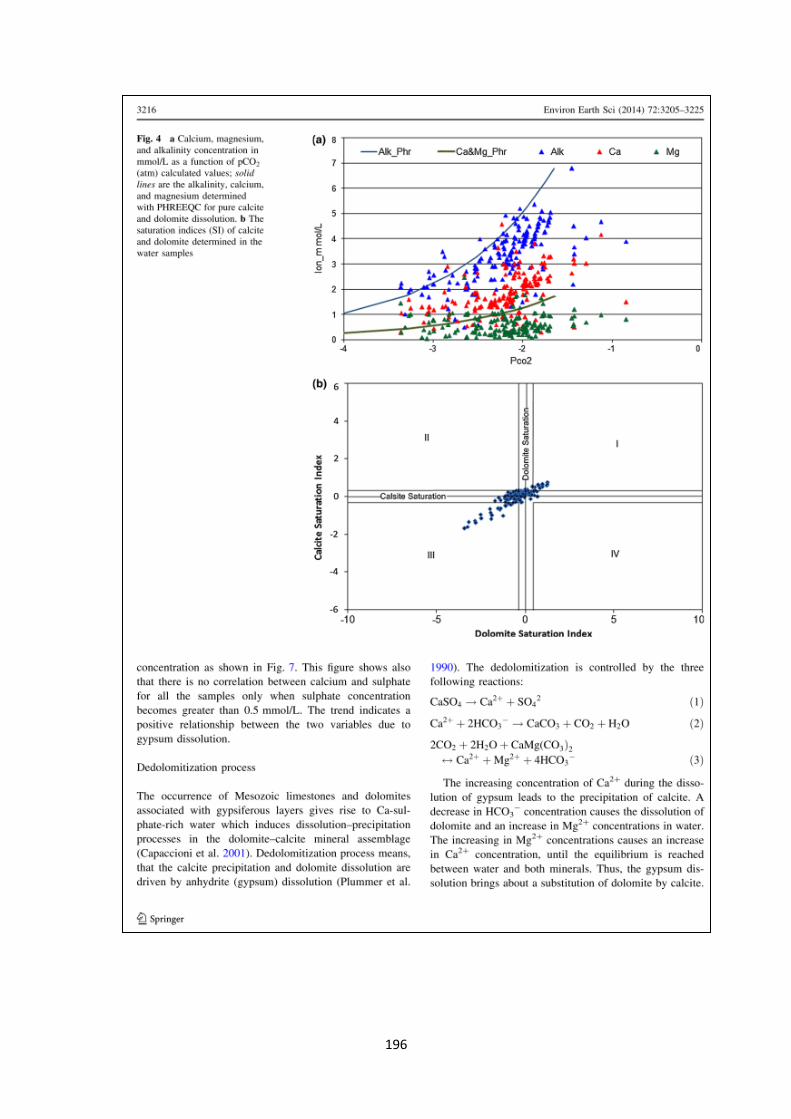
096
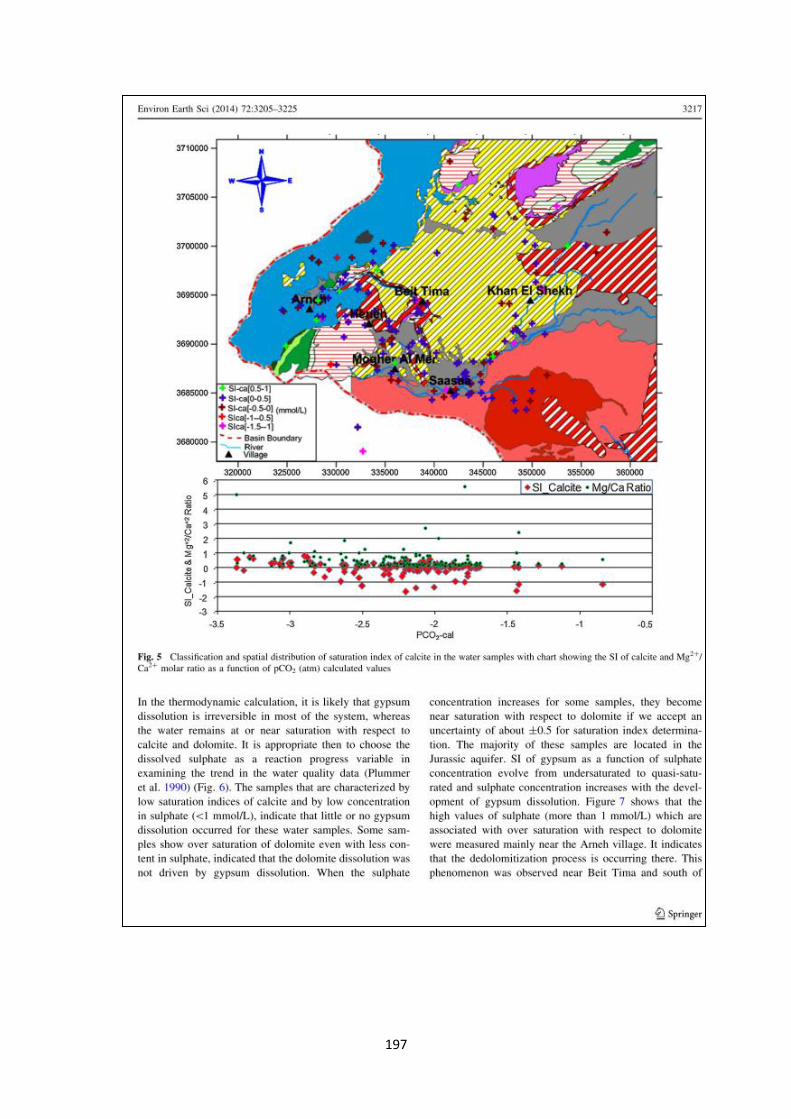
097
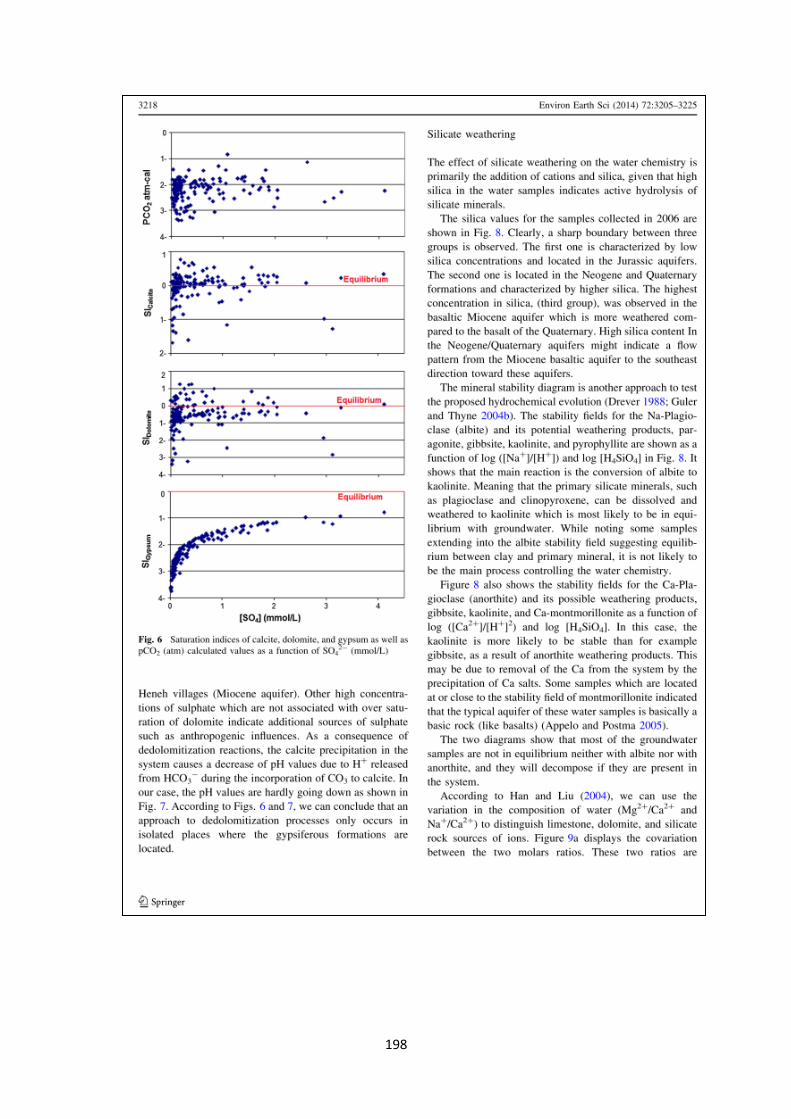
098
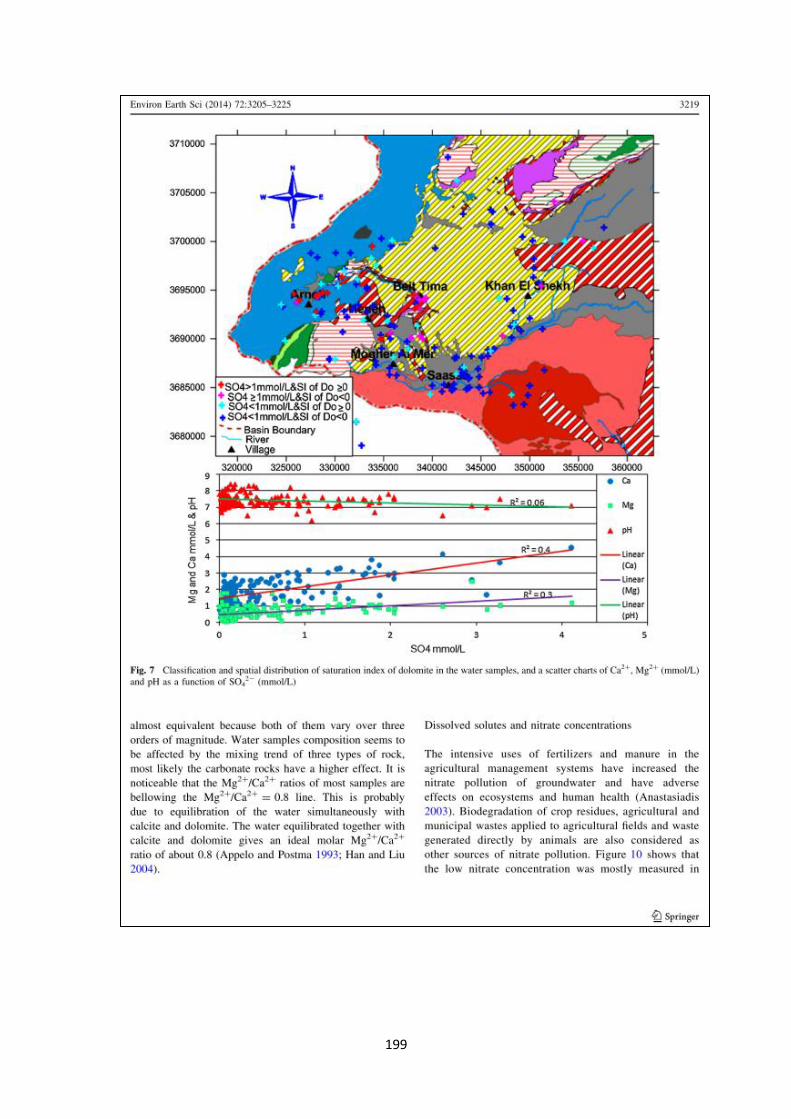
099
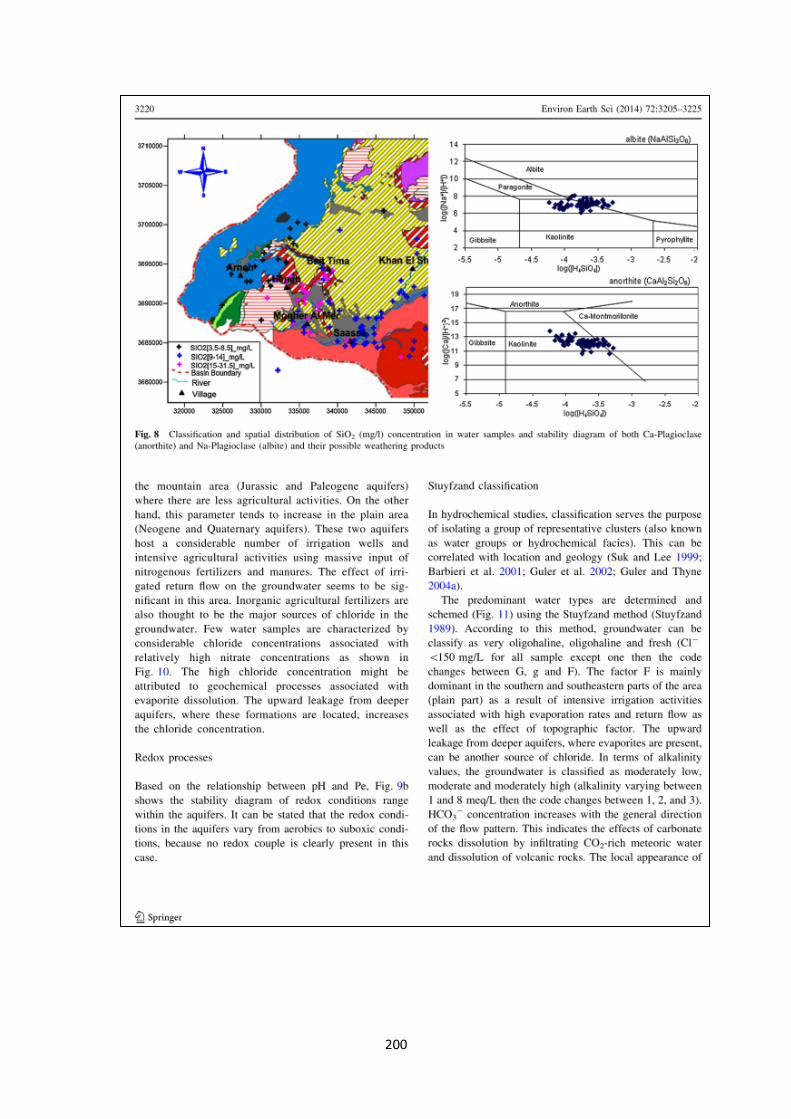
111
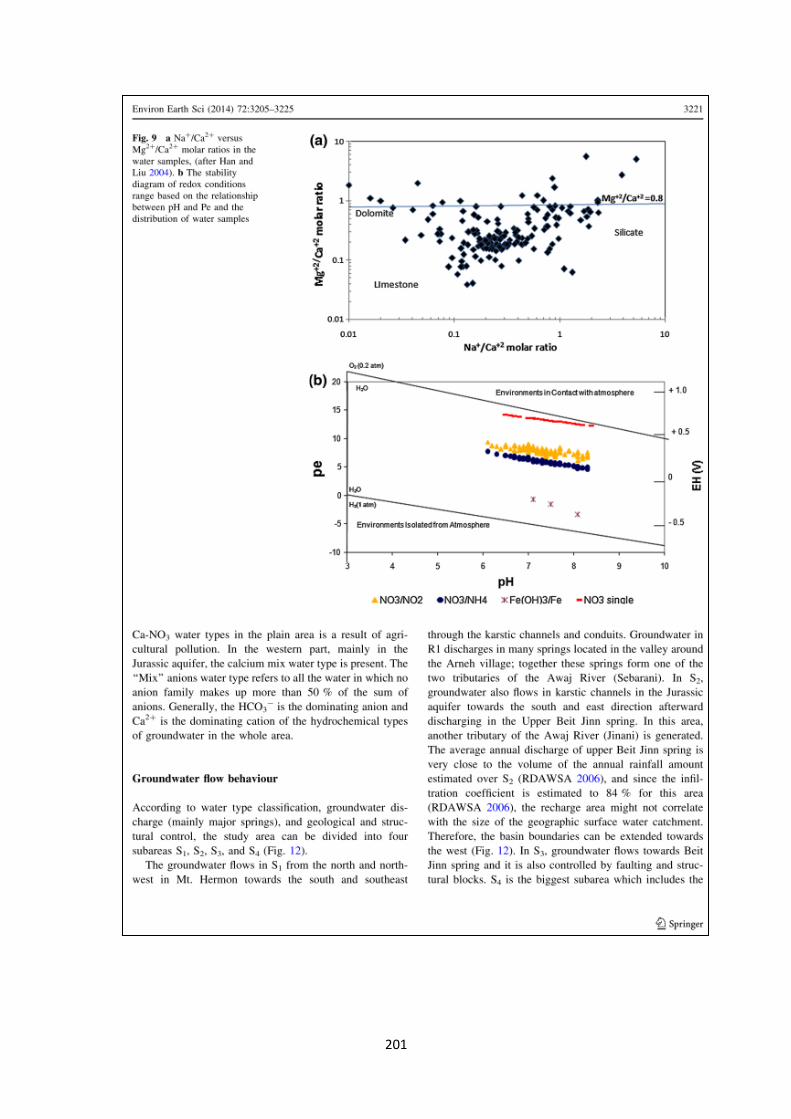
110
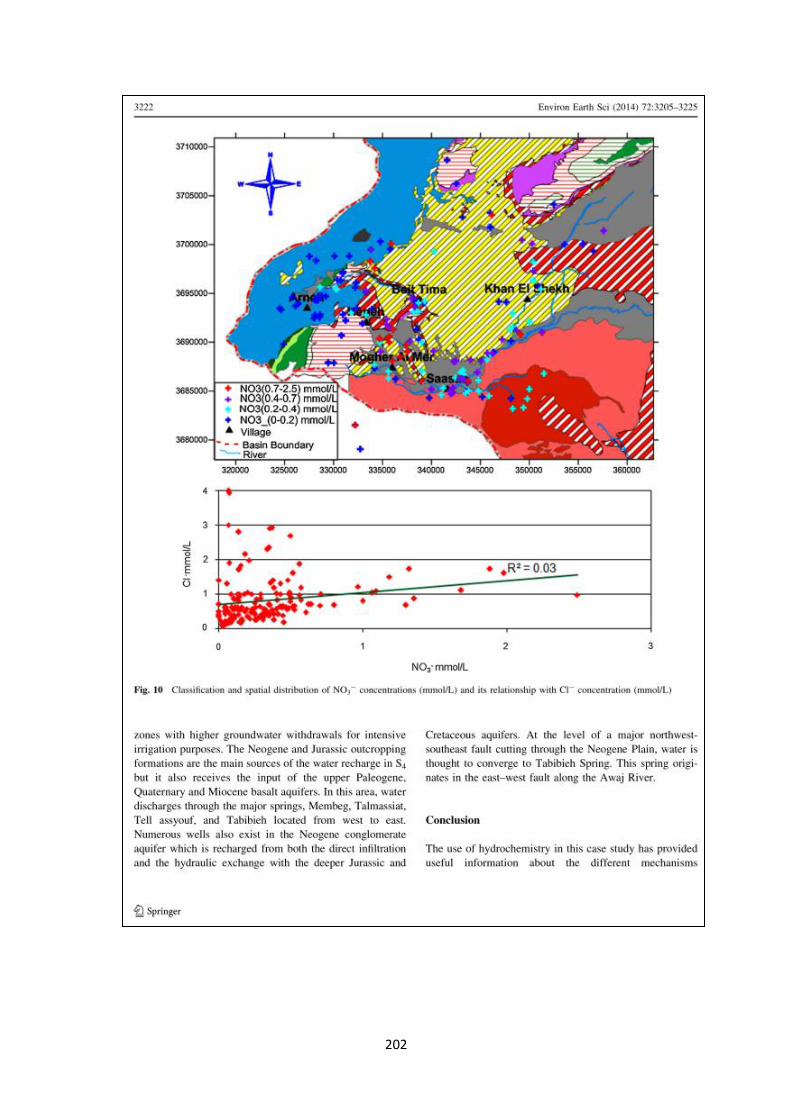
111
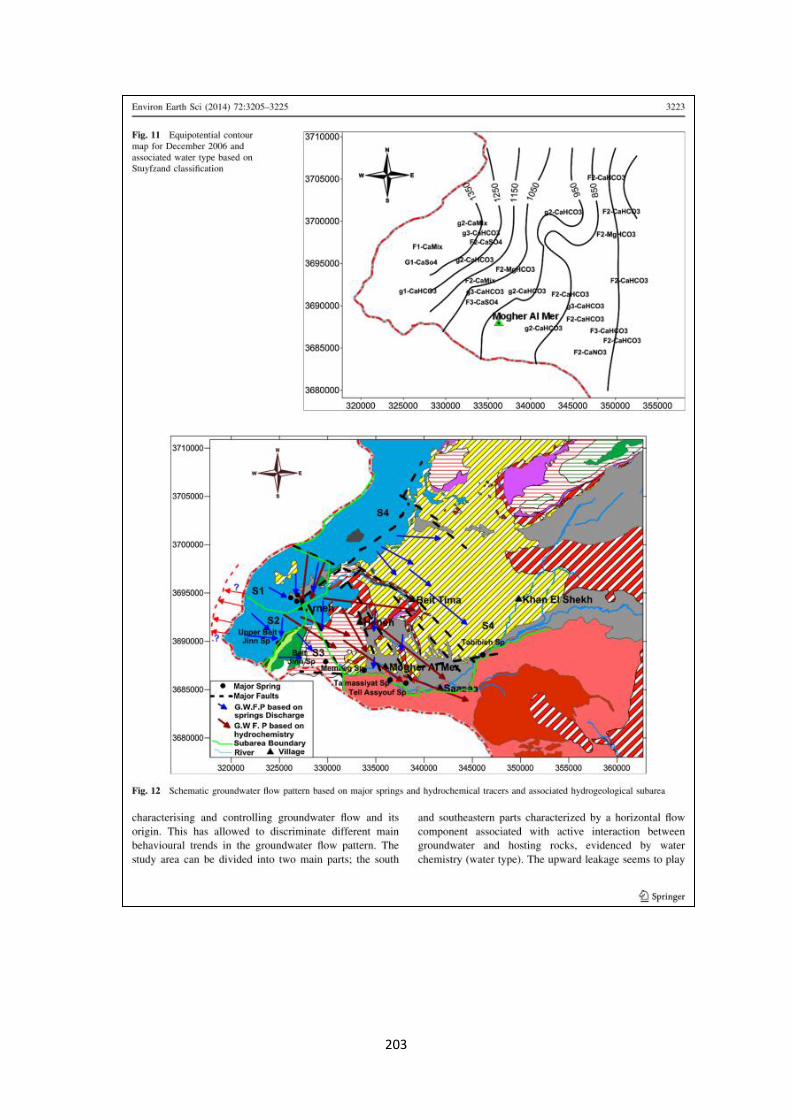
113
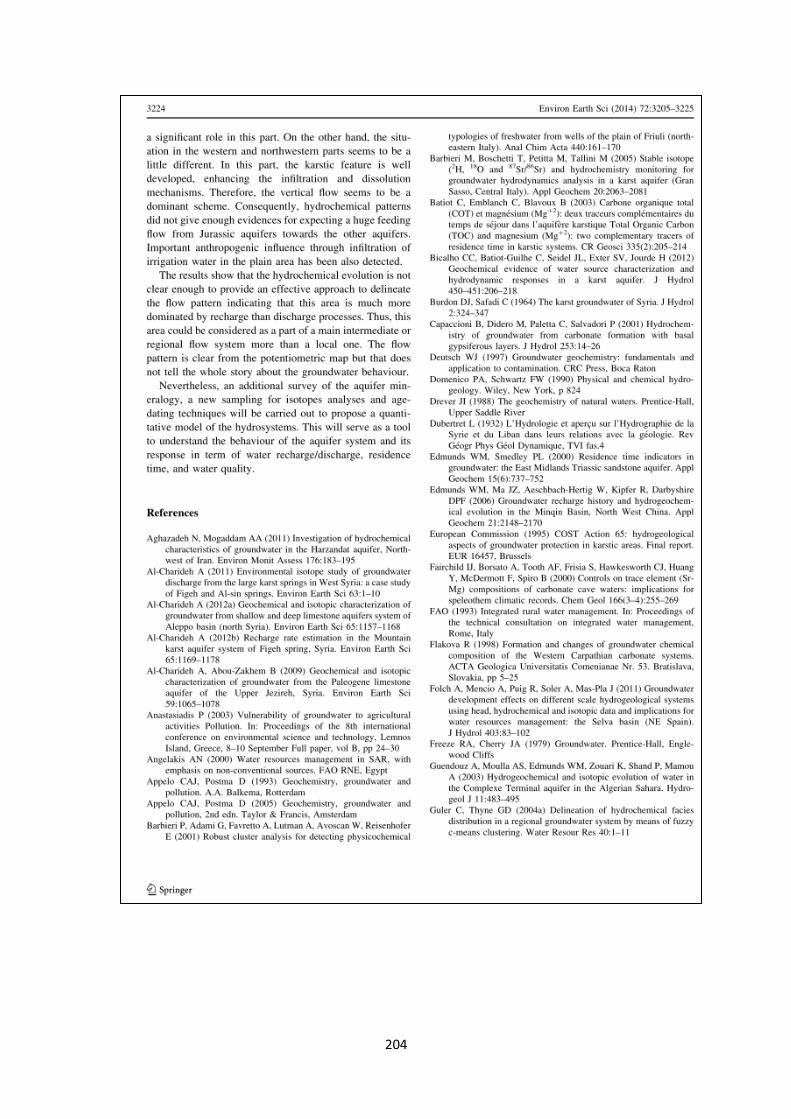
114
115
116
Appendices B Published Article
Article published in the journal of Arabian Journal of Geosciences
Origin and recharge mechanisms of groundwater in the upper part
of the Awaj River (Syria) based on hydrochemistry and
environmental isotope techniques
117
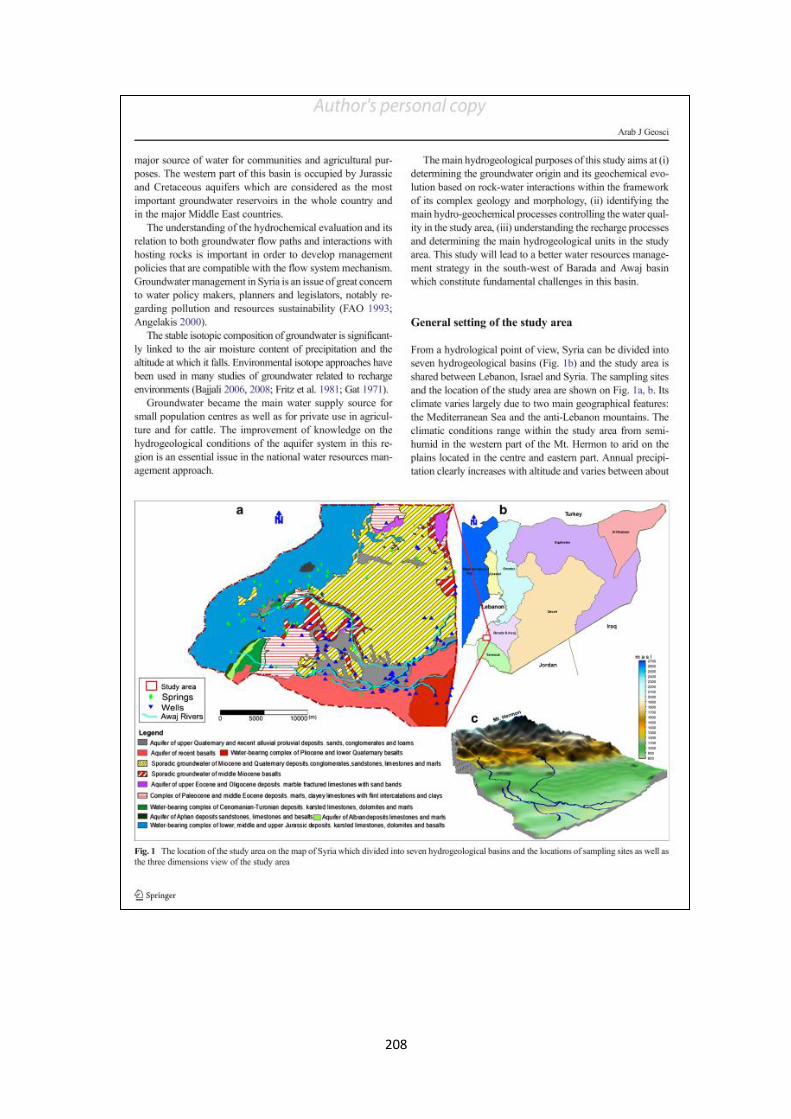
118
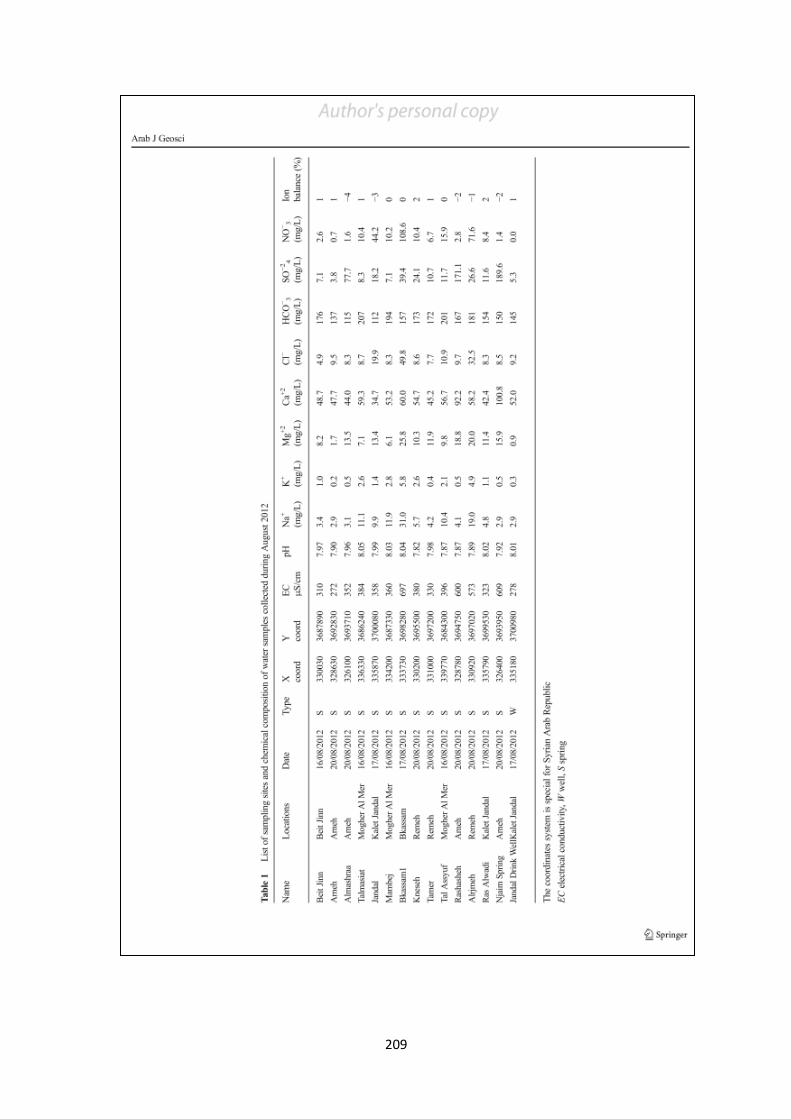
119
101
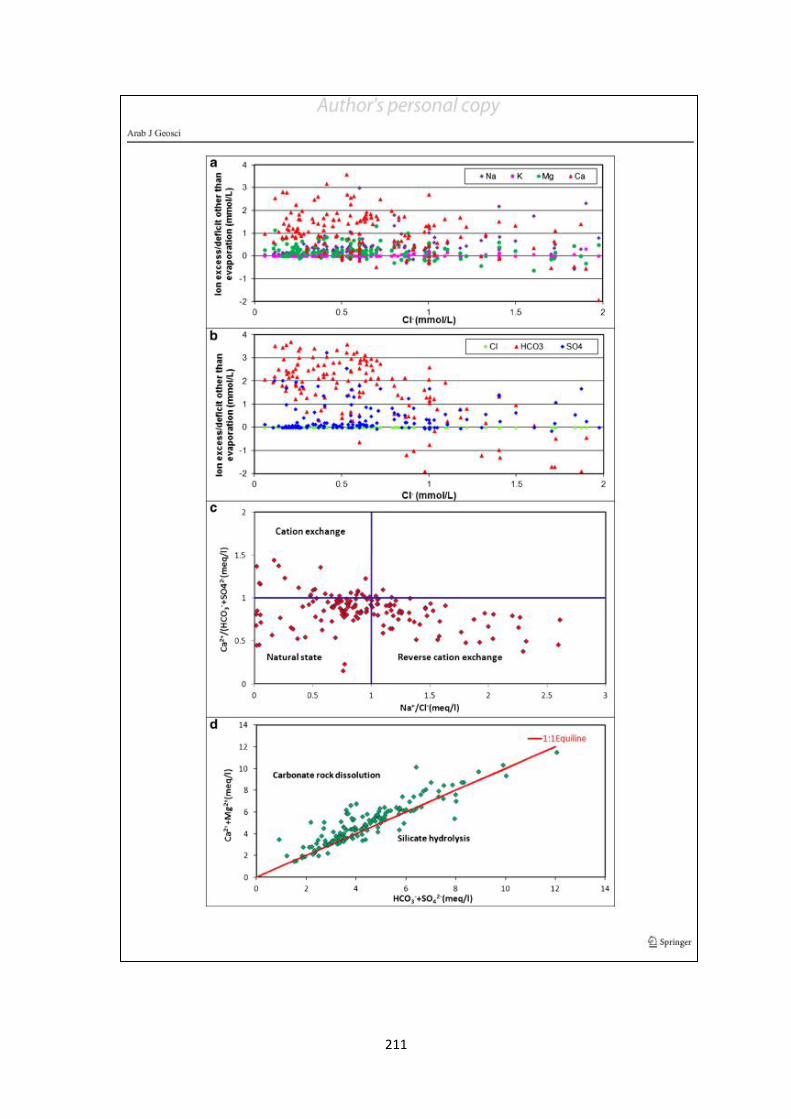
100
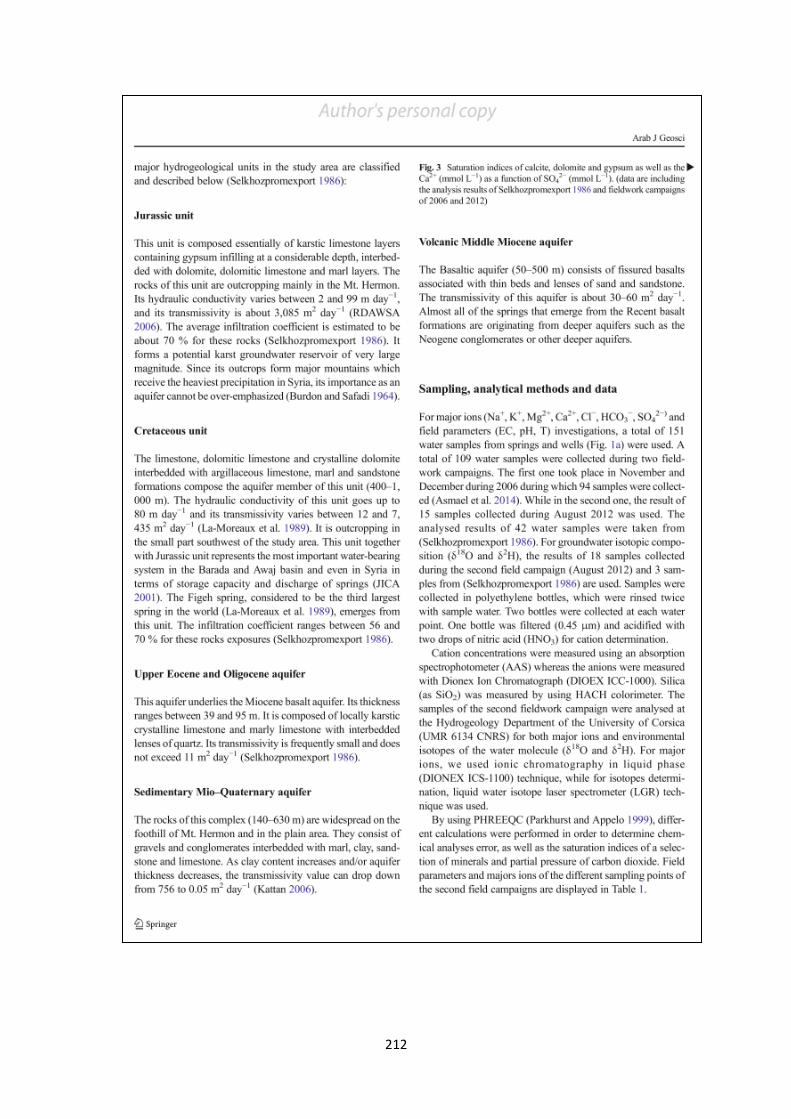
101
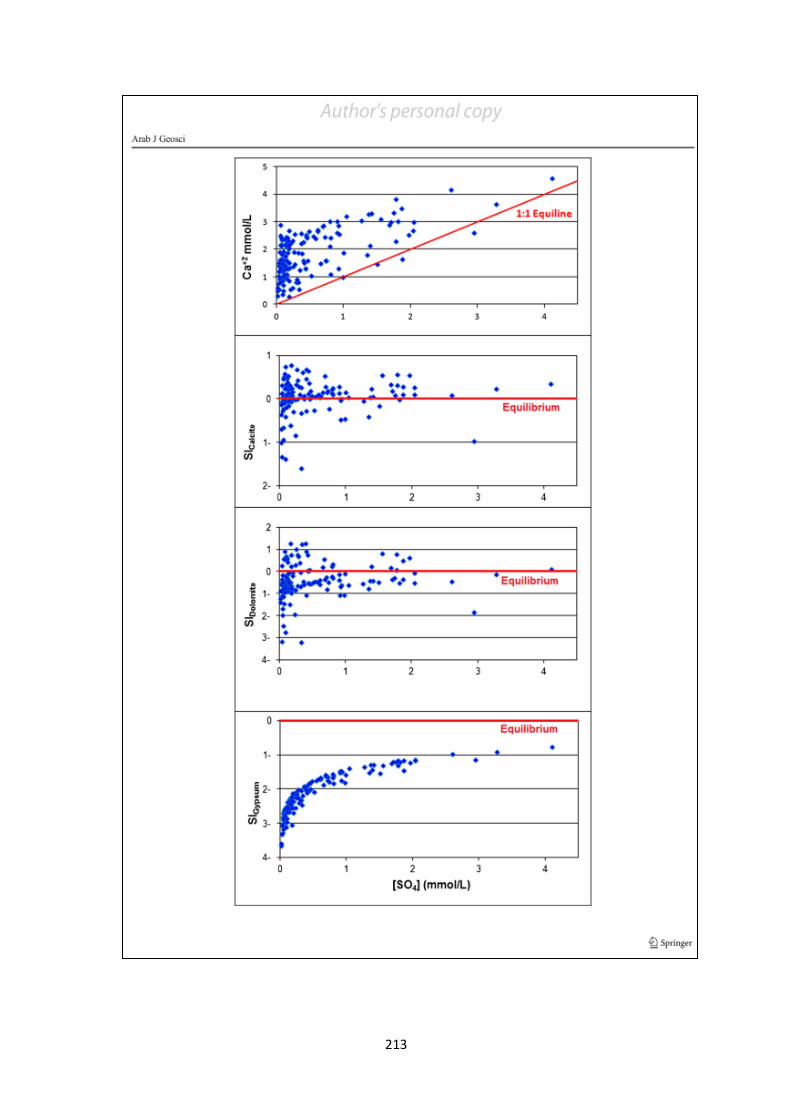
103
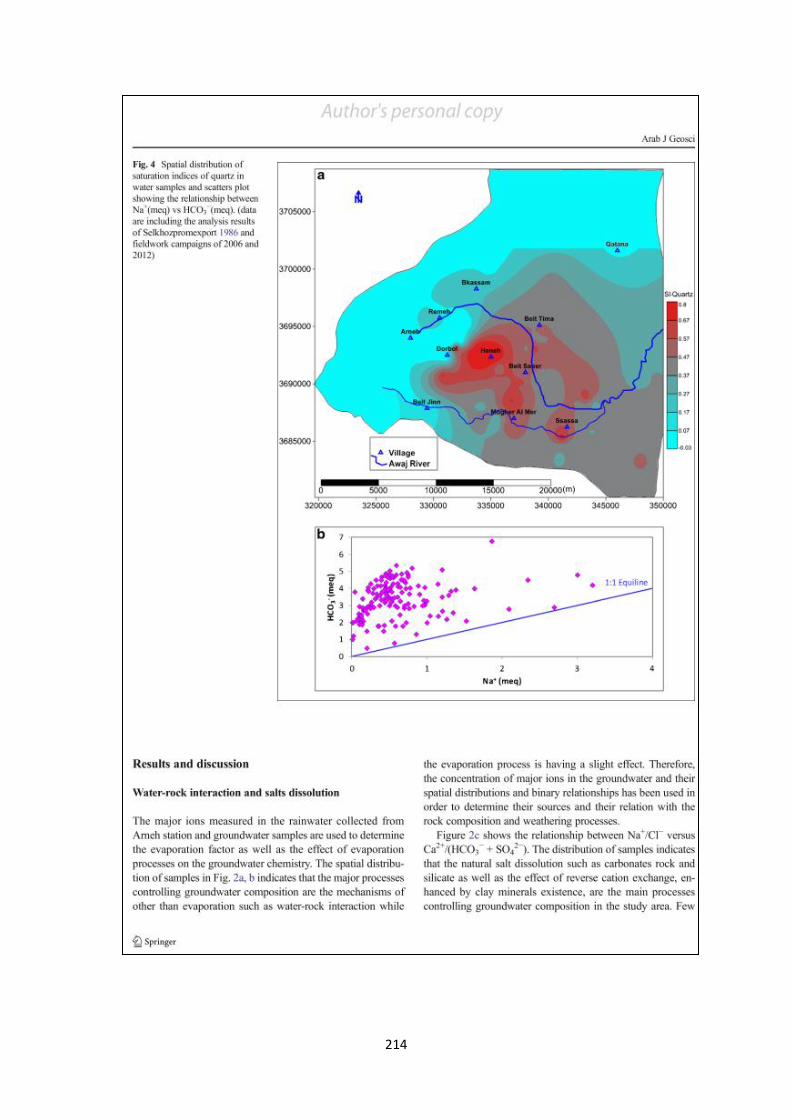
104
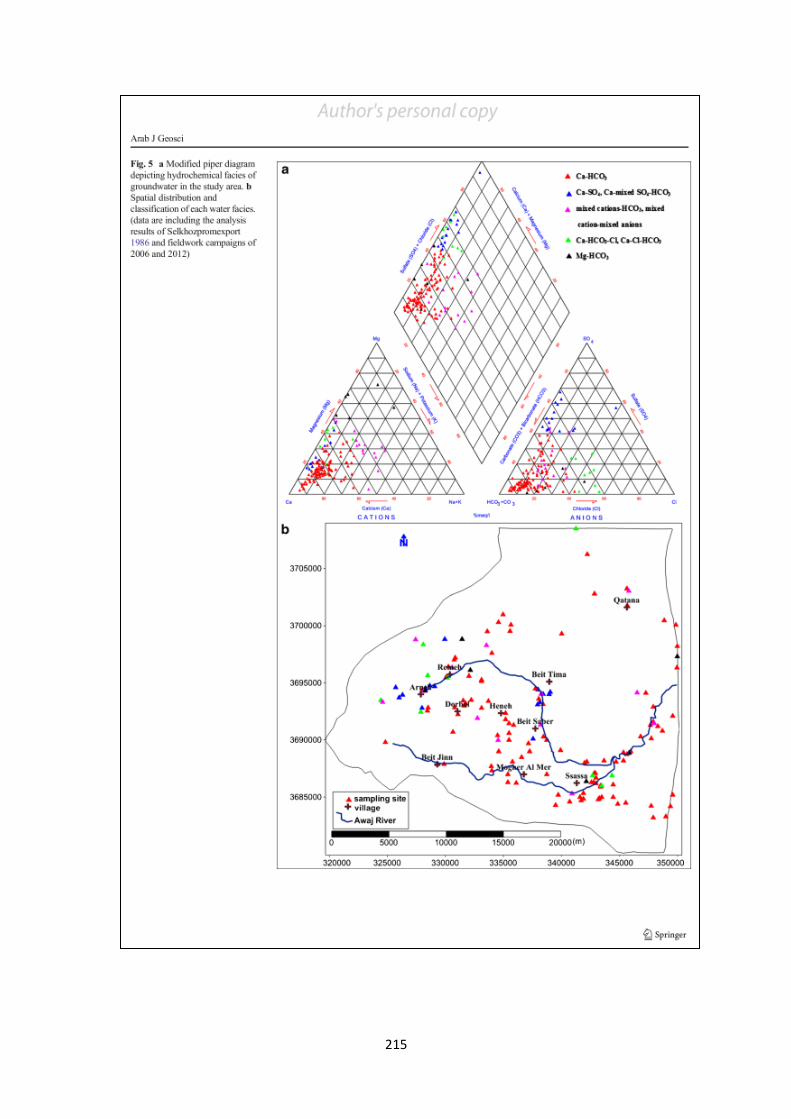
105
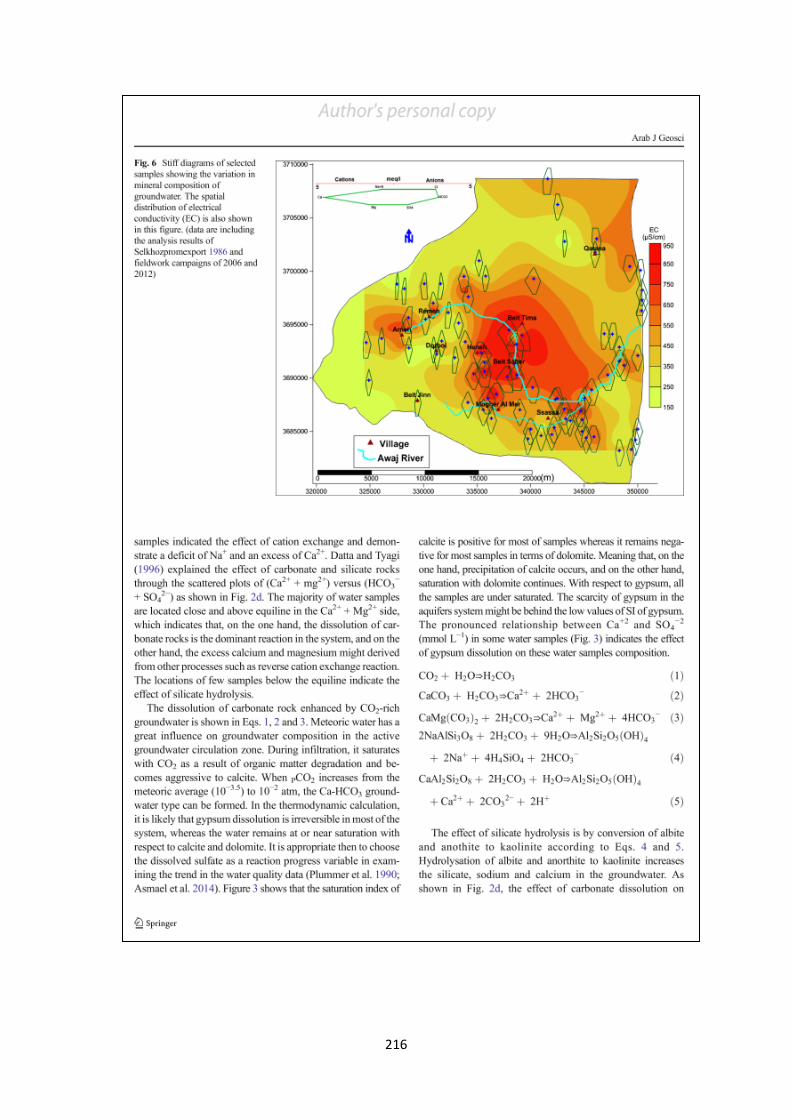
106
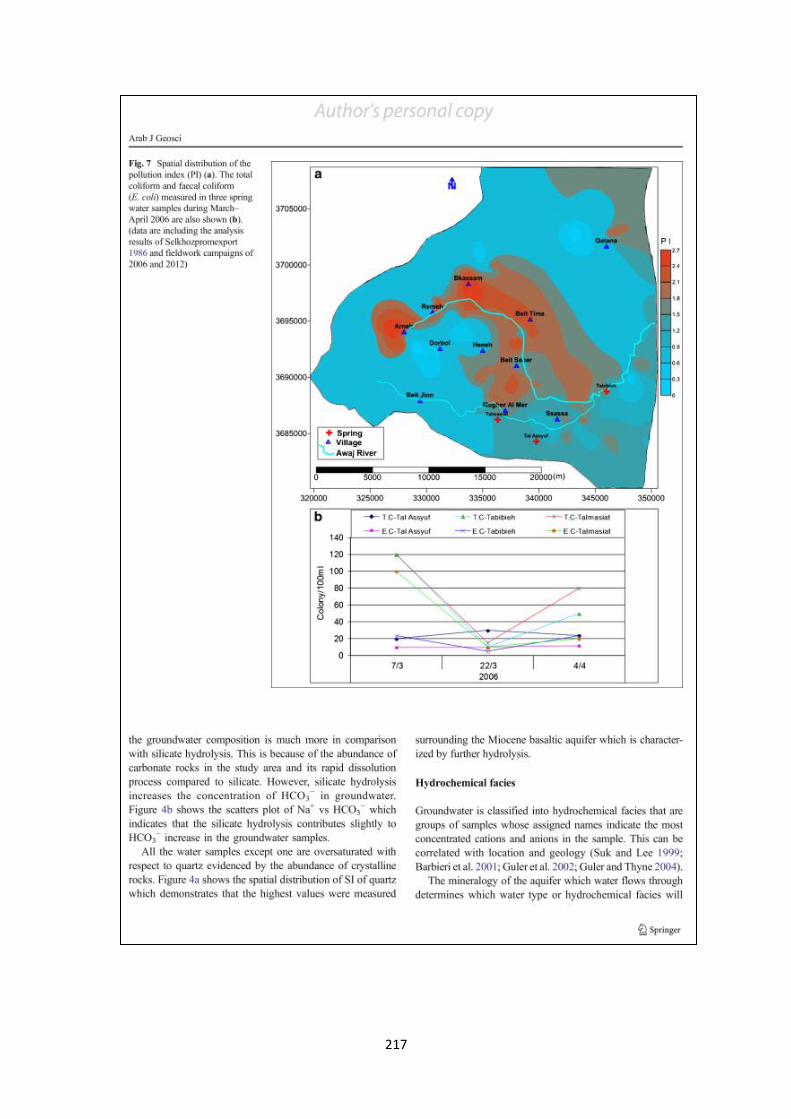
107

108
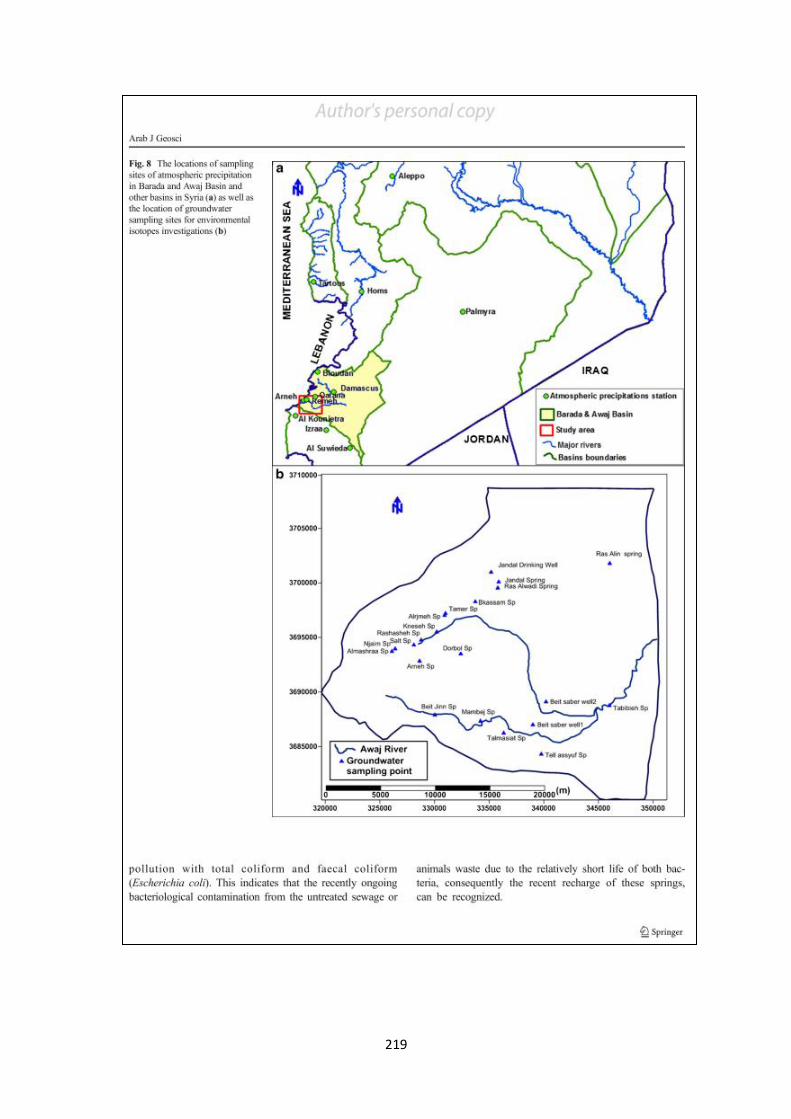
109
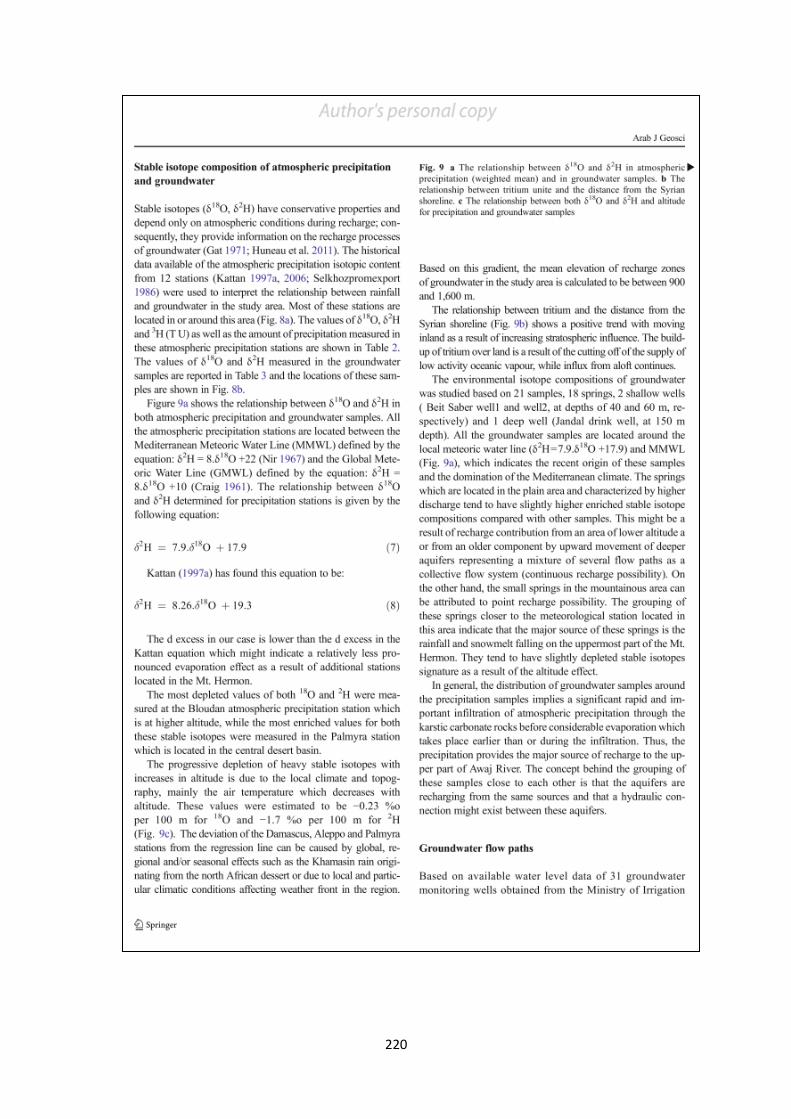
111
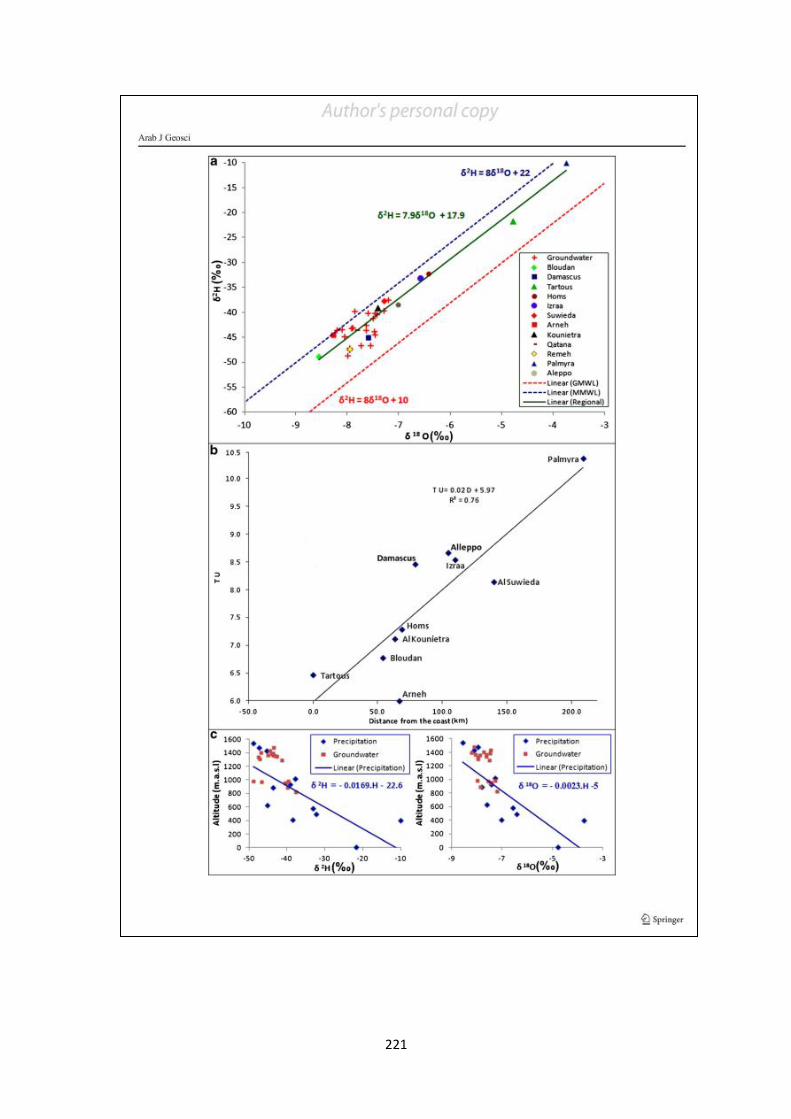
110
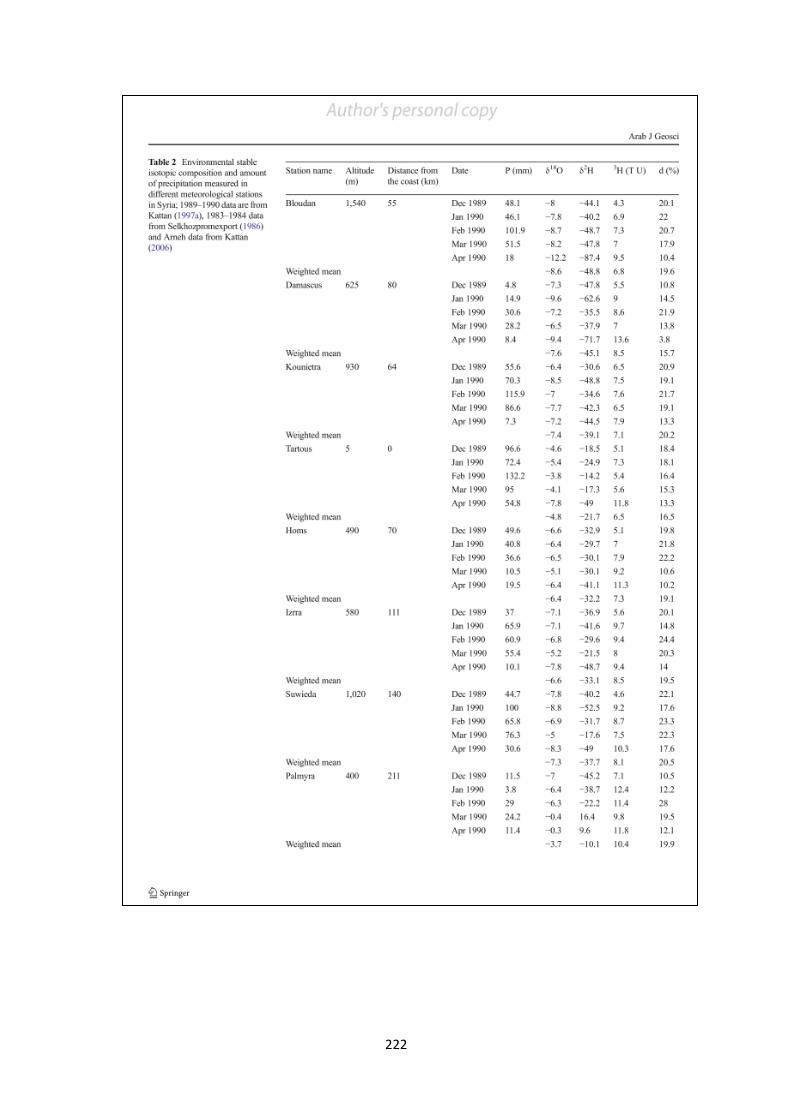
111
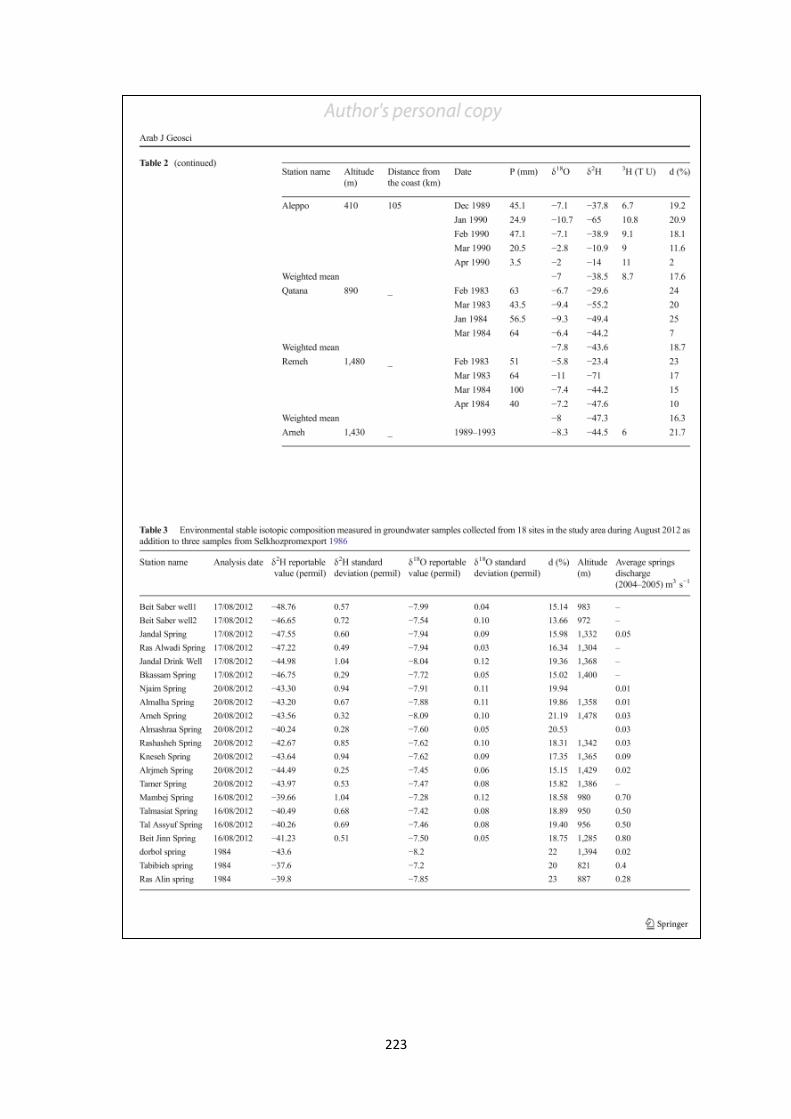
113
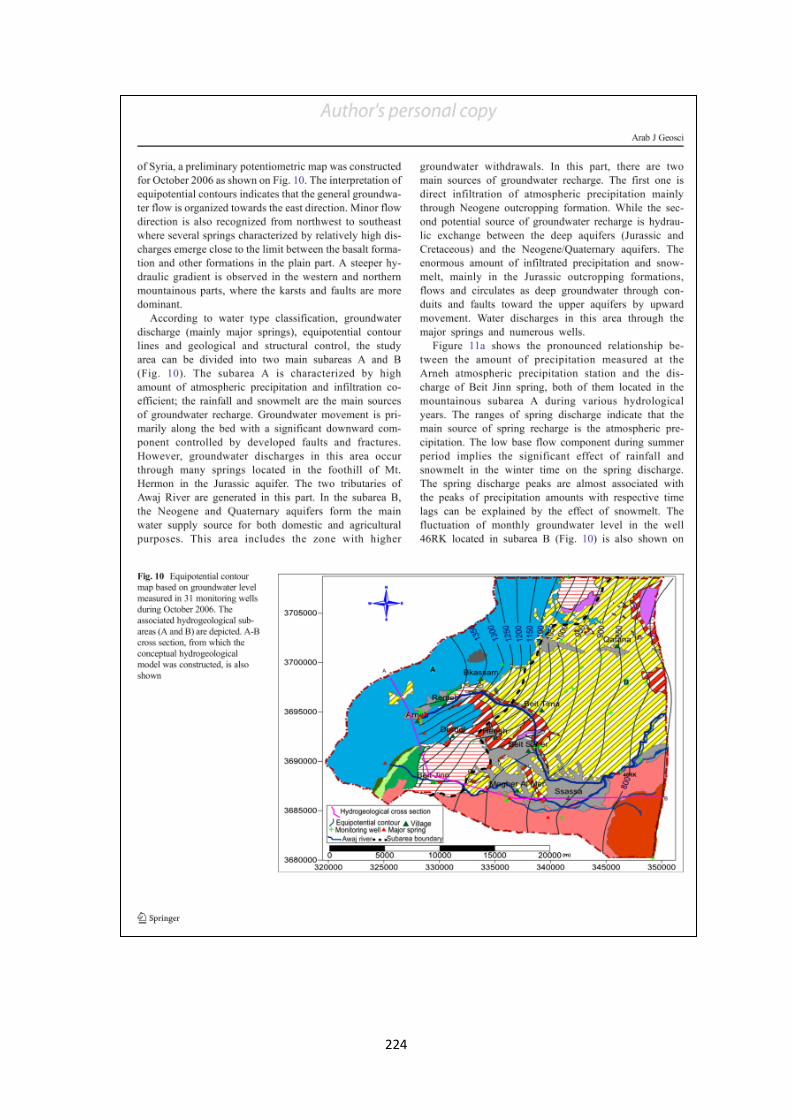
114
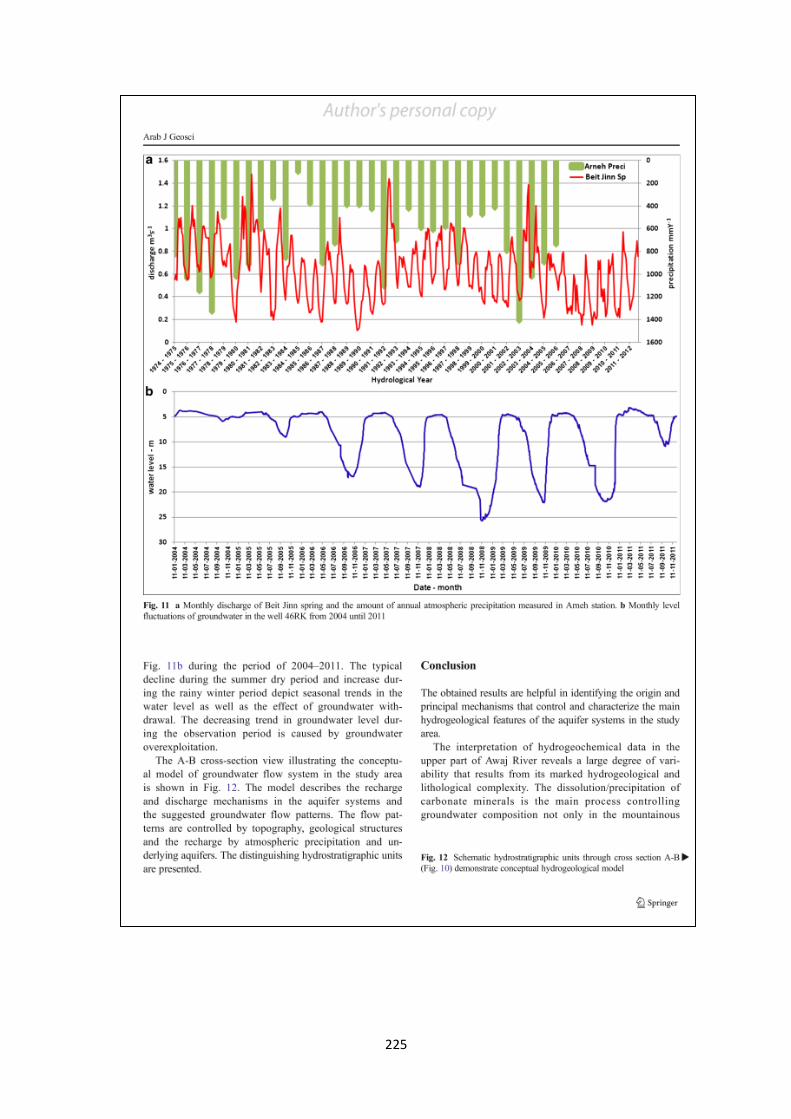
115
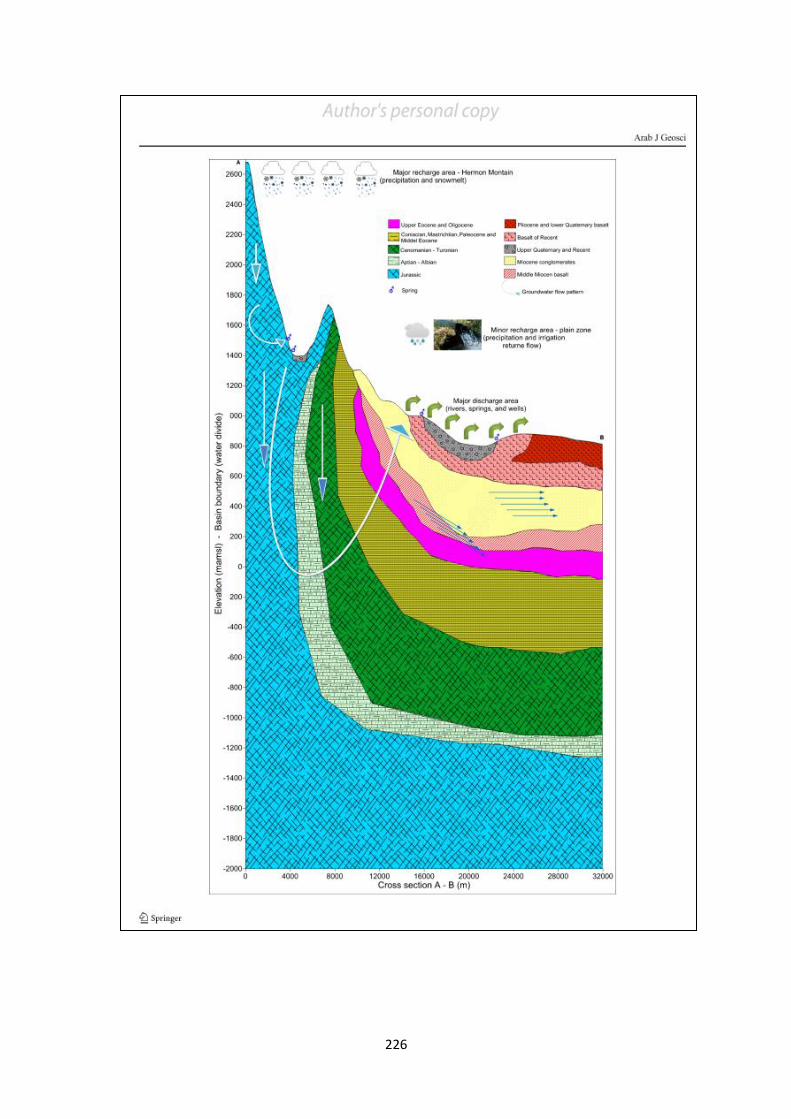
116
117
118
119
Appendices C Published Article
Article published in the journal of Water
Groundwater Modeling as an Alternative Approach to Limited Data
in the Northeastern Part of Mt. Hermon (Syria), to Develop a
Preliminary Water Budget
131
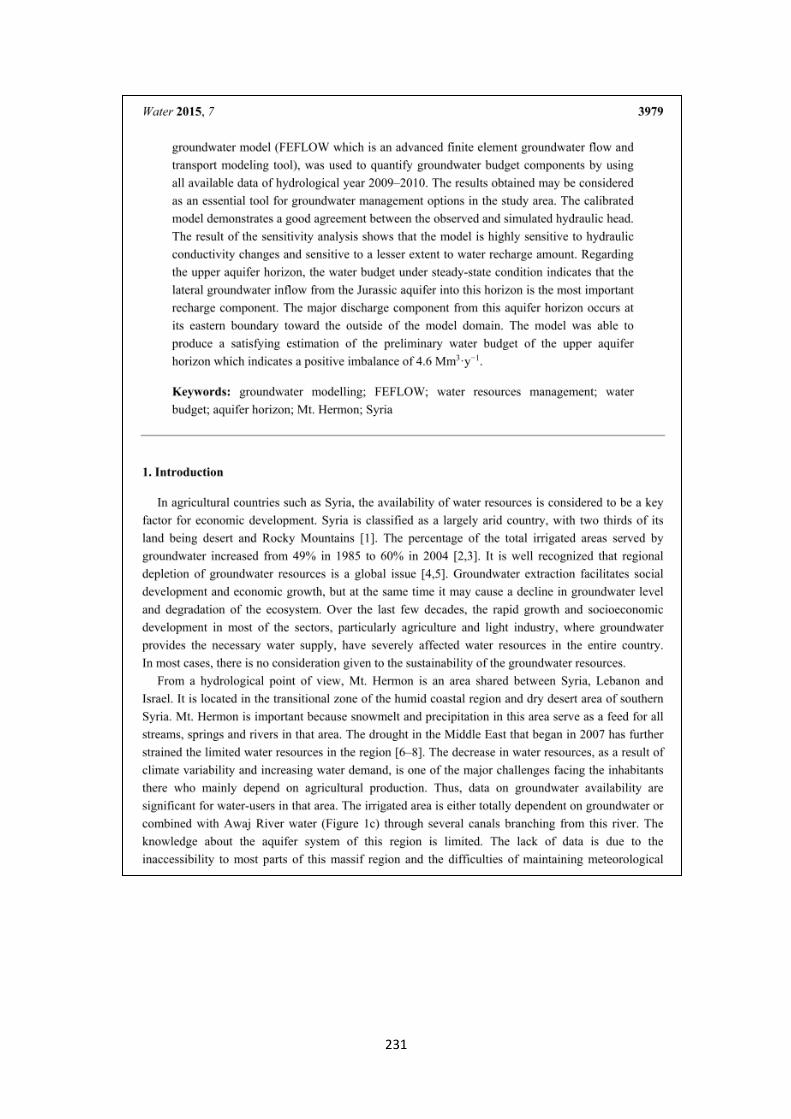
130
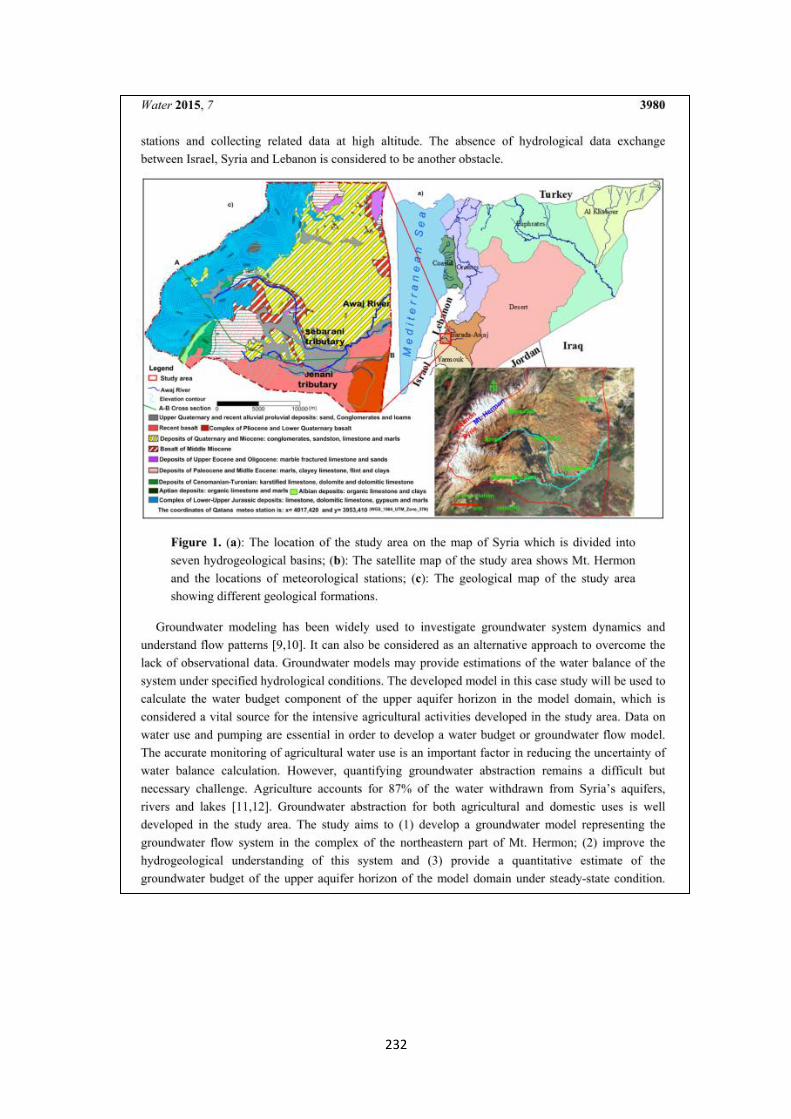
131
133
134
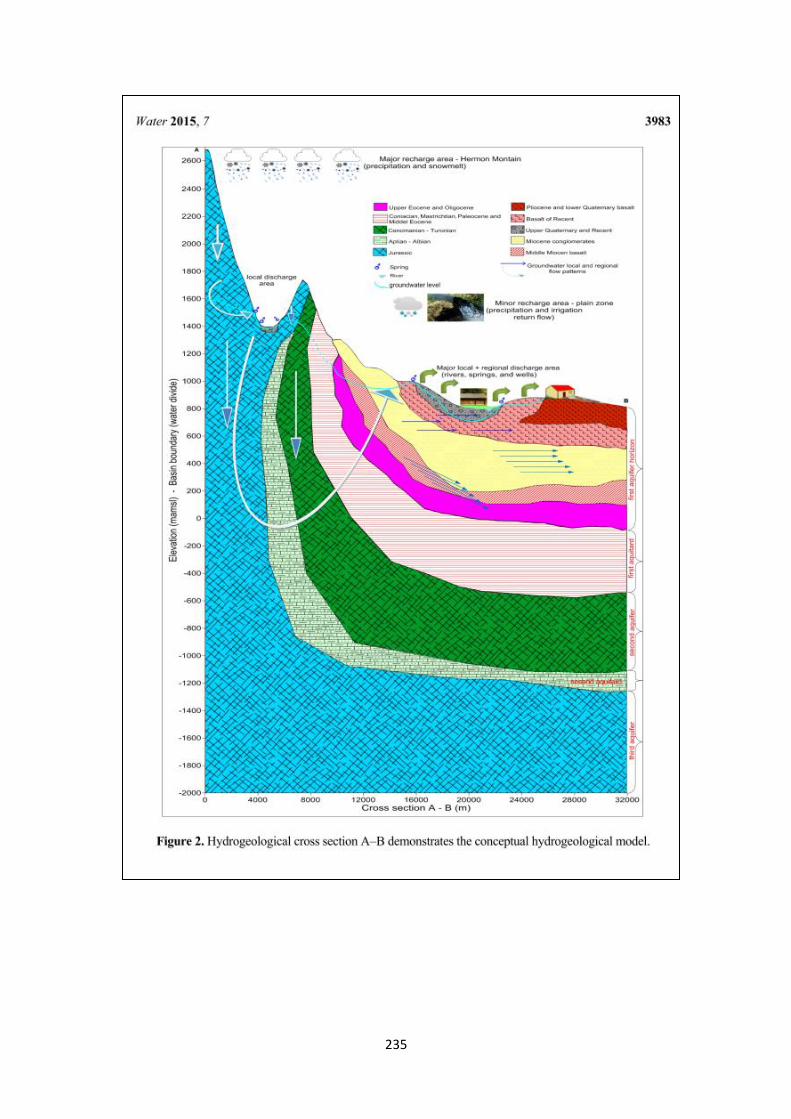
135
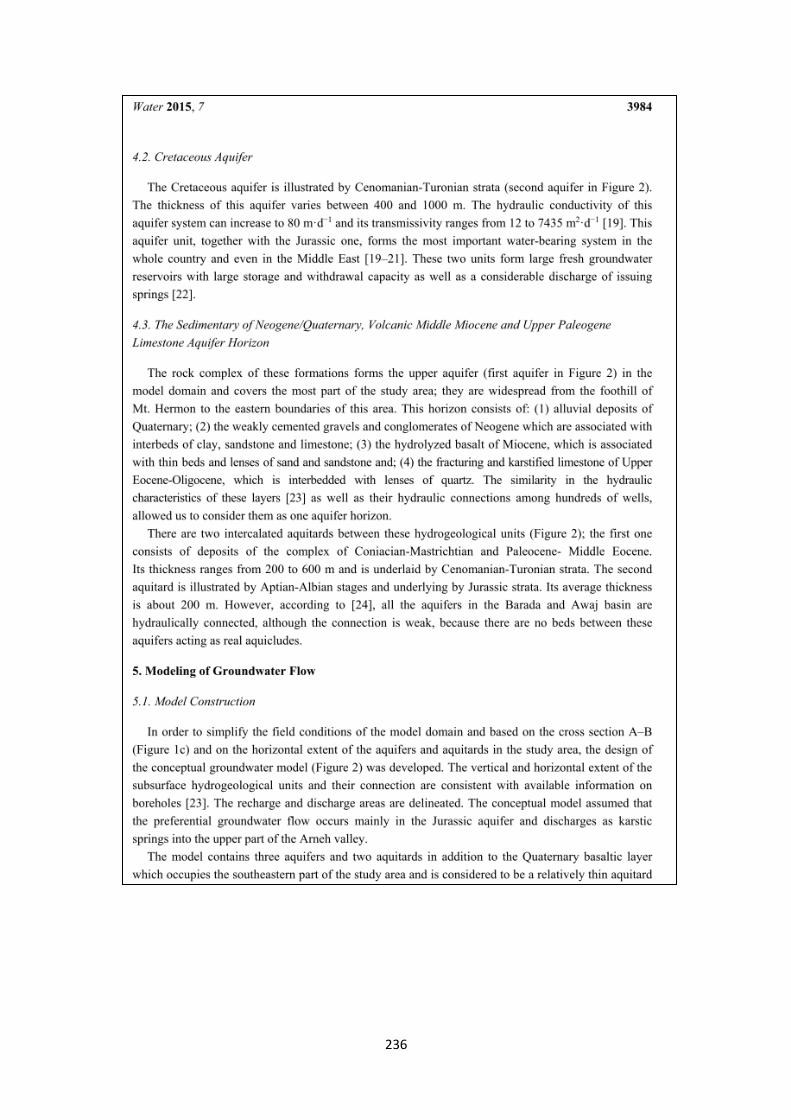
136
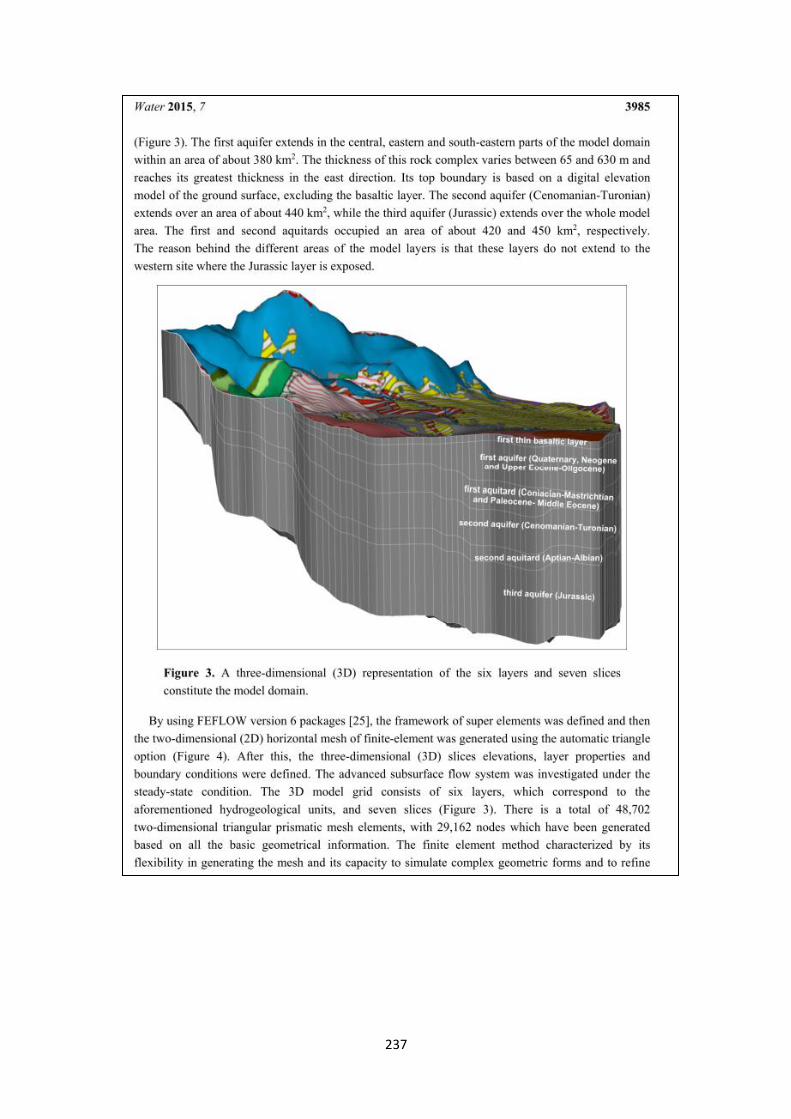
137
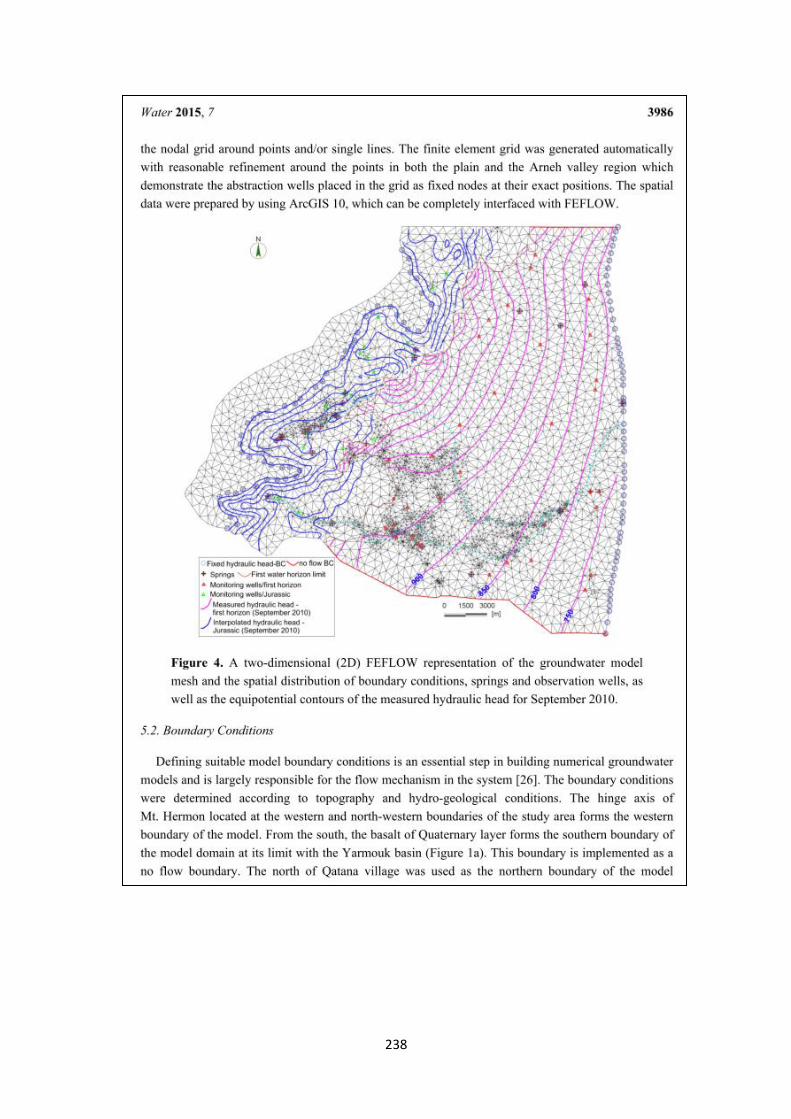
138
139
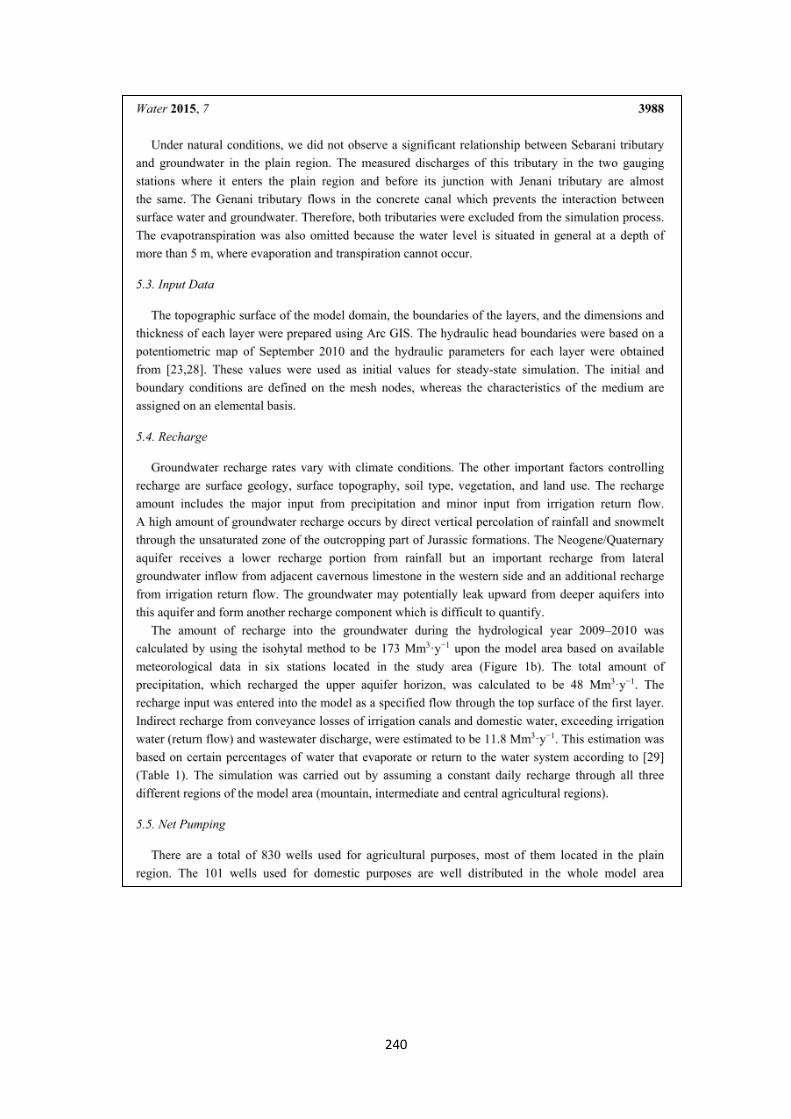
141
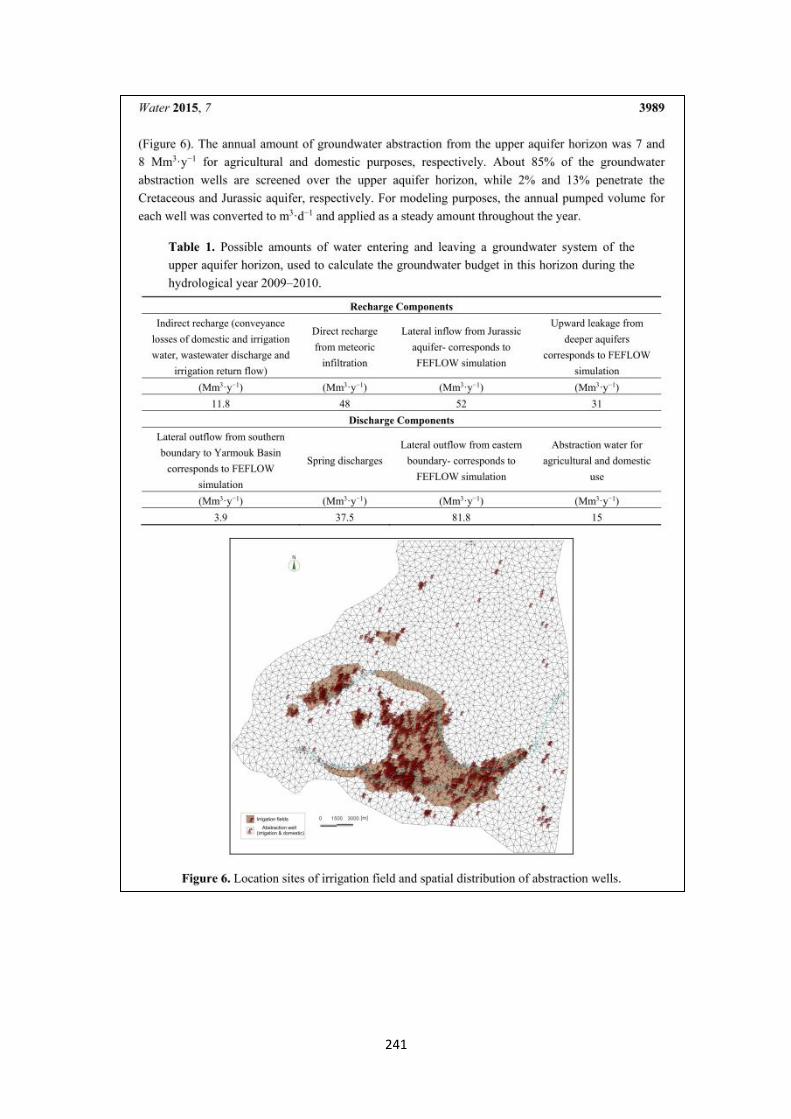
140
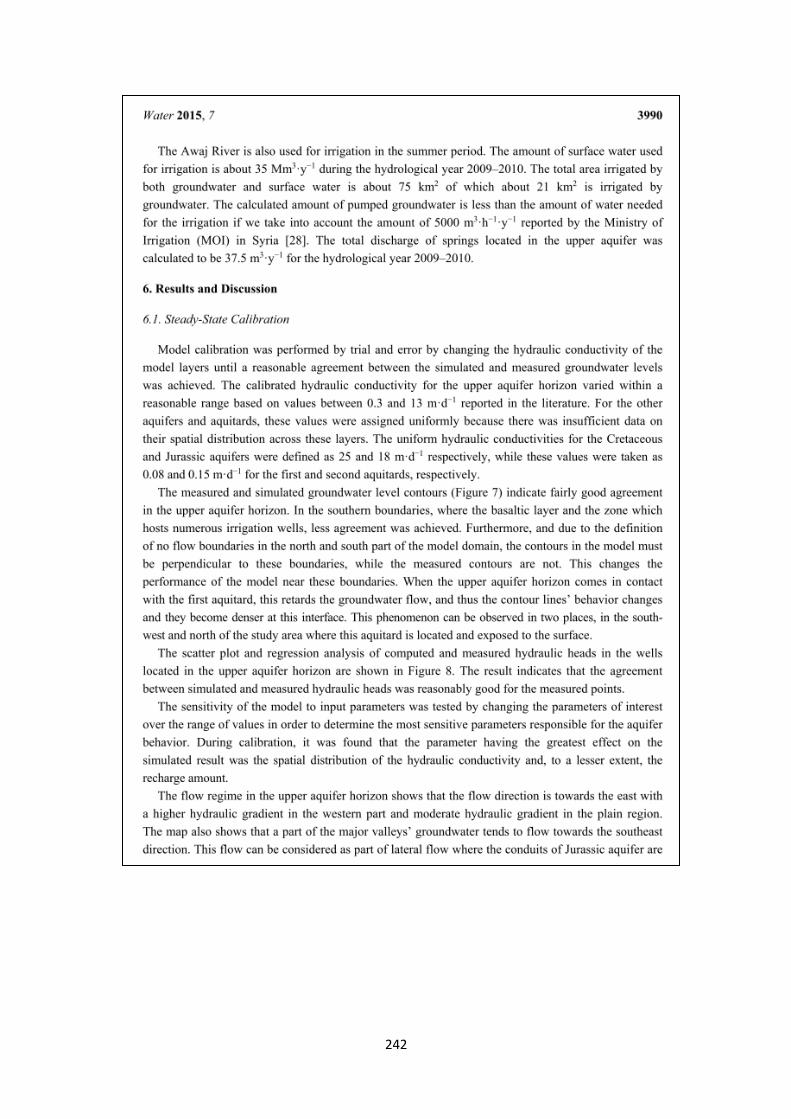
141
143
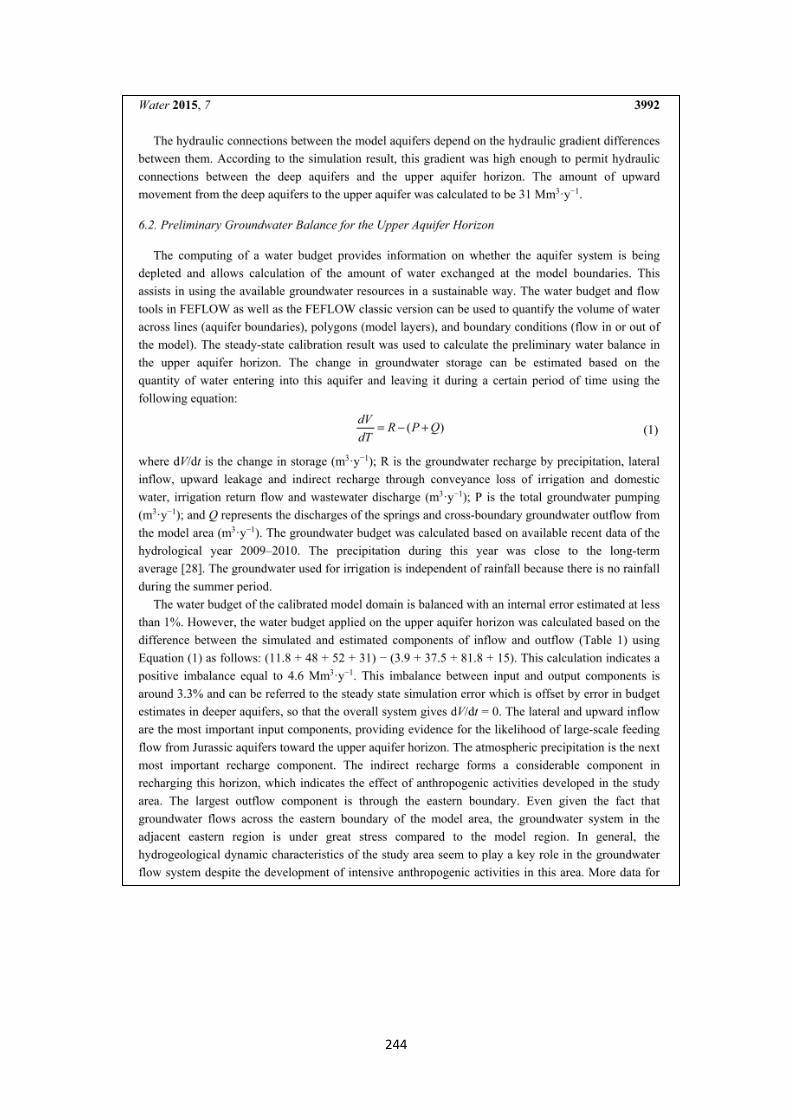
144
145
146
147
148

149
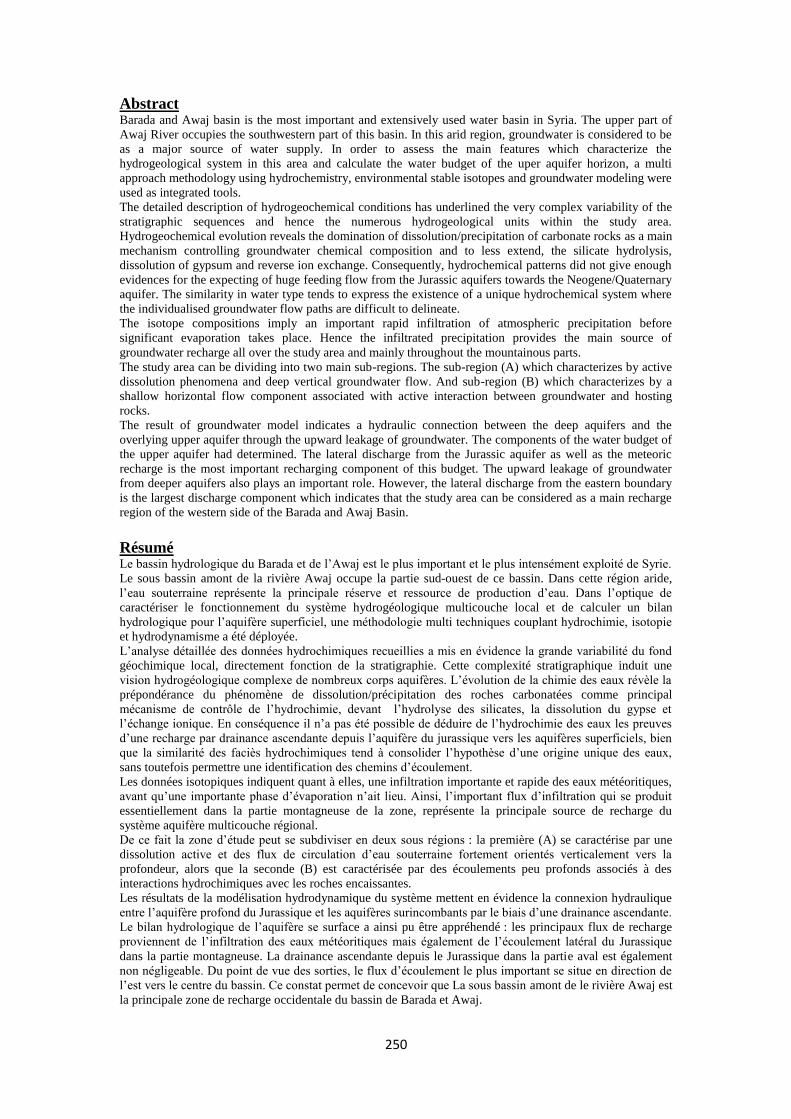
151
Abstract Barada and Awaj basin is the most important and extensively used water basin in Syria. The upper part of
Awaj River occupies the southwestern part of this basin. In this arid region, groundwater is considered to be
as a major source of water supply. In order to assess the main features which characterize the
hydrogeological system in this area and calculate the water budget of the uper aquifer horizon, a multi
approach methodology using hydrochemistry, environmental stable isotopes and groundwater modeling were
used as integrated tools.
The detailed description of hydrogeochemical conditions has underlined the very complex variability of the
stratigraphic sequences and hence the numerous hydrogeological units within the study area.
Hydrogeochemical evolution reveals the domination of dissolution/precipitation of carbonate rocks as a main
mechanism controlling groundwater chemical composition and to less extend, the silicate hydrolysis,
dissolution of gypsum and reverse ion exchange. Consequently, hydrochemical patterns did not give enough
evidences for the expecting of huge feeding flow from the Jurassic aquifers towards the Neogene/Quaternary
aquifer. The similarity in water type tends to express the existence of a unique hydrochemical system where
the individualised groundwater flow paths are difficult to delineate.
The isotope compositions imply an important rapid infiltration of atmospheric precipitation before
significant evaporation takes place. Hence the infiltrated precipitation provides the main source of
groundwater recharge all over the study area and mainly throughout the mountainous parts.
The study area can be dividing into two main sub-regions. The sub-region (A) which characterizes by active
dissolution phenomena and deep vertical groundwater flow. And sub-region (B) which characterizes by a
shallow horizontal flow component associated with active interaction between groundwater and hosting
rocks.
The result of groundwater model indicates a hydraulic connection between the deep aquifers and the
overlying upper aquifer through the upward leakage of groundwater. The components of the water budget of
the upper aquifer had determined. The lateral discharge from the Jurassic aquifer as well as the meteoric
recharge is the most important recharging component of this budget. The upward leakage of groundwater
from deeper aquifers also plays an important role. However, the lateral discharge from the eastern boundary
is the largest discharge component which indicates that the study area can be considered as a main recharge
region of the western side of the Barada and Awaj Basin.
Résumé
Le bassin hydrologique du Barada et de l’Awaj est le plus important et le plus intensément exploité de Syrie.
Le sous bassin amont de la rivière Awaj occupe la partie sud-ouest de ce bassin. Dans cette région aride,
l’eau souterraine représente la principale réserve et ressource de production d’eau. Dans l’optique de
caractériser le fonctionnement du système hydrogéologique multicouche local et de calculer un bilan
hydrologique pour l’aquifère superficiel, une méthodologie multi techniques couplant hydrochimie, isotopie
et hydrodynamisme a été déployée.
L’analyse détaillée des données hydrochimiques recueillies a mis en évidence la grande variabilité du fond
géochimique local, directement fonction de la stratigraphie. Cette complexité stratigraphique induit une
vision hydrogéologique complexe de nombreux corps aquifères. L’évolution de la chimie des eaux révèle la
prépondérance du phénomène de dissolution/précipitation des roches carbonatées comme principal
mécanisme de contrôle de l’hydrochimie, devant l’hydrolyse des silicates, la dissolution du gypse et
l’échange ionique. En conséquence il n’a pas été possible de déduire de l’hydrochimie des eaux les preuves
d’une recharge par drainance ascendante depuis l’aquifère du jurassique vers les aquifères superficiels, bien
que la similarité des faciès hydrochimiques tend à consolider l’hypothèse d’une origine unique des eaux,
sans toutefois permettre une identification des chemins d’écoulement.
Les données isotopiques indiquent quant à elles, une infiltration importante et rapide des eaux météoritiques,
avant qu’une importante phase d’évaporation n’ait lieu. Ainsi, l’important flux d’infiltration qui se produit
essentiellement dans la partie montagneuse de la zone, représente la principale source de recharge du
système aquifère multicouche régional.
De ce fait la zone d’étude peut se subdiviser en deux sous régions : la première (A) se caractérise par une
dissolution active et des flux de circulation d’eau souterraine fortement orientés verticalement vers la
profondeur, alors que la seconde (B) est caractérisée par des écoulements peu profonds associés à des
interactions hydrochimiques avec les roches encaissantes.
Les résultats de la modélisation hydrodynamique du système mettent en évidence la connexion hydraulique
entre l’aquifère profond du Jurassique et les aquifères surincombants par le biais d’une drainance ascendante.
Le bilan hydrologique de l’aquifère se surface a ainsi pu être appréhendé : les principaux flux de recharge
proviennent de l’infiltration des eaux météoritiques mais également de l’écoulement latéral du Jurassique
dans la partie montagneuse. La drainance ascendante depuis le Jurassique dans la partie aval est également
non négligeable. Du point de vue des sorties, le flux d’écoulement le plus important se situe en direction de
l’est vers le centre du bassin. Ce constat permet de concevoir que La sous bassin amont de le rivière Awaj est
la principale zone de recharge occidentale du bassin de Barada et Awaj.


