Embed Size (px)
Citation preview

i
Tuberculosis Stigma, AIDS Stigma, and Tuberculosis Control in Southern Thailand
Aaron Marshall Kipp
A dissertation submitted to the faculty of the University of North Carolina at Chapel Hill in partial fulfillment of the requirements for the degree of Doctor of Philosophy in the
Department of Epidemiology in the School of Public Health.
Chapel Hill 2009
Approved by,
Annelies Van Rie Charles Poole
James Thomas Paul Stewart
Ronald Strauss

ii
ABSTRACT
Aaron Marshall Kipp Tuberculosis Stigma, AIDS Stigma, and Tuberculosis Control in Southern Thailand
(Under the irection of Dr. Annelies Van Rie)
Tuberculosis (TB) remains one of the most important infectious diseases
worldwide, with approximately one-third of the world’s population infected with the
Mycobacterium tuberculosis bacillus and more than 9 million new cases and 1.7 million
deaths annually. Stigma may act as a barrier to TB care, treatment, and control in areas
where quality services are available. Health-related stigma is defined as “a social process
or related personal experience characterized by exclusion, rejection, blame, or
devaluation that results from experience or reasonable anticipation of an adverse social
judgment” because of specific health problem. Few measures of TB stigma exist, making
it difficult to understand its determinants and effect on health behaviors.
Data were collected in southern Thailand where culturally relevant TB and AIDS
stigma scales were developed. Using these scales, a survey of 300 healthy community
members, and a cohort of 480 newly diagnosed TB patients, the aims of this dissertation
were to 1) to identify socio-demographic, TB knowledge, and clinical factors associated
with TB stigma, 2) to estimate the association between stigma and patient delay in
seeking care for TB symptoms, and 3) to estimate the effect of stigma on adherence to
TB treatment.
We found high levels of both TB and AIDS stigma, but few factors were
identified that could contribute to TB stigma. Knowledge of the link between TB and

iii
AIDS, higher AIDS stigma, and knowing someone who died of TB were consistently
associated with TB stigma. However, neither TB nor AIDS stigma had an overall effect on
delay in seeking care for TB symptoms or adherence to treatment. Effects were observed
within sub-groups of gender, HIV status, and presenting symptoms, where higher stigma
increased delay and non-adherence among some, while decreasing delay and improving
adherence among others.
These findings have important implications for future stigma research and
interventions. Specifically, stigma research conducted at the general population level
(community or patient) may miss important effects. Future research should recognize that
stigma may serve as a motivator or barrier, and therefore identify specific sub-groups in
which stigma has an adverse effect and who would therefore benefit from stigma reduction
interventions.

iv
ACKNOWLEDGEMENTS
I would like to first acknowledge my committee chair, Dr. Annelies Van Rie. She has
been a wonderful advisor throughout my academic training, and has been gracious in sharing
her immense amount of TB knowledge with me. I am also thankful for the opportunity she
gave me to work on this project. I am grateful for the training in epidemiologic methods I
received under Dr. Charles Poole, and my understanding of stigma and social epidemiology
would not have been possible without the guidance of Drs. Ronald Strauss and James
Thomas. Finally, Dr. Paul Stewart provided valuable statistical support for this work.
This project would not have been possible without the wonderful work of our
collaborators in Thailand, including Petchawan Pungrassami, Virasakdi Chongsuvivatwong,
and Kittikorn Nilmanat. I am especially grateful to Petchawan for her work in checking and
re-checking the data collected from each study site, as well as for answering the innumerable
questions I asked. We are also thankful for the time and cooperation of the clinic staff,
patients, and community members.
I am also thankful the funding that supported this project. The Thailand study was
funded by an NIH-Fogarty grant #5R21TW0063470103, which supported my first two years
on the project. I am also thankful for the NIH training in infectious disease epidemiology
training grant #5T32AI07011403 which supported my final year of work on the dissertation.
And finally, I am grateful to my supportive and loving wife, Eleanor. Now begins a
new era in our relationship, as she has never known me as anything other than a graduate
student. And to my parents who have been supportive and loving all these years.

v
TABLE OF CONTENTS
TABLE OF CONTENTS ...................................................................................... v
LIST OF TABLES ............................................................................................ viii
LIST OF FIGURES .............................................................................................. x
CHAPTERS
1. INTRODUCTION ............................................................................................ 1
2. REVIEW OF THE LITERATURE .................................................................. 3
BACKGROUND OF HEALTH-RELATED STIGMA ............................................... 3
QUALITATIVE REPORTS OF TUBERCULOSIS STIGMA .................................... 6
QUANTITATIVE MEASURES OF TUBERCULOSIS STIGMA ............................. 9
TUBERCULOSIS STIGMA AND DELAY IN SEEKING CARE FOR TUBERCULOSIS SYMPTOMS ................................................................................ 24
TUBERCULOSIS STIGMA AND ADHERENCE TO TUBERCULOSIS TREATMENT ............................................................................................................ 35
SUMMARY OF LITERATURE REVIEW................................................................ 40
3. SPECIFIC AIMS AND RATIONALE ...........................................................41
SPECIFIC AIM 1 ........................................................................................................ 41
SPECIFIC AIM 2 ........................................................................................................ 41
SPECIFIC AIM 3 ........................................................................................................ 41
RATIONALE .............................................................................................................. 42

vi
4. STUDY DESIGN AND METHODS .............................................................43
SETTING AND STUDY DESIGN ............................................................................ 43
STIGMA SCALES ..................................................................................................... 46
ANALYTIC METHODS ............................................................................................ 50
5. DETERMINANTS OF TUBERCULOSIS STIGMA IN SOUTHERN THAILAND: COMMUNITY AND PATIENT PERSPECTIVES ................67
BACKGROUND ........................................................................................................ 67
METHODS ................................................................................................................. 69
RESULTS ................................................................................................................... 72
DISCUSSION ............................................................................................................. 76
TABLES AND FIGURES .......................................................................................... 80
6. TUBERCULOSIS AND AIDS STIGMA AMONG PATIENTS WHO DELAY SEEKING CARE FOR TUBERCULOSIS SYMPTOMS ..............85
BACKGROUND ........................................................................................................ 85
METHODS ................................................................................................................. 86
RESULTS ................................................................................................................... 89
DISCUSSION ............................................................................................................. 91
TABLES AND FIGURES .......................................................................................... 95
7. TUBERCULOSIS TREATMENT DEFAULT AND NON-ADHERENCE DUE TO TUBERCULOSIS AND AIDS STIGMA ......................................99
BACKGROUND ........................................................................................................ 99
METHODS ............................................................................................................... 100
RESULTS ................................................................................................................. 104
DISCUSSION ........................................................................................................... 107

vii
TABLES AND FIGURES ........................................................................................ 111
8. DISCUSSION AND FUTURE DIRECTIONS ............................................118
OVERVIEW ............................................................................................................. 118
STUDY FINDINGS.................................................................................................. 119
FUTURE DIRECTIONS .......................................................................................... 122
APPENDIX: SENSITIVITY ANALYSIS TABLES FOR SPECIFIC AIM ONE ..........................................................................................................126
REFERENCES .................................................................................................138

viii
LIST OF TABLES
Table 2.1. Summary characteristics for published measures of tuberculosis stigma.............. 23 Table 2.2. Summary of quantitative studies on TB stigma and delays in seeking care. ........ 34 Table 4.1. Final items for the TB stigma scales. ..................................................................... 48 Table 4.2. Final items for the AIDS stigma scales. ................................................................ 49 Table 4.3. Cronbach's alpha for each stigma scale, by participant group. .............................. 49 Table 4.4. Definitions of socio-demographic covariates used in the analyses for
aims 1 – 3. .............................................................................................................. 52 Table 4.5. Definitions of TB knowledge covariates used in the analyses for aims 1 – 3. ...... 53 Table 4.6. Definitions of access to care and clinical covariates used in the analyses
for aims 1 – 3 (only collected for patients with TB). ............................................ 53 Table 4.7. Relationship between stigma perspectives and study participants. ....................... 54 Table 5.1. Relationship between stigma perspectives and study participants. ....................... 80 Table 5.2. Stigma scale characteristics and score distributions. ............................................. 80 Table 5.3. Distribution of participant characteristics, by participant group. .......................... 81 Table 5.4. Adjusted differences in mean, summed stigma scores for participant
characteristics. ........................................................................................................ 82 Table 6.1. Distribution of patient characteristics, by inclusion status. ................................... 95 Table 6.2. Adjusted differences in mean, log-transformed delay times per one point
increase in stigma score. ........................................................................................ 97 Table 7.1. Crude association between non-adherence and default. ...................................... 111 Table 7.2. Baseline participant characteristics (continuous), by treatment outcome. ........... 112 Table 7.3. Baseline participant characteristics (categorical), by treatment outcome. ........... 113 Table 7.4. Second assessment of stigma and TB knowledge among patients completing
intensive phase therapy, by treatment outcome. ................................................. 114

ix
Table 7.5. Odds ratios for the effect of baseline TB and AIDS stigma on treatment default. ................................................................................................................. 115
Table 7.6. Rate ratios for the effect of stigma on non-adherence to TB treatment ............... 116 Table A1. Specified distributions for the two bias parameters needed to perform
a sensitivity analysis of an unmeasured confounder (knowing someone with TB who died) on the association between TB knowledge and TB stigma among patients with TB. .......................................................................... 126
Table A2. Sensitivity analysis of an unmeasured confounder for TB knowledge and
TB stigma from the community perspective among patients with TB. ............... 127 Table A3. Sensitivity analysis of adjusted differences in mean, summed stigma scores
for participant characteristics with stigma item responses coded as 0, 1, 3, 4. .... 128 Table A4. Sensitivity analysis of adjusted differences in mean, summed stigma scores
for participant characteristics with stigma item responses coded as 0, 2, 3, 5. .... 130 Table A5. Sensitivity analysis of adjusted odds ratios for patient characteristics and high
stigma (item-adjusted scores ≥1.75). ................................................................... 132 Table A6. Sensitivity analysis of adjusted odds ratios for patient characteristics and high
stigma (item-adjusted scores ≥2.00). ................................................................... 134 Table A7. Sensitivity analysis of adjusted odds ratios for patient characteristics and high
stigma (item-adjusted scores ≥2.25). ................................................................... 136

x
LIST OF FIGURES
Figure 4.1. Directed acyclic graph for analyzing determinants of TB stigma ........................ 56 Figure 4.2. Directed acyclic graph for analyzing determinants of TB stigma ........................ 56 Figure 4.3. Directed acyclic graph for analyzing the association of TB and AIDS stigma .... 61 Figure 4.4. Directed acyclic graph for analyzing the effects of TB and AIDS stigma on
adherence to TB treatment. ................................................................................... 65 Figure 5.1. Kernel-smoothed, item-adjusted TB stigma score distributions (community
perspective scale). ................................................................................................. 84 Figure 5.2. Kernel-smoothed, item-adjusted TB stigma score distributions (patient
perspective scale).. ................................................................................................ 84 Figure 6.1. Kernel-smoothed distribution of untransformed delay time. ............................... 98 Figure 7.1. Distribution of non-adherence during treatment. ............................................... 117

CHAPTER 1
INTRODUCTION
Tuberculosis (TB) remains one of the most important infectious diseases worldwide
with approximately one-third of the world’s population estimated to be infected with the
Mycobacterium tuberculosis bacillus, and more than 9 million new cases and 1.7 million
deaths annually (Dye, Scheele et al. 1999; WHO 2006; WHO 2008). In 1993, the World
Health Organization (WHO) declared TB a global emergency and recommended that
countries implement the DOTS strategy as a cost effective way of managing and controlling
the TB epidemic (WHO 1999). DOTS is based on five key components: 1) government
commitment, 2) passive case detection by sputum smear microscopy, 3) standardized
treatment for six to eight months incorporating directly observed treatment, 4) regular,
uninterrupted supplies of anti-TB drugs, and 5) standardized recording and reporting. A
target of detecting 70% of new infectious cases and successfully treating 85% of those
detected was established, with the expectation that incidence rates would decline 10% per
year in areas where rates were already stable and HIV co-infection was absent (Dye, Garnett
et al. 1998; Dye, Maher et al. 2006). While 93% of the world’s population is living under
DOTS coverage, it is estimated that only 61% of new smear-positive cases are detected, with
85% of these being treated successfully. Among the 22 high burden countries, only five

2
(China, Indonesia, Myanmar, the Philippines, and Viet Nam) had achieved the WHO targets
for case detection and successful treatment (WHO 2008).
The dynamics of TB disease and control have changed, however, with the onset of the
HIV/AIDS pandemic. In the absence of HIV co-infection, a person infected with TB has a -
10% lifetime risk of developing active disease, with the greatest risk of active disease
occurring in the first two years after infection (Harries and Dye 2006). In contrast,
individuals living with HIV who are not receiving antiretroviral therapy have a 5-15%
annual risk of developing active TB disease and up to a 50% lifetime risk of disease.
Approximately 8% of new TB cases worldwide are co-infected with HIV and 12% of TB
deaths are among those infected with HIV (WHO 2008). This increase in incident disease
can place additional strain on national TB control programs, making it difficult to reach the
WHO targets (Lienhardt and Rodrigues 1997).
With its focus on passive case detection, diagnostic techniques, and directly observed
therapy, DOTS has been criticized as a treatment guideline and biomedical strategy that does
not account for social factors related to TB control, rather than a comprehensive control plan
(Lienhardt and Ogden 2004; Whalen 2006). The new WHO Global Plan to Stop
Tuberculosis (WHO 2006) recognizes that DOTS will not control TB in areas of HIV and
drug resistant TB. It therefore enhances the DOTS strategy, creating a more comprehensive
approach that addresses poverty and other social factors. One of these factors is stigma,
which may act as a barrier to appropriate care and treatment in areas where quality services
are available.

CHAPTER 2
REVIEW OF THE LITERATURE
BACKGROUND OF HEALTH-RELATED STIGMA
In recent years, there has been increasing interest in the role of stigma in affecting
public health issues (Van Brakel 2006). Erving Goffman is credited with writing the seminal
work on stigma, published in 1963 and entitled Stigma: Notes on the Management of Spoiled
Identity (Goffman 1963). Observations on a broad range of conditions and behaviors form
the basis of his work, including physical deformities, hearing loss, epilepsy, schizophrenia,
sexual orientation, and conviction for criminal acts. Through interviews, observation, and
research, he formalized the concept of stigma and described how it affects those who are
stigmatized, particularly as they work to manage their personal and social identity in relation
to that which stigmatizes them. He defines stigma as “an undesirable or discrediting attribute
that an individual possesses, thus reducing that individual’s status in the eyes of society”.
This “discrediting attribute” can fall into one of three categories: abominations of
body (e.g. physical defects), blemishes of character (e.g. behavioral defects), or tribal
attributes (e.g. race, ethnicity, religion) which can be passed on through lineage. He further
separates stigma in discredited (or visible) and discreditable (or hidden) forms. Discredited
attributes refer to those which are known or evident to the observer. Many physical
deformities, race and ethnicity constitute this form of stigma. Discreditable attributes refer to

4
those that are unknown or hidden from the observer. These can be behavioral attributes or
physical attributes that can easily be hidden. The form of stigma that a person has will
influence how he or she interacts with society. Those who are discredited will tend to avoid
social situations or seek to lessen the impact of their attribute when going out in public.
Those who are discreditable will try to manage their stigma. They will expend time and
energy keeping the attribute hidden while deciding to whom they will disclose it. Additional
energy is spent as they anticipate and react to the response of the observer upon disclosure.
Stigma research has blossomed since Goffman’s publication. An unfortunate result
has been the multiple definitions and ambiguous concepts of stigma that have emerged in the
literature (Link and Phelan 2001; Deacon 2006). Ambiguity in the term has important
implications for stigma research and interventions. It is imperative that, when stigma is
discussed and measured, there be little confusion about its concept, underlying mechanisms,
and observable outcomes. Weiss and Ramakrishna define health-related stigma as “a social
process or related personal experience characterized by exclusion, rejection, blame, or
devaluation that results from experience or reasonable anticipation of an adverse social
judgment about a person or group identified with a particular health problem” (Weiss and
Ramakrishna 2006). They draw attention to the need for formal research on the role of
stigma in the burden of illness and propose six research objectives:
1) Document the burden of stigma for serious health problems
2) Compare stigma for different health problems and in different settings
3) Identify determinants of stigma and their effect on health policy, illness experience,
and behavior

5
4) Evaluate changes in stigma over time and in response to interventions and social
change
5) Improve knowledge about the nature and risk of target health problems so that laws
and health policy minimize stigma
6) Develop clear, simple, and unambiguous messages about the complicated health
problems of stigma
Accomplishing these objectives requires a clear understanding of the occurrence of
stigma. As identified in the definition by Weiss and Ramakrishna, stigma can be a social
process (i.e. present in the community) or personal experience, both of which can be
perceived or real effects. Recent literature on health-related stigma has identified five broad
components that incorporate both community and patient perspectives (Nyblade 2006; Van
Brakel 2006). These include:
1) Stigmatizing attitudes toward affected persons. This component can involve feelings
and attitudes of blame, shame, fear, disgust, and prejudice directed at the affected
person.
2) Stigmatizing practices and actions toward affected persons. This component can
involve avoidance, rejection, and discrimination directed at affected person.
3) Perceived stigma by the affected person. This component can involve fear of what
others think or will do because of what they know or suspect about the affected
person.

6
4) Experienced stigma by the affected person. This component can involve actual
experiences of rejection, isolation, and discrimination by the affected person.
5) Internalized stigma by the affected person. This component can include feelings of
shame, guilt, loss of esteem or dignity, and social isolation or withdrawal by the
affected person.
The first two components relate to stigma as it exists in the general population or
community. This includes health care workers, which, while members of the general
population, are in a unique position to interact with persons that have a potentially
stigmatizing health condition, while also having the potential to positively or negatively
impact the stigma perception of the patient (Dodor, Kelly et al. 2009). The latter three
components relate to the person with the stigmatizing attribute.
As identified by Goffman, stigma can occur with many conditions and characteristics.
A recent review of health-related stigma identified leishmaniasis, lymphatic filariasis, Buruli
ulcer, onchocerciasis, leprosy, tuberculosis, and HIV/AIDS as communicable diseases that
carry a stigma (Van Brakel 2006). Of these, stigma associated with HIV/AIDS has perhaps
been the most studied and has contributed significantly to the understanding of health-related
stigma. The literature includes both qualitative and quantitative studies, including published
scales for measuring HIV/AIDS stigma, and reports of the negative impact it can have on
testing, treatment, and risk behavior (Mahajan, Sayles et al. 2008). In contrast to the
HIV/AIDS literature, research on TB stigma is less developed.
QUALITATIVE REPORTS OF TUBERCULOSIS STIGMA

7
Reports of TB stigma come from Asia (Liefooghe, Michiels et al. 1995; Johansson,
Diwan et al. 1996; Long, Johansson et al. 1999; Johansson, Long et al. 2000;
Ngamvithayapong, Winkvist et al. 2000; Long, Johansson et al. 2001; Ali, Rabbani et al.
2003; Balasubramanian, Garg et al. 2004; Sengupta, Pungrassami et al. 2006; Baral, Karki et
al. 2007; Daftary, Padayatchi et al. 2007), Africa (Liefooghe, Baliddawa et al. 1997;
Eastwood and Hill 2004; Daftary, Padayatchi et al. 2007), the Americas (Jaramillo 1998;
Macq, Solis et al. 2005), Europe (Dimitrova, Balabanova et al. 2006), and among immigrants
and minorities (Gibson, Cave et al. 2005; Nnoaham, Pool et al. 2006). These use interviews
and focus groups with TB patients, family members, providers, and community members to
explore the stigma associated with TB. Some also included patients co-infected with HIV
(Ngamvithayapong, Winkvist et al. 2000; Nnoaham, Pool et al. 2006; Sengupta, Pungrassami
et al. 2006; Daftary, Padayatchi et al. 2007).
Tuberculosis is reported to have negative social consequences. This includes family
members requiring the patient to use separate utensils or eat and sleep in a different room
(Long, Johansson et al. 2001) as well as outright avoidance and isolation (Johansson, Diwan
et al. 1996; Long, Johansson et al. 2001). In some studies, women stated their husbands
might leave them if they were diagnosed with TB, while those who were not married feared
their marriage prospects would decrease (Liefooghe, Michiels et al. 1995; Long, Johansson et
al. 1999; Long, Johansson et al. 2001; Balasubramanian, Garg et al. 2004). Some TB
patients feared losing their jobs (Demissie, Getahun et al. 2003). Occasionally, the negative
social consequences of TB continued beyond the period of infectiousness, and in some cases
beyond completion of treatment (Liefooghe, Michiels et al. 1995; Long, Johansson et al.
2001). Fear of being isolated or rejected was reported to cause persons with prolonged cough

8
to try to conceal their disease, withdraw from others, and avoid seeking care for fear of
officially being diagnosed as a TB patient (Johansson, Diwan et al. 1996; Johansson, Long et
al. 2000; Long, Johansson et al. 2001; Demissie, Getahun et al. 2003).
The reasons for stigmatizing attitudes vary, but generally fall into three categories:
inadequate or incorrect knowledge of TB, association of TB with poverty, poor hygiene, or
particular behavior among marginalized populations, and association of TB with the
occurrence of HIV/AIDS. Some reports identified fear of infection and transmission as
sources of stigma (Liefooghe, Baliddawa et al. 1997; Jaramillo 1998). This was compounded
by incorrect knowledge about transmission of TB, including being hereditary (Long,
Johansson et al. 1999; Balasubramanian, Garg et al. 2004) or from smoking (Eastwood and
Hill 2004; Sengupta, Pungrassami et al. 2006). Others reported incorrect knowledge of
treatment and curability (Liefooghe, Baliddawa et al. 1997; Johansson, Long et al. 2000;
Long, Johansson et al. 2001), including viewing a TB diagnosis as a death sentence. When
isolation and rejection were reported to continue beyond the period of infectiousness, it was
due to an incorrect knowledge of treatment and curability and therefore a source of stigma,
rather than a public health measure (Long, Johansson et al. 2001; Baral, Karki et al. 2007).
Tuberculosis stigma may also exist due to the people, circumstances, or behaviors it
is associated with. Some view TB as a dirty disease, and one that is associated with poverty
or poor hygiene (Johansson, Diwan et al. 1996; Eastwood and Hill 2004; Dimitrova,
Balabanova et al. 2006). Additionally, its association with prostitution (Eastwood and Hill
2004; Baral, Karki et al. 2007), immigration or ethnic minorities (Gibson, Cave et al. 2005),
and substance abuse, prison, or unemployment (Dimitrova, Balabanova et al. 2006) means

9
that stigma associated with these groups is transferred onto TB patients or that the diagnosis
makes existing stigma greater.
Finally, there is growing concern that existing TB stigma is compounded and
complicated by the role HIV infection plays in the occurrence of TB. While stigma exists
with both diseases, it is generally recognized that HIV/AIDS is more stigmatizing due to
moral judgments on its mode of transmission (Ngamvithayapong, Winkvist et al. 2000;
Sengupta, Pungrassami et al. 2006). In some cases, patients co-infected with TB and HIV
prefer to disclose their TB status rather than their HIV status knowing that the social
response will be less severe. The effect of HIV on TB stigma appears to occur in two ways.
First, symptoms of TB and AIDS are very similar, leading people to think a person has AIDS
when they may have TB (Nnoaham, Pool et al. 2006; Sengupta, Pungrassami et al. 2006).
Secondly, as the knowledge of the interaction between TB and HIV grows, some feel that a
diagnosis of TB means a concurrent diagnosis of HIV (Godfrey-Faussett and Ayles 2003;
Nnoaham, Pool et al. 2006). Fear of being dually diagnosed can have a negative impact on
patients seeking TB care (Ngamvithayapong, Winkvist et al. 2000; Godfrey-Faussett and
Ayles 2003).
QUANTITATIVE MEASURES OF TUBERCULOSIS STIGMA
Background
In contrast to the amount of quantitative data for HIV-related stigma, specifically in
the area of stigma measures, there is a paucity of published, quantitative measures and
research for TB stigma (Macq, Solis et al. 2006). Attempts to quantify TB stigma have been
made and are reported in the literature (Table 2.1). These include both the general

10
population and patients with TB, and have focused on some of the stigma components within
each population. However, few have been developed specifically for TB stigma and
subsequently evaluated for validity and reliability of the underlying stigma construct. They
therefore provide little additional understanding beyond qualitative findings of what factors
contribute to stigma and what the impact of stigma is on TB control.
Before continuing with a review of published TB measures, however, a brief
overview of scale development is provided along with general requirements for evaluating a
scale provided by DeVellis (DeVellis 1991). Psychometric scales are developed to identify
and measure underlying phenomena, called constructs, that are not directly observable. In
this case, stigma is the underlying construct of interest. There are two primary concerns with
any scale that is developed: validity and reliability. Validity relates to whether or not the
underlying construct gives rise to the scale items, and can include content and construct
validity. Content validity is the extent to which the items selected for a scale are a valid
sample of all possible items that could be included in the scale. While it is impossible to
measure content validity, the use of focus groups, interviews, expert review, and relevant
literature in the development of scale items will enhance the likelihood that a valid sample of
all possible items is used. Construct validity refers to the theoretical relationship between the
behavior of the scale and the underlying construct. Construct validity can be assessed two
ways. First, factor analysis can identify sets of items that are related and therefore likely to
measure the same construct, while excluding items that may be unrelated. Second, the
correlation between the scale and other related scales can be measured, with the assumption
that related constructs are well correlated. Social support and self-esteem are constructs
expected to be inversely correlated with stigma.

11
Reliability of a scale refers to how much of the variance is attributable to the
underlying construct, rather than random error. The primary measure of reliability is
Cronbach’s alpha, which ranges from zero to one. It is generally accepted that an alpha of at
least 0.70 is good to excellent, while an alpha <0.65 is less acceptable (DeVellis 1991; Bland
and Altman 1997). Another way to assess reliability is to have participants test and then re-
test the scale within a short period of time. A correlation between paired scores suggests that
item responses truly measure the underlying construct rather than varying randomly.
However, test/re-test results may be invalid if the construct is believed to change over time.
In summary, a well-developed scale should have evidence of content validity, a
measure of construct validity, and a measure of reliability. Below is a review of published
TB stigma measures (also see Table 2.1).
Review of quantitative measures of tuberculosis stigma
Jenkins (1966) (Jenkins 1966) appears to be the first to measure TB stigma as part of
a study to obtain data on beliefs and attitudes towards TB in the United States of America. A
probability sample of 436 adults from a large urban city were enrolled, with 76% being
White, 12% Latino, and 11% Black. Sixteen items were developed that addressed
perceptions and feelings about TB, including susceptibility, prominence, severity, prevention,
and social impact. Participants were asked to respond on a continuum ranging from 0 to 20,
with higher scores indicating more negative attitudes. Factor analysis of the items was
performed by racial group and items were considered to contribute to a specific factor if
loadings were > 0.30.

12
The only stigma-related factor identified occurred among Blacks and was termed
“escape from social damage”. It contained six items with elements of stigma such as viewing
TB as a dirty disease, affecting bad people, and the willingness to give up a portion of
income to avoid contracting TB. A seventh item indicating that TB was embarrassing did not
meet the factor loading criteria, but loaded more strongly on the “escape from social
damage” factor than on any other. No similar factor was identified among Whites or Latinos,
and Jenkins concludes that Blacks view TB as “a common disease with social stigma”.
Unlike stigma scales developed more recently, the scale identified by Jenkins was not
intended to measure stigma specifically. Rather, in the context of understanding broader
beliefs about TB, a specific measure of stigma was identified. The measure is relatively
rigorous in that it used factor analysis to group related items. However, no measure of
reliability (e.g. Cronbach’s Alpha) was reported and no summary stigma score for the
population is provided.
Westaway (1989) (Westaway 1989) developed a measure of TB stigma as part of a
study to obtain information on knowledge, beliefs, and feelings about TB and to evaluate the
usefulness of social stigma in understanding TB attitudes in South Africa. A convenience
sample of 211 healthy adults was enrolled from urban health clinics. Five items were
developed to specifically measure TB stigma, three of which were taken from Jenkins’
“escaping from social damage” scale. Participants responded to each item on a three point
scale and the responses were summed to create a stigma score. Results indicated that
individuals with a family history of TB reported lower stigma than those with no family
history. Knowledge of TB including signs and symptoms, cause, transmission, diagnosis,
cure, and treatment was not found to be related to stigma.

13
While this study specifically set out to measure TB stigma and discover how TB
knowledge affected stigma, no information is reported on scale characteristics. Given the
small number of items, a factor analysis would likely not have been informative. However,
no measure of reliability was reported. Additionally, no summary stigma score was reported
and it is not clear what statistical methods were used for the analysis.
Jaramillo (1999) (Jaramillo 1999) developed a set of items to measure prejudice
towards people with TB as part of a study to learn whether beliefs about TB transmission
predict prejudice in Colombia. A random sample of 399 adults was surveyed. A social
distance scale consisting of five items was developed to measure prejudice. It included
asking about the respondent’s ability to kiss, share meals with, have sex with, work/study
with, and hug people with TB. Participants responded by indicating strongly disagree, don’t
know, or strongly agree with each item. A prejudice score ranging of 5 – 15 was created by
summing item responses, with lower scores indicating more prejudice. Cronbach’s alpha
was reported to be 0.70. An additional four items were developed to measure feelings
toward people with TB but were not combined in a scale because Cronbach’s alpha was
unacceptably low (0.50). These included fear, loathing, anger, and sorrow. Respondents
indicated very strong, some/don’t know, or none to each of the emotions.
Prejudice scores were normally distributed and reported by gender, age group,
education level, and socio-economic status, but never collapsed across groups. An overall
mean prejudice score of 8.68 was estimated using the assumption of normality within strata
and the reported stratum specific scores. Multivariable linear regression with forward
selection was used to identify predictors of prejudice. Beliefs about TB transmission
(Estimate: 0.25; 95% CI: 0.19, 0.31), fear of persons with TB (0.55; 0.28, 0.82), age (-0.22; -

14
0.36, -0.08), socio-economic status (0.32; 0.08, 0.56), and educational and health care
institutions as sources of TB information (0.62; 0.11, 1.13) were retained as candidate
predictors.
The primary criticism of the Jaramillo scale is that prejudice is only one component
of stigma (Link and Phelan 2001; Weiss, Ramakrishna et al. 2006), and provides limited
insight into TB stigma. Furthermore, the prejudice was measured using social distance and
did not incorporate other emotions (e.g. fear, anger) to create a more comprehensive scale.
Godfrey-Faussett et al. (2002) (Godfrey-Faussett, Kaunda et al. 2002) developed a
stigma index as part of a study to evaluate the extent and causes of delay among patients
with cough seeking health services in Zambia. A convenience sample of 427 patients were
surveyed from two urban health clinics. A number of questions were asked to assess how
comfortable patients were with different levels of social contact with former TB patients and
a relative or spouse who was on treatment. Forms of contact included sharing utensils,
working together, marriage, shaking hands, and sharing a bed. Participants were also asked
if undergoing a TB test would make others think a person also has AIDS. A summary
indicator was created ranging from 1 – 15, with no stigma defined as scores 1 – 4, moderate
stigma as scores 5 – 8, and high stigma as scores 9 – 15. It was not clear how many
questions were used, what the response options were, and no measure of reliability was
reported.
Stigma scores were normally distributed, but no mean score was reported. Based on
the frequency distribution provided, an estimated mean score of 6.15 was calculated. Using
the categories defined in the study, 45% of patients had moderate stigma, while 23% had
high stigma. Chi-square analysis indicated that poor knowledge (p=0.004) and gender

15
(p=0.019) were associated with stigma, but no further information was provided. Godfrey-
Faussett and colleagues found no association between stigma and delay in seeking care for
cough (see review of TB stigma and delay below).
While great effort was made to develop a comprehensive measure of stigma, no
information on the development process or index itself were reported. This makes critiquing
the index difficult and hinders interpretation of the results. This is unfortunate, because the
authors report that a substantial proportion of participants held stigmatizing attitudes on
many of the items, including that 49% felt that undergoing TB testing could indicate to others
the presence of AIDS.
Mak et al. (2006) (Mak, Mo et al. 2006) developed a stigma scale for the purpose of
comparing TB, HIV/AIDS, and SARS stigma in Hong Kong. Random digit dialing was used
to survey 3,011 adults, administering one of the scales to each participant so that each scale
had approximately 1,000 respondents. Fourteen items were developed to measure stigma
based on focus groups and exiting measures of psychiatric stigma. Items addressed affective
(patients are revolting), behavioral (keeping a distance from patients), and cognitive (patients
are a burden to society) aspects of stigma. Participants responded on a six point scale
ranging from strongly disagree to strongly agree. A summary score ranging from 1 – 6 was
created by taking the average response for all items, with higher scores indicating higher
stigma. Scale items for each disease were identical, and Cronbach’s alpha of 0.85, 0.83, and
0.81 was calculated for the HIV/AIDS, TB, and SARS scales, respectively.
The mean TB stigma score was 1.94, ranking lower than AIDS stigma but higher than
SARS stigma. Bivariate analysis indicated that higher stigma was not correlated with
knowledge about transmission, symptoms, and treatment (r=0.03).

16
The scale by Mak and colleagues is a well developed scale with good reliability. It
incorporates multiple dimensions of stigma, including affective, behavioral, and cognitive
aspects. It is further strengthened by the accompanying parallel scale for AIDS stigma.
World Health Organization Regional Office of the Eastern Mediterranean
(WHO/ROEM) (2006) (WHO/ROEM 2006) developed a stigma scale as part of a study to
evaluate TB diagnostic and treatment delay and to identify their determinants in seven
Eastern Mediterranean countries. A total of 5,053 patients with TB were enrolled as a
convenience sample from TB clinics in specific regions of Pakistan (844), Iraq (400), and
Somalia (809), and from nationwide random samples in Iran (800), Egypt (802), Syrian Arab
Republic (800), and Yemen (598). Fifteen items were developed that addressed social
interaction, family and work responsibilities, a woman’s ability to decide on treatment, cost,
and incorrect beliefs about the effect of TB on female reproductive outcomes and
breastfeeding. Participants responded on a five point scale ranging from strongly agree to
strongly disagree, with lower scores indicating higher stigma. To create a summary score,
items were re-coded so that higher scores indicated higher stigma, then transformed to reflect
the percent of the total possible score, ranging from 0 to 100%. Prior to translation into local
languages, the scale was pilot tested to assess content validity (expert review) and test/re-test
reliability (results not provided). Cronbach’s alpha was calculated and found to be
acceptable, but no value was reported.
Mean stigma scores were reported by gender, but not collapsed across gender. An
overall score was estimated using the assumption of normality within both strata and the
reported scores. Mean scores ranged from a low of 50 in Egypt to a high of 71 in Iran.

17
While considerable effort was made to develop, administer, and evaluate TB stigma
in the Eastern Mediterranean region, the scale suffers from two major limitations. First, it
could be argued that five of the 15 items are not appropriate for measuring stigma. These
include the perceived cost of TB treatment, and the four items addressing incorrect beliefs
about the effect of TB on female reproductive outcomes and breastfeeding. While it is
possible that poor TB knowledge can lead to higher stigma, poor TB knowledge itself should
not be confused or mixed with stigma. Second, the reliability of the scale was assessed prior
to its translation into the appropriate languages. It is likely (see Woith and Larson below)
that some reliability would be lost after translation. It would have been more informative to
calculate and report Cronbach’s alphas for the scales actually used in each country.
Macq et al. (2008) developed a stigma scale for the purpose of evaluating an
intervention aimed at reducing stigma and increasing treatment outcomes among patients
with TB in Nicaragua. A convenience sample of 268 new smear positive TB patients were
enrolled from government health centers. Ten items were developed to measure internalized
stigma based on a scale used for mental illness. The scale consists of four sub-dimensions
that include alienation, perceived discrimination, stereotype endorsement, and social
withdrawal. Participants responded on a five point scale ranging from completely disagree to
completely agree. A summary score ranging from 10 – 50 was calculated by summing each
item response. Chronbach’s alpha for the scale was 0.70.
Mean stigma scores were 33.3 and decreased to 30.5 after two months of treatment.
The decrease in stigma was greater among patients in the intervention group than those in the
control group (p=0.03).

18
The scale by Macq and colleagues appears to be a good scale with acceptable
reliability. It is short and focuses on the experiences of patients with TB and may be more
general than just internalized stigma. While the authors mention four sub-dimensions, there
was no indication that factor analysis was used to select and group items, and it does not
appear that the scale should be administered as four separate scales.
Somma et al. (2008) (Somma, Thomas et al. 2008) developed a stigma scale for the
purpose of quantifying the presence of stigma and identifying its socio-cultural determinants,
with particular interest in the role of gender as an effect (measure) modifier, in Bangladesh,
India, Malawi, and Colombia. A convenience sample of 100 patients from each country
undergoing TB treatment were enrolled from health clinics or by community health
volunteers. Eighteen items were developed to measure stigma based on local information
and previous studies. Items covered aspects of disclosure, shame, social isolation, relations
with others, and marriage. Participants responded on a four point scale comprised of no,
uncertain, possibly, and yes. A summary score ranging from 0 – 3 was created by taking the
average response for all items with higher scores indicating higher stigma. Cronbach’s alpha
for each scale were 0.85 (India), 0.77 (Bangladesh), 0.65 (Malawi), and 0.63 (Colombia).
Mean stigma scores ranged from 0.85 (Malawi) to 1.17 (India), although scores were
not normally distributed. Only in Bangladesh did stigma scores differ between men (0.88)
and women (1.12). Multivariable linear regression with normalized stigma scores was
performed to identify predictors of stigma. Separate models were built for Bangladesh,
India, and Malawi (data not available for Colombia) using forward selection with an entry p-
value <0.15. Interactions between gender and each of the explanatory variables were
considered. A large number of statistically significant predictors were reported. For

19
simplicity, only those with associated with increased stigma that had estimates ≥0.20 are
presented here: female gender, never married, unskilled labor (women only), social isolation,
reduced social status, loss of job and wages (women only), reduced income, physical exertion
as a perceived cause, sexual contact as a perceived cause (men only), and seeking care at a
private hospital (women only). Similarly, the following characteristics were associated with
decreased stigma (estimates ≤-0.20): unskilled labor (men only), trade or business
employment, 10 year increase in age, fever, and the climate as a perceived cause. The
strongest predictors were being female in Bangladesh (Estimate: 1.07), perceiving the
climate to be a cause of TB in India (-0.93), and unskilled labor employment (-0.93) and
perceiving sexual contact to be a cause (0.88) in Malawi.
The scale by Somma and colleagues is a well developed scale with good reliability in
India and Bangladesh and moderate reliability in Malawi and Colombia. The reported
results, however, are nearly impossible to interpret. First, no information is provided about
how the scores were normalized. Therefore the estimates indicate the unit increase in the
mean score from an unknown transformation. Secondly, only p-values, not standard errors or
confidence intervals, are reported for the estimates, making any assessment of precision
impossible. Finally, estimates and p-values for the interaction term between gender and
explanatory variables are provided, but not for the estimate (and p-value) within strata of
men and women. Therefore, stratified results could be misinterpreted as important when the
linear combination of main effect and interaction term is, in fact, approximately zero.
Because the models were built using different sets of predictor variables, any comparison of
the effect of determinants across countries is impossible.

20
Woith and Larson (2008) (Woith and Larson 2008) used the Social Impact Scale,
initially developed in the United States to measure stigma associated with HIV/AIDS and
cancer (Fife and Wright 2000), as part of a study to asses the effect of TB stigma on delays in
seeking care and treatment adherence in Russia. This was the only study to use a previously
developed stigma scale. A convenience sample of 105 patients with TB receiving treatment
were enrolled from two outpatient clinics. The Social Impact Scale is a well-developed scale
that enhanced content validity by obtaining input from clinical experts and patients with HIV
on each item. Construct validity was assessed by factor analysis on the selected items and
measuring the correlation with related scales including self-esteem, body image, and personal
control. The final scale consisted of 24 items and four subscales measuring social rejection
(9 items), financial insecurity (3 items), internalized shame (5 items), and social isolation (7
items). Reliability of the original scale was good with Cronbach’s alphas for each scale
ranging from 0.85 to 0.90. Participants respond to each item using a four point scale ranging
from strongly disagree to strongly agree. A summary score for each subscale was created by
summing the item responses, with higher scores indicating higher stigma. Upon translating
the scale into Russian, the reliability of the subscales decreased, with Cronbach’s alphas
between 0.70 and 0.84 for three subscales and 0.50 for internalized shame.
Stigma scores for each subscale were normally distributed. For purposes of reporting
here, mean scores were divided by the number of items in the subscale to create a
standardized score with a range of 1 – 4. This facilitates comparison of scores across scales.
Mean scores for each subscale were, 2.24 (social rejection), 2.62 (financial insecurity), 2.62
(internalized shame), and 2.32 (social isolation). Woith and Larson did not find an
association between stigma and delay (see section on TB stigma and delay below), but did

21
report that higher financial insecurity was associated with lower adherence, while higher
internalized shame was associated with higher adherence (see section on TB stigma and
adherence below).
Woith and Larson chose a well-developed stigma scale to measure TB stigma. It
appears, however, that the combination of changing the disease under investigation and
translation to a different language decreased the reliability and validity. The authors did not
provide any information about whether or not the concept of stigma among Russians was
similar to that measured by the original scale.
Summary of tuberculosis stigma measures
All measures reviewed here included at least one assessment of content validity,
construct validity, or reliability. However, none performed all three. One scale was adapted
from a well-developed scale for AIDS stigma, but was not fully assessed for its usefulness in
measuring TB stigma. The scales developed by Mak et al. and Somma et al. were the most
comprehensive, developed specifically for TB. These were informed from the published
literature and local research and had good to acceptable reliability. They found low levels of
stigma among the general population and patients with TB.
Among those that included some analysis of what factors are associated with stigma,
those that reported results for age and gender found associations with stigma. The role of TB
knowledge was mixed, with two studies reporting knowledge is not associated with stigma
while three found some form of poor or incorrect knowledge associated with stigma.

22
In conclusion, there remains a need for well-developed measures of TB stigma that
address the complex nature of stigma. As these measures are developed, they need to be
assessed for their usefulness across populations and cultures.

23
Table 2.1. Summary characteristics for published measures of tuberculosis stigma.
First author Year Country Population Measured factors No. of items Scale development
Jenkins 1966 United States General population
• Escape from social damage 6 Performed factor analysis
Westaway 1989 South Africa General population
• Social stigma 5 Adapted from Jenkins; No assessment of validity or reliability
Jaramillo 1999 Columbia General population • Avoidance of persons with TB 5
No assessment of validity; Chronbach alpha for subscales was 0.70, 0.50, respectively
Godfrey-Faussett
2002 Zambia Individuals with cough • Social contact ? No assessment of validity or reliability
Mak 2006 Hong Kong General population • Social stigma 14
Item selection informed from published literature and focus groups; Chronbach alpha was 0.83
WHO/ROEM 2006 7 Eastern Mediterranean countries
TB patients • Social stigma 15 Assessed content validity, test/re-test reliability, and Cronbach’s alpha prior to translation
Macq 2008 Nicaragua TB patients • Internalized stigma 10 Assessed content validity; Chronbach alpha was 0.70
Somma 2008 Bangladesh, India, Malawi, Colobmia
TB patients • Social stigma 18
Item selection informed from local interviews a published literature; Cronbach’s alpha for each country was 0.77, 0.85, 0.65, and 0.63, respectively
Woith and Larson
2008 Russia TB patients
• Social rejection • Financial insecurity • Internalized shame • Social isolation
24
Social Impact Scale developed by Fife and Wright(Fife and Wright 2000); Chronbach alpha for subscales was 0.50 to 0.84
24
TUBERCULOSIS STIGMA AND DELAY IN SEEKING CARE FOR
TUBERCULOSIS SYMPTOMS
Background
A common path to TB diagnosis begins with self-medication using home remedies or
medication bought at the local pharmacy (Liefooghe, Baliddawa et al. 1997; Jaramillo 1998;
Sanou, Dembele et al. 2004). If symptoms persist, patients may consult a traditional healer
or visit the village or community doctor. In both cases, a correct diagnosis is rarely made.
Only when symptoms persist or become more severe, will the individual seek care at a health
facility that has the capability of diagnosing TB (Liefooghe, Baliddawa et al. 1997; Watkins
and Plant 2004). Even then a diagnosis may not be made immediately.
Studies on health seeking behavior and diagnostic and treatment delays in the TB
literature typically distinguish between patient delay and health system delay. Patient delay
refers to the time it takes for an individual to present at a health facility after the onset of TB
symptoms. Health system delay refers to the time it takes health providers to diagnose and
prescribe treatment once the patient has presented with symptoms. The sum of both delay
times equals the total time from symptom onset to treatment initiation. The WHO
recommends that individuals with a cough for three weeks or more undergo examination for
TB (WHO 2004). Therefore, a patient delay time of up to three weeks may be acceptable
programmatically. Nevertheless, any delay can increase morbidity and mortality for the
patient and result in an increased number of infections in the community (Madebo and
Lindtjorn 1999; Barker, Millard et al. 2006; Golub, Bur et al. 2006; Lin, Chongsuvivatwong
et al. 2008). In actuality, the amount of time it takes patients to seek care varies greatly. A
study in Tanzania found a median delay of 120 days (17.1 weeks) (Wandwalo and Morkve

25
2000; Wandwalo, Kapalata et al. 2004) while another found a median delay of 2 days (0.3
weeks) in The Gambia (Lienhardt, Rowley et al. 2001).
There is a large body of quantitative literature on factors associated with delay in
seeking care for TB symptoms. A recent review of the literature grouped these factors into
access to care, personal characteristics, socioeconomic, clinical, TB knowledge or beliefs,
and social support or psychosocial factors (Storla, Yimer et al. 2008). However, it is difficult
to draw definitive conclusions about the role of many of these factors because different
definitions of delay are used and there are variations in analytic methodologies. Regardless,
stigma remains one of the factors that has received little attention.
In qualitative studies, decisions to seek care appear to be guided by fear of being
ostracized or isolated due to the potential TB diagnosis. Women in particular were found to
conceal their symptoms to avoid seeking a diagnosis (Johansson, Long et al. 2000). Patients
also mentioned the similarity in symptoms between TB and AIDS as a concern
(Ngamvithayapong, Winkvist et al. 2000; Nnoaham, Pool et al. 2006). Thus, a person with
cough, weakness, and weight loss may avoid seeking care because he or she fears being
diagnosed with AIDS, rather than TB. Other participants feared being labeled as having
AIDS when only TB had been diagnosed (Godfrey-Faussett, Kaunda et al. 2002).
Knowledge of the link between TB and HIV means that a diagnosis of TB is a reason to
suspect AIDS in the eyes of family members and the community. Thus, fear of social
consequences such being labeled as dirty, dangerous, being rejected by family or the
community, losing marriage prospects, or being labeled as an AIDS patient (thus inheriting
any existing AIDS stigma), can all be expressions of TB stigma. In spite of these concerns
26
about the role of TB or AIDS stigma in delays in seeking care for TB symptoms, few studies
have quantified the association between stigma and delay (Table 2.2 and below).
Review of quantitative studies of tuberculosis stigma and delay
Auer et al. (2000) (Auer, Sarol et al. 2000) performed a retrospective study of
patients with TB in the Philippines to explore how illness experience, perceived causes, and
health care experiences affect health seeking behavior. Patients were eligible if they had
completed treatment for pulmonary TB. Of 812 eligible patients, 319 (39%) were
successfully contacted and interviewed. Delay was defined as >4 weeks between symptom
onset and first visit to a health care facility. All patients were interviewed using an extensive
questionnaire. While no formal measure of stigma was used, the questionnaire did include
questions about the emotional impact of TB including guilt, embarrassment, loss of self-
esteem, and feeling ostracized. The Chi-square test was used to analyze the association
between each emotion and delay. The authors state that no association was found between
guilt, embarrassment, and self-esteem, but no data are provided. Feeling ostracized was
associated with delay and an odds ratio could be estimated from the data provided. The
crude odds ratio for the association between feeling ostracized and delay in seeking care was
1.69 (95% CI: 0.97, 2.96).
This study was performed prior to the implementation of standardized, directly
observed therapy and is therefore not comparable to more recent studies. Less than half of
eligible patients were identified, potentially causing selection bias. No attempt was made to
control for confounding, and data were only reported for statistically significant results,
leaving the magnitude and precision of the crude effects for other emotions unknown.

27
Godfrey-Faussett et al. (2002) (Godfrey-Faussett, Kaunda et al. 2002) performed a
study to identify determinants of delay among patients seeking care for cough at government
health services in Zambia. Patients were eligible if they were >15 years old and presented
with a cough that had not been previously assessed in a health center. A convenience sample
of 427 patients was interviewed from two health clinics. Delay was defined as the time
between onset of cough and presentation to that clinic. Data were collected on
demographics, socio-economic status, access to the clinic, illness severity, TB knowledge,
and TB stigma (see section on measures of TB stigma above). For purposes of analysis,
delay was dichotomized as >4 weeks and ≤4 weeks and stigma was categorized as none,
moderate, and high. The Chi-square test was used to test for associations between potential
determinants and delay, and multivariable logistic regression was used to adjust for factors
statistically significant in the bivariate analysis. Delay >4 weeks occurred among 35% of
patients. The authors only report the Chi-square p-value for stigma and delay but provide
enough data to calculate an odds ratio. The crude odds ratios for high and moderate stigma
versus no stigma were 0.86 (95% CI: 0.50, 1.49) and 1.04 (95% CI: 0.66, 1.64), respectively.
Stigma was not included in the multivariable model.
The study by Godrey-Faussett and colleagues suffers from less selection bias than
other delay studies because it included all patients seeking care for a cough, not just patients
with TB. TB stigma is expected to affect everyone developing a prolonged cough and
deciding when to receive care, regardless of whether or not TB is ultimately diagnosed.
Additionally, great effort was made to develop a stigma index, but it measured degrees of
social contact, which is only one component of stigma. It is possible that considerable loss of
information occurred due to categorizing both stigma and delay, when they were initially
28
measured as continuous variables. However, dichotomizing delay at 4 weeks is both
common and reasonable given TB policy.
Yimer et al. (2005) (Yimer, Bjune et al. 2005) performed a study to analyze factors
affecting delay in seeking care at government health institutions among patients with TB in
Ethiopia. Patients were eligible if they were >15 years and had newly diagnosed, smear
positive, pulmonary TB. A convenience sample of 384 patients was enrolled from 20 TB
management units immediately after diagnosis. Delay was defined as the time from
symptom onset to the first visit at a qualified medical provider. Data were collected on
socio-demographics, symptoms, TB knowledge, and TB stigma. No information is provided
on how stigma was measured. Delay was dichotomized as >31 days and ≤30 days, and
stigma was dichotomized as high and low. Crude and adjusted odds ratios were used to
assess the association between potential determinants and delay. Median delay time was 30
days. The crude odds ratio for high versus low stigma was 0.87 (95% CI: 0.57, 1.33). When
all covariates were included in the model, the adjusted odds ratio was 0.88 (95% CI: 0.54,
1.45).
The major criticism of the study by Yimer and colleagues is that no information was
provided on the measurement of stigma. This makes interpretation of the stigma result
impossible. Additionally, it is possible that considerable loss of information occurred due to
categorizing both stigma and delay, which were initially measured as continuous variables.
However, dichotomizing delay at 4 weeks is both common and reasonable given TB policy.
Cambanis et al. (2005, 2007) performed two studies to explore reasons for late
presentation to health services in rural Ethiopia (Cambanis, Yassin et al. 2005) and rural
Cameroon (Cambanis, Ramsay et al. 2007). Study methodologies were identical for the two

29
locations. Patients of all ages were eligible if they had been referred to the health center due
to suspicion of pulmonary TB. A convenience sample of 243 patients was interviewed.
Delay was defined as the time from symptom onset to first health consultation. Information
was collected on demographics, socio-economic status, access to care, symptoms, TB
knowledge, and whether or not TB was perceived as stigmatizing. No information was
provided on how stigma was measured. Delay was dichotomized as > 4 weeks and ≤ 4
weeks, and stigma appears to be dichotomized as yes and no. Crude and adjusted odds ratios
were used to assess the association between potential determinants and delay. Variables with
p<0.20 on bivariate analysis were selected for multivariable logistic regression followed by
backwards elimination to retain all variables with p<0.05. Median delay time in Ethiopia
was 4.3 weeks with a crude odds ratio for perceiving TB as stigmatizing of 1.46 (95% CI:
0.8, 2.5). Median delay time in Cameroon was 2.0 weeks with a crude odds ratio for TB
stigma of 2.50 (95% CI: 1.0, 6.1). Stigma was not retained in either of the multivariable
models.
The major criticism of the studies by Cambanis and colleagues is that no information
is provided on the measurement of stigma. This makes interpretation of the stigma result
impossible as well as uninformative if perceived stigma was asked as a yes/no question.
Additionally, it is possible that considerable loss of information occurred due to categorizing
delay, which was initially measured as a continuous variable. However, dichotomizing delay
at 4 weeks is both common and reasonable given TB policy.
WHO/ROEM (2006) (WHO/ROEM 2006) performed a study to identify
determinants of delay in diagnosis and treatment among patients with TB in seven eastern
Mediterranean countries. Patients with TB were eligible if they were ≥15 years old, had

30
smear positive pulmonary TB, and had been on treatment less than two weeks. A total of
5,053 patients were enrolled as a convenience sample from TB clinics in specific regions of
Pakistan (844), Iraq (400), and Somalia (809), and from nationwide random samples in Iran
(800), Egypt (802), Syrian Arab Republic (800), and Yemen (598). Delay was defined as
time from symptom onset to first health care provider visit. A comprehensive questionnaire
was administered that collected information on socio-demographic characteristics, risk
factors for TB, health seeking behavior, TB knowledge, quality of care, and TB stigma (see
section on measures of TB stigma above). Delay was dichotomized at the median value for
each country, and it was unclear whether stigma was analyzed as a continuous variable or
dichotomized at a median value or other cut-point. Supplemental results from Somalia
(Maamari 2008) indicated that stigma was dichotomized as high (0-2 from the original
response coding) and low (3-4). Multivariable logistic regression with all covariates was
performed in each country except for Iran (linear regression) and Iraq (bivariate analysis
only). Median delay ranged from 9 days in Pakistan to 53 days in Somalia. In Somalia, the
crude odds ratio for stigma and delay was 1.49 (0.77, 2.86), which decreased to 1.06 (0.92,
1.23) in the multivariable analysis. All but one of the countries in the WHO/ROEM report
had stigma results that were statistically not significant, but no results were provided. Only
the Syrian Arab Republic had a statistically significant finding, with an adjusted odds ratio of
0.64 (0.51, 0.82).
It is difficult to draw conclusions from the WHO/ROEM study about the role of
stigma in delays in seeking care, primarily because few of the results are provided. For many
of the countries, the analyses found that the association between stigma and total delay
(combination of patient delay and health services delay) was statistically significant, and

31
these are the results that are provided. These are likely not valid, however, because stigma
reported by the patient is unlikely to have any affect on how the health system performs its
duties. In addition to the questionable validity and reliability of the stigma scale (see the
section on measures of TB stigma above), three covariates were used in the analysis that
could bias the results. These include the first health seeking behavior, first health facility
consulted, and the health facility that made the initial diagnosis. Each of these variables is
likely affected by stigma, in addition to having an effect on the delay time. Therefore, the
multivariable analysis from the WHO study adjusted for variables that were causal
intermediates between stigma and delay, rather than confounders.
Woith and Larson (2008) (Woith and Larson 2008) performed a study of delay in
seeking treatment and adherence to treatment (see section on TB stigma and adherence
below) among patients with pulmonary TB in Russia. Quantitative measures of illness
representation and TB stigma (see section on measures of TB stigma above) were the
predictors of interest. Patients were eligible if they were ≥18 years old, diagnosed with
pulmonary TB, and had completed at least three months of treatment. A total of 105 patients
were enrolled from two outpatient clinics. Delay was defined as the time from symptom
onset to the first physician visit. Patients selected one of 14, four-week time frames ranging
from <4 weeks to >52 weeks. Patients also responded to the TB stigma scale, which
captured four components of stigma: social rejection, financial insecurity, internalized
shame, and social isolation. Delay times and stigma scores were both analyzed as continuous
variables using multivariable linear regression that also included illness representation scores
but no other covariates. Fifty-two percent of patients had a delay time <4 weeks. Stigma
was not found to be associated with delay, and no results were provided.

32
While this is the only study to examine stigma as the primary exposure of interest, it
suffers from many methodologic issues. First, delay time was not well measured. Patients
had already been on treatment for three months when they were asked to recall the duration
of their symptoms and the duration was recorded in four week intervals, rather than a more
precise interval such as weeks or days. Second, the linear regression model assumes the
outcome is normally distributed, whereas the distribution of delay is reported to be highly
skewed with 52% of patients having delay times in the lowest category (<4 weeks).
Additionally, the authors report the distribution of demographic and substance use data, but
none of these are included as confounders in the analysis. Finally, only parameter estimates
for the statistically significant predictors are reported, leaving unknown the magnitude and
precision of the crude stigma effects. These issues, along with the poor reliability of the
translated internalized shame scale (Cronbach’s alpha = 0.50), indicate that the study was not
appropriate for determining whether or not TB stigma has any effect on patient delay times.
Summary of tuberculosis stigma and delay
Only seven studies were found that quantified the association between TB stigma and
delay in seeking care for symptoms. The study populations differed between each study and
there was some variation the definition and categorization of delay. Most studies, however,
dichotomized delay at approximately one month. With the exception of Woith and Larson,
each study suffers from two major limitations. Either stigma was not the primary exposure
of interest so appropriate analyses were not performed, or stigma was not measured using a
formally developed scale. The study by Woith and Larson suffers from other methodologic

33
limitations, primarily in the poor reliability of the internalized shame subscale, and the use of
highly skewed delay data in their linear regression model.
In addition to these methodologic issues, it is difficult to summarize the effects of
stigma due to publication bias. Results from Woith and Larson and five countries in the
WHO/ROEM study were not statistically significant and the authors chose not to present the
results. In light of these limitations, the crude odds ratio for the association between stigma
and delay >4 weeks from the six studies reporting the results ranged from 0.86 to 2.50 (Table
2.2). While these results are likely biased away from the null, the direction of effect suggests
that increased stigma is associated with longer delay. There remains a need for more
rigorous research to quantify the effects of TB stigma on delays in seeking care for TB
symptoms.

34
Table 2.2. Summary of quantitative studies on TB stigma and delays in seeking care.
Study Year Location Study pop. Study size
Median delay
Delay category
Stigma definition
Stigma category
Crude OR (95% CI)*
Adjusted OR (95% CI)
Auer 2000 Philippines Previously treated PTB
319 Not stated
>4 wks; ≤4 wks
Feeling ostracized
Yes; No 1.69 (0.97, 2.96)
Godfrey-Faussett
2002 Zambia Patients with cough
427 2 wks >4 wks; ≤4 wks
Social contact index
High; Moderate; None
Moderate: 0.86 (0.50, 1.49)
High: 1.04 (0.66, 1.64)
Yimer 2005 Ethiopia Sm+ PTB 384 30 days >31 days; ≤30 days
Not reported High; Low 0.87 (0.57, 1.33) 0.88 (0.54, 1.45)
Cambanis 2005 Ethiopia TB suspect 243 4.3 wks >4 wks; ≤4 wks
Perceived as stigmatizing
Yes; No 1.46 (0.8, 2.5)
Cambanis 2007 Cameroon TB suspect 243 2.0 wks >4 wks; ≤4 wks
Perceived as stigmatizing
Yes; No 2.50 (1.0, 6.1)
WHO 2006
Syrian Arab Republic
Sm+ PTB 800 31 days >31 days; ≤31 days
Stigma scale High; Low
1.49 (0.77, 2.86) 1.06 (0.92, 1.23)
Somalia Sm+ PTB 809 53 days >53 days; ≤53 days
Stigma scale Unclear 0.64 (0.51, 0.82)
Egypt Sm+ PTB 802 12 days >12 days; ≤12 days
Stigma scale Unclear
Iraq Sm+ PTB 400 31 days >31 days; ≤31 days
Stigma scale Unclear
Pakistan Sm+ PTB 844 9 days >9 days; ≤9 days
Stigma scale Unclear
Yemen Sm+ PTB 598 28 days >28 days; ≤28 days
Stigma scale Unclear
Iran Sm+ PTB 800 24 days Continuous Stigma scale Unclear Stigma not statistically significant in the linear regression analysis; results not presented.
Woith and Larson
2008 Russia On treatment for PTB
105 <4 wks Continuous 4 wk categories
Social Impact Scale
Continuous Stigma not statistically significant in the linear regression analysis; results not presented.
*OR results from Auer and Godfrey-Faussett estimated from data reported in text. Authors reported Chi-square statistic.
Stigma was not statistically significant in the logistic regression analysis; results not presented

35
TUBERCULOSIS STIGMA AND ADHERENCE TO TUBERCULOSIS
TREATMENT
Background
Adherence to the full course of TB treatment is essential for achieving complete cure
and reducing the development of drug resistant TB (Frieden, Sterling et al. 2003). Non-
adherence, and not just default, can lead to persistent infectiousness, treatment failure,
disease relapse, drug resistance, or death (Chaulk and Kazandjian 1998; Gelmanova,
Keshavjee et al. 2007). The development of standardized short course therapy, usually six to
eight months, and implementation of directly observed therapy have greatly improved
adherence. Typically, patients take four anti-TB drugs (isoniazid, rifampicin, pyrazinamide,
and ethambutol) either three or seven days a week for two months (WHO 2003). This is
referred to as the intensive phase of treatment. It may be extended to a third month if the
patient remains smear positive after the initial two months of treatment. This is followed by
a regimen of isoniazid and rifampicin taken three, or seven days a week for four to six
months. This is referred to as the continuation phase of treatment.
Defaulting from treatment is the most extreme form of non-adherence and is defined
by the WHO as two or more consecutive months without treatment (WHO 2003). Default is
a common definition of non-adherence because it is a standard treatment outcome recorded
in patient records. However, it is not the only form of non-adherence. A recent study found
that adherence to less than 80% of the prescribed treatment is associated with poor outcomes
including treatment failure, death, or subsequent default (Gelmanova, Keshavjee et al. 2007).
Thus, efforts to improve any level of non-adherence will likely improve treatment success
and patient outcomes.

36
A number of barriers to full adherence have been reported. In a recent review of
qualitative studies, Munro et al. (Munro, Lewin et al. 2007) identified eight major factors
affecting adherence to TB treatment: Organization of treatment and care, including access to
care; interpretation of illness and wellness; financial burden; knowledge, attitudes, and
beliefs about treatment; law and immigration; personal characteristics; side effects; and
family, community, and household influence. These factors have been generally supported
through quantitative studies which report that longer distances to the health center (Shargie
and Lindtjorn 2007), type of transportation (Shargie and Lindtjorn 2007), travel cost (Mishra,
Hansen et al. 2005), perceived health status as good (Lertmaharit, Kamol-Ratankul et al.
2005), HIV infection (Connolly, Davies et al. 1999), young and old age (Connolly, Davies et
al. 1999; Santha, Garg et al. 2002; Shargie and Lindtjorn 2007), male gender (Connolly,
Davies et al. 1999; Santha, Garg et al. 2002; Lertmaharit, Kamol-Ratankul et al. 2005), low
income (Mishra, Hansen et al. 2005), employment (Mishra, Hansen et al. 2005; Hasker,
Khodjikhanov et al. 2008), and alcohol or drug use (Santha, Garg et al. 2002; Cayla,
Caminero et al. 2004; Gelmanova, Keshavjee et al. 2007; Hasker, Khodjikhanov et al. 2008)
were associated with default. As with the studies on delay in seeking care for TB symptoms,
it is difficult to draw definitive conclusions about the role of many of these factors because
different definitions of adherence are used, there are variations in analytic methodologies,
and variation in the designation of directly observed therapy and the overall treatment
regimen.
The presence of stigma was identified in half of the qualitative studies and included
patients trying to hide their diagnosis from family, friends, or employers. More specifically,
stigma may adversely affect adherence because patients do not want others to find out they

37
have the disease, much the same as when patients delay seeking care in order to avoid being
labeled as a TB patient. Patients reported the strain of trying to keeping their disease secret
from others (Liefooghe, Michiels et al. 1995; Nair, George et al. 1997), and not complying
with treatment visits helped remove some of the suffering because they would no longer be
seen going to the clinic (Mata 1985; Barnhoorn and Adriaanse 1992; Johansson, Long et al.
1999; Dimitrova, Balabanova et al. 2006). In other cases, fear of transmission and social
consequences led to social isolation at home, rather than being encouraged to seek and
continue treatment (Demissie, Getahun et al. 2003). And some patients reported fear that
their employer would know of their disease (Johansson, Diwan et al. 1996). In contrast to
stigma, family support was overwhelmingly noted as helping patients remain adherent
(Munro, Lewin et al. 2007).
Only two studies have quantified the association between TB stigma and adherence to
TB treatment.
Review of quantitative studies of tuberculosis stigma and adherence
Comolet et al. (1998) (Comolet, Rakotomalala et al. 1998) performed a case-control
study of demographic, knowledge, attitude, and psycho-social factors associated with default
from treatment in Madagascar. Patients were eligible if they had pulmonary TB and had
either completed treatment or been lost to follow-up. Default was defined as missing more
than a month of treatment during the prescribed period. Controls were patients who
completed treatment without interruption. Because none of the patients were currently
receiving treatment, all eligible participants had to be traced, contacted, and interviewed.
Only 38 (40%) of 95 eligible defaulters were traced and interviewed, while 111 (75%) of 150

38
eligible completers were interviewed. All patients were interviewed using an extensive
questionnaire. While no formal measure of stigma was used, the questionnaire did include
the statement “Felt that TB was a shameful disease”. Odds ratios and the Chi-square test was
used to analyze the association between each factor of interest and default. The crude odds
ratio for feeling that TB was shameful and default was 2.97 (95% CI: 1.26, 6.99).
This study was performed prior to the implementation of standardized, directly
observed therapy and is therefore not comparable to more recent studies. Additionally, less
than half of eligible defaulters were included in the study. Selection bias could have been
introduced if feeling shame was related to why they could not be contacted. The authors do
state that bias may have been introduced if defaulters felt shame due to defaulting rather than
from having the disease.
Woith and Larson (2008) (Woith and Larson 2008) performed a study of delays in
seeking treatment (see section on TB stigma and delay) and adherence to treatment among
patients with pulmonary TB in Russia. Quantitative measures of illness representation and
TB stigma (see section on measures of TB stigma) were the predictors of interest. Patients
were eligible if they were ≥18 years old, diagnosed with pulmonary TB, had completed the
intensive phase of treatment, and had received at least four weeks of continuation phase
treatment. A total of 105 patients were enrolled from two outpatient clinics. Adherence was
defined as the proportion of doses taken out of the total doses prescribed from beginning of
the continuation phase until the interview time. Data were collected from the patients’
medical records. Patients also responded to the TB stigma scale, which captured four
components of stigma: social rejection, financial insecurity, internalized shame, and social
isolation. Adherence and stigma scores were both analyzed as continuous variables using

39
multivariable linear regression that also included illness representation scores but no other
covariates. Adherence was highly skewed with 54% of patients having 100% adherence.
Financial insecurity was associated with a 2.78 (95% CI: -5.09, -0.47) point decrease in
adherence, while internalized shame was associated with a 2.49 (95% CI: 0.51, 4.47) point
increase in adherence.
This is the only study of adherence where stigma is the primary exposure of interest.
However, caution should be taken when interpreting these results for the same reasons
mentioned above in their analysis of delay, namely concerns with scale reliability, violation
of the assumption of normality in the adherence distribution, lack of covariates to adjust for
confounding, and uncertainty of the magnitude and precision of the stigma effects.
Therefore, while the results are intriguing, particularly for internalized shame, the
methodologic issues suggest that conclusions about the effect of stigma on adherence cannot
be made.
Summary of tuberculosis stigma and adherence
Only two studies assessed the quantitative association between stigma and adherence
to treatment. One found stigma to be associated with defaulting from treatment, but suffered
from poor participant recruitment and potential selection bias. It also was performed in a
setting where current recommendations on directly observed therapy had not been
implemented. The other found that increased financial insecurity was associated with poor
adherence, but that increased shame was associated with better adherence. This study,
however, suffered from many limitations including poor reliability of the shame

40
measurement and violation of linear regression normality assumptions. Conclusions on the
effect of stigma on adherence cannot be made based on current literature.
SUMMARY OF LITERATURE REVIEW
Numerous reports suggest that TB is a stigmatizing disease and that it has an effect on
patients seeking care and adherence to treatment. Nevertheless, there are very few published
measures of TB stigma that can quantify the presence and effect stigma, as well as identify
determinants of stigma suitable for intervention. Some measures have been recently
published that are well-developed. These indicate relatively low levels of stigma in the study
populations and offer conflicting results about determinants of stigma.
There are very few studies that have quantified the association between TB stigma
and delay in seeking care for symptoms or adherence to treatment. All of them suffer from
methodologic limitations related to measurement of stigma and variation in the study
population, definition of delay, and definition of adherence. While it is difficult to make
conclusions based on the studies’ limitations, the findings suggest that stigma may play a
greater role in affecting treatment adherence than patient delay.

CHAPTER 3
SPECIFIC AIMS AND RATIONALE
SPECIFIC AIM 1
To identify potential socio-demographic, TB knowledge, and clinical factors
associated with TB stigma. We hypothesize that female sex, severe TB symptoms, and HIV
co-infection are associated with higher stigma, while correct TB knowledge and having
known a patient with TB are associated with lower stigma.
SPECIFIC AIM 2
To estimate the association between stigma and patient delay in seeking care for TB
symptoms while controlling for important confounders. We hypothesize that high TB and
AIDS stigma are associated with longer patient delays in seeking care.
SPECIFIC AIM 3
To estimate the effect of stigma on adherence to TB treatment while controlling for
important confounders. We hypothesize that high TB and AIDS stigma are associated with
low adherence to TB treatment.

42
RATIONALE
Tuberculosis is reported to be a stigmatizing disease leading to delays in seeking care
or difficulty adhering to treatment in an effort to avoid the perceived or actual negative social
consequences of being a patient with TB. Most studies of TB stigma have been qualitative
and, until recently, there have been no quantitative measures of TB stigma formally
developed and published. In the absence of an empirical measure of TB stigma, it is
impossible to evaluate the level of stigma present in the community or reported by patients,
identify determinants of high TB stigma, assess the effect that stigma has on health behavior,
and to evaluate stigma interventions. Additionally, pre-existing TB stigma has likely been
compounded by AIDS stigma due to the growing link between TB and HIV. A well
developed and comprehensive TB stigma scale is needed. Therefore, a companion AIDS
stigma scale is needed to fully understand the impact AIDS and TB stigma have on TB
control efforts. Using well-developed stigma scales and data from a study in southern
Thailand, this dissertation aims to identify potential factors associated with TB stigma,
estimate the association between both TB and AIDS stigma and delay in seeking care for TB
symptoms, and estimate the effect of TB and AIDS stigma on TB treatment adherence.

CHAPTER 4
STUDY DESIGN AND METHODS
SETTING AND STUDY DESIGN
Data for this dissertation come from a study in southern Thailand begun in 2003 in
response to the reported, negative impact of TB and AIDS stigma and, at the time, the
paucity of validated scales for measuring stigma. The purpose was to develop culturally
relevant stigma scales in order to quantify TB and AIDS stigma and measure its effect on
patients with TB seeking care for their symptoms and during their TB treatment. The study
involved four phases which are summarized here and describe in detail elsewhere (Sengupta,
Pungrassami et al. 2006; Van Rie, Sengupta et al. 2008). These include scale development
(Phase 1), pilot study and scale modification (Phase 2), cohort study and scale validation
(Phase 3), and community study (Phase 4).
Phase 1: Scale development
Phase one of the study involved identifying relevant stigma items and holding focus
groups (Sengupta, Pungrassami et al. 2006). Relevant literature was reviewed and 42 TB
items and 49 AIDS items were selected which reflected many of the components associated
with stigma. Because TB and AIDS have similar clinical presentations, a number of the

44
items selected were parallel items. That is, a TB item and AIDS item had the exact same
wording with the exception of the disease.
The content validity of these items was ensured by holding focus groups and in-depth
interviews with TB patients, patients co-infected with TB and HIV, family members,
community members, religions leaders, and health care workers. As a result of these
meetings, the number of TB items increased to 56 while the number of AIDS items decreased
to 47. Forty items were parallel items. All items were phrased so that affirmation of the
statement indicated stigmatizing beliefs.
Phase 2: Pilot study
Phase two of the study involved administering the preliminary scale items to patients
with TB. Eligible patients were at least 18 years old, and had received no more than one
month of treatment. Following informed consent, 204 patients responded to the 103 stigma
items on a 4-point Likert scale, indicating strongly disagree, disagree, agree, or strongly
agree.
Exploratory factor analysis was performed on the responses to identify underlying
constructs. Twelve TB items were grouped together as TB stigma from the community
perspective, while 12 additional items were group as TB stigma from the patient perspective.
The remaining 32 TB items were removed due to large numbers of missing responses (13) or
because they did not load on a single factor (19). Similarly, 12 AIDS items were grouped
together as AIDS stigma from the community perspective while 10 additional items were
grouped together as AIDS stigma from the patient perspective. The remaining 25 AIDS

45
items were removed due to large number of missing responses (5) or because they did not
load on a single factor (20). All items retained had a factor loading of at least 0.35.
Phase 3: Cohort study
Phase three of the study involved administering the revised stigma scales to a cohort
of 480 newly diagnosed patients with TB. Original power and sample size calculations were
based on dichotomizing stigma, delay, and adherence at the mean, five weeks, and 80%,
respectively. Given a baseline level of 30% delay and 20% non-adherence, a sample of 460
was expected to have 80% power to detect a ratio effect of 1.5.
Eligible patients were at least 18 years old and newly diagnosed with any type of TB
between August 2005 and July 2006 at the regional TB center or seven hospital-based TB
clinics in southern Thailand. Patients were enrolled if they had been receiving TB treatment
for less than one month and then referred for HIV counseling and testing if their HIV status
was unknown or if they had tested negative more than six months prior to enrollment.
However, an HIV test was not required for participation.
Baseline demographic, clinical, and TB knowledge data were obtained using a
structured questionnaire, and the stigma scales were administered. Patients were followed
during the entire course of treatment or until lost to follow-up and stigma scales were re-
administered after approximately two months of treatment and at the completion of
treatment.
The standard treatment regimen used for new TB cases in southern Thailand is two
months of isoniazid, rifampicin, pyrazinamide, and ethambutol taken daily (2HRZE;
intensive phase) followed by four months of isoniazid and rifampicin taken daily (4HR;

46
continuation phase). Directly observed therapy (DOT) is recommended for all patients,
either at the clinic or by a family or community member, but is not required. This decision is
made jointly by clinic staff and the patient, and depends on the patient’s access to the clinic
and availability of family or community members to perform observation.
Phase 4: Community study
Phase 4 involved the administration of the stigma scales to healthy community
members. In April 2007, a convenience sample of 300 healthy, adult community members
were invited to participate while visiting friends or family members (admitted for reasons
other than TB or AIDS) at one government and one private hospital from which TB patients
had also been enrolled. To rule out possible TB disease among community participants,
individuals were not eligible if they reported a cough for three weeks or longer. HIV status
was unknown but assumed negative as the adult prevalence of HIV in southern Thailand is
low (0.19% among blood donors and 0.59% among women at ante-natal clinics) (RODPC
2007). Baseline demographics, TB knowledge, and experiences with family, friends, or co-
workers with TB or AIDS were collected. The same stigma scales used in the cohort study
(Phase 3) were administered to community members.
STIGMA SCALES
Baseline stigma data collected from the patient cohort was used to perform a
confirmatory factor analysis and finalize the stigma scales (Van Rie, Sengupta et al. 2008).
The original community perspective and patient perspective factors were retained for both the
TB and AIDS scales. One item from each of the community perspective scales was removed
due to improper wording resulting in a low factor loading. The final four stigma scales

47
(Tables 4.1 and 4.2) included a total of 44 items: TB stigma from the community perspective
(11 items) and patient perspective (12 items), and AIDS stigma from the community
perspective (11 items) and patient perspective (10 items). Cronbach’s alpha for each scale
was calculated for both patients with TB and community members. Reliability was good
with alphas ranging from 0.79 to 0.91 (Table 4.3). Stigma scales from the community
perspective were inversely correlated with the O’Brien social support scale. Construct
validation with the Rosenberg self-esteem scale could not be performed due to its poor
reliability in the study population.

48
Table 4.1. Final items for the TB stigma scales. Stigma from the community perspective 1. Some people prefer not to have those with TB living in their community 2. Some people keep their distance from people with TB 3. Some people think that those with TB are disgusting 4. Some people feel uncomfortable about being near those with TB 5. Some people do not want those with TB playing with their children 6. Some people do not want to talk to others with TB 7. If a person has TB, some community members will behave differently towards that
person for the rest of his/her life 8. Some people may not want to eat or drink with friends who have TB 9. Some people try not to touch others with TB 10. Some people may not want to eat or drink with relatives who have TB 11. Some people are afraid of those with TB
Stigma from the patient perspective 1. Some people who have TB feel guilty because their family has the burden of caring for
them 2. Some people who have TB keep their distance from others to avoid spreading TB germs 3. Some people who have TB feel alone 4. Some people who have TB feel hurt of how others react to knowing they have TB 5. Some people who have TB lose friends when they share with them they have TB 6. Some people who have TB are worried about having AIDS 7. Some people who have TB are afraid to tell those outside their family that they have TB 8. Some people who have TB will choose carefully who they tell about having TB 9. Some people who have TB are afraid of going to TB clinics because other people may
see them there 10. Some people who have TB are afraid to tell their family that they have TB 11. Some people who have TB are afraid to tell others that they have TB because others
may think that they also have AIDS 12. Some people who have TB feel guilty for getting TB because of their smoking,
drinking, or other careless behaviors

49
Table 4.2. Final items for the AIDS stigma scales. Stigma from the community perspective 1. Some people prefer not to have those with AIDS living in their community 2. Some people keep distance from people with AIDS 3. Some people think that those with AIDS are disgusting 4. Some people feel uncomfortable being near those with AIDS 5. Some people do not want those with AIDS playing with their children 6. Some people do not want to talk to others with AIDS 7. If a person has AIDS, some community members will behave differently towards that
person for the rest of his or her life 8. Some people try not to touch others with AIDS 9. Some people are afraid of those with AIDS 10. Some people think that people with AIDS are unclean 11. Some people think that people with AIDS get what they deserve Stigma from the patient perspective 1. Some people who have AIDS feel guilty because their family has the burden of caring
for them 2. Some people who have AIDS keep their distance from others to avoid spreading the
AIDS virus 3. Some people who have AIDS feel alone 4. Some people who have AIDS feel hurt because of how others react to knowing they
have AIDS 5. Some people who have AIDS lose friends when they share with them they have AIDS 6. Some people who have AIDS are afraid that other people in the community will talk
about them having AIDS 7. Some people who have AIDS will chose carefully who they tell about having AIDS 8. Some people who have AIDS try very hard to keep the issue of having AIDS a secret 9. Some people who have AIDS worry that others will reveal their secret 10. Some people who have AIDS are afraid to tell those outside their family that they have
AIDS Table 4.3. Cronbach's alpha for each stigma scale, by participant group. Patients
with TB Community members
TB stigma (community perspective) 0.88 0.85 TB stigma (patient perspective) 0.82 0.79 AIDS stigma (community perspective) 0.91 0.85 AIDS stigma (patient perspective) 0.83 0.87
50
ANALYTIC METHODS
Stigma scores and other covariates
Stigma was the primary variable of interest in all three aims, either as an outcome or
exposure. Both the TB and AIDS stigma scales were used in all analyses. Participants
responded to each stigma item on a Likert scale with four levels: strongly disagree, disagree,
agree, and strongly agree, which were coded 0, 1, 2, and 3, respectively. Responses were
summed for each scale, resulting in possible scores ranging from 0 to 33 for both community
perspective scales, 0 to 36 for the TB stigma patient perspective scale, and 0 to 30 for the
AIDS stigma patient perspective scale. Higher scores indicate higher stigma. Summed
stigma scores were analyzed as continuous variables in all analyses unless otherwise noted.
Comparison of summed scores across scales was not possible given different score ranges.
Therefore, item-adjusted scores were created by dividing the summed scores by the number
of items in the scale, creating an adjusted score ranging from 0 to 3 for each scale.
Information was collected on socio-demographic, TB knowledge, access to care, and
clinical factors. These are listed in Tables 4.4 to 4.6 along with the variable categories and
the analyses they were included in. In each analysis, linearity of continuous variables with
the outcome was assessed to ensure modeling assumptions were met. Additional information
on selected variables is found below:
Knowing someone with TB. Community members were asked if they had ever
known a family member, friend, or co-worker who had TB. For those that knew someone
with TB, they were asked if any of the TB patients they knew had died from TB. Patients
with TB were not asked this question.

51
Symptoms. Presenting symptoms were recorded for each patient and categorized
into a hierarchy of mutually exclusive symptom combinations. Cough indicates the presence
of cough but absence of hemoptysis, with or without other symptoms. Hemoptysis indicates
the presence of blood in the cough, with or without other symptoms. Weight loss indicates
the presence of weight loss and absence of cough, with or without fever or extrapulmonary
symptoms. Fever or Extrapulmonary indicates the presence of fever and/or extrapulmonary
symptoms only with no cough or weight loss. No symptoms indicates patients who presented
to the clinic for other reasons (e.g. contact of an active case) and were found to have
evidence of disease.
HIV status. HIV status was only recorded for patients with TB. Those who had
never tested for HIV or who tested negative more than six months earlier were referred for
voluntary HIV counseling and testing. Negative indicates a patient tested negative within the
last six months (including upon presentation to the TB clinic). Known positive indicates a
patient had previously tested positive for HIV. New positive indicates those patients who
were referred for testing and found to be HIV co-infected. Refused indicates patients who
refused to be tested.
TB knowledge (cause). Participants were asked to choose one of nine perceived
causes of their TB. Due to conceptual similarities and small numbers, drinking alcohol was
combined with smoking, while the belief that TB was a punishment for bad deeds or from
God were combined with respondents who chose none of the listed causes.
TB knowledge (transmission). Participants were asked four Yes/No questions about
routes of transmission. Routes of transmission were not exclusive, so participants could
respond that transmission occurs multiple ways. For each route, those who did not know that

52
TB was transmissible were combined with those who believed transmission could not occur
via that route. Due to the large number of covariates included in the analysis of aims two and
three and concerns about sparse data, transmission via touch, sex, and other routes not listed
were combined.
TB knowledge (TB/HIV). Participants were asked three Yes/No questions about the
perceived link between TB and HIV. For each question, those who were uncertain about
TB/HIV were combined with those who did not think there was a link.
Table 4.4. Definitions of socio-demographic covariates used in the analyses for aims 1 – 3.
Variable description Categories Determinants analysis
Delay analysis
Adherence analysis
Gender Male Female
� � �
Age Continuous years � � �
Religion Buddhist Muslim
� � �
Education None or Less than primary school Completed primary school Completed secondary school
� � �
Income Continuous 1,000 Baht per month � � �
Children (≤15yrs) in household
Continuous number children � �
Adults (>15yrs) in household
Continuous number of adults � �
Personally know someone with TB
No Yes (survived) Yes (died)
� (Community
members only)

53
Table 4.5. Definitions of TB knowledge covariates used in the analyses for aims 1 – 3.
Table 4.6. Definitions of access to care and clinical covariates used in the analyses for aims 1 – 3 (only collected for patients with TB).
Variable description Categories Determinants analysis
Delay analysis
Adherence analysis
Cause
Infection Eating or drinking with patient Smoking or Drinking Hard work Heredity Weak body
� � �
Transmission (cough/sneeze)
Yes No or Don’t know
� � �
Transmission (eating/drinking)
Yes No or Don’t know
� � �
Transmission (touch) Yes No or Don’t know
�
Transmission (sex) Yes No or Don’t know
�
Transmission (touch, sex, other)
Yes No or Don’t know
� �
Cure Yes No or Don’t know
�
TB/HIV (TB increases chance of getting AIDS
Yes No or Don’t know
� � �
TB/HIV (AIDS increases chance of getting TB
Yes No or Don’t know
� � �
TB/HIV (Symptoms appear similar)
Yes No or Don’t know
� � �
Variable description Categories Determinants analysis
Delay analysis
Adherence analysis
Friend to visit doctor with
Yes No
�
Time to first qualified provider
Continuous minutes �
Mode of travel first qualified provider
Car or Motorcycle Bus Walk, Bicycle, or Other
�
Symptoms
Cough Hemoptysis Weight loss Fever or Extrapulmonary No symptoms
� � �
Ever tested for HIV Yes No
�
HIV status
Negative New positive Known positive Unknown or Refused
� � �

54
Analytic methods for specific aim one
Data from the 480 patients with TB and 300 healthy community members were used
in the analysis for specific aim one. The two groups were analyzed separately due to
differences in the variables collected. Patients with TB were also expected to differ from
community members in regards to TB stigma simply because they have TB. Thus,
community members and TB patients have knowledge of stigma from their respective
perspectives, but they also have perceptions about stigma in the others’ group (Table 4.7).
TB stigma from the community perspective and patient perspective were the two outcomes of
interest. AIDS stigma from both perspectives was considered a determinant of interest along
with other demographic, TB knowledge, clinical, and TB experience variables (Tables 4.4 –
4.6). Symptoms and HIV status were only collected from patients with TB, while experience
of knowing someone with TB was only collected from community members.
Table 4.7. Relationship between stigma perspectives and study participants. Stigma from the
community perspective Stigma from the
patient perspective Community members
Item responses based on membership in community group
Item responses based on perception of patient group
Patients with TB
Item responses based on membership in and perception of community group
Item responses based on membership in patient group
Primary analysis. Continuous scores for TB stigma from the community perspective
and patient perspective were modeled as separate outcomes using multivariable linear
regression (SAS 9.1, PROC GENMOD with identity link and normal distribution). Separate
regression models were fit for each potential determinant, first among patients with TB, then
among community members. Crude and adjusted differences in mean stigma scores were
estimated along with 95% confidence intervals. Stigma scores were analyzed as continuous

55
variables to avoid loss of information due to categorization. Scores were normally
distributed and therefore met the modeling assumptions.
Sufficient sets of potential confounders for each covariate-stigma relationship were
identified with the aid of directed acyclic graphs (Glymour and Greenland 2008). These
schematics provide a visual aid to help identify sets of adjustment variables sufficient to
control confounding by measured covariates in studies of causal inference. Using the
directed acyclic graphs for the patients with TB (Figure 4.1) and community members
(Figure 4.2), we identified no confounders of the relationship between age or religion and
stigma, and the following potential confounders for the remaining determinants: for gender,
age and religion; for income, age, religion and education; for education, religion and gender;
for TB knowledge, age, education, knowing someone with TB (community members only)
and income (TB patients only); for AIDS stigma, age, gender, religion, education, income,
TB/HIV knowledge, HIV status (TB patients only), and TB symptoms (TB patients only); for
knowing someone with TB, age and income; for HIV status, age, religion and income; and
for TB symptoms, gender and HIV status. No interactions among potential determinants
were considered.

56
Figure 4.1. Directed acyclic graph for analyzing determinants of TB stigma among patients with TB.
Figure 4.2. Directed acyclic graph for analyzing determinants of TB stigma among community members.

57
Sensitivity analysis. In addition to the primary analyses just described, three
sensitivity analyses were performed to 1) assess the impact of an unmeasured confounder of
the association between TB knowledge variables and stigma scores among patients with TB,
2) assess the impact of assuming even spacing between stigma item response options, and 3)
to investigate how robust the results were to different cut-points for “high” stigma.
In the first sensitivity analysis, we suspected that knowing someone with TB may be
an important determinant of stigma and related to the level of TB knowledge. This
information, however, was only collected from community members, and not from patients
with TB. A sensitivity analysis was performed to estimate the impact of this unmeasured
confounder on the observed association between TB knowledge variables and stigma scores
among patients with TB.
To do this, information was needed on the relationship between knowing someone
with TB and stigma (the unmeasured confounder and the outcome), and knowing someone
with TB and each of the covariates (the unmeasured confounder and the exposures of
interest). Thus, two bias parameters were needed, and the adjusted association of each
knowledge variable with stigma was obtained using the following equation
βadj = βcrude – (p – q)βconf
where βadj is the updated parameter estimate for the association between TB knowledge and
stigma after adjusting for all measured confounders and the unmeasured confounder, βcrude is
the parameter estimate for the association between TB knowledge and stigma when not
adjusted for the unmeasured confounder, p-q is the specified difference in proportion

58
between those with and without TB knowledge who have the unmeasured confounder, and
βconf is the parameter estimate for the association between the unmeasured confounder and
stigma. The term ‘(p - q)βconf’ is referred to as the bias factor. That is, the amount by which
the observed, crude estimate is biased. To simplify the sensitivity analysis, the unmeasured
confounder was collapsed to a dichotomous variable: knowing a TB patient who died vs.
knowing a TB patient who lived or not knowing a TB patient.
Information on the frequency of people who knew someone with TB who died was
collected among community members. Therefore, both its distribution within TB knowledge
categories and its association with stigma obtained in the community member analysis could
be used to inform these parameters in the sensitivity analysis. The value of βconf was
specified as 2.5 and 2.0 for community perspective and patient perspective stigma,
respectively. The value p - q was calculated for each knowledge variable and rounded to the
nearest 0.05. Upper and lower bounds for p - q and βconf were specified at ± 0.15 and ± 2.0 of
the observed value, respectively.
Solving for βadj in the preceding equation indicates what the updated association of
TB knowledge with stigma would be given each of the two bias parameter specifications.
Specifically, it identifies the most probable association and the upper and lower extremes
given the specified variation around each parameter. It does not, however, provide
uncertainty estimates around the parameter estimate. To do this required using Monte Carlo
methods to repeatedly sample from the specified bias parameter distributions. A triangular
probability distribution (Greenland and Lash 2008) was specified using the expected value
and upper and lower bounds of the two bias parameters. For each parameter repeatedly
sampled, the unadjusted estimate was updated by subtracting the bias factor to create an

59
adjusted estimate. A final distribution was specified for the adjusted parameter estimate
using the mean of the adjusted estimate and the standard error from the observed, crude
estimate. This provided an estimate of the adjusted association that accounted for both the
simulated systematic error and the standard random error. A fully adjusted parameter
estimate with 95% uncertainty limits (reflecting systematic and random error) was obtained
by identifying the 50th, 2.5th and 97.5th percentiles from this final distribution of estimates.
In the second sensitivity analysis, we assessed the impact of assuming even spacing
between stigma item response options. The original coding of 0 – 3 assumed that the
difference between strongly disagree and disagree is equal to the difference between disagree
and agree. We repeated the original analyses using item response scoring of 0, 1, 3, 4 (a
greater difference between agree and disagree response options), and 0, 2, 3, 5 (a greater
difference between strongly disagree and disagree and strongly agree and agree response
options).
Finally, as there is no consensus on what constitutes high stigma, we performed
logistic regression with original, item-adjusted stigma scores dichotomized at 1.75, 2.00, and
2.25 to investigate how robust the results were to different cut-points for “high” stigma.
Values around two were chosen as that value corresponds to responding “agree”, on average,
to each stigma item.
Analytic methods for specific aim two
Data from the 466 symptomatic patients with TB were used in the analysis for
specific aim two. Patient delay was the primary outcome of interest. TB and AIDS stigma
from both the community perspective and patient perspective, recorded at enrollment, were
60
the exposures of interest. Other covariates included demographic, TB knowledge, access to
care, and clinical variables (Tables 4.4 – 4.6).
Outcome definition. Patient delay was defined as the number of days from the first
TB related symptom to the first visit to a qualified provider for those symptoms. This could
be a public or private hospital, private clinic, or TB center. All patients were enrolled shortly
after diagnosis and asked about the length of time each symptom had been occurring and the
date of the first visit to a qualified provider. If the date was not known, the length of time
since that visit was recorded and subtracted from the study enrollment date to calculate the
date of the first qualified provider visit. The date of first symptom was calculated by
identifying the symptom each patient had experienced the longest and subtracted that length
of time from the enrollment date.
Primary analysis. The delay distribution was normalized using the log10
transformation to satisfy linear regression assumptions. Stigma scores and log-transformed
delay were modeled as continuous variables using multivariable linear regression (SAS 9.1,
PROC GENMOD with identity link and normal distribution). Four regression models were
built using each summed stigma score as the exposure. A sufficient set of confounders was
identified with the aid of directed acyclic graphs and included in the multivariable regression
model (Figure 4.3). These were age, sex, religion, education, income, number of children
and adults in the household, availability of a friend for travel to the health provider, travel
time to the first qualified provider, mode of travel, TB knowledge (cause, transmission, and
HIV interaction), prior testing for AIDS, HIV status, and TB symptoms. A priori interactions
between stigma and gender, HIV status, and TB symptoms were assessed individually by
using interaction terms in the fully adjusted model. An interaction term with a p-value <0.20
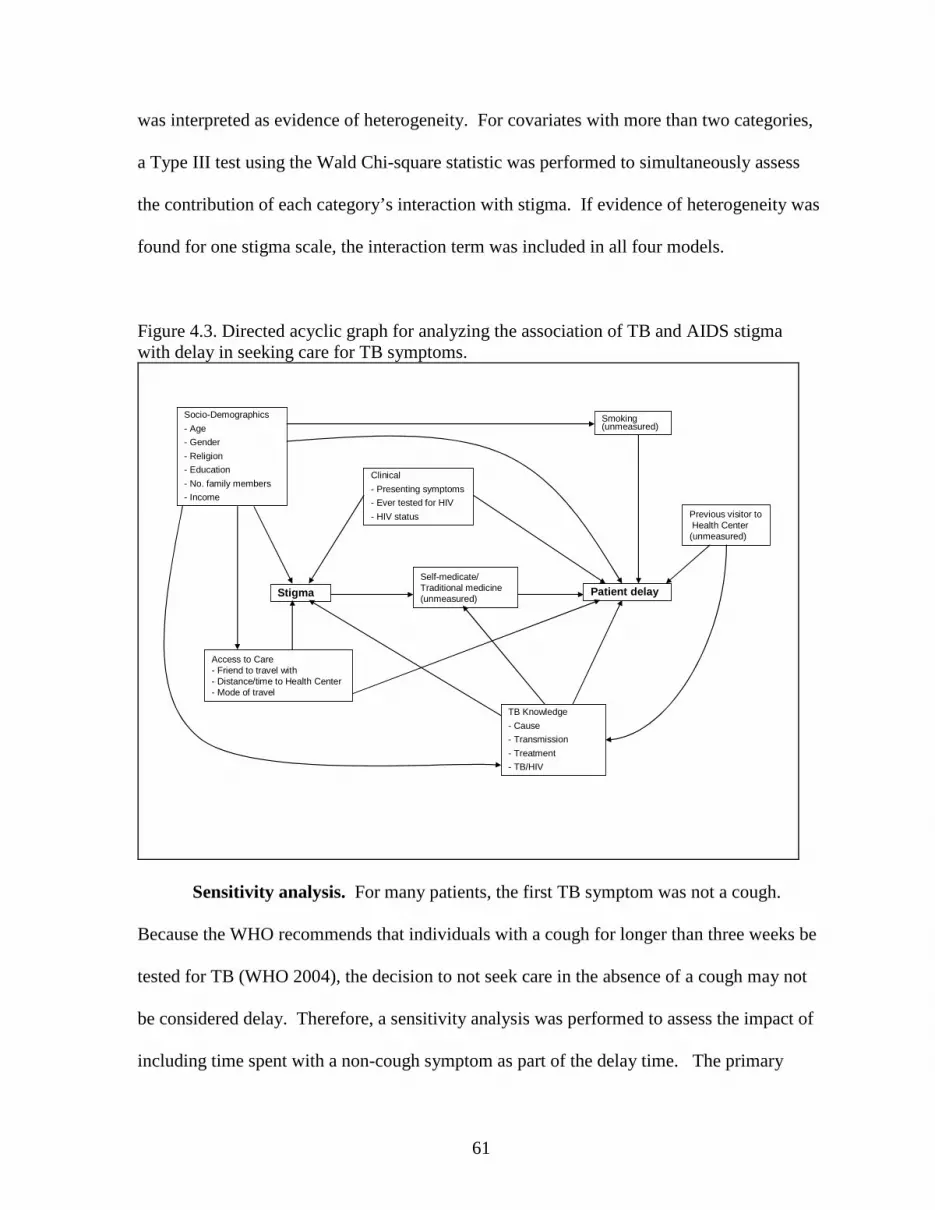
61
was interpreted as evidence of heterogeneity. For covariates with more than two categories,
a Type III test using the Wald Chi-square statistic was performed to simultaneously assess
the contribution of each category’s interaction with stigma. If evidence of heterogeneity was
found for one stigma scale, the interaction term was included in all four models.
Figure 4.3. Directed acyclic graph for analyzing the association of TB and AIDS stigma with delay in seeking care for TB symptoms.
Clinical
- Presenting symptoms
- Ever tested for HIV
- HIV status
Smoking (unmeasured)
Socio-Demographics
- Age
- Gender
- Religion
- Education
- No. family members
- Income
TB Knowledge
- Cause
- Transmission
- Treatment
- TB/HIV
Self-medicate/ Traditional medicine (unmeasured)
Access to Care - Friend to travel with- Distance/time to Health Center- Mode of travel
Previous visitor to Health Center (unmeasured)
Stigma Patient delay
Sensitivity analysis. For many patients, the first TB symptom was not a cough.
Because the WHO recommends that individuals with a cough for longer than three weeks be
tested for TB (WHO 2004), the decision to not seek care in the absence of a cough may not
be considered delay. Therefore, a sensitivity analysis was performed to assess the impact of
including time spent with a non-cough symptom as part of the delay time. The primary

62
analysis was repeated with delay defined as the time from first cough to the first visit at a
qualified provider.
Analytic methods for specific aim three
Data from the 466 symptomatic patients with TB were used in the analysis for
specific aim three. Treatment adherence was the primary outcome of interest. TB and AIDS
stigma from both the community perspective and patient perspective, recorded at enrollment
and after approximately two months of treatment, were the exposures of interest. Other
covariates included demographic, TB knowledge, and clinical variables (Tables 4.4 – 4.6).
Outcome definition. Two adherence outcomes were used in this study. As a
treatment outcome, default was defined as missing more than two consecutive months of
treatment. Non-adherence was defined as the proportion of days with a missed dose during
the observed treatment period (proportion of missed doses) that were not attributed to drug
side effects. Adherence information was documented every time a patient was seen by clinic
staff. For each additional visit, documented information included the date, number of pills
brought to the clinic, number of days a dose was missed, reason for missing doses, number of
doses newly prescribed, and whether or not the patient had begun the continuation phase of
treatment (usually after completing two months of treatment). Standard treatment outcomes
were assigned to each patient at the end of treatment or when lost to follow up. These
include cure, treatment completion, treatment failure, default, death, or transferred out.
Because there are changes in the treatment regimen and symptom between intensive
and continuation phases of treatment, it was important to assign treatment outcomes and non-
adherence to the appropriate phase. Eighty-four percent (n=405) of patients had a clinic visit

63
after beginning continuation phase treatment, indicating that treatment outcomes occurred
during the continuation phase. For the 75 patients missing this information, any visit
occurring after 55 days of treatment was considered to have occurred during the continuation
phase. For all patients, the first clinic visit during the continuation phase of treatment
contained information on adherence during the intensive phase.
Primary default analysis. Defaulters at any time during treatment were compared to
those who completed treatment. Those who died, transferred out, or had their diagnosis
changed to non-TB were excluded from this analysis. Default was further divided into
default during the intensive phase of treatment and default during the continuation phase.
Patients who died, transferred out, or had their diagnosis changed during the intensive phase
were excluded, while patients experiencing these outcomes during the continuation phase
were considered to have completed the intensive phase but were excluded from the
continuation phase analysis.
Multivariable logistic regression (SAS 9.2, PROC GENMOD with logit link and
binomial distribution) was used to assess the association between continuous stigma scores
and default while controlling for measured confounders. Because data comes from a
prospective cohort and default occurred in <10% of patients, the estimated odds ratios are
interpreted as risk ratios. For each definition of default (total, intensive, and continuation),
four regression models were fit using each stigma score measured at the start of treatment as
the exposure of interest. Nine of the 25 defaulters (36%) during the continuation phase of
treatment were missing follow-up stigma scores measured after two months of treatment. As
a result an analysis of two-month stigma scores and continuation phase default was not
performed.

64
A sufficient set of confounders was identified with the aid of directed acyclic graphs
and included in the multivariable regression model (Figure 4.4). These included age, gender,
religion, education, income, number of children and adults in the household, assignment to
directly observed therapy, knowledge of TB transmission and the link between TB and HIV,
presenting symptoms, and HIV status. Assignment of DOT is likely to be independent of
stigma or, possibly, a result of the patient’s stigma. In either case, it does not meet the
criteria for a confounder. Covariates for knowledge of TB cure and cause were not included
due to sparse data and problems with model convergence. Interactions between stigma
scores and covariates were not assessed due to the small number of defaults in many
covariate strata.

65
Figure 4.4. Directed acyclic graph for analyzing the effects of TB and AIDS stigma on adherence to TB treatment.
Stigma Adherence
Clinical
- Presenting symptoms
- HIV status
Alcohol/substance use (unmeasured)
Socio-Demographics
- Age
- Gender
- Religion
- Education
- No. family members
- Income
TB Knowledge
- Cause
- Transmission
- Treatment
- TB/HIV
Directly observed therapy assignment
Primary non-adherence analysis. Non-adherence was analyzed as a repeated
measure. Each patient had one to three observations depending on the timing of stigma re-
assessment or change from intensive to continuation phase treatment. All patients, regardless
of treatment outcome, were included in the non-adherence analysis until they finished
treatment or were lost to follow-up.
Multivariable negative binomial regression (SAS 9.2, PROC GENMOD with log link
and negative binomial distribution) was used to assess the effect of stigma on the rate of non-
adherence while controlling for measured confounder. The negative binomial distribution
was chosen because the frequency distribution of predicted counts fit the observed data better
than those from the Poisson and zero-inflated Poisson distributions. Stigma scores, TB

66
knowledge and treatment phase were included as time-varying exposures and covariates,
respectively. Generalized estimating equations with an exchangeable correlation matrix were
specified to account for within subject correlations due to the repeated observations. Four
regression models were fit using the continuous stigma scores, measured at the start of
treatment and after two months of treatment treatment, as the exposure of interest.
A sufficient set of confounders was identified with the aid of directed acyclic graphs
and included in the multivariable regression model (Figure 4.4). These covariates included
age, gender, religion, education, income, number of children and adults in the household,
knowledge of TB transmission and the link between TB and HIV, presenting symptoms, HIV
status, and treatment phase. Assignment of DOT and knowledge of TB cure and cause were
not included for the same reasons listed above in the analysis of treatment default.
Interactions between stigma scores and gender, HIV status, symptoms, and treatment phase
were assessed using interaction terms in separate models. A p-value <0.20 was interpreted as
evidence of heterogeneity. For covariates with more than two categories, a Type III test
using the Wald Chi-square statistic was performed to simultaneously assess the contribution
of each category’s interaction with stigma. If evidence of heterogeneity was found for one
stigma score, the interaction term was included in all four models.

CHAPTER 5
DETERMINANTS OF TUBERCULOSIS STIGMA IN SOUTHERN
THAILAND: COMMUNITY AND PATIENT PERSPECTIVES
BACKGROUND
Tuberculosis (TB) remains one of the most important infectious diseases worldwide
with an estimated 9.2 million new cases and 1.7 million deaths in 2006 (WHO 2008). In
addition to the traditional focus on treatment and cure rates, attention has turned to a more
comprehensive approach towards disease control that addresses poverty and social factors, of
which stigma is one component (WHO 2006). Stigma was originally defined by Goffman as
“an undesirable or discrediting attribute that an individual possesses, thus reducing that
individual’s status in the eyes of society” (Goffman 1963). The concept has more recently
been expanded to include the larger social process that involves “labeling, stereotyping,
separation, status loss, and discrimination” occurring together in the context of a power
differential (Link and Phelan 2001). This conceptualization incorporates the contribution of
both the community and the patient, with negative social consequences resulting from actual
experiences or anticipation of discriminating responses (Weiss and Ramakrishna 2006).
Individuals diagnosed with TB report fears of isolation and rejection such as losing
employment, becoming divorced or diminishing marriage prospects, not being allowed to
share meals, utensils or sleeping quarters with family members, and general avoidance or

68
gossip among community members (Liefooghe, Michiels et al. 1995; Long, Johansson et al.
2001; Eastwood and Hill 2004; Baral, Karki et al. 2007). Fear of these consequences may
lead to delays in seeking care for TB symptoms and could affect adherence to treatment
(Rubel and Garro 1992; Liefooghe, Michiels et al. 1995; Nair, George et al. 1997; Long,
Johansson et al. 2001; Godfrey-Faussett and Ayles 2003; Baral, Karki et al. 2007).
Qualitative studies have found that stigma may be related to religion, socioeconomic
status, level of education, and gender roles (Johansson, Long et al. 2000; Sengupta,
Pungrassami et al. 2006) with women more often than men feeling that TB is stigmatizing
(Long, Johansson et al. 2001; Eastwood and Hill 2004). Fear of, and negative attitudes
towards, TB may arise from its contagious nature (Ngamvithayapong, Winkvist et al. 2000;
Baral, Karki et al. 2007), incorrect knowledge of its cause, transmission, or treatment (Long,
Johansson et al. 1999; Ngamvithayapong, Winkvist et al. 2000; Eastwood and Hill 2004;
Sengupta, Pungrassami et al. 2006; Baral, Karki et al. 2007), or because of its association
with marginalized groups (Johansson, Long et al. 1999; Ngamvithayapong, Winkvist et al.
2000; Eastwood and Hill 2004; Dimitrova, Balabanova et al. 2006; Sengupta, Pungrassami et
al. 2006; Baral, Karki et al. 2007). As the epidemics of TB and HIV/AIDS have converged in
many areas of the world, there is growing concern that AIDS stigma will compound existing
TB stigma (Ngamvithayapong, Winkvist et al. 2000; Nnoaham, Pool et al. 2006). Focus
groups with community members and patients with TB in southern Thailand identified the
presence of symptoms similar to those of AIDS as a reason for stigmatizing attitudes towards
TB (Sengupta, Pungrassami et al. 2006).
While these reports help identify possible determinants of stigma, quantitative studies
are needed to assess the level of stigma in a population, assess the strength of association

69
between stigma and potential determinants, assess the effect of stigma on public health, and
evaluate the effectiveness of interventions (Weiss and Ramakrishna 2006). Unfortunately,
few quantitative studies have been performed (Macq, Solis et al. 2006). Two used brief
scales that were not formally developed or not evaluated for internal consistency (Westaway
1989; Jaramillo 1999), while one study used a well developed TB-stigma scale with
moderate internal consistency (Somma, Thomas et al. 2008).
We used formally developed and validated scales (Van Rie, Sengupta et al. 2008) to
measure the level of TB stigma from both a community perspective (attitudes and actions of
the community towards individuals with TB) and a patient perspective (feelings and
experiences of patients with TB) and to evaluate the strength of association between stigma
and its potential determinants among newly diagnosed TB patients and healthy community
members.
METHODS
Study site and participants
Adults (>17 years old) newly diagnosed with TB between August 2005 and July 2006
at the regional TB center or seven hospital-based TB clinics in southern Thailand were
eligible to participate. Patients were not enrolled if they had been receiving TB treatment for
more than one month. Patients were referred for counseling and testing if their HIV status
was unknown or if they had tested negative more than six months prior to enrollment.
However, an HIV test was not required for participation.
Additionally, in April 2007, a convenience sample of healthy, adult community
members were invited to participate while visiting friends or family members (admitted for
reasons other than TB or AIDS) at one government and one private hospital from which TB

70
patients had also been enrolled. To rule out possible TB disease among community
participants, individuals were not eligible if they reported a cough for three weeks or longer.
HIV status was unknown but assumed negative as the adult prevalence of HIV in southern
Thailand is low (0.19% among blood donors and 0.59% among women at ante-natal
clinics)(RODPC 2007).
Data collection and stigma scores
Information on age, gender, religion, socioeconomic status, TB knowledge, TB
symptoms (patients only), HIV status (patients only), and knowing someone with TB
(community members only) were collected by trained interviewers using a standardized
questionnaire. Four stigma scales (Tables 5.1 and 5.2) were administered to all participants:
TB stigma from the community perspective (11 items) and patient perspective (12 items), and
AIDS stigma from the community perspective (11 items) and patient perspective (10 items).
Stigma items were scored on a Likert scale with four levels: strongly disagree (0),
disagree (1), agree (2), and strongly agree (3), where a higher response indicates higher
stigma. Responses were summed for each scale and summed scores were used in regression
analyses. Item-adjusted scores were created for comparison between scales by dividing the
summed scores by the number of items in the scale, creating an item-adjusted score ranging
from 0 to 3.
Analysis
Potential determinants of TB stigma were identified from the published literature and
substantive knowledge. Sufficient sets of confounders for each covariate-stigma relationship

71
were identified with the aid of directed acyclic graphs (Glymour and Greenland 2008).
These schematics provide a visual aid to help identify sets of adjustment variables sufficient
to control confounding by measured covariates. Using the directed acyclic graphs, we
identified no confounders of the relationship between age or religion and stigma, and the
following confounders for the remaining potential determinants: for gender, age and
religion; for income, age, religion and education; for education, religion and gender; for TB
knowledge, age, education, knowing someone with TB (community members only) and
income (TB patients only); for AIDS stigma, age, gender, religion, education, income,
TB/HIV knowledge, HIV status (TB patients only), and TB symptoms (TB patients only); for
knowing someone with TB, age and income; for HIV status, age, religion and income; and
for TB symptoms, gender and HIV status.
Continuous scores for community and patient perspectives of TB stigma were
modeled as separate outcomes using multivariable linear regression (SAS 9.1, PROC
GENMOD with identity link and normal distribution). Separate regression models were fit
for each covariate, first among patients with TB, then among community members.
Differences in mean stigma scores were estimated along with 95% confidence intervals.
Sensitivity analyses
We performed three sensitivity analyses. First, we assessed the impact of an
unmeasured confounder (knowing someone who died of TB) of the association between TB
knowledge variables and stigma scores among patients with TB. Two parameters were
needed to perform this analysis: the effect of the confounder on stigma and the difference in
the prevalence of knowing someone who died of TB between index and reference levels of

72
TB knowledge. Triangular probability distributions (Greenland and Lash 2008) for these
parameters were centered at their observed value in the community sample, in which
knowing someone who died of TB was ascertained. Monte Carlo simulations were used to
adjust the estimated association between TB knowledge and stigma for the unmeasured
confounder among patients with TB and to account for increased uncertainty due to
specifying probability distributions for the missing parameters.
In the second sensitivity analysis, we assessed the impact of assuming even spacing
between stigma item response options. We repeated the original analyses using item
response scoring of 0,1,3,4 (a greater difference between agree and disagree response
options), and 0, 2, 3, 5 (a greater difference between strongly disagree and disagree and
strongly agree and agree response options).
Finally, as there is no consensus on what constitutes high stigma, we performed
logistic regression with original item-adjusted stigma scores dichotomized at 1.75, 2.00, and
2.25 to investigate how robust the results were to different cut-points for “high” stigma.
Values around two were chosen as that value corresponds to responding “agree”, on average,
to each stigma item.
RESULTS
Participant characteristics
Information was collected on 480 patients with TB and 300 healthy community
members. Compared with community members, patients tended to be older, less educated,
and more often male and Muslim (Table 5.3). Infection, smoking, or having a weak body
were common beliefs about the cause of TB among all participants. Community members

73
also believed eating or drinking with a person who has TB is a cause, whereas patients
believed working hard can cause TB. Most participants stated that TB can be transmitted by
a cough or sneeze, but beliefs that transmission occurs through routes such as eating and
drinking with a patient were also common, especially among patients. Nearly all patients and
most community members knew TB is curable. High awareness of a link between TB and
HIV was present among all participants.
Most patients reported symptoms typically associated with TB. Upon diagnosis of
TB, 72 (15%) patients were co-infected with HIV and knew their serostatus. Of the 333
patients referred for HIV testing, 79% accepted, resulting in 21 newly identified infections
and an overall HIV prevalence of 20%. Among community members, 89 (30%) knew at
least one person who suffered from TB and 38 of these indicated they knew someone who
had died from TB.
Stigma scale responses
On the TB stigma scales, 14 (2.9%) patients were excluded from the community
perspective scale analysis due to missing item responses, while 20 (4.2%) patients were
excluded from the patient perspective scale analysis due to missing item responses. All
community members had complete item responses. Internal consistency (Cronbach’s
coefficient alpha) for each scale ranged from 0.79 to 0.88 (Table 5.2) and all scores were
approximately normally distributed with mean item-adjusted scores ranging from 1.65 to
1.86 (Figures 5.1 and 5.2). Community members reported higher stigma scores than patients
on both scales.

74
On the AIDS stigma scales, 19 (4.0%) patients had missing item responses on the
community perspective scale, while 17 (3.5%) had missing item responses on the patient
perspective scale. No item responses were missing from community members. Internal
consistency (Cronbach’s coefficient alpha) for each scale ranged from 0.83 to 0.91 (Table
5.2) and all scores were approximately normally distributed with mean item-adjusted scores
ranging from 1.69 to 2.21. Scores for the patient perspective scale were higher than for the
community perspective scale, and community members reported higher stigma than patients
on both scales.
Factors associated with TB stigma
Mean differences (MD) in stigma scores and 95% confidence intervals (CI) for each
potential determinant, by stigma scale and participant group, are shown in Table 5.4. Most
differences were relatively small, estimated to be less than a one point change in the stigma
score, and few characteristics were consistently associated with stigma across scales and
participant groups. For example, while female community members had higher patient
perspective stigma compared with male community members (MD=1.20; CI=0.13, 2.27),
female patients reported lower patient perspective stigma compared with male patients (-
0.80; -1.67, 0.07). There was no evidence that gender affected community perspective
stigma. Similarly, the mean difference in stigma for Muslims versus Buddhists differed in
direction between community members and patients.
Individuals with some or no primary education consistently reported higher stigma on
both scales. The largest mean difference was among community members on the community
perspective scale (1.61; 0.14, 3.08). There was no evidence that income was associated with

75
stigma and little evidence that beliefs about the cause, transmission, and cure of TB affected
stigma. Participants believing that TB is hereditary or curable consistently reported lower
stigma, while those believing that TB could be transmitted sexually consistently had higher
stigma. These estimates, however, were imprecise and included the null.
Higher TB stigma was reported for several factors relating to HIV/AIDS.
Participants who believed that having TB could increase the chance of getting AIDS reported
higher patient perspective stigma regardless of whether they were a community member
(1.17; 0.12, 2.22) or a patient (2.16; 1.38, 2.94). Patients reporting that TB and AIDS
symptoms appear similar had higher stigma, both on the community perspective (0.86; -0.12,
1.84) and patient perspective (0.86; -0.03, 1.75) scales. Participants expressing higher AIDS
stigma consistently reported higher TB stigma, with a one point increase in AIDS stigma
being associated with a 0.38 to 0.63 point increase in TB stigma. Patients with TB who were
aware of their HIV co-infection prior to study enrollment had higher community perspective
(0.66; -0.64, 1.96) and patient perspective (1.54; 0.37, 2.71) stigma.
Patients presenting with fever or extrapulmonary symptoms only had lower
community perspective (-1.70; -3.18, -0.21) and patient perspective (-0.60; -1.92, 0.72)
stigma. The experience of knowing someone who died of TB was associated with higher
community perspective (2.59; 0.96, 4.22) and patient perspective (1.96; 0.36, 3.57) stigma
compared with not knowing anyone with TB.
Sensitivity analyses
When accounting for possible unmeasured confounding due to knowing someone
who died of TB, estimates of the effects of TB knowledge on TB stigma did not change
76
substantially. No substantive differences in results were found when different item scoring
systems were used. Compared with the main analyses, results for dichotomized TB stigma
scores were robust to different cut-points across both populations. However, eating or
drinking with a patient as a route of transmission was consistently associated with increased
stigma when stigma was dichotomized at 2.00. All associations were imprecise when stigma
was dichotomized at 2.25, as few participants had high community (12%) or patient (11%)
perspective stigma at this cut-point.
DISCUSSION
Using formally developed scales with good internal consistency, we quantified TB
stigma from the community perspective (attitudes and actions of the community towards TB
patients) and patient perspective (feelings and experiences of TB patients) in southern
Thailand. TB stigma was observed among both healthy community members and patients
with TB. Evaluated factors had minimal associations with stigma scores: most mean
differences in stigma scores were <1.0 and only three were > 2.0. The largest, most precise,
and consistent associations with TB stigma were those factors relating to the intersection of
TB with HIV.
The belief that TB increases the chances of getting AIDS and the level of AIDS
stigma were consistently and precisely associated with TB stigma. Knowing someone who
died of TB had the largest difference in mean stigma score. While it is possible TB deaths
are independent of HIV, they are many times associated with HIV co-infection. In northern
Thailand, women whose TB/HIV co-infected husbands died from TB believed that TB was
incurable (Ngamvithayapong, Winkvist et al. 2000). In a multi-country study, areas affected

77
by HIV tended to have lower proportions of people who believed TB was curable (Somma,
Thomas et al. 2008).
In a qualitative study in the same area of southern Thailand, religion, low TB
knowledge, severe symptoms, and symptoms similar to AIDS were identified as reasons for
stigmatizing attitudes towards TB (Sengupta, Pungrassami et al. 2006). Some of these
qualitative observations were supported by our quantitative findings, but conclusions are
difficult to make because many socio-demographic factors either showed inconsistent
relationships across scales and/or participant groups, or estimates were very imprecise.
Specifically, all estimates for perceived causes and transmission routes of TB were
imprecise.
Our study underscores the importance of quantitative analyses to further inform the
generalizability and magnitude of qualitative results. Our results also draw attention to the
importance and complexity of assessing different perspectives in stigma research. While
community members and patients with TB have knowledge of stigma from their respective
groups, they also have perceptions about stigma in the others’ group (Table 5.1). These
cross-group perceptions are likely to play an important role in the impact of stigma,
especially TB patients’ perception of the community’s stigma towards them. It remains to be
seen which measure is more important for assessing the effects of stigma on health.
Only three other quantitative studies of TB stigma have been published (Westaway
1989; Jaramillo 1999; Somma, Thomas et al. 2008), and detailed comparisons between these
studies warrant caution, as different scales, study populations, and potential determinants
were used. Similar to our findings, lack of consistent associations between determinants and
stigma among different populations was also observed by Somma and colleagues (Somma,

78
Thomas et al. 2008) in a study in Bangladesh, India, Malawi and Colombia. In that study,
only marital status, financial problems, social distress, and seeking care at a private hospital
were found to increase stigma in more than one study site.
Documenting the level of stigma and identifying determinants of stigma are important
steps towards developing interventions to reduce stigma (Weiss and Ramakrishna 2006). In
contrast to HIV/AIDS, little has been published on interventions for TB stigma. An
evaluation of tuberculosis clubs to decrease stigma among patients undergoing treatment was
performed in Ethiopia and Nicaragua (Demissie, Getahun et al. 2003; Macq, Solis et al.
2008). While these provide increased social support to patients, TB clubs do not address
stigma in the community. Stigma in the community is perceived by individuals suffering
from TB symptoms and may play an important role in whether or not individuals seek care
(Rubel and Garro 1992; Long, Johansson et al. 2001; Baral, Karki et al. 2007).
It is often suggested that increasing knowledge and education can decrease stigma
(Eastwood and Hill 2004; Hoa, Diwan et al. 2004). However, we found that TB knowledge
itself appears to play a minor role in TB stigma. Furthermore, many people who understood
the link between HIV and TB expressed high TB stigma. Thus, correcting misconceptions
may inadvertently lead to higher stigma. In our study, factors related to HIV/AIDS had the
strongest, most precise, and most consistent associations with TB stigma. This suggests that
interventions aimed at decreasing TB stigma should also address the HIV/AIDS epidemic.
This may include macro level factors such as reducing AIDS stigma in the community,
decreasing mortality from AIDS, especially among TB patients, media and public education
campaigns to raise awareness that not all TB patients are co-infected with HIV, and that TB
is curable, even among those who are co-infected with HIV.

79
Some limitations of our study should be noted. First, the small number of responses
for all causes and transmission routes of TB reduced the precision of estimates. Second, the
convenience sample of community members recruited from area hospitals may not be
representative of the general population from which the TB patients arise. It is possible that
the level of stigma in the community may be higher than documented, as people who visit a
hospitalized friend or family member may (temporarily) hold less stigmatizing attitudes
towards people suffering from diseases such as TB.

80
TABLES AND FIGURES Table 5.1. Relationship between stigma perspectives and study participants. Stigma from the
community perspective Stigma from the
patient perspective Community members
Item responses based on membership in community group
Item responses based on perception of patient group
Patients with TB
Item responses based on membership in and perception of
community group
Item responses based on membership in patient group
Sample items*
− Some people are afraid of those with TB
− Some people think that those with TB are disgusting
− Some people prefer not to have those with TB living in their community
− If a person has TB, some community members will behave differently towards that person for the rest of his or her life
− Some people who have TB feel alone − Some people who have TB are afraid
to tell those outside their family that they have TB
− Some people who have TB lose friends when they share with them they have TB
− Some people who have TB feel hurt of how others react to knowing they have TB
* For the AIDS stigma scales, the word “TB” is be replaced with “AIDS”.
Table 5.2. Stigma scale characteristics and score distributions. TB stigma AIDS stigma Community
perspectives scale (11 items)
Patient perspectives
scale (12 items)
Community perspectives
scale (11 items)
Patient perspectives
scale (10 items) Patients with TB Cronbach’s alpha 0.88 0.82 0.91 0.83 Mean summed score (SD) 18.43 (4.95) 19.85 (4.43) 18.58 (5.15) 19.74 (3.52) Mean adjusted score (SD) 1.68 (0.45) 1.65 (0.37) 1.69 (0.47) 1.97 (0.35) Community members Cronbach’s alpha 0.85 0.79 0.85 0.87 Mean summed score (SD) 20.13 (4.87) 22.30 (4.74) 20.77 (5.09) 22.06 (4.27) Mean adjusted score (SD) 1.83 (0.44) 1.86 (0.39) 1.89 (0.46) 2.21 (0.43)
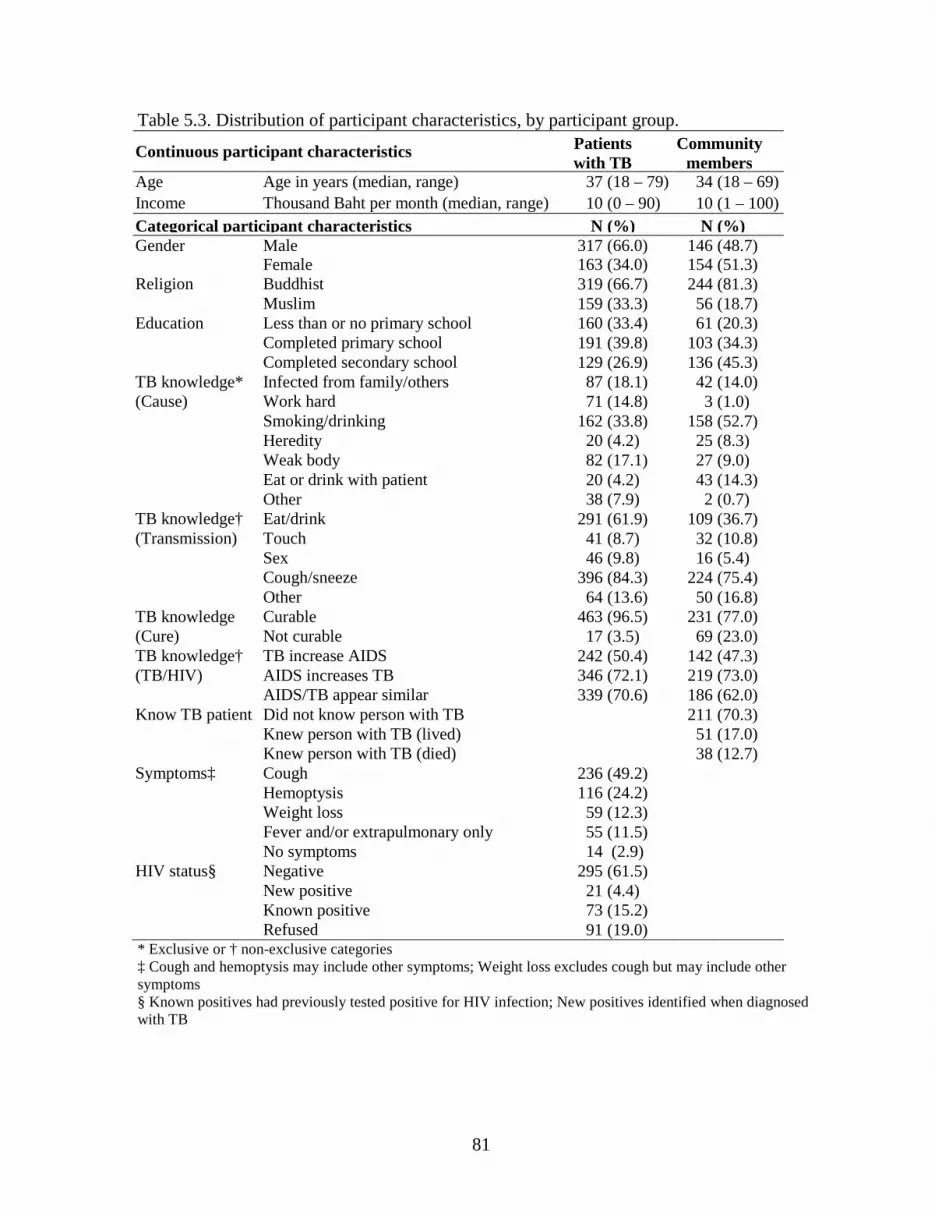
81
Table 5.3. Distribution of participant characteristics, by participant group.
Continuous participant characteristics Patients with TB
Community members
Age Age in years (median, range) 37 (18 – 79) 34 (18 – 69) Income Thousand Baht per month (median, range) 10 (0 – 90) 10 (1 – 100) Categorical participant characteristics N (%) N (%) Gender Male 317 (66.0) 146 (48.7) Female 163 (34.0) 154 (51.3) Religion Buddhist 319 (66.7) 244 (81.3) Muslim 159 (33.3) 56 (18.7) Education Less than or no primary school 160 (33.4) 61 (20.3) Completed primary school 191 (39.8) 103 (34.3) Completed secondary school 129 (26.9) 136 (45.3) TB knowledge* Infected from family/others 87 (18.1) 42 (14.0) (Cause) Work hard 71 (14.8) 3 (1.0) Smoking/drinking 162 (33.8) 158 (52.7) Heredity 20 (4.2) 25 (8.3) Weak body 82 (17.1) 27 (9.0) Eat or drink with patient 20 (4.2) 43 (14.3) Other 38 (7.9) 2 (0.7) TB knowledge† Eat/drink 291 (61.9) 109 (36.7) (Transmission) Touch 41 (8.7) 32 (10.8) Sex 46 (9.8) 16 (5.4) Cough/sneeze 396 (84.3) 224 (75.4) Other 64 (13.6) 50 (16.8) TB knowledge Curable 463 (96.5) 231 (77.0) (Cure) Not curable 17 (3.5) 69 (23.0) TB knowledge† TB increase AIDS 242 (50.4) 142 (47.3) (TB/HIV) AIDS increases TB 346 (72.1) 219 (73.0) AIDS/TB appear similar 339 (70.6) 186 (62.0) Know TB patient Did not know person with TB 211 (70.3) Knew person with TB (lived) 51 (17.0) Knew person with TB (died) 38 (12.7) Symptoms‡ Cough 236 (49.2) Hemoptysis 116 (24.2) Weight loss 59 (12.3) Fever and/or extrapulmonary only 55 (11.5) No symptoms 14 (2.9) HIV status§ Negative 295 (61.5) New positive 21 (4.4) Known positive 73 (15.2) Refused 91 (19.0) * Exclusive or † non-exclusive categories ‡ Cough and hemoptysis may include other symptoms; Weight loss excludes cough but may include other symptoms § Known positives had previously tested positive for HIV infection; New positives identified when diagnosed with TB
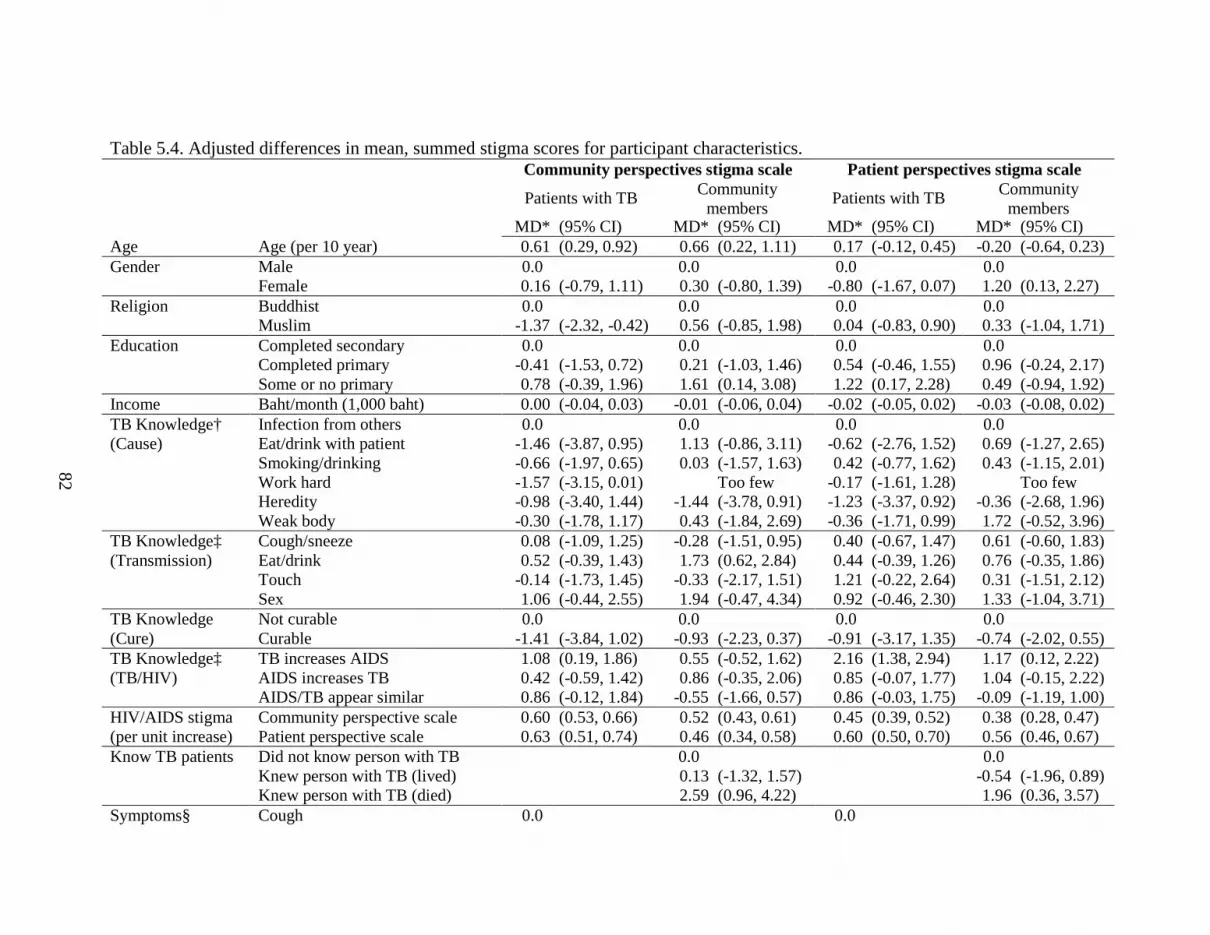
82
Table 5.4. Adjusted differences in mean, summed stigma scores for participant characteristics. Community perspectives stigma scale Patient perspectives stigma scale
Patients with TB Community members
Patients with TB Community members
MD* (95% CI) MD* (95% CI) MD* (95% CI) MD* (95% CI) Age Age (per 10 year) 0.61 (0.29, 0.92) 0.66 (0.22, 1.11) 0.17 (-0.12, 0.45) -0.20 (-0.64, 0.23) Gender Male 0.0 0.0 0.0 0.0 Female 0.16 (-0.79, 1.11) 0.30 (-0.80, 1.39) -0.80 (-1.67, 0.07) 1.20 (0.13, 2.27) Religion Buddhist 0.0 0.0 0.0 0.0 Muslim -1.37 (-2.32, -0.42) 0.56 (-0.85, 1.98) 0.04 (-0.83, 0.90) 0.33 (-1.04, 1.71) Education Completed secondary 0.0 0.0 0.0 0.0 Completed primary -0.41 (-1.53, 0.72) 0.21 (-1.03, 1.46) 0.54 (-0.46, 1.55) 0.96 (-0.24, 2.17) Some or no primary 0.78 (-0.39, 1.96) 1.61 (0.14, 3.08) 1.22 (0.17, 2.28) 0.49 (-0.94, 1.92) Income Baht/month (1,000 baht) 0.00 (-0.04, 0.03) -0.01 (-0.06, 0.04) -0.02 (-0.05, 0.02) -0.03 (-0.08, 0.02) TB Knowledge† Infection from others 0.0 0.0 0.0 0.0 (Cause) Eat/drink with patient -1.46 (-3.87, 0.95) 1.13 (-0.86, 3.11) -0.62 (-2.76, 1.52) 0.69 (-1.27, 2.65) Smoking/drinking -0.66 (-1.97, 0.65) 0.03 (-1.57, 1.63) 0.42 (-0.77, 1.62) 0.43 (-1.15, 2.01) Work hard -1.57 (-3.15, 0.01) Too few -0.17 (-1.61, 1.28) Too few Heredity -0.98 (-3.40, 1.44) -1.44 (-3.78, 0.91) -1.23 (-3.37, 0.92) -0.36 (-2.68, 1.96) Weak body -0.30 (-1.78, 1.17) 0.43 (-1.84, 2.69) -0.36 (-1.71, 0.99) 1.72 (-0.52, 3.96) TB Knowledge‡ Cough/sneeze 0.08 (-1.09, 1.25) -0.28 (-1.51, 0.95) 0.40 (-0.67, 1.47) 0.61 (-0.60, 1.83) (Transmission) Eat/drink 0.52 (-0.39, 1.43) 1.73 (0.62, 2.84) 0.44 (-0.39, 1.26) 0.76 (-0.35, 1.86) Touch -0.14 (-1.73, 1.45) -0.33 (-2.17, 1.51) 1.21 (-0.22, 2.64) 0.31 (-1.51, 2.12) Sex 1.06 (-0.44, 2.55) 1.94 (-0.47, 4.34) 0.92 (-0.46, 2.30) 1.33 (-1.04, 3.71) TB Knowledge Not curable 0.0 0.0 0.0 0.0 (Cure) Curable -1.41 (-3.84, 1.02) -0.93 (-2.23, 0.37) -0.91 (-3.17, 1.35) -0.74 (-2.02, 0.55) TB Knowledge‡ TB increases AIDS 1.08 (0.19, 1.86) 0.55 (-0.52, 1.62) 2.16 (1.38, 2.94) 1.17 (0.12, 2.22) (TB/HIV) AIDS increases TB 0.42 (-0.59, 1.42) 0.86 (-0.35, 2.06) 0.85 (-0.07, 1.77) 1.04 (-0.15, 2.22) AIDS/TB appear similar 0.86 (-0.12, 1.84) -0.55 (-1.66, 0.57) 0.86 (-0.03, 1.75) -0.09 (-1.19, 1.00) HIV/AIDS stigma Community perspective scale 0.60 (0.53, 0.66) 0.52 (0.43, 0.61) 0.45 (0.39, 0.52) 0.38 (0.28, 0.47) (per unit increase) Patient perspective scale 0.63 (0.51, 0.74) 0.46 (0.34, 0.58) 0.60 (0.50, 0.70) 0.56 (0.46, 0.67) Know TB patients Did not know person with TB 0.0 0.0 Knew person with TB (lived) 0.13 (-1.32, 1.57) -0.54 (-1.96, 0.89) Knew person with TB (died) 2.59 (0.96, 4.22) 1.96 (0.36, 3.57) Symptoms§ Cough 0.0 0.0

83
Hemoptysis -0.52 (-1.64, 0.60) -0.59 (-1.60, 0.42) Weight loss -0.20 (-1.70, 1.30) 0.51 (-0.86, 1.88) Fever and/or extrapulmonary only -1.70 (-3.18, -0.21) -0.60 (-1.92, 0.72) No symptoms 1.67 (-0.98, 4.32) -0.32 (-2.76, 2.12) HIV status║ Negative 0.0 0.0 New positive -0.59 (-2.74, 1.55) -0.66 (-2.60, 1.29) Known positive 0.66 (-0.64, 1.96) 1.54 (0.37, 2.71) Unknown/Refused -0.99 (-2.15, 0.18) -0.04 (-1.09, 1.02) * MD, mean difference in summed stigma scores; CI, confidence interval; 0.0 indicates referent level † Exclusive or ‡ non-exclusive categories § Cough and hemoptysis may include other symptoms; Weight loss excludes cough but may include other symptoms ║ Known positives had previously tested positive for HIV infection; New positives identified when diagnosed with TB

84
Figure 5.1. Kernel-smoothed, item-adjusted TB stigma score distributions (community perspective scale). Community members, solid line; TB patients, dashed line.
Figure 5.2. Kernel-smoothed, item-adjusted TB stigma score distributions (patient perspective scale). Community members, solid line; TB patients, dashed line.

85
CHAPTER 6
TUBERCULOSIS AND AIDS STIGMA AMONG PATIENTS WHO DELAY
SEEKING CARE FOR TUBERCULOSIS SYMPTOMS
BACKGROUND
From its introduction in 1994, directly observed therapy (DOTS) has been the backbone
of tuberculosis (TB) control around the world. With its focus on passive case detection,
availability of diagnostic techniques, and directly observed therapy to minimize drug resistant
TB, DOTS has been criticized as a treatment guideline and biomedical strategy that does not
account for social factors related to TB control rather than a comprehensive control plan
(Lienhardt and Ogden 2004; Whalen 2006). Delay in presentation to a health facility is an
important concern of TB control as it contributes to delays in initiating treatment. This can result
in greater morbidity and mortality for the patient and increased transmission of Mycobacterium
tuberculosis in the community (Madebo and Lindtjorn 1999; Barker, Millard et al. 2006; Golub,
Bur et al. 2006; Lin, Chongsuvivatwong et al. 2008).
There is a large body of literature on factors associated with delay in seeking care for TB
symptoms. These can be broadly grouped into access to care, personal characteristics,
socioeconomic, clinical, TB knowledge or beliefs, and social support or psychosocial factors
(Storla, Yimer et al. 2008). One psychosocial factor of interest is health-related stigma, often
defined as a social process “characterized by exclusion, rejection, blame, or devaluation resulting
86
from experience or reasonable anticipation of an adverse social judgment” because of a
particular health condition (Weiss and Ramakrishna 2006). Some studies have suggested that
TB stigma could lead to delays in patients seeking appropriate medical care (Rubel and Garro
1992; Long, Johansson et al. 2001; Baral, Karki et al. 2007). Others note that AIDS stigma and
fears of being labeled as an AIDS patient could deter potential TB patients from seeking care
because of the belief that someone with TB also has AIDS (Ngamvithayapong, Winkvist et al.
2000; Godfrey-Faussett, Kaunda et al. 2002).
Six studies of delay among patients with TB or cough have included some measurement
of stigma as a covariate. In five of these, stigma was not found to be associated with patient
delay (Auer, Sarol et al. 2000; Godfrey-Faussett, Kaunda et al. 2002; Cambanis, Yassin et al.
2005; Yimer, Bjune et al. 2005; Cambanis, Ramsay et al. 2007). A multi-country study by the
World Health Organization (WHO) in their eastern Mediterranean region reported that increased
stigma was associated with decreased patient delay in Somalia (WHO/ROEM 2006). A seventh
study specifically designed to assess the relationship between TB stigma and delay in seeking
care for TB symptoms used a modified stigma scale initially developed for AIDS and cancer
(Woith and Larson 2008). No studies, however, have been performed to assess the effect of both
TB and AIDS stigma on TB patient delay using formally developed and culturally relevant
scales.
Using formally developed stigma scales (Van Rie, Sengupta et al. 2008), this study
sought to investigate whether higher TB or AIDS stigma is associated with longer delay in
seeking care for TB symptoms in southern Thailand.
METHODS

87
Study participants and data collection
Adults (>17 yrs) with newly diagnosed TB between August 2005 and July 2006 were
enrolled from the regional TB center and seven hospital-based TB clinics in southern Thailand.
Patients were not eligible if they had been receiving TB treatment for more than one month.
Information on demographics, socioeconomic status, access to the first qualified health provider
visited (private or public health clinic or hospital), TB knowledge, and TB symptoms were
collected by trained interviewers using a standardized questionnaire. Patients were referred for
counseling and testing if their HIV status was unknown or if they had tested negative more than
six months prior to enrollment. However, an HIV test was not required for participation. Four
stigma scales were administered to all participants: TB stigma from the community perspective
(11 items) and patient perspective (12 items); and AIDS stigma from the community perspective
(11 items) and patient perspective (10 items) (Van Rie, Sengupta et al. 2008). Items were scored
using a Likert scale with four levels: strongly disagree (0), disagree (1), agree (2), and strongly
agree (3), with higher responses indicating higher stigma. Responses were summed for each
scale to create stigma scores to be used in analyses. Stigma scores were standardized by dividing
the summed score by the number of items in the scale, resulting in a possible range of 0 to 3.
These item-adjusted scores were used to compare scores between scales.
Patient delay, defined as the time between onset of TB symptoms and the first visit to a
qualified provider, was the outcome of interest. Health services delay, defined as the time
between first presentation to a provider and diagnosis of TB was not considered in this analysis
because stigma would not be expected to affect clinical decisions or diagnostic processes. Upon
enrollment in the study, patients were asked to recall the duration of their symptoms and when
the first visit to a qualified provider occurred. Delay was calculated as the number of days

88
between these two points. Patients who were asymptomatic were excluded from the analysis.
The delay distribution was normalized using the log10 transformation to satisfy regression
assumptions.
Data analysis
Stigma scores and log-transformed delay were modeled as continuous variables using
multivariable linear regression (SAS 9.1, PROC GENMOD with identity link and normal
distribution). Four regression models were fit using each stigma score as the exposure of
interest. Potential confounders were included in the model based on substantive knowledge and
with the aid of directed acyclic graphs (Glymour and Greenland 2008; Greenland 2008). These
covariates included age, sex, religion, education, income, number of children and adults in the
household, availability of a friend for travel to the health provider, travel time to the first
qualified provider, mode of travel, TB knowledge (cause, transmission, and HIV interaction),
prior testing for AIDS, HIV status, and TB symptoms. We considered interactions between
stigma and gender, HIV status, and TB symptoms. It has been suggested that stigma adversely
affects women (Johansson, Long et al. 2000) and that AIDS factors may play an important role
in both stigma and delay (Ngamvithayapong, Winkvist et al. 2000; Godfrey-Faussett, Kaunda et
al. 2002). These interactions were assessed individually using interaction terms in the fully
adjusted model. Interactions with p ≤ 0.20 in at least one model were used in all four models.
Regression results are presented as mean differences in log-transformed delay. Anti-log
transformation of the parameter estimates requires bias-correction and was not undertaken.
However, anti-log transformation of the upper (or lower) confidence limit provides an upper (or
lower) bound for the relative increase (or decrease) in delay on the day scale, rather than the log-
day scale, which aids in the interpretation of the results.
89
RESULTS
Participant characteristics
Fourteen asymptomatic patients (3%) were excluded from the analysis. An additional 34
(7%) patients were excluded due to improbable calculations of delay (32 with delay <0 days, two
with delay >600 days). The final sample size for analysis was 432 patients. There was very
little difference in exposure and covariate distributions among patients who were included and
those excluded from the analysis, with the exception of mode of transportation (Table 6.1).
Nearly all patients (97%) knew that TB was curable. Patients primarily attributed their
TB to smoking or drinking (34%), followed by infection from someone else (18%) or having a
weak body (17%). While many reported non-infectious causes, they also reported that TB could
be transmitted, either by eating or drinking with a patient or via a patient coughing or sneezing.
Most patients were aware of the link between TB and HIV.
Most patients experienced cough, with or without hemoptysis (76%). Upon diagnosis of
TB, 67 (17%) patients were co-infected with HIV and knew their serostatus. Of the 314 patients
referred for HIV testing, 235 (75%) accepted and 19 new infections were identified for an overall
HIV prevalence of 20%.
Stigma and delay
Stigma scores could not be calculated for 13 (3%) patients due to incomplete item
responses on the TB stigma from the community perspective scale and 16 patients (4%) for each
of the remaining scales. All stigma scores had an approximately normal distribution. Mean
90
item-adjusted scores ranged from 1.65 to 1.97 with the highest score for AIDS stigma from the
patient perspective (Table 6.1).
Delay was highly skewed and ranged from 1 to 365 days (Figure 6.1). Median delay was
26 days with noticeable digit preference. Log10 transformation normalized the delay distribution.
Within categories of covariates, median delay times ranged from 14 days among those who
presented with fever and/or extrapulmonary disease only, to 30 days among those who were HIV
co-infected and those who presented with hemoptysis. The median delay time among men was
one week longer than among women (28 vs. 21.5 days).
Adjusted results for the association of stigma with delay are reported in Table 6.2 as the
mean difference in log-transformed delay per unit increase in the summed stigma score. Results
are reported for all TB patients and then stratified by gender and presenting symptoms. Among
all patients with TB, stigma had no effect on delay with mean differences nearly equal to zero.
Among men, a one unit increase in TB stigma from the community perspective was associated
with a 0.012 (95% CI: -0.001, 0.025) increase in log-delay. Similar results were observed for TB
stigma from the patent perspective. AIDS stigma had no effect on delay times among men. The
opposite was observed among women, where those with higher stigma had a decrease in log-
delay. AIDS stigma from the community perspective was also associated with a 0.015 (95% CI:
-0.032, 0.002) decrease in log-delay among women.
When the effect of stigma on delay was stratified by presenting symptoms, there was no
association between stigma and delay among patients presenting with cough. Patients with
hemoptysis, however, had a 0.022 (95% CI: 0.001, 0.043) increase in log-delay per unit increase
in TB stigma from the community perspective and a 0.035 (95% CI: 0.011, 0.060) increase for
TB stigma from the patient perspective. AIDS stigma from the community perspective had a
91
slightly smaller association. Among patients with fever or extrapulmonary symptoms only, both
TB stigma scales had an inverse relationship with delay. This also occurred for AIDS stigma
from the community perspective where patients had a 0.034 (95% CI: -0.069, 0.002) decrease in
log-delay per unit increase in stigma.
Similar results were observed when delay was calculated as the time from first cough to
the first visit to a qualified provider (Table 6.2).
DISCUSSION
This is the first study to use formally developed TB and AIDS stigma scales to estimate
the association between stigma and delay in seeking care for TB symptoms in the era of the HIV
co-epidemic. Overall, we did not observe an association between TB or AIDS stigma and delay
in seeking health care among individuals who were diagnosed with active TB. However, the
estimates differed by gender, with men who reported higher TB stigma having longer delay
times, and women who reported higher TB stigma having shorter delays. Qualitative studies
have reported that TB stigma adversely affects women more than men, primarily because of their
sensitivity to social interactions (Johansson, Long et al. 2000). In the context of seeking care for
TB symptoms, our findings suggest women who report higher levels of TB stigma may seek care
more quickly in an effort to relieve their symptoms and minimize any social consequences due to
disease.
Among patients with hemoptysis, a symptom highly suggestive of TB, higher TB stigma
was associated with increased delay time, while among patients with fever or extrapulmonary
symptoms only, higher TB and AIDS stigma showed an inverse relationship with delay. It was
interesting to find that, among patients with atypical, non-cough symptoms, higher AIDS stigma

92
from the community perspective was associated with shorter delay times. These patients may
seek care in hopes that their symptoms are attributable to TB, rather than AIDS
(Ngamvithayapong, Winkvist et al. 2000).
The actual impact of stigma on increasing or decreasing the duration of delay may not be
large. The 95% CI limit furthest from the null was for TB stigma from the patient perspective
among those with fever or extrapulmonary disease. Anti-log transformation of this limit (10 -0.069
= 0.85) indicates that the lower bound for any change in delay per unit increase in stigma is a
15% decrease. Given the median delay of 26 days in our study population, this corresponds to a
maximum of a four day decrease in delay time for a one point increase in stigma. The impact of
stigma would likely be greater in populations where the baseline delay is much higher.
Similarly, changes in stigma by more than one point could have a greater impact on delay.
However, a study of possible determinants of TB stigma in the same population found that
modifiable, socio-economic, TB knowledge, and HIV-related factors would only change
summed stigma scores by a maximum of two points.
Only one other study aimed to assess the effect of TB stigma on delay in seeking care for
TB symptoms and did not find any association (Woith and Larson 2008). However, they
modified a stigma scale that had been developed for AIDS and cancer and found poor reliability
among one of the sub-scales. Additionally, measurement of delay had important limitations.
Recall error in delay time likely occurred because all patients had received at least three months
of treatment when enrolled and only crude delay categories of < 4 weeks to > 52 weeks by four-
week intervals were collected.
Other studies of delay included a measure of TB stigma as one of many predictor
variables. These included informal measures of stigma such as feeling ostracized (Auer, Sarol et

93
al. 2000), a single question about whether TB is stigmatizing or not (Cambanis, Yassin et al.
2005; Cambanis, Ramsay et al. 2007), or multi-item measures of stigma that were categorized
for analysis (Godfrey-Faussett, Kaunda et al. 2002; Yimer, Bjune et al. 2005). Among these,
only feeling ostracized was associated with increased delay (Auer, Sarol et al. 2000). A multi-
country study of delay found that high stigma was associated with decreased delay in Somalia
(WHO/ROEM 2006). The scale that was used may not have been a valid measure of stigma
because it included questions on the economic cost of illness and biologic effect on female
reproductive outcomes and breastfeeding. While some researchers suggest that poor TB
knowledge can lead to higher stigma, poor knowledge should not be confused or mixed with
stigma.
Some limitations of our study should be acknowledged. It should be noted that stigma
was assessed only after patients presented at the TB clinics, concurrently with delay time
calculation. The levels of stigma observed may not accurately capture the level of stigma near
the time of symptoms onset if stigma changes over time. Additionally, selection bias may have
occurred because we only enrolled patients who presented at TB clinics. We expect this bias to
be minimal, however, because our findings are already close to the null, and the effect of stigma
would have to be many times stronger among those who never presented. It is also likely that
some recall error occurred. Two-thirds of the patients excluded (32/48) had a calculated delay
time that was negative, indicating error in recalling either the duration of symptoms or when the
first visit to a qualified provider occurred. It is unlikely that this affected our results as these
patients did not differ appreciably from those with valid delay times. For these reasons,
interpreting these results as associations is more appropriate than as causal estimates. Finally,
information on smoking was not collected in this study. While smoking is thought to be a cause

94
of delay because smokers may mistakenly attribute their cough to smoking (Selvam, Wares et al.
2007; Slama, Chiang et al. 2007), we do not expect this to bias our findings because smoking is
unlikely to be associated with TB or AIDS stigma.

95
TABLES AND FIGURES
Table 6.1. Distribution of patient characteristics, by inclusion status.
Continuous characteristics Included (n=432)
Excluded (n=48)
TB stigma Community perspective (mean, SD) 1.67 (0.45) 1.73 (0.41) (Item-adjusted score) Patient perspective (mean, SD) 1.65 (0.37) 1.70 (0.36) AIDS stigma Community perspective (mean, SD) 1.69 (0.47) 1.71 (0.47) (Item-adjusted score) Patient perspective (mean, SD) 1.97 (0.36) 2.00 (0.32) Age Age in years (median, range) 37 (18-79) 36 (18-73) Income Thousand Baht per month (median, range) 10 (0-90) 12 (0-52) Household members Children (<15 years old) (median, range) 1 (0-8) 1 (0-8) Adults (median, range) 3 (0-9) 3 (1-10) Travel time to provider Minutes to qualified provider (median, range) 20 (5-120) 25 (5-120) Categorical characteristics N (%) N (%) Gender Male 284 (65.7) 33 (68.8) Female 148 (34.3) 15 (31.3) Religion Buddhist 286 (66.2) 33 (68.8) Muslim 144 (33.3) 15 (31.3) Education Less than primary school 143 (33.1) 17 (35.4) Completed primary 174 (40.3) 17 (35.4) Completed secondary 115 (26.6) 14 (29.2) Friend to see Yes 398 (92.1) 46 (95.8) doctor with No 34 (7.9) 2 (4.2) Mode of transportation Car/Motorcycle 338 (78.2) 35 (72.9) Bus 69 (16.0) 13 (27.1) Walk, Bicycle, Other 25 (5.8) 0 (0.0) TB knowledge* Infected from family/others 78 (18.1) 9 (18.8) (Cause) Work hard 64 (14.8) 7 (14.6) Smoking/drinking 146 (33.8) 16 (33.3) Heredity 18 (4.2) 2 (4.2) Weak body 75 (17.4) 7 (14.6) Eat or drink with patient 17 (3.9) 3 (6.3) Other 34 (7.9) 4 (8.3) TB knowledge† Eat/drink with patient 263 (60.9) 28 (58.3) (Transmission) Cough/sneeze 357 (82.6) 39 (81.3) Other (touch, sex, other) 113 (26.2) 15 (31.3) TB knowledge Yes 418 (96.8) 45 (93.8) (Cure) No 14 (3.2) 3 (6.3) TB knowledge† TB increases chance of AIDS 221 (51.2) 21 (43.8) (TB/HIV) AIDS increases chance of TB 310 (71.8) 36 (75.0) Symptoms appear similar 305 (70.6) 34 (70.8) Ever tested for AIDS Yes 184 (42.6) 24 (50.0) No 248 (57.4) 24 (50.0) HIV status‡ Negative 266 (61.6) 29 (60.4) New positive 19 (4.4) 2 (4.2) Known positive 67 (15.5) 6 (12.5) Refused test 80 (18.5) 11 (22.9) TB symptoms§ Cough 221 (51.2) 17 (35.4) Hemoptysis 105 (24.3) 11 (22.9)

96
Weight loss 55 (12.7) 4 (8.3) Fever and/or extrapulmonary only 51 (11.8) 2 (4.2) No symptoms 0 (0.0) 14 (29.2) * Exclusive or † non-exclusive categories ‡ Known positives had previously tested positive for HIV infection; New positives identified when diagnosed with § Cough and hemoptysis may include other symptoms; Weight loss excludes cough but may include other symptoms

97
Table 6.2. Adjusted differences in mean, log-transformed delay times per one point increase in stigma score*. Any symptom delay Homog. Pulmonary delay† Stigma scale Stratification MD (95% CI) p-value MD (95% CI) TB stigma (Community perspective) All patients 0.004 (-0.007, 0.014) 0.005 (-0.007, 0.017) TB stigma (Patient perspective) All patients 0.003 (-0.009, 0.015) 0.003 (-0.010, 0.017) AIDS stigma (Community perspective) All patients -0.003 (-0.013, 0.007) -0.004 (-0.015, 0.008) AIDS stigma (Patient perspective) All patients 0.002 (-0.013, 0.016) 0.002 (-0.015, 0.018) TB stigma (Community perspectives) Male 0.012 (-0.001, 0.025) 0.05 0.011 (-0.004, 0.026) Female -0.009 (-0.026, 0.007) -0.007 (-0.028, 0.014) TB stigma (Patient perspective) Male 0.011 (-0.004, 0.026) 0.12 0.010 (-0.007, 0.028) Female -0.007 (-0.025, 0.010) -0.007 (-0.028, 0.014) AIDS stigma (Community perspective) Male 0.004 (-0.009, 0.016) 0.08 0.002 (-0.012, 0.015) Female -0.015 (-0.032, 0.002) -0.015 (-0.035, 0.005) AIDS stigma (Patient perspective) Male 0.000 (-0.019, 0.018) 0.70 0.000 (-0.021, 0.020) Female 0.005 (-0.018, 0.029) 0.005 (-0.023, 0.032) TB stigma (Community perspective) Cough -0.002 (-0.016, 0.012) 0.12 -0.003 (-0.017, 0.011) Hemoptysis 0.022 (0.001, 0.043) 0.024 (0.002, 0.045) Weight Loss 0.011 (-0.018, 0.039) Fever or EPTB -0.018 (-0.050, 0.014) TB stigma (Patient perspective) Cough -0.004 (-0.019, 0.011) 0.01 -0.005 (-0.021, 0.010) Hemoptysis 0.035 (0.011, 0.060) 0.028 (0.002, 0.053) Weight Loss 0.011 (-0.022, 0.044) Fever or EPTB -0.034 (-0.069, 0.002) AIDS stigma (Community perspective) Cough -0.008 (-0.022, 0.006) 0.15 -0.010 (-0.024, 0.004) Hemoptysis 0.015 (-0.004, 0.034) 0.010 (-0.010, 0.030) Weight Loss -0.001 (-0.030, 0.027) Fever or EPTB -0.022 (-0.053, 0.009) AIDS stigma (Patient perspective) Cough -0.005 (-0.024, 0.014) 0.77 -0.003 (-0.022, 0.017) Hemoptysis 0.006 (-0.022, 0.035) 0.012 (-0.018, 0.042) Weight Loss 0.015 (-0.026, 0.056) Fever or EPTB 0.014 (-0.037, 0.064) *Mean difference in log10 transformed days and 95% confidence interval; Homog. p-value, p-value homogeneity test of stratum-specific effects. †Pulmonary delay calculated as the time from first cough to the first visit to a qualified provider

98
Figure 6.1. Kernel-smoothed distribution of untransformed delay time.

99
CHAPTER 7
TUBERCULOSIS TREATMENT DEFAULT AND NON-ADHERENCE DUE
TO TUBERCULOSIS AND AIDS STIGMA
BACKGROUND
Adherence to tuberculosis therapy is important because non-adherence, and not just
default, can lead to prolonged infectiousness, treatment failure, disease relapse, drug
resistance, or death (Chaulk and Kazandjian 1998; Gelmanova, Keshavjee et al. 2007). In a
review of qualitative studies, Munro et al. (Munro, Lewin et al. 2007) identified eight major
factors affecting adherence to TB treatment: organization of treatment and care;
interpretation of illness and wellness; financial burden; knowledge, attitudes, and beliefs
about treatment; law and immigration; personal characteristics; drug side effects; and family,
community, and household influence. These factors have been generally supported through
quantitative studies of adherence and default (Connolly, Davies et al. 1999; Santha, Garg et
al. 2002; Cayla, Caminero et al. 2004; Lertmaharit, Kamol-Ratankul et al. 2005; Mishra,
Hansen et al. 2005; Gelmanova, Keshavjee et al. 2007; Shargie and Lindtjorn 2007; Hasker,
Khodjikhanov et al. 2008).
Health-related stigma, defined as a social process “characterized by exclusion,
rejection, blame, or devaluation resulting from experience or reasonable anticipation of an
adverse social judgment” because of a particular health condition (Weiss and Ramakrishna

100
2006), may also reduce treatment adherence among patients with TB. In an effort to conceal
their disease from others, patients may hide their treatment or try to avoid being seen at the
clinic, resulting in poor adherence (Liefooghe, Michiels et al. 1995; Nair, George et al.
1997). Fear of losing their job may also prevent patients from asking for financial support or
time off to complete treatment, further hindering adherence (Johansson, Diwan et al. 1996).
Stigma and fear of isolation may affect adherence primarily among women, whereas poor
adherence among men is often individually and financially motivated (Johansson, Long et al.
1999). Difficulty coping with a simultaneous AIDS diagnosis or fear that others would
suspect an AIDS diagnosis could also lead to poor adherence among TB patients
(Ngamvithayapong, Winkvist et al. 2000).
Only two studies have investigated the association between TB stigma and treatment
adherence, neither of which used a formally developed measure of stigma validated in the
study population. Comolet et al. found that defaulters were more likely to believe that TB
was a shameful disease (Comolet, Rakotomalala et al. 1998), while Woith and Larson
reported that high levels of financial insecurity were associated with lower adherence,
whereas higher levels of shame were associated with better adherence (Woith and Larson
2008).
The purpose of this study was to estimate the effect of TB and AIDS stigma on
adherence to TB treatment among TB patients in southern Thailand using formally developed
and validated stigma scales.
METHODS
Study participants, data collection, and definitions

101
Adults in southern Thailand with newly diagnosed TB were enrolled from a regional
TB center and seven TB clinics and followed prospectively through treatment. Patients were
eligible if they had been receiving TB treatment for less than one month. Upon enrollment,
information on demographics, socioeconomic status, TB knowledge, and TB symptoms were
collected using a standardized questionnaire. Patients were referred for counseling and
testing if their HIV status was unknown or if they had tested negative more than six months
prior to enrollment, but an HIV test was not required for participation. Stigma was measured
using two TB stigma scales and two AIDS stigma scales previously developed in southern
Thailand (Van Rie, Sengupta et al. 2008). Items were scored using a Likert scale with four
levels: strongly disagree (0), disagree (1), agree (2), and strongly agree (3). Responses were
summed for each scale to create stigma scores, with higher responses indicating higher
stigma. After two months of treatment, participants were re-administered the TB knowledge
questions and stigma scales.
Adherence information was documented every time a patient was seen by clinic staff
and included the number of pills brought back to the clinic, number of days a dose was
missed, reason for missing doses, number of doses newly prescribed, and whether the patient
was receiving the intensive or continuation phase treatment regimen. Standard treatment
outcomes of cure, treatment completion, treatment failure, death, default, or transferred out
(WHO 2003) were assigned to each patient as appropriate.
Two adherence outcomes were used in this study: default and non-adherence.
Default was defined as two or more consecutive months without treatment (WHO 2003).
Non-adherence was defined as the proportion of days on treatment with a missed dose that

102
were not attributable to adverse drug side effects. If no doses were missed and all
prescriptions were collected on time, non-adherence was zero.
In Thailand, standard treatment for new TB cases involves two months of isoniazid,
rifampicin, pyrazinamide, and ethambutol taken daily (2HRZE; intensive phase) followed by
four moths of isoniazid and rifampicin taken daily (4HR; continuation phase). Directly
observe therapy (DOT) is recommended for all patients, either at the clinic or by a family or
community member, but is not required. This decision is made jointly by clinic staff and the
patient, and depends on the patient’s access to the clinic and availability of family or
community members to perform observation.
Dichotomous analysis of default
Multivariable logistic regression (SAS 9.2, PROC GENMOD with logit link and
binomial distribution) was used to assess the risk of baseline stigma on subsequent default
while controlling for measured confounders. Defaulters during the entire course of
treatment, during the intensive phase, and during the continuation phase were compared with
those who completed each specific period. Patients who died, transferred out, or had their
diagnosis changed to non-TB during the period of interest were excluded from that analysis.
For each default analysis, four regression models were built using continuous stigma scores
measured at the start of treatment as the exposure of interest.
Confounders were included in the model based on substantive knowledge and with
the aid of directed acyclic graphs (Glymour and Greenland 2008; Greenland 2008).
Covariates included age, gender, religion, education, income, number of children and adults
in the household, knowledge of TB transmission and the link between TB and HIV,

103
presenting symptoms, and HIV status. Assignment of DOT was likely independent of stigma
or, possibly, a result of the patient’s stigma. In either case, it does not meet the criteria for a
confounder. Covariates for knowledge of TB cure and cause were not included due to sparse
data and problems with model convergence. Interactions between stigma scores and
covariates were not assessed due to the small number of defaults in many covariate strata.
Longitudinal analysis of non-adherence
Non-adherence was analyzed as a repeated observation when there was a change from
intensive to continuation phase treatment or re-assessment of stigma, resulting in one to three
observations per patient. All patients, regardless of treatment outcome, were included in the
analysis until they completed treatment or were lost to follow-up.
Multivariable negative binomial regression (SAS 9.2, PROC GENMOD with log link
and negative binomial distribution) was used to assess the effect of stigma on the rate of non-
adherence while controlling for measured confounders. TB knowledge and treatment phase
were included as time-varying covariates. Generalized estimating equations with an
exchangeable correlation matrix were specified to account for within subject correlations due
to the repeated observations. Four regression models were built using time-varying,
continuous stigma scores as the exposure of interest.
Confounders were included in the model based on substantive knowledge and with
the aid of directed acyclic graphs (Glymour and Greenland 2008; Greenland 2008). These
covariates included age, gender, religion, education, income, number of children and adults
in the household, knowledge of TB transmission and the link between TB and HIV,
presenting symptoms, HIV status, and treatment phase. Assignment of DOT and knowledge

104
of TB cure and cause were not included for the same reasons listed above in the analysis of
treatment default. Interactions between stigma scores and gender, HIV status, symptoms,
and treatment phase were assessed using interaction terms in separate models. A p-value
<0.20 was interpreted as evidence of heterogeneity. For covariates with more than two
categories, a Type III test using the Wald Chi-square statistic was performed to
simultaneously assess the contribution of each category’s interaction with stigma. If
evidence of heterogeneity was found for one stigma score, the interaction term was included
in all four models.
RESULTS
Patient characteristics
A total of 480 patients were enrolled and followed prospectively, of whom 390
(81.3%) completed treatment, 45 (9.4%) defaulted, and 28 (5.8%) died. Twenty (44.4%)
defaults and 12 (43%) deaths occurred during the intensive phase of treatment. The median
time to treatment completion was 182 days, while the median time to default and death was
64 and 88 days, respectively. Sixty-one percent (295/480) of patients did not miss any doses
during the entire course of treatment or until lost to follow-up. Among those missing at least
one dose (n=181), the median number of days with a missed dose was four and median non-
adherence was 2.2% (Figure 7.1). Only 6 (3%) had 20% or greater non-adherence. Four
patients were missing adherence data. Fourteen (3%) asymptomatic patients were excluded
from the analyses.

105
In bivariate analysis, defaulting increased as the rate of non-adherence increased
(Mantel-Hanzel chi-square test, p=0.12) (Table 7.1). However, 63% (27/41) of defaulters
had perfect adherence up to the time of default.
For each stigma scale measured at baseline, between 14 and 20 (3-4%) patients had
incomplete item responses and stigma scores could not be calculated. Missing stigma scores
did not differ between treatment completers and defaulters. Compared with those who
completed treatment, defaulters were more often male, not assigned to DOT, co-infected with
HIV or refused to be tested, and believed that TB was caused by smoking or drinking (Tables
7.2 and 7.3). Fewer defaulters believed that TB could be transmitted via cough or sneeze,
and they presented with hemoptysis less often.
Of the 441 patients completing intensive phase treatment, 423 (96%) completed a
second stigma and TB knowledge assessment (Table 7.4). Median stigma scores did not
change more than one point between the first and second assessment. After two months of
treatment, a lower proportion of defaulters believed that TB was caused by infection from
someone else, and the majority still believed that smoking or drinking was the cause of TB.
In contrast, a larger proportion of treatment completers believed that TB was caused by
infection. Among all patients, the proportion that recognized the link between TB and AIDS
increased.
Dichotomous analysis of default
Results from the analysis comparing defaulters to those who completed treatment are
shown in Table 7.5. There was little evidence that stigma measured at start of treatment had
any effect on default during the entire course of treatment. When patients defaulting during

106
the intensive phase were compared to those completing the intensive phase, higher stigma
scores from the community perspective for both TB and AIDS decreased the risk of default
(adjusted OR: 0.93, 95% CI: 0.83, 1.03; adjusted OR: 0.91, 95% CI: 0.82, 1.01). Stigma
scores from the patient perspective scales had no effect on the risk of default during intensive
phase treatment. In contrast, patients reporting higher TB stigma from the patient
perspective at enrollment had an increased risk of default during the continuation phase of
treatment (adjusted OR: 1.10, 95% CI: 0.98, 1.24). Stigma scores from the community
perspective scales did not have an affect on the risk of default during the continuation phase
of treatment. Of the 25 defaulters completing the intensive phase, 9 (36%) were missing a
second stigma score. Therefore we did not estimate the effect of stigma measured after two
months of treatment on default during the continuation phase.
Longitudinal analysis of non-adherence
In multivariable analysis of the time-varying effect of stigma on non-adherence,
stigma was not found to affect the overall rate of non-adherence (Table 7.6). When results
were stratified by HIV status, stigma had little to no effect on non-adherence among patients
who were HIV negative. Among patients co-infected with HIV, those reporting higher TB
stigma from the community and patient perspectives had 1.08 (95% CI: 1.00, 1.17) and 1.10
(95% CI: 1.01, 1.20) times the rate of non-adherence compared to those with a one point
lower stigma score, respectively. In contrast, among patients who refused the HIV test, those
reporting higher TB stigma from both scales had higher rates of adherence (adjusted RR:
0.93, 95% CI: 0.86, 1.00). AIDS stigma showed no effect on non-adherence with the
107
exception of AIDS stigma from the patient perspective among patients who refused the HIV
test (adjusted OR: 0.89, 95% CI: 0.82, 0.96).
When results were stratified by presenting symptoms, there was little to no effect of
stigma among patients presenting with cough. Among patients presenting with hemoptysis,
those with higher TB stigma from the community perspective had 1.13 (95% CI: 1.05, 1.21)
times the rate of non-adherence. In fact, higher TB stigma from the patient perspective scale
and from both AIDS stigma scales was associated with an increased rate of non-adherence
among patients presenting with either hemoptysis or non-cough symptoms (adjusted RRs of
1.05 to 1.08).
DISCUSSION
Among patients with TB in southern Thailand, TB and AIDS stigma had a minimal
effect on default and adherence when measured using formally developed stigma scales.
However, the observed null effects are likely due to differential effects within specific sub-
groups. Higher stigma from the community perspective scales for both TB and AIDS
decreased the risk of default during the intensive phase of treatment, when patients are still
symptomatic and identifiable in the community. In contrast, higher stigma from both patient
perspective scales increased the risk of default during the continuation phase of treatment,
when patients may be more concerned about their personal experiences, rather than
community perceptions. This finding is similar to results from a retrospective study where
defaulters were more likely to feel that TB was a shameful disease (crude OR of 2.97)
(Comolet, Rakotomalala et al. 1998).

108
Similar to default, we did not find an overall effect of stigma on the rate of non-
adherence. HIV status and presenting symptoms, however, did modify the effect of stigma.
TB and AIDS stigma had little to no effect on adherence among HIV negative patients.
Higher TB stigma from both the community and patient perspective scales, however,
increased the rate of non-adherence among patients co-infected with HIV. In contrast,
among those who refused an HIV test, higher TB stigma and AIDS stigma from the patient
perspective improved adherence. Surprisingly, AIDS stigma also had no effect among
patients who were HIV co-infected. This could occur because HIV status is a hidden, rather
than visible, attribute. As long as a patient does not disclose his or her status, others in the
community will not know, and therefore any existing stigma may not have an adverse effect.
Nevertheless, it has been reported that HIV status itself is associated with default and non-
adherence (Connolly, Davies et al. 1999; Naing, D'Este et al. 2001). Our findings are similar
to that observed among TB patients in Russia, where higher feelings of shame (one aspect of
our patient perspective scale) were associated with improved adherence (Woith and Larson
2008). The Russian study, however, only considered adherence during the continuation
phase of treatment and did not report on the HIV status of participants.
We also found that presenting symptoms modified the effect of stigma on non-
adherence. Among patients with hemoptysis, both TB-and AIDS-stigma, especially TB
stigma from the community perspective, increased the rate of non-adherence. This was also
true among patients presenting without a cough, where higher TB stigma from the patient
perspective and AIDS stigma increased the rates of non-adherence. Unlike HIV status, TB
symptoms are a visible attribute. And because severe or atypical symptoms could suggest
HIV infection, existing AIDS stigma could exert an adverse effect on those patients.

109
When results from both the default and non-adherence analyses are considered,
several important points emerge. First, stigma appears to have a minimal effect on
adherence. The largest effects of stigma that we observed were to increase default or non-
adherence by 10%. Given that default and non-adherence were low in our study population,
this translates into an increase that may not be clinically relevant. Nevertheless, any level of
poor adherence increases the risk of drug resistant TB. Second, stigma has a negative effect
on adherence among specific sub-groups, including patients who are co-infected with HIV
and those presenting with hemoptysis or atypical symptoms. Third, there were instances of
higher stigma improving adherence, rather than being a barrier to it. Both TB and AIDS
stigma from the community perspective decreased the risk of default during the intensive
phase, while TB stigma and AIDS stigma from the patient perspective decreased the rate of
non-adherence among those with unknown HIV status. This suggests that awareness of
cultural norms and fear of social consequences can motivate health behavior. Finally, our
study suggests that important, differential effects exist within specific sub-groups which
could go unobserved if they are collapsed across the entire study population. The effect of
stigma on adherence is complex, with the potential to be a barrier or motivator depending on
the sub-group of the population. Future studies should take this into account to properly
identify the effects of stigma, while interventions should be targeted to the groups that would
benefit from stigma reduction.
Some potential limitations should be addressed. First, data on alcohol and substance
abuse, travel time to the clinic, and quality of care were not collected. While these factors
are suspected to influence adherence (Santha, Garg et al. 2002; Gelmanova, Keshavjee et al.
2007; Shargie and Lindtjorn 2007), we would not expect these factors to affect stigma and

110
therefore they would not confound the observed associations. Some misclassification of
treatment phase could have occurred for the 75 (16%) patients who did not have specific
information on when intensive phase treatment was completed. Such misclassification,
however, is expected to be independent of stigma, default, and non-adherence. Nevertheless,
the differential effects observed for intensive phase default and continuation phase default
may be exaggerated. There was also the potential for misclassification of adherence. While
steps were taken to correctly record doses that were and were not ingested, there is the
possibility that patients disposed of their prescriptions rather than bringing them to the clinic
visit. Our findings could be biased if such practices occurred differentially among patients
with higher stigma.

111
TABLES AND FIGURES
Table 7.1. Crude association between non-adherence and default. Non-adherence All patients* Completers Defaulters COR (95% CI)†
0% 261 235 26 Referent ≤5% 120 113 7 0.56 (0.24, 1.33) ≤10% 25 21 4 1.72 (0.55, 5.40) ≤20% 10 8 2 2.20 (0.46, 11.21) >20% 4 2 2 9.04 (1.22, 66.88)
*excludes 28 deaths, 12 transfers, 5 with changed diagnosis to non-TB, 14 with no symptoms, and one with missing adherence data †OR, odds ratio; CI, confidence interval; Mantel-Hanzel Chi-square test for correlation across ordinal levels: x2=2.70; d.f.=1; exact p-value=0.12

112
Table 7.2. Baseline participant characteristics (continuous), by treatment outcome. Completed
(N=390) Default (N=45)
Others (N=45)*
Median (Range) Median (Range) Median (Range) TB Stigma Community perspectives (11 items) 19 (2 – 33) 19 (7 – 33) 20 (10 – 26) Patient perspectives (12 items) 19 (0 – 36) 20 (9 – 30) 22 (14 – 33) AIDS Stigma Community perspectives (11 items) 20 (5 – 33) 18 (7 – 30) 21 (9 – 32) Patient perspectives (10 items) 20 (3 – 30) 20 (10 – 29) 20 (11 – 28) Age Age in years 36.5 (18 – 79) 34 (21 – 63) 39 (25 – 67) Income Thousand Baht per month 10 (0 – 90) 10 (2 – 50) 9 (1 – 80) Household Members Children (<15 years old) 1 (0 – 8) 1 (0 – 8) 1 (0 – 3) *Includes 28 deaths, 12 who transferred out, and 5 with changed diagnosis to non-TB.

113
Table 7.3. Baseline participant characteristics (categorical), by treatment outcome. Completed Default Others* N (%) N (%) N (%) Gender Male 244 (62.6) 37 (82.2) 36 (80.0) Female 146 (37.4) 8 (17.8) 9 (20.0) Religion Buddhist 261 (66.9) 28 (62.2) 30 (66.7) Muslim 129 (33.1) 15 (33.3) 15 (33.3) Education Less than primary school 126 (32.3) 15 (33.3) 19 (42.2) Completed primary 154 (39.5) 21 (46.7) 16 (35.6) Completed secondary 110 (28.2) 9 (20.0) 10 (22.2) Directly Observed None 212 (54.4) 36 (80.0) 18 (40.0) Therapy Health care worker 77 (19.7) 1 (2.2) 7 (15.6) Family member 101 (25.9) 8 (17.8) 20 (44.4) TB knowledge: No 13 (3.3) 3 (6.7) 1 (2.2) (Cure) Yes 377 (96.7) 42 (93.3) 44 (97.8) TB knowledge: Infected from family/others 72 (18.5) 10 (22.2) 5 (11.1) (Cause) Work hard 58 (14.9) 5 (11.1) 8 (17.8) Smoking/drinking 125 (32.1) 19 (42.2) 18 (40.0) Heredity 18 (4.6) 2 (4.4) 0 (0.0) Weak body 72 (18.5) 6 (13.3) 4 (8.9) Eat/drink with patient 18 (4.6) 1 (2.2) 1 (2.2) Other 27 (6.9) 2 (4.4) 9 (20.0) TB knowledge: Eat/Drink 241 (61.8) 29 (64.4) 21 (46.7) (Transmission) Cough/Sneeze 331 (84.9) 31 (68.9) 34 (75.6) Other (touch, sex, other) 105 (26.9) 16 (35.6) 7 (15.6) TB knowledge: TB increases chance of AIDS 191 (49.0) 25 (55.6) 26 (57.8) (TB/HIV) AIDS increases chance of TB 288 (73.8) 33 (73.3) 25 (55.6) Symptoms appear similar 280 (71.8) 34 (75.6) 25 (55.6) HIV Status Negative 268 (68.7) 17 (37.8) 10 (22.2) Positive 60 (15.1) 14 (31.1) 20 (44.5) Refused test 62 (15.9) 14 (31.1) 15 (33.3) Symptoms Cough 190 (48.7) 22 (48.9) 24 (53.3) Hemoptysis 100 (25.6) 8 (17.8) 8 (17.8) Non-cough 89 (22.8) 12 (26.7) 13 (28.9) No symptoms 11 (2.8) 3 (6.7) 0 (0.0) *Includes 28 deaths, 12 who transferred out, and 5 with changed diagnosis to non-TB.

114
Table 7.4. Second assessment of stigma and TB knowledge among patients completing intensive phase therapy, by treatment outcome (N=423). Complete
(N=385) Default (N=16)
Others (N=22)*
Stigma Median (Range) Median (Range) Median (Range) TB Stigma Community perspectives (11 items) 19 (0 – 30) 18 (12 – 22) 19 (8 – 28) Patient perspectives (12 items) 20 (3 – 35) 19 (13 – 24) 21 (3 – 34) AIDS Stigma Community perspectives (11 items) 20 (5 – 33) 18 (11 – 23) 20 (7 – 33) Patient perspectives (10 items) 20 (0 – 30) 19 (17 – 29) 20 (6 – 30) TB knowledge N (%) N (%) N (%) Cure No 1 (0.3) 0 (0.0) 0 (0.0) Yes 384 (99.7) 16 (100.0) 22 (100.0) Cause Infected from family/others 106 (27.5) 2 (12.5) 5 (22.7) Work hard 45 (11.7) 0 (0.0) 2 (9.1) Smoking/drinking 103 (26.8) 8 (50.0) 9 (40.9) Heredity 16 (4.2) 1 (6.3) 0 (0.0) Weak body 69 (17.9) 2 (12.5) 3 (13.6) Eat/drink with patient 36 (9.4) 2 (12.5) 1 (4.6) Other 10 (2.6) 1 (6.25) 2 (9.1) Transmission Eat/Drink 239 (62.1) 11 (68.8) 11 (50.0) Cough/Sneeze 340 (88.3) 12 (75.0) 14 (63.6) Other (touch, sex, other) 91 (23.6) 1 (6.3) 6 (27.3) TB/HIV TB increases chance of AIDS 243 (63.1) 11 (68.8) 17 (77.3) AIDS increases chance of TB 347 (90.1) 14 (87.5) 21 (95.5) Symptoms appear similar 294 (76.4) 15 (93.8) 19 (86.4) *Includes 14 deaths and 8 who transferred out
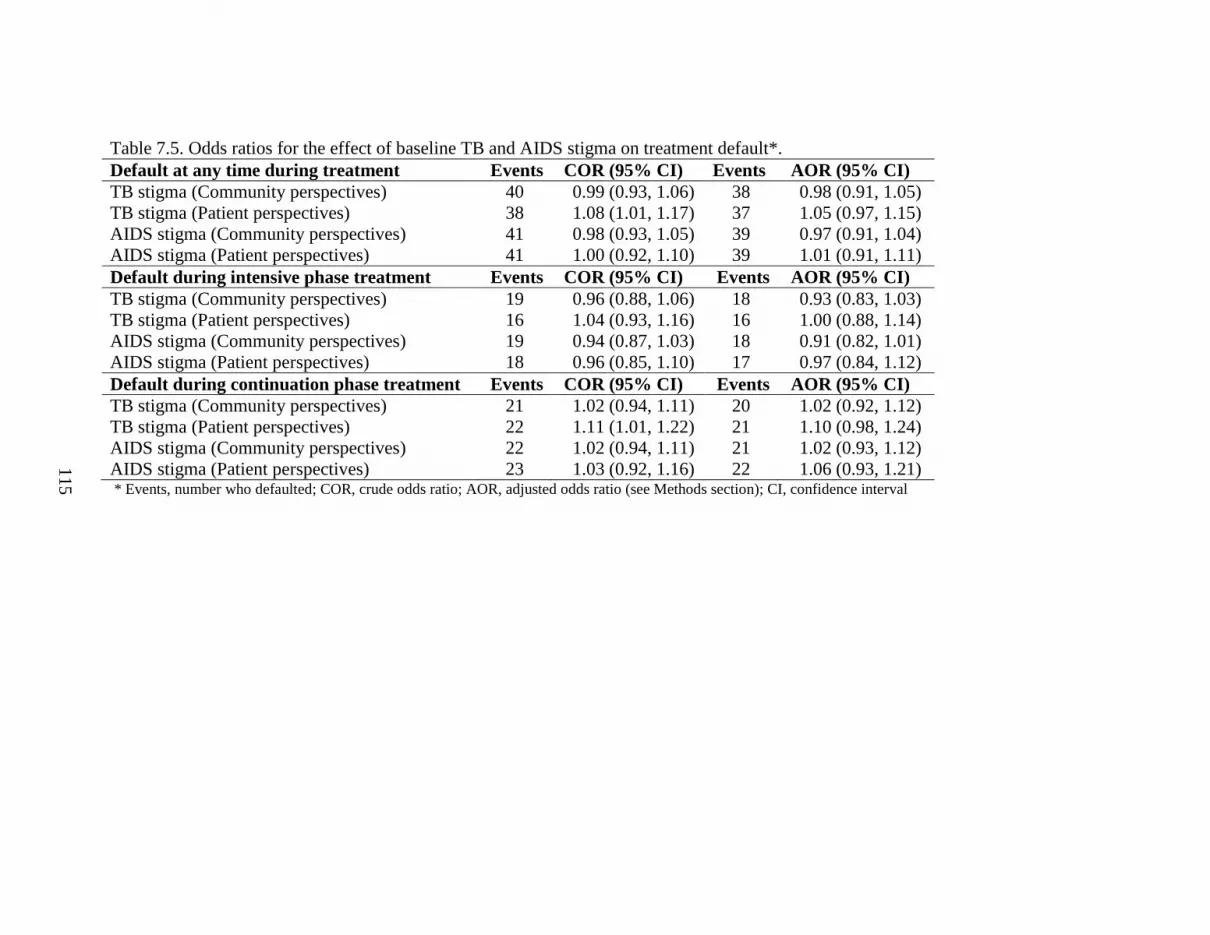
115
Table 7.5. Odds ratios for the effect of baseline TB and AIDS stigma on treatment default*. Default at any time during treatment Events COR (95% CI) Events AOR (95% CI) TB stigma (Community perspectives) 40 0.99 (0.93, 1.06) 38 0.98 (0.91, 1.05) TB stigma (Patient perspectives) 38 1.08 (1.01, 1.17) 37 1.05 (0.97, 1.15) AIDS stigma (Community perspectives) 41 0.98 (0.93, 1.05) 39 0.97 (0.91, 1.04) AIDS stigma (Patient perspectives) 41 1.00 (0.92, 1.10) 39 1.01 (0.91, 1.11) Default during intensive phase treatment Events COR (95% CI) Events AOR (95% CI) TB stigma (Community perspectives) 19 0.96 (0.88, 1.06) 18 0.93 (0.83, 1.03) TB stigma (Patient perspectives) 16 1.04 (0.93, 1.16) 16 1.00 (0.88, 1.14) AIDS stigma (Community perspectives) 19 0.94 (0.87, 1.03) 18 0.91 (0.82, 1.01) AIDS stigma (Patient perspectives) 18 0.96 (0.85, 1.10) 17 0.97 (0.84, 1.12) Default during continuation phase treatment Events COR (95% CI) Events AOR (95% CI) TB stigma (Community perspectives) 21 1.02 (0.94, 1.11) 20 1.02 (0.92, 1.12) TB stigma (Patient perspectives) 22 1.11 (1.01, 1.22) 21 1.10 (0.98, 1.24) AIDS stigma (Community perspectives) 22 1.02 (0.94, 1.11) 21 1.02 (0.93, 1.12) AIDS stigma (Patient perspectives) 23 1.03 (0.92, 1.16) 22 1.06 (0.93, 1.21) * Events, number who defaulted; COR, crude odds ratio; AOR, adjusted odds ratio (see Methods section); CI, confidence interval

116
Table 7.6. Rate ratios for the effect of stigma on non-adherence to TB treatment*. Stigma scale Stratification CRR (95% CI) ARR (95% CI) Homog. p-value TB stigma (community perspective) All patients 1.01 (0.96, 1.07) 0.99 (0.95, 1.03) TB stigma (patient perspective) All patients 1.04 (0.99, 1.09) 1.02 (0.97, 1.07) AIDS stigma (community perspective) All patients 1.02 (0.97, 1.07) 1.01 (0.97, 1.05) AIDS stigma (patient perspective) All patients 1.02 (0.97, 1.08) 1.01 (0.96, 1.06) TB stigma (community perspective) HIV negative 1.00 (0.95, 1.06) 0.99 (0.93, 1.05) 0.01 HIV positive 1.11 (0.99, 1.25) 1.08 (1.00, 1.17) Refused test 0.94 (0.87, 1.02) 0.93 (0.87, 1.00) TB stigma (patient perspective) HIV negative 1.04 (0.98, 1.11) 1.02 (0.95, 1.09) 0.01 HIV positive 1.09 (0.96, 1.23) 1.10 (1.01, 1.20) Refused test 0.95 (0.88, 1.04) 0.93 (0.86, 1.00) AIDS stigma (community perspective) HIV negative 1.03 (0.96, 1.11) 1.01 (0.95, 1.07) 0.60 HIV positive 1.00 (0.94, 1.05) 1.04 (0.98, 1.10) Refused test 0.99 (0.91, 1.09) 0.99 (0.90, 1.08) AIDS stigma (patient perspective) HIV negative 1.05 (0.97, 1.13) 1.04 (0.96, 1.12) 0.03 HIV positive 0.93 (0.84, 1.02) 0.95 (0.86, 1.06) Refused test 0.89 (0.83, 0.97) 0.89 (0.82, 0.96) TB stigma (community perspective) Cough 0.97 (0.92, 1.03) 0.96 (0.90, 1.02) <0.01 Hemoptysis 1.15 (1.07, 1.23) 1.13 (1.05, 1.21) Non-cough 0.96 (0.89, 1.04) 0.97 (0.91, 1.04) TB stigma (patient perspective) Cough 0.99 (0.92, 1.07) 0.99 (0.92, 1.07) 0.25 Hemoptysis 1.11 (1.00, 1.24) 1.08 (0.98, 1.18) Non-cough 1.10 (1.04, 1.16) 1.08 (1.01, 1.15) AIDS stigma (community perspective) Cough 0.98 (0.93, 1.03) 0.96 (0.91, 1.00) <0.01 Hemoptysis 1.10 (0.99, 1.22) 1.08 (0.99, 1.18) Non-cough 1.02 (0.96, 1.09) 1.07 (1.01, 1.14) AIDS stigma (patient perspective) Cough 0.98 (0.92, 1.04) 0.98 (0.92, 1.05) 0.24 Hemoptysis 1.09 (0.96, 1.24) 1.06 (0.94, 1.20) Non-cough 1.05 (0.98, 1.12) 1.05 (0.99, 1.12) *CRR, crude rate ratio; ARR, adjusted rate ratio (see Methods section); CI, confidence interval; Homog. p-value, p-value homogeneity test of stratum-specific effects.

117
Figure 7.1. Distribution of non-adherence during treatment*.
0
10
20
30
40
50
60
70
80
90
100
110
120
130
0%>20
%
Non-adherence
Fre
qu
ency
300
290
280
*6 patients had non-adherence ≥20%; 4 had missing adherence data.

118
CHAPTER 8
DISCUSSION AND FUTURE DIRECTIONS
OVERVIEW
Health-related stigma has received increasing attention as an important factor in
public health. It is now understood to be a complex social process that involves attitudes,
practices, and actions on the part of healthy community members towards affect or
potentially affect individuals, as well as the perceptions, experiences, and internalization of
the community’s beliefs on the part of the affected individual. A complex research agenda
for health-related stigma includes documenting the burden of stigma, comparing stigma in
different settings, identifying determinants and effects of stigma, and evaluating changes in
stigma over time and in response to interventions. While TB stigma has historically been
reported, it remains unclear what impact it has on TB control, including seeking care for
symptoms, adherence, and ultimately ongoing transmission. There is also concern that
stigma related to HIV/AIDS may compound existing TB stigma and adversely affect TB
control.
Numerous measures of HIV/AIDS stigma have been developed, but this has not been
true for TB, making it difficult to quantify the presence, determinants, and effects of stigma
on TB control. Some measures have been published recently that are well-developed, and
they indicate relatively low levels of stigma in the study populations and offer conflicting
results about why stigma exists. There are even fewer studies that have quantified the

119
association between TB stigma and delay in seeking care for symptoms or adherence to
treatment. All of them suffer from methodologic limitations related to measurement of
stigma, variation in the study population, definition of delay, and definition of adherence.
Specifically, few used any formal measure of stigma.
The current study performed in southern Thailand has contributed to the growing
literature of TB and AIDS stigma. The developed scales measure nearly identical
community and patient perspectives of both TB and AIDS stigma, thus reliably capturing the
complex nature of stigma for these overlapping diseases. And the findings from this study
are some of the first to quantitatively evaluate the presence of stigma, its possible
determinants, and the effect it has on seeking care for TB symptoms and adherence to TB
treatment.
STUDY FINDINGS
We found high levels of both TB and AIDS stigma in southern Thailand. Mean,
item-adjusted scores, which can range from zero to three, were observed to range from 1.65
for TB stigma from the patient perspective among TB patients to 2.21 for AIDS stigma from
the patient perspective among healthy community members. A score of one corresponds to a
response of “disagree”, a score of two corresponds to a response of “agree”, and a score of
three corresponds with “strongly agree”. Few factors were identified that could be
determinants of higher TB stigma. Knowledge about the cause, transmission, or curability of
TB were not consistently associated with higher stigma. However, among both community
members and patients with TB, beliefs about the link between TB and AIDS and higher
AIDS stigma consistently resulted in small increases in TB stigma. And among community

120
members, those who knew someone who died of TB had summed stigma scores that were
two points higher, the largest difference observed.
While high levels of TB and AIDS stigma were reported, patients with TB had
relatively short times from symptom onset to first health provider visit (median of 26 days)
and very good adherence to treatment: 61% had perfect adherence, only 3% missed ≥20% of
their days on treatment, and 9% defaulted. In the analysis of stigma on delay times in
seeking care for TB symptoms, the upper bound for changes in delay time was 15%, or
approximately four days relative to the median time, per unit increase in stigma score. In the
analysis of stigma on adherence to treatment, observed effects ranged from an 11% decrease
to 13% increase in the risk of default and non-adherence among sub-groups. As with the
delay analysis, these are small absolute effects given the baseline level of default and
adherence, although any form of incomplete treatment can contribute to the development of
drug resistance. Many of the analyses showed stigma to have a null effect on either delay or
adherence. Given that differences in socio-demographic, TB knowledge, and clinical factors
only resulted in one to two point changes in stigma scores, it can be concluded that stigma
has a minimal impact on TB control in southern Thailand. This is not to suggest, however,
that stigma may not play an important role in TB control in other areas with higher rates of
HIV co-infection, longer delay times, or poorer adherence.
Nevertheless, some important points should not be overlooked. First, in both the
delay and adherence analyses, TB stigma tended to have larger effects than AIDS stigma.
Second, in each of the analyses, there were sub-groups within the study population in which
the effect of stigma was to decrease the delay time (women, presenting with non-cough
symptoms) and improve adherence (patients with TB who refused an HIV test). While this

121
does not suggest that experiences of stigma are not detrimental to individuals, it does
demonstrate how awareness of cultural norms and fear of social consequences can motivate
health behavior. It also suggests that stigma may exert its negative effect within specific sub-
groups of a population and not necessarily across the entire population, where opposite
effects within sub-groups may combine to a null overall effect.
The strengths of these studies should be acknowledged. This is the first study to use
formally developed stigma scales to assess the determinants and effects of stigma on TB
control. As a result, we are confident that stigma was reliably measured. Previous studies
developed stigma scales primarily to measure stigma or used crude measures of stigma in
larger studies of TB services research. This study used the formally developed scales to both
measure the level of stigma and to identify its possible determinants and effects.
Furthermore, this is the first study to investigate the effect of AIDS stigma on TB control,
rather than just TB stigma. As the epidemics of TB and HIV continue to converge, it may be
important to distinguish between these overlapping stigmas.
Previous studies on TB treatment adherence were primarily restricted to retrospective
studies of treatment defaulters and completers. Our adherence study was prospective and
collected data on regular adherence, not just default. As a result, we were able to analyze
less severe forms of non-adherence and were less likely to suffer from selection and recall
bias introduced when defaulters and completers have to be traced and interviewed.
The limitations to our study should also be mentioned. Many of the estimated results
had poor precision. This occurred in the analysis of determinants of TB stigma in which
many categories within the “knowledge of TB cause” domain had small numbers of
respondents. Similarly, the delay and adherence studies stratified results by gender, HIV

122
status, and presenting symptoms. Our original analyses of precision, power and sample size
did not account for these sub-group analyses. Nevertheless, point and interval estimates of
the estimates were small, and increased precision would likely not have changed any of the
conclusions.
The delay analysis suffered from two major limitations. First, it selected only
patients who successfully presented to a TB clinic. Patients with cough symptoms due to
another disease and those who never sought care for their symptoms were not captured by the
study. It is reasonable to assume that stigma could affect their health-seeking behavior.
There was also the potential for recall bias because patients were asked to recall their
duration of symptoms and when their first visit to a qualified doctor occurred. The longer the
duration of symptoms and the longer the duration between first presentation to a clinic and
enrollment in the study, the more these measurements are prone to error. Delay time was
calculated directly from these self reports, and therefore misspecification of delay time could
have occurred in some cases.
The adherence analysis had the potential for misclassification of adherence. While
steps were taken to correctly record doses that were and were not ingested, there is the
possibility that patients disposed of their prescriptions rather than bringing them to the clinic
visit. Our findings could be biased if such practices occurred differentially among patients
with higher stigma.
FUTURE DIRECTIONS
Measurement

123
Health-stigma continues to be a difficult concept to measure because it is a complex
social process. It necessarily involves interaction, whether directly or indirectly, between
those who are healthy and those who are infected or appear to be infected. Two important
issues emerge for future research.
Sub-group effects. Results from these studies suggest that stigma could be both a
motivation and a barrier to accessing health care and controlling disease. At a population
level, the presence of these effects may average out to show a null effect. Thus, exploration
of interactions between stigma and other covariates of interest is important in understanding
the effect of stigma. Qualitative reports have suggested that women are more adversely
affected by the social consequences of stigma. As a result we considered interactions
between stigma and gender. In the analysis of stigma and delay in seeking care for
symptoms, the effect of higher stigma was to increase delay time among men, while
decreasing delay time among women. The difference in effects was small, but the opposite
direction of the effects suggests that future research should be performed giving attention to
these groups, rather than averaging across them. It is likely that other important sub-groups
exist, and future studies should involve sufficient sample sizes to explore these sub-groups.
Unit of measurement. The complex and social nature of stigma raises the question
of whether it should be measured at the individual level or at a community or systems level.
Currently, no aggregate measure of community stigma exists. All scales have been
developed and analyzed within individual units. But conceptualizing stigma as a social
process implies that individuals deciding to seek care for symptoms do so within the context
of a stigmatizing (or non-stigmatizing) community. It is unknown whether asking patients
about their perceived or experienced stigma provides valid information about whether or not
124
the community they live in is a stigmatizing community. This has important implications for
intervention. Typically, if patients report stigmatizing attitudes, and these attitudes are
deemed to negatively affect access to health care or health behavior, then interventions are
suggested to educate the community about the disease. Yet the actual level of stigma in the
community, and whether or not it affects a patient’s access to care, have not been assessed.
Multi-level analyses (or hierarchical models) may prove useful in this context.
Community levels of stigma could be measured by aggregating community perspective
stigma responses from community surveys or through a structural measurement that does not
involve respondents, such as quantifying relevant policies or media in the community.
Theoretically, if this could be measured in a number of well-defined communities, while
simultaneously enrolling patients who present at health facilities within the selected
communities, multilevel models could be used to estimate the effect of community level
stigma on individual outcomes.
Interventions
The results of these studies have implications for stigma interventions. First, stigma
appeared to have opposite effects among different sub-groups. This suggests that for some
individuals, the presence of stigma may act as a motivator. While the presence of high
stigma is a concern, our findings suggest that there may be some instances where stigma
reduction is not necessary to improve health. A second, and related implication, is that of
targeting sub-groups for stigma intervention. Discussions about stigma interventions have
tended to focus on the general population or the entire patient population. However, our
results found that stigma could have a negative, null, or positive effect on health behavior

125
depending on the sub-group under study. Therefore, future interventions should identify sub-
groups that would most benefit from stigma reduction. Not only will this improve the overall
effectiveness of the intervention, but will also conserve resources.
Interventions should also consider stigma from other, related health conditions in
addition to the one under study. In our study, we found that both TB and AIDS stigma had
an effect on TB control. In some contexts, such as areas with high rates of HIV infection,
reductions in AIDS stigma may lead to reductions in TB stigma, while simultaneously
improving TB control.
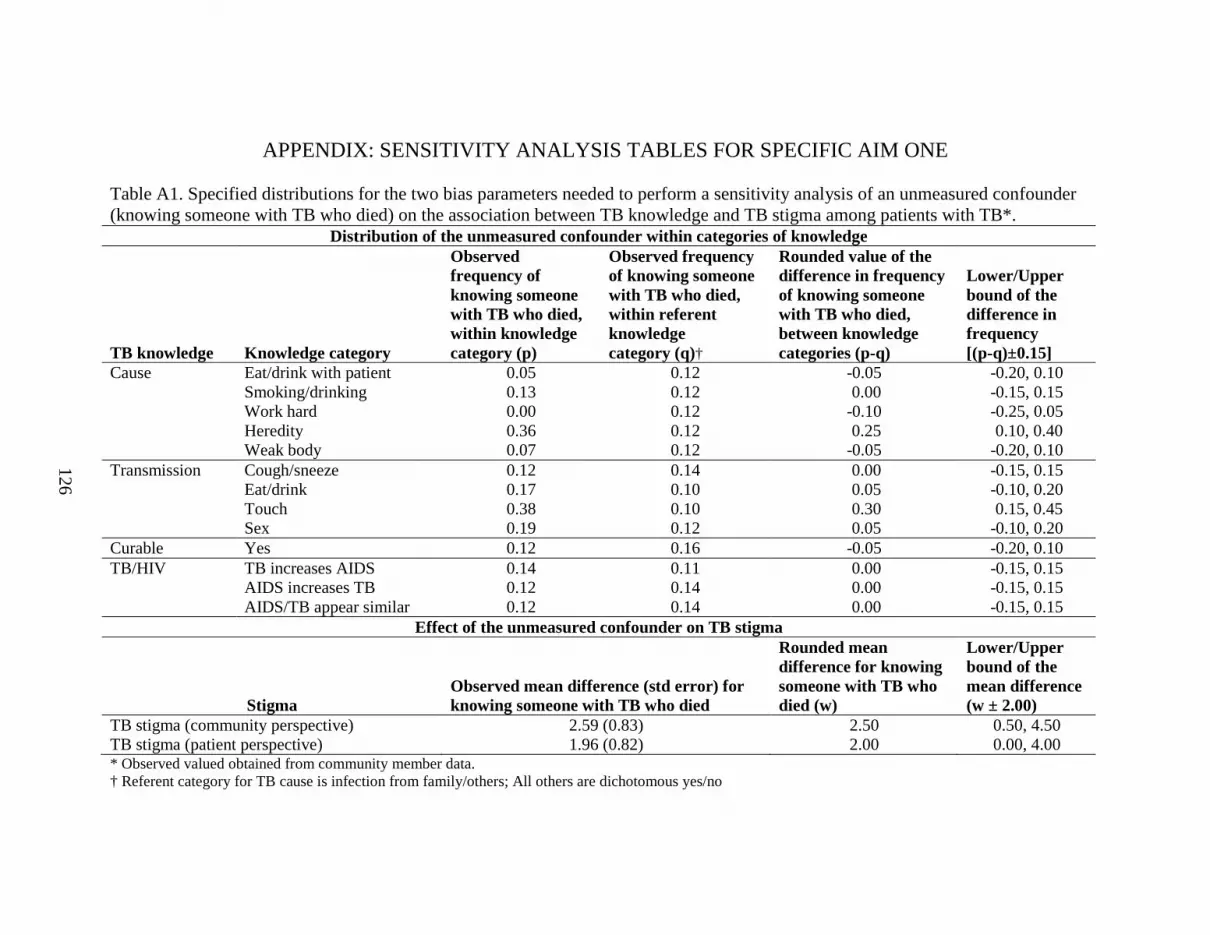
126
APPENDIX: SENSITIVITY ANALYSIS TABLES FOR SPECIFIC AIM ONE Table A1. Specified distributions for the two bias parameters needed to perform a sensitivity analysis of an unmeasured confounder (knowing someone with TB who died) on the association between TB knowledge and TB stigma among patients with TB*.
Distribution of the unmeasured confounder within categories of knowledge
TB knowledge Knowledge category
Observed frequency of knowing someone with TB who died, within knowledge category (p)
Observed frequency of knowing someone with TB who died, within referent knowledge category (q)†
Rounded value of the difference in frequency of knowing someone with TB who died, between knowledge categories (p-q)
Lower/Upper bound of the difference in frequency [(p-q)±0.15]
Cause Eat/drink with patient 0.05 0.12 -0.05 -0.20, 0.10 Smoking/drinking 0.13 0.12 0.00 -0.15, 0.15 Work hard 0.00 0.12 -0.10 -0.25, 0.05 Heredity 0.36 0.12 0.25 0.10, 0.40 Weak body 0.07 0.12 -0.05 -0.20, 0.10 Transmission Cough/sneeze 0.12 0.14 0.00 -0.15, 0.15 Eat/drink 0.17 0.10 0.05 -0.10, 0.20 Touch 0.38 0.10 0.30 0.15, 0.45 Sex 0.19 0.12 0.05 -0.10, 0.20 Curable Yes 0.12 0.16 -0.05 -0.20, 0.10 TB/HIV TB increases AIDS 0.14 0.11 0.00 -0.15, 0.15 AIDS increases TB 0.12 0.14 0.00 -0.15, 0.15 AIDS/TB appear similar 0.12 0.14 0.00 -0.15, 0.15
Effect of the unmeasured confounder on TB stigma
Stigma Observed mean difference (std error) for knowing someone with TB who died
Rounded mean difference for knowing someone with TB who died (w)
Lower/Upper bound of the mean difference (w ± 2.00)
TB stigma (community perspective) 2.59 (0.83) 2.50 0.50, 4.50 TB stigma (patient perspective) 1.96 (0.82) 2.00 0.00, 4.00 * Observed valued obtained from community member data. † Referent category for TB cause is infection from family/others; All others are dichotomous yes/no

127
Table A2. Sensitivity analysis of an unmeasured confounder for TB knowledge and TB stigma from the community perspective among patients with TB*. Community perspective stigma scale Patient perspective stigma scale L95UL LSAE SAE USAE U95UL L95UL LSAE SAE USAE U95UL TB Knowledge† Infection from others 0.00 0.00 (Cause) Eat/drink with patient -3.73 -1.91 -1.31 -0.56 1.09 -2.64 -1.02 -0.53 0.18 1.69 Smoking/drinking -2.01 -1.34 -0.66 0.02 0.72 -0.83 -0.18 0.42 1.02 1.65 Work hard -2.94 -1.80 -1.31 -0.45 0.34 -1.49 -0.37 0.01 0.83 1.52 Heredity -4.12 -2.78 -1.61 -1.03 0.83 -3.90 -2.83 -1.73 -1.23 0.42 Weak body -1.66 -0.75 -0.18 0.60 1.33 -1.66 -0.76 -0.28 0.44 1.10 TB Knowledge‡ Cough/sneeze -1.14 -0.60 0.07 0.76 1.31 -0.72 -0.20 0.41 1.00 1.50 (Transmission) Eat/drink -0.58 -0.38 0.39 0.97 1.35 -0.54 -0.36 0.34 0.84 1.21 Touch -2.57 -2.17 -0.89 -0.22 0.81 -0.92 -0.59 0.62 1.21 2.07 Sex -0.62 0.16 0.93 1.51 2.45 -0.58 0.12 0.81 1.32 2.23 TB Knowledge Not curable 0.00 0.00 (Cure) Curable -3.74 -1.86 -1.26 -0.51 1.20 -3.10 -1.31 -0.81 -0.11 1.51 TB Knowledge‡ TB increases AIDS 0.15 0.41 1.08 1.76 2.04 1.32 1.56 2.17 2.76 2.97 (TB/HIV) AIDS increases TB -0.62 -0.26 0.42 1.10 1.46 -0.07 0.25 0.86 1.45 1.80 AIDS/TB appear similar -0.19 0.19 0.86 1.54 1.87 -0.05 0.26 0.87 1.46 1.79 * SAE, sensitivity analysis estimate of the mean difference in summed stigma score; LSAE/USAE, lower and upper sensitivity analysis estimates given the minimum and maximum bias parameters from the triangular distribution; L95UL/U95UL, lower and upper 95% uncertainty limits obtained by sampling from the distribution of updated mean differences. † Exclusive or ‡ non-exclusive categories.

128
Table A3. Sensitivity analysis of adjusted differences in mean, summed stigma scores for participant characteristics with stigma item responses coded as 0, 1, 3, 4. Community perspectives stigma scale Patient perspectives stigma scale Patients with TB Community
members Patients with TB Community
members MD* (95% CI) MD* (95% CI) MD* (95% CI) MD* (95% CI) Age Age (per 10 year) 1.14 (0.62, 1.66) 1.07 (0.39, 1.76) 0.35 (-0.13, 0.83) -0.29 (-0.94, 0.36) Gender Male 0.0 0.0 0.0 0.0 Female 0.20 (-1.36, 1.76) 0.54 (-1.14, 2.23) -1.37 (-2.80, 0.06) 1.83 (0.23, 3.42) Religion Buddhist 0.0 0.0 0.0 0.0 Muslim -2.32 (-3.89, -0.76) 0.69 (-1.49, 2.87) 0.28 (-1.15, 1.71) 0.27 (-1.77, 2.32) Education Completed secondary 0.0 0.0 0.0 0.0 Completed primary -0.68 (-2.53, 1.17) 0.15 (-1.77, 2.06) 1.04 (-0.61, 2.70) 1.47 (-0.33, 3.26) Some or no primary 1.48 (-0.45, 3.41) 2.41 (0.14, 4.67) 2.26 (0.53, 4.00) 0.88 (-1.25, 3.00) Income Baht/month (1,000 baht) 0.00 (-0.06, 0.06) -0.01 (-0.09, 0.07) -0.03 (-0.08, 0.03) -0.05 (-0.12, 0.02) TB Knowledge† Infection from others 0.0 0.0 0.0 0.0 (Cause) Eat/drink with patient -2.61 (-6.57, 1.35) 1.15 (-1.92, 4.22) -1.27 (-4.79, 2.25) 0.33 (-2.59, 3.25) Smoking/drinking -0.99 (-3.14, 1.16) -0.39 (-2.86, 2.09) 0.78 (-1.19, 2.75) 0.31 (-2.04, 2.66) Work hard -2.42 (-5.02, 0.18) Too few -0.21 (-2.59, 2.17) Too few Heredity -1.94 (-5.91, 2.04) -2.79 (-6.42, 0.83) -2.01 (-5.55, 1.52) -0.97 (-4.42, 2.48) Weak body -0.46 (-2.88, 1.96) 0.61 (-2.89, 4.11) -0.64 (-2.86, 1.58) 2.37 (-0.97, 5.70) TB Knowledge‡ Cough/sneeze 0.43 (-1.48, 2.35) -0.27 (-2.18, 1.63) 0.95 (-0.81, 2.72) 1.24 (-0.56, 3.05) (Transmission) Eat/drink 0.96 (-0.53, 2.45) 2.71 (1.00, 4.42) 0.93 (-0.43, 2.28) 0.81 (-0.84, 2.46) Touch -0.54 (-3.15, 2.07) -0.24 (-3.08, 2.60) 1.91 (-0.45, 4.27) 0.56 (-2.14, 3.26) Sex 1.82 (-0.64, 4.28) 3.45 (-0.26, 7.15) 1.58 (-0.70, 3.85) 2.64 (-0.89, 6.16) TB Knowledge Not curable 0.0 0.0 0.0 0.0 (Cure) Curable -2.43 (-6.41, 1.56) -1.46 (-3.47, 0.55) -1.59 (-5.32, 2.14) -1.24 (-3.15, 0.67) TB Knowledge‡ TB increases AIDS 1.85 (0.41, 3.30) 1.19 (-0.47, 2.84) 3.80 (2.52, 5.08) 2.20 (0.65, 3.75) (TB/HIV) AIDS increases TB 0.59 (-1.06, 2.24) 1.81 (-0.05, 3.67) 1.52 (0.01, 3.04) 1.83 (0.06, 3.59) AIDS/TB appear similar 0.97 (-0.64, 2.58) -1.08 (-2.80, 0.63) 1.35 (-0.11, 2.82) -0.27 (-1.90, 1.37) HIV/AIDS stigma Community perspective scale 0.59 (0.52, 0.65) 0.53 (0.44, 0.63) 0.43 (0.36, 0.50) 0.35 (0.26, 0.45) (per unit increase) Patient perspective scale 0.67 (0.54, 0.79) 0.49 (0.35, 0.63) 0.62 (0.51, 0.73) 0.57 (0.45, 0.70) Know TB patients Did not know person with TB 0.0 0.0 Knew person with TB (lived) -0.05 (-2.29, 2.18) -1.33 (-3.45, 0.79) Knew person with TB (died) 3.67 (1.15, 6.19) 2.68 (0.29, 5.07)

129
Symptoms§ Cough 0.0 0.0 Hemoptysis -0.83 (-2.67, 1.02) -1.07 (-2.73, 0.59) Weight loss -0.50 (-2.98, 1.97) 0.96 (-1.29, 3.22) Fever and/or extrapulmonary only -2.37 (-4.82, 0.08) -1.26 (-3.44, 0.92) No symptoms 3.43 (-0.94, 7.81) -0.22 (-4.24, 3.80) HIV status║ Negative 0.0 0.0 New positive 1.16 (-0.97, 3.30) 2.84 (0.91, 4.77) Known positive -0.86 (-4.38, 2.67) -0.81 (-4.01, 2.39) Refused -1.30 (-3.21, 0.62) -0.04 (-1.79, 1.70) * MD, mean difference in summed stigma scores; CI, confidence interval; 0.0 indicates referent level † Exclusive or ‡ non-exclusive categories § Cough and hemoptysis may include other symptoms; Weight loss excludes cough but may include other symptoms ║ Known positives had previously tested positive for HIV infection; New positives identified when diagnosed with TB

130
Table A4. Sensitivity analysis of adjusted differences in mean, summed stigma scores for participant characteristics with stigma item responses coded as 0, 2, 3, 5. Community perspectives stigma scale Patient perspectives stigma scale Patients with TB Community
members Patients with TB Community
members MD* (95% CI) MD* (95% CI) MD* (95% CI) MD* (95% CI) Age Age (per 10 year) 0.68 (0.24, 1.13) 0.92 (0.25, 1.59) 0.15 (-0.26, 0.55) -0.32 (-1.00, 0.37) Gender Male 0.0 0.0 0.0 0.0 Female 0.28 (-1.06, 1.62) 0.35 (-1.30, 2.00) -1.03 (-2.24, 0.19) 1.78 (0.11, 3.46) Religion Buddhist 0.0 0.0 0.0 0.0 Muslim -1.78 (-3.12, -0.44) 1.00 (-1.11, 3.12) -0.17 (-1.38, 1.04) 0.73 (-1.42, 2.87) Education Completed secondary 0.0 0.0 0.0 0.0 Completed primary -0.54 (-2.12, 1.04) 0.50 (-1.37, 2.36) 0.59 (-0.83, 2.00) 1.41 (-0.47, 3.30) Some or no primary 0.88 (-0.77, 2.53) 2.41 (0.21, 4.62) 1.40 (-0.08, 2.89) 0.60 (-1.64, 2.83) Income Baht/month (1,000 baht) -0.01 (-0.07, 0.04) -0.03 (-0.10, 0.05) -0.03 (-0.07, 0.02) -0.05 (-0.12, 0.03) TB Knowledge† Infection from others 0.0 0.0 0.0 0.0 (Cause) Eat/drink with patient -1.78 (-5.18, 1.62) 2.23 (-0.76, 5.21) -0.59 (-3.60, 2.42) 1.74 (-1.34, 4.82) Smoking/drinking -1.00 (-2.84, 0.84) 0.47 (-1.93, 2.87) 0.50 (-1.19, 2.18) 0.98 (-1.50, 3.45) Work hard -2.28 (-4.51, -0.05) Too few -0.29 (-2.32, 1.75) Too few Heredity -1.01 (-4.43, 2.40) -1.52 (-5.04, 2.01) -1.66 (-4.68, 1.36) -0.11 (-3.75, 3.53) Weak body -0.45 (-2.52, 1.63) 0.67 (-2.74, 4.07) -0.44 (-2.34, 1.46) 2.80 (-0.71, 6.31) TB Knowledge‡ Cough/sneeze -0.19 (-1.84, 1.45) -0.57 (-2.42, 1.29) 0.24 (-1.26, 1.75) 0.60 (-1.31, 2.50) (Transmission) Eat/drink 0.60 (-0.68, 1.89) 2.48 (0.81, 4.15) 0.39 (-0.78, 1.55) 1.46 (-0.27, 3.19) Touch 0.13 (-2.12, 2.37) -0.76 (-3.52, 2.01) 1.73 (-0.28, 3.75) 0.36 (-2.48, 3.20) Sex 1.35 (-0.76, 3.47) 2.36 (-1.25, 5.98) 1.19 (-0.76, 3.13) 1.36 (-2.36, 5.08) TB Knowledge Not curable 0.0 0.0 0.0 0.0 (Cure) Curable -1.80 (-5.23, 1.62) -1.33 (-3.29, 0.63) -1.13 (-4.32, 2.05) -0.97 (-2.98, 1.05) TB Knowledge‡ TB increases AIDS 1.37 (0.13, 2.62) 0.46 (-1.15, 2.07) 2.67 (1.56, 3.78) 1.30 (-0.35, 2.95) (TB/HIV) AIDS increases TB 0.65 (-0.76, 2.07) 0.76 (-1.05, 2.58) 1.02 (-0.28, 2.32) 1.28 (-0.58, 3.14) AIDS/TB appear similar 1.62 (0.24, 2.99) -0.55 (-2.23, 1.12) 1.23 (-0.03, 2.48) -0.01 (-1.73, 1.71) HIV/AIDS stigma Community perspective scale 0.59 (0.52, 0.65) 0.51 (0.42, 0.60) 0.47 (0.41, 0.54) 0.41 (0.31, 0.50) (per unit increase) Patient perspective scale 0.55 (0.45, 0.65) 0.42 (0.32, 0.52) 0.55 (0.47, 0.64) 0.55 (0.46, 0.64) Know TB patients Did not know person with TB 0.0 0.0 Knew person with TB (lived) 0.43 (-1.75, 2.60) -0.29 (-2.52, 1.94) Knew person with TB (died) 4.08 (1.64, 6.53) 3.21 (0.70, 5.72)

131
Symptoms§ Cough 0.0 0.0 Hemoptysis -0.74 (-2.31, 0.83) -0.70 (-2.12, 0.71) Weight loss -0.09 (-2.19, 2.01) 0.56 (-1.36, 2.49) Fever and/or extrapulmonary only -2.72 (-4.80, -0.64) -0.54 (-2.40, 1.32) No symptoms 1.58 (-2.12, 5.29) -0.75 (-4.19, 2.69) HIV status║ Negative 0.0 0.0 New positive 0.81 (-1.02, 2.64) 1.79 (0.14, 3.44) Known positive -0.92 (-3.95, 2.10) -1.17 (-3.90, 1.57) Refused test -1.67 (-3.31, -0.02) -0.06 (-1.55, 1.43) * MD, mean difference in summed stigma scores; CI, confidence interval; 0.0 indicates referent level † Exclusive or ‡ non-exclusive categories § Cough and hemoptysis may include other symptoms; Weight loss excludes cough but may include other symptoms ║ Known positives had previously tested positive for HIV infection; New positives identified when diagnosed with TB

132
Table A5. Sensitivity analysis of adjusted odds ratios for patient characteristics and high stigma (item-adjusted scores ≥1.75). Community perspectives stigma scale Patient perspectives stigma scale
Patients with TB Community
members Patients with TB Community
members OR* (95% CI) OR* (95% CI) OR* (95% CI) OR* (95% CI) Age Age (per 10 year) 1.41 (1.23, 1.62) 1.24 (1.02, 1.50) 1.09 (0.95, 1.24) 0.91 (0.75, 1.10) Gender Male 1.0 1.0 1.0 1.0 Female 1.29 (0.86, 1.93) 1.30 (0.81, 2.07) 0.90 (0.61, 1.34) 1.62 (1.00, 2.63) Religion Buddhist 1.0 1.0 1.0 1.0 Muslim 0.58 (0.39, 0.86) 1.30 (0.72, 2.37) 1.03 (0.70, 1.53) 1.23 (0.66, 2.29) Education Completed secondary 1.0 1.0 1.0 1.0 Completed primary 0.95 (0.59, 1.51) 0.96 (0.57, 1.62) 1.23 (0.77, 1.97) 1.40 (0.82, 2.41) Some or no primary 1.70 (1.04, 2.77) 1.59 (0.84, 3.01) 1.60 (0.98, 2.60) 1.38 (0.72, 2.65) Income Baht/month (1,000 baht) 1.00 (0.98, 1.01) 0.99 (0.97, 1.02) 0.99 (0.97, 1.00) 0.99 (0.97, 1.01) TB Knowledge† Infection from others 1.0 1.0 1.0 1.0 (Cause) Eat/drink with patient 0.88 (0.31, 2.50) 1.26 (0.52, 3.03) 0.72 (0.26, 2.00) 0.43 (0.17, 1.05) Smoking/drinking 1.01 (0.58, 1.77) 1.01 (0.50, 2.05) 1.44 (0.82, 2.50) 0.99 (0.47, 2.08) Work hard 0.63 (0.32, 1.25) Too few 1.00 (0.51, 1.95) Too few Heredity 1.01 (0.35, 2.88) 0.56 (0.20, 1.60) 0.89 (0.32, 2.46) 0.59 (0.20, 1.73) Weak body 1.36 (0.73, 2.57) 2.20 (0.76, 6.32) 1.04 (0.55, 1.95) 1.10 (0.37, 3.21) TB Knowledge‡ Cough/sneeze 1.02 (0.62, 1.67) 0.85 (0.50, 1.46) 1.02 (0.62, 1.67) 1.07 (0.61, 1.85) (Transmission) Eat/drink 1.31 (0.88, 1.93) 2.49 (1.49, 4.16) 1.07 (0.73, 1.56) 1.04 (0.63, 1.72) Touch 0.73 (0.37, 1.45) 1.01 (0.45, 2.25) 2.32 (1.17, 4.63) 0.65 (0.28, 1.48) Sex 1.55 (0.82, 2.93) 2.64 (0.81, 8.62) 1.73 (0.91, 3.29) 1.59 (0.48, 5.24) TB Knowledge Not curable 1.0 1.0 1.0 1.0 (Cure) Curable 0.58 (0.21, 1.61) 0.78 (0.44, 1.38) 0.73 (0.26, 2.07) 0.50 (0.27, 0.95) TB Knowledge‡ TB increases AIDS 1.50 (1.03, 2.19) 1.32 (0.82, 2.10) 2.59 (1.76, 3.79) 2.20 (1.34, 3.62) (TB/HIV) AIDS increases TB 0.94 (0.61, 1.44) 2.07 (1.22, 3.51) 1.40 (0.91, 2.16) 1.85 (1.08, 3.17) AIDS/TB appear similar 1.07 (0.71, 1.63) 0.73 (0.45, 1.19) 1.37 (0.90, 2.08) 1.06 (0.64, 1.75) HIV/AIDS stigma Community perspective scale 1.29 (1.21, 1.37) 1.31 (1.22, 1.41) 1.19 (1.13, 1.25) 1.14 (1.08, 1.21) (per unit increase) Patient perspective scale 1.21 (1.13, 1.30) 1.23 (1.14, 1.32) 1.25 (1.16, 1.34) 1.23 (1.14, 1.32) Know TB patients Did not know person with TB 1.0 1.0 Knew person with TB (lived) 1.39 (0.74, 2.63) 0.73 (0.39, 1.36) Knew person with TB (died) 1.81 (0.86, 3.80) 2.23 (0.97, 5.15)

133
Symptoms§ Cough 1.0 1.0 Hemoptysis 0.81 (0.51, 1.29) 1.04 (0.65, 1.66) Weight loss 0.85 (0.46, 1.57) 1.18 (0.62, 2.23) Fever and/or extrapulmonary only 0.65 (0.35, 1.21) 0.61 (0.32, 1.15) No symptoms 2.68 (0.81, 8.84) 1.33 (0.43, 4.10) HIV status║ Negative 1.0 1.0 New positive 1.15 (0.46, 2.89) 0.54 (0.20, 1.45) Known positive 1.32 (0.76, 2.29) 1.69 (0.98, 2.92) Unknown/Refused 1.15 (0.70, 1.91) 1.10 (0.67, 1.80) * OR, odds ratio; CI, confidence interval; 1.0 indicates referent level † Exclusive or ‡ non-exclusive categories § Cough and hemoptysis may include other symptoms; Weight loss excludes cough but may include other symptoms ║ Known positives had previously tested positive for HIV infection; New positives identified when diagnosed with TB

134
Table A6. Sensitivity analysis of adjusted odds ratios for patient characteristics and high stigma (item-adjusted scores ≥2.00). Community perspectives stigma scale Patient perspectives stigma scale
Patients with TB
Community members
Patients with TB Community members
OR* (95% CI) OR* (95% CI) OR* (95% CI) OR* (95% CI) Age Age (per 10 year) 1.29 (1.12, 1.49) 1.27 (1.05, 1.54) 1.20 (1.02, 1.41) 0.98 (0.81, 1.19) Gender Male 1.0 1.0 1.0 1.0 Female 0.90 (0.57, 1.43) 1.13 (0.70, 1.82) 0.86 (0.51, 1.44) 1.61 (1.00, 2.60) Religion Buddhist 1.0 1.0 1.0 1.0 Muslim 0.45 (0.28, 0.73) 1.31 (0.73, 2.35) 0.98 (0.60, 1.62) 1.19 (0.66, 2.16) Education Completed secondary 1.0 1.0 1.0 1.0 Completed primary 0.88 (0.52, 1.49) 1.03 (0.60, 1.76) 1.26 (0.67, 2.38) 1.54 (0.90, 2.63) Some or no primary 1.17 (0.68, 2.02) 1.51 (0.82, 2.81) 1.90 (1.01, 3.58) 1.43 (0.76, 2.68) Income Baht/month (1,000 baht) 0.99 (0.98, 1.01) 0.99 (0.97, 1.02) 0.99 (0.97, 1.02) 1.00 (0.97, 1.02) TB Knowledge† Infection from others 1.0 1.0 1.0 1.0 (Cause) Eat/drink with patient 0.95 (0.28, 3.29) 1.84 (0.74, 4.55) 0.57 (0.12, 2.77) 0.78 (0.31, 1.97) Smoking/drinking 1.46 (0.76, 2.80) 1.07 (0.51, 2.26) 1.25 (0.60, 2.58) 0.92 (0.44, 1.92) Work hard 1.30 (0.60, 2.82) Too few 1.20 (0.51, 2.82) Too few Heredity 0.77 (0.20, 3.02) 0.46 (0.15, 1.46) 0.27 (0.03, 2.22) 0.71 (0.24, 2.10) Weak body 1.62 (0.80, 3.32) 1.43 (0.50, 4.07) 1.23 (0.54, 2.81) 1.84 (0.67, 5.05) TB Knowledge‡ Cough/sneeze 0.97 (0.56, 1.69) 0.88 (0.51, 1.52) 1.07 (0.57, 2.00) 1.35 (0.77, 2.37) (Transmission) Eat/drink 1.59 (1.02, 2.49) 2.02 (1.23, 3.32) 1.33 (0.81, 2.18) 1.74 (1.06, 2.86) Touch 1.01 (0.48, 2.14) 0.89 (0.39, 2.03) 1.85 (0.88, 3.88) 1.42 (0.63, 3.18) Sex 1.74 (0.89, 3.40) 1.38 (0.48, 3.96) 1.89 (0.93, 3.87) 1.68 (0.59, 4.78) TB Knowledge Not curable 1.0 1.0 1.0 1.0 (Cure) Curable 0.73 (0.25, 2.18) 0.83 (0.46, 1.48) 0.87 (0.24, 3.18) 0.73 (0.41, 1.28) TB Knowledge‡ TB increases AIDS 1.45 (0.95, 2.21) 1.07 (0.67, 1.73) 2.87 (1.72, 4.79) 1.83 (1.13, 2.96) (TB/HIV) AIDS increases TB 1.01 (0.63, 1.63) 1.31 (0.76, 2.27) 1.40 (0.80, 2.45) 1.77 (1.01, 3.11) AIDS/TB appear similar 1.49 (0.92, 2.42) 0.74 (0.45, 1.21) 1.95 (1.08, 3.53) 0.96 (0.59, 1.58) HIV/AIDS stigma Community perspective scale 1.29 (1.20, 1.38) 1.30 (1.21, 1.40) 1.26 (1.17, 1.35) 1.24 (1.16, 1.33) (per unit increase) Patient perspective scale 1.27 (1.18, 1.37) 1.29 (1.19, 1.38) 1.39 (1.26, 1.52) 1.33 (1.23, 1.44) Know TB patients Did not know person with TB 1.0 1.0 Knew person with TB (lived) 1.23 (0.66, 2.32) 0.83 (0.43, 1.59) Knew person with TB (died) 2.47 (1.21, 5.03) 2.22 (1.10, 4.46)

135
Symptoms§ Cough 1.0 1.0 Hemoptysis 0.68 (0.40, 1.17) 0.63 (0.33, 1.20) Weight loss 1.19 (0.61, 2.35) 1.28 (0.61, 2.69) Fever and/or extrapulmonary only 0.46 (0.20, 1.03) 0.74 (0.32, 1.70) No symptoms 2.43 (0.82, 7.27) 1.09 (0.28, 4.20) HIV status║ Negative 1.0 1.0 New positive 0.69 (0.22, 2.18) 0.30 (0.04, 2.33) Known positive 1.08 (0.58, 2.01) 2.24 (1.17, 4.28) Unknown/Refused 0.66 (0.37, 1.19) 1.90 (1.06, 3.41) * OR, odds ratio; CI, confidence interval; 1.0 indicates referent level † Exclusive or ‡ non-exclusive categories § Cough and hemoptysis may include other symptoms; Weight loss excludes cough but may include other symptoms ║ Known positives had previously tested positive for HIV infection; New positives identified when diagnosed with TB

136
Table A7. Sensitivity analysis of adjusted odds ratios for patient characteristics and high stigma (item-adjusted scores ≥2.25). Community perspectives stigma scale Patient perspectives stigma scale
Patients with TB
Community members
Patients with TB Community members
OR* (95% CI) OR* (95% CI) OR* (95% CI) OR* (95% CI) Age Age (per 10 year) 1.06 (0.85, 1.33) 1.09 (0.85, 1.39) 0.96 (0.72, 1.28) 0.95 (0.75, 1.21) Gender Male 1.0 1.0 1.0 1.0 Female 1.32 (0.67, 2.60) 1.16 (0.63, 2.15) 0.97 (0.42, 2.28) 1.32 (0.73, 2.37) Religion Buddhist 1.0 1.0 1.0 1.0 Muslim 0.46 (0.21, 1.03) 1.25 (0.59, 2.62) 0.76 (0.31, 1.84) 1.56 (0.78, 3.10) Education Completed secondary 1.0 1.0 1.0 1.0 Completed primary 0.66 (0.29, 1.53) 1.22 (0.60, 2.45) 0.91 (0.33, 2.55) 2.06 (1.06, 4.00) Some or no primary 1.13 (0.51, 2.48) 1.53 (0.70, 3.35) 1.26 (0.46, 3.46) 1.42 (0.64, 3.19) Income Baht/month (1,000 baht) 0.97 (0.93, 1.00) 0.99 (0.96, 1.02) 1.00 (0.97, 1.03) 0.98 (0.95, 1.02) TB Knowledge† Infection from others 1.0 1.0 1.0 1.0 (Cause) Eat/drink with patient 0.43 (0.05, 3.66) 2.11 (0.67, 6.64) 0.72 (0.08, 6.39) 1.36 (0.42, 4.44) Smoking/drinking 0.70 (0.29, 1.72) 1.12 (0.42, 3.01) 0.68 (0.22, 2.09) 1.40 (0.53, 3.70) Work hard 0.89 (0.31, 2.53) Too few 0.79 (0.20, 3.09) Too few Heredity Too few 0.52 (0.11, 2.44) Too few 0.61 (0.13, 2.81) Weak body 0.78 (0.29, 2.11) 0.43 (0.07, 2.41) 1.08 (0.33, 3.51) 1.27 (0.33, 4.85) TB Knowledge‡ Cough/sneeze 0.65 (0.30, 1.39) 0.68 (0.34, 1.32) 0.69 (0.27, 1.80) 1.23 (0.61, 2.47) (Transmission) Eat/drink 0.95 (0.49, 1.84) 1.46 (0.78, 2.74) 1.45 (0.61, 3.42) 1.95 (1.07, 3.56) Touch 1.14 (0.38, 3.46) 0.69 (0.23, 2.06) 1.24 (0.35, 4.48) 1.58 (0.61, 4.06) Sex 1.21 (0.44, 3.32) 1.69 (0.50, 5.68) 1.65 (0.53, 5.14) 1.42 (0.42, 4.77) TB Knowledge Not curable 1.0 1.0 (Cure) Curable 0.42 (0.11, 1.57) 0.63 (0.31, 1.29) Too few Too few TB Knowledge‡ TB increases AIDS 1.72 (0.88, 3.35) 0.73 (0.39, 1.36) 3.40 (1.34, 8.67) 1.21 (0.67, 2.17) (TB/HIV) AIDS increases TB 5.37 (1.61, 17.91) 0.88 (0.45, 1.73) 1.58 (0.57, 4.37) 1.09 (0.56, 2.11) AIDS/TB appear similar 5.61 (1.69, 18.59) 0.72 (0.39, 1.34) 3.23 (0.94, 11.02) 1.14 (0.62, 2.11) HIV/AIDS stigma Community perspective scale 1.56 (1.37, 1.78) 1.30 (1.20, 1.41) 1.48 (1.30, 1.68) 1.28 (1.18, 1.39) (per unit increase) Patient perspective scale 1.61 (1.40, 1.84) 1.21 (1.12, 1.32) 1.51 (1.32, 1.73) 1.51 (1.35, 1.69) Know TB patients Did not know person with TB 1.0 1.0 Knew person with TB (lived) 1.25 (0.55, 2.84) 1.20 (0.55, 2.63) Knew person with TB (died) 2.37 (1.06, 5.27) 1.71 (0.76, 3.85)

137
Symptoms§ Cough 1.0 1.0 Hemoptysis 0.79 (0.35, 1.81) 0.81 (0.28, 2.39) Weight loss 1.67 (0.66, 4.24) 1.88 (0.60, 5.94) Fever and/or extrapulmonary only 0.16 (0.02, 1.23) 1.02 (0.27, 3.80) No symptoms 0.77 (0.09, 6.27) HIV status║ Negative 1.0 1.0 New positive 1.09 (0.24, 5.01) 0.95 (0.12, 7.66) Known positive 1.07 (0.43, 2.63) 1.15 (0.36, 3.64) Refused test 0.43 (0.14, 1.26) 1.72 (0.67, 4.44) * OR, odds ratio; CI, confidence interval; 1.0 indicates referent level † Exclusive or ‡ non-exclusive categories § Cough and hemoptysis may include other symptoms; Weight loss excludes cough but may include other symptoms ║ Known positives had previously tested positive for HIV infection; New positives identified when diagnosed with TB

138
REFERENCES
Ali, S. S., F. Rabbani, et al. (2003). "Tuberculosis: do we know enough? A study of patients and their families in an out-patient hospital setting in Karachi, Pakistan." Int J Tuberc Lung Dis 7(11): 1052-8.
Auer, C., J. Sarol, Jr., et al. (2000). "Health seeking and perceived causes of tuberculosis
among patients in Manila, Philippines." Trop Med Int Health 5(9): 648-56. Balasubramanian, R., R. Garg, et al. (2004). "Gender disparities in tuberculosis: report from
a rural DOTS programme in south India." Int J Tuberc Lung Dis 8(3): 323-32. Baral, S. C., D. K. Karki, et al. (2007). "Causes of stigma and discrimination associated with
tuberculosis in Nepal: a qualitative study." BMC Public Health 7: 211. Barker, R. D., F. J. Millard, et al. (2006). "Traditional healers, treatment delay, performance
status and death from TB in rural South Africa." Int J Tuberc Lung Dis 10(6): 670-5. Barnhoorn, F. and H. Adriaanse (1992). "In search of factors responsible for noncompliance
among tuberculosis patients in Wardha District, India." Soc Sci Med 34(3): 291-306. Bland, J. M. and D. G. Altman (1997). "Cronbach's alpha." Bmj 314(7080): 572. Cambanis, A., A. Ramsay, et al. (2007). "Duration and associated factors of patient delay
during tuberculosis screening in rural Cameroon." Trop Med Int Health 12(11): 1309-14.
Cambanis, A., M. A. Yassin, et al. (2005). "Rural poverty and delayed presentation to
tuberculosis services in Ethiopia." Trop Med Int Health 10(4): 330-5. Cayla, J. A., J. A. Caminero, et al. (2004). "Current status of treatment completion and
fatality among tuberculosis patients in Spain." Int J Tuberc Lung Dis 8(4): 458-64. Chaulk, C. P. and V. A. Kazandjian (1998). "Directly observed therapy for treatment
completion of pulmonary tuberculosis: Consensus Statement of the Public Health Tuberculosis Guidelines Panel." Jama 279(12): 943-8.
Comolet, T. M., R. Rakotomalala, et al. (1998). "Factors determining compliance with
tuberculosis treatment in an urban environment, Tamatave, Madagascar." Int J Tuberc Lung Dis 2(11): 891-7.
Connolly, C., G. R. Davies, et al. (1999). "Who fails to complete tuberculosis treatment?
Temporal trends and risk factors for treatment interruption in a community-based

139
directly observed therapy programme in a rural district of South Africa." Int J Tuberc Lung Dis 3(12): 1081-7.
Daftary, A., N. Padayatchi, et al. (2007). "HIV testing and disclosure: a qualitative analysis
of TB patients in South Africa." AIDS Care 19(4): 572-7. Deacon, H. (2006). "Towards a Sustainable Theory of Health-Related Stigma: Lessons from
the HIV/AIDS Literature." Journal of Community & Applied Social Psychology 16(6): 418-425.
Demissie, M., H. Getahun, et al. (2003). "Community tuberculosis care through "TB clubs"
in rural North Ethiopia." Soc Sci Med 56(10): 2009-18. DeVellis, R. (1991). Scale Development: Theory and Applications. Newbury, CA, Sage
Publications. Dimitrova, B., D. Balabanova, et al. (2006). "Health service providers' perceptions of barriers
to tuberculosis care in Russia." Health Policy Plan 21(4): 265-74. Dodor, E. A., S. Kelly, et al. (2009). "Health professionals as stigmatisers of tuberculosis:
insights from community members and patients with TB in an urban district in Ghana." Psychol Health Med 14(3): 301-10.
Dye, C., G. P. Garnett, et al. (1998). "Prospects for worldwide tuberculosis control under the
WHO DOTS strategy. Directly observed short-course therapy." Lancet 352(9144): 1886-91.
Dye, C., D. Maher, et al. (2006). "Targets for global tuberculosis control." Int J Tuberc Lung
Dis 10(4): 460-2. Dye, C., S. Scheele, et al. (1999). "Consensus statement. Global burden of tuberculosis:
estimated incidence, prevalence, and mortality by country. WHO Global Surveillance and Monitoring Project." Jama 282(7): 677-86.
Eastwood, S. V. and P. C. Hill (2004). "A gender-focused qualitative study of barriers to
accessing tuberculosis treatment in The Gambia, West Africa." Int J Tuberc Lung Dis 8(1): 70-5.
Fife, B. L. and E. R. Wright (2000). "The dimensionality of stigma: a comparison of its
impact on the self of persons with HIV/AIDS and cancer." J Health Soc Behav 41(1): 50-67.
Frieden, T. R., T. R. Sterling, et al. (2003). "Tuberculosis." Lancet 362(9387): 887-99.

140
Gelmanova, I. Y., S. Keshavjee, et al. (2007). "Barriers to successful tuberculosis treatment in Tomsk, Russian Federation: non-adherence, default and the acquisition of multidrug resistance." Bull World Health Organ 85(9): 703-11.
Gibson, N., A. Cave, et al. (2005). "Socio-cultural factors influencing prevention and
treatment of tuberculosis in immigrant and Aboriginal communities in Canada." Soc Sci Med 61(5): 931-42.
Glymour, M. M. and S. Greenland (2008). Causal Diagrams. Modern Epidemiology. K. J.
Rothman, S. Greenland and T. L. Lash. Philadelphia, Lippincott, Williams and Wilkins.
Godfrey-Faussett, P. and H. Ayles (2003). "Can we control tuberculosis in high HIV
prevalence settings?" Tuberculosis (Edinb) 83(1-3): 68-76. Godfrey-Faussett, P., H. Kaunda, et al. (2002). "Why do patients with a cough delay seeking
care at Lusaka urban health centres? A health systems research approach." Int J Tuberc Lung Dis 6(9): 796-805.
Goffman, E. (1963). Stigma: Notes on the Management of Spoiled Identity. New York,
Simon & Schuster. Golub, J. E., S. Bur, et al. (2006). "Delayed tuberculosis diagnosis and tuberculosis
transmission." Int J Tuberc Lung Dis 10(1): 24-30. Greenland, S. (2008). "Invited commentary: variable selection versus shrinkage in the control
of multiple confounders." Am J Epidemiol 167(5): 523-9; discussion 530-1. Greenland, S. and T. L. Lash (2008). Bias Analysis. Modern Epidemiology. K. J. Rothman,
S. Greenland and T. L. Lash. Philadelphia, Lippincott, Williams and Wilkins: 365-371.
Harries, A. D. and C. Dye (2006). "Tuberculosis." Ann Trop Med Parasitol 100(5-6): 415-31. Hasker, E., M. Khodjikhanov, et al. (2008). "Default from tuberculosis treatment in
Tashkent, Uzbekistan; who are these defaulters and why do they default?" BMC Infect Dis 8: 97.
Hoa, N. P., V. K. Diwan, et al. (2004). "Knowledge about tuberculosis and its treatment
among new pulmonary TB patients in the north and central regions of Vietnam." Int J Tuberc Lung Dis 8(5): 603-8.
Jaramillo, E. (1998). "Pulmonary tuberculosis and health-seeking behaviour: how to get a
delayed diagnosis in Cali, Colombia." Trop Med Int Health 3(2): 138-44.

141
Jaramillo, E. (1999). "Tuberculosis and stigma: Predictors of prejudice against people with tuberculosis." Journal of Health Psychology 4(1): 71-79.
Jenkins, C. D. (1966). "Group differences in perception: A study of community beliefs and
feelings about tuberculosis." American Journal of Sociology 71(4): 417-429. Johansson, E., V. K. Diwan, et al. (1996). "Staff and patient attitudes to tuberculosis and
compliance with treatment: an exploratory study in a district in Vietnam." Tuber Lung Dis 77(2): 178-83.
Johansson, E., N. H. Long, et al. (1999). "Attitudes to compliance with tuberculosis treatment
among women and men in Vietnam." Int J Tuberc Lung Dis 3(10): 862-8. Johansson, E., N. H. Long, et al. (2000). "Gender and tuberculosis control: perspectives on
health seeking behaviour among men and women in Vietnam." Health Policy 52(1): 33-51.
Lertmaharit, S., P. Kamol-Ratankul, et al. (2005). "Factors associated with compliance
among tuberculosis patients in Thailand." J Med Assoc Thai 88 Suppl 4: S149-56. Liefooghe, R., J. B. Baliddawa, et al. (1997). "From their own perspective. A Kenyan
community's perception of tuberculosis." Trop Med Int Health 2(8): 809-21. Liefooghe, R., N. Michiels, et al. (1995). "Perception and social consequences of
tuberculosis: a focus group study of tuberculosis patients in Sialkot, Pakistan." Soc Sci Med 41(12): 1685-92.
Lienhardt, C. and J. A. Ogden (2004). "Tuberculosis control in resource-poor countries: have
we reached the limits of the universal paradigm?" Trop Med Int Health 9(7): 833-41. Lienhardt, C. and L. C. Rodrigues (1997). "Estimation of the impact of the human
immunodeficiency virus infection on tuberculosis: tuberculosis risks re-visited?" Int J Tuberc Lung Dis 1(3): 196-204.
Lienhardt, C., J. Rowley, et al. (2001). "Factors affecting time delay to treatment in a
tuberculosis control programme in a sub-Saharan African country: the experience of The Gambia." Int J Tuberc Lung Dis 5(3): 233-9.
Lin, X., V. Chongsuvivatwong, et al. (2008). "Dose-response relationship between treatment
delay of smear-positive tuberculosis patients and intra-household transmission: a cross-sectional study." Trans R Soc Trop Med Hyg 102(8): 797-804.
Link, B. G. and J. C. Phelan (2001). "Conceptualizing stigma." Annual Review of Sociology
27: 363-385.

142
Long, N. H., E. Johansson, et al. (1999). "Different tuberculosis in men and women: beliefs from focus groups in Vietnam." Soc Sci Med 49(6): 815-22.
Long, N. H., E. Johansson, et al. (2001). "Fear and social isolation as consequences of
tuberculosis in VietNam: a gender analysis." Health Policy 58(1): 69-81. Maamari, F. (2008). "Case-finding tuberculosis patients: diagnostic and treatment delays and
their determinants." East Mediterr Health J 14(3): 531-45. Macq, J., A. Solis, et al. (2006). "Assessing the stigma of tuberculosis." Psychol Health Med
11(3): 346-52. Macq, J., A. Solis, et al. (2008). "Tackling tuberculosis patients' internalized social stigma
through patient centred care: an intervention study in rural Nicaragua." BMC Public Health 8: 154.
Macq, J., A. Solis, et al. (2005). "An exploration of the social stigma of tuberculosis in five
"municipios" of Nicaragua to reflect on local interventions." Health Policy 74(2): 205-17.
Madebo, T. and B. Lindtjorn (1999). "Delay in Treatment of Pulmonary Tuberculosis: An
Analysis of Symptom Duration Among Ethiopian Patients." MedGenMed: E6. Mahajan, A. P., J. N. Sayles, et al. (2008). "Stigma in the HIV/AIDS epidemic: a review of
the literature and recommendations for the way forward." Aids 22 Suppl 2: S67-79. Mak, W. W., P. K. Mo, et al. (2006). "Comparative stigma of HIV/AIDS, SARS, and
tuberculosis in Hong Kong." Soc Sci Med 63(7): 1912-22. Mata, J. I. (1985). "Integrating the client's perspective in planning a tuberculosis education
and treatment program in Honduras." Med Anthropol 9(1): 57-64. Mishra, P., E. H. Hansen, et al. (2005). "Socio-economic status and adherence to tuberculosis
treatment: a case-control study in a district of Nepal." Int J Tuberc Lung Dis 9(10): 1134-9.
Munro, S. A., S. A. Lewin, et al. (2007). "Patient adherence to tuberculosis treatment: a
systematic review of qualitative research." PLoS Med 4(7): e238. Naing, N. N., C. D'Este, et al. (2001). "Factors contributing to poor compliance with anti-TB
treatment among tuberculosis patients." Southeast Asian J Trop Med Public Health 32(2): 369-82.
Nair, D. M., A. George, et al. (1997). "Tuberculosis in Bombay: new insights from poor
urban patients." Health Policy Plan 12(1): 77-85.

143
Ngamvithayapong, J., A. Winkvist, et al. (2000). "High AIDS awareness may cause tuberculosis patient delay: results from an HIV epidemic area, Thailand." Aids 14(10): 1413-9.
Nnoaham, K. E., R. Pool, et al. (2006). "Perceptions and experiences of tuberculosis among
African patients attending a tuberculosis clinic in London." Int J Tuberc Lung Dis 10(9): 1013-7.
Nyblade, L. C. (2006). "Measuring HIV stigma: existing knowledge and gaps." Psychol
Health Med 11(3): 335-45. RODPC (2007). HIV Sentinel Surveillance. Amphur Muang, Songkhla Province, Thailand,
Epidemiology Section, 12th Regional Office of Disease Prevention and Control. Rubel, A. J. and L. C. Garro (1992). "Social and cultural factors in the successful control of
tuberculosis." Public Health Rep 107(6): 626-36. Sanou, A., M. Dembele, et al. (2004). "Access and adhering to tuberculosis treatment:
barriers faced by patients and communities in Burkina Faso." Int J Tuberc Lung Dis 8(12): 1479-83.
Santha, T., R. Garg, et al. (2002). "Risk factors associated with default, failure and death
among tuberculosis patients treated in a DOTS programme in Tiruvallur District, South India, 2000." Int J Tuberc Lung Dis 6(9): 780-8.
Selvam, J. M., F. Wares, et al. (2007). "Health-seeking behaviour of new smear-positive TB
patients under a DOTS programme in Tamil Nadu, India, 2003." Int J Tuberc Lung Dis 11(2): 161-7.
Sengupta, S., P. Pungrassami, et al. (2006). "Social impact of tuberculosis in southern
Thailand: views from patients, care providers and the community." Int J Tuberc Lung Dis 10(9): 1008-12.
Shargie, E. B. and B. Lindtjorn (2007). "Determinants of treatment adherence among smear-
positive pulmonary tuberculosis patients in Southern Ethiopia." PLoS Med 4(2): e37. Slama, K., C. Y. Chiang, et al. (2007). "Tobacco and tuberculosis: a qualitative systematic
review and meta-analysis." Int J Tuberc Lung Dis 11(10): 1049-61. Somma, D., B. E. Thomas, et al. (2008). "Gender and socio-cultural determinants of TB-
related stigma in Bangladesh, India, Malawi and Colombia." Int J Tuberc Lung Dis 12(7): 856-66.
Storla, D. G., S. Yimer, et al. (2008). "A systematic review of delay in the diagnosis and
treatment of tuberculosis." BMC Public Health 8(1): 15.

144
Van Brakel, W. H. (2006). "Measuring health-related stigma--a literature review." Psychol Health Med 11(3): 307-34.
Van Rie, A., S. Sengupta, et al. (2008). "Measuring stigma associated with tuberculosis and
HIV/AIDS in southern Thailand: exploratory and confirmatory factor analyses of two new scales." Trop Med Int Health 13(1): 21-30.
Wandwalo, E., N. Kapalata, et al. (2004). "Collaboration between the national tuberculosis
programme and a non governmental organisation in TB/HIV care at a district level: experience from Tanzania." Afr Health Sci 4(2): 109-14.
Wandwalo, E. R. and O. Morkve (2000). "Delay in tuberculosis case-finding and treatment in
Mwanza, Tanzania." Int J Tuberc Lung Dis 4(2): 133-8. Watkins, R. E. and A. J. Plant (2004). "Pathways to treatment for tuberculosis in Bali: patient
perspectives." Qual Health Res 14(5): 691-703. Weiss, M. G. and J. Ramakrishna (2006). "Stigma interventions and research for
international health." Lancet 367(9509): 536-8. Weiss, M. G., J. Ramakrishna, et al. (2006). "Health-related stigma: rethinking concepts and
interventions." Psychol Health Med 11(3): 277-87. Westaway, M. S. (1989). "Knowledge, beliefs and feelings about tuberculosis." Health Educ
Res 4(2): 205-211. Whalen, C. C. (2006). "Failure of directly observed treatment for tuberculosis in Africa: a
call for new approaches." Clin Infect Dis 42(7): 1048-50. WHO (1999). What is DOTS? A guide to understanding the WHO-recommended control
strategy known as DOTS. Geneva, World Health Organization. WHO (2003). Treatment of Tuberculosis: Guidelines for National Programmes. Geneva,
World Health Organization. WHO (2004). Toman’s tuberculosis: case detection, treatment, and monitoring. Geneva,
World Health Organization. WHO (2006). The Global Plan to Stop Tuberculosis, 2006 - 2015. Geneva, World Health
Organization. WHO (2008). Global tuberculosis control: surveillance, planning, financing. Geneva, World
Health Organization. WHO/ROEM (2006). Diagnostic and treatment delay in tuberculosis. Cairo, World Health
Organization Regional Office for the Eastern Mediterranean.

145
Woith, W. M. and J. L. Larson (2008). "Delay in seeking treatment and adherence to
tuberculosis medications in Russia: a survey of patients from two clinics." Int J Nurs Stud 45(8): 1163-74.
Yimer, S., G. Bjune, et al. (2005). "Diagnostic and treatment delay among pulmonary
tuberculosis patients in Ethiopia: a cross sectional study." BMC Infect Dis 5: 112.