Embed Size (px)
Citation preview

e-el
I1'd~dbNAIOA TEHNCAINOMTOIEVC
234

THIS Du"OC-UMNT' IS 13E ST
QUALITY,,v AVAILABLE. TBa COPY
FtRNSIE DTO DTIC CONTAINED
A SIGNIFICANT NUMBER OF
G ~ E5 'VH I ý1 DO0 NOT
Ž ,, UC..-- LEGIBLY.
REPODCE FOM THIS DoCUM43N1T CONTAINEDREPROUCEDFROM BI1 MN pAGES THLAT H1AVE
BEST AVAILABLE COPY BEEN DELETED

btM1 CONTR'OL DAT A,. R A[ tf. 11,.144t,
11-ikitor Kat~no G~or'ptrattim
4 HS�BINsP M! ... lur.. .#tp 4 Wo i-"tfiiule d.T.. .risw~ -WTAllTii - '
l)Avti Meimiet
3t0 Novoneihr 19'1 0 505
GoIItrac No. N00014,-71,C-I.%7
This document has boon approve.d for public relvase and dale. itildistribution is unlimited,
1*Naval Ship SystrlrnI Con-imaldWashington, D. C.
The purpose of t W study wan to describe, analyiv and compare avail-able models and rnethois for making litantitative predictions of humanperformance in man-machine systemo. The ZZ methods re'viewed w'redivided into those relating to opra'Mhility .nd maintaiiiabi]ity; operability-models further subdivide into an-lvtic (no,,- simulation) nrid simulationnmodels. E•ach m(odel was analy'kd in tern,s of goals, oinwiptions, scopeparameters, data roquirem. its, procpdu-rv, and validniur/aipplit ationstudies. -It was found that m-ost models ý i'ea co rsoxnbl' elfec.tive fir pre-diction, but are less offectivw f,., design jiilyn.is, selection and trainingpurposes. Simulation nrodels ars4 more powerful than annilytic ones.Chulce oi a model s*ern-a to depend on its particular advantages for solu-tion of specific system development problems. The report provid.tirequirements for development of input data banks and data presentation
formats. The most recent studies and the state of the art of humanreliability prediction are reviewed, Recommendations for further re-search are made, centering around a survey of user needs for predictivedata,
'DD,0...1473iem rIty CleIamlflcatlon
492
k& It olil ~ I
11i IW~lAl 14% MIltit iN I
I %1111A II p'It tll ~
1 %miAetr'14%li lMAi lhit ft lIlAi lil yvA II -ITaleh iii ,ey. t t
Mothdi'I s
Opts rak lit y
P ro v' I i 1oni
2 security Classificaiton,
493
II
L0074-oIoU7
COMPARATIVE ANALYSISOF
HUMAN RELIABILITY MODELS
Final ReportContract N00024-71-C-1257
David MeisterA Bunker Ramo
- DDC\
November 1971 JAN 9
"Prepared for
Naval Ship Systems CommandDepartment of the Navy
Washington, D. C.
LJ
E LECTRONIC SYSTEMS DIVISION311i1 LA TIENDA DRIVE, W[STLA.•E VILLAGE. CALIFORNIA 91361
IR I
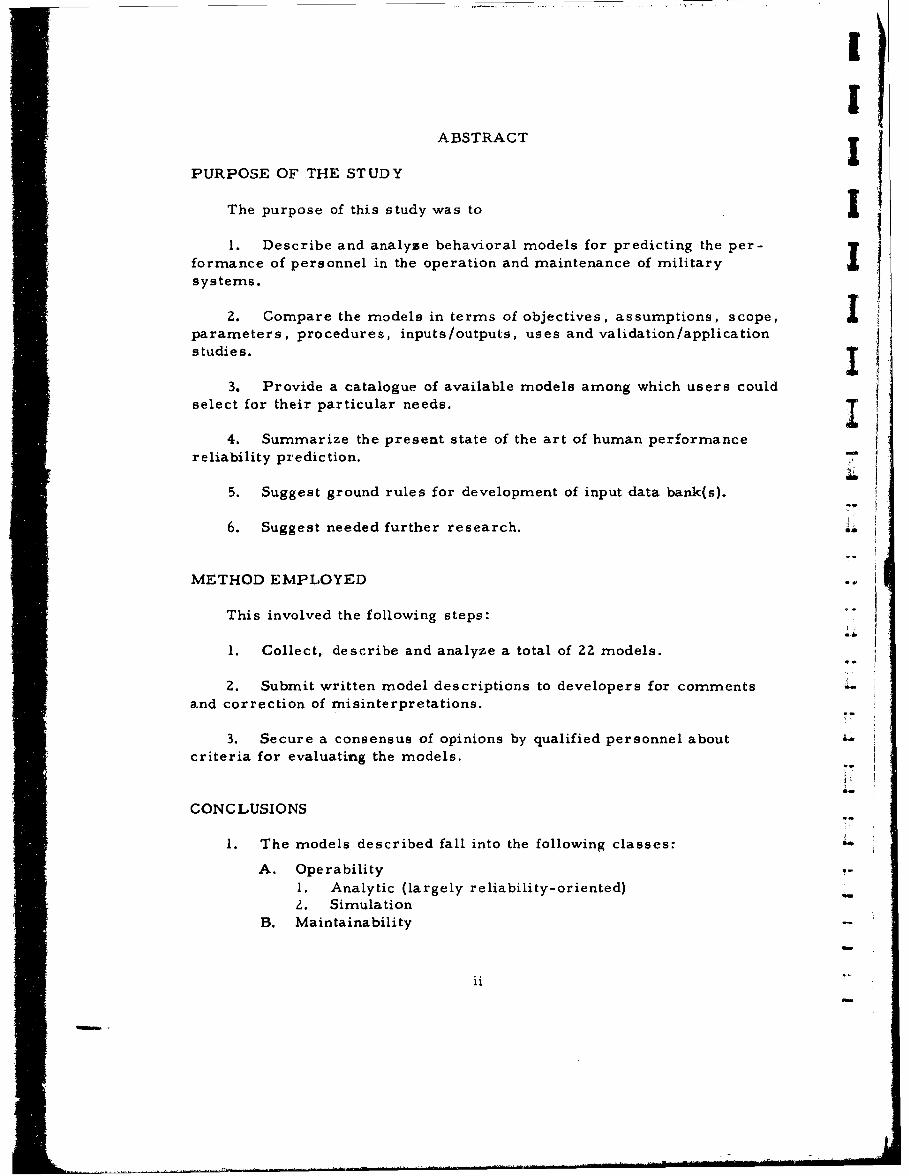
PURPOSE OF THE STUDY
The purpose of this study was to
1. Describe and analyze behavioral models for predicting the per-formance of personnel in the operation and maintenance of militarysystems.
2. Compare the models in terms of objectives, assumptions, scope,parameters, procedures, inputs/outputs, uses and validation/applicationstudies. I
3. Provide a catalogue of available models among which users couldselect for their particular needs. I
4. Summarize the present state of the art of human performancereliability prediction. -
5. Suggest ground rules for development of input data bank(s).
6. Suggest needed further research.
METHOD EMPLOYED
This involved the following steps:
1. Collect, describe and analyze a total of 22 models.
Z. Submit written model descriptions to developers for commentsand correction of misinterpretations.
3. Secure a consensus of opinions by qualified personnel aboutcriteria for evaluating the models.
CONCLUSIONS
1. The models described fall into the following classes:
A. Operability1. Analytic (largely reliability-oriented),. Simulation
B. Maintainability
J ii
I llI
I
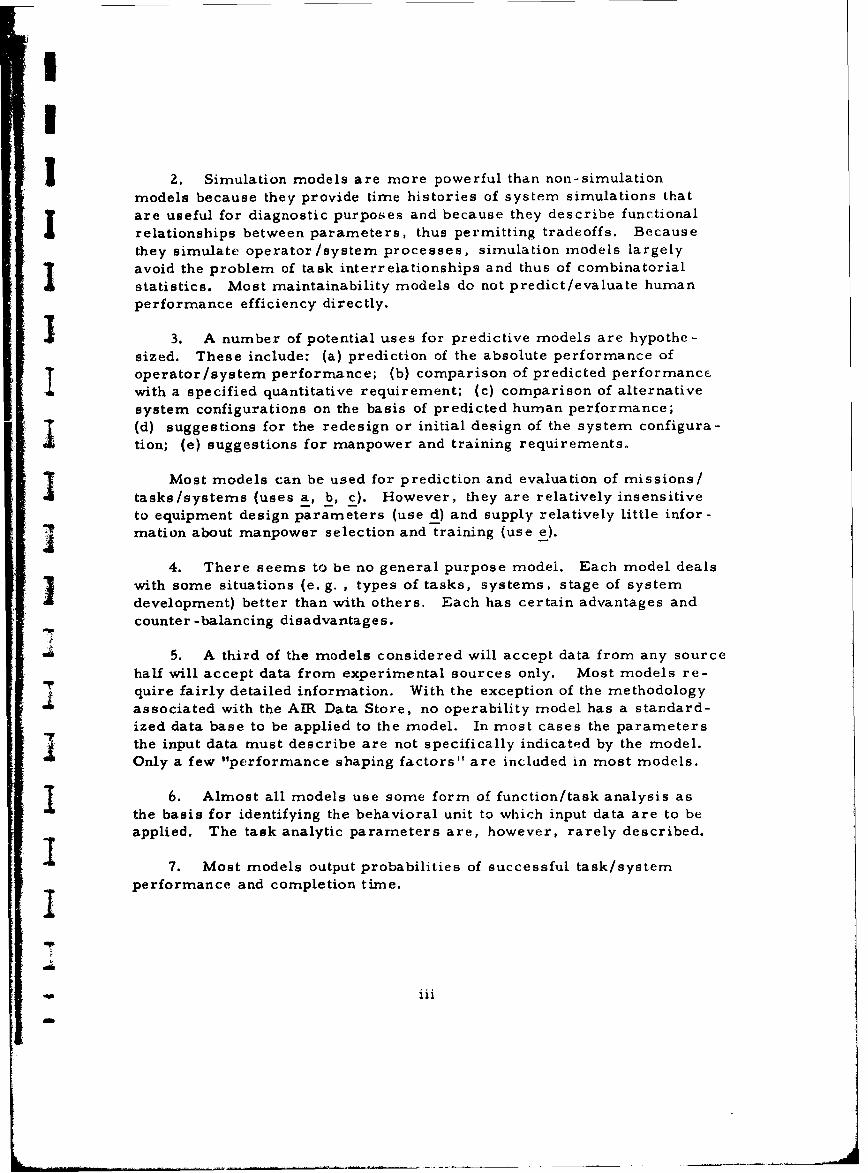
1 2. Simulation models are more powerful than non-simulation
models because they provide time histories of system simulations that
are useful for diagnostic purposes and because they describe functional
relationships between parameters, thus permitting tradeoffs. Because
they simulate operator/system processes, simulation models largely
avoid the problem of task interrelationships and thus of combinatorialstatistics. Most maintainability models do not predict/evaluate humanperformance efficiency directly.
13. A number of potential uses for predictive models are hypothe-
sized. These include: (a) prediction of the absolute performance of
operator/system performance; (b) comparison of predicted performance
with a specified quantitative requirement; (c) comparison of alternative
system configurations on the basis of predicted human performance;
(d) suggestions for the redesign or initial design of the system configura-
tion; (e) suggestions for manpower and training requirements,
Most models can be used for prediction and evaluation of missions/tasks/systems (uses a, b, c). However, they are relatively insensitiveto equipment design parameters (use d) and supply relatively little infor-
] mation about manpower selection and training (use e).
4. There seems to be no general purpose model. Each model dealswith some situations (e.g. , types of tasks, systems, stage of systemdevelopment) better than with others. Each has certain advantages and
counter -balancing disadvantages.
5. A third of the models considered will accept data from any source
half will accept data from experimental sources only. Most models re-quire fairly detailed information. With the exception of the methodologyassociated with the AIR Data Store, no operability model has a standard-
ized data base to be applied to the model. In most cases the parametersthe input data must describe are not specifically indicated by the model.
Only a few "performance shaping factors" are included in most models.
16. Almost all models use some form of function/task analysis asthe basis for identifying the behavioral unit to which input data are to beapplied. The task analytic parameters are, however, rarely described.
I 7. Most models output probabilities of successful task/system
performance and completion time.
Siii
I!I
Ir/
either lacking or incomplete, so that evaluative judgments based on pre-cision/efficiency cannot be made. They provide little information aboutconsistency or ease of use.
9. Development of an effective data bank requires consideration of::
a. The model with which the data will be used;
b. The particular uses to which the data will be put;
C. The parameters of interest to the model user;
d. The level of detail required of the data bank;
e. The output measures of the model with which the databank will be used;
f. The scope of the tasks/behaviors to which the data mustbe applied.
10. Significant problems still remain with regard to
a. Subjective estimates of performance;
b. Task independence vs. interdependence;
c. Relative importance of time and error as dependent per-f ormance variables.
11. Among the 42 responses received to a questionnaire on
evaluative criteria, there was significant agreement on the relativeimportance of the 16 criteria proposed (. 01 level). In general, criteriadescribing how well the model corresponds to real world events areconsidered mcst important; criteria describing the adequacy of modelstructure and ease of use are considered much less important.
12. It is concluded that many of the models reviewed have consider-able potential for solving system development problems relating to human 0•
performance, but that further research is required before they can be Lapplied practically to weapon system development,
ivn|

IN
I RECOMMENDATIONS
1. We assume that each of the models has been developed to re-spond to some assumed system development need and that they differ interms of their capability of satisfying these needs. Since, however, wedo not know what these system development needs are, it is impossibleto determine which of the models will be most useful, or whether in factany of these models will be useful and used. Therefore, it is necessaryto determine
a. Who will make use of these models;
b. What are the uses to which these people will apply thesemodels and at what system development stage, with what
"AAi constraints, etc. ;
c. How precise/detailed must the information be which themodel outputs and in what form;
d. What parameters must the model output data deal with.
I Answers to these questions will determine what requirements should belevied on models and data banks.
Our first recommendation is therefore that a study be performedto answer these questions. By presenting sample outputs of the variousmodels, their input data requirements, to a broad cross section ofpotential users, it should be possible to compare the models in termsof their applicability to actual system development problems.
2. In view of the fact that so many models, lacking other sources,make use of subjective data estimates, it is highly desirable that themost effective method for securing such estimates be developed. Al-though such standard methods (e. g. , paired comparisons) exist, it isnecessary to determine how much reliance one can place on them (i. e.their validity), what parameters one can expect personnel to include intheir judgments, in relation to what tasks, etc.
I 3. Since the focus of human factors efforts must be on system de-sign, and since all the models we have surveyed lack sensitivity to equip-ment design parameters, high priority should be given either to the de-J velopment of a model which is focused on design parameters or to thedevelopment of a data bank which specifically includes such parameters.
IIV
I I1
4. A longer range recommendation which is directed specifically Iat governmental sponsoring agencies is that emphasis be given to thevalidation/application of the most- promising of the models presentlyavailable. The lack of validation is the one most severe deficiency ofavailable models, and makes a comparison among them dependent uponsecondary criteria. No model development effort should be consideredcomplete unless it terminates in one or more application-oriented vali-dation studies.
5. Many other studies should be performed. These include studiesof task interrelationships, conditional dependencies and the effects offeedback on performance. However, the ones suggested are consideredthe most immediately pressing.
vi
I
TAClNOWLEDGMENTSThe author wishes to express his appreciation to a number of people
"without whom this study could not have been performed:
(1) To the developers of the various predictive models, many ofwhom supplied research reports of their models, reviewed the author's
I 'preliminary draft descriptions and commented (some in great length) on
the technical accuracy of these descriptions. The author alone, however,
must bear final responsibility for any inadequacies that the reader mayi •find in this report.
(2) To the many human factors specialists who were kind enough to
fill out the author's questionnaire on criteria for evaluating man-machinemodels. The names of these respondents are given in Appendix A.
S-(3) To Mrs. Dorothy Finley of Bunker Ramo's Human Factors De-partment who performed the statistical analysis of the responses to the
criteria questionnaire.
(4) Not least, to Mr. James P. Jenkins, Head, Systems Effective-ness Branch, Sonar Technology Division, Sonar Directorate, Naval ShipSystems Command, who supported the efforts that led to this report.
* (5) Special thanks are due to Mrs. Carolyn Bagdonas who uncom-
plainingly and with great persistence typed several versions of the manu-
script.
vii
I'+
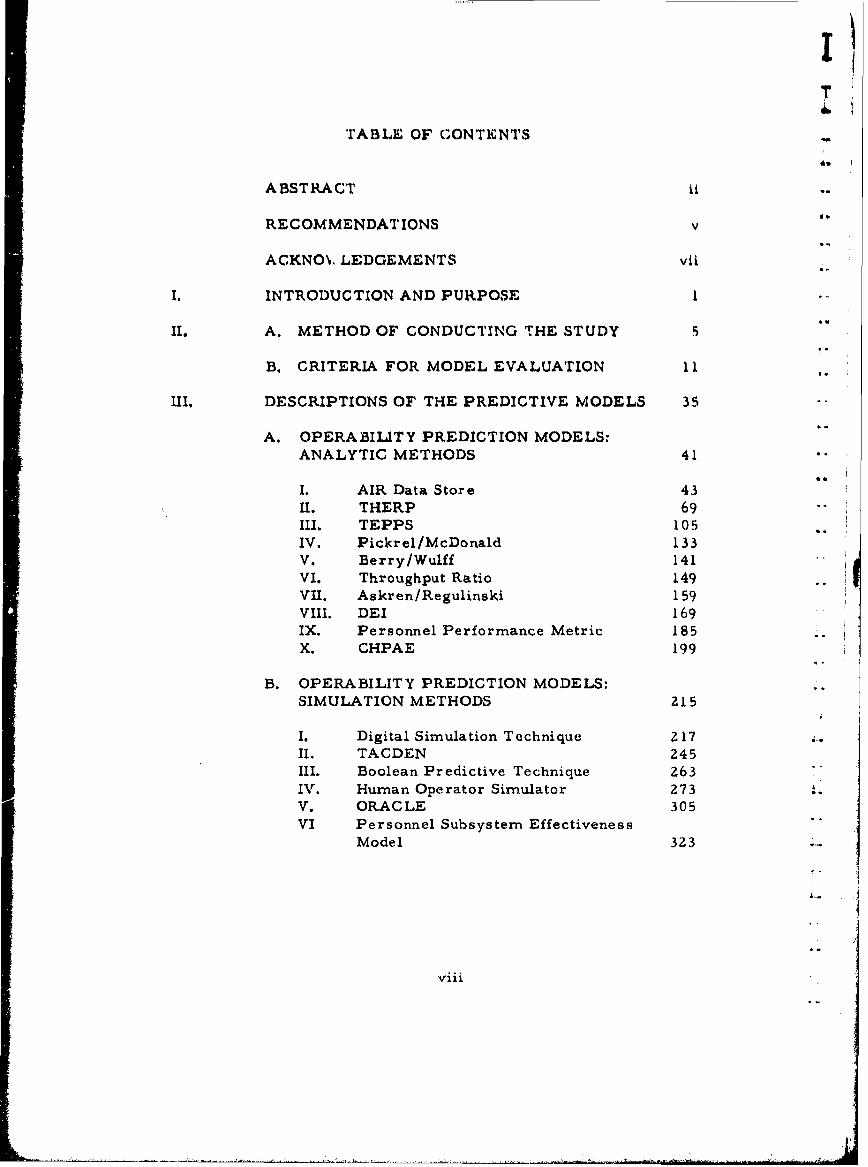
TABLE OF CONTENTS
ABSTRACT iU
RECOMMENDAT IONS v
ACKNON, LEDGEMENTS vii
INTRODUCTION AND PURPOSE 1 .-
II. A. METHOD OF CONDUCTING THE STUDY 5
B. CRITERIA FOR MODEL EVALUATION 11
IHI. DESCRIPTIONS OF THE PREDICTIVE MODELS 35 --
A. OPERABILITY PREDICTION MODELS:ANALYTIC METHODS 41
U.
I. AIR Data Store 43II. THERP 69 "III. TEPPS 105IV. Pickrel/McDonald 133V. Berry/Wulff 141VI. Throughput Ratio 149VII. Askren/Regulinski 159VIII. DEI 169IX. Personnel Performance Metric 185X. CHPAE 199
B. OPERABILITY PREDICTION MODELS:SIMULATION METHODS Z15
I. Digital Simulation Technique 2 17Ii. TACDEN 245III. Boolean Predictive Technique Z63 "IV. Human Operator Simulator 273V. ORACLE 305VI Personnel Subsystem Effectiveness
Model 323
viii
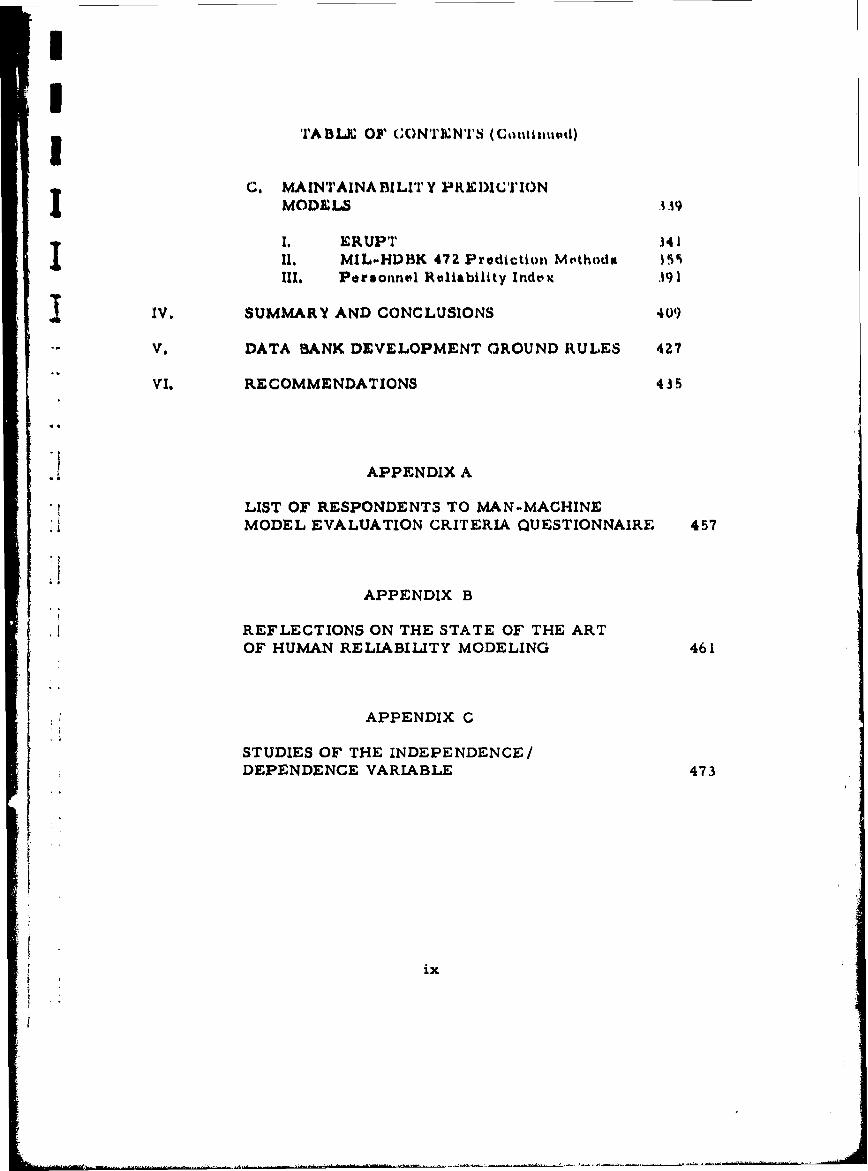
i T1A BLTA OF ON TrEN'rs (Continupd)
C. MAINTAINABILITY PREDIC•IrONMODELS A 19
I, ERUPT 341II. MIL-HDBK 472 Prediction Mothodu ý5sIII. Personnel Reliability Indox ,191
SIV. SUMMARY AND CONCLUSIONS 409
V. DATA BANK DEVELOPMENT GROUND RULES 427
VI. RECOMMENDATIONS 435
APPENDIX A
LIST OF RESPONDENTS TO MAN-MACHINE2 MODEL EVALUATION CRITERIA QUESTIONNAIRE 457
APPENDIX B
REFLECTIONS ON THE STATE OF THE ARTOF HUMAN RELIABILITY MODELING 461
APPENDIX C
STUDIES OF THE INDEPENDENCE/DEPENDENCE VARIABLE 473
ix
[I
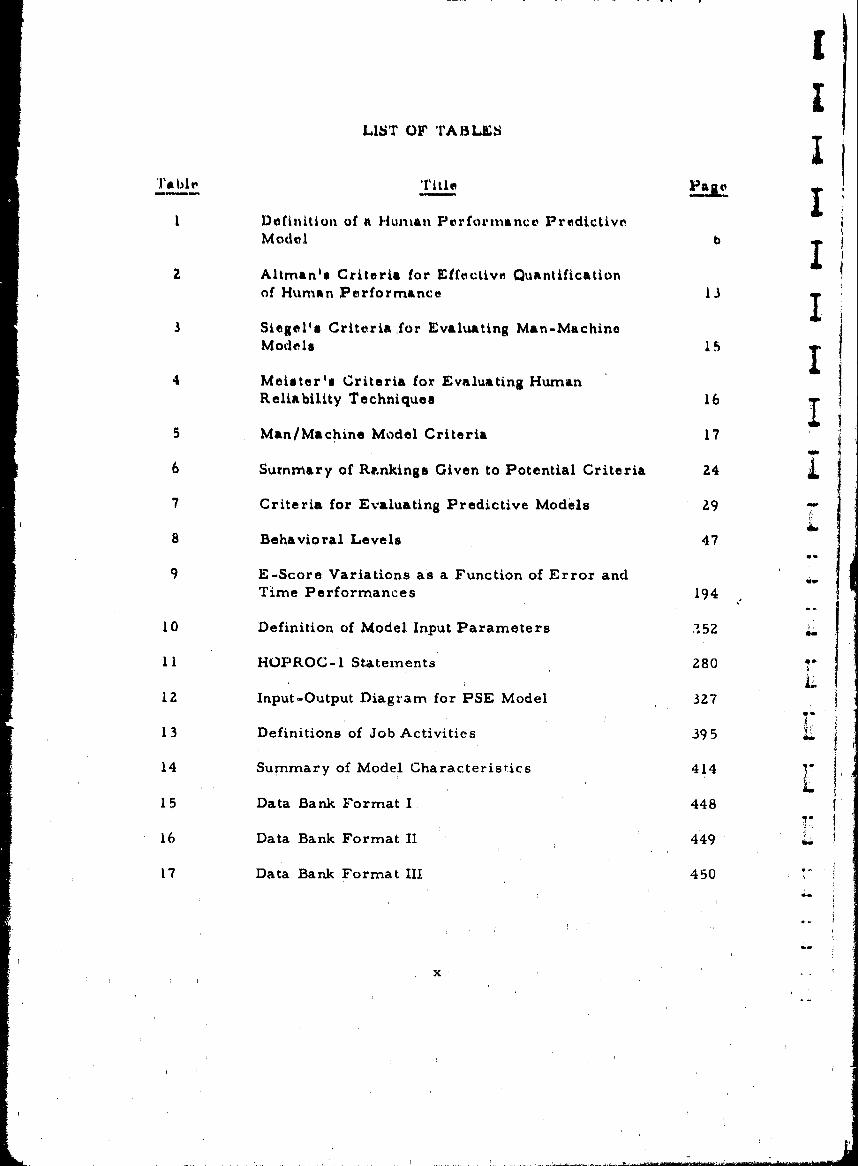
LIST OF rABLES
tabl TiLteTit
I Definition of a Hunwan rerformance PredictiveModel b
2 Altman's Criteria for Effective Quantificationof Human Ferformance 13 1
3 Siegel's Criteria ,for Evaluating Man-MachineModels 15
4 Meister's Criteria for Evaluating HuumanReliability Techniques 16 I
5 Man/Machine Model Criteria 17
6 Summary of Ra.nkings Given to Potential Criteria 24
7 Criteria for Evaluating Predictive Models Z9
8 Behavioral Levels 47
9 E-Score Variations as a Function of Error and .. ,Time Performances 194
10 Definition of Model Input Parameters 152
11 HOPROC-l Statements 280 LU12 Input-Output Diagram for PSE Model 327
13 Definitions of Job Activities 395
14 Summary of Model Characteristics 414
L15 Data Bank Format I 448
16 Data Bank Format 11 449
17 Data Bank Format III 450
x
X ,I
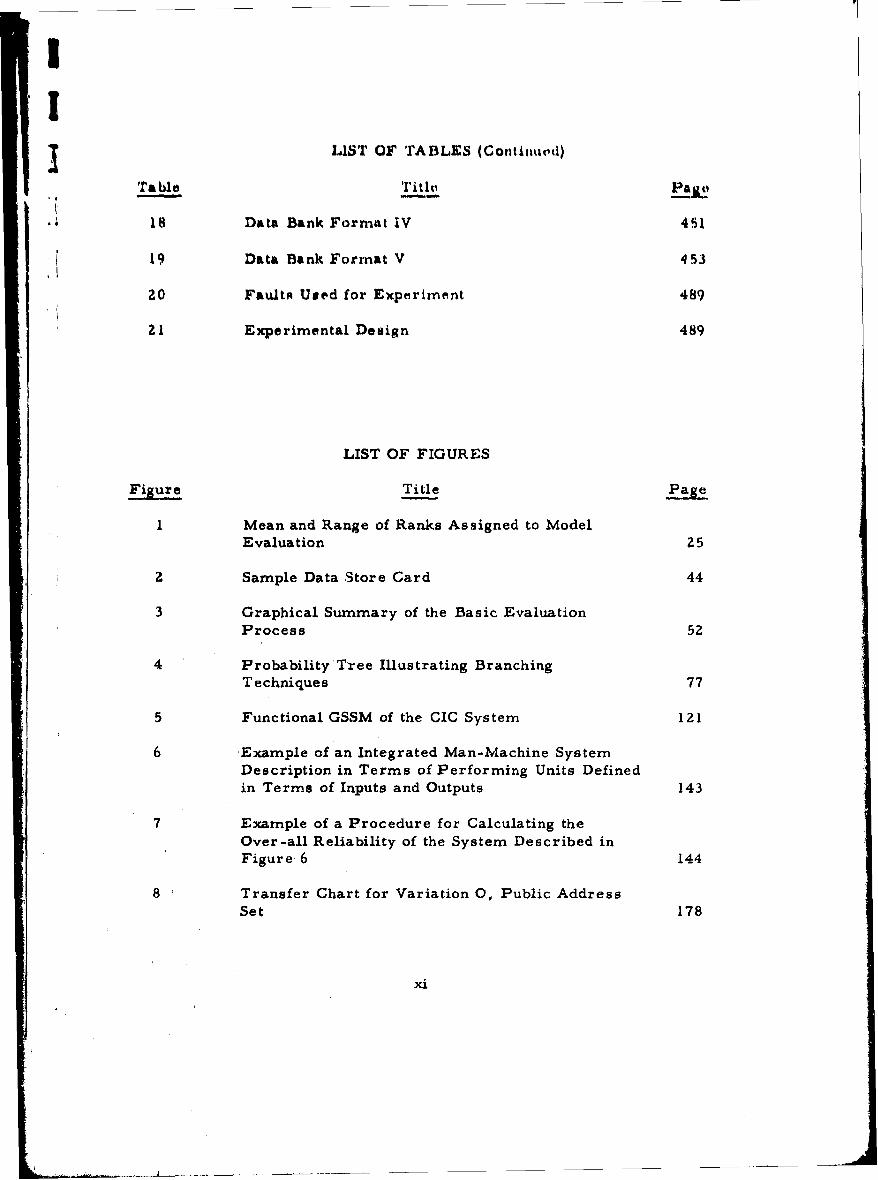
'ILIST OF TABLES (Continurd)
Ta ble It Iti, Pal
18 Data Bank Format IV 451
19 Data Bank Format V 453
20 Faults Used for Experiment 489
21 Experimental Design 489
LIST OF FIGURES
Figure Title
1 Mean and Range of Ranks Assigned to ModelEvaluation 25
2 Sample Data Store Card 44
3 Graphical Summary of the Basic EvaluationProcess 52
4 Probability Tree Illustrating BranchingTechniques 77
5 Functional GSSM of the GIC System 121
6 Example of an Integrated Man-Machine SystemDescription in Terms of Performing Units Definedin Terms of Inputs and Outputs 143
7 Example of a Procedure for Calculating theOver-all Reliability of the System Described inFigure 6 144
8 Transfer Chart for Variation 0, Public AddressSet 178
xi
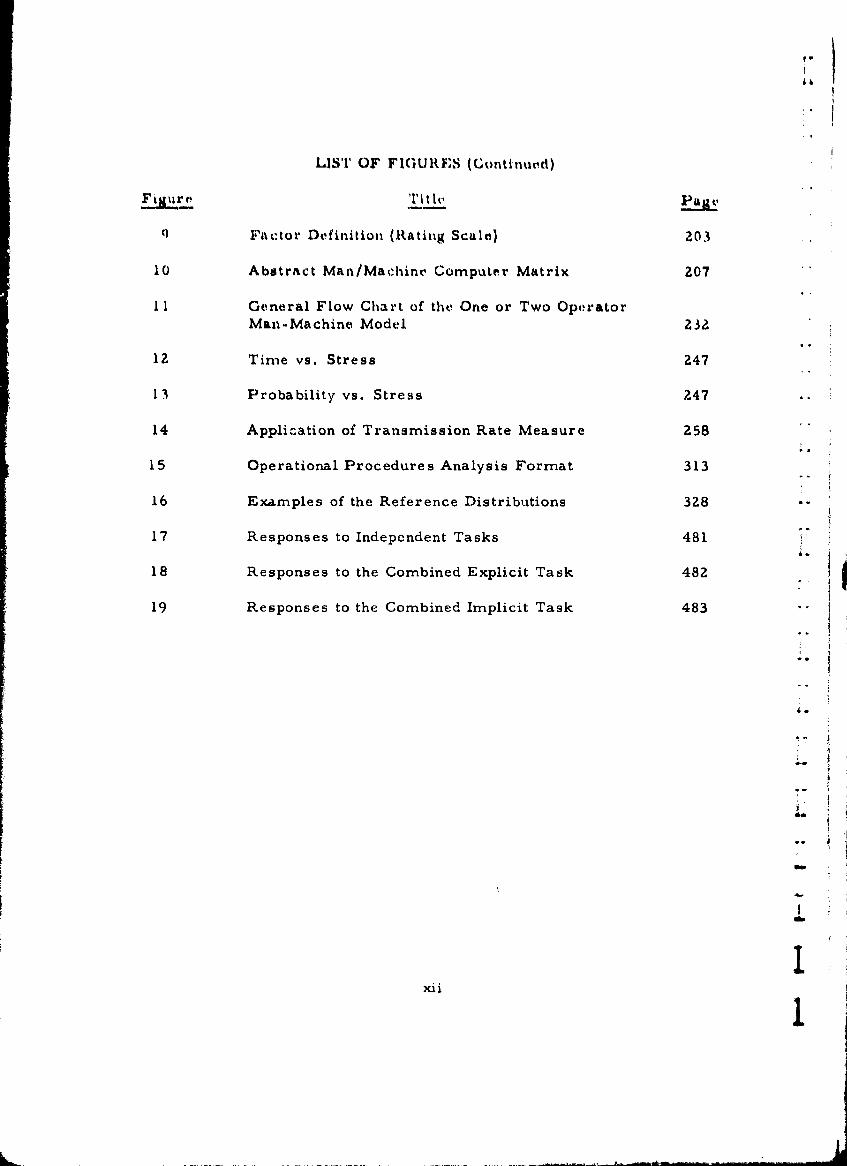
LIST OF FIGURIF,•S (Continued)
Fiur lith* N
q Factor Definition (Rating Scale) 203
10 Abstract Man/Machine, Computer Matrix 207
I I General Flow Chart of the One or Two OperatorMan-Machine Model 232
12 Time vs. Stress 247
13 Probability vs. Stress 247
14 Application of Transmission Rate Measure 258
15 Operational Procedures Analysis Format 313 -.
16 Examples of the Reference Distributions 328
17 Responses to Independent Tasks 481
18 Responses to the Combined Explicit Task 482
19 Responses to the Combined Implicit Task 483
x1I
I!
SECTION I
INTRODUCTION AND PURPOSE
For the Navy to exercise any significant effect on the design of man-machine elements during system development, it must apply methods of
quantitatively predicting the performance of operators and technicians"when the system goes into operation. The term generally used to de-
"*1 scribe that prediction, "human reliability" (HR), connotes a personnelcapacity- akin to that of equipment reliability-to perform equipmentoperation and maintenance tasks in accordance with system requirements.I
Over the past 10 years or more a number of human reliabilitymethods and models have been developed. This is not the place to reviewpast history (which has in any event been done by Swain, Ref. 4); it issufficient to say that the potential model-user may choose among a num-ber of differing solutions to the problem of human performance predic-tion. He may choose between operability and maintainability modeLs;between those that simulate behavioral processes and those that do not;between those that function at a relatively molar task level and thosewhose elements are quite molecular, etc. Since each of these modelsmay be useful for somewhat different system development purposes, or may
* have advantages and disadvantages depending on the user's needs, it isnecessary to analyze and compare the various approaches systematicallybefore making a choice.
Such a comparison is made all the more necessary because the devel-opment of these techniques and the research associated with their devel-opment has uncovered a number of questions, the relevance or importanceof which depends on the particular methodological approach one takes.
Among these questions are:
(1) What metric should be employed in describing humanpe rfo rmance ?
1. This definition of human reliability- or human performance reliability,as the Human Engineering Division of the Aerospace Medical ResearchLaboratory phrases it- must be differentiated from the same term asused by some psychiatrists in the military services to designate thecapability of personnel to resist emotional breakdown under stress.The term as used here has connotations of accuracy.
!I
(2) To what level of detail in behavior and equipment shouldthe method attempt to predict?
(3) How should predictions at one level of man-machine systemfunctioning be combined with predictions at another level?
(4) What kinds of system development and use problems shouldan HR predictive method attempt to solve?
(5) What should be the characteristics of the historical data *0(bank) to be used as the basis for making performancepredictions ?
Perhaps the one critical question that has generated most contro-versy is how much effort should be expended on the development of adata bank to be used for predictive purposes, and what parameters thatdata bank should contain. Swain (Ref. 5) among others has called for anintensive effort in developing such a bank based on empirically gathereddata, and has suggested the parameters that should be included. How-ever, other workers with a different approach, e.g., Blanchard andSmith (Ref. 1 ), Knowles, et al. (Ref. 4 ) would concentrate on the de-velopment of techniques for securing subjective judgments. .
Assuming that a data bank is required, what data items should itcontain.? Here one has a choice between the very molecular equipmentcharacteristics of the AIR Data Store (Ref. 3) and Swain's more molarperformance shaping factors (Ref. 5). And to what behavioral elementsshould that bank be applied? Obviously, since any data bank must beapplied using a method of some sort, the nature of that method will atleast in part determine the characteristics of the data bank.
From that standpoint, any data bank may be considered a behavioralmodel itself (or at least implies such a model), so that if one is to answerthis data bank question logically, it is necessary to adopt a specificmethodological approach; and this requires an analysis such as the one .,
described in this report. The fact is that any research problem selectedis determined at least in part by a methodolegical strategy, even when itis apparently independent of that strategy. In consequence a meaningfuldirection in which to pursue human reliability research cannot be deter-mined until one knows what the various approaches are and what theyimply.
!
te The specific purposes of the study described in this report werethen
A(1) To summarize the present state of the art of human reliabilitypredictive methodology. A major part of the summary is a catalogue ofthe various predictive methods which a potential model-user 2 can examine:1 to find that method which best satisfies his particular needs. The cata-logue contains descriptions of the various models, but only so much de-tail is provided that a user can acquaint himself with the elements of themethodology. Since some of these methods are highly complex, it is im-possible to present them as fully as they deserve. However, referencesare given to basic documents from which details needed for utilizing themodel can be found.
"(Z) To perform a comparative analysis of the various methodologicalapproaches, to indicate their similarities and differences, to extract theirimplications for model use, and to infer the problems which further re-search must solve. As part of this analysis questions are raised abouteach method. There is no intent to denigrate any method by raising thesequestions; they are simply to examine the fascinating theoretical andmethodological problems that still remain to be solved and to indicatewhere further research or development is required.
(3) To examine the methodological problems raised by these pro-blems so that it will be possible to outline a program of research requiredtn solve them.
This report is organized in several sections. After discussing thecriteria used to select the methods under review, and the criteria employed
*• to evaluate the selected methods, each method will be described. These
descriptions are the bulk of the report. A summary of the state of the artof human reliability research is followed by a set of guidelines for the
* {development of data banks. The conclusions reached from the analysesperformed previously lead then to recommendations for research to im-plement the Navy's human reliability program.
2. The term "model-user" refers to those personnel involved in systemdevelopment who can and should make use of human performance pre-dictions to solve developmental problems. These include (the list is"probably not exhaustive) military system planners and project managers,
contractor project managers, design engineers, reliability and humanfactors specialists.
3
REFERENCES
1. Blanchard, R. E. and Smith, R. L. Man-Machine Modeling: SomeCurrent Deficiencies and Future Needs, in Jenkins, J. P. (ed.)Proceedings of U. S. Navy Human Reliability Workshop, 22-23 July1970. NAVSHIP Report 0967-412-4010, February 1971, 183-198.
2. Knowles, W. B. et al. Models, Measures and Judgments in System --
Design. Human Factors, 1969, 11, 577-590.
3. Payne, D. and Altman, J. W. An Index of Electronic EquipmentOperability, Report AIR-C-43-1/62-FR, American Institute forResearch, Pittsburgh, Pa. , 31 January 1962.
4. Swain, A. D. Overview and Status of Human Factors ReliabilityAnalysis. Proceedings, 8th Reliability and Maintainability Conference,Denver, Colorado, July 7-9, 1969, 251-254.
5. Swain, A. D. Development of a Human Error Rate Data Bank. InJenkins, J. P. (ed) Proceedings of U. S. Navy Human ReliabilityWorkshop, 22-23 July 1970. NAVSHIPS Report 067-412-4010, LFebruary 1971, 117-148.
4.
II
SECTION II
A. METHOD OF CONDUCTING THE STUDY
T wo questions summarize the problems the author faced at thestart of this project:
(1) What is meant by the term "model" and what criteria can beused to select the human reliability models to be analyzed?
(2) What criteria can be used to evaluate model effectiveness andhow do we develop these?
What is a Model?
The reason we were concerned about this question is simply that theterm -s too inclusive; too many people take the term "model" in vain.When someone wishes to conceal his jejune thinking behind a facade, hecalls it a "model". Models may be anything: abstract or concrete,shallow or sophisticated, qualitative or mathematical.
Obviously in this project it was impossible to consider all behavioralmodels, simply because there are too many of them; many of them areirrelevant to our interest in human reliability and many simply do not have"the substance even if they have the name.
Consequently, out of sheer self-preservation, it was necessary to-t define the subject matter of the project rather closely.
It would b ideal if we had a satisfactory verbal definition of a model,but all-inclusive definitions of models turn out to be rather abstract andtherefore not very clear. Siegel and Wolf (R.ef.4) tell us that "...the much-bandied term "model" has been so broadly defined as to incorporate vir-
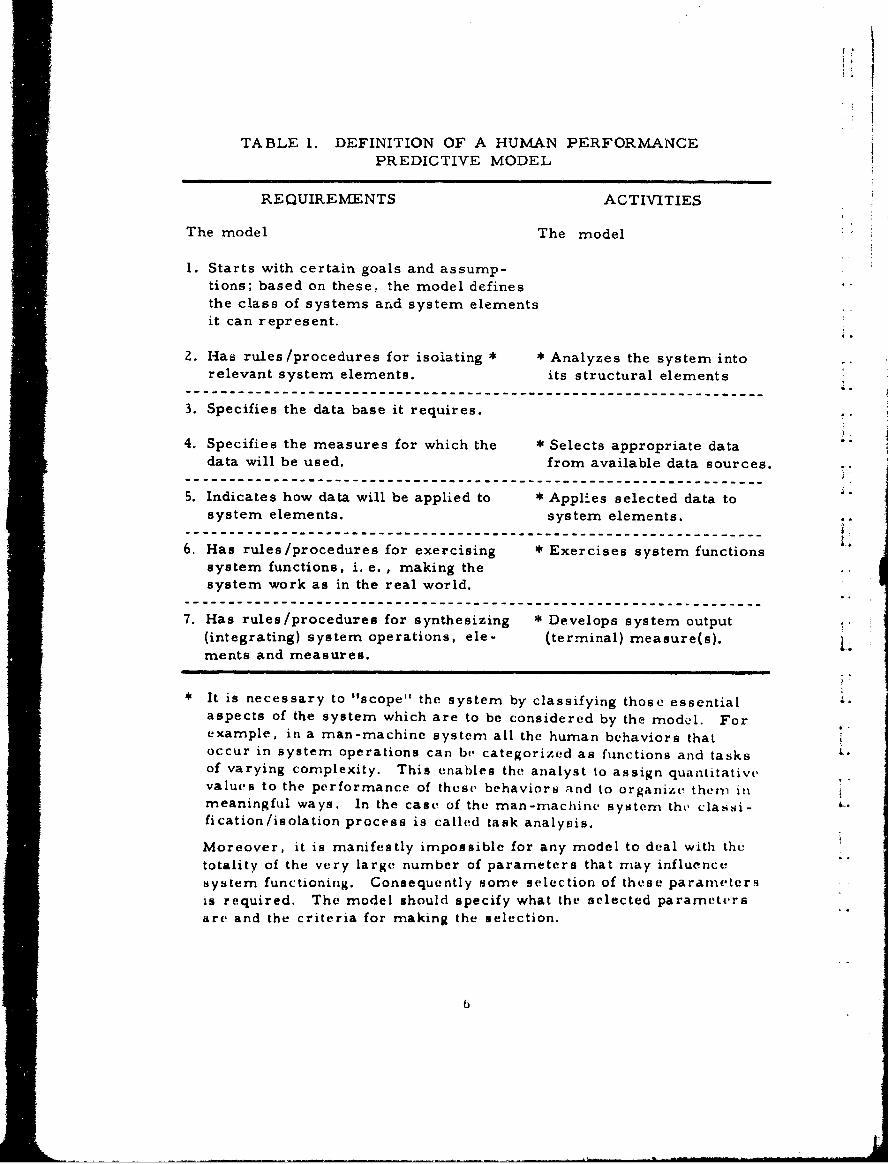
-F tually any form of abstraction used to represent concrete phenomena.SThe procedure adopted to define a model was to describe in a seriesof steps what a model does and use this as a sort of "template" againstwhich to measuLre our models. This ii illustrated in Table 1, which liststhe requirements for a model and then what the model does in relation toa system (presumably a man-machine system).
5
II I: I
TABLE 1. DEFINITION OF A HUMAN PERFORMANCEPREDICTIVE MODEL
REQUIREMENTS ACTIVITIES
The model The model
1. Starts with certain goals and assump-tions; based on these, the model definesthe class of systems and system elements
it can represent.
Z. Has rules/procedures for isolating * *Analyzes the system intorelevant system elements, its structural elements
--------------.......---------------------------------------------
3. Specifies the data base it requires.
"4. Specifies the measures for which the * Selects appropriate datadata will be used. from available data sources.
---------------------------------------------------------5. Indicates how data will be applied to * Applies selected data to
system elements. system elements.---------------------------------------------------------6. Has rules/procedures for exercising * Exercises system functions
system functions, i.e. , making thesystem work as in the real world.
-----------------------------------------------7. Has rules/procedures for synthesizing * Develops system output
(integrating) system operations, ele- (terminal) measure(s).nments and measures.
It is necessary to "scope" the system by classifying those essential
aspects of the system which are to be considered by the model. Forexample, in a man-machine system all the human behaviors thatoccur in system operations can be categorized as functions and tasksof varying complexity. This enables the analyst to assign quantitativevalues to the performance of these behaviors and to organize them inmeaningful ways, In the case of the man-machine system the classi-fication/isolation process is called task analysis.
Moreover, it is manifestly impossible for any model to deal with thetotality of the very large number of parameters that may influencesystem functioning. Consequently some selection of these parametersis required. The model should specify what the selected paramett-rsare and the criteria for making the selection.
.__.=m
3 The model is a way of representing a real world system in a quanti-
tative (preferably) fashion. Here we follow Chapanis' (Ref. 2) usage, in
which a model is defined in terms of its representation of behaviors. A
model of a system is an abstraction which reproduces (simulates) sym-bolically the way in which the system functions operationally.
From that standpoint of reproducing the behavioral process, theauthor confesses that some of the 'niodels" to be reviewed in this reportare not "true" models. A number of them include as part of their metho-dology a representation of system operations (e. g. , a function flow diagramof how the system performs), but others lack even this characteristic.
I. In consequence we have "models"' that are merely procedural tech-
niques or methods for applying predictive data; we have techniques orK "•methods that include certain "model" characteristics; and of course wehave a number of "true" models.
We have not eliminated those methods which are only partial or in-complete models, because to have done so would have meant reducing oursample size by half or more. Moreover, the fact that one method is a
I model whereas another is not is really irrelevant to the question of howwell they predict, although not to the way they predict.
11 We have compounded the fault- if it is a fault- by referring indis-criminately to the methods reviewed as "models" or "methods" or"techniques", but most often as "models". Only the purist should be
disturbed by this usage.
There are three planets in the model universe: the model, the system
(rather, a class of systems) the model is designed to represent, and datawhich permits the model and the system to interact quantitatively.
The left hand column of Table 1 indicates what the model must be in16 order to do its job; the right hand column describes what the model does
when applied to a system.
SI To summarize what we learn from the left hand column, the model
includes: (1) goals and assumptions; (2) definitions of the systems andsystem elements it can deal with; (3) procedures for isolating or analyz-
ing these system elements; (4) specifications for the data base the modelrequires to act upon the system and the measures it derives from thesedata; (5) rules for applying these data to the system elements; (6) rules
I7I7

for exercising system elements as in a Monte Carlo simulation; and (7)rules for synthesizing (combining) system operations and clements toderive a terminal system output (again in quantitative form).
Eventually it will be seen that this listing of model requirementssupplies a set of model-inherent criteria, i.e. , to be maximally effec-tive a model must contain these elements.
For the moment, however, we are most concerned with it.egn (.),definitions of those systems and system elements the model can repre-sent, because this tells us which models deal with human reliability.
There are at least three types of models, and some subvarieties:
(1) Those models that predict human performance but in which thereis little or no consideration of equipment characteristics.
(a) One subvariety deals with the full range of human taskbehaviors. An example is a model which describes how people learn orreact to stress.
(b) Another subvariety deals only with individual isolated humanfunctions. For example, in this category we would place visual reconnais-sance, signal detection, vigilance and decision-making models.
(2) There are models that predict system performance but in whichthere is little or no consideration of human functions, except possibly in-directly. Examples of such models are: economic utility, cost, reliability,
availability.
(3) There are models that include in their operations both human and -"
equipment parameters (i. e., the effect of the human on the equipment andthe effect of the equipment on the human, both of these as they affect sys-tem performance).
(a) One subvariety deals with the full range of human functions,i.e. , perceptual, motor, cognitive, all wrapped up in what we call "tasks"ror "functions".
(b) Another variety deals with isolated individual human func-tions. In this category the most common example is manual control(tracking) models.
8
t AWhat the model deals with depends upon its goals and ansutuptions,For example, the classical equipnment reliability model is interested in
"r predicting reliability at the component, and equipment level, It followstherefore that it does not include humuan behavior (except as reflected inhuman-initiated hardware malfunctions).
What are the goals of the models we were Interested in? To answerthat we had to ask ourselves what our goals in developing human reliahil-"ity models are. Those goals are:
(1) To measure/predict the effect of the human on equipment/systemperformance, and the effect of equipment/system elements on human be-havior.
(Z) Ultimately to determine those equipment (and to a lesser extentmanpower selection and training) characteristics that maximize the like-lihood of most effective human performance (i. e. , human reliability) inthe system context.
The two goals are independent but interrelated. One can predicthuman performance in a system context without determining effectiveequipment characteristics, and similarly one can determine effectiveequipment characteristics without predicting human performance in re-lation to those characteristics (this is classical human engineering). Theauthor happens to believe, however, that human engineering is inefficientunless it is based on measurement and prediction of human performance.He also believes that merely to predict human performance without beingconcerned about the equipment correlates of that performance is incon-sequential, since one can do very little with measurement or prediction byitself. To be meaningful therefore, measurement/prediction must be tiedto design consequences, or it is essentially only an amusing game.
From that standpoint any model that involved human performancealone, i. e. , that had little or no equipment reference, e. g. , decision-making models, or that involved equipment/system performance alone,e.g. , availability models, was not germane to our purpose. Moreover,since we were interested in the relation between human and system per-formance, any model that dealt only with an isolated subset of humanfunctions, even if these had an equipment reference, like manual control,wasalso not germane, since systems do not function without the full range ofhuman behaviors. In other words, if we want to predict the performanceof an operator in a command/control system we cannot be concernedsolely with signal detection or solely with decision-making or solely
9
ri
with tracking capability, etc. because the system involves all of thesein an integrated whole.
It was now possible to establish two major criteria of the modelsto be selected for analysis:
(I) The model (method) must be quantitative or attempt to supplya quantitative value in some way related to the performance effectivenessof the human component of a man-machine system. This automaticallyeliminated purely qualitative models and those Lhat described social (man-
man) systems; it also eliminated models concerned only with I Lachinecomponents.
(2) The model (method) must describe or attempt to describe a rel-atively full range of human behaviors. It may not handle all of them
equally well, and it may handAe them only by implication, but we wishedto avoid mnodels/methods specialized for a single function like Bayesiandecision-making or signal detection, etc. The reason for imposing thisconstraint was simply that systems almost invariably require the fullrange of behaviors; hence a model that could predict for only one or twoof these behaviors- even though it could do this superbly- would be mean-ingless for our purposes.
It would have been possible to apply additional model-selectioncriteria, such as:
The model must contain explicit procedures for application to
actual systems; or
The model must be predictive or evaluative rather than merelydescriptive. However, models vary in terms of the specifici~ty of theirprocedures, and only if the model was hopelessly general or abstractwas it ignored. Moreover, even if the model were not explicitly pre-dictive or evaluative, if its results could be utilized for predictive orevaluative purposes, it was considered.
10
B. CRITERIA FOR MODEL EVALUATION
Any analysis of the models described in this report inevitably involvesevaluation of these models and hence the application of evaluative criteria.There is no possibility of avoiding iese because they are inherent in the
analytic process. Some might reject the concept of evaluation, but to do'i this is to permit no selection of the better from the less good. The analyst
therefore has merely a choice between making his criteria overt (and thusmore susceptible to control) and allowing them to influence his judgmentsunconsciously.
The basic problem one runs into with evaluative criteria is that theyare unavoidably subjective, representing value judgments on the part of"those who analyze the models. Although there is no way of completelyeliminating this subjectivity, it is possible to attempt to constrain thissubjectivity by securing a consensus opinion from a large number ofqualified specialists as to which criteria are most important. This initself can be considered a worthwhile activity, since it has never beendone before.
"The procedure adopted involved several steps:
(1) Analysis of evaluative criteria applied to models by otherworkers in the field;
(2) Development of a comprehensive list of all potential criteria,together with detailed definitions;
i. (3) Submission of the list of criteria to qualified specialists with therequest that they rank these in order of importance;
(4) Development of a subset of criteria for evaluating the modelsreviewed in this report on the basis of an analysis of the re-sponses made in (3).
In developing the list of potential criteria two questions arose:
(1) Should one be idealistic, and include all possible criteria, orj more pragmatic, and limit the selection of criteria to only
those that appear most important?
(2) Is it possible to expect to find agreement amnong a cross-section"of specialists with different orientations and uses for models?This ties in with a point that will be raised a number of times insubsequent discussion: that the choice of a model, based on its"goodness", may well depend on the chooser's use-orientation,or what he wants the model to do for him.
'I
:I
The first question was answered by attempting to be all-inclusive(within limits, of course). Rather than the author exercising any apriori judgments, it was decided to allow the "experts" who would-rankthe citeria maximum opportunity to express themselves.
The second question had to be answered positively; otherwise anymeans of evaluating models would be impossible. If one adopts the pointof view that there are no general evaluative standards, it is impossibleto make any meaningful comparisons of models, because judgmentbecomes purely idiosyncratic. We had to reject this point of view andassume (hope, rather) that despite various points of view some generallyaccepted standards exist among specialists of various persuasions. Thereader will see whether this assumption was justified.
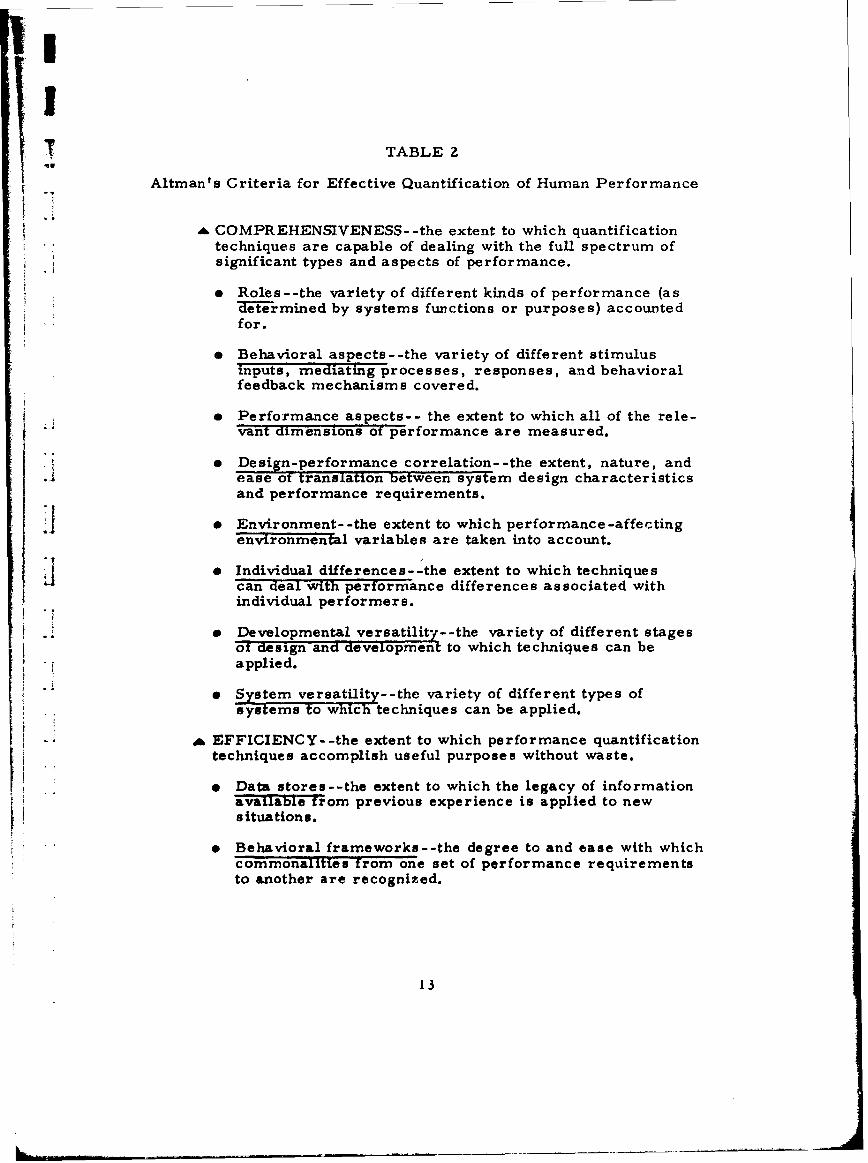
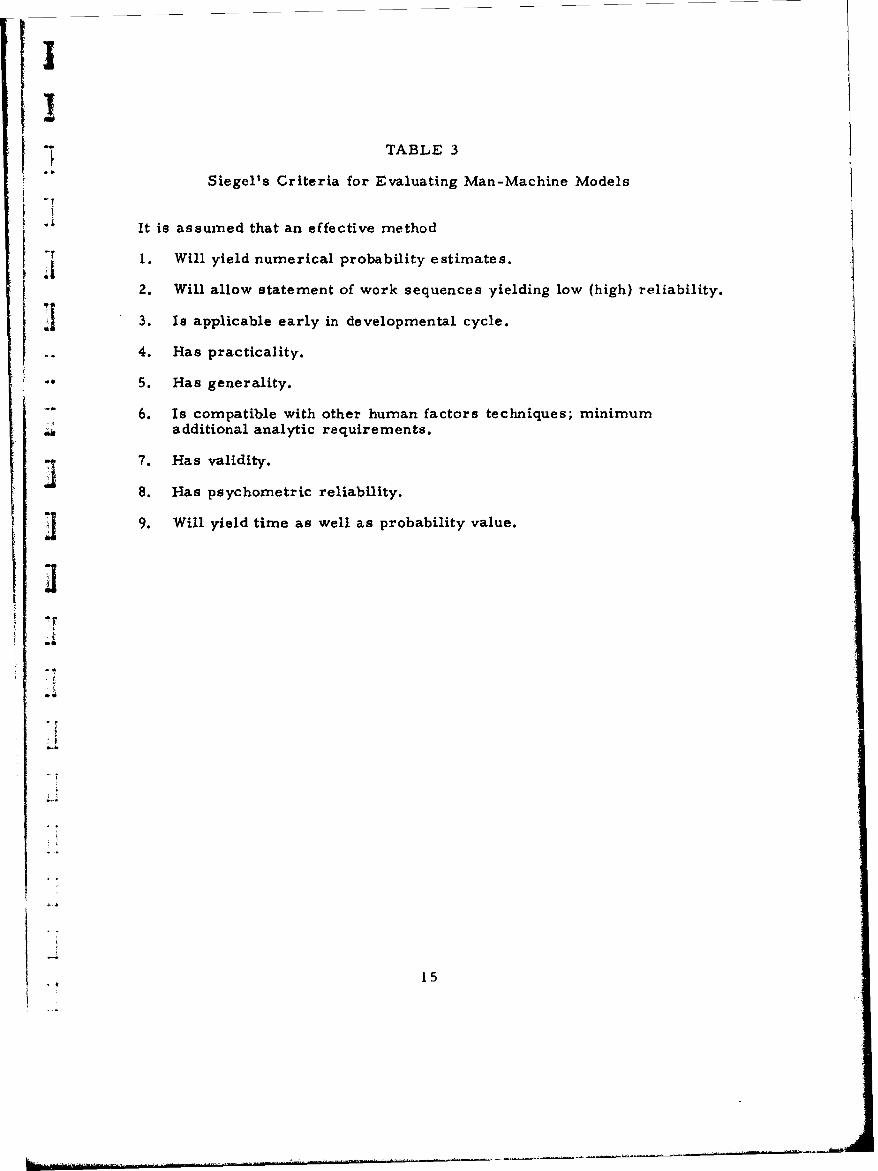
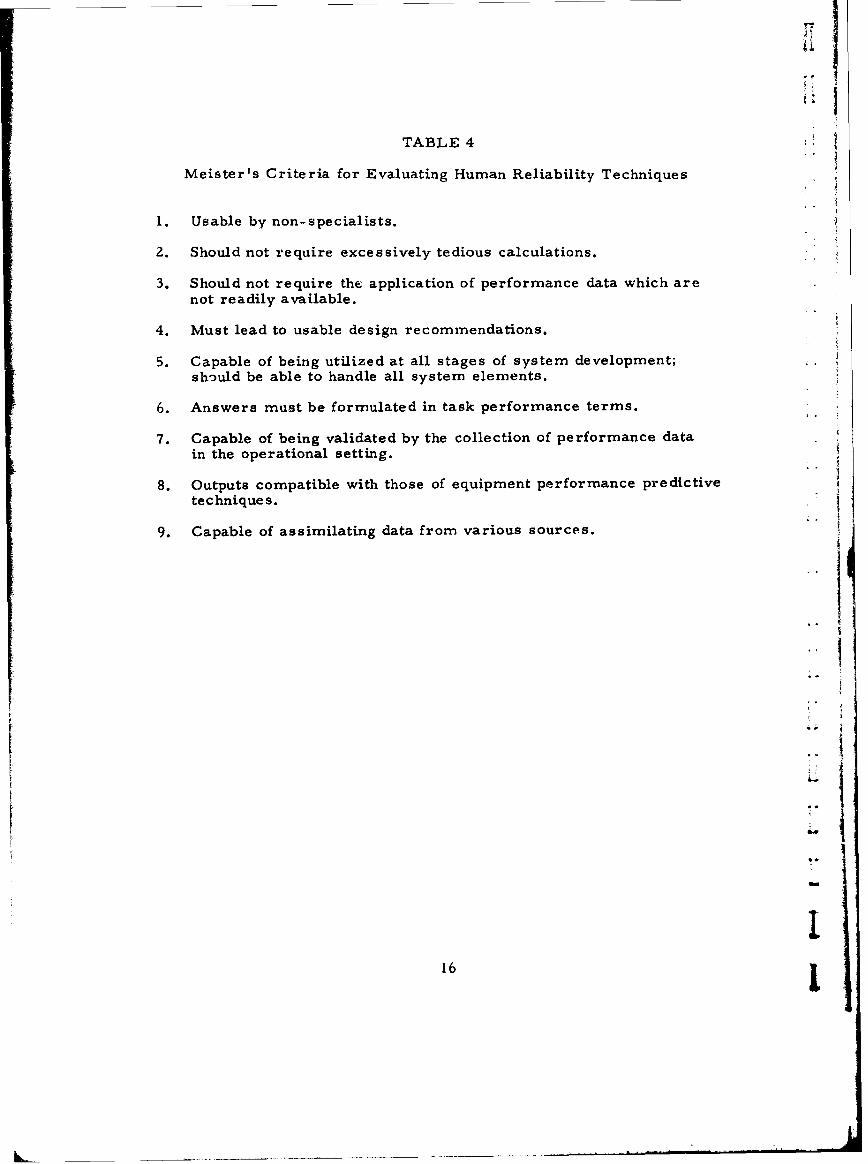
In the development of the list of potential criteria a large number ofsources were consulted, three of which were most useful in supplyingcriteria. The three sources are Altman (Ref. 1), Siegel (Ref. 5) and theauthor's own criteria paper (Ref. 3). In order that the reader may seethe degree of commonality in the standards suggested by these threeauthors, Tables 2, 3 and 4 list the three sets of proposed criteria. Notethe considerable degree of similarity among the three sources.
The various criteria examined appeared to fall into three classes:
(1) Those that describe how well the model corresponds to thereal world or predicts operational system performance.Altman's "homomorphism" is an example of this. Whatwe are actually talking about here is the validity of themodel.
(2) Those that relate to the structure of the model being eval-uated, e.g., its parameters, assumptions, outputs, etc.
(3) Those that describe how efficiently the model can be used,e. g. , its ease of use, its applicability early in the develop-mental cycle.
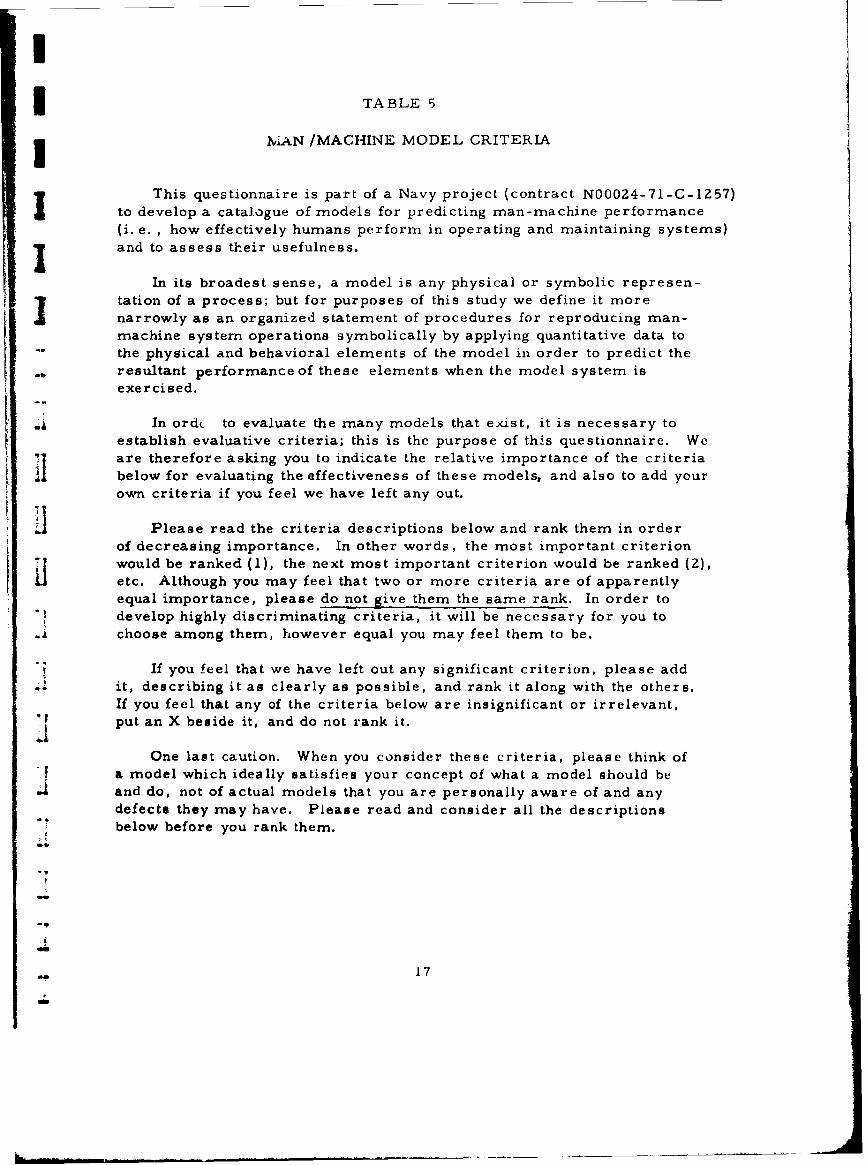
On the basis of an analysis of the three criteria sources referred toabove, as well as other sources (which were, unfortunately, not asproductive) a list of 16 criteria was developed for submission to the sampleof respondent specialists. This is presented in Table 5.
Certain things must be said about these criteria. It recognized thatsome of them are more abstract than others, that some are implied byor dependent upon others, (i. e., if the model contains certain qualities,then other related qualities must automatically exist in that model). Wemake no apology for the less than completely satisfactory status of thesecriteria. Criteria describing such complex qualities cannot be consideredhard and fast evaluative standards. However, they can be useful inreviewing the models.
I2
I!
TABLE 2
Altman's Criteria for Effective Quantification of Human Performance
A COMPREHENSIVENESS- -the extent to which quantificationtechniques are capable of dealing with the full spectrum ofsignificant types and aspects of performance.
* Roles--the variety of different kinds of performance (asdeate mined by systems functions or purposes) accountedfor.
* Behavioral aspects--the variety of different stimulusinputs, mediating processes, responses, and behavioralfeedback mechanisms covered.
o Performance aspects-- the extent to which all of the rele-vant dimensions of performance are measured.
"a Design-performance correlation- -the extent, nature, andease of translation Between system design characteristicsand performance requirements.
* Environment- -the extent to which performance-affectingenvironmental variables are taken into account.
o Individual differences- -the extent to which techniquescan deal with performance differences associated withindividual performers.
e Developmental versatility- -the variety of different stagesof design and development to which techniques can be
"* applied.
e Sstem versatilit - -the variety of different types ofsystems toMwhi1htechniques can be applied.
A EFFICIENCY--the extent to which performance quantificationtechniques accomplish useful purposes without waste.
e Data stores--the extent to which the legacy of informationavailable from previous experience is applied to newsituations.
• Behavioral frameworks--the degree to and ease with whichcommonalities from one set of performance requirementsto another are recognized.
13
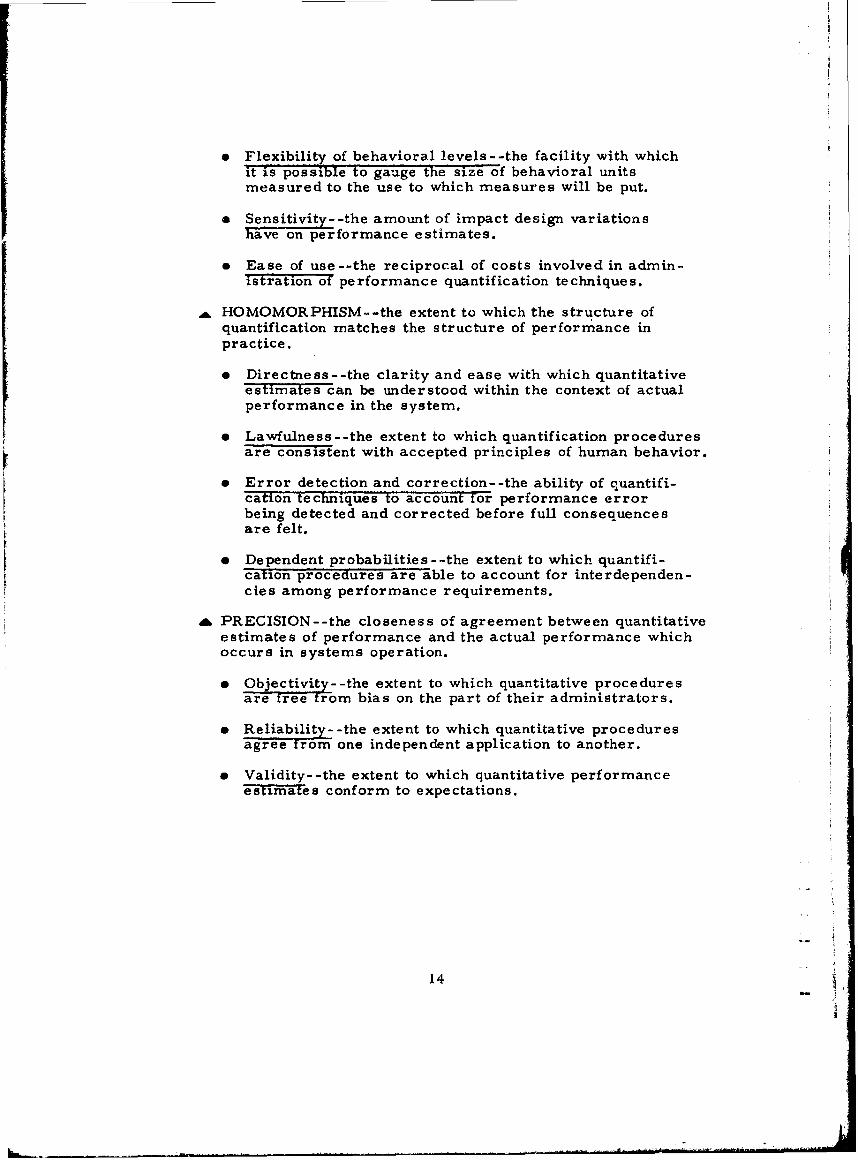
"* Flexibility of behavioral levels--the facility with whichit is possible to gauge the size of behavioral unitsmeasured to the use to which measures will be put.
"* Sensitivity- -the amount of impact design variationshave on performance estimates.
"* Ease of use--the reciprocal of costs involved in admin-istration of performance quantification techniques.
A HOMOMORPHISM--the extent to which the structure ofquantification matches the structure of performance inpractice.
"* Directness--the clarity and ease with which quantitativeestimates-can be understood within the context of actualperformance in the system.
e Lawfulness--the extent to which quantification proceduresare consistent with accepted principles of human behavior.
"* Error detection and correction--the ability of quantifi-cation techniques to account for performance errorbeing detected and corrected before full consequencesare felt.
"* Dependent probabilities--the extent to which quantifi-cation procedures are able to account for interdependen-cies among performance requirements.
A PRECISION--the closeness of agreement between quantitativeestimates of performance and the actual performance whichoccurs in systems operation.
e Objectivity- -the extent to which quantitative proceduresare tree from bias on the part of their administrators.
e Reliability- -the extent to which quantitative proceduresagree from one independent application to another.
e Validity--the extent to which quantitative performanceestimates conform to expectations.
14
II"I I!TABLE 3
Siegel's Criteria for Evaluating Man-Machine Models
" It is assumed that an effective method
"I 1. Will yield numerical probability estimates.2. Will allow statement of work sequences yielding low (high) reliability.
I 3. Is applicable early in developmental cycle.
4. Has practicality.
5. Has generality.
6. Is compatible with other human factors techniques; minimumadditional analytic requirements.
7. Has validity.
8. Has psychometric reliability.
S9. Will yield time as well as probability value.
15
IL
TABLE 4
Meister's Criteria for Evaluating Human Reliability Techniques
1. Usable by non-specialists.
2. Should not require excessively tedious calculations.
3. Should not require the application of performance data which arenot readily available.
4. Must lead to usable design recommendations.
5. Capable of being utilized at all stages of system development;should be able to handle all system elements.
6. Answers must be formulated in task performance terms.
7. Capable of being validated by the collection of performance datain the operational setting.
8. Outputs compatible with those of equipment performance predictivetechniques.
9. Capable of assimilating data from various sources.
16
I3 TABLE 5
I IMAN /MACHINE MODEL CRITERIA
This questionnaire is part of a Navy project (contract N00024-71-C-1257)to develop a catalogue of models for predicting man-machine performance(i. e. , how effectively humans perform in operating and maintaining systems)and to assess their usefulness.
In its broadest sense, a model is any physical or symbolic represen-I tation of a process; but for purposes of this study we define it more
narrowly as an organized statement of procedures for reproducing man-machine system operations symbolically by applying quantitative data tothe physical and behavioral elements of the model in order to predict theresultant performance of these elements when the model system isexercised.
In ordc to evaluate the many models that exist, it is necessary toestablish evaluative criteria; this is the purpose of this questionnaire. Weare therefore asking you to indicate the relative importance of the criteriabelow for evaluating the effectiveness of these models, and also to add yourown criteria if you feel we have left any out.
Please read the criteria descriptions below and rank them in orderof decreasing importance. In other words, the most important criterionwould be ranked (1), the next most important criterion would be ranked (2),etc. Although you may feel that two or more criteria are of apparentlyequal importance, please do not give them the same rank. In order todevelop highly discriminating criteria, it will be necessary for you to
a .choose among them, however equal you may feel them to be.
If you feel that we have left out any significant criterion, please addit, describing it as clearly as possible, and rank it along with the others.If you feel that any of the criteria below are insignificant or irrelevant,J "put an X beside it, and do not rank it.
One last caution. When you consider these criteria, please think ofa model which ideally satisfies your concept of what a model should be
AZ &and do, not of actual models that you are personally aware of and anydefects they may have. Please read and consider all the descriptionsbelow before you rank them.
!--
S-4
-4 17
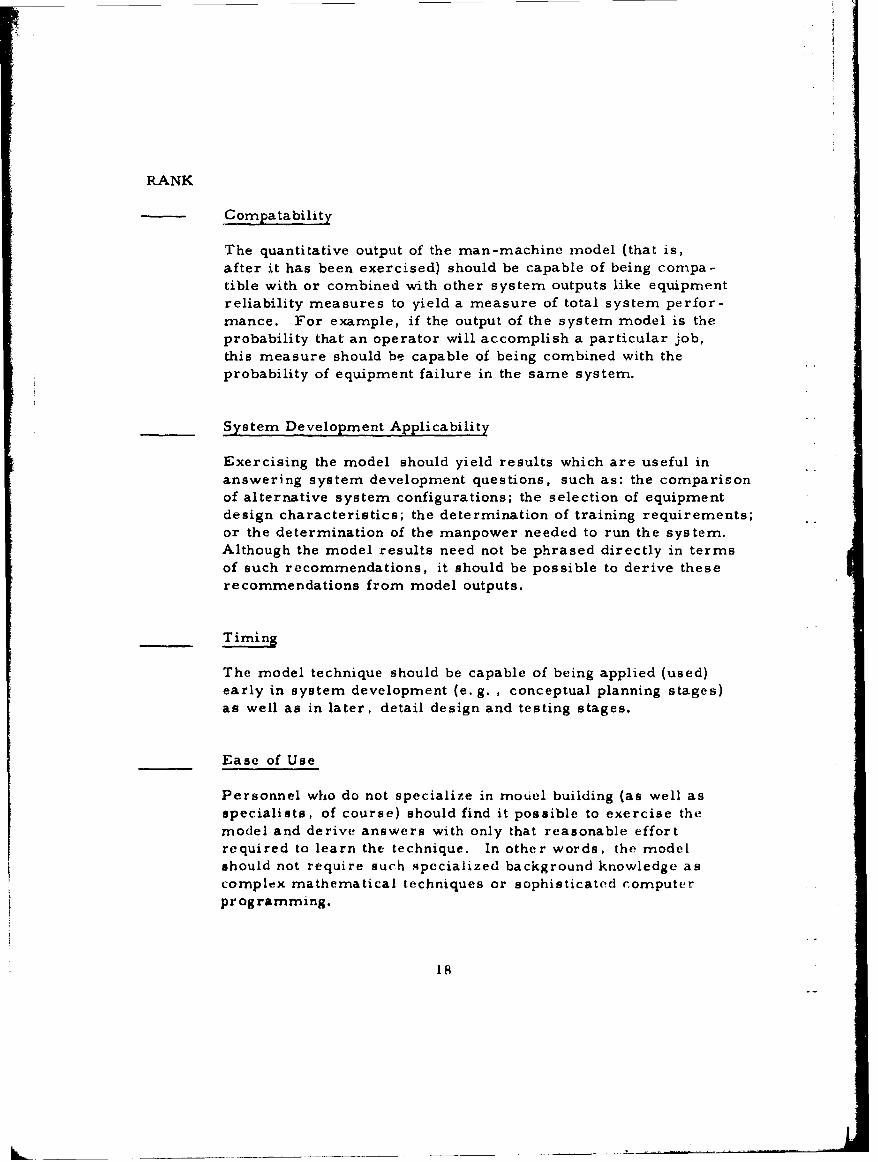
RANK
Compatability
The quantitative output of the man-machine model (that is,after it has been exercised) should be capable of being compa-tible with or combined with other system outputs like equipmentreliability measures to yield a measure of total system perfor-mance. For example, if the output of the system model is theprobability that an operator will accomplish a particular job,
this measure should be capable of being combined with theprobability of equipment failure in the same system.
System Development Applicability
Exercising the model should yield results which are useful in
answering system development questions, such as: the comparisonof alternative system configurations; the selection of equipmentdesign characteristics; the determination of training requirements;or the determination of the manpower needed to run the system.Although the model results need not be phrased directly in terms
of such recommendations, it should be possible to derive theserecommendations from model outputs.
Timing
The model technique should be capable of being applied (used)early in system development (e. g. , conceptual planning stages)as well as in later, detail design and testing stages.
Ease of Use
Personnel who do not specialize in model building (as well as
specialists, of course) should find it possible to exercise themodel and derive answers with only that reasonable effortrequired to learn the technique. In other words, the modelshould not require such specialized background knowledge ascomplex mathematical techniques or sophisticated computerpr og ramming.
18
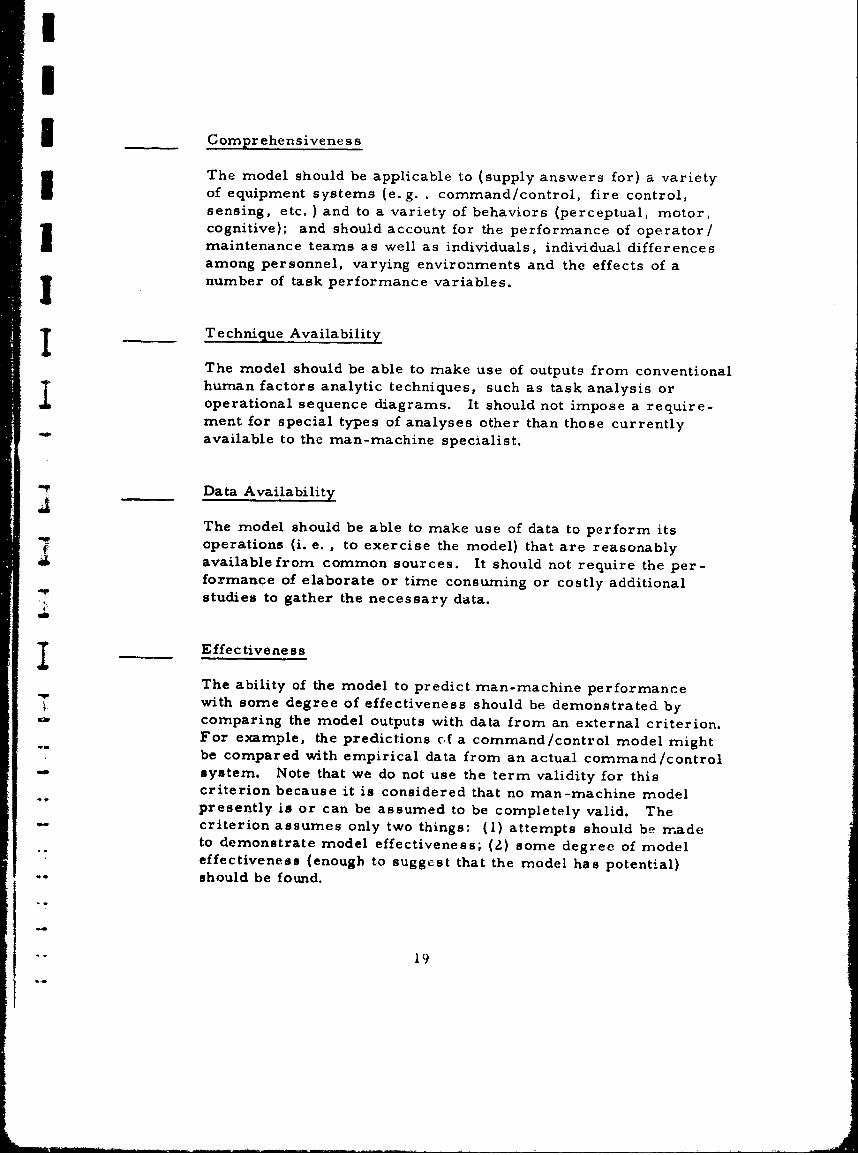
-iGComprehensiveness
The model should be applicable to (supply answers for) a varietyof equipment systems (e.g. , command/control, fire control,sensing, etc.) and to a variety of behaviors (perceptual, motor,cognitive); and should account for the performance of operator/maintenance teams as well as individuals, individual differencesamong personnel, varying environments and the effects of aJI number of task performance variables.
1 Technique Availability
The model should be able to make use of outputs from conventionalhuman factors analytic techniques, such as task analysis oroperational sequence diagrams. It should not impose a require-ment for special types of analyses other than those currently
! •available to the man-machine specialist.
__ Data Availability
The model should be able to make use of data to perform its7operations (i. e. , to exercise the model) that are reasonably
available from common sources. It should not require the per-formance of elaborate or time consuming or costly additionalstudies to gather the necessary data.
I Effectiveness
The ability of the model to predict man-machine performancewith some degree of effectiveness should be demonstrated bycomparing the model outputs with data from an external criterion.For example, the predictions cf a command/control model mightbe compared with empirical data from an actual command/control
-. system. Note that we do not use the term validity for thiscriterion because it is considered that no man-machine modelpresently is or can be assumed to be completely valid. The
-- criterion assumes only two things: (1) attempts should be madeto demonstrate model effectiveness; (2) some degree of modeleffectiveness (enough to suggest that the model has potential)
.-- should be found.
"19
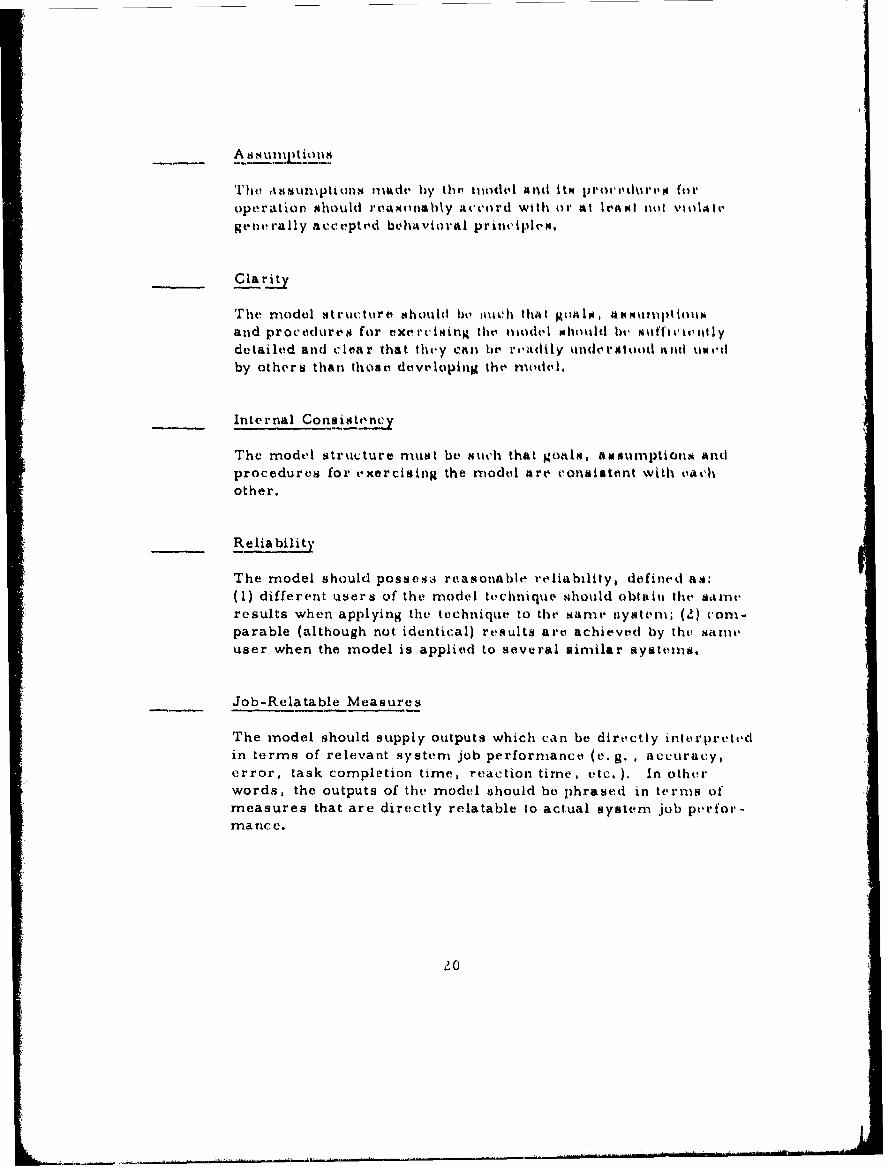
A s • umpt irons
'I'lieh 'A su t ippti mis mudvt by thv mod el and Itm iproot' •dur fo roper ration should r eaonably At cco rd with or at IV AMI no0 VO 1414tgene rally acceptd behavioral principles,
21__Ca ri t
Trhe model struc-ture should l he 01u•'h VAhPl, gt4a4 IUMIpt 01p N
and procodures for oxe rc'isinng the mtuodol hhould ht, Mut'fi't.i'itlydetailed and clear that tlhvy can he ratdily underiitood mid uol.tdby others than those developing tht, modol.
___ Internal ConsistLeny
The model structure must be such that goalls , a0U1ml)tionA antiprocedures for exercising the model are consistent with eachother.
Reliability
The model should possessi roasonable reliability, defined as:(1) different users of the model technique should obtain the sameresults when applying the technique to the same uystenm; (".) 'om-parable (although not identical) results are achieved by thu sanmt,user when the model is applied to several similar systems.
Job-Relatable Measures
The model should supply outputs which can be directly interprtetdin terms of relevant system job performance (e.g. , accuracy,error, task completion time, reaction time , etc. ). In othur"words, the outputs of the model should be phrased in terms ofmeasures that are directly relatable to actual system job perfor -manc e.
I,II
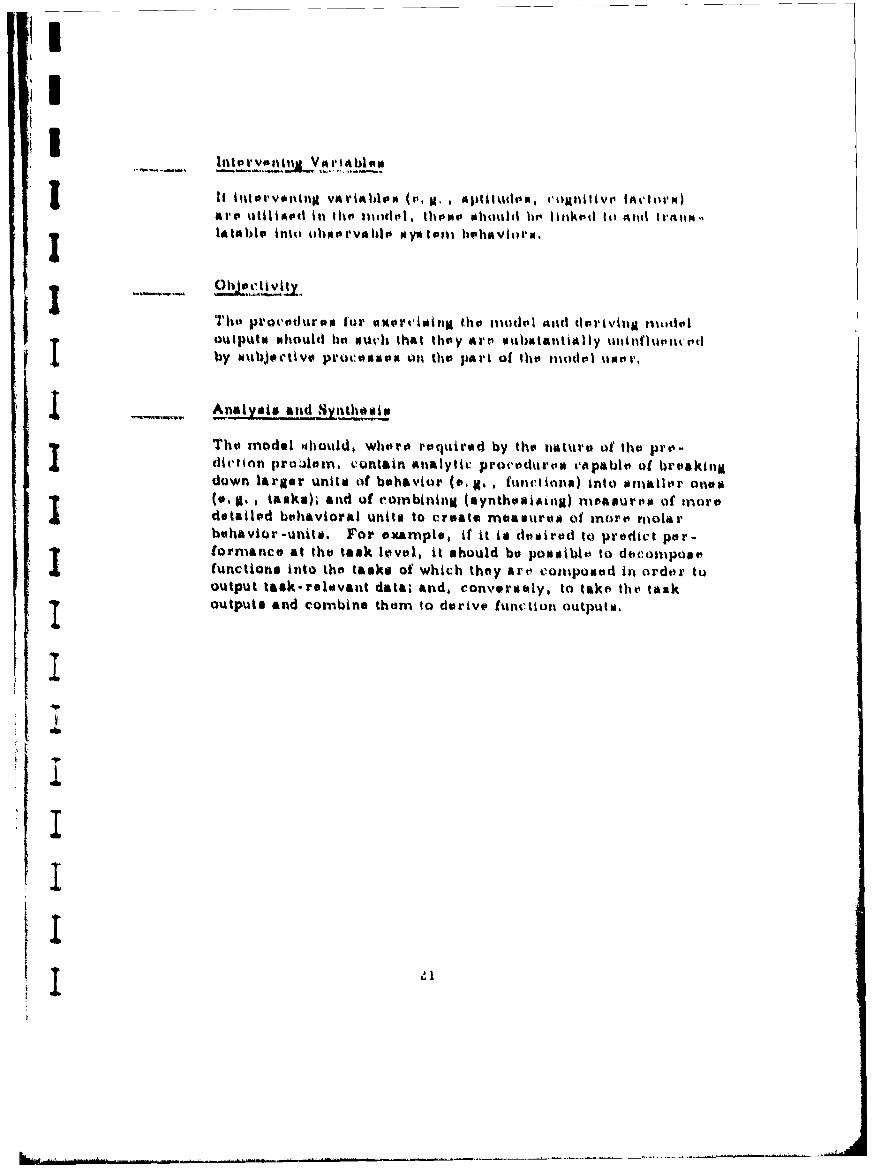
j 11 |tl~tl'Vlltltth vnrta'biPN~ (v, u., * lNl)I, ld~i', I'OIbUItgi l Al'tI'wr~r)
altr %iti iA d it% Iht It o tdto I , Ih% Pa MhoiuId hie Ititik d It ind tIrwiMlatlalhb into oioorvi hoI' eyltvnll bs'haviori,
T'ho Pr'ocothi-ON' furl OxorisCingt tho modl 14t11l Onri\,liti mod-ol,
outputa Phould eho ouch that thoy art' substaintial ly wst tIfrf'li r'lt,by ioIbj t'ljtivs prototmase on thio part of Ibih 111odot %loer,
- ..Analyaa and Spiythoami
iTho model rihould, whor' rocuired by thit naturo of the pro-diciton pro;4lorn, contain analytit procod'turoo 'apablo of britakingdown larger units of behavior (e, 11. . futnctions) Into iitnallr onoe(o. 1. , tasks). and of combining (eynthualinlg) metasures' of monodetailed behavioral units to create meoamiroo of mort molarbehavior-unita. For example, if it Is dowirod to prodict per-forn•anca at tho task love), it should be ponsiblh to decomposefunctions into the tans of which they aro composed in ordor tooutput task-relovant data; and, con\,orsaly, to take the task
I outputs and combine thorn to derive function outputs,
Il

0th ~ r ~ (Ad y~ur , i' l tdt t hril ik 131-twvi m ly ;A u wgibe
:1
The questionnaire presented in Table 5 was sent to a list of 52 poten-tial respondents, representing a cross-section of governmental, industrial,academic and consultant personnel selected because of their seniority in"their respective fields. The list was developed by the author and checked
Ai by the technicAl monitor for the project, J. P. Jenkins, and his staff.
"Of the 52 specialists to whom the questionnaire was sent, about 42responded; their names are listed in Appendix A. We say "about 42"because several specialists responded whose rankings could not be usedbecause they did not follow instructions. On the other hand, severalrespondents induced members of their staffs to complete the questionnaire,which added to the total N. raking 42 an the number who responded, thepercentage of return for this questionnaire was approximately 80%, whichis quite high for a mailed questionnaire.
The reader will note that respondents were asked simply to rank thecriteria in order of importance and to eliminate tie-rank. to avoidclustering of responses. Several respondents asked why the questionnairedid not require paired-comparison selections, or ratings of each criterionon a scale of importance. Neither of these alternatives was selected,although either would have been preferable to forced choice-rankings;however, it was felt that if excessive demands were made on respondents,too many would fail to respond.
Provision was made for respondents to add any criteria they felt werenot included in the list of 16, and to eliminate any criterion which was feltto be irrelevant. About 10%0 of the respondents each suggested as many asfour additional criteria; however, many of these duplicated the criteria inthe questionnaire (although in different words). Of the 672 criteria ranked(42 respondents x 16 criteria), only 25 were eliminated as irrelevant, orless than 4%, suggesting that the overwhelming majority of respondentsfelt that the criteria presented were relevant.
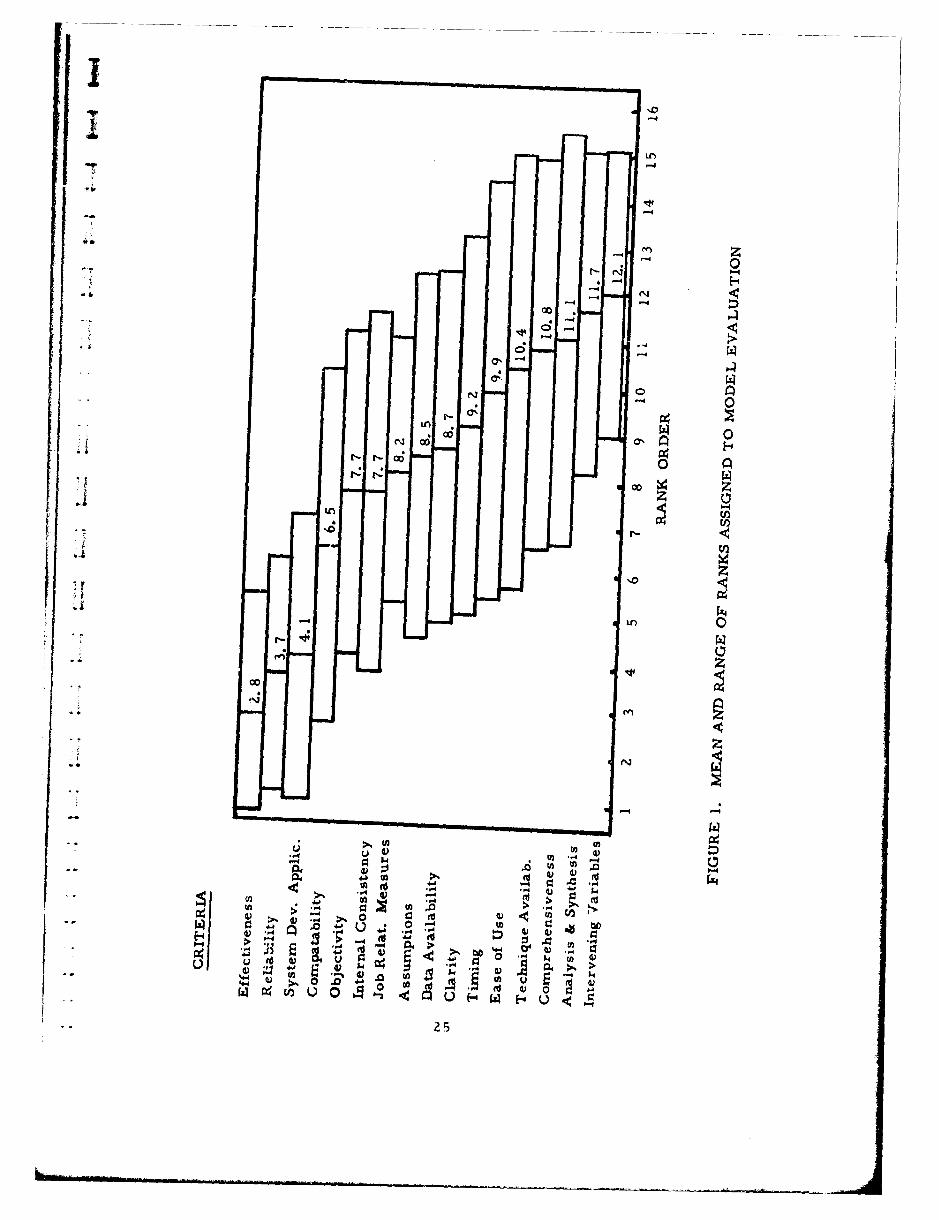
Table 6 and Figure 1 present the results of the analysis of theresponses. In addition to the mean and standard deviation of the rankingsfor each criterion, Kendall's W coefficient of consistency (Ref. 6) wasapplied to the matrix of 16 x 4"Tcriterial rankings. The purpose of the Wanalysis was to determine whether there was overall agreement amongrespondents as to the relative weighting they would apply to the variouscriteria. The W value was . 36, which, with an N of 16, to significant atthe . 01 level. T"'spection of the "raw" rankings in the 16 x 42 matrixalso reveals a high degree rif correspondence among the rankings. Thus,our original fears that there would be wide disagreement among specialists,based on differences in professional orientation, turned out to be unwar-ranted.
23
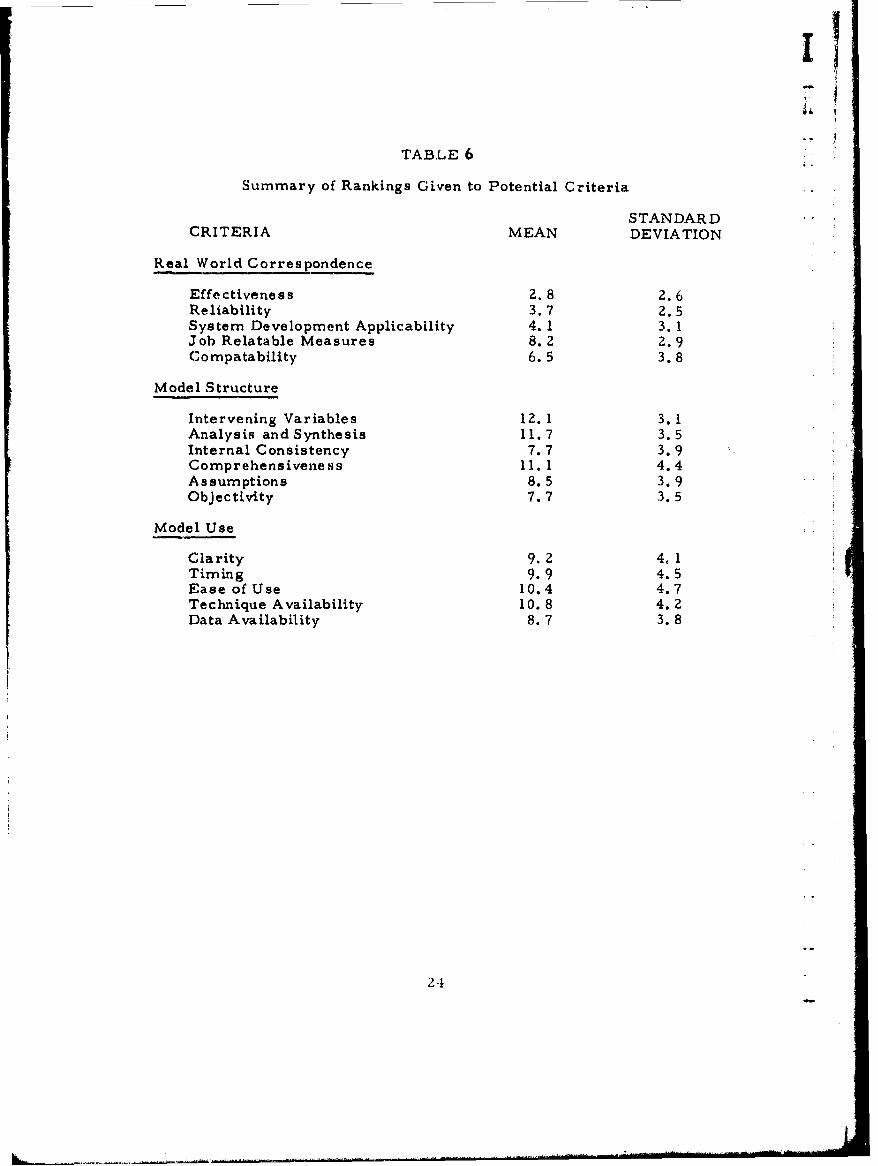
TABLE 6
Summary of Rankings Given to Potential Criteria
STANDARDCRITERIA MEAN DEVIATION
Real World Correspondence
Effectiveness 2..8 2.6Reliability 3.7 2.5System Development Applicability 4.1 3.1Job Relatable Measures 8.2 2.9Compatability 6.5 3.8
Model Structure
Intervening Variables 12.1 3.1Analysis and Synthesis 11.7 3.5Internal Consistency 7.7 3.9Comprehensiveness 11. 1 4.4Assumptions 8.5 3.9Objectivity 7.7 3.5
Model Use
Clarity 9. 2 4o 1Timing 9.9 4.5Ease of Use 10.4 4.7Technique Availability 10.8 4.2Data Availability 8.7 3.8
24
LtlP-4
004
-4 4
004
00 4
IU
-44
ZA 0.0to~
rsv
Z 5
Recalling the three classes of criteria noted previously, the 16
criteria can be divided as follows:
Those involving real-world correspondence:
(1) Effectiveness;(2) Reliability;(3) System development applicability;(4) Job relatable measures;(5) Compatability
Those dealing with model structure:
(6) Intervening variables;(7) Analysis and synthesis;(8) Internal consistency;(9) Comprehensiveness;
(10) Assumptions;(11) Objectivity
Those describing model use:
(12) Clarity;(13) Timing;(14) Ease of use;(15) Technique availability;(16) Data availability.
Table 6 and Figure 1 indicate that 4 of the 5 real world correspondencecriteria were ranked highest; the only exception is job relatable measures,thus indicating that specialists place most emphasis on the capability ofbehavioral models to predict efficiently. The situation is a bit moremuddled with the other two classes of criteria. Of the 6 model structurecriteria, 3 were considered on the whole as being least important; however,internal consistency and assumptions followed hard upon real-worldcorrespondence criteria. Model use criteria occupied a somewhat inter-mediate-low position in the rankings.
These judgments must be tempered by the high degree of responsevariability found, as shown in Figure 1. Differences in criterionweighting corresponding to differences in professional orientation showup markedly. However, greatest consistency (as shown by smallerstandard deviations) is present in real-world correspondence criteria.Although a measure of the significance of differences between rankingsfor individual criteria was not attempted, it is apparent that the 4 real-world correspondence criteria are markedly set apart from the remainingcriteria, whose ranks are closely bunched together.
26
IIj What can one may about the results of the questionnaire responses?
(1) There appears to be general agreement that criteria describinghow well models predict or relate to real-world performance are mostimportant;
(2) Specialists feel that model structure is of less importance thanmodel use;
(3) There is a high degree of variability in rankings of the importanceof the various criteria which tends to support the suggestion that the wayin which one views a model depends to a large extent upon one's professionalorientation and the use to be made of the model.
Based on the preceding analysis and partly in consideration of th3practical problems of applying criteria to models, a number of criteriaamong those tested were selected to evaluate the models reviewed inthis report.
Of the 16 criteria originally developed, 7 were finally selected,several of these being combined because they seemed to representdifferent aspects of the same criterion.
Two of the criteria selected (validity and reliability) achieved thejj highest ranking in the responses made to the questionnaire, and had the
lowest variability in responses. The criterion of system developmentapplicability, which had the next highest ranking in the responses, was
considered to be related to a number of other criteria, i. e., cuniprehen-siveness of systems/task being evaluated, and to timing, i.e., stage ofsystem design at which the model could be applied. In consequence a"third criterion was developed, also termed system development aeplica-.bily, which consisted of the original system development applicability,comprehensiveness and tin ,ng criteria. A fourth criterion was developed,termed model characteriso cs, which combined the original objectivityS~criterion and a new cr terion which appeared to represent the essential"discernable feature of the former criteria dealing with assumptions,
clarity, internal consistency and intervening variables. This last (new)criterion relates to the extent to which the structure of the model wasdescribed in detail.
The other criteria were eliminated because it appeared that theywould not discriminate among the models (i. e. , all the models possessed"the quality in common) or because it would be inordinately difficult tomake the judgments required. For example, it was assumed that all themodels output job relatable measures. Criteria dealing with the indi-vidual aspects of model structure were considered overly complex todiscriminate in their original form.
27
i ri
Originally it had been intended to scale the four evaluative criteriaand thus to provide a quantitative evaluation of the models reviewed. Onmore reasoned reflection, however, this seemed unwarranted, since the [1subtleties of the models make scaling of their dimensions largely unin-terpretable.
Table 7, however, which presents the criteria finally selected does
suggest that a model may possess different amounts of each criterionquality. The criteria listed in Table 7 are the basis for the Evaluationsubsection concluding each model description.
28
m
TABLE 7
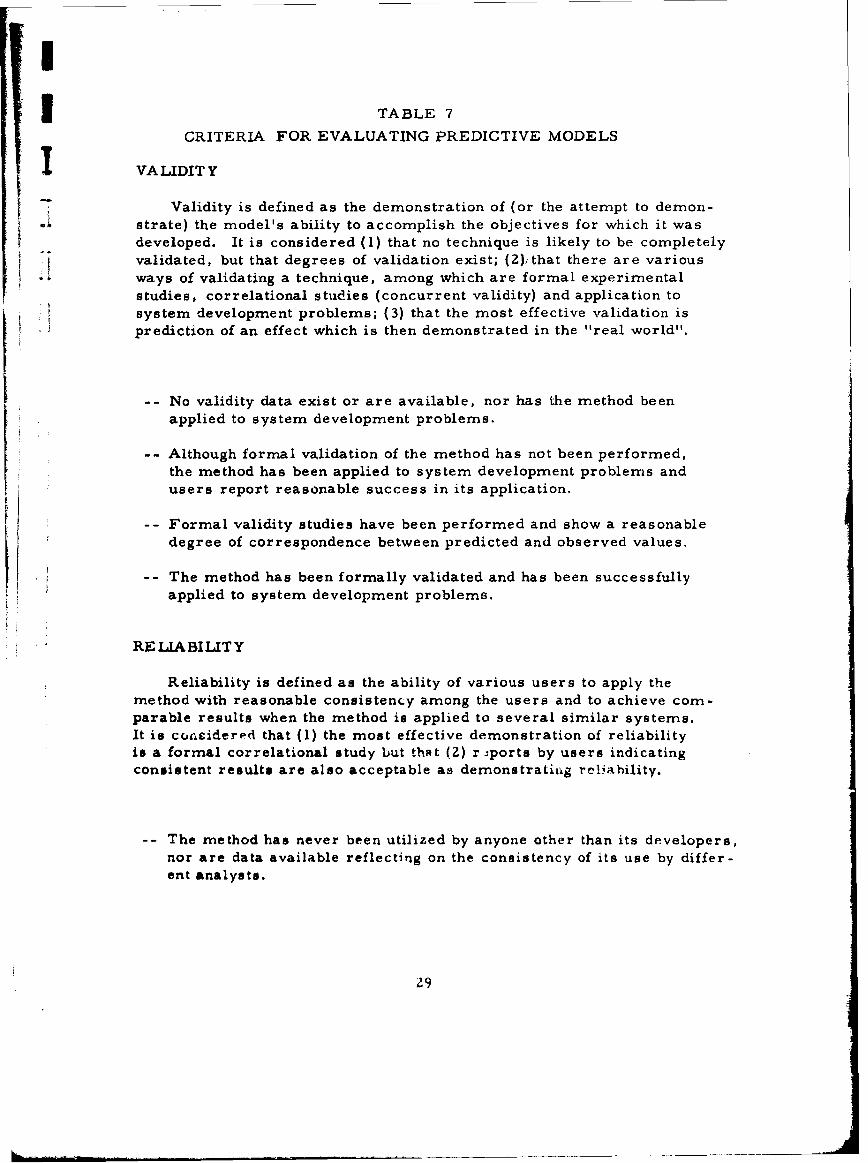
CRITERIA FOR EVALUATING PREDICTIVE MODELS
I VA LIDIT Y
- Validity is defined as the demonstration of (or the attempt to demon-
strate) the model's ability to accomplish the objectives for which it wasdeveloped. It is considered (1) that no technique is likely to be completelyvalidated, but that degrees of validation exist; (2)jthat there are various
i ' ways of validating a technique, among which are formal experimentalstudies, correlational studies (concurrent validity) and application tosystem development problems; (3) that the most effective validation isprediction of an effect which is then demonstrated in the "real world".
-- No validity data exist or are available, nor has the method beenapplied to system development problems.
-- Although formal validation of the method has not been performed,the method has been applied to system development problems andusers report reasonable success in its application.
-- Formal validity studies have been performed and show a reasonabledegree of correspondence between predicted and observed values.
The method has been formally validated and has been successfullyapplied to system development problems.
RELIABILITY
Reliability is defined as the ability of various users to apply themethod with reasonable consistency among the users and to achieve com-parable results when the method is applied to several similar systems.It is considered that (1) the most effective demonstration of reliabilityis a formal correlational study but thst (2) r -ports by users indicatingconsistent results are also acceptable as demonstrating reliability.
-- The method has never been utilized by anyone other than its developers,nor are data available reflecting on the consistency of its use by differ-ent analysts.
29
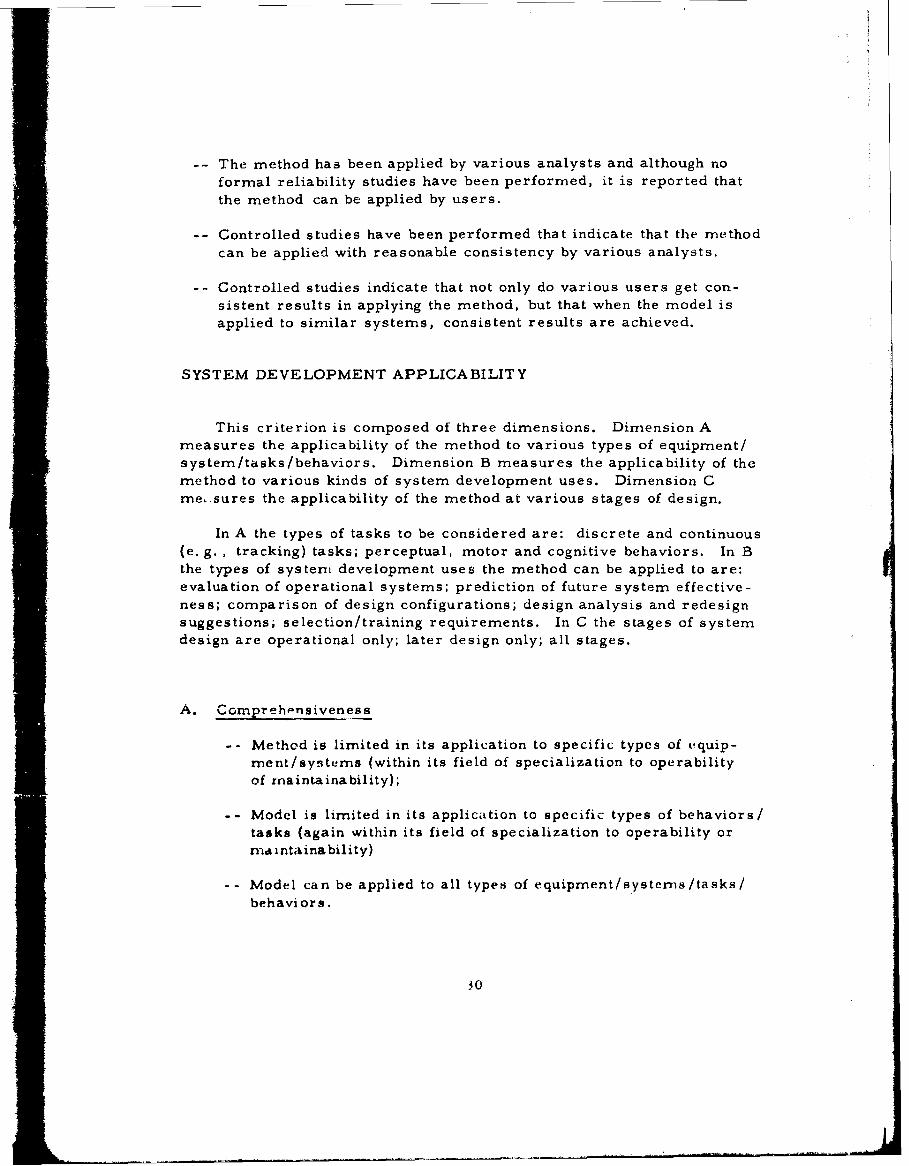
- - The method has been applied by various analysts and although no
formal reliability studies have been performed, it is reported that
the method can be applied by users.
-- Controlled studies have been performed that indicate that the method
can be applied with reasonable consistency by various analysts.
Controlled studies indicate that not only do various users get con-sistent results in applying the method, but that when the model isapplied to similar systems, consistent results are achieved.
SYSTEM DEVELOPMENT APPLICABILITY
This criterion is composed of three dimensions. Dimension Ameasures the applicability of the method to various types of equipment/"system/tasks/behaviors. Dimension B measures the applicability of the
method to various kinds of system development uses. Dimension Cme-.sures the applicability of the method at various stages of design.
In A the types of tasks to be considered are: discrete and continuous(e. g. , tracking) tasks; perceptual, motor and cognitive behaviors. In Bthe types of system development uses the method can be applied to are:
evaluation of operational systems; prediction of future system effective-
ness; comparison of design configurations; design analysis and redesignsuggestions; selection/training requirements. In C the stages of systemdesign are operational only; later design only; all stages.
A. Comprehensiveness
-- Method is limited in its application to specific types of equip-ment/systems (within its field of specialization to operabilityof maintainability);
- - Model is limited in its application to specific types of behaviors/tasks (again within its field of specialization to operability ormaintainability)
-- Model can be applied to all types of equipment/systemns/tasks/behaviors.
30
I
B. Applicability
-- Model does not predict future periormnance bat only measureson-going system performance;
I-Model does not output a prediction of equipment/system or
mission/task effectiveness, but is descriptive only of futuresystem performance;
Model outputs a prediction of equipment/system/Yrrission/task
performance effectiveness, but cannot be used (or used onlywith difficulty) for other purposes (e. g. , design analysis, train-"ing/selection requirements);
-- Model outputs a prediction of system performance effectivenessand can also be used for other purposes such as design analysis,etc.
C. n
-- Model can be applied only to systems that have become opera-"tional.
-- Model can be applied only to systems in their later stage of"design.
-- Model can be applied to systems in early as well as later stagesof design.
"MODEL CHARACTERISTICS
The characteristics of the model are based on two dimensions, A,objectivity, B, definition of structure. All other things being equal, a"model is assumed to be best which requires fewest subjective judgments(and the method of securing these should be explicit); and whose concep-tual structure (assumptions, parameters, etc.) are explicitly defined anddescribed in detail.
31

A. L
- - M O vI,,I 1'i,( 0Irt.' 1iaiiy pldi'it \, " , jklIOA 'Id,111 Pt A llthl 11t , l ,lhod %it
"-e- ur'I li t'1hi 'l t t• I l I' o 1illw i, 1 1
- lod"I trl IO v , )1' orhoilly Ia f 1w A1t1ifi t 'hil% illf 1 hill
-- vlodel refqti"rrst4 "01t, l oi' nly at tow\V m hjoittitl\',' ,~ltlM11iti•i otOt.e r tlw ~d tit svrorillj 111014 im highily lexpliitit
-- M odtl r', t,, pr'actic'ally lit) sO b,hoj•e lv,, ,Id i lt' lgiit M till li
it applivt'hoin,
B. Structure,
-T- a ssuptiouns wAik par'a1moto underlyiilM tho inoth, Aert, I notexplicitly dtfineid u, lescribd in d'ttail.
-T- The assumptions and parmoturti under1'lyingM thth mltodel| Art',explicitly definted and dt'sc rib id in detail,
REFERENCES
1. Altman, J. W. Pro~ress in Qualutifyi.n.Hijan Pevrforirance, Papt- rpresented at the Electronic Industries Association System Effective -ness Workshop, Chicago, 111. 18-.10 September 1968,
2. Chapanis, A. Men, Macihines and Models Anricat_ Ps•ychologist1.961, lb, 113-131.
3. Meister, D. Criteria for Devwlop-nment of a Hunman ReliabilityMethodology. In J. P. Jenkins (Ed.) U. S. Navy Human Reliability
Workshop, Washington, D. G. !2-23 July 1970, NAVSHIPS Report0967-412-4040, February 1971, 45-64.
i

II1
4
I
I
IIIII
I, I l' ,1 , J 1 11 1 K .,I I l w l1 1 m N 11,lNOW k~v ý 11111 % 114\ m ll 41si 33
Ii g l , 1 iA p o 4 N~ s'lP ,11o ,1111tl
H
SNClT)ON III
I)ISCHlPTI'IONS OF THlE' Il~llll 'll l, ,II*I
Tlht,1u, IlmdI 1100crillod ill thim ropo1'I tI'rv lilIted bi'low ill tilt, o~rdh, r
Ill whiCh they A1'% 1A1'O*Vl~ltl&d
-!' fill_ I t' l d ict Mo el
1 , A I y lviiithodn~
(1) A oll'iLAn lnml itillktV IMs' Rlt r1rlCh (AIR) DAIA StOrt'
(.11) T 1 -'l'e chniqui' tot, f Ir t~on k rror RntLt Prediction(III) TEPPS-T''chnqu o (ae Entablilihing P•'r•onnel
Performance Stwndards(IV) Pickrol /McDonald mode!(V) Borry/Wulff model(VI) Throughput Ratio(VII) Askron/Rogulinski model(VIII) DEI-Display Evaluative Indux(IX) Personnel Performance Metric(X) Critical Human Performance and Evaluative Program(CHPAE)
2. Simulation Methods
i (I) Digital Simulation model(II) TACDEN(11) Boolean Predictive technique(IV) MOS-Human Operator Simulation(V) ORACLE-Operations Research and Critical Link
Evaluator(VI) Personnel Subsystem effectiveness model
B. Maintainability Prediction Models
(I) ERUPT -Elementary Reliability Unit Parameter Technique(II) Personnel Reliability Index(III) MIL-HIDBK 472 prediction methods
We do not maintain that this collection of models represents all thosethat might exist; they are,however, all that we could find. To be com-pletely safe,therefore, the set of methods reviewed in this report shouldbe considered only as a sample of all existing models. However, becauseof the many sources that were examined, it is felt that the ones includedrepresent the greatest majority (e. g. , 90%) of presently available man-
'I
FDI PAGE BLANK
35
V...
nIlchine system effectiveness odels, especially of those published inthe "open" literature. Among them, moreover, are those best known toworkers specializing in the area.
As far as sources that were examined to locate models, the followingpossibilities were canvassed:
(1) Letters were sent to other specialists requesting leads.
(2) The published human factors and reliability literature wasreviewed, e.g. , Ergonomics, Human Factors, J. Applied Psychology,Annals of Reliability and Maintainability, government reports, etc.
(3) The American Psychological Association performed a computersearch of its abstracts for the author. However, this covered only thelast three years because its information retrieval system is still in
embryo form.
(4) Various other abstracts and review documents were persued.
(5) Finally, a notice was published in the Human Factors Bulletin(a journal of the Human Factors Society), requesting anyone developingor aware of a behavioral system effectiveness model to contact the
author.
The list above has been divided between models that predict systemoperability (i. e. , the ability to operate the system) and those that predictsystem maintainability (i. e., the ability to perform maintenance on thesystem) and system downtime.
The operability models are further differentiated in terms of whetherthey (a) develop predictive indices by analyzing data banks to select andassign an appropriate value to the behavioral unit being predicted or (b)develop predictive indices by simulating behavioral processes (usually
on a computer). Category (a) operability models do not employ simula-tion methods; category (b) models do. Obviously analysis is involved in
both types of models, if only in performing the task analysis which is thecustomary exordial phase in development of the terminal prediction. How-ever, the reason we call the first category "analytic" is because thedetermination of the predictive value (e. g. , .9997 for task X) is madeonly on the basis of an analysis of available data. For example, in theAIR methodology one must select from its Data Store the predictive values
36
-•_
UI
corresponding to the significant characteristics of the equipment com-ponents involved in the task. Once those values are selected, the terminaltask/equipment/system prediction is determined solely by combination ofthe original selected value(s). Obviously simulation models make use ofdata banks, but in their case the analysis phase is followed by a simula-tion phase (which corresponds to the combinatorial phase of the analyticmodels) and the development of the terminal task/equipment/system pre-diction arises directly from that simulation, not from the analysis.
The maintainability models reviewed are primarily analytic (theone possible exception being Siegel's rersonnel Reliability Index asapplied to his 1-2 man digital simulation model).
The above distinctions are made without prejudice to the fact thatcomputers may be used in the combinatorial operations of the analyticmodels. The essential distinction is that in one case computers are usedto simulate behavioral processes, in the other case they are not so used.
"WU There are other ways of characterizing these models, for example,in terms of the range of behaviors and tasks they cover, but the categoriesselected seem to be the most meaningful.
The following are the category headings around which the model"descriptions are organized:
Introduction A capsule description of the model designed to orientthe reader to further details. This section includes any special charac-teristics that distinguish the model being described.
"Goals Describes what the developer of the model is attempting todo with the model. This is important because the model can only beevaluated in terms of what its objectives are. This section ties in witha later section on Anticipated Model Uses, because only if one knowswhat the model is designed to do can one ask whether these goals areactually accomplished. The implications of these goals in terms of what
they require in the way of model assumpt:ions, parameters, proceduresand data are examined.
Assumptions This section describes any behavioral or non-behavioral assumptions which the model makes. These are examinedin terms of whether they are reasonable (accord with experimental
t evidence or real-world experience), If model assumptions are unrea-sonable, doubt is cast on the validity of the model. This section alsocontains any definitions of special terms used by the model.
37
Methodological Scope This section asks whether the miodel willcover~ the range of tasks and behaviors commnonly found in systemis. Inparticular, the question is asked wht-.the r the model will deal with con -tinuous as well as discrete tasks; with cognitive as well as pterceptual/motor behaviors; with the range of systems coninconly found in themilitary, e. g. , command-control, sensing, piloting, etc.
Paramreters This section asks what the elements of the modelconsiat of and any factors that play a significant role in the operation ofthe model. For example, certain models miake a special point of stressas a factor in mission accomplishment. The implications that theseparameters have for such things as data requirements or type of outputmeasure are also examined.
Data This section includes subsections on input data required, thesources of those data and outputs of the nmodel. Specifically, we ask.-what kinds of input data are needed; how easy or difficult is it to securethese data; is a data bank required or not; what kind of measures doesthe model outpait; how useful are these measures?
Procedures for Model Application The main subsections are: (1)analytic method; (2) method of synthesis; (3) the behavioral unit to whichdata apply. Analytic method refers to the manner in which the modeluser must analyze the system in order to define the behavioral unit being pre -dicted and to determine what dimensions the input data should have. Method ofsynthesis deals with the process that, given that the model user has analyzedthe system down to its component units (e. g. , behaviors, equipmentcomponents) to which predictive data will be applied, he uses to recon-stitute or rebuild lower level units into higher ones. The section de-scribes the analysis -synthesis process and what its implications for dataoutputs are. Finally the section asks to what behavioral unit (presumablythe most molecular) the predictive data are applied?
Anticipated Model Uses This section deals with what the model canbe used for, in terms of the goals already noted. The model's applica-hility is discussed in terms of the following potential uses: prediction ofsystem effectiveness; design analysis; manpower selection; and trainingrequirements, This section examines how effectively the model canaccomplish its goals and satisfy system development requirements.
Validation/Application Studies The evidence for the validity andapplicability of the model is examined in terms of formal studies per-formed arid the various systems to which the model has been actuallyapplied. The adequacy of the validation evidence is examined.
38

I!
SuImary Evaluation This section sums up the prect'ding ,.xanmiza-tion of the model and presents an evahlation of the miode in tv,,ms of thecriteria described in Table 7.
In order for the reader to evaluate the following m'odel dcescriptionscorrectly he should know that nmost of themn were subviitted to their dc-velopers in preliminary draft form for revitw. This pe rmiIltd correc-tion of any technical inaccuracies and also allowed developers to commenton and rebut any judgments made by this author. In a few C'Ascs thewhereabouts of the developers were unknown and so they could not becontacted. However, all but one or two of the ope•rability models wercpresented to their developers for review and their corimment.,, if theywere made and were appropriate, have been included in the Written de-scriptions. This could be done, however, for only 2 of the 6 maintain-ability models.
39
A. OPERABILITY PREDICTION MODELS
i ANALYTIC METHODS
14
1 I I 1
"" ~I
II
J I. INDEX OF ELECTRONIC EQUIPMENT OPERABILITY
(AIR DATA STORE)
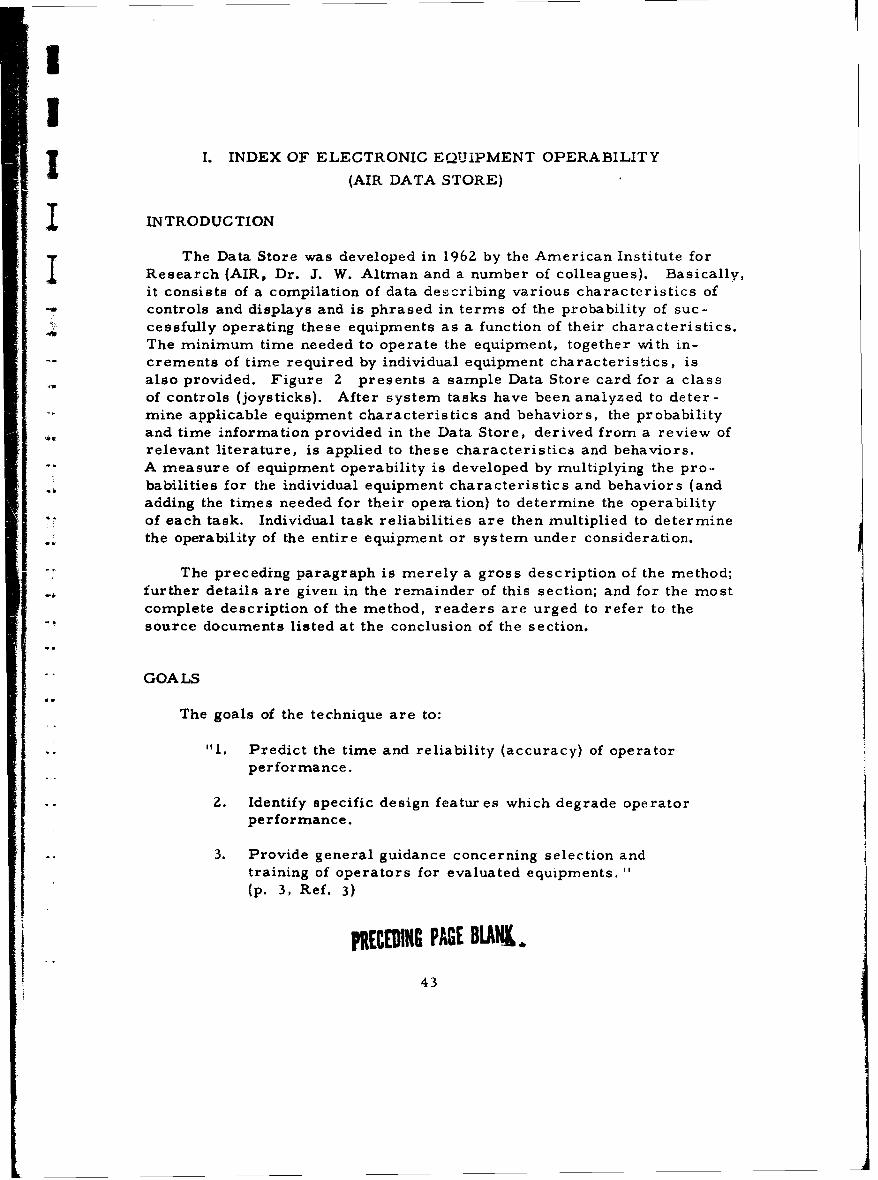
INTRODUCTION
The Data Store was developed in 1962 by the American Institute forResearch (AIR, Dr. J. W. Altman and a number of colleagues). Basically,it consists of a compilation of data describing various characteristics ofcontrols and displays and is phrased in terms of the probability of suc-cessfully operating these equipments as a function of their characteristics.The minimum time needed to operate the equipment, together with in-crements of time required by individual equipment characteristics, isalso provided. Figure 2 presents a sample Data Store card for a classof controls (joysticks). After system tasks have been analyzed to deter-"mine applicable equipment characteristics and behaviors, the probabilityand time information provided in the Data Store, derived from a review ofrelevant literature, is applied to these characteristics and behaviors.A measure of equipment operability is developed by multiplying the pro.-babilities for the individual equipment characteristics and behaviors (andadding the times needed for their opera tion) to determine the operability"of each task. Individual task reliabilities are then multiplied to determinethe operability of the entire equipment or system under consideration.
"The preceding paragraph is merely a gross description of the method;
further details are given in the remainder of this section; and for the mostcomplete description of the method, readers are urged to refer to the"source documents listed at the conclusion of the section.
"GOALS
The goals of the technique are to:
"."I. Predict the time and reliability (accuracy) of operatorperformance.
2. Identify specific design features which degrade operatorperformance.
3. Provide general guidance concerning selection andtraining of operators for evaluated equipments.(p. 3, Ref. 3)
PRECEDING PAGE BLAI.
43
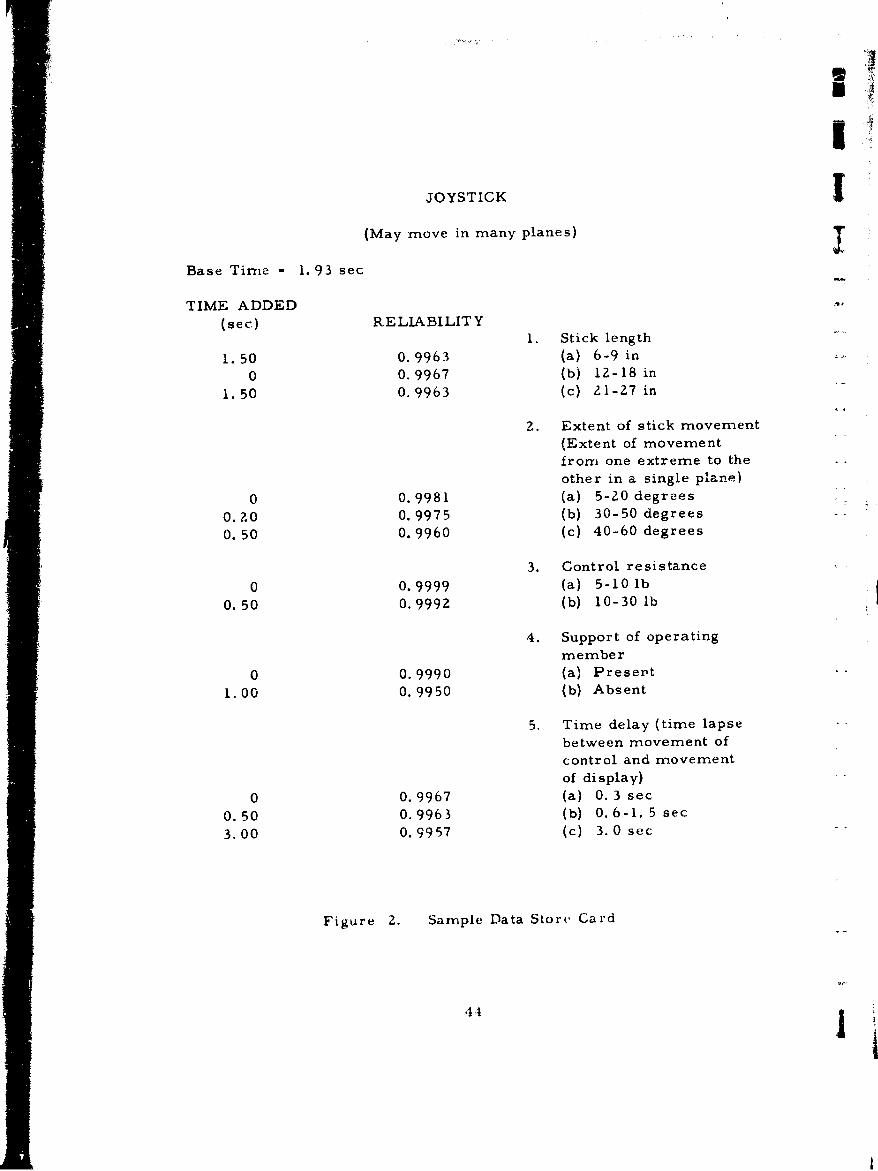
IJOYSTICK
(May move in many planes) I
Base Time - 1.93 sec
TIME ADDED(sec) RELIABILITY
1, Stick length
1.50 0. 9963 (a) 6-9 in
0 0.9967 (b) 12-18 in
1.50 0.9963 (c) 21-27 in
2. Extent of stick movement(Extent of movementfrom one extreme to the
other in a single plane)
0 0.9981 (a) 5-20 degrees
0.?.0 0.9975 (b) 30-50 degrees
0. 50 0.9960 (c) 40-60 degrees
3. Control resistance
0 0.9999 (a) 5-10 lb
0. 50 0.9992 (b) 10-30 lb
4. Support of operatingmember
0 0.9990 (a) Present
1.00 0.9950 (b) Absent
5. Time delay (time lapse
between movement of
control and movement
of display)
0 0.9967 (a) 0. 3 sec
0. 50 0.9963 (b) 0.6-1. 5 sec
3.00 0.9957 (c) 3.0 sec
Figure 2. Sample Data Store Card
44

-IIL
'I|
Other goals are implied in the criteria which guided development ofthe operability index (p. 3, Ref. 3). For example, one of the criteria wasthat specific design features should be explicit in the evaluation process,so that the model should be a diagnostic as well as an overall evaluationtool. Moreover, it was intended that every factor of known importanceshould be included in the procedure.
We shall see later whether all these goals can be accomplished bythe method. We should point out, however, what thes.- goals imply.
The , -,erability index is a prediction of operator performance inrelation to specific tasks and operations required by the system mission.Although it might be possiible to consider the index as a somewhat arbi-trary figure of merit for equipment (in much the same way that Siegel'sDEI measure can be considei ed), the developers insist on its relation-ship to actual operator performance. Consequently, in evaluating theindex, its assumptions and parametric interrelationships can be consider-ed reasonable only if they conform to what is known about human perfor-mance.
,& The goals of the technique also include design diagnosis and selection/training information. In evaluating the adequacy of the method it is there-fore necessary to consider whether one can indeed secure meaningfulinformation from the index relative to design diagnosis and selection/training.
The above statements are made, not to disparage the Data Storetechnique, but because there seems to be a general tendency on the partof model/method developers to extend the goals of their methods beyond•, what may reasonably be expected of these techniques. A technique may
be of considerable value for a limited objective; but if the objective isY extended to cover a wide range of uses, the technique may suffer because
it cannot live up to all that is expected of it.
ASSUMPTIONS
The following assumptions are implicit in the technique:
1. Operator performance is influenced by molecular equipment"design features, e.g. , joystick length. Recall that one of the criteriaapplied in the development of the index was that all factors of known
45
II
inmportance should be incl uded. Obviously, ope rator perfornmatwe itsdirectly or indirectly influenced by a nulltitude of factors. However, thefact that the Data Store includes primarily molecular equipment fe'aturt ssuggests one of two possiblilities: either the developers feel that onlydesign features are significant for operator performance; or the DataStore structure' is influenced by the availitbility of design feature infor- -"
mation in the literature and the non -availability of information on otherfactors in that literature. The second supposition is probably correct:the Data Store was developed on the basis of only 164 studies,
Although more molar processes are implied by the Data Store (seethe mediating processes included), the amount of data on these molarprocesses is very slght- which im probably a reflction on theddequacy of the literature. However, the inability to include centralprocesses (e.g, , task factors such as specificity of instructions, amountof feedback, etc. ), means that the clainm of the index to prformanceprediction can be accepted only in part. Obviously it fails to considermany factors which do influence performance,
If one were using the index solely to evaluate human engineeringadequacy, instead of predicting operator p.irformance (the two are vastlydifferent in scope), the failure to include central processes would be farless important.
-. Behavior can be broken down into a Stimulus-Organism-Response(SOR) framework ("O0" refers to the central processes referred to in (1)) ¶and each aspect can be handled separately, i.e. , can be measured sopa-rately for information reception, internal processing, responding. Thismeans that behavior at a molar level must be broken down into theseindividual elements and then resynthesized. Table 8 (BehavioralLevels) illustrates the analytic process and the recombinations requiredto get from dimensions to mission performance (what we call synthtesis).
A major aspect of the model (we use the term to refer to S-O-R frame-work rather than to the overall technique) must therefore deal with thisanalysis -synthesis process. A basic question that must be raised aboutthis assumption is:
Can one in fact meaningfully extract behavior dealing with informationreception without simultaneously considering its effect on responding, itsrelationship to internal processing, and vice versa? I
4
46 1
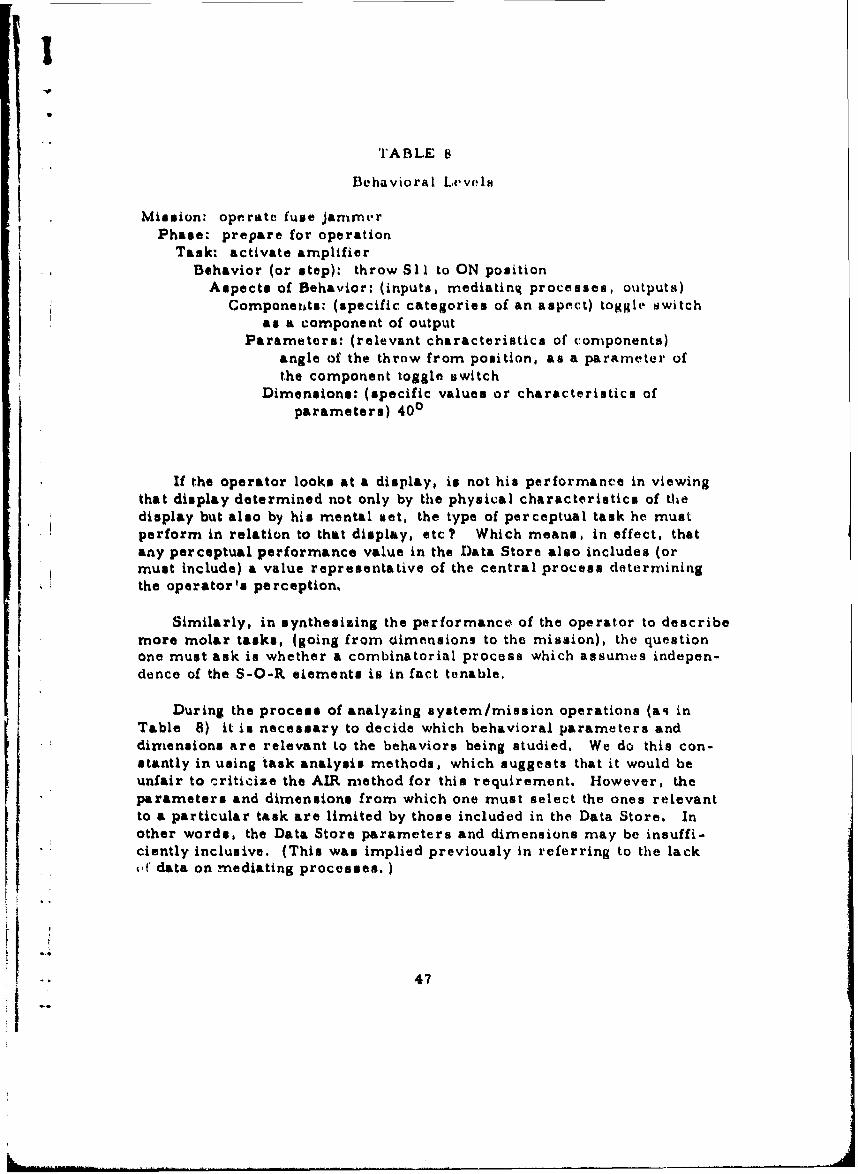
I
TABLE 8
Behavioral Levels
Mission: operate fuse jammerPhase: prepare for operation
Task: activate amplifierBehavior (or step): throw SI1 to ON position
Aspects of Behavior: (inputs, mediating processes, outputs)
Componezuts: (specific categories of an aspect) toggle switchas a component of output
Parameters: (relevant characteristics of components)angle of the throw from position, as a parameter ofthe component toggle switch
Dimensions: (specific values or characteristics of
parameters) 400
If the operator looks at a display, is not his performance in viewingthat display determined not only by the physical characteristics of thedisplay but also by his mental set, the type of perceptual task he must
perform in relation to that display, etc? Which means, in effect, thatany perceptual performance value in the Data Store also includes (ormust include) a value representative of the central process determiningthe operator's perception.
Similarly, in synthesizing the performance of the operator to describemore molar tasks, (going from aimensions to the mission), the questionone must ask is whether a combinatorial process which assumes indepen-dence of the S-O-R elements is in fact tenable.
During the process of analyzing system/mission operations (as inTable 8) it in necessary to decide which behavioral parameters anddimensions are relevant to the behaviors being studied. We do this con-stantly in using task analysis methods, which suggests that it would beunfair to criticize the AIR method for this requirement. However, theparameters and dimensions from which one must select the ones relevantto a particular task are limited by those included in the Data Store. Inother words, the Data Store parameters and dimensions may be insuffi-ciently inclusive. (This was implied previously in referring to the lackof data on mediating processes.
47
3. Our comments so far have focussed on the interaction amongbehavioral parameters. The developers of the method recognize (p. 7,Ref. 3) that the consequences of this interaction are unknown and thatthis is a major limitation of the approach. They indicate that the deter-
mination of interaction effects is currently beyond the state of the art.However, they assume that "tinteraction effects will tend to balance outso that results of evaluation will not be consistently in error. "1
One must ask whether this last assumption (balancing out of inter-action effects) is a tenable one. Does the literature indicate that statis-tical interaction effects are generally non-significant? (Incidentally,one wonders whether it would be possible to take account of statisticallysignificant interaction effects in the original studies to modify the pro-bability values associated with the various dimensions?)
The assumption of non-significant interaction effects considerably
simplifies the methodology and it may in fact be necessary to accept it,if one is to do anything practical with a data bank developed on the basisof experimental studies. If we are reluctant to accept this assumption,it is because the complexity of human behavior strongly suggests impor-tant interaction effects.
4. Ideally, because the AIR model breaks behavior down into itsS-O-R elements, it follows that data should be secured that reflects thosebehavioral elements, e. g. , data describing visual perception, decision-
making, psycho-motor performance, etc. However, the data that areavailable do not describe these behavioral aspects (or at least in theexperimental literature they are so scattered across or contaminated
by machine variables that one cannot readily equate performance withbehaviors independent of machine variables). As a consequence, it isassumed that "a careful study of the sources of machine outputs wouldprovide the information concerning the range of stimuli with which manwould be expected to cope. Similarly, a study of machine inputs, essen-
tially controls, would identify a majority of the characteristics of man'sresponse, "1 (p. 6, Ref. 3). In other words, the range of perceptualbehaviors included in the Data Store is determined by the characteristicsof machine sources of stimuli, and similarly response behaviors are
determined by machine mechanisms of responses. One may ask whetherone can in fact equate a behavior with the machine characteristics thatlead to or influence that behavior? More pragmatically, what this leads
to is that the range of behaviors considered by the Data Store is essen-
tially determined by available machine displays and controls and even
48
more by those controls and displays which were selected for perfor-mance testing by experimenters.
The fact that machine characteristics are used to organize behaviorvalues means that central processes are likely to be overlooked. On theother hand, since one cannot isolate behavioral responses from the stimuli(e. g. , equipment characteristics) that elicit them, the r e i s s o mejustification in using these equipment characteristics to determine therange of the behavior responses. Our objection is directed more to thefact that all of the dimensions relevant to equipment are not included inthe Data Store, because experimenters have not systematically testedall of the available dimensions. (This is not mere carping; a data bankmust be examined in terms of the parameters it includes.)
5. The conceptual structure implied by the S-O-R framework in-volves for the AIR developers four levels of classification: aspect ofbehavior, components, parameters and dimensions. For definitions ofthese, see Table 8. It is important to note that aspects of behavior
,* represent S-O-R elements at a very gross level. Aspects are not equi-valent to individual functions, such as detection, classification, counting,etc. , but to complexes of behavior such as perception. In consequence,individual differences in behavioral functions1 are ignored, although it iswell known that they influence perception or motor responses considerably.
It is understandable why differences in behavioral function are ignoredin the Data Store structure: the performance in the Data Store is organizedby machine characteristics (components, parameters, dimensions) and forthese individual functions are irrelevant. In other words, the characteris-tics of a meter, for example, remain unchanged regardless of the mannezrin which one views the meter.
One side effect of ignoring the individual functions is that the DataStore model does not provide explicit guidance with regard to the iden-tification of functions, tasks, and subtasks; in other words, how oneshould go about breaking down gross system operations into the behavioralunits to which one attaches performance estimates is not indicated, al-
though the general principles are those of task analysis.
1. (e.g. , whether one is viewing a CRT display- perceiving- to countthe number of data items of a given category vs. viewing that dia-play to add new data)
49
[I6. If one looks at the Data Store structure (see Figure Z ), it
would appear as if each of the equipment dimensions had a performancereliability of its own. This is not true. The value provided representsthe effect of that dimension or characteristic on the operator's overallperformance. In other words, a performance reliability of .9999 fora given dimension presumably means that I out of 10, 000 times an errorwould occur as a result of the given dimension. It does not mean that ifthat equipment dimension is included in a design that the operator's per-formance will be .9999. It does not mean that one can describe theoperator's performance in a given task by means of that single dimen-sion, because many dimensions will affect that performance. Since theindividual dimensional value does not represent the operator's perfor-mance, but rather the effect of that dimension on his performance, itdoes not reflect operator performance directly and is actually what canbe termed a "constructed" index, one which assumes a meaning becausea decision has been made to give it that meaning. 2
7. The effect of that dimension is assumed to be independent ofany other dimensional effect of a given parameter of the same component.This assumption is crucial for the process of synthesizing or combiningsubtask and task values to secure an equipment or system value. The-iidependence assumption is related to the assumption that interactiveeffects between parameters cancel out. If they do, then independence isa viable concept.
"The assumption of independence permits application of the "product"trule (i. e. ,multiplication of the individual equipment/task probabilities.,Ropi rtl x rtZ x rt 3 , etc. , where t1 is the ith task; Rt r.l xrs? x rs., etc, , where r. = step reliability. R. r x r x r
3 Sn cl c 2 c 3 'etc. , where c - component. R = the reliability of the selected rele-IPnvant dimension, where p = parameter. This means that the reliajilityof any operation i is a function of the individual reliabilities of the taskscomprising that operation. In turn the reliability of task i is a functionof the reliabilities of the individual components used in that task; the
2. All of which raises a question that has both theoretical and practicalinterest. Constructors of data banks must consider what the relation-ship of the parameters included in their banks is to predicted taskperformance.
50
j
I
r-.
oeliability of the component is a function of the parameters that applyto that component; and the reliability of each parameter is assigned onthe basis of whichever dimensional value is selected as applicable tothat parameter. Figure 3 summarizes the process.
* In general, workers in the field have not accepted the independenceassumption. Behavior is, if anything, interdependent rather than inde-pendent. However, independence is often to be found underlying man-machine prediction models because the complexity posed by interdepen-dence is very difficult to handle with present modeling concepts andda ta.
* One of the side effects of the independence assumption is that eachadditional task, component and rarameter decreases the predicted re-liability of the operation. Moreover, one element with a substantiallyreduced reliability will significantly lower the estimated reliability ofthe entire operation,, even if all the other elements are quite high. This
i• has highly undesirable effects in attempting to calculate the performancereliability of a comple~x equipment or system. As the number of com-ponents and tasks increases, the multiplicative process tends to degradethe estimated reliability of the overall operation to values far below whatone would realistically expect of that operation. We shall see similareffects manifested in TEPPS.
8. We shall discuss the output metric later, but it is instructive.to consider what the probability value derived for a component or taskreally means. The metric is derived from errors made in the originalexperimental study, so that it is assumed that r - I minus the errorfrequency. As Regulinski (Ref. 4) has pointed out, this assumptionapplies only under very rigidly delimited conditions. But we shouldcontinue further to ask what the probability value means, even if theassumption holds. If the value reflects the probability that the act beingdescribed will be performed without error, then it assumes that everyerror on which the metric is based has significant effects on operatorperformance. This is highly unlikely because acts may often be Perfor-"med erroneously and still be completed successfully. Many errors havenon-significant effects (e. g. , they do not fail the mission) or errors canbe noted by the operator and the acts redone correctly. From that stand-point the Data Store methodology is not a completely efficient predictorof behavior.
51
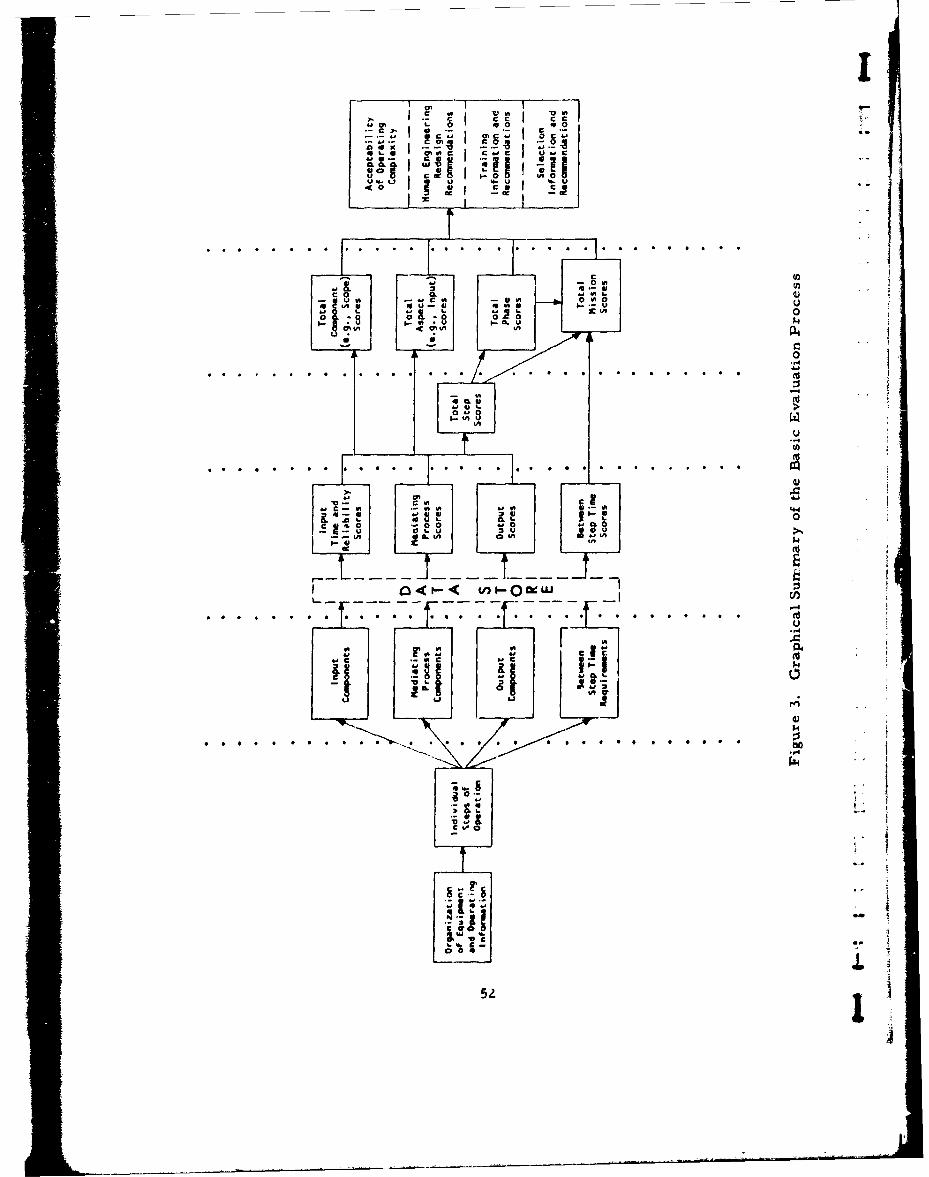
-v IC :1- v
C a0
Ut 0 c
CA,
4-4
0 Z0
u CL
0 0 00 0
C CA
IL.001
Iti
If we have gone into as much detail as we have in relation to theassumptions made by the predictive model, it is because similar ques-tions must be asked by anyone developing a predictive model and a pre-dictive data base. It is apparent from this review of Data Store assumnp-tions that a data base does in fact imply a conceptual structure andmethodology.
There are two major ways of evaluating the validity of a model:(1) conceptually, in terms of what has been termed construct validity orthe reasonableness of the model assumptions; (2) empirically, in termsof the model's ability to predict variations in performance as a functionof variations in model parameters. Ultimately, empirical validity iswhat the model developer must rely on for his justification. It is a ques-tion however, whether empirical validity can be achieved without constructvalidity.
Consequently, it is necessary for the developer in starting hiswork to ask of his model (or his data base) questions such as
'I(1) What is the conceptual structure implied by the body ofdata gathered and the manner in which the data have beengathered ?
I 1(2) Does that conceptual structure realistically reflect human
performance?
(3) What effects do the limitations of data-gathering oppor-tunities have on the compromises that must be made withrelation to that conceptual structure ?
We shall discuss validation studies performed with the Data Storelater.
METHODOLOGICAL SCOPE
The hata Store can be applied to any equipment/system which con-tains controls and displays. The limiting factor here is the type. ofbehavior involved in the system operation. The behaviors the Data Storedeals with are discrete operations; it has difficulty handling continuous(e.g. , tracking) and decision-making behaviors, the latter because theData Store is very limited with regard to data on mediating aa uocesses.
53
* i
However, this limitation is not peculiar to the Data Store; we will en-counter it later in other models. The work of Irwin et al. (Ref. 1) hasshown that the model can be applied to maintenance operations (althoughnot troubleshooting, because this is largely decision-making).
PARAMETERS.
The major parameters utilized in this technique have already beennoted. There are two classes of parameters: (1) structural parameters,describing the elements in the Data Store; and (2) process parameters.Structural parameters are aspects of behavior, components, parametersand dimensions, which have been defined in Table 8.
Process parameters are those relating to the various behaviorallevels into which system operations must be analyzed. These describethe various units of behavior for which one is attempting to predict.Process parameters include the mission, the phase, the task and thebehavior at progressively more molecular (detailed) levels of descrip-tion. "The finest unit for which reasonable performance data can beestablished is the individual step, act or behavior" (p. 5, Ref. 3).
This unit corresponds to what others have called the task elementor the simple stimulus-response act. The behavior or step is describedby the individual stimulus to the operator and the individual response hemakes to that stimulus. Obviously, if one is to include molecular equip-ment dimensions in one's predictions, the behavior predicted nmust beat a level commensurate with those discrete dimensions. Moreover, Ž.this is a level at which complex conceptual behaviors should not berequired. If one throws a switch from one position to another, onlymemory is involved. (Although some would argue that memory is acomplex conceptual behavior.)
There is comparatively little difficulty in determining what that be-havioral level is, because it is usually the level at which operating pro-cedures are written. In contrast to other predictive techniques this is
actually an advantage; whereas it may be difficult to define the task levelprecisely, this is not true of the task element level.
It has other advantages also. If the task element is the irreduciblesubstratum of behavior, the data applied to it can be applied to any systemor equipment because every system/equipment will contain the same be- -havioral level (i. e. , the same discrete task elements). Data gathered atmore molar levels might be more difficult to apply across equipments.
5454
:I Ii~I
DATA
1. Measures Used
There are two basic measures employed in the Data Store:
(a) Time to perform or time to complete the behavioral step or taskelement (in seconds). This is the absolute minimum time needed to com-plete the step. This time holds only if all the parameters listed for agiven component possess optimum dimensions. If the dimensions arenot optimum, an increment of time must be added to the base minimum.What makes a dimension non-optimum is the fact that experimentally itrequired more time to complete the task using a component vA th thatdimension; in that sense, a non-optimum dimension is merely one whichrequires more time; the characteristic is not defined independent of thetime measure. It should be noted that no range is provided for this timemeasure. Presumably this is because the times presented are minima.Ideally, however, where data are based on a distribution of empiricallyderived values, the range, e.g., r, of the distribution should be pre-sented.
(b) Performance reliability which in the case of the Data Store isderived from error data, is in fact equivalent to error data. For example,if 5 errors occur over 10, 000 opportunitites for error, this gives anerror percentage of . 0005 or .9995. Where reliability is defined as 1minus an error percentage, the resultant reliability can be thought ofonly in terms of error likelihood. There is nothing wrong with such adefinition of reliability; it is necessary, however, to recognize that thismeasure deals only with a sub-class of all possible performances. That
* is, as indicated previously, it reflects only those situations in which theoccurrence of an error in essence fails the mission, or in which one isnot concerned with task or mission completion but only with error-occurrence. Again, the range of the reliability distribution is not in-dicated.
"Because the error data from which the reliability measure is deriveddoes not vary as a function time, this reliability measure is not equivalentto that commonly employed by reliability engineers, which is et. It is,however, very similar to a measure of achieved reliability, which is es-
S--sentially s/n, where n w the total number of attempts to complete a taskand s - the number of successful attempts.
55
II th 0I)4A I (IA 4111 0lie th l 1')AI l r•y 1'ileit tho lle 11PAs1i1p titp 1illllpit1'ell•1i1t1 1y, therp to1 1% r k'tAN il wily 1he l1pr k I'1i11IrIt 11 %104d 111oa klli .,
hilly PI4 loIn) Lie 1110 114 1m ," I V(f thI', 1IlIAmb'0 Aild whrlt it 1'P011SIP1Itlo tI Iro
'ogilllIt 1d, I t 0hitldt oo he wiler .tenul thatin01 o "1'r lrhility" '1110 Ii1"P tkiet In1
Allyy (i thi o ridi li onl If'% h11iqtku II lie h (e rirbed %to 'u o1or i lldt ON 1 I. y vIhe moA . kio' of 0qniut eiw1 1 IPrelahilihty, Thth 1'se eonll fir this Im III" ig kthat thoeorror d| tA tr onm which n %IIalkiAl re lha ilit y I1P41 ci 'leAl s I' h dll l rl.do not tiik thn• tinio factor Into Acceoun Aie don the ripiipmovit A•i•'tirhitytl.0ROUh'0, Thw i Alno h•la* ImlirA(t io nd fll- the tly olliblAIhoi %ifd huida•nl relVI
alhllity and eui1iPmll r1ollabilty v aleurom ((it) Ipet t a cuer1e. 1 of Mystem"efe'lvniabi 4s) aulthough the tme I riA form of thr hutae r re (,hally e. g -siuro pe rmito %conihinatioii with I he oquipnient reliabi lity nivos'sre, it isii bit liko vom~himnM ix prlec and oranges.s
i'ht two~ 11ivasura (time and rolialtility) wore derived hindpetidontlyof each other, and the reliability valuo (P. 14, 1 99~6) is viot a porformanvoreliability its a function of the timie rtiquiii'ed to cot ploto tho step (o. 1g,1, 5 seconds), Although the two measures are indopondent, they should b"
somewhat related, i, a, as reliability dtraseo, there is a tendency
for performance time to inerease,
2, Data Sources
'The error and time data used to derive Data Store values were secured
'from 164 experimental studies in the literature, There has beeni some
criticism of the Data Store because its data sources have been no few; but
apparently this represents the distillation of several thougand research
reports. The author has found in his own research (Ref. A) that many
studies do not contain data translatable into thet probability metric and
must therefore be discarded (if the metric is to be employed); and many
of these studies are not well defined in terms of control-display dimen-
sions. This casts some doubt on the feasibility of using the experimental
literature as a data source; but it should be noted that the developers
carried their literature search ouly through the late 50's, and there is
now an additional 10 years worth of literature that might be used as a
data source.
Data defined in terms of relatively molecular equipment dimensions
must be secured from carefully controlled experiments. Field operational
56
mtit s a rali p oth ehw 111111send.l l it-t t 011 tilt Ilthe ii ithiauel 4 ti1p I lsllist AAiti'
.'nsu as ts 111#11 'ism orro (fe's1 Avg A t'e rily lllt'lsw' iitle'ee Ovst y IleeA Is' 11 t' ry Notkil will prilv itto tho typo ill fltil 0Ia Ni i1r. 1 11 e i'a I )AIA N111ei'10 Iypt, lit tIA I
The' Outpsil oft 1110 041 s ltsr (t' 0 , g, s% r lA belit y vAltt) I Ai i w viowtidill two wlayc,
~~ I ~(at) As tilt pl'uiba bit y tof coe'rot a'l bo''at 'hy pori 'otuit'o I aope'ratingl iopovifiotl s'quipmont,
. I ~(h) A*s a figure uf nwrit (or' th.o et~uipmont when opera ted,
Bec~ause the porefarmanco reliability nwltric outiput by the Data11 ~Store takes into Acctount only a few of the factors influoniwng humanperformance, andi is primarily oriented to equipnment charac~tL-ruihst,the author (**la that the Data Storo is more appropriatoly tised ini the'
~1 souso of (b) rather than (a). The reasona why wo may that the DAtAStaor reflects human porformanco only partially hAve been presentodearlier., the inability to account for moalar (centr"al) processes, for
* intoerdepondenc e of behavioral paramotarm and for the factors that do-termine task completion success. For example, it should be noted thatthe Data Store performance reliability does not take into account dif -ferences in the tasks to be porformed with an equipment. It makes adifference to performance reliability whether the operator in merelymonitoring a CRT display or classifying the stimuli on that display.Consequently, if one wishes to be a puirist, the meaning of the Data
Store rneasure in termis of (a) in inadmiasable. These reservationsapply of course only to the "construct" validity of the Data Store model.
* If empirical validation studiem (i. e. Icomparison with actual perfor-mnance values) were to demo,--" rate a high logreo of relationship be-
* tween Data Store predictions and actual reliable performance, one could* forget these objections,
57
III
As & IgMOI,' t itt it'et r, iot 1t thoi t1 iplt'•atltly it on oquipit.pntI(w1110%h wal, we (to,1 IIt•h oridlW I lt%, ou ' f itit 111th * I.t udilogy), thit olli'ottSitso raie tl provt, o ly dto not apply, Any Itnd x t1m•y bI% 'onat1%('10t(d WfwbtAlovor o•olalt ts on o wipahe,, ioil Ui they d(ltit h fit PlorwY tit diff•to,1t -tIAVde t~fePrett Oqut3)ietA1t o1 IItAto thakt ia a11 that onr aska of thoitld k, i'ho lINu1O of 11101-11 r ii dO e, n0ot illiply I MO1deI of aCtal O r•{lrniant,, whoroapi the othor dtowou, In which c'aae the lAIter m•st heconsidered In the light of its relationship to known data on human per-fir ma aw, I
The undorstanditbI r desir, of workoer In the field to prdict humanperformance rather than merely ,quipment oporability (however impor-tint tho latter 1.) haI& led to a confumion hetw•en the two moaningta of theData Store output. This confusion has been intonsified by the form ofthe Data Store output which on the surface (but only on the surface) seemsto be the hun•an equivalent of oquipmont relIability. Itn any event, be-cause of this confusion, more has been expected of the Data Store thanit can reasonably be expected to supply,
All the reservations mentioned previously do not apply to the tin-etmeasure. On the other hand, much less use has been made of the timemeasure than of the reliability output.
PROCE•DURES FOR MODEL APPLICATION
1. Procedures for Analysis
The process by means of which one analyzes mission/operationsinto subtask or step elements has been described previously. It is nodifferent from what one does in any application of task analysis metho-dology.
Operations which may be considered akin to functions or gross tasksmust be broken down to individual tasks; tasks must be broken down tosteps or task elements; each task element must be analyzed in terms ofall the components involved; then the components involved must bebroken down to parameters; and finally the appropriate dimensions ofeach parameter must be selected from the Data Store.
58:
task l ti~ltl it I% lilt tapki h o al m al4 al114 ItW111illi lls' t i' i 'tw
problom aI'inv' with rtogartl to dot~rminhinM wihottipoltI''Ilt arI'eII,volvod in tho tatok e' tetionit, pa rtictular ly for' po i't ophuia 1~ii ,k~ incAAIMI'
ovon though the opperatio' it roispontdini (pr'r captuaily) tti A Am,1t, splayI (mrainly) * ho mitay b" awara tit (Or it% Parat rr'Vapolldi "M to) thll oentir" corn -
plox of other dimplnyo, For oxaniplo, if )to iii monitori'ng otior' of soveralmotors on a display pitnel, him resipuame to that nirter noty he a ((I'tedby th@ prosenct of the othor nittors, T)hi is, in part, t~keia V~ 'AV of bythe parameoter category, (o., g. , numiber of lights in A sti~l firld), but inmlanly cases, till information (which dopondis on tho operatorls mode ofperceptual rt'sponso) in lacking. Tho sitinit pa oblon dooes not exist tothe same degrae for tho response rn)ewhAn~MM~
A There are, howevor, potential sourv'est of vonfusion in the Analysisprocess as a result of the feedbark parameter, Two types of feedbackare recognimed by the Data Store:
"a. Directing Feudback. This typt, of information reaultinR fromoperator performance serves only to direct or aid control manilpu-
lation. Stimuli or information that primarily aid control nianipula-tion, such an labels or associated display foatures, are assessed
an parameters of that control .......
"Ib. Initiating Feedback, Feedback which signals the and of* one step of behavior and serves as the input to the next step, such
as an indicator light or scale value, is assessed with the step ofbehavior it initiated, Such feedback may be ignored, however,
However, there are other types of feedback, which are much moreintractible, e. g. , that which indicates the degree of success with whicha task has been completed. Some consideration will be given to thistype of feedback in later discussions of other predictive techniques.
In general it can be said that feedback does not pose much of a pro--. blem for the Data Store user because he tends to ignore it, at least in
its more complex forms. No attention is paid in the analysis to other
59
U3
modifying task parameters, such an speed -nd precision requirements, Iexposure timo, etc, , for two roasons: they ar, difflcult to identify with
specific equipment components anti the oxporimontal littrature does not Iprovide much data on them,.
One task factor that is explicitly noted is perceptual shift, ThitTrofers to the timn roquired for the oparator to shift his atteniton from onecontrol or display to another. "Normally the time required for perceptualshift can be ignored, mince it ist of very short duration, ,
4. Procedures for Syntheai"
What we mean by synthesis is the ro-combination of the individualstop and task reliabilities and times to derive values for larger behavioralunits and for the system as a whole. This procedure is based on simplemultiplication for reliabilities and addition for times. As Smith et &l.(Ref, 5) point out, time addition is entirely reasonable and the error ofestimate for times is small in terms of its effect on the total prediction.
The multiplicative procedure is much les defensible (because it ignoresthe interdependence of behaviors) and because of the multiplication anerror in predicted reliability at an element level will have compoundingeffects on the accuracy of the total prediction.
3. Data Application
Reliability estimates and times are applied only to the individual
component dimensions. Values for subtaska, tasks, phases and missions
are secured by multiplication and addition, which assumes that any
interactive effects among these subtasks, tasks, etc. are minimal.
ANTICIPATED MODEL USES
1. Prediction of Human Performance
A good deal has already been said about the limitations of the Data
Store as a method of predicting operator performance. We would prefernot to use the Data Store in this sense, although there is some evidence(to be discussed later) for its utility as a predictive model.
60
H~IHi I
I Should the Data Store be used as a predictive device, it should bereserved for tasks involving relatively simple discrete control-displayoporations, in which the reservations noted earlier are less pressing.1The Data Store cannot handle predictions of contingency events or thoseinvolving conceptual or decision-making operations. For example, ifalternative contingency or decision pathways involve the same equipment,
* the user will get the same prediction in either case.
Can one in fact use the techniques ýo predict operator performance?!i-:. Yes, but only if one recognizes the tremendous simplifying assumptions
one must make. This simplification does not matter quite so much inthe design use of the model.
2. Design Analysis
The Data Store is particularly adapted for problems encountered indetail design. Because of its emphasis on equipment characteristics, itmay be used to
-i '(a) compare alternative design configurations
(b) select components.
In comparing alternative designs the procedure is to calculate theperformance reliability/completion time for each configuration and toselect the one with the highest reliability and the shortest completiontime. In the selection of components the engineer would presumablyselect a component with those dimensions providing the highest relia-bility. In such a selection the actual performance reliability of thedimension is less important than its value relative to other dimensions.Thus, if one component dimension has a reliability of . 9999 and another_ 9996, one would presumably select the first.
The Data Store is considered to be of particular value in generatingredesign recommendations. Here the procedure is to identify those com-parisons that contribute most significantly to total mission time andreliability. These then become candidates for redesign.
The Data Store will supply information useful in making functionallocations (i. e. , deciding whether or not a given task should b- auto-mated) but only when equipment details are specified. It supplies noinformation for deciding on the manpower required to operate an equip-
I
i I.
ment, because the methodology is not geared to differences in number ofpersonnel unless they use different equipments. However, a formula isincluded in Irwin et al (Ref. 1) for including the eoffect of one operator
checking another's performance.
3. Training
The Data Store does not pretend to provide information which isapplicable to a total training program. Rather it applies only to thosetasks and components which contribute most to total mission scores andwhich are not amenable to redegign. These would presumably receiveadditional emphasis during training.
Because the Data Store dimensions relate solely to equipment, it isdifficult to see how much it can contribute to the specification of requiredtraining. Certainly the nature of any required training, its content orduration could not be inferred from the Data Store.
4. Selection
The comments on training apply also and even more so to selectionof personnel. Selection relates to aspects of behavior, and these arephrased so grossly that they supply little information. For example, if"it is found that the greatest contributors to mission reliability are inputs,one could recommend that personnel be selected on the basis of visualor auditory aptitudes, The specific nature of these aptitudes would notbe indicated by the Data Store and would have to be inferred from othersources.
VALIDATION/APPLICATION STUDIES
Different types of validation should be considered in the evaluationof any predictive method:
"1 Construct validity or the determination that the model containsthose factors critical to operator performance. Although the developers L.say that construct validity of the index "seems assured', our examinationsuggests this is the case only if one is willing to accept highly simplifying
assumptions.
62
I
I
Z. Content validity or the extent to which the model contains all
those parameters and dimensions needed for operator performance.
-. This has been shown not to be the case.
3. Empirical validity (some would prefer the term "predictive"T validity") or the extent to which Data Store predictions correspond to
actual operator performance. Empirical validity can be determined inseveral ways:
(a) by comparing Data Store predictions against observed/measured performance of operators
(b) by comparing Data Store predictions against subjectiveestimates of operator performance made by experienced personnel
(c) by comparing Data Store predictions against ratings ofequipment operability by experienced personnel; this indicates the
I extent to which the index differentiates among various equipments.
The best estimate of empirical validity is by comparison of predic-f tions against observed/measured performance. This was not possible
during the development of the Data Store. However, Irwin et al (Ref. 1)performed a validation based on comparisons with observed performanceand found that observed reliability was .9989 as against a prediction of9972.
The developers determined validity by comparing the predictedtime and reliability with rankings of equipment in order of complexity(method (c) above). Note that this validity index measures equipmentoperability rather than operator perform'ince. There was fair agree-ment between the Data Store scores and the rankings.
There is consequently some indication that the Data Store metho-sology provides valid estimates of equipment operability and humanperformance, but the evidence is far from satisfying. We shall see inlater discussion that although predictive methods are developed, theyare often not validated so that it is difficult to arrive at a realistic es-
timate of the utility of these methods.
Inter-user reliability, i. e. , the consistency of Data Store sors-. developed by various users, was found to be high.
tI
II
The Data Store has been applied to at least one system development iproject the author is aware of (and probably many more about which hehas no knowledge). Recently the author was talking to a human factorsspecialist who was involved in the system development of the P3C air-craft. The Data Store was used to develop predictions of response timesand the error likelihood of personnel acting as crew of this aircraft. Amockup study indicated good correspondence between predicted and ac-tual response times, although apparently no data were collected concern-ing error responses. The Data Store in this application was used tocreate a sort of baseline with which actual personnel performance could 40be compared.
A point that should be noted is that at present the Data Store is theonly standardized data bank available to system developers. Consequentlythey will tend to use it despite any inadequacies we may have pointed out.This is a strong argument for the development of formalized data banks.
SUMMARY EVALUATION
Validity As noted previously, formal validity studies have been Lperformed and show a reasonable degree of correspondence betweenpredicted and observed values. The Data Store is one of the few tech-niques for which formal validation studies have been attempted.
Reliability Controlled studies have been performed that indicatethe method can be applied with reasonable consistency by various analysts.The rather structured nature of the technique tends to improve its use-reliability.
System Development Applicability
A. Comprehensiveness: The method is limited in its application tospecific types of behaviors and tasks, principally to those of acontrol/display nature.
B. Applicability: The method is primarily useful for predictionsrelated to equipment design features and hence is specaillyvaluable for design analysis.
C. Timing: The method can be applied to systems in early as wellas later stages of design, provided that system design has been
64
........
I m I
Sdetailed down to molecular equipment characteristics. Other-
wise it can be employed only to systems in the later stages of
i design.
Model Characteristics
I A. Objectivity: Requires very few subjective (i. e. , "expert")
judgments.
I B. Structure: Assumptions and parameters underlying the model
are reasonably well defined and explicitly described.
-- REFERENCES
1. Irwin, I. A. et al. Human Reliability in the Performance of Main-tenance. Proceedings, Symposium on Quantification of HumanPerformance, Albuquerque, New Mexico, 1964.
Z. Meister, D. and Mills, R. G. Development of a Human PerformanceReliability Data System: Phase I. Final Report Contract F33615-70-C-1518, July 1971.
3. Payne, D. and Altman, J. W. An Index of Electronic EquipmentOperability, Rpt. AIR-C-43-1/62-FR, 31 January 1962.
4. Regulinski, T. L. Quantification of Human Performance Reliability,
Research Method Rationale. Proceedings, Workshop on HumanReliability, 22-23 July 1970, Washington, D. C.
"5. Smith, R. L. et al. Subjective Judgment as a Means of GeneratingCorrective Maintenance Data. Final Report, F33615-69-C-1396,Integrated Sciences Corp., Santa Monica, Calif. , (no date).
I4
3 65
ADDENDUM
In reviewing the preceding description of the Data Store Dr. Altmanmade the following points (personal communication to author, 8 July1971):
Some points which may be of interest to you for historic perspec-tive are:
1. All of our original models for combining reliabilityestimates involved the use of interaction terms. Inno case were we able to find anything like adequate
data for estimating interactions. We reluctantlywent to the simplistic multiplicative model becauseit was the only way we could avoid, in effect, sayingto the evaluator that we could give him at least somerough guidance on the easier part of performance es-
timating, but that he was strictly on his own when itcame to the tougher part.
Z. We did not want the Data Store part of the OperabilityIndex to be essential for the limited-use proceduredeveloped for the Army--let alone a major export forgeneralized use. The Data Store was intended to pro-vide guidance to the evaluator when he could not ob-
tain more appropriate performance data. In a sense,the Data Store was intended to be a final fallbackposition. Our qualms about the Data Store were largelya result of our conclusion that the existing behavioralsciences and human factors literature are mostly lousyfor generalizing performance data.
3. Aside from our immediate commitments to the Army tocome up with a practical tool, our main objective was Lto demonstrate the feasibility of combining equipmentanalysis and task analysis for purposes of human en- !
gineering evaluation. Although we had also hoped tofind existing bodies of human performance data which
would suffice to support good quantitative estimateswhen equipment and tasks had been appropriately ana- :lyzed and juxtaposed, review of existing literature
quickly led us to essentially negative conclusions
except for stopgap purposes.
66
K I
A 4. My own feeling was that the results were highly favor-able toward the notion of combining equipment and taskanalysis for human engineering evaluation. Given theessentially negative conclusions relative to the stateof existing literature, it seemed to me that three
priority developments were needed to bring human en-A gineering evaluation to the minimum level required if
it was to be a technology rather than essentially adI Tjhoc or "lart":
a. New conceptual and data gathering approachesto establish nominal values for performance
expectations.
b. Better defined and articulated study of theeffects of "conditions of performance, " such
as speed stress, boredom and fatigue, envi-ronmental stress, etc.
c. Empirical study of individual differences,J both training-experience background and
ability variables.
5. 1 would consider models for combining performance esti-mates to be essentially part of the task description andanalysis problem. A proper task analysis should tell"one what the performance components are and how theyrelate to each other. Much more can be done to maketask analysis more relevant to and a more powerful toolfor performance forecasting. The most immediate needis for approaches to task analysis that will support the"description of tasks involved in generating a givenbody of performance data. That is, I feel task analy-"sis has been much neglected as a tool for specifying
"* Itexperimental" conditions.
"�6. Since the time of our work on the Operability Index,
I have felt that human factors needed to develop newapproaches to generating dependable performance data--"approaches which might have quite disparate philo-
- - sophical bases from the usual psychological experi-ment. Over the years, I have made a number of
"b7
II
suggostions for such approaches--from use ofsynthetic tanks with randomized assignment of char-acteristics to incremental building of a data basefrom in-depth study of a small number of tasks andaddition of new tasks only when sufficiently well
nderstood to permit prediction of their performancew'ithin specified accuracy for stated conditions,
68
II3 1, THERP-TECHNIQUE FOR HUMAN E]ROR RATE PREDICTION
INTRODUCTION
T-THERP is probably the bout known of what can be termed the "humanreliability" predictive techniques, having been described and commented
"i' on in a number of text@ , including the author's (Ref. 3) and in evaluativereports (Ref. 1). For that reason, perhaps, we havw given it what mayappear to be a more intensive scrutiny than the others. It is a method
I• for predicting human error rates and for evaluating the degradation toa man-machine system likely to be caused by human errors (in associa-tion, of course, with other interactive factors like equipment reliability,"procedures, etc.). Although historically1 the method was associatedwith and initially built upon the AIR Data Store methodology, it has sincedeveloped independently of that methodology. THERP is one of a numberof techniques strongly influenced by equipment reliability concepts.
Its procedure involves 5 steps which are repeated until the systemU degradation resulting from human error is at an acceptable level.
1. Define the system or subsystem failure which is to be evaluated.
Z. Identify and list all the human operations performed and their
j relationships to system tasks and functions.
3. Predict error rates for each human operation or group ofoperations.
4. Determine the effect of human errors on the system.
5. Recommend changes as necessary to reduce the system orsubsystem failure rate as a consequence of the estimatedeffects of the recommended changes.
These steps are considered "typical of the usual system reliability'* study if one substitutes 'hardware' for 'humans"' (p. 7, Ref. 4)
"I I. Dr. Swain, the primary developer and exponent of THERP,-_ comments:
"THERP is not an extension of the AIR model. All we did wasi to see th,3 AIR Data Store as a source of data; but we later changed
our minds and no longer use it...
"69

NOTE I (Continued)
Following is how THERP originated. I arrived at Sandia in Februaryof 1961 and began to do human engineering work on nuclear weapon sys-tems. It quickly became apparent that my recommendations for equip-'rnent design sometimes were not accepted because I could not tell thedesigners how much benefit (in quantitative terms) my recommendedchanges would provide to the system. After L.W. Rook arrived at Sandiain May of 1961 he atnd I got to talking about the need for quantifying humanperformance influences on system reliability. We were naturally'verymuch influenced by the reliability model used at Sandia as we were partof the Reliability Department and were in the Systems Reliability Divisionof that department. We saw that if we could find measurable human be-haviors analogous to measurable equipment behaviors we could use theconventional reliability model. In other words, we were looking for Pi' s,where pi is the probability of human error. Reliability problems atSandia generally were time-independent (or essentially so), though themodel could handle time-dependent events as well. But generally, theproblem was stated something like the following: What is the probabilitythat Equipment Item A will function in its intended mode when calledupon to do so. And, generally, these equipment items were one-shotdevices or at least devices with a very limited life span so that consider-ations such as mean-time-to-failure were not appropria'te. So we thought6f human behavior in much the same way:, What is the probability thatHuman Behavior A will occur correctly when it is supposed to occur?Often Human Behavior A had to occur within a very definite time frame.In such cases the question' was changed to: What is the probability thatHuman Behavior A will occur correctly within Time Span T? UsuallyHuman Behavior A could be thought of as occurring completely correctly(in terms of its system consequences) or completely incorrectly. But ifthere were degrees of correctness, we would fractionate the question(or, in terms 0f tree diagramming, provide different branches) to pro-vide estimatesof degree's of behavior correctness. In nearly all of ourwork (and in the Sandia applications to date) this type of fractionizationhas not been necessary to answer the system design or planning problemswith which we had to cope.
70
.I
Li
I
3 In addition to the influence of conventional reliability technology,we were influenced by Herman William's article: Williams, H. D."Reliability Evaluation of the Human Component in Man-MachineSystems," Electrical Manufacturing, 1958, 61(4), 78-82. Williamshad been at Sandia Labs and had participated in the first h~uman relia-bility analysis done by anyone, so far as we know. This 195? classifiedstudy is described in SC-R-66-906 by Swain (also see p. 688 of HumanFactors, Dec. 1964). Although we went much farther in developingthe THERP model than the William's approach, we owe him a debt ofgratitude.
"In those early days THERP as a model was not influenced by anyother outside work. Sometime late in 1962 someone sent us a copy ofthe AIR Data Store and the related three documents. We evaluated their"model as too simplistic and not at all appropriate to practical humanreliability work. But we were happy to see all the data on human per-formance in the AIR Data Store which could be used to derive our pi's.
f (One minus the AIR figures' gave the error equivalent for a small lumpof behavior, and is described in SCR-685.) So we used the AIR DataStore rather extensively; for a few years, but never used their modeland THERP was never influenced by it. Therefore, to say that THERPis an extension of the AIR model is quite incorrect.
About ý1964 Rook was struck by the narrow range of reliabilityfigures in the AIR Data Store and did the Monte Carlo analysis whichI reported inSC-R-68-1697. Rook, left Sandia in 1965 and I continuedto develop the THERP model. ý Since then Rigby has added to the model(SC-R-68-1875 and SC-R-69-1208). (End Note 1)
GOALS
The goals specified in the basic document describing THERP are:
(1) To derive "lquantitative estimates of the degradation to a man-•I machine system resulting from human error" (p. Z, Ref. 4).
(2) Or, "'to evaluate the human error contribution to system de-gradation" (p. 7, Ref. 4).
(3) To predict human error rates (p. 8, Ref. 4).
i-7"i ~71
iI
Since the fifth of the steps listed in the Introduction to this sectionis to "recommend changes" (to the system), another goal might bephrased as
(4) To determine those design changes to the system necessitatedby the system failure rate.
In general, the goals we saw applied to the AIR Data Store-to predictthe time and reliability (accuracy) of operator performance, to identifydesign features which degrade operator performance and to aid in selec-tion and training- also apply to THERP, with the possible exception ofselection and training. However, there is a flavor in THERP of appli-cation to the system rather than to the individual operator and equipment,as in the AIR Data Store. In this connection one might note THERP'sconcept of evaluating the human error contribution to system degradation.Moreover, in a recent letter to the author from Swain, the developerindicates that not only behavioral data are included in the application ofthe technique, but also equipment failure data, environmental factors,and other non-human events as well. This is also indicated in the foot-note on p. 7 of Ref. 4, and in a secret report (Ref. 8). Whereas theData Store methodology on which THERP is based provides a figure ofmerit for the individual equipment, THERP is an effort to achieve a truesystem measure. If equipment data are included in the use of the tech-nique, then one must consider THERP as a technique for predictingsystem performance. For example, in the study described in Reference1, the probability was estimated that environmental and other factorswould preclude successful radio transmission from a ground station to"a pilot in the air. However, all the reports describing the technique 7
focus largely on prediction of human performance. 2
2. Although human reliability predictive models aim at predicting "system"effectiveness, in most cases the prediction is carried out only as far asthe operator subsystem. Theoretically, once an operator performance"prediction is available, it can be combined with that for the equipment sub-system to provide an overall system value. However, because theprimary focus of human factors specialists has been on human perfor-mance predictions, and because the combination of human with equipmentperformance predictions is not as easy as a simple multiplicative relation-ship would imply, the combination has not often been performed. See
Verdi, A. P. The Manned Orbital Laboratory (MOL) Man-MachineEffectiveness Model, Appendix B to Report SM-51356, Human Engineer-ing Program Plan, Dunlap and Associates, Santa Monica, California,15 March 1966, under Contract AF04(695)-904 for the MOL SystemProgram Office
for an example of an attempt to perform this combination.
721
I ASSUMPTIONS
There is some difficulty in determining the basic assumptions under-lying THERP, because THERP is very pragmatic about its assumptions."For example, 11THERP makes no assumption as to the dependence or in-dependence of behaviors. It is up to the user of THERP to make theseassumptions. ..... "(p. 12, footnote, Ref. 4) presumably he is skilled inbehavioral technology.
Presumably, analysis of the specific system operations being eval-uated will indicate whether these are dependent or independent; and theirtreatment in probability equations will follow this determination. Fromthis we can infer that THERP assumes both independence and dependencei of behaviors and applies the appropriate treatment as necessary.
In contrast to the Data Store methodology, instead of being restrictedto molecular equipment design features, THERP assumes that manyI factors, many of them very molar, influence behavior. Among thesefactors (Ref. 7) are various psychological and physiological stresses,training, motivation, and situational factors, etc.
These factors must be taken into account in the gathering of errorrate data and the error estimates derived should be modified in accor-
-idance with the presumed effect of these factors on performance. Onedifficulty that arises, however, in accounting for these molar factorson performance is the difficulty of recognizing their influence and esti-I mating the extent of that influence. We shall deal later with THERP'sprocedure for quantizing the effects of these factors.
- If we examine the hypothetical example provided in Reference 4(p. 28) dealing with pilot communication over a radio, we see that theprobability estimates are applied to relatively gross events, e. g. , pilotwill perform his operations on the ground, high stress condition occursfor pilot's air operatione., etc. If operational data are available forthese events or tasks, the analytic procedure does not proceed to anylevel more detailed than this. However, if operational data are notavailable, it is necessary (I) to conduct the necessary laboratory studiesto obtain useful data, (2) to collect error rate data from operations whichhave tasks similar to the tasks for which such data is needed, or (3) toderive error rate data from expert judgment, preferably involving theuse of psychological scaling.
1 73
To the purist there might appear to be some inconsistency aboutthe combination of data from various sources, such as laboratory dataand expert judgment data. For example, it is quite possible that various
types of data may have different errors of estimate; but in most casesthese errors of estimate will be unknown.
The explanation of this apparent discrepancy seems to lie in theheuristic nature of the technique. Whatever assumptions need to be madeto secure data to exercise the technique will be made, on the very reason-able premise that in the absence of more definitive data or ground rules, Ione must do the best one can with what one has.
It is only fair to note that many of the techniques reviewed in thisreport make use of all available data, whatever their source. Thosedata that appear to be most valid or firmly based on experimentation arepreferred, of course; but should such data be lacking the user of thetechnique will rely on less desirable sources.
One of the consequences of the technique's heuristic orientationis a certain degree of reliance on expert judgment which one findsin the use of the technique. In contrast to the Data Store, whosedata are secured from experimental sources, THERP speaks about"estimations" of error rates or "judgments are made"(p. 9, Ref. 4).Inevitably certain assumptions are implied in such judgments, how-ever, the very precise rules for securing expert judgments thatone finds in TEPPS are not noted in THERP.
(Swain notes that his reports contain several references where de-tails concerning the gathering of expert judgments are pointed out.Nevertheless, the author still feels that THERP's procedures for gath-ering expert judgments are not spelled out as they are in TEPPS.)
Because of the greater flexibility in data sources permitted byTHERP, the possibilities for securing applicable data are expanded.Data may be secured from empirically observed performance of per-sonnel; from historical records of operational performance; from"•texpert" judges. The manner in which these data are combined or in
which human operations are assumed to interact is determined by expertjudgment (as reflected in the analysis leading to the developrent of the Iprobabilility tree) as well as by reliance on the experimental literature.
74
, II
lII
An initial step in the procedure is the listing and identification of
the human operations to be evaluated. As a consequence, THERP makes
use of the same analytic technique used by the Data Store and most other
techniques reviewed, i. e. , task analysis. However, the technique does
not require breaking system operations down to the task level, although
in actual practice this is often done. 3
J3. Swain comments: "1 Our technique does not reqire breaking
system operations down to the task level, but we usually do. As a mat-
ter of fact, we usually get down to the step level, where a "step" is a
typical step in a procedures document which is reasonably well human
engineered -- that is, where a step consists of approximately one S-O-R
unit. Example:
Step 1. Adjust the XYZ until peak voltage is indicated on the
voltmeter and record the resistance from the digital multimeter
11- on line 17 of Form ABC.
-- [Generally, a step is one that has about 10 of the types of elements you
would look up if you were using the AIR Data Store. But this is only a
gross approximation.
Just to continue this example a bit, in the absence of hard data, weAo uld normally assign a . 01 error rate to this step. However, this . 01
could be modified considerably depending on various performance shaping
factors. Suppose, for example, that instead of a digital readout for
resistance, the usual backward reading resistance scale would have to
be used. We would have to crank in some extra error rate. How much?
Depends on what data we have. Sandia has conducted some unpublished
studies on reading of test equipment. But suppose there is no Sandia
! • data, and we cannot find data any place in the literature (which I thinkwe could). Now we would get down to the matter of judgment and more
7' of subjectivity would have to be used. In s iminlarcases, several of us have independently made our own estimates, each
with a rationale. And we have argued and arrived at a committ(ee con-
sensus. That might shock non-practitioning purists ..... But if we
I were off by a factor of 2 or even 5, it would be seldom that the overalloutcome of the reliability analysis would differ to any important extent.And if more accuracy would be needed, we would have to run our ownIistudy -- as we have done several times.
i 75
The task analysis procedure is, however, required in additionto Iuncover all the possible human actions and procedures entering into theevaluation. These include contingency operations which might be sub-
stituted for required operations.
The necessity for considering all operations (including those of a
contingency nature) makes the use of a graphic mode of describing orpresenting these operations extremely desirable (see Figure 4).
In this respect, THERP is similar to other techniques like TEPPS or
the digital simulation models to be described later.
Practicality, however, requires that the number of operations to be
considered be restricted. "At this point, the analyst ordinarily makessome restriction in the human operations to be considered further.. .. hedrops from consideration those human opera tions for which it is apparent(our own emphasis) that no significant degradation to system.... failurerates would result as a function of their incorrect performance... " (p. 9,Ref. 4). Although the developer indicates that one must be conservative
in dropping irrelevant human operations, it is apparent that certainjudgments are required based on "expertise". Again this ties in withthe heuristic elements of the technique.
The lack of information on the ground rules to be applied in making
these judgments has certain implications for the user of the technique:on the one hand he is granted considerable freedom; on the other, hemust develop his own criteria.
It was noted in our review of the Data Store that each error was
assumed to have essentially the same effect on operator performance.THERP on the contrary requires that the effect of a given error on
system performance must be determined if it is to be evaluated properly.Hence, one of the major steps in the procedure is to determine theeffects of human errors on the system. This is the probability (Fi)
that an error or class of errors will result in a system failure, failure
being defined as mission non-accomplishment resulting from error or
equipment malfunction. Fi is any failurc mode of interest.San.
This determination is itself a prediction, wince the presumed effect
is something that does not invariably occur; in other words, it is a pro-bability. The determination of error effects may be based on empiricaldata; or where these are not available, it may be based on expert judg -ment.
76 1
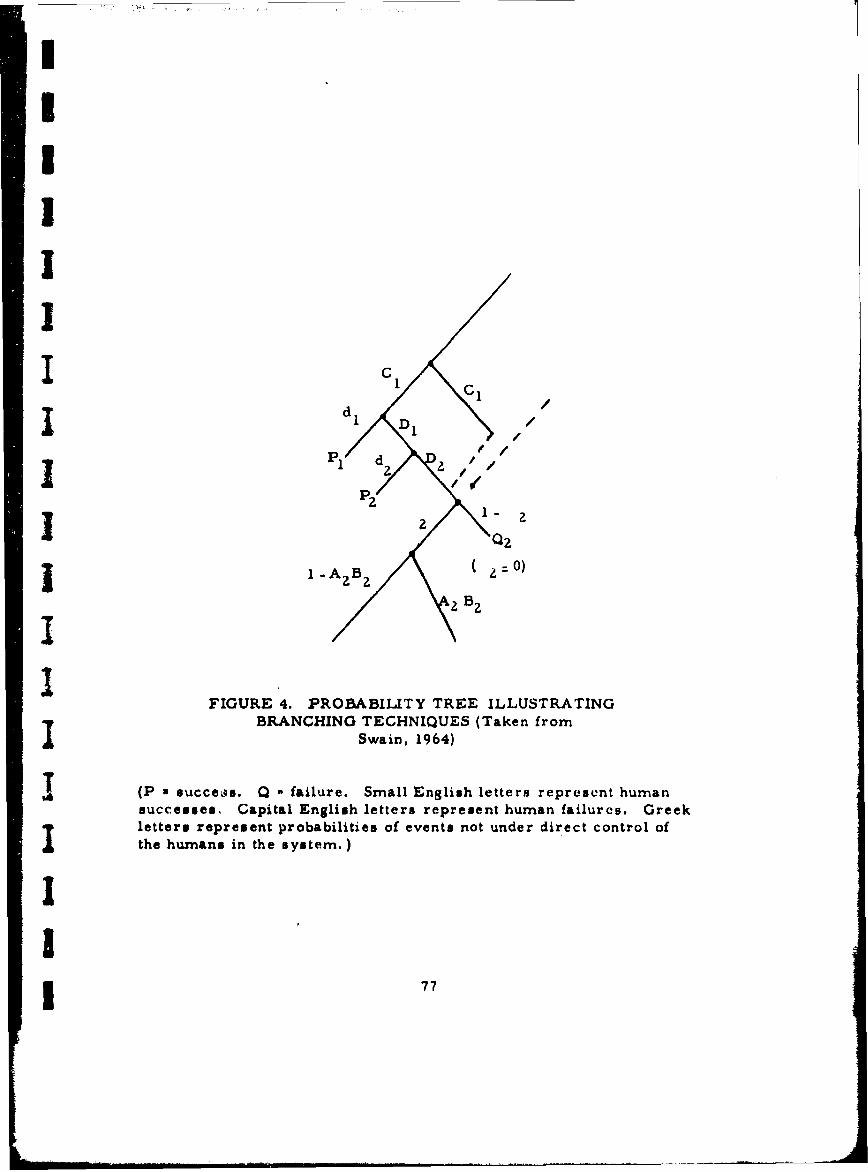
II
1
Id
PI d/
"PZ
A zBJ 2 4-0)
a B 2I\
FIGURE 4. PROBABILITY TREE ILLUSTRATINGBRANCHING TECHNIQUES (Taken from
Swain, 1964)
I (P x succeL~s. Q failure. Small English letters represent humansuccesses, Capital English letters represent human failures. Greekletters represent probabilities of events not under direct control ofthe humans in the system.)
II i
1 77
Obviously Fi represents a degree of methodological sophistication Iwhich one does not find in the AIR Data Store. On the other hand, it
permits again a certain element of subjectivity in THERP operations. 1THERP recognizes, as do other techniques, that behavior is more
interdependent than independent. In fact, a study performed by the de- Ivelopers (Ref. 6) reveals the inadequacies of the independence assump-
tion. However, no explicit rules are given for accepting the assumption
of independence or interdependence. This is left to the user of the technique. I iHowever, it is indicated that "often.. .. independence of certain behaviorscan be assumed even when it is known that the assumption is incorrect.In such cases, it is judged that the resultant calculation. . . is sufficiently Taccurate for the purpose at hand. " (p. 13, footnote, Ref. 4). This sug-gests that independence may be assumed in order to simplify the appli-
cation of the technique. However, Swain notes that "we always make anevaluation of the need to assume lack of independence. "
Again, the pragmatic element in the technique leads to a degree of Isubjectivity in its use.
Certain highly specific assumptions are made by the developers of tTHERP:
(1) One assumption deals with one operator monitoring another's Iperformance. Here, an error probability (that he will not detect an
error made by the second operator) of . 15 is assigned to the operator
monitor. This is based on studies of inspector accuracy in industrial Iassembly line situations. The .85 probability of inspector accuracy mayseem a little high (in view of data supplied by Harris and Chaney, Ref. 2).but is certainly acceptable as a first estimate. 4
4. Swain notes: The . 85 figure is based on a series of rather practical Istudies, initially based on a review of the literature in SCTM-53-61(14)
and later on studies reported in Ergonomic. This . 85 estimate applies
only to a passive type of inspection task where the actual defect rate is Ilow (i. e. , .01 or less) and where the inspection task is simple. Harris
and Chancy obtained different results for different types of inspection
tasks. For example, they show inspector accuracy rates varying from
15 percent to 75 percent as a function of equipment complexity. In our
I78
I
1 (2) A second assumption relates to the self-correction of errors."If a man has X probability of error for an important time-critical taskon which errors occur infrequently, then his probability of making anerror on Trial 2 (after he has made an error on Trial 1) is ?X, for Trial3 (given errors on Trials 1 and 2) it is 4X ..... etc. , until the limiting
condition of a 1. 0 error probability is reached."1 (p. 21, Ref. 4). Thefactor producing this doubling of error probability is stress. If stressis not anticipated, the error rate for both trials is assumed to be the
same, on the grounds that any increased error probability in trial 2would be compensated for by greater attention.
(3) A third assumption deals with behavior under high stress con-ditions. The degree of stress is a parameter which apparently entersinto all THERP calculations (as it does in a number of other techniques)."An estimate of 10-20 percent error rate for pilot tasks analogous tothe critical behaviors of SAC pilots is felt to be reasonable.... " (p. 23,Ref. 4). Again, judgment is required in the determination of whether
= I stress exists, the degree of that stress and the effect of that stress onperformance, as reflected in increased error rates. Such judgments arenecessitated by the inadequacies of the studies performed on this
'parameter.
Other very specific assumptions are made in the solution of a givensystem problem, but these assumptions are peculiar to the system situa-tion and are not inherent in the methodology itself. These are "reason-able" assumptions which are developed for purposes of simplifying what
I would otherwise be an inordinately complex process. For example, theassumption is made that a written procedure used in an operation is the"one supposed to be used and that it is correct. If such assumptions arenot made, the range of possible error situations to be evaluated wouldbecome almost endless.
work dealing with assembly and shop type tasks done on nuclear weapons,
we often use a . 95 or . 99 accuracy rate for the inspector, depending on
the nature of the task. These latter estimates are for inspection tasksin which the inspector's role is not passive and in which he is lookingfor a limited number of clearly defined and recognizable defects. Thesevarious estimates merely indicate that estimates of inspector accuracymay differ considerably when different types of inspection tasks areconsidered.
'7I1 79
I.b
The author would not like to be unfair in seeming to emphasize the Inumber of judgments required in utilizing THERP, although other re-viewers (e.g. , Freitag, Ref. 1) have made the same point. Since thedeveloper of THERP views his approach as being strictly an empiricalone- "if it enables us to make predictions sufficiently accurate for thepurpose at hand, we use it" (p. 17, Ref. 4)- the looseness in the con-ceptual structure underlying THERP is a necessary consequence of its apragmatic orientation. It is a defensible point of view that the lack ofapplicable data on human performance makes flexibility an advantagerather than a disadvantage.
The flexibility we have noted in THERP does have one pragmatic 1 •consequence with which we must deal. That consequence is that the 4THERP user is often left to his own devices (must develop his ownground rules) in making crucial methodological decisions (e. g. , inde-pendence/interdependence; degree of stress, etc.). If he makes thesedecisions correctly he is "home free"; if he does not .....
Pragmatism - the acceptability of any me thod of arriving at anyanswer which solves a problem- is itself an assumption that must beexamined. It must be recognized that this assumption makes it difficult Tto quarrel with the details of any methodology, as long as that methodo-logy appears to "work". Since the author's point of view is that the -
purpose of human reliability predictive models is first to solve systemdevelopment problems and only secondarily to serve as conceptual toolsto explain man-machine behavior, pragmatism is acceptable to him, butonly to the extent that it is buttressed as much as possible by detailedclarifying procedures.
METHODOLOGICAL SCOPE
As in the case of the AIR Data Store, any type of system, functionor task can be handled by THERP, provided the error data for that system,function or task are available. Although the Data Store has limitations interms of not being able to handle continuous type tasks (e. g. , tracking) orcognitive tasks (lacking appropriate data and being constrained by itsassumption of element independence), this limitation does not apply toTHERP, simply because the conceptual and methodological structure is Iso flexible. Whereas the Date Store methodology is limited by its sources,the same cannot be said of THERP, because any set of "reasonable" data,from whatever source, permits one to apply a numerical value for any 4type of behavior.
180 I
'4
UI
J This flexibility in data source is therefore an advantage, providedone accepts the validity of the data from these sources. In other words,for example, if the problem is to determine an error rate for a strategicdecision involving three alternatives, the user of THERP would - in theabsence of any other data- accept estimates (using paired comparisons,"perhaps) by strategic planners of the error rate they have observed forthis type of decision. If this error rate seems reasonable (on logical,empirical or experimental grounds) to the THERP user, he can includethis kind of behavior in the class of problems which THERP can deal with.
In the same way, if he must take into account different types andamounts of feedback (a problem which, we will see, besets other me-thods), the user of THERP can develop a probability value for this feed-back based on whatever data sources he can find. Consequently, THERPis not system/task-limited as are other methods.
PARAMETERS
Besides the customary response time and error measures, con-siderable emphasis is placed on stress in establishing an error rate fora given behavior. This parameter is defined in terms of personnelresponse to emergency situations, and can be categorized in terms of
* LAhigh and low stress producing conditions. In order to account for thestress factor data from SAC pilot situations have been adapted to providean estimate of 10 to 20% error for the pilot and 5 to 155o error rate forin-flight tasks performed by aircrewmen.
What the error rate would be to account for stress occurring insituations other than these is somewhat unclear. 5 Presumably, if theneed arose, applicable data would be secured. The stress parameter is
5. Swain notes: SC-R-69-1Z08 by Rigby and Edelman (see alsopp. 475-48Z in Vol. 10 of Human Factors) presents a later treatment ofstress, and it is not restricted to flight tasks. Using former crewmembers of multiengine aircraft as subject matter experts, Rigbyand Edelman, scaled the AIR data form the Ronan AIR report and note,"In the absence of better data or information to the contrary, it maybe practical to apply these stress levels and error rates to non-aircraftsituations. It is necessary to show only that the emergency of interest
81
I
also related to the increased probability of error in repetitive trials, that Iis, twice the probability of an error occurring in trial 2 when an errorwas made on trial 1, 4 times the probability of error for trial 3, giventhat errors were made on trials 1 and 2, etc. Although stress is not,explicitly indicated as the cause of this increased error rate, it is im-plicit in the explanation given: the "error resulting from operatortenseness..."* (p. 21, Ref. 4). Where non-stressful conditions do notexist, the error probability remains the same on repeated trials.
SObviously stress (or the lack of it) is a basic parameter enteringinto all THERP error probabilities. It should be noted that in contrasttoSiegel's use of the parameter in his digital simulation model, stressin THERP is not operationallr defined by and does no t vary in terms of I'
the specific system situation, but is rather a central (e. g. , emotional)mediating process. The use of a standard error rate for stress (eventhough there are apparently 3 categories of stress: high, low and none)in less precise than Siegells use of the parameter.5A However, Swain(personial communication) indicates that the ZX error rate relationshipfor repeated trials is analogous to the maximum value found in Siegel'stheoretical stress distribution.
In his most recent work (Ref. 7) Swain has pointed out the impor- Ltance of what he calls "performance shaping factors".(PSF) in determiningor at least explaining error rates. Many of these are extremely molar,e. g. , motivation, training, psychological and physiological stress, etc.'and require sophisticated judgments for their measurement.' A numberof 7-point.rating scales have been developed to quantize PSF. Swatinspecifically emphasizes task difficulty, personnel redundancy (treatedearlier) and' manner of use of performance aids. With the exception of
is indeed comparable to some point on the scale. This can be done byjudgment alone, where that is necessary, Empirical estimates can be Lobtained by having subjects (1) insert the given emergency into the scaleand use the mean position or (2) compare the given emergency to two or
,more judiciously chosen items on the scale and convert the obtained Lproportions to scale positions. The validity of such results, of course,will depend upon the degree to which the subjects are experienced inboth the aircraft and non-aircraft situations."
5A. Swain notes: In our earlier work, we used three error rates for thethree stress levels (see SCR-685), but Rigby and Edelman have devel-oped a scale which has five stress levels (see SC-R-69-1208).
I82 1
IlI
personnel redundancy, very little use is presently made of these "per-.
formance shaping factors" because the data relating to them are not
readily available. 6
It is our impression that although Swain recognizes the importance
of various parameters for the determination of error rates, these para-
meters with which THERP deals are not defined with very great pre-
.cision.7 Although this is in line with the empirical, heuristic orientation
of the method is is unfortunate because the parameters which i m pa c t
on human performance are extremely complex.
L i
6. Swain notes: We do make use of (i.e., consider) all theperformance shaping factors listed in my various reports. It is true
that data of the best experimental study caliber is not available for
* these PSFs, and besides that, they tend to be situation-specific anyway,but any human reliability analyst worth his salt must consider them. My
data store report (SC-R-70-4286) notes that when one has error rate data
*• which one wishes to apply to reliability predictions for some set of tasks,
one has to judge how comparable the PSFs are between the tasks of
interest and the tasks for which the error rates are available. To the
extent they are comparable, then one has to modify the error rate data
to estimate the influence of the PSFs. How is this done? Largely judg-
ment, helped, by whatever studies there are which show in general how
different levels of one PSF affect task performance. (We) are trying to
work out a more rigorous method in this regard, but there will still bea lot of "expertise" involved. We hope to answer your correct statement
that these PSFs "are not defined with very great precision. " Our general
approach will use the 7-point scaling of PSFs, some examples of which
are given in SG-R-70-4286.
7. This is a situation which one finds in almost all the models reviewed.
83
DATA
1. Measures Used
THERP employs two primary measures: the probability that anoperation will lead to an error of class i (P;and the probability thatan error or class of errors will result in system failure or failure ofthat part of the system being evaluated (Fi). Pi is based on what istermed an "error rate"7 , which is the frequency of error occurringduring a block of time. It is not error occurring as a function of theeffects of time (as in the sense of equipment wearing out over time),but error as a function of number of repeated triats, e.g. , 5 errorsoccurring over 100 trials gives an error rate of . 02. There is somequestion whether error rate is analogous to equipment failure rate,
since the lattar is more directly a function of time.
simply by deriving a percentage of error occurrence. I1- Pi is theprobability that the operation will be performed without error. Onecan derive an error rate from a probability of successful task accom-plishment simply by subtracting that probability from 1. 0, e. g. , 1. 0- .9998 - error rate of . 000Z. Similarly, a probability of success canbe derived by subtracting the error percentage from unity (e. g. , 1.0-.O00OZ . 9998). In that sense probability of successful task accomplish-
ment and error likelihood are mirror images of each other. FiPi is
the joint probability that an error will occur in an operation and that -
that error (or class of errors) will lead to system failure. Il-FiPi isthe probability that an operation will be performed that does not leadto error and consequent system failure. Qi =1 - (1 .FiP,)ni is the pro-bability of one or more failure conditions existing as a result of classi errors occurring in ni (independent) operations. When one simplifiesthe mathematics the measure employed is simply an error rate (Pi)jmodified by an effect probability (F 1 ).
Both Pi and Fi are point estimates, that is, a single value for atask; they do not consider a range of values (in the sensc of a standarddeviation), nor is there any confidence level associated with these esti-mates. There is no distribution of P.i or F.i as a function of other para-
n 1 1
i ! I
meters such as time, stress, etc. , to which one can refer. In that
sense we can think of them as being essentially ")static" values. 8
8. Swain comments: You are quite right in implying that normallywe use point-estimates for our estimated error rates and forget about
841
I
2 . Output Metric
The output metric is the failure rate associated with the systemI or part of the system being evaluated; it is not a probability of success-ful performance, although that can easily be determined by calculating1 minus the system failure rate. To determine the probability that anygiven task will result in an error leading to failure, the measure is Iminus the probability of no failure or 1- (1-FiPi)ni which is Qi. Totalsystem or subsystem failure rate resulting from human error is ex-pressed as QT ` 1- 1 -Qk) I where the quantity in brackets is
0 1 Qi) G -Qq) ...... 0 1 Qn)'
The output metric is therefore simply the combination of the indi-vidual FiPi's for the individual task behaviors, the combination beingbased on conventional probability theory. Where the tasks are assumedto be independent, the combination is performed through simple multi-plication. Where the tasks are interdependent the probability calculationbecomes a bit more complex. We do not propose in this review to re-peat the very lengthy probability equations required to arrive at a systemfailure rate. These can be found in the basic reference (4),
H distributions and confidence levels. But the THERP model can handledistributions and confidence levels, and I have used it for this purpose.The problem with distributions (unless you have an empirical distribu-tion based on lots of trials) is that they are so iffy.
There is nothing in the THERP model that precludes the use ofMonte Carloing, but given the usual iffy data, why gild the lily? WhatI have done on occasion is to use +I S.D. error rates, based on esti-mates of mean error rates, an assumed normal curve, and an assump-tion of a range ratio (Wechsler's) of 3:1... The use of ;1 S.D. errorrates in a tree diagram and the subsequent mathematical treatment givesone a type of "worst case" method. But even that is unnecessarily com-plicated for many purposes. I have obtained judgments of error ratesand deliberately inflated them by an order of magnitude to see, evenwith this inflation, if a certain horrendous system outcome would result.If one is still safe,. then the analysis need go no farther. If, on the otherhand, there is an unacceptable probability of the unwanted system out--come, then one has to buckle down and do a more detailed analysis.
'8
I 85
3. Data Sources
As indicated earlier, THERP will accept data from any source.The fact that error data describe the task, rather than equipment
characteristics as in the case of the AIR Data Store, makes it muchsimpler to gather the requisite data. On the other hand, the fact thatthe error data do not directly describe equipment characteristics, al-
though the latter are considered in the assignment of an error rate,may make THERP's estimates somewhat insensitive to equipment de-sign variations.
The determination of Fi presents the THERP user with an entirelydifferent situation. Because the effect of an error on the system is involved,Fi probability estimates are largely system-peculiar and therefore mustbe developed anew for each system being considered. For example, de-pending on the way in which circuits are hooked up, an error may be
either inconsequential or catastrophic. This is one of the reasons whyindividual reliability "failure modes and effects" analyses are oftenperformed during system development. It would therefore seem unlikelythat one could develop a "universal" data bank describing Fi error ef-
fects. Here the user must depend largely on the judgment of the systemdeveloper (e. g. , reliability specialist). One can only point out that theseFi estimates may involve some inconsistency between "experts".
The concept of Fi is, however, a definite plus for THERP; withoutit every error is equivalent to a task or system failure, which would bedifficult to justify.
The fact that empirical, experimental and subjective probabilityestimates are utilized indiscriminately in developing THERP estimates
may lead to error in determining these estimates. (Swain claims nomore accuracy in prediction than a factor of five, p. 12, Ref. 4). More-over, regardless of the data source, each probability estimate is con-sidered as equivalent to every other, which simplifies their combination.Swain notes, however (p. 12, Ref. 4) that the assumptions behind eachdata estimate are provided so that the user of t~he reliability study will
not be deluded into assuming an accuracy not present in the estimates.No rules are provided for securing e xp e r t judgments as one finds inTEPPS, for example. 9 Again, however, THERP's pragmatic orientationis important here; only that accuracy needed to solve a particular pro-blem is required, and the implication is that for most practical systemdevelopment problems a high degree of accuracy would be necessary.
86 I
PROCEDURES FOR MODEL APPLICATION
1. Analytic Methods
|I The system operation to be analyzed is defined in terms of apotential error/failure of that operation. In other words, operationsthat are unlikely to lead to error need not be considered. This consid-erably simplifies the analytic procedure, but one must be conservativein doing so, Swain warns us. Although the system operation to beevaluated may be at any level (the total mission, a general function(e. g. , take off, landing) or a specific task (e. g. , communicate messageto tower), in practice whatever level at which the operation is described,"it is reduced to a set of discrete tasks needed to perform the operation.Consequently, the analytic method used is that of task analysis. No par-ticular task analysis variation or specific analytic procedures arespecified; in this respect THERP is similar to all other predictivemethods.
All the human operations (i. e. , tasks) to be performed are identi-fied and listed, including contingency events or decision-alternatives.In this last connection THERP is a considerable advance over the DataStore. Note that although these tasks may not be formally analyzed (interms of written checklists, etc. ) in terms of such factors as time pac-ing factors, stimulus exposure rates, accuracy requirements, concep-4 tual demands, etc. , the analyst is supposed to consider these in termsof his evaluation of task difficulty or stress level.
Analysis is combined with the development of a probability branch-ing tree (Figure 4 ) which is a graphic means of representing steps inthe operation and contingency events. The probability tree is necessaryfor the user to keep in mind the relationship among the alternative path-j L ways. The reader should compare the probability tree with an analogousdevice to represent system operations, the Graphic State Sequence Model"of TEPPS.
9. This subsection should not be concluded without mentioning the psycho-:. logical scaling method frequently employed in THERP and described
more fully in Reference 5. The method itself is too lengthy to includein this report, but Dr. Swain has kindly provided an example of ho vthe method might be used for deriving error rates for SAFE-GUARD(system under development) tasks. The example is provided as an"appendix to this subsection. The reader is cautioned that this appendixis based only on a draft paper.
T. 87
2. Methods of Synthesis I
Two methods of combining data are employed. The first (simplemultiplication) is used when tasks are believed to be essentially inde- Ipendent. The second (somewhat more complex) is used when the analystdecides that the operations to be combined are interdependent.
The interdependence of operations is handled by analysis of thebranches in the probability tree. If, for example, the branches indicatethat the error probability of task C is a function of the combined errorFrobabilities of tasks A and B, then this relationship is transformed intomathematical form and the equation is solved. Dependency relationshipsare decided upon by the user who makes up the probability branchingtree. In any event, THERP's claims to deal with interdependency appearcorrect.
Such interdependency relationships refer only to the probabilitythat a task will or will not be completed successfully. In other words,they deal only with a terminal binary state- successful accomplishmentof the task or failure to accomplish the task. It is not clear whether anypredictive method can handle degrees of successful accomplishment,e. g. , the situation in which a preceding task A can be performed moreor less accurately and the degree of accuracy in A will determine thesuccessful accomplishment of following task B. 10
3. Data Application
Data are applied at two levels: the task element level, but morecommonly at the task level.
10. Swain comments: THERP can handle degrees of successfulaccomplishment by the use of the branching technique. No problemhere. But we haven't found it necessary to go to such a level of com-plexity. I have always preferred to use binary decisions in my analyticwork... As long as one has to male subjective judgments, it's easierif they can be fractionated into a series of yes-no judgments. This isone reason I prefer the paired-comparison scaling technique. And it'sone reason my tree diagrams may look complex but really make thejudgments in the reliability analysis much simpler. (There are just ..
more of them.
88
I
I ANTICIPATED MODEL USES
In this subsection we consider the uses that may be made of thevarious models. The following are the major outputs that a model mayha ve:
A (1) Prediction of system effectiveness
TjUnder this heading we include the following:
a. Determination that the system will perform to specified"requirements. For example, given a system requirement, e.g. , thatthe mission must perform with a reliability of .9995, can the system(including the human operator, of course) perform the mission with that"reliability?
"b. Prediction of the absolute level of efficiency the operationalsystem will achieve (whether or not an operator performance requirementhas been specified). For example, assuming that the system under de-
ii velopment is built to present design, what is the numerical reliability
L. that the system will accomplish its mission (e.g. , .9995, .9870, .8993)?
(2) Design analysis
Under this heading we consider the following as possible uses
of the model-
a. Comparison of alternative design configurations in terms ofthe effect on operator capability.
b. Suggestions for redesign of a system configuration (assuming"* that the model has been exercised on a system and has indicated potential
deficiencies).
"c. Suggestions for initial design of the system configuration.
(3) Manpower selection
-Under this heading we ask whether a modol will suggM-tN ths'Lypes and numbers of personnel needed to operate th, systotm, ind in par-ticular the aptitude/skill level required of theset peruonnl.
I1 89
(4) Training requirement
We may also ask whether a model supplies information relativeto the content or duration of the training required to support the system.
The first model application is quite obvious: this is what predictivemodels should be able to do. The meaningfulness of the remaining appli-cations may, however, not be so immediately apparent. In the designanalysis area, if two or more system configurations are available, be-tween which a choice must be made, applying the model to each confi-guration should produce a prediction of system effectiveness (as in 1 b)which can be used as a figure of merit. The two predictions can thenbe compared and the configuration with the estimated greater effective-ness can then be selected (all other design parameters being equal).Since this application is only a variant on (1), any model should be ableto do this.
If a model can predict, it should also be possible to use it as adiagnostic tool, since the factors responsible for a prediction shouldbe discernable upon detailed examination of the model exercise. Ifequipment deficiencies are responsible for a lowered estimate of effec-tiveness, then those deficiencies should be available from the variousmodel outputs. From these the analyst might infer design changes thatcould improve the system. Although this does not mean that the modelwill output human engineering recommendations as such, the more sen-sitive the model is to the equipment factors that influence effectiveness,the more apparent the items that should be changed will appear. Sim-ilarly, if manpower and training factors are responsible for a loweredprediction of system effectiveness, then the model should provide cluesin this area also.
It should be apparent that any prediction must be caused by one ormore factors entering into that prediction, whether it be equipment, thenumber of personnel, their aptitudes, training, etc. For a model to bemaximally effective, those factors should be deducible from the modeloutputs. It would be unreasonable to provide the user simply with a
numerical estimate and let it go at that; few users are likely to be satis-fied with this.
Obviously the list of model uses represents an ideal set of uses.
Models will vary in the degree to which they can satisfy these uses.Moreover, they may be specialized for one use rather than another. It
ia essential, however, to examine a model in such terms because themodel is only a tool to provide answers, of which the above representthe most important.
90

II'One last point. It may seem unreasonable that a predictive model
should be used for initial design analysis, in the sense of suggestingparticular components, design layouts, etc. To the extent, however,
that a model makes use of a data bank for assignment of error proba-bilities/completion times, that data bank can also be used as a tool forinitial design analysis. If, for example, task A, involving certain be-
haviors and components X, Y and Z, has a substantially lower errorprobability than task B involving other behaviors and components L,M, N, it would make sense for the system designer in any situation inwhich he can use either task A or task B, to select task A. That iswhat we mean by init. L1 design analysis.
1. Prediction of System Effectiveness
THERP's intended purpose is to evaluate system operations interms of the effect of human error. A comparison is made betweenthe predicted system failure rate and the performance required by the
system. In the course of doing so, it predicts what the performanceof those system operations will be- at least that part of it representingthe human's contribution. The obverse side of the prediction of humanerror is the prediction of human success. Manifestly, if the techniqueis valid, it is a powerful instrument for prediction of system effective-
' •ness.
2. Design Analysis
What one eventually does with the prediction in (1) above is torecommend changes to the system. If, after having predicted the system's"failure rate due to human error, that failure rate is unacceptable (in termsof a specified requirement), then the technique should lead to recommen-dations for system redesign.
Here one enters an entirely new ball game. The question one mustask is whether THERP indicates as an inherent part of its technique whatchanges should be made. For each system operation (task) being evalua-ted a Qi value is derived which represents the error probability associatedwith the operation. If, then, one ranks the tasks in terms of their Qivalues, changes should be made in those possessing highest error pro-babilities. After the changes are made, QT is recomputed; if the changesare effective (i. e. , QT is lowered to an acceptable level), the ttechniquehas achieved its goal.
9]
I
The de terminntion of what channns should be mAdo ner wit, httwavr, Ireadily apparent in THERP. TIE1•']X points out tho taok npotliig r'd"|itn,
but does not suggest whst thope cha'igoa i hould ho, R•euiienmbor that thl
task description with which the error probability is a mociatod cuntminscomparatively little information Ahout equipment or task cha ra,'teristik's
(at least at a r olecular loval). lT'or e•arnple , in th, .,xaniplo 'itod InReference 4, the pilot'. reception of the oode was found to bh tho wvako!t
link (p. 48). The possible system rodosigin chatuiges noted woro "1to in-crease the reliability of the pilot's reeeption, to hyposs himn, or ....
(eliminate) the requirement to r 'etive the code in the ait" (p. 40).
These are all logical altv.natives, but they provide the aystemn devwlopor
with relatively little guidance, as*suming that the pilot must recoieo thA
code in the air and cannot be by pAssed.
The point we wish to make is that THERP, like many other models,
pinpoints a source of difficulty but goes no further, To make the task
more reliable by redesigning it requires attention to equipment arnd taakcharacteristics which THERP may not provide because of its leval of
description. Any recommendations for redesign would have to arise
from an independent human engineering analysis of the task and equip-
rne nt.
This is not to say that the guidance THERP provides in pointing out
the operation requiring attention is unimportant. What we do say is that
the guidance may not be at a level detailed enough to make it very usable
to the system designer. In this respect THERP is similar to othtr per-
formance measurement and predictive methods.
If we emphasize this point it is to suggest that a technique special-
ized for prediction of performance may not necessarily be the, best for
design needs (except at a very gross level of design), Performance pre-
diction is one sphere of activity; design guidance is another, and the two
may not eatily cross over.
THERP should do well in comparing alt.,rnativ, d hsign configurattions,
provided that the configurations to be comnparedl involve diffretnt task
operations, rather than the same operations with differont items of
equipment. In essence, THERP develops a prediction of each alternative
configuration and then compares predicted system failure rates. Stel'c-
tion is made of the one with the lower failure rate.
92
VI
J ~ ~~~Who'ie tho astmu,' tookm or P jio'itiottuiml, but 1111lV lilt,(I%3I' ltIl
figul-At io aising" it tom 11uidiholy IhAI Plialiticia ItIIy 4114P1,411 fiti , r ill, 11141
bohlili (o ~ m i wil it,~ der ivo'il utilroom the %su~sv ipuuv:' h tg ma t
pro'atltiw'ms ditlor' simniticittilly ullirs~m Itile ltlvv 1adio 14110 t ill, vaitsly- tll~dffo pot~,t? Thoy will not , ittilpi'm m this is t' ru prollA ililty I'litimalt'm Inupul
10 tihe ISIVhIII IIIeu AV I MI' ith %Ida11 00111MV y s II vs Ii isquil pm1i' l~ di' IA110
THICRP make., till pro lenin'o I imipjui 'vilii rovoummotidattotin (ii'ht- wtiAt* Idoio' N 1111- it m uakoo m no tiN.' of iNta siota ikd dtlta Wil k, st thduio t he Alit
Obviotkoly th0 Or rou' ra1ei' (pu'i vid for' lilt' vA itilluN lapko A rt' lit Particltrim it nold by 04 q iu.ipm t t'u 'Vh 'ltIi iowoAo.'0Il.' m1 N10140 1' coiuldpa rtial out that parl of lb.' or rut rat.' doupoildtitont t ji Okpoifit .'quipmeit /task chAro'ct. ritmiuw, itmnilght hoe difivtuht to work hua-kwa ida fromithe 01 orra rata t.o ik t~ivonc.' I dewign reIoommoP IliA tions,
*3 Mapo' !~~.~ S Sloctioli
T14E1P make.t no claimm ams a te'chnique' to aid ia tile m.'loctioni of*Iporsionnol, Since thr lovol of task dosivription doost not pormit vasty
Into rpro tiation Ini tervms of roqut rod Aptitudom, nothing can tie done inthis area, How.'vor, the. usior might iater from hio knouwledg~e of tilesystem what personnel aptitudos utc, would be' iue'e'dod.
4. Training
THERIP makes 110 Claimp am a lechnique to predict traintintg nee'diiiHowever', should a task be found to havo An unacceptable' orror rato,and redesign is not possible, it might be amsume'd that iadditiouu~U traina-rIng of that amok would he required, Such a recouummendation would, how-over , do little' Yore than poinat out lthe need for t raining,
1 W. S a 1 1 n ot e W It Is Indov'I'c trut' tllalý mignifivanitly difft'lre'uiterror probabilities for taska will viol btn der'ivedi whonu t'quipmuuit't linnuie'sart, moderatei or rmior. 'fhit Is ont, o( tht- finidinigs thatt rvaliv hit us,And it was true' whethe'r we' usevi lhit AIR D)ata Sturv or tiny toltivi SM1iuCtiof dalta or just plain e'xpe'rtis ti 'rho importanit point im that at grott
many human enginee ring nicetite's don't ma ke ali impur dot diffe rkncuv ineffects oil sysiteir reliability kinder most opt-rating Canditions.
ILA. Swain Insists, however, that TIIERP can be used for initial design.
93
I,
IAt this point th oxptirtipto of the analyst would undoubtedly come
inhu play 14nd 11h would de1tormine the ad ditional training requirementsfronk tho c haractit ristics of the mystei, The point, however, is thattho model as a model woutld not suggest these chAnges unless it werehighly sensitive to training pararnoters,
VALIDATION/APPLICATION STUDIES I
It was pointed out in the section on the Data Store that it in possibleto evaluate the validity of a model on either conceptual and/or empirical ,bases. Obviously, if a model ham denonstrated empirical validity, bypredicting effects which are in fact domonstrated operationally, then thequestion of conceptual validity becomes irrelevant, However, no modelhas complhtely demonstrated empirical validity (4lthough in a few caseshighly indicative experiments have been performed). In the absence ofdemonstrated empirical validity, additional confidence can be secured .in a model by oxamnining the concept structure on which the model isbased,
Because a significant characteristic of THERP in that it appears tobe tailored to the system problem which it addresses, it is difficult to
evaluate the methodology on the basis of conceptual validity. Consequently,
empirical validation studies are crucial if one is to make an appropriatejudgment of the technique.
A problem that one runs into, however, in establishing the empiricalvalidity of a model which was derived from and is applied largely to pro-blems arising during system development is that it is difficult to estab-lish a controlled experimental design to measure validity. Moreover, it I.is difficult (although not impossible) to differentiate the purely predictive
aspects of a model from its deductive aspects, e. g. , from the humanengineering design changes that are recomrnendted and implemented. I.
To the extent that a model should find its tise int system devlopment,it is possible that one would not wish to differentiate predictive from Ideductive aspects, It is also entirely possible that for such a model the
concept of validity should be subordinated to that of utility. Swain in-dicates "our own experience shows that it (THIERP) is a practical, work-able and useful method".
94!
I,I
I The difficulty of making appropriate ,Judgrrnntti about THERPI inintensified because the systems to which T*•ERP ham been moat oftenapplied are highly classified and thorefore information conerrni tl thesuccess of THiERP in dealing with thieme mystemN its not avAilable to theauthor,
I It is known that THB&RP has bnr•vi and is being applied to a •u mber ofsystem development projects, e. g. , Safeguard, but again any roport.developed during these projects have been unavailahle to the gen',rtAl
I reader because of security classification. With the exception of the il-lustrative example presented in Refervnce 4, theritfore, which is not Avalidation study, there have betin no illustrations, vxct pt in passingreferences, of how well the techniqute ham worked, although the developerhas indicated in conversations that the method works well,
I The case of THERP, like that of the Data Store, and many othermodels, illustrates the fact that all of the docurnentation and validationone would wish to have is not available. Like the Data Store, THERPhas apparently been applied quite often, but data have not been providedby its users to others working in the field to determine just how promis-3 ing the technique in.
BEVALUATIVE SUMMARY
Validity - Although only one formal validation study has been re-
ported (to the author's knowledge), the method has been applied repeat-edly to system development problems and is reported to work reasonablywell. In fact with the exception of the Air Data Store, this is the onlymethod that has been applied repeatedly in system development, althoughmost of that application has been within the developers' own shop(Sandia Laboratories).
Reliability - No formal data are available on consistency with whichthe method can be applied, although the developer reports no difficulty
in this area.
System Development Applicability
A. Comprehensiveness: Model can be applied to all types of"equipments, tasks, behaviors.
95

II
1, Applicabiity: Method outtuts it prodictiun of Mystem effective. Innww snit •'n, with tho aid of standrcl hnamn ongineorilig techniques,bo vupd for sign mithly•eiuym, I
C, Timiing: Modol can be appkiod to systems in tho early as wellhis lattsi, Mtagom of system domign.
Modol Characteristics
A. Objectivity. Judgments arc reqired and the ground rules forsecuring those are not as detailed as one would desire,
B, Structure: Conceptual structuro is momewhat informal. 1.
96
i i |,. I
! I !
,• _::.9 6
II
I REFERENCES
1. Freitag, M. Quantification of Equipment Reliability: 1. Review ofthe Recent Literature and Recommendations for Future Work. TM-940, U. S. Navy Electronics Laboratory, San Diego, California,3 2 June 1966.
2. Harris, R. and Chaney, W. Human Factors in Quality Assurance,I Wiley, 1969.
3. Meister, D. Human Factors: Theory and Practice, Wiley, 1971.
4. Swain, A. D. A Method for Performing a Human-Factors Relia-bility Analysis. Report SCR-685, Sandia Corporation, Albuquerque,
SNew Mexico, August 1963.
5. Swain, A. D. Field Calibrated Simulation. Proceedings of theSymposium on Human Performance Quantification in Systems Effec-tiveness, Naval Materiel Command, Washington, D. C., January1967, pp. IV-A-I through IV-A-21.
6. Swain, A. D. Some Limitations is Using the Simple MultiplicativeModel in Behavior Quantification. in Askren, W. B. (Ed) Symposiumon P.eliability of Human Performance in Work, AMRL-TR-67-88,Aerospace Medical Research Labs. , Wright-Patterson AFB, Ohio,
* May 1967.
7. Swain, A. D. Development of a Human Error Rate Data Bank.-• Paper presented at the U. S. Navy Workshop on Human Reliability,
,I Washington, D. C. , July 1970.
-. 8. Swain, A. D. , "Human Factors Associated with Prescribed ActionLinks (U)," (CONFIDENTIAL article), Proceedings of the 1 IthMilitary Operations Research Symposium (MORS), Naval Analysis
-- Group, Office of Naval Research, Washington, D. C., Spring 1963,l17-230 (SECRET report).
97
I ______________________________

APPENDIX I
OUTLINE PROCEDURE FOR DERIVING ESTIMATES OF ERROR RATES
FOR SAFEGUARD TASKS(Source: SC-R-67-1045 and references cited therein)
Have subject matter experts develop ordinal scales of HERCULEStasks in terms of error-likeliness.
a. Subject matter experts are those with familiarity and experiencewith HERCULES tasks. These experts will also rank-orderSAFEGUARD tasks.
b. The method used will depend on the number of tasks to be com-pared. Ideally, paired comparison would be used, but from apractical standpoint, some kind of shortcut will be employed. 4
c. There will be at least two separate scales: one for maintenancetasks and one for command and control (C&C) tasks. These twosets of tasks will be rated separately and this separation willbe maintained throughout the procedure outlined in this paper.C&C tasks will be rated, assuming a nuclear conflict has
started. Maintenance tasks will be rated, assuming peace-time conditions. It may be desirable either to rate them,assuming nuclear conflict, or apply a correction factor to thepeacetime rating. This decision will be made later.
d. A criticas part of the rating method will be the development ,-and standardization of the instructions to the raters. The in-tent of the instructions will be to get each rater to be makinghis judgments on the same dimension, error-likeliness, andwith the same scenario in mind.
e. Check inter-judge agreement. Interview outliers to see if theywere using different criteria in spite of above detailed instruc-tions. Discard results from outliers as appropriate. (Thisdiscarding is obviously fraught with methodological pitfalls,but is necessary from a practical viewpoint, and is consistentwith the literature on psychological scaling.)
f. Classify HERCULES tasks in terms of amount of inter-judgeagreement as a means of establishing our confidence in taskrankings. This classification can be used as an aid to th(ýproject personnel and help quantify "subjectivity" in sorne ofthe final decisions that will have to bt, mad,,.
98
(III
II
2. Convert the two sets of rankings to two interval scalhs of error-likeliness, one for maintenance tasks and one for C&C tasks. Pro-cedures for the conversion are found in the cited references.
3. Obtain actual error rates from graded exercising of HERCULES.The stress level is high for tasks performed in HERCULES exer-cising and can be considered equivalent to the stress of militarypersonnel in a Strategic Air Command Standardization Board (SACStandboard) exercise where a man's military career can be madeor broken, depending on his performance and the performance ofthe men under him.
vi 4. Order the above error rates into two sets of ratio scales, one formaintenance tasks and one for C&C tasks.
5. Compare the two sets of interval scales obtained from expertjudgments with the two sets of ratio scales based on HERCULESexercising.
a. Try to resolve any major disagreements between the intervalscaling based on the expert judgments and the interval scalingdefined by the ratio scales. (Obviously, only the intervalsin the scales can be compared because there is no zero pointon the two scales derived from expert judgment.) It cannotbe assumed that disagreement is the result of poor estimatesof error-likeliness; it could be the result of inadequate error
T recording during the exercising. Fortunately, the White Sandsproject leader is very familiar with this exercising, havingparticipated in several, and his judgments will be valuable.
b. Discard those interval values from the judgment data or thoseratio values from the system exercising records which are notconsistent with the overall data.
c. There will likely be some interval values based on expertjudgment for which there are no corresponding error-ratesobtained from system exercising. Retain these intervalvalues unless it can be judged that they are clearly inconsis-tent with the overall data.
I| 99
6. Convert the two HERCULES interval scales into ratio scales usingthe procedure outlined in SC-R-67-1045, "Field Calibrated Simula-tion. "Basically, this conversion involves melding an intervalscale into a ratio scale such that the same relative intervals be-tween data points on the interval scale are approximately maintainedwhile changing the absolute diitances between these data points to bein accord with those data points on'the existing ratio scale. Theactual error rates on the existing ratio scale are known as keystimuli in this process. (In actuality, the conversion is done alge-braically rather than graphically.
7. Using the SAFEGUARD system and task analysis, meld the SAFE-GUARD tasks into the two HERCULES ratio scales. There aredifferent ways of accomplishing this melding. Ideally, we woulddo all of them as a study of methodology to compare the end results.At the very minimum, we should employ Procedure I (the graphicline procedure) and one of the other procedures.
a. Procedure 1. Use a graphic error -likeliness scale for eachset of HERCULES tasks (i. e. , maintenance and C&C) and havethe experts place the SAFEGUARD tasks on the appropriatescale. Neither of the graphic HERCULES scales would haveany actual error rates on it, but would simply show therelative (i. e. , interval) distance between the error -likelinessof all HERCULES tasks on that scale. Each judge would in-dicate relative position of each SAFEGUARD task on theappropriate scale, and his indication would constitute aninterval scaling of the SAFEGUARD tasks which would alsobe a direct ratio scaling. The same procedure would be usedto check inter-judge agreement as was used in rank-orderingHERCULES tasks. The ratio scales from the judges would be Laveraged to develop two combined ratio scales, on'ý for main-tenance and one for C&C tasks.
b. Procedure Z. Using the above experts, develop two intervalscales of SAFEGUARD tasks in the same manner as the intervalLscales of HERCULES tasks were developed. Then the projectpersonnel as a committee would judge which SAFEGUARD tasksare behaviorally similar to which HERCULES tasks and meldthe SAFEGUARD interval scales into the appropriate HERCULESratio scales.
100
II
1c. Procedure 3. Interval scaling of SAFEGUARD tasks would notbe done. The project personnel as a committee would judgewhich SAFEGUARD tasks are behaviorally similar to whichHERCULES tasks and place the SAFEGUARD tasks directly onthe appropriate HERCULES ratio scales. (This approach wouldbe the easiest to implement, but would obviously involve themost risk. )
d. Procedure 4. Using the above experts, throw all the HERCULES
and SAFEGUARD tasks into two pots, one for maintenance tasksand one for C&C tasks, and have them develop two combinedinterval scales in the same manner as the two HERCULES in-"terval scales were developed. These two combined interval
scales would of course be directly translatable into ratioscales. (This approach would be the most difficult to implement,but might be considered to involve the least risk.
8. Periodically re-scale the SAFEGUARD tasks as significant designchanges are made,
9. Compare estimated error rates with "real" error rates as it becomespossible to exercise parts of the SAFEGUARD system. The use ofquotes around "real" reflects the need to judge the validity ofthe Safeguard exercising and not blindly assume that because it isexercise data it is automatically better than the data derived fromexpert judgment.
-. 101

APPENDIX IIJuly 1971
List of RelevantHunman Factors Publications
by Sandia Laboratories
(By Publication Date)(Note: These reports have been released to the public.)
1. Rook, L. W. , Reduction of Human Error in Industrial Production,SCTM-93-62(14), Sendia Labs. . Albuquerque, N. Mex. , June 1962.
2. Swain, A. D., Altman, J. W. , and Rook, L. W. Human ErrorQuantification, A Symposium, SCR-610, Sandia Labs., Albuquerque,New Mexico, April 1963.
3. Swain, A. D., A Method for Performing a Human Factors Relia-bility Analysis, SCR-685, Sandia Labs. , Albuquerque, N. Mex.,
August 1963.
4. Swain, A. D. "rHuman Factors in Design of Reliable Systems," .Proceedings of the Tenth National Symposium on Reliability andQuality Control, Institute of Electrical and Electronic Engineers,New York, January 1964, 250-9. (Also SCR-748) 1.
5. Swain, A. D. THERP, SC-R-64-1338, Sandia Labs, AlbuquerquV,N. Mex. , August 1964.
6. Rook, L. W. , "Evaluation of System Performance from Rank-OrderData," Human Factors, 1964, 6, 533-536. (Also SC-DC-64-1119)
7. Swain, A. D. "Some Problems in the Measurerm nt of Human Per-formance in Man-Machine Systems," Human Factors, 1964, 6, *_
687-700. (Also SC-R-66-906)
8. Rook, L. W. Motivation and Human Error, SC-TM-64-1 35, SandiaLabs, Albuquerque, N. Mtx. , Septtnmber 1965.
9. Swain, A. D. , ''Field Calibrat,.d Simulation" Proceedings of the -
Symposium on Human Performance Quantification in Systems Effec-
tiveness, Naval Materiel Comnmiand and the National Academy ofEngintering, Washington, D. C. January 1967, IV-A-l -IV-A-21.
(Also SC-R-67-104S)
11
10
: +4
I
5 10. Swain, A. D. "Some Limitations in Using the Simple Multiplica-
tive Model in Behavior Quantification," W. B. Askren (Ed.)Symposium on Reliability of Human Performance in Work, AMRL-I TR-67-88, Aerospace Medical Research Labs., Wright-PattersonAFB, Ohio, May 1967, 17-31. (Also SC-R-68-1697)
11. Rigby, L. V. "The Sandia Human Error Rate Bank (SHERB),rR. E. Blanchard and D. H. Harris (Eds.), Man-Machine Fffective-ness Analysis, A Symposium of the Human Factors Society, LosI Angeles Chapter, 15 June 1967, pp. 5-1 to 5-13. (Also SC-R-67-1150)
J 12. Rigby, L. V. and Edelman, D. A. , An Analysis of Human Varia-bility in Mechariical Inspection: Summary, SC-DC-S8-2173, SandiaLabs., Albuquerque, N. Mex. , May 1968.
13. Rigby, L. V. and Edelman, D. A. An Analysis of Human Varia-bility in Mechanical Inspection, SC-RR-68-82-, Sandia Labs.,Albuquerque, N. Mex., May 1968.
14. Rigby, L. V. and Swain, A. D. "Effects of Assembly Error onProduct Acceptability and Reliability," Proceeding of the 7thAnnual Reliability and Maintainability Conference, American Soci-ety of Mechanical Engineers, New York, July 1968, pp. 34.12 to3-19. (Also SC-R-68-1875)
15. Swain, A D. Human Reliability Assessment in Nuclear Reactor tPlants. SC-R-69-1236, Sandia Labs. , Albuquerquo, N. Mex.,April 1969.
16. Swain, A. D. "Overview and Status of Human Factors ReliabilityAnalysis," Proceeding of the 8th Annual Reliability and Maintain-ability Conference, Amer. Inst. of Aeronautics and Astronautics,Ncw York, July 1969, 251-254. (Also SC-R-69-1248)
17. Webster, R. G. and Swain, A. D. "Human Factors Inputs to Large-Scale Field Tests," Synder, M. T. , Kincaid, J. P. , and Potempa,K. W. (Eds.), Human Factors Testing Conference 1-Z October1968, AFI{RL-TR-69-6, Air Force Human Resources Lab. , WrightPatterson AFB, Ohio, October 1969, 35-59. (Also SC-R-70-420) I
103I
Mi1w~ukoot' W~c iJ*. KI.c -i7,p '7~f6,('~~,rC~t).%
J. V'. ,Jonkmm, (Etlý ) IProctmidi, of U. H. Nf\vy 1)IwismI I~hoitl~it~yWorkshIop 22-.1 1 hdV~ 1100,O Nnv~tI 4Mhtp 8V~Irt~ll C.1111~d C)((il',of Naval Rort'N'rehI .o t Nc~vat Air~ Doflovr Ii itrI~ CwiltdI, Dept, %itthl v Walihington. 1), G. F'r'ituwiry 14311, ppj. 111-1 4", (AsiltSC -R. 10 .4286i)
Svot Also
20. Swain, A. D. Dtiaign Ttic hniclquv for' lnpro'vImg t~iumaI Virformncauw,in Production, Industrial And Commrcioral Tochniqut'. Latd., Loncloni(in press).
104
1`N.It 1"tMhMANv I% 8IA NIIA140I 4
I 11-a o all 'f i till (1a Ito n o ( Sl IIItls'Im tlii '44%i 0(11,11 l int o11n s
til t h Ilk -C.)o M -1*1% l lrip 410i At p Ioy 'd le byTII' 1'), ( the 111 INM t13trnittolt'm" t hut)o th.18e ?v 1111e11 toI is ~a hiicik' ~tiow-11rie Model II ( iim ilM wluu c
(10014 tith" t M i)"101% il t it t yiklll Aqtit ilto t'I'vo emu'1 1441,0 he othi thilt) tosli'a
re Iationpsih itm ~oril tho utnitii compritiing thlt- QNSM.
Tho. lteps involvod il applyingM TY1'bPP (n~itih oitoplifivd (if corot'M)
1. Doocribe the oyntom to be oviAluAted,2. Develop the GSSM oil the bA~t1$ Of ( 1),1. Determiltit-prodl dl ye data% (probhabil it y a oil tinito el e llittt's ) for
4,Apply the predictive dakta to GSSM.S. Develop the MSS1Y.6. Perform quantitative analyses to derive a reliability effective-
ness value describiiig the iyattem.
I GOA LS
This model has stiveral goals, which are nwore or Ivss clearIdepending on the particular rkeptor t that on1V reads. Basically TEPPS is
(1) A ncthud fo "tderiving specific personnel performance StandardsI ~~with definite relations to sys temi effectiveness requiremnentsrl (p. 1 0,Ref. 5). In this application the model is supposed to allocate (or appor-tion, as reliability engineers would saty) pro-ustabli~shed systemi effective-
ness requiren-ents (SER's) among the personnel (and Lasks) engaged in
105
IiS~Ir m '
itoril1•l1•m1ni my tm l apkn I~ k , This me lit,rlltl tlt, ki \,ll -1 11111iltll ill pl•, IýAolltltlo
lit' Ihi'11 ll "to04% UISl rdr n whi h 11 h All h11 111 ie t Aim Sd sk I0 P1 1h I tl1l111pa1i mlN i
lit titho I. ,ilillt , iU Ihe' S'i~t foll ~ st e "y l i4 At IN t' (ol A e l 'eivirIII 0 1101.t01"'114Ii1% 1'Phl•ltltily of l 'I ? %, n1d thI'i' •ar'o iN 1'sn uol Au wl In aknd t s whooIto r~rilfw wik It II M 1111 rI'4ttiIll A 1'0 Icq1ill red itI Ilinks, %il , 9M7 1. itini 1h110I rh1niqkko asAli 1 Ann th 1 ind v dI ll% I ptoIfit I'1II c, r1It i I', Iitr , Illit It• f IhI tIS Il
pe rooitiole anti lt sks 1so thAt ,e~ 91 call lIto 14 1 ohlli sh e Alt l Dop'eirtlig lilthe iite1Active loops in vo ed ittihe sy•dteal tlsik I 1tit|Iii t haIe Ii| A riA- IjhI'|ity 1e'•40iiren l I , l'J,994, It sk A ,l (i , 'IWt , , AII u( whii.1% po. rurt -
11a tnie requiremtllll" 5 lwhe coou1lhiild will providtI 907 !,
( 4) The nIo'eIl i s uppold to "Yield t% 11%"enurt' of, systoe effoctive-110s0" whi:h is a01101tiAIly thit s11% A that prudut•ed by T'HIKRP, If onetssiigns predictiona of porf(ormanc relialhlity to the inlivldual tasks in Ithe system, what one d•rives is a meosure o( system olff'ctivoneos (i, 0%the human part of it), I
li the vase of the "derivatives" model (Case I above), one takes theSER and breaks it up amonif various tasks: the probabilities associatedwith these tasks become performrincrs standards, In the second use, ofthe model (its so-called "integrative' use) the SkER is unnec:essary; onetaken the tasks making up the system and, assuming a store of predictivedata, assigns predictions to the individual tasks. It is this application Iwhich in of particular interest to this study and the one described in thismection; however, the devlopor,4 of the method suggest that this application
is dormant because of the lack of man-machint data, From the stand- Iipoint of thie report, however, the lack of data is no reason for not con-sidering the model, since it is always possible that suitable data willbecome available, and in any event the model should suggest the kind Iof data needed.
On page 4 of Reference b a number of potential outputs of the model 1are listed which are of interest to us because these outputs imply modelgoals. Besides the two goals already specified, these outputs imply asgoals of the technique:
(1) determining the quantitative effects of system design changes
on system performance or on personnel performance require- Iments;
(2) determining system components most and least likely to causeerrors;
I106I
mU
i 'r|~hoI- 1,F0 0r1, 01410hlulhlrs ,q 11q 1 4•i~ ,M, !0|1A N Wl i 011h s th.,ll 'l "0I , Trhe,
r',f relttt'iv I(I 1 ymt lil d4 11"lai c'ha1iges A1 itlI the dsit,'1i•11 i t my"I l 111~mosr)P1tIn 1 likoly ts %IW10V 01II'iorl 1o1i li d n vrt 1y 111%i01h ill' T rl ,
Tho vn voit s'1 i f t omr th)lisMht1n I)1'I r1nIS ur9 NdAtidArtlpIM t llt 1tt woi h\, v r'
Ittit "%I G r ptouill~ei'et (iAiltlt l l n ( vt ilikic, nlt iti i the 111olr'io reivir'wr'd).
Ill the I'llulr" 14 ito do "t llevI ln tit~t, the its" 411 Ito' oti' l itime IIA? 111'01e epikflttt'td, T t 0e CV ,I t) p r i~ I itt ,A t i 1%1" tha to I 1 1 hit~lr pI'OvkiF.1Vt) (IeN faAvIIrrCtool for pyaIo1il itl lyl41io' (1), 11 .If, %),
I 1hv 1 ti rI4•,i t••rMefor, Ih1r1l't.rI, h i' apa vi'it tv i 'i gi lll d mdl iO e na lit ' eIiits wo'II Vaw uopr'AtOt'pt ioa'IrnlA ni' r'it'li Atkull. Tlhe' iltloel Allthold there -
(Oro have neral applicability to lmot syat"Inst, 1lthuumgh the dt'volope1rl
4,L eonvaede that it cannot handlo c'ontu1•litu and dviwt-on-,,aking takkk,
""fAt present TEPPS most lowoly rseonibloi an operability suhmodol',that is, it attempts to "predict the degree to which a ilialt-machintv systemis capable of beinM operated, . assuming that the system is ready andavailable| (p. 17. Ref, 5). It doem not consider states resulting fromsystem failure, hence it in not an availability ni-odol.
SI ASSUMPTIONS
To start off with sonie definitions, what TEPPS is vither allocating
or predicting performance to is a unit of behavior called a PEF (per-sonnel-equipynent functional) unit. As was the cast' with THERP also,the basic unit of behavior (PEF unit) is not well defined, but appears to
correspond to what is generally called a task, Certainly it is not at thelevel of the task element but is more detailed than a function. Examplesof PEF units (taken from p. 104, Ref. 6) are: VP observes target track
(two or three points) and computes heading (within t 7 degrees); RCOobserves tote board and determines accuracy of target heading shownthere, based on previously received, mentally recorded heading message.
Note that we are dealing here with behaviors which are relativelysystem-specific, which might make it more difficult for TEPPS to makeuse of a "general" data bank of the AIR type. Blanchard points out,however, that this would depend on the degree of bhavioral generaliza-tion possible from such a data bank.
1m 107
Ii
I'
Nottii tkipo thot th~tio Wskm doci' b r bd il PEF vintmlI Aro' not woll de'-ir'itled ill I'1,11110t of ot.iiplilltit 1'hf t r iNtic which hearn n g•atively
otl thi v'lpA bility ot tiht modelI to hAntlr, dr inign isp'v't i (i. v. , to be ableto pra'ditt diff.rlicW t 1s il pi rrt•ormanv, dp1oitid nd i1 on dili',rtunces in
V pulipiluo dopiign). 1owivw, r therr Appo rti no ronso why thi, PEF%mil ,ct~ihl at hn 1t Iore 1' •Io1'oumly dItifi nod, The'h r-ihance on O. part00NtittiAt cl for 1h1 Col0 i t l of predictivle data (Aee later discussion) tohi s koociAted with PEF mtkitt mAk1kr it difficult, however, to define thePl•E' unit snore pivti'o wly in ternut of equipment charactorintics, sinceit is unlikely that judgw coutld disvrindinato adequately in terms ofniolecular oquipnient chIaractiristics.
,rho Syteim Effectivunrtsu Requiremont (S'R) already referred todescribos the raquired system output, generally in the form of a pro-bability, a time or both, The term reflects only the system requirementimpowed on mystem personnel.
The Index of Task Accomplishn-ent (IOTA) is the probability of A.uccessful accomplishnment of man-machine activities (probability as-sociated with the PEF unit). IOTA's may be derived by observation orby subjective techniques (although TEPPS developers have made primary
iuse of thi expert estinmate technique to derive these data, since directobservation or simulation is very difficult, according to Blanchard).
A basic assumption concerning time is that a maximum value existsfor time (Tmax) beyond which the probability of accomplishing a tasksuccessfully does not change. TEPPS' maximum probability of successiul accomplishment is therefore assumed to occur at Tmax Thisassumption appears to be quite reasonable on the basis of logic andanecdotal evidence, although it is unlikely that one will find substantiveconfirmation in the experimental literature (because of the sparseness 1of that literature). Similarly, below some minimum time (Tmin) pro-
bability of task accomplishment would be expected to be zero (activitycannot be performed). Presumably between Tmin and Tmax probabilityof successful task accomplishment increases as we go from one to theother.
The relationship between probability and time to accomplish a
given activity is assumed to be lognormal. Probability is normally or
lognormally distributed as a function of time. It is also assumed thatthe nrumber of people correctly performing a task is normally or log-normally distributed over time; therefore it is also assumed that the
function would be similar for a single individual and for combinations 1
0108 I
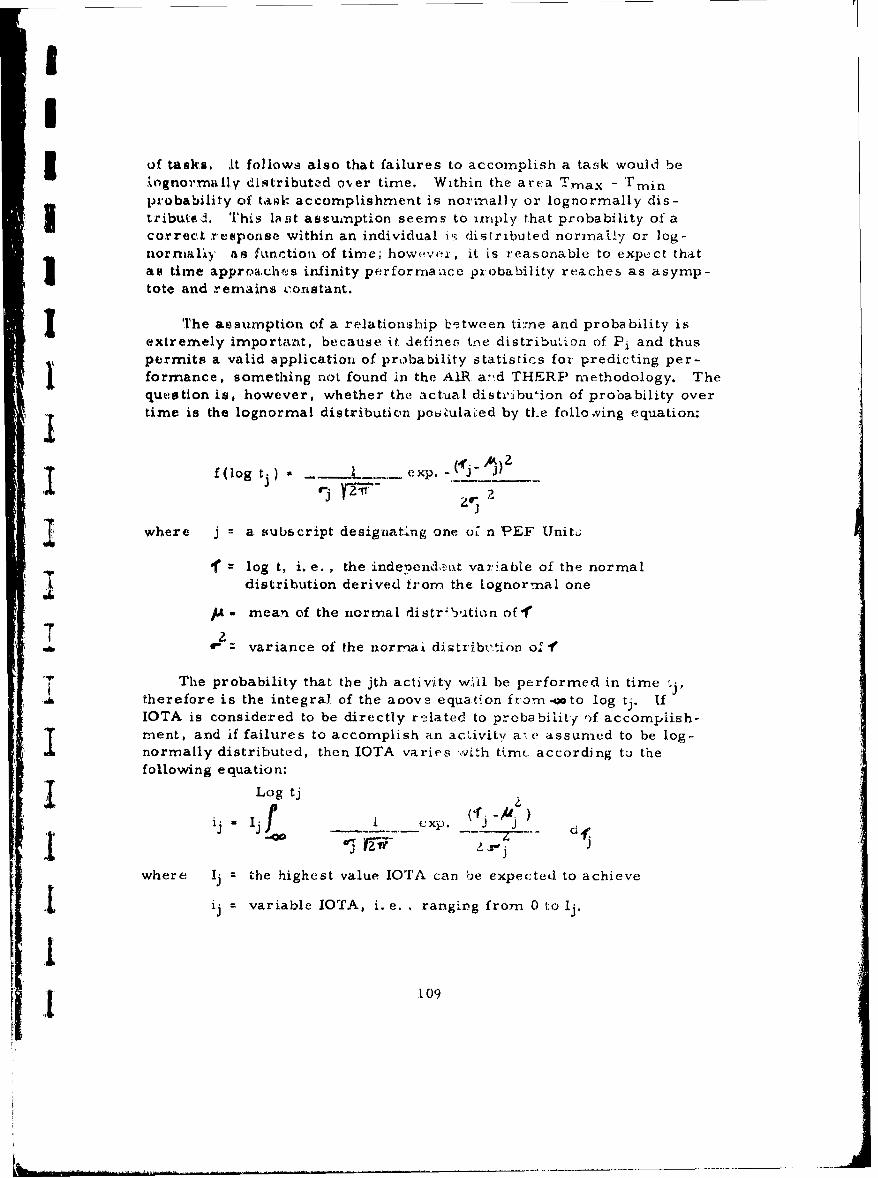
I
of tasks. At fo)lows also that failures to accomplish a task would bexognormnally distributed over time. Within the area Trnax - Trminprobability of tamp accomplishment is normally or lognormally dis-5 tributed. This loist assumption seems to imply that probability of acorrect response within an individual is distributed normally or log-norniahy as function of time; howevex, it is reasonable to expect thatas time approach,%.s infinity performaace pxobability reaches as asymp-tote and remains constant.
The assumption of a relationship between timne and probability isextremely important, because it defines tne distributio-a of Pi and thuspermits a valid application of probability statistics foi predicting per-
1 formance, something not found in the AIR a.•d THERE' methodology. Thequestion is, however, whether the actual distr'ibuion of probability overtime is the lognormal distribution postulaLed by the follo.ving equation:
f (log tj) ... exp. _____J
where j a subscript designati:ng one ol n PEF Unit•
1' log t, i. e. , the indeucnd,ýnt variable of the normaldistribution derived from the lognormal one
,U - mean of the normal distr.b-'tion of 1'
T4 z variance of the norraa dirtribt.tion of-e
The probability that the jth activity w'd1 be performed in timetherefore is the integral, of the aoova equation from -. oto log tj. IfIOTA is considered to be directly related to probabilit/ of accomplish-ment, and if failures to accomplish an activity a!' e assumed to be log-normally distributed, then IOTA varies %vith time according tu thefollowing equation:
1 Log tj4 J,ii U j I __L_ _.-C xi...- Id 1!
-430
where Ij the highest value IOTA can be expected to achieve
j ij variable IOTA, i. e. , ranging from 0 to Ij.
log9
Availability of estimates of the maximum and minimum times(Tmax and Tmin, respectively) within which an activity can be performedestablishes the valuesA and a-.
TEPPS also distinguishes between logical and functional dependen-cies. Logically dependent activities are those whose accomplishmentnecessarily implies the successful occurrence of some prior or con-current activity. A logically dependent relationship assumes that theprior activity will be performed with a reliability of 1. 0, since feed-back from its performance will be complete and the subsequent activitywill not be performed until or unless the prior activity is performed(which means a reliability of 1. 0). A functional dependency is an inter-action such that the degree of effectiveness of one activity is related tothe degree of effectiveness of another. "For example, an activity maybe performed poorly, thus affecting the performance (but not the occur-rence) of another" (p. 8, Ref. 5). Failure to include functional de-pendencies will result in a system effectiveness estimate which ishighly conservative (lower than actual).
There is an implication that, in contrast to what THERP says it
can do, TEPPS cannot handle functional dependencies. "Unfortunately,functional dependencies cannot be treated in reliability or allocation .
models because their occurrence and degree of effectiveness cannot bedetermined without empirical investigations" .. In general, therefore,the determination of system reliability will actually produce an under-estimate.. ." (p. 8, Ref. 5). As we shall see later, this underestima-tion has posed severe difficulties for TEPPS (as well as other models)in its operational use.
One might wonder, however, whether it might not be possible toinclude functional dependency data in TEPPS as part of the IOTA infor- -.
mation provided by the e xp e r t estimates used to secure TEPPSpredictive data. Would it not be possible to refine the expertestimate technique (to be discussed later) so that some indication ofthe functional dependency of tasks could be provided by expert judges?
TEPPS also assumes the existence of redundaiicy, which occurswhen two or more activities or activity sequences give rise to essentiallyidentical outputs, the occurrence oi only one of which is necessary formission success. Two types of redundancy are postulated, which aretermed "true" and "apparent" redundancy. 'True redundant events areindependently conducted activities which yield the same output state,
110
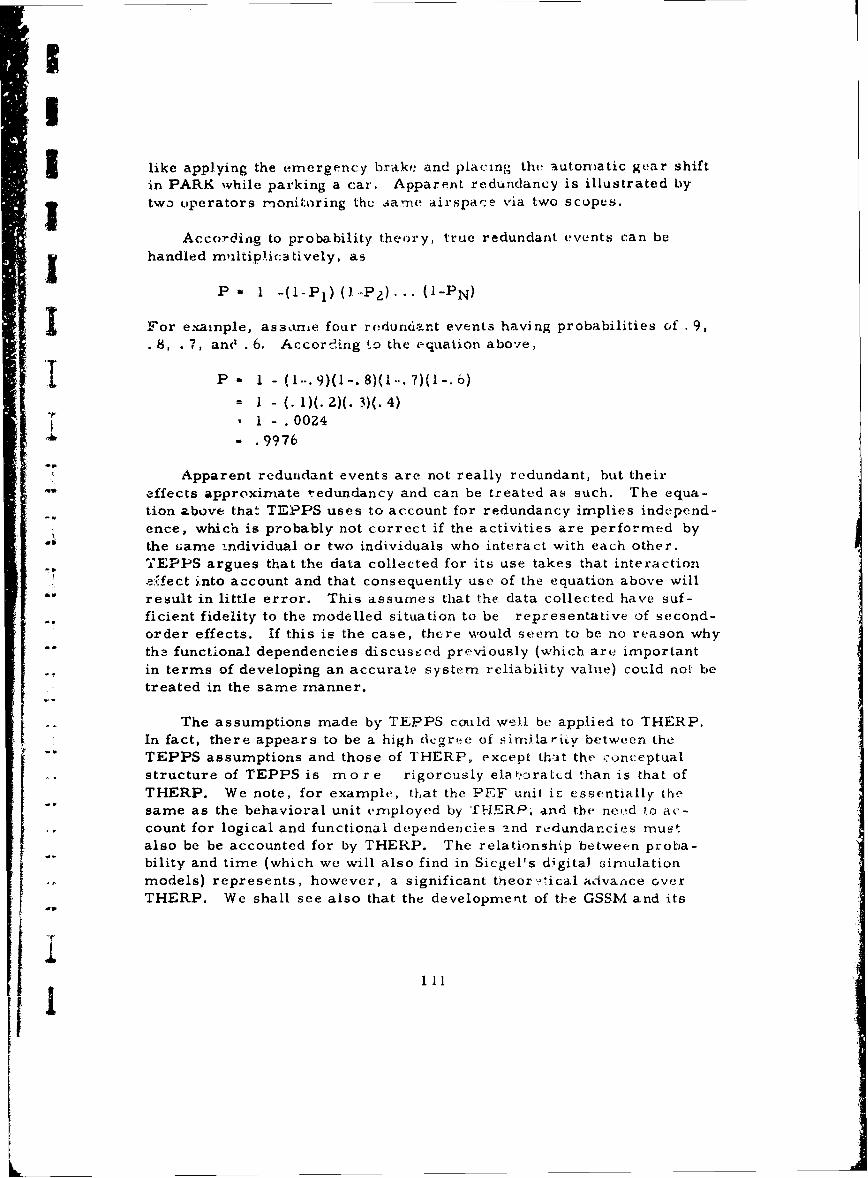
I
like applying the emergencyr brake and placing the automatic gear shiftin PARK while parking a car. Apparent redundancy is illustrated by
tw3 uoperators monitoring the jarne airspa,'e via two scopes.
According to probability theory, true redundant events can be
handled m'iltip.icatively, as
P 1 -(l-PI) ()--P ). (-PN)
For example, asstinie four redundant events having probabilities of .9,8, . 7, anO .6, Accordiing to the equation above,
P- 1. 1 - ... 9) (1-. 8) (1 .. 7) (1-. 6)-- I - (. 1)(. 2)(. 3)(. 4)
1 i-.00Z4- .9976
Apparent redundant events are not really redundant, but their"effects approximate redundancy and can be treated as such. The equa-tion above that TEPPS uses to account for redundancy implies independ-ence, which is probably not correct if the activities are performed bythe i;ame individual or two individuals who interact with each other.TEPPS argues that the data collected for its use takes that interaction""iafect into account and that consequently use of the equation above willresult in little error. This assumes that the data collected have suf-ficient fidelity to the modelled situation to be representative of second-order effects. If this is the case, there would seem to be no reason why"tha functional dependencies discus'ed previously (which are important
-. in terms of developing an accurate system reliability value) could not betreated in the same manner.
The assumptions made by TEPPS could well be applied to THERP.In fact, there appears to be a high degree of sin.ilari[v between the"TEPPS assumptions and those of THERP, except th,-t the ronceptualstructure of TEPPS is mno ore rigorously elaItc:ratcd than is that ofTHERP. We note, for example, tlat the PEF unit ic essentially thesame as the behavioral unit employed by 'H.ERP,. and tbe need to ac-
* count for logical and functional dependencies ind redundancies rnustalso be be accounted for by THERP. The relationship between proba-"bility and time (which we will also find in Siegel's digitai simulationmodels) represents, however, a significant theor tical advance overTHERP. We shall see also that the development of the GSS1M and its
IIl
L _ _ _ _ _ _ _ _ _ __ _ _ _ _ _ _ _ _ _ _
transformation into the MSSM is very similar to THERP's graphicprobability branching tree and its use in probability equations.
In contrast to THERP, however, TEPPS makes no use of stressas a significant parameter. This is perhaps because the "integrative"(system effectiveness) model was derived from the allocation modelwhich would have no use for a concept like stress (since it deals solelywith the apportionment of reliability requirements). This is an inade-quacy in TEPPS which could, however, be remedied without unduedifficulty. 1
METHODOLOGICAL SCOPE
In analyzing the types of systems, functions and tasks to whichTEPPS can be applied it is necessary to distinguish between thc quali-tative analyses possible with the GSSM and the quantitative analysesfor which the MSSM is necessary. Since GSSM is purely descriptive, -"
it can handle any type of system, function or task, including mainten-ance operations. On the other hand, in a mathematical sense TEPPScannot deal with the complex feedback loops involved in continuoustracking-type tasks and in decision-making tasks where there are"1complex and unpredictable interactions among individuals" (p. 17,Rer. 6) because the state of the art in mathematical modeling (uponwhich the MSSM depends) is deficient.
TEPPS is therefore restricted largely to predicting the performanceof discrete activities. In this respect the methodological scope of TEPPSis similar to that of THERP.
PARAMETERS
In the course of the preceding discussion we have covered essen-tially all the parameters that TEPPS includes in its conceptual structure.These include feedback, dependency relationships, redundancies, theinter-relationships between probability and time, and the behavioral
(I) Blanchard scates: "This is actually not an "inadequacy" in that"theoretically" such effects would be reflected in input data if those datahad been obtained under actual conditions or under high fidelity simula- -
tion. Otherwise, one would do as in THERP, and introduce an estimated"adjustment" factor. In short, the technique is thoroughly amenable tothe consideration of the effects of stress and anxiety. quo
112 s
£I
unit being predicted (PEF). All of these have been implied in previousmodels (and are in fact required by any modeling process).
TEPPS is more distinctive, however, when one considers theparameters it does not include in its conceptual structure. As indicatedearlier, it does not deal with stress or any of the "performance shapingfactors" that THERP considers necessary, or with molecular equipmentcharacteristics such as those found in the AIR Data Store.
Blanchard points out (personal communication to author) that thisis true primarily of the derivative use of the model, but not so of itsintegrative use. Presumably, if the input data used for prediction inthe integrative model were to be affected by stress or other "performanceI shaping" factors, then the model would implicitly make use of these para-meters. However, our comment refers to the fact that the model doesnot explicitly call out these parameters and relate them formally to pre-dicted performance.
Whether this reluctance to include more complex parameters re-presents an inadequacy in the TEPPS model or a realistic appraisal ofwhat can presently be accomplished in behavioral modeling is a valuejudgment we would not care to make. However, a defensible model ofbehavioral processes must ultimately take more complex parametersinto account.
DATA
I I. Measures Employed
There are two general measures: probability of task accomplishmentand performance completion time. These can, however, be related toany kind of system-relevant measure, such as number of targets destroyed,radar detection range, etc. which means in effect that the model can han-dle many specific system measures. At the present time the TEPPSapproach is based on the use of probabilistic statements in which theeffectiveness measure is dichotomized into a pass/fail criterion. How-ever, in anticipation of the future development of the model, TEPPS hasexplored distributed measures as well.
I Probabilities are associated with particular effectiveness dimensions.For example, if the dimension of interest is radar detection range at 100miles, a probability of .90 of performing detections at that range mightbe determined. In this situation the radar detection range has beendichotomized into 100 miles and beyond 100 miles.11
II
Or if the dimension of interest were the number of types of targets
to be destroyed (distributed effectiveness dimension), a probabilitycould be associated with each number and type. Since the effectiveness
of a specific man-machine activity is defined formally and logically in
the same manner in which system effectiveness is defined, the appro-priate dimension for some activities might be of the dichotomous type,whereas other might be distributed. In any event, the measure employed
is highly flexible and poses no limitations for application of TEPPS.
2. Data Sources
Like THIERP, TEPPS is highly data-dependent, perhaps more so
TEPPS is conceptually more rigorous and elaborated than THERP, b.
perhaps for that very reason, is more data-limited (or apparently so inthe minds of its developers). Because of the pragmatic nature of THERP,already discussed, THERP will accept data from any source as long as
it will provide a "reasonable" answer. This is not true of TEPPS.
TEPPS would accept empirical data (i. e. , data based on observation
of performance), but ouch data are comparatively rare. It rejects data
available from the experimental literature, as one finds it abstracted inthe AIR Data Store, and sees little possibility that such "universal" data
banks will prove of use, at least in the near future (10 years). "It soonbecame apparent to us that the various laboratory data were not amenableto meaningful manipulations and that little could be gained by furtherattempts to extract data... We made such a conclusion.., with therealization that it left us without a means of exercising our model..With regard to human performance data collected in the field, it isessentially non-existent in any generally useable form. The amountthat is or may be available is probably insignificant for use in generalman-machine models.... " (Ref. Z).
As a consequence, TEPPS has made use of a fairly rigorous but
complex paired-comparison technique to derive "expert" estimates ofperformance probabilities and time. We shall not endeavor to describethe process in detail; readers who are interested should read references1, 5 and 6 (particularly 1). The essence of the technique is to providejudges with individual PEF descriptions and ask them to compare eachdescription against all others to determine which has the hi-I-er pro-bability of accomplishment.
l14
The data resulting from the paired-comparison technique (IOTA)3 form a scale which provides meaningful distances or intervals betweenscale values. However, it is desirable to transforrn Týhese scale values(which vary from around 3. 0 to zero) into a more conventional proba-bility scale with a range from 0. 00 to 1. 0.
If the transforination is accurate, the resultant probabilities can beused as estimates of the probability of accuracy with which tasks can beperformed. (This is necessary for use of the model as a system mea-surement; much less so for the allocation use of the model.) The result-I ant probabilities assume performance under optimum conditions and notime constraints.it Transformation of IOTA to probabilities requires an absolute deter-mination of the probability of task accomplishment for the two activities
' having the highest and lowest scale values. That is, these two probabil-ities are determined on an absolute (. 9999, . 9996) rather than on a com-parative basis (Task I has a higher probability of being accomplishedthan Task Z). If at all possible, estimates of these two tasks would be
_determined empirically (i.e., through observation or from test data).However, it may be necessary to secure the absolute values by means
of judgments.
In any event, having these two "anchor" estimates permits solutionof the two simultaneous equations:
P 1 I-Ae- BS, (1)
P2 I -Ae- BS 2 (2)
where P - obtained probability of one PEF unitS - scale value of that PEF unit
A, B = constants.IIThe myedian of the probability (*stiniates for the two tisks having
highest and lowest probabilities of performanc;, arc insert -d into t quit -
Lions (1) and (?) in pla ce of PI and P2' The equations ark Lh11n -,,,l vVd.
I The reader t1night note sorne similarity betwevn this proccd-ir, atdthe scaling method adopted by THERP. Swain acknowledges a dtIbt tolBlanchard in this connection.
The transformation assumes that performance reliability is an ex-ponential function of the scale values derived from the paired-comparisons.
I1I I l'S
|Ii-4
The basis foe thiii is the best fit regreasion analysis curve developedby Irwin ,t al (Ref. 4) using Data Store values and judges' ratings. Thiscurve is exponential because the' best fit was produced by plotting the
scattergrarn on log paper. IU-4ing the Irwin results as the basis for the equation relating IOTA
to probability values appears to be soniowhat flimsy, Thevre are several
reasons for this: (1) The Irwin study itself has certain deficienciesbased on the lack of data for comparison purposes with the ratings madeby the TEPPS judges; (Z) the tasks judged were Data Store tasks whichare at a more molecular level than the PEF units; (3) the judgesd ratingswere not paired-compari.. ens but involved having the Irwin judges rateeach task in one of 10 categories, ranging from most to least error;consequently we arti talking about rating rather than paird-companions.In connection with this last point, however, Blanchar,-l points out thatrating and paired-comparison methods can both result in interval-
property scales.
Despite the inadequacy of the supporting evidence, we are preparedto accept the exponential relationship (tentatively). If tho're wore nosupporting data at all, it would still be possible to accept the exponential .as an hypothesis. However, there are more basic problems with theentire subjective data methodology.
What we have reference to is the relatively low between-judge agree-sent. Internal (within-judge) consistency was high (,909) but between-judge agreement was only . 683 and decreased in subsequent studies (. 416in the user test, Ref. 7). There is a value of . 667 reported for linearconsistency (p. 27, Ref. 5, but see also Ref. I ) which is defined as theextent to which the paired.. comparison model fits the observed data. Itis not known, however, what the observed data were.
The low levvl of between-judge agreement would tend to negate the
use of the subjective technique; if judges cannot agree on what they report,how much confidence can be placed in their judgments?
The developers of the techniqutc answer the problem by saying that
individuals vary in their judgments. They indicate that the probability ofcorrect performance varies in a normal manner as a function of the nurn..ber of individuals performing. Any probability ,stimate therefore re-presents mean performance. In any event, there is large variability in -
probability of correct performance, and the dispersion in tho judges' com- .
parisons reflect that variability.
116 j
jIf wo' ititt-rpFt th 11 .rgwnitintt oin i tly, (pp. H- uIRcl. 's) 011.
deve-lopers art- saying that vach ",~' ( - l)II).t I''-ol o14r r i' ts a- Sub)-
sot of the popuilaionl who, *ctualty portiolne(I - ~isii wilost. pvrturmaniceI ~~wasn abs erv~ed ;)y the judges, .1 udgt I sa~iw s cibso it pi clitIi ot I with itspa rformAricc' ,&~g a~ .W saw subst poptiiiatioi 2~ \\ kti its~ performantric , tc.If then judge I says that that probabilitly it, ta118k it Cconipl i i iv lit Withtask 1 in higher than that ol la sk 2~, andic judge ý' ha.ys Iliat prob a bilit y oftask accon-plishment with ta sk 2is higher than t hat )f' task 1, this nmer ely
I ~ments mer ely reflects the, normal varia bility of o)bsv'rvvd pvi-forniancein real life. No single judge woukld see all periormancc', so that inevitablyit would be biased.
Under these promises a low bvtween -judge reliabi lity is no bar tousing these judgments as long as int,&rnal consistency is high enough.I Indeed, one would expect to find low between-judge' conisistoncy wherereal performance variability is high.
This is an ingenious argumnent, but not very satisfying, if only be-cause it obscures rather than enlightens. All judgments by this reason-ing, no matter how discrepant (from other judgments), are acceptable
because they reflec~t normal variability and that p~ortion of reality (andonly that portion) that the Judge observed. Thus, if in a given situationhigh interjudge reliability is secured; this is fine; if in the samev situationI ~low interjudge reliability is secured, this is also Undtlc'tstaridablv, Howthen is one to know when a judgment should or should not be accepted?
I Moreover, the whole premise underlying judgments is that a singlejudge's evaluation describes the total picture of the phexinomena beingjudged, and therefore should correspond to the mevan of the rual varia-I bility (assuming that he has had the opportunity to observe a range ofperformances). If one rejects a judge because he is inconsistent amonghis own ratings, why should this be so? since his samiple of behavior
may have in actuality been distorted.
The developers indicate that the t ransfornmed scale values shouldI not be used in the integrative moudel (p. 18, Ref. 7). They See( the inte-grative model as dormant because it requires actual man-machine-performance data.
If we have spent as much time as we have in examining the basesof the e , pert estimation method, it is because the meiivt ho ud
117
requires further investigation. We say this not only because TEPPSuses subjective estimates, but because (to anticipate our ultimate con-clusions), almost every other predictive model makes use of subjectiveestimates, usually in a far less rigorous manner than does TEPPS.Consequently, if this is to be a general procedure, the method must beexplored systematically, its advantages and disadvantages noted, and itmust be standardized. If modelers were to exclude subjective data fromtheir techniques, one ,Aould nut have to consider the problem further; itis apparent, however, that in order to exercise their models they willmake use of such data, regardless of any inadequacies it may have.
Moreover, although one cannot accept Blanchard's statement "thatthe subjective scaling of man-machine activities (is) undoubtedly a validprocedure", on the other hand, one should not reject the method corn-ple tely, 2
So far we have said nothing about time data, which are also securedby subjective estimates; here, however, absolute judgments are required.The results of two studies produced a high degree of variability, so thatthe TEZPPS developers recommend discontinuance of this method. How-ever, see the study by Burger etal. (Ref. 3) and Smith etal. (Ref. 8) which
suggest that the situation is more promising than had previously beenconsidered.
(Z) Blanchard remarks: "I feel that the viewpoint taken of theutility of subjective scaling methods is much to narrow. We must acknow-ledge that the dimension of probability of accomplishment or error is acomplex one, and not held rigidly to traditional interpretations of valuesdesigned to assess uni-dimensionality. Unfortunately, my attempts tocome to grips with a problem with rather unique theoretical as well asmethodological implications had to be made secondarily, with the primaryobjective being to develop and apply a man-machine model. As a result,I am afraid my "shirt-sleeve" efforts were rather feeble compared to thescope of the problem. I sincerely feel that subjective techniques areapplicable to the problem, and perhaps we have not yet evolved the pro-per conceptual framework or model for their use. We must surely tacklethe problem though, since we will need some "interim" technique forobtaining useful input data for modeling purposes until empirical databecome available."
118
UI
The preceding discussion of data sources has been relative to the
use of TEPPS as a system effectivencss prediction model. It is importantto note that when TEPS is used as an allocation (i. c. , apportionment)methodology, it "does not require actual or objective measures of per-formance. . . ; relative measures, far easier to obtain, will do just aswell. That is because allocation of SER's is accomplished through mathe -
* matical consideration of the relative "weightings" of system PEF units"(p. 20, Ref. 5).
3. Output Metric
As in the case of the Data Store and THERP, the output measures
employed by TEPPS are: (1) probability of successful task accomplish-ment; and (2) completion time. Of the two, probably somewhat greateremphasis has been placed on the accomplishment measure. Certainlyworkers in the field have found this mearure of greater interest in everymodel they have considered. The reason for emphasizing probability of
task accomplishment measures rather than time is that for many systems 3
time is not really relevant; as long as the task is accomplished satisfac-torally, the length of time (within reasonable limits, of course) does notmatter. This is true of troubleshooting operations, for example; researchhas indicated that technicians concentrate on making the proper diagnosis,rather than getting through in a specified time. It is indicative that inthe user test performed with TEPPS, many of the time estimates given
by operators were of "infinity", meaning that the time dimension wasmeaningless. Of course, an "infinite" completion time for a task wouldbe intolerable; such a response means merely that, given that the task iscompleted successfully within a certain liberal time maximum, timevariations prior to that maximum would have no significant effect on
mission performance.
(3) On the other hand, a number of the simulation models, '. g.
HOS, ORACLE, place major emphasis on performance time as ;a criterionof effectiveness. This difference in orientation toward system modelingis something that needs further exploration and resolution. Must we havedifferent models for systems in which time and error are morc or lesSimportant ?
119
The developers of TEPPS repeatedly warn us that the probability ofsuccessful accomplishment measure produced by TEPPS will produce a
highly conservative estimate of system effectiveness, because the facil-itating effects of subsystemr interaction, partial task success, task repeti-tion and feedback looping cannot be handled by TEPPS very pr ecisely.ni IPROCEDURES FOR MODEL APPLICATION
1. Analytic Method Tin order to develop the GSSM (Figure 5) which , like THERP's
probability branching tree, is critical to use of the method, it is necessaryto break the total system operation into more elemental units. This mayrequire several developmental iterations before a satisfactory product isachieved, because great emphasis is placed on the accuracy of the GSSM.The analytic process required to develop the GSSM is conventional system/task analysis going from gross system functions to tasks. The task level -
for TEPPS is similar to that of THERP, that is, the task, but not thetask element. Examples are: adjust cursor and read range counter; trans-mit bearing data; mark fade chart. It should be noted that there are noequipment details included in the task description, which, again like C.
THERP, bears on the adequacy of the model for design purposes. How-ever, Blanchard points otst (personal communication) that "there is abso-lutely no reason why equipment details could not be included in the descrip-tions if such details were of interest or considered to be potential sourcesof performance variability. 4
The analytic method requires the description of all alternative modesof operation and contingency events, which leads to a fairly complex pre-sentation. This again is comparable to what THERP does. Included inthe modes of operation considered are redundancies, sequential andparallel activities, alternative pathways (depending on external situationalevents) and feedback loops. According to the developers it is possible toconstruct a GSSM for continuous and decision-making tasks, even though
it is not possible to model them mathematically for the MSSM. "ii,
With regard to feedback loops, it is claimed that TEPPS has a built-
in capability to treat some (although not all) of these loops (p. 20, Ref. 6),thereby reducing somewhat the need for the assumption of independence.However, the fact that TEPPS still employs the independence assumptionmeans first that complete feedback is not modeled and secondly that the
TEPPS output tends to underestimate the effectiveness of the system.
1210ii120iii !
,r
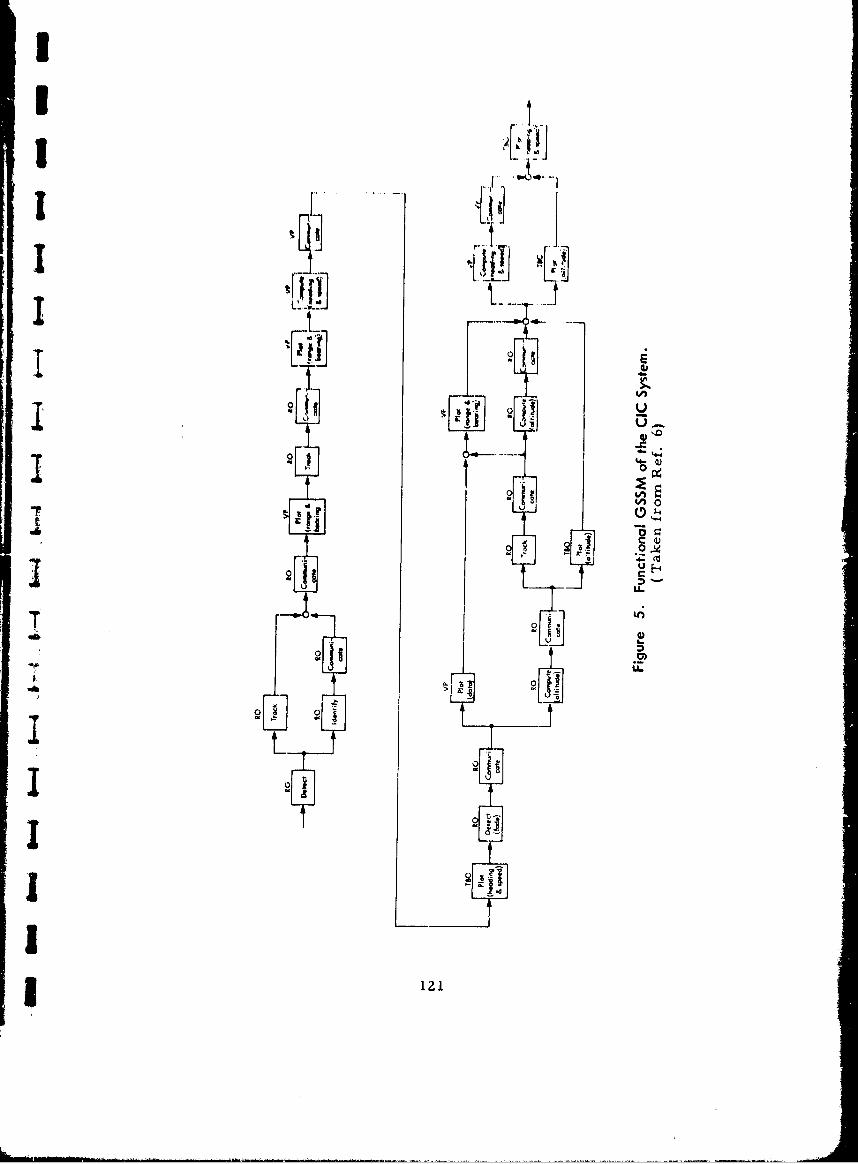
I
j [i1II
I 1 1..
{41 o,.
2 4-o
,I I-p
The output of the task analysis is represented in the GSSM, whichhas in contrast to the absence of detailed procedures for the developmentof THERP's probability tree, fairly rigid construction rules. Ref. 6,p. 10-14 provides a complete guide to the construction of the GSSM.
Whereas the GSSM is esse:itially a flbw diagram describing behavioral ,operations, the MSSM "is essentially identical (in principle) to a reliabilityequation. It can be used for determining system reliability or ... systemprobability of success ... (p. 6, Ref. 6). A computer program is avail-able as part of the TEPPS package which eliminates the necessity foractually constructing a MSSM.
In summary, there appears to be no essential difference between theanalytic method used in TEPPS and that used by THERP, although theformer is more rigorous than the latter (or at least described in moredetail). The GSSM and THERP's probability tree are also essentiallyalike, although it appears to this writer that it is easier to use the former.(This may be simply a bias on his part, based on his greater familiarity -"
with functional flow diagrams, which is what the GSSM is essentially.) The •PEF unit is essentially the same as the THERP task; both do not, as doesthe Data Store, deal on a detail level with the equipment description. Both
TEPPS and THERP have great difficulty dealing with functional dependen- 6 ,cies, although THERP says it can handlc theseTHY'RP deals explicitly with error, i. e. , it achieves Pi by error measure-ment, but TEPPS simply utilizes probability of successful task accomplish-ment without evidence of much interest in error. Like THERP, TEPPS
does not include in its GSSM system operations that do not have a "significant impact on the system output; i. e. , PEF alternatives thatare possible but extremely unlikely. J
2. Method of Synthesis
Synthesis of the system after it has been broken down into its corn- Iiponert PEF units is accomplished through the MSSM. This is essentially"an equation which expresses the relation between the required probabil- Iity of achieving the system output state and the probabilities (to be de-rived) of accomplishing system PEF units", (p. 51, Ref. 6).
In its general form the equation is
P * (PI)(P 2 )(P 3 ) .". (PJ)
12'!
I
II
3 where
P - system effectiveness requirement (SER)
Pj = required probability of accomplishing the jth PEFunit.
I The above equation is therefore identical to a conventional reliabilityequation except that P would be defined as system reliab.lity, rather thana pre-established required SER, and P. would be defined as the reliability
of the jth PEF Unit, rather than the required probability of accomplish-merit.
What this means simply is that although the above equation is forallocation of required probabilities (performance standards), it can be
"used for the determination of system effectiveness, once a weightingfactor (IOTA) is applied to each Pj. Note that the equation is multipli-
cative (i. e. , assumes independence). As a consequence the MSSM isextremely sensitive to the number of PEF units included, so that each
additional PEF unit will result in a lower system reliability estimate.
A method is presented for handling redundancies. The general equa-
tion for redundancies is P -, 1- (1-A)(I-B) . .. (I-N), where A, B... Nare alternative pathways. This gives us the probability of either/orredundant pathways.
All the examples given in Reference 6, however, are one way(--*); they do not show feedback loops. Obviously the lack of such feed-"back loops will produce an overly conservative estimate of human per-
formance, as was shown in the user test (Ref. 7). As far as TEPPS isconcerned, (but this applies also to other predictive models), one pro-blem requiring research is how to identify, model and include in theMSSM feedback effects.
-. 3. Data Application
The basic probability data (derived from IOTA's) and time estimatesrelate to the individual PEF unit and are applied by the computer programto that unit. Again this procedure is identical with what is done on THERP.Once the probability/time values are assigned to the PEF unit, the MSSMproceeds to combine in accordance with the product rule and redundancyI equations noted earlier.
l 123I!
ANTICIPATED MODEL USES I1. Prediction of System Effectiveness
Under this heading we can include two aspects:
a. estimation of system reliability
b. allocation of performance requirements.
As far as estimation of system reliability is concerned, TEPPS willpresumably supply
(1) An absolute estimate of the system reliability to be anti-cipated when the system becomes operational (e. g. , the system willeventually perform with a reliability of .9978).
(2) A comparison of estimated system reliability with thatrequired to achieve mission success (e. g. , estimated system reliabilityis. 9978, but mission success requirements (SER) call for .9987; or,the mission must be accomplished in 16 minutes, whereas required sys-tem performance time is 18 minutes).
Both of these assumed capabilities are identical with those assumedby the AIR Data Store and THERP.
It should be noted that both the above predictive functions are data-limited, that is, the adequacy with which they can be performed dependson having available to the model a store of predictive data and this ade-quacy is only as effective as the accuracy of those data. In addition,their adequacy depends on the ability of the technique to model feedbackloops which compensate for the innate conservatism of using multiplicative 4 1
procedures to synthesize system reliability.
As a consequence of their experiences (see Ref. 7) the developersrecommend allowing the predictive function to be dormant until such timeas an appropriate data bank and more effective modeling techniques becoiteavailable. The author is not that pessimistic. In any event, consideringthe high degree of similarity between the TEPPS and THERP models, andthe fact that THERP (if one believes the published reports) can provide validestimates of system reliability, it is difficult to see why TEPPS cannotdo the same,
124 "xiI
!I
Perha-,s a systematic comparison of the two techniques (based on acomparison of data inputs and data processing operations) would be useful"to determine what modifications to TEPPS might be made to improve its
mm ip predictive capability.
TEPPS should be far more successful with regard to the allocationof performance requirements (i.e. , given an SER of . 9995, how thisrequirement should be apportioned among the various system tasks),
SI since this function does not depend on an empirical data base. Note that4A TEPPS was initially developed for this purpose and that rno other man-
machine model (as far as the author knows presently) pretends to appor-tion SER's quantitatively. This function is also well worth exploiting forthe very early system planning design stages. However, it calls forhaving an SER applied to the personnel operations of a systern, which issomething that is not too often included in system planning.
2. Design Analysis
Under this heading we include several aspects:
2J a. The comparison of alternative system configurations todetermine which should be selected for implementation.
b. The determination of redesign requirements ior a system
which cannot satisfy system requirements.
c. Recommendations for initial design, design changes, selec-tion of components, equipment layouts, etc.
With regard to the comparison of system configurations, it should-. be noted that, as long as the same data inputs are applied to both config-
-• urations, the absolute accuracy of those inputs is of relatively little"importance. One can compare two or more of anything as long as thebasis of comparison is the same. (Obviously the basis of comparisonmust also be relevant, but this is assumed.) From that standpoint TEPPS,along with either of the two models previously considered, can be used torimake such a comparison. The same qualifying statements must be madefor TEPPS as for THERP, in this regard; since both do not deal withequipment details, the comparison will be meaningful only as long as thvbehavioral units (i. e. , tasks or PEF units) differ between the two con-figurations; where the same behavioral units are found in both configura-tions, it is likely that no real differences between the two configurationswill be shown by the comparison.
-I
It. I iiliportIA11 it) to nwidor, how evi, r, that Rypts 1 devClOV pe A l'• rouldhavr mut h niolrt i'olt|drlnvo t I hilN ly yp t tOfhliAI'ti inl Itt; MtsI ~it IN taitidkata-li- lited, hTh' Ahilily Ito 1 1o 'Ir, i tateot'o tivt' atd Awl ittdbaak b'hhAvto1vwould bo nmo1'e i1apo•| 'ItAt. In ally ev"11t, th" NyNtPipI tdeyvo lop la wokhld Itowi|l to c on Id•rt h a' t vIN of tiny 10 hniqlino I( ) p lffrir' piltkll A volta pa1'tlonin efar'ly *y10'011 doNiill.
With 1't'gArd to m rti1'•O M ri'fit domigN /o1/•1 1 iiN i It IIAlt touNTE~PPS, like THIERF. maty iaaclicAto whort11 dit imavdetnAnlysis Itonoceasa ry (in other wor'di, whicth Iciok mn ratS domigi All lluliton), P l'e -
iutiably that FEF unit with the lowpoit predictod reliability b•ecilos acatndidate for rod•elsln. Again, this procedure ist akin to i1THiR'
ratnkintl of Qj valutr', Howevir, 'rTIPPS, like THEIIP, will nIlot Niottuitwhat the nature' of thit domligin vhlAling (vs M. , a diff•'r•nt c'omapolnenit, Adifferent layout) should be, This iN bteause, like THIk P. TEPPS fu1ne"tions largoly with behavioral And not with equipmtwr le•iod'nionii,
3. Manpowur Saloction and Training
TEPPS provides comparatively little informatiun concerning man-power selection and training, A low predicted performance reliability
for a PEF unit may suggest that personnel performing that unit mustbe better qualified or truined more intensively, but does not sulgeitwhat the basis of the selection and training should be.
Although the user test critique (Ref. 7) denigratod the value ofTEPPS for training purposes because the high probability values achieveddid not provide much discriminability among tasks, the author's objec-tions are not based on this point, Even if probabilitie,, for various PEFunits differed markedly, this information would not suggest what is to bedone in training. It is therefore only half an answer. That half (answer)would be useful, but it is our feeling that much the manie informationcould be achieved by other means.
VALIDATION/APPLICATION STUDIES
TEPPS remains unvalidated in the sense of having its predictionscompared with criterion performance data. The Navy user test (Ref. 7)cannot be considered as a validation because no real comparison with
126
thorv wt.' W t~I ittly I No4vy AImio y ift 1\I III w\Ill~,slli11d 11 g I~sil,1 ilm 11111V
tiith Iivloit piogr~4lm, No,iviiitholomm, lit, stotiti'pl soI sA Ivi4i~at0I~tI\ loml t,
11140) mlus s itidIII111 t I Nm Vo I11i t , 011'.mn1 411mitt III o'%,1111111411 Its' 111hsut'tt 1114,1h1 tip
O. P r'~~s i~hu ~ w, %k~ 1 thepi 1w'tdkia 1,114% %imptiom 1 A I tsI,i 141 11 tvhl P;I aho 11
tiVI toolsI WaxM0~ preI'iaul i oll for lilt, uti I h pV I I'm (IQ i ) A il t ill' Pt~ III Ii li'S I iIup rut thd lo ~t, ,11 thA r t' \,I 11% 1i n h h "(A I I himmi't'uttI l 111W 1 4y ~~ 5I t v II II1,%111vs
muic~n at ion, ''1k'tht. Itm was itlided so t ousiy (Iawod"4.
.1 ~EVAL4 UATJIVE SUMMARY
~ IValidity - Although A formual 11ttelt" of the valititly of Ilth misuterAti vopAaI of tho modol ha hoon porformod, tho test wvas no flawed that one
.1-muat conclude that no validity data uximt, nor has tho method botin applirdjj to systorm dovoloprmunt problems,
* ~~Roliability . Tlho user tout (Ro!, 7) suggomts that the permonntie' 'hadno difficulty in following thu procoduires and in applying the TEPPS tech-.niques. , " 1 (p. 42). This suggewtu thaat when tisers are properly trained,%heir development of the GSSM anti MSSM should be reasonably consixtent
I among them,
Li(4) Blanchard notes: "Gonmidtorablt' rescoping of the project durmngits lifetimne resulteid in it being only a ''teist'' of nn-'chanical feasibility
* or its "exervisability". Tht ciSSM was uverminiplified and actually par -
tially incorrect, Also, thero were ýI . jous reservations about tht- dataobtained for tranafnrming the subjective estimates to p values (see pagos18-Z4 of Reference 7). In brief, the result was that there wvas in fact
1 ~no teat at all of TEPPS ability to provide quai'stitative output data relative
to the test systern~.
12

S4yIstem I pooiml Ajlib Aitolily
I)IU A jI'6'ttt It v ii ol i yt ut itIv o g;Tllu I llodtl'W int "111 .'11 i mil,4 u I II i~v ts
A.lph O htio ' It%11tvoiI ~t ' tt " . o1 u ~u oti'uiIr~uu
5.(fvot lopuiptomigo analymiar mi%,r np kund lyu 0091 11 An id 1 t At o ~migt~
d~ii T iliau n g do Thb't, molo idt'tal4 pictli) ,lyAi 111A
Isto "lgomof 40min, rovded II;% I flilontintrm~iol Is vollski4.
Aystvll k~ollitio["
A. Otijocivity, ht, dMA it t s pii hom-tolrq io
21 ~~otti~~iAmNillw ini 1,'i m7t' ii nolM iit ,~ta A ,i CAi ? 1 11 itN titi' 11 A ta ts' ,
K. X.ii~ wkla l ty Smit'k ha , It, haI., Ia'hi , I) -Mot 101w l K-1,1,116 . ti l,
B~ii'rgor, W, .1. r't 4,i Vatlifity 4)1 Expoart i tItM1111-111" titi)'oaati
4. Irwin, 1,I .A, r' tit ~Al. See ontra'ot-vto. A. (1, Nlaiulod 4 Pa'aditultigjH rimatn H. liabi Iiiy. Anni o, a .I and M itt. , I ')h S, 4, 1 $7' t4.).
S. Smith. JR, L., *Wirttlnd, It. A. . LAItuAt hitr (I, It. Ii., 'I'vchn w furlCstablishing Porio ntl Paorforumtncta StAanC~A41 EPPcTchiaI Manual, Roport PTUI-70- %, Vol.1, ?Prmonnod Kusorth Division,Bureau of Naval P01rawnntoI, DOC, 1969.
j ~~6. Sminth, R. L. , We itlatnid, R, A, , Blantc harid, It l. E achugt forEstablishing Persontitil Performiance Standdtrda (f)lyP'I P-VuCt'ClUrI'tGlAide, Report PTB-7O-5, Vol, 11, Personnel Raimvarvh Diviwiun,I Buroati of Naval PersonnelI, Dt-c. 1969.
7. Smith, R.. L. # Weastland . R. A. and Blinchard, It. E~. TL'chnigulw
for Establishing PersonnelPerformance Standard. (TEPPS), Resultsof Navy User Tost, Report PTfl-70-5, Vol. 11l, Pt'rsounnl Re'search3 Division, Bur-iau of Naval Persunnol, De~c. 1969,
8. Smith, R. L. et al. Siubjectivv. J nwlint, as a Mt.-tnt for Gn~ailCorrective Maintenance TimeData. Aerospacei Mlvdical Rusearch
Laboratory, Wright -Patte'rson AFB, Ohtio (in press).
129
I,I
Tl'I|IliR H.;~L~LA 11141''Y -0/l1N'l'kl~1) �P�b1 'IVhE MOD)N¢.LS
I INTRO lUCFtION
I ' , A m ,ajor i l'Api M lf ,lti-mIl'hile predictive miodh Is mt~y btw torlmedtrVIil li |I it Y-otHeI% tt 1, (111, Thr*4t. 111(ldi' Apply 01tttillAtOM Of pV1t0' 111'tlAtlCV•
b)AN~d Oil qIIOlr ' VA'h d|AtA It) IA~kiA Awlt lkitiht pikc Alld. 010•140 01tiilIALONH Arl," thena col•alba ind u ln prohAbtility th•e•ry to output a prelt•ittiual of total
The ,ios widleIy known e xamtple) #4 of Piuch ret liAhblity-ur o td uutidolaare the AIR DAta Store, THI'-I anid TEJPPS. However, fromt the bejlin-ning of intoroet •n hunmAn reliability prediction, which wt, can arbitarilydte from the paablicAtion of the Williams (19S8) paptir, it nunmber ofmodal variations hAve boon devoloped which should be conside'red, Aniongthose we include methods described by Pickrol and McDonald, BDrry and
Wulff, and Navy Llectronics Laboratory Center (Mr, Richard Coburn).
In Addition we should consider reliability-oriented reosarch which bears
upon model development; in particular, tho work of Drs, Aukren andR egulin ski, %,
Because the t achniques wo shall discuss in this section are eithornot complete models, or based upon others Already described, the authordoes not propose to describe them in as much detail as previous tech-
niques
1.
"PRECEU PAGE BLAK.
131
IIJ IV. THE PICKREL,/MCDONAL]) TECHNIQUE
It will become obvious to the reader that this technique bears astrong resemblance to THERP, upon which it is in large part based.The purpose of the technique is to identify and eliminate sources ofcritical human-induced failures. It is unclear from the, authors' pre-"sentation (Ref. 3) whether they use the term "failure" in the sense ofan equipment malfunction resulting from human error, or failure in themore general snse of any degradation (i. e. , failure to accomplish themisuion, delayed mission accomplishment, or degraded mission accom-plishment) resulting from human error. The first definition would dealonly with a subset of the total number of effects possibly resulting fromhuman error.
In any event, although the method will permit an estimate of systemperformance, its intent appears to be more design oriented than merelypredictive. For example, the developers indicate that "the method isdesigned as an aid for allocation of... personnel to tasks... (it) providesa framework for ordering man's inputs to the system.. . and.., an objec-tive measure upon which to base decisions which must be made in termsof costs to reduce or eliminate causes of these errors.. ."(p. 647, Ref.3).
The methodology is, in fact, only a part of a larger plan for applyinghuman factors inputs to design. Thus, the assignment of an error pro-bability to a task is not the end of the operation; "each task is analyzedfor the purpose of identifying probable sources of human errors...Various alternatives.. . are considered. . . " (p. 659-660, Ref. 3). Interms of making the predictive process part of the overall design pro-cess, the method is again similar to THERP.
The assumptions inherent in the technique are more pragmatic thanconceptual. The basic assumption is "that efforts to eliminate sourcesof human errors depend upon the expected frequency that a system fail-uve will follow this error, and the probable consequence of the systemfadure condition" (p. 647, Ref. 3). A subsidiary assumption is thatj "most critical performance occurs during system operations or duringthe proces.sing ot items whose failures may result in loss of the system"(p. 647, Ref. 3). Obviously, it follows from these assumptions that itis necessary to determine the probability (frequency) of error and errorcunsequences. However, other assumptions of a more behavioral natureare not described in the model, which suggests a certain lack of sophis-tication in the methodology.
PRECOI FACE BLANK133
p'A
The methodology involves the following major steps:
(1) Task identification and description;(Z) Estimation of crew activity time and workload;(3) Estimation of probability of error and error effects;(4) Elimination of error sources.
Tasks are defined as major functions to be performed by a crewwhich may consist of one or more persons. It is obvious from the mannerin which crew activity time and workload are determined that the tasksone begins with must be broken down into task elements at a very mole-cular level. It is unclear, however, whether this is also required forestimation of error probabilitieb. In any event, the procedure for per-forming this breakdown involves the development of flow diagrams fortasks and subtasks. Task descriptions involve, in addition to specificstatements of work, "statements of: what must be perceived by the opera-tor, intellectual functions.... (e. g. , recalling information or interpretingdisplay information) and the related responsrs. (p. 651, Ref. 3).
Contingency events (e. g. , emergencies) must also be analyzed.
It should be noted that there is nothing unusual about the analyticprocedure described above. Presumably if the system developer hasperformed an appropriate task analysis, all the items noted above willbe available to him.
The estimation of crew activity time and workload (a procedurecalled "discontinuous analysis" and based on Ref. I) involves assump -
tions that we will' see in Siegel's digital simulation model. Thisassumption is that where the time required to perform crew actions ismore than the time prescribed or available for these actions, a conditionof overload exists which increases the probability of error. "Overload...will indicate portions of the mission.. . which may require modificationif... equipment or crew malfunctions and failures" (p. 655, Ref. 3)(are to be avoided). In contrast to the systematic manner in which this Lassumption is used to influence error probability in Siegel's digital simula-tion model, estimates of overload in Pickrel/McDonald are used in apurely qualitative manner to suggest where human engineering modifica-tions are desirable, In other words, workload analysis here is entirelydistinct from ervor probability estimation and does not enter into theprediction of system effectiveness. As a matter of fact, the originalpaper describing the methodology (Ref. 2) does not include the estima-tion of crew activity times. However, we will describe the process in
134
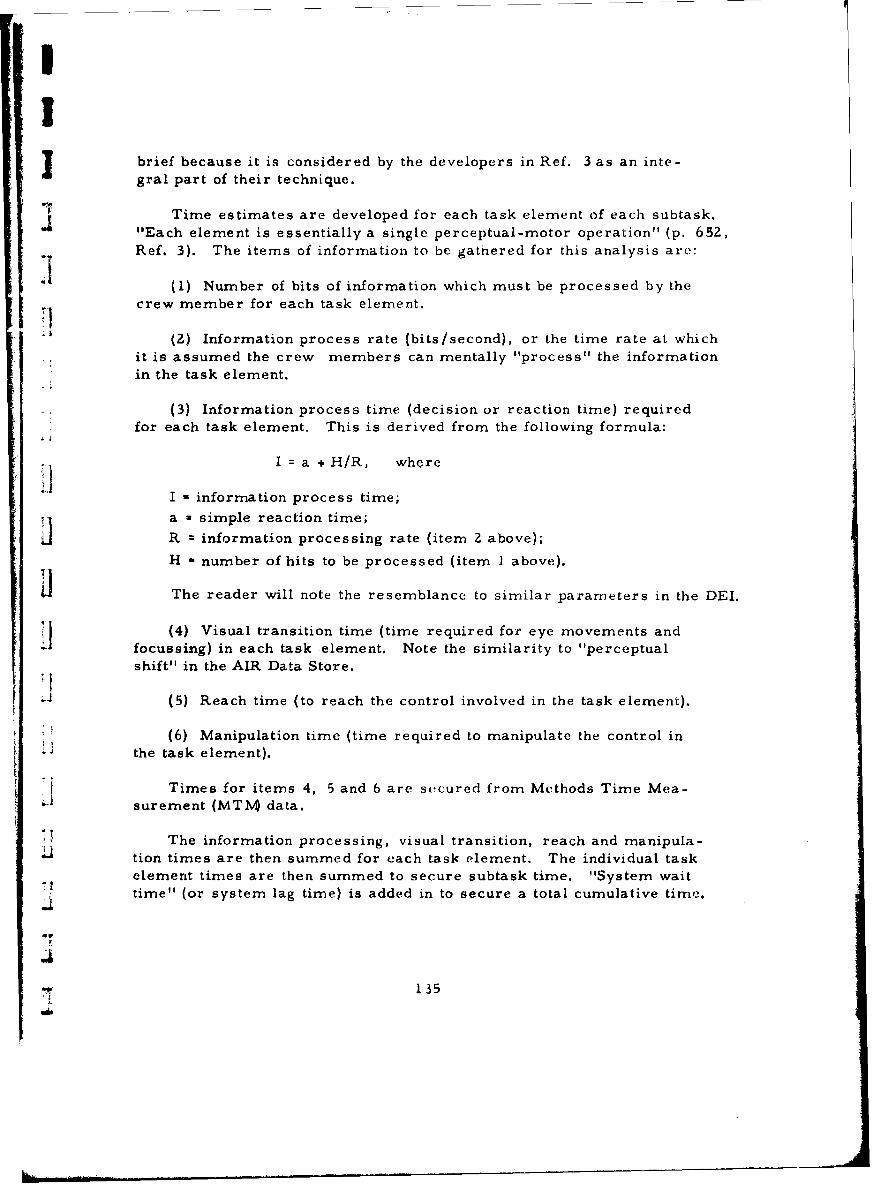
!I
brief because it is considered by the developers in Ref. 3 as an inte-gral part of their technique.
Time estimates are developed for each task element of each subtask."Each element is essentially a single perceptual-motor operation" (p. 632,Ref. 3). The iterns of information to be gathered for this analysis are:
(1) Number of bits of information which must be processed by thecrew member for each task element.
(2) Information process rate (bits/second), or the time rate at whichit is assumed the crew members can mentally "process" the informationin the task element.
- (3) Information process time (decision or reaction time) requiredfor each task element. This is derived from the following formula:
I = a + H/R, where
I * information process time;
i a -simple reaction time;
R information processing rate (item 2 above);
H - number of hits to be processed (item I above).
J The reader will note the resemblance to similar parameters in the DEL.
(4) Visual transition time (time required for eye movements andII focussing) in each task element. Note the similarity to "perceptualshift" in the AIR Data Store.
i (5) Reach time (to reach the control involved in the task element).
* (6) Manipulation time (time required to manipulate the control in-• the task element).
Times for items 4, 5 and 6 are secured from Methods Time Mea-surement (MTM data.
i! The information processing, visual transition, reach and manipula-tion times are then summed for each task element. The individual taskelement times are then summed to secure subtask time. "System waittime" (or system lag time) is added in to secure a total cumulative time.
1W
• ~135
6-,
The above required task times are then compared with available 3task times taken from mission profiles, time line analyses, the missionrequirement, etc. An overload condition exists when the total time
secured above is longer than available time. This situation then calls Ifor a system modification, because manifestly the crew cannot performits mission under these circumstances.
Note that the above procedure is very similar to what the AIR DataStore provides in its analysis of performance time, although the DataStore times are tied directly to equipment characteristics; this is not the
case here.
"Once it is established that there is sufficient time for a given task
to be accomplished, that task can be analyzed in terms of the probabilityof errors occurring and the potential severity of their effects.. . human -
error is defined as the failure to perform a task within a designated _
time... "1 (p. 656, Ref. 3).
We note that this methodology, like others we have reviewed, deals
with' error only on a binary basis; its occurrence or non-occurrence; andcannot take into account qualitative differences in performance. -7
The following items must be estimated:
1. The probability that a specified task will result in a human errorof class i; this is Ei. These estimates are made on the basis of the AIRData Store, as well as "expert" judgments by human factors personnel,information from system simulation studies, experiments and designmockups. It can be presumed that every source of potential data will beexploited, just as it is by the techniques previously reviewed (except,of course, TEPPS). As in the case of THERP, no systematic mannerof securing required data is suggested.
It is somewhat unclear whether Ei refers to the probability of occur-rence of a specified error or to the probability that any error (of any type)will occur. Note that Pi (in THERP) refers to the probability that a givenerror type will occur, based on a previous analysis to determine the mostsignificant errors that might occur. Because the Pickrel/McDonaldmethodology builds on THERP, we will assume it follows the same pat-tern.
136
SI
J 2. The probability that a degrading effect will occur, given the
occurrence of an error of class i; this is Fi. This probability, whichis identical with Fi in THERI, is a judgmental one, based on error and
failure data secured from system tests. When an error is likely to have
more than one effect,
F 1- (1-F 1 )(1-F 2 ) (1-Fn)
3. The probability that a human error of class i will occur and willI have a degrading effect is given by
Note the identity with a similar formulation in THERP (FiPi).
4. The probability that one or more human errors will degrade thesystem is given by
1- (1-Qi) (l-Qj)... ( 1 -Qk) , where
0., Qj, and Qk are the separate probabilities of system degradation re-
i sulting from human errors of classes i, j and k respectively. Alterna-tively the formula
n
which is identical with the formulation in THERP, can be used.
5. The probability that the system will not be degraded, or tasksuccess, is given by
rt = I - T or I minus the probability of human error
SI degradation. This too is identical with THER?.
Up to this point, the Pickrel/McDonald method has done nothing morefor us than THERP could do, and wA th somewhat less sophistication, be-
n cause they have not included any assumptions such as the probability ofoperator detection/correction of an error. The question arises, however,of, given that a failure effect will occur as a result of human error, how
-- significant is that effect. The further development of the technique pro-vides a quantitative (although subjectively determined) way of assessing
I the significance of the error effect. The purpose of this rating is to
I137iiil 1 137
rU.
permit errors and/or tasks to be rank-ordered in terms of their erroreffect criticality and thus weighting the cost of a remedial modification Uagainst expected returns.
The criticality rating for a human error of class i is given as ICEi : Ei . Fi . S
We are familiar With all except Si. This is determined by judging thepotential effect of an error on the basis of the following scale: 1
Safe --- 0-0. 1Marginal--- 0. 1-0. 3Critical- 0. 3-0. 8
Catastrophic--- 0.8-1. 0
The criticality of a given task is given as :fCT Ed- (1-CEi) (-CE j) .... (O-C )
and of a mission as
CM = 1- (I-CT 1 ) (l-CT )... (l-CTn) where
CT1 is the criticality of Task 1, CTZ is the criticality of Task Z,etc. "
The relative rank of the criticalities assigned to tasks provides abasis for determining the amount of effort that should go into providing afix for the problem. The remainder of the process is traditional humanengineering.
It is apparent that, except for the determination of criticality effects,the methodology is almost identical with that of THERP. The one signi- pficant feature is Si, which does appear to represent an advance over F. a..
alone.
Like THERP, the methodology is very pragmatic. Any source ofapplicable data will be utilized; the accuracy of the probability statementsis less important than the use made of them. "Thus, even when theobjection of questionable accuracy is allowed, approximation still enablesthe tasks to be rank-ordered by the criticality ratings" (p. 661, Ref. 3)."While the quantitative techniques of this method may be criticized, ...this alone does not rule out the usef, lness of the method" (p. 661, Ref. 3).
138
I
* EVALUATIVE SUMMARY
i3 Validity - No validity dbta exist or are available; method has neverU been applied to system development problems.
Reliability - No information. Method has never been utilized byanyone other than its developers.
"I System Development Applicability
A. Comprehensiveness: No limitation. Method can be appliedto all types of equipments/systems/tasks.
B. Applicability: Model outputs a prediction of system effective-ness. Although it is intended to be used for design purposes, this
application depends on supplementary human engineering procedures.
7j C. Timing: Method can be applied to systems in early as well
as later stages of design.
Model Characteristics
A. Objectivity: Many subjective judgments required, the basis for,- which is not specified.
B. Structure: Assumptions and parameters underlying the mudelare not specified.
l I1
fill
__ __1 3

REFERENCES
I. Gross, R. L. tt al. Tho Alivt tion, Validatioli mid Automationi ofa Ivlt'thud for Dolinvatinl and Qtantifying AvrotpjAtv Flight CrewPerformanc, Papor prvtsvntI, d at the Wurkahop on Quantification ofHuman Performance, University of New Mexico, Albuquerque, NowMexico, August 1964.
2. Parker, D. B. , Pickrul, E. W. and McDonald, T. A. Eliminationof Potential Sources of Critical Hunman-Induced Failures in SpacoSystems. Presented at Symposium on Quantification of Human Per-formance, University of New Mexico, Albuqurqtt', New Mexico,August 1964.
3. Pickrel, E. W. and McDonald, r. A. Quantification d HumanPerformance in Large Complex Systems. Human Factors, 1964,6 (6), 647-66?..
1i
140
IIj V, '1'HI•, IIPHIA!WY, WUIFF MEl'T''ODI)
One of the oarly (|1959) atuditittio Attll ipillg to) cIttiq'I i A 1elthud ofpredicting the human reliability of tho man-nachinv wyntern won that of
Berry and Wulff (Ref. 1). Their goal NYA* to develop two basit' toc'hniqu"A:(1) one for describing conrponunt reliability whith woeAd he appropriateboth for hardware and personneol components; and (tA) r •ehnique for com-
bining the reliabilities,
To solve the first problem they defined overall myltom reliabilityas the proportion of time that system output is in tolerance, This per-mits one to describe the reliability of a component not in terms of thecomponent itself but in terms of the output of the component, The advan-
tage of this particular concept is that both hardware and hurm.an componentscan be treated identically; in other words, the output clasuifi•.ation isJ essentially neutral.
A reliability of an output of . 90 means that 9/10th of the timo when
a correct input is provided to the operator, his output will be in tolerance.It is important to note that this is not quite the same thing as a . 90 pro-bability of task accomplishment, the usual way in which human reliabilityJ is conceptualized. Nevertheless, it comes close enough to answeringwhat we wish to know about operator performance to satisfy us.
Berry-Wulff propounds certain basic theorems of probability statis-tics which might have been novel to the behavioral scientist then but whichwe are now quite conditioned to accept. The reliabilities of two relatedunits (e. g. , subsystems) may affect each other in multiplicative or addi-tive fashion. A simple serial arrangement of components involves amultiplicative relationship. An additive relationship is used when com-ponents are redundant to another set of components. Figures 6 and 7taken from Reference l)indicates how an estimate for a man-machinesystem is derived.
Of somewhat greater interest to us is that in order to measure thereliability of operator performance, what is needed is an estimate of theproportion of times that the human performance will be acceptable forthe purposes of the system. This involves a procedure analogous to" Isampling by variables" in quality control. It is necessary to know whatthe minimum acceptable output of a component or operator performance"must be. A sample of performance is secured. It is assumed that thedistribution of successive performances will be normal (after the task
1J 141
has boon leArned, of cour e) or thim distribution can be normalised byappropriate transformation, The tank is to estimate tho proportion of
the total distribution of performances falling within the specified toler-ance bands. It is assumed that most human performances will be one-
tailed, sinet, excessively good performance does not impair system
operation,
Even when no performance failure is observed, the proportion offailures may be estimated by, calculating the mean and variance of theobserved performance, using the following equation: Ii
T - M-H where
T a the proportion of performance falling outside the tolerance band;
H a the minimal acceptable quality;M - the mean quality observed, ande-is the standard deviation of the jj
observed quality.
For example, suppose the time dimension were the critical quality,to be measured. The response must'be completed in no longer a time tthan 2 minutes (H). Mean completion time is 1.2 seconds (M) and the• Vof the completion time distribution is . 6. Then
T • Z..0 or ._8 .
.6 .6.
The reliability of the human performance is then found by computing
the area from -00 to T under the unit normal curve, using 'a table ofnormal curve functions. If R is estimated reliability, 'then
R: -where
1- M-H N
B
and I is the incomplete beta function, with parameters A and B equalto N- . N is presumably the number of performance instances (e. g. , Li100) observed.
A special procedure is required where "a single man will producetwo performances, or even that a single performance results in twodifferent dimensions of output of a'single performance" (p. 115, Ref. 1).
142
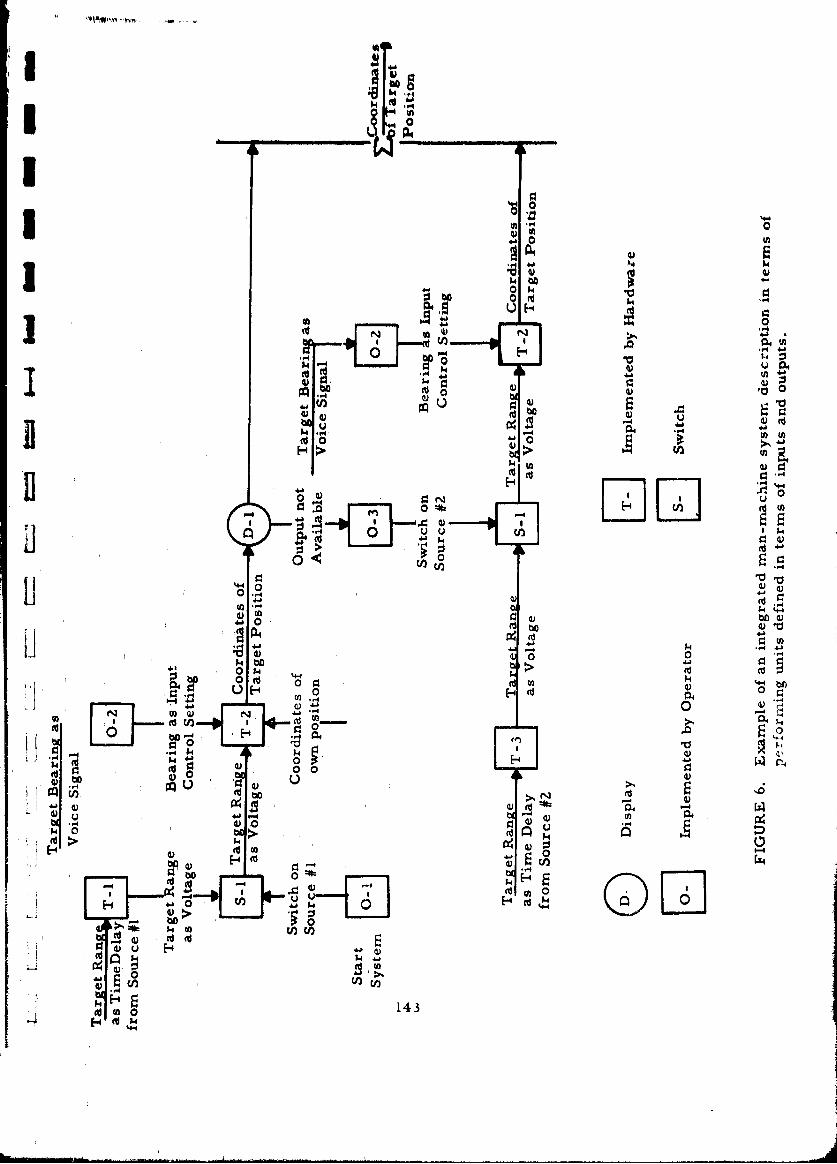
d~IA
?A 4)
"04
4) W
0)a
C44 4) ra'Jo 0f
;4bO00 14 > H
0 w4-4QG4
N 04
(4 u 0 0u C
U 1 0) )'iik il- n(4 bi -#00 0 0
P4
0 H
- ~ ~ $ (4O14
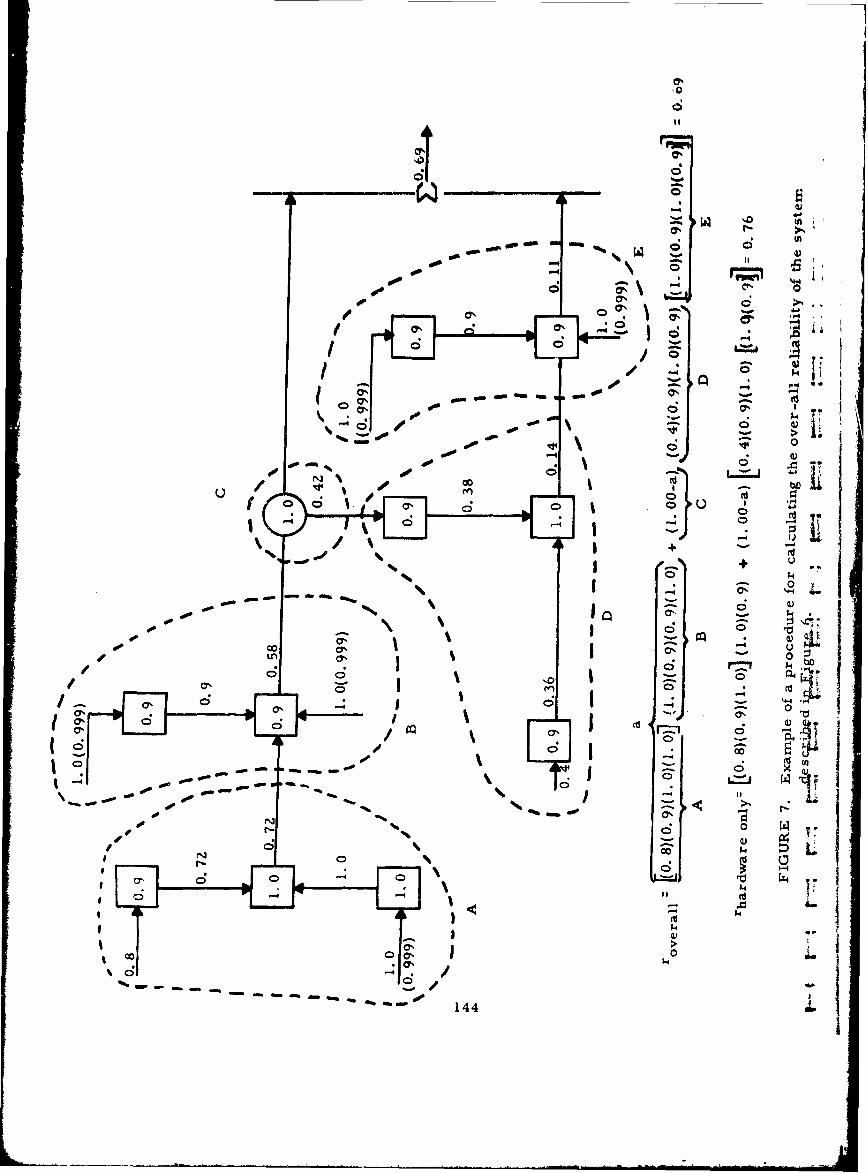
dld
00 It
6=4 >,
- - -~- - ~ %~a %
0 0 do
ago'.00
- 000
Ill
00
0 1 -
- N I-- 0 %H
1000 aaoqb
C)~coc
dw 0 DOWC;'
CY >,F00 a,
144
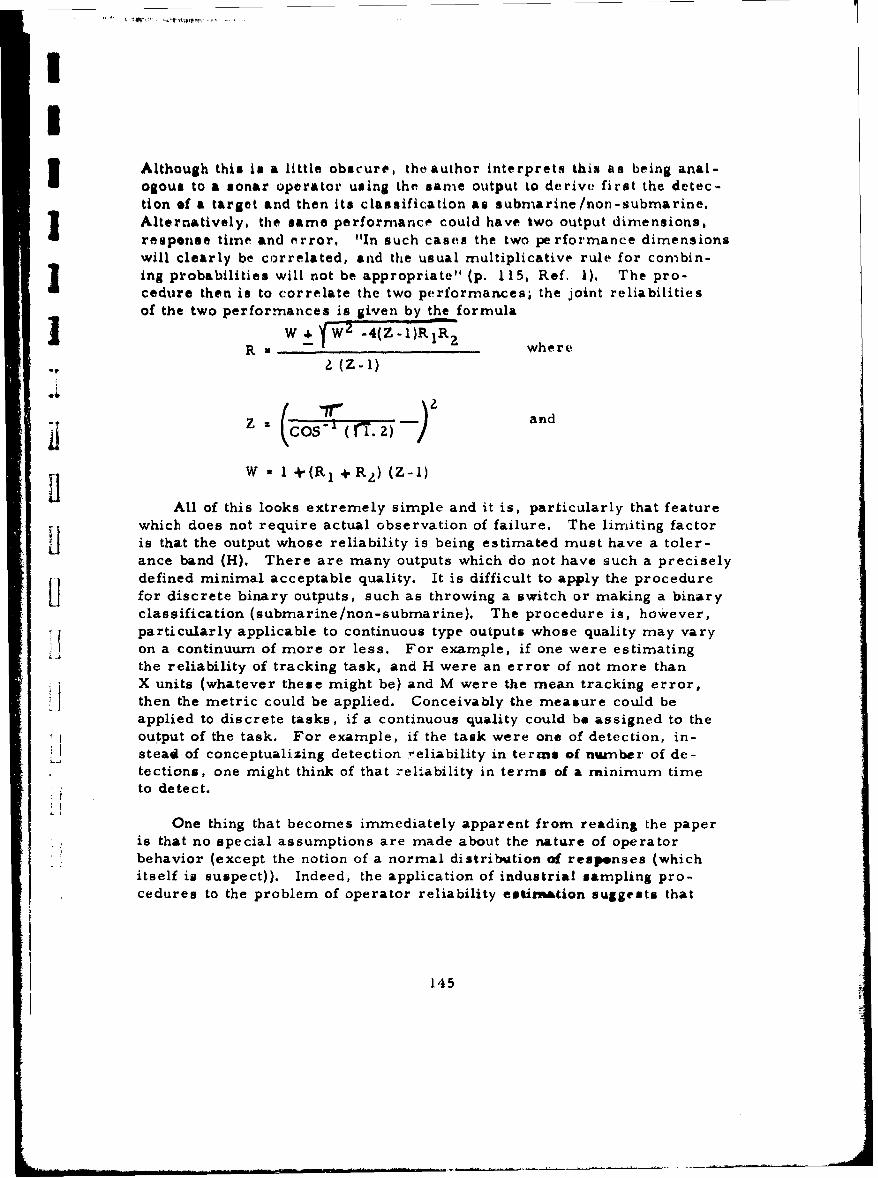
Although this Is a little obscure, theauthor interprets this as being anal-ogous to a sonar operator using the same output to derive first the detec-tion of a target and then its classification as submarine /non-submarine.Alternatively, the same performance could have two output dimensions,
response time and error, "In such cases the two pe rformance dimensionswill clearly be correlated, and the usual multiplicative rule for combin-ing probabilities will not be appropriate" (p. 115, Ref. 1). The pro-cedure then is to correlate the two performances; the joint reliabilitiesof the two performances is given by the formula
w W 2 -4(Z - )R IRzRu -w where
. (Z-l)
Z 0 and
W 1 + (RI + R2) (Z-1)
All of this looks extremely simple and it is, particularly that featurewhich does not require actual observation of failure. The limiting factoris that the output whose reliability is being estimated must have a toler-ance band (H). There are many outputs which do not have such a preciselydefined minimal acceptable quality. It is difficult to apply the procedurefor discrete binary outputs, such as throwing a switch or making a binaryclassification (submarine/non-submarine). The procedure is, however,particularly applicable to continuous type outputs whose quality may varyi on a continuum of more or less. For example, if one were estimatingthe reliability of tracking task, and H were an error of not more thanX units (whatever these might be) and M were the mean tracking error,
L then the metric could be applied. Conceivably the measure could beapplied to discrete tasks, if a continuous quality could be assigned to theoutput of the task. For example, if the task were one of detection, in-
stead of conceptualizing detection ,'eliability in terms of number of de-tections, one might think of that reliability in terms of a minimum timeto detect.
One thing that becomes immediately apparent from reading the paperis that no special assumptions are made about the nature of operatorbehavior (except the notion of a normal distribution of responses (whichitself is suspect)). Indeed, the application of industrial sampling pro-cedures to the problem of operator reliability estimation suggests that
145
the developers think of instances of operator behavior like industrialcomponent samples being inspected. In other words, the "black box"concept of operator behavior. This method is therefore at the other endof the continuum from the more behaviorally oriented Siegel, Blanchardand Swain models.
The reliability prediction made using this procedure describes theproportion of the time the system will be in tolerance. The predictionis not based on error or error rate, and in fact, as we saw previously,does not require any observation of error to secure the reliability esti-mate.1 It assumes that any out of tolerance performance degrades thesystem; as a consequence, one does not have to determine the criticalityof an error as was necessary in THERP or the Pickrel/McDonald methods.Obviously, any output of a component is essential to the system; errors 4o6
can be considered more or less essential only if they merely lead up tothat output.
Moreover, the method does not require building up an estimate basedon molecular or intermediate control-display reliabilities (as we saw inthe AIR Data Store), because it does not deal with the reliability of thecomponent actions themselves, but only with the output of these actions.Nor is it concerned with the size of the unit for which reliability is pre-dicted. An output is completely neutral with regard to the size of thecomponent unit from which it was derived.
Theoretically a reliability estimate is an estimate of performance asa function of time, but because the procedure used here is one based onquality control sampling, it ignores time. It is related to the number ofinstances of occurrence of a given performance. Although the reliabilityestimate is translated into a quasi-time measure (proportion of time), theuse of the sampling concept makes it difficult to attack the meaning ofthe measure because it does not take time into consideration.
The procedure for determining inputs and outputs is in all likelihood la rather simple task analysis organized to reflect not behavioral operationsbut inputs and outputs, the same sort of analysis needed to develop a flowdiagram which in fact is extremely helpful (even if not absolutely required)in this methodology (see Figure 6). The flow diagram is broken out intothose units which are implemented by the operator and those implementedby hardware. The size of the unit and the components involved are at thediscretion of the user of the technique. Since one is concerned only withinputs and outputs, the size of the intervening components is unimportant."Within a given system description it may be appropriate to show a simple
1. However, an out of tolerance output is automatically erroneous.
146
Li
* t •!•, JYW Q ,•,, rg :f r. I A!• q. ....... . a.... ... r ... *..w......... •, '*
It
switch as one performing unit. . and at the same time to show a largecomputer as another... " (p. 114-115, Ref. 1).
The procedure for deriving an estimate of the reliability of the totalsystem involves use of conventional probability statistics. No suggestionsare made by the authors concerning sources of data for T. Obviously onecould measure performance on the component whose output reliability isto be estimated, but this would defeat the idea of predicting early in sys-tem development. The sources of data utilized by other predictivemodels (e.g. , experimental literature, test results) could presumablybe used for this model, but the data would have to be phrased in terms ofminimal acceptable quality. It is unlikely that the experimental literaturewould be phrased in such a way. It would also be extremely difficult totake advantage of subjective estimates, moreover, because judges wouldhave extreme difficulty in estimating variance.
I The purpose of the methodology is to derive an estimate of systemeffectiveness. Because it is concerned only with component outputs, itprovides no information about the design of the component itself. Pre-sumably if the output of a particular unit were unacceptably low, onecould go back to the component itself to try to determine why that outputreliability were low, but nothing in the methodology would suggest thecause. Again, however, this is the case with all the other methodsexamined. Similarly, no information is provided which bears on man-power selection or training.
There are obviously advantages in avoiding behavioral assumptions.If the Berry-Wulff method could be applied to a variety of human perfor-mances, it might be unnecessary to make use of more complex predictivemethods which rely on behavioral assumptions. Unfortunately, the con-
7 cept of a minimal acceptable quality (derived from sampling inspectionoperations) is a severe restriction on the use of the method. This maybe why the author has encountered no data describing the validity of themethod or its application to specific operational problems. Again, oneis left in the air with a predictive method that might be of some use butwhich has never been carried far enough to determine just hov useful it"could be.
1I11 147
iI
Lla HI
EVALUATIVE SUMMARY 3Validity - No data available.
Reliability - No data available.
System Development Applicability
A. Comprehensiveness: Model can presumably be applied to all
equipments, systems and tasks.I
B. Applicability: Method outputs a prediction of system effective-ness, but has no applicability for design analysis, manpower selectionor training.
C. Timing: Because of the nature of the data required to applythe method, it would seem applicable primarily to systems that arealready operational. However, the absence of a more complete descrip- Htion of the method renders this judgment tentative.
Model Characteristics
A. Objectivity: Model is highly objective, requiring few if anyjudgments.
B. Structure: Conceptual structure is ill defined. Many questionsexist.
REFERENCES
1. Berry, P. C. and Wulff. J. J. A Procedure for Predicting Reliabilityof Man-Machine Systems. IRE National Convention Record, 112-120,March 1960.
148
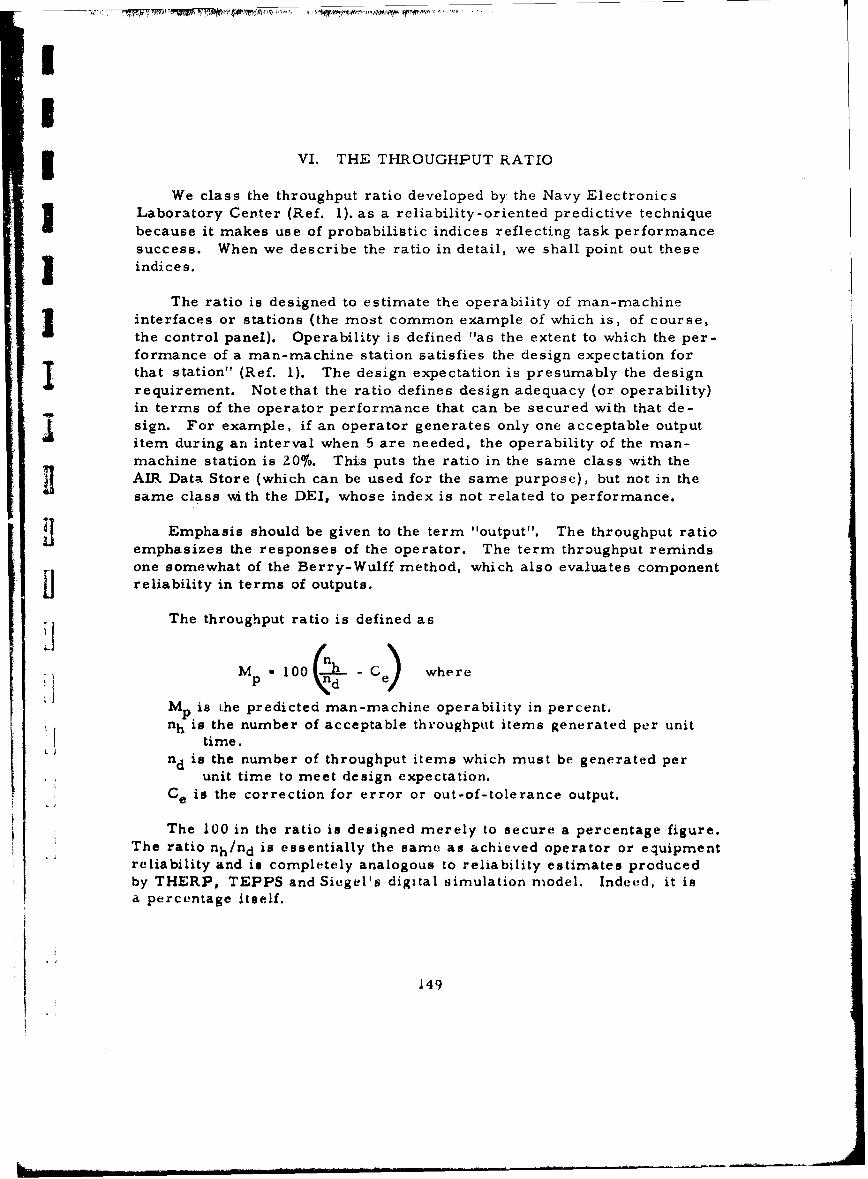
II
3 VI. THE THROUGHPUT RATIO
We class the throughput ratio developed by the Navy ElectronicsLaboratory Center (Ref. 1). as a reliability-oriented predictive techniquebecause it makes use of probabilistic indices reflecting task performancesuccess. When we describe the ratio in detail, we shall point out these
j indices.
The ratio is designed to estimate the operability of man-machineinterfaces or stations (the most common example of which is, of course,
the control panel). Operability is defined "as the extent to which the per-formance of a man-machine station satisfies the design expectation forthat station" (Ref. 1). The design expectation is presumably the designrequirement. Notethat the ratio defines design adequacy (or operability)in terms of the operator performance that can be secured with that de-sign. For example, if an operator generates only one acceptable outputitem during an interval when 5 are needed, the operability of the man-machine station is 20%. This puts the ratio in the same class with theAIR Data Store (which can be used for the same purpose), but not in thesame class with the DEI, whose index is not related to performance.
Emphasis should be given to the term "output". The throughput ratioemphasizes the responses of the operator. The term throughput remindsone somewhat of the Berry-Wulff method, which also evaluates component
Sreliability in terms of outputs.
The throughput ratio is defined as
.pa100 C) where
M pis Lhe predicted man-machine operability in percent.
nh is the number of acceptable throughput items generated per unittime.
nd is the number of throughput items which must be generated perunit time to meet design expectation.
Ce is the correction for error or out-of-tolerance output.
The 100 in the ratio is designed merely to secure a percentage figure.The ratio nh/nd is essentially the same as achieved operator or equipmentreliability and is completely analogous to reliability estimates producedby THERP, TEPPS and Siegel's digital simulation model. Indeod, it isa percentage itself.
149
The definition of nh and nrd implies that the throughput ratio includes
the performance reliability of both the man and the machine, so thattheoretically it would be unnecessary to derive a separate equipment re-liability estimate, Although operator performance at a man-machine
interface cannot be implemented without machine processing, we do notfeel that the throughput ratio can substitute for a value specifically de-scribing equipment relia'bility (e. g. , wearout). Hence we interpret theoperability value to reflect only operator functioning as implemented bythe machine.
Several points should be noted about this measure:?.
(1) The index is in terms of the number of items or responses emit-ted by the operator (hence the term "throughput"t, which implies trans-
mission). The time 'actor is included in the index but only as a constant, 4
i. e. , as so many items per unit time. Hence the ratio is applicable pri-
marily to time-dependent tasks. The suggestion is that the measure ismost suited to tasks requiring repetitive responses that must be completedin a specified time period. The question that arises is whether the mea-sure would be equally applicable to tasks not req.iring repetitive responsesor for equipment which is to be operated only once in a given situation,
e. g. , a missile launch panel. Would the ratio be effective where thenumber of possible responses is not under operator control but is deter-mined solely by the equipment or the situation; or where the quality of -"
the response rather than its quantity is the critical dimension in perfor-mance? Examples of the types of tasks for which the ratio is consideredsatisfactory by its developers are:
(1) speed and accuracy of entering data by means of keysets;(Z) speed and accuracy of updating positions on a CRT by means
of joystick;(3) percentage intelligibility in transmission and receipt of
voice messages of specified redundancy and transmission 17channel characteristics; L.
(4) accuracy in combining component threat probabilities;(5) probability of correctly setting a series of switches; 1,"(6) degradation of detection performance as a function of time
on watch;(7) memory span for aurally presented data items.
(2) Note that the ratio includes a correction factor (Ce), although
Ih is already defined as acceptable items. We interpret this definition I
1150
as a mistake; obviously, if the items are acceptable (i.e. , correct),there is no need for a correction factor involving error.' Hence we
consider nh as simply the number of responses oiutput.
Along this line the developers see the ratio nh/nd as being unaccep-table without some consideration of the consequences of delay and error.Two factors are included in Ce: the probability of detecting/correctingan erroneous output and the system consequence of the error, factorswhich will be familiar to the reader from his review of THERP and thePickrel/McDonald methods. It is accepted that Ce must at the momentbe "somewhat subjective" (Ref. 1), because a foolproof way of scalingthese factors is not yet possible. Howeve.-, something like the scale ofsystem consequences used in Pickrel//McDonald might well be employedhere; as far as the probability of detecting and correcting an error isconcerned, the assumption used in THERP might also apply here (althoughthe THERP assumption involved the concept of stress, which is absent
_ here). There i's some mention of using the AIR Data Store to help gen-erate Ce, but no' details are provided, and the nature of the Data Storeseems unsuited to Ce.
Before proceeding to a detailed examination of the ratio, it may behelpful to review the purposes for which the ratio is to be used. Theseare:
(1) To pompare the operability of alternative designs (note thesimilarity to DEI);
(Z) To help establish system feasibility, which presumablyinvolves comparison of predicted performance with that required of thedesign;
I. Coburn comments that "You suggest.., that since the nuinerator ofthe throughput ratio is in terms of acceptable items, there is no need
for a correction factor. You could make this interpretation; however,we were trying to use the correction factor in a different sense. Thatis we wanted some way to reckon the system impact of error. By thisconcept, acceptable throughput is a positive operability factor, whereasuncorrected detrimental error would be a negative factor."
151
(3) To help correct human engineering dincrepancie ,, which aug-g e st s that the ratio can be used in redesign of designs already evaluated;
(4) To serve as a measurti rnent tool or metric to demonstratesystem acceptability.
The ability of the ratio to perform thesa, functions will be discussedlater.
The ratio applies to something called a man-machine station, whichis not too wll defined. The simplest way to think of that station is interms of any set of controls or displays required to produce the outputto be measured, e.g. , a control console for a computer or a sonar con-sole. In any event, since the ratio reflects an output, it cannot refer toany individual control or display, but rather to all the controls and dis-plays required to produce a specified output. Where a given man-machinestation includes several banks of controls/displays, each of which is usedto produce different output, presumably a separate ratio value would berequired for each output-distinctive set of controls/displays. A problemmay arise when the same man-machine interface is used to produce Lwodifferent outputs, e.g. , a sonar console requiring both detection andtracking. Because of the different behavioral functions involved in twoseparate activities, two distinct ratios might be derived; would thesethen be averaged, or displayed jointly?
The correction factor Ce is a composite of error rate, probability ofnot detecting an error, and probability of function failure resulting fromthe error. Ce is defined as follows:
s X n rsnhflf"
Ce = "r nd x f x whereI rrn d
r. = number of trials in which the control-display operation isperformed incorrectly;
rr = total number of trials in which the control-display operationis performed;
f, probability of the operator not detecting an error;
f -probability of function failure arising from the error.
Since nh/nd represents the ratio of all outputs expected to be performedto all outputs required, without regard to their correctness, Ce must besubtracted from the nh/nd ratio.
I 5Z
4.
II3fI is the probability of not dotocting an errotr because one wishes to
subtract this value from thJ'ioerall ratio,
Note the difference between r./r and I n d . The former refers to, ~I' €
erroneous trials; the latter tu the nuMWbe r of ten or rVsponsett output,A trial is presumably equivalent to the unit time in which the responsesmust be ernitted, so that if unit tite wert, an hour, 10 trials would last10 hours.
The C. factor interrelates error ratt' with detection probability withthe probability of function failure. It its not clear whether there is anyparticular conceptual basis for the way in which C. is defined, but it seemsa bit over-elaborate.
An example will indicate how an operability value is derived.
Assume that 10 responses are required per unit time (nd), but thatonly 5 are emitted (nh).
r . 2 nnorrect trials;rr - 10 trials performed;Sfl .'20 (probability of not detecting an error);
| fZ • . 70 (probability of function failure).Mp would then be calculated as follows:
.-1 , ~x1 )]a00 -X 5
T1 .0 x T N
1I0 [- 5 0003 .4997 x 100 49. 9716
The question may be asked, how sensitive is the correction factor?In the example prepared above, its impact on the nh/nd ratio was minimal.Validation data (if such were available) might provide some indication ofhow discriminating Ce is.
An essential preliminary step in deriving the index is the performanceof a task analysis, as indeed it is for all the other methods reviewed. Thisprobably should include the development of function flow diagrams to tracean output back to the man-machine interface responsible for the output.
I15s
I
Since the throughput ratio deals, lille the Berry-Wulff method, only Iwith the outputs of the man-machine interface, the data needed would seemto refer .only to the type of response output. For example, if the items out-put were messages, the data needed would be the number of messages that Icould on the average be output by operators. If the items output wereswitch settings, one would need data on the number of switches that couldbe set in a given time.
We note, however, that the above description of the required data 77items is insufficient. For example, the number of messages output de-pends on many variables, e.g. , type of message (code or plain English),length of message,, message composition device (typewriter, chord key-board, lightpen, etc. ). Hence it would appear as if the tash analysis would'have to specify those variables that had to be taken into consideration inselecting from the available data. (Of course, if one uses actual systemtest results, this problem does not exist, but there are many situationsin which a.ctual test data are not available. ) What we are trying to say isthat not only must the task analysis methodology specify the Variables tobe included in the applicahle data, but the data source itself must be de-scribed by a number of pertinent variables. A data item which wouldmerely say,' for example, that on the average 27 messages can be trans-mitted per hour would be completely unusable because anyone who wishedto make use of these data would not know whether the 27 messages were5 or 10 or 15 characters long, in code or plain text, etc.
in other words, the task analysis- and this applies to any methodwhich applies data for predictive purposes, other than test data generatedon the very same system being evaluated, or expert judgments based onexperience with that system- must indicate the variables affecting the chut-put performance to be estimated. Unfortunately the procedure for thethroughput ratio, as well as all the other procedures reviewed, nevermake this point clear; nor do they specify for the data they require the,variables describing those data. Undoubtedly this matter is taken intoaccount when the predictive procedure is actually utilized, but failure toindicate this consideration in the description of the technique leaves thetechnique rather up in the air.
The creation of any data bank requires the development of a taxonomyof variables describing the data included in the bank. In many cases thepertinent descriptive variables can be easily inferred by the data bankdeveloper from the nature of the data; however, the data bank user doesnot have the same advantage and will require a descriptive classification
154 --
of the data. The process of selecting the appropriatt data for predic-_ tive purposes is then one of matching the task-analytically derived vari-
ableg against the taxonomic variables describing the data bank. Theprocess reminds one of information-retrieval procedures and is illustratedin reference 2.
The index describes only the individual man-machine station. Thequestion may be asked whether one can combine the percentages for twoor more stations in series or parallel, either by averaging them or apply-ing probability statistics. The answer is unfortunately no; one cannot use
Sprobability statistics because the output measure is not a probability but* a percentage. However, if one were to ignore the "lO0" in the equation
(which is purely for purposes of deriving a percentage), the output valuesof the equation could be interpreted as probabilities, because the elementsof the equation (i.e. , nh/nd, rs/rr, fl, f 2 ) are essentially probabilistic."Used in this way it should be possible to combine individual station valuesto secure a measure of system output.
With regard to the comparison of alternative man-machine interface
configurations, once an operability index has been calculated for eachconfiguration, the comparison is simply a matter of checking one index
j value against another. The higher the index, the better the configuration.
Except for the throughput concept, the index is fairly traditional:
- nh/nd, rs/ r' fl, fz have all been encountered previously. The equationU takes the general form of the traditional reliability equation: I minus a
failure rate, except that here I is replaced by nh/nd. Because of the
7 probabilistic nature of the elements forming the equation, it should bej possible to predict the effectiveness of the single man-machine interface
by disregarding the percentage transformation. 8016 operability forexample, is really a task success probability, although the index measure
is ostensibly oriented around number of items output. In other words, themeasure is actually the probability of successfully outputting a requirednumber of items.
So far we have talked about the assumptions underlying the through-put ratio. No assumptions of a behavioral nature appear to be required,
2 nor can time/error relationships be inferred from the methodology. Thismay or may not be a good thing. f, and f? obviously require certainassumptions if valid measures of these are to be derived, but the descrip-tion of the technique does not suggest any. Mention has already been madeof the possibility of using Swain's assumptions regarding Fi to derive f"and Pickrel/McDonald's scale of system effects to derive f
155
'L I
As with the other techniques reviewed, one wonders how sensitivethe technique is for design purposes. A low operability index would sug-gest the need for some redesign, but the nature of the metric would notsuggest what changes would be desirable. Indeed, the index is not at all
related to any design parameters. This is in contradistinction to DEI,which is conceptually grounded in certain design relationships (formulatedin information terms). It is almost as if, if one wished to use a predic-tive technique for design suggestions, it would have to be accompanied bya technique specifically descriptive of equipment characteristics, some-thing like a checklist, perhaps, with the checklist items being calibratedin terms of the values of the predictive index. This is true of course ofall the techniques reviewed, except possibly DEL.
The effect of any redesign to improve operability could be evaluated *0
with the ratio by determining a ratio value for the redesigned configura-tion and comparing that with the ratio value for the original design.
Again, as with most of the other techniques reviewed, no validationor indeed application data describing the technique are available. As aconsequence, the technique is only hypothetical, which is somewhatfrustrating to anyone interested in evaluating its feasibility and utility.
EVALUATIVE SUMMARY
Validity - No formal data available; has never been applied to systemdevelopment situations.
Reliability - No data available.
System Development Applicability
A. Comprehensiveness: Reasonably applicable to all types ofequipment, systems, task and behaviors.
B. Applicability: Outputs a prediction of effectiveness but cannotbe used (except by inference) for other purposes. •
C. Timing: Applicable to early as well as later stages of design,assuming availability of data.
156

I Modkl Characteristics
A. Objectivity: Few judgments required.
B. Structure: Few assumptions required.
AR EFERENCES
1. Bunker Ramo, Final report on contract N00123-69-C-013Z for
-. Navy Electronics Laboratory Center (undated).
2. Meister, D. and Mills, R. G. Development of a Human Performance
Reliability Data System, Phase I. Final Report, Contract F33615-
70-C-1518, July 1971.
'5Li
1 57
Ij VII. THE ASKREN/REGULINSKI MODEL
The man-machine predictive model most directly derived fromreliability (and probability) theory is that of Askren and Regulinski (Refs.1, Z, 5). As they point out, "Classical reliability analysis uses statis-tical inference to translate time-of-failure observations to a relevant
model or models, and the prediction of reliability is obtained from themodel via probability theory. This requires knowledge of some stochasticfunctions; e. g. , probability density function (PDF) of the failures of theequipment with respect to time for the operations irnvolved. Also, clas-
sical reliability modeling employs the first moment of the random vari-able which for the continuous case is time, denoted by "t", and known asmean-time-to-failure (MTTF), mean-time -to-first-failure (MTTFF) andmean-time-between-failures (MTBF)" (Ref. 1, p. 1).
The model derived is
- t t)dtR (t) = e v
where R(t) is the reliability of human performance for any point in timeof task operation and e(t) is the error rate for the specific task. Askren/Regulinski hold that the above equation "is completely general in that itholds whether the error rate e (t) is time variant or time invariant" (Ref.1, p. 3).
i The similarity of the equation above to the frequently used exponen-
tial equation for equipment reliability (R - e-At) should be immediatelyT obvious.
It may be asked whether the above formulation can actually be con-Ssidered a model. Nevertheless, it is a model by the definition used in
this report because it contains assumptions (e. g. , that the tasks to whichthe formulation is applicable are performed in a time-space continuous
"I domain), parameters (error rate), interrelationships among parameters(PDF), measures (MTTFF), etc., and a set of operations for deriving
-. R(t).
The overall thrust of the work performed by Askren/Regulinski is
that it is necessary to determine the distribution of error as a functionof time (i. e. , PDF) before one can adequately derive a prediction inprobability terms. It has been pointed out that one of the objectionsraised to the reliability-oriented THERP and TEPPS models is that
1EC NI PAGE BUHL1 59
these models utilize point-estimates based on I minus the error rate fas input data to derive system effectiveness predictions. Such a formu-lation would be appropriate only if the shape of the distribution wereexponential (see comments byRegulinski on page 159, Ref. 5). In any .event, lacking knowledge of the nature of the error rate distribution, theresult is an unknown amount of imprecision in the derived predictions.The use of a known error rate distribution to derive a prediction willresult in a significantly more accurate prediction.
Two laboratory-type continuous tasks were developed to generate
error data for testing the Askren/Regulinski model. The first involved"a vigilance task, the second a manual control task (see Refs. I and 2 for" more complete description of the experimental tasks). A number ofdistribution functions (i. e. , normal, exponential, Weibull, Gamma andlog-normal) were tested against the empirical data (which function fittedthe observed data best). Depending on the particular error measureemployed (see following discussion), either the Weibull or log-normal Ldistributions best fitted the data. Again it must be emphasized that thesedistributions were for continuous type laboratory tasks. j
Note that the nature of the error rate distribution might well changedepending on the experimental conditions modifying the task (e. g. , if one
increased accuracy or response time requirements).' Moreover, whatthe distribution would be for discrete tasks cannot be ascertained present-ly. Nevertheless, the basic principle remains valid: in order to makeprecise (relatively, that is) predictions, the nature of the distributionmust be known. Any distribution is, however, valid only for a certaintype of task, and, if there were N task conditions, it is conceivable that
one would need a distribution function for each of them. At the very least,the parametric values in the distribution of function would vary.
(I) Askren points out "The thought is that the basic distribution of
the data (log normal, Weibull, etc. ) may remain the same for a particular
task or a family of tasks, and the equation parameter values would change.
Thus, we might have parameter value changes for various amounts of Ltraining, for various performance standards, various equipment features,
etc. , with the PDF remaining the same,.
160-
160D
I,I
Hopefully, however, one would find that a given distribution function(e. g. , Weibull) was applicable to a class of tasks, so that one would notbe faced with the necessity of deriving a function for each task. Evenhere, however, the specific parametric values for the generalized func-tion (e. g. , the a and b values in the Weibull) would probably vary fromtask to task. 2
Once one knows the distribution applicable to a particular task,"or ckass of tasks, the probability values derived for these tasks usingthe function can be combined according to probability theory to secure aprediP ion of system performance involving these tasks. For example,if a sy!,.ern were composed of the two experimental tasks studied byAskren/Regulinski, the probabilities for each of these two tasks could becombined using conventional probability theory.
Li It is apparent therefore that there is nothing in the Askren/Regulinskiformulation which conflicts with or supersedes the other reliability-
1 oriented models (e. g. , THERP, TEPPS) discussed in this report. Theseother models are not superseded because they contain variables not foundin the Askren/Regulinski model, variables like the effect of stress, whichdescribe the mariner in which behavioral factors the basic error-rate
function. For example, the distribution derived for the two experimentalAskren/Regulinski tasks does not take into account the effects of stressconditions. If the system analyst considered that stress was an import-ant factor in system operation, it would be necessary to include thisadditional factor in the prediction of system performance. 3 Of course,
"1 if one had an error-rate distribution for the two experimental tasks
J!
(2) Askren notes that "Our thesis is that classes or families of humantasks exist for which underlying functions can be determined- -- variationsin the conditions of the task (stress, training, equipment features) can beaccounted for by changes in function parameter values."
(3) Regulinski points out that "Human stress manifests itself inhuman response time. The greater the stress the greater the hazardrate (error rate). Hence no additional factor in the prediction of systemperformance is necessary."
S161
- i"rI
with stress included as part of the experimental conditions, then it would Ibe unnecessary to apply the THERP or TEPPS formulations to secure asystem performance prediction. However, the stress factor would haveto be specifically denoted as one of the conditions under which the data Idistribution applies. Insofar as the combinatorial process in the othermodels discussed utilize conventional probability theory, then specialoperations would not be needed to supplement the Askren/Regulinskimodel, because the latter also applies conventional probability statisticsto combine task predictions into a system prediction.
I consider therefore that the Askren/Regulinski model is essentiallya way of securing more precise human performance probability estimateswhich could then be applied in the other models in exactly the same wayas they do presently. (Askren notes also that it provides a quantitativelanguage which allows direct incorporation in system engineering models.On,. problem that arises is that these other models deal with discretetasks,for which an error rate distribution is not presently available.Eventually, however, distributions for the discrete time domain shouldbecome available.
The Askren/Regulinski model does not take into account the effectsof a given error on system function, as expressed in the THERPianparameter Fi or the Pickrel/McDonald f . (Some such concept is neededbecause errors differ in terms of their system consequences.) However,this matter can be taken care of by defining the measure for which theAskren/Regulinski probability prediction is derived as "errors leading tosystem malfunction" or "errors leading to catastrophic failure" or whatever is desired. But one will get a different distribution depending on Ihow one defines one's measures.
In this connection Askren/Regulinski have conceptualized a seriesof potential measures closely related to traditional equipment reliabilitymeasures. To quote from reference Z (pp. 3-4) "In reliability engineer-ing, the term mean-time-to-failure (MTTF) is applied to components that &are not repairable... , whereas mean-timn-to-first-failure (MTTFF) andmean-time-between-failures (MTBF) are applied to equipment subject torepair. The three terms are useful in dealing with human performance Ireliability. MTTF translates into mean-time -to-human-initiated-failure(MTTHIF) and describes when a system function could be expected to failas a result of an error or an accumulation of errors by one or more Ipersons performing tasks in that function...
I162 I
I
"l"MTTFF and MTBF translate into terms which describe errors whoseeffects are •orrectable. Thus, MTTFF transforms into mean-time-to-first-human error (MTTFHE). This is useful in treating errors that arehighly critical, such that the first occurrence of an error would be costly.The term MTBF converts to mean-time-between human errors (MTBHE).This is useful in treating errors of a less critical nature. ..
Additional measures were also considered necessary to account forerror correction. Building ,,,i the concept of mean-time-to-restore(MTTR), two additional terms were developed: (1) mean-time-to-firsthuman error correction (MTTFHEC- an atrocious acronym, but necessary,one supposes) "which indicates the time on the average for man to correcthis first error. However, man, during the course of a workperiod may
S •commit a number of errors, yet recover from them. Thus a second termdis necessary. This is mean -timne-to -human errors correction (MTTHEG)and indicates the time, on the average, for man to correct all of hiserrors" (Ref. 2, pp. 4-5).
An objection was raised in the discussion reported in reference 5that the Askren/Regulinski model is organized solely around time, par-
= •ticularly in terms of the measures cited above, when what the systemanalyst may want is a prediction of absolute performance, e.g. , howwell--- .87, .95-- will the system perform its mission? The variousIi[ -measures cited in the previous paragraphs are, however, only mirrorimages of an absolute prediction. If one knows, for example, that
-?MTTFNE is 20 minutes, this is translatable into a reliability value ofAlthe . 87.. .95 type.
In the original version of this section the writer indicated that "TheAskren/Regulinski model is not a universal panacea, however. It willnot, for example, solve the problem of conditional probability. By thiswe mean the determination of the effect of one task or task condition onanother concurrent or subsequent task. Probability theory can handlethe problem of combining two or more task probabilities, which havealready incorporated in each of them the effect of the other probabilities.j The Askren/Regulinski model does not, however, suggest how to deter-mine quantitatively these corcitional effects. "
In his comments Regulinski noted that the model will irn fact handleconditional probabilities mathematically. The problem is actually anexperimental one, not a mathematical one. If experiments are perform-ed which describe quantitatively the relationships between two parameters
163
or two tasks pp.' r' foril'i ovor titxll, , th.'kil thw rise'iult1ilt iltm n k hi'i lt 1(l,no Ifleto show their voniditionlAl pI'.1hahillty. 'lhe.iffitilty IN Mollitng lilt' dt~a ,
i11.0 tht, MOdel (Whiikh iM not wit'iessn ily tho re~omlimnibi itt Vlt tit it odoldecvelopers , A~ Ithotigh it tdovm hviI kill Iv th e m'isllii't y kkkithi Whit. 1 %lilt k"111utilize.. 11 nlodcl).
Tho liroblemn abovt, is oiitit' mof euroing Approepi~t, nl Lim~a, 'Illiti Itlpi(tus to a cotiaideratioti of tilt implic~tionm o1 Askri'ii/RoguiIIitlkk fill- datoCollection. MAnliftstly it 14 sn1ort' difficusltito duvolop ;% dAiA dis0triibuthio,than a point t'stlniale, 4 The diffitull y I& cooipounclod if one Oro'ko tosecure such dnta fro on pe rat lna I I.st N OM rC01N. Thet' 1-401 10l OIN I OWthsituation is us ually anniufficiontlIy cu'iat rof Itd Wn ojoerAtionlos tr' sti ng ,Anti
the. opportunity to gaith er latrge am ount s Of' ( tAt hiN u klmi' ''Nta' 'te
tainly this is the writer's own O.XPea'aene.0, rv(I%,%ett~l it% reivrvn.'co 4. litconsequence * if one must makei use.' of labor'ator~y itutlit's to iietkrtl tiltre quisite- data , two difficul ties nr sistk:
(1) the proce'ss of data collection is slowted down-,
()it is necessary to validate' tilt' lAburAtory results tit c ompa a'a on .
with results from~ operational testinig to t'nsurt' that dist ribution A (socued~a.(fromr the laboratory) is much the smnic' as dista'ibuition A' (votcua'ed froti-i
(4) Regulinski znotes that "Obtaining data is not an eiAsy task whethermodeling is to be done ina time continuous or timet dliscrtete domain. I re--spect your opinion regarding development of data distribution vs pointestimate, but reject your implied assertion th~tt it is easier to obtainpoint estimates from operational test sources. TIhe same data (obtainedfrom operational test sources) which yield point e.'stiniatt' gonerally yieldalso data for the densities! [ 1
" Case in point is the vigilance task re.porte.d iln my pape.r, , .,The.' \e' rysame data can lead to point estima t(s of human t .'lia bility. . .. .. ... butIthis leads to the preposterous result of 0), 999ý,7SJO3 (two errors inl 2760trials). In short, if the difficulty is as Monumecntal as you suggest, doesthis justify such approximation as 0. 999279'36 vs 0, 70 as re-ported? Iassert that this is not an approximation gross or other-wise. It wouldappear to be more a case of looking in the middle.' of the night for a lostwatch under a street lamp, and nowhere else, sim-ply because uinder the.'street lamp one can see."
1641
olIlril'Atioial AI ~ k"), W"' klilw fo~I ill~ tt~ plll'I 'e (moo, Itvfi I)] IIAIj~~it~it~fi hltl-II laiAtill'y r"A~ilpsIl tils v~~atiitlal Itanko Iim haArA dmiup
* Thin do "111 11 11pl iPA tholit 11h0 AMIIAI1sCII to hol opI' i ~toby 4411V 111s,61110
j ~ ~ )m rtivi'ularly it A 1u',1ii'l-AIme I A i ~ll tutut 11o 411 l i Ito u'iml it) stilly tob
IitA m is o rsIi %nki tAum tstuloi' Ilomis i it,~%ihNAuI, 11et isi lN O t ieW otr'i-AtIoaial
II~IN u~II 41% l-vilhl. lilhtsi410 1 114111~I I fitIII" rill e Ill ' tltldA~y lot
flit nA okron /i w il o okuaii the di wi toil Oloillol Ilati I iu III a VI I, Pit
tiotIs *'ot NAtuim(4 Its al on. InuINf hothl tiludtonu hdout, disvtriot f
Iliowl t~iy it h liy voiii11111- vii I tilm i t 9oliN I 1on It% thA Whrooy. dot Thon O)Wit
JUNi~I AN Wil tit) il (01'Iill OthIN Iotii~tioN tkWO I'litiN 'Ati to What o)0Ax~Pi /i
I Rogtahuaiki modtel will do (or tam 6 Matnifewily it will providtl at a bsoluteprodiviiti 4llit tak atiti porfor'iuvico roilishility, (2onuavquoiaity wo atii tim
it# i'eotilta to coaipa ro two or' more a ttoiuk~tiveuomuiuain by prodivlttiiii the task probability of eavh confilttrAtiOll Alof Isking the hightst value.Praunimably th. Askron/Rogulinaki niotric in acinmativ" to d# ie n~ in tiltsonso that differown equipuint foattiros will prodtace difft'roitt talik prob-
abilities. How sonsativio 0 tis, we hakve noc idoa; lbuoratrnry sittudiom .4hottdbe done to determine this, it in, huwe'vtr, probatbly iai stinvitive au anlyequtipment roliability predlictive mothod is to domilin utlevm This
i)Rogulinaki comments: "1 hlaetitte that yoi lia ow'h itai I aquairely oilthle )load, So far, ouir research leada Ius to believie thAt smoai clasuvi oftask* are governed by the same density (pdtl) andc that oitreavs chaniM.~v ontlythe parameteir of the distIribution, 'Ihim much h"N a tic .' dorraunsIrAted andis rvasonably t'leara. But the bounds of thw p4 rt.liet' a' Is is riv of 1o ali yroesearch aspect's to he invextigakted,
(6) Rogulitiski coTmmOII15 "What. will it doi fo.r us. ? It tis
moe liktily to ha adgil A gap between the bL'haviural scientisit (humlanlfactors, , . varioty) And the systems unginec a' (reliability. , . variety)who has giveni the problem of modeling at manal-machine system s uch
16 93
Fir
may well not be Nensitive enough to provide meaningful initial and re-dIOMtll Auldanco to the nysttm developer. It is unlikely that we will getmore out of this model in this rospect than we can from the others. TherolevAnce of this m•ctri: to the solution of manpower selection problems.in dubious. The authors in reference 2 makes some claims for the metho-dology relative to dettrmining how much training should be provided, butuntil relevant emnlrical data can be provided, it is difficult to take theclAim seriously.
A•l Hu ian B
will need tRAt -M e" h110) dt
and RB(t) e " h dt
and Rh(t) M e 0 e(t)dt
in order to perform....
Raystem (t) - RA(t) X RhO) X Rb(t)
,and who it not likely to accept point estimate for Rh(t) because byreason of simple logic and training he reje~cts the product of apples andpears to obtain bananas".
(7) Askrin comments, however, thai "The data in Tables 2 and 3of reference 3 show that the mean-tire values improve with training.For example, in Table 2, roll axis, the mean-time-to-first human crrorfor 20 minutes of training (trial #I) is 23. 4 seconds, and for 40 minutesof training (time accumulated for trials I and 2) is 214. 9 seconds. Thuswe have demonstrated that reliability of performance is related to amountof learning. This provides the empirical foundation for the assertion thata particular human perforrnance goal (MTTFHE in this case) could beestablished, and the amount of learning time needed to provide the de-aired MTTFH-E could be derived. '
166
I
SObviously much more must be done before the methodology can beestablished without question. Several of the steps to be performed, in-
cluding determination of generalized distribution functions, their applica-tion to different classes of tasks and in particular their validation, havebeen described previously. After all this is accomplished, it would behihighly desirable to develop and, test the adequacy of a prediction basedon this model for an entire system, to determine whether the model canhandle system prediction problems. Since the method is merely an ex-"tension of conventional reliability estimation procedures, there is noreason why it should nrot be used in the same way as the latter; but thepoint needs to be demonstrated empirically.
EVALUATIVE SUMMARY
Validity - Sinrce the, methodology derives from accepted reliability* I practice and probability statistics, there is no reason to question the
a validity of its application to system development problems.
R'eliability - Since the methodology is a standard one, there is everyreason to believe that different analysts will secure the same resultswhen applying it.
System Development Applicability
A. Cop-iprehensiveness: Although the methodology has as yet been
* iapplied only to a restricted set of tasks, there is nothing in the techniquedescribed which would prevent its being applied to the full range of tasksand behaviors.
B. Applicability: Like other models, the data derived from themethod will predict task/behavior effectiveness, but does not in and ofitself indicate design, manpower selection or training requirements.
C. Timing: Applicable to the entire system development life cycle..A
Model Characteristics
A. Objectivity: Highly objective.
B. Structure: Assumptions and parameters well defined.
167
REFERENCES
1. Askren, W. B. and Regulinski, T. L. Mathematical Modeling ofHuman Performance Errors for Reliability Analysis of Systems.Report AMRL-TR-68-93, Aerospace Medical Research Laboratory,Wright-Patterson AFB, Ohio, January 1969.
2. Askren, W. B. and Regulinski, T. L. Quantifying Human PerformanceReliability. Presented at the Second Annual Psychology in the AirForce Symposium, USAF Academy, Colorado, 20-22 April 1971.
36 Chapanis, A. The Relevance of Laboratory Studies to PracticalSituations. Ergonomics, 1967, 10(5), 557-577.
4. Meister, D. et al. The Effect of Operator Performance Variableson Airborne Electronic Equipment Reliability. Report RADC-TR-70-140, Rome Air Development Center, Griffiss AFB, New York,July 1970.
5. Regulinski, T. L. Quantification of Human Performance Reliability:Research Method Rationale. In proceedings of the U. S. Navy HumanReliability Workshop, 22-23 July 1970, Report NAVSHIPS 0967-412-4010, Washington, D. C., February 1971.
1I
168 =
I
VIII. THE DISPLAY EVALUATIVE INDEX (DEI)
INTRODUCTION
The DEI is a method for calculating a figure of merit of the effec-tiveness of equipment displays to transfer information to the operatorand for the operator to perform control actions. Its primary purposeis to provide a quantitative method for comparing two or more alterna-tive design variations of the same equipment without the necessity ofconstructing mockups and conducting operator performance studies.
GOALS
"The purpose of the DEI technique is to provide a quantitative method
for comparing two or more design variations of the same equipment"...(p. 279, Ref. 2) (in terms, presumably, of their operability). "Thetechnique also provides one basis for an impartial decision in the caseof uncertainty about alternative equipment designs" (p. 279, Ref. 2).The technique is not intended for evaluating a single design. Conceiv-ably one could use it to evaluate a single equipment, because the way inwhich the index is developed, its values range between 0 and I, with Ibeing ideal. Hence, the lower the index, the less desirable the designis. However, this is an ineffective way of utilizing DEf. On the otherhand, the data, already developed by Applied Psychological Services,could represent a basis for some normative referencing.
In practice, because the technique concentrates on controls and"displays, the technique is useful for evaluating control panels, display
"panels, and display/control panels, and not for evaluation of the entiresystem. On the other hand, since these panels are the focal point:1 (usually) of all operator activities in the system, this limitation doesnot bulk too large. Although the technique emphasizes displays, it alsoincludes control factors, and therefore need not be reserved for use
J with display panels only.
The technique also possesses some design diagnostic utility, althoughdesign diagnosis is not one of its enunciated goals. In the process ofcomparing alternative configurations, it is possible to determine whichof the bases or links is responsible for the advantage of one configuration
A over another. Moreover, if one were interested in improving a particularconfiguration, he could modify the design in line with khe principles used(e.g. , fewer controls/displays, less mis-matching, etc. ), measure the
169II
results of the design change in terms of DEI and determine whether thechange produces a higher DEI value (see examples of design variationsin Ref. 1).
There has been some attempt to make use of the DEI as an instru-ment for determining training requirements (Ref. 3), but work on thisis insufficiently advanced to assess the feasibility of doing so.. However,the preliminary indications suggest that the technique possesses somepotential in this respect.
ASSUMPTIONS
The assumptions on which the DEI is based stem from informationprocessing and communication theory, but are easily recognizable incommon sense terms (not that the latter point should be considered anydisadvantage).
"All else being equal, that system is best which:
"11. Requires the least operator information processing per subtaskunit. For example, a predictive display is considered superior to anon-predictive display.
"2. Has the greatest directness between the information transmit-ters (displays) and the receivers (controls). For example, as the numberof nodes in a communications network increases, the efficincy of thenetwork decreases and its vulnerability increases.
"3. Has the least difference between the amount of information pre-sented by an indicator and that required for a control action. For example,differential operator filtering and/or amplification may serve to ir.ncreaseerror potential and decrease informaion transfer affectiveness.
"4. Provides for redundancy of information. For e••naple, a mres-sage can be decoded quicker and with fewer errors whenr it containsred;undant information.
"5. Requires the least intermediate data processing by the operatorbefore he can perform the required control action. For example, unit.conversionc, transformations, multiple cornparisons, integrations, dif-ferentiations and the lEke serve to delay information transfer and tointroduce error potential,
170
Iw
I
""16. Has the least number of . (indicators and control parts) ...
"7, Imposes the least amount of time stress on the operator as heperforms the information processing...
t18. Has the least number of transfers which cannot be accomplished
"within a prescribed time. For example, if the operator must processmore information than time permits, then certain transfers... will notbe performed.
"9. Possesses the least number of critical transfers. For example,a system which contains a greater number of transfers which, if not ac-complished correctly, requires task repetition or causes task failures isless efficient than the system with fewer critical transfers.
"10. Has displays and controls which are optimally encoded. Forexample, .... information transmission rate is lowered for highlysymbolic stimuli. On the other hand, complete lack of encoding mightcreate a large indicator or control matrix which would require huntingand searching.... 11 (p. R79-380, Ref. 2).
] Probability of correct response is tied directly to amount and mannerof information transmission. Any design that requires the operator towork more, by being required to interpret more information or to makejmore decisions based on discontinuities between display and control in-formation, is undesirable.
The necessity for processing information from displays and fromdisplay-control relations')ips may lead to operator stress which in turncould lead to increased probability of error. This is essentially the sameorientation we found in the digital simulation model, except in that model
-• the stress resulted from inability to perform within a prescribed time.-, In DEI the stress results from loading the operator's perceptual-motor
channel capacity with more information than he can handle. The equip-ment is considered to provide information to the operator through itsdisplay and control design; the operator responds more or less effectivelybased on how efficiently he can orgaiiize and act on the information pre-sented. Hence, for optimal response- there must be a match between the
S-. operator's perceptual organization and the equipment's information or-ganization. The conceptualization is quite elegant.
.4
171
Ili
Each of the factors included in the index is essentially independentand hence can be combined multiplicatively. In view of the interactionsgenerally found in factors influencing operator behavior, it is difficultto accept this assumption except as a pragmatic one, to simplify thecalculation of the index. The effect of this multiplicative relationshipis that any single factor which is deficient may exercise an excessiveeffect on the index value of the total configuration. Siegel notes, how-ever, that the transfer chart which is an integral part of the DEI pro-cedure, considers interactions between displays, between displays andthe observer, and between the observer and his controls. In any event,since the technique merely ranks alternative designs, the absolute valueof the DEI index is unimportant.
In the equation for the DEI the various factors are weighted by meansof various exponents. The value of each exponent was not derived con-ceptually but as the result of an empirical fits to criterion data. Asdescribed in Reference 2.. . "appropriate transformations were then
applied. .. so that a multiplicative combination of the base (factor) scoresyielded close agreement between the merit ratings of the system designvariations.., and the DEF" (p. 30). There is no inherent objection tothis procedure, but it must be recognized that the particular weightsestablished have little conceptual basis.
Another assumption is that the display configurations being evalua-ted are properly human engineered (although see assumption 10 on thepreceding page). In other words, the arrangement of stimuli on thedisplay, for example, and the organization of the controls to be operated
in relation to the display are not significant factors in the DEL. Con-sequently the index is primarily sensitive to the nuniber of elementsin the display configuration. This is not a criticism of the DEI as such,because the technique consioers primarily the information transmissionaspects of the design. L
METHODOLOGICAL SCOPE LDEI is suitable for application to any control-display equipment,
including those involving continuous tracking and decision-making
172
IJI functions. The reason the index can include tracking and decision-Ui making activit.ies is that the index abstracts these activities and considers
them only as nodes in the information transmission link. Consequentlythey are given standard link values (4). For example, "If intermediatedata processing is required, this is represented by a box inserted in thelink (creating a total of two links)" (p. Z80, Ref. Z). The repetitivenature of tracking functions becomes unimportant, because no matterhow ma2ly times a perceptual function is repeated as part of the sametask, it receives only a single link value.
:. JIn consequence the technique considers behavioral functions only ina very abstract sense, which is entirely justifiable because DEI does notpretend to predict operator performance, simply differences in designquality.
The technique also considers differences between tasks. Tasks mustbe considered because different tasks may require operation of differentcontrols and displays; where a task does not utilize certain displays/controls, these are ignored. As a consequence, a DEI value must be
1A secured for a sample of tasks.
SJ PARAMETERS
In its original development (see Ref. 1), DEI rested upon 5 basesI.J which were later modified, expanded and retermed factors. These last
a:'e listed below and will be described in more detail when the individualj measures are described.
1. Complexity factor: related to assumptions I and 4 (see sectionon Assumptions).
2. Directness factor: related to assumption 2.3. Data transfer factor: related to assumptions 5 and 6.4. LEncoding factnr: related to assumption 10."5. Time factor. related to assumptio-.s 7 and 8.
. 6. Match factor: related to assumption 3.7. Critical link factor: related to assumption 9.
-. 173
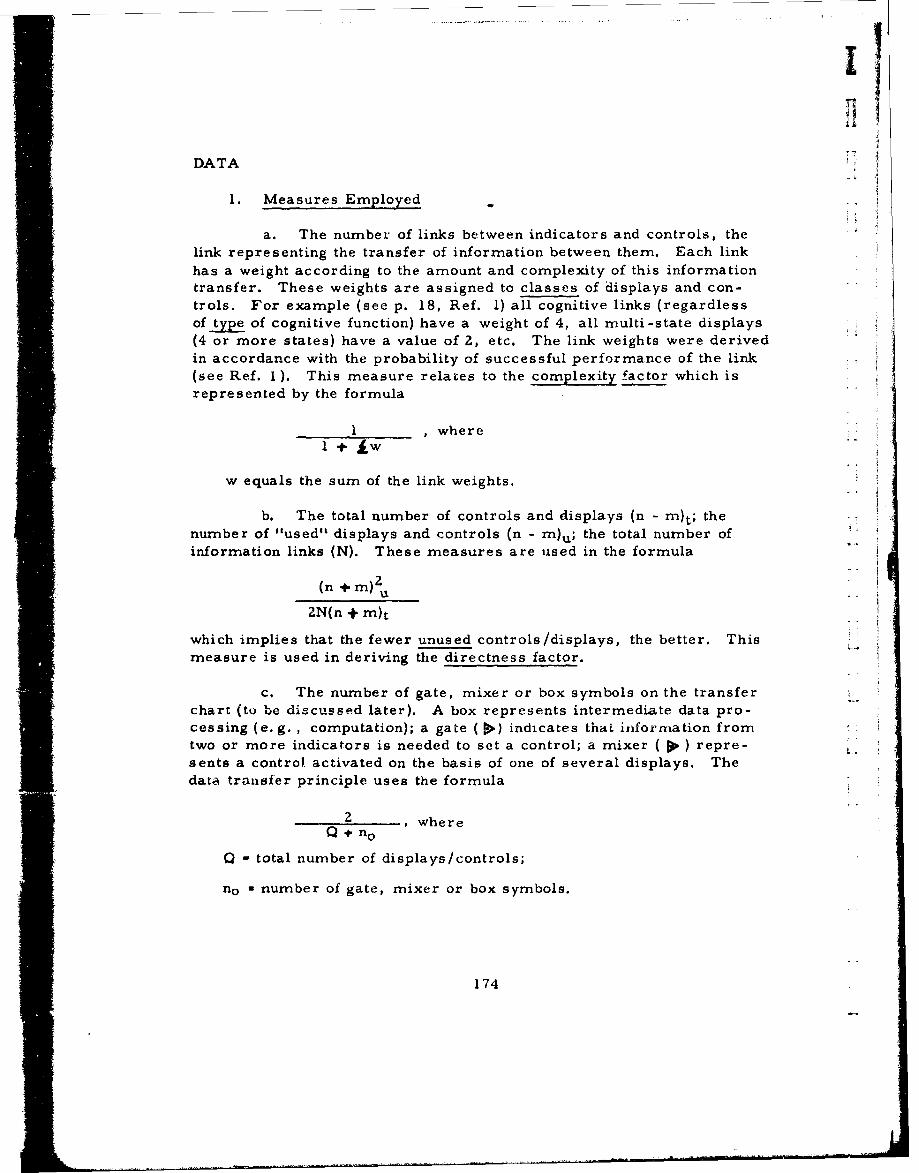
DATA
1.Measures Employed
a. The number of links between indicators and controls, thelink representing the transfer of information between them. Each linkhas a weight according to the amount and complexity of this informationtransfer. These weights are assigned to classes of displays and con-trols. For example (see p. 18, Ref. 1) all cognitive links (regardlessof type of cognitive function) have a weight of 4, all m-ulti~-state displays(4 or more states) have a value of 2, etc. The link weights were derivedin accordance with the probability of successful performance of the link(see Ref. I1). This measure relates to the complexity factor which isrepresented by the formula
I ,where
w equals the sum of the link weights.
b. The total number of controls and displays (n -m)t; thenumber of "used" displays and controls (n - m)u; the total number ofinformation links (N). These measures are used in the formula
(n + m) 2 *
ub
ZN(n + m)t
which implies that the fewer unused controls /displays, the better. Thismeasure is used in deriving the directness factor.
C. The number of gate, mixer or box symbols on the transferchart (to be discussed later). A box represents intermediate data pro-cessing (e.g. , computation); a gate ( )indicates thaL information fromtwo or more indicators is needed to set a control; a mixer ( jk ) repre-sents a control. activated on the basis of one of several displays. Thedat.A traiisfer principle uses the formula
Z where+ nI
Q-total number of displays /controls;
no number of gate, mixer or box symbols.
174
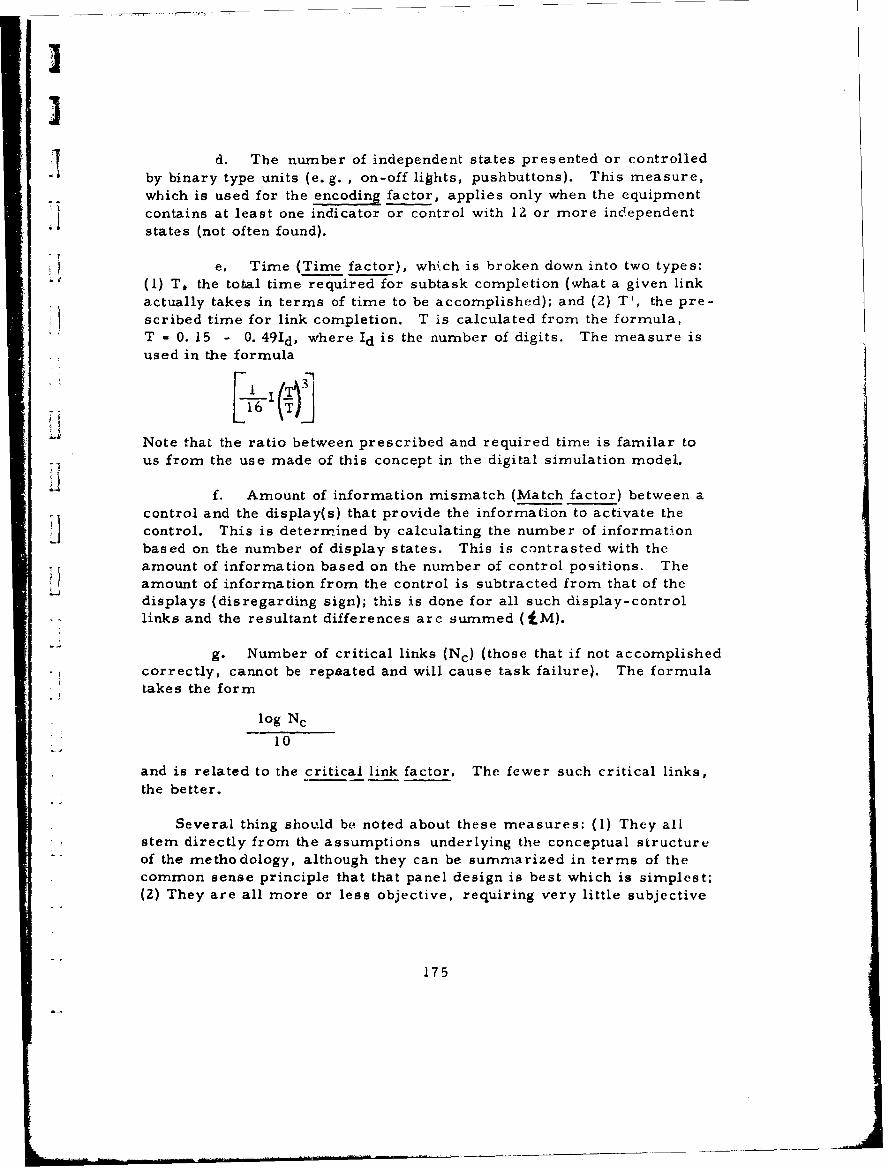
I
d. The number of independent states presented or controlled":1 by binary type units (e. g. , on-off lights, pushbuttons). This measure,
which is used for the encoding factor, applies only when the equipmentcontains at least one indicator or control with 12 or more independent
states (not often found).
"e. Time (Time factor), which is broken down into two types:(1) T, the total time required for subtask completion (what a given linkactually takes in terms of time to be accomplished); and (2) T', the pre-scribed time for link completion. T is calculated from the formula,"T - 0. 15 - 0. 4 9 1 d, where Id is the number of digits. The measure isused in the formula
Note that the ratio between prescribed and required time is familar to
us from the use made of this concept in the digital simulation model.
f. Amount of information mismatch (Match factor) between a
control and the display(s) that provide the information to activate theIi control. This is determined by calculating the number of informationbased on the number of display states. This is contrasted with theamount of information based on the number of control positions. Theamount of information from the control is subtracted from that of thedisplays (disregarding sign); this is done for all such display-controllinks and the resultant differences arc summed ('EM).
g. Number of critical links (Nc) (those that if not accomplishedcorrectly, cannot be repeated and will cause task failure). The formulatakes the form
log Nc
10
and is related to the critical link factor. The fewer such critical links,the better.
Several thing should be noted about these measures: (1) They allstem directly from the assumptions underlying the conceptual structureof the methodology, although they can be summarized in terms of thecommon sense principle that that panel design is best which is simplest;
(2) They are all more or less objective, requiring very little subjective
175
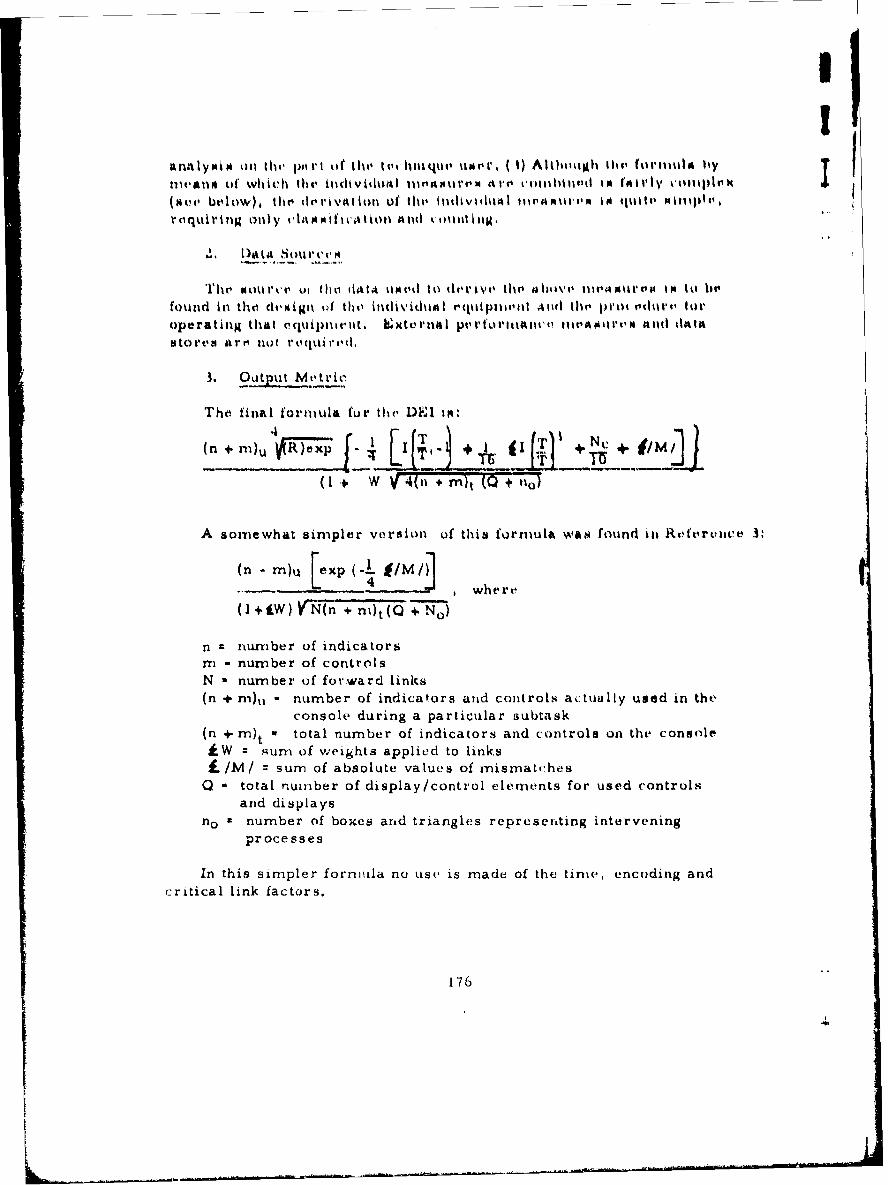
l I
I •n ly i• iton h,' p.t il f tI e III, ti h qull uIrirl (i AlthmiiO h Ihts, (orItuta itynM, anil l Of which the illdtivilotl 1 A1• t11r'" AI'r colli1hllot IM fl t N 11ly vI11i|lirk
(Piuet below), thlt dtiorv~tior of 110h ill~iV141%k~l mn11ANMMII1M 10 (pikkil P411111110.
roquiring only A'lMs~tu'Iton cAnd vmiutltu,
Tlhei Pu urce U1 010 (141A klit'd tO (eny;' theO ah1iV, 111A M" A I it) toohifound in the cliev in of til indiv iduMI r' qufp ilitit And tilt, p1'tl o dki rt fo 0
ope rating that clquiptitritt. Extornu~ per' o rtltiw.'ict, iVA N'I er' And 0,14 AMtor¢e, arm not t' eutiirid,
3. Output Metric
The final formula fur the DE1 im:
(+ nu ý_R)o~xp I T I :E l +N+Ij
(I W n4(n +m)t (0 7) 1T
A somewhat simpler version of this formula was found in Roefrui'e 3:
(n . m)U xple 4 M/1 ,where1 +l *W) -Nlr+n 0 mt (C) + No)-'
n numiber of indicatorsrn - number of controls
N * number of foraward links(n + r)u - number of indicators and controls actually used in the
console during a particular subtask
(n + m)t total number of indicators and controls on the console.W = ,•sum of weights applied to links
./M/ = sum of absolute values of mismatches
0 -total number of display/control elements for used controls
and displays
no m number of boxes and triangles representing intervening
processes
In this simpler formula no use is made of the time, encoding and
critical link factors.
176
II
t~ji~s~ ~''I1111i, 11 Irt I li I till lii'vo 11111ii~snn 161i % III hs'
* hPA IthP I'qiig |Otls I I nIttIpnt• , ii• n i•II ,,. •[t1 g11 n,' I sIllnliin ' •••I •II,
.1110 At•tl I an'I•ll n 1 ilh i l. I fill ,I, vI 11tin '1 ,'111'. 0' l'%11 tin
Tti i~ IVI vA inii, 1 ' it% t P1 114 ti 0 % I'l 10 tin ~ itn lit, 14 til Il l l Pts gjit, i I %to 11 11 Ill
w i, 011 ad ltl• r 114 Ar do "l l%• lil t,~d•m 1'.1 i ll l'• hh AISo lill III 4:1 lll sl~ l AI•
o It , 1 06I'I m I' It \0 1111l'nInt111' , 11 1"1 \ % ;1 in.lnln I' (1) , "M It v
V 0PM tit 0 I It l'~il ,,i t I. I m II II tI ki 11 ,'l t ,~ e i, 1 1 ,1, I ) \k 4 kI~ ~I;.' , n , 4 1'ln~
tilt" Mi w rigAlt t i iil ltli' 1%• FO III, I- tign T \\.l,' kiI I ts l1 n1 1111,01t,
hii tilhn' 'l wnovl" ilt , tl~nnit tiita I tIo t411ik,(irl kittite IVIIIM the tn hII11ti 1 i~d
.ni 'I'h 'oviu ,t mio rn l , ki of ki w:ledur it dh• d wn ItiellA i ¾inl 'ln'i llo onitf O'nili.
-, d~~ipl" y OP'vltlln 11ran hece t drlyIn ltbt uua za~ e :~ l
* ~PRO(UMMI)UUS I'01 MUI)F4 1. APPIACAT'ION
1, Anu~IV Ny-icM 1100S
A dotailedt tAuuik taitalI-si iii not retitt red for tio~ tttin' l inaqma Mlice-the transfora c hAr' wiivii n to A mnajo r steIp in i anpoito0m n~ing tht tt'icc iqtiquvAn be derived dire c tly f'unai lilt pa' uc edir f'e or optivnaliti n the e qumpmoint,T'he usual ope rating pruodturv iii dose rahod int torniini (it dirni ml control -
diaiplay actionsn and henace iii diructly triiiiian~ttabko inut a transfor ChArt.Of course, if the DEI wore to be appliod to a staittv of dtsign before An"operating procedure were availahle, it would he ntlcossary to po.nrformn adetailed task analysis, down to the suhta. (task vlen•e1it) level,
"ITo derivni the D41, fur any system, it is first ntecessar y to selectone or more representative tasks p1rforned.,. A tra-itser chart for eachtask is then propartd. The transfer chart protrays the display and con-trol elements and links them if they affec' each olhther. Analysis of thetransfer -char t providts the basin for obtaining" (p. 8, Ref. 1) the variousfactors. "ln preparing the transfer tChart, the display and control vlementsinvolved are first l1ited. Then the symbols for the displays are drawn
in a column near the ltft of the, chart, thei saymhols for the controls aredrawn in a coluni near th, right. For a particu!ar... chart, links art.drawn between each indicator and the control(s) which it affects... "(p. I1I Ref. I). Figure 8 presents a sample trdnsfer chart (taken from
177
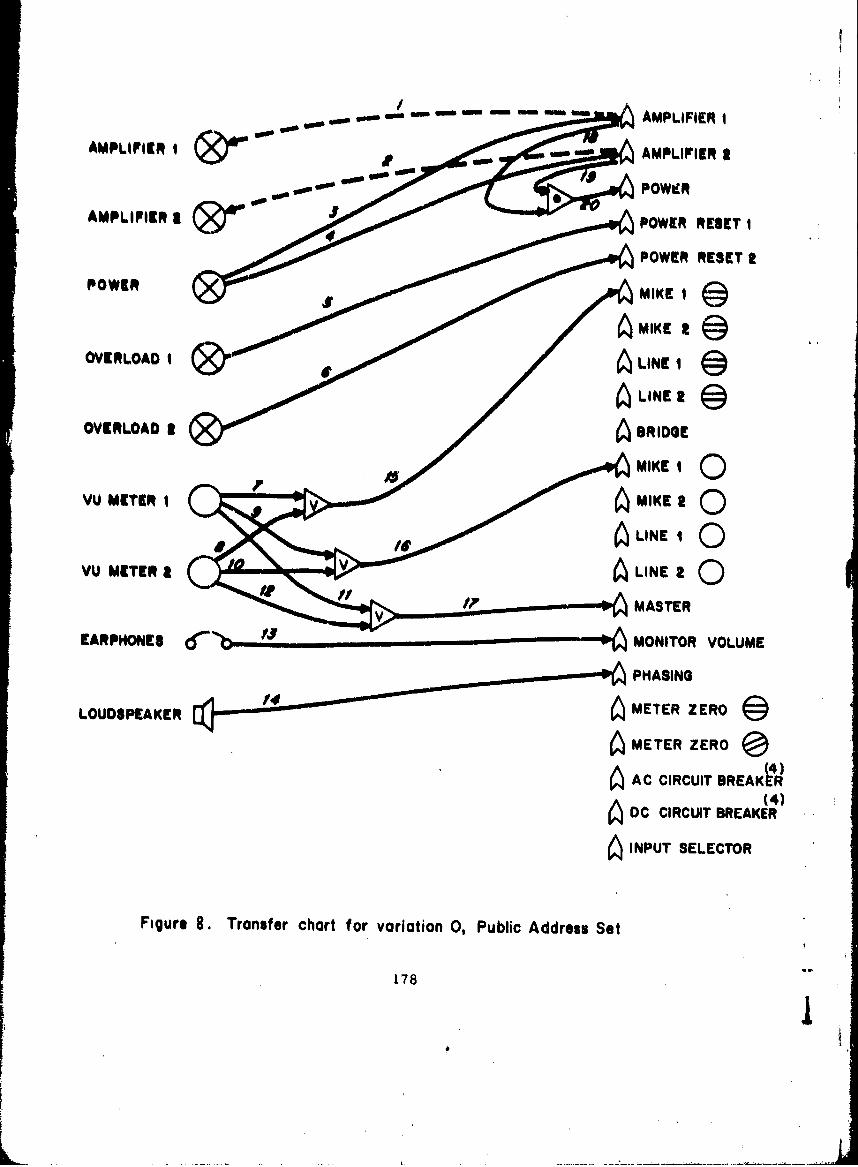
woo 0510AMPLIFIER I
600 00 wol g SOWPOWER
AMPLFIERa jPOWER RESET I
POWER RESET t
POWER MIKE I E
MIKE 2
OVERLOAD 1 LINE I
LINE t
OVERLOAD I3RIG
VU METER I MK
YU METER itLNa
PHASING
LOUDSPEAKER METER ZERO
~METER ZERO~
AC CIRCUIT BREAKWRA (4)
DC CIRCUIT BREAKER
SINPUT SELECTOR
Figure 8.Transfer chart for variation 0, Public Address Set
178
I!
Raf. 1). The, individual measures (described previously) are thenderived dirtictly from the transfer chart by counting and algebraic ma-nipulation of the data.
"~1,a The graphic presentation is thcrfore an essential part of the
tr•chnique, This aspect is similar to that of TEPPS and THERP, except"* jthat the latter produce graphics at a task level rather than at the DEI
,4ubtank li'vl; moreover, TEPPS/THERP graphics do not deal directlywith equipment details.
*4. Method, of Synithesis
These are inherent in the final DEI output metric and therefore neednot concern us here.
3. Data Application
The measures for the individual factors are applied to the individualcontrol-display link. The final output metric relates to the totality of
4 the controls/displays used in a particular operating task. Note that theDEI measure relates solely to the individual task; where system opera-tion involves several tasks, it is possible to derive a combined value forthe various tasks by determining the relative importance of each task,multiplying the DEI value for each task by its weight and adding theresultant values. For example, assume that the DEI values for tasks1, 2 and 3 are respectively . 005, . 004 and . 006. If task I has a rela-tive importance of . 5, task 2, . 2, and task 3, . 3 (summing to 1. 0, ofcourse), then the summed weighted DEI value is represented by
(.005)(. 5) + (. 004)(. 2) + (. 006)(. 3) .0051.
ANTICIPATED MODEL USES
1. Prediction of System Effectiven e,s
Since the technique does not output an estim-ate of performance"(either in probabilistic or other form), it cannot be used to predict theeffectiveness of either an entire system or of a control panel. H-ovever,the technique was not designed for this purpose.
179
2. Design Analysis
In previous reviews we identified thre.± aspects ci this analysis:
a. The comparison of alternative conf'gurations to select oneto be implemented;
b. The determinijation of redesign requirements where thesystem cannot satisfy system requirements;
C. Recommendations for initial design.
DEL was developed specifically to permit comparison of alternativeconfigurations and, judging from the validation data available, it does soquite well! One problem that may arise is knowing by how much one de-sign is superior to another. Since the absolute difference between twodesigns is not related to an absolute differencc in operator performance,it may be difficult to say whether a difference in D:E1 values is sufficientlygreat to warrant selection of the superior design. It stands to reason,however, that the larger the difference, the more significant the designdifferences would be, and the more compelling the rationale for selec-tion of the design with the higher DEL. Other cons ide ra tions, such ascost features (which the initial development of the technique attempted toincorporate, but later discarded) may negate a DEL recommendation,particularly if the DEL difference between two designs is not great.
The technique is not geared to indicate what changes should be madein a design to improve it, although one can use the principles on whichthe methodology is based to suggest redesign possibilities. If design Ais inferior to design B, examination of design A in terms of DEL conceptsmay suggest that improvements could be made by eliminating intermediatedata processing functions, reducing the number of unused displays, etc.
The technique does not pretend to provide any recommendations forinitial design.
3. Selection
Not applicable to this technique.
4. Training
An attempt is being made to apply to DEL to the derivation of train-ing requirements (see Ref. 3). While this effort is preliminary, initialindications are positive.
1801
v/I
VALIDATION /APIPLIGATION F I'UDIES
As we indicated in previous rcvi~ews, one can consider va~lidatiollin terms of either concepts (construct validity), cross-.validation withexternal criteria like experts' uidgrnents, or emipirical operator PC-.rforrnance. It has already bezenj nottvd that the conceptual structure onwhich DEI is based is quit-e. elegant. It is possible to cowsider DEIempirical validity i'i tcrmrs of
1. The ability of the vC zhnique to differentiate amrong alternativeconfigurations;
2. Gourelation. of DZiI vralueL for alternative configurations wiith
experts'I rankings of the humian engineering adequacy of thesc corfifgura-
tions;
3. Correlation of 1-1,0 valueF, for a~lternative configurations with*operator performance effe...-tilreness ohý the~.e conf:igurations.
All three of I.he refei ences nioted at die cor:&lusiou. of this reviewvdemonstrate DEI's ability to differr-it-ate a-niong altierziative conf:,girai -
tions and tasks. Reference 2 pro~vides a table (p. Z85) whi.:dL indicatesthat the technique is highl.y- sensit;`ve to task differe -,ei (wh~ich pres-im..
* ~~ably subsume equipment dffie~zerices as ~v..Rt~ferernce 3 is pairticular..ly interesting in this coavneý_tiui. because tho study was ?crforrrn2d byresearchers other than the deve'CFers (wh'.cl, wouid thus bolster thereliability of thE techniqiie). 11 Vhe DEJ \&as applied to four equipments andfour different s'Thtasks .-:m appce.red to dilfferertiiute these quite satisfac-torily. The only probler.i- encouritered wu, '"doteinoiw- tion of the num-berof states which controls, zancl in pairtirula:-. displays could dS'sume. .. Todeal with this problem a num-bev of con veint:tvýs were adopted. .. In gen..eral, however, applicatio.a oi The L)EI was srairahtfurwiird, Values could
* be obtained fairly quickly, reliability d~id n.ot appear to bo a p7voblem, acidthe index differentiated Fiib-taskt, anka decv'ces Thi T)EI posr ss !9 ddiagnostic value and was ir.1.0tive1y sAtisf'/i.-., vc.ryring iii a-cordance'.with subjective irripre 3iioris of cbt.T1sk *-Žiffit-ulf, - (P. 4t)-47, L-\ 4. 3).
Similar r-,-sults wei C aC1 Le.voo ir, corn-ar',g D)El rao!-.u-jLs ')f con-figurations ard experts' rarihir~gc of ý'ni samne c~oniiz,-raticna, "Thlevalidational st.id'es sugge-.ted that the techni-Uakit empirica liv correlatedin a strong posiltive -nionnebr. ,with dihe opixiiols Of accepted hzimanfactors authorities. ý' (p. 7?, Re(. 1*1
Thtu mithor 'l own pvofereiner for validation would be a measure -
ment of operattor performance~ on dvsign configurations (e. g. , controlpane.'s) ranked in accordance with Dl-.I evaluiations. Presumably opera.toraj mhould porforan more offic~iontly on configurations evaluated asbeing significantly superior in DEI terms. However, it im sometimesdiff cult to set~ up such a validation procedure and data on this kind ofvalld.ation for DE1 ýi ro not available.
Nonetheless , the validation studit-4 thitt havo boon performed of DElare qu.te impressive. Curtainly the evaluative capability of the tech-nique appears unquestionable.
Information concerning its actuial application to the human engineer-ing evaluation of control /display equipment is unfortunately not available.There would seem nio reason, other than perhaps the somewhat laboriouscalculations involved, why this methodology could not be very success-fully used in system development.
EVALUATION SUMMARY
Validity - Formal validation studies have been performed and showa reasonable degree of correspondence between DEI evaluations andother criteria of design adequacy.
Reliabilit1 - Controlled studies indicate that not only do varioususers get consistent results in applying the method, but that when thetechnique is applied to similar systems, consistent results are achieved.
Systenm DevelopmentApplicability
A. Comprehensiveness- Method is limited to display configurations(including related controls, of course).
B. Applicability: Method does not predict or measure operatorperformance, but does evraluate display configurations.
C. Timing: Can be applied at all system development stagesprovided a display configuration deiign is available.
18Z 5
II
Model Characteristics
A. Objectivity: Highly objective; few or no judgments required.
B. Structure: Highly organized and well defined.
REFERENCES
1. Siegel, A. I. , Miehh., W. and Federman, P. Information Transferin Display-Control Systems. IV. Summary Review of the DEI Tech-nique Fourth Quarterly Progress Report, Contract DA36-039-SC-
-: .87Z30, U. S. Army Signal Research and Development Laboratory,Ft. Monrnouth, N. J. , 1962.
2. Sieg,.l, A. I. , Miehle, W. and Federman, P. The DEI Techniquefor Evaluating Equipment Systems from the Information TransferPoint of View. Human Factors, 279-286, June 1964.
3. Wheaton, G. R. , Mirabella, A. and Farina, A. J. Trainee andInstructor Task Quantification: Development of Quantitative, Indicesand a Predictive Methodology. NAVTRADEVCEN 69-C-0278-1.,Naval Training Device Center, Orlando, Florida, January 1971.
183
!I/I
IX. THE PERSONNEL PERFORMANCE METRIC
INTRODUCTION
The methodology described in this section was developed byJ. S. Brady as part of an attmpt to evaluate the contribution of personnelperformance to the successful launch of the Atlas missile. As far as isknown, the technique was never applied and consequently never validated.It has, however, some intrinsic interest because of the problems itattempted to solve.
GOALS
Before describing the methodology in more detail, it must be notedthat it is purely an evaluational technique, not a predictive one. It isused to evaluate personnel performance effects in a system already builtand in process of being exercised (tested or operationally utilized). Con-
S~sequently it cannot be used to make any quantitative predictions of per-
sonnel performance. It is included among the methods reviewed in thisreport because evaluational methods are closely related to predictive ones,since, at the very least, they can supply data that might eventually beuseful in prediction.
ASSUMPTIONS
The general criterion for system performance contains two para-meters, quality and time. Since it is assumed that "the principal observ-able characteristic of the behavior leading to criterion performance isthe exchange of information between man-and-machine... and betweenman-and..man... the "quality" of this intermediate behavior is determinedby the efficiency of selection and utilization of the situational informationavailable in the system. This, in turn, is defined by the procedure...Deviation from procedure, therefore, is considered as error"t (p. Z, 4,Ref. 1).
The assumption above, rigidly applied, means that all deviationsfrom procedure are considered as errors, even when the deviation hasno significant effect on system performance and even represents animprovement in the manner of operating the system. Theoretically, if
the procedure has been correctly developed, no procedural step should
PRECEDING PAGE BLAK
185
be unimportant or non-required, and to a large extent this is true ofhighly automated systems, since the need for performance flexibility(implying alternative procedures) does not exist.
Nevertheless, the assumption that every procedural deviation re-presents an error is bothersome, since we are all aware that everyprocedure is not as crucial as every other procedure. Hence one mustaccount in aome way for those procedural deviations that are minor.As we shall see, Brady attempts to do just this. 'See also the distinctionbetween essential and non-essential tasks in Siegel's digital simulationmodel, which deals with the same problem.
METHODOLOGICAL SCOPE
Because the methodology was developed in the context of a missilesituation, its application appears to be restricted to those industrial andmilitary systems in which execution of the system function is largelyautomated, few degrees of freedom are allowed in personnel performance(e. g. , little decision-making because the situation is highly structured),and total or terminal system performance often cannot be observed orexercised. In such systems personnel functions are limited to "prepara-tion, initiation, selection, surveillance, correction, preventive main-tenance and repair. Hence evaluation of the contribution of personnelperformance must be referred to some derived measure of system per-formance, e. g. , amount of "out of commission" time, number of rejects,etc. " (p. 1, Ref. 1). Personnel actions are rigidly specified and error-defined as deviation from procedure- is intrinsically undesirable. Sincemany system operation- are automatic, "system performance must beinferred from fractional observation" (p. 1, Ref. I).
The kinds of systems possessing the above characteristics are thoseof power station and telephone operation, automated and semi-automatedfactories and early warning radar systems.
PARAMETERS'
The critical parameters in Brady's model are the errors that aremade and the way they are classified. There are four classes of err )rs:
(1) Terminal error- deviations (from procedure) resulting in lossof missile quality.
186
(2) Risk errors- deviations resulting in decreased "confidence"in missile quality, e. g,, omission or inadequate performanceof tests.
1 (3) Delay errors- delay in the performance of requisite actions.
(4) Residual errors- all other procedural deviations.
The first thing to note about the above classification scheme is thaterrors are categorized in terms of their consequent- s to the syrstem.
- ~ The reader will recognize that other models have also included perfor-mance a nsequences in their methods, e.g. , THERP's Fi, but haveseparated the occurrence of the errors, e.g. , their probability of"occurrence, from their effects. Ordinarily we distinguish betweenerrors that may have significant and insignificant effects on performance.Brady's formulation deliberately amalgamates these two continua; this is
A possible in his methodology because he explicitly rejects probability ofoccurrence as an output metric, leaving only the effect-factor.
One practical consequence of the error classification is that inorder iO categorize errors in terms," of their system effects one must
have a detailed knowledge of system operations and functions; and even"then the possibility of error in classifying actions in terms of systemeffects cannot be completely excluded.
"* Si Another thing to note is that the classification of these errors seems
to fall into an inherent scale of their own, in which terminal errors havethe most severe consequences and residual errors have the least severe
-e consequences. Although the developer does not clearly specify the .ela-tionship, terminal errors are presumably akin to catastrophic errors,those leading to abort or actual destruction of the system. "Risk errors"increase the probability of loss of quality. Delay errors may or maynot affect overall performance time, depending upon the occurrence ofmasking by other activities" (p. 4, Ref. 1).
.. One of the difficulties that derive from the Brady methodology isthat the definitions of the various error classes is not very clear cut interms of effect. Residual errors are defined by exception, but this doesnot answer the question whether they have or do nut have any effect onoverall system performance. If one could speak for the developer, he"would probably say that they do affect systenm performance, but sominimally that it may be impossible to discern that effect. Delay errors
187
T
presumably delay the mission, although the masking vffect (somethingwhich also is not clearly defined) may obsc'ure the delay. However, thedefinition of risk errors is quite te'nuous, since any effect they haveappears to be highly conditional on other mission activities.
What Brady appears to be suggesting is that every risk or everyresidual or every delay error has precisely the same effect as any otherrisk, residual or delay error. As we shall see later, this assiumptionposes difficulties for us when the individual classes of error are com-bined to evaluate personnel efficiency.
DATA
1. Input Data
Input data for the personnel performance metric are the performanceevents that the evaluator has observed or measured. Any externally im-posed data bank is irrelevant, since the basis of the evaluation is theperformance of the system itself.
2. Data Sources
The only data source required is measurement apparatus applied tothe system.
3. Output Data
Brady considers the idea of determining the probabilitias of thevarious kinds of errors but rejects the concept because of practicaldifficulties. This is especially so in the case of risk errors which are,as pointed out, highly conditional.
The kinds of problems one finds in the missile launch and missile- LJ
launch-related situations determine the kind of metric which was finallyadopted. The problems can be summarized as follows:
"a. Only a portion of total system performance can be observedat one time.
b. Performance must satisfy several criteria- speed, quality andadherence to procedures.
z188
II
erro' r, ,atch (lt' which t,,l itf, (1tt,-r ntly to th. cuiteri't.
d. Raw tiniv' data contains, pc i , ;o s wvhich are not ate'. t,,d by per-
sonnel piornfolnce.
Therefore, any in ;iSuPe' which is, dt'-rivwd from su.ch datir:
a. Musit bt. additive to pt, rnail .t't:taaulation of fractioial observa.
tions.
b. Must bear a detrniinatt, r, lation to the perfornmance criterion.
c. Must ptermit comparison betwet-n perfornanc es of differentcomposition, preferably all performances should be scalablein a single dimension,
d. Must be selective, i. v. , miust score only relevant performance.Finally, the measure must be s•nsitive enough to discriminatebetween performances of varying degrees of quality,
In sum, the measurement requirements suggest a commonadditive metric which bears a determinate relationshi to missionperformance. (p. 10, Ref. 1)
The reader should note from the above that another criterion ofsystem performance has been added- adherence to procedures. In gen-eral, adherence to procedures is not considered part of system perfor-mance criteria (at least in other models), but rather as a means ofachieving those criteria. The inclusion of adherence as a criterion forsuccessful system performance restricts the technique to those systemsi In which rigid procedurAl adhe,',, is required. Sys no, iii which pro-cedures A,, £fuxible could be evaluated by this technique uniy withdifficulty.
A number of possible ways exist to express the kind of metric Brady
I desires:
(I) Use of a metric exprossina.g the probability of mission success,Salready rejected as being economit ally unfeasible.
(2) Abandon a common metric and express time and error separately.However it becomes impossible to c-umpare two systems or missionswhich differ in terms of more than one measure.
II 189
(3) Define unsuccessful performance as occupying infinite time.That is, if a terminal error is made (i. e. , one leading to missile de-struct or abort), the time to successful completion of the operator'stask is considered to be infinite. However, infinite time cannot becombined with more finite times for missiles that are successfullylaunched.
(4) Utilize a normative approach to time and errors, the resultingmetric being the mean of the standard scores of time and error s. Thisis the approach taken,
(Note that the concern for terminal error presents a continuing .
problem for Brady. Such errors produce a distortion in the normaldistribution of times to launch and therefore have to be treated sepa-rately, as we shall see.
The model output supplies a centile score expressing the mean per-formance of personnel for the system under comparison. The centilevalue provides a score which is translatable into a relative measure ofquality.
PROCEDURES FOR MODEL APPLICATION
1. Analytic Method
In contrast to other methods, no formal or informal task analysisis required, since the formal operating procedure defines what an erroris (but not the type of error), A task analysis may have been employedin the development of the operating procedure, but once that procedurehas been formalized, no further task analysis is required.
Rathera different type of analysis is needed, an error analysis,which focusses on the potential effect of the ervor. (We say "potential"because if the error effects actually occur, e. g. , destruction of the
missile, no error analysis is needed, since the effect is self-defining. IThis error self-definition applies of course only when the effect is suf-ficiently critical to be discernable or inferrable from physical changesin the system, which mey sometimes be difficult.)
In any event, the error analysis involves considerable system know-ledge and exploration and inevitably a considerable amount of judgment
iiJ J190
----- ----
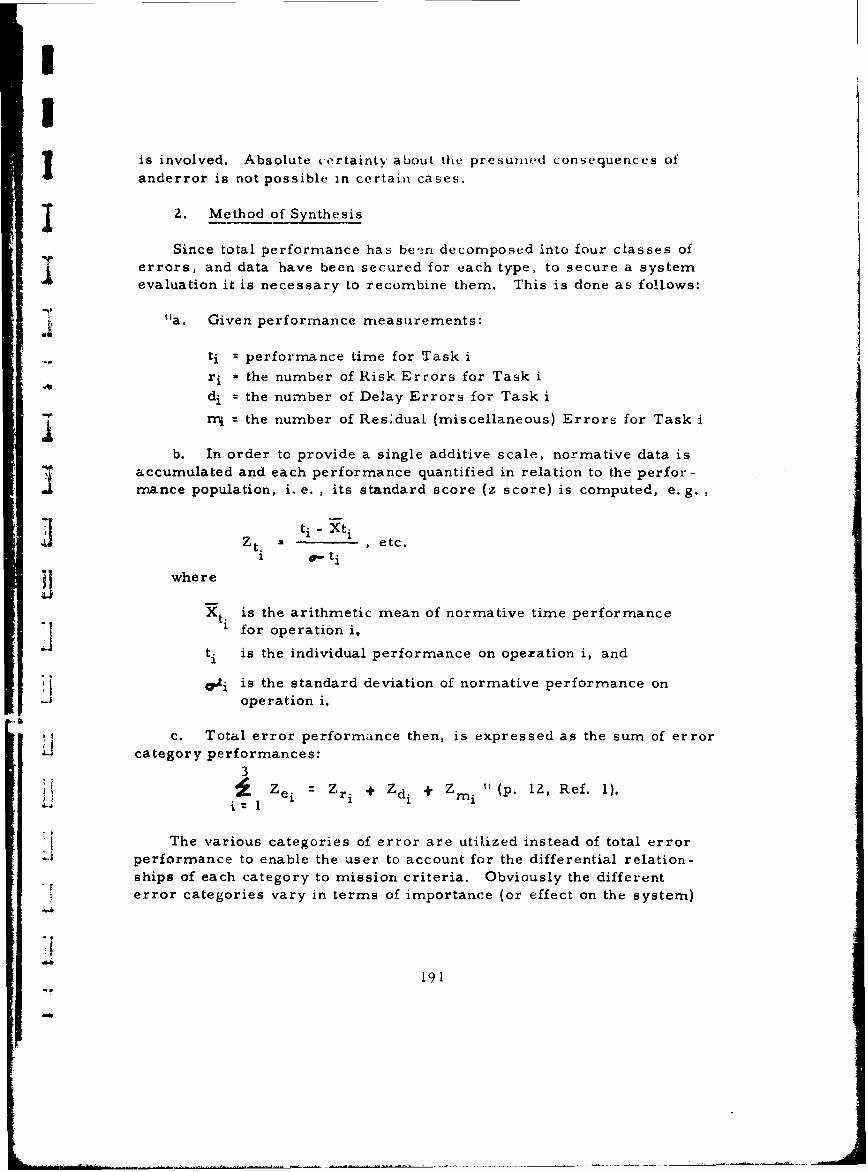
UI
is involved. Absolute certainty about the presuned consequences ofanderror is not possible in certain cases.
2. Method of Synthesis
Since total performance has benri decomposed into four classes oferrors, and data have been secured for each type, to secure a systemevaluation it is necessary to recombine them. This is done as follows:
"t"a. Given performance measurements:
ti = performance time for Task i
ri - the number of Risk Errors for Task idi = the number of Delay Errors for Task i
rnij = the number of Residual (miscellaneous) Errors for Task i
b. In order to provide a single additive scale, normative data isaccumulated and each performance quantified in relation to the perfor-rnance population, i. e. , its standard score (z score) is computed, e. g.
ti- 1 1 etc.t, $ ti
where
Xti is the arithmetic mean of normative time performance
1 for operation i,
ti is the individual performance on opezation i, and
0Ai is the standard deviation of normative performance on-J operation i.
, c. Total error performance then, is expressed as the sum of errorL-, category performances:
3Zei = Zri Zd+ Zmi (p. 12, Ref. 1).
The various categories of error are utilized instead of total errorperformance to enable the user to account for the differential relation-ships of each category to mission criteria. Obviously the differenterror categories vary in terms of importance (or effect on the system)
191
so that it is necessary to keep them separate and to weight them inaccordance with that importance. Consequently Brady defines
aZri + bZdi + cZmiSe . aI a + b + c
where Zel is the mean weighted errol performance measure and a, b
and c are weights.
One of the difficulties with this formulation, which the developerrecognizes, is the derivation of the weights. "In the absence of a rigor-
our analytical basis for establishing weights, any differential weighting
must be purely arbitrary" (p.. 13, Ref. 1). It should be possible, how-ever, to use a scale of tbh sort eiTrployed by Pickrel/McDonald to re-
present the presumed seriousness of the error class.
However, we have failed to deal with terminal errors. We can
include terminal errors if we assume that a terminal error concludesthe operation and hence can be replaced with the standard score valueof the time spent up until the error was made. "The ti'gree to which
error commission affects the mission criteria is expressed in perfor-mance time" (pp. 13-14,, Ref. 1).
Zti (the standard score for performance time on task i) is combinedwith 7-, in accordance with the following formula:
dZt.i + ZeiZE.i- d e 1 where
d represents an arbitrary weighting value.
The assumption that one can utili.ze the standard performance timescore for an operation in place of numnLer of terminal errors makes thisauthor somewhat uneasy.
Summing over the various operations for which a personnel perfor-mance value is desired, we get
n i IZEi
ZE" n
which expresses the mean performance of personnel for the system underconsideration.
192
UU
For cunv,,nionce in interpretation, thte dis Iribution of Z a is trans-formed to have a mean of 80, a standard de'viation Of 10, and to he highfor good performance, i. ', E a SO- 10,
I Table 9 shows how E varies as a function of error and tinme pe,,for-mances. The values of E are based on the following normative data.J Equal category weightings were used.
Mean S.1).Risk errors 5 1Delay errors 20 5Residual errors 50 10
I Time 30 5
Centile equivalents of E-scores are given from a normal distribution.I The validity of this practice is, as the developer points out, open to some
question because of the probable 4-form of the time distribution.
The measure ultimately derived is an additive one which is appro-priate because the sum of all errors can be considered equivalent toperformance. However, the determination of the appropriate weightingfactors for each type is quite obscure; in that sense it would appear thatthe model is not fully articulated. It is possible however, that a differentset of weighting factors would be required for different systems.IANTICIPATED MODEL USES
As pointed out previously, the method is purely evaluative; it doesnot predict. However, it is conceivable that the evaluation of one sys-3tem could suggest the anticipated performance of a comparison system.
The, method supplies no information relative to design, since it doesnot include design considerations in its data. The same applies to man-power selection and training.
•1 - However, the method does output an absolute measure of the adequacyof personnel performance, and presumably if a low centile score wereachieved, this would stimulate some examination of the characteristicsof the system. However, the model would not necessarily point to anyspecific aspects requiring corrective action. Note that the methodSsupplies an output for personnel performance only; hence it is not a
193
I
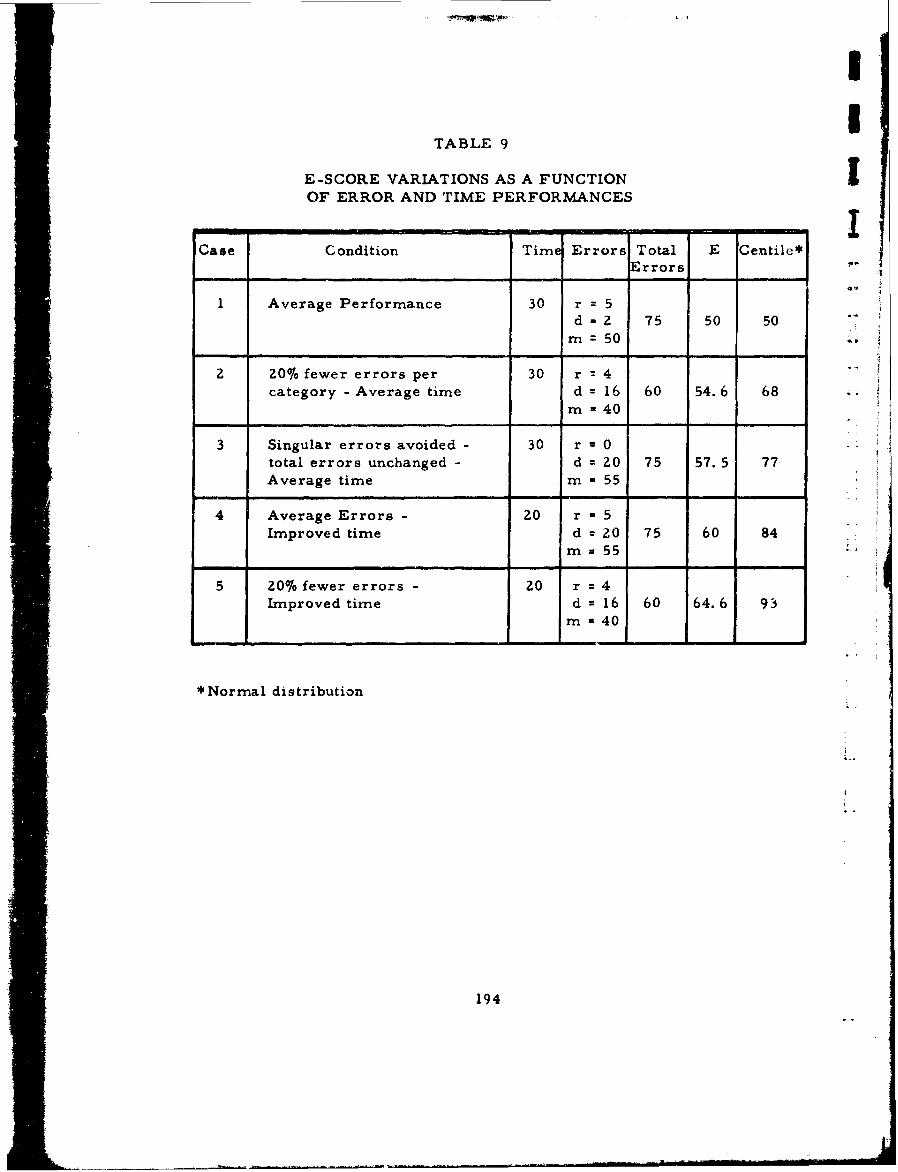
zI
ITTABLE 9
E-SCORE VARIATIONS AS A FUNCTIONOF ERROR AND TIME PERFORMANCES
Case Condition Time Errors Total E Centiic*"Errors
1 Average Performance 30 r 5d 2 75 50 50
m =50
2 20% fewer errors per 30 r : 4category - Average time d = 16 60 54.6 68
m 40
3 Singular errors avoided - 30 r x 0total errors unchanged - d = Z0 75 57. 5 77Average time m = 55
4 Average Errors- 20 r - 5Improved time d = 20 75 60 84
m a 55
5 20% fewer errors - 20 r = 4Improved time d = 16 60 64.6 93
m - 40
* Normal distribution
194
UU
"true" system measure. Because E assumes a normalized distribu-tion, it is questionable whether it could be combined with an equipmentreliability value which assumes some other type of distribution.
VALIDATION/APPLICATION STUDIES
I None.
In summary, the method is of interest primarily because it presentsa somewhat different way of attacking system measurement problems.The use of a normative score based solely on error frequency and timewould be highly attractive because it eliminates the necessity for databenks, etc. , but only if certain of the problems discussed previouslycould be overcome.
There are a number of limitations on the technique:
"The necessity to infer total performance from fractional observa-tions raises the question of sampling the population of crew tasks.A representative rather than a random sample is required to assumethat specific tasks whose over-all importance to the mission and/or
high frequency of occurrence are included in the sample. ]urther,
a. The tasks selected should adequately sample the repertoire of"skills and knowledges of the crew members.
"I b. The samples should ';xercise each crew member on tasics of
differing difficulty.
c. The tasks selected should requi ,g of participation byeach crew member that is representatic of his participation inthe total task pcpulation.
d. The work sample should b,! of such a char;,( ter that the end* product of performance can be evaluated." (p. 17, Ref. 1)
Another problem that must be considered is that when the sample issmall or highly routinized, the opportunity to r take errors will be quite
I limited. Consequently the distributions will b( severely truncated. Thesam", holds for performance times. Since the incerpretation of E on
-. population (centile) grounds is impossible without using the probability
19 5
I-1
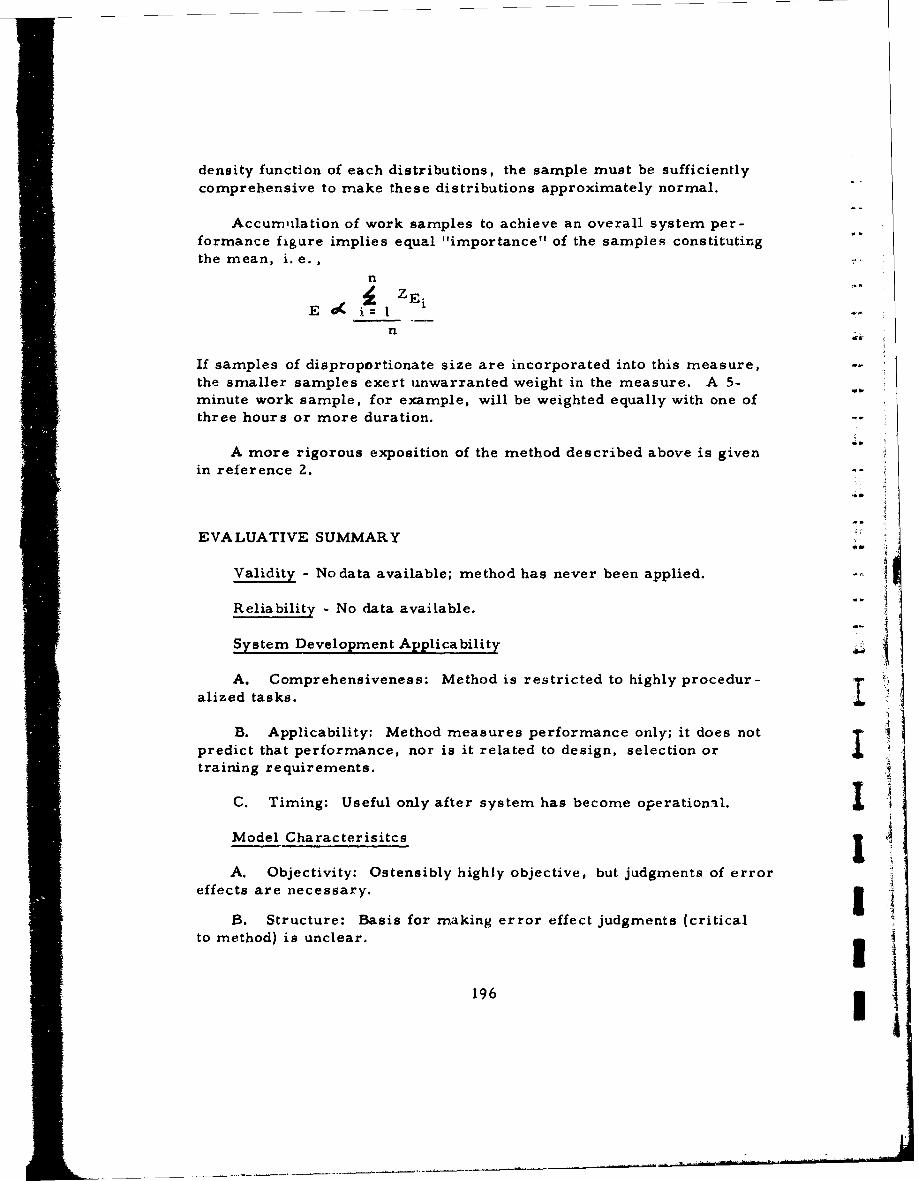
density function of each distributions, the sample must be sufficientlycomprehensive to make these distributions approximately normal.
Accumnilation of work samples to achieve an overall system per-formance figure implies equal "importance" of the samples constitutingthe mean, i. e.,
n ZEiE~ ~
n
If samples of disproportionate size are incorporated into this measure, --
the smaller samples exert unwarranted weight in the measure. A 5-minute work sample, for example, will be weighted equally with one ofthree hours or more duration.
A more rigorous exposition of the method described above is givenin reference 2.
EVALUATIVE SUMMARY
Validity - No data available; method has never been applied.
Reliability - No data available.
System Development Applicability
A. Comprehensiveness: Method is restricted to highly procedur-
alized tasks.
B. Applicability: Method measures performance only; it does notpredict that performance, nor is it related to design, selection ortraining requirements.
C. Timing: Useful only after system has become operational.
Model Characterisitcs
A. Objectivity: Ostensibly highly objective, but judgments of erroreffects are necessary. I
B. Structure: Basis for making error effect judgments (criticalto method) is unclear.
196
II
I
REFERENCES
1. Brady, J. S. and Daily, A. Evaluation of Personnel Performancein Complex Systems. Report GM 6300. 5-1431, ACPLL-TM-60-1,Space Technology -Laboratories, Inc. , Los Angeles, California,"26 April 1961.
2. Brady, J. S. Application of a Personnel Performance Metric.In Majesty, M. S. , Personnel Subsystem Reliability. H. Q. Ballis-
tic Systems Division, USAF, 17 May 1962.
1
.1
I I
:115.
1
IX. C;'ITICA I, HUMAN AlNt')lOtMANC;:l1 AND) l•,VA I4UATION
I 'I~OtIlKAM (C(-HIMN I)
INTRODUCTrION
The mnodol| dlwwta tiipel be•low makes %imp oi( wtit aIthI �'l itvol t1,tt'1pI a-?. it hurmviat pe ,frnrrita i t'e, dit'sttmtt (a lthotu.!th tidivtdtiatl y they atre faintt iar
tu hImman fattorn spwoialiatu); thi umo or i t('eklhtmwt •nd ratings AN a stags,in the p•redi'tivo protess and th" Appliultitut of 4nalyuim 4t Va I' lanc"
"} (ANOVA) leochnitites to d"velop the tornnlthal reliability pl'dtlictinu. 1T1100"c'oncepts apre the roasons why the techniqueo ia dsscribed tit this iepurt,min•e the methodology itaelf is ill defined and rotlotci significant deoft -lent tel.
The methodology hik three phkaoss:
1. a. Analysis of the system,b. Establifhing the rating manualgc. utbifyhing the rating manual,
11. a. The actual rating (evaluation);b. Establishing performance criticality,c. Performing the overall systems criticality analysis,
111. Documentation, maintenance and follow-up phatse.
GOALS
"The objeclives of the applied CHJPAE methodology art- to:
a. Establish a criticality rank related to human porformance.
3b. Predict personnel nffectivity or probability of humAn inducedfailure....
c. Identify and eliminate sources of potential critical human inducedfailures.
I d. Estimate required check redundanny for most probable succLoss.
e. Evaluate designs from a humnan factors or man-cornpatabilitypoint of view.
3 ECEDING PAGE BLAN
3 199
Wt, Arv'i takmiIAr Wit Ah most tit thlise (I)Octivoo f ~Irom pro vitous yrr'N'lo~Wf't kilocl-1l m. OnV ,1'. roilwltl A%(dtliona is lbs 0111,10 HPImont of gloa I it.tori ''oplitimmu" 11mlism r"t'a b~tly (WvhAtovo'r (1mmim mu~t this cot~ntext is*ktpimmosd it) o tami). Th' author (M. A. ltikrousi) tolls us thAt "tho~ toch -
mIkot Voroativ id' Atiu tiSpplicablo to a riyotuot, *Obaystoni, Ovafl1,Actvityty or tA sk, Tho SovAiIatioIn or' rtigAII mlaminO cm~ai ho tailor -miado' . *
(P. 117, Hut. 1)ý "It 11N a VAIOI A vatbl toold for' valkiating vritival
hunmati P" rforA'unc o, portforming humani or ro' analysia , evaluating stya
mininrig training requirunlento Andl sivaikating human oporational roquire -
mosnta, , '(p. lit. Rut, I) IT1hs' atiutho hIAN had OCCAs4iOl it) 1the past to noto the tendonvy of smo.e
model doveloperis to characteriiae their tochniquois as being applivablo totht, entire, ratnge of human factors problemm. Thero appears to bo aprossing natid on their part to Pstablish A territorial clairn, a sort of"territorial imperAtive". Such clirai ma ke it difficult for thisu reviewer(and for modvi umirm in Renoral) to dotormino what the model is actuallysu~itatble for; it alsio generates A certitin degroe of ukepticism (warrantedor not) about theme excaggerations.
ASSUMPTIONS
"Tht. asstumptions of the CHPAE methodology are:
A. Ideal potential human input iritt-racting with ideal machine and/or ienvironmental conditions facilitatte tht, least probability of humnan errorand the highest reliability.
b. Conversely, the worst pussiblit human potential input with theworst possible machine and/or environmnental conditions propagate thegreatest probability of human error and the least reliability for success"(p. 117, Ref. 1).
1440
II
No one could l)Ussibly dimallg1ro with tho ANsNuin•IltitIu ah41v0 , 111tur'they o re u ind trlying the haiet l'onvopti of Iotm11u1 •?•trp1, Bovop'a lei iftheir gener allty, howvor, they throw very lit11, light oti aoit1 of tlh1'wvry crampie x procoassn iwivolvotl iu the, iit•oI•iolod y, For PxA1mphlr, tiltraling protoas in the heart of the tIehniqu,,, Thr,. 'k wul|timtw i11volvedin the selection of the (factors to bo rated and the Aummuvtitttons involvedin the rating proovea Itself ar1 oot enuuniated, Wt have had o•-visionto note previously that sonm model developers igunore thie ifed to clarifytheir assumptionts, which makes it diffitnult to evaluate the tdoquircy ofthe model structure.
METHODOLOOICA L SCOPE
If the reader rfefor back to the goals of the model, it becomomaI apparent that the developer claims universality in terms of the systems,tasks and behaviors to which the methodology can be applied, One mightbe skeptical about this claim if it were not for the fact that almost every-thing can be rated, From that standpoint, if the methodology turns outto be valid, it would appear to be much more flexible than the other
S3 methods reviewed in this report.
iI PARAMETERS
"Development of the evaluation manual (the rating device) is precededby project exploratory systems or task analysis. The purpose of the ex-ploratory analysis is to select representative critical factors which beatrepresent the man/rr.achine and/or man/environment interfaces... Thecritical factors elected to be employed. ... are the factors which providethe optimum evaluation of the system.., and have the highest correlationwith prediction of potential human error. "1 (p. 118, Ref. 1).
11 Typical candidate factors include motivation, personnel qualifications,auditory threshold criticality, visual demands, mechanical indicators,ease of maintenance, biological factors, physical demands, communica-tions, test equipment and tools, work pressure, engineering changeerrors.
Note that such factors encompass the totality of the elements of asystem and the influences operating upon these elemnents. They rangeJ from molecular equipment. characteristics to rather gross personnel
201
qA litiP1. Obvtoumly each ta.tor (particularly thoso of a molar nature)ii1%lt ho dis tnd in ti rma of the olwomonts making up tho factor,
A more pIreo Nitlg i'oblem ha in No ulimi tpon which the analyst willseloect the factorn to be considurod. This basis can be entirely subjOec-tivo, in trneis of estimating tho potential influeknce, of the factor onl,' nor - pmductto, or, as the devoloper indicates, by "correlation withpr'dichtion of potential hiuman error". If the latter suggests some sortof statistical technique, the technique i: not included in the modeldescription. Alternatively. one could ignore the need to make a factoriselection and attermpt to rate all factors; this would, however, requirevry conaidrAblo offor: on the part )f the analyst.
If one is Allowed to second gue.s the developer, the likelihood isthat the ielection will bs made on very subjective bases. The inferredassumption is that the fictors not selected will be those having a minimalimpact on human performance; therefore, their elimination will not sub-stantially affect the final reliability prediction.
DATA
1. Input Data
Despite the fact thAt ratings are involved, considerable input data,are needed. The deve-oper states "Following definition of the factors...data of known probabilties are slotted in their proper or estimated levelin the defined rating scale. The slotted known or experimental proba-bilities in the rating scales are referred to as "inference marks"... Theslotting of inference daita of known or validated task probabilities is acontinuous updating ef:ort. .. " (pp, I)8-i 19, Red. 1),
Where these data are setured is not at all specified. Presumablyit will con-i from the same sources used by othvr inodels reviewed. The
input data consist of probabilities associated with fairly general tasks(not subtasks). For example, "read and identify simple electrical ormechanical instrumentation", saimple vak c-hocks, simple operationalchecks, install complex subassemblis, highly complex instrumentationreadings, highly complex troubleshooting", etc. The probabilitiesassociated with these tasks are apparently used to establish a weightingin terms of points (see Figure 9).
-e
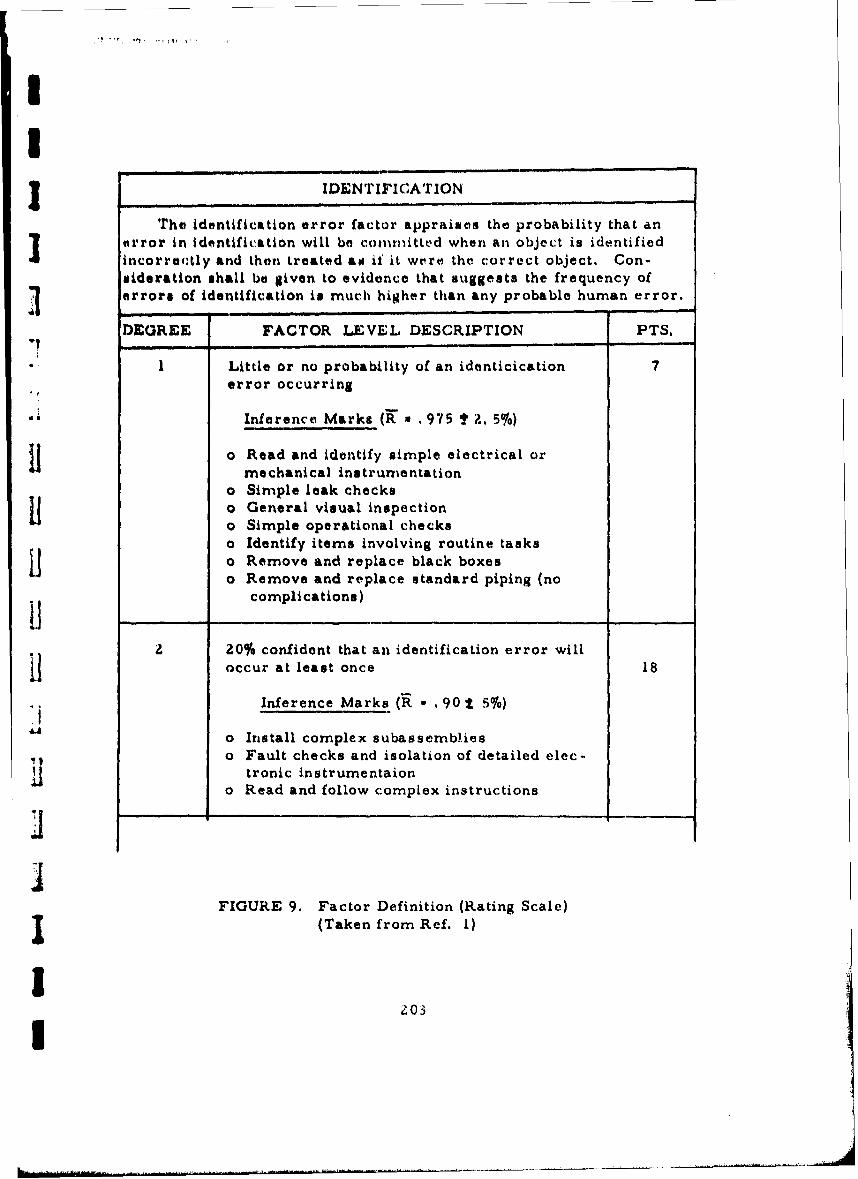
IU3 IDENTIFICATION
The identification error factor appraises the probability that anerror in identification will be co mmitted when an object is identifiedincorrectly and then treated aw it' it wore the correct object. Con-sideration shall be given to evidence that suggests the frequency ofI errors of identification is much higher than any probable human error.
DEGREE FACTOR LEVEL, DESCRIPTION PTS.
1 Little or no probability of an identicication 7error occurring
Inference Marks (R a .975 I Z. 5%)
So Read and identify simple electrical ormechanical instrumentation
o Simple leak checkso General visual inspectiono Simple operational checkso Identify items involving routine taskso Remove and replace black boxeso Remove and replace standard piping (no
complications)
z 20% confident that an identification error willoccur at least once 18
"Inference Marks (R * .90t 5%0)
o Install complex subassembJies
o Fault checks and isolation of detailed elec-tronic instrumentaion
o Read and follow complex instructions
FIGURE 9. Factor Definition (Rating Scale)I (Taken from Ref. I)
I203I
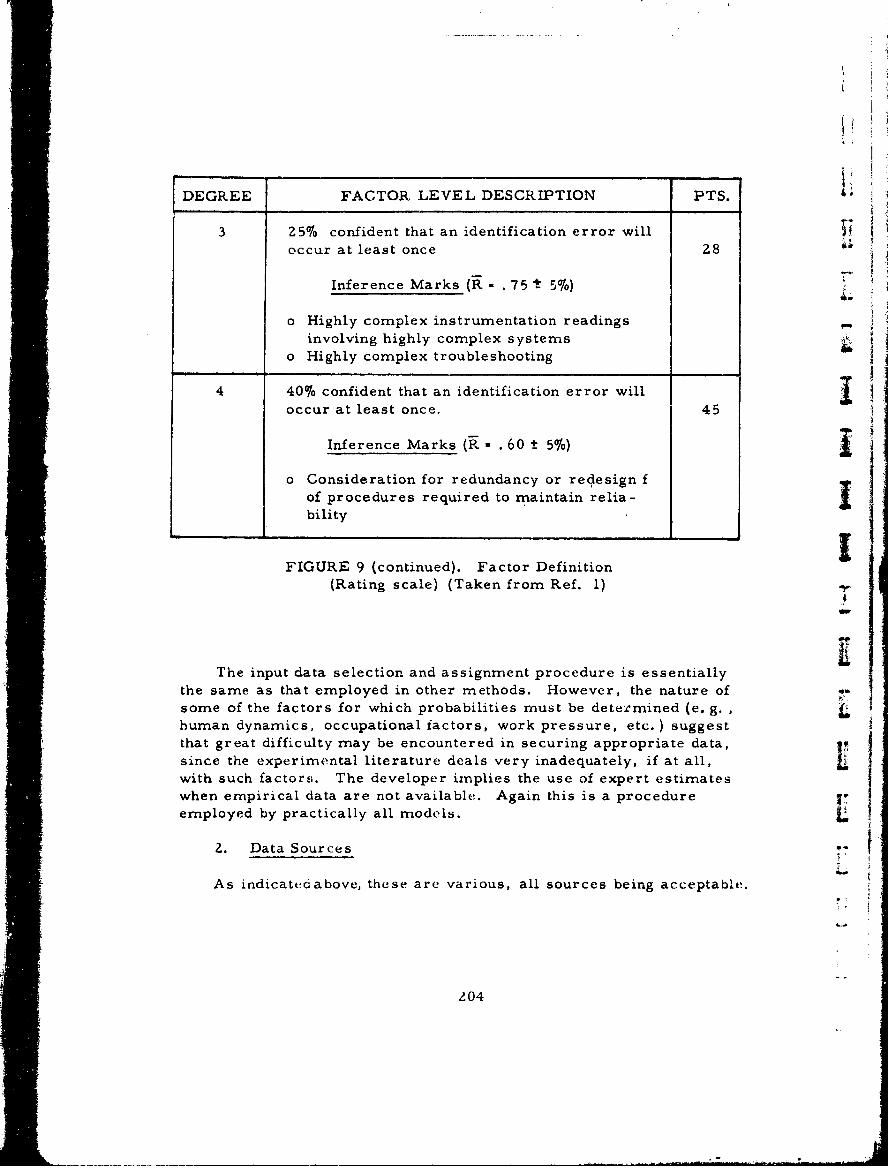
I i I
! I
DEGREE FACTOR, LEVEL DESCRIPTION PTS.
3 25% confident that an identification error willoccur at least once Z8
Inference Marks (R .75 5%)
"o Highly complex instrumentation readingsinvolving highly complex systems
.o Highly complex troubleshooting
4 40% confident that an identification error willoccur at least once. 45
Inference Marks (R17,. 60 t 5%)
o Consideration for redundancy or redesign fof procedures required to maintain relia-bility
FIGURE 9 (continued). Factor Definition(Rating scale) (Taken from Ref. 1)
V
The input data selection and assignment procedure is essentially
the same as that employed in other methods. However, the nature ofsome of the factors for which probabilities must be determined (e. g. ,
human dynamics, occupational factors, work pressure, etc.) suggestthat great difficulty may be encountered in securing appropriate data,since the experimental literature deals very inadequately, if at all,with such factors. The developer implies the use of expert estimateswhen empirical data are not available. Again this is a procedureemployed by practically all models.
Z. Data Sources ;"
As indicatedabove, these are various, all sources being acceptable.
"204
II
1 3. Output Data
Because the output measures derived from this methodology aresomewhat unfamiliar, it would be best to combine their considerationwith a description of the procedures for applying the model.
IPROCEDURES FOR MODEL APPLICATION
3 1. Analytic Method
"As the developer indicates, the basic analytic method is taska analysis. He provides no description, however, of what is involved in
that task analysis, although it is obvious that certain unspecified pro-cesses are implied by the need to select the factors to be evaluated. In
addition, some sort of analysis is required to differentiate the variousfactor degrees and the points allotted to each factor degree.
I Once the critical factors are selected and defined verbally, a ratingmust be assigned to each factor. "The rating scale is by the degree oferror confidence or probable error related to the degree of difficulty"
(p. 118, Ref. 1). Presumably one of the elements in the task analysisis a determination of degree of task difficulty, but no definition of whatdifficulty means is supplied, nor is there any sample rating scale. As
the developer suggested previously, the rating scales may be "tailor-made" to their application, which is fine but provides no guidance to theJ user who may wish to make use of this methodology.
"Values apportioned to the factors are based on the criteria ofoptimum prediction for criticality ranking. The preliminary values areslotted, known or estimated task probabilities.
"After validation of the preliminary manual, the final proportionateI value weightings assigned to the factors are dependent on their correla-tion and contribution or ability to predict a valid critical rank. This canbe accomplished by multiple or correlation coefficients in conjunctionwith trial re-runs of the sample validation procedure, until the ratingmanual is calibrated to provide a valid critical rank" (p. 119, Ref. 1).
The author must confess that much of this procedure is difficultfor him to understand. He interprets the procedure as follows. Factors1 are selected and defined. A rating scale is developed for each factor
II 205
(see Figure 9) which is based on empirical or estimated task probabil-Iities (of successful completion or error likelihood, but which it is im-possible to determine). The intervals on the rating scale (degrees) aregiven a numerical weighting (points). The analyst examines each systemfactor and assignes a point value based on how the factor correspondsto each degree. In other words, harking back to Figure 9, if the taskinvolves reading simple electrical instrumentation, he assigns a valueof 7 points to the factor (identification) involved in that task. Any taskmay have several factors, each of which is assigned its appropriatevalue.
Presumably the validity of the rating scales is assured by runningsimulator or other tests and measuring operator performance on the -*,task. That operator performance is transformed into actual task pro-babilities and the original assigned probabilities are compared with theactual ones, to be revised in accordance with actual performance. Thisis the only interpretation one can make of a validation process, unlessthe model developer implies that validation is a comparison with otherexperimental data in the literature. However, if actual performancevalidation of the rating scales is required, one questions the necessityfor securing probability estimates from the literature. Moreover, thevalidation process would be a very strenuous effort.
Once the ratings are secured (from the validated scales) the ratingvalues are included in a 2 way classification or split matrix as shown inFigure 10. This matrix displays tasks against factors. It is this matrix("computerized as a 12 x 100 combined matrix with a subroutined splitmatrix 5 x 100 for the man affecting factors and 7 x 100 split matrix forthe machine/environmental factors" (p. 119-120, Ref. 1) which is thesource material for the variance analysis described below.
2. Method of Synthesis
The variance analysis model is represented as follows:
i 1. 2. 3.....r (r)Y .j u ai + -j eij
j 1. 2. 3 ..... c
where
Y ij The rating in the ith task row and the jth factor column.
i206
= = =6
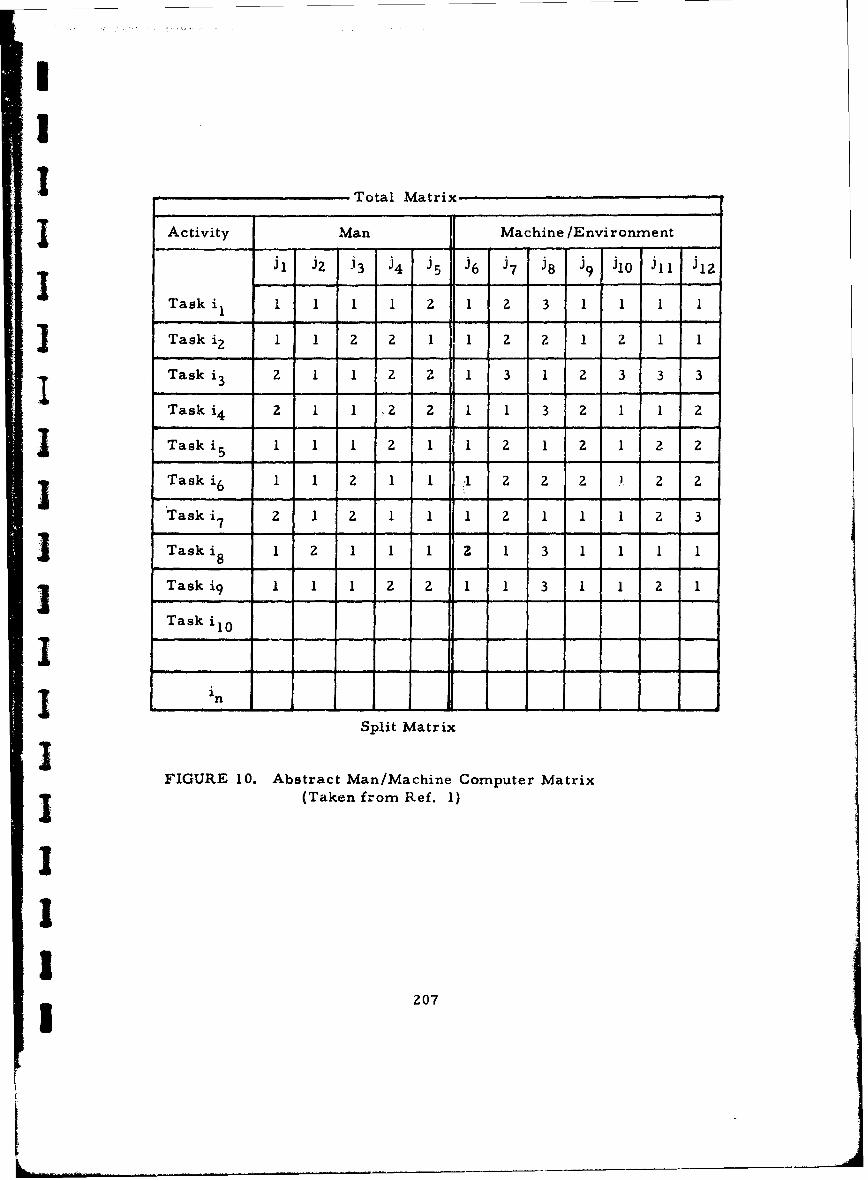
II
________Total Matrix
I Activity Man Machine/EnvironmentJl J2 j3 j4 j5 46 j7 j8 J9 Jl0 ill J12
Task i1 1 1 1 2 1 2 3 1 1 1 1
Task i2 I 1 2 2 1 1 2 1 z I 1
Task i3 2 1 1 2 2 1 3 1 2 3 3 3ITask i 4 2 1 1 12 2 1 1 3 2 1 1 2
STask i5 1 1 1 2 1 1 2 1 2 1 2 2
Task i6 1 1 2 1 1 1 2 2 2 1 2 2
Task i 2 1 2 1 1 1 2 1 1 1 2 3'T s 7 212 1 1 1 1 1 1 2
3 Task i8 1 2 1 1 1 2 1 3 1 1 1 1
Task i9 1 1 1 2 2 1 1 3 1 1 2 1
Tas ik o
ini
Split Matrix3FIGURE 10. Abstract Man/Machine Computer Matrix
(Taken from Ref. 1)
2IIi 207
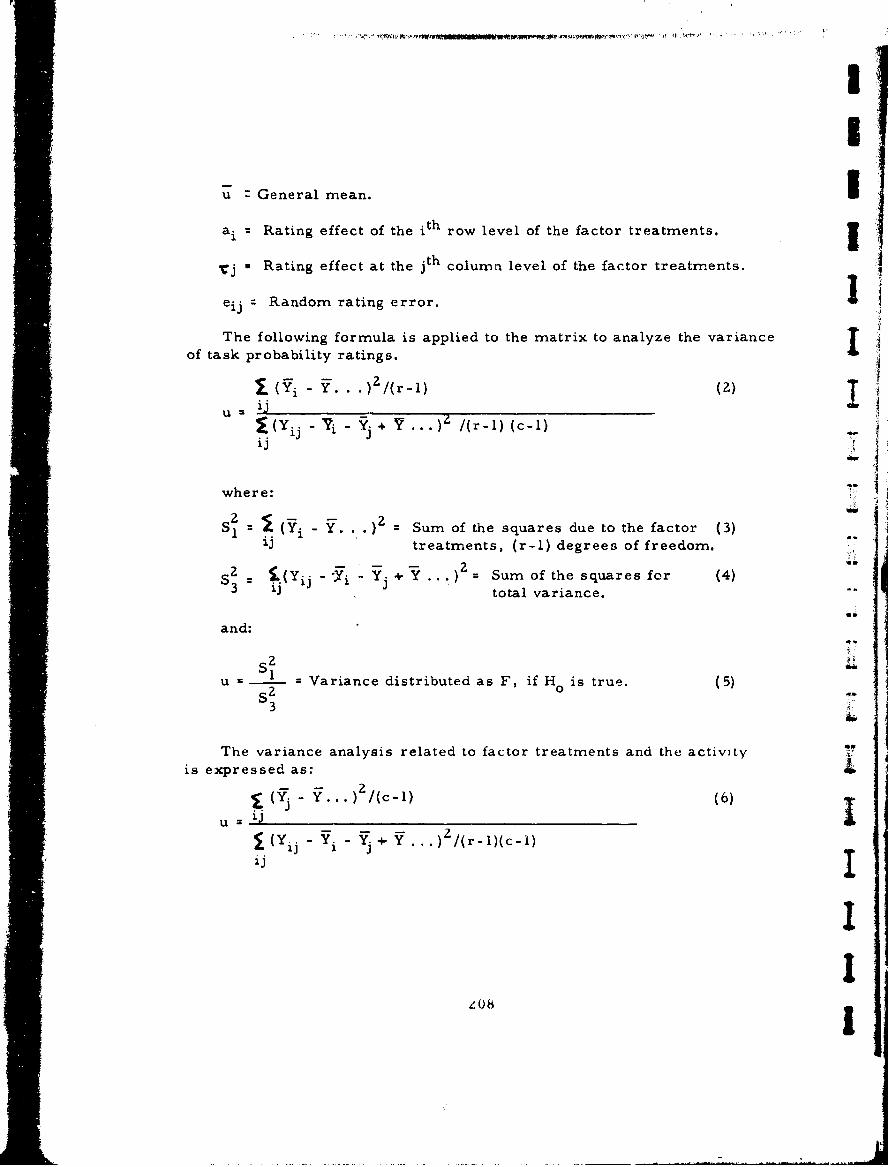
u General mean.I
ai Rating effect of the ith row level of the factor treatments.j
*C Rating effect at the jth column level of the factor treatments.
eij Random rating error.
The following formula is applied to the matrix to analyze the variance Iof task probability ratings.
i(2)
U Zu iii
-Yi -YT 3 Yi . ) /(r-1) (c-1)
where:
(Y .a2 o Sum of the squares due to the factor (3)13 treatments, (r-1) degrees of freedom.
IS 3j =R in e a + t Sum of the squares for (4)t:s
. I 0
3 3
S~The volaoiance anamlysis rela ied to fator mtreatmet andlz the activitym• of taisk epresedabiiys. ins
. 2
- (Yi Y . . /(r -1) (6)
=• u = (Y - Vi distr.ibte as F, i
is hepressed asz ( i- 2m. )
u, = . = Sum of the squares due to the factor (3)________
i-
LS0 II
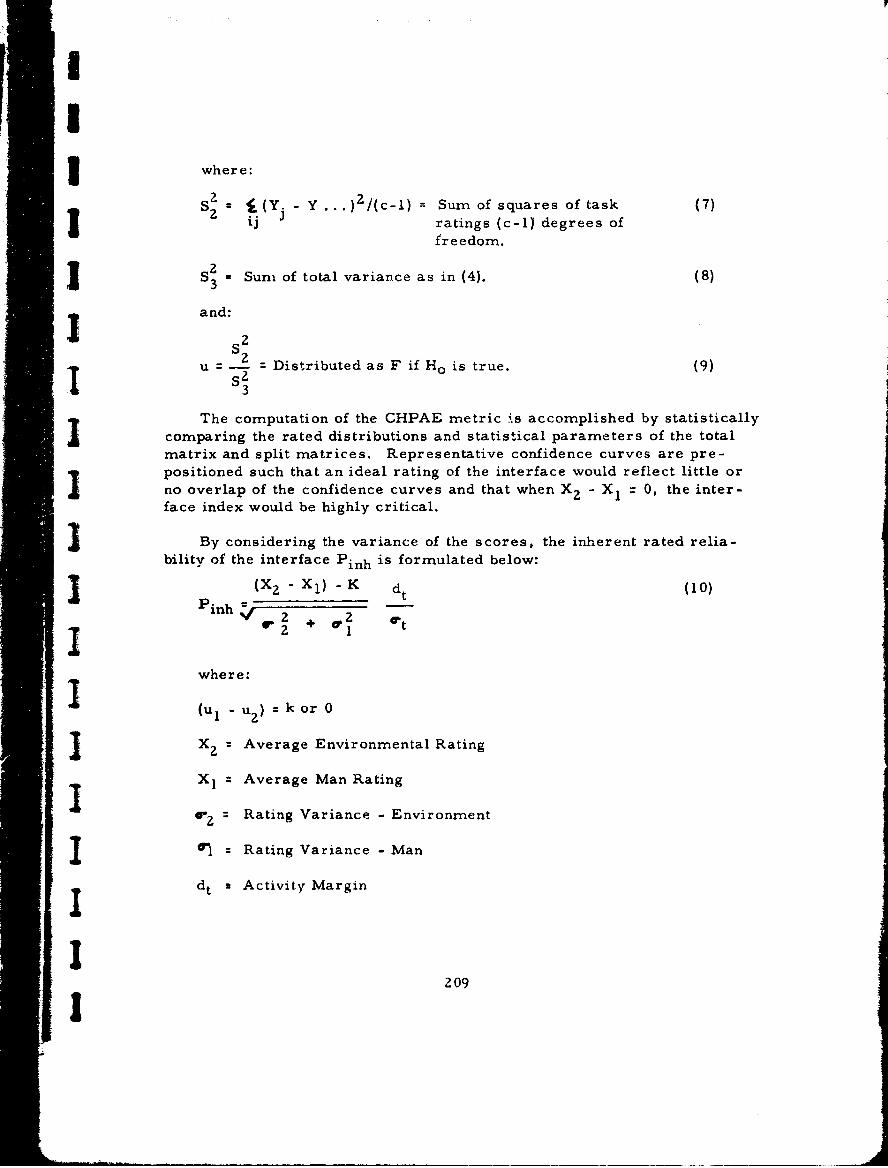
"3 Iwhere:
2-- =iSz - (Y - Y .. ) 2 /(c-1) Sum of squares of task (7)
_ 2 ij ratings (c-i) degrees of
f-reedom.
2I -S = Sum of total variance as in (4). (8)
and:
SD i d F H t
S2S ]u --• Distributed as F if Ho is true. (9)
The computation of the CHPAE metric is accomplished by statistically,, comparing the rated distributions and statistical parameters of the total
matrix and split matrices. Representative confidence curves are pre-positioned such that an ideal rating of the interface would reflect little orno overlap of the confidence curves and that when Xz - X 0, the inter-face index would be highly critical.
i iBy considering the variance of the scores, the inherent rated relia-bility of the interface Pinh is formulated below:
3-nh (Xz - x 1 ) - K dt (10)I II•Bll inh ,/ -
where:
(u_ U )=kor 0
3 X(2= Average Environmental Rating
X,: Average Man Rating
4r? :Rating Variance - Environment
I Rating Variance - Man
dt Activity Margin
2209I
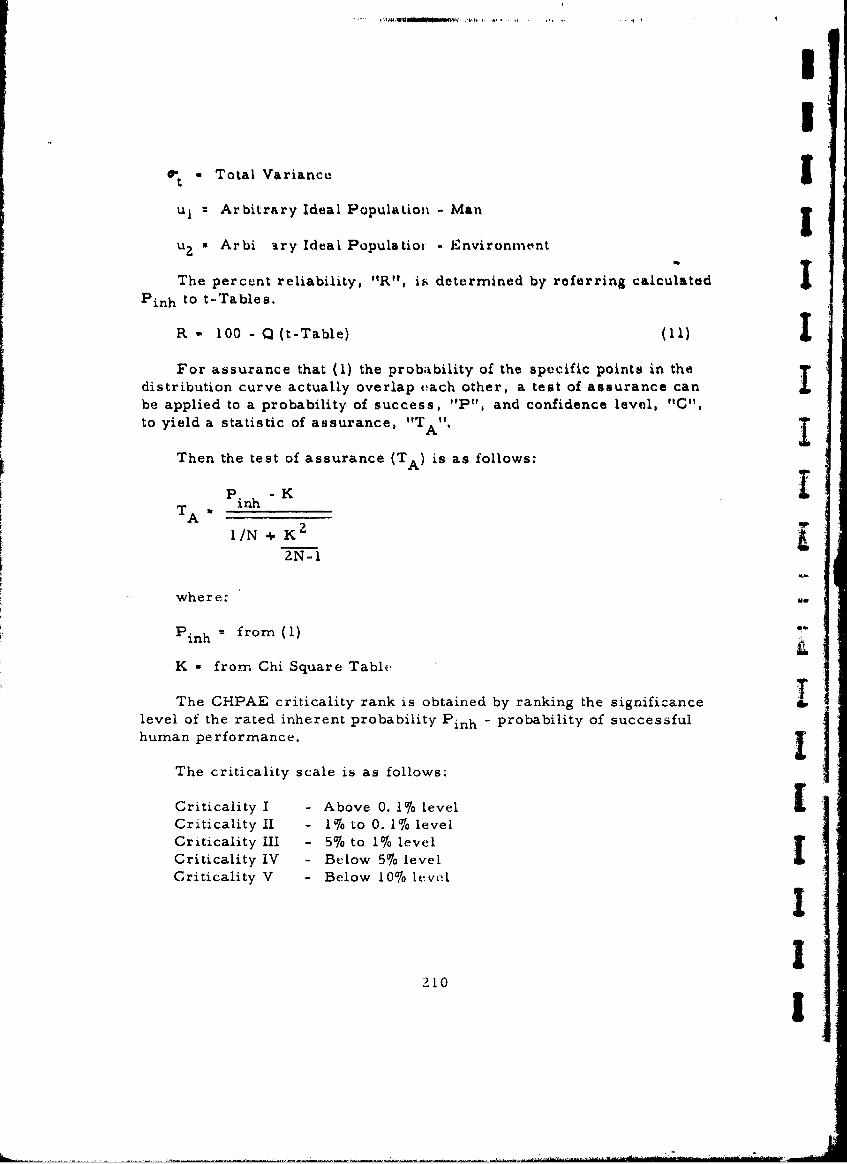
St a Total Varianco Iul = Arbitrary Ideal Population - Man Iu2 a Arbi ary Ideal Populatiot - Environment
The percent reliability, "R'", is determined by referring calculated
Pinh to t-Tables.
R - 100 - Q (t-Table) (11) IFor assurance that (1) the probability of the specific points in the
distribution curve actually overlap each other, a test of assurance canbe applied to a probability of success, "P", and confidence level, "C",to yield a statistic of assurance, "TA". I1
Then the test of assurance (TA) is as follows:
T inhTA - ____
1/N + K2
ZN-I
where:
Pinh from (1)
K - from Chi Square Table
The CHPAE criticality rank is obtained by ranking the significance !level of the rated inherent probability Pinh - probability of successfulhuman performance.
The criticality scale is as follows:
Criticality I - Above 0. lo level [Criticality II - 10% to 0. 11% levelCriticality III - 5% to 11o levelCriticality IV - Below 576 levelCriticality V - Below 10%0 level
II210 I
II
I 3. Output Dat_
The outputs of the methodology are, than, a reliability (R z 1O0-Q),a confidence level (TA), and a set of criticality ratings based on thesignificance level of Pinh, Presumably those subsystems with highcriticality levels are candidates for redesign.
3 ANTICIPATED MODEL USES
The potential model uses we are concerned with are:
(1) Prediction of system effectiveness;(2) Comparison of alternative configurations;(3) Suggestions for redesign;(4) Suggestions for manpower selection and training,
IIWith regard to the prediction of system effectiveness, it is some-what unclear whether the model outputs such an estimate. The term"percent reliability" (R) may or may not be equivalent to the reliabilitymetric employed by the other models reviewed, which can be definedin terms of probability of task completion or error likelihood. Assuming,however, that the metric is logically related to human performance, themodel will predict that performance and thus can be considered a pre-dictive tool.
j As far as design analysis is concerned, the methodology appears tolend itself to a comparison of alternative configurations. R can bedetermined for these configurations and can then be compared.
We see the methodology as having even more potential for designdiagnosis. Since the predicted effectiveness value is based directly onequipment/system characteristics, a low R. or a high subsystem criti-cality rating can be related directly to the design feature which producedthose values.
To the extent that one can validly rate manpower and traing factors,a low R or high subsy.3tem criticality rating which resulted from thesefactors can be related directly to the responsible factors. One does notknow, of course, what dimensions the manpower/training factors wouldpossess (presumably this would be left to the discretion of the modeluser who would be required to make up his own rating manuals).
SI21
1 211
Theoretically &it analysis of the rating scales for those factor-dimensionsshould suggest what aptitudes perasonnol should be selected for, what andhow much training they should be given, etc.
This is tho particular utility of the rating scale methodology: that if
it works (in the tiense of providing 'valid ratings that can be transformedinto meaningful evaluations) it will supply a substantial amount of diag-
nostic information which other models mnight have difficulty supplying.Since the rating is directly applied to thl factor of interest, it will be
highly sensitive to the dimensions on which the factor is defined.
The "catch" of course is that rating scales and ratings are not knownfor providing very valid data because of the subjectivity inherent in thetechnique.
VALIDATION/APPLICATION STUDIES
None reported or known. In consequence the methodology can beconsidered only theoretical.
EVALUATIVE SUMMARY
Validity - No data available. Based on the model description (which
is admittedly'quite vague), there is reason to question the validity thatcould be achieved. The high degree of subjectivity inherent in ratings,and the complexity'of the factors to be rated are not conducive to con-
fidence in the technique. Nonetheless, the concept of making use offactor ratings is an attractive one. The notion of evaluating the adequacy .Wof the man-machine interface in terms pf a significant discrepancy be- Ltween the, separate (split) ratings of the man and of the machine is also
an interesting one. The assumption here is, one suspects, that when asignificant difference in adequacy between these two subsystems is found, Ihuman performance can be anticipated to be poor. Data relative to thevalidity of this assumption is lacking, but it seems to be a reasonable
one.
Reliability - No data available. The degree of reliability to be
anticipated in factor ratings cannot be estimated because of idiosyncracies Kinherent in any rating.
iI
212 I
II
I ystem Development Applicability
i A. Comprehcnsivonese: Very great.
B. Applicability: Can be employed for multiple purposes.
3 C. Timing: Can be applied to systems at all stages of dchvlopnent.
Model Characteristics
A. Objectivity: Highly subjective.
B. Structure: As presently described, very poorly defined.
I3 REFERENCES
1. Barone, M. A. A Methodology to Analyze and Evaluate Critical HumanPerformance. 5th Reliability and Maintainability Conference, 18-20July 1966, New York, N. Y., 116-122.
2
II
II
2.13I
B. OPRAILT PRDCTO MODELS~~' ~ '
IIrrI
I
• B. OPERABILITY PREDICTION MODELS
SIMULATION METHODS
L mc o ACE BLAN.
L
L
I. DIGITAL SIMULATION TECHNIQUE
j (THE SIEGEL 1-2 MAN MODEL)
II INTRODUCTION
In this section, we will consider only the models developed byDr. Arthur Siegel and his co-workers. There are three such models:(1) the 1-2 man model; (2) the 4-20 man model; (3) the 20-99 man model.Of these three models, we shall concentrate only on the first. Thereare three reasons for doing so: (a) the basic model concepts and metho-dology are exemplified in the 1-2 man model, and therefore will serveas an introduction to the larger models, although Siegel indicates (personalcommunication) that "the latter consider different variables, possessdifferent internal constructs, and provide different outputs"; (b) the twolarger models encompass many psychosocial variables which may be ofsomewhat less interest to system developers; (c) a more practical reason:the two larger models are so elaborate that it would require a documentthe size of a book to discuss them fully. (A book, Ref. 6, has alreadybeen written. ) We shall refer from time to time to these larger models,but only to compare them with the original.
We ought perhaps to begin by noting that until this point in the dis-cussion we have been dealing not with full-fledged models, but ratherwith techniques which model man-machine processes only partially. Theauthor defines a model in the Chapanis (Ref. 2) sense of a physical orsymbolic representation of how the man-machine process functions andhumans perform in the machine environment.
The probability branching tree in THERP and the GSSM in TEPPSare such representations, but these are only parts of techniques whose
HJ operations as a whole do not describe processes. The Siegel models aretrue models, since they simulate how the system being predicted functions;the essence of the models' predictive capability is the adequacy with whichthis simulation/representation .iq conducted.
Another thing that should be said about the digital simulation tech-niques is that they are dynamic, whereas the techniques we have consid-ered previously are static. For the preceding techniques only a singleprobability /time value (or a mean and standard deviation) can be appliedto the behavioral unit being predicted. In the digital simulation models,the computer samples from a distribution of values to derive the valueapplied at any one time to the behavioral unit. Moreover, it is the
jt PRECEDIN PEAG217I
interaction of model parameters during the course of the simulationwhich determines that sampling process. This interaction feature is
far less evident in the non-simulation models.
Before proceeding to a detailed description of the Siegel model, itshould be pointed out that the author does not intend to go into the detailsof the computer program used for this model. 'We accept the program-Ming techniques used as given and merely look at them (when we do) interms of their implications for inputs, outputs, data requirements, etc.We will examine the basic assumptions underlying relationships amongparameters, but once these are accepted, it seems reasonable to assumethat the manner in which they are included in the computer can be accept- Ted as being correct.
The best capsule description of the 1-2 man model is given by Siegelhimself in Reference 5 (page 557): "The model is used with a high-speed,general purpose digital computer. The system designer... makes ananalysis of the man-machine system and the task under consideration.The performance of each operator is arranged into ordered, discrete jiactions called "subtasks," and for each of these certain source data arecompiled. These data, together with selected parameter values (e. g. ,
the time allotted for task performance), are put on punched cards and Uintroduced into the digital computer... The computer sequentially simu-lated, according to the rules of the model, the "performance" of each ,subtask by each operator... A simulation is completed when the opera-tors either use all allotted time or successfully complete the task.... results are recorded indicating the areas of operator overload, 7failure, idle time, peak stress, etc. , for the given set of selected para- Umeters. Repetitions of the simulation, with different parameter values,yield a range of records .... If the results indicate modifications to thedesign of the system (are desirable), new designs may be similarlytested to determine the extent of improvements brought about by themodifications."
GOALS
The purpose of the 1-2 man model (described in Refs. 4 and 5) is toserve as a tool for system designers during the design stage and to in- IFdicate where the system (once -onceptualized or formulated) may over orunderload one or two operators. Because the model requires fairly mole-cular inputs (relating to something called a "subtask" which, from Table it"I in Reference 5, is at the task elemnient level), it is less likely that it
218 1
II
I would be used during the preliminary development of a system. Wesay "less likely"; this is not a bar to the use of the model in predesignplanning, provided the designer can conceptually elaborate his plans to
represent a full fledged system. 1
On the other hand, assuming that the system concept has been
elaborated, as would be required to exercise the model, the latter canbe used to indicate (1) whether or not a given system design will performto a desired level of effectiveness or to what extent; (Z) where it doesnot, to indicate those stages of the system mission where the operatoris not working efficiently (i. e. , is over or under loaded); (3) to comparealternative system designs to determine which is best. The specific
questions which the 1-2 man model should answer are:
(1) Can an average operator be expected to complete all requiredtasks successfully within time T (required) for a given procedure and agiven design ?
( (2) How does success probability change with faster/slower opera-tors and longer/shorter time periods?
(3) Where is the operator over or under loaded? (Note: Theoperator is overloaded if he cannot finish in time T; he is underloadedwhen he finishes much more quickly than the time requirement actually
requires. Siegel notes that the model has recently been modified to allowstress to be a function of intermediate goals as well as the total time re-
] quirement.)
(4) What is the frequency distribution of failures as a function of3 stress and operator speeds ?
Certain characteristics of the model are apparent from the questionsit is designed to answer: (1) the model is highly responsive to time; in-deed, as will be seen later, stress or work load is a function of the timeavailable during the mission to complete remaining tasks; (2) the modelis responsive to different types of personnel, uihich is not the case for
other techniques. As a consequence, the model is highly dynamic becauseit permits one to examine system performance as a function of variationsJ lin stress and operator speed.
(1) Indeed, because of the "power" inherent in simulation techniques,we can see the Siegel model being used in early design to perform criticaltradeoffs among parameters.
1i g19
IxI;
The same goals apply to the two larger models. The basic differencesbetween them is the introduction of additional parameters. Thus, questions(1) and (3) above remain the same, but questions (2) and (4) are modifiedto include factors in addition to operator stress and speed, these factors
representing psychologically oriented or psychosocial variables such asmorale, goal aspiration, etc.
The primary use of the models as described in Ref. 6 is to test "the Iman-machine interactions in a proposed design. " ""Testing" here pro-bably means evaluation and in the case of a negative evaluation generation
of ideas for a design fix and retest" (p. 141, Ref. 6). The implication
here is that the model is not used to generate a new system design but toevaluate one that has already been designed. However, when one seesproblem areas in his system design as displayed by the model, someinsights may follow as to methods to compensate for these inadequacies.
There is a statement (Ref. 5, p. 557) that the purpose of the tech- Inique is to predict system effectiveness in early design and to enablecomparative evaluation of alternative system designs. What "early Idesign" means is, of course, subject to interpretation, but obviouslydesign must have proceeded to a fair degree of system elaboration be-
fore the technique can be used. Because our own studies (Ref. 3) in- -dicate that once a design has been elaborated, little or no attention isgiven by contractors to alternatives, the above statement may over-emphasize this aspect of the model's use. If, however, we are talking
about major system projects like the F-1 5 aircraft, for example, andparticularly about specially funded efforts by governmental laboratoriesprior t:, system procurement, then the statement may well be correct.Z [
(2) Siegel contends "that the model is useful in the conceptual,
definition, production, and test phases. It can be shown that such model-ing can yield data useful in each of these phases. In the conceptual phase,the input data may be more gross, but certainly no more gross than the Iother engineering data employed at this point. The rr.odel doesn't carewhether it works on molar or molecular subtasks. If one works with more
molar subtasks during the conceptual phase, his output will probably be Isufficiently precise for the requirements at this stage of an equipmentdevelopment. In the production phase, the model may be employed totest the effvcts, for example, of design modification introduced by value Ienginet'rs. In the te-st phase, it can be employed, for example, to per-form tests which couldn't otherwise bt, performned. Our work on the
effedts of gamma-noutron radiation cn F-106 pvrformance (including Iboth pilot and .quipment) is an exarnile here.''
2.0 I
i ASSUMPTIONS
The basic assumption in the Siegel models is that operator loading
is the basic element in effective man-machine system performance (p. 10,
Ref. 6). Although there may be a variety of reasons why the operator is
loaded or unloaded, these reasons are compressed into a variable called"stress." The model makes the stress variable the key to operator per-
formance in terms of both speed and quality of performance. This in-
crease in stress may be caused by several factors: (1) falling behind in
time on an assigned task sequence; (2) a realization that the operator's
partner is not performing adequately; (3) inability to complete success-
fully a subtask on the first attempt and the need to repeat the subtask;
(4) the need to wait for equipment reactions.
I If one examines these factors in toto, it appears that stress is theconsequence of failure or the expectation of failure. It is possible tothink of other factors creating stress, particularly emergency conditionsthreatening the personal integrity of the operator (danger to life). (Emer-gency stress is included in the larger model. ) An emergency conditionwould, however, cause the operator to abandon his programmed mission
sequence and go into an emergency routine; the latter can then be handledas a separate sequence.
Stress resulting from a recognition of the urgency of the task beingperformed (e.g. , a radar operator's determination that a signal representsan actuai ballistic missile attack or a false alarm) does not appear to behandled by the model, because task urgency in Siegel's models resultsonly from a lack of time to complete essential subtasks. However, this5 is a minor quibble.
It may appear as if the model, depending as heavily as it does on the5 stress parameter, would be inadequate in handling situations in whichthere are no time pressures and hence no stress. (However, there arcprobably few such tasks. ) Moreover, the model can account for such3 situations by utilizing the average probability of completing the subtask(.ij) which assumes a non-stress condition.
]x
Ii
METHODOLOGICAL SCOPE IThe general methodology underlying the model (which see below) can
be applied to any type of system or task. The model's features (e. g. ,1stress or urgency) apply regardless of the specific nature of the system.The psychosocial variables also generally apply. The nature of the re- --
lationships among parameters also assume the status of general rules;for example, the effect of stress on performance, i.e. , that up to somethreshold point stress is organizing (and positively beneficial, at least interms of speed of response and subtask success probability) whereas Ibeyond that point it is disorganizing.
The application of the general model to represent a specific systemdoes, however, require the collection of new data characteristics of thatsystem. For example, subtask execution times will vary depending onthe specific nature of the task. This forces the necessity of gathering newinput data in the application of the model to a new system, and thereforemakes it unlikely that a "universal" data bank will be useful; or, if it canbe, it must be very extensive to cover the very many task idiosyncraciesto be found in diverse systems.
We can say therefore that the overall model is generally applicable Land is not constrained by limitations of decision-making and continuoustasks as found in TEPPS, for example. It is one of the advantages ofthe simulation process that it is not constrained (as are the methodspreviously considered) by the combinatorial limitations of probabilitystatistics. The simulation takes interactive and feedback processesinto account as it performs model operations. i
The model has been applied to diverse systems such as landing anaircraft, firing a missile, searching out, detecting and classifying sub-marines, and r,-entering the atmosphere in a space (craft. The modelh,,s bein used primarily with operator activities, but there seems to beno a priori reason why it could not be, used for maintenance operations,although here a difficulty might be, oncountered in getting adequate data.Siegel notets that the model has becn employd successfully for it number
of maintenance simulations.
rht- model has generally bee-n applied to missions lasting less thanone hour, although the larger modcls involve 24 hour operations up to I.90 ciays.
L22
II!
PARAMETERS
3 The following are the basic parameters of the model. Four principalparameter values are specified for each simulation run.
I The parameter T., the mission time lirit, specifies the total timeallotted to each operator for performance )f the task. This parameter issimilar to the SER employed by TEPPS. For a two-man team, the taskis considered to have been successfully completed only if both operatorscomplete all required subtasks within their respective time limits.
"I The parameter F. is an individuality factor for each operator; itaccounts for variance among individuals operating the system. This par-ameter provides the ability to simulate an operator who usually performsfaster or slower than the average operator for whom an Fj value of unityis assigned. The effects of faster, or more highly motivated operators(Fj (1), and slower operators (Fj >1) in the performance of the task are
examined by performing several computer runs with different Fj values.The range of values for Fj from 0. 7 to 1. 3 has been found to be practic-I ally useful in simulations.
A third parameter which is central to the model is the stress thres-3 hold (Mi). Stress here is a central process (i. e. , the "certainty" in theoperator's mind that there is insufficient time to complete essential sub-tasks) defined as the operator's state of mind prior to his initiation of anessential subtask. However, it is operationally defined as the ratio ofhow much is left to do to the amount of time available in which to do it.
Initial stress build up is recognized in the model as having an organ-izing effect on operator performance as long as the value of stress remainsless than Mj. When stress exceeds Mj, the effect is disorganizing. Mjcan therefore be considered as the operator's breaking point. An Mj valueof 2 indicates that the operator begins to work slower and less accuratelyat the point at which he has more than twice as much work to do (at aver-
-- age speed) as he has time in which to do it. Prior to this point, any back-log of essential subtauks creates a stress factor that makes his actionsfaster and more accurate.
The critical importance of stress is indicated by its relationship toprobability of successful performance of the subtask (ij). Thus theprobability of success increases linearly with stress from a value of
1I1 223
Pij until it assumes a value of unity at the stress threshold. Followingthis point, the probability assumes the average value Pij after which itdecreases linearly until, when stress has a value equal to M- +1, it levelsoff at a value which is decreased from 5j by an amount equai to Pij/2.
Similarly, execution time for the subtask varies as a function ofstress. The average operator requires Fi seconds to perform subtaski when stress is unity. It is assumed that actual subtask time is nor-mally distributed with a mean dependent on ti andi'. ii and JP, are usedunchanged when stress - unity; is decreased with increasing stress (viaan empirically determined cubic equation) antil M. is reached; is usedunchanged when stress equals Mj; and is increased linearly with increas-ing stress beyond Mj. I
In his later work (Ref. 6), Siegel has added a fourth parameter, thetime period P. which is applicable only to cyclic subtasks, those found,
for example, in radar or sonar systems in which the equipment imposesa time, e.g. , scan time, before which the operator cannot initiate his
subtask. When such a subtask occurs in the task sequence, the opera-tor must wait until the start of the next period before he can begin thatsubtask. This is the waiting period P.
The above represent the parameters to be found in all three models.In addition, in the larger models one finds such psychosocial parametersas leadership, group and crew size, equipment data, e. g. , failure rate,repair time, etc. , personnel data, such as areas of specialization, mo-rale threshold, number of working hours per day, probability of emer-gency situation occurrence, etc. We will not endeavor to discuss thesebecause we do feel that they would be included only during the develop-ment of the largest systems. It is our feeling that the model can beapplied with or without any of these more complex variables, dependingon the kind of question to be asked of the model and the availability ofrelevant data.
Several assumptions inherent in the above parameters need verifica-tion. The assumption that probability and execution time increase anddecrease linearly with stress is probably an oversimplification, butacceptable until more precise information is available from experimen-tation. Some minor modifications in this formulation may be found in LReference 6.
224 --
IIj IDATA
1. Measures Employed
"I To exercise the model, 17 items of task analytic input data areneeded for each subtask and each operator. These are punched on cardsfor input to the computer.
a. Operator number: j I or 2, identifies the operator whois assigned to the subtask.
b. Subtask number: i, an integer that identifies the assignedI subtask.
c. Type of subtask: a code indicating one of four special sub-task types. Any type can appear without restriction wherever desired inthe task sequence. A joint subtask (type = J) is one performed simultan-eously by both operators; for example, a communication task is simulatedsimultaneously with one operator talking and one listening. An equipmentsubtask (type - E) is introduced to account for a delay in the task be-cause of factors other than human performance (for example, to simulate
San equipment warmup). No operator stress functions are calculated forthis type of subtask. A decision subtask (type = D) is incorporated intothe sequence to cause branching, skipping, or looping in the task sequenceto simulate a choice made by an operator without the operator taking anyaction. A cyclic subtask (type = C) requires an operator to wait until thestart of the next periodic time interval before he can initiate the subtask.
d. Indication of subtask essentiality: an indicator specifyingwhether or not the successful performance of the subtask is essential tosuccessful completion of the task. This allows the computer to identifyand ignore nonessential subtasks during "highly urgent" conditions. (E -
essential; N - nonessential,) (In recent modifications of the model, thisinput has been expanded to provide for 10 levels of essentiality.)
e. Subtask precedence: d.i (mnemonic delay): a numberindicating a subtask that must be successfully completed by his partnerbefore an operator can begin the current subtask. By proper selectionof dij values, it is possible to cause either operator to "wait" until hispartner has completed a stipulated subtask successfully.
f. Time precedence: Iii: the point in time before which opera-tor j is not permitted to begin subtask i.
22~5I!ZZ
g. Next subtask, success: (i, j)s: the subtask to be performed
next by operator j if he succeeds on subtask i or if he selects the first
alternative course in a decision subtask. Ih. Next subtask, failure: (i,j)f: the subtask to be performed
next by operator j if he fails at subtask i or if he chooses the second of Ttwo alternative courses in a decision subtask.
i. Average subtask execution time: tij: the average time $required hy the jth operator to perform subtask i. This average valuereptesents the case in which the operator is under no stress.
j. Average standard deviation: duiij: taken around the mean
Eij for the average operator while not under stress.
k. Average subtask probability of success: 5i.: the probabilitythat the average operator j while not under, stress can peJrform 'subtask i
successfully or that he will select one or another course of action in a
decision subtask. For most subtasks, probabilities of 0.97 and above
have been'found to be appropriate.,
E1. Time remaining, essential: T : the time required to
perform all remaining essential subtasks (including i) at average execU-tion times. assuming no failures.
m. Time remaining, nonessential: T. N. the time required to
perform, all remaining nonessential subtasks (including i) at average 1)execution times, assuming noffailures.
n. Indication of two special subtask types:, the allowance for one ,
operator to make a decision that will decide the sequence of, future sub- L.
tasks for both operators. The first enables each operator to jump to an
individually specified subtask, depending on what the operator does. The
sCcond type of subtask provides a team decision capability to the model.
o., p. Next task numbers: likeý g. and h. above, for use onspecial subtasks.
q. Goal aspiration: G. : the pe.rformancc n Ilvel at which ,
operator j is satisfied with his pk.rformnancc o0 subtask i. Pure-ly U
optional.
226
I'
2. Data Sources
The level of data input, as -represented by Table I in Reference 5, is
fairly molecular; that is, it describes individual discrete perceptual andmotor actions; indeed, it reminds one a bit of theAIR Data Store. This is
understandable because the subtask is essentially a task element. From
that standpoint, one would think that a ituniversal" data bank of the AIR
type would be extremely useful. (In fact the AIR Data Store has been used
by Siegel on some occasions.) On the other hand, since the model must
describe in detail the functioning of a specific system, one might alsothink that more specific data (specific, that `Is, to the system beingmodeled) would be needed.
Sources'of input data are varied. Data are secured from "taskanalysis, formal experiments, informal measurements, simulatormeasurements, literature search or personal interviews" (p. 13, Ref.
6). Again, Siegel, in referring to the assignment of subtask successprobabilities says, "We have relied largely on logic, a knowledge of
the characteristics of the subtasks under consideration (italics those
of the author) informal observations and interviews with systems
operators" (p. 15, Ref. 6).
The author gets the feeling that most of the input data are gathered
Li by direct questioning of operators (to provide e)dpert judgment) and that,
in contrast to TEPPS,i for example, the data gathering process is rela-
tively (informal. Although Siegel undoubtedly makes use of data banks
(such as, they are), it is likely that some new input data must be gathered
for each new application of the model. Siegel notes that "on the other hand,
experience with the model has indicated that it is relatively insensitive to
3J input data vagaries" (personal communication).
In consequence, there is probably an element of error in both pi and
C data Used to exercise the model. However, this error, particularlyfor ,i' may be relatively less important than in other models. "For most
subtasks probabilities of 0. 97 and above have been found to be appropriate"
(p. 15, Ref. 6). Because subtask probabilities are generally very high,
and because of the nultiplicative limitations of probability statistics are
minimized in simulation models, the effect of these probabilities on the
LI estimate of overall system success (in terms of reducing that estimate)
is minimized. In addition, since 'the overriding parameter in the model
is time, it is likely that success probability has less influence on model
operations than the other techniques previously considered.
227

Like the previous techniques considered, the type of data in-?ut does Inot differentiate significantly between equipment characteristics (e. g.two different types of meters), although it does differentiate betweentypes of equipment components (e. g. , indicator lights and meters). This Ihas negative implications for use of the model results to suggest designmodifications, but it makes the model capable of using almost any kindof data source; an operationally gathered data bank of the type being devel- Ioped by NELC 3 would therefore be useful. However, in view of thernodel'Es need for system-specific data, such a data bank would probablynot supply all necessary data.
Things both positive and negative need be said about the Siegel modeldata inputs. For example, since the model makes use of the same typeof data as the other techniques reviewed, its data are subject to the samequalifications: the probability estimates applied to the subtasks are notreliability estimates as one ordinarily thinks of reliability estimates &(derived from error as a function of time), but rather 1 minus the per-centage of error over a block of trials. This data inadequacy does not,however, have any apparent effect on model precision (probably because Iwe have no way of testing for that effect).
The fact that additional data must be gathered for each new modelIapplication is disquieting because it takes time to gather the data, andthe opportunity for error in gathering those data (particularly from "ex-
pert" judgments) is always present. However, this is more or less trueof the models examined. Siegel notes (personal communication) thatusually only a limited amount of new data must be acquired. Much of the
data secured in past use of the model can be applied anew. Moreover,the model's data gathering requirements make it less necessary to es-tablish a "universal" data bank, and thus relieves the model user of an [onerous burden.
I
(3) See Coburn, R. , "A Human Performance Data Bank for CommandControl," in proceedings, U. S. Navy Human Reliability Workshop, Report INAVSHIPS 0967-412-4010, February 1971, pp. 276-Z8Z.
II
228 I
3. Output Metric
The model outputs a considerbble amount of data for each operatorwhich are listed on page 31 of Reference 6. We do not include them here
because of the large number of these measures. These data are organizedto provide the following dependent variables (per run):
a. average time expended;Sb. average peak stress;
c. average final stress;d. probability of task success;e. average waiting time;f. sum of subtasks ignored;g. sum of subtasks failed.
SThese data can be plotted as a function of the following independent
variables:
a. time available;
b. stress threshold;c. speed factor.
It is apparent that the simulation model provides considerably moreIi data than do the non-simulation techniques previously reviewed. Al-though from a system effectiveness standpoint we are interested primarilyin time expended (completion time) and probability of task success (whichthe other techniques also provide), the other measures supplied by theSiegel model are of considerable interest in analyzing (diagnosing) theconditions that led to a given performance. The fact that one can plot theabove variables as a function of each other is a capability which the pre-
vious techniques do not possess.
PROCEDURES FOR MODEL APPLICATION
1. Analytic Methods
Like the previous models considered, not much is said about themanner in which the basic behavioral unit (the subtask) is abstractedfrom the overall task or mission. Presumably these units are determined
229
II
as the end product of a detailed task analysis, but the details of the analysis
are assumed to be known by the user. 4 IThe subtask is the lowest level behavioral operation possible, e. g.,
throws toggle switch, reads instruments. These subtasks can be accom-plished in from several seconds to a few minutes (which suggests that
some subtasks requiring the longer time are more molar than task ele-ments). This molecular level of operation is required because the simula-.tion must reproduce each individual operator action in real life.
No graphic method of organizing these subtasks in terms of some-thing like a probability branching tree (THERP) or a GSSM (TEPPS) isrequired, because they are not needed to translate the model operationsinto mathematical form; the computer program does this directly.
2. Methods of Synthesis jjThe methods previous examined (the AIR Data Store, THERP, TEPPS)
broke the mission or the task down into smaller behavioral units (i. e.
task elements and tasks). It was therefore necessary to determine howthese smaller units were recombined or synthesized to provide an estimateof system effectiveness for the larger unit.
This procedure is unnecessary for the digital simulation methodsbecause, although analysis is required to prepare subtask inputs for the
simulation, the exercise of the model itself serves as the combinatorialprocess; or perhaps one can say that combination is unnecessary.
Let us say, for example, that subtasks 1-30 must be performed in Lorder to achieve the task output. In a non-simulation model, like THERP,it would be necessary to apply statistical formulae, e.g., U
(T -0 l-Qki i[ft I
(4) Siegel notes: We are anticipating the preparation of a manual on
how to do the input analysis this year. It isn't as hard to do as your text
might imply. We have had about eight differnt people doing them, and no
one has had any particular problem in understanding what to do or how to
do it.
230
II
3 to indicate how the probability values applied to the 30 subtasks were tobe combined to derive the estimate of system effectiveness. This com-binatorial process brought us face to face with the problems of indepen-: dence /dependence relationships.
In the simulation model the simulation itself, just like the operator
in real life, operates through its Monte Carlo sampling process to arrivedirectly at the end result we are looking for. Note also that success orfailure of the entire task or mission is not excessively dependent on the
probability of accomplishment of any single subtask, but whether or notthe operator completes all essential subtasks in the required time. Eachindividual subtask pi has an effect on ultimate system success, but not
necessarily a primary one.
As a consequence, all one has to do at the end of a series of computer
simulation runs is to count the total number of run iterations and the num-ber of successful iterations and divide the second by the first to arrive atthe desired estimate of effectiveness. In fact, this estimate is provided
by the computer.
71 Obviously, the fact that the simulation makes it unnecessary to modelthe combinatorial process in probability mathematics represents a signifi-cant advantage over the non-simulation models. As has been pointed outmany times by others as well as by this writer, our understanding of com-binatorial rules is highly limited.
In place of a discussion of the combinatorial process, we will describe(in very abbreviated form, of course) the simulation sequence. That se-quence is graphically illustrated by Figure 11.
"Because the simulation of any individual task is based in part on arandom process, it is necessary to repeat the simulation many times toobtain sufficiently representative performance data for each set of con-ditions" (p. 18, Ref. 6). A value of N, representing the number of timesa given task is to be simulated, is selected prior to the simulation. NI •usually varies from 100-£00.
"Another initial condition is R", the 9-digit number from which the
"computer generates subsequent pseudo-random numbers needed duringI the course of the simulation. The term "pseudo-random" is used because
the last number generated in one run is used as the first value in the nextJ run and thus any random number generated is not wholly independent of
2!I' 231
I
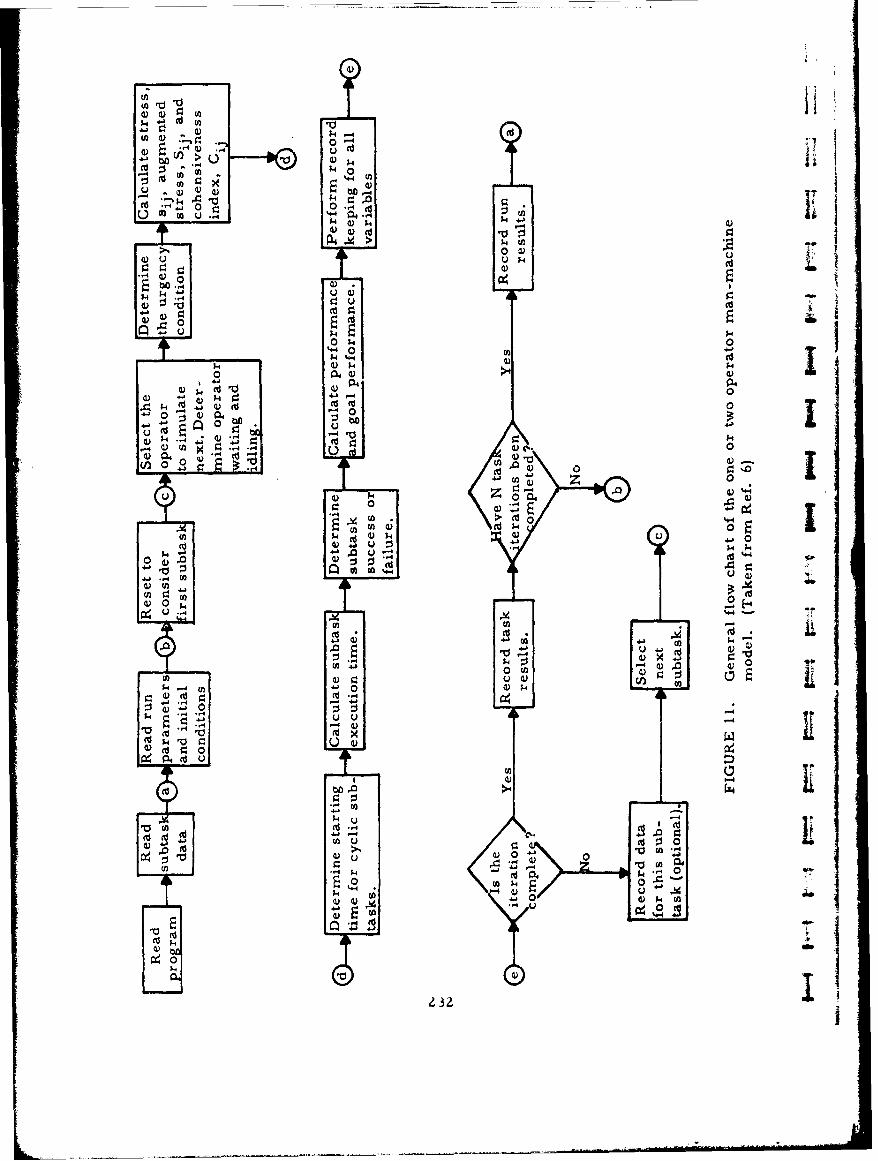
0 4
0 TI
u 01)
040
04J. '4N 4-A
04)
00
Cfu. Cid -
"404 I41 I
U)) k 0
cd 40 u0i
I'I
I the last. The distributions of pseudo-random numbers as generatedare indistinguishable by reasonable statistical tests from numbers whichresult from a truly random or stochastic process" (p. 559, Ref. 5).
The pseud(0-random numbers are used to determine alternative
courses of action: given probabilities of the alternatives which sum to
unity, "a pseudo-random number equi-probable in the range 0-I willdetermine to which action it corresponds" (p. 19, Ref. 6). Where avalue for a variable is known or assumed to have a particular statisticaldistribution (e. g. , normal, Poisson, Weibull), the pseudo-random num-ber is used to select a sample value from the distribution.
Once the program, parameters and initial conditions have been
stor -i by the computer, it begins to process subtask data sequentially.The sequence of subtasks to be performed is determined in accordance
with the operator's success or failure on a prior task and the total timeexpended by the operator on all previous subtasks. At any given time,the operator who has expended less total time is selected and his nextsubtask is simulated. If the selected operator must wait for his partner,the sequence continues using data for the other operator.
Ii tOne of three stages of "urgency" is next determined, based on theremaining time available to the operator for completing the task. Thesituation is non-urgent if there is sufficient time to complete all remain-
ing subtasks; it is urgent if time is available only for completing essen-tial subtasks; it is highly urgent if there is insufficient time for completingeven essential tasks. In the latter two conditions the computer ignores
non-essential subtasks.
(There are systems in which all subtasks are essential in the sensethat the task cannot be performed if any one of them is not completed.This does not void the model logic, however; it simply means that nosubtasks can be ignored by the computer simulation.)
Following determination of the degree of urgency, the stress condi-tion is calculated. During non-urgent and urgent conditions stress isdefined as equal to unity. When the situation is highly urgent, stress isdefined as the ratio of the sum of average execution (completion) timesfor remaining essential subtasks to the total time remaining.
Subtask execution time is next computed, For each subtask it isJ assumed that the actual subtask execution time is normally distributed.
2~33
S* t., gJl*$4s *4** !
IP~lI"' " I
Specific time values are selected by the Monte Carlo technique from anormal distribution limited by a fixed minimum, 0. 75 second. Theselected time values are used unchanged when stress equals unity, are
decreased per third degree polynomial as a function of increasing stressuntil stress assumes the threshold value (M.), used unchanged when s
stress equals M., and increases linearly with increasing stress beyondthreshold unt-il stress equals Mj + 1 and assumes a value of Ztij beyondthat point.
much the same way as are the subtask execution times, with essentiallythe same time-stress relationships.
The above description of how the simulation process is accomplishedis necessarily lacking in detail. In particular we have not consideredteam cohesiveness, the various types of subtasks, etc. Readers inter-ested in specific details are referred to Refs. 5 and 6.
It is apparent that the "principal model variable is stress" (p. 29, IRef. 6). If one objects to the use of this variable in prediciting systemeffectiveness, it is possible to exercise the model without time stress.In this case one sets an arbitrarily large value for required executiontime so that even with a large number of subtask failures no stress build-up occurs. The developers report (p. 29, Ref. 6) that it is standard
practice to make at least one such no-stress run in each series of trialsas a reference for the stress condition. The results of such no-stressruns should be to provide estimates of task success which are overly
optimistic, but pessimistic from the point of view of time; a comparisonof no-stress run results with stress run results should provide a sortof "confidence level" for the system effectiveness estimate.3
ANTICIPATED MODEL USES 31. Prediction of System Effectiveness
Under this heading we consider whether the model can supply Ia. An absolute estimate of the system reliability to be antici-
pated when the system becomes operational (e. g, , the system willeventually perform with a reliability of . 99).
II
ii
I
I
3 b. A comparison of estimated system reliability with thatrequired to achieve mission success (e.g. , estimated system reliability
is .98, but mission success requirements call for a performance of . 99;or, the mission must be accomplished in 32 minutes, whereas estimatedsystem performance time is 34 minutes).
I Both of these assumed model capabilities are identical with thoseclaimed for the techniques previously considered (the Data Store, THERP,TEPPS).
It is obvious from what has been said earlier that the simulationmodel will provide estimates of system performance both for probability
SI of success and task completion time. A comparison with system require-ments is easy enough to provide, assuming that a mission requirementin terms of human performance has been specified.
In considering the above capabilities we have implicitly assumed that-. these predictive estimates would be made during early system develop-
ment. One may question whether the necessary input data can be securedearly enough in system development to make the model results useful.Since the input data needed are highly specific to the particular systembeing modeled, it will be necessary for the system developer to elaboratehis design concept in detail in order to provide the necessary data. How-ever, our studies (Ref. 3) indicate that the system developer, when pushedto do so, can provide these data quite early.
It is the author's feeling after reviewing the non-simulation modelsthat the simulation model does not require significantly more detailedinformation than the other models. True, both THERP and TEPPS mayrequire data at a slightly less detailed level, which should make it some-what easier for the user of these models to get the necessary data; on theother hand, the amount of additional effort required to secure input datafor the simulation model does not seem excessive to us, because themethod employed to secure data for the Siegel model is essentially thesame as that used by THERP and is not as rigorous (and hence presumablyeasier to apply) than that employed by TEPPS.
However, since the effort factor is likely to be a constraint on whetherthe system developer employs a particular technique, it would be very use-ful if one could get realistic time/manhour estimates from model devel-opers as one basis for comparing the techniques. In an ideal sense, thiseffort factor should play a very minimal role in selection of a techniquefor use; but we suspect that it plays a greater role than one, would like.
Il 235
Since all the models so far considered purport to perform the mani Ifunctions, a choice among them would seem to devolve upon the validityand precision of their outputs and the feasibility of employing the respec-tive models in early design. Validity atnd precision will be considered Ilater. With regard to feasibility of model use, there seems to be littledifference between the efforts to develop a probability branching tree,a GSSM and the input data for the digital simulation model. It is assurnedthat the basic computer program (with perhaps slight modifications totailor it to a particular system?) would be availaible for use with anyspecific system. The developers can perhaps give us a better idea of &how long it takes to prepare the input data and program for a computerrun.
Z. Design Analysis
Under this heading we include several aspects:
a. The comparison of alternative system configurations todetermine which should be selected for implementation.
b. The determination of redesign requirements for a system 6b
which cannot satisfy system requirements.
c. Recommendations for initial design, design changes, selec-tion of components, equipment layouts, etc.
With regard to the comparison of alternative system configurations,it is apparent that if the simulation model can predict the system effec-tiveness of one configuration, it can also predict the effectiveness ofanother, and compare the two estimates. (As with the other techniquesconsidered, differences in system configuration will reveal differencesin performance only if the nature and organization of the tasks involvedin the two configurations differ; if the two configurations differ only in -terms of molecular equipment characteristics, it is unlikely that signi-
ficant differences in performance will result because the input data areresponsive more to task factors than to equipment factors.) The Siegelmodel is perhaps more sensitive to such a comparison between configura-tions than the previous models, especially as regards execution timerequirements, the ratio of essential/non-essential subtasks, and decisionand multiple action subtasks. We say "sensitive" because one can developwith the simulation model a function (i. e. , a graphic plot) which relates
236! ds
II performance to any of a number of values asumed by these input#. This
can he done also to somne extent by non-nimulation modeIs (e. g, , rankingof Qi values in THERP) but at greAttr cost because these models lackthe flexibility of computer processing,
The digital simulation model, like most non-simulation models,lacks the capability to point out th, equipmetit design iniplications of asystem inadequacy, It may be eavier with the simulation model to deter-mine the point in time at which performance starts to degradr, (e, g. , fromthe graphic plot), but having determined that degradation or inadequacyexists. this does not indicate what should be done to remedy the situation.
-. As with the other models, the input data for the simulation model do notappear to be overly sensitive to equipment characteristics; hence if theproblem is one of equipment design rather than of task conditions, the
-- model can only suggest the existence of a problem; further human engine-@ring analysis of the situation is required,
.7 This model, like the others, does not provide recommendations forinitial design, It should be noted that the simulation model, again likethe others, does not pretend to supply any such recommendations, Itassumes a system configuration, rather than suggesting one. If this isan inadequacy, it is an inadequacy which all the predictive models re-viewed contain,
3., Selection and Training
:1 The author feels that almost all the models reviewed provide rela-tively little information about these factors, About his own model, how-"ever, Siegel reports that it "has been enmployed to derive training infor-mation and the outputs yield required levels of proficiency to be attainedas a result of training". The discrepancy in viewpoint may be a differencein the interpretation of what constitutes meaningful information. Certainlyinadequate performance in a system simulation (e, g. , inability to comn-plate certain subtasks in required time) may suggest the need for betterselection or more personnel training. Since the simulation model issensitive to variations in personnel capability (the F variable), itaccordingly provides information relative to a need for a change inselection and training. The question for the author (which is unanswered)is, how detailed will that information be? Will it suggest the types ofpersonnel to be selected, their required aptitudes, the amount of trainingthey should receive, the subject matter which training should temphasiz.e,etc, ?
Z37
To anticipate our later argtunent, it would appear that no singlemodal will perform every desired function. The models we have con-sidered so far appear to predict system effnctiveness and to comparealternative configurations to a greater or lesser extent. However, they Iare distinctly lacking in ability to satisfy specific design, selection
and training requirements, One can therefore raise the question whether
it is fair to ask any stingle model to handle all the varied problems that ithe system developer may encounter. Perhaps a number of differentmodels or techniques (specifically developed to satisfy particular re-quirements) shoul1d be considered.
VALIDATION /APPLICATION STUDIES
Of the techniques so far considered only the simulation model hasbeen exposed to any number of validation studies We are talking hereabout empirical rather than construct validity, The validations performedon the previously reviewed techniques have been at best partial ones, in jwhich comparison with operational performance has usually been lacking.
The validation studies performed on the digital simulation model have, jion the contrary, been numerous and varied, (Why the developers of thismodel were more fortunate in having the opportunity to validate is some-thing we cannot go into here,) Although a precise correspondence betweenthe model predictions and operational performance has not been found(nor should one expect to find precise correspondence), the- results ofthe validation studies (reviewed in Refs. 5 and 6) are highly promising. ii
Something that might be termed a "concurrent validity" study hasrecently come to the author's attention. This is a study to develop adigital simulation model for fighter pilot workload (Ref. 1). which was lbased on the Siegel model and used essentially the same input data butwith certain advances (presumably) in computer programming. Presum-ably the new approach provides "additional distribution and simultaneoustask information which have not yet bt,,,n validated" (p. 87, Ret. 1). How-ever, the new model can be considered only a variation of the Siegelmodel. The point of interest to us is, however, that extremely high
correlations (better than . 90) were fo•n.d for those vlnments in common
between the two model variations.
There exists thean a tairly substantial body of evidence which attests
to the validity of the 1-2 man digital simulation model, a body of evidence
which does not exist for the other models/techniques so far reviewed.
238
L __ __ __
iIj EVALUATIVE SUMMARY
Validity - Formal studies have been performed which show a reason-3able degree of correspondence between predicted and observed values. Of
the various simulation techniques, this is the one which has been mostcompletely validated and which in consequence serves as the pace-makorfor other simulation models. However, much less is known about theuse of the model in solving actual systern development problems.
I Reliability - Controlled studies have been performed that indicatethat the method can be applied with acceptable consistency by variousanalysts,
System Development Applicability
A. Comprehensiveness: The method is not limitd in its applicationto systems, tasks or behaviors (including both operation and maintenanceapplications).
B. Applicability: The method outputs a prediction of system effec-tiveness and is reported to provide data useful for other purposes (dosign,
I Jselection, training).
C. Timing: The model can be applied at all stages of systemdevelopment.
Model Characteristics
A. Objectivity: Relatively few judgments are required.
I B. Structure: Conceptually elegant and well described.
3 REFERENCES
I. Asiala, C. F. Digital Simulation Model for Fighter Pilot Workload,Report MDC A0058, McDonnell Aircraft Company, St. Louis, Mo.19 September 1969.
S•2. Chapanis, A. Men, Machines and Models. American Psychologist,1961, 16, 113-131.
3
_--- ! 239
I !
3. Meister, D. and Sullivan, D. J. A Further Study of the Use of IHuman Factors Information by D•.signers. Final Report, Nonr-4974-00, Bunker Ramo, Canoga Park, Cahfornia, March 16, 1967. 1
4. Siegel, A. I. and Wolf, J, J. A Technique for Evaluating Man-Machine System Designs. -Human Factor.-i, 1961, 3p1), 18-28.
5, Siegel, A. I. and Wolf, J. J. A Model for Digital Simulation ofTwo-Operator Man-Machine Systems. Ergonomics, 196Z, 5(4), 1557- 572.
6. Siegel, A. I. and Wolf, J. J. Man-Machine Simulation Models:Psychosocial and Performance Interaction. Wiley, 1969.
2
QO
S.
~-
240
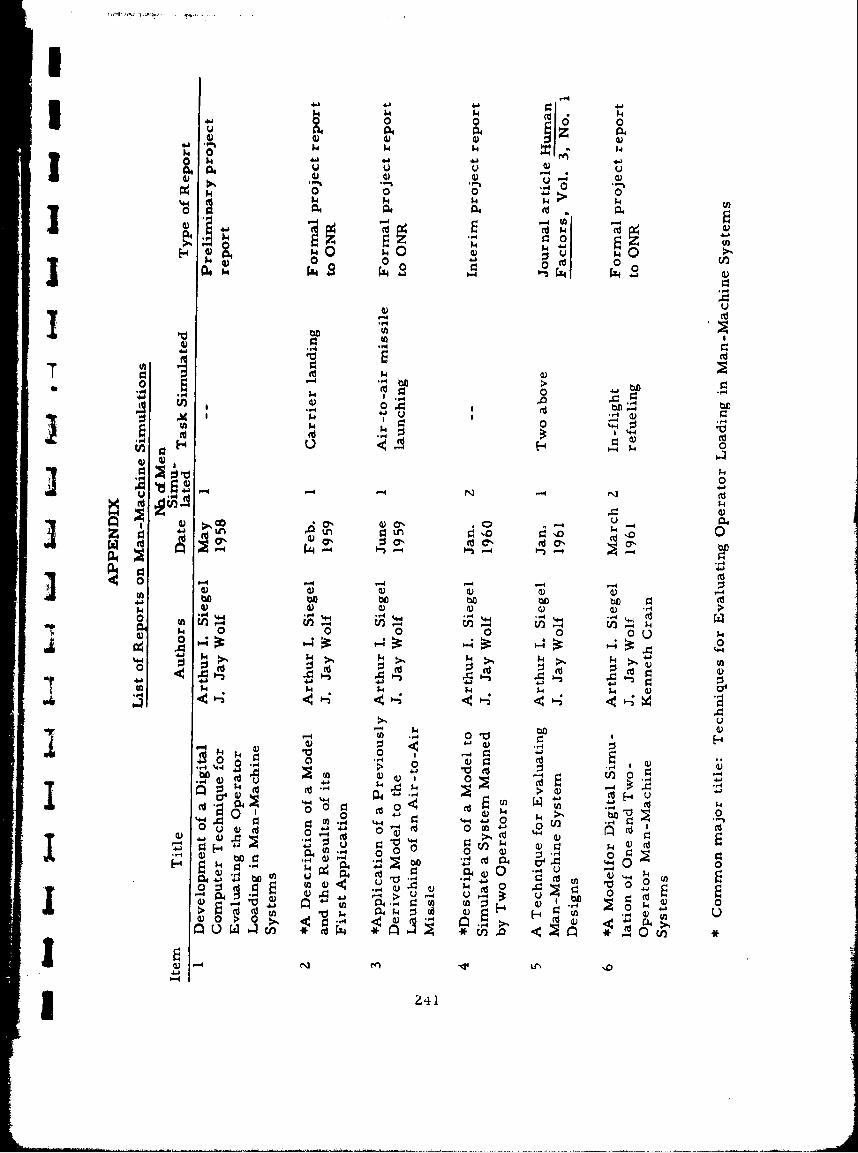
14 14
.44.30-. 0- 0 ~ 00
0 4 04 0 d . 0
~4 0
o4 4 0 0 0 0
04 -4 >4.4UI0r4O
.44) 0 44
4j~Z
00 w a,
ad -
P- 4 '-4 4:
k 0 0) >4
0- .4 44
'o 0
0 -0
4) 440 0 -4)'.
4.,41 ->
1144 144 4) m) 4)4 .
04 04 0 W(0- 44.4
41 -
r-4 04
0) -,-4 -4 0)
k~~~ ~ ~ -a-.:40 jM 4C
XU)C - ) 04C 000.4( CU) 0U -1 u
000 0 4) ) k4)
04 HH Q 0)4 ) cn o
241
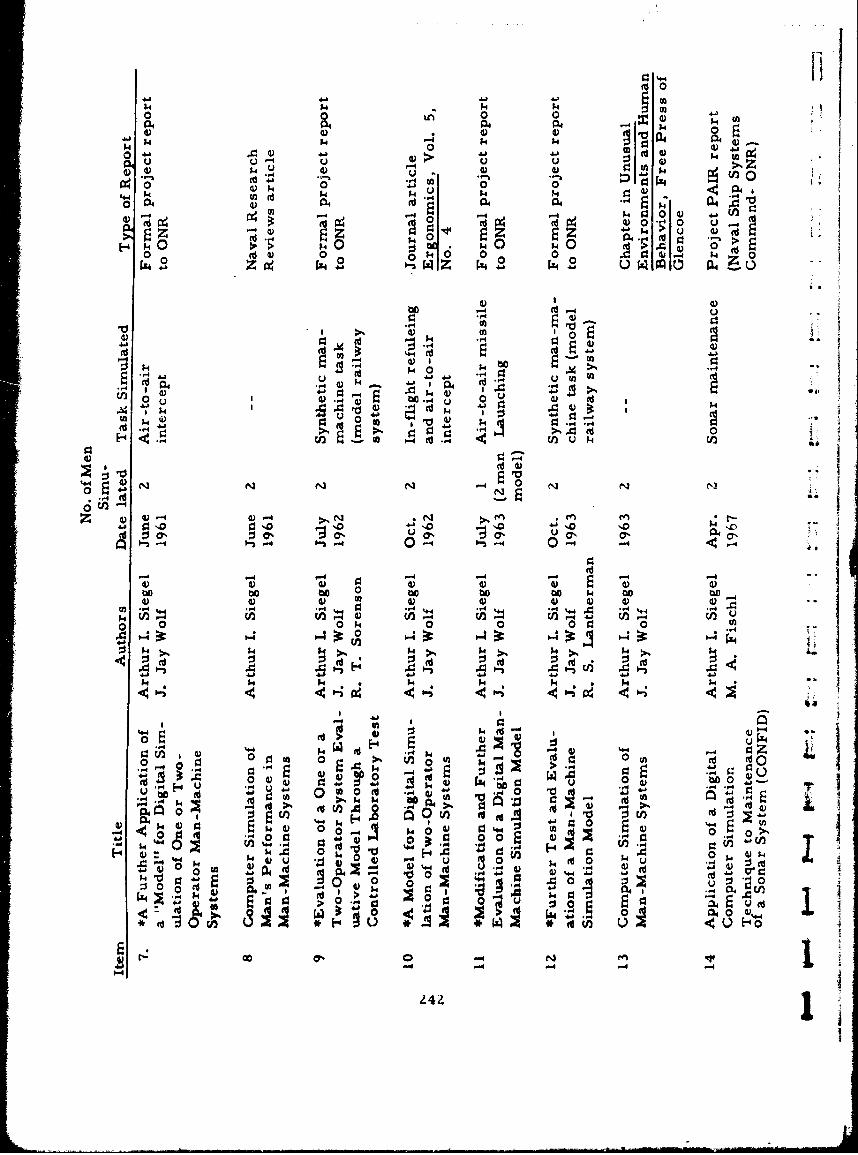
0 0 LA 0 004 P4 04 ;4 0
4) d) d) 'a N4)1.4 N. k~ ~ 4 )~
o~ 0 W 040 4) $41 0.. 4) 4)
k 4) d)co 0
to 0 4
U) .) 04( 4 44)) r., -4 0
-4 41
z~ z' 0. 0 --
C0p 04). bcp 140 4
U) Cd 4) 00 k 0) O
I-4C.. e
0 ~4)
oU,4
0- 0 " :--4 6- 4-- 1
u 0% U p., 00 *4 0 -4
0 w 0 0P ~ 0e 0o 00
LOU ) 4 n4. .. -. 6 U) 4b ( q(
4~ 1.4 14 0 -4..4
k 14 14 1
0 0 U' 0) 0U W V*0 0 CO 00 ~
w~' 0 4)d
k 4)0 '0E- 1- 0 %0
X6 0 .4 ~o ' .,~00 ý4 4)I~ k
p- W 04 0~ I
0
1 N ~ -
-4 P-4 - 4-
242
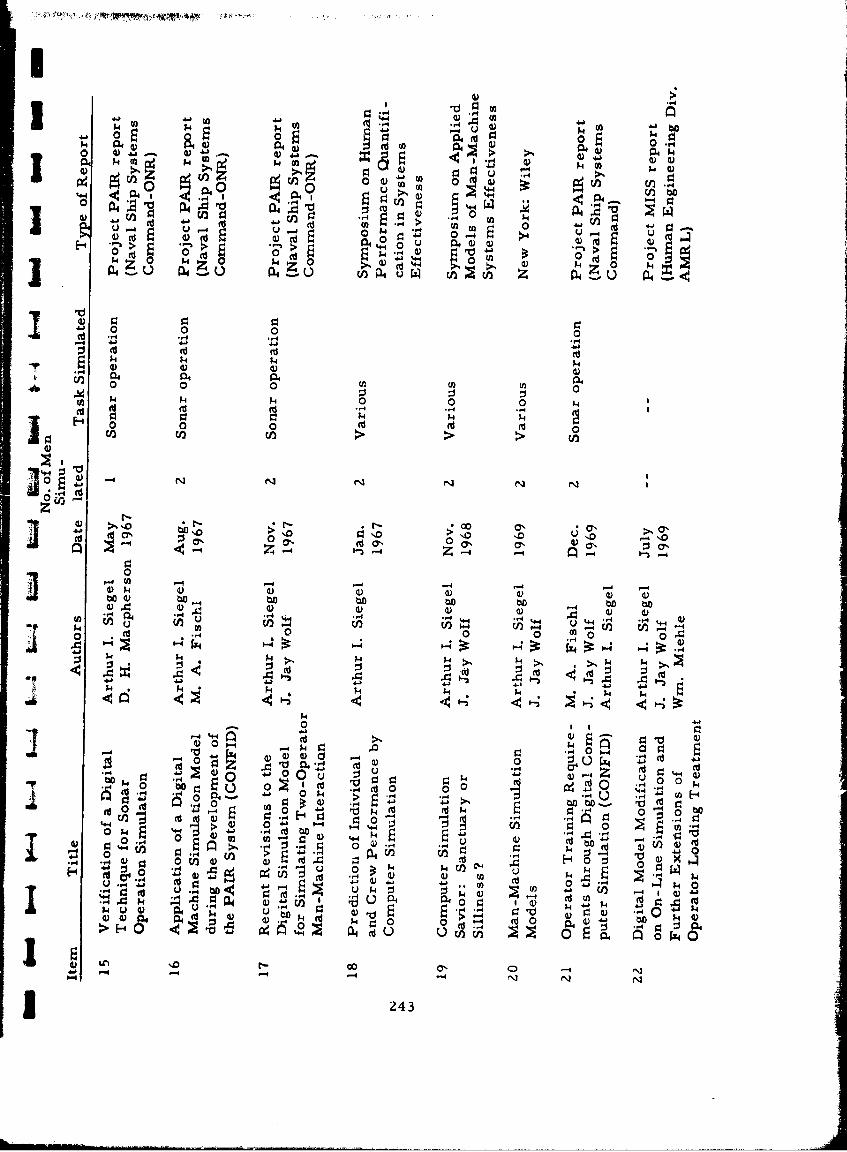
.64) 0
0 0~.-.~ ~04 1 04 1 -- 4 P-(n b
0j 14 g4 0 nA~ 04 -10 ~ :
0 U P0I ~ "_4
4~4.
00 0 0-4-
0 0
0, C7, 0 ,7
z0~
0 0a 0) a
- Cf -4 -4,. -
UUU 0 0 0 (no
,-4 .: .4
$4:44~
440-40 .- (0 004S. Sd (0 -4
, I , :Ho0 ý ý
0o bo 0 -4C 0(
' 0 -4 -N:.1-
W4 (- 4) E . ,4 E-4 -.4 N
44 > 4)243
0 &j4 )4 - o
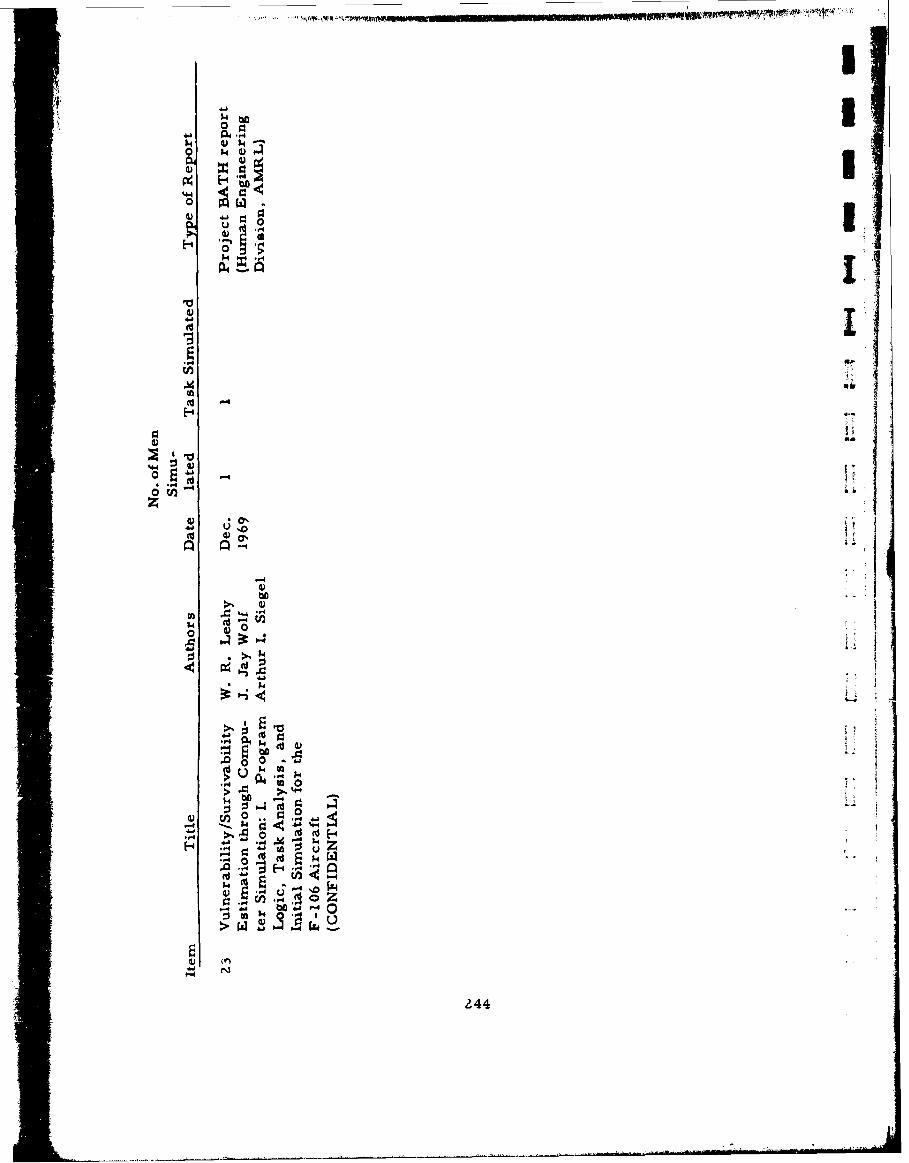
k ba
04
0'-
ob
H 1 '
(U -
- 0 1-
~~ .... W ;I"0 ......
14 z,'.
be~
on
424
'-::: ۥ " ,,b
Illl.... ... i,iiiii H
4--') o.4 5.4; n mnnU•
mi.- U, . *'
mm~ < CC .,
' !4
II
II. THE TACDEN DIGITAL SIMULATION MODELIINTRODUCTION
This section describes a predictive technique which has similarities
to Siegel's 1-2 man digital simulation model. This model- developed byDr. Gilbert Miller and his associates- makes use of a digital computerto simulate the behavioral processes involved in entering messages on adevice known as the TACDEN (AN/MSQ-19). This device consists of a]typewriter-type keyboard for data entry, a magnetic drum for formatstorage, and a CRT for visual display of the data.
A thumbnail description of the development and simulation processwould include as highlights the following steps with which the reader isnow familiar: first a task-equipment analysis (TEA) is developed to
j}represent how message entry is performed; based on this analysis, listsof tasks, together with success probabilities and completion times, etc.are entered into the computer on punched cards; finally the computer
I []simulates the entry of various messages by sampling randomly from theinput data. A series of computer runs is made and performance is pre-dicted in terms of number of correctly entered messages, numbers of
j+ errors in each message, etc.
This description of the above process will not be treated in completedetail for various reasons. First, we consider the model as only an appli-cation of the general digital simulation methodology, represented most
significantly by Siegel's work; consequently we are interested primarilyin the similarities and differences between the Miller and Siegel models.It is possible also to view the Miller model as a validation of the generaldigital simulation methodology because it attacks the prediction problemin a slightly different manner (than did Siegel) and also because a valida-tion study was specifically included in the Miller study. To the extentthat the Miller model produced results similar to those found by Siegel,we may have additional confidence in the general methodology.
SIMILARITIES BETWEEN THE MILLER AND SIEGEL MODELS
In addition to the fact that both models utilize a digital computer, acomputer program, a TEA to derive lists of tasks and the sequence inwhich they are to be performed, a Monte Carlo method of sampling fromdistributions of input data :nu a comparison of sampled data with a per-formance requirement, more specific similarities between the two
24
I 245
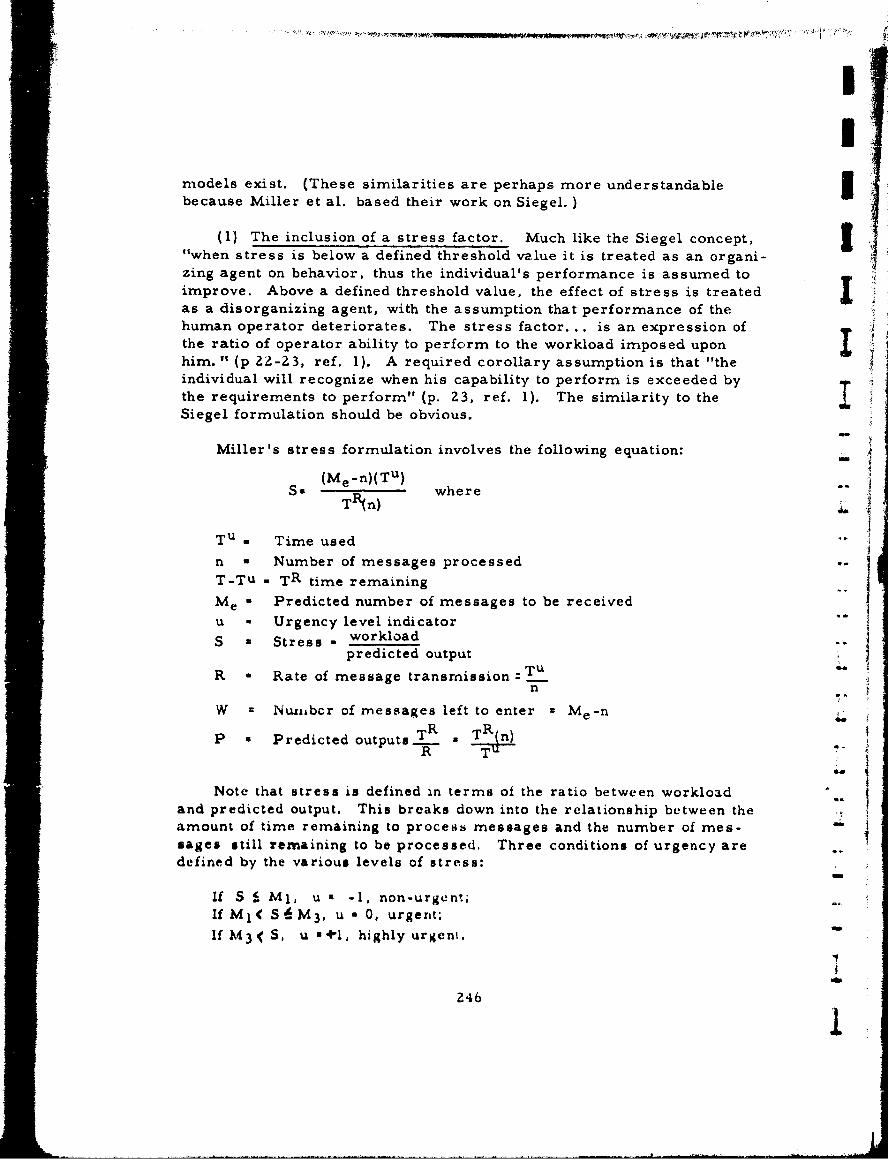
models exist. (These similarities are perhaps more understandablebecause Miller et al. based their work on Siegel.
(1) The inclusion of a stress factor. Much like the Siegel concept,"Cwhen stress is below a defined threshold value it is treated as an organi-zing agent on behavior, thus the individual's performance is assumed to
improve. Above a defined threshold value, the effect of stress is treated Ias a disorganizing agent, with the assumption that performance of thehuman operator deteriorates. The stress factor. .. is an expression of
the ratio of operator ability to perform to the workload imposed uponhim. " (p 22-23, ref. 1). A required corollary assumption is that "theindividual will recognize when his capability to perform is exceeded bythe requirements to perform" (p. 23, ref. 1). The similarity to the ISiegel formulation should be obvious.
Miller's stress formulation involves the following equation:
(Me -n)( Tu) whr
TRjn)
Tu - Time used
n a Number of messages processed uS
T-Tu uTR time remaining
Me e a Predicted number of messages to be received
u a Urgency level indicator
S x Stress - workloadpredicted output
R h Rate of message transmission _ o ssn
W Nurto bcr of messages left to enter w dMe -
P *Predicted outputs L.. *R (n)4.?R Tu
Note that stress is defined in terms of the ratio between workloadand predicted output. This breaks down into the relationship between the
amount of time remaining to process messages and the number of mes- -
sages still remaining to be processed. Three conditions of urgency aredefined by the various levels of stress:
If S j MI, u x -1, non-urgent;If M I( S 6M 3 , u a 0, urgent;
If M 3 < S, u v +, highly urgeni.
246
I II
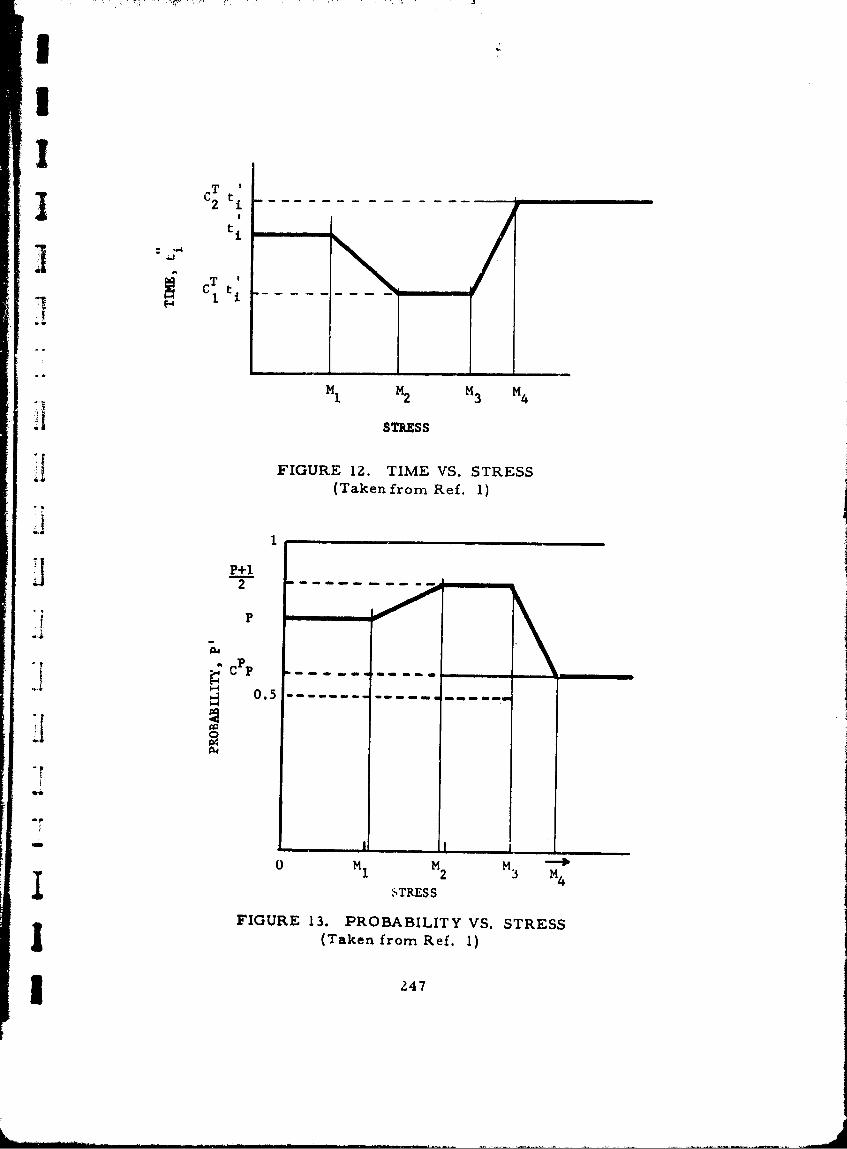
IT
J '2 t
ti
c T t.11
MI M2 M3 M4
STRESS
FIGURE 12. TIME VS. STRESS(Taken from Ref. 1)
Ii P+_.1
pl
-;c P
--0.
0 M M M1. ~23
STRESS
FIGURE 13. PROBABILITY VS. STRESS3 (Taken from Ref. 1)
IZ47
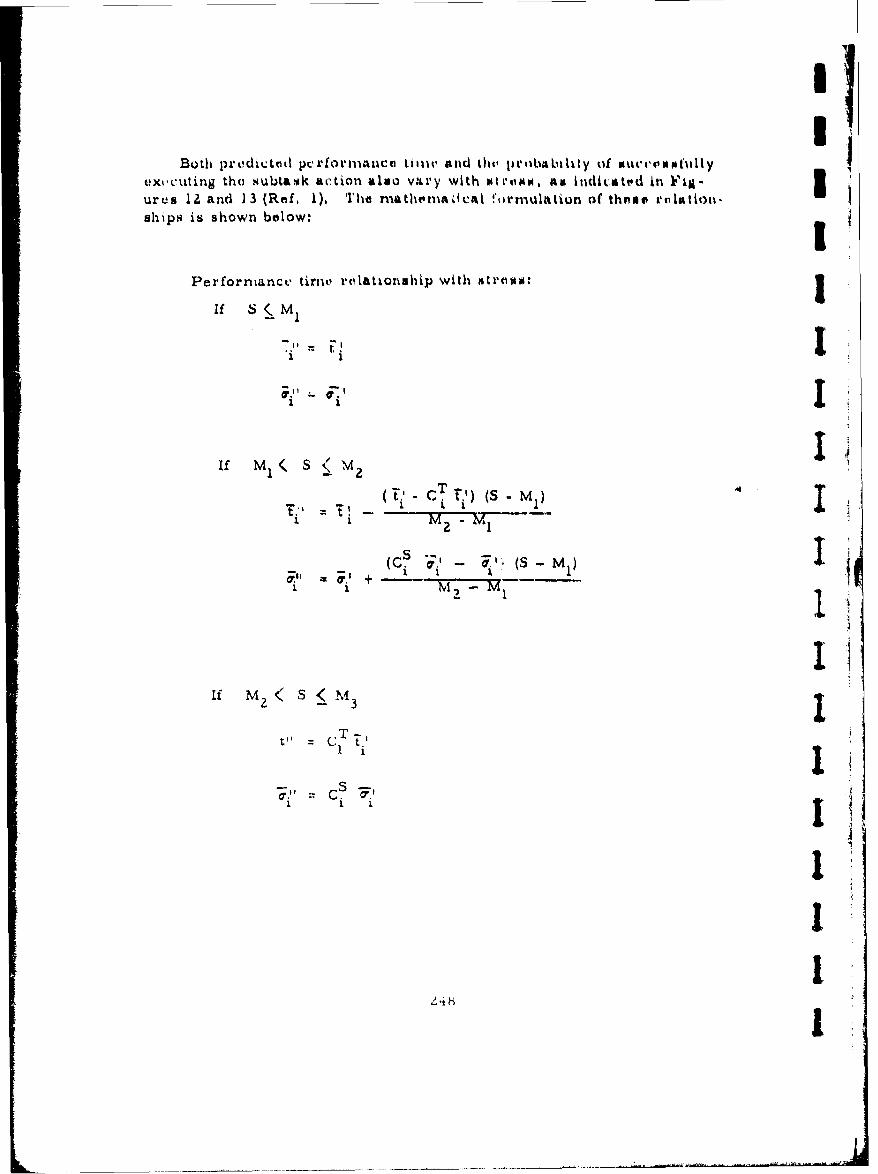
Ii
Both preclii tod pc rformAnco time' and thO prlo•ability tif suec, a pi6illyl
itxcuting the subta.k action also vi'ry with m•I',tig , As i,,dhtatv'd in Fxig -
ur1.s •2 and 13 (Ref, 1). The nmathrtom l c '!ormulatiun of th"eN rolatiohl-shi•ps is shown below:
Perforniance tinme relationship with strois: jIf S \M1
- " M-c �MT ( I(CS - ,l•''--
I
if m 2 < s<M3 I
•,= ci S'V) CT .
1. 1
S4
Z.48
I!
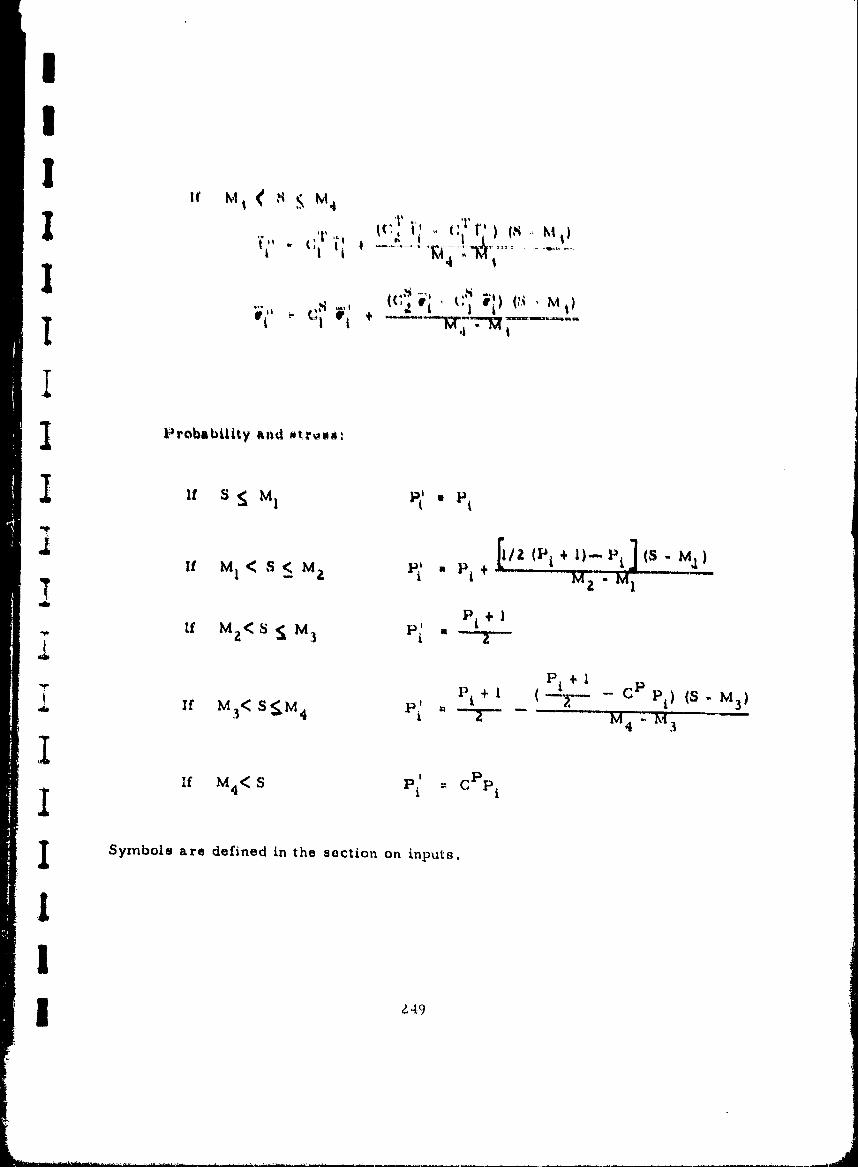
I
If M, < i m
I'"(c , c • {'t, •
I'
I Probability and mtrgui:
if SS m
lif m I<S< m/Z (Pi+ I)--P,](S M)
It mI < s <_ Mz P 1 " . 1' " .
=[P Pi m _if m < S~ S m
P 1 +
Tif M 3 < sM 4 P P1 + I ( C Pd) (S - i 3 )fM M4 WM3!I
If M 4 < S p.1 = CPPii £ 1
SI Symbols are defined in the section on inputa.
4
-- |~4
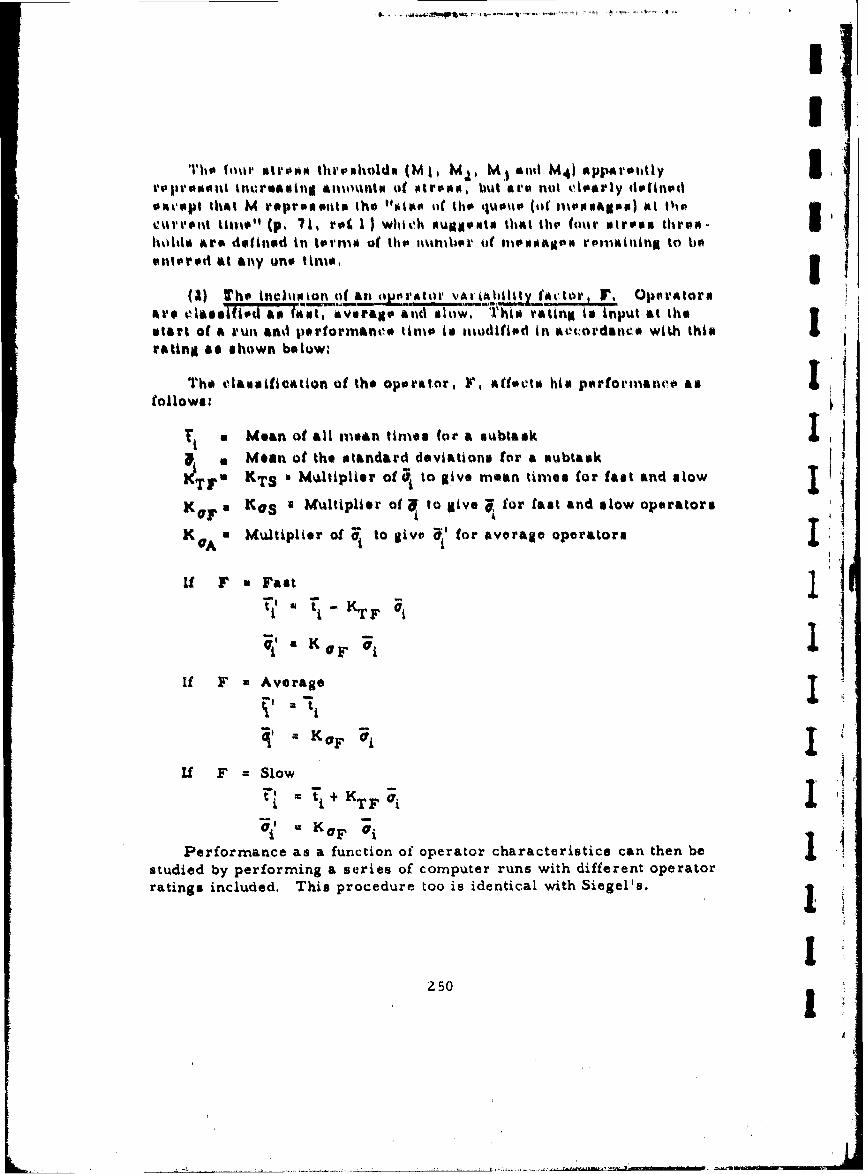
II
Tho I6uar etri.wm thruofholdod (M , M M I anl M4 ) appstrt.itly 3l'jp|ro uont Increasing •mountn of stross, but ar'o not lo•arly doitinedo i'epI that M repreoo lnto the lliii ii( tlt quotk (oIf moo asagoo) at t 0iekrloI-t (p, 71, rot I I which iuggests that th1i (nur strons three -Iholdst are definued tit tornms of tho miInihor Uf 111ssagesl roriatuing to hoentorod at any on* tinms.I
(2) Thto inchkoison ofa Cr~ktorvAviAljitit(Actor r Oportors1kro tCtaussdied Moat. average andi slow, Tihis rating is input at the Iistart of a run and porformanvo time to modified in aeicordan"e with thisrating am shown below.,
Th, classification of the oporatr, F, aiffcts his por'formatw' asfollows:
Ti Mean of all tioan times (fr a subtask IJ. Mean of the standard doviations for a subtauk
2r V KTS a Mudtiplier of Oi to give mean tiniel for fast and slow
K .KS it Multiplier of aF to give , for fast and slow operators
K OA Multiplier of - to give ` for Average operators I
If F Fast 1-, -t I itiUU t i 1Tr0
If F - Average
Uf F =Slow
Of " K F OiI
Performance as a function of operator characteristics can then bestudied by performing a series of computer runs with different operatorratings included. This procedure too is identical with Siegel's.
2Z50I
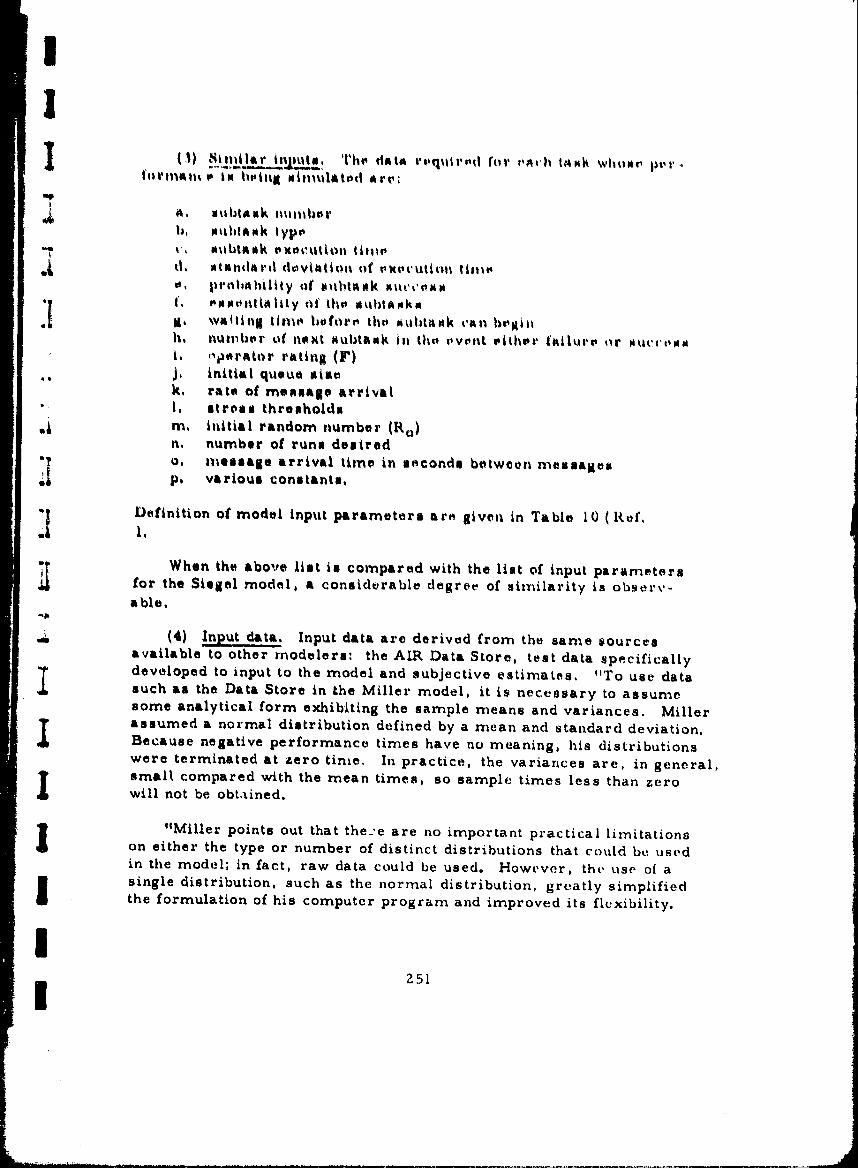
ISI (.i) i'•t.ili ' t a"l '111" data l',,quiri'd (or ,t'A h u4oik wihliol p 'r°
o ilia l•t'1 In h•1 nimig ulattd Art"'9
A, uiubtank iyutoilhtj, muthtApk typo
-. c', OubtRk execution ti11uc
d , AtaidArd Cloviation of exeV utiol- tllit.P•, prohAhility of #%thtak suc'e' N
U, waiting linie ho•fore 11o siubt~itk van htoMi1
h, nu1tiher of next lubtaok it tho sivent 'ithshar failur, or oucc'omoi, operator rating (F)J. initial queue stisk, rate of message arrival"1. stross thresholdstm. initial random numbor (R.)n. number of runs desired
s o, message arrival time in seconds between mnessagesp. various constants,
'I Definition of model input parameters arn given in Table 10 (Rof,.1 1,
for When the above list is compared with the list of input parameters
for the Siegel model, a considerable degree of sin-ilarity is observ-able.
(4) Input data, Input data are derived from the same sourcesavailable to other modelers: the AIR Data Store, test data specificallydeveloped to input to the model and subjective estimates. "To use datasuch as the Data Store in the Miller model, it is necessary to assumesome analytical form exhibiting the sample means and variances. Millerassumed a normal distribution defined by a mean and standard deviation.Because negative performance times have no meaning, his distributionswere terminated at zero time. In practice, the variances are, in general,small compared with the mean times, so sample times less than zerowill not be obtained.
"Miller points out that the.'e are no important practical limitationson either the type or number of distinct distributions that could be usedin the model; in fact, raw data could be used. However, the use of asingle distribution, such as the normal distribution, greatly simplifiedthe formulation of his computer program and improved its flexibility.
251I1
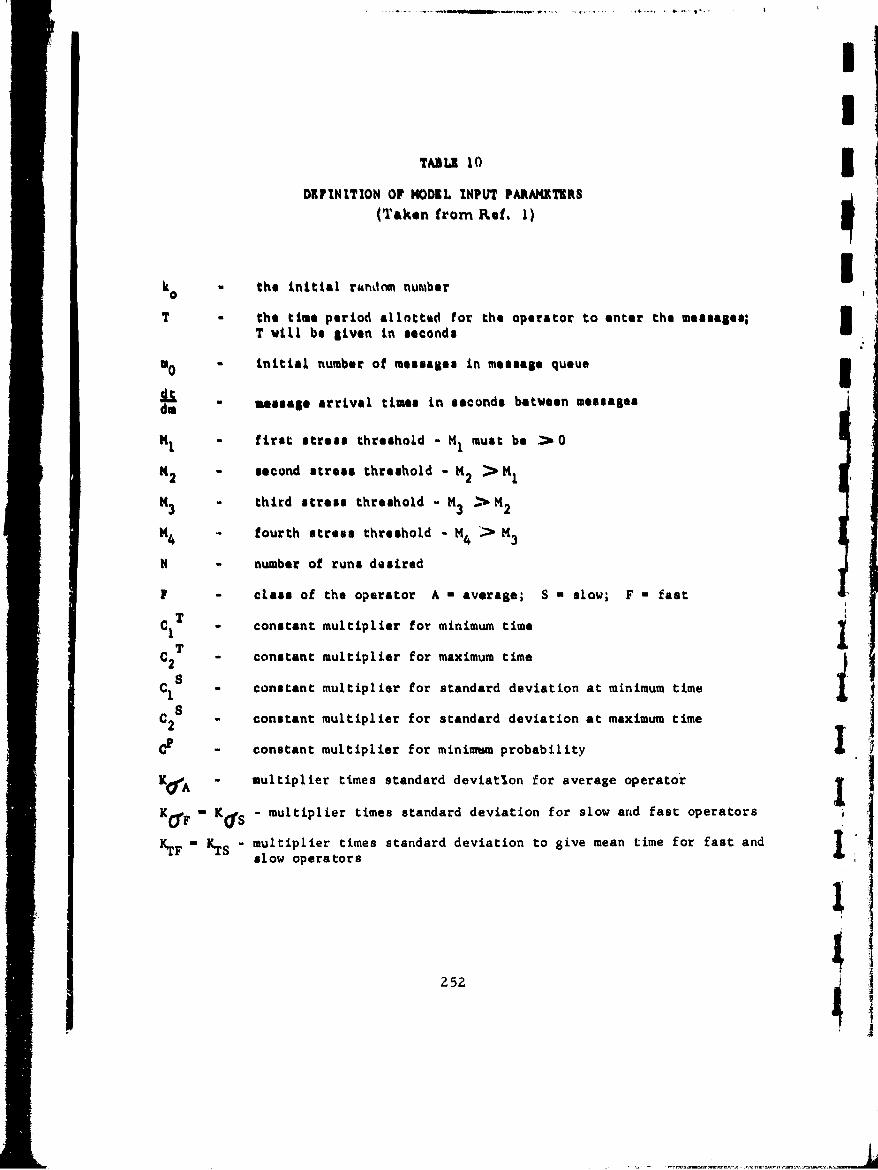
L! I
TAB LK 103DEFINITION OF MODEL INPUT PARAMETERS
(Taken from Ref. 1)
k 0 the initial rundncli number
T - the time period allo~tted for the operator to enter the message*;T will be given in second& I
a initial number of messages in message queue3
i message arrival times in seconds between messages
H first stress threshold - MImust be >0
K2 second stress threshold -2 > 1
M third stress threshold - MK > 233 2
114 fourth stress threshold -. M4 " K3
N number of runs desired
UF class of the operator A average; S - slow; F - fast
,T"C1 I constant multiplier for minimum time
C 2 - constant multiplier for maximum timeS! is o..,o****,,,o*oo*o
C I constant multiplier for standard deviation at minimum time
C2 - constant multiplier for standard deviation at maximum time
C1 - constant multiplier for minimum probability
KiiA - multiplier times standard deviation for average operator
KaF -KaS - multiplier times standard deviation for slow and fast operators
*TF = S - multiplier times standard deviation to give mean time for fast andKrF T slow operators
2521[]252
J i'
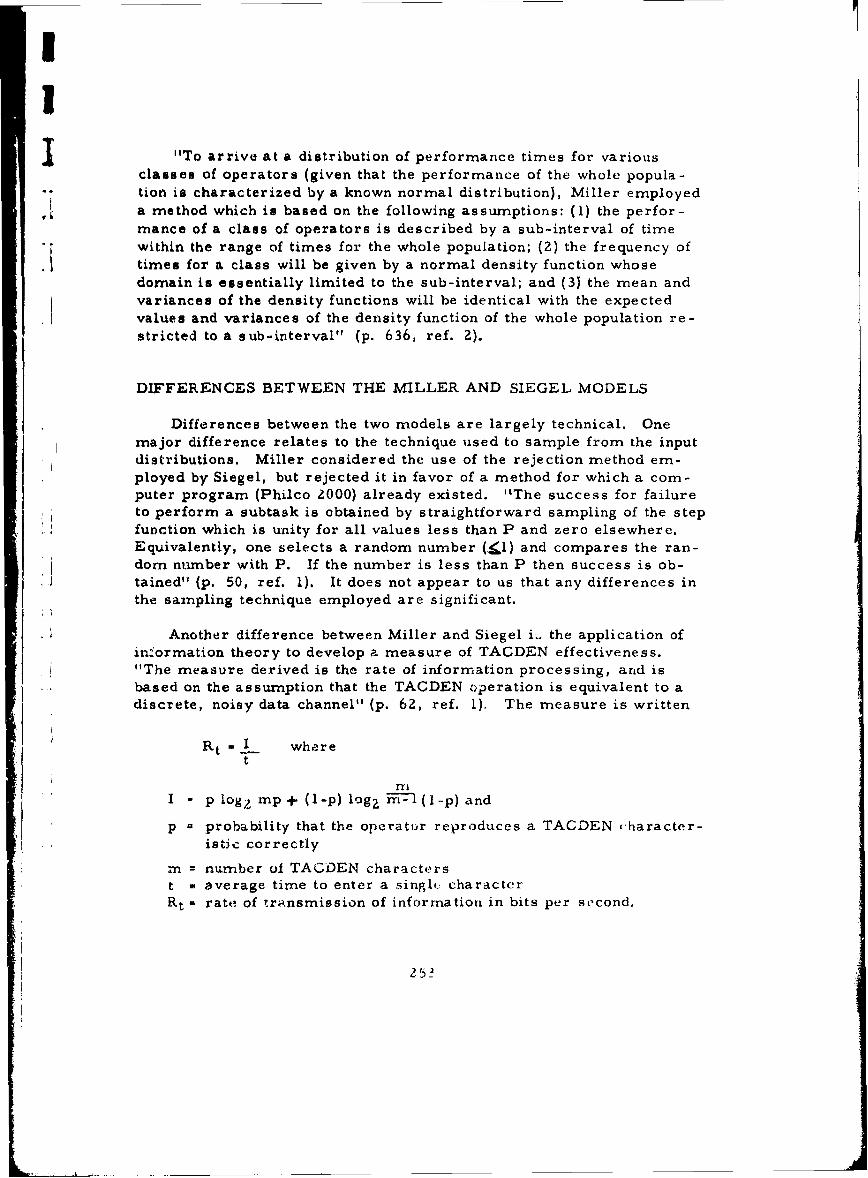
I!
"To arrive at a distribution of performance times for variousclasses of operators (given that the performance of the whole popula-
tion is characterized by a known normal distribution), Miller employeda method which is based on the following assumptions: (I) the perfor-mance of a class of operators is described by a sub-interval of time"within the range of times for the whole population; (2) the frequency of
* i times for a class will be given by a normal density function whosedomain is essentially limited to the sub-interval; and (3) the mean andvariances of the density functions will be identical with the expectedvalues and variances of the density function of the whole population re-stricted to a sub-interval" (p. 636, ref. 2).
DIFFERENCES BETWEEN THE MILLER AND SIEGEL MODELS
Differences between the two models are largely technical. One
major difference relates to the technique used to sample from the inputdistributions. Miller considered the use of the rejection method em-ployed by Siegel, but rejected it in favor of a method for which a com-puter program (Philco ?000) already existed. "The success for failureto perform a subtask is cbtained by straightforward sampling of the stepfunction which is unity for all values less than P and zero elsewhere.Equivalently, one selects a random number (_<I) and compares the ran-doa number with P. If the number is less than P then success is ob-
J tained" (p. 50, ref. 1). It does not appear to us that any differences inthe sampling technique employed are significant.
* i Another difference between Miller and Siegel i.. the application ofinlormation theory to develop a measure of TACDEN effectiveness."The measure derived is the rate of information processing, and is
based on the assumption that the TACDEN operation is equivalent to adiscrete, noisy data channel" (p. 62, ref. 1), The measure is written
Rt = I wheret
I - p log? rnp + (l-p) log, --- (l-p) and
p probability that the operatur reproduces a TACDEN -haracter-
istfic correctly
rm = nun-mber of TAGDEN characterst a average time to enter a singlc characterRt - rate of transmission of information in bits per second.
52S.
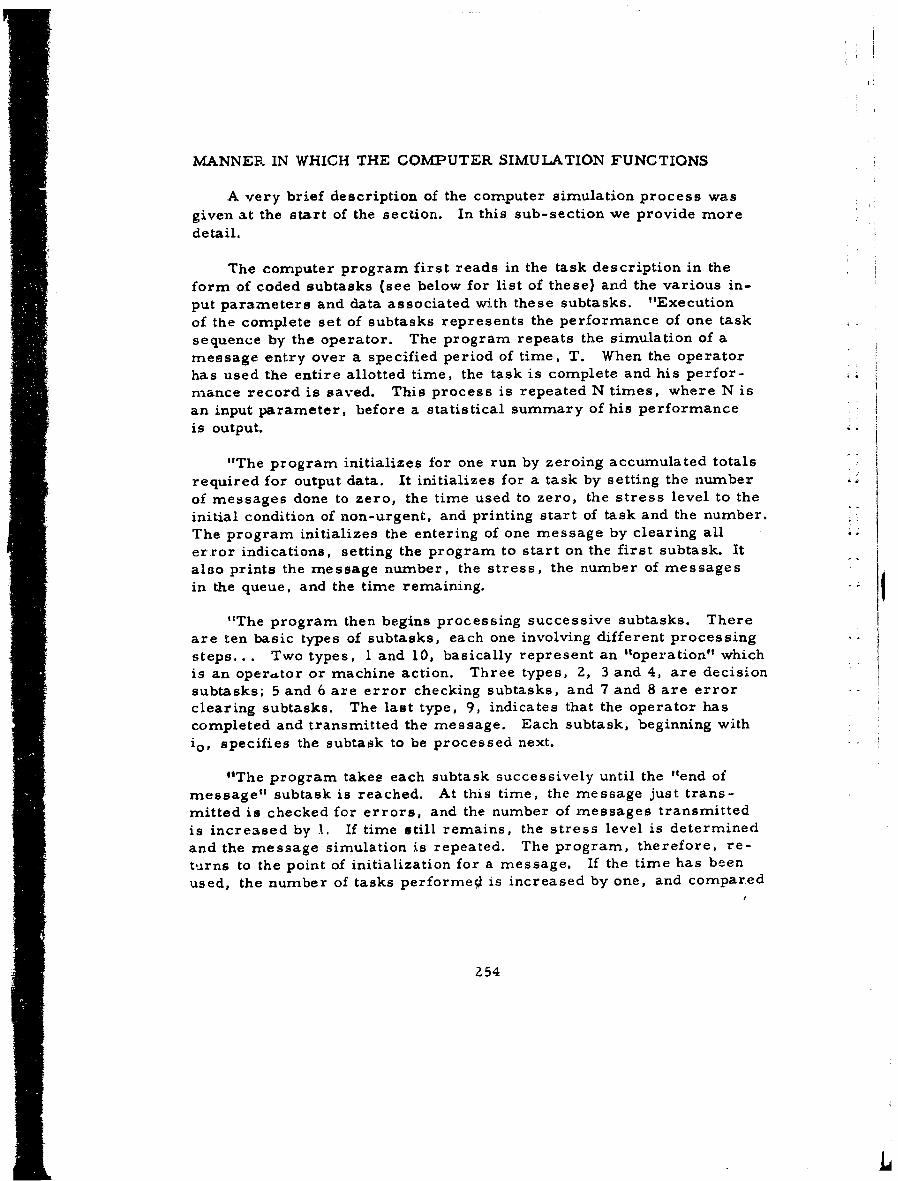
MANNER IN WHICH THE COMPUTER SIMULATION FUNCTIONS
A very brief description of the computer simulation process wasgiven at the start of the section. In this sub-section we provide moredetail.
The computer program first reads in the task description in theform of coded subtasks (see below for list of these) and the various in-put parameters and data associated with these subtasks. "Executionof the complete set of subtasks represents the performance of one tasksequence by the operator. The program repeats the simulation of amessage entry over a specified period of time, T. When the operatorhas used the entire allotted time, the task is complete and his perfor-mance record is saved. This process is repeated N times, where N isan input parameter, before a statistical summary of his performanceis output.
"The program initializes for one run by zeroing accumulated totalsrequired for output data. It initializes for a task by setting the number .
of messages done to zero, the time used to zero, the stress level to theinitial condition of non-urgent, and printing start of task and the number.The program initializes the entering of one message by clearing allerror indications, setting the program to start on the first subtask. Italso prints the message number, the stress, the number of messagesin the queue, and the time remaining.
"The program then begins processing successive subtasks. Thereare ten basic types of subtasks, each one involving different processingsteps... Two types, 1 and 10, basically represent an "operation" whichis an operator or machine action. Three types, 2, 3 and 4, are decisionsubtasks; 5 and 6 are error checking subtasks, and 7 and 8 are error --
clearing subtasks. The last type, 9, indicates that the operator hascompleted and transmitted the message. Each subtask, beginning withio, specifies the subtask to be processed next.
"The program takes each subtask successively until the "end ofmessage" subtask is reached. At this time, the message just trans-mitted is checked for errors, and the number of messages transmittedis increased by 1. If time still remains, the stress level is determinedand the message simulation is repeated. The program, therefore, re-turns to the point of initialization for a message. If the time has beenused, the number of tasks performeol is increased by one, and compared
254
m!t

I to the number requested. If an insufficient number have been completed,the program returns to the task initialization. If sufficient tasks havebeen completed" .. the output data are compiled and printed (see below)"(pp. 7Z-73, ref. 1).
A more detailed description of the above process in relation to thevarious subtasks dealt with is given on pp. 85-qi of ref. 1.
3 MODEL OUTPUTS
The following is a list of outputs provided at the conclusion of a"series of computer runs:
1. Mean and standard deviation of messages entered in timeallotted
jZ. Percent of messages entered incorrectly
3. Mean and standard deviation number of errors per incorrectj message
4. Mean and standard deviation time to enter a message
5. Mean and standard deviation time to enter a correct message
6. Mean and standard deviation time to enter an incorrect message
7. Percent of runs ending in a non-urgent level of stress
"8. Percent of runs ending in an urgent level of stress
9. Percent of runs ending in a highly urgent level of stress.
LEVEL OF INPUT DATA
The level of input data is quite molecular, since the success of pro-babilities and completion times entered into the computer are for sub-tasks, e.g. , position stylus, set switch, observe light, etc. This is
* required because the computer is simulating individual operator actions,which comprise tasks. This is entirely comparable to the level of data
255
required by Siegel's 1-2 man model. It must be pointed out again that 3a very molecular level of input data is required by any simulation me-thodology because the simulation reproduces individual operator actions.In other words, data are required for the simulation model at the samelevel ot detail as indicated by the individual behaviors of the personnel"whose performance is being simulated. This imposes a greater burdenfor data input than might be required by a non-simulation methodology(although some of the latter also require detailed information). Thepoint is that since a non-simulation model is not required to reproducethe individual behaviora of the operator, it can select any level of inputwhich will provide a reasonable prediction.
VALIDATION STUDY
The validation study performed by Miller et al. is of special interestto us because it reflects on the general validity of the digital simulationmethodology. The study used 8 operators who had previous familiarity Iwith the TACDEN device and who knew how to type. The experimentalsession involved 10 messages and 4 stress levels of 12, 10, 8 and 6minutes to complete. The same 10 messages were used for each stresslevel.
Analysis of variance statistics were used to determine the effects of Toperators, messages and stress level and their interactions on messageprocessing time and number of uncorrected errors. Only the results ofthe first 5 messages were included in the analysis, since large gapsexisted in the data of the remaining 5 messages at high stress levels. Oi
All three primary sources of variation had significant influences onprocessing time, but stress did not appear by itself to affect the number ,
of uncorrected errors significantly.
What is of more interest to us in the degree of correspondence be-ltween the TACDEN simulation predictions of performance and the per-formance actually achieved by operators. The following table providesthe essentials of the comparison.
2
=•!14
gz" L
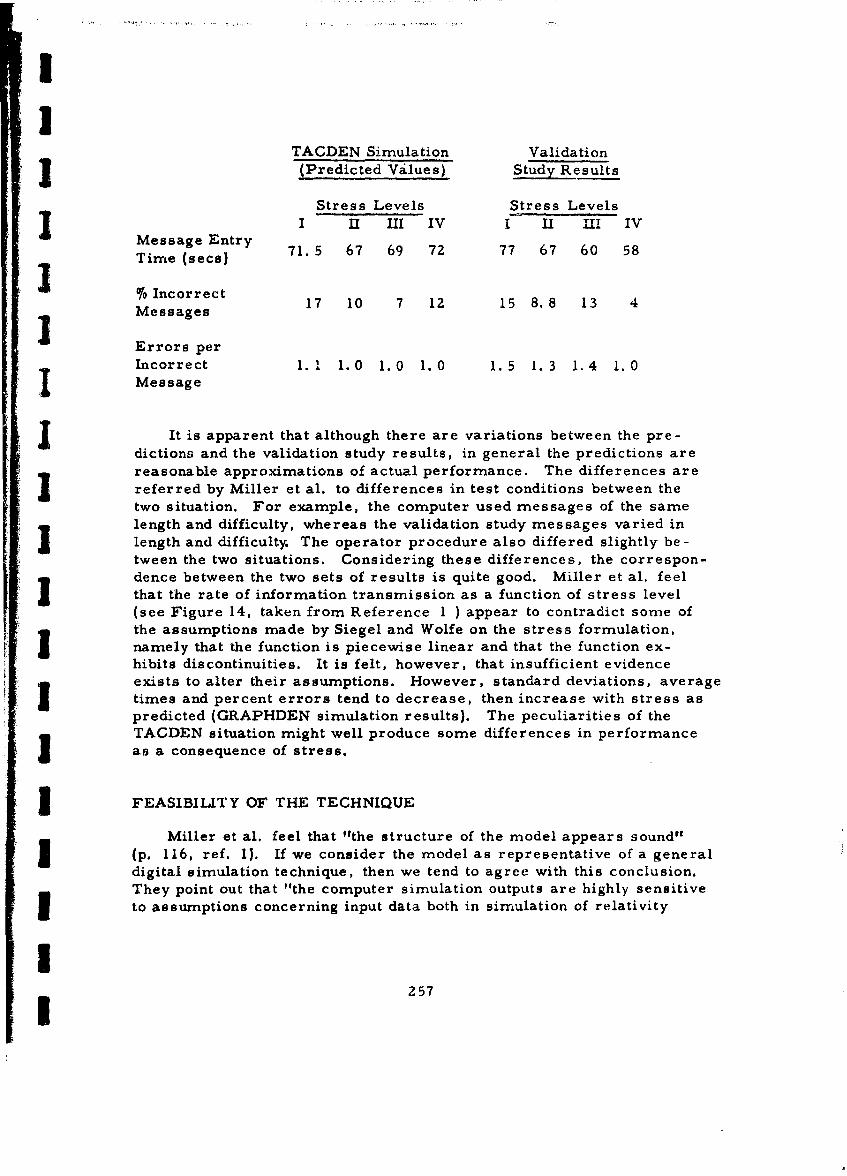
I
TACDEN Simulation ValidationJ(Predicted Values) Study Results
Stress Levels Stress LevelsSI II III IV I II III IVTime (secsa 71. 5 67 69 72 77 67 60 58
I %Incorrect 17 10 7 12 15 8.8 13 4
I Messages
Errors perIncorrect 1. 1 1.0 1.0 1.0 1. 5 1. 3 1.4 1.0
I Message
It is apparent that although there are variations between the pre-dictions and the validation study results, in general the predictions arereasonable approximations of actual performance. The differences arereferred by Miller et al. to differences in test conditions between thetwo situation. For example, the computer used messages of the same
length and difficulty, whereas the validation study messages varied inlength and difficulty. The operator procedure also differed slightly be.-tween the two situations. Considering these differences, the correspon-dence between the two sets of results is quite good. Miller et al. feelthat the rate of information transmission as a function of stress level(see Figure 14, taken from Reference 1 ) appear to contradict some ofthe assumptions made by Siegel and Wolfe on the stress formulation,namely that the function is piecewise linear and that the function ex-hibits discontinuities. It is felt, however, that insufficient evidenceexists to alter their assumptions. However, standard deviations, averagetimes and percent errors tend to decrease, then increase with stress aspredicted (GRAPHDEN simulation results). The peculiarities of theTAGDEN situation might well produce some differences in performanceas a consequence of stress.
FEASIBILITY OF THE TECHNIQUE
Miller et al. feel that "the structure of the model appears sound"I (p. 116, ref. 1). If we consider the model as representative of a generaldigital simulation technique, then we tend to agree with this conclusion.They point out that "the computer simulation outputs are highly sensitive3 to assumptions concerning input data both in simulation of relativity
I257I
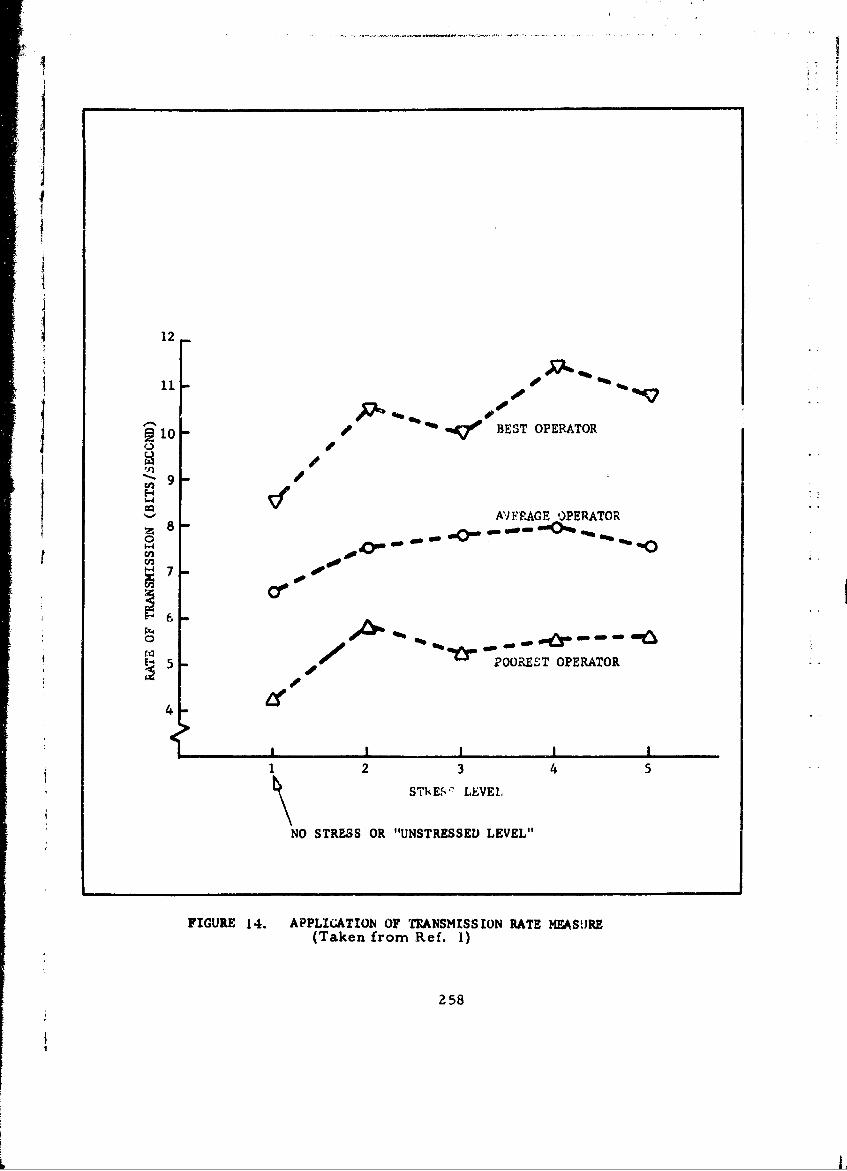
I- -
12
0 s10 -Ave BEST OPERATOR
A"FRAGE OPERATOR
""*0- -tft aft 4
7 5- or6 -
00
43
i1• 2 3 4 5S2 SThEf, LEVEL
NO STRESS OR "UNSTRESSED LEVEL"
FIGURE 14. APPLICATION OF TUANSMISSION RATE MEASURE(Taken from Ref. 1)
258
L
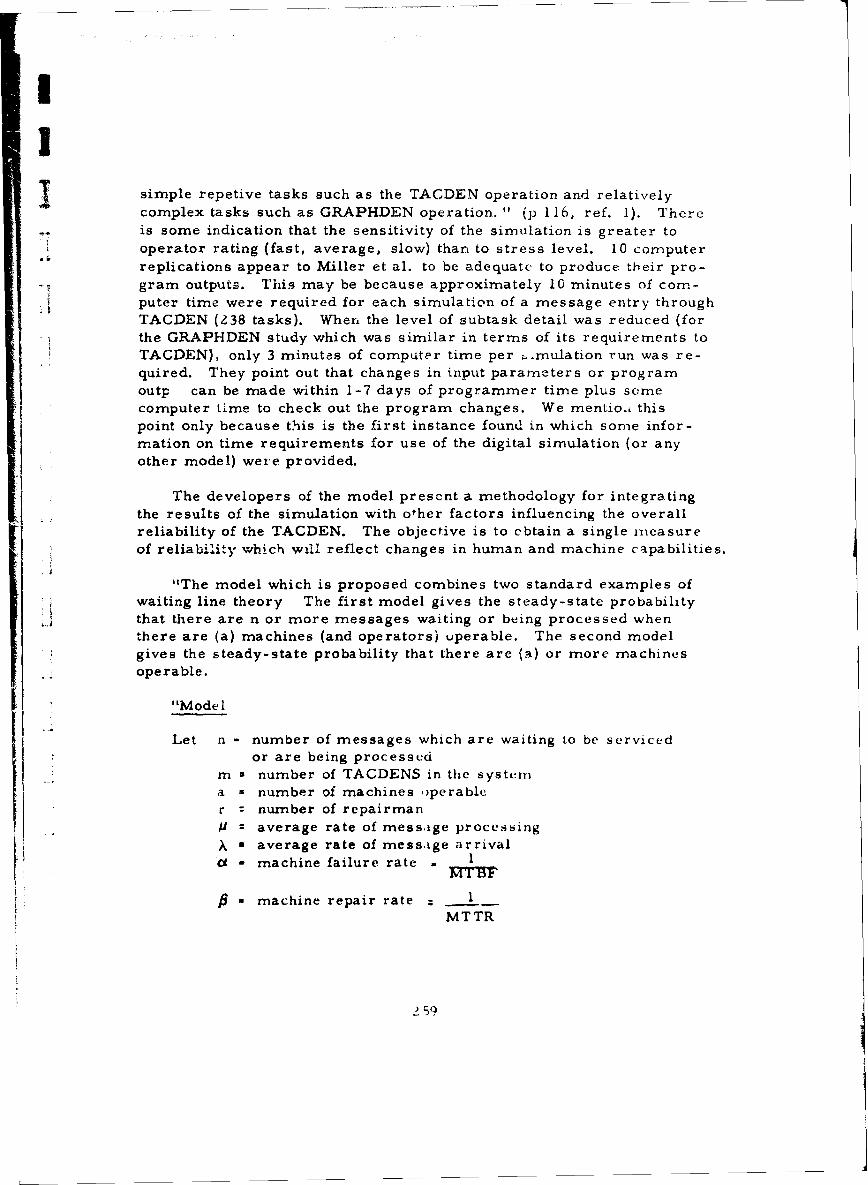
simple repetive tasks such as the TAGDEN operation and relativelycomplex tasks such as GRAPHDEN operation. " (p 116, ref. 1). Thereis some indication that the sensitivity of the simulation is greater tooperator rating (fast, average, slow) than to stress level. 10 computerreplications appear to Miller et al. to be adequate to produce their pro-
-• gram outputs. This may be because approximately 10 minutes of com-puter time were required for each simulation of a message entry throughTACDEN (238 tasks). When the level of subtask detail was reduced (forthe GRAPHDEN study which was similar in terms of its requirements toTACDEN), only 3 minutes of computer time per ;.mulation run was re-quired. They point out that changes in input parameters or programoutp can be made within 1-7 days of programmer time plus somecomputer time to check out the program changes. We mentiot this
point only because this is the first instance found in which some infor-mation on time requirements for use of the digital simulation (or anyother model) were provided.
The developers of the model present a methodology for integratingthe results of the simulation with ofher factors influencing the overallreliability of the TACDEN. The objective is to cbtain a single measure
of reliability which will reflect changes in human and machine capabilities.
"The model which is proposed combines two standard examples ofwaiting line theory The first model gives the steady-state probabilitythat there are n or more messages waiting or being processed whenthere are (a) machines (and operators) uperable. The second modelgives the steady-state probability that there are (a) or more machinesoperable.
""LM ode I
Let n - number of messages which are waiting to be servicedor are being processed
m a number of TACDENS in the systema x number of machines operabler = number of repairman
-1 average rate of message processing
X * average rate of mess.ige arrivalo- machine failure rate . I
* machine repair rate 1MTTR
2 59
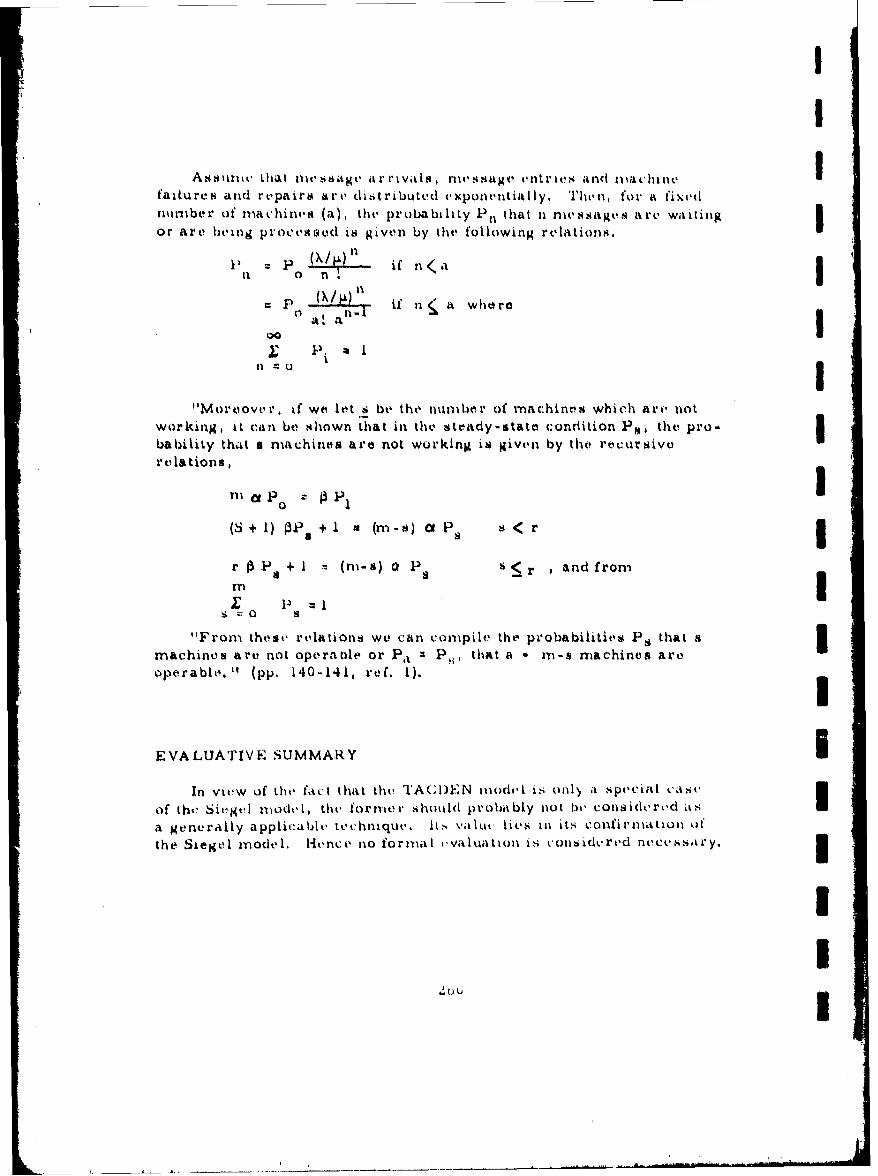
II
Ass i&u that met'ssag a rrivals , rues sag~e vntrws an 0( ac hi ncfaiture s and repairs art, distributed exponentially. Then. for a fixednumbrber of machines (a), the probability 1 0 that n ni s•s•ages arv waiting
or are being procte-s ied is given by the following relations.S= 1- X×/0) ,Ifn,
f o n ! I
= P (X /- if n a where0 at a
I 1 )- * I
" Moroover, if we let s be the number of rmachine s which art, notworking, it can be shown that in the steady-a tate condition P 5s, the pro-bability that a machines are not working is givein by the recursiverelations,
(8 + I) PP + I (mr-N) CA P s < r Ir ~ +) a P < r , and fromN Sm
E P =
"From these relations we can compile the probabilities P. that s 3machines are not opera nle or Fl, P,", that a - m-s machines areoperable." (pp, 140-141, ref. 1). I
EVALUATIVE SUMMARY iIn vie-w of the fact that the TACI)EN model is only a special cast,
of the, Siegel moodel, the former shoutld probably not be) considerred as
a generally applicable technique. Ilts lies in its conlirnlation of
the Siegel model. Hence no formal ,val uation is considered necessary.
uI

I
|I
REFERENCES
1~ . ?AM ik-r, G. X,. * I Hum iihI FacitIors A2)ý. ' RelUt HiR~eport UZ296, Final lRopovt" C.,rtrat t DA ý6-0 V) S(;-()0877 for tIII%
"U. S. Arruy Elec'tro•ic',, Ikosv,'rch and D)t'v 'plI'l nw't l.abo r"toris,Ft., Monmouth, Nw Jersiy, a'nmiry 19•,I.
2. Meister, D. Miethotds of Pri'di,'ting Htiuman IRoliability in Mll -M, hii ,Systemnsa, Hun-tan Factor.s, 196-1, b(6), aI -646.
I
I1II
II'
,!!~b
II3 III. BOOLEAN PREDICTIVE rECHNIQUE
INTRODUCTION
I Another variation on the theme of digital simulation methodspioneered by Siegel is the technique described by Gregg (Reference 1).The major difference between this model and that of Siegel's 1-2 manmodel is the use of Boolean algebra to model the operator's behavior."The sequential dependencies between operator responses and machinefunctions are modeled in Boolean algebra as a set of cause/effect/timerelationships" (Ref. 1, p. 44). The model is processed on an IBM 7094using a set of programs called the Discrete Network Simulator (DNS).In the DNS each event is represented by a Bool,,an change of state (0 to1, 1 to 0) as a result of a logical cause and effect relationship amongsystem elements. The program produces a time history of these binarystates. The human is modeled "as a set of switching functions or relays"
-, (p. 47, Ref. 1).
GOALS
According to the developer, studies using the methodology should"A help to determine
(I) The effects of error and equipment malfunctions on task"performance.
(2) The effects of stress "and other adverse conditions" on operator"performance.
(3) Human error probabilities inherent in system design.
(4) The degree, amount and location within the task sequence ofoperator loading or under loading.
(5) The comparison of alternative design configurations.
"Modeling of a system in Boolean algebra creates a network analogyof the dependencies and interdependencies among system elements. Eachvariable is assigned a characteristic activation and deactivation time
"". (i. e. , the time required for the effective change of state). The Boolean
model is then processed by the simulation program asynchronously intime to present a time history of the binary states of all variables in the"system. Varying inputs are used to create different environments,
"PRECEDING PAK BLANK.263
IIT
change activation and deactivation times, insert malfunctions, and soforth. The resulting output time histories are then studied to determinesystem performance and design adequacy.
"Major characteristics of DNS are as fcllows:
I. Timing parameters are associated with the variables of the networklogic equations.
2. The Boolean equations and the time parameters are converted to
machine language and placed in necessary reference tables in onepass through the computer, eliminating the need for processingthe model for each simulation desired.
3. Simulation is performed independently of pre-processing or " tcom-pilation", with provision for running multiple cases.
4. The time base is the millisecond.
5. A complete behavioral description of the system under study isprovided by the printout of an event history, by time priority.
6. Lists of the states of every element in the network can be providedat any specified time during a simulacion. " (p. 45, Ref. 1).
E •METHODOLOGICAL SCOPE
Because the methodology models oerator behavior as a set ofswitches or relays, it would seem to be particularly applicable to sys-tems whose operations can be modeled as "go/no gc" functions. Thehighly deterministic nature of the model suggests that it can best dealwith highly proceduralize-l operations but would have difficulty withsystems in which decision strategies (cognitive fun(Ations) are flexible.
ASSUMPTIONS
The model assumes that two sets of variables are involved in -%n'.rman-machine system: subtask variables and operator variables. Theformer consist of the requirements set by the machine design and by themission, and derived Yvr conventional task anaiysia, at a level deternnined
!!!• .-
- =-=- 4
I
by the needs of the simulation user. Basically subtask variables arethe behaviors required of the operator, e.g. , meter reading, control
-- *esponses, etc. Operator variables are such things as degree oflearning, motivation, fatigue, skill level, etc. As of the date of thereport upon which this discussion is based (1964), operator variables
"were not included in the model and were assumed to be constant.
The reader will recognize this set of variables as those employedby other models under different terms. For example, operator vari-ables are included by Siegel in his models as an individuality factor.
The Boolean model is completely deterministic. It includes thefollowing assumptions:
"1. Information flow rate, expressed in bits/second, has a concaverelationship with error probability. There is an information
channel capacity of the human operator, expressed as a pointon the information flow rate axis. Underloading channel capa-city can be just as detrimentikl to performance as overloading...
2. Stimulus discriminability or onset is a function of subtaskvariables. It is primarily dependent upon the hardware charac-teristics, such as display size, brightness and sensory channel
chosen (visual or auditory).
3. The human perceives only one display at a time.
4. Psychological stress is not quantifiable because it cannot bedirectly measured. Nor can it successfully be expressed asa dependent variable in a mathematical formula whose inde-"pendent variables are directly measurable. It can, however,be treated as a binary variable, either on or off. Stress isactivated when certain conditions or events occur such as"the operator falling behind his time schedule in subtask per-formance, (emphasis that of this author) operator errors which
compound the stress condition, or crucial display readings."It is deactivated when such conditions are removed, generally
by manual corrective action.
"5. Unstressed behavior is characterized by high motivation, faci-litation of reactions, and the appearance of psychological set..as an influential agent. When stress is activated, it acts as a
"265
I I
'I
triggir: other behaviors, represented by alternate logicalevent sequences, interfere with subtask performance. Errorprobability increases, particularly errors of omission.
6. There is a normal scanning pattern of the displays by theuperator. This pattern is cyclic but not normally repetitive.Under stress, the field of perception is narrowed, i. e. , the lo
normal scanning pattern is altered. Only those displays whichare the stress-producing agents are scanned.
7. Scanning behavior can be conceptualized as a go-no go situation.The operator, acting as a comparator, either senses "go" ateach instrument and moves on to the next display or senses..no go" (a difference between an actual reading and the requiredvalue), fixes his attention on the critical display and makes acorrective motor response. " (p. 46, Ref. 1).
Some of these assumptions will be recognized as having been includedin previous models. The inclusion of stress as a primary factor is sim-"ilar to, and undoubtedly derived from, Siegel's formulation, but is not asconceptually precise. The fact that the assumptions are not presented inmathematical form renders them somewhat suspect. It is difficult to seehow, if one cannot quantify stress or express it in a mathematical formula,one can treat it as a binary variable, since common experience does notsuggest that the stress response (as opposed to an initiating condition)winks on and off. The concept that stress can be removed by an appio-priate corrective action also strikes this author as somewhat dubious.
In contrast to Siegel's formulations, all stress is treated as a nega-tive factor: unstressed behavior is highly motivated, facilitates reactionsand creates psychological set. Error probability increases with stress.All of these assumptions are presumably verifiable from experimentalresearch, but not if, as the developer claims, stress is not quantifiable.
Although it is highly probable that error probability is related to
information flow rate, it remains to be seen whether the concave rela-tionship postulated actually holds. In any event, the assumption of sucha relationship requires that a mathematical equation be provided in order
to pick off the particular error probability that corresponds to a givenamount of information. (In point of fact, how error probability influencesthe determination of the operator's Boolean state is not indicated, espec-ially since the model output seems to be solely a time history. ) The
"266
"!~IT
developer's model does not suggest this equation. Since error proba-bility also increases with stress, it would seem that some relationship
__ should exist between information flow rate and stress, but no suchrelationship is indicated.
A major assumption which is only implied by the model descriptionis that error is inconsequential in system performance because theoperator will invariably succeed by correcting any erroneous responseshe makes. Error is important, but only as a means of causing a chrono-logical mis-match between the mission time requirement and actual eventperformance. It is, however, possible for a model with this assumption
- t to output a measure of the frequency of successful performance, becausedegree of success depends solely on whether or not tasks are performedin the required time frame; if they are performed late, the missionfails.
The assumption above is implied by every model which focuses onn~INthe time factor and ignores error. Whether one can accept such a sweep-ing assumption is something the model user must decide for himself.Such an assumption is reasonable only if the system operator has achieveda certain minimal level of proficiency.
SI PARAMETERS
The model parameters have been discussed in some detail in thesection on Assumptions. Particular attention should be given to the stressformulation, although as far as is known, no use has been made of it intesting the model. As the developer states (p. 49, Ref. 1) "The founda-tions of the theory are stimulus-response, a normal scanning patter ofdisplays, the use of stress as a trigger of alternate behavior chains..."
The developer points out that each subtaGk element (e. g. , monitorattitude display, activate retrothrust switch) is a single stimulus-responseunit. There is a determinable start and completion for each such element.
The operator's normal scanning pattern can be interrupted by prioritiesduring critical situations such as stress. Apparently there is a priorityinterrupt feature in the program. Alternative behavior chains are pro-vided "to predict behavior due to stress" (p. 47, Ref. I). presumablythese reflect decision-making sequences which are triggered by a stress
condition.
21 267
II'
As far as the essential parameters of this model are concerned,the elaboration of the model (at least as presented in reference 1) isinsufficiently detailed to indicate how the parameters are used to pro-duce its outputs.
DATA
1. Input Data
The primary input data requirement is for response times for thevarious subtasks. There is apparently no need for error probabilitydata, on the assumption that error is irrelevant except as a delayingfunction, humans correcting any erroneous actions inevitably. Thisties in with the model's primary interest in the time history of thesystem (an orientation similar to HOS and ORACLE). The effect ofan error is simply to delay performance of the correct response; systemfailure occurs if the error effect is such as to prevent the last milestoneevent from occurring at its required point in time.
The fact that the model is very deterministic enforces a requirementfor very precise input data (stochastic models can take advantage of the"error slop" involved in input data distributions; deterministic modelshave much less margin for error).
2. Data Sources
Presumably response time data could be secured from any source,such as the AIR Data Store. However, the developer implies the neces-sity for gathering these times from a physical simulation apparatus (inhis case something called TRANSAT), which resembles the systembeing modeled. This might increase the accuracy of the model, but itis unlikely that every potential model user would possess a simulator toprovide him with the required data. The question might be asked, more-over, why one would need a model at all if one had to have a simulatorand exercise it before any significant outputs could be derived.
If one accepted the implied requirement (for simulation data as in-puts to the model), it would severely limit the utility of the model. It isour feeling, however, that this requirement was primarily for purposesof testing the model in its formative state and is therefore not a firmrequirement for its use.
Z68
I,!,
S3. Output Data
J The output of the model is a prediction of the times when certainrequired actions would be performed as related to the mission scenario.As indicated above, error occurs when the time of actual performanceI• of an event does not match the time when it is supposed to occur.
SIt is suggested, m oreover, that a distinct perform ance m easure isnot output and that "the simulation is interpretive rather than computa-tional" (p. 46, Ref. 1). Presumably an interpretation must be made ofthe time histories output by the model. This last feature bears somesimilarity to the use made of the outputs in Wherry's HOS.
PROCEDURES FOR MODEI APPLICATION
1. Analytic Method
As with other models a comprehensive task analysis is required asi -. a preliminary to application of the model. Analysis is down to the task
level, e.g. , "reiceive/transmit parameters", but there is an implicationfrom the assumptions dealing with information flow rate, scanning pat-
.. . terns, etc. that a more detailed analytic level is required. However,as is usual, the developer provides no detail, about how the task analy-sis is to be conducted.
Essential elements of the task analysis are flow charts and circuitdiagrams of the subtask sequences. Subtask sequences are coded on the
circuit diagram in accordance with the following Boolean operators:
nand
S÷ - inclusive or
S/ a not (complementation or negation)
A given subtask sequence would then be written in terms of codenames for the subtask elements plus the necessary operators. For
-, "example, subtask 5 (monitor velocity display in pre-retrofire) wouldbe represented as MONVEL whi-h is equivalent to MONATT (monitorattitude display) * / VOCRET (receive retrofire command). In otherwords, monitoring the velocity display involves also monitoring attitudebefore receiving the retrofire command.
26
-. illi Z 69

I
InIANTICIPATICI) MOl)EL UNSI~
In tot rina of the potenitial model uote we havo li~otulatud (proieted1%'tm.aof system effoctivenees, design analysip, nianpowri mi, mlvelion and I rainming), this model to primarily useful for dvaigmi tt1alysis, Infoi'iationreceived from one )f the people who holpod apply the modil It that thedeveloper's major goal was 1tto dotarmiti, where th" dhlayo will ot-tiurdue to human engineering ahort'omingsi" (Rea. 2).
The model could be used for prdicting syatrm off.ctiveness, butonly with great difficulty, because despite all tho rodomontacle providedby its developer, it is not really designed as a predictive tool, Presum-ably, it' ono had two different deosgn configuration#, and compArod por.formance of the model with each configuration, a choico betwoen the twocould be made, but the adequacy of this comparison would depend on howsensitive the model inputs were to design differences, and no informationon this point in provided.
In fact, because the task descriptions required for the model do notseem to reflect any design parameters, there is some question in thisauthor's mind about how the design analysis could be performed, Themodel is not designed for nor could it be very usefully applied to deriveselection and training outputs.
VALIDATION /APPLICATION STUDIES
Information on this subject is not provided by the developer, Refer-ence 2 indicates that the model was exercised, simulating some datagathered on the TRANSAT re-entry simulator; and that the model outputsagreed quite well with actual performance data. However, as referenceZ points out, this "should be no surprise" because "many of our para-meters were established in TRANSAT for the model (time constants), . .
The author cannot feel therefore that this represents an adequatevalidation of the model. Apparently also the model hal not been appliedto any system development project.
It is difficult on the basis of the very inadequate information providedto make an adequate evaluation of this model. There is some doubt whe-ther the methodology can be considered a general model ("theory ofoperator performance", p. 46, Ref. 1) as its developer apparently in-tended it to be.
270
IVLAI~'tSMA
'., Applit alhity: O PlII li timl pari't~tik11 ,I pvt'ttltvvi itim'
* ~~~Mode~l Chaatr~tt
1, Grogg, L, '.A Digital Gonmpultor Ttichanjitie fur Opertor wPerfor.mance Studieii, Proctotdingm, Fifth National Synmpomium~ on~ HuniatFactors in Electronics, May S-.b, 1964, Sam Diego, CalifurniA,sponsortvd by thev P rofessMionlal To chnical Groutp Humitn Factors In
* ~Electronics of the 1I1EE (pp. 44-51).
4. Freitag, Mv. (Perzsonal cummuniurta tion to Othe auithor, ý10 A ugust1971).
271
I
IV, THE' HUMAN 0PHItATI'O, SIMULATOK
i I NT IOI)U T TION
W Wa h$i' tltotndui1t a, o t, S0lPI' 0', MtIIeI''01, whichhlvo1V1tIl o~ll ligo of compltitlormtol' n ml ot N h o11•| lhalvhi Al bu'II• •P 0|tS Wholrrylit
I "14AI Opp•'ator' StimilAtlr (110S) has vorl'ltaitt %A| t toris•l i M which dif•or-I n1tiate it fromt he 1110othl•s,
r4oI p¢xlAmIslo, Whatl'ly mAIko thet jiLh it that -hI I i mitt: A mAAn,,iachinltIaiOdel per so, but rlthol' a aonoeral pu rposio uma modol'" (Hoalt, J). y thiswe iifoer' that W herry makem a distinction betwoon tho mimhulamtad human
-' Operator (thie niodl itself) and aniy opticific syctlm wIth which that operni-tor must intoract. "For HOS to be used for a specific nystom, (goial oriented)procedure@ which the operator in to use with that systom mIust be pre•par•through the use of the Human Operator Procedtkres (HOPROC) languageand enc•oded for HO through the HOPROC Assambler and Leader (HAL)prugram. Further, the displays' and controls' location munt be input toM[OS. Finally, there must be a stmulation of the system hardware, the en-vironment, and any targets of' interest since they will both directly andindirectly determine what occurs during a simulation run" (Ref. 3). Thiswriter is not sure that the distinction, although interesting and technicallycorrect, in critically important to the use of the model.
HOS ti not a stochastic model, an are the other computer-drivenmodelm we have reviewed. It does not sample distributions of performancedata. Rather, it relies on equations describing relationships betweenparameters and performance outputs. The equations are of course basedon experimental data, but the use of functional relationships in equationform rather than sampling from distributions tends to reduce the need fordata banks, "since describing the situation properly (i. a., the procedures,
I tasks, station layout@, etc. ) allows HOS to output whatever data is desired"- i J (Ref. 3)/
HOS is extremely molecular, much more so than the other modelsconsidered, and operates at a very fine level of task element detail. Forexample, it makes use of inputs such as the state of displays and controls(e. g., 5000 feet altitude), their locations within the cockpit, reach distancej and time to reach controls, etc.
Oddly enough, for such a molecular model it is much more behaviroallyoriented than the other models considered. We say this because great em-phasis is placed on cognitive processes, particularly recall, memory decay,strength of recall, etc. which are basic elements in the decision-makingprocess. Other models include the decision-making process, but deal withit as a total entity rather than in terms of the elements making up the
SPRECEDING PAG eOXI 73
decision, Ote milght assuina froin the emiphatis on cle idion - making thittthe in, del was tnot deoterministic, However, the particular decivionii madedepend oti dutorininisitic functions, for oxamplo, the parameter called"hab strength".
Ono other point should be noted. The model in its present form isIspecialiaed for pilot btnavior, Although the developer, Cdr. It, J. Wherry, 4itr. foo l% that it can tbe ada~pted to othe r kinds of systonis.
All things conside red, therefore, one cannot think of HOS asm beingsimply another variation of the general digital simulation model,
GOALS b
"The purpose of HOS in to be a'3le to arrive at accurate data abouthow specified trained op. ratoru will perform specified fhunctions inspecifiod station configurations prior to any 'metal bending' (i. e.,early in the development cycle), be it for dynamic simulation orprototype development.. .. ."(Ref - 3),
Wherry makes much of a distinction between the simulation per seand any uses to which that simulation can be put. He sees NOS as an effortto substitute computer control for the performance of experimental studies."The operator model is to be sufficiently excellent so that its output may beanalysed and used in exactly the same manner as that obtained from anexperiment with a real human operator. Indeed, it is likely that NOS willprovide certain types of data that even the most elaborate human experimentscannot" (p. 1-1. Ref. 2) . For its developer, then, 8OS is not merely orprimarily a methodology for evaluating man-machine system effectiveness.
The developer emphasizes these points,
"I,, The problem of getting adequate simuiation of a humanoperator has little or nothing to do with the problem of analyzinghuman operator data; b. the problem of being able to relatehuman operator data to system -effectiveness criteria is another
(1) Wherry notes, "HOS is not a model of a pilot, but a generalmodel for any seated operator whose primary task is to observe dis-plays, compute internal mediated functions, make decisions, andmanipulate controls. As such, HOS can be used (i. e. , "tailored" tobe, through writing appropriate procedures and defining appropriatedisplays and controls) as a pilot, a sensor operator, a tank driver,a truck driver, a command and control operator, etc. " Present plansare to expand HOS to include a capability for operator mobility, trans-port of objects and object use.
/.74
II
I and sepa rate problem; c. the ability to arrive at suggested modi-fications to station layouts given that one can relate operatorperformance to system performance is still another problem;d. let's not get these problems confused; they are separate anddistinct ones, but accurate human operator data is critical tothud iterative cycle; ..... f. the purpose of HOS is to be able toarrive at accurate data ..... 1 (Ref. 3)
Although the diNtinction between the simulation and its uqes is wellI taken, for our purpose, which is to examine predictive models for theiruse in answoring system development questions, the distinction is not im-portant, Implicit in the development of any model are the uses to whichthat model is to be put, whether or not these uses are explicilly stated.The "pure" scientist need be concerned only about "gathering data",but data gathering without at least an implied use of those data seemssomewhat pointless.
Although the reference documents for this model are somewhat reticentabout goals for HOS, we can infer these goals from the very distinctions thedeveloper makes, For example, he cites the problem of relating operatordata to system-effectiveness criteria, from which we can infer that one ofthe implied model goals is to estimate the effectiveness of a system. Inreferring to Human Operator Simulator programs, Wherry says "thoseprograms,would provide valid data on how well trained and motivatedoperators will be able to perform their tasks in a given system during aRiven mission" (p. 2-5, Ref. 1). The ability of a model to suggest redesignpossibilities is indicated by the earlier reference to station layouts. Theapplication of the model to training requirements is indicated by the state-ment
5 "The outputs of Human Operator Simulator programs could be usedto identify periods of maximal load, frequency of usage, etc. andthus determine what procedures and mission segments on which toconcentrate during the training period" (pp. 2-6, 2-7, Ref. I).
Wherry also suggests the possibility that two complete simulationscould act as adversaries for each other. "This real pilots and othercrew members could be trained against targets which "intelligently" attemptto attack....." (p. 2-7, Ref. I).
5 It is apparent therefore that HOS, like the other models describedpreviously, has goals it attempts to achieve, and these goals are very simi-lar to those of the other models reviewed: estimation of system effective-ness, the comparison of alternative design configurations and the suggestionof redesign possibilities and suggestions for training requirements. In alater section we will discuss how well these goals can be achieved.
2I
i 275
DEFINITIONS AND ASSUMPTIONS
"The HOS model considers an operator to be an intermediary func-tion between a mission described as a series of tasks and the objectivesof that mission.... The operator has two types of interfaces with thesystem: controls and displays .... The operator utilizes a tool, thehardware system, under the dirertion of a set of procedures ......(pp. 1-5, 1-6, Ref. 2).
This concept is essentially the same as that which underlies all otherman-machine models.
In consequence HOS consists of four major components:
(1) the simulated human operator;
(2) the procedures governing system operation;
(3) the physical layout of the operator's workspace;
(4) the mission to be run.
Special attention should be paid to item (3) immediately above. Theinclusion of the physical layout of the workspace as one of the main com-ponents of HOS means that, if that layout is properly taken into account,HOS will be highly sensitive to the design configuration of the system. Itwill be recalled that one of the commrents made by this author relative to7the other models is that they seemed to be insufficiently sensitive to de-sign. Apparently that objection cannot be made about HOS.
The other major components have their analogues in the othermodels, in particular the procedures to be performed and the tasks (mis-sion) to be completed.
Another common sense assumption is that the operator knows whatis to be done and how to operate the system. Perhaps for this reasonthe model does not deal with success probability. Given that an operatorrecalls an instruction, he will perform it correctly; the only element ofuncertainty is how long it will take him to recall the proper procedure.The point is that there appears in this model to be no possibility that theoperator will make an error. In view of the fact that pilots do makeerrors, the failure to consider error in this model -if this is indeed thecase - represents a serious deficiency. 2
(2) See Appendix I to this section on HOS and Human Error.
276
II!
Another important assumption is that "it is a premise of the mndclthat all operator actions are composed of relatively few basic activities"(p. 2-4, Ref. 2). For example, if an action is to "manipulate throttle",we might find that the "manipulate" instruction itself breaks down to"I "r-ach" and "twist" actions. The consequences of this assumption is themicro-level of detail noted previously; the simulator must take more molarbehaviors and decompose thcm into their molecular constituents. To dothis the HOPROC language contains a set of statements which define the"molar instruction (task) as more molecular (subtask) behaviors.
In order to provide a sufficient amount of flexibility in th.- model,instructions or tasks--- e.g., alter desired position of throttle to 50Y0---are defined as goals for the operator rather than as rigid actions for him
- -to take. In thetrottle example given previously, the concept of the task4• as a goal "causes the operator to adjust the throttle setting if the throttle
is not at 50 percent, but to do nothing if the throttle is already at 50 per-cent and he knows it" (p. 2-5, Ref. 2). The concept of the task as a goalto be realized if, as and when circunstances require it provides a certaini amount of flexibility to HOS which other models may not have, and istherefore a very desirable feature.
"This approach to instruction statements enables any operatoractivity to become, in effect, a subroutine, just as in a computerprogram, to be accessed when "desired" by the simulated operator.Thet e subroutines are analogous to operating procedures a manwould learn in a training program. For example, on a certain typeof aircraft a certain fixed procedure is used for the pilot to changeheading. A coordinated turn requires actions to the control stickand r idder pedals plus eye movement to monitor the compass, theturn-and-bank indicator and perhaps, the outside world through thewindow. The same general set of actions is employed each time sucha turn is necessary." (p. 2-5, Ref. 2)
More specific assumptions and the structure of the model will bedescribed in the section on MODEL PARAMETERS.
METHODOLOGICAL SCOPE
HOS in its present formulation is strictly pilot-task-oriented. Thisdoes not mean, however, that the logic of the model cannot be applied toother types of systems and tasks, although a very substantial rewriting ofprogram specifics would probably be required. "The Human OperatorSimulator program should be general enough so that it could be used tosimulate any kind of operator". (p. 2-7, Ref. 1).
277
In its present application, therefore, we must consider the modelas restricted to the simulation of pilot behaviors. This is a serious re- Istriction in comparison with models that can be applied to a variety of
systems. Wherry may well challenge this point on the grounds that HOSis independent of particular system inputs that are applied to it through IHOPROC. However, the HOPROC language is so specialized to flightmissions that it would, as indicated previously, require a major revisionto fit it for other types of systems, e. g. , command/ control.
The model has nu a.Cparent difficulties with continuous-type monitor-ing and tracking tasks. This is because the simulated mission is considered" a series of routine (discrete) activities punctuated by exogeneous events,such as the appearance of a target, and certain major decision points thatmay be specified in time, such as "Return to Base". "The simulated opera-tor may then be ..... conceptualized as most of the time performing a gen-eral monitoring function interspersed with specific mission -directing andcorrective actions" (p. 1-8, Ref. Z) . The point is that, having once beengiven a task, the pilot sets his instruments for the specified parametersand merely corrects any deviations that occur. In other words, continuousactivities are formulated in a discrete manner, as points at which theoperator is required to take a discrete action because a deviation fromthe requirement has appeared. This considerably simplifies the modelbecause it is not required to simulate continuing actions.
The fact that, as we shall see, the model output is primarily timemeans also that no continuing record of errors (deviations in the continuingactivity) need be kept.
MODEL PARAMETERS
It is tmpossible to describe these without describing the structure ofthe HOS model as a whole. In order to understand the logic of the model itis necessary to start with the inputs to HOS. These require a specificlanguage (Human Operator Procedures or HOPROC) to enable users of HOSto input both operating procedures for the system and mission instructionsin English statements. The output of HOPROC is then input to HOS.
"1H06 has been written in FORTRAN IV. HAL, the HOPROC Assem-bler/Loader program has been written in COBOL for syntactical con-venience, and is known as HOPROC-1. HOPROC will shortly be re-written in FORTRAN, incorporating several types of improvements,and will be known as HOPROC-Z. " (p. 1-11, Ref. 2).
278
I"The Human Operator Simulator requires many different types ofinputs, some of which are most easily supplied by means of anEnglish-like language and some of which require only control cardsas a vehicle.... HOPROC statements are translated into HOS-compati-ble code by means of ..... HAL. HAL is the program that translatesinput into a form usable by HOS. I-IAL reads in a card deck of HOPROCstatements, checks the statements for validity, and outputs encodedHOPROC statements, a set of dictionaries and FORTRAN mediated
Sfunction statements ...... " (p. 2-1, Ref. 2)
Five types of directions are provided by HOPROC:
"(1) Operatine procedures for the system being run by theHOS operator, for example, the procedure to use inestablishing communications contact with his flight com-"mander. Operating procedures are analogous to theability provided by operator training on the system.
(2) Mission sequence --- the scenario to be run on a particu-lar HOS experiment.
(3) Communications received.(4) Equations he uses for mental computations (mediated
functions) whenever necessary.(5) Equipment terminology --- the titles by which displays,
controls and o-states are referred.
Items (1), (2) and (3) make use of.... English.... Items (4) and1 (5) are input as simple lists." (p. 2-3, Ref. 2).
HOPROC presently supplies nine statements or instructions whichI are shown in Table 11 (Ref. 2).
Certain terms in Table 11 require further explanation. Display andcontrol are relatively obvious. However, the term "function" refers tomediated function (to be discussed in more detail below) which is a humanthought process or mental computation. "The result of a mediated functionis a value or setting (of a control or display). For example, a HOPROC
I statement might be to go to a certain procedure if the value of (resultingfrom) a mediated function were outside a given tolerance" (p. 2-6, Ref. 2).
The term "o-state" refers to any of several descriptors of humancapability. This parameter introduces a very necessary flexibility into HOS.Note the similarity of the o-state to the F parameter of Siegel and Miller.By specifying a particular 0-state, "the human factors analyst canspecify for each run the operator capability profile he anticipates for thesystem being developed, as results perhaps from expected type of personnelor level of training to be provided" (p. 1-5, Ref. 2) . Unfortunately thedocuments describing HOS do not indicate clearly what the various 0-statesmay be or how they are derived. Fatigue is specifically listed, and thereis a reference to one o-state being a short term memory value. 0-states
S279

go o
S0 014 0 4 0 04 w :44
V0
1 U~~
0~~ N D 0
U0 4 k
P4 oP4 0 Wu%6-4
0H l,0 OJ44~~ 0< 0 041
4'-
4-b 0O~ 3 P-9 1 - E4 10 4-A 0 4 OO 00 0.
o.0 H ",l~ 0 0~H~~1 .d 0 ~
4* U
W0 ' -4 0 z U-A E-4.u -.
0 V k - O0 0 4
.. P4 V 4 0o :3 140 1
Aj ) -4 V w.z 0 w4 0 V)-4 -
V 4 V 10
0 0
0 W.04 0
04 C/2 04P40t~
H 0 HU 0,
0 0 0 0~
14 00
w. 04
H4 4) N04 u P
ZBO
U J d C

Iu0H %H Po
0- 0 - M4
C4 . > 4. ; -4~c 0-4 a) a) tw " (1
P.,)~ 41 141
II 00U 0 0w.0
rd 4 I En
O' Z -4 *Qv)- , 0
U~W.4J~4-U UA~ 41~OuL. v i-
(L) - 0 -m t
r-I 1 L 0 -.. 14 94 k~~1.~0 V'~4
(,n ) 0) - )
r. 04 -4 (d0:D
02 0 43-"4) H u0 -0
> 0 -4W: 'a 0 4 4
10)P4 U 0 4d13 ZH0%4Z 4
P-4 b .14 - H4d) -40 0 4) - 0u- u u:
$3 -
M 44N mu w,0 V 0
2817
;-44

14 w
4.. Cu
uOu
% .07
4H 4
?A 4 01)
Ca~u-u
t4 hh
0 ý0
4)
4 0 .u
0 .,4 4.h0
04)
,-.4 L4J
4) 0 k)
U 0 0
U, U k
N82
IIJ apparently anteor into madiatod (iunctionu, Fur oraniplo, the tui t to po|'Nlt,11
a 11ediated function 111lAy ierC"A we withI fat igui, and rat i•uo will iuw rt1•am ove rth 0 Oife o A a MiLl0ion, 140S ha1 t011 capability of Alic' ing 0-A4ttst i AN A I,1 -0.,
I nO siot progronsom.,
" A nodliatfd function 1m dofined as desLrod infor'lit tio i, tiw dir•etlytdinplayablo t(_he1 prator, which he may oNtimitu by Wit klowledegllfrom seovorat dimplayo, controil or othor m•diatod functions. An
"exanple of a •otdliatd function might be ''wlant rAnIV to tal'rgat" whichcould be cAlc utated if the pilot know his altitudet and dlivo ,•t1lO Andl waslined up with the targuet. In actual uuu, each mediatod function umedin the program requires that an equation be provided when tho mudiatod
-. function is defined for use in the procedures." (p. 2 -1, Ref. S),
"Being calculations, mediated functions arte exprtissod as equations inHOS, and are entered as input via one section of HOPROC.... Any given"mediated function may require as one of its component variables anothermediated function. For example, suppose the desired mediated functionwas "flight hours remaining" to be calculated on the basis of fuel quantityremaining and fuel flow rate. Fuel remaining is readable directly froma gauge, but flow rate may have to be computed by the operator. HOSwill actuate a data gathering sequence that will cause the operator toeither recall or observe the fuel quantity reading and perform anothermediated function for the flow rate. Results of the flow rate cornputa-tion and the fuel quantity value are then used to compute "flight hoursremaining." (p. 2-7, 2-11, Ref. 2).
3 The specific equations mediating functions will be described in con-nection with the ESTIMATOR module of HOS.
A third type of HOS input that uses HOPROC is the titles (names) ofdisplays, controls, settings, and o-states. Each is assigned its ownsection in the HOPROC input deck. The purpose of these titles is to enable3 their use as alphabetic variables names in HOPROC statements.
The concept of an internal clock, which keeps track of elapsed timesince the clock was "set" was also found necessary for HOS. The internalclock refers to and measures the human's ability to estimate time, forexample, if 15 seconds have elapsed since the pilot attempted to start hisengines.
- e Controls, displays and functions
"may be used in conjunction with various qualifiers. We mayrefer to the desired Zosition of any source, the'criticalit of adisplay or function. The upper limit of, and thelwer imitof any display or function may e referred to or we may referto both upper and lower limits simultaneously by speaking"of the limits of a display or a control .... An unqualified sourceis assumed•to refer to the estimated position of that source."j (p. 2-17, Ref. 1)
I3 283
ii
We pass now to HOS, which oprates as a processor uf instructionatatements produced by HAL.
"Its logical processes are closely analogous to the logical processes
of a human operator periorming the same tasks, and the data it produces
is amenable to the same type of analyses as that produced during a human
experiment .....
HOS has four principal modules: the DECODER, the MULTIPLEXOR,
the ESTIMATOR and the BANKER.... Inputs to HOS are from two
sources, the HOPROC compiler via HAL, and a directly-entered data
file representing initial states of certain elements and the location of
displays and controls .... HAL inputs are of two types., The first is the
titles dictionary and the encoded procedure string. The following informa-
tion is provided:
(1) Alphabetic name of the device, function or procedure.(2) Number and name of settings on the device or function.
(3) Kind of device.(4) Encoded procedure string.(5) Pointers to the start of each section.
"The second type of HAL input is a deck of mediated functions inFORTRAN. This deck is combined with special subroutine headercards, compiled and then link-edited with HOS to form the completesimulator.
"Direct inputs (to HOS) include:
(1) Initial states of displays, controls, mediated functions I,and o-states.
(2) Locations of displays and controls (x' y and z coordinates) .
(3) The current values including the actual, the desired, and
upper and lower boundaries of devices and ftInctions.
(4) The last estimated location (x, y and z), time of the estimateand hab strength of controls.
(5) The previously estimated value or setting, time of estimatel,2nd hab strength for displays, functions and controls.
"The DECODER is analogous to the human understanding and decision-making function.. It recalls or receives an instruction, comprehends it,
and decides what:further procedures are necessary to accomplish it.The DECODER is the logical branch point that shunts an instruction to,the proper program routine for handling.
2.84
284
IIU
"The MULTIPLEXOR is the module that decides which procedure shouldbe handled next by the DECODER. It establisheas priorities among possibleinstructions and can generate interrupts when the results of one tasklogically necessitate an alteration in the instruction sequence.... Whenevera sequence of instructions .... is completed, (it) determines the next pro-cedure to initiate ..... Whenever ..... a program is 'waiting" for the com-pletion of some other event before it can continue. .... the MULTIPLEXORscans for other available tasks to occupy the operator.... The MULTIPLEXORis the module that initiates actions on the basis of interrupts. Several typesof interrupts are recognized. The major type originates when the operatormust absorb information from a display which is currently not in an activemode .... The current procedure is interrupted and the procedure to enablethat display is activated and work is commenced on that procedure..... Asecond type (of interrupt) encompasses hardware-originated interruptsthat may affect the sequence of a run, such as the appearance of a warninglight.... A third type of interrupt occurs when, for example, the simulatedoperator requires his left arm to activate some device but he is currentlyusing his left arm to adjust another control. The current procedure maybe interrupted and a scheduled interrupt arranged for when the left armbecomes available .... In the interim the operator may work on othertasks...
3 "The ESTIMATOR is the sensing-remembering core of HOS. Italso provides the time costs both for performing actions and forabsorbing information... The ESTIMATOR utilizes in its computa-3 tions numerical values provided by... the hardware interface. Forinstance, following a decision to set the knob to 50 percent, theESTIMATOR might determine that it will take 0. 9 seconds to absorbthe information on the present position of the knob and that a knob-turn action will take 1. 6 seconds. It will also confirm that the knob'sfinal position will be at 50 percent.
"The ESTIMATOR's function closely simulates a human being'sfunction in the same situation, in that its operation is not fully de-I terministic. There are three kinds of actions: (I) preparation forinformation gathering, such as moving eyes to a display, (2) infor-mation absorption, such as recognizing the value indicated on aI display, and (3) control actuation, such as adjusting a lever... In-formation gathering is a four-stage process. First, if the operatoris, already in contact with the display or control.., he will absorbI its position. If not, recall is attempted, which if successful entailsonly a small time cost.. Second, if recall is not immediately pos-sible, given more time it may be. This process, known as "almost-recall", involves additional small time costs while the operatorcontinually interates the the recall attempt.
1J 285
"The success of any recall attempt is probabilistic, depending on(1) the time since the ,evious observation (t);;(?) how well the op-erator knows the value referred to as hab strength (H); (3) shortterm memory capability as given in an o-state (Ostm); and (4) aconfidence level. The confidence level, expressed as another o-
state (0 .), reflects the operator's willingness to believe his ownmemory, and is the reference against which the probability of re-call is tested for success. Hab strength... decreases over time,therefore the probability of recall (Pr) is expressed as
Pr :H Stfl
"If almost-recall fails, the third and fourth stages are entered inwhich the operator moves his head, eyes, hands, etc. to the displayor control and absorbs the information. The time cost in this caseincludes both the physical movement (computed by means of empiri-cally-derived human performance equations) and the information
absorption time. Information absorption time is computed as the
sum of separate absorption attempts, the number required depending pprimarily on hab strength. Each time the operator looks at a display
he (1) incurs a certain time charge and (2) a new hab strength iscomputed according to the equation
H = 0. 14+ 0.9 SHp where -
H Hab strength 1;S * Similarity between the preceding value of the reading or
seeing and the present value; S .l- (E-Ep)/El
H - Previous H valueEP a Present estimate of value of reading or setting.
Ep a Previous estimate of value of reading or setting.
The previous material was extracted from pages 3-5 through 3-11
of Reference 2.
Other computational functions performed by ESTIMATOR deal withdistance. The inputs for the distance computation are the coordinatesin x, y and z of the two sets of points. The origin of the coordinatesystem is placed at the cockpit position corresponding to the midline
between the pilot's eyes. The equation used is:
286
1II
D a (xlx) 2 + (.l-. ) + (Zl-Z,)
This outputs distance in inches.
3 Another function calculates eye movement and fixation. The inputsare the angle of eye shift and change in convergence angle. Output isthe time in seconds for the eye movement. The basic equation is
T(sec) - 0175 + . 0025A where
A - angle of movement in degrees.
Arm reach time is also calculated in terms of the equation
R - 1.8D + 8.0 where
J R - reach rate in inches/secD distance between points in inches.
I Another function calculates the extrapolated estimate of a value upto the current time. Inputs to this function include last estimate of thevalue, elapsed time since last estimate, previous estimate of the value,.1 elapsed time since previous estimate, and probability of recall of theprevious estimate. Another function computes the modularly decayed
I value of the estimate.
Time to complete a manipulation (turn) of a knob is based on degreesper unit of change in the knob and the hand force that is used. The formulais
T s = .0482 + . 00496F + . 00144D + .000147FD where
Ts = turning time in secondF 2poundsSD - degrees.
The BANKER module accumulates time cost of the actions performedJ by the operator and also serves as the HOS interface with the hardwaresimulator. Obviously time is expended in the decision-making process,when activating a procedure, in using short term memory, making eye,J hand, etc. movements, and absorbing information.
11 287
A number of points should be made about the model parameters. Itis apparent that HOS is based on a number of formalized assumptionsjabout operators. In discussing various approaches to the simulation of 1;the human operator, Wherry indicates that "A more profitable approachwould be to develop sophisticated models which require the formalizationof assumptions about models" (p. Z-Z7, Ref. I). And it is true that, ifone could specify a sufficient number of parametric relationships, acomprehensive model of operator behavior could be established withoutthe need for stochastic sampling, the use of data banks, etc. However,these assumptions, as reflected in the various mediating functions, forexample, depend on the validity of the relationships specified betweenvarious parameters. Wherry feels that considerable data already existto permit the establishment of these parametric relationships. There is,however, some obscurity about how a number of the parameters arederived, in particular the o-states, hab strength, short term memorycapability, memory decay, etc. This makes it difficuIl to analyze theempirical basis of the more important mediating functions. In any event,the adequacy of these formulations can only be determined by the per- -1formance of validation studies (to be discussed below). Despite themolecular character of this model, a number of the parameters, suchas hab strength, short term memory, information absorption, etc. areextremely complex (at least in concept). It is impossible with suchparameters to estimate their validity merely by inspection; they mustbe tested experimentally, and until they are verified, they must beviewed with some suspicion.
One factor that redeems the apparent harshness of the previous para-graph is that the model is concerned primarily- perhaps solely, it is notquite clear- with time as an output. This variable is much more tract-able than the estimation of success probability. Time can be estimated Lmuch more readily than can success. Consequently the model parame-ters associated with time should also be estimated more easily than wouldbe the case otherwise. L
DATA
1. Data Inputs
The3e have been indicated in the previous section of this description,but for convenience are listed below:
Z88
IIJFrom HAL
(1) Encoded procedure staterntnts (the steps required to perform theI flight)
(2) Dictionary of titles for displays, controls and settings(3) Mediated function statements (equations)
Direct Inputs1(1) Initial states of controls, displays, mediated functions and
o- states-. (2) Physical location of controls and displays
(3) Information absorption times (e. g., recall ability)
(4) Output specifications
jJ Of these the most important are the mediated function statements,since these are the only inputs about which any question of validity arises.Two possible sources of error in the function statement may exist; (a)
the data on which the equation is based may be erroneous in part; (b) therelationship between parameters expressed in the equation may be form-
i ulated erroneously.
2. Data Sources
[I Data sources for mediated functions and information absorptiontimes are largely the experimental literature. Because of the mole-cularity of the relationships involved, the data required can only besecured from a highly controlled (i. e. , laboratory) situation, whichsuggests that prototype engineering or operational test sources- or thatfavorite of last resort, the subjective estimate-, would be inadequate toIsupply the necessary data. One could, of course, set up one's own ex-perimental situation to derive a function, but in fact it is most unlikelythat the data would come from the individual experiment. The problemwith the experimental literature, however, is the great disparity inexperimental conditions under which parameters are investigated. How-ever, assuming that one once had sufficient data in which one had con-
fidence, the necessity for further recourse to external data sourceswould be eliminated.
1 Procedure statements (tasks to be performed by the simulatedoperator), titles, locations and initial states of controls and displays"could be derived without excessive difficulty from an analysis of the
_ physical system to which HOS is to be applied. Given a system whosecharacteristics are fixed, no question of the validity of these data canbe raised.
289
:u~r IIn view of the extreme minuteness and precision of the system data
required, this writer questions whether it is possible to derive theseIdata very early in system development, as Wherry postulates. Will
designers be able to provide such detailed information early in develop-
ment, and, having once been provided, will those data remain unchanged?
This is a practical, not a technical question, and can be answered only
by applying the model to an actual system development problem.
3. Data Outputs
HOS has the capability to output data in the form of a detailed time-
history log of what the simulated operator was doing. This includes suchitems as:
a. time action started.b time action completed 44
c. anatomy involved, e.g. , eyes, ears, left arm/hand, right
foot, voice, mental processd. display, control, function or procedure involved inthe action.
Again it must be emphasized that HOS outputs only time and statusinformation. It does not provide any indication of error or the effect oferror on mission performance. At the risk of over emphasizing whatthe developer may feel is a minor point, it must be said again that thiswriter feels this is a serious deficiency in HOS. By restricting its out-put to a time history, the model can be used only in those situations inwhich the user considers error to be irrelevant. In effect, the measureof system effectiveness becomes the amount of time consumed in flyingthe mission. Certainly time is a crucial dimension of system effective-ness, but can one be satisfied with time alone?
Lest we be thought unfair, it would be advisable to quote fromreference 3.
"These output tapes can then be used in a variety of data analysisprograms (time-line analysis, link analysis, etc. ) which will selec-tively use these data. Additionally there wouid be data outputs an-ticipated from the hardware and target simulation programs whichwould give "state" values of those systems in a time-history logformat... These data can be collated and/or corelated with the HOSderived outputs and various system-effectiveness criteria can beimposed to determine the "goodness" of the system... (includingthe functions assigned to operators, the procedures he is to use,
the layouts of the displays and controls, etc. ). When sufficientdata have been collected to determine where the problem areas
290 N
3 are, ... LLoptimization programs can be run to suggest betterlayouts, procedures can be re-written to shorten time used by theoperator for non-critical functions, etc. and these modificationscan be tried out using HOS. "
For a description of the outputs provided by the human operatordata analyser/collate (HODAC) see Appendix II to this section.
J PROCEDURES FOR APPLYING MODEL
I. Analytical Methods
Standard task-equipment analysis (TEA) will supply the necessaryprocedural statements, initial states, etc. Such a TEA is necessarilyvery detailed, the time increments for updating data being very short(usually in the neighborhood of several seconds). In thisconnection it would be useful to get some indication of the amount of workin man hours required to make such an analysis, since the usual TEAperformed during system development is not that detailed. (Thisrequest for development information applies not only to the present modelbut to all the others reviewed.)
3 2. Methods for Synthesizing Data
The original intent of this subsection title was to describe how themodel combined lower level behavioral units to form more molar behav-ioral units, e.g. , how it combined subtask data to secure task data, taskdata to secure function data, etc. This is required by static models ofthe AIR, THERP and TEPPS type. Since simulation models reproduceall required behaviors, c, mbination in the original sense of the termdoes not apply here. In any event, since the data output is time only,and that is combined additively, the problem, if it existed at all for HOS,would be solved very readily.
I ANTICIPATED USES OF THE MODEL
S1. Prediction of System Effectiveness
Under this heading we include the following:
a. Determination that the system will perform to specifiedrequirements. In other words, given a system requirement, e.g. , the
I2
mission must be performed in 30 minutes, can the system (including thehuman operator, of course) perform the mission in 30 minutes?
b. Prediction of the absolute level of efficiency the operationalsystem will achieve. For example, assuming that the system is built topresent design, how long will any particular mission take? If we wereconsidering success probability as a criterion of system effectiveness,one could word the example in terms such as, what is the probabilitythat the system will accomplish its mission?
Despite the fact that the model developer disavows a specific usefor his model- other than to gather data- it is legitimate, for reasonsexplained previously, to ask whether HOS will answer the above ques-tions. We ask this even though we keep in mind that the model is pre-sently adapted only for flight tasks and that it outputs as a measure only
•::• time.
As long as we confine the criterion of; system effectiveness tocompletion or performance time, it is obvious that HOS will answer theabove questions. It will tell the user how long a mission will take, andif a time constraint has been placed on that mission, item (a) is a matterof simple comparison of simulated performance time with the systemtime requirement. Since system lag time is included in HOS, it willoutput a true system measure in the sense of including both machineand human functions.
Even if no time constraint or requirement has been levied on thesystem or mission, the time accumulated over one or more simulationruns will suffice to answer item (b).
Note that the above questions were phrased in terms of total systemeffectiveness. Because of the fine grained detail provided by HOS, items(a) and (b) above can be supplied for individual tasks and subtasks. Or-dinarily a time requirement is levied on the total mission only; however,to complete the mission in that maximum time the mission time require-ment must be apportioned among the tasks and subtasks making up themission. In consequence, the individual tasks and subtasks have theirown maximum time requirements. From that standpoint the fine detailsupplied by HOS will come in handy in determining the effectiveness ofthe smaller behavioral units.
292
mU
2. Design Analysis
Under this heading we consider the following:
a. Comparison of alternative design configurations in termsof the speed with which a mission involving each configuration can beperformed.
b. Suggestions for redesign of a configuration.
C. Suggestions for initial design.
We can eliminate item (c) immediately. Since the method does notmake use of data bank capability estimates associated with individualdesign features (as, one finds, for example, in the AIR methodology),the designer cannot refer to such a data bank for initial design sugges-tions. This is not a criticism of HOS; the methodology does not attackthis type of problem.
With regard to the comparison of alternative designs, it is apparentthat if one can get a measure of system efficiency (performance time)with one system configuration, it takes little more to revise that config-uration, run HOS with the second configuration, and then compare thetwo configurations on the basis of mission time.
HOS is particularly efficient in making this comparison because, aswe indicated earlier, the model is highly sensitive to design details. Thus,even a minor change in cockpit configuration should show up in a differencein performance time. Note the implicit assumption (which we consider"entirely reasonable) that different design features have an impact on timeto respond.
"For the same reasons (design sensitivity and line detail) HOS shouldclearly indicate where a design change would be desirable. This assumesof course that there is an explicit or implicit (i. e. , apportioned) time"constraint or requirement levied on individual tasks and subtasks. Analy-sis of the components (e. g. , reach, shift or turning time, etc.) makingup the total time for a task or subtask will suggest which compcnunts"should be modified to reduce that total time.
293
II
Wherry points out quite cogently that HOS will output time and status Idata which can be used by other human factors techniques fur analysispurposes (e.g. , time-line, link, task and procedural analyses).
3. Manpower Selection
Under this heading we ask whether a model will suggest the types andnumbers of personnel needed to operate a system. In particular we areinterested in the aptitude/capability of required personnel.
HOS will suggest after fine grained analysis of simulation runs wherethe operator is having difficulty performing tasks within maximum timerequirements. From this one might infer that an operator of greatercapability is required, particularly if the source of the difficulty is interms of information absorption time (i. e. , recall capability). However,the model will aot suggest any special aptitudes to meet these require-ments. Since the model apparently deals only with a one or two man team,it is not sensitive to the need for variable numbers of personnel.
Consequently we can say that HOS does not output much informationof value in the manpower selection area.
There is a suggestion in Reference 3 that the model might be ofuse in function allocation (which can be defined either as the determina-tion of whether a function should be performed automatically or manually;or as the determination of the role of the human relative to equipment).Because of the model's sensitivity to design details, it is quite possiblethat HOS could be effective in either definition of function allocation.
4. T raining
We may ask also whether a model supplies information relative tothe content of required operator training or to amount of such training(course duration). As Wherry points out in Reference 1 (pp. Z-6, 2-7),"The outputs of Human Operator Simulator programs could be used toidentify periods of maximal load, frequency of usage, etc. and thusdetermine what procedure and mission segments on which to concentrateduring the training period. " In particular, high load represented as theratio of required operations to time allowed to perform these operationswill suggest where greater emphasis should be placed during training andon what aspects to train. From that standpoint the application of HOSto training is immediate.
294
II
VALIDATION /APPLICATION STUDIES
As of this date information on validation of the HOS model is not3 available. Initial validation runs will commn nce in 1973.
From the standpoint of system effectiveness prediction, validationshould consist of a comparison of a prediction output by HOS with actualoperator performance on the system whose performance was predictedby HOS. The developer of HOS may disagree with this, on the basis3 that HOS is essentially only a data collection instrument.
Assuming, however, that a validation involving comparison of a HOSsimulation with actual system performance was attempted, it could beperformed in either of two ways. Operator performance could be mea-sured in a physical simulation of an aircraft system; this would providea large degree of control over the gathering of data and maximal corre-spondence between HOS and physical performance conditions.
SAlternatively, system performance could be measured by a pilotactually flying the aircraft in the air. Here less control would be possible.
3 In either case it would be important to be able to measure actualoperator performance in as detailed a manner as possible (e. g. , down tosubtaik level and including if possible such elements as reach time, turntime, etc. ). The reason is that even though overall system mission per-formance time might he very much the same in the actual mission ascompared with the HOS simulation, the finer grained elements makingup that time, such as reach, turn, information absorption time, etc.might differ significantly between HOS and the comparison system. Whendealing with such elemental times, differences between HOS predictionsand actual mission performance might be covered up by equipment "slop"in the actual system. This is not to suggest that this is what will actuallyhappen; it is merely something to ensure against.
Admittedly it is difficult to instrument in order to measure suchmolecular behaviors; as Wherry suggests, this is one of the advantagesof HOS, that it will permit prediction of elemental times that are diffi-cult to measure ordinarily. However, in order to have confidence inHOS, parametric relationships, it is desirable to validate not only theoverall model but also its elements.
In this connection a very detailed exposition of the experimrntaldata on which hypothesized parametric relationships are based wouldsupply partial validation of these relationships, if their empirical vali-dation (by comparison with operational performance) is not possible.
1295

Wherry notes (personal communication): "It must be understoodthat most operator data that have been collected and reported in theliterature do not break time measurements down into the "microscopic"level needed by the Human Operator Simulator. The derivations whichI have gone through would require a rather lengthy description and wouldnot prove whether they will ultimately work in HOS or not. For thisreason I see no great purpose being served by telling how I arrived atthe equations at this point - we will ultimately know whether they workby next FY. If they work it really won't matter how they were derived;if they don't work I'll change them or collect the necessary data to derivethem hopefully better than they presently are. "
EVALUATIVE SUMMARY
Validity - No data available, but formal validation studies areplanned.
Reliability - No data available, but the validation studies referredto above should be suggestive in this regard.
Ii
System Development Applicability
A. Comprehensiveness: Presently restricted to piloting operationsbut developmental work on the model will expand its capability to' includealmost any type of task.
B. Applicability: Model will output measure of system effective-ness (in terms of time), but is more specialized as a design diagnostictool. U
C. Timing: Model can be used at any stage of system development,provided that the detailed system information is made available. L
Model CharacteristicsL
A. Objectivity: Highly objective, few judgments required.
B. Structure: Reasonably well defined, although some pockets ofobscurity relative to mediating processes remain.
296

I
I
REFERENCES
1. Wherry, R. J. The Development of Sophisticated Models of Man-Machine System Performance, in Levy, G. W. (ed. J, SymposiumonApplied Models of Man-Machine Systems Performance, ReportNR69H- 591, North American Aviation/Columbus, 3 November 1969.
1 2. Wherry, R. J. The Human Operator Simulator, Naval Air Develop-ment Center, Warminster, Pa. , 25 May 1971.
13. Letter, Cdr. Robert J. Wherry, Jr., Naval Air Development"Center, Warminster, Pa., to author, 25 June 1971.
LIii
i .
i !
297
APPENDIX I
HOS and "Operator Error'
Wherry has provided the following discussion:
It is obvious that from the discussion of HOS output, primaryemphasis has been placed on the time it will take an operator to accom-plish his tasks rather than on whether he has accomplished his taskswell or not. Indeed, from other sections of HOS it may even appearthat the operator is incapable of making an error. To a certain extentthis is true. For example, there are no provisions in the model for the
simulated operator to either forget a step or to perform a step out ofsequence. This is not an oversight, but a planned feature of HOS. Thereasoning back of this design feature is that operators do not omit oraccomplish steps out of sequence (either intentionally or unintentionally) iiunless they are inadequately trained or they are pressed for time becausethey have been given too many tasks to do for a specified time period.Certainly no evaluator would agree to using untrained personnel in asystem and call it a "fair" test of the system, even though they didn'tknow what they were supposed to do. Secondly, there are two legiti-
mate ways to evaluate whether the tasks an individual has been assignedare "too many" or "too complex" or both. One way is inform him thathe must follow all the procedural steps and maintain his performance asbest he can, regardless of how long he takes to accomplish his tasks.The second way is to tell him that he must complete all his tasks withina certain period of time, regardless of how well he does them, and heis free to omit steps if he feels that he must.
If a system is being evaluated for which sufficient time is availableto accomplish all required tasks, following prescribed procedures, andto perform those tasks within required performance limits, then it shouldmake little difference which set of instructions are given to the individual;
his performance should be the same. Note that it is not maintained thatit will be the same, but merely that it should be the same. It is possiblethat individuals working under the latter rule will omit steps that need
not have been left out. If a system is being evaluated for which insufficienttime is available to accomplish all the tasks "accurately" enough if allprocedural steps are adhered to, then either method should uncover thisproblem. The results will be different depending on which set of instruc-tions are given to the operator, but both should indicate that he could notdo everything he was supposed to in the prescribed time period. Omittingsteps in the "real world" may be making the best of a badly designed
2298 I
system (it must be insisted that prescribed procedures are part of thesystem), but that does not change the fact that it is a badly designedsystem.
It may be argued that there are certain times and certain circum-stances in which the operator should follow a simplified set of procedures.This, of course, is allowed in HOS, by defining both sets of proceduresand the decision which must be made (i. e. , where the information comesfrom that allows the operator to decide which set to use).
While the above discussion indicates why HOS is designed in such away that the operator cannot intentionally or unintentionally forget a pro-cedural step, this does not mean that the simulated operator cannot makeother kinds of errors. Below are partial list of the many types of3 "roperator errors" that can be made in HOS:
a. The operator relies on recall of some display which, unknown3 to him has changed in value since he last looked at it. This inturn leads to an erroneous decision or calculation on his part.
b. The operator desires to maintain some display between someupper and lower limit values, however, he is so busy doingother steps that he fails to notice, for some time peliod, that3 the display has exceeded the allowable limits.
c. The operator is attempting to maneuver his vehicle to a certain
position, but because of the complexity of the functions he mustcalculate (e. g. , no predictive display is available), and thedisparate locations of the displays he must use to provide himinformation for the functions to be calculated, he takes too longin accomplishing the function and is incapable of following anacceptable path (e. g. , in a carrier landing he may get "behindthe problem" which leads him to over correct and land too short,too long, or too hard to get a "waveoff".
SThe ability to identify these kinds of errors is contingent or, theability to correlate the output of HOS with the output of the HardwareSimulator, and to have criteria for what the system should be doing. Itcertainly cannot be argued that in the above cases no error occurred.However, it is questionable whether all of these constitute human errors.If one approaches the problem from the standpoint of whether the problemscould be alleviated through better human engineering (inclusion of warningsignals, allocation of certain functions to the hardware rather than to the
299!--

man, reduction of the complexity of tasks assigned, etc. ) it must berecognized that the same man might be able to do the job if the systemwere adequately human engineered. If the operator is doing the best hecan, given the constraints of too many tasks, too complex tasks, poorstation layout, etc. , should the operator be blamed because he can not,do everything we would like him to be able to do? The poor performanceof the system is not the operator's fault; it is the system designers whoare culpable.
i'
300
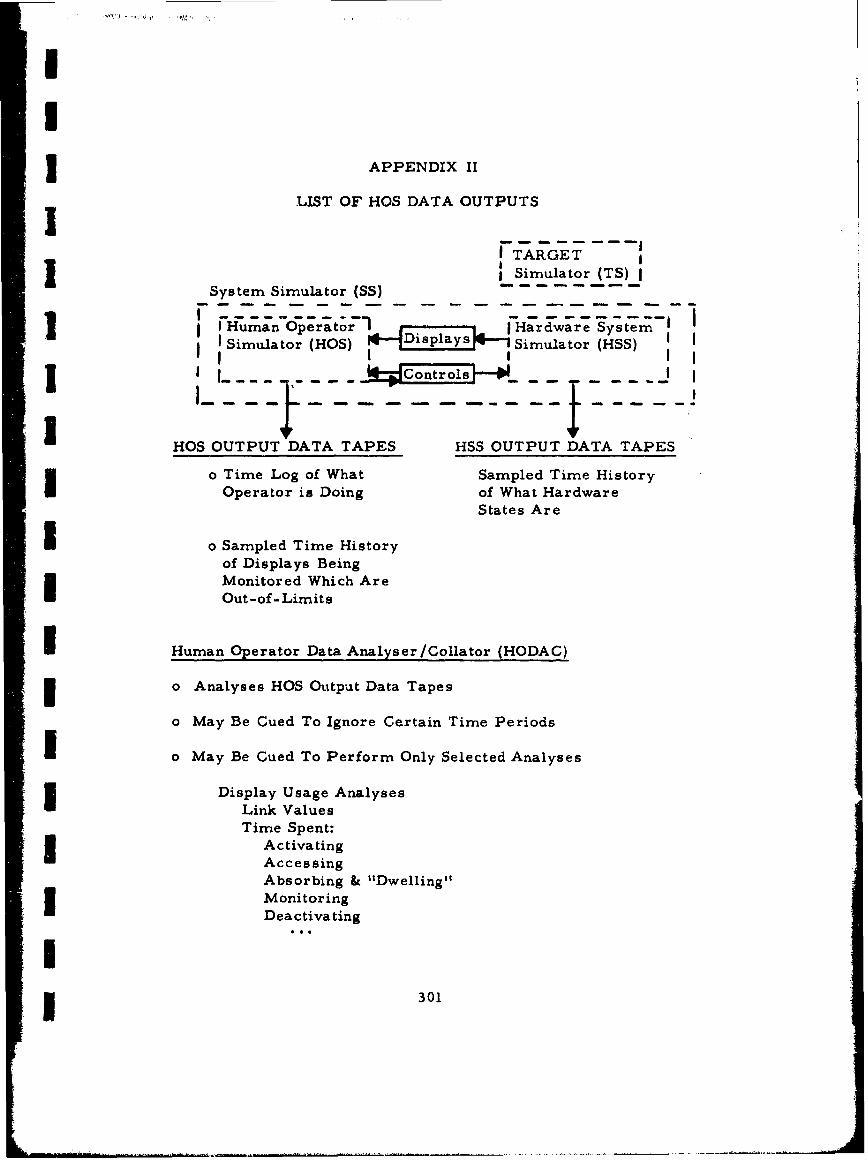
I
I3 APPENDIX II
LIST OF HOS DATA OUTPUTS
'TARGET
System Simulator (SS) Simulator (TS)
I----------d-w1 J •tn--I Human Oper atoIr Displays- Hardware System)Simulator (HOS)II, I
HOS OUTPUT DATA TAPES HSS OUTPUT DATA TAPES
o Time Log of What Sampled Time HistoryOperator is Doing of What Hardware
-i States Are
U Io Sampled Time Historyof Displays BeingMonitored Which AreOut-of-Limits
I Human Operator Data Analyser/Collator (HODAC)
o Analyses HOS Output Data Tapes
o May Be Cued To Ignore Certain Time Periods
* o May Be Cued To Perform Only Selected Analyses
Display Usage AnalysesLink ValuesTime Spent:
Activating
AccessingAbsorbing & "Dwelling"MonitoringDeactivating
3 301
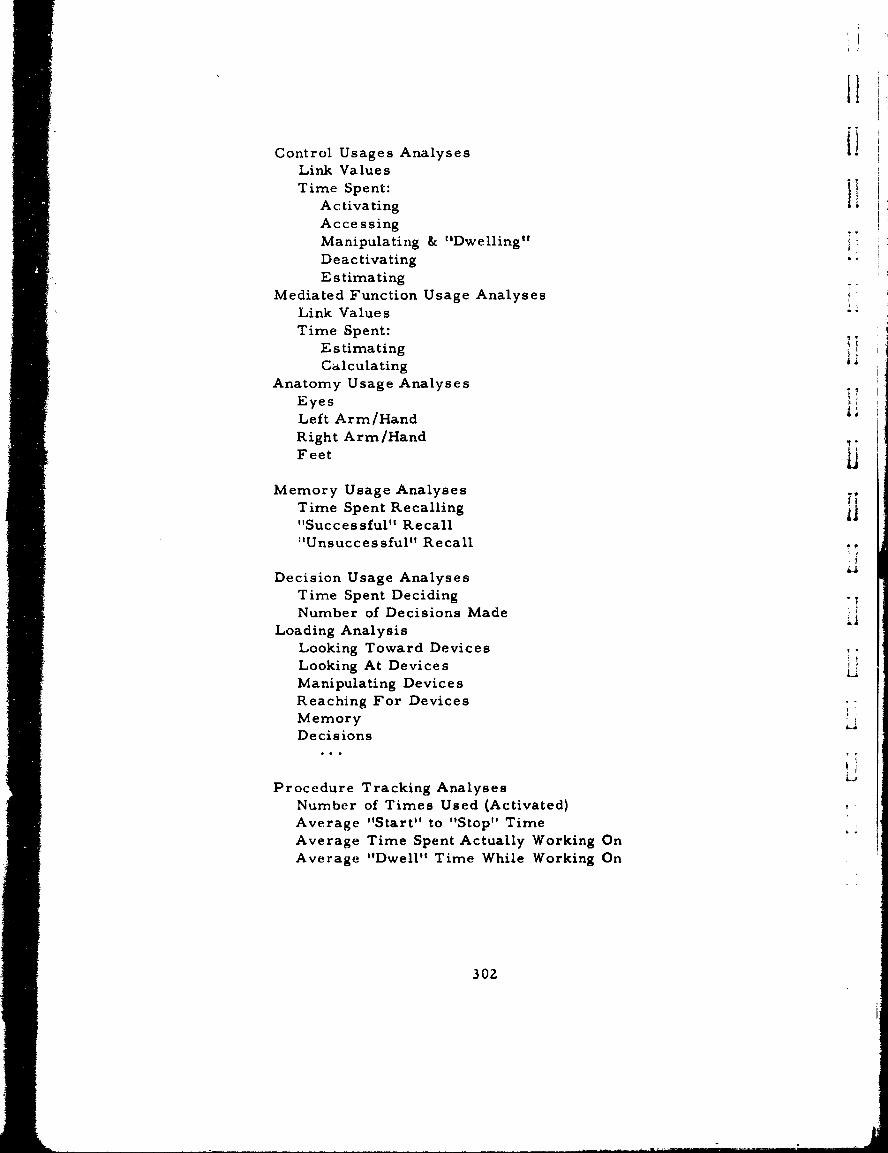
i •i
Control Usages Analyses .Link ValuesTime Spent: Ii
Activating
Accessing"Manipulating & "Dwelling"Deactivating
EstimatingMediated Function Usage Analyses
Link ValuesTime Spent:
EstimatingCalculating L
Anatomy Usage AnalysesEyesLeft Arm/HandRight Arm/HandFeet
Memory Usage AnalysesTime Spent Recalling"Successful" Recall"Unsuccessful" Recall
Decision Usage AnalysesTime Spent Deciding
Number of Decisions Made"Loading Analysis
Looking Toward DevicesLooking At DevicesManipulating Devices
Reaching For DevicesMemoryDecisions
Procedure Tracking Analyses
Number of Times Used (Activated)Average "Start" to "Stop" TimeAverage Time Spent Actually Working OnAverage "Dwell" Time While Working On
302
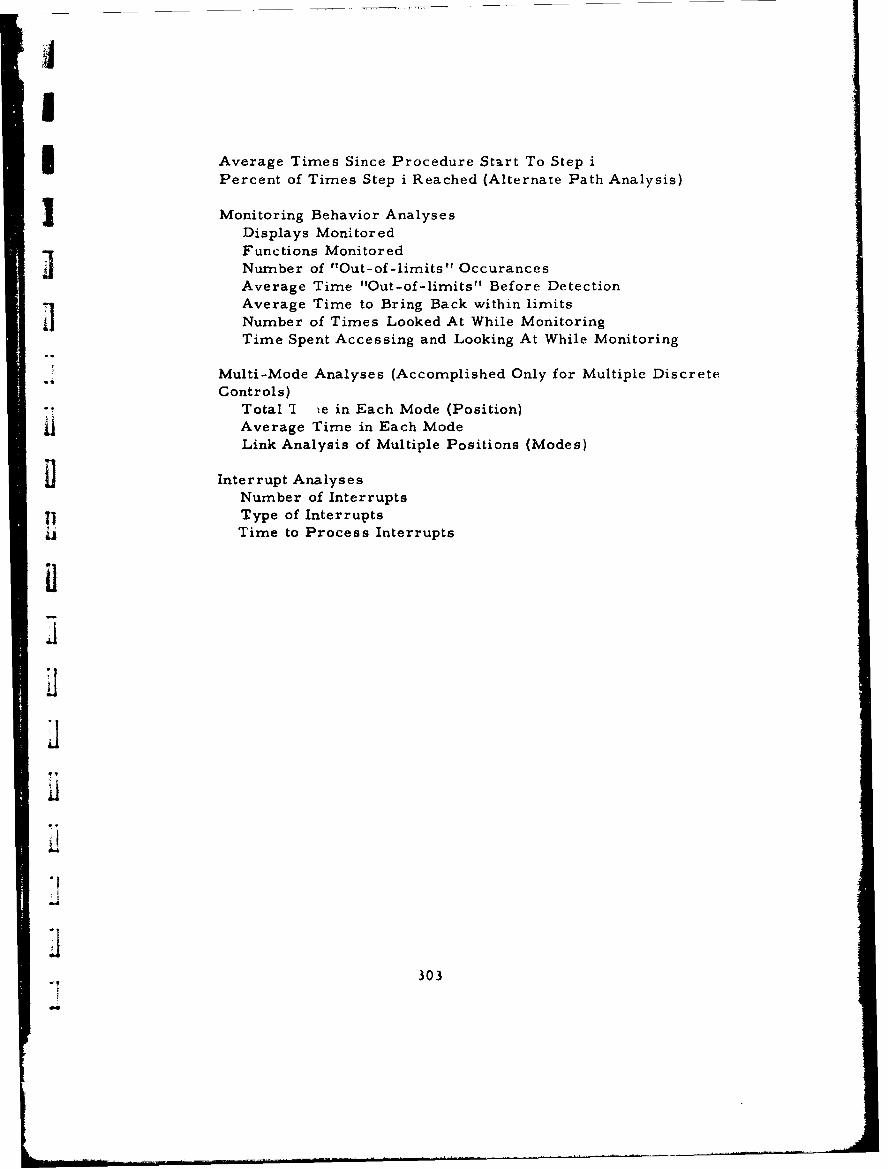
Average Times Since Procedure Start To Step iPercent of Times Step i Reached (Alternate Path Analysis)
j Monitoring Behavior AnalysesDisplays Monitored
Functions MonitoredNumber of "tOut-of-limits" OccurancesAverage Time "Out-of-limits" Before DetectionAverage Time to Bring Back within limits
Number of Times Looked At While MonitoringTime Spent Accessing and Looking At While Monitoring
Multi-Mode Analyses (Accomplished Only for Multiple DiscreteControls)
Total 'I ie in Each Mode (Position)
i Average Time in Each ModeLink Analysis of Multiple Positions (Modes)
Interrupt Analyses
Number of InterruptsType of Interrupts
i Time to Process Interrupts
3I
±1
30)3
"0*
V. ORACLE - DYNAMIC TIME LINE SIMULATION
INTRODUCTION
ORACLE- whose acronym stands for Operations Research andCritical Link Evaluation- is, as the name implies, operations research-oriented. By this we mean that it betrays this influence by its ancestryand the types of concepts it incorporates. The model derives from at-tempts to develop commodity flow models to determine the maximumcapability of the system (see Reference 1 fo" the antecedents of the model).The essence of the model is that it performs what OR specialists call a"traffic analysis" of the system which describes the flow of events over
system channels over time and the queues that may build up. More de-"tails about this will be given later.
The point is that this model derives from a different conceptualframework than the others we have considered, essentially a non-behav-
f framework, although it will be seen that many of the model's inputs
and o,.,puts are very similar to what more behaviorally oriented modelssupply.
jOne of the paragraphs in Reference I (p. 3) summarizes the tech-nique very nicely:
jj"ORACLE... is a general purpose system simulation technique.The technique allows modeling any multicommodity system flowon a scientific digital computer. The system to be analyzed isdefined in terms of a general link-node network which is stressedwith inputs at one or more points and the resulting queues, delays
* iand throughput rates are presented for the analyst.
GOALS
"ORACLE is a diagnostic rather than an evaluational tool. It does notprovide a quantitative assessment of the effectiveness of a system, but bysupplying a picture ("snapshot" is a term frequently used by its developers)of the operation of a system, it permits diagnosis of system elements thathave resulted in an inbalance between inputs and outputs, with consequentperformance queues. "A performance queue is defined as a system com-ponent (man-man, man-machine, machine -machine) interface capabilitythat is less than optimum in response to given input conditions" (p. 2,Ref. Z).
PRECuN PAGE BLAK305
STl | v i -•m_ _- V I,* *

Through it, diagnostic capability the model 'providoe A ready tmratt,,of asbessing the effects of possible changes to tho systom undr otwtly"(p. 3. Ref. 1). We recognize this U4 a moanw of ro'dco1mil•ing the ,,ystomby introducing various changes in mysteom elemntits and determining thileffect of the change on system porformance, This iappears to hb theiprimary goal of the model, although when we dictis, the use,, of themodel it will be seen that this Maneral milthodology has a numbor ofpossible uses.
It is also possible to use the model for initial dosign,
"For example, ORACLE was implemented in a command And con-trol study performed for the United States Air Force during thedefinition phase of the Airborne Warning and Control System(AWACS). In that study, a complete baseline was derived, in-cliding personnel, display and control, data procensing, andcommunications subsystems. The initial step wan to establish a"strawrnan" configuration for each of the subsystems included inthe analysis. No attempt was made to relate personnel to speci-ality areas during initial simulation cycles. The basis for the"strawman" was derived from paper analyses, engineering ex-perience and judgment, and in some cases, intuition, As furtheriterations to the "strawman" were made using the outputs fromORACLE, the qualitative/quantitative measures of man-machinerequirements became firmer, resulting in a baseline systemconfiguration. " tp. 2, Ref. 2).
The developers also point out that the model can be used as a sourceof empirical data. As a simulation of the system, it can be tested andretested any number of times under varying conditions, and the historyof the system performance can be examined critically. Hence it is pos-sible to test an hypothesized system before it is even built. This capa-bility is of course inherent in any simulation model and in fact represents Lthe outstanding capability of such models.
ASSUAPTIONS
Because the model is not behaviorally oriented, it has relativelyfew assumptions (at least of the behavioral type) to be considered. Onebasic assumption is of course that one can conceptualize systems ingeneral in terms of a flow of data, information or events from one point
306
lo u sothor over tillie From th is coti e)JI usIi~alt~ioi n at I lie 10 N1pIl'01 a racttt ri pinll ' tit tho nIlelod Foir e ksillo
Ol I e0V isit IN #%, vP trilptil Ott Of I% tilt to A littIi it ksm A riodo mit~y hor'IinaiN 1rod iaS AU) olomnit in impI I that U' 'Plyom , prvnto, Antilroationtio to opoelfti' sitglo or multi r1o inputs. AndI providsiw 0%.1 miglo tit ,imiti ehatnnel output. Nodoos roproes"Ml comlbin it; i il i ofman-n iathino interfaces porformiing diar'roto taoik- to cowileto Au1I vatit. Into rcnnov Iioiim between nodon are provided by %init I r~ nst
frpath* vallod links. Ldinks provide tor tho Ii lMefel W o dtalkinformiation, tatertalN , Soodi , andlid NOorth botwoont nodeSO, ikt(1also roproionti man -machnoe itote iavo coinbinalono, , , ' (1p. A,
It tit ot couVSP tht, dovolope r s pP rogitti VP In moikre whi leve' as mulilp-tionts ho Withiiel, Ono'* only couicort is for the vonmsrquelwtim of tho &A.muinption, lit thoe alit of ORACLE, the alisumption that all oyotommi cai~tho concoptualitsed in ternis of a flow of events rtaises the question whetheirall types of #ysltems call in faiit 4e so modoled, Obviously contimniunhationlisysletis call, but %atan dystonis emiphaaising docision-miiking or sonaing ormotor operations? It would appear that tht, conv'pt is general enough toencompass them. but the question Arises an to the relative efficiency withwhich various systemns can be handled with such A concopt, J-videueon tthis point will be considered in the discussion Of validAtiOn studio$.
Another assumption inhorent in the miodel tit the concept of mystonieffectiveness represented as a balance between inputs and outputs, Givena system requiremeont, that system is effective when input ratos prorluirequired outputs without any performiance queufe developing (or rather any"intolerable" queues, since it would be unreasoniable to expect a completo
* Iabsenco of queueing). Trhe comiponenlst of the system are visualiaed iac* . required to process these inputs (which define the "load" in the system).
lIn the truest sense of thlo word ORACLE is a workload m-odel. TheJ ~concept of workload has boon encountered before, particu~larly in Siegel's
digital simulation technique, although in the latter vase it was nt'cemssryto introduce behavioral concepts such as "strees" to account foi, overloadpe rformnance.
The conctipt of workload as being the critical measure of system
effectiveness carrios with it the implied assumption that time is thecritical dimersion of systerm performance, We huve encountered this
assumption in other m-odels also, e.g. , Wherry's lAOS, There im an
307
intplivatioi horp that the system and the operator will always perfornwell rwnough to acc'omplish the system requirtiment; the only question in,how long will it take the operator/syutem to accomplish its goal. Inother words, "quality" of performance in thought of purely in terms ofthe time diniomioti, Presumably delays and qutiuing could be greatonough to threaten accomplishment of the system requirement, but thiswounld be acconiplished only through "intolerable" queus.
rho quiestion to be asked is whether a system evaluation in termsof time alone would be completely matisfying to a design ongineer who mayfool that evon whn input rates are not excessive, the operator may stillmake error, And perhaps not accomplish his task,
Finally, although the model employs no overt behavioral apaumptions,it derives its input data from a variety of sources, some of which, likethe AIR Data Store, have behavioral assumptions of their own, Does one,ae it were, assume the assumptions of one's input data sources? This isa moot question, since it is not feasible to regress indefinitely in ques-tioning data sources,
METHODOLOGICAL SCOPE
The developers of ORACLE stress its diversified application "to anysystem involved with transfer of material and/or information from pointto point" (p. 11, Ref, 1). There are three major system applications:to military operations, production and routing (movement, information,transfer). As noted previously, the basic concept of traffic analysis "isnot intended to imply only an analysis of data traffic"•, However, themajor proposed applications of the model seem te be to systems whoseoperations can be conceptualized ii terms of movement, informationtransfer, communication and the like, The developers also recognizethat continuous tasks, "that is, tasks of a monitoring nature, present aproblem, ,. " (p. 9, Ref. Z), but they presumably have a mechanism tohandle the difficulty. "Continuous task time delays may be controlledby employment of an "and gate" node, by incorporation ofa "clever"anode.., or by assigning a time delay to a "normal" node.,," (p. 9, Ref.2.). terms to be defined later).
308
3
:1 MODEL PARAMETERS
We have already mentioned that model events are composed of nodesand links (note the similarity- in part- to Siegel's formulation of DEI interms of information theory),
"Five basic node types have been developed to provide the mani-pulat&)n of traffic flow through an operational seque-nce. Thesenodes are: "norrrmal", Uclever", "and gate", "or gate", and "dummy".The "normal" node 'e..resents a specific system entity with a de-fined man-mechine interface operating at a specific percentage ofloading level and which reauires a dinc.'ete response time. Simi-larly, the "clever" node al&.- represent. a er entity; however,it possesses the capability of providing a Monte CarLo inp,,t sourcefor generation of an alternate path. It is al,,o capable of acceptiihg
ii time milestones from the scenario to terminate a sequence, thusinitiating the next phase upon expiration of a predetermined clocktime, The "and gate" node is similar to both the "normal" and"clever" nodes, except that its initiation depends upon completionof a predetermined number of combination of input links. The "orgate" node is identical to the "and gate" node, except that it initiatesan output over the appropriate link to the first available noder, thatis, the "or gate" is an optimurn-time path locator. The "dummy"node is provided only to allow continuity in the flow sequence with-out imposing time constraints upon units passing throughtthe system.The "dummy" node represents a nonentity, and is assigned zerotime and an infinite capability (loading level). " (pp. 4,6, Ref. 2).
A queue can also be considered a model parameter, A queue isformed at a component if the rate of inputs arriving at the component isgreater than the processing rate.
DATA
1. Input Data
Input data to be applied to the model are largely time oriented. Alist of input data would include:
a. input rates for units;b. initiation times;c. response times for events;
"309
I I I
d. event (node) prioritics;e. probabilities of event: occurrence based on machine availa-
bility and reliability criteria.
In addition the development of the model will specify the functionalelements of the model (i. e. , its man and machine components) and thelinks between them.
The uses of these input data are fairly clear. Input rates (e. g.,the number of messages per unit time) impose loads on the system.Initiation times are required to know when to initiate an event, andobviously response time is needed to determine delays before the nextevent can be triggered.
Event priorities must be assigned because some units are morecritical than others.
"In such cases, the noncritical task is deferred and will go into
queue until the priority unit has been processed and transmitted.It is also possible to limit the maximum queue size, or time inqueue, for low-priority units. This is desirable because suchunits may never be processed if the input rate for critical priorityunits is very high. That is, if the critical unit input rate is al-
most continuous, or if a queue builds up, low-priority units wouldbe deferred each time they tried to enter the node. Thereforethe logic of priority assignment depends on system requirements.For example, some unit types may require immediate processing,while others may be deferred for a certain period of time withoutsystem degradation. Also, certain uinits may be deferred until aspecific quantity accumulates, which will theiu be processed.(pp. 8 -9, R e f. 2).
Probabilities of event occurrence are required to account for delaysresulting from the need to repeat erroneous actions or to select an alter-native pathway when one pathway is clogged
"Alternative path diagrams can also be constructed to provide
for incorporation of contingencies. The alternate path capabilityprovides a means of injecting probabilities of failure into thesimulation by using Monte Carlo techniques to provide a prede-termined probability of occurrence. The probability of failure
may represent equipment reliability or human error probabilities.
310
I
I An alternate path may be incorporated at any node within thesequence diagram, provided that the probability of alternate pathoccurrence and alternate route sequences are designated. " (p. 3,Ref. 2).
Obviously the model accounts for erroneous actions (failure toaccomplish the task), but is interested in these primarily in terms ofthe time delays they produce.
2 . Input Data Sources
"The model makes use of the same data sources that almost all othermodels use. "Time estimates for planned systems are extracted fromprevious dynamic tests, and through experimentation with similar systemtasks. " (p. 4, Ref. 2). A second primary source is the AIR Data Store."Time estimates for existing systems are derived from time studiesavailable from sources such as industrial engineering or from personaljudgments provided by experienced personnel" (p. 4, Ref. 2).
Obviously very detailed information is required to simulate individualoperator/machine actions. Some of these data derive from the charac-teristics of the system being modeled. (i.e. , input rates, initiation timesand event priorities). This suggests that fairly detailed analysis of thesystem being modeled is required. Operator error (event) probabilitiesand operator response times could be derived from experimental litera-ture, once one knew the characteristics of the individual machine corn-ponents with which the operator interacted. Equipment reliability values
could be derived from the fairly extensive equipment reliability literatureon equipment components.
I The need to define the system to be modeled in fairly complete de-tail might present a problem during development. "For example, a dis-play and control device required for a specific task must be completelydefined and its characteristics determined. .. The information required,information available, evaluation and decision-making process... must
-]all be taken into account" (p. 4, Ref. 2).
Because the input data are so heavily dependent on system character-istics, the need for an extensive external data base would seem to becorrespondingly reduced.
1 311
3. Output Data
"The basic measure of performance is the achievement of critical
events within the time span dictated by the scenario, i. e. , did aparticular component achieve required processing rates, etc. , ordid queues form due to an inability to complete the operationalprocedures within required time spans?" (p. 7, Ref. I).
The developers consider that ORACLE can supply various outputs.As we understand them, they are listed below:
a. A prediction of the total processing time required for a
given sequence of events.
b. The identification of queues (length, type) on critical paths.
c. Related to (Z) the determination of those components (e. g.machine, man) associated with these queues.
These outputs can be summarized in the following sentence: wThe
primary output generated by ORACLE is a qualitative/quantitative mea-sure of man-machine workload as related to both system requirements|and time constraints imposed by tasks" (p. 1, Ref. 2).
As indicated initially, the model does not output an estimate of systemeffectiveness, but rather (as in the case of HOS) a time line history ofsystem performance which can then be analyzed for the particular featureof interest to the modeler. Thus, one might look for factors responsible Lfor a queue, or the characteristics of a component at which a queue de-velops. This analysis is enhanced by the capability of calling
"for any number of snapshots at selected times. Each snapshotconsists of a complete instantaneous picture of the system at thattime. That is, the location of every unit, identified by specificposition (link or node) within the system is listed. The analystthen knows which units are in queue at that exact time, the size of
all queues, and the loading of all nodes and links within the system"(p. 10, Ref. 2).
31Z
L. _ ____ ____ ____ ____ ____
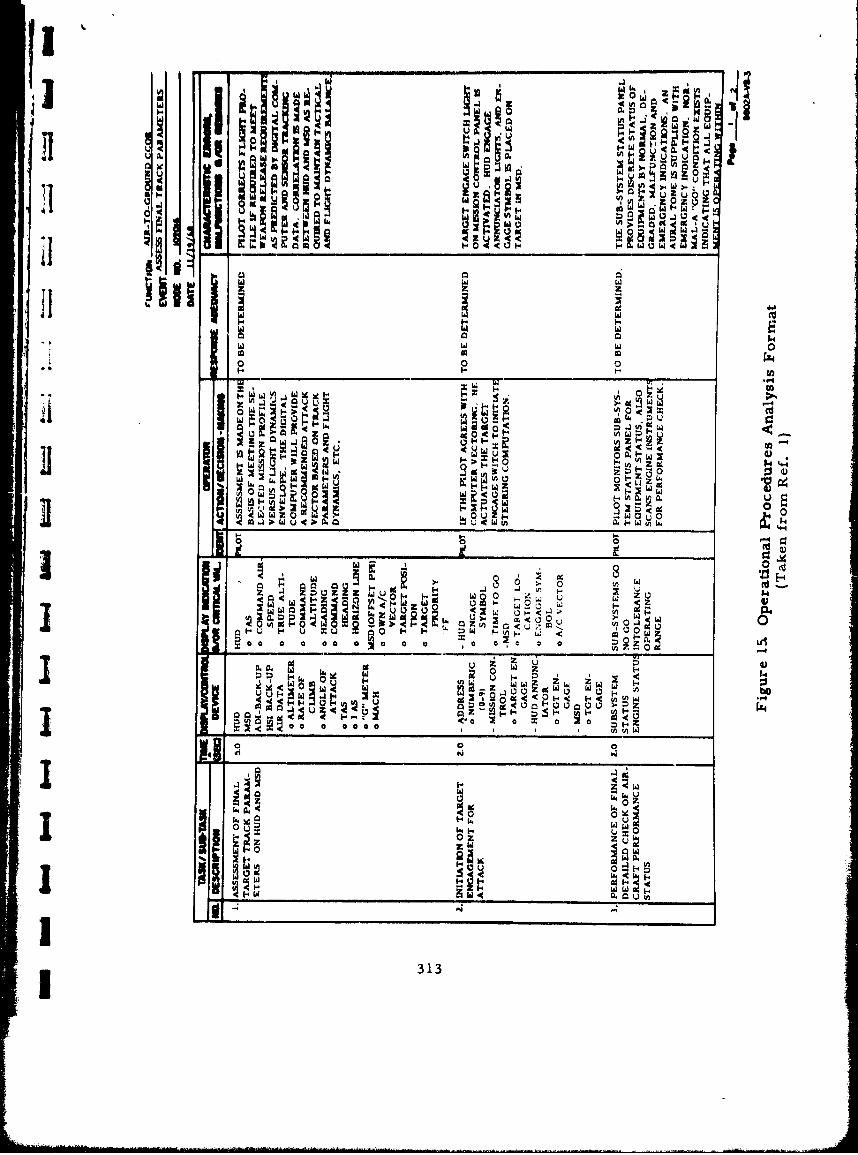
Ing
Eu 0. Hil 2.
_W 0
-C
IJ I.J
0 0 co
Z w 1-4 f- z A t
ý- ;- zC
'n I- oI- I-4
-o -
a f0-l 8 w
UWa .0 t l..
z. A w u p4)- ;U 0 u w05WOORMN WUa.al
I tg:c a a aa a 0 a 0 a0 0D zaIhuII ~ ~ ~ ~ W _________________________
U o wIw13 3130
PROCEDURES FOR MODEL APPLICATION
1. Analytic Methods -
Three primary tasks are required before the model can be run:
a. Establishment of a scenario which structures the operational ,.environment of the system in terms of time. It is necessary to specifythe quantities of particular units flowing through the system, establishunit input rates, initiation times, times of occurrence of selected contin-gencies, etc.
b. Development of operational sequence diagrams (OSD), whosepurpose is to identify the events which must occur to perform each mis-sion function and to define unit traffic flow within the system. The OSDalso includes alternative path diagrams to account for contingencies, etc.
The OSD referred to here is not the same as the one familiar to humanfactors specialists, as defined by Kurke l. It i at a detailed function --
or gross task level ("identify and receive new track, radar continuousscan"), whereas the Kurke OSD describes the detailed task element level.The detail required for system modeling is provided by the operationalprocedures analysis.
c. Performance of an operational procedures analysis: "Theoperational procedures analysis is required in order to define the specifictask characteristics necessary for event performance within each opera-tional sequence diagram. A secondary purpose is to provide a data basefor the evaluation of events shown to be critical b)r the simulation output.The complexity of the analysis is dependent on the level of detail requiredto obtain sufficient data for simulation input purposes". (p. 3. Ref. 2).Figurel5 presents a representative operational analysis format. Note thatperformance times for each task is indicated, together with control/dis-play device characteristics and the critical values of these, the operatoraction or decision-making process, response adequacy and characteristicerrors.
Obviously a very considerable amount of analysis of the system to bemodeled is required. Although this analysis provides most of the informa-tion produced by a behavioral function/task analysis, it seems to requireno behavioral judgments such as might be required to assess stress level,for example. This is perhaps an exaggeration; to describe decision-making
1. Kurke, M. I., Operational Sequence Diagrams in System Design.Human Factors, 1961, 3, 66-73.
314
I processes, errors, etc. must implicitly involve at least a minimalamount of behavioral framework.
2. Methods of Synthesizing Data
Because this is a simulation technique which provides finely detailedtime histories, no synthesis (combination of outputs at a lower level toderive a value for a higher level of behavioral unit) is required. As
I noted in other discussions, this is a definite advantage for simulationmodels, because it avoids the necessity for combinatorial statistics. Atthe same time, however, it is a disadvantage in the sense that it does notprovide a single figure of effectiveness merit for the system as a whole."This must be inferred from an analysis of the individual features of thetime history and must therefore be somewhat judgmental.
3. Input Data Application
The input data required for each event are related to the node andlink units, that is, to the individual operator and his control/displayinterfaces. This follows because the only system elements in the modelare the node and link units.
ANTICIPATED MODEL USES
We have considered other models in terms of the following possibleuses:
(1) Prediction of System Effectiveness
(a) Determination of the absolute efficiency of the system (i. e.-. how long does it take the system to perform its mission,A| how reliably will it perform that mission).
(b) Determination of relative system efficiency (i. e. , in rela-"tion to a specified system requirement, how reliably willthe system accomplish that requirement).
1 (2) Design Analysi
(a) Comparison of alternative s, .;em configurations in termsI of system performance criteria.
1 315
(b) Determination of design inadequacies in the system andindication of redesign alternatives.
(c) Assistance in the initial design of the system.
(3) Manpower Selection
Specification of the required numbers and types of personnelneeded to run the system, with emphasis on needed aptitudesand skills.
(4) Training 4
Assistance in the determination of training required by personnelto operate the system.
ORACLE, like most of the other models we have reviewed, appearsto be primarily effective in the prediction of system effectiveness and in"design analysis. Obviously, exercising a system with a- given load of jobsto be performed and accumulating the time required by the system toprocess these jobs will indicate how long it takes the system to performits mission. Given that one knows what the system requirement is (interms of maximum time to perform), it is a simple matter to compareactual performance with the time constraint and determine whether ornot the system can perform within that constraint.
The particular utility of the model lies in its capability to comparealternative system configurations; indeed, it almost seems from the de-scriptions provided that that is what it was intended to do.
"The -nkalgst may then revise the system configuration by changing
the number of machines or personnel, or by altering capability atcritical points. Stated simply, a man-machine interface may be Uadjusted iii either of two ways to eliminate or reduce a performancequeue to a tolerable level. Output rate may be increased by im-proving man and/or machine performance through qualitative/quantitative adjustment of personnel or machine, or by adjustmentof operational sequence of procedure in order to reduce responsetime. Input rate may be decreased only by changing mission goalrequirements or by changing the system operational environment.After the revision is made, the model is re-run and again analyzed.
The new queue structure is formed and analyzed, and the impact ofstable and tolerable performance queues can be assessed... " (p. 1,Ref. 2).
316
I
I It should be noted that because the model simulates the system soclosely, it should be highly sensitive even to minor variations in configu-ration, although only practical application experience would demonstratethis. In general, models focussing on the time dimension as an outputmeasure appear to be more sensitive to equipment configurational dif-I ferences than are models which rely largely on error probabilities.
Because of the detailed time history that is provided and the detailwith which the system is simulated, the model is particularly effectivefor redesign. The model points out- factors related to mission success,e. g. , queues on critical paths.
"Ir'f a "fix" or adjustment to the system is made, and its impacton time sensitivity is evaluated by manual timeline techniques,a major effort would be required by the analyst. Using the sim-ulation model, it is possible to change several data parametersand to determine the effect of the proposed change in the timei required to submit the job to the computer, and at a momentaryinvestment of from 5 to 30 minutes of computer time. " (p. 10,Ref. 2).
"Another type of output obtained is a measure of the impact ofplanned system revisions. There are two aspects of plannedsystem revisions. One is related to changes in the design of theunits flowing through the system. The second involves changesor revisions to the operational sequence or procedures. Both
Sof these involve a simple matter of changing a few data para-meters and/or changing the operational sequence flow diagram."(p. 10, Ref. 2).
It has already been pointed out that the model can be used for initialdesign. This involves setting up a preliminary crude system configura-tion, testing it, analyzing the output of the simulation, revising the systemconfiguration in the manner described above, running another simulation,comparing it with the results of the first test, etc. - an iterative procedure"that involves successive comparisons of alternative configurations each of
- which becomes progressively more detailed.
"I Because the model does not include specific behavioral parameters"such as skill level, it is not very effective for manpower selection. How-ever, it is possible to test the effects of adding or deleting manpower inthe system, and of changing the allocation of functions between man and"machine (e. g. , redistributing task responsibilities).
1 317
I,
SinmilAt |y tihl inod Io ktiputs (it) not UmU"Nt WhA, tilt I h, tle eing oI t el Irequired for pert NttInv I\kVOuld bho, AMtin 0hi0 nmaty lie l iv tmir III" todtldoes not include beh4%vi WrAl parautnt hidr tuicAtivo of trItA linuM CiCiNv,, al.though wo, have noted thim wia tme difftrulty in oth,,Inl' r mort, hat0ora l|urientd modirtat. 1-'rtunuilyy. howevor, if intolorable tbqueue,, ni ilt %ipat a hunlan interface, it might k.,; decitlad aftist,' dotAild antlywiia of the,problem that additionAl training waN rqquirrid. However, the' NsptcItica-tion of training content or roqul rtd dthrAtion woutld hawv to coei' fraom
analysis of system requirtmonts rather thAn of mod|l oultptait, It isintereomting to noto, Ihuwevor, th-t th, deovoloptero intl et' "thi, modhlwill accept prcdictd lharning curve data and as th, nnttmber of ilimulatiodinigsions increases, symtem performAnce will corr,,pondingly improvol"
(p. II, Ref. 2).
The developers indicate that "upecitic umagoas of ORAGL• 1 ýt nclude,but are not limited to:
"I"a. Determining the number and type of personnel required for agiven task mix and system configurition.
b. Measuring the effect of changes in peraonmel/tatk/configurntionon the system effectiveness.
c, Testing the capability of the configuration to handle the simula-tion ' ia d.
d, Identifying critical elements in the operational sequence.
e. Measuring the effect of degradation of individual system func-
tions, " (p. 5, Ref. 1).
Some information about ORACLE as a computerized technique mightbe of interest.
"ORACLE is a system of 46 functional subroutines whir.h are
assembled and loaded as a "program" according to the de•finitionof the system Laing modeled, These routines perform the follow-ing functions:
* Dynamic core allocation* Event calencrar generation
* Random number generation
318
* i t Jiti il Il 11sal ti att. - e m n il il , 'la , it Im tlni k
ot'it twoA relktiotvlyit "N th Co ~tio tuMIple wytit, toh'ni~Th' w l
eet'Ond feAture is tho tiso of At% ovont 'a londtar- rsthtir thsn A fixisttti"10 Oti~I) r'5l~ Iv~li iii 1110I'0 Ofti'iIit M~A1iblite I'Xit'kitinl I filio,
Stho mod tel rogtuiroli App'oxIimatoly SO, 000 words of cion'storageo, In~ *ddition, fivo high1 spoed "sc' Atc~h" (Iles pl'oviftiiUA c.Aieity of tip to 100, 000 words, And uon magiwttic tapo fil"Art' roquii'd, rho modeli has heon succossifully run tin tho UNIVAG110? And 110$ machinos, Simvulations have alsti beein madte oi tht"IBM 7000 series Although on A much smAllor Pcaai,. Actual running
time on the 11I0N were within A range of from" 5 to 30 minutes forcomputations, with printout requiring from 40 to A40 minutv*. Alithe complexity of the model increased within the creation Of Addi-tional subroutines, the running time and required vore allocation
* prohibited use cot the model to full capacity, This was overcomneby the use of dynamic core allocation routines to replace the largenumihor of partially used dimension Arrays with it single arraywhich in continuously in use, 11 (p. 11, Ref. 2).
VALIDATION/APPLICATJON STUDIES
The m-odel was initially developed for the AWACS system for USAF,in which it was used in the design of the command/control system, Sub-sequently it was used to model a radar production line, It has also beenused in the design of the Test Complex Surveillance and Control System(TCSCS) and in the evaluation of Mallard. The model has also beenapplied to other production line situations anid to a traffic managementstudy.
This listing reveals that the model has beeni applied to a variety ofsystems and problems, presumably with some success. However, the
319
,l'g,'r'.v •1 mul, prm~ i~ the a ltcatl'Ioll iil the .%,g~lnl •ae'tlll~ Ibe ihs~Iei',tltllpd
t" tois% ft'ill, eallp tivikii l I tltVI4 t% ti" a lt' It 411PdI Pt rillitiolflroil, s| N*•l 1141110l I'olltile|Pl
0 r lItIIIA 1-i V I| II g , llf ar ov A I %If% I ill I 'la 0 ilp l l t p ( I r ; Il m l~t V tP \,fk ll Itdly -
till, %1"Ar lt'I ll V hich A lbredictitil is IKP))1iitA'd hy rool~.u I d W l liut looti% pet'-f1 rI' i•ilA it ' I t c o t of A 1%11101 which I•• 4 l oed prInt l i.l y fll , i h I at llo iI -I lli 01itie wh I• llif •P'r •llt Ohvilmoi ly tho at io•ile o|tput l till h " cov ro' lin llto"IlMito %I V4lti' ' vit h It tl'el w llVt-lt I I01, 011iyIi Althol ugh hO•cu'pIi tho nll otel t
ttt'o u•t! di n 01141 figirit |•g ilre of Illeit It may ho dtiffit,01 to (U ptOV11011
Ih•tl r i * 't I'i'r jtl tol ilt'o, llnwovor, tiseri' o art applivatiolil whil, noithol' I14,tilrtot, IHAy tit, it( "toaI iliporitAnce . W . roforI' it) aw wi |tAmity ti
th0it 111MAI (teig in illr i'etlwiall t A syNtIm. In the VtIaN Of iuitial deosign,
tit' % Plirllitll e v01 lid•ty dOOM not roAl ly apply, 11t1Atawe 0t10 iN nut pro.,
ihcting mllythillg oxi' tipt that the systOIem deviloped i1 this way will workwith rol•amuiablo ptfoctivo1iss.i , i, tlhe cawe of r1desiln, the Iixom recom.monded must romody the difficuilty, li such ,aew, tho capability of tilthmodel may he difficult to isolatt from the effects of applying other (0,i4human it, ineering) techniques.
lIn those s ituationa we Are deraling with a utility rather than A validitycriterion. l•ecause of the very Applied nature of these situations, a model
may be highly useful even where, it supplies only partial answers or is inerror to a certain extent,
The validity criterion appliets only to the first of the four uses of amodel: prediction of *ystem effectiveness. Naturally a model cannot beabsolutely invalid and still be useful for dosign, manpower and trainingpurposes. However, if one had two models, the first of which hadslightly greater validity than a second, while the second had significantlygreater utility than the first, the second would, in our opinion, be prefer-able. It is incorrect therefore to place sole reliance on a model's pre-dictive validity,
What we have said should not be interpreted as reflecting on ORACLE'svalidity; we have no evidence for it, one way or another. We ar(, however,impressed by its potential as a design instrument.
320
J J~I VA i.AJAIVI' 141MMAK&Y
Valititly - Nii formnal dt~lt% -avllt',' AlthluOll 11101"' -Al-" V11hio"N i
111~~ltb'r of hm"e~~i l)1i~itI.
Ki.l~e~bihity , Nt, for Al itAtA AVA1il04le, 14lthOUM1h k ilt'h ApI J)iit tilIIN
et 0 Nu' mN 6h 1 Iti t~,c;Il iliffI,' A ie, is i iA 14 11 I n e r' If I It, hthit I
opevra him.. involvr' mtove' int , informWation~ IrArlitt.1' rVOm~l a, til'' C
U., Applicability: Mvode'l outputm meA sure N which can hi' tvaluatvdin tornms of ouytomn of fevtivonvati., but its primAry utit appertrs to be' fordoxign diagnosis.
4~ C. Timing: CAn be applied at all stagoit of symtom clevvlopment.
Modal Characturistics
A. Objectivity, Highly objectivo; few judgments requir-ed.
1 B. Structure: Few behavioral assumptions necessary.
Ii REFERENCES
1. Bicldlecomb, R. et al. Th 'e ORA CLE Systm Simulation Model.Unnumbered, unidated report, Westinghouse Aerospace Division,
Baltimore, Ma ryland.
Z. Stinnett, T. A. ORACLE - A _Dynamic Ti1-me line Siznula 1,tionl 'rch1-nique. Unnumbered, undatod Westinghouse re-port reproducing apaper presented at the IEEE -GMMS ERS International Symnposiumi
on Man-Machine Systems, 8-12 September 19b9, Cambridge,
321
II
VI. PERSONNEL SUBSYSTEM EFFECTIVENESS MODEL
INTRODUCTION
"The model described in this section was developed by Dr. D. T. Hanifan"working at the Western Division of Dunlap and Associates. The model fallsinto the simulation category because of its use of a computer to pace through"the tasks which will be performed operationally by the system. Althoughthe model is not fully articulated (the developer indicated in a phone con-versation that the report on which this description is based did not includeall its details, which have unfortunately not been written elsewhere), thereader will recognize a number of features familiar to him from previousmodel descriptions.
GOALS
The purpose of the Personnel Subsystem Effectiveness (PSE) modelis generally to assess the adequacy of a planned system design (i. e. , itsoperator and/or maintainer aspects, with the term "design" implyingmuch more tha:n merely equipment details) during system development.
k Assuming that quantitative PSE standards or requirements are specified,the probability that the human tasks included in system design will satisfythese requirements can be tested.
A glimpse at the more specific objectives of the method can be securedby examining what its outputs are supposed to be.
"The products of such analyses can be used to:
"... improve hardware designevaluate and improve operational and maintenance procedures
... evaluate computer software to improve human performancecompatability
... assess the adequacy of planned training in terms of impacton system effectivenessprovide a test and evaluation tool
... provide a valuable data base for future operational and systemdesign improvement" (Ref. 1, p. 20).
If one can draw valid interences from the title of the model, the latteris designed to deal with the entire Personnel Subsystem of major systems.We say that because the associations with the term "personnel subsystem"call up images of large complex systems like the Atlas ICBM with which
PREC£ PAGE BLANK,1ý 3
3'[
the author was associated. Consequently, the model is a very ambitiousone, but not more so than a number of other models we have so fa. con-sidered.
ASSUMPTIONS
A basic assumption is that "effectiveness of the personnel subsystemis defined as the probability that mission-critical demands on personn",lwill not exceed personnel capability during a given mission (or acrossmany missions)" (Ref. 1, p. 1). This assumption is implied in a numberof other models reviewed (e.g. , Siegel's digital simulation model), as itis of course a fundamental Human Factors tenet expressed, for example,in time-line analysis; but the PSE model makes this assumption a key-stone of the methodology. For example, "The mission model or scenariodefines the requirement (demand) for performance levels and task accom-plishment time" (Ref. 1, p. 6). Those requirements are likely to be verytime-oriented, because the phrase "mission profile" is used with referenceto the model's input data; the profile suggests a time-line analysis. How-ever, as we shall see, the profile may include requirements in termsother than time, e. g. , error probability.
In any event, the definition in the previous paragraph suggests aprocess of matching requirements against anticipated performance, whichwould necessitate that the system description on which the PSE model is
based contain very explicit requirements for each task being simulated.This may pose relatively little difficulty with regard to completion timerequirements, but may with regard to performance level requirements,since the latter are not ordinarily specified in most of the system devel-opment projects with which the author is familiar. It should be notedthat "Effectiveness has both personnel capability and availability terms.Personnel capability is a complex function of preassignment training,on-the-job training, experience, fatigue, motivation, morale and numer-ous incidental factors, and is generally difficult to cope with satisfactorilyin a quantitative way during typical system development programs. Per-sonnel availability can be determined in a more straightforward mannerby accounting for demands and assignments throughout the system..."The availability term is simply the probability that appropriate pe r-sonnelwill be available upon demand given a complete accounting of all conflict-ing demands and personnel locations throughout the system, includingsuch non-nmission activities as eating, sleeping, sickbay, and the like."(Ref. I, p. 1)
324
II
I
ii Personnel capability can be expressed as probability of task success.However, because capability is recognized as being affected by diverse"factors (note the resemblance here to Swain's "performance shapingfactors"), the input data distributions which are matched against taskrequirements must specifically include these factors. In other words, itis not satisfactory to specify that the probability of accomplishing task X
. is simply .9875, without indicating that the probability will, in the pre-sense of high or low motivation, for examp)ti, be increased or de,.reased.This means that to include these diverse capability factors it is necessaryto supply not one but several input data distributions relevant to any giventask, This is not to say that this cannot be done, but it imposes a severestrain on input data requirements. In the present inadequate state of ourknowledge of behavioral processes, it is possible to utilize the model,but it is unlikely that all the many factors influencing human performancecan be included- at least at present.
Despite the recognition of the many factors that may influence per-sonnel capability, the model includes no further behavioi xl assumptionsof the type we have seen in other models, e. g. , -ie relationship betweenstress and performance, although the developer tecognizeis the potential"effect of stress ("Thus, time stress may decrease petrfornmance level.. .Ref. i, p. 9). The model assumes various personnel types, but it isunclear whetheA' the term "type" refers to personnel specialized for aparticular job or to some other dimension. We would interpret it to
-, mean personnel specialization, rather than something like Siegel's Fdistribution, because personnel type is closely linked to the definition ofpersonnel availability.
METHODOLOGICAL SCOPE
The scope of the model is quite broad, including both operator andmaintenance personnel. There is apparently no restriction on the type of
"- task or behavior which the model can presumably handle.
"-' PARAMETERS
An essential parameter of a requirement -crieiited model such as- this is the "demand" imposed by the task, job or position. Demand is
not further defined, although the developer indicates (p. 2, Ref. 1) that"demands... are distributed in accordance with.. . the probability density
13I 32 5
of demands on personnel capability..." One could of course definedemands as being equivalent to the performance requirement imposedby the task on personnel, but in that case the parameter would seem tobe superfluous.
Whether or not it means the same as demand, performance require-ment is a critical model parameter. Presumably a requirement is as-sociated with each task or subtask in the system scenario. There mayin fact be several such requirements, particularly time and performancelevel which "may be expressed in terms such as accuracy, force exerted,tracks initiated, etc. " (Ref. 1, p. 9).
We have already discussed the concepts of personnel capability andavailability.
DATA
1. Input Data
A great variety of input data are required, as may be seen fromTable 12 (Ref. 1, p. 8). Input data are of the following types:
1. The mission profile (the scenario) which is derived fromthe system description by means of task analysis.
2. The requirements associated with tasks, also derived fromthe same source.
3. Proposed system manning, also derived from the systemdescription.
4. Probability distributions of task completion times andsuccessful task performance, which are derived from avariety of external sources, such as data bank, the resultsof simulation testing, subj-ýctive judgments, etc.
5. Priorities associated with contingent probabilities andalternative action strategies.
6. For the associated Life Cycle Cost Model (which we do notconsider in this description because it is not an effectivenessmodel), man-hour and associated support costs.
326
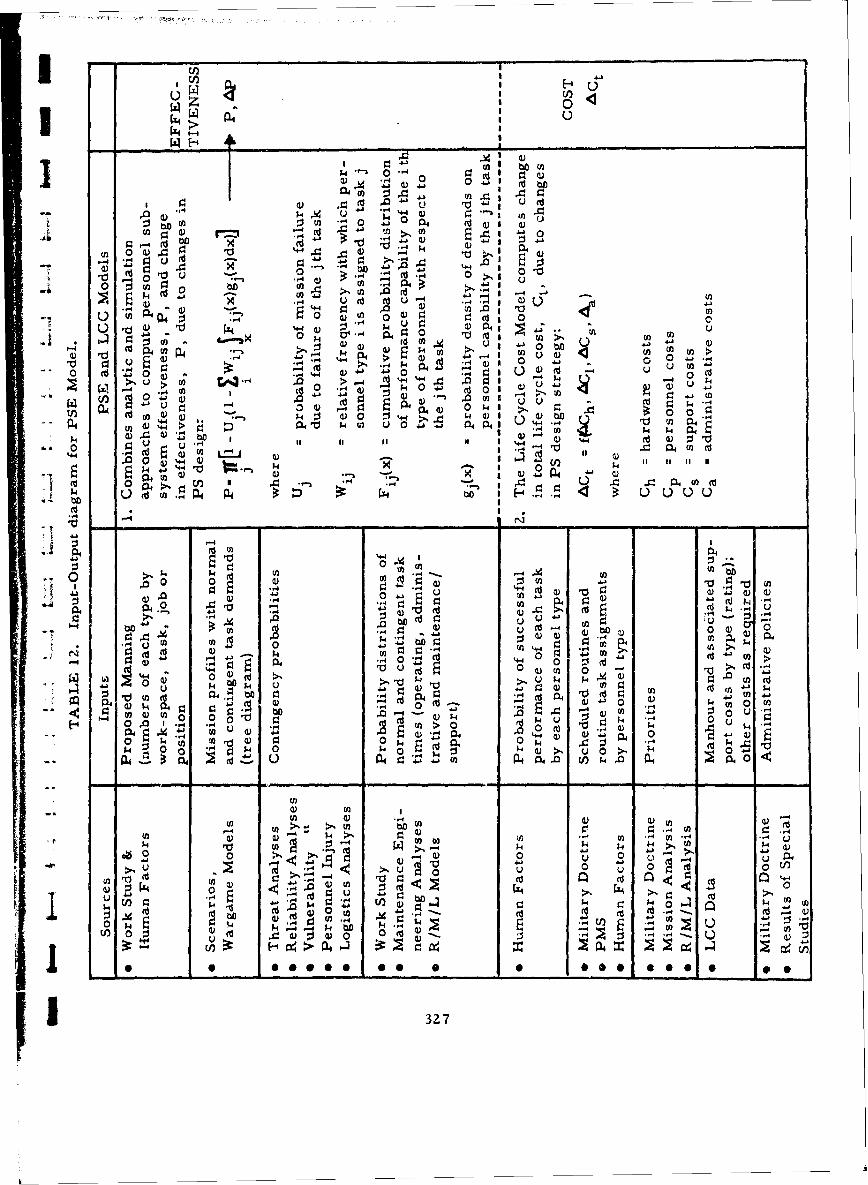
14 I~ uc
(n o4* .044 4
-4~~~ -4 u-j,
0fU 0u >,cd~04).0A -44.U) .0 (141(
4 44 0 a U
4)) u 04~ 0 .4-4~ 0, 0 - j 4
* C- ~ ~ 0 ~ o~*- cd~ 'C Ia U)>4)~~CL
w &
) 4 JU )
Q 0.4~ 4 >) 00. 4J.
.0 >1 '-4 u. U) I t
4 4.0 U 4.j j
-4 0 (U 0S Itd' 0 4j04
. 0 4J L) 44) 4)in(
04 P U 3. Q "- . 0 -( CO0 " ,H4) 1 a _
00> ~ i .- rc p a) U 0 .ri4 )C
U~~U).~~~4- P4([d4b ~UU0 44
-- 4
104 4j-~ U)) 40, 0 )
(d0o W~4 04 m)J44
(d n 4 ) P4 0o -4 ) L 0 u
(n 4 !4 r4 )
1 .4 04 - 4 -4 '-4 rd~ -
.0 -q' 4 (
N4 -14 m. 0 d § Cd $44J4
-~ ~~ 0.~ 4U
-4 U 4
- 444 2
4.)4)~ 4j-40 4 44O) 4-
~~cd~tA U kU f~0P
04 -O r. -4 - - -co 4 04U)04.,q4. CL U0 0 n 0 E
0)* U)U 0 ilo n
ý4~ 0 4V
044 Ix- 0) 4.,q cu -4o* -4%4-
0 $4a (n 0 0 .0
p' 0 ~ k4 ~ 0 C.- k I oU
-4- 46J. *O O 6 0 ** 60:e40
II 327
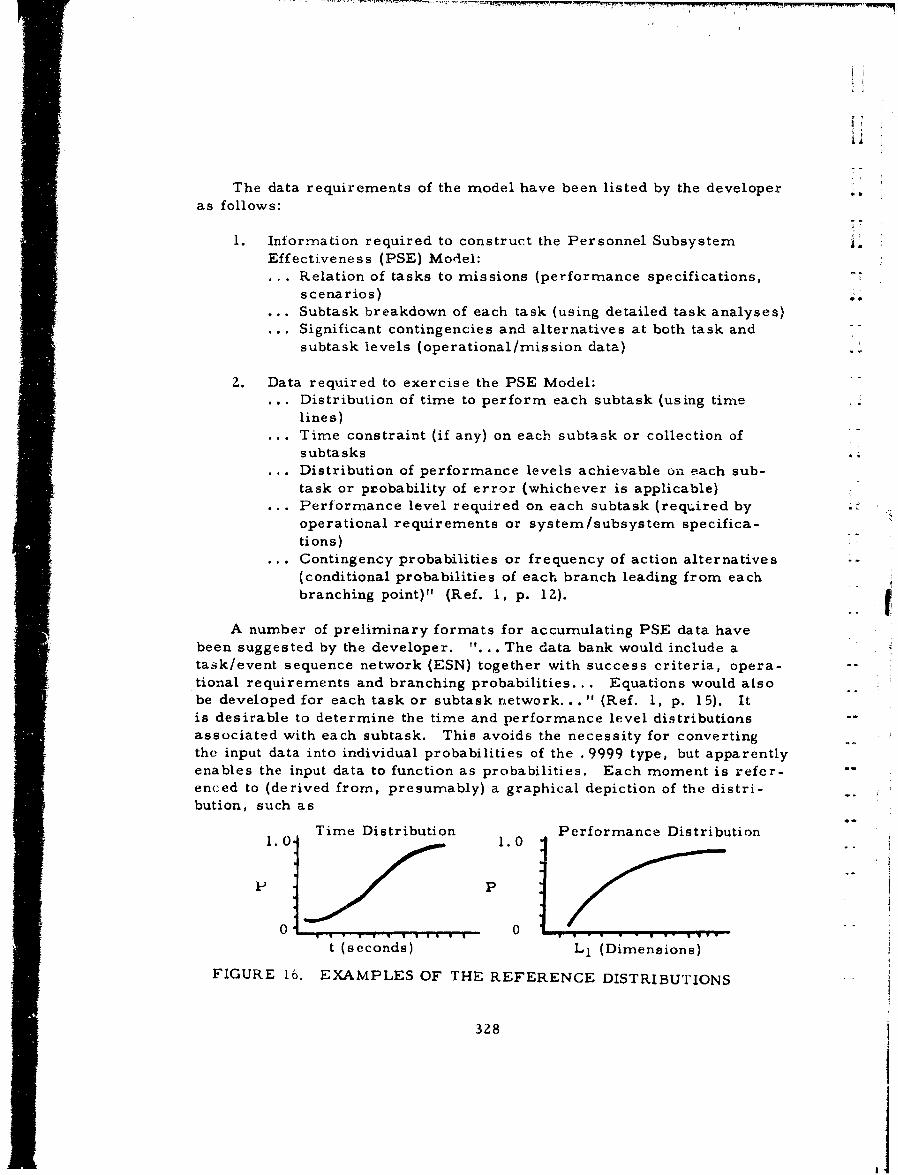
The data requirements of the model have been listed by the developeras follows:
1. Information required to construct the Personnel SubsystemEffectiveness (PSE) Model:... Relation of tasks to missions (performance specifications, ""
scenarios)... Subtask breakdown of each task (using detailed task analyses)... Significant contingencies and alternatives at both task and
subtask levels (operational/mission data)
2. Data required to exercise the PSE Model:... Distribution of time to perform each subtask (using time
lines)... Time constraint (if any) on each subtask or collection of
subtasks... Distribution of performance levels achievable on each sub-
task or probability of error (whichever is applicable)Perlormance level required on each subtask (required by Si
operational requirements or system/subsystem specifica-tions)Contingency probabilities or frequency of action alternatives --
(conditional probabilities of each branch leading from eachbranching point)" (Ref. 1, p. 12).
A number of preliminary formats for accumulating PSE data havebeen suggested by the developer. "... The data bank would include atask/event sequence network (ESN) together with success criteria, opera-tional requirements and branching probabilities... Equations would alsobe developed for each task or subtask network... (Ref. 1, p. 15). Itis desirable to determine the time and performance level distributionsassociated with each subtask. This avoids the necessity for convertingthe input data into individual probabilities of the . 9999 type, but apparentlyenables the input data to function as probabilities. Each moment is refer-enced to (derived from, presumably) a graphical depiction of the distri-bution, such as
. Time Distribution 1.0 Performance Distribution
VP 1-- 0--0 0 0 0 0
.0 1V V I I I I -I
t (seconds) Li (Dimensions)
FIGURE 16. EXAMPLES OF THE REFERENCE DISTRIBUTIONS
328
1
I Obviously the input data must be complete enough that a graphical func-
tion can be derived. Again this imposes a severe strain on input dataT requirements.
"In some cases, performance level is inappropriate or unobtainable"and a probability of error (Pe) can be estimated. For each data set, theassumptions regarding personnel, hardware (inciuding environment andfacilities) and software are given by coded references to appropriate"system documentation. " (Ref. 1, p. 15).
2. Data Source F
Obviously to exercise the model to its full capabilities very complete"system documentation and masses of input data are needed. This re-quirement is lightened only slightly by the fact that raw data can beutilized as inputs, without transforming each datum into a probability.It is therefore likely that without a very extensive data collection effort
,- prior to the application of the model, the latter cannot be fully exercised.
Like other models, external reference data will be secured from any".1 I~ available source. "Initially, data can be obtained from existing sources
and structured judgments. Sessions involving multiple judges qualifiedby operational or design experience as appropriate can be used to obtainjudgment data. Where a series of judgments are to be made, the use ofpaired comparison procedures should be considered together with specialtechniques for detecting and correcting for systematic bias. In such cases,intra- and inter-judge reliability should be reported.. . In critical pro-blemr areas, experimental procedures for estimating human performanceshould be considered, including trial runs in full-scale mockups andlive simulations. Live simulations are generally used only for areas ofcritical human performance in which available data are inadequate,structured judgments are insufficiently credible, and hardware, softwareor personnel design problems have been identified. " (Ref. 1, p. 14)..."Human capability data (from previous experience, from the literature,fromn judgments or derived experimentally) are used to estimate taskperformance levels and times at the gross level or at the detailed, nmicro-
S-. structure level of decisions and actions as required. Branch points de-fining contingencies or alternatives are estimated, either from human
factors, system reliability or mission data" (Ref. I, p. 22).
The necd for extensive data inputs may serve as a possible deterrentto the use of the model, where system development requirements art, very
329
II
timet,-drmanding, cxcept oil nitijor system developnment projevts whe re, Jexplicit requirements for PSE nmodteling are recognized fronm the startof the project. As is the case with other modelsN, it would be useiful tohave msome tstini tes as to the cost in manpower and time to gath, r the Inecessec'y data and exercise the model. Conceivably one could build ageneralized data bank and store it in the computers s memory, but thenecessity for devloping a mission profile and associated requirements Imay be costly in time.
The PSE model does nut, however, impose any requirements fordata different from those required by comparable simulation models,
3. Data Outut I
The model is similar to other method. in that its primary data out-put is a probability of task success which "is the joint probability (P Ltthat a task will be performed at the level L or greater and in time t orless, where the level L and the time t are defined by the demands of themission" (Ref. 1, p. 9). The model therefore emphasize@ both the time Iand the performance level aspects of human performance, in contrast toother models which emphasize one or the other.
"In some instances, either performance level or performance timewill be the single criterion of task success, or performance level will Ineed to be measured along multiple dimensions which may be either in- 3terdependent or independent. Techniques exist for treating either case.In most instances, the criterion for task success can be reduced to arelatively simple bidimensional one made up of time and performancelevel. Required task time may be in terms of clock time (e. g. , mustbe completed within 10 seconds) or it may be referenced to an externalevent (e. g. , must be completed before occurrence of event "a") (Ref. I,p. 9).
Probability of task or mission success is not, however, the only out- -put that can be derived from exercising the model. Because the computercan print out each successive model operation, it is possible to obtain thetime to perform any collection of subtasks up to the total task. As weohave seen with other computerized models, this is an extremely valuableaspect, because it enables the model user to diagnose those points in themission profile where personnel cannot satisfy de-mands.
3I330 I
I
I Snincet an overall oystern rtquiremen t is available (it must be, oth, r-wise it would be irmpossible to dvvelop individual task/subtask rquirtv-Imnts), it is also possible to determine whether the, system requirementcan be achieved by the personnel subsystem. Thus, "the PSE model,suitably progranimed on a computer, is used to computc, "achieved" per-formance times and levels at a level of definition consisto tat with thederived "requirements". "Achieved" and "required" are compared andprobability of task success is computed.. . If the derived system/missiontask requirements are. met, the allocation is complete and forms the
basis for training standards and for test measures to be used duringPersonnel Stbsystem Test and Evaluation (PSTE). If the requirementsare not met, a search is made for ui compatible reallocation or specialstu 'ies arc) made to refine the human capability data" (Ref. 1, p. •2).
PROCEDURES FOR MODEL APPLICATION
"1. Analytic Method
Although a variety of analyses are listed in Table 14, it is apparent
"" that the basic analytic tool, as with the other models, is task analysis..1 As indicated in connection with input data, this analysis requires develop-
ment of a task/event sequence network (ESN) which is a form of block orflow diagram. This may or may not be the same as the tree diagramreferred to in Table 12. The similarity to Swain's probability tree andBlanchard's GSSMI and MSSM should be noted.
Z. Method of Synthesis
Although we have indicated that PSE is a simulation model, it requires,�or .nombinptior ui p•eb•.L'1lti#rs " so,-, I .J the same way that The "non-simula-tion methods do. This may result from the fact that probabxiiiy of successis based on two criteria, i. e. , performance level and time, which means
4 that the probability of successful performance on each criterion is deter-mined separately and the results multiplied.
In order to understand how the model operates conceptually (we shalldeal later with its functional operations), it is necessary to examine thelogic of its approach,
"Consider a situation in which the personnel capability denmands ofthe jth task, job or position are distributed in accordance with the function
1331
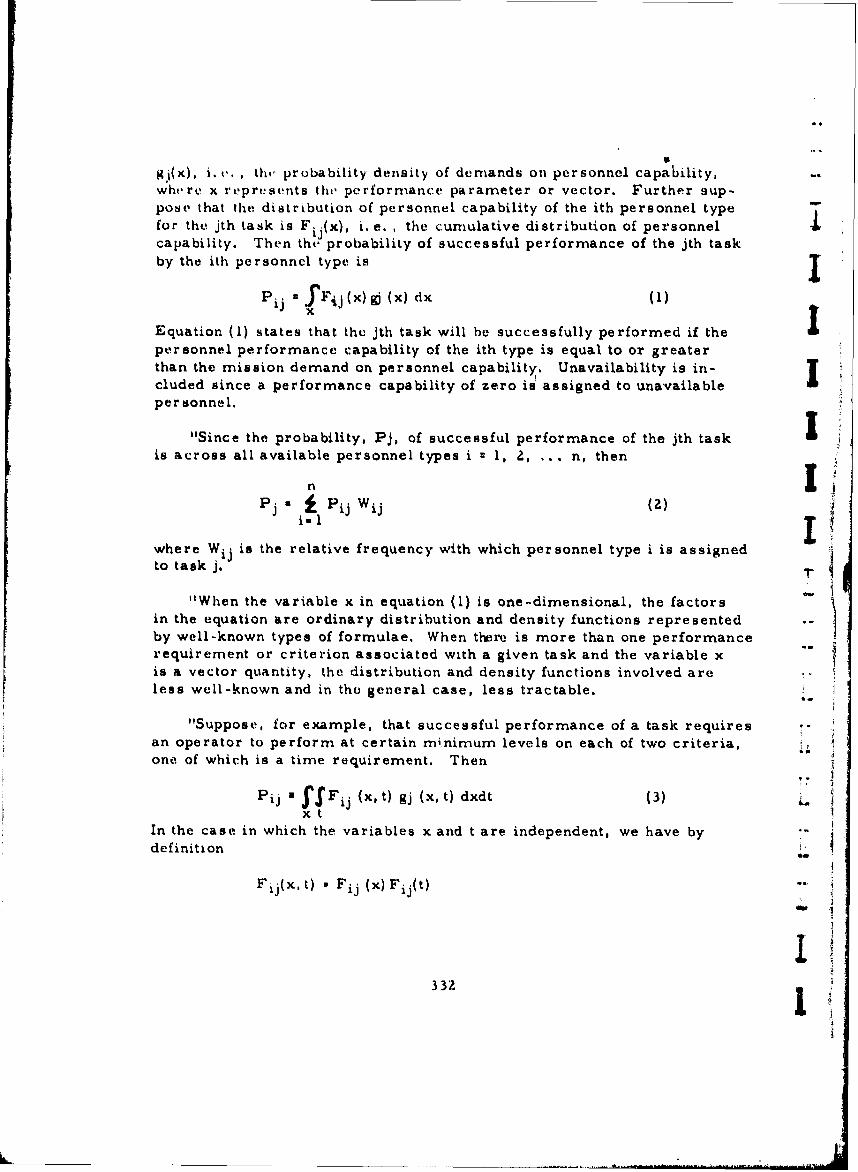
j(x), i. v. , th, probability density of demands on personnel capability,whre x represents tht, performance parameter or vector. Further sup-pose that the distribution of personnel capability of the ith personnel typefor the jth task is Fi(x), i. e. , the cumulative distribution of personnel Icapability. Then the probability of successful performance of the jth taskby the ith personnel type is T
P aFij(x)@j (x) dx (1)PiJX
Equation (1) states that the jth task will he successfully performed if thepersonnel performance capability of the ith type is equal to or greaterthan the mission demand on personnel capability. Unavailability is in-cluded since a performance capability of zero is assigned to unavailablepersonnel.
"Since the probability, Pj, of successful performance of the jth task
is across all available personnel types i 1. 2, ... n, then
nItPj i i (2.)
where Wij is the relative frequency with which personnel type i is assignedto task j.
"When the variable x in equation (1) is one-dimensional, the factorsin the equation are ordinary distribution and density functions representedby well-known types of formulae. When there is more than one performancerequirement or criterion associated with a given task and the variable xis a vector quantity, the distribution and density functions involved are .less well-known and in the general case, less tractable.
"Suppose, for example, that successful performance of a task requiresan operator to perform at certain minimum levels on each of two criteria,one of which is a time requirement. Then
Pij a YjFij (x, t) gj (x, t) dxdt (3)x t
In the case in which the variables x and t are independent, we have bydefinition
Fij(x, t) Fij (x) Fij(t)"
Ii
332
L ... .. .
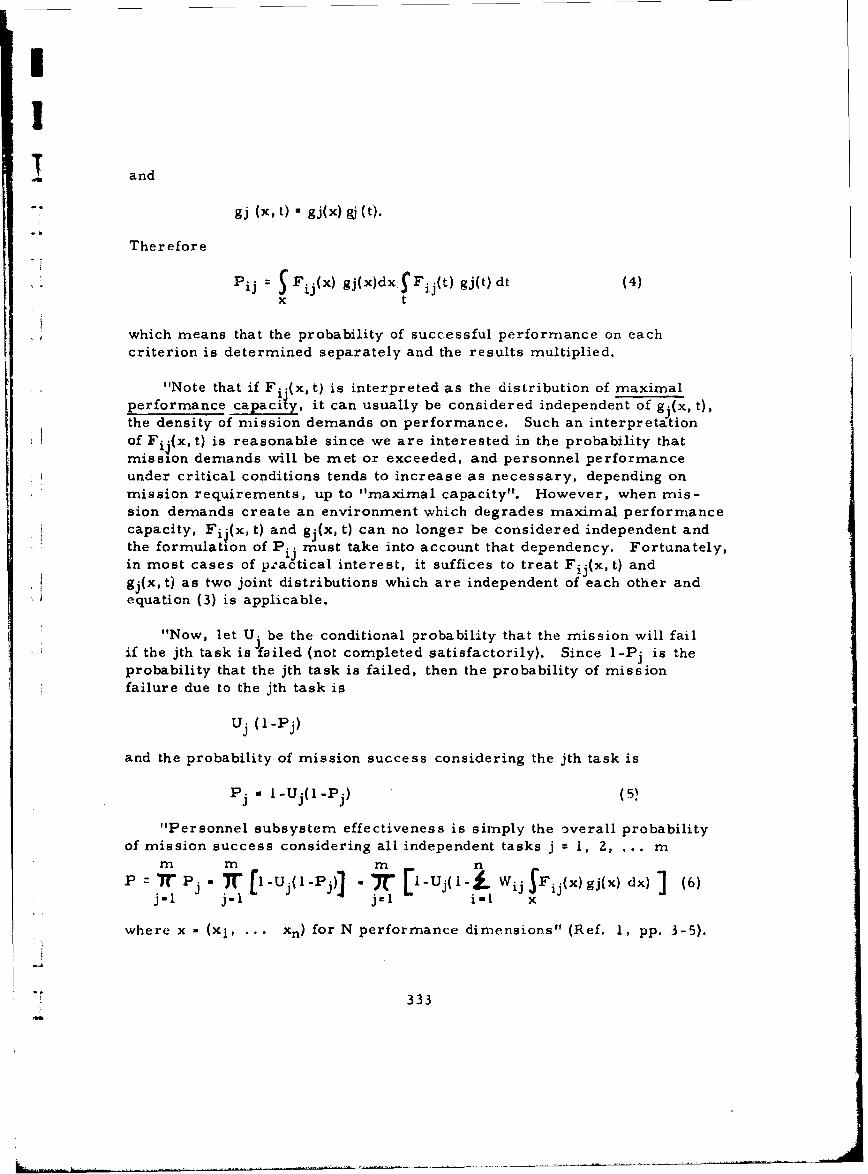
II
and
"gj (x, t) 0 gj(x) gj (t).
Therefore
i Pij " • j Fij~)glxd ~ jlt) gj(t) dt (4)
x t
, which means that the probability of successful performance on each
criterion is determined separately and the results multiplied.
"Note that if F. (x, t) is interpreted as the distribution of maximalperformance capaciiy, it can usually be considered independent of gj(x, t),the density of mission demands on performance. Such an interpretationof Fij(x, t) is reasonable since we are interested in the probability thatmission demands will be met or exceeded, and personnel performanceunder critical conditions tends to increase as necessary, depending onmission requirements, up to "maximal capacity". However, when mis-sion demands create an environment which degrades maximal performancecapacity, F j(x, t) and gj(x, t) can no longer be considered independent andthe formulation of P.. must take into account that dependency. Fortunately,
in most cases of p-actical interest, it suffices to treat Fij(x, t) andgj(x, t) as two joint distributions which are independent of each other andequation (3) is applicable.
"Now, let U. be the conditional probability that the mission will failJif the jth task is failed (not completed satisfactorily). Since l-Pj is the
probability that the jth task is failed, then the probability of missionfailure due to the jth task is
Uj (I -Pj)
and the probability of mission success considering the jth task is
Pj i I -Uj(I -Pj) (5)
"Personnel subsystem effectiveness is simply the overall probabilityof mission success considering all independent tasks j 1 1, 2, ... m
m m m nP rP 7r' [l-uj(l-PjJ] - ~r [l-Uj(l-i Wi~j fF j(x)gjlx) dx) ] (6)
j-l j-1 j-1 i-I x
where x - (x, .... xn) for N performance dimensions" (Ref. 1, pp. 3-5).
333
T
I4
This last equation requires the determination of availability andappropriateness of each of the personnel types i = 1, 2 ... n. Thisrequires the model to have the capability of storing tables of tasks vs.personnel types and their performance level and task time distributions.The mission model, as indicated previously, defines the performancelevel and time requirement for each task. Pij is determined by samplingfrom the performance leve./time distributions for the ith personnel typeand comparing the sampled values with the values demanded by the mission.This is done by the computer "at convenient increments of time duringthe mission" to determine whether the predetermined demands have occur-red, continued or ended.
"If a demand occurs, the personnel-available list is searched foravailable personnel and the one with the highest P. is assigned (and de-
leted from the list). If a demand is continued, the list is unchanged. Ifa demand is ended, the personnel are added to the list. If a demandoccurs but no personnel with P. >0 are available, then the computer de-"termines whether a mission faiiure occurs by solving the appropriatefunction of U- or by sampling a distribution with mean U. If a mission
failure does not occur, the process is repeated at successive intervalsuntil failure occurs or until appropriate personnel become available.Probability of mission failure, (l-P), is computed on a running basis,and sampling is carried out to determine whether the mission has failedor continues.
"The procedures and algorithms for generating and analyzing tasksequences (including alternatives and contingencies) have already beenformulated by Dunlap and Associates, Inc. Programs for combining dis-"tributions (convolution and mixing or furcation) currently exist for theOlivetti Programma 101 desk top computer and for high speed digitalcomputer (e.g. , CDC 6600 or GE 360). "(Ref. 1, pp. 6-7).
3. Level of System Description
The precise level to which input data are applied is somewhat obscure.The model is "developed down to the perception, evaluation, decision ac-tion level of detail in critical problem areas" (Ref. 1, p. 22) which suggeststhe subtask level. On the other hand, the requirement, e. g. , time con-straint, may be at the level of "a collection of subtasks" which suggeststhat probabilities for subtasks may have to be combined in order to makethe required comparison between "achieved" and "required" performance.
334
I
ANTICIPATED MODEL USES
The uses for which the developer feels the model is effective havebeen in part indicated previously. In addition, "the approach described...responds to the frequently-stated requirement that
(1) critical tasks be assigned a quantitative human performance"reliability" index
(2) human performance measurements be made during PSTE forcritical tasks
(3) a systematic method be provided for identifying and recordinghuman-initiated malfunctions which can be... correlated with equipment performancc data to determine the
inter-action of human and equipment perfo•rmanceconverted to reliability indices which can be related tosystem functions (functional flows) for use in predictingsystem performance
(4) hUman performance quantification and evaluation be done oneach critical task and used to determine:... the contribution of each critical task to system effectiveness
"and reliability, and"the minimal level of human performance required to meetsystem operating requirements." (Ref. 1, pp. 20-2t)).
L bet us examine how well the model satisfies the potential uses wehave sperified for other models: prediction of system effectiveness;comparison of alternative design conmigurations; design analysis; man-power selection and training.
It seems reasonable to suppose that if the model lives up to expecta-"* tions, it should be able to estimate future operational performance because
it applies predictive input data to tasks just as other operability models do.Since the existence of a system requirement is critical to model operations,the model obviously will indicate whether or not that requirement will befulfilled.
"Similarly the model should be able to compare alternative configura-tions based on anticipated PSE measures. How sensitive it will be to de-sign differences, however, depends on the equipment parameters to which"the behavioral input data are related. This is as obscure in this modelas it is in most models. Insofar as the designs are based on differentprocedures, the model should be able to evaluate alternative procedures.
335
In the sarne way, the model should be useful in design analysis-[
because of the time-historical record it provides- if the behavioral input
data are linked specifically to equipment design parameters, such thatinput probabilities of success for task N vary as a funttion of differentdesign factors. There is no implication in Reference 1 that this is soexcept that hardware data (of an unspecified type) are mentioned as oneof the model inputs.
The model specifically requires manning inputs; consequently itshould be able to supply information on the effectiveness of differentmanning configurations. It is much less likely that the results of a modelexercise will suggest the particular aptitudes for which system personnelshould be selected, but then the model does not say it can.
It will be recalled that the model is supposed to "'assess the adequacyof planned training in terms of impact on system effectiveness". It is -.
difficult for the author to see in this statement anything but the usualtendency of model developers to inflate the range of capability of theirmodels. It is difficult to see how one could include a planned trairingprogram as an input to the model unless one hypothesized a given levelof effectiveness of that training and adjusted input probabilities and tasktimes correspondingly.
Similarly one sees absolutely no way in which human-initiated mal-functions can be identified by exercising this model, unless an effectfactor, like Swain's Fi, were included; however, the model logic doesnot differentiate between errors that have an equipment consequence and Vthose that do not.
This model does have one capability that perhaps the others do not.It could be used as a test and evaluation tool (during the PSTE phase) byserving as a framework for gathering PSTE data, and then using thesedata as 'nputs to the model to secure a total system figure of merit. Andit is true that the model could be used as a data base to the extent thatinput data are stored in the computer's memory.
In the light of the model's half developed state (and it can be considered"only a skeleton at present), the claims that are made for it should be viewedwith caution.
336• m m4
I'I
I VALIDATION/APPLICATION STUDIES
According to the developer the method has neither been validatednor applied. No supporting data are supplied in the basic reference.However, as was pointed out previously, procedures and algorithms havealready been formulated.
Even with this, however, it would seem to us to be difficult to applythe model to an actual system development project because so many ofthe model details remain obscure. This is unfortunate because for sys-tems large enough to afford personnel subsystems projects, the model"(assuming it works) would seem to be ideal. In consequence, it is im-possible to view this model as haviry anything more than potential.
EVALUATION SUMMARY
Validity - No data available; model has never been applied.
Reliability - No data available.
Ji System Develop)ment Applicability
I A. Comprehensiveness: Model is not limited to specific types ofequipment, tasks, behaviors. One potentially important limiting factormay be that quantitative system requirements must be specified in detail.
B. Applicability: Model outputs a prediction of system effective-ness and can be used for design analysis and manning.
.1 C. Timing: Model can be applied to systems at all stages of system
ctvelopment, depending on how concretely system details nave been con-ceptualized.
Model Characteristics
A. Objectivity: It is hypothesized (from other writings of the dtevel-oper) that the model leans heavily on expert estimates, but specific pro-cedures for securing these are not indicated.
B. Structure: Model structure is not complete. A nuniber of bamicparameters are not explicitly defined.
i 337
REFERENCES
I. Hanifan, D. T. Human Performance Quantification in System
Development: Recent Advances. Final Report, Contract N62462-70-M-0733, performed for Naval Applied Science Laboratory, NewYork, by Dunlap and Associates, Inc. , Santa Monica, Calif.February 1970 (revised July 1970).
i
Ii
•m m I
I
IiIi
338I
iI
III
II
S~C. MAINTAINABILITY PREDICTION MODELS
a
IIII
IIII
1 339
iI
1. pLIMNTA)R.Y IMbiAMitLY IINIT )'AHAMK'tICKTI'ECIINIQUII (01*1!I•'I)
I ~IN TIRODICTlI '' fY IMlSICI,1 TIO)N
Wh1 t11'11 , 0% 1110h1111111h i htip 1 '1ugi1i twio mo oapo l'm I t 111 11•a hl1milli 0to'hniicale i' l ilrali w0 a hs Pa r it I t1• ilpi dteo'v•, ltii1g %•11 s wit' if ''roii'etitiip (11vii ahllity). T'he niethott (14100 not 'oyul re 1.0 unrtiutg of
I ~aretl
A, The probability that i ,ailire is doteelod And rI•pilrodj during niahntolia1le,
11, Thet probability that maintenauwe tidvtu not induce failure,
Tihe model conuists at equations and computitional ruinutes thatenable one to solve for A and AI on the basis of knowit values %)f failureand maintenance Inputs.
9!
GOALS
The dovolopors of this technique (see, refs. 1 And 1) speak of It as Ani"indirect" approach, because it was deliberately derived to avoid thenecessity of collecting data on huiiian-initiated failures, After a reviewof all the failure/maintenance reporting systems in the Navy as of 1967(e. g., 3M), they decided that these systems provided no usable datarelative to human reliability (HR). Therefore they sought to develop atechnique in which HR parameters could be inferred from more readilyavailable indices.
(It might be noted incidentally that studies performed by the authorand others found essentially the same negative situation with regard toAir Force reporting systems.)
This introductory explanation seems necessary because the techniquewas developed essentially to provide information on certain HR parametersand only indirectly to answer certain specific prediction questions. Forexample, "The most significant feature of the technique is that the quanti-fication of these human performance parameters can be accomplished by
64 a using equipment failure and maintenance data without relying on hun'm ,I.initiated failure reporting" (p. 56, ref. 1).
ERUPT is part of a model which evaluates system readiness. From4• the standpoint of HR, therefore, the technique has the primary goal of
estimating two human performance parameters:
(1) O. = the probability that failure is detected and repaired duringmaintenance;
(2) 1 = the probability that maintenance does not induce failure.
PRECEDING PAGE BLANK.341
IntasNte tit tiiw tig the (I reel ioymbolo for' tho Millhs findho beta ovo, we0116111 f~i~ Ol, etPu~ lis~ko, tutfo ti't the po a u1#1.1 iietor holloofrith oiAA siil1 %.~ ActmlAl V wul Arp hilo,ttu wpill tit I . O-~A fmd i, 0. li, hwu'.tloi ths,$"
V~le wnuu'at1u0fivinclsoul ill teont' holy aip l urual that Attallot thel;"u'dI~t (or r'0 111 4% sh i Atlimt'i.
A ondt 1A ctAl ho 'oniatdi'ets no eeutitlAtewoh theffr oefIivioneuy of "ilinto-114knoo toelhuivit Ito r~ fuurlui uue". If thes tochniu'iAtu 1etocts A mltuuuwntionAtid rl u'iosutie~t (A) andh if hio u #tituioN do niot re otult ini AuditinuAl 1Maitutes-liftnoe r014%iu~ii~oeits 0%i) 01114 ewuettiAlly skiminAuviaew hill effic~iency. Ifthellf I-a ramtillto N okld 110 OptimlAttd With teAkoo ialw prooillitn, It 11111,tho kituievowwAry to mlAke %oo oh miethodsu that Attompt to Itl~isawre mainte-noinvo bhAvior. ttrtwtly, like the porooonnol reliability index (alreadtydic ood) or tho teovitniewtai %ioMt by the, author Andh his Oolloapuies (ref.
ThO (IIA0d1iOul thAt needsi tO be aniwwerad abotit this technique is whetherthe niethvd van ho %ioed to pe rform thes varintin Aknetiono a predictivetechnique* mhotild perform-, (a) to estinmate dtirinK design/developmelntthet orff.etivneso that tho hunian vomtponent of the llyntem will assumetiutring oparations; (b) to pormit compariponi4 of alternative design con-figurations tii tormsi of the effectiveness of that human component; (a) tosuggest initial design And redesign posstibilities; (d) to provide informa-tion rtlativ, to manpower selection and training. We shall considerthese poitst later,
ERUPT to part of or can be "sod to develop a measure of what thedevelopers call "readiness reoliability". Thin io defined an the "proba-bility that the weapon is operi~ble at the tinme of its operating mission or,more generally, probability that the weapon to tii "Sol' condition when itis needed" (p. S6, ref. 1). The reader will recognize immediately thatwhat is being described here io more commonly known att systemn availa-
Presumnably the model wvill also predict somenthing called "mission-tactic reliability" - the "probability that the wenpon will successfullycarry out a given m'ission with a prescribed tactic, assuming the weaponis ready (operable) at the beginning of the mission" (p. 56, ref. 1). Thisis more commonly .inderstood as system roliabilit X. However, onlyreadiness reliability was considered in the research effort, and it isdoubtful wvhether the technique can in fact handle mission-tactic reliability,since, as we sh~aU see later, none of the input data relate to operatorperformance. Htonce, If the technique were used for estimating systemreliability, it could do so only for systems so completely automated thatno operator interface (or hardly any) is needed.
Conceivably what the developers had in mind in referring to mission-tactic reliability wait that the general strategy of solving for A and B byinputting known valueis for other parameters could be applied where A and
342~
I• wore oporator leorformAtt'P lar uiPt,' r. t'Aththou hlall i1ip1,ful
techniit'ian lparA1110t.•rl. A and ii w~aId ithro hlic't to ho r•ilpfitih d Illtermsi~ of to~peritoi 1perIormaiwao', AMi Wli%ild tho tithe r ,iiortI P prattiotera.What this ro fit1(itllort wmild ho tois unlt'oltr •lnd I1i n•ly •v•tit lied 1lit7Ivonvort %k N ('irthoru b~evamto It Ii c twill ploteily s4pek'Mtati V4, (bne i' viewthis as Another example of thi tendoncy of dovwolaperm to ipatnd the svopeof their techniqkes beyond what they wore itettid to ti)ch).
DIEFINI TIONS AN I) ASSUMPTI¢ONS
In the cturoe of the preroeding dti%'•nsiitn we defined the two humanperformance parameters with which the model i* concertied and the twomeasures of system effectiveness it mooks to derive, eDeftnitions will bosupplied of the input data And output metric when thebs are discusesldlater. It is, however, desirable to define what is mieant by eleniontaryreliability trnit (EIHU) which apparently plays a major part in thr, modelbecause it defines the level at which input data are gathered, It wouldbe beat to permit the developers to speak for themselves: "One of themost important concepts Associated with the application of IERUPT isthe grouping of system components into ERUs. The selection of ERUsti based on the maintenance level established for the system. Maintenance.1 level in this context is defined as the lowest type of equipment indentureat which maintenance is performed." (p. 57, ref, 1).
To translate into more commonly recognised terminology, ERU is
the same as the lowest level replaceable unit. This is the level ofindenture at which equipments or components will be maintained andrepaired rather than being replaced. In other words, if maintenanceinvolves only removal and replacerrent of hermetically sealed cannisters,then the cannimter level is the ERU and the inherent reliability ( 9 ) used"in the model refers to cannistaers. If, on the othei hand, techniciansmaintain at the circuit level, then it in applied at the ;ircuit (ERU) level.
"On to assumptions. The first assumption is that "the scope of theresearch (on the technique) is limited to human reliability as related tothe operational and maintenance phases of the weapon systems life cycle"(p. v, ref. 1). From this we infer that the methodology in not usableduring the design/development stages of system life. Later, when weexamine required input data, we shall examine this inference in moredetail.
A second assumption of great importance is expressed by "The
general thought is that, if "inherent" or "true" hardware componentfailure rates can be determined under controlled conditions, then theexpected reliability of the ERUs can be calculated. Then, based onfailure rates of these ERUs under actual conditions obtained from main-tenance reports, it will be possible to infer the oL 's and I's from thedifferences" (p. 59, ref. 1).
II 343
'!'o oxproso th, i s.ti.o whAt difr, rttly, it ito itmaaw d that thehardwaro imi•ponootl of a ysten havw n inhe rent, true reliability (I. •.una tilliod by oprational nmalpraeti,:.' or humwan hand"). If thli vAlue i*known, Atnd if on• thoi tAn dotrmino oporational failure ratea, and vancalculato operational reliability, thvn tho difforence between the inherentAnd toporAitinAl reliahilitioi mu11t hv4t 11001% cAM401d by thO only otherfactor inflnu.nc'in ope'rAtioual OlItability, I."a., ,mainte•al•t ce actiona.
SOV.|A1l imints m1%1t b0. ,,tod About this asumptio0n. (1) Th1 •a ump-tiun iniplies that inheront reliability is derived from system test datagathered under controlled conditions. ZatimatoN of inherent reliabilityhave generally been grossly ovorestimated. For example, it in knownthat reliability pradictiona for the alectronw.c equipment on the F-I II (intorms of MTBI') weao at least AVstv.'Al times lower than actual (oper-ational) MTBIF for that equipment. The natural tendency of contractorsto represent their eq%tipment bi the beot possible light leads to highlyuptimistic estimates of reliability d%rg•g development. It might be notedincidentally that many reliability engineers are quite skeptical about theexistence of an "inherent" reliability. In any event, should inherentreliability be overestimated, it to Inevitable that A and B will be overlypessimistic.
i.
(Z) Even assuming that inherent reliability were estimated on thebasis of system teats conducted during development, it is well knownthat such system tests rarely resemble operational usage conditions, 2
so that the inherent reliabUlity values derives will again be distorted,with undqsirable consequences for A and B.
(3) Since A and B alone are considered the cause of the differencebetween inherent and operational reliability, no attention in paid to otherfactors that influence maintenance-induced failure, e.g., inadequatelogistics, poor job aide, etc. Or rather A and B subsume these othervariables. In consequence the human component of the system (A and B)ia. given the discredit for non-human factors that also tend to producemaintenance-induced failures.
It may, however, be argued that since inadequate logistics, poorjob aide, etc. influence the system only through the maintenance techni- 4clan, A and B do in fact represent thes3 other non-behavioral factors.
(4) It must be noted that even in these "enlightened" days, manysystems are developed without the benefit of reliability predictions. Thisis not an objection to the ERUPT methodology, since all systems shouldhave such reliability predictions; it is merely a cautionary note.
Perhaps because the methodology was developed on the basis of oper-ations research concepts and specifically sought to avoid the need forbehavioral data, the technique makes no explicit assumptions of a behavioralnature. However, the model makes implicit behavioral assumnptions which
344
Ishould be clarified, For exampl., one implicit assumption is that the
probability of maintenance-induced failures increases with the numberof opportunities to perform preventive and corrective maintenanceoperations, This can be inferred from the fact that among the inputdata is the number of maintenances before repair/replacement of theERU or since last repair, Since A and B are derived from an equationwhich includes such parameters as maintenance opportunities, timebetween exercises and tests, number of ERU tests, number of correctivemaintenances, etc. we might expect the developers to indicate how thesefactors influence A and B. They do not, however. The equation describessystem availability and by inserting input values for all parameters butA and B, and then solving for A and B, the human parameters are inferred.However, we do not know from the model what causes A and B; we merely
-" extract a value for these. This is not necessarily an objection to themodel, if the values derived for A and B are correct; but it representsan inadequacy.
One might expect A and B to be influenced by such factors as thecomplexity of the equipment being maintained and the technician's skilllevel. ERUPT recognizes the influence of skill level by relating it tothe level of indenture at which the equipment is maintained, but does notinclude skill level in the equation for deriving A and B. Nor does itinclude equipment complexity in that equation. It might, however, beargued that complexity is assumed in the level of indenture for the ERU,but such an indirect relationship is weak at best.
The consequences of not including factors such as equipment corn-plexity and skill level in the equation for A and B means that it is difficultto interpret estimates of A and B in terms of design and personnel impli-cations. We shall have more to say about this in discussing the uses ofthe technique.
METHODOLOGICAL SCOPE
"It should be emphasized that the equations developed for readinessreliability are applicable to any weapon system which meets the under-lying assumptions of the model. However, it is also true that thereadiness reliability measure of effectiveness is not the only measurethat can accept ERUPT human reliability paramet3rs; they can be incor-porated equally well into other models of system reliability" (p. 59,
I ref. 1).Attention has already been drawn to the fact that the model predicts
availability only. From that standpoint the first statement in the precedingparagraph appears correct. However, the assumption that values forA and B,once derived, using ERUPT, can be incorporated in other models, appearsunjustified. Since A and B are derived from other parameters like inherentreliability, number of maintenance actions, etc. any system making useof A and B must include among its parameters the same parameters thatERUPT includes; otherwise the significance of A and B will be distorted.
I34
1 345,
The model therefore is specialized to derive an availability estimate 4and an estimate of maintenance technician performance. It is not limitedto any particular type of system or any particular kind of maintenance.It will not, however, predict system reliability during missions or oper-ator reliability.
MODEL PARAMETERS
"tThe model consists essentially of equations and computational
routines..." (p. 56, ref. 1). In this section we will define and discussthe elements of the model equations. We shall not discuss the computa-tional routines, assuming these to be adequate for the purpose for whichthey were developed.
The equations include the following terms:
(1) 0(i =probability that failure of the i th ERU, if it exists,
is detected and repaired during the first mainte- i,nance following the failure.
(2) 1. = probability that maintenance does not induce
failure in the ith ERU given that the ERU is in
nonfailed condition at the time maintenance isinitiated.
(3) .ij = probability that ith ERU, which is in nonfailedcondition at the time the jth exercise or test is ""initiated, survives the exercise or test.
(4) t. = storage time between exercises or tests of ith ERU.
(5) l-Gi(x) = probability that ith ERU survives a storage time xgiven that it was in "new" condition at beginning ofstorage, i.e., at zero storage time. This is deter-mined from a theoretical distribution estimated Uunder laboratory or test conditions.
(6) NK = number of different integral values of k in the sample Lof corrective maintenances.
(7) k. = number of maintenances before repair/replacement jsince beginning of storage or since last repair ofthe ERU if previous corrective maintenance hasbeen done (including maintenance when last repair/replacement was done). A sample of k-'s is •
required from actual experience to derive maximumlikelihood estimates of 6C and P. -
(i -1 , 2. ...... NK).
3I
346
I,
(8) N frequency of the value of k. in the sample ofcorrective maintenances (i f,2, ... NK). Sizeof sample is equal to
SNi"i=2
()1 =storage time of i th ERU between time when lastexercised and maintained to time of operatingmission.
(10) iV.I number of exercises or tests of ERU before oper-ating mission.
(11) P(/ ) = probability that the ith ERU survives the ith exercise"or test and was last repaired during the
-I maintenance period.
The meaning of most of the elements of the model is apparent. How-ever, the precise significance of a few elements is doubtful. We assumethat il .. represents the inherent reliability of the ERU. In effect, if theERU isjexercised, it will perform without malfunction. 1-Gi (x) is also
presumably a form of inherent reliability, except that it representsreliability during "shelf" or "storage" life.
LiWith regard to NK and ki, an example is provided. "Assume that a
sample of ERU corrective maintenances shows that they have occurredion the first, third, third, second and first preventive maintenances. Thus,
under the definitions,
NK=3 K -1 N =2
K2 =2 N2=1
K 3 N3 -2 "( p. A-3, ref. 1).
The parameters involved in the model are therefore:
(1) inherent reliability(2) storage time(3) shelf life reliability(4) number of corrective maintenances(5) number of preventive maintenances(6) number of equipment tests or exercises
and of course
- (7) malfunction detection/correction probability (A)(8) maintenance -induced failure probability (B)
"which are derived from 1-6.
347
i|
i|:
DATA
1. Measures Used
These are the input data which were discussed in the sectionon model parameters.
2. Data Sources o
"The method for estimation of values for oC and 1 parametersfor an ERU is based on actual shipboard failure experience and mainte-nance data for the ERU" (p. 59, ref. 1). This appears to be in contra-diction to the assumption we made that 7g.. represents inherent or truehardware reliability which is ordinarily • estimated during system"development. It is difficult to see how one could derive a measure ofinherent hardware reliability from operational data, because operationaldata represents the influence of operational factors acting on that inherentreliability. In this connection on page 58 of ref. I it is asserted that the"probability that the ERU which is in a non-failed condition at the time atest is initiated, survives the test" is derived from laboratory test data,rather than from shipboard data. There is an obscurity there that needsexplanation.
Another apparent contradiction is that G (xt) is supposedly derived t"from a theoretical distribution estimated under laboratory or test con-ditions" (p. A-l, ref. 1). If the distribution is derived from laboratoryconditions, it is obviously not gathered from shipboard data. This ambi-guity also needs explication.
Even if one assumes that all the data needed for the model could infact be derived from shipboard, the manner in which those data would begathered requires elaboration. Ideally the various reporting systems Uaboard ship should be able to provide the data inputs from which themodel parameters could be calculated, but these would have to be analyzedand transformed into the individual input measures required. For example,- W even if it could be derived from shipboard data, would not be repre-s•sted on the reporting form in this manner.
It appears then that there is considerable obscurity concerning themanner in which input data could be secured. It is regrettable that thetest case described in reference 1 did not utilize data from an operatingweapon system. If it did, some of the problems relative to data sourcescould have been clarified.
3. Output Measures
The model outputs A and B, of course. It provides a series ofF values (probability that a set of A and B values will produce thecorrective maintenance experience reflected in the result of the inputdata) for each of the values of A and B, in increments of .01. The various
348
I0
3 output measures are:
(1) A
(2) B
(3) Probability that this sample of corrective maintenances couldJ have occurred given this set of A and B values.
(4) The maximum probability that this sample of corrective mainte-nance could have occurred.
(5) Value of A at which (4) occurs.
(6) Value of B at which (4) occurs.-S
The preceding output measures dealt only with A anq.B. Anotheroutput is a prediction of the readiness reliability of the i ERU. Given
J this value, the readiness reliability values of the individual ERUs aremultiplied to provide a measure of system readiness reliability.
Note that the multiplicative relationship inherent in the system readi-ness reliability assumes that all ERUs are needed for reliability; in otherwords, the equation does not take into account the possible effects of anyredundancy. Whether this assumption is justifiable is left up to thereader's judgment.
It should also be noted that if system readiness reliability (availability)is calculated on the basis of shipboard (operational) data, there aresimpler ways of measuring this directly. Availability can be simply
defined as total uptime. Given that one is predicting availability fromtotal time
operational data, availability determination for either the ERU or thesystem as a whole is relatively simple, requiring only the determinationof the proportion of total time that a given unit has been down (as a resultof malfunction and maintenance).
PROCEDURES FOR MODEL APPLICATION
1. Method of Analysis
The initial step in the development of the equation is the selection42 of ERUs. This is required in order to identify the components for whichdata will be collected. The developers indicate that this selection processposes no problem for anyone familiar with the system, and this is probablycorrect, because this type of analysis is routinely performed by reliabilityand maintainability personnel. For this reason, perhaps, no detaileddescription of the process is provided in reference 1. In order to makesuch a selection it is necessary to know the level of maintenance for the
S349
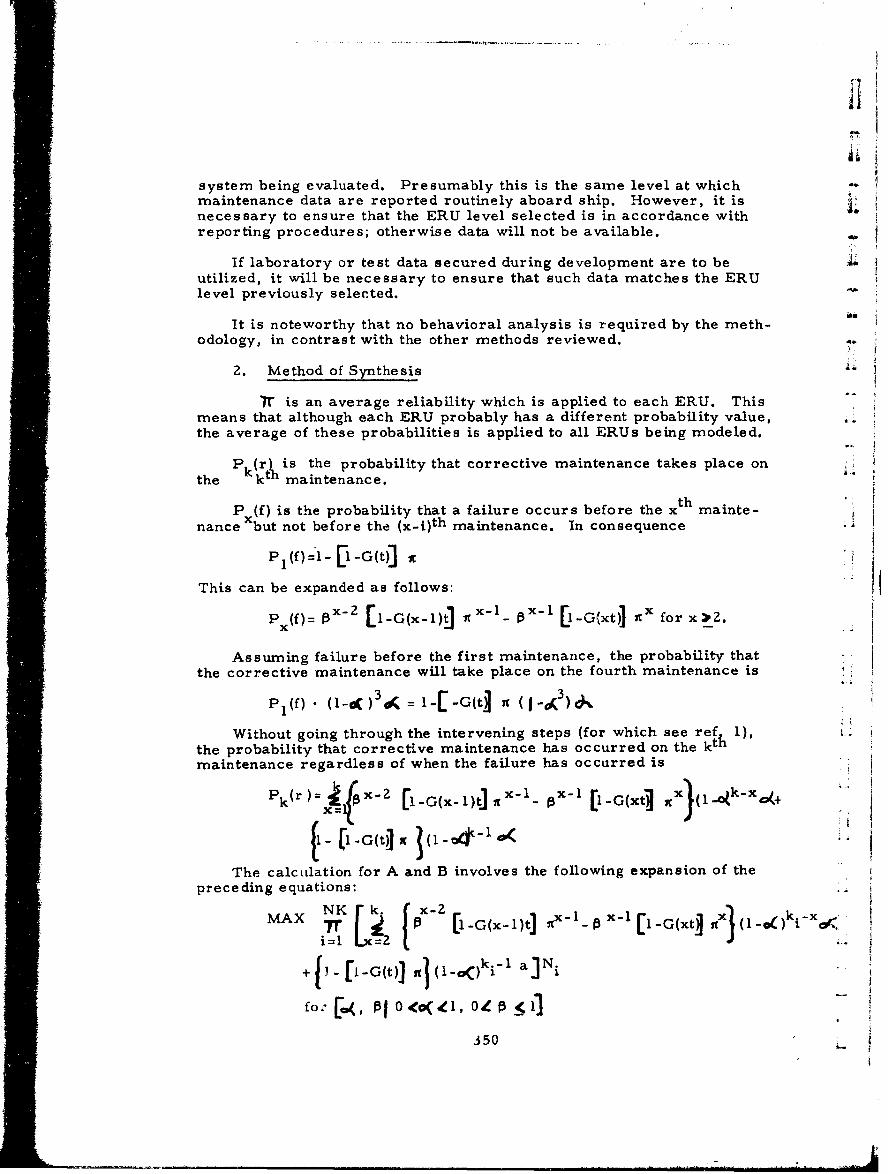
! :di
system being evaluated. Presumably this is the same level at whichmaintenance data are reported routinely aboard ship. However, it isnecessary to ensure that the ERU level selected is in accordance withreporting procedures; otherwise data will not be available.
If laboratory or test data secured during development are to be 4utilized, it will be necessary to ensure that such data matches the ERUlevel previously selected.
iiion
It is noteworthy that no behavioral analysis is required by the meth-odology, in contrast with the other methods reviewed.
2. Method of Synthesis
I• is an average reliability which is applied to each ERU. Thismeans that although each ERU probably has a different probability value,the average of these probabilities is applied to all ERUs being modeled.
"P (rI is the probability that corrective maintenance takes place onthe ict maintenance.
"P (f) is the probability that a failure occurs before the xth mainte-
nance but not before the (xni)th maintenance. In consequence A
P (f)=l-[l-G(t)]
This can be expanded as follows:
p (f) = x- [l11-G(x-l1)t] it~ l [I- [-G(xt)] AO for x)'2.
Assuming failure before the first maintenance, the probability thatthe corrective maintenance will take place on the fourth maintenance is
Without going through the intervening steps (for which see ref 1),the probability that corrective maintenance has occurred on the kthmaintenance regardless of when the failure has occurred is
i [ 1 x- 1 -
The calculation for A and B involves the following expansion of the
preceding equations:
MXNK r k. (X-ZkMAX..r L' 2 [- [l-G(x-1)t] - x-P -ox-l[l-G(xt. x( 1 -o)i00
= • il
+! 1 Ikr) - 2 [G x ) xI -Glx) xt (I _ ) i_ 1-a N
""f o, 01 <Q ,0 4
.350
II
Since the complexity of the equation makes manual computationimpractical, a computer program to perform the calculations is available.A computer search is initiated to define the set of values for A and Bwhich maximize the probability that a specified distribution of failureprobabilities (G(xt)) will occur. The computer program compates aprobability (F value) that a set of A and B values will produce the
corrective maintenance experience reflected in G(xt).
Since we are only indirectly concerned with the derivation of theequations for estimating system readiness, we shall not present theni
1• here. A complete exposition is presented on pp. A-4 and A-5 of ref. 1.-A
3. Model Output
These have already been discussed.
ANTICIPATED MODEL USES
1. Prediction of System Effectiveness
It has already been pointed out that the model derives A and B"which can be used as estimates of the efficiency of the maintenancetechnician. A predicts the efficiency with which malfunctions arediagnosed and remedied; B predicts the liklihood that maintenance-inducedfailures will not occur during preventive maintenance. Ideally thereforeboth A and Bs-s-ould be high.
Interestingly enough, the model does not deal with a situation inwhich a second malfunction is induced by the technician during correctivemaintenance of an original malfunction. This is actually a more commor6situation than inducing a malfunction during preventive maintenance. The
II reason is simply that many systems do not permit preventive maintenanceor else preventive maintenance is very severly restricted. Of the twoparameters estimated, therefore, A would seem to be more valuable.
On the other hand, the value for A should usually be quite high. Unlessthe system is extraordinarily complex or very poorly designed, malfunc-tions will be detected and repaired, although mean time to restore (MTTR)may be quite high. Hence A should always approach 1. 00. It is difficultto understand therefore why the illustrative example in ref. 1 has A values"down to .16. In the case of this low value, the developers talk of mal-
4 functions not being detected promptly during preventive maintenance.It is possible that A should be interpreted as probability of detection andrepair of malfunctions encountered solely during preventive maintenance.However, if this is the case, the objection raised to B applies also to A.In any event, there is an obscurity here that needs clarification.
V IThe model also outputs an estimate of system readiness reliabilityI (availability).
1351
-a Destg Analysis
We are concerned hero with the way in which the derived A andB values can be used either for comparing alternative design configura-tions or for initial design/redesign suggestionp In other words, whatcan one do with A and B?
Because the data inputs to the model are operational, it would seemthat the model would have no use in the design/development phase andconsequently could have no use for design analysis. If one were fanciful,however, one could conceive of applying the model during design withestimated parameters. In other words, based on experience with previoussystems of the same sort as the one being evaluated, derive estimates ofScir tit 1-Gi(x), etc. and work the equation through. This would provide
an estimate of A and B which would obviously be less precise than onederived from operational data, but still perhaps usable. One could thenpredict maintenance technician efficiency for a system still in the devel-opmental stage.
It is unlikely, however, that one would compare design configurationsin this way, however, because it is not at all clear whether the inputparameters to the model are sensitive to differences in equipment design.The operational data would undoubtedly be sensitive to these differences,but the estimated input data would not be, because the model does notindicate any relationship of input parameters to design. By this we meanthat in actual operations design A will have a different it, a differentstorage life, number of corrective maintenances, etc. than would designB. But in the absence of operational data and without design-inputparameter relationships specified, we could not assign different esti-mated input values to the different configurations.
Conceivably the model could have value as a redesign tool. Givena low A and B in actual operations, what should one do to correct thesituation? Again, however, the absence of design relationships withmodel parameters would leave us without any way of interpreting A andB in terms of these relationships. In this respect, this model is nodifferent from the others. One could of course look at a ERU with a lowA and B and try to infer the characteristics that led to the low A and B, LAbut how successful one would be is anyone's guess.
3. Manpower Selection
Not applicable.
4. Training
A low A and/or B could be interpreted as meaning that mainte-nance technicians need more training; but equally well such a low A and/orB could mean that the complexity of the maintenance required is too much
35Z
I
for the technician. In any event, the model would do nothing to suggeut
how much or what type of training would be needed during development.
VALIDATION/APPLICATION STUDIES
The proof of the pudding, it is said, is in the eating. This meansthat although the model may be excellent for the limited uses to which itmay be put - the estimation of A and B - one cannot be sure until a vali-dation study has been performed. Like the other models reviewed (exceptthe digital simulation model), this one has not been validated, or at least:3we have no information on validation.
Validation here would require an independent estimate of A and Bderived from actual shipboard failure and maintenance data. Even thiswould not be a completely satisfactory test of the model because it wouldnot test A and B directly, but only A and B as inferred from other oper-ational parameters. Only measurements of maintenance-induced failures(as performed by the author and his colleagues in ref. 3) would indicatewhether model estimates of A and B were correct. The difficulty hereis that the model was developed in the first place only because theauthors of ref. 1 felt that they could not measure these HR parametersdirectly. If one accepted their proposition (which the author does not),no true validation of the model would be possible.
One other possibility exists: to use the model to estimate systemreadiness reliability and then check on alternative ways of measuringavailability. Since A and B are required for estimating system readinessreliability, if the two different ways of estimating readiness reliabilitycoincided (within reasonable limits), one could infer the correctness of3 the model and hence of A and B.
As pointed out above, no validation study is reported in reference 1.An application test of the model was performed with assumed data and thederived A and B values made what appeared to be sense to the developers.The results indicated that the HR parameters were sensitive to the numberof preventive maintenance actions preceding each corrective maintenanceaction. However, this cannot be considered validation, since the absolutevalues achieved might have been highly erroneous.
A sensitivity analysi's of A and B was also performed on an actualweapon sys,em. This indicated that readiness reliability is quite sensi-tive to human maintenance parameters.
I What then can we say about the model? Its primary advantage is thatit does estimate A and B, and no other model so far reviewed does so.Its greatest deficiency is that it cannot (apparently) be applied during thedesign/development phase.
31 353
EVALUATION SUMMARY
Validity - No data available; model never applied.
Reliability - No data available; model never Applied.
System Development Applicability
A. Comprehensiveness: Metho':d highly limited.
B. Applicability: Model does not predict future performance butestimates system availability on the basis of operational data.
C. Timing: UsefUl only with operational systems.
Model Characteristics I
A. Objectivity: No subjective estimates required.
B. Structure: Ill defined; model parameters obscure.
REFERENCES ""
1. Peek, C., Haynam, K. and Markisohn, G. Human Reliability Research, i.Report PRR-67-2, New Developments Research' Branch, BuPers,Sept. 1967.
2. Markisohn, G. Human Initiated Malfunctions. Proceedings of the LSymposium on Human FPerformance Quantification in Systems Effec-tiveness, Washington, D.C., Jan. 17-18, 1967.
3. Meister', D. et al. The Effect of Operator Performance Variables Lon Airborne Equipment HReliability: Report KIXUD-Ti-7U-140, Rome;Air Development Center, Griffiss AFB, New York, July 1970. L
354
II
I1, MIL-HDBK 474
MAINTAINABILITY PREDICTION METHODS
INTRODUCTION
The four methods described in this section are taken fromMIL HDBK 472 (Ref. 3). They do not include all available prediction1*1 methods and this section does 'not deal with these other methods becauseto do so would require a far more extenisive examination of the maintain-ability prediction area than we can provide. The reader who is particu-larly interested in this field would do well to consult Rigney and Bond(1966, Ref. 5) and Smith et al. (1970, Ref. 6).
Examination of the methods included in Reference 3 should be ade-quate for our purposes because (1) they represent the methods acceptedby the great majority of maintainability engineers, since inclusion of thesemethods in a military handbook gives them at least semi-official status;(2) the research on which these methods are based has been the mostoutstanding of the recent past; (3) our examination of maintainability pre-diction methods is intended only to be representative of these methods, not
LI to, be exhaustive.
This last point is most important. Our goal in this report is to re-view methods that estimate the efficiency of the technician's performance,as do ERUPT and the personnel reliability index. The maintainability pre-diction methods discussed in this section attempt to predict system downtime which is something quite different. Because maintenance task comple-tion times are at the core of all these methods, their output measure isobviously strongly influenced by the technician's effectiveness (along withother jactors such as design and logistics) that results in shorter or longertimes; but the methods themselves do not seek to evaluate efficiency assuch. They have somewhat lesser interest for us because of this. However,in reviewing these methods we shall place primary emphasis on those as-Ii pects that relate to or reflect the influence of technician performance.
We shall discuss each model in turn, but it would be desirable tostart with a capsule summary of their major characteristics.
The models may be classified (following the lead of References 5 and6) into two general types: (a) the time-synthesis methods in which timesassociated with certain elemental maintenance tasks are synthesized or com-bined to derive an overall expected mean time to restore; (b) the correlationmethods in which an equipment is evaluated using a checklist and the check-list scores are inserted into a multiple regression equation which yields anestimate of the expected maintenance burden. The four method3 also differin terms of the types of systems to which they are applicable and their pointof application in the design cycle. For example, one method is for predic-ting flightline maintenance of avionics equipment, a second to predict ship-board and shore electronics gear, etc.
"355

It must bo noted that the focus of the p-ndiction is exclusively intorms of tinme, not orror. This Is becauscr oquipment mnaintainabillty isdefined in terms of downtime. It may be assumed that given infinite timeall systems (except those destroyed or discarded) can be restored to opera-tional use. Hence, the effect of error is simply to increase task time andthus downtime.
356 1
I!
METHOD I (ARINC)
13 GOALS
The purpose of this procedure is "to predict system downtime of"airborne electronic and electro-mechanical systems involving modularreplacement at the flightilne" (p. 1-1, Ref. 3).
Note that this goal is simpler and hence more straightforward than thegoals of the models previously reviewed (i. e., operability models). Againit must be emphasized that the procedure's avowed purpose is not to predictman, machine or system effectiveness, but merely system downtime. Never-theless, every maintainability engineer recognizes that downtime is the re-sultant of the combined effects and effectiveness of equipment, personnel,logistics, administration, etc.
ASSUMPTIONS
ii Reference 3 indicates that "the philosophy of the entire prediction
procedure is based on the principles of synthesis and transferability" (p. 1-2,Ref. 3).
LI The principle of synthesis refers to the assumption that total systemdowntime can be derived by the addition of downtime distributions for moreelemental activities. "Application of the model consists of synthesizing var-ious combinations of the elementary activities to form higher order maintenancetasks which are specific to a given system" (p. 273, Ref. 6). This assump-tion will be quite familiar to the reader who has read the description of theAIR Data Store and similar reliability-oriented methods. It is entirely justi-fiable because response times are obviously additive.
The concept of transferability refers to the assumption that "data appli-cable to one type of system can be applied to similar systems under likeconditions of use and environment....." (p. 1-2, Ref. 3). Again the reader
-,will recognize this assumption as being at the heart of the data bank concept.In terms of the elemental activities with which completion times are sufficientlymolecular, they will be completely generalizable. "The Elemental Activityis a simple maintenance action of short duration and relatively small variancewhich does not vary appreciably from one system to another. An example ofa basic elemental activity would be the opening and shutting of a door...."(p. 1-1, Ref. 3).
I. This designation refers to the developer of the methodology. For specificreferences to authors of the research reports on which this and the othermethods are based, see Reference 6.
1 357
Several points should be noted about the concept of transferability andelemental activities. To be valid the concept must assume independence ofthe elemental activity from the effects of system design, although not neces-sarily from the effects of skill level. This poses certain difficulties. At acertain elementaristic level, the task activity may be virtually independent iof system design, but where this level is can only be determined by testingacross systems.
The concept of elementary activities also forces a highly analyticprocess on the procedure. System operations must be "decomposed", as -
it were, into progressively more elementary components; these must thenbe reconstructed to form the total system. This is standard reliabilitymethodology and we have seen it as part of the reliability-oriented ana-lytic models like the AIR Data Store, THERP, etc.
emMore specific assumptions, related directly to elemental activities,
underlie the methodology:
"(a) The mean time required for the performance of an ElementalActivity is independent of system design and support facilities.
(b) The frequency of occurrence of an Elemental Activity correlateswith some factor of system design or support facilities.
(c) The Elemental Activities in any maintenance category are inde-pendent of each other.
(d) The total time required in any maintenance category is completelyaccounted for by one or more of the Elemental Activities in the
category." (p. 1-14, Ref. 3)
Assumption (d) above means in effect that the elements in any mainten-ance functicn (like localization, repair, etc. ) completely account for the timerequired to perform that function. This is a reasonable assumption, givenany reasonable taxonomy of maintenance behaviors.
Assumption (a) was referred to previously. We are dubious that anyelementary activity can be completely independent of system design, becauseeven the opening or closing of a door will depend in part on such aspects as thenumber of fasteners for the door or the characteristics of the door handle.
Assumption (b) is probably acceptable. For example, the number ofconnectors in a system will in part determine the number of times the techni-cian must connect and disconnect this type of component.
Assumption (c) is almost certainly not correct. If the maintenancecategory is, for example, fault location, it cannot be divorced from what hap-penis in the preceding category of malfunction verification. Rigney and Bond T(p. 61, Ref. 5) point out that "the assumption of independence among
35i358 31!
I separate tasks is almost certainly inaccurate in some instances." However,they also point out that "the ARINC studies have shown a surprising insensi-tivity to category independence conditions; the synthesized distributions (oftimes) were about the same when category correlations were taken into ac-count and when random combinations of categories were effected. It isdifficult to see why this shuuld be so unless the synthesis technique includesso many different items that a masking or blurring of separate effectsoccurs in the total..time distributions" (p. 61, Ref. 5).2 Smith et al (Ref. 7)point out that errors in time estimation of individual categories do not seemj 1to have an excessive effect on the product of such combined time estimates.
The reader should remember, however, that the statements aboveapply only to time; one could not generalize to the multiplicativ'- combinationof error prob=-5 Tfties.
The elemental activities referred to as the "lowest common behavioraldenominator" of this methodology do not correspond to the subtask or taskelement levels found in other models. They (43 in all) more closely corres-pond to the task or even the gross task level. For example, sample behavioralj elements are:
(1) Using test equipment to verify malfunctions ....
J(2) Interpreting symptoms by mental analysis .....
(3) Performing standard test.
IThe grossness of these elements makes it doubtful that they can be indepen-dent of system design.
J Behavioral parameters are largely missing in this method, which isentirely understandable considering that its conceptual orientation is derivedfrom engineering, not from Human Factors. Rigney and Bond point out that"the maintainability time synthesis schemes are relatively free of psychologi-cal variables such as commitment, urgency, susceptibility to stress andmulti-person interaction" (p. 61, Ref. 5). The lack of behavioral parametersactually implies a further assumption: that behavioral factors have littleimpact upon maintenance task times, an assumption which a behavioral specia-list will find it difficult to accept.
METHODOLOGICAL SCOPE
The procedure is restricted to airborne avionics and flight line replace-ment. This restriction is determined by the empirical data sources on whichthe task times for this procedure are based. Since the method depends largelyon the application of its time data bank, the source of that bank restricts itsapplicability. This may appear somewhat at variance with the concept oftransferability, but the transferability refer& only to generalization acrossairborne avionics equipment removed and replaced at the flight line.
I. See also the studies by Mills and Lamb in Appendix C.
1 359
On the other hand, if we are really dealing with elemental activities,and if the times collected pertain to these activities, there is logically noreason why the data could not be used for other types of systems. Sincethis is apparently not true, one can only suspect that these so-called elemental Aactivities are not really as elemental as they perhaps should be.
The implication of the procedural restriction to avionics is that themethod will be employed only if one wishes to predict downtime for avionicsequipment; if other types of equipment are involved, one of the other methodswill be selected. In view of the differences among the other (i.e., opera-bility) models reviewed previously, it might well be that this procedure couldbe followed generally: to look not for a single general purpose model, butto select the one most effective for a given application.
PARAMETERS
If we think of model parameters as being the elements that are involvedin the application of the procedure, the following would be included:
(1) the behavioral elements already discussed (i. e., the maintenancetasks);
(2) system design characteristics, i. e., number, type and locationof components;
(3) component failure rates;
(4) distribution of downtimes for the elements and for the maintenancecategories. T
The maintenance categories referred to are:
(1) preparation time;
(2) malfunction verification time;
(3) fault location time;
(4) part procurement time;
(5) repair time;
(6) final malfunction test time.
From a behavioral standpoint the above correspond to the functions into whichactive repair time can be subdivided. The categories are similar to othersgenerally accepted by workers in the area.
360
I DATAj 1. Input Data Required
The following information must be made available to perform the"• l prediction:
(a) location and failure rate of each component;
(b) number of flight-line replaceable components of each type;
(c) number and type of readouts;
(d) number of types of spares carried;
(e) number of pressure-retaining connectors and magnetrons;
(f) number of test points;
(g) nature of special test equipment;
(h) estimates of durations of average mission;
(i) manning schedules for operations and maintenance personnel;
(j) estimates of time occupied by unscheduled activities.
IISome of the above items will be found in any system; others, like numberof magnetrons, seem highly system-specific.
The major input data are the task completion times associated with theelemental activities, together with the appropriate distributions to be used.Three types of time distributions are available:
(1) the fitted normal distribution;
A(2) the fitted log-normal distribution;
(3) a corrected time log-normal distribution.
j The original prediction method assumed a normal distribution of timesfor the elemental activities. However, further refinement of the procedureresulted in the three distributions above.
A Elemental activities having standard deviations less than an arithmetic
mean of an hour are assumed to be normally distributed. This is because"they are assumed to be of routine nature and hence, execution time shouldnot be significantly influenced by changes of personnel, characteristics orsurrounding events.
1 361
If, however, the standard deviations are greater than the arithmetic imean, or the mean is more than an hour, the elemental activities are con-sidered "both as more complex and as containing many possible subactivities"(p. 1-12, Ref. 3). In this case the tendency is for the applicable distributionto be skewed to the right and is assumed to be of a log-normal nature.
The use of distributions (rather than simply the mean of the distribution)represents a greater degree of sophistication than one has encountered sofar and is a procedure which should be followed with the other models reviewed.It should be noted, however, that it may well be easier to develop time distri-butions than similar distributions of errors.
2. Data Sources
The task times needed to perform the prediction are given to the user;
his only responsibility is to select the appropriate distribution.
Parts lists and location data are available from system documentation.
Failure rates for components are derived from MIL HDBK 217A (Ref. 2)or a comparable source like FARADAMANo subjective judgments are requiredexcept for the decision as to which time distribution should be selected.
3. Output Measures
"The ultimate measure of maintainability is the distribution ofSystem Downtime. Intermediate measures include the distributionof times for the various Elemental Activities, Maintenance Cate-gories, Malfunction Active Repair Time, Malfunction Repair Time,System Repair Time and System Downtime." (p. 1-2, Ref. 3)
PROCEDURES FOR MODEL APPLICATION
1. Analytic Method T?
Obviously the breakdown to elemental activities requires a form offunction/task analysis, although as with the other methods reviewed in thisreport a specific procedure for performing this analysis is not described. LThis analysis merely requires identification of the elemental activity, notany consideration of the parameters influencing these activities.
2. Method of Synthesis
The complexity of this procedure results from its "building block"assumption. Having associated an appropriate task time with the elementalactivities, it is necessary to combine them in the following manner. The
ZA. Computer Applications, Inc. ,Army, Navy, Air Force and NASA FailureRate Data (FARADA) Program, Vol. I, Contract N001Z3-67-C-2S28, NewYork, New York, 1968.
362

II
steps listed below are not to be considered a complete description of theprocedure, which is extremely complex, but are merely illustrative.
v (a) Calculate occurrence probability of each elementalI activity;
(b) Determine probability of completing an elemental activityI by transforming time values into Z values and looking up the equivalent pro-bability in a table of the normal conditions;
(c) For each maintenance category and for each of the 20 timeU values multiply the probability of occurrence of the elemental activity by theprobability of occurrence of each of the 20 times. For each of the 20 timevalues sum the probabilities for all the elemental activities comprising themainter ance category. Plot the distribution of times for each of the cate-gories. I
J The procedure then goes on to make use of the Weibull equation to de-termine administrative time. "Predict the cumulative distribution of admin-istrative time by repeating this process for a minimum of 200 times andplotting the results" (p. 1-20, Ref. 3). From the distribution of MalfunctionActive Repair time randomly select by a table of random numbers a minimumof 200 random values of this time. To each time add a value of administra-tive time. Multiply each of the 200 time values secured previously by 0. 95NI where N is the total average number of malfunctions following a flight whichprovokes a complaint. Plot the distribution of system logistic time anddraw the best fitting line through the plotted points. Determine its proba-bility of occurrence. Multiply each system final test time value by the"readout factor"; plot the distribution of system final test times and drawa best fitting line through the plotted points. All of the preceding steps(which are considerably abbreviated in this description) lead to the determin-ation of system repair time which can be made by drawing a number of ran-dom samples from a distribution of times already available.
I ANTICIPATED MODEL USES
As indicated previously, the procedure is restricted to the prediction ofsystem down time. In terms of the use categories we have employed withother models, the method does not predict effectiveness. Presumably, ifthere is an explicit or implicit standard relating to an acceptable system down-I• time, then one could use the downtime estimate derived from this procedureas an effectiveness measure, but this use of the procedure would be t'!nuousat best.
3. The author had intended to provide a step by step description of the
statistical method involved, but at this point he threw up his hands at the
I difficulty of making that complex procedure intelligible. Hence, the
following paragraph (above) is only a summary.
I3 363
11
As far as its use for comparison of alternative design configurations, theprocedure is far too complex for this. Moreover, by its assumption that theelemental activities are relatively independent of system design, the proce-dure eliminates any design sensitivity.
With regard to design analysis, Smith et. al. (Ref. 6) complain thatthe method cannot be used during design. Rigney and Bond (p. 61, Ref. 5)indicate that "But often the design significance has not been well enoughworked out to give detailed guidance. A project to clarify and extend thedesign meanin - of various parameters in time synthesis might be worth-while. For the results of such a proiect to be practically applied, thedesigner should be told how to identify those features that contribute mostto the time simulation" (underlining that of the author) . We find then thesame problem of design-relevancy in maintainability prediction that weencountered in the models previously reviewed.
Applications of the method to selection and training are not relevant.
VALIDATION/APPLICATION STUDIES
In the original development of the method data were gathered from the VAN/ASB-4 Bomb/Nay system in the B-52 bomber and then applied to 7 othersystems. Graphs are presented in Reference 1 that indicate good agreementbetween predicted and observed times (pp. 1-5 through 1-10, Ref. 3). Rigneyand Bond (p. 60, Ref. 5) indicate that "validation so far appears rather 1.positive". Cunningham (Ref. 1) indicates that "this prediction technique,with at least 42 separate equations, is not for the beginning (maintainability)engineer nor for the beginning statistician. It is our feeling that the predic-tion method is highly complex. ..... At the ELA (maintainability) Workshop,May 1968, one trial was reported using this procedure and that was droppedfor lack of data ..... "
The impression one receives is that although this method demonstratesreasonably good validity, it is unlikely to be used because of its complexity.Apparently utility criteria are as important as -or more so than- validityin the actual use of the method.
EVALUATION SUMMARY 4
Validity - Method has been formally validated. However, it has beeninfrequently applied because of its complexity. L
Reliability - No formal data available, but reasonable reliability canbe inferred from validity testing.
364
]]
J System Development Applnicability
A. Comprehensiveness: Like all time-synthesis methods, limitedby its input data to flight line avionics.
B. Applicability: Does not output prediction of system effectiveness,only downtime. Has no applicability for design analysis, selection ortraining.
I C. Timing: Any time after design concept has been established,provided requisite data are available.
Model Characteristics
3 A. Objectivity: Relatively few subjective judgments required.
B. Structure: Some objection to basic assumptions; otherwise3 model structure is well defined.
3II[I
-[[I
* 365
I!
'METHOD II (Federal Electric Corporation)
SGOALSThese are essentially the same as Method I. However, the procedure
is specialized for shipboard and shore electronic systems. The method hastwo parts, part A predicting corrective maintenance time, part B predictingactive maintenance time (which includes both corrective and preventive
maintenance) . Part A results in a maintainability prediction expressed inhours because it utilizes tabulated maintenance task repair times, recordedin hours. Part B does not use tabulated task times; instead it uses estimatesof man-hours which are based on past experience or an analysis of the de-
sign with respect to maintenance.
ii' ASSUMPTIONS
This method is also a time synthesis method. It assumes that "themagnitude of the repair time.... is the sum of the individual maintenancetask times which are required for its completion" (p. 2-2, Ref. 3). However,the times involved are average times instead of distributions. It also usesstandard electronic part failure rates.
The individual maintenance tasks referred to in the previous paragraphare actually functions rather than tasks, i.e., localization, isolation, dis-U assembly, interchange, reassembly, alignment and checkout. We are dealingin this procedure with behaviors conceptualized at a much grosser level thanMethod 1; in fact, the tasks of Method II resemble the maintenance categoriesV of Method I.:
Another basic assumption which differentiates Method II from Method Iis that of maintenance level. It is assumed that "at the part level of repairit takes longer to perform a repair task than at the subassembly or equipmentlevel because less time is required for the discrete steps involved at thelatter levels" (p. 2-3, Ref. 3). The maintenance times vary then "as a func-fl tion of the depth to which a technician must penetrate an equipment to localizeand isolate failures" (p. 274, Ref. 6). An essential part of the technique isthe selection of task completion times in terms of the level at which maintenance
"4j is to be conducted. There are 9 functional levels: system, subsystem,equipment, group, unit, assembly, subassembly, stage, and part.
The concept of functional level makes Method II much more sophisticatedthan Method I. It should also make the downtime estimates more realisticthan those supplied by Method I; we shall see later if this is true.
"Another assumption, which is crucial for part B of this method, is5 •that judgments can be made of the tasks required for maintenance by analyzingbasic features of design and that the time required for these can be estimated
•I from these judgments. This assumption directly links the methodology withdesign features, a characteristic that was not found in Method I.
PRECEDING PAGE BLANK367
4.
Like Method I there are no behavioral assumptions in this procedure.
The fact that standard times are utilized and not time distributions asin Method I implies an assumption that such distributions are unnecessary.One may criticize this assumption as being statistically naive.
METHODOLOGICAL SCOPE
This methodology is restricted to naval equipment because of thesource of its time data. However, the basic concept structure, e. g. ,corn- •pletion time as a function of maintenance level, would seem to be capable
of generalization to other system-types, if the appropriate task time data Twere gathered. The fact that the method is apparently restricted by itsdata source seems to imply an assumption that the influence of design ontask time is such that no generalization across systems is possible. Yetthe 7 maintenance tasks (or functions, as we would term them) areutilized in describing maintenance of all systems.
PA RAMET ERS •
One finds in this methodology essentially the same parameters as thoseof Method I, except for the crucial parameter of functional maintenance level.Again, system design features and failure rates for components are impor- -"tant. Probability of occurrence is, however, not specifically utilized in thismethod, although component failure rate does influence that probability.
DATASL
!
1. Input Data i
These are essentially the same as those required by Method I. Thespecific items of information needed are listed below: L
a. Packaging, to the extent that a detailed breakdown into the •various equipment groups, items, etc. , can be determined. l
b. Diagnostics, i. e., the diagnostic procedure that would befollowed in the event of failure of each part in the equipment.
c. Repair methods.
d. Parts listing.
e. Electrical and environmental stresses.
368
1U
f. Mounting, the method by which each individually replacedpart is mounted.
Ig. Functional levels, the functional levels at which alignmentand checkout are performed.
Since the prediction method requires that the sum of the maintenancetask times be multiplied by the failure rate to obtain an estimate of numberof hours required for each maintenance action, failure rates must be securedfrom MIL HDBK 217 and NAVSHIPS 93820.
The other major input data needed are the maintenance task times,which are of two types. For part A of the procedure there are tabulationswhich are supplied for each maintenance level and each major maintenancefunction. For part B of the procedure one has to estimate the time for1t these functions.
A specified method for performing this estimation is not provided.For example, an instruction might be:
I "(1) Assuming that each component fails in its most likelymode, note the fault localization features and determinethe necessary steps to localize the fault to the module orfunction. Estimate the average localization time ......
(4) Observe the method used to attach a failed component toLits mounting surface and perform an analysis to estimatethe interchange time." (p. 2-28, Ref. 3).
This is subjectivity at its most extreme, since no ground rules at all are|i• provided, and renders the part B methodology highly suspect. It is inter-
esting, however, that Cunningham (Ref. 1) prefers part B to part A. How-"ever, he indicates that applicable data for part B "can be obtained from acredible data bank or from engineering judgment".
I .2. Data Sources
The task times used in part A were derived from over 300 observationsof maintenance activity in the fleet. The tables for part A provided by Refer-ence 1 serve as the data source. For part B presumably the data source fortask times could be anything.
3. Output Data
For part A the basic maintainability measure is something called equip-ment repair time (ERT) expressed in hours. This is the median of the indivi-dual repair times and can be determined as follows:
I 369
a. When repair times follow a normal distribution, ERTis equal to MTTR.
£(XRERT = E.... =MTTR
6where: X = average part failure rate in failures per 10 hours.
R = repair time required to perform a corrective maintenanceP action in hours.
b. When repair times follow an exponential distribution:
ERT = 0.69 MTTR
c. When repair times follow a log-normal distribution ofrepair times
ERT = MTTRantilog (1 . 1 5 .)
where a is the standard deviation of the logarithms to the base 10 of re-pair times.
d. When repair times follow a log-normal distribution, thegeometric mean time to repair (MTTRG) occurs at the median, thereforeit is a measure of ERT.
X (X log Rp 1>MTTR = antilogGx
For part B the applicable formulation to obtain the mean correctivemaintenance time (1k) in man-hours is
S(cc- Z(XM)
Mc [where X = average part failure rates in failures per 106 hours.
- = the man-hours required to perform a corrective maintenancec task.
370
II
I Mean preventive maintenance time (Fr) is equal to (fM )
where M = the man-hours required to perform a preventive main-Mp tenance action.
f = the frequency of occurrence of preventive maintenance3 actions per 10 hours.
Active maintenance time is the sum of the preventive and correctivemaintenance man-hours required to maintain a product for a specified per-iod, divided by the total number of praventive and corrective maintenancetasks required during that time. Mathematically it is expressed as
(%X)WTt. + (Ef) ITt."' M TXti + 2ft.
Ui where: W = mean active maintenance time
1i] mean corrective maintenance time (resulting from time,c ti)
IT = mean preventive maintenance time (during time t.)U ~p3
LX = the sum of the part failure rates
i L-f = the sum of the frequency of occurrences of preventivemaintenance tasks
t. = operating time during period t.
""t = calendar time in operating inventory.
The total maintenance effort (maintainability index MI) required tomaintain a product in operational status per unit of operating time is
(XK)X"t. + (Lf)"t.MI = . Pt
I PROCEDURES FOR MODEL APPLICATION
1. Analytic Method
I The analytic method is the customary function/task analysis (althoughwithout any behavioral implications). The first w!ep is to determine thefunctional level breakdown of the equipment or system. This is done by
1 371
dividing the equipment or system into its various physical subdivisionsbeginning with the highest subdivision and continuing down to the part,subassembly, assembly, etc., level. A functional level diagram (seeFigure 2-1 of Ref. 3) is usually prepared.
After the functional level breakdown has been established and the dia- fgram prepared, the functional levels at which localization, isolation, access,alignment and checkout features are applicable are determined. These areindicated directly on the diagram.
2. Method of Synthesis
The method of synthesis is essentially the same as that in Method I,although substantially less complex, and involving the notion of functionallevel.
For part A the prediction involves listing the component item, method iiof repair, the circuit designation, type of part and the failure rate of eachpart (referring back to MIL HDBK 217, etc. ). The failure rate values arethen summed. Maintenance task times for each component part are deter-mined by reference to a table of these (which table automatically includesthe function level parameter). These maintenance task times for each .part are then added to secure Rp. The failure rate for the part is multi-plied by the summed maintenance task time to secure kRp and transformedinto logs. The sum of the XR values is determined. These calculationswill then supply equipment failure rate (Xk), JXRp and.X log Rp. Meantime to repair (MTTR) is calculated by
MTTR =
Geometric MTTR is calculated as
~(k log R)1MTTRG = antilog p,
Part B of the procedure for corrective maintenance prediction isessentially the same except that the maintenance task times are estimatedrather than determined from already existent tabulations. For preventivemaintenance prediction the frequency of occurrence of the preventive main-tenance task and the man-hours required for that task are substituted for thecorrective maintenance time estimates.
ANTICIPATED MODEL USES
Same as for Method I. The method is limited to the final design phase.
372
I
I VALIDATION/APPLICATION STUDIES
A validation study carried out on the AN/URC-32 Transceiver and theAN/SRT-16 Transmitter showed reasonably good correlation between pre-dicted and observed maintenance times. However, the actual correlationvalues were not indicated, nor was there any distinction made between partsA and B of the procedure.
From a utilization standpoint this method is much simpler and easier71 to apply than Method I, which would suggest that as between the two methods,
the former would be preferred.
EVALUATION SUMMARY
Validity - Formal validation test., indicate reasonably high validity.
Reliability - No data available.
System Development Applicability
A. Comprehensiveness: Limited to ship systems.
B. Applicability: Like most maintainability prediction models, doesnot predict system effectiveness, only downtime.
C. Timing: Only during final design stage.
Model Characteristics
jA. Objectivity: Part A highly objective; Part B highly subjective.
B. Structure: Part B poorly defined.
I1
373
f
II
METHOD III (Radio Corporation of America)
I GOALS
This method is an example of the correlational approach mentionedpreviously. It differs from the previous methods reviewed by involving theanalysis of maintenance tasks required by a selected set of malfunctions;this analysis is then used to complete 3 checklists whose scores are in-I serted into a multiple regression equation which then outpu+s a time predic-tion. It is significant that of al the methods reviewed in this report, thisis the only one which makes us6 of checklists as a means of inferring fromsystem characteristics to some performance prediction.
Beyond this feature, the method has the same objectives as the two3J previous ones: to predict system downtime.
ASSUMPT IONS
A fundamental assumption underlying this procedure is that systemdowntime "is assumed to be a function of specific design parameters whichrelate to: the physical configuration of the system; the facilities providedfor maintenance.... and the degree of maintenance skills required of per-sonnel.... " (p. 3-1, Ref. 3). Although Method II assumed that one couldestimate downtime by analyzing design features, these were not specifiedin any detail. From that standpoint (and particularly with reference toskills), this maintainability model is far more behaviorally oriented thanthe ones previously reviewed.
The procedure also assumes that because of basic uniformity of design,a random selection of items by class will provide a representative sampleof maintenance tasks. In other words, an essential element of the methodis the use of random sampling procedures. The use of sampling in predictingdowntime implies that on the average it should take the same time to correctone resistor or capacitor failure as for another resistor or capacitor failure.Apparently the possibility of an effect of other design features on maintenancetime is not considered. Whether or not this assumption is justifiable cannotbe determined; in any event, it is heuristically defensible.
1 It might also be noted that the random sampling aspect of this procedurehas become standard for the selection of maintenance tasks to be used inmaintainability demonstrations (Cunningham, Ref. 1).
One of the characteristics of all the maintainability methods reviewedis the emphasis on standardized equipment units to which predictive data canbe applied. In other words, a resistor is a resistor is a resistor, regardlessof the system in which the resistor is found. This is somewhat at variance
PRECEDING PAGE BLANK
1 375
with procedures in the operating (non-maintenance) models reviewed,where the behavioral unit to which predictive data are applied is not veryspecifically defined. Thus, these latter models do not make use of a stan-dard set of behaviors or subtaska. It is of course much more difficult todefine these than to define equipment components. The difficulty is re-flected in the failure over many years to develop a universally acceptedbehavior taxonomy. Yet one might ask whether a viable operability pre-diction method can be developed without such a taxonomy.
One final note. The checklist methodology is based on the original re-search which adopted a correlational approach. It should be noted that onlyone other maintainability model considered (Siegel's personnel reliabilityindex) is based on a correlational approach and none of the operabilitymodels fall into this category. Onemay speculate why this orientation hasnot been utilized more frequently.
METHODOLOGICAL SCOPE
The method is restricted to the prediction of ground electronicsequipment maintainability, apparently on the basis of the systems on whichthe original research was performed. However, since the validity of the methodwas demonstrated fcr ground electronic equipment and the checklicts weresufficiently generalizable, there is no reason why the method could not beexpanded, even if the original research had to be redone in part.
PARAMETERS
The elements of the methodology include:
(1) system design characteristics;
(2) test equipment;
(3) personnel requirements and skills;
(4) component failure rates;
(5) malfunction diagnosis procedures.
Items (1), (2) and (3) above are specifically included in the threechecklists which are an essential foundation for the method. Componentfailure rates are used in the random sampling procedure for selection ofmaintenance tasks. "The size of each n sample (Task Sample) is deter-mined by considering the relative frequency of failure for a particular classof replaceable items" (p. 3-5, Ref. 3). The steps in the malfunction diagrnos-tic procedure are the raw material used for the checklist analyses.
376
*U
I As indicated previously, the method manifests a greater awarenessthan the other maintainability prediction methods reviewed of the behavioralelements involved in system restore time.
DATA
1. Input Data
A very considerable amount of system -specific information is required.Reference S (p. 3-3) indicates that the evaluator should be at least familiarwith following: schematic diagrams, physical layouts, functional operationof the equipment, tools and test equipment, maintenance aids and the opera-tional and maintenance environment,
Input data of the data bank variety (i.e., task times) are not requiredbecause the ultimate time predictions made depend on checklist judgmentswhich are inherent in the anlytic process.
There are three checklists to be applied, Checklist A, which scoresphysical design factors impacting on maintenance of the failed item, re-sembles the typical human engineering checklist for maintainability. Thatis, it deals with such characteristics as access, fasteners, packaging,displays, test points, etc. Checklist B, which scores design facilities,actually includes two separate factors: additional design features (e.g.,
test equipment, connectors and jigs) and certain non-design (e. g. , per-sonnel) features like assistance received from others and visual contactbetween personnel. Checklist C deals with maintenance skills required andhence requires very complex judgments. For example, it demands mea-sures of the amount of energy expended, sensory, alertness, etc. and quan-titative evaluation of these items is measured in terms of the amount ofeffort required in applying these factors. Scores on these checklists vary
from zero to 4.
The original research demonstrated a multiple correlation of . 74between the checklists and maintenance time. However, the primary fac-tor in this correlation was checklist A, which correlated .56 with the criter-ion. Checklists B and C correlated .28 and .16 respectively with the cri-terion. The low correlations of the latter two checklists is quite understand-able because of the complexity of the judgments involved. Rigney and Bond(p. 74, Ref. 5) indicate that the support and personnel variables weredropped because of their low correlation with maintenance time; however,reference 3 still retains them. Rigney and Bond (p. 75, Ref. 5) suggest that"Perhaps the negligible P correlations (personnel) are due partly to restric-tion in range. Military technicians are selected on intelligence (average IQabout 11b); - bout 80 percent of them are aL or above the 6th Stanine of theElectronics Aptitude Index; their amounts of technical training are apt to besimilar; and because of high turnover rates the average technical experience
1 377
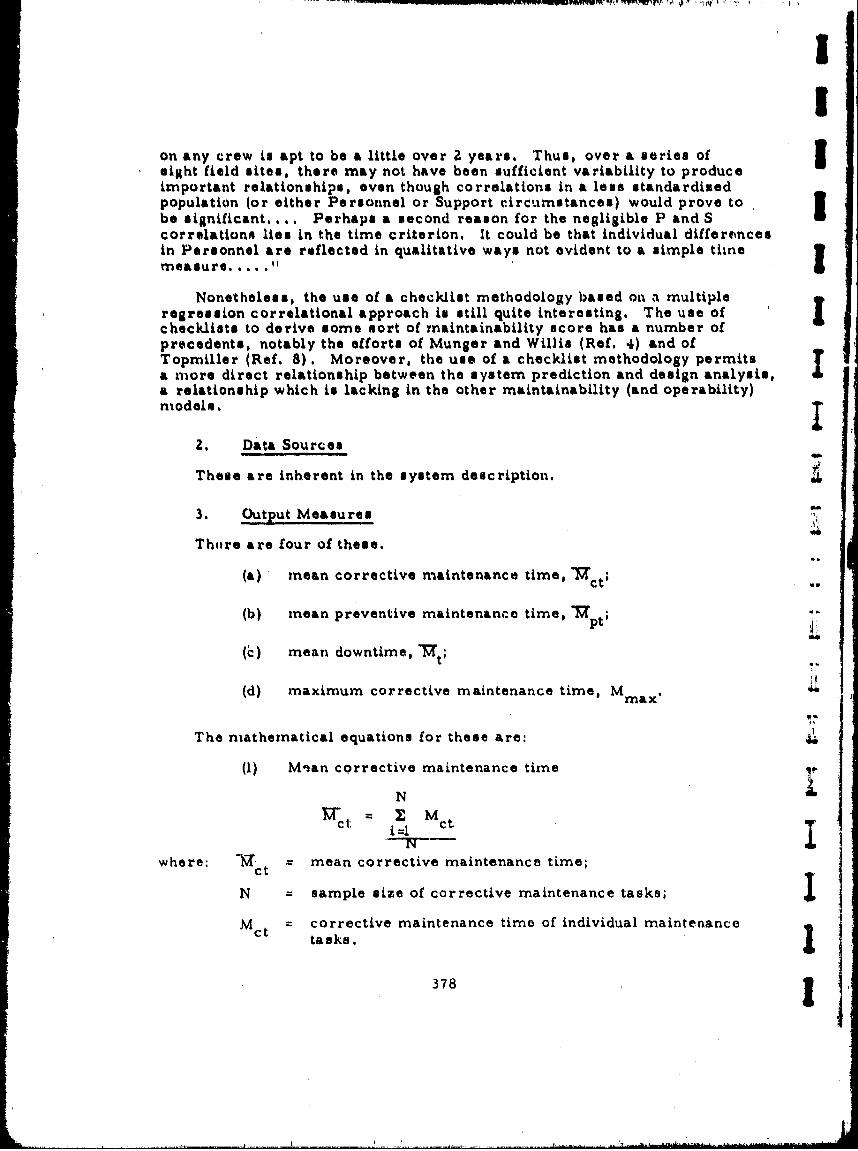
II
on any crew is apt to be a little over 2 years. Thus, over a series of 3eight field sites, there may not have been sufficient variability to produceimportant relationships, even though correlations in a less standardisedpopulation (or either Personnel or Support circumstances) would prove tobe significant.... Perhaps a second reason for the negligible P and Scorrelations lies in the time criterion, It could be that individual differencesin Personnel are reflected in qualitative ways not evident to a simple timemeasure. . . . . 1 1
Nonetheless, the use of a checklist methodology based on a multipleregression correlational approach is still quite interesting. The use of Ichecklists to derive some sort of maintainability score has a number of
precedents, notably the efforts of Munger and Willis (Ref. 4) and ofTopmiller (Ref. 8). Moreover, the use of a checklist methodology permits"a more direct relationship between the system prediction and design analysis,"a relationship which is lacking in the other maintainability (and operability)models.
2. Data Sources
These are inherent in the system description.
3. Output Measures
Thore are four of these.
(a) mean corrective maintenance time, "ctr
(b) mean preventive maintenance time, V
(c) mean downtime, Trt;
(d) maximum corrective maintenance time, Mmax*
The mathematical equations for these are:
(1) Mean corrective maintenance time
N
ct 1 c
where: -it mean corrective maintenance time;
N = sample size of corrective maintenance tasks;
Mct = corrective maintenance time of individual maintenancetasks.
378 I
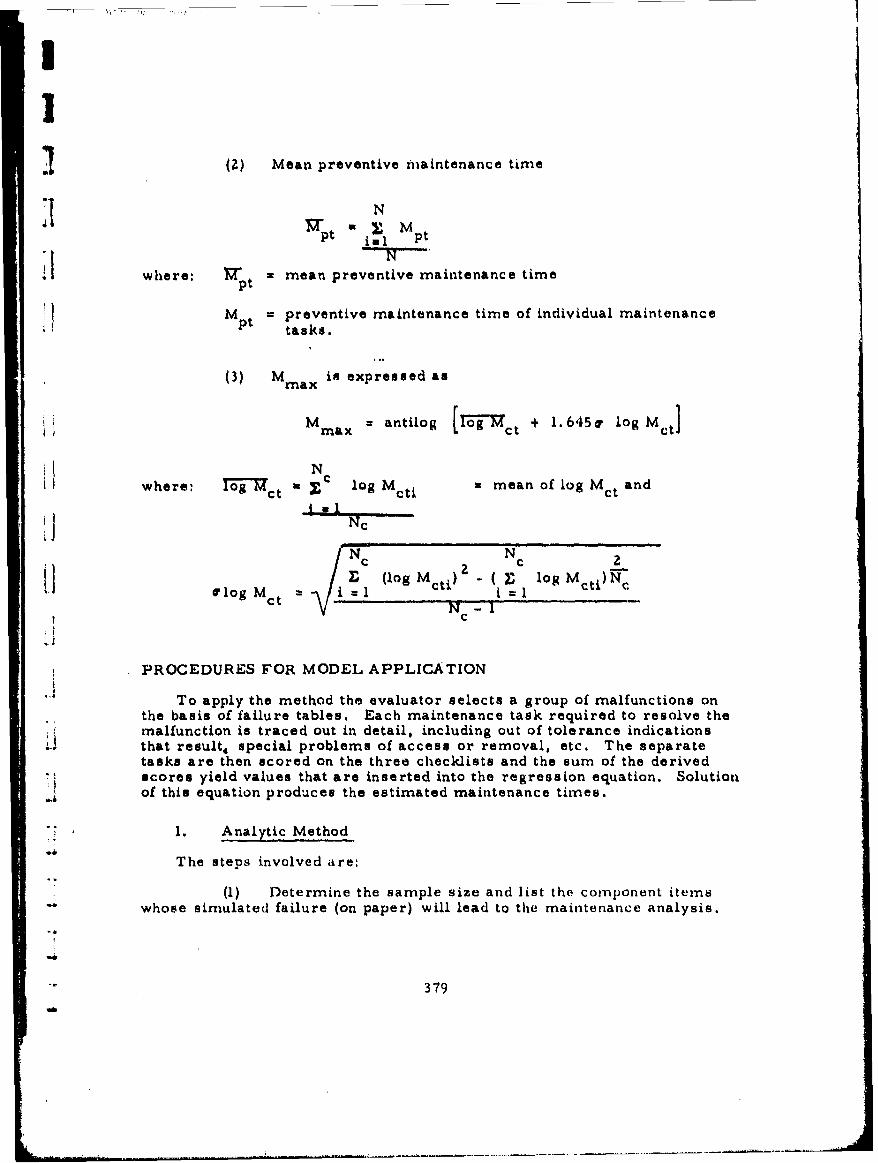
I
(2) Mean preventive maintenance time
"Npt pt
where: = mean preventive maintenance timePtMpt preventive maintenance time of individual maintenance
, tasks.
(3) Mmax is expressed as
M antilog [log M + 1. 645' log Metmax ct
NSwhere: l-gct , log Mcti a mean of log Mct and
NcN
E (log 2~i oTNN I cd t
C
PROCEDURES FOR MODEL APPLICATION
To apply the method the evaluator selects a group of malfunctions onthe basis of failure tables. Each maintenance task required to resolve themalfunction is traced out in detail, including out of tolerance indicationsthat result4 special problems of access or removal, etc. The separatetasks are then scored on the three checklists and the sum of the derivedscores yield values that are inserted into the regression equation. Solutionof this equation produces the estimated maintenance times.
1. Analytic Method
The steps involved are:
(1) Determine the sample size and list the component items"whose simulated failure (on paper) will lead to the maintenance analysis.
379
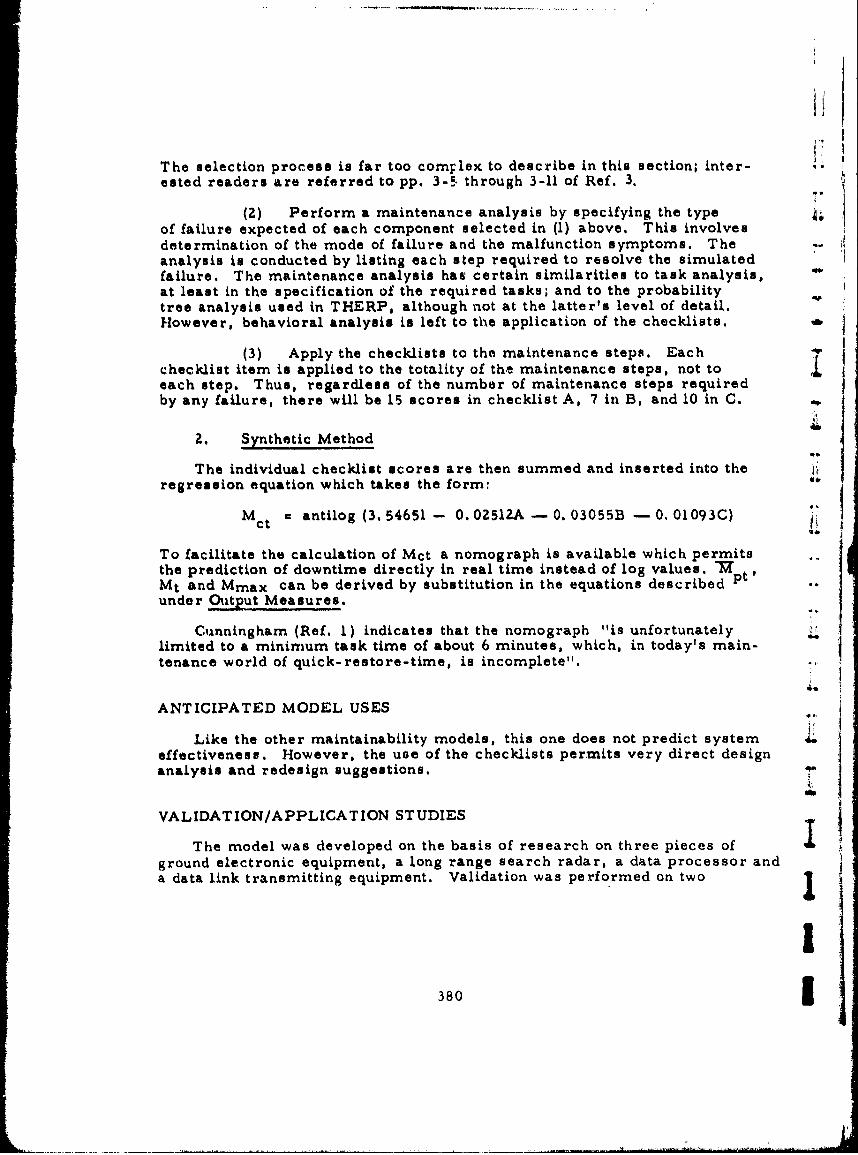
i7
The selection process is far too complex to describe in this section; inter-ested readers are referred to pp. 3-5 through 3-11 of Ref. 3.
(2) Perform a maintenance analysis by specifying the typeof failure expected of each component selected in (1) above. This involvesdetermination of the mode of failure and the malfunction symptoms. The o.analysis is conducted by listing each step required to resolve the simulatedfailure. The maintenance analysis has certain similarities to task analysis, -
at least in the specification of the required tasks; and to the probabilitytree analysis used in THERP, although not at the latter's level of detail.However, behavioral analysis is left to the application of the checklists. -,
(3) Apply the checklists to the maintenance steps. Each '
checklist item is applied to the totality of the maintenance steps, not toeach step. Thus, regardless of the number of maintenance steps requiredby any failure, there will be 15 scores in checklist A, 7 in B, and 10 in C. TI
2. Synthetic Method
The individual checklist scores are then summed and inserted into theregression equation which takes the form:
Mct = antilog (3. 54651 - 0. 02512A - 0. 03055B -0. 01093C)cto
To facilitate the calculation of Mct a nomograph is available which permitsthe prediction of downtime directly in real time instead of log values. WMt and Mmax can be derived by substitution in the equations described ptunder Output Measures.
Cunningham (Ref. 1) indicates that the nomograph "is unfortunately Llimited to a minimum task time of about 6 minutes, which, in today's main-tenance world of quick-restore-time, is incomplete".
ANTICIPATED MODEL USES
Like the other maintainability models, this one does not predict systemeffectiveness. However, the use of the checklists permits very direct designanalysis and redesign suggestions.
VALIDATION/APPLICATION STUDIES
The model was developed on the basis of research on three pieces ofground electronic equipment, a long range search radar, a data processor anda data link transmitting equipment. Validation was performed on two 1
380 3
-iIII
equipments, the AN/FPS-6 radar and the AN/GRT-3/GRR-7. A compari-son of predicted versus actual downtime showed good results for the latter,but relatively poor results for the former. There was a rather high stand-ard error (0. 32 times log Met) which implies a wide spread of obtainedvalues around the predicted value.
"Such a large error term, of course, results from the characteristicsof the original standardization data; the N's are necessarily rathersmall, the simple correlations between checklists and the t~ime criter-ion are not extremely high, and the checklists are themselves moder-ately related to each other. If, now, one were to perform multipleregressions on the new data, one would expect the correlations betweenchecklists and criterion to be higher and the standard errors smaller,"if only because the prediction procedure would be applied to the sameset of failures that was observed in the field ....
RCA has carried through new multiple regressions for the AN/FPS-6 and the AN/GRT-3/GRR-7, using the field-observed troublesas the basis for the maintenance analysis and checklist scoring. Asexpected, the newly-fitted equations provide accurate 'predictions';indeed, the multiple correlations were extremely high (0. 95 forradar, 0. 96 for communications) .... 1" (p. 70, Ref. 5).
Cunningham (Ref. 1) indicates that "the author's experience with thisprediction technique when used for the final design phase prediction, is thatthe measured values were roughly twenty percent higher than predicted, inthe three or four times used. When used in the preliminary design phase,the predictions were found to be totally unreliable."
Smith et. al. (p. 276, Ref. 6) indicate that the predictions derivedfrom this method either over or under-estimated actual maintenance time.
It would appear then that there are serious deficiencies in this method.Nonetheless, if one assumes a relationship between maintenance task timesand maintainability design and support features, additional research usingthis approach would seem quite worthwhile. In fact, the concept of a check-list approach to operability models might well be considered, because ofthe desirability of relating system effectiveness to design features.
EVALUATION SUMMARY
Validity - Formal validation tests prevent conflicting evidence aboutvalidity, some tests showing low validity, others, high validity.
Reliability - No data available, but one would suspect lowered re-liability because of the subjectivity involved in checklist evaluations.
J 381

System Development Applicability I.
A. Comprehensiveness: Limited to ground electronics systems.L
B. Applicability: Like most maintainability prediction models,does not predict system effectiveness, only downtime. May be good tool "for design analysis because checklist A relates design characteristics ..
directly to downtime.
C. Timing: Can be applied during design/development. ,.
Model Characteristics
A. Objectivity: Many subjective elements.
B. Structure: Parameters included in checklist instruments arepoorly defined.
L3
L
V
382
II
I METHOD IV (Republic Aviation)
I This procedure is another of the time-synthesis methods. AsSmith et. al. (p. 274, Ref. 6) indicate, it "basically consists of a frame-work for compiling and combining data on any system. Its generalityprincipally derives from the fact that the model user generates all inputdata for relatively basic, 'macroscopic' equations".
S~GOALS
These are the same as the other methods reviewed: To predict the
mean and/nr total corrective and preventive maintenance downtime of sys-tems and equipments.
ASSUMPTIONS
A major assumption is that maintenance time depends on the specificoperational function which is in progress. "In other words, the procedurerequires the development of a mission/maintenance profile which specifiesthe various operational functinns of the system and the scheduled preventivemaintenance actions required for each operational function" (p. 4-1, Ref. 3).The method is therefore highly mission oriented.
Another major assumption, about which the author is highly dubious,is that estimates of task times can best be made by the maintenance analystworking closely with the design engineer, or by the design engineer himself.However, no procedure is supplied for making such estimates. The readerwill have noted that the author places much importance ,n the necessity fordescribing in detailed form all procedures to be employed. Otherwise,one of the essential evaluative criteria for man-machine predictive models,i.e., reliability, cannot be applied.
The other assumptions inherent in the time-synthesis approach (whichhave been described previously) also apply to the method. The times to beinput to the model are, like Method I, mean values rather than distributions.This is supposedly permissable because of the high degree of correlationbetween predicted and observed values (a correlation which, unfortunately,is not specified).
As in the case of some of the other maintainability models, no behavior-al assumptions are included in the model.
J METHODOLOGICAL SCOPE
Because of the generality of the model and the absence of an inputI time data bank derived from observations on actual equipment, the method
I 383
11
is considered applicable to all systems. "Because of the nature of the Ftime estimating techniques (historical and idiosyncratic), this procedureis applicable to all systems/equipment" (p. 4-2, Ref. 3). For the samereasons the method can also be applied at any design stage, including thevery early period. The output measures derived do not include estimatesof administrative or delay times, because these are not normally definableduring the design of the equipment.
PARAMETERS
These are the same as found in the other methods, e. g., systemdesign characteristics, end item components, failure rates, etc. The listof information required (see below) suggests an effort to "cover the water-front" in terms of factors influencing maintenance task time. Personnel arementioned as part of the operational resources for which information isneeded, but nothing further is done with this parameter.
DATA
1. Input Data
All data needed to apply the model are inherent in the system and inthe experience of the evaluator. The following information is required: II
a. system block diagram, functional flow diagrams and sub-system block and flow diagrams;
b. end item list and end item failure rates;
c. maintenance concept, maintainability goals, operational jfresources, facilities, personnel, support equipment;
d. definition of the task being performed, location, andenvironmental constraints.
2. Data Sources
These are completely unspecified. There is total reliance on the
judgment of the analyst.
3. Output Data ,,
Three measures are provided by the model: (a) mean correctivedowntime (MCDT); (b) mean preventive downtime (MPDT); (c) total downtime(TMDT). These in no way differ from output measures of the other models. .
384
6-I
IN
I PROCEDURES FOR MODEL APPLICATION
1. Analytic Method
There is heavy emphasis on task analysis (without, however, anyconsideration of behavioral parameters). For example,
"The estimated elapsed time required to perform maintenanceon a system will vary as a function of the conceptual and physi-cal constraints within which the estimation was made. Theseconstraints consist of the availability of physical resources(i.e., personnel, spares and consumables, support equipmentand facilities) and applicable maintenance and operational con-cepts (i.e., testing concept, level of repair, mission descrip-tions, etc.) ..... " (p. 4-4, Ref. 3)
These physical and conceptual constraints are very inadequately definedin the above procedure. Or, "A series of mission/maintenance profiles willbe established based on the system operational requirements ..... " (p. 4-5,
SRef. 3).More detailed steps involved in the analysis are:
S(1) The end items of the system are identified down to thesmallest piece of equipment on which a specific maintenance action is tobe performed.
S(2) The failure rate is identified for each item.
(3) The preventive and corrective maintenance actions to beperformed with these items are identified and defined.
(4) A task analysis is conducted for each preventive andcorrective maintenance action in (3).
(5) A distribution of task times for each end item action is3 generated.
(6) The total task time foz an operational function is comparedto the allocated time to determine if the maintainability design of the equip-ment is adequate. If not, an analysis is made of critical design points.
(7) All task times and associated downtimes are integratedover calendar time to derive total preventive downtime, total correctivedowntime and total mean downtime.
It should be noted that the method is extremely genel-i.'. Becauseof this it includes one feature not present in the other methods. Werefer in particular to the comparison of total predicted task time with
1 1. However, note that it contains all the major steps included in theprevious methods.
* 385
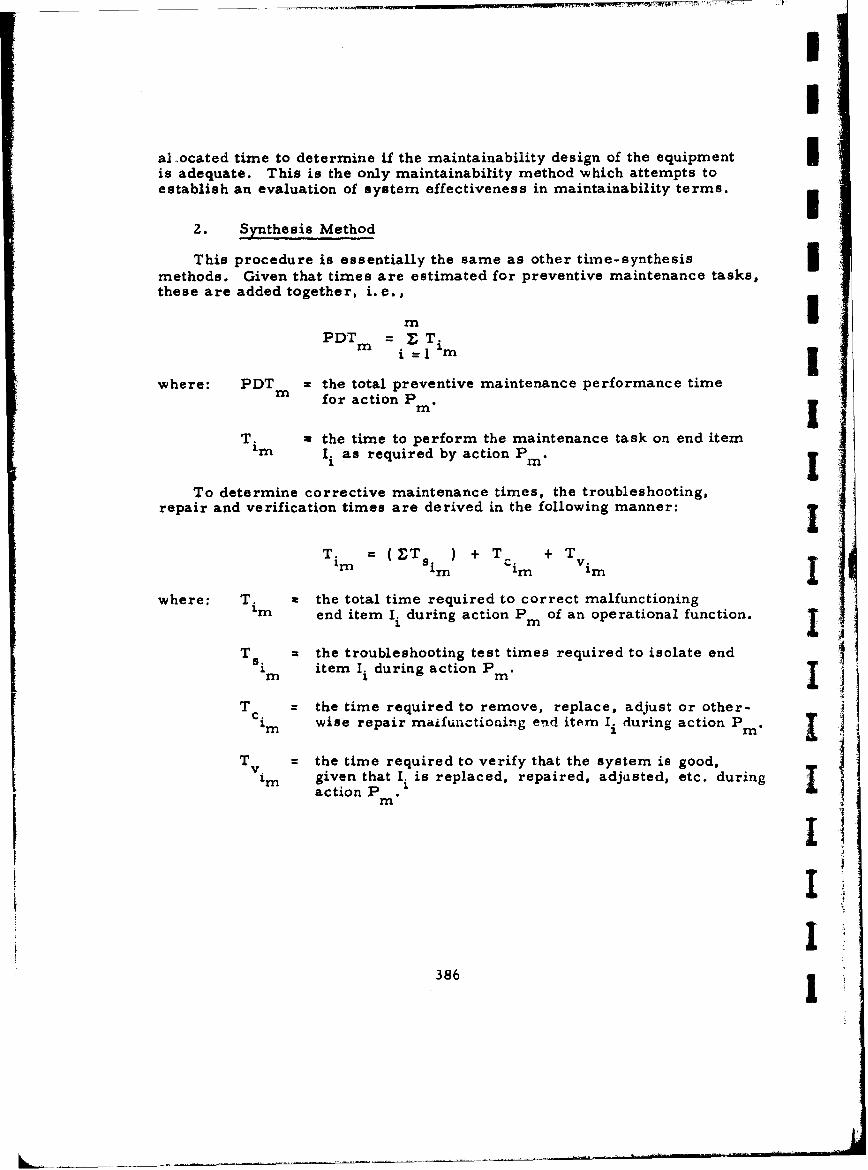
II
al .ocated time to determine if the maintainability design of the equipment Iis adequate. This is the only maintainability method which attempts toestablish an evaluation of system effectiveness in maintainability terms.
2. Synthesis Method
This procedure is essentially the same as other time-synthesismethods. Given that times are estimated for preventive maintenance tasks,these are added together, i.e.,
PDTm iT.=1 1 m
where: PDT z the total preventive maintenance performance timern for action Pm" I
T. x the time to perform the maintenance task on end itemtn I i as required by action Pro. I
To determine corrective maintenance times, the troubleshooting,repair and verification times are derived in the following manner: I
Tim = (ETS ) + T + T viimn im 'im'in I
where: T. the total time required to correct malfunctioning'm end item Ii during action Pm of an operational function. I
T. the troubleshooting test times required to isolate endi m item Ii during action Po.
T = the time required to remove, replace, adjust or other-cim wise repair maifunctioning end item Ii during action P m
T v = the time required to verify that the system is good,im given that I. is replaced, repaired, adjusted, etc. during
action P .
386 1
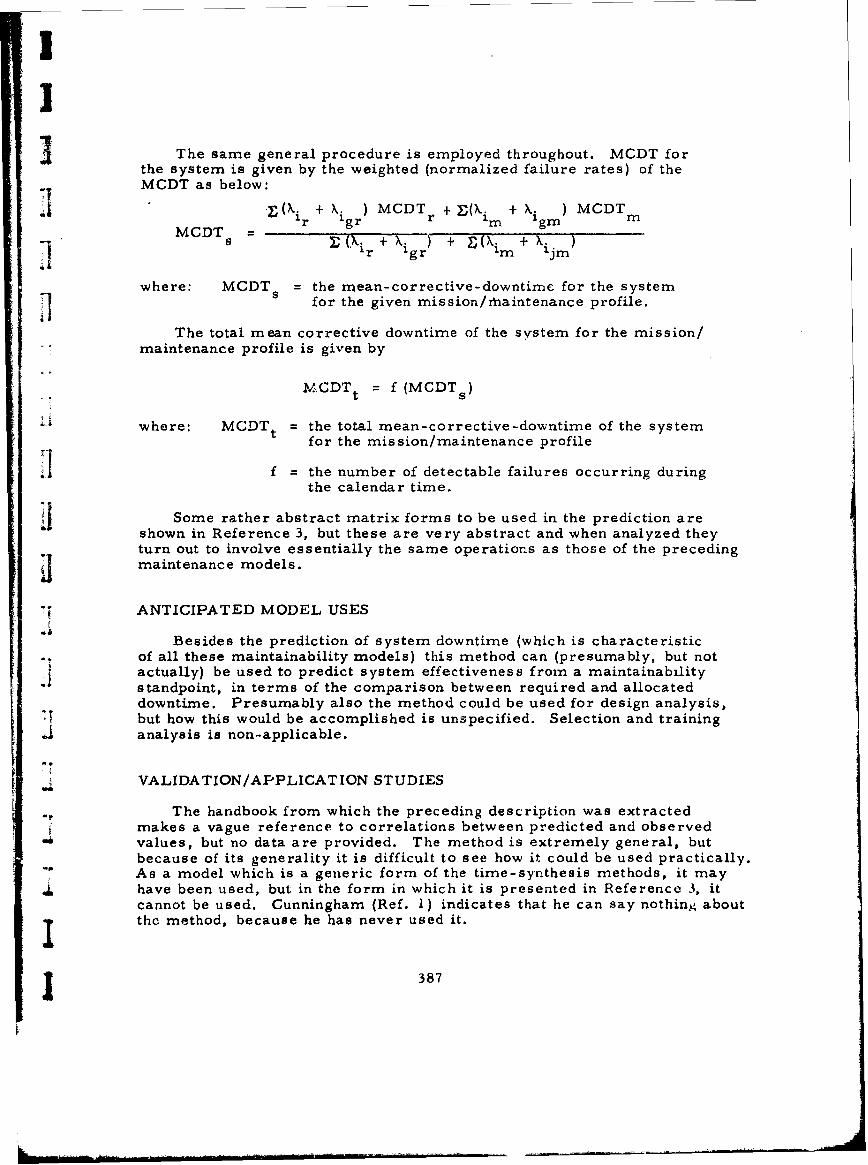
I
The same general procedure is employed throughout. MCDT forthe system is given by the weighted (normalized failure rates) of theMCDT as below:
"(X + Xigr) MCDTr + (Xim + Xigm) MCDTm
SMCDT = r + x•. gr) + ' (Xim + X. jr)
where: MCDT = the mean-corrective-downtime for the system•I for the given mission/fniaintenance profile.
The total mean corrective downtime of the system for the mission/- [maintenance profile is given by
MICDTt = f (MCDTs)
where: MCDTt = the total mean-corrective-downtime of the systemfor the mission/maintenance profile
I f = the number of detectable failures occurring duringthe calendar time.
]• Some rather abstract matrix forms to be used in the prediction areshown in Reference 3, but these are very abstract and when analyzed theyturn out to involve essentially the same operations as those of the preceding
i maintenance models.
ANTICIPATED MODEL USES
Besides the prediction of system downtime (which is characteristicof all these maintainability models) this method can (presumably, but notactually) be used to predict system effectiveness from a maintainability"standpoint, in terms of the comparison between required and allocateddowntime. Presumably also the method could be used for design analysis,
I but how this would be accomplished is unspecified. Selection and traininganalysis is non-applicable.
VALIDA TION/APPLICAT ION STUDIES
The handbook from which the preceding description was extractedmakes a vague reference to correlations between predicted and observedvalues, but no data are provided. The method is extremely general, butbecause of its generality it is difficult to see how it could be used practically."As a model which is a generic form of the time-synthesis methods, it mayhave been used, but in the form in which it is presented in Reference 3, itcannot be used. Cunningham (Ref. 1) indicates that he can say nothing about
i the method, because he has never used it.
1 387

EVALUATION SUMMARY
Validity - No data available. tin ovidonei nmethod has ever' boonused.
Reliabilt• - The lack of structur, in the rn,•'il would igageat hilh
subjectivity and correspondingly low reliability.
System Development Applicability
A. Comprehensiveness: Presuntiably applh:table to all Nysterlr•I.
B. Applicability:, Presumably predictp maintainAbility defignadequacy as well as downtime, but not mystem eifectivontsn.
C. Timing: Can be applied at any stage.
Model Characteristics
A. Objectivity: Highly subjective.
B. Structure: Model is so poorly defined that its use would bedifficult.
3388 1
SUIMMARIY CAOMtN4 I'N1' ON THEI M4A INTA INA 1111,11'Y PREDITlt'ION M0t)I,,S
(CertIai, %AA IeiN i t tof h r 111114101" owlA d olit:
(I ) Th l'o to i Vary IIite io ted %)t It i pe i'sii1oteI 1%t ormIt I I thompeia.odl, avoe itt'one id.ring N101ihod 111 41 11"opie tt ' t il A hA I ytIl ot do
which ppm oimi~ IlA r to hvhtavi~rA I took atial yoto
(,4) IDeepit" 111 he' ittpl e' ity tfit h tit" heItA111411 v 4 ic~ 0qI ei t itll 011plityrad,they appee r .yry wbimpjliNtiv. ttepeitding Ame they do1 la rguely till 01 PltilAddIition of t4ok tiroo To onp ti fi ill IeviilA In NIvethtid 1I diloe,
( 1) A ittittli' of tho 11del16 dep1WIld he0AVily 0o1 0h0 ititiVidual judg.spent of tlei %IlAiiitititatwi analylst, Witholit 01jctyt IIing protduica, to hi' follow.ad tin soetring thoee' Judgments. FrtiN tonds to support Swalini contontionthat ontinoorm are willing to accept data necurod very utteyetoniatis.;Ally,
(4) Mlurv effort ha. gone into Attompts to VAIWAtft maintainabilitymodelb than has lgone into operability modols, E~ven so, thle movornmentalsupport of model vAlidAtion ha. been aparie.
(5) rho maintainability models appear to be roiltrictud by tilecharacteristics of their input data sourcos, In other words, with thle ox-ception of Method IV, there Appears not to have boen an attempt to developa general purpose maintainability prediction method, eont0-Ary to tilesituation with the operability models,
(6) The maintainability models make no effort to tise computersimulation methods, probably because the complexcity of the troubleshootingprocess would make thin inordinately difficult. There has been some re-search on simulation in maintenance (at least in terms of mockup tentdevices (see Reference 5) but this han been directed solely to research )nmaintainability parameters rather than model dev'elopmnent. Althougth themuintainability models we have dealt with are of thle analytic type,they include certain features which we do not find in analytic opera-bility models, namely the use of checklists and multiple regression equa-tions (correlational approach) .
(7) The maintainability predictive models seemn to be somewhat00 more advanced than the operability models reviewed in terms of larger
data bases derived from operational environments and certainly in termsof actual application to system development uses. One gets the impressionof more governmental support in the development of the'gŽ methods. Thereappears also to have been somewhat more practical direction to tile re~searchleading to the development of these models (in other words, the immediateresearch goal was development of a practical predictive rnethod) than onefinds in the operability models. All of this suggests that the development ofthe operability models would proceed further with more consistent govern-j ment support and a more practical direction.
389
, Cu,%nM11iIthall, G. Appliod Maiut 1it lihtly ,i'bmlkl•r'rin (ito IbP publiMht),
, Milita ry Standardtiatioti H4andbook, _ iabil1 stro 41t•dl F urir,Kotto Datta for Elactronic E,,qipi jitm, M7iT-- --A 1-
1. Military StaniIa rdialiton Htknubouk, Maintoinabilit Yprod.tion,MlL--IDfK 471, Dopt, of D)oftnui,, NY 19W-.
4, Mungor, M. HK. and Willis, M. P. , Dovolopint of an Index ofEloctruni Maintainability, Report AIR-A•?-9-FR-407, Arn.ai1Instit-t for Rasearch, Pittaburoh, Pa,i, 19.9,
%, Ri nsy, J. W, and Bond, N. A., Maintainability Prediction. Methodsan1 Reauut, Technical Report 40, university ofSoutnern CriTifornia,,June l9T-4-.
6, Smith, R. L., et, al,, The Status of Maintainability Models: ACritical Review, Human Factors? 12 (3) , 1970, -Z71 .84.
7. Smith, R. L., at. al., Subjective Judgment as a Means of GeneratlnsCorrective MaintcnanceTime Data, integrated Sciences Corporation,Santa Monica, 7,7alifornia, July 1970 (to be published as AMRL report).
8. Topmiller, D. A., A Factor Analytic Approach to Humaan EngineerinAnalysis and Prediction of System Maintainability, Report AMRL-'64-115, Aerospace Medical Reserach Laboratory, Wright-PattersonAFB, Ohio, Dec. 1964.
390
III 111 "it. I't'tNN)'lIR. I'FIIA III4TY !NI)KX
IN TRO I)U C(TlION
TI 'r poro•lie,: rolla4hllly imtel d ,Irk lo'r:d oil Applied Pmyst~'~ i hol•tiqSvl"\,Ivvm by Dr.' A Ithilr • Sivae' ;%ltd hipt x')vowo kri-t' M am 11Illth ~d for~l prl..
vdvidino feI' tdbh 'ck iiti lie tho Otlit At plroficii'ticy of Nnvy r '|. It rotit m1 intnlis1-
"The intdox i. ba wed oi thre compoutidini of prohAhility of oti't, wwf4aI• I pt' rfurianco vwltiom of ,'lth of 9 ehottrotic Job dimtentioma drrivwd on
th1 bauiw Of naIalti-ClhIllelIlonal MItalHI antalywi•. Stipervisor" wer.'asked to report thy nIimbor of uncommionly effoctive (UE) and tincom1.nertly Ineffective (UI!) parfornianco obaorvod ovor a two i.ionth periodIn their techni•ians for each job factor, A ratio,
derived for eAch job factor, yields a value which varies between (J. 00
and 1. 00, When ratios for each job factor are combined the result can
be used to "achieve a total eftectivenesm value for a technician" (p. 11.* Raf. 3).
The effectiveness value can be interpreted as being equivalent to aprediction of the reliability with which the technician will perform hiijob. "Thus, . ,, effective performance zan be called "reliable" perfor-mance and... ineffective performance... can be termed "unreliable"
* ;performance" (p. II, Ref. 3).
The personnel reliability index therefore describes the performance"of the maintenance technician in much the same way that a probability
value derived from THERP, for example, describes the performance ofthe operator in a system. (This applies of course only to the way inwhich the output measure of both techniques can be interpreted; the man-ner in which THERP and the personnel reliability index derive these out-put measures is entirely different.
-. Despite the simplicity of the technique, the concepts underlying it(i. e. , the meaning of the job factors being measured) are extremcly"complex, although superficially they are readily understandable.
391
The importanco of the personnel roliability indx is that it is theonly tachnique we, aret aware of that attempts to predict the efficiencyof maintonanc'o technician porfortnane. Thte other maintainability pr...diction toehniquoo reviewod in this report either predict equipment orsyatem downtime only or the probability that a failure will be dltected sit
and repaired during maintenance (ERUPT). --
In the ditcuesion that follows it it nev"esary to diatiaguish bttwe'n(1) the technique for gathering the data on which the personnel reliabilityindex is based and (2) the use presently being made of those data by Siegel l.and his co-workers in a digital simulation model to derive predictions ofmaintenance downtime (Ref, A).
GOALS
The purpose of the personnel reliability method as an Index of per-"iormnance is to provide "feedback on the technical proficiency of Navyelectronic maintenance personnel" (p. i. Ref. 3). As a performanceevaluative measure it is "modeled after an equipment reliability index"(p. i. Ref. 3).
In descriptions of models reviewed previously we have suggestedthat i predictiver model may have one or more uses or goals which canbe wmnnmarized as follows:
(1) prediction o.( the performance effectiveness of the personnelcomponent of a system;
(2) comparison of alternative system configurations in terms ofthe personnel performance effectiveness anticipated with each configura-
tion;
(3) use of the technique in design analysis, i. e. , to suggest new .
design possibilities or redesign of a system configuration found inade-quate in predicted performance;
(4) use of the technique to suggest manpower selection require-nents,e.g. , number of personnel required and aptitudes/skills needed;
(5) use of the technique to establish training requirements, i. e.suggestions as to the amount of training, its duration and training con-tent.
392
II
The goals of the personnel reliability index as a perforruancoevaluative rn~asure have been described in tern-s of the followingquestions which it. will ans~ver:
"1. What is the cturrent level of effetctiveness of the maintenancepersonnel in a given rating, ship or squadron?.4
•. How does the maintenance personnel effvctiveness level of a"given rating, ship or squadron compare with that of other ratings, shipsor squadrons ?
3, Why is the maintenance effectiveness of a given rating, ship orsquadron low or high?
4. Which specific job skills need improvement within a rating,ship or squadron?
"5. In what maintenance areas is more training needed?" (p. 1,Ref. 3).
"Although these goals appear limited to measurement of current,4 effectiveness, it is legitimate to think of the index as a predictive device
because of its output measure "which is interpretable as a probability"of performance" (p. 65, Ref. 3). From that standpoint it iq legitimateto ask how well the index satisfies the uses listed previously. Theanswer to this question will be discussed in the section on AnticipatedModel Uses.
A secondary (although not unimportant) use of the personnel relia.-"bility index is to supp.y data which can be included in a simulation modelpredicting the maintenance efficiency of the system. Siegel and his co-workers are presently validating the index in this regard with two navalsystems. Since the simulation model is closely tied to the personnelreliability index, it is reasonable to consider also the goals of the re-sultant human reliability prediction technique, which are for
"1. "prcdicting the maintainability of future systems;
2. the provision of significant design verification information.
3. the development of preferred methods of maintenance and useof equipment by operational commands. " (p. ], Ref. 2)
393
ASSUMPTIONS
The technique build* upon the work of Whitlock (Ref. 4) who"investigated the relationship between observation and performanceevaluation. Whitlock pointed out that (1) performance evaluation re-presents a response to the observations of performance; (2) observa.-tions associated with performance evaluation are observations ofperformance specimens; and (3) observations of performance specimenscan be remembered over reasonable rating periods and reported accu-rately at the end of the rating period. A reasonable rating period forWhitlock was up to six months in duration.
"Whitlock defined a performance specimen as "an incident ofrelevant performance which is uncommonly effective or uncommonlyineffective,.. Regarding the definition of uncommon performances,Siegel and Pfeiffer (1966b) pointed out that this definition, in a sense,represents an adaptation of Flanagan's critical incident technique..".(p. 3, Ref. 1), which is widely accepted as a means of eliciting information. -.
A number of studies were performed by Siegel and his co-workerswhich eventually resulted in the personnel reliability index. Thesestudies examined the nature of the scales underlying the index and thecorrelations between the index and other measures. For example,Siegel and his co-workers isolated various job activity factors descrip-.tive of the Naval avionics job by means of multi-dimensional scalinganalysis. These factors are listed in Table 13. Siegel and Pfeiffer(Ref. i) found a correlation of . 73 between peer estimates of personnelproficiency and peer estimates of job proficiency. There is consequentlya substantial basis of research to support the index.
Certain assumptions are inherent in the index methodology andshould be examined.
One major assumption is that the remembered effective and ineffec-tive episodes represent a valid sample of the entire body of either theobserved or the observable performance. The two performance categories --
(observed/observable) must be distinguished. Observable performanceis the totality of the technician's behavior, if one were ir. position toview it. That part of his total (observable) performance which has beenseen by others judging his performance represents the observed perfor-mance. Tne episodes reported as being uncommonly effective and un-commonly ineffective represent that part of the observed behavior whichwas recalled by the judge. 1
1. Siegel adds (personal communication): "However, Siegel and Federman(Ref. 3) demonstrated that the data elicited are reliable (repeatable). IHence, whatever the jadges remembered was similar for two differenttime periods. Moreover, the use of multiple judges in developing thedata base tends to minimize these effects on the data. " 1
394 I
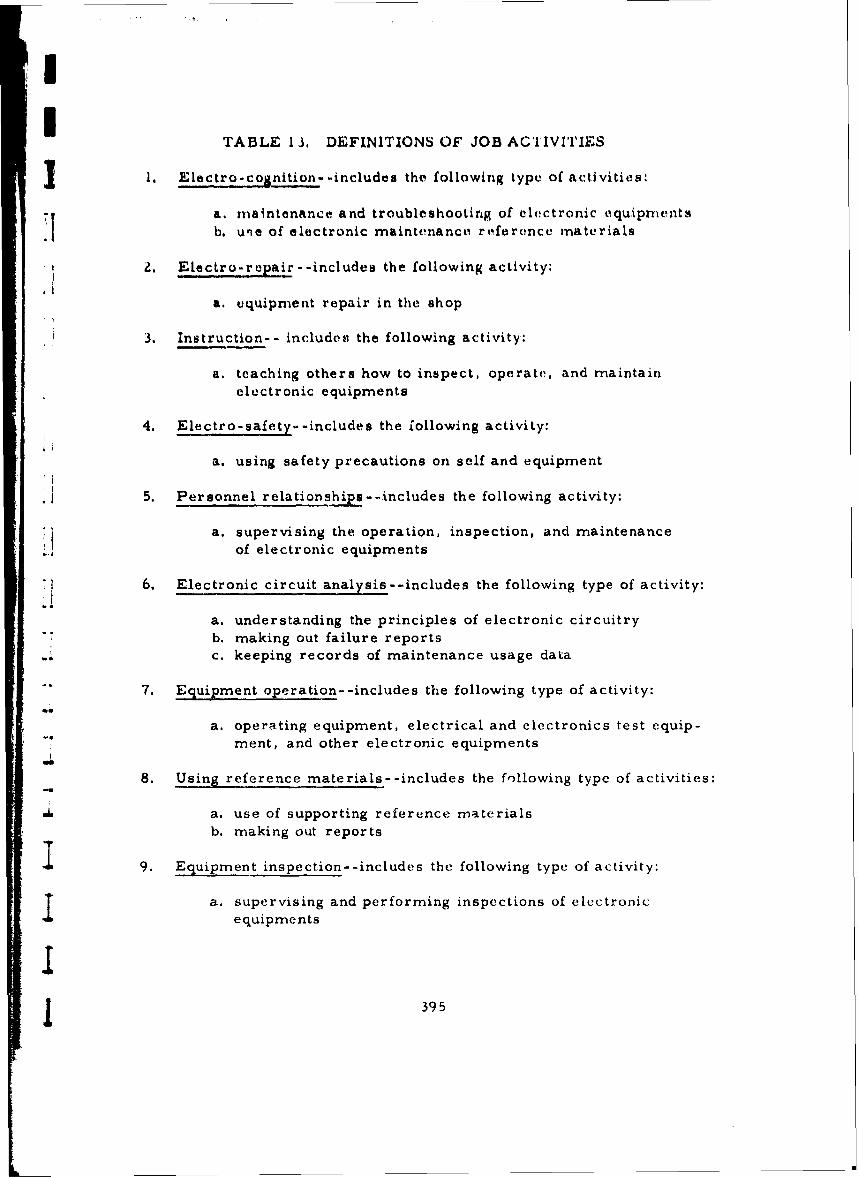
I TABLE 13. DEFINITIONS OF JOB AC'TIVITIES
J 1. Electro-cognition- -includes the following type of activities:
a. maintenance and troubleshootinrg of electronic equipmentsb. u'.e of electronic maintenance referunce materials
2. Electro-repair -- includes the following activity:
a. equipment repair in the shop
3. Instruction-- includes the following activity:
a. teaching others how to inspect, operate, and maintainelectronic equipments
4. Electro-safety- -includes the lollowing activity:
a. using safety precautions on self and equipment
5. Personnel relationshitps--includes the following activity:
a. supervising the operation, inspection, and maintenanceof electronic equipments
i 6. Electronic circuit analysis--includes the following type of activity:
a. understanding the principles of electronic circuitry"b. making out failure reports
.* c. keeping records of maintenance usage data
"7. Equipment operation- -includes the following type of activity:-u
a. operating equipment, electrical and electronics test equip-"-. ment, and other electronic equipments
8. Using reference materials- -includes the following type of activities:
-J. a. use of supporting reference materialsb. making out reports
I 9. Equipment inspection- -includes the following type of activity:
a. supervising and performing inspections of electronicequipments
395
Since the technique depends on observer reports, its adequacyis dependent on the ability of the respondents to analyze the performanceobserveI in terms of the job factors, and to structure the report of theirobservations.
A number of factors may create difficulty in securing accurateresponses to the index: 7
(1) Lack of opportunity on the part of judges to observe all relevantaspects of t e technician's performance. However, use of multiple judgesmay mitigate this problem.
(2) Difficulty in ascertaining which aspects of the technician's be-havior are indeed relevant to his overall performance; in other words,if the technician is consulting blueprints, for example, which of the 9job factors does this behavior apply to? Siegel's most recent work,however, suggests that it is possible to make this assignment. -"
(3) Failure to remember these relevant aspects;
(4) Difficulty in differentiating between what is merely average orreasonably effective performance and that which is uncommonly (out-standingly) effective or ineffective.
Siegel points out, however, that if there has been no opportunityto observe, the judge so notes; that lack of an opportunity to see someperformance should not influence the validity of the index measure sincemissed UE and UI behaviors would be distributed in the same manner asthese seen; that it is relatively easy to differentiate UE and UI behaviorsand that no judges in his data sample had difficulty with the concept.
If one has difficulty in accepting observer reports as a measurementtechnique, it must be pointed out that magnitude estimates of observedperformance are no more subjective than those involved in any otherpsychophysical technique. Siegel points out, moreover, that observerreports have historically produced quantifiable, valid data.
Another assumption implicit in the technique is that the nine jobfactors listed in Table 13 adequately reflect the Naval avionics mainten-ance job. The degree of confidence one may have in these job factorsis enhanced, because they were derived from a factor analytic metho-dology; and indeed they seem to encompass most of the activities involvedin avionics maintenance, for that matter, in most maintenance jobs.Although they differ somewhat from the tasks, functions or stages whichare commonly used to describe the maintenance process, e.g. , diagnosis,
396
II
testing, removal, replacement, etc., there is no reason why thesebehaviorally derived factors (which, moreover, represent elements or
skills underlying maintenance jobs) should correspond to the task cate-
gorizations found in non-behavioral models.
It is assumed in any event that these job factors adequately repre-
sent job or task performance. This implies in measuring performanceeffectiveness that the idiosyncratic characteristics of the individual task
(e. g. , the design of the equipment on which the task is being performed,the context of task performance) are relatively unimportant in influencingthe quality of that performance, although these characteristics may well
"influence the time needed to perform the maintenance.
Because these are factors rather than tasks, they are phrased in"rather general terms. This may actually be advantageous; because of
their generality they can probably be applied to any maintenance job withrelatively little change in their descriptions. On the other hand, one"consequence that may result from the generality of these factors is alimitation on the specificity of the conclusions and recommendations thatcan be derived from their measurement, if these are to be applied to
specific tasks- The problem that may arise when the data must beapplied is precisely how one defines the relationship between the job
factor aad the job.
Since we have 9 factors, each of which gives us a score between0. 00 and 1. 00, they must obviously be combined. Combination is by
"multiplication:
R ri x r 2 x rn, where
.- R - series reliability, and
r - reliability of each job activity.
Howevei, the methodology does take into account conditions under whichthere are redundant and parallel operations. In its application to thedigital simulation model, Siegel notes that "we are not limited to an "and"and "or" logic. Statements could conceivably be connected by conditionalor biconditiortal symbola. These in turn can be expressed in terms of"and", "or", and negation, " (p. 7, Ref. 2).
To return, however, to the original job factors: there is an impli-
cation that the performance reliability of each job component is independent
397
of other job components. Although this is a necessary consequence ofthe multi-dimensional scaling analysis, the factors as they exist in reallife may function interdependently. Attempting to include the elementof interdependence in the index would, however, overly complicate themeasurement.
The index is represented by the following formula:
4UE+ £11 •U where
U+ r etsuno e
nUE represents uncommonly effective behaviors andUl represents uncommonly ineffective behaviors.
Thus, UE - UI represents the totality of observed performance. Theindex yields a value which varies between 0. 00 and 1. 00, which is nicebecause it can then be combined statistically with conventional measuresof equipment reliability which also vary between 0. 00 and 1. 00.
The combination of personnel reliability probabilities with equipmentreliability probabilities may present a probliem (although only theoreti-cally) because of what the respective probabilities represent. Equipmentreliability represents (in most cases) equipment performance varying asa function of time, whereas, whatever a personnel reliability probability
means, it does not represent that quality as a function of time. This isa problem we have encountered before with reliability-oriented predictivemodels. Can two probability measures be combined, even though theymeasure different qualities in differing ways? What will the combined --
measure mean? Again, this difficulty, if indeed it is a difficulty, isinherent in the differing nature of behavioral and equipment measures.
METHODOLOGICAL SCOPE
As presently developed, the technique is based on avionics main-tenance activities. However, because we are dealing with maintenancefactors of some generality, it should be possible to apply it to any typeof maintenance.
Moreover, there would seem to be no reason why the techniqueshould not be expanded to operator factors and activities. Since the tech-nique seems to be particularly sensitive to skills and training, whereasthe other operability prediction models are not, the application of thn
398
3 personnel reliability methodology to operator factors would seem tohave some point.
Through the description of its factors, the technique "tmodels" theset of activities to which it is applied, but models it so generally thatthe limitations found in other techniques relative to continuous anddecision-making activities would not seem to apply. Presumably a newset of operator factors would have to be derived via multi-dimensionalscaling and new data collected via the critical incident method if onewished to apply the methodology to operator tasks.
MODEL PARAMETERS
The personnel reliability parameters are the 9 factors which werederived by multi-dimensional scaling. As is obvious from the descrip-tions of these factors (Table 13), they are rather general. However, theresults in reference 3 (p. 37) indicate that they appear to be significantlydifferentiated among themselves. Moreover, there is considerableinternal consistency within any single factor rating.
I DATA
1. Input Data
As indicated earlier, the two input measures required are the fre-quency of uncommonly effective and uncommonly ineffective behaviors foreach of the niine factors. Neither of these measures is particularly welldefined for the respondent, but Siegel indicates that respondents had notrouble with them. (It might be interesting-- purely from a researchstandpoint-- to have respondents describe the events which they considerUE or UI, to see if, in the opinion of others, these really reflect signif-icantly different behaviors. ) In any event, the measures do discriminateamong ships, ratings and individuals.
I 2. Data Sources
These consist of frequency counts gathered from supervisors. Noexternal data store (e. g. , experimental literature) is required. In fact,the index reliabilities serve as a data store themselves, directly trans-latable into task performance probabilities.
13I 9
II
3. Output Data
This is the ratio, UE/UE 4 UI, which yields a numric indicating a !probability of effective performance for thv teuhnician in tetrms of thespecific job factor. These individual job factors art' then compoundedto produce a total effectiveness value for the technician (sae the discus-sion following). The ratio may be used in two ways: (1) as a measureof effective general performance (e. g. , sailors are 8S•o effective inperforming maintenance as a whole); (Z) when applied to specific Lasks, Ithe index yields the probability of accomplishment of those tasks, Thefirst output represents a sort of capability metric independent ofupocific tasks or equipments; it is purely a measurement output, nota predictive one.
PROCEDURES FOR APPLYING MODEL
I. Analytic Method
One must consider two analyses, the first relating to the procedurewhereby responses for the personnel reliability metric are gathered, thesecond relating to the application of personnel reliability data to the dig-ital simulation model.
The analysis required for securing responses to the personnel reli-
ability metric is performed solely by the respondent. He decides whatthe criteria for ineffective and effective behaviors areIA relates them tothe taski performed for given equipment, and then recalls how a parti-cular individual in the past performed these behaviors.
Although the validity of the responses secured in this manner hasbeen experimentally demonstrated by the Whitlock study referenced pre-viously, the author confesses to a lingering uneasiness about the amountof error that may enter into such judgments when they are elicited fromoperational personnel in the operational environment. We understand thatthe digital simulation maintenance study presently being conducted bySiegel will include a validation of the judgments made by personnel incomparison with their actual performance on maintenance tasks performedin an operational setting. In any event, to ensure valid and reliable re-sulis with the technique, it is necessary to ensure that personnel makingthese judgments clearly understand the effectiveness criteria to beapplied, the operational meaning of the job factors, etc.
IA. Based, of course, on the definitions of the 9 job factors.
400
I In the application of pe rsonnel r(liabilitv data to the simulationmodel, it is necessary to decide which factors artk denmandt,d by eachtask. There should be little difficulty in making this judgment. How-ever, since the simulation rorihdl opt-rattes on the basis of subtasks, andthte time input data refer to subtasks, the reliability indox values refer-"ring to tasks have to be broken down into sub-valueit, for each of the corn -I ponent subtasks. In other words, if job factor X (index value of . 83)describes task Y, and task Y is composed of subtasks 1, 1, 3 .... n,it will he necessary to subdivide .83 among the subtasks of task Y. T'Ihissubdivision has already been performed in exorcising th, simulationmodel.
ST
"2. Synthesis Method
I As indicated previously, the combination of reliability values foreach factor yields a total personnel reliability value for the individual
7 technician. Because of the multiplicative process "a depressed relia-46 ,bility coefficient for any job activity will result in a depressvd reliability
coefficient for the composite value" (p. 11, Ref. 3). This is a disad-. vantage which one finds in the other reliability-oriented techniques.
In the case of the personnel reliability index part of the problem. arises from the fact that each job factor apparently has an equal weightingd • in terms of its effect upon maintenance effectiveness. It is difficult to
see how certain job factors like failure to observe safety precautions,"failure to complete failure reporting forms or inadequate personnelrelationships could have as much an effect as failure to make an adjust-ment or wiring a circuit incorrectly. The former factors would make"maintenance performance less efficient and might increase the timespent on maintenance, but their effects would be less serious than thoseof the latter factors.
"This point may not hold because of the complex relationship betweenthe job factor and the job. Ideally, however, the relative importance ofthe job factors would be reflected (perhaps by some sort of weighting"index) in the process by means of which they are combined to form thetotal personnel reliability value. We realize, however, that the intro-duction of an additional weighting factor might overly complicate thetechnique.
Within the model synthesis im performed according to any of threemodes: series, parallel and series-parallel situations. The series
I41 401
combination mode is completely multiplicative. In the series situation
all activities must be performed satisfactorily. "The assumption that
all decisions in series must be perforned satisfactorily implies that if
a wrong decision is made by an operator, he will not realize that the
decision was wrong until.., the whole task is performed unsatisfactorily.
(p. 12, Ref. -) This assumption makes the author uneasy, however,
Siegel's recent data suggest the assumption is tenable; moreover, it
simplified the combinatorial process.
However, "It is often possible to improve the results by repeating
a process or by calling on someone else to correct deficiencies. ..
(p. 12, Ref. 2),
A parallel situation exists when a task is performed satisfactorilyif either one or another (or both) activities is performed satisfactorily
or else the same job activity is performed by two men and acceptableperformance of either man will constitute acceptable performance fo-
the team. Here the probabilities are combined according to the forriulaI- (l-Pl) (l-P 2 ). The series parallel situation represents a combina-
"tion of the preceding.
3. Data Application
The UE/UI + UE events that make up the index do not refer to indivi-dual tasks but to a complex of activities which come closer to the concept
of "function" than to that of the task. The index, once derived from the"combination of these UE/UI events, is applied to or translated into some-thing called a task. The task is interpreted in terms of the job factors
involved in or required by performance of the task; then the index valuesassociated with each of the factors in the task are combined to predictthe estimated performance of the task. The index data therefore areap ied to the task (which may vary in terms of complexity-- the size ofthe task unit is not specified), although the basis of the initial data is not
the task itself, The author has pointed out previously that there may bedifficulties in equating a job factor with a task.
ANTICIPATED MODEL USES
1. Prediction of System Effectiveness
The personnel reliability index itself does not predict system effec-
tiveness. Initially it provides an evaluation of the performance of the
402
!
personnel about whom the data were gathered. However, the indexvalues can be used for system-predictive purposes when they are trans-lated into task-equivalent probabilities as described previously. In thisapplication the set of index values can be used essentially as a data storefor use in a simulation model which, when exercised, would predict themaintenance task performance of the system. This is the research pre-sently being conducted by Siegel and his co-workers.
Therefore, with regard to the prediction of system effectiveness,5 i, it is possible to make the following statements:
(1) The index itself can be used for this purpose only when mainten-ance of electronic equipment is the effectiveness parameter of interest.Conceivably, in much the same way in which one applies data bank proba-bilities to the non-simulation operability models (e. g. , THERP, TEPPS) onecould (a) take a system description in terms of required maintenance tasks,(b) analytically extract the job factors involved in these tasks, (c) applythe index values already gathered to these factors and (d) recombine thesefactor-task values to produce task-equipment probabilities of performance.One might then be able to make a statement such as, System X has apredicted 85% probability of maintenance effectiveness. If one had asystem requirement specified in terms of maintenance effectiveness, onecould then compare the 85% value with the requirement.
However, maintainability requirements are generally phrased eitherin terms of mean time between failure (MTBF) or a maximum downtimeor maintenance task time. All of these are formulated in terms of time,which the personnel reliability index does not provide.2 Consequently,some other means must be adopted to transform the probability of main-tenance effectiveness values supplied by the personnel reliability indexinto time values. This can be done by utilizing the personnel reliabilityvalues as inputs to a simulation model of maintenance performance.Again, this technique is currently under test by the developers of thepersonnel reliability index technique.
(2) In the form of a data input to a simulation model of maintenanceeffectiveness, the personnel reliability index would seem to be useful asa predictor of system (maintenance) effectiveness. The extent of theadequacy of this application waits upon the results of the study presentlybeing conducted.
2. Siegel notes however that system requirements might be stated in termsof personnel reliability index requirements, which would eliminate thedifficulty.
403
L
2. Design Analysis
We include under this heading several aspects:
a. The comparison of alternative system configurations todetermine which should be selected;
b. The determination of redesign requirements.
Again it is necessary to look at the personnel reliability index in twoways: as a measure of performance and as a data input to a simulationmodel of the system.
(1) As a performance measure. As described on the previous page,one could apply the job factor values secured from previous studies to
the analysis of the; maintenance tasks in each of two projected systemconfigurations and then compare the resultant task-equivalent probabil-ities, selecting the one with the higher probability. However, becauseof the generality of the job factors describing the maintenance tasksmaking up the system, it is possible that differences in various configu-rations will not easily show up, where these are differences in terms
of equipment characteristics alone. Two distinctly different equipmentscould both require inspection or operation or electro-repair; hence theirestimated performance probabilities will not differ. Only if the jobfactors involved in the two equipments are distinctly different will dif-ferences in systeri performance be manifested. Siegel correctly pointsout that the design differences would probably be reflected in the timefor malfunction correction which would be handled in the second use ofthe index, as an input to the maintenance simulation model (see below).
Nor is it likely that the personnel reliability index values would leadto the determination of very specific redesign requirements for a systemwhich is either in test or in operation, because the job factors inherent
in the index are not intended to be particularly sensitive to equipmentdifferences. This is not to say, however, that no redesign requirements
could be derived from the application of the index to these systems, butthese requirements would probably result more from an examination ofthe system design than from the index itself.
(2) As an input to the simulation model, it is expected that thesimulation model will be more sensitive to design differences and thuspermit a meaningful comparison of alternative maintenance configurations
404
II
I or procedures. Howe•ver, it is likely tha.t this sclnsitivity will arisenot especially becau.,, of the personnel reliability inputs to the modelbut because the model exe r1cises (itt systnli, and thi .•xe rc isct pernlitsconfigurational differ,.ncus to show up morte cltarly.
I 3. - 4. Selection and Training
The personnel reliability index appears to hawv, significant potentialin the areas of selection and training. The generality of the job factors,which may be a disadvantage for design, now becormes highly advantageousfor selection and training, because the factors are specifically orientedto personnel capabilities. This advantage applies rnore to training thanto manpower selection. If the probability of performing a task, which isheavily loaded on electro-cognition and personnel re-lationships, is low,"then presumably more training should be given in these areas. One mustrelate the deficient job factors to the particular knowledges and skillsthat must be learned, but this should present few difficulties. As far asselection is concerned, we run into some problems because we do notknow what measurable aptitudes define the electro-cognition and personnelrelationship factors. This, however, simply reflects the inadequate state
V of the art in manpower selection and aptitude classification.
VALIDATION /APPLICATION STUDIES
The personnel reliability index is one of the few models reviewed in"- this report which has been subjected to formal validation studies. Cor--• relations have been obtained with intermediate criteria such as the TPCF,
GOT, ARI, skill, time in service, etc. (see Ref. 1, p. 59), but these"correlations were low (a multiple correlation of . 40 was obtained),although apparently correlation coefficients of this size are as muchas one may reasonably expect.
Validation of the personnel reliability index by comparison withactual maintenance performance has not yet been performed, but is tobe determined as part of the simulation study by Siegel already referred
-. to.
The index has not to this author's knowledge been utilized in actual"". system development, but this is probably because it is still in research
status.
405
-9r
Despite the questions raised in the preceding pages, there is agreat deal to hope for from this model. First, as was pointed out pre-viously, it is the only technique which behaviorally attempts to measureand predict the technician's maintenance effectiveness. Secondly, thetechnique is comparatively simple to use in terms of gathering additionaldata on maintenance effectiveness. Third, it may help in the developmentof a maintenance simulation model which is something we have not had todate. We have also pointed out that perhaps the methodology has applica-bility to operator as well as maintenance job factors.
EVALUATIVE SUMMARY
Validity - Formal tests have been and are being performed; resultsshow reasonable correspondence between predicted and observed values.
Reliability - Formal tests have been and are being performed; relia-bility appears high.
System Development Applicability
"A. Comprehensiveness: Although presently applied only to avionicsmaintenance, the methodology would appear applicable to all types of main-tenance.
B. Applicability: Given that maintenance efficiency is the systemeffectiveness parameter, the index both measures and predicts thateffectiveness. In addition, it appears to have significant potential in theareas of selection and training.
C. Timing: Model can be applied at all stages of system develop-ment in which detailed maintenance task descriptions are provided.
Model Characteristics
A. Objectivity: Index depends on observer reports. However,method of eliciting these is explicit.
B. Structure: Conceptually well defined, despite some difficultyin equating the job factors with maintenance tasks.
406
II
REFERENCES
1. Siegel, A. I. and Pfeiffer, M. G. Post-Training PerformanceCriterion Development and Application. Personnel Psychophysics:Estimating Personnel Subsystem Reliability through MagnitudeEstimation Methods. Applied Psychological Services, 1966.
2. Siegel, A. I. The Applied Psychological Service's Program Planfor Developing a Human Reliability Prediction Method. Paperpresented at U. S. Navy Workshop on Human Reliability, Washington,D. C., July 1970.
3 3. Siegel, A. I. and Federman, P. J. Development of PerformanceEvaluative Measures. Report 7071-2, prepared for the Office ofNaval Research, contract N00014-67-00107, September 1970.
4. Whitlock, G. W. Application of the Psychophysical Law to Perfor-mance Evaluation. J. Applied Psych. , 1963, 47, 15-23.
4I
II
III
1 407
SECTION ISUMMARY AND CONCLUSIONS
In this section we consider what we have learned from the precedingreview of the various models.
Common Elements
Despite individual variations in models, a single life line, as it were,connects them all. That line is the procedure employed by the model-"user in applying a model to make a prediction. It must, however, not beimagined that every step in this procedure is consciously, explicitly per-formed, or that each step is always discrete.
(1) Determination of the evaluative (predictive/descriptive) measure"desired. This involves selection of a model which supplies thatoutput measure. Whether determination of the desired outputmeasure precedes model selection, or the model user selects
a model and simply accepts its output measures, depends on theII ' user.
(2) Analysis (usually by means of function/task analytic methods) ofthe system whose performance is being predicted, to determine
the behavioral units (e.g. , subtasks, tasks, functions) to whichthe prediction will be applied.
(3) Analysis of those behavioral units to determine which parametersmust be considered in making the prediction. 1 This step is oftenperformed implicitly, so that only a few most important parame-ters are considered.
__ (4) Assignment of input data to the behavioral units being predicted.
This involves a series of steps:
1. Among the parameters that may be considered in terms of their possibleimpact on unit performance are: number of identical components froni
which the control to be activated or the display to be read must be selec-ted; orgarization of the controls ard displays; presence or absence offeedback information; response pacing; required accuracy of response;display exposure time; type and number of stimuli presented; functionperformed by the operator. 7(iis list is illustrative only.
P*-CDi LG PAGE BLANK
409
(a) l)etrnrmination uf thii data nourvos aveileabl folr the pro.-dicttiosl, which invol v s 1matc1h'ihi (o pl itcitly tr |11pliSt, lly)certaili paranmeter docribtng 11 tho havioral umits (1, 0% 1
thoslt, fotnd in Stti) (,I)) with thil poli1Alitoi i t 1, hlliplitit in thisdata stourcti. Again. bocauso of inortik, stvailablo diataso crcocI. are' offtih acr *ptod withwin't fo i hillation of theirpa ra1mete ri,
(b) Soi•lcthim fromt the data satrcet of thit d•RI ite1o1s liodeid tomnako the prediction (obviously iut cveiry itot-l ili thl dAtaso•irce is applicablo, becauseo bthAvioral itnits vary in trm•sof tilt functions, equimpent objfot,', etc, which they dsicribe),
(c) Application of the soloctod data itom• to the behavioralunita,
(5) Exercise of the human reliability model to derive the desirvdpredictive output. This oxercise may occur in two ways.
(a) Comnbination (usually by means of probability statistics) ofpredictive values for molecular behavioral units to dertvopredictions for more molar units containing two or more ofthese molecular units (analytic methods),
(b) Simulation of the behavioral operations described by themodel (simulation methods).
(6) Combination of the derived terminal predictive value for theoperator (maintenance man) subsystem with the terminal pro-dictive value for the equipment subsystem to achieve an overallsystem reliability prediction. For example, to illustrate theprocess very simplistically, if operator performance in a systemis estimated to be . 98 and equipment performance in that systemis estimated at . 99, the resultant system reliability value is . 98x .99 = .97. It is our impression that although a system relia- -.
bility prediction is the logical end goal of the process, this com -
bination is not often performed, perhapc because of lack of con-fidence in the validity of the human reliability value.
Another common element that should be discussed are the behavioralmodels that are implicit in various methods. As we pointed out at thebeginning of this report, only a limited number of these methods containmodels (in the Chapanis sense) of man-machine system (MMS) operations.The most outstanding work in such model development has been performed
410
ol' how% tho ?A1VI (%inclilin" ev n it it do~rm 111 0%t li Ill%,p i th tivwtcrills that Ioillv it, l uit. Awl s oistMh it 1wit lipiwou th'At A Iitl'' l~llghii.ii' alloP)4iItII 111101-1 o 0III11 M'ltjtPrlilno I)PIt% tit oilN 111' ll's "illNNIi% 11141 this' 1111's'
411011 pits fc$t4 Itd m iithilloit ) :~, :stsd ~ ~I ntigi ' ~ e
O ti ' %$% t thorey rr 1411 141~ 111110 111-htdo 1111%lllll 001111 tott 11114l11tdlM
tlrvI a0pM iA tiis'hto flipI is' thei ' tio ~it I t lik" Wi MS itt ;111I
form t)it Whtt thot II5M i rohoa M M~ 11 Sla VtI~lt' 11 ki' iI opt Aiki' lni 'IS~ It k 04lIit
tiolt of ill" 111 htteth i lt I titit) thI'ilt, ~ follo ing twt u
(1)to A a y tions, Tis'qu ro'eirselit ' t may who l 1w the 'toilki numbe fsoftIi fouputsa, A oiaximkint Il-lit lin which rosponweM tmust hois mokte, 4 proialhi litsytiloe'toiy''larwuisoeo iayh mlttn toh'ro u
of diatoction, oeli' -Sinvo tho M~MS Is all Artificial t IoIIM rstit ion ( i, tit 4 notfound naturAlly), thip myotom developer spl3Uifiol thill riiquiotlei oil
(A) The requirement *etN A goal fur thts oyaittim and tot, tilt- opratorI a&w part of that systent; system operationu (inchudichii thowe of tho operator)Aar peirfurmed in older to achieve that goal, What in impliod hero is thatidios~,ncratlt. operator hahaviors must be wubordinated to the aysitisni ro.I quirentent if the goal is to be achieved. rho system s'equirumviit thortiforvconstrains the individt.alls freedom of function and lii fact muldo his bv-havior by tdiminating systemn-irrelevant responses. *rho imtplicatitin isthat an the system requirement demands greater precision, (saster rtsspon..sea, etc. the@ freedom of the individual to do 'thin own thing" becomos leas.'rho criteria of operator adequacy are those of the oyattim: the operator
in efficient only when he helps to achieve the systoml requiremeint.
2. .1 his may sound ito some rea~der iksIe the thteuri sing to Its' found inlOrwell's 1984. It in possible (Although the author dons tiot) to defelldthe point of view that as aods% 'y becomes m~ore tochnologically orie'nted,requiring more and complex MMS, it in inevitablv that the human willbecome increasingly constrained by MMS demands, One' can also viewI the Human Factors discipline in a somewhat broader, sociologicalsense! as anl attempt to interpret the mechanisms of anl increasinglyj technological (i. e. MMS-oriented) society.
411
0 1S0IV P " NP 111 Olitil1 $yt ol) it w hille (0 , q ueuting) but paole ivuld mr y in IIheo lit, ra I or (whil hAs N11r Il l ox le~ Iblit y t han hIII N quil)~tittn). , traspsm whi chinli pii vei III hi tihAv tot hly Iit'lv A N &Itg tip lipt ro amNing r powutuns ert WO ins
rpastill or (list' rPAN IB1 his Pr'!0I ProdIuctiont. 0elltilnation of 11on -eaweintial!VPN0It0tUPN "It" In womeo 111node (0,M, . S tolge1'u) Niroso is conoidered Allan ltAItgpolsitive Parnmlltor aN well As it votietr-rrothictivo ono.However, (allure to 110h60ve the AystemI goal intensifies these 411100400.
(4) Adeqtiavy o~f oystom teivign to conom~pttlahod in ternia of satis-(at tioit of syotemt reqiroemento. lKeppatod failure of( the opeorAtor toaccomplish oyatoml g~oAts Implies A systemi inadequ~acy which most heremottthed by soni.' redesign activity, eilher of tht, individual, hill trainingor kINI oquipmont macehanions,. Initial design oi the system to performedby oelecting those mohlelanisiNis (o, g. , personnel, *kill*, functions, tankii,3oquipmant components) which will load to maximum probability Of goalaccomplishment.
SianvŽ theo ptrpose of systom development to to Increase this proba-Wiity of goal accomplishment, a human reliability methodology is must(ffectivo when it call be utillspcl ini the initial design of the system, to
select those personnel whose behavior can be most readily manipulated,to determine what training in neiadvid for the manipulation, to select that.tiaua-machine configuration which comes closest to meeting the systemroquirament, and to predict the operator's ultimate performance inrelation to system goals. The reader will recognise here the various
objectives with which the various moduls/methods were compared.
To help our summary further a matrix chart (Table 14) has beenconstructed to siummariae the similarities and differences am-ong theImodels. The categories around which the matrix has bee-in organizedwill be explained in the remainder of the section, but the reader willsee that they are similar to the categories used ina describing the indi- Ividual modols.
31. It is interestingj that in these models stress is determined exclusivelyby system factors; the internal genesis of stress is largely ignored.I
412 i
II
I
110borp pi'o;'eooding to doiesirihwh~at TabloH iniotrim,it t ialotiilt hi'i aOKPlA111d that thin Chart Is not at vll O thktiw, deviv'" It in simply at1
attempt to tumiiiarise the various titpthodm and their ,hAractatoriti, i,Necessarily such a summary, simply becaupe it ratellorisuvi (lumps)charat-teritstic, tends to obseure detat isl con'sequently in the ditscussinoIbelow we have trawiwn on the individual model desi.riptionp Ia the hody of thereport,
Our first category is the differentiation of the modols into those thatapply simulation and those that do not, An was pointed out in the sectiondealing with ground rules for data bank development, there are other waysof categorising the methods reviewed - e, S. , descriptive vs. predictive or
- predictive vs, evaluative - but we feel that the simulation/1ntlyticdichotomy is the most significoknt. A simulation technique reproduces (viacomputer) the operations actually involved in a mission and secures itsoutput measure as a result of those reproduced operations, An analyticmethod applies data to the operations required by a system without attemptingto reproduce their functioning, These categorizations overlook, of course,major differences among both types of methods,
Although this is a highly significant difference, examination of Table 14reveals that the two types of models also possess many elements incommon, e. g., uite uses to which they are applied, their task scope, thetask analytic process, their output metric, etc,
Twelve of the methods reviewed are analy[tic tochniqu-,•; sixutillse simulation.
It is obvious from the nature of the simul ation pro'es s that tIhe miet hodNmaking use of it are much more powerful than the it i a I y t i c method.,The simulation process permits the determination of functional relationshipmwhich the non-simulation methods cannot provide. This is becautse thesimulation partakes of the character almost of an experimental test. The
411
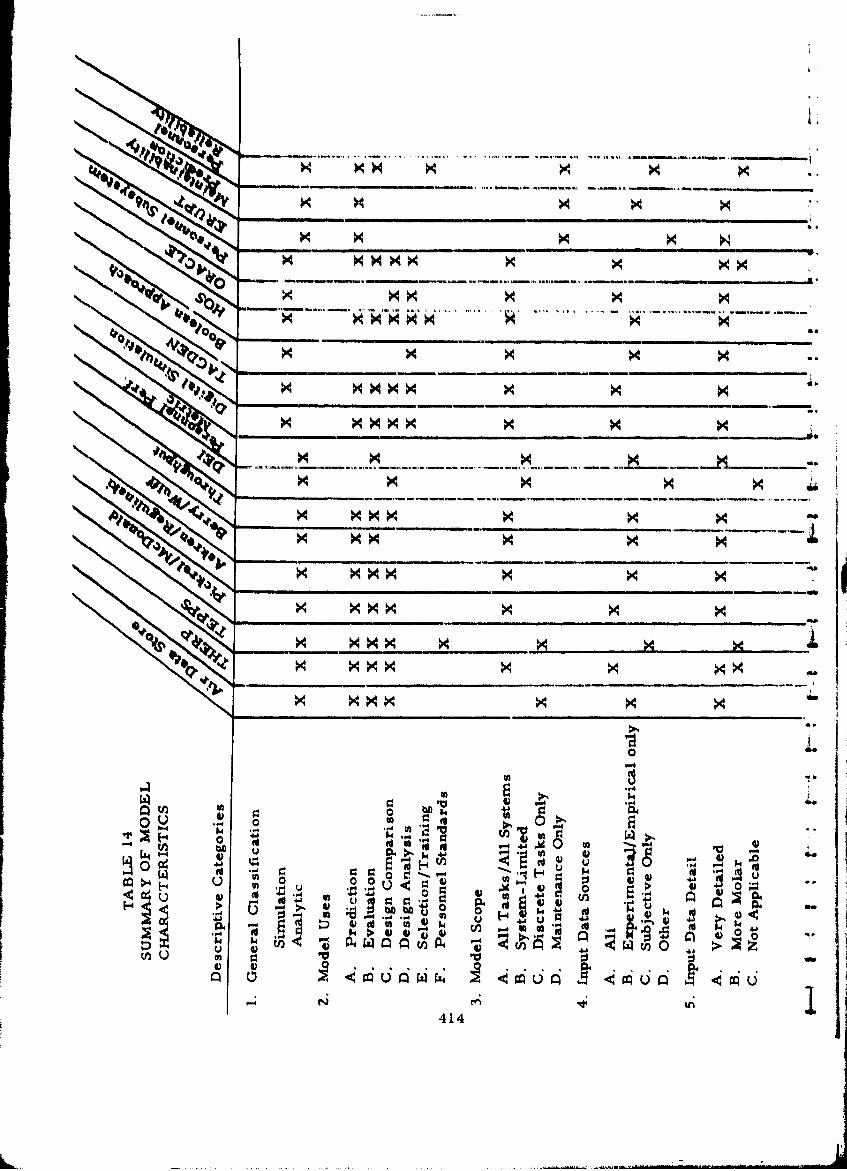
>4 >4
>4 X X
x4 >4 a'
x 4 >4 5
>4 >
-4~
oo4
Z 0
.5. t, 4
0 ~ 04
u 4)
14414
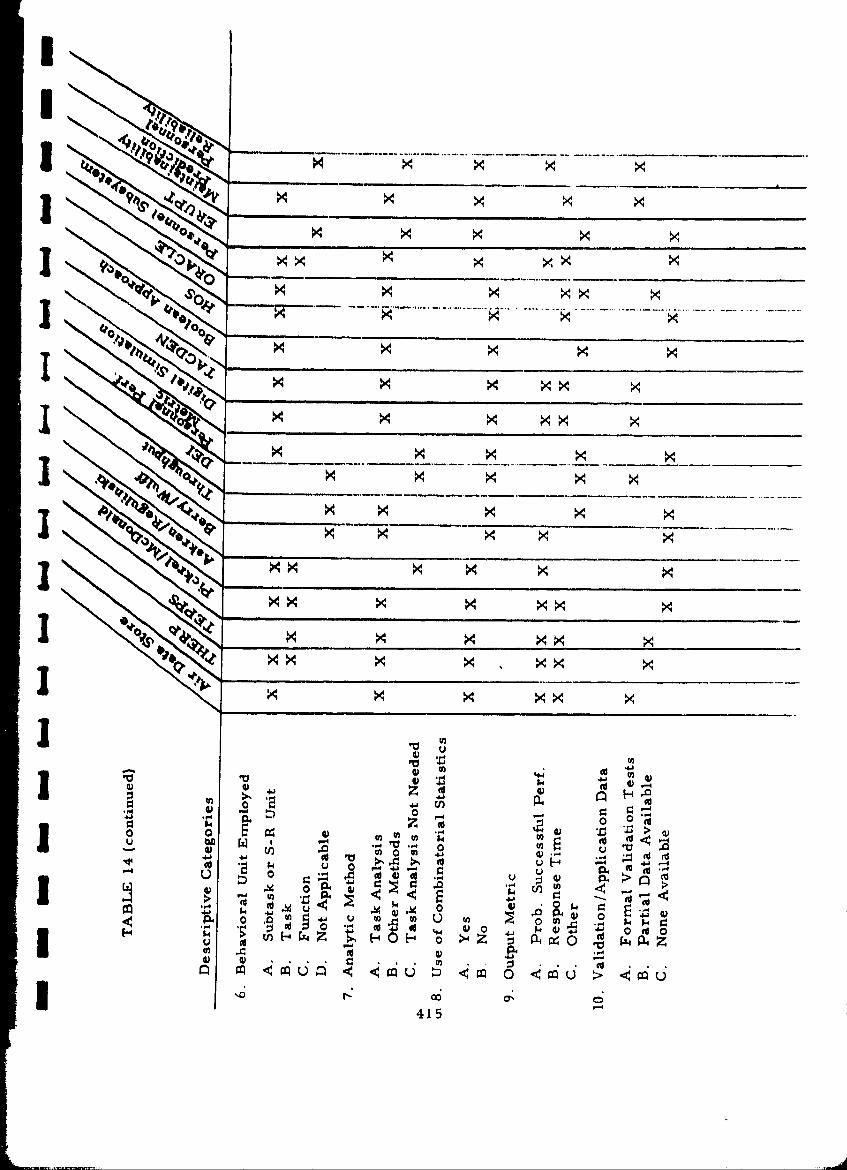
0I1
N~~~~~~4~- 04P---*-*-----~-
_ _
tv >
10 n x0 );. xI Id Oxc
U) M -_
u 0
00a
4 15'.
simulation also permits a detailed examination of how the operations wereperformed - a sort of "time-history".
If the simulation/a n a l y ti c dichotomy were the only basis forselecting a predictive methodology, the simulation methods would win"hands down". The question arises, however, whether for a particularsystem development need the user requires such a powerful tool. It isimpossible to tell because no one has ascertained the precise nature ofthis need.
(Note that we do not consider here the research interest in man-machinemodeling, which is obviously important in its own right. We are concernedhere only with the solution of system development problems.)
The situation is complicated by the fact that there is not one user butseveral. The governmental planner or anyone else involved in the veryearly planning stages of a system (e. g., SOR, ADO, etc, ) might wish toconsider the factors that a simulation model like Siegel's can handle best,i. e., where functional relationships are involved and the planner wishesto trade off various values of the relationship. For example, in planning Ithe crew requirements for E new destroyer class like DX one might wishto explore the relationship between number of personnel required, work-restcycle and work output. In the later stages of design a designer might wish Isimply to compare alternative design configurations or secure an estimateof the error anticipated with a given control panel. In this case a non-simulation method might provide him with a perfectly acceptable answer.
We could be wrong, of course. More powerful methods might bepreferred by all users at all system development stages, but the questionremains open.
Theoretically some very different models provide essentially equivalentoutputs. If one ignores the functional relationship factor which marks thesimulation methods, and the fact that some simulation methods handlecertain parameters that non-simulation methods do not, both types ofmodels provide many of the same outputs, i. e., probability of success andresponse time. (However, the simulation models provide a greater richnessof output, e.g., standard deviations, variability over time.) Certainly thedevelopers of the various models would claim that their models can doeverything that any other model could do. In the absence of data based on -.
a formal application test comparing the effectiveness of the various methods,the choice of method may well devolve on the specific needs of the userand the relative cost-effort involved in applying the different models. .
These utilization factors were generally given a much lower weightingin the ranking of man-machine evaluative criteria. 7
416
I
Nevertheless, however much one might consider them peripheralcompared to factors such as validity and reliability, they could beKu crucial in the acceptance by the user of a particular method. Systemdevelopers prefer to work as little as possible to secure their answersand desire them as quickly as possible. Unfortunately, very little data
-I are available concerning the length of time requiied to gather data fora particular model, the number of man-hours required, time required
'3 Ito exercise the model, etc. In general, as we shall see later when weconsider validation/application, not much is known about the mundaneproblems of applying a model to specific system development questions.
I Consequently the evaluations we can make of the various methods atthis stage of our knowledge cannot be considered final.
Model Uses
Six possible model uses are listed in Table 11 Prediction involvesan estimation or anticipation of the future performance of a system.Evaluation is an assessment of the present state or capability of a system.However, a prediction can also be used to evaluate a system in the designstage, given that some explicit or implicit standard for evaluation exists.For example, if a system in design has an anticipated (predicted) probabilityof successful performance of . 99, and if . 99 is considered satisfactory bythe system developers, then the system has also been evaluated. As canbe seen from Table 14, prediction is closely linked to evaluation, in thesense that the same method used for prediction can also be used toevaluate a system in operation.
It was necessary to differentiate between these two because certainmethods can perform one or the other function, but not both. For example,the personnel performance metric of Brady is purely an evaluative method,since it can be applied only to a system in operation. On the other hand,the maintainability methods currently in use in DOD are strictly predictive;maintainability evaluations employ different methods (not considered in this
3I report).
Most of the models can be used also to compare design configurations,since a prediction applied individually to two or more configurationsautomatically implies a comparison. It should be noted, however, thatthis use is probably more potential than actual. Most models can be usedfor this purpose, since a comparison can be made on any basis, providedthe basis is relevant. However, we suspect that few models have beenused to compare design configurations.
I Most of the methods possess little or no capability in the areas ofmanpower selection and training (definitions of these were provided in the
417
individual model descriptions) despite the fact that claims for thesecapabilities are often made. In part this discrepancy may arisebecause the criteria applied in this report demand greater sensitivityto these factors in the models themselves rather than as deductionsfrom model outputs. In other words, we feel that to be sensitive toselection and/or training, a model must indicate what capabilities shouldbe selected or trained, rather than merely that more adequate selectionor additional training is required. On that basis only a few of the models,i.e., the personnel reliability technique of Siegel and Wherry's HOS,seem to possess this sensitivity. It may be that the majority of themodels available do not include parameters which are sensitive to thesefactors or it may be that a distinctly different type of model (such as -.
-he ptrsonnel reliability technique) is required.
We have similar difficulties in the category of design analysis, whichwe define as the capability of performing a detailed time-historicalanalysis of the system's operations leading to specific redesign recommen-dations. Manifestly, only the simulation methods permit such an analysis, -"
because the analytic methods do not reproduce the individualoperations involved in performing the mission. This may be consideredone of the advantages of the simulation methods. It is felt that such adetailed scrutiny is required for a method to suggest redesign possibilities.This does not mean that the non-simulation methods cannot make suchredesign suggestions; however, they are limited in this respect. Certainof the simulation methods (such as HOS and ORACLE) specialize in this;ORACLE, for example, produces no predictive figure of merit but issolely interpretative.
Only one of the methods reviewed, TEPPS, dealt with the determinationof personnel standards by means of apportionment (its "derivative" use).
It is apparent therefore that almost all the models can performpredictive, evaluative and design comparison functions to some degree ofefficiency. The question naturally arises, how well, but information onthis point is not readily available, since many of these models have notbeen validated, and of those that were validated, the validations were notperformed on the same test situation.
It would appear then that selection of an appropriate model would haveto be based on factors other than their presumed capability to predict,evaluate or perform design comparisons. Each model has certain peculiar-ities that may render it more or less effective in a given situation. One ofthese peculiarities is the question of Model Scope.
418
I Model Scope
Here we deal with the range of situations and behaviors which the* method can handle, Although I11 of the 22 models presumably can deal
with all tasks in all types of systems, this is actually not so. Most ofthese 11 models would have great difficulty dealing with maintenance
operations, which is the reason we included a specific category ofmaintainability models. But a maintainability model can handle onlymaintainability. Other models are system limited. For example, DEL
can be applied to the comparison of control panels only; H-OS is limitedto pilot models (a t p re se nt); and the personnel performancemetric to highly automated ground systems. Other models (AIR, TEPPS)admittedly can deal only with discrete tasks.
I ~T 5 '"'lting a model, therefore, it. Is necessary to ask: what kindof system is involved, what kind of tasks? The combination of model
uses and model scope serves to bound the possible choices even more.Several of the models are so closely related to others that the number
of choices is further restricted. For example, there is not much to chooseI between TAGDEN and Siegel'sa digital simulation model, and since theformer was derived from the latter, the latter would be preferable.Similarly, the Pickrel /McDonald model merely elaborates on THERPand between the two one might well choose the latter, particularly inview of the much more frequent application of the latter. In other casesa model is merely in the formative state, such as HOS; or was neverapplied, like ERUPT or the personnel performance metric, and isconsequently an unknown factor.
I Input Data Sources
Here we were interested in comparing the various models in termsI of the kinds of data sources they utilize. The categories here are (1) all,which means that any available source will be acceptable (although obviously
j certain sources are preferable to others); (2) experimental /empirical only,which we define as data from the experimental literature (e. g., AIR DataStore type) or from prototype or operational testing; (3) subjective only,i. e. , expert judgments; (4) other, which may include reliability failuredata or, as in the case of DEI, a scale applied to quipment characteristics.
From Table 14 we see that about a third of the models will accept dataI ~from any source, about a half will accept data only from experimental/ermpirical sources, while two accept only subjective estimates.
j If we combine the "all" and "subjective only" categories, we see thatapproximately half the models make use of subjective data either as thepreferred data source or as part of their data sources.
11|419
In view of the widespread use of subjective estimates, we consider,along with Blanchard, that it is highly desirable to investigate thismethod further, and our recommendations for needed - e, earch will Pinclude this suggestion. Only TEPPS includes a highly F,•.cific methodologyfor securing subjective estimates, although Swain indicates that he secureshis estimates in a systematic manner (and we hope the others do too).
The point is that, in view of the fact that subjective judgments arewidely used (presumably because other applicable data do not exist) andbecause in the case of TEPPS, even with a highly formal method ofsecuring such judgments, inter-judge reliability was low, means must befound of making such judgments more reliable than they are presently.
It is not that, as Blanchard suggests (along with Burger et al. (Ref. 1)and Hanifan et al. (Ref. 21 subjective data are to be the preferred source,but that if models must make use of this source, we had better attemptto standardize and improve on these data.
Input Data Detail
It is interesting that most models require very detailed information,only TEPPS and the personnel reliability index requiring relatively molardata. This is undoubtedly linked to the fact that the behavioral unit towhich the data are applied is in most cases, as we shall see below, thesubtask, task element or S-R unit. This detailed data requirement hasobvious implications for the development of any data bank. The "not- Iapplicable" category refers to the fact that in the DEI the data are inherentin the design being evaluated and hence cannot be thought of as being "input"to the method.
Behavioral Unit Employed
As indicated above, the behavioral unit employed in most models isthe subtask, task element or S-R unit. Because it is difficult in somecases to determine the precise behavioral level at which a model operates, Iwe indicated for those cases, e.g., THERP, Askren/Regulinski, thatthey .use both the subtask and the task. In onli two cases (personnelreliability index and ERUPT) is the model concerned with anything as grossan a tunction. In a few cases (e.g., DEI) a behavioral unit is not involved.Analytic Metho I l ,
Almost all of the methods employed use some variant of function/task Ianalysis, even when a model is derived from Operations Research concepts,i. e., ORACLE, or from maintainability concepts. All of the methods take
1'
I;
U this analysis as a given, that is, they assume the user knows how toperform the analysis.
1 In consequence the nature of the parameters in relation to whichthe analysis is performed is rarely indicated. By this we mean thatif one is to apply input data to a model, it is necessary to indicatewhether such factors as display exposure time, accuracy requirements,time limitations, etc. (the so-called performance shaping factors of
T Swain) are relevant to the task being analyzed and must therefore betaken into account by the input data. In part this failure to specify inputdata parameters as part of the task analysis results from the fact thatmost data sources do not include data relative to many of these para-meters. It is very probable that the model developer implicitly takessuch parameters into account when gathering his data, but unless hespecifies them formally as part of his model, it will be difficult todevelop an appropriate data bank and for the user of the model to determinewhat data he needs.
Use of Combinatorial Statistics
The term "1combinatorial statistics" refers to the use of probabilitystatistics to derive a system figure of merit by combining output valuesfor more molecular behavioral units to secure data for more molarJI behavioral units. Examination of Table 14 reveals that the use of suchcombinatorial statistics is largely confined to the analytic methods.Simulation methods do not have to "build up" data values by combination,since the simulated operations themselves produce the desired higherlevel outputs. Combination is nece' sary for the analytic methods.because they employ the subtask or task element as the basic behavioralunit.
In view of the difficulties encountered with such combination - theI problems of dependence/independence, and conditional probabilities -
the fact that simulation techniques do not require such combinationrepresents a very definite plus factor for them.
Output Metric
I There are two major outruts of most models, i.e. , the probabilityof successful task or system performance and response time (timerequired to complete the task or mission). Understandably so, becausethese two represent the two measures most adequately describing theeffectiveness of the system.
I A number of what one might term "time-history" simulation models.
i. a., HOS, ORACLE, Boolean technique, do not output a probability value
II 4/.I
as a measure of system effectiveness, Indeed, ut'ih miudolm dinvtowany desire to evaluate the adequacy of systems, although they can beused for this purpose, Such models are largely interpretative; oneexamines the time history of the simulation exercise to diagnoseproblems, Of course, a simulation model can also output an evaluativemeasure, e.g. , Siegel's digital simulation model,
The ability to interpret a time history is of great value, but unlessit is combined with a figure of merit measure, it has restricted useful-ness.
Other models, e.g. , DEL, personnel performance metric, themaintainability models, output other measures which are of specialisedinterest.
Validation /Alplication Data
Validation data may be derived from formal (experimentally controlled)tests; or validation results can be inferred from application of a methodto a problem and seeing how well the problem is solved. We have referredto this second case as providing "partial data". Obviously a formalvalidation is to be preferred to an informal one or to application data. Orthere may be no known efforts to validate or apply a model.
We have already pointed out elsewhere that where a model is derivedfrom and finds its major application to system development problems,there may be some difficulties in setting up a formal validation test. Thismay account in part for the relative paucity of validation data for many ofthe models.
Nevertheless, the absence of validation or even application data for
many models represents a serious deficiency in the government's supportof such model development. Formal validation has been attempted onlyin the case of the AIR Data Store, Siegel's digital simulation model,personnel reliability index, DEI, Miller's TACDEN (which is actually avalidation of Siegel's model) and the maintainability models. TEPPS wassupposed to be validated, but the test conditions were such that one canthink of this only as an application test. According to Swain, THERPhas been validated, but this is essentially based on application experience.experience which, because of the security classification of the problemsto which THERP has been applied, is not available to the general reader.The developers of ORACLE refer to good results in their application ofthe method, but supply no data.
All things considered, if one were to apply only the criterion ofvalidation to the selection of a predictive method, Siegel's digital simulation
4",
III
modol woulid he Neleoted without qucation., Ilowver, Iii view of the"s iparsity of uueh data for the other model N, the validation eriterion
might he considered a somewhat unfair one to apply,
What this part of Table 14 Mhoww h4 Llti if thilt goviVr111wvnt im tovontintte supporting the development of predictive modelis, It must Insiton validation tests and supply the conditionh und er which an adequatevalidation can be performed, Otherwise it is einentially wasting itsmoney,
The most effective validation is, as has been pointed out previounly,a comparison of a prediction with data gathered from an operationalexercise of the systemr or task to which the prediction has been applied.It may appear, as it has to a number of developers commenting on theirmodel descriptions, that such a validation requirement is too stringent;that perhaps other validation measures, e.g., concurrent or constructvalidity, would do as well. However, these are only partial indicationsof validity and do not replace validation based on empirical comparisons.Again, it is up to the government to ensure that the validation is adequateto its purpose,
The conditions of such validation should, wherever possible, approxi-mate those in which the model will be applied. By this is meant that allof the constraining conditions of actual model application, e.g. , fullrange of tasks (not merely tasks selected as being most appropriate to themodel), realistic time demands on supply of model outputs, etc. , should"be included in the validation. For it is entirely possible that a modelwill provide valid answers but be difficult to apply in the use situation.Users may say that they care nothing about a model except for itsvalidity, but that is before they have to apply the model in their ownshops. Consequently the validation situation should throw some light onthe problems of application.
It would appear from a review of Table 14 as a whole that no one modelsatisfies all possible requirements and that a model will be effectivedepending on the use for which it is intended, the type of system andbehavior for which it is specialized, the kind of measure it outputs,whether or not the user wishes to employ simulation, the level of detailwhich is required of the answer, etc, Consequently the selection of amodel requires consideration of all these factors. There is no suchthing as a general purpose model.
42~3
The fact that many of these models are speciallned makes it verydifficult to point out one model as being overwhelmingly superior toanother, Certainly one model is superior to another for a particular%Rgicaion but not when considered over the range of all possible uses,
Moreover, these uses are limited. It is apparent that while mostmodels may do a pretty fair job of predicting and evaluating and possiblyeven comparing design configurations, they seem to be relativelyineffective as far as design analysis, manpower selection and training A.are concerned, It may be necessary to develop individual models ortechniques for these uses.
All of the models are deficient in one respect or another. Obviouslymodels should operate on the basis of distributions of ipput data, but nodata bank presently available contains such distributions with the exceptionof the data used for maintsiatability predictions.
The assumptions, on which many models operate, such as normality .of distribution, relationships between stress and performance, etc. oftenlack verification.'
The manner in which the measure of'probability of successful taskaccomplishment is formulated (i. e., p = 1.0 - error rate) is overlysimplistic and misleading.
Hence a great deal still remains to be done.
Although we have reviewed 1- models or techniques in thisreport, the reader must be aware that the number of these that are stillviable, is far fewer. A number of these models were not carried farenough to make them useful or are still in process of development to thepoint where they can be used.
(Why were they considered then? Because their concepts and approachesare still valuable as indicating ways of looking at the man-machine modeling,problem. For example, certain of the models employ behavioral elements,while others do not. We have already mentioned the dichotomy betweensimulation and non-simulation models. Some models emphasize indepen-dence concepts, while other utilize dependency/independency relationships.Some models make use of at least some behavioral parameters in theirassumptions, while others avoid them. Some models are evaluAtive,while others are strictly interpretative. These models also have a gooddeal to offer us in terms of their implications for input data banks to supportthem , Moreover, someone may be interested enough to pick them up anddevelop them further.
4Z4
I
Models that have not been fully developed (at least in the sense ofbeing validated) are: Pickrel/McDonald, ERUPT; Boolean approach-Berry/Wulff; Throughput. Models still being developed areo HOS;personnel subsystem model, It is fascinating to ask oneself why thosemodels that never reached fruition remained half-developed. There isa parallel here to the many military weapon systems that were cancelledbefore they reached the production or operational etage.
Conceivably some models may have been aborted because they weredeveloped not in response to a specified need and in a systematic fashion,but in response to an unspecified research need or an idiosyncraticinterest in a particular area by the investigator.
Perhaps the greatest value this review may have is in terms ofsuggesting an orderly way in which models should be developed. An"outline of such an orderly procedure would include the following steps:
(1) Determination of the needs for and uses of the models.
* (2) Determination of the parameters required by the model.
(3) Determination of the required characteristics of input datafor the models.
(4) Development of the model.
(5) Formal validation testing of the models.
(6) Formal application testing of the models.
Of these steps the most important (because everything else dependson it) is the first one.
REFERENCES
1 . Burger, W. J. et al. Validity of Expert Judgments of PerformanceTime. Human Factors, 1970, 12(5), 503-510.
2. Hanifan, D. T. and Knowles, W. B. Human Performance in SystemEffectiveness Modeling: Issues, Approaches and Critiq~ue. Dunlapand Associates, Inc. , Santa Monica, California, December 1968.
425
l
SECTION V
DATA 3ANK DEVELOPMENT GROUND RULES
If one is the developer or user of a human reliability predictive model/technique, one of the basic questions he must ask himself is: what kind ofa data bank do I need in order to supply input data to the model/technique?If one wishes to develop a data bank, it is necessary to ask: what kind ofdata (i.e., content and format) should that bank contain?
The preceding paragraph assumes that a data bank is needed as asource of behavioral input data to exercise or apply the technique selected.Only a few of the models reviewed in this report- p e r s on n e 1reliability index and DEI- can perform without the use of input data. Theseinput data can be a standardized set derived from the experimental litera-ture, like the AIR Data Store; or it can be the results of special mockupor prototype testing; or data gathered operationally on systems similar tothe one for which a prediction is to be made; or it may be subjective esti-mates. All of these types of data can be utilized as data banks, and conse-quently the questions posed below apply to all of them.
The purpose of this section is to present certain questions the databank developer/user should ask himself. The answers he receives willhelp to determine the characteristics of the data he will develop and/oruse. The reason for including this section in a report devoted to theanalysis of predictive models is that the data bank is a tool which can onlybe applied to a particular technique to satisfy some user requirement. Adata bank (of whatever type) assumes some method of using the data itcontains. Consequently the data bank configuration must be related to thetypes of models we have reviewed. Another way of saying the same thingis that a particular method or technique implies a particular data bankconfiguration.
Of course, one can fail to consider a possible model application anduser need in developing a data bank, but under these circumstances it islikely that any use of the bank will be quite inefficient. Alternatively onecould assume simply that the data will be applied merely with the aid of
S-- probability statistics, but even this simple assumption implies a modelof the THERP-type. The concept of a data bank assumes or requiressome consideration of contents, format and level of detail.
As a tool, the data bank serves some need on the part of the user.The more closely the data bank characteristics correspond to this need,the more cost-effective the data bank will be.
It is possible, of course, to think in terms of a so-called "universal"data bank which would then have the following characteristics:
(1) Both error probability and response time data (formulated in"terms of known distributions and variances) for
"(a) all human behaviors (motor, perceptual, cognitive)
- 'PRECEDING PAGE BLANK
4Z7
(b) all types of tasks (e. g., continuous, discrete, operatingand maintenance)
(2) data at various levels of behavioral units (e. g., function, task,task element)
(3) data at various equipment levels
(a) the component characteristic (e. g., number of scales ona display, length of switch arm)
(b) component type (e.g., switch, meter, knob, CRT)
(c) equipment assembly (e. g., control panel)
(d) subsystem and system
(4) data accounting for differences in what Swain calls "performanceshaping factors", e. g., stress, motivation, skill level; differ-ences in aptitude of various types; differences in training ofpersonnel
(5) data organized in terms of significant "affecting (independent)variables" like exposure time, order of stimulus presentation,stimulus input rate a.
(6) all of the above interrelated by combination.
A primary question the developer must ask himself then is: am Iattempting to develop a "universal" data bank or will I be satisfied witha bank having a more restricted scope? If he decides that he will developthe universal data bank, then further consideration of the points raised inthis section is largely unnecessary, and certainly such a data bank wouldsatisfy the requirements of all the models reviewed.
However, the task of developing a universal data bank is a very onerousone and we are not likely to see one completed in the very near future.A further question that bears on the advisability of atLempting to developsuch a bank is, does the model user need it? It is possible that becauseof the nature of the questions the user asks that some "degraded" form ofdata bank will be acceptable. In any event, if the question about theuniversal data bank is answered negatively, it is necessary to ask thefurther questions described below.
We have emphasized the "need" for a data bank having particular -.
characteristics. There are two types of need: (1) the requirement ofa particular class or individual model/technique for particular data;(2) the need represented by the particular use to be made of both themodel and the data bank. The first need stems from the second; if the
428
user does not require a particular model/technique (if it will not solvethe system development and use problems he has), then obviously thekind of data required by that model becomes unnecessary. Ultimatelytherefore one must revert to the potential use of the model and data bankto ascertain its requirements.
We assume that the models reviewed in this report sample approxi-mnately the various types of data needed and the way in which these dataare manipulated. Even if these models do not represent all present and
future models (since it is always possible that some have -not beenunearthed and others wiJ1 be developed), they represent the various waysin which one can think about data usage. Therefore the characteristicsof these models sp""fy decision criteria which can be applied to the1 problem of selecting a data bank configuration.
The first thing we note about these models is that they can be cate-gorized - grossly - in two ways: (1) simulation techniques; (2) non-.simu-lation techniques. The first category reproduces successively in a computerthe behavioral operations involved in performing the mission or task inreal life. The output of the reproduction represents the prediction ofeffectiveness. The second category does not reproduce these operationssuccessively but rather assigns a unitary estimate of expected performanceto each behavioral unit and then combines these estimates in accordancewith a concept of how individual behaviors combine in real life to accom-plish the task.
The fact that a model falls into one or the other category has significantdata bank implications. Generally (not always) a simulation model requiresmore detailed data than does a non-simulation model, because it mustreproduce the individual behavioral actions of the personnel performingthe mission. For example, Wherry's HOS requires the locations of con-trols and displays and the values these controls and displays may assume,eye movement and arm reach data, etc. Although non-simulation modelslike the AIR Data Store may require very molecular data, in general"simulation models require a somewhat more detailed data level than donon-simulation models.
Consequently it is necessary for the data bank developer to decidewhether the technique he will apply the data to will involve simulation ornon-simulation. If he can identify the individual technique which willmake use of his data, so much the better; buthe may be unwilling to dothis, because it is always possible that a new technique variation will bedeveloped which he would prefer to use. However, that new technique islikely to be either simulation or non-simulation. (There are other classi-fication dichotemies that can be applied to hurnan reliability models, butthe simulation/non-simulation difference is the most fundamental. )
Of course, the data bank developer could say, I will make my bankas detailed as I can; but this is likely to be unprofitable because it leadsdirectly to an attempt to develop a universal data bank.
I1 429
The choice between simulation and non-simulation techniques as thevehicle for the application of one's data is a matter of relative advantage.In general simulation techniques are more powerful than non-simulation,because
(1) They output functions describing parametric relationships, e. g. ,the relationship between performer speed and accuracy, thuspermitting one to select a particular input value required for agiven output; non-simulation techniques provide only single-valueoutputs.
(2) Since they simulate successive replications of operating perfor-mances, simulation techniques provide a history over time thatcan be examined for diagnostic purposes; non-simtdation tech-niques provide much less diagnostic information.
(3) Moreover, simulation techniques require no combinatorial processas do non-simulation methods, which is an advantage because ofthe problems involved in assigning conditional probabilities. Inconsequence, if the data bank developer assumes that his datawill be used with a non-simulation model, he must also askwhether the data parameters are such that they can be readilycombined.
On the other hand, simulation techniques impose an additional cost inthe sense of requiring more detailed information. In consequence, thechoice of model should be based on whether the user needs for his purposesanything as powerful as a simulation technique. If, for example, one didnot need to determine functional relationships between parametric values,or to diagnose system operations, one might be satisfied with less power-ful techniques requiring less detailed information.
It is not that non-simulation techniques make use of different typesor sources of data other than operational or laboratory testing or theresults of controlled experiments or subjective judgments. It is simplythat the data level is less detailed. An illustrative example is the kindof data required by TEPPS as opposed to the kind of data needed by Siegel'sdigital simulation models.
We have been talking about input data required by the various models.At the gross distinction betweei. simulation/non-simulation, one canspeak only of level of detail. However, each model, regardless cu thecategory to which it belongs, has certain peculiar needs for input data.Therefore each of the models to which it is considered that the data bankmight be applied should be examined to determine if it has special inputdata requirements that must be accomodated by the data bank.
430
A second question the data bank developer should ask is: what is thedesired output measure to be provided by the model? Two types of outputare commonly provided by models: error probability and time. Thereis an intimate relationship between the type of input data required of thedata bank and the output measures the model provides. If a model out-puts error probabilities, then the data input to the model must also be inthe form of error probabilities. The same is true of time. In general,time data are easier to secure for the data bank because fewer performancereplications are required.
Another interactive factor to be considered is the type of system towhich a model will be applied. Some systems are mnore heavily time-dependent than others and will therefore require primarily time data.
One of the categories used in the review of the preceding techniqueswas methodological scope, by which was meant the range of behaviors andfunctions dealt with by-7tRi model. The data bank developer must thereforeask: how much will the data bank cover: (1) perceptual, motor, cognitivebehaviors; (2) continuous/discrete tasks; (3) maintenance functions as wellas operations. All the models reviewed pretend to deal equally well withbehaviors and tasks of types (1) and (2), but some of them deal with thesemore adequately than do others. Since it is easier to collect data onperceptual and motor behaviors involved in discrete tasks, the data bankIdeveloper must ask whether the additional effort required to expand hisscope is needed in terms of the use to which his data will be put. Togather data on cognitive behaviors and continous tasks may require specialcontrolled and expensive experiments.
Again, the type of system to which the model and data will be appliedis important here. If the data bank developer has in mind a class ofsystems with special characteristics, e.g. , involving largely discretetasks, then he can gear his data bank development efforts to that system-class.
e YA great deal has been made in this section of the intended use of themodel and data bank. This is related to the anticipated uses of the modelsjj we have reviewed. These uses can be summarized as follows:
(1) prediction of system effectiveness;(2) comparison of system configurations;(3) redesign to correct deficiencies;(4) manpower selection and training.
SLet us leave aside category (4), for which no model reviewed wasvery useful. Most of the models predict system effectiveness (1) in oneform or another. The models reviewed do differ, however, in their"capacity to deal with uses (2) and (3). These differences depend on thesensitivity of the model to equipnment factors and this sensitivity in turndepends on the extent to which equipment factors arte conceptualized asinfluencing input error probabilities and response times.
431
If a model is selected which emphasizes equipment details (e. g. , HOS),then obviously the data bank developer who will use this model to apply hisdata must incorporate equipment parameters into his data bank.
The question then becomes, what does the ultimate user wish to dowith his model and his data bank? If it is considered important that thedata bank be used for comparison of system configurations and for redesign,then the data bank developer should collect data reflecting the impact of f
relatively molecular equipment characteristics on performance (becauseit is these which most often differentiate among system configurations).
This involves a cost, however. To collect performance data reflec-ting equipment parameters it is necessary to set up data collection situa-tions in which the effect of equipment parameters can be controlled.Practically speaking, this requires a laboratory type situation or recourseto the experimental literature.
If one makes the decision to make one's performance data bank sensitiveto equipment parameters, it is necessary for the developer to specify whatthose parameters are, because only in this way can data be correctly cate- -
gorized. The AIR Data Store provides some examples of potential parame-ters: number of components of a given type; arrangement of these compo-nents of a given type; arrangement of these components; individualcomponent characteristics, such as joystick length; exposure time (fordisplays), etc. One could of course allow one's data collection situationto determine the equipment parameters (this most often happens in opera-tional testing), but this would imply an assumption that the data collectionsituation is representative of all the system-types to which one expects toapply the data. For example, if one were to collect data in a. Terrierlaunch situation, the data secured would be most useful in application toTerrier type systems, and of somewhat lesser use to other types ofsystems.
Finally, the developer should consider what Swain calls "performanceshaping factors" (PSF). This relates to the assumptions and parametersinherent in the various models, because these assumptiro-ns and parametersdeal largely with PSF. The models reviewed do differ in terms of the PSFthey include (or for that matter do not include, because a number of modelsare extremely reserved about these), although a common PSF in many ofthese models is stress. All of these models would include various typesof PSF if data were available on them, e. g. , amount of learning, skilllevel, motivation.
The question the data bank developer must ask himself is: howTimportant is it to include PSF as part of his data bank? Manifestly, themore such PSE data he inputs to a model, the more precise will be theanswers provided by the model, for whatever use he wishes to make ofthe model. Does the eventual user of the model need the increased pre-cision supplied by PSF? Are any of the system-types to which the data
43Z!
N
will be applied especially sensitive to PSF? Should a model requiringfewest such PSF be selected in preference to one requiring more of thesefactors? There is a cost factor here too, because to collect performancedata as these relate to PSF may involve a more extensive collection effortand controls than would otherwise be required.
What all of the preceding discussion comes down to is that the databank developer must relate his development efforts to the anticipatedneeds and uses of his data. This means consideration of models andpossible system development applications. We repeat that the data bankis only a tool to be applied with some model/technique to satisfy someuser requirement. One can think of the model/data bank combination asan interesting research problem, but its practical value - which must atone stage or another be addressed - lies in the use that is made of it.
The question arises whether we (we considered as potential data bankdevelopers) know what users need and want from models and data banks.Since these users are various: designers, system developer managers;government planners, etc., their needs may differ. One could of courseadopt the point of view that the data bank or model developer alreadyknows the user's needs or will tell (impose upon) the user what he can dowith these tools, but the chanceisare that under these circumstances theuser will ignore the tools supplied to him. We have had some unfortunateexperiences along this line in the past with other types of human factorstechniques provided to system developers.
This does not mean that all data bank development work need be post-poned until we determine user requirements for this tool. It does, however,require that the developer attempt to anticipate those uses in very practicalterms.
433
i ~SY,-CTIION VI
RECOMMENDATIONS
The recommendations developed on the basis of the model reviewscan be described in several ways. First, some of these recommendationsare for research, whereas others are for action to be based on research.Secondly, some of these suggestions are for immediate and short term
"-r implementation, whereas others can be accomplished only on a continuinglonger term basis. Each of the recommendations made will be characterizedin this way,
A. Determination of User Parameters
This recommendation is for short term (e. g.. 9-12 months) researchwhich should be implemented immediately.
The author makes the following assumption: that any human factorstechnique, predictive model or methodology (particularly those developedunder government contract) should be directed primarily at satisfying aknown requirement or need of the system development process. In otherwords, any government-sponsored research should have as its ultimateaim the development of more effective systems.
We emphasize the phrase "known requirement. ' Hardly anyone wouldquarrel with the above premise, but in order to implement that prenmiseit is necessary to determine what that system development requirement is,which is often not too easy. Often there is a substantial difference betweenthe aims, processes and methods of system development as these areconceived of by governmental agencies and the aims, processes andmethods actually included in system development at much lower levels.The problem is intensified by the fact that different types of people (forconvenience sake call them "users") are involved in system development:governmental planners, SPO directors, contract managers, design engineers,personnel who will operate the developed system, etc. Each of these mayhave some special answer he wants from the application of a particularmodel or technique. For example, one of the comments made a number oftimes by respondents to the evaluation criteria questionnaire was that theevaluation of a particular model might vary, d c p e n di n g o n th erole a respondent would play in system development.
Actually it is impossible to evaluate the various models meaningfullyunless one thinks of them in terms of the particular system developmentneeds for which they are best fitted. If one can believe many modeldevelopers, each model will satisfy a wide range of system developmentneeds. Actually, each model has individual features (both positive andnegative) which makes that model better or less well adapted to a particularsystem requirement. For example, TEPPS may be particularly effective
PRECEDING PAGE BLANK435
in apportioning a system effectiver~ess requirement among various tasks;THERP may be particularly effective in resolving problems or questionsof effectiveness during development; Siegel's digital simulation model L.may be most effective in supplying trade-off functions among parameterswhen the developer wishes to select the most desirable set of values oftheme parameters. And so it goes for almost all the models reviewed.No model is a "general-purpose" model; and the one a user might wishto select would depend on his particular need. Some methods are moredescriptive than others; some are more predictive than others; othersdiffer in terms of number of outputs they provide or the particular stageIof system development at which they can be applied; some demand aparticular type of data, while others do not, etc.
rIBecause of this aspect it is necessary to look at the various models
in terms of a number of system development factors which include:
(1) Stage of system development at which the model can mosteffectively be applied; I
(2) Nature of the system development problem to 1?e resolved. IFor example, one might not wish to apply an extremely high-poweredmodel when the problem could be more easily and just as effectivelysolved with a lower-powered model; I
(3) Amount of input data required to exercise thi model;
(4) Manpower and time cost required to exercise the model.
Other factors which can only be determined by examining the use situationmay well influence the choice of a particular technique.
Many of the differences in opinion seen in the proceedings of the first'Human Reliability Workshop (Ref. 1) reflected a lack of knowledge on thepart of all participants of the relative importance of the system develop-ment factors mentioned above. If, for example, a technique is denigratedbecause it will supply answers only at a less than optimal level of precision,this is because we do not know whether such partial answers will satisfya particular set of user problems. If the goal of model development isultimately to provide answers which will in fact solve system developmentproblems, then it is necessary to know what techniques and answers userswill accept as capable of solving their problems. it is possible to developtechniques which in theory or even under controiled validation conditionsare satisfactory but which, when given to their users, do not supply .
desired answers.
It appears then that the following questions need to be answered:
436
U
(1) Who are the various types of people wh need to make use of
a predictive model?
(2) How do the uses that each of these types would make of themodels differ? What in fac' are these uses? How important is eachuse? (This report postulated a number of potential uses for the variousmodels, but these were logically rather than empirically based.)
(3) At what stage in system development must users have the
information to be provided by the model?
(4) How precise or detailed must the information be (e. g. , in termsof four figures, such as . 9988, or more gross data)?
(5) In what form should the information be (a probability of taskaccomplishment, a time estimate, a problem diagnosis, a recommendationfor redesign, etc.)?
(6) What type of parameters must the information contain (e. g.,equipment details, training requirements, personnel factors) andprecisely what should be the details of these parameters (e. g., ifequipment recommendations are required, what equipment factors areimportant to include in the answer supplied)?
It must be emphasized that the answers to the above questions do not'yet exist, despite the confidence of some model developers that theirmodels are perfectly adapted to a variety of system development require-ments. It is also possible that model developers do not fully know whatthe needs are to which their models should respond. Upon occasion thisauthor indicated that one or the other model did not handle a particulartype of task or requirement. Developers in responding to the preliminarydrafts of their model descriptions would reply to the above comment thatthe model could deal with the situation, if there were a need to do so,thus suggesting that (a) they did not realize all the potential demands thatmight be levied on their techniques; and (b) there is a need to explorethese demands more fully.
If one had answers to the above questions it would be possible todetermine what requirements should be levied on models and on databanks.
Such a determination probably would not eliminate any of the moreeffective models, since it is quite possible that all of these should bemade available to system developers, because each attacks a particularset of system development questions in a somewhat different way. Itwould then be necessary to determine for which set of uses and users and
437
system development factors a particular method was most applicable.This is the procedure utilized in MIL-HDBK 472 (ref. 2) in which theparticular application of the models included is specified.
To buttress the importance of the proposed study the followingshould be considered. Utility criteria (e. g., ease of use, availabilityof data, etc. ) were generally given a lower weighting by the majorityof respondents to the evaluation criteria questionnaire. Most respondentswould probably echo one man who replied in his cover letter "All I careabout is whether a method works". However, it would be desirable toconsider the experience gained with the four maintainability predictionmodels described in MIL-HDBK 472 (Ref. 2) which presents the fourmethods and allows the user to select the one he wishes applied. AlthoughMethod I is, from the data presented, the best predictor of system downtime, it is apparently rarely used because its mathematical complexitydefies anyone without an advanced degree in mathematics. Method IVis so general that it cannot practically be applied. The point is that ofthe four methods presented, only two are really available, because theothers contain disabilities which directly pertain to user limitations onthe models. Had user requirements and constraints been fully consideredwhen the research for methods I and IV was performed, it is very likelythat these methods would not have been developed, or would have beendeveloped in a different way.
It is highly desirable that the operability performance models shouldavoid the fate of many human factors techniques which, despite muchresearch, money and effort are spurned by the system developmentpersonnel these were designed to help (Ref. 3, 4).
It is therefore recommended that a short term study be institutedto determine user needs with regard to the prediction of human performance.The following questions should be attacked by that study:
(1) Who are the various types of people who would make use of thesemodela? How much use would they make of them? To what uses wouldthey apply them? What information would they wish to secure from themodels ? In how detailed a form? Containing what parameters? Atwhat stage of system development? What limitations would users placeon the models (e. g., in terms of manpower needed, type of manpower,etc. ) ?
(2) Of the various types of models available, which ones appear tobe most suitable to answer particular questions? (Since it is obviouslynot feasible to have all types of users try out each model in turn on theirindividual problems, a substitute method might be to present descriptionsof the model procedures (although not in the depth presented in this report,
438
L!
II
of course), together with sample model outputs, and have users indicatefor what problems these model.types and their outputs would be most1 useful.) This could permit government planners to anticipate userreaction to these models when a human reliability prediction requirementwas levied on a contract.
The methodology suggested for this investigation is a combination ofinterview and questionnaire based on the research performed previouslyby the author and his colleagues (Refs. 3, 4) for the Office of NavalResearch and the Air Force and deterinined empirically to be effectivein providing desired answers.
It should be noted that this methodology differs from the typicalinterview/questionaire procedure in the following aspects:
(1) The methodology requires the development of sample problemsbased on those ordinarily found in system development, thus lending ahigh degree of realism and validity to the questions asked.
(2) Respondents are required by the nature of these questions tosimulate (with paper and pencil only, of course) the processes they wouldordinarily employ to solve these problems.
2.1 (3) The questions contain materials actually representative of theproblems to be solved. For example, in the studies (refs. 3, 4) citedabove, actual system descriptions, functional flow diagrams, etc. wereemployed. In the study proposed the questions would contain extractsfrom model procedures, details of system development problems,"alternative data formats, etc.
(4) Problems should include typical system development constraints,"such as the need to supply information quickly, cost constraints, etc.
Once developed (and obviously considerable care is needed in itsdevelopment), the test instrument should be presented to representativesof identified classes of potential users, such as SPO representatives,contract managers, design engineers, etc. This will require sampling"a number of organizations both in government and industry. The testinstrument should be administered in the form of a highly intensive,structured interview, although there may be occasions where this proceduremay have to be modified.
In considering the outputs of such a study, it is necessary to consider* ione of the major outputs of the Navy's Human Reliability program. As
indicated by Momyama in reference 1, one of those outputs will be a manualor guide to the application of various human performance predictive
"-e 439
techniques. Among the several resultants of the suggested researchwould be guidelines to the type of format in which models should bemade available to potential users,
So, for example, if it were decided to provide a handbook foroperability prediction (similar to MIL-HDBK 472 for maintainabilityprediction), the information needed by users to make maximum use ofthese models would be specified.
In addition, the information gained from the study could be used todevelop planning guidelines for the entire model development/applicationand Human Reliability program. It would also indicate the range ofsystem development needs which the Human Reliability program shouldsatisfy. This might be important in convincing personnel who do notrealize the importance of that program. vim
It is not suggested that further research and development of already --
available models or develvpment of new ones should be postponed whilethe above information is gathered. The brevity of the study effort willnot force a postponement of any planned model or data bank efforts, ""since it is assumed that these efforts will be of value regardless of whatis found as a result of the proposed study. Rather, the study outputsshould be directed toward making more effective use of concurrentresearch.
B. Studies of Subjective Judgment Data ..
This author concurs with others like Blanchard and Swain that furtherinvestigations should be performed to improve the validity and utility ofsubjective ("expert") judgments. The reason for this recommendation isnot that this type of data is to be preferred to any other, but that since somuch use is made of it (in the absence of definitive data banks), muchmore should be done to structure the way in which such data are gatheredand used,
This study is a longer-term effort, which would probably extend over12-24 months.
The study should be directed to answering the following questions: Interms of application to various classes of predictive models
(1) What is the most effective (from the standpoint of validity,reliability, time and cost factors) method (e. g. , paired comparisontechnique) that can be developed to secure subjective judgements?
440
I
I (2) How effective are subjective judgments in relation to varioustypes of required data (e.g., task times, performance reliabilities)?
(3) How much detail is it reasonable to ask of judgment data andwhat parameters can be included? For example, how possible is it to3 include some of Swain's performance shaping factors (Ref. 6)?
(4) What is the highest inter-judge reliability that we can achievewith various methods and how can this be accomplished?
(5) What type of background and how much experience would be3 required to make meaningful judgments?
Obviously there are a number of conditions that should be includedin the study:
-.. (1) alternative methods of securing judgments;
(2) alternative information parameters about which judgments areto be made, such as equipment details, personnel factors, operationalconditions, etc.
(3) relative degrees of personnel background with the type ofperformance being judged;
(4) relative degrees of detail (e.g., number of information categories)[jto be required of the judgments.
S* It is essential, we think, that in addition to inter-judge reliabilitysome measure of the validity of the judgments made should be determined.There are, of course, various ways of establishing that validity, buthopefully the proposed investigation would involve some sort of comparisonbetween the judgments made and actual task performance. This mightrequire selecting a particular Navy system as a reference vehicle aboutwhich judgments were to be made.
C. Development of Design-Oriented Models and/or Data Banks
We have noted in previous sections of this report that many of themodels reviewed supply comparatively little information about theperformance correlates of design factors or supply little design-specificguidance to engineers. Although such models may indicate where aproblem exists, they provide little information concerning the precisesource of the problem. We consider that it is not enough to be able to saythat, for example, an operator is overloaded at point X in the mission
441
without being able to specify the nature of the (equipment) design featuresproducing that overloading (if equipment design features are in fact the
cause). Nor do many of the models provide any initial design guidancein the development of the system.
A4In saying this it must be recognized that many of the presently
available models (as their developers pointed out in personal communication)were not developed for the above purposes. For this reason the government Tmight consider sponsoring the development of models specifically directedat providing this design guidance.
There are two ways in which such design guidance might be provided:
(1) Development of a model on the order of method III in MIL-HDBK472, which predicts maintenance downtime as a function of three checklists
dealing with design, support and personal features of the system;
(2) Development of a data bank based on the experimental humanperformance literature specifically directed at describing the performancecorrelates of design features; this could either be an independent data bank Tor incorporated as part of the NELC data bank which is in process ofdevelopment.
Both these efforts would involve considerable time (e. g., 24 monthsor more).
The development of a model which would predict performance reliability
and task time as a function of checklist judgments would require
(1) the isolation of the design features which appear to influenceoperator performance;
(2) the development of appropriate checklists;
(3) the application of these checklists to a variety of systems inthe operational environment;
(4) the gathering of human performance reliability data on those
systems; and '"(5) finally the performance of multiple regression analyses which
would lead to a predictive equation. Nor should we ignore the necessaryvalidation of the technique.
The advantage of such a model would be that it would permit designengineers to predict very early in system development the human performance
442
I
to be anticipated from that design. Then, if that reliability appearedinadequate, it could be traced back to the individual design factor(as described in the checklist) responsible for the inadequacy. At thepresent time, although human engineering judgments are made duringdevelopment, they are not tied to performance predictions, nor canperformance predictions (from presently available techniques) be easilylinked to human engineering aspects of design.
Somewhat less time would be required for the development of adesign-specific data bank. It is apparent from the investigationsreported in reference 5 that a considerable amount of data exists in theliterature that could be applied to this effort. It would be course benecessary to determinq in advance the specific equipment parameterson the basis of which the data bank would be organized, but it is assumedthat study A (user parameters) would provide this information. Reference5 also suggested a number of alternative data bank formats, the adequacy)f which could also be investigated in the proposed study of user parameters._he relevant discussion from reference 5 is appended at the conclusion ofthis section.
D. Experimental Validation of Presently Available Models
A much longer range recommendation and one which requires moresustained action of the part of governmental sponsoring bodies is toemphasize the validation of the most promising of the models available.It was pointed out previously that a number of the nmodels reviewed hadnever been validated and that even for those models which had receivedsome attention in this regard, the amount of validation data seemedinsufficient. It is suggested, therefore, that those agencies responsiblefor the development of models place additional emphasis on theirvalidation, particularly by comparing model predictions with actual taskperformance.
Even when a model has been formally validated, it often has not beenformally applied, by which is meant that no study has been made of thesuccess with which it has been applied to various system developmentproblems. (Incidentally, this might be one additional aspect to beexamined in the proposed study of user parameters. ) As was shown byMethod I of MIL-HDBK 472, a model may be effective in prediction,but unsuitable (for one reason or another) in actual application. Investigationsof model application could lead to improvements in models that have predictivepower but are difficult to apply,
"The investigations suggested are of a continuing nature and preferablyconducted by the governmental sponsoring agency itself. Hence a single
443
specific study is not recommended. It is of course possible to makecertain suggestions as to how such studies should be conducted. Inaddition to supporting formal validation studies of models underdevelopment, the sponsoring agency should periodically survey thoseusers who have employed a particular model to determine the degreeof satisfaction with the model, the particular uses for which the modelwas found most satisfactory, any user difficulties encountered, etc.This type of information should be fed back to the individual modeldevelopers and to workers in the field generally.
E. Other Studies
So many variables affect the predictive efficiency of man-machinemodels that is difficult and perhaps unjustified to pick out certain onesto be emphasized in experimental studies. It should uj noted, however,that special difficulties were experienced by a number of non-simulationmodels with regard to conditional probabilities and the effect of feedbackloops. Any reasonable method of determining conditional probabilitieswould be highly desirable; the paper by Williams (Ref. 7) illustrates howdifficult the problem is. Similarly, it is possible that a major reasonfor overly pessimistic estimates of performance is that it is difficult .
to account for feedback factors in behavioral models. Ways of includingthese factors more specifically in models would be quite beneficial. "'
Summna
The preceding list of research/action recommendations does not byany means include all possible research suggestions. The furtherdevelopment of any presently available (or for that matter, any future)models will certainly suggest further studies to be performed that arepeculiar to that model. In the preceding section we have concentrated onsuggestions that would have broad range applicability.
In this list of suggestions we have emphasized that research which inour opinion would have the greatest impact on the overall effort to develop .useful models for predictive purposes. Our point of view is that if modelsare to be more than research devices, they must be responsive to systemdevelopment requirements and that, therefore, lacking detailed knowledgeof those requirements, we must determine those requirements and allowthem to guide further model development. It is for that reason thatstudy A has been presented in somewhat more detail than the otherrecommended research.
444
I REFERENCES
1. Jenkins, J. P. (Ed.), Proceedings of the U. S. Navy HumanReliability Workshop, NAVSHIPS 0967-412-4010, 2Z-23 July 1970,published February 1971.
S2. Maintainability Prediction, MIL-HDBK 472, Dept. of Defense,Washington, D.C., 24 May 1966.
1 3. Meister, D. and Sullivan, D. J. A Further Study of the Use ofHuman Factors Inf-rmation by Designers. Bunker Ramo Corporation.
I Canoga Park, Cal., March 16, 1967.
4. Meister, D. Human Factors: Theory and Practice. New York:J Wiley, 1971.
5. Meister, D. and Mills, R. G. Development of a Human PerformanceReliability Data System, Phase I. Report AMRL-TR-71-87,Aerospace Medical Research Laboratory, Wright-Patterson AFB,Ohio, July 1971.
6. Swain, A. D. Development of a Human Error Rate Data Bank. In,Proceedings of the U. S. Navy Human Reliability Workshop, NAVSHIPS0967-412-4010, February 1971.
7. Williams, H. L. Dependent Models for Estimating Human PerformanceReliability. In, Symposium on Man-Machine Effectiveness Analysis,Human Factors Society, Los Angeles, Cal., 15 June 1967.
4II!IIII 445
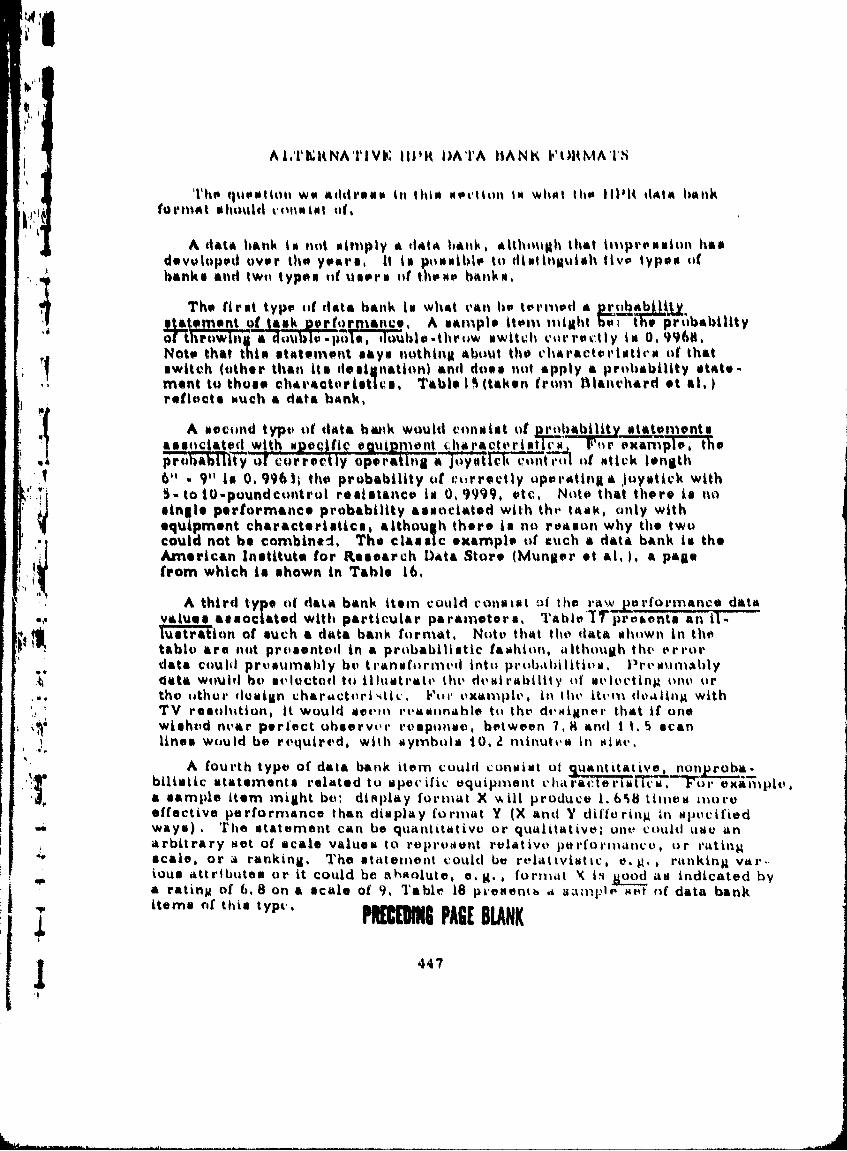
4,
ALITLKNATIVIE. 11111i DATA IAANK FOH)IMAITN
TIh" tuewl lon wo add1oo's s 1 it I h Pim t ion 1i w ho ehse IIIH tialoa hankforllat s hould c'oiltiot tit,
A datat hank Is not mimply a data ban1k, although that impr1fission hamdewvloped over thIt years, It It poostible lt diltinguish rive types ofbanks and twti types tif users tit these bAnks,
The first type of data bank is what Van ho trilld a Prb.i.a lslatemnt otfask v•rfornlance, A sampln item might e th o probability" of throw~ini doulblo-pol; ,loublo-throw twitch cm-rrovtly to 0,.9968,
Note that thin statemnent says nothing about the charactor'istivo o( thatswitch (other than its designation) and does not apply a probability state-mant to those characteristic., Table IN (taken from Blanvhard et al,)reflects osuch a data bank,
A second type, of data hank would consist of Prulability statementsassociated with wpocifit cauipmoft ihamracttristict, For exampleeprogTbility of correctly operating a joystI1 conteol ft stick length611 - 9" Is 0. 996); the probability of ctirrectly upeoratin a joystick with
i tsingle performance probability associatted with thp tANK., only With' "' S-to t0-poundeontrul resistance is 0,9999. etc, Note that there isn o
equipment characteristics, although there is no reason why th. two
could not be combined, The classic example of auch a data bank is theAmerican Institute for Research Data Store (Munger ot al,). a page"from which is shown in Table 16,
A third type of data bank item could consist at ihe raw porformance dataS,. values associated with particular parameters, Tabl&T7 prooentt An ii-
lustration of such a data bank format, Note that the data shewn in thetable are not proeentOd in a probabilistic fiahion, allthouigh the e rl mordata could presumahly be t'ranuformcd Into probaihlitit's , Prtsmrabihly
, dlata would by s vlocted toii llust att, thet dowi rability oif su t•ecting t) orthe other dualin charactorii,•i,, Fitir oxample, in 11th ituim dlo•0Ib withTV reeolhition, it would seem ivrvasuon.hle tit the dv'signer that if onewished near perfect ubserve, responme, between 7, H and I 1, 5 scan
L lines would be reqruired, with myrrbolo t10, minutvs in etiw',
"A fourth type of data bank item could consist ol qfnttt1\, nutaproba-bilistic statements related to specific equipment C'hitrAiteriiitic, Foi- eXApMle,"a sample item inight be, display format X will produce 1. 658 times imoreeffective performance than display format Y (X and Y diifforing in specifiedways) . The statement can be quantitativ oir qualitative; one could use anArbitrary set of scale values to represent relative ptrformtic•v, or rattingscale, or a ranking. The statement could be rela•ivistic, e. ., . riinking var-ioun Attributes or it could be ah~olute, e.g., format X is good as indicated bya rating of 6.8 on a scale of 9, Table 18 presenti, .amp en pi t t f data bank
j items (if this type.PREMEI PACE BLANK
447
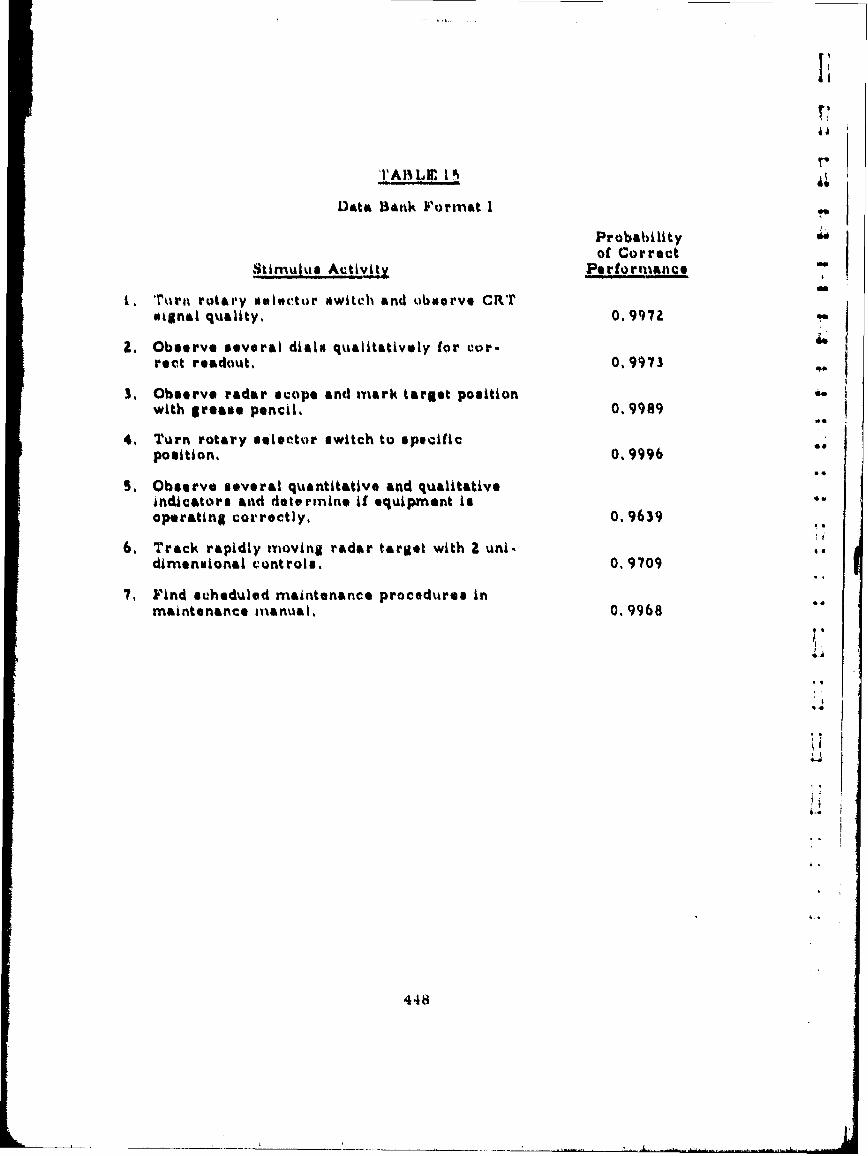
II
TAA 1.Jr. I 0i
Data Bank F'ormat I
Probabilityof Correct
Stimulus Actvitv Pe rformance
i, Trur rotary selector awiteh and obisrve CRTrscgnal quality, 0. 9972
2. Observe several dials qualitatively for cor-rect readout, 0, 9973
3. Observe radar scope and mark target positionwith grease pencil. 0, 9989
4, Turn rotary selector switch to specificposition, 0, 9996
S, Observe several quantitative and qualitativeindicators and determine if equipment isoperating correctly, 0,9639
6, Track rapidly moving radar target with 2 uni-dimenieional controls. 0. 9709
7, Find scheduled maintenance procedures inmaintenance manual, 0.9968
4 4
I-
448
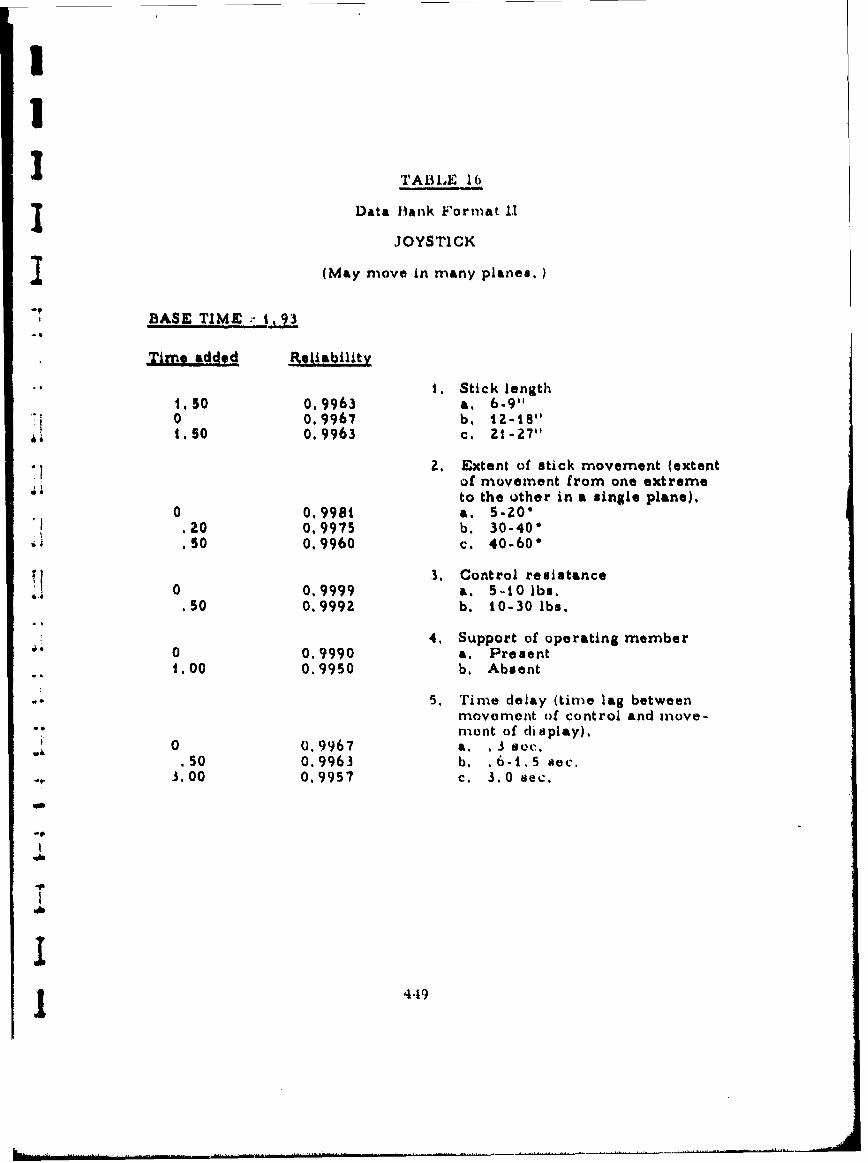
I
I TABLE 16
I Data Hank Format 1,1
JOYSTICK
I (May move in many planes.
BASE TIME t, 23
Tim. addcgd Reliability
I. Stick length1,50 0.9963 a. 6-9""0 0.9967 b, 1Z-18"
- • t. SO 0.9963 c, Zt-2711
2, Extent of stick movement (extentof movement from one extremeto the other in a single plane).
0 0,998t a. 5-ZO0.20 0,9975 b. 30-40".,50 0.9960 c. 40-60"
3. Control resistance0 0.9999 a. 5-10 lbs.
.50 0.9992 b. 10-30 lbs.
4, Support of operating member0 0,9990 a. Present1.00 0.9950 b. Absent
. 5, Time delay (time lag betweenmovemont of control and move-"mont of display).
0 0.9967 a. .3 sec..1 .50 0.9963 b. .6-1.5 sec.
3.00 0.9957 c. 3..0 sec.
-449
II 4
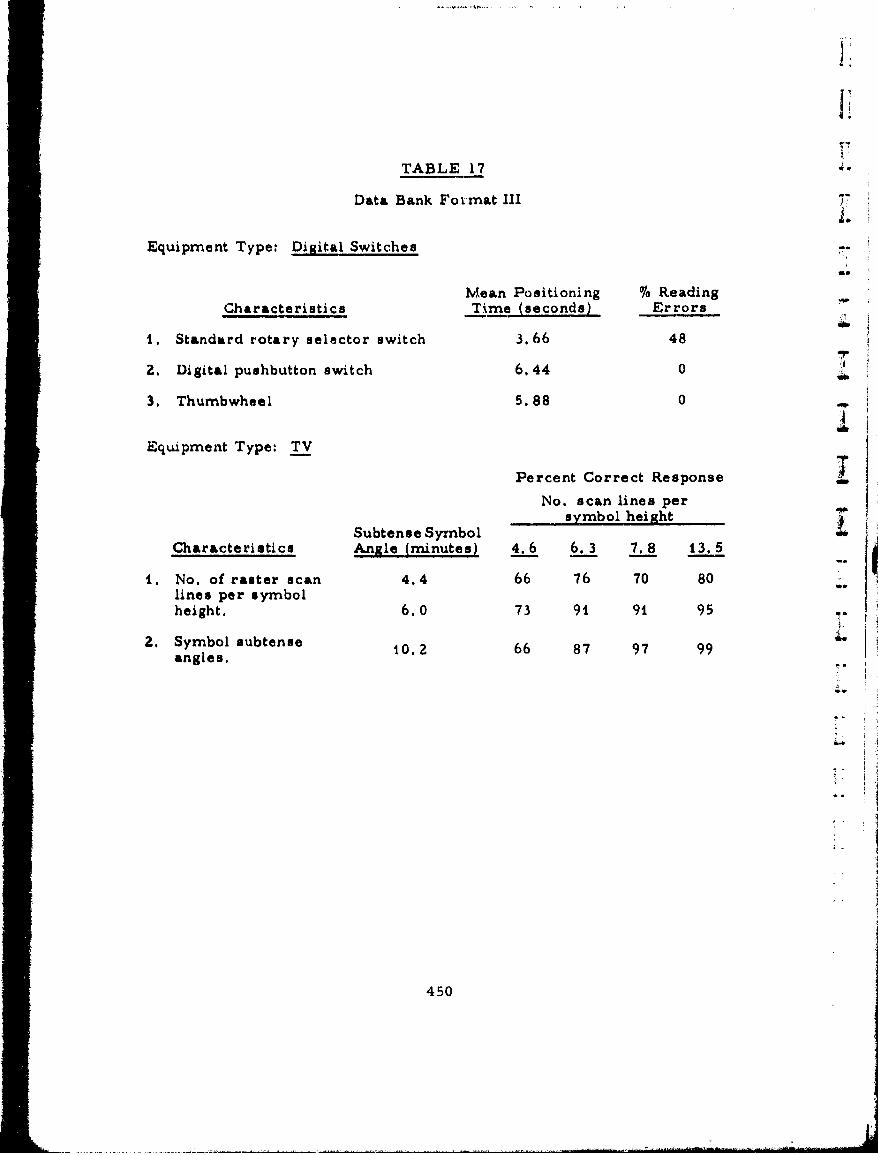
TABLE 17
Data Bank Fovsmat III
Equipment Type: Dillital Switches -
Mean Positioning Jo Reading
Characteristics Tm(seconds) Errors-
t. Standard rotary selector switch 3.66 48
r7
2. Digital pushbutton switch 6. 44 0
3. Thumbwheel 5.88 0 d
Equipment Type: TV
Percent Correct ResponseT
No. scan lines per Ik
Subtense SymbolsyblhitCharacteristics Angle (minutes) 4.6 6. 3 7.8 13.5
j U
t. No. of raster scan 4.4 66 76 70 80lines per symbolheight. 6.0 73 91 91 95
2. Symbol subtense 1 66 87 97 99angles.
450
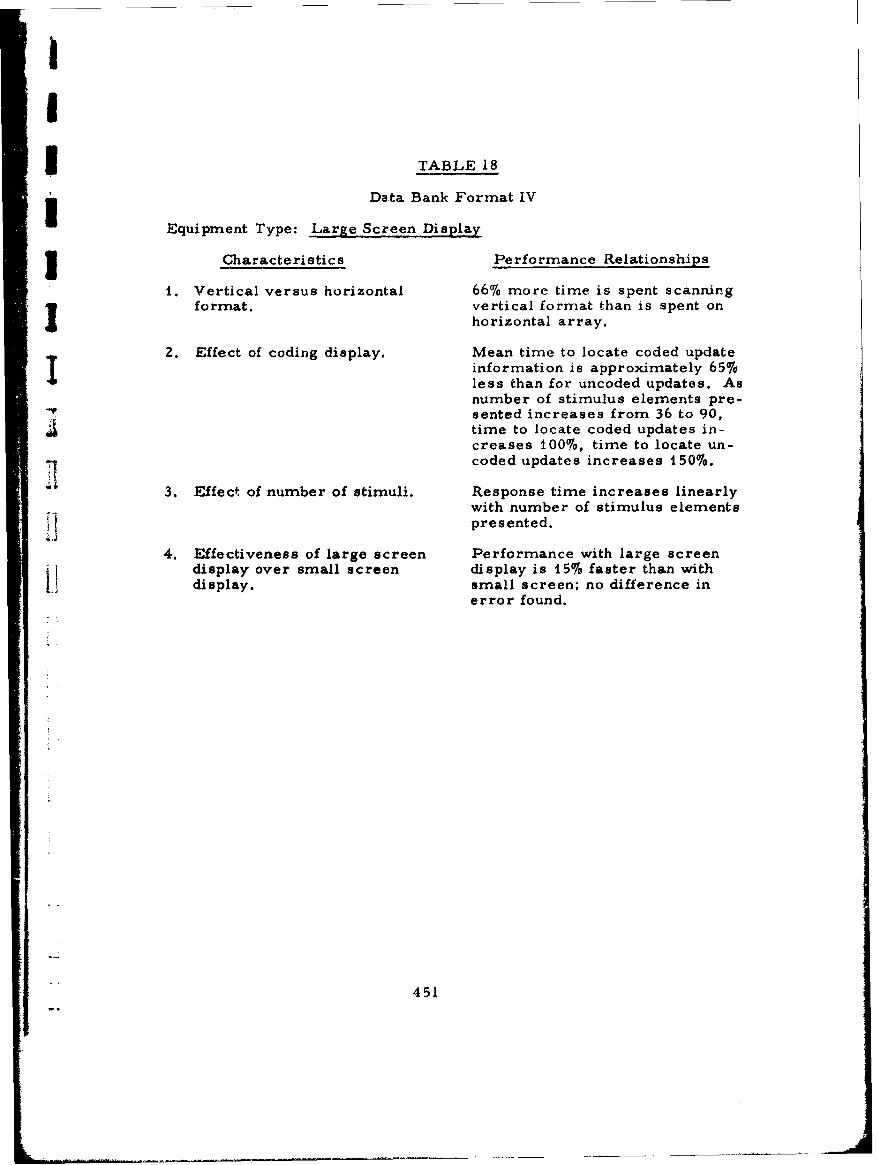
II
5 ITABLE 18
SI Data Bank Format IV
Equipment Type: Large Screen Display
Characteristics Performance Relationships
1. Vertical versus horizontal 66% more time is spent scanningformat, vertical format than is spent on
horizontal array.
2. Effect of coding display. Mean time to locate coded updateinformation is approximately 65%less than for uncoded updates. Asnumber of stimulus elements pre-
7' sented increases from 36 to 90,time to locate coded updates in-creases 100%, time to locate un-coded updates increases 150%.
3. Effect of number of stimuli. Response time increases linearlywith number of stimulus elementsI presented.
4. Effectiveness of large screen Performance with large screendisplay over small screen display is 15% faster than with
Sdisplay. small screen; no difference inerror found.
451
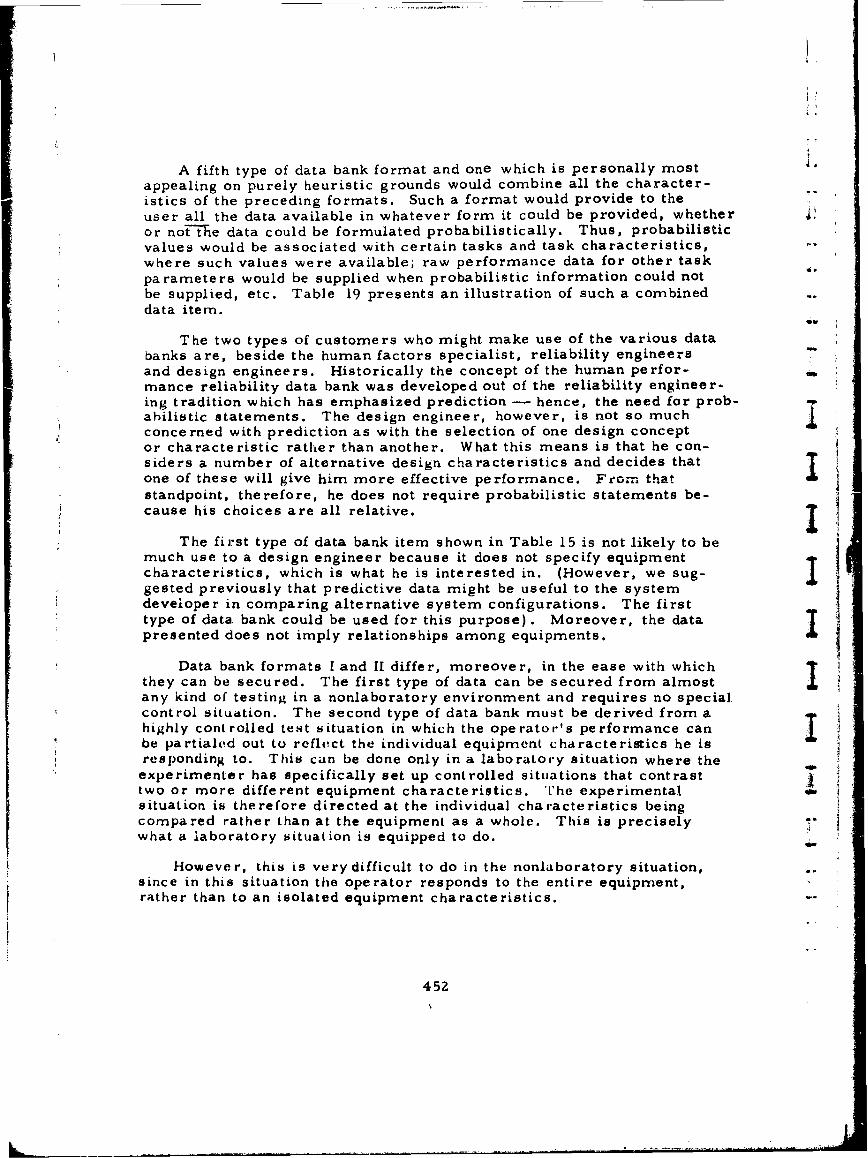
A fifth type of data bank format and one which is personally mostappealing on purely heuristic grounds would combine all the character-istics of the preceding formats. Such a format would provide to theuser all the data available in whatever form it could be provided, whetheror not-the data could be formulated probabilistically. Thus, probabilisticvalues would be associated with certain tasks and task characteristics,where such values were available; raw performance data for other taskparameters would be supplied when probabilistic information could notbe supplied, etc. Table 19 presents an illustration of such a combineddata item.
The two types of customers who might make use of the various databanks are, beside the human factors specialist, reliability engineersand design engineers. Historically the concept of the human perfor- -
mance reliability data bank was developed out of the reliability engineer-ing tradition which has emphasized prediction - hence, the need for prob-abilistic statements. The design engineer, however, is not so muchconcerned with prediction as with the selection of one design conceptor characteristic rather than another. What this means is that he con-siders a number of alternative design characteristics and decides thatone of these will give him more effective performance. Fromn thatstandpoint, therefore, he does not require probabilistic statements be-cause his choices are all relative.
The first type of data bank item shown in Table 15 is not likely to bemuch use to a design engineer because it does not specify equipmentcharacteristics, which is what he is interested in. (However, we sug-gested previously that predictive data might be useful to the systemdeveloper in comparing alternative system configurations. The firsttype of data. bank could be used for this purpose). Moreover, the datapresented does not imply relationships among equipments.
Data bank formats I and II differ, moreover, in the ease with whichthey can be secured. The first type of data can be secured from almostany kind of testing in a nonlaboratory environment and requires no specialcontrol situation. The second type of data bank must be derived from ahighly controlled test situation in which the operator's performance canbe partialed out to reflect the individual equipment characteristics he isresponding to. This can be done only in a laboratory situation where the
experimenter has specifically set up controlled situations that contrasttwo or more different equipment characteristics. The experimentalsituation is therefore directed at the individual characteristics beingcompared rather than at the equipment as a whole. This is precisely ."what a laboratory situation is equipped to do.
However, this is verydifficult to do in the nonlaboratory situation,since in this situation the operator responds to the entire equipment,rather than to an isolated equipment characteristics.
452
L _
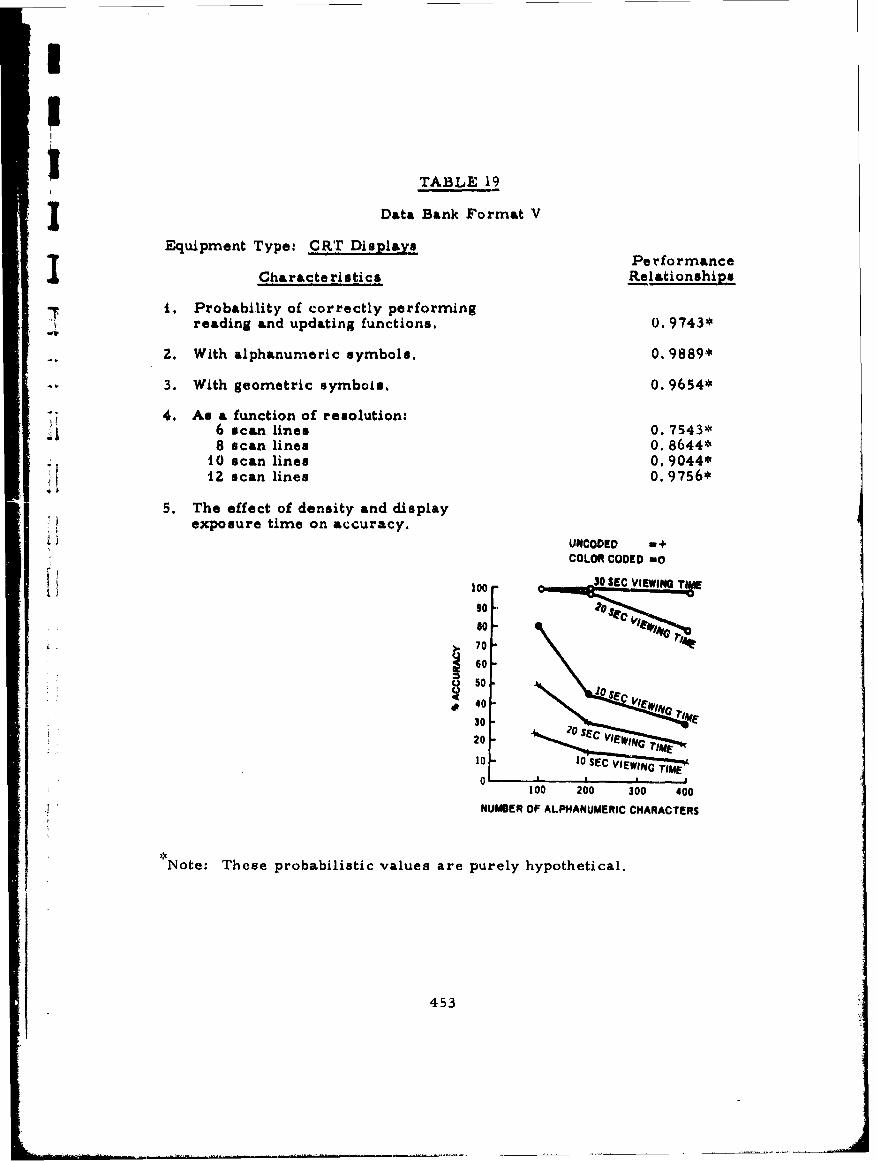
I
TABLE 19
Data Bank Format V
Equipment Type: CRT Displays........ Pe rform ance
Characteristics Relationships
""T 1. Probability of correctly performingSreading and updating functions. 0. 9743*
-NIP
2. With alphanumeric symbols. 0. 9889*
3. With geometric symbols. 0. 9654*
7 7 4. An a function of resolution:6 scan lines 0. 7543*8 scan lines 0. 8644*
10 scan lines 0. 9044*12 scan lines 0. 9756*
5. The effect of density and display"exposure time on accuracy.S• J U N C O V E D W .+ i
COLOR CODED n0
100 -30 SSEC VIEWINGT
so
~. 70
60
u 50• Joe
1I00 200 300 400! NUNSER OF ALPHANUMERIC CHARACTERS
•:Note: These probabilistic values are purely hypothetical.
453
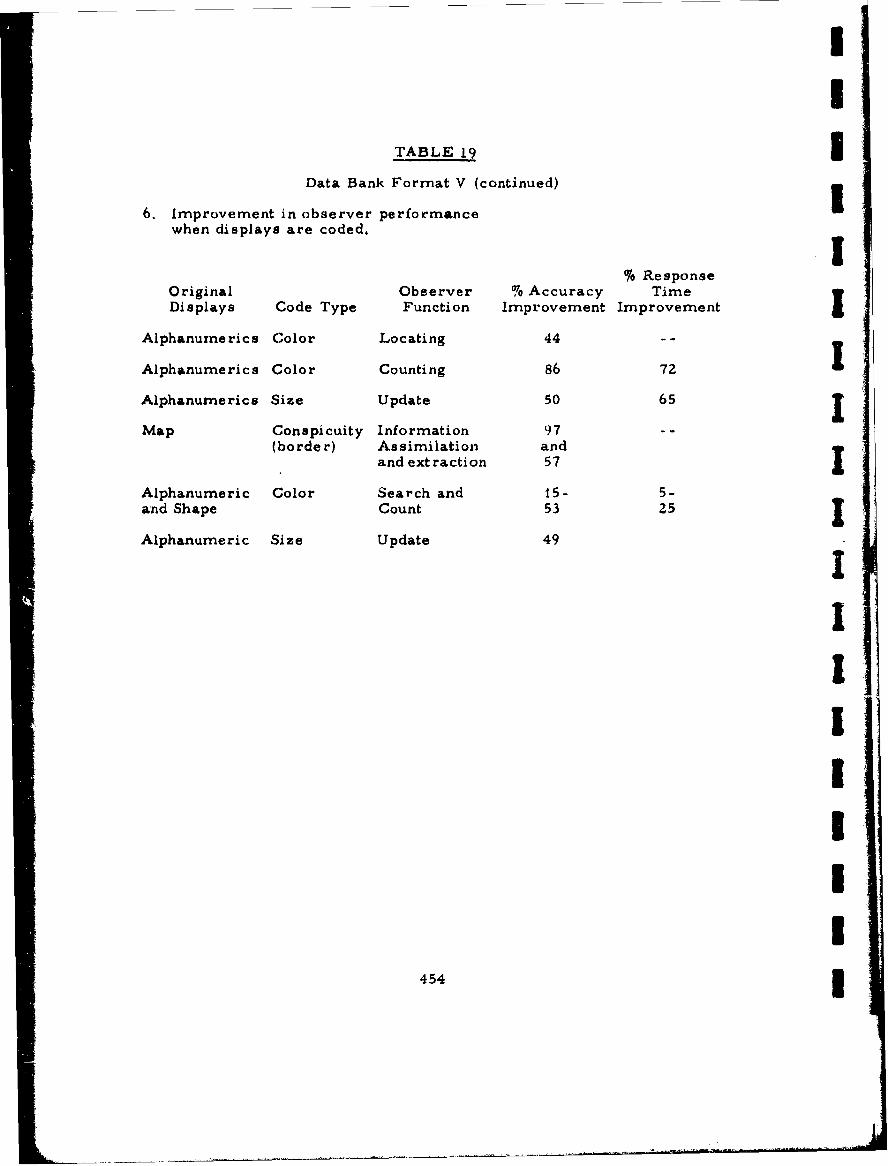
I
TABLE 19 IData Bank Format V (continued)
6. Improvement in observer performancewhen displays are coded.
% ResponseOriginal Observer % Accuracy TimeDisplays Code Type Function Improvement Improvement
Alphanumerics Color Locating 44 --
Alphanumerics Color Counting 86 72
Alphanumerics Size Update 50 65
Map Conspicuity Information 97 --
(border) Assimilation andand extraction 57
Alphanumeric Color Search and 15- 5-and Shape Count 53 25
Alphanumeric Size Update 49
I
IIIII
4541

Altholgh one can use the second type of data bank for design decisions,the engineer does not make use of the absolute value of the probabilitystatement for this purpose. If one joystick length gives U. 9968 perfor-mance, whereas a second length gives 0. 8968 performance, then the de-signer implicitly or explicitly ranks the two characteristics (lengths)and selects the one with the higher probability. It would make no dif-ference to the designer if the absolute performance probabilities weredifferent as long as the two lengths retained their relative performancestanding, nor would it make any difference to the designer if the twocharacteristics were simply ranked 1-2, although he would probably wantsupporting data to back up the ranking.
Data for the third and fourth types of data banks (see Tables 17 and 18)can also be secured from laboratory studies. However, they are easierto develop than either the two previous banks because they do not requirethat their data be transformed into probabilistic values. An examinationof the masses of experimental data to be found in the general behavioralliterature reveals that much of it can be used for data bank formats IIIand IV, but the same thing cannot be said about data bank formats I andII. Much experimental data cannot be adapted to probabilistic statementsbecause they deal with such measures as reaction time, response dura-tion. trials to learn. etc.
All things considered, the third and fourth types of data banks areS: easier for the design engineer to use, they will provide more back-up
information (since they are not confined to probabilistic statements) andone can build up a larger data store, because data from the literaturethat could not be used for the other more restrictive types of data bankscould be used for this one.
In the present state of data availability and considering that one of-- the primary users of the HPR data system should be the design engineer,
it seems only reasonable that all the data bank items should be included inthe MPR data system. This is the format shown in Table 19. This formattakes maximum advantage of all possible data sources by including prob-abilistic statements, where these can be made, and nonprobabilisticperformance data where probabilities are not available. Where possiblethe data should be transformed into probability statements so that theyca-n be umed for predictive purposes. However, all other relevant datarelating human perfor-nance to quipment/task parameters could besupplied in a format which is most suitable for design purposes.
4III 455
I
3 APPENDIX A
I LIST OF RESPONDENTS TO THE MAN-MACHINE
MODEL EVALUATION CRITERIA QUESTIONNAIRE
* F
PRlCEDlIC PACE BLANK
457

I, Altman, .1, W. , Synec, it 4 (Corp, , Allison laikI P,&,2. Arilia , .1. K. L1. S. Nav l 1'oxtgt.%t1% ti SOrhut l, Mmiostroy, t .4 f.3, Ankrrn, W. W 3. luhmmam Il imtvu V •A I?',h, %# W ihI.SaItI' i' I AOhi o,, ()hiu4. Bsonnozt, G. Stiat" UnvwrNity, MAnhnttvii, KAimmm.
S, Carr, It. M. R1Aythrmo Co., 1otrlslotith, It.. 1.0. GhAp.a ,o), A. John Hopkwt4 Utilvsrroity , Il1t~imrov, M%1.7, Christ•s •etn, J. M. utnwlAti t•nIvtor'itin l)Dtiviion, Ah4RI-., WrI', hth-
Patterson AFH, Ohio.8. Coburi, It., Navy Electroti it 1. Laormonry (;rvltio , SAl DVAlhi , Cstlif,
9. Collins J. Office of the Chiref of Naval Op rati•tiN, WaNtilgiont, 1), C,610. Erickson, R. A. Naval Weapion Conte•r, ChinA Lake, CAUlif11. Folley, J. D. Applied Scionvo Aissoctatoo, \Val~lr'iA, Pa,12. Frenrh, R, S. Naval Undermoa R 1 1) Cantitr, San DiVego, CalifornitA,13. Graine, G. N. Naval Ship Systems Coninomnd, Wash ington, 1), C,14. Hagen, W. Human Resources Lub., Williams AFB, Arimona.15. Hanifan, D, '., Harbinger Corp. , Santa Monica, Catlif.16. Hampton, D. Raytheon Co. , Ptrtsmouth, R. 1.17. Harris, D. Anacapa Sciences, Santa Barbara, Calif.18. Hiss, D. Raytheon Co. , Portsmouth, RA. 1.19. Howard, R. Naval Ship Systems Command, Washington, D, C,Z0. Jenkins, J, P. Naval Ship Systems Command, Washington, D, C.21. Jones, D. Martin-Marietta Go. , Orlando, Fla.22. Knowles, W. San Fernando Valley State College, Northridge, Calkft23. Krendel, E. S. Univ. of Pennsylvania, Philadelphia, Pa.24. Lamb, G. Naval Underwater Sound Center, Now London, ConG .25. LaSala, K. Naval Ship Systems Command, Washington, D. C.26. Mackie, R. R. Human Factors Research, Golota, Calif.27. Miller, J. W. Nati. Oceanic & Atmospheric Admin. , Rockville, Md.28. Mills. R. G. Human Engineering Division, AMRL, Wright-Patterson
AFB, Ohio.29. Moore, H. G. Naval Materiel Cormrmand, Washington, D. C.30. Ozkaptan, H. Navy Personnel R & D Lab. , Washington, D. C.31. Parsons, H. M. New York City.32. Pew, R. W. , University of Michigan, Ann Arbor, Michigan.33. Regan, J. J. Naval Training Device Center, Orlando, Florida.34. Rigney, J. University Southern California, Los Angeles, Calii.35. Rizy, E. Raytheon Co. , Portsmouth, R. I.36. Siegel, A. I. Applied Psychological Services, Wayne, Pa.37. Sjoholm, A. A. Bureau of Naval Personnel, Washington, D. C.38. Swain, A. D. Sandia Laboratories, Albuquerque, N. M.39. Topmiller, D. A. Human Engineering Division, AMRL, Wright-
Patterson AFB, Ohio.
458

I a l lk U 1v- ily A 11%l l41U"slv t I ovt nlt avrto li lkrp" ,M
4 .-bpm . . oo l D O 1,(A l
459
II
A 'I'IC'.NI)IX II
1 II I•fll' l.l�T'l'lONS ON Trlll S'rATl1 ()Y 'IIllI': AltT
7 IIU MAN RR'LIA IIt IT Y MOI)A14 LIN0
IN I R O1)UCTliON
"In IIitn AppendliI thti s4tftlir will otictokivol' lo Au1111111!i.ia 1i6' 11111r'rih -
lttils Ill imi' ltnhi o witlh r gtlard t)o lilIt, ( lrt iiloptoU1111, slnd use iof l1lu 'tudsflior qua nt1ItIlk ivoly i•I•. V it Il h ilnd p1, ditctill, n it111 ii phtrl a' nu1a1 1 i'r •,oftictcit •-"noas, In thin h* followm provious a•tnmariv'i writiven by MrltiMlr (1964,Rot, 6), Freotag (140), Hoef, i), Altman (1968, Ito., 1) and Swain (1969,R it, IU), Of those, tho nollst conpreollsivu ' antd s*illificant is tha*t ofAltn; a naolisqueitlly, we. will updato. Altn'iai paplor by quoting from itthoiso sections thati Are most appropriate and adding our own commentsbatied on cuc.luttilns reached in rovitiwing models in thin report, Cor-"tain topics have also beln added to this discussion which wore not coveredin Altman's Mumilmary,
"The road•r may ask whether this discussion does not merely ropeatthe Conclusions section of this report. However, the Conclusion. sectiondealt solely with the models reviewed; this section relates to the entire
. field of human performance quantification (not that the author pretends, to be omniscient) and includes certain topics not explored in full in pre-
vious sections,
Like Altman "I have chosen to use idealized characteristics of quan-titative methods as criteria against which to evaluate progress" (p. 1).
MODEL VALIDITY
. Altman found "little in the way of definitive study of the relationshipbetween quantitative performance estimates and more immediate measures"of job performance. Virtually every study is, or should be, couched by
- the authors in the most guarded terms" (p. 1i). This statement remainsas true today as it was in 1968.
We have found that for almost all of the models/techniques reviewedthere is simply isufficient evidence with which to assess their validity.For some models, e.g. , AIR Data Store, Siegel's digital simulation model,formal tests of predictive efficiency have been made, whereas for others(e. g. , THERP, ORACLE) predictive efticiency has been claimed in
RECEDING PACE BLAK461
applying ngodels to system devolopment but on this point data are not pre-rntndl, Ever% when a formal test of validiLy has been performed, and
iadicateai promise for the method, the validity teot was not performed inth,. context of syste•m development, so that questions about validity inuse still remain to be answered.
In part this unsatisiactory situation exists because there appears tobe some objection on the part of model developers to the notion that themost effective test of validity is comparison of a prediction wkith opera- Itional performance. Most frequently validity comparisons are based onsuch methods as validation by comparison with expert judgments, withother test measures, etc.
Although comparisons of predictions with operational performance
are sometimes difficult to perform, the author feels that only such a Ivalidity test will completely satisfy the validity criterion. It should bethe responsibility of the agency sponsoring the model or method to insist Ton such a test; otherwise the agency cannot determine the value of itsresearch efforts.
RELIABILITY
Altman indicates (p. 11) that "No complete replications study... hascome to my attention... The only time quantitative estimates of relia-bility have been reported seems to be when a fallback to ratings or judg-rnents has been involved" (e. g. , Irwin, Levitz and Freed, Ref. 4). Withregard to the models/techniques reviewed in this report, there is noformal evidence concerning reliability, except for the semi-abortive usertest of TEPPS (Smith et al. , Ref. 11), Either the developer alone hasemployed his method (which is the usual case) or, if the method has beenused by others, data on the adequacy of the replication-use is unavailable. -
Second only to the requirement to demonstrate validity, the sponsoringagency should give high priority to formal efforts to demonstrate relia-bility. A method cannot be considered useful until it has been establishedthat others besides its developers can perform model operations.
OBJECTIVITY 1
We echo Altman when he says that model developers are trying "to
free their administration from obvious bias on the part of the administratort i
462Z
I
I(p. 11). However, there are still subjective elements in most methods,which implies nothing more than that these methods are still incompletely
I developed. Among these elements to which subjective judgments areapplied are (1) the determination of the behavioral tsnit (e.g. , subtask,task) to which the predictive data will be applied; (2) the determinationof the parameters for which relevant data are to be selected; (3) subjec-tive estimates of performance. Subjectivity makes it difficult to secure"reliability; and also makes the method more difficult to use, because the
S. user may not be quite clear about the procedural steps he should employ."What is disturbing about subjectivity is not that it exists (because onewould expect it to exist in prototype methods), but that the subjectiveelements are not identified in the model descriptions, so that one canattempt to reduce their subjectivity as much as possible. Model develop-ers are not as systematic in their descriptions of their methods as onewould wish them to be.
EASE OF USE
Altman indicates "It ought to be obvious how easy available quanti-fication techniques are to use, but this is one of the least reportedaspects" (p. 9). The author can only concur with this statement. From
* :the results of the criteria evaluation questionnaire (see Section II) andfrom comments made at the 1970 Human Reliability Workshop meeting(Ref. 5), the attitude of some model developers seems to be that thisaspect is of miniscule importance. Compared to validity and reliability,they are quite correct; we have pointed out elsewhere, however, that ifa method is difficult to use or involves an excessive "cost" in terms oftime and effort, it is unlikely to be employed, regardless of its predic-tive efficiency.
"One of the requirements that should be levied on the model developeris quantitative information on the time, effort and resources involved inapplying his model, even if we recognize that these will be greater duringmodel development than when the model is used operationally. Very fewof the model descriptions contain such data. Since ease of use informa-tion can be gathered at the sarne time as are reliability data, reliabilitytesting should include ease of use aspects.
463
STAGE OF SYSTEM DEVELOPMENT
"t Theoretically at least, a quantitative performance technique shouldhave utility throughout a good share of the developmental sequence. There I.is virtuall-y no organized information on (this)" (Altman, p. 8).
Most models claim they are applicable throughout the various stagesof ayatem development, but the author doubts this claim, simply becauseethey have never been applied at these stages and information on this pointis lacking. As has been pointed out elsewhere, we do not know what thedemands of the various developmental stages are because we have neverinquired formally into the problem. Moreover, one cannot speak of appli-cability as if it were a binary function; even though all methods -.nay beapplicable at a given developmental stage, they may not be equally appli-cable to that stage, if only because model requirements for data varysubstantially and data availability varies with development stages.
STAGE OF MODEL DEVELOPMENT
It is obvious that no method can be considered fully developed(completed"t, so to speak), nor would any model developer make this Iclaim about his creation. Areas of ambiguity and unresolved questionsare to be found in every method (as may be seen by referring to themodel descriptions themselves).
DESIGN SENSITIVIT Y
Al.tman irdicates (p. V, some doubt as to the sensitivity of modelsjto design-performnance relationships, and we must echo that doubt. Mostmodels reviewed in this report are apparently capable of pointing out wherea system deficiency exists, but niot of relating that deficiency to the re-sponsible equipmernt design characteristic. The determination of equip-ment design features to be modified seems to be more a function of humanengineering analysis following upon application of the model than of modeloutputs themselves.
This situation may in part result from greater emphasis on the quan- Ititative predictive arpects of modeling than on the implications of the
achieved predictions. It is interesting to note that some of the modelsthat do seem to output equipment desigem relationshis (e. g. dt, ORACLE)
46
464
i• I isobvoustha nometod an b cosidredfuly dvelpedI
II
do not output a quantitative assessment of performance capability, butare more specialized for qualitative analysis of system events.
METHODOLOGICAL SCOPE
• .It has been observed that most model developt..-rs seem to claim morefor their methods than the methods, upon close examination, seem to be"able to handle. In general, most models seem to have much less diffi-
-• culty predicting for discrete tasks than for continuous and complex cogni-tive ones. In the case of continuous tasks, this deficiency reflects ourdifficulty in modeling feedback effects; in the case of cognitive tasksbehavioral science as a whole lacks knowledge about cognition.
DATA STORES
With the exception of the AIR Data Store and TEPPS, most data"sources employed by modelers are informal and must be gathered speci-fically for the particular system problem to which the model is applied.All data sources are examined to select most relevant data. This presents
special problerms for the model user. It is our feeling that the averageengineer wishing to make use of a model will be unlikely to engage instrenuous efforts to find r~levant data in the literature or through experi-mentation; if he uses a model he wishes to have the appropriate data storcgiven to him with the model. If this is not available, he will, morelikely than not, reject the model. Even if he does not reject the model,it is unlikely that his data gathering efforts will be adequate to the require-ments of the model. This in fact is the main reason for the push behindthe effort to develop a formal humar, performance data bank.
We have already pointed out the requirements for development of anappropriate data bank: specification of the parameters included in thebank; the model(s) to which the data can most validly be applied; and de-tailed procedures for using the data bank. In this connection it is difficultto determine from published reports of the models which parameters arerelevant to the data required by the model.
It might also be considered that although most workers in the fieldthink of the data bank, as if there were to be only one, it is at least con-ceivable that several data banks, including diiferent parameters, may beneeded to satisfy different model requirements.
465
TASK ANALYSIS METHODOLOGY
Almost all of the mode'ls require some form of task analysis todetermine the behavioral unit to which its predictive data are to be applied.Equally, those models that make use of task analysis assume that theuser is familiar with the method. In consequence, the analytic operationsare usually unspecified, and the level of detail of the behavioral unit,which is critical for model application, is rather vague, in some modelsinvolving several levels ranging from the subtask to the detailed function.
Some modelers feel that this behavioral unit level is unimportant,claiming that the model will fit any unit desired. Regardless of theaccuracy of this claim, failure to define the behavioral unit in specificsmakes it difficult to determine what requirements the model levies onits data bank.
This difficult may reflect merely a lack of specificity in the descrip-tions that modelers provide; `f so, this could be easily remedied. On theother hand, it may reflect the absence of a recognized task taxonomy, tonwhich Altman (p. 8) also noted. In this connection, mention should bemade of continuing efforts by Fleishman and his co-workers (Ref. 2) todevelop a more efficient human pekformance taxonomy. As of this datea taxonomy accepted by most workers in the field does not exist.
SIGNIFICANT ME rHODOLOGICAL PROBLEMS
A number of significant methodological problems noted by Altmancontinue to hamper further development of an effective human performancepredictive model. These include:
(1) The problem of subjective estimates and data banks in general;this has already been treated in some detail.
(2) The problem of independence vs. interdependence of behaviors.Manifestly most behaviors are interdependent but it would be much easierto deal with them (i. e. , to combine the predictive probabilities of eachtask) as if they were independent. As an example of this problem, let usconsider task X which is composed of subtasks xa, xb, xc .... xn. If onewere to measure Xa, Xb, xc. .. . x, individually, and then comrbine theresults of their performances, would the resultant performance valuediffer very much from a measurement of X as a whole? This is the
4661
II
problem to which Mills (Ref. 10) has addressed himself; the resultsof his studies will be discussed later.
A similar problem is that of conditional dependency. An exampleof this problem is the effect of task X, performed concurrently with orat an earlier point in the mission, on task Y. The author began thisproject by thinking of this as a modeling problem, i. e. , that the natureof conditional dependencies would pose more difficulty for some modelsthan for others. However, he has since changed his mind, because itappears that the probability theory is available which can handle thequantitative treatment of this dependency, provided the data are avail-able.
Thus, the binary effect of X as occurring or not occurring upon theoccurrence or non-occurrence of Y can be handled readily, as Williams"(Ref. 13) has shown. However, the problem one has to face is that dif-ferent probabilities of accomplishment of X will result in different pro-babilities of accomplishment of Y. This is a problem of data availability,"rathei than of modeling per se. When, therefore, certain models assertthat they can deal with conditional dependencies, they are probably cor-rect, provided that the requisite data are provided to them.
-. The fact of the matter, however, is that we do not have the requisitedata. Consequently it cannot be asserted that any model can effectively"deal with the problem, except in abstract terms. However, this is notreally the modeler's responsibility. As Altman, p. 11, points out "Twofactors need to be kept in mind about dependent probabilities vis-a-visfuture progress in quantifying human performance evaluations. First,we don't know how much dependency characterizes different circumstancesor behaviors. This means that we currently do not know where to con-centrate our efforts or even how important it is to concern ourselves with
• -the whole issue. Second, there is, to my knowledge, no existing body ofdata which can be drawn upon currently to support even a limited depend-
-t ent probability model of performance. "
(3) Another set of problems revolves around the relative importanceof time and error as dependent performance variables. Certain models
-. ignore error almost completely, or treat it as a factor which merelytends to delay the completion of the mission. Such models assume that,
given that the operator is reasonably well trained and has sufficient time,he will inevitably succeed. Presumably he will recognize when he hasmade an error and will be able to correct it, thus merely lengthening
467
____ ___ ___ ___ ___ ___ ____ ___ ___ ___ ___ ___ ____ ___ ___ ___ ___ ___
mission completion time. Other models utilize error probability as aperformance metric, which assumes that there is some finite likelihoodthat the task and mission will not be completed successfully. Selection -
of one type of model or the other will provide significantly different out-puts, although one could combine the two measures in terms of a pro-bability of completing the mission. successfully within a specified (re-quired) time. The relative roles of time and error therefore need furtherexploration.
Even if one restricted oneself to error alone, the methodologicalproblems one faces do not disappear. It is apparent that one can cate -gorize errors in various ways depending on their consequences. Thereare errors that have an effect on equipment performance, which we termhuman-initiated failures. Then there are errors that have no equipmentconsequences. 'There are errors that are correctable and those that anot. There are errors that have an effect on mission pefformance andthose that do not. As Altman, p. 10, points out, "It is quite character-is tic of humnan performance that errors are detected arid corrected with -
varying probability, time between commission and correction, and con-sequences. Most techniques either ignore this important issue or arerelatively ineffectual at coping with it realistically. "1 Further researchefforts along this line would be most helpful.
SATISFACTION OF USER NEEDS .f
It is probably characteristic of most specialists in a particular sub-ject matter that they feel they know what the user -audlience to which theirtechniques are directed need and want. In the case of Human Factors,methods are often developed for use by engineers, or for application intheir designs, which have never been checked against the engineers' need,willingness or ability to use these methods. As a result, many suchmethods are more honored in the breach than in the observance (MeisterRef. 8).
In this respect, human performance predictive techniques do notvary significantly. Certainly no model reviewved in this r 'eport has beendeveloped after an investigation of user needs which specified the generalrequirements of that model. The fact is that we do not know what the user(e. g. , the system 6.ev~eloper, the governmental planner, the design engin-eer, the reliability and human engineer) nee~ds because he haL- never beenasked.
468

III'
We suspect that most models differ primarily in terms of the parti-
cular system development nee-ds (e. g. , data precision, stage of systemI development applicability, scope of behaviors/tasks to be predicted,level of detail) to which they are sensitive.. Even if these models wereall valid (as determined by their ability to predict operational perfor-mance), they would still probably differ in terms of their efficiency,defined as response t0 or satisfaction of user i.eeds.ION-GOING RESEARCH
The reader should also be aware of the following relevant researchwhich has either just been completed or is still on-going. Again, the listmay not be complete.
(1) Research on prediction of the frequency of human-initiatedfailures.1p
The author and his colleagues have for some years been conductingresearch to develop a method for predicting the incidence of human-initiated failures (HIF). These are equipment failures resulting from an"operator or maiatenance technician error. ThIs research which has beensponsored by the Rome Air Development Center, has its origin in the factthat predictions of equipment reliability made during system developmentare often quite erroneous. It is hypothesized that the factor responsiblefor such predictive inaccuracies is the incidence of equipment failir,' inJ which there is some human involvement.
In the first study of the series (Meister et al. , Ref. 7), it was foundI that 137o of all equipment failures analyzed over a 5 months period resulted
4
149
I;
ftrout opl r&Ator olr t lilato% ttll nce tindoL v'd t'rr or', 11/0 of mita ititt •n' •c tic , ttion
wt, re tit kvn vitI hc itNIo of 6A In vI repol'tk of vqIip II t, I It uwIIAIhIn ctiun a , ~and 18%of all retnatning r, quipment fti lures had sto•eii, Iminim itivolv tI•irnt. The 3froquency of thi usl, failurke app,,nrad to vary as a Itn'l ion of tile type ofConmponent involved. The effect ot HIF was t) c'aus ait Aigniflit'nt Ireduc-
tion in nlnan-tiniv-hetween-failureI
Am a result of the lfirmt study it wns hypothtati, ed thit HIF froquoncywal datth, irnintd primarily by the froquetncy and duration of per sonnel 5intoraction with ,quipynmnt posomssing certain design a•aractetriutics. Astudy iN presently bving porformvd to verify this hyputhosis and to do-velop a usabl te predictive tlochique, based on multiplo rtegression analy-
(2) Dovolopilmeint of a Huntn Pe•formance•Raliabilit Data Syiatm. 1The author und his colleagu N have Alio beon involved in an effort
(Moister and Mllsi, Ref. 9) to establish the paramnters of a Humtan Per- Iformance Reliability (HPR) data system based on the available axperi-mental literature, The heart of the systenm is a taxonomic Ntructure for Tclassifying both general behavioral and man-machine specific studies,Studios aro classified in terma of the behavioral function performed, theNtirniuli presented and the equipment used to respond, onvironmental,
subject and task characteristics, The end product of the clansification 4iN a descriptor, n.g., AA/C./Fl4/Hl/J2./Kl MIl/P7, which is assignedto the data and which is used as the mearis of retrieving those data.
Data are retrieved by first encoding a question asked of the HPRsystem, This is done by translating the question into descriptor cate.-gories, The HPR system then operates on the basis of "and/or" logicto sort progressively through the various categories to achieve theclosest possible match with the entry descriptor. By this matchingprocess, the precise answer to the question asked can be retrieved,alwarys assuming that the data bank contains appropriate data.
To test this concept a preliminary HIPR data bank of 140 studieswas developed. Actual system development projects were used to con-struct sample questions that were asked of the HPR system. The data -,
retrieved were examined in terms of their relevance to the questionsasked, An average of 74% relevant recall was achieved.
470
I
A FINAL NOTE
I'ho author wotild likt, to c on cudo thias r,,vi'w of h uman rt, liabilitymniodt'ý1 by ernphasi in, how irmpo rt,i ft tiost, modi- Is n e not only to th 1
,solution of the practical problmmi of 111AaiI- 1na'bh mt Sy tO11u dtV, ye I. opaetibut also to the discipline of' Human Fai-tor ame a whole,. Thr' dihtiiictivt,character of Hunian Factorm (as differentiatted from experimental psych-
.. ~~oloyy/) in that it dealm with .tystomm*t (in 6ysteni tortnim) andi with oporlition~attasks which psychological studies (and psychological thleories) do not. Thet
"models reviewed (at least the operability anodels) rpi'rs,,ont attvillpts toorganize man-rnachinte, behaviors in a mieaningful, prtdictivo mannor.Nothing like them are to be found amnong the many psychologicul model"that have been devoloped, most of which deal with niolt'cult r stimulus..response oltrrient•. It appears to the author, thtrefore, that furtherprograsm in Human Factors theory and application must depund upon the"construction and testing of modols much as these. Hence the imiportancteof these models which transcends their stated purposes.
REFERENCES
1. Altman, J, W. Pro ress in Quantifying Human Performance, paperpresonted at the Electronics Induntries Association Systems F.Effiec-tiveness Workshop, Chicago, I11. , 18-O0 Septermber 1968.
.. Fleish -tin 'K. A. J. k Jlpt'u,?,U, A(. W. Dev,._ujuw,(nl ,t a T .' ±.z.u11iYof Hu.an Performance: A Review of the Third Year's Progress. Re-port AIR-7Z6-9/70-TPR3, American Institutes for Research, Wash-ington, D. C. , September 1970,
3. Freitag, M, Quantification of Equipment Opurability: I, Review of"". the Recent Literature and Recommendations for Future Work. Tech-
nical Report 940, Navy Elect omnics Laboratory, San Diego, California,Z June 1966.
4, Irwin, I. A. , Levitt, J. J. and Freed, A. M. Human Reliabilityin the Performance of Maintenance. Aerojet-General Corporation,"Sacramento, California, May 1964.
471
i .f
5. J,-,nkins, J, P. (ed, ) Proceedings of U. S. Navy Hunman Reliabilitykhol 01••i-- July 1970, Roport NAVSHIPS 0967-412-4010,
IDept,. of the Navy, Washington, 1). C. , February 1971.
6, Meimter, 1). Methods of Predicting Human Reliability in Man-
Machine Systems. Human Factor, 1964, .0(6), 621-646.
7. Meiste r, D. et al. rheoEffect, of Operator Performance Variableson Airborne Electronic Equipment Reliability, RADC-TR-70-,140,Rome Air Development Center, Griffiss AFB, Ohio, July 1970.
8, Meister, D. Human Factors: Theory and Practice. New York:Wiley, 1971.
9, Meister, D. and Mills, R. G. Developmont of a Human PerformanceReliability Data System, Phase 1. AMRL-TR-71-87, Aerospace
Medical Research Laboratory, Wright-Patterson AFB, Ohio, August1971.
10. Mills, R. 0. et al. Sequential Task Performance: Task Module
Relationships, Reliabilities and Times. Human Engineering Division,
Aerospace Medical Research Laboratory, Wright-Patterson AFB,
Ohio (unpublished paper),
11, Smith, R. L. et al. , Technique for Establishing Personnel Perfor-
mance Standards (TEPPS), Results of Navy User Test, Report PTB-
70-5, Vol. III, Bureau of Naval Personnel, December 1969.
1 Z. Swain, A. D. Overview and Status of Human Factors Reliabilit~y
Analysis. Proceedings of the Eighth Reliability and Maintainability
Conference, Denver, Colorado, July 7-9, 1969, pp. 251-Z54.
13. Williams, N. G, Dependent Models for Estimating Human Perfor-mance Reliability. Proceedings os the Man-Machine Effectiveness
Analysis Symposium, Los Angeles Chapter, Human Factors Society,
15 June 1967.
472 '
I
APPENDIX G
STUDIES OF THE INDEPENDENCE/DEPENDENCE VARLABLV,
I INTRODUCTION
In this section we describe two studies of the indep,,ndence/dependence
I variable, the first performed by Mr. Robert G. Mills (and co-workers) of
the Human Engineering Division of the Aerospace Medical Research Lab-oratory, the second by Mr. Gerald G. Lamb, of the U. S. Naval Under-water Systemsn Center. We have had occasion to comment upon thisvariable in relation to the combinatorial statistics employed by the analy-.sis methods.
Subtasks and tasks may be independent of each other (i. e. , the per -
formance of one is not affected by the performance of the other), in whichcase their individual performance times and rellabilities can be combined
•multiplicatively to derive a performance value for some more molar
behavioral unit which comprises Z or more of these subtasks/tasks. Alter-natively, these subtasks/tasks relate to each other dependently (i. e. , theperformance of one is affected by the performance of the other), in whichcase the nature of that dependency m-iust be ascertained and explicitlyaccounted for in the probability statistics used to secure a higher ordersystem effectiveness value. Manifestly many of the problems faced bythe analytic models (and to a lesser extent by the simulation models)
I. would disappear if the assumption of independence held generally, and infact we have had occasion to note that analytic modelers often assumesubtask/task independence merely to simplify their combinatorial pro-blems.
The qoestion of whether tasks exhibit performance independence ordependence is one which is not susceptible to a theoretical solution; itcan only be answered by studies of the Mills/Lamb type. While theirresults are highly indicative, the reader must he warned that the problem
-. is very complex and no one oý: two studies are sufficient to resolve it. A"complicating factor is that, as Mills very astutely points out, there maybe several varieties of subtask/task dependency. Consequently a singlestudy may deal with only one type of dependency.
SEQUENTIAL TASK PERFORMANCE: TASK MODULE RELATIONSHIPS,RELIABILITIES AND TIMES (Mills, Hatfield and Bachert)
Mills et al. distinguish between what they call behavioral dependency
and operational dependency. Operational dependency is illustrated by
473
"a series of instrument readings which may relate to some overall system
performance measure, but the value obtained from reading one instrumenthas no effect whatsoever on the value that would be obtained from reading
"any other instrument". (All quotations are from Mills, et al.) Opera-
"tional dependency is found "when alternative responses or courses ofaction.., each of which is contingent upon a previous (task's) performanceoutcome or merely its completion (e. g., dialing a telephone)" Behavioraldependency is less clearcut. "Merely the fact that task modules (the termused by Mills et al. to describe behavioral units) must be performed incombination.., might have an effect on HPR (human performance relia-bility) or task time which would be different from that expected based onperformance of each task module separately".
What Mills et al. are saying (or so we interpret them) is that somedependency (operational) derives from the nature of the system configura-
tion, its operating procedures, etc. Manifestly in the telephone examplethey cite each dialing action can be performed only after a preceding action
has been completed.
Other types of task dependency may be performed concurrently, likereading a CRT and listening to a message, and there may consequently besome sensory interaction. Tasks may also be performed sequentially,although the start of one may not depend on the completion of the other.For example, since I am writing this while on an aircraft, when I finishwriting this sentence, I will pick up my Martini, but there is no necessarydependence here; I could just as well drink as I write. The question iswhether the temporal relationship of two logically independent actions .
influences the performance of either one. Must actions be logically inter-related before they exercise an effect on each other, if at all? If unrelatedtasks I through 10 are performed sequentially, does the performance oftask I have an effect on task Z or on task 10? Can one think of temporaldependency as well as functional dependency? And if each exists, how isit affected by the nature of the task (e. g. , perceptual, motor, cognitive)and the nature of the parameters influencing that task (e. g. , speed andaccuracy requirements, etc.)?
So the problem is not an easy one, because one must consider manyfactors that may influence human performance. The two studies describedin this Appendix can therefore be considered only a first, although animportant, step. (It might be thought that one could secure answers tothese questions from already available experimental literature. Unfor-tunately, because the researchers represented in that literature were not
474
dealing with operationally meaningful tasks- for the most part, anyway-
the data they provide is nlot satisfactory. For example, the extensive
literature on serial effects in learning nonsence syllables provides few
clues. Hence we need studies such as the ones reported in this Appendix.)
To study the problem we need subtasks which are essentially inde-pendent of each other but which can be synthesized into a more complex"task. Performance on the latter, more complex task must then be pre-
dicted from a combination of the independent performance estimates
obtained from the former subtasks. If performance on the more complextasks can be estimated from performance of the independent elements ofthat task, then obviously the independence assumption holds.
The description of the study presented below is taken verbatim from
the author's preliminary report. An incomplete version of the study isreported also in the U. S. Navy Human Reliability Workshop Proceedings(op cit).
Subje cts
5 university students made up the subject sample. No special quali-fications were required of them.
/
Apparatus
The apparatus used included a display/control device comprised ofanalog meters, digital read-out display modules, indicator /switch modules,and a numeric keyboard. Also included was a device for displaying singlelines of a computer printout on a trial-by-trial basis and two books oftable s.
The upper display panel contained 5 analog meters and 5 digital read-
out modules. The analog ineLer located in the lower left corner of thepanel was designated the Primary Meter and was labeled "X". The rmaining 4 meters were used to display extraneous information which asnot used in any of the experimental tasks.
3 of the 5 digital display modules were colhlbwtively labeled "YThese modules were located in the lower right corner of the pan(. The"Y" value was presented by lighting the display mechanism of th appro-
priate module. The lower panel of the display/control device c nsisted
475
/L 7/
of a key for each digit 0-9 inclusive and a key for the decimal point. Aseparate key was not available for the negative sign; therefore, the zerokey was used for both zero and minus.
The 8 indicator /switch modules on the lower panel presented instruc-tions and were also used as controls. An instruction was presented by 7
lighting the indicator containing the appropriate legend instruction.
The device for displaying computer printout was controlled by thesubject who, when instructed to do so by the appropriate indicator, ad-vanced the printout to a new line of information by pressing a push- ._button on the side of the display device. A line of information was pre-sented in a window located on the top of the device.
Also used were two books of "Z" tables. Z values were obtainedfrom the tables using X and Y values as table coordinates. Z values forX = 0-69 were contained in one book and values for X = 70-149 in thesecond book. Y values ranged from -99 to *99 in both books.
The subject sat in a 3-sided experimental booth facing the display/control device. The booth was in a room separate from all programmingand driving equipment.
The occurrence of all instructions and stimulus values was controlledautomatically using continuous, punched paper tape. All subject controlresponses and input values were also recorded automatically on punchedpaper tape.
Tasks
Subjec. performed each of 6 tasks, called by the authors "reference
tasks". These were:
I. For reference task 1 - Meter Reference Task: The subject wasinstructed to read a value X displayed on the Primary Meter and inputthe value on the numeric keyboard. Coincident with the READ Xinstruction, a print-out timer was activated. Coincident with an ENDOF KEYBOARD INPUT (EOK) response by the subject, after inputtingX, the tinle taken for the operation was recorded and the timer reset.Times were recorded to 0. 1 second. The EOK response was made
by depressing an indicator/switch module and is henceforth considered
476

I
implicit in any input operation. HPR is determined by later process-ing in which the subject's X input is compared with the correct Xdisplayed. Although the variables compared for HPR differ, the timeand HPR recording operations are also, henceforth, considered coin-cident with any input operation across the remaining tasks below. Xranged from 0 to 149.
2. For reference task 2 - Digital Read-Out Reference Task: This taskmodule is identical to reference task I with the exception that a valueY is read from the digital diaplay. X ranged fro -99 to 499.
3. For reference task 3 - Table Look-Up Reference Task: This taskconsisted of two parts. I irst, the subject read X and Y from a com-puter print-out which displayed these values simultaneously. Theinstruction READ X, Y also instructed the sutject to advance the print-out listing one line to obtain the X, Y values for that trial. The X, Yvalues read were then input by the subject. The second part of thetrial instructed the subject to look up a Z value using the tables. Thetables were entered with the X, Y values read during the first part ofthe trial. Z ranged from -10. 0 to + 10. 0.
4. For reference task 4 - Compute Reference Task: This task moduleis similar in procedure to reference task 3 except X, Y and Z wereobtained from the print-out and then input. The subject then computeda value Q using one of three formulas selected randomly. The threeformulas used were: Q-- (X÷Y)/Z, Q-Y- Z/X, Q-Z/Y'X. 0 rangedfrom -Z480 to +2480.
5. For reference task 5 - Explicit Combined Reference Task: This taskconsisted of four parts. The subject sequctilaly obtained X, Y, and
as in reference task 3. Q was computed as in the second part ofreference task 4. In this task each operation occurs and is measured
explicitly.
6. For reference task 6 - Implicit Combined Reference Task: The sub-ject performed the same operations as in reference task 5 with theexception that he was not given procedural instructions to read X,read Y, and look-up Z. These operations are implicit and thus, areassumed to have been performed in order to compute Q. Thus, forthis task module the subject was simply instructed to COMPUTE Q.HPR was determined as noted above; however, only subject and cor-rect Q values could be compared.
477
Reference tasks 1-4 are considered to represent indepen~dent taskmodules. Reference tasks 5 and 6 represent combined tasks in whichthe independent task modules have been synthesized into a single taskmodule 1.
In the case of reference tasks 3 and 4, however, independence isdifficult to assure because the tasks involve operations performed underother task modules by using X, Y, and Z. By display;--.g thiese latter valuessimultaneously via a different display mode (i. e. , computer print-out) andby requiring separate input on each trial, an attempt has been made toobtain HPR and time measures which can be attributed only to the tablelook-up (i. e. , entering X and Y into the tables, extracting, and inputtingZ) and compute (entering X, Y, and Z into the formula, calculating andinputting Q) aspects of reference tasks 3 and 4. In other words for the.'ook-up module perfect reading of X and Y must be assumed because im-perfect reading is being estimated in reference tasks 1 and 2. The sameIis true for the compute module except for the inclusion of Z which isbeing independently estimated in reference task 3.
The separate inputs of these tasks served the additional purpose of re-ducing the likelihood of reading errors because the values were availablesimultaneously on the print-out and input errors could be cross-checkedduring analysis to remove their effects on either the look-up or computetask modules. Thus, using this approach it was hoped that the operationalfdependency of the look-up and compute t~ask modules upon the task modulesof reading and inputting X and Y and, for reference task 4, looking up Zcould be i noved.
Procedure
Subjects performed task modules in blocks of 50 trials each. Theeventual total number of trials selected was 400 (8 blocks) on each of thercfe,.rence tasks 1-4. An additional 50 trials (9 blocks) on referencetasks 5 and 6 were completed for reasons to be indicated below. Thestart of each trial was separated from the previous trial by a randominter-trial interval ranging in one-second intervals from 5 to 15 seconds.The use of variable inter-trial interval decreased subject anticipation ofthe start of each trial.
Subjects completed blocks in consecutive, daily sessions of one blockper reference task per session. It took very little time to complete a
478
-,me_-_ __ _-•_
block for reference tasks 1-3 (e.g., one block for reference task 1could be completed in 15-20 minutes) and considerable time to completea block for reference tasks 4-6 (e. g. , one block for reference task 5took approximately 1 hour to complete). The length of time for eachdaily session was equated by having subjects perform on two tasks per
f• session. Each pair of tasks to be completed during a given session wasrandomly comprised of one of the reference tasks 1-3 and one of thereference tasks 4-6. This procedure resulted in daily sessions ranging"from I 1/2 - 2 hours for each subject.
Upon completing 8 blocks of each reference task, subjects completedan additional block of reference tasks 5 and 6 during the last two sessions.This procedure was used because it was considered advantageous to ter-minate each subject with data collection on the combined task modulesfor eventual prediction purposes. No use was made of this procedure inthe analysis, however.
In their first session subjects were given a set of written instructionsdetailing the operations to be performed on each of the reference tasks.Following the written instructions, subjects were allowed to ask questionsand they worked through a practice session of 5 trials for each referencetask. They were also told that time and errors were being recorded andthat they should work at a comfortable pace emphasizing accuracy of per-formance.
Results and Conclusions for Task Module Performance Time
Results are available only for performance time. Performance relia-bility data are available, but as of this date of this report had not beenanalyzed.
"" Effects of Learning
The effects of learning across trials were estimated by comparing the"medians of distributions of task performance times obtained for each taskmodule and block of 50 trials collapsed across subjects. Individual sub-ject distributions were representative of group distribution. In this and"remaining analyses only the performance times for the second parts ofreference tasks 3 and 4 are considered.
4. 479
6 o k (ovi all laml,11%0 1 it i Ilu l ,' I I~~% I wf It r , lho' 11"1 I'a Wit \y;% wi4 4 %%11 O ttwIt In ott~l
to'1tteilM IgII llv~~ m po 1At I I'I 11A Ml vI h o tt il lt'% %1111'tage' Ililtrc~; litMI11111% Ir im tit I ,~ tIt6, r,I I c 1 1; N luli I-1 t AP 1 k I I IPIit I~h I' Iii It. Itt If utttut i h it I I wi11
i.tst tle ltlpk fitry III tI, ,1 Ivi llt it Itor tIA it' %oilti' , IN s- PtIheit it 'ii Im e' i t 1A III k
a( t ,i A t k it c Im I, I SOmit A I eto ro IAi tik ~dIII . The' eu io fmpr wi 11,om Illlr' 'ii t i rtlw titrvnk v. o it rid t p r itmeo I% m ,I-ti ahI" AIlkIit It ly ti I v viIIIt, VAo IA(Pk IW *' %11o ot 11 cit I~ I ttgtu I I IPIII1
WVA 14 pt, Vttot. moid ttsl itg i w i id t v I du kl l k t Ibj I'Ii o itt I A It tII Iito' it atId n r' 0 1) oA ~to
n~eiotmsrooh drosigt Ac ross Mocks, Uaiing am~cim~ivoolSIMi it Wtt s' IAN 00-
It' rrinod thAt ksilllfik'AIl diffortit'uri (1)<. L)1) im n moI~ ittliaitio ac'l'u5 Sblocks wort, not presomn if blocksk 1 .4 wortie' ochitld fromtt tho dritA (or
Vach of the' ta-4k m'odule's,T
Front thi s it c An ho. conIwudeltnti OwIva rnitig hadi Nta biliAnd Aflet' 0 rOtrials regardless of task module or siubject. AN a rops~tilI, lator Analysespresented below rely an divitri butionm of task timoi' that hAve beeon Coulli~puodover subjects andl blocks 5-8t for roforence, tanks 1.-I or S-9 (or referetieritasks 5 and b.
Effects of CorubiinioM Task Moduiles Explicitly
Figure 17 presents histograx-ns of the onipirical distribiutions ubtainedfor the independent task modules of referencv tasks 1-4. Figure 18 pro-alsents histogram-s of the empirical distributions obtained far the explicitlycom-bined task modules of refference task S. Figure 19 presents the his-togram of the empirical distribution obtained for the implicit reference -
task 6. E~ach figure shows the probability of a given task time for vathtask module and the flow of operations is depicted across the top of eachfigure. Also shown are the statistical parameters, sample size (N),median (mdn), mean (R), and standard deviation (SD) of each distribution.The figures have been positioned so that an easy vertical comparisonbetween distribution of an independent and explicit consized task modulecan be made.
N in these figures is based on 5 subjects and 4 blocks of 50 trials eachfor reference task 1-4 (i. e. , Nz 1000) and 5 blocks for reference tasks 5and 6 (i.e. .N- 1250). Actual Ns are somewhat less than these valuesbecause of an occasional loss of a time value due to equipment difficulties.
480
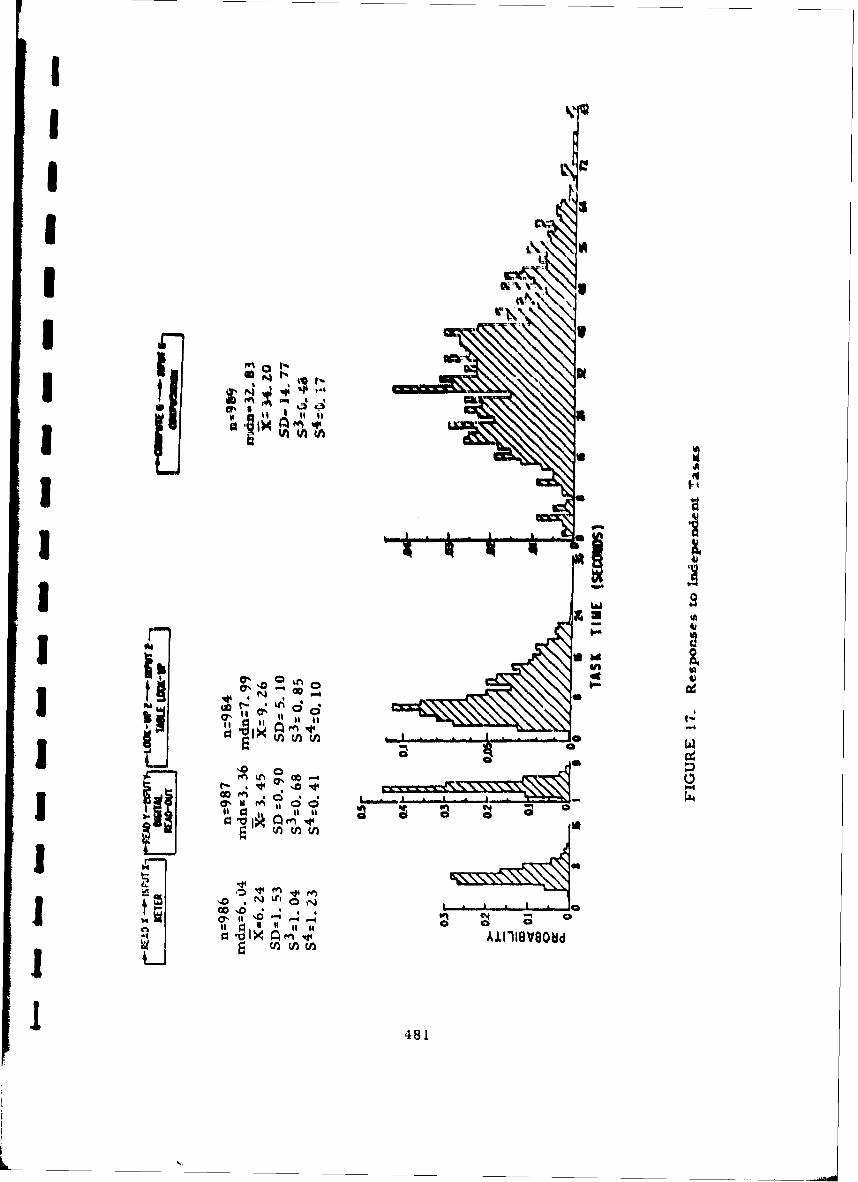
II
Ib IA3IlhiLI7
vE tn ch t\ J
I WI00
I7 0C13 4141
1l 1 .t
4814
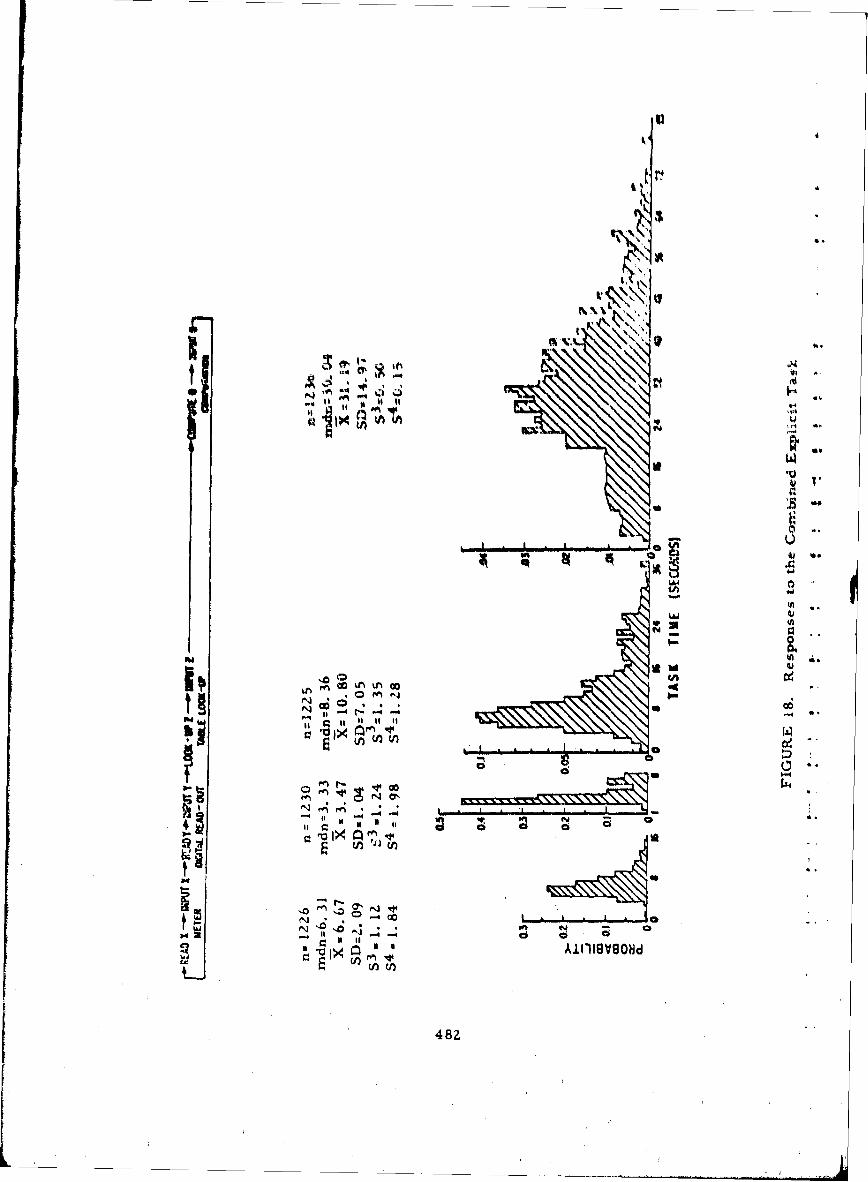
'4 ,
4 4 "
I I,
4 F1
•1_ s ..aaU
, U
41A4
48.4
w
If 0.
0'
NV
482
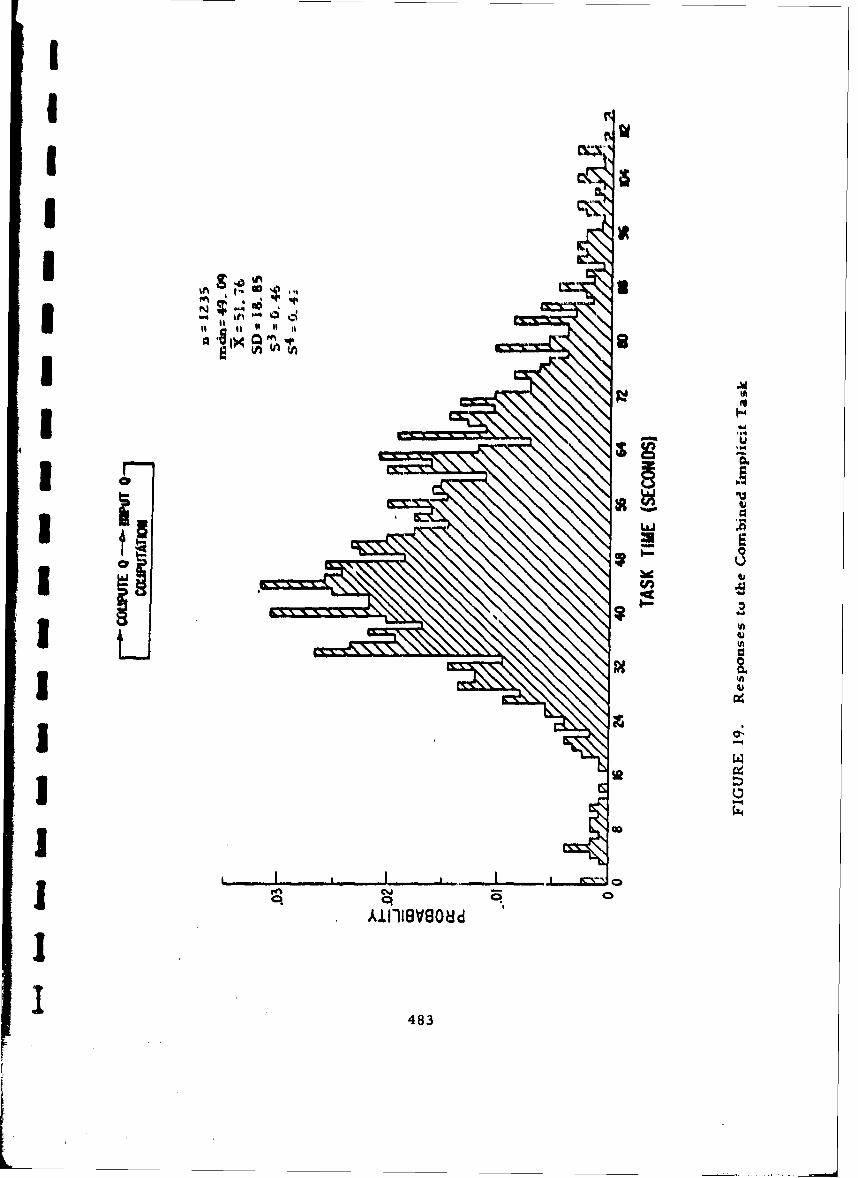
II1 5
II U.' aI -q
I,�jeg, w ii
8I IHI "4
10 Aa1 3 LaJ "4
a I* U,* U)- IC- 0
'aI U,
a
I U,
I 0"-4
I 0
Ip I
i0 0
A±flI8V8O�id
II
483
I
I "1 AH tilt P) k t IN c i aI P t rIhat t4 ok I t , i te vatry v it Plitt"i 1ail Iy It I I ., tillingU101tan lA k 111011%l10. Ill jkwtlitiiatiltiit M 10 Ilth ditrihlA~ tioi l hahN )V~ ap ia t) hi1'tiorml raa , 1. ' Doori'r nA nt intl t iiV tit t ir An ti (m irt miomei a u incl atoA' that allAV 0' e )O At I IV 0v 1 y A ki \vP id And l0.ptok~tar Iiv'. 1'ha 11lapatio dit (IO iAti linus on11irmAn lity wvill be' dvt~lt with f~k-ther'' b.'Inw,
lit comlpAarin Fiua gurt' 17 with k•igura' 18 stabotaitial difforrtnct,11 Arrnot Ap)A ronit brotweou tha' pa'rfnrmAnVO' tiMON Of All inde'pe'ndent task modIuleAnti tho sIA111 MiOd~th' combnihtd a'xplicitly. A t,. tost porfoa'motll tuilth'difforonvot'a ha'twoon tilte indopemletit Anti oxplicit fllt'iN for OACIaI tA~k inn-(hilt) indiCAteti Only 010 tablt, look -up modulo athieved statistical signifi-t'rcAnc (t it 4. SS. p-C( 01, df uw ), With the largo N involved, these Webtarv quite conoterVAtivO (nearly an~y difforence, will bte significant) and tileobiservation that tho'se diutributiO1111 Are niot normal mako thle test suspect.Also theo probability of obtaining the larger times of the explicit table look- b
up module is quite, small, The-oforv, it is unlikoly that this difference isof practical importance in the present study.
However, therv are subtle but systematic differences between thesediatributiona wvhich are worth noting particularly as they may apply inlatter studiots. In the first place the variability of task times increasewhen a task module to combined explicitly. For example, the standard
iI
deviation obtained for the independent table look-up module increasedby 38. 216 when it was combined explicitly.
Secondly, with the exception of the computational task modules, thethird and fourth moments also increased somewhat from independent toexplicit combined task modules. This fact in conjunction with the increasein variability of task module times suggest~s that the distributions of expli-citly combined task modules have also increased in positive skewness andhave become less peaked. The computation task module showed littlechange in its statistical parameters except for median and mean, fromindependent to combined explicit reference tasks.
In order to determine the degree of interrelationships among explici-tly combined task mrodule's performance times, bivariate correlations wereobtained between timres within trials. These correlations ranged from0. 37 between the digital read-out and the table look-up task module timesto 0. 19 between the meter and computation module times; they are quitesmall and indicate only slight dependencies among the times.
484
II
I Thu trun maguitude of these dependencios im reduced further whenthey are evaluated relativo to correlations obtained among Independent
I tak mnodutls within tho same trial number (this represeents artificialcombination based only on havitig thie A nit, tHA1 Iniumbr), The value ofth•s• later corrlalltionls would be vxpectid to be near voro, However,
thoy actually ranged from 0, 33 to 0, 13 indlcatinK that the tines of the
indchpendant task modulcs wear Also correlated slightly. These unex-
pected correlations arr probably due to A combination of two things,3 residual effects of learning (I. t. , times tend to docrease across trialsregardlass of task module) and the fac~t that one fifth of each samplewas obtained from the same subject. Thus, trials and intrasubject vari-
I ability becomo correlating factors,
These factors would also be present in the Lorrelations obtained
among the combined explicit task modules. The true degree of dependency
among explicit combined task modules is reflected by the differences
between their correlations aind those obtained among the indepentent task
I modules. Theme differences ranged from 0. 14 to -0. 02; with the exception
of this latter difference , all differences were in a positive direction in-dicating a slight increase in dependency among explicit combined task
I modules over those treated independently.
Based on the above analyses there is some evidence that task module
performance time i. differentially affected depending upon whether thetask modules are combined or not. However, there are also suggestionsthat the effects of combining may be slight implying little overall impacton prediction based on the use of the summation rule for synthesizing task
module performance times. The issue of prediction is addressed more
i closely immediately bblow.
Prediction of Combined Task Module Performance Time
A Mont Carlo computer simulation program was used to examine thepredictive capability of independent task module performance times.
Principal interest will be in attempts to predict the performance timeof the implicit combined reference task. The general procedure used
was as follows.
1. A probability density function (PDF) was derived from the
empirical distribution obtained for each independent task module. Three
types of PDFs were fit to the empirical time data. The first was the
ISI 485
Wvibull and its parame~tors were derived by employing the linear re-gression method of fit following the lead of Askren and Regulinski. TheSeCond was the Weighted-Weibull. This PDF derives Weibull parametersfrom data fit by linear regression and which have been weighted by theirprobabilitie~s of occurrence. The third PDF employed was the Gaussiannormal using the empirically derived mean and standard deviation asinputs to a computerized Gaussian random number generator. Althoughrepresented as histograms in Figures 17-19, all distributions wereassumed to be continuous in these derivations.
2. A random sample of n- 1000 simulated task module times wasdrawn from each PDF.
3. Using the summation-rule, the times sampled first for each -
module were summed across modules. The resulting time became thefirst simulated time in the predicted distribution of times for the implicitcombined task. Each successive sampled time was also summed across -
modules until a predicted distribution with n =1000 was obtained.
A set of 50Q samples each with n - 1000 was drawn for each independent -
module, thus creating 50 predicted samples each with n - 1000 for theimplicit module. Comparisons were also available between the empiricaldistribution for each independent module and its derived PDFs.
4. The predicted implicit performance time distributions werecompared to those obtained empirically. -
5. The above procedure was also applied to the explicit task modules.This allowed further comparison with the independent modules as well as,with the implicit module.
The results of these tests indicate that the. normal assumption doesnot generally yield the best fit for independent task modules. Only forLthe meter task module does the normal appear as if it is best. The nor-mal is able to predict the empirical means quite well but offers no clearchoice relative to the other PDF types when predicting the empiricalstandard deviations.
The poorer predictive capability achieved under the normal assump-tion is indicated further in attempting to predict implicit task moduleperformance time. In this case the normal fit clearly ranks third behindthe fits achieved by the Weighted- Weibull and the Weibull, respectively.
486
U1I
Attempts to predict the performance time of each explicit taskmodule from independent task module performance time was best underthe normality assumption in only one case. The normal yielded the bestfit for the meter task module. The Weighted-Weibull yielded the best fitfor the digital read-out module and the Weibull yielded the best fit forthe table look-up and compute modules.
These results do not completely rule out the normality assumption
for synthesizing task modules because the error in predicting implicittask performance may have resulted from a failure to account for depen-dencies among modules. The validity of the summation-rule for combiningperformance times was examined by attempting to predict, as closely aspossible, the implicit task time. This was accomplished by simulationusing a mixture of the better PDFs and synthesizing under the summation-rule.
The results of these simulations then provide evidence that theassumption of independence regarding task module performance time isvalid. This statement is based on the fact that close approximation toa distribution of empirical task times can be achieved by summing theindependently derived performance times of its task modules. Thisconclusion is also supported by the fact that substantial correlations wereI not found among the performance times of the explicit task modules.
However, it should be recalled that slight dependency effects of corn-bining task modules explicitly were obtained. Presumably, these effectscould account for much of the remaining error in the mixed simulation.Furthermore, it is possible that this error might become significant astask modules are added or increased in complexity, thus magnifying theeffects of dependency. Examination of the data indicates that the magni-tude of prediction error for independent module performance times doesnot tend to increase or decrease systematically as a function of taskmodule operation. This suggests the error in prediction of synthesizedtask modules will accumulate as a function of the number of task modulesonly and not their complexity. This of course would hold only if the PDF'it were accurate. Determination of the magnitude of this constant error,if it exists, and the synthesis model to account for it should however,J wait until additional data are collected.
The simulation results also indicate that the normality assumption
-I should be rejected as a general assumption in synthesizing task perfor-mance times. This conclusion is based on the fact that prediction of
I487/
task performance time is not as accurate using normally distributedtimes as alternative PDFs. This statement is also supported by thecomparisons of independent and explicit task module performance whichindicates that distribution of times are not normal.
This is not to say that task module times will never be normallydistributed nor that the nor~mal PDF cannot be used. Only that on mostoccasions the normal PDF does 'not produce PDF the best fit to thedata. From a practical point of view the error produced by violating anon-normality assumption may not be large enough for one's purpose towarrant using a better fitting PDF. The general impact using a normalPDF remains to be evaluated.
A TEST OF A BASIC ASSUMPTION OF HUMAN PERFORMANCEMODELLING (Lamb)
Lamb's study tested the independence /dependence variable in anoperational setting in which the task was symptom detection and faultlocation of sonar systemn failure.
The sonar equipment used was an operational sonar simulator atjthe Naval Underwater Systems Center. The failure symptoms were con-centrated in the passive receiving console. This equipment is in fleet usewith many man-years experience in its operation and maintenance.
The faults chosen were common component failures each with anobvious effect on the face of the sonar console (Table 20). The faultswere chosen so that operators using the maintenance troubleshootingmanual for the system could isolate them. They were not unusual orunrepairable types of faults.
Subjects
Twelve Sonar Technicians familiar with the sonar or similar systemsserved as subjects. Their experience with the equipment ranged from sixmonths to four years. Their normal duties included system maintenance.
488
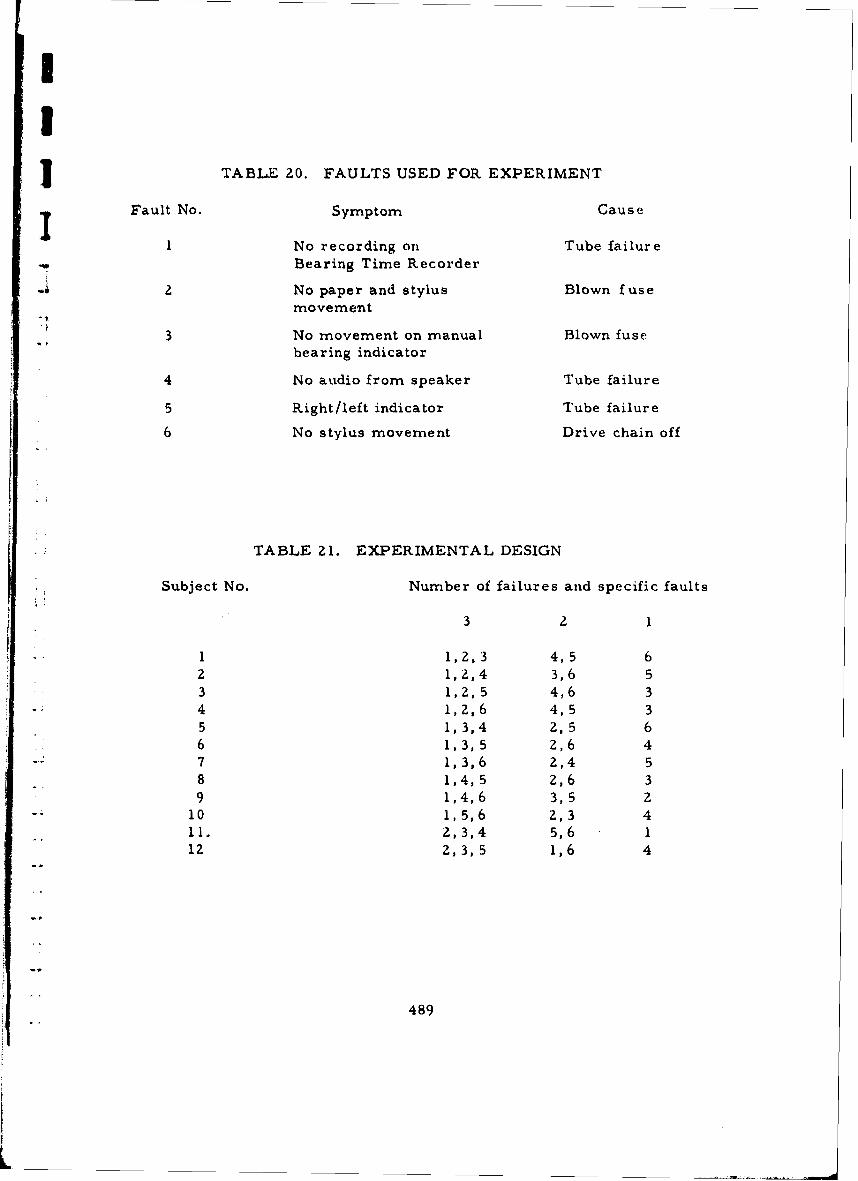
IJ TABLE 20. FAULTS USED FOR EXPERIMENT
I Fault No. Symptom Cause
I No recording on Tube failureBearing Time Recorder
2 No paper and stylus Blown fusemovement
, 3 No movement on manual Blown fuse
bearing indicator
4 No audio from speaker Tube failure
5 Right/left indicator Tube failure
6 No stylus movement Drive chain off
TABLE 21. EXPERIMENTAL DESIGN
Subject No. Number of failures and specific faults
3
1 l,Z.3 4,5 62 1,2,4 3,6 53 1,2,5 4,6 3
-. 4 1,2,6 4, 5 35 1,3,4 2,5 66 1,3,5 2,6 47 1,3,6 2,4 58 1,4,5 2,6 39 1,4,6 3, 5 2
1- 10 1,5,6 2,3 41 . 2.,3,4 5,6 11IZ 2,3,5 1,6 4
489
,
Experimental Design
Each subject participated in three trials; one trial had one fault,another two faults, and the final trial had three faults (Table 21). Noparticular fault occurred more than once for any subject. The order ofthe trials was randomized over subjects to minimize the effects of prac-tice. All possible combinations of the six faults were used to generatethe trials.
Each subject had all three trials in one session. The subject wasread the instructions, given the maintenance manual, and allowed to -,
isolate the fault using any procedure he desired. The subject could atany point indicate that he needed and was going to use test equipmentand was told the results of the test by one of the experimenters. Actual _
test equipment was not used in order to save the time associated withthe manual tasks of setting up the tests since the experiment was con-cerned with fault isolation.
The time to isolate a fault was used as the dependent variable. Thuseach major maintenance action wis recorded and timed. In addition,protocols were recorded for questions about conformity of the experi-mental problems to normal ship-board faults and maintenance procedures.
Results
Quantitative
The basic measures were time to isolate each fault in a given trial,and total time to complete each trial (where a trial had 1, 2, and 3 faults).Total time to solve three faults ranged from 5 to 60 minutes, for twofaults from 2 to 48 minutes, and for one fault from I to 44 minutes. Time -"
to isolate each fault is more indicative of the operator's ability with mul-tiple faults and should vary if independence is not met. The average timeto solve each fault was calculated for sets of:
I fault 11.47 rin.,2 faults 10. 23 min., and3 faults 8. 65 min.
These data suggest that multiple faults are being mod'e quickly solvedthan single faults. However, a statistical comparison did not bear thisout ( t -0.62, p>. 05).
490
There is extreme variability in the time to isolate any single faultover both subjects and conditions. In order to remove some of thisI variability, specific faults were analyzed to see if the time to isolatethem increased or decreased when combined with other faults. Therewas a tendency for times to decrease when combined with other faults.The average times were:
alone 0 (base line)with one other -1. 83with two others -3. 53
! IAgain, a statistical test between the extreme values (alone and with twoothers) showed no significant effect (t .910, p). 05). Therefore, thequantitative data showed independence for fault isolation at the task levelwhen multiple faults were present.
i Qualitative
Since the quantitative data had not led to rejection of the null hypo-thesis (independence of maintenance actions), the qualitative data wereexamined to see if they confirmed the results of the quantitative data.
1 The experimenter's taped observations did, in fact, support heavily
the idea of independence of fault isolation. Subjects were about evenlydivided as to whether they detected all or only one symptom at a time.However, they all proceeded to isolate faults sequentially, beginningentirely anew with the isolation of each fault. This even included closingthe manual and reopening it. Several subjects even commented, t"Finishedwith that one, time for the next one. " There was only one exception: Onesubject isolated two faults simultaneously because they were adjacentblown fuses. This was an experimental consequence of using all possiblecombinations of faults.
It is clear from both the quantitative and qualitative data that at thetask level there is independence of maintenance actions of the type usedin this study.
4
149


