Embed Size (px)
Citation preview

Vol. 3, No. 1, Page 9-29
Copyright © 2009, TSI® Press Printed in the USA. All rights reserved
ICA, LDA, and Gabor Jets for Robust Ear Recognition, and Jet Space Similarity for Ear Detection Daishi Watabe, Hideyasu Sai1, Takuro Ueda, Katsuhiro Sakai1 and Osamu Nakamura2 1Saitama Institute of Technology, Department of Information System, Japan 2Kogakuin University, Department of Computer Science and Communication Engineering, Japan
Received Date: 15 August 2008; Revised Date: 2 February 2009, Accepted Date: 3 March 2009
Abstract Fully automatic and robust ear recognition systems that use only 2D grayscale still images are presented. To exploit robustness against pose variation, changes in lighting, and hair occlusions, we thoroughly examined the techniques: linear discriminant analysis (LDA), independent component analysis (ICA), and Gabor jets. We obtained a 93.3% rank-one recognition rate on a dataset of 121 subjects in 4 image sets taken on various days from the public face database XM2VTS, where 47.0% of the images show hair occlusion, pose variation, and jagged images. To fully automate the recognition algorithm, we developed an ear detection algorithm that uses Gabor jets subjected to training using principal components analysis. A 1.0% equal error rate was obtained in experiments on the XM2VTS database. Our experiments provide evidence that ear biometrics has the potential for use in real-world applications for identifying individuals by their ears.
Keywords Gabor jet, eigen jet, ear biometrics, ICA, LDA, EICA
1. INTRODUCTION Ear biometrics has received little attention compared with well-known techniques of automatic face, eye, or fingerprint recognition, which have applications in both academia and industry. Ears, however, have been an impor-tant aspect of forensic science for many years [1]. The anatomy of the ear has been studied in detail in forensic science. Bertillon described the ear as a stable structure that changes little with age or facial expression [2]. Hence, many studies have been proposed to research ear recognition from the viewpoint of computer vision, some based on 2D grayscale images. To list some representative examples, pattern spectra are obtained by morphological opera-tions [3], the use of compression network has been proposed [4], and using PCA, (principal components analysis) eigen ears have been obtained [5,6]. In addition, genetic algorithms have been used [7], recognition based on force
field transformation [8,9] and model-based approaches have been proposed [10].
Robustness against pose variations and partial occlusion from hair and earrings is desirable for use of these approaches in real-world applications. The use of 3D range images and iterative closest point (ICP)-based approaches [11, 12] have been proposed as yet. However, 3D range sensors must become less expensive before they can be used in real-world applica-tions.
Another issue to be resolved concerns estab-lishing a method for ear detection. Ear detec-tion is a necessary first step in a fully automatic ear recognition system with the aim of localiz-ing and extracting ear regions from the back-ground. Of the above studies, Refs. [11] and [12] discuss ear detection using an entire pro-file, based on color information and 3D range images. However, 3D range sensors are, as yet,
___________________ * Corresponding author information: Daishi Watabe; Saitama Institute of Technology; Fusaiji 1690, Fukaya, Saitama, Japan; +81-48-585-6398 FAX; [email protected]

very expensive.
In the field of face recognition, it is known that Gabor jet-based recognition, as in elastic bunch graph matching (EBGM) [13], is im-mune to slight pose variations. It is also known that linear discriminant analysis (LDA), using class-specific information [14], is immune to illumination change and partial occlusion. By means of higher-order statistics, independent component analysis (ICA) [15] can distinguish individuals better than PCA regarding data that shows day-to-day variations [16]. There is also an attempt, called Enhanced ICA [17], to in-crease the discrimination ability of ICA by using class-specific LDA information. We extend these algorithms to ear recognition and carefully compare their performance for a dataset that includes hair occlusion, pose variation, and inconsistent lighting. Further, we introduce a new 2D-based ear detection algorithm by combining the use of EBGM [13] and PCA [18] in the detection steps of face recognition systems. By combining the algo-rithms introduced for ear recognition and ear detection, we arrive at a scheme for fully auto-matic ear recognition systems based only on grayscale still images.
2. RELATED WORK AND CONTRIBUTIONS
Related Work The use of ears for the purpose of personal identification was first proposed by A. Bertil-lon, a French criminologist, in 1890 [2]. Many advances have since been made in this field, and the method has been widely used to iden-tify criminals in the United States for over 40 years [1]. Automatic ear biometrics research is currently being pursued from various angles, and we review the relevant work in this sec-tion.
Some early studies investigated the feature vectors appropriate for automatic ear biomet-rics.
One of the earliest attempts at automatic ear biometrics published was that of Shinohara [3] in 1992. Shinohara et al. [3] proposed the use of pattern spectra obtained by morphological
operations as feature vectors. They used cosine as a similarity function. In their experiment, ear images of 10 subjects were captured at a fixed face angle and ear images were placed in an ellipsoidal window of 250 × 127. They reported a 100% recognition rate. Although the number of subjects used in the experiment was very small and the images were highly con-trolled, this study provided evidence more than 15 years ago that ears could be used for auto-matic biometrics.
Moreno et al. [4] proposed the use of a neural network called a compression network. This network consists of two stages. The first net-work is prepared associatively on the original ear image to extract statistically salient features called compression vectors; it has been dem-onstrated that a compression network with h hidden units can span the space of the first h eigenvectors of a covariance matrix of the input image. These compression vectors con-stitute the input to the second network of a single perceptron that performs an identifica-tion task (each of its outputs corresponds to one of the individuals to be identified). They used 28 sets of 6 images for 28 subjects. Ears were manually extracted and normalized such that all images had a similar height/width ratio (defined by a value of 1.6). They reported a 93% recognition rate.
Some studies have addressed the value of ear biometrics by comparing its recognition per-formance to that of face recognition.
Viktor et al. [5] compared the performance of PCA in recognizing faces and right ears with day-to-day variations. They reported an ap-proximately 78% rank-one recognition rate for faces and an approximately 52% rank-one recognition rate for ears in a dataset of 75 probe and 76 gallery images of 130 × 150 resolution for 72 subjects taken on various days. On observing the results of some other experiments, they concluded that face-based recognition is superior to ear-based recogni-tion.
Chang et al. [6] reached a different conclusion after performing similar experiments in which the quality of face and ear images in the dataset
10

was controlled more rigorously. They used images from the public face database FERET [18]; images in which the face or ear obscured substantially by hair or earrings were removed from the study. Images were cropped and nor-malized to 30 × 150 resolution. A dataset of 88 subjects photographed on various days re-vealed a rank-one recognition rate of 70.5% for faces and 71.6% for ears, and no statistically significant difference in recognition perform-ance between faces and ears was found. In addition, they reported that bimodal recogni-tion using both the ear and the face had a rank-one recognition rate of 90.9%, for which they found a statistically significant improve-ment over the use of either biometric method alone. This study increased the importance of automatic ear biometrics.
Following these studies, some researchers attempted to create an automatic ear biometric system that consists of ear detection and ear recognition. We therefore first review studies that can be used in cooperative scenarios that involve the subject to be recognized.
Yuizono et al. [7] used template matching for ear detection and a genetic algorithm for ear recognition. They arranged a set of 50 cropped ear gallery images in a single sheet of 10 sub-jects in each row and 5 in each column. With a 20-pixel margin, they created an image 640 (= 20 + 5 × 120 + 20) pixels wide and 2040 (= 20 + 10 × 200 + 20) pixels high. The genotype was designed as a bit pattern expressing the x and y coordinates of the top-left of the ear image under a pattern-matching process on the image sheet of gallery data. For the fitness of the genotype, the evaluation value of the pat-tern matching, essentially given by the squared sums of gray level differences, was used. They created 110 sets of six images for 110 subjects from video sequences to evaluate the perform-ance. Using template matching they cropped the captured images from 240 × 320 to 200 × 100 such that they contained only the ear. They used 80 subjects (50 gallery and 30 probes) to determine the working threshold for recogni-tion. A 1% false rejection rate and 0% false acceptance rate was reported. The dataset of
ear images used was obtained using a face-fixed instrument fixing the angle of the face. Because some images come from same video sequences, they may be very similar. They reported that falsely rejected images were slightly rotated. Hence, a very cooperative scenario is needed for this recognition system.
Hurley et al. [8] introduced a method in which an ear image is transformed into a force field by treating every pixel on the image as a Gaussian attractor. Exploratory pixels placed in this force field move naturally toward potential wells under the influence of this force, forming “channels” on their way to stability. Hurley et al. [8] proposed extracting the posi-tion of the potential wells. In [9], they com-puted a convergence (additive inverse of the gradient of the normalized force field) map indicating the similarity between the conver-gence map and the wells and channels. Further, the validity of their method based on the cross-correlation of thresholded convergence maps, realized using Fourier cross-correlation techniques, was demonstrated. They showed that their method is highly immune to initialization and noise. The performance of the algorithm was evaluated using the public face database XM2VTS [20]. They obtained four images each for 63 subjects by excluding images with hair occlusion and earrings. They reported recognition rates of 99.2% for their method and 62.4% for PCA, with poorly registered images having a 141 × 101 resolu-tion, where ears appear in 111 × 73 sub-images. Using more accurately cropped images with a resolution of 111 × 73, they reported a recog-nition rate of 98.4% for PCA, highlighting the inherent extraction advantage of their force field approach. Recognition from an entire profile was not demonstrated, and rotations of up to 20° were corrected using linear interpo-lation. Although this technique seems favor-able in cooperative scenarios, further refine-ment is expected for use in non-cooperative recognition scenarios.
To accommodate non-cooperative recognition scenarios, some studies report fully automatic ear recognition systems that use both ear
11

detection and extraction from an entire profile, and recognition or verification algorithms.
Jeges and Mate [10] introduced a model-based ear recognition system based on typical edge orientation patterns in the detection step. In the recognition step, 135-dimensional feature vec-tors averaged over the video frames were ex-tracted using active contours, a morphological operation, on the edge orientation pattern. To evaluate the model’s performance, they cap-tured 132 video sequences of 320 × 240 reso-lution containing 3500 ears of 28 subjects. The extracted ears all had a very similar resolution of 80 × 120, as the subjects were sitting at the same distance from the camera. They reported a 5.6% equal-error rate. This preliminary result is attractive, but the model’s effectiveness is demonstrated only in a limited, controlled environment. Robustness against inconsistent lighting, earrings, pose variation, and partial hair occlusion are not demonstrated numeri-cally. It is easily noticed that the edges detected from ear images can differ with relatively small changes in ear orientation, lighting, hair occlusion, or the presence of earrings. There-fore the applicability of this algorithm to non-cooperative identification environments is unclear.
Chen and Bhanu [11] proposed a 3D ear bio-metric system that consists of 3D ear detection, 3D verification, and 3D recognition. In the detection step, a single 3D model along with color information is used to locate the helix and antihelix. For ear identification and verifica-tion, they used the ear helix/antihelix representation obtained in the detection step and local surface patch representation (based on curvatures) computed at feature points. Both shape representations were used to esti-mate the initial rigid transformation between a gallery–probe pair. Then, a modified ICP algorithm was used to iteratively refine the transformation to bring the gallery ear and probe ear into the best alignment in the sense of least root-mean-square error. They reported a 96.8% rank-one recognition rate on the University of California at Riverside dataset of 155 subjects with 902 images, and a 96.36%
rank-one recognition rate on the University of Notre Dame dataset of 302 subjects.
Using a 3D sensor, Yan and Bowyer [12] pre-sented a complete ear biometrics system, in-cluding automated segmentation of the ear in a profile view image and 3D shape matching for recognition. They evaluated their system by conducting the largest experimental study to date in ear biometrics, achieving a rank-one recognition rate of 97.8% for an identification scenario and an equal error rate of 1.2% for a verification scenario on a database of 415 sub-jects and 1,386 probes.
Unfortunately, the methods in [10] and [11] based on a 3D scanner bear a hefty cost (tens of thousands of dollars), and the 3D scanner is too cumbersome and slow for use in real-world applications.
Contribution of this study Our primary concern is an automatic ear biometric system. However, none of the above mentioned studies presented algorithms robust against the presence of earrings, partly occlud-ing hair, pose variation, and inconsistent light-ing, except for the algorithm using 3D sensors. As 3D sensors are very expensive, an alterna-tive solution is vital for achieving a realistic automatic ear biometric system. A number of hints for resolving these issues can be found in methods used for face recognition. To list a few of these, it is known that Gabor jet-based algorithms used in EBGM [13] are robust against slight pose variations. Further, using higher-order statistics, compared to PCA, ICA [15,16] is more robust against day-to-day variations and changes in expression. Further, utilizing class-specific information, LDA [14] is robust against inconsistent lighting and par-tial occlusions. By implementing the class-specific information of LDA into ICA, Enhanced ICA [17] performs better than ICA. These approaches, well-known in the field of face recognition, may be extended to ear bio-metrics that is robust against partly occluding hair, pose variation, and inconsistent lighting. However, good performance for a face data-base does not necessarily imply good perform-ance for an ear database. Therefore, it is
12

important to examine these algorithms for ear recognition to further exploit the capability of robust ear biometrics. Hence, our first contribution is to extend these algorithms to ear recognition and carefully compare the performance for a dataset including hair occlusion, pose variation, and inconsistent lighting, by means of large-scale computation performed on super computers.
Ear detection is the first necessary step in ear recognition systems with the aim of localizing and extracting ear regions from the back-ground. Of the previous approaches to ear biometrics mentioned in Section 2.1, only [7,8,10–12] address this issue. However, in [7] and [8], an ear is detected in a very narrow region surrounding the ear in the profile. For instance, in [7], 240 × 320 images are captured in which the ear size is 200 × 120, and in [8], images are manually cropped to 141 × 101 in which the ear size is 111 × 73. Detections from entire profile images are not demonstrated. The detection step in [10] is based on template matching the edge orientation pattern; its robustness is unclear and is not numerically demonstrated.
Algorithms in [11] and [12], the only ear detection algorithms published in literature to date, detect ear regions from images including the entire profile. They utilize skin color infor-mation and 3D range images to locate ears. However, the colors are not sufficiently strong against changes in illumination, and 3D range sensors must become less expensive before they can be used in real-world applications. Therefore, our second contribution concerns this issue; we introduce a new ear detection algorithm that combines the ideas of EBGM [13] and PCA [18] in the detection stage of face recognition systems.
The aim of this study is to propose robust, fully automatic ear recognition systems by combin-ing the contributions of ear recognition and ear detection.
Comparing the publications reviewed in Sec-tion 2.1, the approach presented in this paper is unique in the following aspects. This approach
is able to deal with hair occlusions, pose variations, and inconsistent lighting from still images. Ours is the only study that investigates a robust, fully automatic ear recognition sys-tem that can extract ear regions from entire profile images and recognize individuals using only 2D grayscale still images.
The remainder of this manuscript is structured as follows. In Section 3, ear recognition algo-rithms using ICA, LDA + Enhanced ICA, and Gabor jets are presented. In Section 4, a new ear detection algorithm is introduced. Section 5 provides a comparison of the ear recognition algorithms introduced in Section 3. In Section 6, comparison of the ear detection algorithms introduced in Section 4 is covered. Discussions are presented in Section 7, and conclusions are presented in Section 8.
3. PROPOSED EAR RECOGNITION ALGORITHM
Sections 3.1–3.3 and 3.5 review the techniques for extracting feature values from image data, while Sections 3.4, 3.6, and 3.7 introduce similarity measures used for recognition after feature extraction.
Feature Vectors of ICA: Local Representation and Factorial Code Given a source signal P, ICA is used to find a mixing matrix M and an independent compo-nent U:
P MU= . (1)
A number of algorithms have been proposed to perform this task. Popular algorithms include Fast ICA described by Hyvarinen [21], In-fomax described by Bell and Sejnowski [22], and JADE by Cardoso and Souloumiac [23]. From the viewpoint of computational re-sources, Fast ICA and Infomax are examined. Two representations proposed by Bartlet [15,16]—a local representation (architecture 1) and a factorial code (architecture 2)—are de-scribed below.
For Bartlet’s architectures 1 and 2, first PCA is applied to the input images. Let X be the matrix of the input image data, in which each image data is placed in a row of X. By substituting the
13

averaged image from each row, it can be as-sumed that the average of the rows of X is 0. By denoting the transpose of by , the total X TXscatter matrix of image pixels given by
TTS XX= are subjected to the eigenvalue
problem TS λ=p p , (2)
and unit eigenvectors are obtained. 1,..., np p
Since is a symmetric matrix, these vectors TSare orthogonal. Then, an image in the j-th row of X is represented by the linear combination
( )j j i j i jii i
c= ⋅ =∑ ∑x x p p p , (3)
where ( )j i⋅x p denotes the dot product of
jx and ip , generating an expansion coeffi-
cient jic . Rearranging this in the form of a matrix, we obtain T T TX P C= . (4)
Hence, X PC= , (5)
where P is the matrix of eigenvectors or principal components that are placed in the rows of P . Here, C is a matrix of expansion coefficients, where each row represents the image in X in the corresponding row. In cases where the number of rows of P is smaller than that of X, the number of principal components is smaller than the number of images, and equality (5) should be regarded as an approxi-mation. Some of the principal components obtained using input images (as in Figure 1 (a)) are shown as in Figure 1 (b) in the form of base images.
(a) Input images.
(b) Base images of PCA (eigen ears).
(c) Base images of local representation.
(d) Base images of factorial code.
(e) Base images of LDA (Fisher ears).
(f) Base images of local representation +
LDA.
(g) Base images of factorial code + LDA.
Figure 1. Sample input images and base images for PCA, local representation (ICA), factorial code (ICA), LDA, local represen-
14

tation + LDA (EICA), and factorial code + LDA (EICA).
The local representation (architecture 1) uses ICA of P,
P MU= . (6)
By substituting Eq. (6) into (5),
X CMU= . (7)
Feature vectors are rows of CM, and the base images are rows of U. Some of the base images in this representation are shown in Figure 1 (c). In this representation, the basis images contain localized features such as eyes, nose, and mouth in case of face images. [15]. The base images shown in Figure 1 (c) display the posi-tions of local features of ears such as the anti-helix (left), superior antihelix crus (second from the left), and inferior antihelix crus (third from the left), which we use in the ear graph representation in Section 3.7.
Equation (5) is rewritten in the following form:
. (8) T TX P C= T
The factorial code (architecture 2) uses ICA of TC .
. (9) TC MU=By substituting (6) into (5),
. T TX P MU=
Hence,
T TX U M P= . (10)
In this representation, feature vectors are rows of and the base images are rows of TU
TM P . The base images for this representa-tion are shown in Figure 1 (d). In this representation, it is known that global features or face-like images appear in the base images [15] in the case of a face. Consistent with this knowledge, one can observe that earlike im-ages appear in the base images (Figure 1 (d)). An interested reader can refer to [14] and [15]
for additional details on application of ICA for face recognition.
In the experiment demonstrated in Section 5.1.2, we surveyed two parameters: the number of principal components (11–242, every 11 steps) and image size (25%–100%, in 5% in-crements) in the PCA phase.
Feature Vectors of Linear Discriminant Analysis The purpose of LDA is to maximize the inter-class scatter while simultaneously minimizing the intraclass scatter. The problem can be for-mulated using the Fisher criterion:
( ) arg maxT
bF T
W W
W S WJ W
W S W= , (11)
where W is a linear transformation matrix. Here, is the interclass scatter, and is the intraclass scatter matrix defined by
Sb Sw
( )(1 j
N Tjw i i
j i cS
= ∈
= − −∑∑ x x x x )j , (12)
( )( )1
,N T
j jbj
S=
= − −∑ x x x x (13)
where N is a number of class, and x is the average of all feature vectors . Here, x i ,j jc n ,
and jx represent the index set, the number of members, and the average of the j-th class, respectively. This problem reduces to the following generalized eigenvalue problem:
bS Swλ=w w . (14)
Interclass scatter matrix S and the intraclass scatter matrix are obtained from the expansion coefficient of C of the images in the gallery. By solving (14), a maximum of N − 1 (number of classes minus 1) generalized unit eigenvectors
b
1
Sw
1,..., N−w w , called discriminant vectors, are obtained. The linear transforma-
15

tion is a transformation W attaining a maximum of Eq. (13). This transformation maps feature vectors described by expansion coefficients of principal compo-nents to the LDA-based feature vectors, emphasizing interclass scatter as follows:
( 1,...,Tlda NP −= w w
Tlda lC P=
Clda
ldaC =
Tlda
)1
T , (15) daC
where is a matrix of feature vectors obtained by LDA. Rearranging this, we obtain
. (16) TldaCP
This equality can be interpreted as follows. LDA feature vectors in each row of are obtained by dot products of PCA feature vec-tors in the rows of C and discriminant vectors in the columns of
ldaC
P . Since (16) implies
, using (5) we have ( ) 1Tlda ldaC C P
−=
lda ( ) 1TldaX C P= P
−. (17)
The base images are rows of ( TldaP e
of which are shown in Figure 1 (e). Following [14], we have applied LDA on PCA feature spaces to avoid problems of small sample sizes. An interested reader can refer to [14] for additional details.
) 1−P , som
In the experiment demonstrated in Sections 5.1.2 and 5.2.2, we surveyed two parameters: the number of principal components (11–242, every 11 steps) and image size (25%–100%, in 5% increments) in the PCA phase. The range of the parameter search (~242) is determined by the maximum expected rank of intraclass scatter , which is known to be at most 242 wS[= (363 − 1) − (121 − 1)].
Feature Vectors of Enhanced ICA Using class-specific information, as in LDA, may enhance the discrimination ability of ICA. Based on this concept, Enhanced ICA was introduced by Chang and Pedrycz [17] by
in architecture 1, LDA is applied to CM in Eq. (7) to obtain a version of Enhanced ICA repre-sentation based on architecture 1: T
1_ 1_A lda A ldaC CMP=, (18)
where feature vectors are rows of
8), we have
1_A ldaC .
From (1
( ) 11_ 1_
TA lda A ldaCM C P
−= . (19)
), we have
By using (7
( ) 11_ 1_
TA lda A ldaX C P
−= U . (20)
The base images are rows of ( ) 11_
TA ldaP U
−,
some of which are shown in F
It can be observed that these base images
igure 1 (f).
are
In architecture 2, LDA is applied to in Eq. the
“earlike” and do not display the location of local features, as in the case without LDA (Figure 1 (c)). The base images are “earlike” and represent global features as in the images of LDA (Figure 1 (e)).
U T
(10) to obtain the version of LDA representation based on architecture 2:
T T2_ 2_A lda A ldaC U P= , (21)
where feature vectors are rows of .
From (21), we have
2_A ldaC
( ) 12 _ 2 _
T TA lda A ldaU C P
−= . (22)
By using (11), we obtain
( ) 12 _ 2 _
T TA lda A ldaX C P M
−= P . (23)
The base images are rows of ( ) 12 _
T TA ldaP M
−, P
Figure 1 (g). Thesome of which are shown in base images are “earlike” and represent global features as in the images of LDA (Figure 1 (e)).
applying ICA between PCA and LDA. That is,
16

An interested reader can refer to [17] for addi-tional details on the application of Enhanced ICA for face recognition.
In the experiment demonstrated in Section 5.1.2, we surveyed two parameters: the number of principal components (11–242, every 11 steps) and image size (25%–100%, in incre-ments of 5%) in the PCA phase.
Similarity Measures Used for PCA, ICA, LDA, and EICA For PCA, ICA, LDA, and Enhanced ICA, a standard cosine and a measure called the Mahalanobis cosine are used as similarity measures. Let ( ), = ⋅v w v w be a standard Euclidean inner product of feature vectors v and , and w θ be the angle between feature vectors and . Then, the cosine of the angle between them is given by
v w
( )
( )( ),
cos, ,
θ =v w
v v w w (24)
Note that an inner product defining the Mahalanobis distance is given by
(25) ( ) ( 1, ,M
S −=v w v w)where S−1
S is a pseudo inverse of a scatter
matrix . We introduce a notion of the Mahalanobis cosine defined by
( )
( ) ( ),
cos, ,
MM
M M
θ =v w
v v w w, (26)
which has not yet been examined thoroughly.
For a better understanding of this measure, let us consider the table of similarities T, where each column index corresponds to an identity in the gallery and each row index corresponds to that of the probe. Let us consider the whitening or sphering of gallery data by the scatter matrix S of the gallery. Let us also consider the whitening or sphering of probe data by the scatter matrix S of the gallery. Then, the similarity table T with the standard cosine measure between these sphered galler-
ies and the probe is identical to the similarity table with the Mahalanobis cosine measure of the gallery and probe before sphering. The authors of [15,16], in order to investigate the discrimination ability of their proposed feature vectors, used L1, L2, the Mahalanobis dis-tance, and the cosine as similarity functions. They reported that the cosine outperforms other similarity functions. Hence, we have introduced this similarity function in order to further exploit its capabilities. In Section 5, we compare the recognition performance of these feature vectors using the nearest-neighbor classifier.
Gabor Jets A Gabor filter is defined by the following kernel function [13]:
( )
2 2 2
2 2
2
( ) exp2
exp exp2
i
σ σ
σ
⎛ ⎞⎜ ⎟Ψ = −⎜ ⎟⎝ ⎠
⎛ ⎞⎛ ⎞× ⋅ −⎜ ⎟⎜ ⎟⎜ ⎟⎝ ⎠⎝ ⎠
k
k k vv
k v
(27)
where ( ),x y=v is the coordinate of a point
under consideration, and ( , )x yk k=k is a wave vector representing a plane wave. This kernel function is a plane wave restricted by a Gaus-sian kernel. The width of the Gaussian kernel depends on the parameter σ . In this study, we set 2σ π= . The second term ( )2exp
Ψ k (v)d∫
2σ in (27) is responsible for placing the kernel (27) in a DC-free condition .
This condition is also called a wavelet condi-tion.
2v = 0
Corresponding to eight different orientations with index 0,..., 7μ = , and five different fre-quencies with index 0,..., 4ν = , 40 ( ) wave vectors
8 5 40× =
jk given by
( )( 2)/22 cos( / 8),sin( / 8)
8j
j
ν π πμ πμ
μ ν
− +=
= +
k (28)
are employed to cover a band evenly in fre-quency space. These wave vectors define 40 kernel functions that are convoluted with a
17

given grayscale image ( )I v expressed as a
function of a coordinate ( , )x y=v as follows:
18
( ) ( ) ( ) 2
1,..., 40jjJ I d
j
= Ψ −
=∫ kv u v u u , (29)
These convolutions are realized using Fourier transform and form a 40-dimensional complex vector, ( )1 40( ) ( ) … ( )J J= , ,J v v v . This vector is termed a Gabor jet and is used as a visual fea-ture of a grayscale image I(v) at the point v under consideration. The primary visual area of the brain contains neurons with orientation selectivity similar to that of Gabor jets. Fur-ther, the receptive field characteristic of simple cells in the visual cortex of cats is approxi-mated using the Gabor filter [24]. Interested readers can refer to [13] for additional details. In the experiment demonstrated in Sections 5.1.2 and 5.2.2, we surveyed the parameter of image size (25%–100%, in 5% increments). Jet Similarity Function Owing to phase rotation, jets taken from image points only a few pixels apart have very different coefficients, although they represent almost the same local feature. Therefore, we either ignore the phase or compensate for its variation explicitly. For ear detection, ignoring the phase, we use the following similarity function:
2 2
'( , ')
'
j jj
a
j jj j
a aS
a a=
∑
∑ ∑J J
, (30)
for sampled jets J and reconstructed jets obtained by PCA, which will be detailed in Section 4.
'J
For ear recognition, compensating for the phase shift between two jets J and ' refer-
ring to object locations with small relative displacement , we use the following similar-ity function:
J
d
( )
2 2
' cos '( , ')
'
j j j jj
j jj j
a aS
a aφ
φ φ− − ⋅=∑
∑ ∑
d kJ J , (31)
where 0 ,.. 39( ., )z z=J and exp( )j jz a iφ= .
To compute this function, the displacement must be estimated. Following the instructions in [25] and [26], this displacement is obtained by computing the maximum of (31) in its sec-ond-order Taylor expansion.
d
Ear Graph Representation and Similarity between the Graphs Anthropometric observation reveals that the shape of the triangle made by the body of the antihelix, superior antihelix crus, and inferior antihelix crus varis greatly from individual to individual [3]. It follows that Gabor jets [13] on these feature points and the relative geometrical information of these points are obtained from the gallery images and stored in the form of a labeled graph. These graphs are termed “ear graphs” and will be used for per-sonal identification (Figure 2). For ear detec-tion, PCA of the Gabor jets is employed (Sec-tion 4) to obtain eigen jets. The averaged ear graph with eigen jets is termed the “eigen ear graph.”
By sampling the Gabor jets of points on the gallery and probe images, the similarity between the two images is obtained. The similarity is defined as the maximum of the following product function:
( ) ( )( ), 'i iS S= J v J v3
1i=∏ , (32)

body of the antihelix
superior antihelix crus
Gabor jets
an ear graph
inferior antihelix crus body of the
antihelix
superior antihelix crus
eigen jetseigen jets
eigen ear graph the eigen ear graph
inferior antihelix crus
inferior antihelix crus body of the
antihelix
superior antihelix crus
body of the antihelix
inferior antihelix crus
superior antihelix crus
body of the antihelix
superior antihelix crus
Gabor jets
an ear graph
inferior antihelix crus body of the
antihelix
superior antihelix crus
eigen jetseigen jets
eigen ear graph the eigen ear graph
inferior antihelix crus
inferior antihelix crus body of the
antihelix
superior antihelix crus
body of the antihelix
inferior antihelix crus
superior antihelix crus
Figure 2. Ear graph and eigen ear graph.
where are the vertices of the ear graph from the gallery image, and are the correspond-ing points of the probe image obtained by template matching. Here,
iv'iv
S is Sa (J,J') +1( 2) for ear detection and Sφ (J,J') +1( 2) for ear recognition. In Section 5, we compare the recognition performance of these feature vec-tors using the nearest-neighbor classifier.
4. PROPOSED EAR DETECTION ALGORITHM
Ear detection is a necessary first step in ear recognition systems, which aims at localizing and extracting ear regions from the background. In the detection phase of EBGM [13], scanning of the averaged face graph with averaged geo-metric information, whose vertices are labeled with averaged jets, is used. In the paper on eigen-face recognition [18], a detection algo-rithm is proposed based on the “distance from face space” (DFFS), which exploits the dis-tance between the vectorized image of the scanning window and the reconstructed image determined using PCA. Motivated by these ideas, we introduce a new ear detection algo-rithm that exploits the similarity between the Gabor jets and the reconstructed jets deter-mined using eigen jets obtained by PCA.
The algorithm is as follows:
1. Average geometric information of an ear graph in the gallery is obtained.
2. Let RJ be the 240-dimensional vector obtained using the Gabor jets of three feature points, , of each ear graph in the gallery. Applying PCA to the 240-dimensional vector RJ , we obtain unit eigen jets, 1, , nu u… . The vector space spanned by these eigen jets is called the jet space.
2 3( ), ( ), and ( )1J v J v J v
3. An averaged ear graph with eigen jets is termed the “eigen ear graph.”
4. Raster scanning of the eigen ear graph is performed by sampling the Gabor jets of
3 at each corre-sponding point of the probe image, and a 240-dimensional vector 'RJ is obtained
for each point. Here, 'RJ is projected to the jet space by the following equation:
2( ), ( ), and ( )' ' '1J v J v J v
. (33) ( )1
'' 'n
k kk=
= ⋅∑R RJ J u u
19

Reconstructed jets, ,
are obtained from . The similarity be-tween the reconstructed jets and sampled jets is computed using Eqs. (30) and (32). We call this jet space similarity. The location with the highest jet space similarity is the probable location of the ear. In real-world applications, an image may show no ears or more than one ear. Therefore, by applying operating thresh-olds determined by receiver operator characteristics (e.g., by the similarity at an equal error rate), one can determine the likely location of the ear.
2' ( ), '( ), and '( )' ' '1J v J v J v
''RJ3
5. EXPERIMENTS ON EAR RECOGNITION
Hair Occlusion and Pose Variation Experiment The database used in the hair occlusion and pose variation experiment First, the performances of recognition algo-rithms in Section 3 were examined. In this experiment, following [10], right-profile im-ages with a resolution of 720 × 576 from the XM2VTS database [20] were used. In this database, pictures of 294 subjects were cap-tured during four sessions spread over a 5-month period. There are two samples of each subject in each session, which means that this database consists of eight samples for each subject.
In all, 121 subjects were selected with their right ears somewhat visible in four separate sessions. For some subjects, one of the images in a session may not contain a visible ear. Thus, we selected one image out of the two for each session. Hence, we obtained 121 sets of four images.
Since PCA, ICA, LDA, and EICA are algo-rithms aimed at enhancing the discrimination ability of feature vectors, it is necessary to create initial feature vectors from the region of interest that are subjected to these algorithms. Following the instructions in [14,15,17,18], we used the vectorized clipping window of the region under consideration. Hence, for PCA,
ICA, LDA, and EICA, the ear images are clipped to 73 × 111 pixels.
The centroid of the three feature points is ar-ranged to lie within the 73 × 111 clipping win-dow. Histogram equalization is applied to preprocess the images (Figure 3) and vector-ized.
Figure 3. An example of ear cropping.
Within the 121 sets, 36% have images partly occluded by hair, 4% have pose variations of up to 12°, and 7% are jagged images (Figure 4).
Given that [14,15,17] aim to describe new feature vectors, in order to crop ear images, we need to establish landmarks by a manual proc-ess or by object detection algorithms. Since this section focuses only on a pure comparison of recognition performance, excluding the effects of inaccuracy of the detection algorithm, we manually located three feature points as accurately as possible.
Hair occlusion and pose variation experiment For each experiment, there is a separate (gallery, probe) dataset. The gallery represents a “watch list,” which is a list of those people enrolled in the system who are to be recognized. Probes are images given to the system to be matched against the gallery. For each probe, an element of the gallery with the highest similarity to the probe is selected. If the identity of the selected element of the gallery matches that of the probe, the person is identified successfully. Then the probe image is graded as rank one. (By extending the
20

Figure 4. Database used in the pose variation and hair occlusion experiment.
question “Is the top match correct?” to “Is the correct answer in the top n matches?” a probe is graded as rank n if there are n − 1 gallery images whose similarities with the probe are higher than those with the correct gallery data corresponding to the identity of the probe. The ratio of the number of probe images graded as rank one to that of all probe sets is called the rank-one recognition rate [19].) In an identification scenario, we evaluate the recognition performance of the algorithms using the rank-one recognition rate. As there are four sets of images, we examined 12 (= 4 × 3) gallery and probe set pairs.
The basic principle of this experiment is four-fold cross validation. One set out of the four is selected as the probe set, and the remaining three provide PCA eigenvectors and serve as the gallery set. For this ear recognition experiment, we surveyed two parameters: the number of principal components (10–241, every 11 steps) and image size (25%–100%, in increments of 5%) in the PCA phase. Hence, 22 (principal components) × 16 (image sizes) for 18 (algorithms) × 2 (similarities) × 12 (gallery probe combinations) are examined for PCA, ICA, LDA, and EICA. For recognition
based on Gabor jets, 16 image sizes × 12 (gallery probe combinations) are examined. The best-performing image size and number of principal components were obtained by means of MPI programming on 32 Itanium processors running in parallel. We implemented these algorithms in Section 3 using C++ with IT++ library, which allows similar code to be written to that for MATLAB.
A combination of PCA, ICA, and LDA is also examined. The rank-one recognition rate for each image size and number of principal components are averaged over 12 combinations of the gallery and probe. The best averaged rank-one recognition rates, with 95% confidence intervals, are given in Figure 5, where the ordinate axis stands for the rank-one recognition rate (%) for each algorithm aligned on the abscissa axis.
In this figure, E denotes the Euclidean cosine, and M denotes the Mahalanobis cosine; both are used for similarity measurement. Here, “info1” denotes Infomax architecture 1, and so on.
Comparing overall, we obtained the following results:
21

Figure 5. Hair occlusion and pose variation experiment.
• The average rank-one recognition rate of EICA (e.g., PCA + fast2 + LDA + E) (93.3 ± 1.7; n = 12) was 13.7% higher than that of PCA (PCA + E) (79.6 ± 3.0; n = 12), 8.4% higher than that of ICA (e.g., PCA + fast2 + E) (84.7 ± 3.1; n = 12), and 3.3% higher than that of Gabor jets (91.0 ± 1.0; n = 12) on the basis of a pair-sample t-test (t = 9.79, 6.18, 2.59 respectively, 11 d.f., p < 0.005).
Regarding the effect of implementing LDA, we obtained the following findings:
• The average rank-one recognition rate of EICA (e.g., PCA + fast2 + LDA + E) (93.3 ± 1.7; n = 12) was 8.4% higher than that of ICA (e.g., PCA + fast2 + E) (84.7 ± 3.1; n = 12) on the basis of a pair-sample t-test ( t = 6.18, 11 d.f., p < 0.005).
22
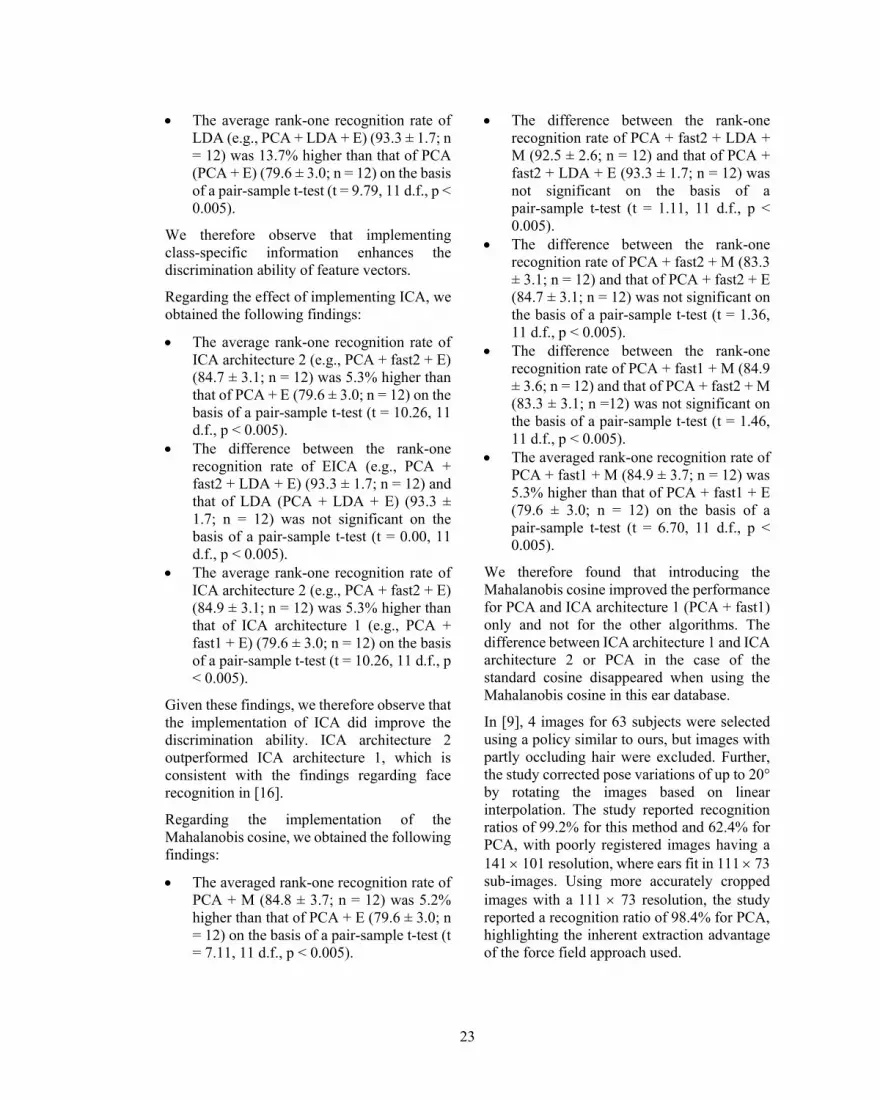
• The average rank-one recognition rate of LDA (e.g., PCA + LDA + E) (93.3 ± 1.7; n = 12) was 13.7% higher than that of PCA (PCA + E) (79.6 ± 3.0; n = 12) on the basis of a pair-sample t-test (t = 9.79, 11 d.f., p < 0.005).
We therefore observe that implementing class-specific information enhances the discrimination ability of feature vectors.
Regarding the effect of implementing ICA, we obtained the following findings:
• The average rank-one recognition rate of ICA architecture 2 (e.g., PCA + fast2 + E) (84.7 ± 3.1; n = 12) was 5.3% higher than that of PCA + E (79.6 ± 3.0; n = 12) on the basis of a pair-sample t-test (t = 10.26, 11 d.f., p < 0.005).
• The difference between the rank-one recognition rate of EICA (e.g., PCA + fast2 + LDA + E) (93.3 ± 1.7; n = 12) and that of LDA (PCA + LDA + E) (93.3 ± 1.7; n = 12) was not significant on the basis of a pair-sample t-test (t = 0.00, 11 d.f., p < 0.005).
• The average rank-one recognition rate of ICA architecture 2 (e.g., PCA + fast2 + E) (84.9 ± 3.1; n = 12) was 5.3% higher than that of ICA architecture 1 (e.g., PCA + fast1 + E) (79.6 ± 3.0; n = 12) on the basis of a pair-sample t-test (t = 10.26, 11 d.f., p < 0.005).
Given these findings, we therefore observe that the implementation of ICA did improve the discrimination ability. ICA architecture 2 outperformed ICA architecture 1, which is consistent with the findings regarding face recognition in [16].
Regarding the implementation of the Mahalanobis cosine, we obtained the following findings:
• The averaged rank-one recognition rate of PCA + M (84.8 ± 3.7; n = 12) was 5.2% higher than that of PCA + E (79.6 ± 3.0; n = 12) on the basis of a pair-sample t-test (t = 7.11, 11 d.f., p < 0.005).
• The difference between the rank-one recognition rate of PCA + fast2 + LDA + M (92.5 ± 2.6; n = 12) and that of PCA + fast2 + LDA + E (93.3 ± 1.7; n = 12) was not significant on the basis of a pair-sample t-test (t = 1.11, 11 d.f., p < 0.005).
• The difference between the rank-one recognition rate of PCA + fast2 + M (83.3 ± 3.1; n = 12) and that of PCA + fast2 + E (84.7 ± 3.1; n = 12) was not significant on the basis of a pair-sample t-test (t = 1.36, 11 d.f., p < 0.005).
• The difference between the rank-one recognition rate of PCA + fast1 + M (84.9 ± 3.6; n = 12) and that of PCA + fast2 + M (83.3 ± 3.1; n =12) was not significant on the basis of a pair-sample t-test (t = 1.46, 11 d.f., p < 0.005).
• The averaged rank-one recognition rate of PCA + fast1 + M (84.9 ± 3.7; n = 12) was 5.3% higher than that of PCA + fast1 + E (79.6 ± 3.0; n = 12) on the basis of a pair-sample t-test (t = 6.70, 11 d.f., p < 0.005).
We therefore found that introducing the Mahalanobis cosine improved the performance for PCA and ICA architecture 1 (PCA + fast1) only and not for the other algorithms. The difference between ICA architecture 1 and ICA architecture 2 or PCA in the case of the standard cosine disappeared when using the Mahalanobis cosine in this ear database.
In [9], 4 images for 63 subjects were selected using a policy similar to ours, but images with partly occluding hair were excluded. Further, the study corrected pose variations of up to 20° by rotating the images based on linear interpolation. The study reported recognition ratios of 99.2% for this method and 62.4% for PCA, with poorly registered images having a 141 × 101 resolution, where ears fit in 111 × 73 sub-images. Using more accurately cropped images with a 111 × 73 resolution, the study reported a recognition ratio of 98.4% for PCA, highlighting the inherent extraction advantage of the force field approach used.
23

As we have a dedicated accurate ear detection algorithm, we used accurately cropped images for the comparison of algorithms in the ear recognition phase. Further, one of the objectives of this study was to find algorithms that are robust against slight pose variations and partial hair occlusions; therefore, we made no changes with respect to pose variations and included slightly less controlled images, making a larger image set of 121 subjects than that used in [9].
Illumination Change Experiment Database for the experiment testing robustness against illumination change Next, the system’s recognition performance was examined. In this experiment, right-profile images with a resolution of 486 × 640 from the PIE database were used [28]. This database consists of images of 68 subjects. For a given pose, 24 images were captured under various illuminations for each subject. The ear image was clipped to 40 × 60 pixels. The centroid of the three feature points described in Section 3.7 was set to lie within the 40 × 60 clipping window. Since images with different illuminations were captured within a very short interval, the reference points were located at the same places for all 24 images. Histogram equalization was applied to preprocess the images. After eliminating images with no information after contrast enhancement, 20 images of each subject remained, making 20 sets of 64 images corresponding to 64 subjects (Figure 6).
Experiment testing robustness against illumination changes The principle behind this experiment is similar to the 20-fold cross-validation scheme. One image is selected as a probe, and the remaining 19 images are used for PCA preprocessing. A gallery image is selected out of 19 images. This experiment is repeated 20 times, according to the images selected as the probe. The rank-one recognition rates for these experiments are shown in Figure 7, where the ordinate axis is the rank-one recognition rate (%) for each algorithm aligned on the abscissa axis. In order
(a) Images before contrast enhancement.
(b) Images after contrast enhancement.
Figure 6. Database for the experiment testing robustness against illumination
changes.
Figure 7. Illumination change experiment
(with standard cosine).
to perform a statistical comparison, we have provided a 95% confidence interval for the graph. Abbreviations in this figure are similar to those in Figure 5.
24

The results of this experiment are remarkable. LDA has the best performance among all algorithms. These results are even better than those discussed in Section 5.1. Hence, through the experiments described in Sections 5.1 and 5.2, it can be seen that the accurate location of the ear and the use of a large number of training data can overcome the issues of lighting control.
Experiment for robustness against image size reduction in comparison with frontal face In this experiment, XM2VTS datasets were used. Ten coordinates of eyes, a nose, and a lip (Figure 8) manually configured for three sessions for 200 subjects were provided by XM2VTS; these three sets of frontal images were used for the comparison experiment.
Figure 8. Feature points of a face.
The images were resized to the ear size by linear interpolation for a fair comparison. Given that the resolution of an ear image is 73 × 116 pixels, the frontal face was first rescaled so that the facial parts fit in a 92 × 92 window. Recognition ratios were examined thoroughly at increments of 10% reductions in size from 100% to 30%. For this experiment, Gabor jets were used. The results are presented in Figure 9, where the ordinate axis is the rank-one recognition rate (%) and the abscissa axis is the image size reduction ratio (%) from the initial size.
Figure 9. Robustness against image size
reduction in comparison with frontal face.
In order to perform a statistical comparison, we provided a 95% confidence interval for the graph. It is interesting that, in cases where images were of very low resolution, ear recognition outperformed face recognition.
The same conclusion may not be reached if other algorithms are employed. However, preliminary experiments performed on PCA, ICA, LDA, and Enhanced ICA revealed that the trends are more or less the same.
6. EXPERIMENTS ON EAR DETECTION
In the ear detection experiment, four datasets of 121 subjects from Section 5.1.1 were used. One set was selected as a training set, and ear detection experiments were performed on the remaining three sets. Experimental data was obtained by exchanging training sets four times. The criterion used to establish correct determination was that the three feature points, as in the previous sections, were manually selected for all four sets. Some examples of ear detection are presented in Figure 10.
From the center of gravity of these three feature points, the foreground is established as a disk with a radius of 1 pixel. A false acceptance ratio (FAR) and a false rejection ratio (FRR) yield a receiver operator
25

Figure 10. Examples of ear detection.
characteristic (ROC) curve in the form of a scatter diagram (Figure 11), where the ordinate axis is the FRR (%), and the abscissa axis is the FAR (%). In order to perform a statistical comparison, we have provided a 95% confidence interval for each graph.
Figure 11. Receiver operator
characteristic (ROC) of ear detection algorithms.
It can be seen that the proposed ear detection algorithm introduced in Section 4 performs better than averaged jets and DFFS.
7. DISCUSSION Summarizing the results from the ear recognition experiments in Section 5, we find the following. ICA enhances the discrimination ability of PCA. Consistent with studies on face recognition (e.g., [15] and [16]), the use of statistics of higher order than those in PCA may be effective in creating feature vectors appropriate for discrimination in the presence of day-to-day variation using this ear dataset. The discrimination ability of ICA is further enhanced by using LDA. Consistent with studies on face recognition (e.g., [14] and [17]), the use of class-specific information may be effective in creating feature vectors appropriate for discrimination in the presence of pose variations, hair occlusions, and lighting inconsistency using this ear dataset.
However, no significant performance difference was found between EICA and LDA in this dataset. Similar results were reported in [17] for face recognition. This might be a data-specific issue. However, it may be that seeking the independence of the data and class-specific information are not independent search strategies, and they may be somehow related to each other. The fact that base images for LDA-based algorithms represent all global features may somehow point to the reason for this. Further research should be performed to determine the true cause of this lack of difference in performance. In this experiment, we did not use class-specific information for Gabor jets. However, the performance of Gabor jets is high (slightly lower than but close to that of EICA and LDA). Ears have a very “wavy” shape, similar to that of Gabor kernels. This may be the reason for the high discrimination ability of the Gabor jets on ears.
Given the relatively high performance of Gabor jets, further research should be performed regarding the use of class-specific information on Gabor jets.
26

Overall, given the image sets used in the experiments in Section 5, we found evidence that ear biometrics using the present algorithms is relatively robust against pose variations, hair occlusion, and inconsistent lighting.
Summarizing the findings from the ear detection experiments in Section 6, we found that the new ear detection algorithm proposed in Section 4 outperforms that in [13] (averaged jets) and [18] (DFFS). This result can be easily understood because the proposed new algorithm merges the approaches of [13] and [18]. Similar to the case of ear recognition, the wavy shape of Gabor kernels may enhance the detection ability of DFFS.
8. CONCLUSIONS Fully automatic and robust ear recognition systems using only 2D grayscale still images have been presented. Combining the experimental results of ear detection and ear recognition in Sections 5 and 6, an ear detection algorithm based on jet space similarity and a LDA-based ear recognition algorithm together provide robustness against pose variations, hair occlusions, and changes in lighting, yielding a fully automatic ear recognition system. Our experiments provide evidence that ear biometrics has the potential to be used in real-world applications for identifying humans by their ears.
ACKNOWLEDGMENTS We acknowledge the use of the XM2VTS database, the PIE database and associated documentation.
Parts of the experimental results of this research were obtained using supercomputing resources at the Information Synergy Center, Tohoku University. We thank Mr. Y. Noguchi for assistance in MPI programming. We would also like to thank the anonymous referees for their valuable comments in improving this paper.
REFERENCES [1] A. Iannarelli, Ear Identification, Foren-
sic Identification Series, Paramount Publishing Company, Fremont, 1989.
[2] A. Bertillon, “La photographie judi-ciaire,” avec un appendice sur la classi-fication et l’identification anthoro-pometriques, Gauthier-Villars, Paris, 1890.
[3] K. Shinohara, T. Minami, and Y. Yuki, “Personal Identification through Ear-Images with Morphological Opera-tions,” The Journal of the IIEEJ, Vol. 21, No. 5, pp. 528-535, 1992.
[4] B. Moreno and A. Sanchez, “On the Use of Outer Ear Images for Personal Identification in Security Applications,” IEEE 33rd Annual Intl. Conf. on Secu-rity Technology, pp. 469-476, 1999.
[5] B. Viktor, K.W. Bowyer, and S. Sarkar, “An Evaluation of Face and Ear Bio-metrics,” Proceedings of International Conference on Pattern Recognition, pp. 429-432, 2002.
[6] K. Chang, K.W. Bowyer, and S. Sarkar, “Comparison and Combination of Ear and Face Images in Appearance-Based Biometrics,” IEEE Transactions on Pat-tern Analysis and Machine Intelligence, Vol. 25, No. 9, pp. 1160-1165, 2003.
[7] T. Yuizono, Y. Wang, K. Satoh, and S. Nakayama, “Study on Individual Rec-ognition for Ear Images by Using Ge-netic Local search,” Proceedings of the 2002 Congress on Evolutionary Computation (CEC2002), pp. 237-242, 2002.
[8] D. J. Hurley, M. S. Nixon, and J. N. Carter, “Force Field Energy Functionals for Image Feature Extraction,” Image and Vision Computing Journal, Vol. 20, pp. 311-317, 2002.
[9] D. J. Hurley, M. S. Nixon, and J. N. Carter, “Force field extraction for ear biometrics,” Computer Vision and Im-
27

age Understanding, Vol. 98, No. 3, pp. 491-512, 2005.
[10] E. Jeges and L. Mate, “Model-Based Human Ear Localization and Feature Extraction,” IC-MED Journal, Vol. 1, 2, pp. 101-112, 2007.
[11] H. Chen and B. Bhanu, “Human Ear Recognition in 3D,” IEEE Transactions on Pattern Analysis and Machine Intel-ligence, Vol. 29, 4, pp. 718-737, 2007.
[12] P. Yan and K. W. Bowyer, “Biometric Recognition Using 3D Ear Shape,” IEEE Transactions on Pattern Analysis and Machine Intelligence, Vol. 29, 8, pp. 1297-1308, 2007.
[13] L. Wiskott, J-M. Fellous, N. Kruger, and C. Malsburg, “Face Recognition by Elastic Bunch Graph Matching,” IEEE Transactions on Pattern Analysis and Machine Intelligence, Vol. 19, No. 7, pp. 775-779, 1997.
[14] P. N. Belhumeur, J. P. Hespanha, D. J. Kriegman, “Eigenfaces vs Fisherfaces: Recognition using class specific linear projection,” IEEE Transactions on Pat-tern Analysis and Machine Intelligence, Vol. 19, No. 7, pp. 711-720, 1997.
[15] M. S. Bartlett, “Face Recognition by Independent Component Analysis,” IEEE Transactions on Neurarl net-works, Vol. 13, No. 6, pp. 1450-1464, 2002.
[16] B. A. Draper, K. Beak, M. S. Bartlett, and J. R. Beveridge, “Recognizing faces with PCA and ICA,” Computer Vision and Image Understanding, Vol. 9, pp. 115-137, 2003.
[17] K. Keun-Chang W. Pedrycz, “Face Recognition Using an Enhanced Inde-pendent Component Analysis Ap-proach,” IEEE Transactions on Neural Networks, Vol. 18, No.2 , pp. 530-541, 2007.
[18] M. Turk and A. Pentland, “Eigenfaces for Recognition,” Journal of Cognitive
Neuroscience, Vol. 3, No. 1, pp. 71-86, 1991
[19] P.J. Philips, H. Wechsler, J. Huang, and P.J. Rauss, “The FERET database and evaluation procedure for face-recognition algorithms,” Image and Vision Computing, Vol. 16, pp. 295-306, 1998.
[20] K. Messer, J. Matas, J. Kittler, J. Luettin, and G. Maitre, “XM2VTSDB: the extended M2VTS Database,” Pro-ceedings 2nd Conference on Audio and Video-base Biometric Personal Verifi-cation (AVBPA '99) Washington DC, 1999, SVSSP, URL: http://www.ee.surrey.ac.uk/Research/VSSP/xm2vtsdb/
[21] A. Hyvarinen and E. Oja. “A fast fixed-point algorithm for independent component analysis,” Neural Computa-tion, Vol. 9, pp. 1483-1492, 1997.
[22] A. J. Bell and T. J. Sejnowski. “Infor-mation maximization approach to blind separation and blind deconvolution,” Neural Computation, Vol. 7, pp. 1129-1159, 1995.
[23] J.-F. Cardoso and A. Souloumiac. “Blind beamforming for non Gaussian signals,” IEE Proceedings F, Vol. 140, No. 6, pp. 362-370, 1993.
[24] J. Daugman, “Entropy reduction and decorrelation in visual coding by ori-ented neural receptive fields,” Transac-tions on Biomedical Engineering, Vol. 36, No. 1, pp. 107-114, 1989.
[25] D.J. Fleet and A.D. Jepson, “Computa-tion of component image velocity from local phase information,” International Journal of Computer Vision, Vol. 5, No. 1, pp. 77-104, 1990.
[26] W.H. Theimer and H.A. Mallot, “Phase-based binocular vergence con-trol and depth reconstruction using ac-tive vision,” CVGIP - Image Under-
28

Takuro Ueda re-ceived his B.E. de-gree from Saitama Institute of Tech-nology, Japan, in 2007. His research interests include biometrics and im-age processing.
standing, Vol. 60, No. 3, pp. 343-358, 1994.
[27] D. Watabe, H. Sai, K.Sakai, and O. Nakamura, “Ear Biometrics using jet space similarity,” IEEE Canadian Con-ference on Electrical and Computer Engineering, pp. 1259-1263, 2008.
[28] T. Sim, S.Barker, and M. Best, “The CMU Pose, illumination, and Expres-sion Database,” IEEE Transactions on Pattern Analysis and Machine Intelli-gence, Vol. 5, No. 12, pp. 1615-1618, 2003.
Katsuhiro Sakai received his B.E. and M.S. degrees from Tohoku Uni-versity, Japan, in 1967 and 1970, respectively. He obtained his D.E. degree from Osaka University, Japan.
He is a professor at Saitama Institute of Technology, Japan. His research interest includes computational fluid dynamics and environment engineering, specifically wind turbines. He is a member of The Japan Society of Fluid Mechanics.
AUTHOR INFORMATION Daishi Watabe received his M.S. and D.S. degrees from Tohoku Uni-versity, Japan, in 1998 and 2000, respectively. He is currently an associ-ate professor of graduate school at Saitama Institute of
Technology. His research interests include biometrics, statistical machine learning, and numerical analysis. He is a member of the Institute of Electronic Engineers of Japan, the Institute of Image and Television Engineers, and IEEE.
Osamu Nakamura received his B.E. degree in Electron-ics in 1969, M.E. degree in Electrical Engineering in 1971, and D.E. de-gree in 1983, all from Kogakuin University. Since
1971, he has been working on learning theory, image processing, and picture coding. From 1989 to 1990, he was an invited professor at INRS-telecommunications, Montreal, Canada. He is currently a professor at the Department of Information and Communication Engineering and the graduate school of Kogakuin Univer-sity, Japan. He is a member of the Institute of Electronic Engineers of Japan and IEEE.
Hideyasu Sai re-ceived his B.E. and M.E. degrees from Saitama Institute of Technology, Japan, in 2002 and 2007, respectively. He is currently a graduate student at the insti-tute. His research interests include
biometrics and image processing. He is a member of the Institute of Electronic Engineers of Japan and the Institute of Elec-tronics, Information and Communication Engineers.
29


