Embed Size (px)
Citation preview
CGU HS Committee on River Ice Processes and the Environment
19th Workshop on the Hydraulics of Ice Covered Rivers
Whitehorse, YK, Canada, July 10th-12th, 2017
Ice-Related Floods and Flood Delineation along Streams and Small Rivers
Benoit Turcotte1, Knut Alfredsen2, Spyros Beltaos3, and Brian C. Burrell4
Research Engineer, Université Laval, Quebec City, QC
Professor, Department of Hydraulic and Environmental Engineering, Norwegian University of
Science and Technology, Trodheim, Norway
Research Scientist, National Water Research Institute, Environment Canada, Burlington, ON
Senior Water Resources Engineer, Water Resources Group, Amec Foster Wheeler Environment
& Infrastructure, Fredericton, NB
[email protected]; [email protected]
ABSTRACT: Streams and small rivers drain relatively small watersheds and are dominant in the
headwater region of large drainage systems. Globally, their cumulative length is an order of
magnitude superior to the length of larger rivers and, despite their limited width and depth, they
can generate significant flooding and severe damage. Streams that have shaped, but also adapted
to valleys of hilly topography present highly variable morphologies and hydraulic conditions over
relatively short distances. A source and a consequence of this diversity is the great variety and
relative intensity of ice processes taking place in their channel during the cold season. Most of
these processes, passive or dynamic, can generate flooding under specific, but common
hydrometeorological conditions. The rise in water levels along streams in hilly and mountainous
regions (gradient above 0.1%) is not only associated with an increased channel roughness, but also
with partial to complete channel blockage. Their unique winter hydrological regime deserves a
special consideration in flood analyses and mitigation. This paper presents an overview of distinct
ice processes taking place in small and steep streams and it illustrates, using quantitative examples,
the preponderance of high water levels and flooding events during the cold season. Approaches to
determine the frequency of ice-related floods are compared to those applied to larger rivers. This
paper is relevant to river engineers and scientists working above 40 degrees of latitude. While it
emphasizes flooding issues, it is also of interest to fluvial geomorphologists as well as aquatic and
riparian biologists.
1. Introduction
A combination of the natural variability of hydrological processes, the impact of climate change,
and human development in flood-prone areas has resulted in greater flood damages around the
globe in recent years. In Canada, this has led to an accelerated governmental effort to delineate
flood hazard areas along watercourses. Research and technical groups have been formed and
funded to define state-of-the-art techniques to delineate flood hazard, to quantify flood risk, and
to lessen flood damages.
Prior publications of this research group have emphasized that ice-jam floods should be considered
in the delineation of the flood zone in cold regions (Burrell et al., 1995; Kovachis et al., 2017).
This effort was inspired by the known fact that the frequency of ice jam-induced high water levels
is often considerable and, at many locations, greater than the frequency of open water high water
levels (Beltaos, 1995, Humes and Dublin, 1988, Tuthill et al., 1996). In addition to the flood
elevation, ice jams are also associated with the presence of drifting ice floes on the flood plain,
which increases the damage potential to infrastructure (Kovachis et al., 2017) and therefore affects
what is defined as the global flood risk, i.e., the frequency of high water levels multiplied by the
exposed vulnerability.
Small watercourses of highly variable sizes and morphologies dominate headwater regions of large
drainage systems and small coastal watersheds. Despite their relatively limited width, depth and
carrying discharge, they can generate significant flooding and severe damage. In cold countries, a
broad diversity of intense ice processes often result in the blockage of stream and small river
channels, especially if steep, causing water levels to rise above the bank elevation, despite the low
discharge. These processes cause water and ice floes to spread onto the flood plain, and can lead
to formation of ice (a few centimetres to many metres thick) outside the channel margin.
The present paper focuses on the winter dynamics of small watercourses, which are commonly
referred to as streams and small rivers. The characteristics of small watercourses and ice processes
are described in the next sections. This is followed by a discussion of the hydraulic effects of ice
processes and of flood hazard and risk delineation. A positive collateral effect of this research is
the potential development of improved methods to forecast and mitigate ice-induced floods. This
paper provides useful information to engineers designing infrastructure along streams in areas
above 40o latitude, as well as to public security services and other public agencies in charge of
organizing concerted efforts to improve the societal resilience to floods.
2. Characteristics of streams
This paper focuses on ice-induced floods taking place along small rivers and streams, which will
simply be referred to as “streams”. Table 1 presents a list of quantitative (hydrological and
geometric) parameters that can be used to differentiate streams from smaller, ephemeral headwater
channels and from larger rivers. These ranges largely correspond to what Meybeck et al. (1996)
considers a small river, a stream, or a small stream, and it could include some brooks.
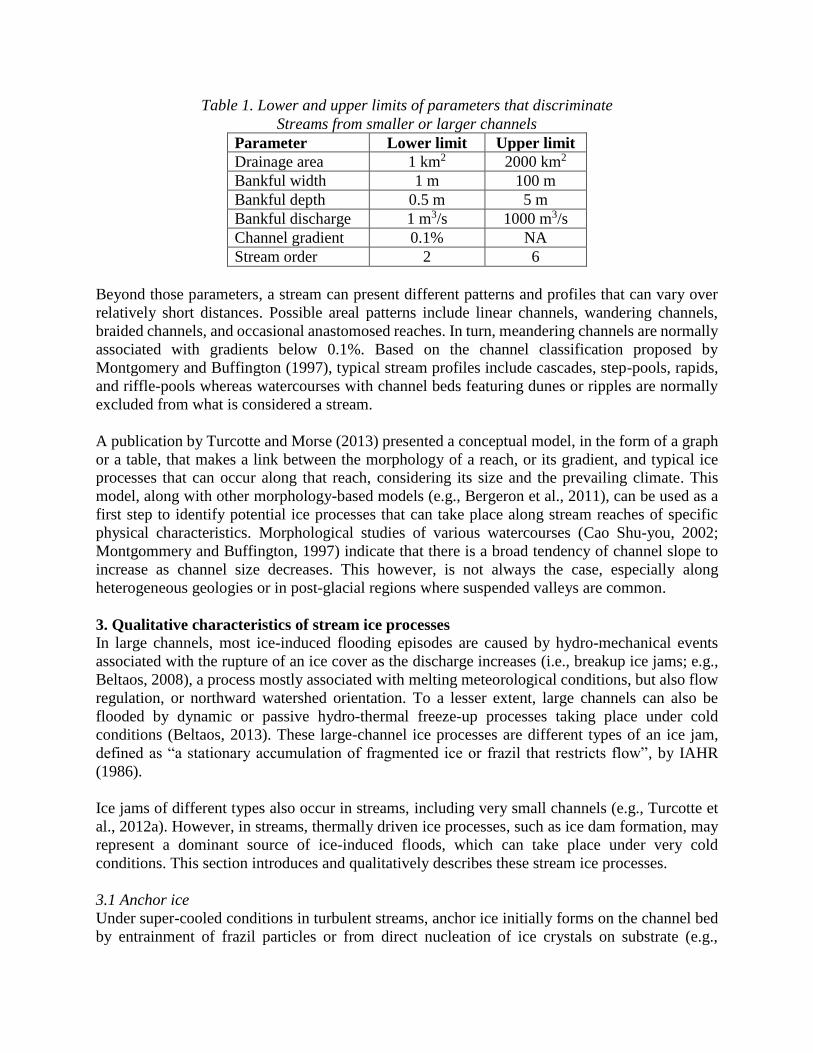
Table 1. Lower and upper limits of parameters that discriminate
Streams from smaller or larger channels
Parameter Lower limit Upper limit
Drainage area 1 km2 2000 km2
Bankful width 1 m 100 m
Bankful depth 0.5 m 5 m
Bankful discharge 1 m3/s 1000 m3/s
Channel gradient 0.1% NA
Stream order 2 6
Beyond those parameters, a stream can present different patterns and profiles that can vary over
relatively short distances. Possible areal patterns include linear channels, wandering channels,
braided channels, and occasional anastomosed reaches. In turn, meandering channels are normally
associated with gradients below 0.1%. Based on the channel classification proposed by
Montgomery and Buffington (1997), typical stream profiles include cascades, step-pools, rapids,
and riffle-pools whereas watercourses with channel beds featuring dunes or ripples are normally
excluded from what is considered a stream.
A publication by Turcotte and Morse (2013) presented a conceptual model, in the form of a graph
or a table, that makes a link between the morphology of a reach, or its gradient, and typical ice
processes that can occur along that reach, considering its size and the prevailing climate. This
model, along with other morphology-based models (e.g., Bergeron et al., 2011), can be used as a
first step to identify potential ice processes that can take place along stream reaches of specific
physical characteristics. Morphological studies of various watercourses (Cao Shu-you, 2002;
Montgommery and Buffington, 1997) indicate that there is a broad tendency of channel slope to
increase as channel size decreases. This however, is not always the case, especially along
heterogeneous geologies or in post-glacial regions where suspended valleys are common.
3. Qualitative characteristics of stream ice processes
In large channels, most ice-induced flooding episodes are caused by hydro-mechanical events
associated with the rupture of an ice cover as the discharge increases (i.e., breakup ice jams; e.g.,
Beltaos, 2008), a process mostly associated with melting meteorological conditions, but also flow
regulation, or northward watershed orientation. To a lesser extent, large channels can also be
flooded by dynamic or passive hydro-thermal freeze-up processes taking place under cold
conditions (Beltaos, 2013). These large-channel ice processes are different types of an ice jam,
defined as “a stationary accumulation of fragmented ice or frazil that restricts flow”, by IAHR
(1986).
Ice jams of different types also occur in streams, including very small channels (e.g., Turcotte et
al., 2012a). However, in streams, thermally driven ice processes, such as ice dam formation, may
represent a dominant source of ice-induced floods, which can take place under very cold
conditions. This section introduces and qualitatively describes these stream ice processes.
3.1 Anchor ice
Under super-cooled conditions in turbulent streams, anchor ice initially forms on the channel bed
by entrainment of frazil particles or from direct nucleation of ice crystals on substrate (e.g.,
Malenchak and Clark, 2013), and it further thickens by in situ growth or by interception of drifting
frazil particles (Figure 1A). Anchor ice is generally seen on top of the substrate, but it can also be
(hydraulically) compacted within the substrate in shallow and/or high turbulent areas (e.g., Stickler
and Alfredsen, 2009). A flume experiment by Kerr et al. (2002) shows how the roughness of the
anchor ice-covered bed may initially increase and then decrease as the surface of the anchor ice
becomes smoothened. The presence of anchor ice also raises the effective bed elevation and this
condition, together with roughness alteration, reduces the flow conveyance capacity of the stream,
generating a rise in water levels, with potential local flooding, especially if the anchor ice layer
develops over many days (e.g., Stickler et al., 2010).
Asvall (1997) described a combined anchor ice- and frazil ice- flooding event that affected multiple
basements and led to a shutdown of the sewage system in the city of Otta (Norway). Strømslid et
al. (2012) reported that anchor ice formation and frazil accumulation in the Bardu River (Norway)
can generate significant local flooding, affecting roads and farmlands. They further mentioned that
the morning release of anchor ice (which is part of the most common anchor ice diurnal cycle
reported in the literature) contributed in downstream ice jamming that generated further flooding
(a process that is often reported in the literature and described further on). In this particular case,
hydropower regulation exacerbated the impact. In turn, Girling and Groenveld (1999) reported an
anchor ice-induced water level rise that reduced the head of the Limestone generation station
(Canada), leading to an annual production loss of over one million dollars. On a more positive
note, anchor ice-induced floods along streams may be beneficial to the riparian vegetation (e.g.,
Lind and Nilsson, 2015).
3.2 Ice dams
Anchor ice development is not always spatially homogeneous and surface smoothening may never
occur. At steps in the channel profile or where large rocks are aligned across more uniform channel
profiles, anchor ice development may be locally promoted to the extent where it becomes emergent
(Figure 1B). Ice dams form where anchor ice creates a channel blockage and this initiates the
process of icing, which is the progressive flooding and freezing of water on cold surfaces (see also
section 3.4). As the water flows on the dam surface, more ice is produced and the upstream water
level further rises, which can eventually produce overbank flooding. This freeze-up process is
described in more detail by Turcotte et al. (2011, 2013).
Perforated or breached ice dams can remain in place throughout the winter, letting low flows freely
transit underneath. Though breached ice dams represent relatively fragile structures, they can resist
increasing runoff long enough to generate overbank flooding, especially in narrow channels where
high dams are frozen against (or supported by) the bank or in the presence of a thick, stabilizing,
in-channel snow layer. The structural failure of a single ice dam under an increasing discharge can
generate a cascade effect leading to a dynamic breakup over a significant downstream distance
with a potentially damaging ice run and ice jam. Observations from Scandinavia and field data
from the Montmorency River (Canada, Figure 2), suggest that the sudden failure of series of ice
dams can even take place during their formation, under cold conditions and a stable, low runoff.
The wave that results from the failure of ice dams, either under cold conditions or an increasing
discharge, can be termed “dave” for “ice dam released wave”. Only time will tell if this “cold
breakup” process is common enough for this terminology to be adopted by the river ice scientific
community.
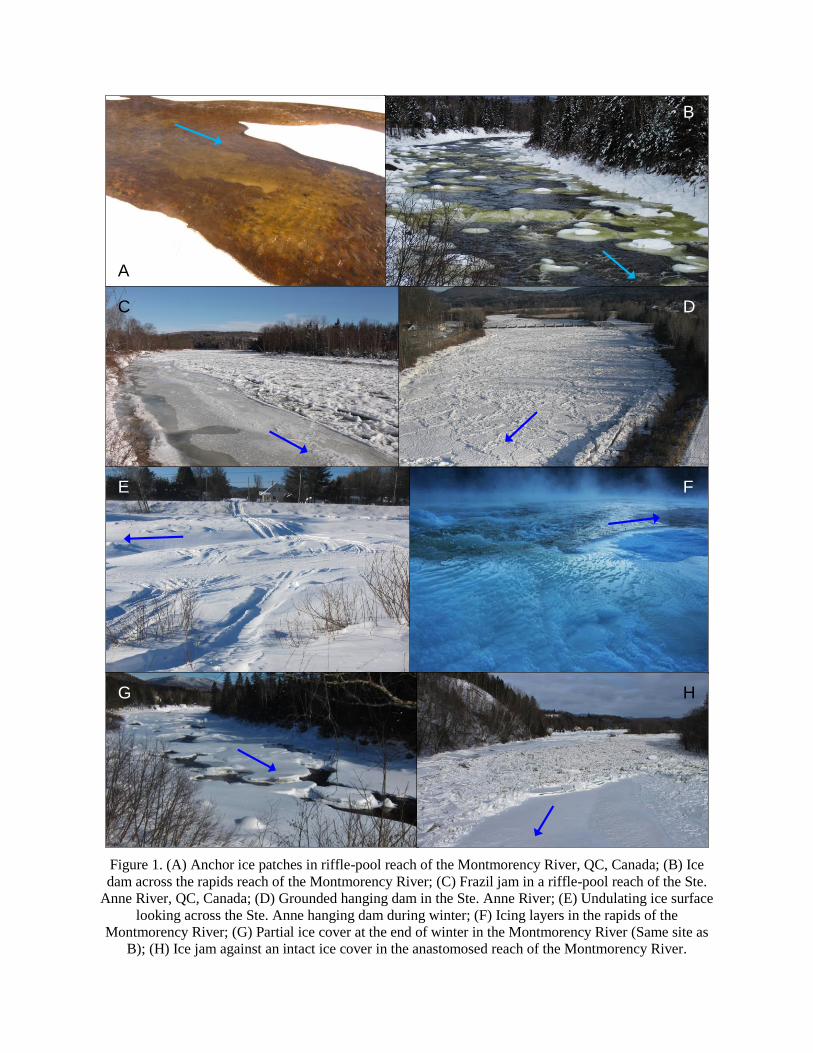
Figure 1. (A) Anchor ice patches in riffle-pool reach of the Montmorency River, QC, Canada; (B) Ice
dam across the rapids reach of the Montmorency River; (C) Frazil jam in a riffle-pool reach of the Ste.
Anne River, QC, Canada; (D) Grounded hanging dam in the Ste. Anne River; (E) Undulating ice surface
looking across the Ste. Anne hanging dam during winter; (F) Icing layers in the rapids of the
Montmorency River; (G) Partial ice cover at the end of winter in the Montmorency River (Same site as
B); (H) Ice jam against an intact ice cover in the anastomosed reach of the Montmorency River.
A
B
C D
E F
G H
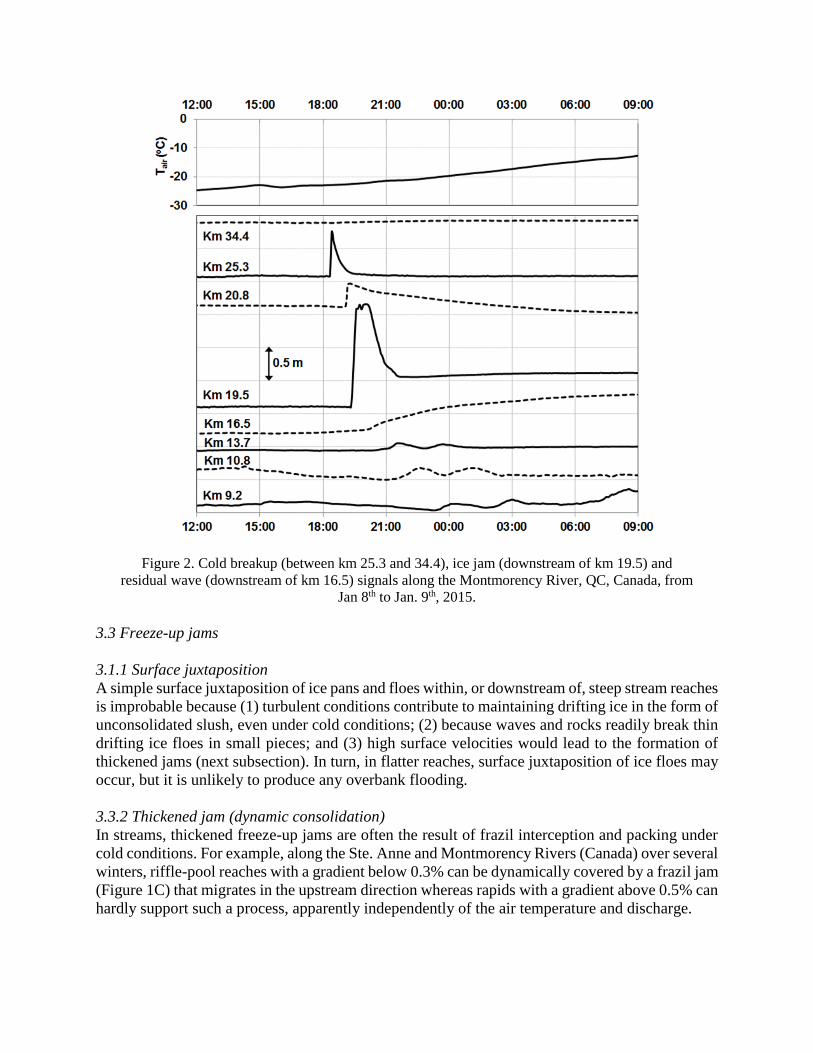
Figure 2. Cold breakup (between km 25.3 and 34.4), ice jam (downstream of km 19.5) and
residual wave (downstream of km 16.5) signals along the Montmorency River, QC, Canada, from
Jan 8th to Jan. 9th, 2015.
3.3 Freeze-up jams
3.1.1 Surface juxtaposition
A simple surface juxtaposition of ice pans and floes within, or downstream of, steep stream reaches
is improbable because (1) turbulent conditions contribute to maintaining drifting ice in the form of
unconsolidated slush, even under cold conditions; (2) because waves and rocks readily break thin
drifting ice floes in small pieces; and (3) high surface velocities would lead to the formation of
thickened jams (next subsection). In turn, in flatter reaches, surface juxtaposition of ice floes may
occur, but it is unlikely to produce any overbank flooding.
3.3.2 Thickened jam (dynamic consolidation)
In streams, thickened freeze-up jams are often the result of frazil interception and packing under
cold conditions. For example, along the Ste. Anne and Montmorency Rivers (Canada) over several
winters, riffle-pool reaches with a gradient below 0.3% can be dynamically covered by a frazil jam
(Figure 1C) that migrates in the upstream direction whereas rapids with a gradient above 0.5% can
hardly support such a process, apparently independently of the air temperature and discharge.
More commonly along larger rivers, but also in streams, freeze-up jams are associated with ice
runs intercepted by a stable surface ice cover section, which would be the case downstream of
steeper reaches. These ice runs can either originate from an unstable ice cover development (or
hydrological) condition or from an increasing runoff that lifts, breaks, and carries the recently
formed ice cover. Since the ice cover is often thin in early winter, the probability of a “wide channel
jam” made by shoving and compaction (e.g., Beltaos, 1995) is higher for a given stream during
the first winter cold spells. In turn, a “narrow channel jam” is less likely to produce flooding
because of its relatively limited thickness. Depending on the prevailing hydrological and hydraulic
conditions, thickened freeze-up jams made of frazil or ice floes can generate overbank flooding in
a similar way as described in section 3.5 for breakup ice jams.
3.3.3. Hanging dams (passive accumulation)
A surface ice cover usually forms first in low gradient segments such as pools and lakes or
reservoir heads while frazil production (and snow slush entrainment) in steeper upstream reaches
can last several additional days or weeks. In these circumstances, if the drifting frazil slush or ice
floes do not accumulate in the form of a thickened ice jam, they will be entrained under the ice
cover. The river-ice literature suggests that a surface velocity above 0.7 m/s will lead to ice floes
entrainment whereas unconsolidated frazil slush may be entrained under a floating obstacle at
much lower surface velocities (Beltaos, 2013). Such ice front dynamics also depend on prevailing
air temperature, supercooling conditions, and channel depth.
In streams, entrained ice floes may become grounded, and in this case, a thickened jam would
result. Similarly, large portions of a hanging dam made of frazil and snow slush may become
grounded (e.g., Vergeynst et al., 2017) and its surface appearance may resemble that of a thickened
ice jam (Figure 1D). As the ice accumulates under the ice cover, upstream velocities may be
reduced enough to promote the frontal (upstream) progression of a surface or a thickened jam.
Therefore, the ice cover formation may alternate between dynamic frontal progression and passive
downstream deposition and thickening. Once most of the river is covered, the combination of a
receding discharge and channel insulation contributes to thermally erode a tunnel into the hanging
dam core. This causes the hanging dam to become increasingly grounded, as can be presumed by
observing its undulated surface (Figure 1E).
In unregulated streams, the reported presence of a hanging dam may indicate a recurrent ice
accumulation location whereas in regulated streams, the presence, location and thickness of a
hanging dam may vary significantly from one winter to another. Under specific
hydrometeorological conditions affecting ice deposition patterns and thicknesses, overbank
flooding and icing may occur. Floods caused by hanging dams are relatively rare, but have been
reported on small rivers (e.g. Beltaos et al., 2007a; 2007b; Vergeynst et al., 2017). A large hanging
dam in a channel represents an important hydraulic and drifting ice obstacle, and it takes a
significant amount of heat or rise in discharge to respectively melt it or mobilize it.
3.4 Aufeis and icing
Aufeis formation is mostly known as a post-freeze-up process occurring in braided channels of
arctic and subarctic regions (Grayson, 2010, Daly, 2013). Aufeis represents an ice accumulation
formed by progressive freezing of water layers that emerge from under an existing ice cover
through cracks because of pressurized flow conditions. This may originate from a complex,
spatiotemporal combination of (1) ice-induced flow fluctuations and (2) a progressive reduction
in the water carrying capacity of the channel. Aufeis is known to generate extensive overbank ice
production under cold conditions, and it can also generate additional flooding as the discharge
increases in the spring while the channel is still blocked by ice (e.g., Daly et al., 2011; Toniolo et
al., 2017).
More generally, and including braided channel aufeis, stream “icing” is the general process of ice
layers forming on cold surfaces including banks, in-channel emerging rocks, and existing ice
surfaces. This process follows anchor ice development, it represents an important part of ice dams’
formation (e.g., Turcotte et al., 2011) and it is therefore often associated with ice development in
steep streams (Figure 1F). Culverts, especially those made of steel, are prone to generate icing.
This process can also be observed where groundwater seepage or tributary flows cannot find their
way under an existing ice cover. Carey (1973) contains additional information on stream icing.
3.5 Breakup ice jams
Breakup ice jams in sizeable rivers are almost always of the wide-channel kind. As the channel
size decreases, narrow-channel jams may be more common. Criteria for distinguishing between
the two types of jams are discussed in Beltaos (1995). The most common hydrological condition
that leads to breakup ice jams is when the runoff increases, either in the spring or during winter in
temperate regions, but breakup ice jams can also be caused by reservoir management. Hydropower
operation can be restricted in winter to avoid river ice breakup (e.g., Gebre et al. 2013).
In low gradient streams, where a floating surface ice cover is present, the increasing flow and stage
lift the cover and separate it from bank and bed locations of attachment. Eventually, the cover is
mobilized and soon afterwards breaks down into ice blocks. In steeper reaches, the ice cover is
more fragile because it is often initially fragmented (e.g., Turcotte et al., 2012b; Figure 1G). In
this case, the increasing discharge can mobilize small ice blocks that may become trapped against
rocks and thicker ice slabs. This blockage generates a local stage rise and an increased stress that
can result in a reach-scale ice cover mobilisation. In all cases, the resulting ice run may be arrested
by intact ice farther downstream and form a jam.
Different hydraulic, morphologic and cryologic conditions promote ice jamming and several
authors have been able to specify channel characteristics where ice jams are common. Typical ice
jam locations that are specifically attributed to streams, based on the writers’ experience, include:
At slope reductions, including large pools, reservoir or lake entrances,
Entering multichannel reaches (secondary or anastomosed channels that evacuate water),
At locations of low and wide flood plains (becoming a floodway; e.g., Calkins, 1983),
At sharp bends and constrictions,
Downstream of confluences (especially when tributaries breakup first),
At channel enlargements (where the ice run energy is dissipated over a large surface), and
Against large obstacles such as boulders, culverts or in-channel structures.
It most cases, the presence of an intact ice cover is required to initiate ice jamming (Figure 1H).
Therefore, apart from reaches located downstream of lakes (e.g., Lind et al., 2016) or large
reservoirs, ice jams can take place along any stream sizes and morphologies (Turcotte and Morse,
2013).
Breakup jams sometimes contain not only ice blocks but also frazil slush. The latter originates in
relatively thick freeze-up jams that never froze solid during the winter. This is especially likely to
occur in streams (e.g., Pigeon et al., 2015) or even in larger rivers that contain rapids (a good
example is the relatively large Athabasca River above Fort McMurray along which the average
slope is nearly 0.1%). The presence of frazil and snow slush can reduce seepage through the voids
inside the jam (Beltaos, 1999) and generate higher upstream water levels.
4. Hydraulic impact of stream ice processes
This section presents water depth and discharge data associated with various stream ice processes
and illustrates their importance to delineate the flood zone.
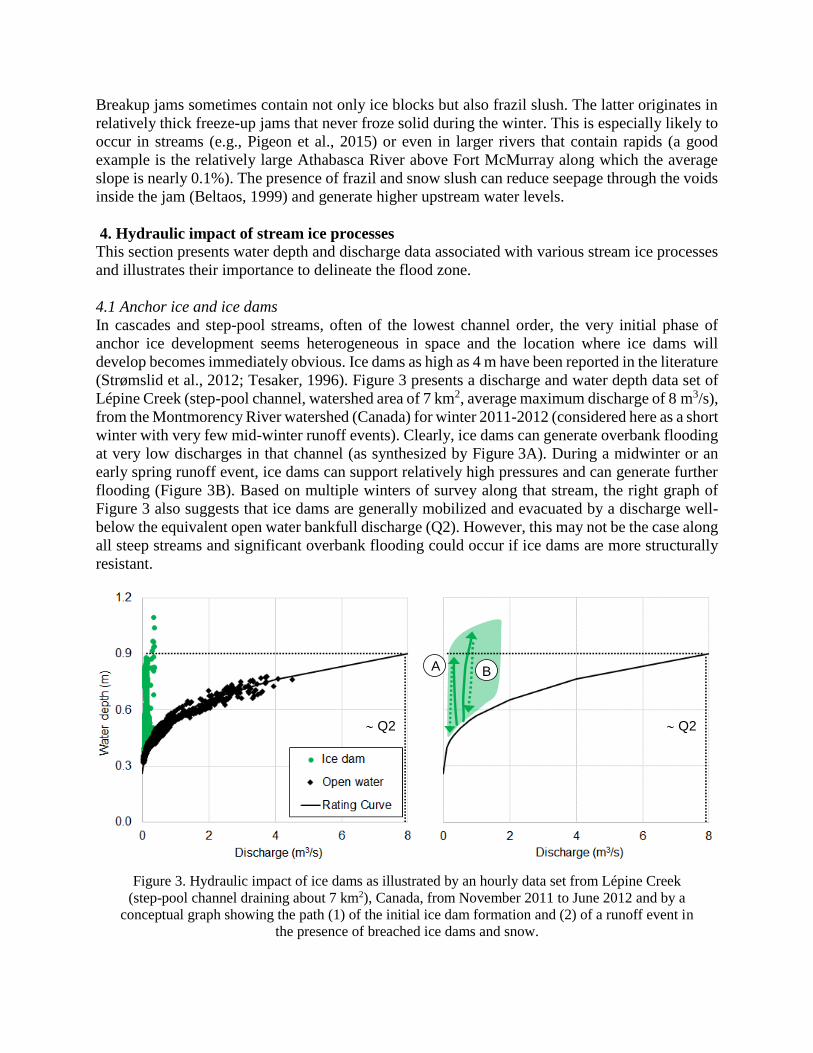
4.1 Anchor ice and ice dams
In cascades and step-pool streams, often of the lowest channel order, the very initial phase of
anchor ice development seems heterogeneous in space and the location where ice dams will
develop becomes immediately obvious. Ice dams as high as 4 m have been reported in the literature
(Strømslid et al., 2012; Tesaker, 1996). Figure 3 presents a discharge and water depth data set of
Lépine Creek (step-pool channel, watershed area of 7 km2, average maximum discharge of 8 m3/s),
from the Montmorency River watershed (Canada) for winter 2011-2012 (considered here as a short
winter with very few mid-winter runoff events). Clearly, ice dams can generate overbank flooding
at very low discharges in that channel (as synthesized by Figure 3A). During a midwinter or an
early spring runoff event, ice dams can support relatively high pressures and can generate further
flooding (Figure 3B). Based on multiple winters of survey along that stream, the right graph of
Figure 3 also suggests that ice dams are generally mobilized and evacuated by a discharge well-
below the equivalent open water bankfull discharge (Q2). However, this may not be the case along
all steep streams and significant overbank flooding could occur if ice dams are more structurally
resistant.
Figure 3. Hydraulic impact of ice dams as illustrated by an hourly data set from Lépine Creek
(step-pool channel draining about 7 km2), Canada, from November 2011 to June 2012 and by a
conceptual graph showing the path (1) of the initial ice dam formation and (2) of a runoff event in
the presence of breached ice dams and snow.
A B
Q2 Q2
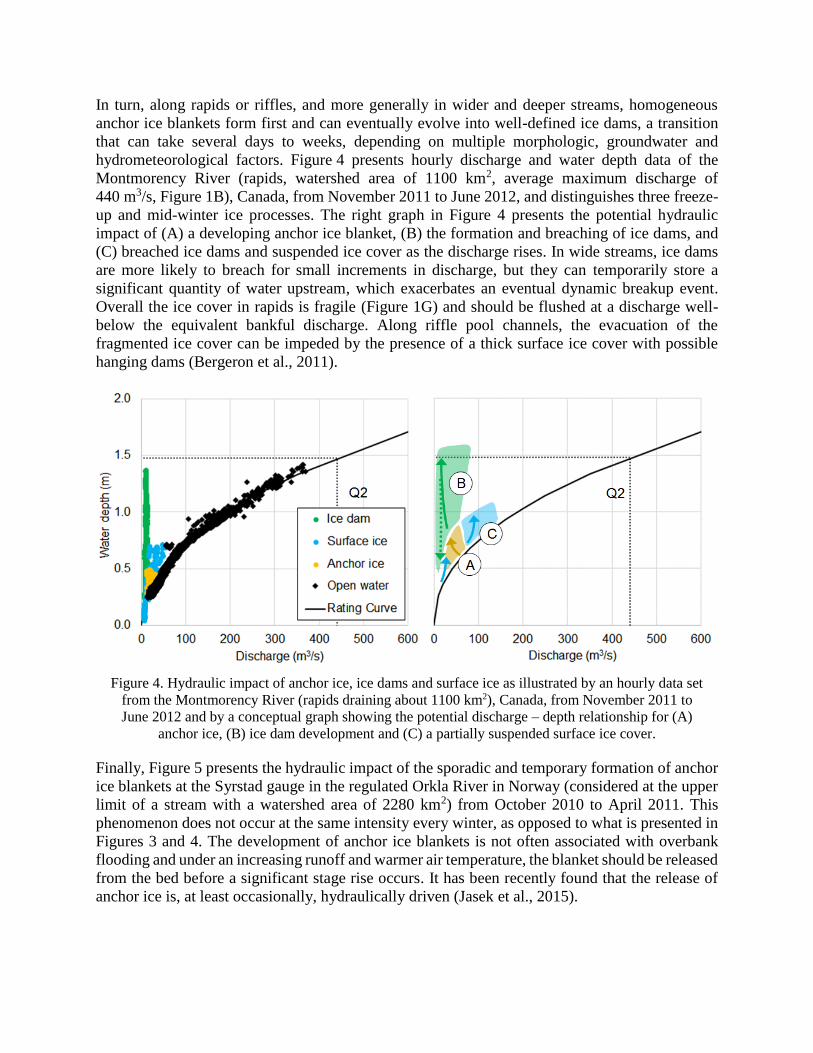
In turn, along rapids or riffles, and more generally in wider and deeper streams, homogeneous
anchor ice blankets form first and can eventually evolve into well-defined ice dams, a transition
that can take several days to weeks, depending on multiple morphologic, groundwater and
hydrometeorological factors. Figure 4 presents hourly discharge and water depth data of the
Montmorency River (rapids, watershed area of 1100 km2, average maximum discharge of
440 m3/s, Figure 1B), Canada, from November 2011 to June 2012, and distinguishes three freeze-
up and mid-winter ice processes. The right graph in Figure 4 presents the potential hydraulic
impact of (A) a developing anchor ice blanket, (B) the formation and breaching of ice dams, and
(C) breached ice dams and suspended ice cover as the discharge rises. In wide streams, ice dams
are more likely to breach for small increments in discharge, but they can temporarily store a
significant quantity of water upstream, which exacerbates an eventual dynamic breakup event.
Overall the ice cover in rapids is fragile (Figure 1G) and should be flushed at a discharge well-
below the equivalent bankful discharge. Along riffle pool channels, the evacuation of the
fragmented ice cover can be impeded by the presence of a thick surface ice cover with possible
hanging dams (Bergeron et al., 2011).
Figure 4. Hydraulic impact of anchor ice, ice dams and surface ice as illustrated by an hourly data set
from the Montmorency River (rapids draining about 1100 km2), Canada, from November 2011 to
June 2012 and by a conceptual graph showing the potential discharge – depth relationship for (A)
anchor ice, (B) ice dam development and (C) a partially suspended surface ice cover.
Finally, Figure 5 presents the hydraulic impact of the sporadic and temporary formation of anchor
ice blankets at the Syrstad gauge in the regulated Orkla River in Norway (considered at the upper
limit of a stream with a watershed area of 2280 km2) from October 2010 to April 2011. This
phenomenon does not occur at the same intensity every winter, as opposed to what is presented in
Figures 3 and 4. The development of anchor ice blankets is not often associated with overbank
flooding and under an increasing runoff and warmer air temperature, the blanket should be released
from the bed before a significant stage rise occurs. It has been recently found that the release of
anchor ice is, at least occasionally, hydraulically driven (Jasek et al., 2015).
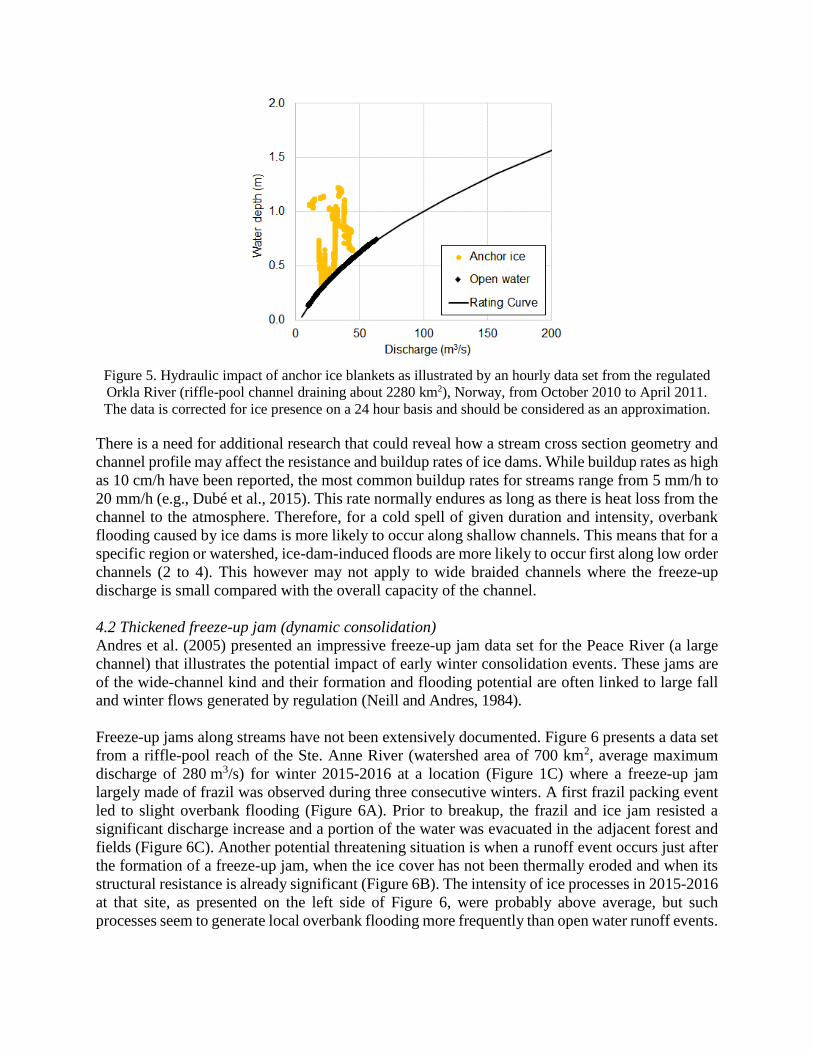
Figure 5. Hydraulic impact of anchor ice blankets as illustrated by an hourly data set from the regulated
Orkla River (riffle-pool channel draining about 2280 km2), Norway, from October 2010 to April 2011.
The data is corrected for ice presence on a 24 hour basis and should be considered as an approximation.
There is a need for additional research that could reveal how a stream cross section geometry and
channel profile may affect the resistance and buildup rates of ice dams. While buildup rates as high
as 10 cm/h have been reported, the most common buildup rates for streams range from 5 mm/h to
20 mm/h (e.g., Dubé et al., 2015). This rate normally endures as long as there is heat loss from the
channel to the atmosphere. Therefore, for a cold spell of given duration and intensity, overbank
flooding caused by ice dams is more likely to occur along shallow channels. This means that for a
specific region or watershed, ice-dam-induced floods are more likely to occur first along low order
channels (2 to 4). This however may not apply to wide braided channels where the freeze-up
discharge is small compared with the overall capacity of the channel.
4.2 Thickened freeze-up jam (dynamic consolidation)
Andres et al. (2005) presented an impressive freeze-up jam data set for the Peace River (a large
channel) that illustrates the potential impact of early winter consolidation events. These jams are
of the wide-channel kind and their formation and flooding potential are often linked to large fall
and winter flows generated by regulation (Neill and Andres, 1984).
Freeze-up jams along streams have not been extensively documented. Figure 6 presents a data set
from a riffle-pool reach of the Ste. Anne River (watershed area of 700 km2, average maximum
discharge of 280 m3/s) for winter 2015-2016 at a location (Figure 1C) where a freeze-up jam
largely made of frazil was observed during three consecutive winters. A first frazil packing event
led to slight overbank flooding (Figure 6A). Prior to breakup, the frazil and ice jam resisted a
significant discharge increase and a portion of the water was evacuated in the adjacent forest and
fields (Figure 6C). Another potential threatening situation is when a runoff event occurs just after
the formation of a freeze-up jam, when the ice cover has not been thermally eroded and when its
structural resistance is already significant (Figure 6B). The intensity of ice processes in 2015-2016
at that site, as presented on the left side of Figure 6, were probably above average, but such
processes seem to generate local overbank flooding more frequently than open water runoff events.
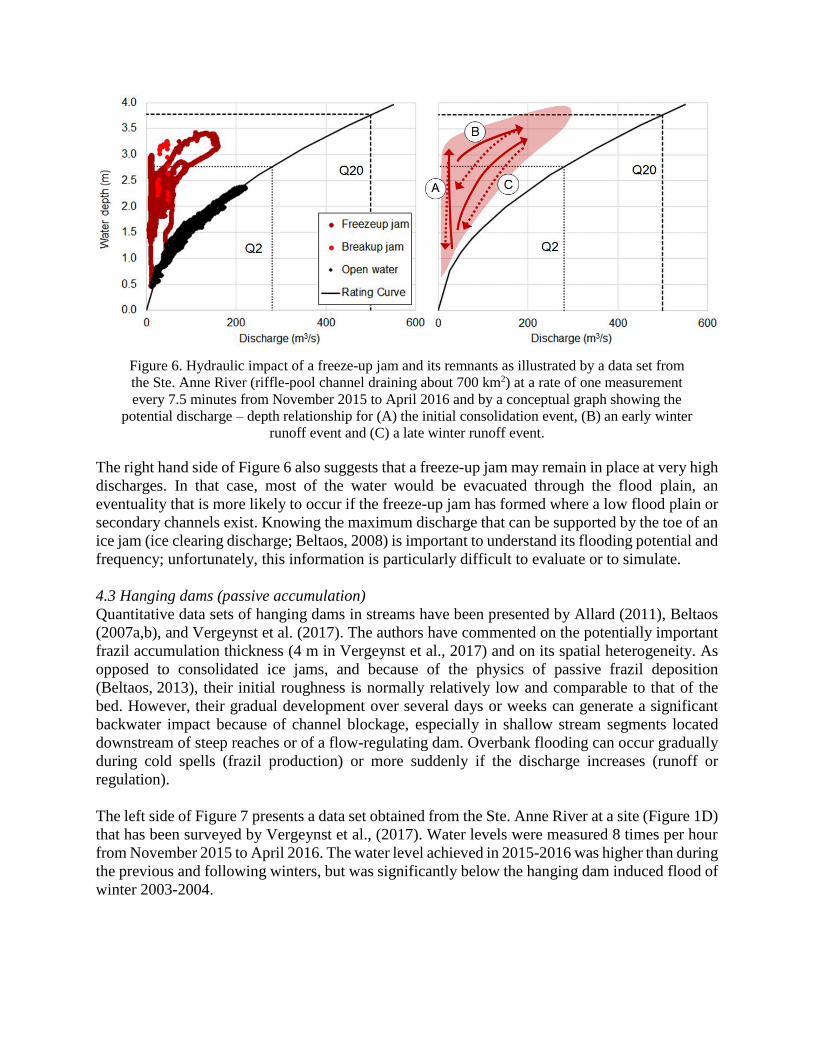
Figure 6. Hydraulic impact of a freeze-up jam and its remnants as illustrated by a data set from
the Ste. Anne River (riffle-pool channel draining about 700 km2) at a rate of one measurement
every 7.5 minutes from November 2015 to April 2016 and by a conceptual graph showing the
potential discharge – depth relationship for (A) the initial consolidation event, (B) an early winter
runoff event and (C) a late winter runoff event.
The right hand side of Figure 6 also suggests that a freeze-up jam may remain in place at very high
discharges. In that case, most of the water would be evacuated through the flood plain, an
eventuality that is more likely to occur if the freeze-up jam has formed where a low flood plain or
secondary channels exist. Knowing the maximum discharge that can be supported by the toe of an
ice jam (ice clearing discharge; Beltaos, 2008) is important to understand its flooding potential and
frequency; unfortunately, this information is particularly difficult to evaluate or to simulate.
4.3 Hanging dams (passive accumulation)
Quantitative data sets of hanging dams in streams have been presented by Allard (2011), Beltaos
(2007a,b), and Vergeynst et al. (2017). The authors have commented on the potentially important
frazil accumulation thickness (4 m in Vergeynst et al., 2017) and on its spatial heterogeneity. As
opposed to consolidated ice jams, and because of the physics of passive frazil deposition
(Beltaos, 2013), their initial roughness is normally relatively low and comparable to that of the
bed. However, their gradual development over several days or weeks can generate a significant
backwater impact because of channel blockage, especially in shallow stream segments located
downstream of steep reaches or of a flow-regulating dam. Overbank flooding can occur gradually
during cold spells (frazil production) or more suddenly if the discharge increases (runoff or
regulation).
The left side of Figure 7 presents a data set obtained from the Ste. Anne River at a site (Figure 1D)
that has been surveyed by Vergeynst et al., (2017). Water levels were measured 8 times per hour
from November 2015 to April 2016. The water level achieved in 2015-2016 was higher than during
the previous and following winters, but was significantly below the hanging dam induced flood of
winter 2003-2004.
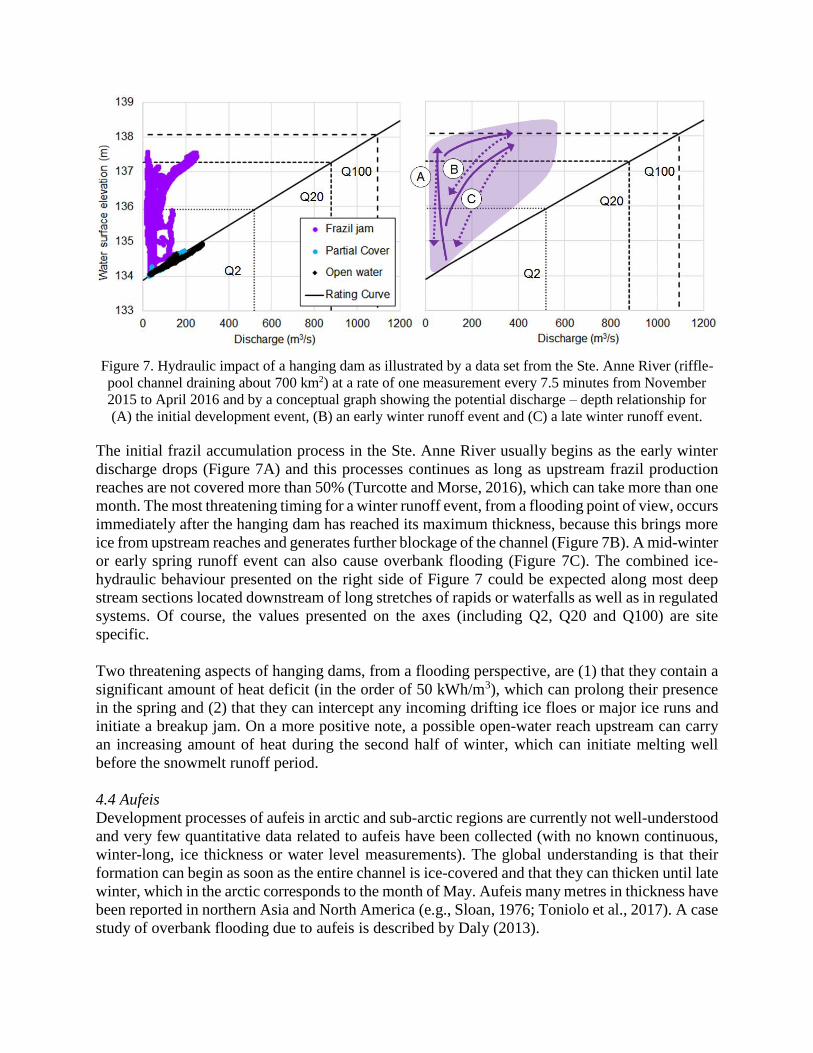
Figure 7. Hydraulic impact of a hanging dam as illustrated by a data set from the Ste. Anne River (riffle-
pool channel draining about 700 km2) at a rate of one measurement every 7.5 minutes from November
2015 to April 2016 and by a conceptual graph showing the potential discharge – depth relationship for
(A) the initial development event, (B) an early winter runoff event and (C) a late winter runoff event.
The initial frazil accumulation process in the Ste. Anne River usually begins as the early winter
discharge drops (Figure 7A) and this processes continues as long as upstream frazil production
reaches are not covered more than 50% (Turcotte and Morse, 2016), which can take more than one
month. The most threatening timing for a winter runoff event, from a flooding point of view, occurs
immediately after the hanging dam has reached its maximum thickness, because this brings more
ice from upstream reaches and generates further blockage of the channel (Figure 7B). A mid-winter
or early spring runoff event can also cause overbank flooding (Figure 7C). The combined ice-
hydraulic behaviour presented on the right side of Figure 7 could be expected along most deep
stream sections located downstream of long stretches of rapids or waterfalls as well as in regulated
systems. Of course, the values presented on the axes (including Q2, Q20 and Q100) are site
specific.
Two threatening aspects of hanging dams, from a flooding perspective, are (1) that they contain a
significant amount of heat deficit (in the order of 50 kWh/m3), which can prolong their presence
in the spring and (2) that they can intercept any incoming drifting ice floes or major ice runs and
initiate a breakup jam. On a more positive note, a possible open-water reach upstream can carry
an increasing amount of heat during the second half of winter, which can initiate melting well
before the snowmelt runoff period.
4.4 Aufeis
Development processes of aufeis in arctic and sub-arctic regions are currently not well-understood
and very few quantitative data related to aufeis have been collected (with no known continuous,
winter-long, ice thickness or water level measurements). The global understanding is that their
formation can begin as soon as the entire channel is ice-covered and that they can thicken until late
winter, which in the arctic corresponds to the month of May. Aufeis many metres in thickness have
been reported in northern Asia and North America (e.g., Sloan, 1976; Toniolo et al., 2017). A case
study of overbank flooding due to aufeis is described by Daly (2013).
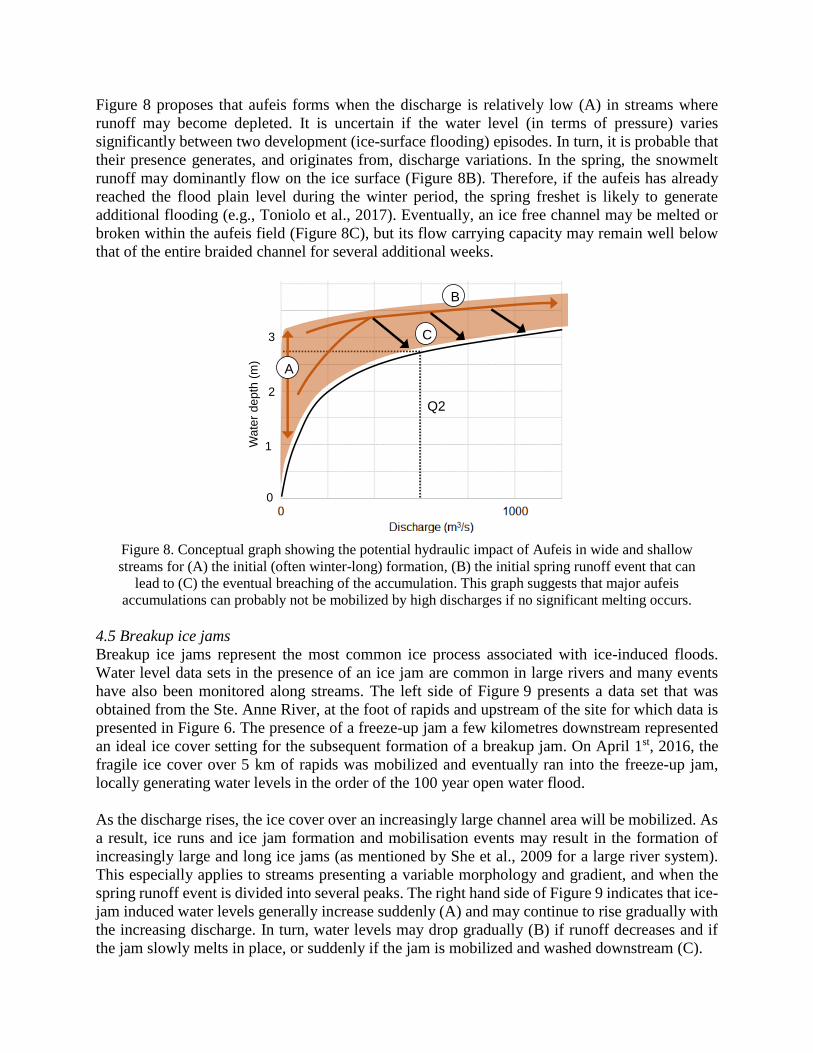
Figure 8 proposes that aufeis forms when the discharge is relatively low (A) in streams where
runoff may become depleted. It is uncertain if the water level (in terms of pressure) varies
significantly between two development (ice-surface flooding) episodes. In turn, it is probable that
their presence generates, and originates from, discharge variations. In the spring, the snowmelt
runoff may dominantly flow on the ice surface (Figure 8B). Therefore, if the aufeis has already
reached the flood plain level during the winter period, the spring freshet is likely to generate
additional flooding (e.g., Toniolo et al., 2017). Eventually, an ice free channel may be melted or
broken within the aufeis field (Figure 8C), but its flow carrying capacity may remain well below
that of the entire braided channel for several additional weeks.
Figure 8. Conceptual graph showing the potential hydraulic impact of Aufeis in wide and shallow
streams for (A) the initial (often winter-long) formation, (B) the initial spring runoff event that can
lead to (C) the eventual breaching of the accumulation. This graph suggests that major aufeis
accumulations can probably not be mobilized by high discharges if no significant melting occurs.
4.5 Breakup ice jams
Breakup ice jams represent the most common ice process associated with ice-induced floods.
Water level data sets in the presence of an ice jam are common in large rivers and many events
have also been monitored along streams. The left side of Figure 9 presents a data set that was
obtained from the Ste. Anne River, at the foot of rapids and upstream of the site for which data is
presented in Figure 6. The presence of a freeze-up jam a few kilometres downstream represented
an ideal ice cover setting for the subsequent formation of a breakup jam. On April 1st, 2016, the
fragile ice cover over 5 km of rapids was mobilized and eventually ran into the freeze-up jam,
locally generating water levels in the order of the 100 year open water flood.
As the discharge rises, the ice cover over an increasingly large channel area will be mobilized. As
a result, ice runs and ice jam formation and mobilisation events may result in the formation of
increasingly large and long ice jams (as mentioned by She et al., 2009 for a large river system).
This especially applies to streams presenting a variable morphology and gradient, and when the
spring runoff event is divided into several peaks. The right hand side of Figure 9 indicates that ice-
jam induced water levels generally increase suddenly (A) and may continue to rise gradually with
the increasing discharge. In turn, water levels may drop gradually (B) if runoff decreases and if
the jam slowly melts in place, or suddenly if the jam is mobilized and washed downstream (C).
3
0
Q2
Wa
ter
de
pth
(m
)
1
2
A
B
C
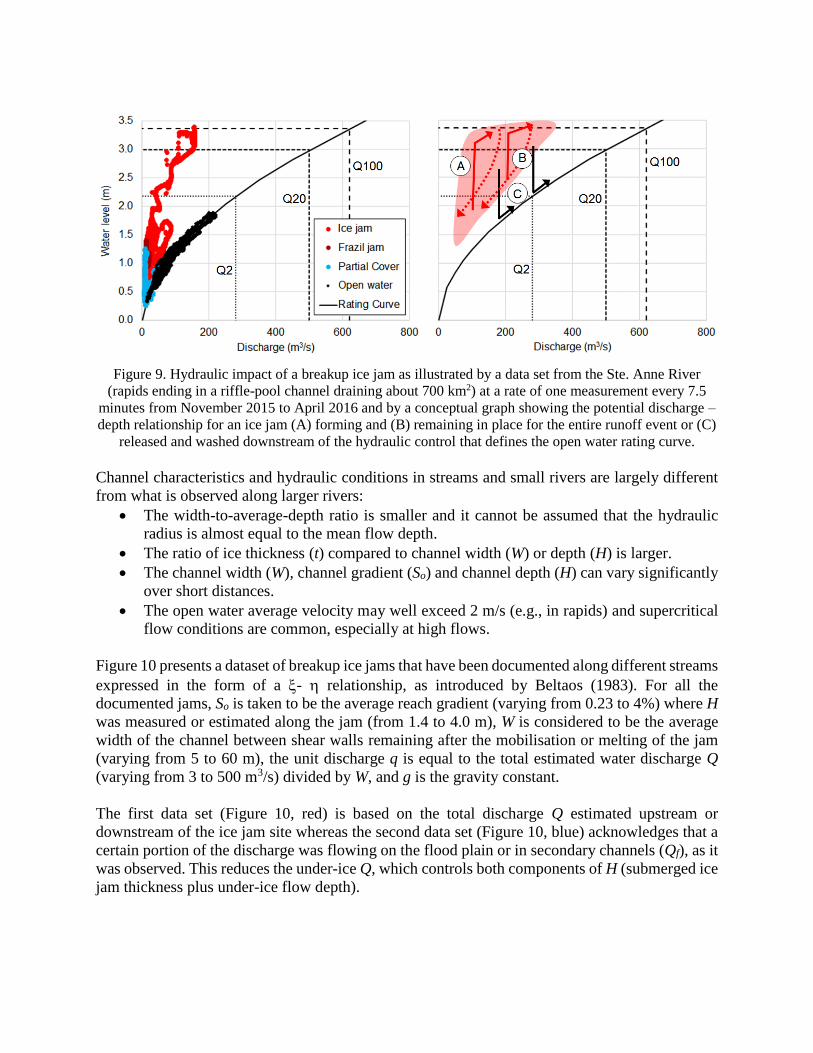
Figure 9. Hydraulic impact of a breakup ice jam as illustrated by a data set from the Ste. Anne River
(rapids ending in a riffle-pool channel draining about 700 km2) at a rate of one measurement every 7.5
minutes from November 2015 to April 2016 and by a conceptual graph showing the potential discharge –
depth relationship for an ice jam (A) forming and (B) remaining in place for the entire runoff event or (C)
released and washed downstream of the hydraulic control that defines the open water rating curve.
Channel characteristics and hydraulic conditions in streams and small rivers are largely different
from what is observed along larger rivers:
The width-to-average-depth ratio is smaller and it cannot be assumed that the hydraulic
radius is almost equal to the mean flow depth.
The ratio of ice thickness (t) compared to channel width (W) or depth (H) is larger.
The channel width (W), channel gradient (So) and channel depth (H) can vary significantly
over short distances.
The open water average velocity may well exceed 2 m/s (e.g., in rapids) and supercritical
flow conditions are common, especially at high flows.
Figure 10 presents a dataset of breakup ice jams that have been documented along different streams
expressed in the form of a - relationship, as introduced by Beltaos (1983). For all the
documented jams, So is taken to be the average reach gradient (varying from 0.23 to 4%) where H
was measured or estimated along the jam (from 1.4 to 4.0 m), W is considered to be the average
width of the channel between shear walls remaining after the mobilisation or melting of the jam
(varying from 5 to 60 m), the unit discharge q is equal to the total estimated water discharge Q
(varying from 3 to 500 m3/s) divided by W, and g is the gravity constant.
The first data set (Figure 10, red) is based on the total discharge Q estimated upstream or
downstream of the ice jam site whereas the second data set (Figure 10, blue) acknowledges that a
certain portion of the discharge was flowing on the flood plain or in secondary channels (Qf), as it
was observed. This reduces the under-ice Q, which controls both components of H (submerged ice
jam thickness plus under-ice flow depth).
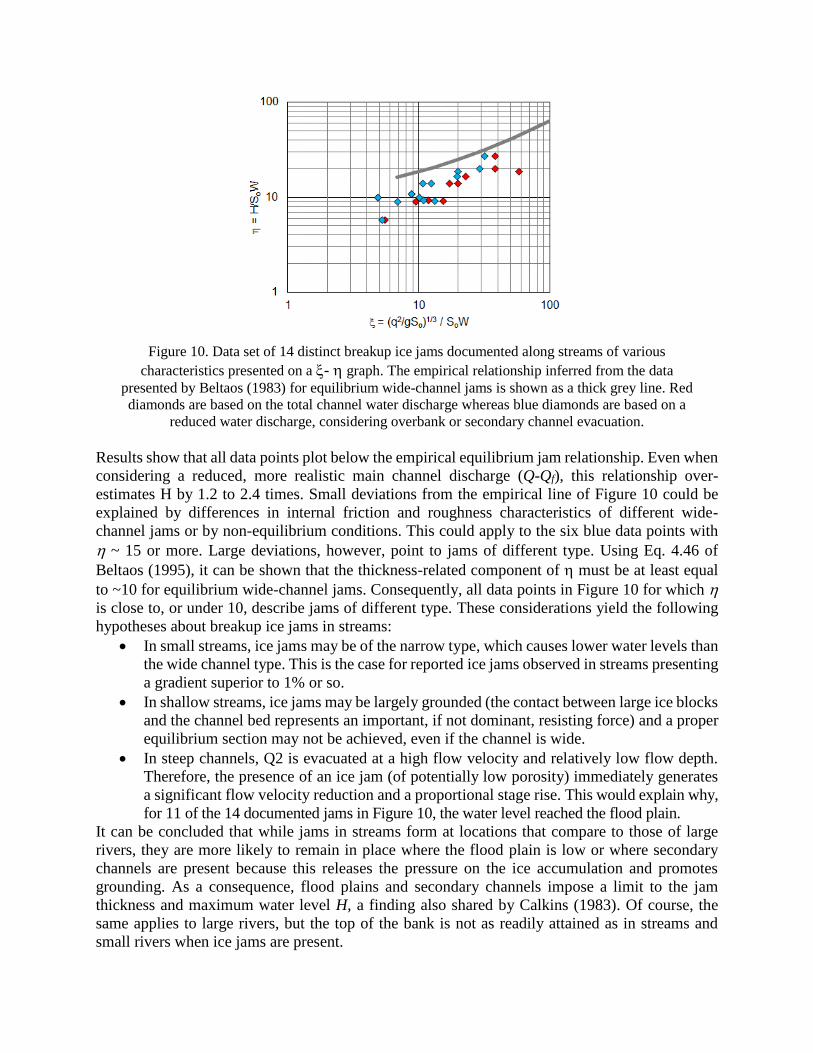
Figure 10. Data set of 14 distinct breakup ice jams documented along streams of various
characteristics presented on a - graph. The empirical relationship inferred from the data
presented by Beltaos (1983) for equilibrium wide-channel jams is shown as a thick grey line. Red
diamonds are based on the total channel water discharge whereas blue diamonds are based on a
reduced water discharge, considering overbank or secondary channel evacuation.
Results show that all data points plot below the empirical equilibrium jam relationship. Even when
considering a reduced, more realistic main channel discharge (Q-Qf), this relationship over-
estimates H by 1.2 to 2.4 times. Small deviations from the empirical line of Figure 10 could be
explained by differences in internal friction and roughness characteristics of different wide-
channel jams or by non-equilibrium conditions. This could apply to the six blue data points with
~ 15 or more. Large deviations, however, point to jams of different type. Using Eq. 4.46 of
Beltaos (1995), it can be shown that the thickness-related component of must be at least equal
to ~10 for equilibrium wide-channel jams. Consequently, all data points in Figure 10 for which
is close to, or under 10, describe jams of different type. These considerations yield the following
hypotheses about breakup ice jams in streams:
In small streams, ice jams may be of the narrow type, which causes lower water levels than
the wide channel type. This is the case for reported ice jams observed in streams presenting
a gradient superior to 1% or so.
In shallow streams, ice jams may be largely grounded (the contact between large ice blocks
and the channel bed represents an important, if not dominant, resisting force) and a proper
equilibrium section may not be achieved, even if the channel is wide.
In steep channels, Q2 is evacuated at a high flow velocity and relatively low flow depth.
Therefore, the presence of an ice jam (of potentially low porosity) immediately generates
a significant flow velocity reduction and a proportional stage rise. This would explain why,
for 11 of the 14 documented jams in Figure 10, the water level reached the flood plain.
It can be concluded that while jams in streams form at locations that compare to those of large
rivers, they are more likely to remain in place where the flood plain is low or where secondary
channels are present because this releases the pressure on the ice accumulation and promotes
grounding. As a consequence, flood plains and secondary channels impose a limit to the jam
thickness and maximum water level H, a finding also shared by Calkins (1983). Of course, the
same applies to large rivers, but the top of the bank is not as readily attained as in streams and
small rivers when ice jams are present.
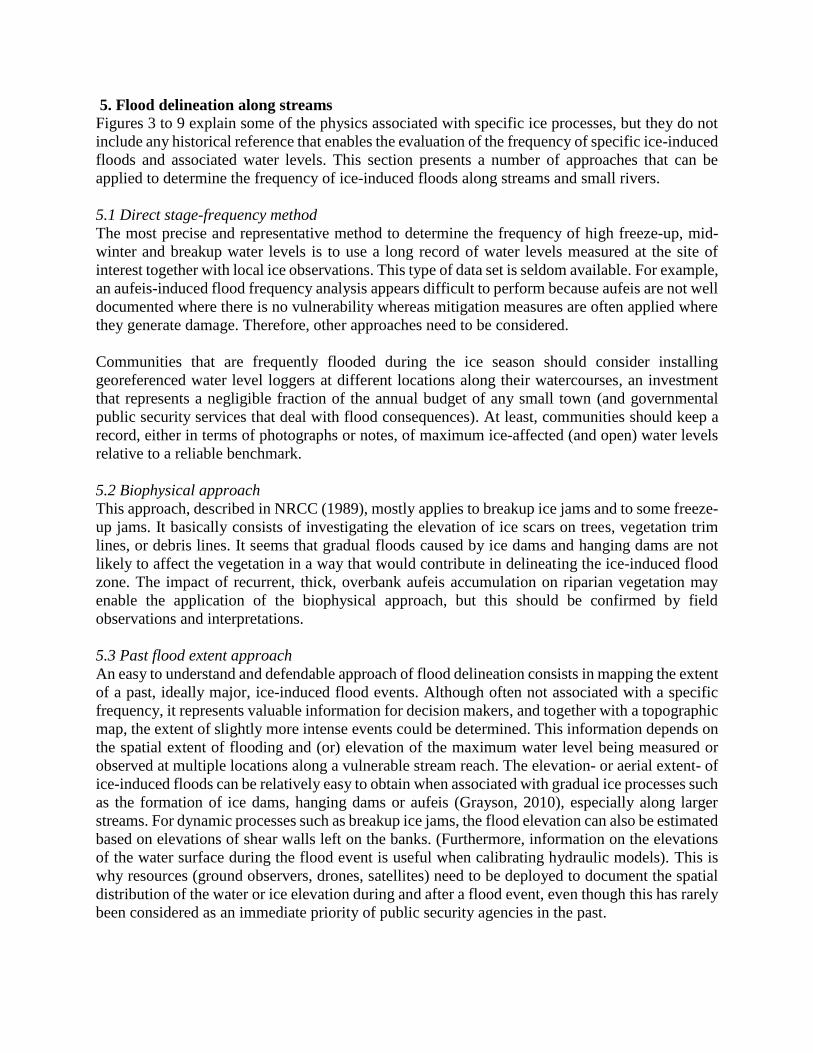
5. Flood delineation along streams
Figures 3 to 9 explain some of the physics associated with specific ice processes, but they do not
include any historical reference that enables the evaluation of the frequency of specific ice-induced
floods and associated water levels. This section presents a number of approaches that can be
applied to determine the frequency of ice-induced floods along streams and small rivers.
5.1 Direct stage-frequency method
The most precise and representative method to determine the frequency of high freeze-up, mid-
winter and breakup water levels is to use a long record of water levels measured at the site of
interest together with local ice observations. This type of data set is seldom available. For example,
an aufeis-induced flood frequency analysis appears difficult to perform because aufeis are not well
documented where there is no vulnerability whereas mitigation measures are often applied where
they generate damage. Therefore, other approaches need to be considered.
Communities that are frequently flooded during the ice season should consider installing
georeferenced water level loggers at different locations along their watercourses, an investment
that represents a negligible fraction of the annual budget of any small town (and governmental
public security services that deal with flood consequences). At least, communities should keep a
record, either in terms of photographs or notes, of maximum ice-affected (and open) water levels
relative to a reliable benchmark.
5.2 Biophysical approach
This approach, described in NRCC (1989), mostly applies to breakup ice jams and to some freeze-
up jams. It basically consists of investigating the elevation of ice scars on trees, vegetation trim
lines, or debris lines. It seems that gradual floods caused by ice dams and hanging dams are not
likely to affect the vegetation in a way that would contribute in delineating the ice-induced flood
zone. The impact of recurrent, thick, overbank aufeis accumulation on riparian vegetation may
enable the application of the biophysical approach, but this should be confirmed by field
observations and interpretations.
5.3 Past flood extent approach
An easy to understand and defendable approach of flood delineation consists in mapping the extent
of a past, ideally major, ice-induced flood events. Although often not associated with a specific
frequency, it represents valuable information for decision makers, and together with a topographic
map, the extent of slightly more intense events could be determined. This information depends on
the spatial extent of flooding and (or) elevation of the maximum water level being measured or
observed at multiple locations along a vulnerable stream reach. The elevation- or aerial extent- of
ice-induced floods can be relatively easy to obtain when associated with gradual ice processes such
as the formation of ice dams, hanging dams or aufeis (Grayson, 2010), especially along larger
streams. For dynamic processes such as breakup ice jams, the flood elevation can also be estimated
based on elevations of shear walls left on the banks. (Furthermore, information on the elevations
of the water surface during the flood event is useful when calibrating hydraulic models). This is
why resources (ground observers, drones, satellites) need to be deployed to document the spatial
distribution of the water or ice elevation during and after a flood event, even though this has rarely
been considered as an immediate priority of public security agencies in the past.
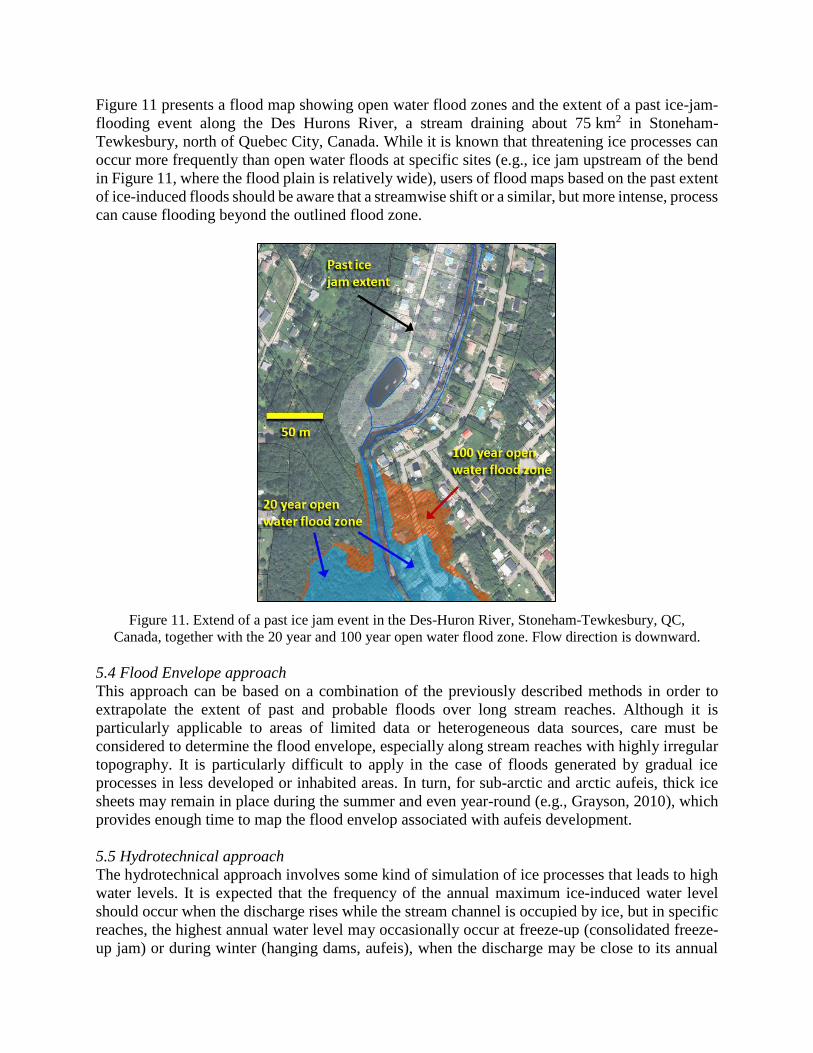
Figure 11 presents a flood map showing open water flood zones and the extent of a past ice-jam-
flooding event along the Des Hurons River, a stream draining about 75 km2 in Stoneham-
Tewkesbury, north of Quebec City, Canada. While it is known that threatening ice processes can
occur more frequently than open water floods at specific sites (e.g., ice jam upstream of the bend
in Figure 11, where the flood plain is relatively wide), users of flood maps based on the past extent
of ice-induced floods should be aware that a streamwise shift or a similar, but more intense, process
can cause flooding beyond the outlined flood zone.
Figure 11. Extend of a past ice jam event in the Des-Huron River, Stoneham-Tewkesbury, QC,
Canada, together with the 20 year and 100 year open water flood zone. Flow direction is downward.
5.4 Flood Envelope approach
This approach can be based on a combination of the previously described methods in order to
extrapolate the extent of past and probable floods over long stream reaches. Although it is
particularly applicable to areas of limited data or heterogeneous data sources, care must be
considered to determine the flood envelope, especially along stream reaches with highly irregular
topography. It is particularly difficult to apply in the case of floods generated by gradual ice
processes in less developed or inhabited areas. In turn, for sub-arctic and arctic aufeis, thick ice
sheets may remain in place during the summer and even year-round (e.g., Grayson, 2010), which
provides enough time to map the flood envelop associated with aufeis development.
5.5 Hydrotechnical approach
The hydrotechnical approach involves some kind of simulation of ice processes that leads to high
water levels. It is expected that the frequency of the annual maximum ice-induced water level
should occur when the discharge rises while the stream channel is occupied by ice, but in specific
reaches, the highest annual water level may occasionally occur at freeze-up (consolidated freeze-
up jam) or during winter (hanging dams, aufeis), when the discharge may be close to its annual
minimum. This information must be known and documented in order to evaluate the frequency of
high, ice-induced water levels.
In large rivers, the hydrotechnical approach has mostly been applied to evaluate the frequency of
water levels caused by breakup ice jams, which typically control the annual maximum ice-
influenced stage (Beltaos 2012, Gerard 1989, Tuthill et al 1996, White and Beltaos, 2008).
Kovachis et al. (2017) refers to the equilibrium jam approximation as presented in Figure 10 for
large channels (which evaluates the upper boundary of the red zone in Figure 9). In this case, the
frequency of the water level (H) can be linked to the frequency of a unit discharge (q) in the
presence of ice and to the frequency of ice jam occurrence. This can only be evaluated if: (1) a
reliable discharge data set exists1; and (2) ice jam dates are known. In the case of no (or limited)
available discharge data and historical ice jam observations, these parameters could be indirectly
determined using different models that would contribute in defining specific conditions and
thresholds (e.g., the limits of the red zone in Figure 9). The development and operation of
(conceptual, hydrodynamic, empiric or deterministic) river ice models are normally performed by
experts who are familiar with the site of interest (e.g. Beltaos, 2008; Turcotte et al., 2015b; Tuthill
et al. 1996, White, 2008). Note that the ice cover and ice jam mobilization discharges are among
the most under examined and documented parameters associated with breakup, and yet they are
probably among the most important to quantify.
For breakup ice jams in small streams (especially if narrow or steep), the general approach may be
similar, but the equilibrium jam curve (Figure 10), or the ice jam computation in models such as
HEC-RAS (Beltaos and Tang, 2013), may not apply (as discussed in Section 4.5). Assuming that
some kind of ice jam frequency record exists, the corresponding water levels (H) could be:
Computed with numerical models that are adaptable to different stream types: RIVICE (public
domain), CRISSP and ICESIM (proprietary models).
Estimated using common hydraulic equations or models. In turn, this could be based (1) on an
evaluation of the discharge (Q) that leads to initial overbank flooding, considering a probable
ice jam thickness and composite roughness, (2) on the assumption that any additional Q would
not contribute to thickening of the ice jam, and (3) on the assumption that the ice would be
confined in the channel. A comparable synthetic approach was proposed by Calkins (1983).
In most cases, some kind of empirical, often site-calibrated, function is needed to perform a
representative hydrotechnical investigation and this requires considerable information gathering
and data collection/ analyses, which makes the whole process expensive.
Although no synthetic equation, as presented in Figure 10 or in Calkins (1983), exists to apply the
hydrotechnical approach in order to evaluate the frequency of water levels associated with other
ice processes, the procedure remains similar:
1) Simulate the water levels associated with an ice blockage of specific mass of thickness, based
on past measurements and discharge estimations1. Note that for streams, the daily average
discharge can significantly underestimate the peak flow and a representative peak factor
(varying from 1.05 to more than 10) should be used if instantaneous discharge estimates are
not available.
1 The presence of ice effects on stream stage is clearly indicated in historical records, so as to warn users that associated
flows are estimates and may not be as reliable as open water values. Missing data points are often associated with
valuable extreme events.
2) Refer to the literature or develop a site-specific model that empirically links the process to
other hydro-meteorological parameters for which the frequency can be determined (e.g., a
discharge, a number of cumulated degree-days, a number of watts lost per square meters, etc.).
This can only be accomplished if the physics of specific ice processes is mostly understood,
which is not always the case (e.g., aufeis).
3) Create a relationship between the simulated water level and the frequency of the driving
parameters.
Figure 11A presents a relationship linking the simulated amount of frazil slush, snow slush, and
ice floes contained in a grounded hanging dam, based on an updated version of the model presented
by Turcotte and Morse (2016) on the x axis, and a measured water level during 8 different winters
on the y axis. The application of the same ice production-transport-deposition model to 40 years
of hydrometeorological data yields the frequency of the ice accumulation in that specific reach
(Figure 11B). The combination of both relationships yields the frequency of water levels
associated with the formation of the hanging dam under low flow conditions (Figure 11C). This
approach assumes that the ice produced by upstream reaches always accumulates following a
similar pattern year after year, which can only be partially true (see the scatter in Figure 11A), and
needs to be adapted to occasional mid-winter runoff events that produce higher water levels for a
given amount of ice.
For thickened freeze-up jams, ice dams and aufeis, if no direct historical water level data (as
presented in Figure 11A) is available, a reach specific blockage-frequency relationship could be
developed, based on observations or numerical simulations, and it could be combined with
discharge-frequency and ice decay-frequency empirical functions. Different ice experts would
probably have different means to perform such an ice-induced flood frequency analysis.
In municipalities where a significant amount of damage has been reported on a relatively regular
basis, independently of the origin of the flood, the hydrotechnical approach may be by-passed by
a flood risk analysis and mapping (with reported costs associated with specific areas). Hybrid
methods that consist of associating an average damage to a specific ice process and to simply
simulate the occurrence or non-occurrence of that process can also represent a defendable flood
risk determination option. The occurrence of specific ice processes may be confirmed by remote
sensing approaches such as satellite images (e.g., Mermoz et al., 2009). The higher resolution of
the new generation of satellites now enables the interpretation of the ice cover type along small
rivers, but not for small streams where the use of ground observations, time-lapse cameras or
drones will probably remain necessary.
The development of techniques to define the flood zone and the flood risk along streams depends
on the availability of field data (as presented in 5.1). Therefore, there is a need to appropriately
monitor river ice processes (Turcotte et al., 2017) on streams susceptible to high annual water
levels predominantly caused by ice processes.
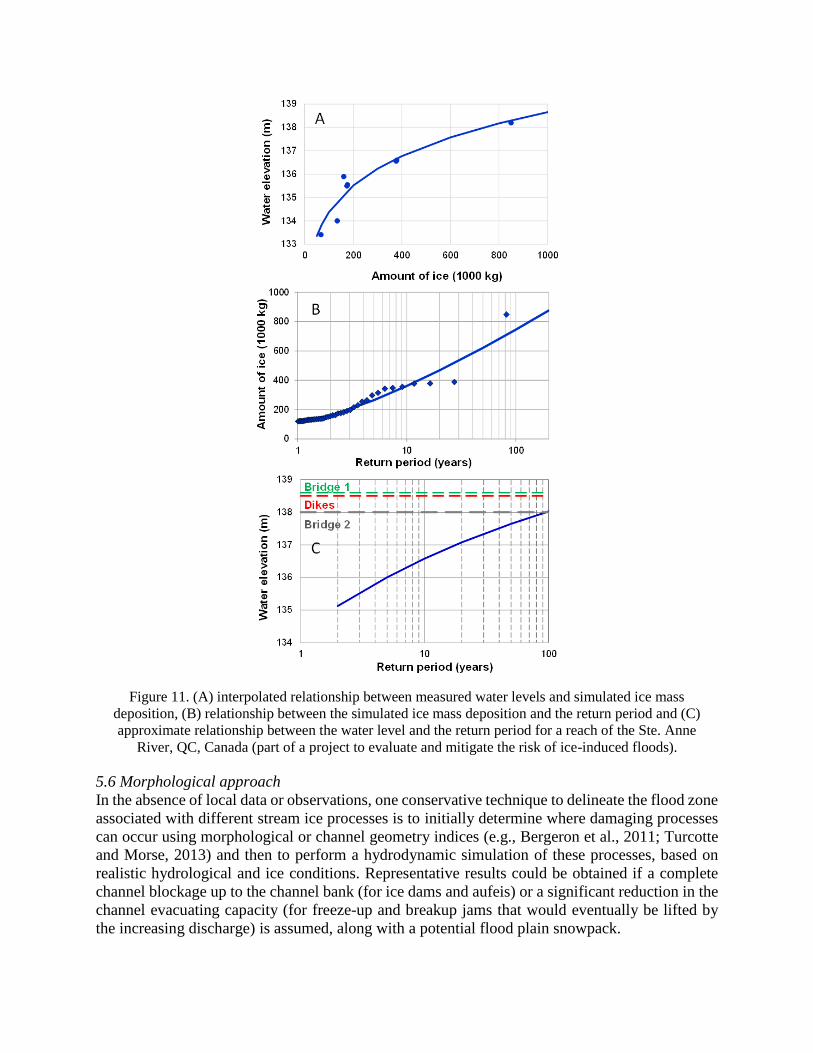
Figure 11. (A) interpolated relationship between measured water levels and simulated ice mass
deposition, (B) relationship between the simulated ice mass deposition and the return period and (C)
approximate relationship between the water level and the return period for a reach of the Ste. Anne
River, QC, Canada (part of a project to evaluate and mitigate the risk of ice-induced floods).
5.6 Morphological approach
In the absence of local data or observations, one conservative technique to delineate the flood zone
associated with different stream ice processes is to initially determine where damaging processes
can occur using morphological or channel geometry indices (e.g., Bergeron et al., 2011; Turcotte
and Morse, 2013) and then to perform a hydrodynamic simulation of these processes, based on
realistic hydrological and ice conditions. Representative results could be obtained if a complete
channel blockage up to the channel bank (for ice dams and aufeis) or a significant reduction in the
channel evacuating capacity (for freeze-up and breakup jams that would eventually be lifted by
the increasing discharge) is assumed, along with a potential flood plain snowpack.
This method has been used by Lier (2002) for the Karasjohka River in Norway. Potential flooding
scenarios from ice jams were simulated using the hydrodynamic model MIKE-11. Three ice jam
locations were tested, including two sites where no ice jam had been reported, but where conditions
appeared conducive for ice jam formation, based on river topography. The findings from this study
suggested that the ice-jam-flood frequency (and potential damage) was higher than the open water
flood frequency.
6. Overview of Ice-induced Flood Mitigation along Streams
Engineers and community planners involved with land development should be aware that even
small channels may become completely congested by ice, and that damaging ice-related flood
events can result. The frequency and intensity of the ice-related flood hazard depends upon the
causative ice processes, hydrometeorological conditions, and the hydraulic characteristics of the
channel and flood plain. The damage of the ice-related flooding depends upon the amount of
development in flood prone areas (i.e. exposed to the flood hazard), and the susceptibility of that
development to flood damages.
Several measures can be used to reduce the risk of ice-related flooding and they can be classified
from different perspectives (e.g., Turcotte and Morse, 2015a). More on the topic can be learned in
Belore et al. (1990), Burrell (1995), Haechnel (1998), Tuthill (1995, 2013), and in White and Kay
(1996). It is important to mention that mitigation measures successfully applied in large river
environments may not be transferable to smaller channels, especially when they imply a
modification of ice, hydraulic and hydrological conditions (e.g., Conventional [Abdelnour et al.,
1998] vs. experimental ice booms [Lafleur et al., 2017]). A study done by Laval University for St.
Raymond, QC, Canada (Turcotte and Morse, 2015a), is an example of an ice-induced flood risk
assessment and mitigation study adapted to a large stream. More research is need to develop ice-
induced flood guidelines specifically adapted to streams.
7. Concluding remarks
This paper has described different qualitative and quantitative ice processes that can cause flooding
along streams and small rivers. Floods in streams and small rivers are caused by thermally-driven
ice processes (mostly heat loss that generates ice formation leading to a gradual water level rise)
by hydro-mechanical ice processes (rise in discharge causing a sudden ice movement and
consequent rise in water level), or by a combination of both (e.g., freeze-up jams made of frazil
[thermal process] and ice runs [mechanical process]). No certified and versatile approach exists to
determine the limit of the ice-induced flood zone along streams and small rivers. A classic answer
provided by river-ice experts is that every site and every ice jam is unique. That being said, the
performance and adaptability of different approaches should be documented in order to provide a
basis for future development of guidelines with respect to the flood hazard and risk mapping along
ice-affected streams.
Municipalities that have suffered damage from ice-induced floods should consider documenting
ice processes and their hydrologic impact in order to facilitate the development of adapted flood
maps that are representative of ice-affected watercourses. In all cases, the damage associated with
a specific water level should consider that various ice processes can generate even more damage
for the same stage compared to open water floods (e.g., Humes and Dublin, 1988).
The effect of climate change on the ice regimes of streams may evolve more drastically than along
larger rivers, generating more or less intense floods. Therefore, care must be taken when
delineating the ice-induced flood zone along streams based on past data and observations.
Acknowledgments
This paper arose from discussions during a meeting of the CGU-Hydrology Committee on River
Ice Processes and the Environment, of which the authors are members. The members of the
Committee are thanked for their advice and encouragement during the preparation of this paper.
The authors also express appreciation to their employers for their support. The data presented in
this paper that refers to the Ste. Anne River, QC, Canada, has been obtained from an extensive,
multi-year survey funded by the Quebec Ministry of Public Security [CPS 15-16-08]. Brian Morse,
professor at Université Laval, and Karl-Erich Lindenschmidt, professor at the University of
Saskatchewan, provided constructive reviews of this paper.
References
Abdelnour, R., Nicholson, C., and Gong, Y., (1998), The Design, Fabrication and Deployment of
an Ice Boom to Protect Two Hydroelectric Power Plant Water Intakes from Ice Blockages
during Winter, IAHR Ice Symposium, 1998, Potsdam, New York, July.
Allard, G., Buffin-Belanger, T., Bergeron, N., 2011. Analysis of frazil ice as a geomorphic agent
in a frazil pool. River Research and Applications 27, 1136–1148.
Andres, D., Jasek, M., Fonstad, G., 2005. Field and theoritical study of the toe region of a
consolidated ice cover. In: Proceeding of the 13th Workshop on River Ice, Hanover, NH.
Asvall, R. P. (1997). Extreme Frazil and Bottom Ice Formation Causing Ice Problems in a
Regulated River. 9th Workshop on the Hydraulics of Ice Covered Rivers. Fredricton, New
Brunswick, Committee on River Ice Processes and the Environment. 1: 173 - 182.
Belore, H.S. Burrell, B.C., and Beltaos, S., 1990. Ice jam mitigation. Canadian Journal of Civil
Engineering 17, 675-685.
Beltaos, S., 1983. River ice jams: theory, case studies and applications. ASCE Journal of
Hydraulic Engineering 109(10), 1338-1359.
Beltaos, S. (editor). 1995. River ice jams. Water Resources Publications, Highlands Ranch,
Colorado, USA.
Beltaos, S. 1999. Flow through breakup ice jams. Can. J. of Civ. Eng., 26 (2), 177-185
Beltaos, S. (editor). 2008. River Ice Breakup. Water Resources Publications, Highlands Ranch,
Colorado, USA.
Beltaos, S. 2012. Distributed function analysis of ice jam flood frequency. Cold Regions Science
and Technology, 71: 1–10.
Beltaos, S. (editor). 2013. River Ice Formation. Committee on River Ice Processes and the
Environment, Edmonton, Aberta.
Beltaos, S., Boyle, P., and Hryciw, K. 2007a. 2005-06 ice-jam flooding, Kaministiquia River near
Fort William Historical Park. Proc. (CD-ROM) 14th River Ice Workshop, Québec City, CGU-
HS CRIPE, paper No. a1.
Beltaos, S., Hulley, M., Keene, B. and Watt, E. 2007b. Frazil-ice flooding and potential
mitigation: Moira River at Belleville. Proc. (CD-ROM) 14th River Ice Workshop, Québec
City, CGU-HS CRIPE, paper No. a29.
Beltaos, S. and Tang, P. 2013. Applying HEC-RAS to simulate river ice jams: snags and practical
hints. 17th CGU-HS CRIPE Workshop on the hydraulics of Ice Covered Rivers, Edmonton,
AB.
Bergeron, N.E., Buffin-Bélanger, T., Dubé, J., 2011. Conceptual model of river ice types and
dynamics along sedimentary links. River Research and Applications 27, 1159–1167. Burrell, B.C. 1995. Mitigation. In River ice Jams, Beltaos, S. (Ed.), Water Resources Publications,
Highlands Ranch, Colorado.
Burrell, B. C., Huokuna, M., Beltaos, S., Kovachis, N., Turcotte, B. and Jasek, M., 2015. Flood
Hazard and Risk Delineation of Ice-Related Floods : Present Status and Outlook. Proc. 18th
Workshop on the Hydraulics of Ice Covered Rivers, Quebec City, Quebec, Canada, August 18-
20, 2015.
Cao Shu-you, 2002. Review of regime theory of alluvial channels. Journal of Hydrodynamics ,
Ser. B ,3,1 – 7, China Ocean Pres, Beijing
Calkins, D.J. 1983. Ice jams in shallow rivers with floodplain flow. Canadian Journal of Civil
Engineering, 10(3), 538-548.
Carey, K.L., 1973. Icings Developed from Surface Water and Ground Water. Cold Regions
Research and Engineering Laboratory, Hanover, NH.
Daly, S. (2013) Aufeis. Chapter 6 in: River Ice Formation (S. Beltaos, editor), Committee on River
Ice processes and the Environment, Edmonton, Alberta, Canada, 159-180.
Daly, S.F., Zuflet, J.E., Fitzgerald, P., Gelvin, A., Newman, S., 2011. Aufeis Formation in Jarvis
Creek and Flood Mitigation. USACE ERDC/CRREL TR-11-14. 80 p.
Dubé, M., Turcotte, B., Morse, B., 2015. Steep channel freezeup processes: understanding
complexity with statistical and physical models. Can. J. Civ. Eng. 42: 622-633.
Flato, G.M. and Gerard, R. 1986. Calculation of ice jam profiles. Proceedings, 4th Workshop on
River Ice, Montreal, Canada, Paper C-3.
Gebre, SB, Alfredsen, K, Lia, L., Stickler, M and Tesaker, E. (2013) Review of Ice Effects on
Hydropower Systems . Journal of Cold Regions Engineering, 27, p. 196-222.
Gerard, R. 1989. Chapter 10: Ice-jam floods. In: Hydrology of Floods in Canada (editor-in-chief:
W.E. Watt), National Research Council of Canada, Ottawa, Ontario, Canada, 169-184.
Girling, W. and J. Groenveld (1999). Anchor Ice Formation below Limestone Generating Station.
10th Workshop on the Hydraulics of Ice Covered Rivers. Winnipeg, Manitoba, Committee on
River Ice Processes and the Environment. 1: 160-173.
Grayson, R., 2010. Asian ice shields and climate change. World Placer Journal 10, 21–45.
Haehnel, R.B., 1998. Nonstructural Ice Control. Special Report 98-14, Cold Regions Research and
Engineering Laboratory, U.S. Army Corps of Engineers. Hanover, NH, USA, 36 p.
Humes, T.M. and Dublin, J. 1988. A comparison of the 1976 and the 1987 St. John River ice jam
flooding with emphasis on antecedent conditions. Proceedings of Workshop on the Hydraulics of
River Ice/Ice Jams, Winnipeg, Canada, National Research Council of Canada Associate
Committee on Hydrology, Ottawa, Canada, 43-62.
IAHR Working Group on River Ice Hydraulics. 1986. River ice jams: a state of the art report.
Proceedings, IAHR International Ice Symposium, Iowa City, U.S.A., III, 561-594.
Jasek, M., Shen, H.T., Pan, J., Paslawski, K., 2015. Anchor ice Waves and their Impact on Winter Ice
Cover Stability. 18th CGU-HS CRIPE Workshop on the hydraulics of Ice Covered Rivers.
Quebec City, QC.
Kerr, D., H. Shen and S. Daly (2002). Evolution and hydraulic resistance of anchor ice on gravel
bed. Cold Regions Science and Technology 35: 101-114
Kovachis, N., Burrell, B.C., Huokuna, M., Beltaos, S., Turcotte, B., Jasek, M. 2017. Ice-jam flood
delineation: Challenges and research needs. Canadian Water Resources Journal (in press).
Lafleur, C., Morse, B., Turcotte, B., Simard-Robitaille, T., 2017. Floating ice boom design to
manage frazil ice induced floods. In: Proc. Of the 19th CGU-HS-CRIPE Workshop on the
Hydraulics of Ice Covered Rivers. Whitehorse, YK.
Lier, Ø.E. (2002) Flomsonekart Delprosjekt Karasjon (Flood zone map – subproject Karasjok).
NVE Report 1 – 2002.
Lind, L., Alfredsen, K., Kuglerová, L., Nilsson, C. (2016). Hydrological and thermal controls of
ice formation in 25 boreal stream reaches. Journal of Hydrology, 540: 797-811.
Lind, L. and C. Nilsson (2015). Vegetation patterns in small boreal streams relate toice and winter
floods. Journal of Ecology 103: 431-440
Malenchak, J. and S. Clark (2013). Anchor ice. River Ice Formation. S. Beltaos. Edmonton,
Committee on River Ice Processes and the Environment. 1: 135 - 157.
Mermoz, S., Allain, S., Bernier, M., Pottier, E., Gherbouj, I. 2009. Classification of river ice using
polarimetric SAR data. Can J. Remote Sensing 35(5), 460-473.
Meybeck, M., Friedrich, G., Thomas R. and Chapman, D. 1996. Chapter 6: Rivers In Water
Quality Assessments - A Guide to Use of Biota, Sediments and Water in Environmental
Monitoring - Second Edition, Edited by Deborah Chapman.ISBN 0 419 21590 5 (HB) 0 419
21600 6 (PB), UNESCO/WHO/UNEP, New York, USA.
Montgomery, D.R., Buffington, J.M., 1997. Channel-reach morphology in mountain drainage
basins. GSA Bulletin 109 (5), 596–611.
Neill, C.R. and Andres, D.D. 1984. Freeze-up flood stages associated with fluctuating reservoir
releases. Cold Regions Engineering Speciality Conference, Edmonton, Alberta, Canadian Society
for Civil Engineering, Montreal, Canada, 249-264.
NRCC, 1989. Hydrology of Floods In Canada: A Guide to Planning and Design (Ed Watt, Editor),
National Research Council of Canada, Associate Committee on Hydrology, Ottawa, Ontario,
Canada.
Pigeon, F., Leclerc, M., Morse, B., Turcotte, B., 2015. Breakup 2014 on the Montmorency River.
In: Proc. Of the 18th CGU-HS-CRIPE Workshop on the Hydraulics of Ice Covered Rivers.
Quebec City, QC.
She, Y.T., Andrishak, R., Hicks, F., Morse, B., Stander, E., Krath, C., Keller, D., Abarca, N.,
Nolin, S., Tanekou, F.N., Mahabir, C., 2009. Athabasca River ice jam formation and release
events in 2006 and 2007. Cold Regions Science and Technology 55, 249–261.
Sloan, C.E., Zenone, C., Mayo, L.R., 1976. Icings along the Trans-Alaska pipeline route. United
States Geological Survey (USGS) Professional Paper No. 979, 31pp.
Stickler, M. and K. Alfredsen (2009). Anchor ice formation in streams: A field study. Hydrological
Processes 23: 2307-2315
Stickler, M., K. Alfredsen, T. Linnansaari and H.-P. Fjeldstad (2010). The influence of dynamic
ice formation on hydraulic heterogeneity in steep streams. River research and applications
26(9): 1187-1197
Strømslid, T., T. Andersen, R. P. Asvall, M. Stickler, J. Dahlen and S. Kristiansen (2012).
Sluttrapport B0952(S) FOU isproblem i vassdraStatkraftB.0952
Tesaker, E. (1996). Interaction between ice and water flow in rapids. Proc. 13th International IAHR
Ice Symposium, Beijing, China.
Toniolo, H., Stutzke, J., Lai, A., Youcha, E., Tschetter, T., Vas, D., Keech, J., Irving, K., 2017.
Antecedent Conditions and Damage Caused by 2015 Spring Flooding on the Sagavanirktok
River, Alaska. J. Cold Reg. Eng., 2017, 31(2). DOI: 10.1061/(ASCE)CR.1943-5495.0000127
Turcotte, B., Morse, B., Anctil, F., 2011. Steep channels freezeup processes. In: Proceedings of
the 16th CGU-HS CRIPE Workshop on the Hydraulics of Ice Covered Rivers, Winnipeg, MB,
Canada.
Turcotte, B., Morse, B., Anctil, F., 2012a. Impacts of precipitation on the cryologic regime of
stream channels. Hydrological Processes 26, 2653–2662.
Turcotte, B., Morse, B., Anctil, F., 2012b. Cryologic continuum of a steep watershed. Hydrological
Processes.
Turcotte, B., Morse, B., 2013. A global river ice classification model. Journal of Hydrology 507.
134-148.
Turcotte, B., Morse, B., Dubé, M., Anctil, F. 2013. Quantifying steep channel freezeup processes.
Cold Regions Science and Techology 94, 21-36.
Turcotte, B., Morse, B., Dubé, M., Anctil, F., 2014. Quantifying steep channel freezeup processes.
Cold Regions Science and Technology.
Turcotte, B., Morse, B., 2015a. Ice-induced flooding mitigation at St. Raymond, QC, Canada. In:
Proc. Of the 18th CGU-HS-CRIPE Workshop on the Hydraulics of Ice Covered Rivers. Quebec
City, QC.
Turcotte, B., Morse, B., 2015b. River ice breakup forecast and annual risk distribution in a climate
change perspective. In: Proc. Of the 18th CGU-HS-CRIPE Workshop on the Hydraulics of Ice
Covered Rivers. Quebec City, QC.
Turcotte, B., Morse, B., 2016. A simple 1-D model to simulate frazil jam formation and mitigation
strategies. In: proceedings of the 23rd IAHR International Symposium on Ice. Ann Arbor, MI.
Turcotte, B., Nafzigger, J., Clark, S., Beltaos, S., Jasek, M., Alfredsen, K., Lind, L., Stander, E.,
2017. In: Proc. Of the 19th CGU-HS-CRIPE Workshop on the Hydraulics of Ice Covered
Rivers. Whitehorse, YK.
Tuthill, A.M. 1995. Structural Ice Control, Review of Existing Methods. USACE CRREL Special
Report 95-18.
Tuthill, A.M. 2013. River ice control. In (S. Beltaos, ed.): River ice formation. Committee on River
Ice Processes and the Environment, Edmonton, Alberta, Canada. 24 pp.
Tuthill, A.M., J.L. Wuebben, S.F. Daly, and K.D. White. 1996. Probability distributions for peak
stage on rivers affected by ice jams. J. Cold Regions Engineering, 10(1), 36-57.
Vergeynst, J., Morse, B., Turcotte, B., 2017. Quantifying frazil production, transport and
deposition in a gravel bed river: Case study of the St. Raymond hanging dam. Cold Regions
Science and Technology. (in press).
White, K.D., 2008. Breakup Ice Jam Forecasting. In S. Beltaos (ed.): River ice Breakup. Water
resources publications, Highland Ranch, Colorado.
White, K.D. and Kay, R.L. 1996. Ice Jam Flooding and Mitigation, Lower Platte River Basin,
Nebraska. US Army Corps of Engineers, Cold Regions Research & Engieering Laboratory
(CRREL) Special Report 96-1.
White, K.D. and Beltaos, S. 2008. Chapter 9: Development of Ice-Affected Stage Frequency
Curves. In: River Ice Breakup (S. Beltaos, ed.), Water Resources Publications, Highlands
Ranch, Co., USA, 305-325.


