Embed Size (px)
Citation preview

Running head: IDENTIFYING QUAILTY APPS
Identifying quality educational apps: Lessons from ‘top’ mathematics apps in the Apple App
Store

IDENTIFYING QUALITY APPS 2
ABSTRACT There are 80,000+ educational apps in the Apple App Store and math apps are the most common.
We searched for ‘math’ in the education category and selected the top 10 apps for each of the 3
filters provided by Apple (Relevance, Popularity, Rating) and 3 age categories (0-5, 6-8, 9-11).
Using these top 90 apps, we examined the basic information (e.g., price), educational content,
and user ratings to see whether the information provided in app stores helps parents and
educators find quality educational apps. There was a surprising lack of transparency and
meaningful information. The Apple App store needs to explain how it selects ‘top’ apps and
developers need to provide benchmarks of educational quality in their app descriptions.
Keywords: Tablet computers, App Store, educational technology, mathematics education,
mobile, educational apps

IDENTIFYING QUALITY APPS 3
Identifying quality educational apps: Lessons from ‘top’ mathematics apps in the Apple App
Store
1. Introduction
A growing problem for many Western countries (e.g., Canada, U.S.A) is a decline in the
areas of Science Technology Engineering and Mathematics (i.e., STEM); their students
consistently underperform in international mathematics tests and their fluency with basic
operations has decreased since the 1990s (Imbo & LeFevre, 2009; LeFevre et al., 2014). This
poor performance is partially behind the deployment of tablets in schools, as we turn to
technology to solve the problem (e.g., Ontario spent $150 million on iPads, Rieti 2014). In fact,
mathematics apps account for the greatest number of subject-specific content in the Apple App
Store (Dubé, Alam, Xu, Wen, & Kacmaz, 2019; Shuler, 2012). Thus, it seems that mathematics
apps are prevalent and popular and this is partly because the draw of ‘easy to use’, ‘accessible’,
and ‘fun’ mathematics games directly opposes the commonly held belief that mathematics as a
subject is ‘difficult,’ ‘inaccessible,’ and ‘boring’ (Dowker, Sarkar, & Looi, 2016). However,
many math apps are poorly designed and finding quality math apps is a challenge for educators.
This difficulty in locating quality educational apps is not limited to math (Callaghan & Reich,
2018), and results from studying these popular math apps will help identify the challenges
locating quality educational apps in any subject.
Critically, research shows that educational math apps can be effective if they are well
designed. Fabian, Topping, and Barron (2016) reviewed over 60 studies conducted prior to 2012
investigating the effectiveness of mobiles devices (e.g., cellphones, iPods, tablets) as
mathematics education tools. They concluded that mobile apps can increase behavioural
engagement during math practice (e.g., Liao, Chen, Cheng, Chen, & Chan, 2011), improve math

IDENTIFYING QUALITY APPS 4
achievement (Main & O’Rourke, 2011), and even improve students’ attitudes towards
mathematics (e.g., Wu, Hsiao, Change, & Sung, 2006). Further, a recent review by Dubé et al.
(2019) of over 200 math app studies came to a similar conclusion but highlighted that app quality
varies substantially (i.e., few offer high fidelity interactions grounded in appropriate learning
theories). Thus, a logical next question is to ask how educators and parents find quality apps
when they are so uncommon.
1.2 How Educators and Parents Find Quality Apps
From a purely mechanical point of view, the process of finding an educational app
involves four steps. First, the educator or parent opens the App Store and enters keywords into a
search bar. Second, they choose ‘filters’ to help narrow their search. The Apple App Store filters
include genre (i.e., educational vs other), search strategy (Relevance, Popularity, Rating), age (0-
5, 6-8, 9-11), device supported (iPad only, Phone only, both), and Price (free or paid) (see Figure
1 in methods). Third, the search returns a list of apps but only provides a small icon and the
app’s name. Fourth, an individual app is clicked and its ‘app page’ is returned (see Figure 2). The
app page includes images of the app, a written description, and other information such as price
and file size. The app page is the only detailed source of information provided in the App Store
and is crucial to how educational apps are chosen. Yet, there is little research on whether app
page information is useful (i.e., includes benchmarks of educational quality).
1.2.1 Educational benchmarks. An app’s written descriptions and images are used by
developers to advertise their apps (Lee & Raghu, 2014) and listing key educational features (i.e.,
benchmarks) is one strategy developers could employ. However, research shows that purely
aesthetic aspects of app pages are better predictors of non-educational app popularity than the
written descriptions (Wang & Li, 2017). While written descriptions and images could countian

IDENTIFYING QUALITY APPS 5
educational benchmarks, research has yet to produce a clear consensus on which benchmarks
apps should contain.
Several frameworks are used to evaluate educational apps but many are subject specific
(see Rosell-Aguilar, 2017 framework for language apps), focused on more technical aspects of
an app (e.g., usability, Walker, 2011), or not empirically supported (e.g., Peachey, 2013,
Schrock, 2013; Vincent, 2012). In contrast, Cayton-Hodges, Feng, and Pan (2015) conducted a
content analysis of 16 elementary math apps and concluded that five benchmarks from Vaala and
Levine (2015) are useful indicators of quality. These benchmarks are particularly useful because
they are portable across different academic subject areas (literacy and math apps), are focused on
the educational aspect of the apps (cf., technical), and have been supported by subsequent
research (Cayton-Hodges et al., 2015). The benchmarks include curriculum, feedback,
scaffolding, using a learning theory, and involving educators in the app’s development team.
Curriculum refers to apps using lessons or containing an academic program that is already taught
in a school or specific course. Feedback refers to apps providing information about student
performance on a task, which has been shown to improve mathematics achievement outcomes
(Volk, Cotic, Zajc, & Starcic, 2017). Scaffolding occurs when an app uses instructional
techniques that move students progressively toward a stronger understanding (e.g., leveling,
Larkin & Calder, 2016). Learning theory refers to apps based on a particular pedagogical
approach, which is shown to improve achievement outcomes (Dubé et al., 2019). Development
team refers to apps indicating that their development process either consulted or included
educational experts. The question is whether these benchmarks are actually present in popular
educational math apps.

IDENTIFYING QUALITY APPS 6
Currently, only one study has evaluated whether benchmarks similar to these are present
in preschool math apps. Callaghan and Reich (2018) conducted a content analysis of 50 popular
preschool literacy and math apps in the Apple App Store and concluded that many do not contain
the five benchmarks. For example, neither feedback (56% did not) or scaffolding (68% did not)
were common. Their work suggests that the so-called ‘top’ preschool literacy and math apps
available in the Apple App Store contain many low-quality apps. Educators cannot rely on an
app being popular or at the top of the App Store list and assume it will be of sufficient quality.
Instead, they must use the information provided to them on an app’s page to make their own
determination. Critically, we do not know if the typical app page includes information on
benchmarks.
1.2.2 Other indicators of app quality and accessibility. App pages include other details
that can inform quality and accessibility. Price, language, and file size are indicators of an app’s
accessibility, as each of these can serve as a barrier to download. Little is known about the
pricing or monetization of educational apps (Lee & Raghu, 2014). For example, we do not know
whether educational apps are more expensive than the average app or the relative frequency of
free apps versus paid apps. An app’s language support (multilingual vs English only) is
indicative of how accessible the app market is to non-English speaking learners (Rosell-Aguilar,
2017), as the Apple App Store in Western markets is English first and contains primarily English
language apps (Lee & Raghu, 2014). The file size of an app also serves as a barrier; in that large
files take time to download, require devices with more storage, and consume a considerable
portion of a family’s mobile data plan.
In contrast, user ratings and App Store rankings may indicate app quality. User ratings
are a numerical score (out of 5 stars) provided by people who have downloaded the app. The

IDENTIFYING QUALITY APPS 7
App Store ranking is an internal rating of an app set by Apple and is a predictor of user demand
for non-educational apps (Carare, 2012). Thus, both ratings and rankings could tell parents and
educators which apps are deemed high quality by the marketplace (i.e., Apple and other users).
Despite their potential usefulness, none of these aspects have been considered in previous
research.
1.2 Study Goals
Taken together, research suggests that quality math apps can be effective but that quality
apps have to be sought out. The present study analyzes how elementary math apps are described
in the Apple App Store to determine whether a) the information provided can be used by
educators and parents to find quality apps and b) the apps are available to a wide range of
students (i.e., accessible). Given that math apps are the most popular type of educational app
(Dubé, et al., 2019; Shuler, 2012), results from studying math apps apply to the majority of the
educational app marketplace. The following research questions guided our investigation:
1. Are math apps accessible?
a. Which monetization methods are developers using for math apps (e.g., free vs.
payed)?
b. Do developers provide support for multiple languages in their apps?
c. Is math app file size a barrier to use?
2. Do developers provide benchmarks of educational quality in the App Store?
a. Are apps titled with informative names (e.g., slice fractions) that convey which
subjects they cover?
b. Is the math subject of an app identified in the written description and how many
math subjects are covered in a typical math app?
c. Do app pages include the five educational benchmarks across their images and
written descriptions.
3. How does the Apple’s App Store help educators find quality apps?
a. Do app user ratings provide a meaningful indication of app quality?

IDENTIFYING QUALITY APPS 8
b. Do app rankings provided by Apple provide a meaningful indication of app
quality?
4. Does app accessibility, the presence of educational benchmarks, or Apple’s ratings and
rankings differ by the age of the target user (i.e., <5, 6-8, 9-11)?
1. Method
2.1 Data Source
2.1.1 App selection. The app search process was designed to resemble how users search
the App Store. The app search process was conducted 9 separate times using different filtering
options (see Figure 1) and the top 10 apps were included (90 apps total). The top 10 apps from
each search were selected as these apps appeared ‘above the fold’ on the search page. For every
search, the word “math” was entered as the keyword and the app category set to education. For
each of the three ‘filters’ provided by Apple (popularity, relevance, rating), a search was
conducted for each of the age ranges set by Apple (<5, 6-8, 9-11). Searches using different filters
within the same age category produced duplicate apps while searches conducted in different age
ranges did not. Excluding duplicates, the data set contained 73 unique apps representing the top
math apps presented to educators and parents when they search the App Store.
Figure 1. App search process

IDENTIFYING QUALITY APPS 9
2.1.2 App coding. The app coding system was developed around the structure of the
individual app pages (see figure 2), which were categorized into three text-based sections
(banner information, written description, and basic information) and two image-based sections of
the app (icon, preview). Four researchers coded the information within these sections in the
following steps. One, screen capture an image of the app page and download all preview images
available for each app. Two, transcribe the banner information (title, payment type, user ranking,
ratings), the written descriptions, the basic information (file size, language support), and any
words found in the preview images verbatim into an excel file. Three, code the transcribed
information according to the framework in Table 1. Inter-rater reliability was established by
having all coders recode 10 random apps and agreement was 83%.
Figure 2. Example app page and coding areas.

IDENTIFYING QUALITY APPS 10
Table 1
Individual codes for the text-based section
Categories Codes Within Sections Coding Rules Banner Payment type: What
monetization system is used? Apps were coded as using one of four monetization methods: Free apps require no purchase at any time. In-app purchase apps can be installed for free but require a purchase or subscription to unlock their full feature set. One-time fee apps have an initial cost but no future costs. Both one-time fee & in-app purchase apps require an initial purchase to install and future purchases to unlock features.
User ratings: What is the user rating of the app?
User ratings are expressed on a scale of 1 to 5 stars. Not all apps have a rating.
Ranking: How does Apple rank the app compared to others?
Rankings are expressed as a whole number (e.g., #174) without a range. Not all apps have a rank.
App title: Does the title identify the math subject?
App titles were coded as either identifying a specific math subject (e.g., Slice Fractions) =1 or not = 0.
Preview & Written Description
Math subjects: What math subjects are mentioned?
Math subjects were coded as either present = 1, absent = 0: arithmetic, numbers, algebra, geometry, measurements, math reasoning, and other (open category).
Educational benchmarks: Each benchmark was coded as either present = 1, absent = 0: Curriculum refers to apps using the lessons or academic program taught in a school or in a specific course. Scaffolding refers to apps using instructional techniques that move students progressively toward stronger understanding. Feedback refers to apps providing information about student performance on a task. Learning theory refers to apps that use a specific pedagogical framework. Development team refers to apps that involve educators in the creation of the app.
Basic Information
File size: What is the file size? The file size in megabytes (MB) required for installation. Language support: Is the app multilingual?
Apps that reported supporting more than one language were coded as multilingual.

IDENTIFYING QUALITY APPS 11
2. Results
The following analyses present an overview for each coding category and then
investigates differences among the age ranges (i.e., R4). Differences among the popularity,
relevance, and rating filters was not possible because of duplication of apps within each filter.
3.1 R1. Are App Store Math Apps Accessible to A Broad Audience?
3.1.1 Monetization method. Of the 73 apps, only 16% are free, 34% require a one-time
fee, 45% have in-app purchases, and 4% require both a one-time fee and future in-app purchases,
which suggests that educational app developers prefer the in-app monetization method overall,
χ2(3, n = 73) = 29.30, p <. 001. The preferred monetization system differed by age range (see
Figure 3). Specifically, the <5 age range had fewer one-time fee apps and more in-app purchase
apps than expected (Adjusted Residual = 6.7), χ2(3, n = 22) = 9.091, p = .011. The mean price for
one-time fee apps was $14.48 (SD = 14.32) and did not differ significantly by age range, F< 1,
M<5 = $12.37 (SD = 5.65), M6-8 = $13.67 (SD = 16.85), M9-11 = $15.52 (SD = 14.96).
Figure 3. The percentage of apps by monetization system and age range.
IDENTIFYING QUALITY APPS 12
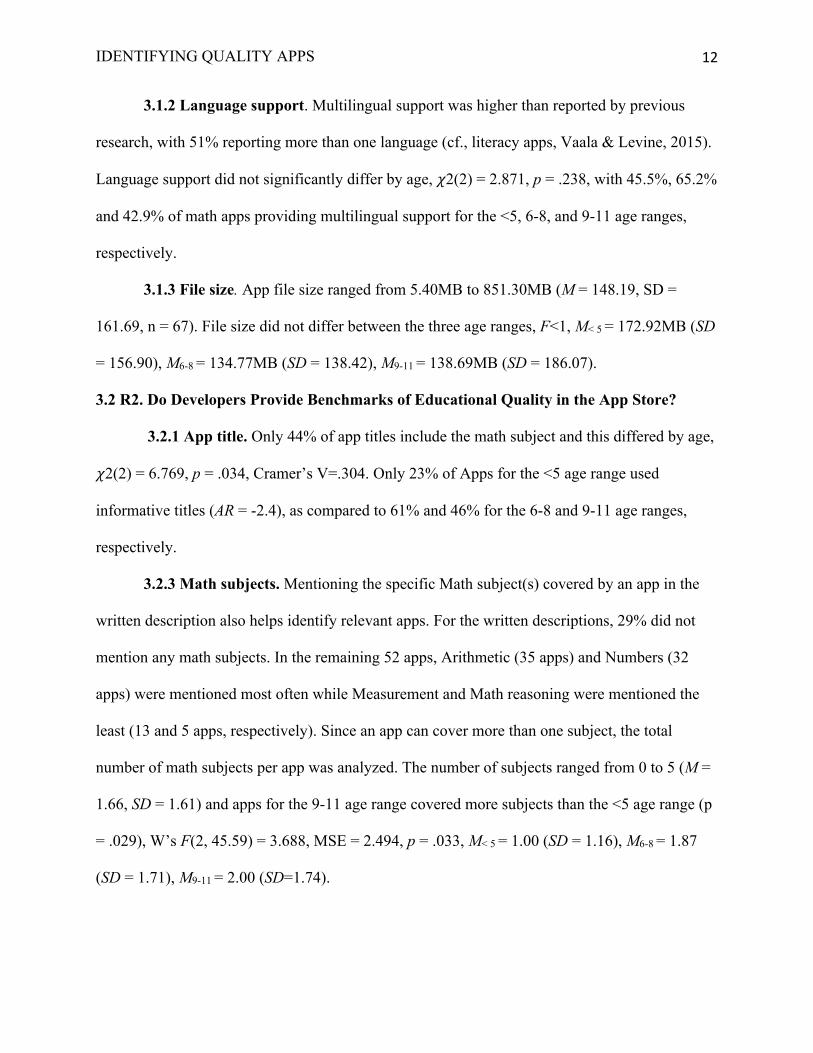
3.1.2 Language support. Multilingual support was higher than reported by previous
research, with 51% reporting more than one language (cf., literacy apps, Vaala & Levine, 2015).
Language support did not significantly differ by age, 𝜒2(2) = 2.871, p = .238, with 45.5%, 65.2%
and 42.9% of math apps providing multilingual support for the <5, 6-8, and 9-11 age ranges,
respectively.
3.1.3 File size. App file size ranged from 5.40MB to 851.30MB (M = 148.19, SD =
161.69, n = 67). File size did not differ between the three age ranges, F<1, M< 5 = 172.92MB (SD
= 156.90), M6-8 = 134.77MB (SD = 138.42), M9-11 = 138.69MB (SD = 186.07).
3.2 R2. Do Developers Provide Benchmarks of Educational Quality in the App Store?
3.2.1 App title. Only 44% of app titles include the math subject and this differed by age,
𝜒2(2) = 6.769, p = .034, Cramer’s V=.304. Only 23% of Apps for the <5 age range used
informative titles (AR = -2.4), as compared to 61% and 46% for the 6-8 and 9-11 age ranges,
respectively.
3.2.3 Math subjects. Mentioning the specific Math subject(s) covered by an app in the
written description also helps identify relevant apps. For the written descriptions, 29% did not
mention any math subjects. In the remaining 52 apps, Arithmetic (35 apps) and Numbers (32
apps) were mentioned most often while Measurement and Math reasoning were mentioned the
least (13 and 5 apps, respectively). Since an app can cover more than one subject, the total
number of math subjects per app was analyzed. The number of subjects ranged from 0 to 5 (M =
1.66, SD = 1.61) and apps for the 9-11 age range covered more subjects than the <5 age range (p
= .029), W’s F(2, 45.59) = 3.688, MSE = 2.494, p = .033, M< 5 = 1.00 (SD = 1.16), M6-8 = 1.87
(SD = 1.71), M9-11 = 2.00 (SD=1.74).

IDENTIFYING QUALITY APPS 13
3.2.4 Educational benchmarks. On average, the apps mentioned 1.67 educational
benchmarks out of five (SD = 1.12) in either the written descriptions or images (see Figure 4).
Comparisons of benchmarks across written descriptions and images were analyzed using
Wilcoxon’s signed rank test (Wilcoxon, 1945) whereas comparisons between age groups were
analyzed separately for written descriptions and images using Kruskal-Wallis Independent
samples test (Kruskal, 1952; see Figure 4).
Figure 4. The proportion of apps by benchmark (Scaffolding-S, Feedback-F, Curriculum-C, Learning theory-L, and Development team-D and information source (Written-W, Image-I) for each age range.

IDENTIFYING QUALITY APPS 14
Scaffolding. Overall, scaffolding was mentioned in 37% of apps when considering both
written descriptions and pictures. Written descriptions contained fewer mentions of scaffolding
than pictures (8% vs 34%, respectively), Z = -3.962, p < .001. For written descriptions, there
was no difference by age, H(2) = 0.623, p =.732. For pictures, there was a difference, with a
mean rank of 27.82 for <5 years old, 37.20 for 6-8 years old, and 44.05 for 9-11 years old, H(2)
= 10.681, p = .005.
Feedback. Feedback was mentioned in 49.3% of apps. Written descriptions contained
fewer mentions of feedback than pictures (23% vs 40%, respectively), Z = 2.353, p = .019. For
both written descriptions and pictures, there was no difference by age, H(2) = 1.825, p =.401,
H(2) = 2.140, p = .343, respectively.
Curriculum. Curriculum was mentioned in 32.9% of apps. There was a trend for written
descriptions to contain more mentions of curriculum than pictures (26% vs 15%, respectively), Z
= -1.886, p =.059. For both written descriptions and pictures, there was no difference by age,
H(2) = .876, p = .645, H(2) = 1.628, p =.443, respectively.
Learning Theory. Learning theory was mentioned in 17.8% of apps. Written descriptions
and pictures contained similar mentions of learning theories (8% vs 12%, respectively), Z = .905,
p =.366. For written descriptions, there was no difference by age, H(2) = 1.642, p =.440. For
pictures, there was a difference, with a mean rank of 37.48 for <5 years old, 42.02 for 6-8 years
old, and 32.50 for 9-11 years old, H(2) = 7.891, p = .019.
Development Team. Development team was mentioned in 30.1% of apps. Written
descriptions contained greater mentions of development teams than pictures (30% vs 3%,
respectively), Z = -7.761, p < .001. For both written descriptions and pictures, there was no
difference by age, H(2) = 1.719, p =.423, H(2) = 1.264, p = .532, respectively.

IDENTIFYING QUALITY APPS 15
A comparison of the benchmarks when considering both written descriptions and
pictures, using Cochran’s Q test, indicates that the learning theory benchmark was mentioned
significantly less frequently than the feedback benchmark (17% vs 49%, respectively), χ2 (2) =
17.544, p < .001, with no other significant differences between any two benchmarks.
3.3 Exploratory Analysis of Image Style
When coding the app images for benchmarks, it became apparent that there were
common styles of app images and that they ranged substantially in visual complexity. To
investigate this further, the app images were coded according to both style and complexity (see
table 2 for description of codes). The styles were adapted from a resource used by educational
app developers (Knotko, 2018). Complexity of app images was calculated (cf., judged) such that
images with more visual information per pixel were deemed more complex (i.e., pixels per
byte).1 Given that image style and complexity were not considered at the outset of the study
design, these results are exploratory.
1 For each math app, every app image provided in the app store was downloaded and used to calculate the average pixels per byte for that app. This was done by a) dividing the total number of pixels in each app image (e.g., 1020 X 1980 image = 2,019.600 pixels) by its file size (bytes) and b) determining the average pixels per byte across each app’s set of images. The logic of the pixels per byte measure is that computer image compression produces larger sized images when there are more differences between pixels. If pixels are similar then an image is less complex (e.g., a solid blue picture has no differences between pixels) and it requires fewer bytes to encode that information. Thus the pixels per byte of data is inversely related to complexity such that the fewer number of pixels generated per byte the more complex the image.

IDENTIFYING QUALITY APPS 16
Table 2 Educational benchmarks, image styles, and picture complexity by age range
Measures Definitions Age Range
<5 6-8 9-11 Overall
Image Styles % of Apps
Classic a screen capture of the app in use. 55 52 86 66 Device picture of the device (phone/tablet) with the app running.
23 17 11 16
Tutorial pictures with captions that explain how to use the app.
0 4 4 3
Connected pictures that combine together to create a holistic collage (aesthetic focus).
5 4 4 4
Features pictures with bullet-points that state the app’s features.
50 70 46 55
Photography pictures of people using the app in a ‘real-life’ setting.
5 0 4 3
Image Complexity Mean (SE)
Number of pixels per byte of data: The fewer the pixels created per byte the more complex the image.
1321 (431)
2750 (421)
2658 (382)
2284
For image styles, the average app used 1.47 image styles out of six (SD = 0.78). The
proportion of apps using a given image style were analyzed using Cochran’s Q test. Amongst all
the styles, the classic (66%) and features (55%) image styles were significantly more common
than the device (16%), connected (4%), photography (3%), or tutorial (3%) image styles, χ2 (5)
= 146.723, p < .001. For the classic image style, there was a significant difference by age, with a
mean rank of 32.91 for <5 years old, 32.04 for 6-8 years old, and 44.29 for 9-11 years old, H(2)
= 7.955, p = .019. There were no significant differences by age for the other image styles but the
complexity of the images did differ by age, with images used in apps target at <5 year-olds being
more complex than the other age ranges, F(2,70) = 3.584, MSE = 4088085, p = 0.03.

IDENTIFYING QUALITY APPS 17
3.4 R3. How Does Apple’s App Store Help Educators Find Quality Apps?
Correlational analyses were performed to identify the relationship between ratings or
rankings and a) number of educational benchmarks across both written descriptions and images,
b) the presence or absence of each benchmark individually across written descriptions and
images, c) app price, and d) the visual complexity of app images.
3.4.1 User ratings. Unexpectedly, only 55% (40 apps) had a user rating and the average
user rating was 4.35/5 (SD = .47). User ratings for the 9-11 age range (M = 4.59, SD = 0.39)
were significantly higher than the <5 age range (M = 4.11, SD=0.56) (p=.002), but neither
differed from the 6-8 age range (M = 4.40, SD = 0.29), F(2,37) = 4.24, MSE = .191, p = 0.02. App
ratings were not significantly related to the total number of educational benchmarks mentioned
across the written descriptions and images (r = .08, p = .302) but they were related to the
curriculum benchmark (r = .29, p = .035). Ratings were not related to price (r = .10, p = .426)
but there was a non-significant trend for image complexity (r = .21, p = .09). This pattern of
relationships could suggest that higher user ratings reflect both the presence of a curriculum and
more visual complexity in an app.
3.4.2 Rank. Only 37% (27 apps) of apps had a ranking assigned by Apple and the
average ranking was 82.96 (SD = 56.45). There was no significant difference in rank between the
age ranges, F<1; M< 5 = 98.0 (SD = 66.6), M6-8 = 65.5 (SD = 51.1), M9-11 = 94.0 (SD = 32.4).
Rankings were not significantly related to the total number of benchmarks (r = .07, p = .370) but
they were related to the development team benchmark (r = .38, p = .025). Rankings were not
related to price (r = -.378, p = .311) or image complexity (r = .-234, p = .120). This pattern of
relationships could suggest that Apple ranks apps higher if they include educational experts in
the development process.

IDENTIFYING QUALITY APPS 18
4. Discussion
4.1 R1. Are App Store Math Apps Accessible to a Broad Audience?
The monetization method developers choose has significant bearing on who can access
educational content and how the cost of creating educational content is passed-on to users.
Educational technology can either increase access by removing barriers (e.g., Sesame Street,
Lamont & Small, 2010) or decrease access by placing educational resources behind barriers
(e.g., high cost; Berliner, 2013; Ke & Kwak, 2013). Tawfik, Reeves, and Stich (2016) propose
that no educational technology is neutral in its access and argue for the existence of an ‘app gap’
in which educational apps are be increasingly used by higher SES families and schools.
The average price ($14 each) and file size (150MB) of the top math apps are magnitudes
greater than the typical app ($1, 38MB; Lee & Raghu, 2014). A single $14 math app shared
across a classroom may be affordable, but most apps only address one subject and the likely
reality is that dozens of apps would be needed for each grade. Similarly, downloading a single
150MB app on the fiber network of a well-resourced school or wealthy family may only take
seconds but downloading dozens of similarly sized apps on a more typical 5-10mbps network
could take hours. Clearly, the cost and file sizes of these popular math apps are creating barriers
to access and these barriers may be redirecting educators and families to less than ideal solutions.
The high cost of apps may push educators towards either free apps (34% of apps) or apps
that start free but require later in-app purchases (45%). Importantly, free apps are not free. Rather
the cost is recouped through advertisements or by including mechanics that slow progression
unless a fee is paid (see AppCensus, 2019). Thus, educational apps are far costlier than the
typical app and this means disadvantaged communities will gravitate towards free apps that

IDENTIFYING QUALITY APPS 19
either seek to monetize students’ attention or use progression mechanics that conflict with
properly paced learning.
Making an app available in multiple languages or at least usable by students from diverse
language backgrounds is another way to increase accessibility (Rosell-Aguilar, 2017). Over half
of math apps reported multilingual support but whether the apps are truly multilingual or achieve
this by relying on cloud-based translation (i.e., google translate) is not known. There is an
overreliance on computer translation over human translation for literacy apps (Vaala & Levine,
2015) and this strategy is problematic. Computer translations are most accurate when sentences
are simple and free of culturally specific meanings (Anastasiou & Gupta, 2011). This may push
developers away from using complex and culturally authentic explanations of concepts in their
apps as to avoid mistranslations. Thus, future work on the quality of multilingual support is
needed.
4.2 R2. Do Developers Provide Benchmarks of Educational Quality in the App Store?
Overall, developers do not provide enough information about math apps for educators to
make informed choices. The titles of most math apps and a full third of the written descriptions
do not provide any information about the content focus of the app (i.e., subtraction vs algebra).
Further, apps aimed at younger children were less likely to have informative titles (only, 23% of
apps). Math app developers may view app titles as a marketing device that conveys the tone or
feel of the app (i.e., game vs tutoring). Indeed, developers of non-educational apps believe titles
are a critical marketing tool (Wang & Li, 2016). Therefore, the app titles do not provide
educators with enough information to identify the specific apps to use in a lesson.
The written descriptions and images mention only 33% of the educational benchmarks
deemed essential for quality educational apps (Vaala & Levine, 2015). Interestingly, developers

IDENTIFYING QUALITY APPS 20
include some educational benchmarks more than others and use the written descriptions or
images to convey different benchmarks. First off, developers mention feedback more frequently
and learning theories less frequently. The inclusion of feedback is positive given research
showing that informative feedback is essential to quality math apps (Callaghan & Reich, 2018).
This focus could be due to the ease with which accuracy feedback can be provided in a math
context. The lack of learning theories is not a surprise but is problematic. Even researchers often
ignore or do not clearly identify the learning theory they use to conceptualize the role of tablets
in mathematics education (Dubé et al., 2019). Despite its latch-key status, the learning theories
apps use are important for educators to know. If a teacher is looking for an app to help students’
memorize multiplication facts, then a more behaviourist based app could be appropriate (Musti-
Rao & Plati, 2015). If a teacher is looking to encourage reflection then an app based in
reciprocal peer tutoring may be a better choice (Yang, Chang, Cheng, & Chan, 2016). They key
is providing educators with enough information so they can choose apps that align with their
specific goals (Stevenson, 2008).
Surprisingly, scaffolding and feedback were mentioned far more frequently via images
than through written descriptions. It may seem odd that such abstract information the likes of
scaffolding would be conveyed through imagery. However, this result makes sense when
considering the image style used by developers. The ‘feature’ image style involved a picture of
the app alongside bullet-points and developers used this style to emphasize their inclusion of
feedback and scaffolding. Thus, developers may be placing a premium on these two benchmarks
and on app images to convey what they believe to be the most important signifiers of quality to
their potential users. In contrast, the remaining benchmarks were all mentioned more frequently
in the written descriptions and this could occur because they are less valued by developers or

IDENTIFYING QUALITY APPS 21
because to reduce to bullet points. Regardless, the clear outcome is that very little information on
these key benchmarks is provided and teachers and parents will be forced to download several
apps until they find quality ones.
Finally, the analysis of the image styles and complexity was an unplanned but
informative exploratory outcome of the study. The results indicate that developers may rely on
three primary image styles to convey information about their apps (classic, device, and features).
Further, the images varied in complexity with apps targeted at children under 5 using more
complex images. Perhaps developers are focusing more on flashy imagery to attract young users
than on meaningful descriptions. Indeed, a visual analysis of the educational benchmarks (see
Figure 4) indicates a preference for fewer benchmarks in <5 apps. Developers might believe
children are selecting apps and that is why the focus is placed on aesthetics over content.
Regardless, users looking for apps targeted at a young audience may experience an even more
difficult time finding enough information to identify quality math apps.
4.3 R3. Does Apple’s App Store Help Educators Find Quality Apps?
Apple needs to be more transparent in how it chooses its top apps and calculates user
ratings and rankings. It seems that apps containing complex visuals or a curriculum receive
higher ratings from users while apps developed by experts receive higher rankings from Apple.
However, very few apps actually had user ratings or Apple rankings and this makes little sense.
The user ratings of the average top math app was high (4.35/5), but 45% of the apps did not
report a user rating. Similarly, 63% of apps did not have a ranking and it is unclear how an app’s
ranking is calculated and what the app ranking means. Many app rankings consisted of a number
devoid of context (e.g., 83); the 83rd app out of 10,000 might be suggestive of quality but the
83rd app out of 84 is not. As such, Apple is exploiting ratings and rankings to surface specific

IDENTIFYING QUALITY APPS 22
apps to educators and parents but these supposed signifiers of quality are often hidden from users
or do not convey much meaning when they are present.
4.4 Limitations
The App Store underwent another redesign since the completion of this study. This
redesign placed greater emphasis on app images and included a new featured page of apps called
‘Today’ that puts an emphasis on video. As a result, many developers have incorporated videos
of their apps running alongside their app images. These videos are another source of data for
future analysis.
5. Conclusions
Given the monetization methods limiting access, the dearth of meaningful information on
educational benchmarks, and the opaque nature of user ratings and rankings, educators and
parents seem forced to purchase and try multiple apps to determine which ones are relevant to
their lessons let alone identify ones that are of sufficient quality. This is not a reasonable or
tenable path forward given the high number of educational apps that exist. This problem could
and should be addressed through two avenues. One, Apple could provide educational app
developers a template for their app pages and require developers to adhere to these templates
honestly. The benchmarks identified by Vaala et al (2015) are a good place to start for
developing such a template. A template for app developers would not be out of step with Apple’s
current policies around what developers can and cannot claim in the App Store. Two, Apple
should make all user ratings and rankings available to educators and present this information in
context. Doing so would be a relatively easy but impactful change Apple could make to the App
Store. Considering that Apple has long espoused education as central to both its business model
and culture (McEwen & Dubé, 2017), making changes along these lines would be of benefit to
IDENTIFYING QUALITY APPS 23
them and to the educators and parents reliant on their educational app marketplace. Finally, this
study only looked at math apps; considering that math apps are the most commonly produced
educational app, this raises serious concerns about how all educational apps are described in the
app marketplace. Simply, apps can only aid educational practice if parents and educators can find
good ones.
IDENTIFYING QUALITY APPS 24
Statements
Data availability statement: Source data used for this study can be found on the authors’ website. Disclosure statement: There is no potential conflict of interest in the working being described here.
Funding details: funding for this work was provided by the Social Sciences and Humanities Research Council of Canada (430-2017-00230)

IDENTIFYING QUALITY APPS 25
References
Anastasiou, D., & Gupta, R. (2011). Comparison of crowdsourcing translation with machine
translation. Journal of Information Science, 37, 637-659.
AppCensus (2019). AppCensus: Learn the privacy cost of free apps. Retrieved Jan 9, 2019, from
https://appcensus.mobi
Aziz, N. (2013). Children’s interaction with tablet applications: Gestures and interface design.
International Journal of Computer and Information Technology, 2(03), 447–450.
Berliner, D. C. (2013). Inequality, poverty, and the socialization of America’s youth for the
responsibilities of citizenship. Theory Into Practice, 52(3), 203–209.
Callaghan, M. N., & Reich, S. M. (2018). Are educational preschool apps designed to teach? An
analysis of the app market. Learning, Media and Technology, 43:3, 280-293.
Cayton-Hodges, G. A., & Feng, Gary. Pan, X. (2015). Tablet-Based Math Assessment: What
Can We Learn from Math Apps? Educational Technology & Society, 18(2), 3–20.
Carare, O. (2012). The impact of bestseller rank on demand: Evidence from the app market.
International Economic Review, 53, 717-742
Connell, S. L., Lauricella, A. R., & Wartella, E. (2015). Parental co-use of media technology
with their young children in the USA. Journal of Children and Media, 9(1), 5–21.
Dowker, A., Sarkar, A., & Looi, C. Y. (2016). Mathematics anxiety: What have we learned in
60 years? Frontiers in Psychology, 7(1333), 385–416. doi:10.3389/fpsyg.2016.00508
Dubé, A. K., & Alam, S. S., Xu, C., Wen, R., & Kacmaz, G. (2019). Tablets as elementary
mathematics education tools: A review of research and theory. In K. M. Robinson, D.
Kotsopolous, & H. Osana (Eds), Interdisciplinary perspectives on early mathematical
minds. Springer International Publishing.

IDENTIFYING QUALITY APPS 26
Dündar, H., & Akçayir, M. (2014). Implementing tablet PCs in schools: Students’ attitudes and
opinions. Computers in Human Behavior, 32, 40-46.
Fabian, K., Topping, K. J., & Barron, I. G. (2016). Mobile technology and mathematics: effects
on students’ attitudes, engagement, and achievement. Journal of Computers in Education,
3(1), 77–104.
Goodwin, K., & Highfield, K. (2012). iTouch and iLearn: an examination of ‘educational’ Apps.
Paper presented at the Early Education and Technology for Children conference, March
14--16, 2012, Salt Lake City,
Handal, B, El-Khoury, J., Campbell, C., & Cavanagh, M. (2013). A framework for categorizing
mobile applications in mathematics education. Education Conference Papers. Paper 70
Imbo, I., & LeFevre, J.-A. (2009). Cultural differences in complex addition: Efficient Chinese
versus adaptive Belgians and Canadians. Journal of Experimental Psychology: Learning,
Memory, and Cognition, 35(6).
Ke, F., & Kwak, D. (2013). Online learning across ethnicity and age: a study on learning
interaction participation, perception, and learning satisfaction. Computers & Education,
61, 43–51.
Knotko, L. (2018). The ultimate guide to app store screenshots: Size, styles, tips and ASO best
practices. Retrieved Jan 8, 2019, from https://splitmetrics.com/blog/app-store-
screenshots-aso-guide/
Kruskal, W. H., & Wallis, W. A. (1952). Use of ranks in one-criterion variance analysis. Journal
of the American statistical Association, 47(260), 583-621.
Larkin, K., & Calder, N. (2016). Mathematics education and mobile technologies. Journal of
Mathematics Educational Research, 28, 1-7.

IDENTIFYING QUALITY APPS 27
LeFevre, J.-A., Penner-Wilger, M., Pyke, A. A., Shanahan, T., & Deslauriers, W. A. (2014).
Putting two and two together: Declines in arithmetic fluency among young Canadian
adults, 1993 to 2005. CogSciTechReports,1–8.
Lee, G., & Raghu, T. (2014). Determinants of mobile apps’ success: Evidence from the app store
market. Journal of Management Information Systems, 31, 133-170.
Liao, C. C., Chen, Z.-H., Cheng, H. N., Chen, F.-C., & Chan, T.-W. (2011). My-Mini-Pet: a
handheld pet- nurturing game to engage students in arithmetic practices. Journal of
Computer Assisted learning, 27(1), 76–89.
Lamont, M., & Small, M. L. (2010). Cultural diversity and anti-poverty policy. International
Social Science Journal, 61(199), 169–180.
Main, S., & O’Rourke, J. (2011). New directions for traditional lessons: Can handheld game
consolesenhance mental mathematics skills? Australian Journal of Teacher Education,
36(2), 4.
McEwen, R., & Dubé, A. K. (2016). Intuitive or idiomatic? An information studies and cognitive
psychology study of child-tablet computer interaction. Journal of the Association for
Information Science and Technology, 67, 1169-1181
McEwen, R., & Dubé, A. K. (2017). Understanding tablets from early childhood to adulthood:
Encounters with touch technology. New York: Routledge.
Peachey, N. (2013). Criteria for evaluating web tools and apps. Retrieved from: http://
nikpeachey.blogspot.co.uk/2013/04/criteria-for-evaluating-web-tools-and.html
OECD (2014), PISA 2012 Results: What Students Know and Can Do – Student Performance in
Mathematics, Reading and Science (Volume I, Revised edition, February 2014), PISA,
OECD Publishing. http://dx.doi.org/10.1787/9789264208780-en

IDENTIFYING QUALITY APPS 28
Rosell-Aguilar, F. (2017). State of the app: A taxonomy and framework for evaluating language
learning mobile applications. Computer Assisted Language Instruction Consortium, 34,
243-258.
Reiti, J. (2014). Ontario announces $150 million investment for iPads in the classroom.
Retrieved Jan 24, 2017, from http://www.cbc.ca/news/canada/hamilton/ontario-
announces-150-million-investment-for-ipads-in-the-classroom-1.2755755
Schrock, K. (2013). Critical evaluation of mobile apps. Retrieved from http://www.ipad-
s4teaching.net/uploads/3/9/2/2/392267/evalipad_content.pdf
Schuler, C. (2012). ilearn ii: An analysis of the education category of the itunes app store.
New York: The Joan Ganz Cooney Center at Sesame Workshop.
Strouse, G., Hubber, P. J., Kloos, H., Stacy, S. T., Cartwright, M., Arwood, Z., & Canfield, J. P.
(2017). Addressing the math-practice gap in elementary school: Are tablets a feasible
tool for informal math practice? Frontiers in Psychology, 8, 179.
Tawfik, A. A., Reeves, T. D., & Stich, A. (2016). Intended and unintended consequences of
educational technology on social inequality. TechTrends, 60, 598-605.
Vaala, S., Ly, A., & Levine, M. H. (2015). Getting a read on the app stores: A market scan and
analysis of children’s literacy apps. New York, NY. Retrieved from
https://eric.ed.gov/?id=ED574396
Vincent, T. (2012). Ways to evaluate educational apps. Retrieved from http://learningin-
hand.com/blog/ways-to-evaluate-educational-apps.html
Walker,

IDENTIFYING QUALITY APPS 29
Volk, M., Cotic, M., Zajc, M., & Starcic, A. I., (2017). Tablet-based cross-curricular maths vs.
traditional maths classroom practice for higher-order learning outcomes. Computers &
Education, 114, 1-23.
Walker, H. (2011). Evaluating the effectiveness of apps for mobile devices. Journal of Special
Education Technology, 26(4), 59–63.
Wang, M., & Li, X. (2016). Effects of the aesthetic design of icons on app downloads: Evidence
from an Android market. Electronic Commerce Research, 17, 83-102.
Wilcoxon, F. (1945). Individual comparisons by ranking methods. Biometrics bulletin, 1(6), 80-
83.
Wu, L. J., Hsiao, H. S., Chang, K. E., & Sung, Y. T. (2006). Construct mathematic path and
interactive problem solving discussion system in mobile learning environment. In
Proceeding of the IADIS International Conference on Mobile Learning, 2006. Dublin,
Ireland (pp. 288–292).
Yang, E. F. Y., Chang, B., Cheng, H. N. H., & Chan, T. (2016). Improving pupils’ mathematical
communication abilities through computer - supported reciprocal peer tutoring.
Educational Technology & Society, 19(3), 157–169.


