Embed Size (px)
Citation preview
Computer Networks 54 (2010) 278–290
Contents lists available at ScienceDirect
Computer Networks
journal homepage: www.elsevier .com/locate /comnet
Identifying the capacity gains of multihop cellular networks
Ayman Radwan a, Hossam S. Hassanein b,*, Abd-Elhamid M. Taha b
a Telecommunications Research Lab, ECE Department, Queen’s University, Kingston, ON, Canada K7L 3N6b Telecommunications Research Lab, School of Computing, Queen’s University, Kingston, ON, Canada K7L 3N6
a r t i c l e i n f o
Article history:Available online 12 August 2009
Keywords:Cellular networksMultihop relayCDMAInterferenceCapacity
1389-1286/$ - see front matter � 2009 Elsevier B.Vdoi:10.1016/j.comnet.2009.05.018
* Corresponding author. Tel.: +1 613 533 6052; faE-mail addresses: [email protected]
cs.queensu.ca (H. S. Hassanein), [email protected] (A
a b s t r a c t
Claims for the advantages of applying multihop relay in CDMA cellular networks have beenwidely accepted in the literature. However, such claims have yet to be closely examined. Inthis paper, capacity increase in CDMA cellular networks through multihop relay is quanti-fied. As CDMA networks are interference-limited, interference has to be analyzed to esti-mate the system capacity. Toward this end, we derive formulas to calculate interferenceexperienced in multihop CDMA cellular networks by both base stations and mobile termi-nals. The formulas are generic and applicable whether or not power control is exercisedbetween mobile terminals. The capacity of multihop CDMA cellular network is comparedto that of single hop CDMA cellular network to verify the claimed advantage. We demon-strate that a 23% capacity increase is achieved when relaying with power control. We alsoextend the work to illustrate the effect of call distribution on the capacity of the cell and itsneighbors – both in the single and multiple hop cases. Furthermore, we ascertain that calldistribution inside a cell hardly affects the capacity of adjacent cells when using multihoprelay. This specific advantage overcomes the inherent capacity degradation caused by nearborder calls, which is the biggest burden on the capacity of single hop CDMA cellular net-works. To the best of our knowledge, this effort is the first of its kind in this area.
� 2009 Elsevier B.V. All rights reserved.
1. Introduction
The adoption of a Wideband Code Division MultipleAccess (WCDMA) system and its evolutions by the ThirdGeneration Partnership Project (3GPP) responds to an everincreasing demand for multimedia applications and main-tainable service during user mobility. However, WCDMAsystems are inherently interference-limited, which meansthat their capacities are affected by usage, positions andmobility of the systems’ users. Various proposals havebeen made to overcome this limitation including enhancedfunctionalities for Radio Resource Management (RRM)overseeing admission [1] or power control [2], and propos-
. All rights reserved.
x: +1 613 533 6513.(A. Radwan), hossam@
-E. M. Taha).
als for adaptive coverage responding to congestion andhotspot instances [3].
However, a solution that has recently been gainingprominent attention involves exploiting the advancesmade in the area of multihop wireless relay. Instead of Mo-bile Terminals (MTs) directly connecting through the ac-cess gateways, i.e. Base Stations (BSs), MTs are indirectlyconnected through other network elements. These ele-ments can be either dedicated Relay Stations (RSs), mostlywith fixed positions and substantial power supply, or otherMTs offering their capabilities in term of transmission orprocessing powers. Relaying can be performed either in-band, i.e. direct and indirect access made using the sameaccess technology, or out-of-band, in which case two ormore access technologies are utilized. In all cases, theresulting hybrid architecture, called Multihop Cellular Net-works (MCNs) [4], stands as a viable solution not only toenhance the capacity of 3G networks, but also to extendtheir coverage to deadspots, and increase their resilience
A. Radwan et al. / Computer Networks 54 (2010) 278–290 279
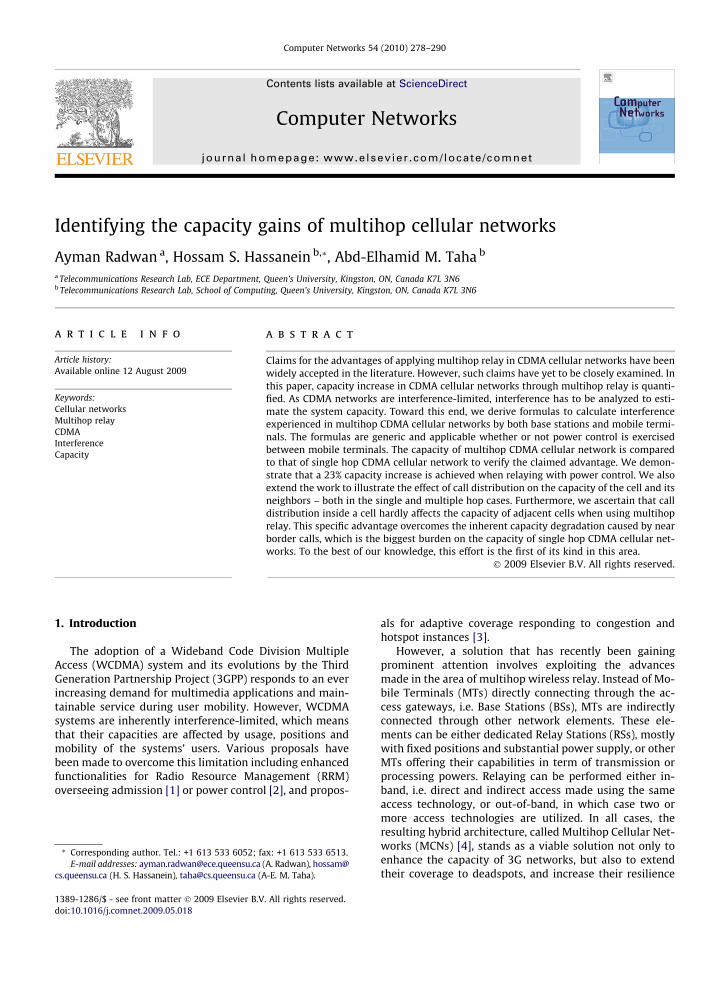
to instances of congestion, failure or emergency. Fig. 1schematizes the general advantages of MCNs over regular,i.e. single hop, cellular networks.
Much work has been devoted to investigating the differ-ent aspects of MCNs. Early proposals such as Qiao and Wu’siCar [5] and Lin and Hsu’s MCN-b and MCN-p [6] outlinethe main architectures utilizing dedicated RSs for respec-tively, in-band and out-of-band MCNs. Architectures utiliz-ing MTs for in-band relay includes Sawfat’s A-Cell [7] andYamao et al.’s Hop Station [8]. Other works attended tothe operational requirements of MCNs. For example, Riy-ami et al. [9] and Tam et al. [10] investigate channel assign-ment and resource utilization schemes for in-band TDD–WCDMA systems with MTs. Tam et al. [11] also offeredschemes for load balancing and congestion relief. In [12],Safwat builds on his A-Cell proposal offering an RRMframework comprising modules for call admission control,channel assignment and scheduling. Le and Hossain [4]offer a brief survey of MCNs and propose a resource alloca-tion scheme with power and rate control components forout-of-band MT relay. Showing a further advantage ofMCNs, Cho et al. [13] display enhancements in handoffmanagement with the assistance of RSs. As user compensa-tion is an essential element for MCNs, proposals such thatof Lindstrom and Lungaro [14] have been sought to ensuresimultaneously provider’s profitability and user satisfac-tion. Finally, and towards the vision of All-IP wireless, Cav-alcanti et al. [15] investigate the general issues relevant toimplementing IP-based MCNs.
Despite the many studies, however, the claimed advan-tages of MCN have never been rigorously quantified. Suchquantification is unavoidable if serious frameworks forRRM functionalities are to be realized. This is especiallythe case in CDMA systems where interference affects thecapabilities of the network in a dominant manner. Theobjective of this work is hence to quantify, through rigor-ous analysis, the total interference experienced by BSsand relaying MTs in multihop CDMA cellular networks.Specifically, our contributions in this work are as follows.
Fig. 1. Multihop relay to solve cellular networks drawback (1) Conges-tion, (2) Interference, (3) Higher data rate for distant MTs, (4) Dead spots,(5) Load balance and (6) BS failure.
First, we derive formulas for in-band multihop relay inCDMA networks that are generic in their application inthe sense that: (a) they are not based on a specific under-lying algorithm for channel assignment or scheduling; (b)they are applicable whether or not power control is exer-cised between the relaying MTs; and (c) they accommo-date any user/nodal distribution. The second contributionis the offered computational framework for investigatingthe capacities of MCNs. While in this work we focus onin-band MT-based relay, the framework presented accom-modates the use of either RSs or MTs, or both, and can beapplied to environments with mixed access technologies.Third, we verify the claimed advantages of applying multi-hop relay in cellular networks and identify the operationalinstances where it is most needed. To the best of ourknowledge, this work is the first of its kind in the area.
In this paper, we analyze and quantify the potentialcapacity increase associated with the use of multihop com-munication in CDMA cellular networks. Such capacity in-crease depends on the resulting interference. For thisreason, we begin by analyzing the interference in multihopCDMA cellular networks and derive formulas to calculateinterference at the BSs as well as at the relaying MTs. Theseformulas are used to estimate the network capacity. Thecapacity of MCN is then compared to that of single hop cel-lular networks. We show that using multihop relaying (in ageneric, non-optimized setting) can achieve a 23% increasein capacity when using power control in all hops. We alsoshow that a 10% increase is possible even with power con-trol only applied in the last hop before the BS. The analysisis further extended to accommodate uniform and non-uni-form call distributions. We show the effect of call distribu-tion on the capacity of the network, and highlight scenarioswhere multihop communication is deeply needed andmost rewarding, i.e. when the density of active terminalsincreases at cell borders.
The remainder of this paper is organized as follows. InSection 2, the models used in the analysis are introduced,including the network and propagation models. In Section3, interference analysis is presented. General formulas toquantify interference are derived and then modified to rep-resent different scenarios of transmission power and calldistribution. Section 4 provides numerical results to illus-trate the possible capacity increase and show the effectof call distribution. Section 5 concludes the paper.
2. The system models
2.1. The network model
We consider a CDMA cellular network with hexagonalcells, with each cell neighboring 6 other cells. Each cell isalso virtually divided into k-concentric discs centered atthe cell’s BS. The discs have equal width and are numbered0 to k � 1, with disc 0 being the innermost disc. At any gi-ven time, an MT is associated with only one of the discsbased on the MT’s distance from the BS. This distance canbe estimated from the power of the received pilot signalat the MT. When multihop relay is used, only the MTsresiding inside disc 0 are allowed to communicate directly
280 A. Radwan et al. / Computer Networks 54 (2010) 278–290
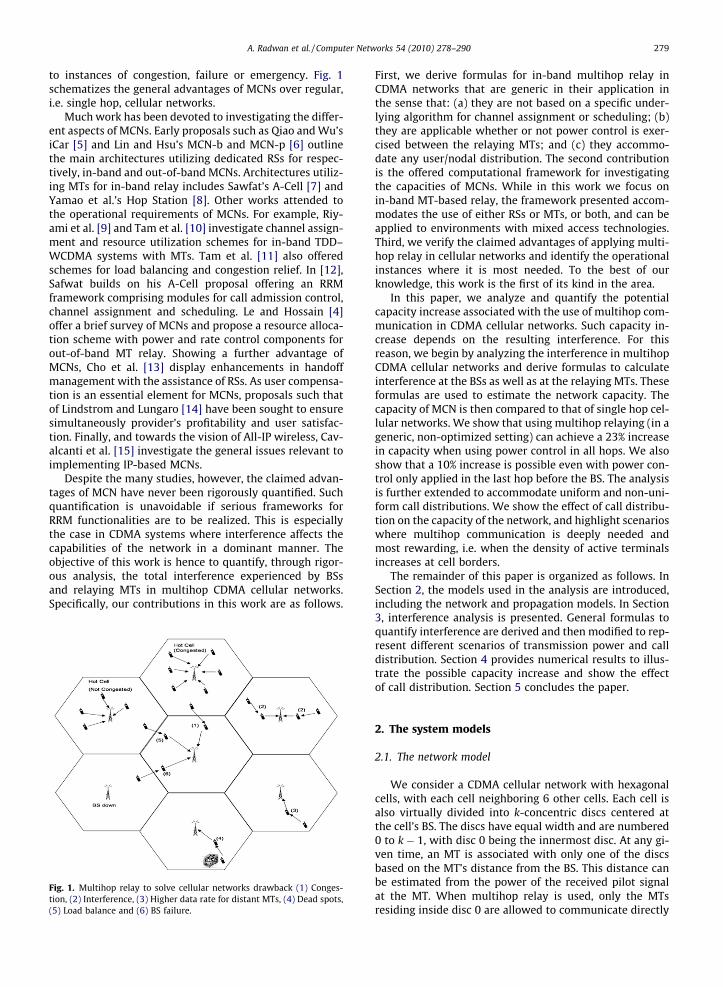
with BS in one hop. All other MTs, i.e. MTs within the cellbut residing outside the innermost disc, must use multihoprelay to communicate with the BS. MTs residing in discnð0 < n < kÞ communicate with the BS by relaying theirdata through MTs in disc n � 1. This setup limits the num-ber of hops to a maximum of k hops. An example of a cellwith four discs is shown in Fig. 2, where two MTs are com-municating with the BS through multihop relay. The spe-cial case when a cell has only 1 disc represents the singlehop case.
In this paper, all MTs and BSs are assumed to use omni-directional antennas. It is also assumed that MTs are denseenough that an MT in an arbitrary disc n can always findwithin its transmission range another MT in disc n � 1 torelay its data.
Utilizing a scheme for power control involves adjustingthe transmission power of transmitting MTs based on howfar they are from their receiving element, whether it is theBS or another MT. Power is adjusted to preserve the batterylife of the transmitting MT while maintaining the power atthe receiving end above a predefined threshold. Thisthreshold, denoted SR, dictates the minimum power re-quired for correct reception. Two cases for MTs’ transmis-sion power are considered in this paper:
(1) Fixed Transmission Power: In this case, power con-trol is applied only for MTs inside the innermost.All other MTs use fixed transmission power.
(2) Complete Power Control: In this case, power controlis applied at all hops. As in case (1), the BS overseespower control in the innermost disc. However, for allother discs MTs exercise power control in theirtransmission independently from the BS.
Both cases are studied in Section 3.2.We adopt a generic model that can be applied in either
TDD or FDD networks. The results obtained in this paperare considered to be per time slot, per frequency-band.The analysis considers an uplink slot in which data flow
Fig. 2. A cell with 4 discs.
from MTs to the BS. The usage of omnidirectional antennasin multihop communication makes the uplink case anddownlink case very similar. Expanding this analysis to in-clude the downlink case needs only a slight modificationto consider the BS transmission. This is a subject of futurework.
2.2. Propagation model
In general, the capacity of CDMA networks depends onthe actual interference experienced during network opera-tion. In order to quantify interference in multihop CDMAnetworks, a reasonable model for signal propagation isneeded. In this analysis, we use the lognormal attenuationmodel, widely accepted for use in the analysis of CDMAnetworks. In the model, the power of a signal attenuatesproportionally to the product of the mth power of the dis-tance travelled and a lognormal component representingshadowing effects. The power of a received signal, Sr , isthen calculated by
Sr ¼ Stxd�m10n=10; ð1Þ
where Stx is the transmission power of the signal, d is thedistance travelled by the signal and n is shadowing effectin dB. The path loss power, denoted m, usually varies be-tween 2.7 and 5.0. The typical value of m is 4, which isthe value used throughout this paper. Variable n is nor-mally distributed with zero mean and a standard deviationof r, varying between the values of 5 and 12 and indepen-dent from the distance. The shadowing effect does not de-pend on the distance signals travel and is usuallyestimated using expectations that can be shown to be sca-lar [16]. Accordingly, the effects of shadowing will be ig-nored in our analysis.
3. Interference analysis
Studying the capacity of Time Division Multiple Access(TDMA) or Frequency Division Multiple Access (FDMA)networks is relatively easier than in CDMA networks, asin the latter capacity depends on the actual interferenceexperienced during the network operation. An integral fac-tor in this operation is the ratio of the power of the desiredsignal to the power of interference at receiver, commonlyknown as the signal to interference ratio (SIR). SIR mustbe maintained above a certain threshold; a decrease inthe SIR, invariably indicating an increase in the interfer-ence levels, results in a decrease in a CDMA network’scapacity. CDMA networks are hence described as ‘‘interfer-ence-limited”. Consequently, studying interference is cru-cial in analyzing the capacity of multihop CDMA cellularnetworks.
In this section, we derive formulas to calculate interfer-ence in multihop CDMA cellular networks. We consider anuplink slot. In single hop networks, the BS is the only entityreceiving signals inside the cell during an uplink slot. How-ever, in multihop networks the relaying MTs and the BSmay be receiving data. Therefore, interference must beconsidered at both the BS and at the relaying MTs.
A. Radwan et al. / Computer Networks 54 (2010) 278–290 281
Interference in cellular networks is composed of intra-cell interference and inter-cell interference. Intra-cellinterference results from signals transmitted from insidethe same cell, while inter-cell interference results from sig-nals originating in neighboring cells.
3.1. Fundamental interference formulas
We begin by deriving formulas for interference at theBS. Intra-cell interference at the BS is the total power ofall signals received at the BS originating inside the cell,excluding the desired signal. The interference from a singleMTx, denoted Ix, at the BS is expressed as
Ix ¼ Sxd�mx ; ð2Þ
where Sx is the transmission power, and dx is the distancebetween MTx and the BS in consideration. From (2), it canbe seen that the resulting interference decreases as the dis-tance between the source and the receiver increases. Thetotal intra-cell interference, denoted IIntraBS, is the sum of(2) over all MTs transmitting inside the same cell. Thissummation results in the expression
IIntraBS ¼X
x
Sxd�mx ð3Þ
and can be further divided into summations over each discseparately, yielding
IIntraBS ¼Xk�1
i¼0
XNi
x
Sxd�mx ; ð4Þ
where Ni is the number of all MTs transmitting inside disci. Each inner summation represents total interference froma certain disc. To calculate this summation, the averageinterference from one MT inside this disc is calculated byintegrating over the disc’s area and then multiplied bythe number of transmitting MTs inside the disc. Applyingthis to (4) yields
IIntraBS ¼Xk�1
i¼0
Ni
Z ZAðiÞ
Sxdðx; yÞ�mf ðx; yÞdxdy
" #; ð5Þ
where AðiÞ is the area of disc i and f ðx; yÞ is the distributionof MTs inside disc. While hexagonal cells are assumed,integrations are performed on circular cells using polarcoordinates. This has been shown to be a reasonableapproximation in [17]. Transforming to polar coordinatesresults in the following form
IIntraBS ¼Xk�1
i¼0
Ni
Z 2p
0
Z ri
ri�1
Sxr�mþ1f ðr; hÞdrdh
" #; ð6Þ
where ri is the outer radius of disc i and r�1 is zero. Theinnermost disc is different from other discs. In the twocases considered in this paper, power control is always as-sumed to be exercised inside the innermost disc. Thismeans that signals from MTs inside the innermost discare always received at the BS with a predefined power SR.Therefore, we split the summation in (6) into two parts.The first part is the first term only and represents interfer-ence from the innermost disc and the second part is theremainder of terms and represents interference from discs
1 through ðk� 1Þ. This splitting results in the followingform
IIntraBS ¼ N0SR þXk�1
i¼1
Ni
Z 2p
0
Z ri
ri�1
Sxr�mþ1f ðr; hÞdrdh
" #: ð7Þ
Next, we calculate inter-cell interference at the BS. Onlyfirst tier neighboring cells are taken into account in thiscalculation. In the multihop case, MTs use multiple hopsto reach BSs, i.e. MTs utilize limited transmission powerand their effect on farther cells is negligible. However, con-sidering only the first tier is uncommon in the single hopcase, where usually the second tier is also involved in thecomputation [16]. Despite this consideration, which cer-tainly favors the single hop case, the advantages of multi-hop cellular networks remain evident as will be shownbelow. Each cell has six neighbors. The interference fromeach neighbor at the BS is the same as they are equidistant.It hence suffices to calculate the interference from one celland multiply it by 6.
The interference from one neighboring cell, denotedIInterBS 1, is the summation of interference from all its activeMTs. The same steps used in intra-cell interference are ap-plied here, with two differences. The first term in (7) iscompletely different since the signals from MTs insidethe innermost disc of neighboring cells are received withpower SR at neighboring BSs. These signals are receivedat the BS of consideration with power SBS, which is calcu-lated by
SBS ¼ SRdi
dj
� �m
; ð8Þ
where di is the distance from the MT to its serving BS and dj
is the distance to the BS in consideration. To get the inter-ference from the innermost disc of the neighboring cell, Eq.(8) is integrated over the area of the disc and multiplied bythe number of transmitting MTs inside the disc.
For the other discs, the difference lies in the distancebetween the MTs and the BS in consideration. In derivingthe formula for intra-cell interference, the BS was assumedto be at the origin with the concentric discs centered at theBS. This makes the distance between any interfering MTand the BS simply the radius ðrÞ of the polar coordinatesof the MT. Here, the neighboring BS becomes the new ori-gin of computation, making the BS of consideration atpoint ðL;0Þ, where L is the distance between two neighbor-ing BSs. Hence, the distance between the interfering MTand its serving BS is r and the distance between the inter-fering MT and the BS in consideration isðr2 þ L2 � 2Lr cosðhÞÞ1=2. Applying these differences to (7),yields
IInterBS 1 ¼ N0SR
Z 2Q
0
Z r0
0
rmþ1
ðr2 þ L2 � 2Lr cosðhÞÞm2
f ðr; hÞdrdh
þXk�1
i¼1
Ni
Z 2Q
0
Z ri
ri�1
Sxr
ðr2 þ L2 � 2Lr cosðhÞÞm2
f ðr; hÞdrdh
" #:
ð9Þ
The total interference at BS, denoted by IT BS, is the sum ofintra-cell interference and inter-cell interference and canbe expressed as
282 A. Radwan et al. / Computer Networks 54 (2010) 278–290
IT BS ¼ IIntraBS þ 6IInterBS 1: ð10Þ
We derive interference at relaying MTs in a similar way tointerference at the BSs. A fundamental difference is thatinterference at the MTs depends on the position of relayingMT, which determines the distance to the serving BS andits neighboring BSs. Interference at relaying MTs is calcu-lated based on their distance to their serving BS.
Both intra-cell interference and inter-cell interferenceat relaying MTs can be represented by the formula for in-ter-cell interference at the BS, i.e. Eq. (9), with slightadjustments. In intra-cell interference calculation, theserving BS is at the origin. The relaying MT is at a distanceb from the BS, i.e. point ðb;0Þ. Applying these adjustmentsthe intra-cell interference at a relaying MT a distance bfrom its BS, denoted by IIntraMT , can be calculated by
IIntraMT ¼ N0SR
Z 2Q
0
Z r0
0
rmþ1
ðr2 þ b2 � 2br cosðhÞÞm2
f ðr; hÞdrdh
þXk�1
i¼1
Ni
Z 2Q
0
Z ri
ri�1
Sxr
ðr2 þ b2 � 2br cosðhÞÞm2
f ðr; hÞdrdh
" #:
ð11Þ
The inter-cell interference at a relaying MT differs fromthat at the BS because the first tier neighboring BSs arenot equidistant from the relaying MT in consideration. Thisnecessitates calculating the inter-cell interference fromeach neighboring cell separately. For calculating inter-cellinterference at a relaying MT, the neighboring BS is as-sumed at the origin. The relaying MT is at a distance b fromits serving BS, and a distance bn from the neighboring BS.This distance bn is calculated for each neighboring BS n.Modifying (9), the inter-cell interference from one neigh-boring BS n, denoted IInterMT n at a relaying MT a distanceb from its serving BS is given by
IInterMT n ¼ N0SR
Z 2Q
0
Z r0
0
rmþ1
ðr2 þ b2n � 2bnr cosðhÞÞ
m2
f ðr; hÞdrdh
þXk�1
i¼1
Ni
Z 2Q
0
Z ri
ri�1
Sxr
ðr2 þ b2n � 2bnr cosðhÞÞ
m2
f ðr; hÞdrdh
" #:
ð12Þ
The total interference at a relaying MT, denoted IT MT , isthen the sum of intra-cell interference and inter-cell inter-ference from all neighboring cells and can be expressed by
IT MT ¼ IIntraMT þX6
n¼1
IInterMT n: ð13Þ
3.2. Transmission power
Having derived the basic interference formulas at the BSand relaying MTs, further investigation of certain variablesis required. First, the value of the transmission power forMTs has to be determined. As described in Section 2.1above, two cases are considered for MTs transmissionpower. The calculation will be affected by the values ofthe transmission powers of MTs residing outside the inner-most disc since the BS oversees power control of MTs in-side the innermost disc. Consequently, the terms for theinnermost disc will remain unchanged.
The fixed transmission case is easy to deal with. All MTsoutside the innermost disc use a predetermined fixedtransmission power denoted STR. This value is constantand can be used to replace Sx in all the interference formu-las derived above. However, determining the value STR isbased on the width of the discs. The value must guaranteethat signals transmitted by MTs at the outer edge of a disccan reach the next disc with a power of at least SR. The va-lue of the constant transmission power can then be deter-mined by
STR ¼ SRrm0 ; ð14Þ
where r0 is the radius of the innermost disc, and also thewidth of all discs.
The power control case where power control is appliedat all hops is not as straightforward. MTs outside the inner-most disc do not use fixed transmission power. Instead,their signals are received with a constant power, SR, at theirintended receivers. This means that MTs use variabletransmission power based on the distance to their receiv-ers. The controllable transmission power would be contin-uously determined for each MT. Using (1), the transmissionpower of a transmitting MT, denoted Stx, can be calculatedby
Stx ¼ SRdmtx; ð15Þ
where dtx is the distance between an MT and its intendedreceiver. In order to calculate the average transmissionpower of an MT, Eq. (15) has to be averaged over all possi-ble positions of its receiver.
For MTs outside the innermost disc, receivers can beanywhere in the intersection area between their transmis-sion range and the next disc closer to the BS. This area isshown with the shaded area in Fig. 2 for MTx. Transmissionrange is the area around the transmitting MT, where thepower of its transmitted signal is at least SR. The transmis-sion range depends on the maximum transmission powerof an MT, denoted SMAX , which is set such that a signal sentfrom an MT at the outer edge of a disc can reach the nextdisc with power SR. Hence, SMAX is equal to STR used in thefixed transmission case. This means that the transmissionrange of any MT is a circle centered at this MT with radiusr0. Therefore, the average transmission power of a certainMT depends on the width of discs and the position of MTwith respect to disc edges. Here, we calculate the averagetransmission power as a function of the distance fromthe BS.
If MTx is in disc n and is a distance dx from the BS, itsaverage transmission power, denoted Sav, can be calculatedby
Sav ¼SR
Aint
Z 2p
0
Z rn�1
rn�2
r r2 þ d2x � 2rdx cosðhÞ
� �m=2drdh
such thatffiffiffiffiffiffiffiffiffiffiffiffiffiffiffiffiffiffiffiffiffiffiffiffiffiffiffiffiffiffiffiffiffiffiffiffiffiffiffiffiffiffiffiffiffir2 þ d2
x � 2rdx cosðhÞq
6 r0; ð16Þ
where Aint is the intersection area between transmissionrange of MTx and disc ðn� 1Þ. The condition in (16) guaran-tees that the receiver resides inside the transmission rangeof transmitting MTx.
0.0E+00
2.0E-03
4.0E-03
6.0E-03
8.0E-03
1.0E-02
1.2E-02
1.4E-02
0 0.1 0.2 0.3 0.4 0.5 0.6 0.7 0.8 0.9 1
Distance from BS
Ave
rage
Pow
er
3 discs 4 discs 5 discs 6 discs
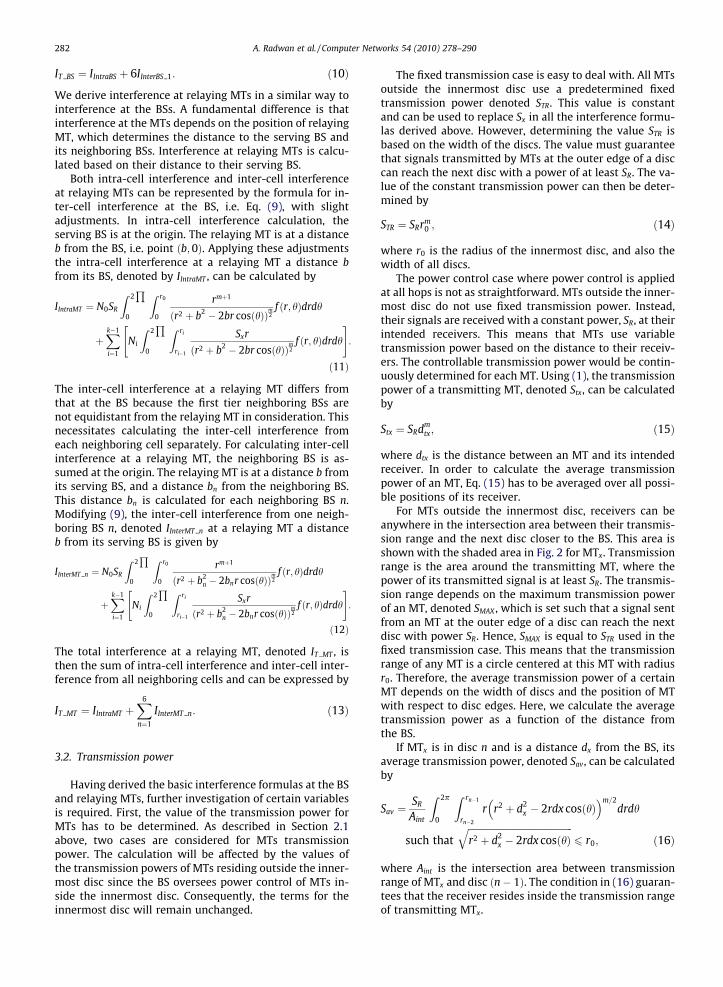
Fig. 3. Average transmission power of MTs.
A. Radwan et al. / Computer Networks 54 (2010) 278–290 283
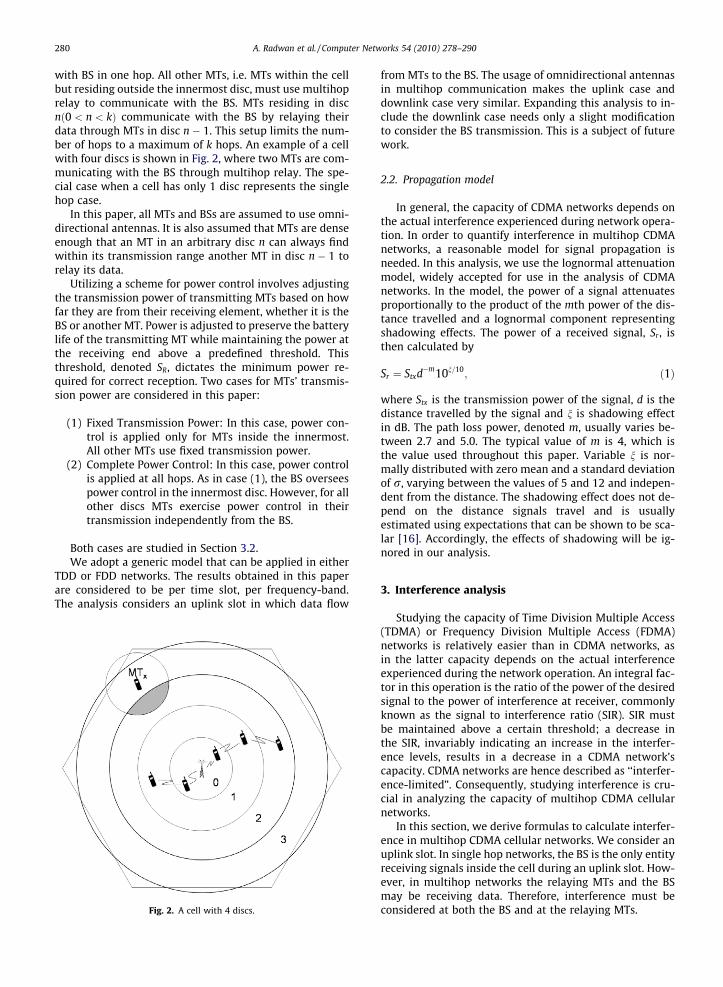
Fig. 3 shows the average transmission power of MTs,normalized by SR, as a function of distance from the BS.The figure shows different plots for different numbers ofdiscs. To simplify exposition, we will assume that the cellradius is unity.
From Fig. 3, it can be seen that the average transmis-sion power of an MT increases as the distance from theBS increases. This increase ends when the MT reachesthe outer edge of a disc. At that point, the average trans-mission power drops drastically then starts increasingagain. MTs inside the innermost disc only have one possi-ble receiver, the BS. The required transmission power in-creases as the MT becomes farther from the BS, so thatthe signal reaches BS with power SR. For other discs, asthe MT moves away from the outer edge of the closerdisc, the MT’s average transmission power increases asthe distance to candidate receivers increases. Also notethat at the outer edge of each disc the average transmis-sion power is almost SMAX . We remark that as the numberof discs gets larger, the average transmission power be-comes more uniform. In contrast, for a small number ofdiscs the variation in the average transmission power sig-nificantly increases. This observation indicates the neces-sity of exercising global power control when using a smallnumber of discs.
Using curve fitting, a function SiðrÞ for average trans-mission power as a function of distance from BS can be ob-tained for each disc. This function is used to replace Sx ininterference calculations.
3.3. Call and MTs distribution
All interference formulas derived above have a distri-bution function f ðx; yÞ and number of MTs in disc i;Ni.Both values need to be determined to perform the com-putation. We first study the case with uniform call distri-bution, then study the more complicated case with non-uniform call distribution. In both cases, the transmittingMTs are assumed to be uniformly distributed over thearea of the disc they reside in. Based on this assumption,the intra-cell interference formula and the inter-cellinterference formula at BS can be respectively modifiedas follows
IIntraBS ¼ N0SR þXk�1
i¼1
Ni
AðiÞ
Z 2p
0
Z ri
ri�1
Sxr�mþ1drdh
" #; ð17Þ
IInterBS 1 ¼N0SR
Að0Þ
Z 2Q
0
Z r0
0
rmþ1
ðr2 þ L2 � 2Lr cosðhÞÞm2
drdh
þXk�1
i¼1
Ni
AðiÞ
Z 2Q
0
Z ri
ri�1
Sxr
ðr2 þ L2 � 2Lr cosðhÞÞm2
drdh
" #:
ð18Þ
Eq. (18) can be used to represent intra-cell interference andinter-cell interference at a relaying MT, by respectivelyreplacing L by b and bn.
It is noteworthy that there is a variable Ni in every termin all interference formulas. As mentioned earlier, Ni is de-fined as the total number of transmitting MTs inside disc i.This total number includes MTs transmitting their owndata, MTs relaying others’ data and MTs doing both. Thisnumber is the factor that differentiates the uniform calldistribution case from the non-uniform one. In both cases,this number can be divided into MTs transmitting theirown data, denoted NOi and additional relaying MTs, de-noted NRi.
In the uniform call distribution case, the number of MTstransmitting their own data in each disc can be determinedby the ratio of the disc area to the area of the whole cell.Hence, number of MTs sending their own data in disc i is
NOi ¼NT
ATAðiÞ; ð19Þ
where NT is the total number of calls originating in eachcell and AT is the cell area. The number of additional relay-ing MTs is dependent on the ability of MTs sending theirown data to relay others’ data as well. Consequently, thenumber of additional relaying MTs in disc iðNRiÞ is the per-centage að0 6 a 6 1Þ of signals transmitted by MTs in discðiþ 1Þ that cannot be relayed by MTs sending their owndata in disc i. By recursion, the number of additional relay-ing MTs in disc i can be given by
NRi ¼ aNi�1 ¼NT
AT
Xk�1
n¼iþ1
an�iAðnÞ: ð20Þ
The total number of transmitting MTs in disc i thenbecomes
Ni ¼ Noi þ NRi ¼NT
AT
Xk�1
n¼i
an�iAðnÞ: ð21Þ
In the case of non-uniform call distribution, the call distri-bution inside a cell is varied by changing the number ofcalls originating from each disc. This is done by defininga weight vector Wn ¼ ðwn0;wn1; . . . ;wnðk�1ÞÞ where wni rep-resents the weight for each disc i and
Pk�1i¼0 wni ¼ 1. The
number of MTs transmitting their own data in disc i hencebecomes
NOi ¼ w�niNT ð22Þ
and the number of additional relaying MTs is just the per-centage að0 6 a 6 1Þ of signals transmitted by MTs in discðiþ 1Þ, which cannot be relayed by MTs sending their owndata in disc i. The weight vector is varied from
1.2
1.25
1.3
1.35
1.4
rfer
ence
per
cal
l (C
k) Power ControlNo Power Control
284 A. Radwan et al. / Computer Networks 54 (2010) 278–290
ð1;0;0; . . . ;0Þ, which means that all calls originate insidethe innermost disc to ð0;0; . . . ;0;1Þ, where all calls are in-side the outermost disc. In between, the concentration ofcalls gradually shifts from around the BS toward the cellborders. The special case of uniform distribution can berepresented by the weight vector through dividing the areaof each disc by the total cell area.
1
1.05
1.1
1.15
0 1 2 3 4 5 6 7Number of discs
Ave
rage
Inte
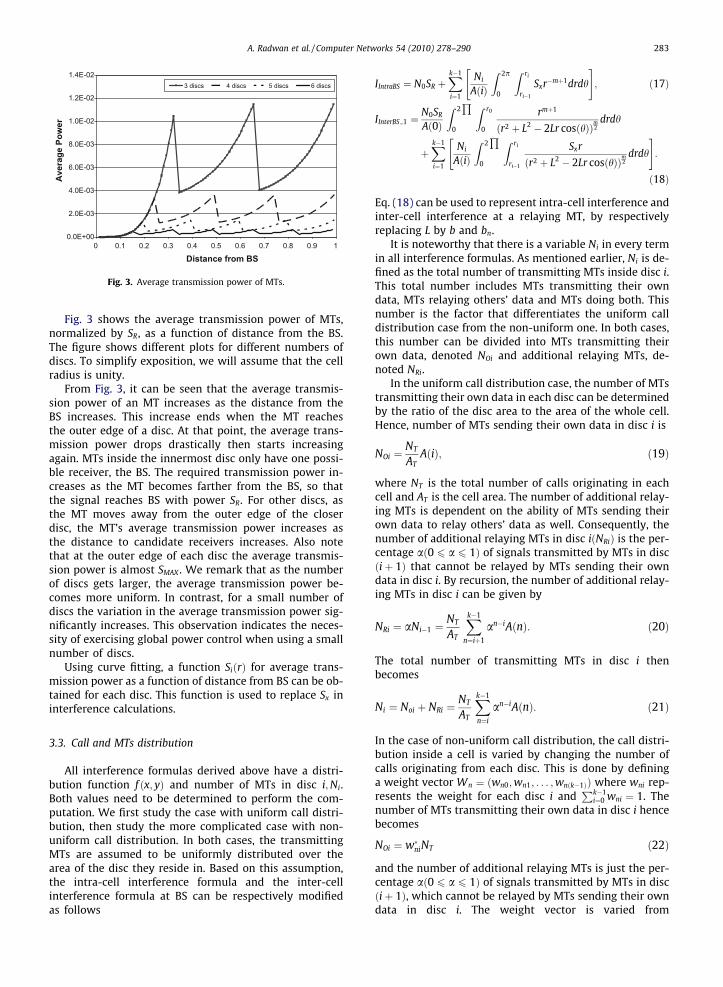
Fig. 4. Average interference ðCkÞ per call.
4. Numerical results and discussion
In this section, we display numerical results for theinterference formulas derived above and discuss ourfindings.
4.1. Capacity increase under uniform distribution
First, the capacity of a multihop CDMA cellular networkis compared to that of a single hop network under uniformcall distribution. Using the above formulas, the total inter-ference at the BS or MT, denoted IT , can be expressed as afunction of NT and SR in the form of
IT ¼ CkNT SR; ð23Þ
where Ck can be defined as the average interference causedper original call and is dependent on the number of discs.Ck is the total interference normalized by ðNT � SRÞ.Neglecting thermal noise, SIR can now be expressed as
SIR ¼ SR
CkNT SR � SR: ð24Þ
According to the IS-95 standard [18], the bit energy tointerference density ratio ðEb=I0Þ must be maintainedabove a certain threshold s to guarantee a given bit errorrate (BER), e.g. for IS-95 s ¼ 5 (7 dB) for BER of 10�3. Thevalue of Eb=I0 can be calculated from the formula of SIRby dividing the power of the desired signal by the data rateR, and the interference by the bandwidth W [19]. Substitut-ing in (24) and keeping Eb=I0 above threshold s, an upperbound on NT is obtained as
NT 6W=sRþ 1
Ck: ð25Þ
If the interference at the BS is used, this upper bound canbe defined as the maximum number of simultaneous callsthat can be supported by this BS.
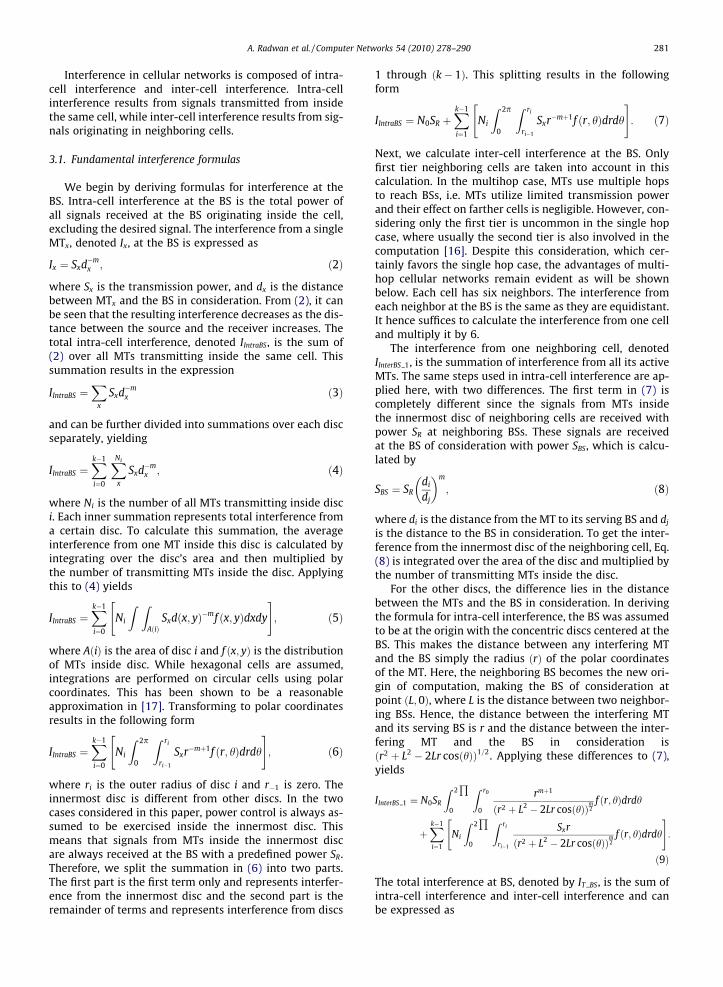
It should be clear that the maximum number of allowedsimultaneous calls originated in each cell is dependent onCk. Decreasing Ck increases the maximum number ofsimultaneous calls and hence increases the practical capac-ity. For this reason, Ck is plotted against the number ofdiscs in Fig. 4. The values obtained in the case of powercontrol are compared to the case with no power control.The special case with 1 disc represents the case of singlehop CDMA cellular network.
In these results, it is assumed that all MTs are transmit-ting with the same data rate and with a continuous bitstream. This setup means that MTs sending their own datacannot relay other’s information, which results in the per-centage of additional relaying MTs ðaÞ to be 1. Substituting
with a equals 1 in (21), the total number of transmittingMTs when call distribution is uniform becomes
Ni ¼NT
AT
Xk�1
n¼i
AðnÞ ¼ NT
D2 D2 � r2i�1
� �; ð26Þ
where D is the radius of the cell, and is taken to be unityhere.
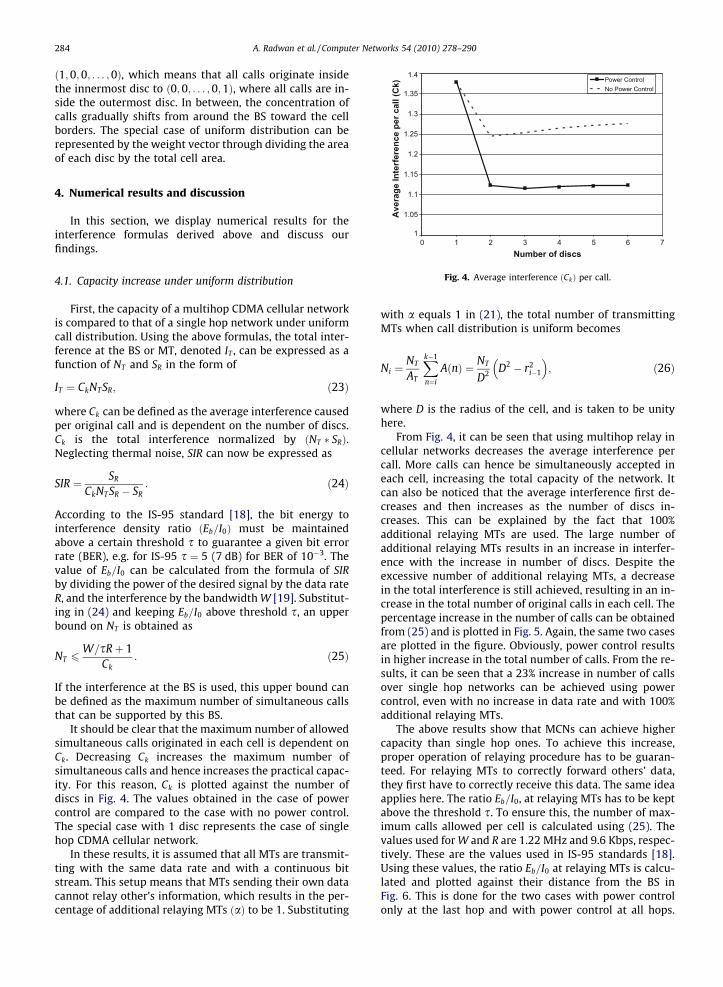
From Fig. 4, it can be seen that using multihop relay incellular networks decreases the average interference percall. More calls can hence be simultaneously accepted ineach cell, increasing the total capacity of the network. Itcan also be noticed that the average interference first de-creases and then increases as the number of discs in-creases. This can be explained by the fact that 100%additional relaying MTs are used. The large number ofadditional relaying MTs results in an increase in interfer-ence with the increase in number of discs. Despite theexcessive number of additional relaying MTs, a decreasein the total interference is still achieved, resulting in an in-crease in the total number of original calls in each cell. Thepercentage increase in the number of calls can be obtainedfrom (25) and is plotted in Fig. 5. Again, the same two casesare plotted in the figure. Obviously, power control resultsin higher increase in the total number of calls. From the re-sults, it can be seen that a 23% increase in number of callsover single hop networks can be achieved using powercontrol, even with no increase in data rate and with 100%additional relaying MTs.
The above results show that MCNs can achieve highercapacity than single hop ones. To achieve this increase,proper operation of relaying procedure has to be guaran-teed. For relaying MTs to correctly forward others’ data,they first have to correctly receive this data. The same ideaapplies here. The ratio Eb=I0, at relaying MTs has to be keptabove the threshold s. To ensure this, the number of max-imum calls allowed per cell is calculated using (25). Thevalues used for W and R are 1.22 MHz and 9.6 Kbps, respec-tively. These are the values used in IS-95 standards [18].Using these values, the ratio Eb=I0 at relaying MTs is calcu-lated and plotted against their distance from the BS inFig. 6. This is done for the two cases with power controlonly at the last hop and with power control at all hops.
0
5
10
15
20
25
0 1 2 3 4 5 6 7
Perc
enta
ge In
crea
se in
Num
ber
Number of discs
Power ControlNo Power Control
of C
alls
Fig. 5. Percentage increase in number of simultaneous calls.
5
7
9
11
13
15
17
19
0 0.1 0.2 0.3 0.4 0.5 0.6 0.7 0.8 0.9 1
Distance from BS
Eb/I0
in d
B
k = 2 k = 3 k = 4 k = 5 k = 6
Fig. 6. Bit energy to interference density ratio ðEb=I0Þ at relaying MTs withcomplete power control.
6.8
7
7.2
7.4
7.6
7.8
8
8.2
0 1 2 3 4 5 6 7
Number of discs
Eb/I0
in d
B
Fig. 7. Bit energy to interference density ratio ðEb=I0Þ with power controlusing same number of calls as single hop.
0
0.2
0.4
0.6
0.8
1
1.2
1.4
1.6
0 1 2 3 4 5 6 7
Number of discs
Ave
rage
Inte
rfer
ence
per
cal
l (C
k)
α = 0 α = 0.25 α = 0.5 α = 0.75 α = 1
Fig. 8. Average interference per call ðCkÞ with different percentage ofadditional relaying MTs ðaÞ.
A. Radwan et al. / Computer Networks 54 (2010) 278–290 285
We only show the results from the case with completepower control to save space.
Recall that there are no relaying MTs in the outermostdisc. The graphs do not show Eb=I0 inside these discs.Fig. 6 shows that Eb=I0 at relaying MTs is kept above thethreshold ðs ¼ 7 dBÞ, guaranteeing proper relay.
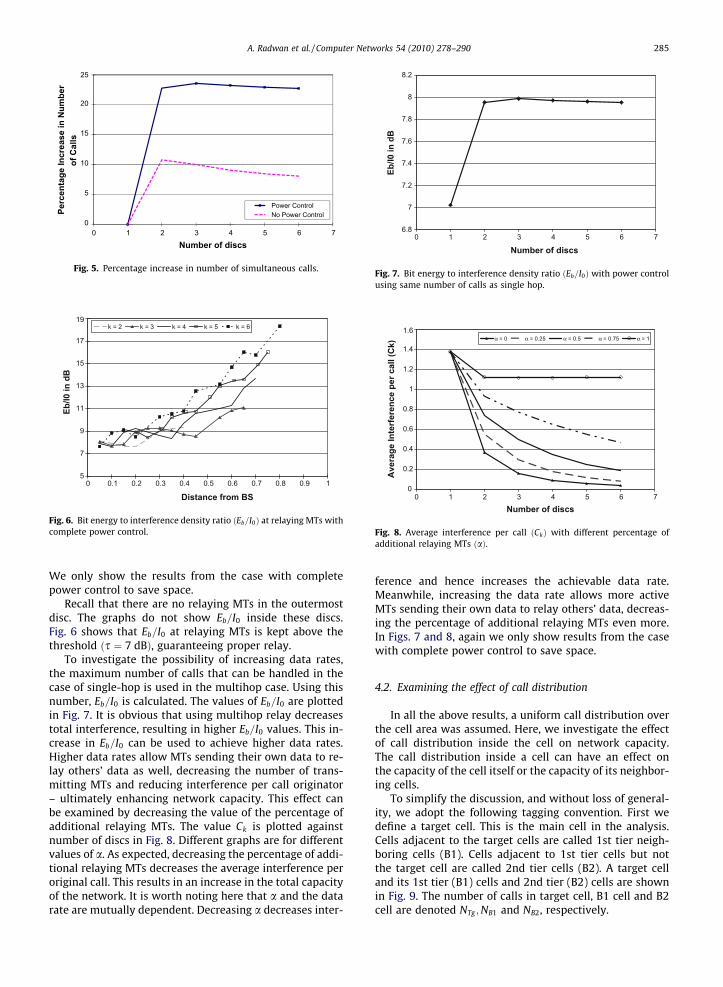
To investigate the possibility of increasing data rates,the maximum number of calls that can be handled in thecase of single-hop is used in the multihop case. Using thisnumber, Eb=I0 is calculated. The values of Eb=I0 are plottedin Fig. 7. It is obvious that using multihop relay decreasestotal interference, resulting in higher Eb=I0 values. This in-crease in Eb=I0 can be used to achieve higher data rates.Higher data rates allow MTs sending their own data to re-lay others’ data as well, decreasing the number of trans-mitting MTs and reducing interference per call originator– ultimately enhancing network capacity. This effect canbe examined by decreasing the value of the percentage ofadditional relaying MTs. The value Ck is plotted againstnumber of discs in Fig. 8. Different graphs are for differentvalues of a. As expected, decreasing the percentage of addi-tional relaying MTs decreases the average interference peroriginal call. This results in an increase in the total capacityof the network. It is worth noting here that a and the datarate are mutually dependent. Decreasing a decreases inter-
ference and hence increases the achievable data rate.Meanwhile, increasing the data rate allows more activeMTs sending their own data to relay others’ data, decreas-ing the percentage of additional relaying MTs even more.In Figs. 7 and 8, again we only show results from the casewith complete power control to save space.
4.2. Examining the effect of call distribution
In all the above results, a uniform call distribution overthe cell area was assumed. Here, we investigate the effectof call distribution inside the cell on network capacity.The call distribution inside a cell can have an effect onthe capacity of the cell itself or the capacity of its neighbor-ing cells.
To simplify the discussion, and without loss of general-ity, we adopt the following tagging convention. First wedefine a target cell. This is the main cell in the analysis.Cells adjacent to the target cells are called 1st tier neigh-boring cells (B1). Cells adjacent to 1st tier cells but notthe target cell are called 2nd tier cells (B2). A target celland its 1st tier (B1) cells and 2nd tier (B2) cells are shownin Fig. 9. The number of calls in target cell, B1 cell and B2cell are denoted NTg ;NB1 and NB2, respectively.
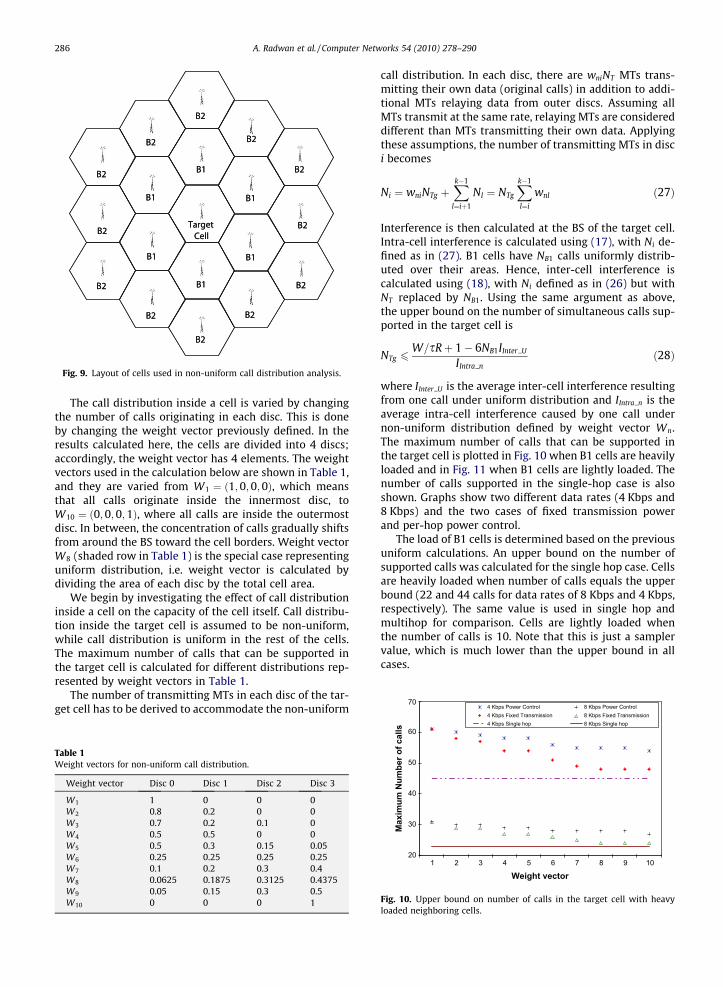
Fig. 9. Layout of cells used in non-uniform call distribution analysis.
704 Kbps Power Control 8 Kbps Power Control4 Kbps Fixed Transmission 8 Kbps Fixed Transmission
286 A. Radwan et al. / Computer Networks 54 (2010) 278–290
The call distribution inside a cell is varied by changingthe number of calls originating in each disc. This is doneby changing the weight vector previously defined. In theresults calculated here, the cells are divided into 4 discs;accordingly, the weight vector has 4 elements. The weightvectors used in the calculation below are shown in Table 1,and they are varied from W1 ¼ ð1;0;0;0Þ, which meansthat all calls originate inside the innermost disc, toW10 ¼ ð0;0;0;1Þ, where all calls are inside the outermostdisc. In between, the concentration of calls gradually shiftsfrom around the BS toward the cell borders. Weight vectorW8 (shaded row in Table 1) is the special case representinguniform distribution, i.e. weight vector is calculated bydividing the area of each disc by the total cell area.
We begin by investigating the effect of call distributioninside a cell on the capacity of the cell itself. Call distribu-tion inside the target cell is assumed to be non-uniform,while call distribution is uniform in the rest of the cells.The maximum number of calls that can be supported inthe target cell is calculated for different distributions rep-resented by weight vectors in Table 1.
The number of transmitting MTs in each disc of the tar-get cell has to be derived to accommodate the non-uniform
Table 1Weight vectors for non-uniform call distribution.
Weight vector Disc 0 Disc 1 Disc 2 Disc 3
W1 1 0 0 0W2 0.8 0.2 0 0W3 0.7 0.2 0.1 0W4 0.5 0.5 0 0W5 0.5 0.3 0.15 0.05W6 0.25 0.25 0.25 0.25W7 0.1 0.2 0.3 0.4W8 0.0625 0.1875 0.3125 0.4375W9 0.05 0.15 0.3 0.5W10 0 0 0 1
call distribution. In each disc, there are wniNT MTs trans-mitting their own data (original calls) in addition to addi-tional MTs relaying data from outer discs. Assuming allMTs transmit at the same rate, relaying MTs are considereddifferent than MTs transmitting their own data. Applyingthese assumptions, the number of transmitting MTs in disci becomes
Ni ¼ wniNTg þXk�1
l¼iþ1
Nl ¼ NTg
Xk�1
l¼i
wnl ð27Þ
Interference is then calculated at the BS of the target cell.Intra-cell interference is calculated using (17), with Ni de-fined as in (27). B1 cells have NB1 calls uniformly distrib-uted over their areas. Hence, inter-cell interference iscalculated using (18), with Ni defined as in (26) but withNT replaced by NB1. Using the same argument as above,the upper bound on the number of simultaneous calls sup-ported in the target cell is
NTg 6W=sRþ 1� 6NB1IInter U
IIntra nð28Þ
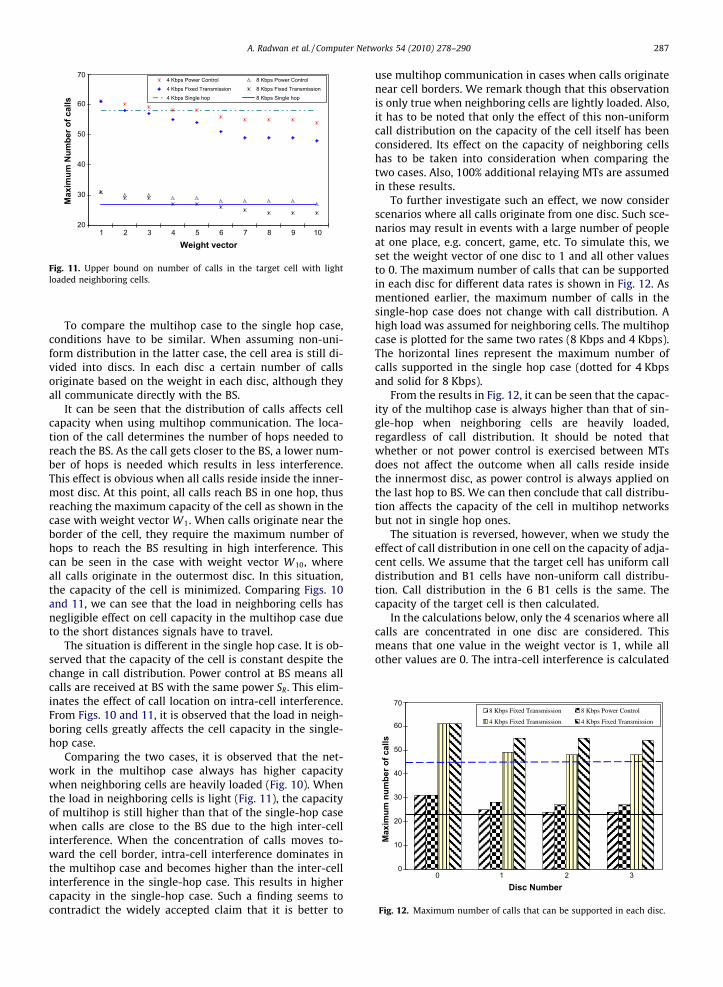
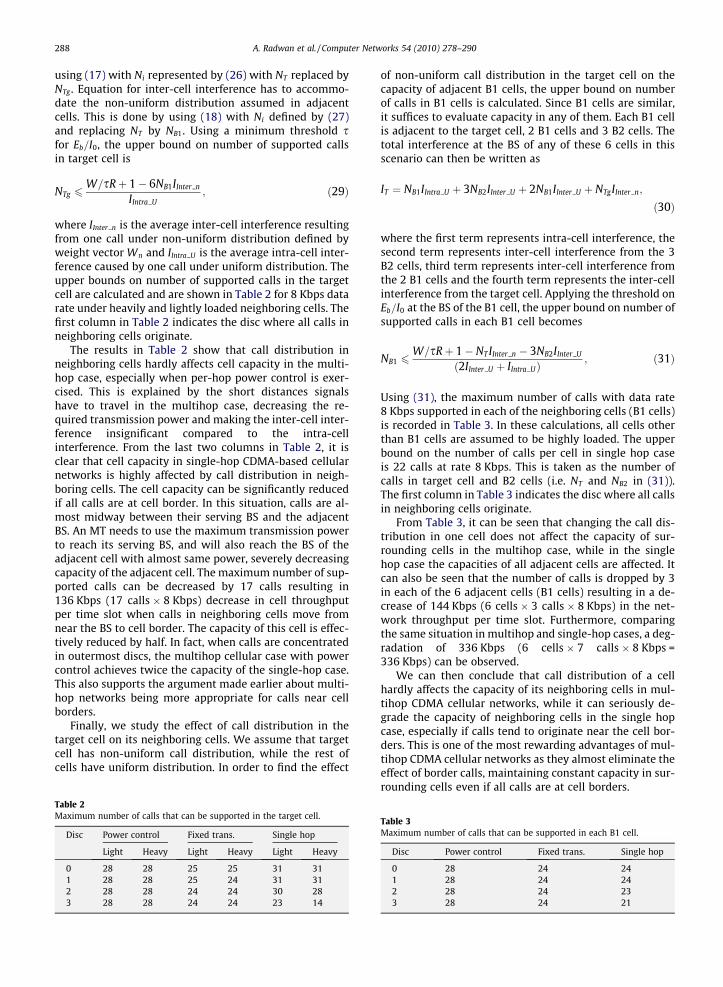
where IInter U is the average inter-cell interference resultingfrom one call under uniform distribution and IIntra n is theaverage intra-cell interference caused by one call undernon-uniform distribution defined by weight vector Wn.The maximum number of calls that can be supported inthe target cell is plotted in Fig. 10 when B1 cells are heavilyloaded and in Fig. 11 when B1 cells are lightly loaded. Thenumber of calls supported in the single-hop case is alsoshown. Graphs show two different data rates (4 Kbps and8 Kbps) and the two cases of fixed transmission powerand per-hop power control.
The load of B1 cells is determined based on the previousuniform calculations. An upper bound on the number ofsupported calls was calculated for the single hop case. Cellsare heavily loaded when number of calls equals the upperbound (22 and 44 calls for data rates of 8 Kbps and 4 Kbps,respectively). The same value is used in single hop andmultihop for comparison. Cells are lightly loaded whenthe number of calls is 10. Note that this is just a samplervalue, which is much lower than the upper bound in allcases.
20
30
40
50
60
1 2 3 4 5 6 7 8 9 10
Weight vector
4 Kbps Single hop 8 Kbps Single hop
Max
imum
Num
ber o
f cal
ls
Fig. 10. Upper bound on number of calls in the target cell with heavyloaded neighboring cells.
20
30
40
50
60
70
1 2 3 4 5 6 7 8 9 10
Weight vector
4 Kbps Power Control 8 Kbps Power Control4 Kbps Fixed Transmission 8 Kbps Fixed Transmission4 Kbps Single hop 8 Kbps Single hop
Max
imum
Num
ber o
f cal
ls
Fig. 11. Upper bound on number of calls in the target cell with lightloaded neighboring cells.
0
10
20
30
40
50
60
708 Kbps Fixed Transmission 8 Kbps Power Control
4 Kbps Fixed Transmission 4 Kbps Fixed Transmission
3210Disc Number
Max
imum
num
ber o
f cal
ls
Fig. 12. Maximum number of calls that can be supported in each disc.
A. Radwan et al. / Computer Networks 54 (2010) 278–290 287
To compare the multihop case to the single hop case,conditions have to be similar. When assuming non-uni-form distribution in the latter case, the cell area is still di-vided into discs. In each disc a certain number of callsoriginate based on the weight in each disc, although theyall communicate directly with the BS.
It can be seen that the distribution of calls affects cellcapacity when using multihop communication. The loca-tion of the call determines the number of hops needed toreach the BS. As the call gets closer to the BS, a lower num-ber of hops is needed which results in less interference.This effect is obvious when all calls reside inside the inner-most disc. At this point, all calls reach BS in one hop, thusreaching the maximum capacity of the cell as shown in thecase with weight vector W1. When calls originate near theborder of the cell, they require the maximum number ofhops to reach the BS resulting in high interference. Thiscan be seen in the case with weight vector W10, whereall calls originate in the outermost disc. In this situation,the capacity of the cell is minimized. Comparing Figs. 10and 11, we can see that the load in neighboring cells hasnegligible effect on cell capacity in the multihop case dueto the short distances signals have to travel.
The situation is different in the single hop case. It is ob-served that the capacity of the cell is constant despite thechange in call distribution. Power control at BS means allcalls are received at BS with the same power SR. This elim-inates the effect of call location on intra-cell interference.From Figs. 10 and 11, it is observed that the load in neigh-boring cells greatly affects the cell capacity in the single-hop case.
Comparing the two cases, it is observed that the net-work in the multihop case always has higher capacitywhen neighboring cells are heavily loaded (Fig. 10). Whenthe load in neighboring cells is light (Fig. 11), the capacityof multihop is still higher than that of the single-hop casewhen calls are close to the BS due to the high inter-cellinterference. When the concentration of calls moves to-ward the cell border, intra-cell interference dominates inthe multihop case and becomes higher than the inter-cellinterference in the single-hop case. This results in highercapacity in the single-hop case. Such a finding seems tocontradict the widely accepted claim that it is better to
use multihop communication in cases when calls originatenear cell borders. We remark though that this observationis only true when neighboring cells are lightly loaded. Also,it has to be noted that only the effect of this non-uniformcall distribution on the capacity of the cell itself has beenconsidered. Its effect on the capacity of neighboring cellshas to be taken into consideration when comparing thetwo cases. Also, 100% additional relaying MTs are assumedin these results.
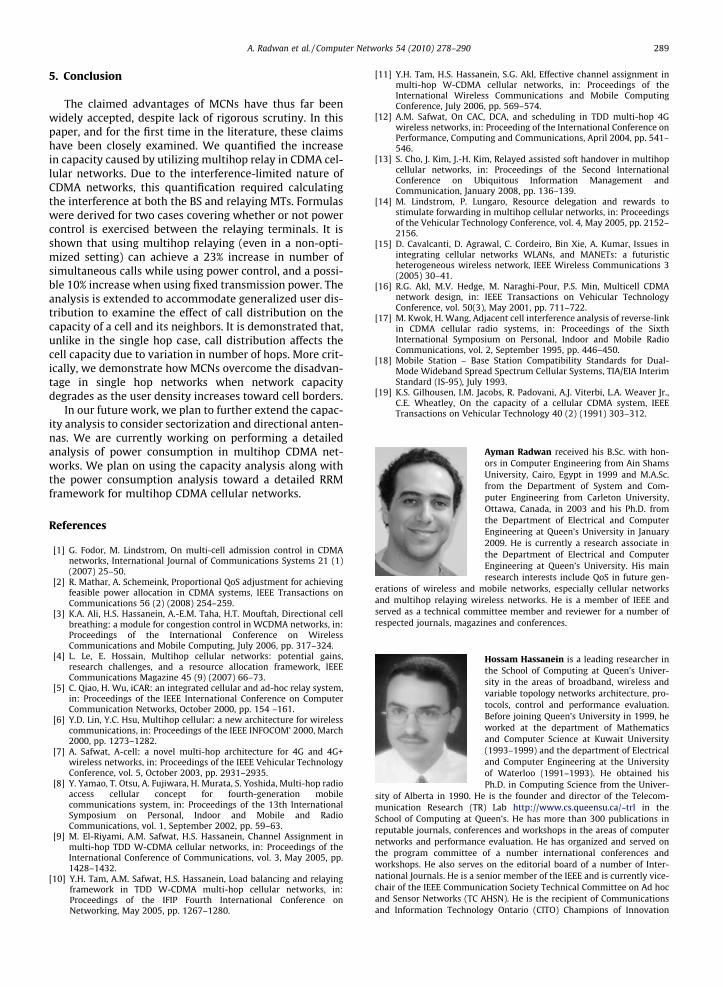
To further investigate such an effect, we now considerscenarios where all calls originate from one disc. Such sce-narios may result in events with a large number of peopleat one place, e.g. concert, game, etc. To simulate this, weset the weight vector of one disc to 1 and all other valuesto 0. The maximum number of calls that can be supportedin each disc for different data rates is shown in Fig. 12. Asmentioned earlier, the maximum number of calls in thesingle-hop case does not change with call distribution. Ahigh load was assumed for neighboring cells. The multihopcase is plotted for the same two rates (8 Kbps and 4 Kbps).The horizontal lines represent the maximum number ofcalls supported in the single hop case (dotted for 4 Kbpsand solid for 8 Kbps).
From the results in Fig. 12, it can be seen that the capac-ity of the multihop case is always higher than that of sin-gle-hop when neighboring cells are heavily loaded,regardless of call distribution. It should be noted thatwhether or not power control is exercised between MTsdoes not affect the outcome when all calls reside insidethe innermost disc, as power control is always applied onthe last hop to BS. We can then conclude that call distribu-tion affects the capacity of the cell in multihop networksbut not in single hop ones.
The situation is reversed, however, when we study theeffect of call distribution in one cell on the capacity of adja-cent cells. We assume that the target cell has uniform calldistribution and B1 cells have non-uniform call distribu-tion. Call distribution in the 6 B1 cells is the same. Thecapacity of the target cell is then calculated.
In the calculations below, only the 4 scenarios where allcalls are concentrated in one disc are considered. Thismeans that one value in the weight vector is 1, while allother values are 0. The intra-cell interference is calculated
288 A. Radwan et al. / Computer Networks 54 (2010) 278–290
using (17) with Ni represented by (26) with NT replaced byNTg . Equation for inter-cell interference has to accommo-date the non-uniform distribution assumed in adjacentcells. This is done by using (18) with Ni defined by (27)and replacing NT by NB1. Using a minimum threshold sfor Eb=I0, the upper bound on number of supported callsin target cell is
NTg 6W=sRþ 1� 6NB1IInter n
IIntra U; ð29Þ
where IInter n is the average inter-cell interference resultingfrom one call under non-uniform distribution defined byweight vector Wn and IIntra U is the average intra-cell inter-ference caused by one call under uniform distribution. Theupper bounds on number of supported calls in the targetcell are calculated and are shown in Table 2 for 8 Kbps datarate under heavily and lightly loaded neighboring cells. Thefirst column in Table 2 indicates the disc where all calls inneighboring cells originate.
The results in Table 2 show that call distribution inneighboring cells hardly affects cell capacity in the multi-hop case, especially when per-hop power control is exer-cised. This is explained by the short distances signalshave to travel in the multihop case, decreasing the re-quired transmission power and making the inter-cell inter-ference insignificant compared to the intra-cellinterference. From the last two columns in Table 2, it isclear that cell capacity in single-hop CDMA-based cellularnetworks is highly affected by call distribution in neigh-boring cells. The cell capacity can be significantly reducedif all calls are at cell border. In this situation, calls are al-most midway between their serving BS and the adjacentBS. An MT needs to use the maximum transmission powerto reach its serving BS, and will also reach the BS of theadjacent cell with almost same power, severely decreasingcapacity of the adjacent cell. The maximum number of sup-ported calls can be decreased by 17 calls resulting in136 Kbps (17 calls � 8 Kbps) decrease in cell throughputper time slot when calls in neighboring cells move fromnear the BS to cell border. The capacity of this cell is effec-tively reduced by half. In fact, when calls are concentratedin outermost discs, the multihop cellular case with powercontrol achieves twice the capacity of the single-hop case.This also supports the argument made earlier about multi-hop networks being more appropriate for calls near cellborders.
Finally, we study the effect of call distribution in thetarget cell on its neighboring cells. We assume that targetcell has non-uniform call distribution, while the rest ofcells have uniform distribution. In order to find the effect
Table 2Maximum number of calls that can be supported in the target cell.
Disc Power control Fixed trans. Single hop
Light Heavy Light Heavy Light Heavy
0 28 28 25 25 31 311 28 28 25 24 31 312 28 28 24 24 30 283 28 28 24 24 23 14
of non-uniform call distribution in the target cell on thecapacity of adjacent B1 cells, the upper bound on numberof calls in B1 cells is calculated. Since B1 cells are similar,it suffices to evaluate capacity in any of them. Each B1 cellis adjacent to the target cell, 2 B1 cells and 3 B2 cells. Thetotal interference at the BS of any of these 6 cells in thisscenario can then be written as
IT ¼ NB1IIntra U þ 3NB2IInter U þ 2NB1IInter U þ NTgIInter n;
ð30Þ
where the first term represents intra-cell interference, thesecond term represents inter-cell interference from the 3B2 cells, third term represents inter-cell interference fromthe 2 B1 cells and the fourth term represents the inter-cellinterference from the target cell. Applying the threshold onEb=I0 at the BS of the B1 cell, the upper bound on number ofsupported calls in each B1 cell becomes
NB1 6W=sRþ 1� NT IInter n � 3NB2IInter U
ð2IInter U þ IIntra UÞ; ð31Þ
Using (31), the maximum number of calls with data rate8 Kbps supported in each of the neighboring cells (B1 cells)is recorded in Table 3. In these calculations, all cells otherthan B1 cells are assumed to be highly loaded. The upperbound on the number of calls per cell in single hop caseis 22 calls at rate 8 Kbps. This is taken as the number ofcalls in target cell and B2 cells (i.e. NT and NB2 in (31)).The first column in Table 3 indicates the disc where all callsin neighboring cells originate.
From Table 3, it can be seen that changing the call dis-tribution in one cell does not affect the capacity of sur-rounding cells in the multihop case, while in the singlehop case the capacities of all adjacent cells are affected. Itcan also be seen that the number of calls is dropped by 3in each of the 6 adjacent cells (B1 cells) resulting in a de-crease of 144 Kbps (6 cells � 3 calls � 8 Kbps) in the net-work throughput per time slot. Furthermore, comparingthe same situation in multihop and single-hop cases, a deg-radation of 336 Kbps (6 cells � 7 calls � 8 Kbps =336 Kbps) can be observed.
We can then conclude that call distribution of a cellhardly affects the capacity of its neighboring cells in mul-tihop CDMA cellular networks, while it can seriously de-grade the capacity of neighboring cells in the single hopcase, especially if calls tend to originate near the cell bor-ders. This is one of the most rewarding advantages of mul-tihop CDMA cellular networks as they almost eliminate theeffect of border calls, maintaining constant capacity in sur-rounding cells even if all calls are at cell borders.
Table 3Maximum number of calls that can be supported in each B1 cell.
Disc Power control Fixed trans. Single hop
0 28 24 241 28 24 242 28 24 233 28 24 21
A. Radwan et al. / Computer Networks 54 (2010) 278–290 289
5. Conclusion
The claimed advantages of MCNs have thus far beenwidely accepted, despite lack of rigorous scrutiny. In thispaper, and for the first time in the literature, these claimshave been closely examined. We quantified the increasein capacity caused by utilizing multihop relay in CDMA cel-lular networks. Due to the interference-limited nature ofCDMA networks, this quantification required calculatingthe interference at both the BS and relaying MTs. Formulaswere derived for two cases covering whether or not powercontrol is exercised between the relaying terminals. It isshown that using multihop relaying (even in a non-opti-mized setting) can achieve a 23% increase in number ofsimultaneous calls while using power control, and a possi-ble 10% increase when using fixed transmission power. Theanalysis is extended to accommodate generalized user dis-tribution to examine the effect of call distribution on thecapacity of a cell and its neighbors. It is demonstrated that,unlike in the single hop case, call distribution affects thecell capacity due to variation in number of hops. More crit-ically, we demonstrate how MCNs overcome the disadvan-tage in single hop networks when network capacitydegrades as the user density increases toward cell borders.
In our future work, we plan to further extend the capac-ity analysis to consider sectorization and directional anten-nas. We are currently working on performing a detailedanalysis of power consumption in multihop CDMA net-works. We plan on using the capacity analysis along withthe power consumption analysis toward a detailed RRMframework for multihop CDMA cellular networks.
References
[1] G. Fodor, M. Lindstrom, On multi-cell admission control in CDMAnetworks, International Journal of Communications Systems 21 (1)(2007) 25–50.
[2] R. Mathar, A. Schemeink, Proportional QoS adjustment for achievingfeasible power allocation in CDMA systems, IEEE Transactions onCommunications 56 (2) (2008) 254–259.
[3] K.A. Ali, H.S. Hassanein, A.-E.M. Taha, H.T. Mouftah, Directional cellbreathing: a module for congestion control in WCDMA networks, in:Proceedings of the International Conference on WirelessCommunications and Mobile Computing, July 2006, pp. 317–324.
[4] L. Le, E. Hossain, Multihop cellular networks: potential gains,research challenges, and a resource allocation framework, IEEECommunications Magazine 45 (9) (2007) 66–73.
[5] C. Qiao, H. Wu, iCAR: an integrated cellular and ad-hoc relay system,in: Proceedings of the IEEE International Conference on ComputerCommunication Networks, October 2000, pp. 154 –161.
[6] Y.D. Lin, Y.C. Hsu, Multihop cellular: a new architecture for wirelesscommunications, in: Proceedings of the IEEE INFOCOM’ 2000, March2000, pp. 1273–1282.
[7] A. Safwat, A-cell: a novel multi-hop architecture for 4G and 4G+wireless networks, in: Proceedings of the IEEE Vehicular TechnologyConference, vol. 5, October 2003, pp. 2931–2935.
[8] Y. Yamao, T. Otsu, A. Fujiwara, H. Murata, S. Yoshida, Multi-hop radioaccess cellular concept for fourth-generation mobilecommunications system, in: Proceedings of the 13th InternationalSymposium on Personal, Indoor and Mobile and RadioCommunications, vol. 1, September 2002, pp. 59–63.
[9] M. El-Riyami, A.M. Safwat, H.S. Hassanein, Channel Assignment inmulti-hop TDD W-CDMA cellular networks, in: Proceedings of theInternational Conference of Communications, vol. 3, May 2005, pp.1428–1432.
[10] Y.H. Tam, A.M. Safwat, H.S. Hassanein, Load balancing and relayingframework in TDD W-CDMA multi-hop cellular networks, in:Proceedings of the IFIP Fourth International Conference onNetworking, May 2005, pp. 1267–1280.
[11] Y.H. Tam, H.S. Hassanein, S.G. Akl, Effective channel assignment inmulti-hop W-CDMA cellular networks, in: Proceedings of theInternational Wireless Communications and Mobile ComputingConference, July 2006, pp. 569–574.
[12] A.M. Safwat, On CAC, DCA, and scheduling in TDD multi-hop 4Gwireless networks, in: Proceeding of the International Conference onPerformance, Computing and Communications, April 2004, pp. 541–546.
[13] S. Cho, J. Kim, J.-H. Kim, Relayed assisted soft handover in multihopcellular networks, in: Proceedings of the Second InternationalConference on Ubiquitous Information Management andCommunication, January 2008, pp. 136–139.
[14] M. Lindstrom, P. Lungaro, Resource delegation and rewards tostimulate forwarding in multihop cellular networks, in: Proceedingsof the Vehicular Technology Conference, vol. 4, May 2005, pp. 2152–2156.
[15] D. Cavalcanti, D. Agrawal, C. Cordeiro, Bin Xie, A. Kumar, Issues inintegrating cellular networks WLANs, and MANETs: a futuristicheterogeneous wireless network, IEEE Wireless Communications 3(2005) 30–41.
[16] R.G. Akl, M.V. Hedge, M. Naraghi-Pour, P.S. Min, Multicell CDMAnetwork design, in: IEEE Transactions on Vehicular TechnologyConference, vol. 50(3), May 2001, pp. 711–722.
[17] M. Kwok, H. Wang, Adjacent cell interference analysis of reverse-linkin CDMA cellular radio systems, in: Proceedings of the SixthInternational Symposium on Personal, Indoor and Mobile RadioCommunications, vol. 2, September 1995, pp. 446–450.
[18] Mobile Station – Base Station Compatibility Standards for Dual-Mode Wideband Spread Spectrum Cellular Systems, TIA/EIA InterimStandard (IS-95), July 1993.
[19] K.S. Gilhousen, I.M. Jacobs, R. Padovani, A.J. Viterbi, L.A. Weaver Jr.,C.E. Wheatley, On the capacity of a cellular CDMA system, IEEETransactions on Vehicular Technology 40 (2) (1991) 303–312.
Ayman Radwan received his B.Sc. with hon-ors in Computer Engineering from Ain ShamsUniversity, Cairo, Egypt in 1999 and M.A.Sc.from the Department of System and Com-puter Engineering from Carleton University,Ottawa, Canada, in 2003 and his Ph.D. fromthe Department of Electrical and ComputerEngineering at Queen’s University in January2009. He is currently a research associate inthe Department of Electrical and ComputerEngineering at Queen’s University. His mainresearch interests include QoS in future gen-
erations of wireless and mobile networks, especially cellular networksand multihop relaying wireless networks. He is a member of IEEE andserved as a technical committee member and reviewer for a number of
respected journals, magazines and conferences.Hossam Hassanein is a leading researcher inthe School of Computing at Queen’s Univer-sity in the areas of broadband, wireless andvariable topology networks architecture, pro-tocols, control and performance evaluation.Before joining Queen’s University in 1999, heworked at the department of Mathematicsand Computer Science at Kuwait University(1993–1999) and the department of Electricaland Computer Engineering at the Universityof Waterloo (1991–1993). He obtained hisPh.D. in Computing Science from the Univer-
sity of Alberta in 1990. He is the founder and director of the Telecom-munication Research (TR) Lab http://www.cs.queensu.ca/~trl in theSchool of Computing at Queen’s. He has more than 300 publications in
reputable journals, conferences and workshops in the areas of computernetworks and performance evaluation. He has organized and served onthe program committee of a number international conferences andworkshops. He also serves on the editorial board of a number of Inter-national Journals. He is a senior member of the IEEE and is currently vice-chair of the IEEE Communication Society Technical Committee on Ad hocand Sensor Networks (TC AHSN). He is the recipient of Communicationsand Information Technology Ontario (CITO) Champions of Innovation
290 A. Radwan et al. / Computer Networks 54 (2010) 278–290
Research award in 2003. In 2007, He received best paper awards at theIEEE Wireless Communications and Networks and the IEEE Global Commu-nication Conferences (both flagship IEEE communications societyconferences).
Abd-Elhamid M. Taha received his B.Sc. andM.Sc. in Electrical Engineering from KuwaitUniversity, Kuwait in 1999 and 2002, and hisPh.D. from the Department of Electrical andComputer Engineering of Queen’s University,Canada in September 2007. He is currently apost-doctorate fellow at the School of Com-puting, Queen’s University. He has authoredseveral publications including journals, refer-eed conference papers, and book chapters. Healso served as a technical program committeemember of multiple international IEEE con-
ferences and symposia, and as a reviewer for respected journals, maga-zines and conferences. His areas of interest include radio resource
management in wireless and mobile networks, especially in the contextof wireless overlays with heterogeneous access and wireless mesh net-works. He is a member of the IEEE, ComSoc and ACM.


