Embed Size (px)
Citation preview
IECM User Documentation: User Manual Table of Contents • i
IECM User Documentation: User Manual
December 2018

IECM User Documentation: User Manual Table of Contents • ii
IECM User Documentation:
User Manual
Originally Prepared November 2009 by:
Michael B. Berkenpas
John J. Fry
Karen Kietzke
Edward S. Rubin
Revised December 2018 by:
Karen Kietzke
Haibo Zhai
The Integrated Environmental Control Model Team
Carnegie Mellon University
Pittsburgh, PA 15213
www.iecm-online.com
IECM User Documentation: User Manual Table of Contents • iii
Table of Contents
1. Introduction 1
1.1. The Integrated Environmental Control Model ................................................................................................ 1 1.2. Purpose ........................................................................................................................................................... 1 1.3. System Requirements ..................................................................................................................................... 1
1.3.1. MacOS X and Linux ............................................................................................................................ 1 1.4. Uncertainty Features ....................................................................................................................................... 1 1.5. Sensitivity Analysis ........................................................................................................................................ 2 1.6. Software Used in Development ...................................................................................................................... 2 1.7. Disclaimer of Warranties and Limitation of Liabilities .................................................................................. 2 1.8. Copyright Notices ........................................................................................................................................... 3 1.9. User Documentation and Help ........................................................................................................................ 3
2. Microsoft® Windows Conventions 4
2.1. Windows ......................................................................................................................................................... 4 2.2. Using a Mouse or Touchscreen ....................................................................................................................... 4 2.3. Pull-Down Menus ........................................................................................................................................... 4
2.3.1. Choosing a Command from a Pull-Down Menu .................................................................................. 5 2.4. Keystroke Commands ..................................................................................................................................... 5
2.4.1. Alt Commands ..................................................................................................................................... 5 2.4.2. Ctrl Commands ................................................................................................................................... 5
2.5. Editing Text .................................................................................................................................................... 6 2.6. Using the Clipboard ........................................................................................................................................ 6 2.7. The Taskbar..................................................................................................................................................... 6
2.7.1. Switching Applications or Windows .................................................................................................... 7 2.7.2. The Start Button ................................................................................................................................... 7
2.7.2.1. The Start Menu .......................................................................................................................... 8 2.7.2.1.1. Start Menu Folders .......................................................................................................... 9 2.7.2.1.2. The Settings Button ......................................................................................................... 9
3. Installing the IECM 10
3.1. What's included in the Model Package ......................................................................................................... 10 3.2. Installation .................................................................................................................................................... 10
3.2.1. Installing the IECM on MacOS and Linux ......................................................................................... 10 3.2.1.1. MacOS ..................................................................................................................................... 10 3.2.1.2. Linux ........................................................................................................................................ 11
3.2.2. Installation Steps ................................................................................................................................ 11 3.2.2.1. Running the IECM Setup Application ..................................................................................... 11 3.2.2.2. Welcome Dialog....................................................................................................................... 11 3.2.2.3. License Agreement .................................................................................................................. 12 3.2.2.4. Information .............................................................................................................................. 12 3.2.2.5. Select Destination Location ..................................................................................................... 13 3.2.2.6. Select Start Menu Folder ......................................................................................................... 13 3.2.2.7. Select Additional Tasks ............................................................................................................ 14
IECM User Documentation: User Manual Table of Contents • iv
3.2.2.8. Ready to Install ........................................................................................................................ 15 3.2.2.9. Installation Progress ................................................................................................................. 15 3.2.2.10. Installation Complete ............................................................................................................. 16
3.2.3. Canceling the Installation ................................................................................................................... 16 3.2.4. Errors During Installation ................................................................................................................... 16
3.3. Removing the IECM Software ..................................................................................................................... 16 3.3.1. Uninstall the IECM Using the Included Uninstall Application .......................................................... 17 3.3.2. Uninstall the IECM Using Settings on Windows 10 .......................................................................... 17 3.3.3. Uninstall the IECM Using the Control Panel on Windows 7 ............................................................. 17 3.3.4. Uninstall the IECM Using the Control Panel on Windows XP .......................................................... 17
4. Using the IECM 19
4.1. The IECM Interface ...................................................................................................................................... 19 4.1.1. Starting the IECM Interface ............................................................................................................... 19 4.1.2. The Main Window .............................................................................................................................. 20
4.1.2.1. The Main Window Menu Bar .................................................................................................. 20 4.1.2.1.1. The File Menu ............................................................................................................... 21 4.1.2.1.2. The Help Menu .............................................................................................................. 21
4.1.2.2. The Main Window Toolbar ...................................................................................................... 22 4.1.3. Creating and Opening Sessions .......................................................................................................... 22
4.1.3.1. Creating a New Session from Model Defaults ......................................................................... 22 4.1.3.1.1. Choose a Plant Type ...................................................................................................... 23 4.1.3.1.2. Choose a Name .............................................................................................................. 23
4.1.3.2. Opening an Existing Session ................................................................................................... 23 4.1.3.2.1. Choose a Session Database ........................................................................................... 24
4.1.3.2.1.1. Opening a Session Database ................................................................................. 25 4.1.3.2.2. Choose a Session ........................................................................................................... 26
4.1.4. The Session Window .......................................................................................................................... 27 4.1.4.1. The Session Window Menu Bar ............................................................................................... 27
4.1.4.1.1. The File Menu ............................................................................................................... 28 4.1.4.1.1.1. The Export Menu .................................................................................................. 28
4.1.4.1.2. The Edit Menu ............................................................................................................... 29 4.1.4.1.3. The Go Menu................................................................................................................. 30 4.1.4.1.4. The Help Menu .............................................................................................................. 30
4.1.4.2. The Session Window Toolbar .................................................................................................. 30 4.1.4.2.1. The "New Session" Button ............................................................................................ 31 4.1.4.2.2. The "Open Session" Button ........................................................................................... 31 4.1.4.2.3. The "Save Session" Button ............................................................................................ 31 4.1.4.2.4. The "Save Session As" Button ....................................................................................... 31 4.1.4.2.5. The "Go to Previous Screen" Button ............................................................................. 32 4.1.4.2.6. The "Go to Next Screen" Button ................................................................................... 32 4.1.4.2.7. The "Go to Previous Screen in History" Button ............................................................ 32 4.1.4.2.8. The "Go to Next Screen in History" Button .................................................................. 32 4.1.4.2.9. The Location of the Current Screen .............................................................................. 32 4.1.4.2.10. The "Close Window" Button ....................................................................................... 33 4.1.4.2.11. The "Exit" Button ........................................................................................................ 33
4.1.4.3. The Status Bar .......................................................................................................................... 33 4.1.4.4. The Navigation Panel ............................................................................................................... 34
4.1.4.4.1. How to Use the Navigation Panel ................................................................................. 34 4.1.4.4.2. Organization of the Navigation Panel ........................................................................... 35
4.1.4.4.2.1. Program Areas ....................................................................................................... 36 4.1.4.4.2.2. Technologies ......................................................................................................... 36
IECM User Documentation: User Manual Table of Contents • v
4.1.4.4.2.3. Process Types ........................................................................................................ 38 4.1.4.4.2.4. Screens .................................................................................................................. 39
4.1.4.4.3. Organization in the Old Tab-Style Interface .................................................................. 40 4.1.5. Saving Sessions .................................................................................................................................. 40
4.1.5.1. The "Session Modified" Indicator in the Window Title ........................................................... 41 4.1.5.2. Save ......................................................................................................................................... 41 4.1.5.3. Save As .................................................................................................................................... 41
4.1.6. Closing Sessions ................................................................................................................................. 42 4.1.7. Deleting Sessions ............................................................................................................................... 43 4.1.8. Unlocking Sessions ............................................................................................................................ 43 4.1.9. Exiting the IECM Interface ................................................................................................................ 44
4.2. Configuring the Plant .................................................................................................................................... 45 4.2.1. The "CONFIGURE SESSION" Program Area .................................................................................. 45
4.2.1.1. The "Plant Design" Screen ....................................................................................................... 45 4.2.1.1.1. The Configuration Menus.............................................................................................. 46
4.2.1.1.1.1. The Overall Configuration Menu .......................................................................... 46 4.2.1.1.1.2. The Individual Configuration Menus .................................................................... 47
4.2.1.1.2. The Overall Plant Diagram ............................................................................................ 49 4.2.1.2. The "Plant Location" Screen .................................................................................................... 50 4.2.1.3. The "Unit Systems" Screen ...................................................................................................... 51
4.2.1.3.1. IECM Default Unit System ........................................................................................... 51 4.2.1.3.2. Current Session Unit System ......................................................................................... 52 4.2.1.3.3. Result Flow Rates .......................................................................................................... 52 4.2.1.3.4. Result Time Period ........................................................................................................ 52 4.2.1.3.5. Performance Table ......................................................................................................... 53 4.2.1.3.6. Cost Table ...................................................................................................................... 53
4.3. Setting Parameters ........................................................................................................................................ 54 4.3.1. Overview ............................................................................................................................................ 54 4.3.2. Diagram Screens ................................................................................................................................ 54
4.3.2.1. Overall Plant Diagram ............................................................................................................. 54 4.3.2.2. Technology and Process Type Overview Diagrams ................................................................. 55
4.3.3. Parameter Screens .............................................................................................................................. 55 4.3.3.1. Standard Parameters ................................................................................................................ 56
4.3.3.1.1. Title ............................................................................................................................... 56 4.3.3.1.2. Unc ................................................................................................................................ 56 4.3.3.1.3. Value .............................................................................................................................. 56
4.3.3.1.3.1. Menu Values ......................................................................................................... 56 4.3.3.1.3.2. Text Values ............................................................................................................ 57
4.3.3.1.4. Calc ............................................................................................................................... 57 4.3.3.1.5. Min ................................................................................................................................ 58 4.3.3.1.6. Max ............................................................................................................................... 58 4.3.3.1.7. Default ........................................................................................................................... 58
4.3.3.2. Read-Only Parameters ............................................................................................................. 58 4.3.3.3. The Uncertainty Editor ............................................................................................................ 59
4.3.3.3.1. #1: Parameter Information ............................................................................................. 59 4.3.3.3.2. #2: The Distribution Menu ............................................................................................ 60 4.3.3.3.3. #3: The "Use Nominal Values" Checkbox ..................................................................... 61 4.3.3.3.4. #4: The Sample Size ...................................................................................................... 61 4.3.3.3.5. #5: The Nominal Minimum & Maximum ..................................................................... 62 4.3.3.3.6. #6: Normalized Distribution Parameters ....................................................................... 62 4.3.3.3.7. #7: Nominal Distribution Parameters ............................................................................ 62 4.3.3.3.8. #8: Distribution Requirements ...................................................................................... 63
IECM User Documentation: User Manual Table of Contents • vi
4.3.3.3.9. #9: Status ....................................................................................................................... 63 4.3.3.3.10. #10: Distribution Information ..................................................................................... 63 4.3.3.3.11. Uncertainty on Menus ................................................................................................. 64 4.3.3.3.12. User-defined Distributions .......................................................................................... 64 4.3.3.3.13. Batch Processing ......................................................................................................... 66
4.3.3.4. The Database Button ................................................................................................................ 67 4.3.3.4.1. Coal Databases .............................................................................................................. 68 4.3.3.4.2. Reservoir Databases ...................................................................................................... 71
4.3.3.5. Highlighted Parameters ............................................................................................................ 74 4.3.3.6. The Right-Click Menu ............................................................................................................. 74
4.4. Getting Results ............................................................................................................................................. 75 4.4.1. Overview ............................................................................................................................................ 75 4.4.2. Diagram Screens ................................................................................................................................ 75
4.4.2.1. The Overall Plant Diagram ...................................................................................................... 75 4.4.2.2. Other Diagrams ........................................................................................................................ 75
4.4.2.2.1. Units .............................................................................................................................. 76 4.4.3. Table Screens ...................................................................................................................................... 76
4.4.3.1. One Table ................................................................................................................................. 76 4.4.3.2. Two Tables ............................................................................................................................... 78 4.4.3.3. Units ......................................................................................................................................... 80
4.4.4. The Right-Click Menu........................................................................................................................ 80 4.5. Analysis Tools ............................................................................................................................................... 80
4.5.1. Overview ............................................................................................................................................ 80 4.5.2. Sensitivity Analysis ............................................................................................................................ 80
4.5.2.1. Choose Independent Variable .................................................................................................. 81 4.5.2.1.1. Parameter Chooser ........................................................................................................ 81 4.5.2.1.2. Information .................................................................................................................... 82 4.5.2.1.3. Configuration ................................................................................................................ 82 4.5.2.1.4. Values ............................................................................................................................ 83
4.5.2.2. Choose Dependent Variable(s) ................................................................................................. 84 4.5.3. Uncertainty ......................................................................................................................................... 85
4.5.3.1. Configure Uncertainty ............................................................................................................. 85 4.5.3.1.1. Sample Size ................................................................................................................... 86 4.5.3.1.2. Sampling Method .......................................................................................................... 86 4.5.3.1.3. Uncertainty Areas .......................................................................................................... 87
4.5.3.1.3.1. Uncertainty Areas in a Pulverized Coal (PC) Plant............................................... 87 4.5.3.1.3.2. Uncertainty Areas in a Natural Gas Combined Cycle (NGCC) Plant ................... 87 4.5.3.1.3.3. Uncertainty Areas in an Integrated Gasification Combined Cycle (IGCC) Plant . 87
4.5.3.2. Choose Variable(s) ................................................................................................................... 88 4.6. Exporting Data .............................................................................................................................................. 88
5. How to Use the Modules Included With the IECM 90
5.1. Common Input and Result Screens ............................................................................................................... 90 5.1.1. Costs ................................................................................................................................................... 90
5.1.1.1. Capital Cost Inputs................................................................................................................... 90 5.1.1.2. Capital Cost Results ................................................................................................................. 93 5.1.1.3. Cost of CO2 Avoided & Captured ............................................................................................ 94 5.1.1.4. Cost Summary Results ............................................................................................................. 96 5.1.1.5. O&M Cost Inputs .................................................................................................................... 97 5.1.1.6. O&M Cost Results ................................................................................................................... 98 5.1.1.7. Total Cost Results .................................................................................................................... 99 5.1.1.8. Retrofit or Adjustment Factor Inputs ..................................................................................... 100
IECM User Documentation: User Manual Table of Contents • vii
5.1.2. Fuels ................................................................................................................................................. 100 5.1.2.1. Coal Properties ....................................................................................................................... 100
5.1.2.1.1. Ash Properties ............................................................................................................. 100 5.1.2.2. Natural Gas Properties ........................................................................................................... 101
5.1.3. Gas Streams ...................................................................................................................................... 101 5.1.3.1. Flue Gas Components ............................................................................................................ 101 5.1.3.2. Syngas Components ............................................................................................................... 102
5.1.4. Other ................................................................................................................................................. 104 5.1.4.1. Mass In/Out ........................................................................................................................... 104 5.1.4.2. Plant Performance .................................................................................................................. 105 5.1.4.3. T&S Config ........................................................................................................................... 107
5.2. Pulverized Coal (PC) Plant ......................................................................................................................... 107 5.2.1. CONFIGURE SESSION .................................................................................................................. 107
5.2.1.1. Plant Design ........................................................................................................................... 107 5.2.1.2. Plant Location ........................................................................................................................ 114 5.2.1.3. Unit Systems .......................................................................................................................... 115
5.2.2. SET PARAMETERS ........................................................................................................................ 115 5.2.2.1. Overall Plant .......................................................................................................................... 115
5.2.2.1.1. Diagram ....................................................................................................................... 116 5.2.2.1.2. Performance ................................................................................................................ 116 5.2.2.1.3. Region-Specific Cost Factors ...................................................................................... 117 5.2.2.1.4. Regulations & Taxes .................................................................................................... 118 5.2.2.1.5. Financing & Cost Year ................................................................................................ 120 5.2.2.1.6. Fuel & Land Cost ........................................................................................................ 122 5.2.2.1.7. Capital Cost ................................................................................................................. 123 5.2.2.1.8. O&M Cost ................................................................................................................... 123 5.2.2.1.9. Reference Plant ........................................................................................................... 125
5.2.2.2. Fuel ........................................................................................................................................ 125 5.2.2.2.1. Coal Properties ............................................................................................................ 126 5.2.2.2.2. Ash Properties ............................................................................................................. 127 5.2.2.2.3. Auxiliary Gas............................................................................................................... 128 5.2.2.2.4. Mercury ....................................................................................................................... 129 5.2.2.2.5. Cost ............................................................................................................................. 130
5.2.2.3. Base Plant .............................................................................................................................. 130 5.2.2.3.1. Boiler Diagram ............................................................................................................ 131 5.2.2.3.2. Air Preheater Diagram ................................................................................................. 131 5.2.2.3.3. Base Plant Performance ............................................................................................... 132 5.2.2.3.4. Steam Cycle Diagram .................................................................................................. 134 5.2.2.3.5. Steam Cycle Performance ........................................................................................... 134 5.2.2.3.6. Furnace Factors ........................................................................................................... 135 5.2.2.3.7. Capital Cost ................................................................................................................. 136 5.2.2.3.8. O&M Cost ................................................................................................................... 137 5.2.2.3.9. Retrofit or Adjustment Factors .................................................................................... 138
5.2.2.4. NOx Control ........................................................................................................................... 138 5.2.2.4.1. In-Furnace Controls ..................................................................................................... 138
5.2.2.4.1.1. In-Furnace Controls Diagram ............................................................................. 139 5.2.2.4.1.2. Config ................................................................................................................. 139 5.2.2.4.1.3. Performance ........................................................................................................ 141 5.2.2.4.1.4. Capital Cost......................................................................................................... 142 5.2.2.4.1.5. O&M Cost .......................................................................................................... 143
5.2.2.4.2. Hot-Side SCR .............................................................................................................. 144 5.2.2.4.2.1. Hot-Side SCR Diagram ....................................................................................... 144
IECM User Documentation: User Manual Table of Contents • viii
5.2.2.4.2.2. Config ................................................................................................................. 144 5.2.2.4.2.3. Performance ........................................................................................................ 146 5.2.2.4.2.4. Performance (continued) ..................................................................................... 148 5.2.2.4.2.5. Capital Cost......................................................................................................... 149 5.2.2.4.2.6. O&M Cost .......................................................................................................... 150 5.2.2.4.2.7. Retrofit or Adjustment Factors ............................................................................ 150
5.2.2.5. Mercury ................................................................................................................................. 151 5.2.2.5.1. Activated Carbon Inj. Diagram .................................................................................... 151 5.2.2.5.2. Removal Efficiency ..................................................................................................... 152 5.2.2.5.3. Carbon Injection .......................................................................................................... 154 5.2.2.5.4. Capital Cost ................................................................................................................. 154 5.2.2.5.5. O&M Cost ................................................................................................................... 155 5.2.2.5.6. Retrofit or Adjustment Factors .................................................................................... 155
5.2.2.6. TSP Control ........................................................................................................................... 156 5.2.2.6.1. Cold-Side ESP ............................................................................................................. 157
5.2.2.6.1.1. Cold-Side ESP Diagram ...................................................................................... 157 5.2.2.6.1.2. Performance ........................................................................................................ 157 5.2.2.6.1.3. Capital Cost......................................................................................................... 158 5.2.2.6.1.4. O&M Cost .......................................................................................................... 159 5.2.2.6.1.5. Retrofit or Adjustment Factors ............................................................................ 159
5.2.2.6.2. Fabric Filter ................................................................................................................. 160 5.2.2.6.2.1. Fabric Filter Diagram .......................................................................................... 160 5.2.2.6.2.2. Config ................................................................................................................. 160 5.2.2.6.2.3. Performance ........................................................................................................ 161 5.2.2.6.2.4. Capital Cost......................................................................................................... 163 5.2.2.6.2.5. O&M Cost .......................................................................................................... 163 5.2.2.6.2.6. Retrofit or Adjustment Factors ............................................................................ 163
5.2.2.7. SO2 Control ............................................................................................................................ 164 5.2.2.7.1. Wet FGD...................................................................................................................... 164
5.2.2.7.1.1. Wet FGD Diagram .............................................................................................. 164 5.2.2.7.1.2. Config ................................................................................................................. 165 5.2.2.7.1.3. Performance ........................................................................................................ 166 5.2.2.7.1.4. Oxidation ............................................................................................................ 168 5.2.2.7.1.5. Additives ............................................................................................................. 168 5.2.2.7.1.6. Capital Cost......................................................................................................... 169 5.2.2.7.1.7. O&M Cost .......................................................................................................... 170 5.2.2.7.1.8. Retrofit or Adjustment Factors ............................................................................ 171
5.2.2.7.2. Spray Dryer ................................................................................................................. 171 5.2.2.7.2.1. Spray Dryer Diagram .......................................................................................... 172 5.2.2.7.2.2. Config ................................................................................................................. 172 5.2.2.7.2.3. Performance ........................................................................................................ 173 5.2.2.7.2.4. Capital Cost......................................................................................................... 175 5.2.2.7.2.5. O&M Cost .......................................................................................................... 175 5.2.2.7.2.6. Retrofit or Adjustment Factors ............................................................................ 176
5.2.2.8. CO2 Capture, Transport & Storage ........................................................................................ 176 5.2.2.8.1. Amine System (CCS System) ...................................................................................... 176
5.2.2.8.1.1. Amine System Diagram ...................................................................................... 177 5.2.2.8.1.2. Config ................................................................................................................. 177 5.2.2.8.1.3. Performance ........................................................................................................ 180 5.2.2.8.1.4. Capture ................................................................................................................ 182 5.2.2.8.1.5. T&S Config ......................................................................................................... 184 5.2.2.8.1.6. Capital Cost......................................................................................................... 184
IECM User Documentation: User Manual Table of Contents • ix
5.2.2.8.1.7. Variable O&M Cost ............................................................................................ 185 5.2.2.8.1.8. Fixed O&M Cost ................................................................................................ 186 5.2.2.8.1.9. Retrofit or Adjustment Factors ............................................................................ 186
5.2.2.8.2. Ammonia System (CCS System)................................................................................. 188 5.2.2.8.2.1. Ammonia System Diagram ................................................................................. 188 5.2.2.8.2.2. Config ................................................................................................................. 189 5.2.2.8.2.3. Performance ........................................................................................................ 190 5.2.2.8.2.4. Capture ................................................................................................................ 192 5.2.2.8.2.5. T&S Config ......................................................................................................... 193 5.2.2.8.2.6. Capital Cost......................................................................................................... 194 5.2.2.8.2.7. O&M Cost .......................................................................................................... 194 5.2.2.8.2.8. Retrofit or Adjustment Factors ............................................................................ 195
5.2.2.8.3. Auxiliary Boiler System .............................................................................................. 196 5.2.2.8.3.1. Auxiliary Boiler Diagram ................................................................................... 196 5.2.2.8.3.2. Performance ........................................................................................................ 197
5.2.2.8.4. Chemical Looping (CCS System) ............................................................................... 197 5.2.2.8.4.1. Chemical Looping Diagram ................................................................................ 198 5.2.2.8.4.2. Air Separation Diagram ...................................................................................... 198 5.2.2.8.4.3. Heat Recovery System Diagram ......................................................................... 199 5.2.2.8.4.4. Chemical Looping Config ................................................................................... 200 5.2.2.8.4.5. Air Separation Config ......................................................................................... 201 5.2.2.8.4.6. Performance ........................................................................................................ 202 5.2.2.8.4.7. Carbonator .......................................................................................................... 203 5.2.2.8.4.8. Calciner ............................................................................................................... 204 5.2.2.8.4.9. T&S Config ......................................................................................................... 205 5.2.2.8.4.10. Capital Cost....................................................................................................... 205 5.2.2.8.4.11. O&M Cost ......................................................................................................... 206 5.2.2.8.4.12. Retrofit or Adjustment Factors .......................................................................... 207
5.2.2.8.5. Membrane System (CCS System) ............................................................................... 208 5.2.2.8.5.1. Config ................................................................................................................. 208 5.2.2.8.5.2. Membrane System Diagram................................................................................ 210 5.2.2.8.5.3. Performance ........................................................................................................ 211 5.2.2.8.5.4. Capture ................................................................................................................ 212 5.2.2.8.5.5. Purification.......................................................................................................... 216 5.2.2.8.5.6. T&S Config ......................................................................................................... 217 5.2.2.8.5.7. Capital Cost......................................................................................................... 218 5.2.2.8.5.8. O&M Cost .......................................................................................................... 218 5.2.2.8.5.9. Retrofit or Adjustment Factors ............................................................................ 219
5.2.2.8.6. Solid Sorbents PSA (CCS System) .............................................................................. 219 5.2.2.8.6.1. Solid Sorbents PSA ............................................................................................. 219 5.2.2.8.6.2. Config ................................................................................................................. 220 5.2.2.8.6.3. Performance ........................................................................................................ 222 5.2.2.8.6.4. Capture ................................................................................................................ 223 5.2.2.8.6.5. T&S Config ......................................................................................................... 224 5.2.2.8.6.6. Capital Cost......................................................................................................... 225 5.2.2.8.6.7. O&M Cost .......................................................................................................... 225 5.2.2.8.6.8. Retrofit or Adjustment Factors ............................................................................ 226
5.2.2.8.7. Solid Sorbents TSA (CCS System) ............................................................................. 226 5.2.2.8.7.1. Solid Sorbents TSA Diagram .............................................................................. 227 5.2.2.8.7.2. Config - Capture ................................................................................................. 227 5.2.2.8.7.3. Config - Bypass .................................................................................................. 229 5.2.2.8.7.4. Performance ........................................................................................................ 230
IECM User Documentation: User Manual Table of Contents • x
5.2.2.8.7.5. Capture - Adsorber .............................................................................................. 232 5.2.2.8.7.6. Capture - Regenerator ......................................................................................... 233 5.2.2.8.7.7. T&S Config ......................................................................................................... 234 5.2.2.8.7.8. Capital Cost......................................................................................................... 235 5.2.2.8.7.9. O&M Cost .......................................................................................................... 235 5.2.2.8.7.10. Retrofit or Adjustment Factors .......................................................................... 236
5.2.2.8.8. Air Separation Unit ...................................................................................................... 237 5.2.2.8.9. FG Recycle & Purification .......................................................................................... 238
5.2.2.8.9.1. Diagram .............................................................................................................. 238 5.2.2.8.9.2. Config ................................................................................................................. 238 5.2.2.8.9.3. FG Recycle ......................................................................................................... 239 5.2.2.8.9.4. Purification.......................................................................................................... 240 5.2.2.8.9.5. T&S Config ......................................................................................................... 242 5.2.2.8.9.6. Capital Cost......................................................................................................... 242 5.2.2.8.9.7. O&M Cost .......................................................................................................... 243 5.2.2.8.9.8. Retrofit or Adjustment Factors ............................................................................ 244
5.2.2.8.10. Pipeline Transport ..................................................................................................... 244 5.2.2.8.10.1. Pipeline Transport Diagram .............................................................................. 244 5.2.2.8.10.2. Config ............................................................................................................... 245 5.2.2.8.10.3. Financing .......................................................................................................... 246 5.2.2.8.10.4. Capital Cost....................................................................................................... 246 5.2.2.8.10.5. O&M Cost......................................................................................................... 247 5.2.2.8.10.6. Retrofit or Adjustment Factors .......................................................................... 247
5.2.2.8.11. Pipeline Transport (ERROR) ..................................................................................... 248 5.2.2.8.12. User-Specified Transport ........................................................................................... 248 5.2.2.8.13. CO2 Storage ............................................................................................................... 249
5.2.2.8.13.1. CO2 Storage Diagram ....................................................................................... 249 5.2.2.8.13.2. Financing .......................................................................................................... 249 5.2.2.8.13.3. Reservoir ........................................................................................................... 250 5.2.2.8.13.4. Performance ...................................................................................................... 251 5.2.2.8.13.5. Pre-injection Cost ............................................................................................. 252 5.2.2.8.13.6. Operations Cost ................................................................................................. 252 5.2.2.8.13.7. Post-injection Cost ............................................................................................ 253
5.2.2.9. Water Systems ........................................................................................................................ 253 5.2.2.9.1. Hybrid Cooling System ............................................................................................... 253
5.2.2.9.1.1. Diagram .............................................................................................................. 254 5.2.2.9.1.2. Seasons ............................................................................................................... 254
5.2.2.9.2. Air Cooled Condenser or Dry Unit .............................................................................. 255 5.2.2.9.2.1. Air Cooled Condenser ......................................................................................... 255 5.2.2.9.2.2. Config ................................................................................................................. 255 5.2.2.9.2.3. Performance ........................................................................................................ 256 5.2.2.9.2.4. Capital Cost......................................................................................................... 257 5.2.2.9.2.5. O&M Cost .......................................................................................................... 258 5.2.2.9.2.6. Retrofit or Adjustment Factors ............................................................................ 258
5.2.2.9.3. Wet Cooling Tower or Wet Unit .................................................................................. 259 5.2.2.9.3.1. Cooling Tower Diagram ...................................................................................... 259 5.2.2.9.3.2. Slip Stream Diagram ........................................................................................... 260 5.2.2.9.3.3. Config ................................................................................................................. 260 5.2.2.9.3.4. Performance ........................................................................................................ 261 5.2.2.9.3.5. Capital Cost......................................................................................................... 262 5.2.2.9.3.6. O&M Cost .......................................................................................................... 263 5.2.2.9.3.7. Retrofit or Adjustment Factors ............................................................................ 263
IECM User Documentation: User Manual Table of Contents • xi
5.2.2.10. By-Prod. Mgmt .................................................................................................................... 264 5.2.2.10.1. Bottom Ash Pond Diagram ....................................................................................... 264 5.2.2.10.2. Fly Ash Disposal Diagram ........................................................................................ 265 5.2.2.10.3. Flue Gas Treatment Diagram .................................................................................... 265 5.2.2.10.4. Bottom Ash Performance .......................................................................................... 266 5.2.2.10.5. Wastewater Treatment Diagram ................................................................................ 266 5.2.2.10.6. Wastewater Treatment Perf. ...................................................................................... 267 5.2.2.10.7. Chemical Treatment Perf. .......................................................................................... 268 5.2.2.10.8. Vapor Comp/Evap Perf.............................................................................................. 268 5.2.2.10.9. Capital Cost ............................................................................................................... 269 5.2.2.10.10. O&M Cost............................................................................................................... 269 5.2.2.10.11. Retrofit or Adjustment Factors ................................................................................ 270
5.2.2.11. Water Life Cycle Assessment .............................................................................................. 270 5.2.2.11.1. Coal ........................................................................................................................... 271 5.2.2.11.2. Natural Gas ................................................................................................................ 271 5.2.2.11.3. Plant Infrastructure .................................................................................................... 273 5.2.2.11.4. Plant Operation .......................................................................................................... 273 5.2.2.11.5. Chemical Production ................................................................................................. 274
5.2.3. GET RESULTS ................................................................................................................................ 274 5.2.3.1. Overall Plant .......................................................................................................................... 274
5.2.3.1.1. Diagram ....................................................................................................................... 275 5.2.3.1.2. Plant Performance ....................................................................................................... 275 5.2.3.1.3. Mass In/Out ................................................................................................................. 276 5.2.3.1.4. Solids In/Out ............................................................................................................... 276 5.2.3.1.5. Gas In/Out ................................................................................................................... 277 5.2.3.1.6. Total Capital Cost ........................................................................................................ 278 5.2.3.1.7. Overall Plant Cost ....................................................................................................... 279 5.2.3.1.8. Cost Summary ............................................................................................................. 280
5.2.3.2. Fuel ........................................................................................................................................ 280 5.2.3.2.1. Coal (PC) or Diagram (IGCC) .................................................................................... 281 5.2.3.2.2. Auxiliary Gas (PC) or Diagram (NGCC) .................................................................... 282
5.2.3.3. Base Plant .............................................................................................................................. 282 5.2.3.3.1. Boiler ........................................................................................................................... 283
5.2.3.3.1.1. Diagram .............................................................................................................. 283 5.2.3.3.1.2. Flue Gas .............................................................................................................. 284 5.2.3.3.1.3. Capital Cost......................................................................................................... 284 5.2.3.3.1.4. O&M Cost .......................................................................................................... 285 5.2.3.3.1.5. Total Cost ............................................................................................................ 286
5.2.3.3.2. Air Preheater ................................................................................................................ 286 5.2.3.3.2.1. Diagram .............................................................................................................. 286 5.2.3.3.2.2. Flue Gas .............................................................................................................. 289 5.2.3.3.2.3. Oxidant ............................................................................................................... 290
5.2.3.3.3. Steam Cycle................................................................................................................. 291 5.2.3.3.3.1. Diagram .............................................................................................................. 291
5.2.3.4. NOx Control ........................................................................................................................... 291 5.2.3.4.1. In-Furnace Controls ..................................................................................................... 291
5.2.3.4.1.1. Diagram .............................................................................................................. 292 5.2.3.4.1.2. Flue Gas .............................................................................................................. 294 5.2.3.4.1.3. Capital Cost......................................................................................................... 295 5.2.3.4.1.4. O&M Cost .......................................................................................................... 296 5.2.3.4.1.5. Total Cost ............................................................................................................ 297
5.2.3.4.2. Hot-Side SCR .............................................................................................................. 297
IECM User Documentation: User Manual Table of Contents • xii
5.2.3.4.2.1. Diagram .............................................................................................................. 298 5.2.3.4.2.2. Flue Gas .............................................................................................................. 300 5.2.3.4.2.3. Capital Cost......................................................................................................... 300 5.2.3.4.2.4. O&M Cost .......................................................................................................... 301 5.2.3.4.2.5. Total Cost ............................................................................................................ 303
5.2.3.5. Mercury ................................................................................................................................. 303 5.2.3.5.1. Diagram ....................................................................................................................... 304 5.2.3.5.2. Flue Gas ...................................................................................................................... 305 5.2.3.5.3. Capital Cost ................................................................................................................. 306 5.2.3.5.4. O&M Cost ................................................................................................................... 307 5.2.3.5.5. Total Cost .................................................................................................................... 308
5.2.3.6. TSP Control ........................................................................................................................... 309 5.2.3.6.1. Cold-Side ESP ............................................................................................................. 309
5.2.3.6.1.1. Diagram .............................................................................................................. 309 5.2.3.6.1.2. Flue Gas .............................................................................................................. 311 5.2.3.6.1.3. Capital Cost......................................................................................................... 312 5.2.3.6.1.4. O&M Cost .......................................................................................................... 313 5.2.3.6.1.5. Total Cost ............................................................................................................ 313
5.2.3.6.2. Fabric Filter ................................................................................................................. 314 5.2.3.6.2.1. Diagram .............................................................................................................. 314 5.2.3.6.2.2. Flue Gas .............................................................................................................. 315 5.2.3.6.2.3. Capital Cost......................................................................................................... 316 5.2.3.6.2.4. O&M Cost .......................................................................................................... 317 5.2.3.6.2.5. Total Cost ............................................................................................................ 317
5.2.3.7. SO2 Control ............................................................................................................................ 318 5.2.3.7.1. Wet FGD...................................................................................................................... 318
5.2.3.7.1.1. Diagram .............................................................................................................. 318 5.2.3.7.1.2. Flue Gas .............................................................................................................. 320 5.2.3.7.1.3. Bypass ................................................................................................................. 321 5.2.3.7.1.4. Capital Cost......................................................................................................... 321 5.2.3.7.1.5. O&M Cost .......................................................................................................... 322 5.2.3.7.1.6. Total Cost ............................................................................................................ 323
5.2.3.7.2. Spray Dryer ................................................................................................................. 323 5.2.3.7.2.1. Diagram .............................................................................................................. 324 5.2.3.7.2.2. Flue Gas .............................................................................................................. 326 5.2.3.7.2.3. Capital Cost......................................................................................................... 326 5.2.3.7.2.4. O&M Cost .......................................................................................................... 327 5.2.3.7.2.5. Total Cost ............................................................................................................ 328
5.2.3.8. CO2 Capture, Transport & Storage ........................................................................................ 328 5.2.3.8.1. Amine System (CCS System) ...................................................................................... 328
5.2.3.8.1.1. Diagram .............................................................................................................. 329 5.2.3.8.1.2. Flue Gas .............................................................................................................. 330 5.2.3.8.1.3. Bypass ................................................................................................................. 331 5.2.3.8.1.4. Capital Cost......................................................................................................... 332 5.2.3.8.1.5. O&M Cost .......................................................................................................... 334 5.2.3.8.1.6. Total Cost ............................................................................................................ 335 5.2.3.8.1.7. Summary ............................................................................................................. 336
5.2.3.8.2. Ammonia System (CCS System)................................................................................. 337 5.2.3.8.2.1. Diagram .............................................................................................................. 337 5.2.3.8.2.2. Flue Gas .............................................................................................................. 339 5.2.3.8.2.3. Bypass ................................................................................................................. 340 5.2.3.8.2.4. Capital Cost......................................................................................................... 341
IECM User Documentation: User Manual Table of Contents • xiii
5.2.3.8.2.5. O&M Cost .......................................................................................................... 342 5.2.3.8.2.6. Total Cost ............................................................................................................ 343 5.2.3.8.2.7. Summary ............................................................................................................. 344
5.2.3.8.3. Chemical Looping (CCS System) ............................................................................... 345 5.2.3.8.3.1. Chemical Looping Diagram ................................................................................ 345 5.2.3.8.3.2. Air Separation Diagram ...................................................................................... 346 5.2.3.8.3.3. Heat Recovery System Diagram ......................................................................... 347 5.2.3.8.3.4. Flue Gas .............................................................................................................. 348 5.2.3.8.3.5. Bypass ................................................................................................................. 349 5.2.3.8.3.6. Capital Cost......................................................................................................... 350 5.2.3.8.3.7. O&M Cost .......................................................................................................... 351 5.2.3.8.3.8. Total Cost ............................................................................................................ 352 5.2.3.8.3.9. Summary ............................................................................................................. 352
5.2.3.8.4. Membrane System (CCS System) ............................................................................... 353 5.2.3.8.4.1. Diagram .............................................................................................................. 354 5.2.3.8.4.2. Flue Gas .............................................................................................................. 356 5.2.3.8.4.3. Bypass ................................................................................................................. 357 5.2.3.8.4.4. Purif. Gas ............................................................................................................ 358 5.2.3.8.4.5. Capital Cost......................................................................................................... 359 5.2.3.8.4.6. O&M Cost .......................................................................................................... 360 5.2.3.8.4.7. Total Cost ............................................................................................................ 361 5.2.3.8.4.8. Summary ............................................................................................................. 361
5.2.3.8.5. Solid Sorbents PSA (CCS System) .............................................................................. 362 5.2.3.8.5.1. Diagram .............................................................................................................. 363 5.2.3.8.5.2. Flue Gas .............................................................................................................. 364 5.2.3.8.5.3. Bypass ................................................................................................................. 365 5.2.3.8.5.4. Capital Cost......................................................................................................... 366 5.2.3.8.5.5. O&M Cost .......................................................................................................... 367 5.2.3.8.5.6. Total Cost ............................................................................................................ 368 5.2.3.8.5.7. Summary ............................................................................................................. 368
5.2.3.8.6. Solid Sorbents TSA (CCS System) ............................................................................. 369 5.2.3.8.6.1. Diagram .............................................................................................................. 370 5.2.3.8.6.2. Flue Gas .............................................................................................................. 371 5.2.3.8.6.3. Bypass ................................................................................................................. 372 5.2.3.8.6.4. Capital Cost......................................................................................................... 373 5.2.3.8.6.5. O&M Cost .......................................................................................................... 375 5.2.3.8.6.6. Total Cost ............................................................................................................ 376 5.2.3.8.6.7. Summary ............................................................................................................. 376
5.2.3.8.7. Auxiliary Boiler ........................................................................................................... 377 5.2.3.8.7.1. Diagram .............................................................................................................. 378 5.2.3.8.7.2. Auxiliary Gas ...................................................................................................... 379 5.2.3.8.7.3. Flue Gas .............................................................................................................. 380 5.2.3.8.7.4. Costs ................................................................................................................... 380
5.2.3.8.8. Air Separation Unit ...................................................................................................... 380 5.2.3.8.9. FG Recycle & Purification .......................................................................................... 380
5.2.3.8.9.1. Diagram .............................................................................................................. 381 5.2.3.8.9.2. DCC Gas ............................................................................................................. 382 5.2.3.8.9.3. Purif. Gas ............................................................................................................ 383 5.2.3.8.9.4. Capital Cost......................................................................................................... 383 5.2.3.8.9.5. O&M Cost .......................................................................................................... 384 5.2.3.8.9.6. Total Cost ............................................................................................................ 385 5.2.3.8.9.7. Summary ............................................................................................................. 386
IECM User Documentation: User Manual Table of Contents • xiv
5.2.3.8.10. Pipeline Transport ..................................................................................................... 387 5.2.3.8.10.1. Diagram ............................................................................................................ 387 5.2.3.8.10.2. Flue Gas ............................................................................................................ 388 5.2.3.8.10.3. Gas .................................................................................................................... 389 5.2.3.8.10.4. Capital Cost....................................................................................................... 390 5.2.3.8.10.5. O&M Cost......................................................................................................... 391 5.2.3.8.10.6. Total Cost .......................................................................................................... 392
5.2.3.8.11. CO2 Storage ............................................................................................................... 393 5.2.3.8.11.1. Diagram............................................................................................................. 393 5.2.3.8.11.2. Pre-Injection Cost ............................................................................................. 394 5.2.3.8.11.3. Operations Cost ................................................................................................. 395 5.2.3.8.11.4. Post-injection Cost ............................................................................................ 396 5.2.3.8.11.5. Total Cost .......................................................................................................... 397
5.2.3.9. Water Systems ........................................................................................................................ 397 5.2.3.9.1. Water ........................................................................................................................... 397
5.2.3.9.1.1. Makeup Water (PC) ............................................................................................ 397 5.2.3.9.1.2. Makeup Water (IGCC) ........................................................................................ 398 5.2.3.9.1.3. Water Consumption............................................................................................. 399 5.2.3.9.1.4. Cooling Water ..................................................................................................... 399
5.2.3.9.2. Hybrid Cooling System ............................................................................................... 400 5.2.3.9.2.1. Diagram .............................................................................................................. 400 5.2.3.9.2.2. Total Cost ............................................................................................................ 401
5.2.3.9.3. Air Cooled Condenser or Dry Unit .............................................................................. 401 5.2.3.9.3.1. Diagram .............................................................................................................. 401 5.2.3.9.3.2. Capital Cost......................................................................................................... 402 5.2.3.9.3.3. O&M Cost .......................................................................................................... 403 5.2.3.9.3.4. Total Cost ............................................................................................................ 404
5.2.3.9.4. Wet Cooling Tower or Wet Unit .................................................................................. 404 5.2.3.9.4.1. Cooling Tower Diagram ...................................................................................... 404 5.2.3.9.4.2. Slip Stream Diagram ........................................................................................... 406 5.2.3.9.4.3. Capital Cost......................................................................................................... 407 5.2.3.9.4.4. O&M Cost .......................................................................................................... 408 5.2.3.9.4.5. Total Cost ............................................................................................................ 408
5.2.3.10. By-Prod. Mgmt .................................................................................................................... 409 5.2.3.10.1. Bottom Ash Pond ...................................................................................................... 409 5.2.3.10.2. Fly Ash Disposal ....................................................................................................... 410 5.2.3.10.3. Flue Gas Treatment ................................................................................................... 411 5.2.3.10.4. Wastewater Treatment (chemical) ............................................................................. 412 5.2.3.10.5. Wastewater Treatment (mechanical) ......................................................................... 413 5.2.3.10.6. Capital Cost ............................................................................................................... 414 5.2.3.10.7. O&M Cost ................................................................................................................. 415 5.2.3.10.8. Total Cost .................................................................................................................. 416
5.2.3.11. Stack .................................................................................................................................... 416 5.2.3.11.1. Diagram ..................................................................................................................... 416 5.2.3.11.2. Flue Gas .................................................................................................................... 418 5.2.3.11.3. Emission Taxes .......................................................................................................... 419
5.2.3.12. Water Life Cycle Assessment .............................................................................................. 419 5.2.3.12.1. Water Withdrawals .................................................................................................... 420 5.2.3.12.2. Water Consumption ................................................................................................... 421
5.3. Natural Gas Comb. Cycle (NGCC) Plant ................................................................................................... 422 5.3.1. CONFIGURE SESSION .................................................................................................................. 422
5.3.1.1. Plant Design ........................................................................................................................... 422
IECM User Documentation: User Manual Table of Contents • xv
5.3.1.2. Plant Location ........................................................................................................................ 423 5.3.1.3. Unit Systems .......................................................................................................................... 423
5.3.2. SET PARAMETERS ........................................................................................................................ 424 5.3.2.1. Overall Plant .......................................................................................................................... 424
5.3.2.1.1. Diagram ....................................................................................................................... 424 5.3.2.1.2. Performance ................................................................................................................ 424 5.3.2.1.3. Region-Specific Cost Factors ...................................................................................... 425 5.3.2.1.4. Regulations & Taxes .................................................................................................... 425 5.3.2.1.5. Financing & Cost Year ................................................................................................ 426 5.3.2.1.6. Fuel & Land Cost ........................................................................................................ 426 5.3.2.1.7. Capital Cost ................................................................................................................. 426 5.3.2.1.8. O&M Cost ................................................................................................................... 426 5.3.2.1.9. Reference Plant ........................................................................................................... 427
5.3.2.2. Fuel ........................................................................................................................................ 428 5.3.2.2.1. Properties ..................................................................................................................... 428 5.3.2.2.2. Cost ............................................................................................................................. 428
5.3.2.3. Power Block........................................................................................................................... 428 5.3.2.3.1. Gas Turbine Diagram .................................................................................................. 429 5.3.2.3.2. Steam Turbine Diagram ............................................................................................... 430 5.3.2.3.3. Gas Turbine Performance ............................................................................................ 430 5.3.2.3.4. Steam Cycle Performance ........................................................................................... 432 5.3.2.3.5. Emission Factors ......................................................................................................... 433 5.3.2.3.6. Capital Cost ................................................................................................................. 433 5.3.2.3.7. O&M Cost ................................................................................................................... 433 5.3.2.3.8. Retrofit or Adjustment Factors .................................................................................... 434
5.3.2.4. CO2 Capture, Transport & Storage ........................................................................................ 434 5.3.2.4.1. Amine System (CCS System) ...................................................................................... 434 5.3.2.4.2. Ammonia System (CCS System)................................................................................. 434 5.3.2.4.3. Pipeline Transport ....................................................................................................... 434 5.3.2.4.4. User-Specified Transport ............................................................................................. 434 5.3.2.4.5. CO2 Storage ................................................................................................................. 435
5.3.2.5. Water Systems ........................................................................................................................ 435 5.3.2.6. Water Life Cycle Assessment................................................................................................. 435
5.3.3. GET RESULTS ................................................................................................................................ 435 5.3.3.1. Overall Plant .......................................................................................................................... 435
5.3.3.1.1. Diagram ....................................................................................................................... 435 5.3.3.1.2. Plant Performance ....................................................................................................... 435 5.3.3.1.3. Mass In/Out ................................................................................................................. 436 5.3.3.1.4. Gas Emissions ............................................................................................................. 437 5.3.3.1.5. Total Capital Cost ........................................................................................................ 437 5.3.3.1.6. Overall Plant Cost ....................................................................................................... 438 5.3.3.1.7. Cost Summary ............................................................................................................. 439
5.3.3.2. Fuel ........................................................................................................................................ 439 5.3.3.3. Power Block........................................................................................................................... 439
5.3.3.3.1. Gas Turbine Diagram .................................................................................................. 440 5.3.3.3.2. Steam Turbine Diagram ............................................................................................... 441 5.3.3.3.3. Syngas ......................................................................................................................... 442 5.3.3.3.4. Flue Gas ...................................................................................................................... 443 5.3.3.3.5. Capital Cost ................................................................................................................. 443 5.3.3.3.6. O&M Cost ................................................................................................................... 444 5.3.3.3.7. Total Cost .................................................................................................................... 445
5.3.3.4. CO2 Capture, Transport & Storage ........................................................................................ 445
IECM User Documentation: User Manual Table of Contents • xvi
5.3.3.4.1. Amine System (CCS System) ...................................................................................... 445 5.3.3.4.2. Ammonia System (CCS System)................................................................................. 445 5.3.3.4.3. Auxiliary Boiler ........................................................................................................... 445 5.3.3.4.4. CO2 Transport System ................................................................................................. 445
5.3.3.5. Water Systems ........................................................................................................................ 445 5.3.3.6. Stack ...................................................................................................................................... 445 5.3.3.7. Water Life Cycle Assessment................................................................................................. 445
5.4. Int. Gasif. Comb. Cycle (IGCC) Plant ........................................................................................................ 446 5.4.1. CONFIGURE SESSION .................................................................................................................. 446
5.4.1.1. Plant Design ........................................................................................................................... 446 5.4.1.2. Plant Location ........................................................................................................................ 448 5.4.1.3. Unit Systems .......................................................................................................................... 448
5.4.2. SET PARAMETERS ........................................................................................................................ 448 5.4.2.1. Overall Plant .......................................................................................................................... 448
5.4.2.1.1. Diagram ....................................................................................................................... 449 5.4.2.1.2. Performance ................................................................................................................ 449 5.4.2.1.3. Region-Specific Cost Factors ...................................................................................... 450 5.4.2.1.4. Regulations & Taxes .................................................................................................... 450 5.4.2.1.5. Financing & Cost Year ................................................................................................ 451 5.4.2.1.6. Fuel & Land Cost ........................................................................................................ 451 5.4.2.1.7. Capital Cost ................................................................................................................. 451 5.4.2.1.8. O&M Cost ................................................................................................................... 451 5.4.2.1.9. Reference Plant ........................................................................................................... 453
5.4.2.2. Fuel ........................................................................................................................................ 453 5.4.2.2.1. Coal Properties ............................................................................................................ 453 5.4.2.2.2. Ash Properties ............................................................................................................. 454 5.4.2.2.3. Cost ............................................................................................................................. 455
5.4.2.3. Air Separation Unit ................................................................................................................ 455 5.4.2.3.1. Air Separation Diagram ............................................................................................... 455 5.4.2.3.2. Performance ................................................................................................................ 456 5.4.2.3.3. Capital Cost ................................................................................................................. 457 5.4.2.3.4. O&M Cost ................................................................................................................... 457 5.4.2.3.5. Retrofit or Adjustment Factors .................................................................................... 457
5.4.2.4. Gasifier Area .......................................................................................................................... 457 5.4.2.4.1. GE ............................................................................................................................... 457
5.4.2.4.1.1. GE Gasifier Diagram .......................................................................................... 457 5.4.2.4.1.2. Performance ........................................................................................................ 458 5.4.2.4.1.3. Syngas Out .......................................................................................................... 460 5.4.2.4.1.4. Capital Cost......................................................................................................... 460 5.4.2.4.1.5. O&M Cost .......................................................................................................... 461 5.4.2.4.1.6. Retrofit or Adjustment Factors ............................................................................ 461
5.4.2.4.2. Shell............................................................................................................................. 462 5.4.2.4.2.1. Shell Gasifier Diagram ....................................................................................... 462 5.4.2.4.2.2. Performance ........................................................................................................ 463 5.4.2.4.2.3. Syngas Out .......................................................................................................... 464 5.4.2.4.2.4. Capital Cost......................................................................................................... 465 5.4.2.4.2.5. O&M Cost .......................................................................................................... 465 5.4.2.4.2.6. Retrofit or Adjustment Factors ............................................................................ 465
5.4.2.5. Sulfur Removal ...................................................................................................................... 466 5.4.2.5.1. Selexol Sulfur Removal ............................................................................................... 466
5.4.2.5.1.1. Sulfur Capture System Diagram ......................................................................... 467 5.4.2.5.1.2. Performance ........................................................................................................ 468
IECM User Documentation: User Manual Table of Contents • xvii
5.4.2.5.1.3. Capital Cost......................................................................................................... 469 5.4.2.5.1.4. O&M Cost .......................................................................................................... 470 5.4.2.5.1.5. Retrofit or Adjustment Factors ............................................................................ 471
5.4.2.5.2. Sulfinol Sulfur Removal .............................................................................................. 472 5.4.2.5.2.1. Sulfur Capture System Diagram ......................................................................... 472 5.4.2.5.2.2. Performance ........................................................................................................ 473 5.4.2.5.2.3. Capital Cost......................................................................................................... 474 5.4.2.5.2.4. O&M Cost .......................................................................................................... 475 5.4.2.5.2.5. Retrofit or Adjustment Factors ............................................................................ 476
5.4.2.6. CO2 Capture, Transport & Storage ........................................................................................ 476 5.4.2.6.1. Chemical Looping ....................................................................................................... 476
5.4.2.6.1.1. Chemical Looping Diagram ................................................................................ 477 5.4.2.6.1.2. Purification Unit Diagram ................................................................................... 477 5.4.2.6.1.3. Config ................................................................................................................. 478 5.4.2.6.1.4. Performance ........................................................................................................ 479 5.4.2.6.1.5. T&S Config ......................................................................................................... 480 5.4.2.6.1.6. Capital Cost......................................................................................................... 481 5.4.2.6.1.7. O&M Cost .......................................................................................................... 481 5.4.2.6.1.8. Retrofit or Adjustment Factors ............................................................................ 482
5.4.2.6.2. Water Gas Shift Reactor .............................................................................................. 482 5.4.2.6.2.1. Water Gas Shift Reactor Diagram ....................................................................... 482 5.4.2.6.2.2. Performance ........................................................................................................ 483 5.4.2.6.2.3. Capital Cost......................................................................................................... 483 5.4.2.6.2.4. O&M Cost .......................................................................................................... 484 5.4.2.6.2.5. Retrofit or Adjustment Factors ............................................................................ 484
5.4.2.6.3. Ionic Liquid CO2 Capture ............................................................................................ 485 5.4.2.6.3.1. Ionic Liquid Diagram .......................................................................................... 485 5.4.2.6.3.2. Config ................................................................................................................. 486 5.4.2.6.3.3. Performance ........................................................................................................ 486 5.4.2.6.3.4. Capture ................................................................................................................ 487 5.4.2.6.3.5. T&S Config ......................................................................................................... 488 5.4.2.6.3.6. Capital Cost......................................................................................................... 489 5.4.2.6.3.7. O&M Cost .......................................................................................................... 489 5.4.2.6.3.8. Retrofit or Adjustment Factors ............................................................................ 490
5.4.2.6.4. Selexol CO2 Capture ................................................................................................... 491 5.4.2.6.4.1. Selexol CO2 Capture Diagram ............................................................................ 492 5.4.2.6.4.2. Performance ........................................................................................................ 492 5.4.2.6.4.3. T&S Config ......................................................................................................... 493 5.4.2.6.4.4. Capital Cost......................................................................................................... 494 5.4.2.6.4.5. O&M Cost .......................................................................................................... 494 5.4.2.6.4.6. Retrofit or Adjustment Factors ............................................................................ 495
5.4.2.6.5. Pipeline Transport ....................................................................................................... 496 5.4.2.6.6. User-Specified Transport ............................................................................................. 496
5.4.2.7. Power Block........................................................................................................................... 496 5.4.2.8. Water Systems ........................................................................................................................ 496
5.4.3. GET RESULTS ................................................................................................................................ 496 5.4.3.1. Overall Plant .......................................................................................................................... 496
5.4.3.1.1. Diagram ....................................................................................................................... 496 5.4.3.1.2. Plant Performance ....................................................................................................... 497 5.4.3.1.3. Mass In/Out ................................................................................................................. 498 5.4.3.1.4. Gas Emissions ............................................................................................................. 498 5.4.3.1.5. Total Capital Cost ........................................................................................................ 499
IECM User Documentation: User Manual Table of Contents • xviii
5.4.3.1.6. Overall Plant Cost ....................................................................................................... 499 5.4.3.1.7. Cost Summary ............................................................................................................. 500
5.4.3.2. Fuel ........................................................................................................................................ 501 5.4.3.3. Air Separation Unit ................................................................................................................ 501
5.4.3.3.1. Diagram ....................................................................................................................... 501 5.4.3.3.2. Gas Flow ..................................................................................................................... 502 5.4.3.3.3. Capital Cost ................................................................................................................. 503 5.4.3.3.4. O&M Cost ................................................................................................................... 504 5.4.3.3.5. Total Cost .................................................................................................................... 504
5.4.3.4. Gasifier Area .......................................................................................................................... 504 5.4.3.4.1. GE ............................................................................................................................... 505
5.4.3.4.1.1. Diagram .............................................................................................................. 505 5.4.3.4.1.2. Oxidant ............................................................................................................... 506 5.4.3.4.1.3. Syngas ................................................................................................................. 507 5.4.3.4.1.4. Capital Cost......................................................................................................... 508 5.4.3.4.1.5. O&M Cost .......................................................................................................... 509 5.4.3.4.1.6. Total Cost ............................................................................................................ 509
5.4.3.4.2. Shell............................................................................................................................. 510 5.4.3.4.2.1. Diagram .............................................................................................................. 510 5.4.3.4.2.2. Oxidant ............................................................................................................... 511 5.4.3.4.2.3. Syngas ................................................................................................................. 512 5.4.3.4.2.4. Capital Cost......................................................................................................... 513 5.4.3.4.2.5. O&M Cost .......................................................................................................... 514 5.4.3.4.2.6. Total Cost ............................................................................................................ 514
5.4.3.5. Sulfur Removal ...................................................................................................................... 515 5.4.3.5.1. Sulfur Capture System (Selexol) ................................................................................. 515
5.4.3.5.1.1. Diagram .............................................................................................................. 515 5.4.3.5.1.2. Capital Cost......................................................................................................... 516 5.4.3.5.1.3. O&M Cost .......................................................................................................... 517 5.4.3.5.1.4. Total Cost ............................................................................................................ 518
5.4.3.5.2. Sulfur Capture System (Sulfinol) ................................................................................ 518 5.4.3.5.2.1. Diagram .............................................................................................................. 518 5.4.3.5.2.2. Capital Cost......................................................................................................... 519 5.4.3.5.2.3. O&M Cost .......................................................................................................... 520 5.4.3.5.2.4. Total Cost ............................................................................................................ 521
5.4.3.5.3. Hydrolyzer ................................................................................................................... 521 5.4.3.5.3.1. Syngas ................................................................................................................. 521
5.4.3.5.4. Selexol Sulfur System ................................................................................................. 522 5.4.3.5.4.1. Syngas ................................................................................................................. 522
5.4.3.5.5. Sulfinol Sulfur Capture ............................................................................................... 523 5.4.3.5.5.1. Syngas ................................................................................................................. 523
5.4.3.5.6. Claus Plant................................................................................................................... 524 5.4.3.5.6.1. Air ....................................................................................................................... 524 5.4.3.5.6.2. Treated Gas ......................................................................................................... 525
5.4.3.5.7. Beavon-Stretford Plant ................................................................................................ 526 5.4.3.5.7.1. Treated Gas ......................................................................................................... 526 5.4.3.5.7.2. Flue Gas .............................................................................................................. 527
5.4.3.6. CO2 Capture, Transport & Storage ........................................................................................ 527 5.4.3.6.1. Chemical Looping ....................................................................................................... 527
5.4.3.6.1.1. Diagram .............................................................................................................. 528 5.4.3.6.1.2. Air ....................................................................................................................... 529 5.4.3.6.1.3. Syngas ................................................................................................................. 530
IECM User Documentation: User Manual Table of Contents • xix
5.4.3.6.1.4. Capital Cost......................................................................................................... 530 5.4.3.6.1.5. O&M Cost .......................................................................................................... 531 5.4.3.6.1.6. Total Cost ............................................................................................................ 532 5.4.3.6.1.7. Summary ............................................................................................................. 532
5.4.3.6.2. Purification Unit .......................................................................................................... 533 5.4.3.6.2.1. Diagram .............................................................................................................. 533
5.4.3.6.3. Water Gas Shift Reactor .............................................................................................. 534 5.4.3.6.3.1. Diagram .............................................................................................................. 534 5.4.3.6.3.2. Syngas ................................................................................................................. 535 5.4.3.6.3.3. Capital Cost......................................................................................................... 535 5.4.3.6.3.4. O&M Cost .......................................................................................................... 536 5.4.3.6.3.5. Total Cost ............................................................................................................ 537
5.4.3.6.4. Ionic Liquid CO2 Capture ............................................................................................ 537 5.4.3.6.4.1. Diagram .............................................................................................................. 537 5.4.3.6.4.2. Syngas ................................................................................................................. 538 5.4.3.6.4.3. Capital Cost......................................................................................................... 539 5.4.3.6.4.4. O&M Cost .......................................................................................................... 540 5.4.3.6.4.5. Total Cost ............................................................................................................ 541 5.4.3.6.4.6. Summary ............................................................................................................. 541
5.4.3.6.5. Selexol CO2 Capture ................................................................................................... 542 5.4.3.6.5.1. Diagram .............................................................................................................. 542 5.4.3.6.5.2. Syngas ................................................................................................................. 543 5.4.3.6.5.3. Capital Cost......................................................................................................... 544 5.4.3.6.5.4. O&M Cost .......................................................................................................... 545 5.4.3.6.5.5. Total Cost ............................................................................................................ 546 5.4.3.6.5.6. Summary ............................................................................................................. 546
5.4.3.6.6. CO2 Transport System ................................................................................................. 547 5.4.3.7. Power Block........................................................................................................................... 547 5.4.3.8. Water Systems ........................................................................................................................ 547 5.4.3.9. Stack ...................................................................................................................................... 547
6. A Case Study 548
6.1. Introduction ................................................................................................................................................ 548 6.2. Start the IECM ............................................................................................................................................ 548 6.3. Create a New Session ................................................................................................................................. 549 6.4. Configure Session ....................................................................................................................................... 551 6.5. Set Parameters ............................................................................................................................................ 552
6.5.1. Overall Plant ..................................................................................................................................... 553 6.5.1.1. Performance ........................................................................................................................... 554
6.5.2. Fuel................................................................................................................................................... 555 6.5.2.1. Choose a Coal ........................................................................................................................ 555
6.5.3. Base Plant ......................................................................................................................................... 558 6.5.3.1. Base Plant Performance ......................................................................................................... 559
6.5.4. Other Input Areas and Technologies ................................................................................................ 564 6.6. Get Results .................................................................................................................................................. 565
6.6.1. Overall Plant ..................................................................................................................................... 566 6.6.1.1. Performance Summary .......................................................................................................... 567 6.6.1.2. Gas In/Out .............................................................................................................................. 568 6.6.1.3. Cost Summary ....................................................................................................................... 570
6.6.2. Base Plant ......................................................................................................................................... 570 6.6.2.1. Diagram ................................................................................................................................. 571 6.6.2.2. Capital Cost ........................................................................................................................... 572
IECM User Documentation: User Manual Table of Contents • xx
6.6.2.3. O&M Cost ............................................................................................................................. 573 6.7. Graphs ......................................................................................................................................................... 573
7. Introduction to Uncertainty Analysis 575
7.1. Uncertainty Analysis ................................................................................................................................... 575 7.2. Introduction ................................................................................................................................................ 575 7.3. Philosophy of Uncertainty Analysis ........................................................................................................... 575 7.4. Types of Uncertain Quantities .................................................................................................................... 576 7.5. Encoding Uncertainties as Probability Distributions .................................................................................. 576
7.5.1. Statistical Techniques ....................................................................................................................... 576 7.5.2. Judgments about Uncertainties ......................................................................................................... 577
7.5.2.1. Availability ............................................................................................................................. 577 7.5.2.2. Representativeness ................................................................................................................. 577 7.5.2.3. Anchoring and Adjustment .................................................................................................... 577 7.5.2.4. Motivational Bias ................................................................................................................... 577
7.6. Designing an Elicitation Protocol ............................................................................................................... 577 7.7. A Non-technical Example ........................................................................................................................... 578 7.8. A Technical Example .................................................................................................................................. 578

IECM User Documentation: User Manual Acknowledgments • xxi
Acknowledgments
This Integrated Environmental Control Model (IECM) was developed for the U.S. Department of
Energy’s National Energy Technology Laboratory (DOE/NETL). Any opinions, findings,
conclusions or recommendations expressed in this material are those of the authors alone and do not
reflect the views of any agency.
IECM User Documentation: User Manual Introduction • 1
1. Introduction
1.1. The Integrated Environmental Control Model This Integrated Environmental Control Model (IECM) was developed for the U.S. Department of
Energy’s National Energy Technology Laboratory (DOE/NETL).
1.2. Purpose The purpose of the model is to calculate the performance, emissions and cost of employing alternative
environmental control methods in a coal-fired or gas-fired power plant, including pulverized coal (PC)
plants, integrated gasification combined cycle (IGCC) plants, and natural gas combined cycle (NGCC)
plants. In each case, the model consists of a base plant and various control technology modules. These
modules may be implemented together in a variety of combinations.
1.3. System Requirements The IECM software runs in the following environments:
• Windows XP (32 bit only)
• Windows Vista, 7, 8, and 10
• MacOS X and Linux under Wine
The IECM requires approximately 65 Megabytes of disk space.
1.3.1. MacOS X and Linux
We do not currently provide Mac- or Linux-native versions of the IECM; however, the Windows
version runs under Wine. The IECM is currently a 32-bit application and requires 32-bit Wine. See
"3.2.1. Installing the IECM on MacOS and Linux" on page 10 for more information.
1.4. Uncertainty Features The ability to characterize uncertainties explicitly is a feature unique to this model. As many as one
hundred input parameters can be assigned probability distributions. When input parameters are uncertain,
an uncertainty distribution of results is available. Such result distributions give the likelihood of a
particular value, in contrast to conventional single-value estimates. (See "7. Introduction to Uncertainty
Analysis" on page 575.)
IECM User Documentation: User Manual Introduction • 2
The IECM normally displays only single deterministic values. However, a graph or table of the
uncertainty distribution for any parameter or result may be requested—for instance, to analyze advanced
technology costs. (See "4.3.3.6. The Right-Click Menu" on page 74 and "4.4.4. The Right-Click Menu"
on page 80.)
The IECM also provides a list of all uncertain parameters and results, allowing the user to easily view
relevant results and detect any unanticipated effects. (See "4.5.3.2. Choose Variable(s)" on page 88.)
The uncertainty system can also be used for batch processing by giving each parameter to be varied a
"distribution" containing the desired values, where each "sample" is one set of input values. Result
distributions are then viewed as tables, allowing the user to see which result corresponds with each input
set. (See "4.3.3.3.13. Batch Processing" on page 66.)
1.5. Sensitivity Analysis The IECM allows most parameters to be used as independent variables in a sensitivity analysis. Once the
independent variable has been chosen and its values specified, a list of dependent variables is provided,
allowing the user to see the effects of the independent variable across the entire model as well as focus on
a specific result. (See "4.5.2. Sensitivity Analysis" on page 80.)
1.6. Software Used in Development The IECM is currently compiled using Code::Blocks (http://www.codeblocks.org/). The "mingw_fortran"
setup is used, which includes GCC/G++ and GFortran. The interface is written in C++, using the
wxWidgets GUI toolkit (http://wxwidgets.org/). The underlying engineering models are written in
Fortran. The necessary runtime libraries are included with the IECM Interface software.
All databases are in SQLite (http://sqlite.org/) format.
The installer is built using InnoSetup (http://www.jrsoftware.org/isinfo.php).
1.7. Disclaimer of Warranties and Limitation of Liabilities This report was prepared by the organization(s) named below as an account of work sponsored or
cosponsored by the U.S. Department of Energy National Energy Technology Laboratory (NETL).
NEITHER NETL, ANY MEMBER OF NETL, ANY COSPONSOR, THE ORGANIZATION(S)
NAMED BELOW, NOR ANY PERSON ACTING ON BEHALF OF THEM:
(A) MAKES ANY WARRANTY OR REPRESENTATION WHATSOEVER, EXPRESS OR IMPLIED,
(I) WITH RESPECT TO THE USE OF ANY INFORMATION, APPARATUS, METHOD, PROCESS,
OR SIMILAR ITEM DISCLOSED IN THIS REPORT, INCLUDING MERCHANTABILITY AND
FITNESS FOR A PARTICULAR PURPOSE, OR (II) THAT SUCH USE DOES NOT INFRINGE ON
OR INTERFERE WITH PRIVATELY OWNED RIGHTS, INCLUDING ANY PARTY'S
INTELLECTUAL PROPERTY, OR (III) THAT THIS REPORT IS SUITABLE TO ANY PARTICULAR
USER'S CIRCUMSTANCE; OR
(B) ASSUMES RESPONSIBILITY FOR ANY DAMAGES OR OTHER LIABILITY WHATSOEVER
(INCLUDING ANY CONSEQUENTIAL DAMAGES, EVEN IF DOE OR ANY DOE
REPRESENTATIVE HAS BEEN ADVISED OF THE POSSIBILITY OF SUCH DAMAGES)
RESULTING FROM YOUR SELECTION OR USE OF THIS REPORT OR ANY INFORMATION,
APPARATUS, METHOD, PROCESS, OR SIMILAR ITEM DISCLOSED IN THIS REPORT.
Organization(s) that prepared this report: Carnegie Mellon University

IECM User Documentation: User Manual Introduction • 3
1.8. Copyright Notices Integrated Environmental Control Model (IECM), Copyright © 1997-2017, Carnegie Mellon University.
All Rights Reserved.
Median Latin Hypercube and Hammersley Sequence Sampling, Copyright © 1997, Urmila Diwekar,
Carnegie Mellon University. All Rights Reserved. (Covered by the IECM license.)
WxWidgets, Copyright © 1992-2013 Julian Smart, Vadim Zeitlin, Stefan Csomor, Robert Roebling, and
other members of the wxWidgets team (full list and license at
<http://docs.wxwidgets.org/3.0/page_copyright.html>). Portions © 1996 Artificial Intelligence
Applications Institute.
Code::Blocks, Copyright © 2004-2013 Code::Blocks Team (license at
<http://www.codeblocks.org/license>).
MinGW+GCC, Copyright © 2012 Free Software Foundation, Inc. (license at
<http://www.mingw.org/license>).
Inno Setup, Copyright © 1997-2013 Jordan Russell. All rights reserved. Portions Copyright © 2000-2013
Martijn Laan. All rights reserved. (info including license at <http://www.jrsoftware.org/isinfo.php>).
1.9. User Documentation and Help The user manual (this document) is included with the IECM. Other documents, including technical
documentation, can be downloaded at http://www.iecm-online.com/iecm_docpubs.html.

IECM User Documentation: User Manual Microsoft® Windows Conventions • 4
2. Microsoft® Windows Conventions
2.1. Windows The Windows operating environment is based on both graphics and text. Although it is designed to be
intuitive, a certain amount of learning is required to use it effectively. Please review the documentation
on Windows that came with your personal computer if you are new to the Windows environment.
2.2. Using a Mouse or Touchscreen Many commands in Windows are executed by moving the mouse pointer to an item and pressing the left
or right button on the mouse.
In this documentation, the following terms will be used for mouse operations:
Click - Place the mouse cursor onto a menu, button, field, etc., and press the left button on the mouse. (If
you are using a touchscreen, tap the menu, button, field, etc., with one finger.)
Right Click - Place the mouse cursor onto a menu, button, field, etc., and press the right button on the
mouse. (If you are using a touchscreen, touch and hold with one finger until a box or circle appears, then
lift your finger off the screen.)
Double-Click - Place the mouse cursor onto a menu, button, field, etc., and press the left button on the
mouse two times rapidly. (If you are using a touchscreen, rapidly tap twice with one finger.)
Click and Drag - Place the mouse cursor onto a menu, button, field, etc., press the left button on the
mouse, and—while holding the button down—move the mouse to another location. (If you are using a
touchscreen, tap and drag with one finger.)
2.3. Pull-Down Menus Pull-down menus appear frequently in Windows. Here are a couple of examples from the IECM:
Illustration 1: The IECM's main Menu Bar, with "File" and "Help" pull-down menus
Illustration 2: The "Fuel Type" pull-down menu on the IECM's "Plant Design" screen
IECM User Documentation: User Manual Microsoft® Windows Conventions • 5
2.3.1. Choosing a Command from a Pull-Down Menu
1. Activate the pull-down menu by doing one of the following:
◦ Place the mouse arrow on the title of the menu (first example) or the triangle on the side
of the menu (second example) and click.
◦ If a letter in the menu title is underlined, hold down the Alt key on the keyboard and
press the letter in the menu title which is underlined. For example, to access the "File"
menu in the first example, you would press Alt-F. (See "2.4. Keystroke Commands" on
page 5.)
2. Choose from the menu by doing one of the following:
◦ Place the mouse arrow on the action you want to perform and click.
◦ If a letter in the title is underlined, press that letter.
2.4. Keystroke Commands Many operations in Windows can be executed by a combination of keystrokes as well as a mouse click.
These keystroke combinations involve the Alt key and the Ctrl key.
NOTE: Once an Alt key combination is active, the Ctrl key combinations will not work. The Ctrl key
combinations are meant to bypass menus.
2.4.1. Alt Commands
When the name of an operation appears with one letter underlined, you may execute that operation by
holding down the Alt key while pressing the key for the underlined letter at the same time.
For example: "File - hold down the Alt key and press the F key to activate the 'File' pull-down menu."
In this documentation, instructions for Alt keystrokes are abbreviated in the form “Press Alt-X” where
X is the letter key. (NOTE: While the capital letter is given in this documentation, do not press the
shift key while entering the command.)
For example: "Press Alt-F to activate the 'File' menu."
2.4.2. Ctrl Commands
Some operations have been assigned specific keystroke combinations involving the Ctrl key. You may
execute them by holding down the Ctrl key while pressing the key for the appropriate letter. Most are
listed on the pull-down menu from which the command is normally selected.
In this documentation, instructions for Ctrl keystrokes are abbreviated in the form “Press Ctrl-X”
where X is the letter key. (NOTE: While the capital letter is given in this documentation, do not press
the shift key while entering the command.)
Some of the more common Ctrl commands are the following:
Ctrl-N – New Session Ctrl-O – Open Session Ctrl-S – Save Session
Ctrl-C – Copy Ctrl-X – Cut Ctrl-V – Paste
Ctrl-P – Print Ctrl-W – Close Window Ctrl-Q – Exit
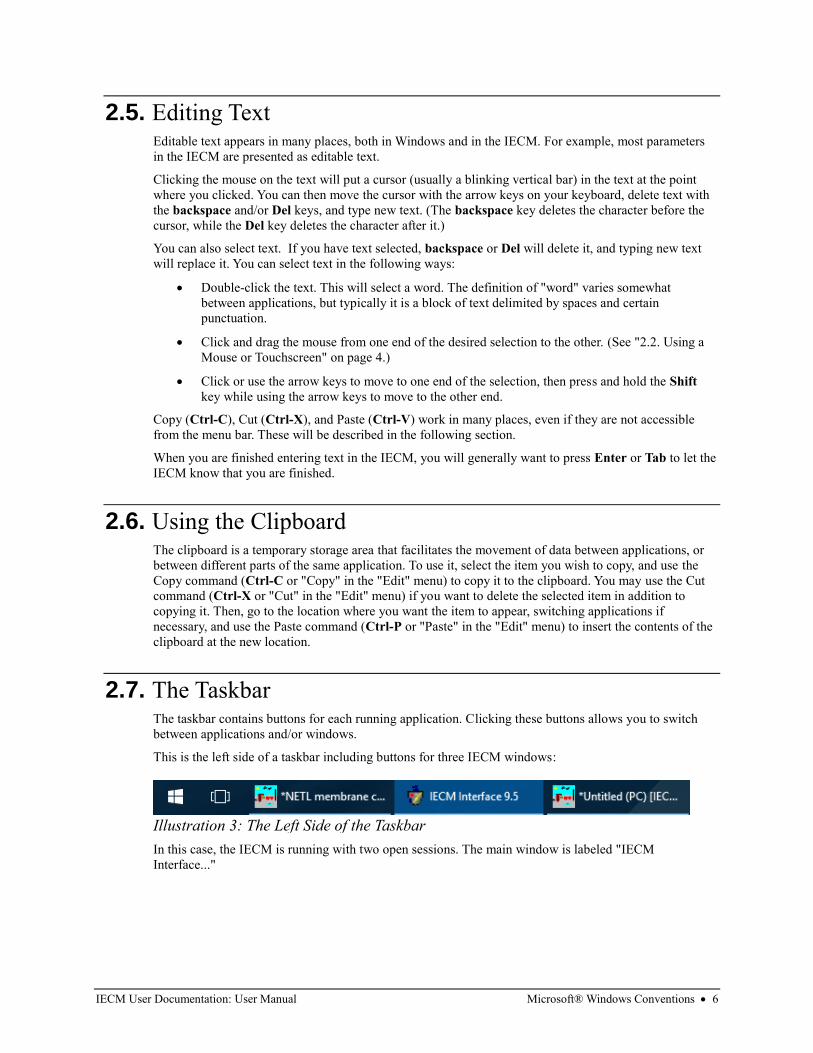
IECM User Documentation: User Manual Microsoft® Windows Conventions • 6
2.5. Editing Text Editable text appears in many places, both in Windows and in the IECM. For example, most parameters
in the IECM are presented as editable text.
Clicking the mouse on the text will put a cursor (usually a blinking vertical bar) in the text at the point
where you clicked. You can then move the cursor with the arrow keys on your keyboard, delete text with
the backspace and/or Del keys, and type new text. (The backspace key deletes the character before the
cursor, while the Del key deletes the character after it.)
You can also select text. If you have text selected, backspace or Del will delete it, and typing new text
will replace it. You can select text in the following ways:
• Double-click the text. This will select a word. The definition of "word" varies somewhat
between applications, but typically it is a block of text delimited by spaces and certain
punctuation.
• Click and drag the mouse from one end of the desired selection to the other. (See "2.2. Using a
Mouse or Touchscreen" on page 4.)
• Click or use the arrow keys to move to one end of the selection, then press and hold the Shift
key while using the arrow keys to move to the other end.
Copy (Ctrl-C), Cut (Ctrl-X), and Paste (Ctrl-V) work in many places, even if they are not accessible
from the menu bar. These will be described in the following section.
When you are finished entering text in the IECM, you will generally want to press Enter or Tab to let the
IECM know that you are finished.
2.6. Using the Clipboard The clipboard is a temporary storage area that facilitates the movement of data between applications, or
between different parts of the same application. To use it, select the item you wish to copy, and use the
Copy command (Ctrl-C or "Copy" in the "Edit" menu) to copy it to the clipboard. You may use the Cut
command (Ctrl-X or "Cut" in the "Edit" menu) if you want to delete the selected item in addition to
copying it. Then, go to the location where you want the item to appear, switching applications if
necessary, and use the Paste command (Ctrl-P or "Paste" in the "Edit" menu) to insert the contents of the
clipboard at the new location.
2.7. The Taskbar The taskbar contains buttons for each running application. Clicking these buttons allows you to switch
between applications and/or windows.
This is the left side of a taskbar including buttons for three IECM windows:
In this case, the IECM is running with two open sessions. The main window is labeled "IECM
Interface..."
Illustration 3: The Left Side of the Taskbar

IECM User Documentation: User Manual Microsoft® Windows Conventions • 7
2.7.1. Switching Applications or Windows
You can switch to a different application or window by clicking the corresponding button on the
taskbar. You can also do this by pressing Alt-Tab. If you're using Alt-Tab, hold the Alt key down and
press Tab repeatedly until the window you want is selected, then release the Alt key.
2.7.2. The Start Button
The Start Button is located on the left side of the taskbar. It looks something like this:
The Start Button brings up the Start Menu, which gives you access to your applications, settings, and
files.
Illustration 4: The Start Button
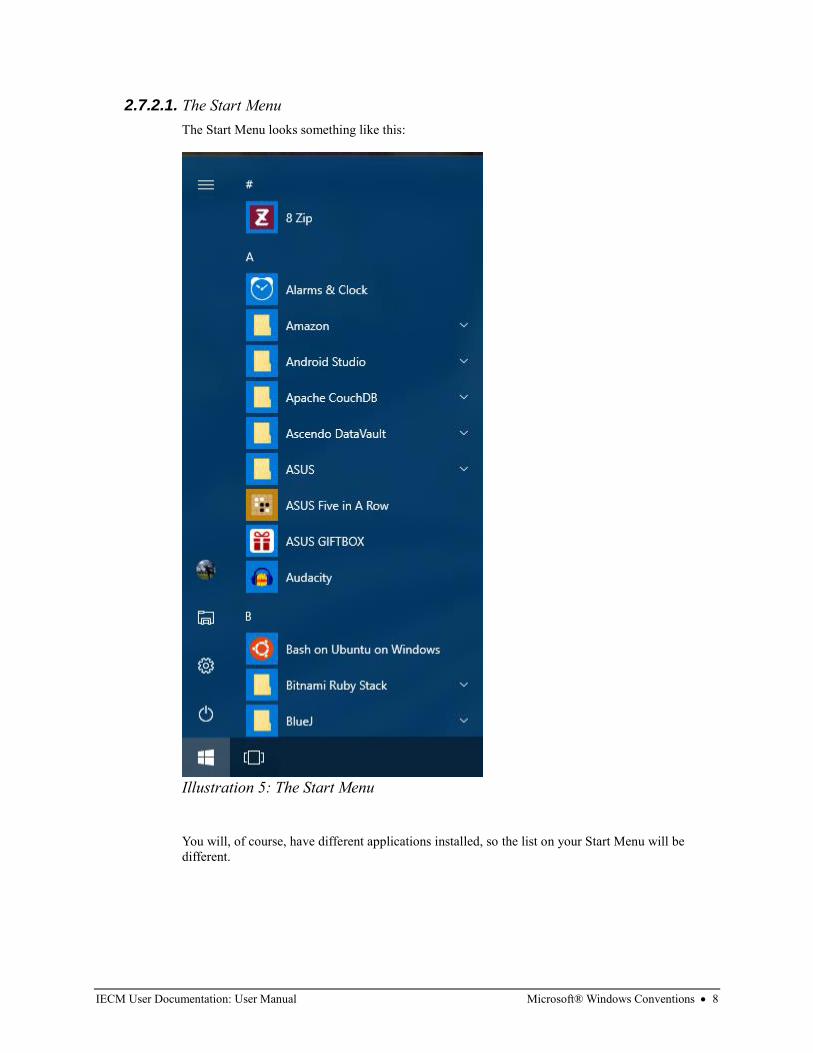
IECM User Documentation: User Manual Microsoft® Windows Conventions • 8
2.7.2.1. The Start Menu
The Start Menu looks something like this:
You will, of course, have different applications installed, so the list on your Start Menu will be
different.
Illustration 5: The Start Menu
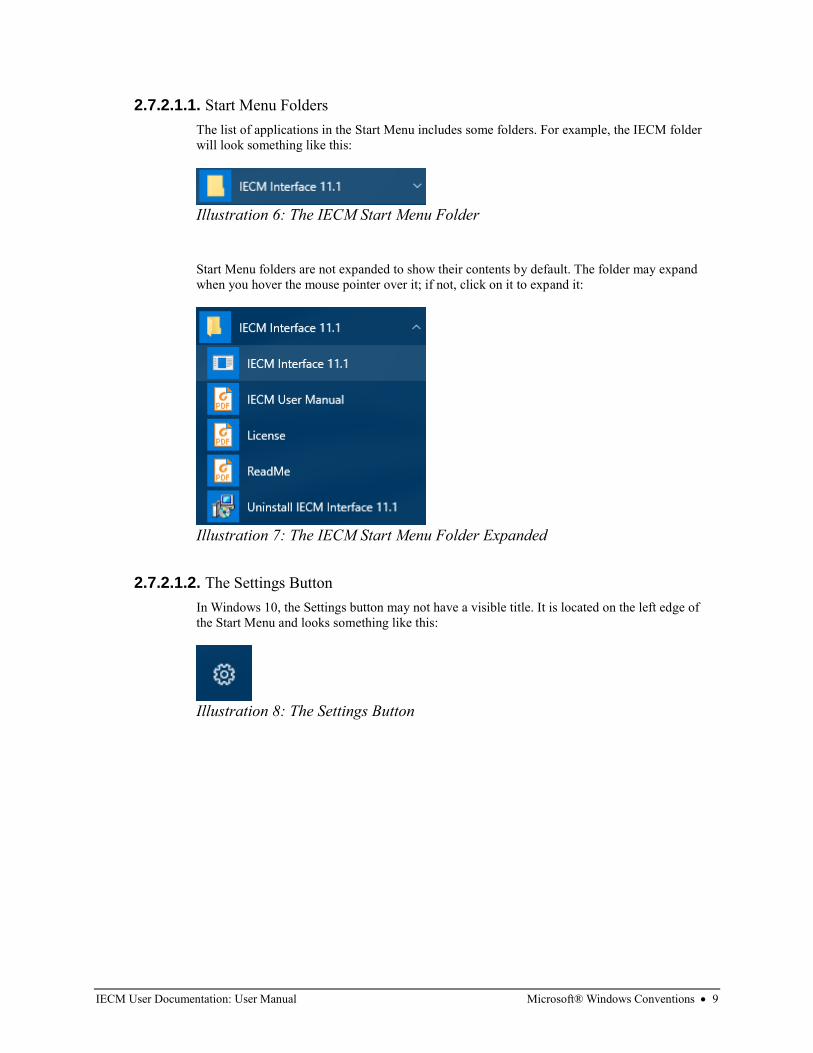
IECM User Documentation: User Manual Microsoft® Windows Conventions • 9
2.7.2.1.1. Start Menu Folders
The list of applications in the Start Menu includes some folders. For example, the IECM folder
will look something like this:
Start Menu folders are not expanded to show their contents by default. The folder may expand
when you hover the mouse pointer over it; if not, click on it to expand it:
2.7.2.1.2. The Settings Button
In Windows 10, the Settings button may not have a visible title. It is located on the left edge of
the Start Menu and looks something like this:
Illustration 6: The IECM Start Menu Folder
Illustration 7: The IECM Start Menu Folder Expanded
Illustration 8: The Settings Button

IECM User Documentation: User Manual Installing the IECM • 10
3. Installing the IECM
3.1. What's included in the Model Package The IECM package is contained in a single installation program in compressed form. This file is
available on the IECM web site (http://www.iecm-online.com/iecm_dl.html). It contains the following:
• The IECM Interface application: This includes the underlying engineering models as well as
the user interface.
• Runtime libraries needed by the IECM Interface: These include libraries needed by the
GFortran and GCC compilers.
• Images used by the IECM Interface: These include backgrounds and components of various
diagrams.
• Databases used by the IECM Interface: These include default fuels and reservoirs for CO2
storage, along with some case studies.
• License and readme files.
• The User Manual.
Note: Technical Manuals are not distributed with the model package, but can be downloaded from the
IECM web site at http://www.iecm-online.com/iecm_docpubs.html.
3.2. Installation To install the IECM, you must use the IECM setup application downloaded from the IECM web site
(http://www.iecm-online.com/iecm_dl.html).
3.2.1. Installing the IECM on MacOS and Linux
We do not currently provide Mac- or Linux-native versions if the IECM; however, the Windows
version runs under Wine. Wine is available at http://www.winehq.org/. Currently, the IECM is a 32-bit
application and requires 32-bit Wine.
The use of the IECM under Wine is not officially supported; however, we will try to avoid doing
anything that would cause it to stop working.
3.2.1.1. MacOS
If you are running MacOS X, we suggest you use Wineskin, available at
http://wineskin.urgesoftware.com/. The manual, available on the Wineskin web site
http://wineskin.urgesoftware.com/tiki-index.php?page=Manual, has some information on how to use
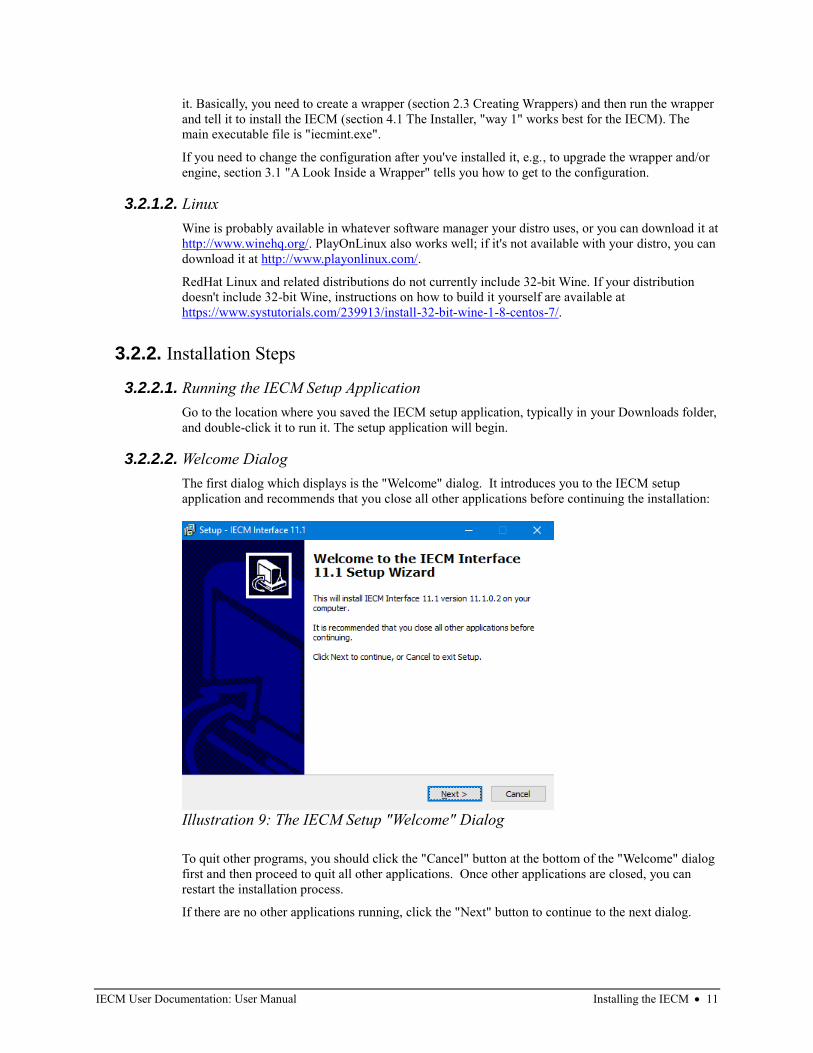
IECM User Documentation: User Manual Installing the IECM • 11
it. Basically, you need to create a wrapper (section 2.3 Creating Wrappers) and then run the wrapper
and tell it to install the IECM (section 4.1 The Installer, "way 1" works best for the IECM). The
main executable file is "iecmint.exe".
If you need to change the configuration after you've installed it, e.g., to upgrade the wrapper and/or
engine, section 3.1 "A Look Inside a Wrapper" tells you how to get to the configuration.
3.2.1.2. Linux
Wine is probably available in whatever software manager your distro uses, or you can download it at
http://www.winehq.org/. PlayOnLinux also works well; if it's not available with your distro, you can
download it at http://www.playonlinux.com/.
RedHat Linux and related distributions do not currently include 32-bit Wine. If your distribution
doesn't include 32-bit Wine, instructions on how to build it yourself are available at
https://www.systutorials.com/239913/install-32-bit-wine-1-8-centos-7/.
3.2.2. Installation Steps
3.2.2.1. Running the IECM Setup Application
Go to the location where you saved the IECM setup application, typically in your Downloads folder,
and double-click it to run it. The setup application will begin.
3.2.2.2. Welcome Dialog
The first dialog which displays is the "Welcome" dialog. It introduces you to the IECM setup
application and recommends that you close all other applications before continuing the installation:
To quit other programs, you should click the "Cancel" button at the bottom of the "Welcome" dialog
first and then proceed to quit all other applications. Once other applications are closed, you can
restart the installation process.
If there are no other applications running, click the "Next" button to continue to the next dialog.
Illustration 9: The IECM Setup "Welcome" Dialog
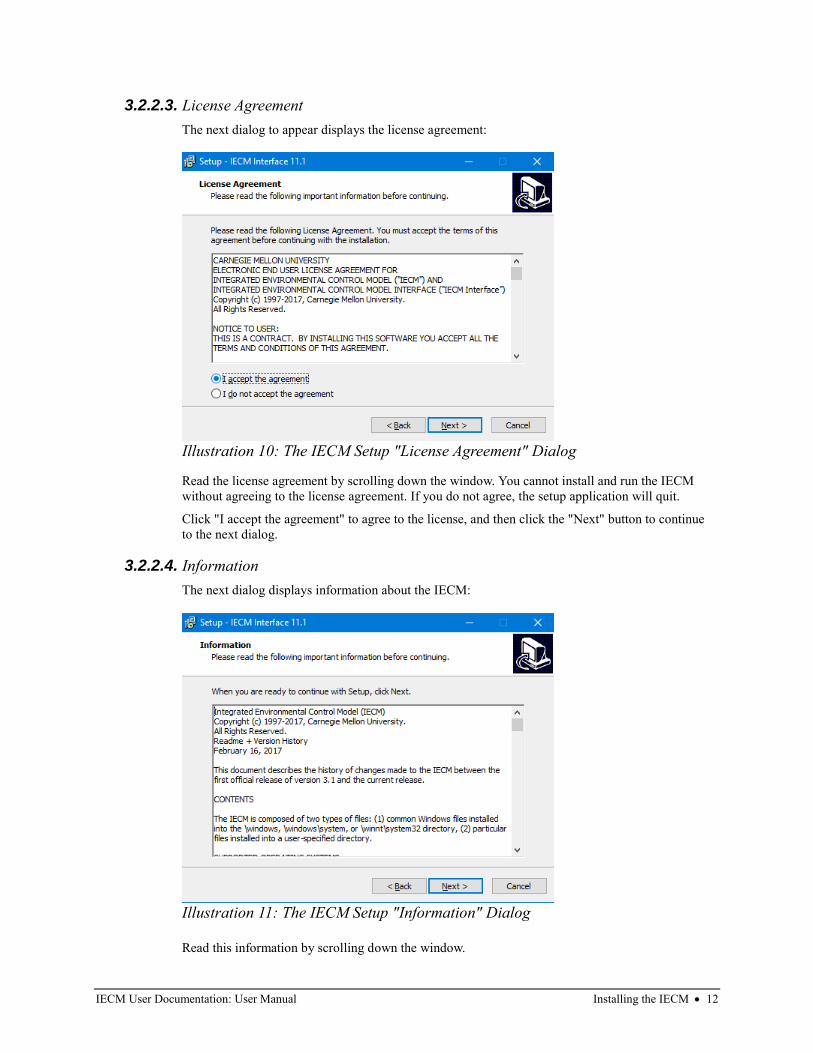
IECM User Documentation: User Manual Installing the IECM • 12
3.2.2.3. License Agreement
The next dialog to appear displays the license agreement:
Read the license agreement by scrolling down the window. You cannot install and run the IECM
without agreeing to the license agreement. If you do not agree, the setup application will quit.
Click "I accept the agreement" to agree to the license, and then click the "Next" button to continue
to the next dialog.
3.2.2.4. Information
The next dialog displays information about the IECM:
Read this information by scrolling down the window.
Illustration 10: The IECM Setup "License Agreement" Dialog
Illustration 11: The IECM Setup "Information" Dialog
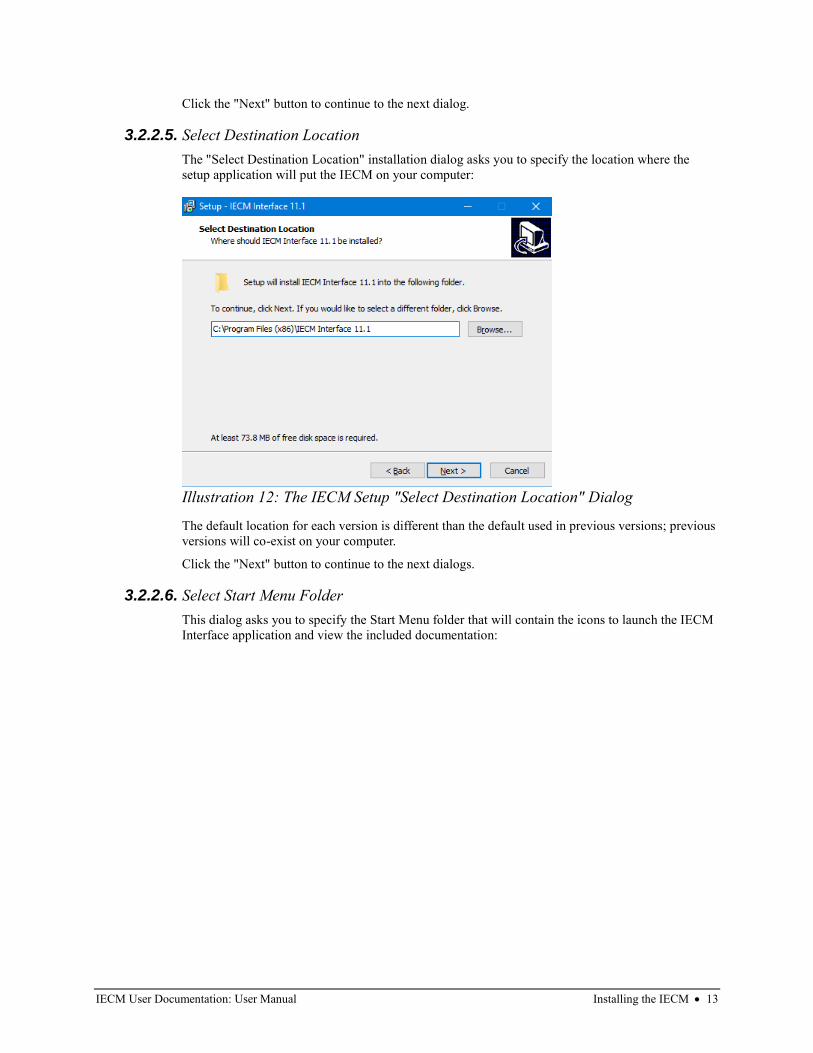
IECM User Documentation: User Manual Installing the IECM • 13
Click the "Next" button to continue to the next dialog.
3.2.2.5. Select Destination Location
The "Select Destination Location" installation dialog asks you to specify the location where the
setup application will put the IECM on your computer:
The default location for each version is different than the default used in previous versions; previous
versions will co-exist on your computer.
Click the "Next" button to continue to the next dialogs.
3.2.2.6. Select Start Menu Folder
This dialog asks you to specify the Start Menu folder that will contain the icons to launch the IECM
Interface application and view the included documentation:
Illustration 12: The IECM Setup "Select Destination Location" Dialog
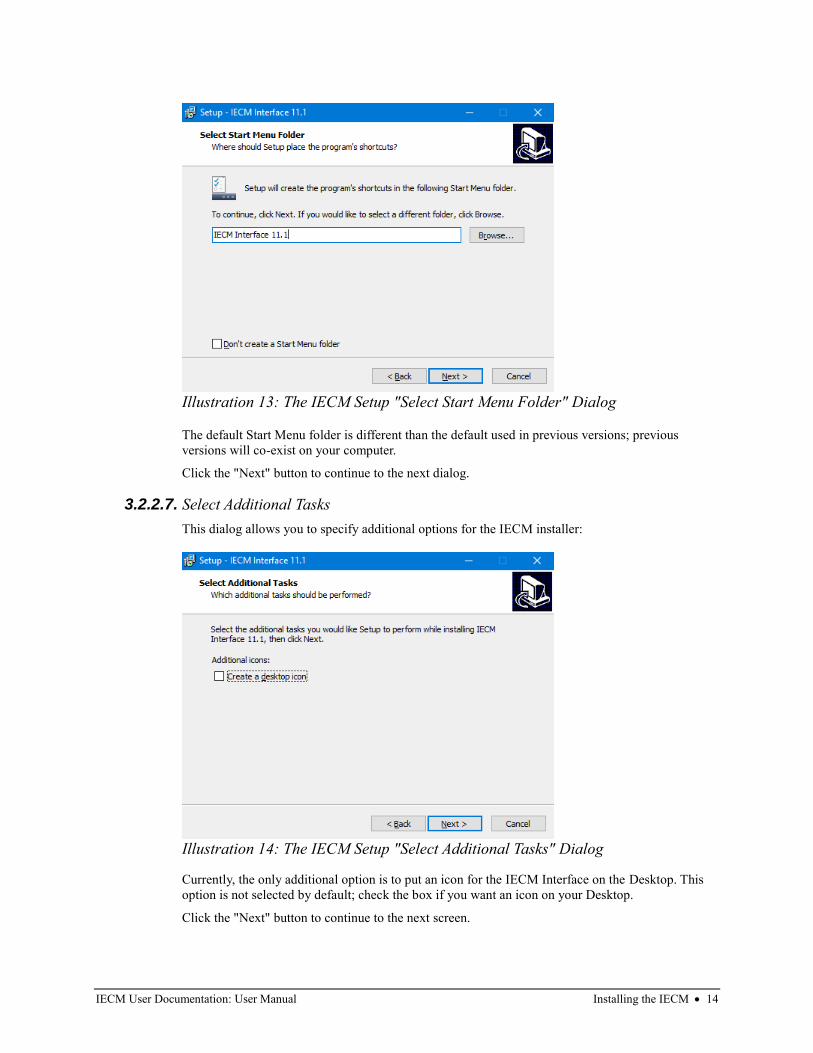
IECM User Documentation: User Manual Installing the IECM • 14
The default Start Menu folder is different than the default used in previous versions; previous
versions will co-exist on your computer.
Click the "Next" button to continue to the next dialog.
3.2.2.7. Select Additional Tasks
This dialog allows you to specify additional options for the IECM installer:
Currently, the only additional option is to put an icon for the IECM Interface on the Desktop. This
option is not selected by default; check the box if you want an icon on your Desktop.
Click the "Next" button to continue to the next screen.
Illustration 13: The IECM Setup "Select Start Menu Folder" Dialog
Illustration 14: The IECM Setup "Select Additional Tasks" Dialog
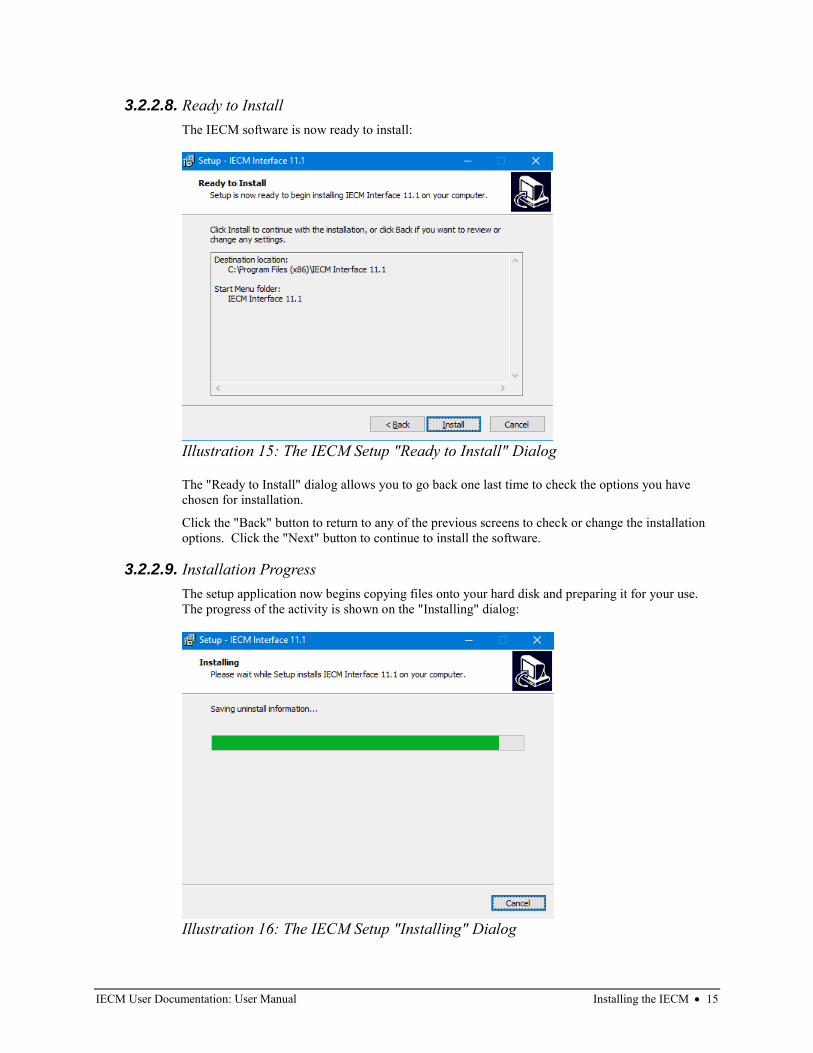
IECM User Documentation: User Manual Installing the IECM • 15
3.2.2.8. Ready to Install
The IECM software is now ready to install:
The "Ready to Install" dialog allows you to go back one last time to check the options you have
chosen for installation.
Click the "Back" button to return to any of the previous screens to check or change the installation
options. Click the "Next" button to continue to install the software.
3.2.2.9. Installation Progress
The setup application now begins copying files onto your hard disk and preparing it for your use.
The progress of the activity is shown on the "Installing" dialog:
Illustration 15: The IECM Setup "Ready to Install" Dialog
Illustration 16: The IECM Setup "Installing" Dialog
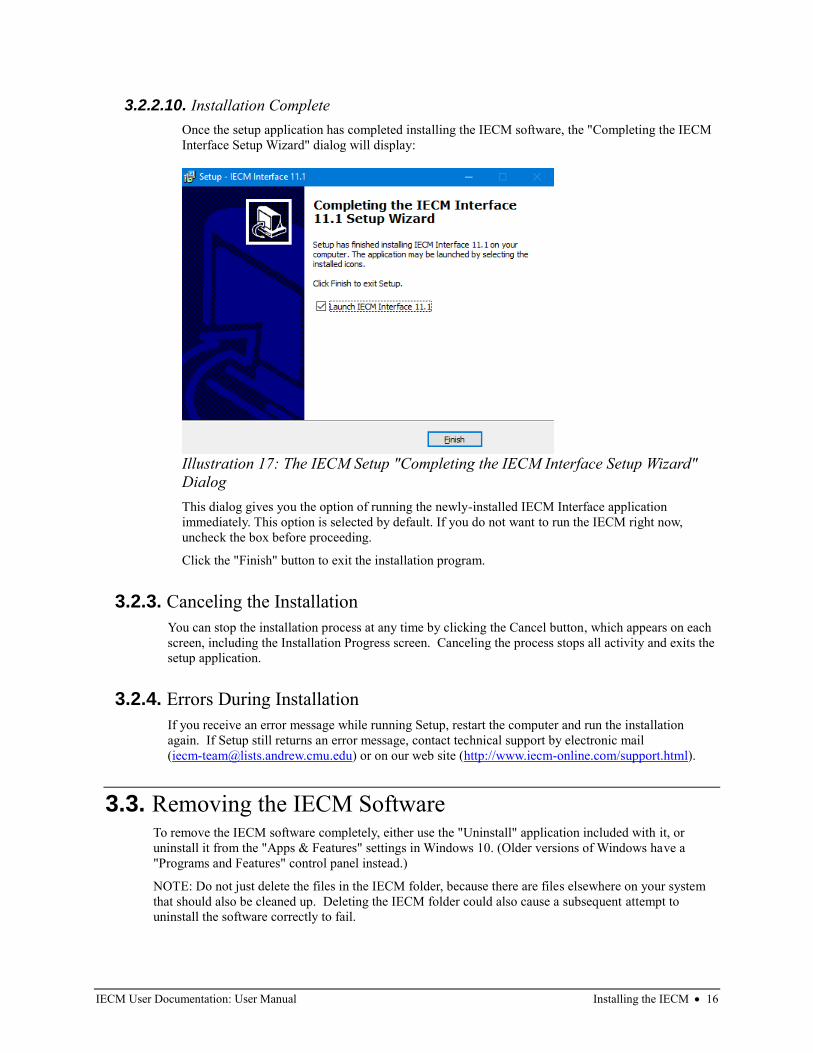
IECM User Documentation: User Manual Installing the IECM • 16
3.2.2.10. Installation Complete
Once the setup application has completed installing the IECM software, the "Completing the IECM
Interface Setup Wizard" dialog will display:
This dialog gives you the option of running the newly-installed IECM Interface application
immediately. This option is selected by default. If you do not want to run the IECM right now,
uncheck the box before proceeding.
Click the "Finish" button to exit the installation program.
3.2.3. Canceling the Installation
You can stop the installation process at any time by clicking the Cancel button, which appears on each
screen, including the Installation Progress screen. Canceling the process stops all activity and exits the
setup application.
3.2.4. Errors During Installation
If you receive an error message while running Setup, restart the computer and run the installation
again. If Setup still returns an error message, contact technical support by electronic mail
([email protected]) or on our web site (http://www.iecm-online.com/support.html).
3.3. Removing the IECM Software To remove the IECM software completely, either use the "Uninstall" application included with it, or
uninstall it from the "Apps & Features" settings in Windows 10. (Older versions of Windows have a
"Programs and Features" control panel instead.)
NOTE: Do not just delete the files in the IECM folder, because there are files elsewhere on your system
that should also be cleaned up. Deleting the IECM folder could also cause a subsequent attempt to
uninstall the software correctly to fail.
Illustration 17: The IECM Setup "Completing the IECM Interface Setup Wizard"
Dialog
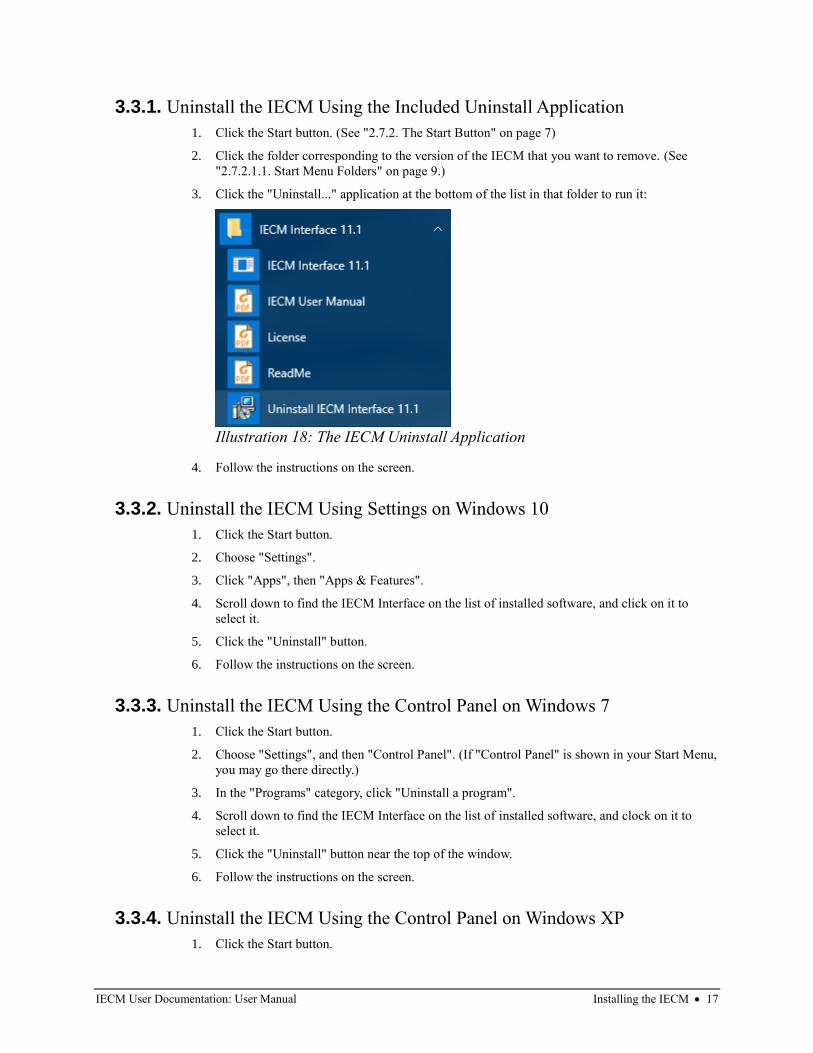
IECM User Documentation: User Manual Installing the IECM • 17
3.3.1. Uninstall the IECM Using the Included Uninstall Application
1. Click the Start button. (See "2.7.2. The Start Button" on page 7)
2. Click the folder corresponding to the version of the IECM that you want to remove. (See
"2.7.2.1.1. Start Menu Folders" on page 9.)
3. Click the "Uninstall..." application at the bottom of the list in that folder to run it:
4. Follow the instructions on the screen.
3.3.2. Uninstall the IECM Using Settings on Windows 10
1. Click the Start button.
2. Choose "Settings".
3. Click "Apps", then "Apps & Features".
4. Scroll down to find the IECM Interface on the list of installed software, and click on it to
select it.
5. Click the "Uninstall" button.
6. Follow the instructions on the screen.
3.3.3. Uninstall the IECM Using the Control Panel on Windows 7
1. Click the Start button.
2. Choose "Settings", and then "Control Panel". (If "Control Panel" is shown in your Start Menu,
you may go there directly.)
3. In the "Programs" category, click "Uninstall a program".
4. Scroll down to find the IECM Interface on the list of installed software, and clock on it to
select it.
5. Click the "Uninstall" button near the top of the window.
6. Follow the instructions on the screen.
3.3.4. Uninstall the IECM Using the Control Panel on Windows XP
1. Click the Start button.
Illustration 18: The IECM Uninstall Application

IECM User Documentation: User Manual Installing the IECM • 18
2. Choose "Settings", and then "Control Panel". (If "Control Panel" is shown in your Start Menu,
you may go there directly.)
3. Click "Add or Remove Programs"
4. Scroll down to find the IECM Interface on the list of installed software, and click on it to
select it.
5. Click the "Remove" button.
6. Follow the instructions on the screen.

IECM User Documentation: User Manual Using the IECM • 19
4. Using the IECM
4.1. The IECM Interface
4.1.1. Starting the IECM Interface
To run the IECM Interface, do the following:
1. Click the Start button. (See "2.7.2. The Start Button" on page 7.)
2. Click the folder corresponding to the version of the IECM that you want to run. (See
"2.7.2.1.1. Start Menu Folders" on page 9.)
3. Click the "IECM Interface..." application at the top of the list in that folder to run it:
Illustration 19: The IECM Interface Application in the Start Menu
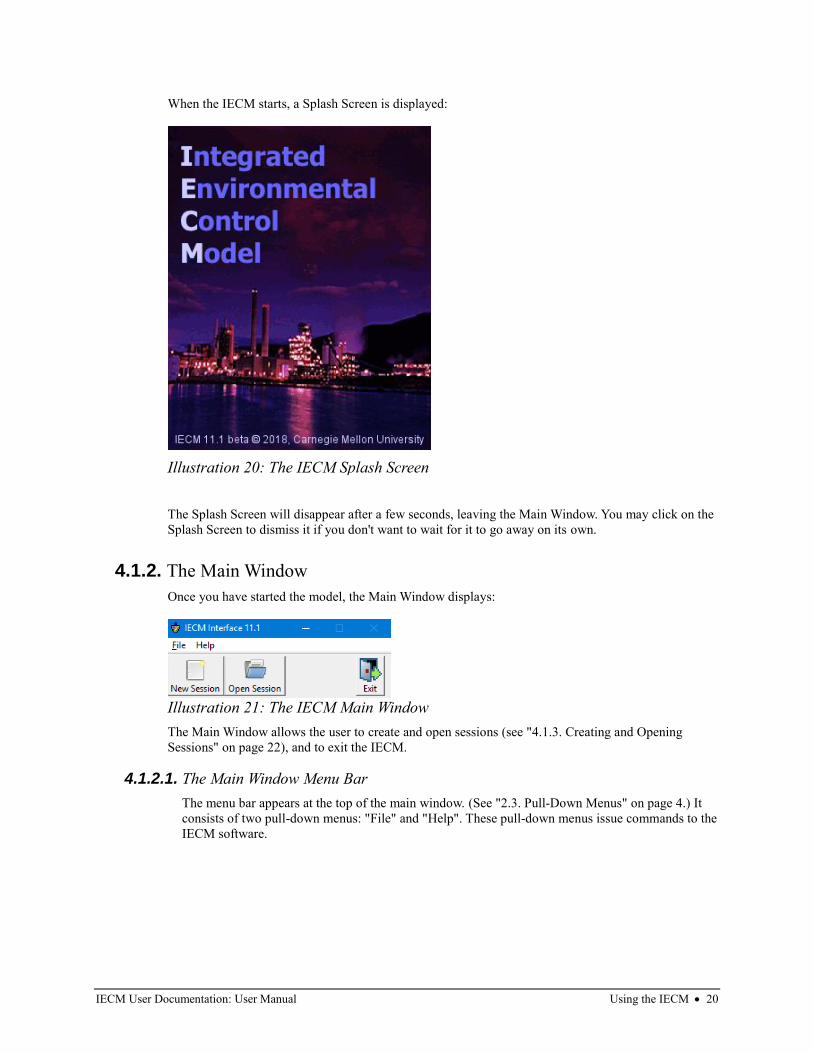
IECM User Documentation: User Manual Using the IECM • 20
When the IECM starts, a Splash Screen is displayed:
The Splash Screen will disappear after a few seconds, leaving the Main Window. You may click on the
Splash Screen to dismiss it if you don't want to wait for it to go away on its own.
4.1.2. The Main Window
Once you have started the model, the Main Window displays:
The Main Window allows the user to create and open sessions (see "4.1.3. Creating and Opening
Sessions" on page 22), and to exit the IECM.
4.1.2.1. The Main Window Menu Bar
The menu bar appears at the top of the main window. (See "2.3. Pull-Down Menus" on page 4.) It
consists of two pull-down menus: "File" and "Help". These pull-down menus issue commands to the
IECM software.
Illustration 20: The IECM Splash Screen
Illustration 21: The IECM Main Window
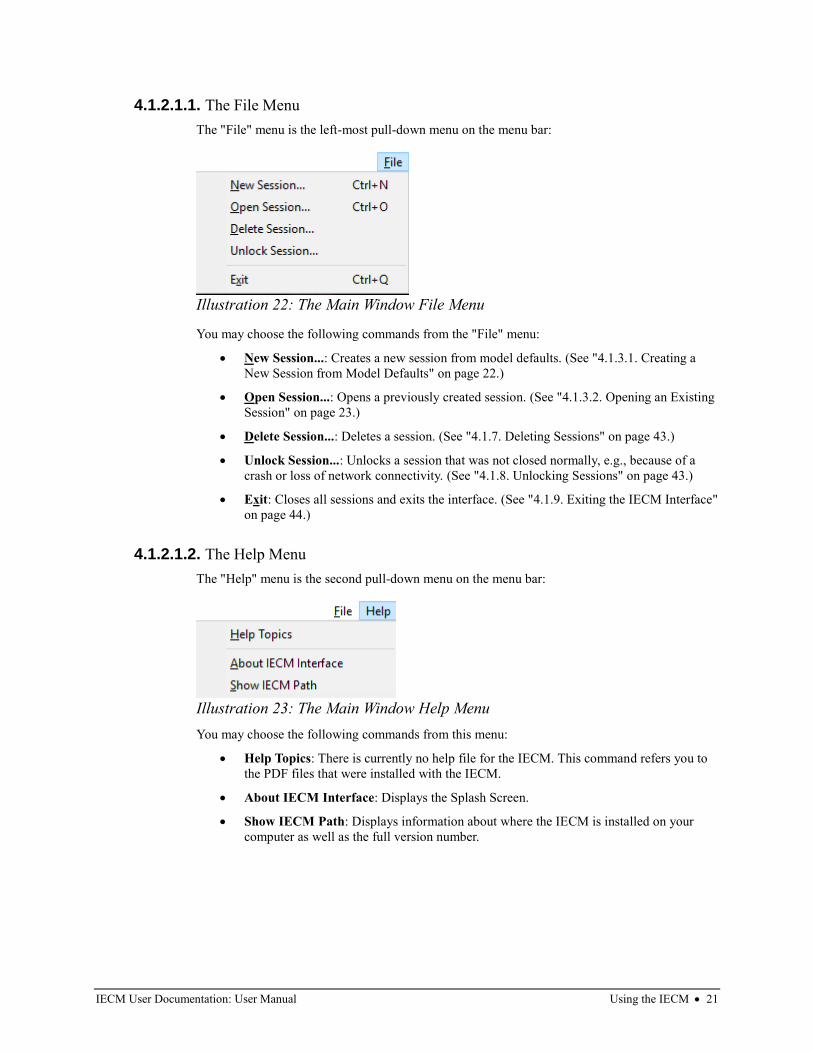
IECM User Documentation: User Manual Using the IECM • 21
4.1.2.1.1. The File Menu
The "File" menu is the left-most pull-down menu on the menu bar:
You may choose the following commands from the "File" menu:
• New Session...: Creates a new session from model defaults. (See "4.1.3.1. Creating a
New Session from Model Defaults" on page 22.)
• Open Session...: Opens a previously created session. (See "4.1.3.2. Opening an Existing
Session" on page 23.)
• Delete Session...: Deletes a session. (See "4.1.7. Deleting Sessions" on page 43.)
• Unlock Session...: Unlocks a session that was not closed normally, e.g., because of a
crash or loss of network connectivity. (See "4.1.8. Unlocking Sessions" on page 43.)
• Exit: Closes all sessions and exits the interface. (See "4.1.9. Exiting the IECM Interface"
on page 44.)
4.1.2.1.2. The Help Menu
The "Help" menu is the second pull-down menu on the menu bar:
You may choose the following commands from this menu:
• Help Topics: There is currently no help file for the IECM. This command refers you to
the PDF files that were installed with the IECM.
• About IECM Interface: Displays the Splash Screen.
• Show IECM Path: Displays information about where the IECM is installed on your
computer as well as the full version number.
Illustration 22: The Main Window File Menu
Illustration 23: The Main Window Help Menu
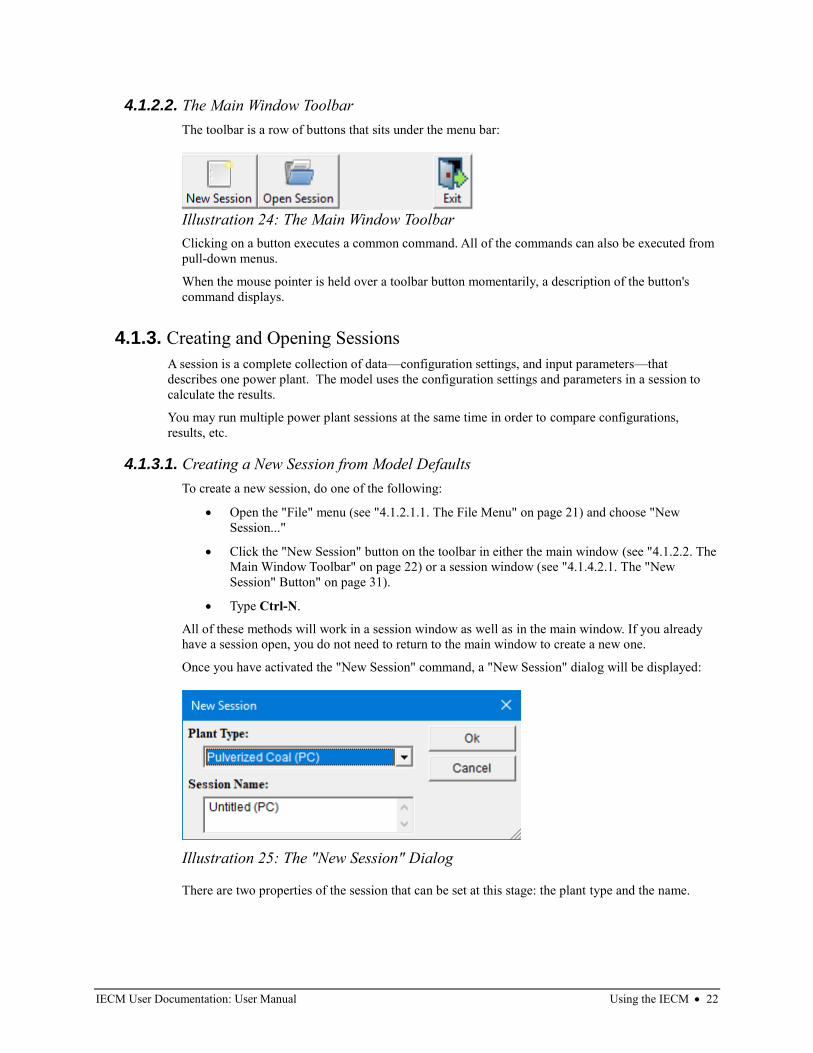
IECM User Documentation: User Manual Using the IECM • 22
4.1.2.2. The Main Window Toolbar
The toolbar is a row of buttons that sits under the menu bar:
Clicking on a button executes a common command. All of the commands can also be executed from
pull-down menus.
When the mouse pointer is held over a toolbar button momentarily, a description of the button's
command displays.
4.1.3. Creating and Opening Sessions
A session is a complete collection of data—configuration settings, and input parameters—that
describes one power plant. The model uses the configuration settings and parameters in a session to
calculate the results.
You may run multiple power plant sessions at the same time in order to compare configurations,
results, etc.
4.1.3.1. Creating a New Session from Model Defaults
To create a new session, do one of the following:
• Open the "File" menu (see "4.1.2.1.1. The File Menu" on page 21) and choose "New
Session..."
• Click the "New Session" button on the toolbar in either the main window (see "4.1.2.2. The
Main Window Toolbar" on page 22) or a session window (see "4.1.4.2.1. The "New
Session" Button" on page 31).
• Type Ctrl-N.
All of these methods will work in a session window as well as in the main window. If you already
have a session open, you do not need to return to the main window to create a new one.
Once you have activated the "New Session" command, a "New Session" dialog will be displayed:
There are two properties of the session that can be set at this stage: the plant type and the name.
Illustration 24: The Main Window Toolbar
Illustration 25: The "New Session" Dialog
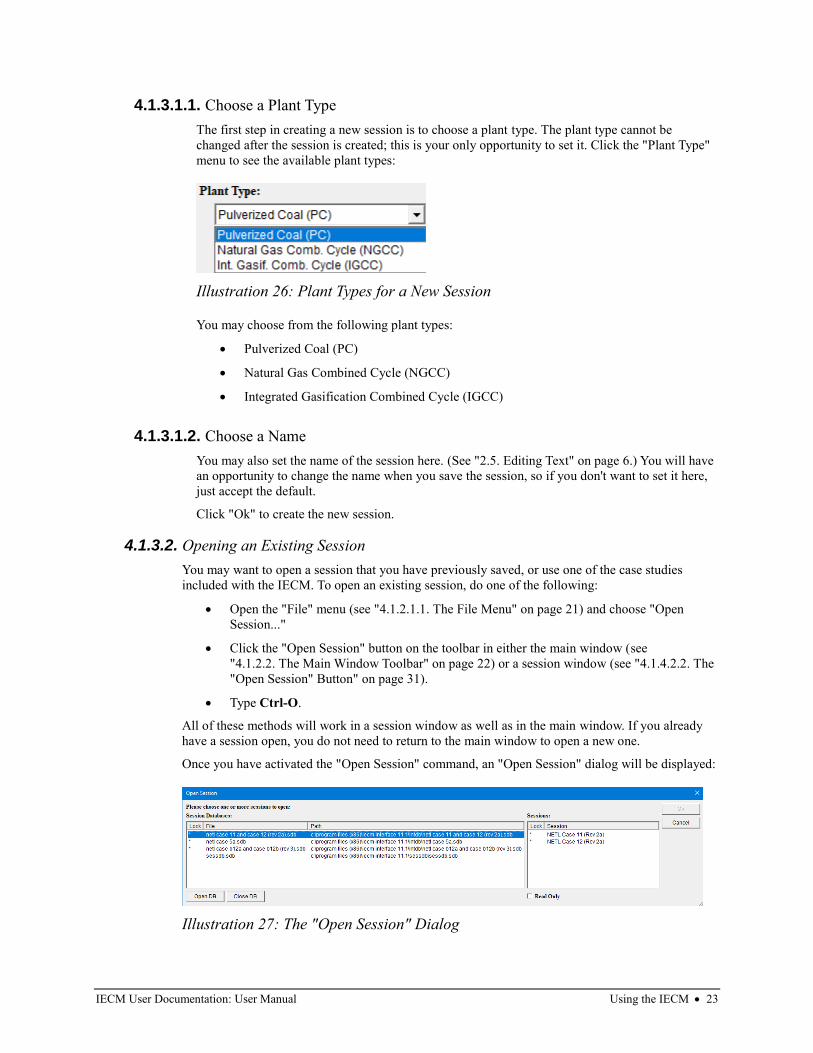
IECM User Documentation: User Manual Using the IECM • 23
4.1.3.1.1. Choose a Plant Type
The first step in creating a new session is to choose a plant type. The plant type cannot be
changed after the session is created; this is your only opportunity to set it. Click the "Plant Type"
menu to see the available plant types:
You may choose from the following plant types:
• Pulverized Coal (PC)
• Natural Gas Combined Cycle (NGCC)
• Integrated Gasification Combined Cycle (IGCC)
4.1.3.1.2. Choose a Name
You may also set the name of the session here. (See "2.5. Editing Text" on page 6.) You will have
an opportunity to change the name when you save the session, so if you don't want to set it here,
just accept the default.
Click "Ok" to create the new session.
4.1.3.2. Opening an Existing Session
You may want to open a session that you have previously saved, or use one of the case studies
included with the IECM. To open an existing session, do one of the following:
• Open the "File" menu (see "4.1.2.1.1. The File Menu" on page 21) and choose "Open
Session..."
• Click the "Open Session" button on the toolbar in either the main window (see
"4.1.2.2. The Main Window Toolbar" on page 22) or a session window (see "4.1.4.2.2. The
"Open Session" Button" on page 31).
• Type Ctrl-O.
All of these methods will work in a session window as well as in the main window. If you already
have a session open, you do not need to return to the main window to open a new one.
Once you have activated the "Open Session" command, an "Open Session" dialog will be displayed:
Illustration 26: Plant Types for a New Session
Illustration 27: The "Open Session" Dialog
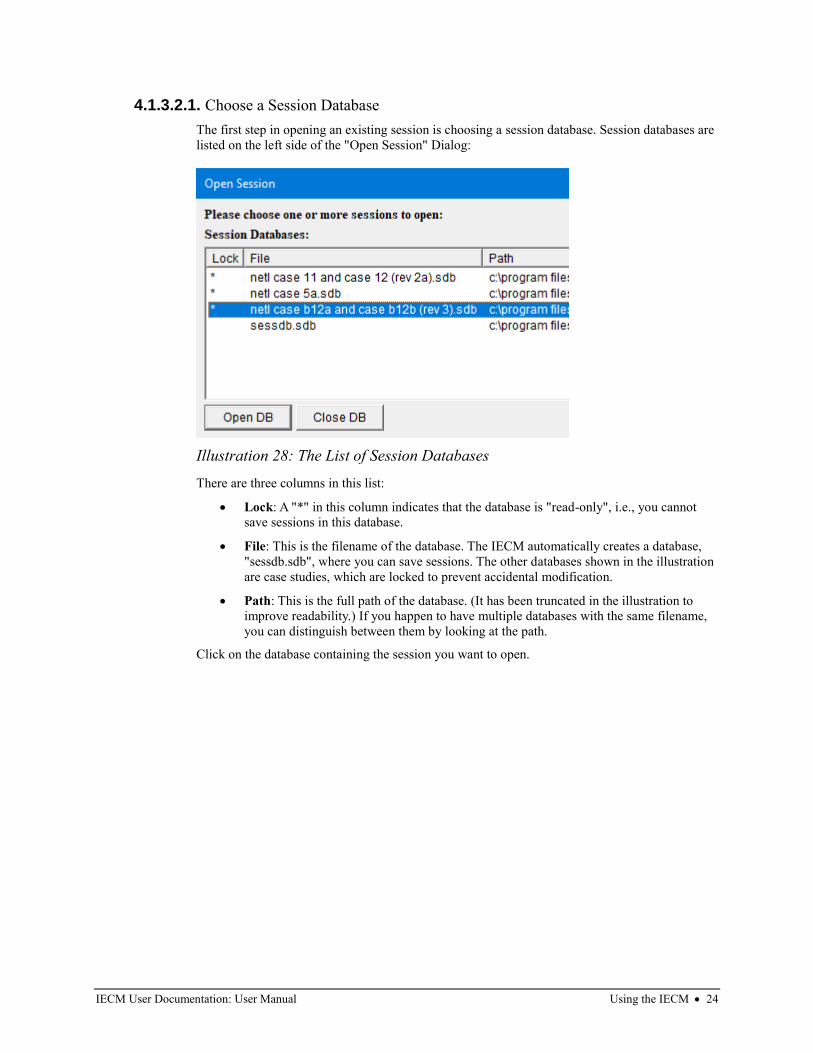
IECM User Documentation: User Manual Using the IECM • 24
4.1.3.2.1. Choose a Session Database
The first step in opening an existing session is choosing a session database. Session databases are
listed on the left side of the "Open Session" Dialog:
There are three columns in this list:
• Lock: A "*" in this column indicates that the database is "read-only", i.e., you cannot
save sessions in this database.
• File: This is the filename of the database. The IECM automatically creates a database,
"sessdb.sdb", where you can save sessions. The other databases shown in the illustration
are case studies, which are locked to prevent accidental modification.
• Path: This is the full path of the database. (It has been truncated in the illustration to
improve readability.) If you happen to have multiple databases with the same filename,
you can distinguish between them by looking at the path.
Click on the database containing the session you want to open.
Illustration 28: The List of Session Databases
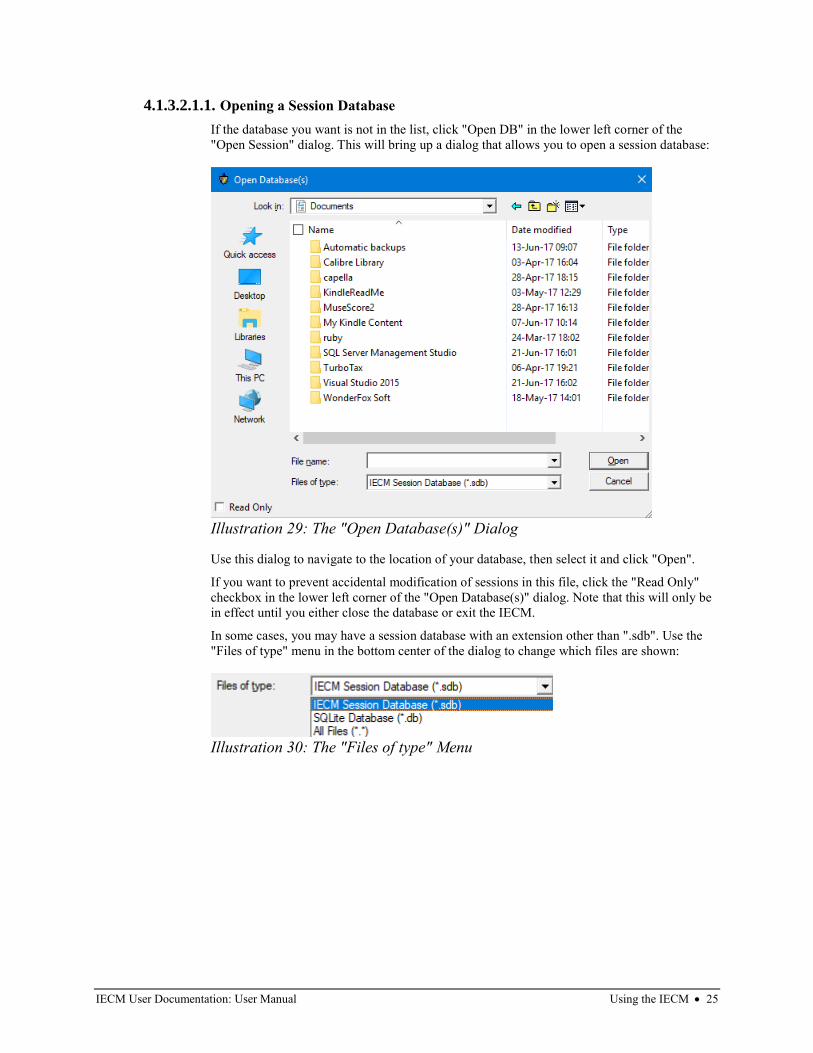
IECM User Documentation: User Manual Using the IECM • 25
4.1.3.2.1.1. Opening a Session Database
If the database you want is not in the list, click "Open DB" in the lower left corner of the
"Open Session" dialog. This will bring up a dialog that allows you to open a session database:
Use this dialog to navigate to the location of your database, then select it and click "Open".
If you want to prevent accidental modification of sessions in this file, click the "Read Only"
checkbox in the lower left corner of the "Open Database(s)" dialog. Note that this will only be
in effect until you either close the database or exit the IECM.
In some cases, you may have a session database with an extension other than ".sdb". Use the
"Files of type" menu in the bottom center of the dialog to change which files are shown:
Illustration 29: The "Open Database(s)" Dialog
Illustration 30: The "Files of type" Menu
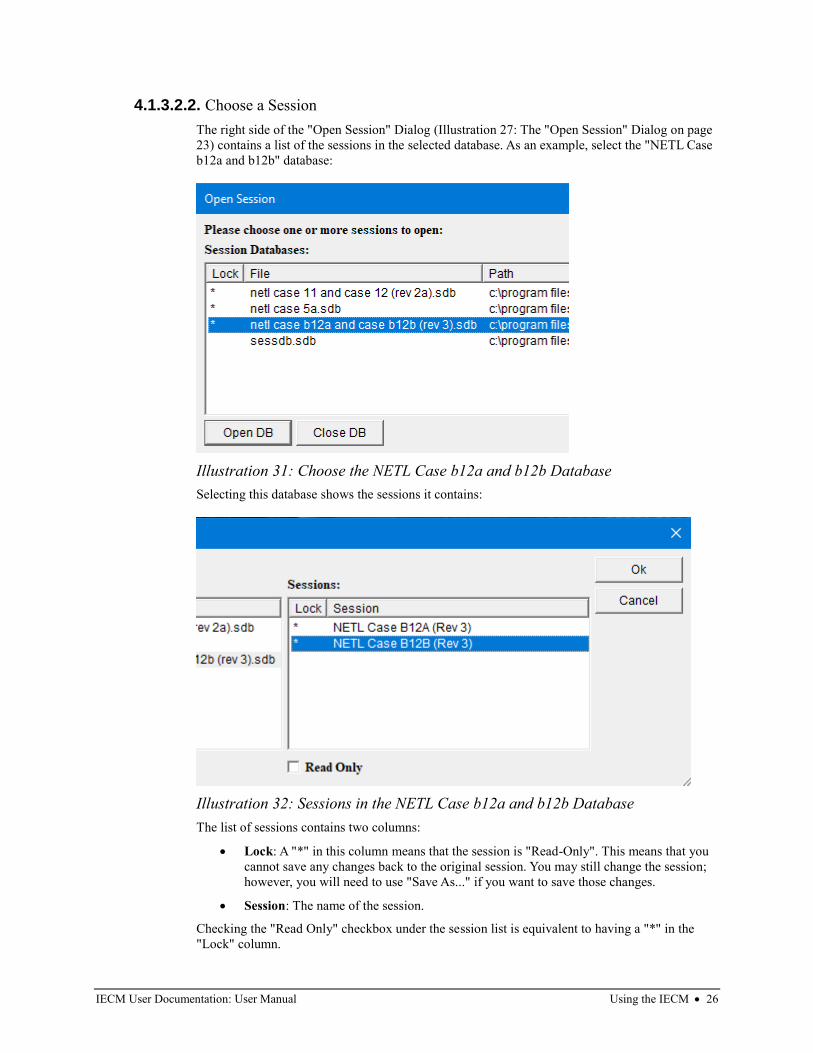
IECM User Documentation: User Manual Using the IECM • 26
4.1.3.2.2. Choose a Session
The right side of the "Open Session" Dialog (Illustration 27: The "Open Session" Dialog on page
23) contains a list of the sessions in the selected database. As an example, select the "NETL Case
b12a and b12b" database:
Selecting this database shows the sessions it contains:
The list of sessions contains two columns:
• Lock: A "*" in this column means that the session is "Read-Only". This means that you
cannot save any changes back to the original session. You may still change the session;
however, you will need to use "Save As..." if you want to save those changes.
• Session: The name of the session.
Checking the "Read Only" checkbox under the session list is equivalent to having a "*" in the
"Lock" column.
Illustration 31: Choose the NETL Case b12a and b12b Database
Illustration 32: Sessions in the NETL Case b12a and b12b Database
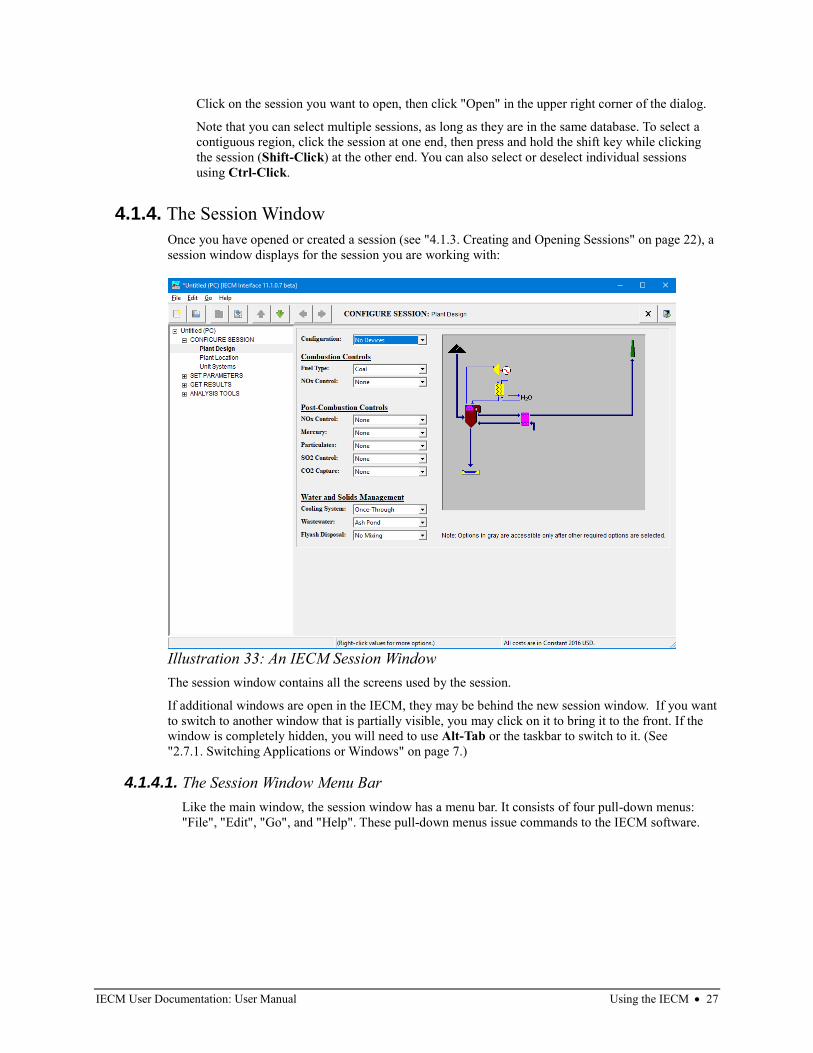
IECM User Documentation: User Manual Using the IECM • 27
Click on the session you want to open, then click "Open" in the upper right corner of the dialog.
Note that you can select multiple sessions, as long as they are in the same database. To select a
contiguous region, click the session at one end, then press and hold the shift key while clicking
the session (Shift-Click) at the other end. You can also select or deselect individual sessions
using Ctrl-Click.
4.1.4. The Session Window
Once you have opened or created a session (see "4.1.3. Creating and Opening Sessions" on page 22), a
session window displays for the session you are working with:
The session window contains all the screens used by the session.
If additional windows are open in the IECM, they may be behind the new session window. If you want
to switch to another window that is partially visible, you may click on it to bring it to the front. If the
window is completely hidden, you will need to use Alt-Tab or the taskbar to switch to it. (See
"2.7.1. Switching Applications or Windows" on page 7.)
4.1.4.1. The Session Window Menu Bar
Like the main window, the session window has a menu bar. It consists of four pull-down menus:
"File", "Edit", "Go", and "Help". These pull-down menus issue commands to the IECM software.
Illustration 33: An IECM Session Window
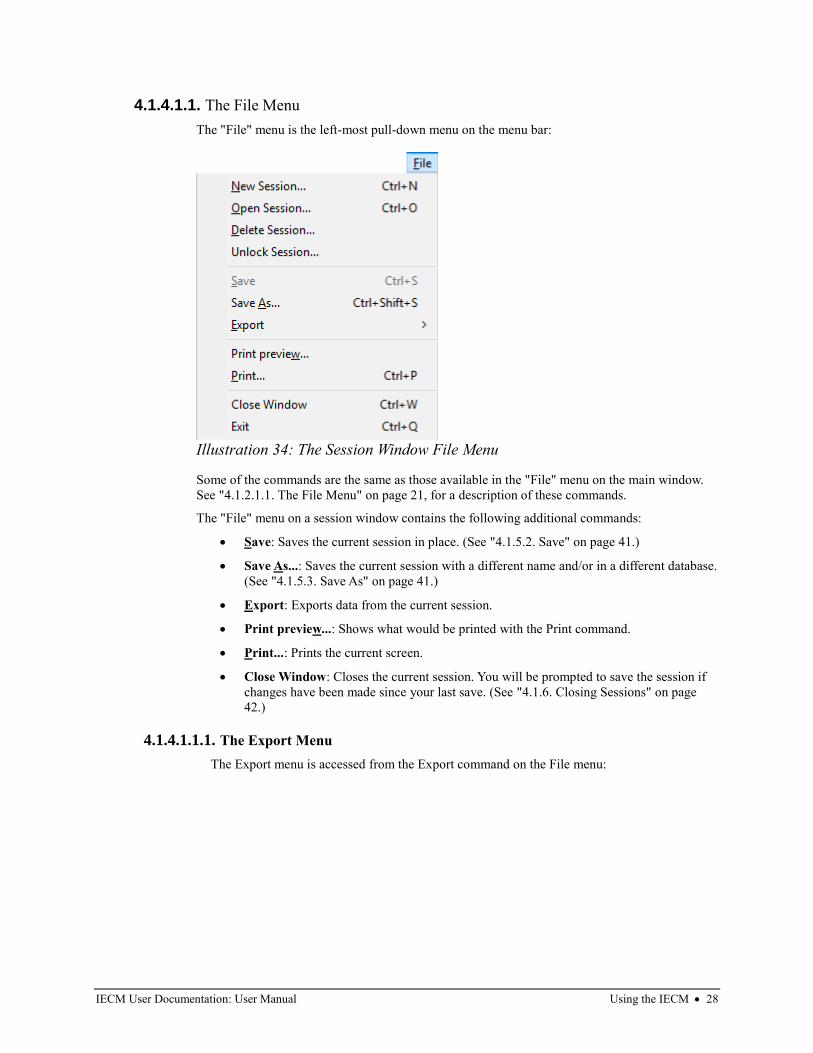
IECM User Documentation: User Manual Using the IECM • 28
4.1.4.1.1. The File Menu
The "File" menu is the left-most pull-down menu on the menu bar:
Some of the commands are the same as those available in the "File" menu on the main window.
See "4.1.2.1.1. The File Menu" on page 21, for a description of these commands.
The "File" menu on a session window contains the following additional commands:
• Save: Saves the current session in place. (See "4.1.5.2. Save" on page 41.)
• Save As...: Saves the current session with a different name and/or in a different database.
(See "4.1.5.3. Save As" on page 41.)
• Export: Exports data from the current session.
• Print preview...: Shows what would be printed with the Print command.
• Print...: Prints the current screen.
• Close Window: Closes the current session. You will be prompted to save the session if
changes have been made since your last save. (See "4.1.6. Closing Sessions" on page
42.)
4.1.4.1.1.1. The Export Menu
The Export menu is accessed from the Export command on the File menu:
Illustration 34: The Session Window File Menu
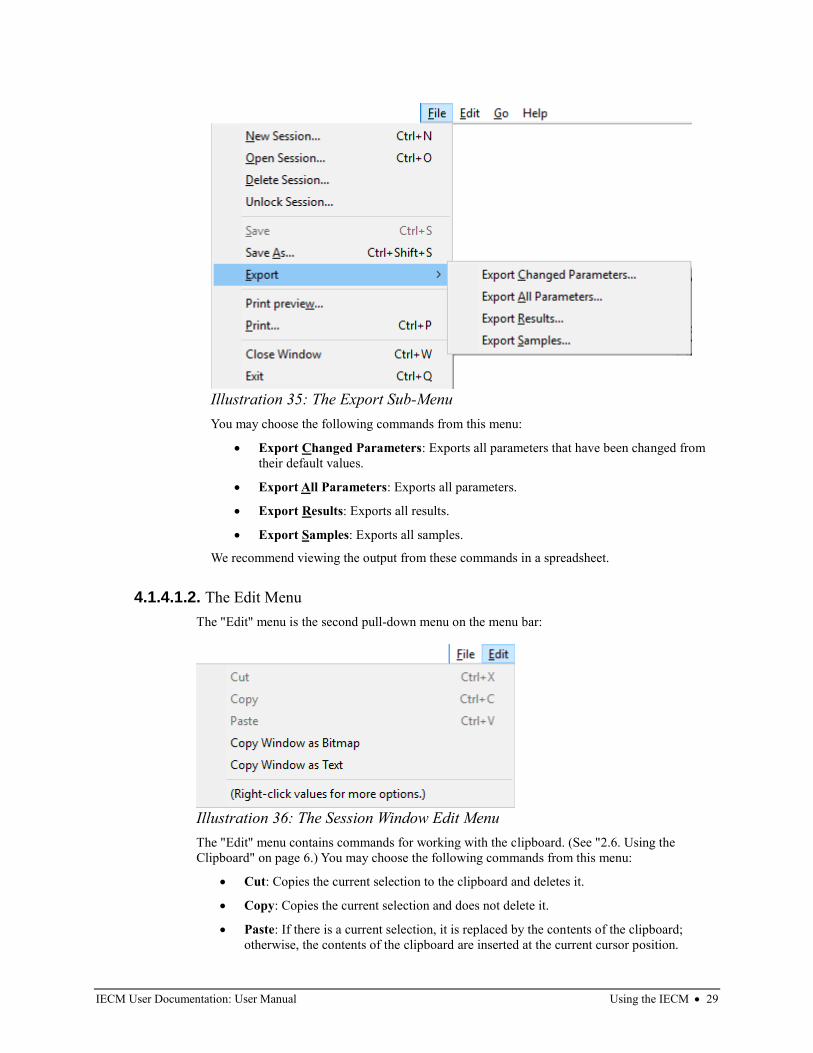
IECM User Documentation: User Manual Using the IECM • 29
You may choose the following commands from this menu:
• Export Changed Parameters: Exports all parameters that have been changed from
their default values.
• Export All Parameters: Exports all parameters.
• Export Results: Exports all results.
• Export Samples: Exports all samples.
We recommend viewing the output from these commands in a spreadsheet.
4.1.4.1.2. The Edit Menu
The "Edit" menu is the second pull-down menu on the menu bar:
The "Edit" menu contains commands for working with the clipboard. (See "2.6. Using the
Clipboard" on page 6.) You may choose the following commands from this menu:
• Cut: Copies the current selection to the clipboard and deletes it.
• Copy: Copies the current selection and does not delete it.
• Paste: If there is a current selection, it is replaced by the contents of the clipboard;
otherwise, the contents of the clipboard are inserted at the current cursor position.
Illustration 35: The Export Sub-Menu
Illustration 36: The Session Window Edit Menu
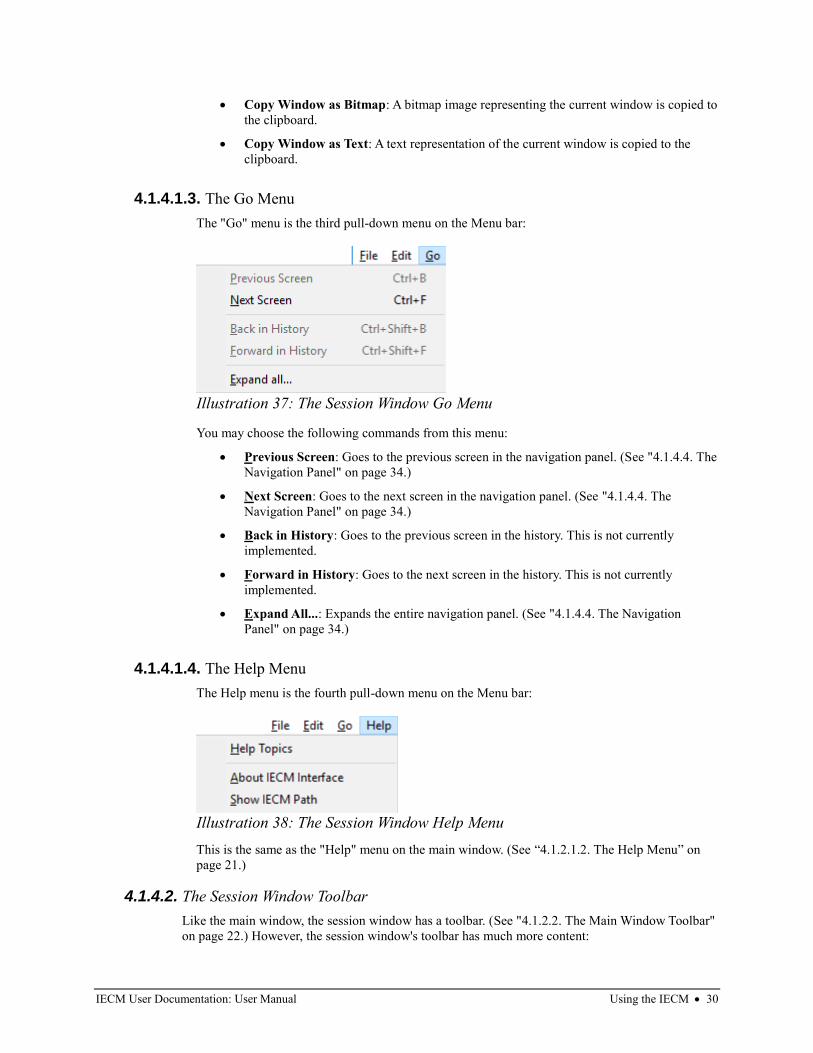
IECM User Documentation: User Manual Using the IECM • 30
• Copy Window as Bitmap: A bitmap image representing the current window is copied to
the clipboard.
• Copy Window as Text: A text representation of the current window is copied to the
clipboard.
4.1.4.1.3. The Go Menu
The "Go" menu is the third pull-down menu on the Menu bar:
You may choose the following commands from this menu:
• Previous Screen: Goes to the previous screen in the navigation panel. (See "4.1.4.4. The
Navigation Panel" on page 34.)
• Next Screen: Goes to the next screen in the navigation panel. (See "4.1.4.4. The
Navigation Panel" on page 34.)
• Back in History: Goes to the previous screen in the history. This is not currently
implemented.
• Forward in History: Goes to the next screen in the history. This is not currently
implemented.
• Expand All...: Expands the entire navigation panel. (See "4.1.4.4. The Navigation
Panel" on page 34.)
4.1.4.1.4. The Help Menu
The Help menu is the fourth pull-down menu on the Menu bar:
This is the same as the "Help" menu on the main window. (See “4.1.2.1.2. The Help Menu” on
page 21.)
4.1.4.2. The Session Window Toolbar
Like the main window, the session window has a toolbar. (See "4.1.2.2. The Main Window Toolbar"
on page 22.) However, the session window's toolbar has much more content:
Illustration 37: The Session Window Go Menu
Illustration 38: The Session Window Help Menu
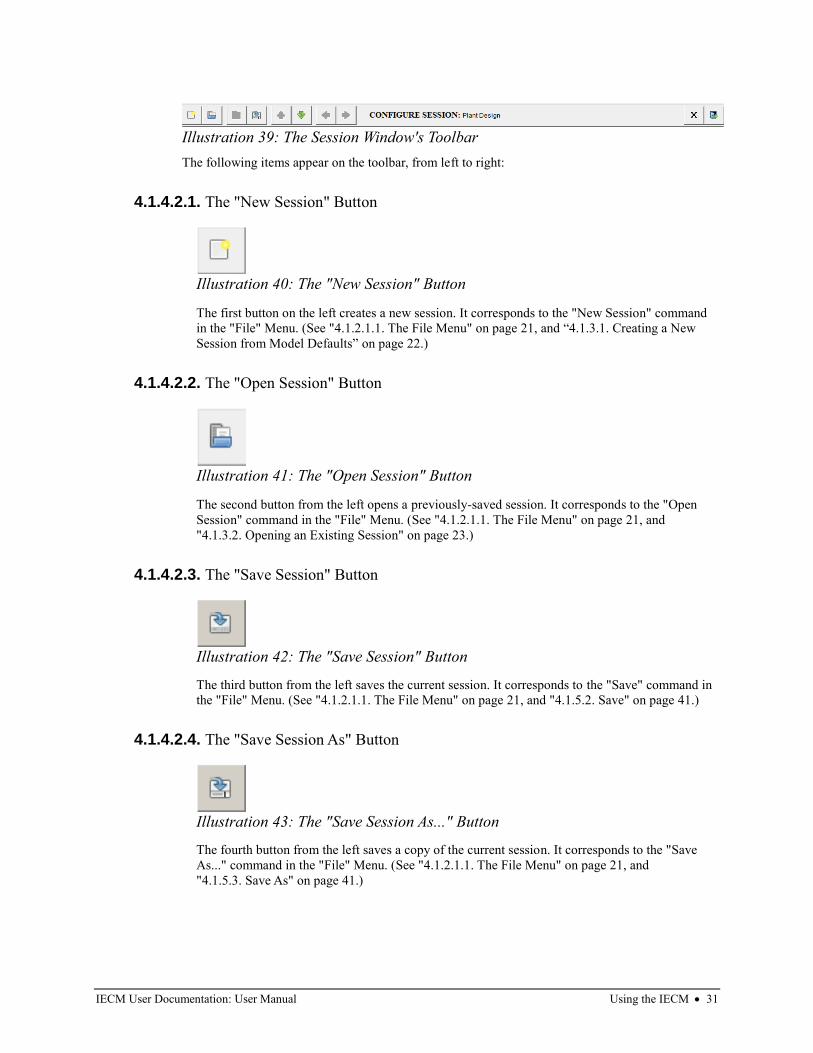
IECM User Documentation: User Manual Using the IECM • 31
The following items appear on the toolbar, from left to right:
4.1.4.2.1. The "New Session" Button
The first button on the left creates a new session. It corresponds to the "New Session" command
in the "File" Menu. (See "4.1.2.1.1. The File Menu" on page 21, and “4.1.3.1. Creating a New
Session from Model Defaults” on page 22.)
4.1.4.2.2. The "Open Session" Button
The second button from the left opens a previously-saved session. It corresponds to the "Open
Session" command in the "File" Menu. (See "4.1.2.1.1. The File Menu" on page 21, and
"4.1.3.2. Opening an Existing Session" on page 23.)
4.1.4.2.3. The "Save Session" Button
The third button from the left saves the current session. It corresponds to the "Save" command in
the "File" Menu. (See "4.1.2.1.1. The File Menu" on page 21, and "4.1.5.2. Save" on page 41.)
4.1.4.2.4. The "Save Session As" Button
The fourth button from the left saves a copy of the current session. It corresponds to the "Save
As..." command in the "File" Menu. (See "4.1.2.1.1. The File Menu" on page 21, and
"4.1.5.3. Save As" on page 41.)
Illustration 39: The Session Window's Toolbar
Illustration 40: The "New Session" Button
Illustration 41: The "Open Session" Button
Illustration 42: The "Save Session" Button
Illustration 43: The "Save Session As..." Button
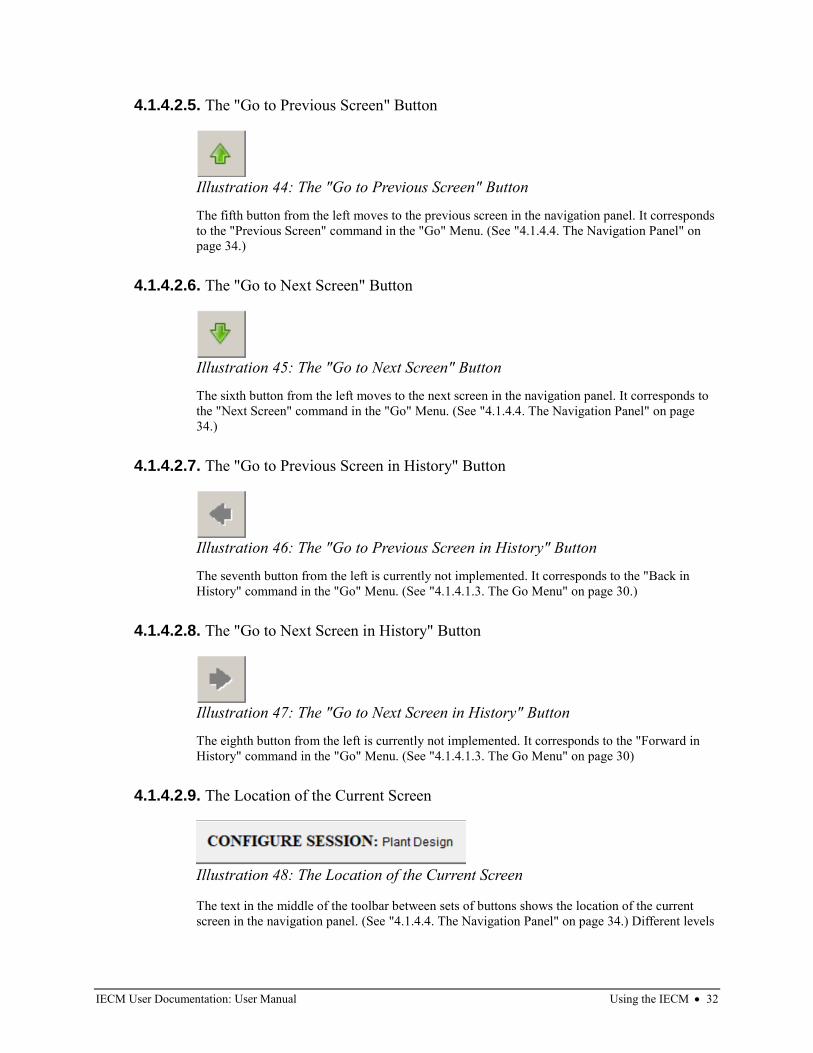
IECM User Documentation: User Manual Using the IECM • 32
4.1.4.2.5. The "Go to Previous Screen" Button
The fifth button from the left moves to the previous screen in the navigation panel. It corresponds
to the "Previous Screen" command in the "Go" Menu. (See "4.1.4.4. The Navigation Panel" on
page 34.)
4.1.4.2.6. The "Go to Next Screen" Button
The sixth button from the left moves to the next screen in the navigation panel. It corresponds to
the "Next Screen" command in the "Go" Menu. (See "4.1.4.4. The Navigation Panel" on page
34.)
4.1.4.2.7. The "Go to Previous Screen in History" Button
The seventh button from the left is currently not implemented. It corresponds to the "Back in
History" command in the "Go" Menu. (See "4.1.4.1.3. The Go Menu" on page 30.)
4.1.4.2.8. The "Go to Next Screen in History" Button
The eighth button from the left is currently not implemented. It corresponds to the "Forward in
History" command in the "Go" Menu. (See "4.1.4.1.3. The Go Menu" on page 30)
4.1.4.2.9. The Location of the Current Screen
The text in the middle of the toolbar between sets of buttons shows the location of the current
screen in the navigation panel. (See "4.1.4.4. The Navigation Panel" on page 34.) Different levels
Illustration 44: The "Go to Previous Screen" Button
Illustration 45: The "Go to Next Screen" Button
Illustration 46: The "Go to Previous Screen in History" Button
Illustration 47: The "Go to Next Screen in History" Button
Illustration 48: The Location of the Current Screen
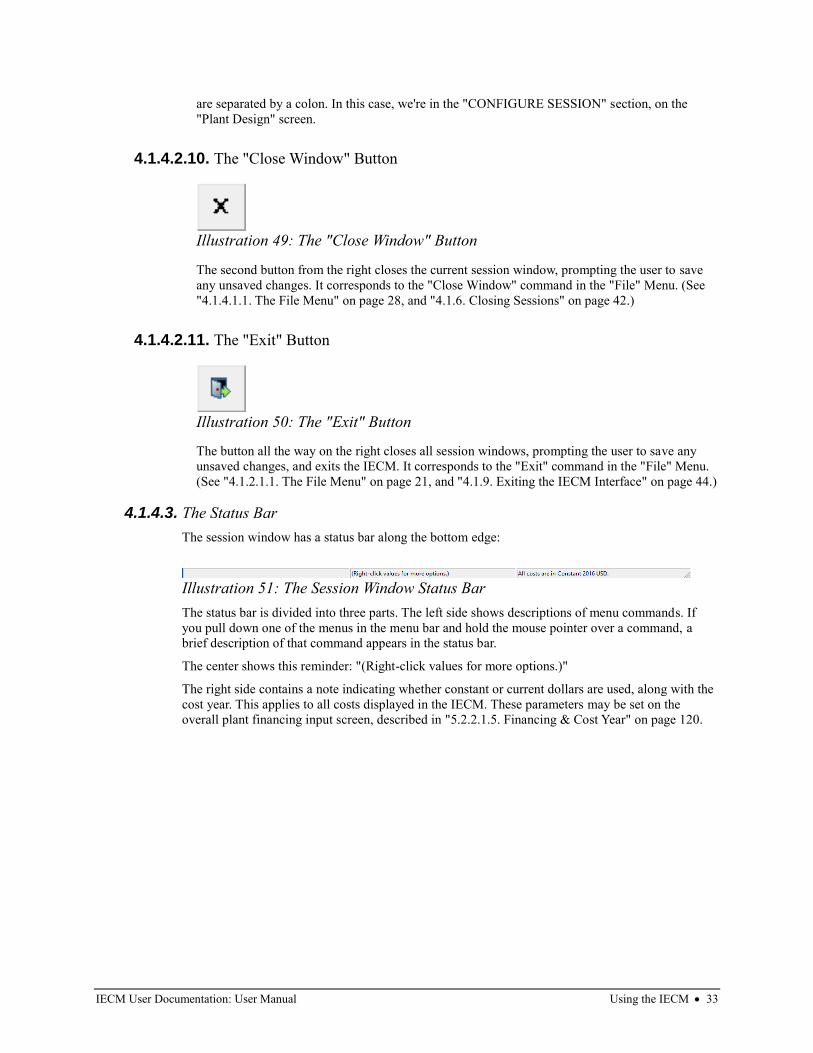
IECM User Documentation: User Manual Using the IECM • 33
are separated by a colon. In this case, we're in the "CONFIGURE SESSION" section, on the
"Plant Design" screen.
4.1.4.2.10. The "Close Window" Button
The second button from the right closes the current session window, prompting the user to save
any unsaved changes. It corresponds to the "Close Window" command in the "File" Menu. (See
"4.1.4.1.1. The File Menu" on page 28, and "4.1.6. Closing Sessions" on page 42.)
4.1.4.2.11. The "Exit" Button
The button all the way on the right closes all session windows, prompting the user to save any
unsaved changes, and exits the IECM. It corresponds to the "Exit" command in the "File" Menu.
(See "4.1.2.1.1. The File Menu" on page 21, and "4.1.9. Exiting the IECM Interface" on page 44.)
4.1.4.3. The Status Bar
The session window has a status bar along the bottom edge:
The status bar is divided into three parts. The left side shows descriptions of menu commands. If
you pull down one of the menus in the menu bar and hold the mouse pointer over a command, a
brief description of that command appears in the status bar.
The center shows this reminder: "(Right-click values for more options.)"
The right side contains a note indicating whether constant or current dollars are used, along with the
cost year. This applies to all costs displayed in the IECM. These parameters may be set on the
overall plant financing input screen, described in "5.2.2.1.5. Financing & Cost Year" on page 120.
Illustration 49: The "Close Window" Button
Illustration 50: The "Exit" Button
Illustration 51: The Session Window Status Bar
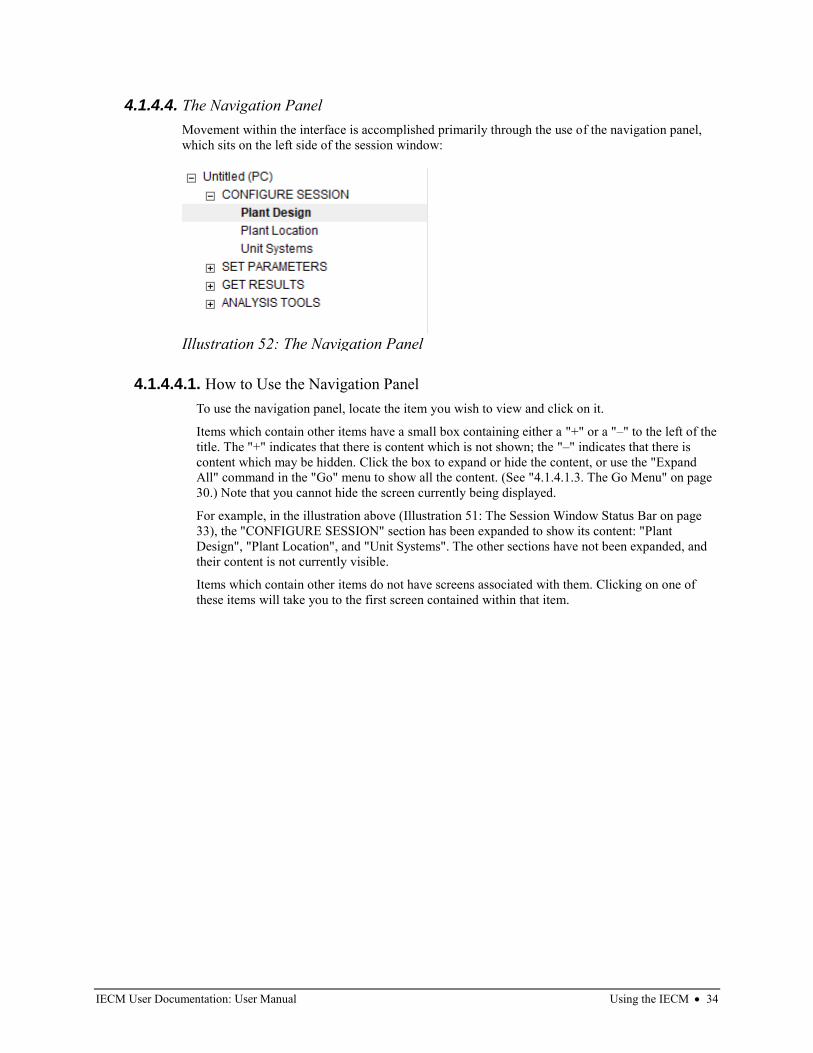
IECM User Documentation: User Manual Using the IECM • 34
4.1.4.4. The Navigation Panel
Movement within the interface is accomplished primarily through the use of the navigation panel,
which sits on the left side of the session window:
4.1.4.4.1. How to Use the Navigation Panel
To use the navigation panel, locate the item you wish to view and click on it.
Items which contain other items have a small box containing either a "+" or a "–" to the left of the
title. The "+" indicates that there is content which is not shown; the "–" indicates that there is
content which may be hidden. Click the box to expand or hide the content, or use the "Expand
All" command in the "Go" menu to show all the content. (See "4.1.4.1.3. The Go Menu" on page
30.) Note that you cannot hide the screen currently being displayed.
For example, in the illustration above (Illustration 51: The Session Window Status Bar on page
33), the "CONFIGURE SESSION" section has been expanded to show its content: "Plant
Design", "Plant Location", and "Unit Systems". The other sections have not been expanded, and
their content is not currently visible.
Items which contain other items do not have screens associated with them. Clicking on one of
these items will take you to the first screen contained within that item.
Illustration 52: The Navigation Panel
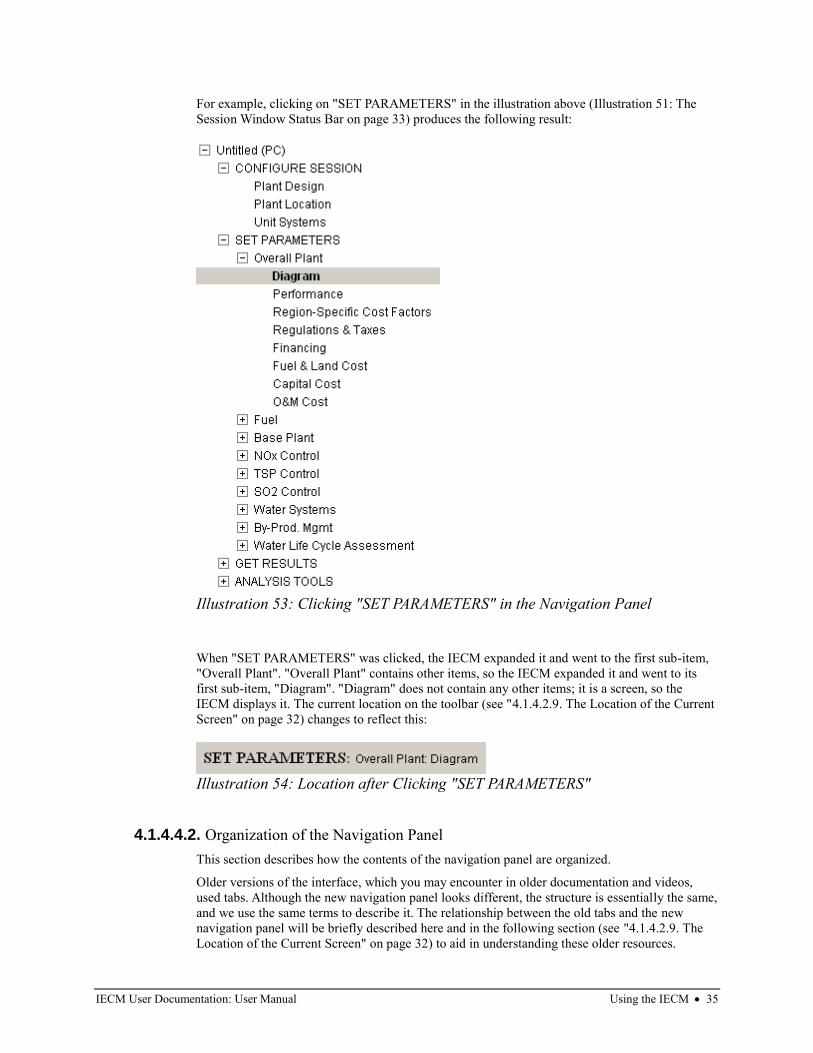
IECM User Documentation: User Manual Using the IECM • 35
For example, clicking on "SET PARAMETERS" in the illustration above (Illustration 51: The
Session Window Status Bar on page 33) produces the following result:
When "SET PARAMETERS" was clicked, the IECM expanded it and went to the first sub-item,
"Overall Plant". "Overall Plant" contains other items, so the IECM expanded it and went to its
first sub-item, "Diagram". "Diagram" does not contain any other items; it is a screen, so the
IECM displays it. The current location on the toolbar (see "4.1.4.2.9. The Location of the Current
Screen" on page 32) changes to reflect this:
4.1.4.4.2. Organization of the Navigation Panel
This section describes how the contents of the navigation panel are organized.
Older versions of the interface, which you may encounter in older documentation and videos,
used tabs. Although the new navigation panel looks different, the structure is essentially the same,
and we use the same terms to describe it. The relationship between the old tabs and the new
navigation panel will be briefly described here and in the following section (see "4.1.4.2.9. The
Location of the Current Screen" on page 32) to aid in understanding these older resources.
Illustration 53: Clicking "SET PARAMETERS" in the Navigation Panel
Illustration 54: Location after Clicking "SET PARAMETERS"
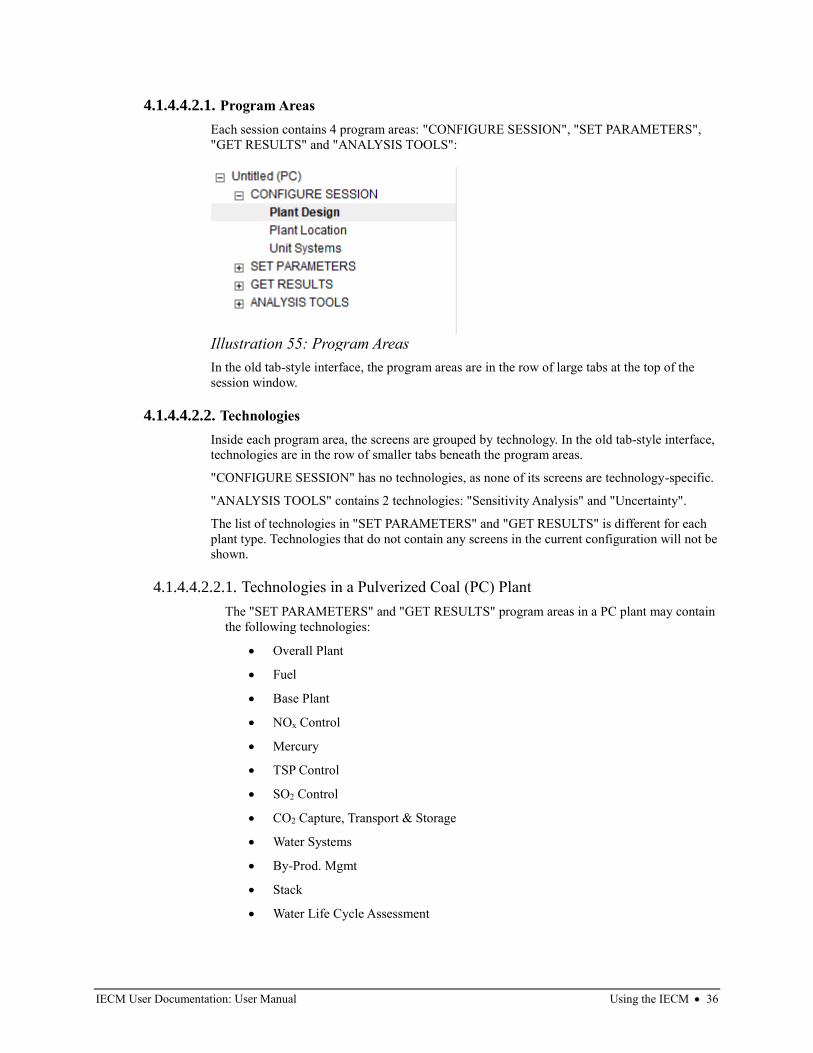
IECM User Documentation: User Manual Using the IECM • 36
4.1.4.4.2.1. Program Areas
Each session contains 4 program areas: "CONFIGURE SESSION", "SET PARAMETERS",
"GET RESULTS" and "ANALYSIS TOOLS":
In the old tab-style interface, the program areas are in the row of large tabs at the top of the
session window.
4.1.4.4.2.2. Technologies
Inside each program area, the screens are grouped by technology. In the old tab-style interface,
technologies are in the row of smaller tabs beneath the program areas.
"CONFIGURE SESSION" has no technologies, as none of its screens are technology-specific.
"ANALYSIS TOOLS" contains 2 technologies: "Sensitivity Analysis" and "Uncertainty".
The list of technologies in "SET PARAMETERS" and "GET RESULTS" is different for each
plant type. Technologies that do not contain any screens in the current configuration will not be
shown.
4.1.4.4.2.2.1. Technologies in a Pulverized Coal (PC) Plant
The "SET PARAMETERS" and "GET RESULTS" program areas in a PC plant may contain
the following technologies:
• Overall Plant
• Fuel
• Base Plant
• NOx Control
• Mercury
• TSP Control
• SO2 Control
• CO2 Capture, Transport & Storage
• Water Systems
• By-Prod. Mgmt
• Stack
• Water Life Cycle Assessment
Illustration 55: Program Areas
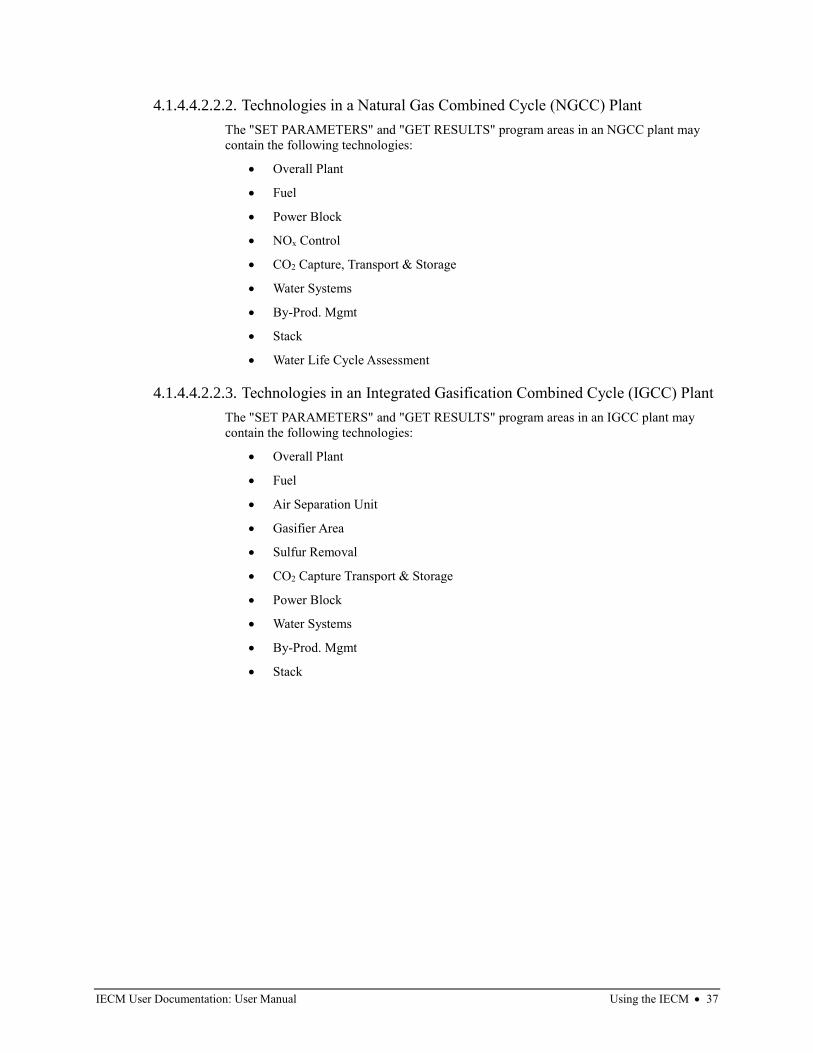
IECM User Documentation: User Manual Using the IECM • 37
4.1.4.4.2.2.2. Technologies in a Natural Gas Combined Cycle (NGCC) Plant
The "SET PARAMETERS" and "GET RESULTS" program areas in an NGCC plant may
contain the following technologies:
• Overall Plant
• Fuel
• Power Block
• NOx Control
• CO2 Capture, Transport & Storage
• Water Systems
• By-Prod. Mgmt
• Stack
• Water Life Cycle Assessment
4.1.4.4.2.2.3. Technologies in an Integrated Gasification Combined Cycle (IGCC) Plant
The "SET PARAMETERS" and "GET RESULTS" program areas in an IGCC plant may
contain the following technologies:
• Overall Plant
• Fuel
• Air Separation Unit
• Gasifier Area
• Sulfur Removal
• CO2 Capture Transport & Storage
• Power Block
• Water Systems
• By-Prod. Mgmt
• Stack
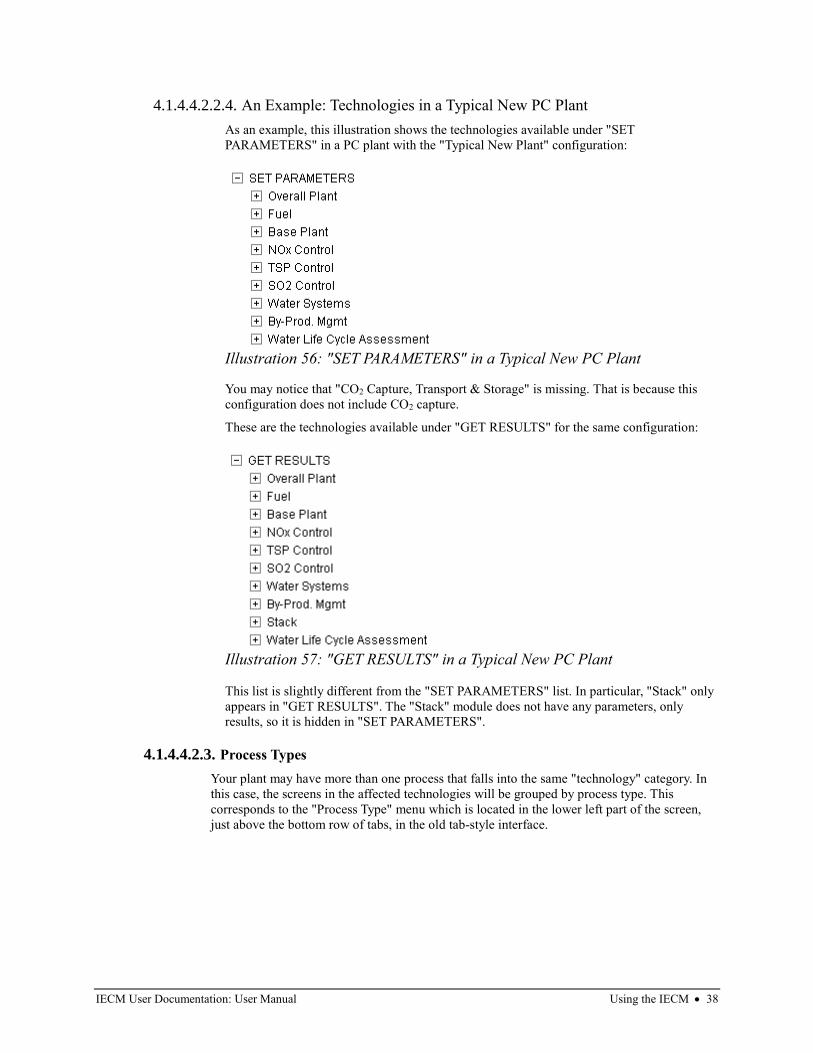
IECM User Documentation: User Manual Using the IECM • 38
4.1.4.4.2.2.4. An Example: Technologies in a Typical New PC Plant
As an example, this illustration shows the technologies available under "SET
PARAMETERS" in a PC plant with the "Typical New Plant" configuration:
You may notice that "CO2 Capture, Transport & Storage" is missing. That is because this
configuration does not include CO2 capture.
These are the technologies available under "GET RESULTS" for the same configuration:
This list is slightly different from the "SET PARAMETERS" list. In particular, "Stack" only
appears in "GET RESULTS". The "Stack" module does not have any parameters, only
results, so it is hidden in "SET PARAMETERS".
4.1.4.4.2.3. Process Types
Your plant may have more than one process that falls into the same "technology" category. In
this case, the screens in the affected technologies will be grouped by process type. This
corresponds to the "Process Type" menu which is located in the lower left part of the screen,
just above the bottom row of tabs, in the old tab-style interface.
Illustration 56: "SET PARAMETERS" in a Typical New PC Plant
Illustration 57: "GET RESULTS" in a Typical New PC Plant
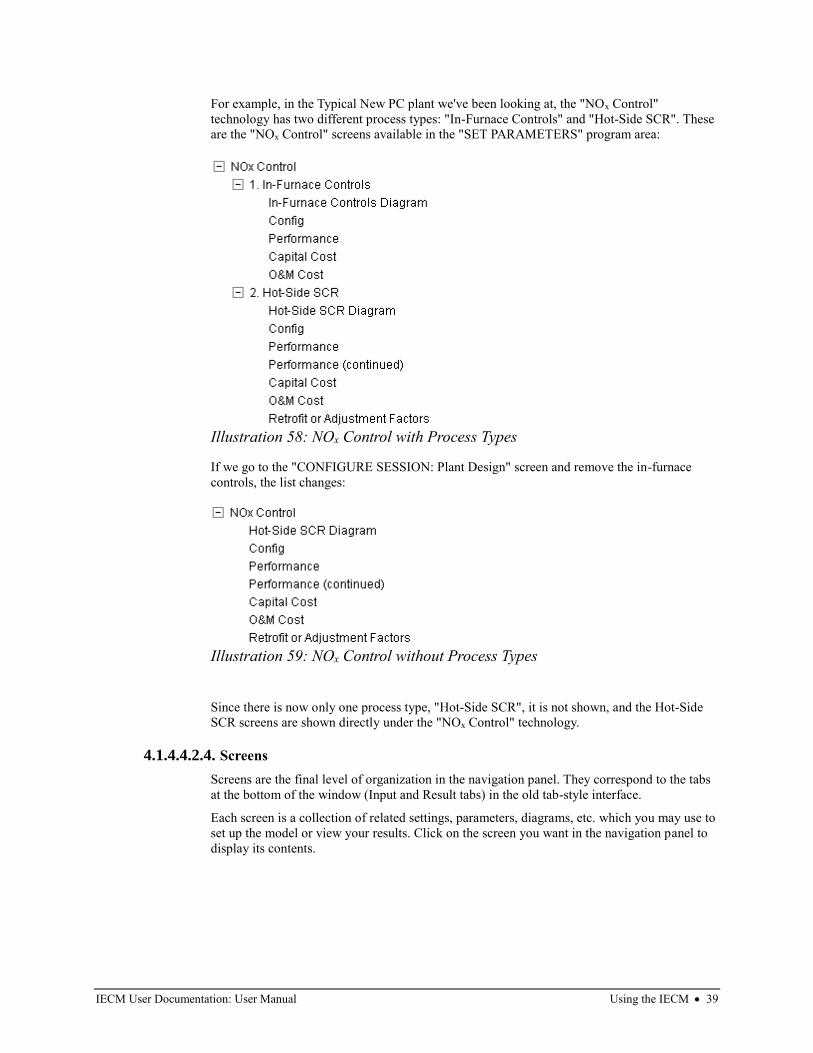
IECM User Documentation: User Manual Using the IECM • 39
For example, in the Typical New PC plant we've been looking at, the "NOx Control"
technology has two different process types: "In-Furnace Controls" and "Hot-Side SCR". These
are the "NOx Control" screens available in the "SET PARAMETERS" program area:
If we go to the "CONFIGURE SESSION: Plant Design" screen and remove the in-furnace
controls, the list changes:
Since there is now only one process type, "Hot-Side SCR", it is not shown, and the Hot-Side
SCR screens are shown directly under the "NOx Control" technology.
4.1.4.4.2.4. Screens
Screens are the final level of organization in the navigation panel. They correspond to the tabs
at the bottom of the window (Input and Result tabs) in the old tab-style interface.
Each screen is a collection of related settings, parameters, diagrams, etc. which you may use to
set up the model or view your results. Click on the screen you want in the navigation panel to
display its contents.
Illustration 58: NOx Control with Process Types
Illustration 59: NOx Control without Process Types
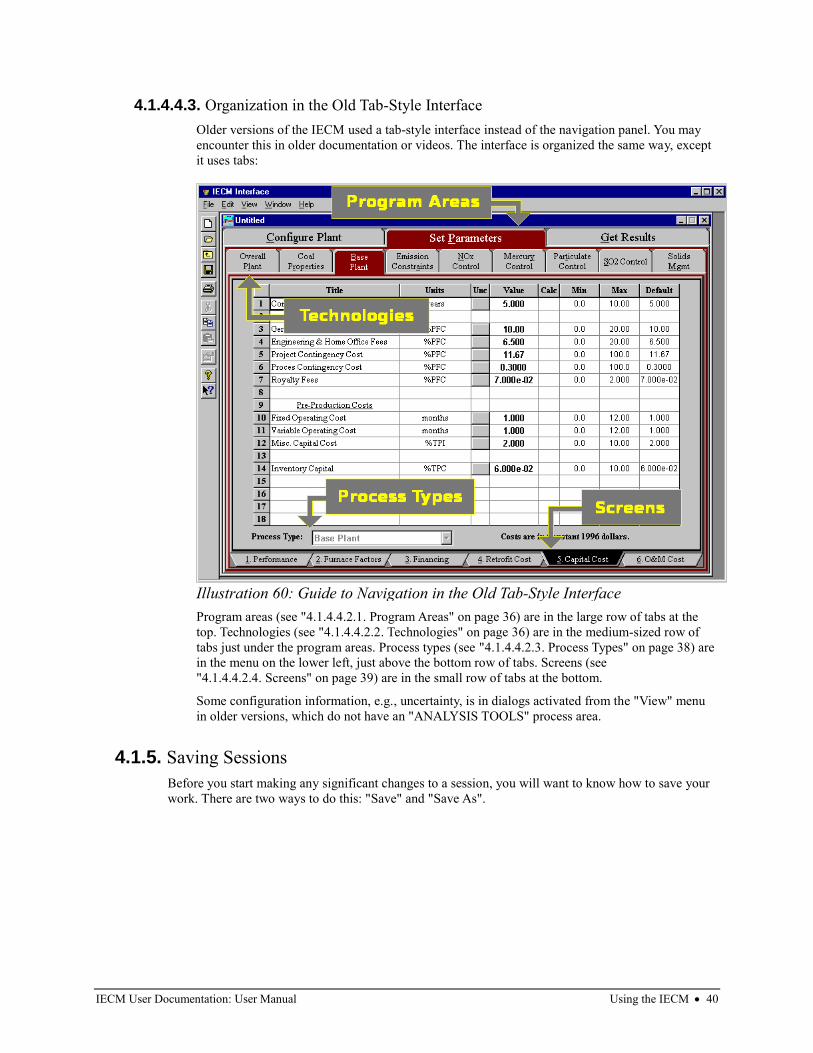
IECM User Documentation: User Manual Using the IECM • 40
4.1.4.4.3. Organization in the Old Tab-Style Interface
Older versions of the IECM used a tab-style interface instead of the navigation panel. You may
encounter this in older documentation or videos. The interface is organized the same way, except
it uses tabs:
Program areas (see "4.1.4.4.2.1. Program Areas" on page 36) are in the large row of tabs at the
top. Technologies (see "4.1.4.4.2.2. Technologies" on page 36) are in the medium-sized row of
tabs just under the program areas. Process types (see "4.1.4.4.2.3. Process Types" on page 38) are
in the menu on the lower left, just above the bottom row of tabs. Screens (see
"4.1.4.4.2.4. Screens" on page 39) are in the small row of tabs at the bottom.
Some configuration information, e.g., uncertainty, is in dialogs activated from the "View" menu
in older versions, which do not have an "ANALYSIS TOOLS" process area.
4.1.5. Saving Sessions
Before you start making any significant changes to a session, you will want to know how to save your
work. There are two ways to do this: "Save" and "Save As".
Illustration 60: Guide to Navigation in the Old Tab-Style Interface
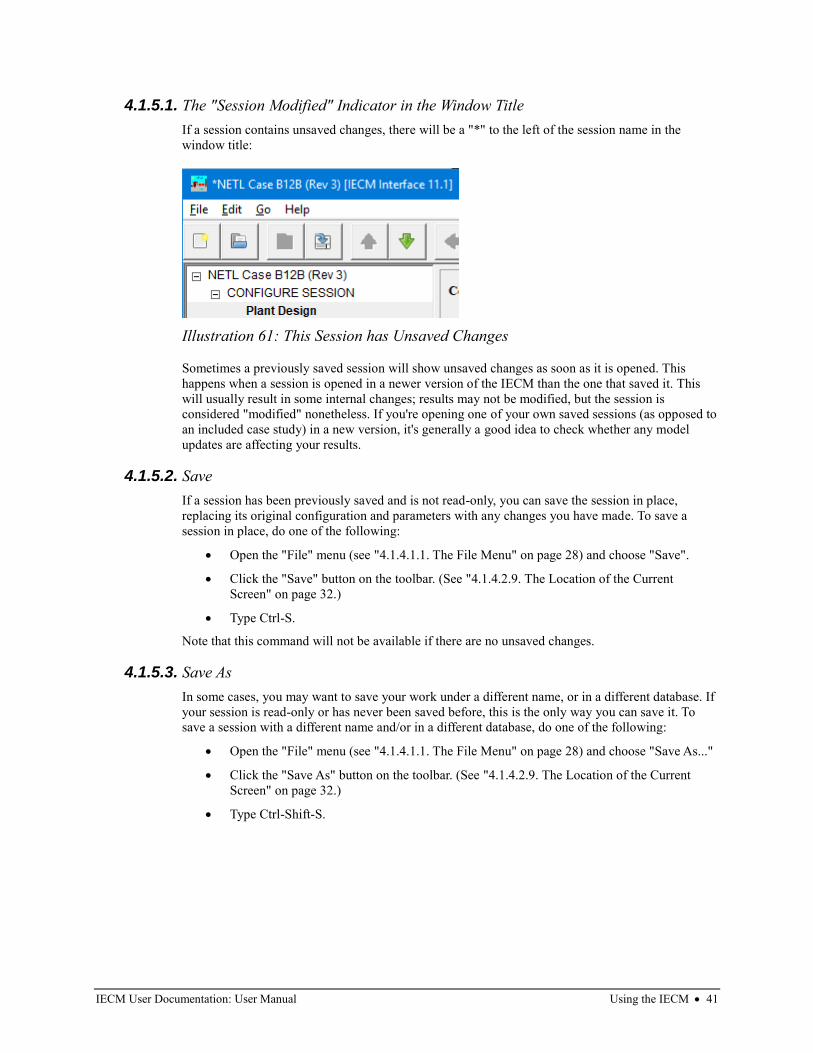
IECM User Documentation: User Manual Using the IECM • 41
4.1.5.1. The "Session Modified" Indicator in the Window Title
If a session contains unsaved changes, there will be a "*" to the left of the session name in the
window title:
Sometimes a previously saved session will show unsaved changes as soon as it is opened. This
happens when a session is opened in a newer version of the IECM than the one that saved it. This
will usually result in some internal changes; results may not be modified, but the session is
considered "modified" nonetheless. If you're opening one of your own saved sessions (as opposed to
an included case study) in a new version, it's generally a good idea to check whether any model
updates are affecting your results.
4.1.5.2. Save
If a session has been previously saved and is not read-only, you can save the session in place,
replacing its original configuration and parameters with any changes you have made. To save a
session in place, do one of the following:
• Open the "File" menu (see "4.1.4.1.1. The File Menu" on page 28) and choose "Save".
• Click the "Save" button on the toolbar. (See "4.1.4.2.9. The Location of the Current
Screen" on page 32.)
• Type Ctrl-S.
Note that this command will not be available if there are no unsaved changes.
4.1.5.3. Save As
In some cases, you may want to save your work under a different name, or in a different database. If
your session is read-only or has never been saved before, this is the only way you can save it. To
save a session with a different name and/or in a different database, do one of the following:
• Open the "File" menu (see "4.1.4.1.1. The File Menu" on page 28) and choose "Save As..."
• Click the "Save As" button on the toolbar. (See "4.1.4.2.9. The Location of the Current
Screen" on page 32.)
• Type Ctrl-Shift-S.
Illustration 61: This Session has Unsaved Changes
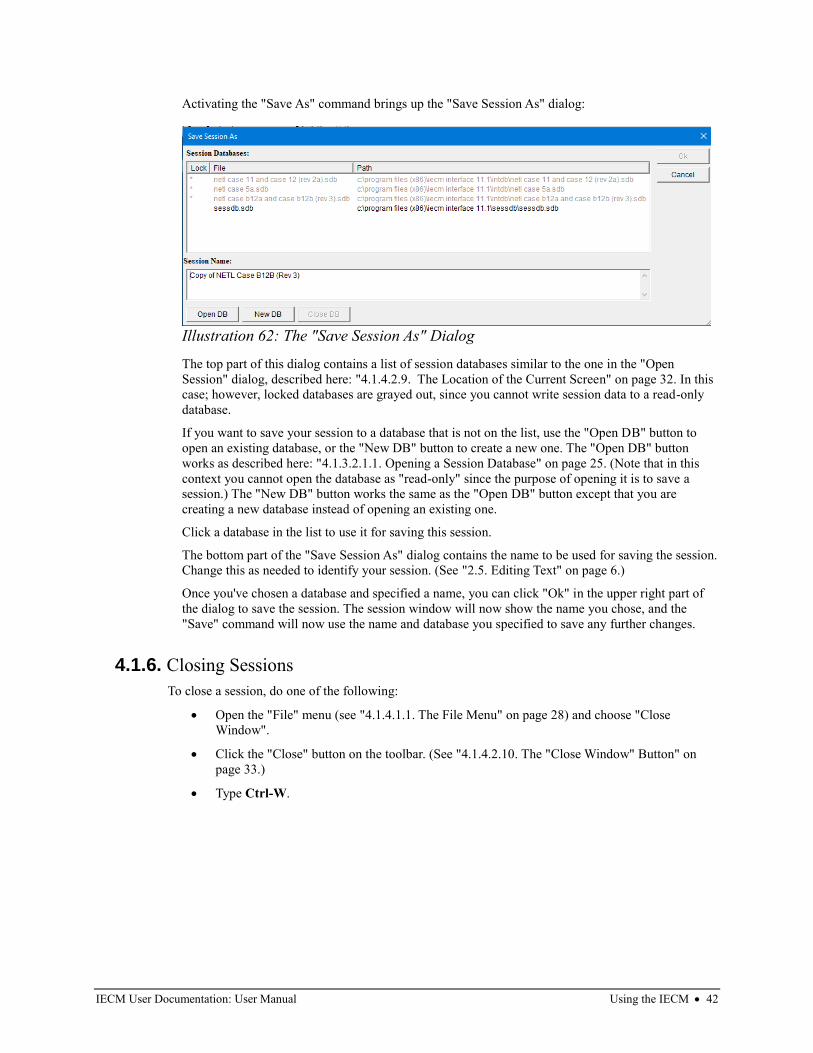
IECM User Documentation: User Manual Using the IECM • 42
Activating the "Save As" command brings up the "Save Session As" dialog:
The top part of this dialog contains a list of session databases similar to the one in the "Open
Session" dialog, described here: "4.1.4.2.9. The Location of the Current Screen" on page 32. In this
case; however, locked databases are grayed out, since you cannot write session data to a read-only
database.
If you want to save your session to a database that is not on the list, use the "Open DB" button to
open an existing database, or the "New DB" button to create a new one. The "Open DB" button
works as described here: "4.1.3.2.1.1. Opening a Session Database" on page 25. (Note that in this
context you cannot open the database as "read-only" since the purpose of opening it is to save a
session.) The "New DB" button works the same as the "Open DB" button except that you are
creating a new database instead of opening an existing one.
Click a database in the list to use it for saving this session.
The bottom part of the "Save Session As" dialog contains the name to be used for saving the session.
Change this as needed to identify your session. (See "2.5. Editing Text" on page 6.)
Once you've chosen a database and specified a name, you can click "Ok" in the upper right part of
the dialog to save the session. The session window will now show the name you chose, and the
"Save" command will now use the name and database you specified to save any further changes.
4.1.6. Closing Sessions
To close a session, do one of the following:
• Open the "File" menu (see "4.1.4.1.1. The File Menu" on page 28) and choose "Close
Window".
• Click the "Close" button on the toolbar. (See "4.1.4.2.10. The "Close Window" Button" on
page 33.)
• Type Ctrl-W.
Illustration 62: The "Save Session As" Dialog
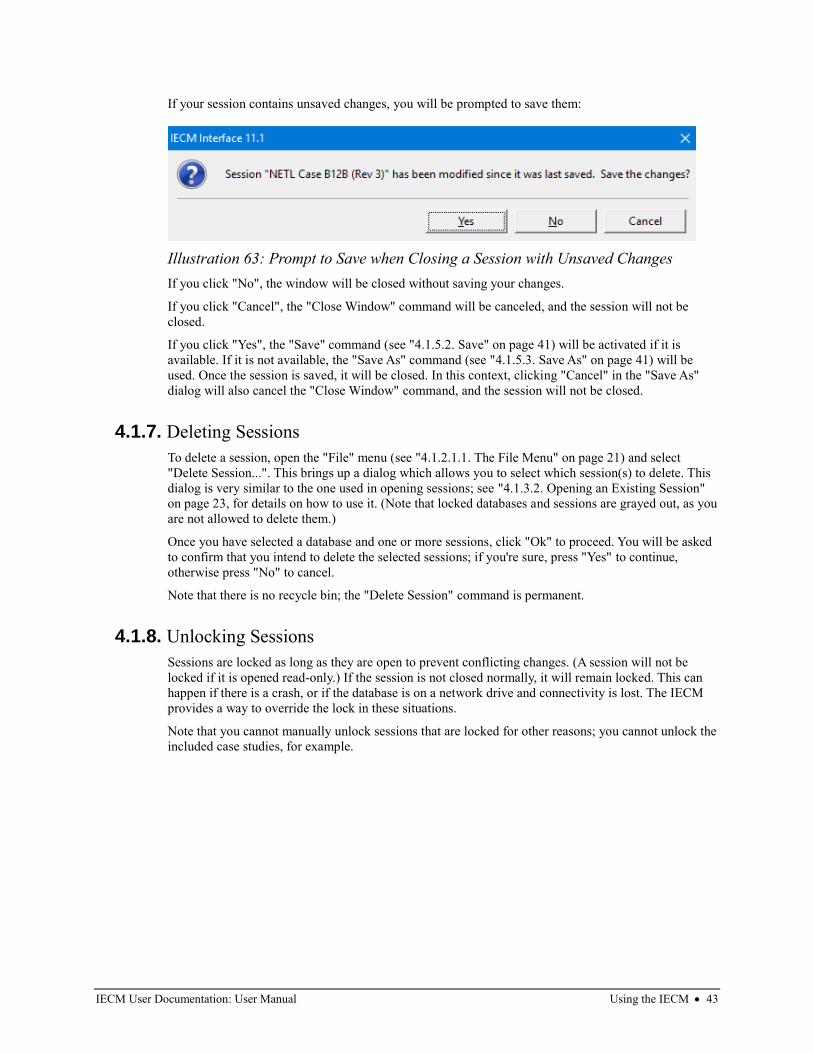
IECM User Documentation: User Manual Using the IECM • 43
If your session contains unsaved changes, you will be prompted to save them:
If you click "No", the window will be closed without saving your changes.
If you click "Cancel", the "Close Window" command will be canceled, and the session will not be
closed.
If you click "Yes", the "Save" command (see "4.1.5.2. Save" on page 41) will be activated if it is
available. If it is not available, the "Save As" command (see "4.1.5.3. Save As" on page 41) will be
used. Once the session is saved, it will be closed. In this context, clicking "Cancel" in the "Save As"
dialog will also cancel the "Close Window" command, and the session will not be closed.
4.1.7. Deleting Sessions
To delete a session, open the "File" menu (see "4.1.2.1.1. The File Menu" on page 21) and select
"Delete Session...". This brings up a dialog which allows you to select which session(s) to delete. This
dialog is very similar to the one used in opening sessions; see "4.1.3.2. Opening an Existing Session"
on page 23, for details on how to use it. (Note that locked databases and sessions are grayed out, as you
are not allowed to delete them.)
Once you have selected a database and one or more sessions, click "Ok" to proceed. You will be asked
to confirm that you intend to delete the selected sessions; if you're sure, press "Yes" to continue,
otherwise press "No" to cancel.
Note that there is no recycle bin; the "Delete Session" command is permanent.
4.1.8. Unlocking Sessions
Sessions are locked as long as they are open to prevent conflicting changes. (A session will not be
locked if it is opened read-only.) If the session is not closed normally, it will remain locked. This can
happen if there is a crash, or if the database is on a network drive and connectivity is lost. The IECM
provides a way to override the lock in these situations.
Note that you cannot manually unlock sessions that are locked for other reasons; you cannot unlock the
included case studies, for example.
Illustration 63: Prompt to Save when Closing a Session with Unsaved Changes
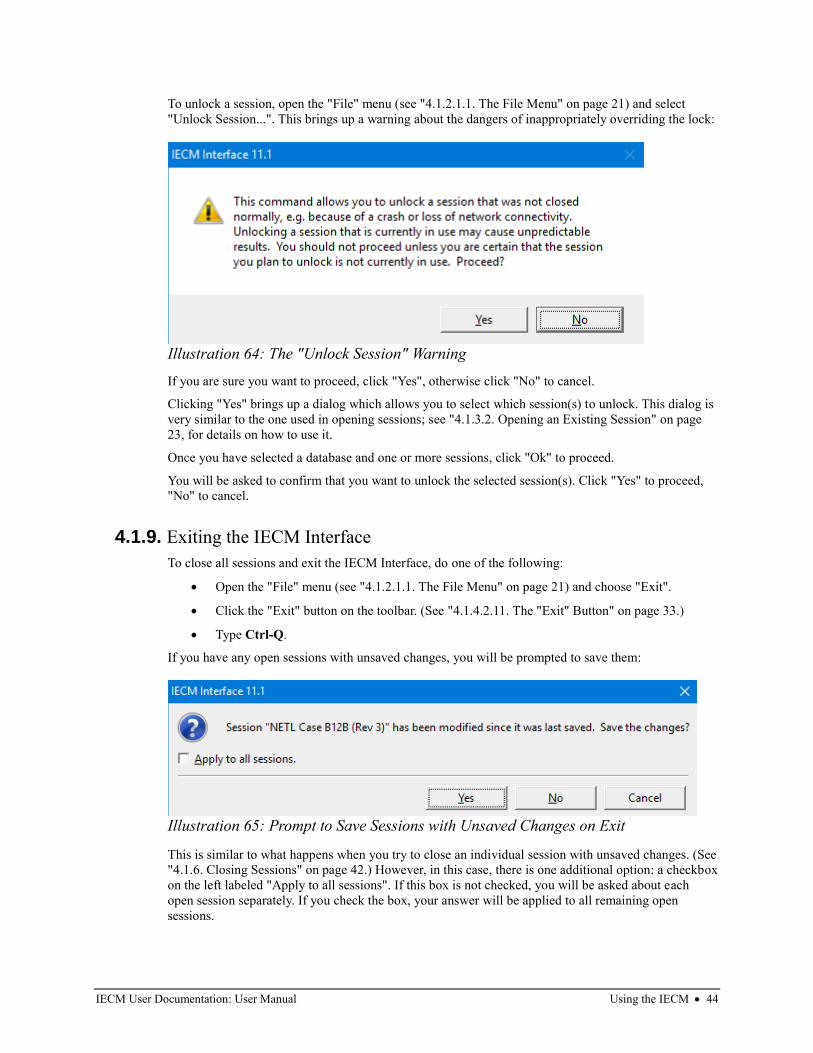
IECM User Documentation: User Manual Using the IECM • 44
To unlock a session, open the "File" menu (see "4.1.2.1.1. The File Menu" on page 21) and select
"Unlock Session...". This brings up a warning about the dangers of inappropriately overriding the lock:
If you are sure you want to proceed, click "Yes", otherwise click "No" to cancel.
Clicking "Yes" brings up a dialog which allows you to select which session(s) to unlock. This dialog is
very similar to the one used in opening sessions; see "4.1.3.2. Opening an Existing Session" on page
23, for details on how to use it.
Once you have selected a database and one or more sessions, click "Ok" to proceed.
You will be asked to confirm that you want to unlock the selected session(s). Click "Yes" to proceed,
"No" to cancel.
4.1.9. Exiting the IECM Interface
To close all sessions and exit the IECM Interface, do one of the following:
• Open the "File" menu (see "4.1.2.1.1. The File Menu" on page 21) and choose "Exit".
• Click the "Exit" button on the toolbar. (See "4.1.4.2.11. The "Exit" Button" on page 33.)
• Type Ctrl-Q.
If you have any open sessions with unsaved changes, you will be prompted to save them:
This is similar to what happens when you try to close an individual session with unsaved changes. (See
"4.1.6. Closing Sessions" on page 42.) However, in this case, there is one additional option: a checkbox
on the left labeled "Apply to all sessions". If this box is not checked, you will be asked about each
open session separately. If you check the box, your answer will be applied to all remaining open
sessions.
Illustration 64: The "Unlock Session" Warning
Illustration 65: Prompt to Save Sessions with Unsaved Changes on Exit
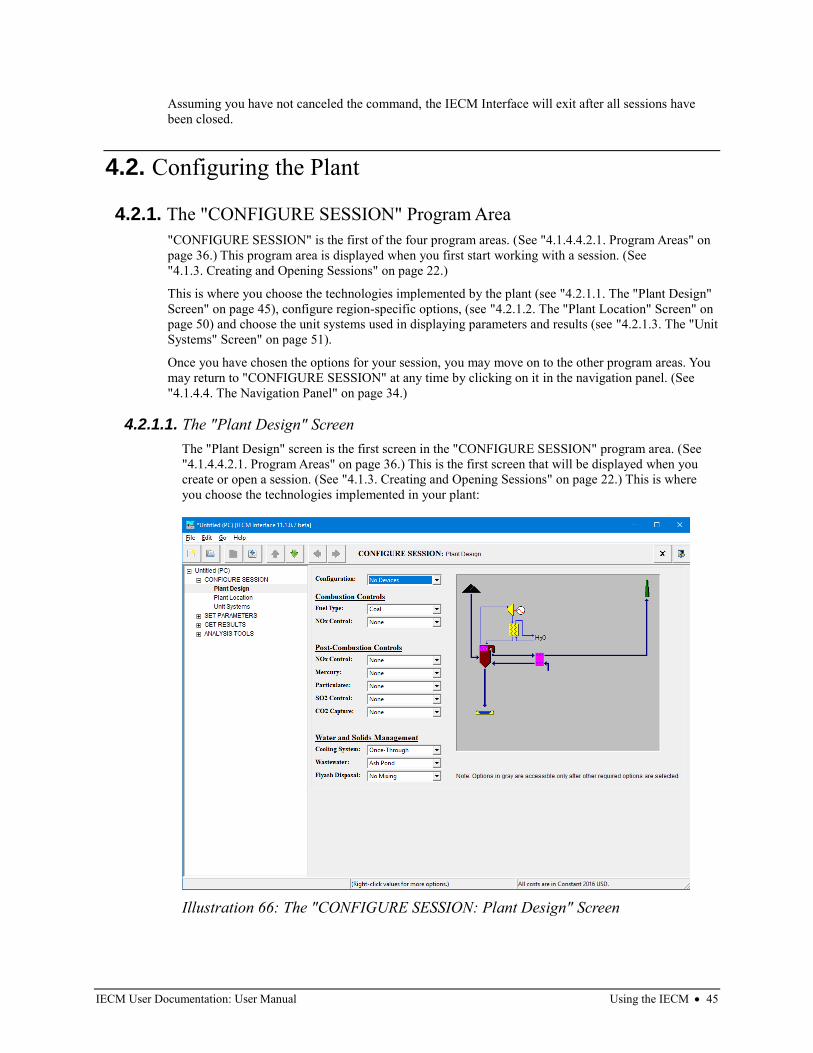
IECM User Documentation: User Manual Using the IECM • 45
Assuming you have not canceled the command, the IECM Interface will exit after all sessions have
been closed.
4.2. Configuring the Plant
4.2.1. The "CONFIGURE SESSION" Program Area
"CONFIGURE SESSION" is the first of the four program areas. (See "4.1.4.4.2.1. Program Areas" on
page 36.) This program area is displayed when you first start working with a session. (See
"4.1.3. Creating and Opening Sessions" on page 22.)
This is where you choose the technologies implemented by the plant (see "4.2.1.1. The "Plant Design"
Screen" on page 45), configure region-specific options, (see "4.2.1.2. The "Plant Location" Screen" on
page 50) and choose the unit systems used in displaying parameters and results (see "4.2.1.3. The "Unit
Systems" Screen" on page 51).
Once you have chosen the options for your session, you may move on to the other program areas. You
may return to "CONFIGURE SESSION" at any time by clicking on it in the navigation panel. (See
"4.1.4.4. The Navigation Panel" on page 34.)
4.2.1.1. The "Plant Design" Screen
The "Plant Design" screen is the first screen in the "CONFIGURE SESSION" program area. (See
"4.1.4.4.2.1. Program Areas" on page 36.) This is the first screen that will be displayed when you
create or open a session. (See "4.1.3. Creating and Opening Sessions" on page 22.) This is where
you choose the technologies implemented in your plant:
Illustration 66: The "CONFIGURE SESSION: Plant Design" Screen
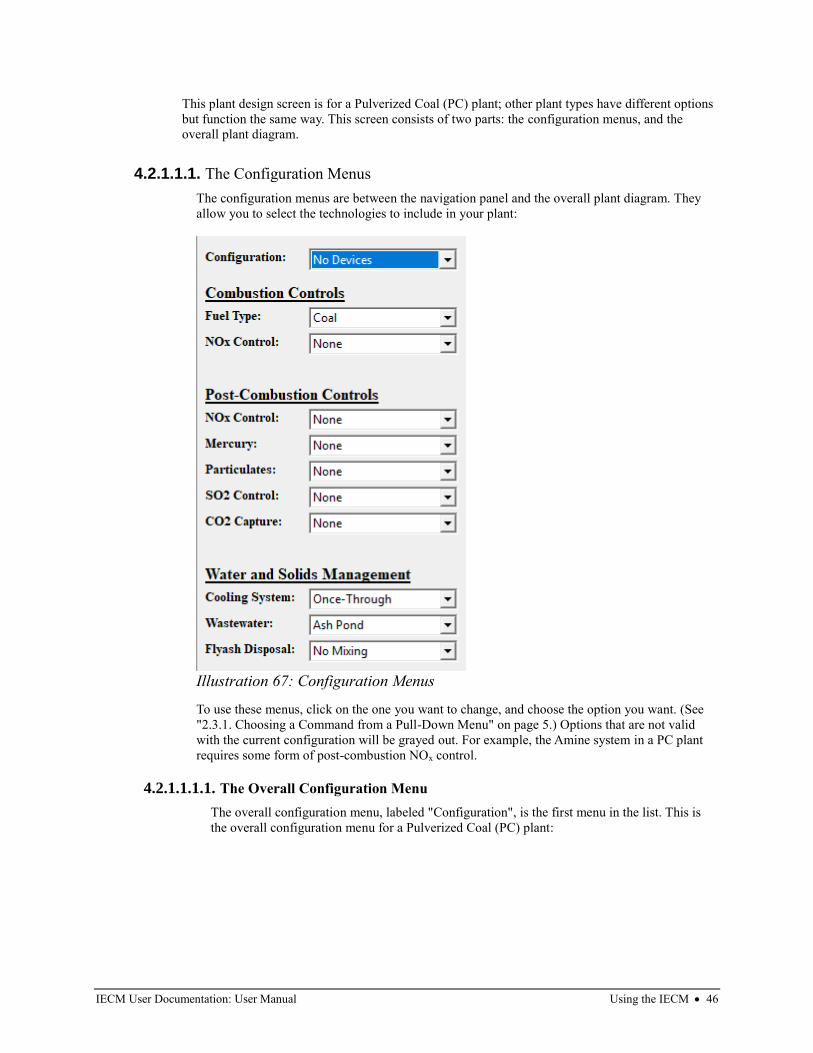
IECM User Documentation: User Manual Using the IECM • 46
This plant design screen is for a Pulverized Coal (PC) plant; other plant types have different options
but function the same way. This screen consists of two parts: the configuration menus, and the
overall plant diagram.
4.2.1.1.1. The Configuration Menus
The configuration menus are between the navigation panel and the overall plant diagram. They
allow you to select the technologies to include in your plant:
To use these menus, click on the one you want to change, and choose the option you want. (See
"2.3.1. Choosing a Command from a Pull-Down Menu" on page 5.) Options that are not valid
with the current configuration will be grayed out. For example, the Amine system in a PC plant
requires some form of post-combustion NOx control.
4.2.1.1.1.1. The Overall Configuration Menu
The overall configuration menu, labeled "Configuration", is the first menu in the list. This is
the overall configuration menu for a Pulverized Coal (PC) plant:
Illustration 67: Configuration Menus
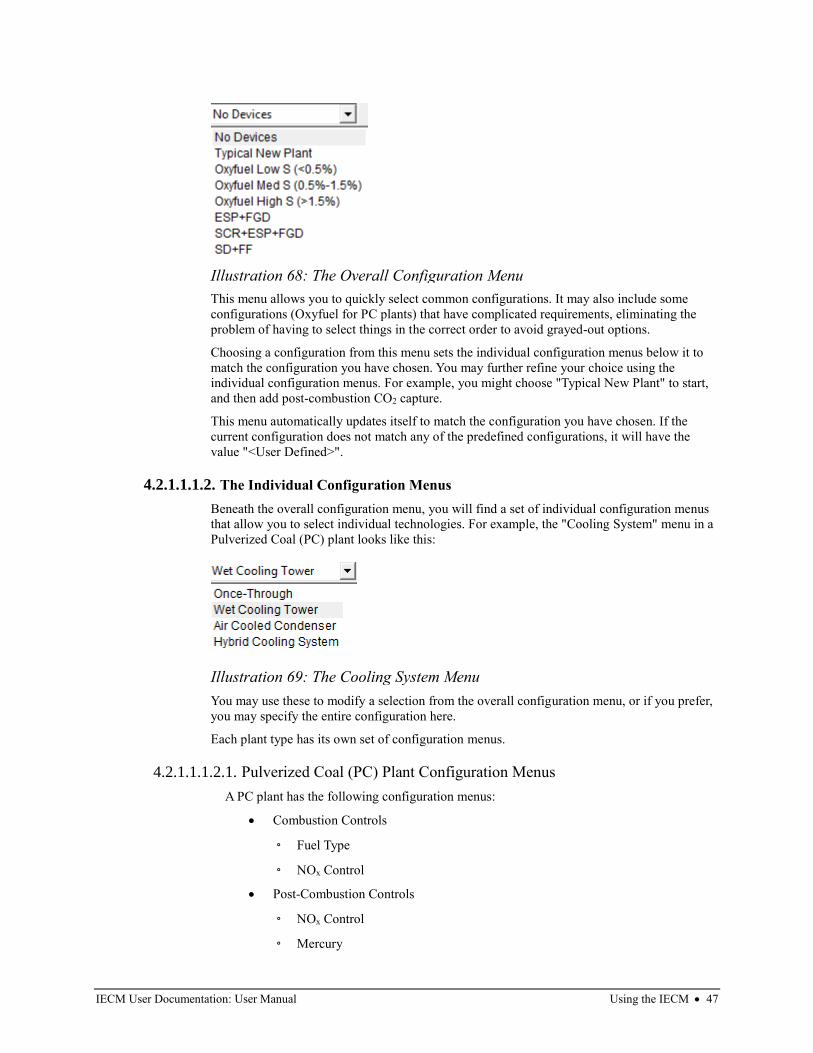
IECM User Documentation: User Manual Using the IECM • 47
This menu allows you to quickly select common configurations. It may also include some
configurations (Oxyfuel for PC plants) that have complicated requirements, eliminating the
problem of having to select things in the correct order to avoid grayed-out options.
Choosing a configuration from this menu sets the individual configuration menus below it to
match the configuration you have chosen. You may further refine your choice using the
individual configuration menus. For example, you might choose "Typical New Plant" to start,
and then add post-combustion CO2 capture.
This menu automatically updates itself to match the configuration you have chosen. If the
current configuration does not match any of the predefined configurations, it will have the
value "<User Defined>".
4.2.1.1.1.2. The Individual Configuration Menus
Beneath the overall configuration menu, you will find a set of individual configuration menus
that allow you to select individual technologies. For example, the "Cooling System" menu in a
Pulverized Coal (PC) plant looks like this:
You may use these to modify a selection from the overall configuration menu, or if you prefer,
you may specify the entire configuration here.
Each plant type has its own set of configuration menus.
4.2.1.1.1.2.1. Pulverized Coal (PC) Plant Configuration Menus
A PC plant has the following configuration menus:
• Combustion Controls
◦ Fuel Type
◦ NOx Control
• Post-Combustion Controls
◦ NOx Control
◦ Mercury
Illustration 68: The Overall Configuration Menu
Illustration 69: The Cooling System Menu
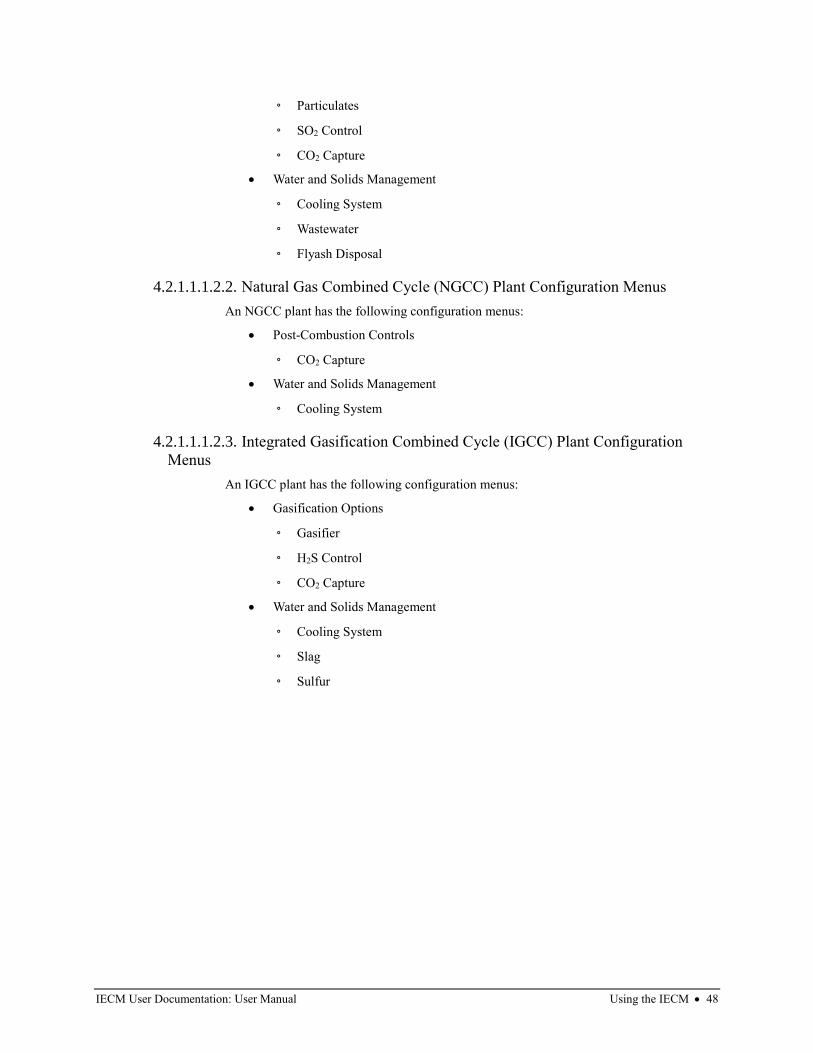
IECM User Documentation: User Manual Using the IECM • 48
◦ Particulates
◦ SO2 Control
◦ CO2 Capture
• Water and Solids Management
◦ Cooling System
◦ Wastewater
◦ Flyash Disposal
4.2.1.1.1.2.2. Natural Gas Combined Cycle (NGCC) Plant Configuration Menus
An NGCC plant has the following configuration menus:
• Post-Combustion Controls
◦ CO2 Capture
• Water and Solids Management
◦ Cooling System
4.2.1.1.1.2.3. Integrated Gasification Combined Cycle (IGCC) Plant Configuration
Menus
An IGCC plant has the following configuration menus:
• Gasification Options
◦ Gasifier
◦ H2S Control
◦ CO2 Capture
• Water and Solids Management
◦ Cooling System
◦ Slag
◦ Sulfur
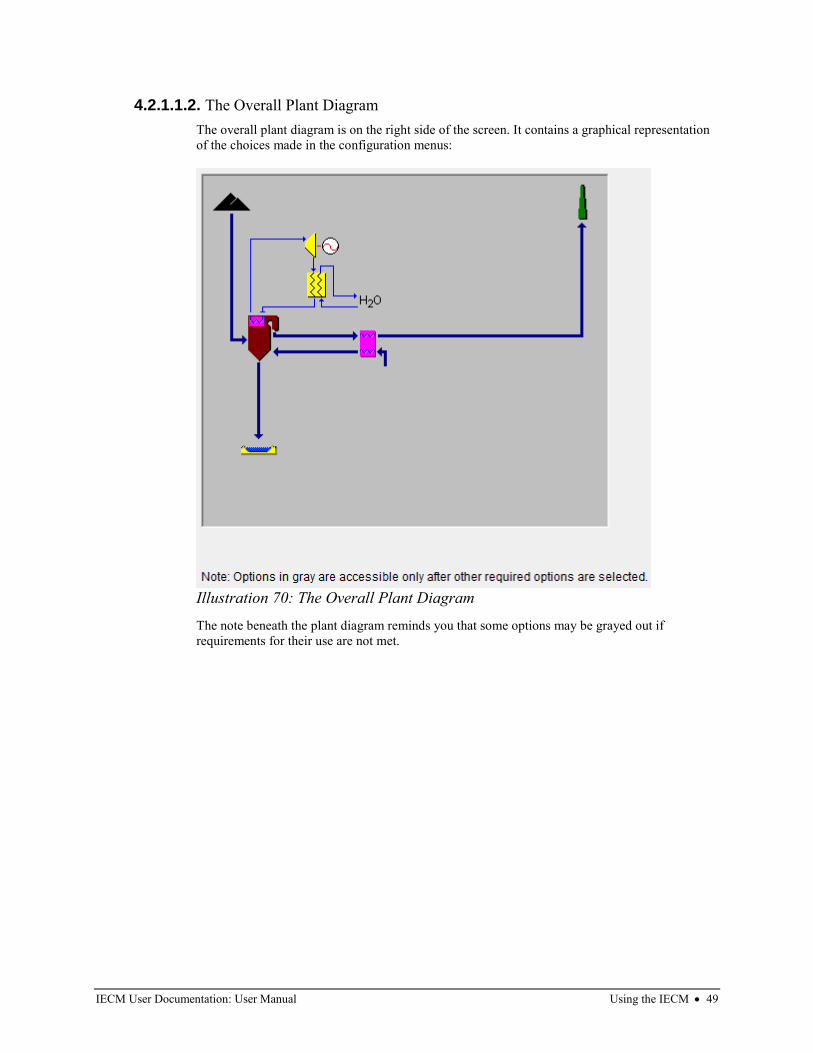
IECM User Documentation: User Manual Using the IECM • 49
4.2.1.1.2. The Overall Plant Diagram
The overall plant diagram is on the right side of the screen. It contains a graphical representation
of the choices made in the configuration menus:
The note beneath the plant diagram reminds you that some options may be grayed out if
requirements for their use are not met.
Illustration 70: The Overall Plant Diagram
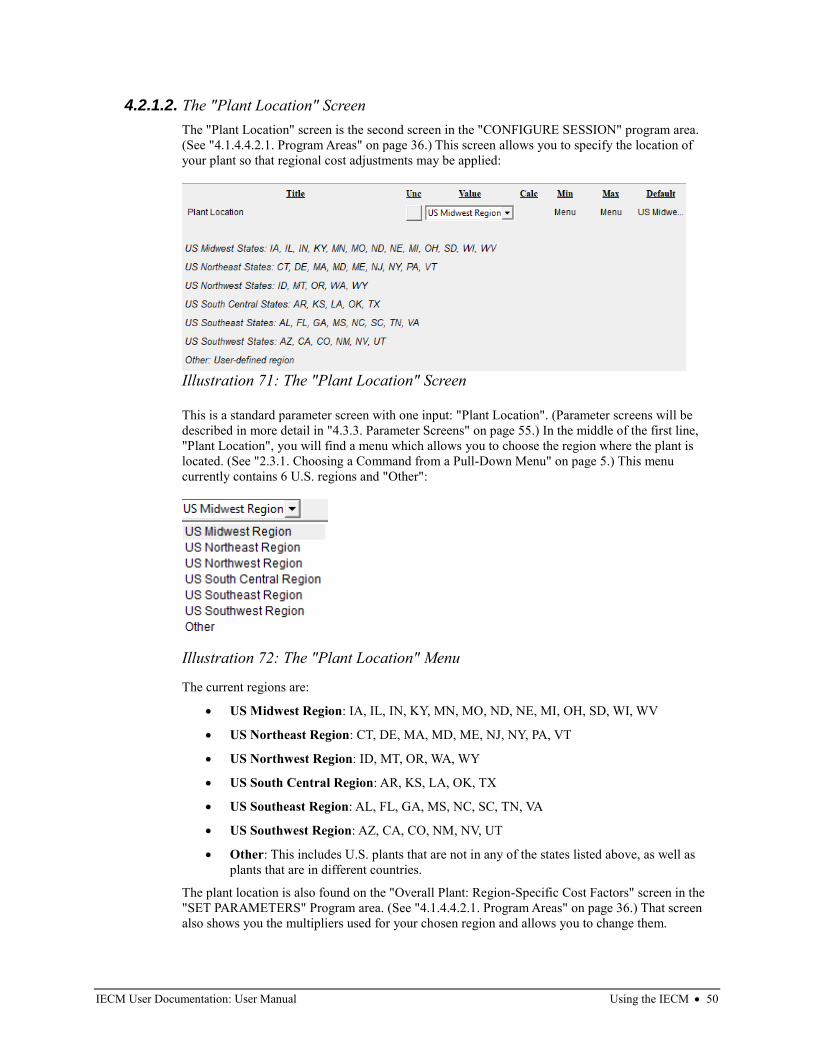
IECM User Documentation: User Manual Using the IECM • 50
4.2.1.2. The "Plant Location" Screen
The "Plant Location" screen is the second screen in the "CONFIGURE SESSION" program area.
(See "4.1.4.4.2.1. Program Areas" on page 36.) This screen allows you to specify the location of
your plant so that regional cost adjustments may be applied:
This is a standard parameter screen with one input: "Plant Location". (Parameter screens will be
described in more detail in "4.3.3. Parameter Screens" on page 55.) In the middle of the first line,
"Plant Location", you will find a menu which allows you to choose the region where the plant is
located. (See "2.3.1. Choosing a Command from a Pull-Down Menu" on page 5.) This menu
currently contains 6 U.S. regions and "Other":
The current regions are:
• US Midwest Region: IA, IL, IN, KY, MN, MO, ND, NE, MI, OH, SD, WI, WV
• US Northeast Region: CT, DE, MA, MD, ME, NJ, NY, PA, VT
• US Northwest Region: ID, MT, OR, WA, WY
• US South Central Region: AR, KS, LA, OK, TX
• US Southeast Region: AL, FL, GA, MS, NC, SC, TN, VA
• US Southwest Region: AZ, CA, CO, NM, NV, UT
• Other: This includes U.S. plants that are not in any of the states listed above, as well as
plants that are in different countries.
The plant location is also found on the "Overall Plant: Region-Specific Cost Factors" screen in the
"SET PARAMETERS" Program area. (See "4.1.4.4.2.1. Program Areas" on page 36.) That screen
also shows you the multipliers used for your chosen region and allows you to change them.
Illustration 71: The "Plant Location" Screen
Illustration 72: The "Plant Location" Menu
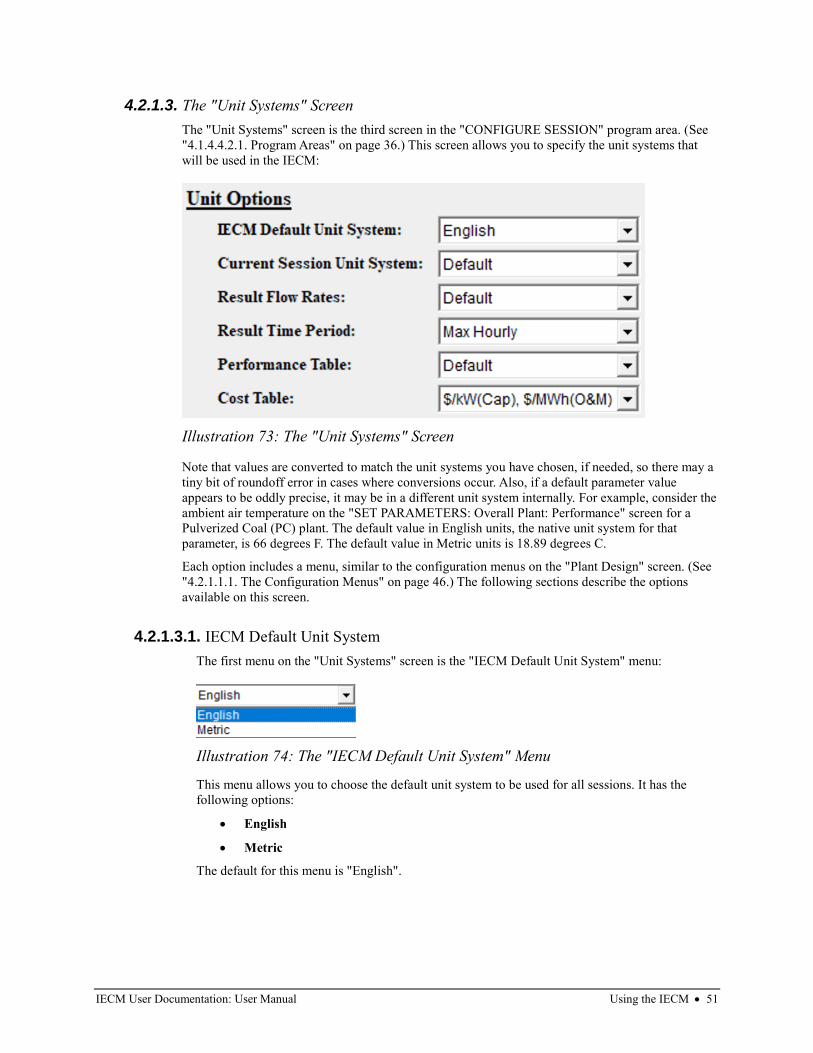
IECM User Documentation: User Manual Using the IECM • 51
4.2.1.3. The "Unit Systems" Screen
The "Unit Systems" screen is the third screen in the "CONFIGURE SESSION" program area. (See
"4.1.4.4.2.1. Program Areas" on page 36.) This screen allows you to specify the unit systems that
will be used in the IECM:
Note that values are converted to match the unit systems you have chosen, if needed, so there may a
tiny bit of roundoff error in cases where conversions occur. Also, if a default parameter value
appears to be oddly precise, it may be in a different unit system internally. For example, consider the
ambient air temperature on the "SET PARAMETERS: Overall Plant: Performance" screen for a
Pulverized Coal (PC) plant. The default value in English units, the native unit system for that
parameter, is 66 degrees F. The default value in Metric units is 18.89 degrees C.
Each option includes a menu, similar to the configuration menus on the "Plant Design" screen. (See
"4.2.1.1.1. The Configuration Menus" on page 46.) The following sections describe the options
available on this screen.
4.2.1.3.1. IECM Default Unit System
The first menu on the "Unit Systems" screen is the "IECM Default Unit System" menu:
This menu allows you to choose the default unit system to be used for all sessions. It has the
following options:
• English
• Metric
The default for this menu is "English".
Illustration 73: The "Unit Systems" Screen
Illustration 74: The "IECM Default Unit System" Menu
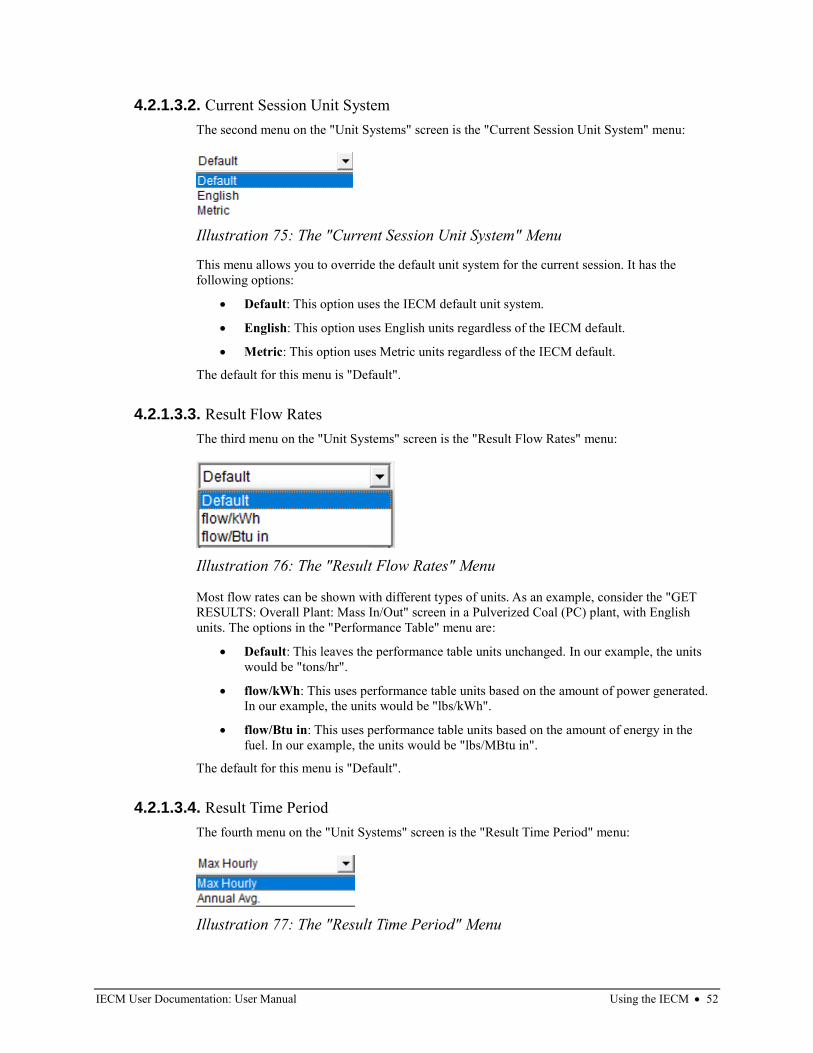
IECM User Documentation: User Manual Using the IECM • 52
4.2.1.3.2. Current Session Unit System
The second menu on the "Unit Systems" screen is the "Current Session Unit System" menu:
This menu allows you to override the default unit system for the current session. It has the
following options:
• Default: This option uses the IECM default unit system.
• English: This option uses English units regardless of the IECM default.
• Metric: This option uses Metric units regardless of the IECM default.
The default for this menu is "Default".
4.2.1.3.3. Result Flow Rates
The third menu on the "Unit Systems" screen is the "Result Flow Rates" menu:
Most flow rates can be shown with different types of units. As an example, consider the "GET
RESULTS: Overall Plant: Mass In/Out" screen in a Pulverized Coal (PC) plant, with English
units. The options in the "Performance Table" menu are:
• Default: This leaves the performance table units unchanged. In our example, the units
would be "tons/hr".
• flow/kWh: This uses performance table units based on the amount of power generated.
In our example, the units would be "lbs/kWh".
• flow/Btu in: This uses performance table units based on the amount of energy in the
fuel. In our example, the units would be "lbs/MBtu in".
The default for this menu is "Default".
4.2.1.3.4. Result Time Period
The fourth menu on the "Unit Systems" screen is the "Result Time Period" menu:
Illustration 75: The "Current Session Unit System" Menu
Illustration 76: The "Result Flow Rates" Menu
Illustration 77: The "Result Time Period" Menu
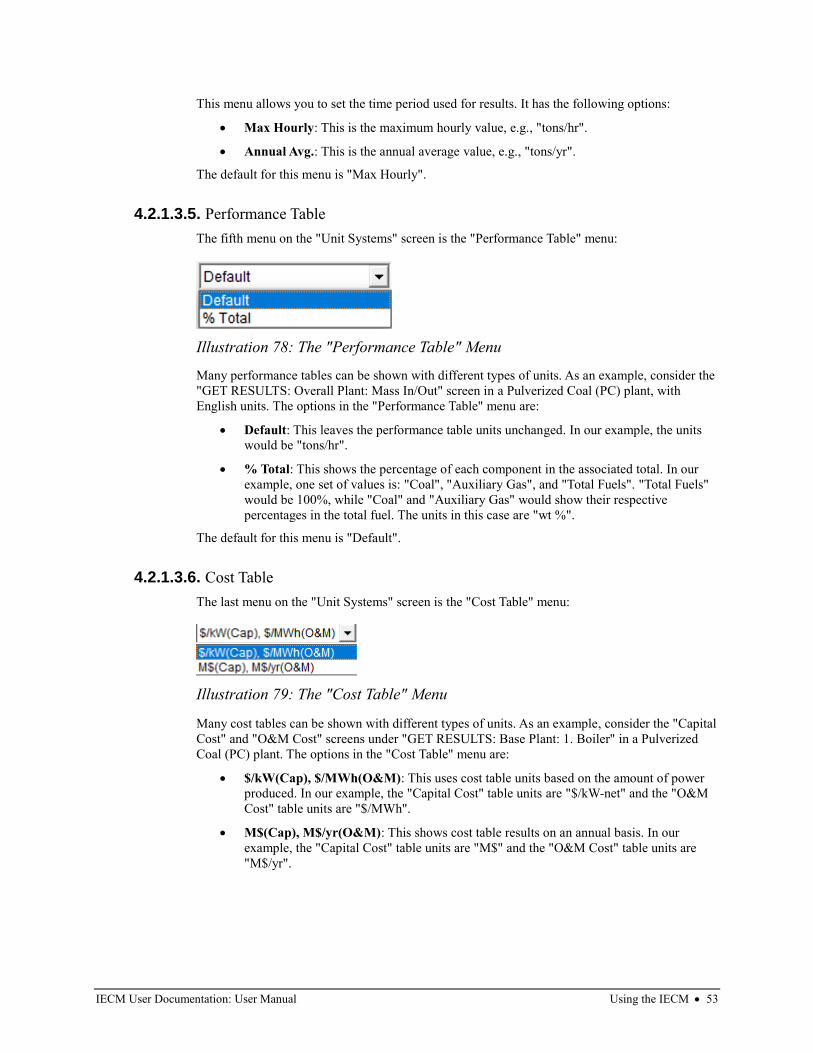
IECM User Documentation: User Manual Using the IECM • 53
This menu allows you to set the time period used for results. It has the following options:
• Max Hourly: This is the maximum hourly value, e.g., "tons/hr".
• Annual Avg.: This is the annual average value, e.g., "tons/yr".
The default for this menu is "Max Hourly".
4.2.1.3.5. Performance Table
The fifth menu on the "Unit Systems" screen is the "Performance Table" menu:
Many performance tables can be shown with different types of units. As an example, consider the
"GET RESULTS: Overall Plant: Mass In/Out" screen in a Pulverized Coal (PC) plant, with
English units. The options in the "Performance Table" menu are:
• Default: This leaves the performance table units unchanged. In our example, the units
would be "tons/hr".
• % Total: This shows the percentage of each component in the associated total. In our
example, one set of values is: "Coal", "Auxiliary Gas", and "Total Fuels". "Total Fuels"
would be 100%, while "Coal" and "Auxiliary Gas" would show their respective
percentages in the total fuel. The units in this case are "wt %".
The default for this menu is "Default".
4.2.1.3.6. Cost Table
The last menu on the "Unit Systems" screen is the "Cost Table" menu:
Many cost tables can be shown with different types of units. As an example, consider the "Capital
Cost" and "O&M Cost" screens under "GET RESULTS: Base Plant: 1. Boiler" in a Pulverized
Coal (PC) plant. The options in the "Cost Table" menu are:
• $/kW(Cap), $/MWh(O&M): This uses cost table units based on the amount of power
produced. In our example, the "Capital Cost" table units are "$/kW-net" and the "O&M
Cost" table units are "$/MWh".
• M$(Cap), M$/yr(O&M): This shows cost table results on an annual basis. In our
example, the "Capital Cost" table units are "M$" and the "O&M Cost" table units are
"M$/yr".
Illustration 78: The "Performance Table" Menu
Illustration 79: The "Cost Table" Menu
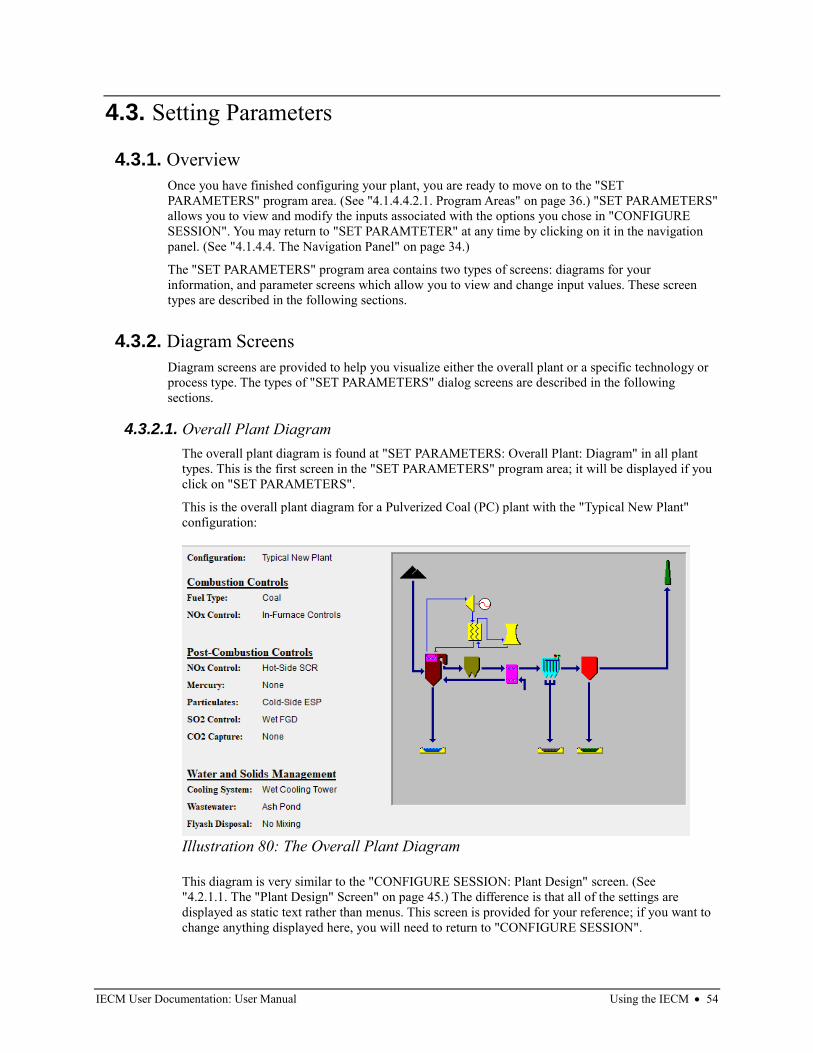
IECM User Documentation: User Manual Using the IECM • 54
4.3. Setting Parameters
4.3.1. Overview
Once you have finished configuring your plant, you are ready to move on to the "SET
PARAMETERS" program area. (See "4.1.4.4.2.1. Program Areas" on page 36.) "SET PARAMETERS"
allows you to view and modify the inputs associated with the options you chose in "CONFIGURE
SESSION". You may return to "SET PARAMTETER" at any time by clicking on it in the navigation
panel. (See "4.1.4.4. The Navigation Panel" on page 34.)
The "SET PARAMETERS" program area contains two types of screens: diagrams for your
information, and parameter screens which allow you to view and change input values. These screen
types are described in the following sections.
4.3.2. Diagram Screens
Diagram screens are provided to help you visualize either the overall plant or a specific technology or
process type. The types of "SET PARAMETERS" dialog screens are described in the following
sections.
4.3.2.1. Overall Plant Diagram
The overall plant diagram is found at "SET PARAMETERS: Overall Plant: Diagram" in all plant
types. This is the first screen in the "SET PARAMETERS" program area; it will be displayed if you
click on "SET PARAMETERS".
This is the overall plant diagram for a Pulverized Coal (PC) plant with the "Typical New Plant"
configuration:
This diagram is very similar to the "CONFIGURE SESSION: Plant Design" screen. (See
"4.2.1.1. The "Plant Design" Screen" on page 45.) The difference is that all of the settings are
displayed as static text rather than menus. This screen is provided for your reference; if you want to
change anything displayed here, you will need to return to "CONFIGURE SESSION".
Illustration 80: The Overall Plant Diagram
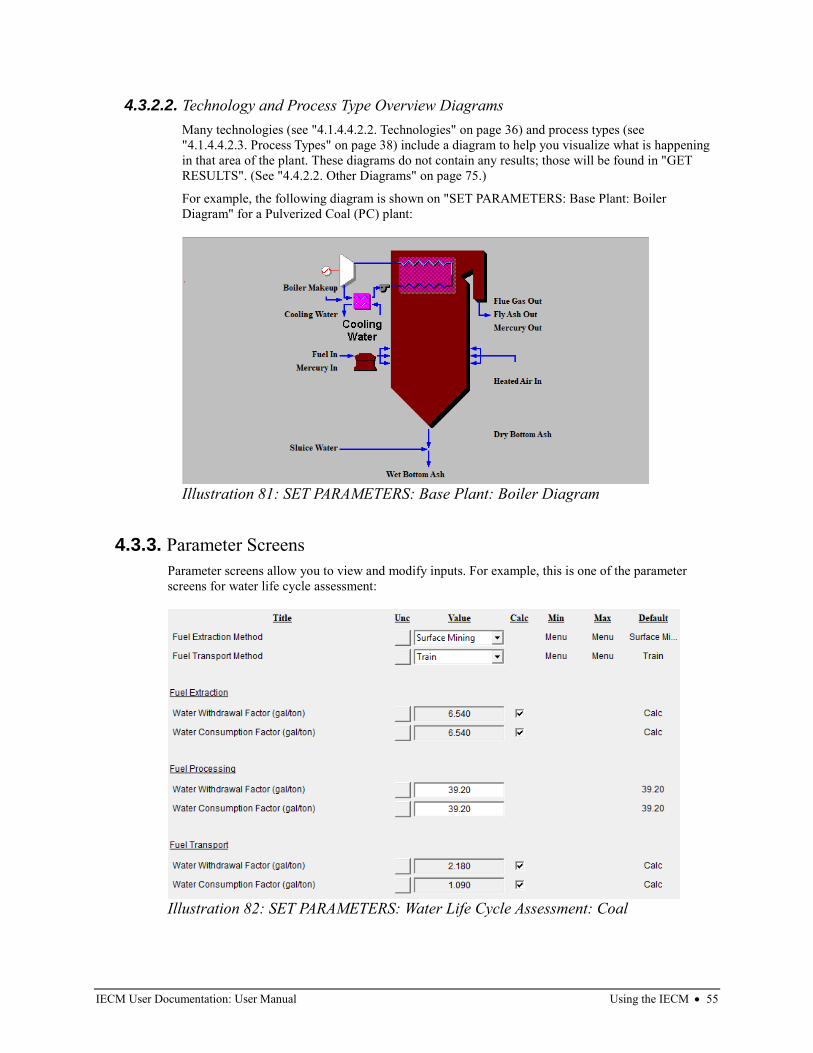
IECM User Documentation: User Manual Using the IECM • 55
4.3.2.2. Technology and Process Type Overview Diagrams
Many technologies (see "4.1.4.4.2.2. Technologies" on page 36) and process types (see
"4.1.4.4.2.3. Process Types" on page 38) include a diagram to help you visualize what is happening
in that area of the plant. These diagrams do not contain any results; those will be found in "GET
RESULTS". (See "4.4.2.2. Other Diagrams" on page 75.)
For example, the following diagram is shown on "SET PARAMETERS: Base Plant: Boiler
Diagram" for a Pulverized Coal (PC) plant:
4.3.3. Parameter Screens
Parameter screens allow you to view and modify inputs. For example, this is one of the parameter
screens for water life cycle assessment:
Illustration 81: SET PARAMETERS: Base Plant: Boiler Diagram
Illustration 82: SET PARAMETERS: Water Life Cycle Assessment: Coal
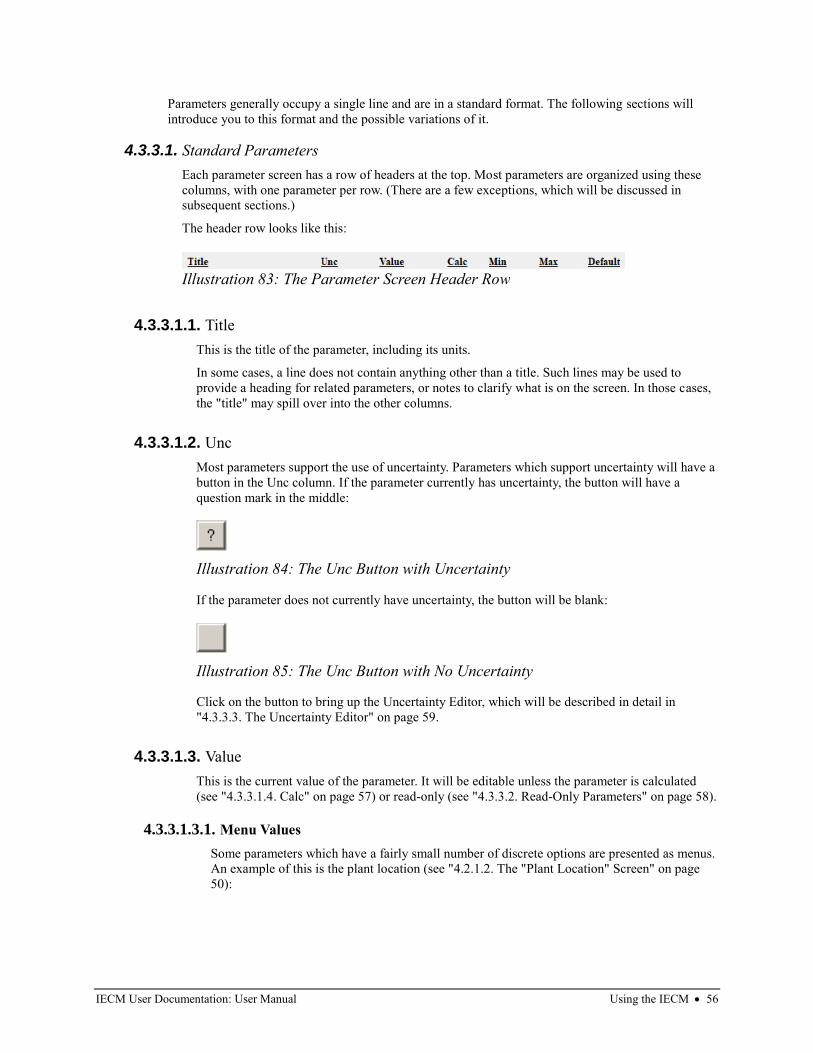
IECM User Documentation: User Manual Using the IECM • 56
Parameters generally occupy a single line and are in a standard format. The following sections will
introduce you to this format and the possible variations of it.
4.3.3.1. Standard Parameters
Each parameter screen has a row of headers at the top. Most parameters are organized using these
columns, with one parameter per row. (There are a few exceptions, which will be discussed in
subsequent sections.)
The header row looks like this:
4.3.3.1.1. Title
This is the title of the parameter, including its units.
In some cases, a line does not contain anything other than a title. Such lines may be used to
provide a heading for related parameters, or notes to clarify what is on the screen. In those cases,
the "title" may spill over into the other columns.
4.3.3.1.2. Unc
Most parameters support the use of uncertainty. Parameters which support uncertainty will have a
button in the Unc column. If the parameter currently has uncertainty, the button will have a
question mark in the middle:
If the parameter does not currently have uncertainty, the button will be blank:
Click on the button to bring up the Uncertainty Editor, which will be described in detail in
"4.3.3.3. The Uncertainty Editor" on page 59.
4.3.3.1.3. Value
This is the current value of the parameter. It will be editable unless the parameter is calculated
(see "4.3.3.1.4. Calc" on page 57) or read-only (see "4.3.3.2. Read-Only Parameters" on page 58).
4.3.3.1.3.1. Menu Values
Some parameters which have a fairly small number of discrete options are presented as menus.
An example of this is the plant location (see "4.2.1.2. The "Plant Location" Screen" on page
50):
Illustration 83: The Parameter Screen Header Row
Illustration 84: The Unc Button with Uncertainty
Illustration 85: The Unc Button with No Uncertainty
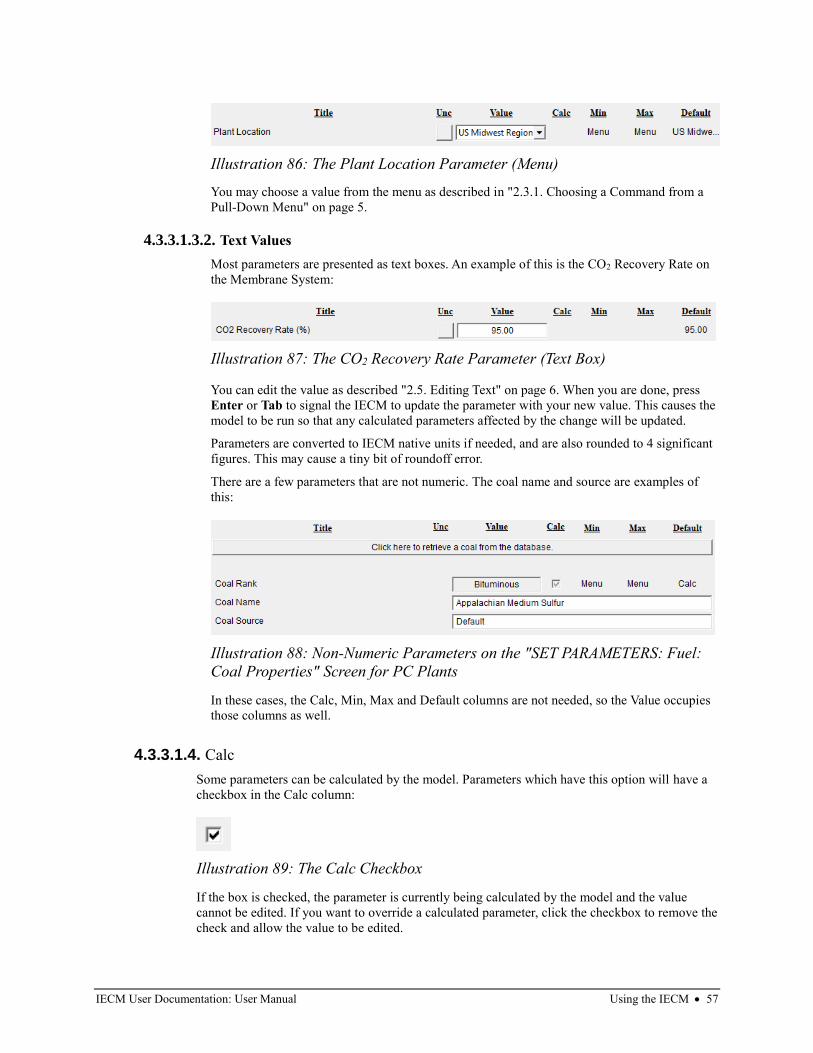
IECM User Documentation: User Manual Using the IECM • 57
You may choose a value from the menu as described in "2.3.1. Choosing a Command from a
Pull-Down Menu" on page 5.
4.3.3.1.3.2. Text Values
Most parameters are presented as text boxes. An example of this is the CO2 Recovery Rate on
the Membrane System:
You can edit the value as described "2.5. Editing Text" on page 6. When you are done, press
Enter or Tab to signal the IECM to update the parameter with your new value. This causes the
model to be run so that any calculated parameters affected by the change will be updated.
Parameters are converted to IECM native units if needed, and are also rounded to 4 significant
figures. This may cause a tiny bit of roundoff error.
There are a few parameters that are not numeric. The coal name and source are examples of
this:
In these cases, the Calc, Min, Max and Default columns are not needed, so the Value occupies
those columns as well.
4.3.3.1.4. Calc
Some parameters can be calculated by the model. Parameters which have this option will have a
checkbox in the Calc column:
If the box is checked, the parameter is currently being calculated by the model and the value
cannot be edited. If you want to override a calculated parameter, click the checkbox to remove the
check and allow the value to be edited.
Illustration 86: The Plant Location Parameter (Menu)
Illustration 87: The CO2 Recovery Rate Parameter (Text Box)
Illustration 88: Non-Numeric Parameters on the "SET PARAMETERS: Fuel:
Coal Properties" Screen for PC Plants
Illustration 89: The Calc Checkbox
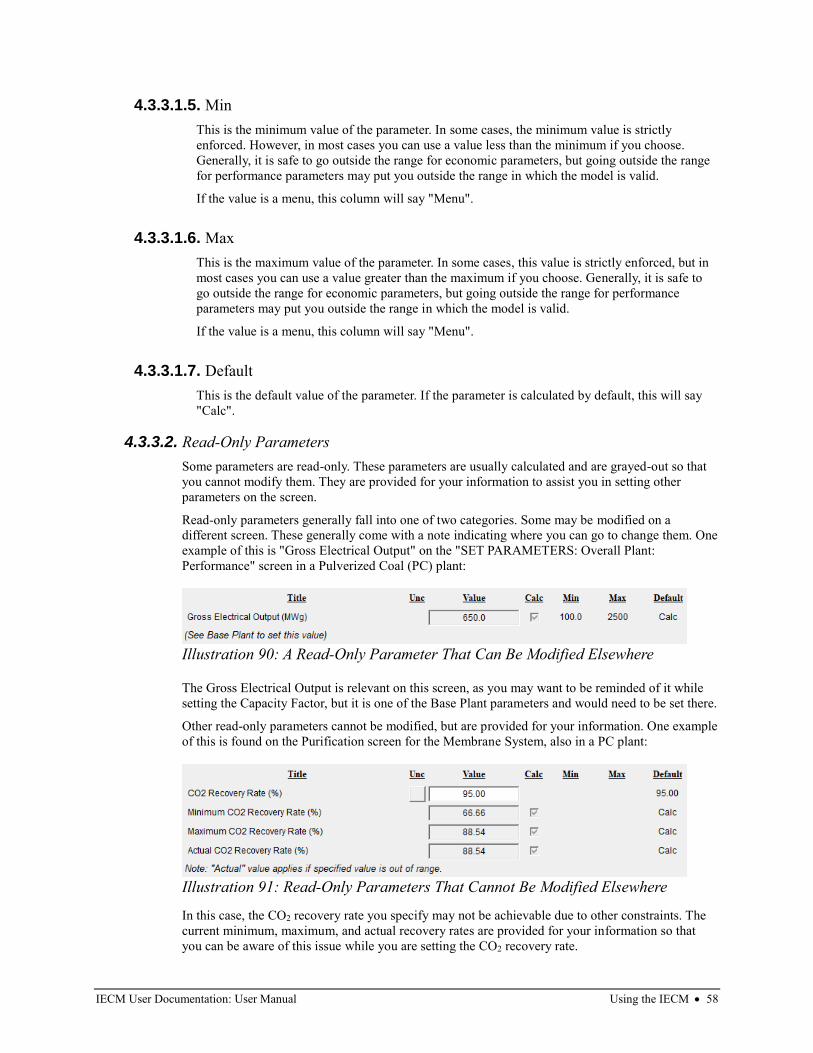
IECM User Documentation: User Manual Using the IECM • 58
4.3.3.1.5. Min
This is the minimum value of the parameter. In some cases, the minimum value is strictly
enforced. However, in most cases you can use a value less than the minimum if you choose.
Generally, it is safe to go outside the range for economic parameters, but going outside the range
for performance parameters may put you outside the range in which the model is valid.
If the value is a menu, this column will say "Menu".
4.3.3.1.6. Max
This is the maximum value of the parameter. In some cases, this value is strictly enforced, but in
most cases you can use a value greater than the maximum if you choose. Generally, it is safe to
go outside the range for economic parameters, but going outside the range for performance
parameters may put you outside the range in which the model is valid.
If the value is a menu, this column will say "Menu".
4.3.3.1.7. Default
This is the default value of the parameter. If the parameter is calculated by default, this will say
"Calc".
4.3.3.2. Read-Only Parameters
Some parameters are read-only. These parameters are usually calculated and are grayed-out so that
you cannot modify them. They are provided for your information to assist you in setting other
parameters on the screen.
Read-only parameters generally fall into one of two categories. Some may be modified on a
different screen. These generally come with a note indicating where you can go to change them. One
example of this is "Gross Electrical Output" on the "SET PARAMETERS: Overall Plant:
Performance" screen in a Pulverized Coal (PC) plant:
The Gross Electrical Output is relevant on this screen, as you may want to be reminded of it while
setting the Capacity Factor, but it is one of the Base Plant parameters and would need to be set there.
Other read-only parameters cannot be modified, but are provided for your information. One example
of this is found on the Purification screen for the Membrane System, also in a PC plant:
In this case, the CO2 recovery rate you specify may not be achievable due to other constraints. The
current minimum, maximum, and actual recovery rates are provided for your information so that
you can be aware of this issue while you are setting the CO2 recovery rate.
Illustration 90: A Read-Only Parameter That Can Be Modified Elsewhere
Illustration 91: Read-Only Parameters That Cannot Be Modified Elsewhere
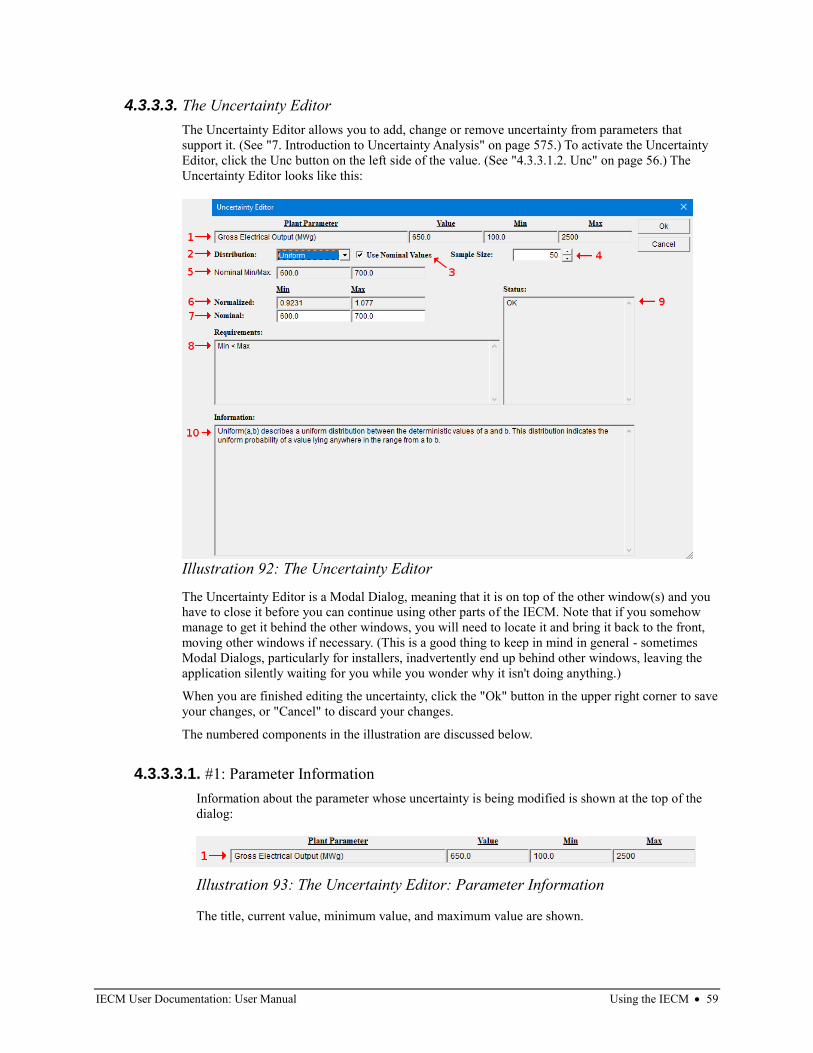
IECM User Documentation: User Manual Using the IECM • 59
4.3.3.3. The Uncertainty Editor
The Uncertainty Editor allows you to add, change or remove uncertainty from parameters that
support it. (See "7. Introduction to Uncertainty Analysis" on page 575.) To activate the Uncertainty
Editor, click the Unc button on the left side of the value. (See "4.3.3.1.2. Unc" on page 56.) The
Uncertainty Editor looks like this:
The Uncertainty Editor is a Modal Dialog, meaning that it is on top of the other window(s) and you
have to close it before you can continue using other parts of the IECM. Note that if you somehow
manage to get it behind the other windows, you will need to locate it and bring it back to the front,
moving other windows if necessary. (This is a good thing to keep in mind in general - sometimes
Modal Dialogs, particularly for installers, inadvertently end up behind other windows, leaving the
application silently waiting for you while you wonder why it isn't doing anything.)
When you are finished editing the uncertainty, click the "Ok" button in the upper right corner to save
your changes, or "Cancel" to discard your changes.
The numbered components in the illustration are discussed below.
4.3.3.3.1. #1: Parameter Information
Information about the parameter whose uncertainty is being modified is shown at the top of the
dialog:
The title, current value, minimum value, and maximum value are shown.
Illustration 92: The Uncertainty Editor
Illustration 93: The Uncertainty Editor: Parameter Information
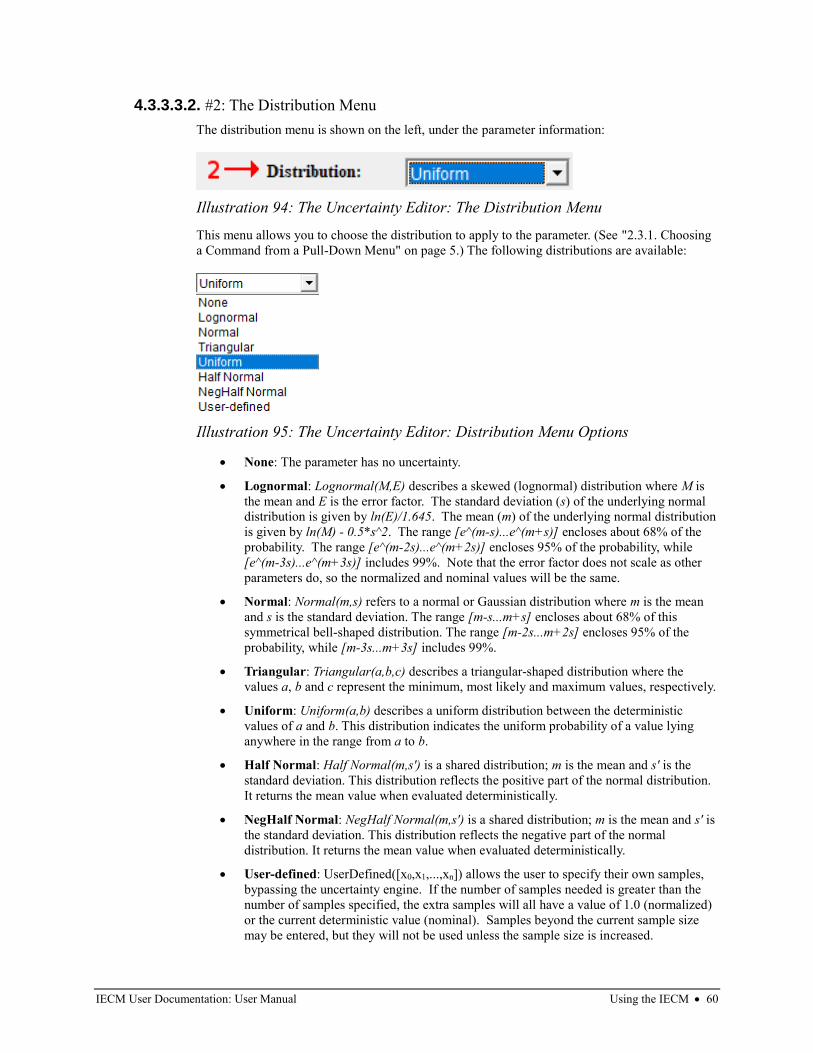
IECM User Documentation: User Manual Using the IECM • 60
4.3.3.3.2. #2: The Distribution Menu
The distribution menu is shown on the left, under the parameter information:
This menu allows you to choose the distribution to apply to the parameter. (See "2.3.1. Choosing
a Command from a Pull-Down Menu" on page 5.) The following distributions are available:
• None: The parameter has no uncertainty.
• Lognormal: Lognormal(M,E) describes a skewed (lognormal) distribution where M is
the mean and E is the error factor. The standard deviation (s) of the underlying normal
distribution is given by ln(E)/1.645. The mean (m) of the underlying normal distribution
is given by ln(M) - 0.5*s^2. The range [e^(m-s)...e^(m+s)] encloses about 68% of the
probability. The range [e^(m-2s)...e^(m+2s)] encloses 95% of the probability, while
[e^(m-3s)...e^(m+3s)] includes 99%. Note that the error factor does not scale as other
parameters do, so the normalized and nominal values will be the same.
• Normal: Normal(m,s) refers to a normal or Gaussian distribution where m is the mean
and s is the standard deviation. The range [m-s...m+s] encloses about 68% of this
symmetrical bell-shaped distribution. The range [m-2s...m+2s] encloses 95% of the
probability, while [m-3s...m+3s] includes 99%.
• Triangular: Triangular(a,b,c) describes a triangular-shaped distribution where the
values a, b and c represent the minimum, most likely and maximum values, respectively.
• Uniform: Uniform(a,b) describes a uniform distribution between the deterministic
values of a and b. This distribution indicates the uniform probability of a value lying
anywhere in the range from a to b.
• Half Normal: Half Normal(m,s') is a shared distribution; m is the mean and s' is the
standard deviation. This distribution reflects the positive part of the normal distribution.
It returns the mean value when evaluated deterministically.
• NegHalf Normal: NegHalf Normal(m,s') is a shared distribution; m is the mean and s' is
the standard deviation. This distribution reflects the negative part of the normal
distribution. It returns the mean value when evaluated deterministically.
• User-defined: UserDefined([x0,x1,...,xn]) allows the user to specify their own samples,
bypassing the uncertainty engine. If the number of samples needed is greater than the
number of samples specified, the extra samples will all have a value of 1.0 (normalized)
or the current deterministic value (nominal). Samples beyond the current sample size
may be entered, but they will not be used unless the sample size is increased.
Illustration 94: The Uncertainty Editor: The Distribution Menu
Illustration 95: The Uncertainty Editor: Distribution Menu Options
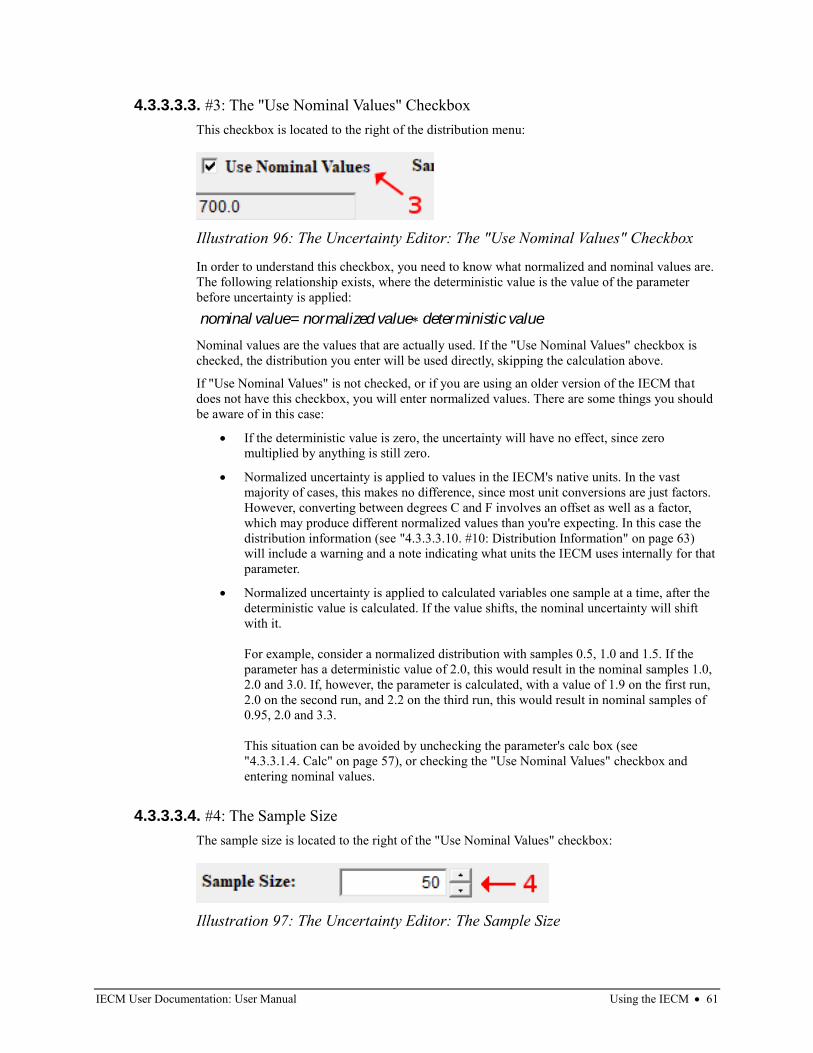
IECM User Documentation: User Manual Using the IECM • 61
4.3.3.3.3. #3: The "Use Nominal Values" Checkbox
This checkbox is located to the right of the distribution menu:
In order to understand this checkbox, you need to know what normalized and nominal values are.
The following relationship exists, where the deterministic value is the value of the parameter
before uncertainty is applied:
Nominal values are the values that are actually used. If the "Use Nominal Values" checkbox is
checked, the distribution you enter will be used directly, skipping the calculation above.
If "Use Nominal Values" is not checked, or if you are using an older version of the IECM that
does not have this checkbox, you will enter normalized values. There are some things you should
be aware of in this case:
• If the deterministic value is zero, the uncertainty will have no effect, since zero
multiplied by anything is still zero.
• Normalized uncertainty is applied to values in the IECM's native units. In the vast
majority of cases, this makes no difference, since most unit conversions are just factors.
However, converting between degrees C and F involves an offset as well as a factor,
which may produce different normalized values than you're expecting. In this case the
distribution information (see "4.3.3.3.10. #10: Distribution Information" on page 63)
will include a warning and a note indicating what units the IECM uses internally for that
parameter.
• Normalized uncertainty is applied to calculated variables one sample at a time, after the
deterministic value is calculated. If the value shifts, the nominal uncertainty will shift
with it.
For example, consider a normalized distribution with samples 0.5, 1.0 and 1.5. If the
parameter has a deterministic value of 2.0, this would result in the nominal samples 1.0,
2.0 and 3.0. If, however, the parameter is calculated, with a value of 1.9 on the first run,
2.0 on the second run, and 2.2 on the third run, this would result in nominal samples of
0.95, 2.0 and 3.3.
This situation can be avoided by unchecking the parameter's calc box (see
"4.3.3.1.4. Calc" on page 57), or checking the "Use Nominal Values" checkbox and
entering nominal values.
4.3.3.3.4. #4: The Sample Size
The sample size is located to the right of the "Use Nominal Values" checkbox:
nominal value= normalized value∗ deterministicvalue
Illustration 96: The Uncertainty Editor: The "Use Nominal Values" Checkbox
Illustration 97: The Uncertainty Editor: The Sample Size
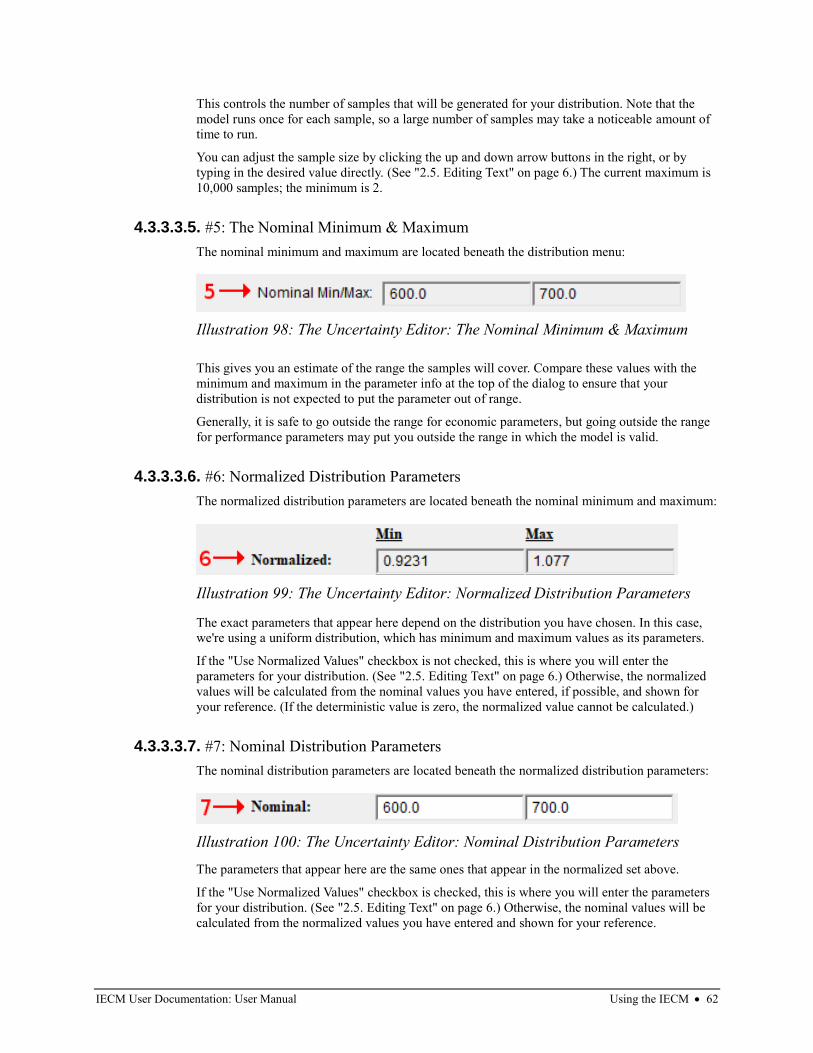
IECM User Documentation: User Manual Using the IECM • 62
This controls the number of samples that will be generated for your distribution. Note that the
model runs once for each sample, so a large number of samples may take a noticeable amount of
time to run.
You can adjust the sample size by clicking the up and down arrow buttons in the right, or by
typing in the desired value directly. (See "2.5. Editing Text" on page 6.) The current maximum is
10,000 samples; the minimum is 2.
4.3.3.3.5. #5: The Nominal Minimum & Maximum
The nominal minimum and maximum are located beneath the distribution menu:
This gives you an estimate of the range the samples will cover. Compare these values with the
minimum and maximum in the parameter info at the top of the dialog to ensure that your
distribution is not expected to put the parameter out of range.
Generally, it is safe to go outside the range for economic parameters, but going outside the range
for performance parameters may put you outside the range in which the model is valid.
4.3.3.3.6. #6: Normalized Distribution Parameters
The normalized distribution parameters are located beneath the nominal minimum and maximum:
The exact parameters that appear here depend on the distribution you have chosen. In this case,
we're using a uniform distribution, which has minimum and maximum values as its parameters.
If the "Use Normalized Values" checkbox is not checked, this is where you will enter the
parameters for your distribution. (See "2.5. Editing Text" on page 6.) Otherwise, the normalized
values will be calculated from the nominal values you have entered, if possible, and shown for
your reference. (If the deterministic value is zero, the normalized value cannot be calculated.)
4.3.3.3.7. #7: Nominal Distribution Parameters
The nominal distribution parameters are located beneath the normalized distribution parameters:
The parameters that appear here are the same ones that appear in the normalized set above.
If the "Use Normalized Values" checkbox is checked, this is where you will enter the parameters
for your distribution. (See "2.5. Editing Text" on page 6.) Otherwise, the nominal values will be
calculated from the normalized values you have entered and shown for your reference.
Illustration 98: The Uncertainty Editor: The Nominal Minimum & Maximum
Illustration 99: The Uncertainty Editor: Normalized Distribution Parameters
Illustration 100: The Uncertainty Editor: Nominal Distribution Parameters
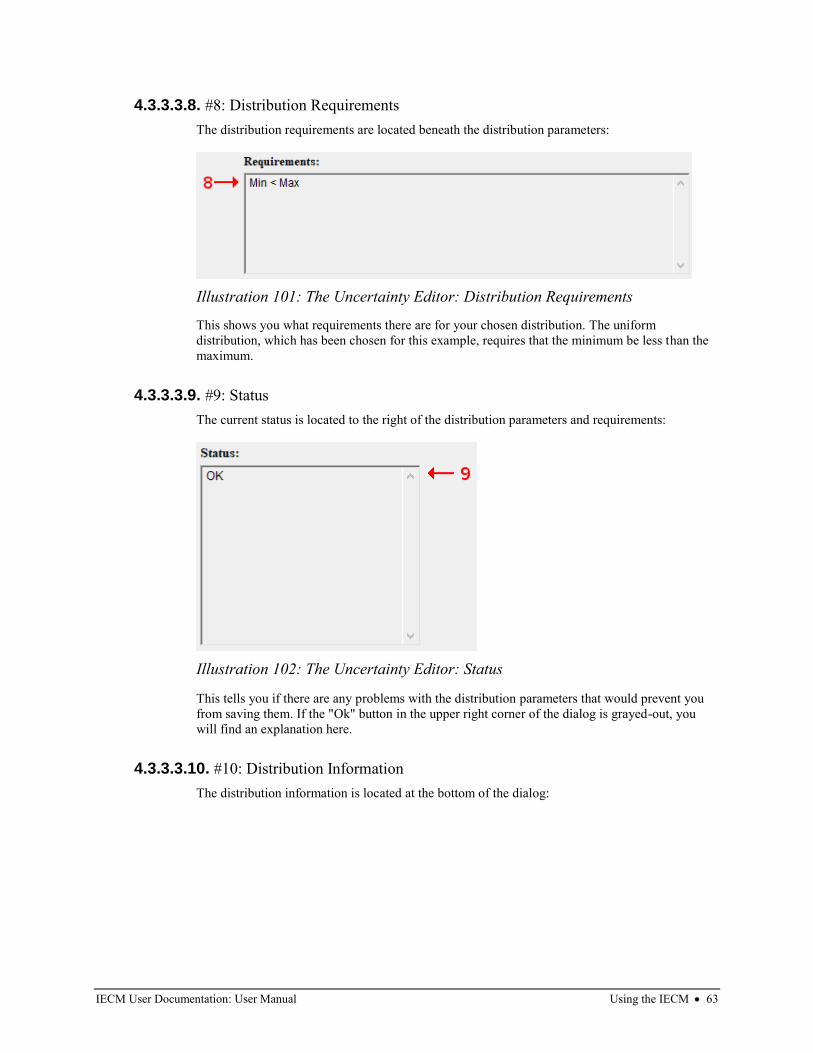
IECM User Documentation: User Manual Using the IECM • 63
4.3.3.3.8. #8: Distribution Requirements
The distribution requirements are located beneath the distribution parameters:
This shows you what requirements there are for your chosen distribution. The uniform
distribution, which has been chosen for this example, requires that the minimum be less than the
maximum.
4.3.3.3.9. #9: Status
The current status is located to the right of the distribution parameters and requirements:
This tells you if there are any problems with the distribution parameters that would prevent you
from saving them. If the "Ok" button in the upper right corner of the dialog is grayed-out, you
will find an explanation here.
4.3.3.3.10. #10: Distribution Information
The distribution information is located at the bottom of the dialog:
Illustration 101: The Uncertainty Editor: Distribution Requirements
Illustration 102: The Uncertainty Editor: Status
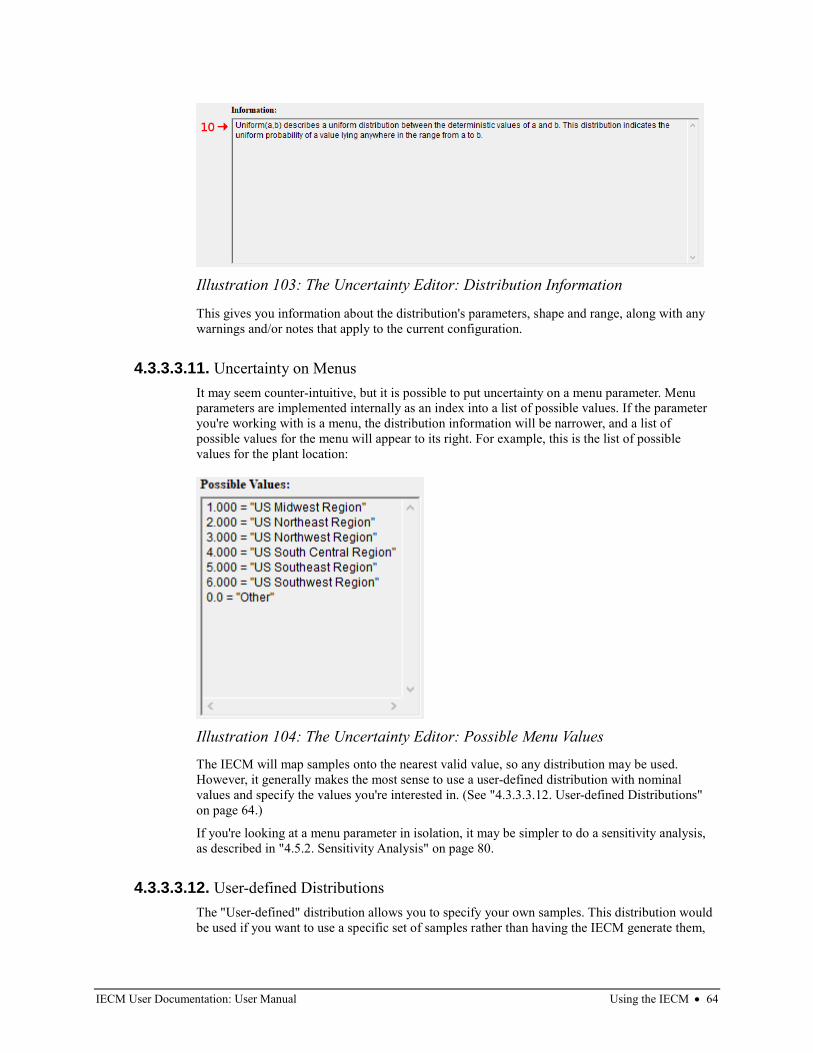
IECM User Documentation: User Manual Using the IECM • 64
This gives you information about the distribution's parameters, shape and range, along with any
warnings and/or notes that apply to the current configuration.
4.3.3.3.11. Uncertainty on Menus
It may seem counter-intuitive, but it is possible to put uncertainty on a menu parameter. Menu
parameters are implemented internally as an index into a list of possible values. If the parameter
you're working with is a menu, the distribution information will be narrower, and a list of
possible values for the menu will appear to its right. For example, this is the list of possible
values for the plant location:
The IECM will map samples onto the nearest valid value, so any distribution may be used.
However, it generally makes the most sense to use a user-defined distribution with nominal
values and specify the values you're interested in. (See "4.3.3.3.12. User-defined Distributions"
on page 64.)
If you're looking at a menu parameter in isolation, it may be simpler to do a sensitivity analysis,
as described in "4.5.2. Sensitivity Analysis" on page 80.
4.3.3.3.12. User-defined Distributions
The "User-defined" distribution allows you to specify your own samples. This distribution would
be used if you want to use a specific set of samples rather than having the IECM generate them,
Illustration 103: The Uncertainty Editor: Distribution Information
Illustration 104: The Uncertainty Editor: Possible Menu Values
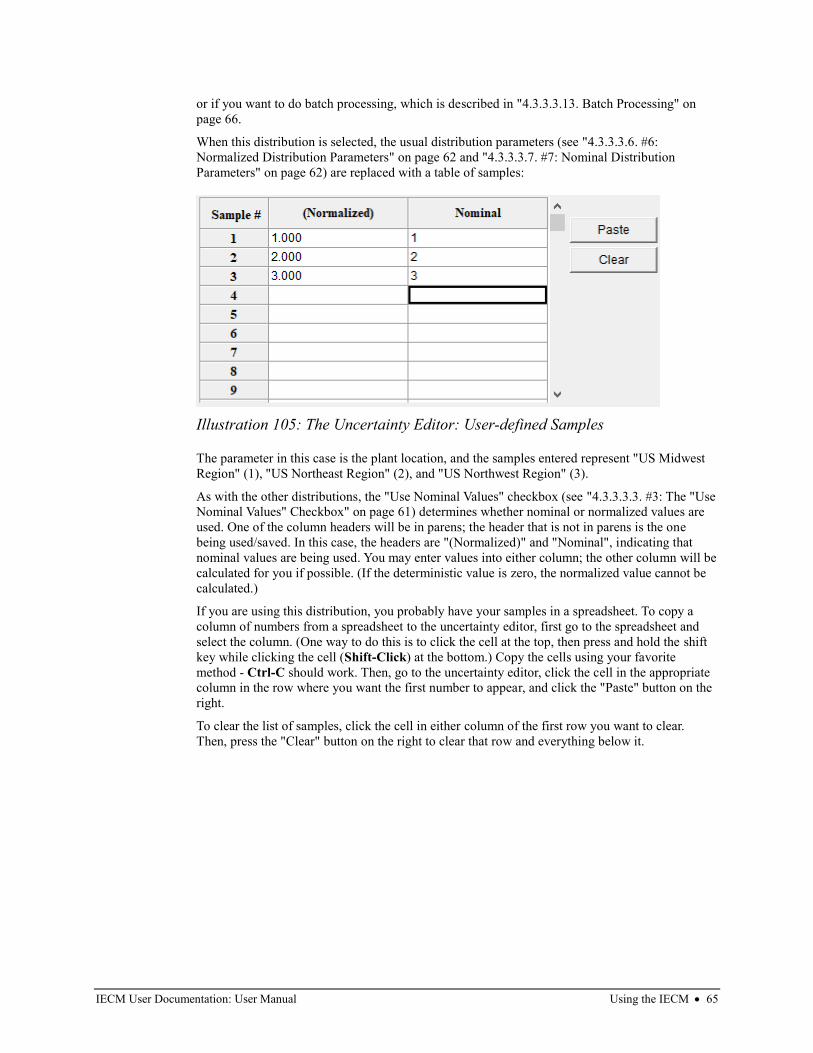
IECM User Documentation: User Manual Using the IECM • 65
or if you want to do batch processing, which is described in "4.3.3.3.13. Batch Processing" on
page 66.
When this distribution is selected, the usual distribution parameters (see "4.3.3.3.6. #6:
Normalized Distribution Parameters" on page 62 and "4.3.3.3.7. #7: Nominal Distribution
Parameters" on page 62) are replaced with a table of samples:
The parameter in this case is the plant location, and the samples entered represent "US Midwest
Region" (1), "US Northeast Region" (2), and "US Northwest Region" (3).
As with the other distributions, the "Use Nominal Values" checkbox (see "4.3.3.3.3. #3: The "Use
Nominal Values" Checkbox" on page 61) determines whether nominal or normalized values are
used. One of the column headers will be in parens; the header that is not in parens is the one
being used/saved. In this case, the headers are "(Normalized)" and "Nominal", indicating that
nominal values are being used. You may enter values into either column; the other column will be
calculated for you if possible. (If the deterministic value is zero, the normalized value cannot be
calculated.)
If you are using this distribution, you probably have your samples in a spreadsheet. To copy a
column of numbers from a spreadsheet to the uncertainty editor, first go to the spreadsheet and
select the column. (One way to do this is to click the cell at the top, then press and hold the shift
key while clicking the cell (Shift-Click) at the bottom.) Copy the cells using your favorite
method - Ctrl-C should work. Then, go to the uncertainty editor, click the cell in the appropriate
column in the row where you want the first number to appear, and click the "Paste" button on the
right.
To clear the list of samples, click the cell in either column of the first row you want to clear.
Then, press the "Clear" button on the right to clear that row and everything below it.
Illustration 105: The Uncertainty Editor: User-defined Samples
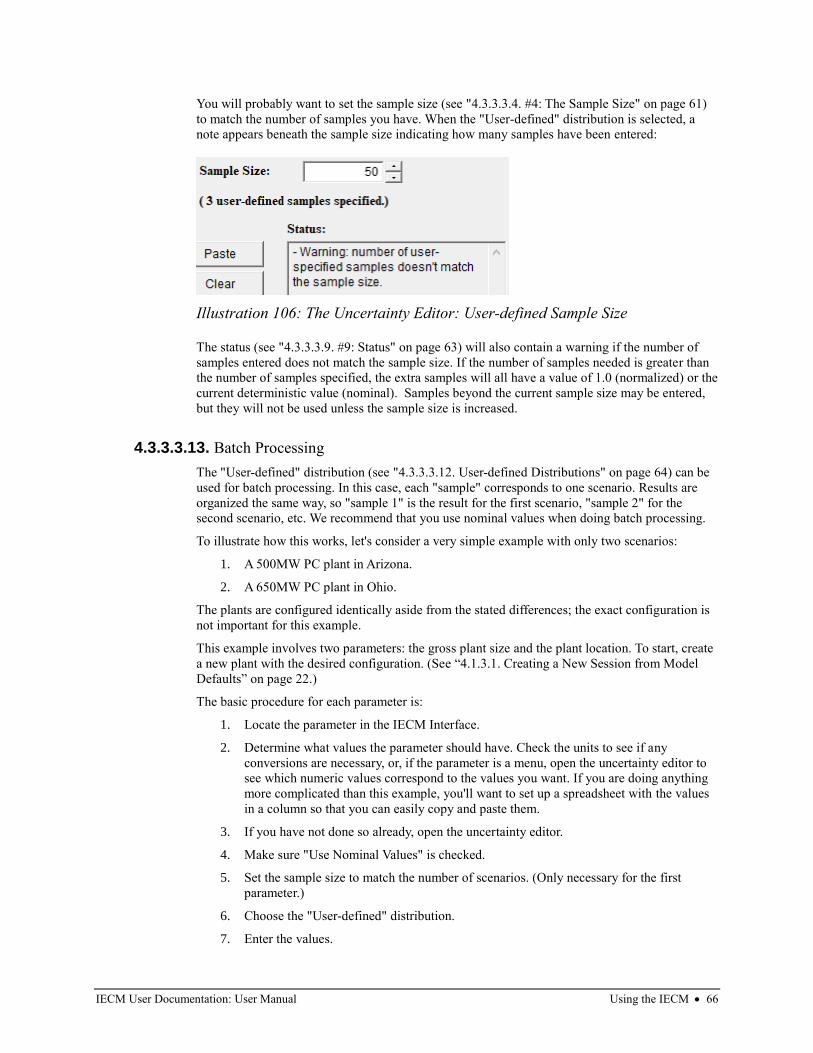
IECM User Documentation: User Manual Using the IECM • 66
You will probably want to set the sample size (see "4.3.3.3.4. #4: The Sample Size" on page 61)
to match the number of samples you have. When the "User-defined" distribution is selected, a
note appears beneath the sample size indicating how many samples have been entered:
The status (see "4.3.3.3.9. #9: Status" on page 63) will also contain a warning if the number of
samples entered does not match the sample size. If the number of samples needed is greater than
the number of samples specified, the extra samples will all have a value of 1.0 (normalized) or the
current deterministic value (nominal). Samples beyond the current sample size may be entered,
but they will not be used unless the sample size is increased.
4.3.3.3.13. Batch Processing
The "User-defined" distribution (see "4.3.3.3.12. User-defined Distributions" on page 64) can be
used for batch processing. In this case, each "sample" corresponds to one scenario. Results are
organized the same way, so "sample 1" is the result for the first scenario, "sample 2" for the
second scenario, etc. We recommend that you use nominal values when doing batch processing.
To illustrate how this works, let's consider a very simple example with only two scenarios:
1. A 500MW PC plant in Arizona.
2. A 650MW PC plant in Ohio.
The plants are configured identically aside from the stated differences; the exact configuration is
not important for this example.
This example involves two parameters: the gross plant size and the plant location. To start, create
a new plant with the desired configuration. (See “4.1.3.1. Creating a New Session from Model
Defaults” on page 22.)
The basic procedure for each parameter is:
1. Locate the parameter in the IECM Interface.
2. Determine what values the parameter should have. Check the units to see if any
conversions are necessary, or, if the parameter is a menu, open the uncertainty editor to
see which numeric values correspond to the values you want. If you are doing anything
more complicated than this example, you'll want to set up a spreadsheet with the values
in a column so that you can easily copy and paste them.
3. If you have not done so already, open the uncertainty editor.
4. Make sure "Use Nominal Values" is checked.
5. Set the sample size to match the number of scenarios. (Only necessary for the first
parameter.)
6. Choose the "User-defined" distribution.
7. Enter the values.
Illustration 106: The Uncertainty Editor: User-defined Sample Size
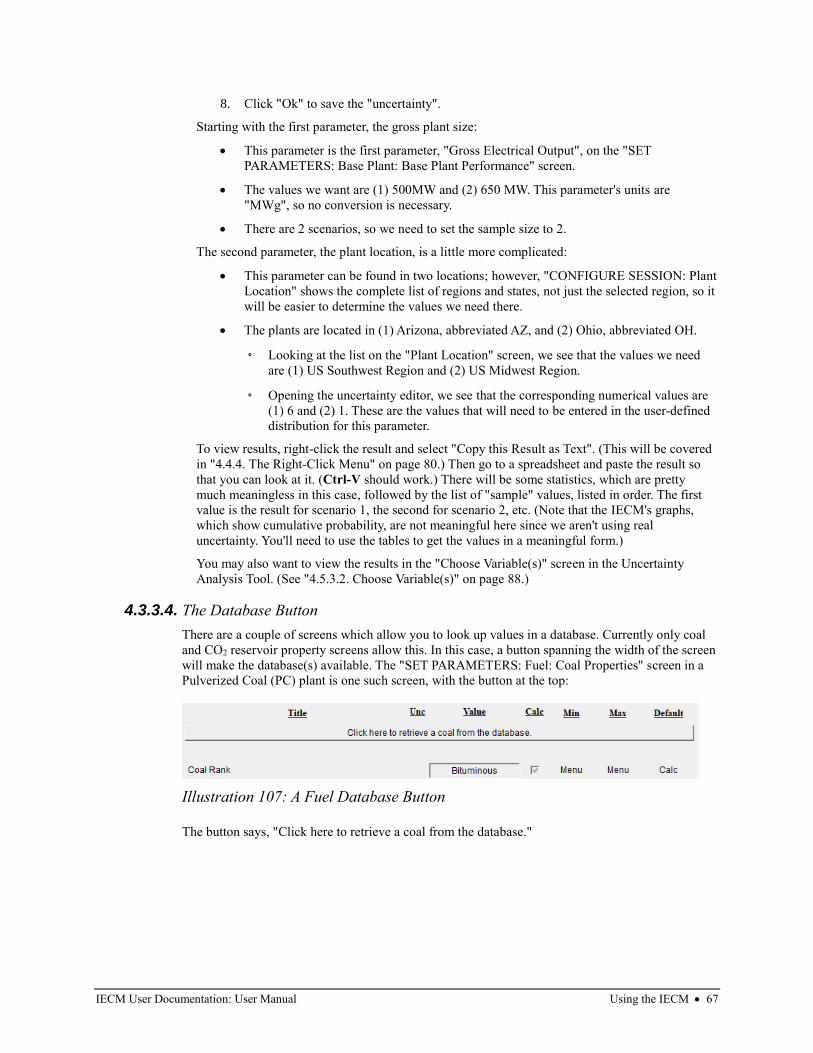
IECM User Documentation: User Manual Using the IECM • 67
8. Click "Ok" to save the "uncertainty".
Starting with the first parameter, the gross plant size:
• This parameter is the first parameter, "Gross Electrical Output", on the "SET
PARAMETERS: Base Plant: Base Plant Performance" screen.
• The values we want are (1) 500MW and (2) 650 MW. This parameter's units are
"MWg", so no conversion is necessary.
• There are 2 scenarios, so we need to set the sample size to 2.
The second parameter, the plant location, is a little more complicated:
• This parameter can be found in two locations; however, "CONFIGURE SESSION: Plant
Location" shows the complete list of regions and states, not just the selected region, so it
will be easier to determine the values we need there.
• The plants are located in (1) Arizona, abbreviated AZ, and (2) Ohio, abbreviated OH.
◦ Looking at the list on the "Plant Location" screen, we see that the values we need
are (1) US Southwest Region and (2) US Midwest Region.
◦ Opening the uncertainty editor, we see that the corresponding numerical values are
(1) 6 and (2) 1. These are the values that will need to be entered in the user-defined
distribution for this parameter.
To view results, right-click the result and select "Copy this Result as Text". (This will be covered
in "4.4.4. The Right-Click Menu" on page 80.) Then go to a spreadsheet and paste the result so
that you can look at it. (Ctrl-V should work.) There will be some statistics, which are pretty
much meaningless in this case, followed by the list of "sample" values, listed in order. The first
value is the result for scenario 1, the second for scenario 2, etc. (Note that the IECM's graphs,
which show cumulative probability, are not meaningful here since we aren't using real
uncertainty. You'll need to use the tables to get the values in a meaningful form.)
You may also want to view the results in the "Choose Variable(s)" screen in the Uncertainty
Analysis Tool. (See "4.5.3.2. Choose Variable(s)" on page 88.)
4.3.3.4. The Database Button
There are a couple of screens which allow you to look up values in a database. Currently only coal
and CO2 reservoir property screens allow this. In this case, a button spanning the width of the screen
will make the database(s) available. The "SET PARAMETERS: Fuel: Coal Properties" screen in a
Pulverized Coal (PC) plant is one such screen, with the button at the top:
The button says, "Click here to retrieve a coal from the database."
Illustration 107: A Fuel Database Button
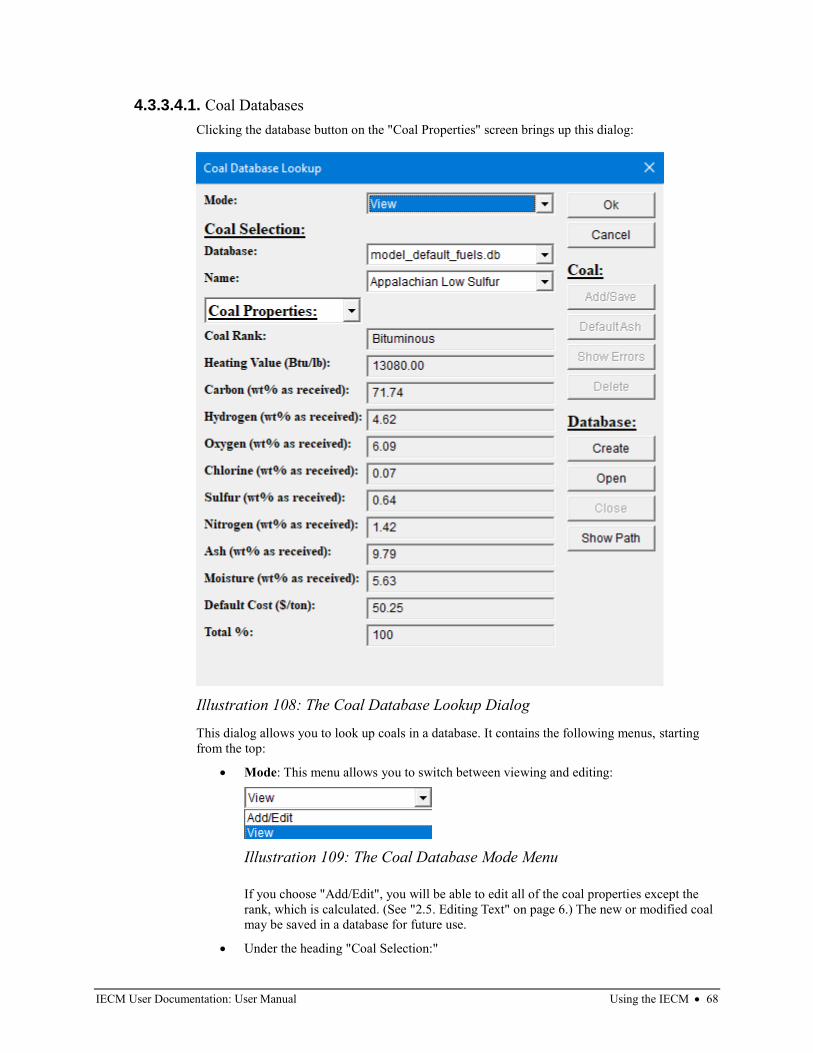
IECM User Documentation: User Manual Using the IECM • 68
4.3.3.4.1. Coal Databases
Clicking the database button on the "Coal Properties" screen brings up this dialog:
This dialog allows you to look up coals in a database. It contains the following menus, starting
from the top:
• Mode: This menu allows you to switch between viewing and editing:
If you choose "Add/Edit", you will be able to edit all of the coal properties except the
rank, which is calculated. (See "2.5. Editing Text" on page 6.) The new or modified coal
may be saved in a database for future use.
• Under the heading "Coal Selection:"
Illustration 108: The Coal Database Lookup Dialog
Illustration 109: The Coal Database Mode Menu
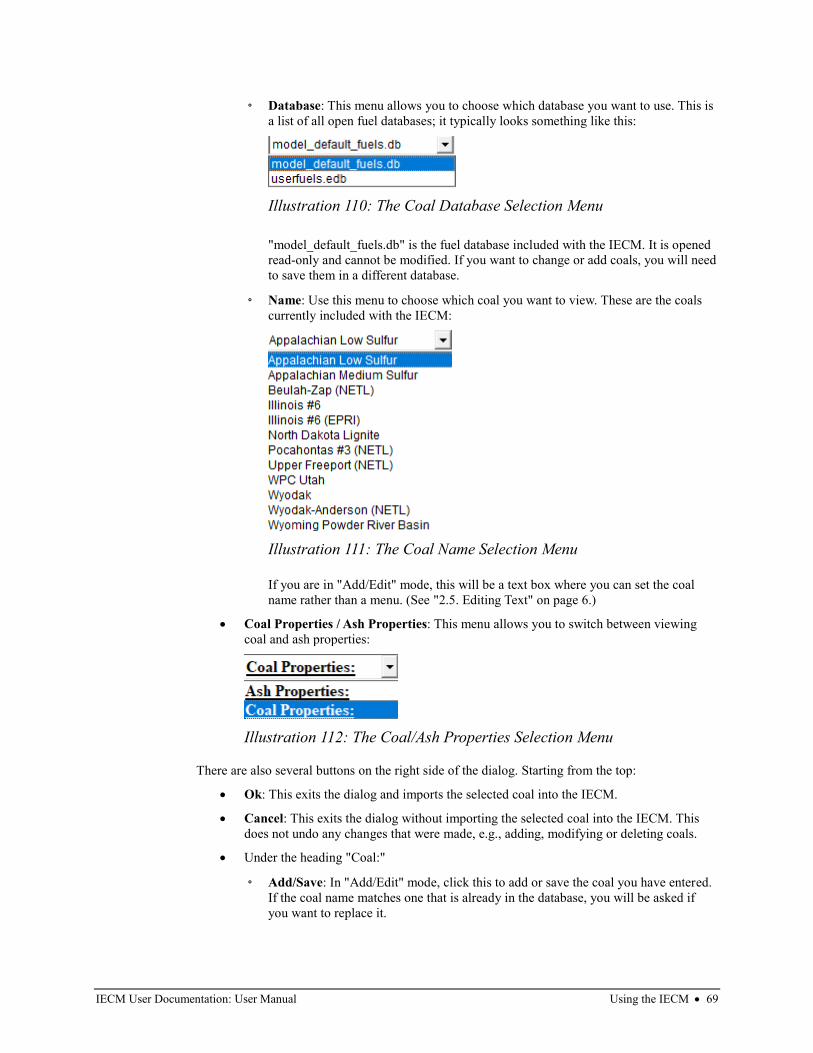
IECM User Documentation: User Manual Using the IECM • 69
◦ Database: This menu allows you to choose which database you want to use. This is
a list of all open fuel databases; it typically looks something like this:
"model_default_fuels.db" is the fuel database included with the IECM. It is opened
read-only and cannot be modified. If you want to change or add coals, you will need
to save them in a different database.
◦ Name: Use this menu to choose which coal you want to view. These are the coals
currently included with the IECM:
If you are in "Add/Edit" mode, this will be a text box where you can set the coal
name rather than a menu. (See "2.5. Editing Text" on page 6.)
• Coal Properties / Ash Properties: This menu allows you to switch between viewing
coal and ash properties:
There are also several buttons on the right side of the dialog. Starting from the top:
• Ok: This exits the dialog and imports the selected coal into the IECM.
• Cancel: This exits the dialog without importing the selected coal into the IECM. This
does not undo any changes that were made, e.g., adding, modifying or deleting coals.
• Under the heading "Coal:"
◦ Add/Save: In "Add/Edit" mode, click this to add or save the coal you have entered.
If the coal name matches one that is already in the database, you will be asked if
you want to replace it.
Illustration 110: The Coal Database Selection Menu
Illustration 111: The Coal Name Selection Menu
Illustration 112: The Coal/Ash Properties Selection Menu
IECM User Documentation: User Manual Using the IECM • 70
◦ Default Ash: In "Add/Edit" mode, click this button to use a default set of ash
properties based on the coal rank.
◦ Show Errors: In "Add/Edit" mode, if the "Add/Save" button is grayed out, click
this button to find out why.
◦ Delete: In "View" mode, if the coal you are viewing is in a writable database, you
will have the option of deleting it. Click this button to delete the current coal.
• Under the heading "Database:"
◦ Create: Click this button to create a new coal database. The procedure is very
similar to the one for opening a new session database, except that in this case you
are creating a new database rather than opening an existing one. (See
"4.1.3.2.1.1. Opening a Session Database" on page 25.) The default file type is
"IECM Fuel Database (*.edb)".
◦ Open: Click this button to open an existing coal database. The procedure is the
same as the one for opening a session database, described in "4.1.3.2.1.1. Opening a
Session Database" on page 25. The default file type is "IECM Fuel Database
(*edb)".
◦ Close: Click this button to close the current database. You are not allowed to close
the model default fuels database.
◦ Show Path: Click this button to view the full path of the current database in the file
system. If you end up with two databases that have the same name, this can help
you distinguish between them.
The procedure for adding or modifying a coal is:
1. Locate the coal that you want to edit. If you're adding a new coal, it doesn't matter which
one you start with.
2. Switch to "Add/Edit" mode.
3. Enter the coal name and properties.
4. Either switch to "Ash Properties" and enter the ash properties, or click the "Default Ash"
button.
5. If you're adding a new coal, select the database you want to use, opening or creating it if
necessary.
6. If the "Add/Save" button is grayed out, click "Show Errors" and correct the problem.
7. Click the "Add/Save" button. You should receive confirmation that your changes have
been saved.
8. At this point your changes are saved, and you can exit the dialog using either the "Ok"
or the "Cancel" button.
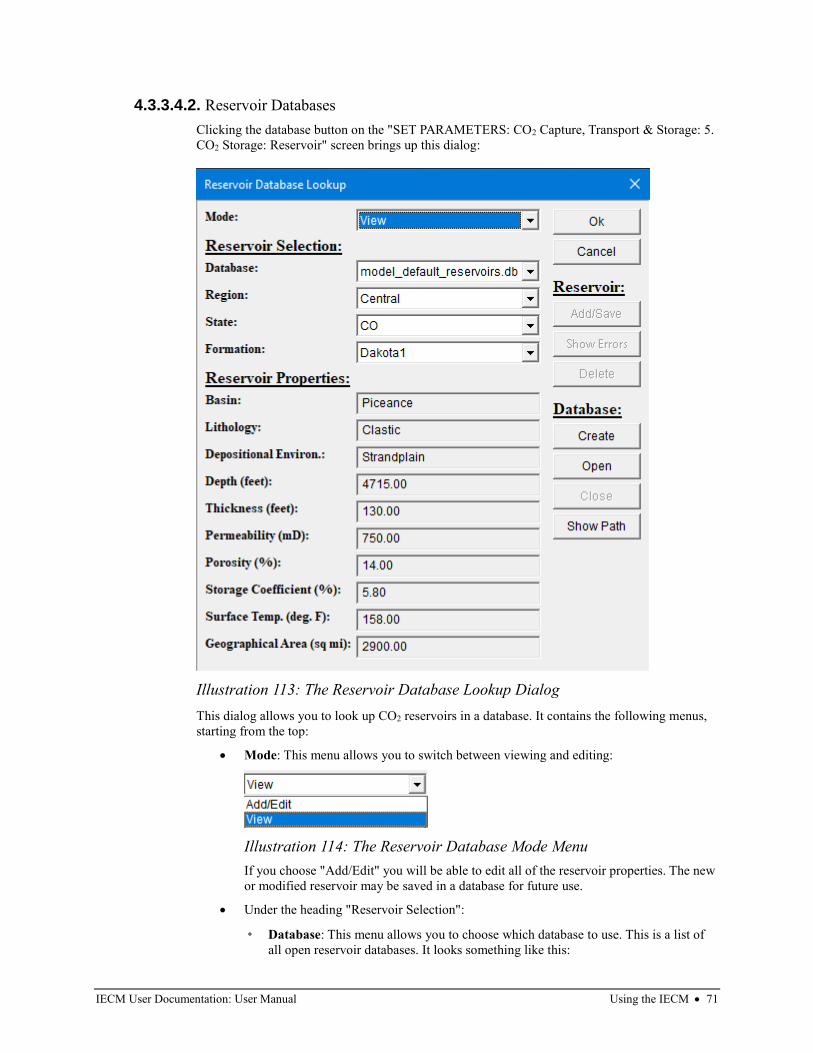
IECM User Documentation: User Manual Using the IECM • 71
4.3.3.4.2. Reservoir Databases
Clicking the database button on the "SET PARAMETERS: CO2 Capture, Transport & Storage: 5.
CO2 Storage: Reservoir" screen brings up this dialog:
This dialog allows you to look up CO2 reservoirs in a database. It contains the following menus,
starting from the top:
• Mode: This menu allows you to switch between viewing and editing:
If you choose "Add/Edit" you will be able to edit all of the reservoir properties. The new
or modified reservoir may be saved in a database for future use.
• Under the heading "Reservoir Selection":
◦ Database: This menu allows you to choose which database to use. This is a list of
all open reservoir databases. It looks something like this:
Illustration 113: The Reservoir Database Lookup Dialog
Illustration 114: The Reservoir Database Mode Menu
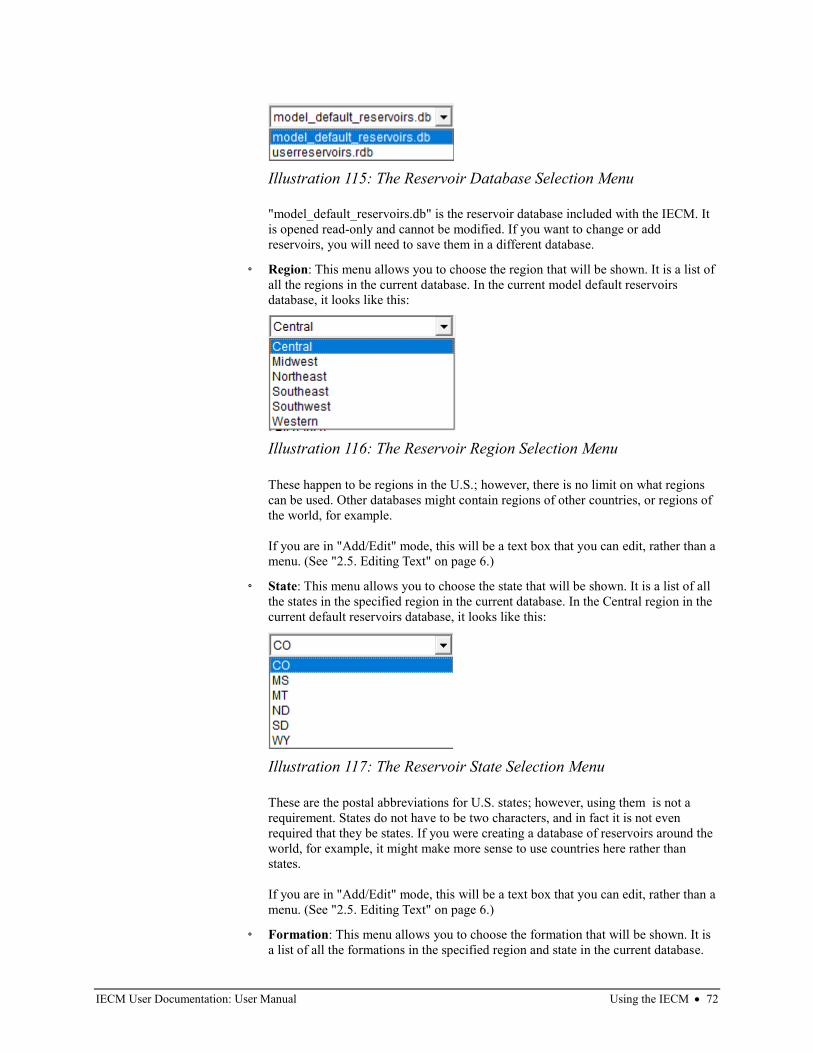
IECM User Documentation: User Manual Using the IECM • 72
"model_default_reservoirs.db" is the reservoir database included with the IECM. It
is opened read-only and cannot be modified. If you want to change or add
reservoirs, you will need to save them in a different database.
◦ Region: This menu allows you to choose the region that will be shown. It is a list of
all the regions in the current database. In the current model default reservoirs
database, it looks like this:
These happen to be regions in the U.S.; however, there is no limit on what regions
can be used. Other databases might contain regions of other countries, or regions of
the world, for example.
If you are in "Add/Edit" mode, this will be a text box that you can edit, rather than a
menu. (See "2.5. Editing Text" on page 6.)
◦ State: This menu allows you to choose the state that will be shown. It is a list of all
the states in the specified region in the current database. In the Central region in the
current default reservoirs database, it looks like this:
These are the postal abbreviations for U.S. states; however, using them is not a
requirement. States do not have to be two characters, and in fact it is not even
required that they be states. If you were creating a database of reservoirs around the
world, for example, it might make more sense to use countries here rather than
states.
If you are in "Add/Edit" mode, this will be a text box that you can edit, rather than a
menu. (See "2.5. Editing Text" on page 6.)
◦ Formation: This menu allows you to choose the formation that will be shown. It is
a list of all the formations in the specified region and state in the current database.
Illustration 115: The Reservoir Database Selection Menu
Illustration 116: The Reservoir Region Selection Menu
Illustration 117: The Reservoir State Selection Menu
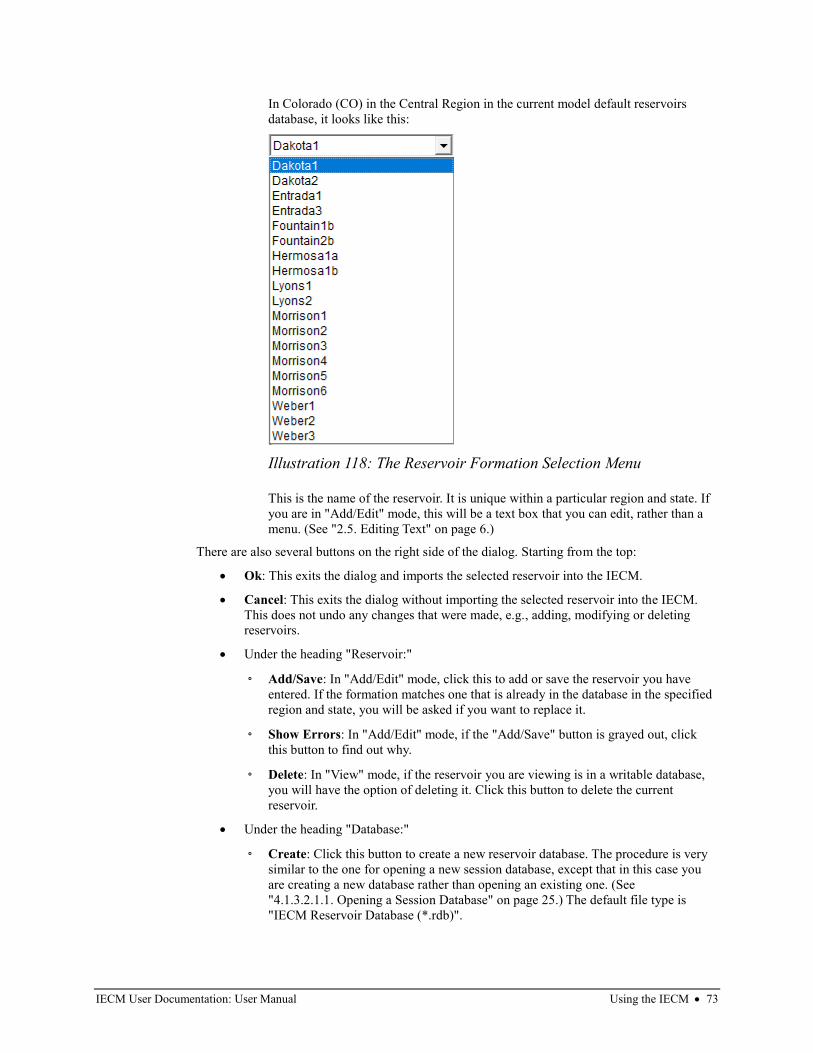
IECM User Documentation: User Manual Using the IECM • 73
In Colorado (CO) in the Central Region in the current model default reservoirs
database, it looks like this:
This is the name of the reservoir. It is unique within a particular region and state. If
you are in "Add/Edit" mode, this will be a text box that you can edit, rather than a
menu. (See "2.5. Editing Text" on page 6.)
There are also several buttons on the right side of the dialog. Starting from the top:
• Ok: This exits the dialog and imports the selected reservoir into the IECM.
• Cancel: This exits the dialog without importing the selected reservoir into the IECM.
This does not undo any changes that were made, e.g., adding, modifying or deleting
reservoirs.
• Under the heading "Reservoir:"
◦ Add/Save: In "Add/Edit" mode, click this to add or save the reservoir you have
entered. If the formation matches one that is already in the database in the specified
region and state, you will be asked if you want to replace it.
◦ Show Errors: In "Add/Edit" mode, if the "Add/Save" button is grayed out, click
this button to find out why.
◦ Delete: In "View" mode, if the reservoir you are viewing is in a writable database,
you will have the option of deleting it. Click this button to delete the current
reservoir.
• Under the heading "Database:"
◦ Create: Click this button to create a new reservoir database. The procedure is very
similar to the one for opening a new session database, except that in this case you
are creating a new database rather than opening an existing one. (See
"4.1.3.2.1.1. Opening a Session Database" on page 25.) The default file type is
"IECM Reservoir Database (*.rdb)".
Illustration 118: The Reservoir Formation Selection Menu
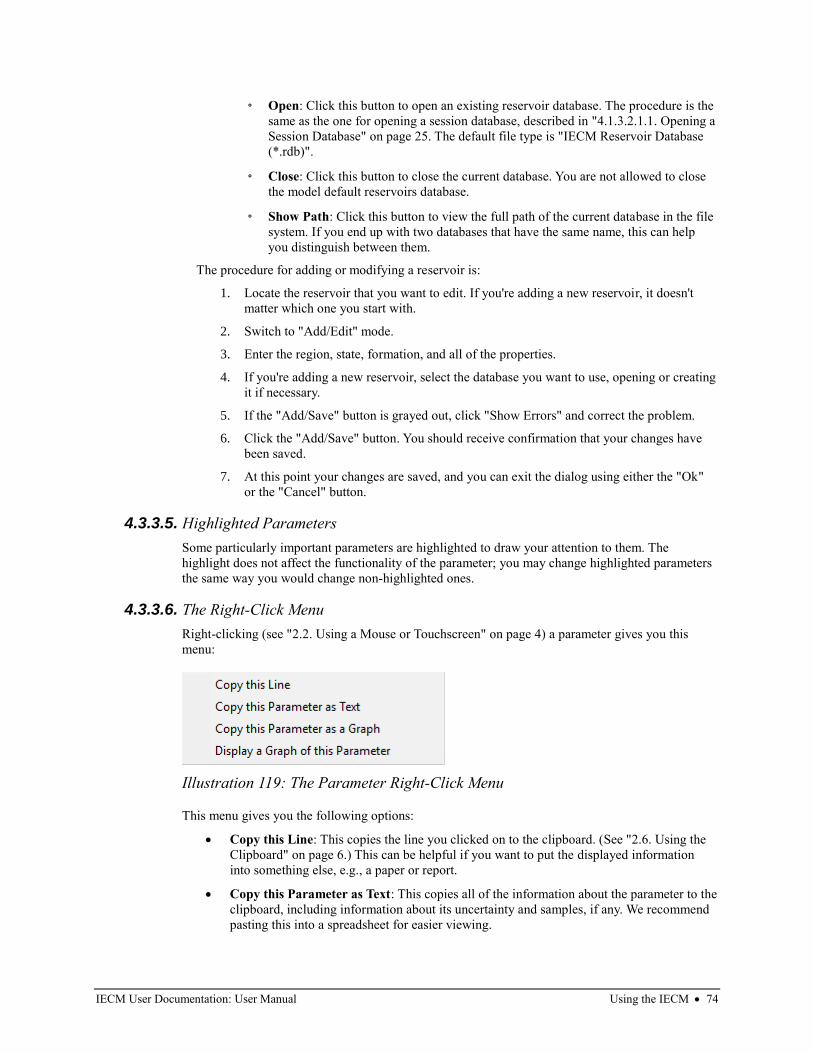
IECM User Documentation: User Manual Using the IECM • 74
◦ Open: Click this button to open an existing reservoir database. The procedure is the
same as the one for opening a session database, described in "4.1.3.2.1.1. Opening a
Session Database" on page 25. The default file type is "IECM Reservoir Database
(*.rdb)".
◦ Close: Click this button to close the current database. You are not allowed to close
the model default reservoirs database.
◦ Show Path: Click this button to view the full path of the current database in the file
system. If you end up with two databases that have the same name, this can help
you distinguish between them.
The procedure for adding or modifying a reservoir is:
1. Locate the reservoir that you want to edit. If you're adding a new reservoir, it doesn't
matter which one you start with.
2. Switch to "Add/Edit" mode.
3. Enter the region, state, formation, and all of the properties.
4. If you're adding a new reservoir, select the database you want to use, opening or creating
it if necessary.
5. If the "Add/Save" button is grayed out, click "Show Errors" and correct the problem.
6. Click the "Add/Save" button. You should receive confirmation that your changes have
been saved.
7. At this point your changes are saved, and you can exit the dialog using either the "Ok"
or the "Cancel" button.
4.3.3.5. Highlighted Parameters
Some particularly important parameters are highlighted to draw your attention to them. The
highlight does not affect the functionality of the parameter; you may change highlighted parameters
the same way you would change non-highlighted ones.
4.3.3.6. The Right-Click Menu
Right-clicking (see "2.2. Using a Mouse or Touchscreen" on page 4) a parameter gives you this
menu:
This menu gives you the following options:
• Copy this Line: This copies the line you clicked on to the clipboard. (See "2.6. Using the
Clipboard" on page 6.) This can be helpful if you want to put the displayed information
into something else, e.g., a paper or report.
• Copy this Parameter as Text: This copies all of the information about the parameter to the
clipboard, including information about its uncertainty and samples, if any. We recommend
pasting this into a spreadsheet for easier viewing.
Illustration 119: The Parameter Right-Click Menu
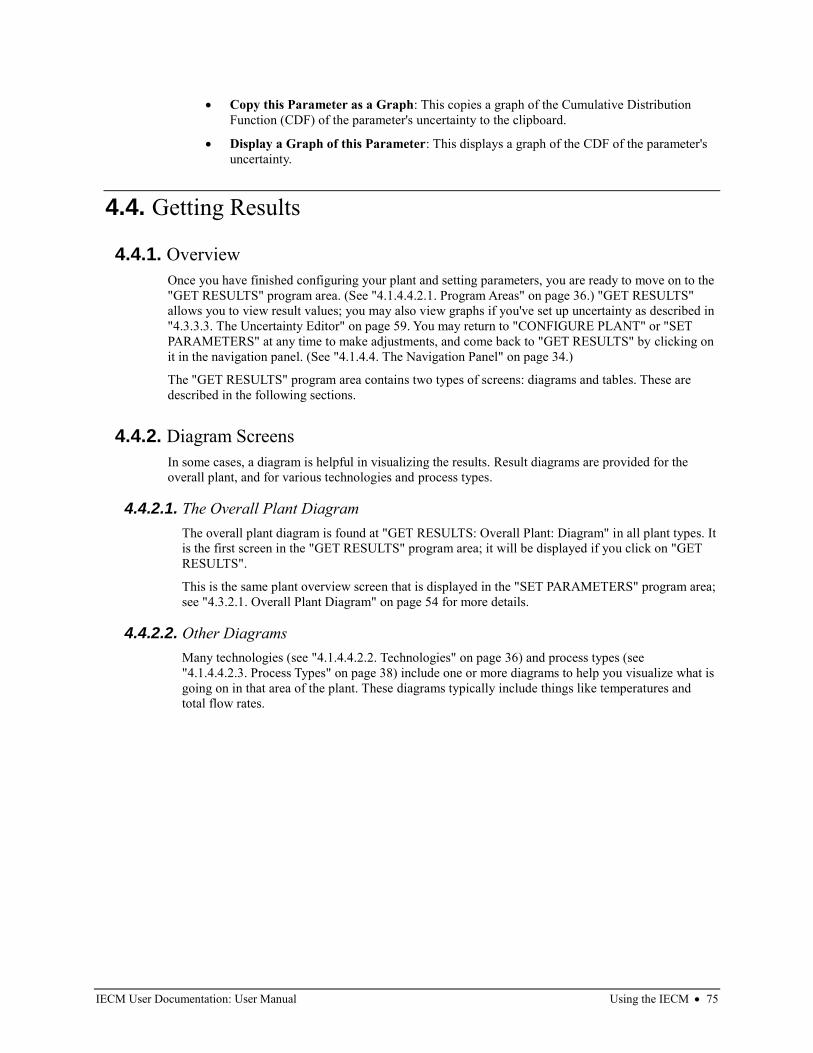
IECM User Documentation: User Manual Using the IECM • 75
• Copy this Parameter as a Graph: This copies a graph of the Cumulative Distribution
Function (CDF) of the parameter's uncertainty to the clipboard.
• Display a Graph of this Parameter: This displays a graph of the CDF of the parameter's
uncertainty.
4.4. Getting Results
4.4.1. Overview
Once you have finished configuring your plant and setting parameters, you are ready to move on to the
"GET RESULTS" program area. (See "4.1.4.4.2.1. Program Areas" on page 36.) "GET RESULTS"
allows you to view result values; you may also view graphs if you've set up uncertainty as described in
"4.3.3.3. The Uncertainty Editor" on page 59. You may return to "CONFIGURE PLANT" or "SET
PARAMETERS" at any time to make adjustments, and come back to "GET RESULTS" by clicking on
it in the navigation panel. (See "4.1.4.4. The Navigation Panel" on page 34.)
The "GET RESULTS" program area contains two types of screens: diagrams and tables. These are
described in the following sections.
4.4.2. Diagram Screens
In some cases, a diagram is helpful in visualizing the results. Result diagrams are provided for the
overall plant, and for various technologies and process types.
4.4.2.1. The Overall Plant Diagram
The overall plant diagram is found at "GET RESULTS: Overall Plant: Diagram" in all plant types. It
is the first screen in the "GET RESULTS" program area; it will be displayed if you click on "GET
RESULTS".
This is the same plant overview screen that is displayed in the "SET PARAMETERS" program area;
see "4.3.2.1. Overall Plant Diagram" on page 54 for more details.
4.4.2.2. Other Diagrams
Many technologies (see "4.1.4.4.2.2. Technologies" on page 36) and process types (see
"4.1.4.4.2.3. Process Types" on page 38) include one or more diagrams to help you visualize what is
going on in that area of the plant. These diagrams typically include things like temperatures and
total flow rates.
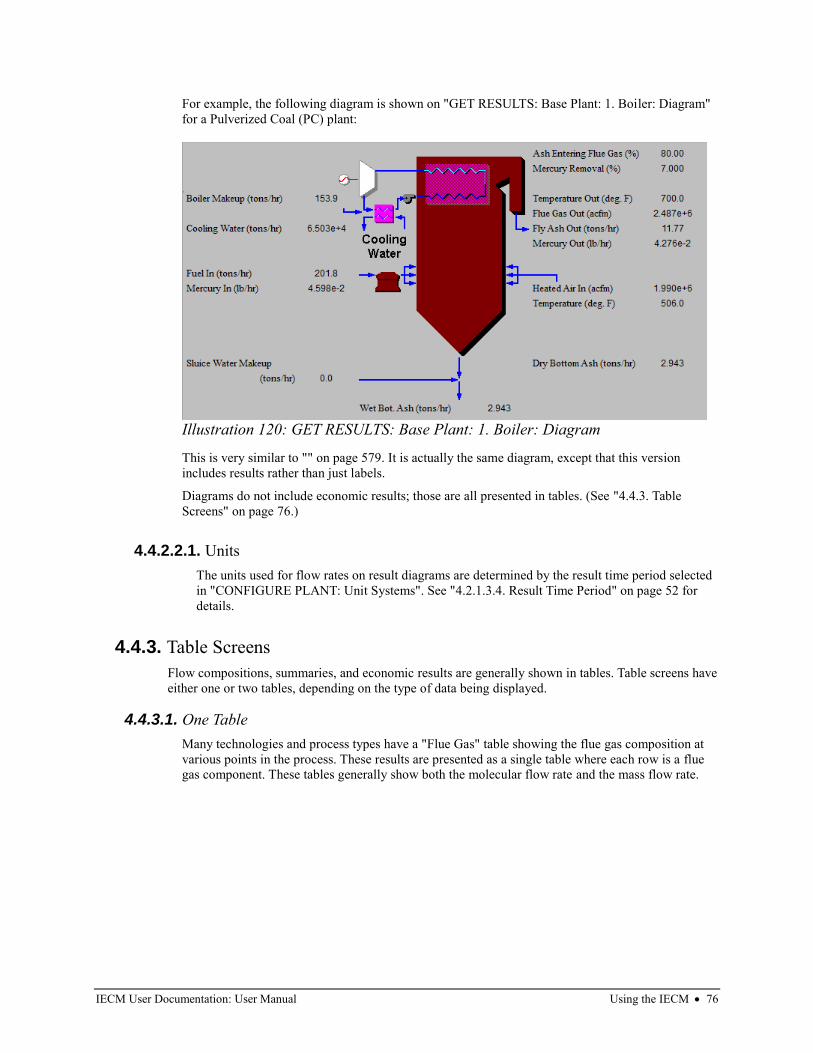
IECM User Documentation: User Manual Using the IECM • 76
For example, the following diagram is shown on "GET RESULTS: Base Plant: 1. Boiler: Diagram"
for a Pulverized Coal (PC) plant:
This is very similar to "" on page 579. It is actually the same diagram, except that this version
includes results rather than just labels.
Diagrams do not include economic results; those are all presented in tables. (See "4.4.3. Table
Screens" on page 76.)
4.4.2.2.1. Units
The units used for flow rates on result diagrams are determined by the result time period selected
in "CONFIGURE PLANT: Unit Systems". See "4.2.1.3.4. Result Time Period" on page 52 for
details.
4.4.3. Table Screens
Flow compositions, summaries, and economic results are generally shown in tables. Table screens have
either one or two tables, depending on the type of data being displayed.
4.4.3.1. One Table
Many technologies and process types have a "Flue Gas" table showing the flue gas composition at
various points in the process. These results are presented as a single table where each row is a flue
gas component. These tables generally show both the molecular flow rate and the mass flow rate.
Illustration 120: GET RESULTS: Base Plant: 1. Boiler: Diagram
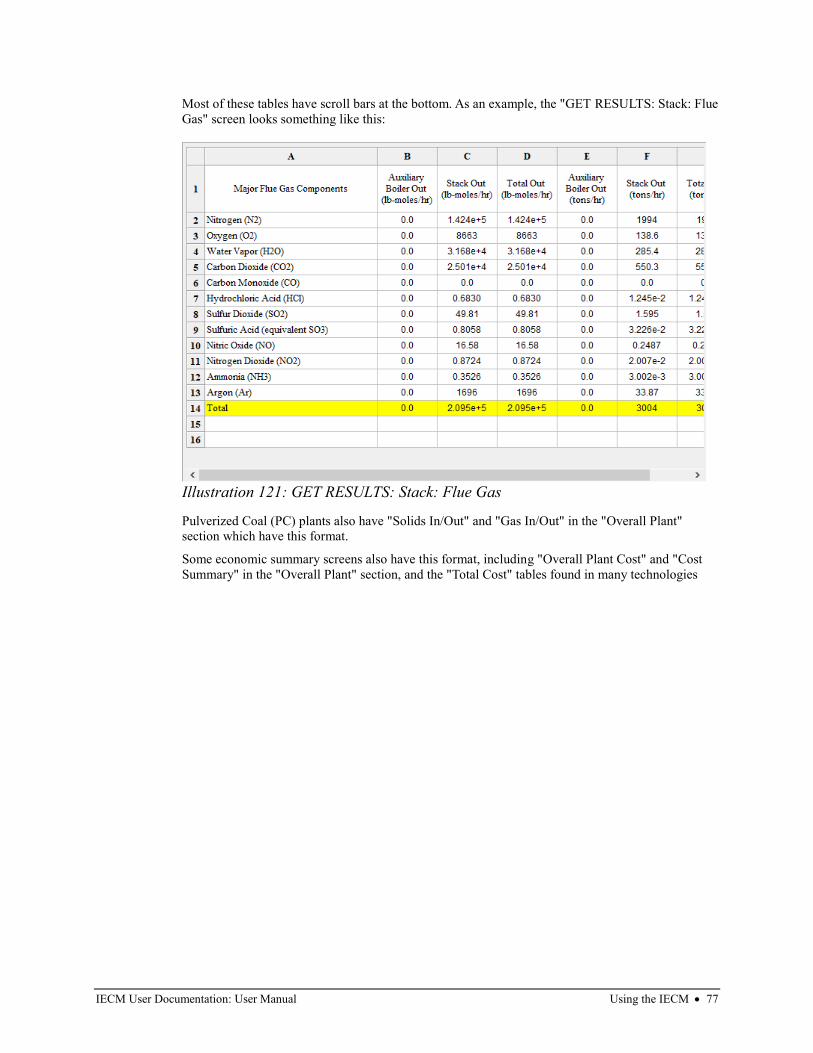
IECM User Documentation: User Manual Using the IECM • 77
Most of these tables have scroll bars at the bottom. As an example, the "GET RESULTS: Stack: Flue
Gas" screen looks something like this:
Pulverized Coal (PC) plants also have "Solids In/Out" and "Gas In/Out" in the "Overall Plant"
section which have this format.
Some economic summary screens also have this format, including "Overall Plant Cost" and "Cost
Summary" in the "Overall Plant" section, and the "Total Cost" tables found in many technologies
Illustration 121: GET RESULTS: Stack: Flue Gas
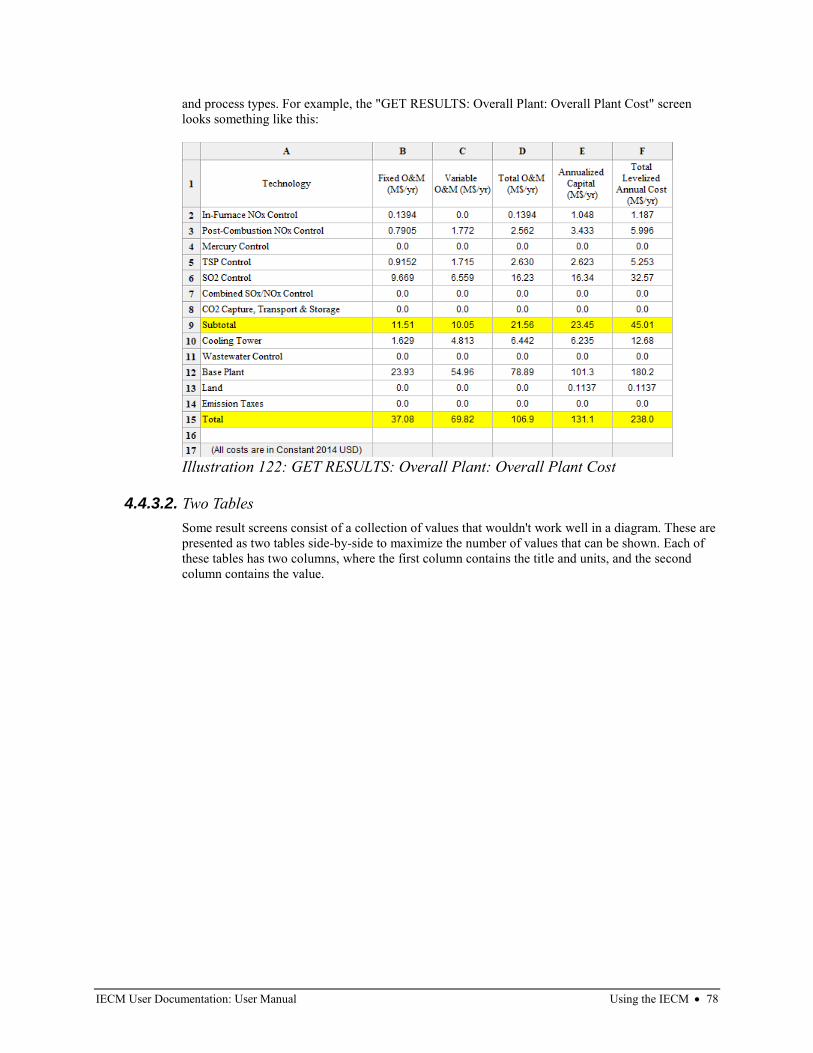
IECM User Documentation: User Manual Using the IECM • 78
and process types. For example, the "GET RESULTS: Overall Plant: Overall Plant Cost" screen
looks something like this:
4.4.3.2. Two Tables
Some result screens consist of a collection of values that wouldn't work well in a diagram. These are
presented as two tables side-by-side to maximize the number of values that can be shown. Each of
these tables has two columns, where the first column contains the title and units, and the second
column contains the value.
Illustration 122: GET RESULTS: Overall Plant: Overall Plant Cost
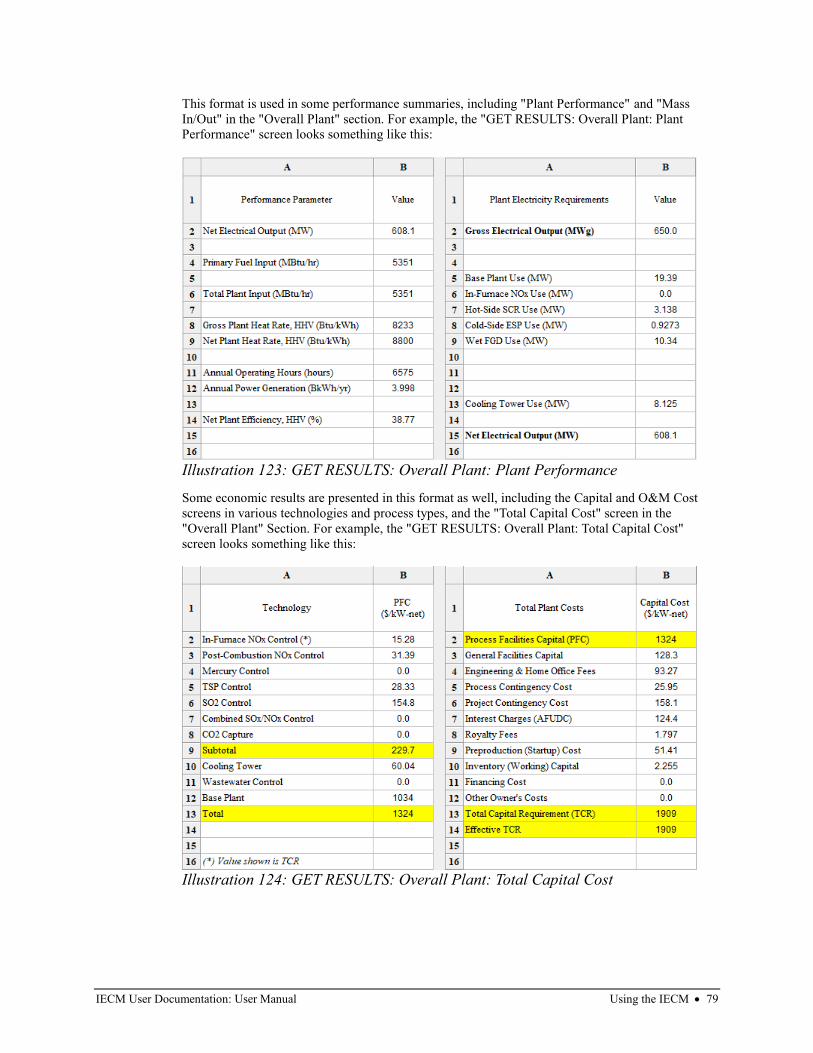
IECM User Documentation: User Manual Using the IECM • 79
This format is used in some performance summaries, including "Plant Performance" and "Mass
In/Out" in the "Overall Plant" section. For example, the "GET RESULTS: Overall Plant: Plant
Performance" screen looks something like this:
Some economic results are presented in this format as well, including the Capital and O&M Cost
screens in various technologies and process types, and the "Total Capital Cost" screen in the
"Overall Plant" Section. For example, the "GET RESULTS: Overall Plant: Total Capital Cost"
screen looks something like this:
Illustration 123: GET RESULTS: Overall Plant: Plant Performance
Illustration 124: GET RESULTS: Overall Plant: Total Capital Cost
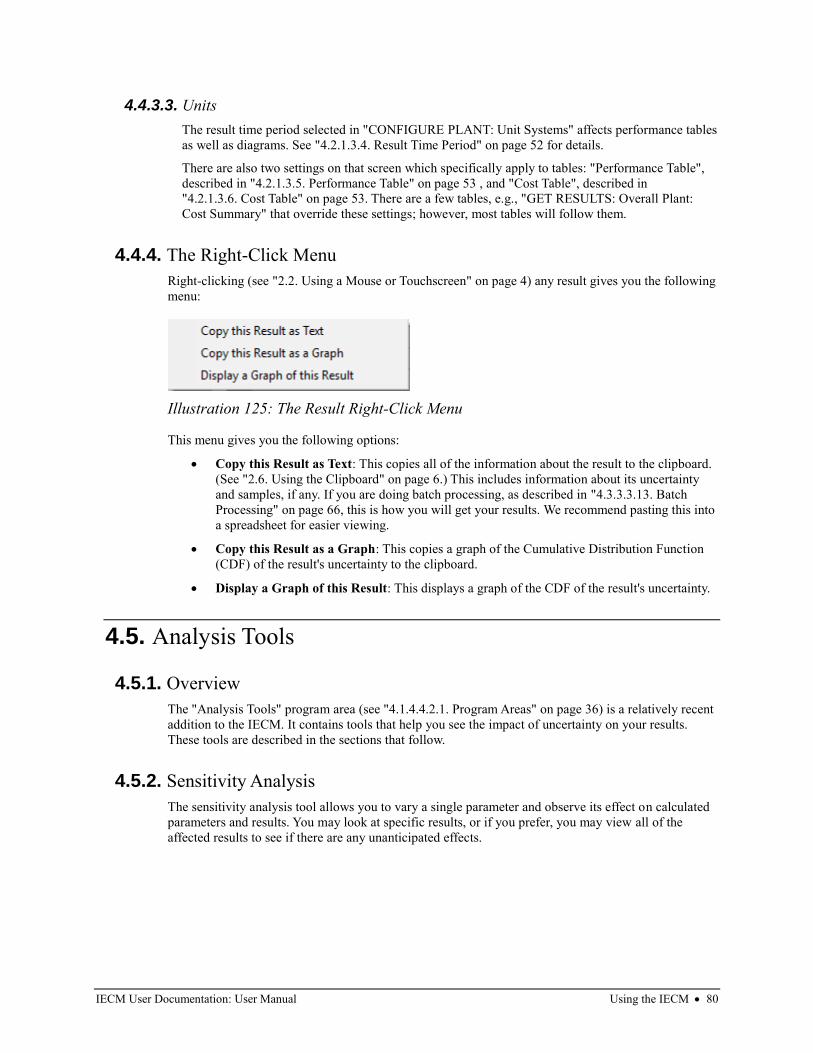
IECM User Documentation: User Manual Using the IECM • 80
4.4.3.3. Units
The result time period selected in "CONFIGURE PLANT: Unit Systems" affects performance tables
as well as diagrams. See "4.2.1.3.4. Result Time Period" on page 52 for details.
There are also two settings on that screen which specifically apply to tables: "Performance Table",
described in "4.2.1.3.5. Performance Table" on page 53 , and "Cost Table", described in
"4.2.1.3.6. Cost Table" on page 53. There are a few tables, e.g., "GET RESULTS: Overall Plant:
Cost Summary" that override these settings; however, most tables will follow them.
4.4.4. The Right-Click Menu
Right-clicking (see "2.2. Using a Mouse or Touchscreen" on page 4) any result gives you the following
menu:
This menu gives you the following options:
• Copy this Result as Text: This copies all of the information about the result to the clipboard.
(See "2.6. Using the Clipboard" on page 6.) This includes information about its uncertainty
and samples, if any. If you are doing batch processing, as described in "4.3.3.3.13. Batch
Processing" on page 66, this is how you will get your results. We recommend pasting this into
a spreadsheet for easier viewing.
• Copy this Result as a Graph: This copies a graph of the Cumulative Distribution Function
(CDF) of the result's uncertainty to the clipboard.
• Display a Graph of this Result: This displays a graph of the CDF of the result's uncertainty.
4.5. Analysis Tools
4.5.1. Overview
The "Analysis Tools" program area (see "4.1.4.4.2.1. Program Areas" on page 36) is a relatively recent
addition to the IECM. It contains tools that help you see the impact of uncertainty on your results.
These tools are described in the sections that follow.
4.5.2. Sensitivity Analysis
The sensitivity analysis tool allows you to vary a single parameter and observe its effect on calculated
parameters and results. You may look at specific results, or if you prefer, you may view all of the
affected results to see if there are any unanticipated effects.
Illustration 125: The Result Right-Click Menu
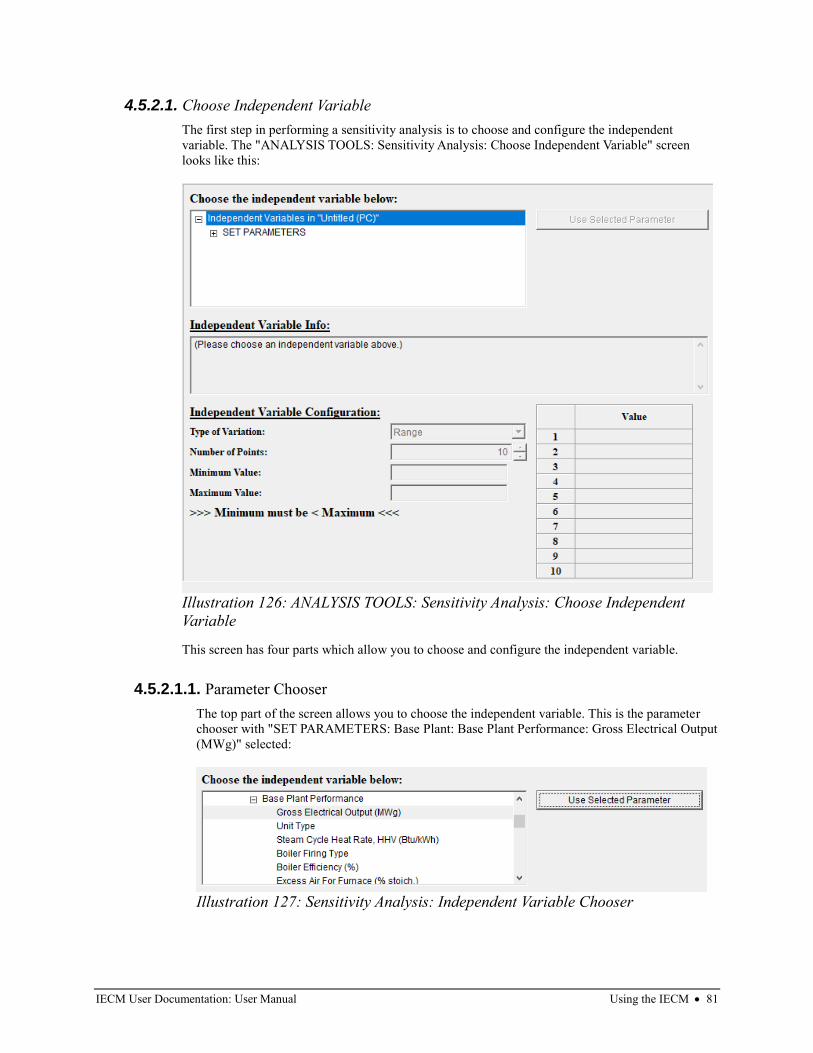
IECM User Documentation: User Manual Using the IECM • 81
4.5.2.1. Choose Independent Variable
The first step in performing a sensitivity analysis is to choose and configure the independent
variable. The "ANALYSIS TOOLS: Sensitivity Analysis: Choose Independent Variable" screen
looks like this:
This screen has four parts which allow you to choose and configure the independent variable.
4.5.2.1.1. Parameter Chooser
The top part of the screen allows you to choose the independent variable. This is the parameter
chooser with "SET PARAMETERS: Base Plant: Base Plant Performance: Gross Electrical Output
(MWg)" selected:
Illustration 126: ANALYSIS TOOLS: Sensitivity Analysis: Choose Independent
Variable
Illustration 127: Sensitivity Analysis: Independent Variable Chooser
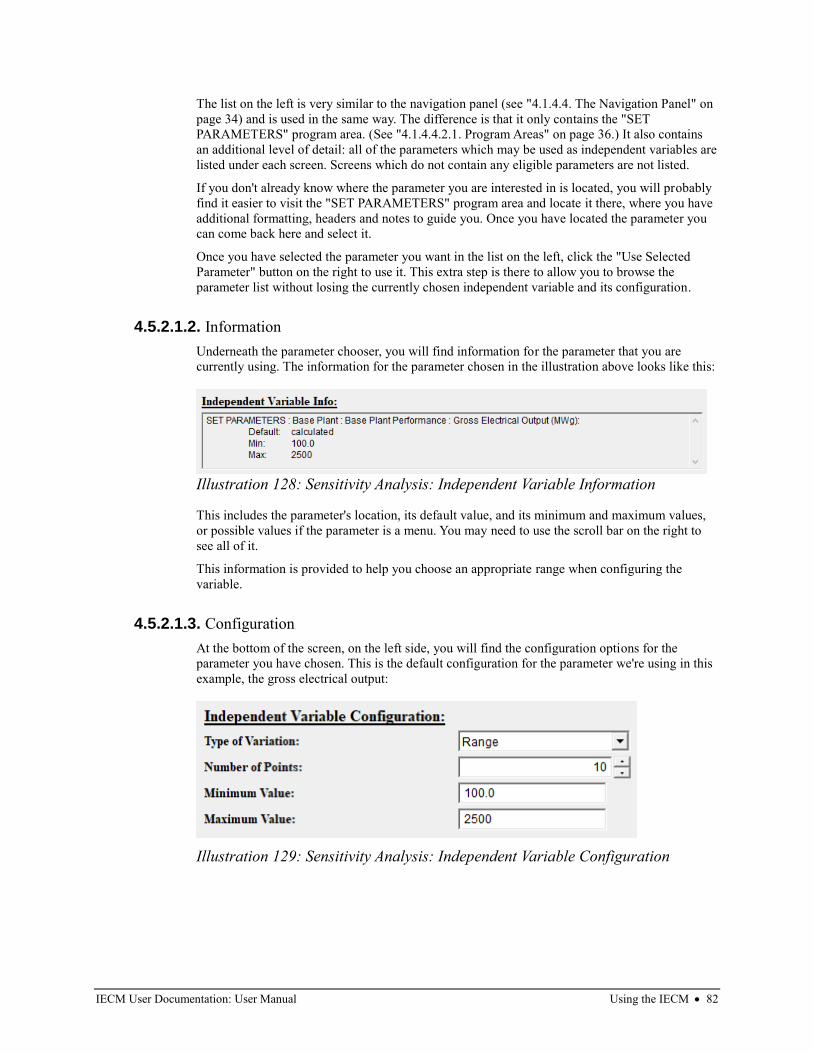
IECM User Documentation: User Manual Using the IECM • 82
The list on the left is very similar to the navigation panel (see "4.1.4.4. The Navigation Panel" on
page 34) and is used in the same way. The difference is that it only contains the "SET
PARAMETERS" program area. (See "4.1.4.4.2.1. Program Areas" on page 36.) It also contains
an additional level of detail: all of the parameters which may be used as independent variables are
listed under each screen. Screens which do not contain any eligible parameters are not listed.
If you don't already know where the parameter you are interested in is located, you will probably
find it easier to visit the "SET PARAMETERS" program area and locate it there, where you have
additional formatting, headers and notes to guide you. Once you have located the parameter you
can come back here and select it.
Once you have selected the parameter you want in the list on the left, click the "Use Selected
Parameter" button on the right to use it. This extra step is there to allow you to browse the
parameter list without losing the currently chosen independent variable and its configuration.
4.5.2.1.2. Information
Underneath the parameter chooser, you will find information for the parameter that you are
currently using. The information for the parameter chosen in the illustration above looks like this:
This includes the parameter's location, its default value, and its minimum and maximum values,
or possible values if the parameter is a menu. You may need to use the scroll bar on the right to
see all of it.
This information is provided to help you choose an appropriate range when configuring the
variable.
4.5.2.1.3. Configuration
At the bottom of the screen, on the left side, you will find the configuration options for the
parameter you have chosen. This is the default configuration for the parameter we're using in this
example, the gross electrical output:
Illustration 128: Sensitivity Analysis: Independent Variable Information
Illustration 129: Sensitivity Analysis: Independent Variable Configuration
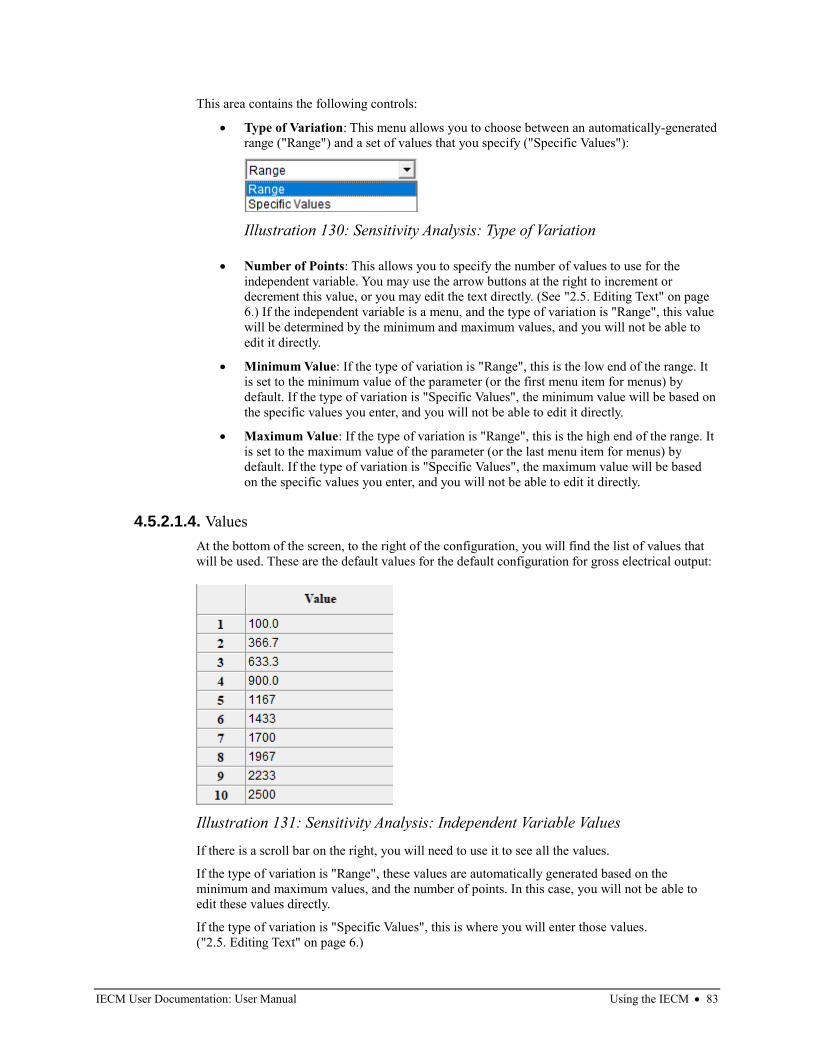
IECM User Documentation: User Manual Using the IECM • 83
This area contains the following controls:
• Type of Variation: This menu allows you to choose between an automatically-generated
range ("Range") and a set of values that you specify ("Specific Values"):
• Number of Points: This allows you to specify the number of values to use for the
independent variable. You may use the arrow buttons at the right to increment or
decrement this value, or you may edit the text directly. (See "2.5. Editing Text" on page
6.) If the independent variable is a menu, and the type of variation is "Range", this value
will be determined by the minimum and maximum values, and you will not be able to
edit it directly.
• Minimum Value: If the type of variation is "Range", this is the low end of the range. It
is set to the minimum value of the parameter (or the first menu item for menus) by
default. If the type of variation is "Specific Values", the minimum value will be based on
the specific values you enter, and you will not be able to edit it directly.
• Maximum Value: If the type of variation is "Range", this is the high end of the range. It
is set to the maximum value of the parameter (or the last menu item for menus) by
default. If the type of variation is "Specific Values", the maximum value will be based
on the specific values you enter, and you will not be able to edit it directly.
4.5.2.1.4. Values
At the bottom of the screen, to the right of the configuration, you will find the list of values that
will be used. These are the default values for the default configuration for gross electrical output:
If there is a scroll bar on the right, you will need to use it to see all the values.
If the type of variation is "Range", these values are automatically generated based on the
minimum and maximum values, and the number of points. In this case, you will not be able to
edit these values directly.
If the type of variation is "Specific Values", this is where you will enter those values.
("2.5. Editing Text" on page 6.)
Illustration 130: Sensitivity Analysis: Type of Variation
Illustration 131: Sensitivity Analysis: Independent Variable Values
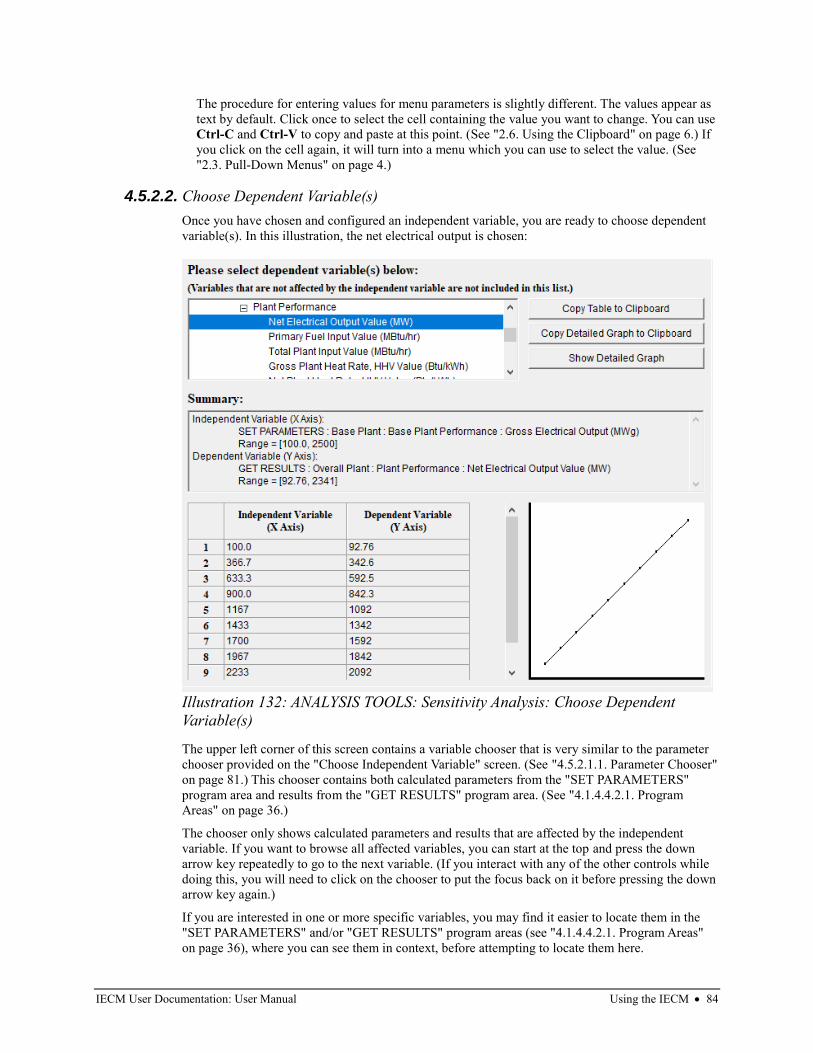
IECM User Documentation: User Manual Using the IECM • 84
The procedure for entering values for menu parameters is slightly different. The values appear as
text by default. Click once to select the cell containing the value you want to change. You can use
Ctrl-C and Ctrl-V to copy and paste at this point. (See "2.6. Using the Clipboard" on page 6.) If
you click on the cell again, it will turn into a menu which you can use to select the value. (See
"2.3. Pull-Down Menus" on page 4.)
4.5.2.2. Choose Dependent Variable(s)
Once you have chosen and configured an independent variable, you are ready to choose dependent
variable(s). In this illustration, the net electrical output is chosen:
The upper left corner of this screen contains a variable chooser that is very similar to the parameter
chooser provided on the "Choose Independent Variable" screen. (See "4.5.2.1.1. Parameter Chooser"
on page 81.) This chooser contains both calculated parameters from the "SET PARAMETERS"
program area and results from the "GET RESULTS" program area. (See "4.1.4.4.2.1. Program
Areas" on page 36.)
The chooser only shows calculated parameters and results that are affected by the independent
variable. If you want to browse all affected variables, you can start at the top and press the down
arrow key repeatedly to go to the next variable. (If you interact with any of the other controls while
doing this, you will need to click on the chooser to put the focus back on it before pressing the down
arrow key again.)
If you are interested in one or more specific variables, you may find it easier to locate them in the
"SET PARAMETERS" and/or "GET RESULTS" program areas (see "4.1.4.4.2.1. Program Areas"
on page 36), where you can see them in context, before attempting to locate them here.
Illustration 132: ANALYSIS TOOLS: Sensitivity Analysis: Choose Dependent
Variable(s)
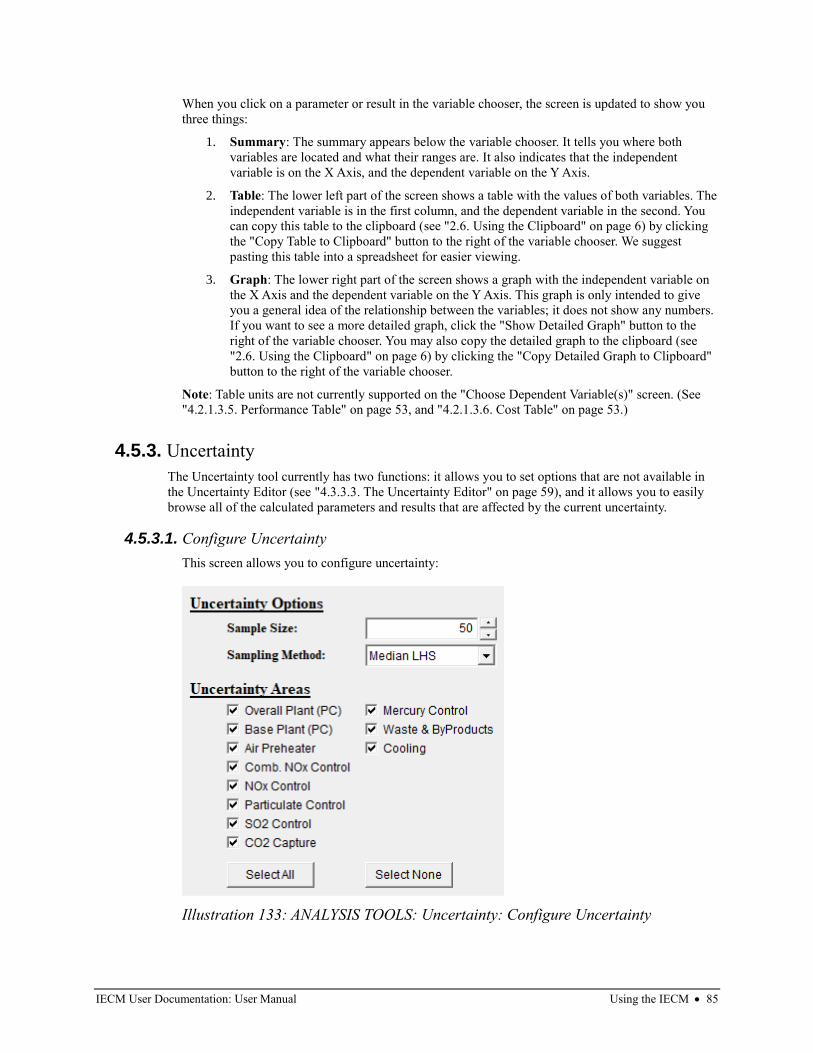
IECM User Documentation: User Manual Using the IECM • 85
When you click on a parameter or result in the variable chooser, the screen is updated to show you
three things:
1. Summary: The summary appears below the variable chooser. It tells you where both
variables are located and what their ranges are. It also indicates that the independent
variable is on the X Axis, and the dependent variable on the Y Axis.
2. Table: The lower left part of the screen shows a table with the values of both variables. The
independent variable is in the first column, and the dependent variable in the second. You
can copy this table to the clipboard (see "2.6. Using the Clipboard" on page 6) by clicking
the "Copy Table to Clipboard" button to the right of the variable chooser. We suggest
pasting this table into a spreadsheet for easier viewing.
3. Graph: The lower right part of the screen shows a graph with the independent variable on
the X Axis and the dependent variable on the Y Axis. This graph is only intended to give
you a general idea of the relationship between the variables; it does not show any numbers.
If you want to see a more detailed graph, click the "Show Detailed Graph" button to the
right of the variable chooser. You may also copy the detailed graph to the clipboard (see
"2.6. Using the Clipboard" on page 6) by clicking the "Copy Detailed Graph to Clipboard"
button to the right of the variable chooser.
Note: Table units are not currently supported on the "Choose Dependent Variable(s)" screen. (See
"4.2.1.3.5. Performance Table" on page 53, and "4.2.1.3.6. Cost Table" on page 53.)
4.5.3. Uncertainty
The Uncertainty tool currently has two functions: it allows you to set options that are not available in
the Uncertainty Editor (see "4.3.3.3. The Uncertainty Editor" on page 59), and it allows you to easily
browse all of the calculated parameters and results that are affected by the current uncertainty.
4.5.3.1. Configure Uncertainty
This screen allows you to configure uncertainty:
Illustration 133: ANALYSIS TOOLS: Uncertainty: Configure Uncertainty
IECM User Documentation: User Manual Using the IECM • 86
4.5.3.1.1. Sample Size
This is the number of samples that will be generated/used. It is generally set in the uncertainty
editor, but you may set it here as well. (See "4.3.3.3.4. #4: The Sample Size" on page 61.)
4.5.3.1.2. Sampling Method
This is a menu which allows you to select the method used to generate samples. (See "2.3. Pull-
Down Menus" on page 4.) The following options are available:
• Median LHS and Random LHS: Latin Hypercube is a stratified sampling method that
divides the sampling space into equally probable intervals, or strata. For each input
variable, the method samples each interval in a random order. When the samples from
each input variable are combined, one resultant output is determined. This process is
repeated m times, forming a final result of m output values. These m output values
contain the uncertainty of the output variable, based on all the uncertainties of the entire
set of input variables. The value m is referred to as the sample size.
The model contains two variations of Latin Hypercube sampling: Random and Median.
Random LHS samples each strata randomly, while Median LHS samples each strata by
its median value. (See: Diwekar, U.M. and J.R. Kalagnanam, (1997) "Efficient Sampling
Technique for Optimization under Uncertainty," AIChE Journal, Vol. 43, No. 2, pp. 440-
7.) Median LHS is the default sampling method.
Both forms of Latin Hypercube have the advantage of sampling more uniformly over the
input distributions relative to Monte Carlo sampling, resulting in less noise in the final
distribution. Another advantage is the reduced number of samples that must be taken to
satisfy a given precision. Latin Hypercube has the drawback that the precision is more
difficult to calculate using statistical methods. Finally, the output is random but not
independent.
• Random Sample: This is also known as Monte Carlo. Monte Carlo is the simplest and
best-known sampling method. It draws values at random from the uncertainty
distribution of each input variable in the decision tree. For a particular sampling run,
each input variable is randomly sampled once. The random samples from each input
result in one final output value. This process is repeated m times and results in a final
solution set. This set can then be evaluated with standard statistical techniques to
determine the mean, precision, and confidence.
This method has the advantage of providing an easy method of determining the precision
for a specific number of samples using standard statistical techniques. However, it
suffers from requiring a large number of samples for a given precision. It also has the
drawback of substantial noise in the resulting distribution. For these reasons, Latin
Hypercube sampling is preferred as the model default.
• Hammersley: The Hammersley sequence sampling technique is more efficient than
either the Monte Carlo or Latin-Hypercube sampling techniques. (See: Diwekar, U.M.
and J.R. Kalagnanam, (1997) "Efficient Sampling Technique for Optimization under
Uncertainty," AIChE Journal, Vol. 43, No. 2, pp. 440-7.) The sampling method is loosely
based on the Monte Carlo method. However, instead of using a random number
generator, it uses a quasi-random number generator based on Hammersley points to
uniformly sample a unit hypercube. These points are an optimal design for placing n
points on a k-dimensional hypercube. The sample points are then inverted over a
cumulative probability distribution to define the sample set for any uncertainty variable.
Hammersley has the advantage of high precision and consistent behavior in addition to
better computational efficiency. The method reduces the number of samples required
IECM User Documentation: User Manual Using the IECM • 87
relative to the other sampling methods for calculating uncertainty by a factor of 2 to 100.
The actual sample reduction varies with the uncertainty function being sampled.
4.5.3.1.3. Uncertainty Areas
This is a set of checkboxes which allows you to enable or disable uncertainty in specific sections
of the plant. The "Select All" and "Select None" buttons beneath the checkboxes allow you to
easily select all or none of the areas. The list of areas varies by plant type.
4.5.3.1.3.1. Uncertainty Areas in a Pulverized Coal (PC) Plant
A PC plant has the following uncertainty areas:
• Overall Plant (PC)
• Base Plant (PC)
• Air Preheater
• Comb. NOx Control
• NOx Control
• Particulate Control
• SO2 Control
• CO2 Control
• Mercury Control
• Waste & Byproducts
• Cooling
4.5.3.1.3.2. Uncertainty Areas in a Natural Gas Combined Cycle (NGCC) Plant
An NGCC plant has the following uncertainty areas:
• Overall Plant (NGCC)
• Turbine Systems
• CO2 Capture
• Cooling
4.5.3.1.3.3. Uncertainty Areas in an Integrated Gasification Combined Cycle (IGCC) Plant
An IGCC plant has the following uncertainty areas:
• Overall Plant (IGCC)
• Oxidant & Fuel
• Gasifier Area
• Sulfur Control
• CO2 Control
• NOx Control
• Cooling
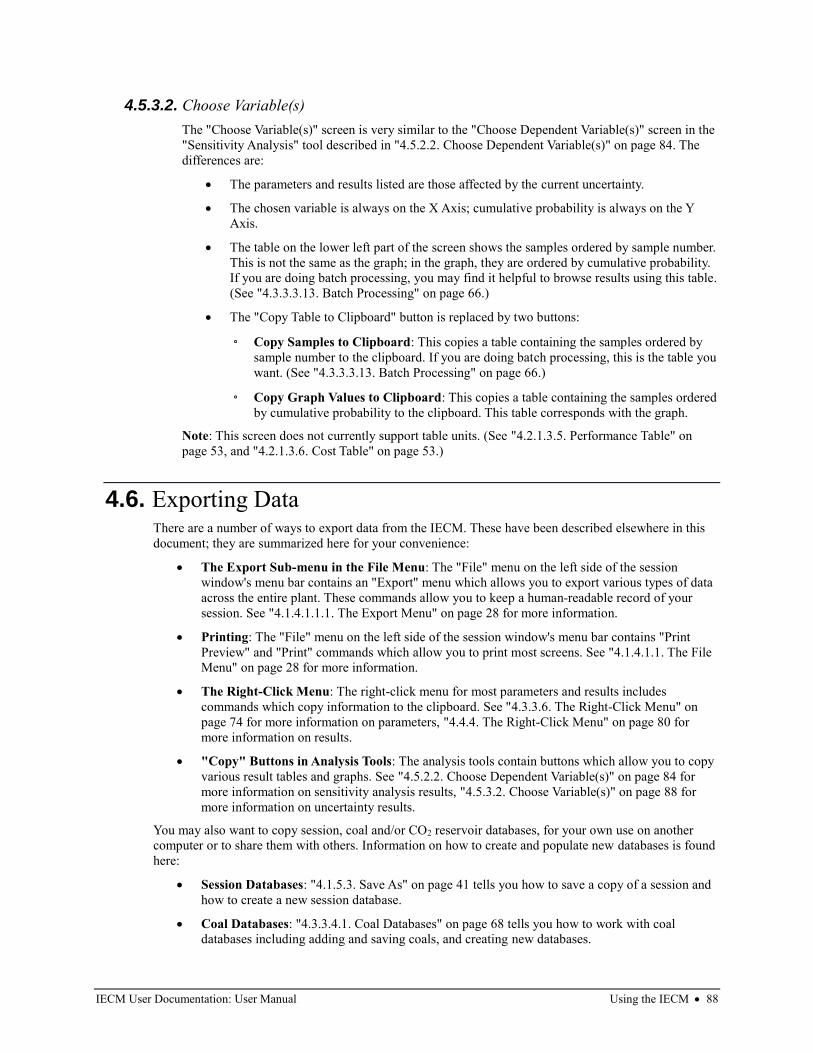
IECM User Documentation: User Manual Using the IECM • 88
4.5.3.2. Choose Variable(s)
The "Choose Variable(s)" screen is very similar to the "Choose Dependent Variable(s)" screen in the
"Sensitivity Analysis" tool described in "4.5.2.2. Choose Dependent Variable(s)" on page 84. The
differences are:
• The parameters and results listed are those affected by the current uncertainty.
• The chosen variable is always on the X Axis; cumulative probability is always on the Y
Axis.
• The table on the lower left part of the screen shows the samples ordered by sample number.
This is not the same as the graph; in the graph, they are ordered by cumulative probability.
If you are doing batch processing, you may find it helpful to browse results using this table.
(See "4.3.3.3.13. Batch Processing" on page 66.)
• The "Copy Table to Clipboard" button is replaced by two buttons:
◦ Copy Samples to Clipboard: This copies a table containing the samples ordered by
sample number to the clipboard. If you are doing batch processing, this is the table you
want. (See "4.3.3.3.13. Batch Processing" on page 66.)
◦ Copy Graph Values to Clipboard: This copies a table containing the samples ordered
by cumulative probability to the clipboard. This table corresponds with the graph.
Note: This screen does not currently support table units. (See "4.2.1.3.5. Performance Table" on
page 53, and "4.2.1.3.6. Cost Table" on page 53.)
4.6. Exporting Data There are a number of ways to export data from the IECM. These have been described elsewhere in this
document; they are summarized here for your convenience:
• The Export Sub-menu in the File Menu: The "File" menu on the left side of the session
window's menu bar contains an "Export" menu which allows you to export various types of data
across the entire plant. These commands allow you to keep a human-readable record of your
session. See "4.1.4.1.1.1. The Export Menu" on page 28 for more information.
• Printing: The "File" menu on the left side of the session window's menu bar contains "Print
Preview" and "Print" commands which allow you to print most screens. See "4.1.4.1.1. The File
Menu" on page 28 for more information.
• The Right-Click Menu: The right-click menu for most parameters and results includes
commands which copy information to the clipboard. See "4.3.3.6. The Right-Click Menu" on
page 74 for more information on parameters, "4.4.4. The Right-Click Menu" on page 80 for
more information on results.
• "Copy" Buttons in Analysis Tools: The analysis tools contain buttons which allow you to copy
various result tables and graphs. See "4.5.2.2. Choose Dependent Variable(s)" on page 84 for
more information on sensitivity analysis results, "4.5.3.2. Choose Variable(s)" on page 88 for
more information on uncertainty results.
You may also want to copy session, coal and/or CO2 reservoir databases, for your own use on another
computer or to share them with others. Information on how to create and populate new databases is found
here:
• Session Databases: "4.1.5.3. Save As" on page 41 tells you how to save a copy of a session and
how to create a new session database.
• Coal Databases: "4.3.3.4.1. Coal Databases" on page 68 tells you how to work with coal
databases including adding and saving coals, and creating new databases.

IECM User Documentation: User Manual Using the IECM • 89
• CO2 Reservoir Databases: "4.3.3.4.2. Reservoir Databases" on page 71 tells you how to work
with reservoir databases including adding and saving reservoirs, and creating new databases.
Note: There may be a couple of additional files associated with your databases. For example, the session
database "my-sessions.sdb" may also include the files "my-sessions.sdb-shm" and "my-sessions.sdb-wal".
These files are created in some cases by the database engine to record recent changes. If these files exist
when you copy your database, you will need to copy them as well.
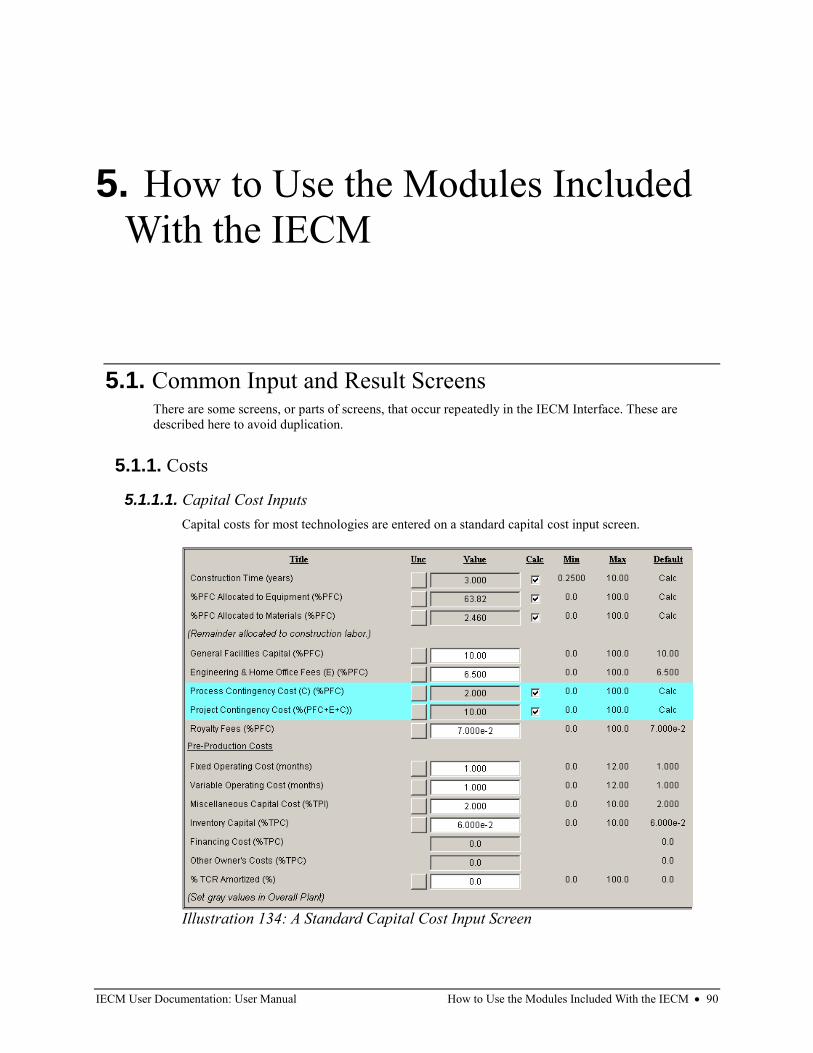
IECM User Documentation: User Manual How to Use the Modules Included With the IECM • 90
5. How to Use the Modules Included
With the IECM
5.1. Common Input and Result Screens There are some screens, or parts of screens, that occur repeatedly in the IECM Interface. These are
described here to avoid duplication.
5.1.1. Costs
5.1.1.1. Capital Cost Inputs
Capital costs for most technologies are entered on a standard capital cost input screen.
Illustration 134: A Standard Capital Cost Input Screen
IECM User Documentation: User Manual How to Use the Modules Included With the IECM • 91
The necessary capital cost input parameters associated with a technology are on this input screen.
The capital cost parameters and terminology used in the IECM are based on the methodologies
developed by the Electric Power Research Institute (EPRI). They have prepared a Technical
Assessment Guide (TAG) in order to provide a consistent basis for reporting cost and revenues
associated with the electric power industry. This system of reporting is used by a wide audience,
including energy engineers, researchers, planners, and managers. The IECM has been developed
around this TAG system so that costs associated with various technologies can be compared directly
on a consistent basis and communicated in the language used by the audience listed above.
Total Plant Cost (TPC) is the sum of the process facilities capital, general facilities capital,
engineering and home office fees, and the contingencies (project and process). This is considered
the cost on an instantaneous basis (overnight), and expressed in December dollars of a reference
year.
Direct Capital Costs: Direct capital costs for each process area are calculated in the IECM. These
calculations are reduced form equations derived from more sophisticated models and reports. The
sum of the direct capital costs associated with each process area is defined as the process facilities
capital (PFC). This is the basis for all other capital cost parameters.
The process facilities capital for the technology is the total constructed cost of all on-site processing
and generating units, including all direct and indirect construction costs. All sales taxes and freight
costs are included where applicable implicitly. These direct capital costs are generally calculated by
the IECM and not presented directly on input screens. However, when important input variables are
required for these calculations, they are listed at the top of the input screen.
Indirect Capital Costs: Costs that are indirectly applied to the technology are based on the process
facilities cost. Each of the cost factors below is expressed as a percentage of the process facilities
cost, and is entered on this screen. Each parameter is described briefly below.
• Construction Time: This is the idealized construction period in years. It is used to
determine the allowance for funds used during construction (AFUDC). The construction
time for individual technologies is set to the construction time for the overall plant by
default.
• Some calculations, including some capital cost factors, only apply to part of the process
facilities capital (PFC). The following parameters determine the allocation of the PFC. The
remainder is allocated to construction labor:
◦ %PFC Allocated to Equipment
◦ %PFC Allocated to Materials
• General Facilities Capital (GFC): The general facilities include construction costs of
roads, office buildings, shops, laboratories, etc. Sales taxes and freight costs are included
implicitly. The cost typically ranges from 5-20% of the PFC.
• Engineering & Home Office Fees (E): The engineering & home office fees are a percent
of total direct capital cost. This is an overhead fee paid to the architect/engineering
company. These fees typically range from 7-15% of the PFC.
• Process Contingency Cost (C): This quantifies the design uncertainty and cost of a
commercial-scale system. This is generally applied on an area-by-area basis. Higher
contingency factors are applied to new regeneration systems tested at a pilot plant and
lower factors to full-size or commercial systems. This is a percentage of the PFC.
• Project Contingency Cost: This is factor covering the cost of additional equipment or
other costs resulting from a more detailed design. Higher contingency factors will be
applied to simplified or preliminary designs and lower factors to detailed or finalized
designs. This is a percentage of PFC + E + C, where E is Engineering & Home Office Fees,
and C is the Process Contingency Cost.

IECM User Documentation: User Manual How to Use the Modules Included With the IECM • 92
• Royalty Fees: Royalty charges may apply to some portions of generating units
incorporating new proprietary technologies. This is a percentage of the PFC.
• Pre-Production Costs: These costs consider the operator training, equipment checkout,
major changes in unit equipment, extra maintenance, and inefficient use of fuel or other
materials during start-up. These are typically applied to O&M costs over a specified period
of time (months).
◦ Fixed Operating Cost: This is the number of months of fixed operating costs
(operating and maintenance labor, administrative and support labor, and maintenance
materials) used for plant startup.
◦ Variable Operating Cost: This is the number of months of variable operating costs at
full capacity (chemicals, water, and other consumables, and waste disposal changes)
used for plant startup. Full capacity estimates of the variable operating costs will
assume operations at 100% load.
◦ Misc. Capital Cost: This is a percent of total plant investment (sum of TPC and
AFUDC) to cover expected changes to equipment to bring the system up to full
capacity.
• Inventory Capital: Percent of the total direct capital for raw material supply based on
100% capacity during a 60-day period. These materials are considered storage. The
inventory capital includes fuels, consumables, by-products, and spare parts. This is
typically 0.5% of the TPC.
• Financing Cost: This is a percentage of the TPC.
• Other Owner's Costs: This is a percentage of the TPC.
• %TCR Amortized: This is the percentage of the total capital required (TCR) that has been
amortized. This value is 0% for new equipment and may be set as high as 100% for
equipment that has been paid off.
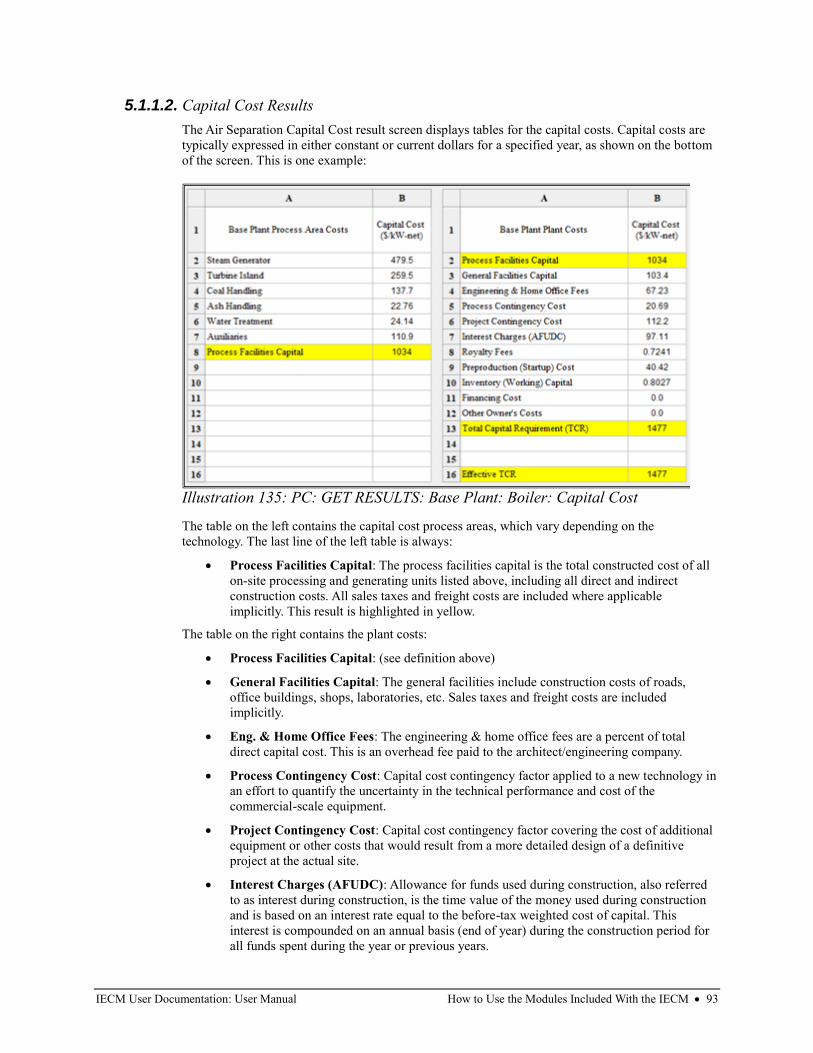
IECM User Documentation: User Manual How to Use the Modules Included With the IECM • 93
5.1.1.2. Capital Cost Results
The Air Separation Capital Cost result screen displays tables for the capital costs. Capital costs are
typically expressed in either constant or current dollars for a specified year, as shown on the bottom
of the screen. This is one example:
The table on the left contains the capital cost process areas, which vary depending on the
technology. The last line of the left table is always:
• Process Facilities Capital: The process facilities capital is the total constructed cost of all
on-site processing and generating units listed above, including all direct and indirect
construction costs. All sales taxes and freight costs are included where applicable
implicitly. This result is highlighted in yellow.
The table on the right contains the plant costs:
• Process Facilities Capital: (see definition above)
• General Facilities Capital: The general facilities include construction costs of roads,
office buildings, shops, laboratories, etc. Sales taxes and freight costs are included
implicitly.
• Eng. & Home Office Fees: The engineering & home office fees are a percent of total
direct capital cost. This is an overhead fee paid to the architect/engineering company.
• Process Contingency Cost: Capital cost contingency factor applied to a new technology in
an effort to quantify the uncertainty in the technical performance and cost of the
commercial-scale equipment.
• Project Contingency Cost: Capital cost contingency factor covering the cost of additional
equipment or other costs that would result from a more detailed design of a definitive
project at the actual site.
• Interest Charges (AFUDC): Allowance for funds used during construction, also referred
to as interest during construction, is the time value of the money used during construction
and is based on an interest rate equal to the before-tax weighted cost of capital. This
interest is compounded on an annual basis (end of year) during the construction period for
all funds spent during the year or previous years.
Illustration 135: PC: GET RESULTS: Base Plant: Boiler: Capital Cost
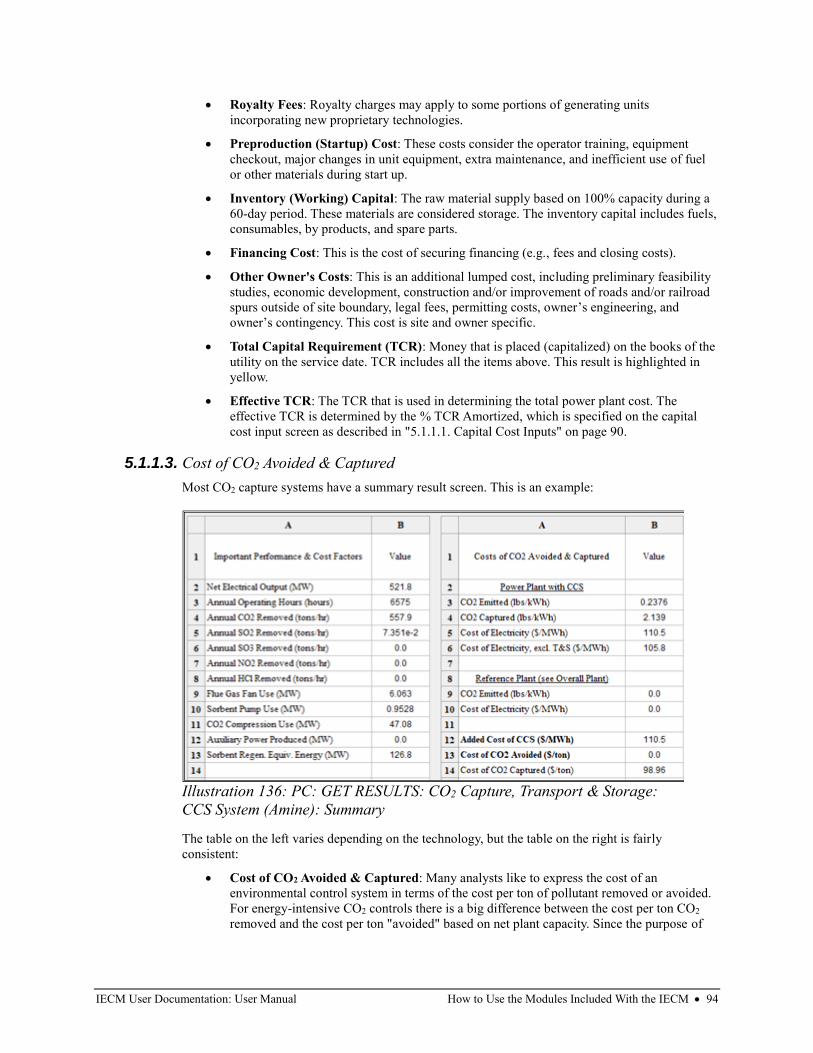
IECM User Documentation: User Manual How to Use the Modules Included With the IECM • 94
• Royalty Fees: Royalty charges may apply to some portions of generating units
incorporating new proprietary technologies.
• Preproduction (Startup) Cost: These costs consider the operator training, equipment
checkout, major changes in unit equipment, extra maintenance, and inefficient use of fuel
or other materials during start up.
• Inventory (Working) Capital: The raw material supply based on 100% capacity during a
60-day period. These materials are considered storage. The inventory capital includes fuels,
consumables, by products, and spare parts.
• Financing Cost: This is the cost of securing financing (e.g., fees and closing costs).
• Other Owner's Costs: This is an additional lumped cost, including preliminary feasibility
studies, economic development, construction and/or improvement of roads and/or railroad
spurs outside of site boundary, legal fees, permitting costs, owner’s engineering, and
owner’s contingency. This cost is site and owner specific.
• Total Capital Requirement (TCR): Money that is placed (capitalized) on the books of the
utility on the service date. TCR includes all the items above. This result is highlighted in
yellow.
• Effective TCR: The TCR that is used in determining the total power plant cost. The
effective TCR is determined by the % TCR Amortized, which is specified on the capital
cost input screen as described in "5.1.1.1. Capital Cost Inputs" on page 90.
5.1.1.3. Cost of CO2 Avoided & Captured
Most CO2 capture systems have a summary result screen. This is an example:
The table on the left varies depending on the technology, but the table on the right is fairly
consistent:
• Cost of CO2 Avoided & Captured: Many analysts like to express the cost of an
environmental control system in terms of the cost per ton of pollutant removed or avoided.
For energy-intensive CO2 controls there is a big difference between the cost per ton CO2
removed and the cost per ton "avoided" based on net plant capacity. Since the purpose of
Illustration 136: PC: GET RESULTS: CO2 Capture, Transport & Storage:
CCS System (Amine): Summary
IECM User Documentation: User Manual How to Use the Modules Included With the IECM • 95
adding a CO2 unit is to reduce the CO2 emissions per net kWh delivered, the cost of CO2
avoidance is the economic indicator that is widely used in this field.
◦ Power Plant with CCS
▪ CO2 Emitted: This is the amount of CO2 vented to the air for every kilowatt hour
of electricity produced in the power plant that is using CO2 Capture Technology.
▪ CO2 Captured: This is the amount of CO2 captured for every kilowatt hour of
electricity produced in the power plant that is using CO2 Capture Technology.
▪ Cost of Electricity: The IECM framework calculates the cost of electricity (COE)
for the overall Capture Plant by dividing the total annualized plant cost ($/yr) by
the net electricity generated (kWh/yr).
▪ Cost of Electricity, excl. T&S: This is the value above minus the cost of CO2
transport and storage.
◦ Reference Plant
▪ CO2 Emitted: This is the amount of CO2 vented to the air for every kilowatt hour
of electricity produced in the power plant with NO CO2 Capture.
▪ Cost of Electricity: The IECM framework calculates the cost of electricity (COE)
for the overall Reference Plant by dividing the total annualized plant cost ($/yr) by
the net electricity generated (kWh/yr).
▪ Added Cost of CCS: This is the difference in the cost of electricity between the
capture and reference plants.
Added Cost of CCS = (Cost of Electricity cap. - Cost of Electricity ref.)
▪ Cost of CO2 Avoided: This is the economic indicator widely used in the field,
calculated as the difference between the cost of electricity in the capture plant and
the reference plant divided by the difference between the CO2 emissions in the
reference plant and the capture plant.
Cost of CO2 Avoided = (Cost of Electricity cap. - Cost of Electricity ref.) / (CO2
emissions ref. - CO2 emissions cap.)
▪ Cost of CO2 Captured: This is the cost of capturing CO2.
Cost of CO2 Captured = (Cost of Electricity Excl. T&S cap. - Cost of Electricity
ref.) / (CO2 emissions cap.)
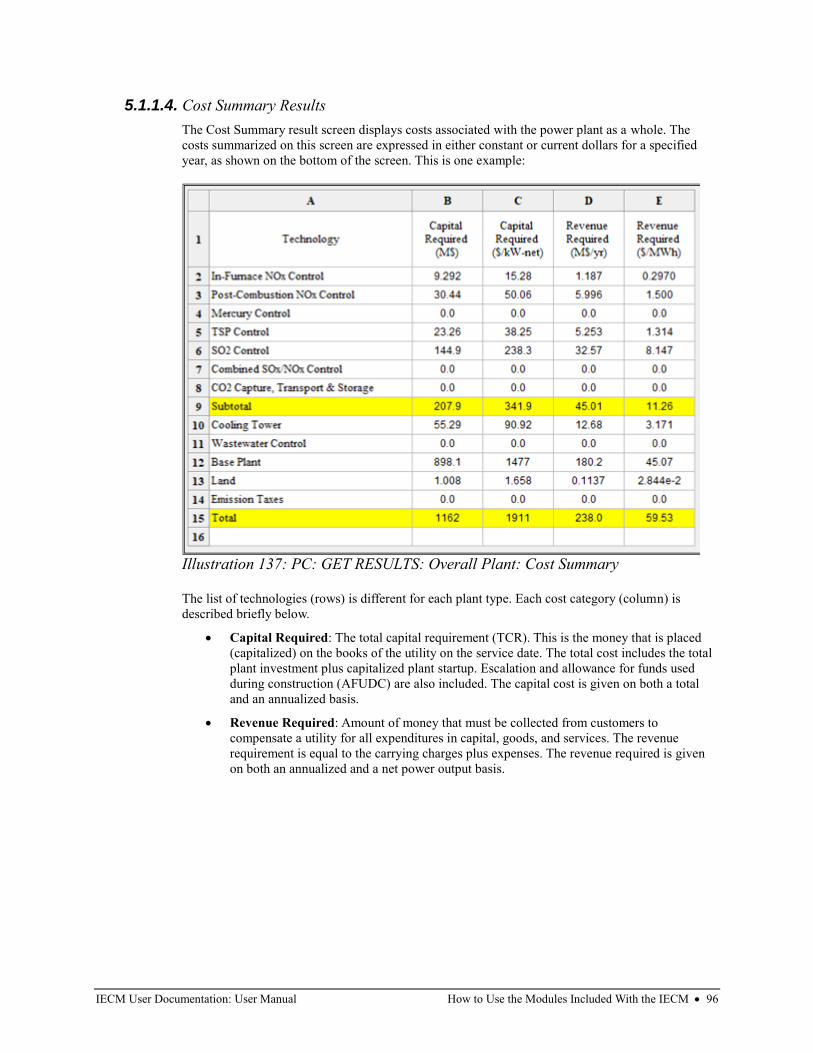
IECM User Documentation: User Manual How to Use the Modules Included With the IECM • 96
5.1.1.4. Cost Summary Results
The Cost Summary result screen displays costs associated with the power plant as a whole. The
costs summarized on this screen are expressed in either constant or current dollars for a specified
year, as shown on the bottom of the screen. This is one example:
The list of technologies (rows) is different for each plant type. Each cost category (column) is
described briefly below.
• Capital Required: The total capital requirement (TCR). This is the money that is placed
(capitalized) on the books of the utility on the service date. The total cost includes the total
plant investment plus capitalized plant startup. Escalation and allowance for funds used
during construction (AFUDC) are also included. The capital cost is given on both a total
and an annualized basis.
• Revenue Required: Amount of money that must be collected from customers to
compensate a utility for all expenditures in capital, goods, and services. The revenue
requirement is equal to the carrying charges plus expenses. The revenue required is given
on both an annualized and a net power output basis.
Illustration 137: PC: GET RESULTS: Overall Plant: Cost Summary
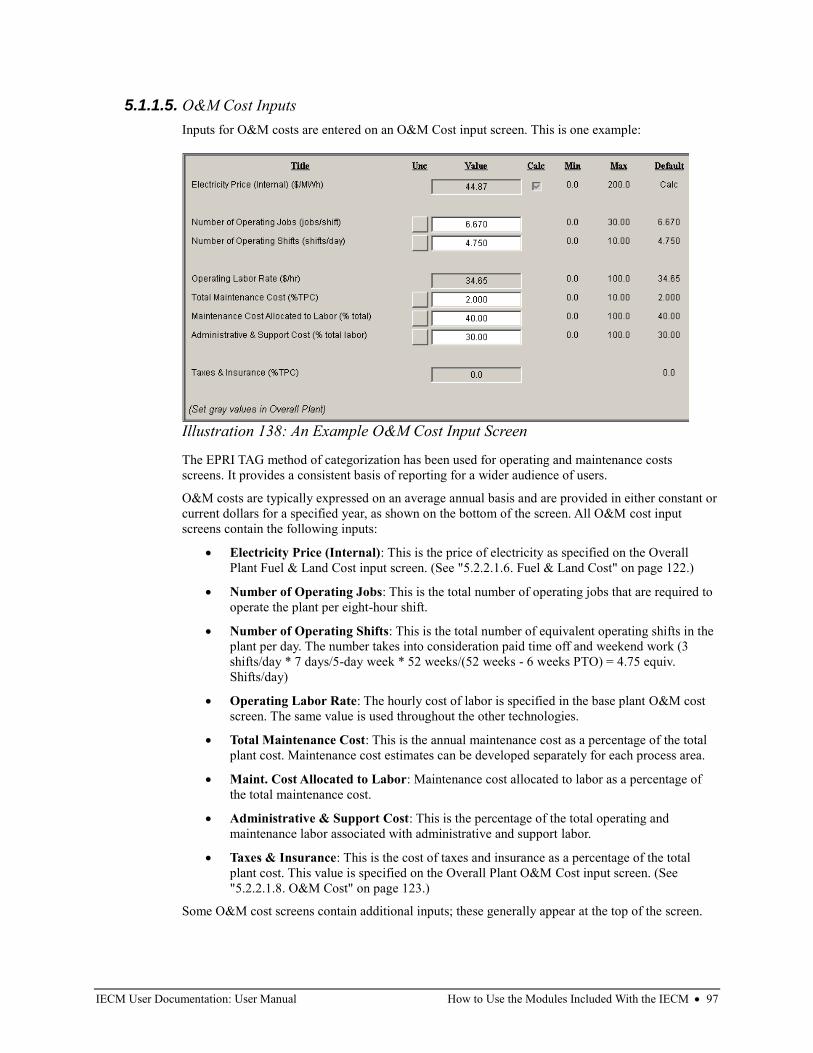
IECM User Documentation: User Manual How to Use the Modules Included With the IECM • 97
5.1.1.5. O&M Cost Inputs
Inputs for O&M costs are entered on an O&M Cost input screen. This is one example:
The EPRI TAG method of categorization has been used for operating and maintenance costs
screens. It provides a consistent basis of reporting for a wider audience of users.
O&M costs are typically expressed on an average annual basis and are provided in either constant or
current dollars for a specified year, as shown on the bottom of the screen. All O&M cost input
screens contain the following inputs:
• Electricity Price (Internal): This is the price of electricity as specified on the Overall
Plant Fuel & Land Cost input screen. (See "5.2.2.1.6. Fuel & Land Cost" on page 122.)
• Number of Operating Jobs: This is the total number of operating jobs that are required to
operate the plant per eight-hour shift.
• Number of Operating Shifts: This is the total number of equivalent operating shifts in the
plant per day. The number takes into consideration paid time off and weekend work (3
shifts/day * 7 days/5-day week * 52 weeks/(52 weeks - 6 weeks PTO) = 4.75 equiv.
Shifts/day)
• Operating Labor Rate: The hourly cost of labor is specified in the base plant O&M cost
screen. The same value is used throughout the other technologies.
• Total Maintenance Cost: This is the annual maintenance cost as a percentage of the total
plant cost. Maintenance cost estimates can be developed separately for each process area.
• Maint. Cost Allocated to Labor: Maintenance cost allocated to labor as a percentage of
the total maintenance cost.
• Administrative & Support Cost: This is the percentage of the total operating and
maintenance labor associated with administrative and support labor.
• Taxes & Insurance: This is the cost of taxes and insurance as a percentage of the total
plant cost. This value is specified on the Overall Plant O&M Cost input screen. (See
"5.2.2.1.8. O&M Cost" on page 123.)
Some O&M cost screens contain additional inputs; these generally appear at the top of the screen.
Illustration 138: An Example O&M Cost Input Screen
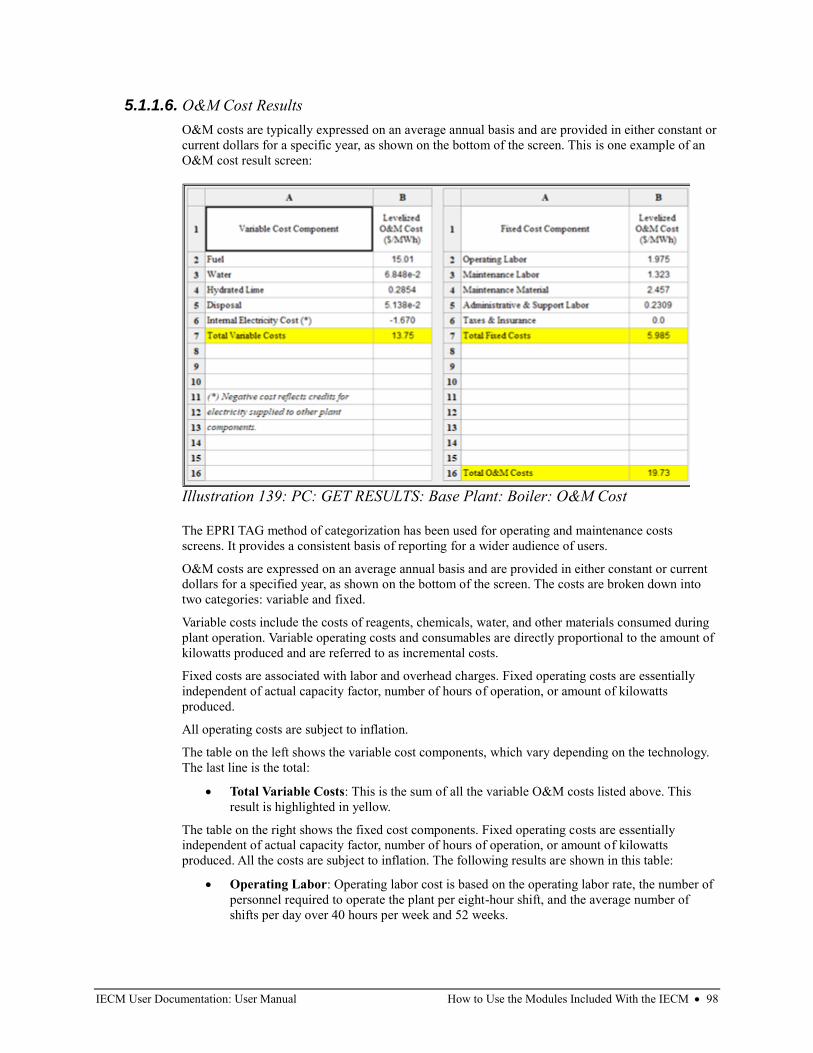
IECM User Documentation: User Manual How to Use the Modules Included With the IECM • 98
5.1.1.6. O&M Cost Results
O&M costs are typically expressed on an average annual basis and are provided in either constant or
current dollars for a specific year, as shown on the bottom of the screen. This is one example of an
O&M cost result screen:
The EPRI TAG method of categorization has been used for operating and maintenance costs
screens. It provides a consistent basis of reporting for a wider audience of users.
O&M costs are expressed on an average annual basis and are provided in either constant or current
dollars for a specified year, as shown on the bottom of the screen. The costs are broken down into
two categories: variable and fixed.
Variable costs include the costs of reagents, chemicals, water, and other materials consumed during
plant operation. Variable operating costs and consumables are directly proportional to the amount of
kilowatts produced and are referred to as incremental costs.
Fixed costs are associated with labor and overhead charges. Fixed operating costs are essentially
independent of actual capacity factor, number of hours of operation, or amount of kilowatts
produced.
All operating costs are subject to inflation.
The table on the left shows the variable cost components, which vary depending on the technology.
The last line is the total:
• Total Variable Costs: This is the sum of all the variable O&M costs listed above. This
result is highlighted in yellow.
The table on the right shows the fixed cost components. Fixed operating costs are essentially
independent of actual capacity factor, number of hours of operation, or amount of kilowatts
produced. All the costs are subject to inflation. The following results are shown in this table:
• Operating Labor: Operating labor cost is based on the operating labor rate, the number of
personnel required to operate the plant per eight-hour shift, and the average number of
shifts per day over 40 hours per week and 52 weeks.
Illustration 139: PC: GET RESULTS: Base Plant: Boiler: O&M Cost
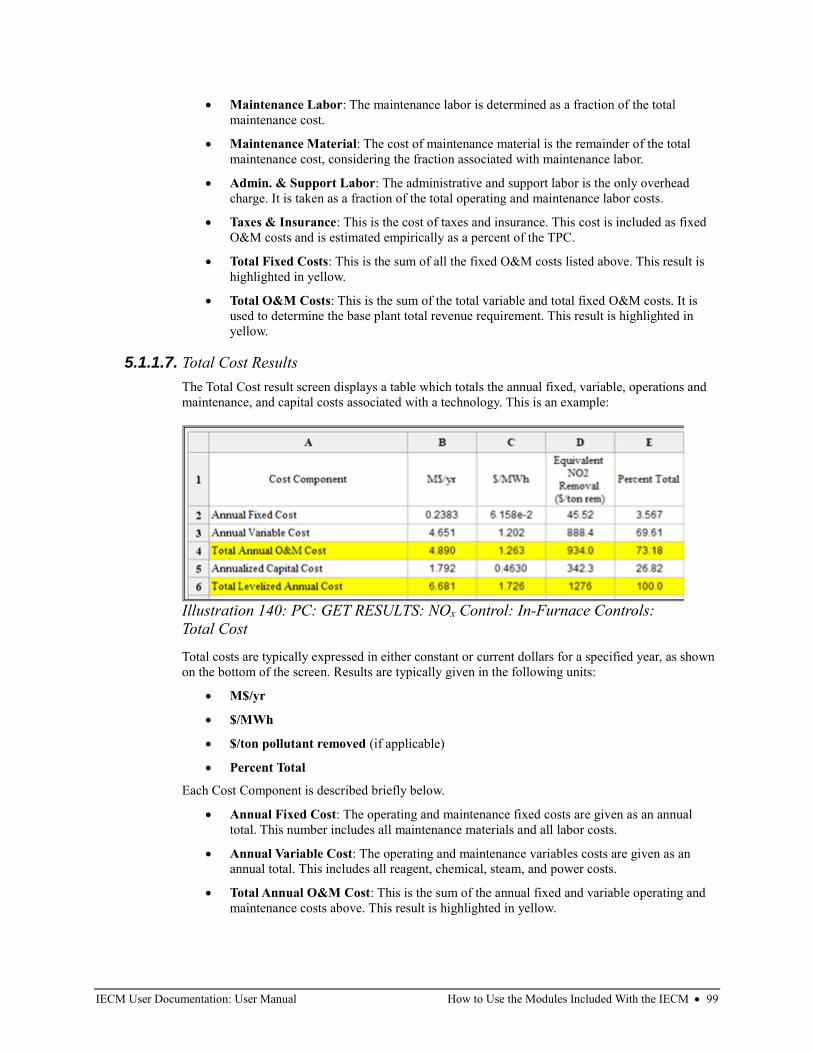
IECM User Documentation: User Manual How to Use the Modules Included With the IECM • 99
• Maintenance Labor: The maintenance labor is determined as a fraction of the total
maintenance cost.
• Maintenance Material: The cost of maintenance material is the remainder of the total
maintenance cost, considering the fraction associated with maintenance labor.
• Admin. & Support Labor: The administrative and support labor is the only overhead
charge. It is taken as a fraction of the total operating and maintenance labor costs.
• Taxes & Insurance: This is the cost of taxes and insurance. This cost is included as fixed
O&M costs and is estimated empirically as a percent of the TPC.
• Total Fixed Costs: This is the sum of all the fixed O&M costs listed above. This result is
highlighted in yellow.
• Total O&M Costs: This is the sum of the total variable and total fixed O&M costs. It is
used to determine the base plant total revenue requirement. This result is highlighted in
yellow.
5.1.1.7. Total Cost Results
The Total Cost result screen displays a table which totals the annual fixed, variable, operations and
maintenance, and capital costs associated with a technology. This is an example:
Total costs are typically expressed in either constant or current dollars for a specified year, as shown
on the bottom of the screen. Results are typically given in the following units:
• M$/yr
• $/MWh
• $/ton pollutant removed (if applicable)
• Percent Total
Each Cost Component is described briefly below.
• Annual Fixed Cost: The operating and maintenance fixed costs are given as an annual
total. This number includes all maintenance materials and all labor costs.
• Annual Variable Cost: The operating and maintenance variables costs are given as an
annual total. This includes all reagent, chemical, steam, and power costs.
• Total Annual O&M Cost: This is the sum of the annual fixed and variable operating and
maintenance costs above. This result is highlighted in yellow.
Illustration 140: PC: GET RESULTS: NOx Control: In-Furnace Controls:
Total Cost
IECM User Documentation: User Manual How to Use the Modules Included With the IECM • 100
• Annualized Capital Cost: This is the total capital cost expressed on an annualized basis,
taking into consideration the levelized carrying charge factor, or fixed charge factor, over
the entire book life.
• Total Levelized Annual Cost: The total annual cost is the sum of the total annual O&M
cost and annualized capital cost items above. This result is highlighted in yellow.
5.1.1.8. Retrofit or Adjustment Factor Inputs
The retrofit cost factor of each process is a multiplicative cost adjustment, which considers the cost
of retrofitted capital equipment relative to similar equipment installed in a new plant. These factors
affect the capital costs directly and the operating and maintenance costs indirectly.
Direct capital costs for each process area are calculated in the IECM. These calculations are reduced
form equations derived from more sophisticated models and reports. The sum of the direct capital
costs associated with each process area is defined as the process facilities capital (PFC). The retrofit
cost factor provided for each of the process areas can be used as a tool for adjusting the anticipated
costs and uncertainties across the process area separate from the other areas.
Uncertainty can be applied to the retrofit cost factor for each process area in each technology. Thus,
uncertainty can be applied as a general factor across an entire process area, rather than as a specific
uncertainty for the particular cost on the capital or O&M input screens. Any uncertainty applied to a
process area through the retrofit cost factor compounds any uncertainties specified in the capital and
O&M cost input screens.
The set of capital cost process areas on the retrofit cost input screen varies with the technology.
5.1.2. Fuels
5.1.2.1. Coal Properties
Some screens deal with the composition of coal. The coal properties are:
• Heating Value: Higher heating value (HHV) is the thermal energy produced in Btu/lb of
fuel (wet) from completely burning the fuel to produce carbon dioxide and liquid water.
The latent heat of condensation is included in the value.
• Carbon: The weight percent of carbon in the fuel on an elemental (C) and wet basis.
• Hydrogen: This is the weight percent of hydrogen in the fuel on an elemental (H) and wet
basis.
• Oxygen: This is the weight percent of oxygen in the fuel on an elemental (O) and wet
basis.
• Chlorine: This is the weight percent of chlorine in the fuel on an elemental (Cl) and wet
basis.
• Sulfur: This is the weight percent of sulfur in the fuel on an elemental (S) and wet basis.
• Nitrogen: This is the weight percent of nitrogen in the fuel on an elemental (N) and wet
basis.
• Ash: This is the weight percent of ash in the fuel on a wet basis.
• Moisture: This is the weight percent of moisture in the fuel on a wet basis.
5.1.2.1.1. Ash Properties
Some screens deal with the composition of ash in the coal. The ash properties are:
• SiO2: The percent by weight of silicon dioxide in the ash.
IECM User Documentation: User Manual How to Use the Modules Included With the IECM • 101
• Al2O3: The percent by weight of Aluminum Oxide in the ash.
• Fe2O3: The percent by weight of ferric oxide in the ash.
• CaO: The percent by weight of calcium oxide in the ash.
• MgO: The percent by weight of magnesium oxide in the ash.
• Na2O: The percent by weight of sodium oxide in the ash.
• K2O: The percent by weight of potassium oxide in the ash.
• TiO2: The percent by weight of titanium dioxide in the ash.
• MnO2: The percent by weight of manganese dioxide in the ash.
• P2O5: The percent by weight of phosphorus pentoxide in the ash.
• SO3: The percent by weight of sulfur trioxide in the ash.
5.1.2.2. Natural Gas Properties
Some screens deal with the composition of natural gas. The natural gas properties are:
• Heating Value: Higher heating value (HHV) is the thermal energy produced in Btu/lb of
fuel from completely burning the fuel to produce carbon dioxide and liquid water. The
latent heat of condensation is included in the value.
• Methane (CH4): The volume, by percent, of methane in the natural gas.
• Ethane (C2H6): The volume, by percent, of ethane in the natural gas.
• Propane (C3H8): The volume, by percent, of propane in the natural gas.
• Carbon Dioxide (CO2): The volume, by percent, of carbon dioxide in the natural gas.
• Oxygen (O2): The volume, by percent, of oxygen in the natural gas.
• Nitrogen (N2): The volume, by percent, of nitrogen in the natural gas.
• Hydrogen Sulfide (H2S): The volume, by percent, of hydrogen sulfide in the natural gas.
5.1.3. Gas Streams
5.1.3.1. Flue Gas Components
Most technologies have at least one result screen that deals with flue gas. This is one example:
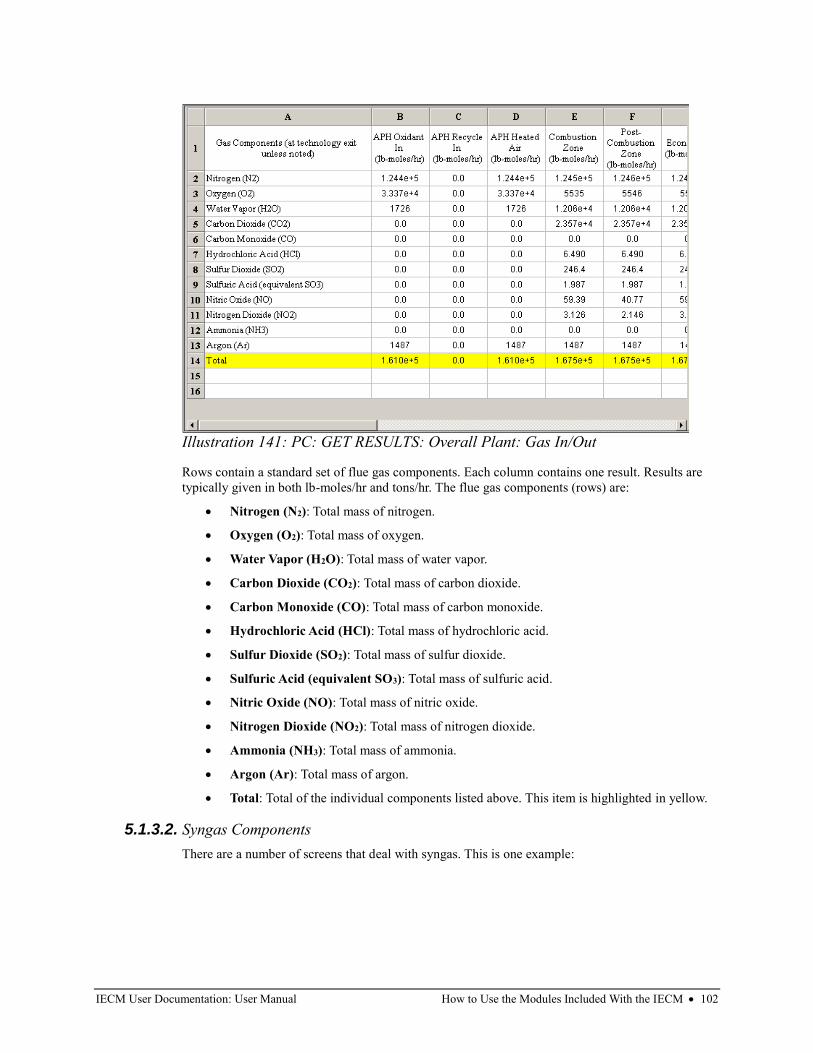
IECM User Documentation: User Manual How to Use the Modules Included With the IECM • 102
Rows contain a standard set of flue gas components. Each column contains one result. Results are
typically given in both lb-moles/hr and tons/hr. The flue gas components (rows) are:
• Nitrogen (N2): Total mass of nitrogen.
• Oxygen (O2): Total mass of oxygen.
• Water Vapor (H2O): Total mass of water vapor.
• Carbon Dioxide (CO2): Total mass of carbon dioxide.
• Carbon Monoxide (CO): Total mass of carbon monoxide.
• Hydrochloric Acid (HCl): Total mass of hydrochloric acid.
• Sulfur Dioxide (SO2): Total mass of sulfur dioxide.
• Sulfuric Acid (equivalent SO3): Total mass of sulfuric acid.
• Nitric Oxide (NO): Total mass of nitric oxide.
• Nitrogen Dioxide (NO2): Total mass of nitrogen dioxide.
• Ammonia (NH3): Total mass of ammonia.
• Argon (Ar): Total mass of argon.
• Total: Total of the individual components listed above. This item is highlighted in yellow.
5.1.3.2. Syngas Components
There are a number of screens that deal with syngas. This is one example:
Illustration 141: PC: GET RESULTS: Overall Plant: Gas In/Out
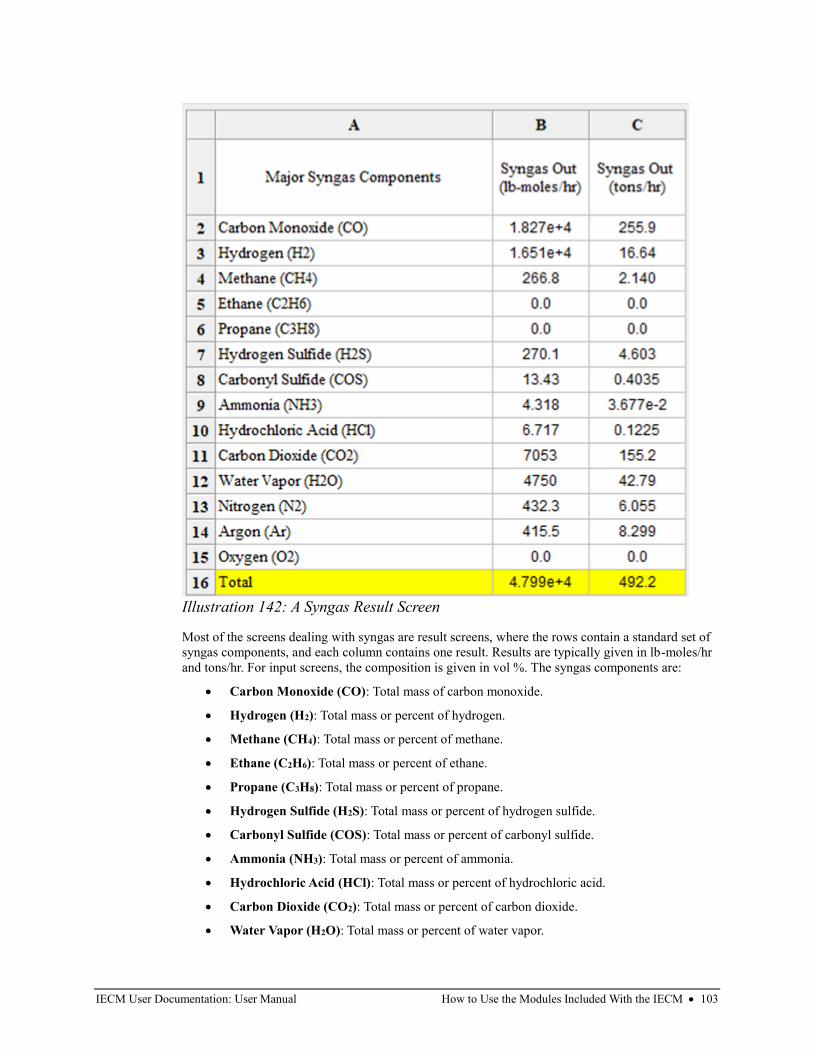
IECM User Documentation: User Manual How to Use the Modules Included With the IECM • 103
Most of the screens dealing with syngas are result screens, where the rows contain a standard set of
syngas components, and each column contains one result. Results are typically given in lb-moles/hr
and tons/hr. For input screens, the composition is given in vol %. The syngas components are:
• Carbon Monoxide (CO): Total mass of carbon monoxide.
• Hydrogen (H2): Total mass or percent of hydrogen.
• Methane (CH4): Total mass or percent of methane.
• Ethane (C2H6): Total mass or percent of ethane.
• Propane (C3H8): Total mass or percent of propane.
• Hydrogen Sulfide (H2S): Total mass or percent of hydrogen sulfide.
• Carbonyl Sulfide (COS): Total mass or percent of carbonyl sulfide.
• Ammonia (NH3): Total mass or percent of ammonia.
• Hydrochloric Acid (HCl): Total mass or percent of hydrochloric acid.
• Carbon Dioxide (CO2): Total mass or percent of carbon dioxide.
• Water Vapor (H2O): Total mass or percent of water vapor.
Illustration 142: A Syngas Result Screen
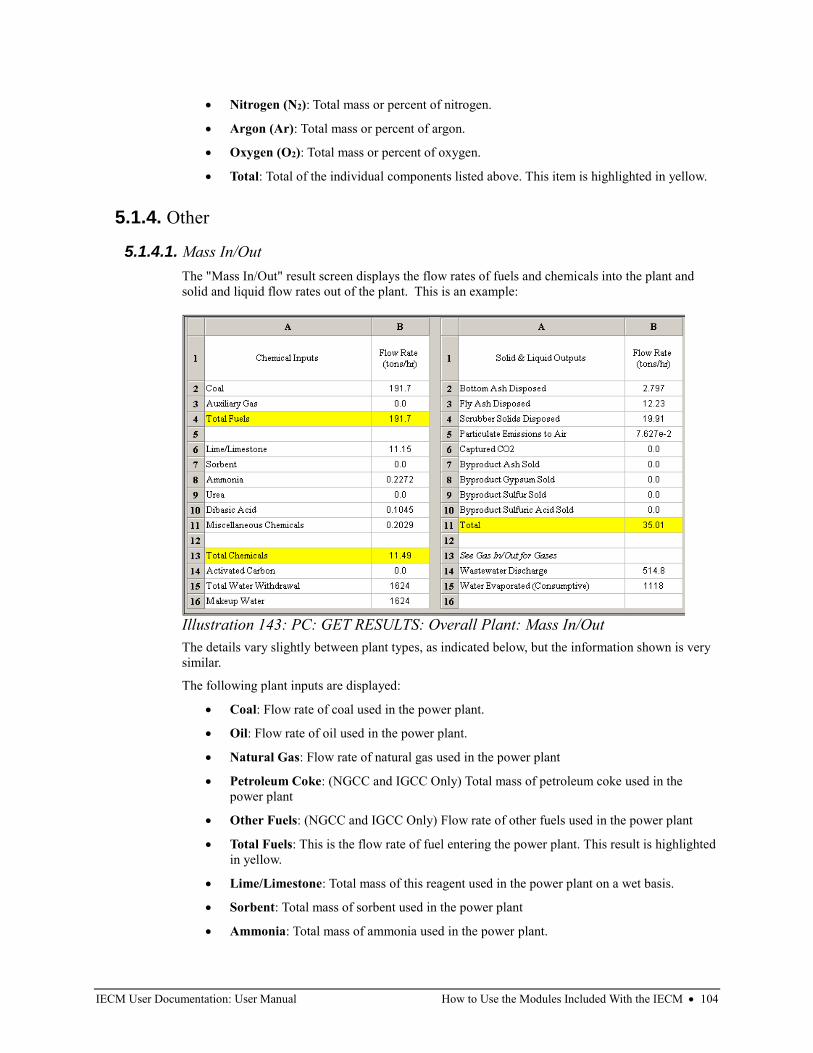
IECM User Documentation: User Manual How to Use the Modules Included With the IECM • 104
• Nitrogen (N2): Total mass or percent of nitrogen.
• Argon (Ar): Total mass or percent of argon.
• Oxygen (O2): Total mass or percent of oxygen.
• Total: Total of the individual components listed above. This item is highlighted in yellow.
5.1.4. Other
5.1.4.1. Mass In/Out
The "Mass In/Out" result screen displays the flow rates of fuels and chemicals into the plant and
solid and liquid flow rates out of the plant. This is an example:
The details vary slightly between plant types, as indicated below, but the information shown is very
similar.
The following plant inputs are displayed:
• Coal: Flow rate of coal used in the power plant.
• Oil: Flow rate of oil used in the power plant.
• Natural Gas: Flow rate of natural gas used in the power plant
• Petroleum Coke: (NGCC and IGCC Only) Total mass of petroleum coke used in the
power plant
• Other Fuels: (NGCC and IGCC Only) Flow rate of other fuels used in the power plant
• Total Fuels: This is the flow rate of fuel entering the power plant. This result is highlighted
in yellow.
• Lime/Limestone: Total mass of this reagent used in the power plant on a wet basis.
• Sorbent: Total mass of sorbent used in the power plant
• Ammonia: Total mass of ammonia used in the power plant.
Illustration 143: PC: GET RESULTS: Overall Plant: Mass In/Out
IECM User Documentation: User Manual How to Use the Modules Included With the IECM • 105
• Urea: (PC Only) Total mass of urea used in the power plant. Urea is the reagent used to
reduce NOx in the SNCR technology.
• Dibasic Acid: (PC Only) Total mass of dibasic acid used in the power plant.
• Activated Carbon: Flow rate of activated carbon injected in the power plant.
• Other Chemicals, Solvents & Catalyst: (NGCC and IGCC Only) Flow rate of other
chemicals, solvents and catalysts used in the power plant.
• Total Chemicals: Flow rate of reagent entering the power plant. This result is highlighted
in yellow.
• Oxidant: (IGCC Only) Flow rate of oxidant entering the power plant. This includes
oxygen, nitrogen and argon.
• Process Water: (NGCC and IGCC Only) Flow rate of water used in the power plant.
Plant Outputs:
• Bottom Ash Disposed: (PC Only) Total mass of bottom ash collected in the power plant on
a dry basis.
• Slag: (NGCC and IGCC Only) Flow rate of slag from the power plant on a dry basis.
• Fly Ash Disposed: (PC Only) Total mass of fly ash collected in the power plant on a dry
basis.
• Ash Disposed: (NGCC and IGCC Only) Flow rate of ash from the power plant on a dry
basis.
• Scrubber Solids Disposed: (PC and NGCC Only) Total mass of scrubber solid wastes
collected in the power plant on a dry basis.
• Other Solids Disposed: (IGCC Only) Flow rate of scrubber and other treatment solid
wastes from the power plant on a dry basis.
• Particulate Emissions to Air: Flow rate of particulates emitted to the air from the plant.
• Captured CO2: Flow rate of the captured CO2.
• Byproduct Ash Sold: Flow rate of ash (bottom and fly ash) sold in commerce as a by-
product on a dry basis.
• Byproduct Gypsum Sold: Flow rate of flue gas treatment solids sold in commerce as a by-
product on a dry basis.
• Byproduct Sulfur Sold: Flow rate of elemental sulfur recovered from flue gas and sold in
commerce as a by-product on a dry basis.
• Byproduct Sulfuric Acid Sold: Total mass of sulfuric acid recovered from the flue gas and
sold in commerce as a by-product.
• Total: This is the total wet solid mass exiting the power plant. This result is highlighted in
yellow.
• Water Evaporated (Consumptive): This is the amount of water lost due to evaporation.
• Cooling Water Discharge: (Only shown when Once-Through Cooling is in use.) This is
the total cooling water required.
5.1.4.2. Plant Performance
The Plant Performance result screen displays performance results for the plant as a whole. Heat rates
and power in and out of the power plant are given. This is an example:
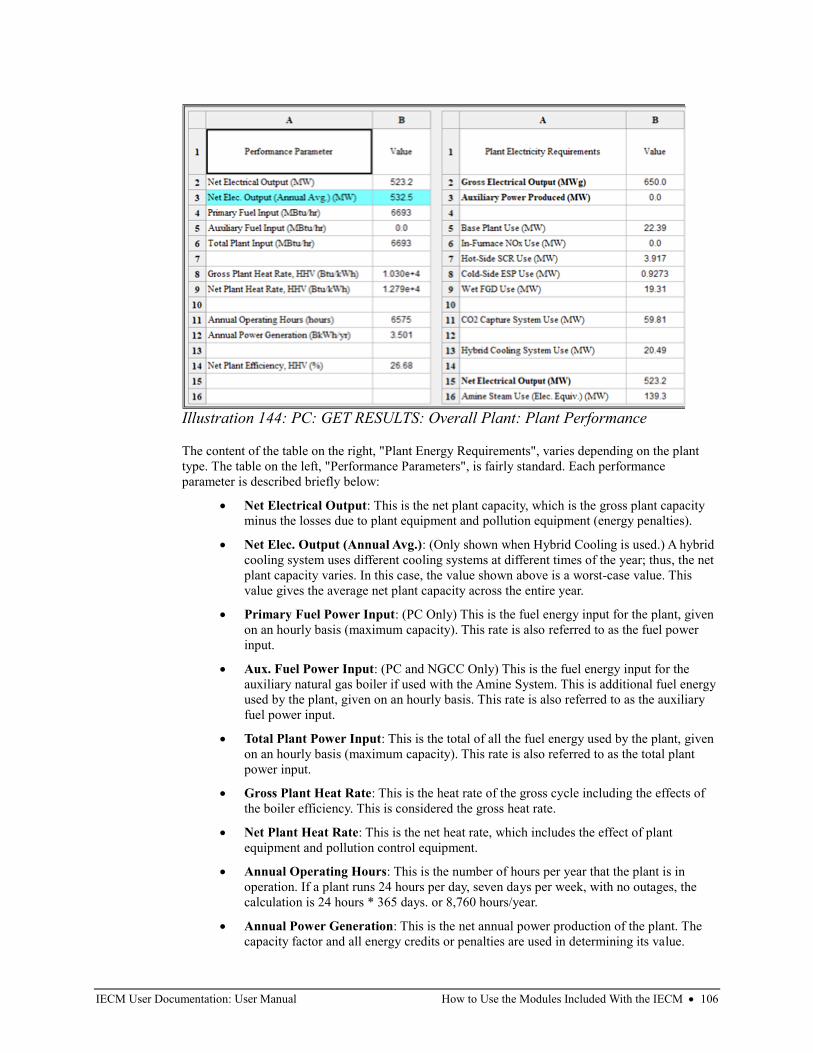
IECM User Documentation: User Manual How to Use the Modules Included With the IECM • 106
The content of the table on the right, "Plant Energy Requirements", varies depending on the plant
type. The table on the left, "Performance Parameters", is fairly standard. Each performance
parameter is described briefly below:
• Net Electrical Output: This is the net plant capacity, which is the gross plant capacity
minus the losses due to plant equipment and pollution equipment (energy penalties).
• Net Elec. Output (Annual Avg.): (Only shown when Hybrid Cooling is used.) A hybrid
cooling system uses different cooling systems at different times of the year; thus, the net
plant capacity varies. In this case, the value shown above is a worst-case value. This
value gives the average net plant capacity across the entire year.
• Primary Fuel Power Input: (PC Only) This is the fuel energy input for the plant, given
on an hourly basis (maximum capacity). This rate is also referred to as the fuel power
input.
• Aux. Fuel Power Input: (PC and NGCC Only) This is the fuel energy input for the
auxiliary natural gas boiler if used with the Amine System. This is additional fuel energy
used by the plant, given on an hourly basis. This rate is also referred to as the auxiliary
fuel power input.
• Total Plant Power Input: This is the total of all the fuel energy used by the plant, given
on an hourly basis (maximum capacity). This rate is also referred to as the total plant
power input.
• Gross Plant Heat Rate: This is the heat rate of the gross cycle including the effects of
the boiler efficiency. This is considered the gross heat rate.
• Net Plant Heat Rate: This is the net heat rate, which includes the effect of plant
equipment and pollution control equipment.
• Annual Operating Hours: This is the number of hours per year that the plant is in
operation. If a plant runs 24 hours per day, seven days per week, with no outages, the
calculation is 24 hours * 365 days. or 8,760 hours/year.
• Annual Power Generation: This is the net annual power production of the plant. The
capacity factor and all energy credits or penalties are used in determining its value.
Illustration 144: PC: GET RESULTS: Overall Plant: Plant Performance
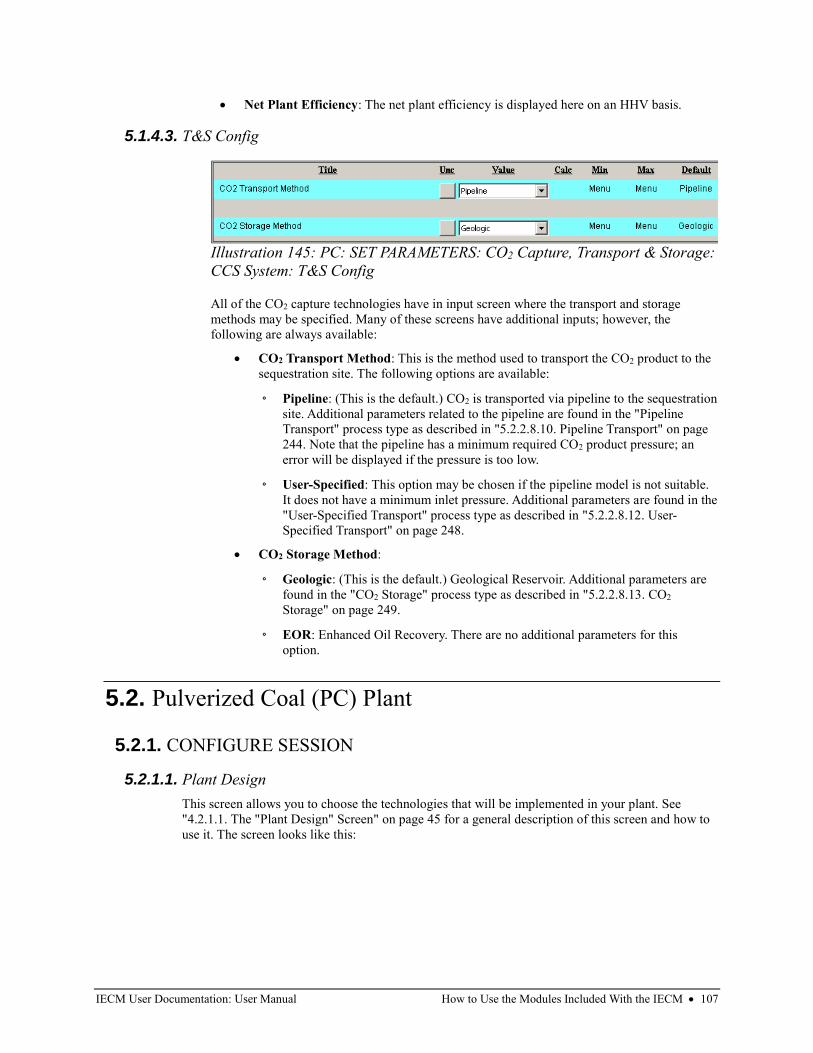
IECM User Documentation: User Manual How to Use the Modules Included With the IECM • 107
• Net Plant Efficiency: The net plant efficiency is displayed here on an HHV basis.
5.1.4.3. T&S Config
All of the CO2 capture technologies have in input screen where the transport and storage
methods may be specified. Many of these screens have additional inputs; however, the
following are always available:
• CO2 Transport Method: This is the method used to transport the CO2 product to the
sequestration site. The following options are available:
◦ Pipeline: (This is the default.) CO2 is transported via pipeline to the sequestration
site. Additional parameters related to the pipeline are found in the "Pipeline
Transport" process type as described in "5.2.2.8.10. Pipeline Transport" on page
244. Note that the pipeline has a minimum required CO2 product pressure; an
error will be displayed if the pressure is too low.
◦ User-Specified: This option may be chosen if the pipeline model is not suitable.
It does not have a minimum inlet pressure. Additional parameters are found in the
"User-Specified Transport" process type as described in "5.2.2.8.12. User-
Specified Transport" on page 248.
• CO2 Storage Method:
◦ Geologic: (This is the default.) Geological Reservoir. Additional parameters are
found in the "CO2 Storage" process type as described in "5.2.2.8.13. CO2
Storage" on page 249.
◦ EOR: Enhanced Oil Recovery. There are no additional parameters for this
option.
5.2. Pulverized Coal (PC) Plant
5.2.1. CONFIGURE SESSION
5.2.1.1. Plant Design
This screen allows you to choose the technologies that will be implemented in your plant. See
"4.2.1.1. The "Plant Design" Screen" on page 45 for a general description of this screen and how to
use it. The screen looks like this:
Illustration 145: PC: SET PARAMETERS: CO2 Capture, Transport & Storage:
CCS System: T&S Config
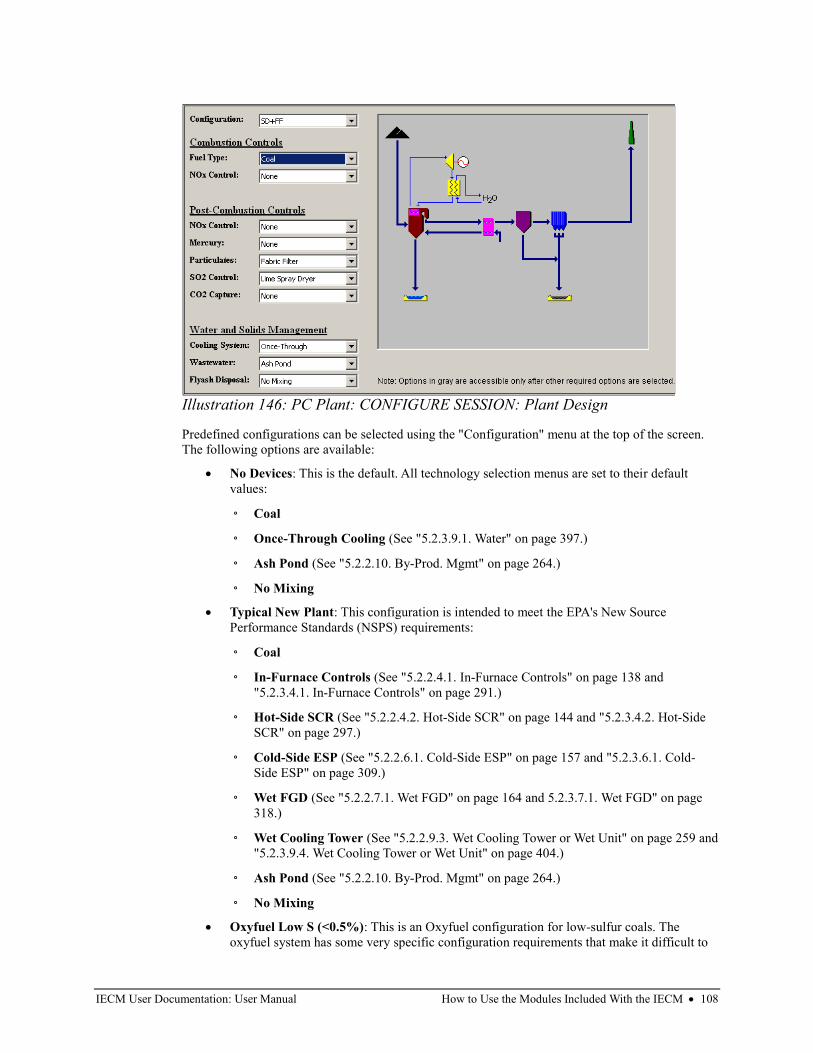
IECM User Documentation: User Manual How to Use the Modules Included With the IECM • 108
Predefined configurations can be selected using the "Configuration" menu at the top of the screen.
The following options are available:
• No Devices: This is the default. All technology selection menus are set to their default
values:
◦ Coal
◦ Once-Through Cooling (See "5.2.3.9.1. Water" on page 397.)
◦ Ash Pond (See "5.2.2.10. By-Prod. Mgmt" on page 264.)
◦ No Mixing
• Typical New Plant: This configuration is intended to meet the EPA's New Source
Performance Standards (NSPS) requirements:
◦ Coal
◦ In-Furnace Controls (See "5.2.2.4.1. In-Furnace Controls" on page 138 and
"5.2.3.4.1. In-Furnace Controls" on page 291.)
◦ Hot-Side SCR (See "5.2.2.4.2. Hot-Side SCR" on page 144 and "5.2.3.4.2. Hot-Side
SCR" on page 297.)
◦ Cold-Side ESP (See "5.2.2.6.1. Cold-Side ESP" on page 157 and "5.2.3.6.1. Cold-
Side ESP" on page 309.)
◦ Wet FGD (See "5.2.2.7.1. Wet FGD" on page 164 and 5.2.3.7.1. Wet FGD" on page
318.)
◦ Wet Cooling Tower (See "5.2.2.9.3. Wet Cooling Tower or Wet Unit" on page 259 and
"5.2.3.9.4. Wet Cooling Tower or Wet Unit" on page 404.)
◦ Ash Pond (See "5.2.2.10. By-Prod. Mgmt" on page 264.)
◦ No Mixing
• Oxyfuel Low S (<0.5%): This is an Oxyfuel configuration for low-sulfur coals. The
oxyfuel system has some very specific configuration requirements that make it difficult to
Illustration 146: PC Plant: CONFIGURE SESSION: Plant Design
IECM User Documentation: User Manual How to Use the Modules Included With the IECM • 109
select in the menus directly. We recommend that you start with this configuration and make
adjustments as needed:
◦ Coal
◦ In-Furnace Controls (See "5.2.2.4.1. In-Furnace Controls" on page 138 and
"5.2.3.4.1. In-Furnace Controls" on page 291.)
◦ Fabric Filter (See "5.2.2.6.2. Fabric Filter" on page 160 and "5.2.3.6.2. Fabric Filter"
on page 314.)
◦ Lime Spray Dryer (See "5.2.2.7.2. Spray Dryer" on page 171 and "5.2.3.7.2. Spray
Dryer" on page 323.)
◦ Oxyfuel Low S (<0.5%) (See "5.2.2.8.9. FG Recycle & Purification" on page 238 and
"5.2.3.8.9. FG Recycle & Purification" on page 380.)
◦ Wet Cooling Tower (See "5.2.2.9.3. Wet Cooling Tower or Wet Unit" on page 259 and
"5.2.3.9.4. Wet Cooling Tower or Wet Unit" on page 404.)
◦ Ash Pond (See "5.2.2.10. By-Prod. Mgmt" on page 264.)
◦ No Mixing
• Oxyfuel Med S (0.5%-1.5%): This is an Oxyfuel configuration for medium-sulfur coals.
The oxyfuel system has some very specific configuration requirements that make it
difficult to select in the menus directly. We recommend that you start with this
configuration and make adjustments as needed:
◦ Coal
◦ In-Furnace Controls (See "5.2.2.4.1. In-Furnace Controls" on page 138 and
"5.2.3.4.1. In-Furnace Controls" on page 291.)
◦ Fabric Filter (See "5.2.2.6.2. Fabric Filter" on page 160 and "5.2.3.6.2. Fabric Filter"
on page 314.)
◦ Lime Spray Dryer (See "5.2.2.7.2. Spray Dryer" on page 171 and "5.2.3.7.2. Spray
Dryer" on page 323.)
◦ Oxyfuel Med S (0.5%-1.5%) (See "5.2.2.8.9. FG Recycle & Purification" on page
238 and "5.2.3.8.9. FG Recycle & Purification" on page 380.)
◦ Wet Cooling Tower (See "5.2.2.9.3. Wet Cooling Tower or Wet Unit" on page 259 and
"5.2.3.9.4. Wet Cooling Tower or Wet Unit" on page 404.)
◦ Ash Pond (See "5.2.2.10. By-Prod. Mgmt" on page 264.)
◦ No Mixing
• Oxyfuel High S (>1.5%): This is an Oxyfuel configuration for high-sulfur coals. The
oxyfuel system has some very specific configuration requirements that make it difficult to
select in the menus directly. We recommend that you start with this configuration and make
adjustments as needed:
◦ Coal
◦ In-Furnace Controls (See "5.2.2.4.1. In-Furnace Controls" on page 138 and
"5.2.3.4.1. In-Furnace Controls" on page 291.)
◦ Fabric Filter (See "5.2.2.6.2. Fabric Filter" on page 160 and "5.2.3.6.2. Fabric Filter"
on page 314.)
IECM User Documentation: User Manual How to Use the Modules Included With the IECM • 110
◦ Wet FGD (See "5.2.2.7.1. Wet FGD" on page 164 and 5.2.3.7.1. Wet FGD" on page
318.)
◦ Oxyfuel High S (>1.5%) (See "5.2.2.8.9. FG Recycle & Purification" on page 238
and "5.2.3.8.9. FG Recycle & Purification" on page 380Wet Cooling Tower (See
"5.2.2.9.3. Wet Cooling Tower or Wet Unit" on page 259 and "5.2.3.9.4. Wet Cooling
Tower or Wet Unit" on page 404.)
◦ Ash Pond (See "5.2.2.10. By-Prod. Mgmt" on page 264.)
◦ No Mixing
• ESP+FGD: This is a simple configuration with just a Cold-Side ESP and a Wet FGD:
◦ Coal
◦ Cold-Side ESP (See "5.2.2.6.1. Cold-Side ESP" on page 157 and "5.2.3.6.1. Cold-
Side ESP" on page 309.)
◦ Wet FGD (See "5.2.2.7.1. Wet FGD" on page 164 and 5.2.3.7.1. Wet FGD" on page
318.)
◦ Once-Through Cooling (See "5.2.3.9.1. Water" on page 397.)
◦ Ash Pond (See "5.2.2.10. By-Prod. Mgmt" on page 264.)
◦ No Mixing
• SCR+ESP+FGD: This is a simple configuration with just a Hot-Side SCR, Cold-Side ESP
and Wet FGD:
◦ Coal
◦ Hot-Side SCR (See "5.2.2.4.2. Hot-Side SCR" on page 144 and "5.2.3.4.2. Hot-Side
SCR" on page 297.)
◦ Cold-Side ESP (See "5.2.2.6.1. Cold-Side ESP" on page 157 and "5.2.3.6.1. Cold-
Side ESP" on page 309.)
◦ Wet FGD (See "5.2.2.7.1. Wet FGD" on page 164 and 5.2.3.7.1. Wet FGD" on page
318.)
◦ Once-Through Cooling (See "5.2.3.9.1. Water" on page 397.)
◦ Ash Pond (See "5.2.2.10. By-Prod. Mgmt" on page 264.)
◦ No Mixing
• SD+FF: This is a simple configuration with just a Spray Dryer and a Fabric Filter:
◦ Coal
◦ Fabric Filter (See "5.2.2.6.2. Fabric Filter" on page 160 and "5.2.3.6.2. Fabric Filter"
on page 314.)
◦ Lime Spray Dryer (See "5.2.2.7.2. Spray Dryer" on page 171 and "5.2.3.7.2. Spray
Dryer" on page 323.)
◦ Once-Through Cooling (See "5.2.3.9.1. Water" on page 397.)
◦ Ash Pond (See "5.2.2.10. By-Prod. Mgmt" on page 264.)
◦ No Mixing
• <User Defined>: This is shown when the current configuration does not match any of the
predefined configurations.
IECM User Documentation: User Manual How to Use the Modules Included With the IECM • 111
Technologies may also be chosen individually. You may either start with one of the predefined
configurations and adjust it, or create your own configuration from scratch. The available options
are described below:
• Combustion Controls: These configuration options determine the type of furnace and any
technologies for reducing NOx emissions.
◦ Fuel Type:
▪ Coal: This is currently the only fuel type supported in the PC plant.
◦ NOx Control:
▪ None: This is the default.
▪ In-Furnace Controls: Controls include an assortment of options which combine
low NOx burners (LNB) with overfire air (OFA), selective non-catalytic reduction
(SNCR), and natural gas reburn. These options are selected from a pull-down
menu on the configuration input screen. (See "5.2.2.4.1. In-Furnace Controls" on
page 138 and "5.2.3.4.1. In-Furnace Controls" on page 291.)
• Post-Combustion Controls: These configuration options determine the presence and type
of post-combustion emissions controls.
◦ NOx Control:
▪ None: This is the default. No post-combustion NOx control is used.
▪ Hot Side SCR: for a Hot-Side Selective Catalytic Reduction technology.
Although an SCR technology can be positioned at various points along the flue
gas train, the IECM considers only the hot-side, high dust configuration. "Hot
Side SCR" may be used together with In-Furnace Controls. (See "5.2.2.4.2. Hot-
Side SCR" on page 144 and "5.2.3.4.2. Hot-Side SCR" on page 297.)
◦ Mercury:
▪ None: This is the default. No post-combustion mercury control is used.
▪ Carbon Injection: Although some mercury removal is accomplished naturally in
a power plant. It is believed that some mercury is captured or trapped in ash and is
removed with bottom ash and fly ash. Carbon injection is provided as a
technology to achieve higher removals by injecting fine particles of activated
carbon into the flue gas after the air preheater. This option requires some form of
particulate control to assure the removal of the injected carbon immediately
downstream of the air preheater. (See "5.2.2.5. Mercury" on page 151 and
"5.2.3.5. Mercury" on page 303.)
◦ Particulates:
▪ None: This is the default. No post-combustion particulate control is used. This
option is not available when the mercury technology "Carbon Injection" is chosen.
This assures the removal of the carbon being injected immediately downstream of
the air preheater.
▪ Cold Side ESP: A Cold-Side Electrostatic Precipitator is used. (See
"5.2.2.6.1. Cold-Side ESP" on page 157 and "5.2.3.6.1. Cold-Side ESP" on page
309.)
▪ Fabric Filter: You may choose the type of fabric filter on the configuration input
screen. (See "5.2.2.6.2. Fabric Filter" on page 160 and "5.2.3.6.2. Fabric Filter" on
page 314.)
◦ SO2 Control:
IECM User Documentation: User Manual How to Use the Modules Included With the IECM • 112
▪ None: This is the default. No post-combustion SO2 control is used. Some CO2
removal technologies require SO2 control; if one of those is chosen, this option
will be disabled.
▪ Wet FGD: A Wet Flue Gas Desulfurization technology is used. Multiple reagent
options are available on the configuration input screen. (See "5.2.2.7.1. Wet FGD"
on page 164 and 5.2.3.7.1. Wet FGD" on page 318.)
▪ Lime Spray Dryer: A dry scrubber using lime as a reagent. The interface places
this technology before the particulate control technology in the plant design and
diagrams. (See "5.2.2.7.2. Spray Dryer" on page 171 and "5.2.3.7.2. Spray Dryer"
on page 323.)
◦ CO2 Capture:
▪ None: This is the default. No CO2 capture is used.
▪ Amine System: This option puts an amine scrubber at the end of the flue gas
train. This option requires post-combustion NOx control.
▪ Ammonia System: An ammonia-based CO2 capture process is used. This option
requires post-combustion NOx and SO2 control. (See "5.2.2.8.2. Ammonia System
(CCS System)" on page 188 and "5.2.3.8.2. Ammonia System (CCS System)" on
page 337.)
▪ Membrane System: A polymeric membrane system is used for CO2 capture. This
option requires post-combustion NOx and SO2 control. (See "5.2.2.8.5. Membrane
System (CCS System)" on page 208 and "5.2.3.8.4. Membrane System (CCS
System)" on page 353.)
▪ Solid Sorbents PSA: A solid sorbents-based pressure swing adsorption (PSA)
system is used for CO2 capture. This option requires post-combustion NOx and
SO2 control. (See "5.2.2.8.6. Solid Sorbents PSA (CCS System)" on page 219 and
"5.2.3.8.5. Solid Sorbents PSA (CCS System)" on page 362.
▪ Solid Sorbents TSA: A solid sorbents-based temperature swing adsorption (TSA)
system is used for CO2 capture. This option requires post-combustion NOx and
SO2 control. (See "5.2.2.8.7. Solid Sorbents TSA (CCS System)" on page 226 and
"5.2.3.8.6. Solid Sorbents TSA (CCS System)" on page 369.)
▪ Oxyfuel Low S (<0.5%): This is an oxyfuel system for use with low-sulfur
(<0.5%) coals. This option requires a specific configuration; we recommend that
you start with the predefined configuration of the same name in the
"Configuration" menu to access it and make any adjustments needed from there.
(See "5.2.2.8.9. FG Recycle & Purification" on page 238 and "5.2.3.8.9. FG
Recycle & Purification" on page 380.)
▪ Oxyfuel Med S (0.5%-1.5%): This is an oxyfuel system for use with medium-
sulfur (0.5% - 1.5%) coals. This option requires a specific configuration; we
recommend that you start with the predefined configuration of the same name in
the "Configuration" menu to access it and make any adjustments needed from
there. (See "5.2.2.8.9. FG Recycle & Purification" on page 238 and "5.2.3.8.9. FG
Recycle & Purification" on page 380.)
▪ Oxyfuel High S (>1.5%): This is an oxyfuel system for use with high-sulfur
(>1.5%) coals. This option requires a specific configuration; we recommend that
you start with the predefined configuration of the same name in the
"Configuration" menu to access it and make any adjustments needed from there.
(See "5.2.2.8.9. FG Recycle & Purification" on page 238 and "5.2.3.8.9. FG
Recycle & Purification" on page 380.)
IECM User Documentation: User Manual How to Use the Modules Included With the IECM • 113
▪ Chemical Looping: Post-combustion chemical looping uses a calcium looping
(CaL) process for CO2 capture. This option requires post-combustion NOx control.
It is not compatible with the hybrid cooling system. (See "5.2.2.8.4. Chemical
Looping (CCS System)" on page 197 and "5.2.3.8.3. Chemical Looping (CCS
System)" on page 345.)
• Water and Solids Management
◦ Cooling System: This option determines the cooling technology:
▪ Once-Through: (This is the default.) Cooling water is withdrawn from a natural
waterbody, passed through the steam condenser and returned to the waterbody.
(See "5.2.3.9.1. Water" on page 397.)
▪ Wet Cooling Tower: Cooling water is recirculated through the wet tower and
back to the condenser. The tower mainly relies on the latent heat of water
evaporation to transfer waste heat to the atmosphere. (See "5.2.2.9.3. Wet Cooling
Tower or Wet Unit" on page 259 and "5.2.3.9.4. Wet Cooling Tower or Wet Unit"
on page 404.)
▪ Air Cooled Condenser: The air cooled condenser utilizes the sensible heating of
atmospheric air passed across finned-tube heat exchangers to reject heat. (See
"5.2.2.9.2. Air Cooled Condenser or Dry Unit" on page 255 and "5.2.3.9.3. Air
Cooled Condenser or Dry Unit" on page 401.)
▪ Hybrid Cooling System: A hybrid cooling system consists of both wet and dry
cooling units and uses a dry cooling unit as the primary cooling system and a wet
cooling system just during the summer or a peak period, thereby reducing water
consumption. This option is not compatible with the chemical looping CO2
capture technology. (See "5.2.2.9.1. Hybrid Cooling System" on page 253 and
"5.2.3.9.2. Hybrid Cooling System" on page 400.)
◦ Wastewater:
▪ Ash Pond: (This is the default.) Bottom ash is sluiced with water and transported
to a bottom ash pond. (See "5.2.2.10. By-Prod. Mgmt" on page 264.)
▪ Chemical Treatment: A chemical treatment system is used to remove pollutants
from the wastewater. (See "5.2.2.10. By-Prod. Mgmt" on page 264.)
▪ Mechanical Treatment: A vapor compression evaporation (VCE) system is used
to remove pollutants from the wastewater. (See "5.2.2.10. By-Prod. Mgmt" on
page 264.)
◦ Flyash Disposal: This configuration setting determines how flyash is disposed. Fly
ash collected from a particulate removal system is typically combined with other solid
waste streams if other waste streams exist. The waste disposal option has little effect
on the rest of the IECM. The choices are:
▪ No Mixing: This is the default. The flyash is disposed separately. (See
"5.2.2.10. By-Prod. Mgmt" on page 264.)
▪ Mixed w/FGD Wastes: This option disposes flyash with FGD wastes. It is only
available if a wet FGD and some form of particulate control are configured. (See
"5.2.2.10. By-Prod. Mgmt" on page 264.)
▪ Mixed w/ Bottom Ash: This option disposes flyash with bottom ash (e.g., in the
pond). It is only available if some form of particulate control is configured. (See
"5.2.2.10. By-Prod. Mgmt" on page 264.)
IECM User Documentation: User Manual How to Use the Modules Included With the IECM • 114
5.2.1.2. Plant Location
This screen is the same for all plant types.
The plant location is used to provide some default cost multipliers, which may be viewed and
modified in detail in the overall plant parameters. (See "5.2.2.1.3. Region-Specific Cost Factors" on
page 117.)
This screen contains a single parameter, the plant location. It is a menu which has the following
options:
• US Midwest Region: This is the default. It includes the following US states:
◦ Iowa (IA)
◦ Illinois (IL)
◦ Indiana (IN)
◦ Kentucky (KY)
◦ Michigan (MI)
◦ Minnesota (MN)
◦ Missouri (MO)
◦ North Dakota (ND)
◦ Nebraska (NE)
◦ Ohio (OH)
◦ South Dakota (SD)
◦ Wisconsin (WI)
◦ West Virginia (WV)
• US Northeast Region: This region includes the following US states:
◦ Connecticut (CT)
◦ Delaware (DE)
◦ Massachusetts (MA)
◦ Maryland (MD)
◦ Maine (ME)
◦ New Jersey (NJ)
◦ New York (NY)
◦ Pennsylvania (PA)
◦ Vermont (VT)
• US Northwest Region: This region includes the following US states:
◦ Idaho (ID)
◦ Montana (MT)
◦ Oregon (OR)
◦ Washington (WA)
IECM User Documentation: User Manual How to Use the Modules Included With the IECM • 115
◦ Wyoming (WY)
• US South Central Region: This region includes the following US states:
◦ Arkansas (AR)
◦ Kansas (KS)
◦ Louisiana (LA)
◦ Oklahoma (OK)
◦ Texas (TX)
• US Southeast Region: This region includes the following US states:
◦ Alabama (AL)
◦ Florida (FL)
◦ Georgia (GA)
◦ Mississippi (MS)
◦ North Carolina (NC)
◦ South Carolina (SC)
◦ Tennessee (TN)
◦ Virginia (VA)
• US Southwest Region: This region includes the following US states:
◦ Arizona (AZ)
◦ California (CA)
◦ Colorado (CO)
◦ New Mexico (NM)
◦ Nevada (NV)
◦ Utah (UT)
• Other: This includes any location not explicitly listed above. The cost multipliers will all
be set to 1.0, as the IECM does not include data for them. You may provide your own
multipliers in the overall plant parameters, as described in "5.2.2.1.3. Region-Specific Cost
Factors" on page 117.
5.2.1.3. Unit Systems
This screen allows you to choose the unit systems used in displaying parameters and results See
"4.2.1.3. The "Unit Systems" Screen" on page 51 for more details.
5.2.2. SET PARAMETERS
5.2.2.1. Overall Plant
The input parameter screens described in the following sections are available when "Pulverized Coal
(PC)" is selected as the plant type from the "New Session" pull down menu. These screens apply to
the power plant as a whole, not to specific technologies.
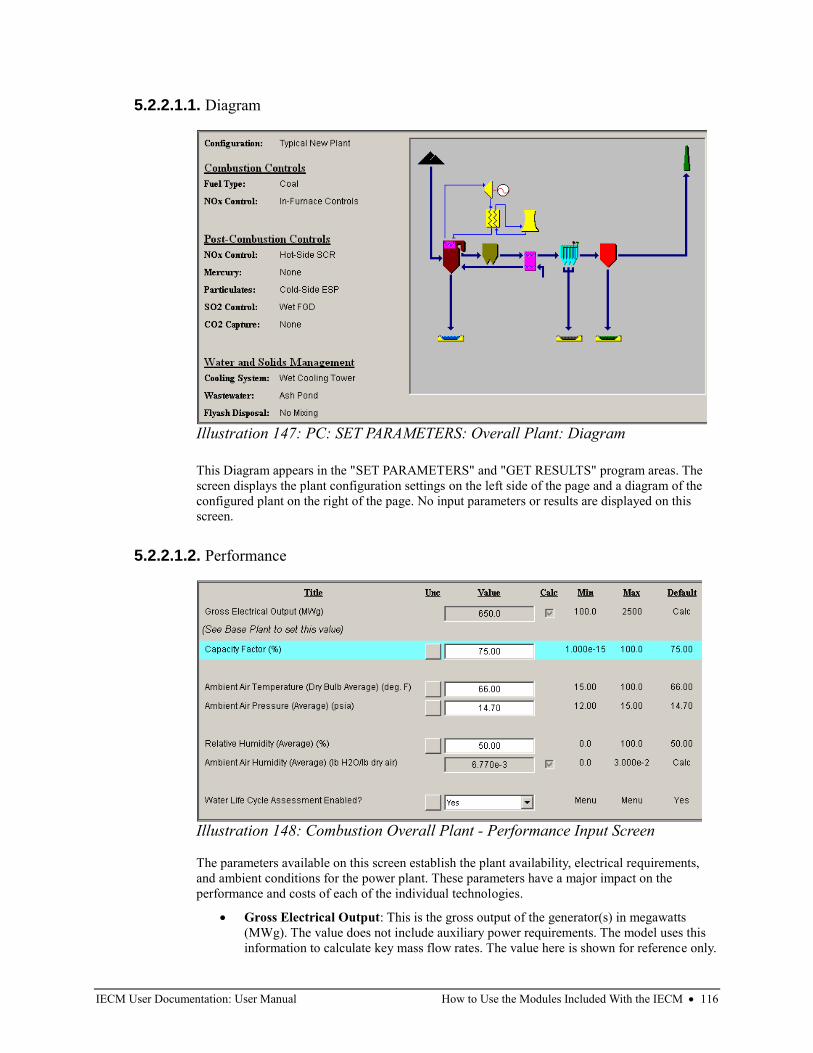
IECM User Documentation: User Manual How to Use the Modules Included With the IECM • 116
5.2.2.1.1. Diagram
This Diagram appears in the "SET PARAMETERS" and "GET RESULTS" program areas. The
screen displays the plant configuration settings on the left side of the page and a diagram of the
configured plant on the right of the page. No input parameters or results are displayed on this
screen.
5.2.2.1.2. Performance
The parameters available on this screen establish the plant availability, electrical requirements,
and ambient conditions for the power plant. These parameters have a major impact on the
performance and costs of each of the individual technologies.
• Gross Electrical Output: This is the gross output of the generator(s) in megawatts
(MWg). The value does not include auxiliary power requirements. The model uses this
information to calculate key mass flow rates. The value here is shown for reference only.
Illustration 147: PC: SET PARAMETERS: Overall Plant: Diagram
Illustration 148: Combustion Overall Plant - Performance Input Screen
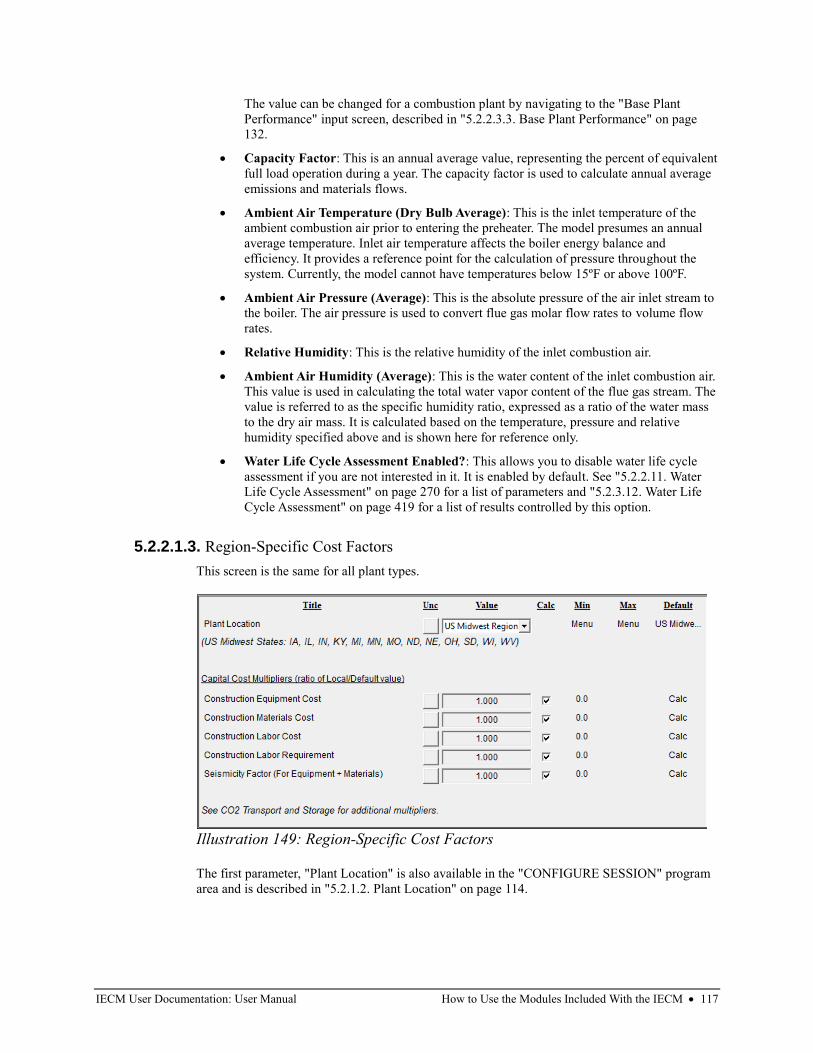
IECM User Documentation: User Manual How to Use the Modules Included With the IECM • 117
The value can be changed for a combustion plant by navigating to the "Base Plant
Performance" input screen, described in "5.2.2.3.3. Base Plant Performance" on page
132.
• Capacity Factor: This is an annual average value, representing the percent of equivalent
full load operation during a year. The capacity factor is used to calculate annual average
emissions and materials flows.
• Ambient Air Temperature (Dry Bulb Average): This is the inlet temperature of the
ambient combustion air prior to entering the preheater. The model presumes an annual
average temperature. Inlet air temperature affects the boiler energy balance and
efficiency. It provides a reference point for the calculation of pressure throughout the
system. Currently, the model cannot have temperatures below 15ºF or above 100ºF.
• Ambient Air Pressure (Average): This is the absolute pressure of the air inlet stream to
the boiler. The air pressure is used to convert flue gas molar flow rates to volume flow
rates.
• Relative Humidity: This is the relative humidity of the inlet combustion air.
• Ambient Air Humidity (Average): This is the water content of the inlet combustion air.
This value is used in calculating the total water vapor content of the flue gas stream. The
value is referred to as the specific humidity ratio, expressed as a ratio of the water mass
to the dry air mass. It is calculated based on the temperature, pressure and relative
humidity specified above and is shown here for reference only.
• Water Life Cycle Assessment Enabled?: This allows you to disable water life cycle
assessment if you are not interested in it. It is enabled by default. See "5.2.2.11. Water
Life Cycle Assessment" on page 270 for a list of parameters and "5.2.3.12. Water Life
Cycle Assessment" on page 419 for a list of results controlled by this option.
5.2.2.1.3. Region-Specific Cost Factors
This screen is the same for all plant types.
The first parameter, "Plant Location" is also available in the "CONFIGURE SESSION" program
area and is described in "5.2.1.2. Plant Location" on page 114.
Illustration 149: Region-Specific Cost Factors
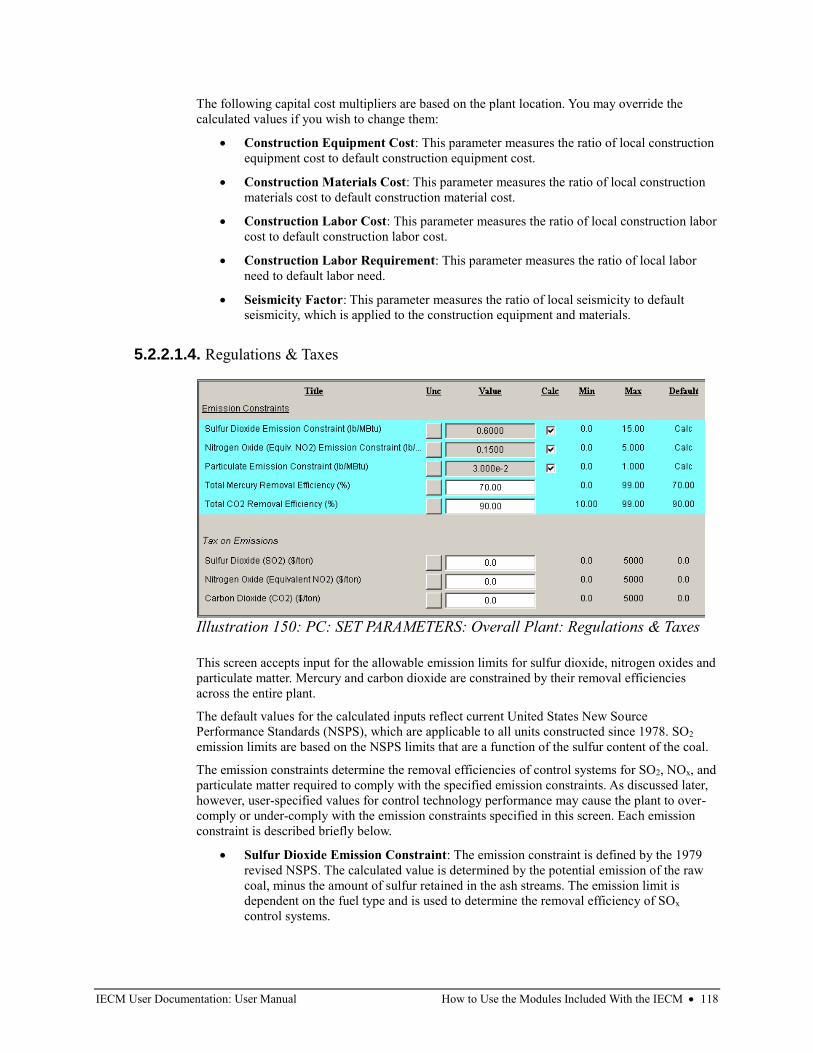
IECM User Documentation: User Manual How to Use the Modules Included With the IECM • 118
The following capital cost multipliers are based on the plant location. You may override the
calculated values if you wish to change them:
• Construction Equipment Cost: This parameter measures the ratio of local construction
equipment cost to default construction equipment cost.
• Construction Materials Cost: This parameter measures the ratio of local construction
materials cost to default construction material cost.
• Construction Labor Cost: This parameter measures the ratio of local construction labor
cost to default construction labor cost.
• Construction Labor Requirement: This parameter measures the ratio of local labor
need to default labor need.
• Seismicity Factor: This parameter measures the ratio of local seismicity to default
seismicity, which is applied to the construction equipment and materials.
5.2.2.1.4. Regulations & Taxes
This screen accepts input for the allowable emission limits for sulfur dioxide, nitrogen oxides and
particulate matter. Mercury and carbon dioxide are constrained by their removal efficiencies
across the entire plant.
The default values for the calculated inputs reflect current United States New Source
Performance Standards (NSPS), which are applicable to all units constructed since 1978. SO2
emission limits are based on the NSPS limits that are a function of the sulfur content of the coal.
The emission constraints determine the removal efficiencies of control systems for SO2, NOx, and
particulate matter required to comply with the specified emission constraints. As discussed later,
however, user-specified values for control technology performance may cause the plant to over-
comply or under-comply with the emission constraints specified in this screen. Each emission
constraint is described briefly below.
• Sulfur Dioxide Emission Constraint: The emission constraint is defined by the 1979
revised NSPS. The calculated value is determined by the potential emission of the raw
coal, minus the amount of sulfur retained in the ash streams. The emission limit is
dependent on the fuel type and is used to determine the removal efficiency of SOx
control systems.
Illustration 150: PC: SET PARAMETERS: Overall Plant: Regulations & Taxes

IECM User Documentation: User Manual How to Use the Modules Included With the IECM • 119
• Nitrogen Oxide Emission Constraint: The combined emissions of NO2 and NO3 of
present power plants are constrained by NSPS standards. The limit is a function of the
coal rank and fuel type and is used to determine the removal efficiency of NOx control
systems.
• Particulate Emission Constraint: The emission constraint of the total suspended
particulates is defined by the NSPS standards of 1978. The limit is a function of the fuel
type and is used to determine the removal efficiency of particulate control systems.
• Total Mercury Removal Efficiency: This is the overall removal of mercury, including
all forms, from the entire power plant. It is used to determine the particular removals in
other technologies.
• Total CO2 Removal Efficiency: This is the overall CO2 capture efficiency required to
meet the emission standard.
This screen also allows the user to enter the taxes on emissions in dollars per ton. The final costs
determined from these inputs are available in the Stack results section of the IECM. (See
"5.2.3.11.3. Emission Taxes" on page 419.) The costs are added to the overall plant cost, not a
particular technology. The following taxes on emissions may be specified:
• Sulfur Dioxide (SO2): The user may enter a cost to the plant of emitting sulfur dioxide
in dollars per ton.
• Nitrogen Oxide (equiv. NOx): The user may enter a cost to the plant of emitting
nitrogen oxide in dollars per ton.
• Carbon Dioxide (CO2): The user may enter a cost to the plant of emitting carbon
dioxide in dollars per ton.
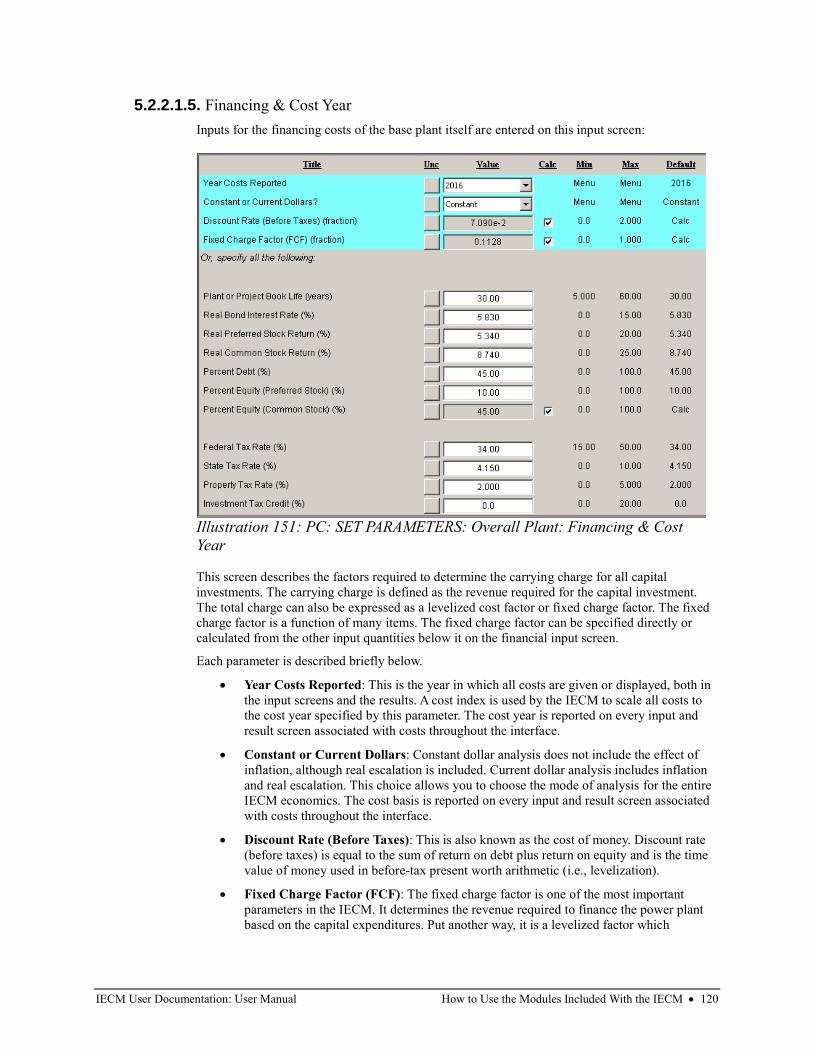
IECM User Documentation: User Manual How to Use the Modules Included With the IECM • 120
5.2.2.1.5. Financing & Cost Year
Inputs for the financing costs of the base plant itself are entered on this input screen:
This screen describes the factors required to determine the carrying charge for all capital
investments. The carrying charge is defined as the revenue required for the capital investment.
The total charge can also be expressed as a levelized cost factor or fixed charge factor. The fixed
charge factor is a function of many items. The fixed charge factor can be specified directly or
calculated from the other input quantities below it on the financial input screen.
Each parameter is described briefly below.
• Year Costs Reported: This is the year in which all costs are given or displayed, both in
the input screens and the results. A cost index is used by the IECM to scale all costs to
the cost year specified by this parameter. The cost year is reported on every input and
result screen associated with costs throughout the interface.
• Constant or Current Dollars: Constant dollar analysis does not include the effect of
inflation, although real escalation is included. Current dollar analysis includes inflation
and real escalation. This choice allows you to choose the mode of analysis for the entire
IECM economics. The cost basis is reported on every input and result screen associated
with costs throughout the interface.
• Discount Rate (Before Taxes): This is also known as the cost of money. Discount rate
(before taxes) is equal to the sum of return on debt plus return on equity and is the time
value of money used in before-tax present worth arithmetic (i.e., levelization).
• Fixed Charge Factor (FCF): The fixed charge factor is one of the most important
parameters in the IECM. It determines the revenue required to finance the power plant
based on the capital expenditures. Put another way, it is a levelized factor which
Illustration 151: PC: SET PARAMETERS: Overall Plant: Financing & Cost
Year
IECM User Documentation: User Manual How to Use the Modules Included With the IECM • 121
accounts for the revenue per dollar of total plant cost that must be collected from
customers in order to pay the carrying charges on that capital investment.
One may specify a fixed charge factor, or fill in the following inputs and the model will calculate
the FCF based on them:
• Inflation Rate: (This parameter is only visible when current dollars are selected.) This is
the rise in price levels caused by an increase in the available currency and credit without
a proportionate increase in available goods or services. It does not include real
escalation.
• Plant or Project Book Life: This is the years of service expected from a capital
investment. It is also the period over which an investment is recovered through book
depreciation.
• Real Bond Interest Rate: This is a debt security associated with a loan or mortgage. It
is the most secure form of security but the lowest in its return.
• Real Preferred Stock Return: This equity security is the second most speculative type
and pays the second highest rate of return. The holder of the stock is a part owner of the
company.
• Real Common Stock Return: This is the most speculative type of equity security sold
by a utility and pays the highest relative return. The holder of the stock is a part owner of
the company.
• Percent Debt: This is the percent of the total capitalization that is associated with debt
money. This includes loans and mortgage bonds.
• Percent Equity (Preferred Stock): This is the percent of the total capitalization that is
associated with the sale of preferred stock.
• Percent Equity (Common Stock): This value is the remainder of the capitalization,
calculated as 100% minus the percent debt, minus the percent equity in preferred stock.
• Federal Tax Rate: This is the federal tax rate. It is used to calculate the amount of taxes
paid and deferred.
• State Tax Rate: This is the state tax rate. It is used to calculate the amount of taxes paid
and deferred.
• Property Tax Rate: The property tax rate, or ad valorem, is used to calculate the
carrying charge.
• Investment Tax Credit: This is an immediate reduction in income taxes equal to a
percentage of the installed cost of a new capital investment. It is zero by default. It is
used to set the initial balance and the book depreciation.
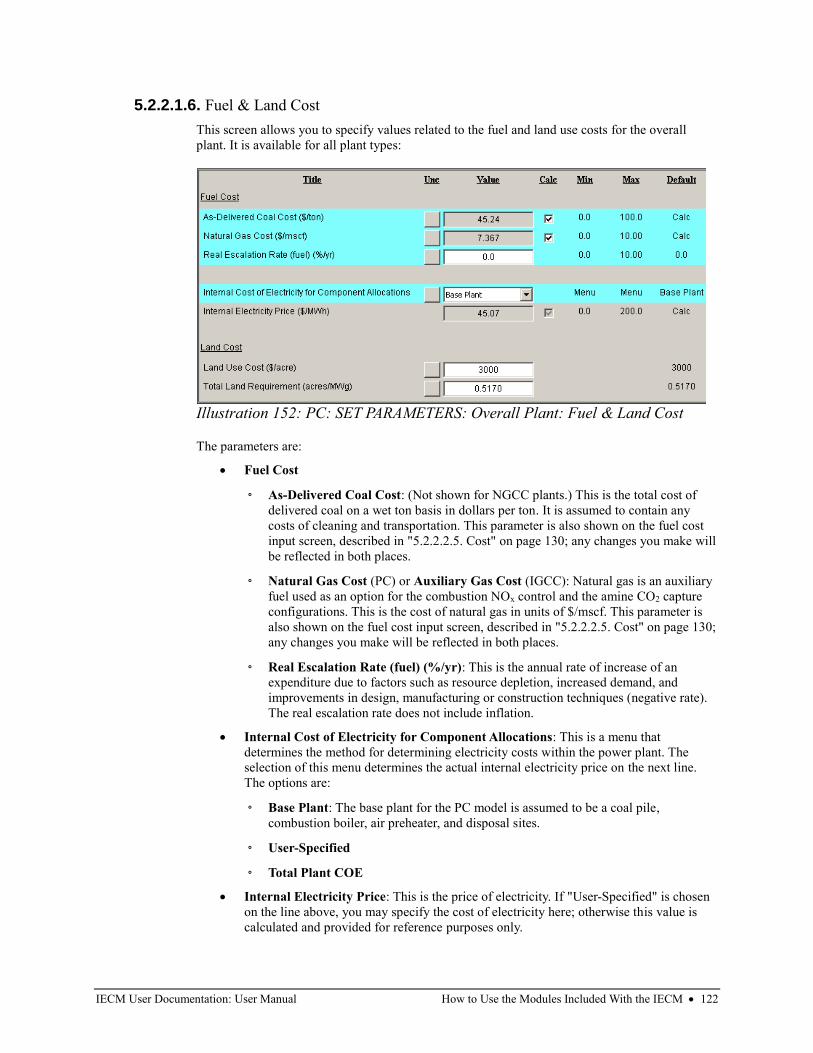
IECM User Documentation: User Manual How to Use the Modules Included With the IECM • 122
5.2.2.1.6. Fuel & Land Cost
This screen allows you to specify values related to the fuel and land use costs for the overall
plant. It is available for all plant types:
The parameters are:
• Fuel Cost
◦ As-Delivered Coal Cost: (Not shown for NGCC plants.) This is the total cost of
delivered coal on a wet ton basis in dollars per ton. It is assumed to contain any
costs of cleaning and transportation. This parameter is also shown on the fuel cost
input screen, described in "5.2.2.2.5. Cost" on page 130; any changes you make will
be reflected in both places.
◦ Natural Gas Cost (PC) or Auxiliary Gas Cost (IGCC): Natural gas is an auxiliary
fuel used as an option for the combustion NOx control and the amine CO2 capture
configurations. This is the cost of natural gas in units of $/mscf. This parameter is
also shown on the fuel cost input screen, described in "5.2.2.2.5. Cost" on page 130;
any changes you make will be reflected in both places.
◦ Real Escalation Rate (fuel) (%/yr): This is the annual rate of increase of an
expenditure due to factors such as resource depletion, increased demand, and
improvements in design, manufacturing or construction techniques (negative rate).
The real escalation rate does not include inflation.
• Internal Cost of Electricity for Component Allocations: This is a menu that
determines the method for determining electricity costs within the power plant. The
selection of this menu determines the actual internal electricity price on the next line.
The options are:
◦ Base Plant: The base plant for the PC model is assumed to be a coal pile,
combustion boiler, air preheater, and disposal sites.
◦ User-Specified
◦ Total Plant COE
• Internal Electricity Price: This is the price of electricity. If "User-Specified" is chosen
on the line above, you may specify the cost of electricity here; otherwise this value is
calculated and provided for reference purposes only.
Illustration 152: PC: SET PARAMETERS: Overall Plant: Fuel & Land Cost
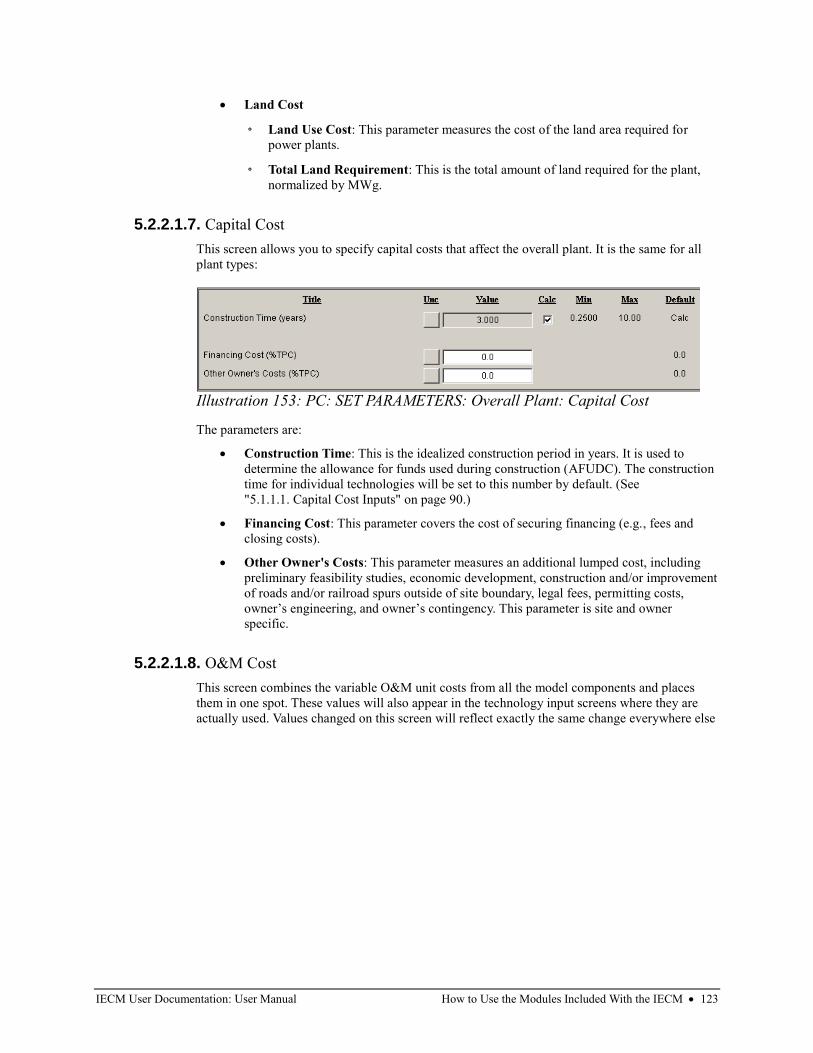
IECM User Documentation: User Manual How to Use the Modules Included With the IECM • 123
• Land Cost
◦ Land Use Cost: This parameter measures the cost of the land area required for
power plants.
◦ Total Land Requirement: This is the total amount of land required for the plant,
normalized by MWg.
5.2.2.1.7. Capital Cost
This screen allows you to specify capital costs that affect the overall plant. It is the same for all
plant types:
The parameters are:
• Construction Time: This is the idealized construction period in years. It is used to
determine the allowance for funds used during construction (AFUDC). The construction
time for individual technologies will be set to this number by default. (See
"5.1.1.1. Capital Cost Inputs" on page 90.)
• Financing Cost: This parameter covers the cost of securing financing (e.g., fees and
closing costs).
• Other Owner's Costs: This parameter measures an additional lumped cost, including
preliminary feasibility studies, economic development, construction and/or improvement
of roads and/or railroad spurs outside of site boundary, legal fees, permitting costs,
owner’s engineering, and owner’s contingency. This parameter is site and owner
specific.
5.2.2.1.8. O&M Cost
This screen combines the variable O&M unit costs from all the model components and places
them in one spot. These values will also appear in the technology input screens where they are
actually used. Values changed on this screen will reflect exactly the same change everywhere else
Illustration 153: PC: SET PARAMETERS: Overall Plant: Capital Cost
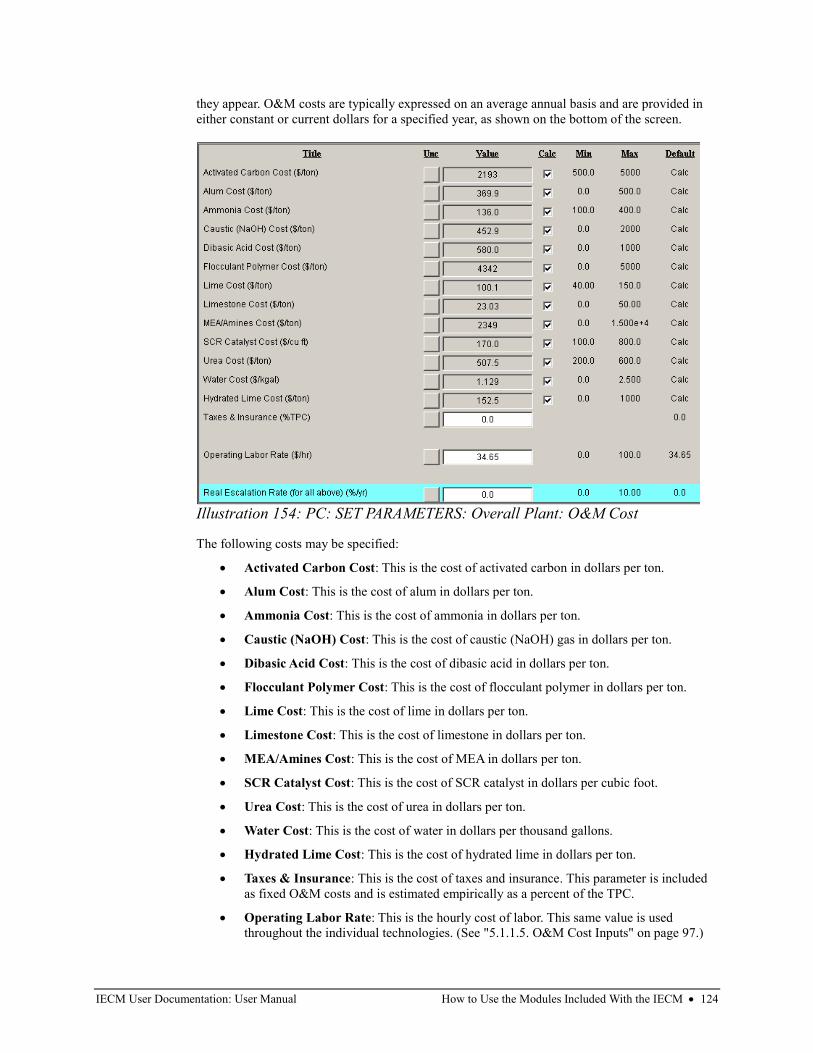
IECM User Documentation: User Manual How to Use the Modules Included With the IECM • 124
they appear. O&M costs are typically expressed on an average annual basis and are provided in
either constant or current dollars for a specified year, as shown on the bottom of the screen.
The following costs may be specified:
• Activated Carbon Cost: This is the cost of activated carbon in dollars per ton.
• Alum Cost: This is the cost of alum in dollars per ton.
• Ammonia Cost: This is the cost of ammonia in dollars per ton.
• Caustic (NaOH) Cost: This is the cost of caustic (NaOH) gas in dollars per ton.
• Dibasic Acid Cost: This is the cost of dibasic acid in dollars per ton.
• Flocculant Polymer Cost: This is the cost of flocculant polymer in dollars per ton.
• Lime Cost: This is the cost of lime in dollars per ton.
• Limestone Cost: This is the cost of limestone in dollars per ton.
• MEA/Amines Cost: This is the cost of MEA in dollars per ton.
• SCR Catalyst Cost: This is the cost of SCR catalyst in dollars per cubic foot.
• Urea Cost: This is the cost of urea in dollars per ton.
• Water Cost: This is the cost of water in dollars per thousand gallons.
• Hydrated Lime Cost: This is the cost of hydrated lime in dollars per ton.
• Taxes & Insurance: This is the cost of taxes and insurance. This parameter is included
as fixed O&M costs and is estimated empirically as a percent of the TPC.
• Operating Labor Rate: This is the hourly cost of labor. This same value is used
throughout the individual technologies. (See "5.1.1.5. O&M Cost Inputs" on page 97.)
Illustration 154: PC: SET PARAMETERS: Overall Plant: O&M Cost
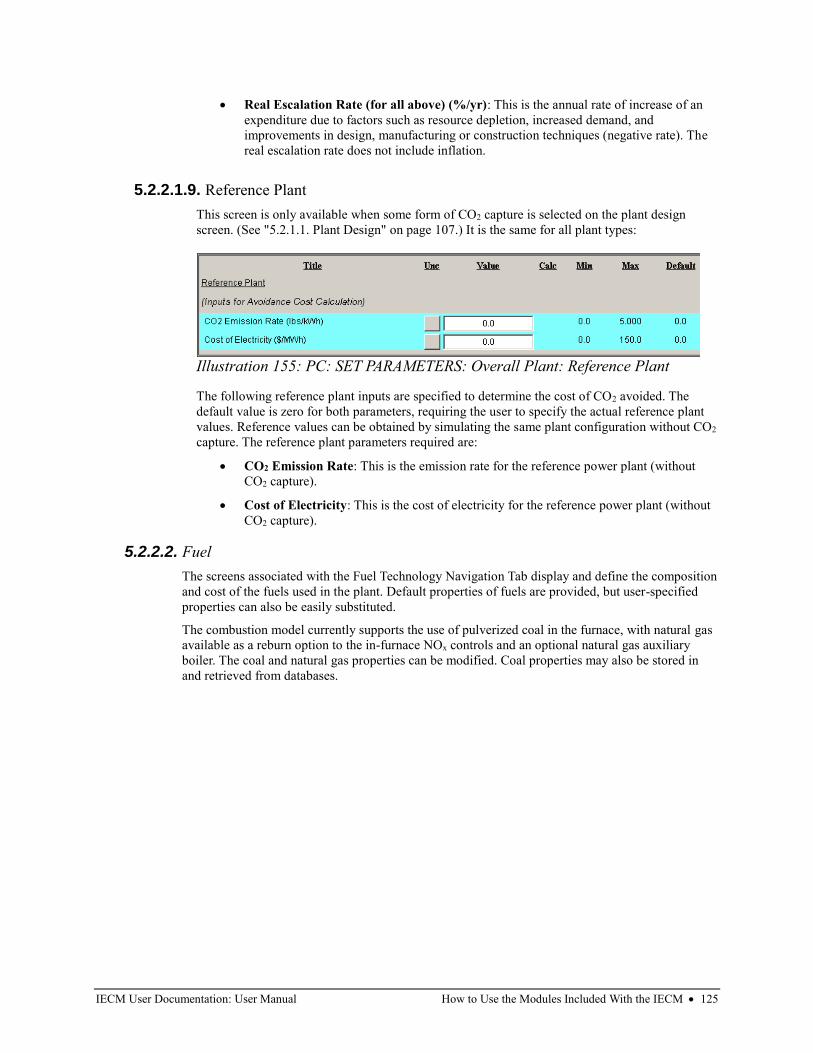
IECM User Documentation: User Manual How to Use the Modules Included With the IECM • 125
• Real Escalation Rate (for all above) (%/yr): This is the annual rate of increase of an
expenditure due to factors such as resource depletion, increased demand, and
improvements in design, manufacturing or construction techniques (negative rate). The
real escalation rate does not include inflation.
5.2.2.1.9. Reference Plant
This screen is only available when some form of CO2 capture is selected on the plant design
screen. (See "5.2.1.1. Plant Design" on page 107.) It is the same for all plant types:
The following reference plant inputs are specified to determine the cost of CO2 avoided. The
default value is zero for both parameters, requiring the user to specify the actual reference plant
values. Reference values can be obtained by simulating the same plant configuration without CO2
capture. The reference plant parameters required are:
• CO2 Emission Rate: This is the emission rate for the reference power plant (without
CO2 capture).
• Cost of Electricity: This is the cost of electricity for the reference power plant (without
CO2 capture).
5.2.2.2. Fuel
The screens associated with the Fuel Technology Navigation Tab display and define the composition
and cost of the fuels used in the plant. Default properties of fuels are provided, but user-specified
properties can also be easily substituted.
The combustion model currently supports the use of pulverized coal in the furnace, with natural gas
available as a reburn option to the in-furnace NOx controls and an optional natural gas auxiliary
boiler. The coal and natural gas properties can be modified. Coal properties may also be stored in
and retrieved from databases.
Illustration 155: PC: SET PARAMETERS: Overall Plant: Reference Plant
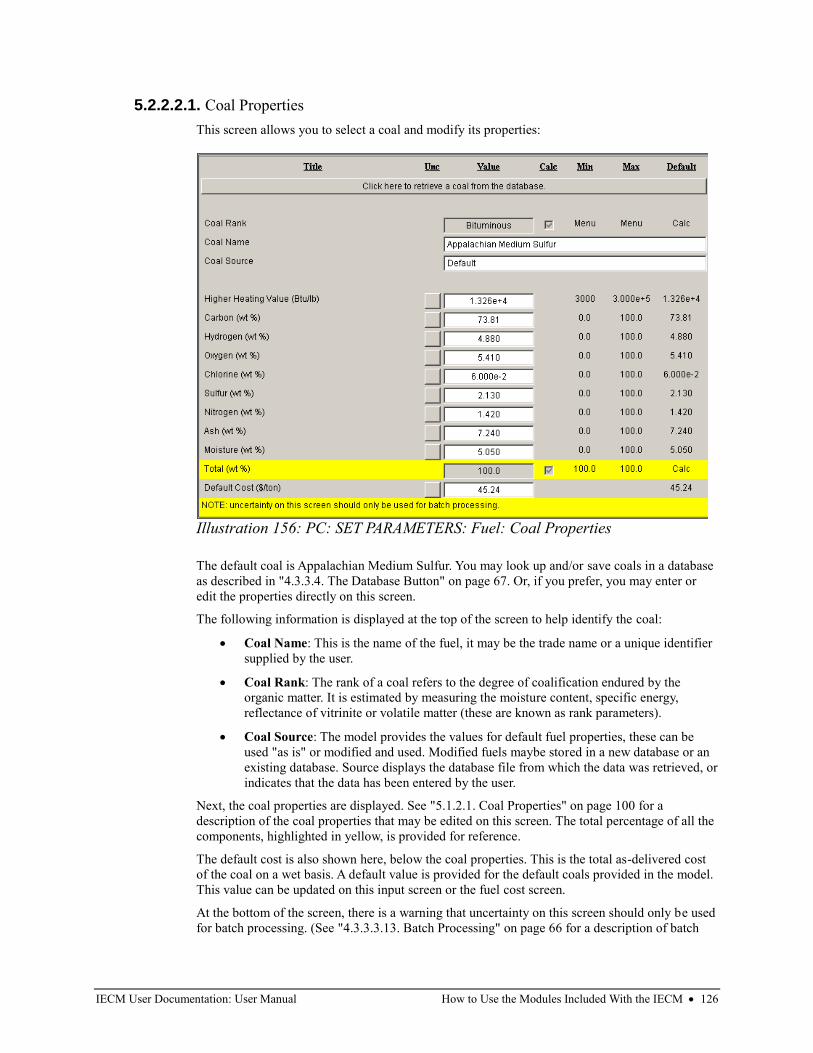
IECM User Documentation: User Manual How to Use the Modules Included With the IECM • 126
5.2.2.2.1. Coal Properties
This screen allows you to select a coal and modify its properties:
The default coal is Appalachian Medium Sulfur. You may look up and/or save coals in a database
as described in "4.3.3.4. The Database Button" on page 67. Or, if you prefer, you may enter or
edit the properties directly on this screen.
The following information is displayed at the top of the screen to help identify the coal:
• Coal Name: This is the name of the fuel, it may be the trade name or a unique identifier
supplied by the user.
• Coal Rank: The rank of a coal refers to the degree of coalification endured by the
organic matter. It is estimated by measuring the moisture content, specific energy,
reflectance of vitrinite or volatile matter (these are known as rank parameters).
• Coal Source: The model provides the values for default fuel properties, these can be
used "as is" or modified and used. Modified fuels maybe stored in a new database or an
existing database. Source displays the database file from which the data was retrieved, or
indicates that the data has been entered by the user.
Next, the coal properties are displayed. See "5.1.2.1. Coal Properties" on page 100 for a
description of the coal properties that may be edited on this screen. The total percentage of all the
components, highlighted in yellow, is provided for reference.
The default cost is also shown here, below the coal properties. This is the total as-delivered cost
of the coal on a wet basis. A default value is provided for the default coals provided in the model.
This value can be updated on this input screen or the fuel cost screen.
At the bottom of the screen, there is a warning that uncertainty on this screen should only be used
for batch processing. (See "4.3.3.3.13. Batch Processing" on page 66 for a description of batch
Illustration 156: PC: SET PARAMETERS: Fuel: Coal Properties
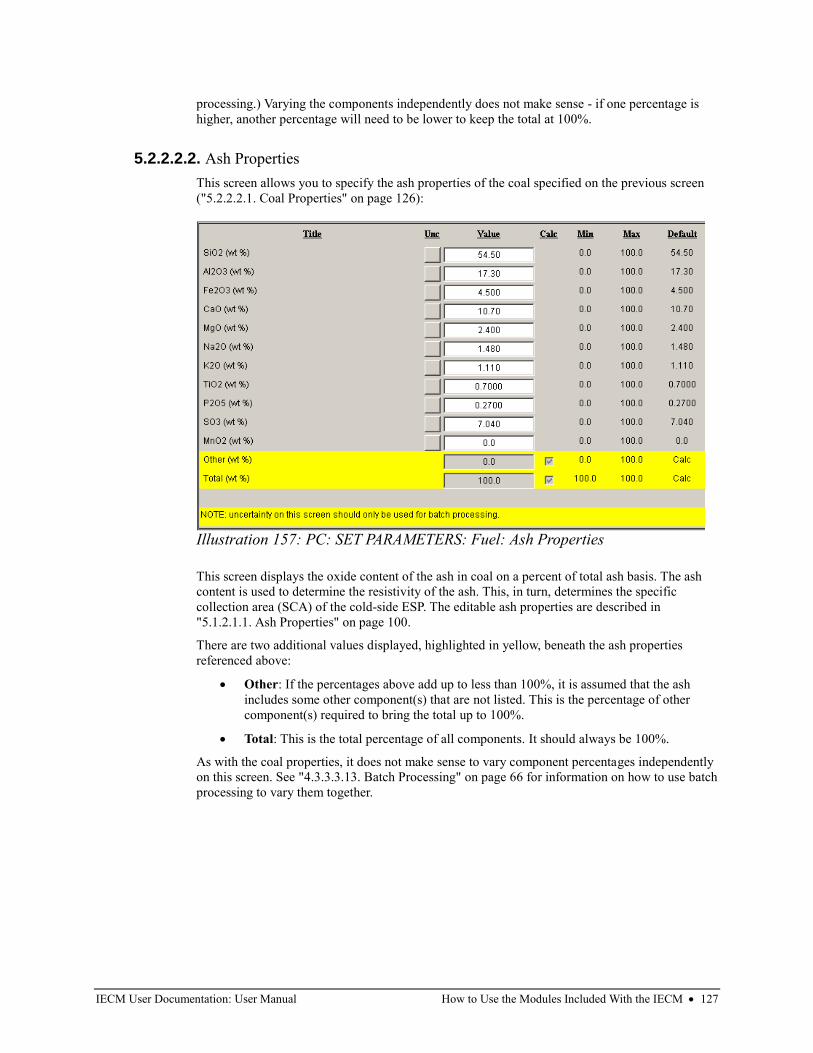
IECM User Documentation: User Manual How to Use the Modules Included With the IECM • 127
processing.) Varying the components independently does not make sense - if one percentage is
higher, another percentage will need to be lower to keep the total at 100%.
5.2.2.2.2. Ash Properties
This screen allows you to specify the ash properties of the coal specified on the previous screen
("5.2.2.2.1. Coal Properties" on page 126):
This screen displays the oxide content of the ash in coal on a percent of total ash basis. The ash
content is used to determine the resistivity of the ash. This, in turn, determines the specific
collection area (SCA) of the cold-side ESP. The editable ash properties are described in
"5.1.2.1.1. Ash Properties" on page 100.
There are two additional values displayed, highlighted in yellow, beneath the ash properties
referenced above:
• Other: If the percentages above add up to less than 100%, it is assumed that the ash
includes some other component(s) that are not listed. This is the percentage of other
component(s) required to bring the total up to 100%.
• Total: This is the total percentage of all components. It should always be 100%.
As with the coal properties, it does not make sense to vary component percentages independently
on this screen. See "4.3.3.3.13. Batch Processing" on page 66 for information on how to use batch
processing to vary them together.
Illustration 157: PC: SET PARAMETERS: Fuel: Ash Properties
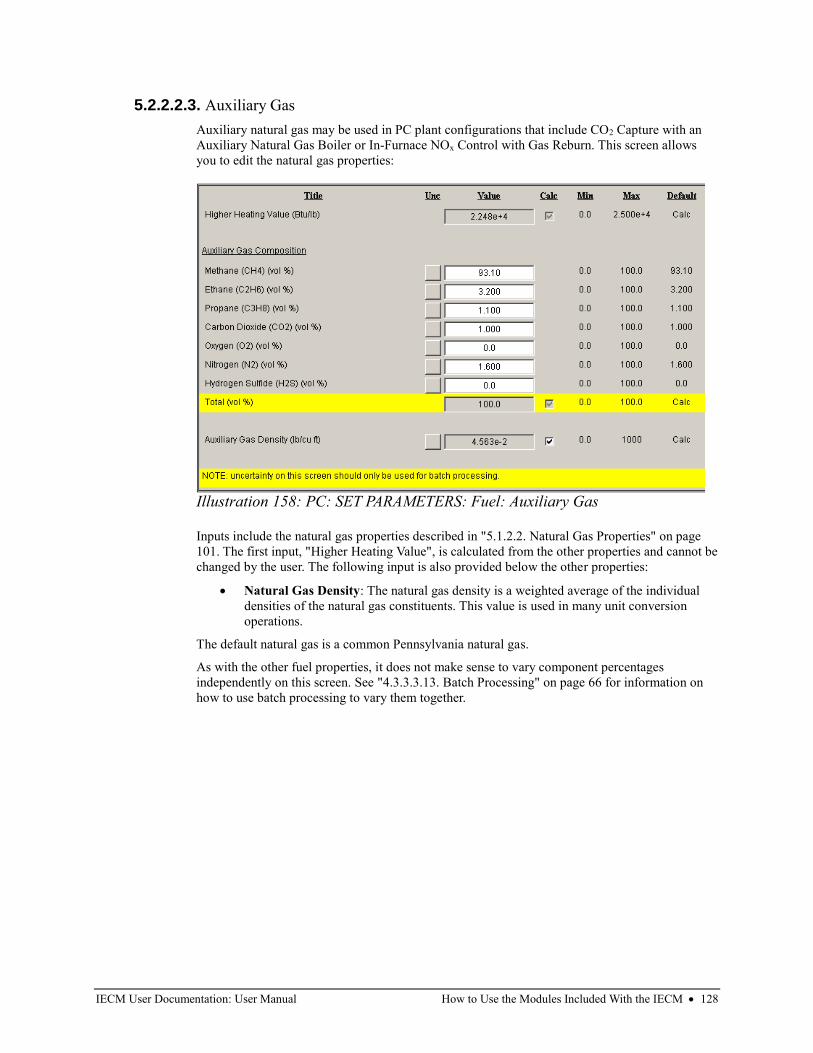
IECM User Documentation: User Manual How to Use the Modules Included With the IECM • 128
5.2.2.2.3. Auxiliary Gas
Auxiliary natural gas may be used in PC plant configurations that include CO2 Capture with an
Auxiliary Natural Gas Boiler or In-Furnace NOx Control with Gas Reburn. This screen allows
you to edit the natural gas properties:
Inputs include the natural gas properties described in "5.1.2.2. Natural Gas Properties" on page
101. The first input, "Higher Heating Value", is calculated from the other properties and cannot be
changed by the user. The following input is also provided below the other properties:
• Natural Gas Density: The natural gas density is a weighted average of the individual
densities of the natural gas constituents. This value is used in many unit conversion
operations.
The default natural gas is a common Pennsylvania natural gas.
As with the other fuel properties, it does not make sense to vary component percentages
independently on this screen. See "4.3.3.3.13. Batch Processing" on page 66 for information on
how to use batch processing to vary them together.
Illustration 158: PC: SET PARAMETERS: Fuel: Auxiliary Gas
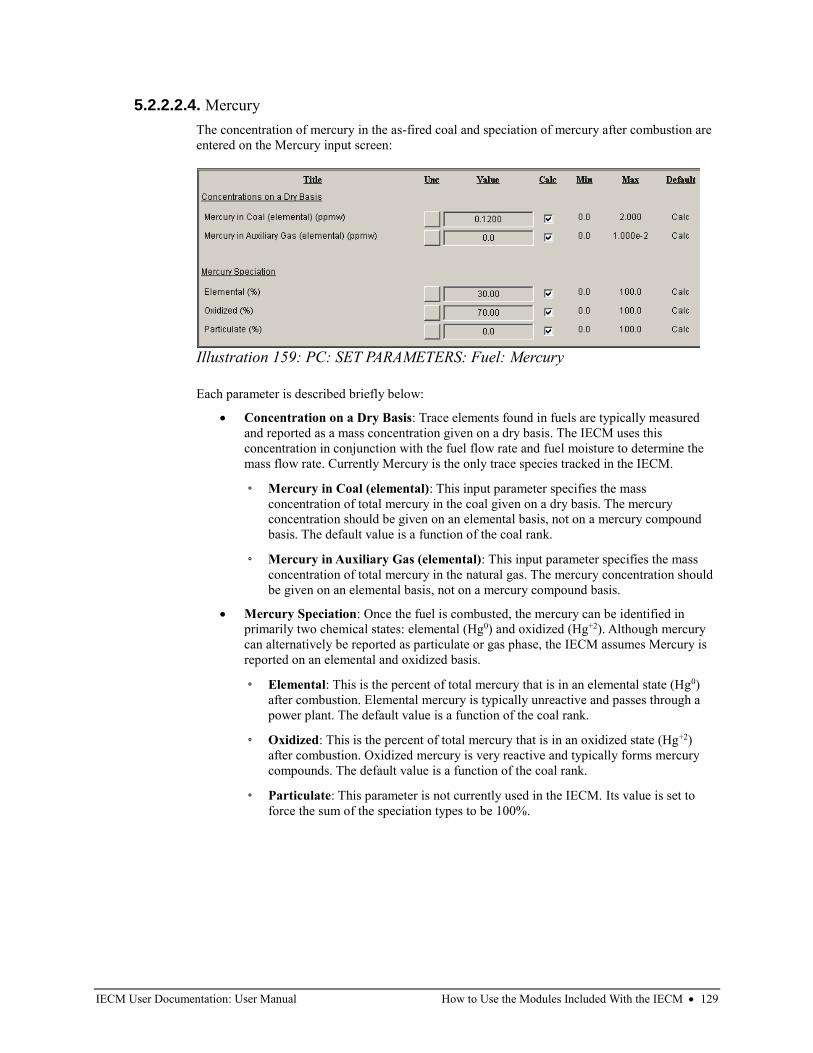
IECM User Documentation: User Manual How to Use the Modules Included With the IECM • 129
5.2.2.2.4. Mercury
The concentration of mercury in the as-fired coal and speciation of mercury after combustion are
entered on the Mercury input screen:
Each parameter is described briefly below:
• Concentration on a Dry Basis: Trace elements found in fuels are typically measured
and reported as a mass concentration given on a dry basis. The IECM uses this
concentration in conjunction with the fuel flow rate and fuel moisture to determine the
mass flow rate. Currently Mercury is the only trace species tracked in the IECM.
◦ Mercury in Coal (elemental): This input parameter specifies the mass
concentration of total mercury in the coal given on a dry basis. The mercury
concentration should be given on an elemental basis, not on a mercury compound
basis. The default value is a function of the coal rank.
◦ Mercury in Auxiliary Gas (elemental): This input parameter specifies the mass
concentration of total mercury in the natural gas. The mercury concentration should
be given on an elemental basis, not on a mercury compound basis.
• Mercury Speciation: Once the fuel is combusted, the mercury can be identified in
primarily two chemical states: elemental (Hg0) and oxidized (Hg+2). Although mercury
can alternatively be reported as particulate or gas phase, the IECM assumes Mercury is
reported on an elemental and oxidized basis.
◦ Elemental: This is the percent of total mercury that is in an elemental state (Hg0)
after combustion. Elemental mercury is typically unreactive and passes through a
power plant. The default value is a function of the coal rank.
◦ Oxidized: This is the percent of total mercury that is in an oxidized state (Hg+2)
after combustion. Oxidized mercury is very reactive and typically forms mercury
compounds. The default value is a function of the coal rank.
◦ Particulate: This parameter is not currently used in the IECM. Its value is set to
force the sum of the speciation types to be 100%.
Illustration 159: PC: SET PARAMETERS: Fuel: Mercury
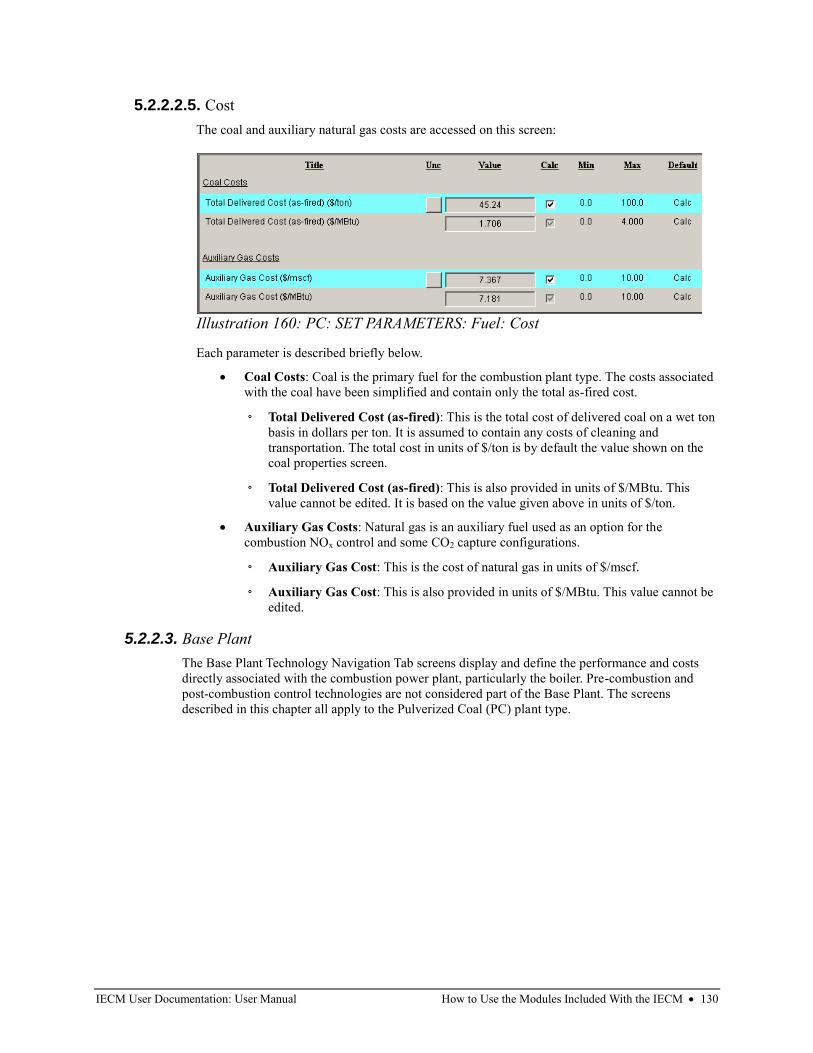
IECM User Documentation: User Manual How to Use the Modules Included With the IECM • 130
5.2.2.2.5. Cost
The coal and auxiliary natural gas costs are accessed on this screen:
Each parameter is described briefly below.
• Coal Costs: Coal is the primary fuel for the combustion plant type. The costs associated
with the coal have been simplified and contain only the total as-fired cost.
◦ Total Delivered Cost (as-fired): This is the total cost of delivered coal on a wet ton
basis in dollars per ton. It is assumed to contain any costs of cleaning and
transportation. The total cost in units of $/ton is by default the value shown on the
coal properties screen.
◦ Total Delivered Cost (as-fired): This is also provided in units of $/MBtu. This
value cannot be edited. It is based on the value given above in units of $/ton.
• Auxiliary Gas Costs: Natural gas is an auxiliary fuel used as an option for the
combustion NOx control and some CO2 capture configurations.
◦ Auxiliary Gas Cost: This is the cost of natural gas in units of $/mscf.
◦ Auxiliary Gas Cost: This is also provided in units of $/MBtu. This value cannot be
edited.
5.2.2.3. Base Plant
The Base Plant Technology Navigation Tab screens display and define the performance and costs
directly associated with the combustion power plant, particularly the boiler. Pre-combustion and
post-combustion control technologies are not considered part of the Base Plant. The screens
described in this chapter all apply to the Pulverized Coal (PC) plant type.
Illustration 160: PC: SET PARAMETERS: Fuel: Cost
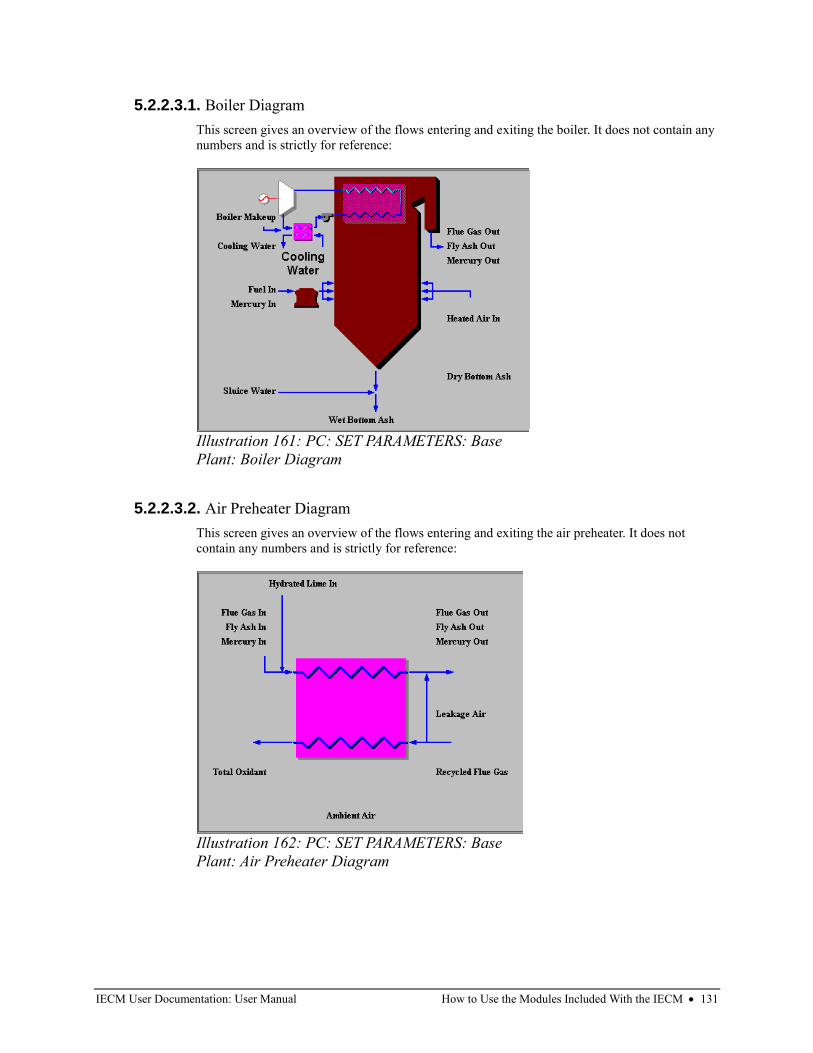
IECM User Documentation: User Manual How to Use the Modules Included With the IECM • 131
5.2.2.3.1. Boiler Diagram
This screen gives an overview of the flows entering and exiting the boiler. It does not contain any
numbers and is strictly for reference:
5.2.2.3.2. Air Preheater Diagram
This screen gives an overview of the flows entering and exiting the air preheater. It does not
contain any numbers and is strictly for reference:
Illustration 161: PC: SET PARAMETERS: Base
Plant: Boiler Diagram
Illustration 162: PC: SET PARAMETERS: Base
Plant: Air Preheater Diagram
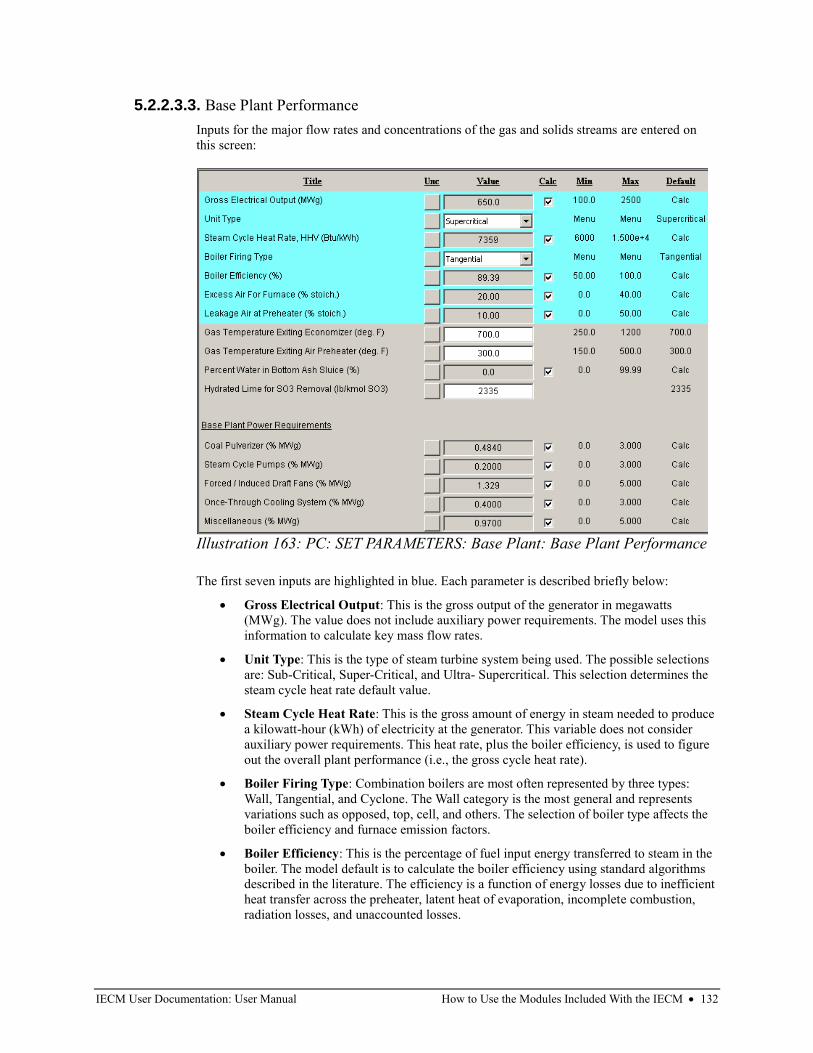
IECM User Documentation: User Manual How to Use the Modules Included With the IECM • 132
5.2.2.3.3. Base Plant Performance
Inputs for the major flow rates and concentrations of the gas and solids streams are entered on
this screen:
The first seven inputs are highlighted in blue. Each parameter is described briefly below:
• Gross Electrical Output: This is the gross output of the generator in megawatts
(MWg). The value does not include auxiliary power requirements. The model uses this
information to calculate key mass flow rates.
• Unit Type: This is the type of steam turbine system being used. The possible selections
are: Sub-Critical, Super-Critical, and Ultra- Supercritical. This selection determines the
steam cycle heat rate default value.
• Steam Cycle Heat Rate: This is the gross amount of energy in steam needed to produce
a kilowatt-hour (kWh) of electricity at the generator. This variable does not consider
auxiliary power requirements. This heat rate, plus the boiler efficiency, is used to figure
out the overall plant performance (i.e., the gross cycle heat rate).
• Boiler Firing Type: Combination boilers are most often represented by three types:
Wall, Tangential, and Cyclone. The Wall category is the most general and represents
variations such as opposed, top, cell, and others. The selection of boiler type affects the
boiler efficiency and furnace emission factors.
• Boiler Efficiency: This is the percentage of fuel input energy transferred to steam in the
boiler. The model default is to calculate the boiler efficiency using standard algorithms
described in the literature. The efficiency is a function of energy losses due to inefficient
heat transfer across the preheater, latent heat of evaporation, incomplete combustion,
radiation losses, and unaccounted losses.
Illustration 163: PC: SET PARAMETERS: Base Plant: Base Plant Performance
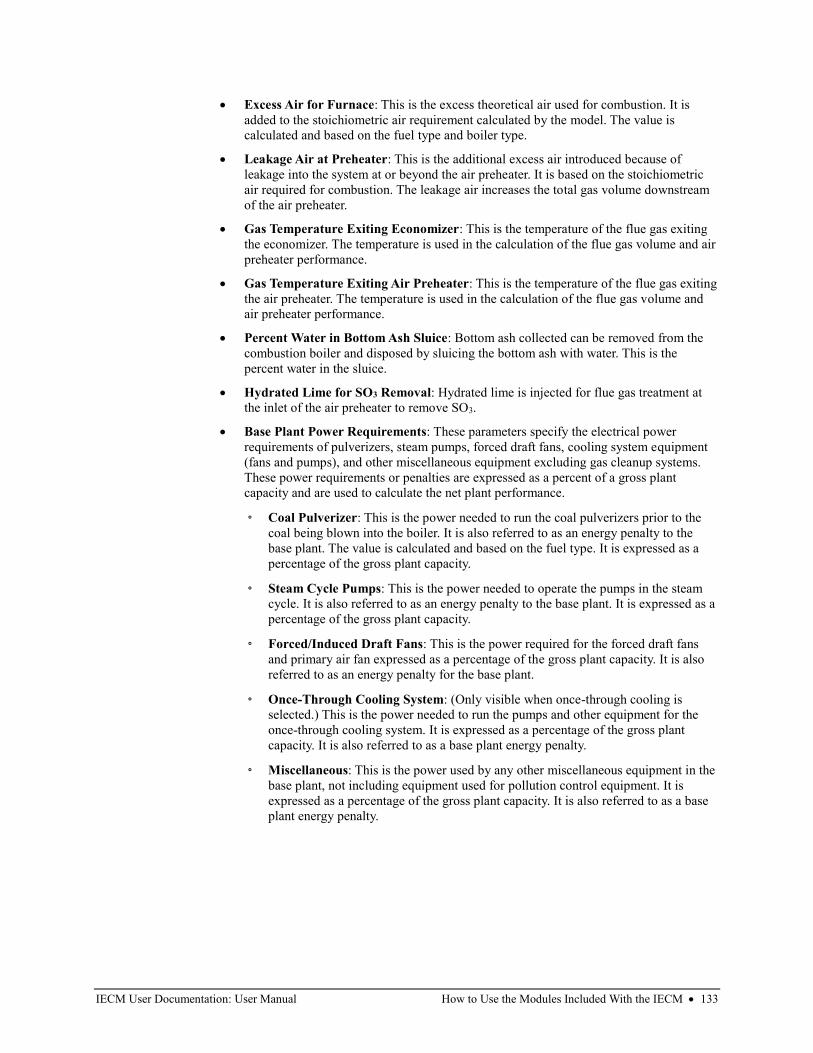
IECM User Documentation: User Manual How to Use the Modules Included With the IECM • 133
• Excess Air for Furnace: This is the excess theoretical air used for combustion. It is
added to the stoichiometric air requirement calculated by the model. The value is
calculated and based on the fuel type and boiler type.
• Leakage Air at Preheater: This is the additional excess air introduced because of
leakage into the system at or beyond the air preheater. It is based on the stoichiometric
air required for combustion. The leakage air increases the total gas volume downstream
of the air preheater.
• Gas Temperature Exiting Economizer: This is the temperature of the flue gas exiting
the economizer. The temperature is used in the calculation of the flue gas volume and air
preheater performance.
• Gas Temperature Exiting Air Preheater: This is the temperature of the flue gas exiting
the air preheater. The temperature is used in the calculation of the flue gas volume and
air preheater performance.
• Percent Water in Bottom Ash Sluice: Bottom ash collected can be removed from the
combustion boiler and disposed by sluicing the bottom ash with water. This is the
percent water in the sluice.
• Hydrated Lime for SO3 Removal: Hydrated lime is injected for flue gas treatment at
the inlet of the air preheater to remove SO3.
• Base Plant Power Requirements: These parameters specify the electrical power
requirements of pulverizers, steam pumps, forced draft fans, cooling system equipment
(fans and pumps), and other miscellaneous equipment excluding gas cleanup systems.
These power requirements or penalties are expressed as a percent of a gross plant
capacity and are used to calculate the net plant performance.
◦ Coal Pulverizer: This is the power needed to run the coal pulverizers prior to the
coal being blown into the boiler. It is also referred to as an energy penalty to the
base plant. The value is calculated and based on the fuel type. It is expressed as a
percentage of the gross plant capacity.
◦ Steam Cycle Pumps: This is the power needed to operate the pumps in the steam
cycle. It is also referred to as an energy penalty to the base plant. It is expressed as a
percentage of the gross plant capacity.
◦ Forced/Induced Draft Fans: This is the power required for the forced draft fans
and primary air fan expressed as a percentage of the gross plant capacity. It is also
referred to as an energy penalty for the base plant.
◦ Once-Through Cooling System: (Only visible when once-through cooling is
selected.) This is the power needed to run the pumps and other equipment for the
once-through cooling system. It is expressed as a percentage of the gross plant
capacity. It is also referred to as a base plant energy penalty.
◦ Miscellaneous: This is the power used by any other miscellaneous equipment in the
base plant, not including equipment used for pollution control equipment. It is
expressed as a percentage of the gross plant capacity. It is also referred to as a base
plant energy penalty.
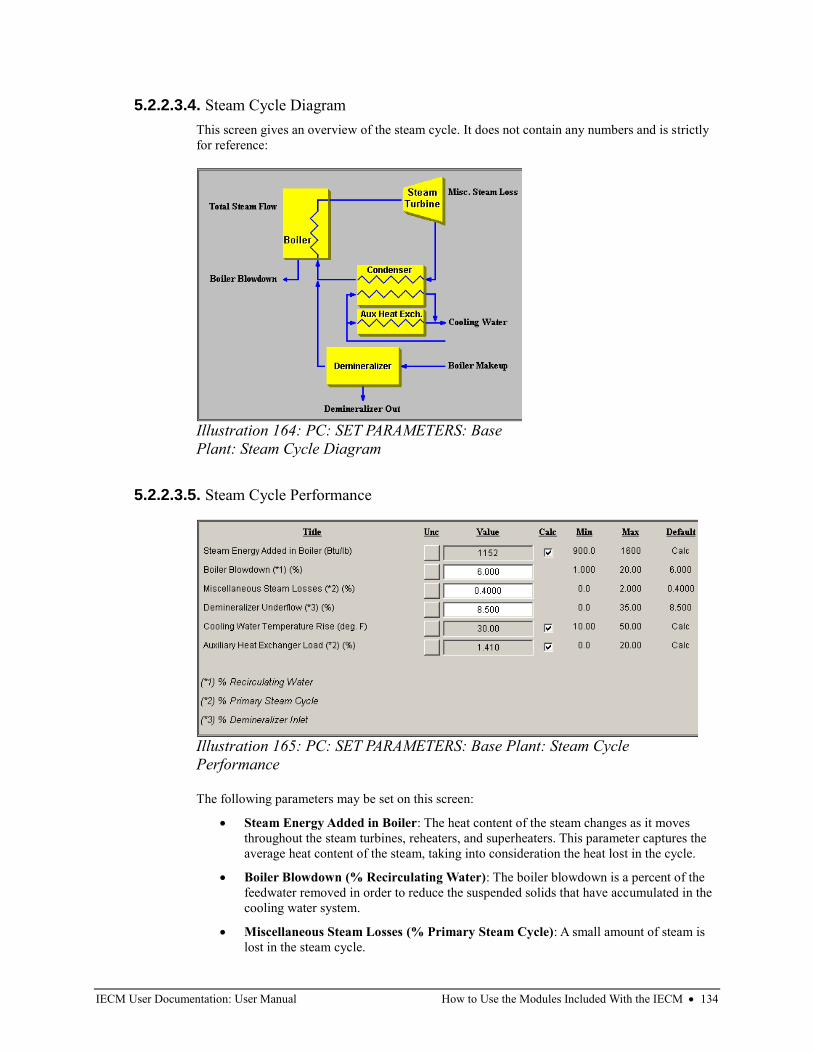
IECM User Documentation: User Manual How to Use the Modules Included With the IECM • 134
5.2.2.3.4. Steam Cycle Diagram
This screen gives an overview of the steam cycle. It does not contain any numbers and is strictly
for reference:
5.2.2.3.5. Steam Cycle Performance
The following parameters may be set on this screen:
• Steam Energy Added in Boiler: The heat content of the steam changes as it moves
throughout the steam turbines, reheaters, and superheaters. This parameter captures the
average heat content of the steam, taking into consideration the heat lost in the cycle.
• Boiler Blowdown (% Recirculating Water): The boiler blowdown is a percent of the
feedwater removed in order to reduce the suspended solids that have accumulated in the
cooling water system.
• Miscellaneous Steam Losses (% Primary Steam Cycle): A small amount of steam is
lost in the steam cycle.
Illustration 164: PC: SET PARAMETERS: Base
Plant: Steam Cycle Diagram
Illustration 165: PC: SET PARAMETERS: Base Plant: Steam Cycle
Performance
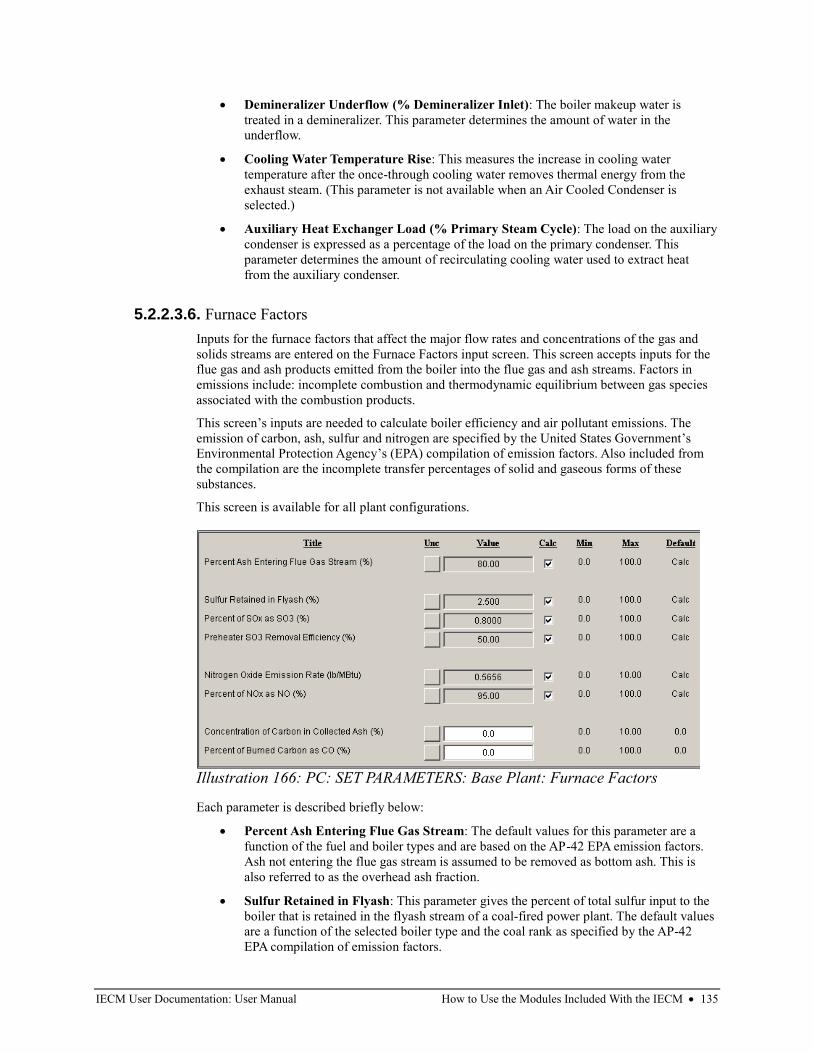
IECM User Documentation: User Manual How to Use the Modules Included With the IECM • 135
• Demineralizer Underflow (% Demineralizer Inlet): The boiler makeup water is
treated in a demineralizer. This parameter determines the amount of water in the
underflow.
• Cooling Water Temperature Rise: This measures the increase in cooling water
temperature after the once-through cooling water removes thermal energy from the
exhaust steam. (This parameter is not available when an Air Cooled Condenser is
selected.)
• Auxiliary Heat Exchanger Load (% Primary Steam Cycle): The load on the auxiliary
condenser is expressed as a percentage of the load on the primary condenser. This
parameter determines the amount of recirculating cooling water used to extract heat
from the auxiliary condenser.
5.2.2.3.6. Furnace Factors
Inputs for the furnace factors that affect the major flow rates and concentrations of the gas and
solids streams are entered on the Furnace Factors input screen. This screen accepts inputs for the
flue gas and ash products emitted from the boiler into the flue gas and ash streams. Factors in
emissions include: incomplete combustion and thermodynamic equilibrium between gas species
associated with the combustion products.
This screen’s inputs are needed to calculate boiler efficiency and air pollutant emissions. The
emission of carbon, ash, sulfur and nitrogen are specified by the United States Government’s
Environmental Protection Agency’s (EPA) compilation of emission factors. Also included from
the compilation are the incomplete transfer percentages of solid and gaseous forms of these
substances.
This screen is available for all plant configurations.
Each parameter is described briefly below:
• Percent Ash Entering Flue Gas Stream: The default values for this parameter are a
function of the fuel and boiler types and are based on the AP-42 EPA emission factors.
Ash not entering the flue gas stream is assumed to be removed as bottom ash. This is
also referred to as the overhead ash fraction.
• Sulfur Retained in Flyash: This parameter gives the percent of total sulfur input to the
boiler that is retained in the flyash stream of a coal-fired power plant. The default values
are a function of the selected boiler type and the coal rank as specified by the AP-42
EPA compilation of emission factors.
Illustration 166: PC: SET PARAMETERS: Base Plant: Furnace Factors

IECM User Documentation: User Manual How to Use the Modules Included With the IECM • 136
• Percent of SOx as SO3: This parameter quantifies the sulfur species in the flue gas
stream. Sulfur not converted to SO2 is assumed to be converted to SO3. The default
value is based on emission factors derived by Southern Company1 and are a function of
the selected coal.
• Preheater SO3 Removal Efficiency: Sulfuric acid (H2SO4) is created downstream of the
boiler by the reaction of SO3 with H2O. A percent of the sulfuric acid is condensed on
particulates in the preheater and removed from the flue gas. This parameter specifies the
amount of SO3 removed from the flue gas in the preheater as a function of the coal rank.
The default value is taken from the removal efficiency reported in the literature
(references are below). This efficiency then determines the mass of SO3 removed from
the flue gas in the collector. For more information see also:
◦ http://www.netl.doe.gov/publications/proceedings/98/98fg/hardman.pdf
◦ http://www.netl.doe.gov/publications/proceedings/98/98fg/rubin.pdf
• Nitrogen Oxide Emission Rate: This parameter establishes the level of NOx emissions
from the boiler. The default values reflect the AP-42 EPA emission factors. It is a
function of boiler firing method and the coal rank. The model calculates this value and
expresses it in pounds of equivalent NO2 per ton of coal.
• Percent of NOx as NO: This parameter establishes the level of nitric oxide (NO) in the
flue gas stream. The remainder of the total NOx emissions is assumed to be nitrogen
dioxide (NO2). The default parameters reflect the AP-42 EPA emission factors and are
dependent on the fuel type.
• Concentration of Carbon in Collected Ash: This parameter accounts for retention of
carbon in the fly ash and bottom ash. The amount of carbon in the collected ash streams
is typically known. It is used to calculate the total unburned carbon in coal, boiler
efficiency and flue gas composition.
• Percent of Burned Carbon as CO: This parameter accounts for any incomplete
combustion in the furnace, and is used to calculate boiler efficiency and flue gas
composition. The remainder is assumed to be CO2 or unburned carbon.
5.2.2.3.7. Capital Cost
This is a standard capital cost input screen as described in "5.1.1.1. Capital Cost Inputs" on page
90.
1 Hardman, R., R. Stacy, et al. (1998). Estimating Total Sulfuric Acid Emissions from Coal-Fired Power
Plants, Southern Company Services.
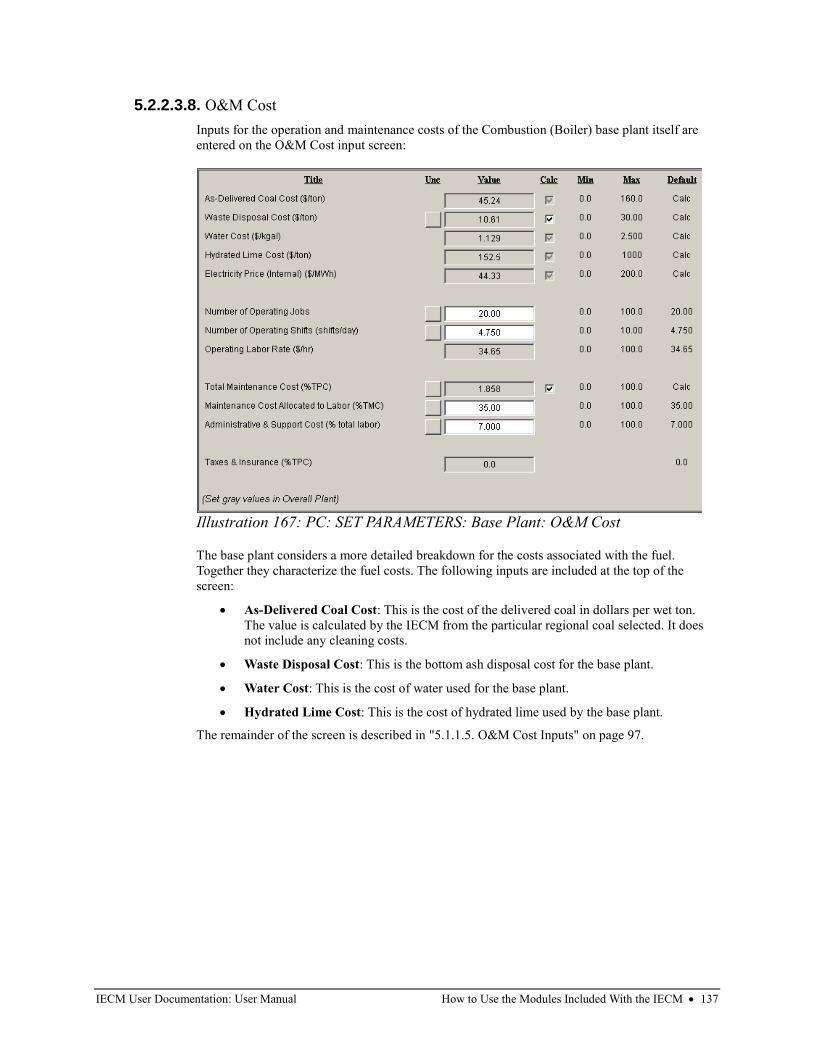
IECM User Documentation: User Manual How to Use the Modules Included With the IECM • 137
5.2.2.3.8. O&M Cost
Inputs for the operation and maintenance costs of the Combustion (Boiler) base plant itself are
entered on the O&M Cost input screen:
The base plant considers a more detailed breakdown for the costs associated with the fuel.
Together they characterize the fuel costs. The following inputs are included at the top of the
screen:
• As-Delivered Coal Cost: This is the cost of the delivered coal in dollars per wet ton.
The value is calculated by the IECM from the particular regional coal selected. It does
not include any cleaning costs.
• Waste Disposal Cost: This is the bottom ash disposal cost for the base plant.
• Water Cost: This is the cost of water used for the base plant.
• Hydrated Lime Cost: This is the cost of hydrated lime used by the base plant.
The remainder of the screen is described in "5.1.1.5. O&M Cost Inputs" on page 97.
Illustration 167: PC: SET PARAMETERS: Base Plant: O&M Cost
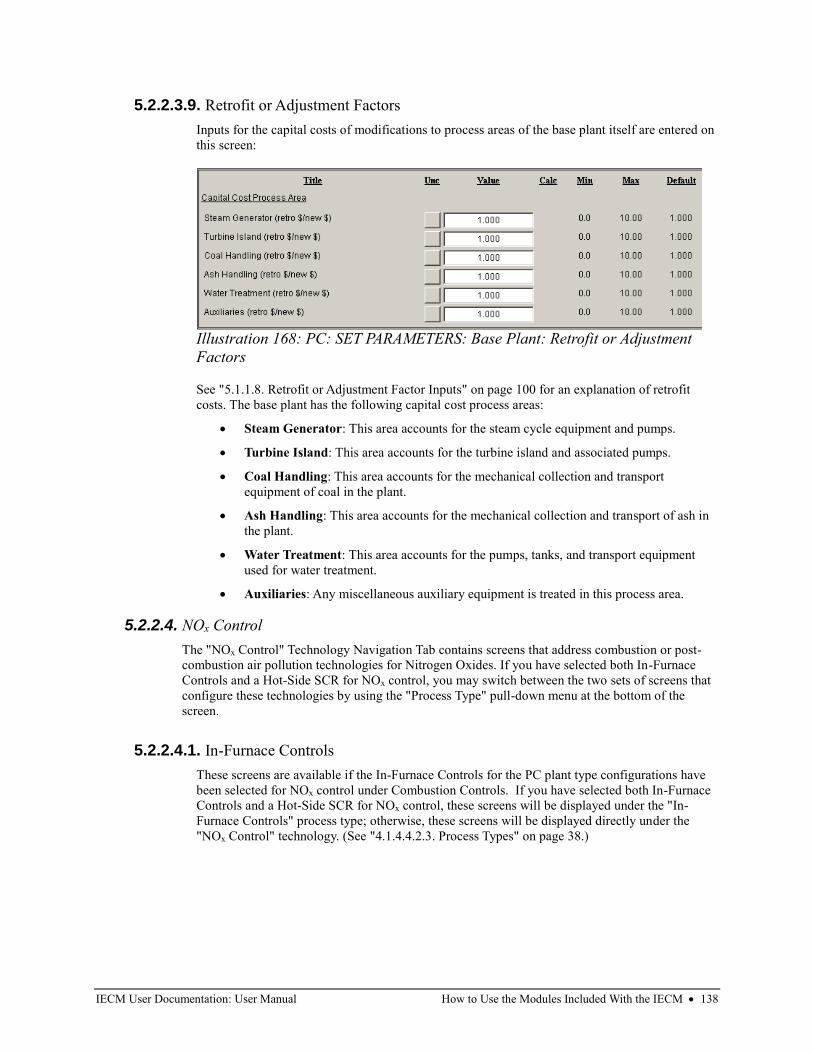
IECM User Documentation: User Manual How to Use the Modules Included With the IECM • 138
5.2.2.3.9. Retrofit or Adjustment Factors
Inputs for the capital costs of modifications to process areas of the base plant itself are entered on
this screen:
See "5.1.1.8. Retrofit or Adjustment Factor Inputs" on page 100 for an explanation of retrofit
costs. The base plant has the following capital cost process areas:
• Steam Generator: This area accounts for the steam cycle equipment and pumps.
• Turbine Island: This area accounts for the turbine island and associated pumps.
• Coal Handling: This area accounts for the mechanical collection and transport
equipment of coal in the plant.
• Ash Handling: This area accounts for the mechanical collection and transport of ash in
the plant.
• Water Treatment: This area accounts for the pumps, tanks, and transport equipment
used for water treatment.
• Auxiliaries: Any miscellaneous auxiliary equipment is treated in this process area.
5.2.2.4. NOx Control
The "NOx Control" Technology Navigation Tab contains screens that address combustion or post-
combustion air pollution technologies for Nitrogen Oxides. If you have selected both In-Furnace
Controls and a Hot-Side SCR for NOx control, you may switch between the two sets of screens that
configure these technologies by using the "Process Type" pull-down menu at the bottom of the
screen.
5.2.2.4.1. In-Furnace Controls
These screens are available if the In-Furnace Controls for the PC plant type configurations have
been selected for NOx control under Combustion Controls. If you have selected both In-Furnace
Controls and a Hot-Side SCR for NOx control, these screens will be displayed under the "In-
Furnace Controls" process type; otherwise, these screens will be displayed directly under the
"NOx Control" technology. (See "4.1.4.4.2.3. Process Types" on page 38.)
Illustration 168: PC: SET PARAMETERS: Base Plant: Retrofit or Adjustment
Factors
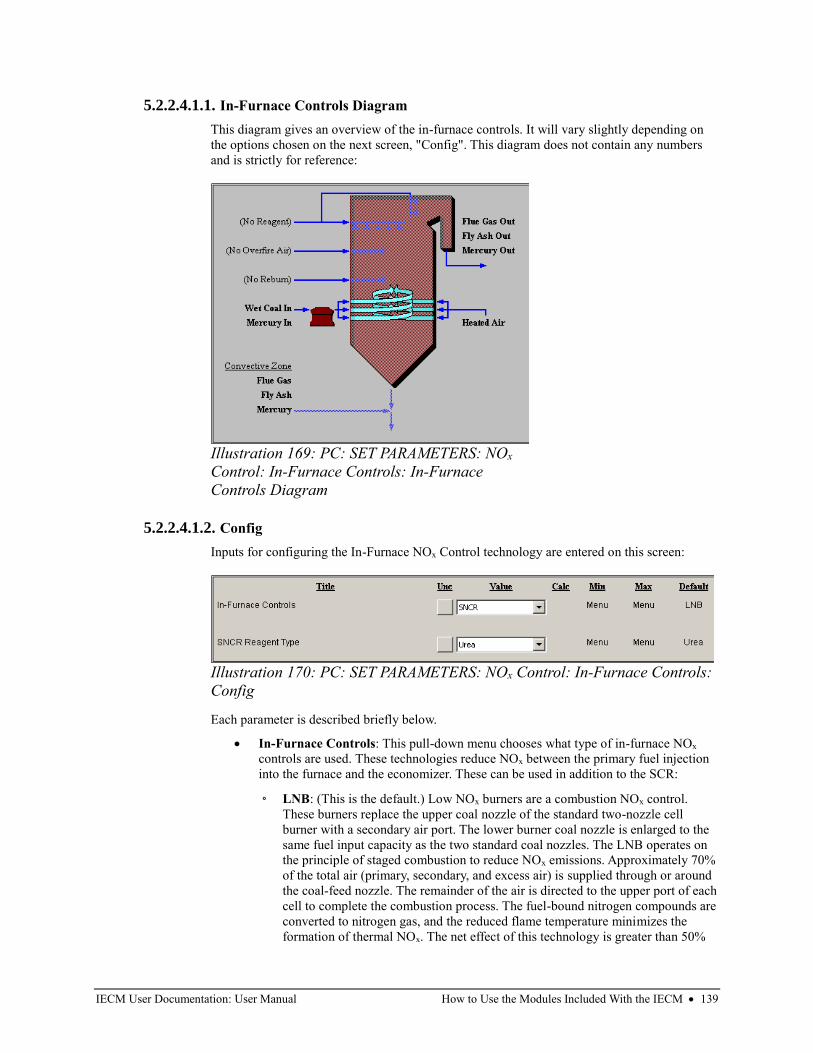
IECM User Documentation: User Manual How to Use the Modules Included With the IECM • 139
5.2.2.4.1.1. In-Furnace Controls Diagram
This diagram gives an overview of the in-furnace controls. It will vary slightly depending on
the options chosen on the next screen, "Config". This diagram does not contain any numbers
and is strictly for reference:
5.2.2.4.1.2. Config
Inputs for configuring the In-Furnace NOx Control technology are entered on this screen:
Each parameter is described briefly below.
• In-Furnace Controls: This pull-down menu chooses what type of in-furnace NOx
controls are used. These technologies reduce NOx between the primary fuel injection
into the furnace and the economizer. These can be used in addition to the SCR:
◦ LNB: (This is the default.) Low NOx burners are a combustion NOx control.
These burners replace the upper coal nozzle of the standard two-nozzle cell
burner with a secondary air port. The lower burner coal nozzle is enlarged to the
same fuel input capacity as the two standard coal nozzles. The LNB operates on
the principle of staged combustion to reduce NOx emissions. Approximately 70%
of the total air (primary, secondary, and excess air) is supplied through or around
the coal-feed nozzle. The remainder of the air is directed to the upper port of each
cell to complete the combustion process. The fuel-bound nitrogen compounds are
converted to nitrogen gas, and the reduced flame temperature minimizes the
formation of thermal NOx. The net effect of this technology is greater than 50%
Illustration 169: PC: SET PARAMETERS: NOx
Control: In-Furnace Controls: In-Furnace
Controls Diagram
Illustration 170: PC: SET PARAMETERS: NOx Control: In-Furnace Controls:
Config
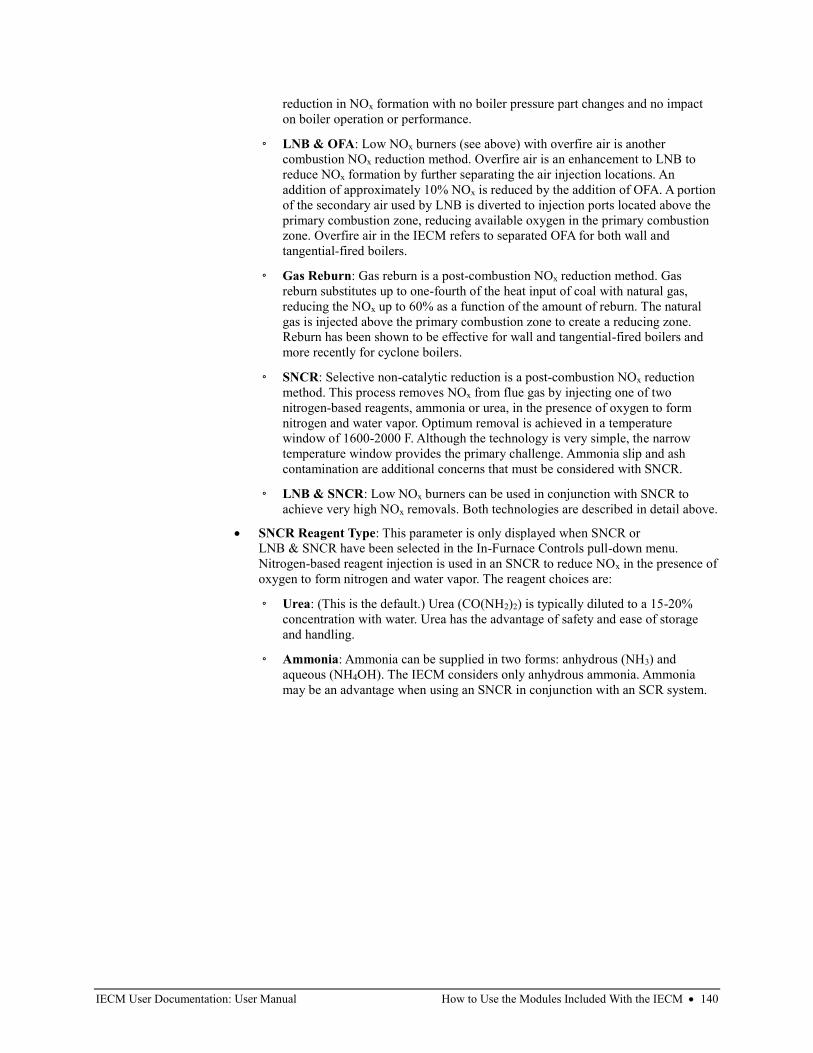
IECM User Documentation: User Manual How to Use the Modules Included With the IECM • 140
reduction in NOx formation with no boiler pressure part changes and no impact
on boiler operation or performance.
◦ LNB & OFA: Low NOx burners (see above) with overfire air is another
combustion NOx reduction method. Overfire air is an enhancement to LNB to
reduce NOx formation by further separating the air injection locations. An
addition of approximately 10% NOx is reduced by the addition of OFA. A portion
of the secondary air used by LNB is diverted to injection ports located above the
primary combustion zone, reducing available oxygen in the primary combustion
zone. Overfire air in the IECM refers to separated OFA for both wall and
tangential-fired boilers.
◦ Gas Reburn: Gas reburn is a post-combustion NOx reduction method. Gas
reburn substitutes up to one-fourth of the heat input of coal with natural gas,
reducing the NOx up to 60% as a function of the amount of reburn. The natural
gas is injected above the primary combustion zone to create a reducing zone.
Reburn has been shown to be effective for wall and tangential-fired boilers and
more recently for cyclone boilers.
◦ SNCR: Selective non-catalytic reduction is a post-combustion NOx reduction
method. This process removes NOx from flue gas by injecting one of two
nitrogen-based reagents, ammonia or urea, in the presence of oxygen to form
nitrogen and water vapor. Optimum removal is achieved in a temperature
window of 1600-2000 F. Although the technology is very simple, the narrow
temperature window provides the primary challenge. Ammonia slip and ash
contamination are additional concerns that must be considered with SNCR.
◦ LNB & SNCR: Low NOx burners can be used in conjunction with SNCR to
achieve very high NOx removals. Both technologies are described in detail above.
• SNCR Reagent Type: This parameter is only displayed when SNCR or
LNB & SNCR have been selected in the In-Furnace Controls pull-down menu.
Nitrogen-based reagent injection is used in an SNCR to reduce NOx in the presence of
oxygen to form nitrogen and water vapor. The reagent choices are:
◦ Urea: (This is the default.) Urea (CO(NH2)2) is typically diluted to a 15-20%
concentration with water. Urea has the advantage of safety and ease of storage
and handling.
◦ Ammonia: Ammonia can be supplied in two forms: anhydrous (NH3) and
aqueous (NH4OH). The IECM considers only anhydrous ammonia. Ammonia
may be an advantage when using an SNCR in conjunction with an SCR system.
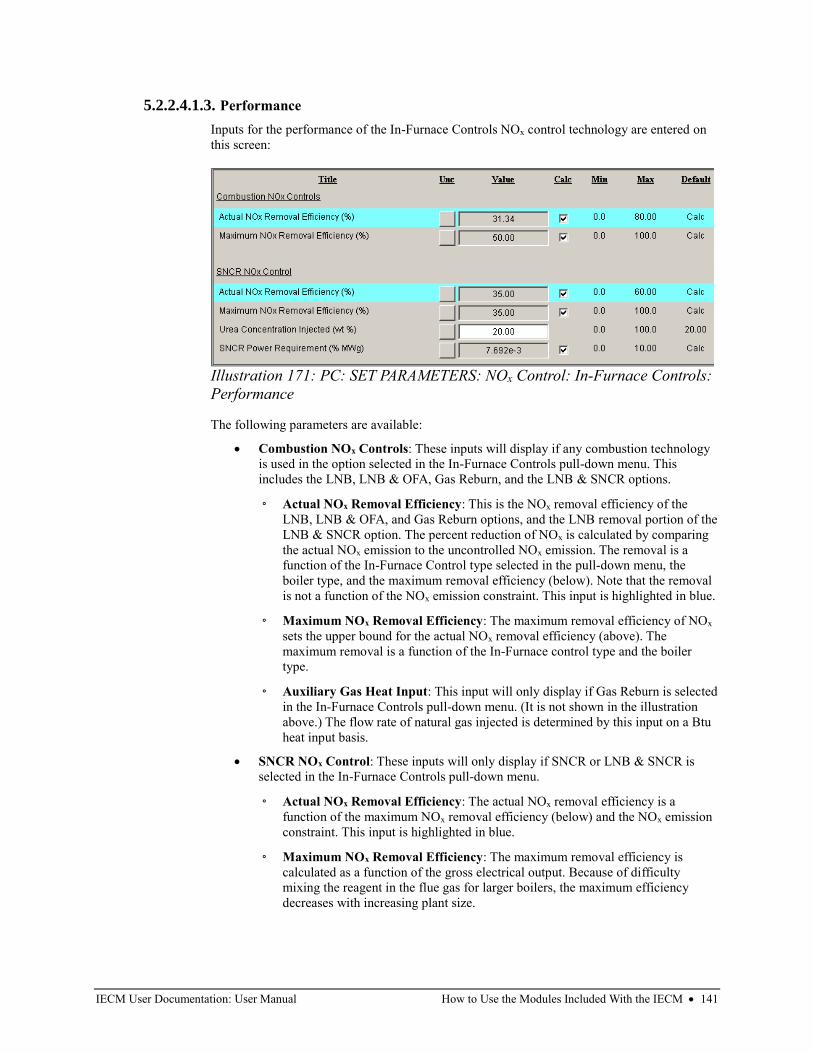
IECM User Documentation: User Manual How to Use the Modules Included With the IECM • 141
5.2.2.4.1.3. Performance
Inputs for the performance of the In-Furnace Controls NOx control technology are entered on
this screen:
The following parameters are available:
• Combustion NOx Controls: These inputs will display if any combustion technology
is used in the option selected in the In-Furnace Controls pull-down menu. This
includes the LNB, LNB & OFA, Gas Reburn, and the LNB & SNCR options.
◦ Actual NOx Removal Efficiency: This is the NOx removal efficiency of the
LNB, LNB & OFA, and Gas Reburn options, and the LNB removal portion of the
LNB & SNCR option. The percent reduction of NOx is calculated by comparing
the actual NOx emission to the uncontrolled NOx emission. The removal is a
function of the In-Furnace Control type selected in the pull-down menu, the
boiler type, and the maximum removal efficiency (below). Note that the removal
is not a function of the NOx emission constraint. This input is highlighted in blue.
◦ Maximum NOx Removal Efficiency: The maximum removal efficiency of NOx
sets the upper bound for the actual NOx removal efficiency (above). The
maximum removal is a function of the In-Furnace control type and the boiler
type.
◦ Auxiliary Gas Heat Input: This input will only display if Gas Reburn is selected
in the In-Furnace Controls pull-down menu. (It is not shown in the illustration
above.) The flow rate of natural gas injected is determined by this input on a Btu
heat input basis.
• SNCR NOx Control: These inputs will only display if SNCR or LNB & SNCR is
selected in the In-Furnace Controls pull-down menu.
◦ Actual NOx Removal Efficiency: The actual NOx removal efficiency is a
function of the maximum NOx removal efficiency (below) and the NOx emission
constraint. This input is highlighted in blue.
◦ Maximum NOx Removal Efficiency: The maximum removal efficiency is
calculated as a function of the gross electrical output. Because of difficulty
mixing the reagent in the flue gas for larger boilers, the maximum efficiency
decreases with increasing plant size.
Illustration 171: PC: SET PARAMETERS: NOx Control: In-Furnace Controls:
Performance
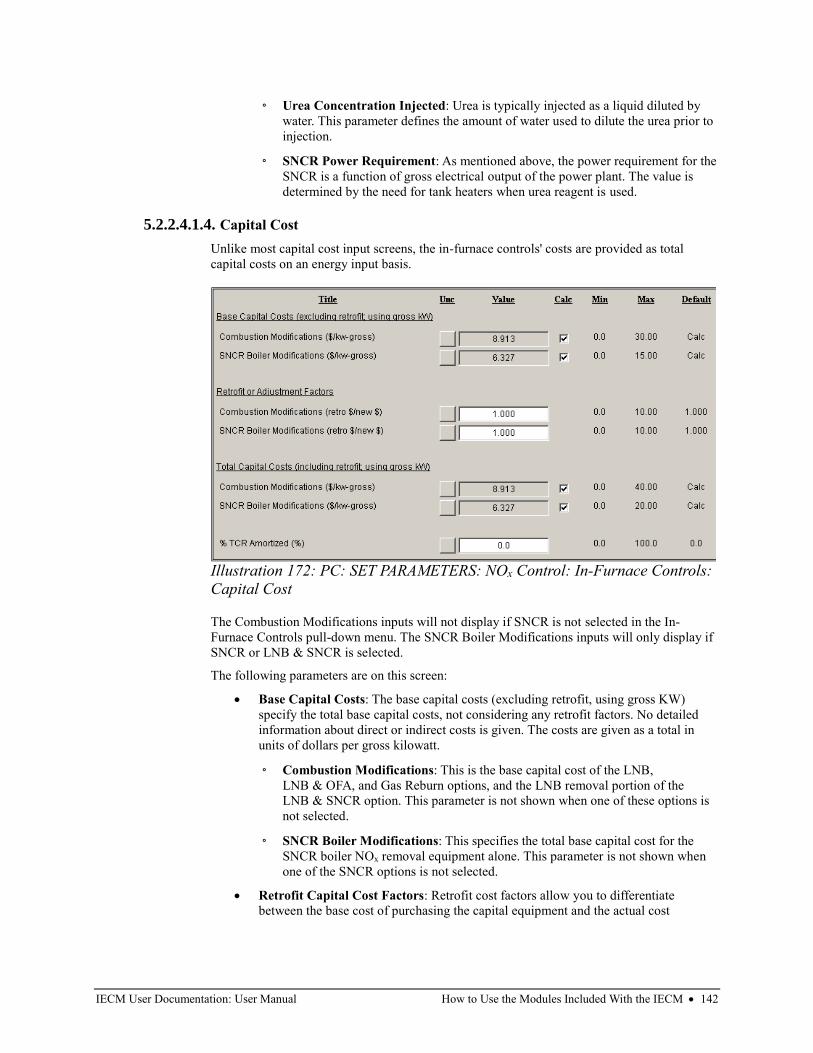
IECM User Documentation: User Manual How to Use the Modules Included With the IECM • 142
◦ Urea Concentration Injected: Urea is typically injected as a liquid diluted by
water. This parameter defines the amount of water used to dilute the urea prior to
injection.
◦ SNCR Power Requirement: As mentioned above, the power requirement for the
SNCR is a function of gross electrical output of the power plant. The value is
determined by the need for tank heaters when urea reagent is used.
5.2.2.4.1.4. Capital Cost
Unlike most capital cost input screens, the in-furnace controls' costs are provided as total
capital costs on an energy input basis.
The Combustion Modifications inputs will not display if SNCR is not selected in the In-
Furnace Controls pull-down menu. The SNCR Boiler Modifications inputs will only display if
SNCR or LNB & SNCR is selected.
The following parameters are on this screen:
• Base Capital Costs: The base capital costs (excluding retrofit, using gross KW)
specify the total base capital costs, not considering any retrofit factors. No detailed
information about direct or indirect costs is given. The costs are given as a total in
units of dollars per gross kilowatt.
◦ Combustion Modifications: This is the base capital cost of the LNB,
LNB & OFA, and Gas Reburn options, and the LNB removal portion of the
LNB & SNCR option. This parameter is not shown when one of these options is
not selected.
◦ SNCR Boiler Modifications: This specifies the total base capital cost for the
SNCR boiler NOx removal equipment alone. This parameter is not shown when
one of the SNCR options is not selected.
• Retrofit Capital Cost Factors: Retrofit cost factors allow you to differentiate
between the base cost of purchasing the capital equipment and the actual cost
Illustration 172: PC: SET PARAMETERS: NOx Control: In-Furnace Controls:
Capital Cost
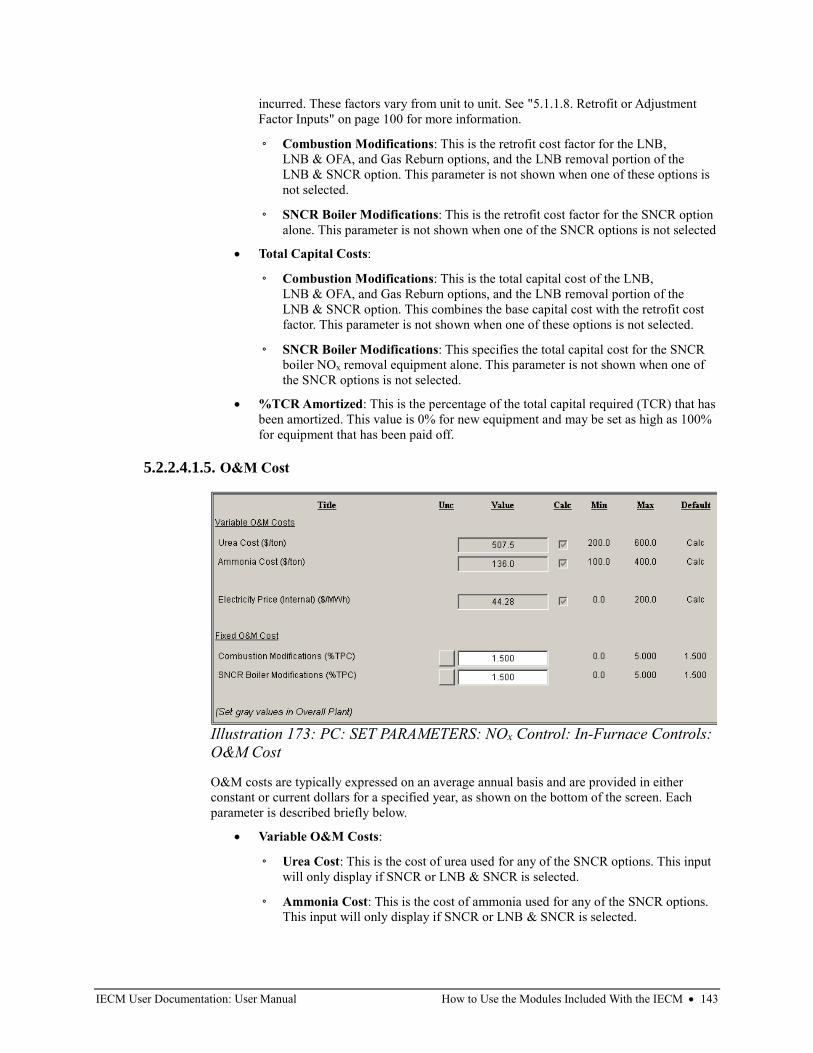
IECM User Documentation: User Manual How to Use the Modules Included With the IECM • 143
incurred. These factors vary from unit to unit. See "5.1.1.8. Retrofit or Adjustment
Factor Inputs" on page 100 for more information.
◦ Combustion Modifications: This is the retrofit cost factor for the LNB,
LNB & OFA, and Gas Reburn options, and the LNB removal portion of the
LNB & SNCR option. This parameter is not shown when one of these options is
not selected.
◦ SNCR Boiler Modifications: This is the retrofit cost factor for the SNCR option
alone. This parameter is not shown when one of the SNCR options is not selected
• Total Capital Costs:
◦ Combustion Modifications: This is the total capital cost of the LNB,
LNB & OFA, and Gas Reburn options, and the LNB removal portion of the
LNB & SNCR option. This combines the base capital cost with the retrofit cost
factor. This parameter is not shown when one of these options is not selected.
◦ SNCR Boiler Modifications: This specifies the total capital cost for the SNCR
boiler NOx removal equipment alone. This parameter is not shown when one of
the SNCR options is not selected.
• %TCR Amortized: This is the percentage of the total capital required (TCR) that has
been amortized. This value is 0% for new equipment and may be set as high as 100%
for equipment that has been paid off.
5.2.2.4.1.5. O&M Cost
O&M costs are typically expressed on an average annual basis and are provided in either
constant or current dollars for a specified year, as shown on the bottom of the screen. Each
parameter is described briefly below.
• Variable O&M Costs:
◦ Urea Cost: This is the cost of urea used for any of the SNCR options. This input
will only display if SNCR or LNB & SNCR is selected.
◦ Ammonia Cost: This is the cost of ammonia used for any of the SNCR options.
This input will only display if SNCR or LNB & SNCR is selected.
Illustration 173: PC: SET PARAMETERS: NOx Control: In-Furnace Controls:
O&M Cost
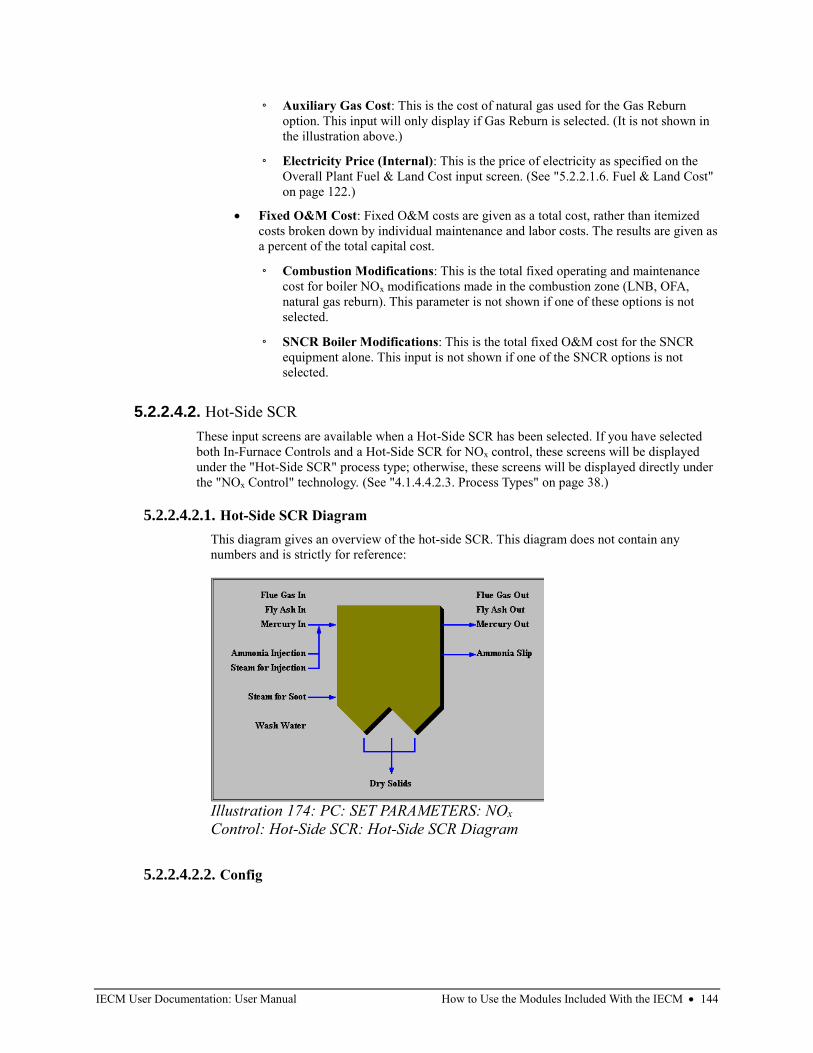
IECM User Documentation: User Manual How to Use the Modules Included With the IECM • 144
◦ Auxiliary Gas Cost: This is the cost of natural gas used for the Gas Reburn
option. This input will only display if Gas Reburn is selected. (It is not shown in
the illustration above.)
◦ Electricity Price (Internal): This is the price of electricity as specified on the
Overall Plant Fuel & Land Cost input screen. (See "5.2.2.1.6. Fuel & Land Cost"
on page 122.)
• Fixed O&M Cost: Fixed O&M costs are given as a total cost, rather than itemized
costs broken down by individual maintenance and labor costs. The results are given as
a percent of the total capital cost.
◦ Combustion Modifications: This is the total fixed operating and maintenance
cost for boiler NOx modifications made in the combustion zone (LNB, OFA,
natural gas reburn). This parameter is not shown if one of these options is not
selected.
◦ SNCR Boiler Modifications: This is the total fixed O&M cost for the SNCR
equipment alone. This input is not shown if one of the SNCR options is not
selected.
5.2.2.4.2. Hot-Side SCR
These input screens are available when a Hot-Side SCR has been selected. If you have selected
both In-Furnace Controls and a Hot-Side SCR for NOx control, these screens will be displayed
under the "Hot-Side SCR" process type; otherwise, these screens will be displayed directly under
the "NOx Control" technology. (See "4.1.4.4.2.3. Process Types" on page 38.)
5.2.2.4.2.1. Hot-Side SCR Diagram
This diagram gives an overview of the hot-side SCR. This diagram does not contain any
numbers and is strictly for reference:
5.2.2.4.2.2. Config
Illustration 174: PC: SET PARAMETERS: NOx
Control: Hot-Side SCR: Hot-Side SCR Diagram
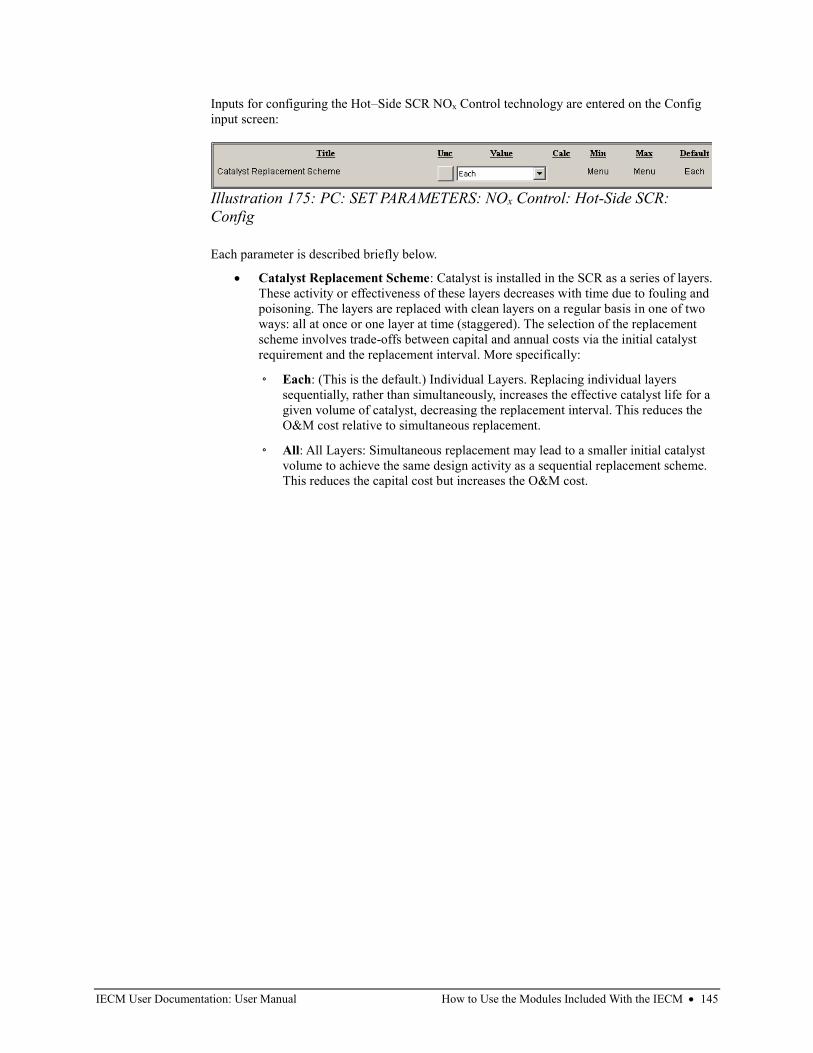
IECM User Documentation: User Manual How to Use the Modules Included With the IECM • 145
Inputs for configuring the Hot–Side SCR NOx Control technology are entered on the Config
input screen:
Each parameter is described briefly below.
• Catalyst Replacement Scheme: Catalyst is installed in the SCR as a series of layers.
These activity or effectiveness of these layers decreases with time due to fouling and
poisoning. The layers are replaced with clean layers on a regular basis in one of two
ways: all at once or one layer at time (staggered). The selection of the replacement
scheme involves trade-offs between capital and annual costs via the initial catalyst
requirement and the replacement interval. More specifically:
◦ Each: (This is the default.) Individual Layers. Replacing individual layers
sequentially, rather than simultaneously, increases the effective catalyst life for a
given volume of catalyst, decreasing the replacement interval. This reduces the
O&M cost relative to simultaneous replacement.
◦ All: All Layers: Simultaneous replacement may lead to a smaller initial catalyst
volume to achieve the same design activity as a sequential replacement scheme.
This reduces the capital cost but increases the O&M cost.
Illustration 175: PC: SET PARAMETERS: NOx Control: Hot-Side SCR:
Config
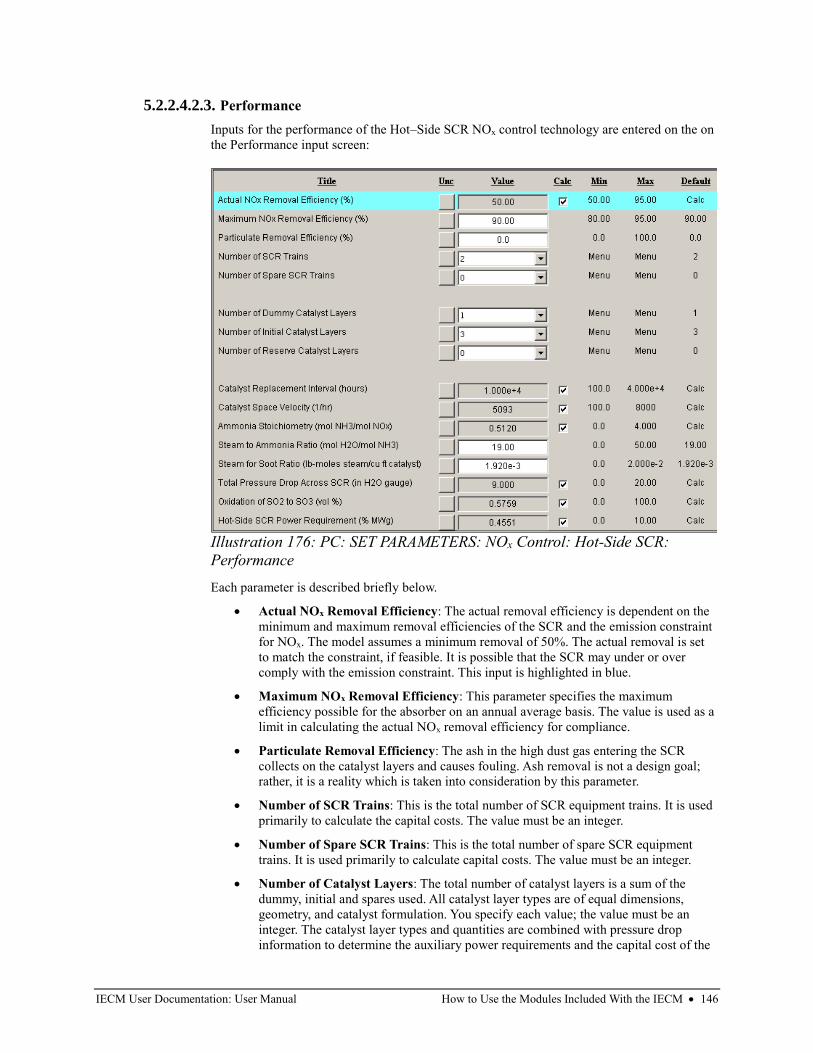
IECM User Documentation: User Manual How to Use the Modules Included With the IECM • 146
5.2.2.4.2.3. Performance
Inputs for the performance of the Hot–Side SCR NOx control technology are entered on the on
the Performance input screen:
Each parameter is described briefly below.
• Actual NOx Removal Efficiency: The actual removal efficiency is dependent on the
minimum and maximum removal efficiencies of the SCR and the emission constraint
for NOx. The model assumes a minimum removal of 50%. The actual removal is set
to match the constraint, if feasible. It is possible that the SCR may under or over
comply with the emission constraint. This input is highlighted in blue.
• Maximum NOx Removal Efficiency: This parameter specifies the maximum
efficiency possible for the absorber on an annual average basis. The value is used as a
limit in calculating the actual NOx removal efficiency for compliance.
• Particulate Removal Efficiency: The ash in the high dust gas entering the SCR
collects on the catalyst layers and causes fouling. Ash removal is not a design goal;
rather, it is a reality which is taken into consideration by this parameter.
• Number of SCR Trains: This is the total number of SCR equipment trains. It is used
primarily to calculate the capital costs. The value must be an integer.
• Number of Spare SCR Trains: This is the total number of spare SCR equipment
trains. It is used primarily to calculate capital costs. The value must be an integer.
• Number of Catalyst Layers: The total number of catalyst layers is a sum of the
dummy, initial and spares used. All catalyst layer types are of equal dimensions,
geometry, and catalyst formulation. You specify each value; the value must be an
integer. The catalyst layer types and quantities are combined with pressure drop
information to determine the auxiliary power requirements and the capital cost of the
Illustration 176: PC: SET PARAMETERS: NOx Control: Hot-Side SCR:
Performance
IECM User Documentation: User Manual How to Use the Modules Included With the IECM • 147
SCR technology. A layer may be interpreted as either a full layer (e.g., typically 1
meter deep), or a half layer (e.g., typically 0.5 meters deep) to represent alternative
SCR catalyst replacement schemes. There is a limit of 8 total initial and reserve
layers. The following inputs allow you to specify the number of catalyst layers:
◦ Number of Dummy Catalyst Layers: This is the number of dummy catalyst
layers. The value must be an integer. A dummy layer corrects the flow
distribution. It is used to calculate the total pressure drop across the SCR and the
auxiliary power requirements.
◦ Number of Initial Catalyst Layers: This is the number of initial active catalyst
layers. The value must be an integer. Three layers are installed initially. It is used
to calculate the total pressure drop across the SCR and the auxiliary power
requirements.
◦ Number of Reserve Catalyst Layers: This is the number of reserve or extra
catalyst layers. These are available for later catalyst additions. The value must be
an integer. It is used to calculate the total pressure drop across the SCR and the
auxiliary power requirements.
• Catalyst Replacement Interval: This parameter calculates the operating hour
interval between catalyst replacements. The interval is determined by the decision to
replace all at once or each of them separately after each interval. Currently, the model
is not set up to replace two half layers simultaneously.
• Catalyst Space Velocity: The calculated space velocity is determined by several
factors, including many of the reference parameters in the next Section. The space
velocity is used to determine the catalyst volume required.
• Ammonia Stoichiometry: This is the molar stoichiometry ratio of ammonia to NOx
entering the SCR device. The calculated quantity is based on an assumed NOx
removal reaction stoichiometry of 1:1 for both NO and NO2, and a specified ammonia
slip. It affects the amount of ammonia used and the amount of NOx converted to
moisture.
• Steam to Ammonia Ratio: The molar ratio of steam to ammonia is used to determine
the amount of steam injected to vaporize the ammonia. The value assumes the steam
is saturated at 450 degrees Fahrenheit and the ammonia is diluted to 5 volume percent
of the injected gas.
• Steam for Soot Ratio: This is the steam required for soot blowing.
• Total Pressure Drop Across SCR: The total is determined from the individual
pressure drops due to air preheater deposits, the active catalyst layers, the dummy
catalyst layers, the ammonia injection system and the duct work. It is used to calculate
the total pressure drop across the SCR and the auxiliary power requirements.
• Oxidation of SO2 to SO3: The oxidation rate is calculated for a high sulfur catalyst
and affects the flue gas composition. It uses the space velocity and the inlet
temperature. The SO3 produced acts as an ash-conditioning agent if an ESP is used
downstream.
• Hot-Side SCR Power Requirement: The default calculation of auxiliary power is
based on the additional pressure drop, electricity to operate pumps and compressors,
and equivalent energy for steam consumed. It is expressed as a percent of the gross
plant capacity.
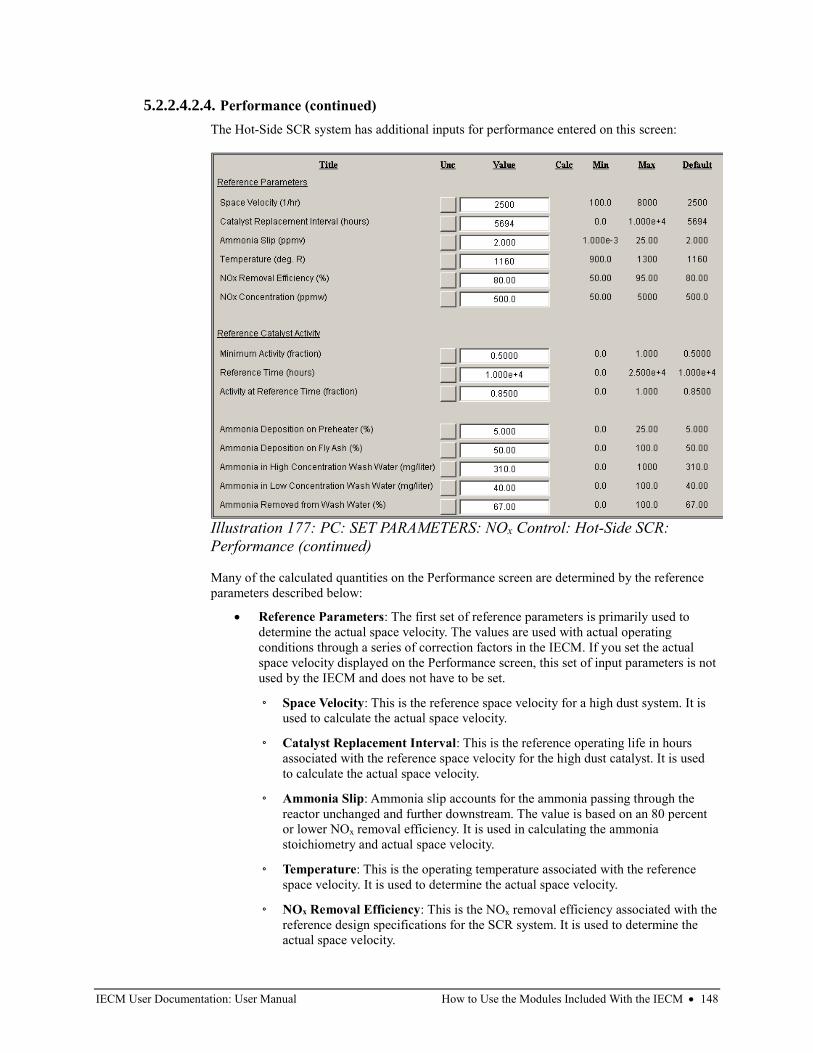
IECM User Documentation: User Manual How to Use the Modules Included With the IECM • 148
5.2.2.4.2.4. Performance (continued)
The Hot-Side SCR system has additional inputs for performance entered on this screen:
Many of the calculated quantities on the Performance screen are determined by the reference
parameters described below:
• Reference Parameters: The first set of reference parameters is primarily used to
determine the actual space velocity. The values are used with actual operating
conditions through a series of correction factors in the IECM. If you set the actual
space velocity displayed on the Performance screen, this set of input parameters is not
used by the IECM and does not have to be set.
◦ Space Velocity: This is the reference space velocity for a high dust system. It is
used to calculate the actual space velocity.
◦ Catalyst Replacement Interval: This is the reference operating life in hours
associated with the reference space velocity for the high dust catalyst. It is used
to calculate the actual space velocity.
◦ Ammonia Slip: Ammonia slip accounts for the ammonia passing through the
reactor unchanged and further downstream. The value is based on an 80 percent
or lower NOx removal efficiency. It is used in calculating the ammonia
stoichiometry and actual space velocity.
◦ Temperature: This is the operating temperature associated with the reference
space velocity. It is used to determine the actual space velocity.
◦ NOx Removal Efficiency: This is the NOx removal efficiency associated with the
reference design specifications for the SCR system. It is used to determine the
actual space velocity.
Illustration 177: PC: SET PARAMETERS: NOx Control: Hot-Side SCR:
Performance (continued)
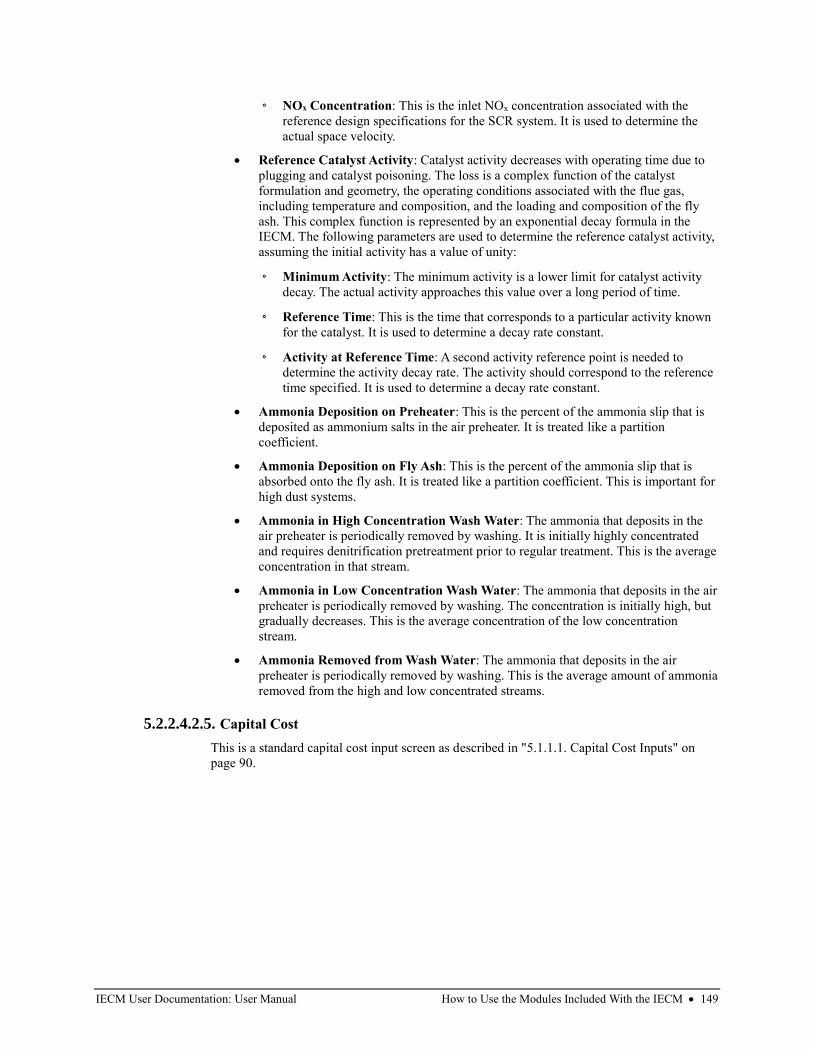
IECM User Documentation: User Manual How to Use the Modules Included With the IECM • 149
◦ NOx Concentration: This is the inlet NOx concentration associated with the
reference design specifications for the SCR system. It is used to determine the
actual space velocity.
• Reference Catalyst Activity: Catalyst activity decreases with operating time due to
plugging and catalyst poisoning. The loss is a complex function of the catalyst
formulation and geometry, the operating conditions associated with the flue gas,
including temperature and composition, and the loading and composition of the fly
ash. This complex function is represented by an exponential decay formula in the
IECM. The following parameters are used to determine the reference catalyst activity,
assuming the initial activity has a value of unity:
◦ Minimum Activity: The minimum activity is a lower limit for catalyst activity
decay. The actual activity approaches this value over a long period of time.
◦ Reference Time: This is the time that corresponds to a particular activity known
for the catalyst. It is used to determine a decay rate constant.
◦ Activity at Reference Time: A second activity reference point is needed to
determine the activity decay rate. The activity should correspond to the reference
time specified. It is used to determine a decay rate constant.
• Ammonia Deposition on Preheater: This is the percent of the ammonia slip that is
deposited as ammonium salts in the air preheater. It is treated like a partition
coefficient.
• Ammonia Deposition on Fly Ash: This is the percent of the ammonia slip that is
absorbed onto the fly ash. It is treated like a partition coefficient. This is important for
high dust systems.
• Ammonia in High Concentration Wash Water: The ammonia that deposits in the
air preheater is periodically removed by washing. It is initially highly concentrated
and requires denitrification pretreatment prior to regular treatment. This is the average
concentration in that stream.
• Ammonia in Low Concentration Wash Water: The ammonia that deposits in the air
preheater is periodically removed by washing. The concentration is initially high, but
gradually decreases. This is the average concentration of the low concentration
stream.
• Ammonia Removed from Wash Water: The ammonia that deposits in the air
preheater is periodically removed by washing. This is the average amount of ammonia
removed from the high and low concentrated streams.
5.2.2.4.2.5. Capital Cost
This is a standard capital cost input screen as described in "5.1.1.1. Capital Cost Inputs" on
page 90.
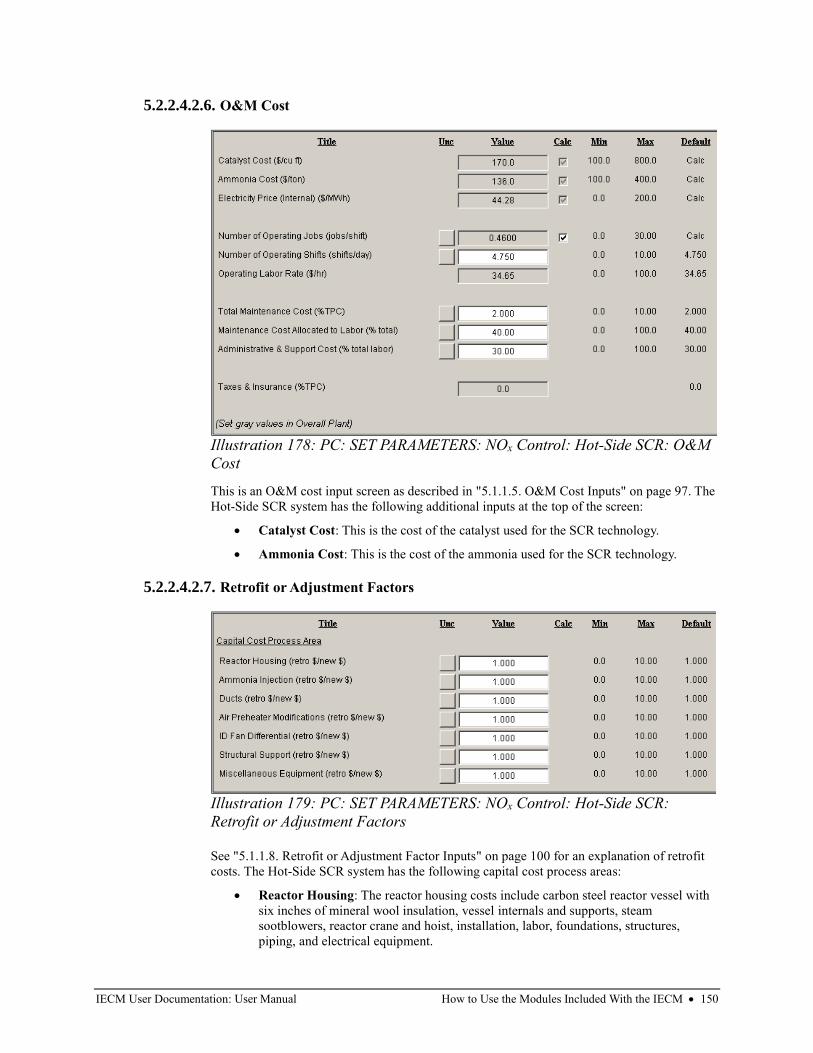
IECM User Documentation: User Manual How to Use the Modules Included With the IECM • 150
5.2.2.4.2.6. O&M Cost
This is an O&M cost input screen as described in "5.1.1.5. O&M Cost Inputs" on page 97. The
Hot-Side SCR system has the following additional inputs at the top of the screen:
• Catalyst Cost: This is the cost of the catalyst used for the SCR technology.
• Ammonia Cost: This is the cost of the ammonia used for the SCR technology.
5.2.2.4.2.7. Retrofit or Adjustment Factors
See "5.1.1.8. Retrofit or Adjustment Factor Inputs" on page 100 for an explanation of retrofit
costs. The Hot-Side SCR system has the following capital cost process areas:
• Reactor Housing: The reactor housing costs include carbon steel reactor vessel with
six inches of mineral wool insulation, vessel internals and supports, steam
sootblowers, reactor crane and hoist, installation, labor, foundations, structures,
piping, and electrical equipment.
Illustration 178: PC: SET PARAMETERS: NOx Control: Hot-Side SCR: O&M
Cost
Illustration 179: PC: SET PARAMETERS: NOx Control: Hot-Side SCR:
Retrofit or Adjustment Factors
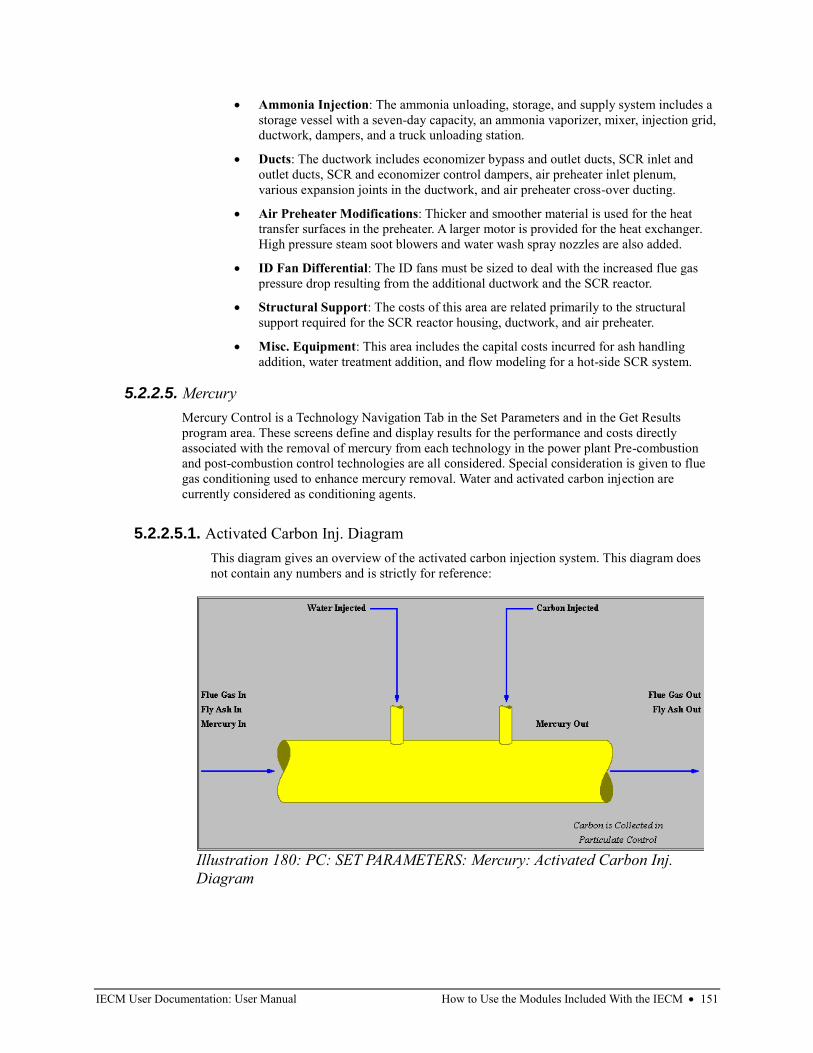
IECM User Documentation: User Manual How to Use the Modules Included With the IECM • 151
• Ammonia Injection: The ammonia unloading, storage, and supply system includes a
storage vessel with a seven-day capacity, an ammonia vaporizer, mixer, injection grid,
ductwork, dampers, and a truck unloading station.
• Ducts: The ductwork includes economizer bypass and outlet ducts, SCR inlet and
outlet ducts, SCR and economizer control dampers, air preheater inlet plenum,
various expansion joints in the ductwork, and air preheater cross-over ducting.
• Air Preheater Modifications: Thicker and smoother material is used for the heat
transfer surfaces in the preheater. A larger motor is provided for the heat exchanger.
High pressure steam soot blowers and water wash spray nozzles are also added.
• ID Fan Differential: The ID fans must be sized to deal with the increased flue gas
pressure drop resulting from the additional ductwork and the SCR reactor.
• Structural Support: The costs of this area are related primarily to the structural
support required for the SCR reactor housing, ductwork, and air preheater.
• Misc. Equipment: This area includes the capital costs incurred for ash handling
addition, water treatment addition, and flow modeling for a hot-side SCR system.
5.2.2.5. Mercury
Mercury Control is a Technology Navigation Tab in the Set Parameters and in the Get Results
program area. These screens define and display results for the performance and costs directly
associated with the removal of mercury from each technology in the power plant Pre-combustion
and post-combustion control technologies are all considered. Special consideration is given to flue
gas conditioning used to enhance mercury removal. Water and activated carbon injection are
currently considered as conditioning agents.
5.2.2.5.1. Activated Carbon Inj. Diagram
This diagram gives an overview of the activated carbon injection system. This diagram does
not contain any numbers and is strictly for reference:
Illustration 180: PC: SET PARAMETERS: Mercury: Activated Carbon Inj.
Diagram
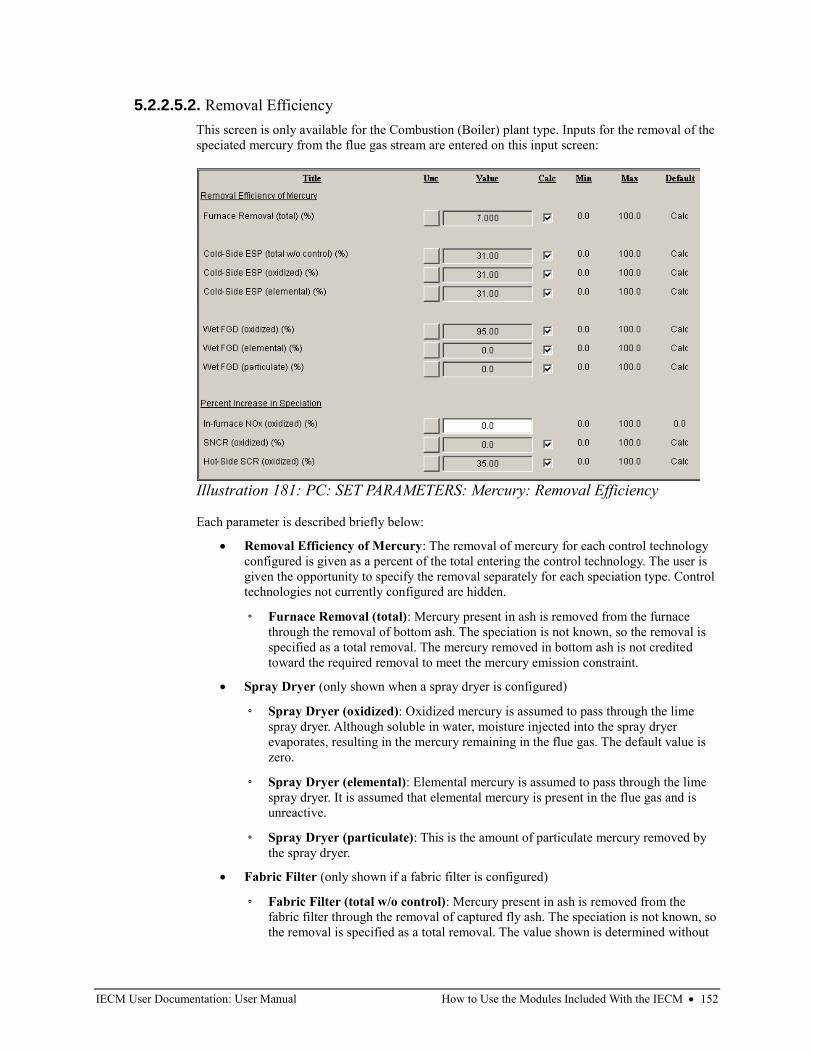
IECM User Documentation: User Manual How to Use the Modules Included With the IECM • 152
5.2.2.5.2. Removal Efficiency
This screen is only available for the Combustion (Boiler) plant type. Inputs for the removal of the
speciated mercury from the flue gas stream are entered on this input screen:
Each parameter is described briefly below:
• Removal Efficiency of Mercury: The removal of mercury for each control technology
configured is given as a percent of the total entering the control technology. The user is
given the opportunity to specify the removal separately for each speciation type. Control
technologies not currently configured are hidden.
◦ Furnace Removal (total): Mercury present in ash is removed from the furnace
through the removal of bottom ash. The speciation is not known, so the removal is
specified as a total removal. The mercury removed in bottom ash is not credited
toward the required removal to meet the mercury emission constraint.
• Spray Dryer (only shown when a spray dryer is configured)
◦ Spray Dryer (oxidized): Oxidized mercury is assumed to pass through the lime
spray dryer. Although soluble in water, moisture injected into the spray dryer
evaporates, resulting in the mercury remaining in the flue gas. The default value is
zero.
◦ Spray Dryer (elemental): Elemental mercury is assumed to pass through the lime
spray dryer. It is assumed that elemental mercury is present in the flue gas and is
unreactive.
◦ Spray Dryer (particulate): This is the amount of particulate mercury removed by
the spray dryer.
• Fabric Filter (only shown if a fabric filter is configured)
◦ Fabric Filter (total w/o control): Mercury present in ash is removed from the
fabric filter through the removal of captured fly ash. The speciation is not known, so
the removal is specified as a total removal. The value shown is determined without
Illustration 181: PC: SET PARAMETERS: Mercury: Removal Efficiency
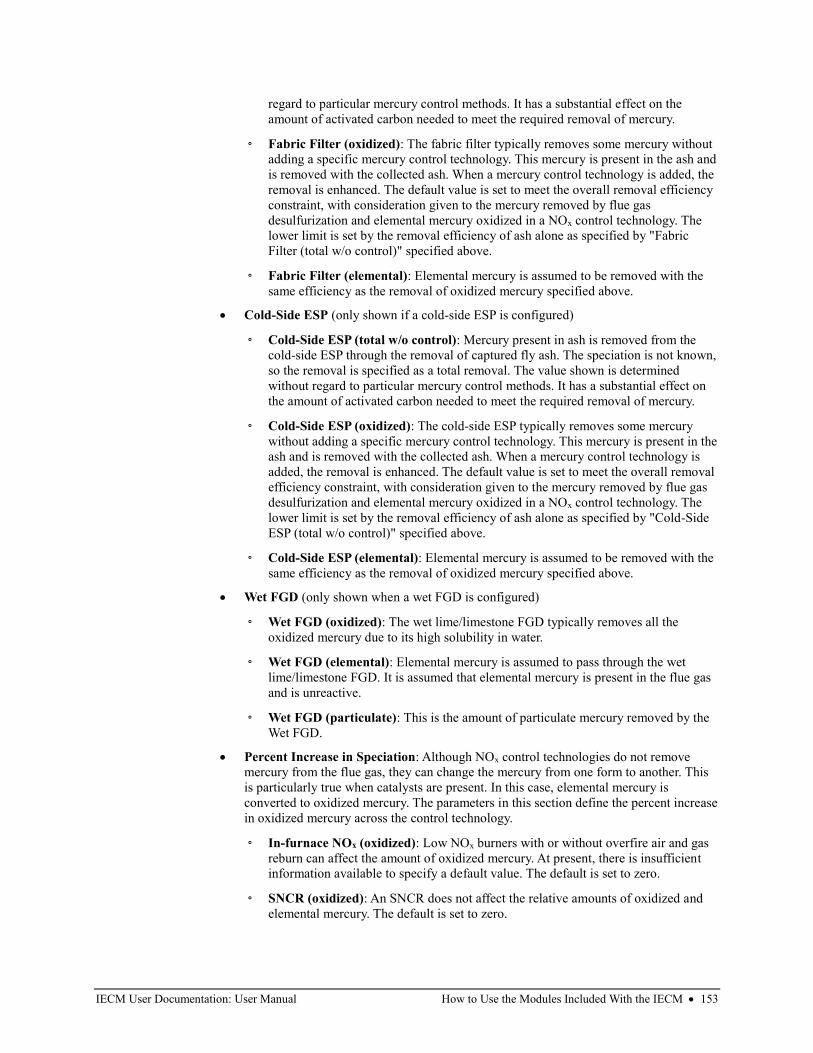
IECM User Documentation: User Manual How to Use the Modules Included With the IECM • 153
regard to particular mercury control methods. It has a substantial effect on the
amount of activated carbon needed to meet the required removal of mercury.
◦ Fabric Filter (oxidized): The fabric filter typically removes some mercury without
adding a specific mercury control technology. This mercury is present in the ash and
is removed with the collected ash. When a mercury control technology is added, the
removal is enhanced. The default value is set to meet the overall removal efficiency
constraint, with consideration given to the mercury removed by flue gas
desulfurization and elemental mercury oxidized in a NOx control technology. The
lower limit is set by the removal efficiency of ash alone as specified by "Fabric
Filter (total w/o control)" specified above.
◦ Fabric Filter (elemental): Elemental mercury is assumed to be removed with the
same efficiency as the removal of oxidized mercury specified above.
• Cold-Side ESP (only shown if a cold-side ESP is configured)
◦ Cold-Side ESP (total w/o control): Mercury present in ash is removed from the
cold-side ESP through the removal of captured fly ash. The speciation is not known,
so the removal is specified as a total removal. The value shown is determined
without regard to particular mercury control methods. It has a substantial effect on
the amount of activated carbon needed to meet the required removal of mercury.
◦ Cold-Side ESP (oxidized): The cold-side ESP typically removes some mercury
without adding a specific mercury control technology. This mercury is present in the
ash and is removed with the collected ash. When a mercury control technology is
added, the removal is enhanced. The default value is set to meet the overall removal
efficiency constraint, with consideration given to the mercury removed by flue gas
desulfurization and elemental mercury oxidized in a NOx control technology. The
lower limit is set by the removal efficiency of ash alone as specified by "Cold-Side
ESP (total w/o control)" specified above.
◦ Cold-Side ESP (elemental): Elemental mercury is assumed to be removed with the
same efficiency as the removal of oxidized mercury specified above.
• Wet FGD (only shown when a wet FGD is configured)
◦ Wet FGD (oxidized): The wet lime/limestone FGD typically removes all the
oxidized mercury due to its high solubility in water.
◦ Wet FGD (elemental): Elemental mercury is assumed to pass through the wet
lime/limestone FGD. It is assumed that elemental mercury is present in the flue gas
and is unreactive.
◦ Wet FGD (particulate): This is the amount of particulate mercury removed by the
Wet FGD.
• Percent Increase in Speciation: Although NOx control technologies do not remove
mercury from the flue gas, they can change the mercury from one form to another. This
is particularly true when catalysts are present. In this case, elemental mercury is
converted to oxidized mercury. The parameters in this section define the percent increase
in oxidized mercury across the control technology.
◦ In-furnace NOx (oxidized): Low NOx burners with or without overfire air and gas
reburn can affect the amount of oxidized mercury. At present, there is insufficient
information available to specify a default value. The default is set to zero.
◦ SNCR (oxidized): An SNCR does not affect the relative amounts of oxidized and
elemental mercury. The default is set to zero.
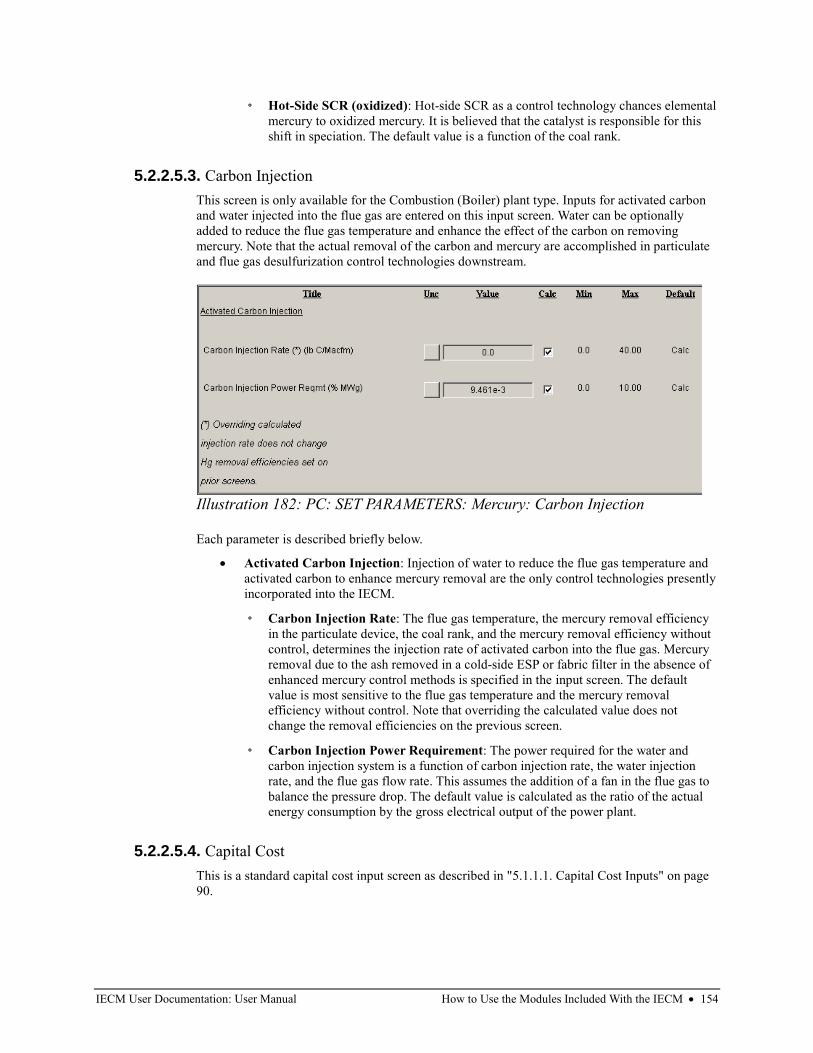
IECM User Documentation: User Manual How to Use the Modules Included With the IECM • 154
◦ Hot-Side SCR (oxidized): Hot-side SCR as a control technology chances elemental
mercury to oxidized mercury. It is believed that the catalyst is responsible for this
shift in speciation. The default value is a function of the coal rank.
5.2.2.5.3. Carbon Injection
This screen is only available for the Combustion (Boiler) plant type. Inputs for activated carbon
and water injected into the flue gas are entered on this input screen. Water can be optionally
added to reduce the flue gas temperature and enhance the effect of the carbon on removing
mercury. Note that the actual removal of the carbon and mercury are accomplished in particulate
and flue gas desulfurization control technologies downstream.
Each parameter is described briefly below.
• Activated Carbon Injection: Injection of water to reduce the flue gas temperature and
activated carbon to enhance mercury removal are the only control technologies presently
incorporated into the IECM.
◦ Carbon Injection Rate: The flue gas temperature, the mercury removal efficiency
in the particulate device, the coal rank, and the mercury removal efficiency without
control, determines the injection rate of activated carbon into the flue gas. Mercury
removal due to the ash removed in a cold-side ESP or fabric filter in the absence of
enhanced mercury control methods is specified in the input screen. The default
value is most sensitive to the flue gas temperature and the mercury removal
efficiency without control. Note that overriding the calculated value does not
change the removal efficiencies on the previous screen.
◦ Carbon Injection Power Requirement: The power required for the water and
carbon injection system is a function of carbon injection rate, the water injection
rate, and the flue gas flow rate. This assumes the addition of a fan in the flue gas to
balance the pressure drop. The default value is calculated as the ratio of the actual
energy consumption by the gross electrical output of the power plant.
5.2.2.5.4. Capital Cost
This is a standard capital cost input screen as described in "5.1.1.1. Capital Cost Inputs" on page
90.
Illustration 182: PC: SET PARAMETERS: Mercury: Carbon Injection
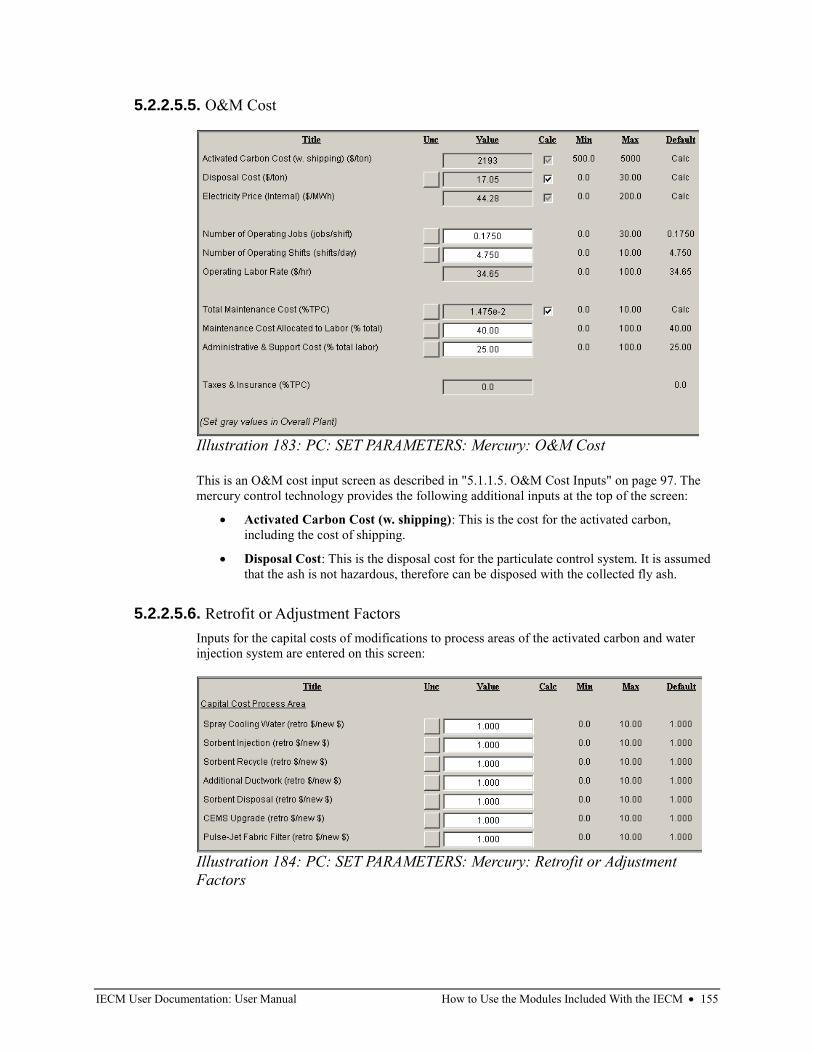
IECM User Documentation: User Manual How to Use the Modules Included With the IECM • 155
5.2.2.5.5. O&M Cost
This is an O&M cost input screen as described in "5.1.1.5. O&M Cost Inputs" on page 97. The
mercury control technology provides the following additional inputs at the top of the screen:
• Activated Carbon Cost (w. shipping): This is the cost for the activated carbon,
including the cost of shipping.
• Disposal Cost: This is the disposal cost for the particulate control system. It is assumed
that the ash is not hazardous, therefore can be disposed with the collected fly ash.
5.2.2.5.6. Retrofit or Adjustment Factors
Inputs for the capital costs of modifications to process areas of the activated carbon and water
injection system are entered on this screen:
Illustration 183: PC: SET PARAMETERS: Mercury: O&M Cost
Illustration 184: PC: SET PARAMETERS: Mercury: Retrofit or Adjustment
Factors
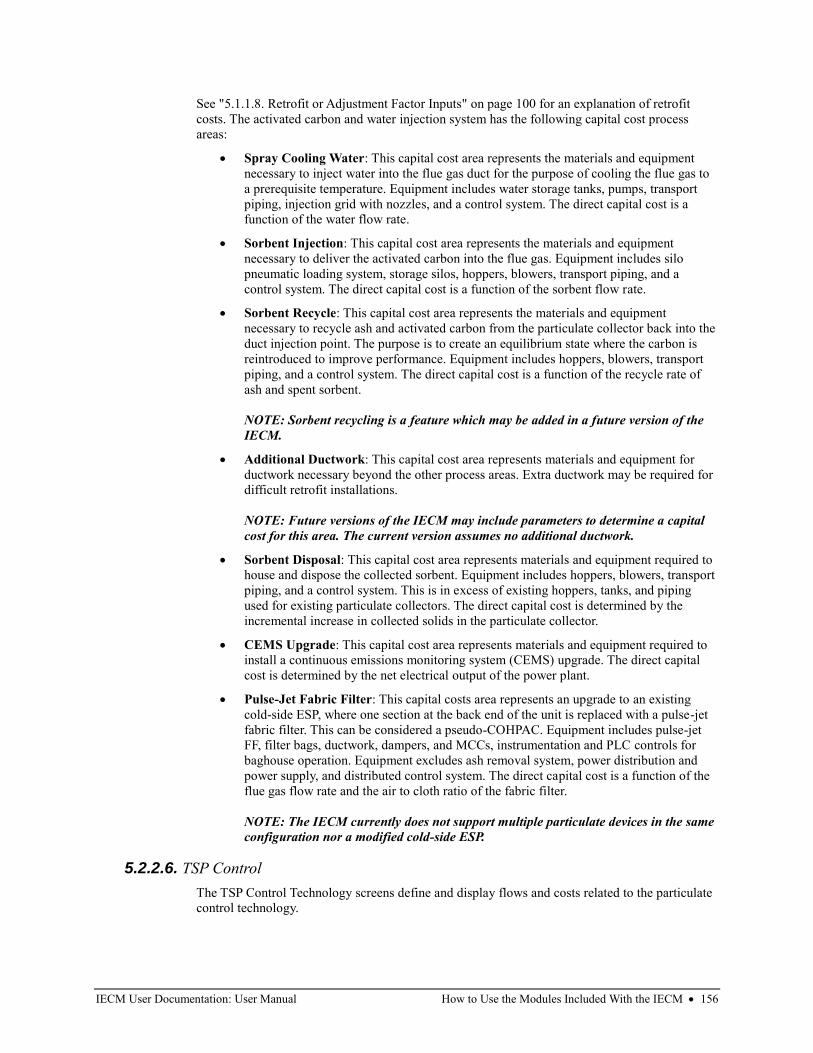
IECM User Documentation: User Manual How to Use the Modules Included With the IECM • 156
See "5.1.1.8. Retrofit or Adjustment Factor Inputs" on page 100 for an explanation of retrofit
costs. The activated carbon and water injection system has the following capital cost process
areas:
• Spray Cooling Water: This capital cost area represents the materials and equipment
necessary to inject water into the flue gas duct for the purpose of cooling the flue gas to
a prerequisite temperature. Equipment includes water storage tanks, pumps, transport
piping, injection grid with nozzles, and a control system. The direct capital cost is a
function of the water flow rate.
• Sorbent Injection: This capital cost area represents the materials and equipment
necessary to deliver the activated carbon into the flue gas. Equipment includes silo
pneumatic loading system, storage silos, hoppers, blowers, transport piping, and a
control system. The direct capital cost is a function of the sorbent flow rate.
• Sorbent Recycle: This capital cost area represents the materials and equipment
necessary to recycle ash and activated carbon from the particulate collector back into the
duct injection point. The purpose is to create an equilibrium state where the carbon is
reintroduced to improve performance. Equipment includes hoppers, blowers, transport
piping, and a control system. The direct capital cost is a function of the recycle rate of
ash and spent sorbent.
NOTE: Sorbent recycling is a feature which may be added in a future version of the
IECM.
• Additional Ductwork: This capital cost area represents materials and equipment for
ductwork necessary beyond the other process areas. Extra ductwork may be required for
difficult retrofit installations.
NOTE: Future versions of the IECM may include parameters to determine a capital
cost for this area. The current version assumes no additional ductwork.
• Sorbent Disposal: This capital cost area represents materials and equipment required to
house and dispose the collected sorbent. Equipment includes hoppers, blowers, transport
piping, and a control system. This is in excess of existing hoppers, tanks, and piping
used for existing particulate collectors. The direct capital cost is determined by the
incremental increase in collected solids in the particulate collector.
• CEMS Upgrade: This capital cost area represents materials and equipment required to
install a continuous emissions monitoring system (CEMS) upgrade. The direct capital
cost is determined by the net electrical output of the power plant.
• Pulse-Jet Fabric Filter: This capital costs area represents an upgrade to an existing
cold-side ESP, where one section at the back end of the unit is replaced with a pulse-jet
fabric filter. This can be considered a pseudo-COHPAC. Equipment includes pulse-jet
FF, filter bags, ductwork, dampers, and MCCs, instrumentation and PLC controls for
baghouse operation. Equipment excludes ash removal system, power distribution and
power supply, and distributed control system. The direct capital cost is a function of the
flue gas flow rate and the air to cloth ratio of the fabric filter.
NOTE: The IECM currently does not support multiple particulate devices in the same
configuration nor a modified cold-side ESP.
5.2.2.6. TSP Control
The TSP Control Technology screens define and display flows and costs related to the particulate
control technology.
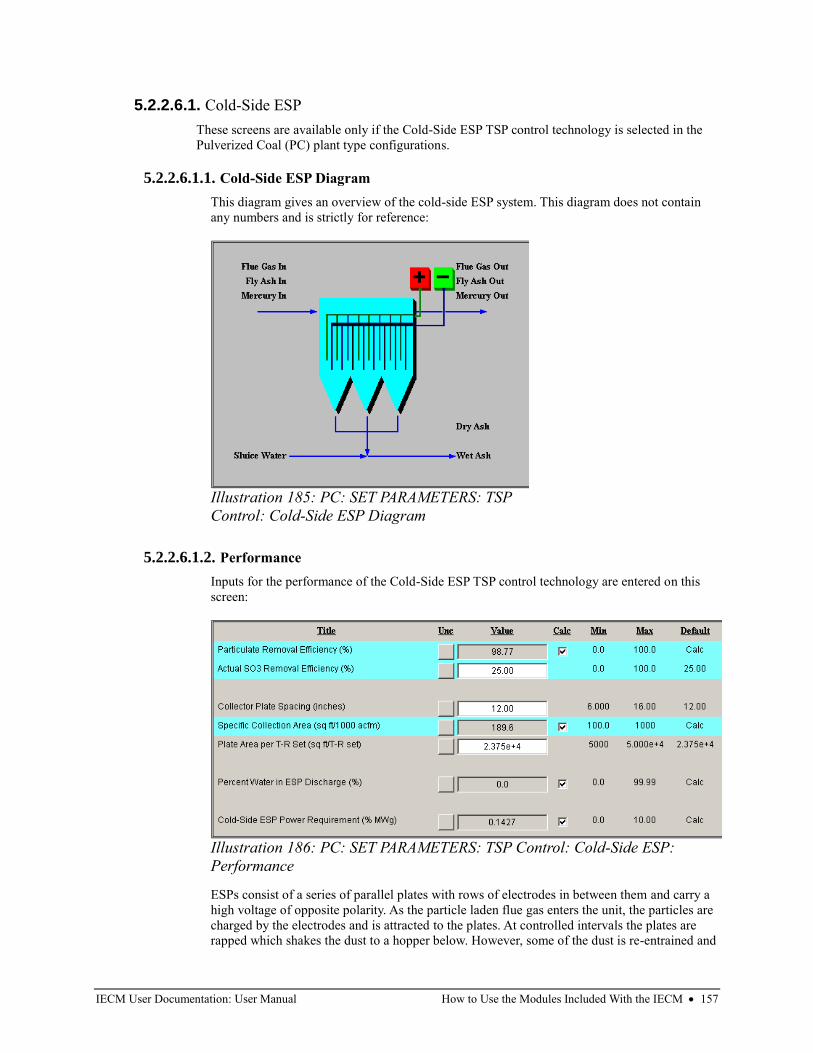
IECM User Documentation: User Manual How to Use the Modules Included With the IECM • 157
5.2.2.6.1. Cold-Side ESP
These screens are available only if the Cold-Side ESP TSP control technology is selected in the
Pulverized Coal (PC) plant type configurations.
5.2.2.6.1.1. Cold-Side ESP Diagram
This diagram gives an overview of the cold-side ESP system. This diagram does not contain
any numbers and is strictly for reference:
5.2.2.6.1.2. Performance
Inputs for the performance of the Cold-Side ESP TSP control technology are entered on this
screen:
ESPs consist of a series of parallel plates with rows of electrodes in between them and carry a
high voltage of opposite polarity. As the particle laden flue gas enters the unit, the particles are
charged by the electrodes and is attracted to the plates. At controlled intervals the plates are
rapped which shakes the dust to a hopper below. However, some of the dust is re-entrained and
Illustration 185: PC: SET PARAMETERS: TSP
Control: Cold-Side ESP Diagram
Illustration 186: PC: SET PARAMETERS: TSP Control: Cold-Side ESP:
Performance
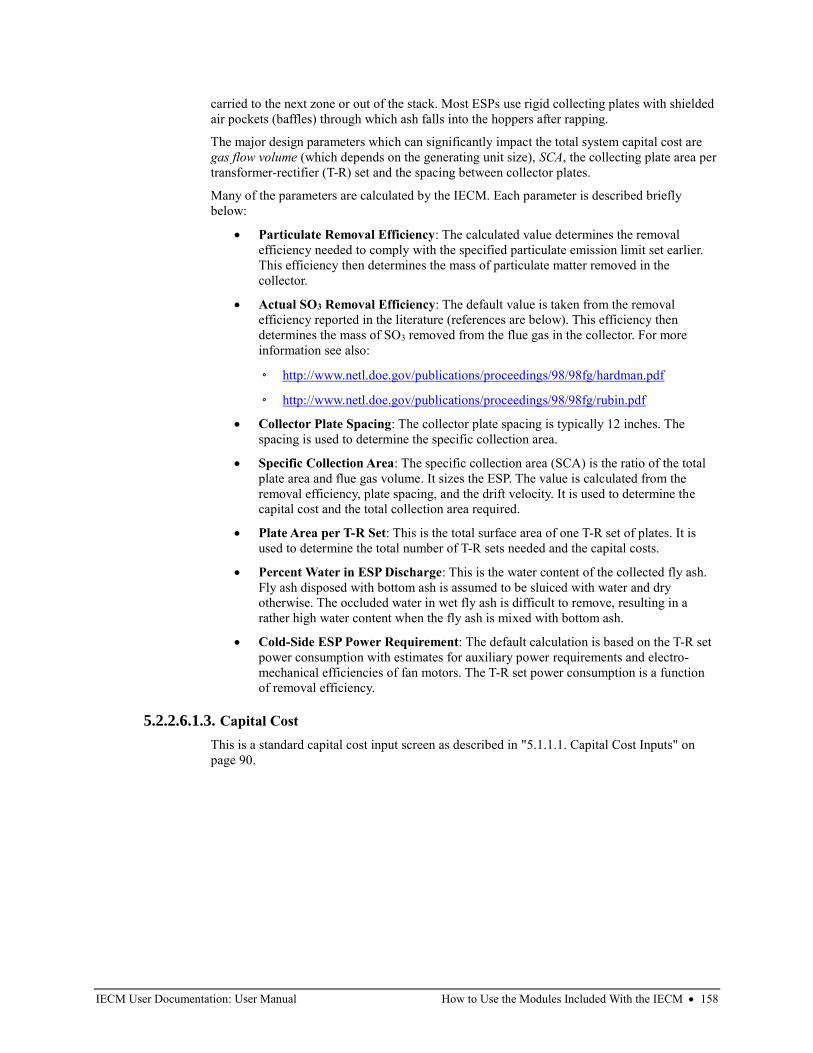
IECM User Documentation: User Manual How to Use the Modules Included With the IECM • 158
carried to the next zone or out of the stack. Most ESPs use rigid collecting plates with shielded
air pockets (baffles) through which ash falls into the hoppers after rapping.
The major design parameters which can significantly impact the total system capital cost are
gas flow volume (which depends on the generating unit size), SCA, the collecting plate area per
transformer-rectifier (T-R) set and the spacing between collector plates.
Many of the parameters are calculated by the IECM. Each parameter is described briefly
below:
• Particulate Removal Efficiency: The calculated value determines the removal
efficiency needed to comply with the specified particulate emission limit set earlier.
This efficiency then determines the mass of particulate matter removed in the
collector.
• Actual SO3 Removal Efficiency: The default value is taken from the removal
efficiency reported in the literature (references are below). This efficiency then
determines the mass of SO3 removed from the flue gas in the collector. For more
information see also:
◦ http://www.netl.doe.gov/publications/proceedings/98/98fg/hardman.pdf
◦ http://www.netl.doe.gov/publications/proceedings/98/98fg/rubin.pdf
• Collector Plate Spacing: The collector plate spacing is typically 12 inches. The
spacing is used to determine the specific collection area.
• Specific Collection Area: The specific collection area (SCA) is the ratio of the total
plate area and flue gas volume. It sizes the ESP. The value is calculated from the
removal efficiency, plate spacing, and the drift velocity. It is used to determine the
capital cost and the total collection area required.
• Plate Area per T-R Set: This is the total surface area of one T-R set of plates. It is
used to determine the total number of T-R sets needed and the capital costs.
• Percent Water in ESP Discharge: This is the water content of the collected fly ash.
Fly ash disposed with bottom ash is assumed to be sluiced with water and dry
otherwise. The occluded water in wet fly ash is difficult to remove, resulting in a
rather high water content when the fly ash is mixed with bottom ash.
• Cold-Side ESP Power Requirement: The default calculation is based on the T-R set
power consumption with estimates for auxiliary power requirements and electro-
mechanical efficiencies of fan motors. The T-R set power consumption is a function
of removal efficiency.
5.2.2.6.1.3. Capital Cost
This is a standard capital cost input screen as described in "5.1.1.1. Capital Cost Inputs" on
page 90.
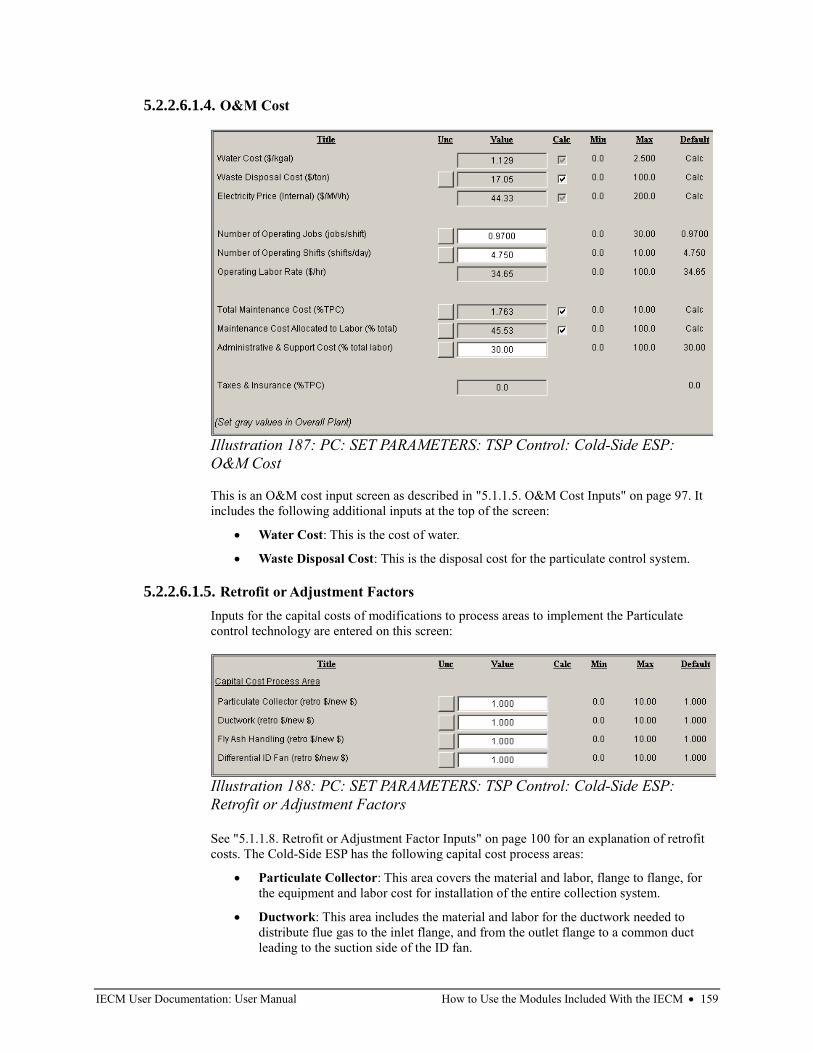
IECM User Documentation: User Manual How to Use the Modules Included With the IECM • 159
5.2.2.6.1.4. O&M Cost
This is an O&M cost input screen as described in "5.1.1.5. O&M Cost Inputs" on page 97. It
includes the following additional inputs at the top of the screen:
• Water Cost: This is the cost of water.
• Waste Disposal Cost: This is the disposal cost for the particulate control system.
5.2.2.6.1.5. Retrofit or Adjustment Factors
Inputs for the capital costs of modifications to process areas to implement the Particulate
control technology are entered on this screen:
See "5.1.1.8. Retrofit or Adjustment Factor Inputs" on page 100 for an explanation of retrofit
costs. The Cold-Side ESP has the following capital cost process areas:
• Particulate Collector: This area covers the material and labor, flange to flange, for
the equipment and labor cost for installation of the entire collection system.
• Ductwork: This area includes the material and labor for the ductwork needed to
distribute flue gas to the inlet flange, and from the outlet flange to a common duct
leading to the suction side of the ID fan.
Illustration 187: PC: SET PARAMETERS: TSP Control: Cold-Side ESP:
O&M Cost
Illustration 188: PC: SET PARAMETERS: TSP Control: Cold-Side ESP:
Retrofit or Adjustment Factors
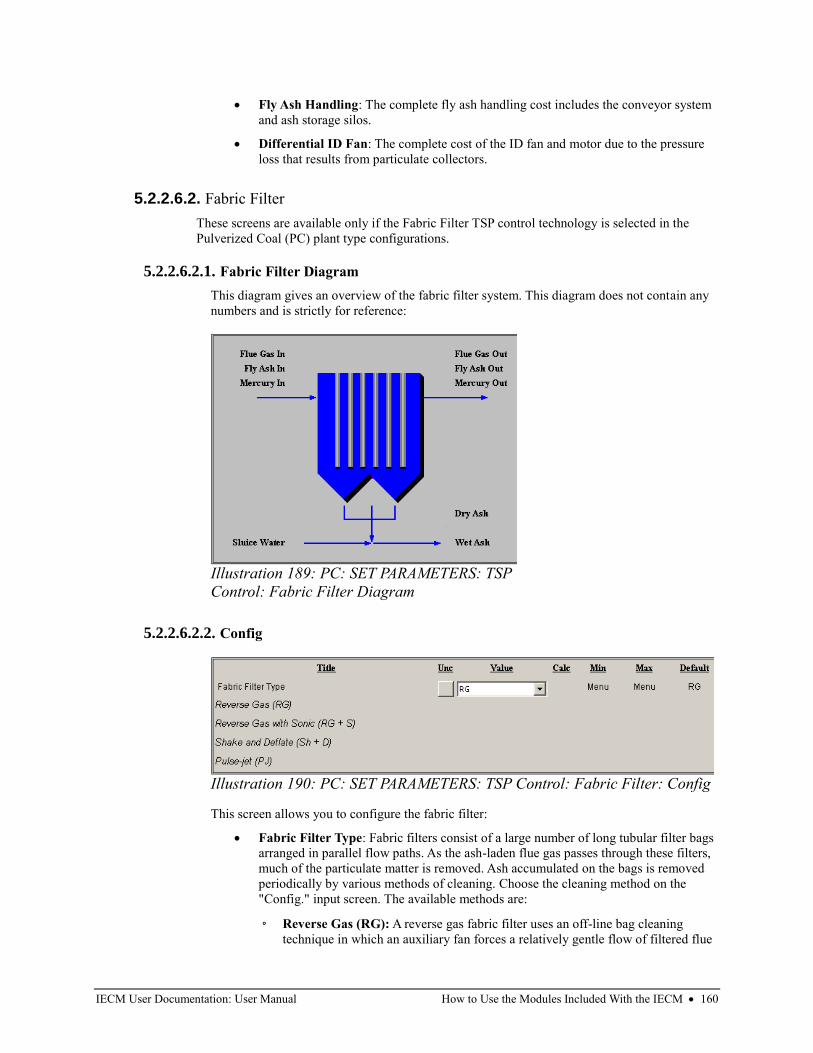
IECM User Documentation: User Manual How to Use the Modules Included With the IECM • 160
• Fly Ash Handling: The complete fly ash handling cost includes the conveyor system
and ash storage silos.
• Differential ID Fan: The complete cost of the ID fan and motor due to the pressure
loss that results from particulate collectors.
5.2.2.6.2. Fabric Filter
These screens are available only if the Fabric Filter TSP control technology is selected in the
Pulverized Coal (PC) plant type configurations.
5.2.2.6.2.1. Fabric Filter Diagram
This diagram gives an overview of the fabric filter system. This diagram does not contain any
numbers and is strictly for reference:
5.2.2.6.2.2. Config
This screen allows you to configure the fabric filter:
• Fabric Filter Type: Fabric filters consist of a large number of long tubular filter bags
arranged in parallel flow paths. As the ash-laden flue gas passes through these filters,
much of the particulate matter is removed. Ash accumulated on the bags is removed
periodically by various methods of cleaning. Choose the cleaning method on the
"Config." input screen. The available methods are:
◦ Reverse Gas (RG): A reverse gas fabric filter uses an off-line bag cleaning
technique in which an auxiliary fan forces a relatively gentle flow of filtered flue
Illustration 189: PC: SET PARAMETERS: TSP
Control: Fabric Filter Diagram
Illustration 190: PC: SET PARAMETERS: TSP Control: Fabric Filter: Config
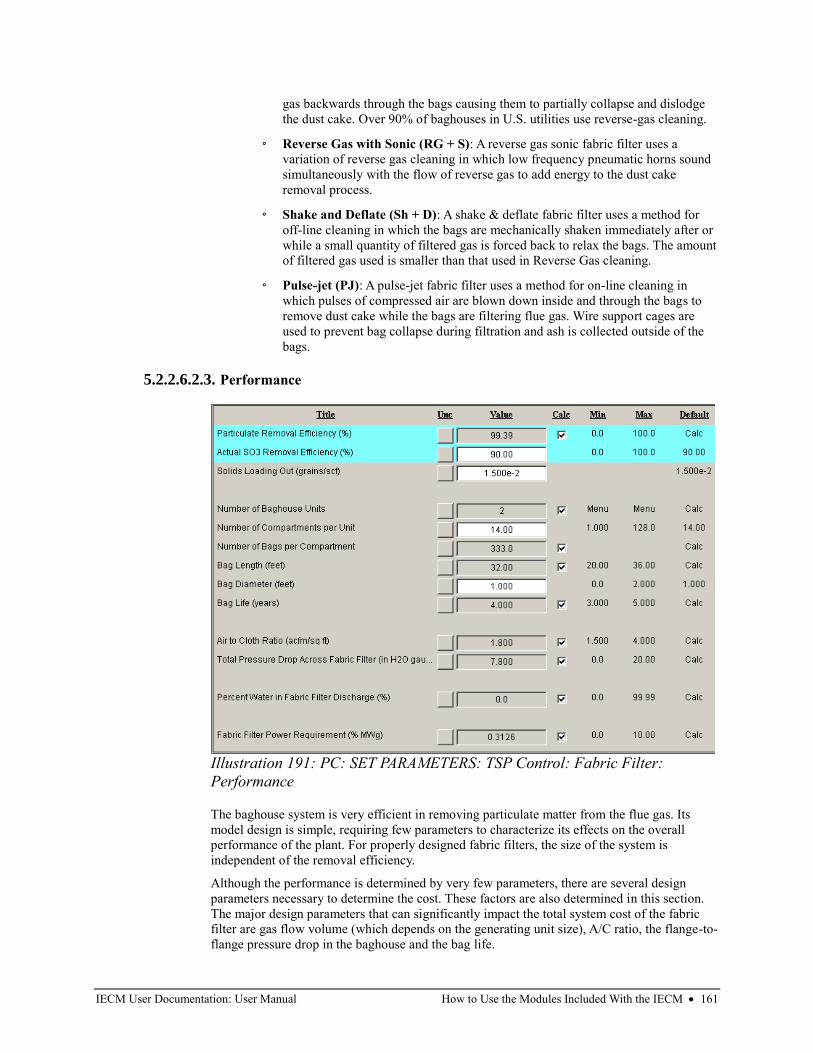
IECM User Documentation: User Manual How to Use the Modules Included With the IECM • 161
gas backwards through the bags causing them to partially collapse and dislodge
the dust cake. Over 90% of baghouses in U.S. utilities use reverse-gas cleaning.
◦ Reverse Gas with Sonic (RG + S): A reverse gas sonic fabric filter uses a
variation of reverse gas cleaning in which low frequency pneumatic horns sound
simultaneously with the flow of reverse gas to add energy to the dust cake
removal process.
◦ Shake and Deflate (Sh + D): A shake & deflate fabric filter uses a method for
off-line cleaning in which the bags are mechanically shaken immediately after or
while a small quantity of filtered gas is forced back to relax the bags. The amount
of filtered gas used is smaller than that used in Reverse Gas cleaning.
◦ Pulse-jet (PJ): A pulse-jet fabric filter uses a method for on-line cleaning in
which pulses of compressed air are blown down inside and through the bags to
remove dust cake while the bags are filtering flue gas. Wire support cages are
used to prevent bag collapse during filtration and ash is collected outside of the
bags.
5.2.2.6.2.3. Performance
The baghouse system is very efficient in removing particulate matter from the flue gas. Its
model design is simple, requiring few parameters to characterize its effects on the overall
performance of the plant. For properly designed fabric filters, the size of the system is
independent of the removal efficiency.
Although the performance is determined by very few parameters, there are several design
parameters necessary to determine the cost. These factors are also determined in this section.
The major design parameters that can significantly impact the total system cost of the fabric
filter are gas flow volume (which depends on the generating unit size), A/C ratio, the flange-to-
flange pressure drop in the baghouse and the bag life.
Illustration 191: PC: SET PARAMETERS: TSP Control: Fabric Filter:
Performance
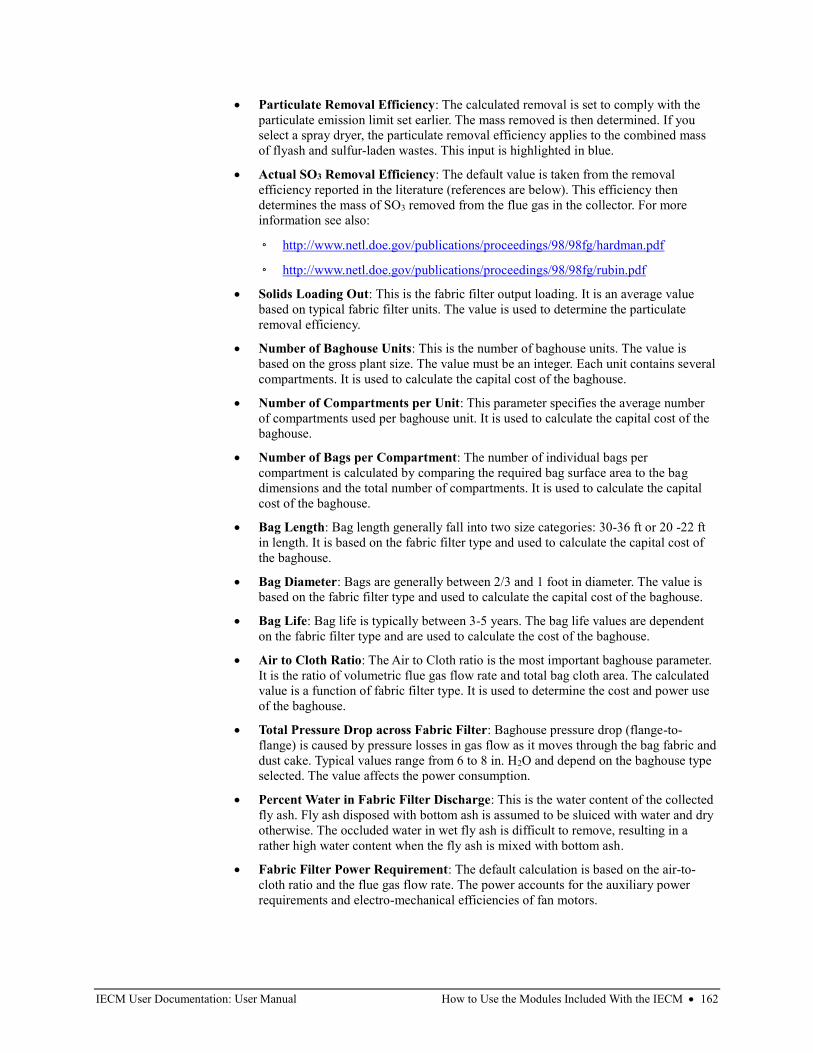
IECM User Documentation: User Manual How to Use the Modules Included With the IECM • 162
• Particulate Removal Efficiency: The calculated removal is set to comply with the
particulate emission limit set earlier. The mass removed is then determined. If you
select a spray dryer, the particulate removal efficiency applies to the combined mass
of flyash and sulfur-laden wastes. This input is highlighted in blue.
• Actual SO3 Removal Efficiency: The default value is taken from the removal
efficiency reported in the literature (references are below). This efficiency then
determines the mass of SO3 removed from the flue gas in the collector. For more
information see also:
◦ http://www.netl.doe.gov/publications/proceedings/98/98fg/hardman.pdf
◦ http://www.netl.doe.gov/publications/proceedings/98/98fg/rubin.pdf
• Solids Loading Out: This is the fabric filter output loading. It is an average value
based on typical fabric filter units. The value is used to determine the particulate
removal efficiency.
• Number of Baghouse Units: This is the number of baghouse units. The value is
based on the gross plant size. The value must be an integer. Each unit contains several
compartments. It is used to calculate the capital cost of the baghouse.
• Number of Compartments per Unit: This parameter specifies the average number
of compartments used per baghouse unit. It is used to calculate the capital cost of the
baghouse.
• Number of Bags per Compartment: The number of individual bags per
compartment is calculated by comparing the required bag surface area to the bag
dimensions and the total number of compartments. It is used to calculate the capital
cost of the baghouse.
• Bag Length: Bag length generally fall into two size categories: 30-36 ft or 20 -22 ft
in length. It is based on the fabric filter type and used to calculate the capital cost of
the baghouse.
• Bag Diameter: Bags are generally between 2/3 and 1 foot in diameter. The value is
based on the fabric filter type and used to calculate the capital cost of the baghouse.
• Bag Life: Bag life is typically between 3-5 years. The bag life values are dependent
on the fabric filter type and are used to calculate the cost of the baghouse.
• Air to Cloth Ratio: The Air to Cloth ratio is the most important baghouse parameter.
It is the ratio of volumetric flue gas flow rate and total bag cloth area. The calculated
value is a function of fabric filter type. It is used to determine the cost and power use
of the baghouse.
• Total Pressure Drop across Fabric Filter: Baghouse pressure drop (flange-to-
flange) is caused by pressure losses in gas flow as it moves through the bag fabric and
dust cake. Typical values range from 6 to 8 in. H2O and depend on the baghouse type
selected. The value affects the power consumption.
• Percent Water in Fabric Filter Discharge: This is the water content of the collected
fly ash. Fly ash disposed with bottom ash is assumed to be sluiced with water and dry
otherwise. The occluded water in wet fly ash is difficult to remove, resulting in a
rather high water content when the fly ash is mixed with bottom ash.
• Fabric Filter Power Requirement: The default calculation is based on the air-to-
cloth ratio and the flue gas flow rate. The power accounts for the auxiliary power
requirements and electro-mechanical efficiencies of fan motors.
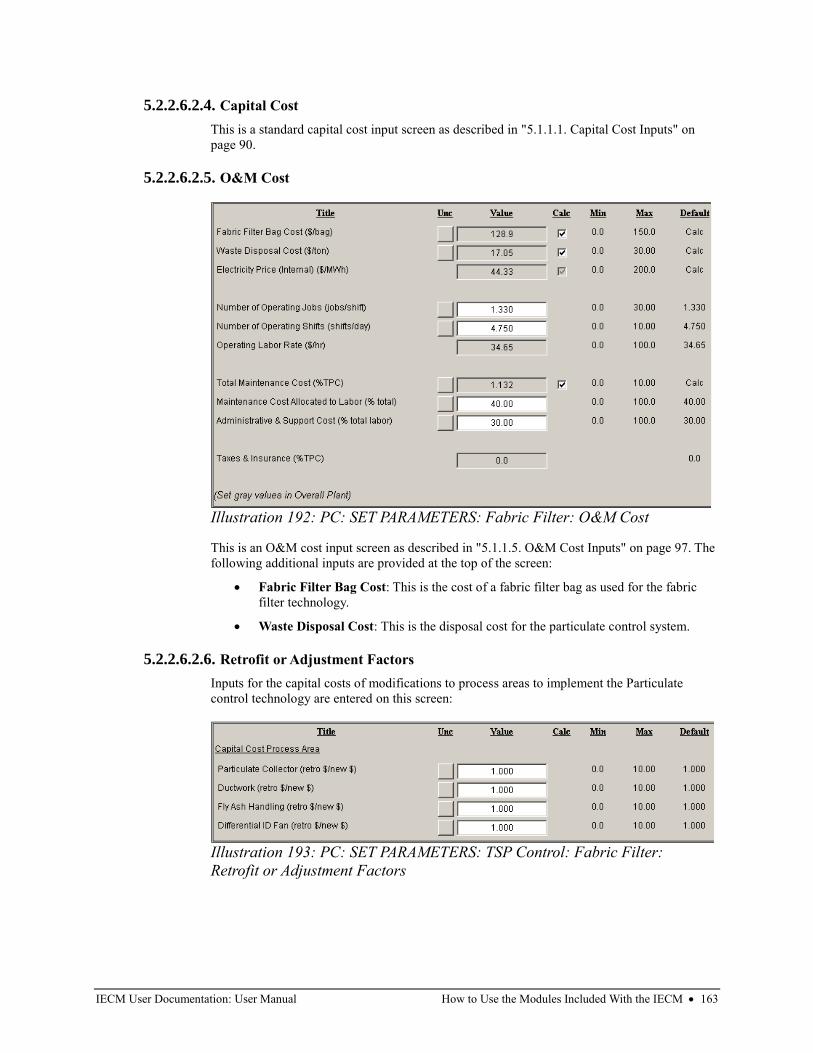
IECM User Documentation: User Manual How to Use the Modules Included With the IECM • 163
5.2.2.6.2.4. Capital Cost
This is a standard capital cost input screen as described in "5.1.1.1. Capital Cost Inputs" on
page 90.
5.2.2.6.2.5. O&M Cost
This is an O&M cost input screen as described in "5.1.1.5. O&M Cost Inputs" on page 97. The
following additional inputs are provided at the top of the screen:
• Fabric Filter Bag Cost: This is the cost of a fabric filter bag as used for the fabric
filter technology.
• Waste Disposal Cost: This is the disposal cost for the particulate control system.
5.2.2.6.2.6. Retrofit or Adjustment Factors
Inputs for the capital costs of modifications to process areas to implement the Particulate
control technology are entered on this screen:
Illustration 192: PC: SET PARAMETERS: Fabric Filter: O&M Cost
Illustration 193: PC: SET PARAMETERS: TSP Control: Fabric Filter:
Retrofit or Adjustment Factors
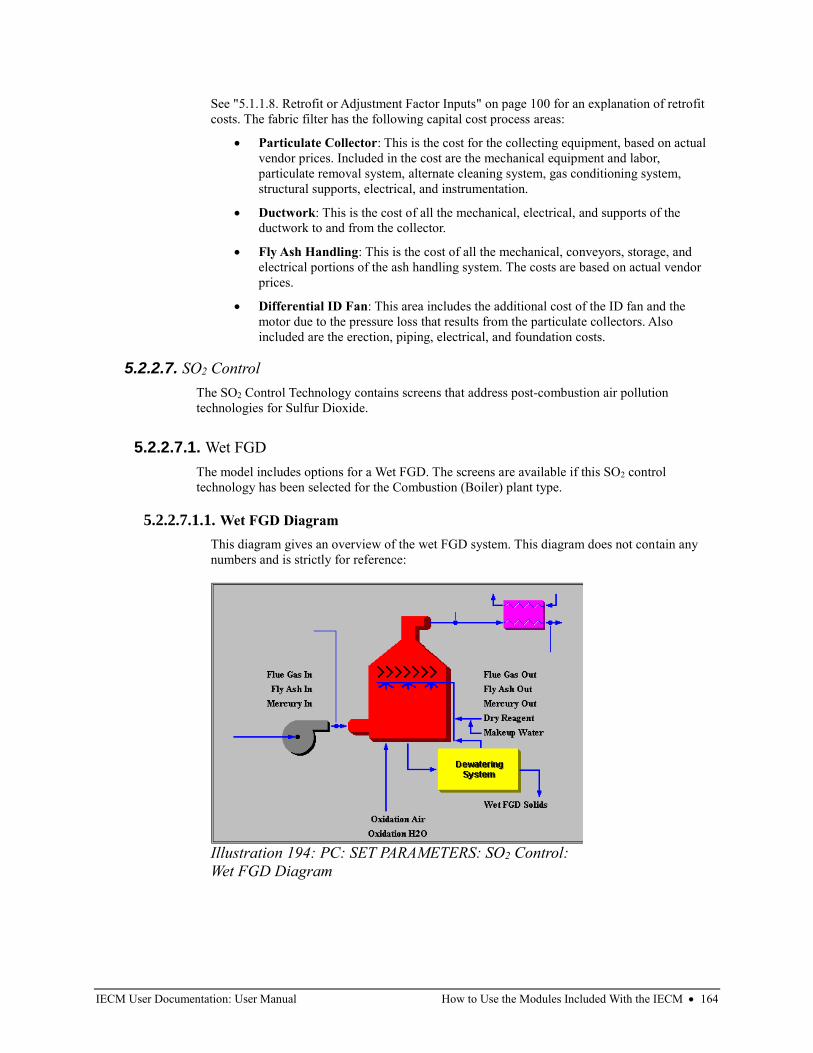
IECM User Documentation: User Manual How to Use the Modules Included With the IECM • 164
See "5.1.1.8. Retrofit or Adjustment Factor Inputs" on page 100 for an explanation of retrofit
costs. The fabric filter has the following capital cost process areas:
• Particulate Collector: This is the cost for the collecting equipment, based on actual
vendor prices. Included in the cost are the mechanical equipment and labor,
particulate removal system, alternate cleaning system, gas conditioning system,
structural supports, electrical, and instrumentation.
• Ductwork: This is the cost of all the mechanical, electrical, and supports of the
ductwork to and from the collector.
• Fly Ash Handling: This is the cost of all the mechanical, conveyors, storage, and
electrical portions of the ash handling system. The costs are based on actual vendor
prices.
• Differential ID Fan: This area includes the additional cost of the ID fan and the
motor due to the pressure loss that results from the particulate collectors. Also
included are the erection, piping, electrical, and foundation costs.
5.2.2.7. SO2 Control
The SO2 Control Technology contains screens that address post-combustion air pollution
technologies for Sulfur Dioxide.
5.2.2.7.1. Wet FGD
The model includes options for a Wet FGD. The screens are available if this SO2 control
technology has been selected for the Combustion (Boiler) plant type.
5.2.2.7.1.1. Wet FGD Diagram
This diagram gives an overview of the wet FGD system. This diagram does not contain any
numbers and is strictly for reference:
Illustration 194: PC: SET PARAMETERS: SO2 Control:
Wet FGD Diagram
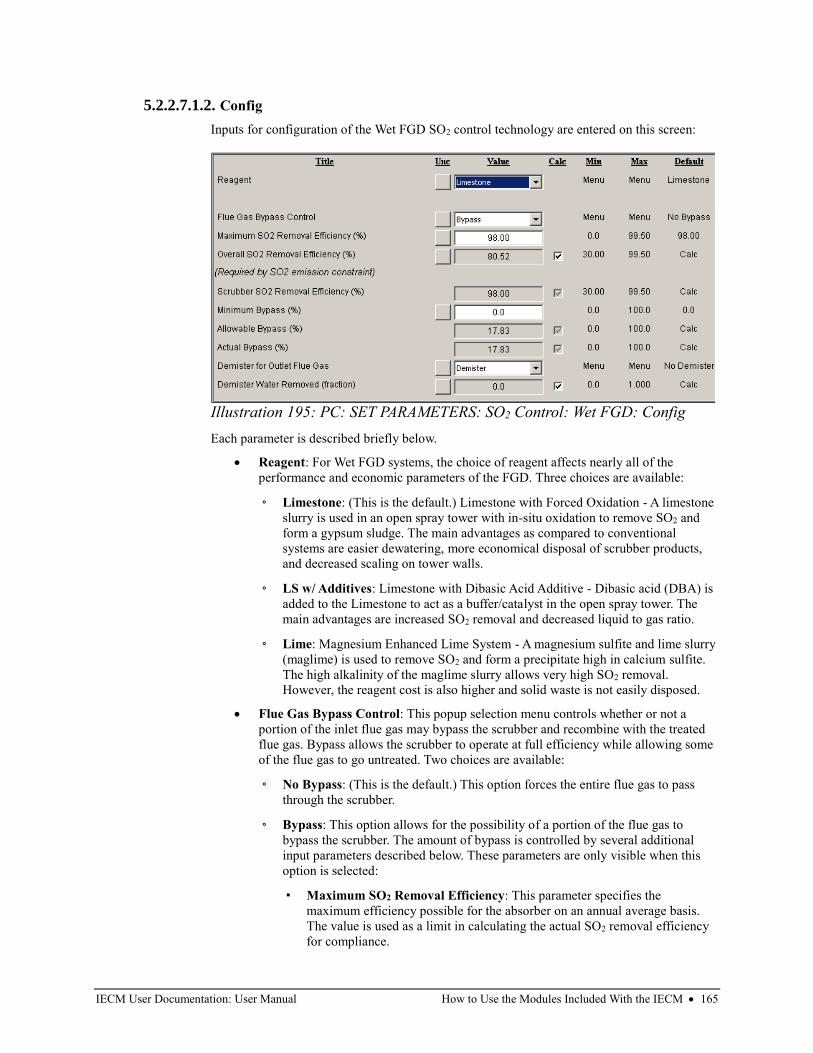
IECM User Documentation: User Manual How to Use the Modules Included With the IECM • 165
5.2.2.7.1.2. Config
Inputs for configuration of the Wet FGD SO2 control technology are entered on this screen:
Each parameter is described briefly below.
• Reagent: For Wet FGD systems, the choice of reagent affects nearly all of the
performance and economic parameters of the FGD. Three choices are available:
◦ Limestone: (This is the default.) Limestone with Forced Oxidation - A limestone
slurry is used in an open spray tower with in-situ oxidation to remove SO2 and
form a gypsum sludge. The main advantages as compared to conventional
systems are easier dewatering, more economical disposal of scrubber products,
and decreased scaling on tower walls.
◦ LS w/ Additives: Limestone with Dibasic Acid Additive - Dibasic acid (DBA) is
added to the Limestone to act as a buffer/catalyst in the open spray tower. The
main advantages are increased SO2 removal and decreased liquid to gas ratio.
◦ Lime: Magnesium Enhanced Lime System - A magnesium sulfite and lime slurry
(maglime) is used to remove SO2 and form a precipitate high in calcium sulfite.
The high alkalinity of the maglime slurry allows very high SO2 removal.
However, the reagent cost is also higher and solid waste is not easily disposed.
• Flue Gas Bypass Control: This popup selection menu controls whether or not a
portion of the inlet flue gas may bypass the scrubber and recombine with the treated
flue gas. Bypass allows the scrubber to operate at full efficiency while allowing some
of the flue gas to go untreated. Two choices are available:
◦ No Bypass: (This is the default.) This option forces the entire flue gas to pass
through the scrubber.
◦ Bypass: This option allows for the possibility of a portion of the flue gas to
bypass the scrubber. The amount of bypass is controlled by several additional
input parameters described below. These parameters are only visible when this
option is selected:
▪ Maximum SO2 Removal Efficiency: This parameter specifies the
maximum efficiency possible for the absorber on an annual average basis.
The value is used as a limit in calculating the actual SO2 removal efficiency
for compliance.
Illustration 195: PC: SET PARAMETERS: SO2 Control: Wet FGD: Config
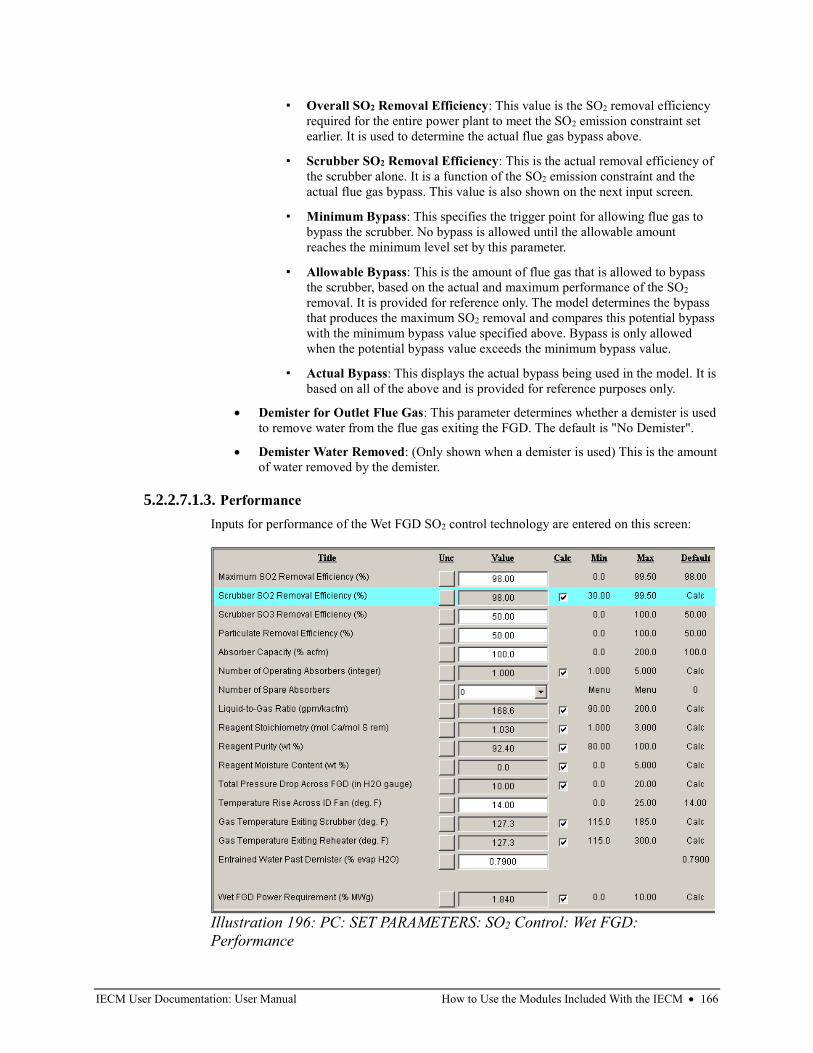
IECM User Documentation: User Manual How to Use the Modules Included With the IECM • 166
▪ Overall SO2 Removal Efficiency: This value is the SO2 removal efficiency
required for the entire power plant to meet the SO2 emission constraint set
earlier. It is used to determine the actual flue gas bypass above.
▪ Scrubber SO2 Removal Efficiency: This is the actual removal efficiency of
the scrubber alone. It is a function of the SO2 emission constraint and the
actual flue gas bypass. This value is also shown on the next input screen.
▪ Minimum Bypass: This specifies the trigger point for allowing flue gas to
bypass the scrubber. No bypass is allowed until the allowable amount
reaches the minimum level set by this parameter.
▪ Allowable Bypass: This is the amount of flue gas that is allowed to bypass
the scrubber, based on the actual and maximum performance of the SO2
removal. It is provided for reference only. The model determines the bypass
that produces the maximum SO2 removal and compares this potential bypass
with the minimum bypass value specified above. Bypass is only allowed
when the potential bypass value exceeds the minimum bypass value.
▪ Actual Bypass: This displays the actual bypass being used in the model. It is
based on all of the above and is provided for reference purposes only.
• Demister for Outlet Flue Gas: This parameter determines whether a demister is used
to remove water from the flue gas exiting the FGD. The default is "No Demister".
• Demister Water Removed: (Only shown when a demister is used) This is the amount
of water removed by the demister.
5.2.2.7.1.3. Performance
Inputs for performance of the Wet FGD SO2 control technology are entered on this screen:
Illustration 196: PC: SET PARAMETERS: SO2 Control: Wet FGD:
Performance
IECM User Documentation: User Manual How to Use the Modules Included With the IECM • 167
Each parameter is described briefly below:
• Maximum SO2 Removal Efficiency: This parameter specifies the maximum
efficiency possible for the absorber on an annual average basis. The value is used as a
limit in calculating the actual SO2 removal efficiency for compliance.
• Scrubber SO2 Removal Efficiency: This is the annual average SO2 removal
efficiency achieved in the absorber. The calculated value assumes compliance with
the SO2 emission limit specified earlier, if possible. The efficiency is used to
determine the liquid to gas ratio and emissions. This input is highlighted in blue.
• Scrubber SO3 Removal Efficiency: The default value is taken from the removal
efficiency reported in the literature (references are below). This efficiency then
determines the mass of SO3 removed from the flue gas in the collector. For more
information see also:
◦ http://www.netl.doe.gov/publications/proceedings/98/98fg/hardman.pdf
◦ http://www.netl.doe.gov/publications/proceedings/98/98fg/rubin.pdf
• Particulate Removal Efficiency: This is the percent removal of particulate matter
entering the FGD system from the upstream particulate collector. Particulate
collectors are designed to comply with the specified particulate emission limit. This is
additional particulate removal.
• Absorber Capacity: This is the percent of the flue gas treated by each operating
absorber. This value is used to determine the number of operating absorbers and the
capital costs.
• Number of Operating Absorbers: This is the number of operating scrubber towers.
The number is determined by the absorber capacity and is used to calculate the capital
costs. The value must be an integer.
• Number of Spare Absorbers: This is the total number of spare absorber vessels. It is
used primarily to calculate capital costs. The value must be an integer.
• Liquid to Gas Ratio: The design of spray towers for high efficiency is achieved by
using high liquid-to-gas (L/G) ratios. The calculated value is a function of the reagent
type, the removal efficiency, and stoichiometry. It determines the power requirement
and capital cost.
• Reagent Stoichiometry: This is the moles of calcium per mole of sulfur removed
from the absorber. The stoichiometry is calculated as a function of the reagent type. It
is used to determine the liquid to gas ratio, reagent usage, reagent waste, and capital
cost.
• Reagent Purity: This is the percent of the reagent that is lime (CaO) or limestone
(CaCO3). The calculated value is a function of the reagent type. This parameter
determines the waste solids produced and the reagent needed to remove the necessary
SO2.
• Reagent Moisture Content: This is the moisture content of the reagent. The
remaining reagent impurities are assumed to be inert substances such as silicon
dioxide (sand). This parameter is used to determine the waste solids produced.
• Total Pressure Drop across FGD: This is the total pressure drop across the FGD
vessel prior to the reheater. This is used in the calculations of the power requirements
(or energy penalty) and thermodynamic properties of the flue gas.
• Temperature Rise Across ID Fan: An induced draft (ID) fan is assumed to be
located upstream of the FGD system. The fan raises the temperature of the flue gas
due to dissipation of electro-mechanical.
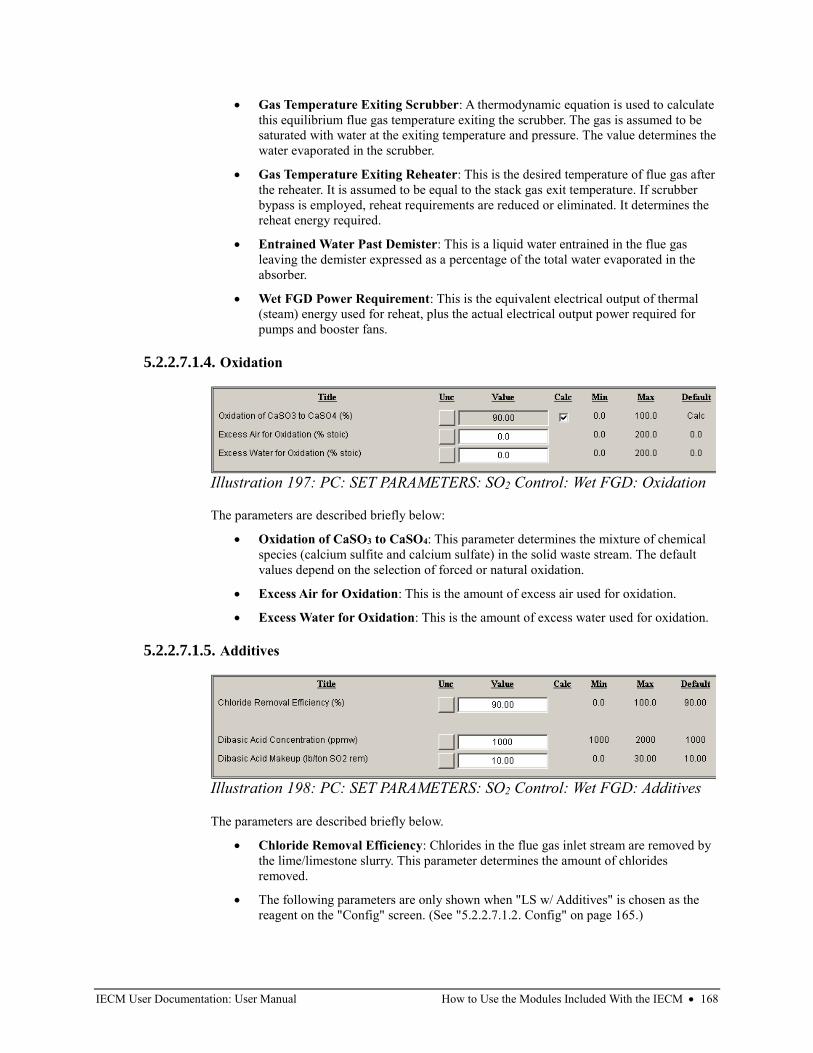
IECM User Documentation: User Manual How to Use the Modules Included With the IECM • 168
• Gas Temperature Exiting Scrubber: A thermodynamic equation is used to calculate
this equilibrium flue gas temperature exiting the scrubber. The gas is assumed to be
saturated with water at the exiting temperature and pressure. The value determines the
water evaporated in the scrubber.
• Gas Temperature Exiting Reheater: This is the desired temperature of flue gas after
the reheater. It is assumed to be equal to the stack gas exit temperature. If scrubber
bypass is employed, reheat requirements are reduced or eliminated. It determines the
reheat energy required.
• Entrained Water Past Demister: This is a liquid water entrained in the flue gas
leaving the demister expressed as a percentage of the total water evaporated in the
absorber.
• Wet FGD Power Requirement: This is the equivalent electrical output of thermal
(steam) energy used for reheat, plus the actual electrical output power required for
pumps and booster fans.
5.2.2.7.1.4. Oxidation
The parameters are described briefly below:
• Oxidation of CaSO3 to CaSO4: This parameter determines the mixture of chemical
species (calcium sulfite and calcium sulfate) in the solid waste stream. The default
values depend on the selection of forced or natural oxidation.
• Excess Air for Oxidation: This is the amount of excess air used for oxidation.
• Excess Water for Oxidation: This is the amount of excess water used for oxidation.
5.2.2.7.1.5. Additives
The parameters are described briefly below.
• Chloride Removal Efficiency: Chlorides in the flue gas inlet stream are removed by
the lime/limestone slurry. This parameter determines the amount of chlorides
removed.
• The following parameters are only shown when "LS w/ Additives" is chosen as the
reagent on the "Config" screen. (See "5.2.2.7.1.2. Config" on page 165.)
Illustration 197: PC: SET PARAMETERS: SO2 Control: Wet FGD: Oxidation
Illustration 198: PC: SET PARAMETERS: SO2 Control: Wet FGD: Additives
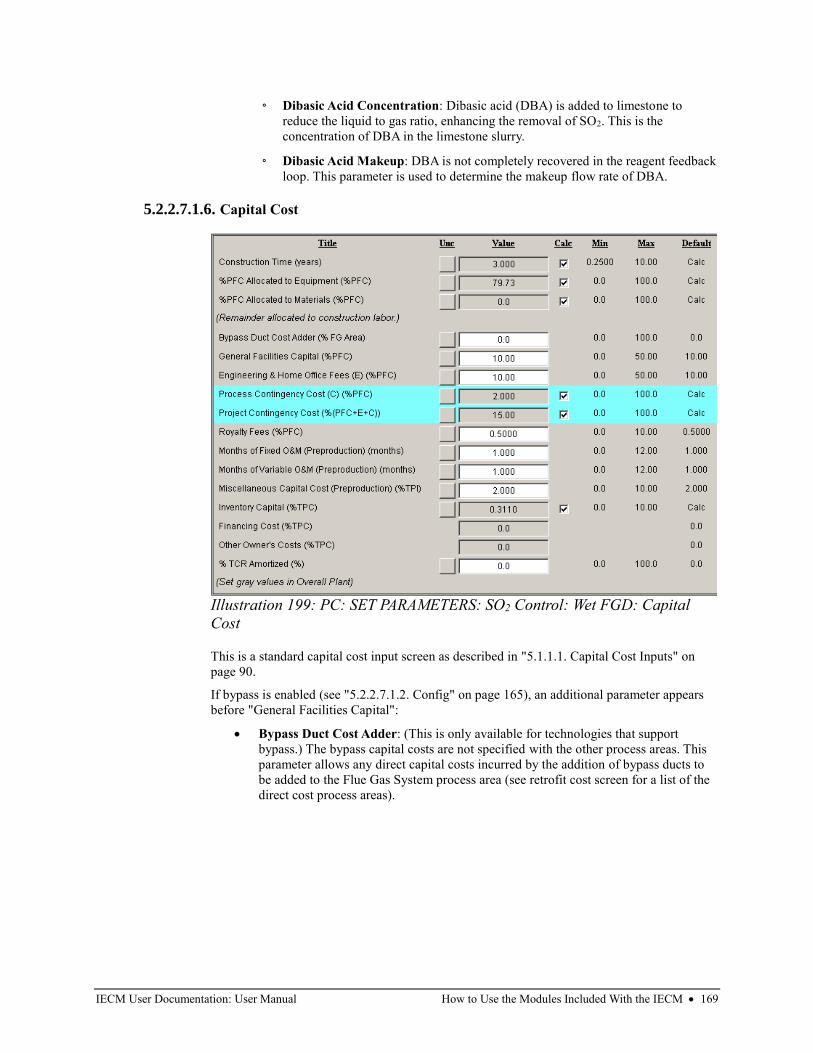
IECM User Documentation: User Manual How to Use the Modules Included With the IECM • 169
◦ Dibasic Acid Concentration: Dibasic acid (DBA) is added to limestone to
reduce the liquid to gas ratio, enhancing the removal of SO2. This is the
concentration of DBA in the limestone slurry.
◦ Dibasic Acid Makeup: DBA is not completely recovered in the reagent feedback
loop. This parameter is used to determine the makeup flow rate of DBA.
5.2.2.7.1.6. Capital Cost
This is a standard capital cost input screen as described in "5.1.1.1. Capital Cost Inputs" on
page 90.
If bypass is enabled (see "5.2.2.7.1.2. Config" on page 165), an additional parameter appears
before "General Facilities Capital":
• Bypass Duct Cost Adder: (This is only available for technologies that support
bypass.) The bypass capital costs are not specified with the other process areas. This
parameter allows any direct capital costs incurred by the addition of bypass ducts to
be added to the Flue Gas System process area (see retrofit cost screen for a list of the
direct cost process areas).
Illustration 199: PC: SET PARAMETERS: SO2 Control: Wet FGD: Capital
Cost
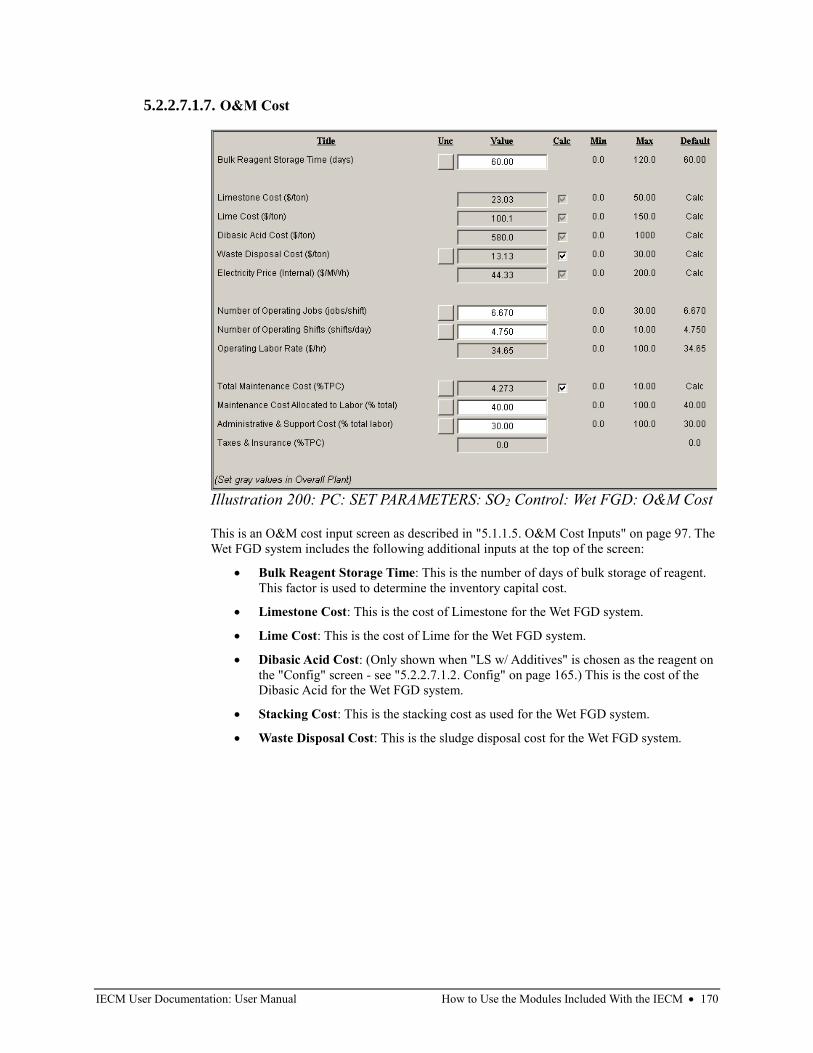
IECM User Documentation: User Manual How to Use the Modules Included With the IECM • 170
5.2.2.7.1.7. O&M Cost
This is an O&M cost input screen as described in "5.1.1.5. O&M Cost Inputs" on page 97. The
Wet FGD system includes the following additional inputs at the top of the screen:
• Bulk Reagent Storage Time: This is the number of days of bulk storage of reagent.
This factor is used to determine the inventory capital cost.
• Limestone Cost: This is the cost of Limestone for the Wet FGD system.
• Lime Cost: This is the cost of Lime for the Wet FGD system.
• Dibasic Acid Cost: (Only shown when "LS w/ Additives" is chosen as the reagent on
the "Config" screen - see "5.2.2.7.1.2. Config" on page 165.) This is the cost of the
Dibasic Acid for the Wet FGD system.
• Stacking Cost: This is the stacking cost as used for the Wet FGD system.
• Waste Disposal Cost: This is the sludge disposal cost for the Wet FGD system.
Illustration 200: PC: SET PARAMETERS: SO2 Control: Wet FGD: O&M Cost
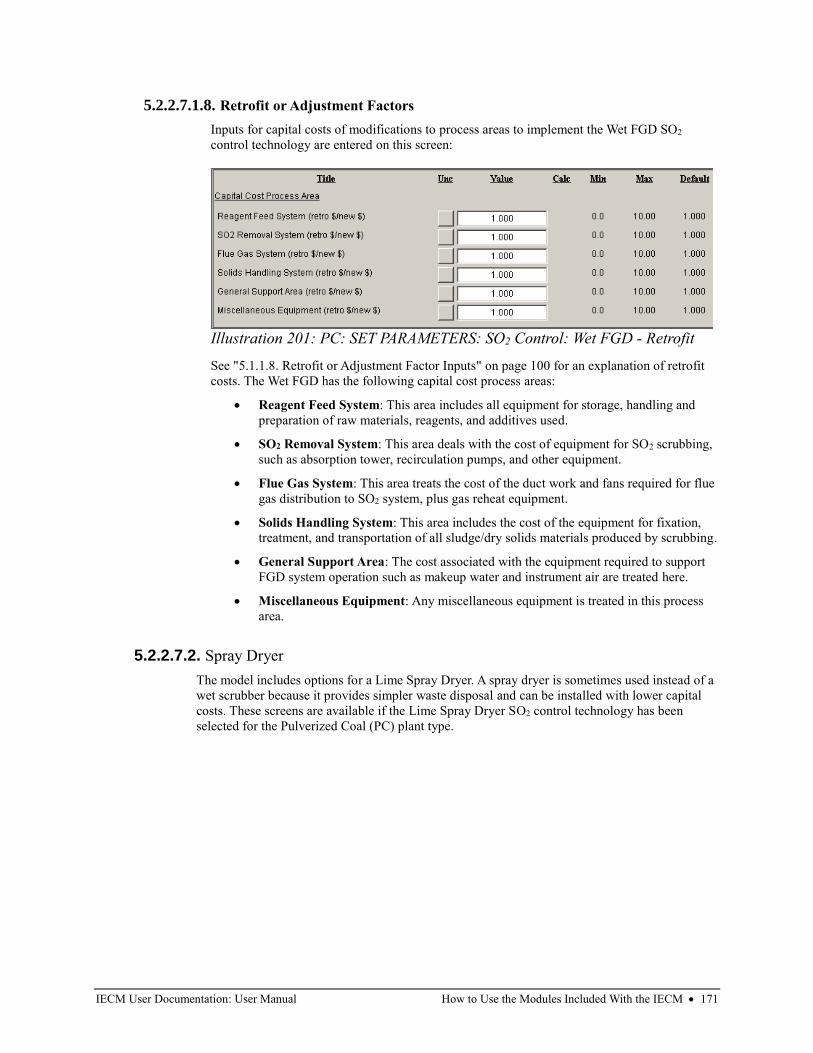
IECM User Documentation: User Manual How to Use the Modules Included With the IECM • 171
5.2.2.7.1.8. Retrofit or Adjustment Factors
Inputs for capital costs of modifications to process areas to implement the Wet FGD SO2
control technology are entered on this screen:
See "5.1.1.8. Retrofit or Adjustment Factor Inputs" on page 100 for an explanation of retrofit
costs. The Wet FGD has the following capital cost process areas:
• Reagent Feed System: This area includes all equipment for storage, handling and
preparation of raw materials, reagents, and additives used.
• SO2 Removal System: This area deals with the cost of equipment for SO2 scrubbing,
such as absorption tower, recirculation pumps, and other equipment.
• Flue Gas System: This area treats the cost of the duct work and fans required for flue
gas distribution to SO2 system, plus gas reheat equipment.
• Solids Handling System: This area includes the cost of the equipment for fixation,
treatment, and transportation of all sludge/dry solids materials produced by scrubbing.
• General Support Area: The cost associated with the equipment required to support
FGD system operation such as makeup water and instrument air are treated here.
• Miscellaneous Equipment: Any miscellaneous equipment is treated in this process
area.
5.2.2.7.2. Spray Dryer
The model includes options for a Lime Spray Dryer. A spray dryer is sometimes used instead of a
wet scrubber because it provides simpler waste disposal and can be installed with lower capital
costs. These screens are available if the Lime Spray Dryer SO2 control technology has been
selected for the Pulverized Coal (PC) plant type.
Illustration 201: PC: SET PARAMETERS: SO2 Control: Wet FGD - Retrofit
Cost Input Screen
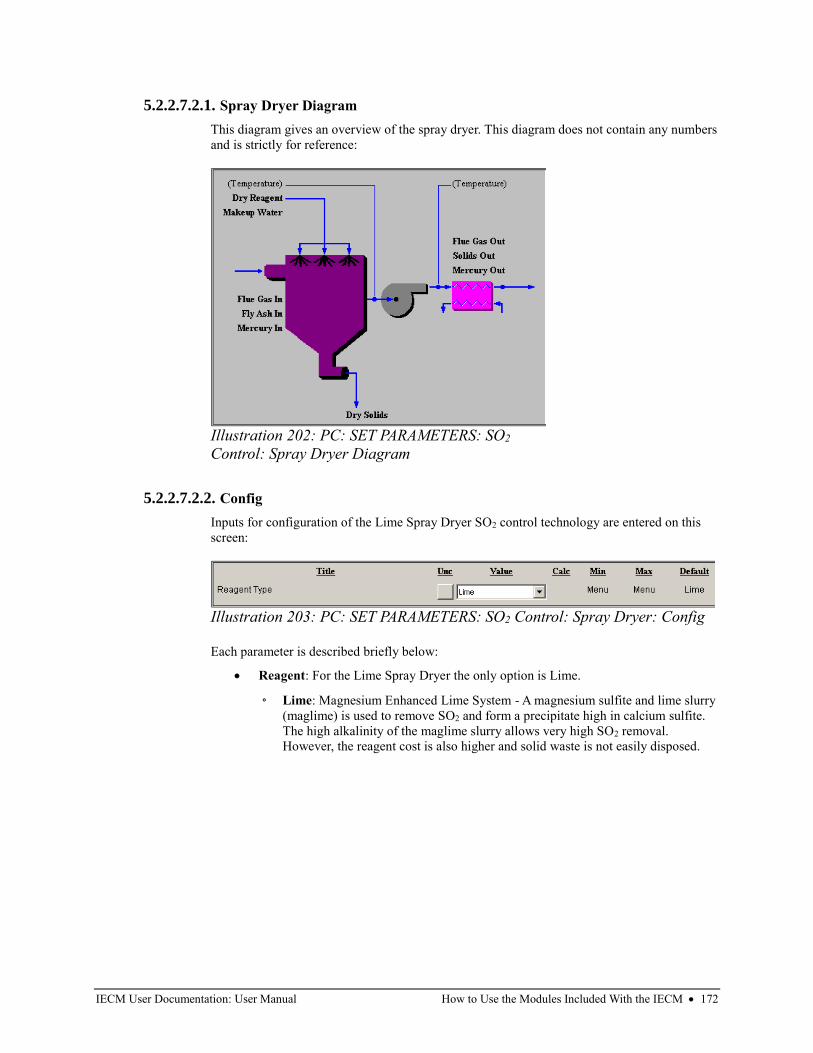
IECM User Documentation: User Manual How to Use the Modules Included With the IECM • 172
5.2.2.7.2.1. Spray Dryer Diagram
This diagram gives an overview of the spray dryer. This diagram does not contain any numbers
and is strictly for reference:
5.2.2.7.2.2. Config
Inputs for configuration of the Lime Spray Dryer SO2 control technology are entered on this
screen:
Each parameter is described briefly below:
• Reagent: For the Lime Spray Dryer the only option is Lime.
◦ Lime: Magnesium Enhanced Lime System - A magnesium sulfite and lime slurry
(maglime) is used to remove SO2 and form a precipitate high in calcium sulfite.
The high alkalinity of the maglime slurry allows very high SO2 removal.
However, the reagent cost is also higher and solid waste is not easily disposed.
Illustration 202: PC: SET PARAMETERS: SO2
Control: Spray Dryer Diagram
Illustration 203: PC: SET PARAMETERS: SO2 Control: Spray Dryer: Config
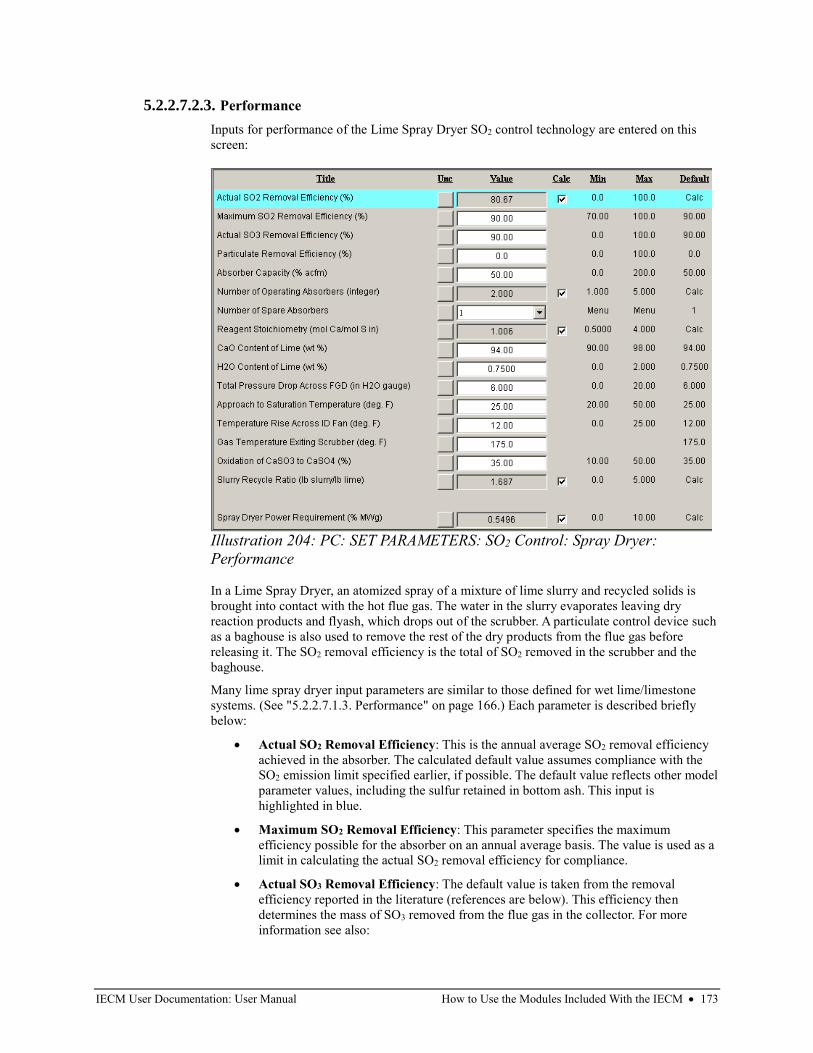
IECM User Documentation: User Manual How to Use the Modules Included With the IECM • 173
5.2.2.7.2.3. Performance
Inputs for performance of the Lime Spray Dryer SO2 control technology are entered on this
screen:
In a Lime Spray Dryer, an atomized spray of a mixture of lime slurry and recycled solids is
brought into contact with the hot flue gas. The water in the slurry evaporates leaving dry
reaction products and flyash, which drops out of the scrubber. A particulate control device such
as a baghouse is also used to remove the rest of the dry products from the flue gas before
releasing it. The SO2 removal efficiency is the total of SO2 removed in the scrubber and the
baghouse.
Many lime spray dryer input parameters are similar to those defined for wet lime/limestone
systems. (See "5.2.2.7.1.3. Performance" on page 166.) Each parameter is described briefly
below:
• Actual SO2 Removal Efficiency: This is the annual average SO2 removal efficiency
achieved in the absorber. The calculated default value assumes compliance with the
SO2 emission limit specified earlier, if possible. The default value reflects other model
parameter values, including the sulfur retained in bottom ash. This input is
highlighted in blue.
• Maximum SO2 Removal Efficiency: This parameter specifies the maximum
efficiency possible for the absorber on an annual average basis. The value is used as a
limit in calculating the actual SO2 removal efficiency for compliance.
• Actual SO3 Removal Efficiency: The default value is taken from the removal
efficiency reported in the literature (references are below). This efficiency then
determines the mass of SO3 removed from the flue gas in the collector. For more
information see also:
Illustration 204: PC: SET PARAMETERS: SO2 Control: Spray Dryer:
Performance
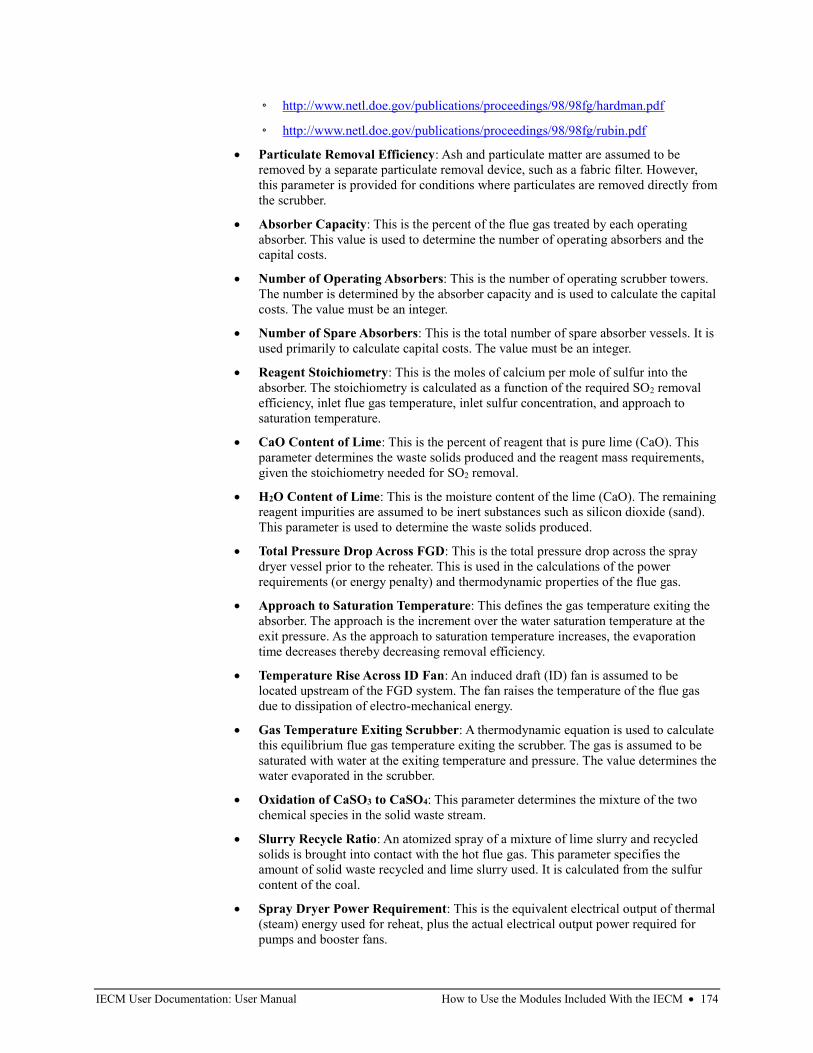
IECM User Documentation: User Manual How to Use the Modules Included With the IECM • 174
◦ http://www.netl.doe.gov/publications/proceedings/98/98fg/hardman.pdf
◦ http://www.netl.doe.gov/publications/proceedings/98/98fg/rubin.pdf
• Particulate Removal Efficiency: Ash and particulate matter are assumed to be
removed by a separate particulate removal device, such as a fabric filter. However,
this parameter is provided for conditions where particulates are removed directly from
the scrubber.
• Absorber Capacity: This is the percent of the flue gas treated by each operating
absorber. This value is used to determine the number of operating absorbers and the
capital costs.
• Number of Operating Absorbers: This is the number of operating scrubber towers.
The number is determined by the absorber capacity and is used to calculate the capital
costs. The value must be an integer.
• Number of Spare Absorbers: This is the total number of spare absorber vessels. It is
used primarily to calculate capital costs. The value must be an integer.
• Reagent Stoichiometry: This is the moles of calcium per mole of sulfur into the
absorber. The stoichiometry is calculated as a function of the required SO2 removal
efficiency, inlet flue gas temperature, inlet sulfur concentration, and approach to
saturation temperature.
• CaO Content of Lime: This is the percent of reagent that is pure lime (CaO). This
parameter determines the waste solids produced and the reagent mass requirements,
given the stoichiometry needed for SO2 removal.
• H2O Content of Lime: This is the moisture content of the lime (CaO). The remaining
reagent impurities are assumed to be inert substances such as silicon dioxide (sand).
This parameter is used to determine the waste solids produced.
• Total Pressure Drop Across FGD: This is the total pressure drop across the spray
dryer vessel prior to the reheater. This is used in the calculations of the power
requirements (or energy penalty) and thermodynamic properties of the flue gas.
• Approach to Saturation Temperature: This defines the gas temperature exiting the
absorber. The approach is the increment over the water saturation temperature at the
exit pressure. As the approach to saturation temperature increases, the evaporation
time decreases thereby decreasing removal efficiency.
• Temperature Rise Across ID Fan: An induced draft (ID) fan is assumed to be
located upstream of the FGD system. The fan raises the temperature of the flue gas
due to dissipation of electro-mechanical energy.
• Gas Temperature Exiting Scrubber: A thermodynamic equation is used to calculate
this equilibrium flue gas temperature exiting the scrubber. The gas is assumed to be
saturated with water at the exiting temperature and pressure. The value determines the
water evaporated in the scrubber.
• Oxidation of CaSO3 to CaSO4: This parameter determines the mixture of the two
chemical species in the solid waste stream.
• Slurry Recycle Ratio: An atomized spray of a mixture of lime slurry and recycled
solids is brought into contact with the hot flue gas. This parameter specifies the
amount of solid waste recycled and lime slurry used. It is calculated from the sulfur
content of the coal.
• Spray Dryer Power Requirement: This is the equivalent electrical output of thermal
(steam) energy used for reheat, plus the actual electrical output power required for
pumps and booster fans.
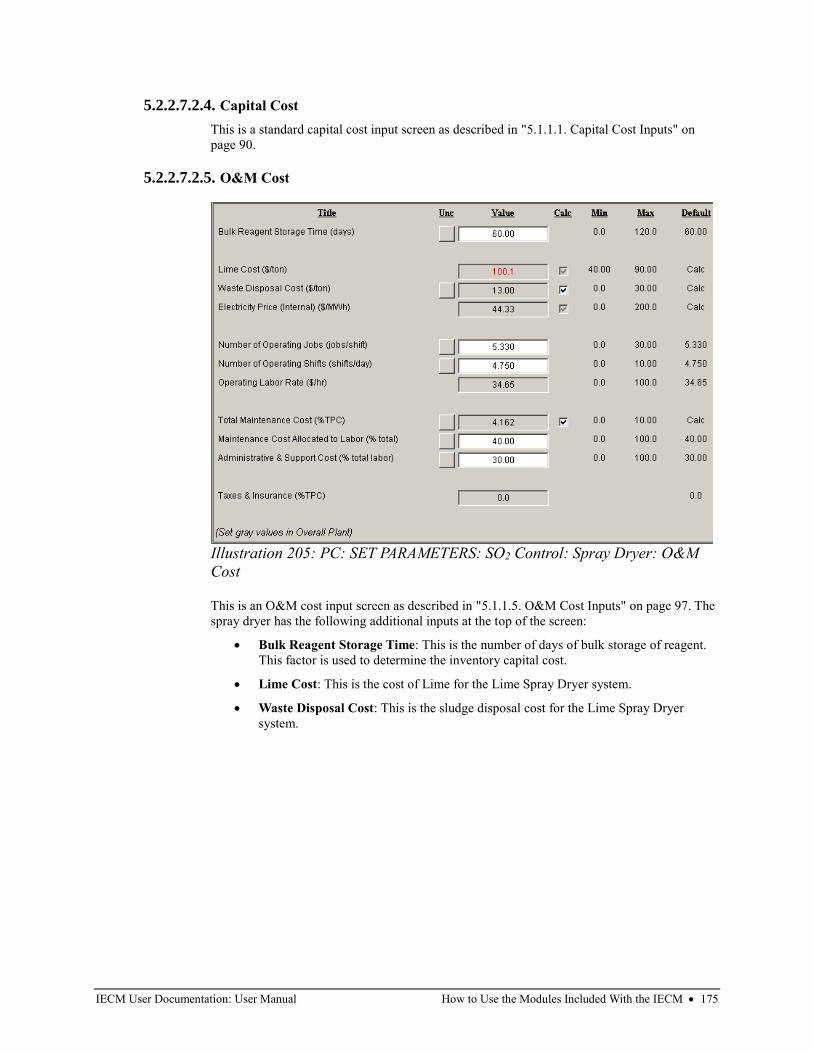
IECM User Documentation: User Manual How to Use the Modules Included With the IECM • 175
5.2.2.7.2.4. Capital Cost
This is a standard capital cost input screen as described in "5.1.1.1. Capital Cost Inputs" on
page 90.
5.2.2.7.2.5. O&M Cost
This is an O&M cost input screen as described in "5.1.1.5. O&M Cost Inputs" on page 97. The
spray dryer has the following additional inputs at the top of the screen:
• Bulk Reagent Storage Time: This is the number of days of bulk storage of reagent.
This factor is used to determine the inventory capital cost.
• Lime Cost: This is the cost of Lime for the Lime Spray Dryer system.
• Waste Disposal Cost: This is the sludge disposal cost for the Lime Spray Dryer
system.
Illustration 205: PC: SET PARAMETERS: SO2 Control: Spray Dryer: O&M
Cost
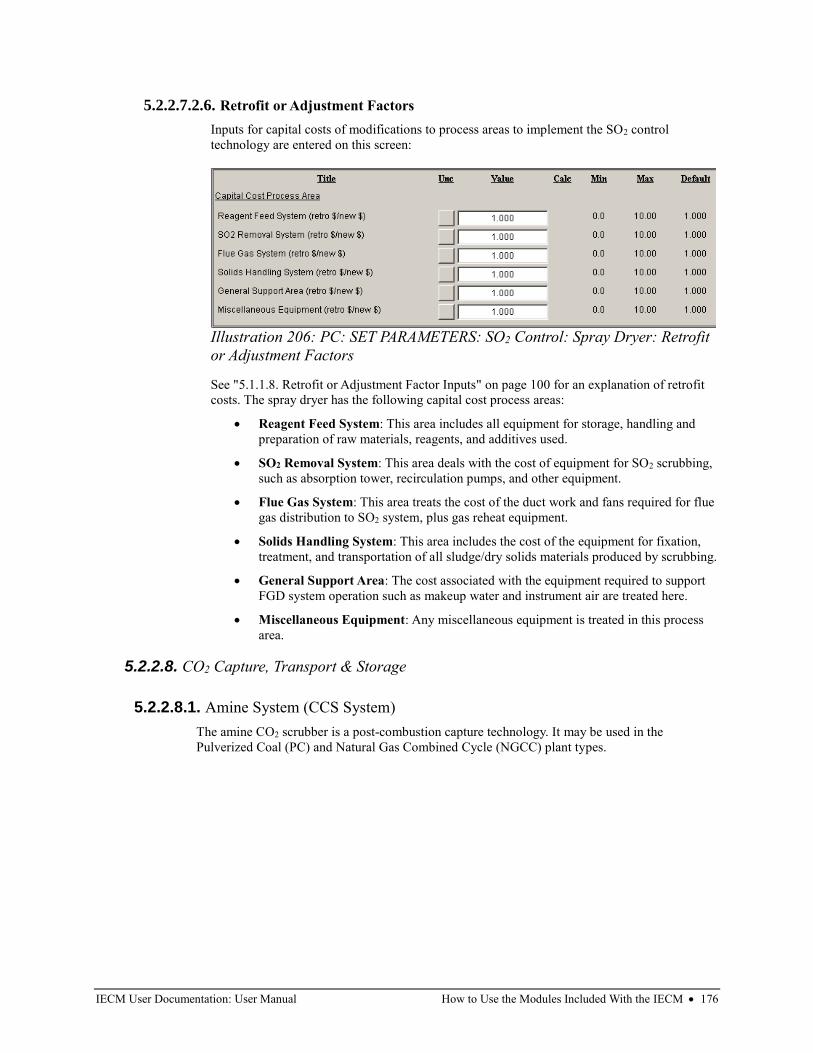
IECM User Documentation: User Manual How to Use the Modules Included With the IECM • 176
5.2.2.7.2.6. Retrofit or Adjustment Factors
Inputs for capital costs of modifications to process areas to implement the SO2 control
technology are entered on this screen:
See "5.1.1.8. Retrofit or Adjustment Factor Inputs" on page 100 for an explanation of retrofit
costs. The spray dryer has the following capital cost process areas:
• Reagent Feed System: This area includes all equipment for storage, handling and
preparation of raw materials, reagents, and additives used.
• SO2 Removal System: This area deals with the cost of equipment for SO2 scrubbing,
such as absorption tower, recirculation pumps, and other equipment.
• Flue Gas System: This area treats the cost of the duct work and fans required for flue
gas distribution to SO2 system, plus gas reheat equipment.
• Solids Handling System: This area includes the cost of the equipment for fixation,
treatment, and transportation of all sludge/dry solids materials produced by scrubbing.
• General Support Area: The cost associated with the equipment required to support
FGD system operation such as makeup water and instrument air are treated here.
• Miscellaneous Equipment: Any miscellaneous equipment is treated in this process
area.
5.2.2.8. CO2 Capture, Transport & Storage
5.2.2.8.1. Amine System (CCS System)
The amine CO2 scrubber is a post-combustion capture technology. It may be used in the
Pulverized Coal (PC) and Natural Gas Combined Cycle (NGCC) plant types.
Illustration 206: PC: SET PARAMETERS: SO2 Control: Spray Dryer: Retrofit
or Adjustment Factors
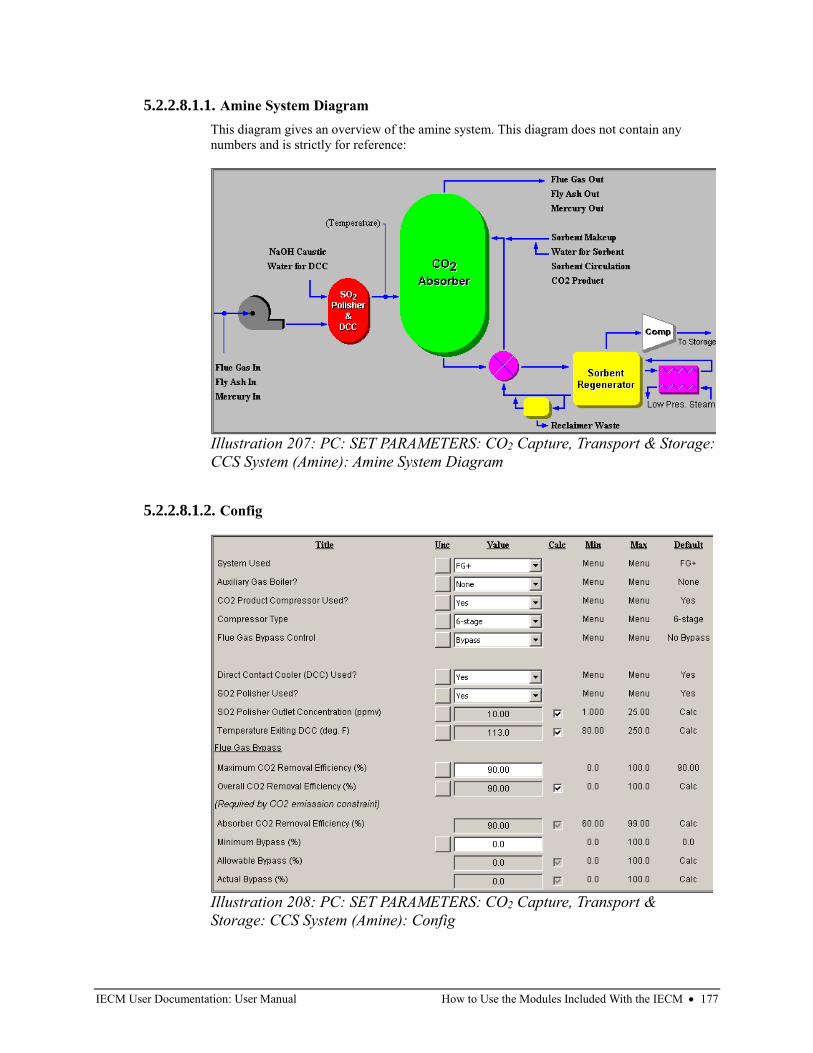
IECM User Documentation: User Manual How to Use the Modules Included With the IECM • 177
5.2.2.8.1.1. Amine System Diagram
This diagram gives an overview of the amine system. This diagram does not contain any
numbers and is strictly for reference:
5.2.2.8.1.2. Config
Illustration 207: PC: SET PARAMETERS: CO2 Capture, Transport & Storage:
CCS System (Amine): Amine System Diagram
Illustration 208: PC: SET PARAMETERS: CO2 Capture, Transport &
Storage: CCS System (Amine): Config
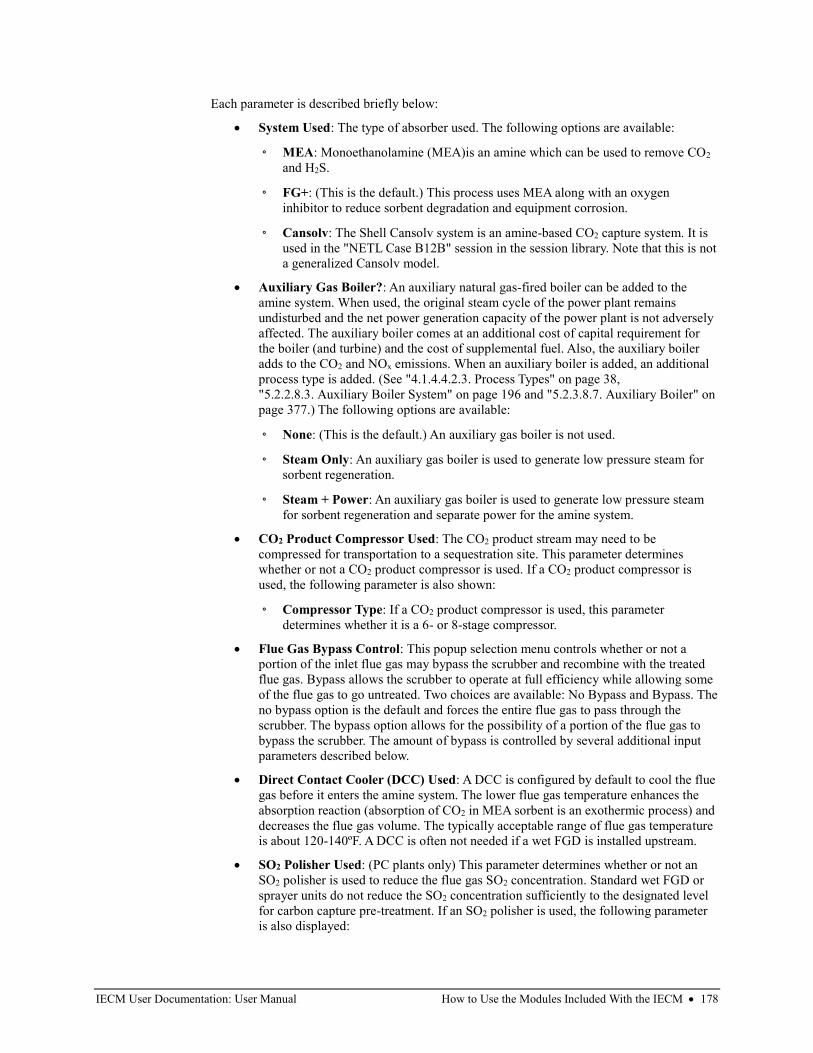
IECM User Documentation: User Manual How to Use the Modules Included With the IECM • 178
Each parameter is described briefly below:
• System Used: The type of absorber used. The following options are available:
◦ MEA: Monoethanolamine (MEA)is an amine which can be used to remove CO2
and H2S.
◦ FG+: (This is the default.) This process uses MEA along with an oxygen
inhibitor to reduce sorbent degradation and equipment corrosion.
◦ Cansolv: The Shell Cansolv system is an amine-based CO2 capture system. It is
used in the "NETL Case B12B" session in the session library. Note that this is not
a generalized Cansolv model.
• Auxiliary Gas Boiler?: An auxiliary natural gas-fired boiler can be added to the
amine system. When used, the original steam cycle of the power plant remains
undisturbed and the net power generation capacity of the power plant is not adversely
affected. The auxiliary boiler comes at an additional cost of capital requirement for
the boiler (and turbine) and the cost of supplemental fuel. Also, the auxiliary boiler
adds to the CO2 and NOx emissions. When an auxiliary boiler is added, an additional
process type is added. (See "4.1.4.4.2.3. Process Types" on page 38,
"5.2.2.8.3. Auxiliary Boiler System" on page 196 and "5.2.3.8.7. Auxiliary Boiler" on
page 377.) The following options are available:
◦ None: (This is the default.) An auxiliary gas boiler is not used.
◦ Steam Only: An auxiliary gas boiler is used to generate low pressure steam for
sorbent regeneration.
◦ Steam + Power: An auxiliary gas boiler is used to generate low pressure steam
for sorbent regeneration and separate power for the amine system.
• CO2 Product Compressor Used: The CO2 product stream may need to be
compressed for transportation to a sequestration site. This parameter determines
whether or not a CO2 product compressor is used. If a CO2 product compressor is
used, the following parameter is also shown:
◦ Compressor Type: If a CO2 product compressor is used, this parameter
determines whether it is a 6- or 8-stage compressor.
• Flue Gas Bypass Control: This popup selection menu controls whether or not a
portion of the inlet flue gas may bypass the scrubber and recombine with the treated
flue gas. Bypass allows the scrubber to operate at full efficiency while allowing some
of the flue gas to go untreated. Two choices are available: No Bypass and Bypass. The
no bypass option is the default and forces the entire flue gas to pass through the
scrubber. The bypass option allows for the possibility of a portion of the flue gas to
bypass the scrubber. The amount of bypass is controlled by several additional input
parameters described below.
• Direct Contact Cooler (DCC) Used: A DCC is configured by default to cool the flue
gas before it enters the amine system. The lower flue gas temperature enhances the
absorption reaction (absorption of CO2 in MEA sorbent is an exothermic process) and
decreases the flue gas volume. The typically acceptable range of flue gas temperature
is about 120-140ºF. A DCC is often not needed if a wet FGD is installed upstream.
• SO2 Polisher Used: (PC plants only) This parameter determines whether or not an
SO2 polisher is used to reduce the flue gas SO2 concentration. Standard wet FGD or
sprayer units do not reduce the SO2 concentration sufficiently to the designated level
for carbon capture pre-treatment. If an SO2 polisher is used, the following parameter
is also displayed:
IECM User Documentation: User Manual How to Use the Modules Included With the IECM • 179
◦ SO2 Polisher Outlet Concentration: This is the SO2 concentration exiting the
polisher, if one is in use. This value is used to determine the amount of reagent
required. The default is based on the sorbent.
• Temperature Exiting DCC: (Only displayed when a DCC is used.) This is the
temperature exiting the DCC. The desirable temperature of the flue gas entering the
CO2 capture system is about 113-122ºF. If the inlet temperature to the DCC is at or
below this temperature, the DCC is not used.
• Flue Gas Bypass: These parameters control the amount of bypass. They are only
displayed if bypass is chosen above:
◦ Maximum CO2 Removal Efficiency: This parameter specifies the maximum
efficiency possible for the absorber on an annual average basis. The value is used
as a limit in calculating the actual CO2 removal efficiency for compliance.
◦ Overall CO2 Removal Efficiency: This value is the CO2 removal efficiency
required for the entire power plant to meet the CO2 emission constraint set earlier.
It is used to determine the actual flue gas bypass above.
◦ Absorber CO2 Removal Efficiency: This is the actual removal efficiency of the
absorber alone. It is a function of the CO2 emission constraint and the actual flue
gas bypass.
◦ Minimum Bypass: This specifies the trigger point for allowing flue gas to
bypass the scrubber. No bypass is allowed until the allowable amount reaches the
minimum level set by this parameter.
◦ Allowable Bypass: This is the amount of flue gas that is allowed to bypass the
scrubber, based on the actual and maximum performance of the CO2 removal. It
is provided for reference only. The model determines the bypass that produces
the maximum CO2 removal and compares this potential bypass with the
minimum bypass value specified above. Bypass is only allowed when the
potential bypass value exceeds the minimum bypass value.
◦ Actual Bypass: This displays the actual bypass being used in the model. It is
based on all of the above and is provided for reference purposes only.
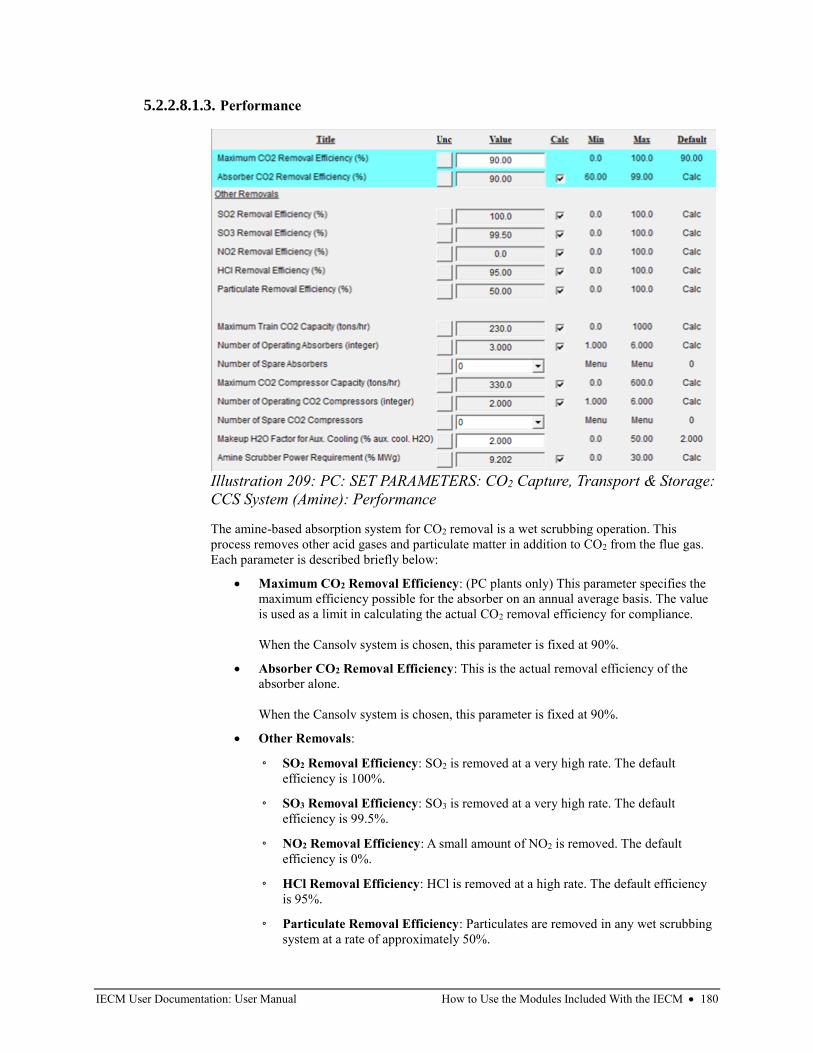
IECM User Documentation: User Manual How to Use the Modules Included With the IECM • 180
5.2.2.8.1.3. Performance
The amine-based absorption system for CO2 removal is a wet scrubbing operation. This
process removes other acid gases and particulate matter in addition to CO2 from the flue gas.
Each parameter is described briefly below:
• Maximum CO2 Removal Efficiency: (PC plants only) This parameter specifies the
maximum efficiency possible for the absorber on an annual average basis. The value
is used as a limit in calculating the actual CO2 removal efficiency for compliance.
When the Cansolv system is chosen, this parameter is fixed at 90%.
• Absorber CO2 Removal Efficiency: This is the actual removal efficiency of the
absorber alone.
When the Cansolv system is chosen, this parameter is fixed at 90%.
• Other Removals:
◦ SO2 Removal Efficiency: SO2 is removed at a very high rate. The default
efficiency is 100%.
◦ SO3 Removal Efficiency: SO3 is removed at a very high rate. The default
efficiency is 99.5%.
◦ NO2 Removal Efficiency: A small amount of NO2 is removed. The default
efficiency is 0%.
◦ HCl Removal Efficiency: HCl is removed at a high rate. The default efficiency
is 95%.
◦ Particulate Removal Efficiency: Particulates are removed in any wet scrubbing
system at a rate of approximately 50%.
Illustration 209: PC: SET PARAMETERS: CO2 Capture, Transport & Storage:
CCS System (Amine): Performance
IECM User Documentation: User Manual How to Use the Modules Included With the IECM • 181
• Trace Removals: (currently only shown in NGCC plants)
◦ Mercury Removal Efficiency (oxidized): This is the removal efficiency of the
oxidized portion of mercury from the CO2 absorber. The removed portion can be
found in the bottom ash and the remainder found in the flue gas.
◦ Mercury Removal Efficiency (elemental): This is the removal efficiency of the
elemental portion of mercury from the CO2 absorber. The removed portion can be
found in the bottom ash and the remainder found in the flue gas.
• Maximum Train CO2 Capacity: The default maximum train size is used with the
actual CO2 capture rate to determine the number of trains required.
• Number of Operating Absorbers: This is the total number of operating absorber
vessels. It is determined by the train capacity specified above and is used primarily to
calculate capital costs. The value must be an integer.
• Number of Spare Absorbers: This is the total number of spare absorber vessels. It is
used primarily to calculate capital costs. Up to two spare absorbers may be specified.
• Maximum CO2 Compressor Capacity: This is the maximum amount of CO2
product that can be compressed per hour at the specified pressure (see the storage
input screen).
• Number of Operating CO2 Compressors: This is the total number of operating CO2
compressors. It is used primarily to calculate capital costs. The value must be an
integer.
• Number of Spare CO2 Compressors: This is the total number of spare CO2
compressors. It is used primarily to calculate capital costs. Up to two spare CO2
compressors may be specified.
• Makeup H2O Factor for Aux. Cooling: (Only shown when an Air Cooled
Condenser is used for plant cooling.) When CCS and an Air Cooled Condenser are
used, the CCS system uses an auxiliary cooling system. This parameter specifies the
amount of makeup water required for the auxiliary cooling system.
• Amine Scrubber Power Requirement: This is the equivalent electrical output of
thermal (steam) energy used for reheat, plus the actual electrical power required for
pumps and booster fans.
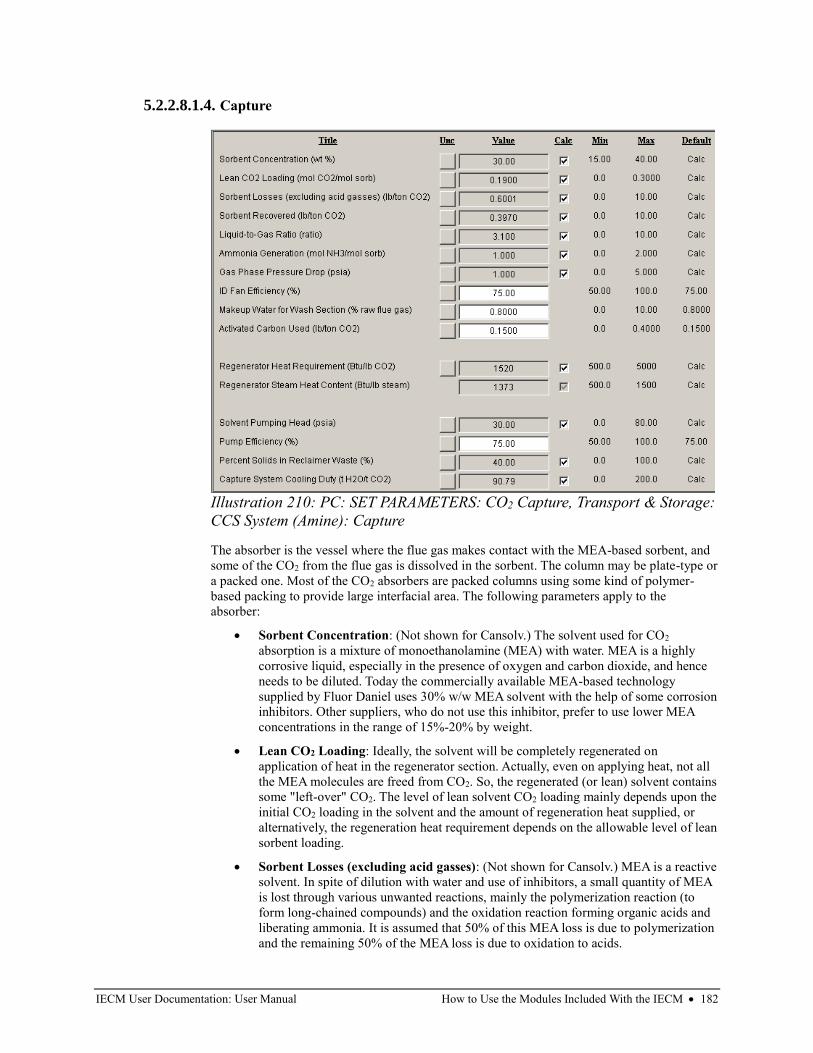
IECM User Documentation: User Manual How to Use the Modules Included With the IECM • 182
5.2.2.8.1.4. Capture
The absorber is the vessel where the flue gas makes contact with the MEA-based sorbent, and
some of the CO2 from the flue gas is dissolved in the sorbent. The column may be plate-type or
a packed one. Most of the CO2 absorbers are packed columns using some kind of polymer-
based packing to provide large interfacial area. The following parameters apply to the
absorber:
• Sorbent Concentration: (Not shown for Cansolv.) The solvent used for CO2
absorption is a mixture of monoethanolamine (MEA) with water. MEA is a highly
corrosive liquid, especially in the presence of oxygen and carbon dioxide, and hence
needs to be diluted. Today the commercially available MEA-based technology
supplied by Fluor Daniel uses 30% w/w MEA solvent with the help of some corrosion
inhibitors. Other suppliers, who do not use this inhibitor, prefer to use lower MEA
concentrations in the range of 15%-20% by weight.
• Lean CO2 Loading: Ideally, the solvent will be completely regenerated on
application of heat in the regenerator section. Actually, even on applying heat, not all
the MEA molecules are freed from CO2. So, the regenerated (or lean) solvent contains
some "left-over" CO2. The level of lean solvent CO2 loading mainly depends upon the
initial CO2 loading in the solvent and the amount of regeneration heat supplied, or
alternatively, the regeneration heat requirement depends on the allowable level of lean
sorbent loading.
• Sorbent Losses (excluding acid gasses): (Not shown for Cansolv.) MEA is a reactive
solvent. In spite of dilution with water and use of inhibitors, a small quantity of MEA
is lost through various unwanted reactions, mainly the polymerization reaction (to
form long-chained compounds) and the oxidation reaction forming organic acids and
liberating ammonia. It is assumed that 50% of this MEA loss is due to polymerization
and the remaining 50% of the MEA loss is due to oxidation to acids.
Illustration 210: PC: SET PARAMETERS: CO2 Capture, Transport & Storage:
CCS System (Amine): Capture
IECM User Documentation: User Manual How to Use the Modules Included With the IECM • 183
• Sorbent Recovered: (Not shown for Cansolv.) This is the amount of sorbent
regenerated by caustic added to the reclaimer.
• Liquid to Gas Ratio: (Not shown for Cansolv.) The liquid to gas ration is the ratio of
total molar flow rate of the liquid (MEA sorbent plus water) to the total molar flow
rate of flue gas being treated in the absorber.
• Ammonia Generation: (Not shown for Cansolv.) The oxidation of MEA to organic
acids (oxalic, formic, etc.) also leads to formation of NH3. Each mole of MEA lost in
oxidation, liberates a mole of ammonia (NH3).
• Gas Phase Pressure Drop: (Not shown for Cansolv.) This is the pressure drop that
the flue gas has to overcome as it passes through a very tall absorber column,
countercurrent to the sorbent flow.
• ID Fan Efficiency: The cooled flue gas is pressurized using a flue gas blower before
it enters the absorber. This is the efficiency of the fan/blower to convert electrical
power input into mechanical work output.
• Makeup Water for Wash Section: This is the amount of makeup water required by
the wash section, expressed as a percent of the weight of the raw flue gas.
• Activated Carbon Used: (Not shown for Cansolv.) This is the amount of activated
carbon in the sorbent circuit to help remove the polymeric sorbent compounds.
The regenerator is the column where the weak intermediate compound (carbamate) formed
between the MEA-based sorbent and dissolved CO2 is broken down with the application of
heat and CO2 gets separated from the sorbent to leave reusable sorbent behind. In case of
unhindered amines like MEA, the carbamate formed is stable and it takes large amount of
energy to dissociate. It also consists of a flash separator where CO2 is separated from most of
the moisture and evaporated sorbent, to give a fairly rich CO2 stream. The following
parameters apply to the regenerator:
• Regeneration Heat Requirement: This is the total amount of heat energy required in
the reboiler for sorbent regeneration.
• Steam Heat Content: The regeneration heat is provided in the form of LP steam
extracted from the steam turbine (in case of coal-fired power plants and combined-
cycle gas plants), through the reboiler (a heat exchanger). In case of simple cycle
natural gas fired power plants, a heat recovery unit maybe required. This is the
enthalpy or heat content of the steam used for solvent regeneration.
• Heat-to-Electricity Efficiency: (Only shown when an auxiliary boiler is not used.)
This is the efficiency of converting low pressure steam to electricity. The value
reflects the loss of electricity to the base plant when the LP steam is used for
regenerator heat.
• Solvent Pumping Head: The solvent has to flow through the absorber column
(generally through packed media) countercurrent to the flue gas flowing upwards. So,
some pressure loss is encountered in the absorber column and sufficient solvent head
has to be provided to overcome these pressure losses. Solvent circulation pumps are
used to provide the pressure head.
• Pump Efficiency: This is the efficiency of the solvent circulation pumps to convert
electrical power input into mechanical power output.
• Percent Solids in Reclaimer Waste: (Not shown for Cansolv.) This is the amount of
solids typically present in the reclaimer waste.
• Capture System Cooling Duty: This is the total amount of cooling water normalized
by CO2 product.
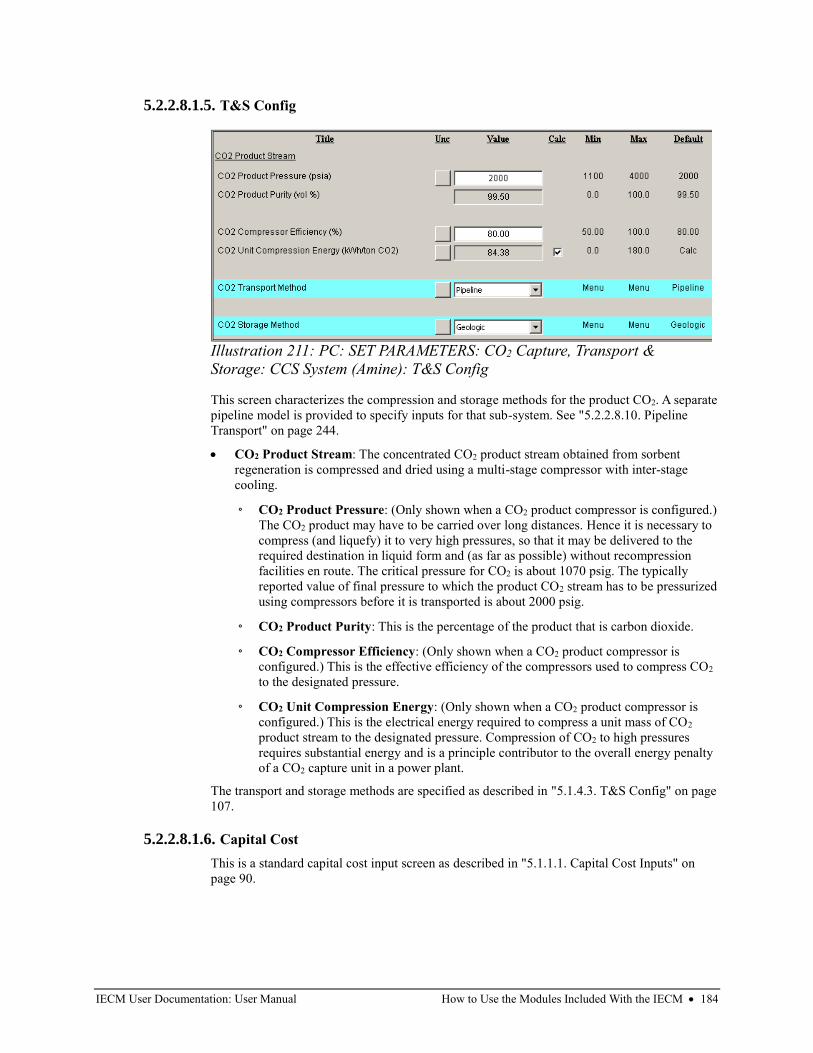
IECM User Documentation: User Manual How to Use the Modules Included With the IECM • 184
5.2.2.8.1.5. T&S Config
This screen characterizes the compression and storage methods for the product CO2. A separate
pipeline model is provided to specify inputs for that sub-system. See "5.2.2.8.10. Pipeline
Transport" on page 244.
• CO2 Product Stream: The concentrated CO2 product stream obtained from sorbent
regeneration is compressed and dried using a multi-stage compressor with inter-stage
cooling.
◦ CO2 Product Pressure: (Only shown when a CO2 product compressor is configured.)
The CO2 product may have to be carried over long distances. Hence it is necessary to
compress (and liquefy) it to very high pressures, so that it may be delivered to the
required destination in liquid form and (as far as possible) without recompression
facilities en route. The critical pressure for CO2 is about 1070 psig. The typically
reported value of final pressure to which the product CO2 stream has to be pressurized
using compressors before it is transported is about 2000 psig.
◦ CO2 Product Purity: This is the percentage of the product that is carbon dioxide.
◦ CO2 Compressor Efficiency: (Only shown when a CO2 product compressor is
configured.) This is the effective efficiency of the compressors used to compress CO2
to the designated pressure.
◦ CO2 Unit Compression Energy: (Only shown when a CO2 product compressor is
configured.) This is the electrical energy required to compress a unit mass of CO2
product stream to the designated pressure. Compression of CO2 to high pressures
requires substantial energy and is a principle contributor to the overall energy penalty
of a CO2 capture unit in a power plant.
The transport and storage methods are specified as described in "5.1.4.3. T&S Config" on page
107.
5.2.2.8.1.6. Capital Cost
This is a standard capital cost input screen as described in "5.1.1.1. Capital Cost Inputs" on
page 90.
Illustration 211: PC: SET PARAMETERS: CO2 Capture, Transport &
Storage: CCS System (Amine): T&S Config
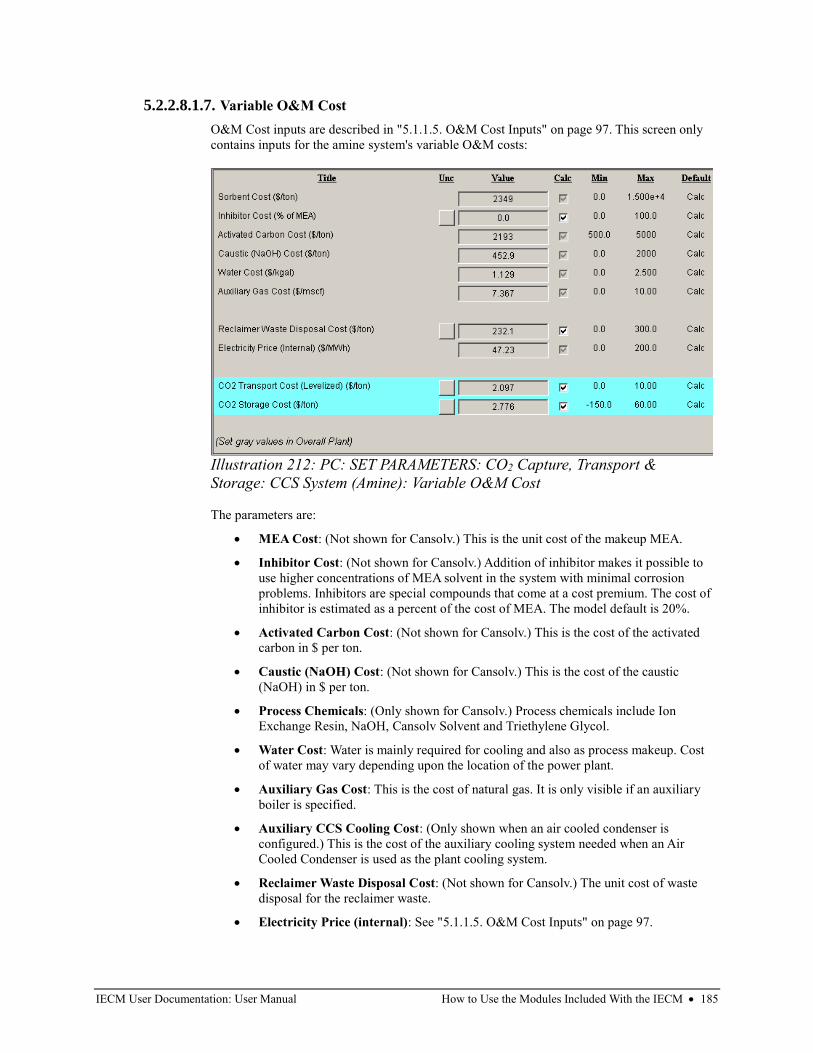
IECM User Documentation: User Manual How to Use the Modules Included With the IECM • 185
5.2.2.8.1.7. Variable O&M Cost
O&M Cost inputs are described in "5.1.1.5. O&M Cost Inputs" on page 97. This screen only
contains inputs for the amine system's variable O&M costs:
The parameters are:
• MEA Cost: (Not shown for Cansolv.) This is the unit cost of the makeup MEA.
• Inhibitor Cost: (Not shown for Cansolv.) Addition of inhibitor makes it possible to
use higher concentrations of MEA solvent in the system with minimal corrosion
problems. Inhibitors are special compounds that come at a cost premium. The cost of
inhibitor is estimated as a percent of the cost of MEA. The model default is 20%.
• Activated Carbon Cost: (Not shown for Cansolv.) This is the cost of the activated
carbon in $ per ton.
• Caustic (NaOH) Cost: (Not shown for Cansolv.) This is the cost of the caustic
(NaOH) in $ per ton.
• Process Chemicals: (Only shown for Cansolv.) Process chemicals include Ion
Exchange Resin, NaOH, Cansolv Solvent and Triethylene Glycol.
• Water Cost: Water is mainly required for cooling and also as process makeup. Cost
of water may vary depending upon the location of the power plant.
• Auxiliary Gas Cost: This is the cost of natural gas. It is only visible if an auxiliary
boiler is specified.
• Auxiliary CCS Cooling Cost: (Only shown when an air cooled condenser is
configured.) This is the cost of the auxiliary cooling system needed when an Air
Cooled Condenser is used as the plant cooling system.
• Reclaimer Waste Disposal Cost: (Not shown for Cansolv.) The unit cost of waste
disposal for the reclaimer waste.
• Electricity Price (internal): See "5.1.1.5. O&M Cost Inputs" on page 97.
Illustration 212: PC: SET PARAMETERS: CO2 Capture, Transport &
Storage: CCS System (Amine): Variable O&M Cost
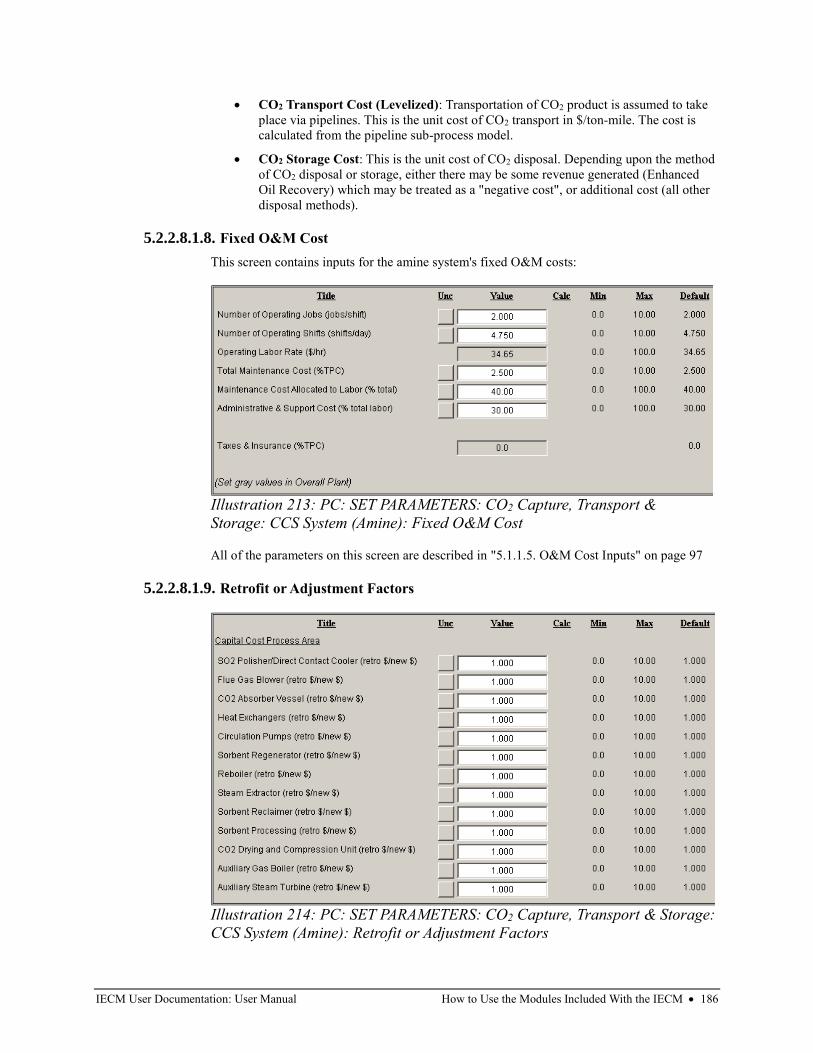
IECM User Documentation: User Manual How to Use the Modules Included With the IECM • 186
• CO2 Transport Cost (Levelized): Transportation of CO2 product is assumed to take
place via pipelines. This is the unit cost of CO2 transport in $/ton-mile. The cost is
calculated from the pipeline sub-process model.
• CO2 Storage Cost: This is the unit cost of CO2 disposal. Depending upon the method
of CO2 disposal or storage, either there may be some revenue generated (Enhanced
Oil Recovery) which may be treated as a "negative cost", or additional cost (all other
disposal methods).
5.2.2.8.1.8. Fixed O&M Cost
This screen contains inputs for the amine system's fixed O&M costs:
All of the parameters on this screen are described in "5.1.1.5. O&M Cost Inputs" on page 97
5.2.2.8.1.9. Retrofit or Adjustment Factors
Illustration 213: PC: SET PARAMETERS: CO2 Capture, Transport &
Storage: CCS System (Amine): Fixed O&M Cost
Illustration 214: PC: SET PARAMETERS: CO2 Capture, Transport & Storage:
CCS System (Amine): Retrofit or Adjustment Factors
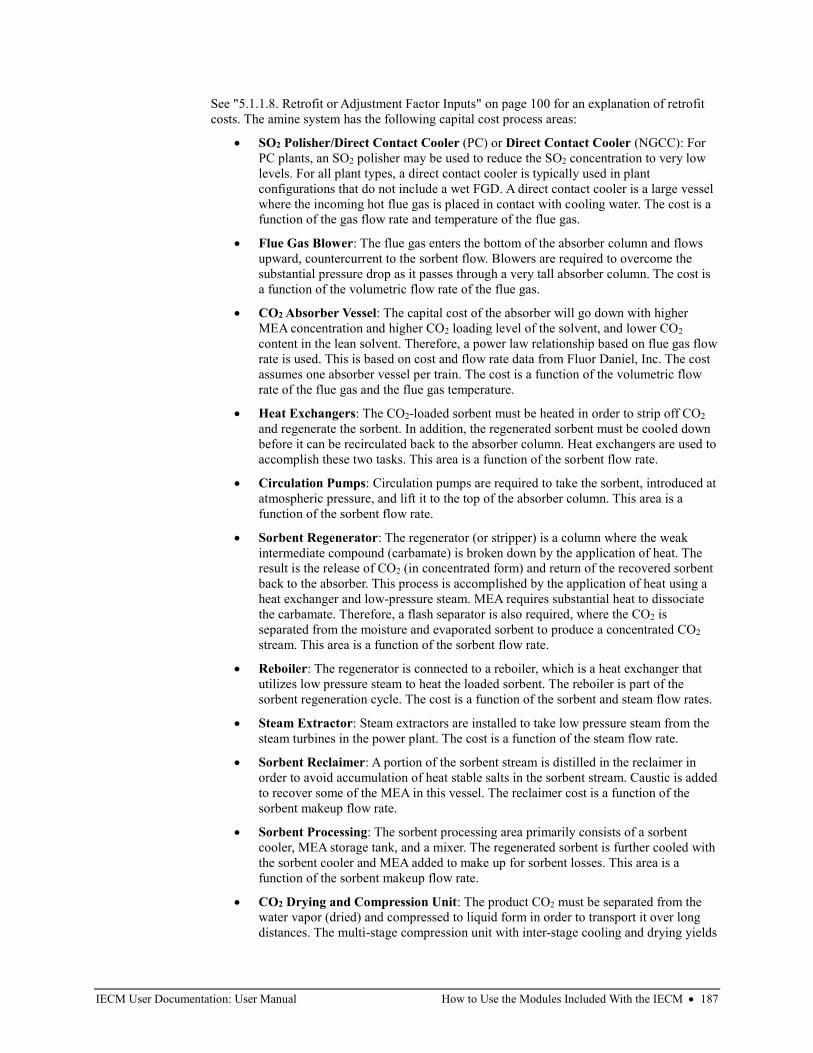
IECM User Documentation: User Manual How to Use the Modules Included With the IECM • 187
See "5.1.1.8. Retrofit or Adjustment Factor Inputs" on page 100 for an explanation of retrofit
costs. The amine system has the following capital cost process areas:
• SO2 Polisher/Direct Contact Cooler (PC) or Direct Contact Cooler (NGCC): For
PC plants, an SO2 polisher may be used to reduce the SO2 concentration to very low
levels. For all plant types, a direct contact cooler is typically used in plant
configurations that do not include a wet FGD. A direct contact cooler is a large vessel
where the incoming hot flue gas is placed in contact with cooling water. The cost is a
function of the gas flow rate and temperature of the flue gas.
• Flue Gas Blower: The flue gas enters the bottom of the absorber column and flows
upward, countercurrent to the sorbent flow. Blowers are required to overcome the
substantial pressure drop as it passes through a very tall absorber column. The cost is
a function of the volumetric flow rate of the flue gas.
• CO2 Absorber Vessel: The capital cost of the absorber will go down with higher
MEA concentration and higher CO2 loading level of the solvent, and lower CO2
content in the lean solvent. Therefore, a power law relationship based on flue gas flow
rate is used. This is based on cost and flow rate data from Fluor Daniel, Inc. The cost
assumes one absorber vessel per train. The cost is a function of the volumetric flow
rate of the flue gas and the flue gas temperature.
• Heat Exchangers: The CO2-loaded sorbent must be heated in order to strip off CO2
and regenerate the sorbent. In addition, the regenerated sorbent must be cooled down
before it can be recirculated back to the absorber column. Heat exchangers are used to
accomplish these two tasks. This area is a function of the sorbent flow rate.
• Circulation Pumps: Circulation pumps are required to take the sorbent, introduced at
atmospheric pressure, and lift it to the top of the absorber column. This area is a
function of the sorbent flow rate.
• Sorbent Regenerator: The regenerator (or stripper) is a column where the weak
intermediate compound (carbamate) is broken down by the application of heat. The
result is the release of CO2 (in concentrated form) and return of the recovered sorbent
back to the absorber. This process is accomplished by the application of heat using a
heat exchanger and low-pressure steam. MEA requires substantial heat to dissociate
the carbamate. Therefore, a flash separator is also required, where the CO2 is
separated from the moisture and evaporated sorbent to produce a concentrated CO2
stream. This area is a function of the sorbent flow rate.
• Reboiler: The regenerator is connected to a reboiler, which is a heat exchanger that
utilizes low pressure steam to heat the loaded sorbent. The reboiler is part of the
sorbent regeneration cycle. The cost is a function of the sorbent and steam flow rates.
• Steam Extractor: Steam extractors are installed to take low pressure steam from the
steam turbines in the power plant. The cost is a function of the steam flow rate.
• Sorbent Reclaimer: A portion of the sorbent stream is distilled in the reclaimer in
order to avoid accumulation of heat stable salts in the sorbent stream. Caustic is added
to recover some of the MEA in this vessel. The reclaimer cost is a function of the
sorbent makeup flow rate.
• Sorbent Processing: The sorbent processing area primarily consists of a sorbent
cooler, MEA storage tank, and a mixer. The regenerated sorbent is further cooled with
the sorbent cooler and MEA added to make up for sorbent losses. This area is a
function of the sorbent makeup flow rate.
• CO2 Drying and Compression Unit: The product CO2 must be separated from the
water vapor (dried) and compressed to liquid form in order to transport it over long
distances. The multi-stage compression unit with inter-stage cooling and drying yields
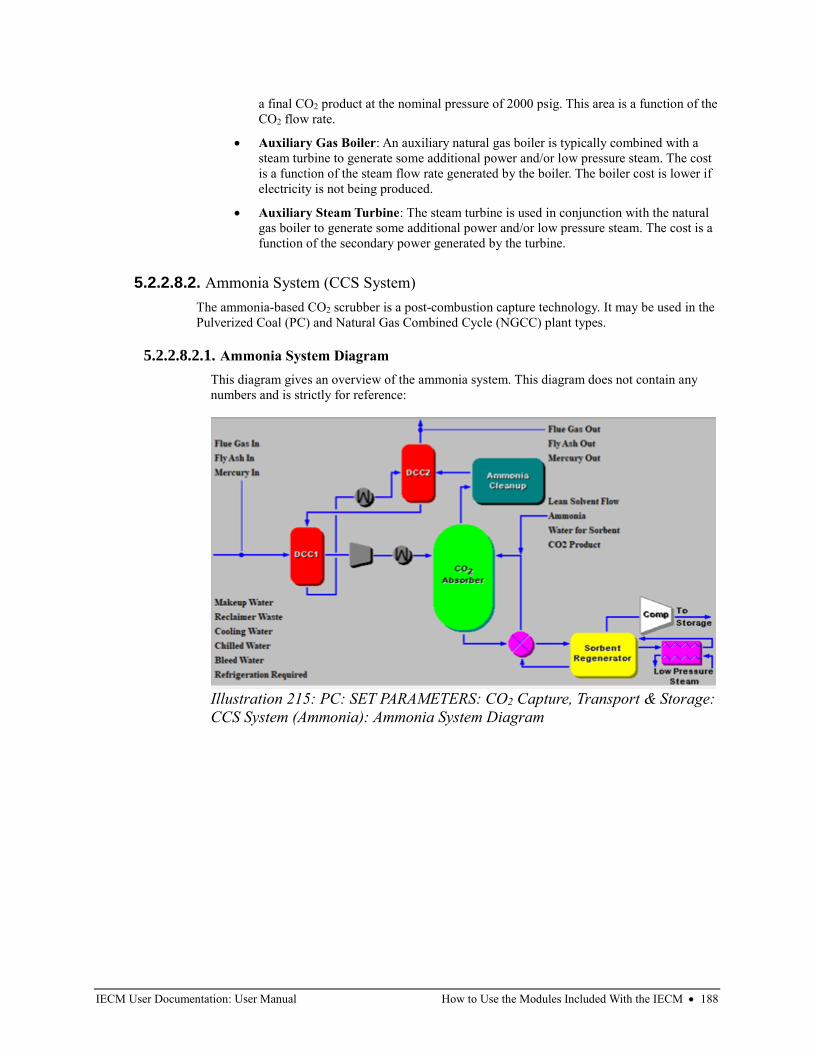
IECM User Documentation: User Manual How to Use the Modules Included With the IECM • 188
a final CO2 product at the nominal pressure of 2000 psig. This area is a function of the
CO2 flow rate.
• Auxiliary Gas Boiler: An auxiliary natural gas boiler is typically combined with a
steam turbine to generate some additional power and/or low pressure steam. The cost
is a function of the steam flow rate generated by the boiler. The boiler cost is lower if
electricity is not being produced.
• Auxiliary Steam Turbine: The steam turbine is used in conjunction with the natural
gas boiler to generate some additional power and/or low pressure steam. The cost is a
function of the secondary power generated by the turbine.
5.2.2.8.2. Ammonia System (CCS System)
The ammonia-based CO2 scrubber is a post-combustion capture technology. It may be used in the
Pulverized Coal (PC) and Natural Gas Combined Cycle (NGCC) plant types.
5.2.2.8.2.1. Ammonia System Diagram
This diagram gives an overview of the ammonia system. This diagram does not contain any
numbers and is strictly for reference:
Illustration 215: PC: SET PARAMETERS: CO2 Capture, Transport & Storage:
CCS System (Ammonia): Ammonia System Diagram
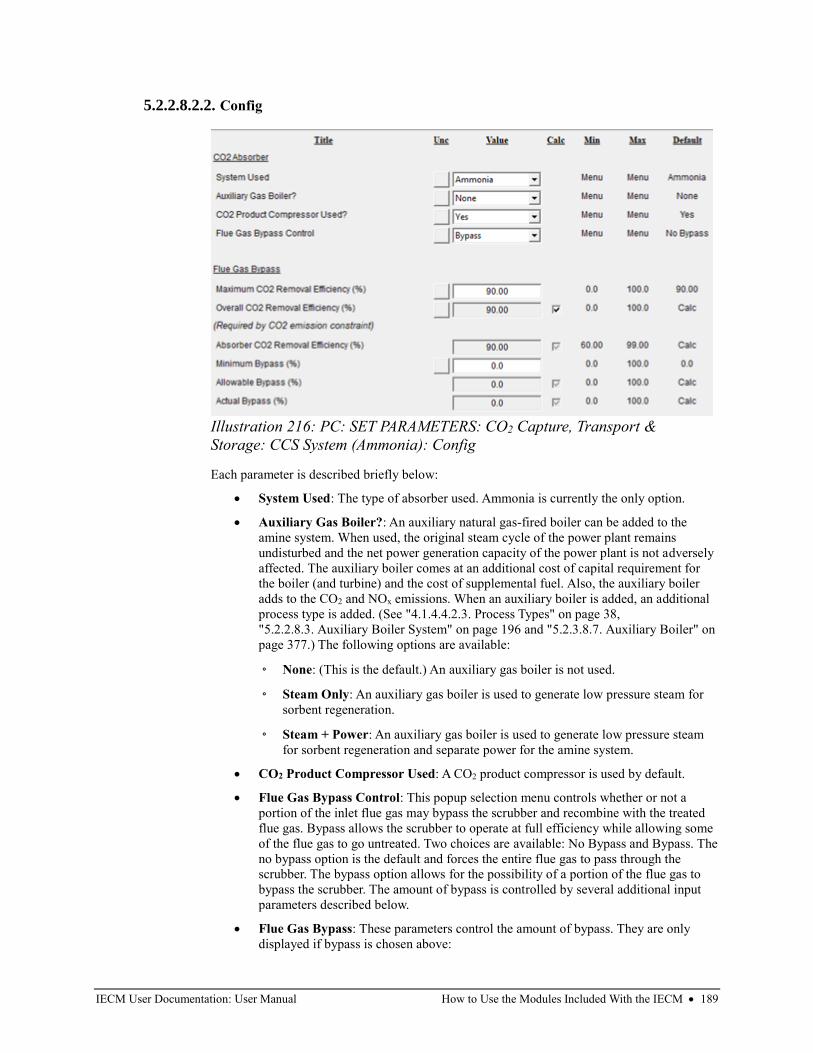
IECM User Documentation: User Manual How to Use the Modules Included With the IECM • 189
5.2.2.8.2.2. Config
Each parameter is described briefly below:
• System Used: The type of absorber used. Ammonia is currently the only option.
• Auxiliary Gas Boiler?: An auxiliary natural gas-fired boiler can be added to the
amine system. When used, the original steam cycle of the power plant remains
undisturbed and the net power generation capacity of the power plant is not adversely
affected. The auxiliary boiler comes at an additional cost of capital requirement for
the boiler (and turbine) and the cost of supplemental fuel. Also, the auxiliary boiler
adds to the CO2 and NOx emissions. When an auxiliary boiler is added, an additional
process type is added. (See "4.1.4.4.2.3. Process Types" on page 38,
"5.2.2.8.3. Auxiliary Boiler System" on page 196 and "5.2.3.8.7. Auxiliary Boiler" on
page 377.) The following options are available:
◦ None: (This is the default.) An auxiliary gas boiler is not used.
◦ Steam Only: An auxiliary gas boiler is used to generate low pressure steam for
sorbent regeneration.
◦ Steam + Power: An auxiliary gas boiler is used to generate low pressure steam
for sorbent regeneration and separate power for the amine system.
• CO2 Product Compressor Used: A CO2 product compressor is used by default.
• Flue Gas Bypass Control: This popup selection menu controls whether or not a
portion of the inlet flue gas may bypass the scrubber and recombine with the treated
flue gas. Bypass allows the scrubber to operate at full efficiency while allowing some
of the flue gas to go untreated. Two choices are available: No Bypass and Bypass. The
no bypass option is the default and forces the entire flue gas to pass through the
scrubber. The bypass option allows for the possibility of a portion of the flue gas to
bypass the scrubber. The amount of bypass is controlled by several additional input
parameters described below.
• Flue Gas Bypass: These parameters control the amount of bypass. They are only
displayed if bypass is chosen above:
Illustration 216: PC: SET PARAMETERS: CO2 Capture, Transport &
Storage: CCS System (Ammonia): Config
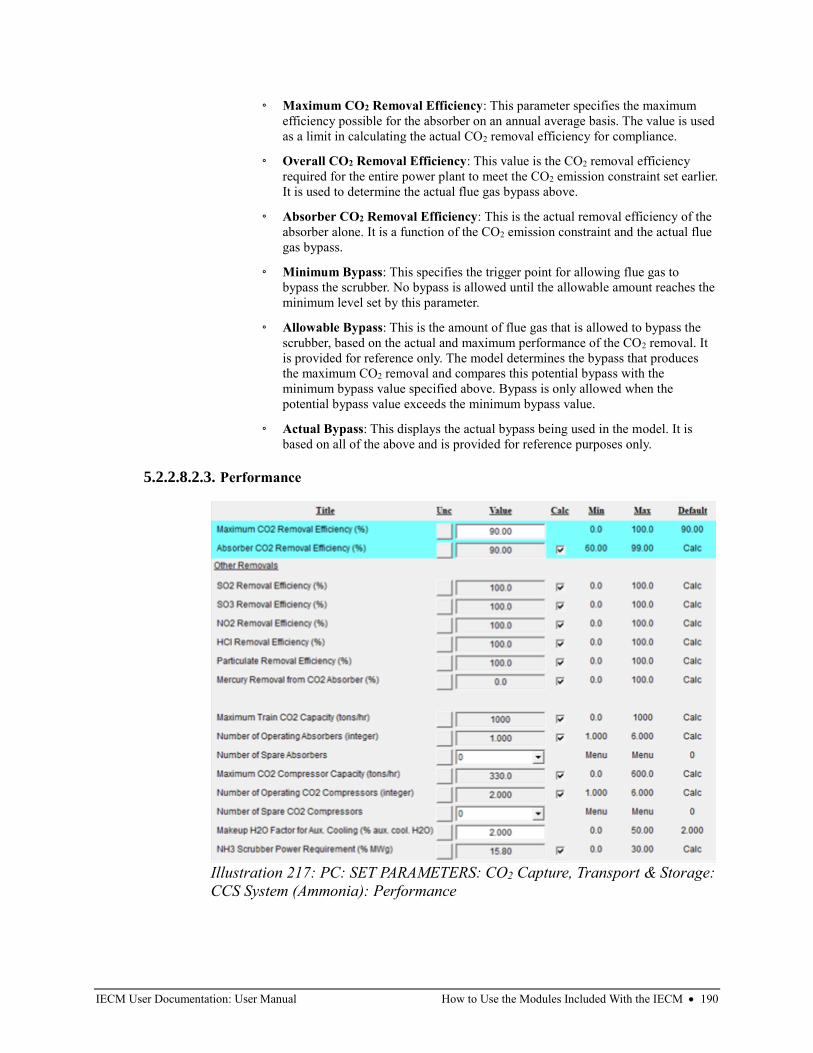
IECM User Documentation: User Manual How to Use the Modules Included With the IECM • 190
◦ Maximum CO2 Removal Efficiency: This parameter specifies the maximum
efficiency possible for the absorber on an annual average basis. The value is used
as a limit in calculating the actual CO2 removal efficiency for compliance.
◦ Overall CO2 Removal Efficiency: This value is the CO2 removal efficiency
required for the entire power plant to meet the CO2 emission constraint set earlier.
It is used to determine the actual flue gas bypass above.
◦ Absorber CO2 Removal Efficiency: This is the actual removal efficiency of the
absorber alone. It is a function of the CO2 emission constraint and the actual flue
gas bypass.
◦ Minimum Bypass: This specifies the trigger point for allowing flue gas to
bypass the scrubber. No bypass is allowed until the allowable amount reaches the
minimum level set by this parameter.
◦ Allowable Bypass: This is the amount of flue gas that is allowed to bypass the
scrubber, based on the actual and maximum performance of the CO2 removal. It
is provided for reference only. The model determines the bypass that produces
the maximum CO2 removal and compares this potential bypass with the
minimum bypass value specified above. Bypass is only allowed when the
potential bypass value exceeds the minimum bypass value.
◦ Actual Bypass: This displays the actual bypass being used in the model. It is
based on all of the above and is provided for reference purposes only.
5.2.2.8.2.3. Performance
Illustration 217: PC: SET PARAMETERS: CO2 Capture, Transport & Storage:
CCS System (Ammonia): Performance
IECM User Documentation: User Manual How to Use the Modules Included With the IECM • 191
Each parameter is described briefly below:
• Maximum CO2 Removal Efficiency: This parameter specifies the maximum
efficiency possible for the absorber on an annual average basis. The value is used as a
limit in calculating the actual CO2 removal efficiency for compliance.
• Absorber CO2 Removal Efficiency: This is the actual removal efficiency of the
absorber alone.
• Other Removals:
◦ SO2 Removal Efficiency: SO2 is removed at a very high rate. The default
efficiency is 1005%.
◦ SO3 Removal Efficiency: SO3 is removed at a very high rate. The default
efficiency is 99.5%.
◦ NO2 Removal Efficiency: A small amount of NO2 is removed. The default
efficiency is 0%.
◦ HCl Removal Efficiency: HCl is removed at a high rate. The default efficiency
is 95%.
◦ Particulate Removal Efficiency: Particulates are removed in any wet scrubbing
system at a rate of approximately 50%.
• Trace Removals:
◦ Mercury Removal Efficiency (oxidized)
◦ Mercury Removal Efficiency (elemental)
• Maximum Train CO2 Capacity: The default maximum train size is used with the
actual CO2 capture rate to determine the number of trains required.
• Number of Operating Absorbers: This is the total number of operating absorber
vessels. It is determined by the train capacity specified above and is used primarily to
calculate capital costs. The value must be an integer.
• Number of Spare Absorbers: This is the total number of spare absorber vessels. It is
used primarily to calculate capital costs. Up to two spare absorbers may be specified.
• Maximum CO2 Compressor Capacity: (Only shown if a CO2 product compressor is
used.) This is the maximum amount of CO2 product that can be compressed per hour
at the specified pressure (see the storage input screen).
• Number of Operating CO2 Compressors: (Only shown if a CO2 product
compressor is used.) This is the total number of operating CO2 compressors. It is used
primarily to calculate capital costs. The value must be an integer.
• Number of Spare CO2 Compressors: (Only shown if a CO2 product compressor is
used.) This is the total number of spare CO2 compressors. It is used primarily to
calculate capital costs. Up to two spare CO2 compressors may be specified.
• Makeup H2O Factor for Aux. Cooling: (Only shown when an Air Cooled
Condenser is used for plant cooling.) When CCS and an Air Cooled Condenser are
used, the CCS system uses an auxiliary cooling system. This parameter specifies the
amount of makeup water required for the auxiliary cooling system.
• Amine Scrubber Power Requirement: This is the equivalent electrical output of
thermal (steam) energy used for reheat, plus the actual electrical power required for
pumps and booster fans.
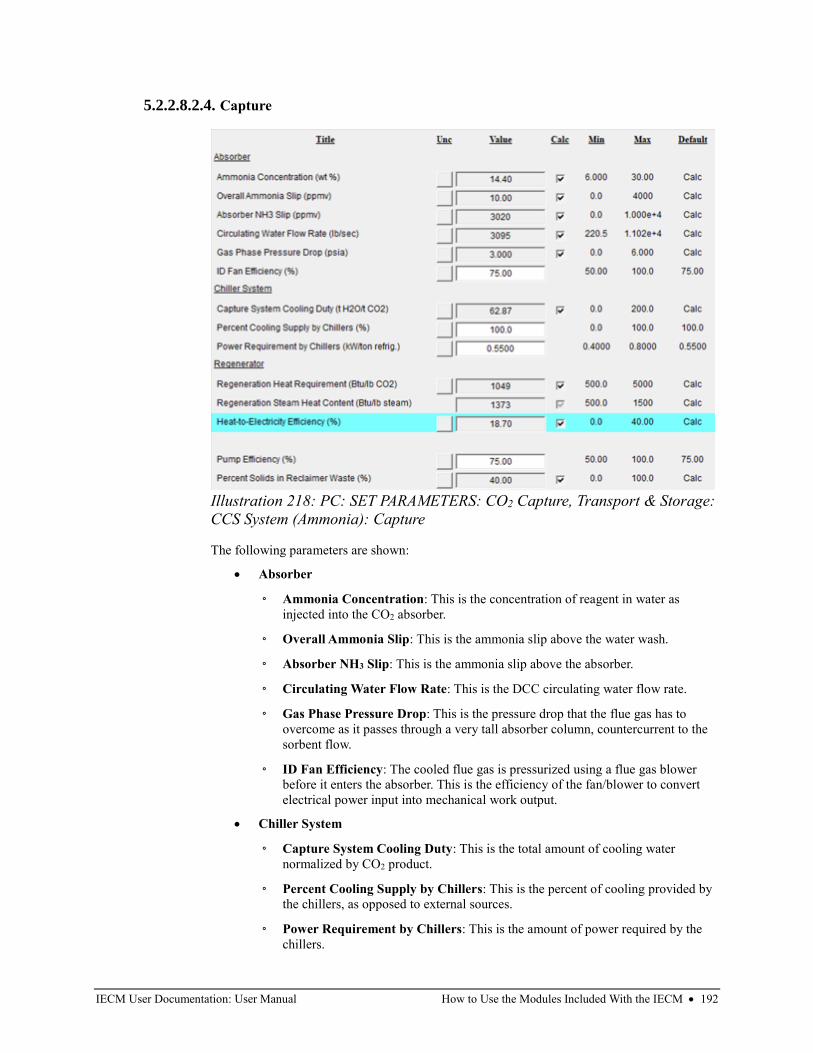
IECM User Documentation: User Manual How to Use the Modules Included With the IECM • 192
5.2.2.8.2.4. Capture
The following parameters are shown:
• Absorber
◦ Ammonia Concentration: This is the concentration of reagent in water as
injected into the CO2 absorber.
◦ Overall Ammonia Slip: This is the ammonia slip above the water wash.
◦ Absorber NH3 Slip: This is the ammonia slip above the absorber.
◦ Circulating Water Flow Rate: This is the DCC circulating water flow rate.
◦ Gas Phase Pressure Drop: This is the pressure drop that the flue gas has to
overcome as it passes through a very tall absorber column, countercurrent to the
sorbent flow.
◦ ID Fan Efficiency: The cooled flue gas is pressurized using a flue gas blower
before it enters the absorber. This is the efficiency of the fan/blower to convert
electrical power input into mechanical work output.
• Chiller System
◦ Capture System Cooling Duty: This is the total amount of cooling water
normalized by CO2 product.
◦ Percent Cooling Supply by Chillers: This is the percent of cooling provided by
the chillers, as opposed to external sources.
◦ Power Requirement by Chillers: This is the amount of power required by the
chillers.
Illustration 218: PC: SET PARAMETERS: CO2 Capture, Transport & Storage:
CCS System (Ammonia): Capture
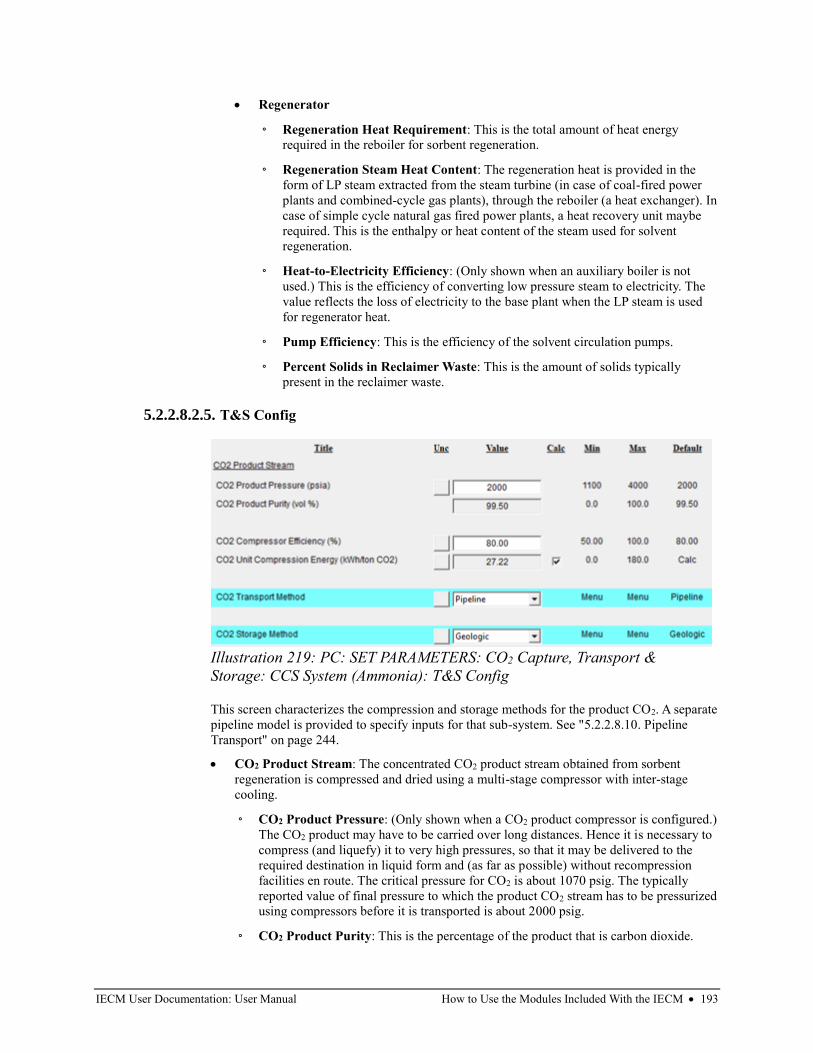
IECM User Documentation: User Manual How to Use the Modules Included With the IECM • 193
• Regenerator
◦ Regeneration Heat Requirement: This is the total amount of heat energy
required in the reboiler for sorbent regeneration.
◦ Regeneration Steam Heat Content: The regeneration heat is provided in the
form of LP steam extracted from the steam turbine (in case of coal-fired power
plants and combined-cycle gas plants), through the reboiler (a heat exchanger). In
case of simple cycle natural gas fired power plants, a heat recovery unit maybe
required. This is the enthalpy or heat content of the steam used for solvent
regeneration.
◦ Heat-to-Electricity Efficiency: (Only shown when an auxiliary boiler is not
used.) This is the efficiency of converting low pressure steam to electricity. The
value reflects the loss of electricity to the base plant when the LP steam is used
for regenerator heat.
◦ Pump Efficiency: This is the efficiency of the solvent circulation pumps.
◦ Percent Solids in Reclaimer Waste: This is the amount of solids typically
present in the reclaimer waste.
5.2.2.8.2.5. T&S Config
This screen characterizes the compression and storage methods for the product CO2. A separate
pipeline model is provided to specify inputs for that sub-system. See "5.2.2.8.10. Pipeline
Transport" on page 244.
• CO2 Product Stream: The concentrated CO2 product stream obtained from sorbent
regeneration is compressed and dried using a multi-stage compressor with inter-stage
cooling.
◦ CO2 Product Pressure: (Only shown when a CO2 product compressor is configured.)
The CO2 product may have to be carried over long distances. Hence it is necessary to
compress (and liquefy) it to very high pressures, so that it may be delivered to the
required destination in liquid form and (as far as possible) without recompression
facilities en route. The critical pressure for CO2 is about 1070 psig. The typically
reported value of final pressure to which the product CO2 stream has to be pressurized
using compressors before it is transported is about 2000 psig.
◦ CO2 Product Purity: This is the percentage of the product that is carbon dioxide.
Illustration 219: PC: SET PARAMETERS: CO2 Capture, Transport &
Storage: CCS System (Ammonia): T&S Config
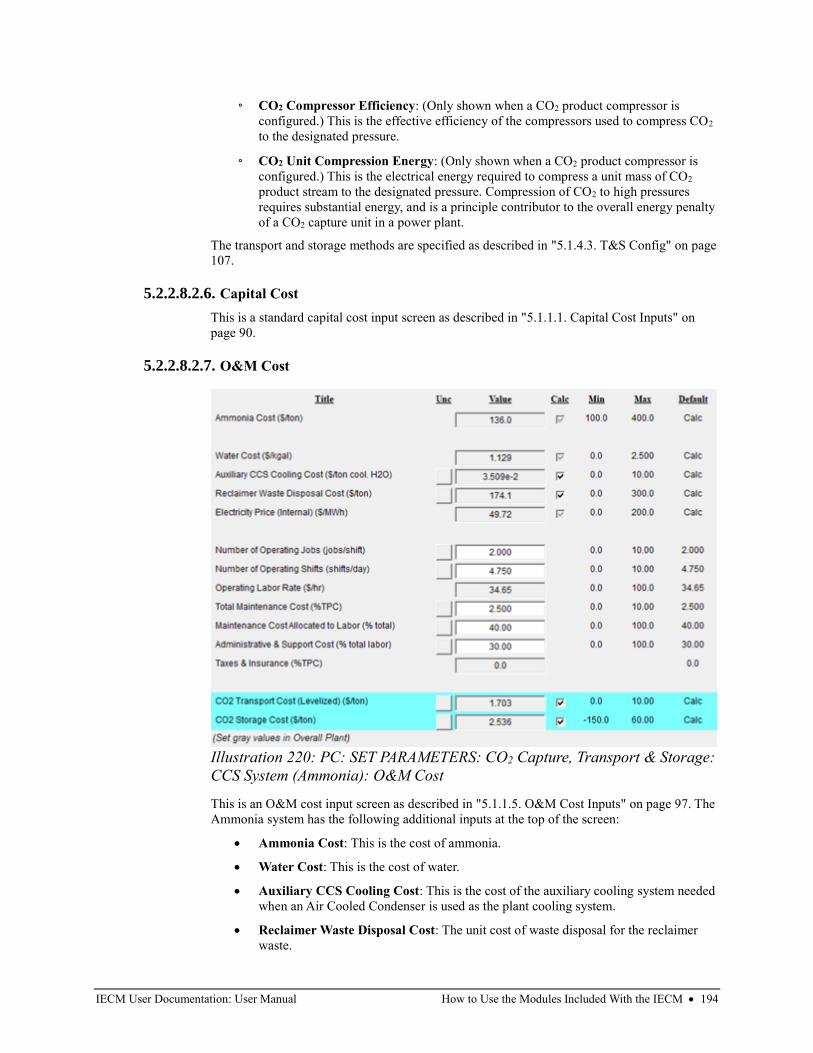
IECM User Documentation: User Manual How to Use the Modules Included With the IECM • 194
◦ CO2 Compressor Efficiency: (Only shown when a CO2 product compressor is
configured.) This is the effective efficiency of the compressors used to compress CO2
to the designated pressure.
◦ CO2 Unit Compression Energy: (Only shown when a CO2 product compressor is
configured.) This is the electrical energy required to compress a unit mass of CO2
product stream to the designated pressure. Compression of CO2 to high pressures
requires substantial energy, and is a principle contributor to the overall energy penalty
of a CO2 capture unit in a power plant.
The transport and storage methods are specified as described in "5.1.4.3. T&S Config" on page
107.
5.2.2.8.2.6. Capital Cost
This is a standard capital cost input screen as described in "5.1.1.1. Capital Cost Inputs" on
page 90.
5.2.2.8.2.7. O&M Cost
This is an O&M cost input screen as described in "5.1.1.5. O&M Cost Inputs" on page 97. The
Ammonia system has the following additional inputs at the top of the screen:
• Ammonia Cost: This is the cost of ammonia.
• Water Cost: This is the cost of water.
• Auxiliary CCS Cooling Cost: This is the cost of the auxiliary cooling system needed
when an Air Cooled Condenser is used as the plant cooling system.
• Reclaimer Waste Disposal Cost: The unit cost of waste disposal for the reclaimer
waste.
Illustration 220: PC: SET PARAMETERS: CO2 Capture, Transport & Storage:
CCS System (Ammonia): O&M Cost
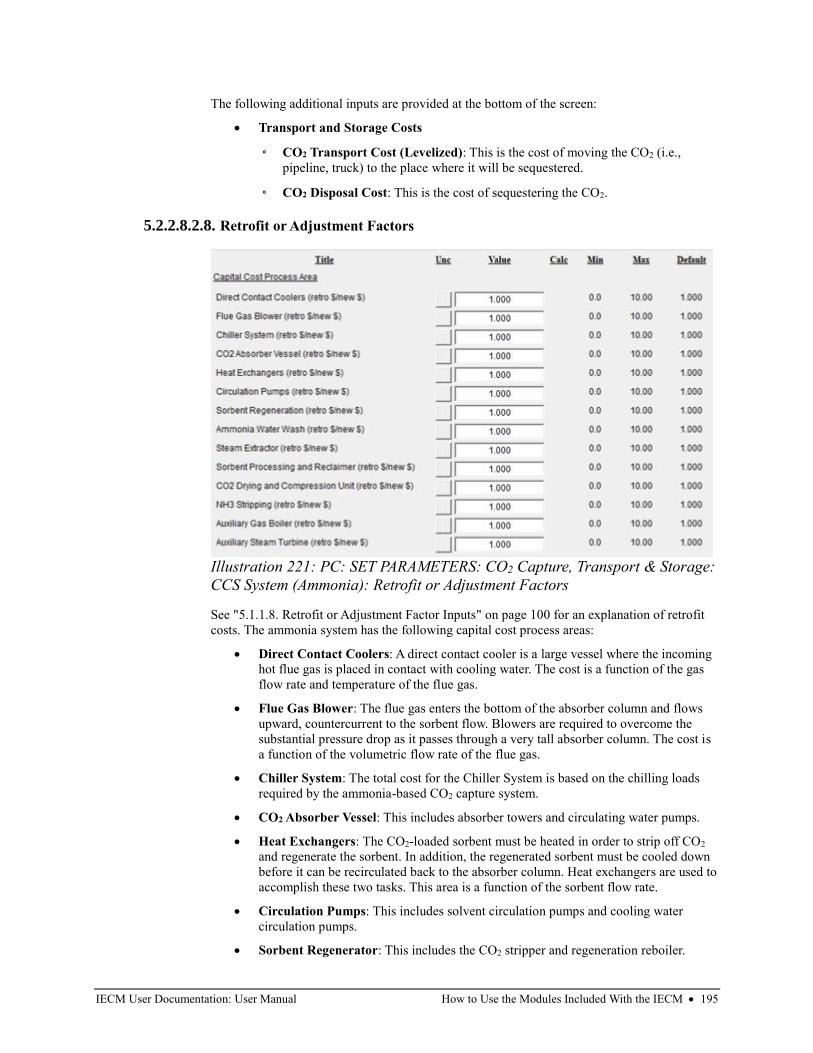
IECM User Documentation: User Manual How to Use the Modules Included With the IECM • 195
The following additional inputs are provided at the bottom of the screen:
• Transport and Storage Costs
◦ CO2 Transport Cost (Levelized): This is the cost of moving the CO2 (i.e.,
pipeline, truck) to the place where it will be sequestered.
◦ CO2 Disposal Cost: This is the cost of sequestering the CO2.
5.2.2.8.2.8. Retrofit or Adjustment Factors
See "5.1.1.8. Retrofit or Adjustment Factor Inputs" on page 100 for an explanation of retrofit
costs. The ammonia system has the following capital cost process areas:
• Direct Contact Coolers: A direct contact cooler is a large vessel where the incoming
hot flue gas is placed in contact with cooling water. The cost is a function of the gas
flow rate and temperature of the flue gas.
• Flue Gas Blower: The flue gas enters the bottom of the absorber column and flows
upward, countercurrent to the sorbent flow. Blowers are required to overcome the
substantial pressure drop as it passes through a very tall absorber column. The cost is
a function of the volumetric flow rate of the flue gas.
• Chiller System: The total cost for the Chiller System is based on the chilling loads
required by the ammonia-based CO2 capture system.
• CO2 Absorber Vessel: This includes absorber towers and circulating water pumps.
• Heat Exchangers: The CO2-loaded sorbent must be heated in order to strip off CO2
and regenerate the sorbent. In addition, the regenerated sorbent must be cooled down
before it can be recirculated back to the absorber column. Heat exchangers are used to
accomplish these two tasks. This area is a function of the sorbent flow rate.
• Circulation Pumps: This includes solvent circulation pumps and cooling water
circulation pumps.
• Sorbent Regenerator: This includes the CO2 stripper and regeneration reboiler.
Illustration 221: PC: SET PARAMETERS: CO2 Capture, Transport & Storage:
CCS System (Ammonia): Retrofit or Adjustment Factors
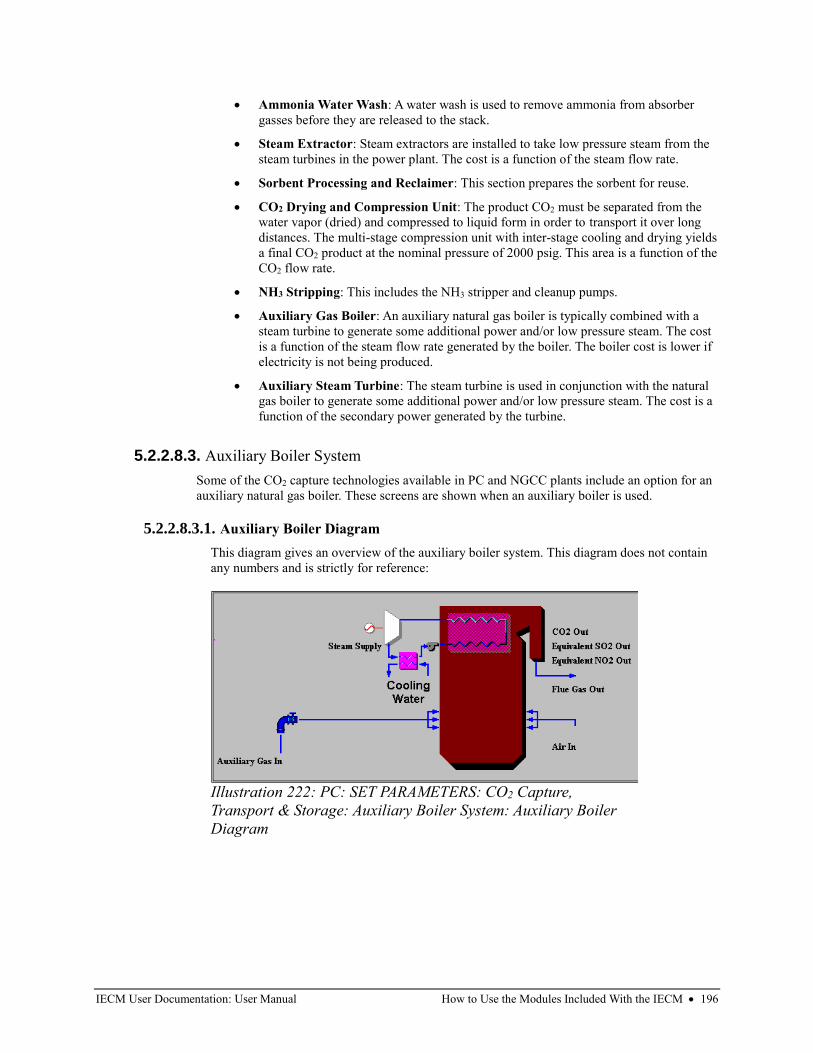
IECM User Documentation: User Manual How to Use the Modules Included With the IECM • 196
• Ammonia Water Wash: A water wash is used to remove ammonia from absorber
gasses before they are released to the stack.
• Steam Extractor: Steam extractors are installed to take low pressure steam from the
steam turbines in the power plant. The cost is a function of the steam flow rate.
• Sorbent Processing and Reclaimer: This section prepares the sorbent for reuse.
• CO2 Drying and Compression Unit: The product CO2 must be separated from the
water vapor (dried) and compressed to liquid form in order to transport it over long
distances. The multi-stage compression unit with inter-stage cooling and drying yields
a final CO2 product at the nominal pressure of 2000 psig. This area is a function of the
CO2 flow rate.
• NH3 Stripping: This includes the NH3 stripper and cleanup pumps.
• Auxiliary Gas Boiler: An auxiliary natural gas boiler is typically combined with a
steam turbine to generate some additional power and/or low pressure steam. The cost
is a function of the steam flow rate generated by the boiler. The boiler cost is lower if
electricity is not being produced.
• Auxiliary Steam Turbine: The steam turbine is used in conjunction with the natural
gas boiler to generate some additional power and/or low pressure steam. The cost is a
function of the secondary power generated by the turbine.
5.2.2.8.3. Auxiliary Boiler System
Some of the CO2 capture technologies available in PC and NGCC plants include an option for an
auxiliary natural gas boiler. These screens are shown when an auxiliary boiler is used.
5.2.2.8.3.1. Auxiliary Boiler Diagram
This diagram gives an overview of the auxiliary boiler system. This diagram does not contain
any numbers and is strictly for reference:
Illustration 222: PC: SET PARAMETERS: CO2 Capture,
Transport & Storage: Auxiliary Boiler System: Auxiliary Boiler
Diagram
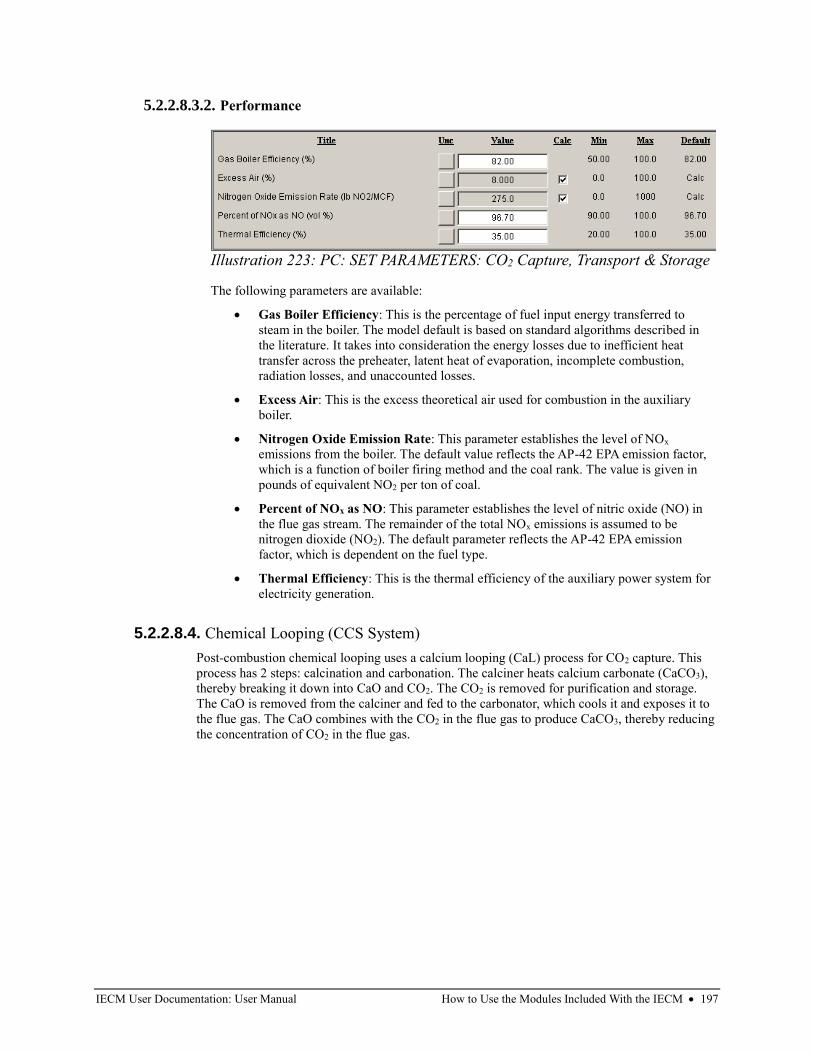
IECM User Documentation: User Manual How to Use the Modules Included With the IECM • 197
5.2.2.8.3.2. Performance
The following parameters are available:
• Gas Boiler Efficiency: This is the percentage of fuel input energy transferred to
steam in the boiler. The model default is based on standard algorithms described in
the literature. It takes into consideration the energy losses due to inefficient heat
transfer across the preheater, latent heat of evaporation, incomplete combustion,
radiation losses, and unaccounted losses.
• Excess Air: This is the excess theoretical air used for combustion in the auxiliary
boiler.
• Nitrogen Oxide Emission Rate: This parameter establishes the level of NOx
emissions from the boiler. The default value reflects the AP-42 EPA emission factor,
which is a function of boiler firing method and the coal rank. The value is given in
pounds of equivalent NO2 per ton of coal.
• Percent of NOx as NO: This parameter establishes the level of nitric oxide (NO) in
the flue gas stream. The remainder of the total NOx emissions is assumed to be
nitrogen dioxide (NO2). The default parameter reflects the AP-42 EPA emission
factor, which is dependent on the fuel type.
• Thermal Efficiency: This is the thermal efficiency of the auxiliary power system for
electricity generation.
5.2.2.8.4. Chemical Looping (CCS System)
Post-combustion chemical looping uses a calcium looping (CaL) process for CO2 capture. This
process has 2 steps: calcination and carbonation. The calciner heats calcium carbonate (CaCO3),
thereby breaking it down into CaO and CO2. The CO2 is removed for purification and storage.
The CaO is removed from the calciner and fed to the carbonator, which cools it and exposes it to
the flue gas. The CaO combines with the CO2 in the flue gas to produce CaCO3, thereby reducing
the concentration of CO2 in the flue gas.
Illustration 223: PC: SET PARAMETERS: CO2 Capture, Transport & Storage
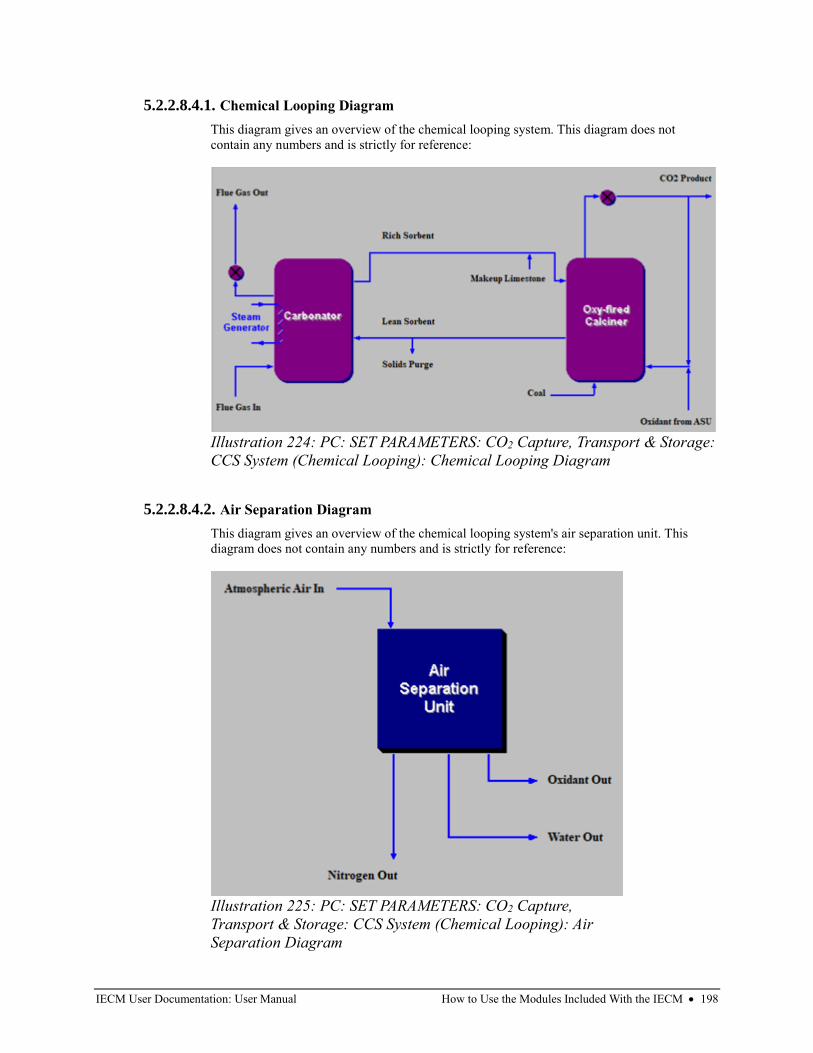
IECM User Documentation: User Manual How to Use the Modules Included With the IECM • 198
5.2.2.8.4.1. Chemical Looping Diagram
This diagram gives an overview of the chemical looping system. This diagram does not
contain any numbers and is strictly for reference:
5.2.2.8.4.2. Air Separation Diagram
This diagram gives an overview of the chemical looping system's air separation unit. This
diagram does not contain any numbers and is strictly for reference:
Illustration 224: PC: SET PARAMETERS: CO2 Capture, Transport & Storage:
CCS System (Chemical Looping): Chemical Looping Diagram
Illustration 225: PC: SET PARAMETERS: CO2 Capture,
Transport & Storage: CCS System (Chemical Looping): Air
Separation Diagram
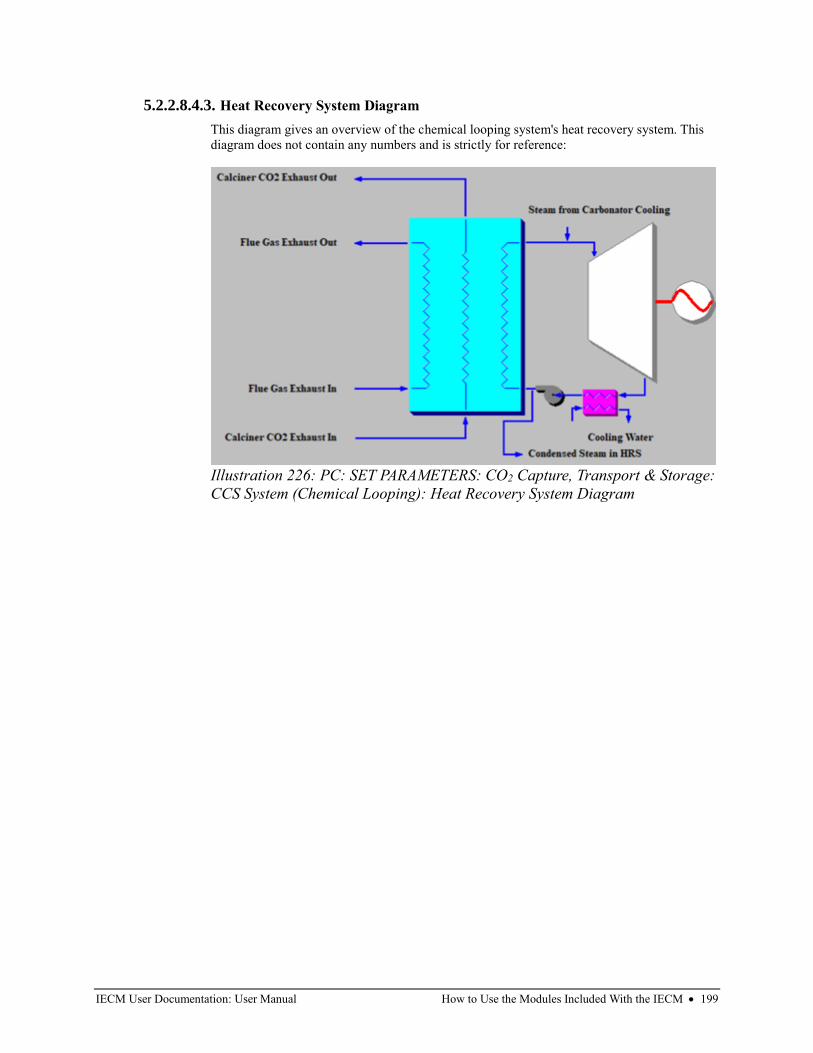
IECM User Documentation: User Manual How to Use the Modules Included With the IECM • 199
5.2.2.8.4.3. Heat Recovery System Diagram
This diagram gives an overview of the chemical looping system's heat recovery system. This
diagram does not contain any numbers and is strictly for reference:
Illustration 226: PC: SET PARAMETERS: CO2 Capture, Transport & Storage:
CCS System (Chemical Looping): Heat Recovery System Diagram
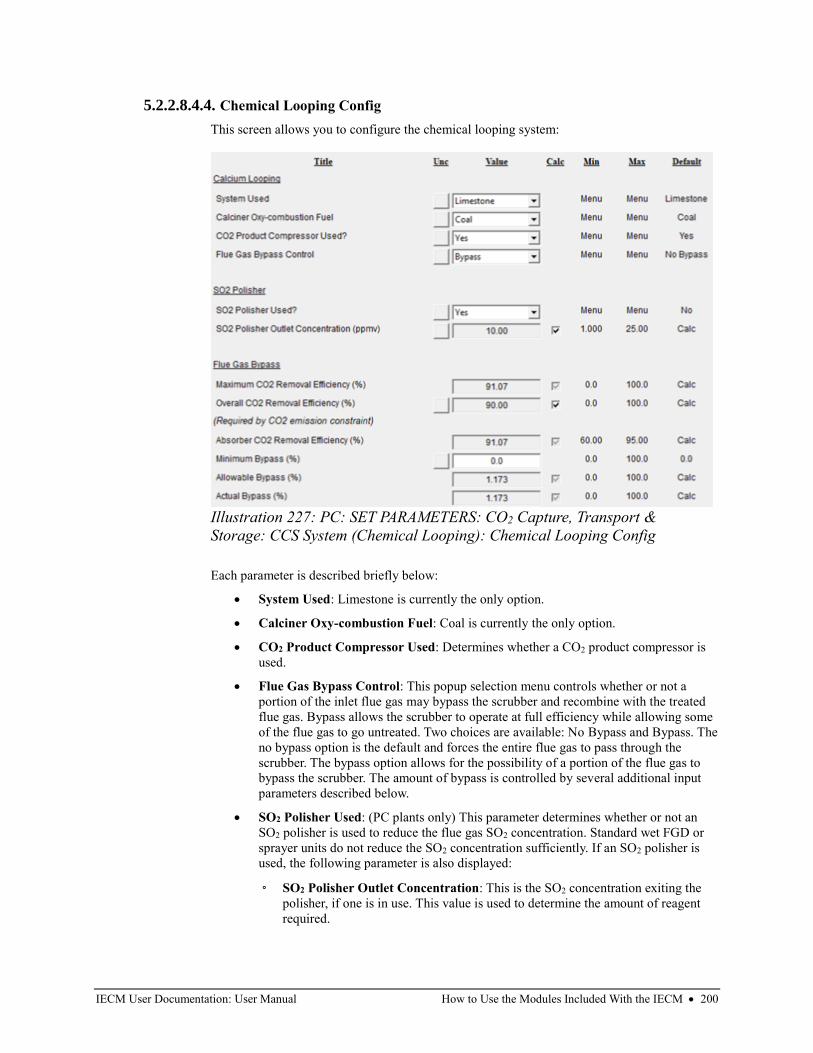
IECM User Documentation: User Manual How to Use the Modules Included With the IECM • 200
5.2.2.8.4.4. Chemical Looping Config
This screen allows you to configure the chemical looping system:
Each parameter is described briefly below:
• System Used: Limestone is currently the only option.
• Calciner Oxy-combustion Fuel: Coal is currently the only option.
• CO2 Product Compressor Used: Determines whether a CO2 product compressor is
used.
• Flue Gas Bypass Control: This popup selection menu controls whether or not a
portion of the inlet flue gas may bypass the scrubber and recombine with the treated
flue gas. Bypass allows the scrubber to operate at full efficiency while allowing some
of the flue gas to go untreated. Two choices are available: No Bypass and Bypass. The
no bypass option is the default and forces the entire flue gas to pass through the
scrubber. The bypass option allows for the possibility of a portion of the flue gas to
bypass the scrubber. The amount of bypass is controlled by several additional input
parameters described below.
• SO2 Polisher Used: (PC plants only) This parameter determines whether or not an
SO2 polisher is used to reduce the flue gas SO2 concentration. Standard wet FGD or
sprayer units do not reduce the SO2 concentration sufficiently. If an SO2 polisher is
used, the following parameter is also displayed:
◦ SO2 Polisher Outlet Concentration: This is the SO2 concentration exiting the
polisher, if one is in use. This value is used to determine the amount of reagent
required.
Illustration 227: PC: SET PARAMETERS: CO2 Capture, Transport &
Storage: CCS System (Chemical Looping): Chemical Looping Config
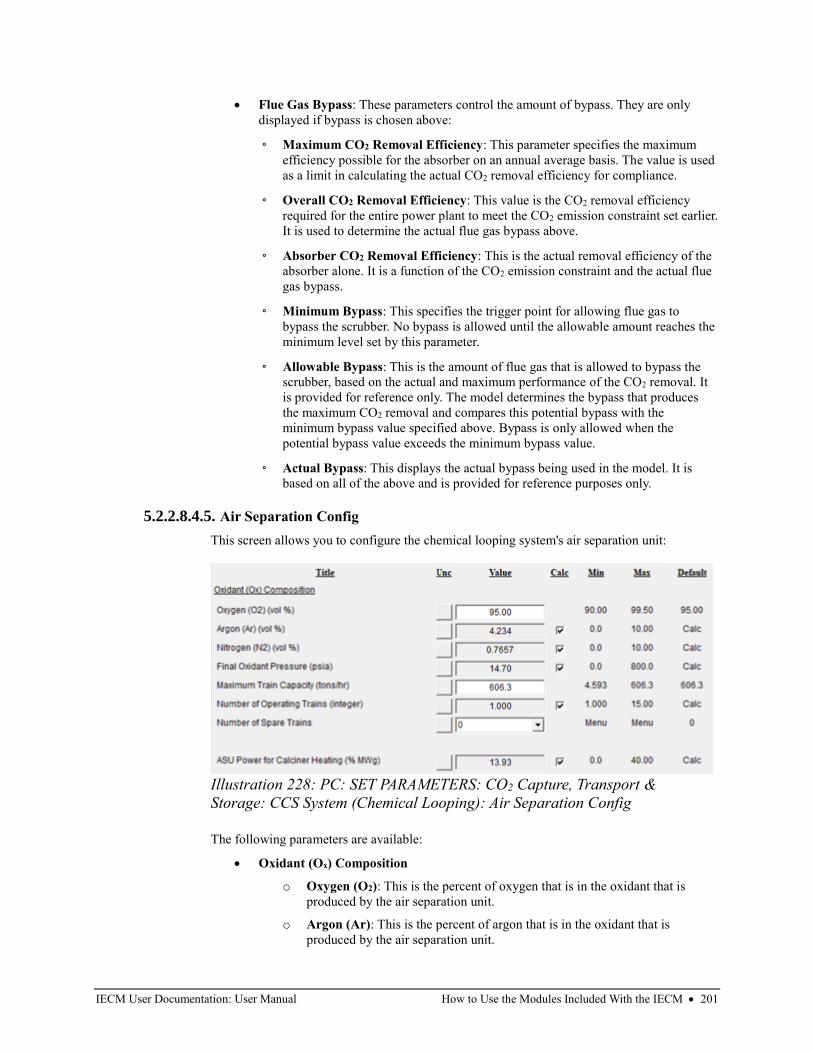
IECM User Documentation: User Manual How to Use the Modules Included With the IECM • 201
• Flue Gas Bypass: These parameters control the amount of bypass. They are only
displayed if bypass is chosen above:
◦ Maximum CO2 Removal Efficiency: This parameter specifies the maximum
efficiency possible for the absorber on an annual average basis. The value is used
as a limit in calculating the actual CO2 removal efficiency for compliance.
◦ Overall CO2 Removal Efficiency: This value is the CO2 removal efficiency
required for the entire power plant to meet the CO2 emission constraint set earlier.
It is used to determine the actual flue gas bypass above.
◦ Absorber CO2 Removal Efficiency: This is the actual removal efficiency of the
absorber alone. It is a function of the CO2 emission constraint and the actual flue
gas bypass.
◦ Minimum Bypass: This specifies the trigger point for allowing flue gas to
bypass the scrubber. No bypass is allowed until the allowable amount reaches the
minimum level set by this parameter.
◦ Allowable Bypass: This is the amount of flue gas that is allowed to bypass the
scrubber, based on the actual and maximum performance of the CO2 removal. It
is provided for reference only. The model determines the bypass that produces
the maximum CO2 removal and compares this potential bypass with the
minimum bypass value specified above. Bypass is only allowed when the
potential bypass value exceeds the minimum bypass value.
◦ Actual Bypass: This displays the actual bypass being used in the model. It is
based on all of the above and is provided for reference purposes only.
5.2.2.8.4.5. Air Separation Config
This screen allows you to configure the chemical looping system's air separation unit:
The following parameters are available:
• Oxidant (Ox) Composition
o Oxygen (O2): This is the percent of oxygen that is in the oxidant that is
produced by the air separation unit.
o Argon (Ar): This is the percent of argon that is in the oxidant that is
produced by the air separation unit.
Illustration 228: PC: SET PARAMETERS: CO2 Capture, Transport &
Storage: CCS System (Chemical Looping): Air Separation Config
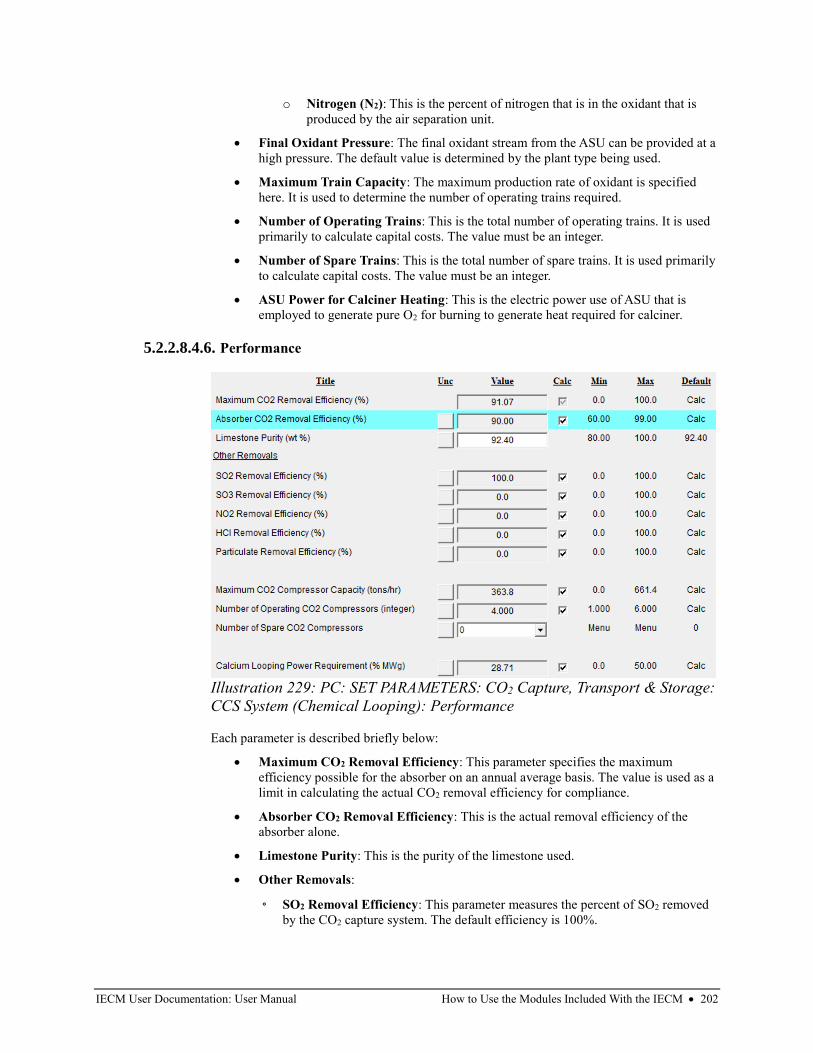
IECM User Documentation: User Manual How to Use the Modules Included With the IECM • 202
o Nitrogen (N2): This is the percent of nitrogen that is in the oxidant that is
produced by the air separation unit.
• Final Oxidant Pressure: The final oxidant stream from the ASU can be provided at a
high pressure. The default value is determined by the plant type being used.
• Maximum Train Capacity: The maximum production rate of oxidant is specified
here. It is used to determine the number of operating trains required.
• Number of Operating Trains: This is the total number of operating trains. It is used
primarily to calculate capital costs. The value must be an integer.
• Number of Spare Trains: This is the total number of spare trains. It is used primarily
to calculate capital costs. The value must be an integer.
• ASU Power for Calciner Heating: This is the electric power use of ASU that is
employed to generate pure O2 for burning to generate heat required for calciner.
5.2.2.8.4.6. Performance
Each parameter is described briefly below:
• Maximum CO2 Removal Efficiency: This parameter specifies the maximum
efficiency possible for the absorber on an annual average basis. The value is used as a
limit in calculating the actual CO2 removal efficiency for compliance.
• Absorber CO2 Removal Efficiency: This is the actual removal efficiency of the
absorber alone.
• Limestone Purity: This is the purity of the limestone used.
• Other Removals:
◦ SO2 Removal Efficiency: This parameter measures the percent of SO2 removed
by the CO2 capture system. The default efficiency is 100%.
Illustration 229: PC: SET PARAMETERS: CO2 Capture, Transport & Storage:
CCS System (Chemical Looping): Performance
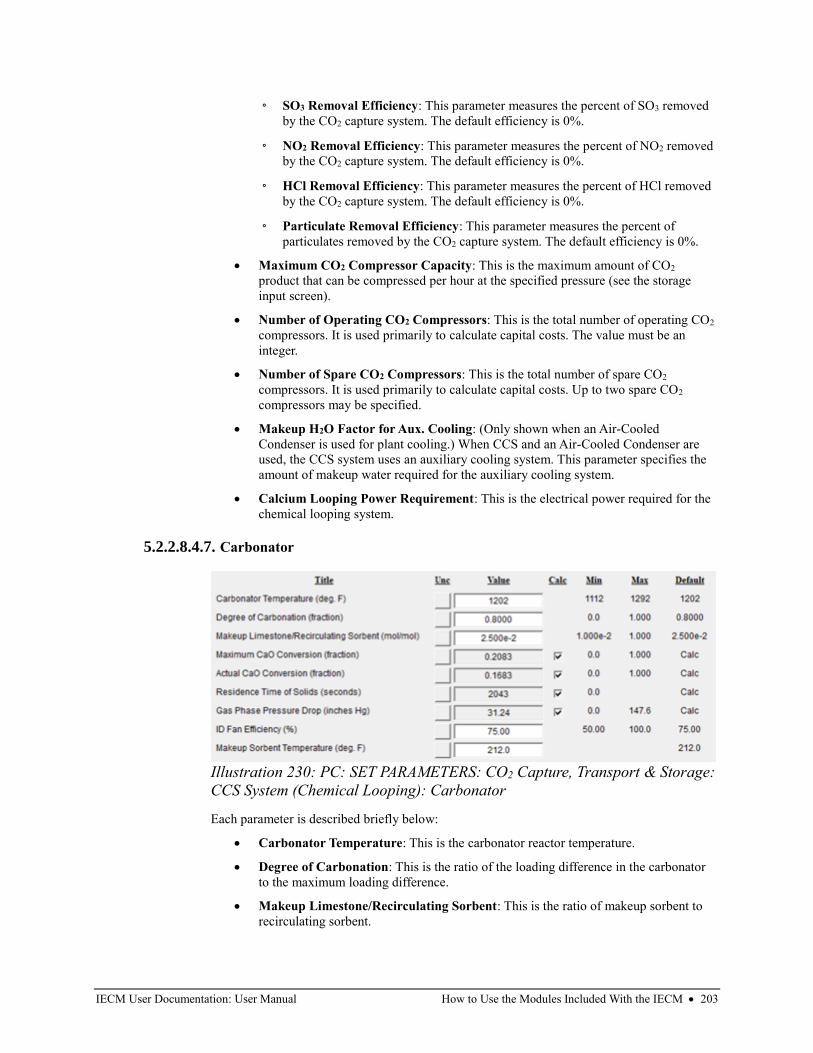
IECM User Documentation: User Manual How to Use the Modules Included With the IECM • 203
◦ SO3 Removal Efficiency: This parameter measures the percent of SO3 removed
by the CO2 capture system. The default efficiency is 0%.
◦ NO2 Removal Efficiency: This parameter measures the percent of NO2 removed
by the CO2 capture system. The default efficiency is 0%.
◦ HCl Removal Efficiency: This parameter measures the percent of HCl removed
by the CO2 capture system. The default efficiency is 0%.
◦ Particulate Removal Efficiency: This parameter measures the percent of
particulates removed by the CO2 capture system. The default efficiency is 0%.
• Maximum CO2 Compressor Capacity: This is the maximum amount of CO2
product that can be compressed per hour at the specified pressure (see the storage
input screen).
• Number of Operating CO2 Compressors: This is the total number of operating CO2
compressors. It is used primarily to calculate capital costs. The value must be an
integer.
• Number of Spare CO2 Compressors: This is the total number of spare CO2
compressors. It is used primarily to calculate capital costs. Up to two spare CO2
compressors may be specified.
• Makeup H2O Factor for Aux. Cooling: (Only shown when an Air-Cooled
Condenser is used for plant cooling.) When CCS and an Air-Cooled Condenser are
used, the CCS system uses an auxiliary cooling system. This parameter specifies the
amount of makeup water required for the auxiliary cooling system.
• Calcium Looping Power Requirement: This is the electrical power required for the
chemical looping system.
5.2.2.8.4.7. Carbonator
Each parameter is described briefly below:
• Carbonator Temperature: This is the carbonator reactor temperature.
• Degree of Carbonation: This is the ratio of the loading difference in the carbonator
to the maximum loading difference.
• Makeup Limestone/Recirculating Sorbent: This is the ratio of makeup sorbent to
recirculating sorbent.
Illustration 230: PC: SET PARAMETERS: CO2 Capture, Transport & Storage:
CCS System (Chemical Looping): Carbonator
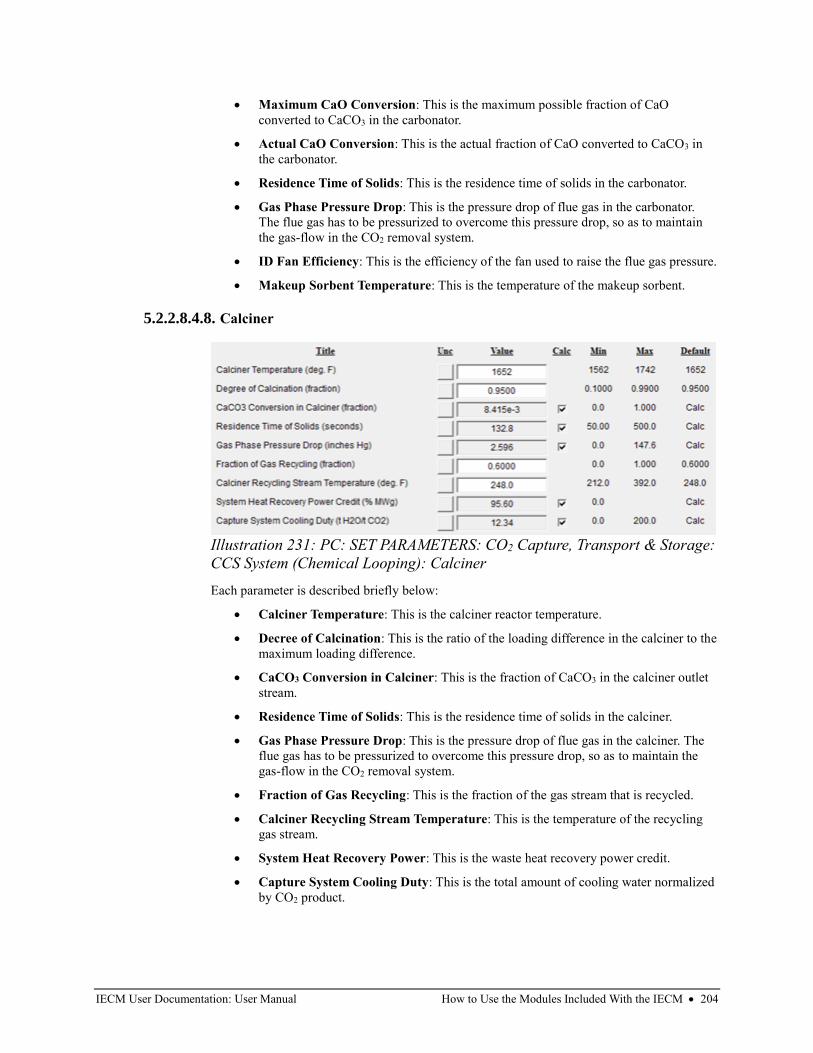
IECM User Documentation: User Manual How to Use the Modules Included With the IECM • 204
• Maximum CaO Conversion: This is the maximum possible fraction of CaO
converted to CaCO3 in the carbonator.
• Actual CaO Conversion: This is the actual fraction of CaO converted to CaCO3 in
the carbonator.
• Residence Time of Solids: This is the residence time of solids in the carbonator.
• Gas Phase Pressure Drop: This is the pressure drop of flue gas in the carbonator.
The flue gas has to be pressurized to overcome this pressure drop, so as to maintain
the gas-flow in the CO2 removal system.
• ID Fan Efficiency: This is the efficiency of the fan used to raise the flue gas pressure.
• Makeup Sorbent Temperature: This is the temperature of the makeup sorbent.
5.2.2.8.4.8. Calciner
Each parameter is described briefly below:
• Calciner Temperature: This is the calciner reactor temperature.
• Decree of Calcination: This is the ratio of the loading difference in the calciner to the
maximum loading difference.
• CaCO3 Conversion in Calciner: This is the fraction of CaCO3 in the calciner outlet
stream.
• Residence Time of Solids: This is the residence time of solids in the calciner.
• Gas Phase Pressure Drop: This is the pressure drop of flue gas in the calciner. The
flue gas has to be pressurized to overcome this pressure drop, so as to maintain the
gas-flow in the CO2 removal system.
• Fraction of Gas Recycling: This is the fraction of the gas stream that is recycled.
• Calciner Recycling Stream Temperature: This is the temperature of the recycling
gas stream.
• System Heat Recovery Power: This is the waste heat recovery power credit.
• Capture System Cooling Duty: This is the total amount of cooling water normalized
by CO2 product.
Illustration 231: PC: SET PARAMETERS: CO2 Capture, Transport & Storage:
CCS System (Chemical Looping): Calciner
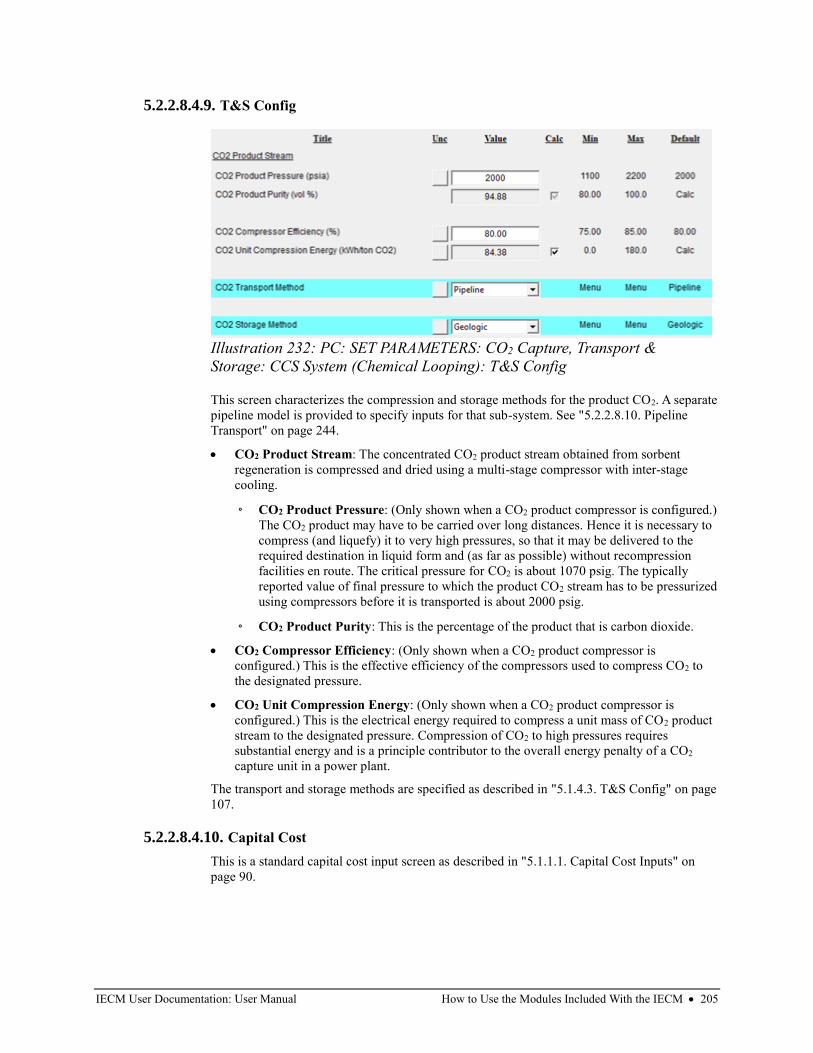
IECM User Documentation: User Manual How to Use the Modules Included With the IECM • 205
5.2.2.8.4.9. T&S Config
This screen characterizes the compression and storage methods for the product CO2. A separate
pipeline model is provided to specify inputs for that sub-system. See "5.2.2.8.10. Pipeline
Transport" on page 244.
• CO2 Product Stream: The concentrated CO2 product stream obtained from sorbent
regeneration is compressed and dried using a multi-stage compressor with inter-stage
cooling.
◦ CO2 Product Pressure: (Only shown when a CO2 product compressor is configured.)
The CO2 product may have to be carried over long distances. Hence it is necessary to
compress (and liquefy) it to very high pressures, so that it may be delivered to the
required destination in liquid form and (as far as possible) without recompression
facilities en route. The critical pressure for CO2 is about 1070 psig. The typically
reported value of final pressure to which the product CO2 stream has to be pressurized
using compressors before it is transported is about 2000 psig.
◦ CO2 Product Purity: This is the percentage of the product that is carbon dioxide.
• CO2 Compressor Efficiency: (Only shown when a CO2 product compressor is
configured.) This is the effective efficiency of the compressors used to compress CO2 to
the designated pressure.
• CO2 Unit Compression Energy: (Only shown when a CO2 product compressor is
configured.) This is the electrical energy required to compress a unit mass of CO2 product
stream to the designated pressure. Compression of CO2 to high pressures requires
substantial energy and is a principle contributor to the overall energy penalty of a CO2
capture unit in a power plant.
The transport and storage methods are specified as described in "5.1.4.3. T&S Config" on page
107.
5.2.2.8.4.10. Capital Cost
This is a standard capital cost input screen as described in "5.1.1.1. Capital Cost Inputs" on
page 90.
Illustration 232: PC: SET PARAMETERS: CO2 Capture, Transport &
Storage: CCS System (Chemical Looping): T&S Config
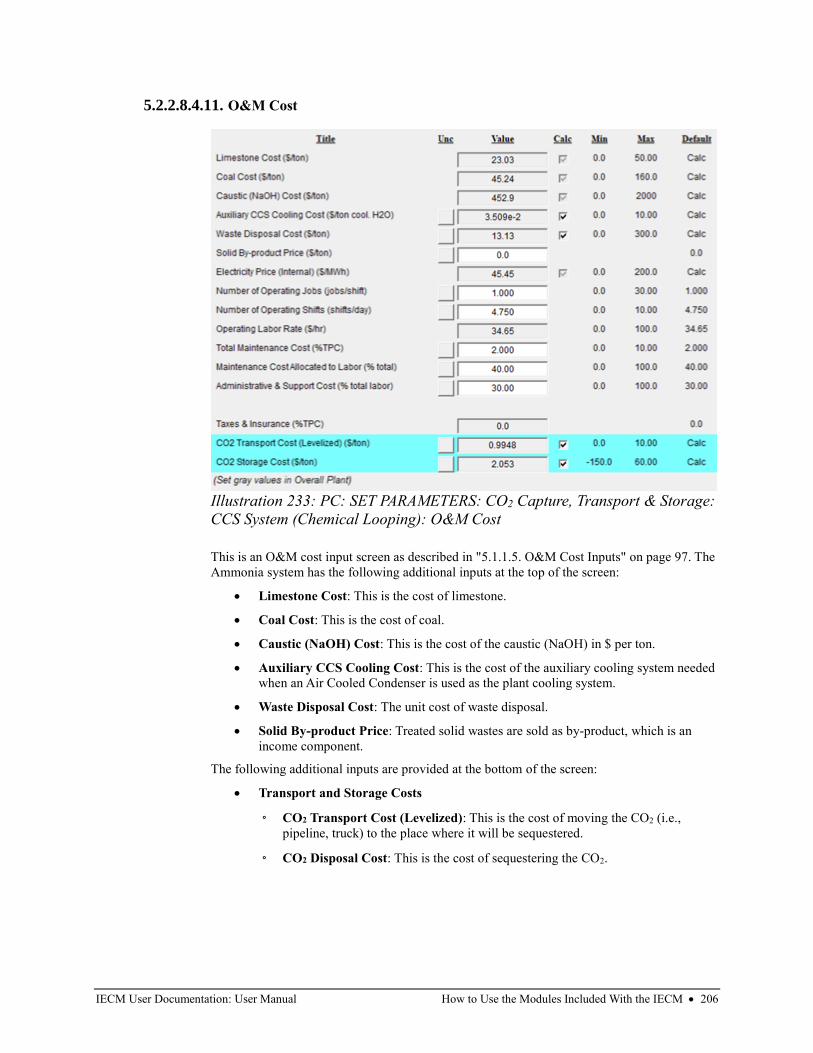
IECM User Documentation: User Manual How to Use the Modules Included With the IECM • 206
5.2.2.8.4.11. O&M Cost
This is an O&M cost input screen as described in "5.1.1.5. O&M Cost Inputs" on page 97. The
Ammonia system has the following additional inputs at the top of the screen:
• Limestone Cost: This is the cost of limestone.
• Coal Cost: This is the cost of coal.
• Caustic (NaOH) Cost: This is the cost of the caustic (NaOH) in $ per ton.
• Auxiliary CCS Cooling Cost: This is the cost of the auxiliary cooling system needed
when an Air Cooled Condenser is used as the plant cooling system.
• Waste Disposal Cost: The unit cost of waste disposal.
• Solid By-product Price: Treated solid wastes are sold as by-product, which is an
income component.
The following additional inputs are provided at the bottom of the screen:
• Transport and Storage Costs
◦ CO2 Transport Cost (Levelized): This is the cost of moving the CO2 (i.e.,
pipeline, truck) to the place where it will be sequestered.
◦ CO2 Disposal Cost: This is the cost of sequestering the CO2.
Illustration 233: PC: SET PARAMETERS: CO2 Capture, Transport & Storage:
CCS System (Chemical Looping): O&M Cost
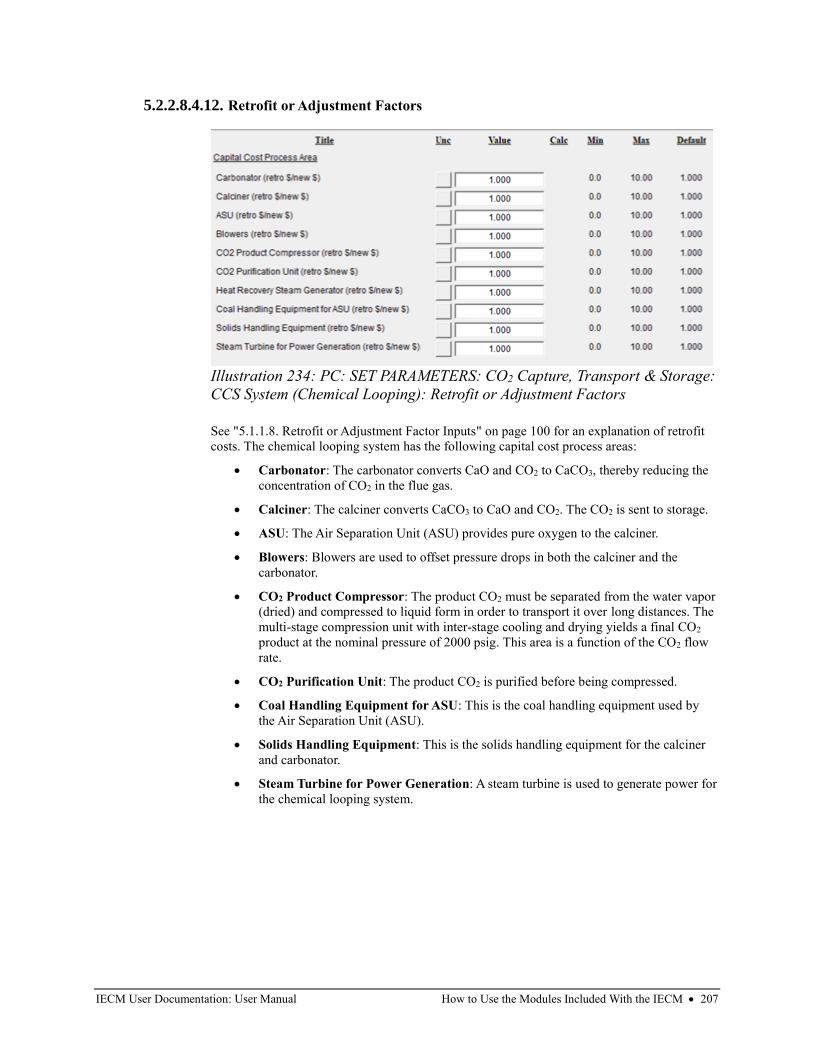
IECM User Documentation: User Manual How to Use the Modules Included With the IECM • 207
5.2.2.8.4.12. Retrofit or Adjustment Factors
See "5.1.1.8. Retrofit or Adjustment Factor Inputs" on page 100 for an explanation of retrofit
costs. The chemical looping system has the following capital cost process areas:
• Carbonator: The carbonator converts CaO and CO2 to CaCO3, thereby reducing the
concentration of CO2 in the flue gas.
• Calciner: The calciner converts CaCO3 to CaO and CO2. The CO2 is sent to storage.
• ASU: The Air Separation Unit (ASU) provides pure oxygen to the calciner.
• Blowers: Blowers are used to offset pressure drops in both the calciner and the
carbonator.
• CO2 Product Compressor: The product CO2 must be separated from the water vapor
(dried) and compressed to liquid form in order to transport it over long distances. The
multi-stage compression unit with inter-stage cooling and drying yields a final CO2
product at the nominal pressure of 2000 psig. This area is a function of the CO2 flow
rate.
• CO2 Purification Unit: The product CO2 is purified before being compressed.
• Coal Handling Equipment for ASU: This is the coal handling equipment used by
the Air Separation Unit (ASU).
• Solids Handling Equipment: This is the solids handling equipment for the calciner
and carbonator.
• Steam Turbine for Power Generation: A steam turbine is used to generate power for
the chemical looping system.
Illustration 234: PC: SET PARAMETERS: CO2 Capture, Transport & Storage:
CCS System (Chemical Looping): Retrofit or Adjustment Factors
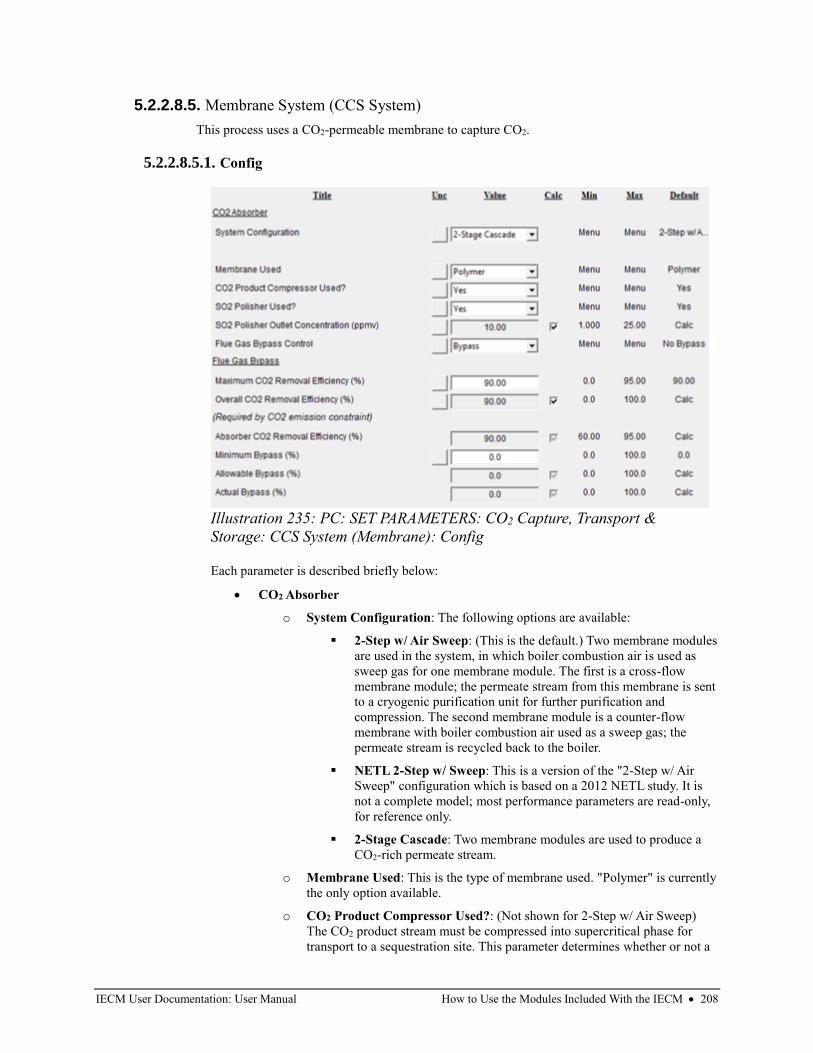
IECM User Documentation: User Manual How to Use the Modules Included With the IECM • 208
5.2.2.8.5. Membrane System (CCS System)
This process uses a CO2-permeable membrane to capture CO2.
5.2.2.8.5.1. Config
Each parameter is described briefly below:
• CO2 Absorber
o System Configuration: The following options are available:
▪ 2-Step w/ Air Sweep: (This is the default.) Two membrane modules
are used in the system, in which boiler combustion air is used as
sweep gas for one membrane module. The first is a cross-flow
membrane module; the permeate stream from this membrane is sent
to a cryogenic purification unit for further purification and
compression. The second membrane module is a counter-flow
membrane with boiler combustion air used as a sweep gas; the
permeate stream is recycled back to the boiler.
▪ NETL 2-Step w/ Sweep: This is a version of the "2-Step w/ Air
Sweep" configuration which is based on a 2012 NETL study. It is
not a complete model; most performance parameters are read-only,
for reference only.
▪ 2-Stage Cascade: Two membrane modules are used to produce a
CO2-rich permeate stream.
o Membrane Used: This is the type of membrane used. "Polymer" is currently
the only option available.
o CO2 Product Compressor Used?: (Not shown for 2-Step w/ Air Sweep)
The CO2 product stream must be compressed into supercritical phase for
transport to a sequestration site. This parameter determines whether or not a
Illustration 235: PC: SET PARAMETERS: CO2 Capture, Transport &
Storage: CCS System (Membrane): Config
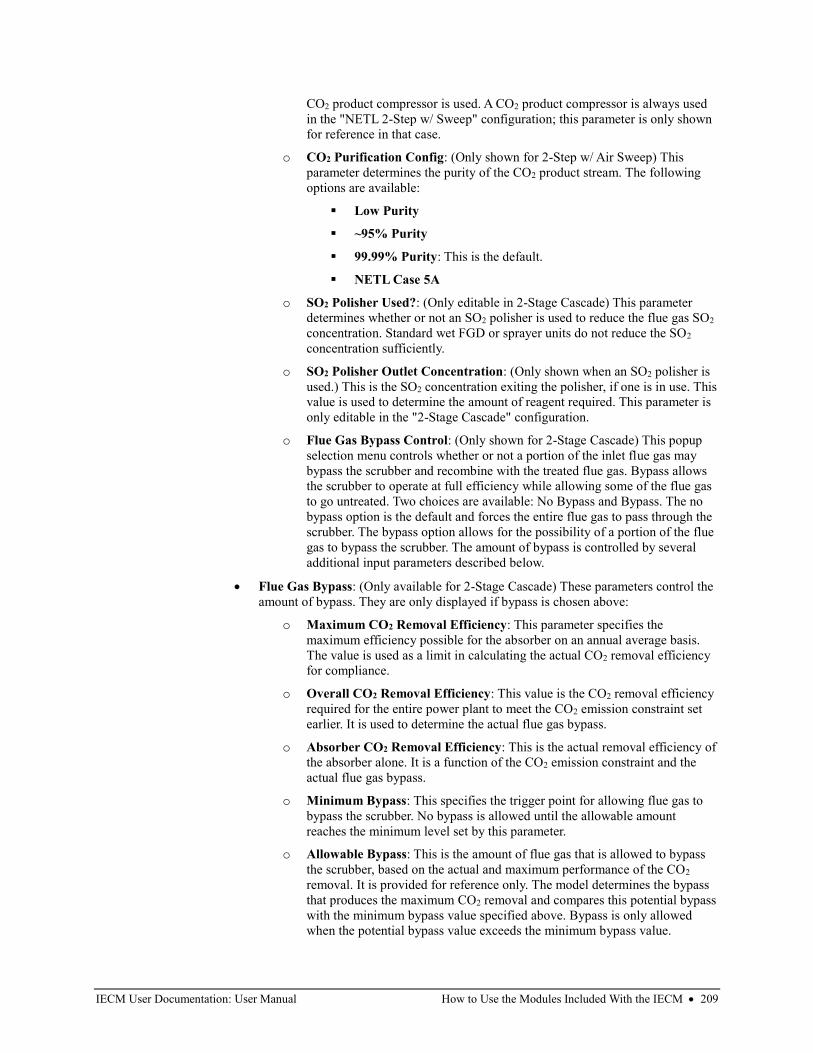
IECM User Documentation: User Manual How to Use the Modules Included With the IECM • 209
CO2 product compressor is used. A CO2 product compressor is always used
in the "NETL 2-Step w/ Sweep" configuration; this parameter is only shown
for reference in that case.
o CO2 Purification Config: (Only shown for 2-Step w/ Air Sweep) This
parameter determines the purity of the CO2 product stream. The following
options are available:
▪ Low Purity
▪ ~95% Purity
▪ 99.99% Purity: This is the default.
▪ NETL Case 5A
o SO2 Polisher Used?: (Only editable in 2-Stage Cascade) This parameter
determines whether or not an SO2 polisher is used to reduce the flue gas SO2
concentration. Standard wet FGD or sprayer units do not reduce the SO2
concentration sufficiently.
o SO2 Polisher Outlet Concentration: (Only shown when an SO2 polisher is
used.) This is the SO2 concentration exiting the polisher, if one is in use. This
value is used to determine the amount of reagent required. This parameter is
only editable in the "2-Stage Cascade" configuration.
o Flue Gas Bypass Control: (Only shown for 2-Stage Cascade) This popup
selection menu controls whether or not a portion of the inlet flue gas may
bypass the scrubber and recombine with the treated flue gas. Bypass allows
the scrubber to operate at full efficiency while allowing some of the flue gas
to go untreated. Two choices are available: No Bypass and Bypass. The no
bypass option is the default and forces the entire flue gas to pass through the
scrubber. The bypass option allows for the possibility of a portion of the flue
gas to bypass the scrubber. The amount of bypass is controlled by several
additional input parameters described below.
• Flue Gas Bypass: (Only available for 2-Stage Cascade) These parameters control the
amount of bypass. They are only displayed if bypass is chosen above:
o Maximum CO2 Removal Efficiency: This parameter specifies the
maximum efficiency possible for the absorber on an annual average basis.
The value is used as a limit in calculating the actual CO2 removal efficiency
for compliance.
o Overall CO2 Removal Efficiency: This value is the CO2 removal efficiency
required for the entire power plant to meet the CO2 emission constraint set
earlier. It is used to determine the actual flue gas bypass.
o Absorber CO2 Removal Efficiency: This is the actual removal efficiency of
the absorber alone. It is a function of the CO2 emission constraint and the
actual flue gas bypass.
o Minimum Bypass: This specifies the trigger point for allowing flue gas to
bypass the scrubber. No bypass is allowed until the allowable amount
reaches the minimum level set by this parameter.
o Allowable Bypass: This is the amount of flue gas that is allowed to bypass
the scrubber, based on the actual and maximum performance of the CO2
removal. It is provided for reference only. The model determines the bypass
that produces the maximum CO2 removal and compares this potential bypass
with the minimum bypass value specified above. Bypass is only allowed
when the potential bypass value exceeds the minimum bypass value.
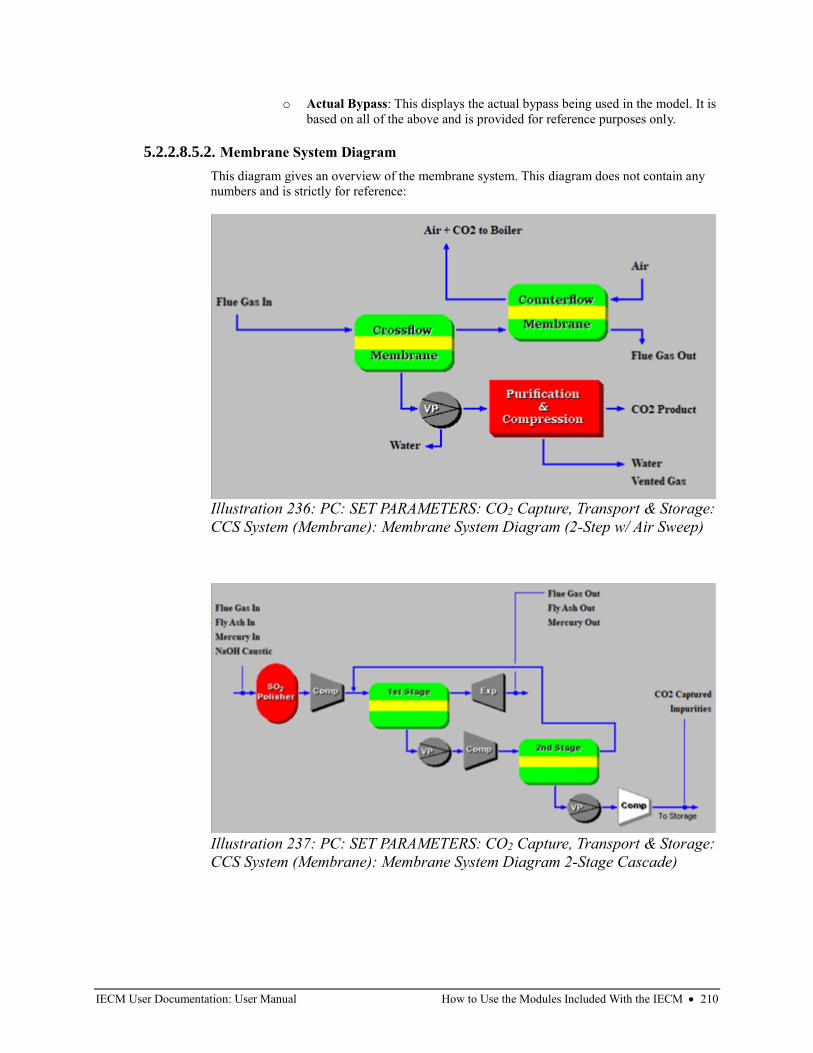
IECM User Documentation: User Manual How to Use the Modules Included With the IECM • 210
o Actual Bypass: This displays the actual bypass being used in the model. It is
based on all of the above and is provided for reference purposes only.
5.2.2.8.5.2. Membrane System Diagram
This diagram gives an overview of the membrane system. This diagram does not contain any
numbers and is strictly for reference:
Illustration 236: PC: SET PARAMETERS: CO2 Capture, Transport & Storage:
CCS System (Membrane): Membrane System Diagram (2-Step w/ Air Sweep)
Illustration 237: PC: SET PARAMETERS: CO2 Capture, Transport & Storage:
CCS System (Membrane): Membrane System Diagram 2-Stage Cascade)
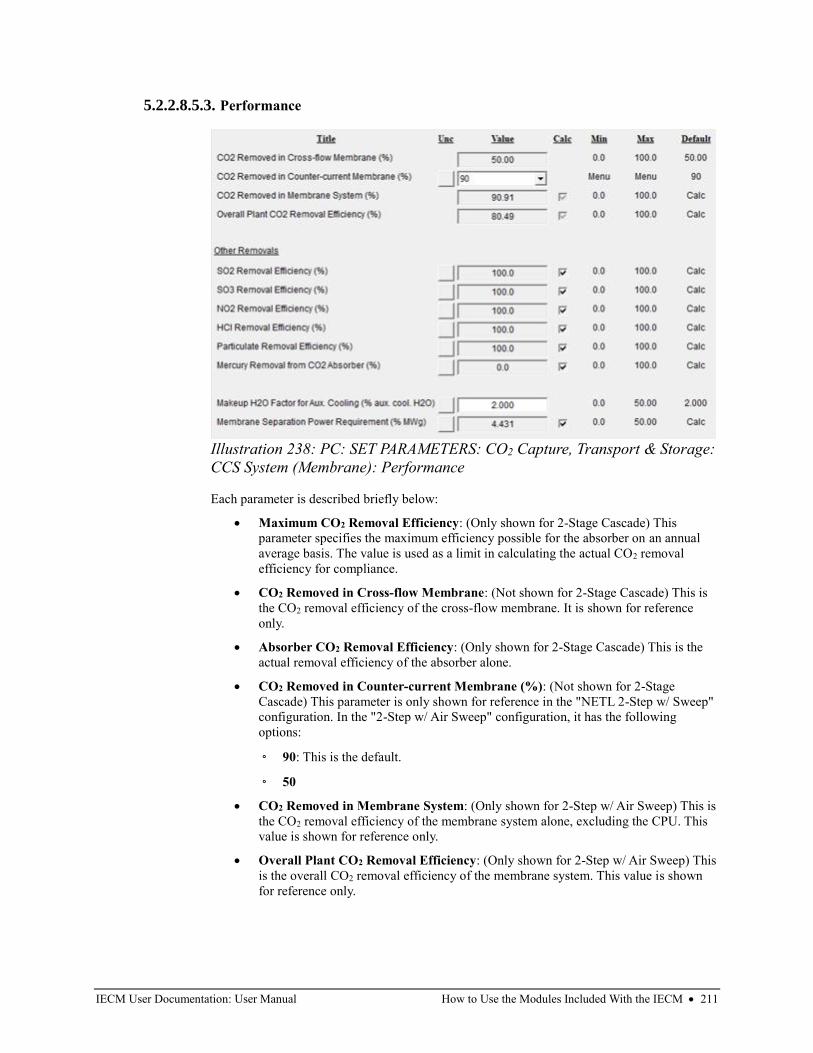
IECM User Documentation: User Manual How to Use the Modules Included With the IECM • 211
5.2.2.8.5.3. Performance
Each parameter is described briefly below:
• Maximum CO2 Removal Efficiency: (Only shown for 2-Stage Cascade) This
parameter specifies the maximum efficiency possible for the absorber on an annual
average basis. The value is used as a limit in calculating the actual CO2 removal
efficiency for compliance.
• CO2 Removed in Cross-flow Membrane: (Not shown for 2-Stage Cascade) This is
the CO2 removal efficiency of the cross-flow membrane. It is shown for reference
only.
• Absorber CO2 Removal Efficiency: (Only shown for 2-Stage Cascade) This is the
actual removal efficiency of the absorber alone.
• CO2 Removed in Counter-current Membrane (%): (Not shown for 2-Stage
Cascade) This parameter is only shown for reference in the "NETL 2-Step w/ Sweep"
configuration. In the "2-Step w/ Air Sweep" configuration, it has the following
options:
◦ 90: This is the default.
◦ 50
• CO2 Removed in Membrane System: (Only shown for 2-Step w/ Air Sweep) This is
the CO2 removal efficiency of the membrane system alone, excluding the CPU. This
value is shown for reference only.
• Overall Plant CO2 Removal Efficiency: (Only shown for 2-Step w/ Air Sweep) This
is the overall CO2 removal efficiency of the membrane system. This value is shown
for reference only.
Illustration 238: PC: SET PARAMETERS: CO2 Capture, Transport & Storage:
CCS System (Membrane): Performance
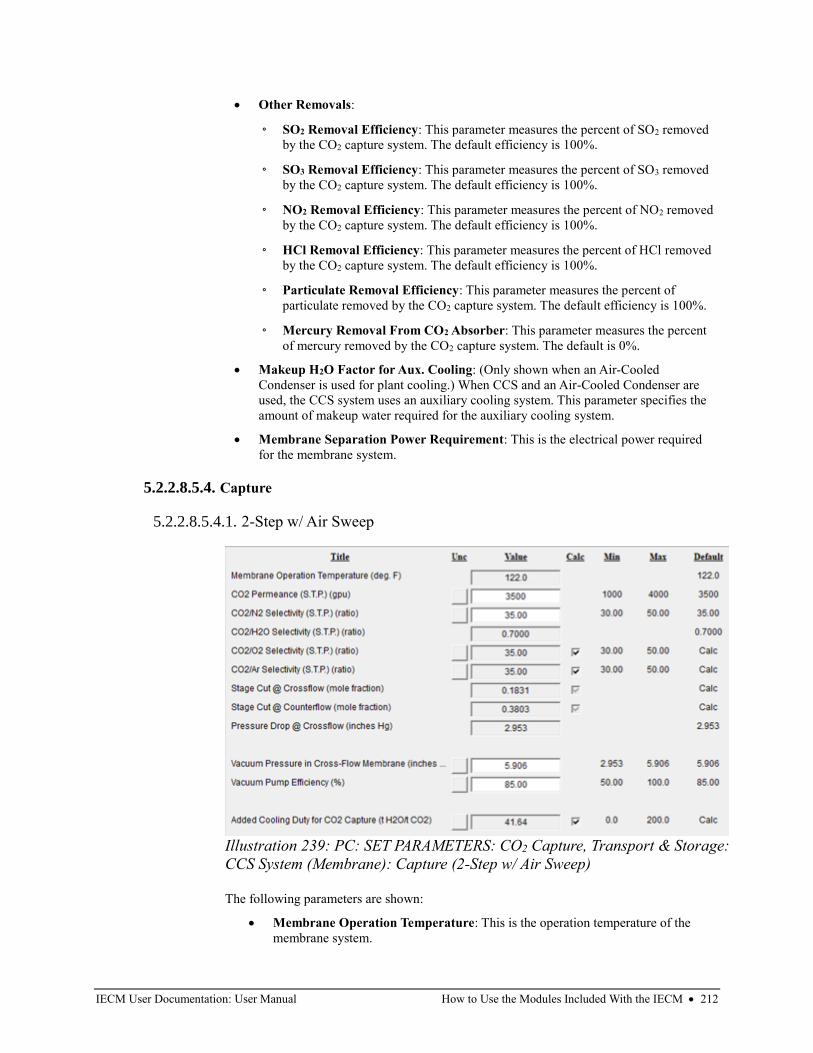
IECM User Documentation: User Manual How to Use the Modules Included With the IECM • 212
• Other Removals:
◦ SO2 Removal Efficiency: This parameter measures the percent of SO2 removed
by the CO2 capture system. The default efficiency is 100%.
◦ SO3 Removal Efficiency: This parameter measures the percent of SO3 removed
by the CO2 capture system. The default efficiency is 100%.
◦ NO2 Removal Efficiency: This parameter measures the percent of NO2 removed
by the CO2 capture system. The default efficiency is 100%.
◦ HCl Removal Efficiency: This parameter measures the percent of HCl removed
by the CO2 capture system. The default efficiency is 100%.
◦ Particulate Removal Efficiency: This parameter measures the percent of
particulate removed by the CO2 capture system. The default efficiency is 100%.
◦ Mercury Removal From CO2 Absorber: This parameter measures the percent
of mercury removed by the CO2 capture system. The default is 0%.
• Makeup H2O Factor for Aux. Cooling: (Only shown when an Air-Cooled
Condenser is used for plant cooling.) When CCS and an Air-Cooled Condenser are
used, the CCS system uses an auxiliary cooling system. This parameter specifies the
amount of makeup water required for the auxiliary cooling system.
• Membrane Separation Power Requirement: This is the electrical power required
for the membrane system.
5.2.2.8.5.4. Capture
5.2.2.8.5.4.1. 2-Step w/ Air Sweep
The following parameters are shown:
• Membrane Operation Temperature: This is the operation temperature of the
membrane system.
Illustration 239: PC: SET PARAMETERS: CO2 Capture, Transport & Storage:
CCS System (Membrane): Capture (2-Step w/ Air Sweep)
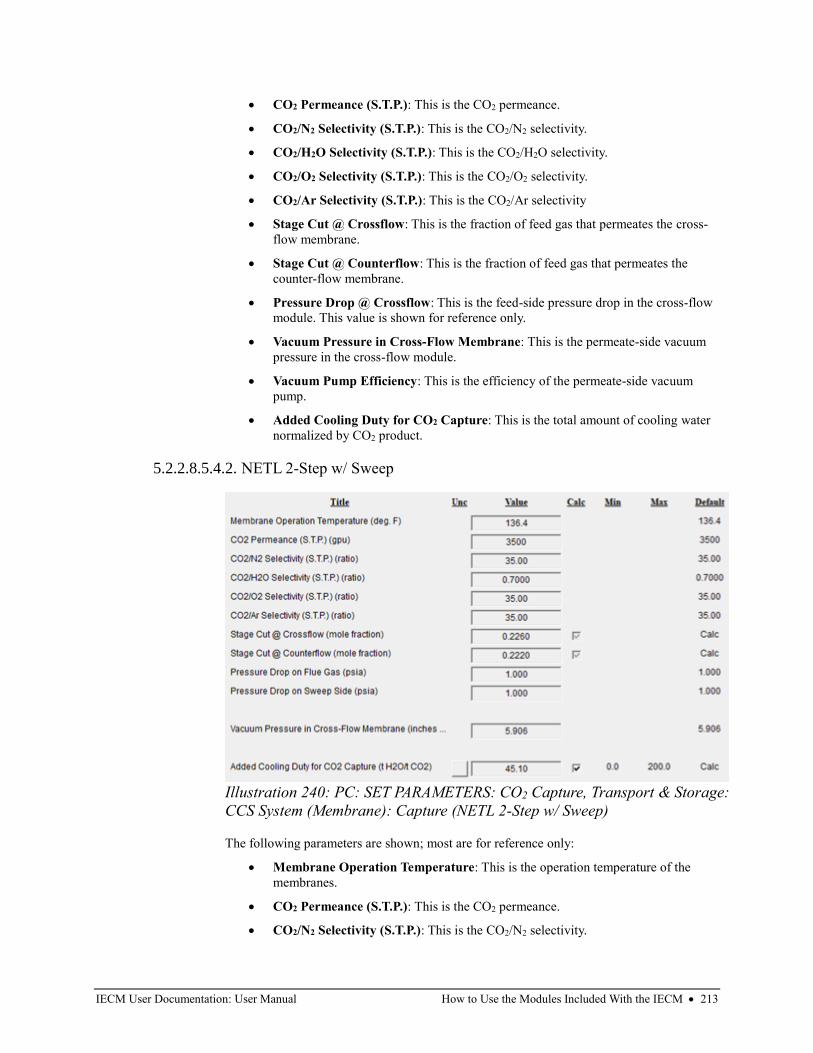
IECM User Documentation: User Manual How to Use the Modules Included With the IECM • 213
• CO2 Permeance (S.T.P.): This is the CO2 permeance.
• CO2/N2 Selectivity (S.T.P.): This is the CO2/N2 selectivity.
• CO2/H2O Selectivity (S.T.P.): This is the CO2/H2O selectivity.
• CO2/O2 Selectivity (S.T.P.): This is the CO2/O2 selectivity.
• CO2/Ar Selectivity (S.T.P.): This is the CO2/Ar selectivity
• Stage Cut @ Crossflow: This is the fraction of feed gas that permeates the cross-
flow membrane.
• Stage Cut @ Counterflow: This is the fraction of feed gas that permeates the
counter-flow membrane.
• Pressure Drop @ Crossflow: This is the feed-side pressure drop in the cross-flow
module. This value is shown for reference only.
• Vacuum Pressure in Cross-Flow Membrane: This is the permeate-side vacuum
pressure in the cross-flow module.
• Vacuum Pump Efficiency: This is the efficiency of the permeate-side vacuum
pump.
• Added Cooling Duty for CO2 Capture: This is the total amount of cooling water
normalized by CO2 product.
5.2.2.8.5.4.2. NETL 2-Step w/ Sweep
The following parameters are shown; most are for reference only:
• Membrane Operation Temperature: This is the operation temperature of the
membranes.
• CO2 Permeance (S.T.P.): This is the CO2 permeance.
• CO2/N2 Selectivity (S.T.P.): This is the CO2/N2 selectivity.
Illustration 240: PC: SET PARAMETERS: CO2 Capture, Transport & Storage:
CCS System (Membrane): Capture (NETL 2-Step w/ Sweep)
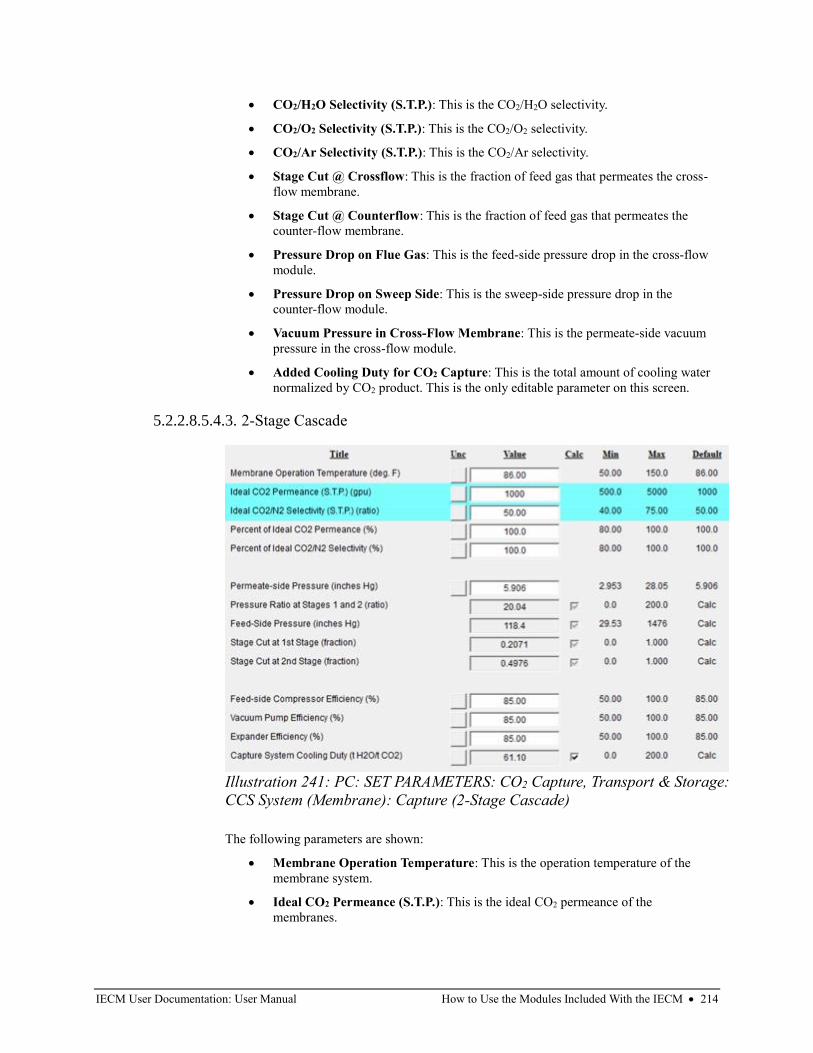
IECM User Documentation: User Manual How to Use the Modules Included With the IECM • 214
• CO2/H2O Selectivity (S.T.P.): This is the CO2/H2O selectivity.
• CO2/O2 Selectivity (S.T.P.): This is the CO2/O2 selectivity.
• CO2/Ar Selectivity (S.T.P.): This is the CO2/Ar selectivity.
• Stage Cut @ Crossflow: This is the fraction of feed gas that permeates the cross-
flow membrane.
• Stage Cut @ Counterflow: This is the fraction of feed gas that permeates the
counter-flow membrane.
• Pressure Drop on Flue Gas: This is the feed-side pressure drop in the cross-flow
module.
• Pressure Drop on Sweep Side: This is the sweep-side pressure drop in the
counter-flow module.
• Vacuum Pressure in Cross-Flow Membrane: This is the permeate-side vacuum
pressure in the cross-flow module.
• Added Cooling Duty for CO2 Capture: This is the total amount of cooling water
normalized by CO2 product. This is the only editable parameter on this screen.
5.2.2.8.5.4.3. 2-Stage Cascade
The following parameters are shown:
• Membrane Operation Temperature: This is the operation temperature of the
membrane system.
• Ideal CO2 Permeance (S.T.P.): This is the ideal CO2 permeance of the
membranes.
Illustration 241: PC: SET PARAMETERS: CO2 Capture, Transport & Storage:
CCS System (Membrane): Capture (2-Stage Cascade)
IECM User Documentation: User Manual How to Use the Modules Included With the IECM • 215
• Ideal CO2/N2 Selectivity (S.T.P.): This is the ideal CO2/N2 selectivity of the
membranes.
• Percent of Ideal CO2 Permeance: This is the percent of ideal CO2 permeance that
is actually achieved.
• Percent of Ideal CO2/N2 Selectivity: This is the percent of ideal CO2/N2
selectivity that is actually achieved.
• Permeate-side Pressure: This is the permeate-side pressure in the membrane
module.
• Pressure Ratio at Stages 1 and 2: This is the feed vs. permeate side pressure ratio
across the membrane. It is shown for reference only.
• Feed-Side Pressure: This is the feed-side pressure in the membrane module. It is
shown for reference only.
• Stage Cut at 1st Stage: This is the fraction of feed gas that permeates the first
membrane. This value is shown for reference only.
• Stage Cut at 2nd Stage: This is the fraction of feed gas that permeates the second
membrane. This value is shown for reference only.
• Feed-side Compressor Efficiency: This is the efficiency of the feed-side
compressor.
• Vacuum Pump Efficiency: This is the efficiency of the permeate-side vacuum
pump.
• Expander Efficiency: This is the efficiency of the expander.
• Capture System Cooling Duty: This is the total amount of cooling water
normalized by CO2 product.
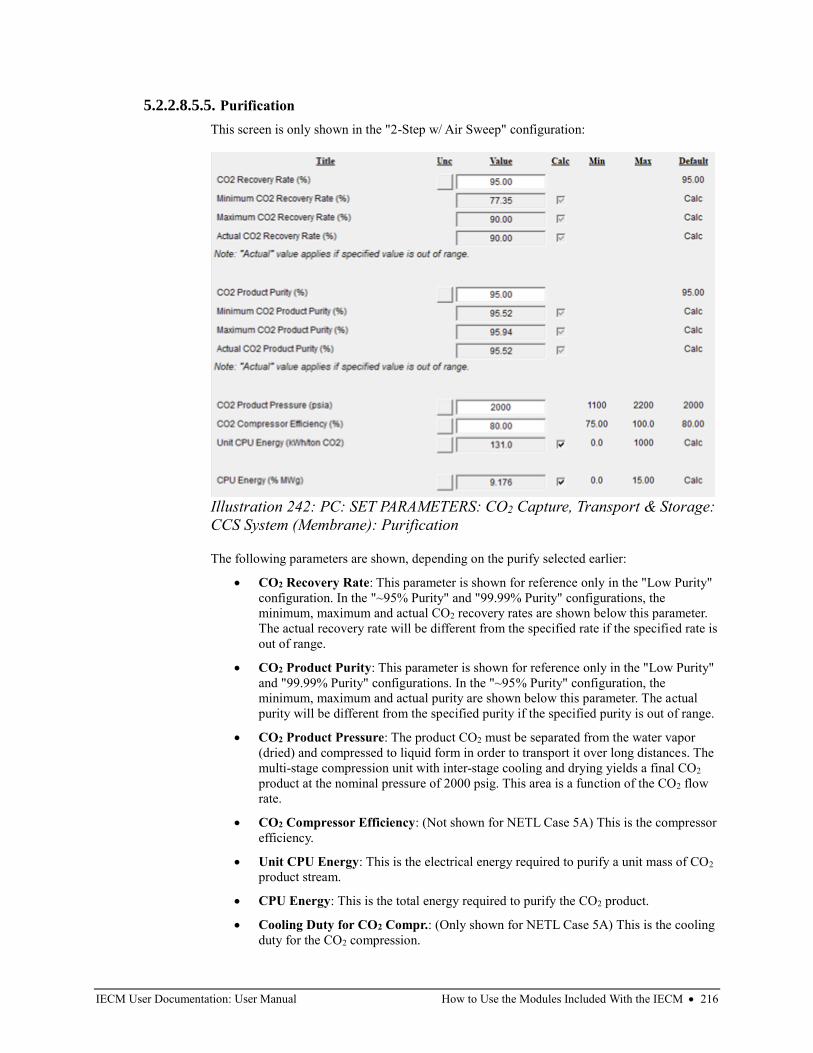
IECM User Documentation: User Manual How to Use the Modules Included With the IECM • 216
5.2.2.8.5.5. Purification
This screen is only shown in the "2-Step w/ Air Sweep" configuration:
The following parameters are shown, depending on the purify selected earlier:
• CO2 Recovery Rate: This parameter is shown for reference only in the "Low Purity"
configuration. In the "~95% Purity" and "99.99% Purity" configurations, the
minimum, maximum and actual CO2 recovery rates are shown below this parameter.
The actual recovery rate will be different from the specified rate if the specified rate is
out of range.
• CO2 Product Purity: This parameter is shown for reference only in the "Low Purity"
and "99.99% Purity" configurations. In the "~95% Purity" configuration, the
minimum, maximum and actual purity are shown below this parameter. The actual
purity will be different from the specified purity if the specified purity is out of range.
• CO2 Product Pressure: The product CO2 must be separated from the water vapor
(dried) and compressed to liquid form in order to transport it over long distances. The
multi-stage compression unit with inter-stage cooling and drying yields a final CO2
product at the nominal pressure of 2000 psig. This area is a function of the CO2 flow
rate.
• CO2 Compressor Efficiency: (Not shown for NETL Case 5A) This is the compressor
efficiency.
• Unit CPU Energy: This is the electrical energy required to purify a unit mass of CO2
product stream.
• CPU Energy: This is the total energy required to purify the CO2 product.
• Cooling Duty for CO2 Compr.: (Only shown for NETL Case 5A) This is the cooling
duty for the CO2 compression.
Illustration 242: PC: SET PARAMETERS: CO2 Capture, Transport & Storage:
CCS System (Membrane): Purification
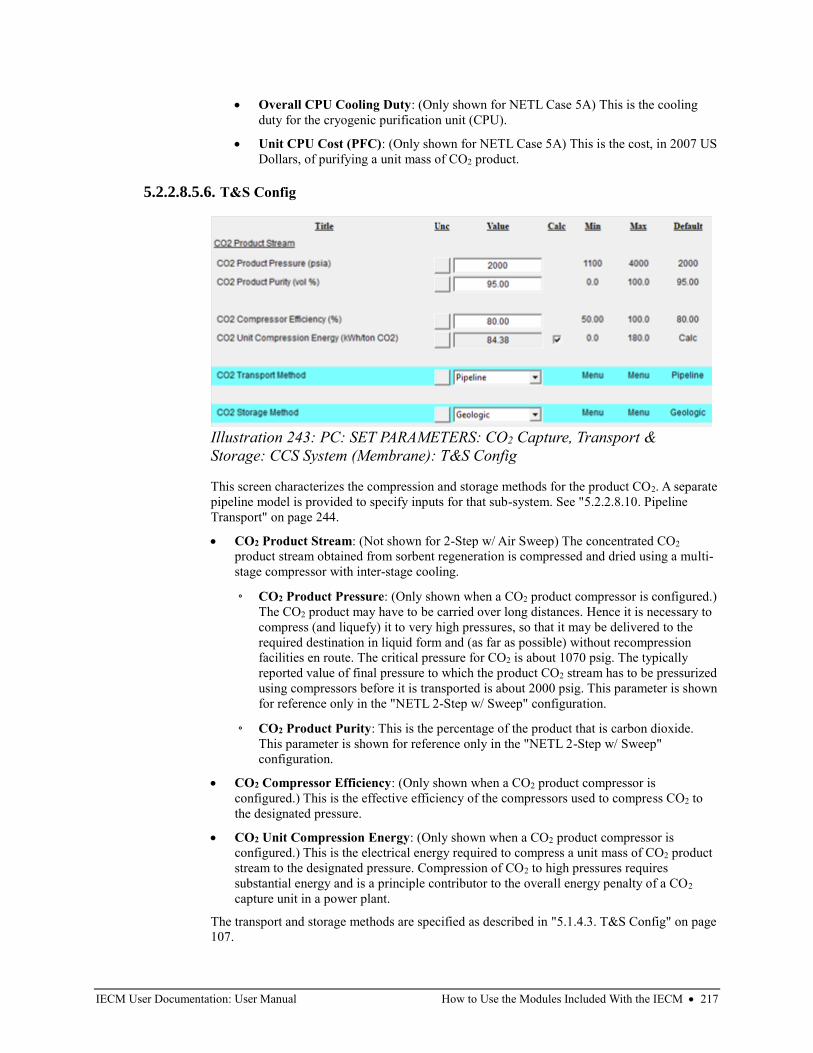
IECM User Documentation: User Manual How to Use the Modules Included With the IECM • 217
• Overall CPU Cooling Duty: (Only shown for NETL Case 5A) This is the cooling
duty for the cryogenic purification unit (CPU).
• Unit CPU Cost (PFC): (Only shown for NETL Case 5A) This is the cost, in 2007 US
Dollars, of purifying a unit mass of CO2 product.
5.2.2.8.5.6. T&S Config
This screen characterizes the compression and storage methods for the product CO2. A separate
pipeline model is provided to specify inputs for that sub-system. See "5.2.2.8.10. Pipeline
Transport" on page 244.
• CO2 Product Stream: (Not shown for 2-Step w/ Air Sweep) The concentrated CO2
product stream obtained from sorbent regeneration is compressed and dried using a multi-
stage compressor with inter-stage cooling.
◦ CO2 Product Pressure: (Only shown when a CO2 product compressor is configured.)
The CO2 product may have to be carried over long distances. Hence it is necessary to
compress (and liquefy) it to very high pressures, so that it may be delivered to the
required destination in liquid form and (as far as possible) without recompression
facilities en route. The critical pressure for CO2 is about 1070 psig. The typically
reported value of final pressure to which the product CO2 stream has to be pressurized
using compressors before it is transported is about 2000 psig. This parameter is shown
for reference only in the "NETL 2-Step w/ Sweep" configuration.
◦ CO2 Product Purity: This is the percentage of the product that is carbon dioxide.
This parameter is shown for reference only in the "NETL 2-Step w/ Sweep"
configuration.
• CO2 Compressor Efficiency: (Only shown when a CO2 product compressor is
configured.) This is the effective efficiency of the compressors used to compress CO2 to
the designated pressure.
• CO2 Unit Compression Energy: (Only shown when a CO2 product compressor is
configured.) This is the electrical energy required to compress a unit mass of CO2 product
stream to the designated pressure. Compression of CO2 to high pressures requires
substantial energy and is a principle contributor to the overall energy penalty of a CO2
capture unit in a power plant.
The transport and storage methods are specified as described in "5.1.4.3. T&S Config" on page
107.
Illustration 243: PC: SET PARAMETERS: CO2 Capture, Transport &
Storage: CCS System (Membrane): T&S Config
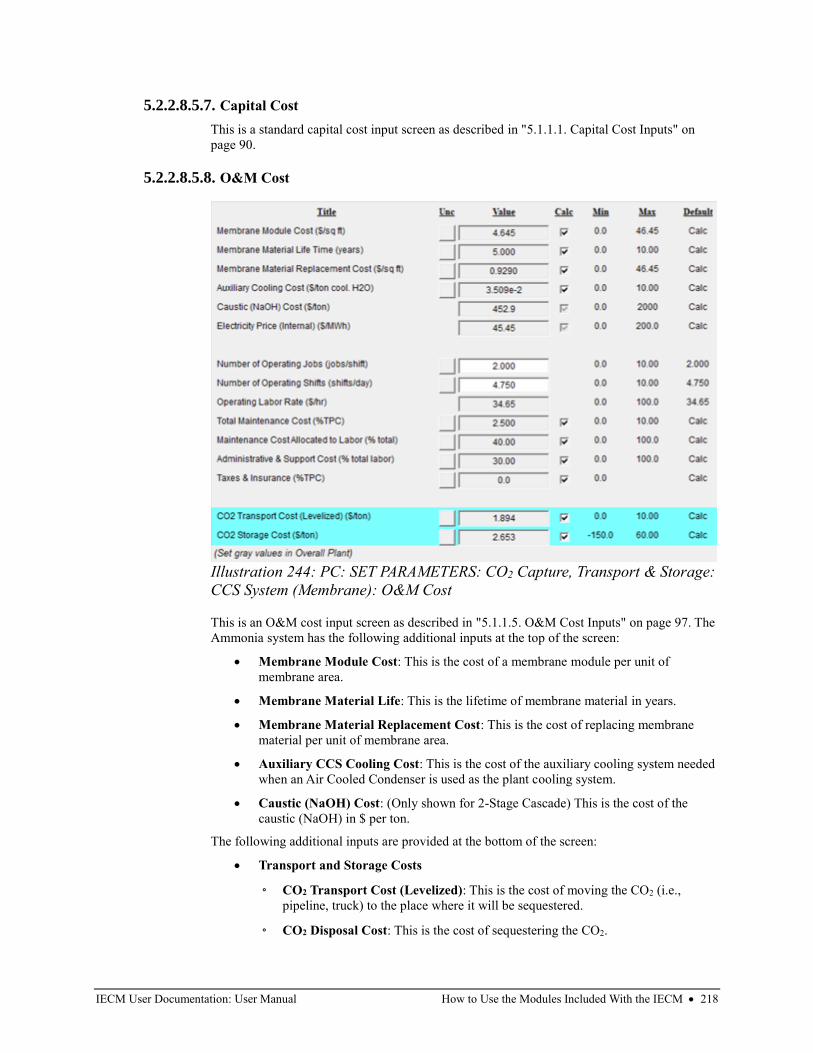
IECM User Documentation: User Manual How to Use the Modules Included With the IECM • 218
5.2.2.8.5.7. Capital Cost
This is a standard capital cost input screen as described in "5.1.1.1. Capital Cost Inputs" on
page 90.
5.2.2.8.5.8. O&M Cost
This is an O&M cost input screen as described in "5.1.1.5. O&M Cost Inputs" on page 97. The
Ammonia system has the following additional inputs at the top of the screen:
• Membrane Module Cost: This is the cost of a membrane module per unit of
membrane area.
• Membrane Material Life: This is the lifetime of membrane material in years.
• Membrane Material Replacement Cost: This is the cost of replacing membrane
material per unit of membrane area.
• Auxiliary CCS Cooling Cost: This is the cost of the auxiliary cooling system needed
when an Air Cooled Condenser is used as the plant cooling system.
• Caustic (NaOH) Cost: (Only shown for 2-Stage Cascade) This is the cost of the
caustic (NaOH) in $ per ton.
The following additional inputs are provided at the bottom of the screen:
• Transport and Storage Costs
◦ CO2 Transport Cost (Levelized): This is the cost of moving the CO2 (i.e.,
pipeline, truck) to the place where it will be sequestered.
◦ CO2 Disposal Cost: This is the cost of sequestering the CO2.
Illustration 244: PC: SET PARAMETERS: CO2 Capture, Transport & Storage:
CCS System (Membrane): O&M Cost
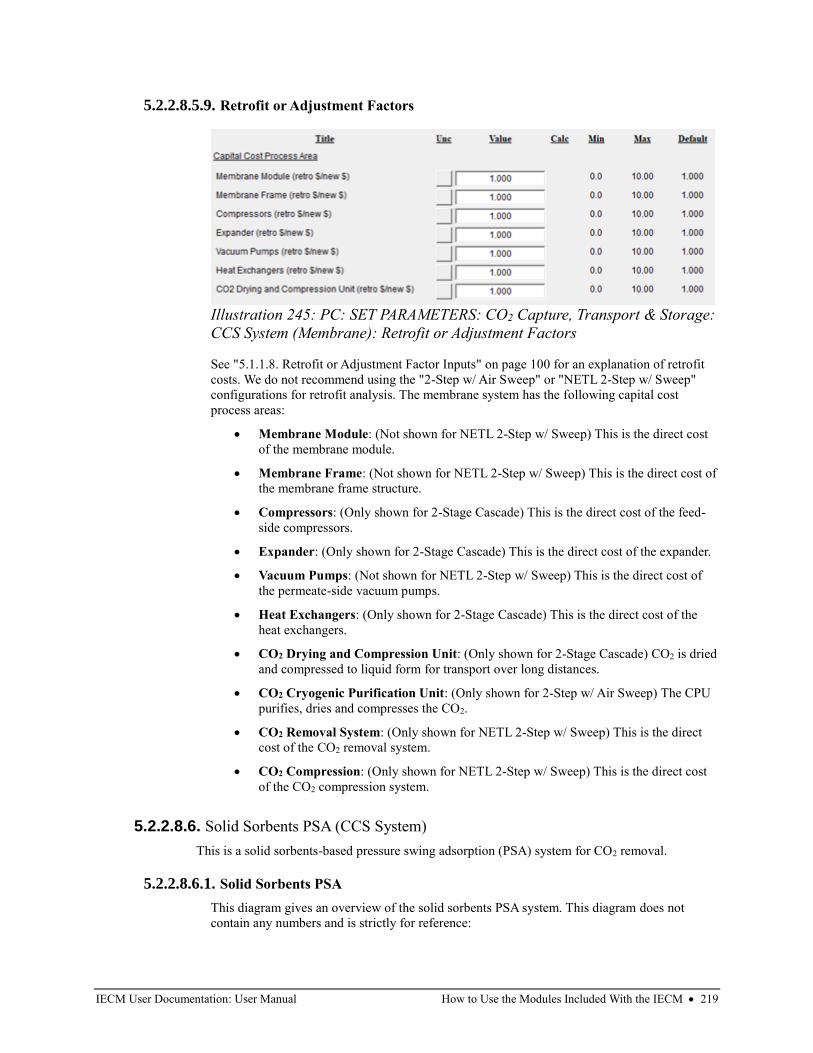
IECM User Documentation: User Manual How to Use the Modules Included With the IECM • 219
5.2.2.8.5.9. Retrofit or Adjustment Factors
See "5.1.1.8. Retrofit or Adjustment Factor Inputs" on page 100 for an explanation of retrofit
costs. We do not recommend using the "2-Step w/ Air Sweep" or "NETL 2-Step w/ Sweep"
configurations for retrofit analysis. The membrane system has the following capital cost
process areas:
• Membrane Module: (Not shown for NETL 2-Step w/ Sweep) This is the direct cost
of the membrane module.
• Membrane Frame: (Not shown for NETL 2-Step w/ Sweep) This is the direct cost of
the membrane frame structure.
• Compressors: (Only shown for 2-Stage Cascade) This is the direct cost of the feed-
side compressors.
• Expander: (Only shown for 2-Stage Cascade) This is the direct cost of the expander.
• Vacuum Pumps: (Not shown for NETL 2-Step w/ Sweep) This is the direct cost of
the permeate-side vacuum pumps.
• Heat Exchangers: (Only shown for 2-Stage Cascade) This is the direct cost of the
heat exchangers.
• CO2 Drying and Compression Unit: (Only shown for 2-Stage Cascade) CO2 is dried
and compressed to liquid form for transport over long distances.
• CO2 Cryogenic Purification Unit: (Only shown for 2-Step w/ Air Sweep) The CPU
purifies, dries and compresses the CO2.
• CO2 Removal System: (Only shown for NETL 2-Step w/ Sweep) This is the direct
cost of the CO2 removal system.
• CO2 Compression: (Only shown for NETL 2-Step w/ Sweep) This is the direct cost
of the CO2 compression system.
5.2.2.8.6. Solid Sorbents PSA (CCS System)
This is a solid sorbents-based pressure swing adsorption (PSA) system for CO2 removal.
5.2.2.8.6.1. Solid Sorbents PSA
This diagram gives an overview of the solid sorbents PSA system. This diagram does not
contain any numbers and is strictly for reference:
Illustration 245: PC: SET PARAMETERS: CO2 Capture, Transport & Storage:
CCS System (Membrane): Retrofit or Adjustment Factors
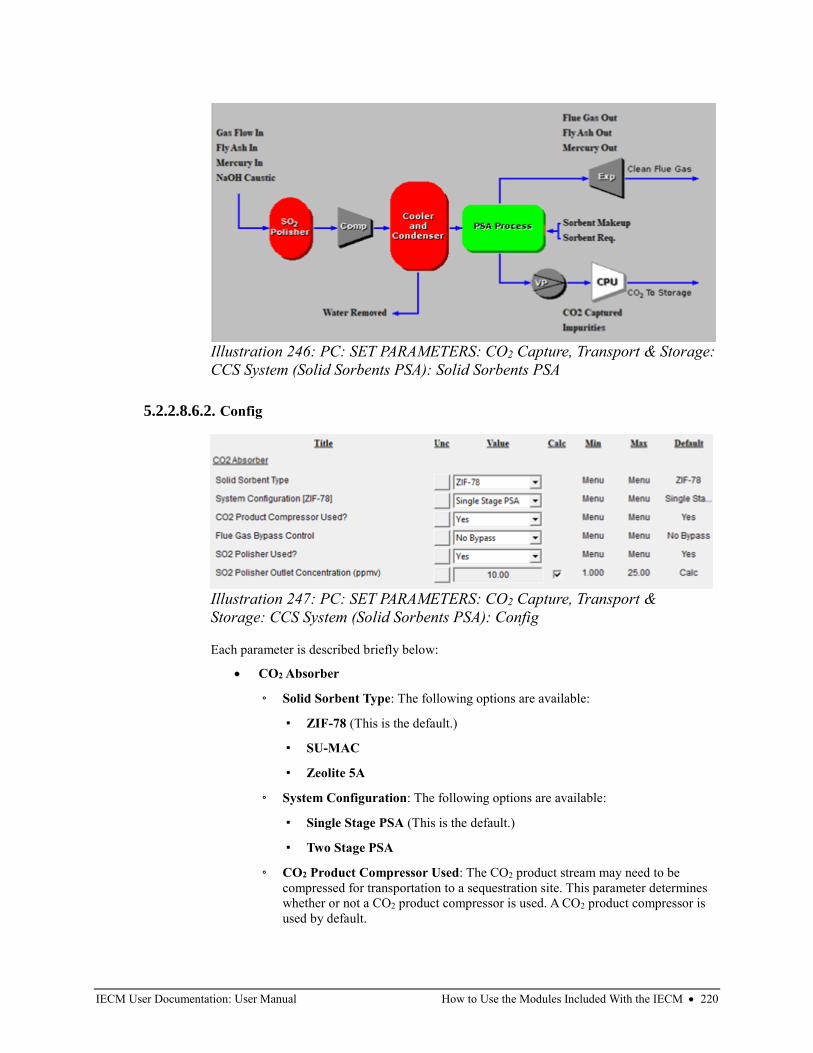
IECM User Documentation: User Manual How to Use the Modules Included With the IECM • 220
5.2.2.8.6.2. Config
Each parameter is described briefly below:
• CO2 Absorber
◦ Solid Sorbent Type: The following options are available:
▪ ZIF-78 (This is the default.)
▪ SU-MAC
▪ Zeolite 5A
◦ System Configuration: The following options are available:
▪ Single Stage PSA (This is the default.)
▪ Two Stage PSA
◦ CO2 Product Compressor Used: The CO2 product stream may need to be
compressed for transportation to a sequestration site. This parameter determines
whether or not a CO2 product compressor is used. A CO2 product compressor is
used by default.
Illustration 246: PC: SET PARAMETERS: CO2 Capture, Transport & Storage:
CCS System (Solid Sorbents PSA): Solid Sorbents PSA
Illustration 247: PC: SET PARAMETERS: CO2 Capture, Transport &
Storage: CCS System (Solid Sorbents PSA): Config
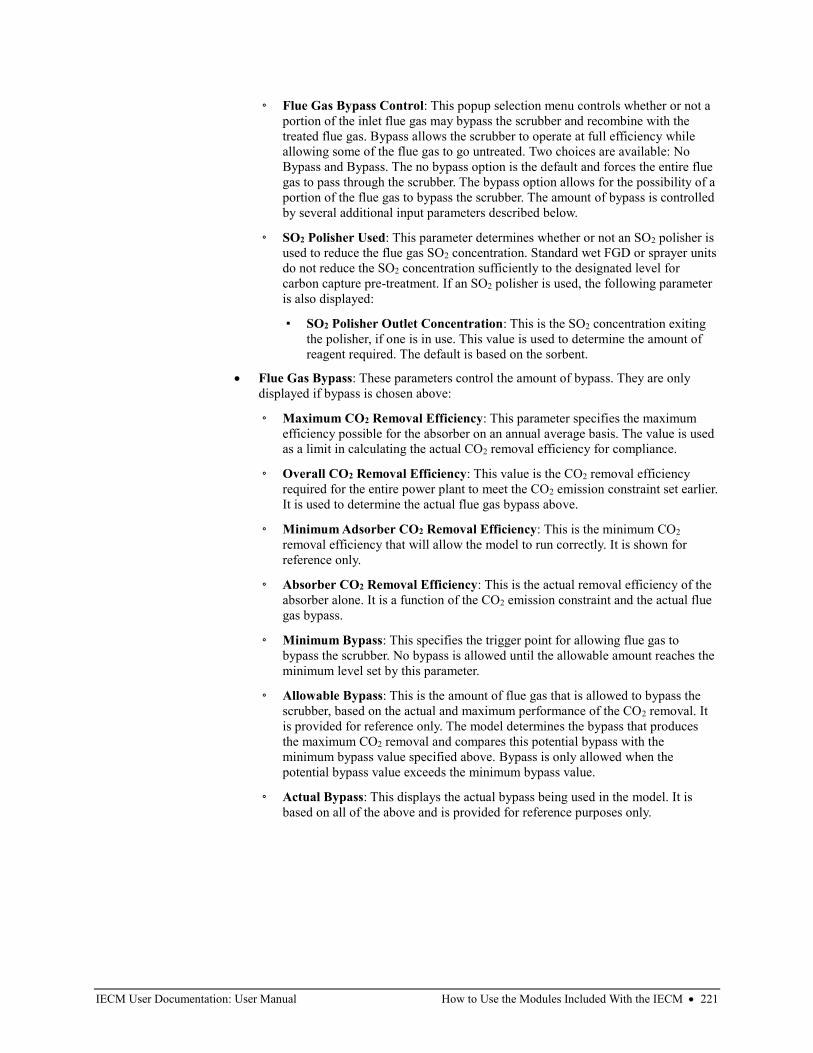
IECM User Documentation: User Manual How to Use the Modules Included With the IECM • 221
◦ Flue Gas Bypass Control: This popup selection menu controls whether or not a
portion of the inlet flue gas may bypass the scrubber and recombine with the
treated flue gas. Bypass allows the scrubber to operate at full efficiency while
allowing some of the flue gas to go untreated. Two choices are available: No
Bypass and Bypass. The no bypass option is the default and forces the entire flue
gas to pass through the scrubber. The bypass option allows for the possibility of a
portion of the flue gas to bypass the scrubber. The amount of bypass is controlled
by several additional input parameters described below.
◦ SO2 Polisher Used: This parameter determines whether or not an SO2 polisher is
used to reduce the flue gas SO2 concentration. Standard wet FGD or sprayer units
do not reduce the SO2 concentration sufficiently to the designated level for
carbon capture pre-treatment. If an SO2 polisher is used, the following parameter
is also displayed:
▪ SO2 Polisher Outlet Concentration: This is the SO2 concentration exiting
the polisher, if one is in use. This value is used to determine the amount of
reagent required. The default is based on the sorbent.
• Flue Gas Bypass: These parameters control the amount of bypass. They are only
displayed if bypass is chosen above:
◦ Maximum CO2 Removal Efficiency: This parameter specifies the maximum
efficiency possible for the absorber on an annual average basis. The value is used
as a limit in calculating the actual CO2 removal efficiency for compliance.
◦ Overall CO2 Removal Efficiency: This value is the CO2 removal efficiency
required for the entire power plant to meet the CO2 emission constraint set earlier.
It is used to determine the actual flue gas bypass above.
◦ Minimum Adsorber CO2 Removal Efficiency: This is the minimum CO2
removal efficiency that will allow the model to run correctly. It is shown for
reference only.
◦ Absorber CO2 Removal Efficiency: This is the actual removal efficiency of the
absorber alone. It is a function of the CO2 emission constraint and the actual flue
gas bypass.
◦ Minimum Bypass: This specifies the trigger point for allowing flue gas to
bypass the scrubber. No bypass is allowed until the allowable amount reaches the
minimum level set by this parameter.
◦ Allowable Bypass: This is the amount of flue gas that is allowed to bypass the
scrubber, based on the actual and maximum performance of the CO2 removal. It
is provided for reference only. The model determines the bypass that produces
the maximum CO2 removal and compares this potential bypass with the
minimum bypass value specified above. Bypass is only allowed when the
potential bypass value exceeds the minimum bypass value.
◦ Actual Bypass: This displays the actual bypass being used in the model. It is
based on all of the above and is provided for reference purposes only.
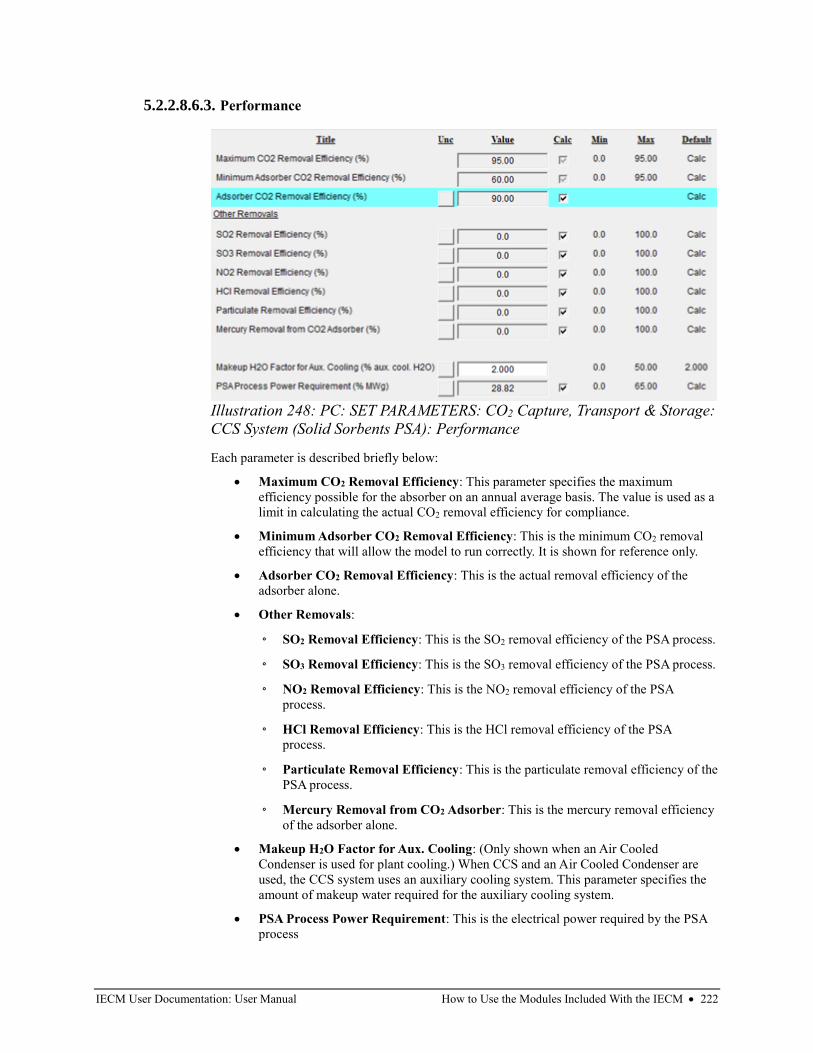
IECM User Documentation: User Manual How to Use the Modules Included With the IECM • 222
5.2.2.8.6.3. Performance
Each parameter is described briefly below:
• Maximum CO2 Removal Efficiency: This parameter specifies the maximum
efficiency possible for the absorber on an annual average basis. The value is used as a
limit in calculating the actual CO2 removal efficiency for compliance.
• Minimum Adsorber CO2 Removal Efficiency: This is the minimum CO2 removal
efficiency that will allow the model to run correctly. It is shown for reference only.
• Adsorber CO2 Removal Efficiency: This is the actual removal efficiency of the
adsorber alone.
• Other Removals:
◦ SO2 Removal Efficiency: This is the SO2 removal efficiency of the PSA process.
◦ SO3 Removal Efficiency: This is the SO3 removal efficiency of the PSA process.
◦ NO2 Removal Efficiency: This is the NO2 removal efficiency of the PSA
process.
◦ HCl Removal Efficiency: This is the HCl removal efficiency of the PSA
process.
◦ Particulate Removal Efficiency: This is the particulate removal efficiency of the
PSA process.
◦ Mercury Removal from CO2 Adsorber: This is the mercury removal efficiency
of the adsorber alone.
• Makeup H2O Factor for Aux. Cooling: (Only shown when an Air Cooled
Condenser is used for plant cooling.) When CCS and an Air Cooled Condenser are
used, the CCS system uses an auxiliary cooling system. This parameter specifies the
amount of makeup water required for the auxiliary cooling system.
• PSA Process Power Requirement: This is the electrical power required by the PSA
process
Illustration 248: PC: SET PARAMETERS: CO2 Capture, Transport & Storage:
CCS System (Solid Sorbents PSA): Performance
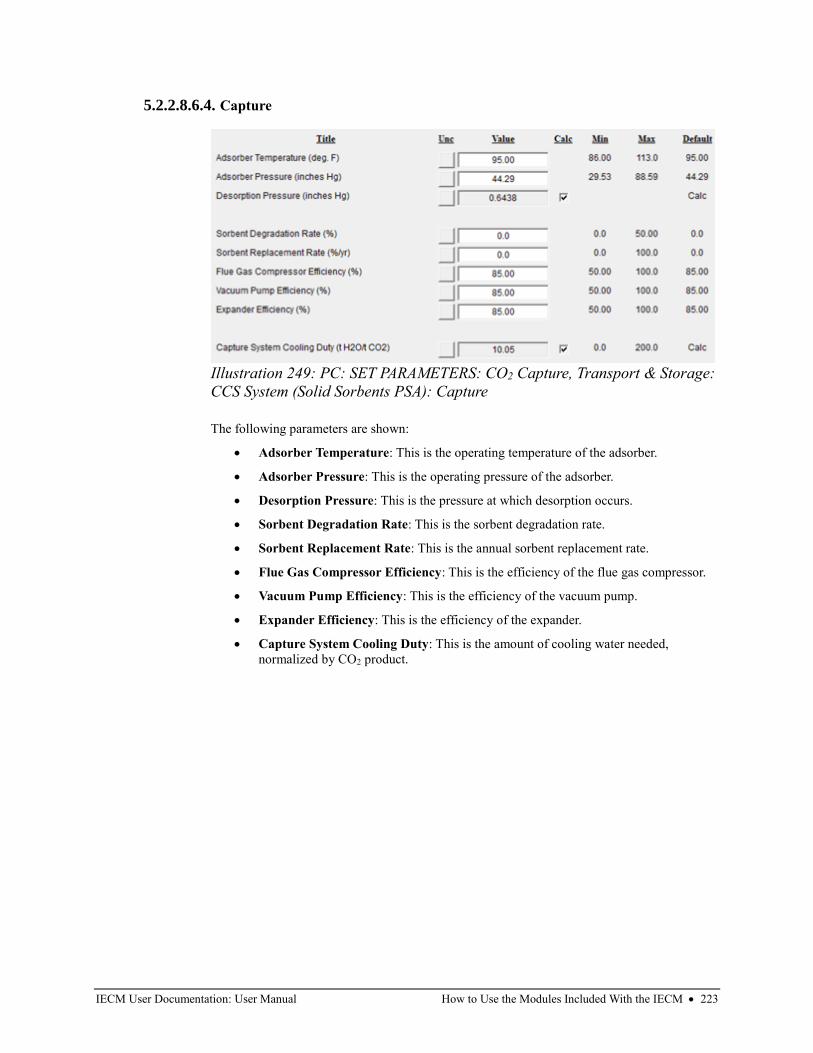
IECM User Documentation: User Manual How to Use the Modules Included With the IECM • 223
5.2.2.8.6.4. Capture
The following parameters are shown:
• Adsorber Temperature: This is the operating temperature of the adsorber.
• Adsorber Pressure: This is the operating pressure of the adsorber.
• Desorption Pressure: This is the pressure at which desorption occurs.
• Sorbent Degradation Rate: This is the sorbent degradation rate.
• Sorbent Replacement Rate: This is the annual sorbent replacement rate.
• Flue Gas Compressor Efficiency: This is the efficiency of the flue gas compressor.
• Vacuum Pump Efficiency: This is the efficiency of the vacuum pump.
• Expander Efficiency: This is the efficiency of the expander.
• Capture System Cooling Duty: This is the amount of cooling water needed,
normalized by CO2 product.
Illustration 249: PC: SET PARAMETERS: CO2 Capture, Transport & Storage:
CCS System (Solid Sorbents PSA): Capture
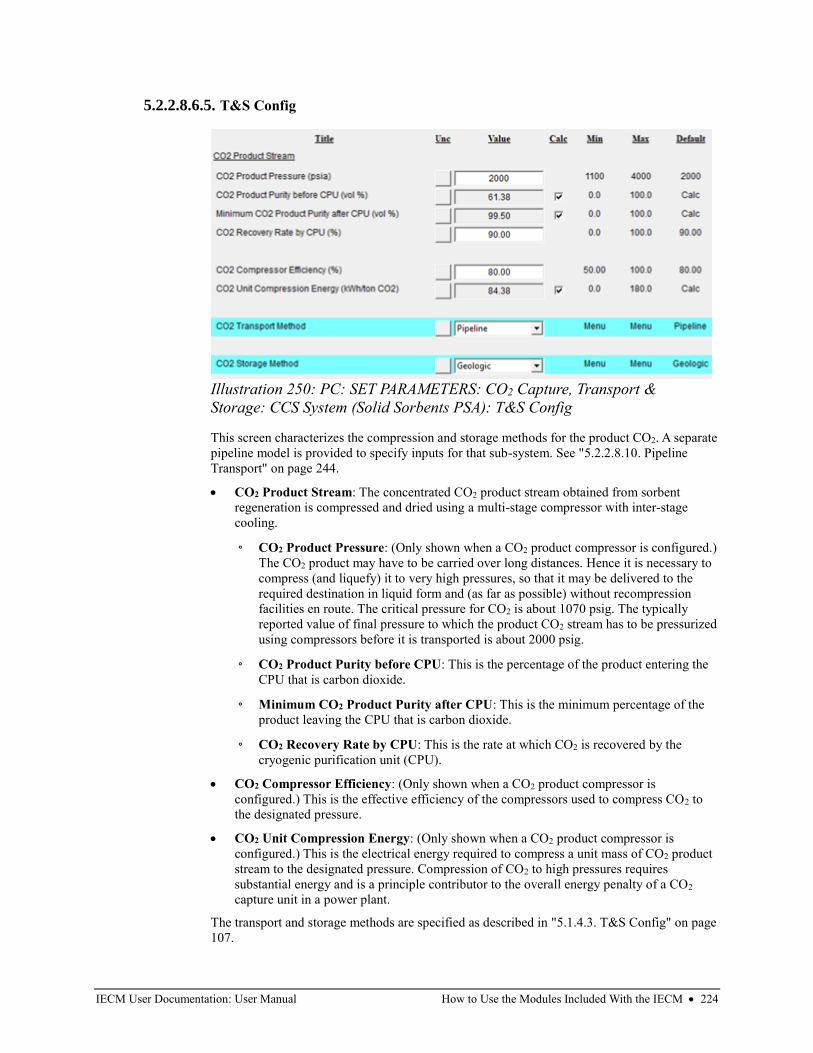
IECM User Documentation: User Manual How to Use the Modules Included With the IECM • 224
5.2.2.8.6.5. T&S Config
This screen characterizes the compression and storage methods for the product CO2. A separate
pipeline model is provided to specify inputs for that sub-system. See "5.2.2.8.10. Pipeline
Transport" on page 244.
• CO2 Product Stream: The concentrated CO2 product stream obtained from sorbent
regeneration is compressed and dried using a multi-stage compressor with inter-stage
cooling.
◦ CO2 Product Pressure: (Only shown when a CO2 product compressor is configured.)
The CO2 product may have to be carried over long distances. Hence it is necessary to
compress (and liquefy) it to very high pressures, so that it may be delivered to the
required destination in liquid form and (as far as possible) without recompression
facilities en route. The critical pressure for CO2 is about 1070 psig. The typically
reported value of final pressure to which the product CO2 stream has to be pressurized
using compressors before it is transported is about 2000 psig.
◦ CO2 Product Purity before CPU: This is the percentage of the product entering the
CPU that is carbon dioxide.
◦ Minimum CO2 Product Purity after CPU: This is the minimum percentage of the
product leaving the CPU that is carbon dioxide.
◦ CO2 Recovery Rate by CPU: This is the rate at which CO2 is recovered by the
cryogenic purification unit (CPU).
• CO2 Compressor Efficiency: (Only shown when a CO2 product compressor is
configured.) This is the effective efficiency of the compressors used to compress CO2 to
the designated pressure.
• CO2 Unit Compression Energy: (Only shown when a CO2 product compressor is
configured.) This is the electrical energy required to compress a unit mass of CO2 product
stream to the designated pressure. Compression of CO2 to high pressures requires
substantial energy and is a principle contributor to the overall energy penalty of a CO2
capture unit in a power plant.
The transport and storage methods are specified as described in "5.1.4.3. T&S Config" on page
107.
Illustration 250: PC: SET PARAMETERS: CO2 Capture, Transport &
Storage: CCS System (Solid Sorbents PSA): T&S Config
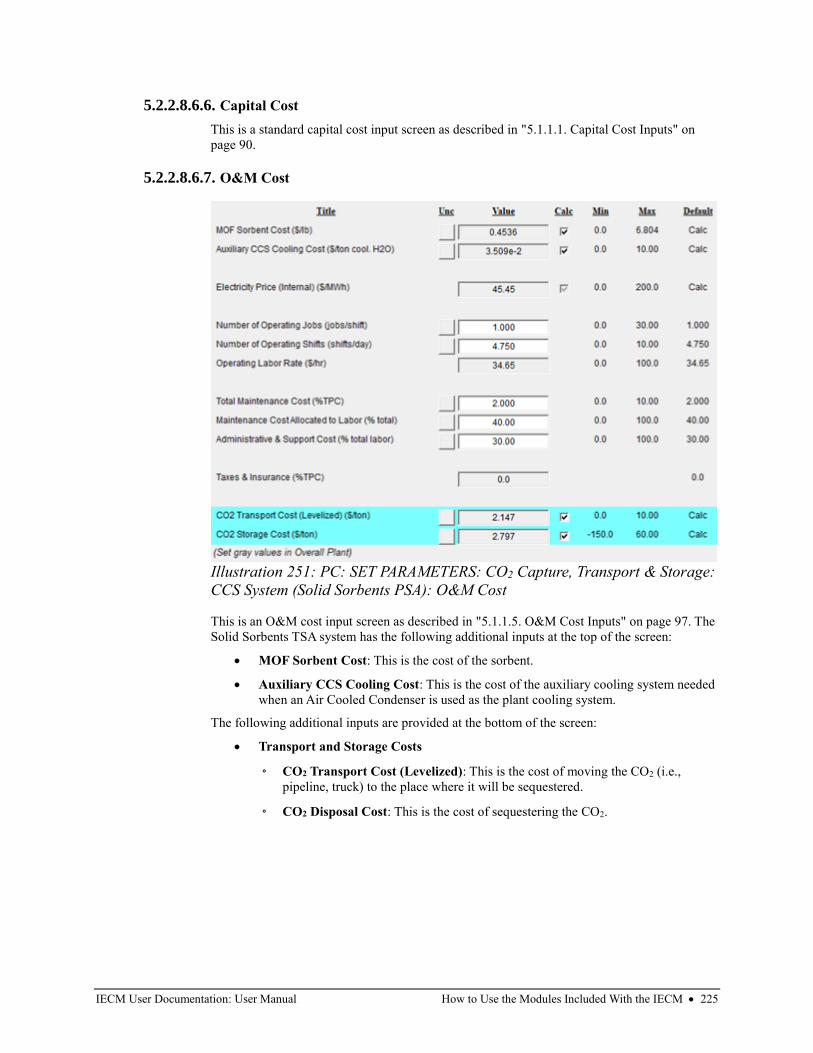
IECM User Documentation: User Manual How to Use the Modules Included With the IECM • 225
5.2.2.8.6.6. Capital Cost
This is a standard capital cost input screen as described in "5.1.1.1. Capital Cost Inputs" on
page 90.
5.2.2.8.6.7. O&M Cost
This is an O&M cost input screen as described in "5.1.1.5. O&M Cost Inputs" on page 97. The
Solid Sorbents TSA system has the following additional inputs at the top of the screen:
• MOF Sorbent Cost: This is the cost of the sorbent.
• Auxiliary CCS Cooling Cost: This is the cost of the auxiliary cooling system needed
when an Air Cooled Condenser is used as the plant cooling system.
The following additional inputs are provided at the bottom of the screen:
• Transport and Storage Costs
◦ CO2 Transport Cost (Levelized): This is the cost of moving the CO2 (i.e.,
pipeline, truck) to the place where it will be sequestered.
◦ CO2 Disposal Cost: This is the cost of sequestering the CO2.
Illustration 251: PC: SET PARAMETERS: CO2 Capture, Transport & Storage:
CCS System (Solid Sorbents PSA): O&M Cost
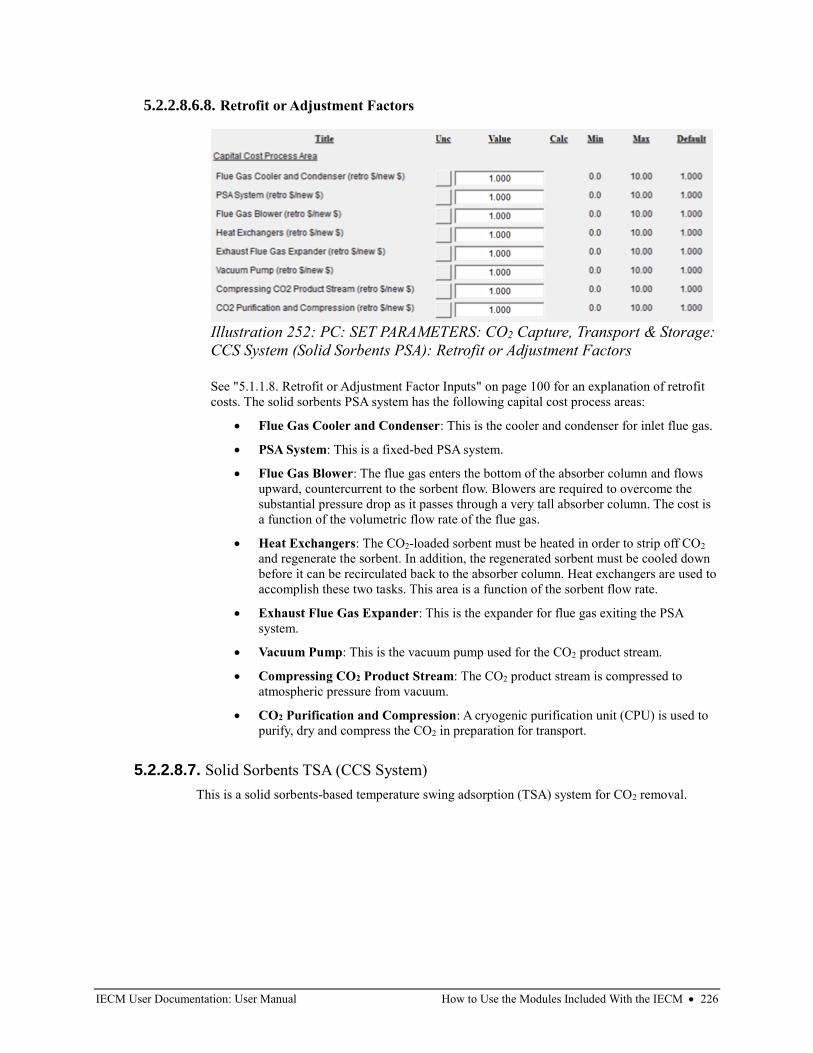
IECM User Documentation: User Manual How to Use the Modules Included With the IECM • 226
5.2.2.8.6.8. Retrofit or Adjustment Factors
See "5.1.1.8. Retrofit or Adjustment Factor Inputs" on page 100 for an explanation of retrofit
costs. The solid sorbents PSA system has the following capital cost process areas:
• Flue Gas Cooler and Condenser: This is the cooler and condenser for inlet flue gas.
• PSA System: This is a fixed-bed PSA system.
• Flue Gas Blower: The flue gas enters the bottom of the absorber column and flows
upward, countercurrent to the sorbent flow. Blowers are required to overcome the
substantial pressure drop as it passes through a very tall absorber column. The cost is
a function of the volumetric flow rate of the flue gas.
• Heat Exchangers: The CO2-loaded sorbent must be heated in order to strip off CO2
and regenerate the sorbent. In addition, the regenerated sorbent must be cooled down
before it can be recirculated back to the absorber column. Heat exchangers are used to
accomplish these two tasks. This area is a function of the sorbent flow rate.
• Exhaust Flue Gas Expander: This is the expander for flue gas exiting the PSA
system.
• Vacuum Pump: This is the vacuum pump used for the CO2 product stream.
• Compressing CO2 Product Stream: The CO2 product stream is compressed to
atmospheric pressure from vacuum.
• CO2 Purification and Compression: A cryogenic purification unit (CPU) is used to
purify, dry and compress the CO2 in preparation for transport.
5.2.2.8.7. Solid Sorbents TSA (CCS System)
This is a solid sorbents-based temperature swing adsorption (TSA) system for CO2 removal.
Illustration 252: PC: SET PARAMETERS: CO2 Capture, Transport & Storage:
CCS System (Solid Sorbents PSA): Retrofit or Adjustment Factors
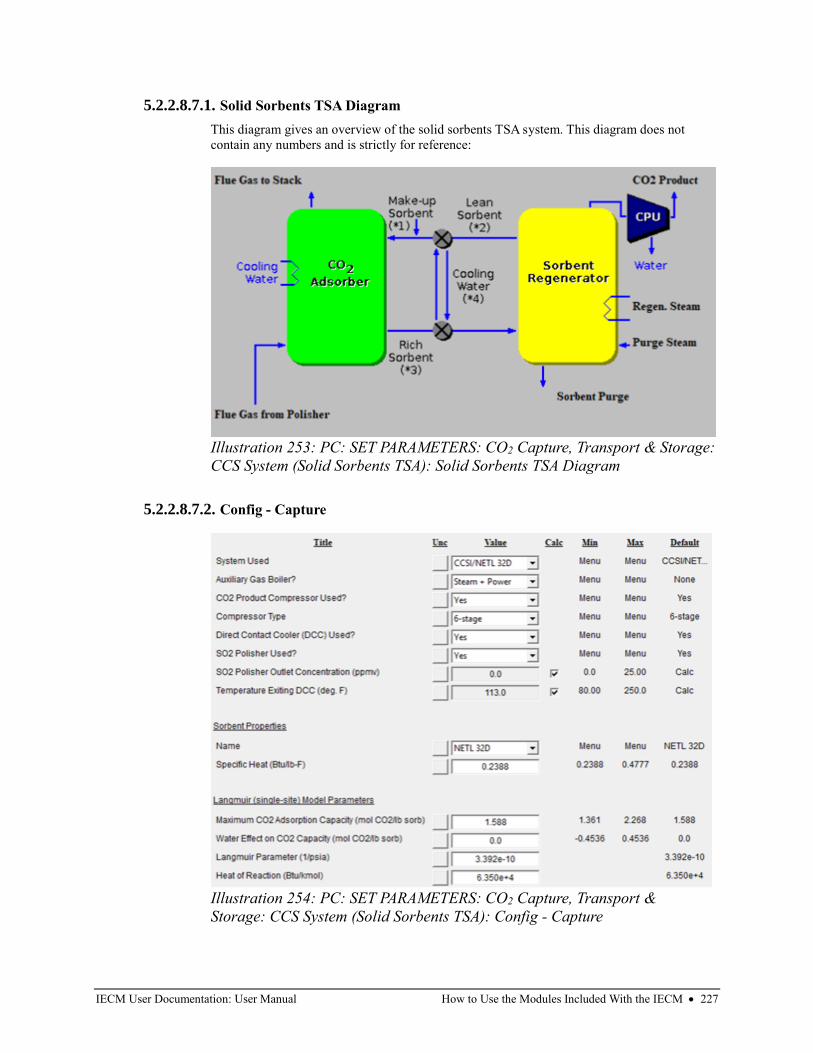
IECM User Documentation: User Manual How to Use the Modules Included With the IECM • 227
5.2.2.8.7.1. Solid Sorbents TSA Diagram
This diagram gives an overview of the solid sorbents TSA system. This diagram does not
contain any numbers and is strictly for reference:
5.2.2.8.7.2. Config - Capture
Illustration 253: PC: SET PARAMETERS: CO2 Capture, Transport & Storage:
CCS System (Solid Sorbents TSA): Solid Sorbents TSA Diagram
Illustration 254: PC: SET PARAMETERS: CO2 Capture, Transport &
Storage: CCS System (Solid Sorbents TSA): Config - Capture
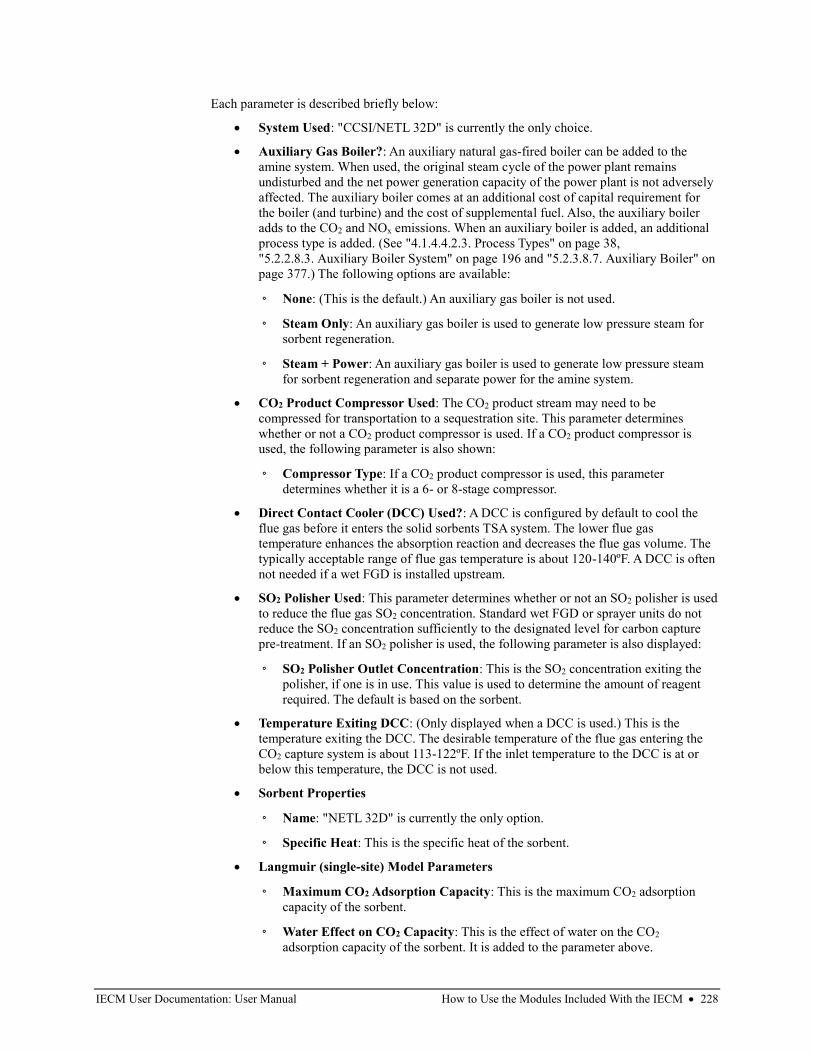
IECM User Documentation: User Manual How to Use the Modules Included With the IECM • 228
Each parameter is described briefly below:
• System Used: "CCSI/NETL 32D" is currently the only choice.
• Auxiliary Gas Boiler?: An auxiliary natural gas-fired boiler can be added to the
amine system. When used, the original steam cycle of the power plant remains
undisturbed and the net power generation capacity of the power plant is not adversely
affected. The auxiliary boiler comes at an additional cost of capital requirement for
the boiler (and turbine) and the cost of supplemental fuel. Also, the auxiliary boiler
adds to the CO2 and NOx emissions. When an auxiliary boiler is added, an additional
process type is added. (See "4.1.4.4.2.3. Process Types" on page 38,
"5.2.2.8.3. Auxiliary Boiler System" on page 196 and "5.2.3.8.7. Auxiliary Boiler" on
page 377.) The following options are available:
◦ None: (This is the default.) An auxiliary gas boiler is not used.
◦ Steam Only: An auxiliary gas boiler is used to generate low pressure steam for
sorbent regeneration.
◦ Steam + Power: An auxiliary gas boiler is used to generate low pressure steam
for sorbent regeneration and separate power for the amine system.
• CO2 Product Compressor Used: The CO2 product stream may need to be
compressed for transportation to a sequestration site. This parameter determines
whether or not a CO2 product compressor is used. If a CO2 product compressor is
used, the following parameter is also shown:
◦ Compressor Type: If a CO2 product compressor is used, this parameter
determines whether it is a 6- or 8-stage compressor.
• Direct Contact Cooler (DCC) Used?: A DCC is configured by default to cool the
flue gas before it enters the solid sorbents TSA system. The lower flue gas
temperature enhances the absorption reaction and decreases the flue gas volume. The
typically acceptable range of flue gas temperature is about 120-140ºF. A DCC is often
not needed if a wet FGD is installed upstream.
• SO2 Polisher Used: This parameter determines whether or not an SO2 polisher is used
to reduce the flue gas SO2 concentration. Standard wet FGD or sprayer units do not
reduce the SO2 concentration sufficiently to the designated level for carbon capture
pre-treatment. If an SO2 polisher is used, the following parameter is also displayed:
◦ SO2 Polisher Outlet Concentration: This is the SO2 concentration exiting the
polisher, if one is in use. This value is used to determine the amount of reagent
required. The default is based on the sorbent.
• Temperature Exiting DCC: (Only displayed when a DCC is used.) This is the
temperature exiting the DCC. The desirable temperature of the flue gas entering the
CO2 capture system is about 113-122ºF. If the inlet temperature to the DCC is at or
below this temperature, the DCC is not used.
• Sorbent Properties
◦ Name: "NETL 32D" is currently the only option.
◦ Specific Heat: This is the specific heat of the sorbent.
• Langmuir (single-site) Model Parameters
◦ Maximum CO2 Adsorption Capacity: This is the maximum CO2 adsorption
capacity of the sorbent.
◦ Water Effect on CO2 Capacity: This is the effect of water on the CO2
adsorption capacity of the sorbent. It is added to the parameter above.
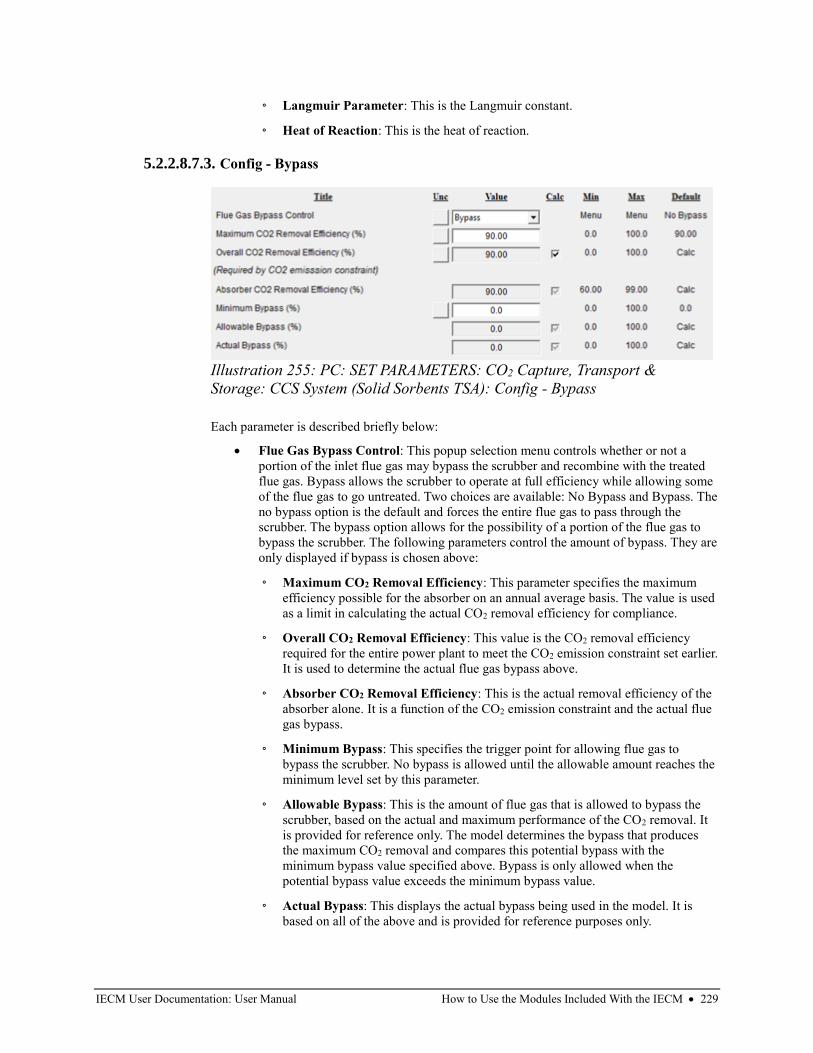
IECM User Documentation: User Manual How to Use the Modules Included With the IECM • 229
◦ Langmuir Parameter: This is the Langmuir constant.
◦ Heat of Reaction: This is the heat of reaction.
5.2.2.8.7.3. Config - Bypass
Each parameter is described briefly below:
• Flue Gas Bypass Control: This popup selection menu controls whether or not a
portion of the inlet flue gas may bypass the scrubber and recombine with the treated
flue gas. Bypass allows the scrubber to operate at full efficiency while allowing some
of the flue gas to go untreated. Two choices are available: No Bypass and Bypass. The
no bypass option is the default and forces the entire flue gas to pass through the
scrubber. The bypass option allows for the possibility of a portion of the flue gas to
bypass the scrubber. The following parameters control the amount of bypass. They are
only displayed if bypass is chosen above:
◦ Maximum CO2 Removal Efficiency: This parameter specifies the maximum
efficiency possible for the absorber on an annual average basis. The value is used
as a limit in calculating the actual CO2 removal efficiency for compliance.
◦ Overall CO2 Removal Efficiency: This value is the CO2 removal efficiency
required for the entire power plant to meet the CO2 emission constraint set earlier.
It is used to determine the actual flue gas bypass above.
◦ Absorber CO2 Removal Efficiency: This is the actual removal efficiency of the
absorber alone. It is a function of the CO2 emission constraint and the actual flue
gas bypass.
◦ Minimum Bypass: This specifies the trigger point for allowing flue gas to
bypass the scrubber. No bypass is allowed until the allowable amount reaches the
minimum level set by this parameter.
◦ Allowable Bypass: This is the amount of flue gas that is allowed to bypass the
scrubber, based on the actual and maximum performance of the CO2 removal. It
is provided for reference only. The model determines the bypass that produces
the maximum CO2 removal and compares this potential bypass with the
minimum bypass value specified above. Bypass is only allowed when the
potential bypass value exceeds the minimum bypass value.
◦ Actual Bypass: This displays the actual bypass being used in the model. It is
based on all of the above and is provided for reference purposes only.
Illustration 255: PC: SET PARAMETERS: CO2 Capture, Transport &
Storage: CCS System (Solid Sorbents TSA): Config - Bypass
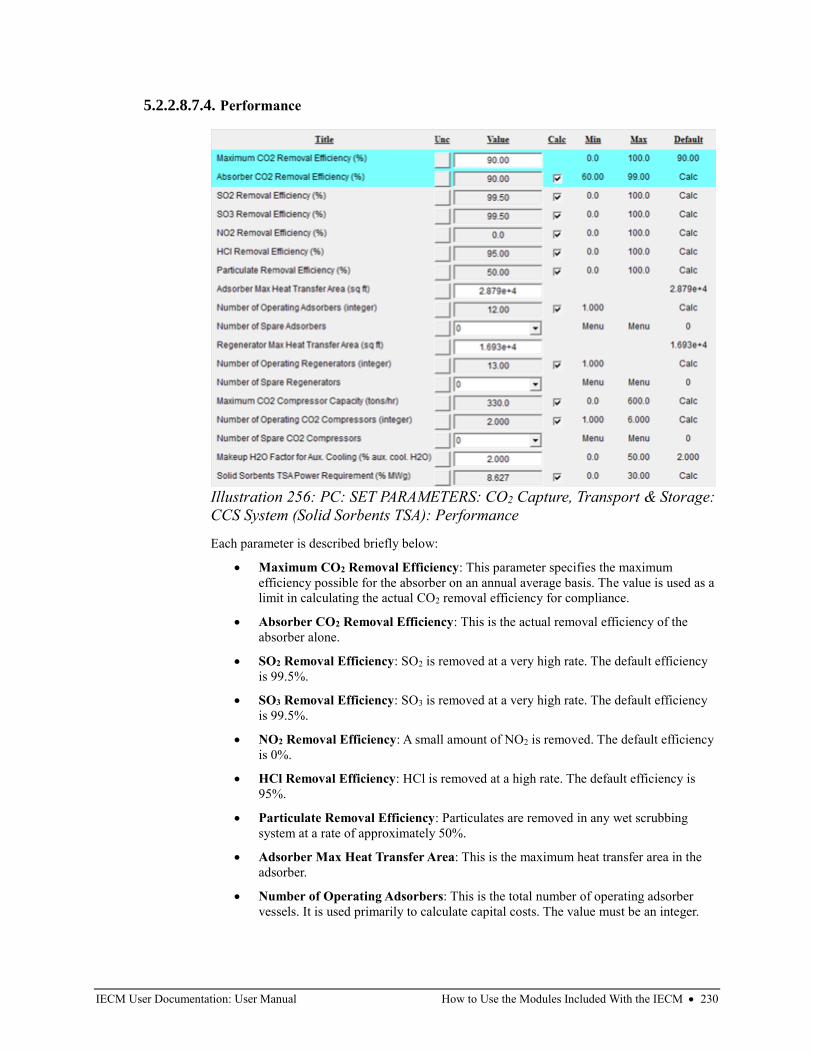
IECM User Documentation: User Manual How to Use the Modules Included With the IECM • 230
5.2.2.8.7.4. Performance
Each parameter is described briefly below:
• Maximum CO2 Removal Efficiency: This parameter specifies the maximum
efficiency possible for the absorber on an annual average basis. The value is used as a
limit in calculating the actual CO2 removal efficiency for compliance.
• Absorber CO2 Removal Efficiency: This is the actual removal efficiency of the
absorber alone.
• SO2 Removal Efficiency: SO2 is removed at a very high rate. The default efficiency
is 99.5%.
• SO3 Removal Efficiency: SO3 is removed at a very high rate. The default efficiency
is 99.5%.
• NO2 Removal Efficiency: A small amount of NO2 is removed. The default efficiency
is 0%.
• HCl Removal Efficiency: HCl is removed at a high rate. The default efficiency is
95%.
• Particulate Removal Efficiency: Particulates are removed in any wet scrubbing
system at a rate of approximately 50%.
• Adsorber Max Heat Transfer Area: This is the maximum heat transfer area in the
adsorber.
• Number of Operating Adsorbers: This is the total number of operating adsorber
vessels. It is used primarily to calculate capital costs. The value must be an integer.
Illustration 256: PC: SET PARAMETERS: CO2 Capture, Transport & Storage:
CCS System (Solid Sorbents TSA): Performance
IECM User Documentation: User Manual How to Use the Modules Included With the IECM • 231
• Number of Spare Adsorbers: This is the total number of spare adsorber vessels. It is
used primarily to calculate capital costs. Up to two spare absorbers may be specified.
• Regenerator Max Heat Transfer Area: This is the maximum heat transfer area in
the regenerator
• Number of Operating Regenerators: This is the total number of operating
regenerators. It is used primarily to calculate capital costs. The value must be an
integer.
• Number of Spare Regenerators: This is the total number of spare regenerators. It is
used primarily to calculate capital costs. Up to two spare regenerators may be
specified.
• Maximum CO2 Compressor Capacity: This is the maximum amount of CO2
product that can be compressed per hour at the specified pressure (see the storage
input screen).
• Number of Operating CO2 Compressors: This is the total number of operating CO2
compressors. It is used primarily to calculate capital costs. The value must be an
integer.
• Number of Spare CO2 Compressors: This is the total number of spare CO2
compressors. It is used primarily to calculate capital costs. Up to two spare CO2
compressors may be specified.
• Makeup H2O Factor for Aux. Cooling: (Only shown when an Air Cooled
Condenser is used for plant cooling.) When CCS and an Air Cooled Condenser are
used, the CCS system uses an auxiliary cooling system. This parameter specifies the
amount of makeup water required for the auxiliary cooling system.
• Solid Sorbents TSA Power Requirement: This is the electrical power required for
the solid sorbents TSA system.
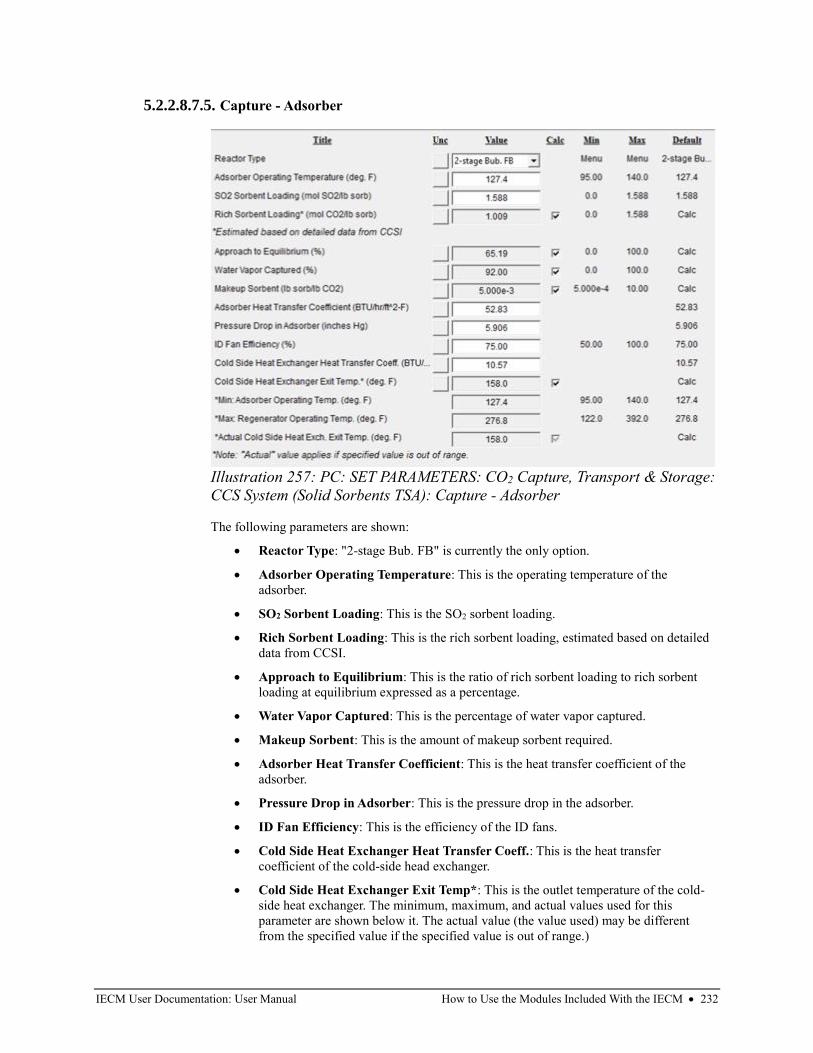
IECM User Documentation: User Manual How to Use the Modules Included With the IECM • 232
5.2.2.8.7.5. Capture - Adsorber
The following parameters are shown:
• Reactor Type: "2-stage Bub. FB" is currently the only option.
• Adsorber Operating Temperature: This is the operating temperature of the
adsorber.
• SO2 Sorbent Loading: This is the SO2 sorbent loading.
• Rich Sorbent Loading: This is the rich sorbent loading, estimated based on detailed
data from CCSI.
• Approach to Equilibrium: This is the ratio of rich sorbent loading to rich sorbent
loading at equilibrium expressed as a percentage.
• Water Vapor Captured: This is the percentage of water vapor captured.
• Makeup Sorbent: This is the amount of makeup sorbent required.
• Adsorber Heat Transfer Coefficient: This is the heat transfer coefficient of the
adsorber.
• Pressure Drop in Adsorber: This is the pressure drop in the adsorber.
• ID Fan Efficiency: This is the efficiency of the ID fans.
• Cold Side Heat Exchanger Heat Transfer Coeff.: This is the heat transfer
coefficient of the cold-side head exchanger.
• Cold Side Heat Exchanger Exit Temp*: This is the outlet temperature of the cold-
side heat exchanger. The minimum, maximum, and actual values used for this
parameter are shown below it. The actual value (the value used) may be different
from the specified value if the specified value is out of range.)
Illustration 257: PC: SET PARAMETERS: CO2 Capture, Transport & Storage:
CCS System (Solid Sorbents TSA): Capture - Adsorber
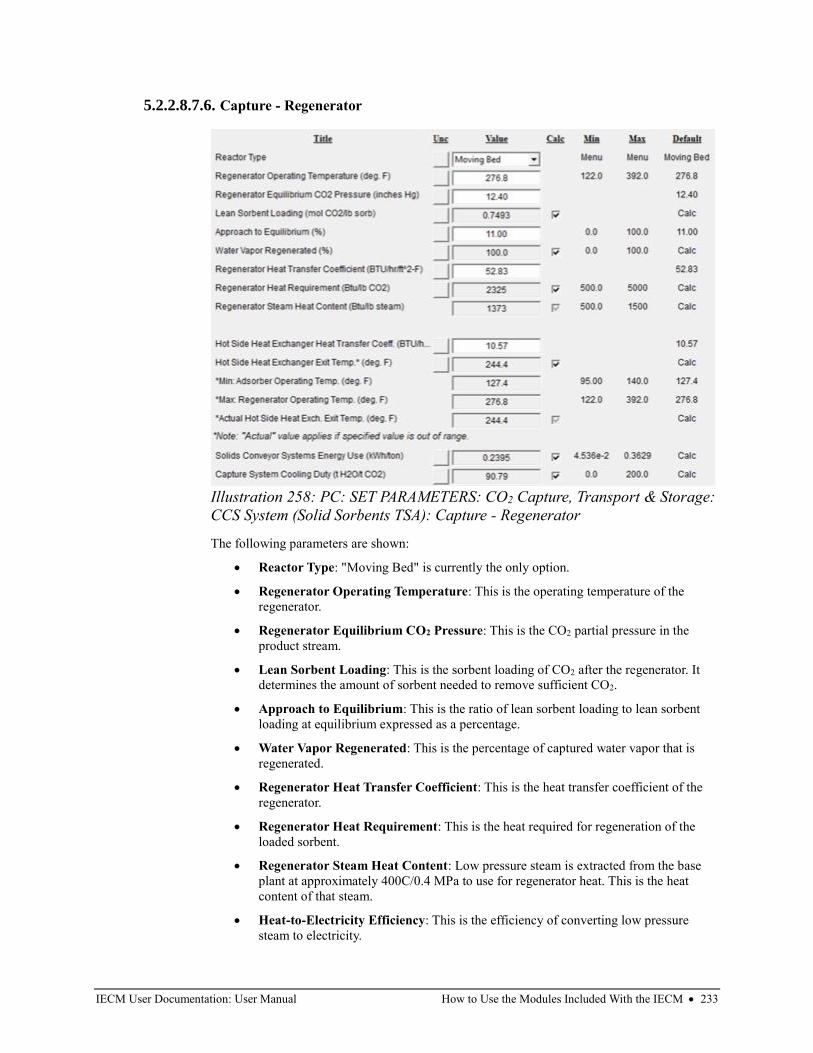
IECM User Documentation: User Manual How to Use the Modules Included With the IECM • 233
5.2.2.8.7.6. Capture - Regenerator
The following parameters are shown:
• Reactor Type: "Moving Bed" is currently the only option.
• Regenerator Operating Temperature: This is the operating temperature of the
regenerator.
• Regenerator Equilibrium CO2 Pressure: This is the CO2 partial pressure in the
product stream.
• Lean Sorbent Loading: This is the sorbent loading of CO2 after the regenerator. It
determines the amount of sorbent needed to remove sufficient CO2.
• Approach to Equilibrium: This is the ratio of lean sorbent loading to lean sorbent
loading at equilibrium expressed as a percentage.
• Water Vapor Regenerated: This is the percentage of captured water vapor that is
regenerated.
• Regenerator Heat Transfer Coefficient: This is the heat transfer coefficient of the
regenerator.
• Regenerator Heat Requirement: This is the heat required for regeneration of the
loaded sorbent.
• Regenerator Steam Heat Content: Low pressure steam is extracted from the base
plant at approximately 400C/0.4 MPa to use for regenerator heat. This is the heat
content of that steam.
• Heat-to-Electricity Efficiency: This is the efficiency of converting low pressure
steam to electricity.
Illustration 258: PC: SET PARAMETERS: CO2 Capture, Transport & Storage:
CCS System (Solid Sorbents TSA): Capture - Regenerator
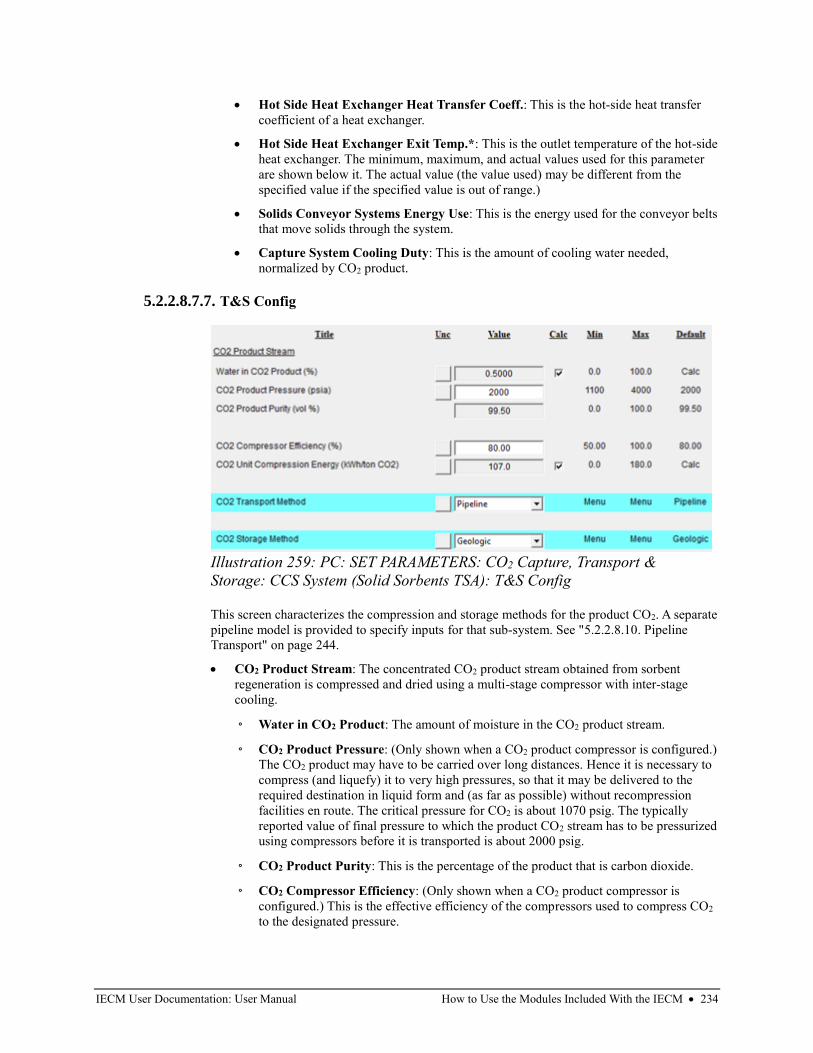
IECM User Documentation: User Manual How to Use the Modules Included With the IECM • 234
• Hot Side Heat Exchanger Heat Transfer Coeff.: This is the hot-side heat transfer
coefficient of a heat exchanger.
• Hot Side Heat Exchanger Exit Temp.*: This is the outlet temperature of the hot-side
heat exchanger. The minimum, maximum, and actual values used for this parameter
are shown below it. The actual value (the value used) may be different from the
specified value if the specified value is out of range.)
• Solids Conveyor Systems Energy Use: This is the energy used for the conveyor belts
that move solids through the system.
• Capture System Cooling Duty: This is the amount of cooling water needed,
normalized by CO2 product.
5.2.2.8.7.7. T&S Config
This screen characterizes the compression and storage methods for the product CO2. A separate
pipeline model is provided to specify inputs for that sub-system. See "5.2.2.8.10. Pipeline
Transport" on page 244.
• CO2 Product Stream: The concentrated CO2 product stream obtained from sorbent
regeneration is compressed and dried using a multi-stage compressor with inter-stage
cooling.
◦ Water in CO2 Product: The amount of moisture in the CO2 product stream.
◦ CO2 Product Pressure: (Only shown when a CO2 product compressor is configured.)
The CO2 product may have to be carried over long distances. Hence it is necessary to
compress (and liquefy) it to very high pressures, so that it may be delivered to the
required destination in liquid form and (as far as possible) without recompression
facilities en route. The critical pressure for CO2 is about 1070 psig. The typically
reported value of final pressure to which the product CO2 stream has to be pressurized
using compressors before it is transported is about 2000 psig.
◦ CO2 Product Purity: This is the percentage of the product that is carbon dioxide.
◦ CO2 Compressor Efficiency: (Only shown when a CO2 product compressor is
configured.) This is the effective efficiency of the compressors used to compress CO2
to the designated pressure.
Illustration 259: PC: SET PARAMETERS: CO2 Capture, Transport &
Storage: CCS System (Solid Sorbents TSA): T&S Config
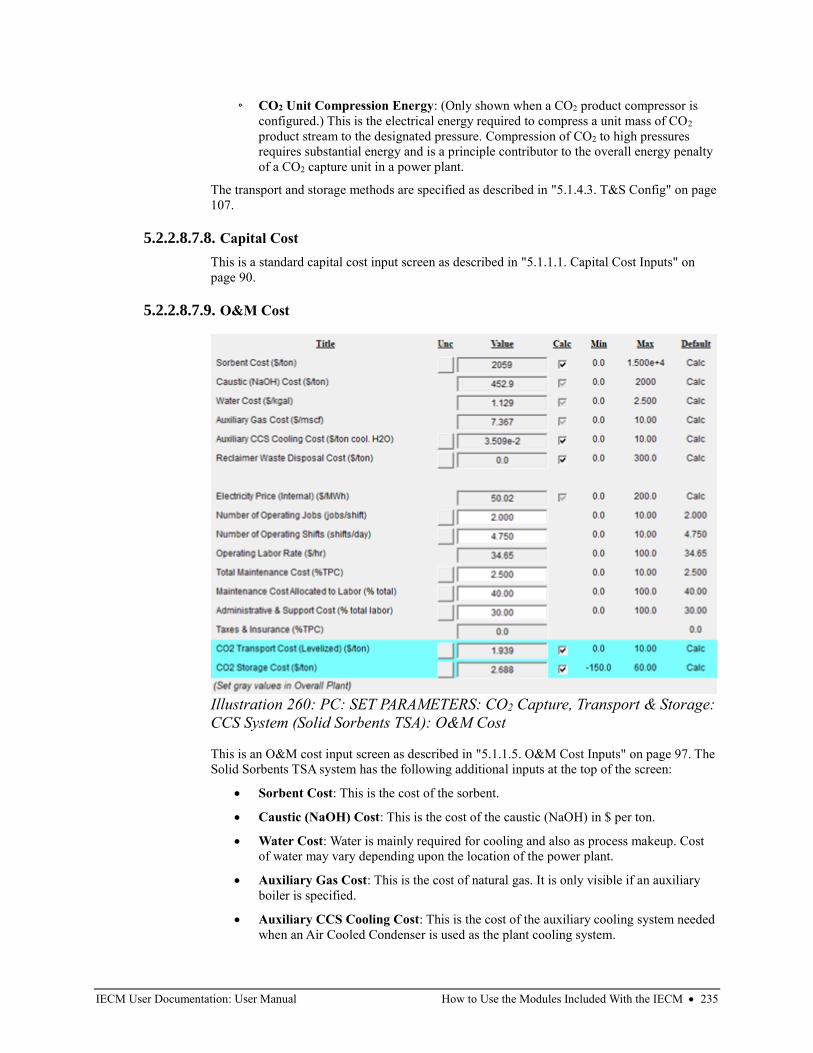
IECM User Documentation: User Manual How to Use the Modules Included With the IECM • 235
◦ CO2 Unit Compression Energy: (Only shown when a CO2 product compressor is
configured.) This is the electrical energy required to compress a unit mass of CO2
product stream to the designated pressure. Compression of CO2 to high pressures
requires substantial energy and is a principle contributor to the overall energy penalty
of a CO2 capture unit in a power plant.
The transport and storage methods are specified as described in "5.1.4.3. T&S Config" on page
107.
5.2.2.8.7.8. Capital Cost
This is a standard capital cost input screen as described in "5.1.1.1. Capital Cost Inputs" on
page 90.
5.2.2.8.7.9. O&M Cost
This is an O&M cost input screen as described in "5.1.1.5. O&M Cost Inputs" on page 97. The
Solid Sorbents TSA system has the following additional inputs at the top of the screen:
• Sorbent Cost: This is the cost of the sorbent.
• Caustic (NaOH) Cost: This is the cost of the caustic (NaOH) in $ per ton.
• Water Cost: Water is mainly required for cooling and also as process makeup. Cost
of water may vary depending upon the location of the power plant.
• Auxiliary Gas Cost: This is the cost of natural gas. It is only visible if an auxiliary
boiler is specified.
• Auxiliary CCS Cooling Cost: This is the cost of the auxiliary cooling system needed
when an Air Cooled Condenser is used as the plant cooling system.
Illustration 260: PC: SET PARAMETERS: CO2 Capture, Transport & Storage:
CCS System (Solid Sorbents TSA): O&M Cost
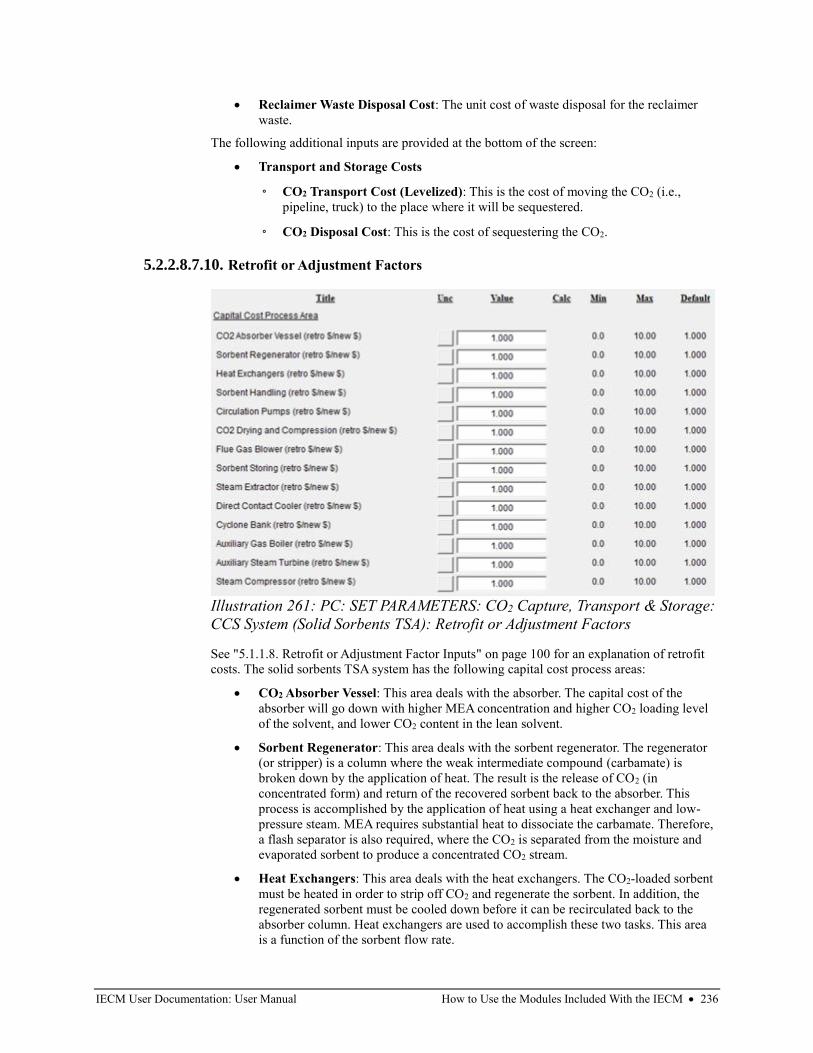
IECM User Documentation: User Manual How to Use the Modules Included With the IECM • 236
• Reclaimer Waste Disposal Cost: The unit cost of waste disposal for the reclaimer
waste.
The following additional inputs are provided at the bottom of the screen:
• Transport and Storage Costs
◦ CO2 Transport Cost (Levelized): This is the cost of moving the CO2 (i.e.,
pipeline, truck) to the place where it will be sequestered.
◦ CO2 Disposal Cost: This is the cost of sequestering the CO2.
5.2.2.8.7.10. Retrofit or Adjustment Factors
See "5.1.1.8. Retrofit or Adjustment Factor Inputs" on page 100 for an explanation of retrofit
costs. The solid sorbents TSA system has the following capital cost process areas:
• CO2 Absorber Vessel: This area deals with the absorber. The capital cost of the
absorber will go down with higher MEA concentration and higher CO2 loading level
of the solvent, and lower CO2 content in the lean solvent.
• Sorbent Regenerator: This area deals with the sorbent regenerator. The regenerator
(or stripper) is a column where the weak intermediate compound (carbamate) is
broken down by the application of heat. The result is the release of CO2 (in
concentrated form) and return of the recovered sorbent back to the absorber. This
process is accomplished by the application of heat using a heat exchanger and low-
pressure steam. MEA requires substantial heat to dissociate the carbamate. Therefore,
a flash separator is also required, where the CO2 is separated from the moisture and
evaporated sorbent to produce a concentrated CO2 stream.
• Heat Exchangers: This area deals with the heat exchangers. The CO2-loaded sorbent
must be heated in order to strip off CO2 and regenerate the sorbent. In addition, the
regenerated sorbent must be cooled down before it can be recirculated back to the
absorber column. Heat exchangers are used to accomplish these two tasks. This area
is a function of the sorbent flow rate.
Illustration 261: PC: SET PARAMETERS: CO2 Capture, Transport & Storage:
CCS System (Solid Sorbents TSA): Retrofit or Adjustment Factors
IECM User Documentation: User Manual How to Use the Modules Included With the IECM • 237
• Sorbent Handling: This area deals with the sorbent handling. The sorbent processing
area primarily consists of a sorbent cooler, MEA storage tank, and a mixer. The
regenerated sorbent is further cooled with the sorbent cooler and MEA added to make
up for sorbent losses.
• Circulation Pumps: This area deals with the circulation pumps. Circulation pumps
are required to take the sorbent, introduced at atmospheric pressure, and lift it to the
top of the absorber column. This area is a function of the sorbent flow rate.
• CO2 Drying and Compression: This area deals with the CO2 drying and
compression. The product CO2 must be separated from the water vapor (dried) and
compressed to liquid form in order to transport it over long distances. The multi-stage
compression unit with inter-stage cooling and drying yields a final CO2 product at the
nominal pressure of 2000 psig. This area is a function of the CO2 flow rate.
• Flue Gas Blower: This area deals with the flue gas blower. The flue gas enters the
bottom of the absorber column and flows upward, countercurrent to the sorbent flow.
Blowers are required to overcome the substantial pressure drop as it passes through a
very tall absorber column. The cost is a function of the volumetric flow rate of the
flue gas.
• Sorbent Storing: This area deals with the sorbent storing. A portion of the sorbent
stream is distilled in the reclaimer in order to avoid accumulation of heat stable salts
in the sorbent stream. Caustic is added to recover some of the MEA in this vessel. The
reclaimer cost is a function of the sorbent makeup flow rate.
• Steam Extractor: This area deals with the steam extractor. Steam extractors are
installed to take low pressure steam from the steam turbines in the power plant. The
cost is a function of the steam flow rate.
• Direct Contact Cooler: This area deals with the direct contact cooler. A direct
contact cooler is typically used in plant configurations that do not include a wet FGD.
A direct contact cooler is a large vessel where the incoming hot flue gas is placed in
contact with cooling water. The cost is a function of the gas flow rate and temperature
of the flue gas.
• Cyclone Bank: This area deals with the cyclone bank. The regenerator is connected
to a reboiler, which is a heat exchanger that utilizes low pressure steam to heat the
loaded sorbent. The reboiler is part of the sorbent regeneration cycle. The cost is a
function of the sorbent and steam flow rates.
• Auxiliary Gas Boiler: This area deals with the auxiliary gas boiler. An auxiliary
natural gas boiler is typically combined with a steam turbine to generate some
additional power and/or low pressure steam. The cost is a function of the steam flow
rate generated by the boiler. The boiler cost is lower if electricity is not being
produced.
• Auxiliary Steam Turbine: This area deals with the auxiliary steam turbine. The
steam turbine is used in conjunction with the natural gas boiler to generate some
additional power and/or low-pressure steam. The cost is a function of the secondary
power generated by the turbine.
• Steam Compressor: This area deals with the steam compressor. Water and steam are
used to transfer heat between the heat exchangers.
5.2.2.8.8. Air Separation Unit
See "5.4.2.3. Air Separation Unit" on page 455 for a description of the screens in this process
type.
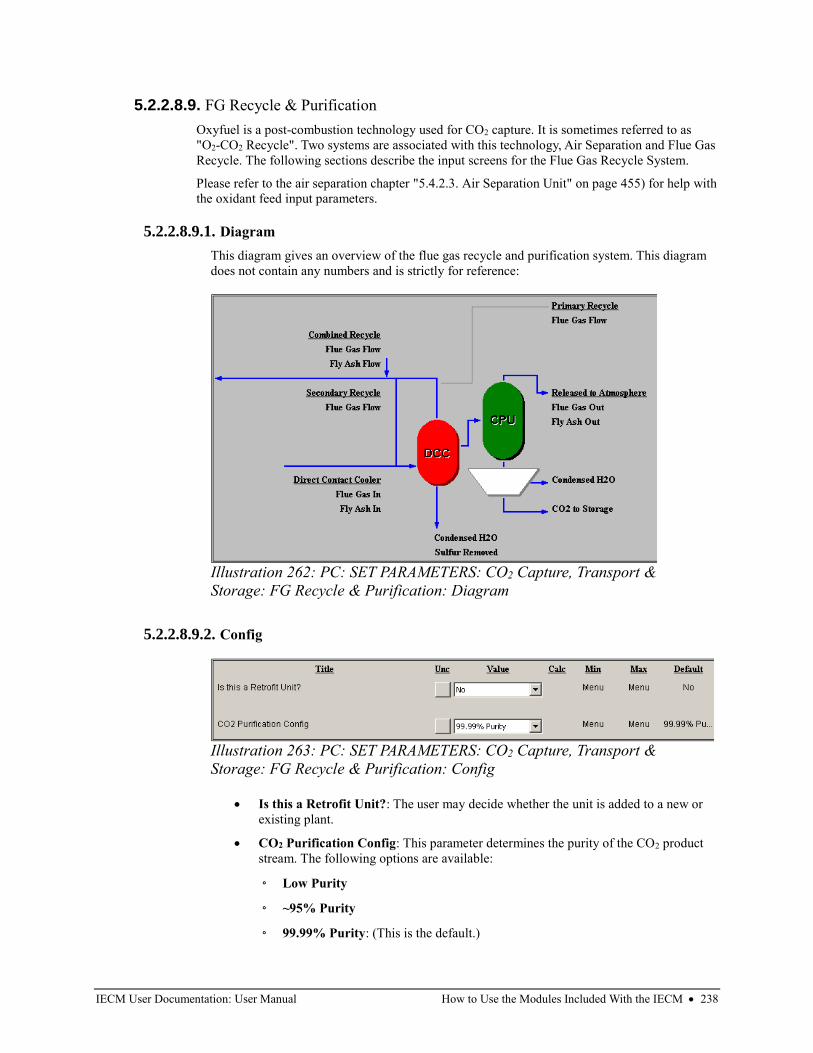
IECM User Documentation: User Manual How to Use the Modules Included With the IECM • 238
5.2.2.8.9. FG Recycle & Purification
Oxyfuel is a post-combustion technology used for CO2 capture. It is sometimes referred to as
"O2-CO2 Recycle". Two systems are associated with this technology, Air Separation and Flue Gas
Recycle. The following sections describe the input screens for the Flue Gas Recycle System.
Please refer to the air separation chapter "5.4.2.3. Air Separation Unit" on page 455) for help with
the oxidant feed input parameters.
5.2.2.8.9.1. Diagram
This diagram gives an overview of the flue gas recycle and purification system. This diagram
does not contain any numbers and is strictly for reference:
5.2.2.8.9.2. Config
• Is this a Retrofit Unit?: The user may decide whether the unit is added to a new or
existing plant.
• CO2 Purification Config: This parameter determines the purity of the CO2 product
stream. The following options are available:
◦ Low Purity
◦ ~95% Purity
◦ 99.99% Purity: (This is the default.)
Illustration 262: PC: SET PARAMETERS: CO2 Capture, Transport &
Storage: FG Recycle & Purification: Diagram
Illustration 263: PC: SET PARAMETERS: CO2 Capture, Transport &
Storage: FG Recycle & Purification: Config
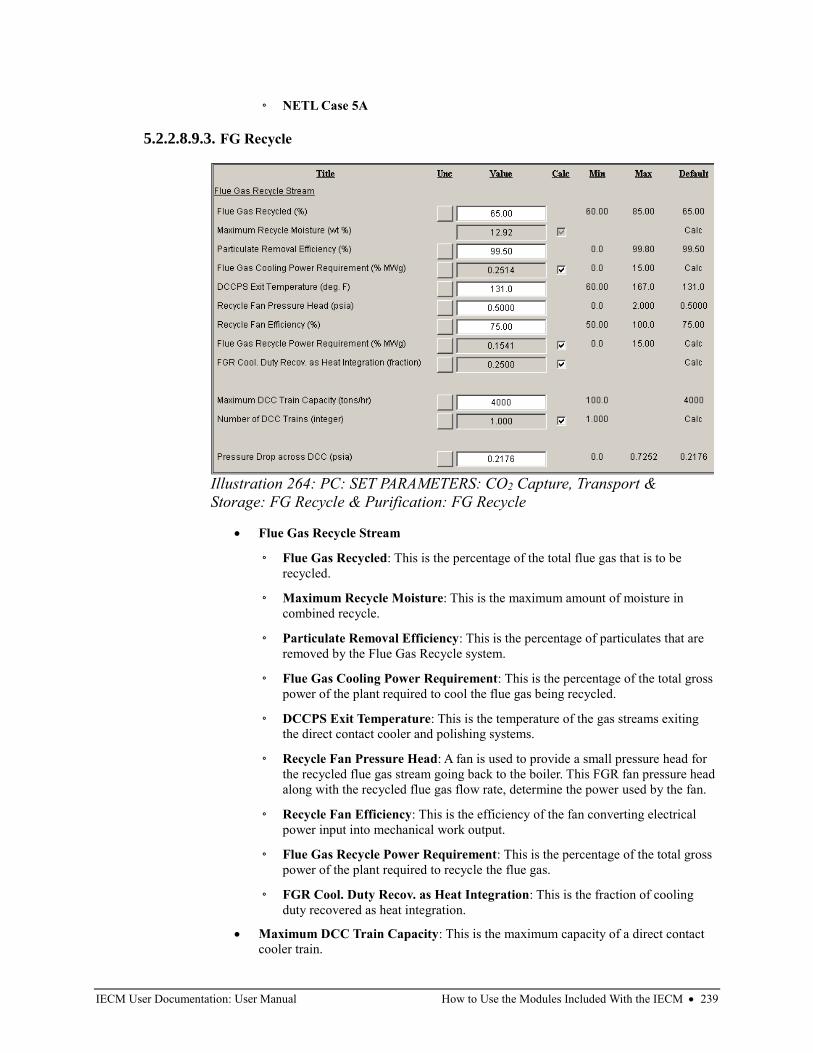
IECM User Documentation: User Manual How to Use the Modules Included With the IECM • 239
◦ NETL Case 5A
5.2.2.8.9.3. FG Recycle
• Flue Gas Recycle Stream
◦ Flue Gas Recycled: This is the percentage of the total flue gas that is to be
recycled.
◦ Maximum Recycle Moisture: This is the maximum amount of moisture in
combined recycle.
◦ Particulate Removal Efficiency: This is the percentage of particulates that are
removed by the Flue Gas Recycle system.
◦ Flue Gas Cooling Power Requirement: This is the percentage of the total gross
power of the plant required to cool the flue gas being recycled.
◦ DCCPS Exit Temperature: This is the temperature of the gas streams exiting
the direct contact cooler and polishing systems.
◦ Recycle Fan Pressure Head: A fan is used to provide a small pressure head for
the recycled flue gas stream going back to the boiler. This FGR fan pressure head
along with the recycled flue gas flow rate, determine the power used by the fan.
◦ Recycle Fan Efficiency: This is the efficiency of the fan converting electrical
power input into mechanical work output.
◦ Flue Gas Recycle Power Requirement: This is the percentage of the total gross
power of the plant required to recycle the flue gas.
◦ FGR Cool. Duty Recov. as Heat Integration: This is the fraction of cooling
duty recovered as heat integration.
• Maximum DCC Train Capacity: This is the maximum capacity of a direct contact
cooler train.
Illustration 264: PC: SET PARAMETERS: CO2 Capture, Transport &
Storage: FG Recycle & Purification: FG Recycle
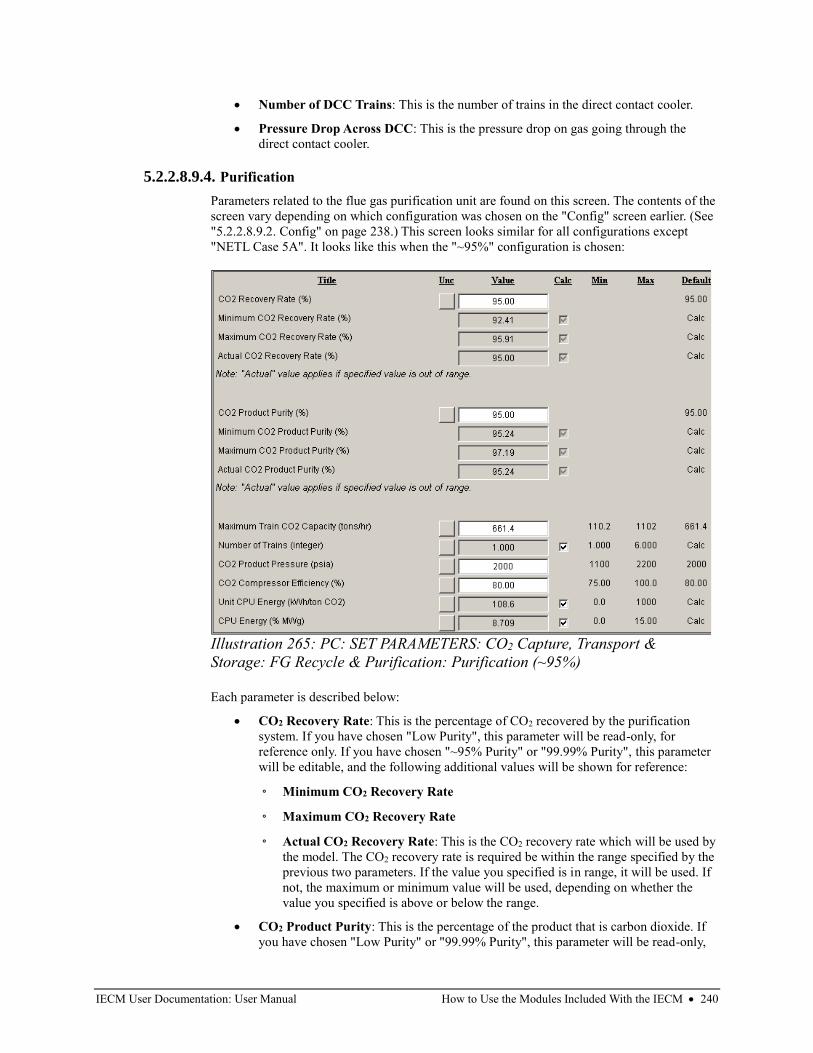
IECM User Documentation: User Manual How to Use the Modules Included With the IECM • 240
• Number of DCC Trains: This is the number of trains in the direct contact cooler.
• Pressure Drop Across DCC: This is the pressure drop on gas going through the
direct contact cooler.
5.2.2.8.9.4. Purification
Parameters related to the flue gas purification unit are found on this screen. The contents of the
screen vary depending on which configuration was chosen on the "Config" screen earlier. (See
"5.2.2.8.9.2. Config" on page 238.) This screen looks similar for all configurations except
"NETL Case 5A". It looks like this when the "~95%" configuration is chosen:
Each parameter is described below:
• CO2 Recovery Rate: This is the percentage of CO2 recovered by the purification
system. If you have chosen "Low Purity", this parameter will be read-only, for
reference only. If you have chosen "~95% Purity" or "99.99% Purity", this parameter
will be editable, and the following additional values will be shown for reference:
◦ Minimum CO2 Recovery Rate
◦ Maximum CO2 Recovery Rate
◦ Actual CO2 Recovery Rate: This is the CO2 recovery rate which will be used by
the model. The CO2 recovery rate is required be within the range specified by the
previous two parameters. If the value you specified is in range, it will be used. If
not, the maximum or minimum value will be used, depending on whether the
value you specified is above or below the range.
• CO2 Product Purity: This is the percentage of the product that is carbon dioxide. If
you have chosen "Low Purity" or "99.99% Purity", this parameter will be read-only,
Illustration 265: PC: SET PARAMETERS: CO2 Capture, Transport &
Storage: FG Recycle & Purification: Purification (~95%)
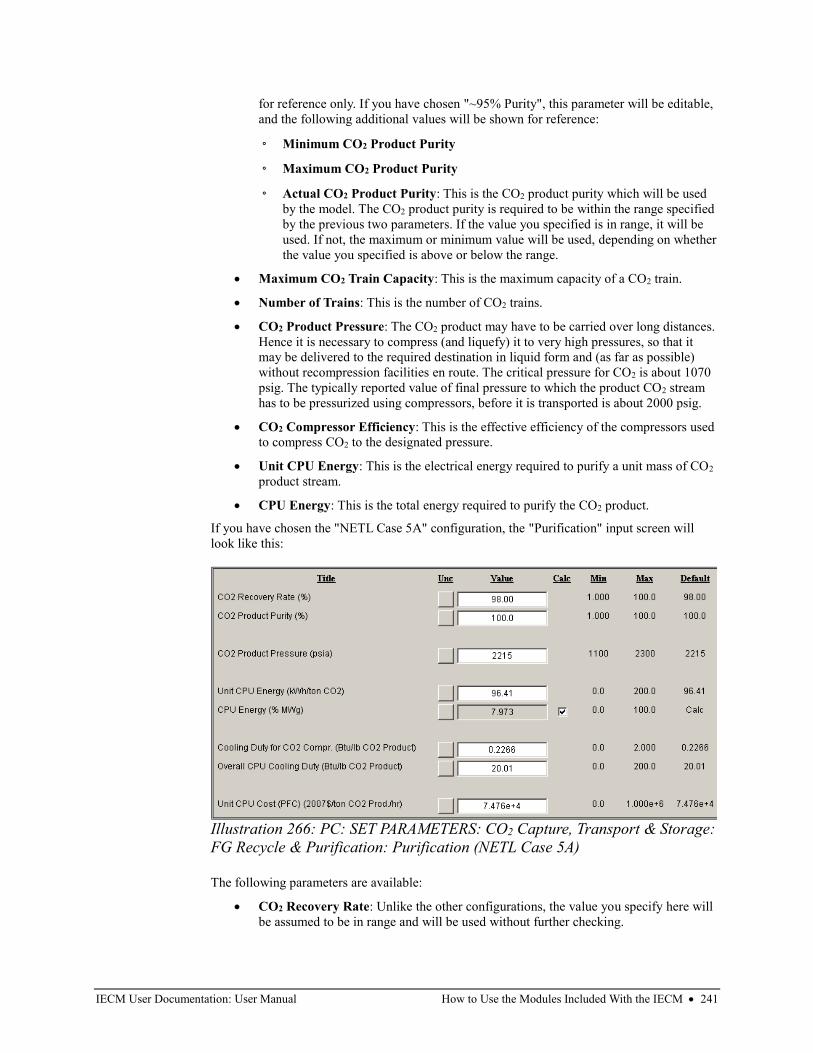
IECM User Documentation: User Manual How to Use the Modules Included With the IECM • 241
for reference only. If you have chosen "~95% Purity", this parameter will be editable,
and the following additional values will be shown for reference:
◦ Minimum CO2 Product Purity
◦ Maximum CO2 Product Purity
◦ Actual CO2 Product Purity: This is the CO2 product purity which will be used
by the model. The CO2 product purity is required to be within the range specified
by the previous two parameters. If the value you specified is in range, it will be
used. If not, the maximum or minimum value will be used, depending on whether
the value you specified is above or below the range.
• Maximum CO2 Train Capacity: This is the maximum capacity of a CO2 train.
• Number of Trains: This is the number of CO2 trains.
• CO2 Product Pressure: The CO2 product may have to be carried over long distances.
Hence it is necessary to compress (and liquefy) it to very high pressures, so that it
may be delivered to the required destination in liquid form and (as far as possible)
without recompression facilities en route. The critical pressure for CO2 is about 1070
psig. The typically reported value of final pressure to which the product CO2 stream
has to be pressurized using compressors, before it is transported is about 2000 psig.
• CO2 Compressor Efficiency: This is the effective efficiency of the compressors used
to compress CO2 to the designated pressure.
• Unit CPU Energy: This is the electrical energy required to purify a unit mass of CO2
product stream.
• CPU Energy: This is the total energy required to purify the CO2 product.
If you have chosen the "NETL Case 5A" configuration, the "Purification" input screen will
look like this:
The following parameters are available:
• CO2 Recovery Rate: Unlike the other configurations, the value you specify here will
be assumed to be in range and will be used without further checking.
Illustration 266: PC: SET PARAMETERS: CO2 Capture, Transport & Storage:
FG Recycle & Purification: Purification (NETL Case 5A)
IECM User Documentation: User Manual How to Use the Modules Included With the IECM • 242
• CO2 Product Purity: This is the percentage of the product that is carbon dioxide.
Unlike the other configurations, the value you specify here will be assumed to be in
range and will be used without further checking.
• CO2 Product Pressure: The CO2 product may have to be carried over long distances.
Hence it is necessary to compress (and liquefy) it to very high pressures, so that it
may be delivered to the required destination in liquid form and (as far as possible)
without recompression facilities en route. The critical pressure for CO2 is about 1070
psig. The typically reported value of final pressure to which the product CO2 stream
has to be pressurized using compressors, before it is transported is about 2000 psig.
• Unit CPU Energy: This is the electrical energy required to purify a unit mass of CO2.
• CPU Energy: This is the total energy required to purify the CO2 product.
• Cooling Duty for CO2 Compr.: This is the cooling duty for the CO2 compressor.
• Overall CPU Cooling Duty: This is the overall cooling duty for the cryogenic
purification system.
• Unit CPU Cost: This is the cost, in 2007 US Dollars, of purifying a unit mass of CO2
product.
5.2.2.8.9.5. T&S Config
This screen allows you to choose the CO2 transport and storage methods as described in
"5.1.4.3. T&S Config" on page 107.
5.2.2.8.9.6. Capital Cost
This is a standard capital cost input screen as described in "5.1.1.1. Capital Cost Inputs" on
page 90.
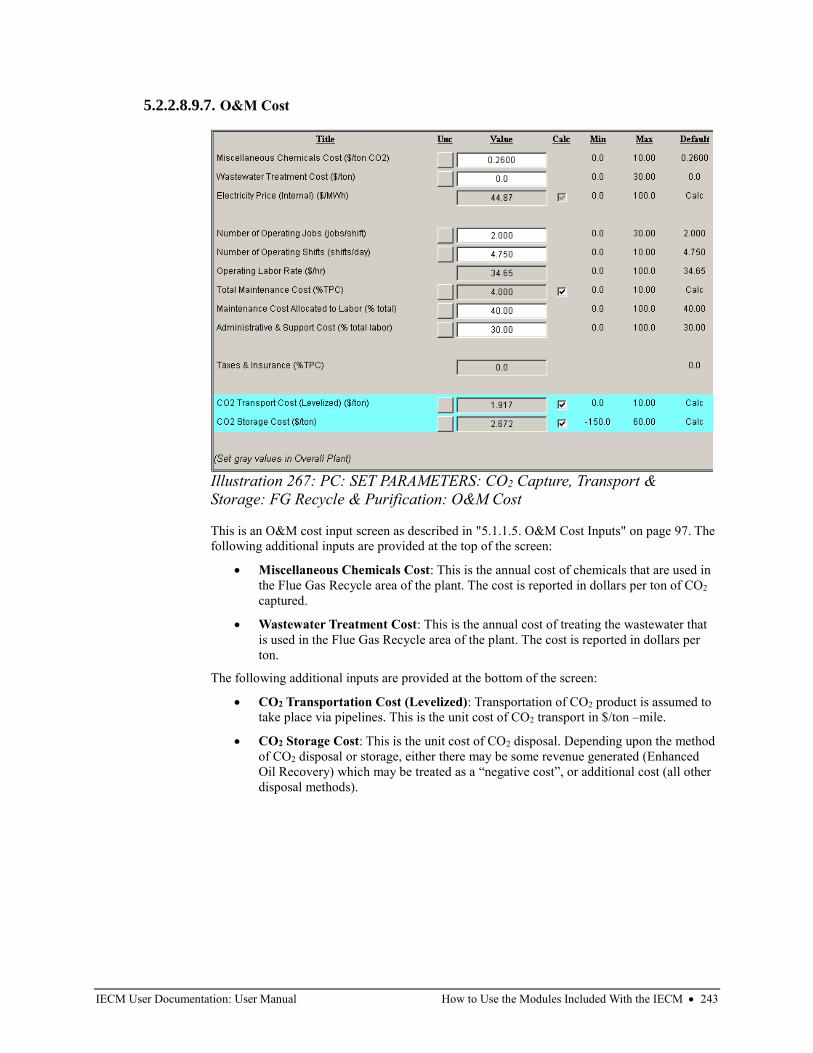
IECM User Documentation: User Manual How to Use the Modules Included With the IECM • 243
5.2.2.8.9.7. O&M Cost
This is an O&M cost input screen as described in "5.1.1.5. O&M Cost Inputs" on page 97. The
following additional inputs are provided at the top of the screen:
• Miscellaneous Chemicals Cost: This is the annual cost of chemicals that are used in
the Flue Gas Recycle area of the plant. The cost is reported in dollars per ton of CO2
captured.
• Wastewater Treatment Cost: This is the annual cost of treating the wastewater that
is used in the Flue Gas Recycle area of the plant. The cost is reported in dollars per
ton.
The following additional inputs are provided at the bottom of the screen:
• CO2 Transportation Cost (Levelized): Transportation of CO2 product is assumed to
take place via pipelines. This is the unit cost of CO2 transport in $/ton –mile.
• CO2 Storage Cost: This is the unit cost of CO2 disposal. Depending upon the method
of CO2 disposal or storage, either there may be some revenue generated (Enhanced
Oil Recovery) which may be treated as a “negative cost”, or additional cost (all other
disposal methods).
Illustration 267: PC: SET PARAMETERS: CO2 Capture, Transport &
Storage: FG Recycle & Purification: O&M Cost
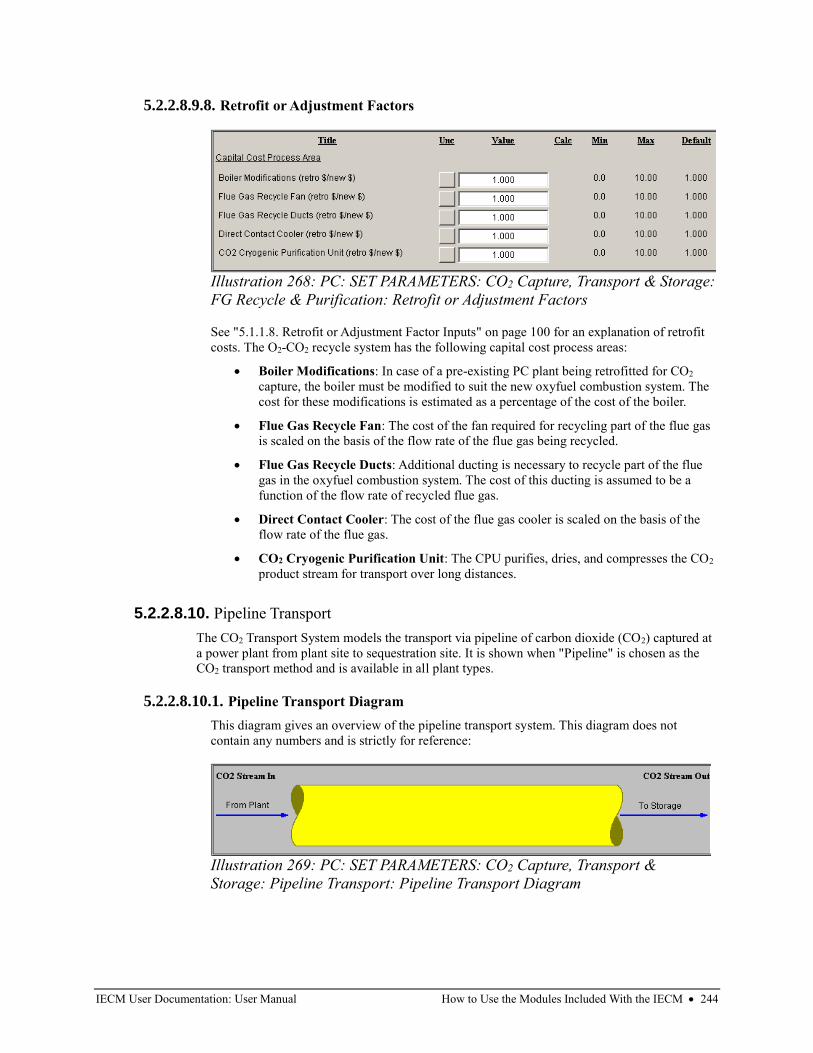
IECM User Documentation: User Manual How to Use the Modules Included With the IECM • 244
5.2.2.8.9.8. Retrofit or Adjustment Factors
See "5.1.1.8. Retrofit or Adjustment Factor Inputs" on page 100 for an explanation of retrofit
costs. The O2-CO2 recycle system has the following capital cost process areas:
• Boiler Modifications: In case of a pre-existing PC plant being retrofitted for CO2
capture, the boiler must be modified to suit the new oxyfuel combustion system. The
cost for these modifications is estimated as a percentage of the cost of the boiler.
• Flue Gas Recycle Fan: The cost of the fan required for recycling part of the flue gas
is scaled on the basis of the flow rate of the flue gas being recycled.
• Flue Gas Recycle Ducts: Additional ducting is necessary to recycle part of the flue
gas in the oxyfuel combustion system. The cost of this ducting is assumed to be a
function of the flow rate of recycled flue gas.
• Direct Contact Cooler: The cost of the flue gas cooler is scaled on the basis of the
flow rate of the flue gas.
• CO2 Cryogenic Purification Unit: The CPU purifies, dries, and compresses the CO2
product stream for transport over long distances.
5.2.2.8.10. Pipeline Transport
The CO2 Transport System models the transport via pipeline of carbon dioxide (CO2) captured at
a power plant from plant site to sequestration site. It is shown when "Pipeline" is chosen as the
CO2 transport method and is available in all plant types.
5.2.2.8.10.1. Pipeline Transport Diagram
This diagram gives an overview of the pipeline transport system. This diagram does not
contain any numbers and is strictly for reference:
Illustration 268: PC: SET PARAMETERS: CO2 Capture, Transport & Storage:
FG Recycle & Purification: Retrofit or Adjustment Factors
Illustration 269: PC: SET PARAMETERS: CO2 Capture, Transport &
Storage: Pipeline Transport: Pipeline Transport Diagram
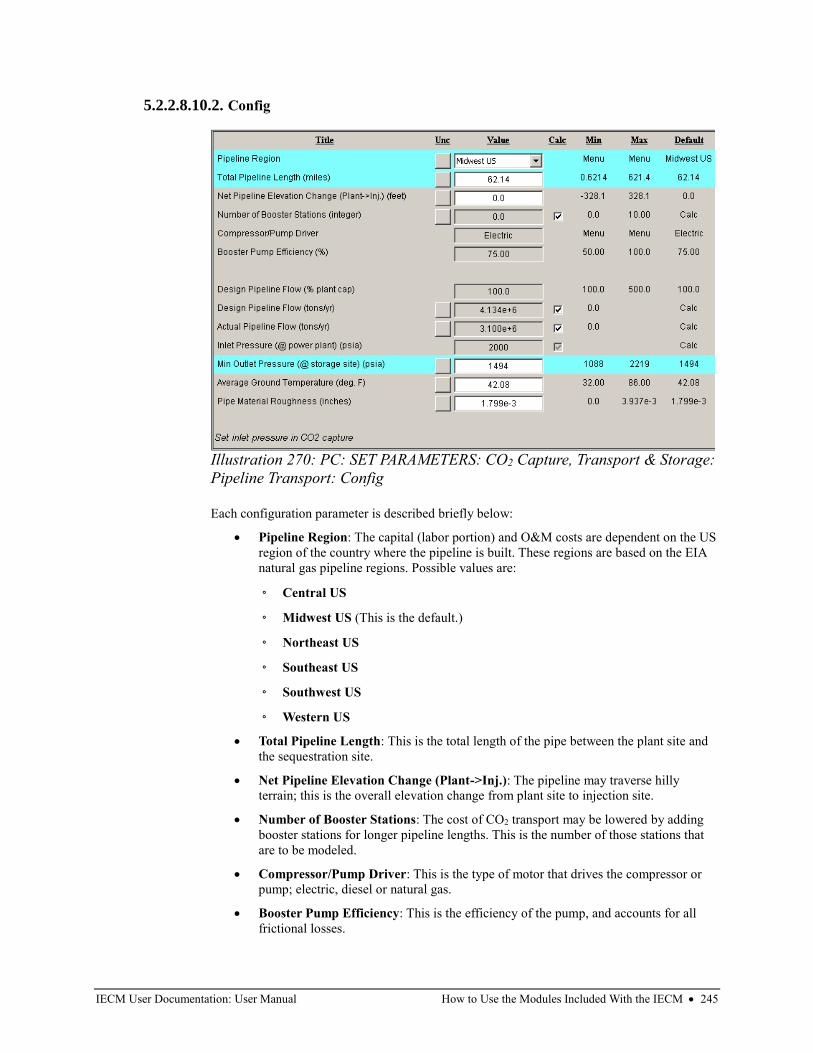
IECM User Documentation: User Manual How to Use the Modules Included With the IECM • 245
5.2.2.8.10.2. Config
Each configuration parameter is described briefly below:
• Pipeline Region: The capital (labor portion) and O&M costs are dependent on the US
region of the country where the pipeline is built. These regions are based on the EIA
natural gas pipeline regions. Possible values are:
◦ Central US
◦ Midwest US (This is the default.)
◦ Northeast US
◦ Southeast US
◦ Southwest US
◦ Western US
• Total Pipeline Length: This is the total length of the pipe between the plant site and
the sequestration site.
• Net Pipeline Elevation Change (Plant->Inj.): The pipeline may traverse hilly
terrain; this is the overall elevation change from plant site to injection site.
• Number of Booster Stations: The cost of CO2 transport may be lowered by adding
booster stations for longer pipeline lengths. This is the number of those stations that
are to be modeled.
• Compressor/Pump Driver: This is the type of motor that drives the compressor or
pump; electric, diesel or natural gas.
• Booster Pump Efficiency: This is the efficiency of the pump, and accounts for all
frictional losses.
Illustration 270: PC: SET PARAMETERS: CO2 Capture, Transport & Storage:
Pipeline Transport: Config
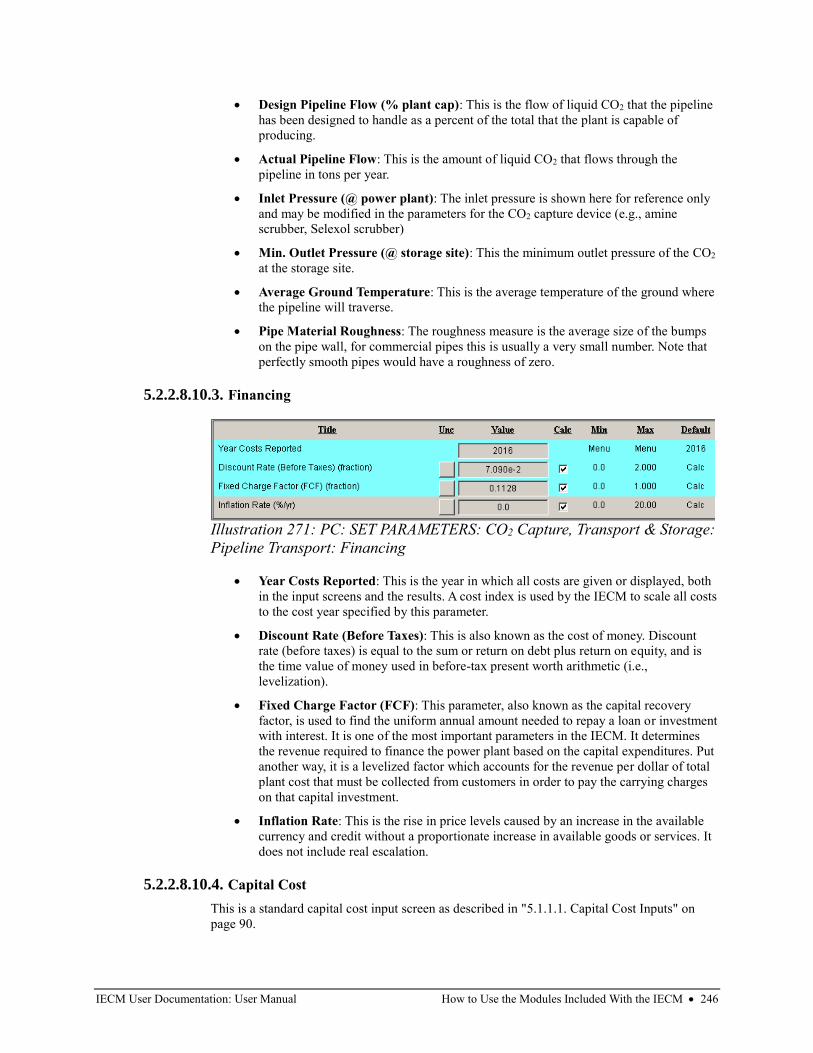
IECM User Documentation: User Manual How to Use the Modules Included With the IECM • 246
• Design Pipeline Flow (% plant cap): This is the flow of liquid CO2 that the pipeline
has been designed to handle as a percent of the total that the plant is capable of
producing.
• Actual Pipeline Flow: This is the amount of liquid CO2 that flows through the
pipeline in tons per year.
• Inlet Pressure (@ power plant): The inlet pressure is shown here for reference only
and may be modified in the parameters for the CO2 capture device (e.g., amine
scrubber, Selexol scrubber)
• Min. Outlet Pressure (@ storage site): This the minimum outlet pressure of the CO2
at the storage site.
• Average Ground Temperature: This is the average temperature of the ground where
the pipeline will traverse.
• Pipe Material Roughness: The roughness measure is the average size of the bumps
on the pipe wall, for commercial pipes this is usually a very small number. Note that
perfectly smooth pipes would have a roughness of zero.
5.2.2.8.10.3. Financing
• Year Costs Reported: This is the year in which all costs are given or displayed, both
in the input screens and the results. A cost index is used by the IECM to scale all costs
to the cost year specified by this parameter.
• Discount Rate (Before Taxes): This is also known as the cost of money. Discount
rate (before taxes) is equal to the sum or return on debt plus return on equity, and is
the time value of money used in before-tax present worth arithmetic (i.e.,
levelization).
• Fixed Charge Factor (FCF): This parameter, also known as the capital recovery
factor, is used to find the uniform annual amount needed to repay a loan or investment
with interest. It is one of the most important parameters in the IECM. It determines
the revenue required to finance the power plant based on the capital expenditures. Put
another way, it is a levelized factor which accounts for the revenue per dollar of total
plant cost that must be collected from customers in order to pay the carrying charges
on that capital investment.
• Inflation Rate: This is the rise in price levels caused by an increase in the available
currency and credit without a proportionate increase in available goods or services. It
does not include real escalation.
5.2.2.8.10.4. Capital Cost
This is a standard capital cost input screen as described in "5.1.1.1. Capital Cost Inputs" on
page 90.
Illustration 271: PC: SET PARAMETERS: CO2 Capture, Transport & Storage:
Pipeline Transport: Financing
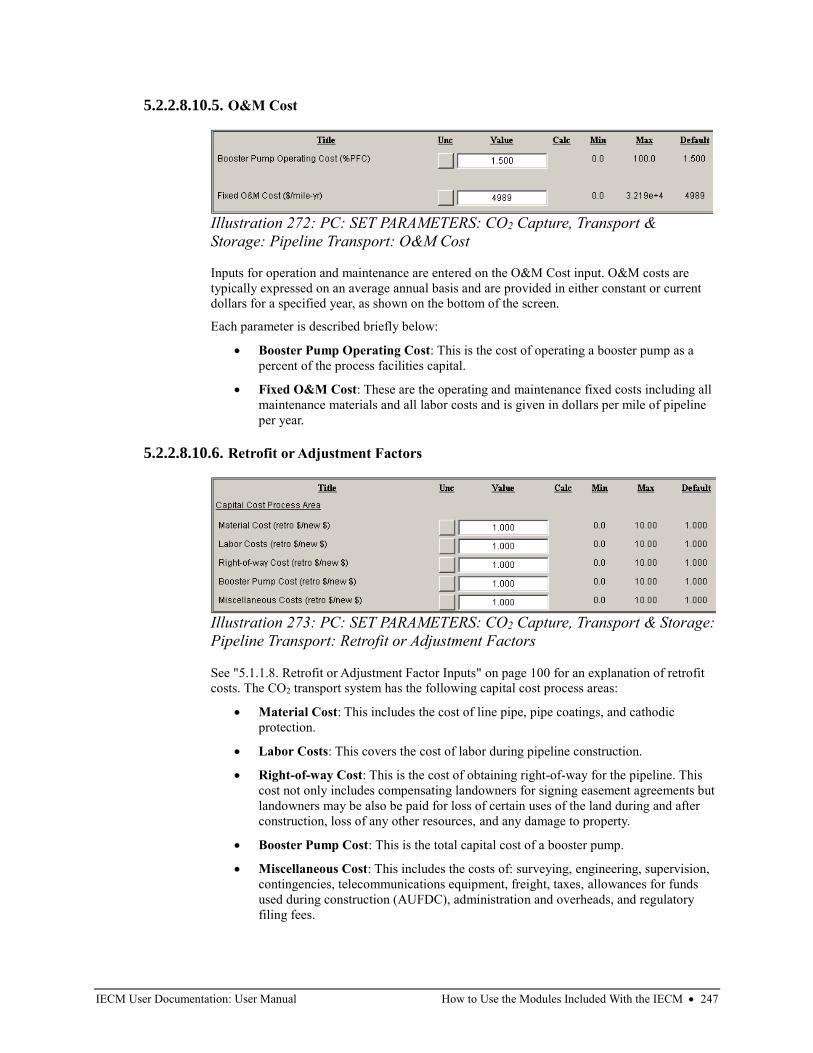
IECM User Documentation: User Manual How to Use the Modules Included With the IECM • 247
5.2.2.8.10.5. O&M Cost
Inputs for operation and maintenance are entered on the O&M Cost input. O&M costs are
typically expressed on an average annual basis and are provided in either constant or current
dollars for a specified year, as shown on the bottom of the screen.
Each parameter is described briefly below:
• Booster Pump Operating Cost: This is the cost of operating a booster pump as a
percent of the process facilities capital.
• Fixed O&M Cost: These are the operating and maintenance fixed costs including all
maintenance materials and all labor costs and is given in dollars per mile of pipeline
per year.
5.2.2.8.10.6. Retrofit or Adjustment Factors
See "5.1.1.8. Retrofit or Adjustment Factor Inputs" on page 100 for an explanation of retrofit
costs. The CO2 transport system has the following capital cost process areas:
• Material Cost: This includes the cost of line pipe, pipe coatings, and cathodic
protection.
• Labor Costs: This covers the cost of labor during pipeline construction.
• Right-of-way Cost: This is the cost of obtaining right-of-way for the pipeline. This
cost not only includes compensating landowners for signing easement agreements but
landowners may be also be paid for loss of certain uses of the land during and after
construction, loss of any other resources, and any damage to property.
• Booster Pump Cost: This is the total capital cost of a booster pump.
• Miscellaneous Cost: This includes the costs of: surveying, engineering, supervision,
contingencies, telecommunications equipment, freight, taxes, allowances for funds
used during construction (AUFDC), administration and overheads, and regulatory
filing fees.
Illustration 272: PC: SET PARAMETERS: CO2 Capture, Transport &
Storage: Pipeline Transport: O&M Cost
Illustration 273: PC: SET PARAMETERS: CO2 Capture, Transport & Storage:
Pipeline Transport: Retrofit or Adjustment Factors
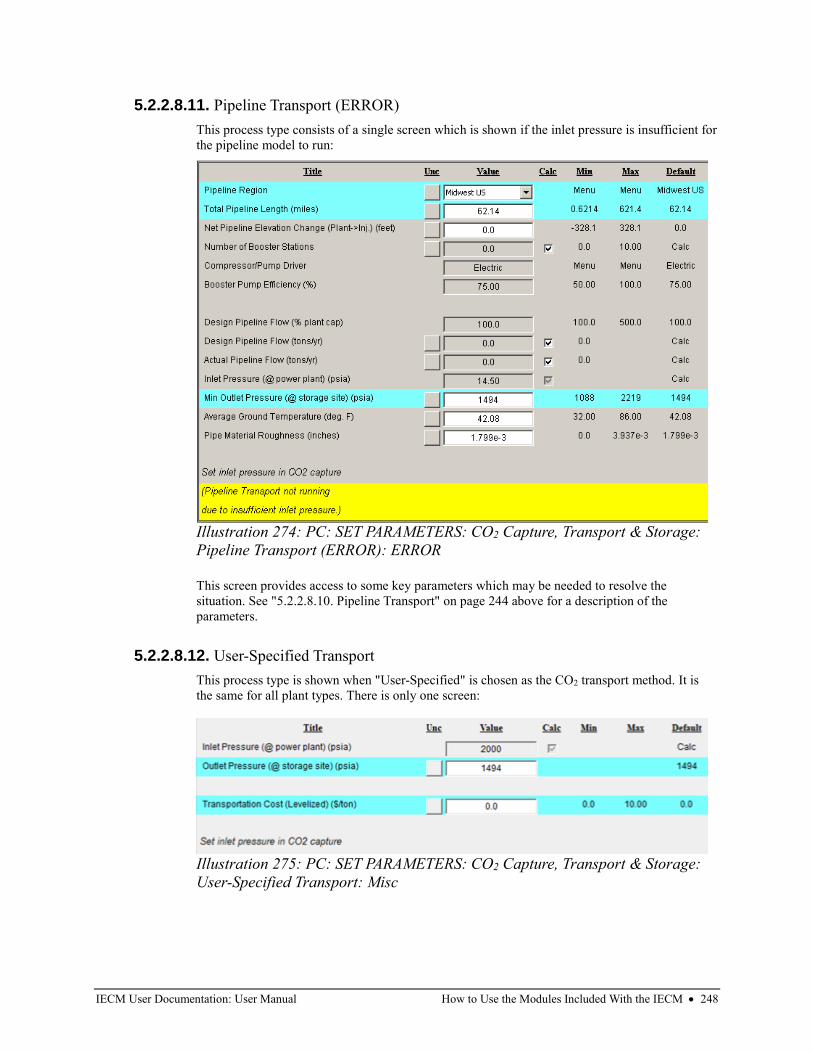
IECM User Documentation: User Manual How to Use the Modules Included With the IECM • 248
5.2.2.8.11. Pipeline Transport (ERROR)
This process type consists of a single screen which is shown if the inlet pressure is insufficient for
the pipeline model to run:
This screen provides access to some key parameters which may be needed to resolve the
situation. See "5.2.2.8.10. Pipeline Transport" on page 244 above for a description of the
parameters.
5.2.2.8.12. User-Specified Transport
This process type is shown when "User-Specified" is chosen as the CO2 transport method. It is
the same for all plant types. There is only one screen:
Illustration 274: PC: SET PARAMETERS: CO2 Capture, Transport & Storage:
Pipeline Transport (ERROR): ERROR
Illustration 275: PC: SET PARAMETERS: CO2 Capture, Transport & Storage:
User-Specified Transport: Misc
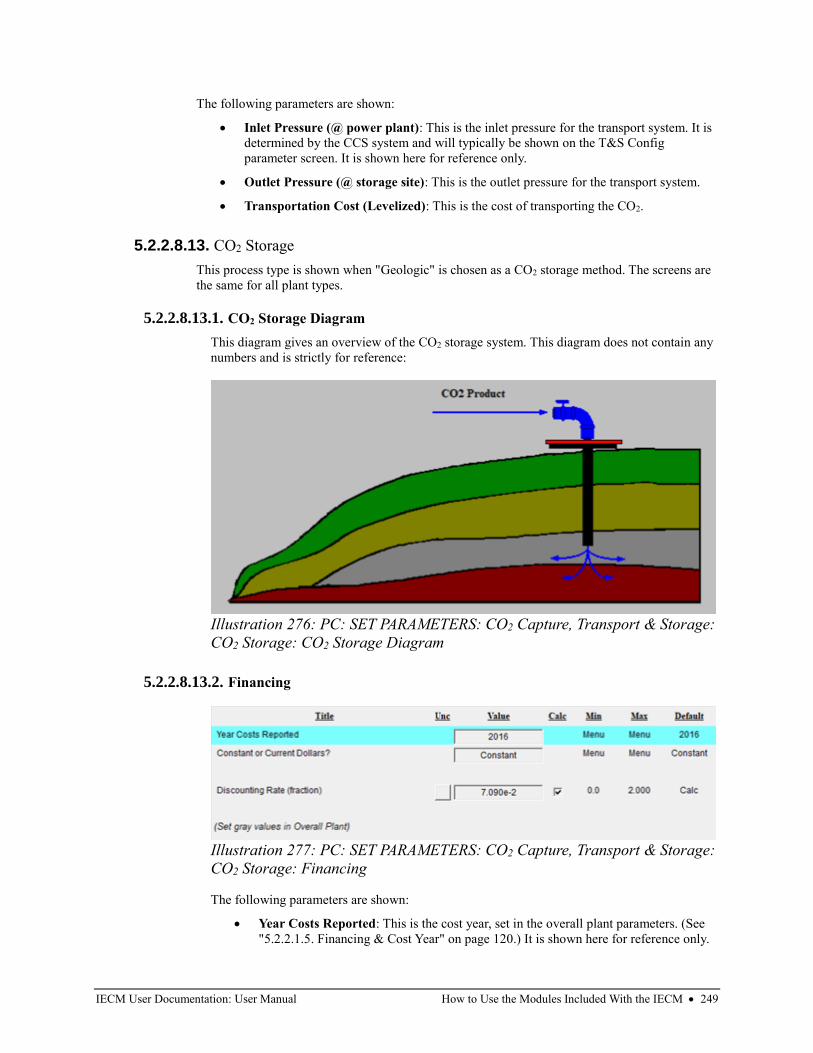
IECM User Documentation: User Manual How to Use the Modules Included With the IECM • 249
The following parameters are shown:
• Inlet Pressure (@ power plant): This is the inlet pressure for the transport system. It is
determined by the CCS system and will typically be shown on the T&S Config
parameter screen. It is shown here for reference only.
• Outlet Pressure (@ storage site): This is the outlet pressure for the transport system.
• Transportation Cost (Levelized): This is the cost of transporting the CO2.
5.2.2.8.13. CO2 Storage
This process type is shown when "Geologic" is chosen as a CO2 storage method. The screens are
the same for all plant types.
5.2.2.8.13.1. CO2 Storage Diagram
This diagram gives an overview of the CO2 storage system. This diagram does not contain any
numbers and is strictly for reference:
5.2.2.8.13.2. Financing
The following parameters are shown:
• Year Costs Reported: This is the cost year, set in the overall plant parameters. (See
"5.2.2.1.5. Financing & Cost Year" on page 120.) It is shown here for reference only.
Illustration 276: PC: SET PARAMETERS: CO2 Capture, Transport & Storage:
CO2 Storage: CO2 Storage Diagram
Illustration 277: PC: SET PARAMETERS: CO2 Capture, Transport & Storage:
CO2 Storage: Financing
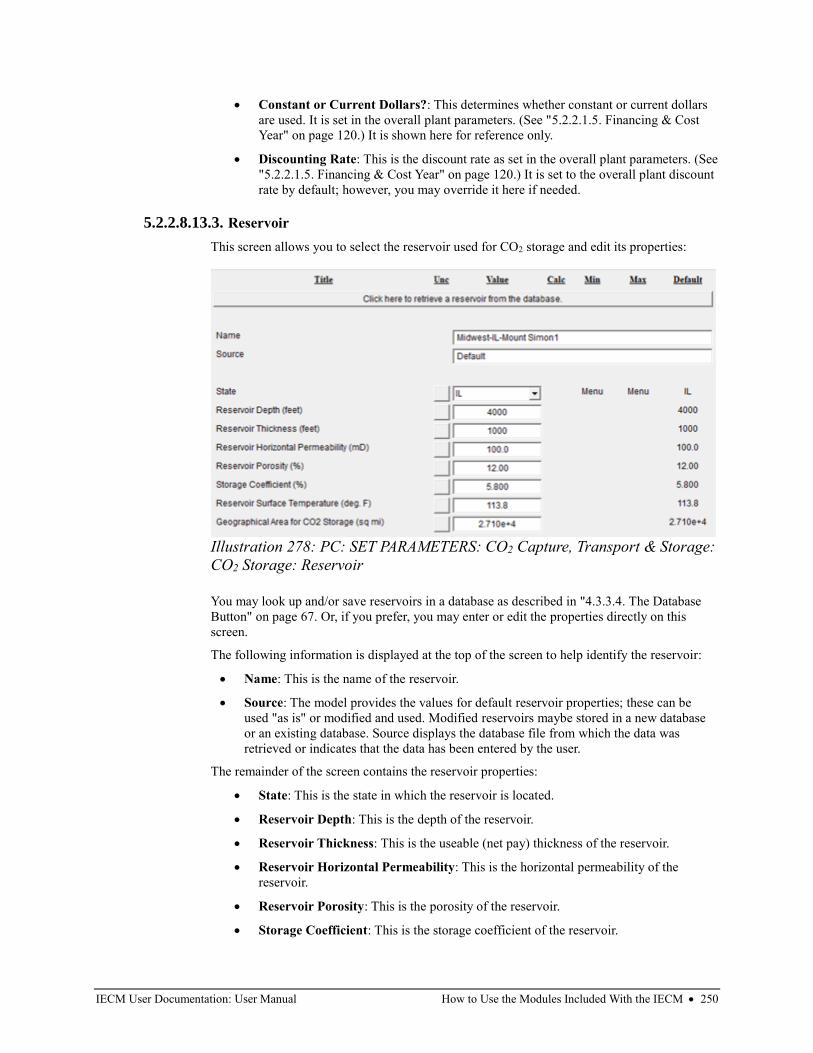
IECM User Documentation: User Manual How to Use the Modules Included With the IECM • 250
• Constant or Current Dollars?: This determines whether constant or current dollars
are used. It is set in the overall plant parameters. (See "5.2.2.1.5. Financing & Cost
Year" on page 120.) It is shown here for reference only.
• Discounting Rate: This is the discount rate as set in the overall plant parameters. (See
"5.2.2.1.5. Financing & Cost Year" on page 120.) It is set to the overall plant discount
rate by default; however, you may override it here if needed.
5.2.2.8.13.3. Reservoir
This screen allows you to select the reservoir used for CO2 storage and edit its properties:
You may look up and/or save reservoirs in a database as described in "4.3.3.4. The Database
Button" on page 67. Or, if you prefer, you may enter or edit the properties directly on this
screen.
The following information is displayed at the top of the screen to help identify the reservoir:
• Name: This is the name of the reservoir.
• Source: The model provides the values for default reservoir properties; these can be
used "as is" or modified and used. Modified reservoirs maybe stored in a new database
or an existing database. Source displays the database file from which the data was
retrieved or indicates that the data has been entered by the user.
The remainder of the screen contains the reservoir properties:
• State: This is the state in which the reservoir is located.
• Reservoir Depth: This is the depth of the reservoir.
• Reservoir Thickness: This is the useable (net pay) thickness of the reservoir.
• Reservoir Horizontal Permeability: This is the horizontal permeability of the
reservoir.
• Reservoir Porosity: This is the porosity of the reservoir.
• Storage Coefficient: This is the storage coefficient of the reservoir.
Illustration 278: PC: SET PARAMETERS: CO2 Capture, Transport & Storage:
CO2 Storage: Reservoir
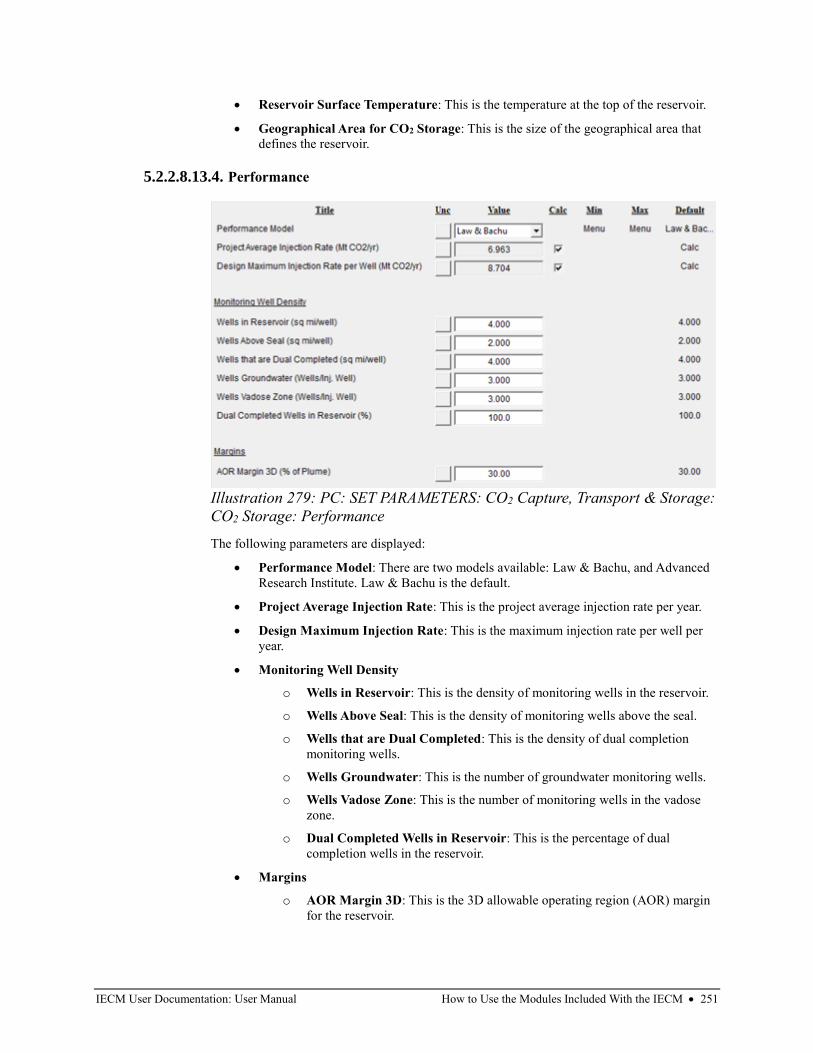
IECM User Documentation: User Manual How to Use the Modules Included With the IECM • 251
• Reservoir Surface Temperature: This is the temperature at the top of the reservoir.
• Geographical Area for CO2 Storage: This is the size of the geographical area that
defines the reservoir.
5.2.2.8.13.4. Performance
The following parameters are displayed:
• Performance Model: There are two models available: Law & Bachu, and Advanced
Research Institute. Law & Bachu is the default.
• Project Average Injection Rate: This is the project average injection rate per year.
• Design Maximum Injection Rate: This is the maximum injection rate per well per
year.
• Monitoring Well Density
o Wells in Reservoir: This is the density of monitoring wells in the reservoir.
o Wells Above Seal: This is the density of monitoring wells above the seal.
o Wells that are Dual Completed: This is the density of dual completion
monitoring wells.
o Wells Groundwater: This is the number of groundwater monitoring wells.
o Wells Vadose Zone: This is the number of monitoring wells in the vadose
zone.
o Dual Completed Wells in Reservoir: This is the percentage of dual
completion wells in the reservoir.
• Margins
o AOR Margin 3D: This is the 3D allowable operating region (AOR) margin
for the reservoir.
Illustration 279: PC: SET PARAMETERS: CO2 Capture, Transport & Storage:
CO2 Storage: Performance
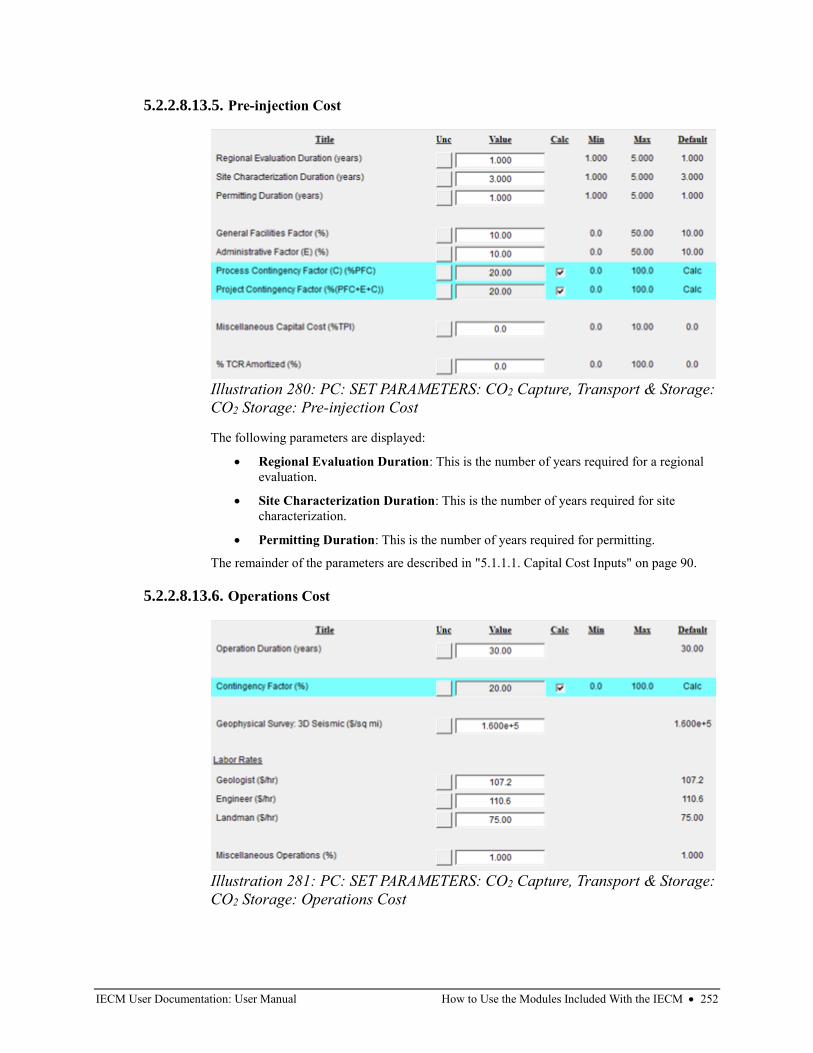
IECM User Documentation: User Manual How to Use the Modules Included With the IECM • 252
5.2.2.8.13.5. Pre-injection Cost
The following parameters are displayed:
• Regional Evaluation Duration: This is the number of years required for a regional
evaluation.
• Site Characterization Duration: This is the number of years required for site
characterization.
• Permitting Duration: This is the number of years required for permitting.
The remainder of the parameters are described in "5.1.1.1. Capital Cost Inputs" on page 90.
5.2.2.8.13.6. Operations Cost
Illustration 280: PC: SET PARAMETERS: CO2 Capture, Transport & Storage:
CO2 Storage: Pre-injection Cost
Illustration 281: PC: SET PARAMETERS: CO2 Capture, Transport & Storage:
CO2 Storage: Operations Cost
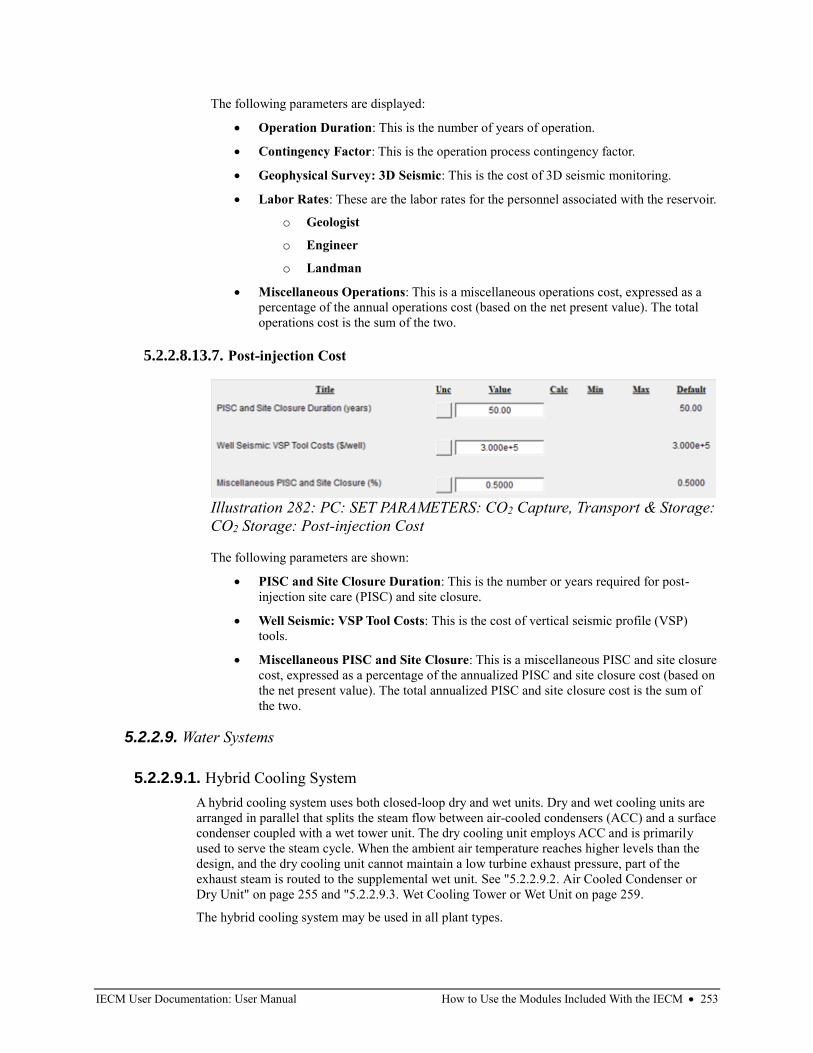
IECM User Documentation: User Manual How to Use the Modules Included With the IECM • 253
The following parameters are displayed:
• Operation Duration: This is the number of years of operation.
• Contingency Factor: This is the operation process contingency factor.
• Geophysical Survey: 3D Seismic: This is the cost of 3D seismic monitoring.
• Labor Rates: These are the labor rates for the personnel associated with the reservoir.
o Geologist
o Engineer
o Landman
• Miscellaneous Operations: This is a miscellaneous operations cost, expressed as a
percentage of the annual operations cost (based on the net present value). The total
operations cost is the sum of the two.
5.2.2.8.13.7. Post-injection Cost
The following parameters are shown:
• PISC and Site Closure Duration: This is the number or years required for post-
injection site care (PISC) and site closure.
• Well Seismic: VSP Tool Costs: This is the cost of vertical seismic profile (VSP)
tools.
• Miscellaneous PISC and Site Closure: This is a miscellaneous PISC and site closure
cost, expressed as a percentage of the annualized PISC and site closure cost (based on
the net present value). The total annualized PISC and site closure cost is the sum of
the two.
5.2.2.9. Water Systems
5.2.2.9.1. Hybrid Cooling System
A hybrid cooling system uses both closed-loop dry and wet units. Dry and wet cooling units are
arranged in parallel that splits the steam flow between air-cooled condensers (ACC) and a surface
condenser coupled with a wet tower unit. The dry cooling unit employs ACC and is primarily
used to serve the steam cycle. When the ambient air temperature reaches higher levels than the
design, and the dry cooling unit cannot maintain a low turbine exhaust pressure, part of the
exhaust steam is routed to the supplemental wet unit. See "5.2.2.9.2. Air Cooled Condenser or
Dry Unit" on page 255 and "5.2.2.9.3. Wet Cooling Tower or Wet Unit on page 259.
The hybrid cooling system may be used in all plant types.
Illustration 282: PC: SET PARAMETERS: CO2 Capture, Transport & Storage:
CO2 Storage: Post-injection Cost
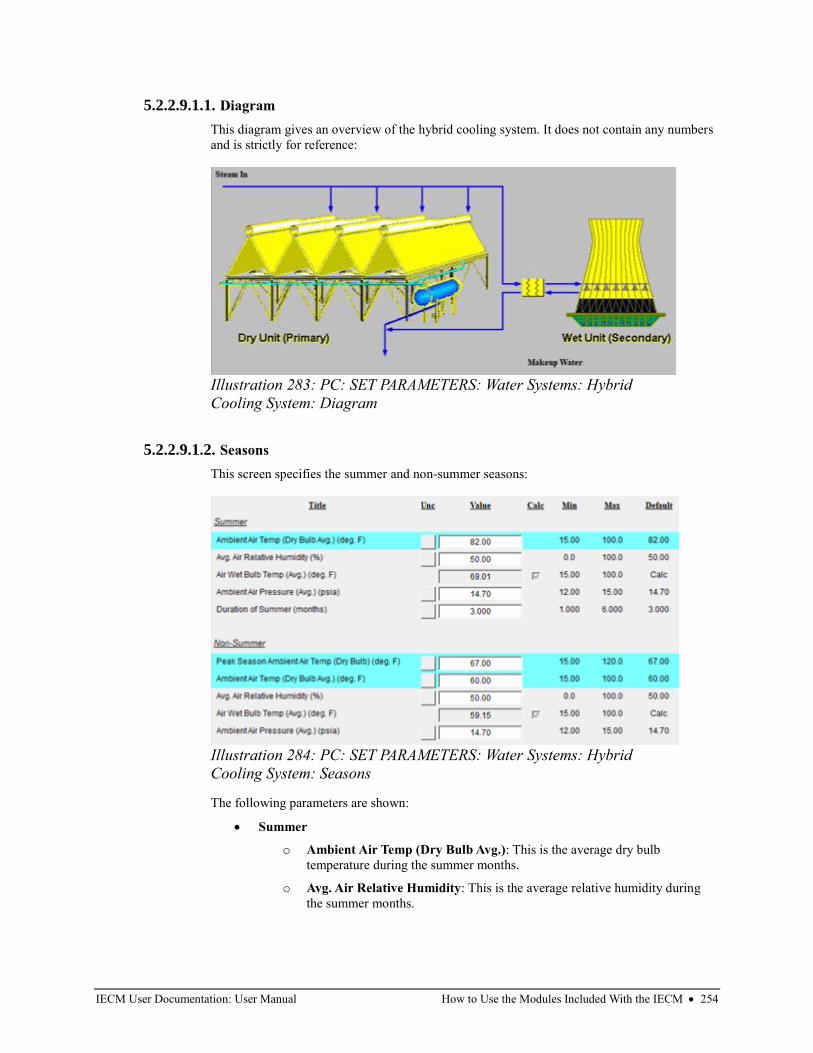
IECM User Documentation: User Manual How to Use the Modules Included With the IECM • 254
5.2.2.9.1.1. Diagram
This diagram gives an overview of the hybrid cooling system. It does not contain any numbers
and is strictly for reference:
5.2.2.9.1.2. Seasons
This screen specifies the summer and non-summer seasons:
The following parameters are shown:
• Summer
o Ambient Air Temp (Dry Bulb Avg.): This is the average dry bulb
temperature during the summer months.
o Avg. Air Relative Humidity: This is the average relative humidity during
the summer months.
Illustration 283: PC: SET PARAMETERS: Water Systems: Hybrid
Cooling System: Diagram
Illustration 284: PC: SET PARAMETERS: Water Systems: Hybrid
Cooling System: Seasons
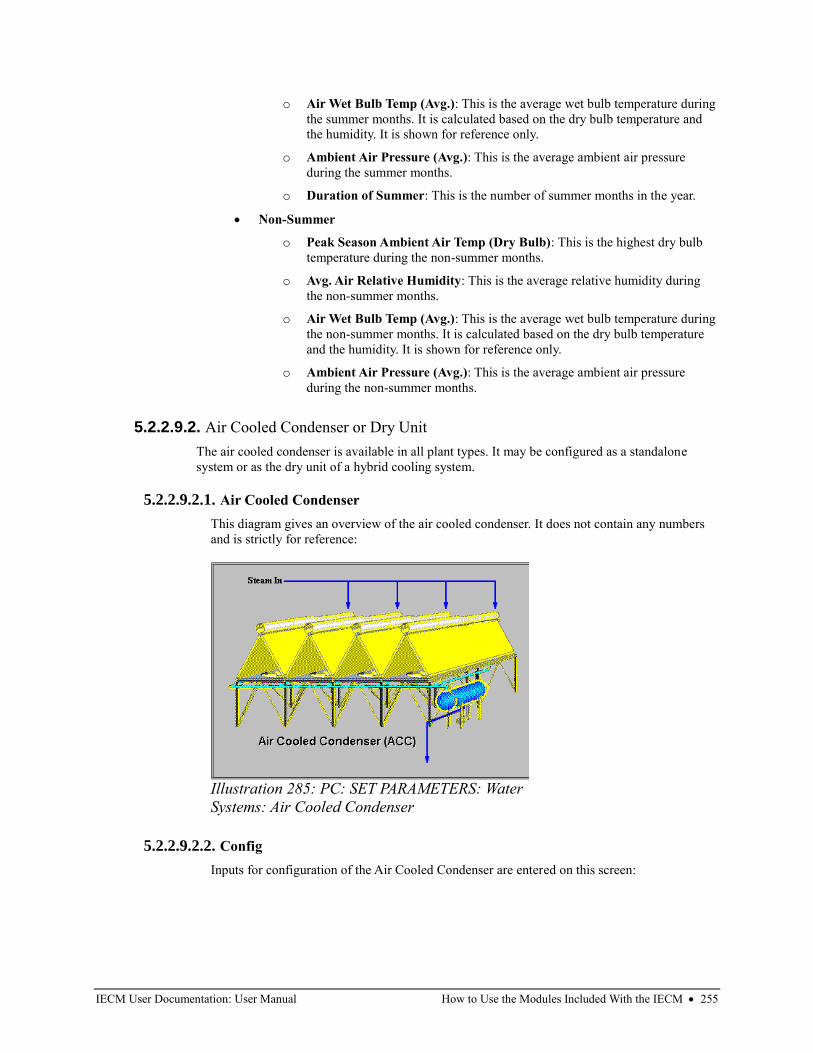
IECM User Documentation: User Manual How to Use the Modules Included With the IECM • 255
o Air Wet Bulb Temp (Avg.): This is the average wet bulb temperature during
the summer months. It is calculated based on the dry bulb temperature and
the humidity. It is shown for reference only.
o Ambient Air Pressure (Avg.): This is the average ambient air pressure
during the summer months.
o Duration of Summer: This is the number of summer months in the year.
• Non-Summer
o Peak Season Ambient Air Temp (Dry Bulb): This is the highest dry bulb
temperature during the non-summer months.
o Avg. Air Relative Humidity: This is the average relative humidity during
the non-summer months.
o Air Wet Bulb Temp (Avg.): This is the average wet bulb temperature during
the non-summer months. It is calculated based on the dry bulb temperature
and the humidity. It is shown for reference only.
o Ambient Air Pressure (Avg.): This is the average ambient air pressure
during the non-summer months.
5.2.2.9.2. Air Cooled Condenser or Dry Unit
The air cooled condenser is available in all plant types. It may be configured as a standalone
system or as the dry unit of a hybrid cooling system.
5.2.2.9.2.1. Air Cooled Condenser
This diagram gives an overview of the air cooled condenser. It does not contain any numbers
and is strictly for reference:
5.2.2.9.2.2. Config
Inputs for configuration of the Air Cooled Condenser are entered on this screen:
Illustration 285: PC: SET PARAMETERS: Water
Systems: Air Cooled Condenser
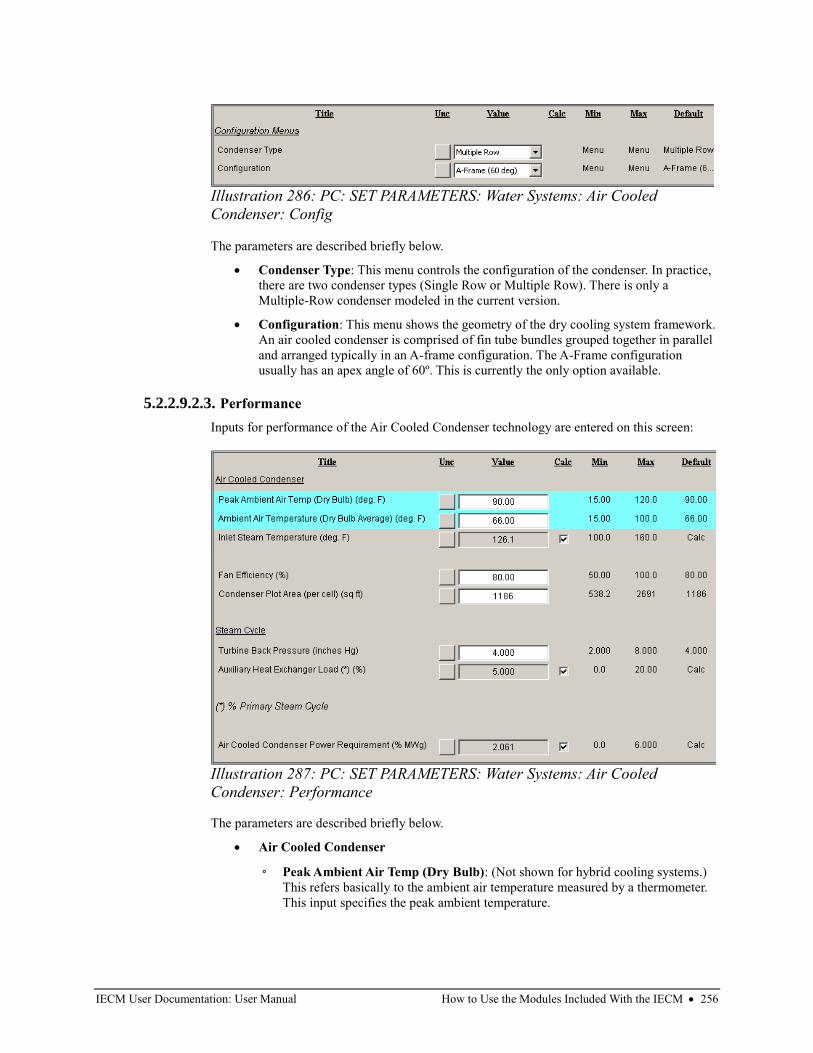
IECM User Documentation: User Manual How to Use the Modules Included With the IECM • 256
The parameters are described briefly below.
• Condenser Type: This menu controls the configuration of the condenser. In practice,
there are two condenser types (Single Row or Multiple Row). There is only a
Multiple-Row condenser modeled in the current version.
• Configuration: This menu shows the geometry of the dry cooling system framework.
An air cooled condenser is comprised of fin tube bundles grouped together in parallel
and arranged typically in an A-frame configuration. The A-Frame configuration
usually has an apex angle of 60º. This is currently the only option available.
5.2.2.9.2.3. Performance
Inputs for performance of the Air Cooled Condenser technology are entered on this screen:
The parameters are described briefly below.
• Air Cooled Condenser
◦ Peak Ambient Air Temp (Dry Bulb): (Not shown for hybrid cooling systems.)
This refers basically to the ambient air temperature measured by a thermometer.
This input specifies the peak ambient temperature.
Illustration 286: PC: SET PARAMETERS: Water Systems: Air Cooled
Condenser: Config
Illustration 287: PC: SET PARAMETERS: Water Systems: Air Cooled
Condenser: Performance
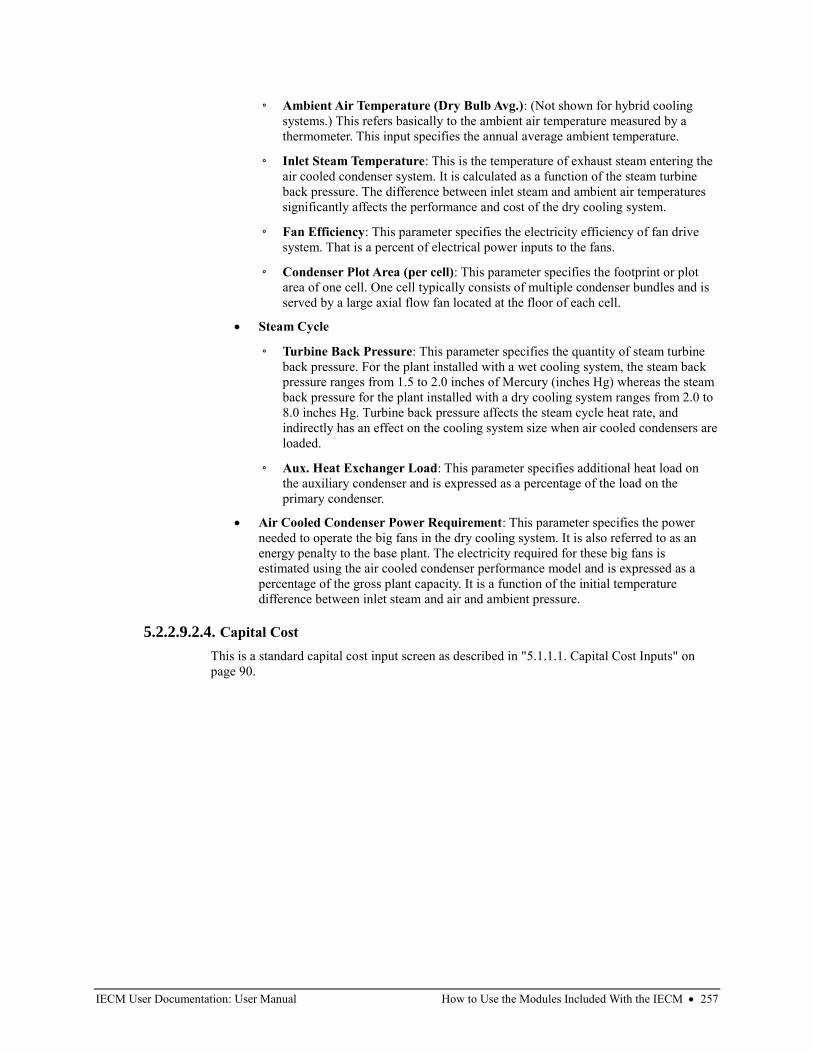
IECM User Documentation: User Manual How to Use the Modules Included With the IECM • 257
◦ Ambient Air Temperature (Dry Bulb Avg.): (Not shown for hybrid cooling
systems.) This refers basically to the ambient air temperature measured by a
thermometer. This input specifies the annual average ambient temperature.
◦ Inlet Steam Temperature: This is the temperature of exhaust steam entering the
air cooled condenser system. It is calculated as a function of the steam turbine
back pressure. The difference between inlet steam and ambient air temperatures
significantly affects the performance and cost of the dry cooling system.
◦ Fan Efficiency: This parameter specifies the electricity efficiency of fan drive
system. That is a percent of electrical power inputs to the fans.
◦ Condenser Plot Area (per cell): This parameter specifies the footprint or plot
area of one cell. One cell typically consists of multiple condenser bundles and is
served by a large axial flow fan located at the floor of each cell.
• Steam Cycle
◦ Turbine Back Pressure: This parameter specifies the quantity of steam turbine
back pressure. For the plant installed with a wet cooling system, the steam back
pressure ranges from 1.5 to 2.0 inches of Mercury (inches Hg) whereas the steam
back pressure for the plant installed with a dry cooling system ranges from 2.0 to
8.0 inches Hg. Turbine back pressure affects the steam cycle heat rate, and
indirectly has an effect on the cooling system size when air cooled condensers are
loaded.
◦ Aux. Heat Exchanger Load: This parameter specifies additional heat load on
the auxiliary condenser and is expressed as a percentage of the load on the
primary condenser.
• Air Cooled Condenser Power Requirement: This parameter specifies the power
needed to operate the big fans in the dry cooling system. It is also referred to as an
energy penalty to the base plant. The electricity required for these big fans is
estimated using the air cooled condenser performance model and is expressed as a
percentage of the gross plant capacity. It is a function of the initial temperature
difference between inlet steam and air and ambient pressure.
5.2.2.9.2.4. Capital Cost
This is a standard capital cost input screen as described in "5.1.1.1. Capital Cost Inputs" on
page 90.
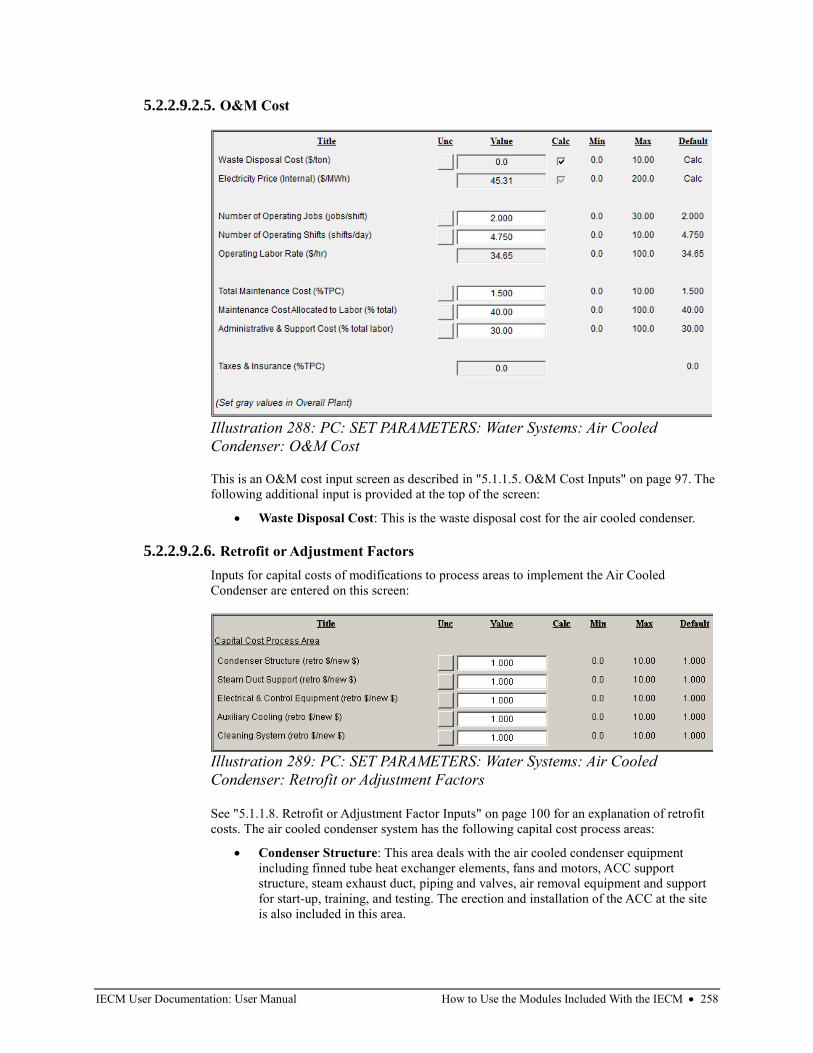
IECM User Documentation: User Manual How to Use the Modules Included With the IECM • 258
5.2.2.9.2.5. O&M Cost
This is an O&M cost input screen as described in "5.1.1.5. O&M Cost Inputs" on page 97. The
following additional input is provided at the top of the screen:
• Waste Disposal Cost: This is the waste disposal cost for the air cooled condenser.
5.2.2.9.2.6. Retrofit or Adjustment Factors
Inputs for capital costs of modifications to process areas to implement the Air Cooled
Condenser are entered on this screen:
See "5.1.1.8. Retrofit or Adjustment Factor Inputs" on page 100 for an explanation of retrofit
costs. The air cooled condenser system has the following capital cost process areas:
• Condenser Structure: This area deals with the air cooled condenser equipment
including finned tube heat exchanger elements, fans and motors, ACC support
structure, steam exhaust duct, piping and valves, air removal equipment and support
for start-up, training, and testing. The erection and installation of the ACC at the site
is also included in this area.
Illustration 288: PC: SET PARAMETERS: Water Systems: Air Cooled
Condenser: O&M Cost
Illustration 289: PC: SET PARAMETERS: Water Systems: Air Cooled
Condenser: Retrofit or Adjustment Factors
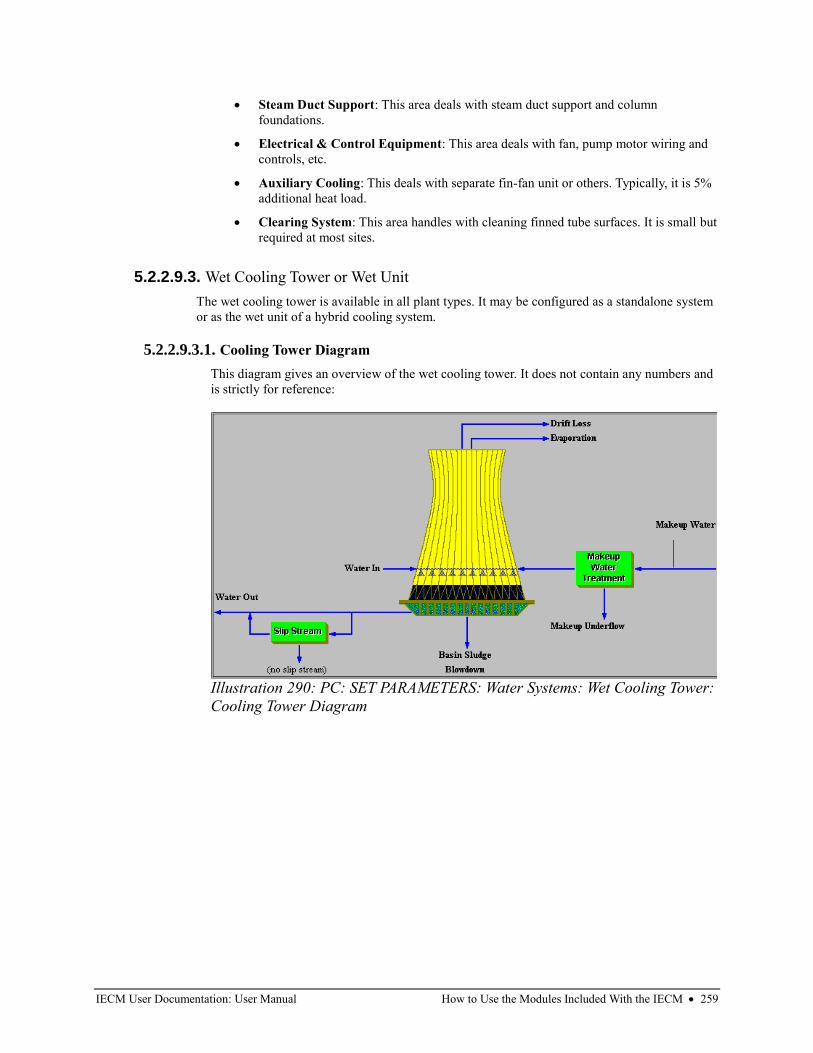
IECM User Documentation: User Manual How to Use the Modules Included With the IECM • 259
• Steam Duct Support: This area deals with steam duct support and column
foundations.
• Electrical & Control Equipment: This area deals with fan, pump motor wiring and
controls, etc.
• Auxiliary Cooling: This deals with separate fin-fan unit or others. Typically, it is 5%
additional heat load.
• Clearing System: This area handles with cleaning finned tube surfaces. It is small but
required at most sites.
5.2.2.9.3. Wet Cooling Tower or Wet Unit
The wet cooling tower is available in all plant types. It may be configured as a standalone system
or as the wet unit of a hybrid cooling system.
5.2.2.9.3.1. Cooling Tower Diagram
This diagram gives an overview of the wet cooling tower. It does not contain any numbers and
is strictly for reference:
Illustration 290: PC: SET PARAMETERS: Water Systems: Wet Cooling Tower:
Cooling Tower Diagram
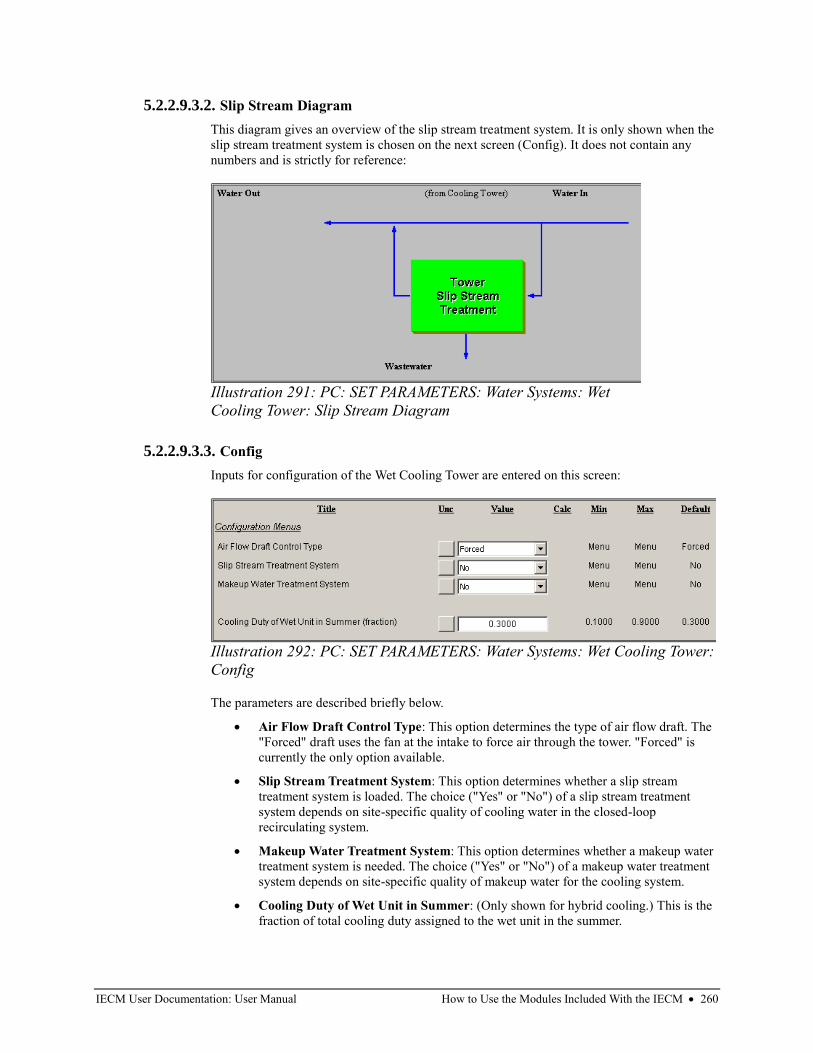
IECM User Documentation: User Manual How to Use the Modules Included With the IECM • 260
5.2.2.9.3.2. Slip Stream Diagram
This diagram gives an overview of the slip stream treatment system. It is only shown when the
slip stream treatment system is chosen on the next screen (Config). It does not contain any
numbers and is strictly for reference:
5.2.2.9.3.3. Config
Inputs for configuration of the Wet Cooling Tower are entered on this screen:
The parameters are described briefly below.
• Air Flow Draft Control Type: This option determines the type of air flow draft. The
"Forced" draft uses the fan at the intake to force air through the tower. "Forced" is
currently the only option available.
• Slip Stream Treatment System: This option determines whether a slip stream
treatment system is loaded. The choice ("Yes" or "No") of a slip stream treatment
system depends on site-specific quality of cooling water in the closed-loop
recirculating system.
• Makeup Water Treatment System: This option determines whether a makeup water
treatment system is needed. The choice ("Yes" or "No") of a makeup water treatment
system depends on site-specific quality of makeup water for the cooling system.
• Cooling Duty of Wet Unit in Summer: (Only shown for hybrid cooling.) This is the
fraction of total cooling duty assigned to the wet unit in the summer.
Illustration 291: PC: SET PARAMETERS: Water Systems: Wet
Cooling Tower: Slip Stream Diagram
Illustration 292: PC: SET PARAMETERS: Water Systems: Wet Cooling Tower:
Config
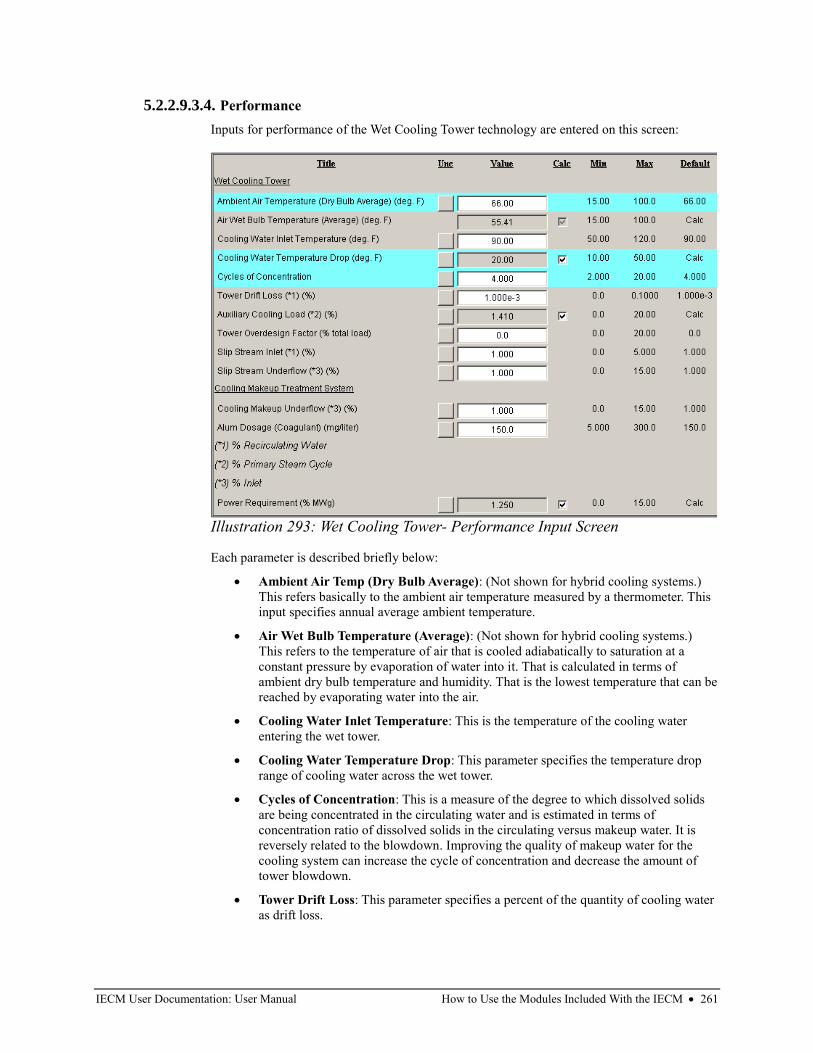
IECM User Documentation: User Manual How to Use the Modules Included With the IECM • 261
5.2.2.9.3.4. Performance
Inputs for performance of the Wet Cooling Tower technology are entered on this screen:
Each parameter is described briefly below:
• Ambient Air Temp (Dry Bulb Average): (Not shown for hybrid cooling systems.)
This refers basically to the ambient air temperature measured by a thermometer. This
input specifies annual average ambient temperature.
• Air Wet Bulb Temperature (Average): (Not shown for hybrid cooling systems.)
This refers to the temperature of air that is cooled adiabatically to saturation at a
constant pressure by evaporation of water into it. That is calculated in terms of
ambient dry bulb temperature and humidity. That is the lowest temperature that can be
reached by evaporating water into the air.
• Cooling Water Inlet Temperature: This is the temperature of the cooling water
entering the wet tower.
• Cooling Water Temperature Drop: This parameter specifies the temperature drop
range of cooling water across the wet tower.
• Cycles of Concentration: This is a measure of the degree to which dissolved solids
are being concentrated in the circulating water and is estimated in terms of
concentration ratio of dissolved solids in the circulating versus makeup water. It is
reversely related to the blowdown. Improving the quality of makeup water for the
cooling system can increase the cycle of concentration and decrease the amount of
tower blowdown.
• Tower Drift Loss: This parameter specifies a percent of the quantity of cooling water
as drift loss.
Illustration 293: Wet Cooling Tower- Performance Input Screen
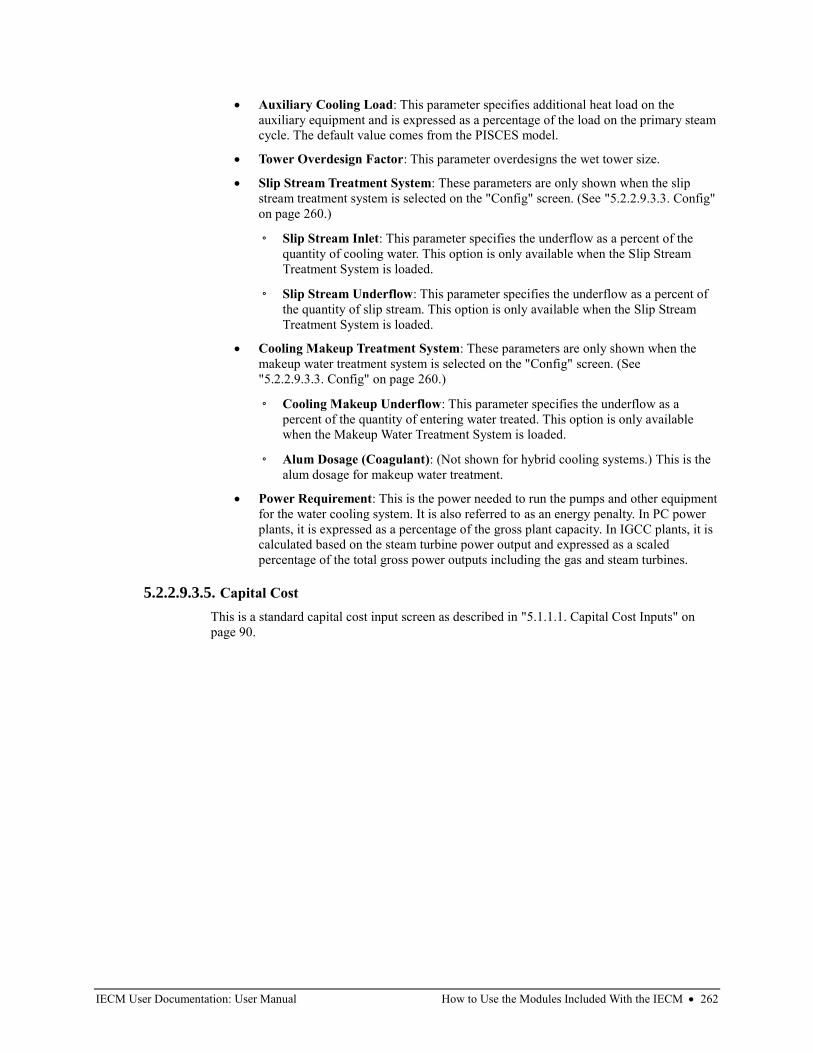
IECM User Documentation: User Manual How to Use the Modules Included With the IECM • 262
• Auxiliary Cooling Load: This parameter specifies additional heat load on the
auxiliary equipment and is expressed as a percentage of the load on the primary steam
cycle. The default value comes from the PISCES model.
• Tower Overdesign Factor: This parameter overdesigns the wet tower size.
• Slip Stream Treatment System: These parameters are only shown when the slip
stream treatment system is selected on the "Config" screen. (See "5.2.2.9.3.3. Config"
on page 260.)
◦ Slip Stream Inlet: This parameter specifies the underflow as a percent of the
quantity of cooling water. This option is only available when the Slip Stream
Treatment System is loaded.
◦ Slip Stream Underflow: This parameter specifies the underflow as a percent of
the quantity of slip stream. This option is only available when the Slip Stream
Treatment System is loaded.
• Cooling Makeup Treatment System: These parameters are only shown when the
makeup water treatment system is selected on the "Config" screen. (See
"5.2.2.9.3.3. Config" on page 260.)
◦ Cooling Makeup Underflow: This parameter specifies the underflow as a
percent of the quantity of entering water treated. This option is only available
when the Makeup Water Treatment System is loaded.
◦ Alum Dosage (Coagulant): (Not shown for hybrid cooling systems.) This is the
alum dosage for makeup water treatment.
• Power Requirement: This is the power needed to run the pumps and other equipment
for the water cooling system. It is also referred to as an energy penalty. In PC power
plants, it is expressed as a percentage of the gross plant capacity. In IGCC plants, it is
calculated based on the steam turbine power output and expressed as a scaled
percentage of the total gross power outputs including the gas and steam turbines.
5.2.2.9.3.5. Capital Cost
This is a standard capital cost input screen as described in "5.1.1.1. Capital Cost Inputs" on
page 90.
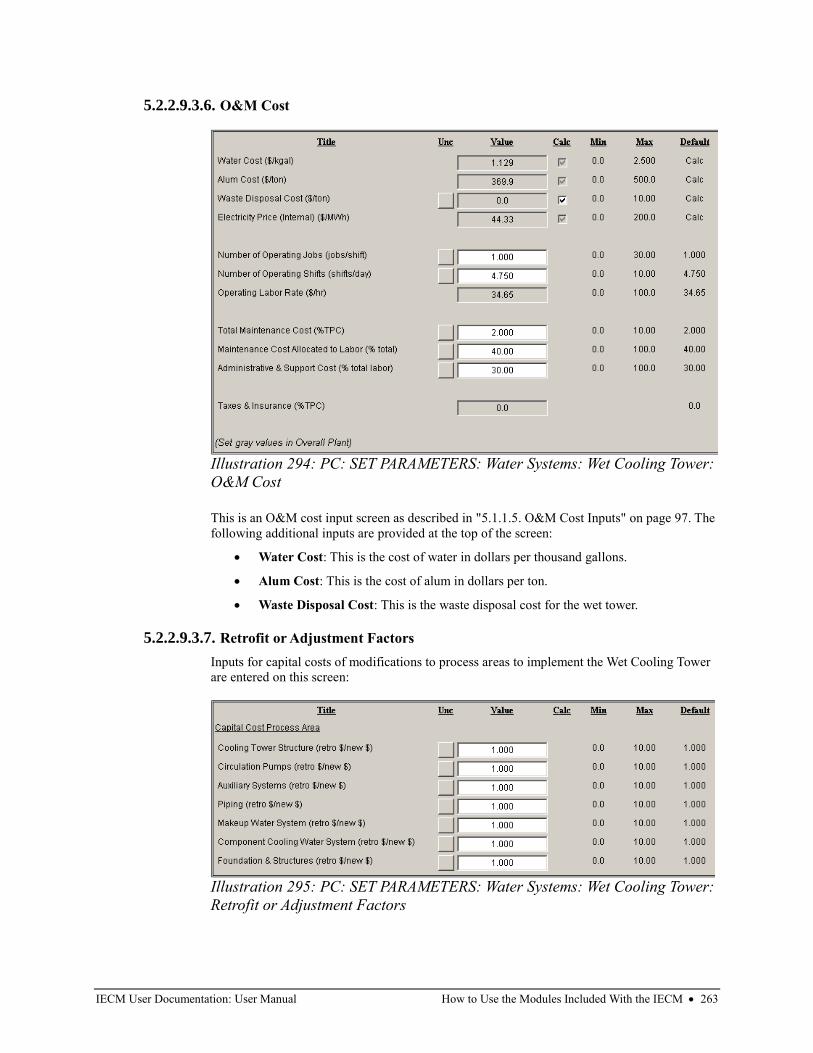
IECM User Documentation: User Manual How to Use the Modules Included With the IECM • 263
5.2.2.9.3.6. O&M Cost
This is an O&M cost input screen as described in "5.1.1.5. O&M Cost Inputs" on page 97. The
following additional inputs are provided at the top of the screen:
• Water Cost: This is the cost of water in dollars per thousand gallons.
• Alum Cost: This is the cost of alum in dollars per ton.
• Waste Disposal Cost: This is the waste disposal cost for the wet tower.
5.2.2.9.3.7. Retrofit or Adjustment Factors
Inputs for capital costs of modifications to process areas to implement the Wet Cooling Tower
are entered on this screen:
Illustration 294: PC: SET PARAMETERS: Water Systems: Wet Cooling Tower:
O&M Cost
Illustration 295: PC: SET PARAMETERS: Water Systems: Wet Cooling Tower:
Retrofit or Adjustment Factors
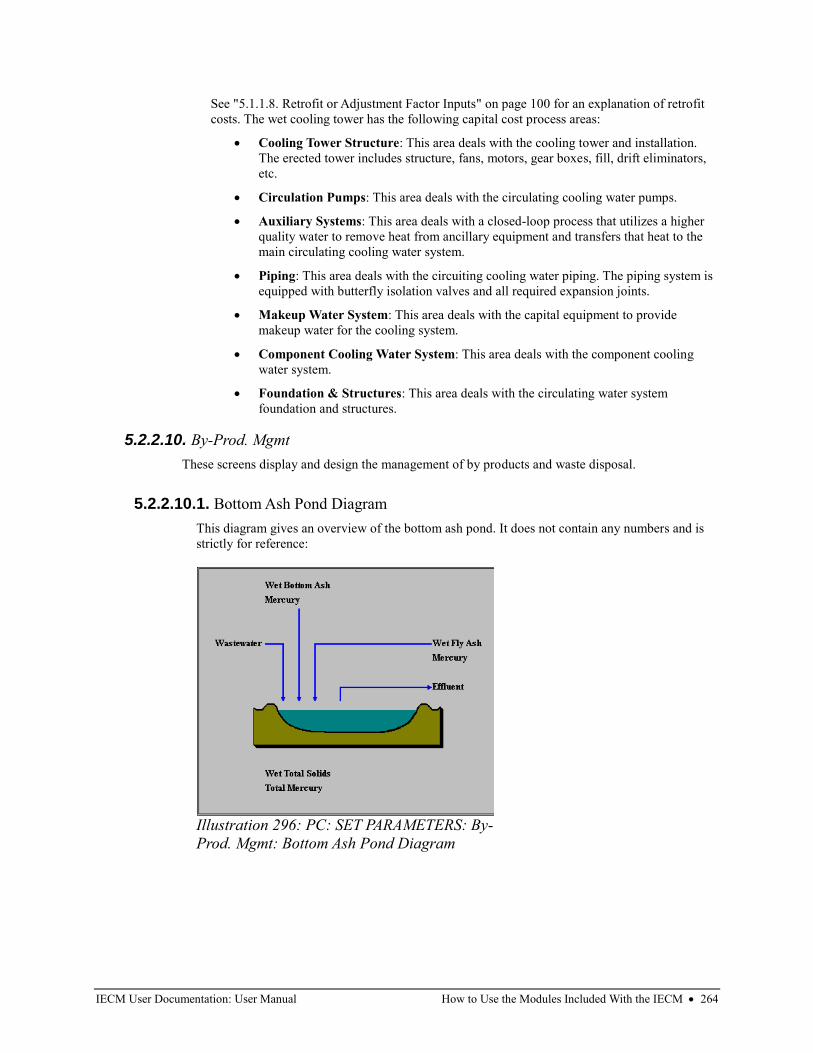
IECM User Documentation: User Manual How to Use the Modules Included With the IECM • 264
See "5.1.1.8. Retrofit or Adjustment Factor Inputs" on page 100 for an explanation of retrofit
costs. The wet cooling tower has the following capital cost process areas:
• Cooling Tower Structure: This area deals with the cooling tower and installation.
The erected tower includes structure, fans, motors, gear boxes, fill, drift eliminators,
etc.
• Circulation Pumps: This area deals with the circulating cooling water pumps.
• Auxiliary Systems: This area deals with a closed-loop process that utilizes a higher
quality water to remove heat from ancillary equipment and transfers that heat to the
main circulating cooling water system.
• Piping: This area deals with the circuiting cooling water piping. The piping system is
equipped with butterfly isolation valves and all required expansion joints.
• Makeup Water System: This area deals with the capital equipment to provide
makeup water for the cooling system.
• Component Cooling Water System: This area deals with the component cooling
water system.
• Foundation & Structures: This area deals with the circulating water system
foundation and structures.
5.2.2.10. By-Prod. Mgmt
These screens display and design the management of by products and waste disposal.
5.2.2.10.1. Bottom Ash Pond Diagram
This diagram gives an overview of the bottom ash pond. It does not contain any numbers and is
strictly for reference:
Illustration 296: PC: SET PARAMETERS: By-
Prod. Mgmt: Bottom Ash Pond Diagram
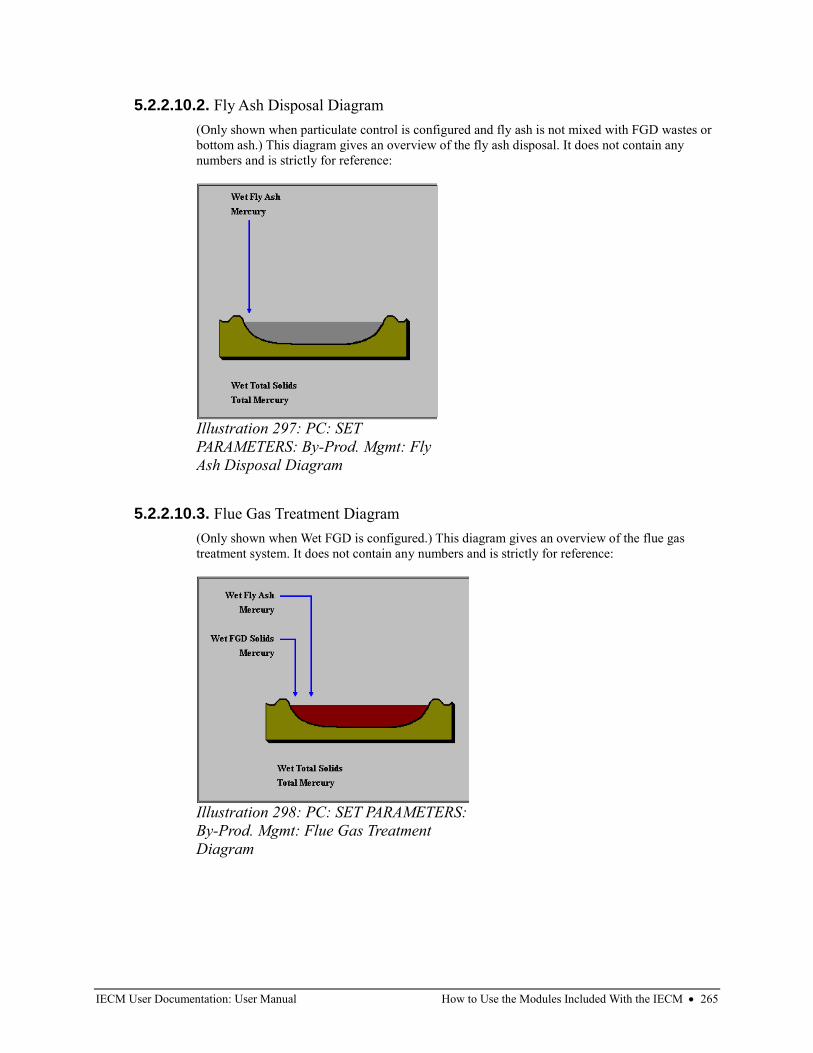
IECM User Documentation: User Manual How to Use the Modules Included With the IECM • 265
5.2.2.10.2. Fly Ash Disposal Diagram
(Only shown when particulate control is configured and fly ash is not mixed with FGD wastes or
bottom ash.) This diagram gives an overview of the fly ash disposal. It does not contain any
numbers and is strictly for reference:
5.2.2.10.3. Flue Gas Treatment Diagram
(Only shown when Wet FGD is configured.) This diagram gives an overview of the flue gas
treatment system. It does not contain any numbers and is strictly for reference:
Illustration 297: PC: SET
PARAMETERS: By-Prod. Mgmt: Fly
Ash Disposal Diagram
Illustration 298: PC: SET PARAMETERS:
By-Prod. Mgmt: Flue Gas Treatment
Diagram
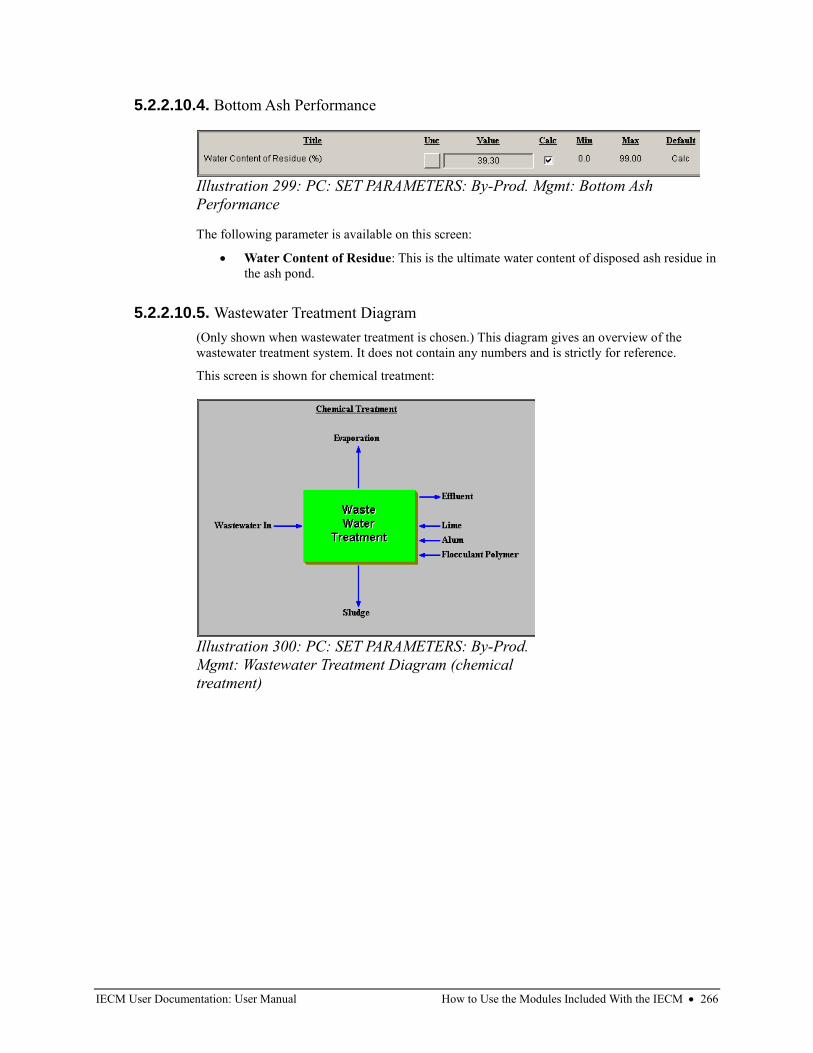
IECM User Documentation: User Manual How to Use the Modules Included With the IECM • 266
5.2.2.10.4. Bottom Ash Performance
The following parameter is available on this screen:
• Water Content of Residue: This is the ultimate water content of disposed ash residue in
the ash pond.
5.2.2.10.5. Wastewater Treatment Diagram
(Only shown when wastewater treatment is chosen.) This diagram gives an overview of the
wastewater treatment system. It does not contain any numbers and is strictly for reference.
This screen is shown for chemical treatment:
Illustration 299: PC: SET PARAMETERS: By-Prod. Mgmt: Bottom Ash
Performance
Illustration 300: PC: SET PARAMETERS: By-Prod.
Mgmt: Wastewater Treatment Diagram (chemical
treatment)
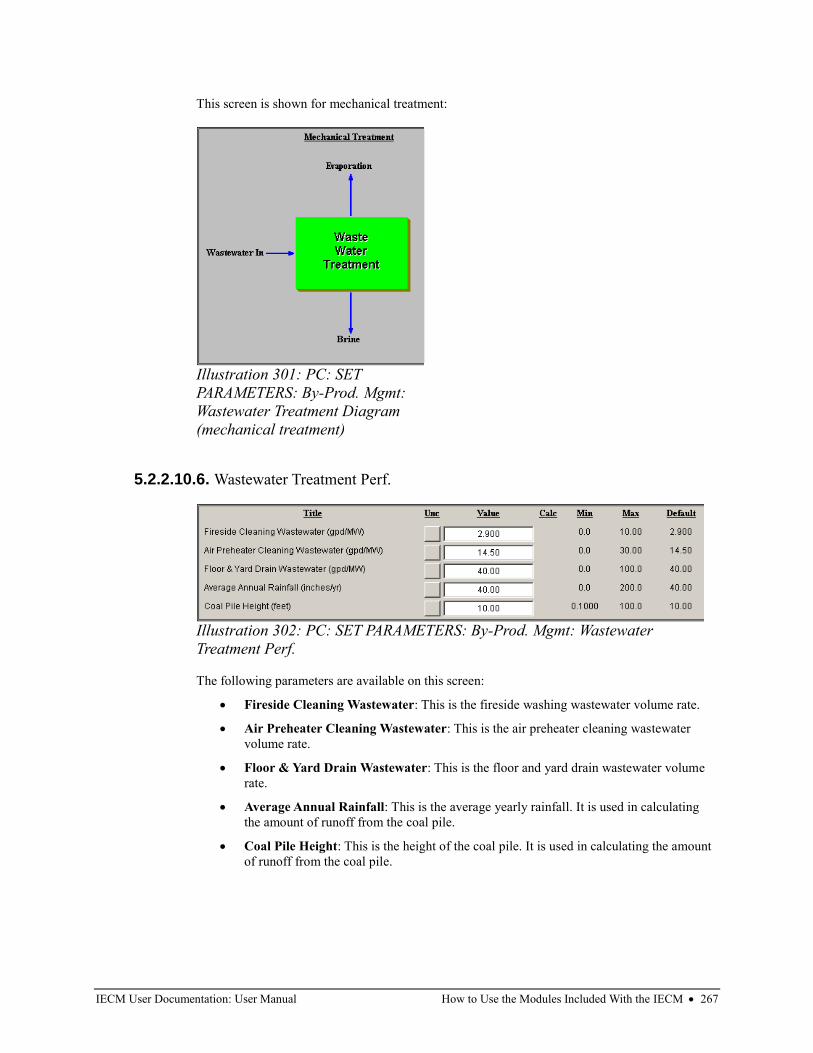
IECM User Documentation: User Manual How to Use the Modules Included With the IECM • 267
This screen is shown for mechanical treatment:
5.2.2.10.6. Wastewater Treatment Perf.
The following parameters are available on this screen:
• Fireside Cleaning Wastewater: This is the fireside washing wastewater volume rate.
• Air Preheater Cleaning Wastewater: This is the air preheater cleaning wastewater
volume rate.
• Floor & Yard Drain Wastewater: This is the floor and yard drain wastewater volume
rate.
• Average Annual Rainfall: This is the average yearly rainfall. It is used in calculating
the amount of runoff from the coal pile.
• Coal Pile Height: This is the height of the coal pile. It is used in calculating the amount
of runoff from the coal pile.
Illustration 301: PC: SET
PARAMETERS: By-Prod. Mgmt:
Wastewater Treatment Diagram
(mechanical treatment)
Illustration 302: PC: SET PARAMETERS: By-Prod. Mgmt: Wastewater
Treatment Perf.
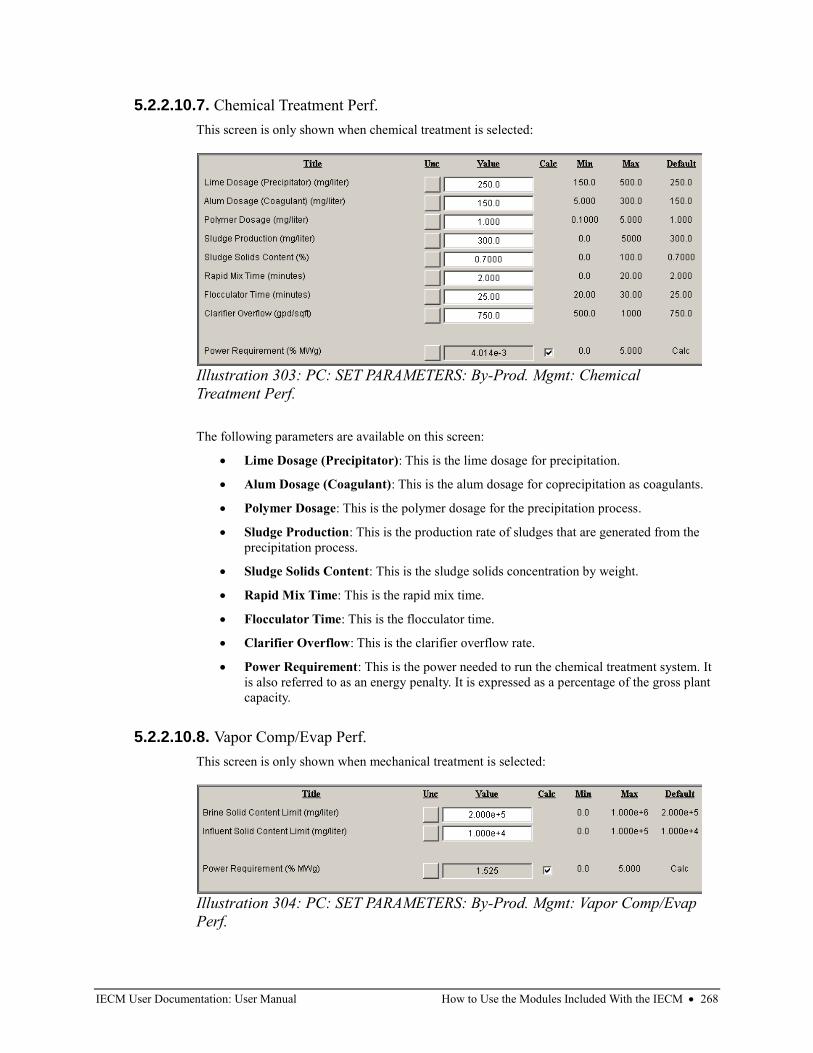
IECM User Documentation: User Manual How to Use the Modules Included With the IECM • 268
5.2.2.10.7. Chemical Treatment Perf.
This screen is only shown when chemical treatment is selected:
The following parameters are available on this screen:
• Lime Dosage (Precipitator): This is the lime dosage for precipitation.
• Alum Dosage (Coagulant): This is the alum dosage for coprecipitation as coagulants.
• Polymer Dosage: This is the polymer dosage for the precipitation process.
• Sludge Production: This is the production rate of sludges that are generated from the
precipitation process.
• Sludge Solids Content: This is the sludge solids concentration by weight.
• Rapid Mix Time: This is the rapid mix time.
• Flocculator Time: This is the flocculator time.
• Clarifier Overflow: This is the clarifier overflow rate.
• Power Requirement: This is the power needed to run the chemical treatment system. It
is also referred to as an energy penalty. It is expressed as a percentage of the gross plant
capacity.
5.2.2.10.8. Vapor Comp/Evap Perf.
This screen is only shown when mechanical treatment is selected:
Illustration 303: PC: SET PARAMETERS: By-Prod. Mgmt: Chemical
Treatment Perf.
Illustration 304: PC: SET PARAMETERS: By-Prod. Mgmt: Vapor Comp/Evap
Perf.
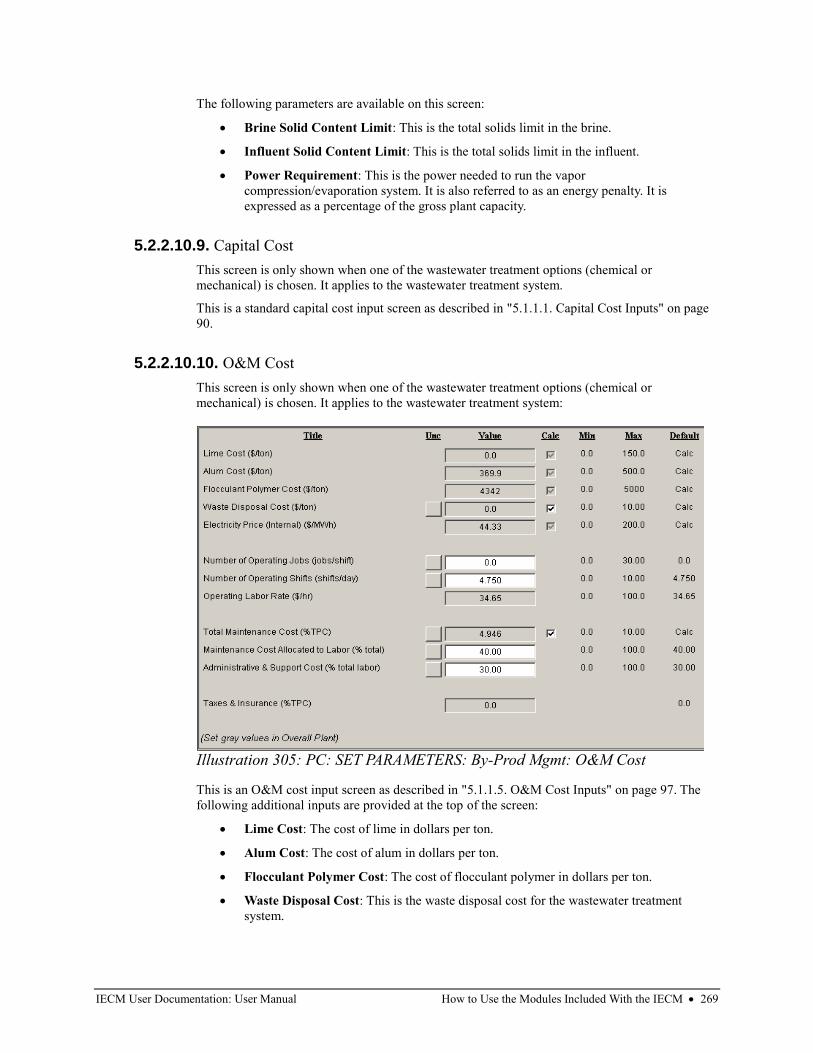
IECM User Documentation: User Manual How to Use the Modules Included With the IECM • 269
The following parameters are available on this screen:
• Brine Solid Content Limit: This is the total solids limit in the brine.
• Influent Solid Content Limit: This is the total solids limit in the influent.
• Power Requirement: This is the power needed to run the vapor
compression/evaporation system. It is also referred to as an energy penalty. It is
expressed as a percentage of the gross plant capacity.
5.2.2.10.9. Capital Cost
This screen is only shown when one of the wastewater treatment options (chemical or
mechanical) is chosen. It applies to the wastewater treatment system.
This is a standard capital cost input screen as described in "5.1.1.1. Capital Cost Inputs" on page
90.
5.2.2.10.10. O&M Cost
This screen is only shown when one of the wastewater treatment options (chemical or
mechanical) is chosen. It applies to the wastewater treatment system:
This is an O&M cost input screen as described in "5.1.1.5. O&M Cost Inputs" on page 97. The
following additional inputs are provided at the top of the screen:
• Lime Cost: The cost of lime in dollars per ton.
• Alum Cost: The cost of alum in dollars per ton.
• Flocculant Polymer Cost: The cost of flocculant polymer in dollars per ton.
• Waste Disposal Cost: This is the waste disposal cost for the wastewater treatment
system.
Illustration 305: PC: SET PARAMETERS: By-Prod Mgmt: O&M Cost
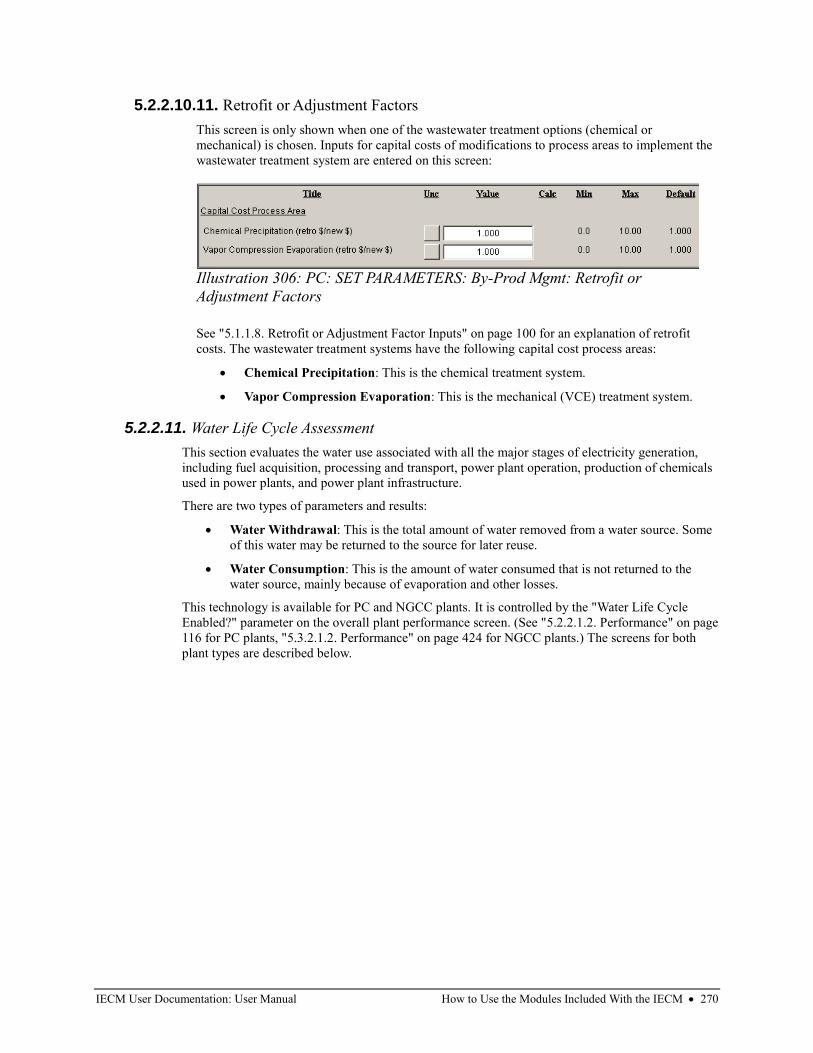
IECM User Documentation: User Manual How to Use the Modules Included With the IECM • 270
5.2.2.10.11. Retrofit or Adjustment Factors
This screen is only shown when one of the wastewater treatment options (chemical or
mechanical) is chosen. Inputs for capital costs of modifications to process areas to implement the
wastewater treatment system are entered on this screen:
See "5.1.1.8. Retrofit or Adjustment Factor Inputs" on page 100 for an explanation of retrofit
costs. The wastewater treatment systems have the following capital cost process areas:
• Chemical Precipitation: This is the chemical treatment system.
• Vapor Compression Evaporation: This is the mechanical (VCE) treatment system.
5.2.2.11. Water Life Cycle Assessment
This section evaluates the water use associated with all the major stages of electricity generation,
including fuel acquisition, processing and transport, power plant operation, production of chemicals
used in power plants, and power plant infrastructure.
There are two types of parameters and results:
• Water Withdrawal: This is the total amount of water removed from a water source. Some
of this water may be returned to the source for later reuse.
• Water Consumption: This is the amount of water consumed that is not returned to the
water source, mainly because of evaporation and other losses.
This technology is available for PC and NGCC plants. It is controlled by the "Water Life Cycle
Enabled?" parameter on the overall plant performance screen. (See "5.2.2.1.2. Performance" on page
116 for PC plants, "5.3.2.1.2. Performance" on page 424 for NGCC plants.) The screens for both
plant types are described below.
Illustration 306: PC: SET PARAMETERS: By-Prod Mgmt: Retrofit or
Adjustment Factors
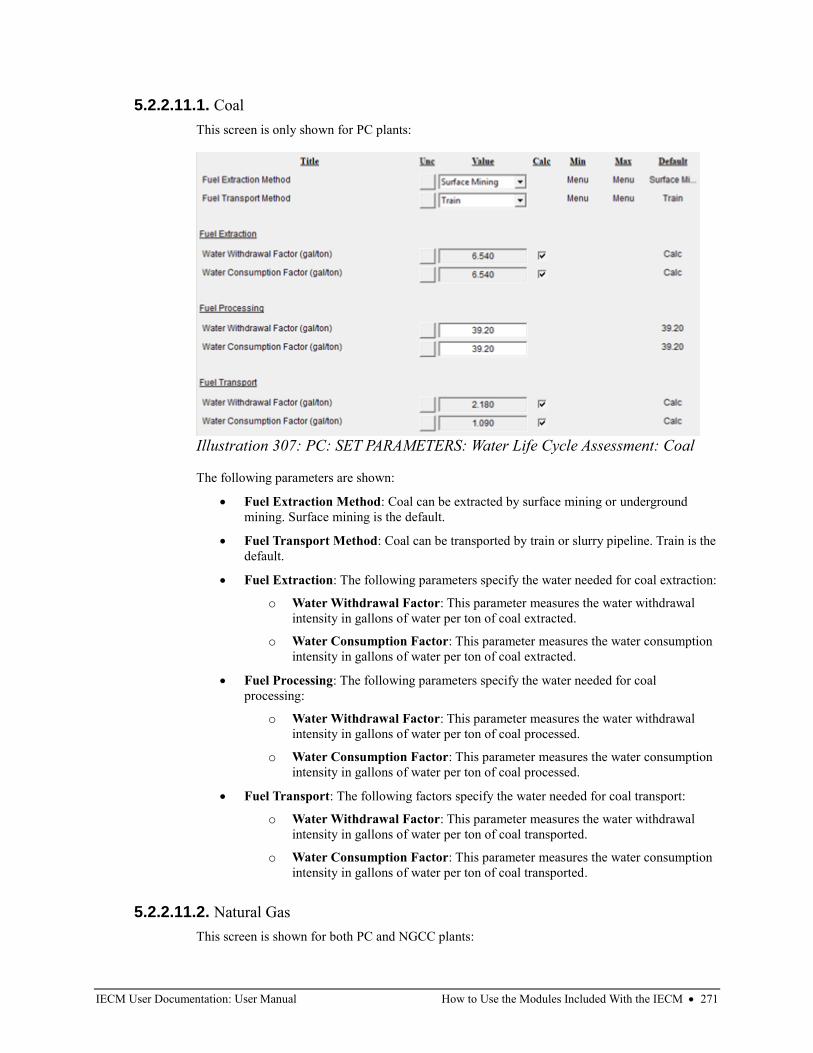
IECM User Documentation: User Manual How to Use the Modules Included With the IECM • 271
5.2.2.11.1. Coal
This screen is only shown for PC plants:
The following parameters are shown:
• Fuel Extraction Method: Coal can be extracted by surface mining or underground
mining. Surface mining is the default.
• Fuel Transport Method: Coal can be transported by train or slurry pipeline. Train is the
default.
• Fuel Extraction: The following parameters specify the water needed for coal extraction:
o Water Withdrawal Factor: This parameter measures the water withdrawal
intensity in gallons of water per ton of coal extracted.
o Water Consumption Factor: This parameter measures the water consumption
intensity in gallons of water per ton of coal extracted.
• Fuel Processing: The following parameters specify the water needed for coal
processing:
o Water Withdrawal Factor: This parameter measures the water withdrawal
intensity in gallons of water per ton of coal processed.
o Water Consumption Factor: This parameter measures the water consumption
intensity in gallons of water per ton of coal processed.
• Fuel Transport: The following factors specify the water needed for coal transport:
o Water Withdrawal Factor: This parameter measures the water withdrawal
intensity in gallons of water per ton of coal transported.
o Water Consumption Factor: This parameter measures the water consumption
intensity in gallons of water per ton of coal transported.
5.2.2.11.2. Natural Gas
This screen is shown for both PC and NGCC plants:
Illustration 307: PC: SET PARAMETERS: Water Life Cycle Assessment: Coal
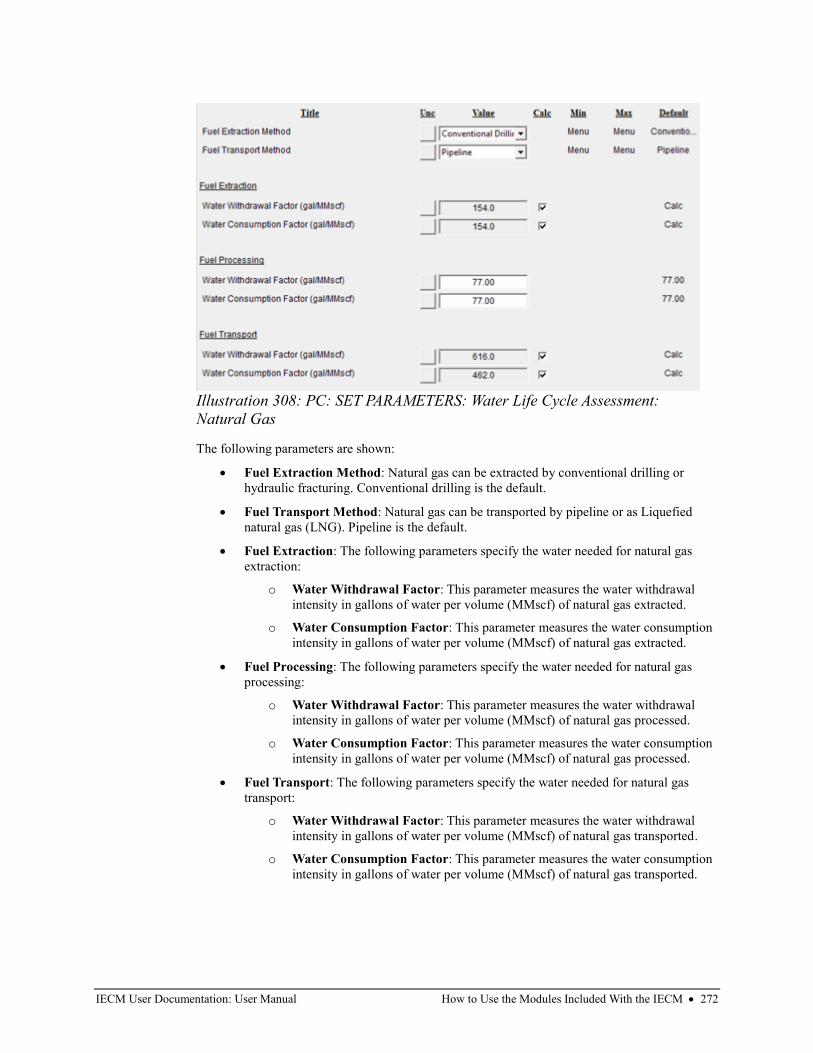
IECM User Documentation: User Manual How to Use the Modules Included With the IECM • 272
The following parameters are shown:
• Fuel Extraction Method: Natural gas can be extracted by conventional drilling or
hydraulic fracturing. Conventional drilling is the default.
• Fuel Transport Method: Natural gas can be transported by pipeline or as Liquefied
natural gas (LNG). Pipeline is the default.
• Fuel Extraction: The following parameters specify the water needed for natural gas
extraction:
o Water Withdrawal Factor: This parameter measures the water withdrawal
intensity in gallons of water per volume (MMscf) of natural gas extracted.
o Water Consumption Factor: This parameter measures the water consumption
intensity in gallons of water per volume (MMscf) of natural gas extracted.
• Fuel Processing: The following parameters specify the water needed for natural gas
processing:
o Water Withdrawal Factor: This parameter measures the water withdrawal
intensity in gallons of water per volume (MMscf) of natural gas processed.
o Water Consumption Factor: This parameter measures the water consumption
intensity in gallons of water per volume (MMscf) of natural gas processed.
• Fuel Transport: The following parameters specify the water needed for natural gas
transport:
o Water Withdrawal Factor: This parameter measures the water withdrawal
intensity in gallons of water per volume (MMscf) of natural gas transported.
o Water Consumption Factor: This parameter measures the water consumption
intensity in gallons of water per volume (MMscf) of natural gas transported.
Illustration 308: PC: SET PARAMETERS: Water Life Cycle Assessment:
Natural Gas
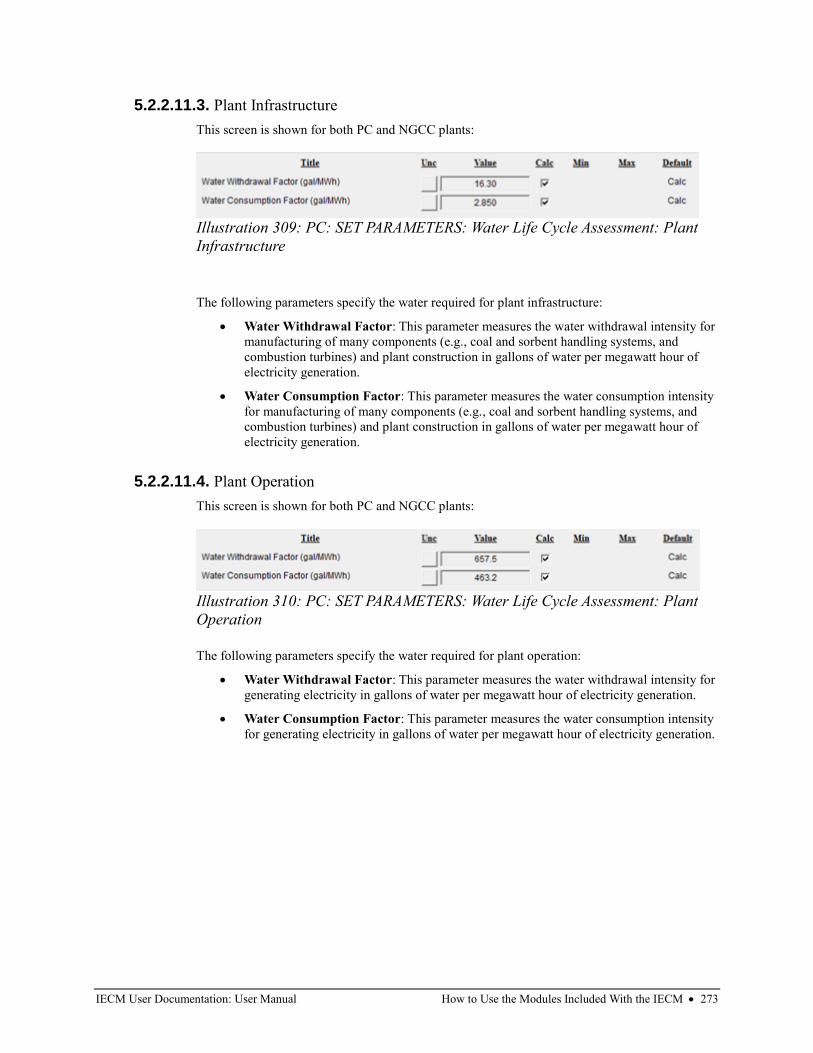
IECM User Documentation: User Manual How to Use the Modules Included With the IECM • 273
5.2.2.11.3. Plant Infrastructure
This screen is shown for both PC and NGCC plants:
The following parameters specify the water required for plant infrastructure:
• Water Withdrawal Factor: This parameter measures the water withdrawal intensity for
manufacturing of many components (e.g., coal and sorbent handling systems, and
combustion turbines) and plant construction in gallons of water per megawatt hour of
electricity generation.
• Water Consumption Factor: This parameter measures the water consumption intensity
for manufacturing of many components (e.g., coal and sorbent handling systems, and
combustion turbines) and plant construction in gallons of water per megawatt hour of
electricity generation.
5.2.2.11.4. Plant Operation
This screen is shown for both PC and NGCC plants:
The following parameters specify the water required for plant operation:
• Water Withdrawal Factor: This parameter measures the water withdrawal intensity for
generating electricity in gallons of water per megawatt hour of electricity generation.
• Water Consumption Factor: This parameter measures the water consumption intensity
for generating electricity in gallons of water per megawatt hour of electricity generation.
Illustration 309: PC: SET PARAMETERS: Water Life Cycle Assessment: Plant
Infrastructure
Illustration 310: PC: SET PARAMETERS: Water Life Cycle Assessment: Plant
Operation
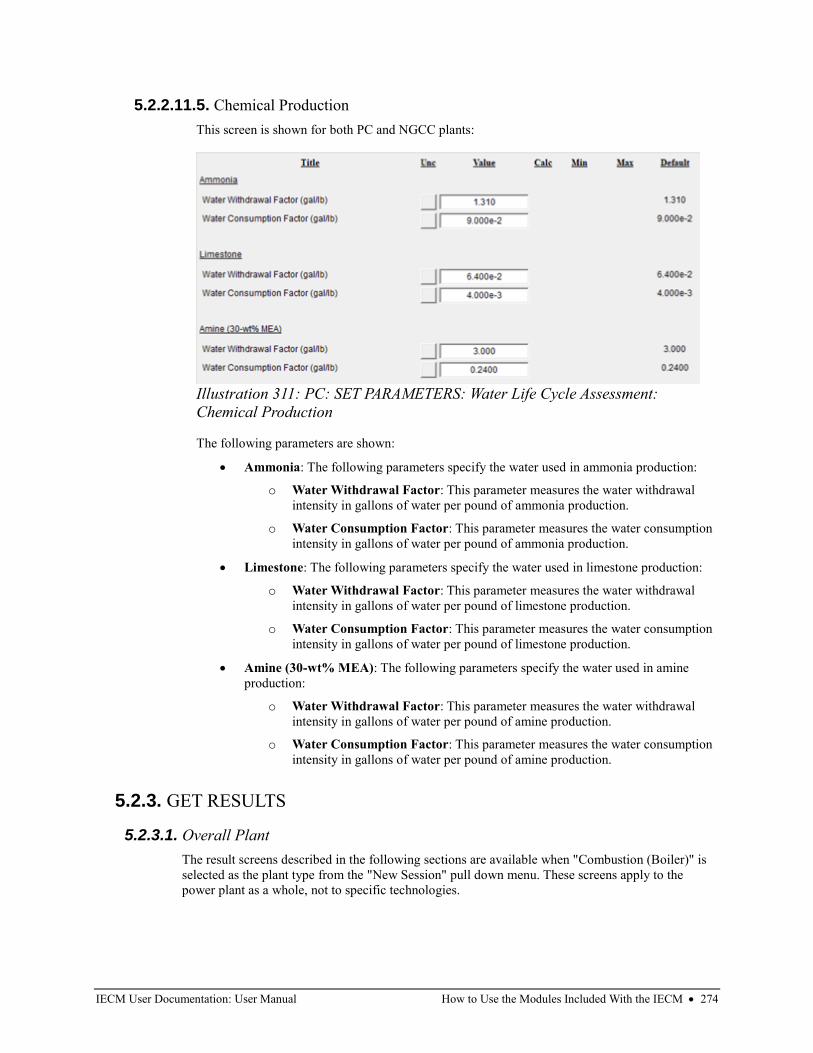
IECM User Documentation: User Manual How to Use the Modules Included With the IECM • 274
5.2.2.11.5. Chemical Production
This screen is shown for both PC and NGCC plants:
The following parameters are shown:
• Ammonia: The following parameters specify the water used in ammonia production:
o Water Withdrawal Factor: This parameter measures the water withdrawal
intensity in gallons of water per pound of ammonia production.
o Water Consumption Factor: This parameter measures the water consumption
intensity in gallons of water per pound of ammonia production.
• Limestone: The following parameters specify the water used in limestone production:
o Water Withdrawal Factor: This parameter measures the water withdrawal
intensity in gallons of water per pound of limestone production.
o Water Consumption Factor: This parameter measures the water consumption
intensity in gallons of water per pound of limestone production.
• Amine (30-wt% MEA): The following parameters specify the water used in amine
production:
o Water Withdrawal Factor: This parameter measures the water withdrawal
intensity in gallons of water per pound of amine production.
o Water Consumption Factor: This parameter measures the water consumption
intensity in gallons of water per pound of amine production.
5.2.3. GET RESULTS
5.2.3.1. Overall Plant
The result screens described in the following sections are available when "Combustion (Boiler)" is
selected as the plant type from the "New Session" pull down menu. These screens apply to the
power plant as a whole, not to specific technologies.
Illustration 311: PC: SET PARAMETERS: Water Life Cycle Assessment:
Chemical Production
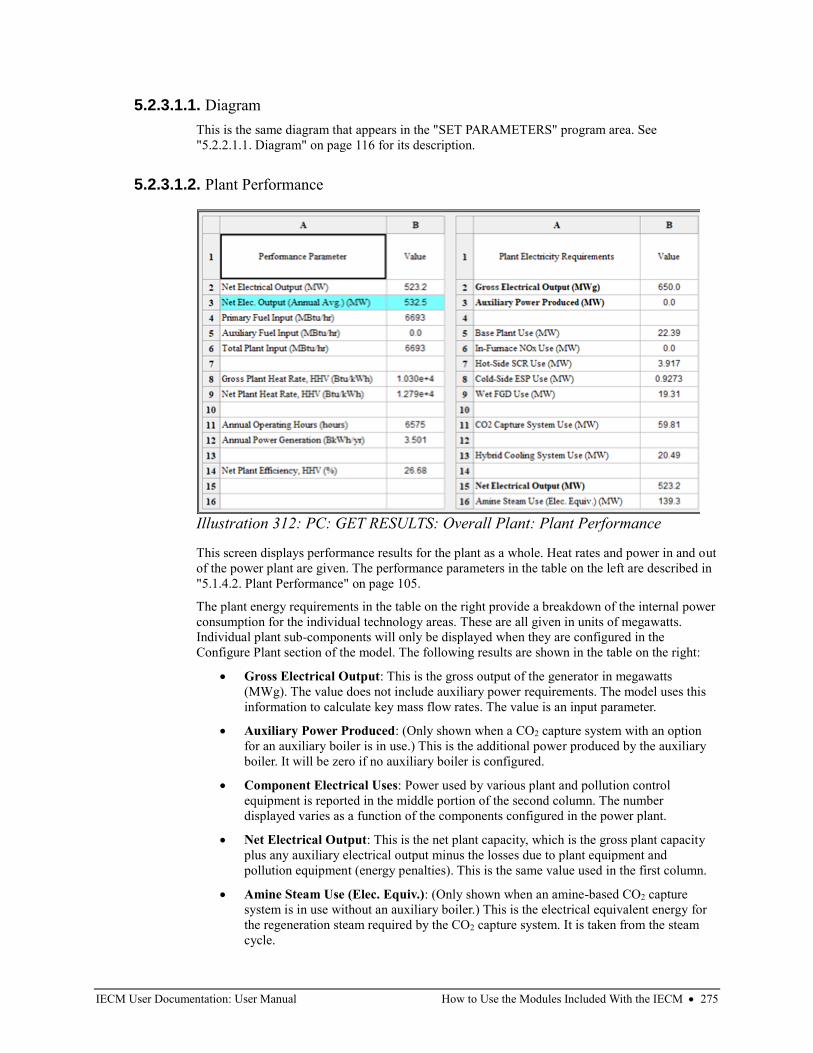
IECM User Documentation: User Manual How to Use the Modules Included With the IECM • 275
5.2.3.1.1. Diagram
This is the same diagram that appears in the "SET PARAMETERS" program area. See
"5.2.2.1.1. Diagram" on page 116 for its description.
5.2.3.1.2. Plant Performance
This screen displays performance results for the plant as a whole. Heat rates and power in and out
of the power plant are given. The performance parameters in the table on the left are described in
"5.1.4.2. Plant Performance" on page 105.
The plant energy requirements in the table on the right provide a breakdown of the internal power
consumption for the individual technology areas. These are all given in units of megawatts.
Individual plant sub-components will only be displayed when they are configured in the
Configure Plant section of the model. The following results are shown in the table on the right:
• Gross Electrical Output: This is the gross output of the generator in megawatts
(MWg). The value does not include auxiliary power requirements. The model uses this
information to calculate key mass flow rates. The value is an input parameter.
• Auxiliary Power Produced: (Only shown when a CO2 capture system with an option
for an auxiliary boiler is in use.) This is the additional power produced by the auxiliary
boiler. It will be zero if no auxiliary boiler is configured.
• Component Electrical Uses: Power used by various plant and pollution control
equipment is reported in the middle portion of the second column. The number
displayed varies as a function of the components configured in the power plant.
• Net Electrical Output: This is the net plant capacity, which is the gross plant capacity
plus any auxiliary electrical output minus the losses due to plant equipment and
pollution equipment (energy penalties). This is the same value used in the first column.
• Amine Steam Use (Elec. Equiv.): (Only shown when an amine-based CO2 capture
system is in use without an auxiliary boiler.) This is the electrical equivalent energy for
the regeneration steam required by the CO2 capture system. It is taken from the steam
cycle.
Illustration 312: PC: GET RESULTS: Overall Plant: Plant Performance
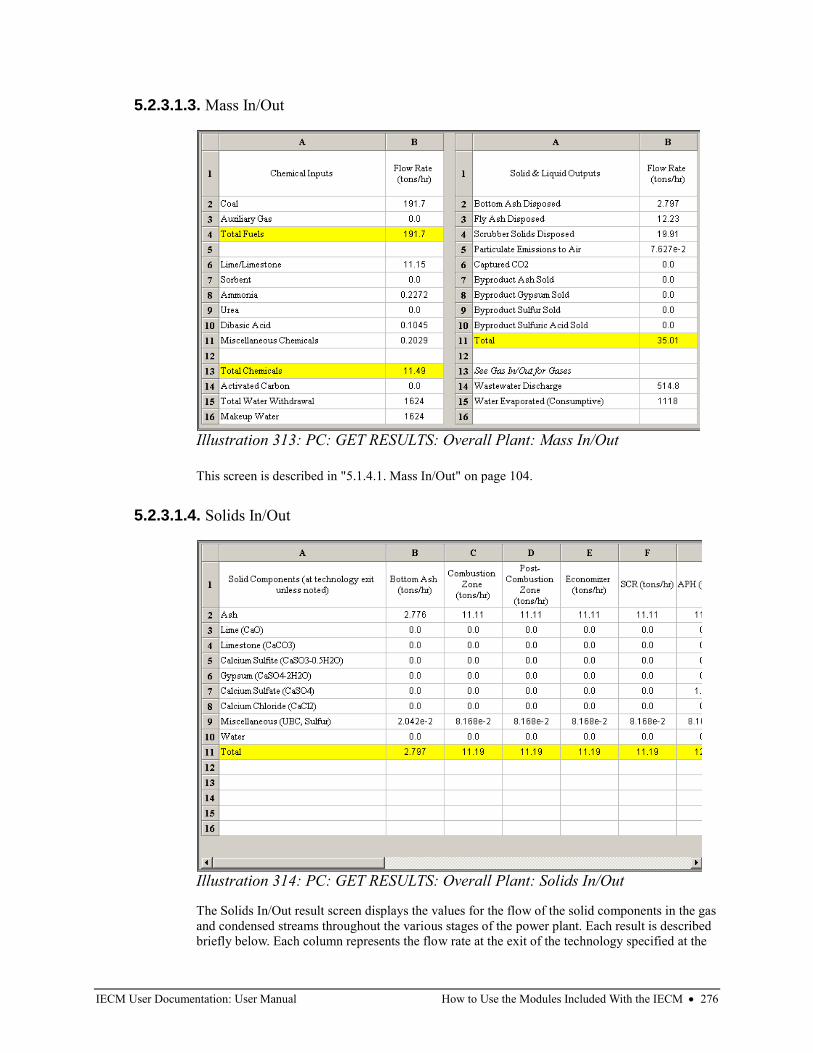
IECM User Documentation: User Manual How to Use the Modules Included With the IECM • 276
5.2.3.1.3. Mass In/Out
This screen is described in "5.1.4.1. Mass In/Out" on page 104.
5.2.3.1.4. Solids In/Out
The Solids In/Out result screen displays the values for the flow of the solid components in the gas
and condensed streams throughout the various stages of the power plant. Each result is described
briefly below. Each column represents the flow rate at the exit of the technology specified at the
Illustration 313: PC: GET RESULTS: Overall Plant: Mass In/Out
Illustration 314: PC: GET RESULTS: Overall Plant: Solids In/Out
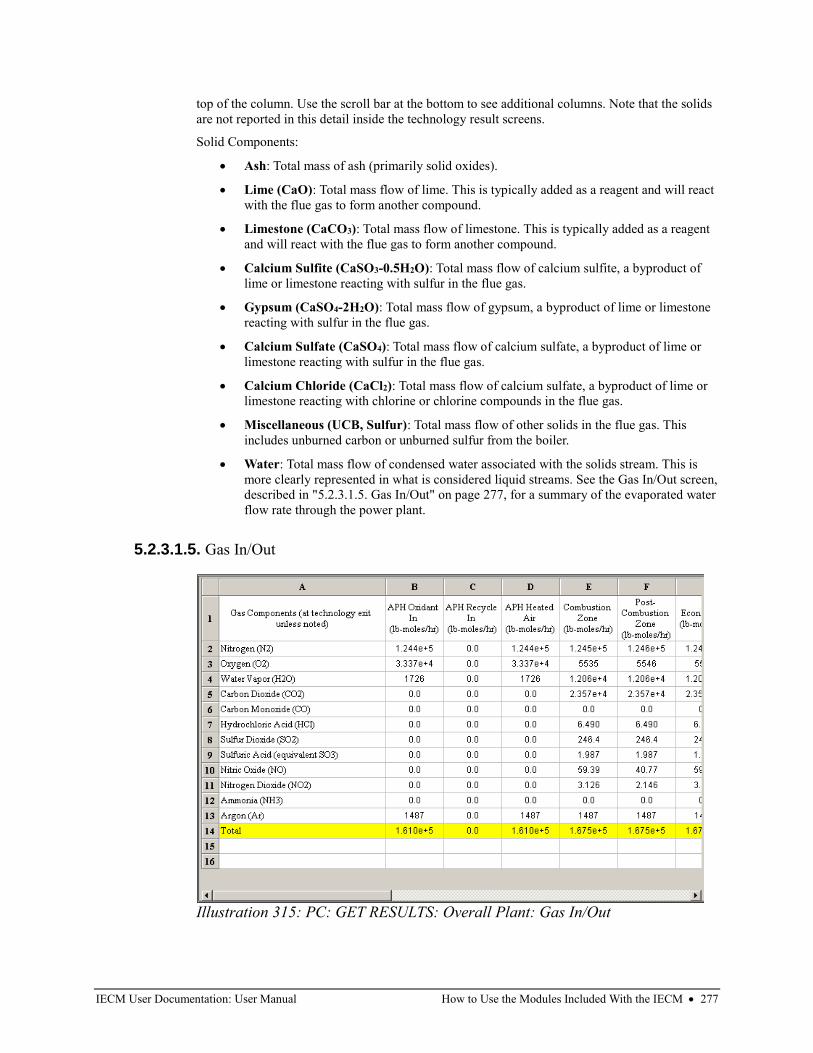
IECM User Documentation: User Manual How to Use the Modules Included With the IECM • 277
top of the column. Use the scroll bar at the bottom to see additional columns. Note that the solids
are not reported in this detail inside the technology result screens.
Solid Components:
• Ash: Total mass of ash (primarily solid oxides).
• Lime (CaO): Total mass flow of lime. This is typically added as a reagent and will react
with the flue gas to form another compound.
• Limestone (CaCO3): Total mass flow of limestone. This is typically added as a reagent
and will react with the flue gas to form another compound.
• Calcium Sulfite (CaSO3-0.5H2O): Total mass flow of calcium sulfite, a byproduct of
lime or limestone reacting with sulfur in the flue gas.
• Gypsum (CaSO4-2H2O): Total mass flow of gypsum, a byproduct of lime or limestone
reacting with sulfur in the flue gas.
• Calcium Sulfate (CaSO4): Total mass flow of calcium sulfate, a byproduct of lime or
limestone reacting with sulfur in the flue gas.
• Calcium Chloride (CaCl2): Total mass flow of calcium sulfate, a byproduct of lime or
limestone reacting with chlorine or chlorine compounds in the flue gas.
• Miscellaneous (UCB, Sulfur): Total mass flow of other solids in the flue gas. This
includes unburned carbon or unburned sulfur from the boiler.
• Water: Total mass flow of condensed water associated with the solids stream. This is
more clearly represented in what is considered liquid streams. See the Gas In/Out screen,
described in "5.2.3.1.5. Gas In/Out" on page 277, for a summary of the evaporated water
flow rate through the power plant.
5.2.3.1.5. Gas In/Out
Illustration 315: PC: GET RESULTS: Overall Plant: Gas In/Out
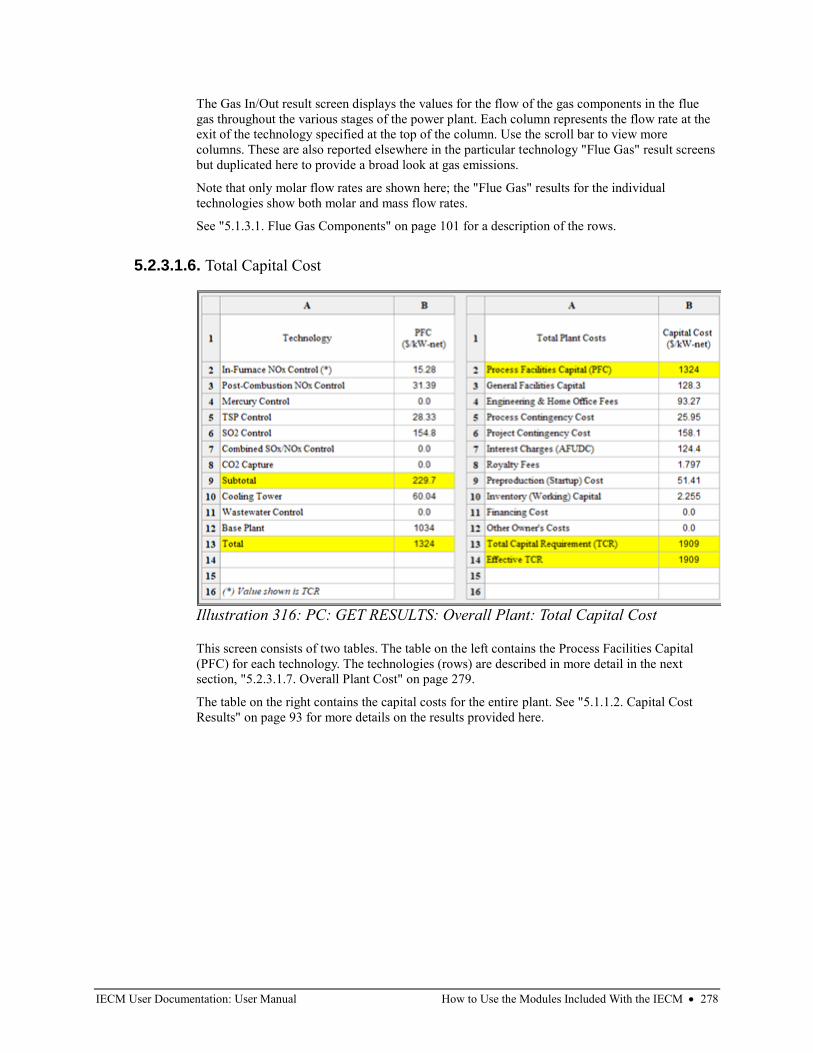
IECM User Documentation: User Manual How to Use the Modules Included With the IECM • 278
The Gas In/Out result screen displays the values for the flow of the gas components in the flue
gas throughout the various stages of the power plant. Each column represents the flow rate at the
exit of the technology specified at the top of the column. Use the scroll bar to view more
columns. These are also reported elsewhere in the particular technology "Flue Gas" result screens
but duplicated here to provide a broad look at gas emissions.
Note that only molar flow rates are shown here; the "Flue Gas" results for the individual
technologies show both molar and mass flow rates.
See "5.1.3.1. Flue Gas Components" on page 101 for a description of the rows.
5.2.3.1.6. Total Capital Cost
This screen consists of two tables. The table on the left contains the Process Facilities Capital
(PFC) for each technology. The technologies (rows) are described in more detail in the next
section, "5.2.3.1.7. Overall Plant Cost" on page 279.
The table on the right contains the capital costs for the entire plant. See "5.1.1.2. Capital Cost
Results" on page 93 for more details on the results provided here.
Illustration 316: PC: GET RESULTS: Overall Plant: Total Capital Cost
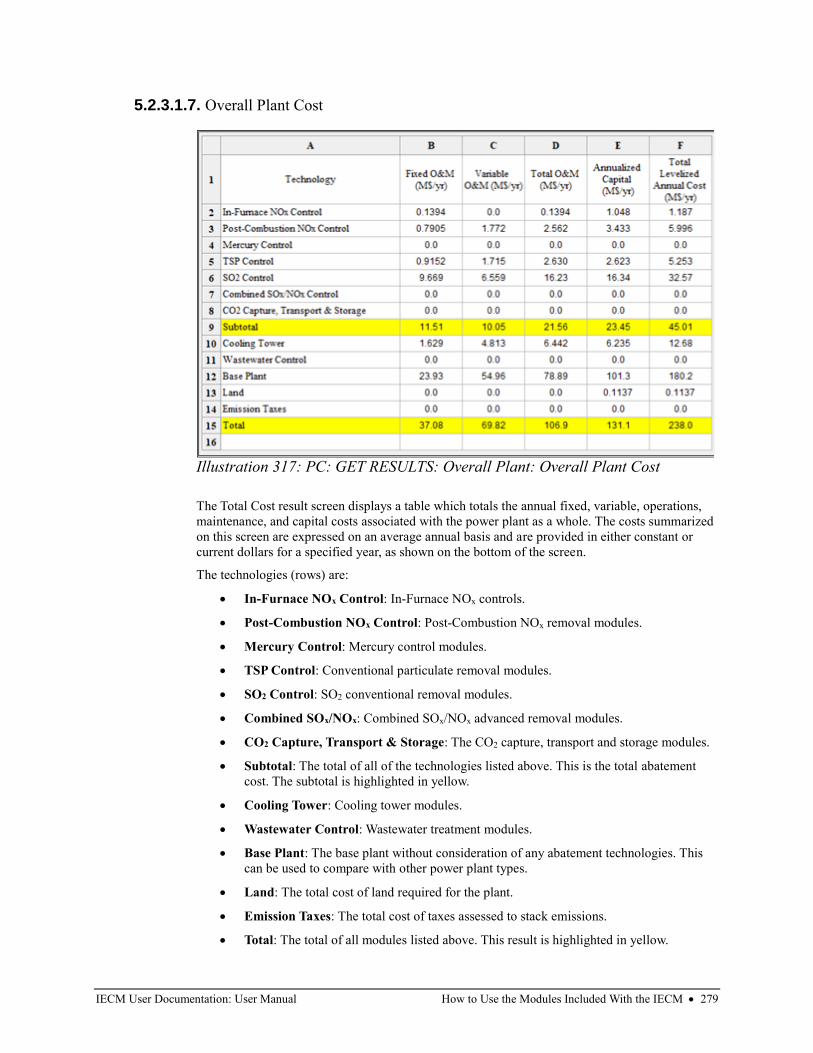
IECM User Documentation: User Manual How to Use the Modules Included With the IECM • 279
5.2.3.1.7. Overall Plant Cost
The Total Cost result screen displays a table which totals the annual fixed, variable, operations,
maintenance, and capital costs associated with the power plant as a whole. The costs summarized
on this screen are expressed on an average annual basis and are provided in either constant or
current dollars for a specified year, as shown on the bottom of the screen.
The technologies (rows) are:
• In-Furnace NOx Control: In-Furnace NOx controls.
• Post-Combustion NOx Control: Post-Combustion NOx removal modules.
• Mercury Control: Mercury control modules.
• TSP Control: Conventional particulate removal modules.
• SO2 Control: SO2 conventional removal modules.
• Combined SOx/NOx: Combined SOx/NOx advanced removal modules.
• CO2 Capture, Transport & Storage: The CO2 capture, transport and storage modules.
• Subtotal: The total of all of the technologies listed above. This is the total abatement
cost. The subtotal is highlighted in yellow.
• Cooling Tower: Cooling tower modules.
• Wastewater Control: Wastewater treatment modules.
• Base Plant: The base plant without consideration of any abatement technologies. This
can be used to compare with other power plant types.
• Land: The total cost of land required for the plant.
• Emission Taxes: The total cost of taxes assessed to stack emissions.
• Total: The total of all modules listed above. This result is highlighted in yellow.
Illustration 317: PC: GET RESULTS: Overall Plant: Overall Plant Cost
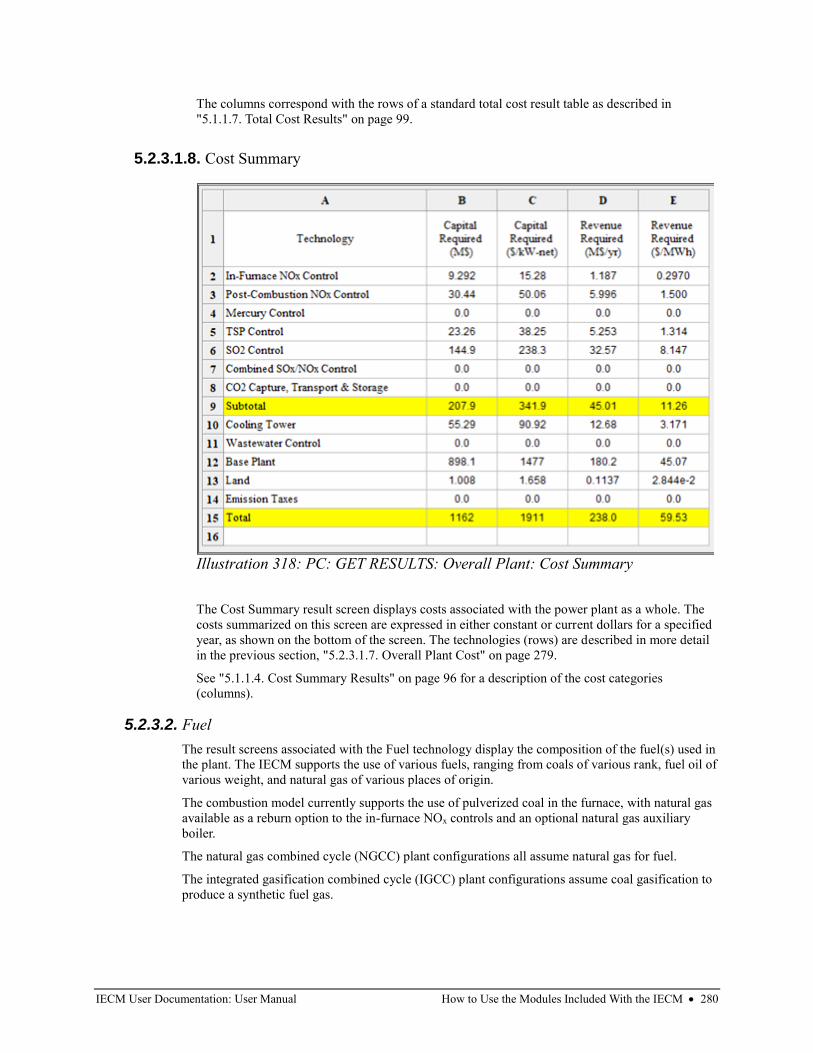
IECM User Documentation: User Manual How to Use the Modules Included With the IECM • 280
The columns correspond with the rows of a standard total cost result table as described in
"5.1.1.7. Total Cost Results" on page 99.
5.2.3.1.8. Cost Summary
The Cost Summary result screen displays costs associated with the power plant as a whole. The
costs summarized on this screen are expressed in either constant or current dollars for a specified
year, as shown on the bottom of the screen. The technologies (rows) are described in more detail
in the previous section, "5.2.3.1.7. Overall Plant Cost" on page 279.
See "5.1.1.4. Cost Summary Results" on page 96 for a description of the cost categories
(columns).
5.2.3.2. Fuel
The result screens associated with the Fuel technology display the composition of the fuel(s) used in
the plant. The IECM supports the use of various fuels, ranging from coals of various rank, fuel oil of
various weight, and natural gas of various places of origin.
The combustion model currently supports the use of pulverized coal in the furnace, with natural gas
available as a reburn option to the in-furnace NOx controls and an optional natural gas auxiliary
boiler.
The natural gas combined cycle (NGCC) plant configurations all assume natural gas for fuel.
The integrated gasification combined cycle (IGCC) plant configurations assume coal gasification to
produce a synthetic fuel gas.
Illustration 318: PC: GET RESULTS: Overall Plant: Cost Summary
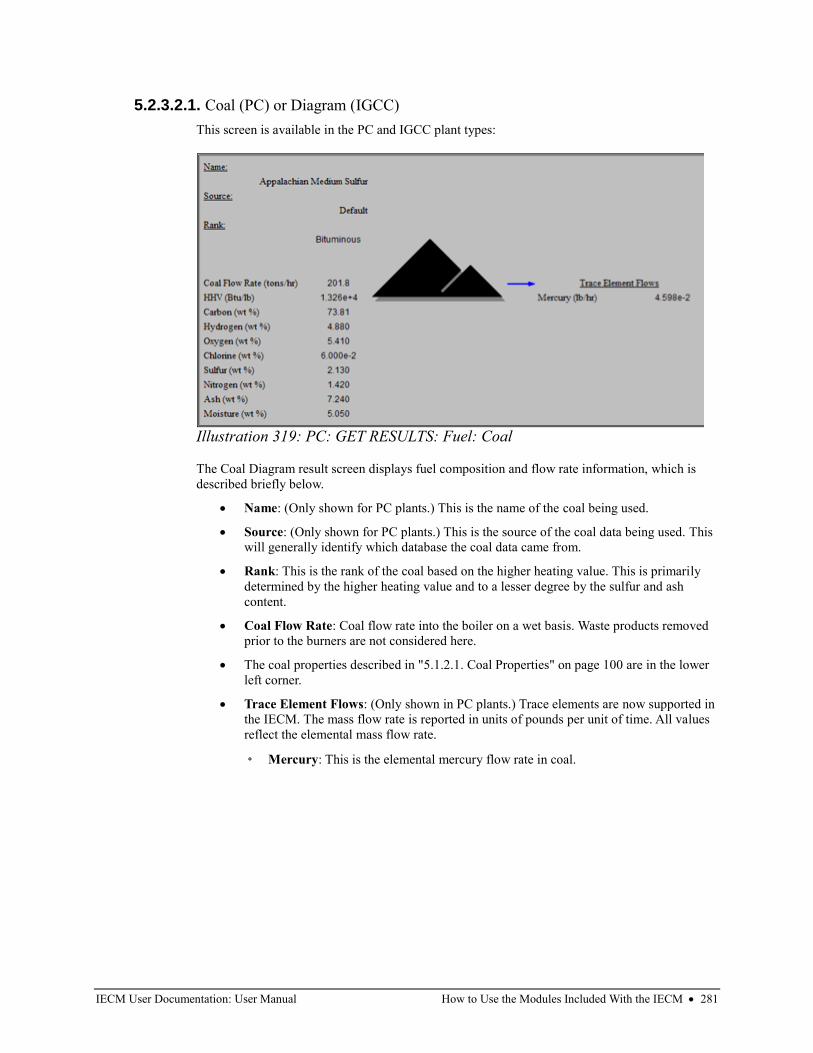
IECM User Documentation: User Manual How to Use the Modules Included With the IECM • 281
5.2.3.2.1. Coal (PC) or Diagram (IGCC)
This screen is available in the PC and IGCC plant types:
The Coal Diagram result screen displays fuel composition and flow rate information, which is
described briefly below.
• Name: (Only shown for PC plants.) This is the name of the coal being used.
• Source: (Only shown for PC plants.) This is the source of the coal data being used. This
will generally identify which database the coal data came from.
• Rank: This is the rank of the coal based on the higher heating value. This is primarily
determined by the higher heating value and to a lesser degree by the sulfur and ash
content.
• Coal Flow Rate: Coal flow rate into the boiler on a wet basis. Waste products removed
prior to the burners are not considered here.
• The coal properties described in "5.1.2.1. Coal Properties" on page 100 are in the lower
left corner.
• Trace Element Flows: (Only shown in PC plants.) Trace elements are now supported in
the IECM. The mass flow rate is reported in units of pounds per unit of time. All values
reflect the elemental mass flow rate.
◦ Mercury: This is the elemental mercury flow rate in coal.
Illustration 319: PC: GET RESULTS: Fuel: Coal
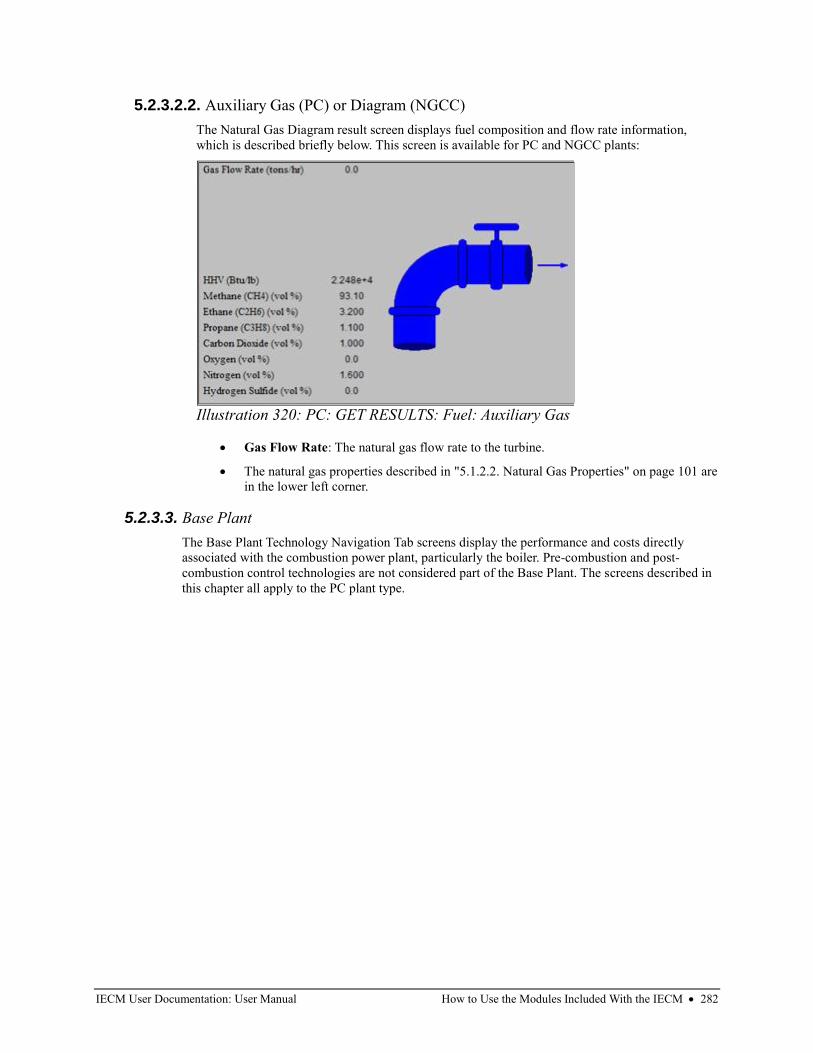
IECM User Documentation: User Manual How to Use the Modules Included With the IECM • 282
5.2.3.2.2. Auxiliary Gas (PC) or Diagram (NGCC)
The Natural Gas Diagram result screen displays fuel composition and flow rate information,
which is described briefly below. This screen is available for PC and NGCC plants:
• Gas Flow Rate: The natural gas flow rate to the turbine.
• The natural gas properties described in "5.1.2.2. Natural Gas Properties" on page 101 are
in the lower left corner.
5.2.3.3. Base Plant
The Base Plant Technology Navigation Tab screens display the performance and costs directly
associated with the combustion power plant, particularly the boiler. Pre-combustion and post-
combustion control technologies are not considered part of the Base Plant. The screens described in
this chapter all apply to the PC plant type.
Illustration 320: PC: GET RESULTS: Fuel: Auxiliary Gas
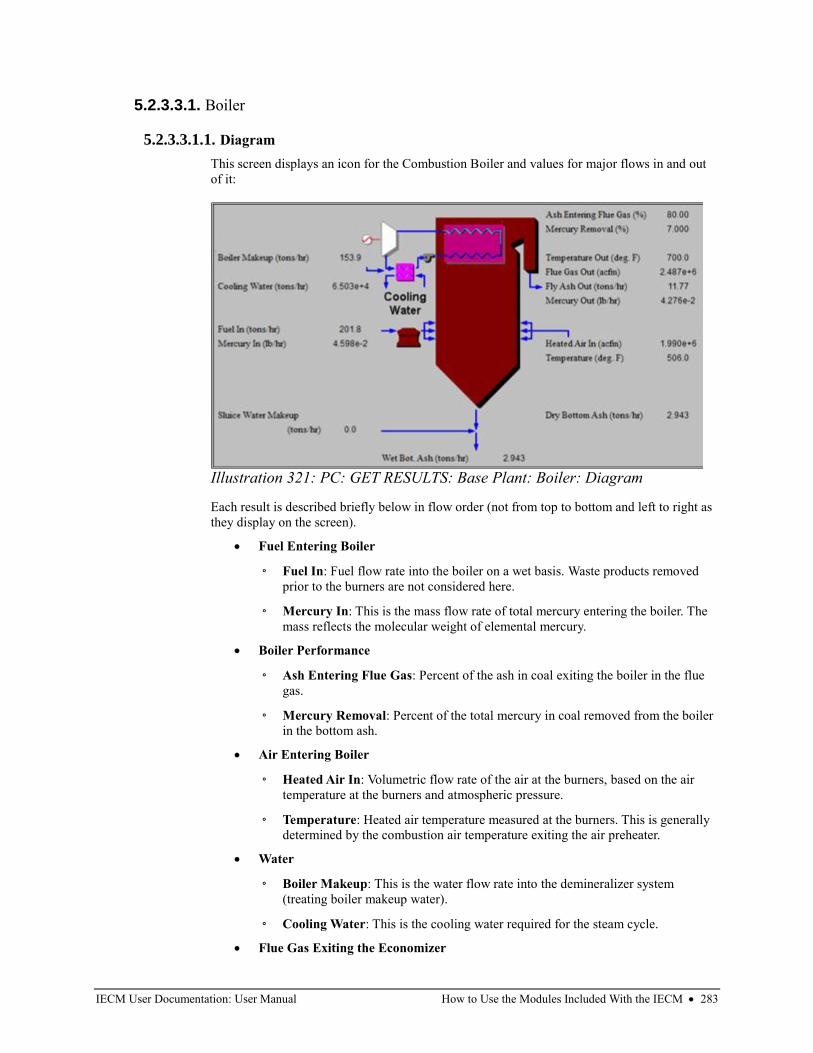
IECM User Documentation: User Manual How to Use the Modules Included With the IECM • 283
5.2.3.3.1. Boiler
5.2.3.3.1.1. Diagram
This screen displays an icon for the Combustion Boiler and values for major flows in and out
of it:
Each result is described briefly below in flow order (not from top to bottom and left to right as
they display on the screen).
• Fuel Entering Boiler
◦ Fuel In: Fuel flow rate into the boiler on a wet basis. Waste products removed
prior to the burners are not considered here.
◦ Mercury In: This is the mass flow rate of total mercury entering the boiler. The
mass reflects the molecular weight of elemental mercury.
• Boiler Performance
◦ Ash Entering Flue Gas: Percent of the ash in coal exiting the boiler in the flue
gas.
◦ Mercury Removal: Percent of the total mercury in coal removed from the boiler
in the bottom ash.
• Air Entering Boiler
◦ Heated Air In: Volumetric flow rate of the air at the burners, based on the air
temperature at the burners and atmospheric pressure.
◦ Temperature: Heated air temperature measured at the burners. This is generally
determined by the combustion air temperature exiting the air preheater.
• Water
◦ Boiler Makeup: This is the water flow rate into the demineralizer system
(treating boiler makeup water).
◦ Cooling Water: This is the cooling water required for the steam cycle.
• Flue Gas Exiting the Economizer
Illustration 321: PC: GET RESULTS: Base Plant: Boiler: Diagram
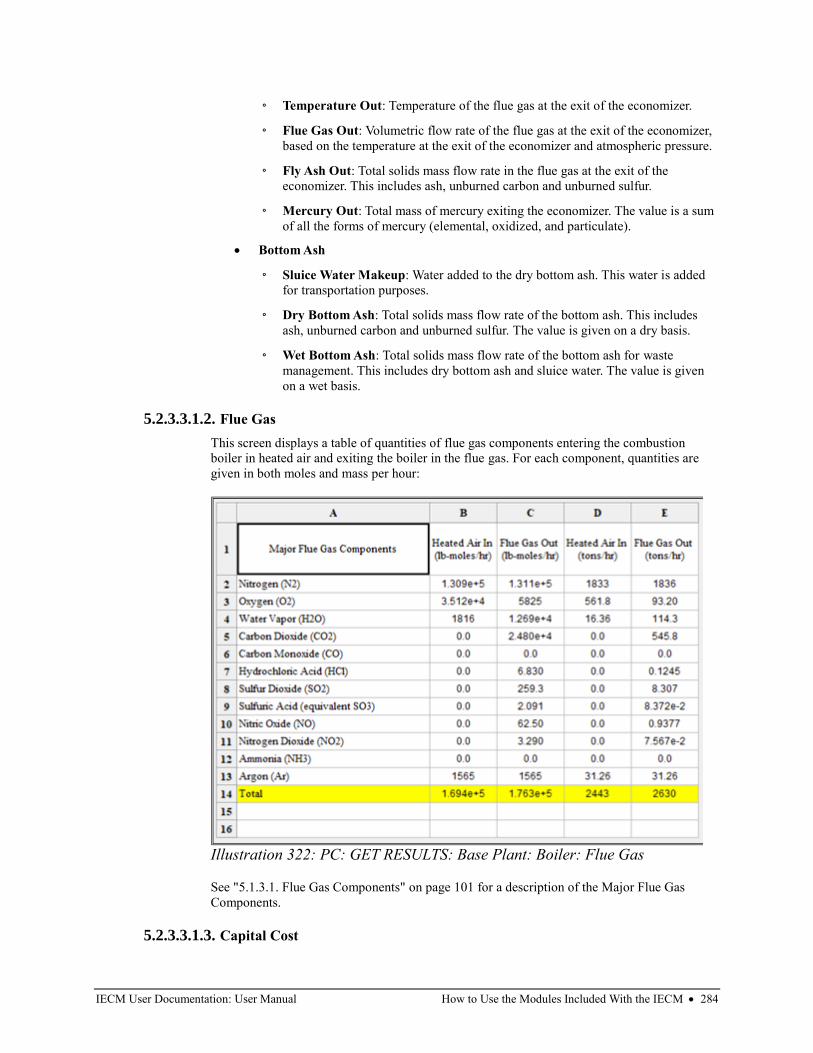
IECM User Documentation: User Manual How to Use the Modules Included With the IECM • 284
◦ Temperature Out: Temperature of the flue gas at the exit of the economizer.
◦ Flue Gas Out: Volumetric flow rate of the flue gas at the exit of the economizer,
based on the temperature at the exit of the economizer and atmospheric pressure.
◦ Fly Ash Out: Total solids mass flow rate in the flue gas at the exit of the
economizer. This includes ash, unburned carbon and unburned sulfur.
◦ Mercury Out: Total mass of mercury exiting the economizer. The value is a sum
of all the forms of mercury (elemental, oxidized, and particulate).
• Bottom Ash
◦ Sluice Water Makeup: Water added to the dry bottom ash. This water is added
for transportation purposes.
◦ Dry Bottom Ash: Total solids mass flow rate of the bottom ash. This includes
ash, unburned carbon and unburned sulfur. The value is given on a dry basis.
◦ Wet Bottom Ash: Total solids mass flow rate of the bottom ash for waste
management. This includes dry bottom ash and sluice water. The value is given
on a wet basis.
5.2.3.3.1.2. Flue Gas
This screen displays a table of quantities of flue gas components entering the combustion
boiler in heated air and exiting the boiler in the flue gas. For each component, quantities are
given in both moles and mass per hour:
See "5.1.3.1. Flue Gas Components" on page 101 for a description of the Major Flue Gas
Components.
5.2.3.3.1.3. Capital Cost
Illustration 322: PC: GET RESULTS: Base Plant: Boiler: Flue Gas
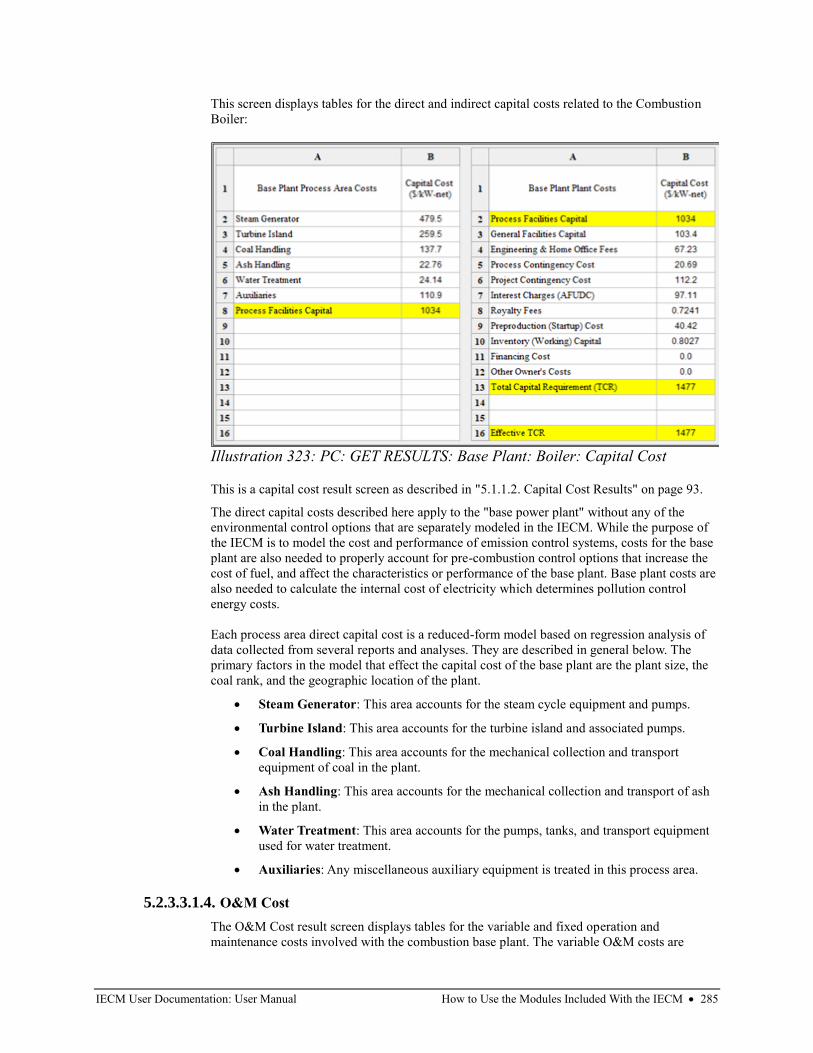
IECM User Documentation: User Manual How to Use the Modules Included With the IECM • 285
This screen displays tables for the direct and indirect capital costs related to the Combustion
Boiler:
This is a capital cost result screen as described in "5.1.1.2. Capital Cost Results" on page 93.
The direct capital costs described here apply to the "base power plant" without any of the
environmental control options that are separately modeled in the IECM. While the purpose of
the IECM is to model the cost and performance of emission control systems, costs for the base
plant are also needed to properly account for pre-combustion control options that increase the
cost of fuel, and affect the characteristics or performance of the base plant. Base plant costs are
also needed to calculate the internal cost of electricity which determines pollution control
energy costs.
Each process area direct capital cost is a reduced-form model based on regression analysis of
data collected from several reports and analyses. They are described in general below. The
primary factors in the model that effect the capital cost of the base plant are the plant size, the
coal rank, and the geographic location of the plant.
• Steam Generator: This area accounts for the steam cycle equipment and pumps.
• Turbine Island: This area accounts for the turbine island and associated pumps.
• Coal Handling: This area accounts for the mechanical collection and transport
equipment of coal in the plant.
• Ash Handling: This area accounts for the mechanical collection and transport of ash
in the plant.
• Water Treatment: This area accounts for the pumps, tanks, and transport equipment
used for water treatment.
• Auxiliaries: Any miscellaneous auxiliary equipment is treated in this process area.
5.2.3.3.1.4. O&M Cost
The O&M Cost result screen displays tables for the variable and fixed operation and
maintenance costs involved with the combustion base plant. The variable O&M costs are
Illustration 323: PC: GET RESULTS: Base Plant: Boiler: Capital Cost
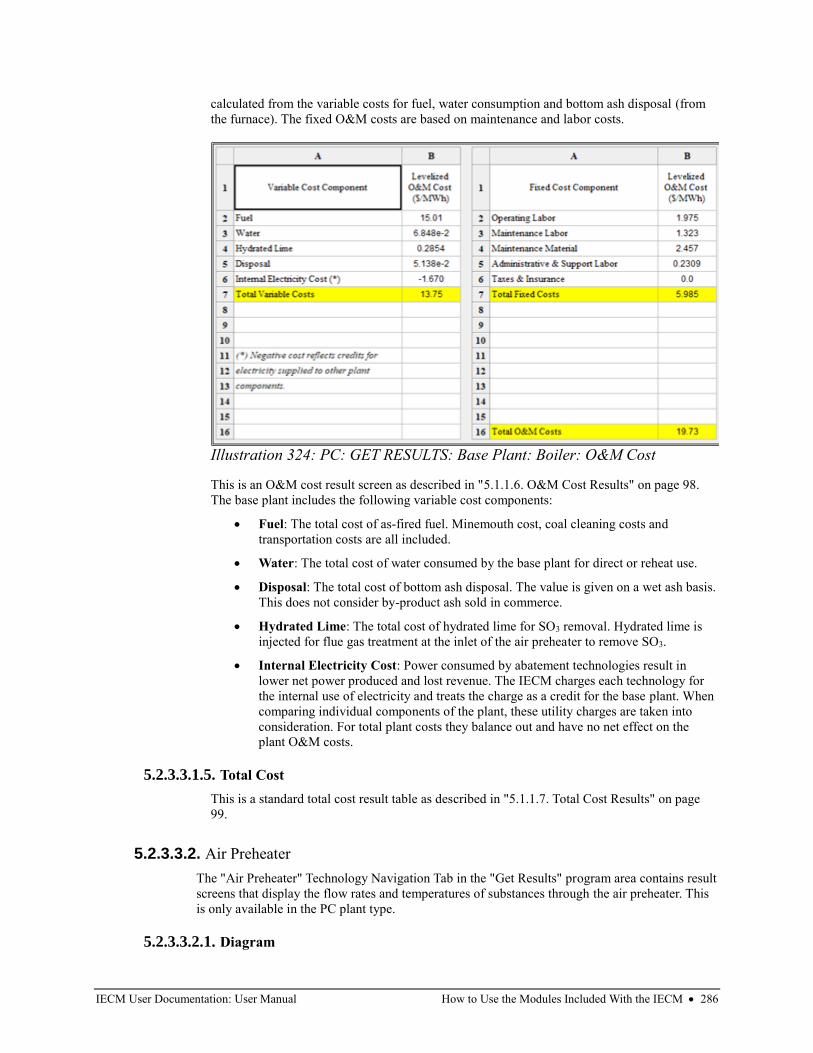
IECM User Documentation: User Manual How to Use the Modules Included With the IECM • 286
calculated from the variable costs for fuel, water consumption and bottom ash disposal (from
the furnace). The fixed O&M costs are based on maintenance and labor costs.
This is an O&M cost result screen as described in "5.1.1.6. O&M Cost Results" on page 98.
The base plant includes the following variable cost components:
• Fuel: The total cost of as-fired fuel. Minemouth cost, coal cleaning costs and
transportation costs are all included.
• Water: The total cost of water consumed by the base plant for direct or reheat use.
• Disposal: The total cost of bottom ash disposal. The value is given on a wet ash basis.
This does not consider by-product ash sold in commerce.
• Hydrated Lime: The total cost of hydrated lime for SO3 removal. Hydrated lime is
injected for flue gas treatment at the inlet of the air preheater to remove SO3.
• Internal Electricity Cost: Power consumed by abatement technologies result in
lower net power produced and lost revenue. The IECM charges each technology for
the internal use of electricity and treats the charge as a credit for the base plant. When
comparing individual components of the plant, these utility charges are taken into
consideration. For total plant costs they balance out and have no net effect on the
plant O&M costs.
5.2.3.3.1.5. Total Cost
This is a standard total cost result table as described in "5.1.1.7. Total Cost Results" on page
99.
5.2.3.3.2. Air Preheater
The "Air Preheater" Technology Navigation Tab in the "Get Results" program area contains result
screens that display the flow rates and temperatures of substances through the air preheater. This
is only available in the PC plant type.
5.2.3.3.2.1. Diagram
Illustration 324: PC: GET RESULTS: Base Plant: Boiler: O&M Cost
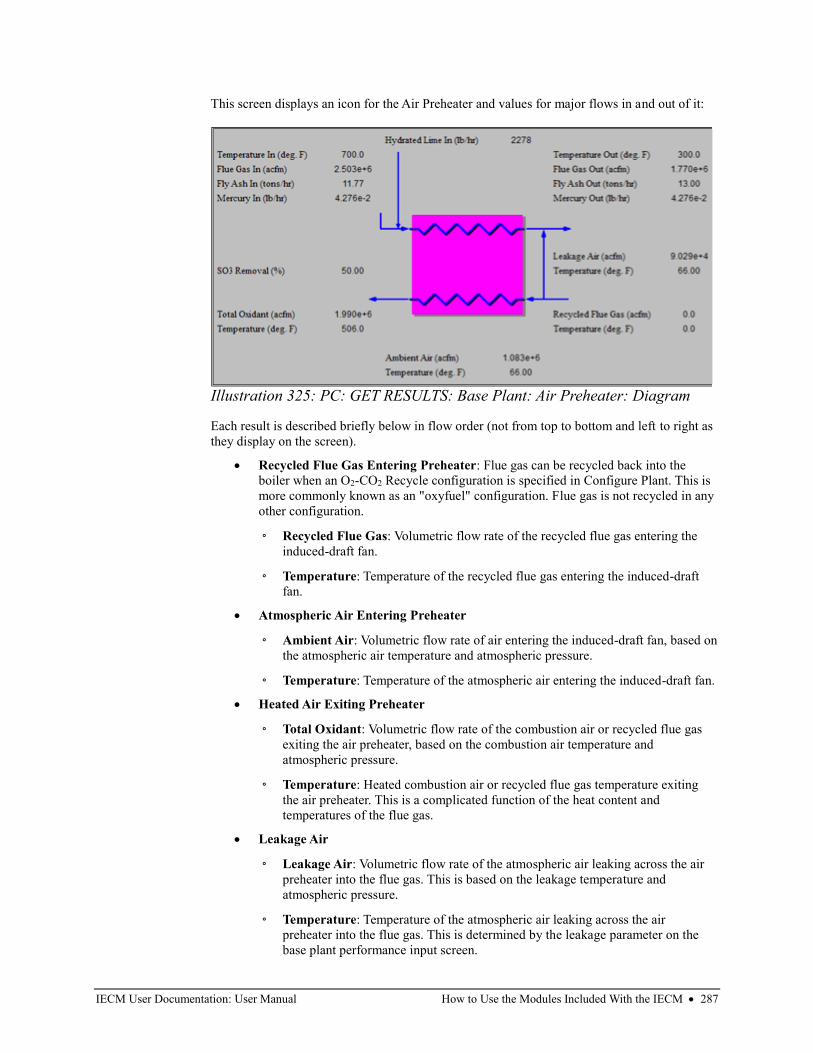
IECM User Documentation: User Manual How to Use the Modules Included With the IECM • 287
This screen displays an icon for the Air Preheater and values for major flows in and out of it:
Each result is described briefly below in flow order (not from top to bottom and left to right as
they display on the screen).
• Recycled Flue Gas Entering Preheater: Flue gas can be recycled back into the
boiler when an O2-CO2 Recycle configuration is specified in Configure Plant. This is
more commonly known as an "oxyfuel" configuration. Flue gas is not recycled in any
other configuration.
◦ Recycled Flue Gas: Volumetric flow rate of the recycled flue gas entering the
induced-draft fan.
◦ Temperature: Temperature of the recycled flue gas entering the induced-draft
fan.
• Atmospheric Air Entering Preheater
◦ Ambient Air: Volumetric flow rate of air entering the induced-draft fan, based on
the atmospheric air temperature and atmospheric pressure.
◦ Temperature: Temperature of the atmospheric air entering the induced-draft fan.
• Heated Air Exiting Preheater
◦ Total Oxidant: Volumetric flow rate of the combustion air or recycled flue gas
exiting the air preheater, based on the combustion air temperature and
atmospheric pressure.
◦ Temperature: Heated combustion air or recycled flue gas temperature exiting
the air preheater. This is a complicated function of the heat content and
temperatures of the flue gas.
• Leakage Air
◦ Leakage Air: Volumetric flow rate of the atmospheric air leaking across the air
preheater into the flue gas. This is based on the leakage temperature and
atmospheric pressure.
◦ Temperature: Temperature of the atmospheric air leaking across the air
preheater into the flue gas. This is determined by the leakage parameter on the
base plant performance input screen.
Illustration 325: PC: GET RESULTS: Base Plant: Air Preheater: Diagram
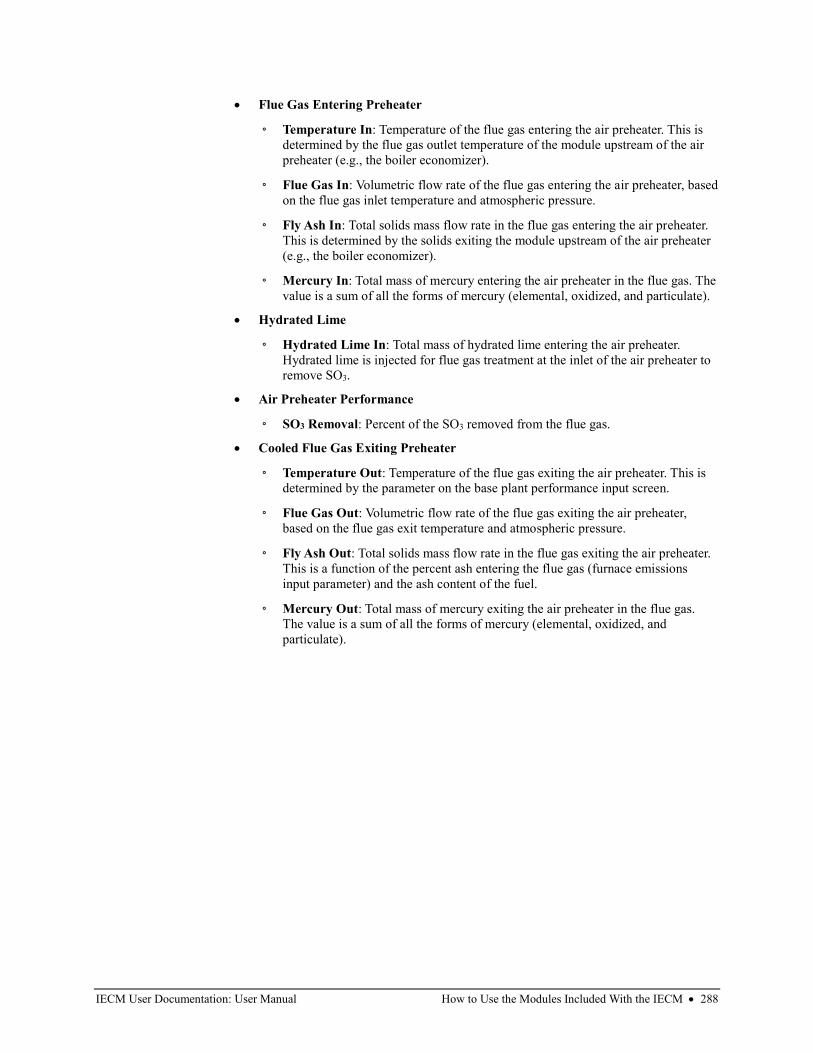
IECM User Documentation: User Manual How to Use the Modules Included With the IECM • 288
• Flue Gas Entering Preheater
◦ Temperature In: Temperature of the flue gas entering the air preheater. This is
determined by the flue gas outlet temperature of the module upstream of the air
preheater (e.g., the boiler economizer).
◦ Flue Gas In: Volumetric flow rate of the flue gas entering the air preheater, based
on the flue gas inlet temperature and atmospheric pressure.
◦ Fly Ash In: Total solids mass flow rate in the flue gas entering the air preheater.
This is determined by the solids exiting the module upstream of the air preheater
(e.g., the boiler economizer).
◦ Mercury In: Total mass of mercury entering the air preheater in the flue gas. The
value is a sum of all the forms of mercury (elemental, oxidized, and particulate).
• Hydrated Lime
◦ Hydrated Lime In: Total mass of hydrated lime entering the air preheater.
Hydrated lime is injected for flue gas treatment at the inlet of the air preheater to
remove SO3.
• Air Preheater Performance
◦ SO3 Removal: Percent of the SO3 removed from the flue gas.
• Cooled Flue Gas Exiting Preheater
◦ Temperature Out: Temperature of the flue gas exiting the air preheater. This is
determined by the parameter on the base plant performance input screen.
◦ Flue Gas Out: Volumetric flow rate of the flue gas exiting the air preheater,
based on the flue gas exit temperature and atmospheric pressure.
◦ Fly Ash Out: Total solids mass flow rate in the flue gas exiting the air preheater.
This is a function of the percent ash entering the flue gas (furnace emissions
input parameter) and the ash content of the fuel.
◦ Mercury Out: Total mass of mercury exiting the air preheater in the flue gas.
The value is a sum of all the forms of mercury (elemental, oxidized, and
particulate).
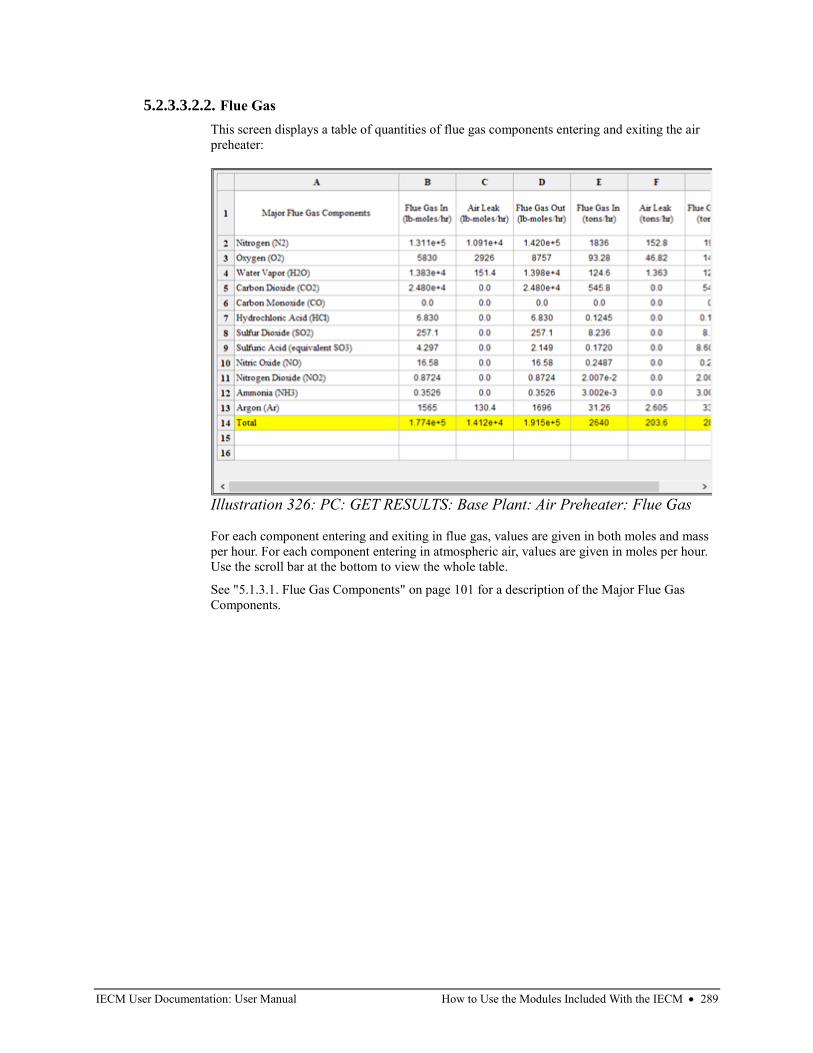
IECM User Documentation: User Manual How to Use the Modules Included With the IECM • 289
5.2.3.3.2.2. Flue Gas
This screen displays a table of quantities of flue gas components entering and exiting the air
preheater:
For each component entering and exiting in flue gas, values are given in both moles and mass
per hour. For each component entering in atmospheric air, values are given in moles per hour.
Use the scroll bar at the bottom to view the whole table.
See "5.1.3.1. Flue Gas Components" on page 101 for a description of the Major Flue Gas
Components.
Illustration 326: PC: GET RESULTS: Base Plant: Air Preheater: Flue Gas
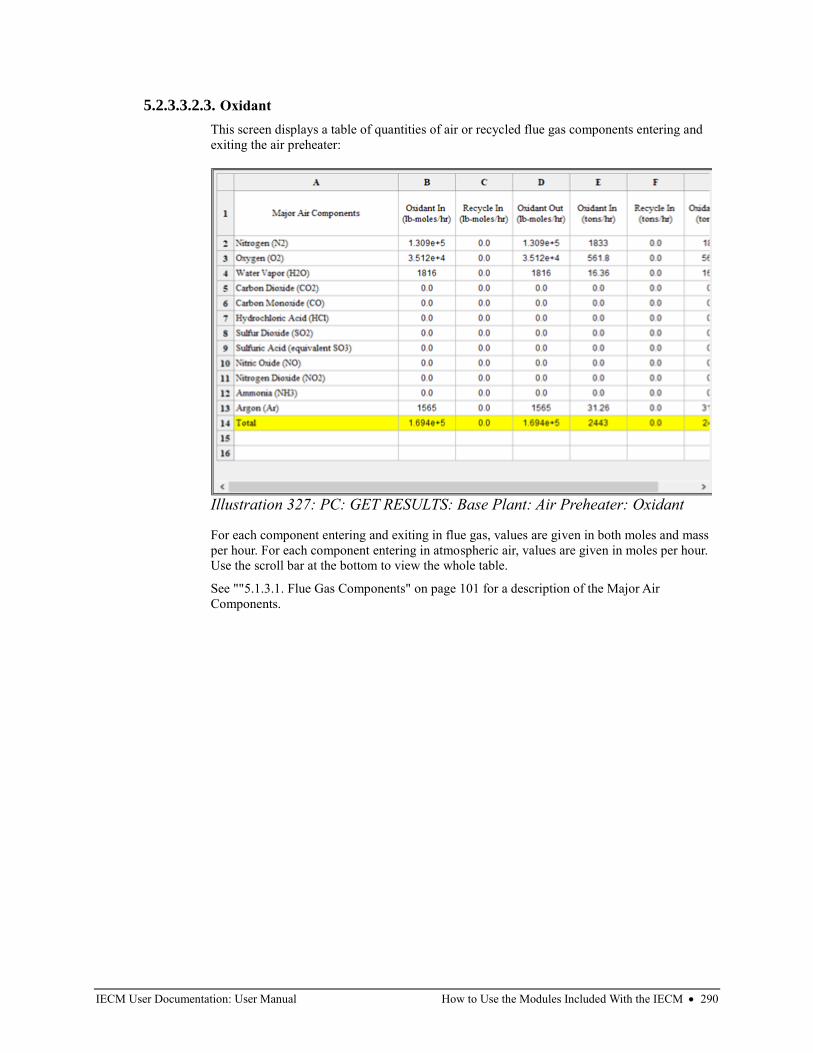
IECM User Documentation: User Manual How to Use the Modules Included With the IECM • 290
5.2.3.3.2.3. Oxidant
This screen displays a table of quantities of air or recycled flue gas components entering and
exiting the air preheater:
For each component entering and exiting in flue gas, values are given in both moles and mass
per hour. For each component entering in atmospheric air, values are given in moles per hour.
Use the scroll bar at the bottom to view the whole table.
See ""5.1.3.1. Flue Gas Components" on page 101 for a description of the Major Air
Components.
Illustration 327: PC: GET RESULTS: Base Plant: Air Preheater: Oxidant
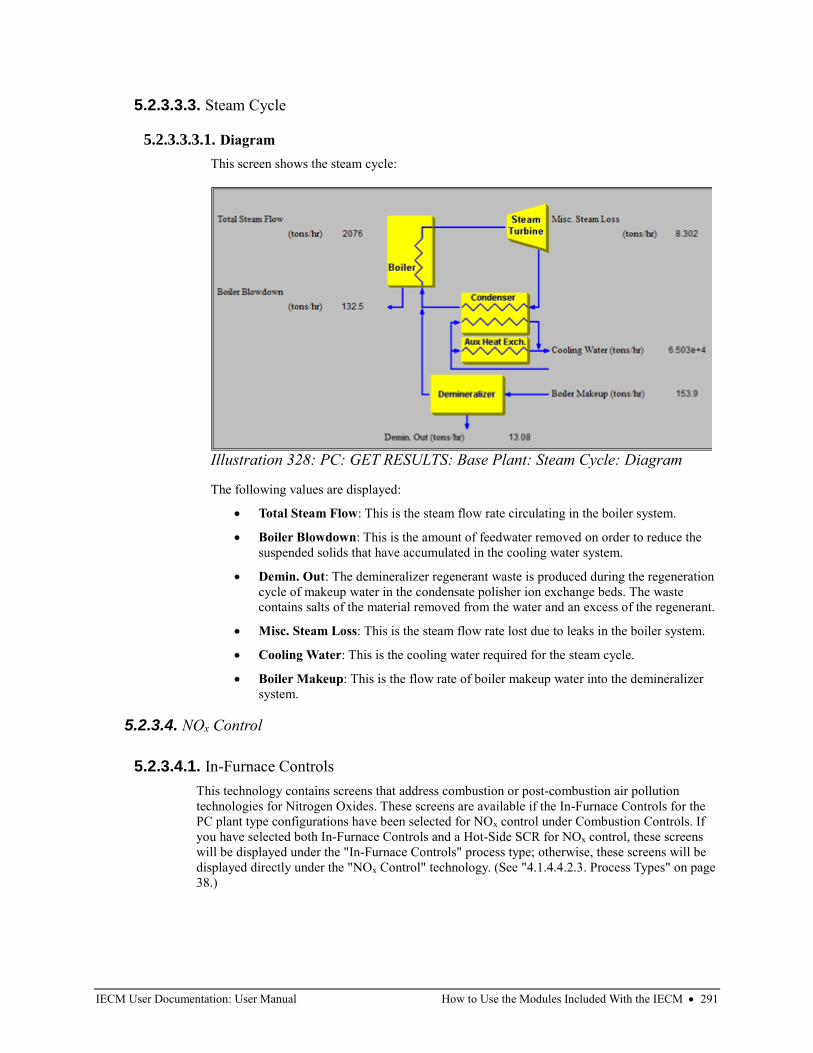
IECM User Documentation: User Manual How to Use the Modules Included With the IECM • 291
5.2.3.3.3. Steam Cycle
5.2.3.3.3.1. Diagram
This screen shows the steam cycle:
The following values are displayed:
• Total Steam Flow: This is the steam flow rate circulating in the boiler system.
• Boiler Blowdown: This is the amount of feedwater removed on order to reduce the
suspended solids that have accumulated in the cooling water system.
• Demin. Out: The demineralizer regenerant waste is produced during the regeneration
cycle of makeup water in the condensate polisher ion exchange beds. The waste
contains salts of the material removed from the water and an excess of the regenerant.
• Misc. Steam Loss: This is the steam flow rate lost due to leaks in the boiler system.
• Cooling Water: This is the cooling water required for the steam cycle.
• Boiler Makeup: This is the flow rate of boiler makeup water into the demineralizer
system.
5.2.3.4. NOx Control
5.2.3.4.1. In-Furnace Controls
This technology contains screens that address combustion or post-combustion air pollution
technologies for Nitrogen Oxides. These screens are available if the In-Furnace Controls for the
PC plant type configurations have been selected for NOx control under Combustion Controls. If
you have selected both In-Furnace Controls and a Hot-Side SCR for NOx control, these screens
will be displayed under the "In-Furnace Controls" process type; otherwise, these screens will be
displayed directly under the "NOx Control" technology. (See "4.1.4.4.2.3. Process Types" on page
38.)
Illustration 328: PC: GET RESULTS: Base Plant: Steam Cycle: Diagram
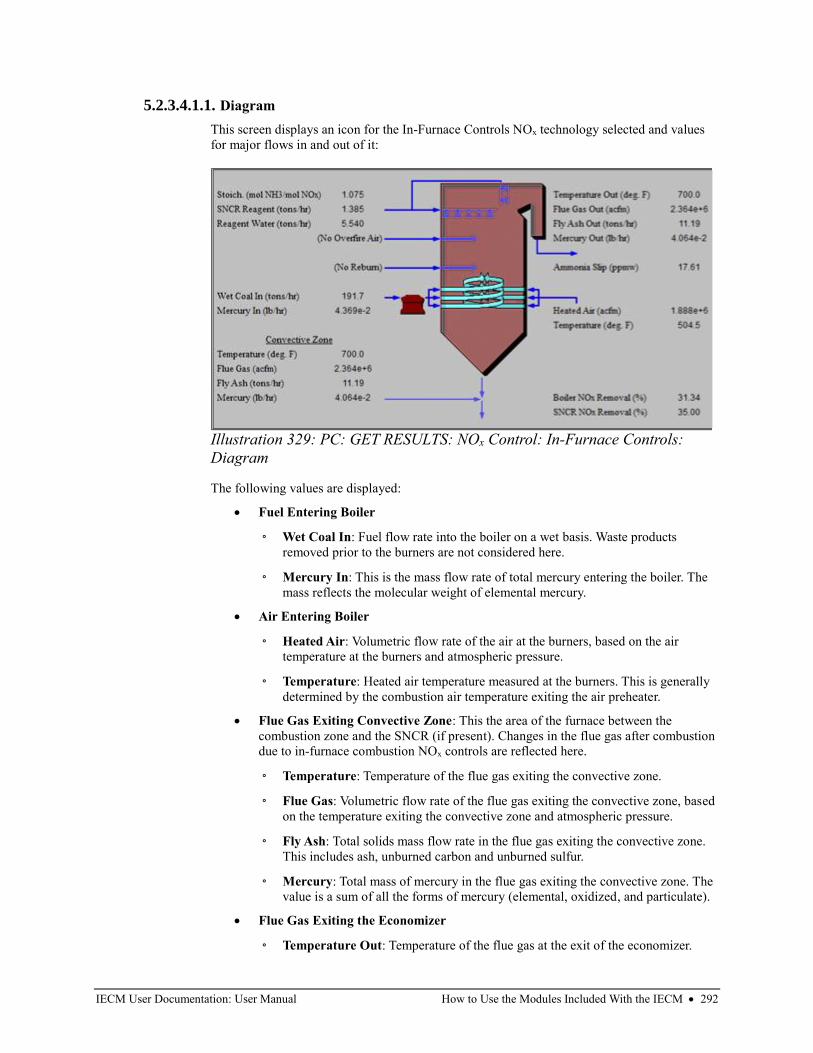
IECM User Documentation: User Manual How to Use the Modules Included With the IECM • 292
5.2.3.4.1.1. Diagram
This screen displays an icon for the In-Furnace Controls NOx technology selected and values
for major flows in and out of it:
The following values are displayed:
• Fuel Entering Boiler
◦ Wet Coal In: Fuel flow rate into the boiler on a wet basis. Waste products
removed prior to the burners are not considered here.
◦ Mercury In: This is the mass flow rate of total mercury entering the boiler. The
mass reflects the molecular weight of elemental mercury.
• Air Entering Boiler
◦ Heated Air: Volumetric flow rate of the air at the burners, based on the air
temperature at the burners and atmospheric pressure.
◦ Temperature: Heated air temperature measured at the burners. This is generally
determined by the combustion air temperature exiting the air preheater.
• Flue Gas Exiting Convective Zone: This the area of the furnace between the
combustion zone and the SNCR (if present). Changes in the flue gas after combustion
due to in-furnace combustion NOx controls are reflected here.
◦ Temperature: Temperature of the flue gas exiting the convective zone.
◦ Flue Gas: Volumetric flow rate of the flue gas exiting the convective zone, based
on the temperature exiting the convective zone and atmospheric pressure.
◦ Fly Ash: Total solids mass flow rate in the flue gas exiting the convective zone.
This includes ash, unburned carbon and unburned sulfur.
◦ Mercury: Total mass of mercury in the flue gas exiting the convective zone. The
value is a sum of all the forms of mercury (elemental, oxidized, and particulate).
• Flue Gas Exiting the Economizer
◦ Temperature Out: Temperature of the flue gas at the exit of the economizer.
Illustration 329: PC: GET RESULTS: NOx Control: In-Furnace Controls:
Diagram
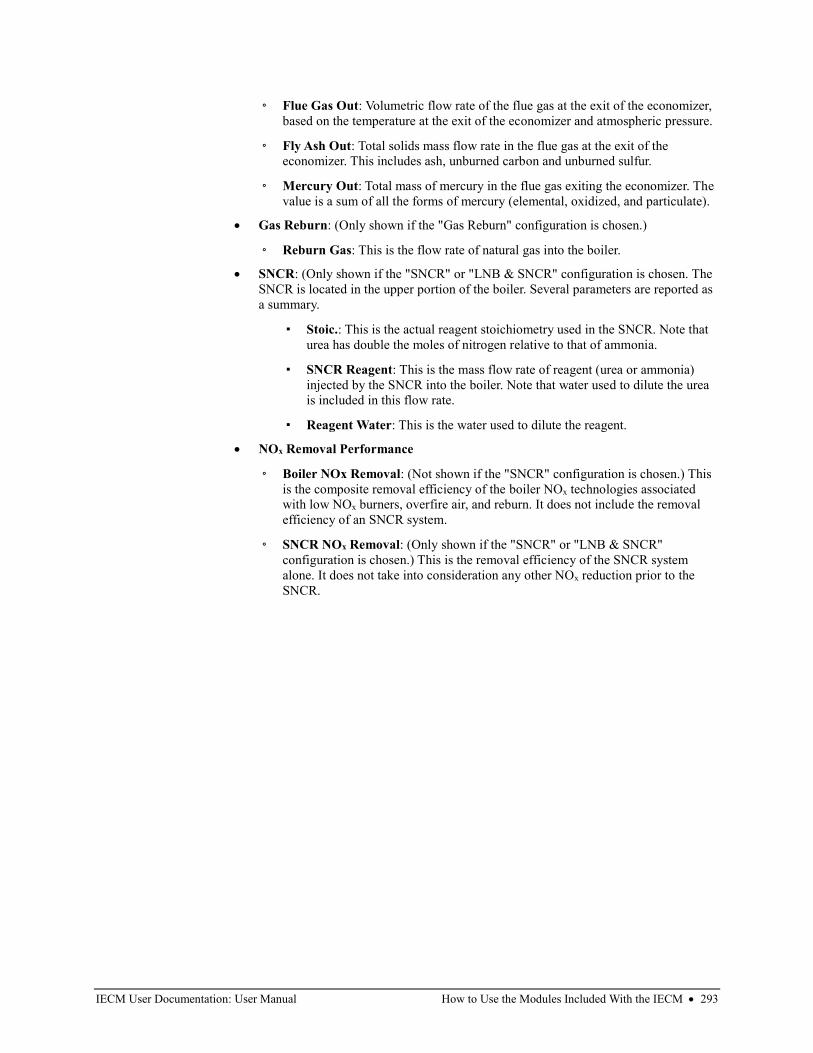
IECM User Documentation: User Manual How to Use the Modules Included With the IECM • 293
◦ Flue Gas Out: Volumetric flow rate of the flue gas at the exit of the economizer,
based on the temperature at the exit of the economizer and atmospheric pressure.
◦ Fly Ash Out: Total solids mass flow rate in the flue gas at the exit of the
economizer. This includes ash, unburned carbon and unburned sulfur.
◦ Mercury Out: Total mass of mercury in the flue gas exiting the economizer. The
value is a sum of all the forms of mercury (elemental, oxidized, and particulate).
• Gas Reburn: (Only shown if the "Gas Reburn" configuration is chosen.)
◦ Reburn Gas: This is the flow rate of natural gas into the boiler.
• SNCR: (Only shown if the "SNCR" or "LNB & SNCR" configuration is chosen. The
SNCR is located in the upper portion of the boiler. Several parameters are reported as
a summary.
▪ Stoic.: This is the actual reagent stoichiometry used in the SNCR. Note that
urea has double the moles of nitrogen relative to that of ammonia.
▪ SNCR Reagent: This is the mass flow rate of reagent (urea or ammonia)
injected by the SNCR into the boiler. Note that water used to dilute the urea
is included in this flow rate.
▪ Reagent Water: This is the water used to dilute the reagent.
• NOx Removal Performance
◦ Boiler NOx Removal: (Not shown if the "SNCR" configuration is chosen.) This
is the composite removal efficiency of the boiler NOx technologies associated
with low NOx burners, overfire air, and reburn. It does not include the removal
efficiency of an SNCR system.
◦ SNCR NOx Removal: (Only shown if the "SNCR" or "LNB & SNCR"
configuration is chosen.) This is the removal efficiency of the SNCR system
alone. It does not take into consideration any other NOx reduction prior to the
SNCR.
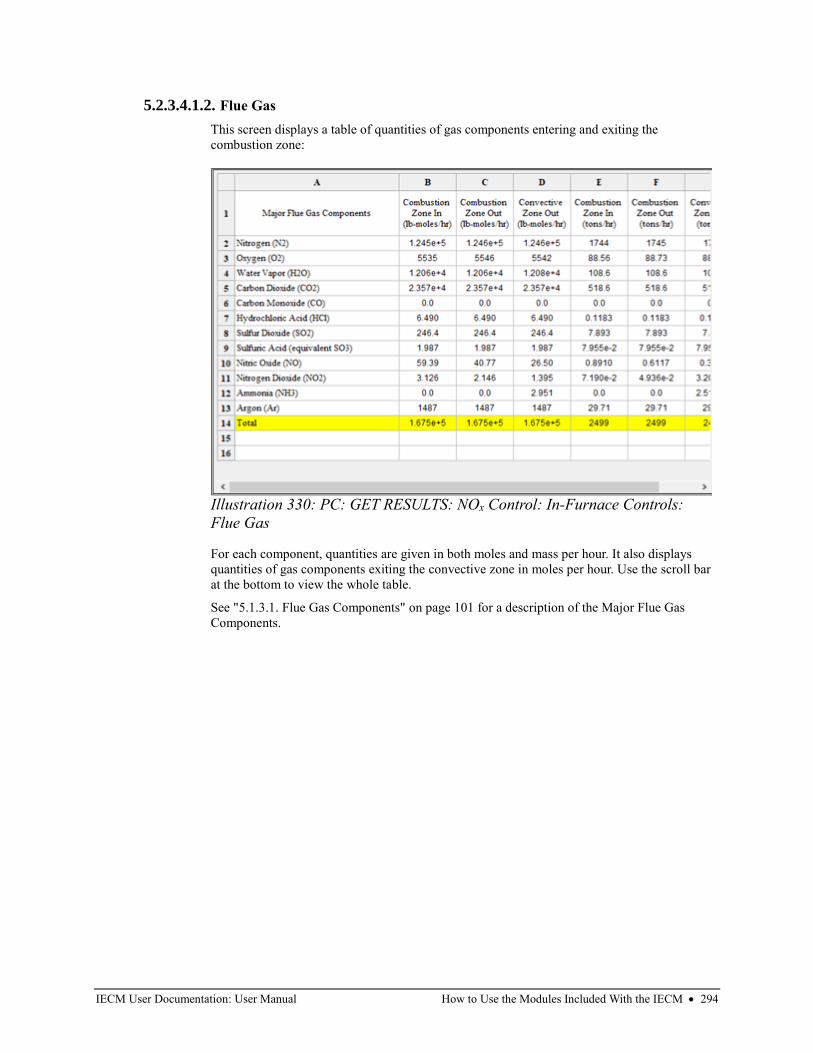
IECM User Documentation: User Manual How to Use the Modules Included With the IECM • 294
5.2.3.4.1.2. Flue Gas
This screen displays a table of quantities of gas components entering and exiting the
combustion zone:
For each component, quantities are given in both moles and mass per hour. It also displays
quantities of gas components exiting the convective zone in moles per hour. Use the scroll bar
at the bottom to view the whole table.
See "5.1.3.1. Flue Gas Components" on page 101 for a description of the Major Flue Gas
Components.
Illustration 330: PC: GET RESULTS: NOx Control: In-Furnace Controls:
Flue Gas
IECM User Documentation: User Manual How to Use the Modules Included With the IECM • 295
5.2.3.4.1.3. Capital Cost
This screen displays a table for the capital costs related to the In-Furnace Controls NOx control
technology:
Capital costs are typically expressed in either constant or current dollars for a specified year, as
shown in the status bar at the bottom of the screen. (See "4.1.4.3. The Status Bar" on page 33.)
The following values are shown:
• Combustion NOx Capital Requirement: The total capital costs, including retrofit
costs, for the LNB, OFA, and gas reburn technologies are included here. A zero is
displayed when none of these technologies are installed.
• SNCR Capital Requirement: The total capital costs, including retrofit costs, for the
SNCR technology is included here. A zero is displayed when an SNCR is not
installed.
• Total Capital Requirement: Sum of the above.
• Effective TCR: The TCR of the retrofit NOx controls that is used in determining the
total power plant cost. The effective TCR is determined by the "TCR Recovery
Factor" for the hot-side SCR.
Illustration 331: PC: GET RESULTS: NOx
Control: In-Furnace Controls: Capital
Cost
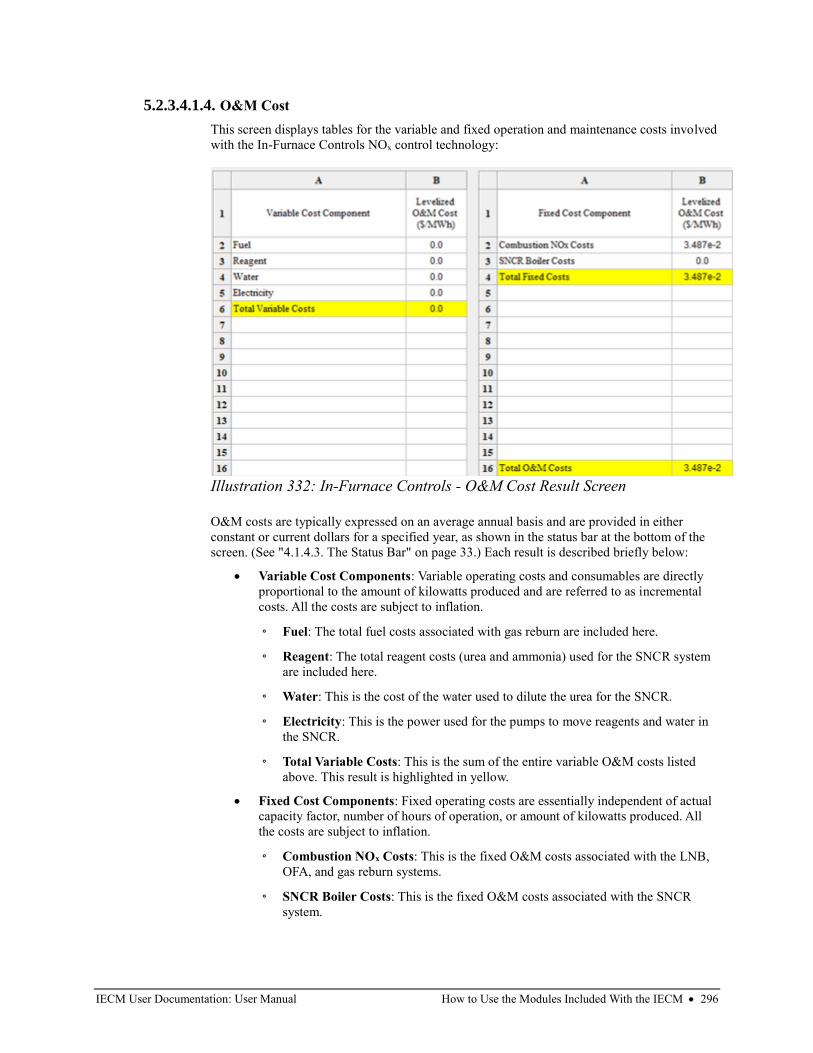
IECM User Documentation: User Manual How to Use the Modules Included With the IECM • 296
5.2.3.4.1.4. O&M Cost
This screen displays tables for the variable and fixed operation and maintenance costs involved
with the In-Furnace Controls NOx control technology:
O&M costs are typically expressed on an average annual basis and are provided in either
constant or current dollars for a specified year, as shown in the status bar at the bottom of the
screen. (See "4.1.4.3. The Status Bar" on page 33.) Each result is described briefly below:
• Variable Cost Components: Variable operating costs and consumables are directly
proportional to the amount of kilowatts produced and are referred to as incremental
costs. All the costs are subject to inflation.
◦ Fuel: The total fuel costs associated with gas reburn are included here.
◦ Reagent: The total reagent costs (urea and ammonia) used for the SNCR system
are included here.
◦ Water: This is the cost of the water used to dilute the urea for the SNCR.
◦ Electricity: This is the power used for the pumps to move reagents and water in
the SNCR.
◦ Total Variable Costs: This is the sum of the entire variable O&M costs listed
above. This result is highlighted in yellow.
• Fixed Cost Components: Fixed operating costs are essentially independent of actual
capacity factor, number of hours of operation, or amount of kilowatts produced. All
the costs are subject to inflation.
◦ Combustion NOx Costs: This is the fixed O&M costs associated with the LNB,
OFA, and gas reburn systems.
◦ SNCR Boiler Costs: This is the fixed O&M costs associated with the SNCR
system.
Illustration 332: In-Furnace Controls - O&M Cost Result Screen
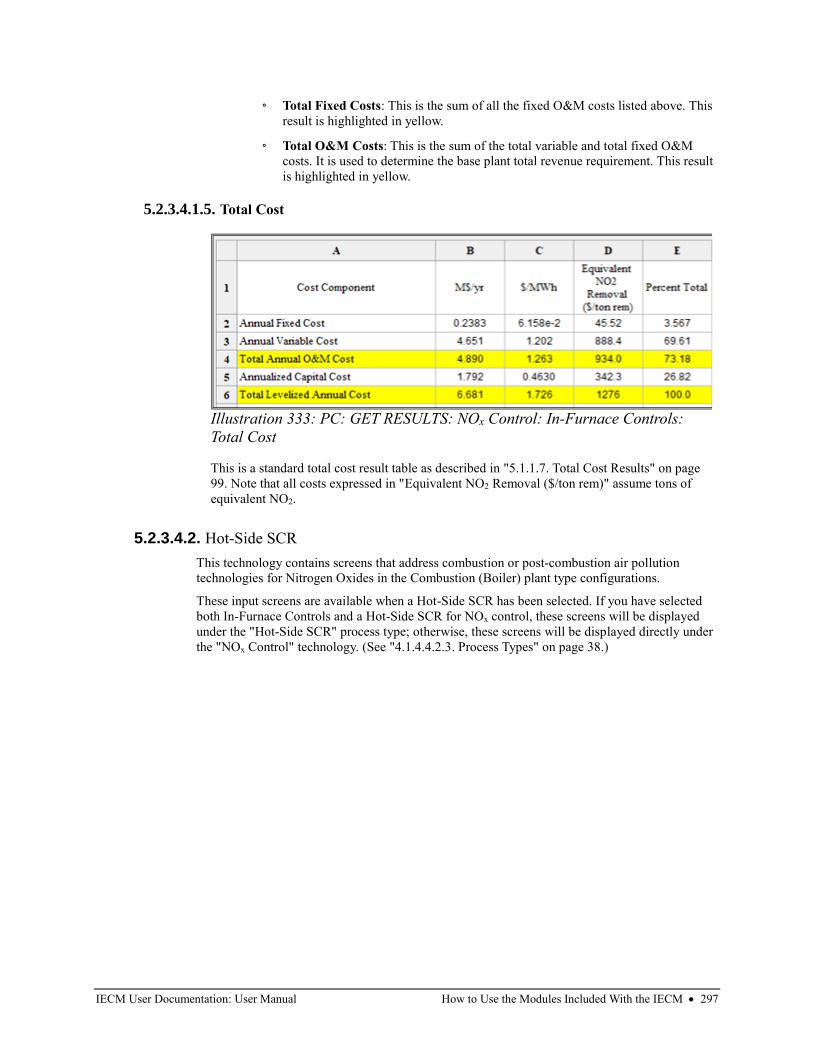
IECM User Documentation: User Manual How to Use the Modules Included With the IECM • 297
◦ Total Fixed Costs: This is the sum of all the fixed O&M costs listed above. This
result is highlighted in yellow.
◦ Total O&M Costs: This is the sum of the total variable and total fixed O&M
costs. It is used to determine the base plant total revenue requirement. This result
is highlighted in yellow.
5.2.3.4.1.5. Total Cost
This is a standard total cost result table as described in "5.1.1.7. Total Cost Results" on page
99. Note that all costs expressed in "Equivalent NO2 Removal ($/ton rem)" assume tons of
equivalent NO2.
5.2.3.4.2. Hot-Side SCR
This technology contains screens that address combustion or post-combustion air pollution
technologies for Nitrogen Oxides in the Combustion (Boiler) plant type configurations.
These input screens are available when a Hot-Side SCR has been selected. If you have selected
both In-Furnace Controls and a Hot-Side SCR for NOx control, these screens will be displayed
under the "Hot-Side SCR" process type; otherwise, these screens will be displayed directly under
the "NOx Control" technology. (See "4.1.4.4.2.3. Process Types" on page 38.)
Illustration 333: PC: GET RESULTS: NOx Control: In-Furnace Controls:
Total Cost
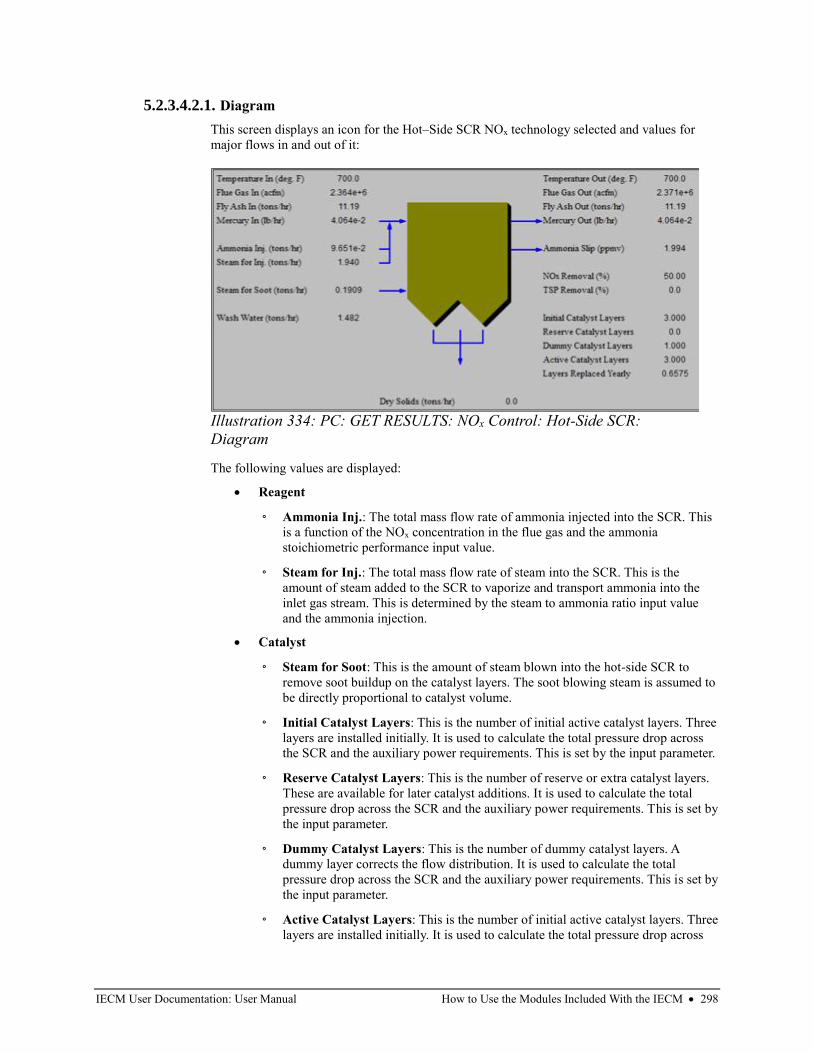
IECM User Documentation: User Manual How to Use the Modules Included With the IECM • 298
5.2.3.4.2.1. Diagram
This screen displays an icon for the Hot–Side SCR NOx technology selected and values for
major flows in and out of it:
The following values are displayed:
• Reagent
◦ Ammonia Inj.: The total mass flow rate of ammonia injected into the SCR. This
is a function of the NOx concentration in the flue gas and the ammonia
stoichiometric performance input value.
◦ Steam for Inj.: The total mass flow rate of steam into the SCR. This is the
amount of steam added to the SCR to vaporize and transport ammonia into the
inlet gas stream. This is determined by the steam to ammonia ratio input value
and the ammonia injection.
• Catalyst
◦ Steam for Soot: This is the amount of steam blown into the hot-side SCR to
remove soot buildup on the catalyst layers. The soot blowing steam is assumed to
be directly proportional to catalyst volume.
◦ Initial Catalyst Layers: This is the number of initial active catalyst layers. Three
layers are installed initially. It is used to calculate the total pressure drop across
the SCR and the auxiliary power requirements. This is set by the input parameter.
◦ Reserve Catalyst Layers: This is the number of reserve or extra catalyst layers.
These are available for later catalyst additions. It is used to calculate the total
pressure drop across the SCR and the auxiliary power requirements. This is set by
the input parameter.
◦ Dummy Catalyst Layers: This is the number of dummy catalyst layers. A
dummy layer corrects the flow distribution. It is used to calculate the total
pressure drop across the SCR and the auxiliary power requirements. This is set by
the input parameter.
◦ Active Catalyst Layers: This is the number of initial active catalyst layers. Three
layers are installed initially. It is used to calculate the total pressure drop across
Illustration 334: PC: GET RESULTS: NOx Control: Hot-Side SCR:
Diagram
IECM User Documentation: User Manual How to Use the Modules Included With the IECM • 299
the SCR and the auxiliary power requirements. It is equal to the number of initial
and reserve catalyst layers.
◦ Layers Replaced Yearly: Average catalyst layer replacement rate per year. This
assumes that all catalyst layers are of equal depth.
• Flue Gas Entering SCR
◦ Temperature In: Temperature of the flue gas entering the SCR. This is
determined by the flue gas outlet temperature of the module upstream of the SCR
(e.g., the boiler economizer)
◦ Flue Gas In: Volumetric flow rate of flue gas entering the SCR, based on the flue
gas temperature entering the SCR and atmospheric pressure.
◦ Fly Ash In: Total solids mass flow rate in the flue gas entering the SCR. This is
determined by the solids exiting from the module upstream of the SCR (e.g., the
boiler economizer).
◦ Mercury In: Total mass of mercury entering the hot-side SCR in the flue gas.
The value is a sum of all the forms of mercury (elemental, oxidized, and
particulate).
• Flue Gas Exiting SCR
◦ Temperature Out: Temperature of the flue gas exiting the SCR. The model
currently does not alter this temperature through the SCR.
◦ Flue Gas Out: Volumetric flow rate of the flue gas exiting the SCR, based on the
flue gas temperature exiting the SCR and atmospheric pressure.
◦ Fly Ash Out: Total solids mass flow rate in the flue gas exiting the SCR. This is
a function of the ash removal parameter on the SCR performance input screen.
◦ Mercury Out: Total mass of mercury exiting the hot-side SCR in the flue gas.
The value is a sum of all the forms of mercury (elemental, oxidized, and
particulate).
◦ Ammonia Slip: Total mass flow rate of ammonia that is unreacted and exits the
SCR in the flue gas stream. This is a function if the ammonia injection flow rate,
NOx concentration in the flue gas, and NOx removal efficiency.
• SCR Performance
◦ NOx Removal: Actual removal efficiency of NOx in the SCR. This is a function
of the minimum (50%) and maximum removal efficiencies (SCR performance
input parameter) and the emission constraint for NOx (emission constraints input
parameter). It is possible that the SCR may over or under-comply with the
emission constraint.
◦ TSP Removal: Actual particulate removal efficiency in the SCR. This is set by
the SCR input parameter.
• Collected Solids
◦ Dry Solids: Total solids mass flow rate of solids removed from the SCR. This is
a function of the solids content in the flue gas and the particulate removal
efficiency of the SCR.
• Wash Water
◦ Wash Water: The ammonia that deposits in the air preheater is periodically
removed by washing.
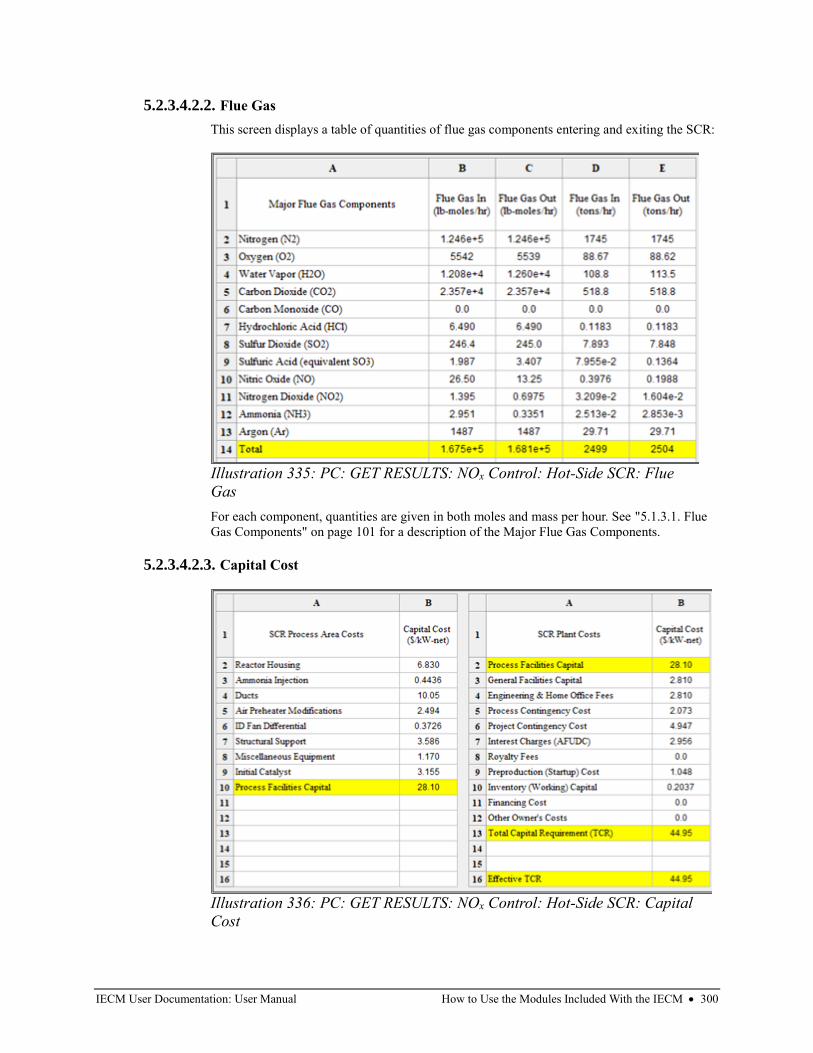
IECM User Documentation: User Manual How to Use the Modules Included With the IECM • 300
5.2.3.4.2.2. Flue Gas
This screen displays a table of quantities of flue gas components entering and exiting the SCR:
For each component, quantities are given in both moles and mass per hour. See "5.1.3.1. Flue
Gas Components" on page 101 for a description of the Major Flue Gas Components.
5.2.3.4.2.3. Capital Cost
Illustration 335: PC: GET RESULTS: NOx Control: Hot-Side SCR: Flue
Gas
Illustration 336: PC: GET RESULTS: NOx Control: Hot-Side SCR: Capital
Cost
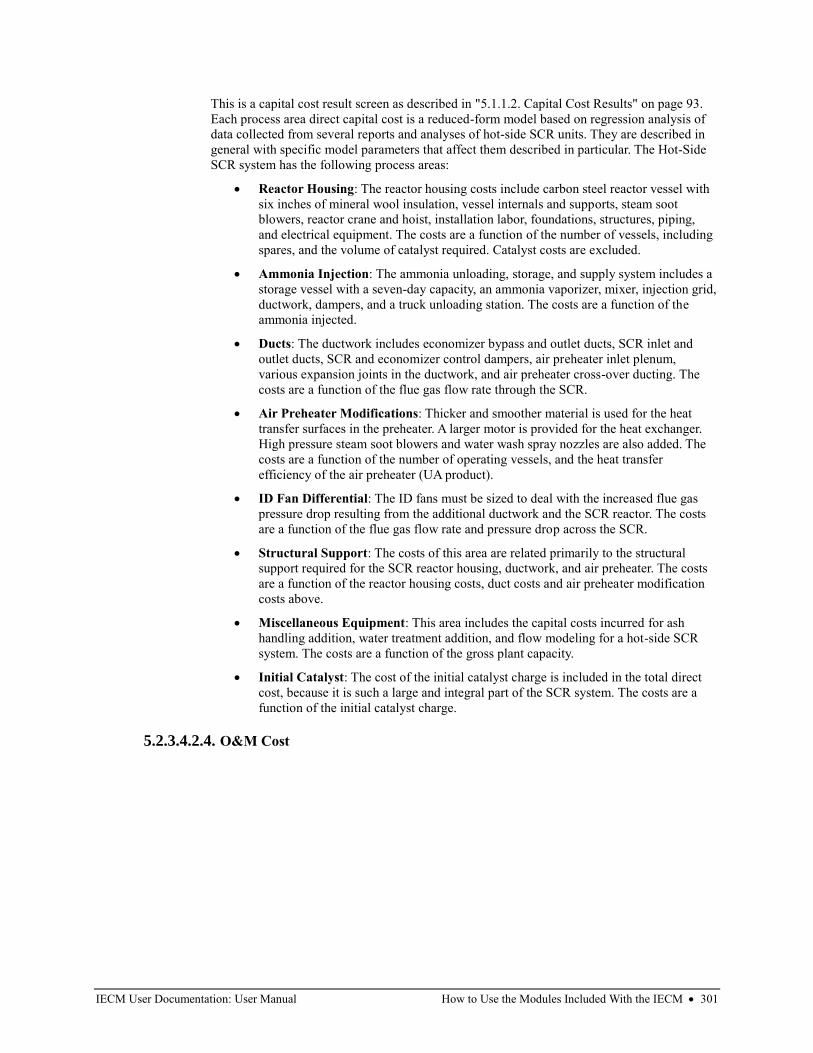
IECM User Documentation: User Manual How to Use the Modules Included With the IECM • 301
This is a capital cost result screen as described in "5.1.1.2. Capital Cost Results" on page 93.
Each process area direct capital cost is a reduced-form model based on regression analysis of
data collected from several reports and analyses of hot-side SCR units. They are described in
general with specific model parameters that affect them described in particular. The Hot-Side
SCR system has the following process areas:
• Reactor Housing: The reactor housing costs include carbon steel reactor vessel with
six inches of mineral wool insulation, vessel internals and supports, steam soot
blowers, reactor crane and hoist, installation labor, foundations, structures, piping,
and electrical equipment. The costs are a function of the number of vessels, including
spares, and the volume of catalyst required. Catalyst costs are excluded.
• Ammonia Injection: The ammonia unloading, storage, and supply system includes a
storage vessel with a seven-day capacity, an ammonia vaporizer, mixer, injection grid,
ductwork, dampers, and a truck unloading station. The costs are a function of the
ammonia injected.
• Ducts: The ductwork includes economizer bypass and outlet ducts, SCR inlet and
outlet ducts, SCR and economizer control dampers, air preheater inlet plenum,
various expansion joints in the ductwork, and air preheater cross-over ducting. The
costs are a function of the flue gas flow rate through the SCR.
• Air Preheater Modifications: Thicker and smoother material is used for the heat
transfer surfaces in the preheater. A larger motor is provided for the heat exchanger.
High pressure steam soot blowers and water wash spray nozzles are also added. The
costs are a function of the number of operating vessels, and the heat transfer
efficiency of the air preheater (UA product).
• ID Fan Differential: The ID fans must be sized to deal with the increased flue gas
pressure drop resulting from the additional ductwork and the SCR reactor. The costs
are a function of the flue gas flow rate and pressure drop across the SCR.
• Structural Support: The costs of this area are related primarily to the structural
support required for the SCR reactor housing, ductwork, and air preheater. The costs
are a function of the reactor housing costs, duct costs and air preheater modification
costs above.
• Miscellaneous Equipment: This area includes the capital costs incurred for ash
handling addition, water treatment addition, and flow modeling for a hot-side SCR
system. The costs are a function of the gross plant capacity.
• Initial Catalyst: The cost of the initial catalyst charge is included in the total direct
cost, because it is such a large and integral part of the SCR system. The costs are a
function of the initial catalyst charge.
5.2.3.4.2.4. O&M Cost
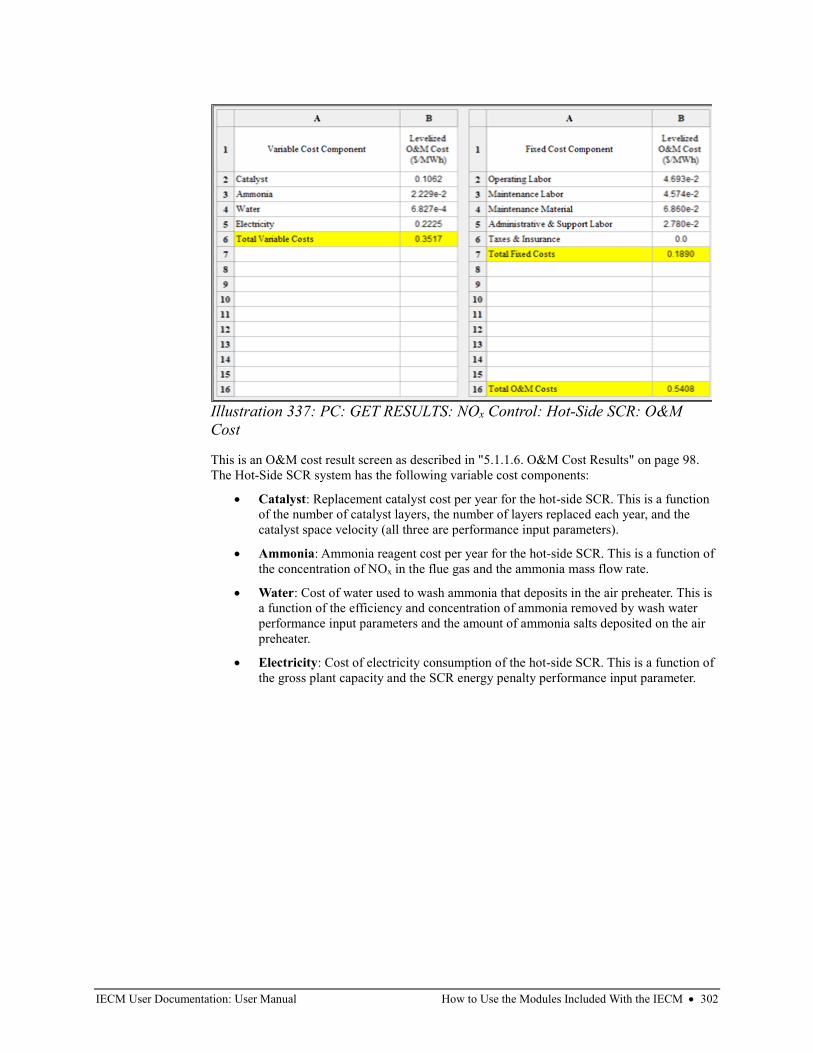
IECM User Documentation: User Manual How to Use the Modules Included With the IECM • 302
This is an O&M cost result screen as described in "5.1.1.6. O&M Cost Results" on page 98.
The Hot-Side SCR system has the following variable cost components:
• Catalyst: Replacement catalyst cost per year for the hot-side SCR. This is a function
of the number of catalyst layers, the number of layers replaced each year, and the
catalyst space velocity (all three are performance input parameters).
• Ammonia: Ammonia reagent cost per year for the hot-side SCR. This is a function of
the concentration of NOx in the flue gas and the ammonia mass flow rate.
• Water: Cost of water used to wash ammonia that deposits in the air preheater. This is
a function of the efficiency and concentration of ammonia removed by wash water
performance input parameters and the amount of ammonia salts deposited on the air
preheater.
• Electricity: Cost of electricity consumption of the hot-side SCR. This is a function of
the gross plant capacity and the SCR energy penalty performance input parameter.
Illustration 337: PC: GET RESULTS: NOx Control: Hot-Side SCR: O&M
Cost
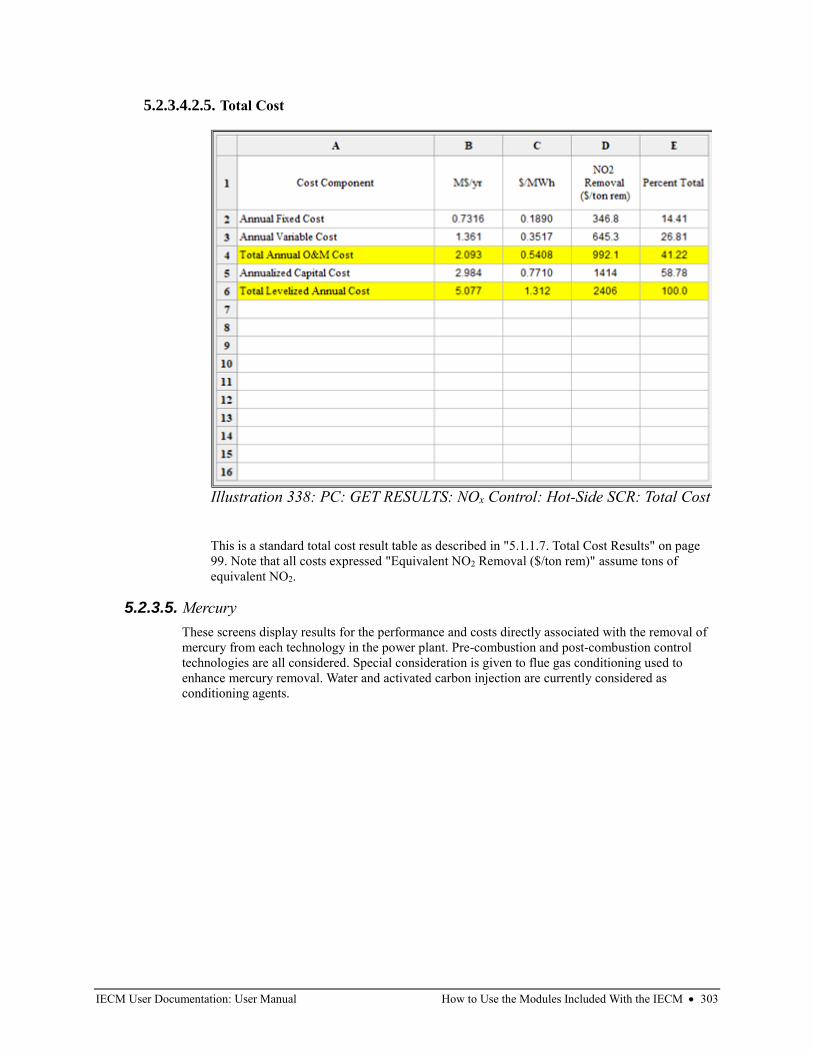
IECM User Documentation: User Manual How to Use the Modules Included With the IECM • 303
5.2.3.4.2.5. Total Cost
This is a standard total cost result table as described in "5.1.1.7. Total Cost Results" on page
99. Note that all costs expressed "Equivalent NO2 Removal ($/ton rem)" assume tons of
equivalent NO2.
5.2.3.5. Mercury
These screens display results for the performance and costs directly associated with the removal of
mercury from each technology in the power plant. Pre-combustion and post-combustion control
technologies are all considered. Special consideration is given to flue gas conditioning used to
enhance mercury removal. Water and activated carbon injection are currently considered as
conditioning agents.
Illustration 338: PC: GET RESULTS: NOx Control: Hot-Side SCR: Total Cost
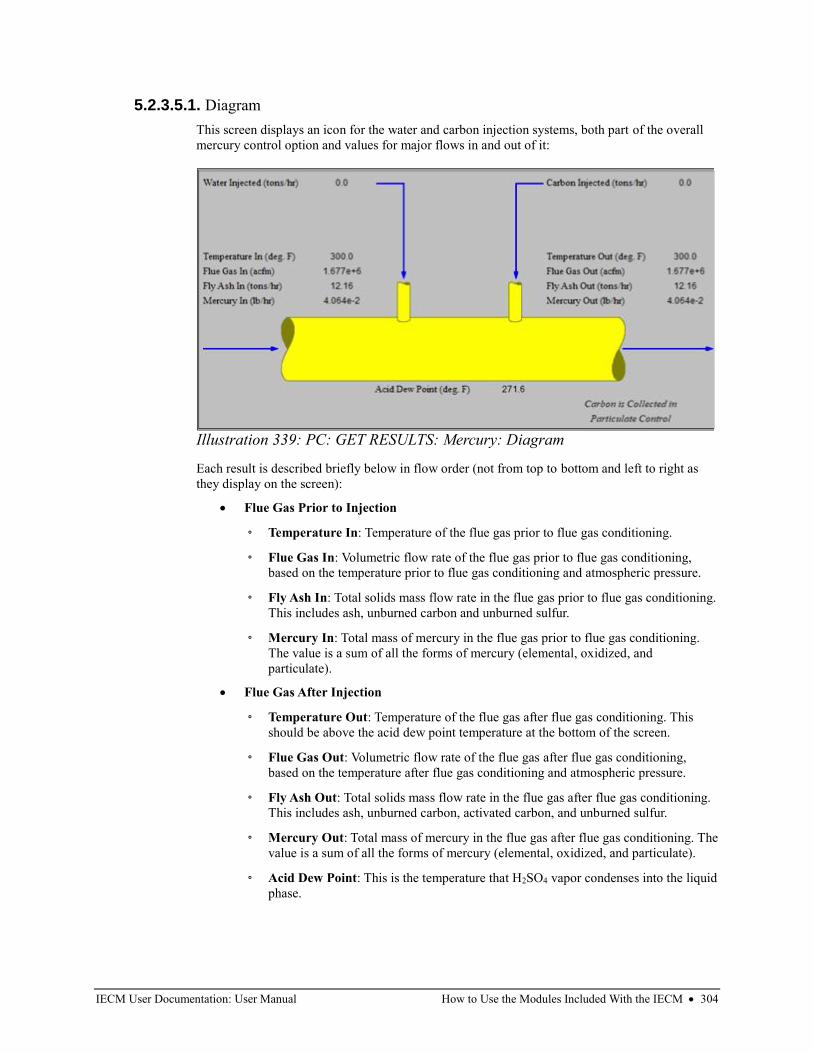
IECM User Documentation: User Manual How to Use the Modules Included With the IECM • 304
5.2.3.5.1. Diagram
This screen displays an icon for the water and carbon injection systems, both part of the overall
mercury control option and values for major flows in and out of it:
Each result is described briefly below in flow order (not from top to bottom and left to right as
they display on the screen):
• Flue Gas Prior to Injection
◦ Temperature In: Temperature of the flue gas prior to flue gas conditioning.
◦ Flue Gas In: Volumetric flow rate of the flue gas prior to flue gas conditioning,
based on the temperature prior to flue gas conditioning and atmospheric pressure.
◦ Fly Ash In: Total solids mass flow rate in the flue gas prior to flue gas conditioning.
This includes ash, unburned carbon and unburned sulfur.
◦ Mercury In: Total mass of mercury in the flue gas prior to flue gas conditioning.
The value is a sum of all the forms of mercury (elemental, oxidized, and
particulate).
• Flue Gas After Injection
◦ Temperature Out: Temperature of the flue gas after flue gas conditioning. This
should be above the acid dew point temperature at the bottom of the screen.
◦ Flue Gas Out: Volumetric flow rate of the flue gas after flue gas conditioning,
based on the temperature after flue gas conditioning and atmospheric pressure.
◦ Fly Ash Out: Total solids mass flow rate in the flue gas after flue gas conditioning.
This includes ash, unburned carbon, activated carbon, and unburned sulfur.
◦ Mercury Out: Total mass of mercury in the flue gas after flue gas conditioning. The
value is a sum of all the forms of mercury (elemental, oxidized, and particulate).
◦ Acid Dew Point: This is the temperature that H2SO4 vapor condenses into the liquid
phase.
Illustration 339: PC: GET RESULTS: Mercury: Diagram
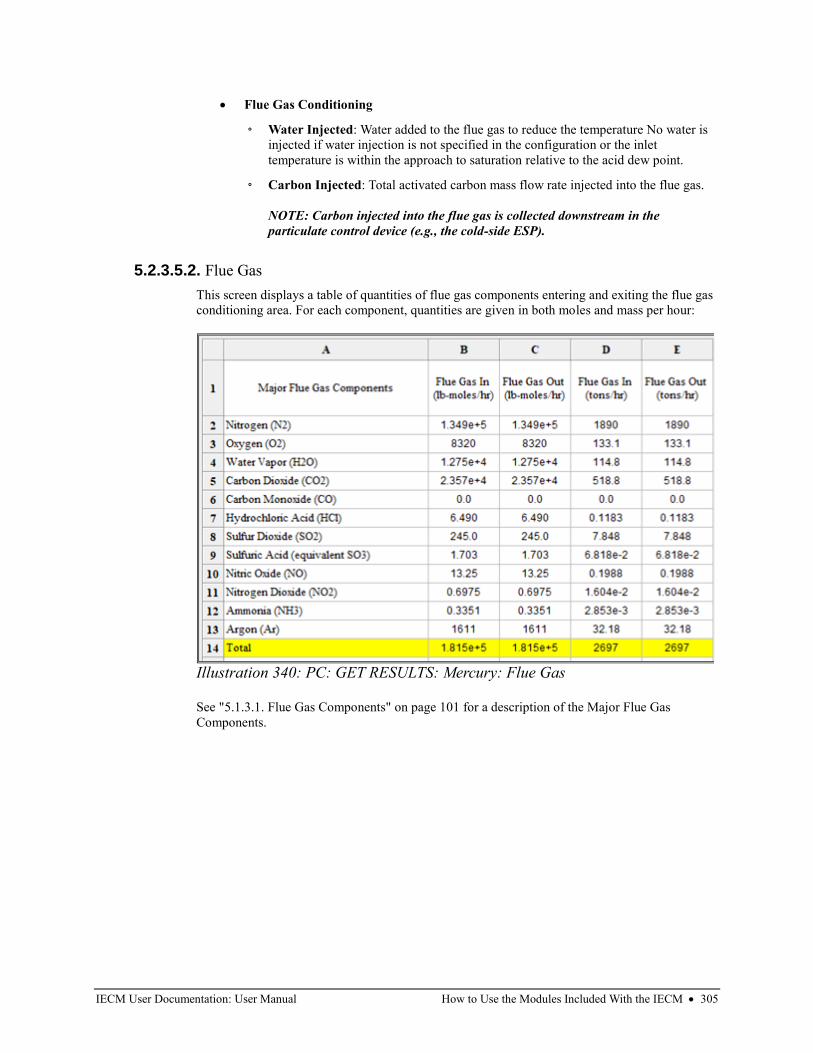
IECM User Documentation: User Manual How to Use the Modules Included With the IECM • 305
• Flue Gas Conditioning
◦ Water Injected: Water added to the flue gas to reduce the temperature No water is
injected if water injection is not specified in the configuration or the inlet
temperature is within the approach to saturation relative to the acid dew point.
◦ Carbon Injected: Total activated carbon mass flow rate injected into the flue gas.
NOTE: Carbon injected into the flue gas is collected downstream in the
particulate control device (e.g., the cold-side ESP).
5.2.3.5.2. Flue Gas
This screen displays a table of quantities of flue gas components entering and exiting the flue gas
conditioning area. For each component, quantities are given in both moles and mass per hour:
See "5.1.3.1. Flue Gas Components" on page 101 for a description of the Major Flue Gas
Components.
Illustration 340: PC: GET RESULTS: Mercury: Flue Gas
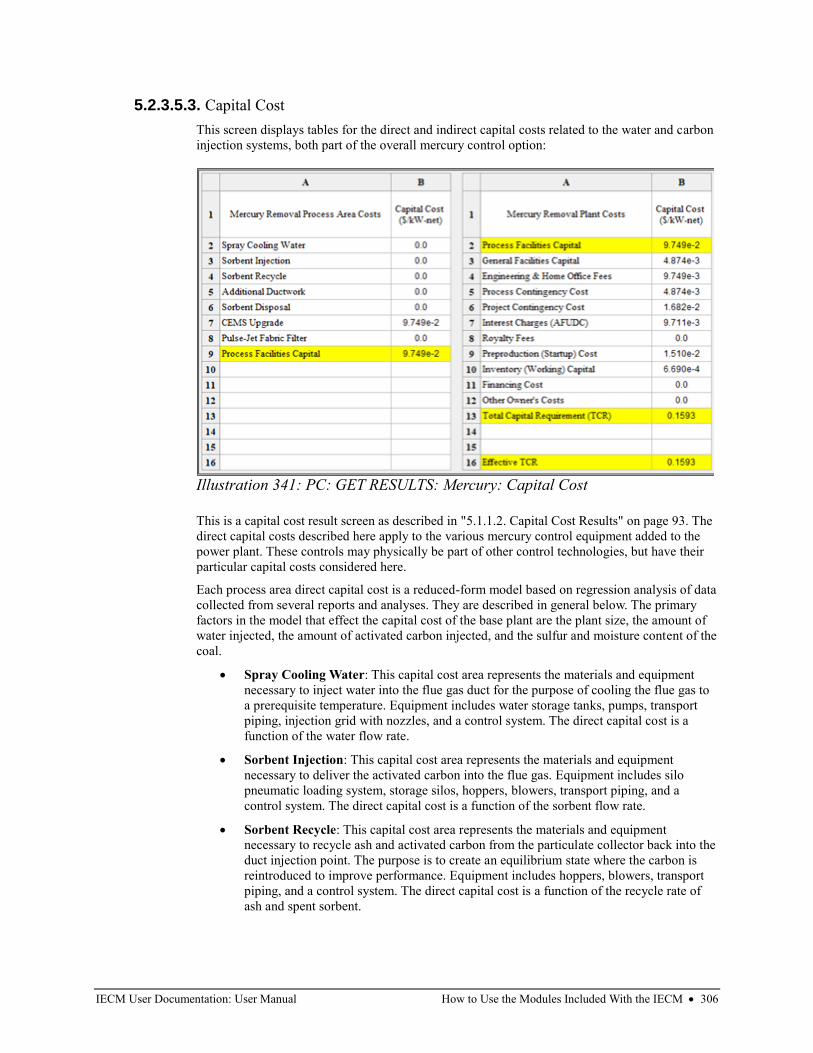
IECM User Documentation: User Manual How to Use the Modules Included With the IECM • 306
5.2.3.5.3. Capital Cost
This screen displays tables for the direct and indirect capital costs related to the water and carbon
injection systems, both part of the overall mercury control option:
This is a capital cost result screen as described in "5.1.1.2. Capital Cost Results" on page 93. The
direct capital costs described here apply to the various mercury control equipment added to the
power plant. These controls may physically be part of other control technologies, but have their
particular capital costs considered here.
Each process area direct capital cost is a reduced-form model based on regression analysis of data
collected from several reports and analyses. They are described in general below. The primary
factors in the model that effect the capital cost of the base plant are the plant size, the amount of
water injected, the amount of activated carbon injected, and the sulfur and moisture content of the
coal.
• Spray Cooling Water: This capital cost area represents the materials and equipment
necessary to inject water into the flue gas duct for the purpose of cooling the flue gas to
a prerequisite temperature. Equipment includes water storage tanks, pumps, transport
piping, injection grid with nozzles, and a control system. The direct capital cost is a
function of the water flow rate.
• Sorbent Injection: This capital cost area represents the materials and equipment
necessary to deliver the activated carbon into the flue gas. Equipment includes silo
pneumatic loading system, storage silos, hoppers, blowers, transport piping, and a
control system. The direct capital cost is a function of the sorbent flow rate.
• Sorbent Recycle: This capital cost area represents the materials and equipment
necessary to recycle ash and activated carbon from the particulate collector back into the
duct injection point. The purpose is to create an equilibrium state where the carbon is
reintroduced to improve performance. Equipment includes hoppers, blowers, transport
piping, and a control system. The direct capital cost is a function of the recycle rate of
ash and spent sorbent.
Illustration 341: PC: GET RESULTS: Mercury: Capital Cost
IECM User Documentation: User Manual How to Use the Modules Included With the IECM • 307
NOTE: Sorbent recycling is a feature that may be added in a future version of the
IECM.
• Additional Ductwork: This capital cost area represents materials and equipment for
ductwork necessary beyond the other process areas. Extra ductwork may be required for
difficult retrofit installations.
NOTE: Future versions of the IECM may include parameters to determine a capital
cost for this area. The current version assumes no additional ductwork.
• Sorbent Disposal: This capital cost area represents materials and equipment required to
house and dispose the collected sorbent. Equipment includes hoppers, blowers, transport
piping, and a control system. This is in excess of existing hoppers, tanks, and piping
used for existing particulate collectors. The direct capital cost is determined by the
incremental increase in collected solids in the particulate collector.
• CEMS Upgrade: This capital cost area represents materials and equipment required to
install a continuous emissions monitoring system (CEMS) upgrade. The direct capital
cost is determined by the net electrical output of the power plant.
• Pulse-Jet Fabric Filter: This capital costs area represents an upgrade to an existing
cold-side ESP, where one section at the back end of the unit is replaced with a pulse-jet
fabric filter. This can be considered a pseudo-COHPAC. Equipment includes pulse-jet
FF, filter bags, ductwork, dampers, and MCCs, instrumentation and PLC controls for
baghouse operation. Equipment excludes ash removal system, power distribution and
power supply, and distributed control system. The direct capital cost is a function of the
flue gas flow rate and the air to cloth ratio of the fabric filter.
NOTE: The IECM currently does not support multiple particulate devices in the same
configuration nor a modified cold-side ESP.
5.2.3.5.4. O&M Cost
This screen displays tables for the variable and fixed operation and maintenance costs related to
the water and carbon injection systems, both part of the overall mercury control option. The
variable O&M costs are calculated from the variable costs for carbon, water consumption and fly
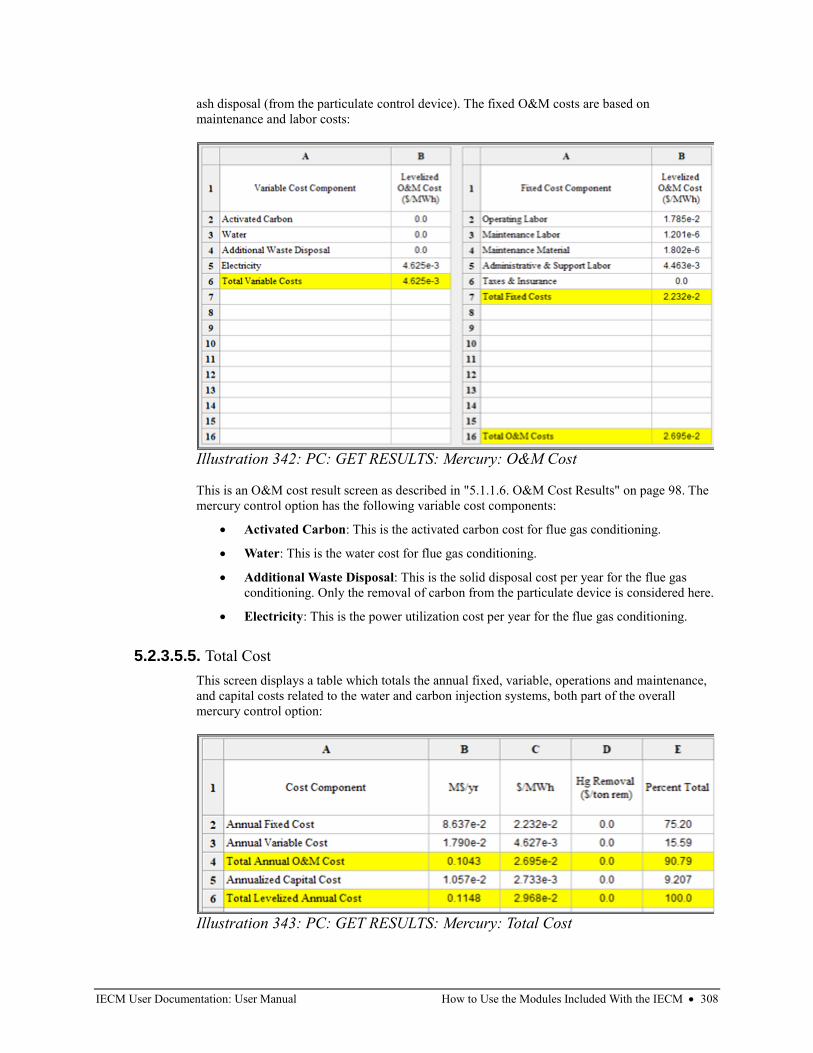
IECM User Documentation: User Manual How to Use the Modules Included With the IECM • 308
ash disposal (from the particulate control device). The fixed O&M costs are based on
maintenance and labor costs:
This is an O&M cost result screen as described in "5.1.1.6. O&M Cost Results" on page 98. The
mercury control option has the following variable cost components:
• Activated Carbon: This is the activated carbon cost for flue gas conditioning.
• Water: This is the water cost for flue gas conditioning.
• Additional Waste Disposal: This is the solid disposal cost per year for the flue gas
conditioning. Only the removal of carbon from the particulate device is considered here.
• Electricity: This is the power utilization cost per year for the flue gas conditioning.
5.2.3.5.5. Total Cost
This screen displays a table which totals the annual fixed, variable, operations and maintenance,
and capital costs related to the water and carbon injection systems, both part of the overall
mercury control option:
Illustration 342: PC: GET RESULTS: Mercury: O&M Cost
Illustration 343: PC: GET RESULTS: Mercury: Total Cost
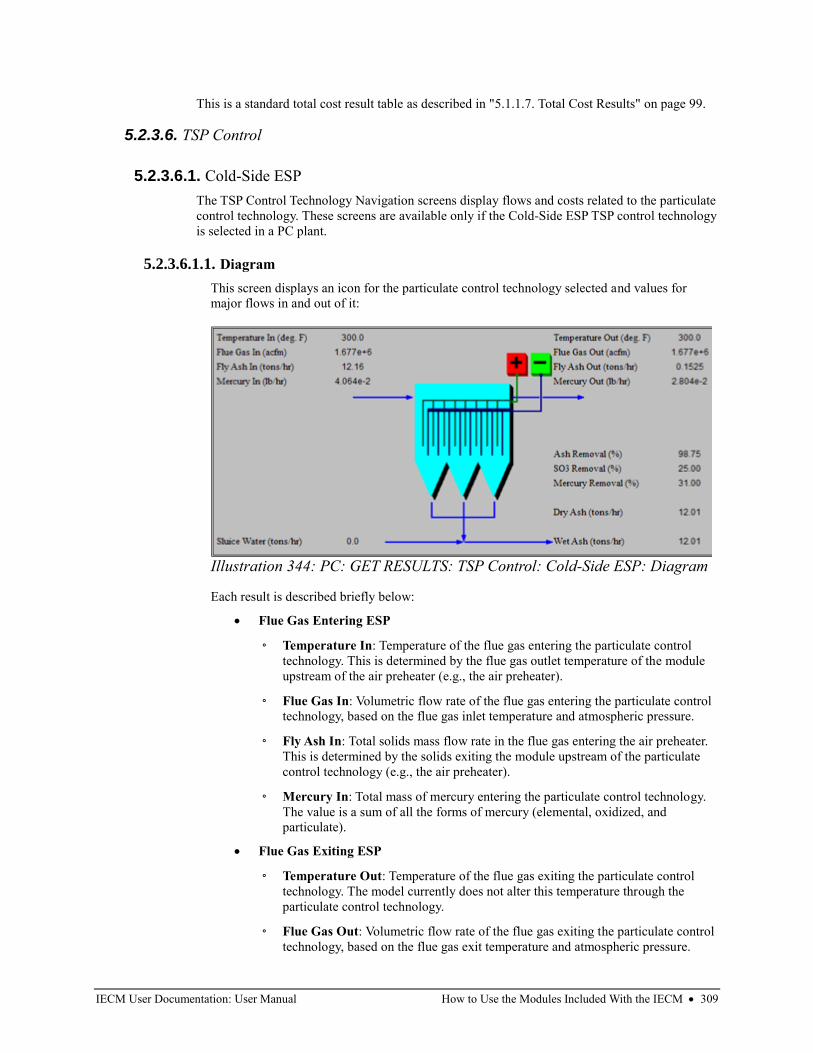
IECM User Documentation: User Manual How to Use the Modules Included With the IECM • 309
This is a standard total cost result table as described in "5.1.1.7. Total Cost Results" on page 99.
5.2.3.6. TSP Control
5.2.3.6.1. Cold-Side ESP
The TSP Control Technology Navigation screens display flows and costs related to the particulate
control technology. These screens are available only if the Cold-Side ESP TSP control technology
is selected in a PC plant.
5.2.3.6.1.1. Diagram
This screen displays an icon for the particulate control technology selected and values for
major flows in and out of it:
Each result is described briefly below:
• Flue Gas Entering ESP
◦ Temperature In: Temperature of the flue gas entering the particulate control
technology. This is determined by the flue gas outlet temperature of the module
upstream of the air preheater (e.g., the air preheater).
◦ Flue Gas In: Volumetric flow rate of the flue gas entering the particulate control
technology, based on the flue gas inlet temperature and atmospheric pressure.
◦ Fly Ash In: Total solids mass flow rate in the flue gas entering the air preheater.
This is determined by the solids exiting the module upstream of the particulate
control technology (e.g., the air preheater).
◦ Mercury In: Total mass of mercury entering the particulate control technology.
The value is a sum of all the forms of mercury (elemental, oxidized, and
particulate).
• Flue Gas Exiting ESP
◦ Temperature Out: Temperature of the flue gas exiting the particulate control
technology. The model currently does not alter this temperature through the
particulate control technology.
◦ Flue Gas Out: Volumetric flow rate of the flue gas exiting the particulate control
technology, based on the flue gas exit temperature and atmospheric pressure.
Illustration 344: PC: GET RESULTS: TSP Control: Cold-Side ESP: Diagram
IECM User Documentation: User Manual How to Use the Modules Included With the IECM • 310
◦ Fly Ash Out: Total solids mass flow rate in the flue gas exiting the particulate
control technology. This is a function of the ash content of the inlet flue gas and
the ash removal efficiency performance input parameter.
◦ Mercury Out: Total mass of mercury exiting the particulate control technology.
The value is a sum of all the forms of mercury (elemental, oxidized, and
particulate).
• ESP Performance
◦ Ash Removal: Ash removal efficiency of the particulate control technology. This
is a function of the ash emission constraint and the inlet ash mass flow rate.
◦ SO3 Removal: Percent of SO3 in the flue gas removed from the particulate
control technology. The SO3 is assumed to combine with H2O and leave with the
ash solids as a sulfate (in the form of H2SO4).
◦ Mercury Removal: Percent of the total mercury removed from the particulate
control technology. The value reflects a weighted average based on the particular
species of mercury present (elemental, oxidized, and particulate).
• Collected Fly Ash
◦ Dry Ash: Total mass flow rate of the solids removed from the ESP. This is a
function of the solids content in the flue gas and the particulate removal
efficiency of the ESP. The value is given on a dry basis.
◦ Sluice Water: Water added to the dry fly ash. This water is added for
transportation purposes.
◦ Wet Ash: Total mass flow rate of the solids removed for waste management. This
includes dry fly ash and sluice water. The value is given on a wet basis.
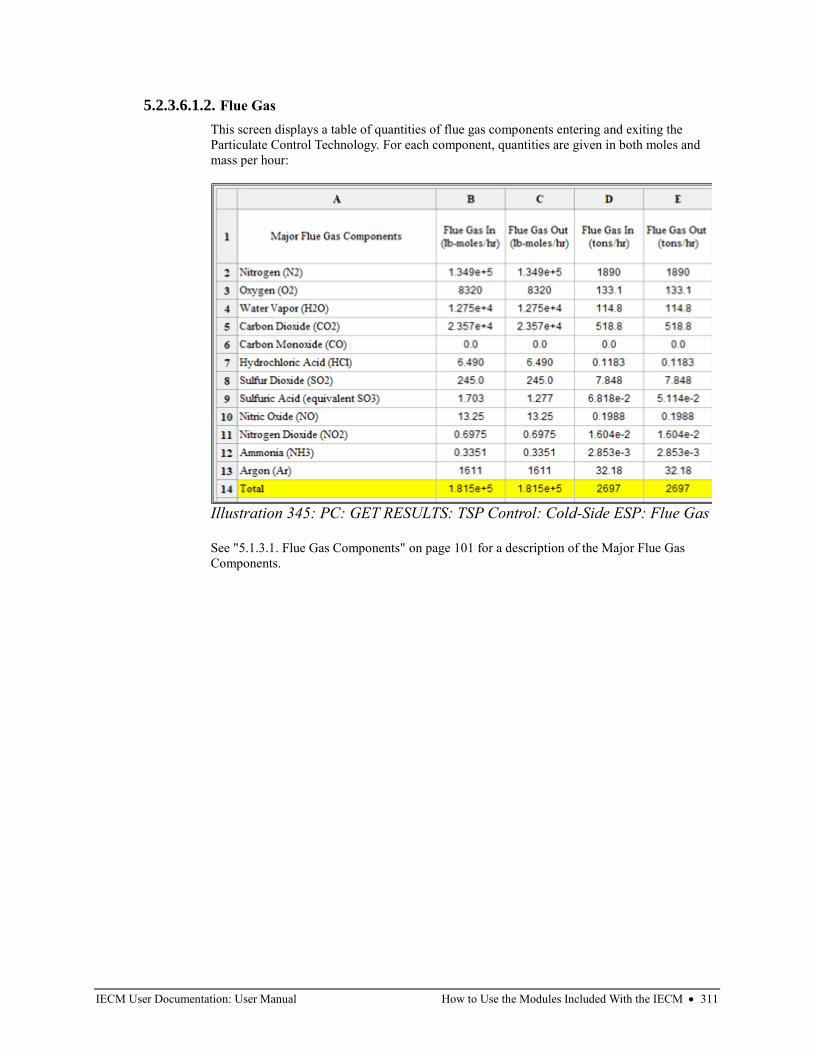
IECM User Documentation: User Manual How to Use the Modules Included With the IECM • 311
5.2.3.6.1.2. Flue Gas
This screen displays a table of quantities of flue gas components entering and exiting the
Particulate Control Technology. For each component, quantities are given in both moles and
mass per hour:
See "5.1.3.1. Flue Gas Components" on page 101 for a description of the Major Flue Gas
Components.
Illustration 345: PC: GET RESULTS: TSP Control: Cold-Side ESP: Flue Gas
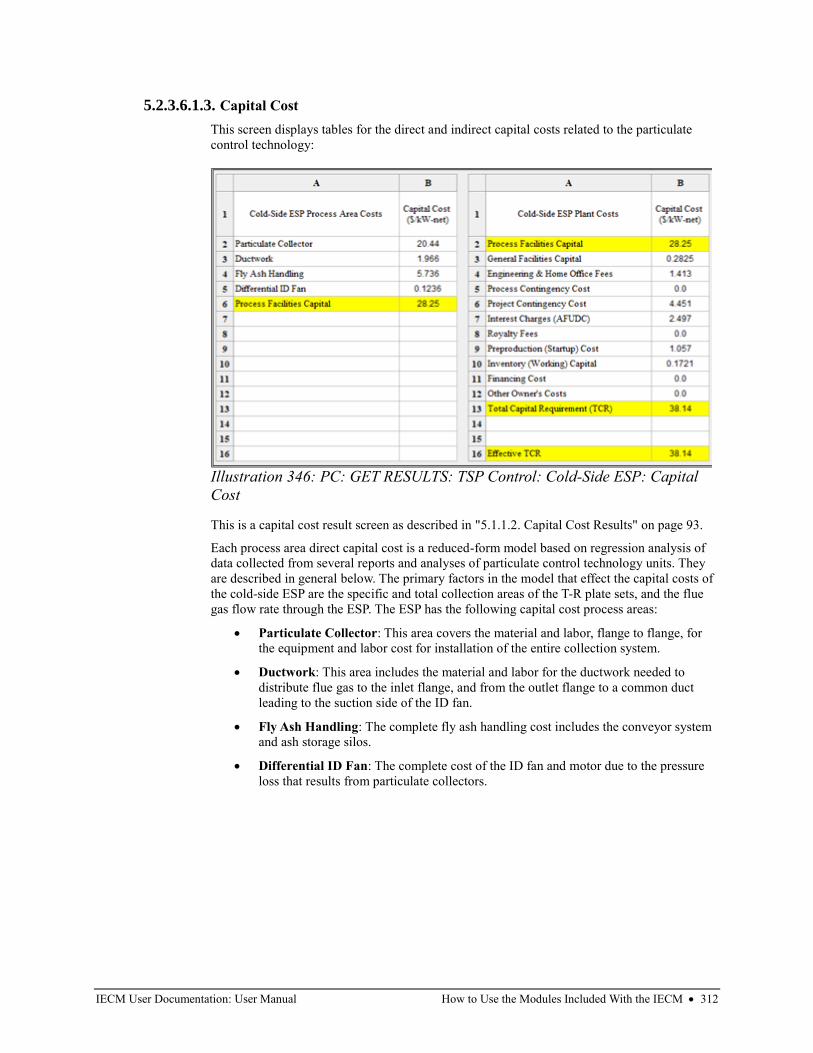
IECM User Documentation: User Manual How to Use the Modules Included With the IECM • 312
5.2.3.6.1.3. Capital Cost
This screen displays tables for the direct and indirect capital costs related to the particulate
control technology:
This is a capital cost result screen as described in "5.1.1.2. Capital Cost Results" on page 93.
Each process area direct capital cost is a reduced-form model based on regression analysis of
data collected from several reports and analyses of particulate control technology units. They
are described in general below. The primary factors in the model that effect the capital costs of
the cold-side ESP are the specific and total collection areas of the T-R plate sets, and the flue
gas flow rate through the ESP. The ESP has the following capital cost process areas:
• Particulate Collector: This area covers the material and labor, flange to flange, for
the equipment and labor cost for installation of the entire collection system.
• Ductwork: This area includes the material and labor for the ductwork needed to
distribute flue gas to the inlet flange, and from the outlet flange to a common duct
leading to the suction side of the ID fan.
• Fly Ash Handling: The complete fly ash handling cost includes the conveyor system
and ash storage silos.
• Differential ID Fan: The complete cost of the ID fan and motor due to the pressure
loss that results from particulate collectors.
Illustration 346: PC: GET RESULTS: TSP Control: Cold-Side ESP: Capital
Cost
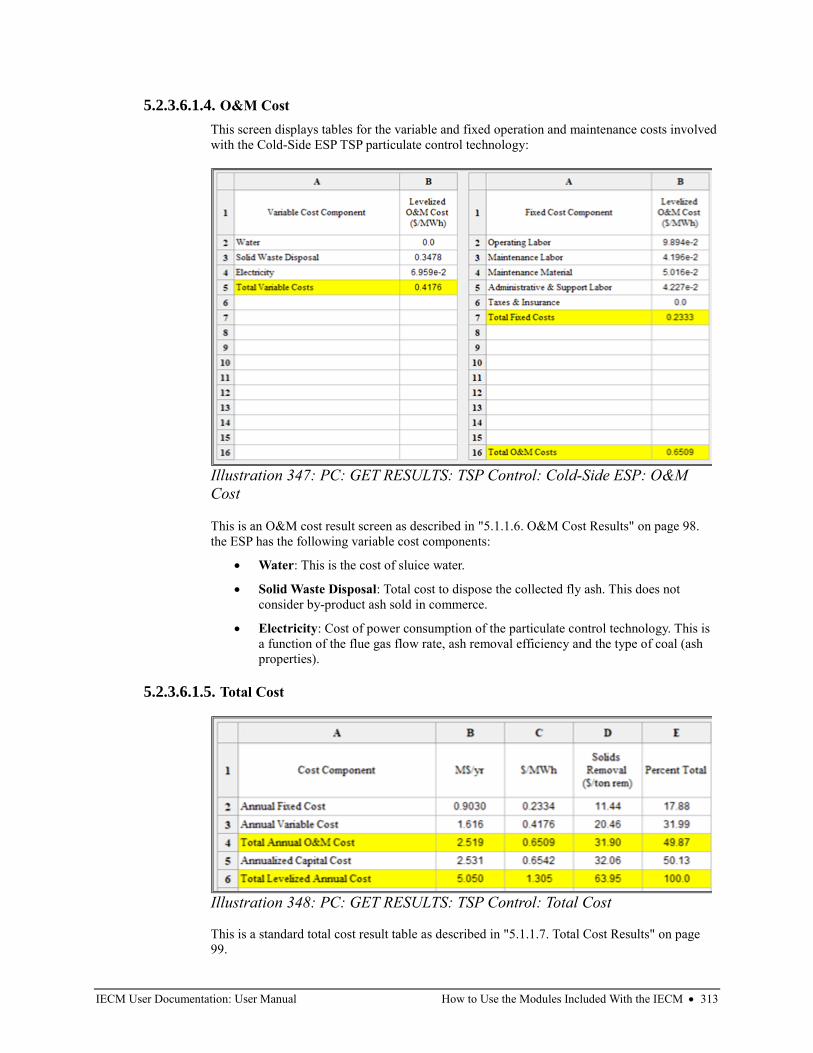
IECM User Documentation: User Manual How to Use the Modules Included With the IECM • 313
5.2.3.6.1.4. O&M Cost
This screen displays tables for the variable and fixed operation and maintenance costs involved
with the Cold-Side ESP TSP particulate control technology:
This is an O&M cost result screen as described in "5.1.1.6. O&M Cost Results" on page 98.
the ESP has the following variable cost components:
• Water: This is the cost of sluice water.
• Solid Waste Disposal: Total cost to dispose the collected fly ash. This does not
consider by-product ash sold in commerce.
• Electricity: Cost of power consumption of the particulate control technology. This is
a function of the flue gas flow rate, ash removal efficiency and the type of coal (ash
properties).
5.2.3.6.1.5. Total Cost
This is a standard total cost result table as described in "5.1.1.7. Total Cost Results" on page
99.
Illustration 347: PC: GET RESULTS: TSP Control: Cold-Side ESP: O&M
Cost
Illustration 348: PC: GET RESULTS: TSP Control: Total Cost
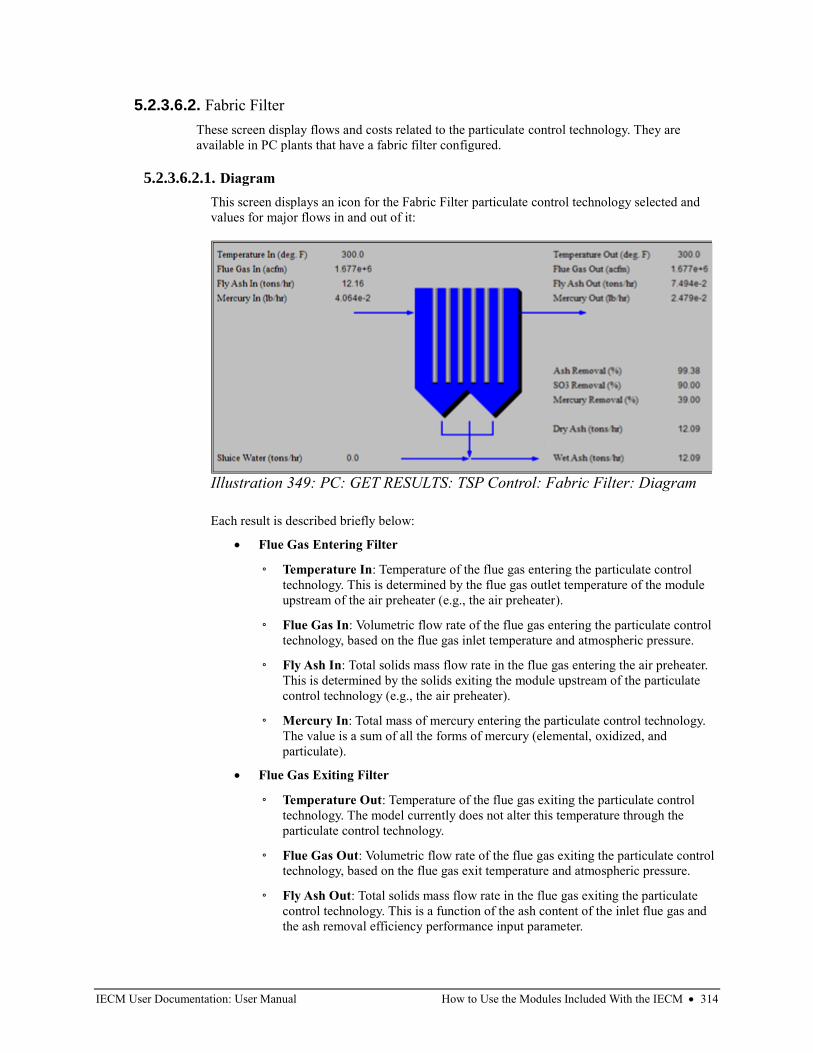
IECM User Documentation: User Manual How to Use the Modules Included With the IECM • 314
5.2.3.6.2. Fabric Filter
These screen display flows and costs related to the particulate control technology. They are
available in PC plants that have a fabric filter configured.
5.2.3.6.2.1. Diagram
This screen displays an icon for the Fabric Filter particulate control technology selected and
values for major flows in and out of it:
Each result is described briefly below:
• Flue Gas Entering Filter
◦ Temperature In: Temperature of the flue gas entering the particulate control
technology. This is determined by the flue gas outlet temperature of the module
upstream of the air preheater (e.g., the air preheater).
◦ Flue Gas In: Volumetric flow rate of the flue gas entering the particulate control
technology, based on the flue gas inlet temperature and atmospheric pressure.
◦ Fly Ash In: Total solids mass flow rate in the flue gas entering the air preheater.
This is determined by the solids exiting the module upstream of the particulate
control technology (e.g., the air preheater).
◦ Mercury In: Total mass of mercury entering the particulate control technology.
The value is a sum of all the forms of mercury (elemental, oxidized, and
particulate).
• Flue Gas Exiting Filter
◦ Temperature Out: Temperature of the flue gas exiting the particulate control
technology. The model currently does not alter this temperature through the
particulate control technology.
◦ Flue Gas Out: Volumetric flow rate of the flue gas exiting the particulate control
technology, based on the flue gas exit temperature and atmospheric pressure.
◦ Fly Ash Out: Total solids mass flow rate in the flue gas exiting the particulate
control technology. This is a function of the ash content of the inlet flue gas and
the ash removal efficiency performance input parameter.
Illustration 349: PC: GET RESULTS: TSP Control: Fabric Filter: Diagram
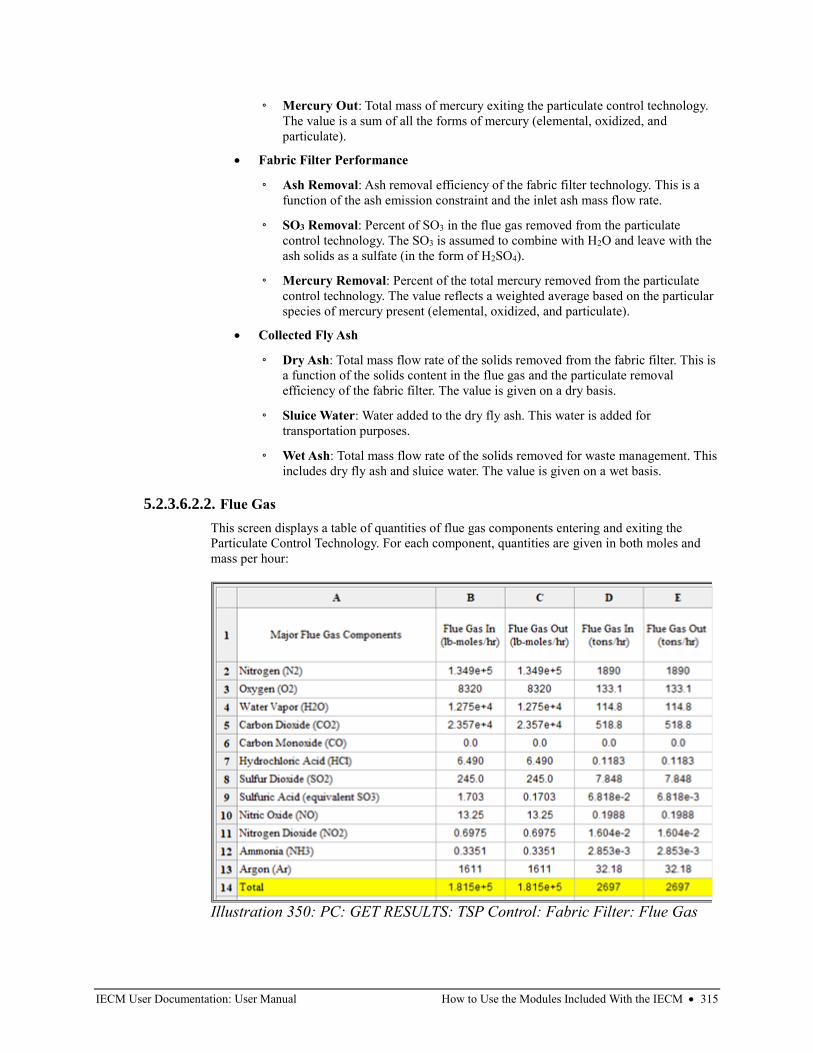
IECM User Documentation: User Manual How to Use the Modules Included With the IECM • 315
◦ Mercury Out: Total mass of mercury exiting the particulate control technology.
The value is a sum of all the forms of mercury (elemental, oxidized, and
particulate).
• Fabric Filter Performance
◦ Ash Removal: Ash removal efficiency of the fabric filter technology. This is a
function of the ash emission constraint and the inlet ash mass flow rate.
◦ SO3 Removal: Percent of SO3 in the flue gas removed from the particulate
control technology. The SO3 is assumed to combine with H2O and leave with the
ash solids as a sulfate (in the form of H2SO4).
◦ Mercury Removal: Percent of the total mercury removed from the particulate
control technology. The value reflects a weighted average based on the particular
species of mercury present (elemental, oxidized, and particulate).
• Collected Fly Ash
◦ Dry Ash: Total mass flow rate of the solids removed from the fabric filter. This is
a function of the solids content in the flue gas and the particulate removal
efficiency of the fabric filter. The value is given on a dry basis.
◦ Sluice Water: Water added to the dry fly ash. This water is added for
transportation purposes.
◦ Wet Ash: Total mass flow rate of the solids removed for waste management. This
includes dry fly ash and sluice water. The value is given on a wet basis.
5.2.3.6.2.2. Flue Gas
This screen displays a table of quantities of flue gas components entering and exiting the
Particulate Control Technology. For each component, quantities are given in both moles and
mass per hour:
Illustration 350: PC: GET RESULTS: TSP Control: Fabric Filter: Flue Gas
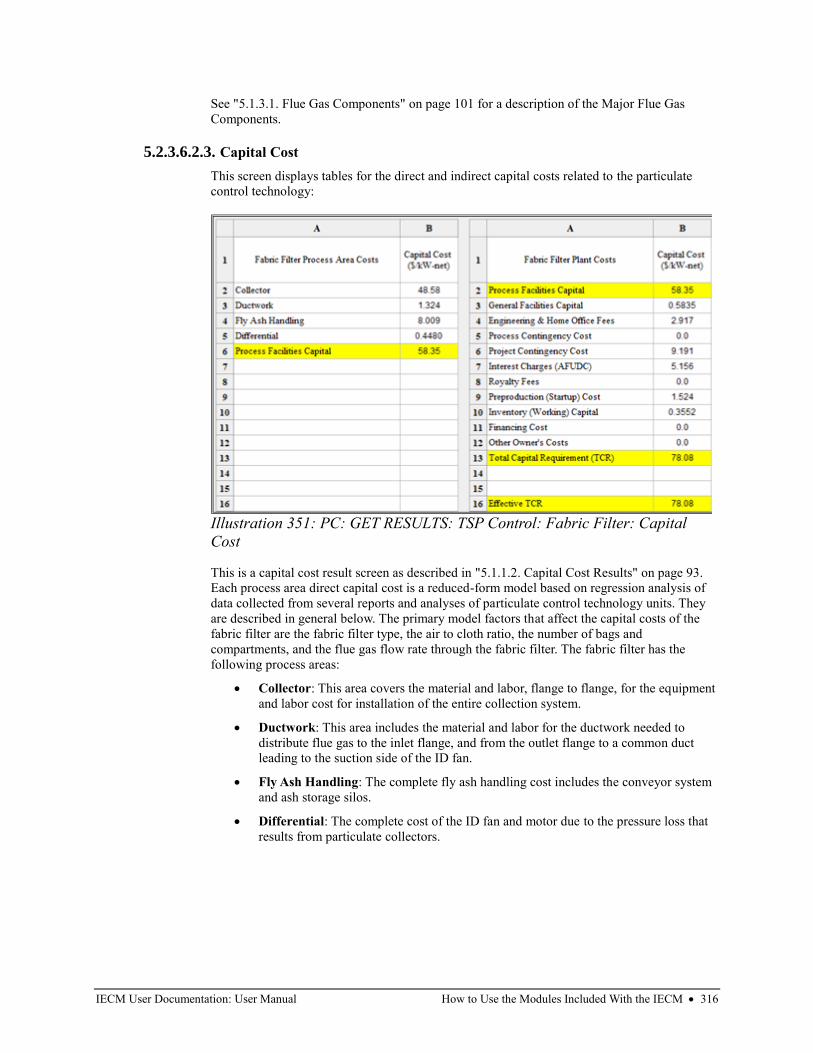
IECM User Documentation: User Manual How to Use the Modules Included With the IECM • 316
See "5.1.3.1. Flue Gas Components" on page 101 for a description of the Major Flue Gas
Components.
5.2.3.6.2.3. Capital Cost
This screen displays tables for the direct and indirect capital costs related to the particulate
control technology:
This is a capital cost result screen as described in "5.1.1.2. Capital Cost Results" on page 93.
Each process area direct capital cost is a reduced-form model based on regression analysis of
data collected from several reports and analyses of particulate control technology units. They
are described in general below. The primary model factors that affect the capital costs of the
fabric filter are the fabric filter type, the air to cloth ratio, the number of bags and
compartments, and the flue gas flow rate through the fabric filter. The fabric filter has the
following process areas:
• Collector: This area covers the material and labor, flange to flange, for the equipment
and labor cost for installation of the entire collection system.
• Ductwork: This area includes the material and labor for the ductwork needed to
distribute flue gas to the inlet flange, and from the outlet flange to a common duct
leading to the suction side of the ID fan.
• Fly Ash Handling: The complete fly ash handling cost includes the conveyor system
and ash storage silos.
• Differential: The complete cost of the ID fan and motor due to the pressure loss that
results from particulate collectors.
Illustration 351: PC: GET RESULTS: TSP Control: Fabric Filter: Capital
Cost
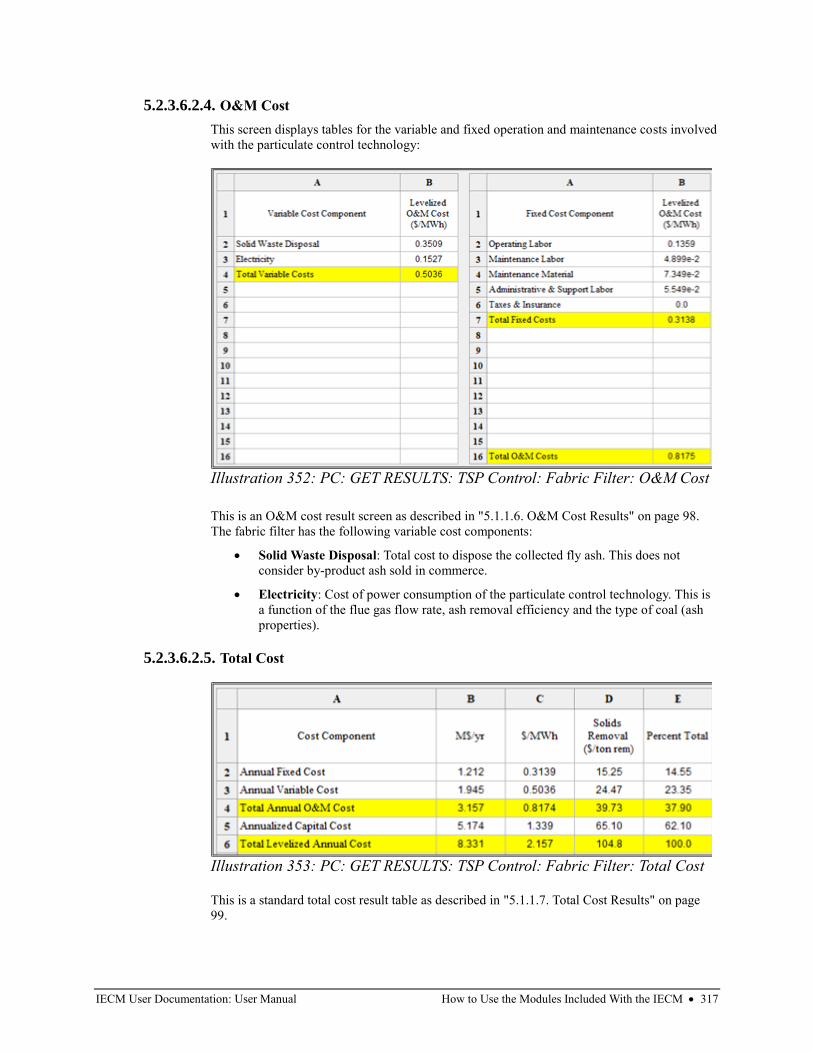
IECM User Documentation: User Manual How to Use the Modules Included With the IECM • 317
5.2.3.6.2.4. O&M Cost
This screen displays tables for the variable and fixed operation and maintenance costs involved
with the particulate control technology:
This is an O&M cost result screen as described in "5.1.1.6. O&M Cost Results" on page 98.
The fabric filter has the following variable cost components:
• Solid Waste Disposal: Total cost to dispose the collected fly ash. This does not
consider by-product ash sold in commerce.
• Electricity: Cost of power consumption of the particulate control technology. This is
a function of the flue gas flow rate, ash removal efficiency and the type of coal (ash
properties).
5.2.3.6.2.5. Total Cost
This is a standard total cost result table as described in "5.1.1.7. Total Cost Results" on page
99.
Illustration 352: PC: GET RESULTS: TSP Control: Fabric Filter: O&M Cost
Illustration 353: PC: GET RESULTS: TSP Control: Fabric Filter: Total Cost
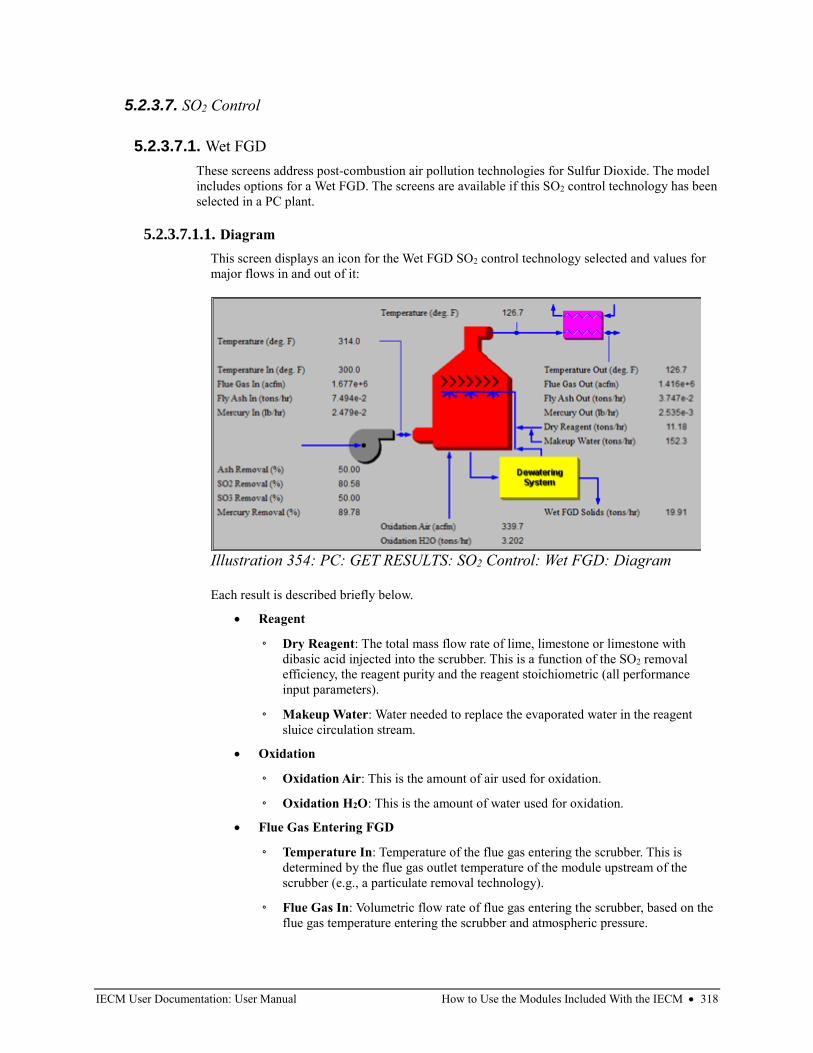
IECM User Documentation: User Manual How to Use the Modules Included With the IECM • 318
5.2.3.7. SO2 Control
5.2.3.7.1. Wet FGD
These screens address post-combustion air pollution technologies for Sulfur Dioxide. The model
includes options for a Wet FGD. The screens are available if this SO2 control technology has been
selected in a PC plant.
5.2.3.7.1.1. Diagram
This screen displays an icon for the Wet FGD SO2 control technology selected and values for
major flows in and out of it:
Each result is described briefly below.
• Reagent
◦ Dry Reagent: The total mass flow rate of lime, limestone or limestone with
dibasic acid injected into the scrubber. This is a function of the SO2 removal
efficiency, the reagent purity and the reagent stoichiometric (all performance
input parameters).
◦ Makeup Water: Water needed to replace the evaporated water in the reagent
sluice circulation stream.
• Oxidation
◦ Oxidation Air: This is the amount of air used for oxidation.
◦ Oxidation H2O: This is the amount of water used for oxidation.
• Flue Gas Entering FGD
◦ Temperature In: Temperature of the flue gas entering the scrubber. This is
determined by the flue gas outlet temperature of the module upstream of the
scrubber (e.g., a particulate removal technology).
◦ Flue Gas In: Volumetric flow rate of flue gas entering the scrubber, based on the
flue gas temperature entering the scrubber and atmospheric pressure.
Illustration 354: PC: GET RESULTS: SO2 Control: Wet FGD: Diagram
IECM User Documentation: User Manual How to Use the Modules Included With the IECM • 319
◦ Fly Ash In: Total solids mass flow rate in the flue gas entering the scrubber. This
is determined by the solids exiting from the module upstream of the scrubber
(e.g., a particulate removal technology).
◦ Mercury In: Total mass of mercury entering the scrubber. The value is a sum of
all the forms of mercury (elemental, oxidized, and particulate).
◦ Temperature: Temperature of the flue gas entering the scrubber after the forced
draft fan. This is determined by the flue gas inlet temperature of the FGD and the
temperature rise across ID fan input parameter.
• Flue Gas Exiting FGD
◦ Temperature: Temperature of the flue gas immediately on exiting the scrubber,
prior to any flue gas bypass remixing and prior to reheating.
◦ Temperature Out: Temperature of the flue gas exiting the scrubber. This is a
function of flue gas bypass, saturation temperature, reheater and the flue gas
component concentrations.
◦ Flue Gas Out: Volumetric flow rate of the flue gas exiting the scrubber after the
reheater, based on the flue gas temperature exiting the scrubber and atmospheric
pressure.
◦ Fly Ash Out: Total solids mass flow rate in the flue gas exiting the scrubber after
the reheater. This is a function of the ash removal and flue gas bypass input
parameters.
◦ Mercury Out: Total mass of mercury exiting the scrubber after the reheater. The
value is a sum of all the forms of mercury (elemental, oxidized, and particulate).
• FGD Performance
◦ Ash Removal: Actual particulate removal efficiency in the scrubber. This is set
by the scrubber ash removal input parameter.
◦ SO2 Removal: Actual removal efficiency of SO2 in the scrubber. This is a
function of the maximum removal efficiency (scrubber performance input
parameter) and the emission constraint for SO2 (emission constraints input
parameter). It is possible that the scrubber may over or under-comply with the
emission constraint.
◦ SO3 Removal: Percent of SO3 in the flue gas removed from the scrubber. The
SO3 is assumed to combine with H2O and leave with the ash solids or sluice
water as a sulfate (in the form of H2SO4).
◦ Mercury Removal: Percent of the total mercury removed from the scrubber. The
value reflects a weighted average based on the particular species of mercury
present (elemental, oxidized, and particulate).
• Collected Solids
◦ Wet FGD Solids: Total solids mass flow rate of solids removed from the
scrubber. This is a function of the solids content in the flue gas and the particulate
removal efficiency of the scrubber. The solids are shown on a wet basis.
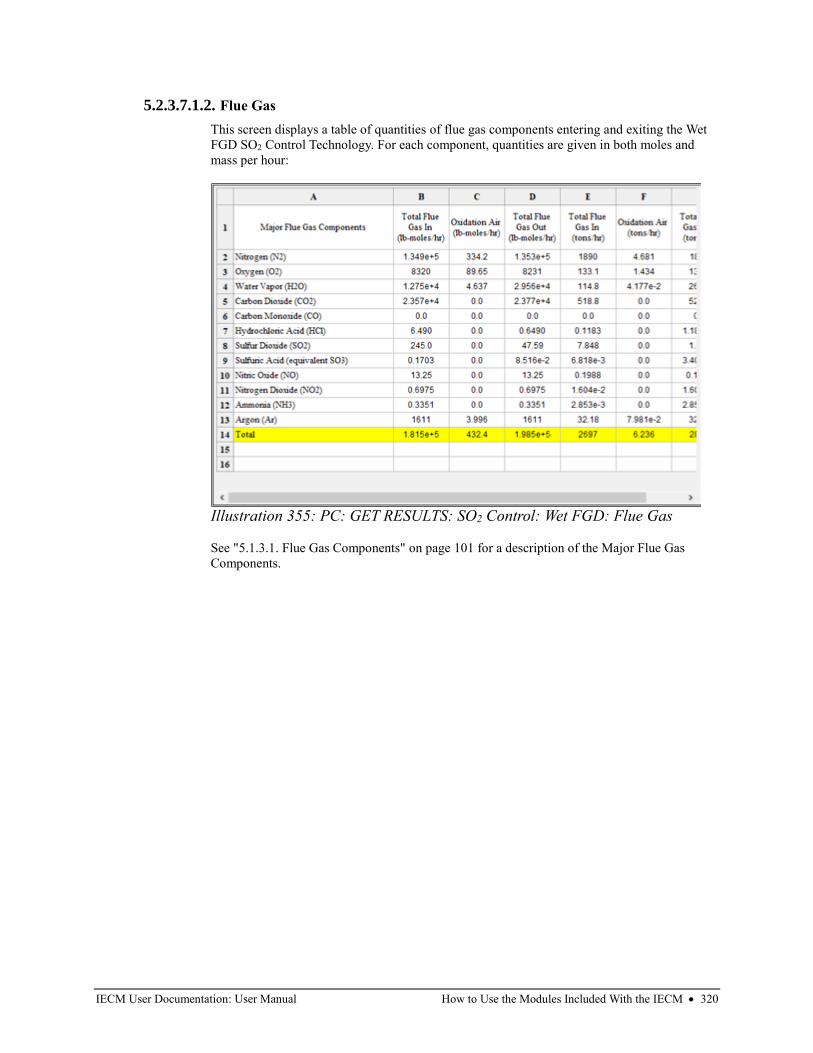
IECM User Documentation: User Manual How to Use the Modules Included With the IECM • 320
5.2.3.7.1.2. Flue Gas
This screen displays a table of quantities of flue gas components entering and exiting the Wet
FGD SO2 Control Technology. For each component, quantities are given in both moles and
mass per hour:
See "5.1.3.1. Flue Gas Components" on page 101 for a description of the Major Flue Gas
Components.
Illustration 355: PC: GET RESULTS: SO2 Control: Wet FGD: Flue Gas
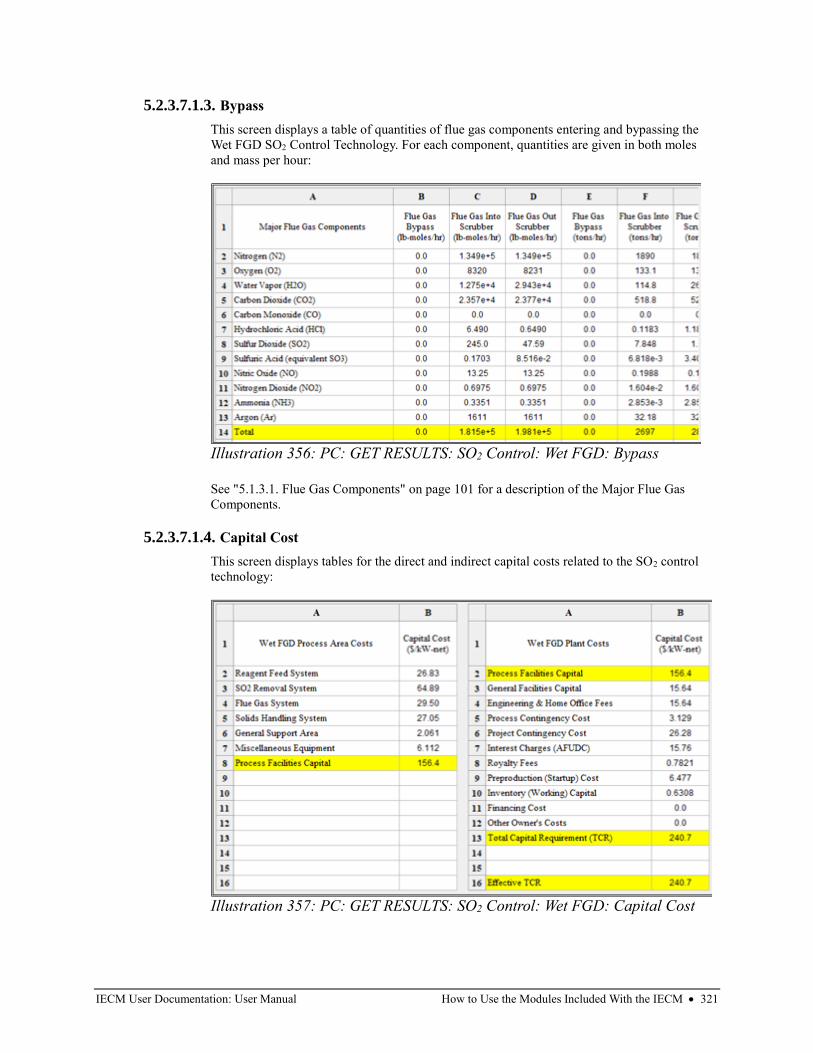
IECM User Documentation: User Manual How to Use the Modules Included With the IECM • 321
5.2.3.7.1.3. Bypass
This screen displays a table of quantities of flue gas components entering and bypassing the
Wet FGD SO2 Control Technology. For each component, quantities are given in both moles
and mass per hour:
See "5.1.3.1. Flue Gas Components" on page 101 for a description of the Major Flue Gas
Components.
5.2.3.7.1.4. Capital Cost
This screen displays tables for the direct and indirect capital costs related to the SO2 control
technology:
Illustration 356: PC: GET RESULTS: SO2 Control: Wet FGD: Bypass
Illustration 357: PC: GET RESULTS: SO2 Control: Wet FGD: Capital Cost
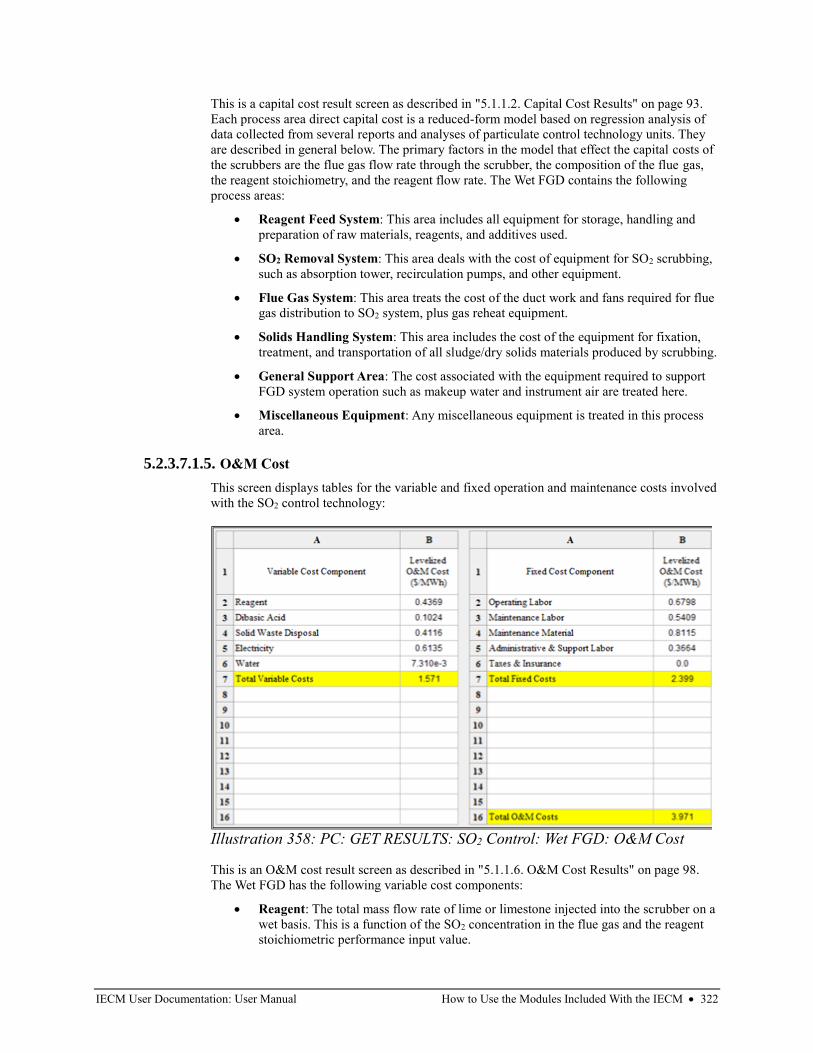
IECM User Documentation: User Manual How to Use the Modules Included With the IECM • 322
This is a capital cost result screen as described in "5.1.1.2. Capital Cost Results" on page 93.
Each process area direct capital cost is a reduced-form model based on regression analysis of
data collected from several reports and analyses of particulate control technology units. They
are described in general below. The primary factors in the model that effect the capital costs of
the scrubbers are the flue gas flow rate through the scrubber, the composition of the flue gas,
the reagent stoichiometry, and the reagent flow rate. The Wet FGD contains the following
process areas:
• Reagent Feed System: This area includes all equipment for storage, handling and
preparation of raw materials, reagents, and additives used.
• SO2 Removal System: This area deals with the cost of equipment for SO2 scrubbing,
such as absorption tower, recirculation pumps, and other equipment.
• Flue Gas System: This area treats the cost of the duct work and fans required for flue
gas distribution to SO2 system, plus gas reheat equipment.
• Solids Handling System: This area includes the cost of the equipment for fixation,
treatment, and transportation of all sludge/dry solids materials produced by scrubbing.
• General Support Area: The cost associated with the equipment required to support
FGD system operation such as makeup water and instrument air are treated here.
• Miscellaneous Equipment: Any miscellaneous equipment is treated in this process
area.
5.2.3.7.1.5. O&M Cost
This screen displays tables for the variable and fixed operation and maintenance costs involved
with the SO2 control technology:
This is an O&M cost result screen as described in "5.1.1.6. O&M Cost Results" on page 98.
The Wet FGD has the following variable cost components:
• Reagent: The total mass flow rate of lime or limestone injected into the scrubber on a
wet basis. This is a function of the SO2 concentration in the flue gas and the reagent
stoichiometric performance input value.
Illustration 358: PC: GET RESULTS: SO2 Control: Wet FGD: O&M Cost
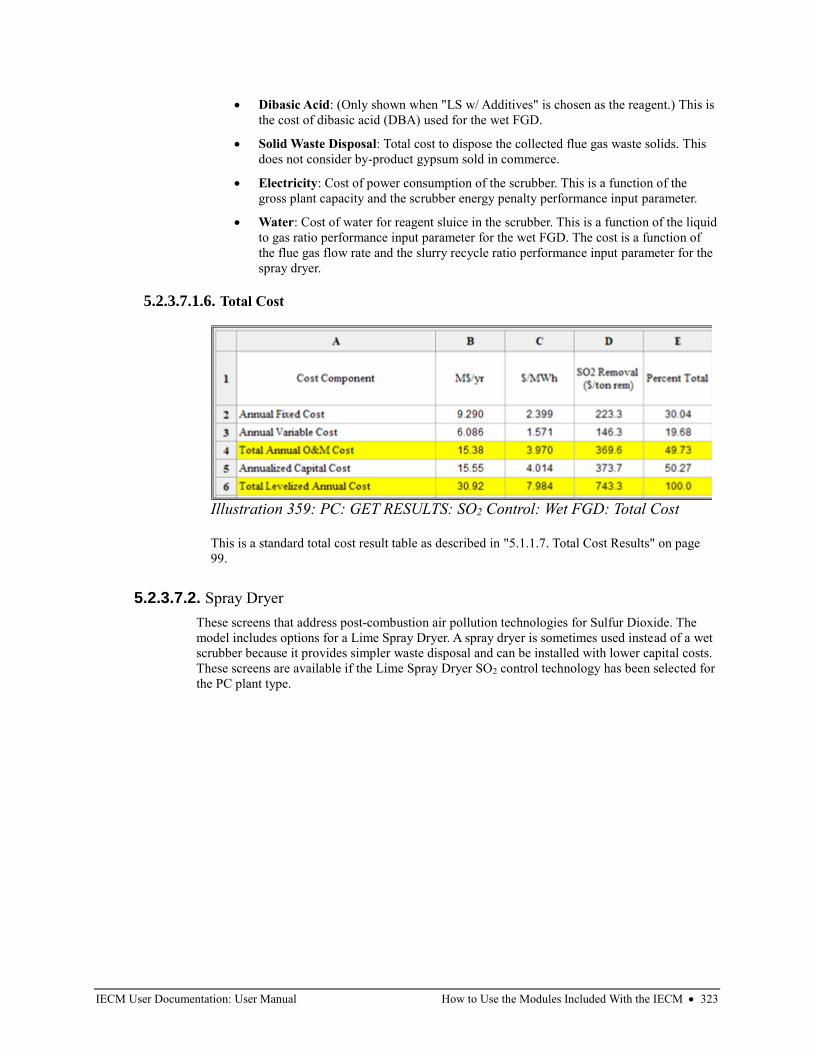
IECM User Documentation: User Manual How to Use the Modules Included With the IECM • 323
• Dibasic Acid: (Only shown when "LS w/ Additives" is chosen as the reagent.) This is
the cost of dibasic acid (DBA) used for the wet FGD.
• Solid Waste Disposal: Total cost to dispose the collected flue gas waste solids. This
does not consider by-product gypsum sold in commerce.
• Electricity: Cost of power consumption of the scrubber. This is a function of the
gross plant capacity and the scrubber energy penalty performance input parameter.
• Water: Cost of water for reagent sluice in the scrubber. This is a function of the liquid
to gas ratio performance input parameter for the wet FGD. The cost is a function of
the flue gas flow rate and the slurry recycle ratio performance input parameter for the
spray dryer.
5.2.3.7.1.6. Total Cost
This is a standard total cost result table as described in "5.1.1.7. Total Cost Results" on page
99.
5.2.3.7.2. Spray Dryer
These screens that address post-combustion air pollution technologies for Sulfur Dioxide. The
model includes options for a Lime Spray Dryer. A spray dryer is sometimes used instead of a wet
scrubber because it provides simpler waste disposal and can be installed with lower capital costs.
These screens are available if the Lime Spray Dryer SO2 control technology has been selected for
the PC plant type.
Illustration 359: PC: GET RESULTS: SO2 Control: Wet FGD: Total Cost
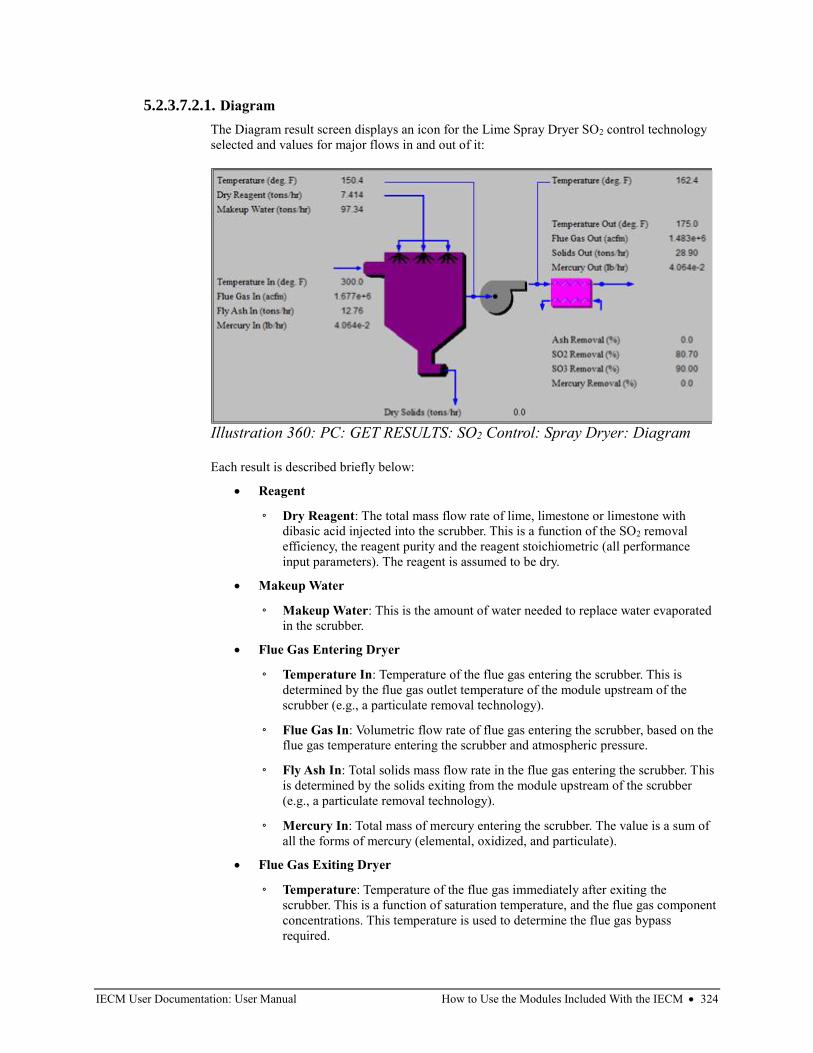
IECM User Documentation: User Manual How to Use the Modules Included With the IECM • 324
5.2.3.7.2.1. Diagram
The Diagram result screen displays an icon for the Lime Spray Dryer SO2 control technology
selected and values for major flows in and out of it:
Each result is described briefly below:
• Reagent
◦ Dry Reagent: The total mass flow rate of lime, limestone or limestone with
dibasic acid injected into the scrubber. This is a function of the SO2 removal
efficiency, the reagent purity and the reagent stoichiometric (all performance
input parameters). The reagent is assumed to be dry.
• Makeup Water
◦ Makeup Water: This is the amount of water needed to replace water evaporated
in the scrubber.
• Flue Gas Entering Dryer
◦ Temperature In: Temperature of the flue gas entering the scrubber. This is
determined by the flue gas outlet temperature of the module upstream of the
scrubber (e.g., a particulate removal technology).
◦ Flue Gas In: Volumetric flow rate of flue gas entering the scrubber, based on the
flue gas temperature entering the scrubber and atmospheric pressure.
◦ Fly Ash In: Total solids mass flow rate in the flue gas entering the scrubber. This
is determined by the solids exiting from the module upstream of the scrubber
(e.g., a particulate removal technology).
◦ Mercury In: Total mass of mercury entering the scrubber. The value is a sum of
all the forms of mercury (elemental, oxidized, and particulate).
• Flue Gas Exiting Dryer
◦ Temperature: Temperature of the flue gas immediately after exiting the
scrubber. This is a function of saturation temperature, and the flue gas component
concentrations. This temperature is used to determine the flue gas bypass
required.
Illustration 360: PC: GET RESULTS: SO2 Control: Spray Dryer: Diagram
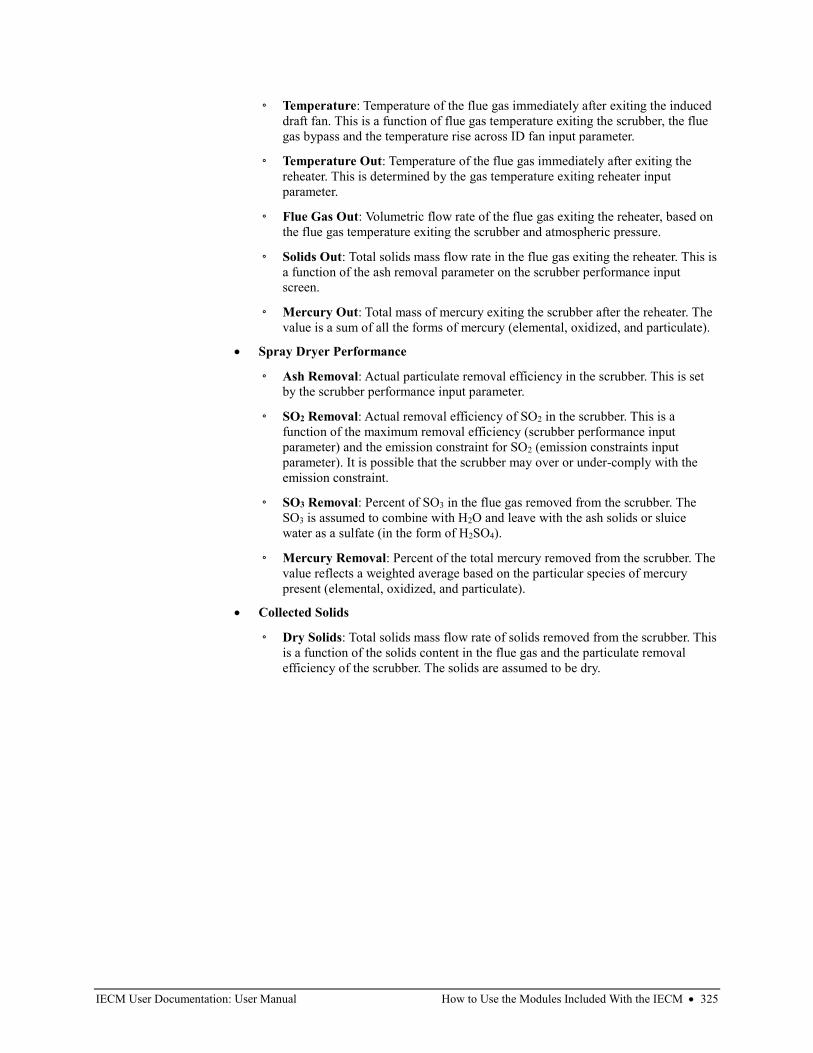
IECM User Documentation: User Manual How to Use the Modules Included With the IECM • 325
◦ Temperature: Temperature of the flue gas immediately after exiting the induced
draft fan. This is a function of flue gas temperature exiting the scrubber, the flue
gas bypass and the temperature rise across ID fan input parameter.
◦ Temperature Out: Temperature of the flue gas immediately after exiting the
reheater. This is determined by the gas temperature exiting reheater input
parameter.
◦ Flue Gas Out: Volumetric flow rate of the flue gas exiting the reheater, based on
the flue gas temperature exiting the scrubber and atmospheric pressure.
◦ Solids Out: Total solids mass flow rate in the flue gas exiting the reheater. This is
a function of the ash removal parameter on the scrubber performance input
screen.
◦ Mercury Out: Total mass of mercury exiting the scrubber after the reheater. The
value is a sum of all the forms of mercury (elemental, oxidized, and particulate).
• Spray Dryer Performance
◦ Ash Removal: Actual particulate removal efficiency in the scrubber. This is set
by the scrubber performance input parameter.
◦ SO2 Removal: Actual removal efficiency of SO2 in the scrubber. This is a
function of the maximum removal efficiency (scrubber performance input
parameter) and the emission constraint for SO2 (emission constraints input
parameter). It is possible that the scrubber may over or under-comply with the
emission constraint.
◦ SO3 Removal: Percent of SO3 in the flue gas removed from the scrubber. The
SO3 is assumed to combine with H2O and leave with the ash solids or sluice
water as a sulfate (in the form of H2SO4).
◦ Mercury Removal: Percent of the total mercury removed from the scrubber. The
value reflects a weighted average based on the particular species of mercury
present (elemental, oxidized, and particulate).
• Collected Solids
◦ Dry Solids: Total solids mass flow rate of solids removed from the scrubber. This
is a function of the solids content in the flue gas and the particulate removal
efficiency of the scrubber. The solids are assumed to be dry.
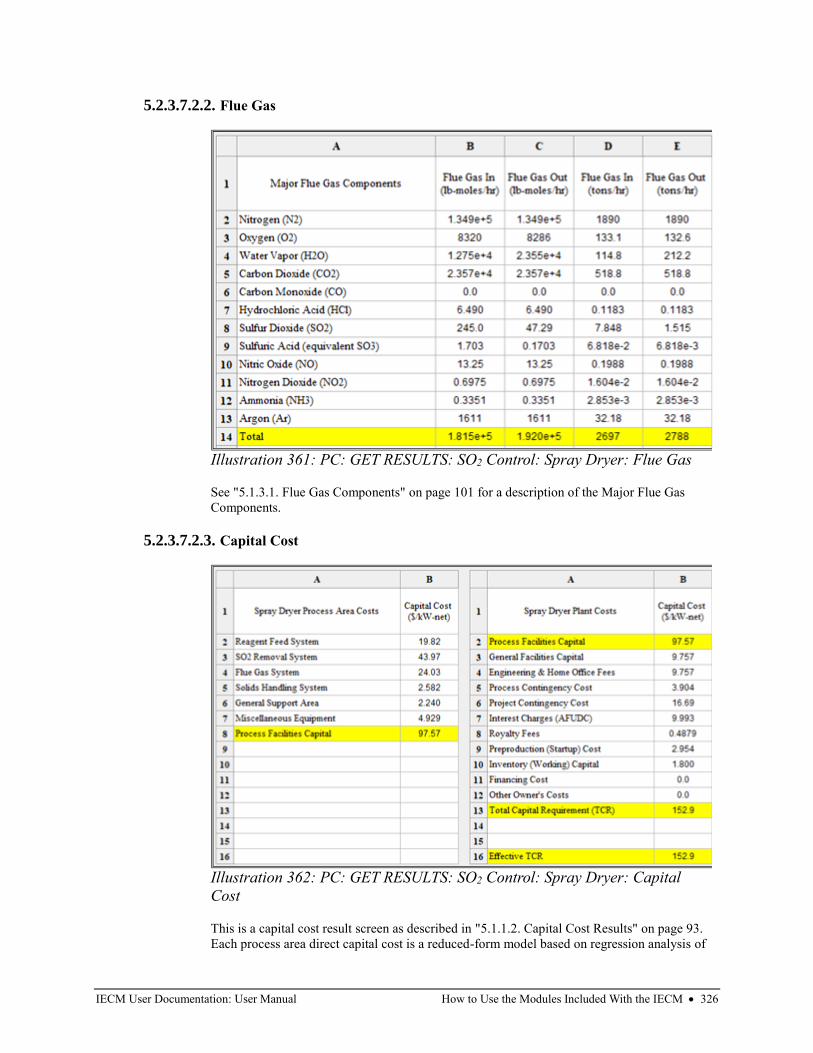
IECM User Documentation: User Manual How to Use the Modules Included With the IECM • 326
5.2.3.7.2.2. Flue Gas
See "5.1.3.1. Flue Gas Components" on page 101 for a description of the Major Flue Gas
Components.
5.2.3.7.2.3. Capital Cost
This is a capital cost result screen as described in "5.1.1.2. Capital Cost Results" on page 93.
Each process area direct capital cost is a reduced-form model based on regression analysis of
Illustration 361: PC: GET RESULTS: SO2 Control: Spray Dryer: Flue Gas
Illustration 362: PC: GET RESULTS: SO2 Control: Spray Dryer: Capital
Cost
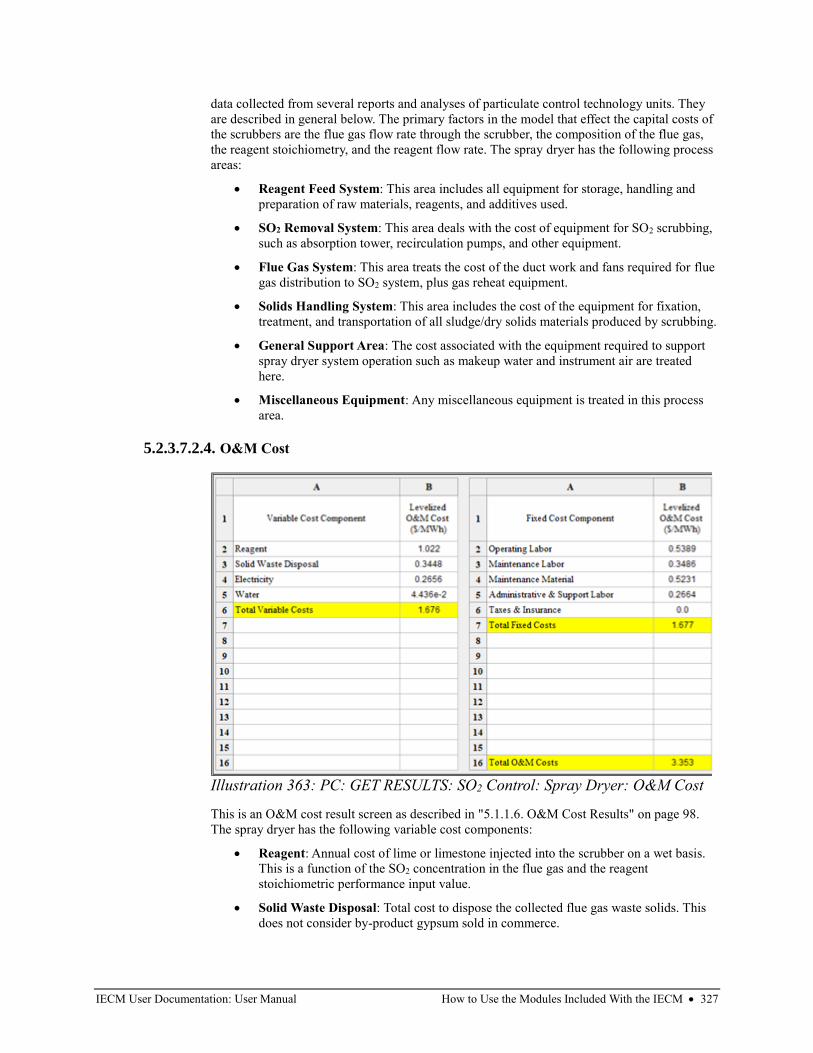
IECM User Documentation: User Manual How to Use the Modules Included With the IECM • 327
data collected from several reports and analyses of particulate control technology units. They
are described in general below. The primary factors in the model that effect the capital costs of
the scrubbers are the flue gas flow rate through the scrubber, the composition of the flue gas,
the reagent stoichiometry, and the reagent flow rate. The spray dryer has the following process
areas:
• Reagent Feed System: This area includes all equipment for storage, handling and
preparation of raw materials, reagents, and additives used.
• SO2 Removal System: This area deals with the cost of equipment for SO2 scrubbing,
such as absorption tower, recirculation pumps, and other equipment.
• Flue Gas System: This area treats the cost of the duct work and fans required for flue
gas distribution to SO2 system, plus gas reheat equipment.
• Solids Handling System: This area includes the cost of the equipment for fixation,
treatment, and transportation of all sludge/dry solids materials produced by scrubbing.
• General Support Area: The cost associated with the equipment required to support
spray dryer system operation such as makeup water and instrument air are treated
here.
• Miscellaneous Equipment: Any miscellaneous equipment is treated in this process
area.
5.2.3.7.2.4. O&M Cost
This is an O&M cost result screen as described in "5.1.1.6. O&M Cost Results" on page 98.
The spray dryer has the following variable cost components:
• Reagent: Annual cost of lime or limestone injected into the scrubber on a wet basis.
This is a function of the SO2 concentration in the flue gas and the reagent
stoichiometric performance input value.
• Solid Waste Disposal: Total cost to dispose the collected flue gas waste solids. This
does not consider by-product gypsum sold in commerce.
Illustration 363: PC: GET RESULTS: SO2 Control: Spray Dryer: O&M Cost
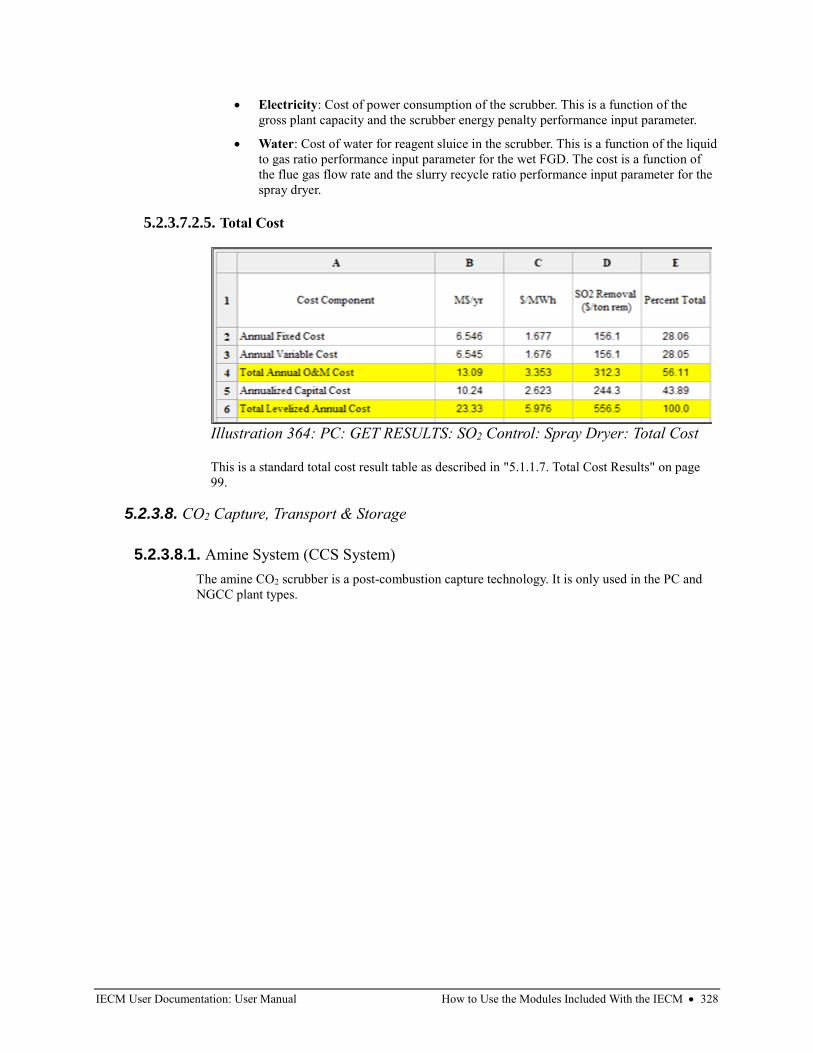
IECM User Documentation: User Manual How to Use the Modules Included With the IECM • 328
• Electricity: Cost of power consumption of the scrubber. This is a function of the
gross plant capacity and the scrubber energy penalty performance input parameter.
• Water: Cost of water for reagent sluice in the scrubber. This is a function of the liquid
to gas ratio performance input parameter for the wet FGD. The cost is a function of
the flue gas flow rate and the slurry recycle ratio performance input parameter for the
spray dryer.
5.2.3.7.2.5. Total Cost
This is a standard total cost result table as described in "5.1.1.7. Total Cost Results" on page
99.
5.2.3.8. CO2 Capture, Transport & Storage
5.2.3.8.1. Amine System (CCS System)
The amine CO2 scrubber is a post-combustion capture technology. It is only used in the PC and
NGCC plant types.
Illustration 364: PC: GET RESULTS: SO2 Control: Spray Dryer: Total Cost
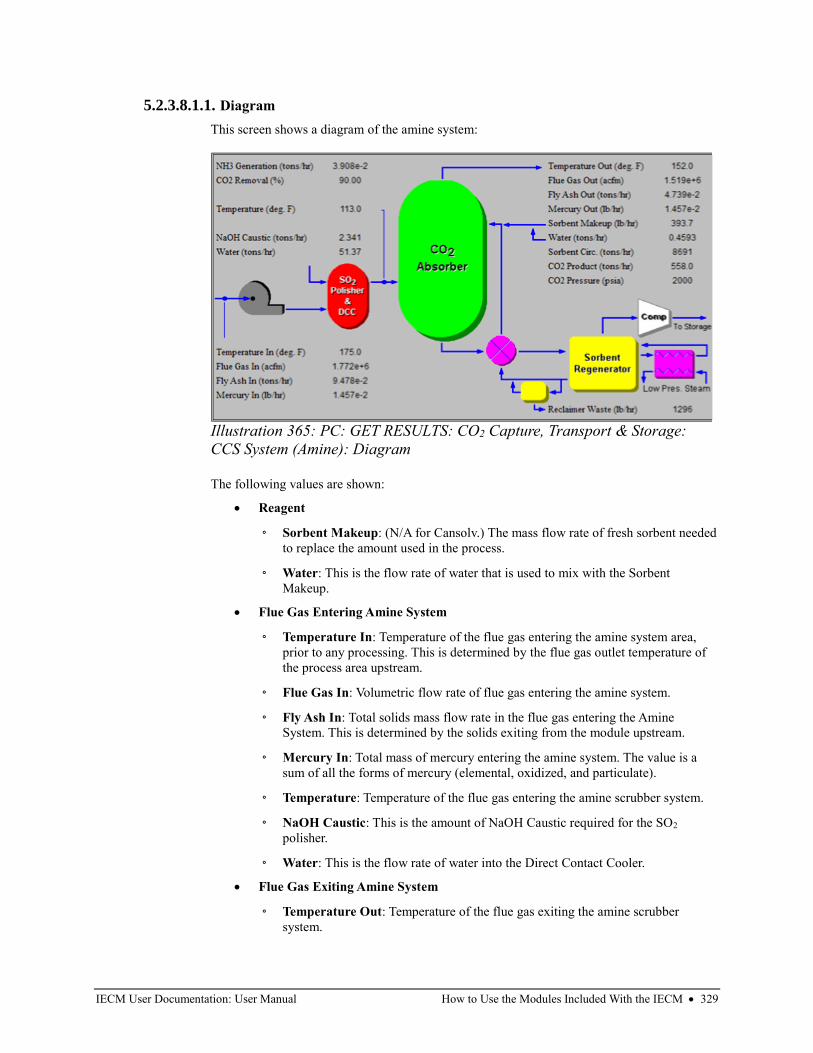
IECM User Documentation: User Manual How to Use the Modules Included With the IECM • 329
5.2.3.8.1.1. Diagram
This screen shows a diagram of the amine system:
The following values are shown:
• Reagent
◦ Sorbent Makeup: (N/A for Cansolv.) The mass flow rate of fresh sorbent needed
to replace the amount used in the process.
◦ Water: This is the flow rate of water that is used to mix with the Sorbent
Makeup.
• Flue Gas Entering Amine System
◦ Temperature In: Temperature of the flue gas entering the amine system area,
prior to any processing. This is determined by the flue gas outlet temperature of
the process area upstream.
◦ Flue Gas In: Volumetric flow rate of flue gas entering the amine system.
◦ Fly Ash In: Total solids mass flow rate in the flue gas entering the Amine
System. This is determined by the solids exiting from the module upstream.
◦ Mercury In: Total mass of mercury entering the amine system. The value is a
sum of all the forms of mercury (elemental, oxidized, and particulate).
◦ Temperature: Temperature of the flue gas entering the amine scrubber system.
◦ NaOH Caustic: This is the amount of NaOH Caustic required for the SO2
polisher.
◦ Water: This is the flow rate of water into the Direct Contact Cooler.
• Flue Gas Exiting Amine System
◦ Temperature Out: Temperature of the flue gas exiting the amine scrubber
system.
Illustration 365: PC: GET RESULTS: CO2 Capture, Transport & Storage:
CCS System (Amine): Diagram
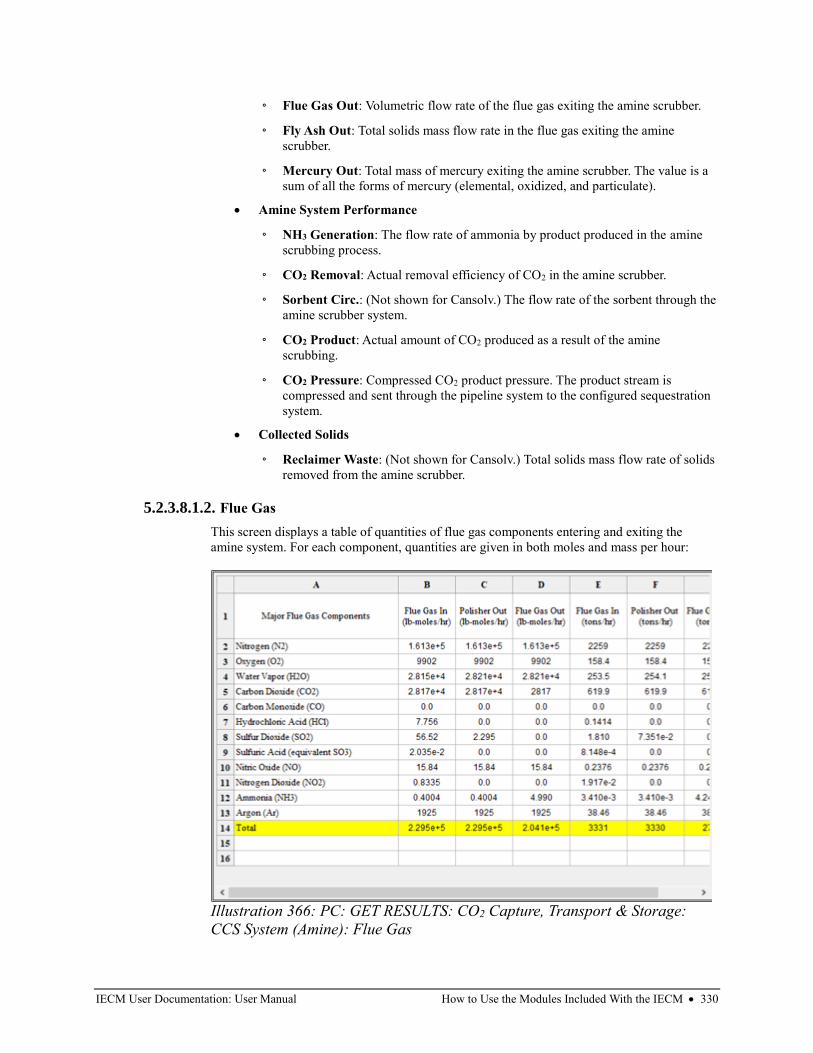
IECM User Documentation: User Manual How to Use the Modules Included With the IECM • 330
◦ Flue Gas Out: Volumetric flow rate of the flue gas exiting the amine scrubber.
◦ Fly Ash Out: Total solids mass flow rate in the flue gas exiting the amine
scrubber.
◦ Mercury Out: Total mass of mercury exiting the amine scrubber. The value is a
sum of all the forms of mercury (elemental, oxidized, and particulate).
• Amine System Performance
◦ NH3 Generation: The flow rate of ammonia by product produced in the amine
scrubbing process.
◦ CO2 Removal: Actual removal efficiency of CO2 in the amine scrubber.
◦ Sorbent Circ.: (Not shown for Cansolv.) The flow rate of the sorbent through the
amine scrubber system.
◦ CO2 Product: Actual amount of CO2 produced as a result of the amine
scrubbing.
◦ CO2 Pressure: Compressed CO2 product pressure. The product stream is
compressed and sent through the pipeline system to the configured sequestration
system.
• Collected Solids
◦ Reclaimer Waste: (Not shown for Cansolv.) Total solids mass flow rate of solids
removed from the amine scrubber.
5.2.3.8.1.2. Flue Gas
This screen displays a table of quantities of flue gas components entering and exiting the
amine system. For each component, quantities are given in both moles and mass per hour:
Illustration 366: PC: GET RESULTS: CO2 Capture, Transport & Storage:
CCS System (Amine): Flue Gas
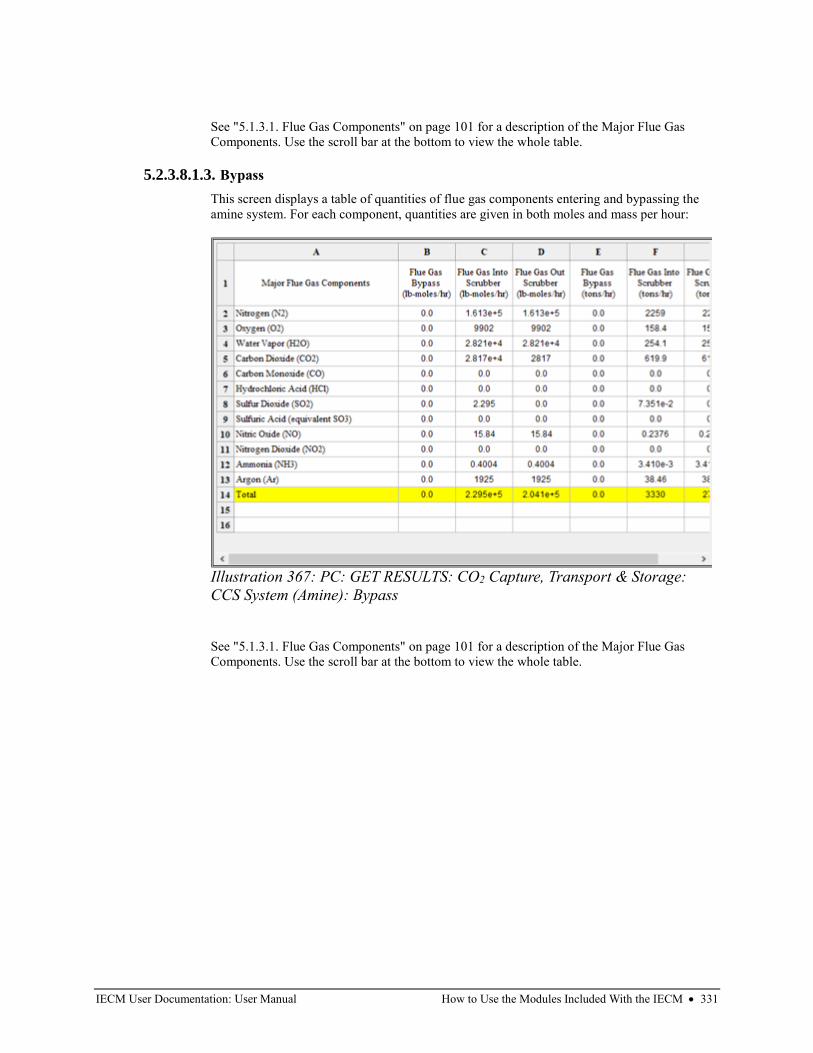
IECM User Documentation: User Manual How to Use the Modules Included With the IECM • 331
See "5.1.3.1. Flue Gas Components" on page 101 for a description of the Major Flue Gas
Components. Use the scroll bar at the bottom to view the whole table.
5.2.3.8.1.3. Bypass
This screen displays a table of quantities of flue gas components entering and bypassing the
amine system. For each component, quantities are given in both moles and mass per hour:
See "5.1.3.1. Flue Gas Components" on page 101 for a description of the Major Flue Gas
Components. Use the scroll bar at the bottom to view the whole table.
Illustration 367: PC: GET RESULTS: CO2 Capture, Transport & Storage:
CCS System (Amine): Bypass
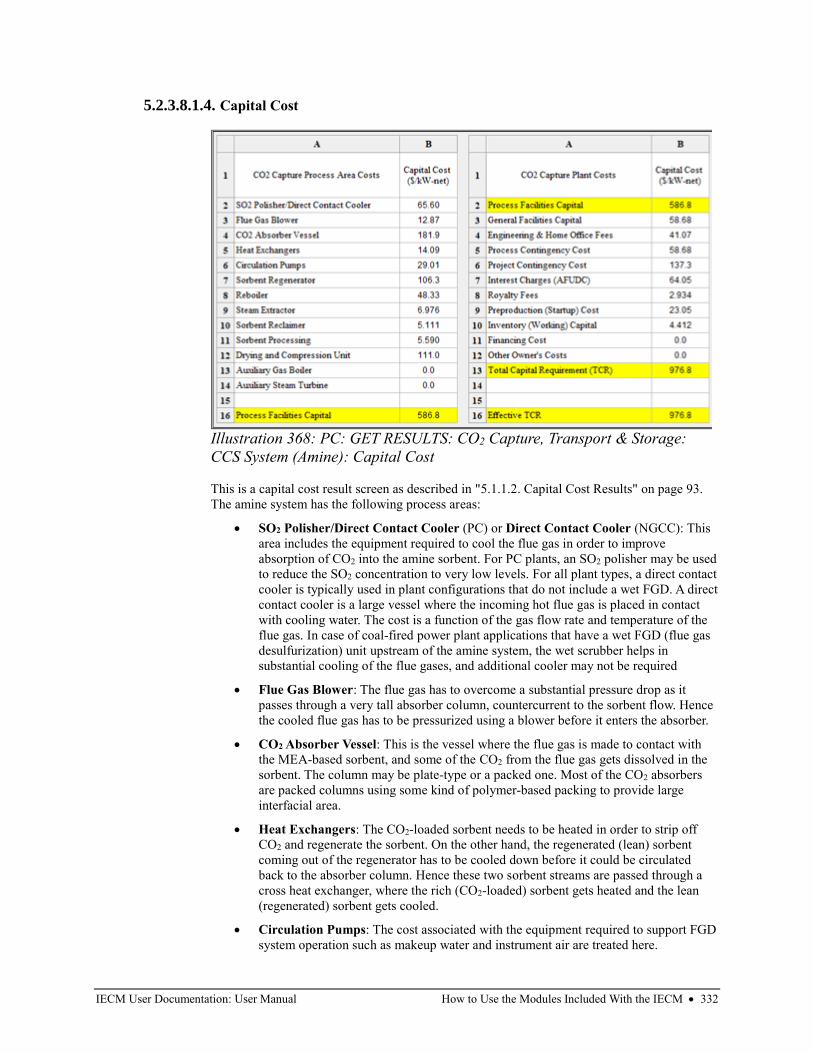
IECM User Documentation: User Manual How to Use the Modules Included With the IECM • 332
5.2.3.8.1.4. Capital Cost
This is a capital cost result screen as described in "5.1.1.2. Capital Cost Results" on page 93.
The amine system has the following process areas:
• SO2 Polisher/Direct Contact Cooler (PC) or Direct Contact Cooler (NGCC): This
area includes the equipment required to cool the flue gas in order to improve
absorption of CO2 into the amine sorbent. For PC plants, an SO2 polisher may be used
to reduce the SO2 concentration to very low levels. For all plant types, a direct contact
cooler is typically used in plant configurations that do not include a wet FGD. A direct
contact cooler is a large vessel where the incoming hot flue gas is placed in contact
with cooling water. The cost is a function of the gas flow rate and temperature of the
flue gas. In case of coal-fired power plant applications that have a wet FGD (flue gas
desulfurization) unit upstream of the amine system, the wet scrubber helps in
substantial cooling of the flue gases, and additional cooler may not be required
• Flue Gas Blower: The flue gas has to overcome a substantial pressure drop as it
passes through a very tall absorber column, countercurrent to the sorbent flow. Hence
the cooled flue gas has to be pressurized using a blower before it enters the absorber.
• CO2 Absorber Vessel: This is the vessel where the flue gas is made to contact with
the MEA-based sorbent, and some of the CO2 from the flue gas gets dissolved in the
sorbent. The column may be plate-type or a packed one. Most of the CO2 absorbers
are packed columns using some kind of polymer-based packing to provide large
interfacial area.
• Heat Exchangers: The CO2-loaded sorbent needs to be heated in order to strip off
CO2 and regenerate the sorbent. On the other hand, the regenerated (lean) sorbent
coming out of the regenerator has to be cooled down before it could be circulated
back to the absorber column. Hence these two sorbent streams are passed through a
cross heat exchanger, where the rich (CO2-loaded) sorbent gets heated and the lean
(regenerated) sorbent gets cooled.
• Circulation Pumps: The cost associated with the equipment required to support FGD
system operation such as makeup water and instrument air are treated here.
Illustration 368: PC: GET RESULTS: CO2 Capture, Transport & Storage:
CCS System (Amine): Capital Cost
IECM User Documentation: User Manual How to Use the Modules Included With the IECM • 333
• Sorbent Regenerator: This is the column where the weak intermediate compound
(carbamate) formed between the MEA-based sorbent and dissolved CO2 is broken
down with the application of heat and CO2 gets separated from the sorbent to leave
reusable sorbent behind. In case of unhindered amines like MEA, the carbamate
formed is stable and it takes large amount of energy to dissociate. It also consists of a
flash separator where CO2 is separated from most of the moisture and evaporated
sorbent, to give a fairly rich CO2 stream.
• Reboiler: The regenerator is connected with a reboiler which is basically a heat
exchanger where low-pressure steam extracted from the power plant is used to heat
the loaded sorbent.
• Steam Extractor: In case of coal-fired power plants that generate electricity in a
steam turbine, a part of the LP/IP steam has to be diverted to the reboiler for sorbent
regeneration. Steam extractors are installed to take out steam from the steam turbines.
• Sorbent Reclaimer: Presence of acid gas impurities (SO2, SO3, NO2 and HCl) in the
flue gas leads to formation of heat stable salts in the sorbent stream, which cannot be
dissociated even on application of heat. In order to avoid accumulation of these salts
in the sorbent stream and to recover some of this lost MEA sorbent, a part of the
sorbent stream is periodically distilled in this vessel. Addition of caustic helps in
freeing of some of the MEA. The recovered MEA is taken back to the sorbent stream
while the bottom sludge (reclaimer waste) is sent for proper disposal.
• Sorbent Processing: The regenerated sorbent has to be further cooled down even
after passing through the rich/lean cross heat exchanger using a cooler, so that the
sorbent temperature is brought back to acceptable level (about 40 deg C). Also, in
order to make up for the sorbent losses, a small quantity of fresh MEA sorbent has to
be added to the sorbent stream. So, the sorbent processing area primarily consists of
sorbent cooler, MEA storage tank, and a mixer. It also consists of an activated carbon
bed filter that adsorbs impurities (degradation products of MEA) from the sorbent
stream.
• Drying and Compression Unit: The CO2 product may have to be carried very long
distances via pipelines. Hence it is desirable that it does not contain any moisture in
order to avoid corrosion in the pipelines. Also, it has to be compressed to very high
pressures so that it gets liquefied and can overcome the pressure losses during the
pipeline transport. The multi-stage compression unit with inter-stage cooling and
drying yields a final CO2 product at the specified pressure (about 2000 psig) that
contains moisture and other impurities (e.g., N2) at acceptable levels.
• Auxiliary Natural Gas Boiler: The cost of the natural gas boiler is estimated on the
basis of the steam flow rate generated from the auxiliary boiler.
• Auxiliary Steam Turbine: The regeneration heat is provided in the form of low
pressure (LP) steam extracted from the steam turbine (in case of coal-fired power
plants and combined-cycle gas plants), through the reboiler (a heat exchanger). In
case of simple cycle natural gas fired power plants, a heat recovery unit maybe
required.

IECM User Documentation: User Manual How to Use the Modules Included With the IECM • 334
5.2.3.8.1.5. O&M Cost
This is an O&M cost result screen as described in "5.1.1.6. O&M Cost Results" on page 98.
The amine system has the following variable cost components:
• Sorbent: (Not shown for Cansolv.) This is the annual cost of the sorbent used in the
system. This is a function of the concentration of CO2 in the flue gas and the flue gas
flow rate.
• Process Chemicals: (Only shown for Cansolv.) Process Chemicals include Ion
Exchange Resin, NaOH, Cansolv Solvent and Triethylene Glycol.
• Auxiliary Gas (PC) or Natural Gas (NGCC): If the user has added an auxiliary
natural gas boiler, the cost of the natural gas used to fuel the boiler is added here.
• Corrosion Inhibitor: (Not shown for Cansolv.) The inhibitor helps in two ways:
reduced sorbent degradation and reduced equipment corrosion. This is the annual cost
of the corrosion inhibitor.
• Activated Carbon: (Not shown for Cansolv.) This is the cost of activated carbon
used to adsorb impurities from the sorbent (degradation products of MEA).
• Caustic (NaOH): (Not shown for Cansolv.) This is the annual cost of caustic. The
presence of acid gas impurities (SO2, SO3, NO2 and HCl) in the flue gas leads to
formation of heat stable salts in the sorbent stream, which cannot be dissociated even
on application of heat. In order to avoid accumulation of these salts in the sorbent
stream and to recover some of this lost MEA sorbent, a part of the sorbent stream is
periodically distilled in this vessel. Addition of caustic helps in freeing of some of the
MEA. The recovered MEA is taken back to the sorbent stream while the bottom
sludge (reclaimer waste) is sent for proper disposal.
• Reclaimer Waste Disposal: (Not shown for Cansolv.) This is the reclaimer waste
disposal cost per year.
• Electricity: The cost of electricity consumed by the Amine System.
Illustration 369: PC: GET RESULTS: CO2 Capture, Transport & Storage:
CCS System (Amine): O&M Cost
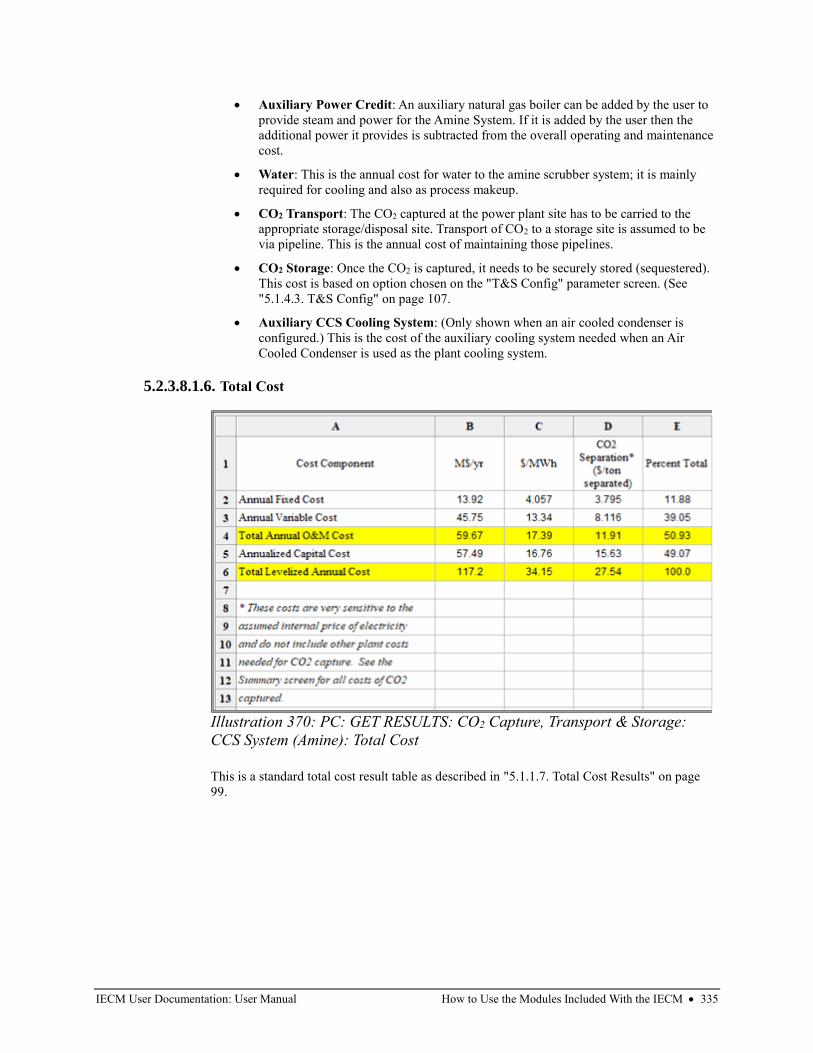
IECM User Documentation: User Manual How to Use the Modules Included With the IECM • 335
• Auxiliary Power Credit: An auxiliary natural gas boiler can be added by the user to
provide steam and power for the Amine System. If it is added by the user then the
additional power it provides is subtracted from the overall operating and maintenance
cost.
• Water: This is the annual cost for water to the amine scrubber system; it is mainly
required for cooling and also as process makeup.
• CO2 Transport: The CO2 captured at the power plant site has to be carried to the
appropriate storage/disposal site. Transport of CO2 to a storage site is assumed to be
via pipeline. This is the annual cost of maintaining those pipelines.
• CO2 Storage: Once the CO2 is captured, it needs to be securely stored (sequestered).
This cost is based on option chosen on the "T&S Config" parameter screen. (See
"5.1.4.3. T&S Config" on page 107.
• Auxiliary CCS Cooling System: (Only shown when an air cooled condenser is
configured.) This is the cost of the auxiliary cooling system needed when an Air
Cooled Condenser is used as the plant cooling system.
5.2.3.8.1.6. Total Cost
This is a standard total cost result table as described in "5.1.1.7. Total Cost Results" on page
99.
Illustration 370: PC: GET RESULTS: CO2 Capture, Transport & Storage:
CCS System (Amine): Total Cost
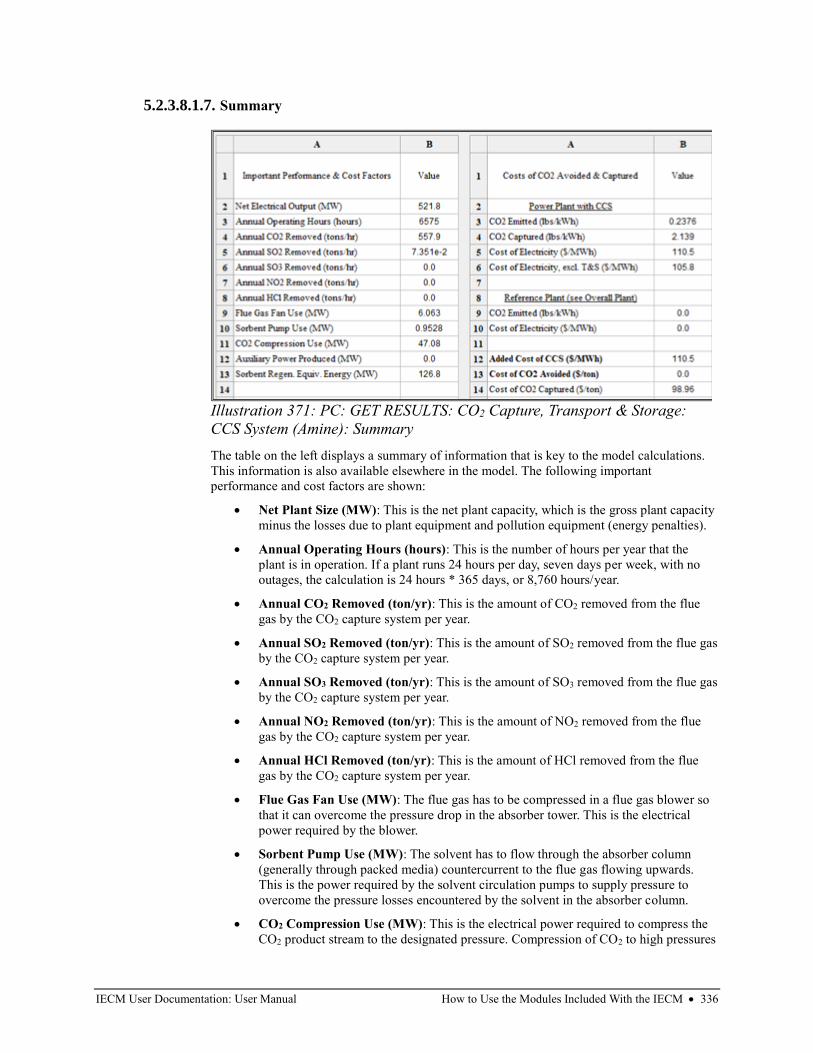
IECM User Documentation: User Manual How to Use the Modules Included With the IECM • 336
5.2.3.8.1.7. Summary
The table on the left displays a summary of information that is key to the model calculations.
This information is also available elsewhere in the model. The following important
performance and cost factors are shown:
• Net Plant Size (MW): This is the net plant capacity, which is the gross plant capacity
minus the losses due to plant equipment and pollution equipment (energy penalties).
• Annual Operating Hours (hours): This is the number of hours per year that the
plant is in operation. If a plant runs 24 hours per day, seven days per week, with no
outages, the calculation is 24 hours * 365 days, or 8,760 hours/year.
• Annual CO2 Removed (ton/yr): This is the amount of CO2 removed from the flue
gas by the CO2 capture system per year.
• Annual SO2 Removed (ton/yr): This is the amount of SO2 removed from the flue gas
by the CO2 capture system per year.
• Annual SO3 Removed (ton/yr): This is the amount of SO3 removed from the flue gas
by the CO2 capture system per year.
• Annual NO2 Removed (ton/yr): This is the amount of NO2 removed from the flue
gas by the CO2 capture system per year.
• Annual HCl Removed (ton/yr): This is the amount of HCl removed from the flue
gas by the CO2 capture system per year.
• Flue Gas Fan Use (MW): The flue gas has to be compressed in a flue gas blower so
that it can overcome the pressure drop in the absorber tower. This is the electrical
power required by the blower.
• Sorbent Pump Use (MW): The solvent has to flow through the absorber column
(generally through packed media) countercurrent to the flue gas flowing upwards.
This is the power required by the solvent circulation pumps to supply pressure to
overcome the pressure losses encountered by the solvent in the absorber column.
• CO2 Compression Use (MW): This is the electrical power required to compress the
CO2 product stream to the designated pressure. Compression of CO2 to high pressures
Illustration 371: PC: GET RESULTS: CO2 Capture, Transport & Storage:
CCS System (Amine): Summary
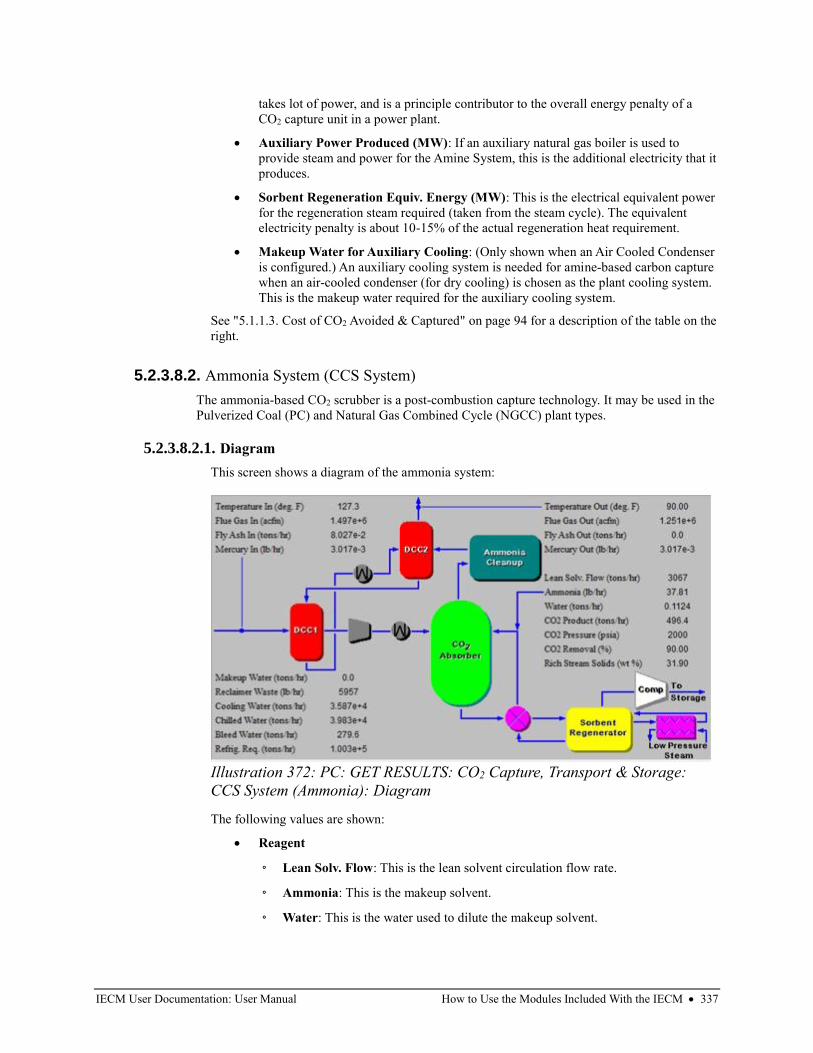
IECM User Documentation: User Manual How to Use the Modules Included With the IECM • 337
takes lot of power, and is a principle contributor to the overall energy penalty of a
CO2 capture unit in a power plant.
• Auxiliary Power Produced (MW): If an auxiliary natural gas boiler is used to
provide steam and power for the Amine System, this is the additional electricity that it
produces.
• Sorbent Regeneration Equiv. Energy (MW): This is the electrical equivalent power
for the regeneration steam required (taken from the steam cycle). The equivalent
electricity penalty is about 10-15% of the actual regeneration heat requirement.
• Makeup Water for Auxiliary Cooling: (Only shown when an Air Cooled Condenser
is configured.) An auxiliary cooling system is needed for amine-based carbon capture
when an air-cooled condenser (for dry cooling) is chosen as the plant cooling system.
This is the makeup water required for the auxiliary cooling system.
See "5.1.1.3. Cost of CO2 Avoided & Captured" on page 94 for a description of the table on the
right.
5.2.3.8.2. Ammonia System (CCS System)
The ammonia-based CO2 scrubber is a post-combustion capture technology. It may be used in the
Pulverized Coal (PC) and Natural Gas Combined Cycle (NGCC) plant types.
5.2.3.8.2.1. Diagram
This screen shows a diagram of the ammonia system:
The following values are shown:
• Reagent
◦ Lean Solv. Flow: This is the lean solvent circulation flow rate.
◦ Ammonia: This is the makeup solvent.
◦ Water: This is the water used to dilute the makeup solvent.
Illustration 372: PC: GET RESULTS: CO2 Capture, Transport & Storage:
CCS System (Ammonia): Diagram
IECM User Documentation: User Manual How to Use the Modules Included With the IECM • 338
• DCC
◦ Makeup Water: This is the amount of makeup water required.
◦ Reclaimer Waste: Total solids mass flow rate of solids removed from the
ammonia scrubber.
◦ Cooling Water: This is the total cooling water required for the ammonia system.
◦ Chilled Water: This is the amount of chilled water required for all of the chillers
in the ammonia system.
◦ Bleed Water: This is the amount of bleed water.
◦ Refrig. Req.: This is the amount of refrigeration required for all of the chillers in
the ammonia system.
• Flue Gas Entering Ammonia System
◦ Temperature In: Temperature of the flue gas entering the ammonia system.
◦ Flue Gas In: Volumetric flow rate of flue gas entering the ammonia system.
◦ Fly Ash In: Total solids mass flow rate in the flue gas entering the ammonia
system. This is determined by the solids exiting from the module upstream.
◦ Mercury In: Total mass of mercury entering the ammonia system. The value is a
sum of all the forms of mercury (elemental, oxidized, and particulate).
• Flue Gas Exiting Ammonia System
◦ Temperature Out: Temperature of the flue gas exiting the ammonia system.
◦ Flue Gas Out: Volumetric flow rate of the flue gas exiting the ammonia system
◦ Fly Ash Out: Total solids mass flow rate in the flue gas exiting the ammonia
system.
◦ Mercury Out: Total mass of mercury exiting the ammonia system. The value is a
sum of all the forms of mercury (elemental, oxidized, and particulate).
• Ammonia System Performance
◦ CO2 Product: Actual amount of CO2 produced.
◦ CO2 Pressure: Compressed CO2 product pressure. The product stream is
compressed for transport to a sequestration site.
◦ CO2 Removal: Actual removal efficiency of CO2.
◦ Rich Stream Solids: This is the percentage by weight of solids in the rich
solution.
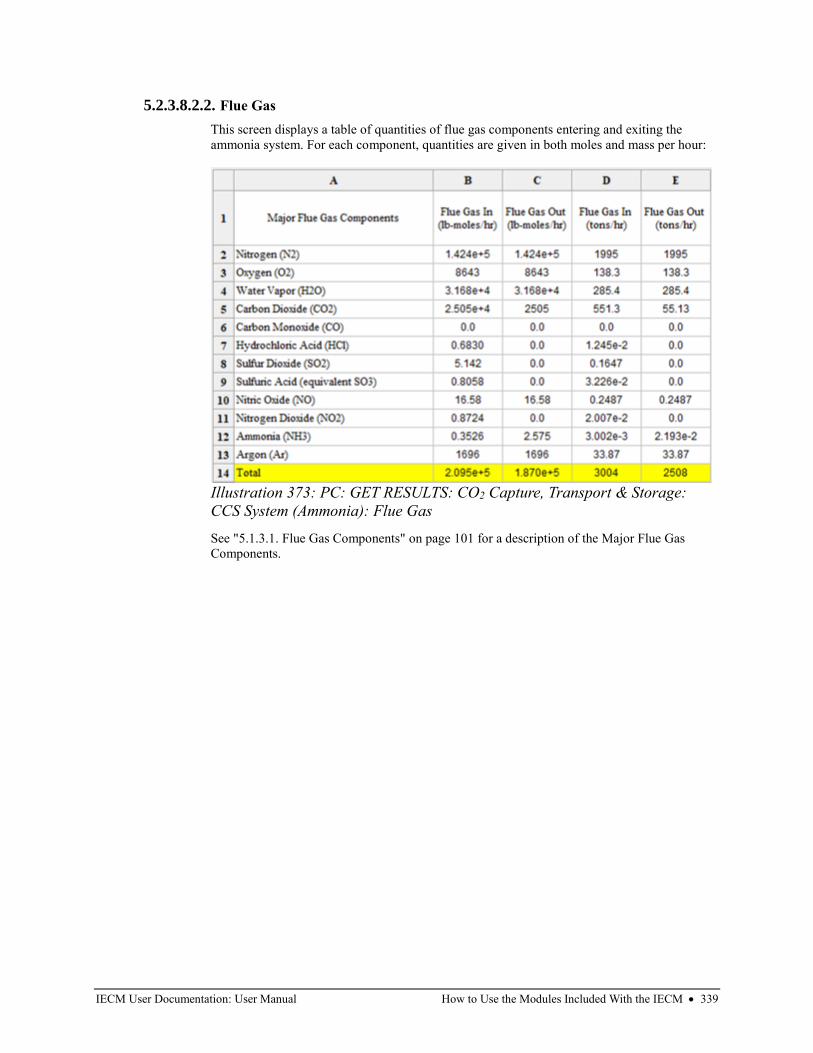
IECM User Documentation: User Manual How to Use the Modules Included With the IECM • 339
5.2.3.8.2.2. Flue Gas
This screen displays a table of quantities of flue gas components entering and exiting the
ammonia system. For each component, quantities are given in both moles and mass per hour:
See "5.1.3.1. Flue Gas Components" on page 101 for a description of the Major Flue Gas
Components.
Illustration 373: PC: GET RESULTS: CO2 Capture, Transport & Storage:
CCS System (Ammonia): Flue Gas
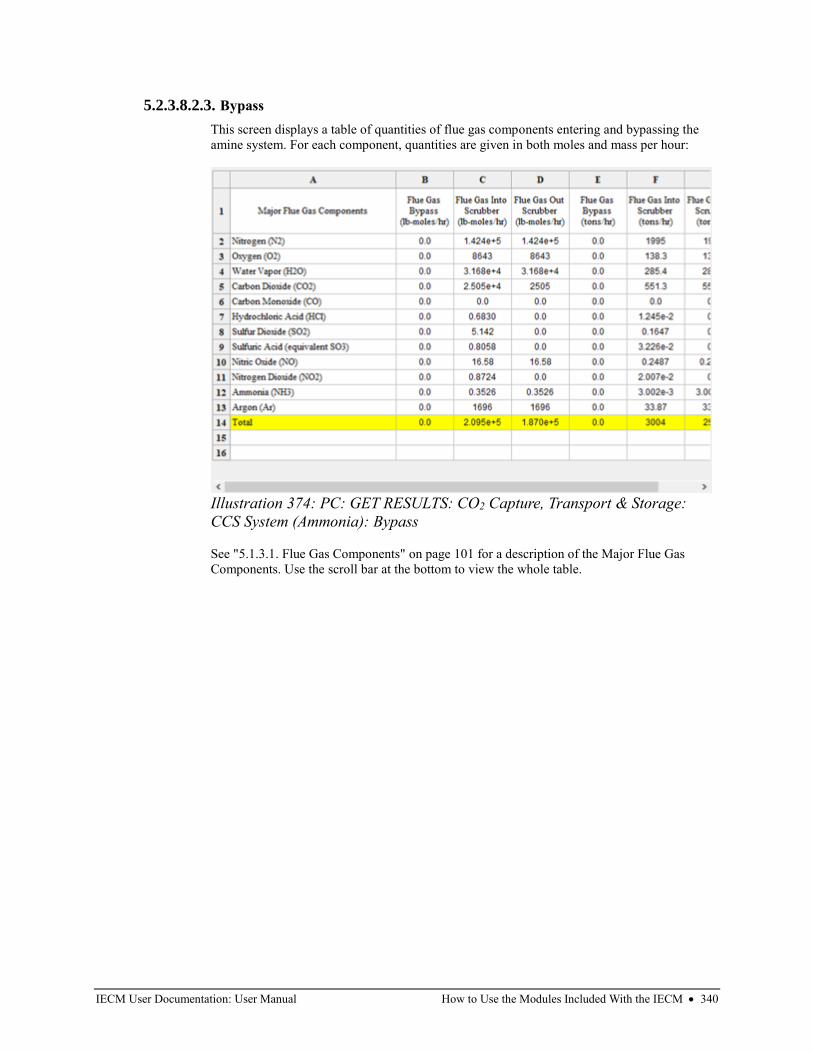
IECM User Documentation: User Manual How to Use the Modules Included With the IECM • 340
5.2.3.8.2.3. Bypass
This screen displays a table of quantities of flue gas components entering and bypassing the
amine system. For each component, quantities are given in both moles and mass per hour:
See "5.1.3.1. Flue Gas Components" on page 101 for a description of the Major Flue Gas
Components. Use the scroll bar at the bottom to view the whole table.
Illustration 374: PC: GET RESULTS: CO2 Capture, Transport & Storage:
CCS System (Ammonia): Bypass
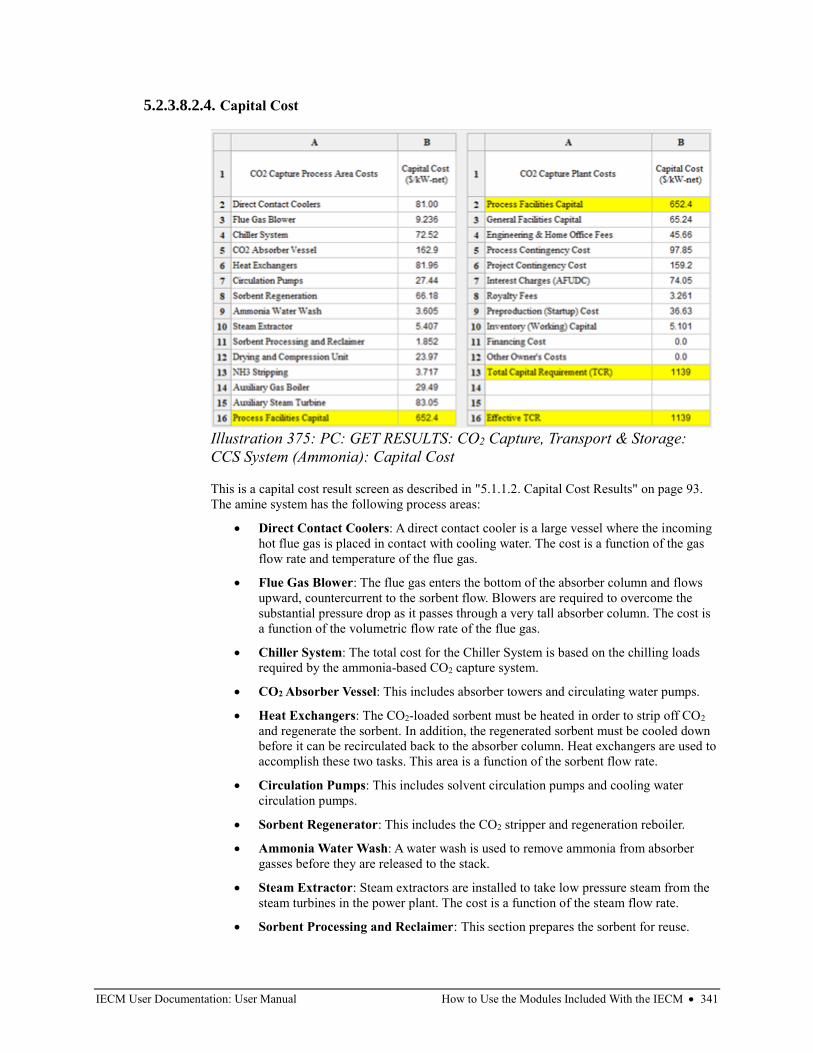
IECM User Documentation: User Manual How to Use the Modules Included With the IECM • 341
5.2.3.8.2.4. Capital Cost
This is a capital cost result screen as described in "5.1.1.2. Capital Cost Results" on page 93.
The amine system has the following process areas:
• Direct Contact Coolers: A direct contact cooler is a large vessel where the incoming
hot flue gas is placed in contact with cooling water. The cost is a function of the gas
flow rate and temperature of the flue gas.
• Flue Gas Blower: The flue gas enters the bottom of the absorber column and flows
upward, countercurrent to the sorbent flow. Blowers are required to overcome the
substantial pressure drop as it passes through a very tall absorber column. The cost is
a function of the volumetric flow rate of the flue gas.
• Chiller System: The total cost for the Chiller System is based on the chilling loads
required by the ammonia-based CO2 capture system.
• CO2 Absorber Vessel: This includes absorber towers and circulating water pumps.
• Heat Exchangers: The CO2-loaded sorbent must be heated in order to strip off CO2
and regenerate the sorbent. In addition, the regenerated sorbent must be cooled down
before it can be recirculated back to the absorber column. Heat exchangers are used to
accomplish these two tasks. This area is a function of the sorbent flow rate.
• Circulation Pumps: This includes solvent circulation pumps and cooling water
circulation pumps.
• Sorbent Regenerator: This includes the CO2 stripper and regeneration reboiler.
• Ammonia Water Wash: A water wash is used to remove ammonia from absorber
gasses before they are released to the stack.
• Steam Extractor: Steam extractors are installed to take low pressure steam from the
steam turbines in the power plant. The cost is a function of the steam flow rate.
• Sorbent Processing and Reclaimer: This section prepares the sorbent for reuse.
Illustration 375: PC: GET RESULTS: CO2 Capture, Transport & Storage:
CCS System (Ammonia): Capital Cost
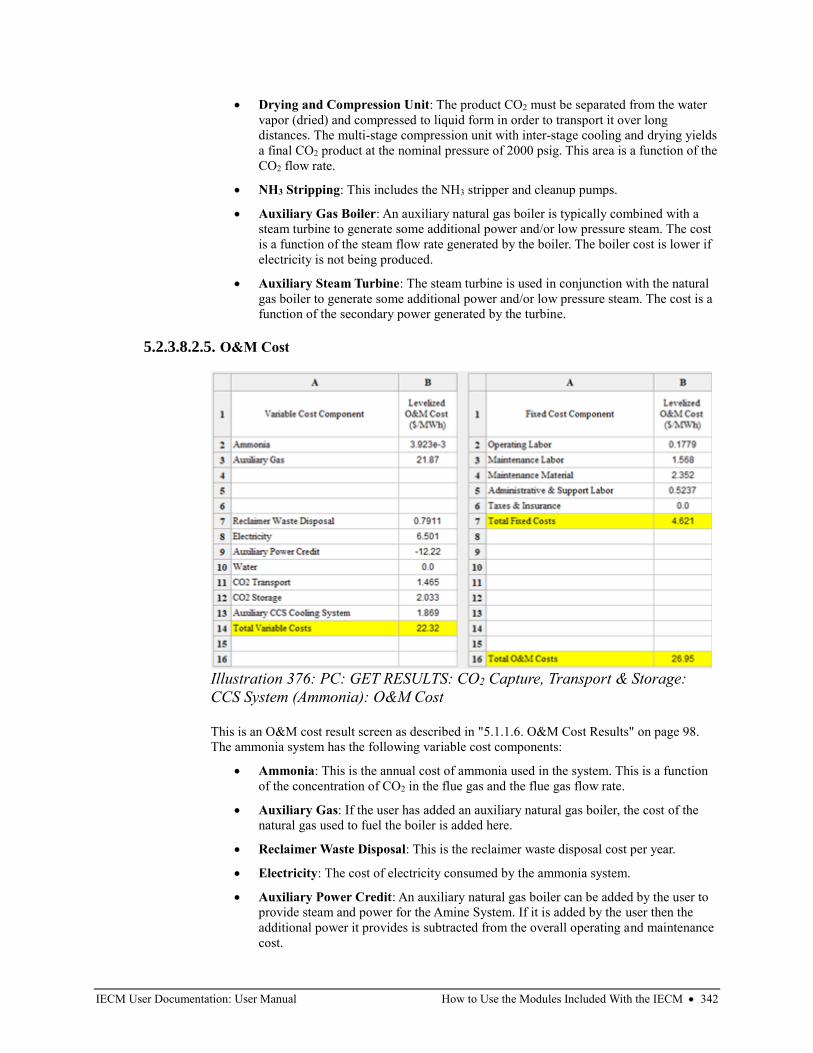
IECM User Documentation: User Manual How to Use the Modules Included With the IECM • 342
• Drying and Compression Unit: The product CO2 must be separated from the water
vapor (dried) and compressed to liquid form in order to transport it over long
distances. The multi-stage compression unit with inter-stage cooling and drying yields
a final CO2 product at the nominal pressure of 2000 psig. This area is a function of the
CO2 flow rate.
• NH3 Stripping: This includes the NH3 stripper and cleanup pumps.
• Auxiliary Gas Boiler: An auxiliary natural gas boiler is typically combined with a
steam turbine to generate some additional power and/or low pressure steam. The cost
is a function of the steam flow rate generated by the boiler. The boiler cost is lower if
electricity is not being produced.
• Auxiliary Steam Turbine: The steam turbine is used in conjunction with the natural
gas boiler to generate some additional power and/or low pressure steam. The cost is a
function of the secondary power generated by the turbine.
5.2.3.8.2.5. O&M Cost
This is an O&M cost result screen as described in "5.1.1.6. O&M Cost Results" on page 98.
The ammonia system has the following variable cost components:
• Ammonia: This is the annual cost of ammonia used in the system. This is a function
of the concentration of CO2 in the flue gas and the flue gas flow rate.
• Auxiliary Gas: If the user has added an auxiliary natural gas boiler, the cost of the
natural gas used to fuel the boiler is added here.
• Reclaimer Waste Disposal: This is the reclaimer waste disposal cost per year.
• Electricity: The cost of electricity consumed by the ammonia system.
• Auxiliary Power Credit: An auxiliary natural gas boiler can be added by the user to
provide steam and power for the Amine System. If it is added by the user then the
additional power it provides is subtracted from the overall operating and maintenance
cost.
Illustration 376: PC: GET RESULTS: CO2 Capture, Transport & Storage:
CCS System (Ammonia): O&M Cost
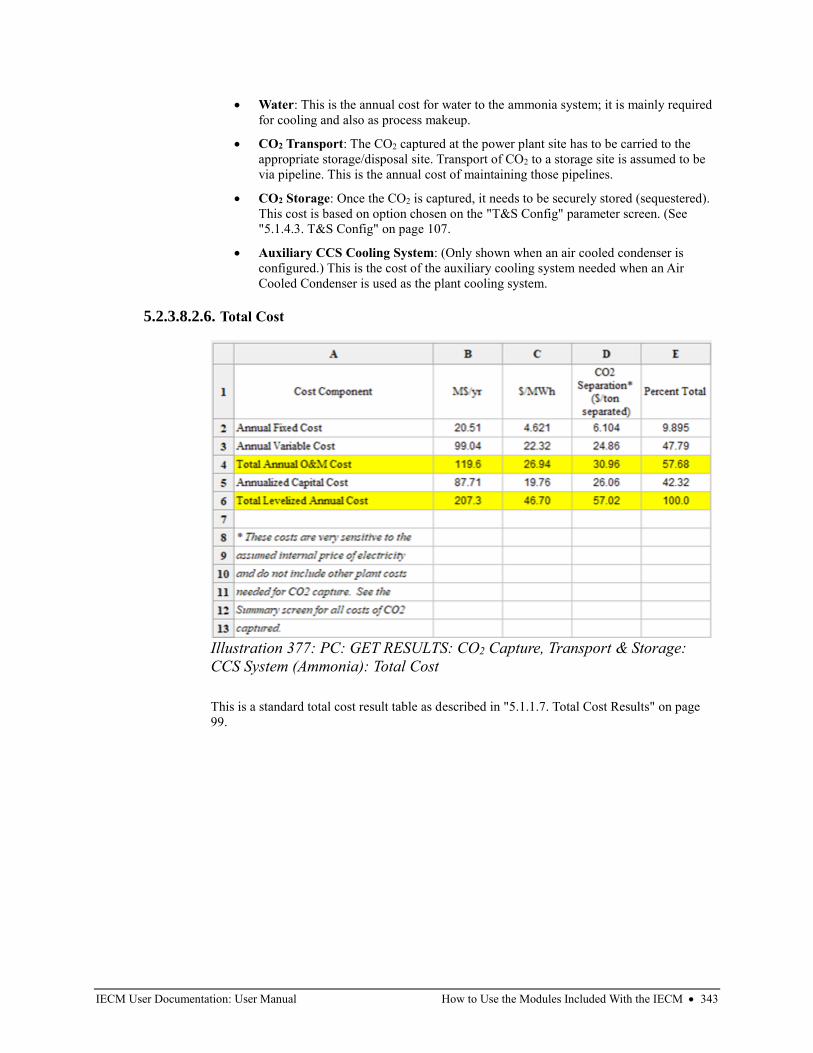
IECM User Documentation: User Manual How to Use the Modules Included With the IECM • 343
• Water: This is the annual cost for water to the ammonia system; it is mainly required
for cooling and also as process makeup.
• CO2 Transport: The CO2 captured at the power plant site has to be carried to the
appropriate storage/disposal site. Transport of CO2 to a storage site is assumed to be
via pipeline. This is the annual cost of maintaining those pipelines.
• CO2 Storage: Once the CO2 is captured, it needs to be securely stored (sequestered).
This cost is based on option chosen on the "T&S Config" parameter screen. (See
"5.1.4.3. T&S Config" on page 107.
• Auxiliary CCS Cooling System: (Only shown when an air cooled condenser is
configured.) This is the cost of the auxiliary cooling system needed when an Air
Cooled Condenser is used as the plant cooling system.
5.2.3.8.2.6. Total Cost
This is a standard total cost result table as described in "5.1.1.7. Total Cost Results" on page
99.
Illustration 377: PC: GET RESULTS: CO2 Capture, Transport & Storage:
CCS System (Ammonia): Total Cost
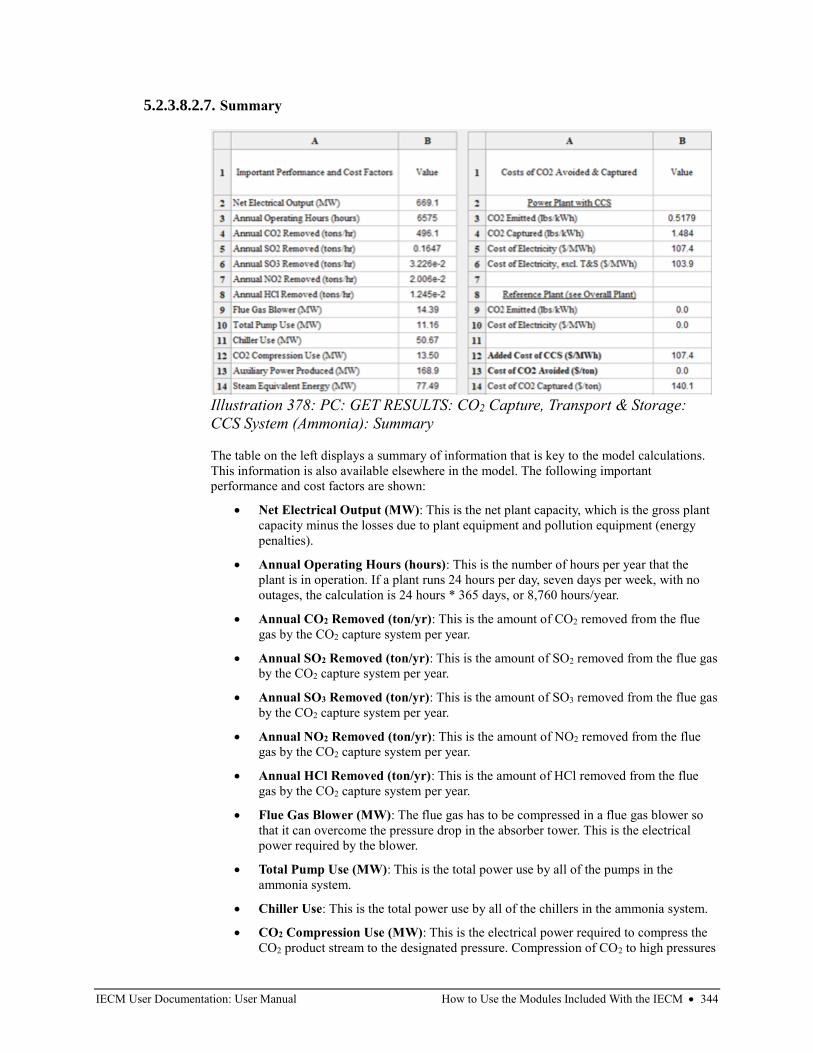
IECM User Documentation: User Manual How to Use the Modules Included With the IECM • 344
5.2.3.8.2.7. Summary
The table on the left displays a summary of information that is key to the model calculations.
This information is also available elsewhere in the model. The following important
performance and cost factors are shown:
• Net Electrical Output (MW): This is the net plant capacity, which is the gross plant
capacity minus the losses due to plant equipment and pollution equipment (energy
penalties).
• Annual Operating Hours (hours): This is the number of hours per year that the
plant is in operation. If a plant runs 24 hours per day, seven days per week, with no
outages, the calculation is 24 hours * 365 days, or 8,760 hours/year.
• Annual CO2 Removed (ton/yr): This is the amount of CO2 removed from the flue
gas by the CO2 capture system per year.
• Annual SO2 Removed (ton/yr): This is the amount of SO2 removed from the flue gas
by the CO2 capture system per year.
• Annual SO3 Removed (ton/yr): This is the amount of SO3 removed from the flue gas
by the CO2 capture system per year.
• Annual NO2 Removed (ton/yr): This is the amount of NO2 removed from the flue
gas by the CO2 capture system per year.
• Annual HCl Removed (ton/yr): This is the amount of HCl removed from the flue
gas by the CO2 capture system per year.
• Flue Gas Blower (MW): The flue gas has to be compressed in a flue gas blower so
that it can overcome the pressure drop in the absorber tower. This is the electrical
power required by the blower.
• Total Pump Use (MW): This is the total power use by all of the pumps in the
ammonia system.
• Chiller Use: This is the total power use by all of the chillers in the ammonia system.
• CO2 Compression Use (MW): This is the electrical power required to compress the
CO2 product stream to the designated pressure. Compression of CO2 to high pressures
Illustration 378: PC: GET RESULTS: CO2 Capture, Transport & Storage:
CCS System (Ammonia): Summary
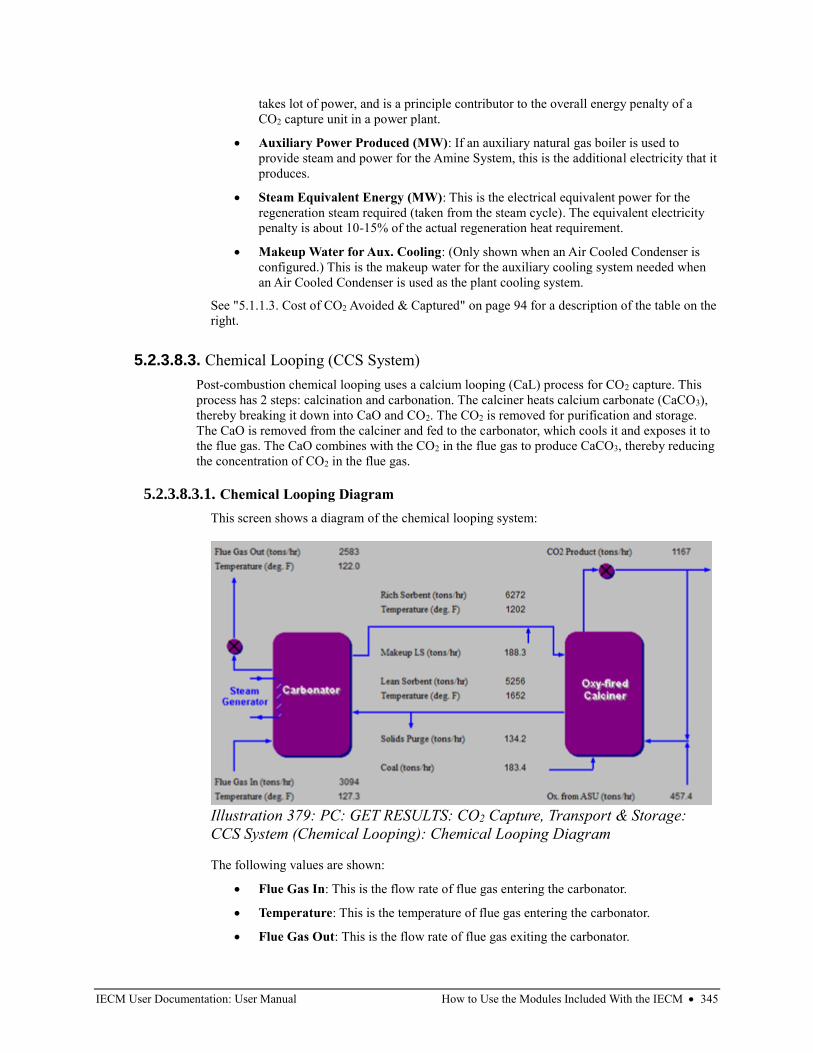
IECM User Documentation: User Manual How to Use the Modules Included With the IECM • 345
takes lot of power, and is a principle contributor to the overall energy penalty of a
CO2 capture unit in a power plant.
• Auxiliary Power Produced (MW): If an auxiliary natural gas boiler is used to
provide steam and power for the Amine System, this is the additional electricity that it
produces.
• Steam Equivalent Energy (MW): This is the electrical equivalent power for the
regeneration steam required (taken from the steam cycle). The equivalent electricity
penalty is about 10-15% of the actual regeneration heat requirement.
• Makeup Water for Aux. Cooling: (Only shown when an Air Cooled Condenser is
configured.) This is the makeup water for the auxiliary cooling system needed when
an Air Cooled Condenser is used as the plant cooling system.
See "5.1.1.3. Cost of CO2 Avoided & Captured" on page 94 for a description of the table on the
right.
5.2.3.8.3. Chemical Looping (CCS System)
Post-combustion chemical looping uses a calcium looping (CaL) process for CO2 capture. This
process has 2 steps: calcination and carbonation. The calciner heats calcium carbonate (CaCO3),
thereby breaking it down into CaO and CO2. The CO2 is removed for purification and storage.
The CaO is removed from the calciner and fed to the carbonator, which cools it and exposes it to
the flue gas. The CaO combines with the CO2 in the flue gas to produce CaCO3, thereby reducing
the concentration of CO2 in the flue gas.
5.2.3.8.3.1. Chemical Looping Diagram
This screen shows a diagram of the chemical looping system:
The following values are shown:
• Flue Gas In: This is the flow rate of flue gas entering the carbonator.
• Temperature: This is the temperature of flue gas entering the carbonator.
• Flue Gas Out: This is the flow rate of flue gas exiting the carbonator.
Illustration 379: PC: GET RESULTS: CO2 Capture, Transport & Storage:
CCS System (Chemical Looping): Chemical Looping Diagram
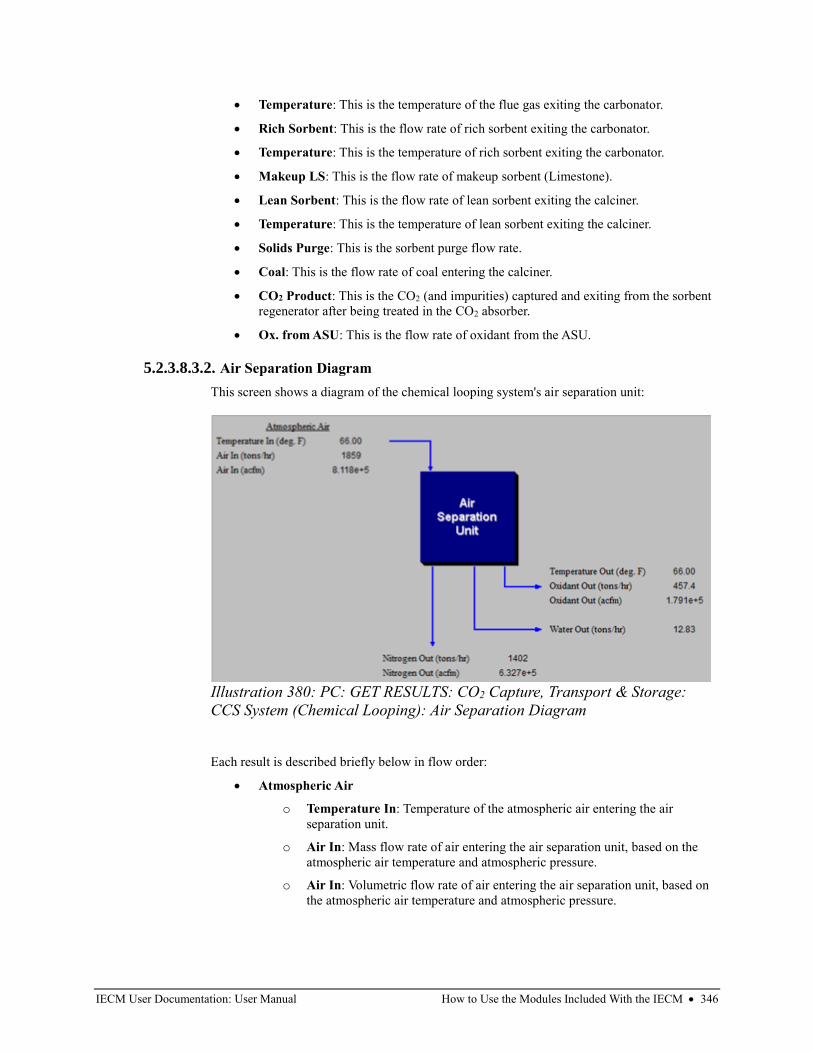
IECM User Documentation: User Manual How to Use the Modules Included With the IECM • 346
• Temperature: This is the temperature of the flue gas exiting the carbonator.
• Rich Sorbent: This is the flow rate of rich sorbent exiting the carbonator.
• Temperature: This is the temperature of rich sorbent exiting the carbonator.
• Makeup LS: This is the flow rate of makeup sorbent (Limestone).
• Lean Sorbent: This is the flow rate of lean sorbent exiting the calciner.
• Temperature: This is the temperature of lean sorbent exiting the calciner.
• Solids Purge: This is the sorbent purge flow rate.
• Coal: This is the flow rate of coal entering the calciner.
• CO2 Product: This is the CO2 (and impurities) captured and exiting from the sorbent
regenerator after being treated in the CO2 absorber.
• Ox. from ASU: This is the flow rate of oxidant from the ASU.
5.2.3.8.3.2. Air Separation Diagram
This screen shows a diagram of the chemical looping system's air separation unit:
Each result is described briefly below in flow order:
• Atmospheric Air
o Temperature In: Temperature of the atmospheric air entering the air
separation unit.
o Air In: Mass flow rate of air entering the air separation unit, based on the
atmospheric air temperature and atmospheric pressure.
o Air In: Volumetric flow rate of air entering the air separation unit, based on
the atmospheric air temperature and atmospheric pressure.
Illustration 380: PC: GET RESULTS: CO2 Capture, Transport & Storage:
CCS System (Chemical Looping): Air Separation Diagram
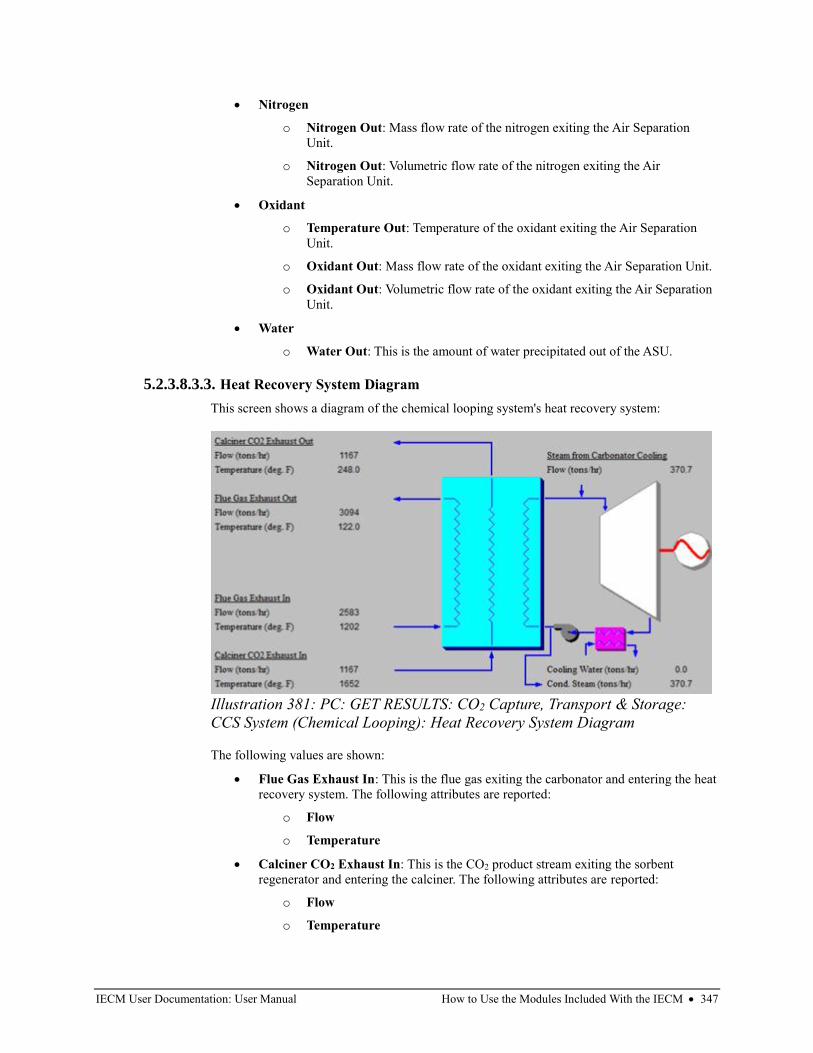
IECM User Documentation: User Manual How to Use the Modules Included With the IECM • 347
• Nitrogen
o Nitrogen Out: Mass flow rate of the nitrogen exiting the Air Separation
Unit.
o Nitrogen Out: Volumetric flow rate of the nitrogen exiting the Air
Separation Unit.
• Oxidant
o Temperature Out: Temperature of the oxidant exiting the Air Separation
Unit.
o Oxidant Out: Mass flow rate of the oxidant exiting the Air Separation Unit.
o Oxidant Out: Volumetric flow rate of the oxidant exiting the Air Separation
Unit.
• Water
o Water Out: This is the amount of water precipitated out of the ASU.
5.2.3.8.3.3. Heat Recovery System Diagram
This screen shows a diagram of the chemical looping system's heat recovery system:
The following values are shown:
• Flue Gas Exhaust In: This is the flue gas exiting the carbonator and entering the heat
recovery system. The following attributes are reported:
o Flow
o Temperature
• Calciner CO2 Exhaust In: This is the CO2 product stream exiting the sorbent
regenerator and entering the calciner. The following attributes are reported:
o Flow
o Temperature
Illustration 381: PC: GET RESULTS: CO2 Capture, Transport & Storage:
CCS System (Chemical Looping): Heat Recovery System Diagram
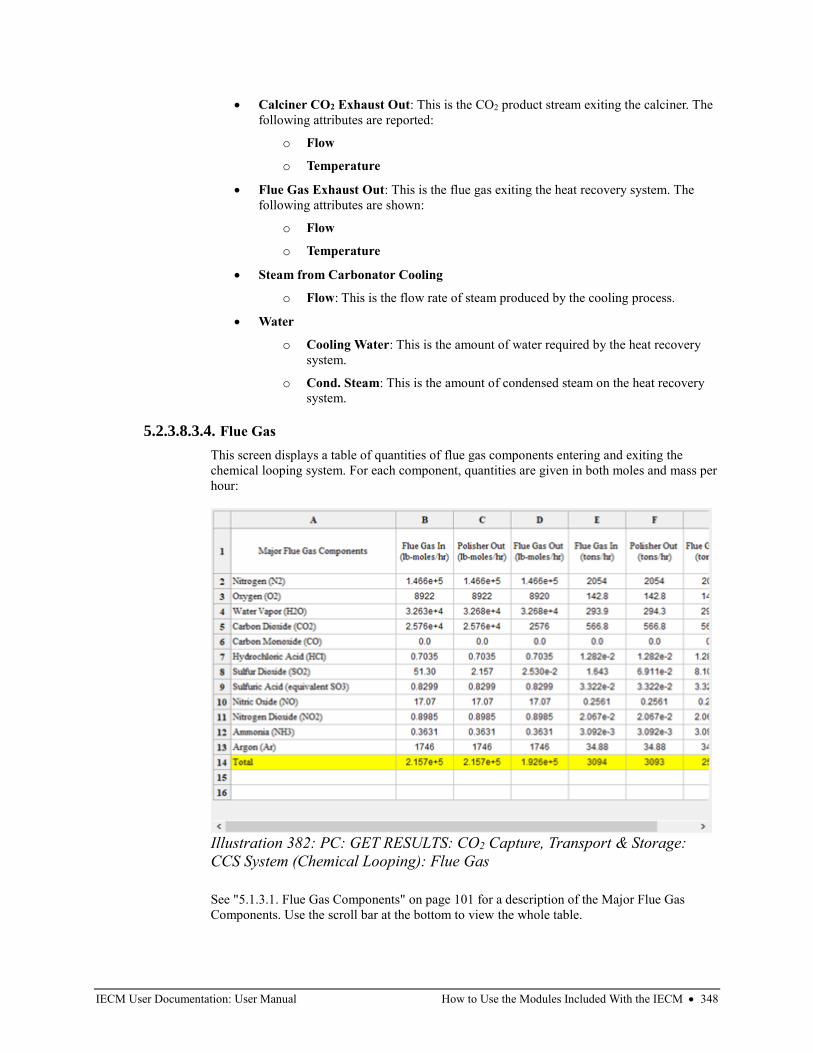
IECM User Documentation: User Manual How to Use the Modules Included With the IECM • 348
• Calciner CO2 Exhaust Out: This is the CO2 product stream exiting the calciner. The
following attributes are reported:
o Flow
o Temperature
• Flue Gas Exhaust Out: This is the flue gas exiting the heat recovery system. The
following attributes are shown:
o Flow
o Temperature
• Steam from Carbonator Cooling
o Flow: This is the flow rate of steam produced by the cooling process.
• Water
o Cooling Water: This is the amount of water required by the heat recovery
system.
o Cond. Steam: This is the amount of condensed steam on the heat recovery
system.
5.2.3.8.3.4. Flue Gas
This screen displays a table of quantities of flue gas components entering and exiting the
chemical looping system. For each component, quantities are given in both moles and mass per
hour:
See "5.1.3.1. Flue Gas Components" on page 101 for a description of the Major Flue Gas
Components. Use the scroll bar at the bottom to view the whole table.
Illustration 382: PC: GET RESULTS: CO2 Capture, Transport & Storage:
CCS System (Chemical Looping): Flue Gas
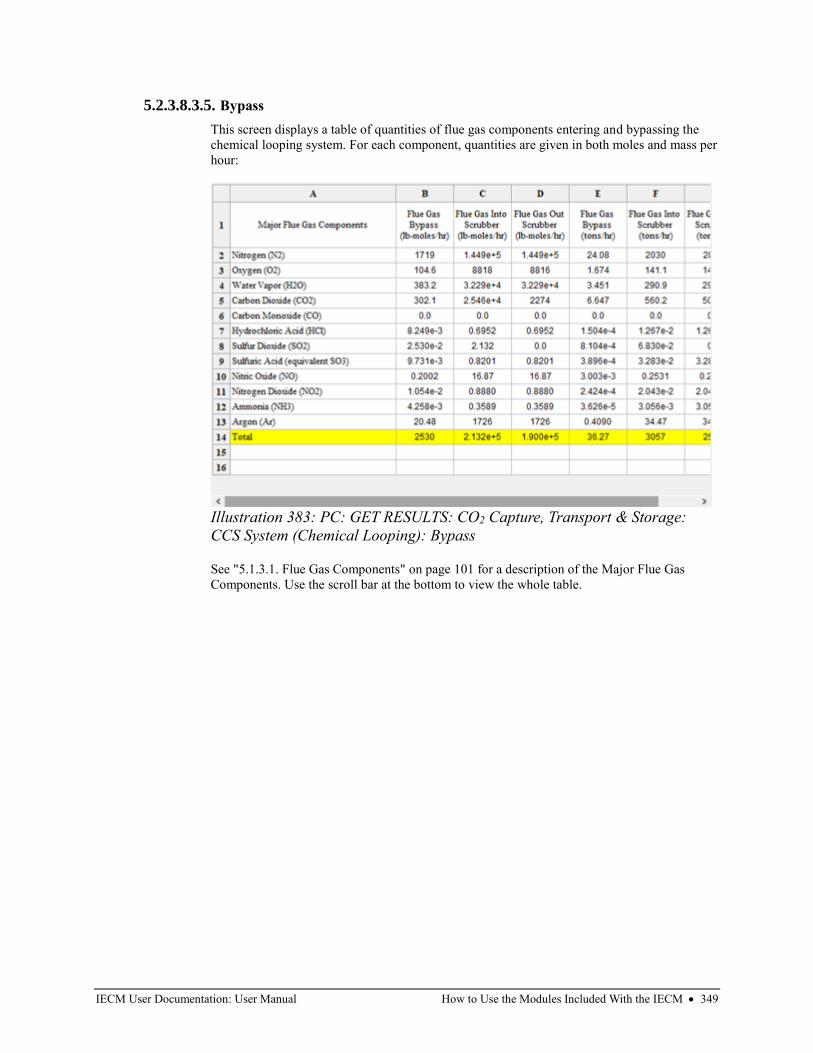
IECM User Documentation: User Manual How to Use the Modules Included With the IECM • 349
5.2.3.8.3.5. Bypass
This screen displays a table of quantities of flue gas components entering and bypassing the
chemical looping system. For each component, quantities are given in both moles and mass per
hour:
See "5.1.3.1. Flue Gas Components" on page 101 for a description of the Major Flue Gas
Components. Use the scroll bar at the bottom to view the whole table.
Illustration 383: PC: GET RESULTS: CO2 Capture, Transport & Storage:
CCS System (Chemical Looping): Bypass
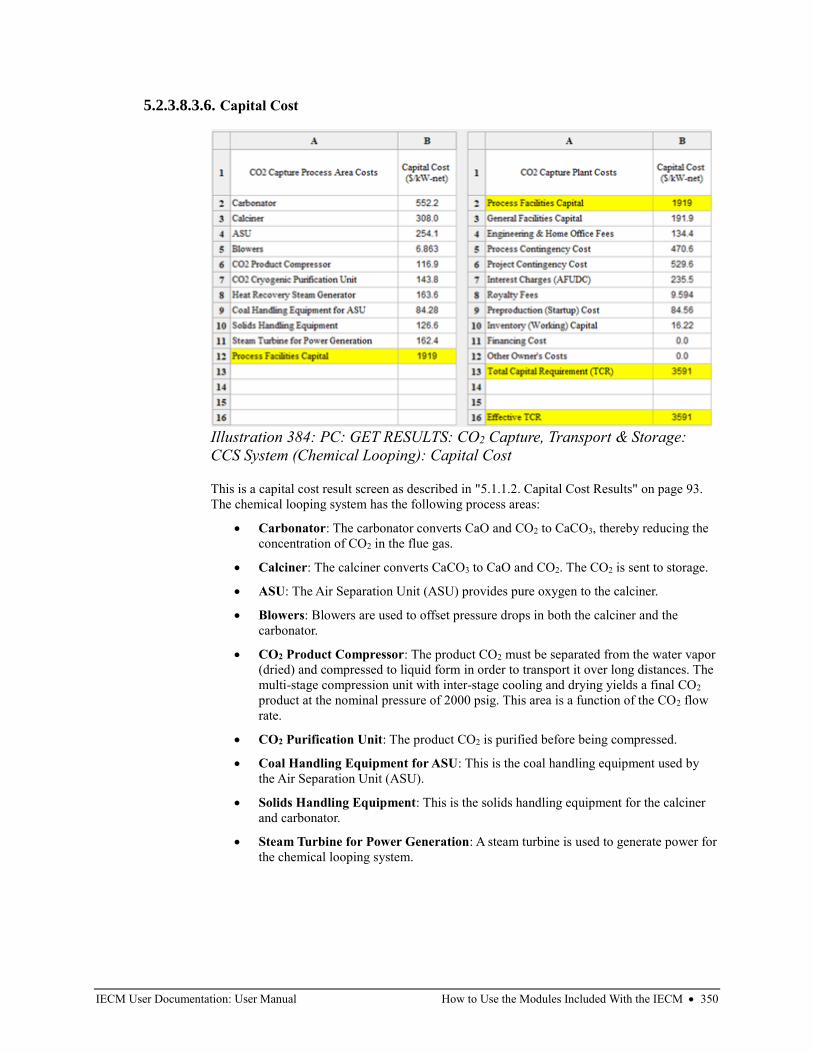
IECM User Documentation: User Manual How to Use the Modules Included With the IECM • 350
5.2.3.8.3.6. Capital Cost
This is a capital cost result screen as described in "5.1.1.2. Capital Cost Results" on page 93.
The chemical looping system has the following process areas:
• Carbonator: The carbonator converts CaO and CO2 to CaCO3, thereby reducing the
concentration of CO2 in the flue gas.
• Calciner: The calciner converts CaCO3 to CaO and CO2. The CO2 is sent to storage.
• ASU: The Air Separation Unit (ASU) provides pure oxygen to the calciner.
• Blowers: Blowers are used to offset pressure drops in both the calciner and the
carbonator.
• CO2 Product Compressor: The product CO2 must be separated from the water vapor
(dried) and compressed to liquid form in order to transport it over long distances. The
multi-stage compression unit with inter-stage cooling and drying yields a final CO2
product at the nominal pressure of 2000 psig. This area is a function of the CO2 flow
rate.
• CO2 Purification Unit: The product CO2 is purified before being compressed.
• Coal Handling Equipment for ASU: This is the coal handling equipment used by
the Air Separation Unit (ASU).
• Solids Handling Equipment: This is the solids handling equipment for the calciner
and carbonator.
• Steam Turbine for Power Generation: A steam turbine is used to generate power for
the chemical looping system.
Illustration 384: PC: GET RESULTS: CO2 Capture, Transport & Storage:
CCS System (Chemical Looping): Capital Cost
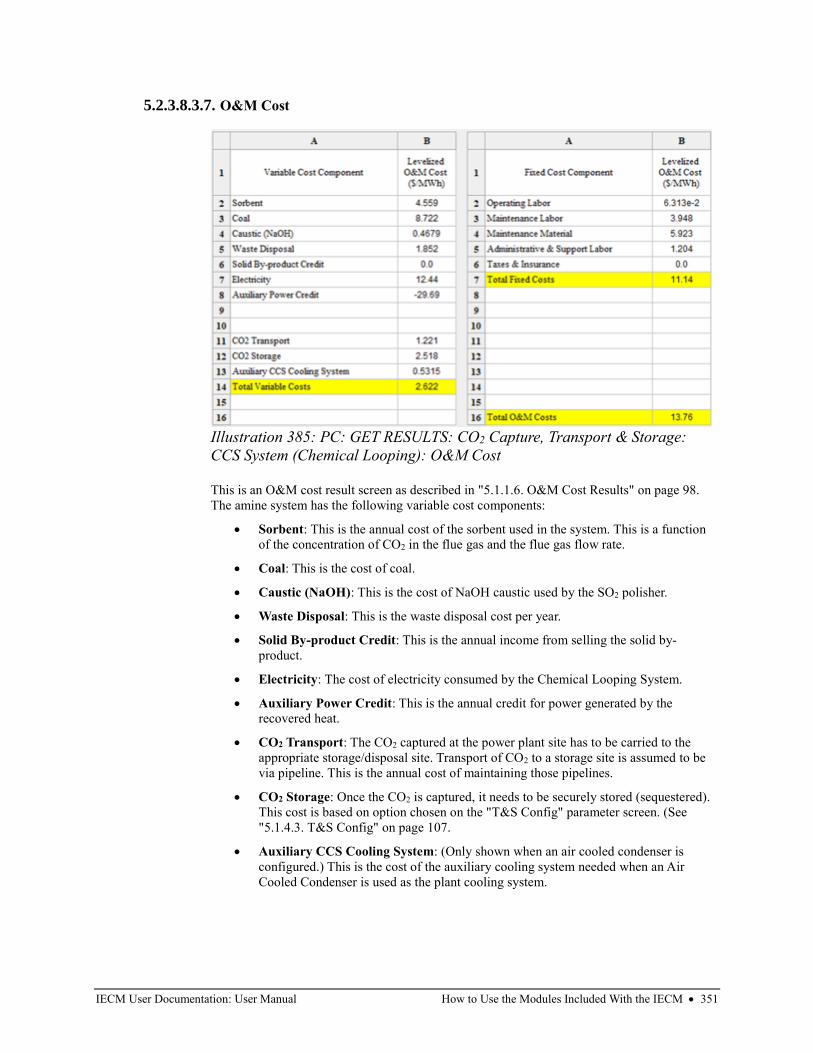
IECM User Documentation: User Manual How to Use the Modules Included With the IECM • 351
5.2.3.8.3.7. O&M Cost
This is an O&M cost result screen as described in "5.1.1.6. O&M Cost Results" on page 98.
The amine system has the following variable cost components:
• Sorbent: This is the annual cost of the sorbent used in the system. This is a function
of the concentration of CO2 in the flue gas and the flue gas flow rate.
• Coal: This is the cost of coal.
• Caustic (NaOH): This is the cost of NaOH caustic used by the SO2 polisher.
• Waste Disposal: This is the waste disposal cost per year.
• Solid By-product Credit: This is the annual income from selling the solid by-
product.
• Electricity: The cost of electricity consumed by the Chemical Looping System.
• Auxiliary Power Credit: This is the annual credit for power generated by the
recovered heat.
• CO2 Transport: The CO2 captured at the power plant site has to be carried to the
appropriate storage/disposal site. Transport of CO2 to a storage site is assumed to be
via pipeline. This is the annual cost of maintaining those pipelines.
• CO2 Storage: Once the CO2 is captured, it needs to be securely stored (sequestered).
This cost is based on option chosen on the "T&S Config" parameter screen. (See
"5.1.4.3. T&S Config" on page 107.
• Auxiliary CCS Cooling System: (Only shown when an air cooled condenser is
configured.) This is the cost of the auxiliary cooling system needed when an Air
Cooled Condenser is used as the plant cooling system.
Illustration 385: PC: GET RESULTS: CO2 Capture, Transport & Storage:
CCS System (Chemical Looping): O&M Cost
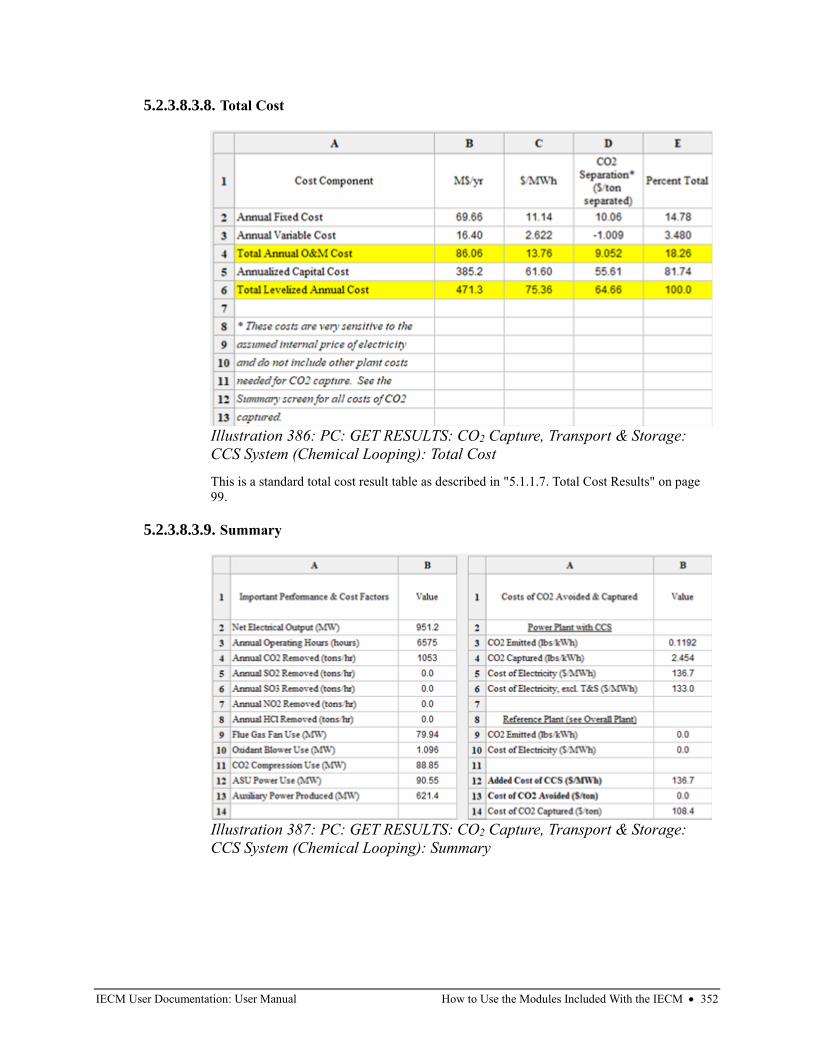
IECM User Documentation: User Manual How to Use the Modules Included With the IECM • 352
5.2.3.8.3.8. Total Cost
This is a standard total cost result table as described in "5.1.1.7. Total Cost Results" on page
99.
5.2.3.8.3.9. Summary
Illustration 386: PC: GET RESULTS: CO2 Capture, Transport & Storage:
CCS System (Chemical Looping): Total Cost
Illustration 387: PC: GET RESULTS: CO2 Capture, Transport & Storage:
CCS System (Chemical Looping): Summary
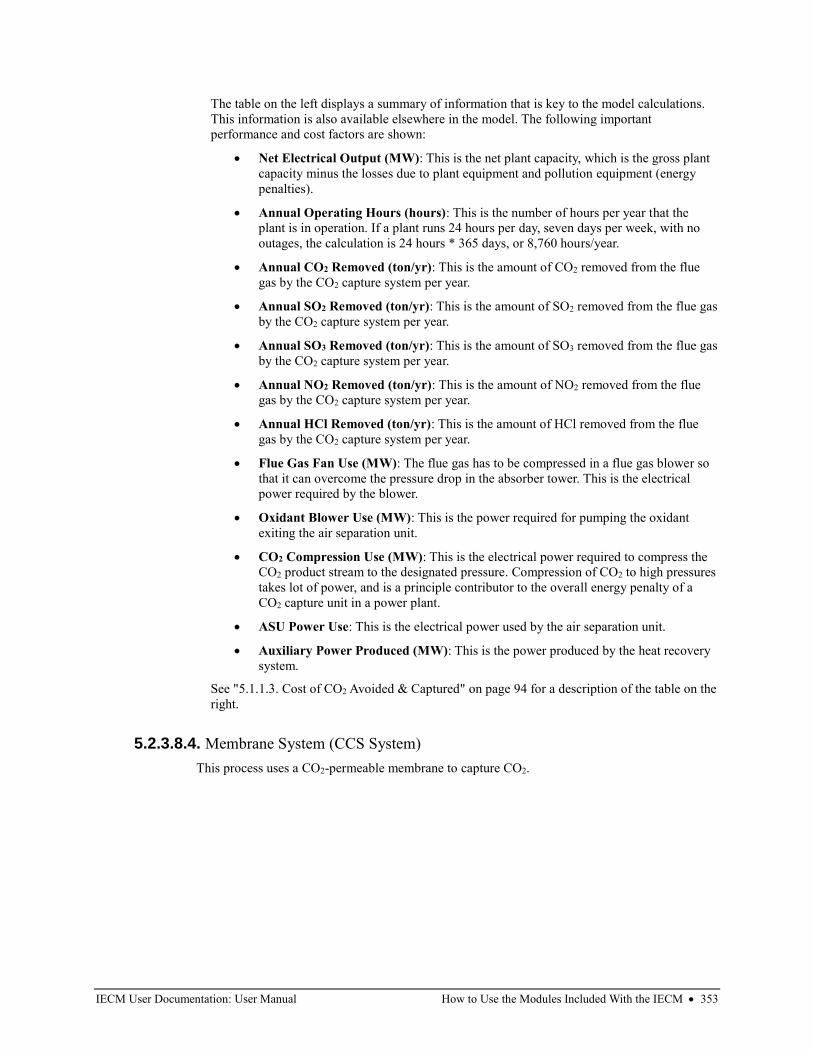
IECM User Documentation: User Manual How to Use the Modules Included With the IECM • 353
The table on the left displays a summary of information that is key to the model calculations.
This information is also available elsewhere in the model. The following important
performance and cost factors are shown:
• Net Electrical Output (MW): This is the net plant capacity, which is the gross plant
capacity minus the losses due to plant equipment and pollution equipment (energy
penalties).
• Annual Operating Hours (hours): This is the number of hours per year that the
plant is in operation. If a plant runs 24 hours per day, seven days per week, with no
outages, the calculation is 24 hours * 365 days, or 8,760 hours/year.
• Annual CO2 Removed (ton/yr): This is the amount of CO2 removed from the flue
gas by the CO2 capture system per year.
• Annual SO2 Removed (ton/yr): This is the amount of SO2 removed from the flue gas
by the CO2 capture system per year.
• Annual SO3 Removed (ton/yr): This is the amount of SO3 removed from the flue gas
by the CO2 capture system per year.
• Annual NO2 Removed (ton/yr): This is the amount of NO2 removed from the flue
gas by the CO2 capture system per year.
• Annual HCl Removed (ton/yr): This is the amount of HCl removed from the flue
gas by the CO2 capture system per year.
• Flue Gas Fan Use (MW): The flue gas has to be compressed in a flue gas blower so
that it can overcome the pressure drop in the absorber tower. This is the electrical
power required by the blower.
• Oxidant Blower Use (MW): This is the power required for pumping the oxidant
exiting the air separation unit.
• CO2 Compression Use (MW): This is the electrical power required to compress the
CO2 product stream to the designated pressure. Compression of CO2 to high pressures
takes lot of power, and is a principle contributor to the overall energy penalty of a
CO2 capture unit in a power plant.
• ASU Power Use: This is the electrical power used by the air separation unit.
• Auxiliary Power Produced (MW): This is the power produced by the heat recovery
system.
See "5.1.1.3. Cost of CO2 Avoided & Captured" on page 94 for a description of the table on the
right.
5.2.3.8.4. Membrane System (CCS System)
This process uses a CO2-permeable membrane to capture CO2.
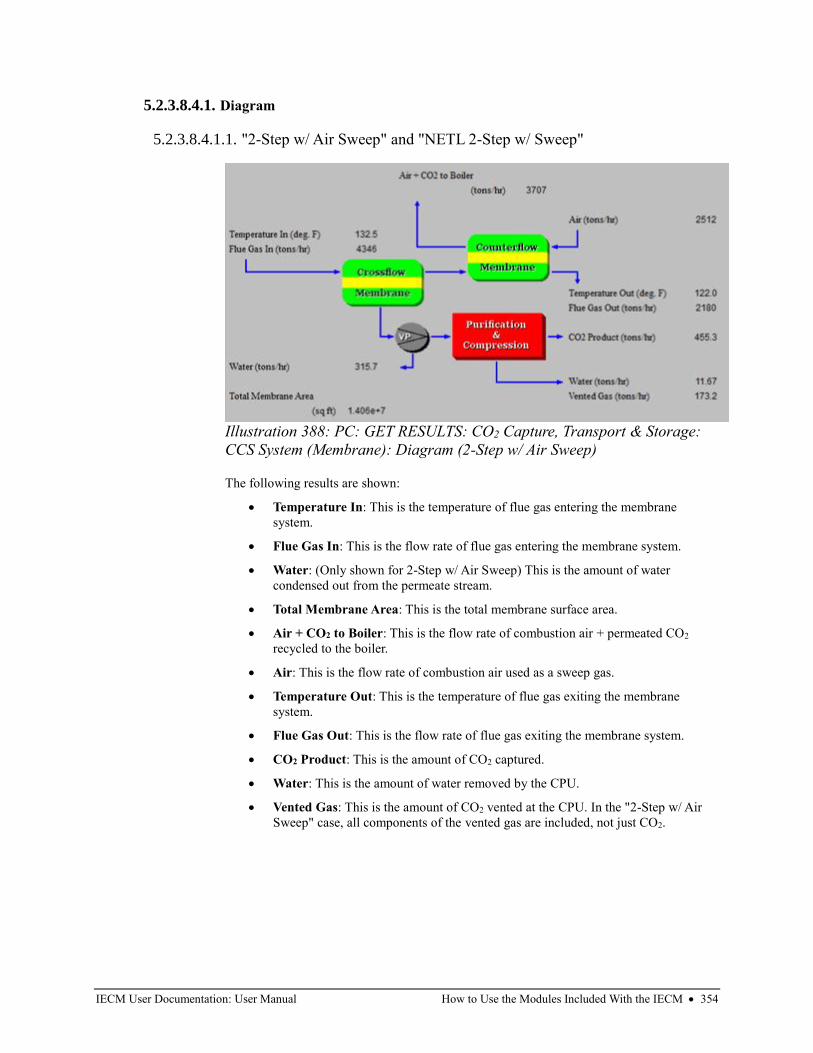
IECM User Documentation: User Manual How to Use the Modules Included With the IECM • 354
5.2.3.8.4.1. Diagram
5.2.3.8.4.1.1. "2-Step w/ Air Sweep" and "NETL 2-Step w/ Sweep"
The following results are shown:
• Temperature In: This is the temperature of flue gas entering the membrane
system.
• Flue Gas In: This is the flow rate of flue gas entering the membrane system.
• Water: (Only shown for 2-Step w/ Air Sweep) This is the amount of water
condensed out from the permeate stream.
• Total Membrane Area: This is the total membrane surface area.
• Air + CO2 to Boiler: This is the flow rate of combustion air + permeated CO2
recycled to the boiler.
• Air: This is the flow rate of combustion air used as a sweep gas.
• Temperature Out: This is the temperature of flue gas exiting the membrane
system.
• Flue Gas Out: This is the flow rate of flue gas exiting the membrane system.
• CO2 Product: This is the amount of CO2 captured.
• Water: This is the amount of water removed by the CPU.
• Vented Gas: This is the amount of CO2 vented at the CPU. In the "2-Step w/ Air
Sweep" case, all components of the vented gas are included, not just CO2.
Illustration 388: PC: GET RESULTS: CO2 Capture, Transport & Storage:
CCS System (Membrane): Diagram (2-Step w/ Air Sweep)
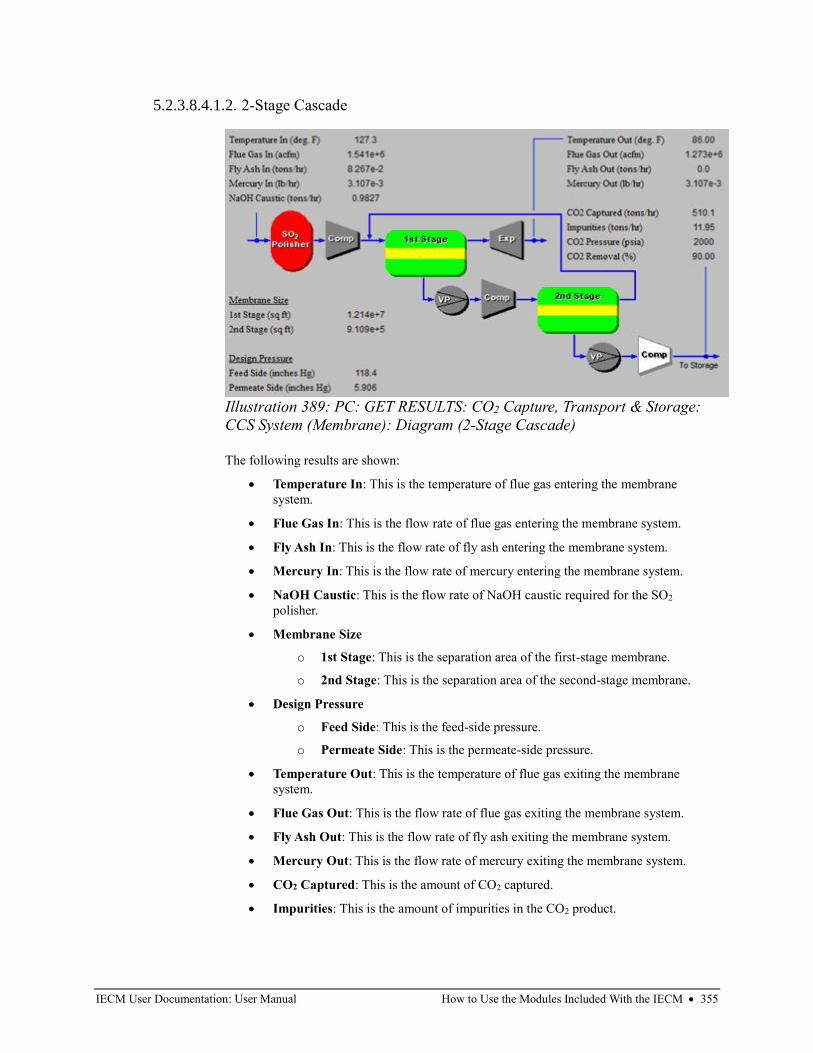
IECM User Documentation: User Manual How to Use the Modules Included With the IECM • 355
5.2.3.8.4.1.2. 2-Stage Cascade
The following results are shown:
• Temperature In: This is the temperature of flue gas entering the membrane
system.
• Flue Gas In: This is the flow rate of flue gas entering the membrane system.
• Fly Ash In: This is the flow rate of fly ash entering the membrane system.
• Mercury In: This is the flow rate of mercury entering the membrane system.
• NaOH Caustic: This is the flow rate of NaOH caustic required for the SO2
polisher.
• Membrane Size
o 1st Stage: This is the separation area of the first-stage membrane.
o 2nd Stage: This is the separation area of the second-stage membrane.
• Design Pressure
o Feed Side: This is the feed-side pressure.
o Permeate Side: This is the permeate-side pressure.
• Temperature Out: This is the temperature of flue gas exiting the membrane
system.
• Flue Gas Out: This is the flow rate of flue gas exiting the membrane system.
• Fly Ash Out: This is the flow rate of fly ash exiting the membrane system.
• Mercury Out: This is the flow rate of mercury exiting the membrane system.
• CO2 Captured: This is the amount of CO2 captured.
• Impurities: This is the amount of impurities in the CO2 product.
Illustration 389: PC: GET RESULTS: CO2 Capture, Transport & Storage:
CCS System (Membrane): Diagram (2-Stage Cascade)
IECM User Documentation: User Manual How to Use the Modules Included With the IECM • 356
• CO2 Pressure: This is the compressed CO2 product pressure. The product stream is
compressed and sent through the pipeline system to the configured sequestration
system.
• CO2 Removal: This is the CO2 removal efficiency.
5.2.3.8.4.2. Flue Gas
This screen displays a table of quantities of flue gas components entering and exiting the
membrane system. For each component, quantities are given in both moles and mass per hour:
See "5.1.3.1. Flue Gas Components" on page 101 for a description of the Major Flue Gas
Components. Use the scroll bar at the bottom to view the whole table.
Note that the "Polisher Out" columns are not shown for the "2-Stage Cascade" configuration.
Illustration 390: PC: GET RESULTS: CO2 Capture, Transport & Storage:
CCS System (Membrane): Flue Gas

IECM User Documentation: User Manual How to Use the Modules Included With the IECM • 357
5.2.3.8.4.3. Bypass
This screen displays a table of quantities of flue gas components entering and bypassing the 2-
Stage Cascade membrane system. (It is only shown for that configuration.) For each
component, quantities are given in both moles and mass per hour:
See "5.1.3.1. Flue Gas Components" on page 101 for a description of the Major Flue Gas
Components. Use the scroll bar at the bottom to view the whole table.
Illustration 391: PC: GET RESULTS: CO2 Capture, Transport & Storage:
CCS System (Membrane): Bypass
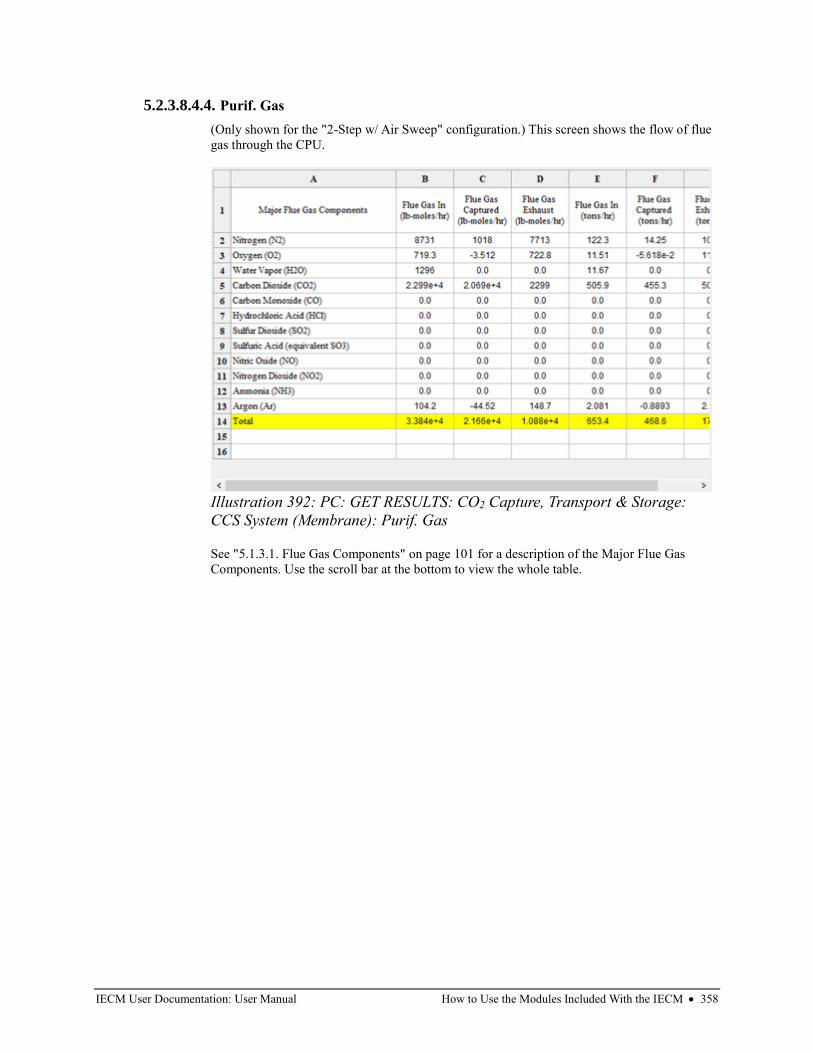
IECM User Documentation: User Manual How to Use the Modules Included With the IECM • 358
5.2.3.8.4.4. Purif. Gas
(Only shown for the "2-Step w/ Air Sweep" configuration.) This screen shows the flow of flue
gas through the CPU.
See "5.1.3.1. Flue Gas Components" on page 101 for a description of the Major Flue Gas
Components. Use the scroll bar at the bottom to view the whole table.
Illustration 392: PC: GET RESULTS: CO2 Capture, Transport & Storage:
CCS System (Membrane): Purif. Gas
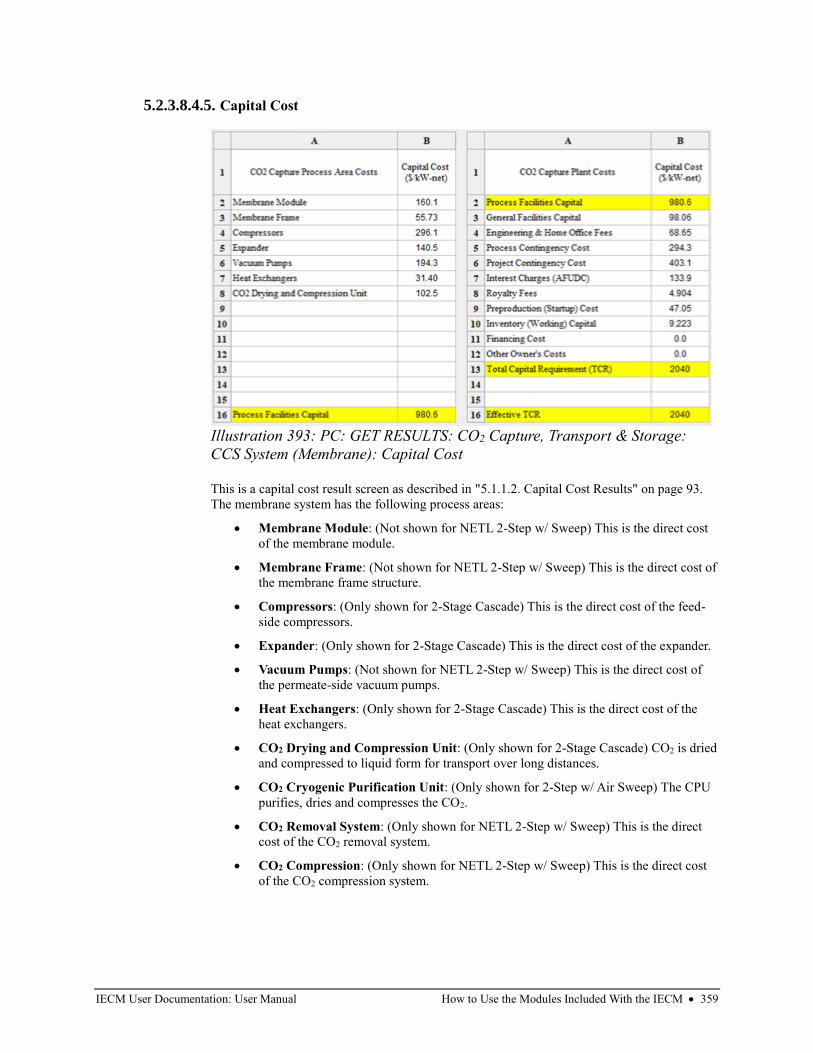
IECM User Documentation: User Manual How to Use the Modules Included With the IECM • 359
5.2.3.8.4.5. Capital Cost
This is a capital cost result screen as described in "5.1.1.2. Capital Cost Results" on page 93.
The membrane system has the following process areas:
• Membrane Module: (Not shown for NETL 2-Step w/ Sweep) This is the direct cost
of the membrane module.
• Membrane Frame: (Not shown for NETL 2-Step w/ Sweep) This is the direct cost of
the membrane frame structure.
• Compressors: (Only shown for 2-Stage Cascade) This is the direct cost of the feed-
side compressors.
• Expander: (Only shown for 2-Stage Cascade) This is the direct cost of the expander.
• Vacuum Pumps: (Not shown for NETL 2-Step w/ Sweep) This is the direct cost of
the permeate-side vacuum pumps.
• Heat Exchangers: (Only shown for 2-Stage Cascade) This is the direct cost of the
heat exchangers.
• CO2 Drying and Compression Unit: (Only shown for 2-Stage Cascade) CO2 is dried
and compressed to liquid form for transport over long distances.
• CO2 Cryogenic Purification Unit: (Only shown for 2-Step w/ Air Sweep) The CPU
purifies, dries and compresses the CO2.
• CO2 Removal System: (Only shown for NETL 2-Step w/ Sweep) This is the direct
cost of the CO2 removal system.
• CO2 Compression: (Only shown for NETL 2-Step w/ Sweep) This is the direct cost
of the CO2 compression system.
Illustration 393: PC: GET RESULTS: CO2 Capture, Transport & Storage:
CCS System (Membrane): Capital Cost
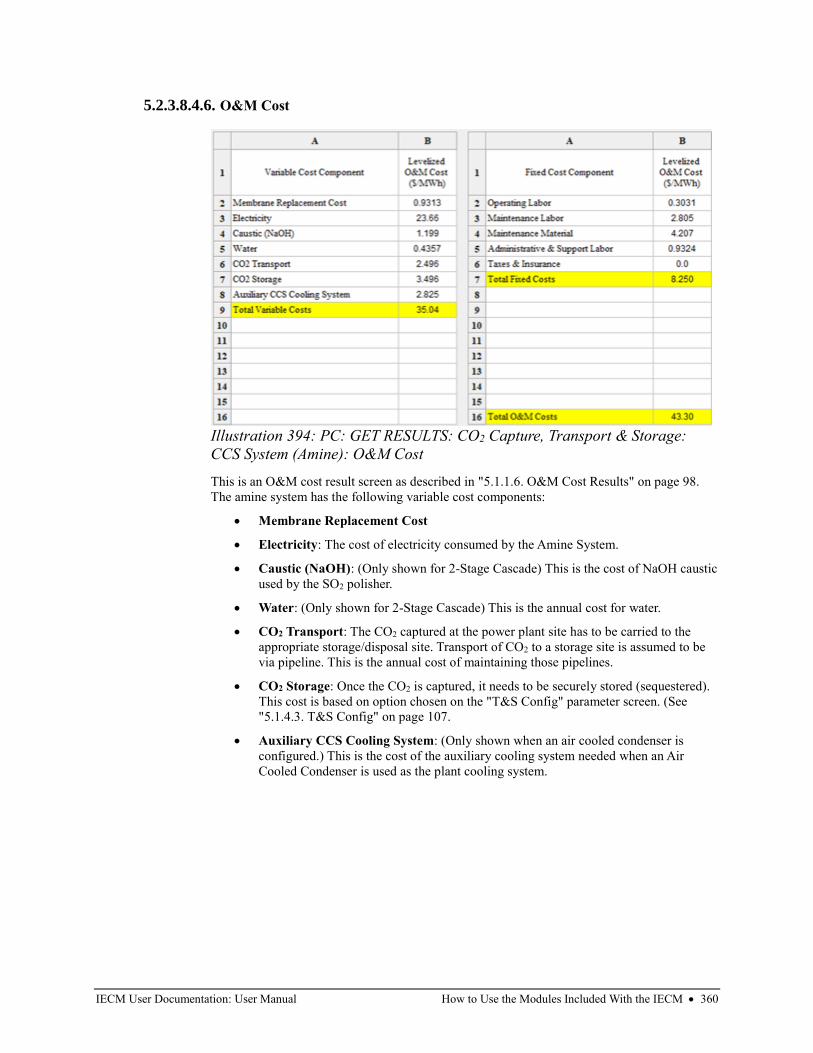
IECM User Documentation: User Manual How to Use the Modules Included With the IECM • 360
5.2.3.8.4.6. O&M Cost
This is an O&M cost result screen as described in "5.1.1.6. O&M Cost Results" on page 98.
The amine system has the following variable cost components:
• Membrane Replacement Cost
• Electricity: The cost of electricity consumed by the Amine System.
• Caustic (NaOH): (Only shown for 2-Stage Cascade) This is the cost of NaOH caustic
used by the SO2 polisher.
• Water: (Only shown for 2-Stage Cascade) This is the annual cost for water.
• CO2 Transport: The CO2 captured at the power plant site has to be carried to the
appropriate storage/disposal site. Transport of CO2 to a storage site is assumed to be
via pipeline. This is the annual cost of maintaining those pipelines.
• CO2 Storage: Once the CO2 is captured, it needs to be securely stored (sequestered).
This cost is based on option chosen on the "T&S Config" parameter screen. (See
"5.1.4.3. T&S Config" on page 107.
• Auxiliary CCS Cooling System: (Only shown when an air cooled condenser is
configured.) This is the cost of the auxiliary cooling system needed when an Air
Cooled Condenser is used as the plant cooling system.
Illustration 394: PC: GET RESULTS: CO2 Capture, Transport & Storage:
CCS System (Amine): O&M Cost
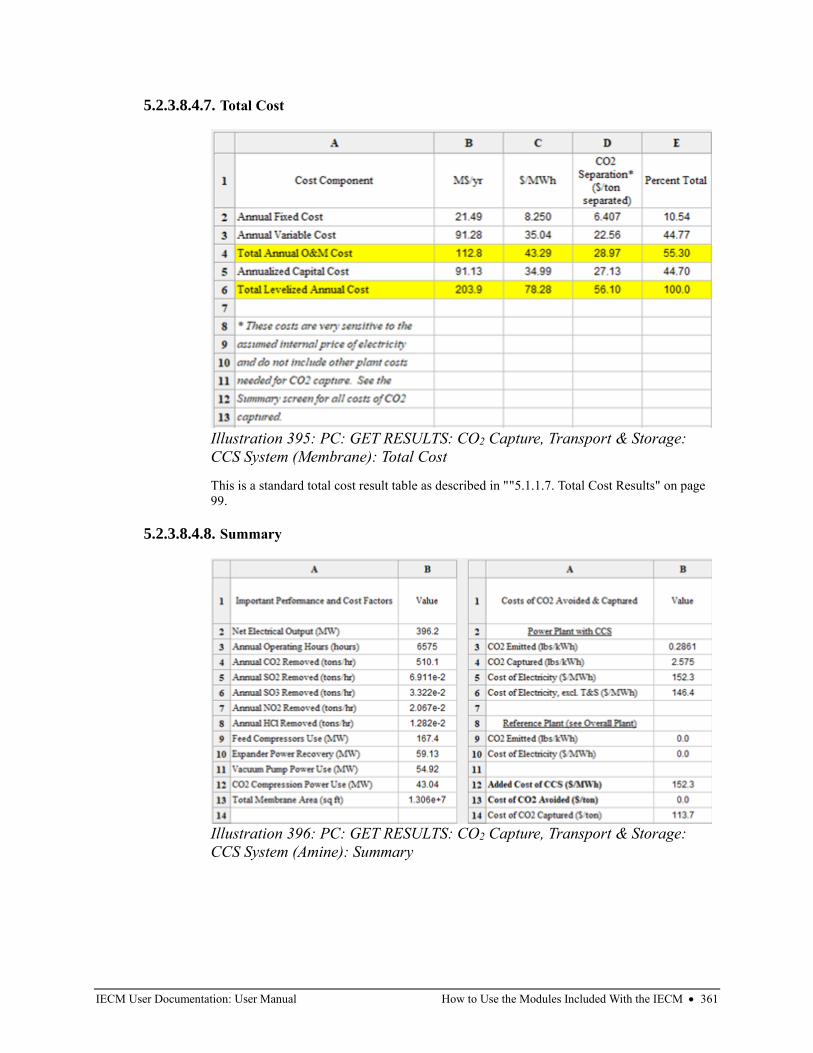
IECM User Documentation: User Manual How to Use the Modules Included With the IECM • 361
5.2.3.8.4.7. Total Cost
This is a standard total cost result table as described in ""5.1.1.7. Total Cost Results" on page
99.
5.2.3.8.4.8. Summary
Illustration 395: PC: GET RESULTS: CO2 Capture, Transport & Storage:
CCS System (Membrane): Total Cost
Illustration 396: PC: GET RESULTS: CO2 Capture, Transport & Storage:
CCS System (Amine): Summary
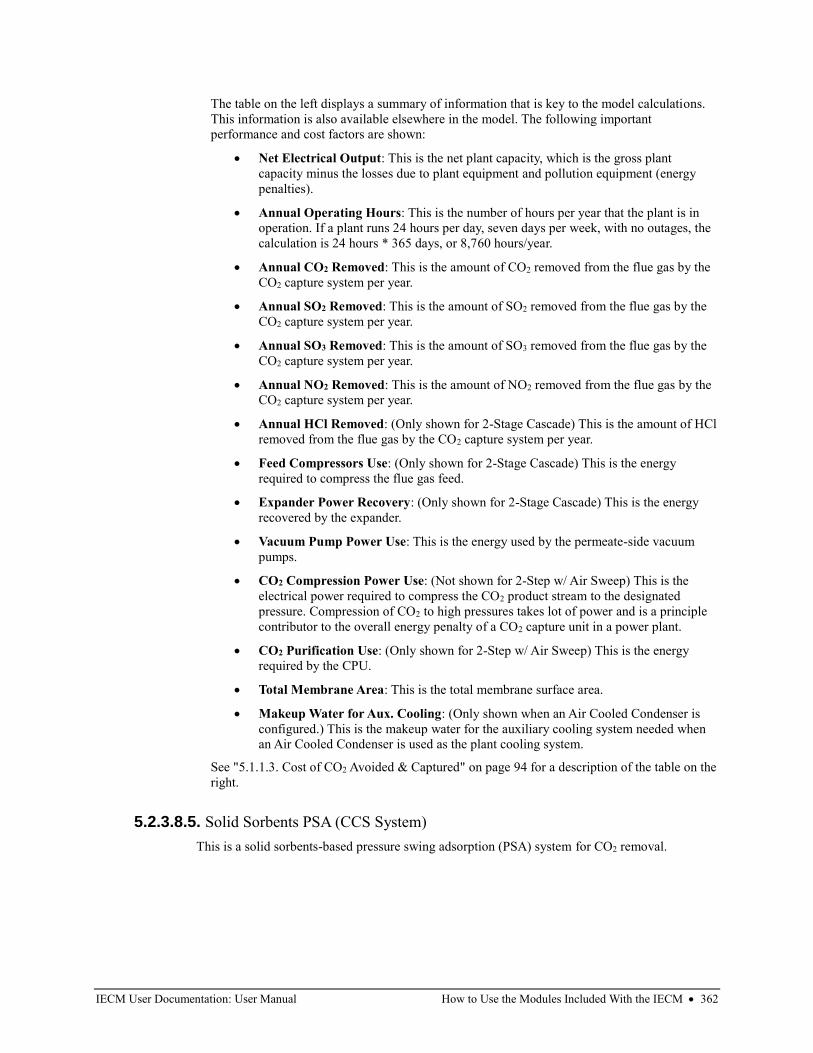
IECM User Documentation: User Manual How to Use the Modules Included With the IECM • 362
The table on the left displays a summary of information that is key to the model calculations.
This information is also available elsewhere in the model. The following important
performance and cost factors are shown:
• Net Electrical Output: This is the net plant capacity, which is the gross plant
capacity minus the losses due to plant equipment and pollution equipment (energy
penalties).
• Annual Operating Hours: This is the number of hours per year that the plant is in
operation. If a plant runs 24 hours per day, seven days per week, with no outages, the
calculation is 24 hours * 365 days, or 8,760 hours/year.
• Annual CO2 Removed: This is the amount of CO2 removed from the flue gas by the
CO2 capture system per year.
• Annual SO2 Removed: This is the amount of SO2 removed from the flue gas by the
CO2 capture system per year.
• Annual SO3 Removed: This is the amount of SO3 removed from the flue gas by the
CO2 capture system per year.
• Annual NO2 Removed: This is the amount of NO2 removed from the flue gas by the
CO2 capture system per year.
• Annual HCl Removed: (Only shown for 2-Stage Cascade) This is the amount of HCl
removed from the flue gas by the CO2 capture system per year.
• Feed Compressors Use: (Only shown for 2-Stage Cascade) This is the energy
required to compress the flue gas feed.
• Expander Power Recovery: (Only shown for 2-Stage Cascade) This is the energy
recovered by the expander.
• Vacuum Pump Power Use: This is the energy used by the permeate-side vacuum
pumps.
• CO2 Compression Power Use: (Not shown for 2-Step w/ Air Sweep) This is the
electrical power required to compress the CO2 product stream to the designated
pressure. Compression of CO2 to high pressures takes lot of power and is a principle
contributor to the overall energy penalty of a CO2 capture unit in a power plant.
• CO2 Purification Use: (Only shown for 2-Step w/ Air Sweep) This is the energy
required by the CPU.
• Total Membrane Area: This is the total membrane surface area.
• Makeup Water for Aux. Cooling: (Only shown when an Air Cooled Condenser is
configured.) This is the makeup water for the auxiliary cooling system needed when
an Air Cooled Condenser is used as the plant cooling system.
See "5.1.1.3. Cost of CO2 Avoided & Captured" on page 94 for a description of the table on the
right.
5.2.3.8.5. Solid Sorbents PSA (CCS System)
This is a solid sorbents-based pressure swing adsorption (PSA) system for CO2 removal.
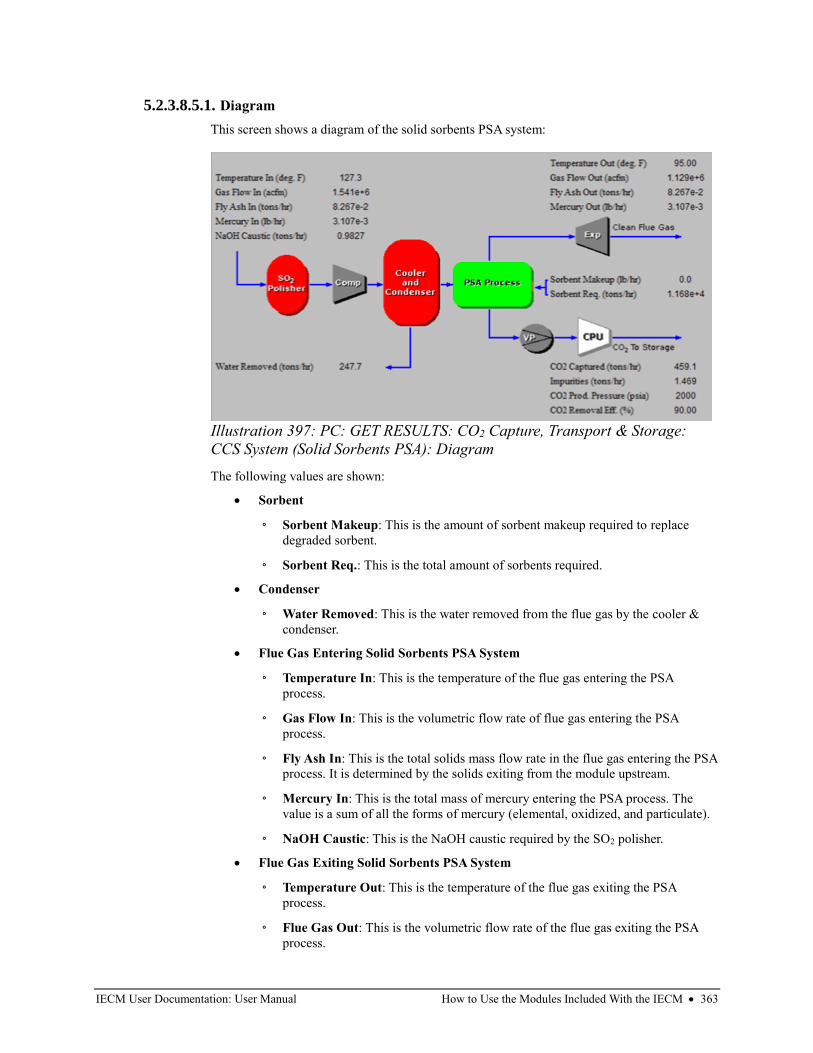
IECM User Documentation: User Manual How to Use the Modules Included With the IECM • 363
5.2.3.8.5.1. Diagram
This screen shows a diagram of the solid sorbents PSA system:
The following values are shown:
• Sorbent
◦ Sorbent Makeup: This is the amount of sorbent makeup required to replace
degraded sorbent.
◦ Sorbent Req.: This is the total amount of sorbents required.
• Condenser
◦ Water Removed: This is the water removed from the flue gas by the cooler &
condenser.
• Flue Gas Entering Solid Sorbents PSA System
◦ Temperature In: This is the temperature of the flue gas entering the PSA
process.
◦ Gas Flow In: This is the volumetric flow rate of flue gas entering the PSA
process.
◦ Fly Ash In: This is the total solids mass flow rate in the flue gas entering the PSA
process. It is determined by the solids exiting from the module upstream.
◦ Mercury In: This is the total mass of mercury entering the PSA process. The
value is a sum of all the forms of mercury (elemental, oxidized, and particulate).
◦ NaOH Caustic: This is the NaOH caustic required by the SO2 polisher.
• Flue Gas Exiting Solid Sorbents PSA System
◦ Temperature Out: This is the temperature of the flue gas exiting the PSA
process.
◦ Flue Gas Out: This is the volumetric flow rate of the flue gas exiting the PSA
process.
Illustration 397: PC: GET RESULTS: CO2 Capture, Transport & Storage:
CCS System (Solid Sorbents PSA): Diagram
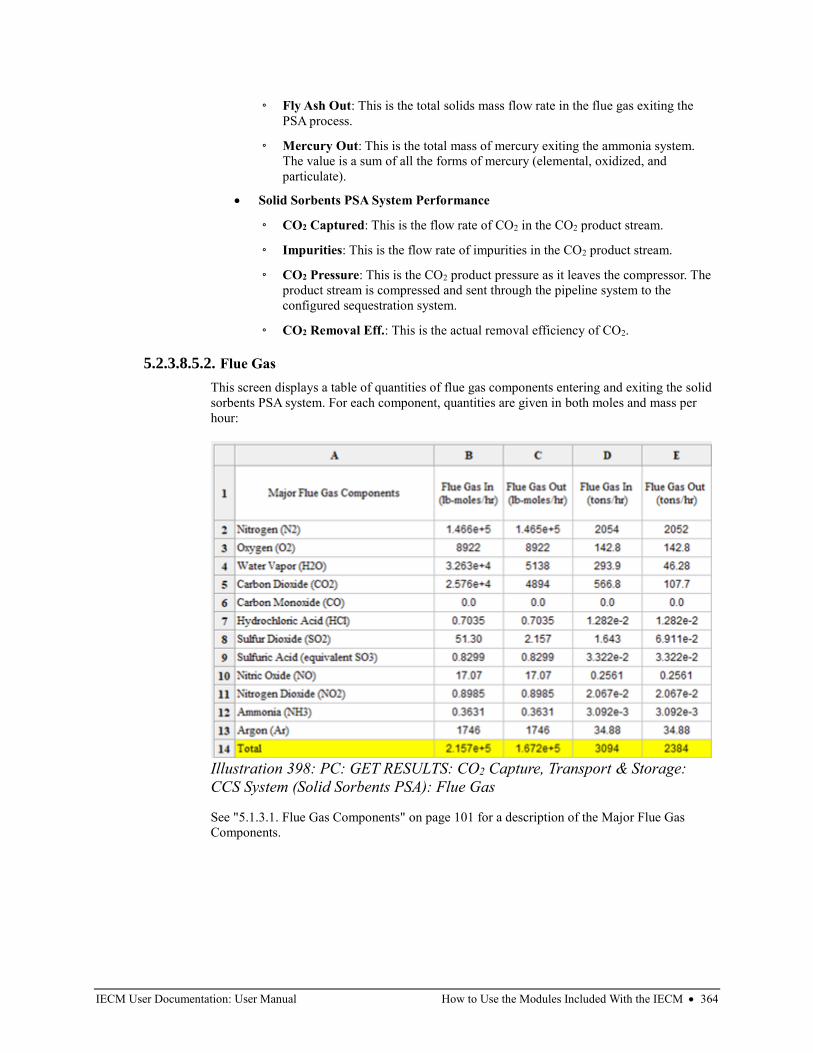
IECM User Documentation: User Manual How to Use the Modules Included With the IECM • 364
◦ Fly Ash Out: This is the total solids mass flow rate in the flue gas exiting the
PSA process.
◦ Mercury Out: This is the total mass of mercury exiting the ammonia system.
The value is a sum of all the forms of mercury (elemental, oxidized, and
particulate).
• Solid Sorbents PSA System Performance
◦ CO2 Captured: This is the flow rate of CO2 in the CO2 product stream.
◦ Impurities: This is the flow rate of impurities in the CO2 product stream.
◦ CO2 Pressure: This is the CO2 product pressure as it leaves the compressor. The
product stream is compressed and sent through the pipeline system to the
configured sequestration system.
◦ CO2 Removal Eff.: This is the actual removal efficiency of CO2.
5.2.3.8.5.2. Flue Gas
This screen displays a table of quantities of flue gas components entering and exiting the solid
sorbents PSA system. For each component, quantities are given in both moles and mass per
hour:
See "5.1.3.1. Flue Gas Components" on page 101 for a description of the Major Flue Gas
Components.
Illustration 398: PC: GET RESULTS: CO2 Capture, Transport & Storage:
CCS System (Solid Sorbents PSA): Flue Gas
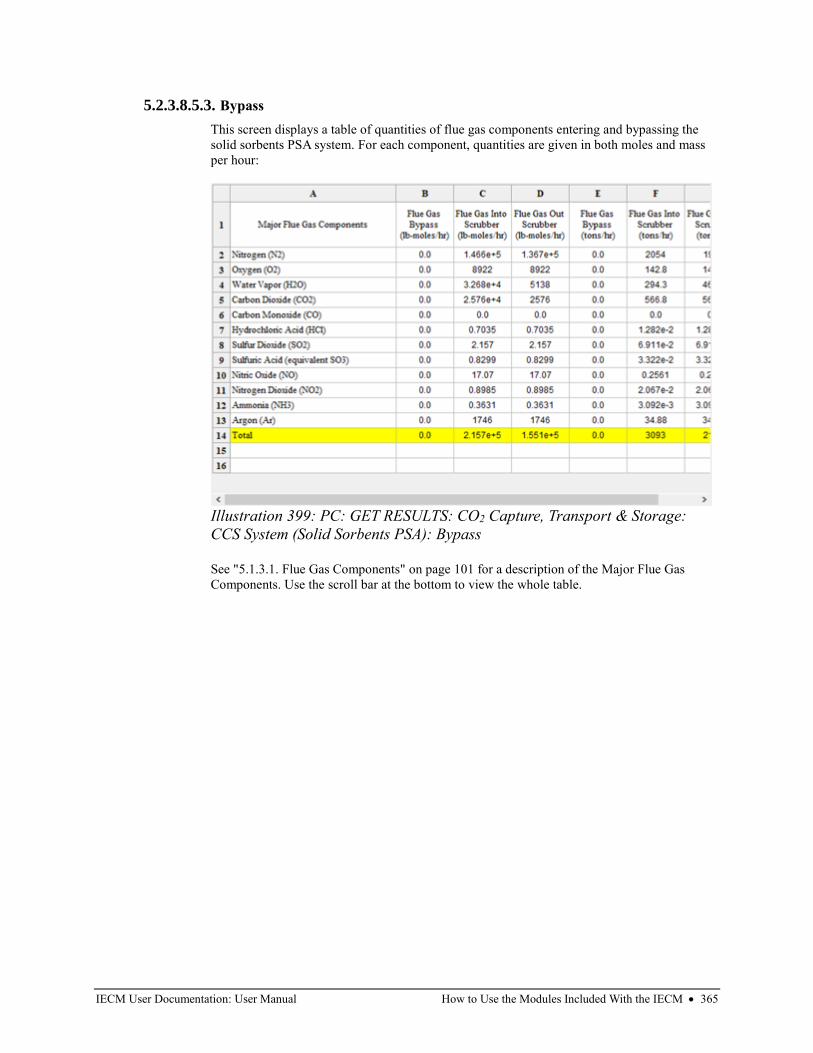
IECM User Documentation: User Manual How to Use the Modules Included With the IECM • 365
5.2.3.8.5.3. Bypass
This screen displays a table of quantities of flue gas components entering and bypassing the
solid sorbents PSA system. For each component, quantities are given in both moles and mass
per hour:
See "5.1.3.1. Flue Gas Components" on page 101 for a description of the Major Flue Gas
Components. Use the scroll bar at the bottom to view the whole table.
Illustration 399: PC: GET RESULTS: CO2 Capture, Transport & Storage:
CCS System (Solid Sorbents PSA): Bypass
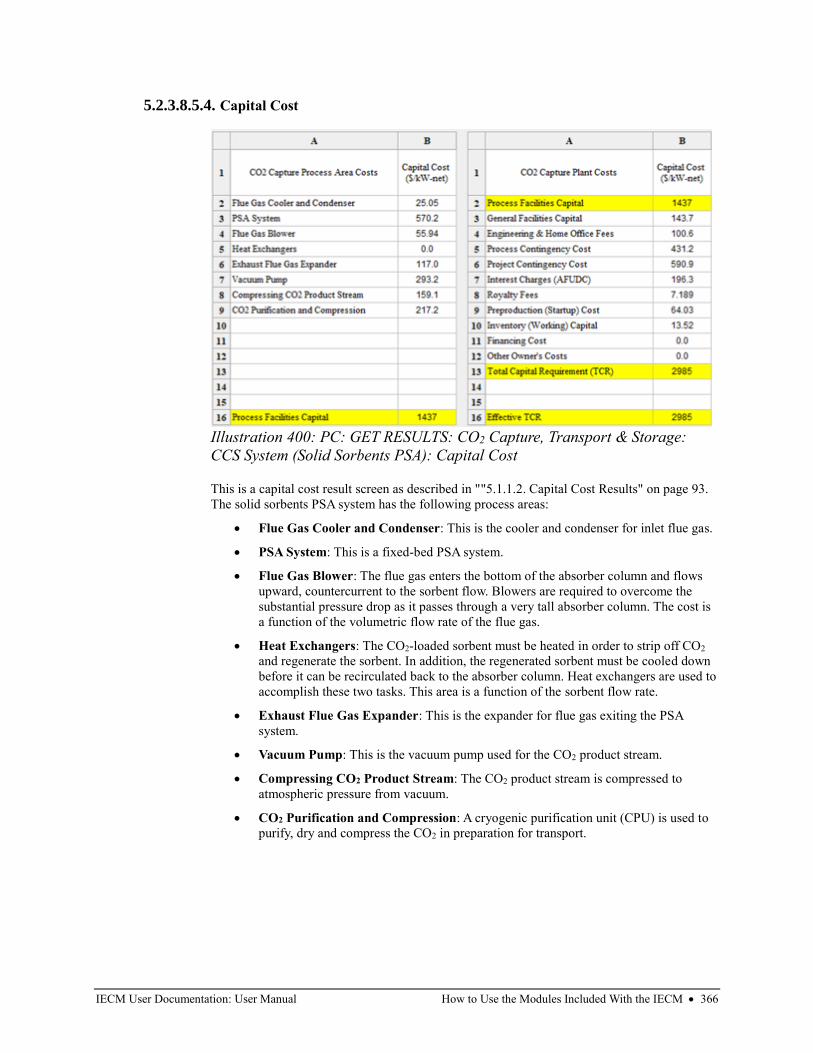
IECM User Documentation: User Manual How to Use the Modules Included With the IECM • 366
5.2.3.8.5.4. Capital Cost
This is a capital cost result screen as described in ""5.1.1.2. Capital Cost Results" on page 93.
The solid sorbents PSA system has the following process areas:
• Flue Gas Cooler and Condenser: This is the cooler and condenser for inlet flue gas.
• PSA System: This is a fixed-bed PSA system.
• Flue Gas Blower: The flue gas enters the bottom of the absorber column and flows
upward, countercurrent to the sorbent flow. Blowers are required to overcome the
substantial pressure drop as it passes through a very tall absorber column. The cost is
a function of the volumetric flow rate of the flue gas.
• Heat Exchangers: The CO2-loaded sorbent must be heated in order to strip off CO2
and regenerate the sorbent. In addition, the regenerated sorbent must be cooled down
before it can be recirculated back to the absorber column. Heat exchangers are used to
accomplish these two tasks. This area is a function of the sorbent flow rate.
• Exhaust Flue Gas Expander: This is the expander for flue gas exiting the PSA
system.
• Vacuum Pump: This is the vacuum pump used for the CO2 product stream.
• Compressing CO2 Product Stream: The CO2 product stream is compressed to
atmospheric pressure from vacuum.
• CO2 Purification and Compression: A cryogenic purification unit (CPU) is used to
purify, dry and compress the CO2 in preparation for transport.
Illustration 400: PC: GET RESULTS: CO2 Capture, Transport & Storage:
CCS System (Solid Sorbents PSA): Capital Cost
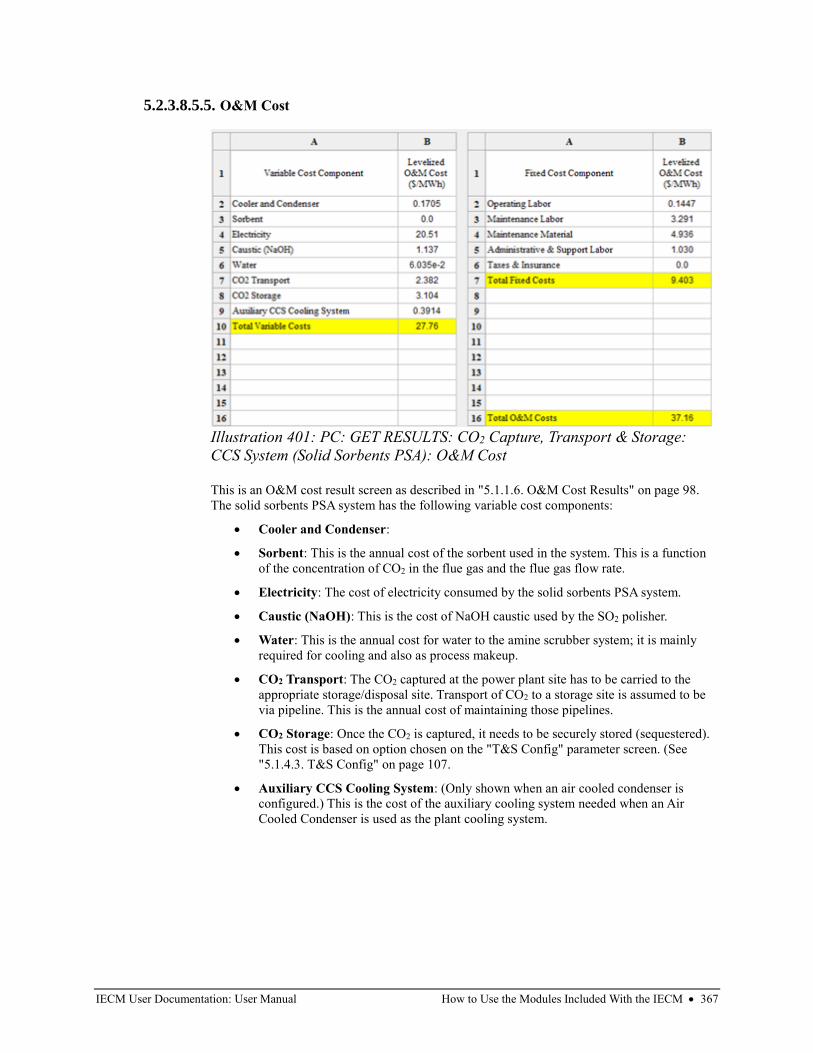
IECM User Documentation: User Manual How to Use the Modules Included With the IECM • 367
5.2.3.8.5.5. O&M Cost
This is an O&M cost result screen as described in "5.1.1.6. O&M Cost Results" on page 98.
The solid sorbents PSA system has the following variable cost components:
• Cooler and Condenser:
• Sorbent: This is the annual cost of the sorbent used in the system. This is a function
of the concentration of CO2 in the flue gas and the flue gas flow rate.
• Electricity: The cost of electricity consumed by the solid sorbents PSA system.
• Caustic (NaOH): This is the cost of NaOH caustic used by the SO2 polisher.
• Water: This is the annual cost for water to the amine scrubber system; it is mainly
required for cooling and also as process makeup.
• CO2 Transport: The CO2 captured at the power plant site has to be carried to the
appropriate storage/disposal site. Transport of CO2 to a storage site is assumed to be
via pipeline. This is the annual cost of maintaining those pipelines.
• CO2 Storage: Once the CO2 is captured, it needs to be securely stored (sequestered).
This cost is based on option chosen on the "T&S Config" parameter screen. (See
"5.1.4.3. T&S Config" on page 107.
• Auxiliary CCS Cooling System: (Only shown when an air cooled condenser is
configured.) This is the cost of the auxiliary cooling system needed when an Air
Cooled Condenser is used as the plant cooling system.
Illustration 401: PC: GET RESULTS: CO2 Capture, Transport & Storage:
CCS System (Solid Sorbents PSA): O&M Cost
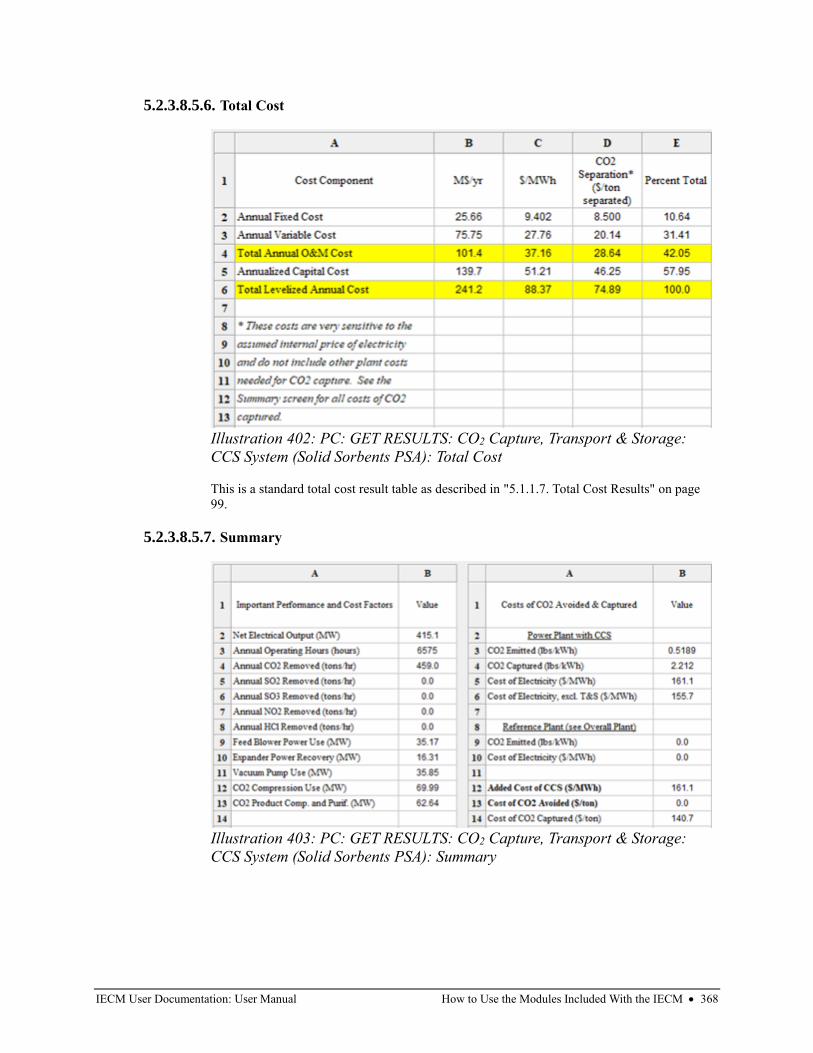
IECM User Documentation: User Manual How to Use the Modules Included With the IECM • 368
5.2.3.8.5.6. Total Cost
This is a standard total cost result table as described in "5.1.1.7. Total Cost Results" on page
99.
5.2.3.8.5.7. Summary
Illustration 402: PC: GET RESULTS: CO2 Capture, Transport & Storage:
CCS System (Solid Sorbents PSA): Total Cost
Illustration 403: PC: GET RESULTS: CO2 Capture, Transport & Storage:
CCS System (Solid Sorbents PSA): Summary
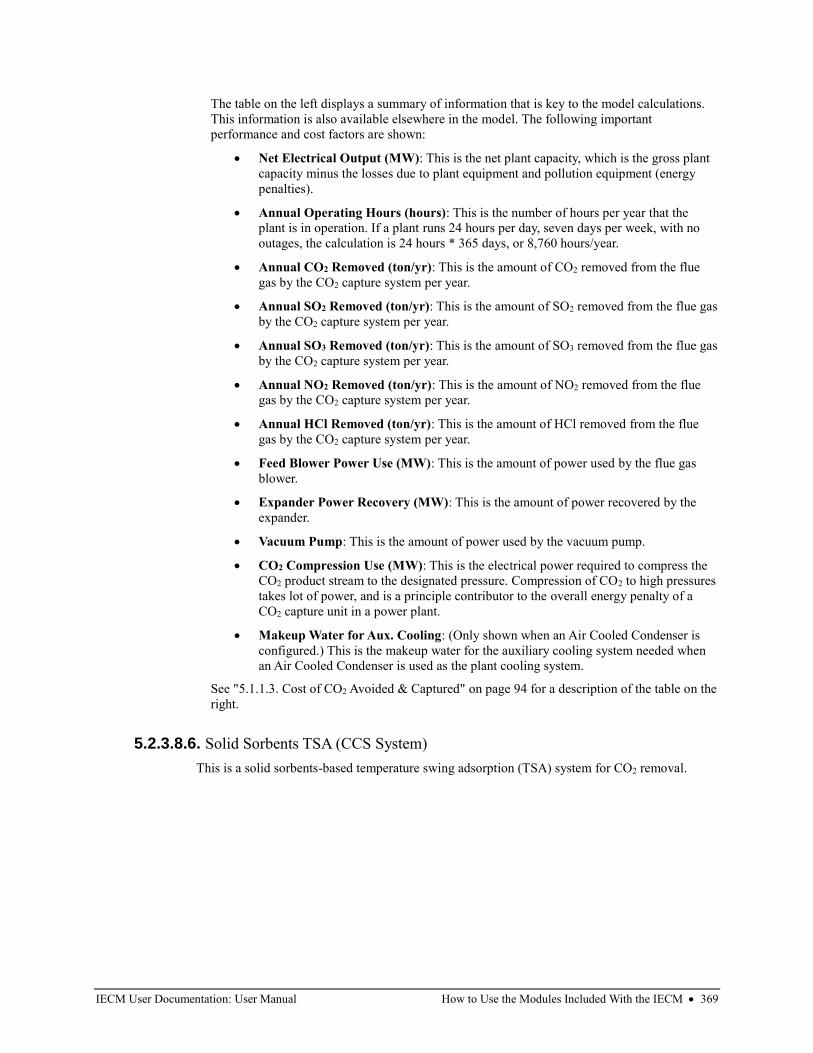
IECM User Documentation: User Manual How to Use the Modules Included With the IECM • 369
The table on the left displays a summary of information that is key to the model calculations.
This information is also available elsewhere in the model. The following important
performance and cost factors are shown:
• Net Electrical Output (MW): This is the net plant capacity, which is the gross plant
capacity minus the losses due to plant equipment and pollution equipment (energy
penalties).
• Annual Operating Hours (hours): This is the number of hours per year that the
plant is in operation. If a plant runs 24 hours per day, seven days per week, with no
outages, the calculation is 24 hours * 365 days, or 8,760 hours/year.
• Annual CO2 Removed (ton/yr): This is the amount of CO2 removed from the flue
gas by the CO2 capture system per year.
• Annual SO2 Removed (ton/yr): This is the amount of SO2 removed from the flue gas
by the CO2 capture system per year.
• Annual SO3 Removed (ton/yr): This is the amount of SO3 removed from the flue gas
by the CO2 capture system per year.
• Annual NO2 Removed (ton/yr): This is the amount of NO2 removed from the flue
gas by the CO2 capture system per year.
• Annual HCl Removed (ton/yr): This is the amount of HCl removed from the flue
gas by the CO2 capture system per year.
• Feed Blower Power Use (MW): This is the amount of power used by the flue gas
blower.
• Expander Power Recovery (MW): This is the amount of power recovered by the
expander.
• Vacuum Pump: This is the amount of power used by the vacuum pump.
• CO2 Compression Use (MW): This is the electrical power required to compress the
CO2 product stream to the designated pressure. Compression of CO2 to high pressures
takes lot of power, and is a principle contributor to the overall energy penalty of a
CO2 capture unit in a power plant.
• Makeup Water for Aux. Cooling: (Only shown when an Air Cooled Condenser is
configured.) This is the makeup water for the auxiliary cooling system needed when
an Air Cooled Condenser is used as the plant cooling system.
See "5.1.1.3. Cost of CO2 Avoided & Captured" on page 94 for a description of the table on the
right.
5.2.3.8.6. Solid Sorbents TSA (CCS System)
This is a solid sorbents-based temperature swing adsorption (TSA) system for CO2 removal.
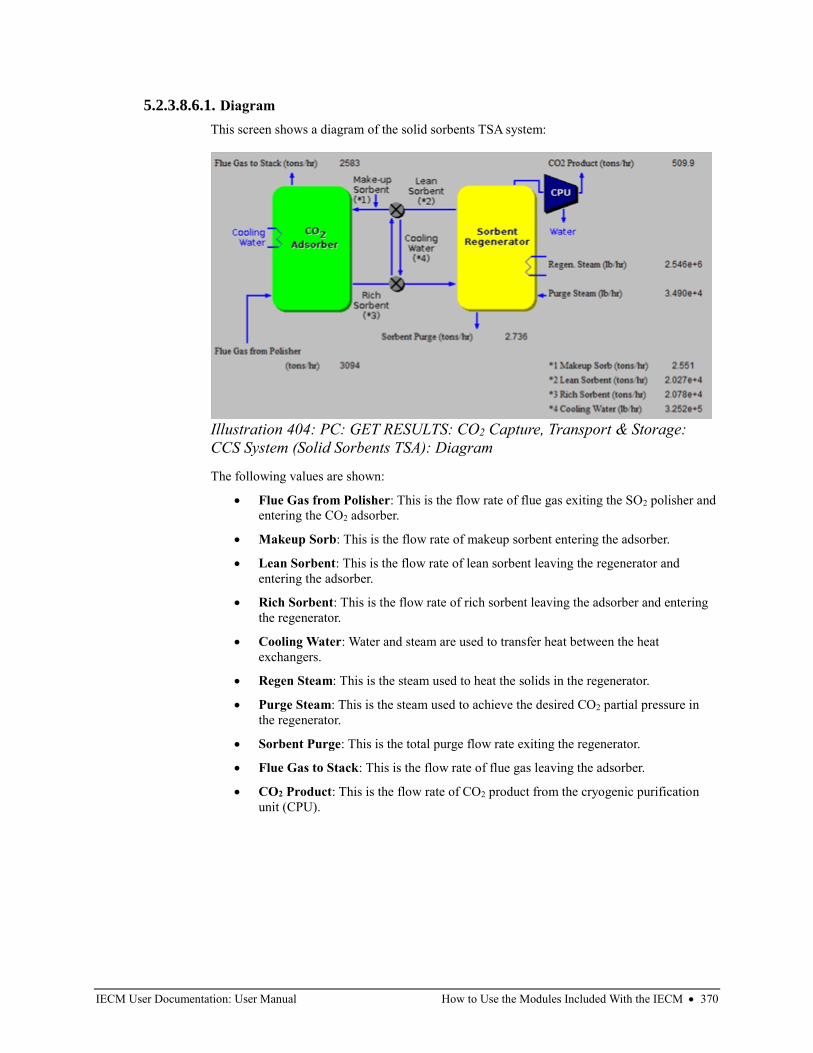
IECM User Documentation: User Manual How to Use the Modules Included With the IECM • 370
5.2.3.8.6.1. Diagram
This screen shows a diagram of the solid sorbents TSA system:
The following values are shown:
• Flue Gas from Polisher: This is the flow rate of flue gas exiting the SO2 polisher and
entering the CO2 adsorber.
• Makeup Sorb: This is the flow rate of makeup sorbent entering the adsorber.
• Lean Sorbent: This is the flow rate of lean sorbent leaving the regenerator and
entering the adsorber.
• Rich Sorbent: This is the flow rate of rich sorbent leaving the adsorber and entering
the regenerator.
• Cooling Water: Water and steam are used to transfer heat between the heat
exchangers.
• Regen Steam: This is the steam used to heat the solids in the regenerator.
• Purge Steam: This is the steam used to achieve the desired CO2 partial pressure in
the regenerator.
• Sorbent Purge: This is the total purge flow rate exiting the regenerator.
• Flue Gas to Stack: This is the flow rate of flue gas leaving the adsorber.
• CO2 Product: This is the flow rate of CO2 product from the cryogenic purification
unit (CPU).
Illustration 404: PC: GET RESULTS: CO2 Capture, Transport & Storage:
CCS System (Solid Sorbents TSA): Diagram
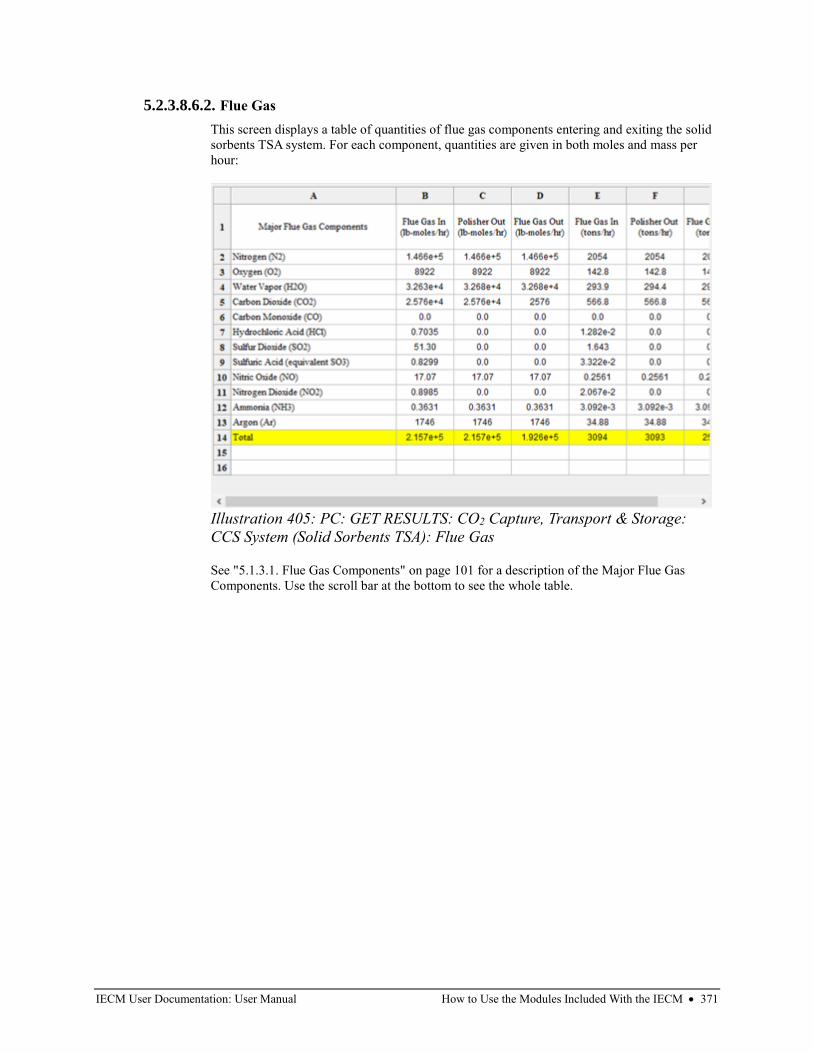
IECM User Documentation: User Manual How to Use the Modules Included With the IECM • 371
5.2.3.8.6.2. Flue Gas
This screen displays a table of quantities of flue gas components entering and exiting the solid
sorbents TSA system. For each component, quantities are given in both moles and mass per
hour:
See "5.1.3.1. Flue Gas Components" on page 101 for a description of the Major Flue Gas
Components. Use the scroll bar at the bottom to see the whole table.
Illustration 405: PC: GET RESULTS: CO2 Capture, Transport & Storage:
CCS System (Solid Sorbents TSA): Flue Gas
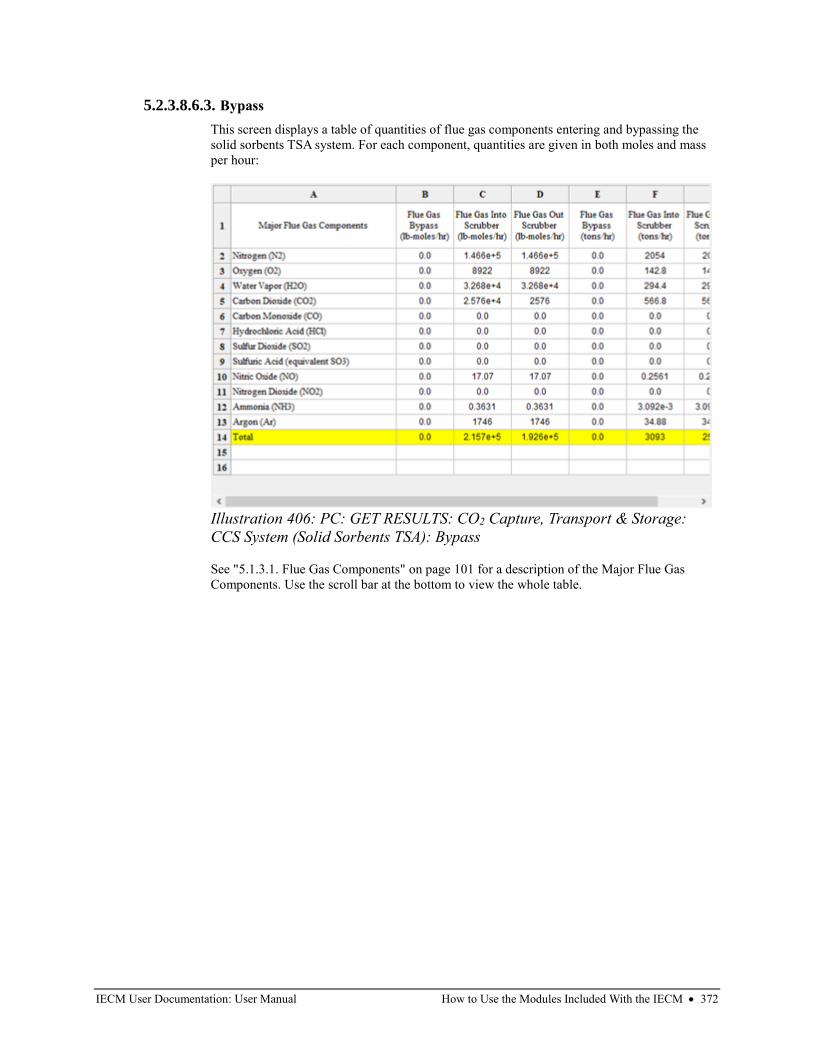
IECM User Documentation: User Manual How to Use the Modules Included With the IECM • 372
5.2.3.8.6.3. Bypass
This screen displays a table of quantities of flue gas components entering and bypassing the
solid sorbents TSA system. For each component, quantities are given in both moles and mass
per hour:
See "5.1.3.1. Flue Gas Components" on page 101 for a description of the Major Flue Gas
Components. Use the scroll bar at the bottom to view the whole table.
Illustration 406: PC: GET RESULTS: CO2 Capture, Transport & Storage:
CCS System (Solid Sorbents TSA): Bypass
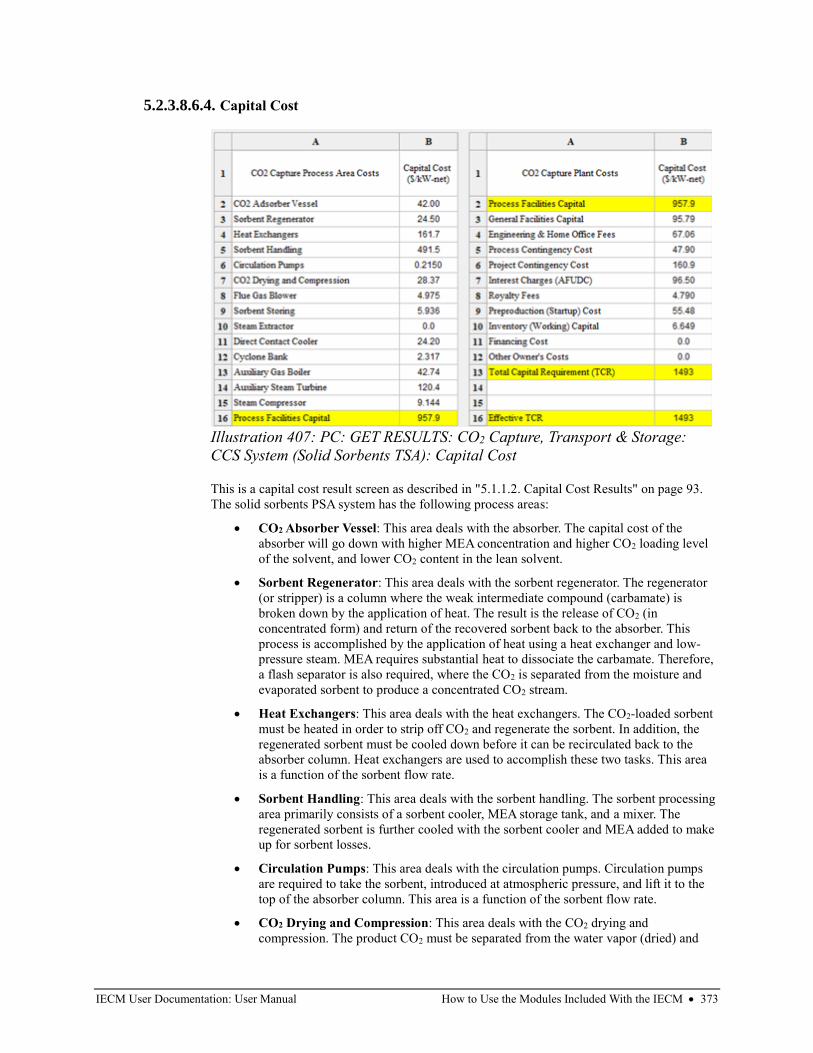
IECM User Documentation: User Manual How to Use the Modules Included With the IECM • 373
5.2.3.8.6.4. Capital Cost
This is a capital cost result screen as described in "5.1.1.2. Capital Cost Results" on page 93.
The solid sorbents PSA system has the following process areas:
• CO2 Absorber Vessel: This area deals with the absorber. The capital cost of the
absorber will go down with higher MEA concentration and higher CO2 loading level
of the solvent, and lower CO2 content in the lean solvent.
• Sorbent Regenerator: This area deals with the sorbent regenerator. The regenerator
(or stripper) is a column where the weak intermediate compound (carbamate) is
broken down by the application of heat. The result is the release of CO2 (in
concentrated form) and return of the recovered sorbent back to the absorber. This
process is accomplished by the application of heat using a heat exchanger and low-
pressure steam. MEA requires substantial heat to dissociate the carbamate. Therefore,
a flash separator is also required, where the CO2 is separated from the moisture and
evaporated sorbent to produce a concentrated CO2 stream.
• Heat Exchangers: This area deals with the heat exchangers. The CO2-loaded sorbent
must be heated in order to strip off CO2 and regenerate the sorbent. In addition, the
regenerated sorbent must be cooled down before it can be recirculated back to the
absorber column. Heat exchangers are used to accomplish these two tasks. This area
is a function of the sorbent flow rate.
• Sorbent Handling: This area deals with the sorbent handling. The sorbent processing
area primarily consists of a sorbent cooler, MEA storage tank, and a mixer. The
regenerated sorbent is further cooled with the sorbent cooler and MEA added to make
up for sorbent losses.
• Circulation Pumps: This area deals with the circulation pumps. Circulation pumps
are required to take the sorbent, introduced at atmospheric pressure, and lift it to the
top of the absorber column. This area is a function of the sorbent flow rate.
• CO2 Drying and Compression: This area deals with the CO2 drying and
compression. The product CO2 must be separated from the water vapor (dried) and
Illustration 407: PC: GET RESULTS: CO2 Capture, Transport & Storage:
CCS System (Solid Sorbents TSA): Capital Cost
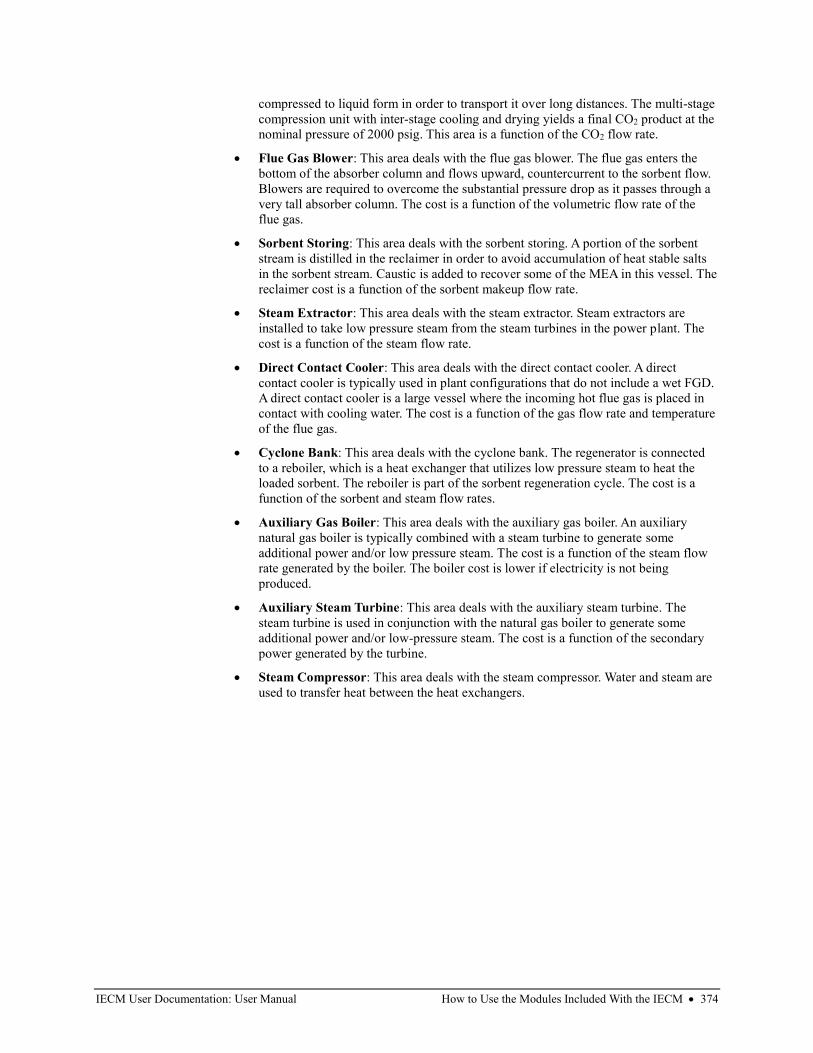
IECM User Documentation: User Manual How to Use the Modules Included With the IECM • 374
compressed to liquid form in order to transport it over long distances. The multi-stage
compression unit with inter-stage cooling and drying yields a final CO2 product at the
nominal pressure of 2000 psig. This area is a function of the CO2 flow rate.
• Flue Gas Blower: This area deals with the flue gas blower. The flue gas enters the
bottom of the absorber column and flows upward, countercurrent to the sorbent flow.
Blowers are required to overcome the substantial pressure drop as it passes through a
very tall absorber column. The cost is a function of the volumetric flow rate of the
flue gas.
• Sorbent Storing: This area deals with the sorbent storing. A portion of the sorbent
stream is distilled in the reclaimer in order to avoid accumulation of heat stable salts
in the sorbent stream. Caustic is added to recover some of the MEA in this vessel. The
reclaimer cost is a function of the sorbent makeup flow rate.
• Steam Extractor: This area deals with the steam extractor. Steam extractors are
installed to take low pressure steam from the steam turbines in the power plant. The
cost is a function of the steam flow rate.
• Direct Contact Cooler: This area deals with the direct contact cooler. A direct
contact cooler is typically used in plant configurations that do not include a wet FGD.
A direct contact cooler is a large vessel where the incoming hot flue gas is placed in
contact with cooling water. The cost is a function of the gas flow rate and temperature
of the flue gas.
• Cyclone Bank: This area deals with the cyclone bank. The regenerator is connected
to a reboiler, which is a heat exchanger that utilizes low pressure steam to heat the
loaded sorbent. The reboiler is part of the sorbent regeneration cycle. The cost is a
function of the sorbent and steam flow rates.
• Auxiliary Gas Boiler: This area deals with the auxiliary gas boiler. An auxiliary
natural gas boiler is typically combined with a steam turbine to generate some
additional power and/or low pressure steam. The cost is a function of the steam flow
rate generated by the boiler. The boiler cost is lower if electricity is not being
produced.
• Auxiliary Steam Turbine: This area deals with the auxiliary steam turbine. The
steam turbine is used in conjunction with the natural gas boiler to generate some
additional power and/or low-pressure steam. The cost is a function of the secondary
power generated by the turbine.
• Steam Compressor: This area deals with the steam compressor. Water and steam are
used to transfer heat between the heat exchangers.
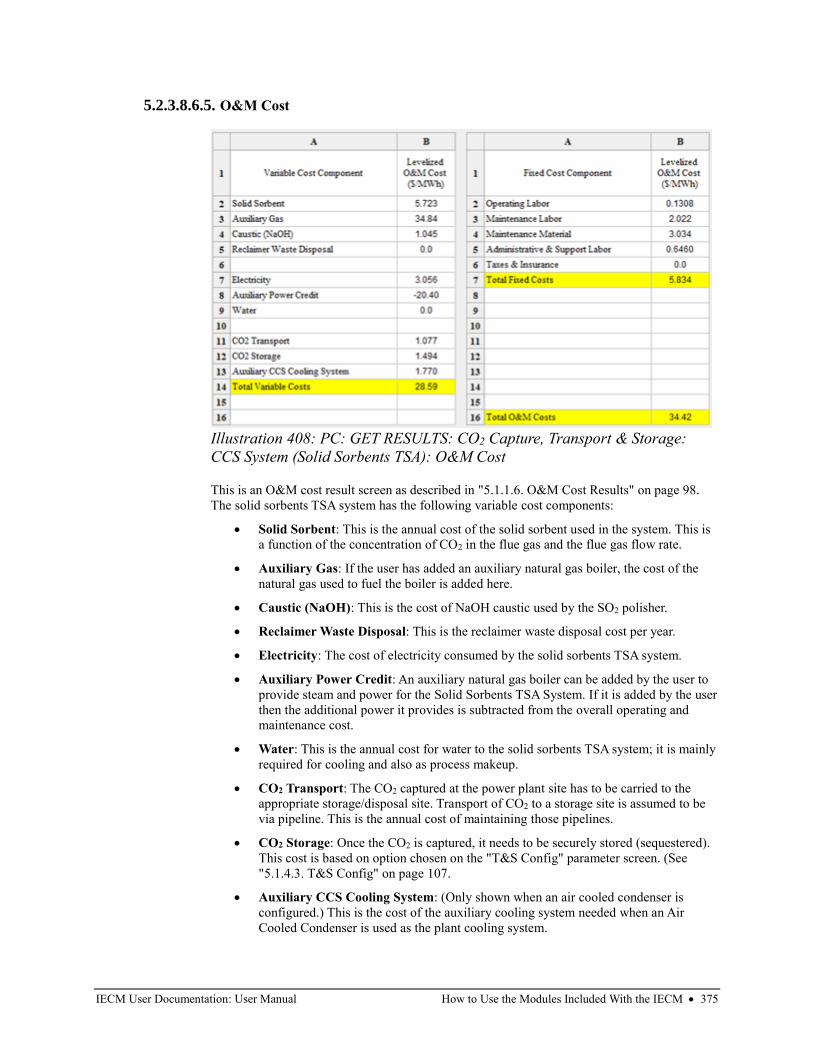
IECM User Documentation: User Manual How to Use the Modules Included With the IECM • 375
5.2.3.8.6.5. O&M Cost
This is an O&M cost result screen as described in "5.1.1.6. O&M Cost Results" on page 98.
The solid sorbents TSA system has the following variable cost components:
• Solid Sorbent: This is the annual cost of the solid sorbent used in the system. This is
a function of the concentration of CO2 in the flue gas and the flue gas flow rate.
• Auxiliary Gas: If the user has added an auxiliary natural gas boiler, the cost of the
natural gas used to fuel the boiler is added here.
• Caustic (NaOH): This is the cost of NaOH caustic used by the SO2 polisher.
• Reclaimer Waste Disposal: This is the reclaimer waste disposal cost per year.
• Electricity: The cost of electricity consumed by the solid sorbents TSA system.
• Auxiliary Power Credit: An auxiliary natural gas boiler can be added by the user to
provide steam and power for the Solid Sorbents TSA System. If it is added by the user
then the additional power it provides is subtracted from the overall operating and
maintenance cost.
• Water: This is the annual cost for water to the solid sorbents TSA system; it is mainly
required for cooling and also as process makeup.
• CO2 Transport: The CO2 captured at the power plant site has to be carried to the
appropriate storage/disposal site. Transport of CO2 to a storage site is assumed to be
via pipeline. This is the annual cost of maintaining those pipelines.
• CO2 Storage: Once the CO2 is captured, it needs to be securely stored (sequestered).
This cost is based on option chosen on the "T&S Config" parameter screen. (See
"5.1.4.3. T&S Config" on page 107.
• Auxiliary CCS Cooling System: (Only shown when an air cooled condenser is
configured.) This is the cost of the auxiliary cooling system needed when an Air
Cooled Condenser is used as the plant cooling system.
Illustration 408: PC: GET RESULTS: CO2 Capture, Transport & Storage:
CCS System (Solid Sorbents TSA): O&M Cost
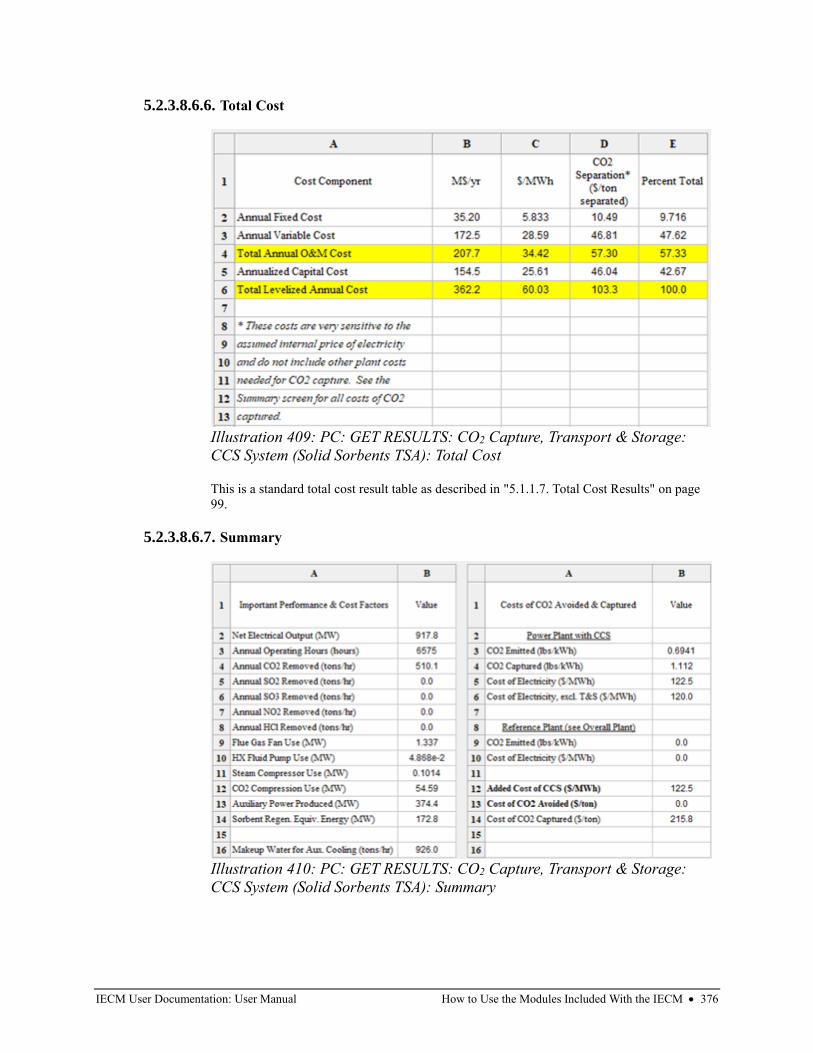
IECM User Documentation: User Manual How to Use the Modules Included With the IECM • 376
5.2.3.8.6.6. Total Cost
This is a standard total cost result table as described in "5.1.1.7. Total Cost Results" on page
99.
5.2.3.8.6.7. Summary
Illustration 409: PC: GET RESULTS: CO2 Capture, Transport & Storage:
CCS System (Solid Sorbents TSA): Total Cost
Illustration 410: PC: GET RESULTS: CO2 Capture, Transport & Storage:
CCS System (Solid Sorbents TSA): Summary
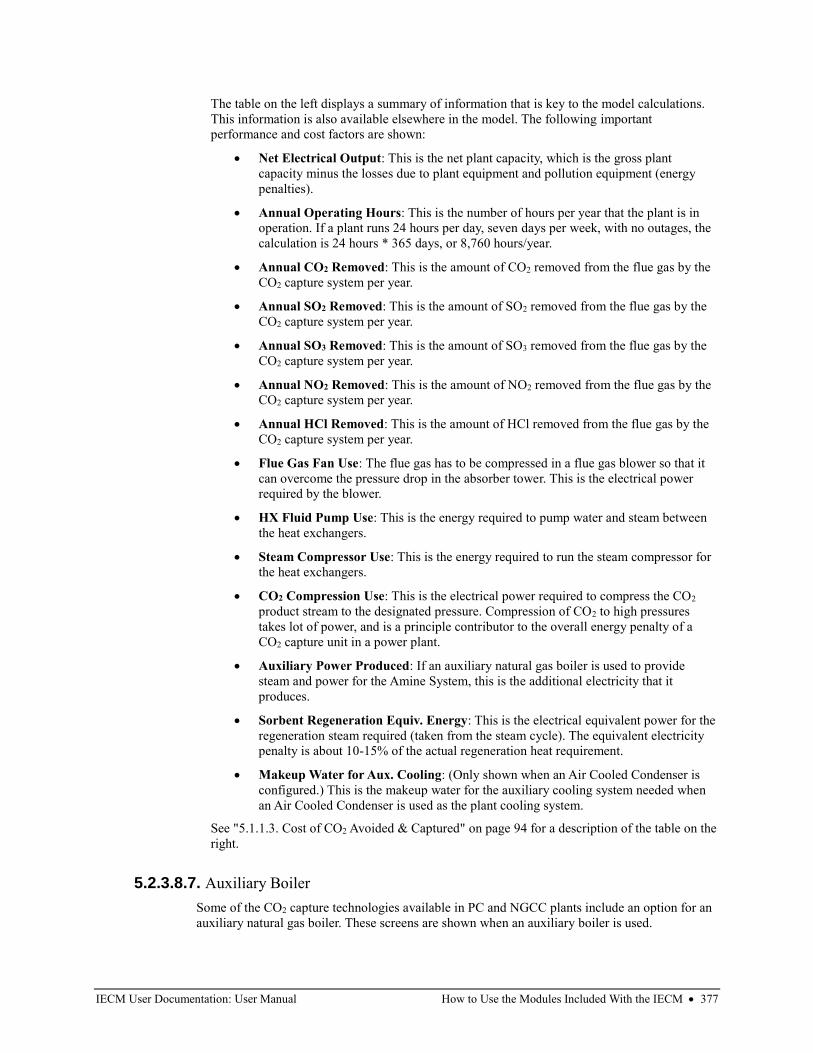
IECM User Documentation: User Manual How to Use the Modules Included With the IECM • 377
The table on the left displays a summary of information that is key to the model calculations.
This information is also available elsewhere in the model. The following important
performance and cost factors are shown:
• Net Electrical Output: This is the net plant capacity, which is the gross plant
capacity minus the losses due to plant equipment and pollution equipment (energy
penalties).
• Annual Operating Hours: This is the number of hours per year that the plant is in
operation. If a plant runs 24 hours per day, seven days per week, with no outages, the
calculation is 24 hours * 365 days, or 8,760 hours/year.
• Annual CO2 Removed: This is the amount of CO2 removed from the flue gas by the
CO2 capture system per year.
• Annual SO2 Removed: This is the amount of SO2 removed from the flue gas by the
CO2 capture system per year.
• Annual SO3 Removed: This is the amount of SO3 removed from the flue gas by the
CO2 capture system per year.
• Annual NO2 Removed: This is the amount of NO2 removed from the flue gas by the
CO2 capture system per year.
• Annual HCl Removed: This is the amount of HCl removed from the flue gas by the
CO2 capture system per year.
• Flue Gas Fan Use: The flue gas has to be compressed in a flue gas blower so that it
can overcome the pressure drop in the absorber tower. This is the electrical power
required by the blower.
• HX Fluid Pump Use: This is the energy required to pump water and steam between
the heat exchangers.
• Steam Compressor Use: This is the energy required to run the steam compressor for
the heat exchangers.
• CO2 Compression Use: This is the electrical power required to compress the CO2
product stream to the designated pressure. Compression of CO2 to high pressures
takes lot of power, and is a principle contributor to the overall energy penalty of a
CO2 capture unit in a power plant.
• Auxiliary Power Produced: If an auxiliary natural gas boiler is used to provide
steam and power for the Amine System, this is the additional electricity that it
produces.
• Sorbent Regeneration Equiv. Energy: This is the electrical equivalent power for the
regeneration steam required (taken from the steam cycle). The equivalent electricity
penalty is about 10-15% of the actual regeneration heat requirement.
• Makeup Water for Aux. Cooling: (Only shown when an Air Cooled Condenser is
configured.) This is the makeup water for the auxiliary cooling system needed when
an Air Cooled Condenser is used as the plant cooling system.
See "5.1.1.3. Cost of CO2 Avoided & Captured" on page 94 for a description of the table on the
right.
5.2.3.8.7. Auxiliary Boiler
Some of the CO2 capture technologies available in PC and NGCC plants include an option for an
auxiliary natural gas boiler. These screens are shown when an auxiliary boiler is used.
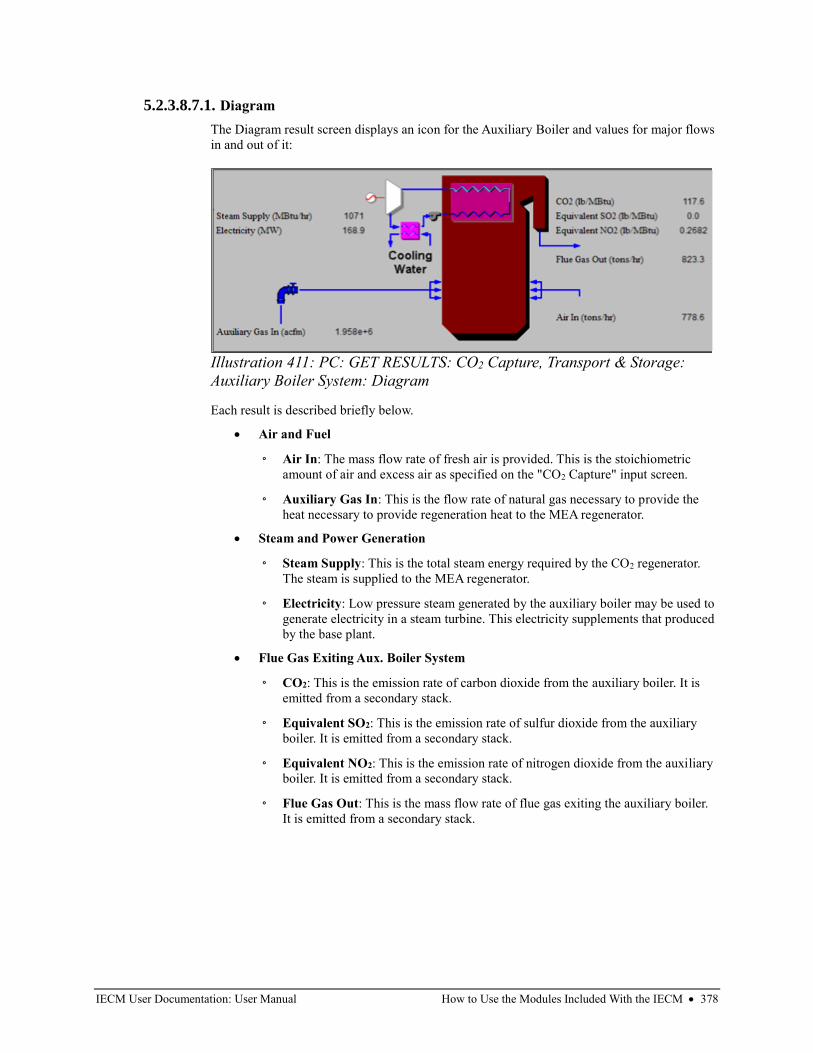
IECM User Documentation: User Manual How to Use the Modules Included With the IECM • 378
5.2.3.8.7.1. Diagram
The Diagram result screen displays an icon for the Auxiliary Boiler and values for major flows
in and out of it:
Each result is described briefly below.
• Air and Fuel
◦ Air In: The mass flow rate of fresh air is provided. This is the stoichiometric
amount of air and excess air as specified on the "CO2 Capture" input screen.
◦ Auxiliary Gas In: This is the flow rate of natural gas necessary to provide the
heat necessary to provide regeneration heat to the MEA regenerator.
• Steam and Power Generation
◦ Steam Supply: This is the total steam energy required by the CO2 regenerator.
The steam is supplied to the MEA regenerator.
◦ Electricity: Low pressure steam generated by the auxiliary boiler may be used to
generate electricity in a steam turbine. This electricity supplements that produced
by the base plant.
• Flue Gas Exiting Aux. Boiler System
◦ CO2: This is the emission rate of carbon dioxide from the auxiliary boiler. It is
emitted from a secondary stack.
◦ Equivalent SO2: This is the emission rate of sulfur dioxide from the auxiliary
boiler. It is emitted from a secondary stack.
◦ Equivalent NO2: This is the emission rate of nitrogen dioxide from the auxiliary
boiler. It is emitted from a secondary stack.
◦ Flue Gas Out: This is the mass flow rate of flue gas exiting the auxiliary boiler.
It is emitted from a secondary stack.
Illustration 411: PC: GET RESULTS: CO2 Capture, Transport & Storage:
Auxiliary Boiler System: Diagram
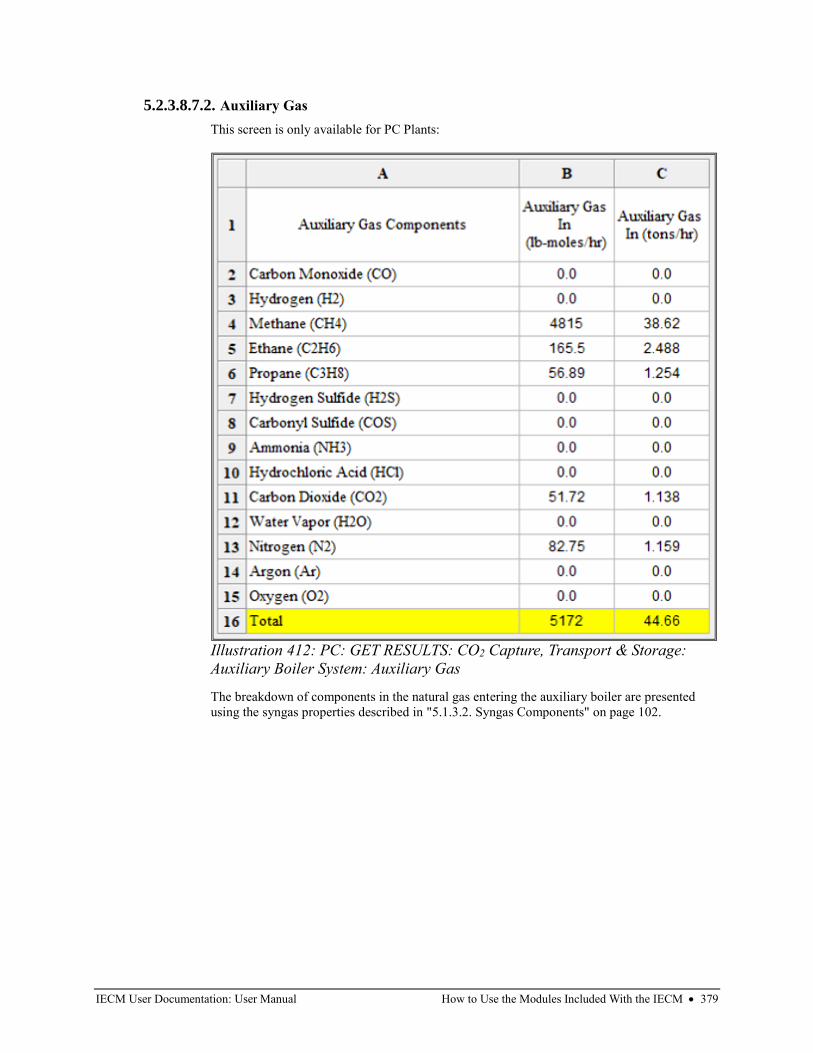
IECM User Documentation: User Manual How to Use the Modules Included With the IECM • 379
5.2.3.8.7.2. Auxiliary Gas
This screen is only available for PC Plants:
The breakdown of components in the natural gas entering the auxiliary boiler are presented
using the syngas properties described in "5.1.3.2. Syngas Components" on page 102.
Illustration 412: PC: GET RESULTS: CO2 Capture, Transport & Storage:
Auxiliary Boiler System: Auxiliary Gas
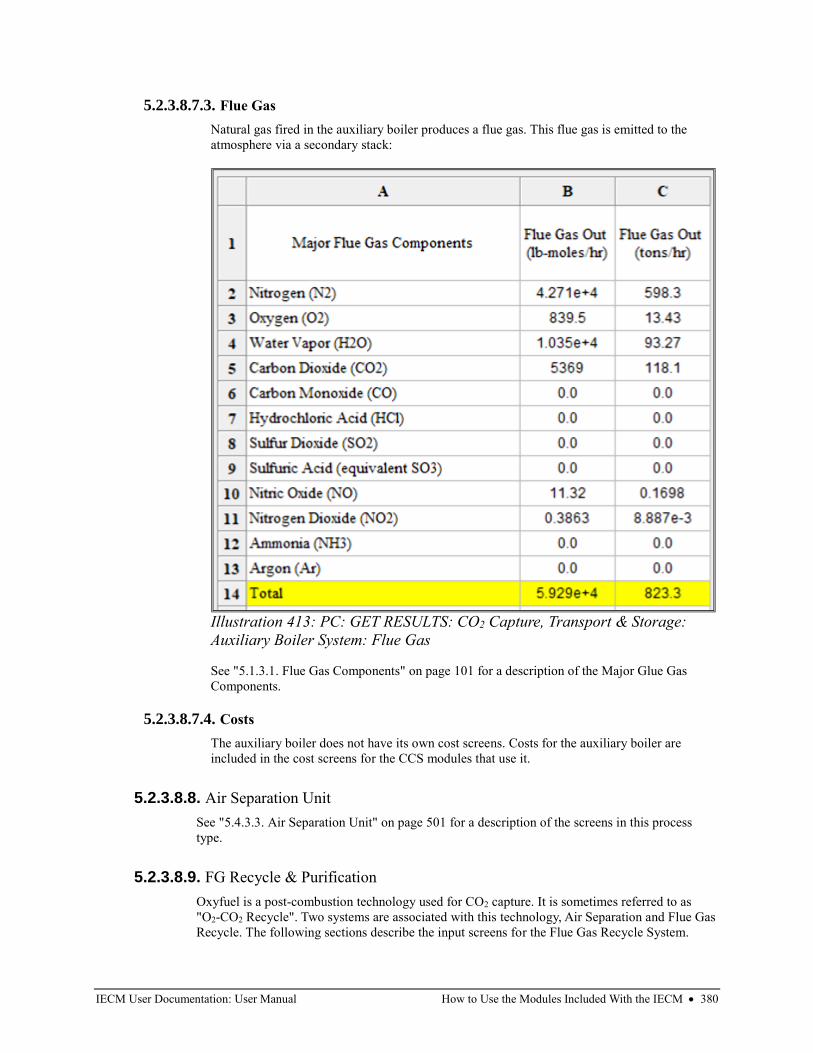
IECM User Documentation: User Manual How to Use the Modules Included With the IECM • 380
5.2.3.8.7.3. Flue Gas
Natural gas fired in the auxiliary boiler produces a flue gas. This flue gas is emitted to the
atmosphere via a secondary stack:
See "5.1.3.1. Flue Gas Components" on page 101 for a description of the Major Glue Gas
Components.
5.2.3.8.7.4. Costs
The auxiliary boiler does not have its own cost screens. Costs for the auxiliary boiler are
included in the cost screens for the CCS modules that use it.
5.2.3.8.8. Air Separation Unit
See "5.4.3.3. Air Separation Unit" on page 501 for a description of the screens in this process
type.
5.2.3.8.9. FG Recycle & Purification
Oxyfuel is a post-combustion technology used for CO2 capture. It is sometimes referred to as
"O2-CO2 Recycle". Two systems are associated with this technology, Air Separation and Flue Gas
Recycle. The following sections describe the input screens for the Flue Gas Recycle System.
Illustration 413: PC: GET RESULTS: CO2 Capture, Transport & Storage:
Auxiliary Boiler System: Flue Gas
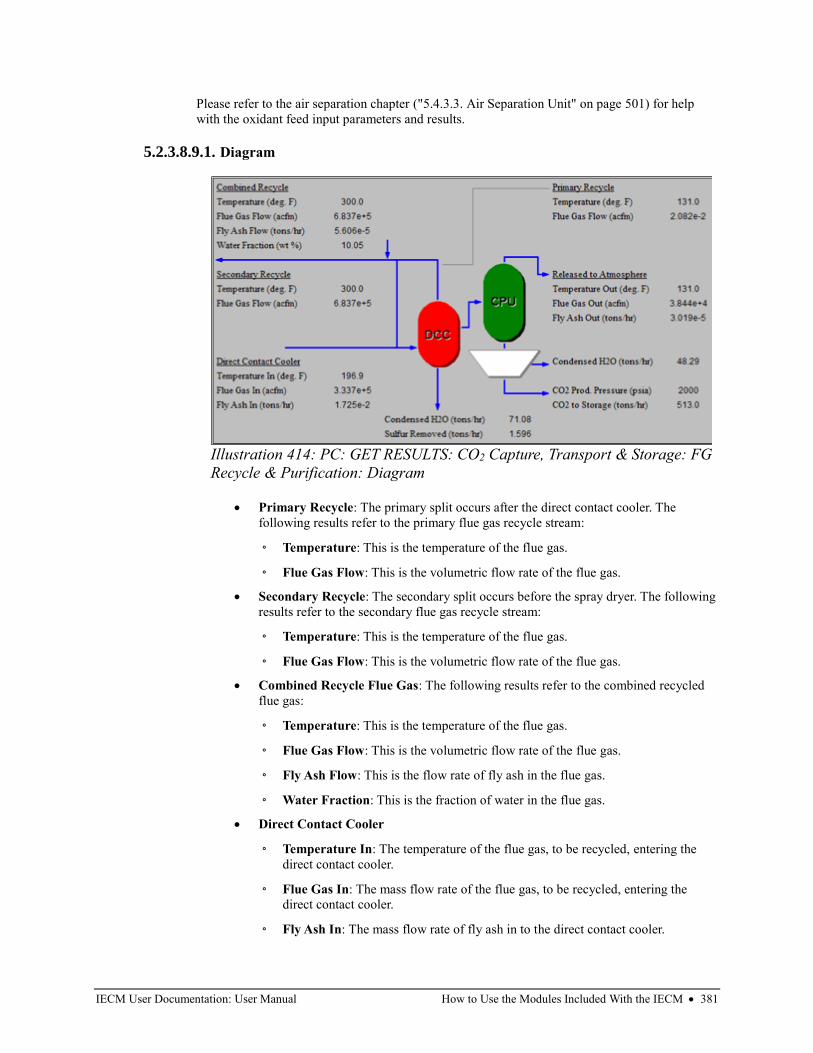
IECM User Documentation: User Manual How to Use the Modules Included With the IECM • 381
Please refer to the air separation chapter ("5.4.3.3. Air Separation Unit" on page 501) for help
with the oxidant feed input parameters and results.
5.2.3.8.9.1. Diagram
• Primary Recycle: The primary split occurs after the direct contact cooler. The
following results refer to the primary flue gas recycle stream:
◦ Temperature: This is the temperature of the flue gas.
◦ Flue Gas Flow: This is the volumetric flow rate of the flue gas.
• Secondary Recycle: The secondary split occurs before the spray dryer. The following
results refer to the secondary flue gas recycle stream:
◦ Temperature: This is the temperature of the flue gas.
◦ Flue Gas Flow: This is the volumetric flow rate of the flue gas.
• Combined Recycle Flue Gas: The following results refer to the combined recycled
flue gas:
◦ Temperature: This is the temperature of the flue gas.
◦ Flue Gas Flow: This is the volumetric flow rate of the flue gas.
◦ Fly Ash Flow: This is the flow rate of fly ash in the flue gas.
◦ Water Fraction: This is the fraction of water in the flue gas.
• Direct Contact Cooler
◦ Temperature In: The temperature of the flue gas, to be recycled, entering the
direct contact cooler.
◦ Flue Gas In: The mass flow rate of the flue gas, to be recycled, entering the
direct contact cooler.
◦ Fly Ash In: The mass flow rate of fly ash in to the direct contact cooler.
Illustration 414: PC: GET RESULTS: CO2 Capture, Transport & Storage: FG
Recycle & Purification: Diagram
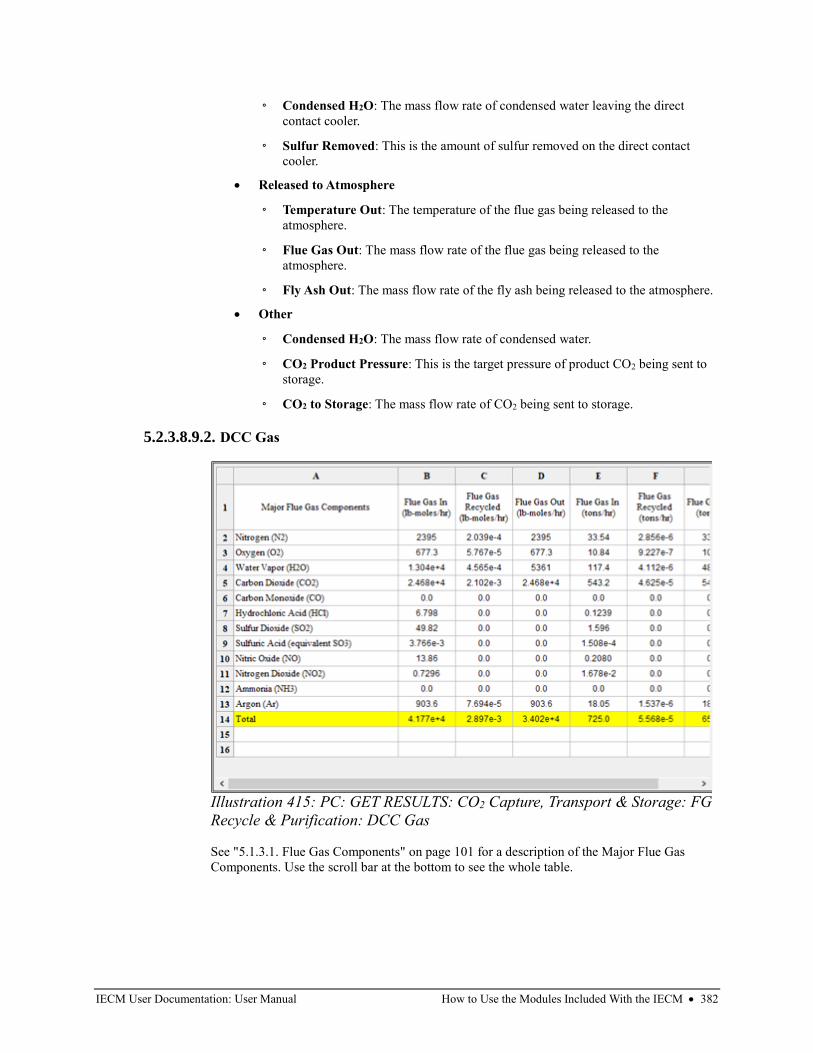
IECM User Documentation: User Manual How to Use the Modules Included With the IECM • 382
◦ Condensed H2O: The mass flow rate of condensed water leaving the direct
contact cooler.
◦ Sulfur Removed: This is the amount of sulfur removed on the direct contact
cooler.
• Released to Atmosphere
◦ Temperature Out: The temperature of the flue gas being released to the
atmosphere.
◦ Flue Gas Out: The mass flow rate of the flue gas being released to the
atmosphere.
◦ Fly Ash Out: The mass flow rate of the fly ash being released to the atmosphere.
• Other
◦ Condensed H2O: The mass flow rate of condensed water.
◦ CO2 Product Pressure: This is the target pressure of product CO2 being sent to
storage.
◦ CO2 to Storage: The mass flow rate of CO2 being sent to storage.
5.2.3.8.9.2. DCC Gas
See "5.1.3.1. Flue Gas Components" on page 101 for a description of the Major Flue Gas
Components. Use the scroll bar at the bottom to see the whole table.
Illustration 415: PC: GET RESULTS: CO2 Capture, Transport & Storage: FG
Recycle & Purification: DCC Gas
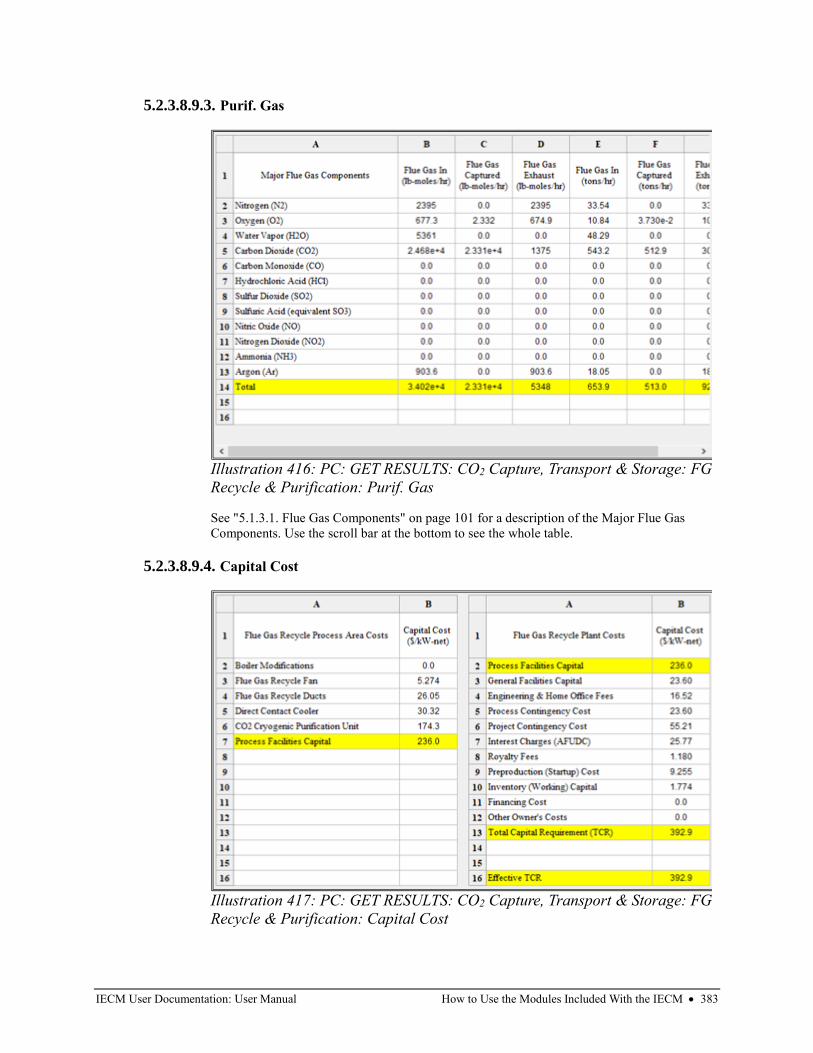
IECM User Documentation: User Manual How to Use the Modules Included With the IECM • 383
5.2.3.8.9.3. Purif. Gas
See "5.1.3.1. Flue Gas Components" on page 101 for a description of the Major Flue Gas
Components. Use the scroll bar at the bottom to see the whole table.
5.2.3.8.9.4. Capital Cost
Illustration 416: PC: GET RESULTS: CO2 Capture, Transport & Storage: FG
Recycle & Purification: Purif. Gas
Illustration 417: PC: GET RESULTS: CO2 Capture, Transport & Storage: FG
Recycle & Purification: Capital Cost
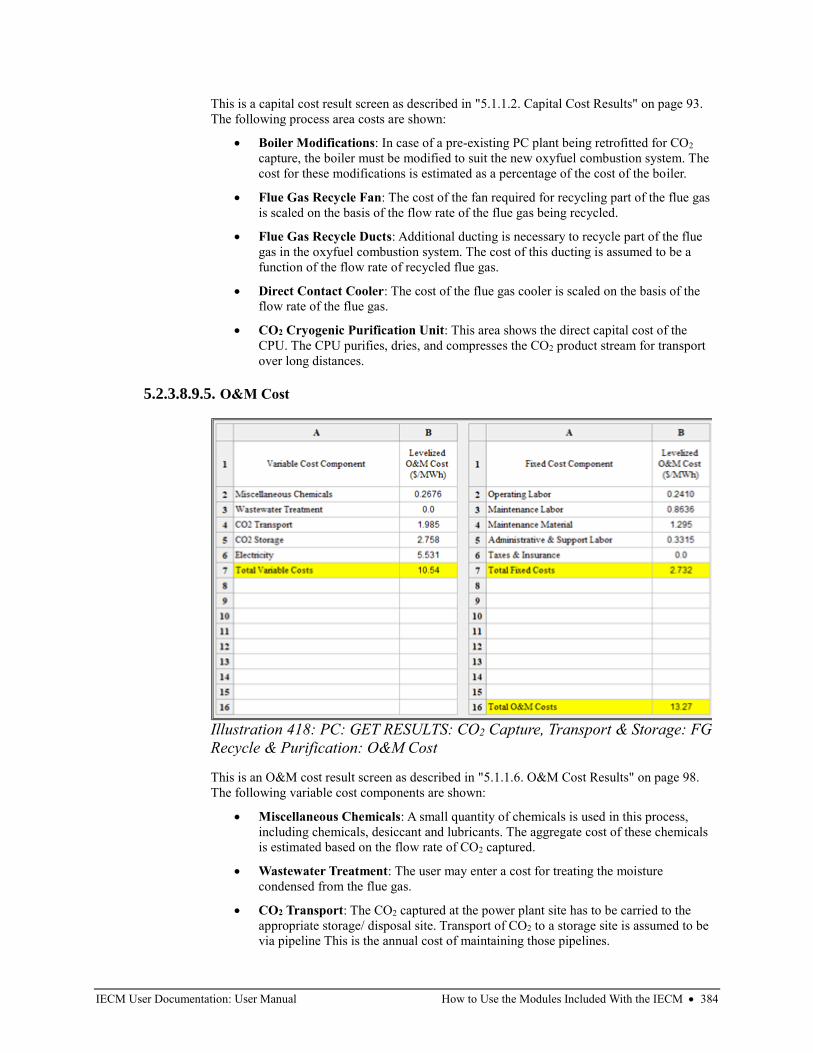
IECM User Documentation: User Manual How to Use the Modules Included With the IECM • 384
This is a capital cost result screen as described in "5.1.1.2. Capital Cost Results" on page 93.
The following process area costs are shown:
• Boiler Modifications: In case of a pre-existing PC plant being retrofitted for CO2
capture, the boiler must be modified to suit the new oxyfuel combustion system. The
cost for these modifications is estimated as a percentage of the cost of the boiler.
• Flue Gas Recycle Fan: The cost of the fan required for recycling part of the flue gas
is scaled on the basis of the flow rate of the flue gas being recycled.
• Flue Gas Recycle Ducts: Additional ducting is necessary to recycle part of the flue
gas in the oxyfuel combustion system. The cost of this ducting is assumed to be a
function of the flow rate of recycled flue gas.
• Direct Contact Cooler: The cost of the flue gas cooler is scaled on the basis of the
flow rate of the flue gas.
• CO2 Cryogenic Purification Unit: This area shows the direct capital cost of the
CPU. The CPU purifies, dries, and compresses the CO2 product stream for transport
over long distances.
5.2.3.8.9.5. O&M Cost
This is an O&M cost result screen as described in "5.1.1.6. O&M Cost Results" on page 98.
The following variable cost components are shown:
• Miscellaneous Chemicals: A small quantity of chemicals is used in this process,
including chemicals, desiccant and lubricants. The aggregate cost of these chemicals
is estimated based on the flow rate of CO2 captured.
• Wastewater Treatment: The user may enter a cost for treating the moisture
condensed from the flue gas.
• CO2 Transport: The CO2 captured at the power plant site has to be carried to the
appropriate storage/ disposal site. Transport of CO2 to a storage site is assumed to be
via pipeline This is the annual cost of maintaining those pipelines.
Illustration 418: PC: GET RESULTS: CO2 Capture, Transport & Storage: FG
Recycle & Purification: O&M Cost
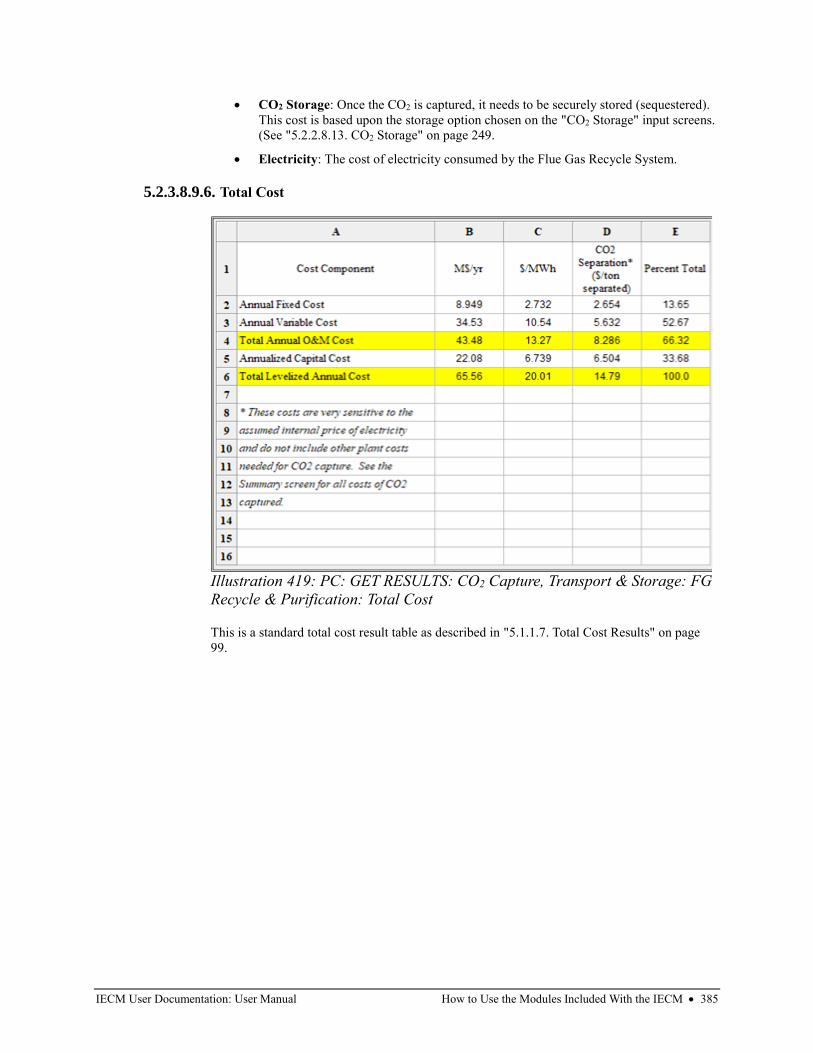
IECM User Documentation: User Manual How to Use the Modules Included With the IECM • 385
• CO2 Storage: Once the CO2 is captured, it needs to be securely stored (sequestered).
This cost is based upon the storage option chosen on the "CO2 Storage" input screens.
(See "5.2.2.8.13. CO2 Storage" on page 249.
• Electricity: The cost of electricity consumed by the Flue Gas Recycle System.
5.2.3.8.9.6. Total Cost
This is a standard total cost result table as described in "5.1.1.7. Total Cost Results" on page
99.
Illustration 419: PC: GET RESULTS: CO2 Capture, Transport & Storage: FG
Recycle & Purification: Total Cost
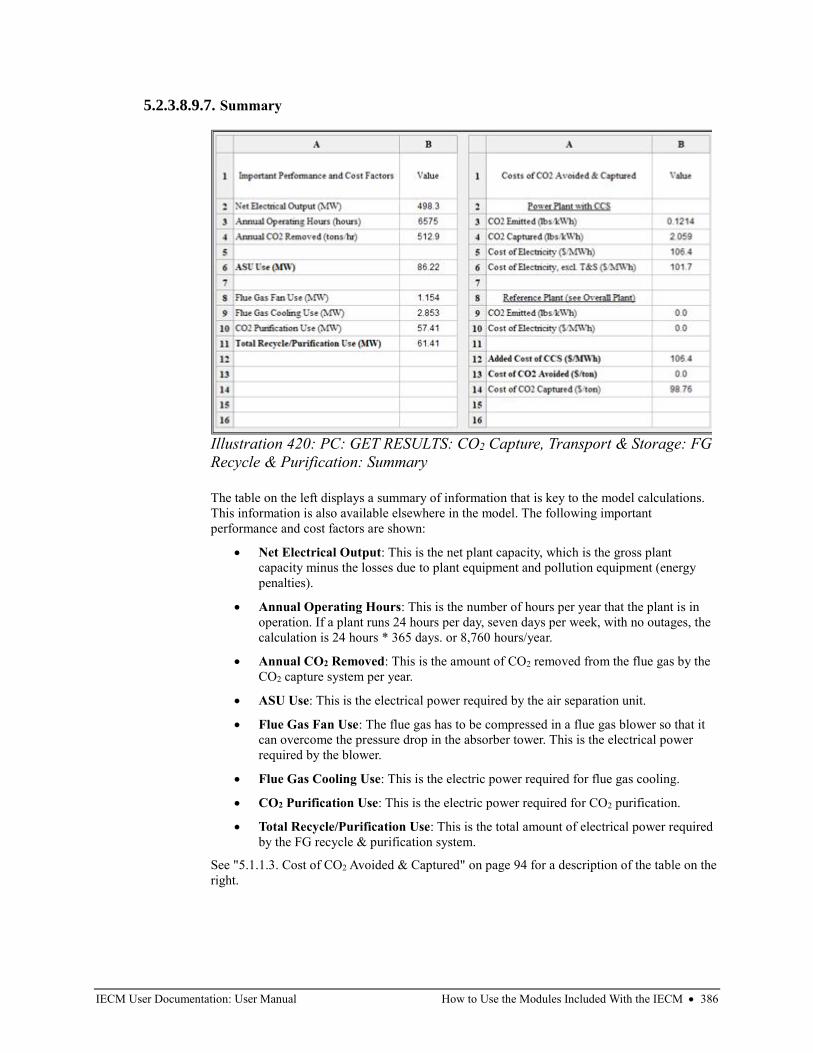
IECM User Documentation: User Manual How to Use the Modules Included With the IECM • 386
5.2.3.8.9.7. Summary
The table on the left displays a summary of information that is key to the model calculations.
This information is also available elsewhere in the model. The following important
performance and cost factors are shown:
• Net Electrical Output: This is the net plant capacity, which is the gross plant
capacity minus the losses due to plant equipment and pollution equipment (energy
penalties).
• Annual Operating Hours: This is the number of hours per year that the plant is in
operation. If a plant runs 24 hours per day, seven days per week, with no outages, the
calculation is 24 hours * 365 days. or 8,760 hours/year.
• Annual CO2 Removed: This is the amount of CO2 removed from the flue gas by the
CO2 capture system per year.
• ASU Use: This is the electrical power required by the air separation unit.
• Flue Gas Fan Use: The flue gas has to be compressed in a flue gas blower so that it
can overcome the pressure drop in the absorber tower. This is the electrical power
required by the blower.
• Flue Gas Cooling Use: This is the electric power required for flue gas cooling.
• CO2 Purification Use: This is the electric power required for CO2 purification.
• Total Recycle/Purification Use: This is the total amount of electrical power required
by the FG recycle & purification system.
See "5.1.1.3. Cost of CO2 Avoided & Captured" on page 94 for a description of the table on the
right.
Illustration 420: PC: GET RESULTS: CO2 Capture, Transport & Storage: FG
Recycle & Purification: Summary
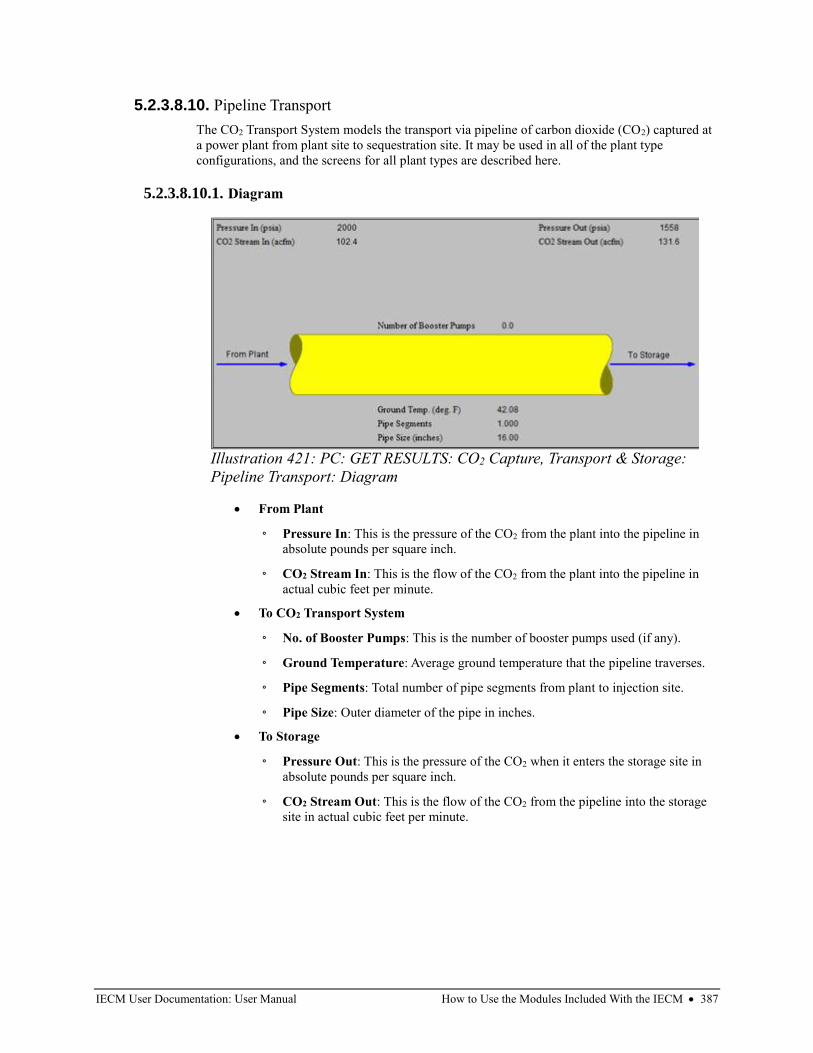
IECM User Documentation: User Manual How to Use the Modules Included With the IECM • 387
5.2.3.8.10. Pipeline Transport
The CO2 Transport System models the transport via pipeline of carbon dioxide (CO2) captured at
a power plant from plant site to sequestration site. It may be used in all of the plant type
configurations, and the screens for all plant types are described here.
5.2.3.8.10.1. Diagram
• From Plant
◦ Pressure In: This is the pressure of the CO2 from the plant into the pipeline in
absolute pounds per square inch.
◦ CO2 Stream In: This is the flow of the CO2 from the plant into the pipeline in
actual cubic feet per minute.
• To CO2 Transport System
◦ No. of Booster Pumps: This is the number of booster pumps used (if any).
◦ Ground Temperature: Average ground temperature that the pipeline traverses.
◦ Pipe Segments: Total number of pipe segments from plant to injection site.
◦ Pipe Size: Outer diameter of the pipe in inches.
• To Storage
◦ Pressure Out: This is the pressure of the CO2 when it enters the storage site in
absolute pounds per square inch.
◦ CO2 Stream Out: This is the flow of the CO2 from the pipeline into the storage
site in actual cubic feet per minute.
Illustration 421: PC: GET RESULTS: CO2 Capture, Transport & Storage:
Pipeline Transport: Diagram
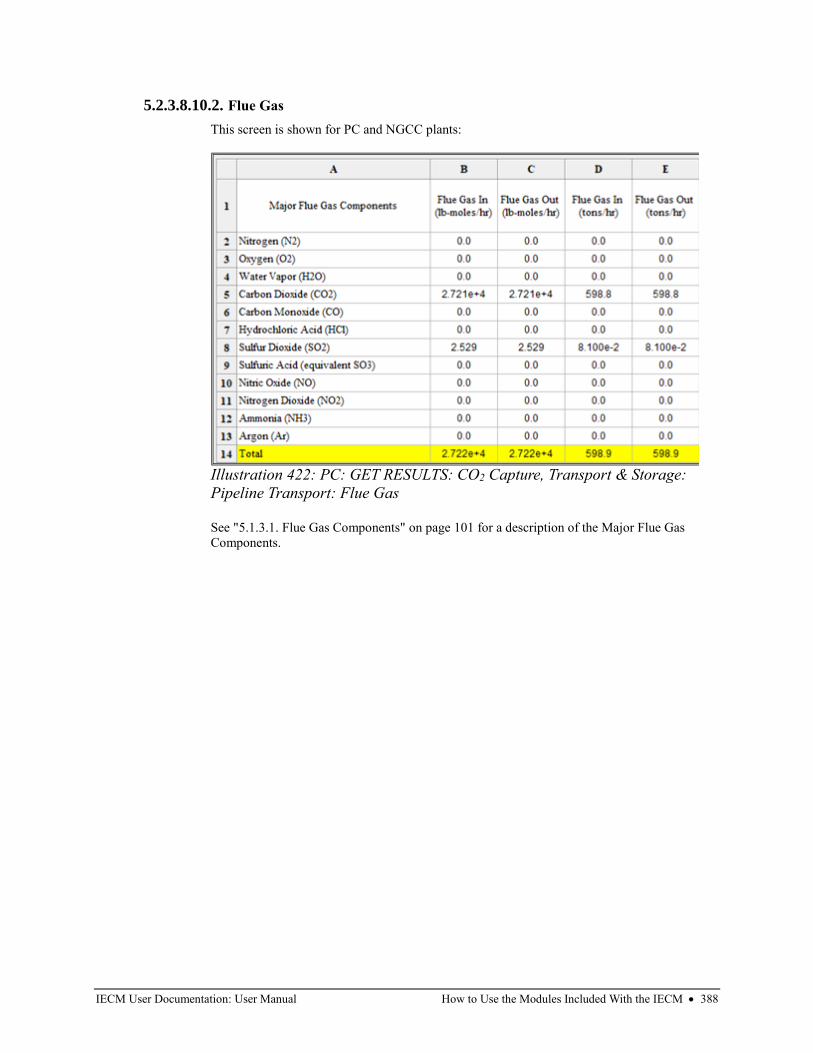
IECM User Documentation: User Manual How to Use the Modules Included With the IECM • 388
5.2.3.8.10.2. Flue Gas
This screen is shown for PC and NGCC plants:
See "5.1.3.1. Flue Gas Components" on page 101 for a description of the Major Flue Gas
Components.
Illustration 422: PC: GET RESULTS: CO2 Capture, Transport & Storage:
Pipeline Transport: Flue Gas
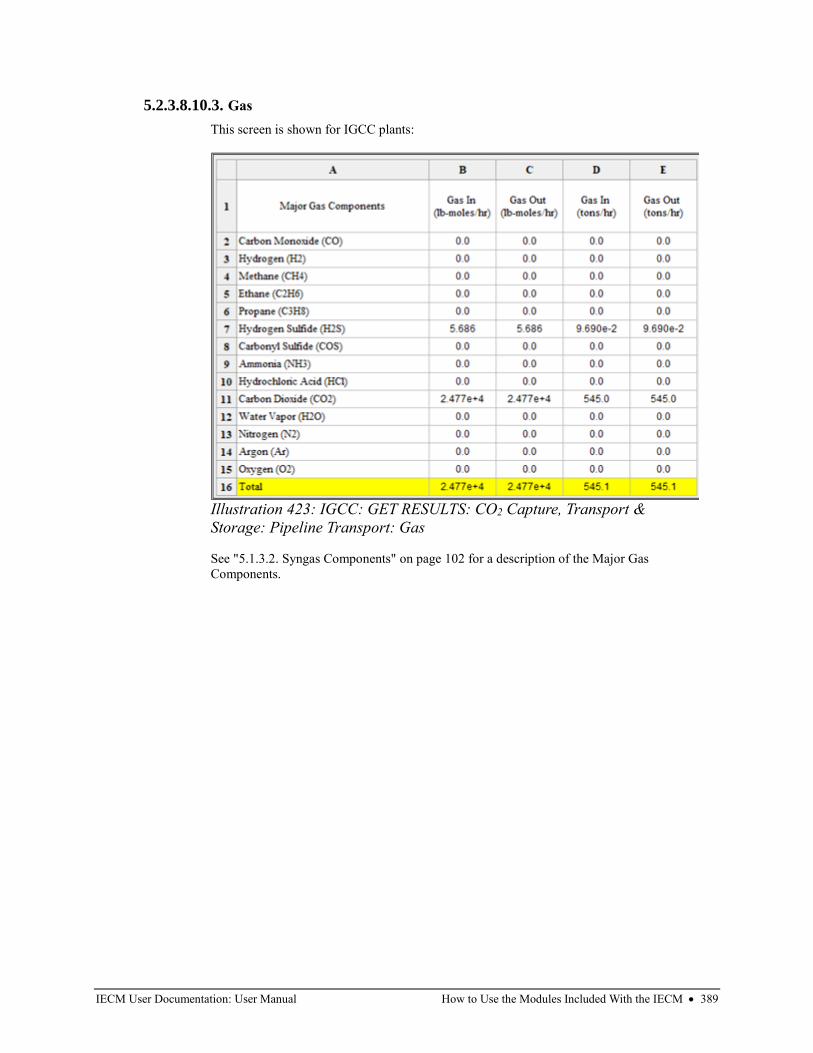
IECM User Documentation: User Manual How to Use the Modules Included With the IECM • 389
5.2.3.8.10.3. Gas
This screen is shown for IGCC plants:
See "5.1.3.2. Syngas Components" on page 102 for a description of the Major Gas
Components.
Illustration 423: IGCC: GET RESULTS: CO2 Capture, Transport &
Storage: Pipeline Transport: Gas
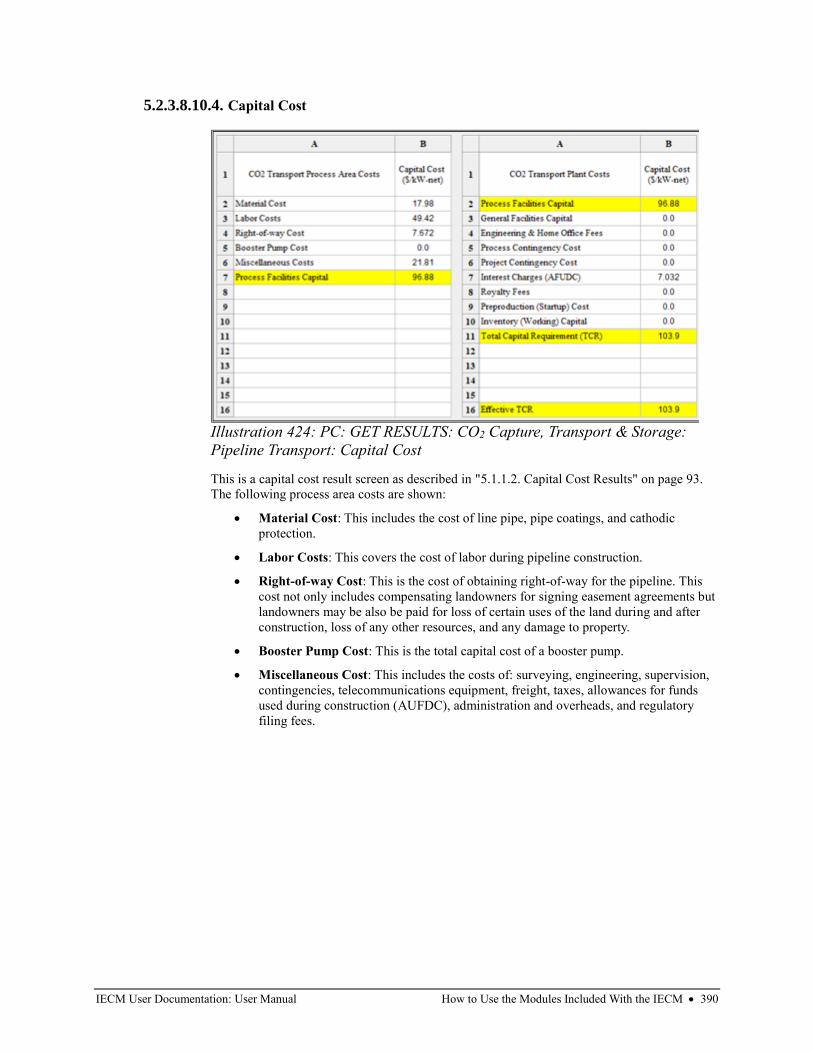
IECM User Documentation: User Manual How to Use the Modules Included With the IECM • 390
5.2.3.8.10.4. Capital Cost
This is a capital cost result screen as described in "5.1.1.2. Capital Cost Results" on page 93.
The following process area costs are shown:
• Material Cost: This includes the cost of line pipe, pipe coatings, and cathodic
protection.
• Labor Costs: This covers the cost of labor during pipeline construction.
• Right-of-way Cost: This is the cost of obtaining right-of-way for the pipeline. This
cost not only includes compensating landowners for signing easement agreements but
landowners may be also be paid for loss of certain uses of the land during and after
construction, loss of any other resources, and any damage to property.
• Booster Pump Cost: This is the total capital cost of a booster pump.
• Miscellaneous Cost: This includes the costs of: surveying, engineering, supervision,
contingencies, telecommunications equipment, freight, taxes, allowances for funds
used during construction (AUFDC), administration and overheads, and regulatory
filing fees.
Illustration 424: PC: GET RESULTS: CO2 Capture, Transport & Storage:
Pipeline Transport: Capital Cost
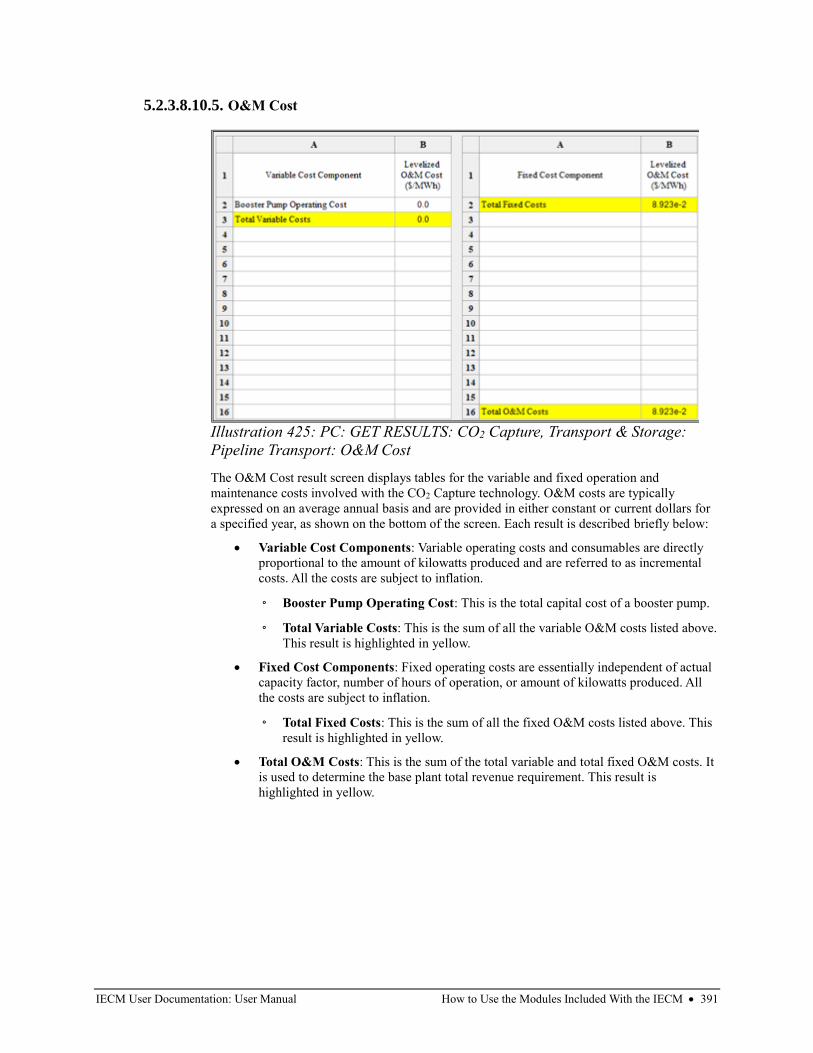
IECM User Documentation: User Manual How to Use the Modules Included With the IECM • 391
5.2.3.8.10.5. O&M Cost
The O&M Cost result screen displays tables for the variable and fixed operation and
maintenance costs involved with the CO2 Capture technology. O&M costs are typically
expressed on an average annual basis and are provided in either constant or current dollars for
a specified year, as shown on the bottom of the screen. Each result is described briefly below:
• Variable Cost Components: Variable operating costs and consumables are directly
proportional to the amount of kilowatts produced and are referred to as incremental
costs. All the costs are subject to inflation.
◦ Booster Pump Operating Cost: This is the total capital cost of a booster pump.
◦ Total Variable Costs: This is the sum of all the variable O&M costs listed above.
This result is highlighted in yellow.
• Fixed Cost Components: Fixed operating costs are essentially independent of actual
capacity factor, number of hours of operation, or amount of kilowatts produced. All
the costs are subject to inflation.
◦ Total Fixed Costs: This is the sum of all the fixed O&M costs listed above. This
result is highlighted in yellow.
• Total O&M Costs: This is the sum of the total variable and total fixed O&M costs. It
is used to determine the base plant total revenue requirement. This result is
highlighted in yellow.
Illustration 425: PC: GET RESULTS: CO2 Capture, Transport & Storage:
Pipeline Transport: O&M Cost
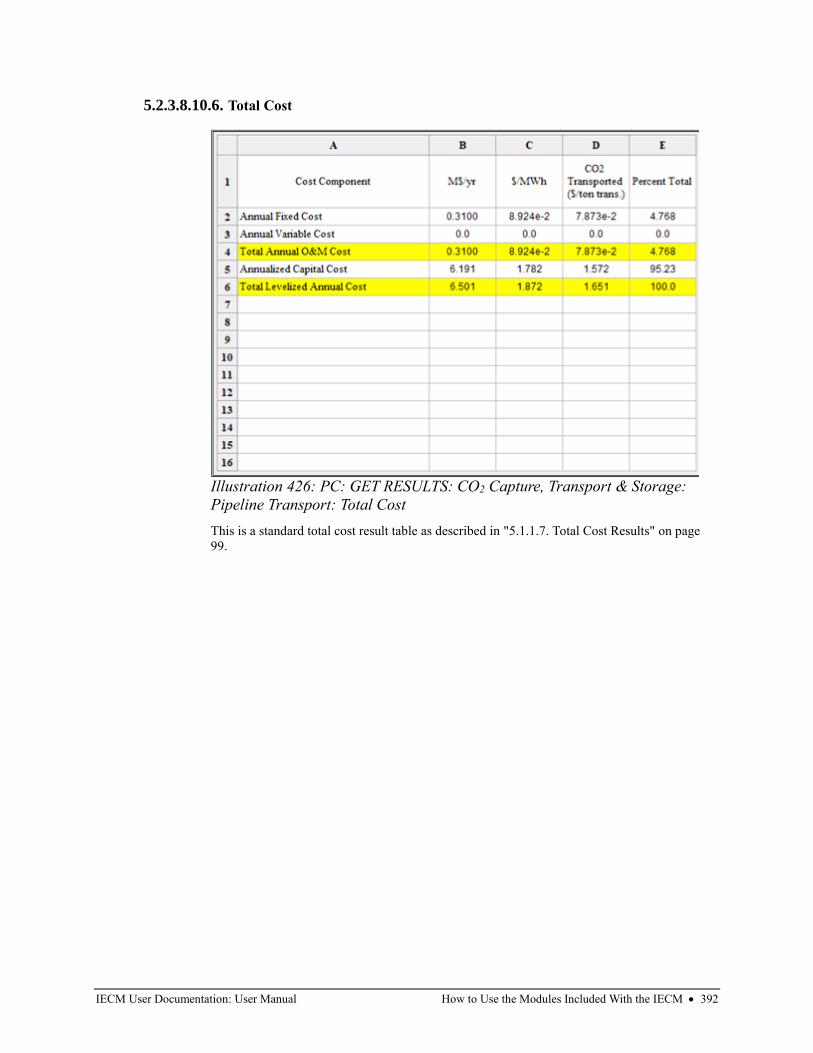
IECM User Documentation: User Manual How to Use the Modules Included With the IECM • 392
5.2.3.8.10.6. Total Cost
This is a standard total cost result table as described in "5.1.1.7. Total Cost Results" on page
99.
Illustration 426: PC: GET RESULTS: CO2 Capture, Transport & Storage:
Pipeline Transport: Total Cost
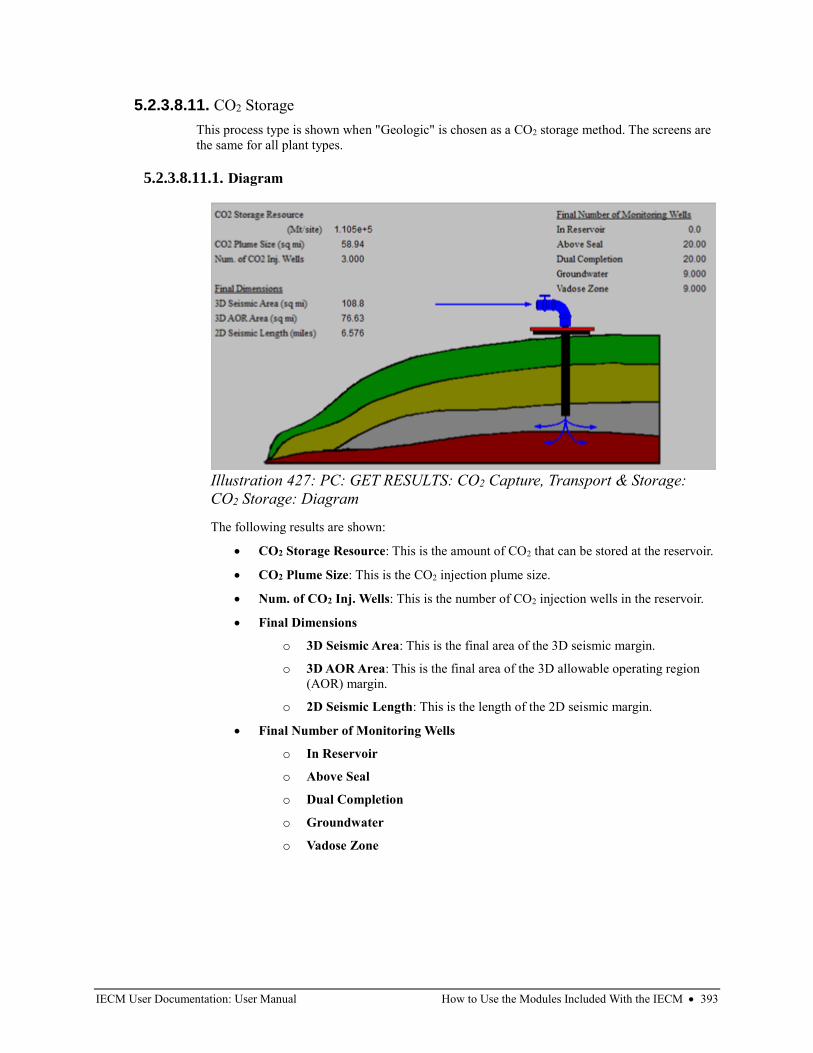
IECM User Documentation: User Manual How to Use the Modules Included With the IECM • 393
5.2.3.8.11. CO2 Storage
This process type is shown when "Geologic" is chosen as a CO2 storage method. The screens are
the same for all plant types.
5.2.3.8.11.1. Diagram
The following results are shown:
• CO2 Storage Resource: This is the amount of CO2 that can be stored at the reservoir.
• CO2 Plume Size: This is the CO2 injection plume size.
• Num. of CO2 Inj. Wells: This is the number of CO2 injection wells in the reservoir.
• Final Dimensions
o 3D Seismic Area: This is the final area of the 3D seismic margin.
o 3D AOR Area: This is the final area of the 3D allowable operating region
(AOR) margin.
o 2D Seismic Length: This is the length of the 2D seismic margin.
• Final Number of Monitoring Wells
o In Reservoir
o Above Seal
o Dual Completion
o Groundwater
o Vadose Zone
Illustration 427: PC: GET RESULTS: CO2 Capture, Transport & Storage:
CO2 Storage: Diagram
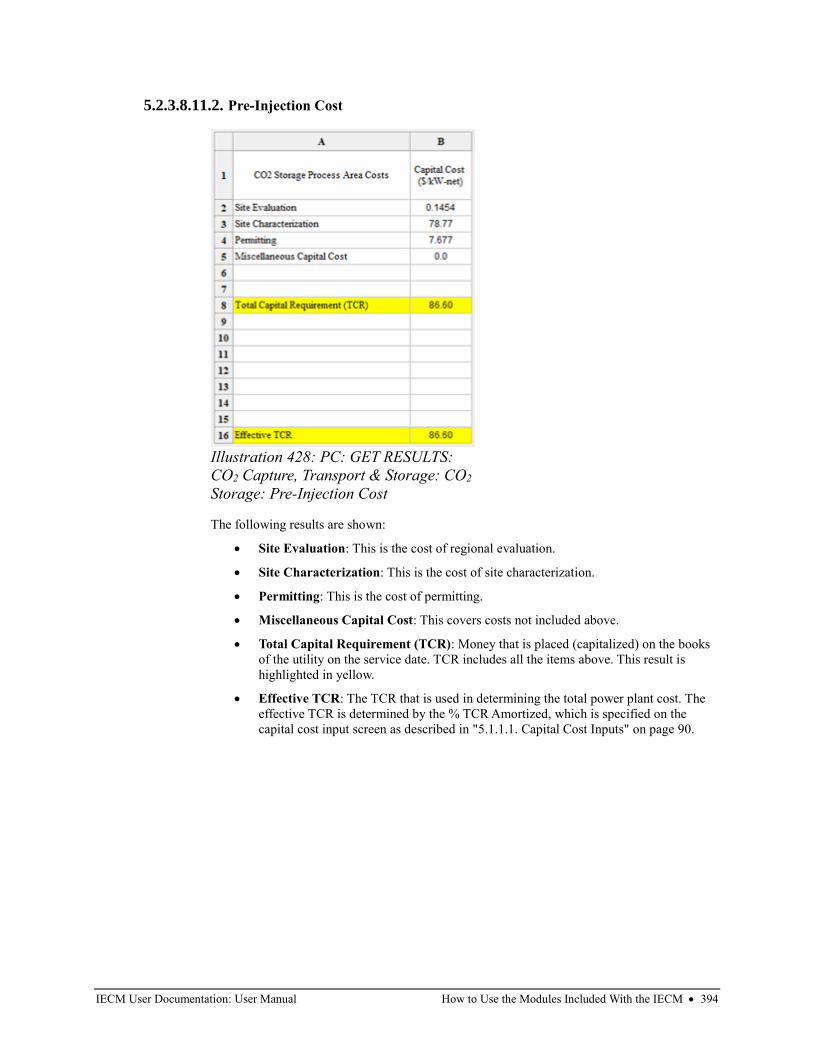
IECM User Documentation: User Manual How to Use the Modules Included With the IECM • 394
5.2.3.8.11.2. Pre-Injection Cost
The following results are shown:
• Site Evaluation: This is the cost of regional evaluation.
• Site Characterization: This is the cost of site characterization.
• Permitting: This is the cost of permitting.
• Miscellaneous Capital Cost: This covers costs not included above.
• Total Capital Requirement (TCR): Money that is placed (capitalized) on the books
of the utility on the service date. TCR includes all the items above. This result is
highlighted in yellow.
• Effective TCR: The TCR that is used in determining the total power plant cost. The
effective TCR is determined by the % TCR Amortized, which is specified on the
capital cost input screen as described in "5.1.1.1. Capital Cost Inputs" on page 90.
Illustration 428: PC: GET RESULTS:
CO2 Capture, Transport & Storage: CO2
Storage: Pre-Injection Cost
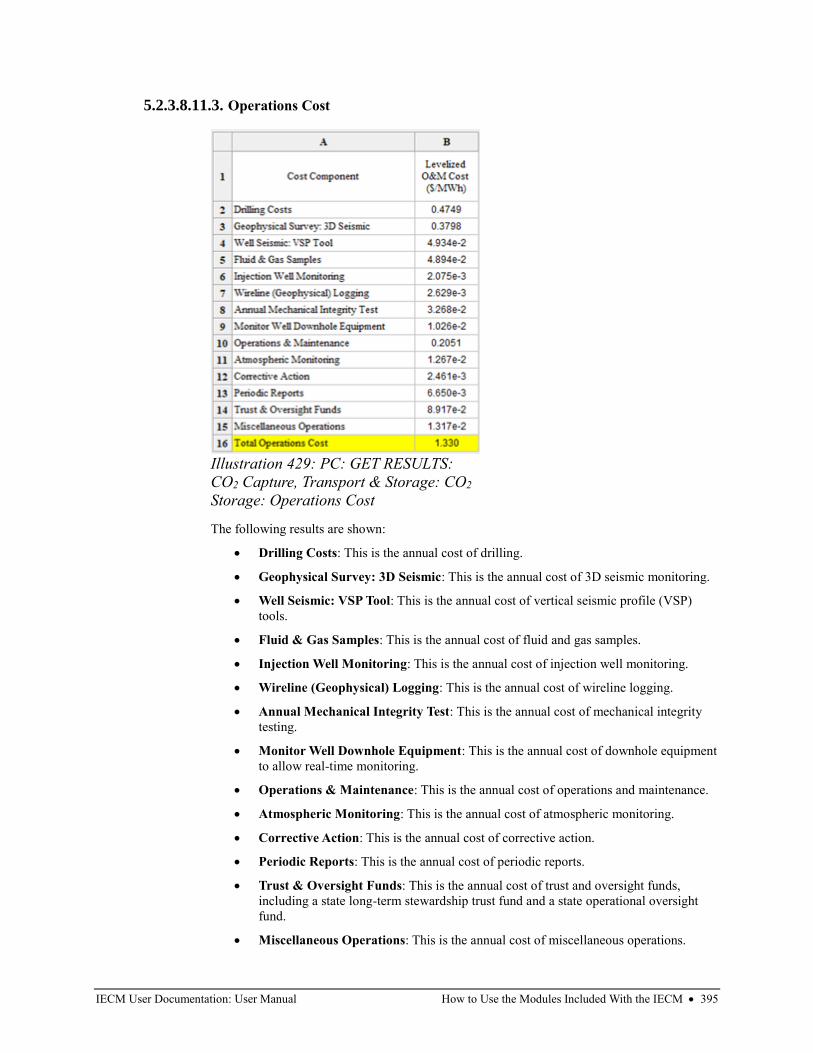
IECM User Documentation: User Manual How to Use the Modules Included With the IECM • 395
5.2.3.8.11.3. Operations Cost
The following results are shown:
• Drilling Costs: This is the annual cost of drilling.
• Geophysical Survey: 3D Seismic: This is the annual cost of 3D seismic monitoring.
• Well Seismic: VSP Tool: This is the annual cost of vertical seismic profile (VSP)
tools.
• Fluid & Gas Samples: This is the annual cost of fluid and gas samples.
• Injection Well Monitoring: This is the annual cost of injection well monitoring.
• Wireline (Geophysical) Logging: This is the annual cost of wireline logging.
• Annual Mechanical Integrity Test: This is the annual cost of mechanical integrity
testing.
• Monitor Well Downhole Equipment: This is the annual cost of downhole equipment
to allow real-time monitoring.
• Operations & Maintenance: This is the annual cost of operations and maintenance.
• Atmospheric Monitoring: This is the annual cost of atmospheric monitoring.
• Corrective Action: This is the annual cost of corrective action.
• Periodic Reports: This is the annual cost of periodic reports.
• Trust & Oversight Funds: This is the annual cost of trust and oversight funds,
including a state long-term stewardship trust fund and a state operational oversight
fund.
• Miscellaneous Operations: This is the annual cost of miscellaneous operations.
Illustration 429: PC: GET RESULTS:
CO2 Capture, Transport & Storage: CO2
Storage: Operations Cost
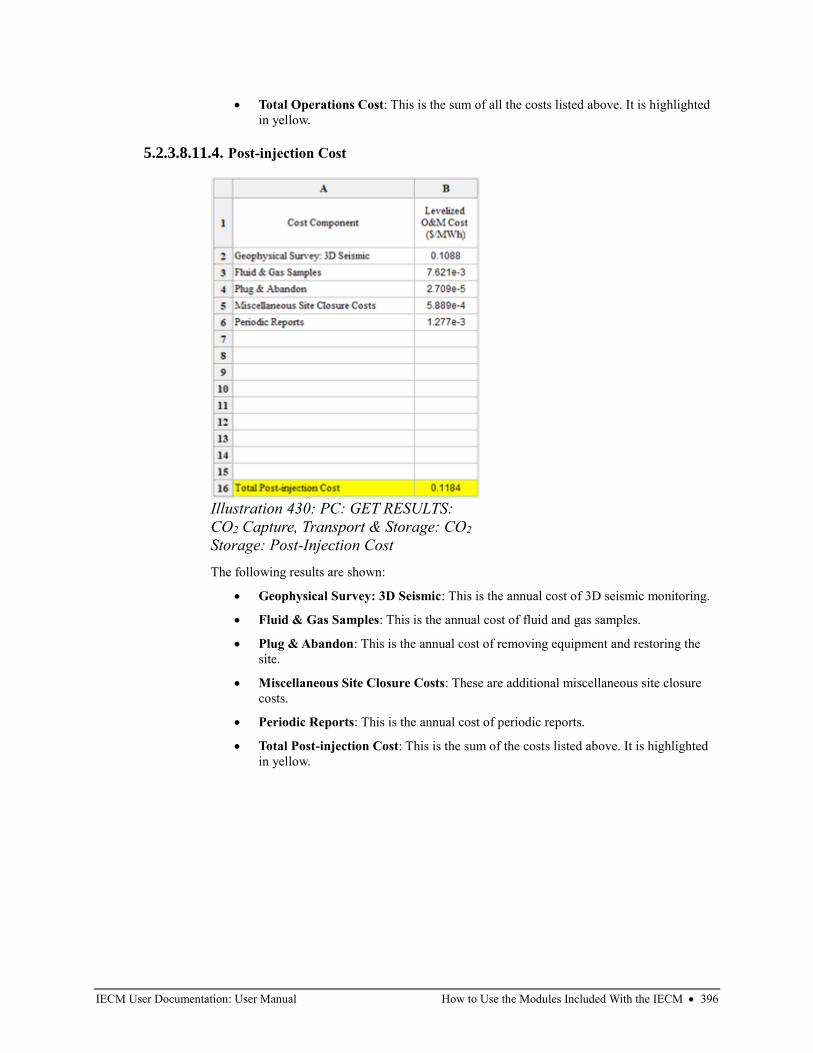
IECM User Documentation: User Manual How to Use the Modules Included With the IECM • 396
• Total Operations Cost: This is the sum of all the costs listed above. It is highlighted
in yellow.
5.2.3.8.11.4. Post-injection Cost
The following results are shown:
• Geophysical Survey: 3D Seismic: This is the annual cost of 3D seismic monitoring.
• Fluid & Gas Samples: This is the annual cost of fluid and gas samples.
• Plug & Abandon: This is the annual cost of removing equipment and restoring the
site.
• Miscellaneous Site Closure Costs: These are additional miscellaneous site closure
costs.
• Periodic Reports: This is the annual cost of periodic reports.
• Total Post-injection Cost: This is the sum of the costs listed above. It is highlighted
in yellow.
Illustration 430: PC: GET RESULTS:
CO2 Capture, Transport & Storage: CO2
Storage: Post-Injection Cost
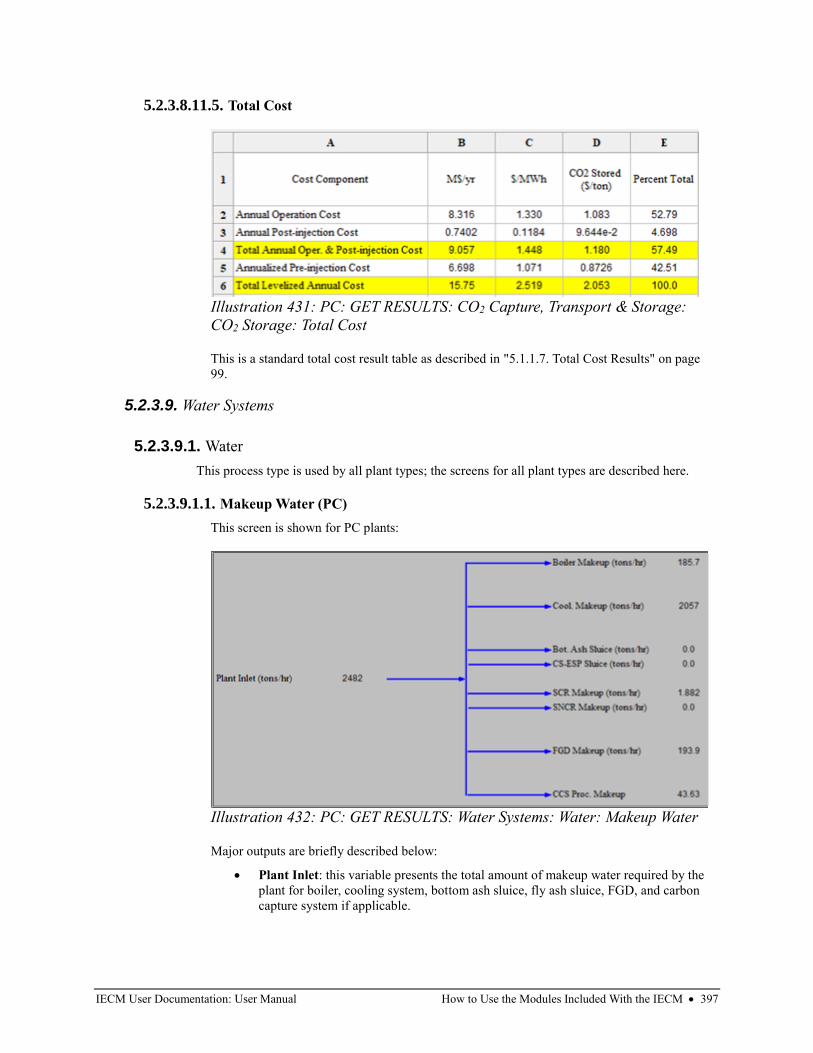
IECM User Documentation: User Manual How to Use the Modules Included With the IECM • 397
5.2.3.8.11.5. Total Cost
This is a standard total cost result table as described in "5.1.1.7. Total Cost Results" on page
99.
5.2.3.9. Water Systems
5.2.3.9.1. Water
This process type is used by all plant types; the screens for all plant types are described here.
5.2.3.9.1.1. Makeup Water (PC)
This screen is shown for PC plants:
Major outputs are briefly described below:
• Plant Inlet: this variable presents the total amount of makeup water required by the
plant for boiler, cooling system, bottom ash sluice, fly ash sluice, FGD, and carbon
capture system if applicable.
Illustration 431: PC: GET RESULTS: CO2 Capture, Transport & Storage:
CO2 Storage: Total Cost
Illustration 432: PC: GET RESULTS: Water Systems: Water: Makeup Water
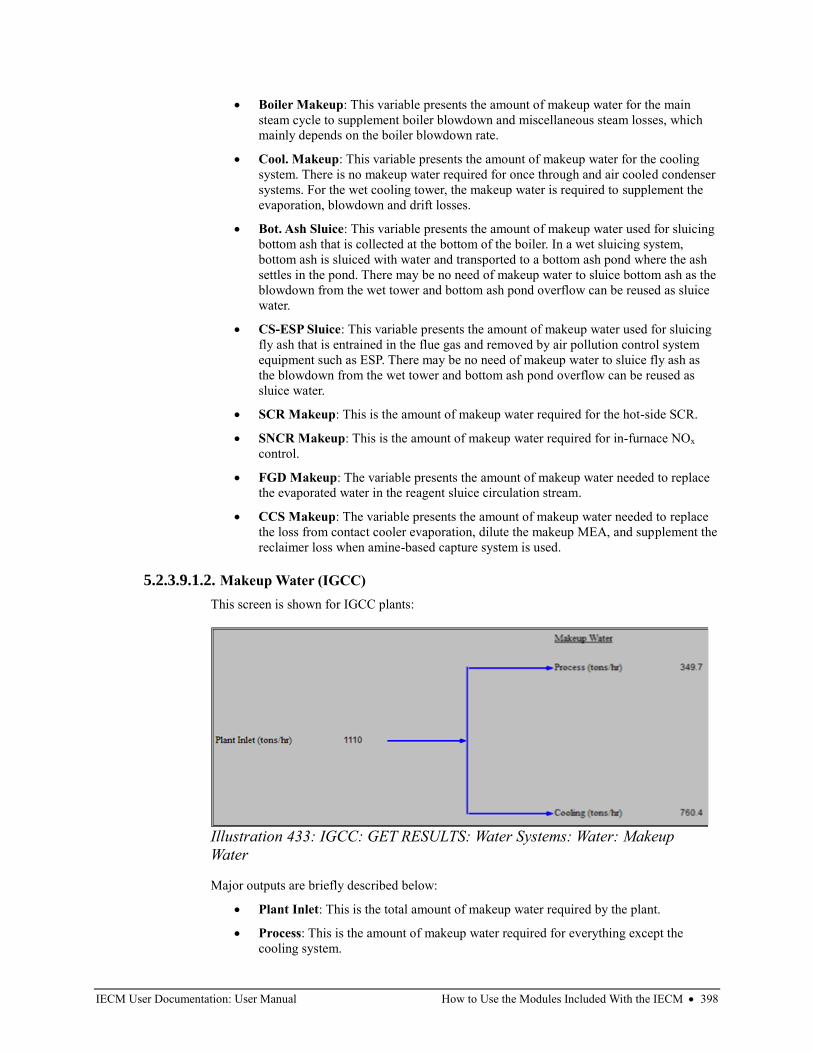
IECM User Documentation: User Manual How to Use the Modules Included With the IECM • 398
• Boiler Makeup: This variable presents the amount of makeup water for the main
steam cycle to supplement boiler blowdown and miscellaneous steam losses, which
mainly depends on the boiler blowdown rate.
• Cool. Makeup: This variable presents the amount of makeup water for the cooling
system. There is no makeup water required for once through and air cooled condenser
systems. For the wet cooling tower, the makeup water is required to supplement the
evaporation, blowdown and drift losses.
• Bot. Ash Sluice: This variable presents the amount of makeup water used for sluicing
bottom ash that is collected at the bottom of the boiler. In a wet sluicing system,
bottom ash is sluiced with water and transported to a bottom ash pond where the ash
settles in the pond. There may be no need of makeup water to sluice bottom ash as the
blowdown from the wet tower and bottom ash pond overflow can be reused as sluice
water.
• CS-ESP Sluice: This variable presents the amount of makeup water used for sluicing
fly ash that is entrained in the flue gas and removed by air pollution control system
equipment such as ESP. There may be no need of makeup water to sluice fly ash as
the blowdown from the wet tower and bottom ash pond overflow can be reused as
sluice water.
• SCR Makeup: This is the amount of makeup water required for the hot-side SCR.
• SNCR Makeup: This is the amount of makeup water required for in-furnace NOx
control.
• FGD Makeup: The variable presents the amount of makeup water needed to replace
the evaporated water in the reagent sluice circulation stream.
• CCS Makeup: The variable presents the amount of makeup water needed to replace
the loss from contact cooler evaporation, dilute the makeup MEA, and supplement the
reclaimer loss when amine-based capture system is used.
5.2.3.9.1.2. Makeup Water (IGCC)
This screen is shown for IGCC plants:
Major outputs are briefly described below:
• Plant Inlet: This is the total amount of makeup water required by the plant.
• Process: This is the amount of makeup water required for everything except the
cooling system.
Illustration 433: IGCC: GET RESULTS: Water Systems: Water: Makeup
Water
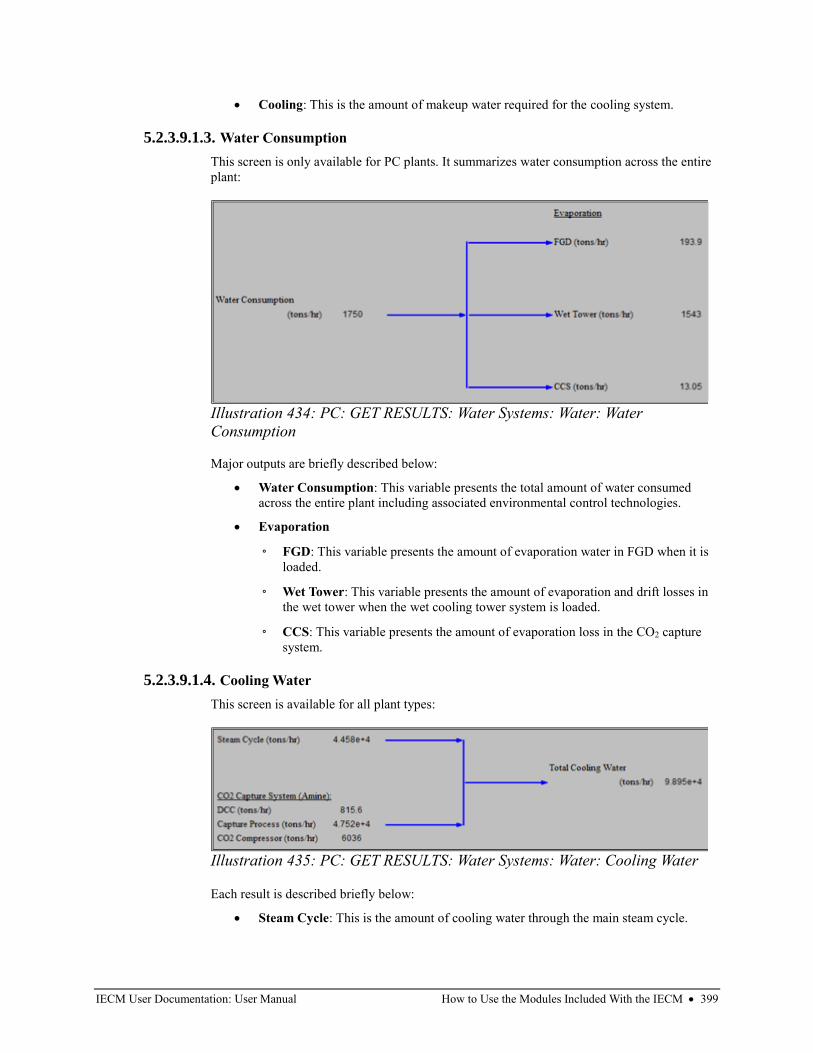
IECM User Documentation: User Manual How to Use the Modules Included With the IECM • 399
• Cooling: This is the amount of makeup water required for the cooling system.
5.2.3.9.1.3. Water Consumption
This screen is only available for PC plants. It summarizes water consumption across the entire
plant:
Major outputs are briefly described below:
• Water Consumption: This variable presents the total amount of water consumed
across the entire plant including associated environmental control technologies.
• Evaporation
◦ FGD: This variable presents the amount of evaporation water in FGD when it is
loaded.
◦ Wet Tower: This variable presents the amount of evaporation and drift losses in
the wet tower when the wet cooling tower system is loaded.
◦ CCS: This variable presents the amount of evaporation loss in the CO2 capture
system.
5.2.3.9.1.4. Cooling Water
This screen is available for all plant types:
Each result is described briefly below:
• Steam Cycle: This is the amount of cooling water through the main steam cycle.
Illustration 434: PC: GET RESULTS: Water Systems: Water: Water
Consumption
Illustration 435: PC: GET RESULTS: Water Systems: Water: Cooling Water
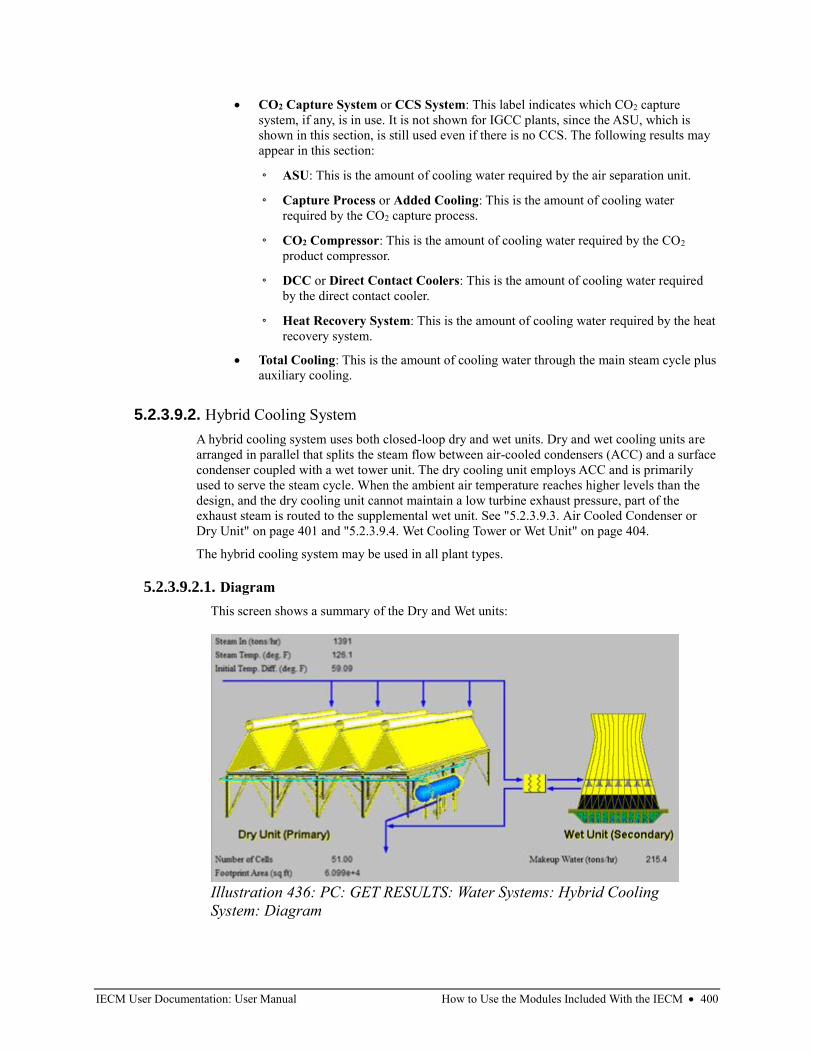
IECM User Documentation: User Manual How to Use the Modules Included With the IECM • 400
• CO2 Capture System or CCS System: This label indicates which CO2 capture
system, if any, is in use. It is not shown for IGCC plants, since the ASU, which is
shown in this section, is still used even if there is no CCS. The following results may
appear in this section:
◦ ASU: This is the amount of cooling water required by the air separation unit.
◦ Capture Process or Added Cooling: This is the amount of cooling water
required by the CO2 capture process.
◦ CO2 Compressor: This is the amount of cooling water required by the CO2
product compressor.
◦ DCC or Direct Contact Coolers: This is the amount of cooling water required
by the direct contact cooler.
◦ Heat Recovery System: This is the amount of cooling water required by the heat
recovery system.
• Total Cooling: This is the amount of cooling water through the main steam cycle plus
auxiliary cooling.
5.2.3.9.2. Hybrid Cooling System
A hybrid cooling system uses both closed-loop dry and wet units. Dry and wet cooling units are
arranged in parallel that splits the steam flow between air-cooled condensers (ACC) and a surface
condenser coupled with a wet tower unit. The dry cooling unit employs ACC and is primarily
used to serve the steam cycle. When the ambient air temperature reaches higher levels than the
design, and the dry cooling unit cannot maintain a low turbine exhaust pressure, part of the
exhaust steam is routed to the supplemental wet unit. See "5.2.3.9.3. Air Cooled Condenser or
Dry Unit" on page 401 and "5.2.3.9.4. Wet Cooling Tower or Wet Unit" on page 404.
The hybrid cooling system may be used in all plant types.
5.2.3.9.2.1. Diagram
This screen shows a summary of the Dry and Wet units:
Illustration 436: PC: GET RESULTS: Water Systems: Hybrid Cooling
System: Diagram
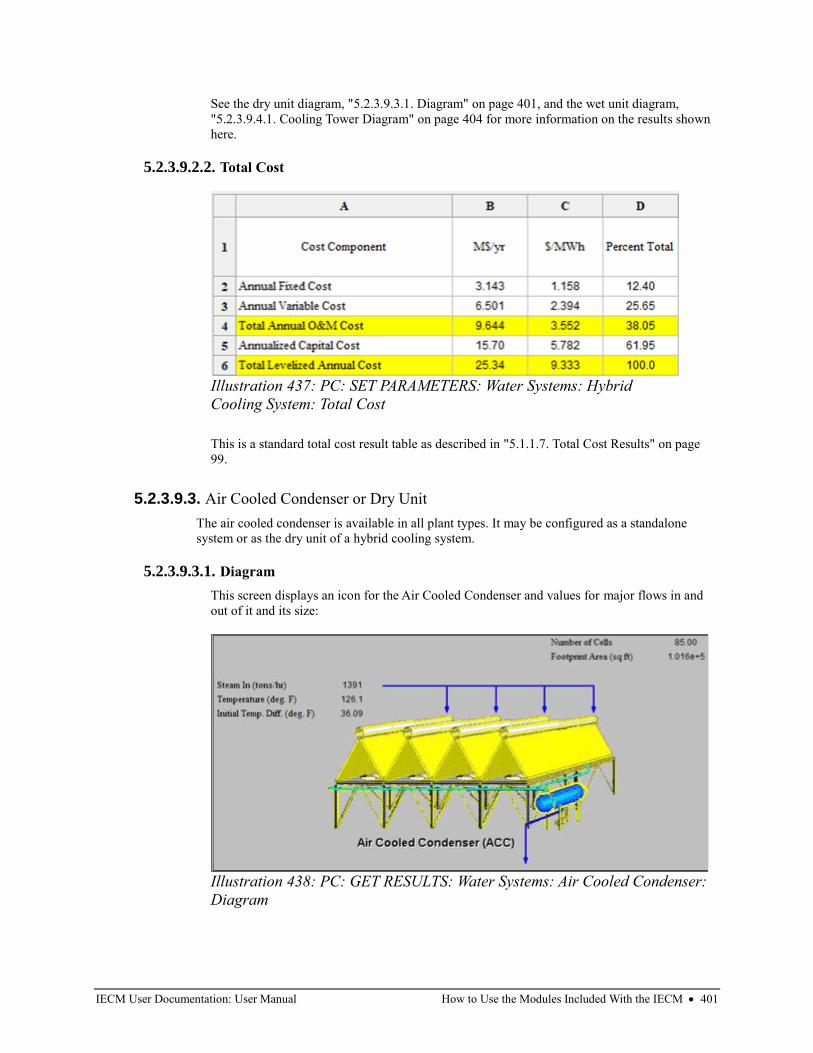
IECM User Documentation: User Manual How to Use the Modules Included With the IECM • 401
See the dry unit diagram, "5.2.3.9.3.1. Diagram" on page 401, and the wet unit diagram,
"5.2.3.9.4.1. Cooling Tower Diagram" on page 404 for more information on the results shown
here.
5.2.3.9.2.2. Total Cost
This is a standard total cost result table as described in "5.1.1.7. Total Cost Results" on page
99.
5.2.3.9.3. Air Cooled Condenser or Dry Unit
The air cooled condenser is available in all plant types. It may be configured as a standalone
system or as the dry unit of a hybrid cooling system.
5.2.3.9.3.1. Diagram
This screen displays an icon for the Air Cooled Condenser and values for major flows in and
out of it and its size:
Illustration 437: PC: SET PARAMETERS: Water Systems: Hybrid
Cooling System: Total Cost
Illustration 438: PC: GET RESULTS: Water Systems: Air Cooled Condenser:
Diagram
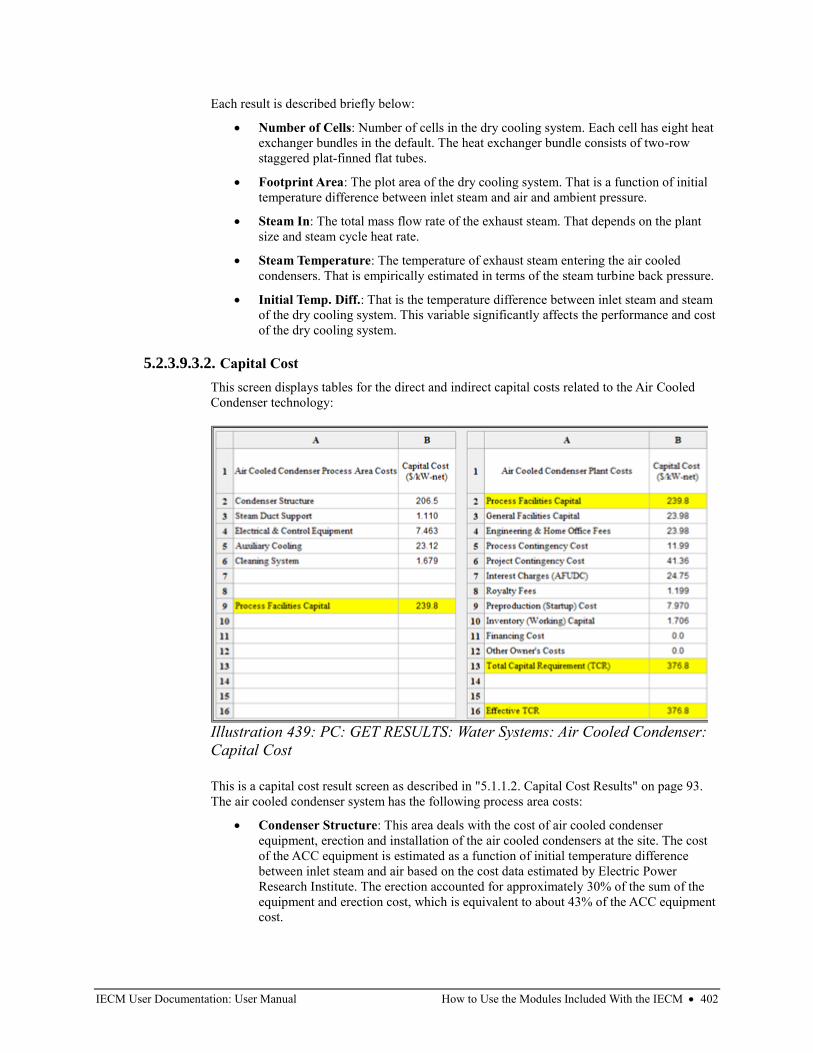
IECM User Documentation: User Manual How to Use the Modules Included With the IECM • 402
Each result is described briefly below:
• Number of Cells: Number of cells in the dry cooling system. Each cell has eight heat
exchanger bundles in the default. The heat exchanger bundle consists of two-row
staggered plat-finned flat tubes.
• Footprint Area: The plot area of the dry cooling system. That is a function of initial
temperature difference between inlet steam and air and ambient pressure.
• Steam In: The total mass flow rate of the exhaust steam. That depends on the plant
size and steam cycle heat rate.
• Steam Temperature: The temperature of exhaust steam entering the air cooled
condensers. That is empirically estimated in terms of the steam turbine back pressure.
• Initial Temp. Diff.: That is the temperature difference between inlet steam and steam
of the dry cooling system. This variable significantly affects the performance and cost
of the dry cooling system.
5.2.3.9.3.2. Capital Cost
This screen displays tables for the direct and indirect capital costs related to the Air Cooled
Condenser technology:
This is a capital cost result screen as described in "5.1.1.2. Capital Cost Results" on page 93.
The air cooled condenser system has the following process area costs:
• Condenser Structure: This area deals with the cost of air cooled condenser
equipment, erection and installation of the air cooled condensers at the site. The cost
of the ACC equipment is estimated as a function of initial temperature difference
between inlet steam and air based on the cost data estimated by Electric Power
Research Institute. The erection accounted for approximately 30% of the sum of the
equipment and erection cost, which is equivalent to about 43% of the ACC equipment
cost.
Illustration 439: PC: GET RESULTS: Water Systems: Air Cooled Condenser:
Capital Cost
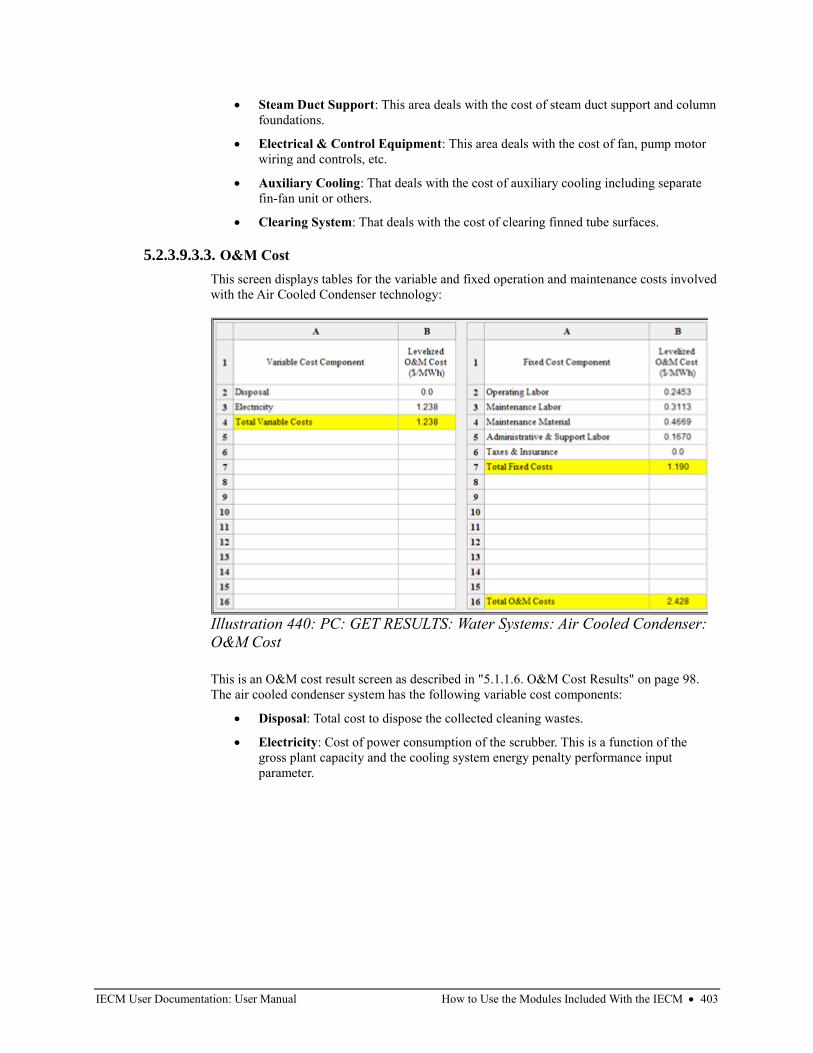
IECM User Documentation: User Manual How to Use the Modules Included With the IECM • 403
• Steam Duct Support: This area deals with the cost of steam duct support and column
foundations.
• Electrical & Control Equipment: This area deals with the cost of fan, pump motor
wiring and controls, etc.
• Auxiliary Cooling: That deals with the cost of auxiliary cooling including separate
fin-fan unit or others.
• Clearing System: That deals with the cost of clearing finned tube surfaces.
5.2.3.9.3.3. O&M Cost
This screen displays tables for the variable and fixed operation and maintenance costs involved
with the Air Cooled Condenser technology:
This is an O&M cost result screen as described in "5.1.1.6. O&M Cost Results" on page 98.
The air cooled condenser system has the following variable cost components:
• Disposal: Total cost to dispose the collected cleaning wastes.
• Electricity: Cost of power consumption of the scrubber. This is a function of the
gross plant capacity and the cooling system energy penalty performance input
parameter.
Illustration 440: PC: GET RESULTS: Water Systems: Air Cooled Condenser:
O&M Cost
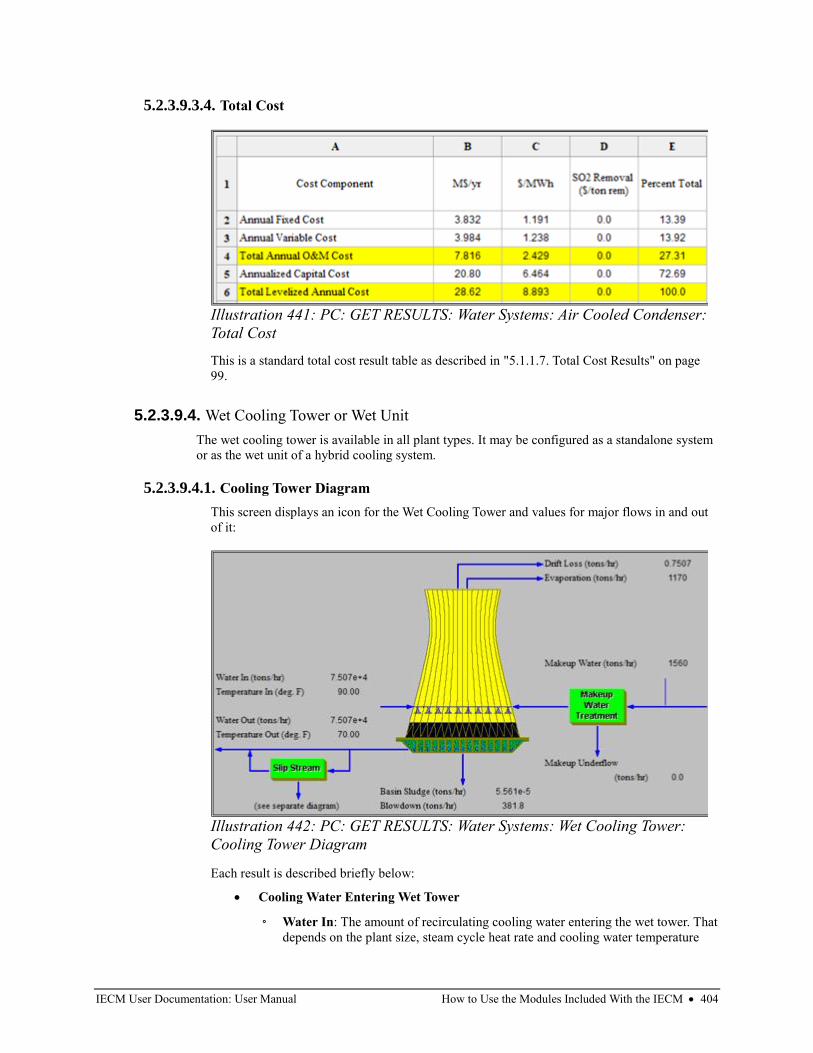
IECM User Documentation: User Manual How to Use the Modules Included With the IECM • 404
5.2.3.9.3.4. Total Cost
This is a standard total cost result table as described in "5.1.1.7. Total Cost Results" on page
99.
5.2.3.9.4. Wet Cooling Tower or Wet Unit
The wet cooling tower is available in all plant types. It may be configured as a standalone system
or as the wet unit of a hybrid cooling system.
5.2.3.9.4.1. Cooling Tower Diagram
This screen displays an icon for the Wet Cooling Tower and values for major flows in and out
of it:
Each result is described briefly below:
• Cooling Water Entering Wet Tower
◦ Water In: The amount of recirculating cooling water entering the wet tower. That
depends on the plant size, steam cycle heat rate and cooling water temperature
Illustration 441: PC: GET RESULTS: Water Systems: Air Cooled Condenser:
Total Cost
Illustration 442: PC: GET RESULTS: Water Systems: Wet Cooling Tower:
Cooling Tower Diagram

IECM User Documentation: User Manual How to Use the Modules Included With the IECM • 405
drop range. That is the sum of cooling water through the main steam cycle, and
amine-based carbon capture system if applicable.
◦ Temperature In: The temperature of recirculating cooling water entering the wet
tower.
• Cooling Water Exiting Wet Tower
◦ Water Out: The amount of recirculating cooling water exiting the wet tower.
That is equal to the amount of cooling water entering the wet tower based on
water mass balance. That is the sum of cooling water through the main steam
cycle, and amine-based carbon capture system if applicable.
◦ Temperature Out: The temperature of recirculating cooling water exiting the
wet tower. That is calculated in terms of the inlet cooling water temperature and
cooling water temperature drop range.
• Wet Tower Performance
◦ Makeup Water: The cooling tower operation is maintained by making up fresh
water at the same rate as the water losses (evaporation, blowdown, and drift loss)
from the tower.
◦ Makeup Underflow: This output gives the amount of wastes from cooling
makeup water treatment system.
◦ Evaporation: In wet cooling towers, water has direct contact with ambient air
and cooling is achieved mainly by the evaporation process in which some of the
water leaves with the air. The evaporation process is the largest source of cooling
tower water losses. That is estimated based on the mass and energy balance
mode. Evaporation loss varies with meteorological conditions and displays a
seasonal pattern.
◦ Blowdown: Because water evaporated in the cooling tower consists of pure
water, the concentration of salts or other impurities will increase in the
recirculating water. To avoid a high concentration and subsequent scaling of the
surface within the tower, it is necessary to blow down a portion of the water that
depends on the cycle of concentration and evaporation loss.
◦ Drift Loss: A relatively small amount of entrained water lost as fine droplets in
the air discharge from a tower, which is frequently referred to as tower drift loss.
◦ Basin Sludge: This output specifies the amount of the basin sludge of the cooling
tower system. That is an intermittent waste stream that contains collected soil,
dust, and suspended solids in the tower basin.
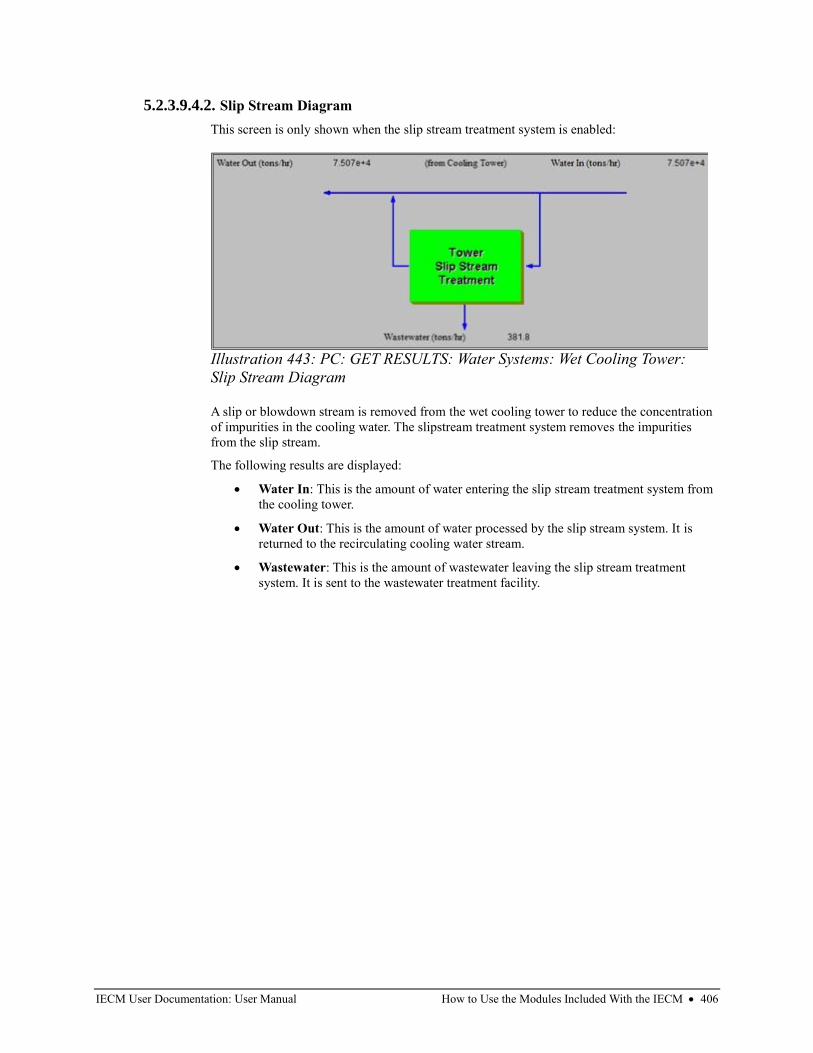
IECM User Documentation: User Manual How to Use the Modules Included With the IECM • 406
5.2.3.9.4.2. Slip Stream Diagram
This screen is only shown when the slip stream treatment system is enabled:
A slip or blowdown stream is removed from the wet cooling tower to reduce the concentration
of impurities in the cooling water. The slipstream treatment system removes the impurities
from the slip stream.
The following results are displayed:
• Water In: This is the amount of water entering the slip stream treatment system from
the cooling tower.
• Water Out: This is the amount of water processed by the slip stream system. It is
returned to the recirculating cooling water stream.
• Wastewater: This is the amount of wastewater leaving the slip stream treatment
system. It is sent to the wastewater treatment facility.
Illustration 443: PC: GET RESULTS: Water Systems: Wet Cooling Tower:
Slip Stream Diagram
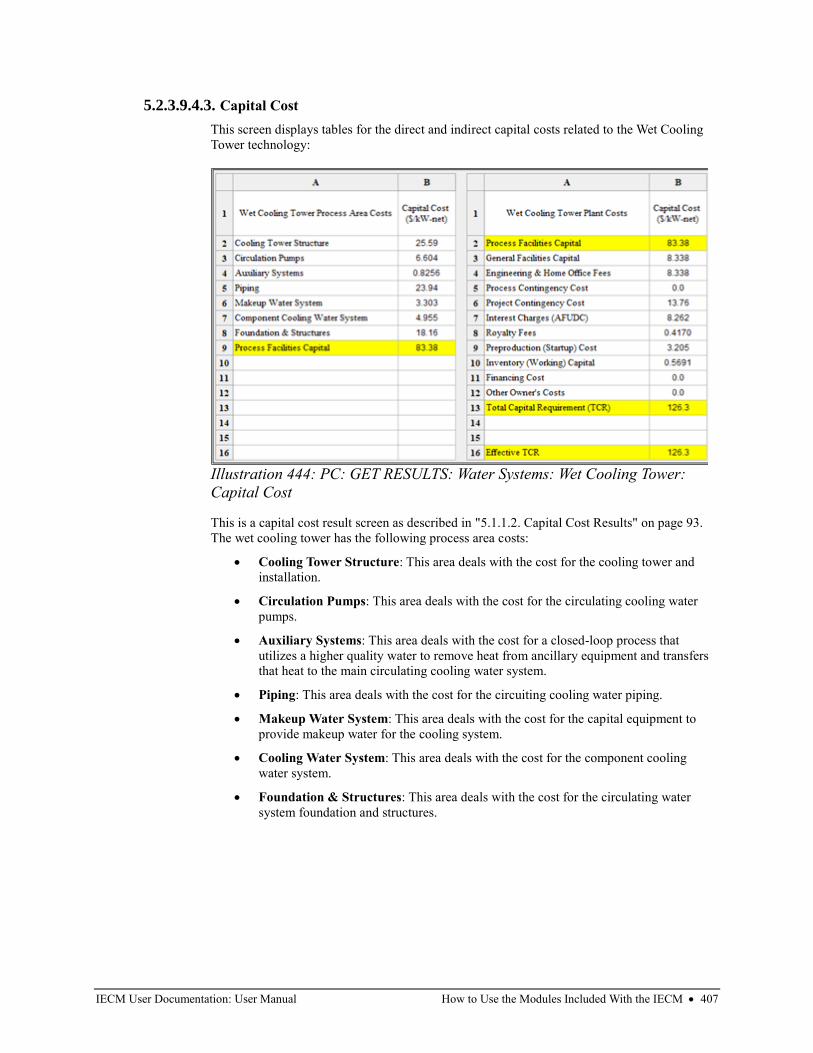
IECM User Documentation: User Manual How to Use the Modules Included With the IECM • 407
5.2.3.9.4.3. Capital Cost
This screen displays tables for the direct and indirect capital costs related to the Wet Cooling
Tower technology:
This is a capital cost result screen as described in "5.1.1.2. Capital Cost Results" on page 93.
The wet cooling tower has the following process area costs:
• Cooling Tower Structure: This area deals with the cost for the cooling tower and
installation.
• Circulation Pumps: This area deals with the cost for the circulating cooling water
pumps.
• Auxiliary Systems: This area deals with the cost for a closed-loop process that
utilizes a higher quality water to remove heat from ancillary equipment and transfers
that heat to the main circulating cooling water system.
• Piping: This area deals with the cost for the circuiting cooling water piping.
• Makeup Water System: This area deals with the cost for the capital equipment to
provide makeup water for the cooling system.
• Cooling Water System: This area deals with the cost for the component cooling
water system.
• Foundation & Structures: This area deals with the cost for the circulating water
system foundation and structures.
Illustration 444: PC: GET RESULTS: Water Systems: Wet Cooling Tower:
Capital Cost
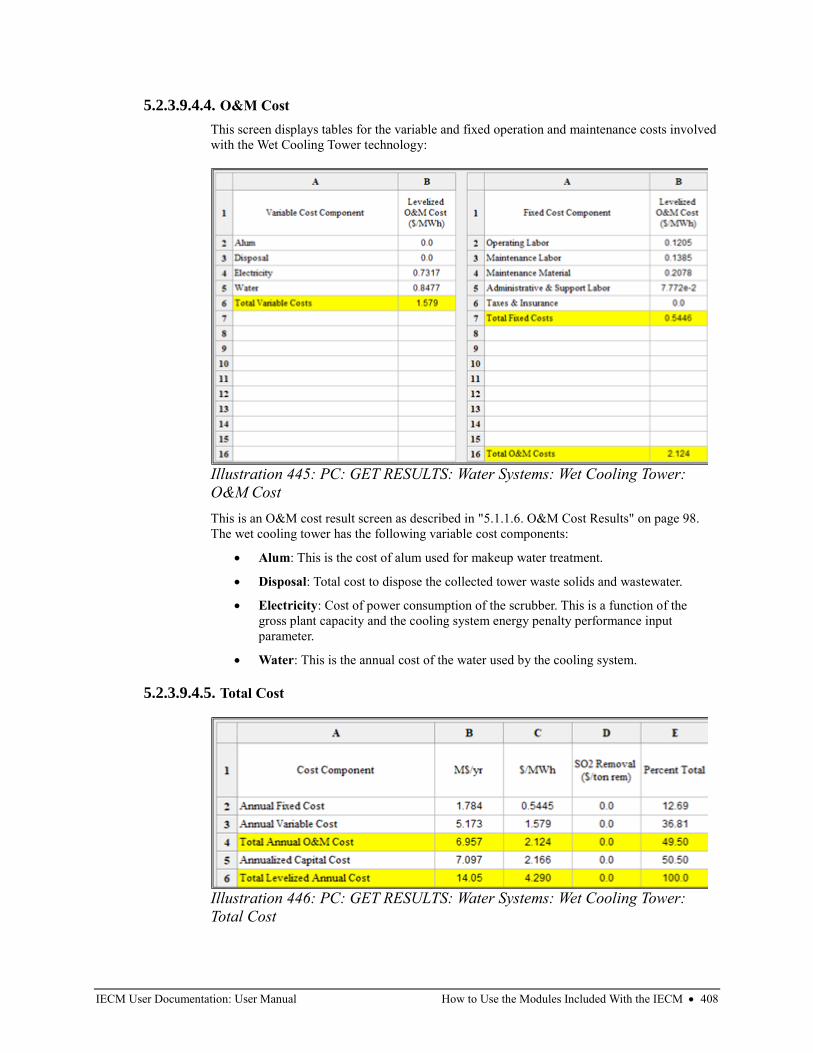
IECM User Documentation: User Manual How to Use the Modules Included With the IECM • 408
5.2.3.9.4.4. O&M Cost
This screen displays tables for the variable and fixed operation and maintenance costs involved
with the Wet Cooling Tower technology:
This is an O&M cost result screen as described in "5.1.1.6. O&M Cost Results" on page 98.
The wet cooling tower has the following variable cost components:
• Alum: This is the cost of alum used for makeup water treatment.
• Disposal: Total cost to dispose the collected tower waste solids and wastewater.
• Electricity: Cost of power consumption of the scrubber. This is a function of the
gross plant capacity and the cooling system energy penalty performance input
parameter.
• Water: This is the annual cost of the water used by the cooling system.
5.2.3.9.4.5. Total Cost
Illustration 445: PC: GET RESULTS: Water Systems: Wet Cooling Tower:
O&M Cost
Illustration 446: PC: GET RESULTS: Water Systems: Wet Cooling Tower:
Total Cost
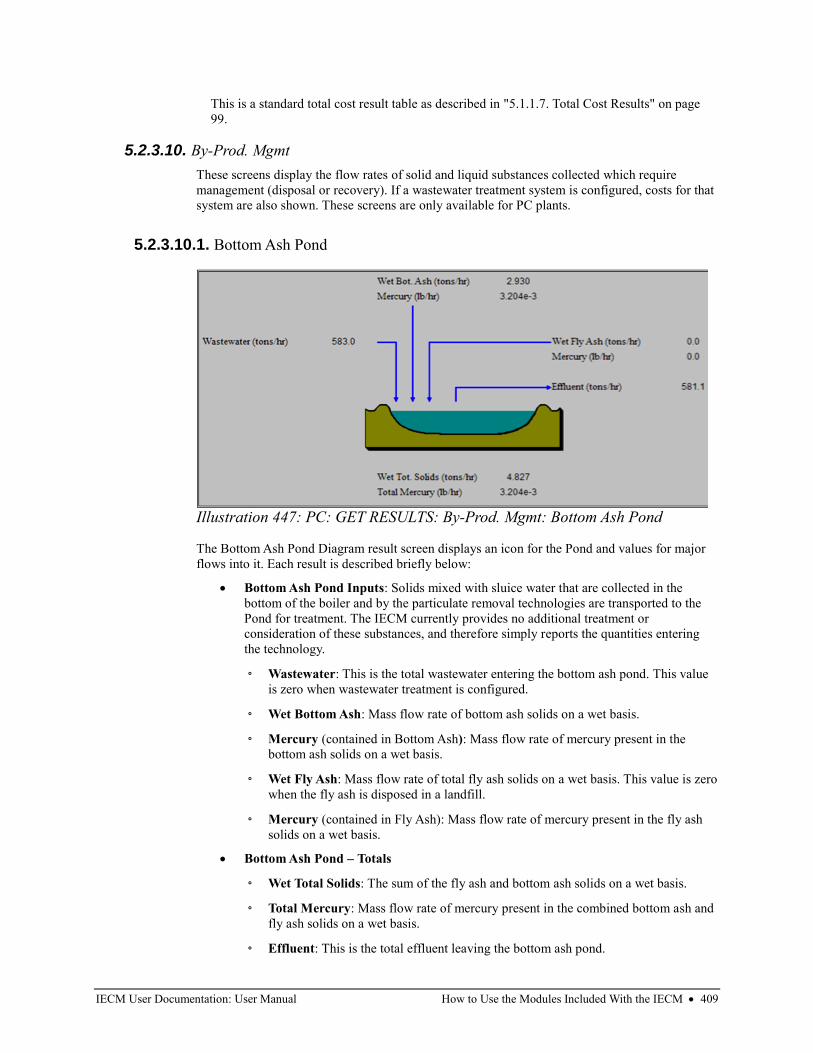
IECM User Documentation: User Manual How to Use the Modules Included With the IECM • 409
This is a standard total cost result table as described in "5.1.1.7. Total Cost Results" on page
99.
5.2.3.10. By-Prod. Mgmt
These screens display the flow rates of solid and liquid substances collected which require
management (disposal or recovery). If a wastewater treatment system is configured, costs for that
system are also shown. These screens are only available for PC plants.
5.2.3.10.1. Bottom Ash Pond
The Bottom Ash Pond Diagram result screen displays an icon for the Pond and values for major
flows into it. Each result is described briefly below:
• Bottom Ash Pond Inputs: Solids mixed with sluice water that are collected in the
bottom of the boiler and by the particulate removal technologies are transported to the
Pond for treatment. The IECM currently provides no additional treatment or
consideration of these substances, and therefore simply reports the quantities entering
the technology.
◦ Wastewater: This is the total wastewater entering the bottom ash pond. This value
is zero when wastewater treatment is configured.
◦ Wet Bottom Ash: Mass flow rate of bottom ash solids on a wet basis.
◦ Mercury (contained in Bottom Ash): Mass flow rate of mercury present in the
bottom ash solids on a wet basis.
◦ Wet Fly Ash: Mass flow rate of total fly ash solids on a wet basis. This value is zero
when the fly ash is disposed in a landfill.
◦ Mercury (contained in Fly Ash): Mass flow rate of mercury present in the fly ash
solids on a wet basis.
• Bottom Ash Pond – Totals
◦ Wet Total Solids: The sum of the fly ash and bottom ash solids on a wet basis.
◦ Total Mercury: Mass flow rate of mercury present in the combined bottom ash and
fly ash solids on a wet basis.
◦ Effluent: This is the total effluent leaving the bottom ash pond.
Illustration 447: PC: GET RESULTS: By-Prod. Mgmt: Bottom Ash Pond
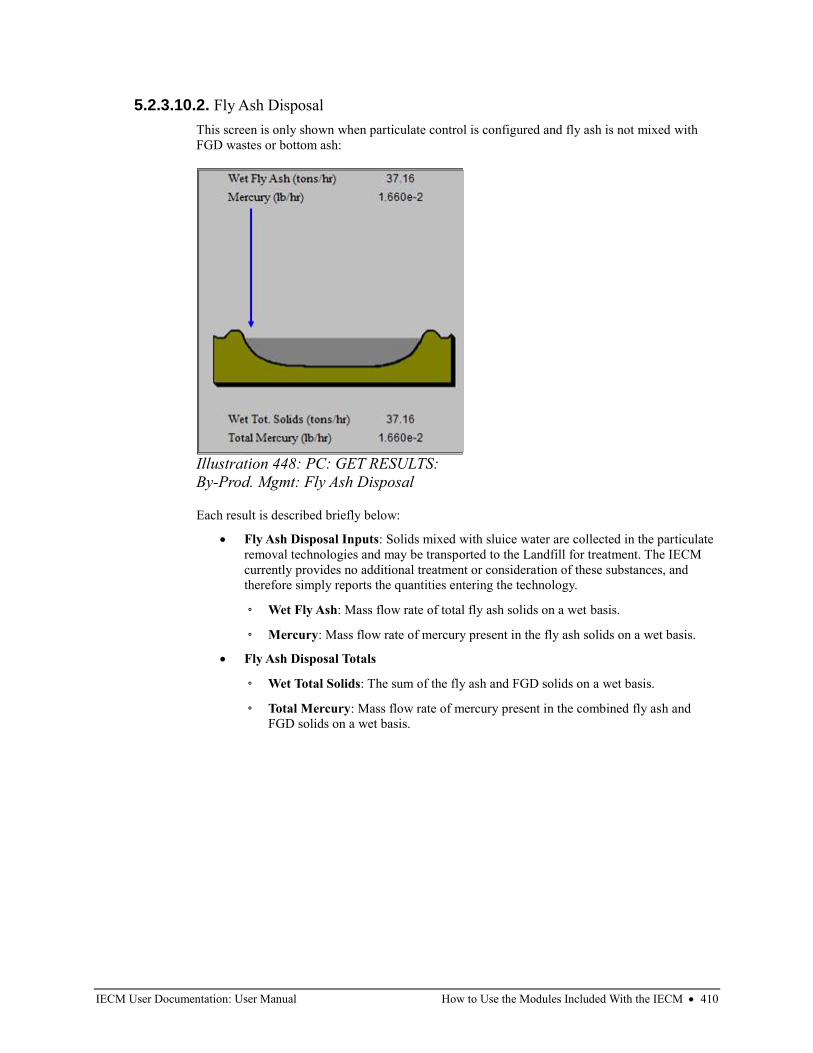
IECM User Documentation: User Manual How to Use the Modules Included With the IECM • 410
5.2.3.10.2. Fly Ash Disposal
This screen is only shown when particulate control is configured and fly ash is not mixed with
FGD wastes or bottom ash:
Each result is described briefly below:
• Fly Ash Disposal Inputs: Solids mixed with sluice water are collected in the particulate
removal technologies and may be transported to the Landfill for treatment. The IECM
currently provides no additional treatment or consideration of these substances, and
therefore simply reports the quantities entering the technology.
◦ Wet Fly Ash: Mass flow rate of total fly ash solids on a wet basis.
◦ Mercury: Mass flow rate of mercury present in the fly ash solids on a wet basis.
• Fly Ash Disposal Totals
◦ Wet Total Solids: The sum of the fly ash and FGD solids on a wet basis.
◦ Total Mercury: Mass flow rate of mercury present in the combined fly ash and
FGD solids on a wet basis.
Illustration 448: PC: GET RESULTS:
By-Prod. Mgmt: Fly Ash Disposal

IECM User Documentation: User Manual How to Use the Modules Included With the IECM • 411
5.2.3.10.3. Flue Gas Treatment
This screen is only shown when a Wet FGD is configured:
The Flue Gas Treatment Diagram result screen displays an icon for the Landfill and values for
major flows into it. Each result is described briefly below:
• Flue Gas Treatment Inputs: Solids mixed with sluice water that are collected in the
bottom of the boiler and by the particulate removal technologies are transported to the
Pond for treatment. The IECM currently provides no additional treatment or
consideration of these substances, and therefore simply reports the quantities entering
the technology.
◦ Wet Fly Ash: Mass flow rate of total fly ash solids on a wet basis. This value is zero
when the fly ash is disposed in a landfill.
◦ Mercury (contained in Fly Ash): Mass flow rate of mercury present in the fly ash
solids on a wet basis.
◦ Wet FGD Solids: Mass flow rate of wet FGD solids.
◦ Mercury (contained in Wet FGD Solids): Mass flow rate of mercury present in the
Wet FGD solids.
• Flue Gas Treatment Totals
◦ Wet Total Solids: The sum of the wet FGD solids and the fly ash on a wet basis.
◦ Total Mercury: Mass flow rate of mercury present in the combined wet FGD solids
and fly ash solids on a wet basis.
Illustration 449: PC: GET RESULTS: By-Prod. Mgmt: Flue Gas Treatment
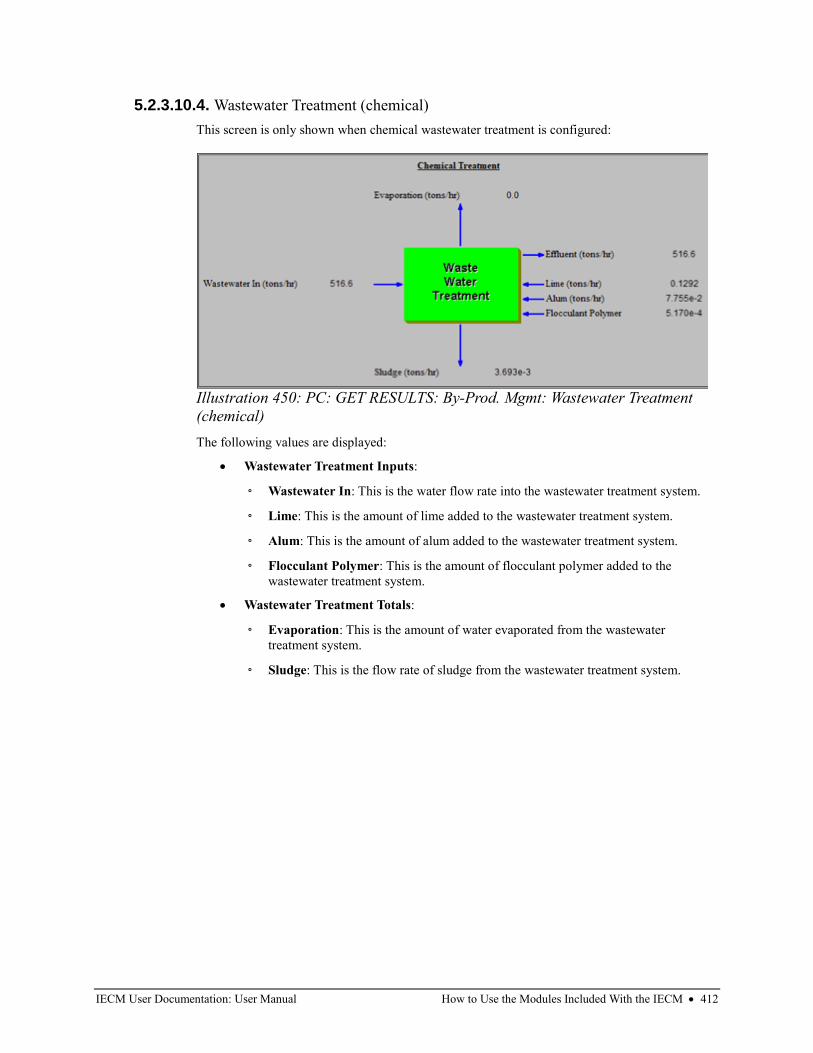
IECM User Documentation: User Manual How to Use the Modules Included With the IECM • 412
5.2.3.10.4. Wastewater Treatment (chemical)
This screen is only shown when chemical wastewater treatment is configured:
The following values are displayed:
• Wastewater Treatment Inputs:
◦ Wastewater In: This is the water flow rate into the wastewater treatment system.
◦ Lime: This is the amount of lime added to the wastewater treatment system.
◦ Alum: This is the amount of alum added to the wastewater treatment system.
◦ Flocculant Polymer: This is the amount of flocculant polymer added to the
wastewater treatment system.
• Wastewater Treatment Totals:
◦ Evaporation: This is the amount of water evaporated from the wastewater
treatment system.
◦ Sludge: This is the flow rate of sludge from the wastewater treatment system.
Illustration 450: PC: GET RESULTS: By-Prod. Mgmt: Wastewater Treatment
(chemical)
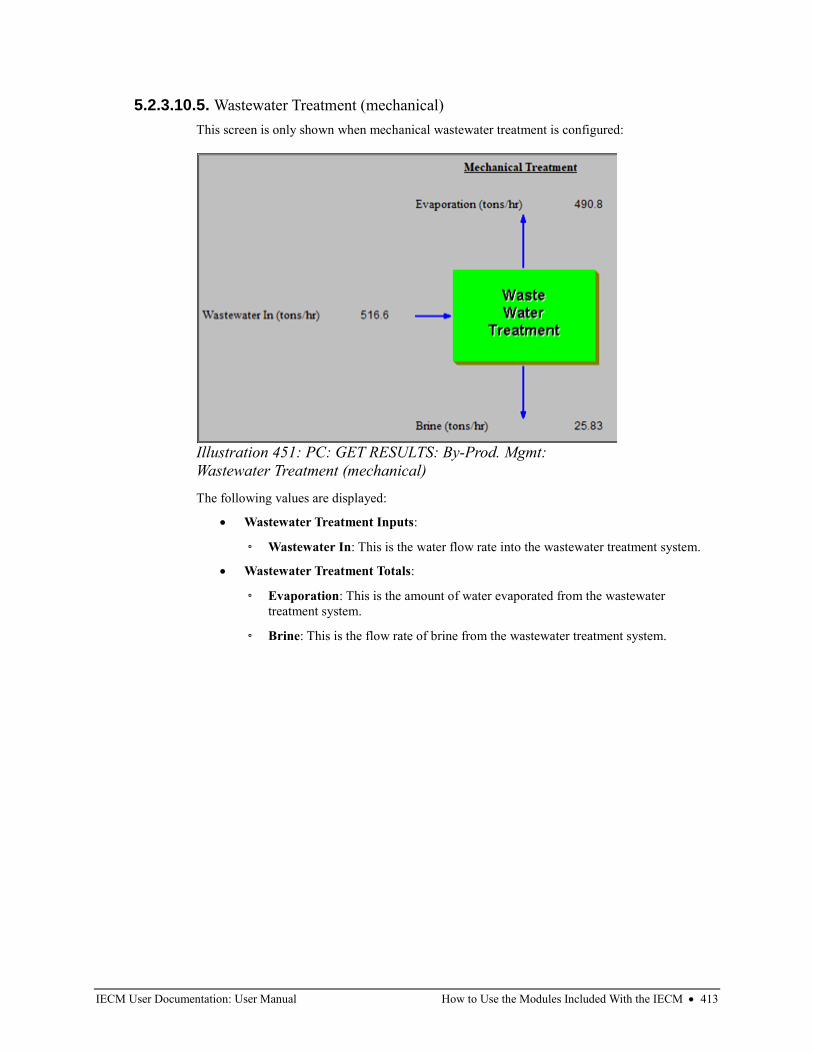
IECM User Documentation: User Manual How to Use the Modules Included With the IECM • 413
5.2.3.10.5. Wastewater Treatment (mechanical)
This screen is only shown when mechanical wastewater treatment is configured:
The following values are displayed:
• Wastewater Treatment Inputs:
◦ Wastewater In: This is the water flow rate into the wastewater treatment system.
• Wastewater Treatment Totals:
◦ Evaporation: This is the amount of water evaporated from the wastewater
treatment system.
◦ Brine: This is the flow rate of brine from the wastewater treatment system.
Illustration 451: PC: GET RESULTS: By-Prod. Mgmt:
Wastewater Treatment (mechanical)
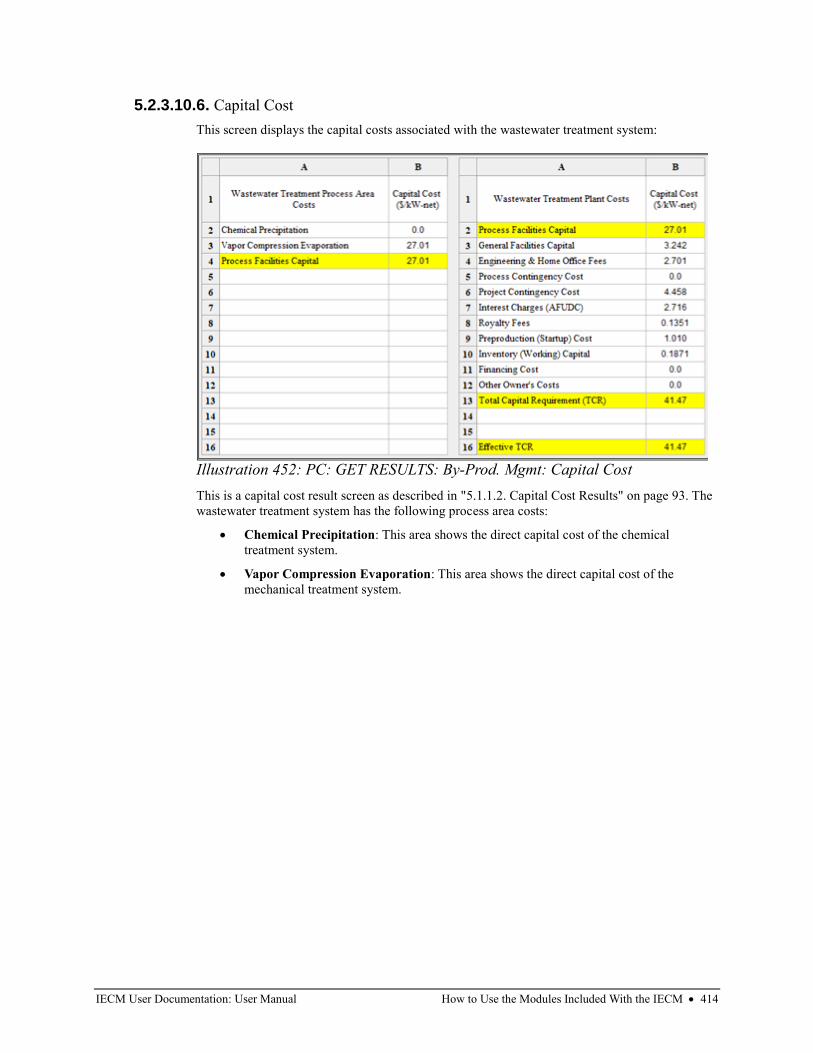
IECM User Documentation: User Manual How to Use the Modules Included With the IECM • 414
5.2.3.10.6. Capital Cost
This screen displays the capital costs associated with the wastewater treatment system:
This is a capital cost result screen as described in "5.1.1.2. Capital Cost Results" on page 93. The
wastewater treatment system has the following process area costs:
• Chemical Precipitation: This area shows the direct capital cost of the chemical
treatment system.
• Vapor Compression Evaporation: This area shows the direct capital cost of the
mechanical treatment system.
Illustration 452: PC: GET RESULTS: By-Prod. Mgmt: Capital Cost
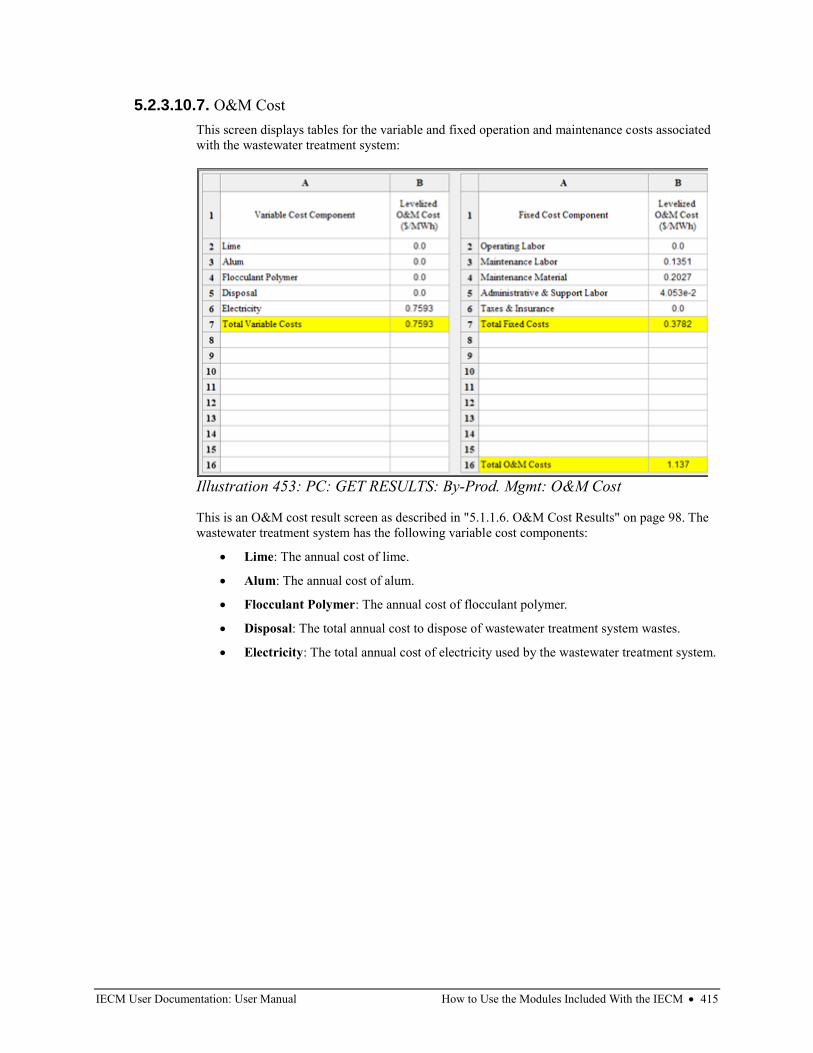
IECM User Documentation: User Manual How to Use the Modules Included With the IECM • 415
5.2.3.10.7. O&M Cost
This screen displays tables for the variable and fixed operation and maintenance costs associated
with the wastewater treatment system:
This is an O&M cost result screen as described in "5.1.1.6. O&M Cost Results" on page 98. The
wastewater treatment system has the following variable cost components:
• Lime: The annual cost of lime.
• Alum: The annual cost of alum.
• Flocculant Polymer: The annual cost of flocculant polymer.
• Disposal: The total annual cost to dispose of wastewater treatment system wastes.
• Electricity: The total annual cost of electricity used by the wastewater treatment system.
Illustration 453: PC: GET RESULTS: By-Prod. Mgmt: O&M Cost
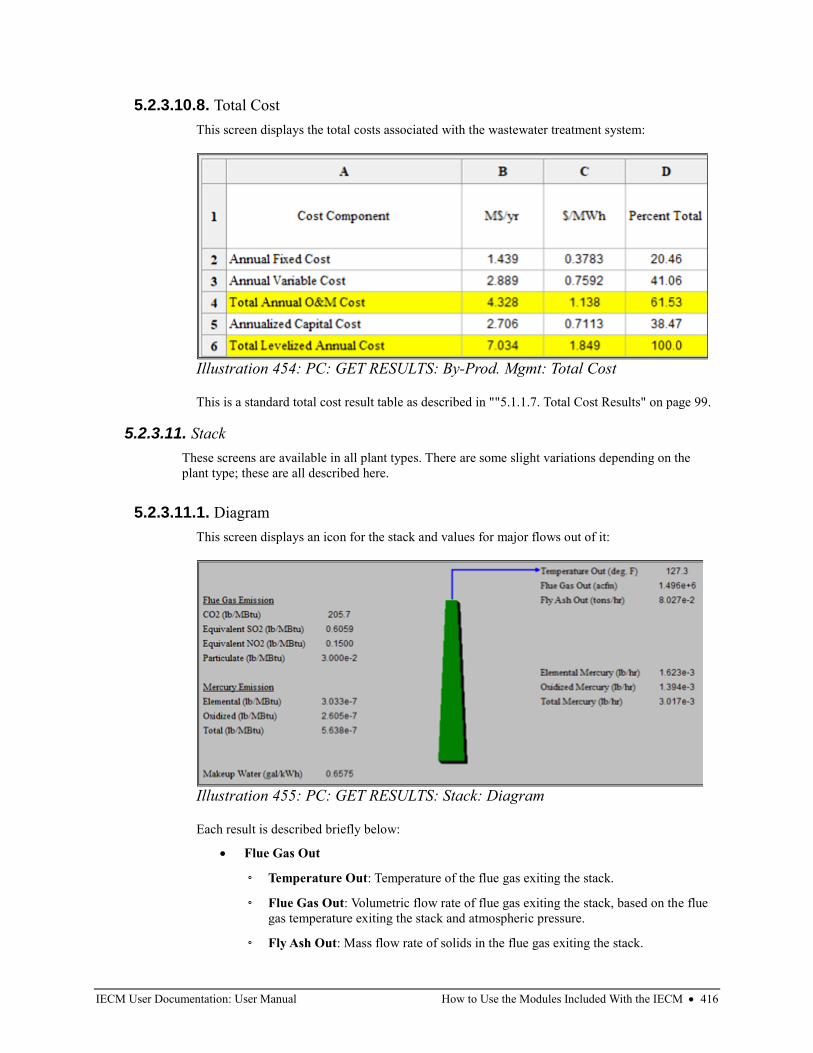
IECM User Documentation: User Manual How to Use the Modules Included With the IECM • 416
5.2.3.10.8. Total Cost
This screen displays the total costs associated with the wastewater treatment system:
This is a standard total cost result table as described in ""5.1.1.7. Total Cost Results" on page 99.
5.2.3.11. Stack
These screens are available in all plant types. There are some slight variations depending on the
plant type; these are all described here.
5.2.3.11.1. Diagram
This screen displays an icon for the stack and values for major flows out of it:
Each result is described briefly below:
• Flue Gas Out
◦ Temperature Out: Temperature of the flue gas exiting the stack.
◦ Flue Gas Out: Volumetric flow rate of flue gas exiting the stack, based on the flue
gas temperature exiting the stack and atmospheric pressure.
◦ Fly Ash Out: Mass flow rate of solids in the flue gas exiting the stack.
Illustration 454: PC: GET RESULTS: By-Prod. Mgmt: Total Cost
Illustration 455: PC: GET RESULTS: Stack: Diagram
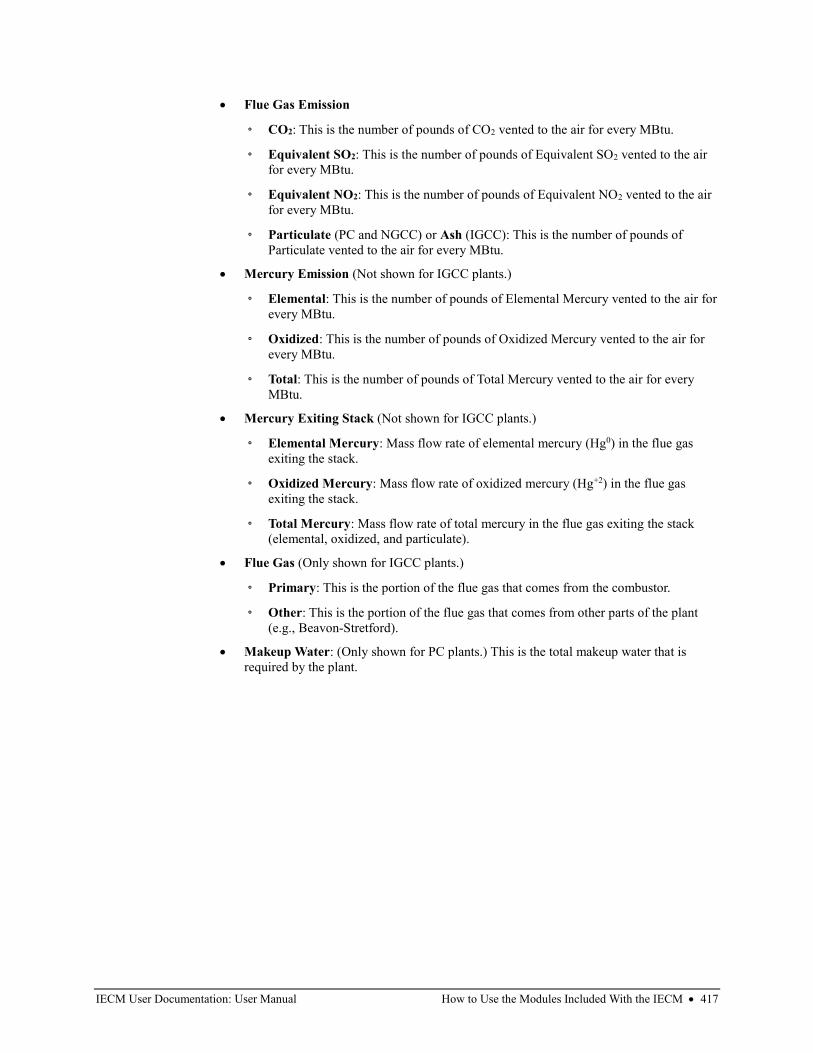
IECM User Documentation: User Manual How to Use the Modules Included With the IECM • 417
• Flue Gas Emission
◦ CO2: This is the number of pounds of CO2 vented to the air for every MBtu.
◦ Equivalent SO2: This is the number of pounds of Equivalent SO2 vented to the air
for every MBtu.
◦ Equivalent NO2: This is the number of pounds of Equivalent NO2 vented to the air
for every MBtu.
◦ Particulate (PC and NGCC) or Ash (IGCC): This is the number of pounds of
Particulate vented to the air for every MBtu.
• Mercury Emission (Not shown for IGCC plants.)
◦ Elemental: This is the number of pounds of Elemental Mercury vented to the air for
every MBtu.
◦ Oxidized: This is the number of pounds of Oxidized Mercury vented to the air for
every MBtu.
◦ Total: This is the number of pounds of Total Mercury vented to the air for every
MBtu.
• Mercury Exiting Stack (Not shown for IGCC plants.)
◦ Elemental Mercury: Mass flow rate of elemental mercury (Hg0) in the flue gas
exiting the stack.
◦ Oxidized Mercury: Mass flow rate of oxidized mercury (Hg+2) in the flue gas
exiting the stack.
◦ Total Mercury: Mass flow rate of total mercury in the flue gas exiting the stack
(elemental, oxidized, and particulate).
• Flue Gas (Only shown for IGCC plants.)
◦ Primary: This is the portion of the flue gas that comes from the combustor.
◦ Other: This is the portion of the flue gas that comes from other parts of the plant
(e.g., Beavon-Stretford).
• Makeup Water: (Only shown for PC plants.) This is the total makeup water that is
required by the plant.
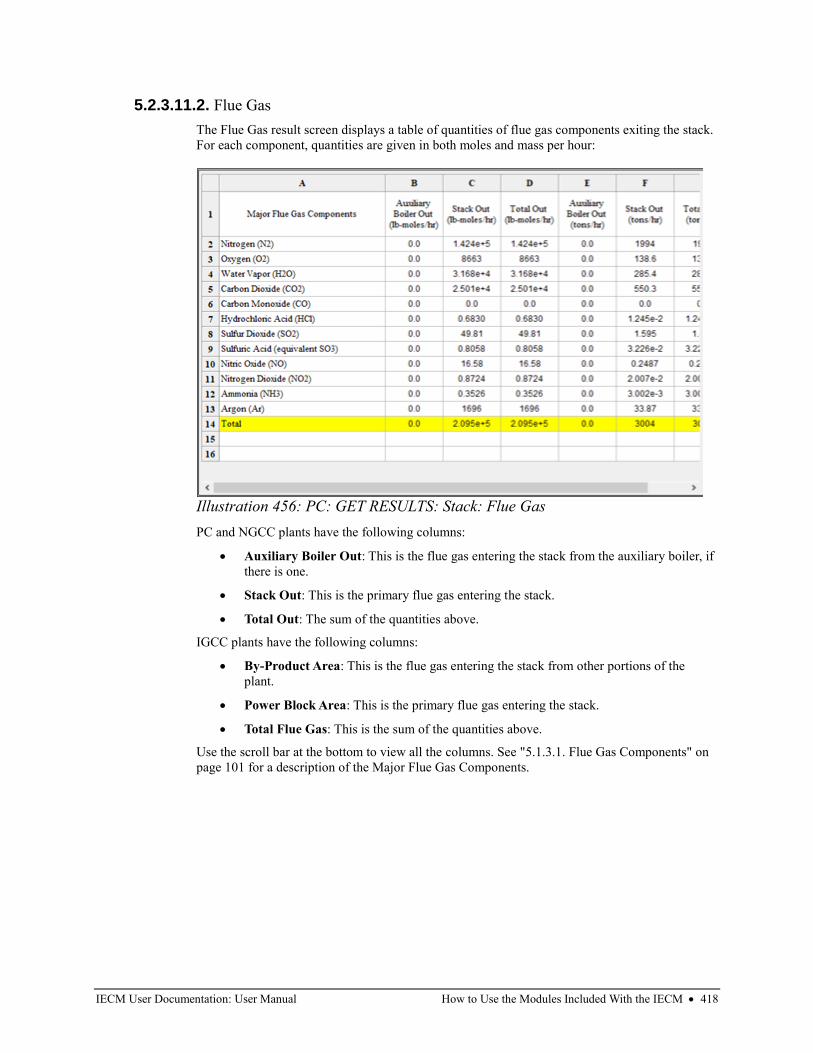
IECM User Documentation: User Manual How to Use the Modules Included With the IECM • 418
5.2.3.11.2. Flue Gas
The Flue Gas result screen displays a table of quantities of flue gas components exiting the stack.
For each component, quantities are given in both moles and mass per hour:
PC and NGCC plants have the following columns:
• Auxiliary Boiler Out: This is the flue gas entering the stack from the auxiliary boiler, if
there is one.
• Stack Out: This is the primary flue gas entering the stack.
• Total Out: The sum of the quantities above.
IGCC plants have the following columns:
• By-Product Area: This is the flue gas entering the stack from other portions of the
plant.
• Power Block Area: This is the primary flue gas entering the stack.
• Total Flue Gas: This is the sum of the quantities above.
Use the scroll bar at the bottom to view all the columns. See "5.1.3.1. Flue Gas Components" on
page 101 for a description of the Major Flue Gas Components.
Illustration 456: PC: GET RESULTS: Stack: Flue Gas
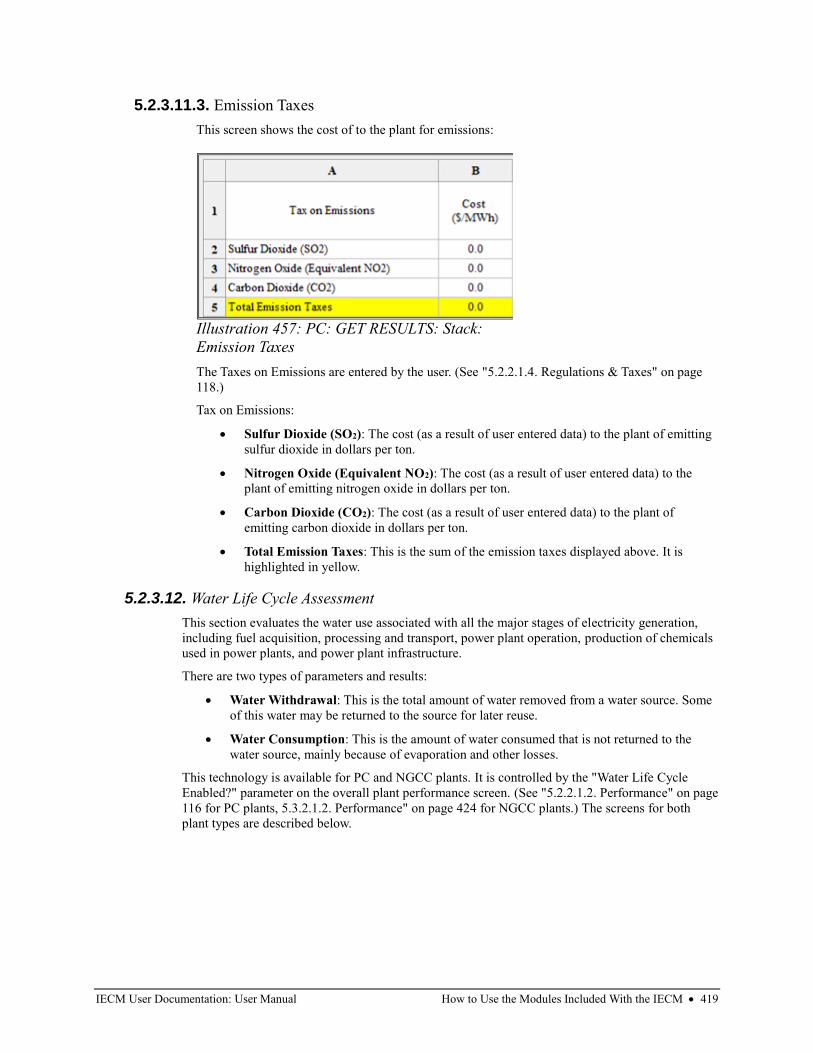
IECM User Documentation: User Manual How to Use the Modules Included With the IECM • 419
5.2.3.11.3. Emission Taxes
This screen shows the cost of to the plant for emissions:
The Taxes on Emissions are entered by the user. (See "5.2.2.1.4. Regulations & Taxes" on page
118.)
Tax on Emissions:
• Sulfur Dioxide (SO2): The cost (as a result of user entered data) to the plant of emitting
sulfur dioxide in dollars per ton.
• Nitrogen Oxide (Equivalent NO2): The cost (as a result of user entered data) to the
plant of emitting nitrogen oxide in dollars per ton.
• Carbon Dioxide (CO2): The cost (as a result of user entered data) to the plant of
emitting carbon dioxide in dollars per ton.
• Total Emission Taxes: This is the sum of the emission taxes displayed above. It is
highlighted in yellow.
5.2.3.12. Water Life Cycle Assessment
This section evaluates the water use associated with all the major stages of electricity generation,
including fuel acquisition, processing and transport, power plant operation, production of chemicals
used in power plants, and power plant infrastructure.
There are two types of parameters and results:
• Water Withdrawal: This is the total amount of water removed from a water source. Some
of this water may be returned to the source for later reuse.
• Water Consumption: This is the amount of water consumed that is not returned to the
water source, mainly because of evaporation and other losses.
This technology is available for PC and NGCC plants. It is controlled by the "Water Life Cycle
Enabled?" parameter on the overall plant performance screen. (See "5.2.2.1.2. Performance" on page
116 for PC plants, 5.3.2.1.2. Performance" on page 424 for NGCC plants.) The screens for both
plant types are described below.
Illustration 457: PC: GET RESULTS: Stack:
Emission Taxes
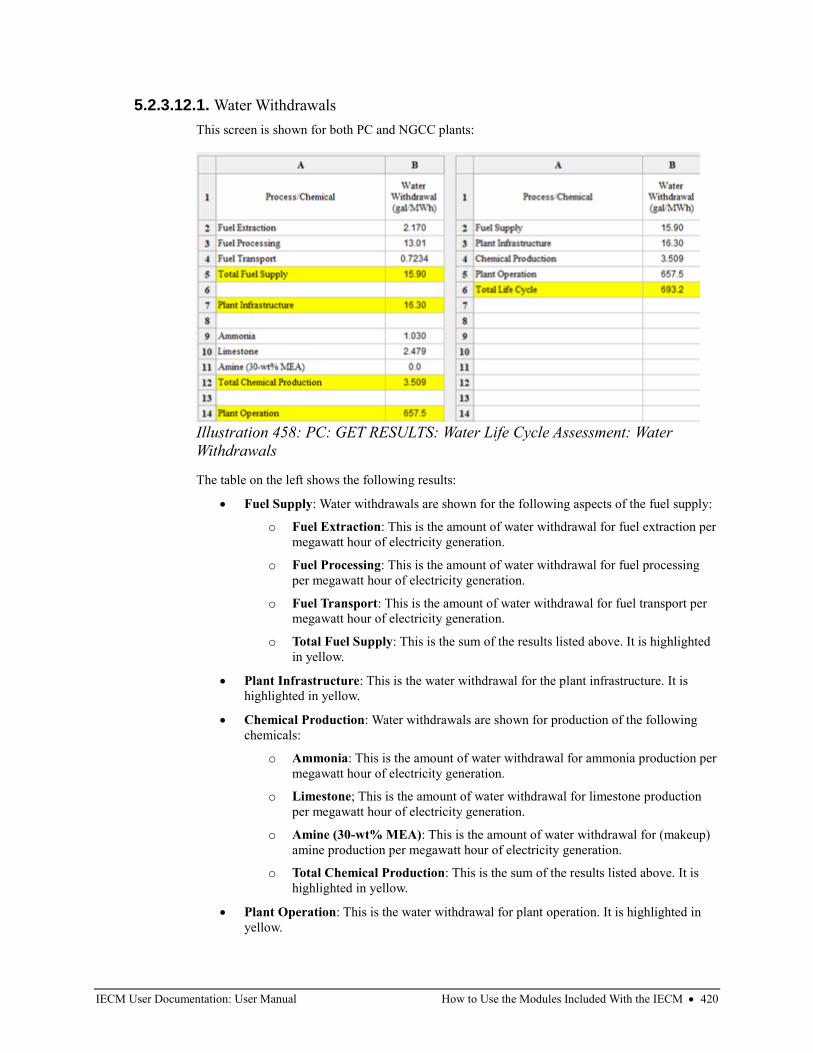
IECM User Documentation: User Manual How to Use the Modules Included With the IECM • 420
5.2.3.12.1. Water Withdrawals
This screen is shown for both PC and NGCC plants:
The table on the left shows the following results:
• Fuel Supply: Water withdrawals are shown for the following aspects of the fuel supply:
o Fuel Extraction: This is the amount of water withdrawal for fuel extraction per
megawatt hour of electricity generation.
o Fuel Processing: This is the amount of water withdrawal for fuel processing
per megawatt hour of electricity generation.
o Fuel Transport: This is the amount of water withdrawal for fuel transport per
megawatt hour of electricity generation.
o Total Fuel Supply: This is the sum of the results listed above. It is highlighted
in yellow.
• Plant Infrastructure: This is the water withdrawal for the plant infrastructure. It is
highlighted in yellow.
• Chemical Production: Water withdrawals are shown for production of the following
chemicals:
o Ammonia: This is the amount of water withdrawal for ammonia production per
megawatt hour of electricity generation.
o Limestone; This is the amount of water withdrawal for limestone production
per megawatt hour of electricity generation.
o Amine (30-wt% MEA): This is the amount of water withdrawal for (makeup)
amine production per megawatt hour of electricity generation.
o Total Chemical Production: This is the sum of the results listed above. It is
highlighted in yellow.
• Plant Operation: This is the water withdrawal for plant operation. It is highlighted in
yellow.
Illustration 458: PC: GET RESULTS: Water Life Cycle Assessment: Water
Withdrawals
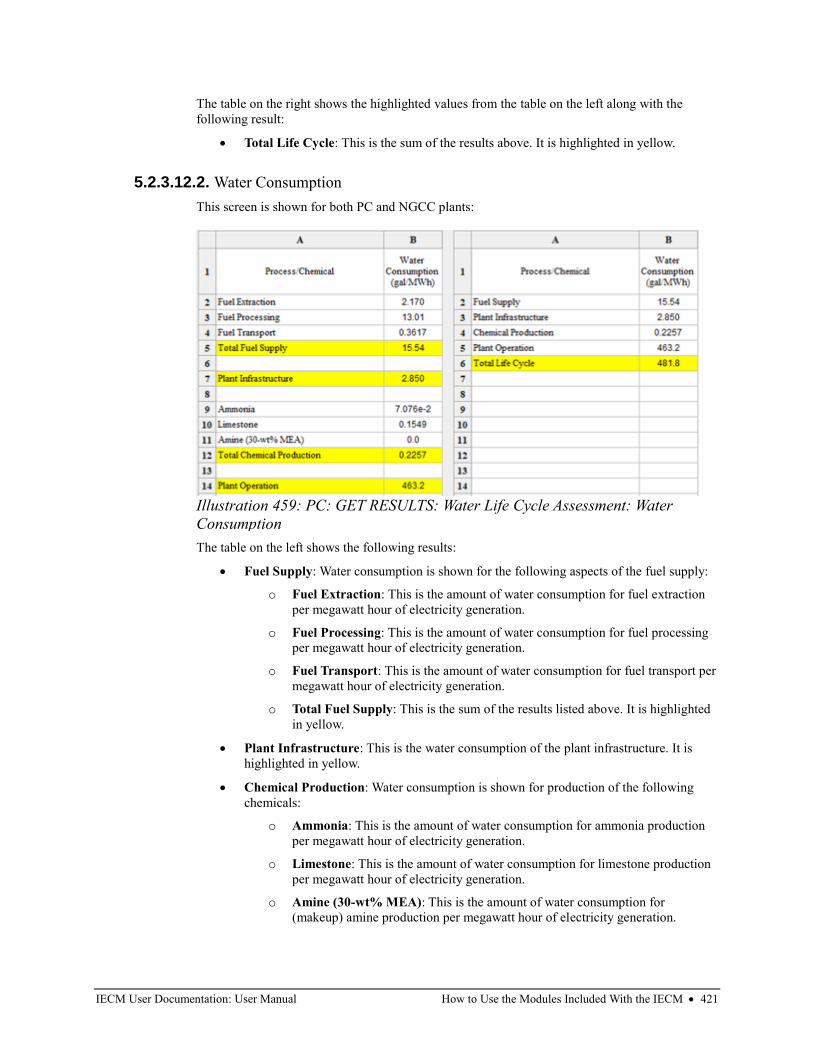
IECM User Documentation: User Manual How to Use the Modules Included With the IECM • 421
The table on the right shows the highlighted values from the table on the left along with the
following result:
• Total Life Cycle: This is the sum of the results above. It is highlighted in yellow.
5.2.3.12.2. Water Consumption
This screen is shown for both PC and NGCC plants:
The table on the left shows the following results:
• Fuel Supply: Water consumption is shown for the following aspects of the fuel supply:
o Fuel Extraction: This is the amount of water consumption for fuel extraction
per megawatt hour of electricity generation.
o Fuel Processing: This is the amount of water consumption for fuel processing
per megawatt hour of electricity generation.
o Fuel Transport: This is the amount of water consumption for fuel transport per
megawatt hour of electricity generation.
o Total Fuel Supply: This is the sum of the results listed above. It is highlighted
in yellow.
• Plant Infrastructure: This is the water consumption of the plant infrastructure. It is
highlighted in yellow.
• Chemical Production: Water consumption is shown for production of the following
chemicals:
o Ammonia: This is the amount of water consumption for ammonia production
per megawatt hour of electricity generation.
o Limestone: This is the amount of water consumption for limestone production
per megawatt hour of electricity generation.
o Amine (30-wt% MEA): This is the amount of water consumption for
(makeup) amine production per megawatt hour of electricity generation.
Illustration 459: PC: GET RESULTS: Water Life Cycle Assessment: Water
Consumption
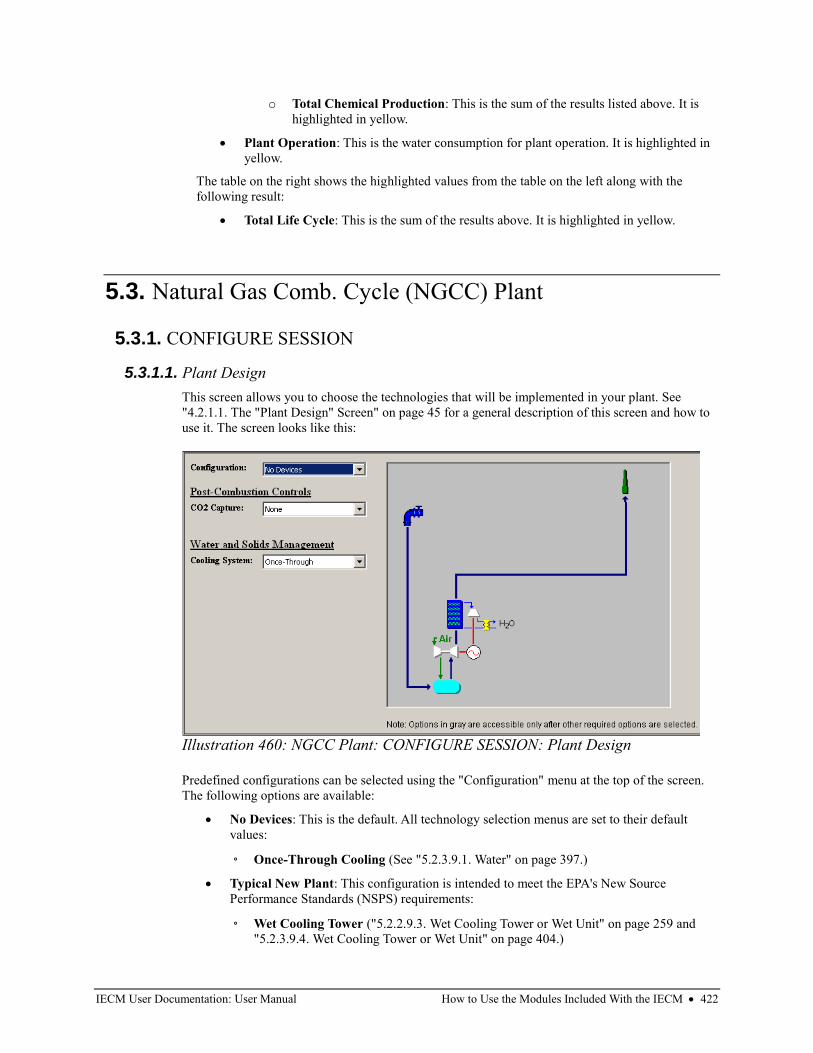
IECM User Documentation: User Manual How to Use the Modules Included With the IECM • 422
o Total Chemical Production: This is the sum of the results listed above. It is
highlighted in yellow.
• Plant Operation: This is the water consumption for plant operation. It is highlighted in
yellow.
The table on the right shows the highlighted values from the table on the left along with the
following result:
• Total Life Cycle: This is the sum of the results above. It is highlighted in yellow.
5.3. Natural Gas Comb. Cycle (NGCC) Plant
5.3.1. CONFIGURE SESSION
5.3.1.1. Plant Design
This screen allows you to choose the technologies that will be implemented in your plant. See
"4.2.1.1. The "Plant Design" Screen" on page 45 for a general description of this screen and how to
use it. The screen looks like this:
Predefined configurations can be selected using the "Configuration" menu at the top of the screen.
The following options are available:
• No Devices: This is the default. All technology selection menus are set to their default
values:
◦ Once-Through Cooling (See "5.2.3.9.1. Water" on page 397.)
• Typical New Plant: This configuration is intended to meet the EPA's New Source
Performance Standards (NSPS) requirements:
◦ Wet Cooling Tower ("5.2.2.9.3. Wet Cooling Tower or Wet Unit" on page 259 and
"5.2.3.9.4. Wet Cooling Tower or Wet Unit" on page 404.)
Illustration 460: NGCC Plant: CONFIGURE SESSION: Plant Design
IECM User Documentation: User Manual How to Use the Modules Included With the IECM • 423
• MEA Scrubber: This is a "Typical New Plant" with the addition of an amine system for
CO2 capture:
◦ Amine System (See "5.2.2.8.1. Amine System (CCS System)" on page 176 and
"5.2.3.8.1. Amine System (CCS System)" on page 328.)
◦ Wet Cooling Tower (See "5.2.2.9.3. Wet Cooling Tower or Wet Unit" on page 259 and
"5.2.3.9.4. Wet Cooling Tower or Wet Unit" on page 404.)
• <User Defined>: This is shown when the current configuration does not match any of the
predefined configurations.
Technologies may also be chosen individually. You may either start with one of the predefined
configurations and adjust it, or create your own configuration from scratch. The available options
are described below:
• Post-Combustion Controls
◦ CO2 Capture:
▪ None: This is the default. No CO2 capture is used.
▪ Amine System: This is an MEA scrubber for capturing CO2. (See
"5.2.2.8.1. Amine System (CCS System)" on page 176 and "5.2.3.8.1. Amine
System (CCS System)" on page 328.)
▪ Ammonia System: An ammonia-based CO2 capture process is used. (See
"5.2.2.8.2. Ammonia System (CCS System)" on page 188 and
"5.2.3.8.2. Ammonia System (CCS System)" on page 337.)
• Water and Solids Management
◦ Cooling System:
▪ Once-Through: This is the default. Cooling water is withdrawn from a natural
waterbody, passed through the steam condenser and returned to the waterbody.
(See "5.2.3.9.1. Water" on page 397.)
▪ Wet Cooling Tower: Cooling water is recirculated through the wet tower and
back to the condenser. The tower mainly relies on the latent heat of water
evaporation to transfer waste heat to the atmosphere. ("5.2.2.9.3. Wet Cooling
Tower or Wet Unit" on page 259 and "5.2.3.9.4. Wet Cooling Tower or Wet Unit"
on page 404.)
▪ Air Cooled Condenser: The air cooled condenser utilizes the sensible heating of
atmospheric air passed across finned-tube heat exchangers to reject heat. (See
"5.2.2.9.2. Air Cooled Condenser or Dry Unit" on page 255 and "5.2.3.9.3. Air
Cooled Condenser or Dry Unit" on page 401.)
▪ Hybrid Cooling System: This combines a wet cooling tower and an air cooled
condenser. (See "5.2.2.9.1. Hybrid Cooling System" on page 253 and
"5.2.3.9.2. Hybrid Cooling System" on page 400.)
5.3.1.2. Plant Location
This screen is the same in all plant types. See "5.2.1.2. Plant Location" on page 114 for its
description.
5.3.1.3. Unit Systems
This screen is the same in all plant types. See "5.2.1.3. Unit Systems" on page 115 for its
description.
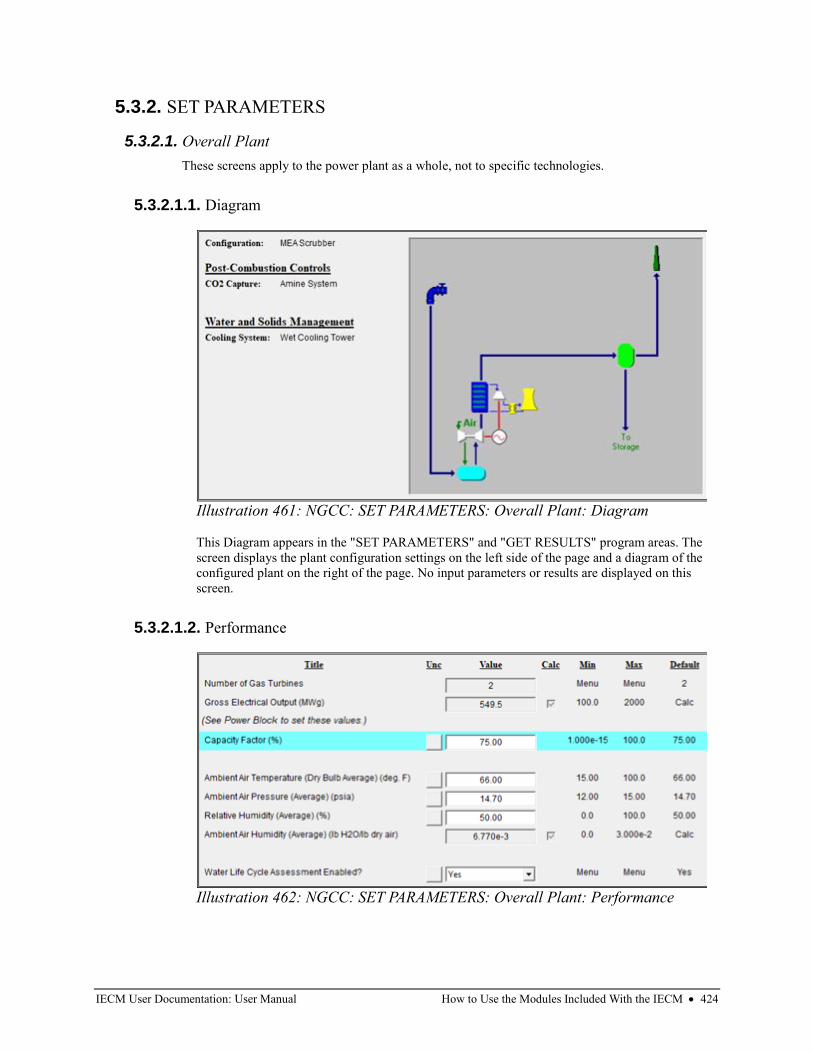
IECM User Documentation: User Manual How to Use the Modules Included With the IECM • 424
5.3.2. SET PARAMETERS
5.3.2.1. Overall Plant
These screens apply to the power plant as a whole, not to specific technologies.
5.3.2.1.1. Diagram
This Diagram appears in the "SET PARAMETERS" and "GET RESULTS" program areas. The
screen displays the plant configuration settings on the left side of the page and a diagram of the
configured plant on the right of the page. No input parameters or results are displayed on this
screen.
5.3.2.1.2. Performance
Illustration 461: NGCC: SET PARAMETERS: Overall Plant: Diagram
Illustration 462: NGCC: SET PARAMETERS: Overall Plant: Performance
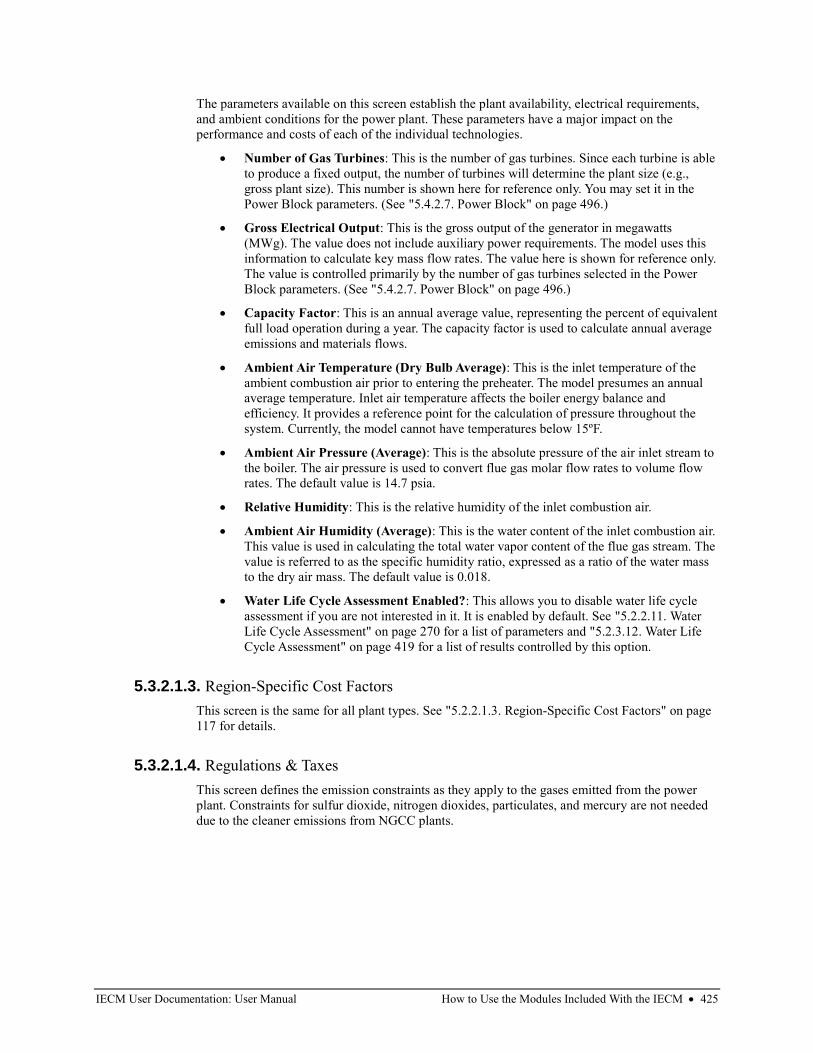
IECM User Documentation: User Manual How to Use the Modules Included With the IECM • 425
The parameters available on this screen establish the plant availability, electrical requirements,
and ambient conditions for the power plant. These parameters have a major impact on the
performance and costs of each of the individual technologies.
• Number of Gas Turbines: This is the number of gas turbines. Since each turbine is able
to produce a fixed output, the number of turbines will determine the plant size (e.g.,
gross plant size). This number is shown here for reference only. You may set it in the
Power Block parameters. (See "5.4.2.7. Power Block" on page 496.)
• Gross Electrical Output: This is the gross output of the generator in megawatts
(MWg). The value does not include auxiliary power requirements. The model uses this
information to calculate key mass flow rates. The value here is shown for reference only.
The value is controlled primarily by the number of gas turbines selected in the Power
Block parameters. (See "5.4.2.7. Power Block" on page 496.)
• Capacity Factor: This is an annual average value, representing the percent of equivalent
full load operation during a year. The capacity factor is used to calculate annual average
emissions and materials flows.
• Ambient Air Temperature (Dry Bulb Average): This is the inlet temperature of the
ambient combustion air prior to entering the preheater. The model presumes an annual
average temperature. Inlet air temperature affects the boiler energy balance and
efficiency. It provides a reference point for the calculation of pressure throughout the
system. Currently, the model cannot have temperatures below 15ºF.
• Ambient Air Pressure (Average): This is the absolute pressure of the air inlet stream to
the boiler. The air pressure is used to convert flue gas molar flow rates to volume flow
rates. The default value is 14.7 psia.
• Relative Humidity: This is the relative humidity of the inlet combustion air.
• Ambient Air Humidity (Average): This is the water content of the inlet combustion air.
This value is used in calculating the total water vapor content of the flue gas stream. The
value is referred to as the specific humidity ratio, expressed as a ratio of the water mass
to the dry air mass. The default value is 0.018.
• Water Life Cycle Assessment Enabled?: This allows you to disable water life cycle
assessment if you are not interested in it. It is enabled by default. See "5.2.2.11. Water
Life Cycle Assessment" on page 270 for a list of parameters and "5.2.3.12. Water Life
Cycle Assessment" on page 419 for a list of results controlled by this option.
5.3.2.1.3. Region-Specific Cost Factors
This screen is the same for all plant types. See "5.2.2.1.3. Region-Specific Cost Factors" on page
117 for details.
5.3.2.1.4. Regulations & Taxes
This screen defines the emission constraints as they apply to the gases emitted from the power
plant. Constraints for sulfur dioxide, nitrogen dioxides, particulates, and mercury are not needed
due to the cleaner emissions from NGCC plants.
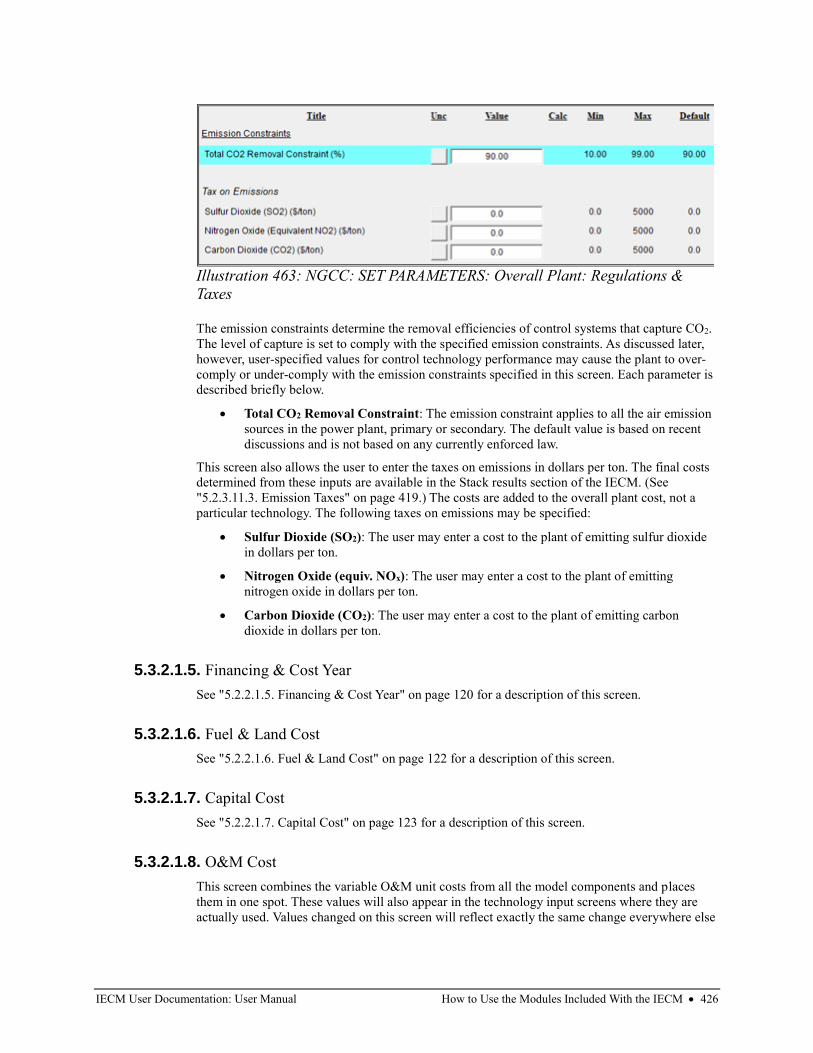
IECM User Documentation: User Manual How to Use the Modules Included With the IECM • 426
The emission constraints determine the removal efficiencies of control systems that capture CO2.
The level of capture is set to comply with the specified emission constraints. As discussed later,
however, user-specified values for control technology performance may cause the plant to over-
comply or under-comply with the emission constraints specified in this screen. Each parameter is
described briefly below.
• Total CO2 Removal Constraint: The emission constraint applies to all the air emission
sources in the power plant, primary or secondary. The default value is based on recent
discussions and is not based on any currently enforced law.
This screen also allows the user to enter the taxes on emissions in dollars per ton. The final costs
determined from these inputs are available in the Stack results section of the IECM. (See
"5.2.3.11.3. Emission Taxes" on page 419.) The costs are added to the overall plant cost, not a
particular technology. The following taxes on emissions may be specified:
• Sulfur Dioxide (SO2): The user may enter a cost to the plant of emitting sulfur dioxide
in dollars per ton.
• Nitrogen Oxide (equiv. NOx): The user may enter a cost to the plant of emitting
nitrogen oxide in dollars per ton.
• Carbon Dioxide (CO2): The user may enter a cost to the plant of emitting carbon
dioxide in dollars per ton.
5.3.2.1.5. Financing & Cost Year
See "5.2.2.1.5. Financing & Cost Year" on page 120 for a description of this screen.
5.3.2.1.6. Fuel & Land Cost
See "5.2.2.1.6. Fuel & Land Cost" on page 122 for a description of this screen.
5.3.2.1.7. Capital Cost
See "5.2.2.1.7. Capital Cost" on page 123 for a description of this screen.
5.3.2.1.8. O&M Cost
This screen combines the variable O&M unit costs from all the model components and places
them in one spot. These values will also appear in the technology input screens where they are
actually used. Values changed on this screen will reflect exactly the same change everywhere else
Illustration 463: NGCC: SET PARAMETERS: Overall Plant: Regulations &
Taxes
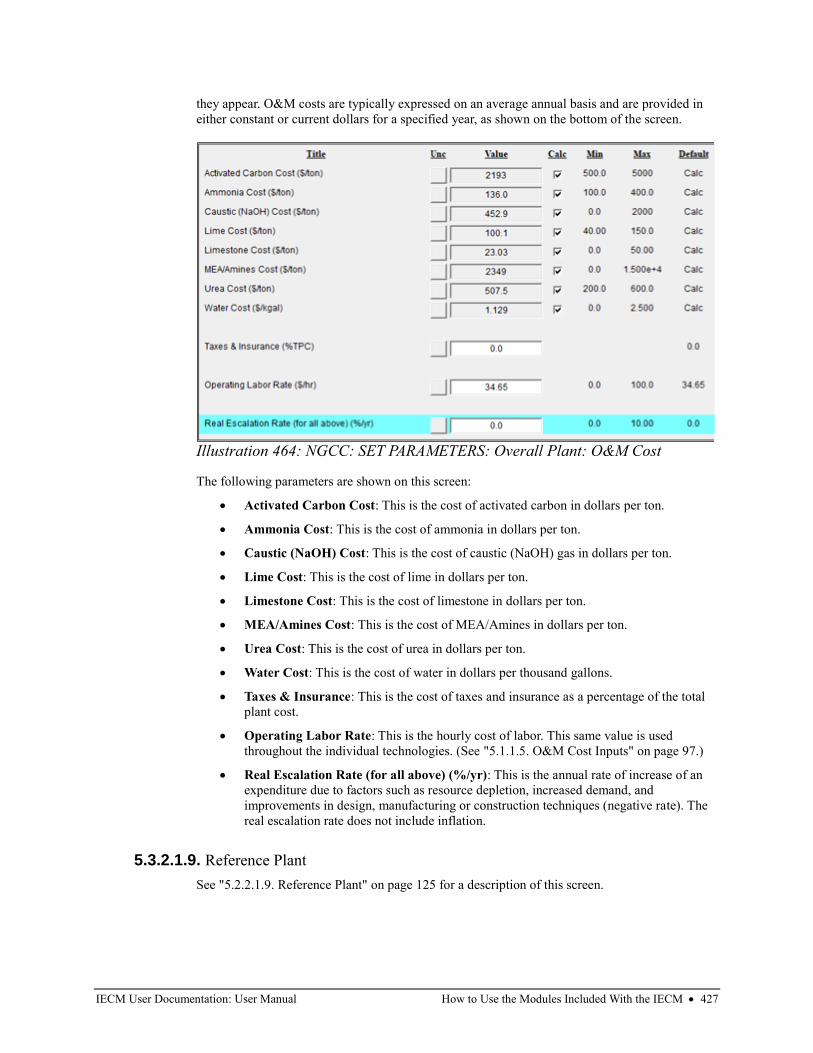
IECM User Documentation: User Manual How to Use the Modules Included With the IECM • 427
they appear. O&M costs are typically expressed on an average annual basis and are provided in
either constant or current dollars for a specified year, as shown on the bottom of the screen.
The following parameters are shown on this screen:
• Activated Carbon Cost: This is the cost of activated carbon in dollars per ton.
• Ammonia Cost: This is the cost of ammonia in dollars per ton.
• Caustic (NaOH) Cost: This is the cost of caustic (NaOH) gas in dollars per ton.
• Lime Cost: This is the cost of lime in dollars per ton.
• Limestone Cost: This is the cost of limestone in dollars per ton.
• MEA/Amines Cost: This is the cost of MEA/Amines in dollars per ton.
• Urea Cost: This is the cost of urea in dollars per ton.
• Water Cost: This is the cost of water in dollars per thousand gallons.
• Taxes & Insurance: This is the cost of taxes and insurance as a percentage of the total
plant cost.
• Operating Labor Rate: This is the hourly cost of labor. This same value is used
throughout the individual technologies. (See "5.1.1.5. O&M Cost Inputs" on page 97.)
• Real Escalation Rate (for all above) (%/yr): This is the annual rate of increase of an
expenditure due to factors such as resource depletion, increased demand, and
improvements in design, manufacturing or construction techniques (negative rate). The
real escalation rate does not include inflation.
5.3.2.1.9. Reference Plant
See "5.2.2.1.9. Reference Plant" on page 125 for a description of this screen.
Illustration 464: NGCC: SET PARAMETERS: Overall Plant: O&M Cost
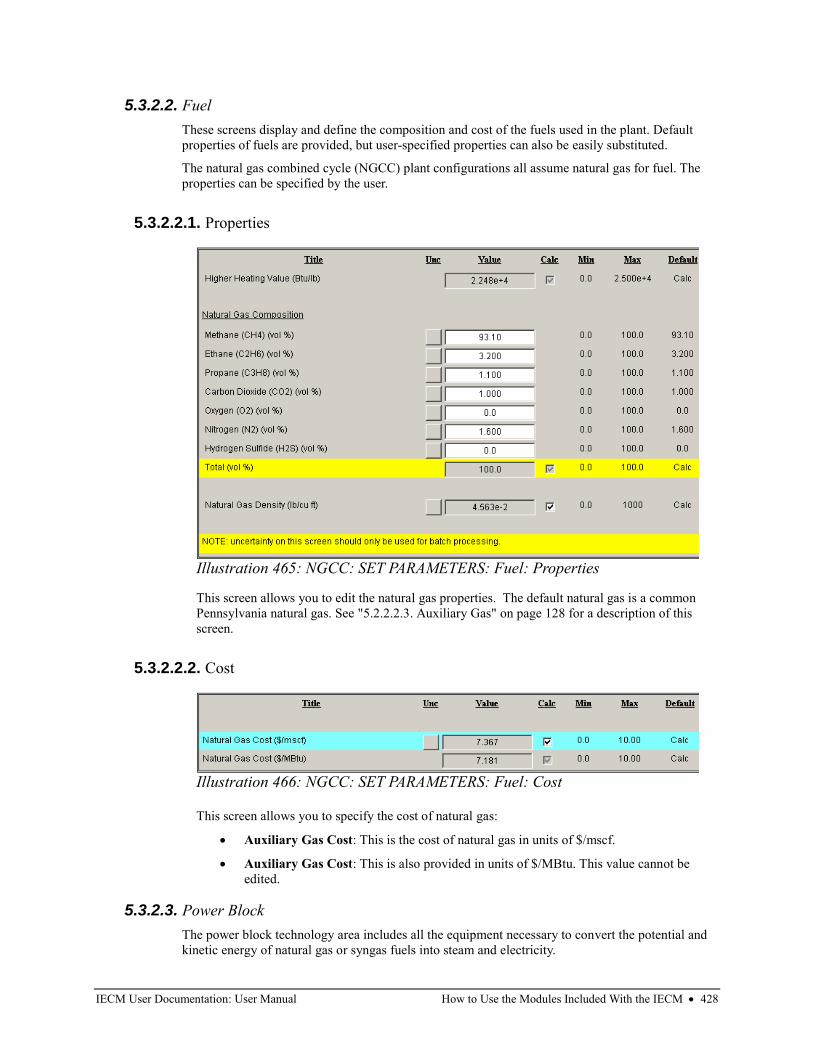
IECM User Documentation: User Manual How to Use the Modules Included With the IECM • 428
5.3.2.2. Fuel
These screens display and define the composition and cost of the fuels used in the plant. Default
properties of fuels are provided, but user-specified properties can also be easily substituted.
The natural gas combined cycle (NGCC) plant configurations all assume natural gas for fuel. The
properties can be specified by the user.
5.3.2.2.1. Properties
This screen allows you to edit the natural gas properties. The default natural gas is a common
Pennsylvania natural gas. See "5.2.2.2.3. Auxiliary Gas" on page 128 for a description of this
screen.
5.3.2.2.2. Cost
This screen allows you to specify the cost of natural gas:
• Auxiliary Gas Cost: This is the cost of natural gas in units of $/mscf.
• Auxiliary Gas Cost: This is also provided in units of $/MBtu. This value cannot be
edited.
5.3.2.3. Power Block
The power block technology area includes all the equipment necessary to convert the potential and
kinetic energy of natural gas or syngas fuels into steam and electricity.
Illustration 465: NGCC: SET PARAMETERS: Fuel: Properties
Illustration 466: NGCC: SET PARAMETERS: Fuel: Cost
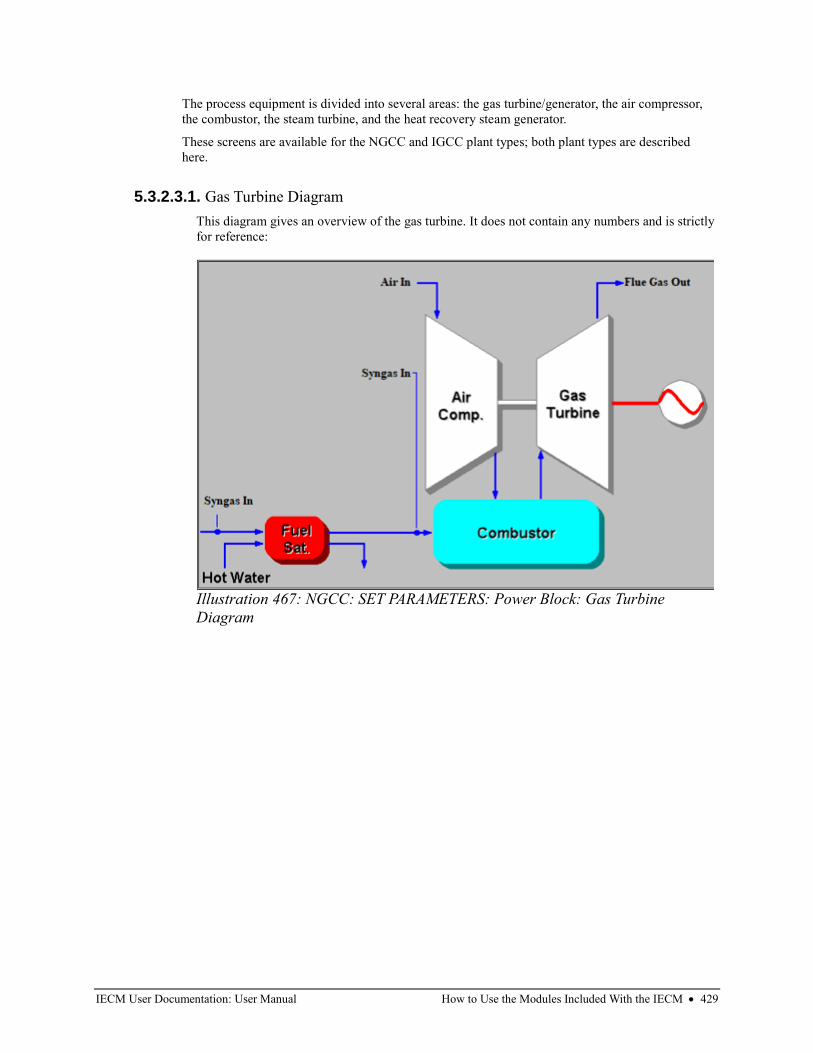
IECM User Documentation: User Manual How to Use the Modules Included With the IECM • 429
The process equipment is divided into several areas: the gas turbine/generator, the air compressor,
the combustor, the steam turbine, and the heat recovery steam generator.
These screens are available for the NGCC and IGCC plant types; both plant types are described
here.
5.3.2.3.1. Gas Turbine Diagram
This diagram gives an overview of the gas turbine. It does not contain any numbers and is strictly
for reference:
Illustration 467: NGCC: SET PARAMETERS: Power Block: Gas Turbine
Diagram
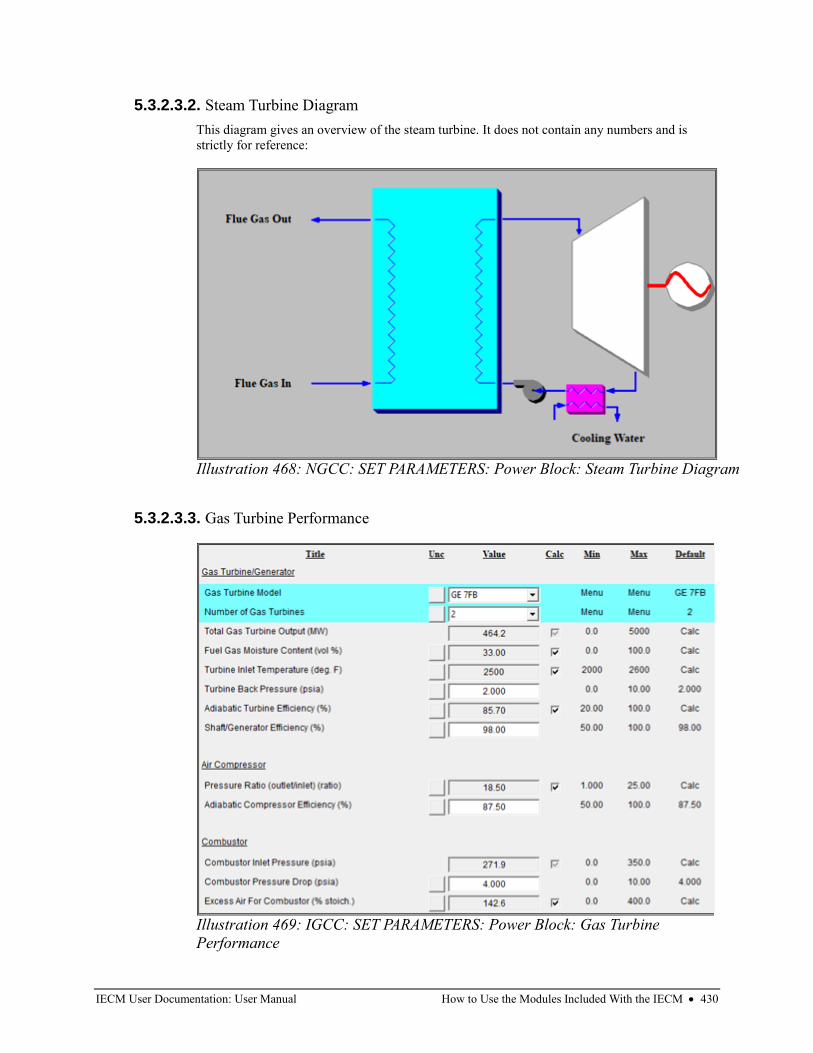
IECM User Documentation: User Manual How to Use the Modules Included With the IECM • 430
5.3.2.3.2. Steam Turbine Diagram
This diagram gives an overview of the steam turbine. It does not contain any numbers and is
strictly for reference:
5.3.2.3.3. Gas Turbine Performance
Illustration 468: NGCC: SET PARAMETERS: Power Block: Steam Turbine Diagram
Illustration 469: IGCC: SET PARAMETERS: Power Block: Gas Turbine
Performance
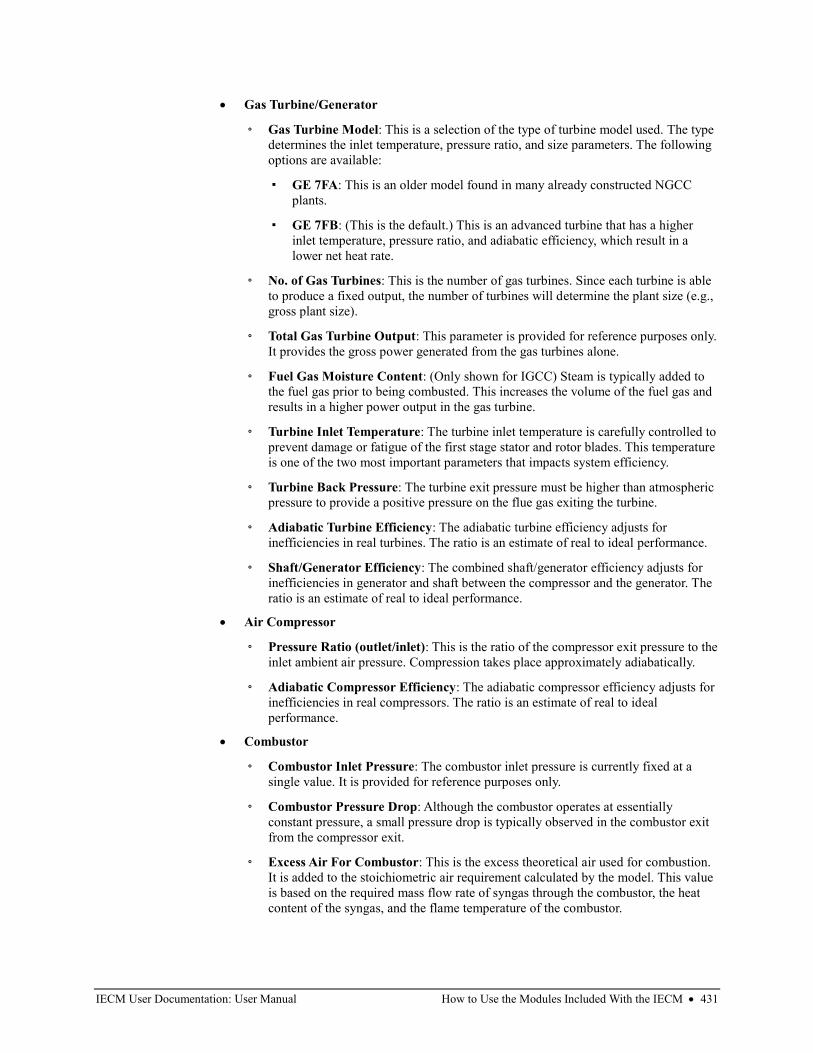
IECM User Documentation: User Manual How to Use the Modules Included With the IECM • 431
• Gas Turbine/Generator
◦ Gas Turbine Model: This is a selection of the type of turbine model used. The type
determines the inlet temperature, pressure ratio, and size parameters. The following
options are available:
▪ GE 7FA: This is an older model found in many already constructed NGCC
plants.
▪ GE 7FB: (This is the default.) This is an advanced turbine that has a higher
inlet temperature, pressure ratio, and adiabatic efficiency, which result in a
lower net heat rate.
◦ No. of Gas Turbines: This is the number of gas turbines. Since each turbine is able
to produce a fixed output, the number of turbines will determine the plant size (e.g.,
gross plant size).
◦ Total Gas Turbine Output: This parameter is provided for reference purposes only.
It provides the gross power generated from the gas turbines alone.
◦ Fuel Gas Moisture Content: (Only shown for IGCC) Steam is typically added to
the fuel gas prior to being combusted. This increases the volume of the fuel gas and
results in a higher power output in the gas turbine.
◦ Turbine Inlet Temperature: The turbine inlet temperature is carefully controlled to
prevent damage or fatigue of the first stage stator and rotor blades. This temperature
is one of the two most important parameters that impacts system efficiency.
◦ Turbine Back Pressure: The turbine exit pressure must be higher than atmospheric
pressure to provide a positive pressure on the flue gas exiting the turbine.
◦ Adiabatic Turbine Efficiency: The adiabatic turbine efficiency adjusts for
inefficiencies in real turbines. The ratio is an estimate of real to ideal performance.
◦ Shaft/Generator Efficiency: The combined shaft/generator efficiency adjusts for
inefficiencies in generator and shaft between the compressor and the generator. The
ratio is an estimate of real to ideal performance.
• Air Compressor
◦ Pressure Ratio (outlet/inlet): This is the ratio of the compressor exit pressure to the
inlet ambient air pressure. Compression takes place approximately adiabatically.
◦ Adiabatic Compressor Efficiency: The adiabatic compressor efficiency adjusts for
inefficiencies in real compressors. The ratio is an estimate of real to ideal
performance.
• Combustor
◦ Combustor Inlet Pressure: The combustor inlet pressure is currently fixed at a
single value. It is provided for reference purposes only.
◦ Combustor Pressure Drop: Although the combustor operates at essentially
constant pressure, a small pressure drop is typically observed in the combustor exit
from the compressor exit.
◦ Excess Air For Combustor: This is the excess theoretical air used for combustion.
It is added to the stoichiometric air requirement calculated by the model. This value
is based on the required mass flow rate of syngas through the combustor, the heat
content of the syngas, and the flame temperature of the combustor.
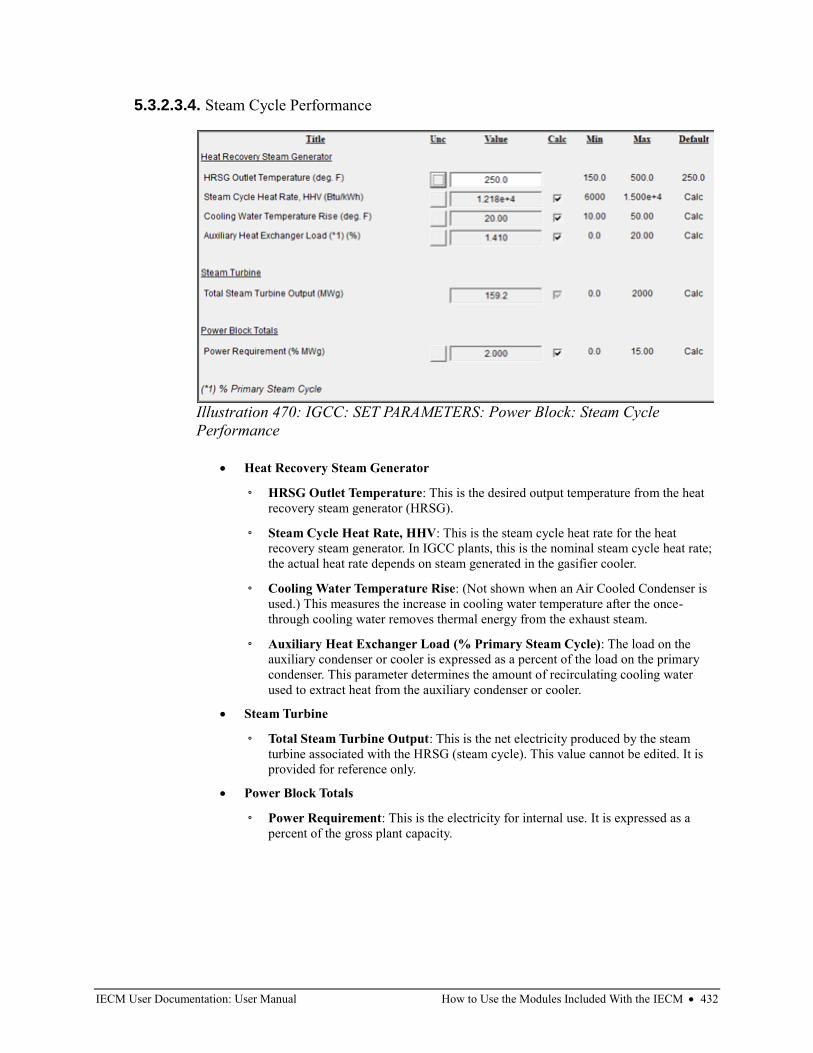
IECM User Documentation: User Manual How to Use the Modules Included With the IECM • 432
5.3.2.3.4. Steam Cycle Performance
• Heat Recovery Steam Generator
◦ HRSG Outlet Temperature: This is the desired output temperature from the heat
recovery steam generator (HRSG).
◦ Steam Cycle Heat Rate, HHV: This is the steam cycle heat rate for the heat
recovery steam generator. In IGCC plants, this is the nominal steam cycle heat rate;
the actual heat rate depends on steam generated in the gasifier cooler.
◦ Cooling Water Temperature Rise: (Not shown when an Air Cooled Condenser is
used.) This measures the increase in cooling water temperature after the once-
through cooling water removes thermal energy from the exhaust steam.
◦ Auxiliary Heat Exchanger Load (% Primary Steam Cycle): The load on the
auxiliary condenser or cooler is expressed as a percent of the load on the primary
condenser. This parameter determines the amount of recirculating cooling water
used to extract heat from the auxiliary condenser or cooler.
• Steam Turbine
◦ Total Steam Turbine Output: This is the net electricity produced by the steam
turbine associated with the HRSG (steam cycle). This value cannot be edited. It is
provided for reference only.
• Power Block Totals
◦ Power Requirement: This is the electricity for internal use. It is expressed as a
percent of the gross plant capacity.
Illustration 470: IGCC: SET PARAMETERS: Power Block: Steam Cycle
Performance
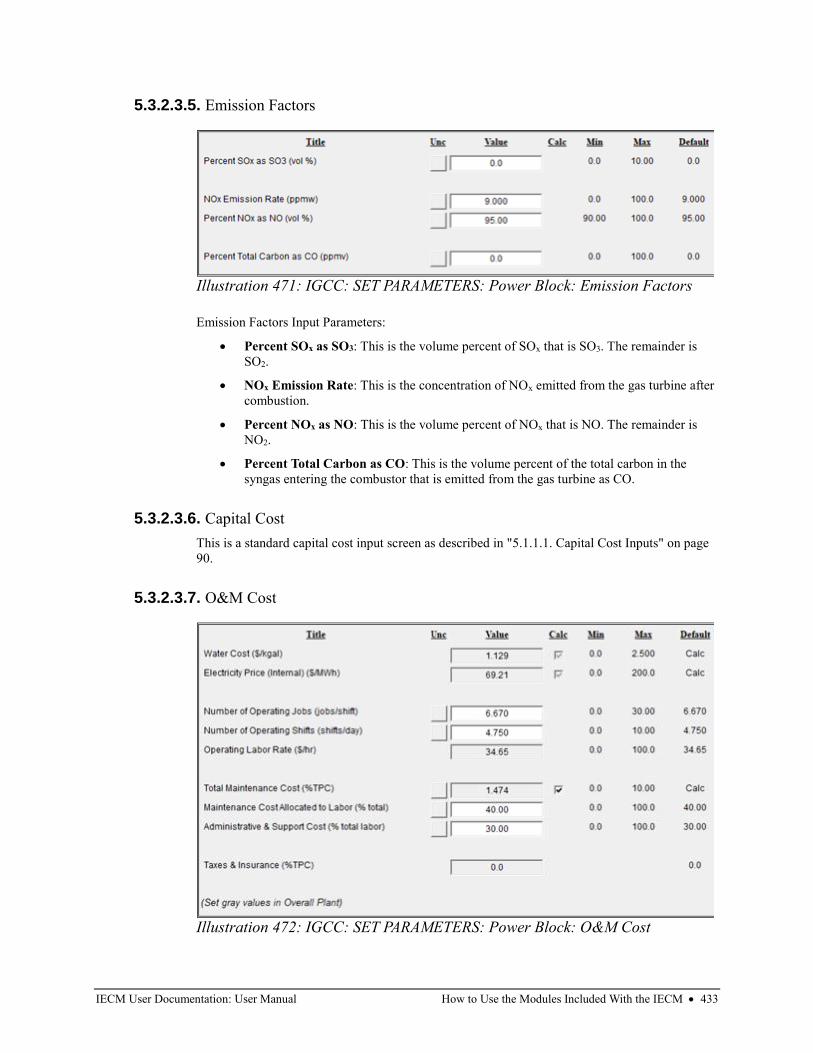
IECM User Documentation: User Manual How to Use the Modules Included With the IECM • 433
5.3.2.3.5. Emission Factors
Emission Factors Input Parameters:
• Percent SOx as SO3: This is the volume percent of SOx that is SO3. The remainder is
SO2.
• NOx Emission Rate: This is the concentration of NOx emitted from the gas turbine after
combustion.
• Percent NOx as NO: This is the volume percent of NOx that is NO. The remainder is
NO2.
• Percent Total Carbon as CO: This is the volume percent of the total carbon in the
syngas entering the combustor that is emitted from the gas turbine as CO.
5.3.2.3.6. Capital Cost
This is a standard capital cost input screen as described in "5.1.1.1. Capital Cost Inputs" on page
90.
5.3.2.3.7. O&M Cost
Illustration 471: IGCC: SET PARAMETERS: Power Block: Emission Factors
Illustration 472: IGCC: SET PARAMETERS: Power Block: O&M Cost
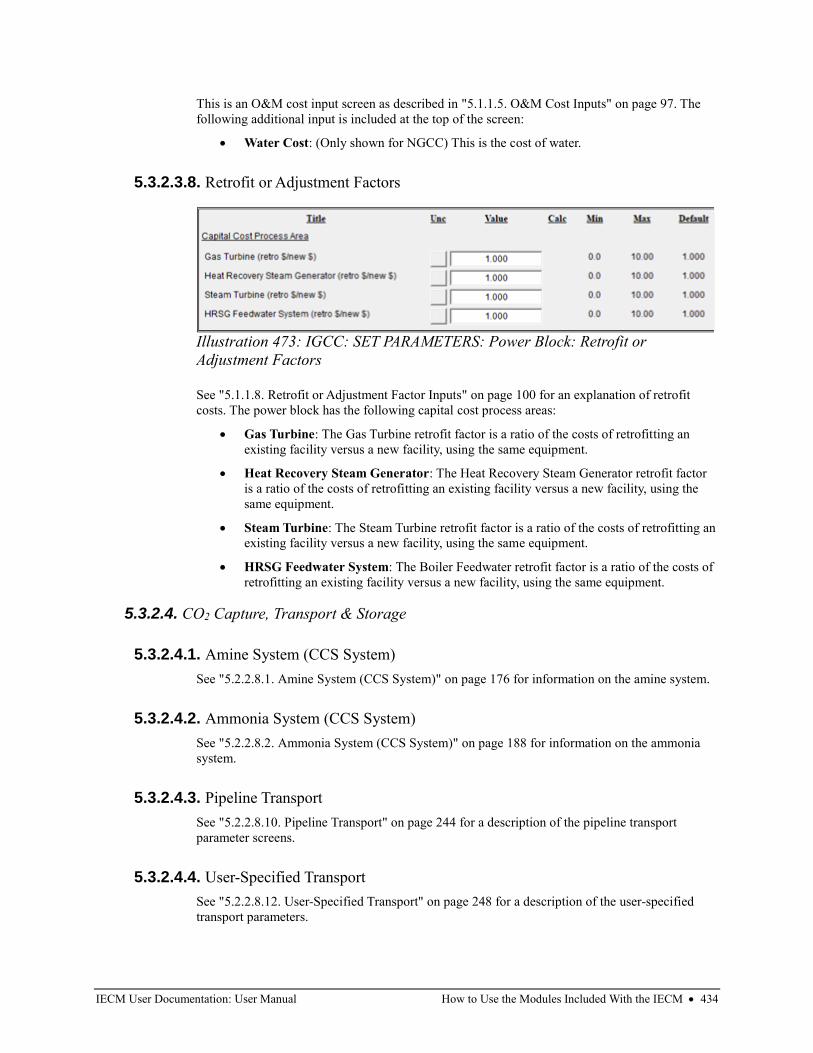
IECM User Documentation: User Manual How to Use the Modules Included With the IECM • 434
This is an O&M cost input screen as described in "5.1.1.5. O&M Cost Inputs" on page 97. The
following additional input is included at the top of the screen:
• Water Cost: (Only shown for NGCC) This is the cost of water.
5.3.2.3.8. Retrofit or Adjustment Factors
See "5.1.1.8. Retrofit or Adjustment Factor Inputs" on page 100 for an explanation of retrofit
costs. The power block has the following capital cost process areas:
• Gas Turbine: The Gas Turbine retrofit factor is a ratio of the costs of retrofitting an
existing facility versus a new facility, using the same equipment.
• Heat Recovery Steam Generator: The Heat Recovery Steam Generator retrofit factor
is a ratio of the costs of retrofitting an existing facility versus a new facility, using the
same equipment.
• Steam Turbine: The Steam Turbine retrofit factor is a ratio of the costs of retrofitting an
existing facility versus a new facility, using the same equipment.
• HRSG Feedwater System: The Boiler Feedwater retrofit factor is a ratio of the costs of
retrofitting an existing facility versus a new facility, using the same equipment.
5.3.2.4. CO2 Capture, Transport & Storage
5.3.2.4.1. Amine System (CCS System)
See "5.2.2.8.1. Amine System (CCS System)" on page 176 for information on the amine system.
5.3.2.4.2. Ammonia System (CCS System)
See "5.2.2.8.2. Ammonia System (CCS System)" on page 188 for information on the ammonia
system.
5.3.2.4.3. Pipeline Transport
See "5.2.2.8.10. Pipeline Transport" on page 244 for a description of the pipeline transport
parameter screens.
5.3.2.4.4. User-Specified Transport
See "5.2.2.8.12. User-Specified Transport" on page 248 for a description of the user-specified
transport parameters.
Illustration 473: IGCC: SET PARAMETERS: Power Block: Retrofit or
Adjustment Factors
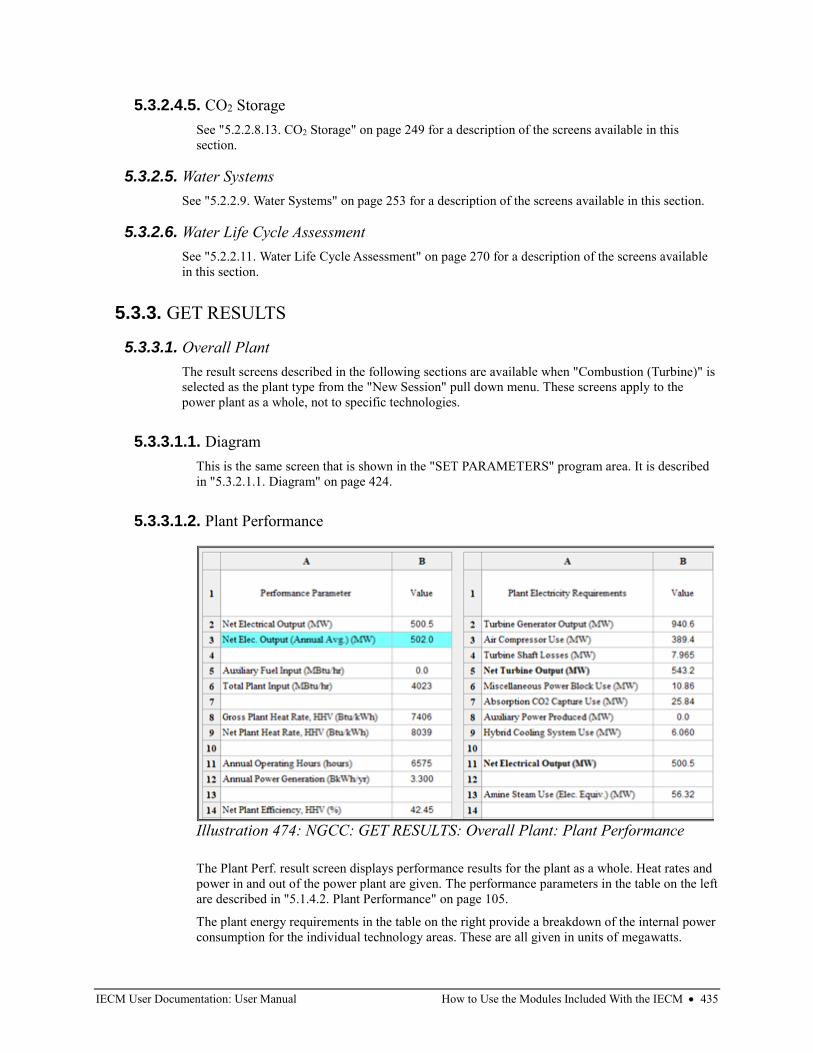
IECM User Documentation: User Manual How to Use the Modules Included With the IECM • 435
5.3.2.4.5. CO2 Storage
See "5.2.2.8.13. CO2 Storage" on page 249 for a description of the screens available in this
section.
5.3.2.5. Water Systems
See "5.2.2.9. Water Systems" on page 253 for a description of the screens available in this section.
5.3.2.6. Water Life Cycle Assessment
See "5.2.2.11. Water Life Cycle Assessment" on page 270 for a description of the screens available
in this section.
5.3.3. GET RESULTS
5.3.3.1. Overall Plant
The result screens described in the following sections are available when "Combustion (Turbine)" is
selected as the plant type from the "New Session" pull down menu. These screens apply to the
power plant as a whole, not to specific technologies.
5.3.3.1.1. Diagram
This is the same screen that is shown in the "SET PARAMETERS" program area. It is described
in "5.3.2.1.1. Diagram" on page 424.
5.3.3.1.2. Plant Performance
The Plant Perf. result screen displays performance results for the plant as a whole. Heat rates and
power in and out of the power plant are given. The performance parameters in the table on the left
are described in "5.1.4.2. Plant Performance" on page 105.
The plant energy requirements in the table on the right provide a breakdown of the internal power
consumption for the individual technology areas. These are all given in units of megawatts.
Illustration 474: NGCC: GET RESULTS: Overall Plant: Plant Performance
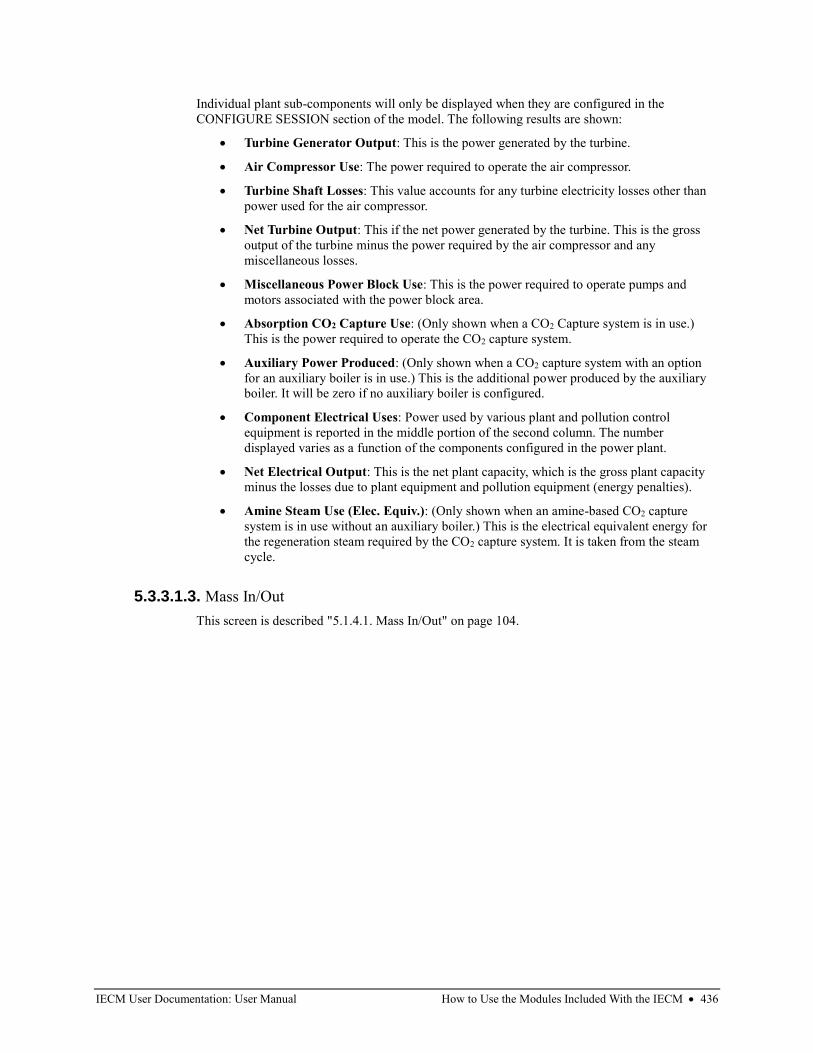
IECM User Documentation: User Manual How to Use the Modules Included With the IECM • 436
Individual plant sub-components will only be displayed when they are configured in the
CONFIGURE SESSION section of the model. The following results are shown:
• Turbine Generator Output: This is the power generated by the turbine.
• Air Compressor Use: The power required to operate the air compressor.
• Turbine Shaft Losses: This value accounts for any turbine electricity losses other than
power used for the air compressor.
• Net Turbine Output: This if the net power generated by the turbine. This is the gross
output of the turbine minus the power required by the air compressor and any
miscellaneous losses.
• Miscellaneous Power Block Use: This is the power required to operate pumps and
motors associated with the power block area.
• Absorption CO2 Capture Use: (Only shown when a CO2 Capture system is in use.)
This is the power required to operate the CO2 capture system.
• Auxiliary Power Produced: (Only shown when a CO2 capture system with an option
for an auxiliary boiler is in use.) This is the additional power produced by the auxiliary
boiler. It will be zero if no auxiliary boiler is configured.
• Component Electrical Uses: Power used by various plant and pollution control
equipment is reported in the middle portion of the second column. The number
displayed varies as a function of the components configured in the power plant.
• Net Electrical Output: This is the net plant capacity, which is the gross plant capacity
minus the losses due to plant equipment and pollution equipment (energy penalties).
• Amine Steam Use (Elec. Equiv.): (Only shown when an amine-based CO2 capture
system is in use without an auxiliary boiler.) This is the electrical equivalent energy for
the regeneration steam required by the CO2 capture system. It is taken from the steam
cycle.
5.3.3.1.3. Mass In/Out
This screen is described "5.1.4.1. Mass In/Out" on page 104.
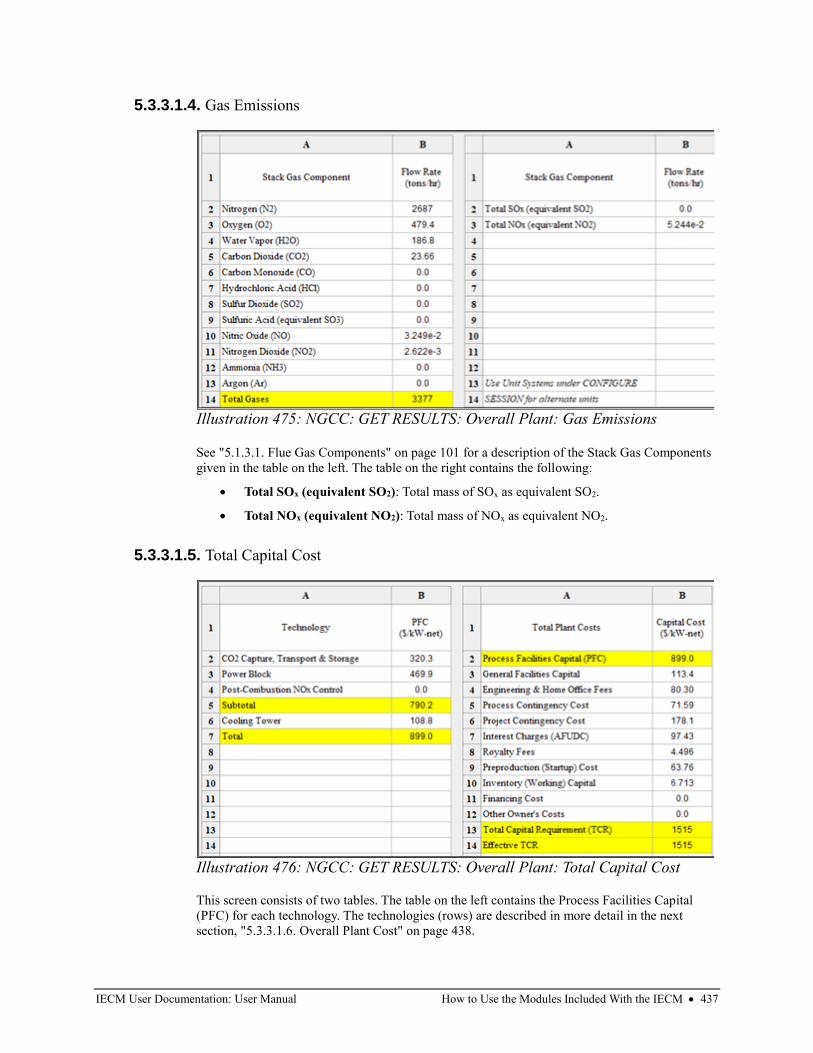
IECM User Documentation: User Manual How to Use the Modules Included With the IECM • 437
5.3.3.1.4. Gas Emissions
See "5.1.3.1. Flue Gas Components" on page 101 for a description of the Stack Gas Components
given in the table on the left. The table on the right contains the following:
• Total SOx (equivalent SO2): Total mass of SOx as equivalent SO2.
• Total NOx (equivalent NO2): Total mass of NOx as equivalent NO2.
5.3.3.1.5. Total Capital Cost
This screen consists of two tables. The table on the left contains the Process Facilities Capital
(PFC) for each technology. The technologies (rows) are described in more detail in the next
section, "5.3.3.1.6. Overall Plant Cost" on page 438.
Illustration 475: NGCC: GET RESULTS: Overall Plant: Gas Emissions
Illustration 476: NGCC: GET RESULTS: Overall Plant: Total Capital Cost
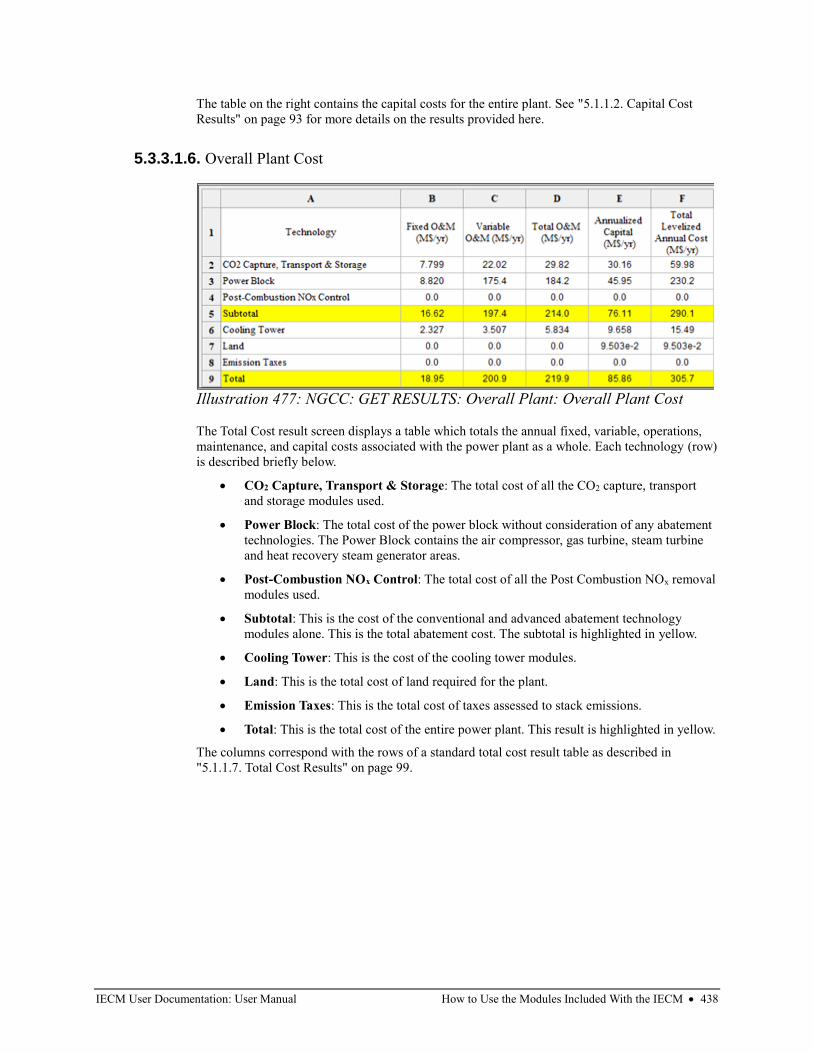
IECM User Documentation: User Manual How to Use the Modules Included With the IECM • 438
The table on the right contains the capital costs for the entire plant. See "5.1.1.2. Capital Cost
Results" on page 93 for more details on the results provided here.
5.3.3.1.6. Overall Plant Cost
The Total Cost result screen displays a table which totals the annual fixed, variable, operations,
maintenance, and capital costs associated with the power plant as a whole. Each technology (row)
is described briefly below.
• CO2 Capture, Transport & Storage: The total cost of all the CO2 capture, transport
and storage modules used.
• Power Block: The total cost of the power block without consideration of any abatement
technologies. The Power Block contains the air compressor, gas turbine, steam turbine
and heat recovery steam generator areas.
• Post-Combustion NOx Control: The total cost of all the Post Combustion NOx removal
modules used.
• Subtotal: This is the cost of the conventional and advanced abatement technology
modules alone. This is the total abatement cost. The subtotal is highlighted in yellow.
• Cooling Tower: This is the cost of the cooling tower modules.
• Land: This is the total cost of land required for the plant.
• Emission Taxes: This is the total cost of taxes assessed to stack emissions.
• Total: This is the total cost of the entire power plant. This result is highlighted in yellow.
The columns correspond with the rows of a standard total cost result table as described in
"5.1.1.7. Total Cost Results" on page 99.
Illustration 477: NGCC: GET RESULTS: Overall Plant: Overall Plant Cost

IECM User Documentation: User Manual How to Use the Modules Included With the IECM • 439
5.3.3.1.7. Cost Summary
The Cost Summary result screen displays costs associated with the power plant as a whole. The
costs summarized on this screen are expressed in either constant or current dollars for a specified
year, as shown on the bottom of the screen. The technologies (rows) are described in more detail
in the previous section, "5.3.3.1.6. Overall Plant Cost" on page 438.
The cost categories (columns) are described in "5.1.1.7. Total Cost Results" on page 99.
5.3.3.2. Fuel
This section displays the composition and cost of the fuels used in the plant. The natural gas
combined cycle (NGCC) plant configurations all assume natural gas for fuel.
This section is shared with the other plant types and is described in "5.2.3.2. Fuel" on page 280.
5.3.3.3. Power Block
The power block technology area includes all the equipment necessary to convert the potential and
kinetic energy of natural gas or syngas fuels into steam and electricity.
The process equipment is divided into several areas: the gas turbine/generator, the air compressor,
the combustor, the steam turbine, and the heat recovery steam generator.
These screens are available for the NGCC and IGCC plant types; both plant types are described
here.
Illustration 478: NGCC: GET RESULTS: Overall Plant: Cost Summary
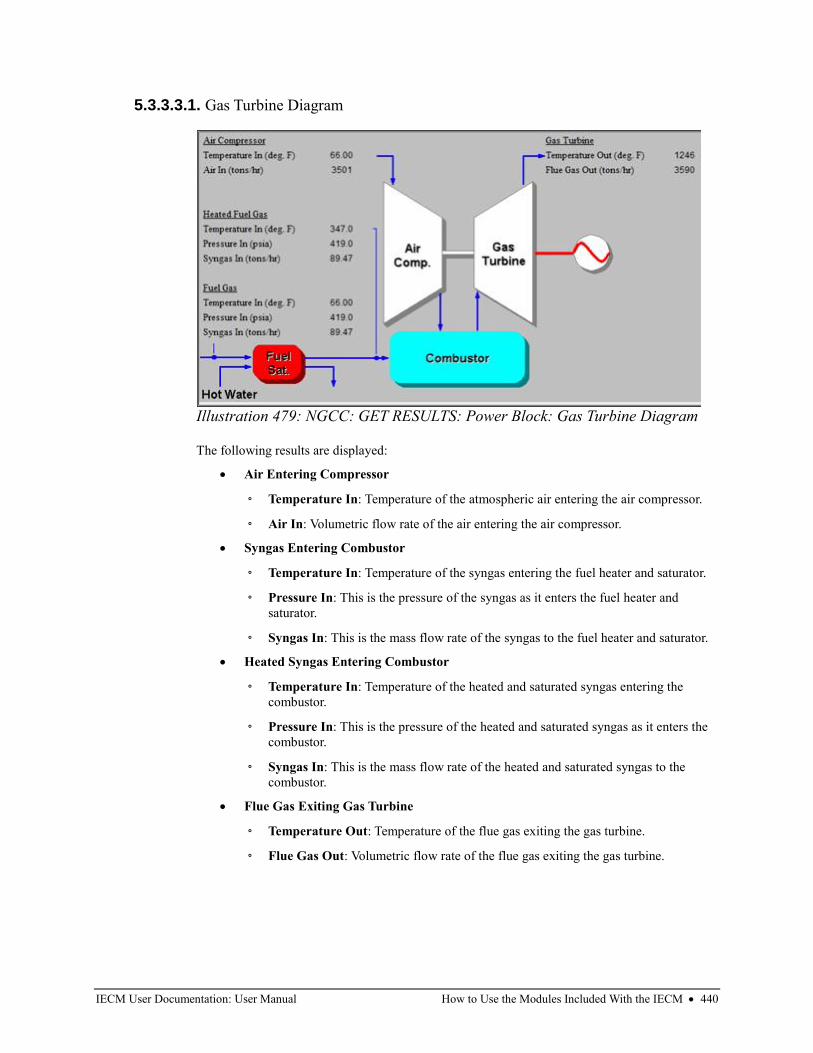
IECM User Documentation: User Manual How to Use the Modules Included With the IECM • 440
5.3.3.3.1. Gas Turbine Diagram
The following results are displayed:
• Air Entering Compressor
◦ Temperature In: Temperature of the atmospheric air entering the air compressor.
◦ Air In: Volumetric flow rate of the air entering the air compressor.
• Syngas Entering Combustor
◦ Temperature In: Temperature of the syngas entering the fuel heater and saturator.
◦ Pressure In: This is the pressure of the syngas as it enters the fuel heater and
saturator.
◦ Syngas In: This is the mass flow rate of the syngas to the fuel heater and saturator.
• Heated Syngas Entering Combustor
◦ Temperature In: Temperature of the heated and saturated syngas entering the
combustor.
◦ Pressure In: This is the pressure of the heated and saturated syngas as it enters the
combustor.
◦ Syngas In: This is the mass flow rate of the heated and saturated syngas to the
combustor.
• Flue Gas Exiting Gas Turbine
◦ Temperature Out: Temperature of the flue gas exiting the gas turbine.
◦ Flue Gas Out: Volumetric flow rate of the flue gas exiting the gas turbine.
Illustration 479: NGCC: GET RESULTS: Power Block: Gas Turbine Diagram
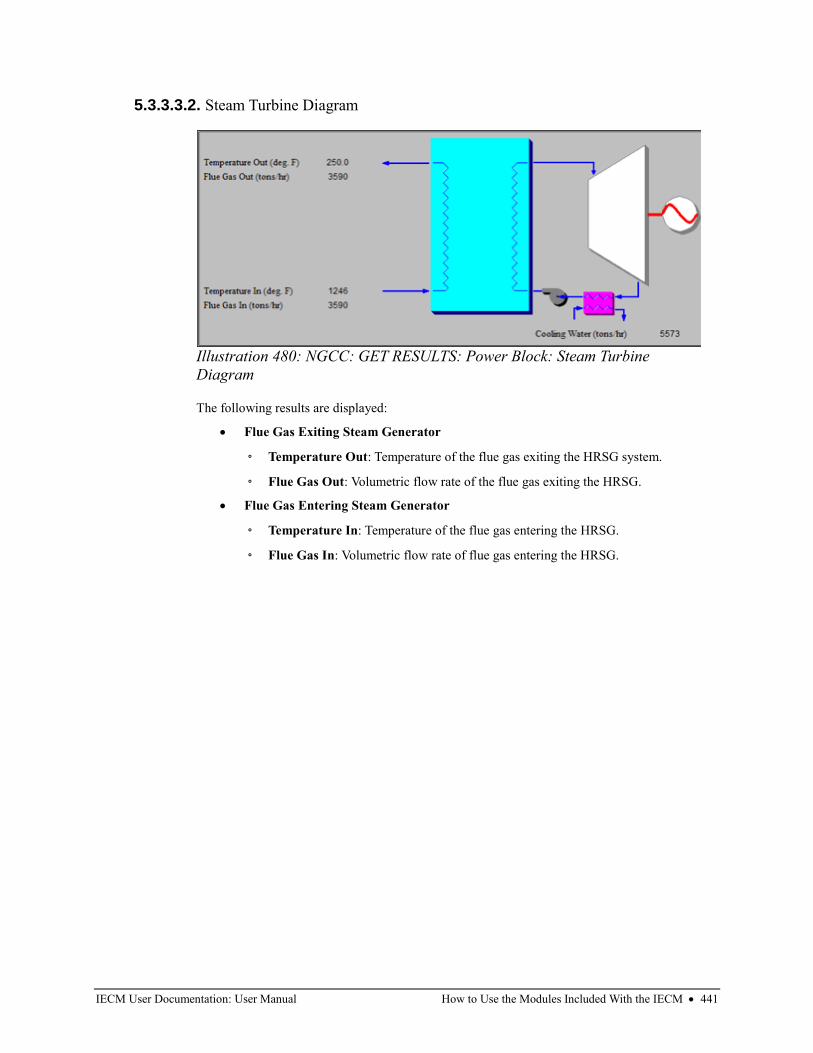
IECM User Documentation: User Manual How to Use the Modules Included With the IECM • 441
5.3.3.3.2. Steam Turbine Diagram
The following results are displayed:
• Flue Gas Exiting Steam Generator
◦ Temperature Out: Temperature of the flue gas exiting the HRSG system.
◦ Flue Gas Out: Volumetric flow rate of the flue gas exiting the HRSG.
• Flue Gas Entering Steam Generator
◦ Temperature In: Temperature of the flue gas entering the HRSG.
◦ Flue Gas In: Volumetric flow rate of flue gas entering the HRSG.
Illustration 480: NGCC: GET RESULTS: Power Block: Steam Turbine
Diagram
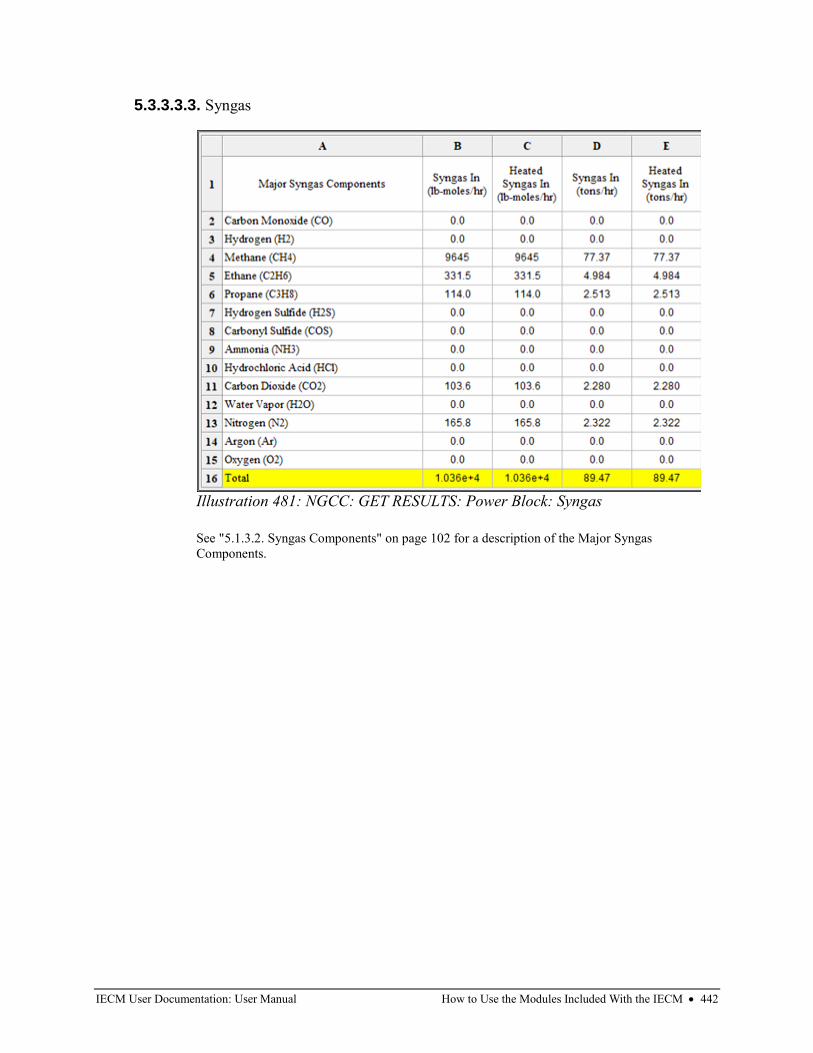
IECM User Documentation: User Manual How to Use the Modules Included With the IECM • 442
5.3.3.3.3. Syngas
See "5.1.3.2. Syngas Components" on page 102 for a description of the Major Syngas
Components.
Illustration 481: NGCC: GET RESULTS: Power Block: Syngas
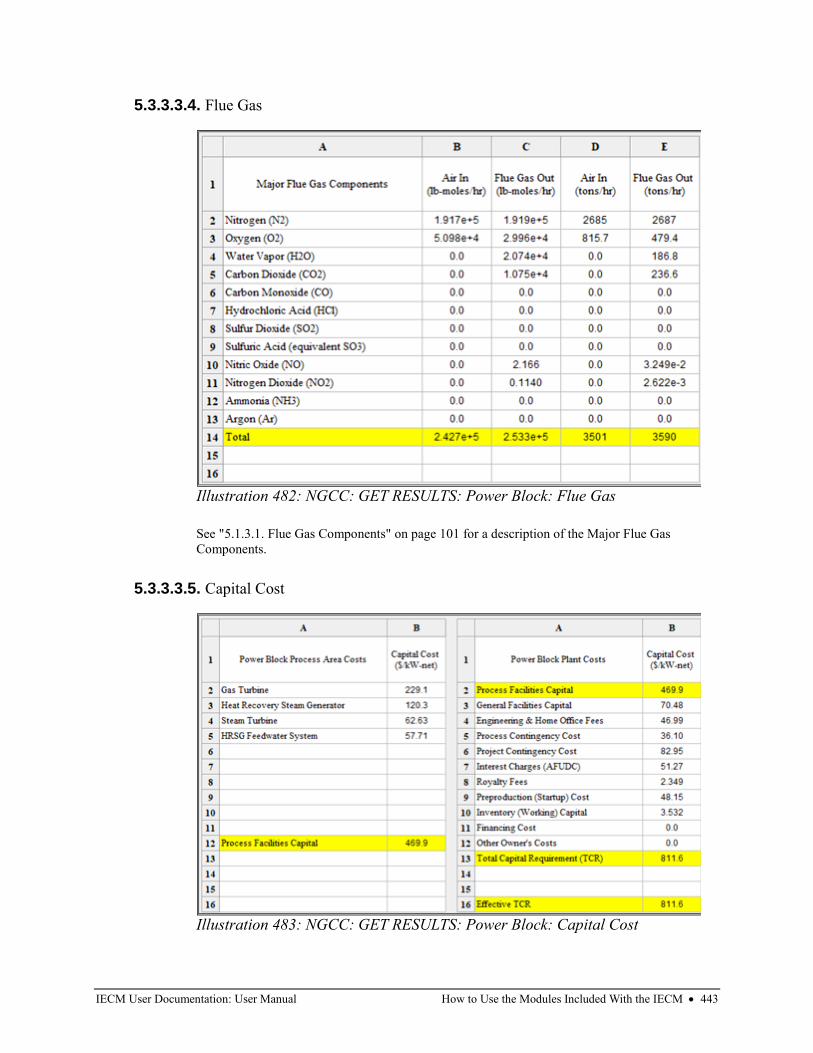
IECM User Documentation: User Manual How to Use the Modules Included With the IECM • 443
5.3.3.3.4. Flue Gas
See "5.1.3.1. Flue Gas Components" on page 101 for a description of the Major Flue Gas
Components.
5.3.3.3.5. Capital Cost
Illustration 482: NGCC: GET RESULTS: Power Block: Flue Gas
Illustration 483: NGCC: GET RESULTS: Power Block: Capital Cost
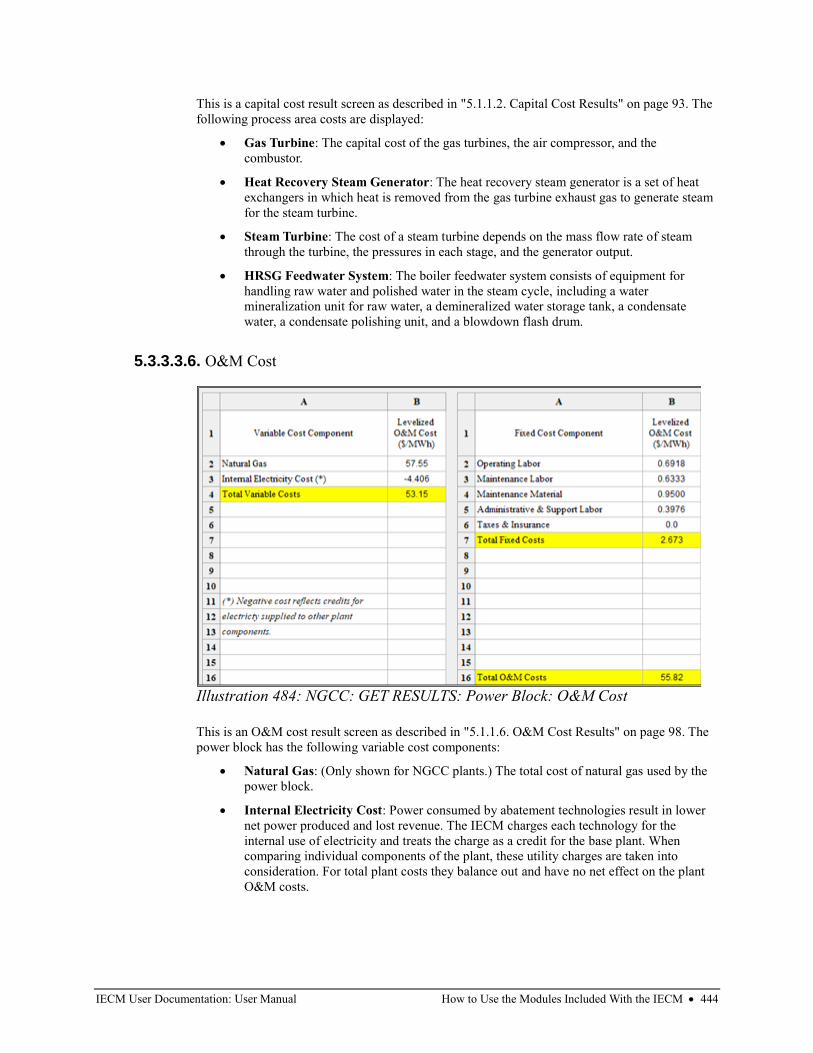
IECM User Documentation: User Manual How to Use the Modules Included With the IECM • 444
This is a capital cost result screen as described in "5.1.1.2. Capital Cost Results" on page 93. The
following process area costs are displayed:
• Gas Turbine: The capital cost of the gas turbines, the air compressor, and the
combustor.
• Heat Recovery Steam Generator: The heat recovery steam generator is a set of heat
exchangers in which heat is removed from the gas turbine exhaust gas to generate steam
for the steam turbine.
• Steam Turbine: The cost of a steam turbine depends on the mass flow rate of steam
through the turbine, the pressures in each stage, and the generator output.
• HRSG Feedwater System: The boiler feedwater system consists of equipment for
handling raw water and polished water in the steam cycle, including a water
mineralization unit for raw water, a demineralized water storage tank, a condensate
water, a condensate polishing unit, and a blowdown flash drum.
5.3.3.3.6. O&M Cost
This is an O&M cost result screen as described in "5.1.1.6. O&M Cost Results" on page 98. The
power block has the following variable cost components:
• Natural Gas: (Only shown for NGCC plants.) The total cost of natural gas used by the
power block.
• Internal Electricity Cost: Power consumed by abatement technologies result in lower
net power produced and lost revenue. The IECM charges each technology for the
internal use of electricity and treats the charge as a credit for the base plant. When
comparing individual components of the plant, these utility charges are taken into
consideration. For total plant costs they balance out and have no net effect on the plant
O&M costs.
Illustration 484: NGCC: GET RESULTS: Power Block: O&M Cost
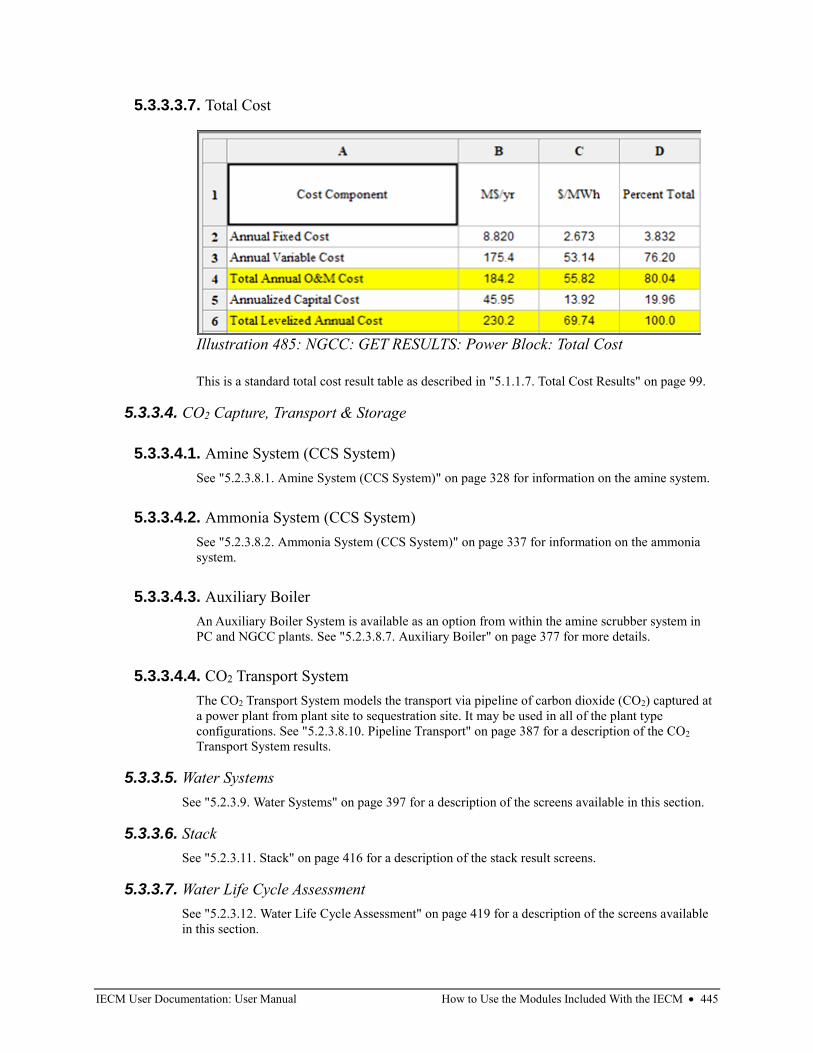
IECM User Documentation: User Manual How to Use the Modules Included With the IECM • 445
5.3.3.3.7. Total Cost
This is a standard total cost result table as described in "5.1.1.7. Total Cost Results" on page 99.
5.3.3.4. CO2 Capture, Transport & Storage
5.3.3.4.1. Amine System (CCS System)
See "5.2.3.8.1. Amine System (CCS System)" on page 328 for information on the amine system.
5.3.3.4.2. Ammonia System (CCS System)
See "5.2.3.8.2. Ammonia System (CCS System)" on page 337 for information on the ammonia
system.
5.3.3.4.3. Auxiliary Boiler
An Auxiliary Boiler System is available as an option from within the amine scrubber system in
PC and NGCC plants. See "5.2.3.8.7. Auxiliary Boiler" on page 377 for more details.
5.3.3.4.4. CO2 Transport System
The CO2 Transport System models the transport via pipeline of carbon dioxide (CO2) captured at
a power plant from plant site to sequestration site. It may be used in all of the plant type
configurations. See "5.2.3.8.10. Pipeline Transport" on page 387 for a description of the CO2
Transport System results.
5.3.3.5. Water Systems
See "5.2.3.9. Water Systems" on page 397 for a description of the screens available in this section.
5.3.3.6. Stack
See "5.2.3.11. Stack" on page 416 for a description of the stack result screens.
5.3.3.7. Water Life Cycle Assessment
See "5.2.3.12. Water Life Cycle Assessment" on page 419 for a description of the screens available
in this section.
Illustration 485: NGCC: GET RESULTS: Power Block: Total Cost
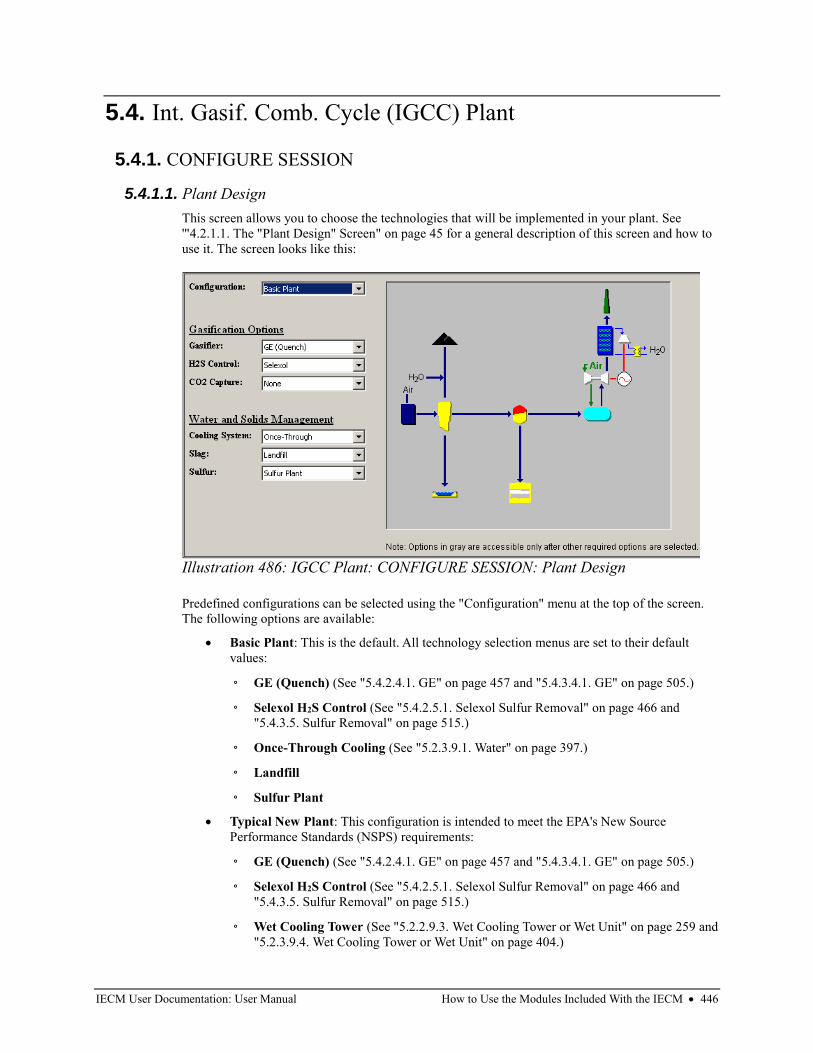
IECM User Documentation: User Manual How to Use the Modules Included With the IECM • 446
5.4. Int. Gasif. Comb. Cycle (IGCC) Plant
5.4.1. CONFIGURE SESSION
5.4.1.1. Plant Design
This screen allows you to choose the technologies that will be implemented in your plant. See
'"4.2.1.1. The "Plant Design" Screen" on page 45 for a general description of this screen and how to
use it. The screen looks like this:
Predefined configurations can be selected using the "Configuration" menu at the top of the screen.
The following options are available:
• Basic Plant: This is the default. All technology selection menus are set to their default
values:
◦ GE (Quench) (See "5.4.2.4.1. GE" on page 457 and "5.4.3.4.1. GE" on page 505.)
◦ Selexol H2S Control (See "5.4.2.5.1. Selexol Sulfur Removal" on page 466 and
"5.4.3.5. Sulfur Removal" on page 515.)
◦ Once-Through Cooling (See "5.2.3.9.1. Water" on page 397.)
◦ Landfill
◦ Sulfur Plant
• Typical New Plant: This configuration is intended to meet the EPA's New Source
Performance Standards (NSPS) requirements:
◦ GE (Quench) (See "5.4.2.4.1. GE" on page 457 and "5.4.3.4.1. GE" on page 505.)
◦ Selexol H2S Control (See "5.4.2.5.1. Selexol Sulfur Removal" on page 466 and
"5.4.3.5. Sulfur Removal" on page 515.)
◦ Wet Cooling Tower (See "5.2.2.9.3. Wet Cooling Tower or Wet Unit" on page 259 and
"5.2.3.9.4. Wet Cooling Tower or Wet Unit" on page 404.)
Illustration 486: IGCC Plant: CONFIGURE SESSION: Plant Design
IECM User Documentation: User Manual How to Use the Modules Included With the IECM • 447
◦ Landfill
◦ Sulfur Plant
• <User Defined>: This is shown when the current configuration does not match any of the
predefined configurations.
Technologies may also be chosen individually. You may either start with one of the predefined
configurations and adjust it, or create your own configuration from scratch. The available options
are described below:
• Gasification Options
◦ Gasifier:
▪ GE (Quench): (This is the default.) GE gasification is a form of entrained flow
gasification in which coal is fed to the gasifier in a water slurry. A quench cooling
system is used in all cases. See "5.4.2.4.1. GE" on page 457 and "5.4.3.4.1. GE"
on page 505.
▪ Shell: The shell gasification system is a dry-feed entrained flow gasification
technology. Radiant syngas cooling is used for non-capture cases, and a quench
cooling system is used for capture cases. See "5.4.2.4.2. Shell " on page 462 and
"5.4.3.4.2. Shell" on page 510.
◦ H2S Control: See "5.4.2.5. Sulfur Removal" on page 466 and "5.4.3.5. Sulfur
Removal" on page 515.
▪ Sulfinol: The Sulfinol process uses a combination of physical (Sulfolane) and
chemical (DIPA or MDEA) solvents to remove hydrogen sulfide, carbonyl sulfide
and mercaptans from the raw syngas. This option cannot be used with "Sour Shift
+ Selexol" CO2 capture. See "5.4.2.5.2. Sulfinol Sulfur Removal" on page 472 and
"5.4.3.5. Sulfur Removal" on page 515.
▪ Selexol: (This is the default.) The Selexol process uses dimethyl ether of
polyethylene glycol to remove hydrogen sulfide and some CO2 from the raw
syngas. See "5.4.2.5.1. Selexol Sulfur Removal" on page 466 and "5.4.3.5. Sulfur
Removal" on page 515.
◦ CO2 Capture:
▪ None: This is the default. No CO2 capture is used.
▪ Sour Shift + Selexol: A CO2 capture system is used, which consists of gas shift
reactors and a Selexol-based CO2 removal system. This option requires Selexol
Sulfur Removal. See "5.4.2.6.2. Water Gas Shift Reactor" on page 482,
"5.4.2.6.4. Selexol CO2 Capture" on page 491, "5.4.3.6.3. Water Gas Shift
Reactor" on page 534 and "5.4.3.6.5. Selexol CO2 Capture" on page 542.
▪ Chemical Looping: In the Chemical Looping Combustion process, fuel is
combusted with the aid of an Oxygen Carrier rather than through direct contact
with air. The products of combustion include only water and CO2, allowing a very
high purity CO2 stream to be obtained by condensing the water vapor. See
"5.4.2.6.1. Chemical Looping" on page 476, "5.4.3.6.1. Chemical Looping" on
page 527, and "5.4.3.6.2. Purification Unit" on page 533.
▪ Sour Shift + Ionic Liquid: A CO2 capture system is used, which consists of gas
shift reactors and an ionic liquid-based CO2 removal system. See "5.4.2.6.2. Water
Gas Shift Reactor" on page 482, "5.4.2.6.3. Ionic Liquid CO2 Capture" on page
485, "5.4.3.6.3. Water Gas Shift Reactor" on page 534, and "5.4.3.6.4. Ionic
Liquid CO2 Capture" on page 537.
IECM User Documentation: User Manual How to Use the Modules Included With the IECM • 448
• Water and Solids Management
◦ Cooling System:
▪ Once-Through: This is the default. Cooling water is withdrawn from a natural
waterbody, passed through the steam condenser and returned to the waterbody.
(See "5.2.3.9. Water Systems" on page 397.)
▪ Wet Cooling Tower: Cooling water is recirculated through the wet tower and
back to the condenser. The tower mainly relies on the latent heat of water
evaporation to transfer waste heat to the atmosphere. (See "5.2.2.9. Water
Systems" on page 253 and "5.2.3.9. Water Systems" on page 397.)
▪ Air Cooled Condenser: The air cooled condenser utilizes the sensible heating of
atmospheric air passed across finned-tube heat exchangers to reject heat.
("5.2.2.9. Water Systems" on page 253 and "5.2.3.9. Water Systems" on page
397.)
▪ Hybrid Cooling System: This combines a wet cooling tower and an air cooled
condenser. (See "5.2.2.9. Water Systems" on page 253 and "5.2.3.9. Water
Systems" on page 397.)
◦ Slag:
▪ Landfill: The slag collected is disposed in a landfill. This option is the only one
currently available in the model.
◦ Sulfur: Sulfur captured can be processed by the following equipment options:
▪ Sulfur Plant: Sulfur is processed into a solid form. This option is the only one
currently available in the model.
5.4.1.2. Plant Location
This screen is the same in all plant types. See "5.2.1.2. Plant Location" on page 114 for its
description.
5.4.1.3. Unit Systems
This screen is the same in all plant types. See "5.2.1.3. Unit Systems" on page 115 for its
description.
5.4.2. SET PARAMETERS
5.4.2.1. Overall Plant
These screens apply to the power plant as a whole, not to specific technologies.
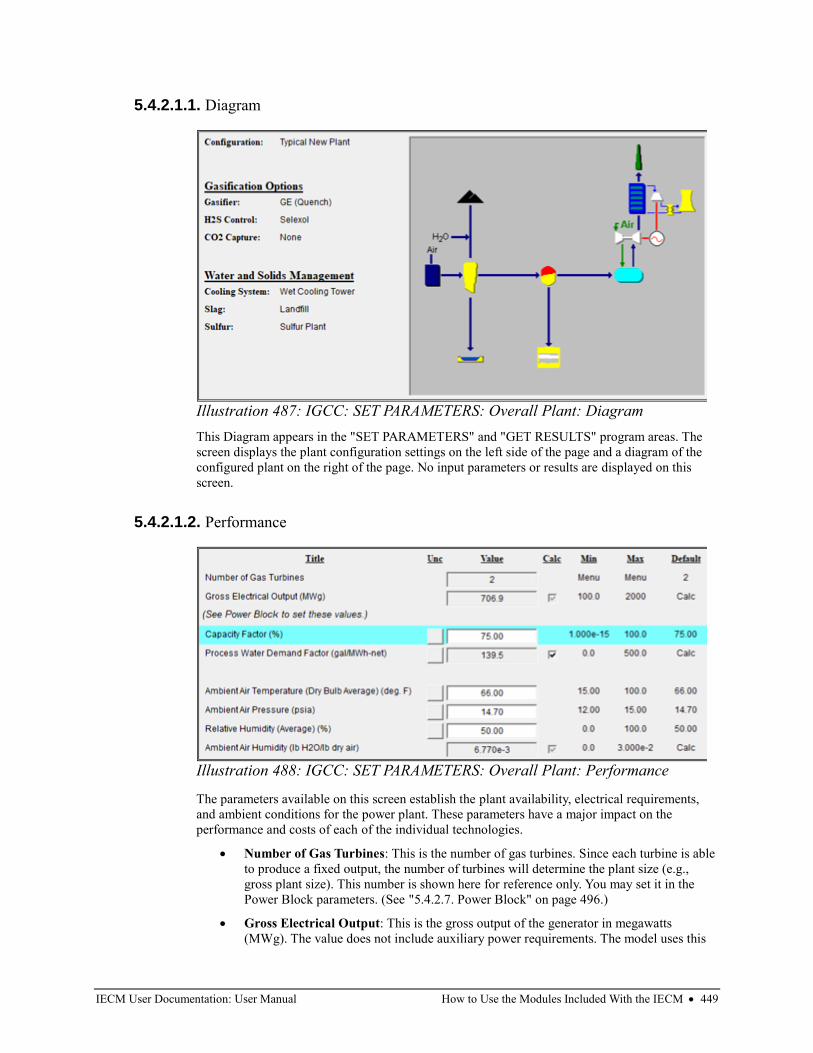
IECM User Documentation: User Manual How to Use the Modules Included With the IECM • 449
5.4.2.1.1. Diagram
This Diagram appears in the "SET PARAMETERS" and "GET RESULTS" program areas. The
screen displays the plant configuration settings on the left side of the page and a diagram of the
configured plant on the right of the page. No input parameters or results are displayed on this
screen.
5.4.2.1.2. Performance
The parameters available on this screen establish the plant availability, electrical requirements,
and ambient conditions for the power plant. These parameters have a major impact on the
performance and costs of each of the individual technologies.
• Number of Gas Turbines: This is the number of gas turbines. Since each turbine is able
to produce a fixed output, the number of turbines will determine the plant size (e.g.,
gross plant size). This number is shown here for reference only. You may set it in the
Power Block parameters. (See "5.4.2.7. Power Block" on page 496.)
• Gross Electrical Output: This is the gross output of the generator in megawatts
(MWg). The value does not include auxiliary power requirements. The model uses this
Illustration 487: IGCC: SET PARAMETERS: Overall Plant: Diagram
Illustration 488: IGCC: SET PARAMETERS: Overall Plant: Performance
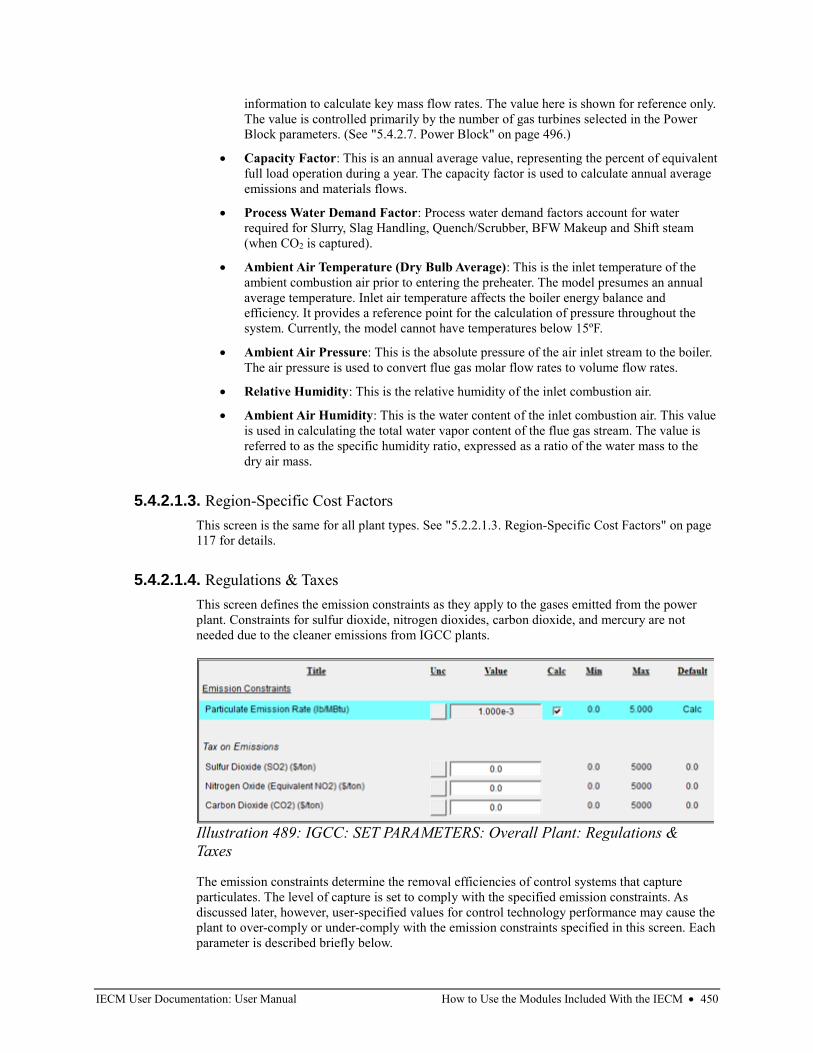
IECM User Documentation: User Manual How to Use the Modules Included With the IECM • 450
information to calculate key mass flow rates. The value here is shown for reference only.
The value is controlled primarily by the number of gas turbines selected in the Power
Block parameters. (See "5.4.2.7. Power Block" on page 496.)
• Capacity Factor: This is an annual average value, representing the percent of equivalent
full load operation during a year. The capacity factor is used to calculate annual average
emissions and materials flows.
• Process Water Demand Factor: Process water demand factors account for water
required for Slurry, Slag Handling, Quench/Scrubber, BFW Makeup and Shift steam
(when CO2 is captured).
• Ambient Air Temperature (Dry Bulb Average): This is the inlet temperature of the
ambient combustion air prior to entering the preheater. The model presumes an annual
average temperature. Inlet air temperature affects the boiler energy balance and
efficiency. It provides a reference point for the calculation of pressure throughout the
system. Currently, the model cannot have temperatures below 15ºF.
• Ambient Air Pressure: This is the absolute pressure of the air inlet stream to the boiler.
The air pressure is used to convert flue gas molar flow rates to volume flow rates.
• Relative Humidity: This is the relative humidity of the inlet combustion air.
• Ambient Air Humidity: This is the water content of the inlet combustion air. This value
is used in calculating the total water vapor content of the flue gas stream. The value is
referred to as the specific humidity ratio, expressed as a ratio of the water mass to the
dry air mass.
5.4.2.1.3. Region-Specific Cost Factors
This screen is the same for all plant types. See "5.2.2.1.3. Region-Specific Cost Factors" on page
117 for details.
5.4.2.1.4. Regulations & Taxes
This screen defines the emission constraints as they apply to the gases emitted from the power
plant. Constraints for sulfur dioxide, nitrogen dioxides, carbon dioxide, and mercury are not
needed due to the cleaner emissions from IGCC plants.
The emission constraints determine the removal efficiencies of control systems that capture
particulates. The level of capture is set to comply with the specified emission constraints. As
discussed later, however, user-specified values for control technology performance may cause the
plant to over-comply or under-comply with the emission constraints specified in this screen. Each
parameter is described briefly below.
Illustration 489: IGCC: SET PARAMETERS: Overall Plant: Regulations &
Taxes
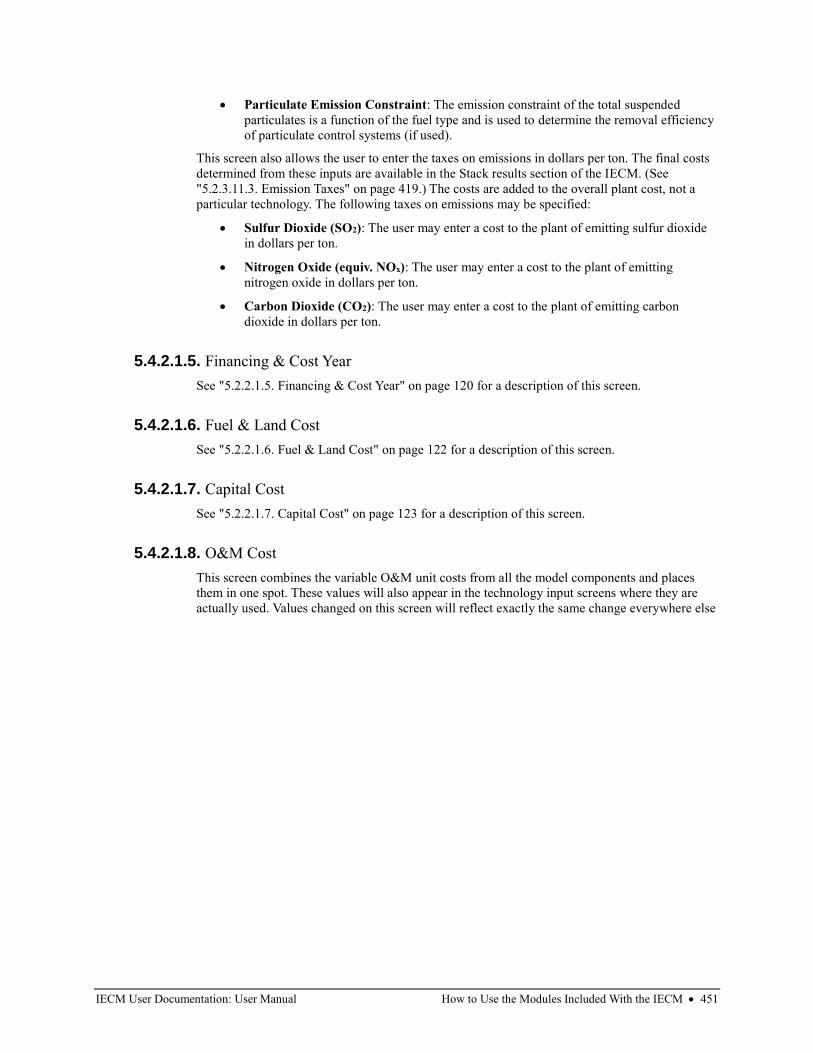
IECM User Documentation: User Manual How to Use the Modules Included With the IECM • 451
• Particulate Emission Constraint: The emission constraint of the total suspended
particulates is a function of the fuel type and is used to determine the removal efficiency
of particulate control systems (if used).
This screen also allows the user to enter the taxes on emissions in dollars per ton. The final costs
determined from these inputs are available in the Stack results section of the IECM. (See
"5.2.3.11.3. Emission Taxes" on page 419.) The costs are added to the overall plant cost, not a
particular technology. The following taxes on emissions may be specified:
• Sulfur Dioxide (SO2): The user may enter a cost to the plant of emitting sulfur dioxide
in dollars per ton.
• Nitrogen Oxide (equiv. NOx): The user may enter a cost to the plant of emitting
nitrogen oxide in dollars per ton.
• Carbon Dioxide (CO2): The user may enter a cost to the plant of emitting carbon
dioxide in dollars per ton.
5.4.2.1.5. Financing & Cost Year
See "5.2.2.1.5. Financing & Cost Year" on page 120 for a description of this screen.
5.4.2.1.6. Fuel & Land Cost
See "5.2.2.1.6. Fuel & Land Cost" on page 122 for a description of this screen.
5.4.2.1.7. Capital Cost
See "5.2.2.1.7. Capital Cost" on page 123 for a description of this screen.
5.4.2.1.8. O&M Cost
This screen combines the variable O&M unit costs from all the model components and places
them in one spot. These values will also appear in the technology input screens where they are
actually used. Values changed on this screen will reflect exactly the same change everywhere else
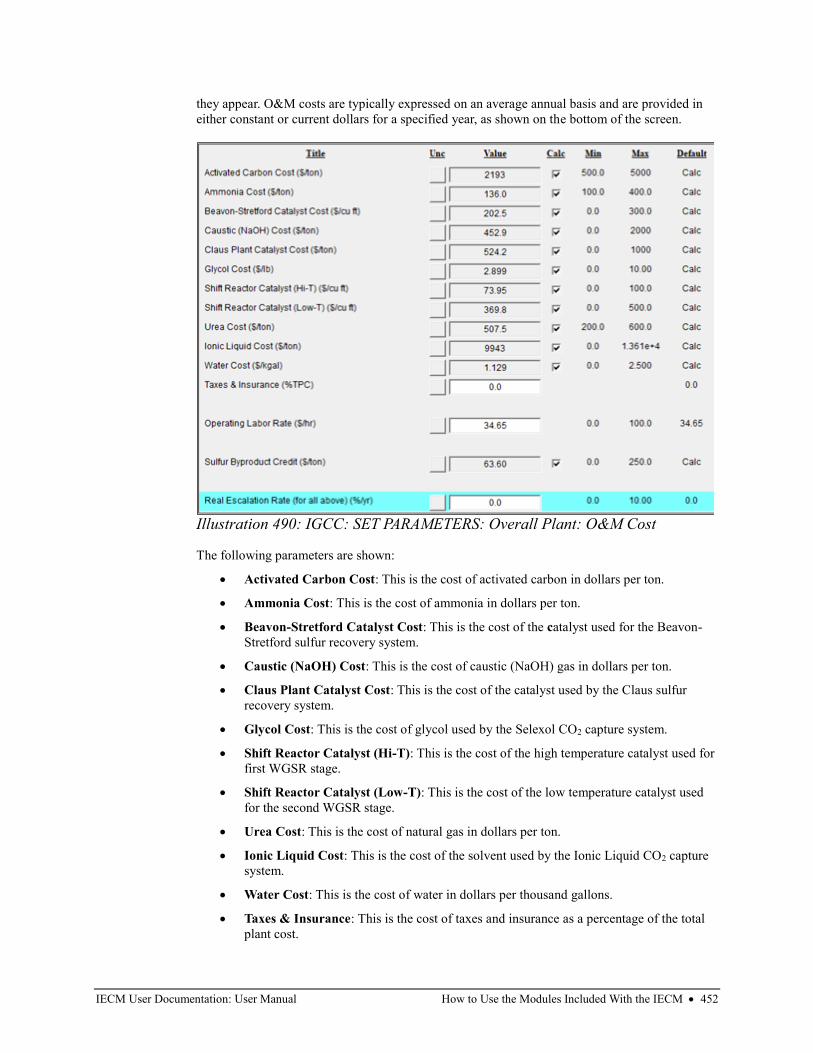
IECM User Documentation: User Manual How to Use the Modules Included With the IECM • 452
they appear. O&M costs are typically expressed on an average annual basis and are provided in
either constant or current dollars for a specified year, as shown on the bottom of the screen.
The following parameters are shown:
• Activated Carbon Cost: This is the cost of activated carbon in dollars per ton.
• Ammonia Cost: This is the cost of ammonia in dollars per ton.
• Beavon-Stretford Catalyst Cost: This is the cost of the catalyst used for the Beavon-
Stretford sulfur recovery system.
• Caustic (NaOH) Cost: This is the cost of caustic (NaOH) gas in dollars per ton.
• Claus Plant Catalyst Cost: This is the cost of the catalyst used by the Claus sulfur
recovery system.
• Glycol Cost: This is the cost of glycol used by the Selexol CO2 capture system.
• Shift Reactor Catalyst (Hi-T): This is the cost of the high temperature catalyst used for
first WGSR stage.
• Shift Reactor Catalyst (Low-T): This is the cost of the low temperature catalyst used
for the second WGSR stage.
• Urea Cost: This is the cost of natural gas in dollars per ton.
• Ionic Liquid Cost: This is the cost of the solvent used by the Ionic Liquid CO2 capture
system.
• Water Cost: This is the cost of water in dollars per thousand gallons.
• Taxes & Insurance: This is the cost of taxes and insurance as a percentage of the total
plant cost.
Illustration 490: IGCC: SET PARAMETERS: Overall Plant: O&M Cost
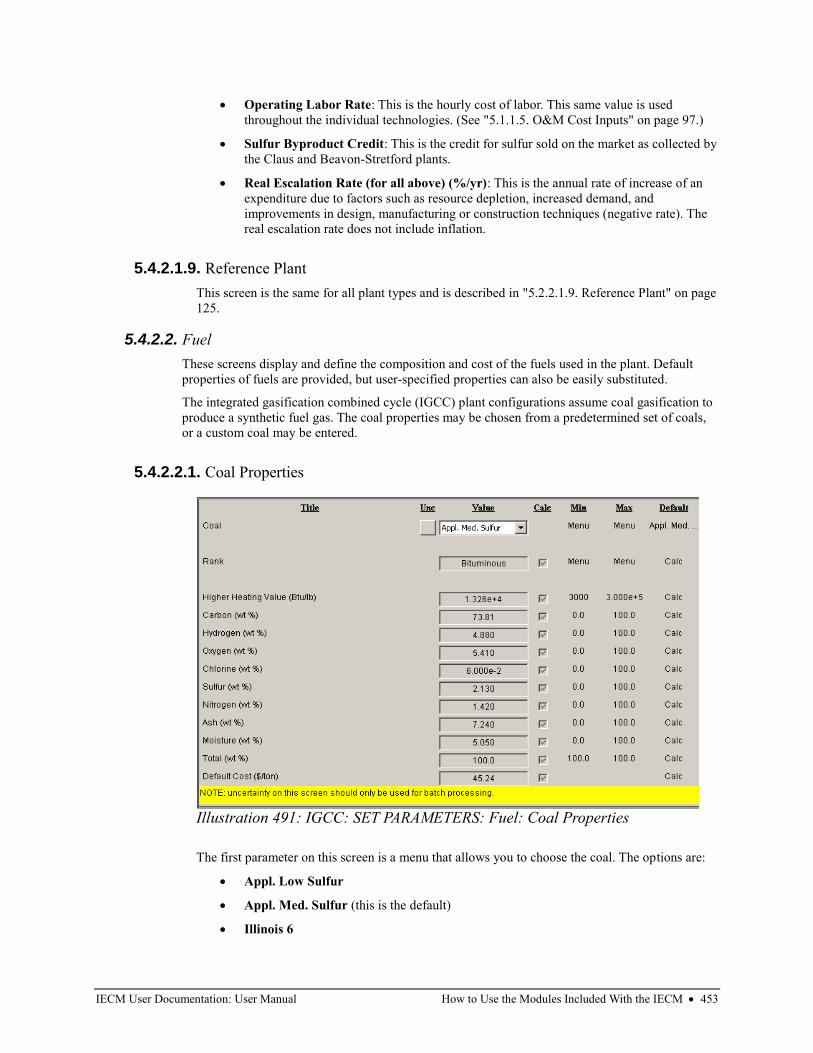
IECM User Documentation: User Manual How to Use the Modules Included With the IECM • 453
• Operating Labor Rate: This is the hourly cost of labor. This same value is used
throughout the individual technologies. (See "5.1.1.5. O&M Cost Inputs" on page 97.)
• Sulfur Byproduct Credit: This is the credit for sulfur sold on the market as collected by
the Claus and Beavon-Stretford plants.
• Real Escalation Rate (for all above) (%/yr): This is the annual rate of increase of an
expenditure due to factors such as resource depletion, increased demand, and
improvements in design, manufacturing or construction techniques (negative rate). The
real escalation rate does not include inflation.
5.4.2.1.9. Reference Plant
This screen is the same for all plant types and is described in "5.2.2.1.9. Reference Plant" on page
125.
5.4.2.2. Fuel
These screens display and define the composition and cost of the fuels used in the plant. Default
properties of fuels are provided, but user-specified properties can also be easily substituted.
The integrated gasification combined cycle (IGCC) plant configurations assume coal gasification to
produce a synthetic fuel gas. The coal properties may be chosen from a predetermined set of coals,
or a custom coal may be entered.
5.4.2.2.1. Coal Properties
The first parameter on this screen is a menu that allows you to choose the coal. The options are:
• Appl. Low Sulfur
• Appl. Med. Sulfur (this is the default)
• Illinois 6
Illustration 491: IGCC: SET PARAMETERS: Fuel: Coal Properties
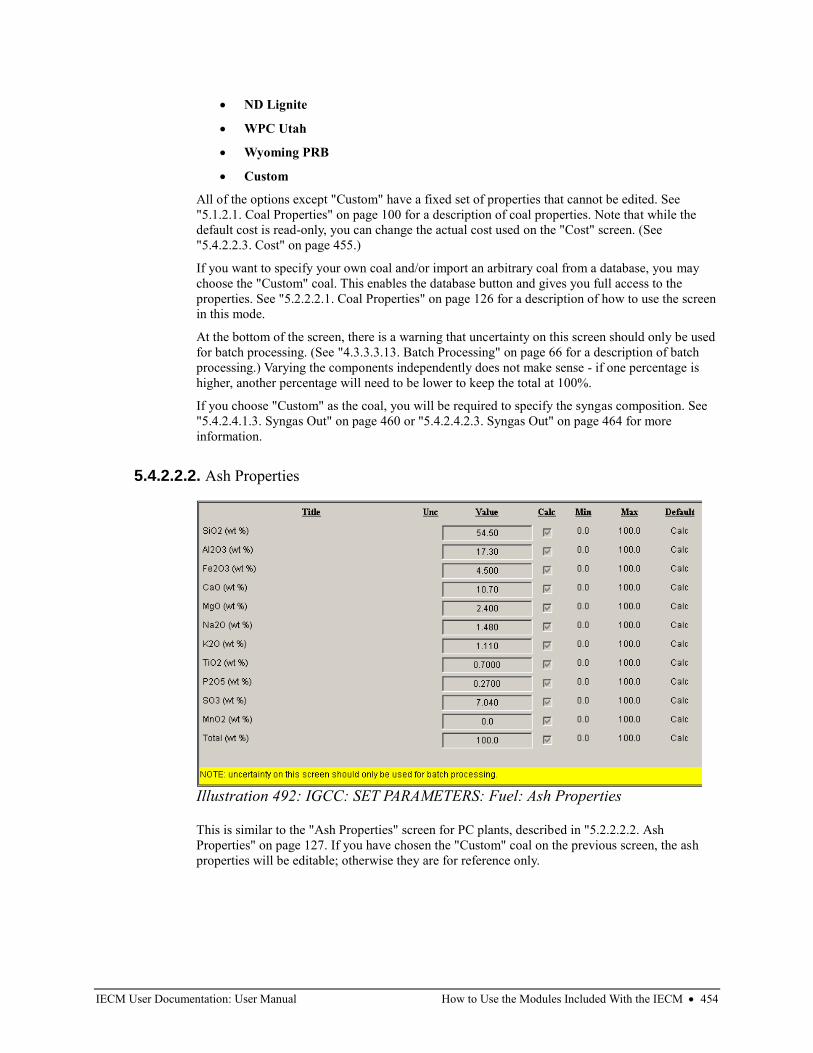
IECM User Documentation: User Manual How to Use the Modules Included With the IECM • 454
• ND Lignite
• WPC Utah
• Wyoming PRB
• Custom
All of the options except "Custom" have a fixed set of properties that cannot be edited. See
"5.1.2.1. Coal Properties" on page 100 for a description of coal properties. Note that while the
default cost is read-only, you can change the actual cost used on the "Cost" screen. (See
"5.4.2.2.3. Cost" on page 455.)
If you want to specify your own coal and/or import an arbitrary coal from a database, you may
choose the "Custom" coal. This enables the database button and gives you full access to the
properties. See "5.2.2.2.1. Coal Properties" on page 126 for a description of how to use the screen
in this mode.
At the bottom of the screen, there is a warning that uncertainty on this screen should only be used
for batch processing. (See "4.3.3.3.13. Batch Processing" on page 66 for a description of batch
processing.) Varying the components independently does not make sense - if one percentage is
higher, another percentage will need to be lower to keep the total at 100%.
If you choose "Custom" as the coal, you will be required to specify the syngas composition. See
"5.4.2.4.1.3. Syngas Out" on page 460 or "5.4.2.4.2.3. Syngas Out" on page 464 for more
information.
5.4.2.2.2. Ash Properties
This is similar to the "Ash Properties" screen for PC plants, described in "5.2.2.2.2. Ash
Properties" on page 127. If you have chosen the "Custom" coal on the previous screen, the ash
properties will be editable; otherwise they are for reference only.
Illustration 492: IGCC: SET PARAMETERS: Fuel: Ash Properties
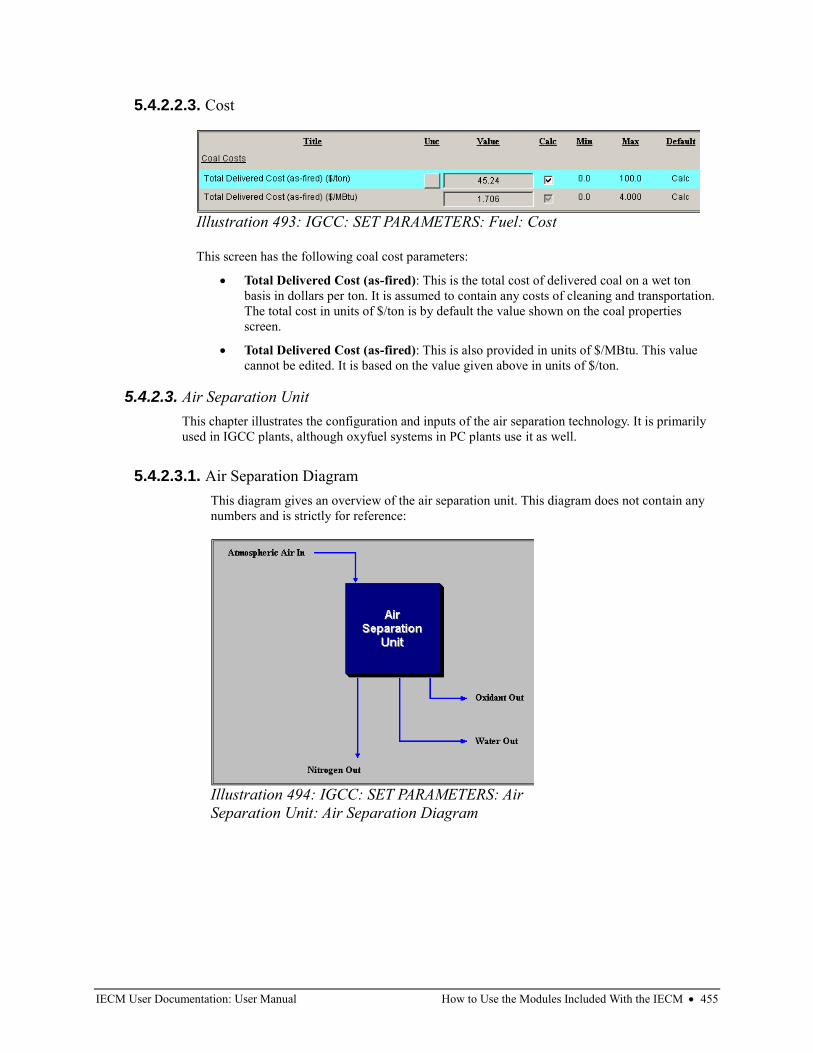
IECM User Documentation: User Manual How to Use the Modules Included With the IECM • 455
5.4.2.2.3. Cost
This screen has the following coal cost parameters:
• Total Delivered Cost (as-fired): This is the total cost of delivered coal on a wet ton
basis in dollars per ton. It is assumed to contain any costs of cleaning and transportation.
The total cost in units of $/ton is by default the value shown on the coal properties
screen.
• Total Delivered Cost (as-fired): This is also provided in units of $/MBtu. This value
cannot be edited. It is based on the value given above in units of $/ton.
5.4.2.3. Air Separation Unit
This chapter illustrates the configuration and inputs of the air separation technology. It is primarily
used in IGCC plants, although oxyfuel systems in PC plants use it as well.
5.4.2.3.1. Air Separation Diagram
This diagram gives an overview of the air separation unit. This diagram does not contain any
numbers and is strictly for reference:
Illustration 493: IGCC: SET PARAMETERS: Fuel: Cost
Illustration 494: IGCC: SET PARAMETERS: Air
Separation Unit: Air Separation Diagram
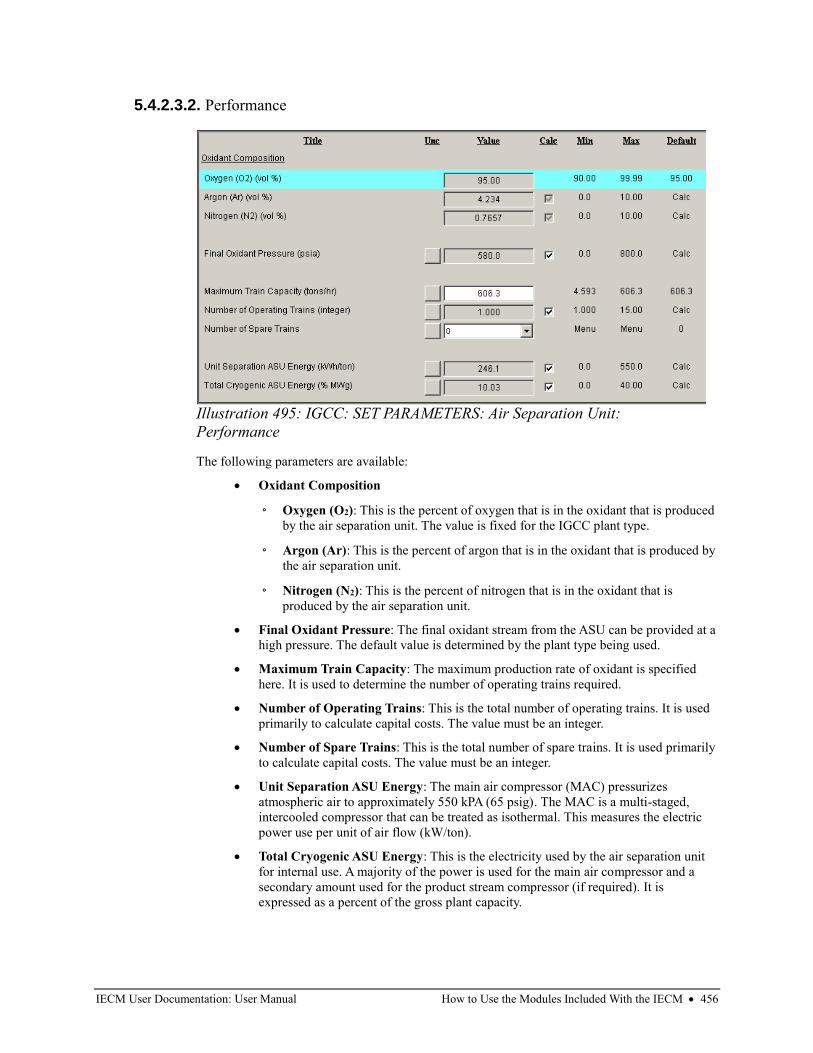
IECM User Documentation: User Manual How to Use the Modules Included With the IECM • 456
5.4.2.3.2. Performance
The following parameters are available:
• Oxidant Composition
◦ Oxygen (O2): This is the percent of oxygen that is in the oxidant that is produced
by the air separation unit. The value is fixed for the IGCC plant type.
◦ Argon (Ar): This is the percent of argon that is in the oxidant that is produced by
the air separation unit.
◦ Nitrogen (N2): This is the percent of nitrogen that is in the oxidant that is
produced by the air separation unit.
• Final Oxidant Pressure: The final oxidant stream from the ASU can be provided at a
high pressure. The default value is determined by the plant type being used.
• Maximum Train Capacity: The maximum production rate of oxidant is specified
here. It is used to determine the number of operating trains required.
• Number of Operating Trains: This is the total number of operating trains. It is used
primarily to calculate capital costs. The value must be an integer.
• Number of Spare Trains: This is the total number of spare trains. It is used primarily
to calculate capital costs. The value must be an integer.
• Unit Separation ASU Energy: The main air compressor (MAC) pressurizes
atmospheric air to approximately 550 kPA (65 psig). The MAC is a multi-staged,
intercooled compressor that can be treated as isothermal. This measures the electric
power use per unit of air flow (kW/ton).
• Total Cryogenic ASU Energy: This is the electricity used by the air separation unit
for internal use. A majority of the power is used for the main air compressor and a
secondary amount used for the product stream compressor (if required). It is
expressed as a percent of the gross plant capacity.
Illustration 495: IGCC: SET PARAMETERS: Air Separation Unit:
Performance
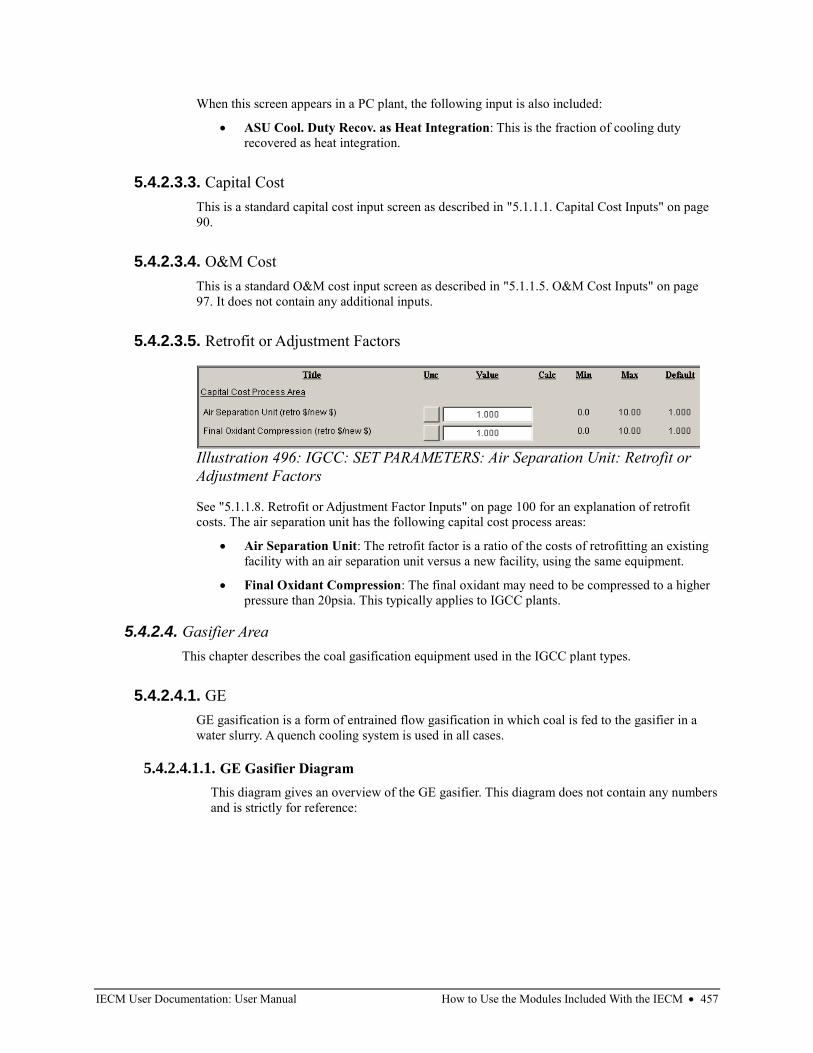
IECM User Documentation: User Manual How to Use the Modules Included With the IECM • 457
When this screen appears in a PC plant, the following input is also included:
• ASU Cool. Duty Recov. as Heat Integration: This is the fraction of cooling duty
recovered as heat integration.
5.4.2.3.3. Capital Cost
This is a standard capital cost input screen as described in "5.1.1.1. Capital Cost Inputs" on page
90.
5.4.2.3.4. O&M Cost
This is a standard O&M cost input screen as described in "5.1.1.5. O&M Cost Inputs" on page
97. It does not contain any additional inputs.
5.4.2.3.5. Retrofit or Adjustment Factors
See "5.1.1.8. Retrofit or Adjustment Factor Inputs" on page 100 for an explanation of retrofit
costs. The air separation unit has the following capital cost process areas:
• Air Separation Unit: The retrofit factor is a ratio of the costs of retrofitting an existing
facility with an air separation unit versus a new facility, using the same equipment.
• Final Oxidant Compression: The final oxidant may need to be compressed to a higher
pressure than 20psia. This typically applies to IGCC plants.
5.4.2.4. Gasifier Area
This chapter describes the coal gasification equipment used in the IGCC plant types.
5.4.2.4.1. GE
GE gasification is a form of entrained flow gasification in which coal is fed to the gasifier in a
water slurry. A quench cooling system is used in all cases.
5.4.2.4.1.1. GE Gasifier Diagram
This diagram gives an overview of the GE gasifier. This diagram does not contain any numbers
and is strictly for reference:
Illustration 496: IGCC: SET PARAMETERS: Air Separation Unit: Retrofit or
Adjustment Factors
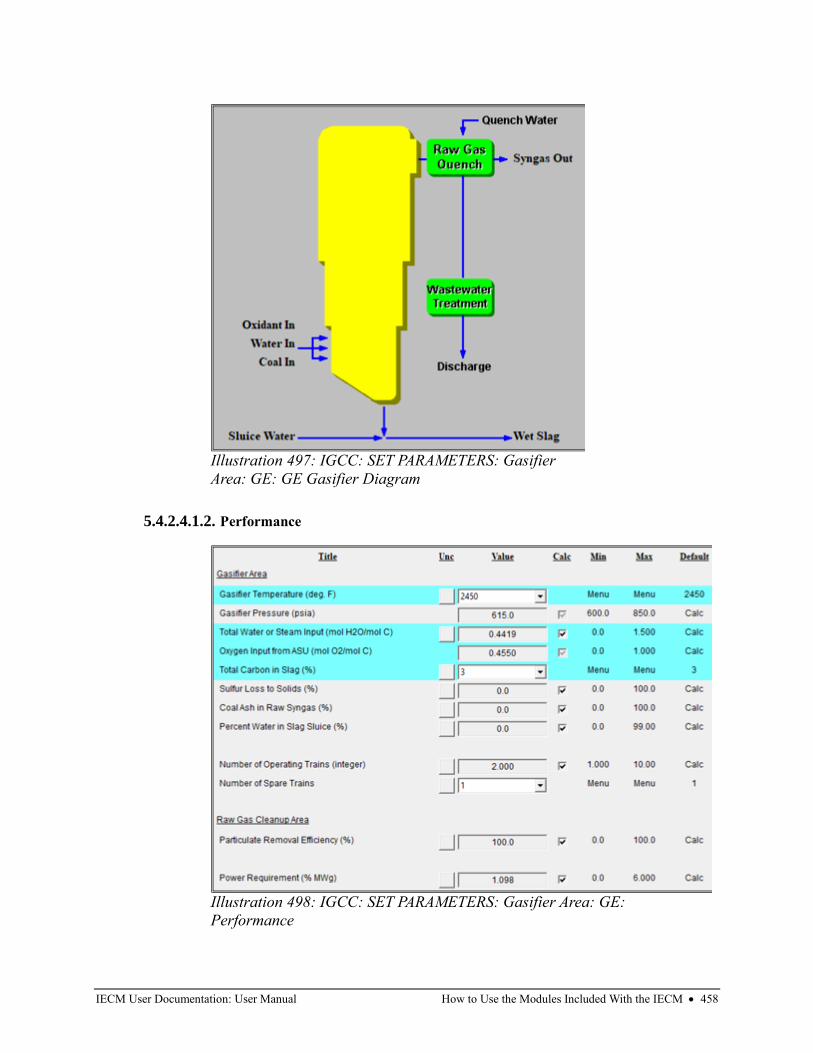
IECM User Documentation: User Manual How to Use the Modules Included With the IECM • 458
5.4.2.4.1.2. Performance
Illustration 497: IGCC: SET PARAMETERS: Gasifier
Area: GE: GE Gasifier Diagram
Illustration 498: IGCC: SET PARAMETERS: Gasifier Area: GE:
Performance
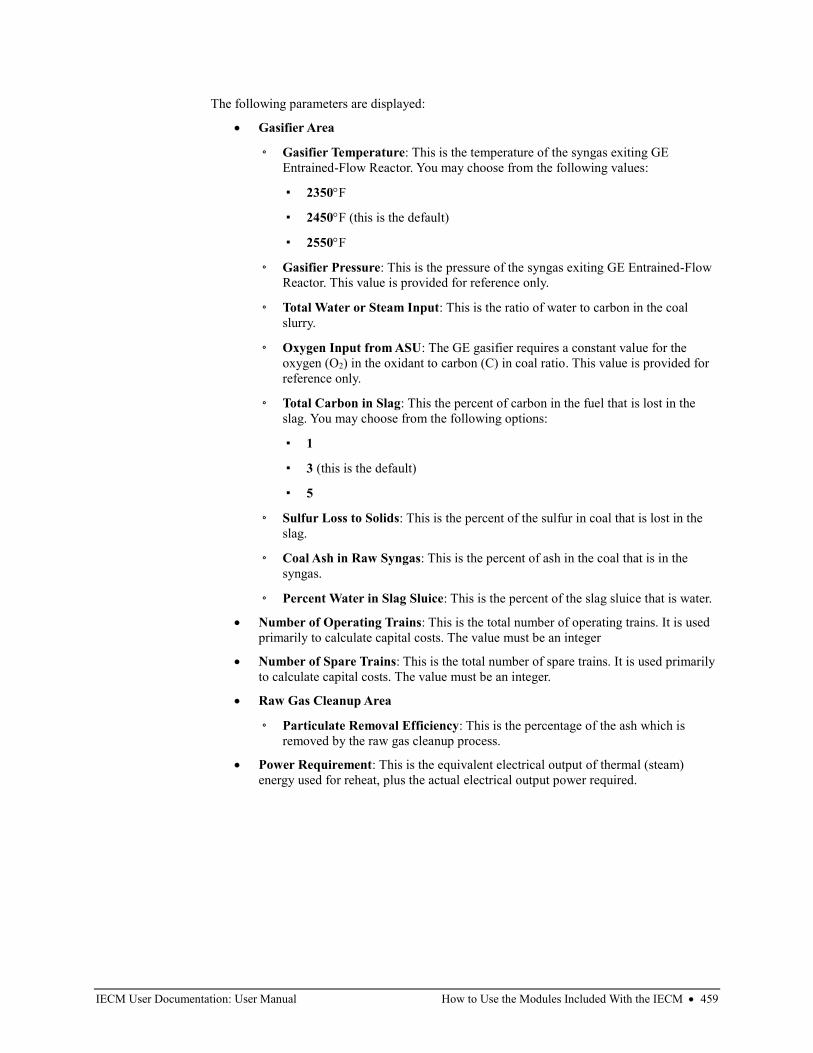
IECM User Documentation: User Manual How to Use the Modules Included With the IECM • 459
The following parameters are displayed:
• Gasifier Area
◦ Gasifier Temperature: This is the temperature of the syngas exiting GE
Entrained-Flow Reactor. You may choose from the following values:
▪ 2350F
▪ 2450F (this is the default)
▪ 2550F
◦ Gasifier Pressure: This is the pressure of the syngas exiting GE Entrained-Flow
Reactor. This value is provided for reference only.
◦ Total Water or Steam Input: This is the ratio of water to carbon in the coal
slurry.
◦ Oxygen Input from ASU: The GE gasifier requires a constant value for the
oxygen (O2) in the oxidant to carbon (C) in coal ratio. This value is provided for
reference only.
◦ Total Carbon in Slag: This the percent of carbon in the fuel that is lost in the
slag. You may choose from the following options:
▪ 1
▪ 3 (this is the default)
▪ 5
◦ Sulfur Loss to Solids: This is the percent of the sulfur in coal that is lost in the
slag.
◦ Coal Ash in Raw Syngas: This is the percent of ash in the coal that is in the
syngas.
◦ Percent Water in Slag Sluice: This is the percent of the slag sluice that is water.
• Number of Operating Trains: This is the total number of operating trains. It is used
primarily to calculate capital costs. The value must be an integer
• Number of Spare Trains: This is the total number of spare trains. It is used primarily
to calculate capital costs. The value must be an integer.
• Raw Gas Cleanup Area
◦ Particulate Removal Efficiency: This is the percentage of the ash which is
removed by the raw gas cleanup process.
• Power Requirement: This is the equivalent electrical output of thermal (steam)
energy used for reheat, plus the actual electrical output power required.
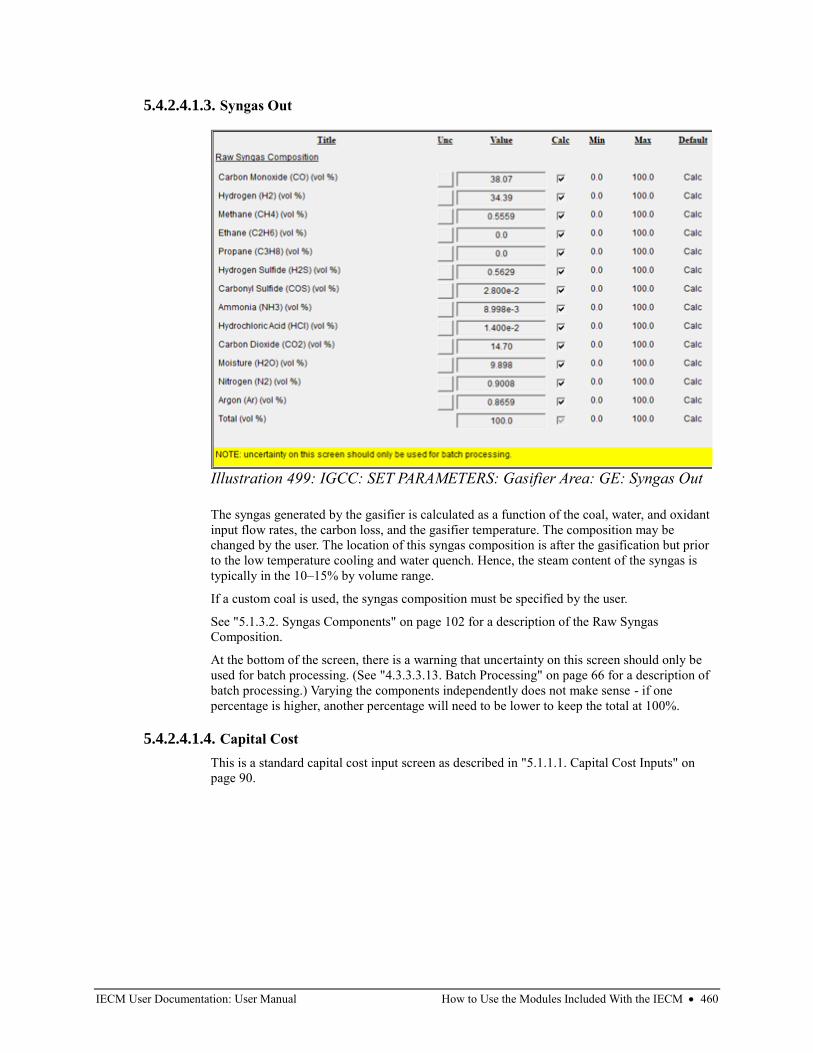
IECM User Documentation: User Manual How to Use the Modules Included With the IECM • 460
5.4.2.4.1.3. Syngas Out
The syngas generated by the gasifier is calculated as a function of the coal, water, and oxidant
input flow rates, the carbon loss, and the gasifier temperature. The composition may be
changed by the user. The location of this syngas composition is after the gasification but prior
to the low temperature cooling and water quench. Hence, the steam content of the syngas is
typically in the 10–15% by volume range.
If a custom coal is used, the syngas composition must be specified by the user.
See "5.1.3.2. Syngas Components" on page 102 for a description of the Raw Syngas
Composition.
At the bottom of the screen, there is a warning that uncertainty on this screen should only be
used for batch processing. (See "4.3.3.3.13. Batch Processing" on page 66 for a description of
batch processing.) Varying the components independently does not make sense - if one
percentage is higher, another percentage will need to be lower to keep the total at 100%.
5.4.2.4.1.4. Capital Cost
This is a standard capital cost input screen as described in "5.1.1.1. Capital Cost Inputs" on
page 90.
Illustration 499: IGCC: SET PARAMETERS: Gasifier Area: GE: Syngas Out
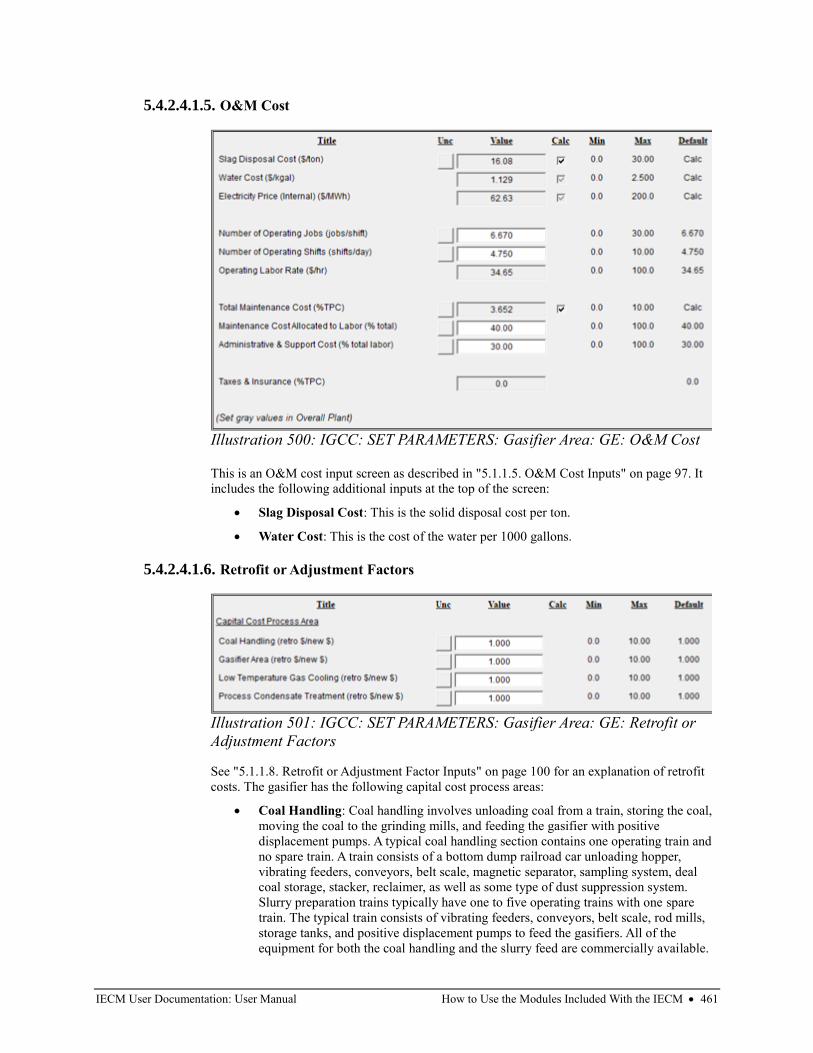
IECM User Documentation: User Manual How to Use the Modules Included With the IECM • 461
5.4.2.4.1.5. O&M Cost
This is an O&M cost input screen as described in "5.1.1.5. O&M Cost Inputs" on page 97. It
includes the following additional inputs at the top of the screen:
• Slag Disposal Cost: This is the solid disposal cost per ton.
• Water Cost: This is the cost of the water per 1000 gallons.
5.4.2.4.1.6. Retrofit or Adjustment Factors
See "5.1.1.8. Retrofit or Adjustment Factor Inputs" on page 100 for an explanation of retrofit
costs. The gasifier has the following capital cost process areas:
• Coal Handling: Coal handling involves unloading coal from a train, storing the coal,
moving the coal to the grinding mills, and feeding the gasifier with positive
displacement pumps. A typical coal handling section contains one operating train and
no spare train. A train consists of a bottom dump railroad car unloading hopper,
vibrating feeders, conveyors, belt scale, magnetic separator, sampling system, deal
coal storage, stacker, reclaimer, as well as some type of dust suppression system.
Slurry preparation trains typically have one to five operating trains with one spare
train. The typical train consists of vibrating feeders, conveyors, belt scale, rod mills,
storage tanks, and positive displacement pumps to feed the gasifiers. All of the
equipment for both the coal handling and the slurry feed are commercially available.
Illustration 500: IGCC: SET PARAMETERS: Gasifier Area: GE: O&M Cost
Illustration 501: IGCC: SET PARAMETERS: Gasifier Area: GE: Retrofit or
Adjustment Factors
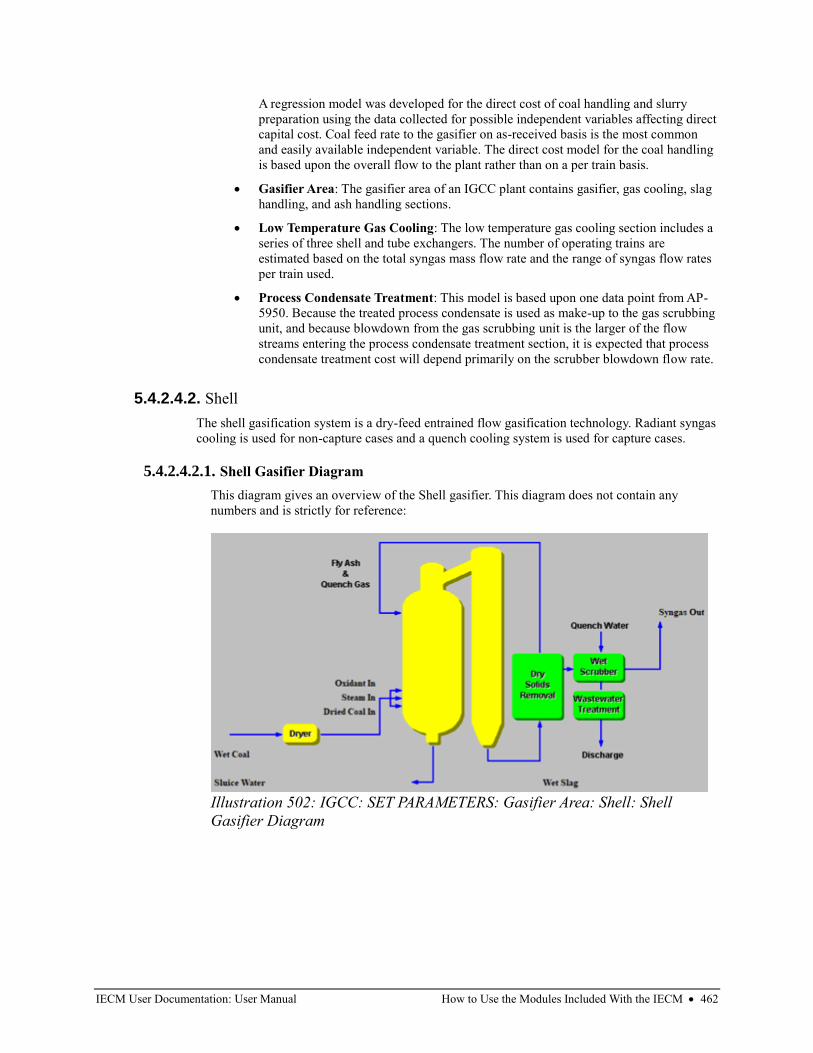
IECM User Documentation: User Manual How to Use the Modules Included With the IECM • 462
A regression model was developed for the direct cost of coal handling and slurry
preparation using the data collected for possible independent variables affecting direct
capital cost. Coal feed rate to the gasifier on as-received basis is the most common
and easily available independent variable. The direct cost model for the coal handling
is based upon the overall flow to the plant rather than on a per train basis.
• Gasifier Area: The gasifier area of an IGCC plant contains gasifier, gas cooling, slag
handling, and ash handling sections.
• Low Temperature Gas Cooling: The low temperature gas cooling section includes a
series of three shell and tube exchangers. The number of operating trains are
estimated based on the total syngas mass flow rate and the range of syngas flow rates
per train used.
• Process Condensate Treatment: This model is based upon one data point from AP-
5950. Because the treated process condensate is used as make-up to the gas scrubbing
unit, and because blowdown from the gas scrubbing unit is the larger of the flow
streams entering the process condensate treatment section, it is expected that process
condensate treatment cost will depend primarily on the scrubber blowdown flow rate.
5.4.2.4.2. Shell
The shell gasification system is a dry-feed entrained flow gasification technology. Radiant syngas
cooling is used for non-capture cases and a quench cooling system is used for capture cases.
5.4.2.4.2.1. Shell Gasifier Diagram
This diagram gives an overview of the Shell gasifier. This diagram does not contain any
numbers and is strictly for reference:
Illustration 502: IGCC: SET PARAMETERS: Gasifier Area: Shell: Shell
Gasifier Diagram
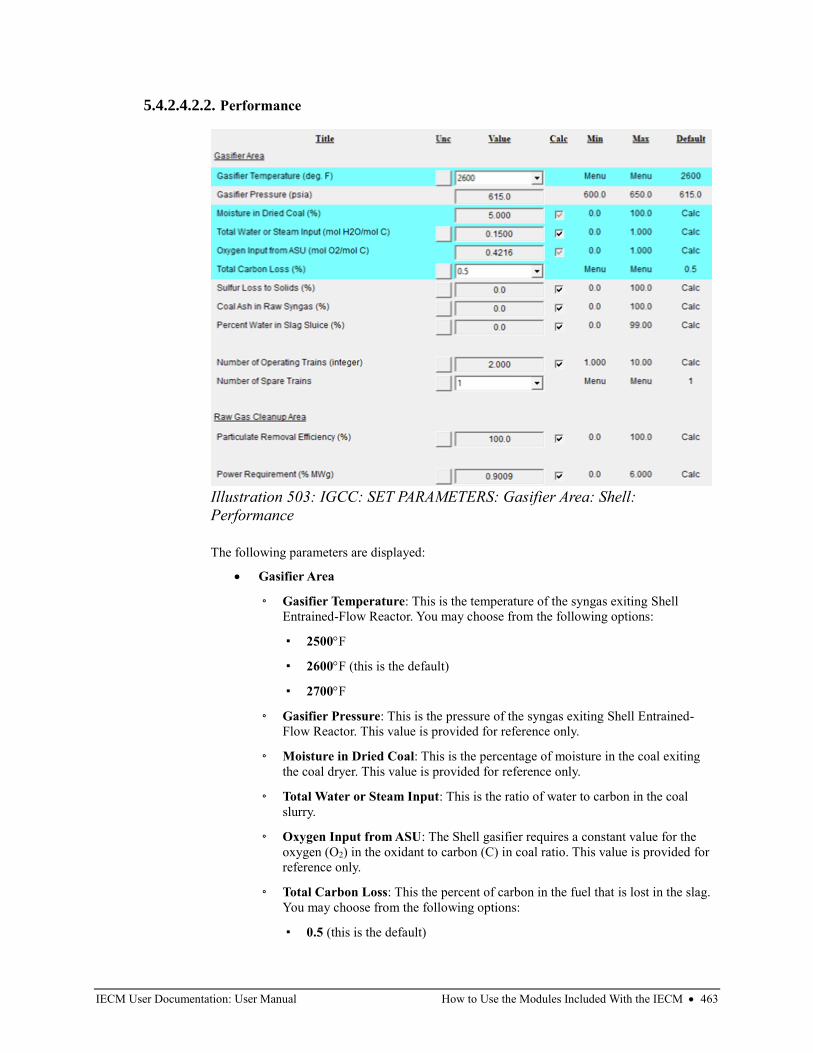
IECM User Documentation: User Manual How to Use the Modules Included With the IECM • 463
5.4.2.4.2.2. Performance
The following parameters are displayed:
• Gasifier Area
◦ Gasifier Temperature: This is the temperature of the syngas exiting Shell
Entrained-Flow Reactor. You may choose from the following options:
▪ 2500F
▪ 2600F (this is the default)
▪ 2700F
◦ Gasifier Pressure: This is the pressure of the syngas exiting Shell Entrained-
Flow Reactor. This value is provided for reference only.
◦ Moisture in Dried Coal: This is the percentage of moisture in the coal exiting
the coal dryer. This value is provided for reference only.
◦ Total Water or Steam Input: This is the ratio of water to carbon in the coal
slurry.
◦ Oxygen Input from ASU: The Shell gasifier requires a constant value for the
oxygen (O2) in the oxidant to carbon (C) in coal ratio. This value is provided for
reference only.
◦ Total Carbon Loss: This the percent of carbon in the fuel that is lost in the slag.
You may choose from the following options:
▪ 0.5 (this is the default)
Illustration 503: IGCC: SET PARAMETERS: Gasifier Area: Shell:
Performance
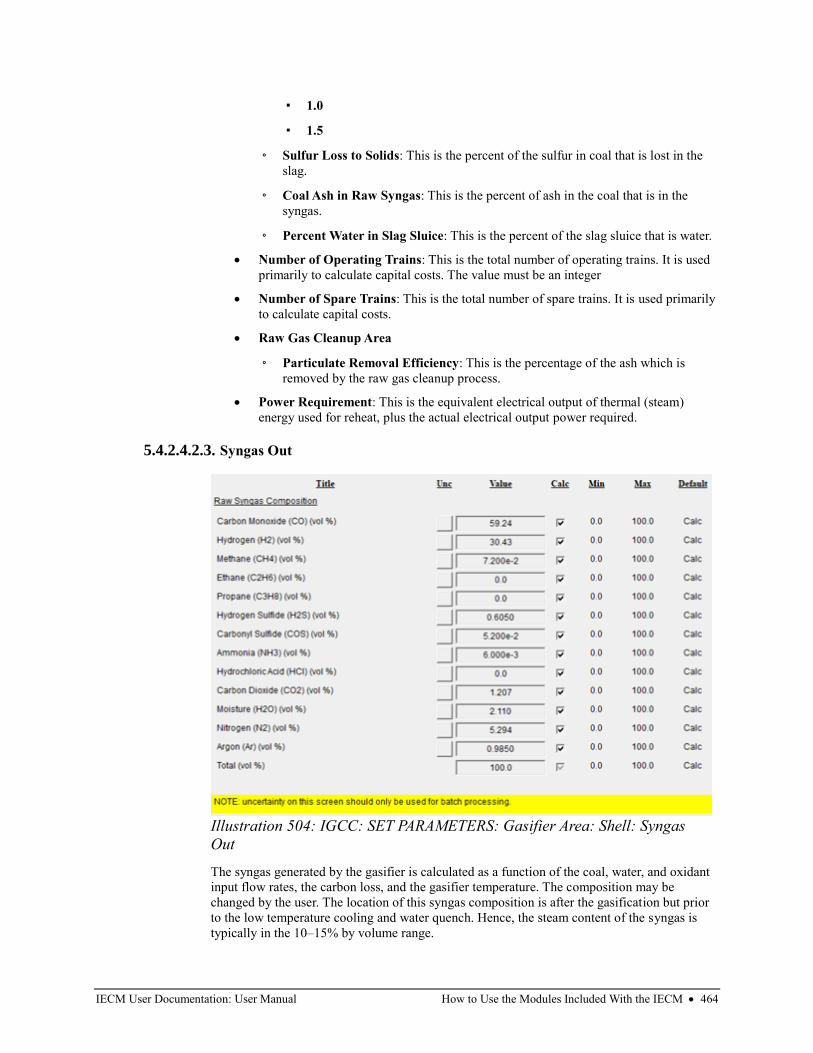
IECM User Documentation: User Manual How to Use the Modules Included With the IECM • 464
▪ 1.0
▪ 1.5
◦ Sulfur Loss to Solids: This is the percent of the sulfur in coal that is lost in the
slag.
◦ Coal Ash in Raw Syngas: This is the percent of ash in the coal that is in the
syngas.
◦ Percent Water in Slag Sluice: This is the percent of the slag sluice that is water.
• Number of Operating Trains: This is the total number of operating trains. It is used
primarily to calculate capital costs. The value must be an integer
• Number of Spare Trains: This is the total number of spare trains. It is used primarily
to calculate capital costs.
• Raw Gas Cleanup Area
◦ Particulate Removal Efficiency: This is the percentage of the ash which is
removed by the raw gas cleanup process.
• Power Requirement: This is the equivalent electrical output of thermal (steam)
energy used for reheat, plus the actual electrical output power required.
5.4.2.4.2.3. Syngas Out
The syngas generated by the gasifier is calculated as a function of the coal, water, and oxidant
input flow rates, the carbon loss, and the gasifier temperature. The composition may be
changed by the user. The location of this syngas composition is after the gasification but prior
to the low temperature cooling and water quench. Hence, the steam content of the syngas is
typically in the 10–15% by volume range.
Illustration 504: IGCC: SET PARAMETERS: Gasifier Area: Shell: Syngas
Out
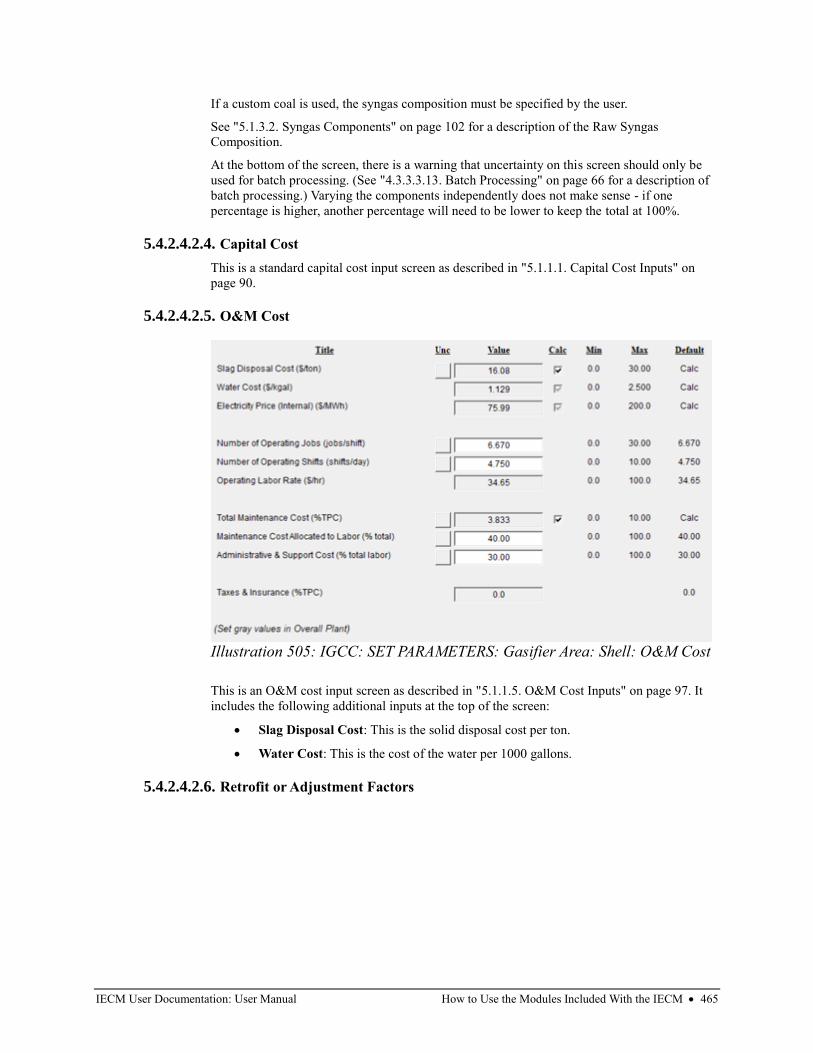
IECM User Documentation: User Manual How to Use the Modules Included With the IECM • 465
If a custom coal is used, the syngas composition must be specified by the user.
See "5.1.3.2. Syngas Components" on page 102 for a description of the Raw Syngas
Composition.
At the bottom of the screen, there is a warning that uncertainty on this screen should only be
used for batch processing. (See "4.3.3.3.13. Batch Processing" on page 66 for a description of
batch processing.) Varying the components independently does not make sense - if one
percentage is higher, another percentage will need to be lower to keep the total at 100%.
5.4.2.4.2.4. Capital Cost
This is a standard capital cost input screen as described in "5.1.1.1. Capital Cost Inputs" on
page 90.
5.4.2.4.2.5. O&M Cost
This is an O&M cost input screen as described in "5.1.1.5. O&M Cost Inputs" on page 97. It
includes the following additional inputs at the top of the screen:
• Slag Disposal Cost: This is the solid disposal cost per ton.
• Water Cost: This is the cost of the water per 1000 gallons.
5.4.2.4.2.6. Retrofit or Adjustment Factors
Illustration 505: IGCC: SET PARAMETERS: Gasifier Area: Shell: O&M Cost
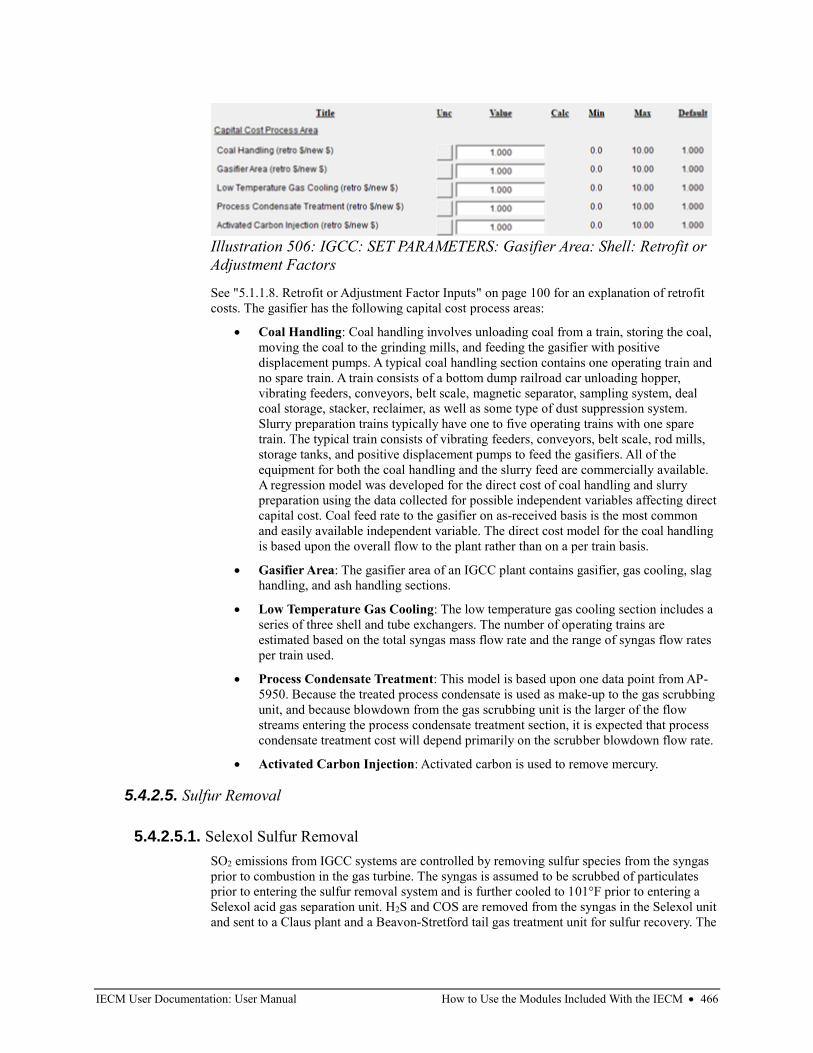
IECM User Documentation: User Manual How to Use the Modules Included With the IECM • 466
See "5.1.1.8. Retrofit or Adjustment Factor Inputs" on page 100 for an explanation of retrofit
costs. The gasifier has the following capital cost process areas:
• Coal Handling: Coal handling involves unloading coal from a train, storing the coal,
moving the coal to the grinding mills, and feeding the gasifier with positive
displacement pumps. A typical coal handling section contains one operating train and
no spare train. A train consists of a bottom dump railroad car unloading hopper,
vibrating feeders, conveyors, belt scale, magnetic separator, sampling system, deal
coal storage, stacker, reclaimer, as well as some type of dust suppression system.
Slurry preparation trains typically have one to five operating trains with one spare
train. The typical train consists of vibrating feeders, conveyors, belt scale, rod mills,
storage tanks, and positive displacement pumps to feed the gasifiers. All of the
equipment for both the coal handling and the slurry feed are commercially available.
A regression model was developed for the direct cost of coal handling and slurry
preparation using the data collected for possible independent variables affecting direct
capital cost. Coal feed rate to the gasifier on as-received basis is the most common
and easily available independent variable. The direct cost model for the coal handling
is based upon the overall flow to the plant rather than on a per train basis.
• Gasifier Area: The gasifier area of an IGCC plant contains gasifier, gas cooling, slag
handling, and ash handling sections.
• Low Temperature Gas Cooling: The low temperature gas cooling section includes a
series of three shell and tube exchangers. The number of operating trains are
estimated based on the total syngas mass flow rate and the range of syngas flow rates
per train used.
• Process Condensate Treatment: This model is based upon one data point from AP-
5950. Because the treated process condensate is used as make-up to the gas scrubbing
unit, and because blowdown from the gas scrubbing unit is the larger of the flow
streams entering the process condensate treatment section, it is expected that process
condensate treatment cost will depend primarily on the scrubber blowdown flow rate.
• Activated Carbon Injection: Activated carbon is used to remove mercury.
5.4.2.5. Sulfur Removal
5.4.2.5.1. Selexol Sulfur Removal
SO2 emissions from IGCC systems are controlled by removing sulfur species from the syngas
prior to combustion in the gas turbine. The syngas is assumed to be scrubbed of particulates
prior to entering the sulfur removal system and is further cooled to 101°F prior to entering a
Selexol acid gas separation unit. H2S and COS are removed from the syngas in the Selexol unit
and sent to a Claus plant and a Beavon-Stretford tail gas treatment unit for sulfur recovery. The
Illustration 506: IGCC: SET PARAMETERS: Gasifier Area: Shell: Retrofit or
Adjustment Factors
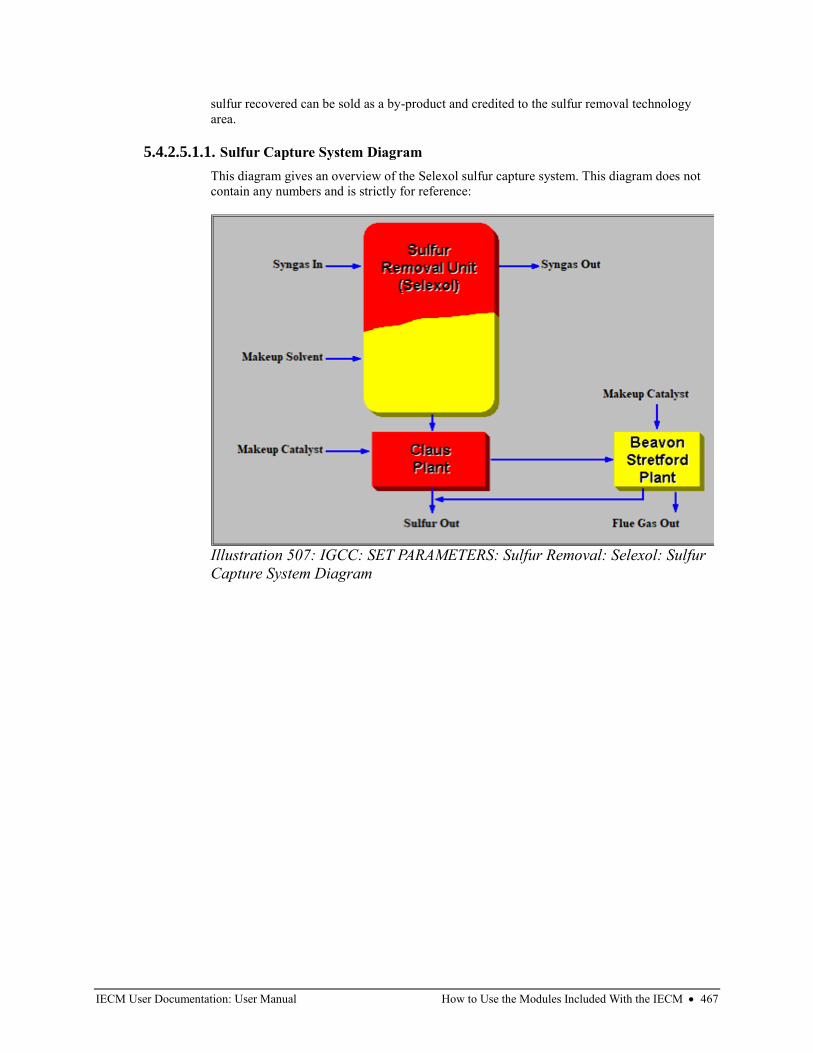
IECM User Documentation: User Manual How to Use the Modules Included With the IECM • 467
sulfur recovered can be sold as a by-product and credited to the sulfur removal technology
area.
5.4.2.5.1.1. Sulfur Capture System Diagram
This diagram gives an overview of the Selexol sulfur capture system. This diagram does not
contain any numbers and is strictly for reference:
Illustration 507: IGCC: SET PARAMETERS: Sulfur Removal: Selexol: Sulfur
Capture System Diagram
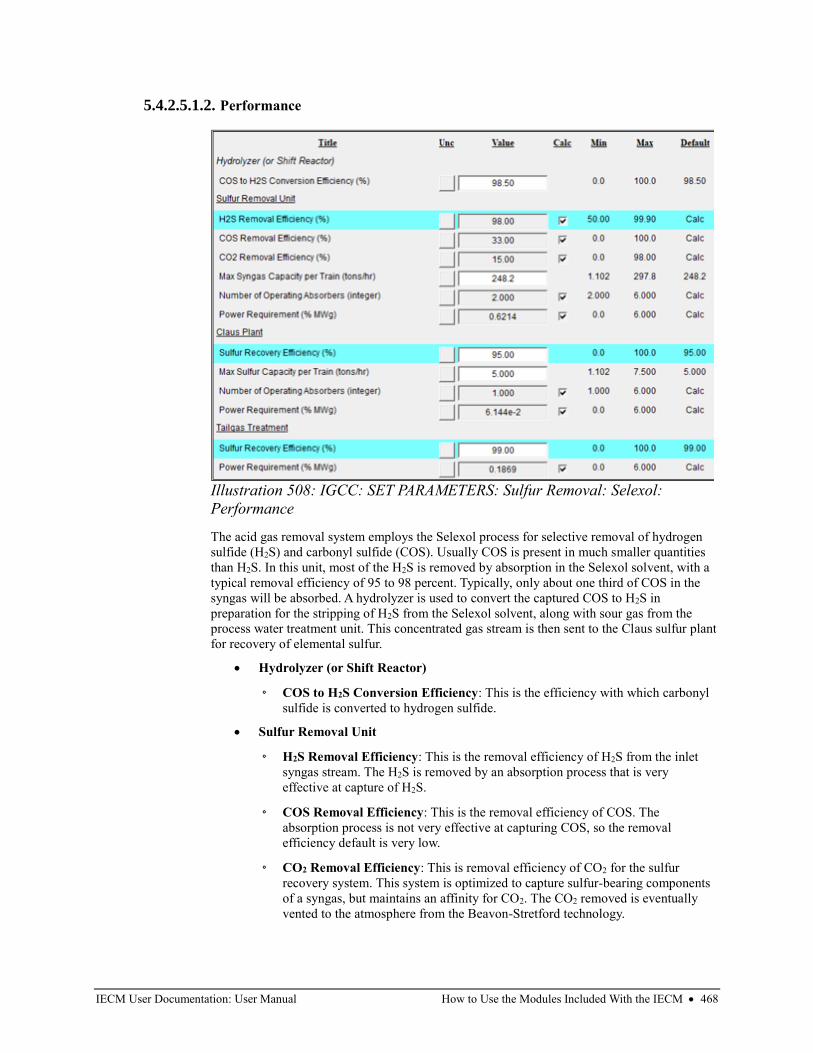
IECM User Documentation: User Manual How to Use the Modules Included With the IECM • 468
5.4.2.5.1.2. Performance
The acid gas removal system employs the Selexol process for selective removal of hydrogen
sulfide (H2S) and carbonyl sulfide (COS). Usually COS is present in much smaller quantities
than H2S. In this unit, most of the H2S is removed by absorption in the Selexol solvent, with a
typical removal efficiency of 95 to 98 percent. Typically, only about one third of COS in the
syngas will be absorbed. A hydrolyzer is used to convert the captured COS to H2S in
preparation for the stripping of H2S from the Selexol solvent, along with sour gas from the
process water treatment unit. This concentrated gas stream is then sent to the Claus sulfur plant
for recovery of elemental sulfur.
• Hydrolyzer (or Shift Reactor)
◦ COS to H2S Conversion Efficiency: This is the efficiency with which carbonyl
sulfide is converted to hydrogen sulfide.
• Sulfur Removal Unit
◦ H2S Removal Efficiency: This is the removal efficiency of H2S from the inlet
syngas stream. The H2S is removed by an absorption process that is very
effective at capture of H2S.
◦ COS Removal Efficiency: This is the removal efficiency of COS. The
absorption process is not very effective at capturing COS, so the removal
efficiency default is very low.
◦ CO2 Removal Efficiency: This is removal efficiency of CO2 for the sulfur
recovery system. This system is optimized to capture sulfur-bearing components
of a syngas, but maintains an affinity for CO2. The CO2 removed is eventually
vented to the atmosphere from the Beavon-Stretford technology.
Illustration 508: IGCC: SET PARAMETERS: Sulfur Removal: Selexol:
Performance
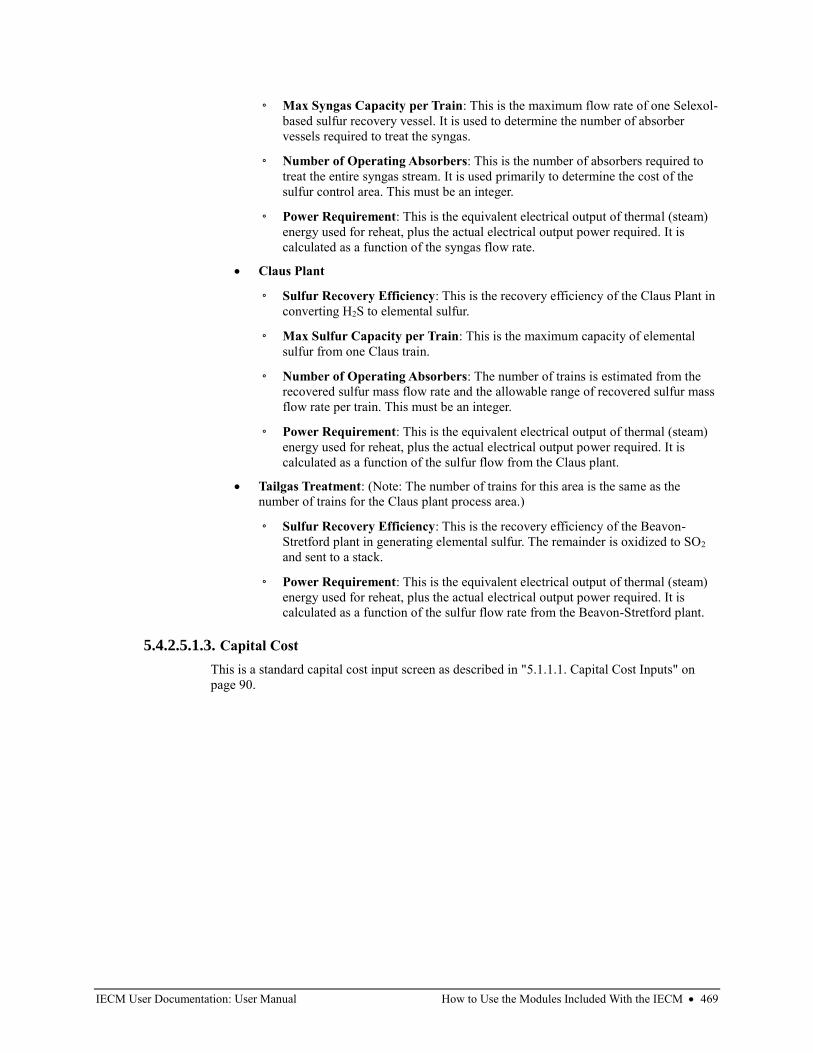
IECM User Documentation: User Manual How to Use the Modules Included With the IECM • 469
◦ Max Syngas Capacity per Train: This is the maximum flow rate of one Selexol-
based sulfur recovery vessel. It is used to determine the number of absorber
vessels required to treat the syngas.
◦ Number of Operating Absorbers: This is the number of absorbers required to
treat the entire syngas stream. It is used primarily to determine the cost of the
sulfur control area. This must be an integer.
◦ Power Requirement: This is the equivalent electrical output of thermal (steam)
energy used for reheat, plus the actual electrical output power required. It is
calculated as a function of the syngas flow rate.
• Claus Plant
◦ Sulfur Recovery Efficiency: This is the recovery efficiency of the Claus Plant in
converting H2S to elemental sulfur.
◦ Max Sulfur Capacity per Train: This is the maximum capacity of elemental
sulfur from one Claus train.
◦ Number of Operating Absorbers: The number of trains is estimated from the
recovered sulfur mass flow rate and the allowable range of recovered sulfur mass
flow rate per train. This must be an integer.
◦ Power Requirement: This is the equivalent electrical output of thermal (steam)
energy used for reheat, plus the actual electrical output power required. It is
calculated as a function of the sulfur flow from the Claus plant.
• Tailgas Treatment: (Note: The number of trains for this area is the same as the
number of trains for the Claus plant process area.)
◦ Sulfur Recovery Efficiency: This is the recovery efficiency of the Beavon-
Stretford plant in generating elemental sulfur. The remainder is oxidized to SO2
and sent to a stack.
◦ Power Requirement: This is the equivalent electrical output of thermal (steam)
energy used for reheat, plus the actual electrical output power required. It is
calculated as a function of the sulfur flow rate from the Beavon-Stretford plant.
5.4.2.5.1.3. Capital Cost
This is a standard capital cost input screen as described in "5.1.1.1. Capital Cost Inputs" on
page 90.

IECM User Documentation: User Manual How to Use the Modules Included With the IECM • 470
5.4.2.5.1.4. O&M Cost
This is an O&M cost input screen as described in "5.1.1.5. O&M Cost Inputs" on page 97. The
following additional inputs are provided at the top of the screen:
• Selexol Solvent Cost: This is the unit cost of Selexol.
• Claus Plant Catalyst Cost: This is the unit cost of catalyst used in the Claus plant.
• Beavon-Stretford Catalyst Cost: This is the unit cost of catalyst used in the Beavon-
Stretford plant.
• Sulfur Byproduct Credit: This is the unit price of sulfur sold on the market.
• Sulfur Disposal Cost: This is the unit cost of any disposal wastes generated by the
sulfur recovery processes.
• Sulfur Sold on Market: This is the fraction of the collected sulfur that is sold on the
market. Any remaining sulfur is assumed to be utilized at no cost (i.e., neither
disposed nor sold).
Illustration 509: IGCC: SET PARAMETERS: Sulfur Removal: Selexol: O&M
Cost
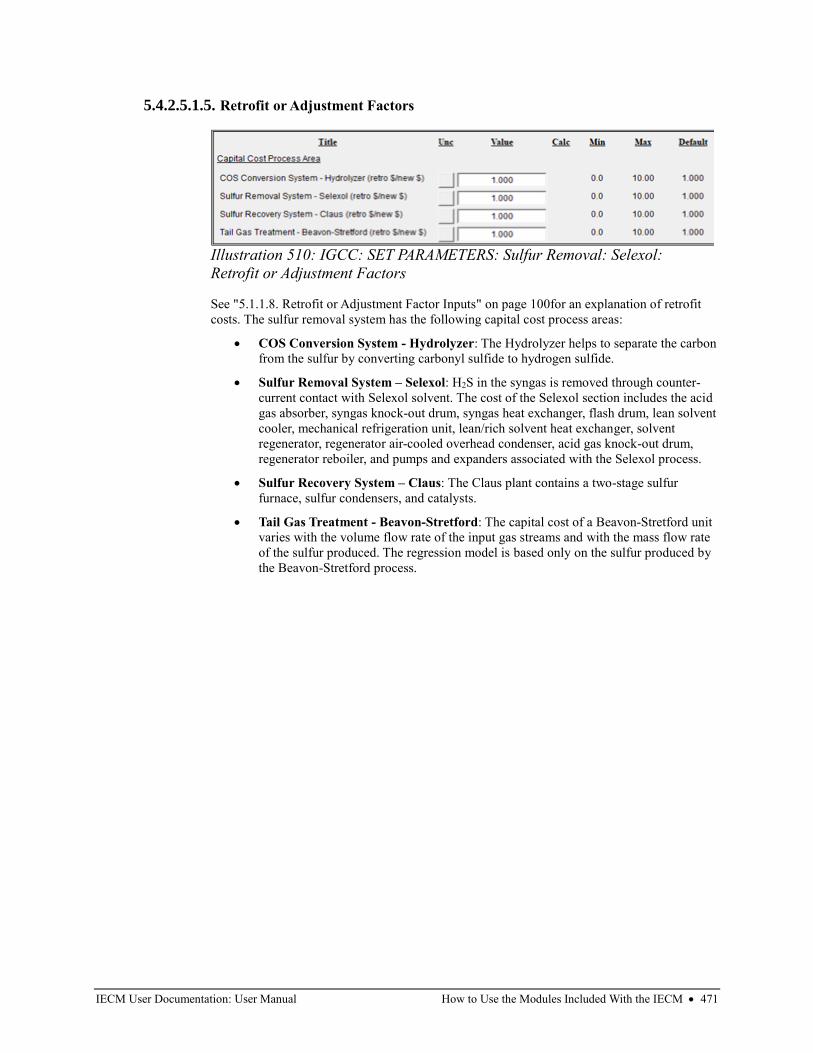
IECM User Documentation: User Manual How to Use the Modules Included With the IECM • 471
5.4.2.5.1.5. Retrofit or Adjustment Factors
See "5.1.1.8. Retrofit or Adjustment Factor Inputs" on page 100for an explanation of retrofit
costs. The sulfur removal system has the following capital cost process areas:
• COS Conversion System - Hydrolyzer: The Hydrolyzer helps to separate the carbon
from the sulfur by converting carbonyl sulfide to hydrogen sulfide.
• Sulfur Removal System – Selexol: H2S in the syngas is removed through counter-
current contact with Selexol solvent. The cost of the Selexol section includes the acid
gas absorber, syngas knock-out drum, syngas heat exchanger, flash drum, lean solvent
cooler, mechanical refrigeration unit, lean/rich solvent heat exchanger, solvent
regenerator, regenerator air-cooled overhead condenser, acid gas knock-out drum,
regenerator reboiler, and pumps and expanders associated with the Selexol process.
• Sulfur Recovery System – Claus: The Claus plant contains a two-stage sulfur
furnace, sulfur condensers, and catalysts.
• Tail Gas Treatment - Beavon-Stretford: The capital cost of a Beavon-Stretford unit
varies with the volume flow rate of the input gas streams and with the mass flow rate
of the sulfur produced. The regression model is based only on the sulfur produced by
the Beavon-Stretford process.
Illustration 510: IGCC: SET PARAMETERS: Sulfur Removal: Selexol:
Retrofit or Adjustment Factors
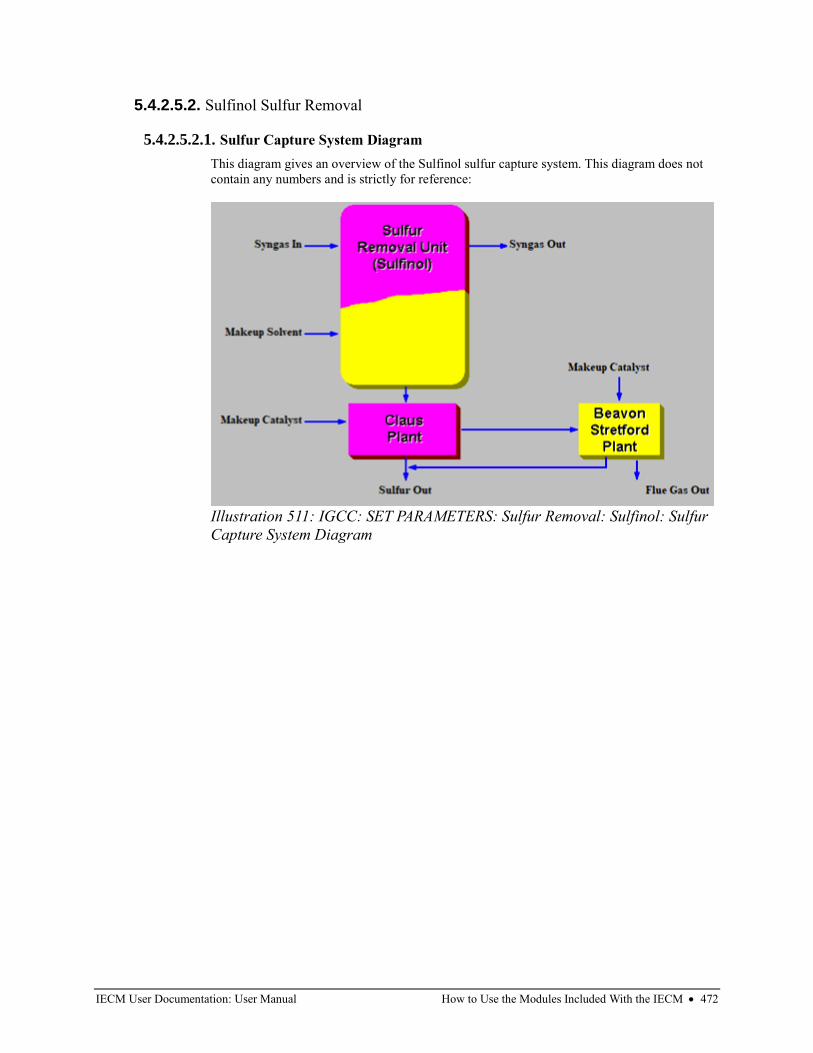
IECM User Documentation: User Manual How to Use the Modules Included With the IECM • 472
5.4.2.5.2. Sulfinol Sulfur Removal
5.4.2.5.2.1. Sulfur Capture System Diagram
This diagram gives an overview of the Sulfinol sulfur capture system. This diagram does not
contain any numbers and is strictly for reference:
Illustration 511: IGCC: SET PARAMETERS: Sulfur Removal: Sulfinol: Sulfur
Capture System Diagram
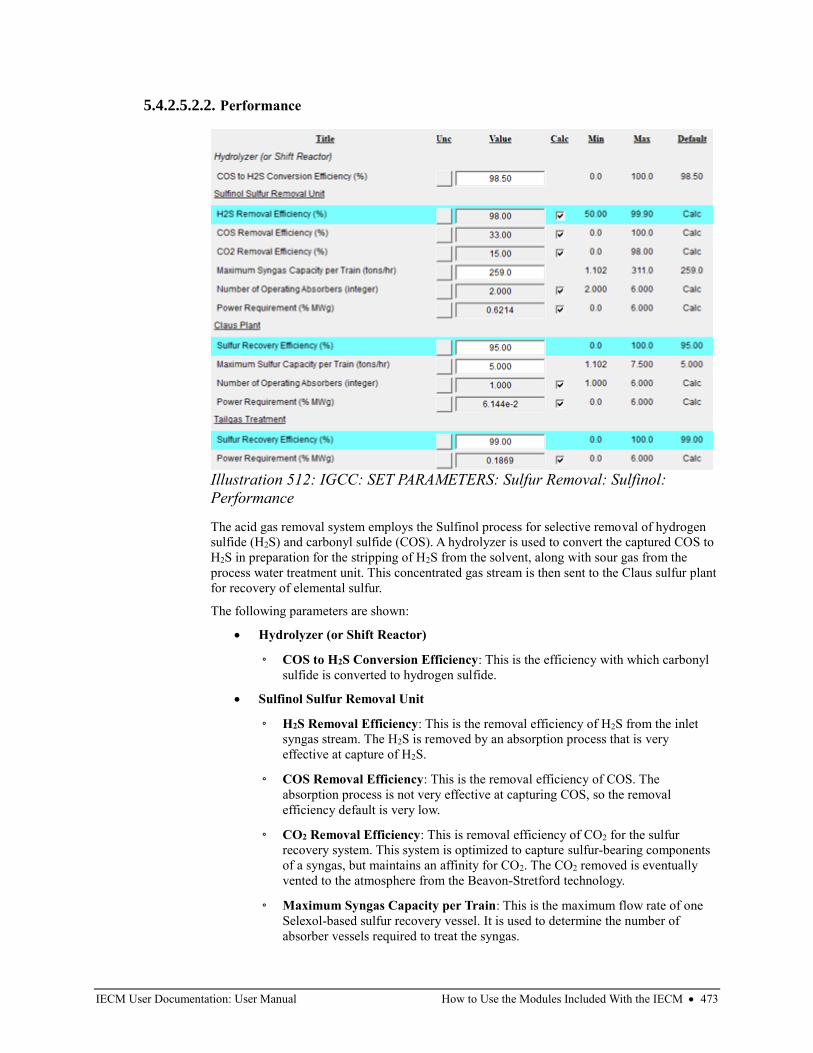
IECM User Documentation: User Manual How to Use the Modules Included With the IECM • 473
5.4.2.5.2.2. Performance
The acid gas removal system employs the Sulfinol process for selective removal of hydrogen
sulfide (H2S) and carbonyl sulfide (COS). A hydrolyzer is used to convert the captured COS to
H2S in preparation for the stripping of H2S from the solvent, along with sour gas from the
process water treatment unit. This concentrated gas stream is then sent to the Claus sulfur plant
for recovery of elemental sulfur.
The following parameters are shown:
• Hydrolyzer (or Shift Reactor)
◦ COS to H2S Conversion Efficiency: This is the efficiency with which carbonyl
sulfide is converted to hydrogen sulfide.
• Sulfinol Sulfur Removal Unit
◦ H2S Removal Efficiency: This is the removal efficiency of H2S from the inlet
syngas stream. The H2S is removed by an absorption process that is very
effective at capture of H2S.
◦ COS Removal Efficiency: This is the removal efficiency of COS. The
absorption process is not very effective at capturing COS, so the removal
efficiency default is very low.
◦ CO2 Removal Efficiency: This is removal efficiency of CO2 for the sulfur
recovery system. This system is optimized to capture sulfur-bearing components
of a syngas, but maintains an affinity for CO2. The CO2 removed is eventually
vented to the atmosphere from the Beavon-Stretford technology.
◦ Maximum Syngas Capacity per Train: This is the maximum flow rate of one
Selexol-based sulfur recovery vessel. It is used to determine the number of
absorber vessels required to treat the syngas.
Illustration 512: IGCC: SET PARAMETERS: Sulfur Removal: Sulfinol:
Performance
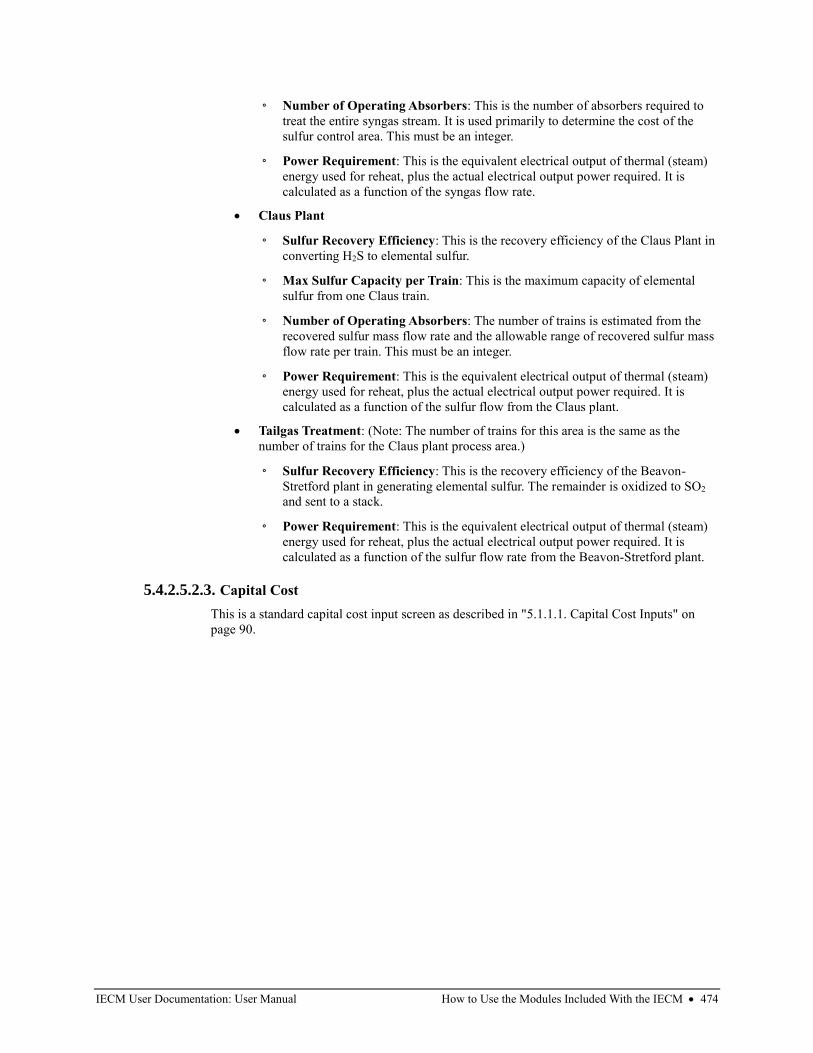
IECM User Documentation: User Manual How to Use the Modules Included With the IECM • 474
◦ Number of Operating Absorbers: This is the number of absorbers required to
treat the entire syngas stream. It is used primarily to determine the cost of the
sulfur control area. This must be an integer.
◦ Power Requirement: This is the equivalent electrical output of thermal (steam)
energy used for reheat, plus the actual electrical output power required. It is
calculated as a function of the syngas flow rate.
• Claus Plant
◦ Sulfur Recovery Efficiency: This is the recovery efficiency of the Claus Plant in
converting H2S to elemental sulfur.
◦ Max Sulfur Capacity per Train: This is the maximum capacity of elemental
sulfur from one Claus train.
◦ Number of Operating Absorbers: The number of trains is estimated from the
recovered sulfur mass flow rate and the allowable range of recovered sulfur mass
flow rate per train. This must be an integer.
◦ Power Requirement: This is the equivalent electrical output of thermal (steam)
energy used for reheat, plus the actual electrical output power required. It is
calculated as a function of the sulfur flow from the Claus plant.
• Tailgas Treatment: (Note: The number of trains for this area is the same as the
number of trains for the Claus plant process area.)
◦ Sulfur Recovery Efficiency: This is the recovery efficiency of the Beavon-
Stretford plant in generating elemental sulfur. The remainder is oxidized to SO2
and sent to a stack.
◦ Power Requirement: This is the equivalent electrical output of thermal (steam)
energy used for reheat, plus the actual electrical output power required. It is
calculated as a function of the sulfur flow rate from the Beavon-Stretford plant.
5.4.2.5.2.3. Capital Cost
This is a standard capital cost input screen as described in "5.1.1.1. Capital Cost Inputs" on
page 90.
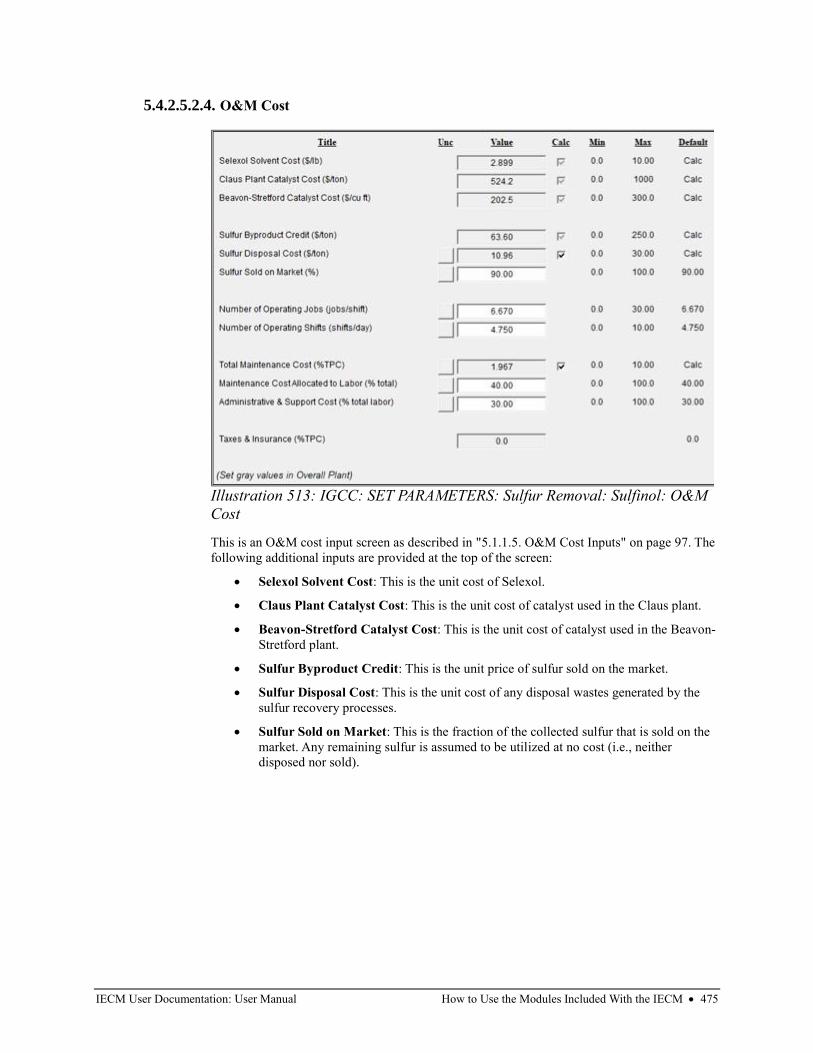
IECM User Documentation: User Manual How to Use the Modules Included With the IECM • 475
5.4.2.5.2.4. O&M Cost
This is an O&M cost input screen as described in "5.1.1.5. O&M Cost Inputs" on page 97. The
following additional inputs are provided at the top of the screen:
• Selexol Solvent Cost: This is the unit cost of Selexol.
• Claus Plant Catalyst Cost: This is the unit cost of catalyst used in the Claus plant.
• Beavon-Stretford Catalyst Cost: This is the unit cost of catalyst used in the Beavon-
Stretford plant.
• Sulfur Byproduct Credit: This is the unit price of sulfur sold on the market.
• Sulfur Disposal Cost: This is the unit cost of any disposal wastes generated by the
sulfur recovery processes.
• Sulfur Sold on Market: This is the fraction of the collected sulfur that is sold on the
market. Any remaining sulfur is assumed to be utilized at no cost (i.e., neither
disposed nor sold).
Illustration 513: IGCC: SET PARAMETERS: Sulfur Removal: Sulfinol: O&M
Cost
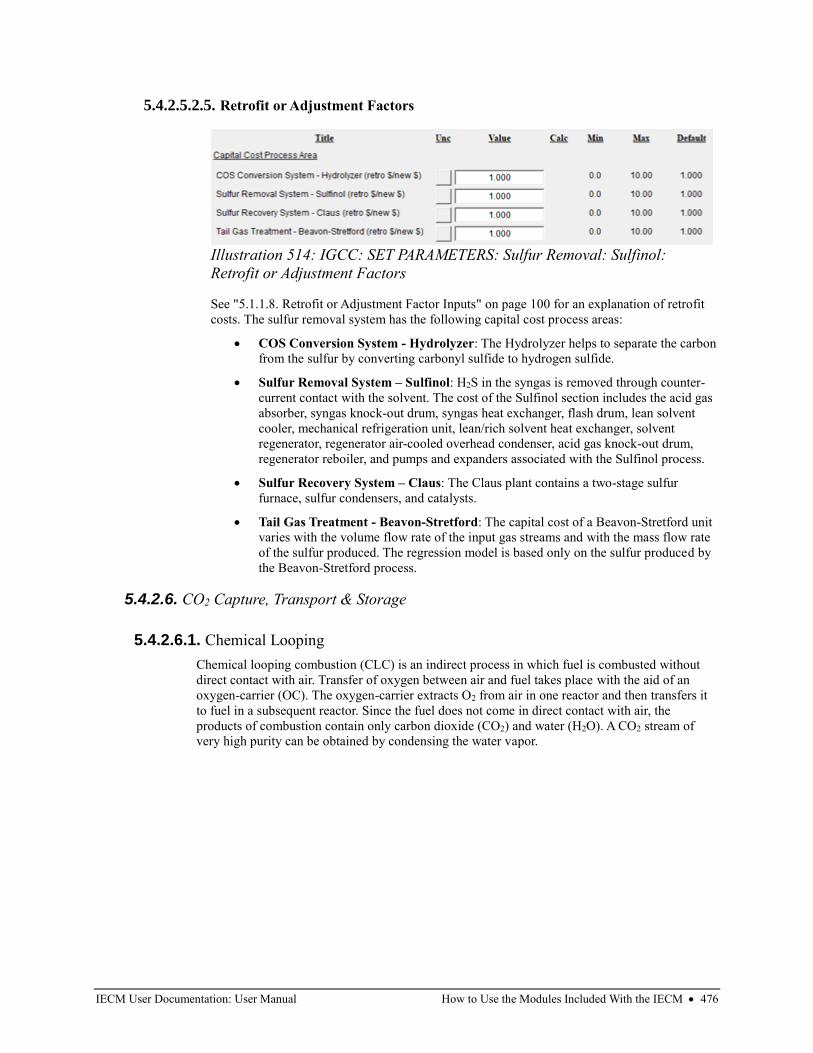
IECM User Documentation: User Manual How to Use the Modules Included With the IECM • 476
5.4.2.5.2.5. Retrofit or Adjustment Factors
See "5.1.1.8. Retrofit or Adjustment Factor Inputs" on page 100 for an explanation of retrofit
costs. The sulfur removal system has the following capital cost process areas:
• COS Conversion System - Hydrolyzer: The Hydrolyzer helps to separate the carbon
from the sulfur by converting carbonyl sulfide to hydrogen sulfide.
• Sulfur Removal System – Sulfinol: H2S in the syngas is removed through counter-
current contact with the solvent. The cost of the Sulfinol section includes the acid gas
absorber, syngas knock-out drum, syngas heat exchanger, flash drum, lean solvent
cooler, mechanical refrigeration unit, lean/rich solvent heat exchanger, solvent
regenerator, regenerator air-cooled overhead condenser, acid gas knock-out drum,
regenerator reboiler, and pumps and expanders associated with the Sulfinol process.
• Sulfur Recovery System – Claus: The Claus plant contains a two-stage sulfur
furnace, sulfur condensers, and catalysts.
• Tail Gas Treatment - Beavon-Stretford: The capital cost of a Beavon-Stretford unit
varies with the volume flow rate of the input gas streams and with the mass flow rate
of the sulfur produced. The regression model is based only on the sulfur produced by
the Beavon-Stretford process.
5.4.2.6. CO2 Capture, Transport & Storage
5.4.2.6.1. Chemical Looping
Chemical looping combustion (CLC) is an indirect process in which fuel is combusted without
direct contact with air. Transfer of oxygen between air and fuel takes place with the aid of an
oxygen-carrier (OC). The oxygen-carrier extracts O2 from air in one reactor and then transfers it
to fuel in a subsequent reactor. Since the fuel does not come in direct contact with air, the
products of combustion contain only carbon dioxide (CO2) and water (H2O). A CO2 stream of
very high purity can be obtained by condensing the water vapor.
Illustration 514: IGCC: SET PARAMETERS: Sulfur Removal: Sulfinol:
Retrofit or Adjustment Factors
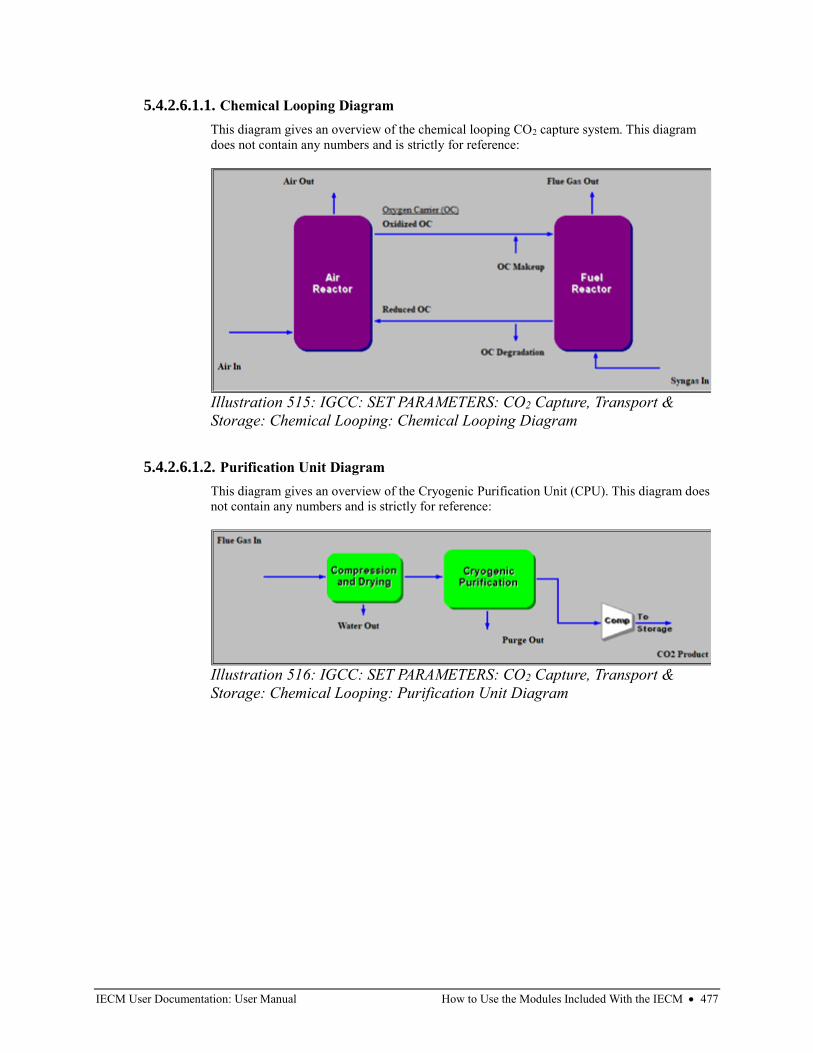
IECM User Documentation: User Manual How to Use the Modules Included With the IECM • 477
5.4.2.6.1.1. Chemical Looping Diagram
This diagram gives an overview of the chemical looping CO2 capture system. This diagram
does not contain any numbers and is strictly for reference:
5.4.2.6.1.2. Purification Unit Diagram
This diagram gives an overview of the Cryogenic Purification Unit (CPU). This diagram does
not contain any numbers and is strictly for reference:
Illustration 515: IGCC: SET PARAMETERS: CO2 Capture, Transport &
Storage: Chemical Looping: Chemical Looping Diagram
Illustration 516: IGCC: SET PARAMETERS: CO2 Capture, Transport &
Storage: Chemical Looping: Purification Unit Diagram
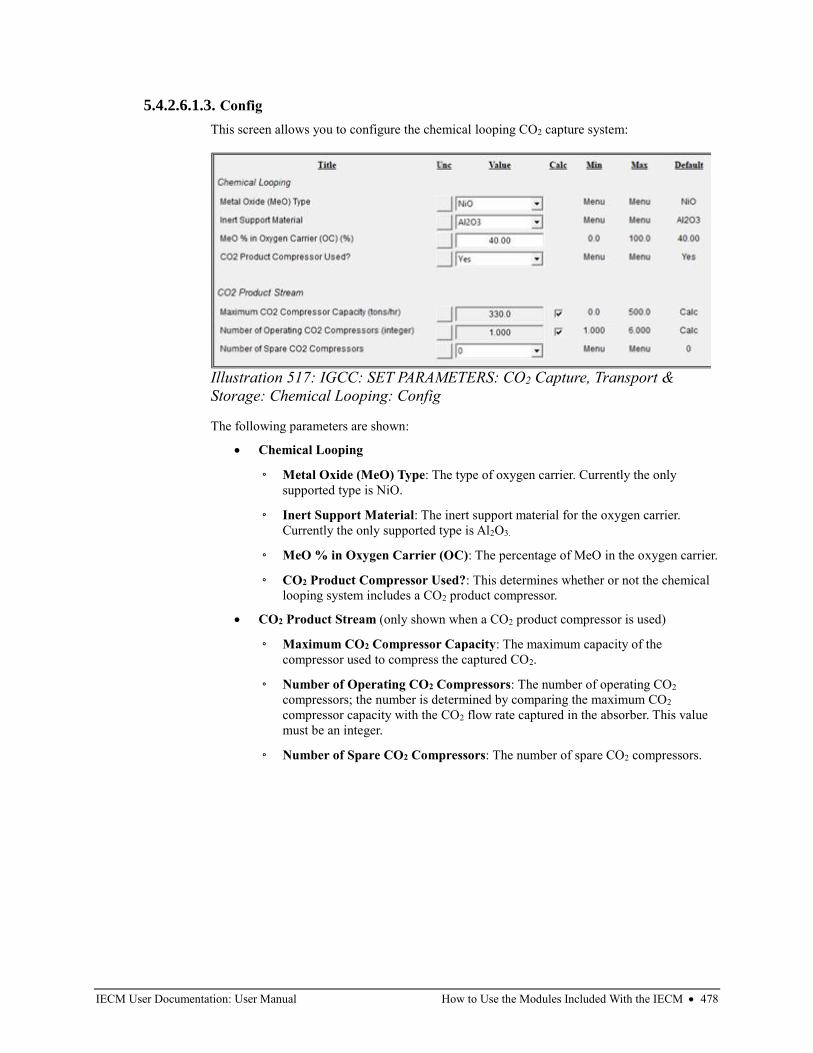
IECM User Documentation: User Manual How to Use the Modules Included With the IECM • 478
5.4.2.6.1.3. Config
This screen allows you to configure the chemical looping CO2 capture system:
The following parameters are shown:
• Chemical Looping
◦ Metal Oxide (MeO) Type: The type of oxygen carrier. Currently the only
supported type is NiO.
◦ Inert Support Material: The inert support material for the oxygen carrier.
Currently the only supported type is Al2O3.
◦ MeO % in Oxygen Carrier (OC): The percentage of MeO in the oxygen carrier.
◦ CO2 Product Compressor Used?: This determines whether or not the chemical
looping system includes a CO2 product compressor.
• CO2 Product Stream (only shown when a CO2 product compressor is used)
◦ Maximum CO2 Compressor Capacity: The maximum capacity of the
compressor used to compress the captured CO2.
◦ Number of Operating CO2 Compressors: The number of operating CO2
compressors; the number is determined by comparing the maximum CO2
compressor capacity with the CO2 flow rate captured in the absorber. This value
must be an integer.
◦ Number of Spare CO2 Compressors: The number of spare CO2 compressors.
Illustration 517: IGCC: SET PARAMETERS: CO2 Capture, Transport &
Storage: Chemical Looping: Config
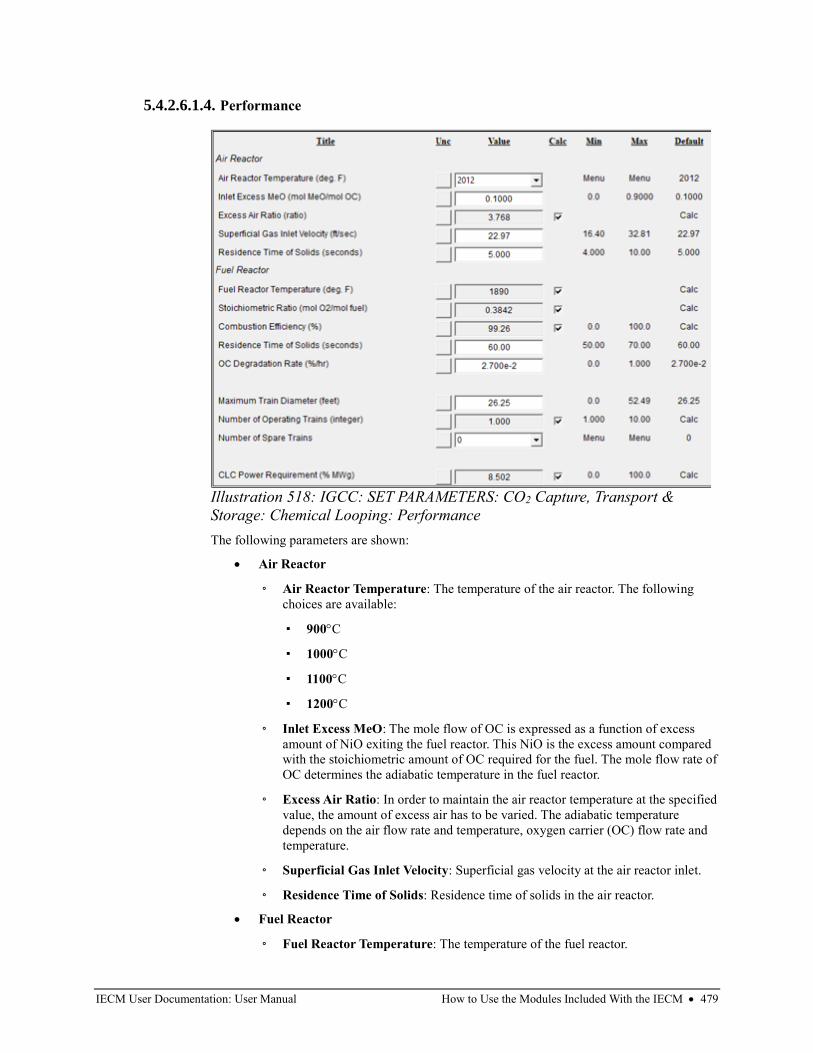
IECM User Documentation: User Manual How to Use the Modules Included With the IECM • 479
5.4.2.6.1.4. Performance
The following parameters are shown:
• Air Reactor
◦ Air Reactor Temperature: The temperature of the air reactor. The following
choices are available:
▪ 900C
▪ 1000C
▪ 1100C
▪ 1200C
◦ Inlet Excess MeO: The mole flow of OC is expressed as a function of excess
amount of NiO exiting the fuel reactor. This NiO is the excess amount compared
with the stoichiometric amount of OC required for the fuel. The mole flow rate of
OC determines the adiabatic temperature in the fuel reactor.
◦ Excess Air Ratio: In order to maintain the air reactor temperature at the specified
value, the amount of excess air has to be varied. The adiabatic temperature
depends on the air flow rate and temperature, oxygen carrier (OC) flow rate and
temperature.
◦ Superficial Gas Inlet Velocity: Superficial gas velocity at the air reactor inlet.
◦ Residence Time of Solids: Residence time of solids in the air reactor.
• Fuel Reactor
◦ Fuel Reactor Temperature: The temperature of the fuel reactor.
Illustration 518: IGCC: SET PARAMETERS: CO2 Capture, Transport &
Storage: Chemical Looping: Performance
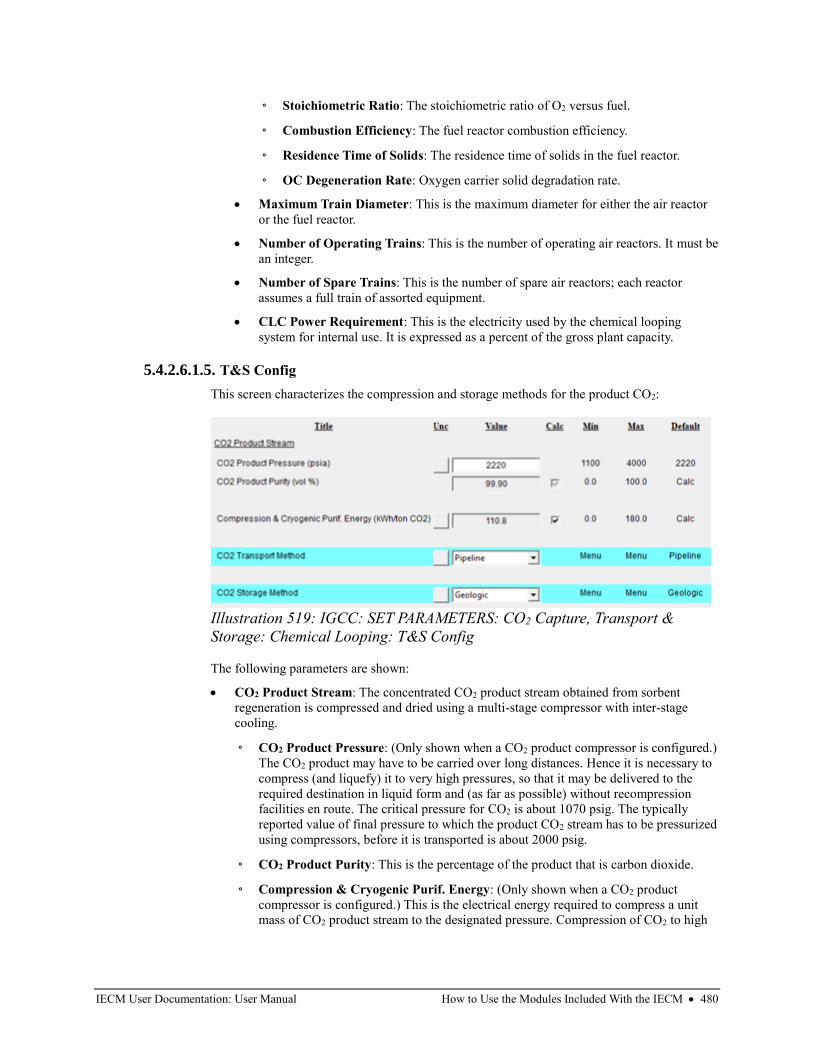
IECM User Documentation: User Manual How to Use the Modules Included With the IECM • 480
◦ Stoichiometric Ratio: The stoichiometric ratio of O2 versus fuel.
◦ Combustion Efficiency: The fuel reactor combustion efficiency.
◦ Residence Time of Solids: The residence time of solids in the fuel reactor.
◦ OC Degeneration Rate: Oxygen carrier solid degradation rate.
• Maximum Train Diameter: This is the maximum diameter for either the air reactor
or the fuel reactor.
• Number of Operating Trains: This is the number of operating air reactors. It must be
an integer.
• Number of Spare Trains: This is the number of spare air reactors; each reactor
assumes a full train of assorted equipment.
• CLC Power Requirement: This is the electricity used by the chemical looping
system for internal use. It is expressed as a percent of the gross plant capacity.
5.4.2.6.1.5. T&S Config
This screen characterizes the compression and storage methods for the product CO2:
The following parameters are shown:
• CO2 Product Stream: The concentrated CO2 product stream obtained from sorbent
regeneration is compressed and dried using a multi-stage compressor with inter-stage
cooling.
◦ CO2 Product Pressure: (Only shown when a CO2 product compressor is configured.)
The CO2 product may have to be carried over long distances. Hence it is necessary to
compress (and liquefy) it to very high pressures, so that it may be delivered to the
required destination in liquid form and (as far as possible) without recompression
facilities en route. The critical pressure for CO2 is about 1070 psig. The typically
reported value of final pressure to which the product CO2 stream has to be pressurized
using compressors, before it is transported is about 2000 psig.
◦ CO2 Product Purity: This is the percentage of the product that is carbon dioxide.
◦ Compression & Cryogenic Purif. Energy: (Only shown when a CO2 product
compressor is configured.) This is the electrical energy required to compress a unit
mass of CO2 product stream to the designated pressure. Compression of CO2 to high
Illustration 519: IGCC: SET PARAMETERS: CO2 Capture, Transport &
Storage: Chemical Looping: T&S Config
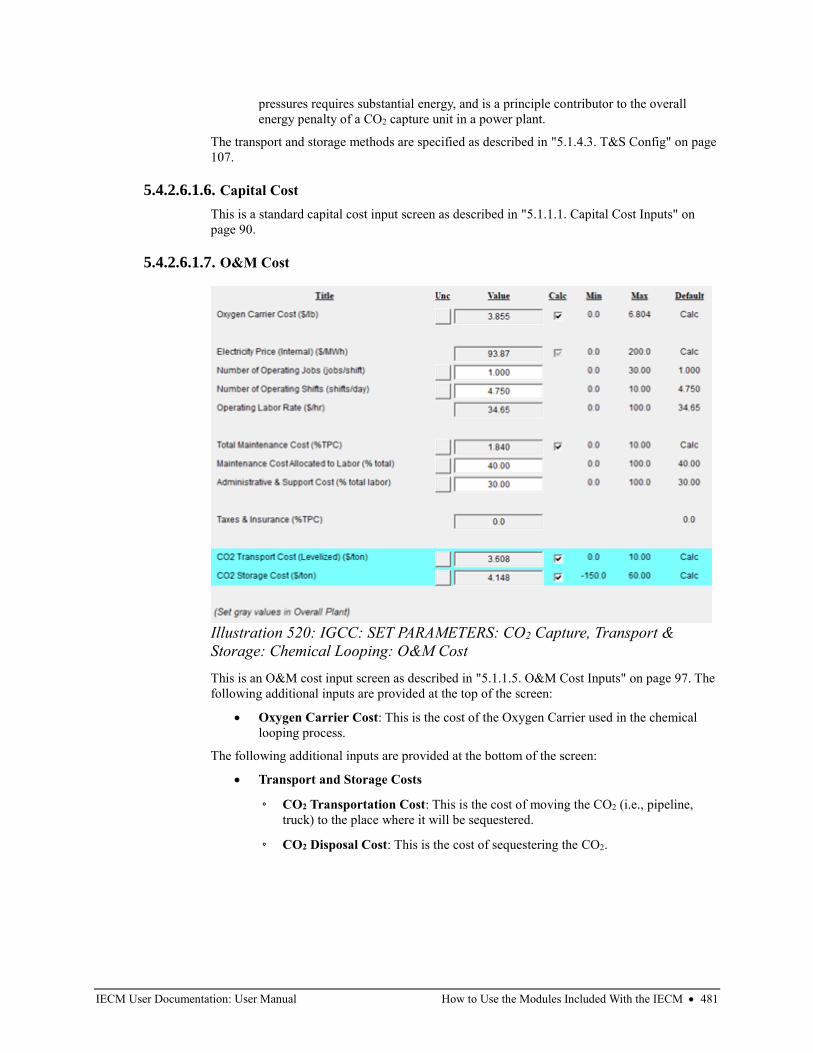
IECM User Documentation: User Manual How to Use the Modules Included With the IECM • 481
pressures requires substantial energy, and is a principle contributor to the overall
energy penalty of a CO2 capture unit in a power plant.
The transport and storage methods are specified as described in "5.1.4.3. T&S Config" on page
107.
5.4.2.6.1.6. Capital Cost
This is a standard capital cost input screen as described in "5.1.1.1. Capital Cost Inputs" on
page 90.
5.4.2.6.1.7. O&M Cost
This is an O&M cost input screen as described in "5.1.1.5. O&M Cost Inputs" on page 97. The
following additional inputs are provided at the top of the screen:
• Oxygen Carrier Cost: This is the cost of the Oxygen Carrier used in the chemical
looping process.
The following additional inputs are provided at the bottom of the screen:
• Transport and Storage Costs
◦ CO2 Transportation Cost: This is the cost of moving the CO2 (i.e., pipeline,
truck) to the place where it will be sequestered.
◦ CO2 Disposal Cost: This is the cost of sequestering the CO2.
Illustration 520: IGCC: SET PARAMETERS: CO2 Capture, Transport &
Storage: Chemical Looping: O&M Cost
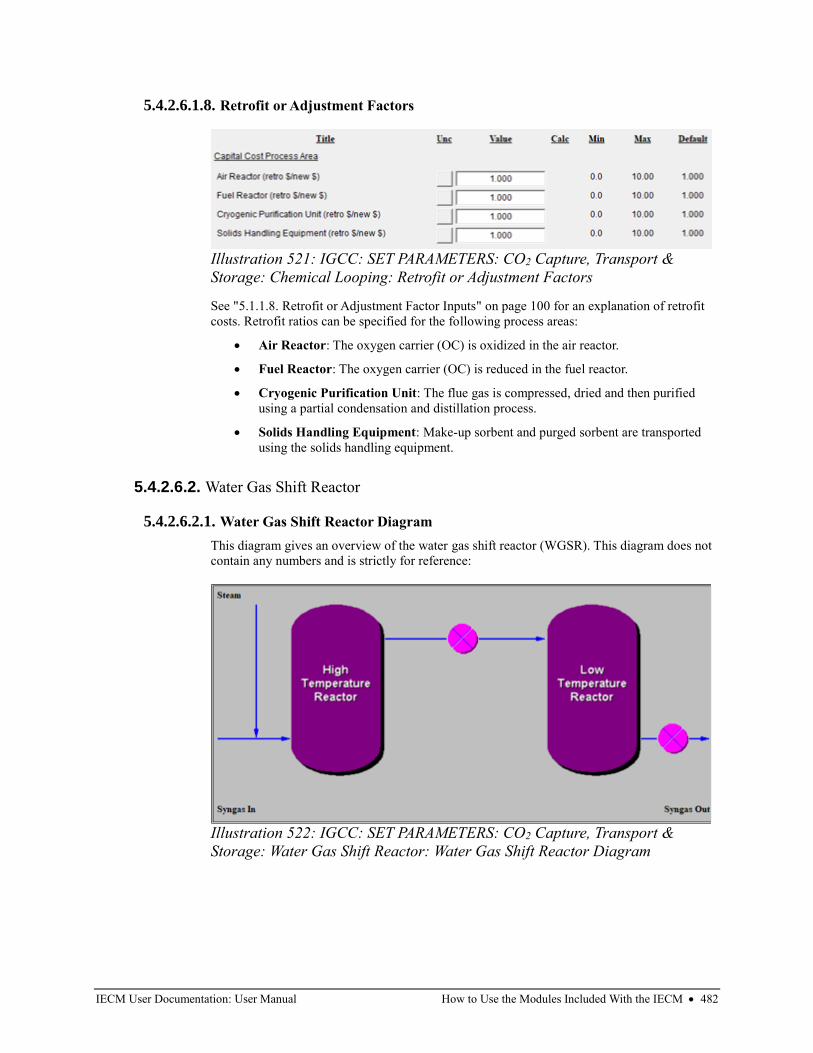
IECM User Documentation: User Manual How to Use the Modules Included With the IECM • 482
5.4.2.6.1.8. Retrofit or Adjustment Factors
See "5.1.1.8. Retrofit or Adjustment Factor Inputs" on page 100 for an explanation of retrofit
costs. Retrofit ratios can be specified for the following process areas:
• Air Reactor: The oxygen carrier (OC) is oxidized in the air reactor.
• Fuel Reactor: The oxygen carrier (OC) is reduced in the fuel reactor.
• Cryogenic Purification Unit: The flue gas is compressed, dried and then purified
using a partial condensation and distillation process.
• Solids Handling Equipment: Make-up sorbent and purged sorbent are transported
using the solids handling equipment.
5.4.2.6.2. Water Gas Shift Reactor
5.4.2.6.2.1. Water Gas Shift Reactor Diagram
This diagram gives an overview of the water gas shift reactor (WGSR). This diagram does not
contain any numbers and is strictly for reference:
Illustration 521: IGCC: SET PARAMETERS: CO2 Capture, Transport &
Storage: Chemical Looping: Retrofit or Adjustment Factors
Illustration 522: IGCC: SET PARAMETERS: CO2 Capture, Transport &
Storage: Water Gas Shift Reactor: Water Gas Shift Reactor Diagram
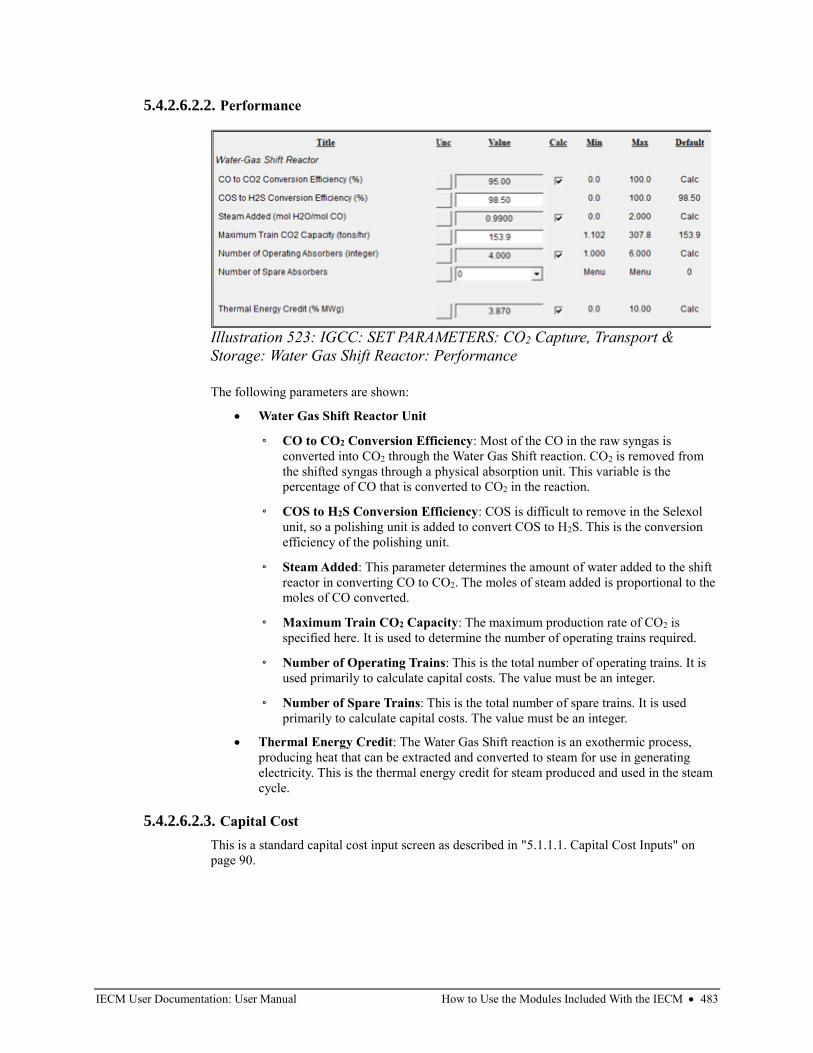
IECM User Documentation: User Manual How to Use the Modules Included With the IECM • 483
5.4.2.6.2.2. Performance
The following parameters are shown:
• Water Gas Shift Reactor Unit
◦ CO to CO2 Conversion Efficiency: Most of the CO in the raw syngas is
converted into CO2 through the Water Gas Shift reaction. CO2 is removed from
the shifted syngas through a physical absorption unit. This variable is the
percentage of CO that is converted to CO2 in the reaction.
◦ COS to H2S Conversion Efficiency: COS is difficult to remove in the Selexol
unit, so a polishing unit is added to convert COS to H2S. This is the conversion
efficiency of the polishing unit.
◦ Steam Added: This parameter determines the amount of water added to the shift
reactor in converting CO to CO2. The moles of steam added is proportional to the
moles of CO converted.
◦ Maximum Train CO2 Capacity: The maximum production rate of CO2 is
specified here. It is used to determine the number of operating trains required.
◦ Number of Operating Trains: This is the total number of operating trains. It is
used primarily to calculate capital costs. The value must be an integer.
◦ Number of Spare Trains: This is the total number of spare trains. It is used
primarily to calculate capital costs. The value must be an integer.
• Thermal Energy Credit: The Water Gas Shift reaction is an exothermic process,
producing heat that can be extracted and converted to steam for use in generating
electricity. This is the thermal energy credit for steam produced and used in the steam
cycle.
5.4.2.6.2.3. Capital Cost
This is a standard capital cost input screen as described in "5.1.1.1. Capital Cost Inputs" on
page 90.
Illustration 523: IGCC: SET PARAMETERS: CO2 Capture, Transport &
Storage: Water Gas Shift Reactor: Performance
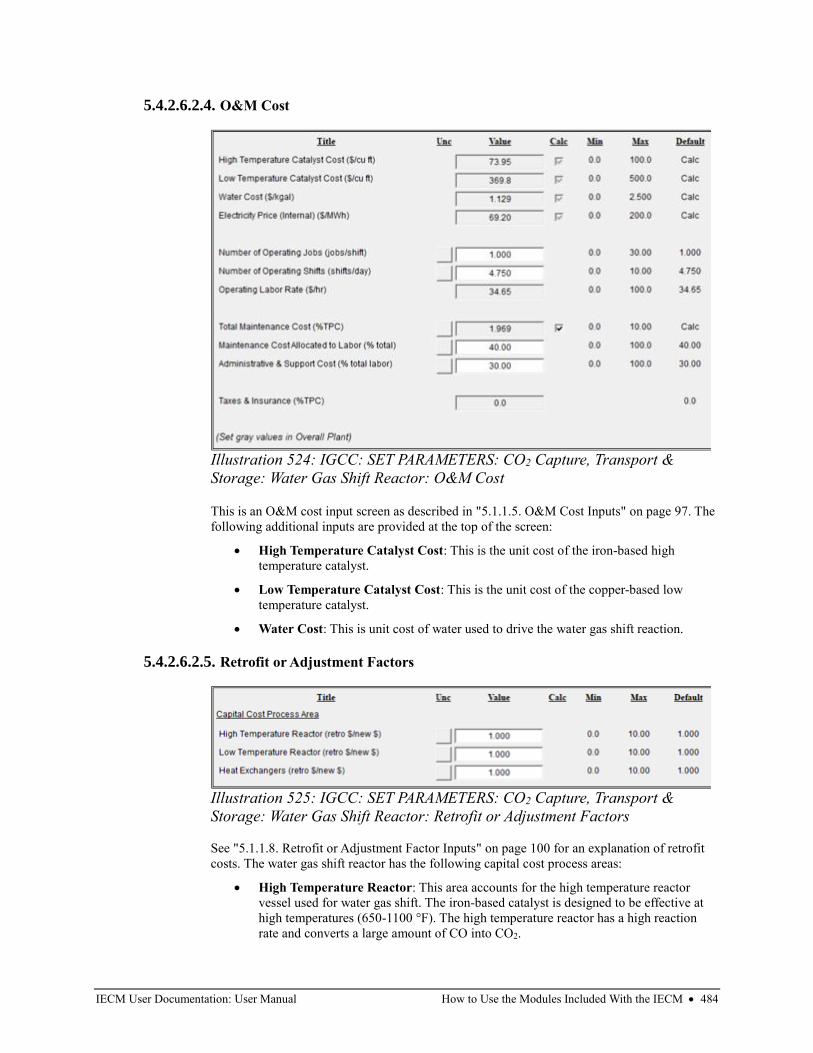
IECM User Documentation: User Manual How to Use the Modules Included With the IECM • 484
5.4.2.6.2.4. O&M Cost
This is an O&M cost input screen as described in "5.1.1.5. O&M Cost Inputs" on page 97. The
following additional inputs are provided at the top of the screen:
• High Temperature Catalyst Cost: This is the unit cost of the iron-based high
temperature catalyst.
• Low Temperature Catalyst Cost: This is the unit cost of the copper-based low
temperature catalyst.
• Water Cost: This is unit cost of water used to drive the water gas shift reaction.
5.4.2.6.2.5. Retrofit or Adjustment Factors
See "5.1.1.8. Retrofit or Adjustment Factor Inputs" on page 100 for an explanation of retrofit
costs. The water gas shift reactor has the following capital cost process areas:
• High Temperature Reactor: This area accounts for the high temperature reactor
vessel used for water gas shift. The iron-based catalyst is designed to be effective at
high temperatures (650-1100 °F). The high temperature reactor has a high reaction
rate and converts a large amount of CO into CO2.
Illustration 524: IGCC: SET PARAMETERS: CO2 Capture, Transport &
Storage: Water Gas Shift Reactor: O&M Cost
Illustration 525: IGCC: SET PARAMETERS: CO2 Capture, Transport &
Storage: Water Gas Shift Reactor: Retrofit or Adjustment Factors
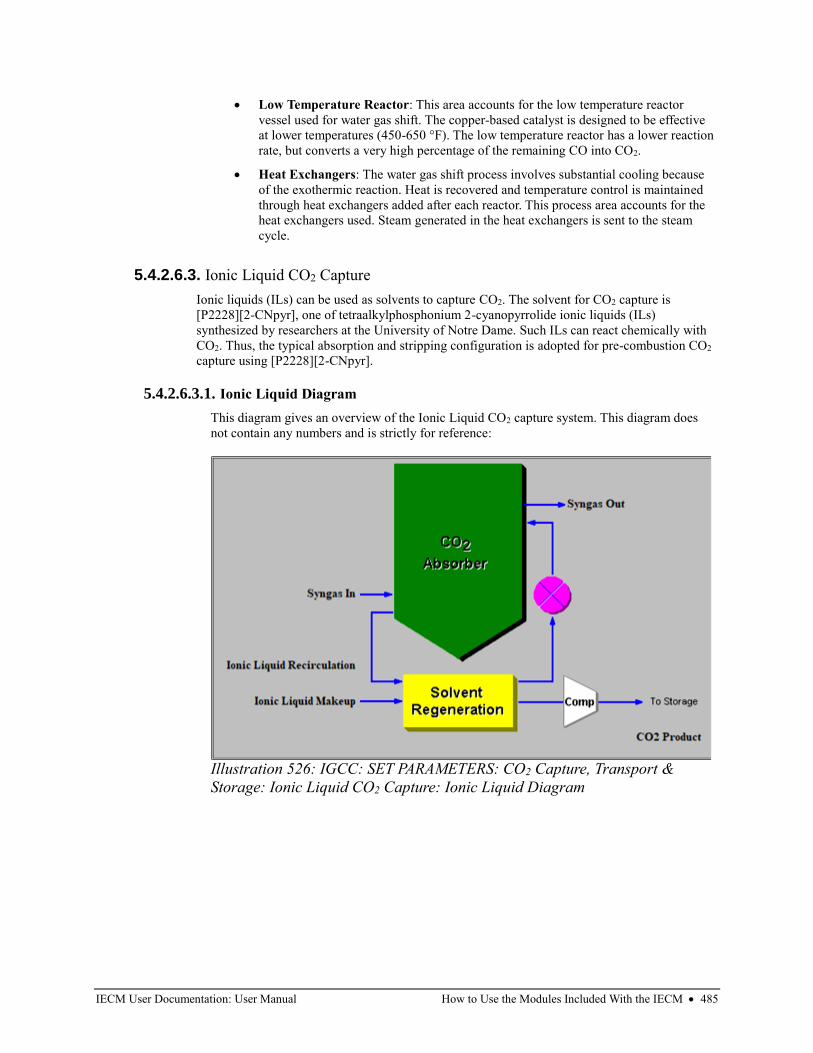
IECM User Documentation: User Manual How to Use the Modules Included With the IECM • 485
• Low Temperature Reactor: This area accounts for the low temperature reactor
vessel used for water gas shift. The copper-based catalyst is designed to be effective
at lower temperatures (450-650 °F). The low temperature reactor has a lower reaction
rate, but converts a very high percentage of the remaining CO into CO2.
• Heat Exchangers: The water gas shift process involves substantial cooling because
of the exothermic reaction. Heat is recovered and temperature control is maintained
through heat exchangers added after each reactor. This process area accounts for the
heat exchangers used. Steam generated in the heat exchangers is sent to the steam
cycle.
5.4.2.6.3. Ionic Liquid CO2 Capture
Ionic liquids (ILs) can be used as solvents to capture CO2. The solvent for CO2 capture is
[P2228][2-CNpyr], one of tetraalkylphosphonium 2-cyanopyrrolide ionic liquids (ILs)
synthesized by researchers at the University of Notre Dame. Such ILs can react chemically with
CO2. Thus, the typical absorption and stripping configuration is adopted for pre-combustion CO2
capture using [P2228][2-CNpyr].
5.4.2.6.3.1. Ionic Liquid Diagram
This diagram gives an overview of the Ionic Liquid CO2 capture system. This diagram does
not contain any numbers and is strictly for reference:
Illustration 526: IGCC: SET PARAMETERS: CO2 Capture, Transport &
Storage: Ionic Liquid CO2 Capture: Ionic Liquid Diagram
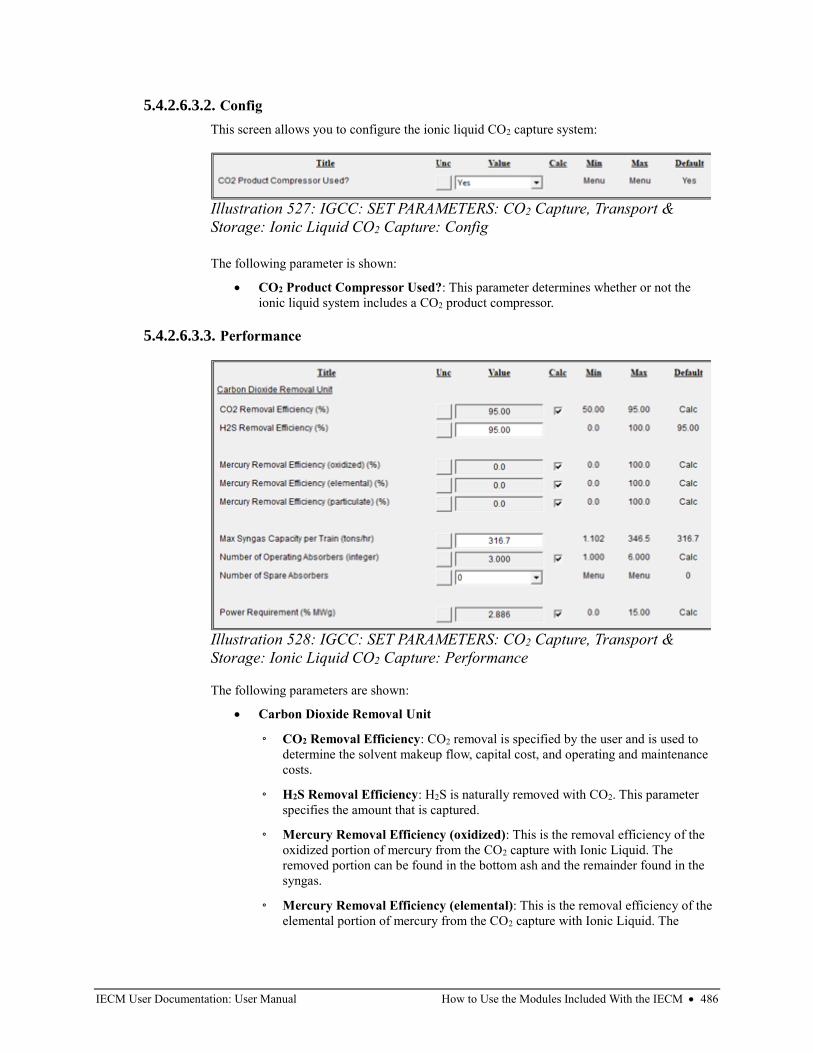
IECM User Documentation: User Manual How to Use the Modules Included With the IECM • 486
5.4.2.6.3.2. Config
This screen allows you to configure the ionic liquid CO2 capture system:
The following parameter is shown:
• CO2 Product Compressor Used?: This parameter determines whether or not the
ionic liquid system includes a CO2 product compressor.
5.4.2.6.3.3. Performance
The following parameters are shown:
• Carbon Dioxide Removal Unit
◦ CO2 Removal Efficiency: CO2 removal is specified by the user and is used to
determine the solvent makeup flow, capital cost, and operating and maintenance
costs.
◦ H2S Removal Efficiency: H2S is naturally removed with CO2. This parameter
specifies the amount that is captured.
◦ Mercury Removal Efficiency (oxidized): This is the removal efficiency of the
oxidized portion of mercury from the CO2 capture with Ionic Liquid. The
removed portion can be found in the bottom ash and the remainder found in the
syngas.
◦ Mercury Removal Efficiency (elemental): This is the removal efficiency of the
elemental portion of mercury from the CO2 capture with Ionic Liquid. The
Illustration 527: IGCC: SET PARAMETERS: CO2 Capture, Transport &
Storage: Ionic Liquid CO2 Capture: Config
Illustration 528: IGCC: SET PARAMETERS: CO2 Capture, Transport &
Storage: Ionic Liquid CO2 Capture: Performance
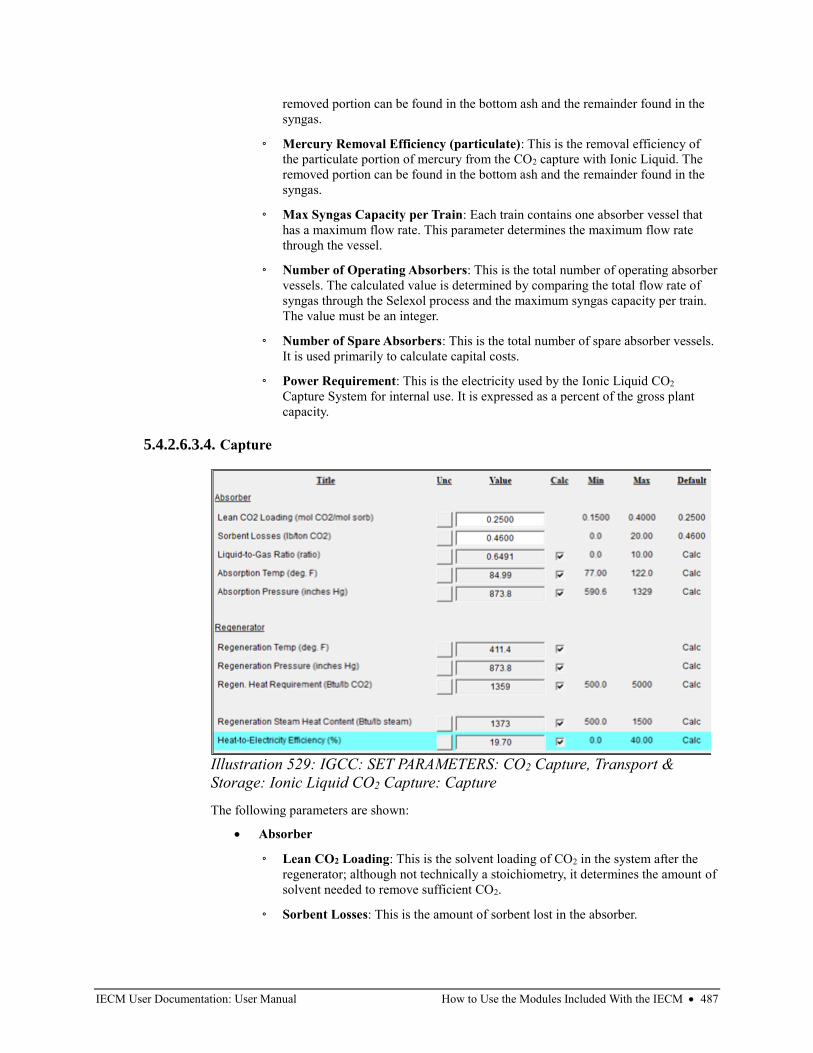
IECM User Documentation: User Manual How to Use the Modules Included With the IECM • 487
removed portion can be found in the bottom ash and the remainder found in the
syngas.
◦ Mercury Removal Efficiency (particulate): This is the removal efficiency of
the particulate portion of mercury from the CO2 capture with Ionic Liquid. The
removed portion can be found in the bottom ash and the remainder found in the
syngas.
◦ Max Syngas Capacity per Train: Each train contains one absorber vessel that
has a maximum flow rate. This parameter determines the maximum flow rate
through the vessel.
◦ Number of Operating Absorbers: This is the total number of operating absorber
vessels. The calculated value is determined by comparing the total flow rate of
syngas through the Selexol process and the maximum syngas capacity per train.
The value must be an integer.
◦ Number of Spare Absorbers: This is the total number of spare absorber vessels.
It is used primarily to calculate capital costs.
◦ Power Requirement: This is the electricity used by the Ionic Liquid CO2
Capture System for internal use. It is expressed as a percent of the gross plant
capacity.
5.4.2.6.3.4. Capture
The following parameters are shown:
• Absorber
◦ Lean CO2 Loading: This is the solvent loading of CO2 in the system after the
regenerator; although not technically a stoichiometry, it determines the amount of
solvent needed to remove sufficient CO2.
◦ Sorbent Losses: This is the amount of sorbent lost in the absorber.
Illustration 529: IGCC: SET PARAMETERS: CO2 Capture, Transport &
Storage: Ionic Liquid CO2 Capture: Capture
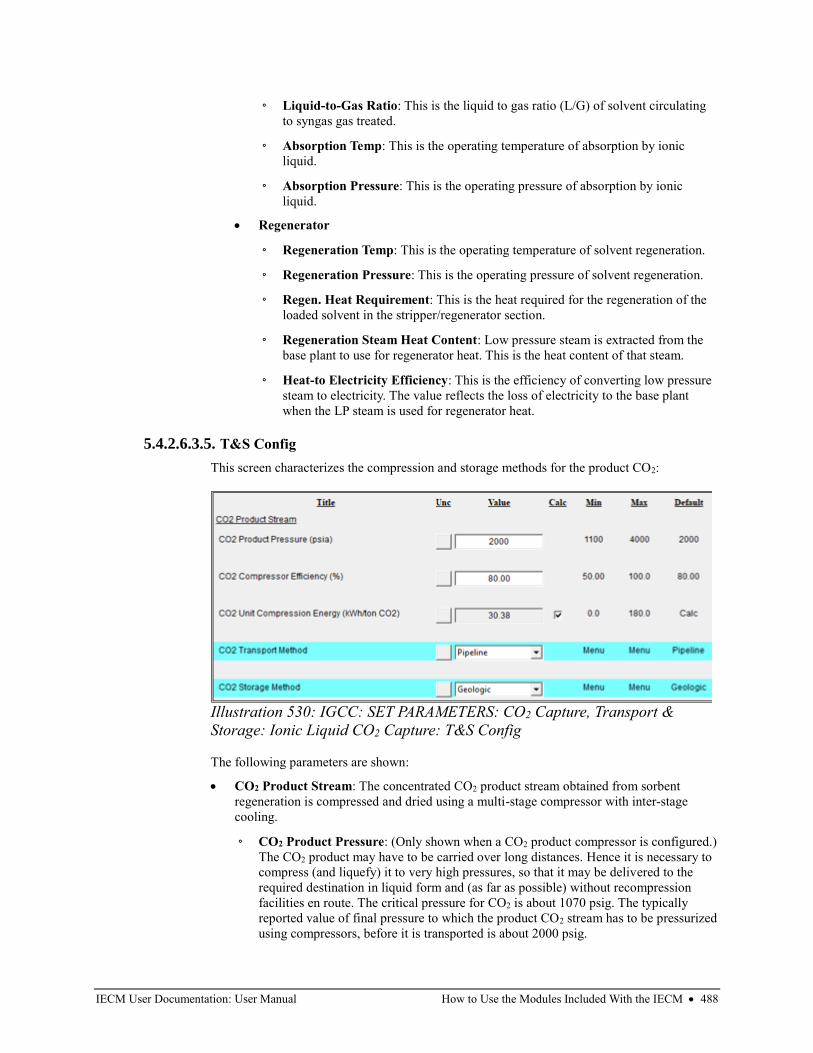
IECM User Documentation: User Manual How to Use the Modules Included With the IECM • 488
◦ Liquid-to-Gas Ratio: This is the liquid to gas ratio (L/G) of solvent circulating
to syngas gas treated.
◦ Absorption Temp: This is the operating temperature of absorption by ionic
liquid.
◦ Absorption Pressure: This is the operating pressure of absorption by ionic
liquid.
• Regenerator
◦ Regeneration Temp: This is the operating temperature of solvent regeneration.
◦ Regeneration Pressure: This is the operating pressure of solvent regeneration.
◦ Regen. Heat Requirement: This is the heat required for the regeneration of the
loaded solvent in the stripper/regenerator section.
◦ Regeneration Steam Heat Content: Low pressure steam is extracted from the
base plant to use for regenerator heat. This is the heat content of that steam.
◦ Heat-to Electricity Efficiency: This is the efficiency of converting low pressure
steam to electricity. The value reflects the loss of electricity to the base plant
when the LP steam is used for regenerator heat.
5.4.2.6.3.5. T&S Config
This screen characterizes the compression and storage methods for the product CO2:
The following parameters are shown:
• CO2 Product Stream: The concentrated CO2 product stream obtained from sorbent
regeneration is compressed and dried using a multi-stage compressor with inter-stage
cooling.
◦ CO2 Product Pressure: (Only shown when a CO2 product compressor is configured.)
The CO2 product may have to be carried over long distances. Hence it is necessary to
compress (and liquefy) it to very high pressures, so that it may be delivered to the
required destination in liquid form and (as far as possible) without recompression
facilities en route. The critical pressure for CO2 is about 1070 psig. The typically
reported value of final pressure to which the product CO2 stream has to be pressurized
using compressors, before it is transported is about 2000 psig.
Illustration 530: IGCC: SET PARAMETERS: CO2 Capture, Transport &
Storage: Ionic Liquid CO2 Capture: T&S Config
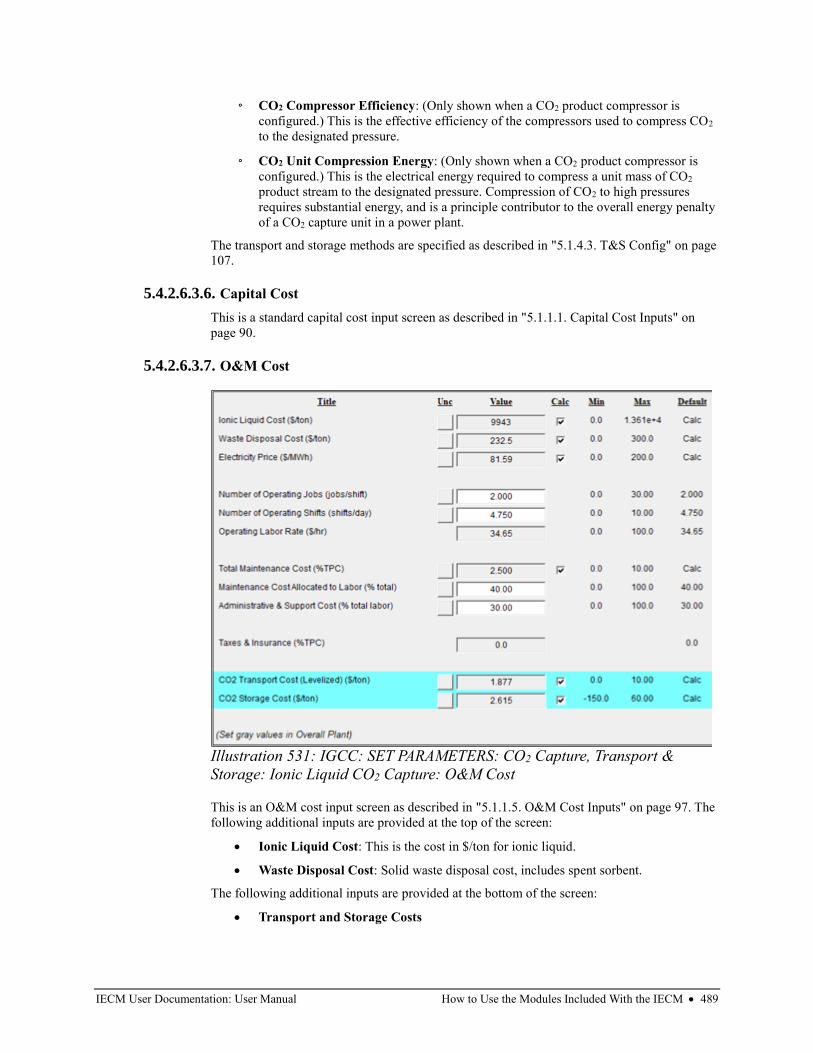
IECM User Documentation: User Manual How to Use the Modules Included With the IECM • 489
◦ CO2 Compressor Efficiency: (Only shown when a CO2 product compressor is
configured.) This is the effective efficiency of the compressors used to compress CO2
to the designated pressure.
◦ CO2 Unit Compression Energy: (Only shown when a CO2 product compressor is
configured.) This is the electrical energy required to compress a unit mass of CO2
product stream to the designated pressure. Compression of CO2 to high pressures
requires substantial energy, and is a principle contributor to the overall energy penalty
of a CO2 capture unit in a power plant.
The transport and storage methods are specified as described in "5.1.4.3. T&S Config" on page
107.
5.4.2.6.3.6. Capital Cost
This is a standard capital cost input screen as described in "5.1.1.1. Capital Cost Inputs" on
page 90.
5.4.2.6.3.7. O&M Cost
This is an O&M cost input screen as described in "5.1.1.5. O&M Cost Inputs" on page 97. The
following additional inputs are provided at the top of the screen:
• Ionic Liquid Cost: This is the cost in $/ton for ionic liquid.
• Waste Disposal Cost: Solid waste disposal cost, includes spent sorbent.
The following additional inputs are provided at the bottom of the screen:
• Transport and Storage Costs
Illustration 531: IGCC: SET PARAMETERS: CO2 Capture, Transport &
Storage: Ionic Liquid CO2 Capture: O&M Cost
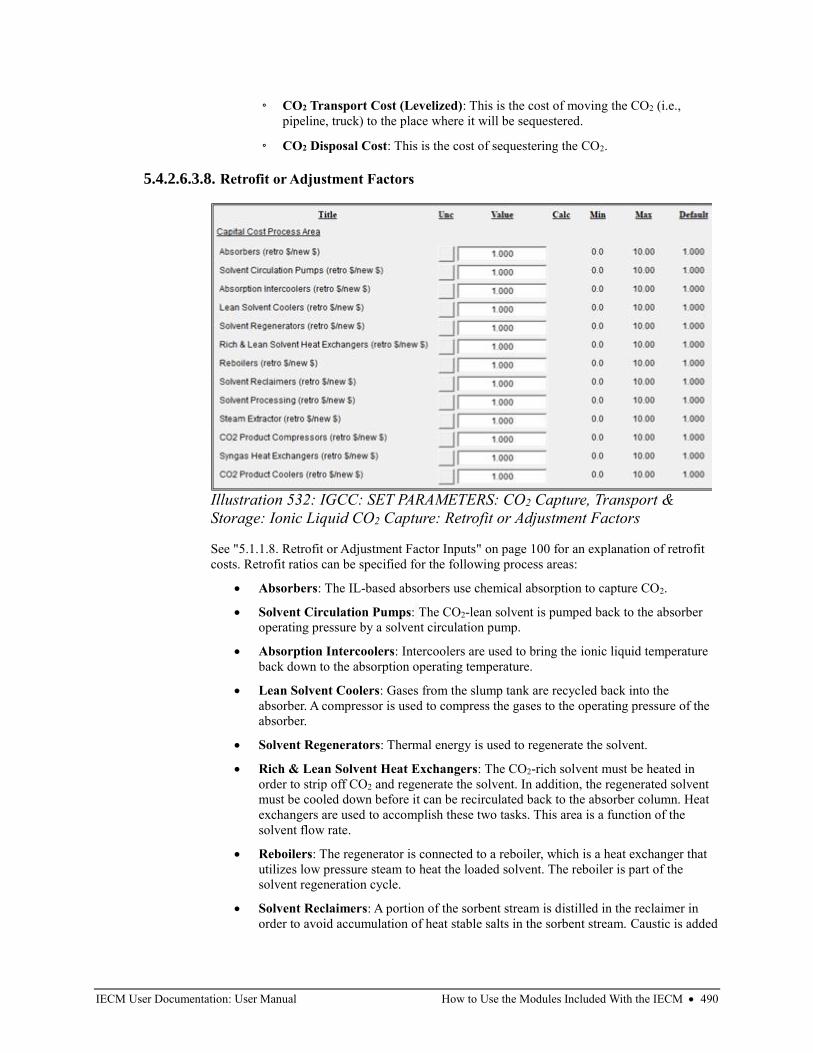
IECM User Documentation: User Manual How to Use the Modules Included With the IECM • 490
◦ CO2 Transport Cost (Levelized): This is the cost of moving the CO2 (i.e.,
pipeline, truck) to the place where it will be sequestered.
◦ CO2 Disposal Cost: This is the cost of sequestering the CO2.
5.4.2.6.3.8. Retrofit or Adjustment Factors
See "5.1.1.8. Retrofit or Adjustment Factor Inputs" on page 100 for an explanation of retrofit
costs. Retrofit ratios can be specified for the following process areas:
• Absorbers: The IL-based absorbers use chemical absorption to capture CO2.
• Solvent Circulation Pumps: The CO2-lean solvent is pumped back to the absorber
operating pressure by a solvent circulation pump.
• Absorption Intercoolers: Intercoolers are used to bring the ionic liquid temperature
back down to the absorption operating temperature.
• Lean Solvent Coolers: Gases from the slump tank are recycled back into the
absorber. A compressor is used to compress the gases to the operating pressure of the
absorber.
• Solvent Regenerators: Thermal energy is used to regenerate the solvent.
• Rich & Lean Solvent Heat Exchangers: The CO2-rich solvent must be heated in
order to strip off CO2 and regenerate the solvent. In addition, the regenerated solvent
must be cooled down before it can be recirculated back to the absorber column. Heat
exchangers are used to accomplish these two tasks. This area is a function of the
solvent flow rate.
• Reboilers: The regenerator is connected to a reboiler, which is a heat exchanger that
utilizes low pressure steam to heat the loaded solvent. The reboiler is part of the
solvent regeneration cycle.
• Solvent Reclaimers: A portion of the sorbent stream is distilled in the reclaimer in
order to avoid accumulation of heat stable salts in the sorbent stream. Caustic is added
Illustration 532: IGCC: SET PARAMETERS: CO2 Capture, Transport &
Storage: Ionic Liquid CO2 Capture: Retrofit or Adjustment Factors
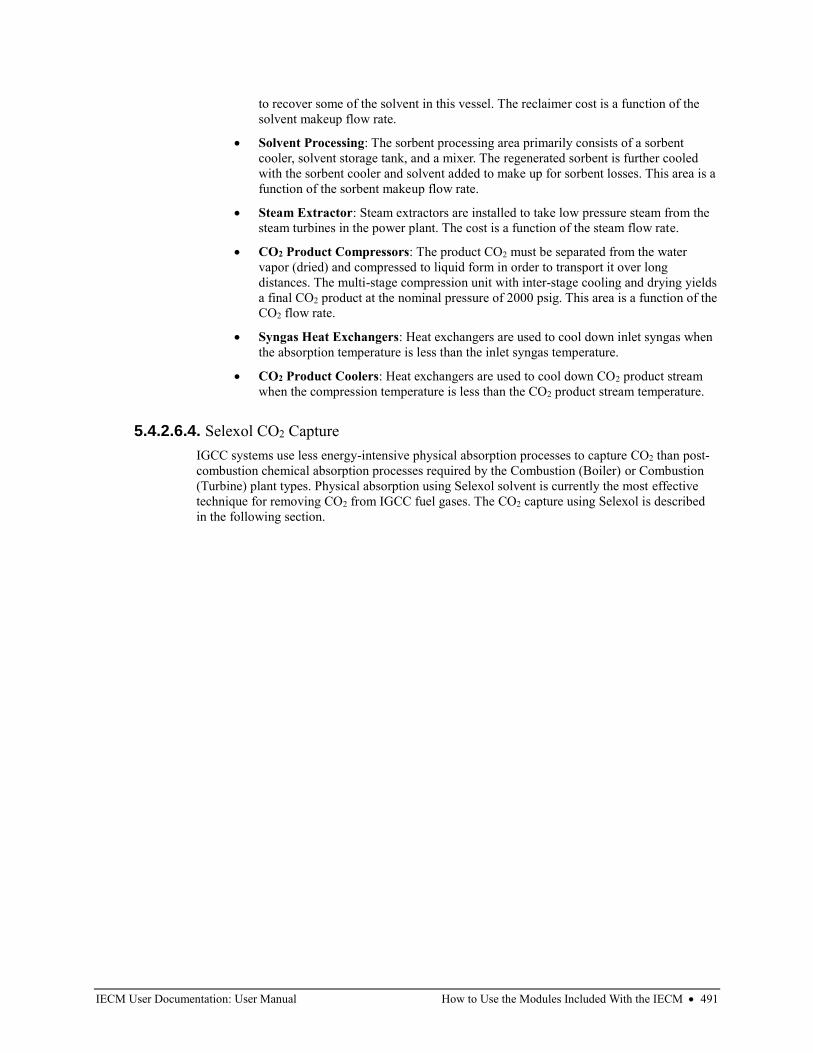
IECM User Documentation: User Manual How to Use the Modules Included With the IECM • 491
to recover some of the solvent in this vessel. The reclaimer cost is a function of the
solvent makeup flow rate.
• Solvent Processing: The sorbent processing area primarily consists of a sorbent
cooler, solvent storage tank, and a mixer. The regenerated sorbent is further cooled
with the sorbent cooler and solvent added to make up for sorbent losses. This area is a
function of the sorbent makeup flow rate.
• Steam Extractor: Steam extractors are installed to take low pressure steam from the
steam turbines in the power plant. The cost is a function of the steam flow rate.
• CO2 Product Compressors: The product CO2 must be separated from the water
vapor (dried) and compressed to liquid form in order to transport it over long
distances. The multi-stage compression unit with inter-stage cooling and drying yields
a final CO2 product at the nominal pressure of 2000 psig. This area is a function of the
CO2 flow rate.
• Syngas Heat Exchangers: Heat exchangers are used to cool down inlet syngas when
the absorption temperature is less than the inlet syngas temperature.
• CO2 Product Coolers: Heat exchangers are used to cool down CO2 product stream
when the compression temperature is less than the CO2 product stream temperature.
5.4.2.6.4. Selexol CO2 Capture
IGCC systems use less energy-intensive physical absorption processes to capture CO2 than post-
combustion chemical absorption processes required by the Combustion (Boiler) or Combustion
(Turbine) plant types. Physical absorption using Selexol solvent is currently the most effective
technique for removing CO2 from IGCC fuel gases. The CO2 capture using Selexol is described
in the following section.
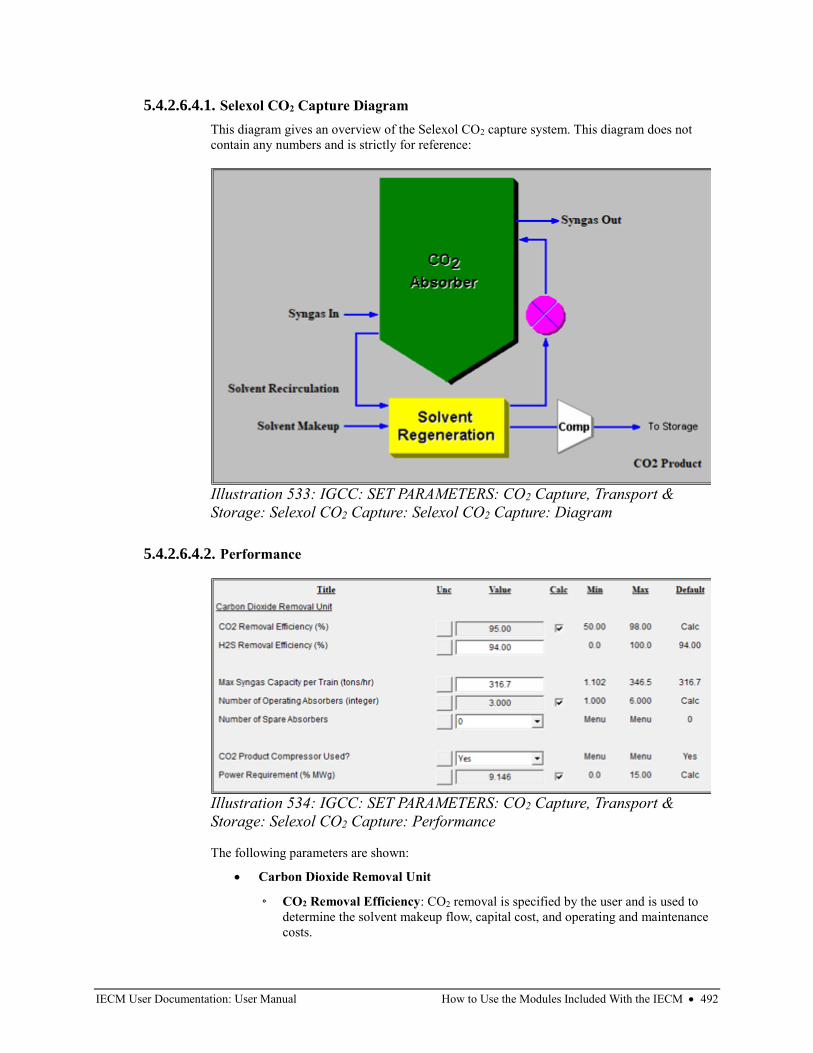
IECM User Documentation: User Manual How to Use the Modules Included With the IECM • 492
5.4.2.6.4.1. Selexol CO2 Capture Diagram
This diagram gives an overview of the Selexol CO2 capture system. This diagram does not
contain any numbers and is strictly for reference:
5.4.2.6.4.2. Performance
The following parameters are shown:
• Carbon Dioxide Removal Unit
◦ CO2 Removal Efficiency: CO2 removal is specified by the user and is used to
determine the solvent makeup flow, capital cost, and operating and maintenance
costs.
Illustration 533: IGCC: SET PARAMETERS: CO2 Capture, Transport &
Storage: Selexol CO2 Capture: Selexol CO2 Capture: Diagram
Illustration 534: IGCC: SET PARAMETERS: CO2 Capture, Transport &
Storage: Selexol CO2 Capture: Performance
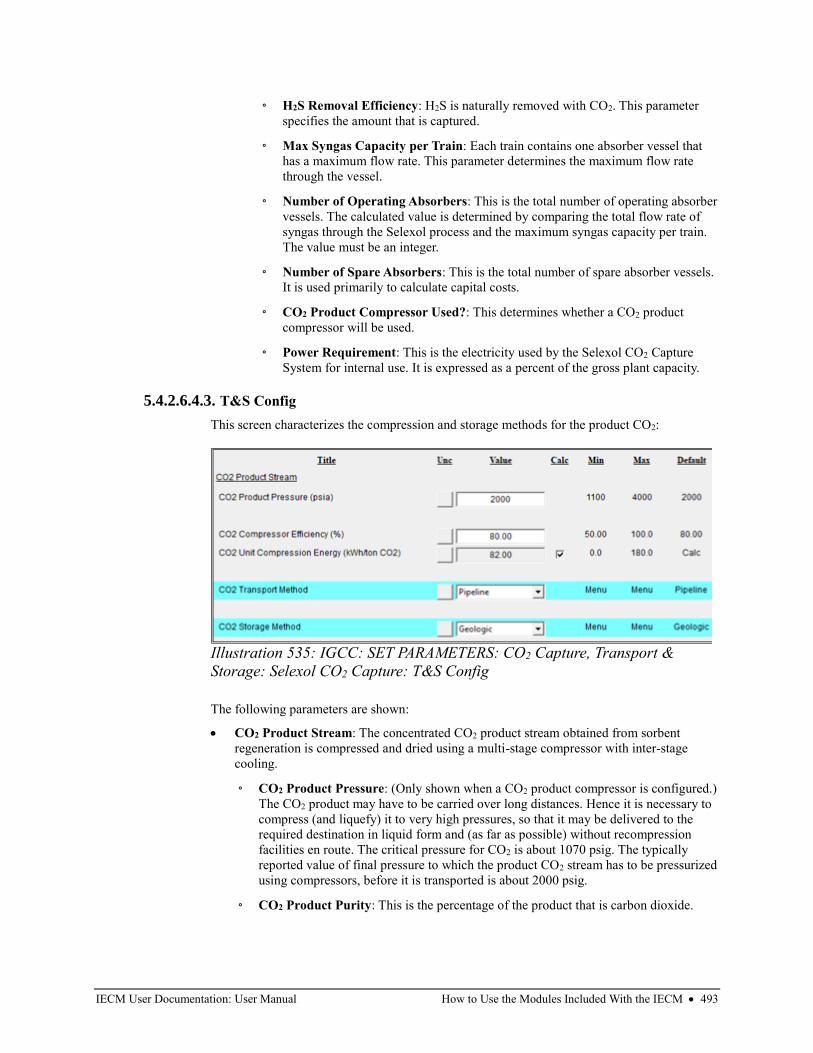
IECM User Documentation: User Manual How to Use the Modules Included With the IECM • 493
◦ H2S Removal Efficiency: H2S is naturally removed with CO2. This parameter
specifies the amount that is captured.
◦ Max Syngas Capacity per Train: Each train contains one absorber vessel that
has a maximum flow rate. This parameter determines the maximum flow rate
through the vessel.
◦ Number of Operating Absorbers: This is the total number of operating absorber
vessels. The calculated value is determined by comparing the total flow rate of
syngas through the Selexol process and the maximum syngas capacity per train.
The value must be an integer.
◦ Number of Spare Absorbers: This is the total number of spare absorber vessels.
It is used primarily to calculate capital costs.
◦ CO2 Product Compressor Used?: This determines whether a CO2 product
compressor will be used.
◦ Power Requirement: This is the electricity used by the Selexol CO2 Capture
System for internal use. It is expressed as a percent of the gross plant capacity.
5.4.2.6.4.3. T&S Config
This screen characterizes the compression and storage methods for the product CO2:
The following parameters are shown:
• CO2 Product Stream: The concentrated CO2 product stream obtained from sorbent
regeneration is compressed and dried using a multi-stage compressor with inter-stage
cooling.
◦ CO2 Product Pressure: (Only shown when a CO2 product compressor is configured.)
The CO2 product may have to be carried over long distances. Hence it is necessary to
compress (and liquefy) it to very high pressures, so that it may be delivered to the
required destination in liquid form and (as far as possible) without recompression
facilities en route. The critical pressure for CO2 is about 1070 psig. The typically
reported value of final pressure to which the product CO2 stream has to be pressurized
using compressors, before it is transported is about 2000 psig.
◦ CO2 Product Purity: This is the percentage of the product that is carbon dioxide.
Illustration 535: IGCC: SET PARAMETERS: CO2 Capture, Transport &
Storage: Selexol CO2 Capture: T&S Config
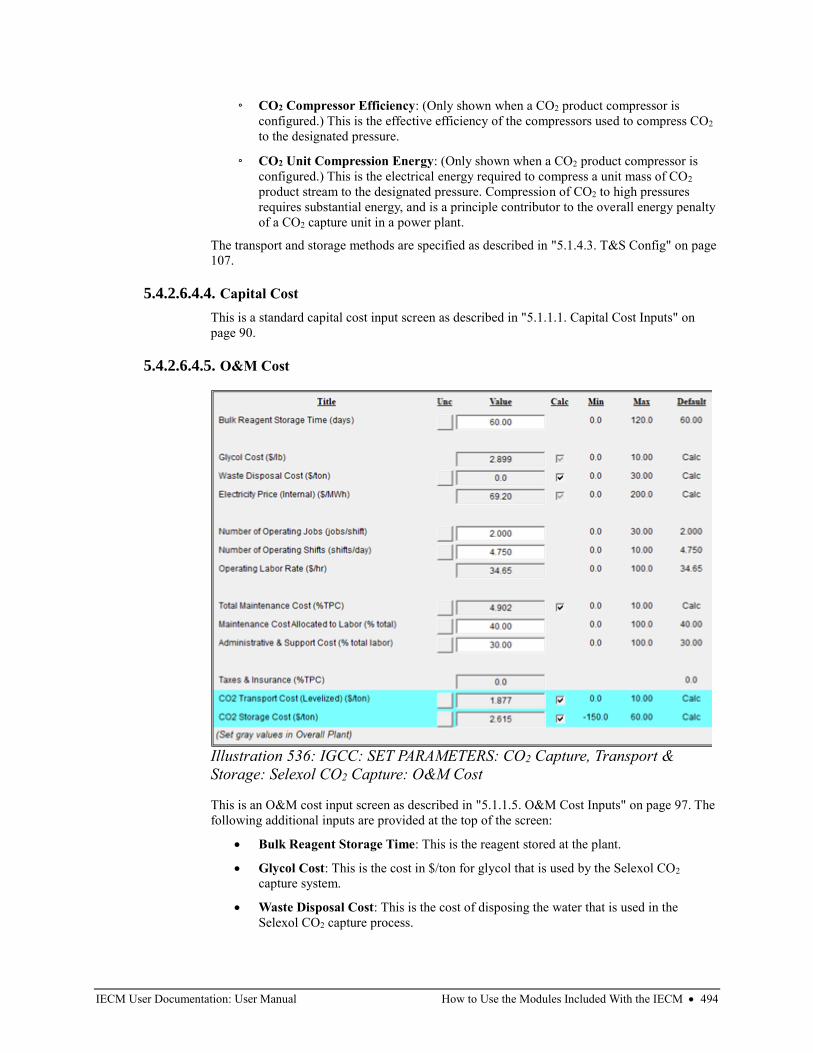
IECM User Documentation: User Manual How to Use the Modules Included With the IECM • 494
◦ CO2 Compressor Efficiency: (Only shown when a CO2 product compressor is
configured.) This is the effective efficiency of the compressors used to compress CO2
to the designated pressure.
◦ CO2 Unit Compression Energy: (Only shown when a CO2 product compressor is
configured.) This is the electrical energy required to compress a unit mass of CO2
product stream to the designated pressure. Compression of CO2 to high pressures
requires substantial energy, and is a principle contributor to the overall energy penalty
of a CO2 capture unit in a power plant.
The transport and storage methods are specified as described in "5.1.4.3. T&S Config" on page
107.
5.4.2.6.4.4. Capital Cost
This is a standard capital cost input screen as described in "5.1.1.1. Capital Cost Inputs" on
page 90.
5.4.2.6.4.5. O&M Cost
This is an O&M cost input screen as described in "5.1.1.5. O&M Cost Inputs" on page 97. The
following additional inputs are provided at the top of the screen:
• Bulk Reagent Storage Time: This is the reagent stored at the plant.
• Glycol Cost: This is the cost in $/ton for glycol that is used by the Selexol CO2
capture system.
• Waste Disposal Cost: This is the cost of disposing the water that is used in the
Selexol CO2 capture process.
Illustration 536: IGCC: SET PARAMETERS: CO2 Capture, Transport &
Storage: Selexol CO2 Capture: O&M Cost
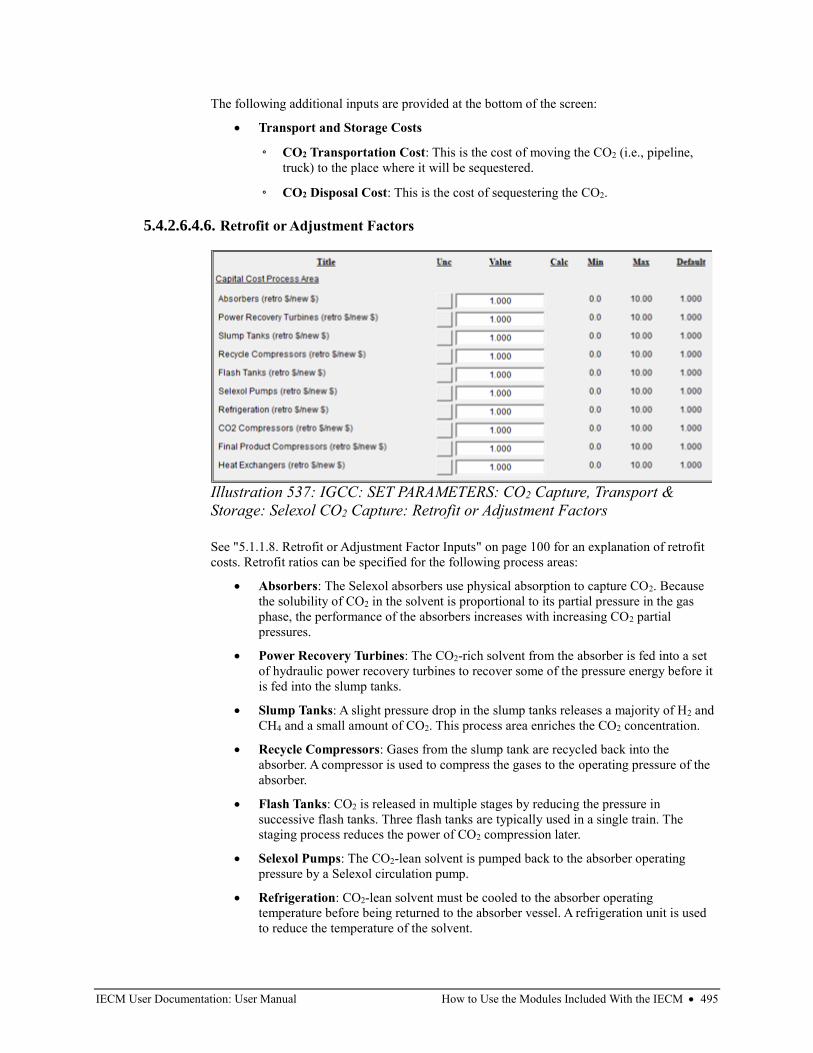
IECM User Documentation: User Manual How to Use the Modules Included With the IECM • 495
The following additional inputs are provided at the bottom of the screen:
• Transport and Storage Costs
◦ CO2 Transportation Cost: This is the cost of moving the CO2 (i.e., pipeline,
truck) to the place where it will be sequestered.
◦ CO2 Disposal Cost: This is the cost of sequestering the CO2.
5.4.2.6.4.6. Retrofit or Adjustment Factors
See "5.1.1.8. Retrofit or Adjustment Factor Inputs" on page 100 for an explanation of retrofit
costs. Retrofit ratios can be specified for the following process areas:
• Absorbers: The Selexol absorbers use physical absorption to capture CO2. Because
the solubility of CO2 in the solvent is proportional to its partial pressure in the gas
phase, the performance of the absorbers increases with increasing CO2 partial
pressures.
• Power Recovery Turbines: The CO2-rich solvent from the absorber is fed into a set
of hydraulic power recovery turbines to recover some of the pressure energy before it
is fed into the slump tanks.
• Slump Tanks: A slight pressure drop in the slump tanks releases a majority of H2 and
CH4 and a small amount of CO2. This process area enriches the CO2 concentration.
• Recycle Compressors: Gases from the slump tank are recycled back into the
absorber. A compressor is used to compress the gases to the operating pressure of the
absorber.
• Flash Tanks: CO2 is released in multiple stages by reducing the pressure in
successive flash tanks. Three flash tanks are typically used in a single train. The
staging process reduces the power of CO2 compression later.
• Selexol Pumps: The CO2-lean solvent is pumped back to the absorber operating
pressure by a Selexol circulation pump.
• Refrigeration: CO2-lean solvent must be cooled to the absorber operating
temperature before being returned to the absorber vessel. A refrigeration unit is used
to reduce the temperature of the solvent.
Illustration 537: IGCC: SET PARAMETERS: CO2 Capture, Transport &
Storage: Selexol CO2 Capture: Retrofit or Adjustment Factors
IECM User Documentation: User Manual How to Use the Modules Included With the IECM • 496
• CO2 Compressors: CO2 released from the first two flash tanks is compressed to the
flashing pressure of the first flash tank. The two CO2 streams are then combined and
sent to the final product compressors.
• Final Product Compressors: The product CO2 must be separated from the water
vapor (dried) and compressed to liquid form in order to transport it over long
distances. The multi-stage compression unit with inter-stage cooling and drying yields
a final CO2 product at the nominal pressure of 2000 psig. This area is a function of the
CO2 flow rate.
• Heat Exchangers: This process area considers miscellaneous heat exchangers used in
the overall process.
5.4.2.6.5. Pipeline Transport
See "5.2.2.8.10. Pipeline Transport" on page 244 for a description of the pipeline transport
parameter screens.
5.4.2.6.6. User-Specified Transport
See "5.2.2.8.12. User-Specified Transport" on page 248 for a description of the user-specified
transport parameters.
5.4.2.7. Power Block
The power block technology area includes all the equipment necessary to convert the potential and
kinetic energy of natural gas or syngas fuels into steam and electricity.
The process equipment is divided into several areas: the gas turbine/generator, the air compressor,
the combustor, the steam turbine, and the heat recovery steam generator. These are all available in
the Combustion (Turbine) and IGCC plant types.
See "5.3.2.3. Power Block" on page 428 for a description of the power block input screens.
5.4.2.8. Water Systems
See "5.2.2.9. Water Systems" on page 253 for a description of the screens available in this section.
5.4.3. GET RESULTS
5.4.3.1. Overall Plant
These screens apply to the power plant as a whole, not to specific technologies.
5.4.3.1.1. Diagram
This is the same diagram that appears in the "SET PARAMETERS" program area. It is described
in "5.4.2.1.1. Diagram" on page 449.
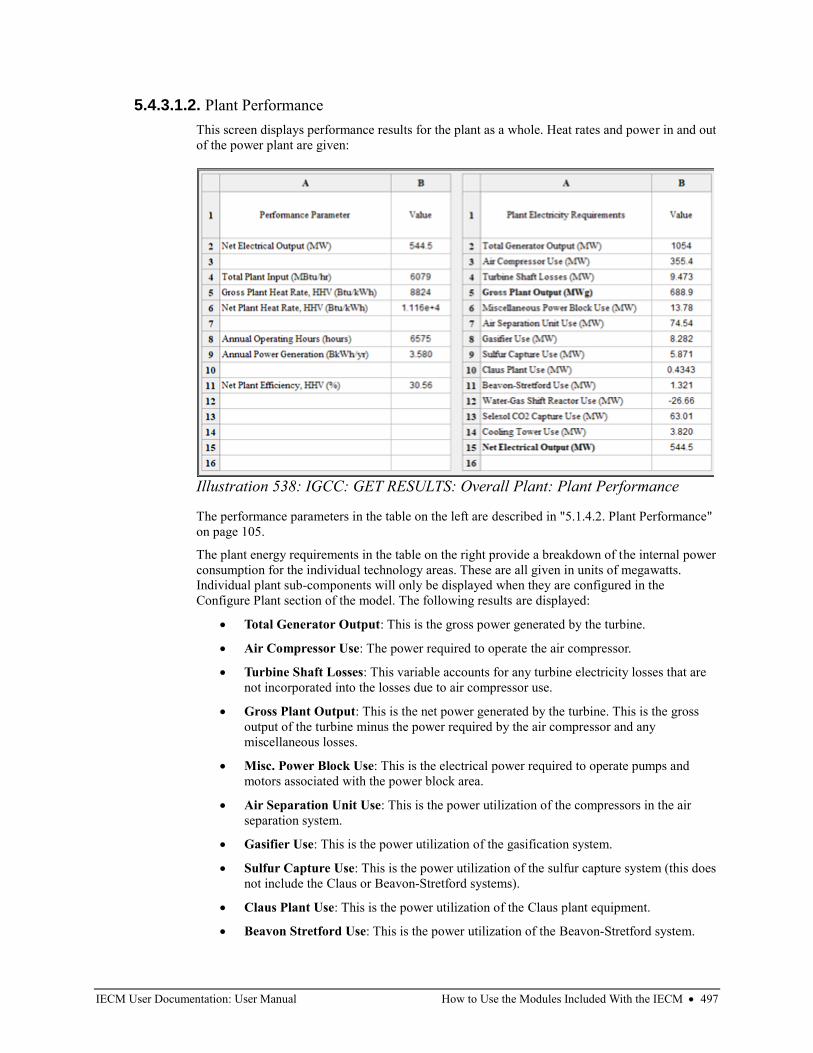
IECM User Documentation: User Manual How to Use the Modules Included With the IECM • 497
5.4.3.1.2. Plant Performance
This screen displays performance results for the plant as a whole. Heat rates and power in and out
of the power plant are given:
The performance parameters in the table on the left are described in "5.1.4.2. Plant Performance"
on page 105.
The plant energy requirements in the table on the right provide a breakdown of the internal power
consumption for the individual technology areas. These are all given in units of megawatts.
Individual plant sub-components will only be displayed when they are configured in the
Configure Plant section of the model. The following results are displayed:
• Total Generator Output: This is the gross power generated by the turbine.
• Air Compressor Use: The power required to operate the air compressor.
• Turbine Shaft Losses: This variable accounts for any turbine electricity losses that are
not incorporated into the losses due to air compressor use.
• Gross Plant Output: This is the net power generated by the turbine. This is the gross
output of the turbine minus the power required by the air compressor and any
miscellaneous losses.
• Misc. Power Block Use: This is the electrical power required to operate pumps and
motors associated with the power block area.
• Air Separation Unit Use: This is the power utilization of the compressors in the air
separation system.
• Gasifier Use: This is the power utilization of the gasification system.
• Sulfur Capture Use: This is the power utilization of the sulfur capture system (this does
not include the Claus or Beavon-Stretford systems).
• Claus Plant Use: This is the power utilization of the Claus plant equipment.
• Beavon Stretford Use: This is the power utilization of the Beavon-Stretford system.
Illustration 538: IGCC: GET RESULTS: Overall Plant: Plant Performance
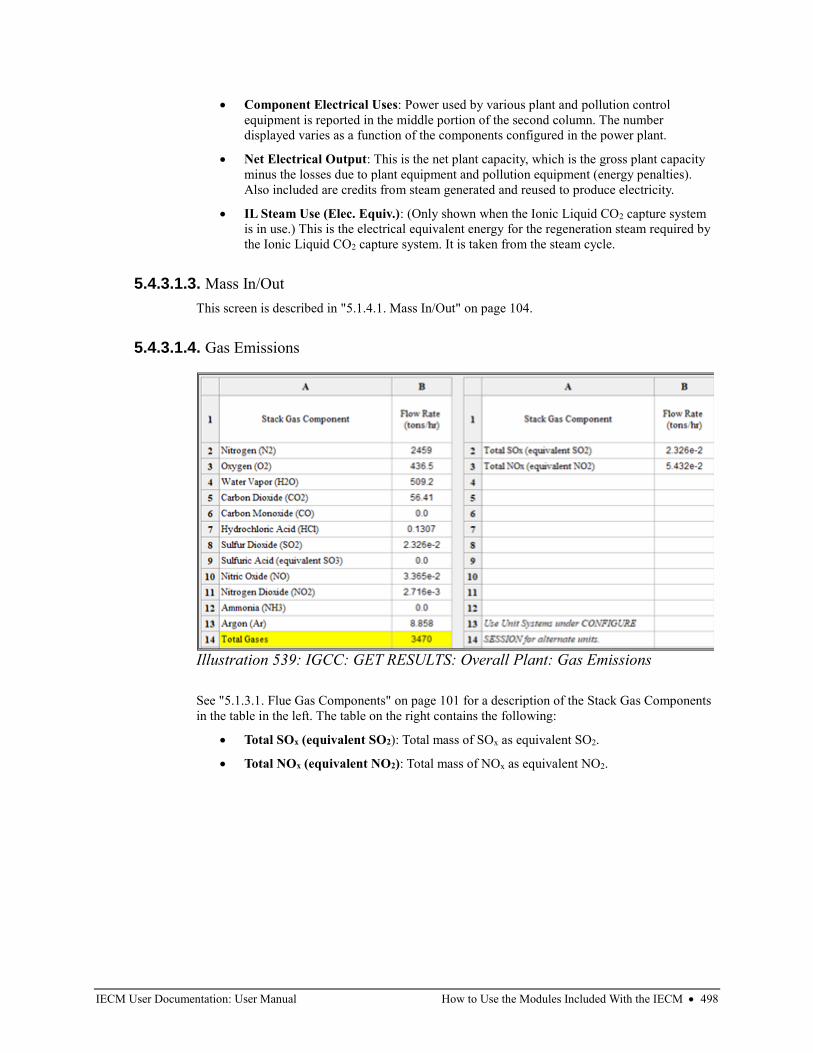
IECM User Documentation: User Manual How to Use the Modules Included With the IECM • 498
• Component Electrical Uses: Power used by various plant and pollution control
equipment is reported in the middle portion of the second column. The number
displayed varies as a function of the components configured in the power plant.
• Net Electrical Output: This is the net plant capacity, which is the gross plant capacity
minus the losses due to plant equipment and pollution equipment (energy penalties).
Also included are credits from steam generated and reused to produce electricity.
• IL Steam Use (Elec. Equiv.): (Only shown when the Ionic Liquid CO2 capture system
is in use.) This is the electrical equivalent energy for the regeneration steam required by
the Ionic Liquid CO2 capture system. It is taken from the steam cycle.
5.4.3.1.3. Mass In/Out
This screen is described in "5.1.4.1. Mass In/Out" on page 104.
5.4.3.1.4. Gas Emissions
See "5.1.3.1. Flue Gas Components" on page 101 for a description of the Stack Gas Components
in the table in the left. The table on the right contains the following:
• Total SOx (equivalent SO2): Total mass of SOx as equivalent SO2.
• Total NOx (equivalent NO2): Total mass of NOx as equivalent NO2.
Illustration 539: IGCC: GET RESULTS: Overall Plant: Gas Emissions
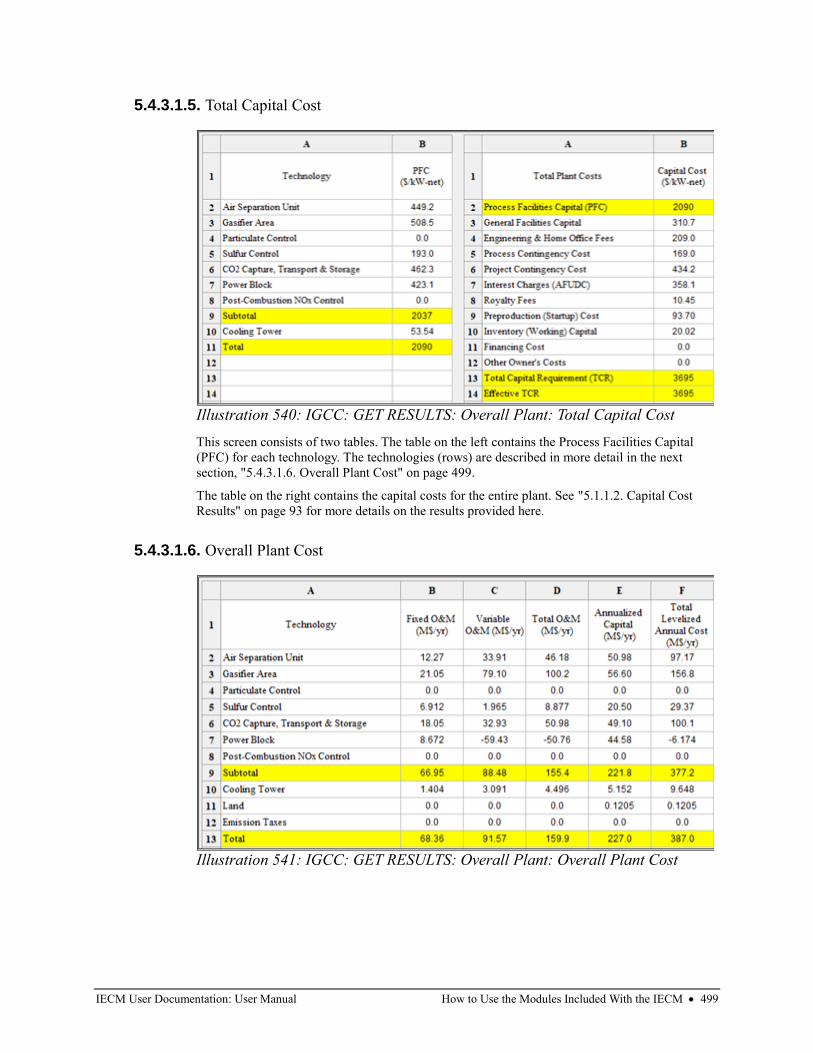
IECM User Documentation: User Manual How to Use the Modules Included With the IECM • 499
5.4.3.1.5. Total Capital Cost
This screen consists of two tables. The table on the left contains the Process Facilities Capital
(PFC) for each technology. The technologies (rows) are described in more detail in the next
section, "5.4.3.1.6. Overall Plant Cost" on page 499.
The table on the right contains the capital costs for the entire plant. See "5.1.1.2. Capital Cost
Results" on page 93 for more details on the results provided here.
5.4.3.1.6. Overall Plant Cost
Illustration 540: IGCC: GET RESULTS: Overall Plant: Total Capital Cost
Illustration 541: IGCC: GET RESULTS: Overall Plant: Overall Plant Cost
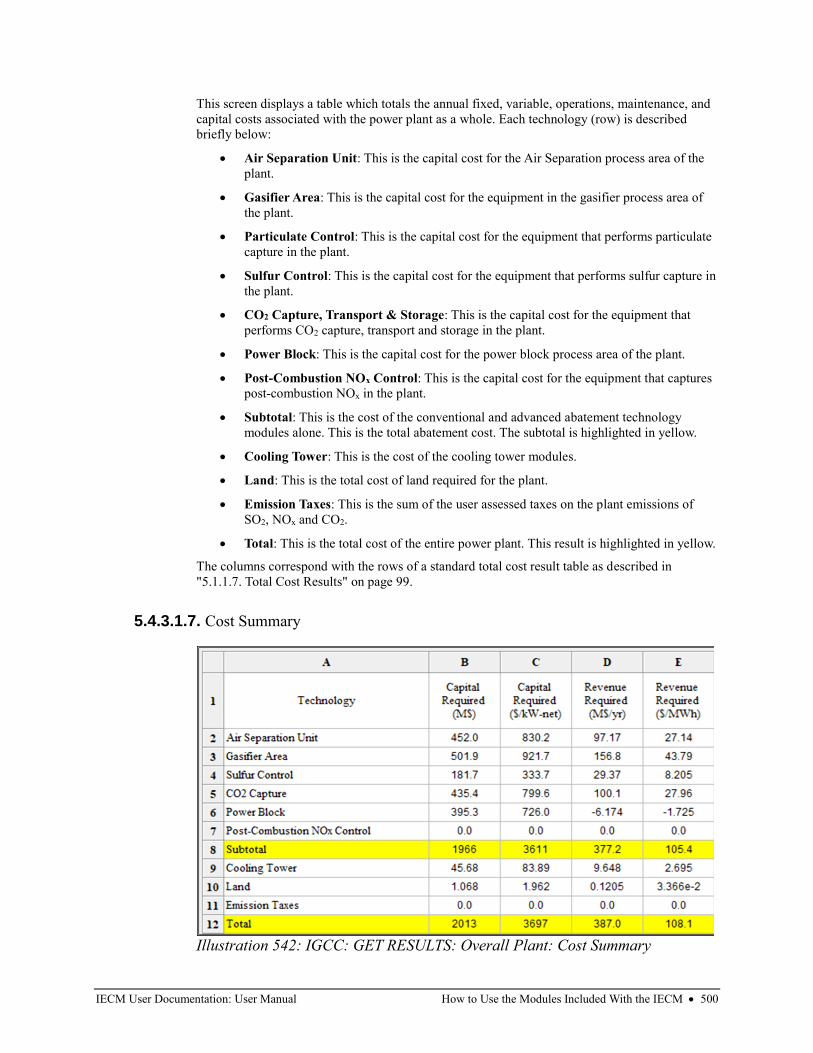
IECM User Documentation: User Manual How to Use the Modules Included With the IECM • 500
This screen displays a table which totals the annual fixed, variable, operations, maintenance, and
capital costs associated with the power plant as a whole. Each technology (row) is described
briefly below:
• Air Separation Unit: This is the capital cost for the Air Separation process area of the
plant.
• Gasifier Area: This is the capital cost for the equipment in the gasifier process area of
the plant.
• Particulate Control: This is the capital cost for the equipment that performs particulate
capture in the plant.
• Sulfur Control: This is the capital cost for the equipment that performs sulfur capture in
the plant.
• CO2 Capture, Transport & Storage: This is the capital cost for the equipment that
performs CO2 capture, transport and storage in the plant.
• Power Block: This is the capital cost for the power block process area of the plant.
• Post-Combustion NOx Control: This is the capital cost for the equipment that captures
post-combustion NOx in the plant.
• Subtotal: This is the cost of the conventional and advanced abatement technology
modules alone. This is the total abatement cost. The subtotal is highlighted in yellow.
• Cooling Tower: This is the cost of the cooling tower modules.
• Land: This is the total cost of land required for the plant.
• Emission Taxes: This is the sum of the user assessed taxes on the plant emissions of
SO2, NOx and CO2.
• Total: This is the total cost of the entire power plant. This result is highlighted in yellow.
The columns correspond with the rows of a standard total cost result table as described in
"5.1.1.7. Total Cost Results" on page 99.
5.4.3.1.7. Cost Summary
Illustration 542: IGCC: GET RESULTS: Overall Plant: Cost Summary
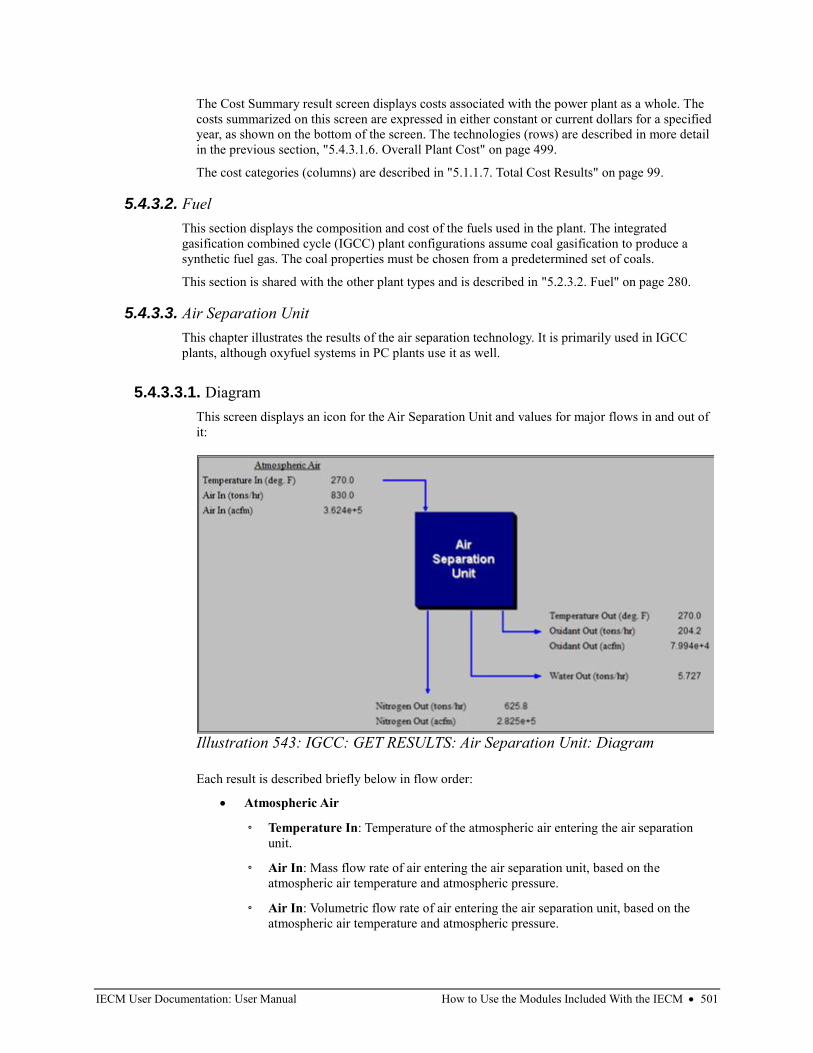
IECM User Documentation: User Manual How to Use the Modules Included With the IECM • 501
The Cost Summary result screen displays costs associated with the power plant as a whole. The
costs summarized on this screen are expressed in either constant or current dollars for a specified
year, as shown on the bottom of the screen. The technologies (rows) are described in more detail
in the previous section, "5.4.3.1.6. Overall Plant Cost" on page 499.
The cost categories (columns) are described in "5.1.1.7. Total Cost Results" on page 99.
5.4.3.2. Fuel
This section displays the composition and cost of the fuels used in the plant. The integrated
gasification combined cycle (IGCC) plant configurations assume coal gasification to produce a
synthetic fuel gas. The coal properties must be chosen from a predetermined set of coals.
This section is shared with the other plant types and is described in "5.2.3.2. Fuel" on page 280.
5.4.3.3. Air Separation Unit
This chapter illustrates the results of the air separation technology. It is primarily used in IGCC
plants, although oxyfuel systems in PC plants use it as well.
5.4.3.3.1. Diagram
This screen displays an icon for the Air Separation Unit and values for major flows in and out of
it:
Each result is described briefly below in flow order:
• Atmospheric Air
◦ Temperature In: Temperature of the atmospheric air entering the air separation
unit.
◦ Air In: Mass flow rate of air entering the air separation unit, based on the
atmospheric air temperature and atmospheric pressure.
◦ Air In: Volumetric flow rate of air entering the air separation unit, based on the
atmospheric air temperature and atmospheric pressure.
Illustration 543: IGCC: GET RESULTS: Air Separation Unit: Diagram
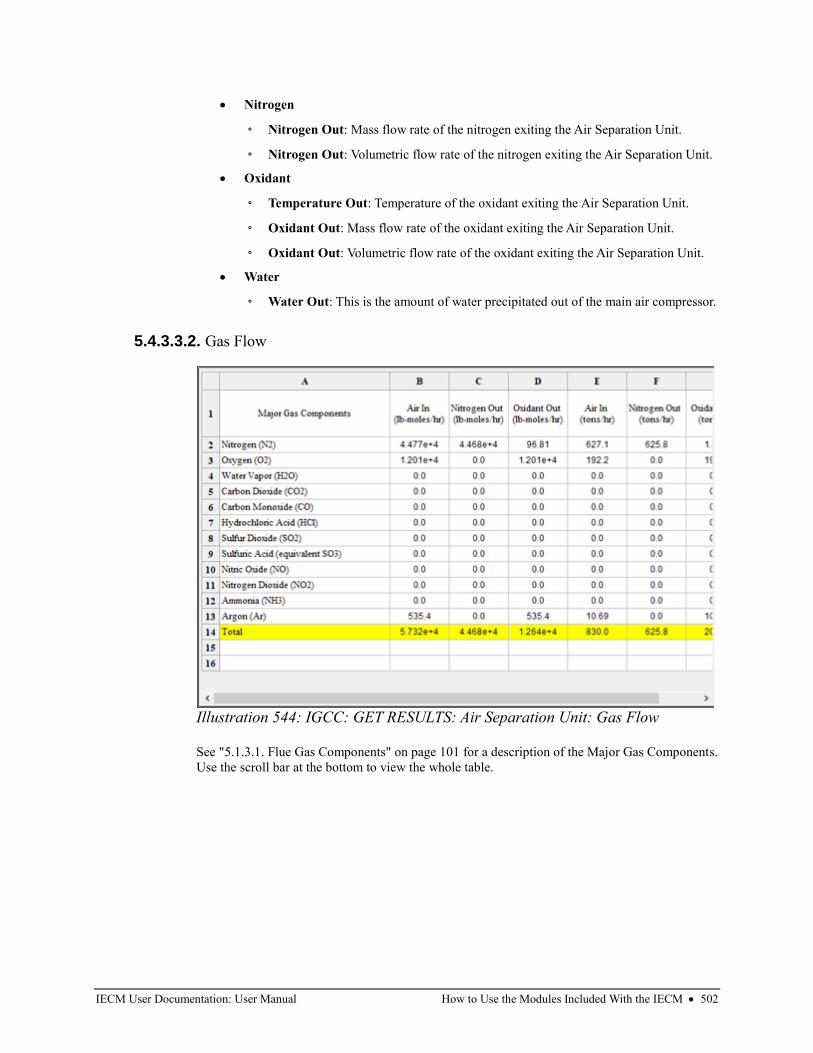
IECM User Documentation: User Manual How to Use the Modules Included With the IECM • 502
• Nitrogen
◦ Nitrogen Out: Mass flow rate of the nitrogen exiting the Air Separation Unit.
◦ Nitrogen Out: Volumetric flow rate of the nitrogen exiting the Air Separation Unit.
• Oxidant
◦ Temperature Out: Temperature of the oxidant exiting the Air Separation Unit.
◦ Oxidant Out: Mass flow rate of the oxidant exiting the Air Separation Unit.
◦ Oxidant Out: Volumetric flow rate of the oxidant exiting the Air Separation Unit.
• Water
◦ Water Out: This is the amount of water precipitated out of the main air compressor.
5.4.3.3.2. Gas Flow
See "5.1.3.1. Flue Gas Components" on page 101 for a description of the Major Gas Components.
Use the scroll bar at the bottom to view the whole table.
Illustration 544: IGCC: GET RESULTS: Air Separation Unit: Gas Flow
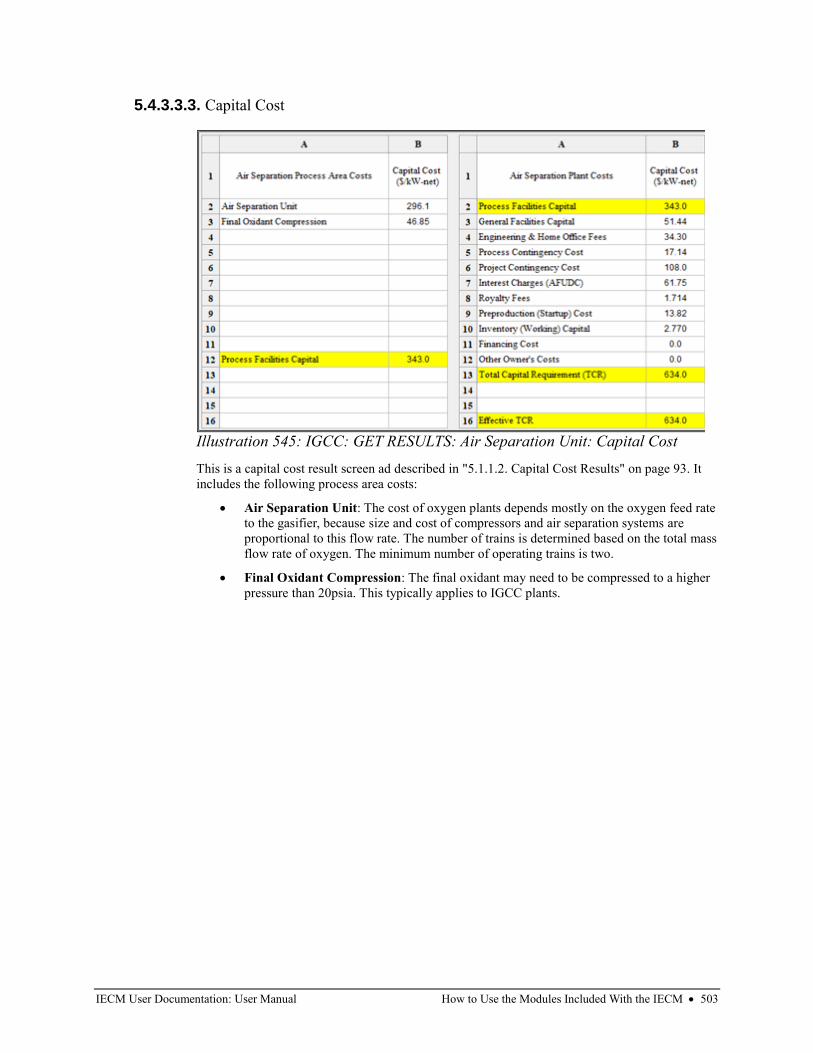
IECM User Documentation: User Manual How to Use the Modules Included With the IECM • 503
5.4.3.3.3. Capital Cost
This is a capital cost result screen ad described in "5.1.1.2. Capital Cost Results" on page 93. It
includes the following process area costs:
• Air Separation Unit: The cost of oxygen plants depends mostly on the oxygen feed rate
to the gasifier, because size and cost of compressors and air separation systems are
proportional to this flow rate. The number of trains is determined based on the total mass
flow rate of oxygen. The minimum number of operating trains is two.
• Final Oxidant Compression: The final oxidant may need to be compressed to a higher
pressure than 20psia. This typically applies to IGCC plants.
Illustration 545: IGCC: GET RESULTS: Air Separation Unit: Capital Cost
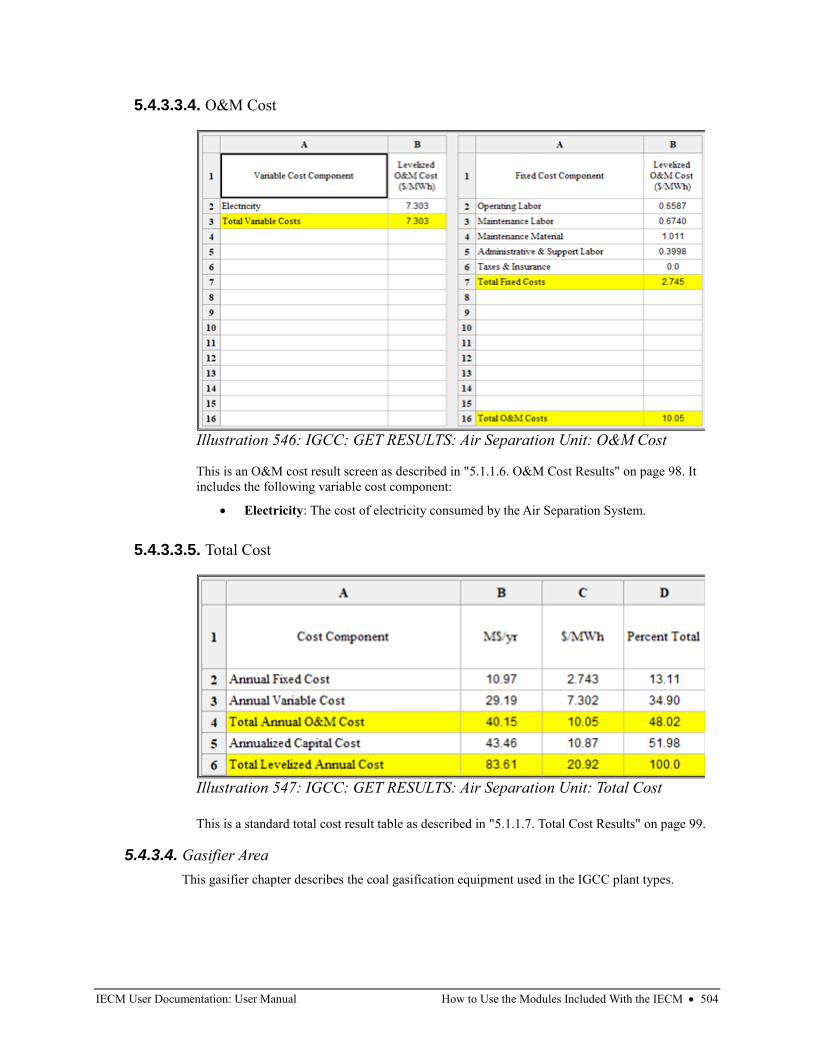
IECM User Documentation: User Manual How to Use the Modules Included With the IECM • 504
5.4.3.3.4. O&M Cost
This is an O&M cost result screen as described in "5.1.1.6. O&M Cost Results" on page 98. It
includes the following variable cost component:
• Electricity: The cost of electricity consumed by the Air Separation System.
5.4.3.3.5. Total Cost
This is a standard total cost result table as described in "5.1.1.7. Total Cost Results" on page 99.
5.4.3.4. Gasifier Area
This gasifier chapter describes the coal gasification equipment used in the IGCC plant types.
Illustration 546: IGCC: GET RESULTS: Air Separation Unit: O&M Cost
Illustration 547: IGCC: GET RESULTS: Air Separation Unit: Total Cost
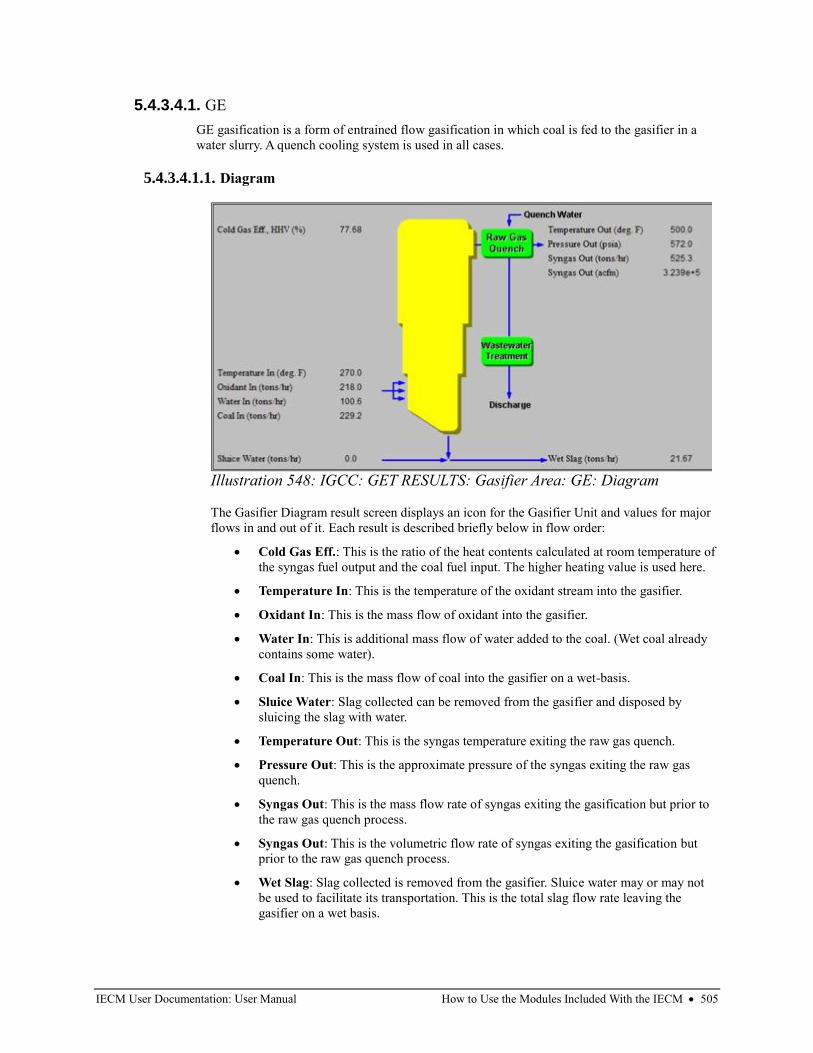
IECM User Documentation: User Manual How to Use the Modules Included With the IECM • 505
5.4.3.4.1. GE
GE gasification is a form of entrained flow gasification in which coal is fed to the gasifier in a
water slurry. A quench cooling system is used in all cases.
5.4.3.4.1.1. Diagram
The Gasifier Diagram result screen displays an icon for the Gasifier Unit and values for major
flows in and out of it. Each result is described briefly below in flow order:
• Cold Gas Eff.: This is the ratio of the heat contents calculated at room temperature of
the syngas fuel output and the coal fuel input. The higher heating value is used here.
• Temperature In: This is the temperature of the oxidant stream into the gasifier.
• Oxidant In: This is the mass flow of oxidant into the gasifier.
• Water In: This is additional mass flow of water added to the coal. (Wet coal already
contains some water).
• Coal In: This is the mass flow of coal into the gasifier on a wet-basis.
• Sluice Water: Slag collected can be removed from the gasifier and disposed by
sluicing the slag with water.
• Temperature Out: This is the syngas temperature exiting the raw gas quench.
• Pressure Out: This is the approximate pressure of the syngas exiting the raw gas
quench.
• Syngas Out: This is the mass flow rate of syngas exiting the gasification but prior to
the raw gas quench process.
• Syngas Out: This is the volumetric flow rate of syngas exiting the gasification but
prior to the raw gas quench process.
• Wet Slag: Slag collected is removed from the gasifier. Sluice water may or may not
be used to facilitate its transportation. This is the total slag flow rate leaving the
gasifier on a wet basis.
Illustration 548: IGCC: GET RESULTS: Gasifier Area: GE: Diagram
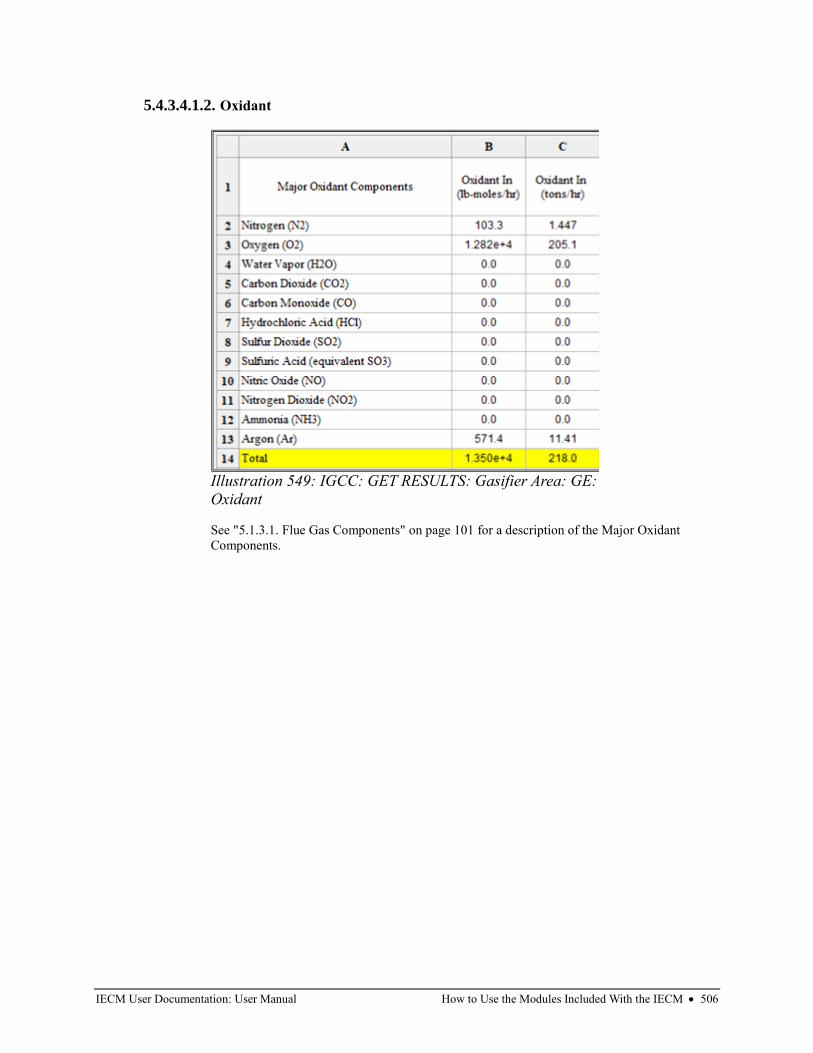
IECM User Documentation: User Manual How to Use the Modules Included With the IECM • 506
5.4.3.4.1.2. Oxidant
See "5.1.3.1. Flue Gas Components" on page 101 for a description of the Major Oxidant
Components.
Illustration 549: IGCC: GET RESULTS: Gasifier Area: GE:
Oxidant
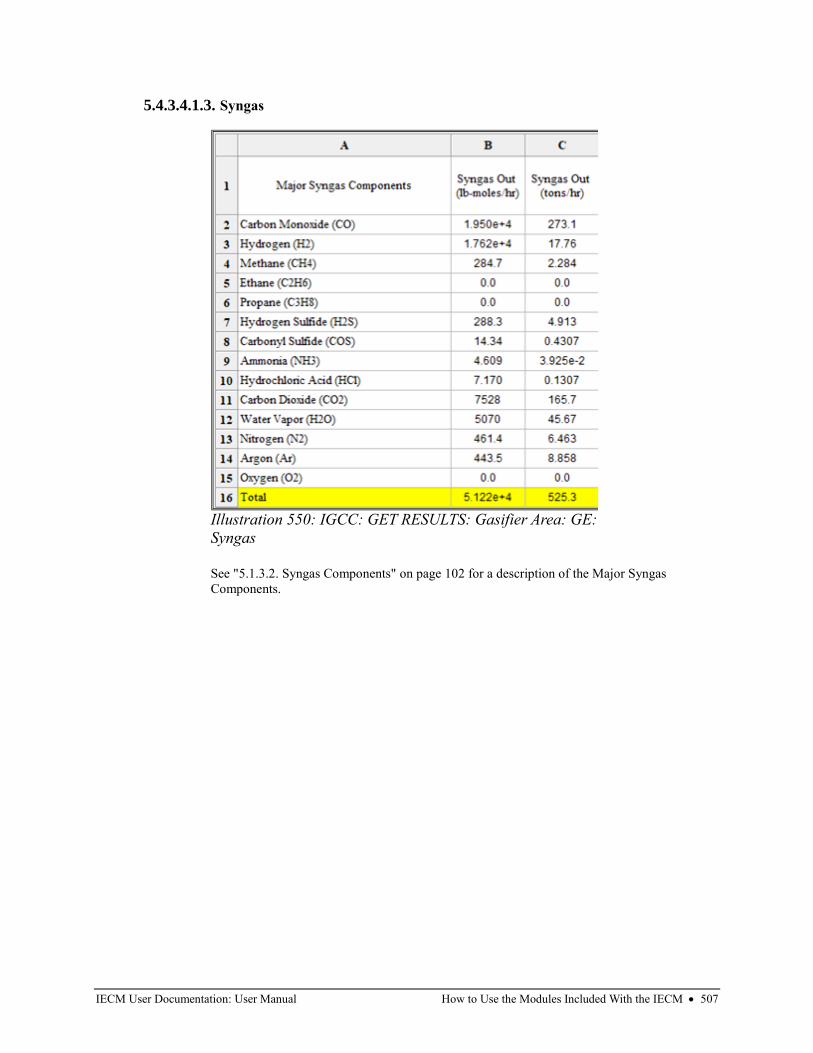
IECM User Documentation: User Manual How to Use the Modules Included With the IECM • 507
5.4.3.4.1.3. Syngas
See "5.1.3.2. Syngas Components" on page 102 for a description of the Major Syngas
Components.
Illustration 550: IGCC: GET RESULTS: Gasifier Area: GE:
Syngas
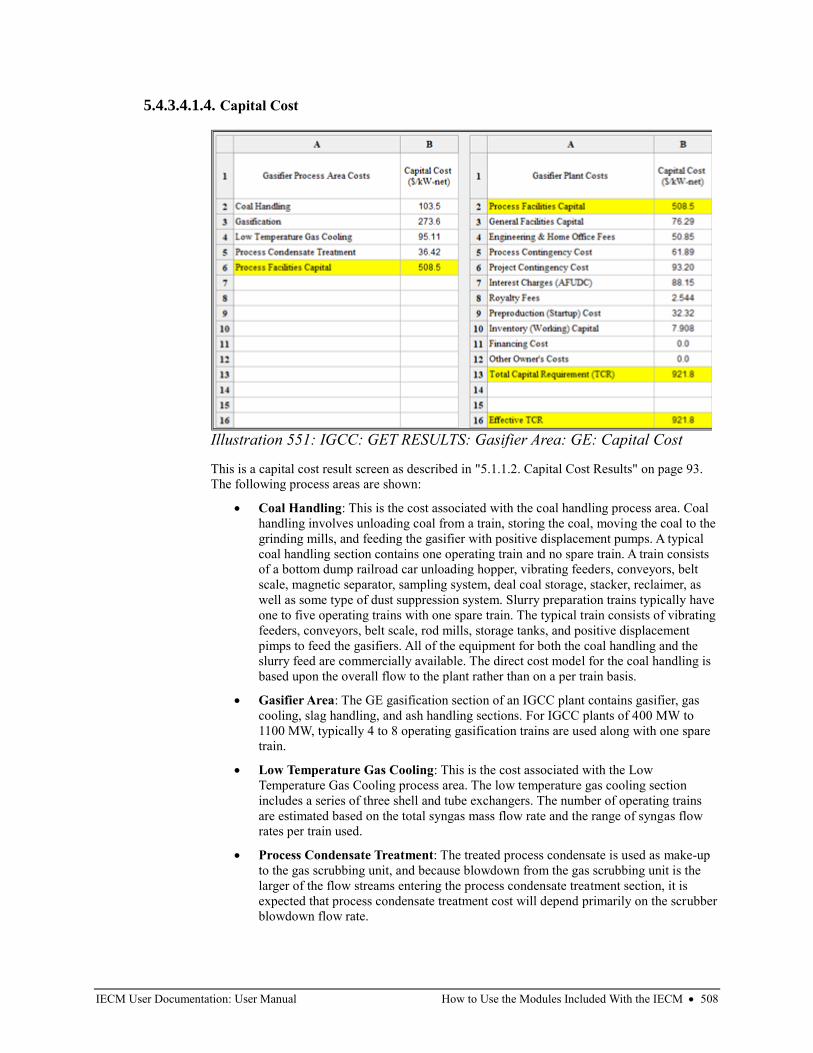
IECM User Documentation: User Manual How to Use the Modules Included With the IECM • 508
5.4.3.4.1.4. Capital Cost
This is a capital cost result screen as described in "5.1.1.2. Capital Cost Results" on page 93.
The following process areas are shown:
• Coal Handling: This is the cost associated with the coal handling process area. Coal
handling involves unloading coal from a train, storing the coal, moving the coal to the
grinding mills, and feeding the gasifier with positive displacement pumps. A typical
coal handling section contains one operating train and no spare train. A train consists
of a bottom dump railroad car unloading hopper, vibrating feeders, conveyors, belt
scale, magnetic separator, sampling system, deal coal storage, stacker, reclaimer, as
well as some type of dust suppression system. Slurry preparation trains typically have
one to five operating trains with one spare train. The typical train consists of vibrating
feeders, conveyors, belt scale, rod mills, storage tanks, and positive displacement
pimps to feed the gasifiers. All of the equipment for both the coal handling and the
slurry feed are commercially available. The direct cost model for the coal handling is
based upon the overall flow to the plant rather than on a per train basis.
• Gasifier Area: The GE gasification section of an IGCC plant contains gasifier, gas
cooling, slag handling, and ash handling sections. For IGCC plants of 400 MW to
1100 MW, typically 4 to 8 operating gasification trains are used along with one spare
train.
• Low Temperature Gas Cooling: This is the cost associated with the Low
Temperature Gas Cooling process area. The low temperature gas cooling section
includes a series of three shell and tube exchangers. The number of operating trains
are estimated based on the total syngas mass flow rate and the range of syngas flow
rates per train used.
• Process Condensate Treatment: The treated process condensate is used as make-up
to the gas scrubbing unit, and because blowdown from the gas scrubbing unit is the
larger of the flow streams entering the process condensate treatment section, it is
expected that process condensate treatment cost will depend primarily on the scrubber
blowdown flow rate.
Illustration 551: IGCC: GET RESULTS: Gasifier Area: GE: Capital Cost
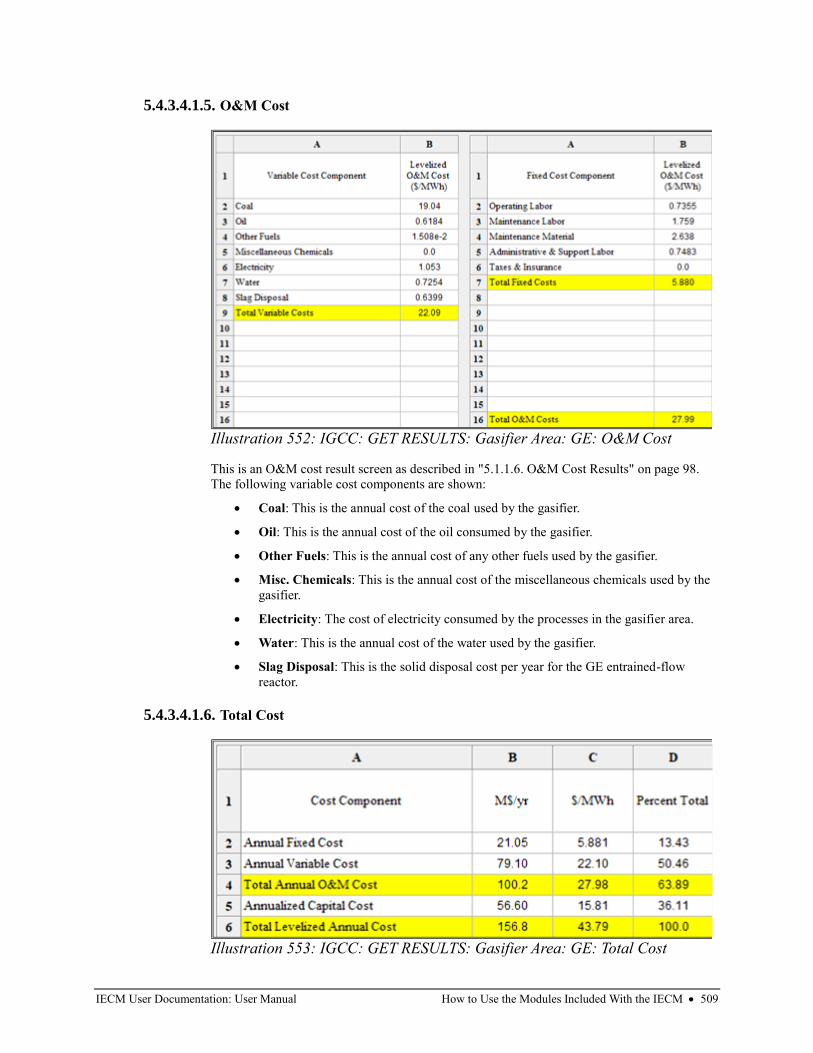
IECM User Documentation: User Manual How to Use the Modules Included With the IECM • 509
5.4.3.4.1.5. O&M Cost
This is an O&M cost result screen as described in "5.1.1.6. O&M Cost Results" on page 98.
The following variable cost components are shown:
• Coal: This is the annual cost of the coal used by the gasifier.
• Oil: This is the annual cost of the oil consumed by the gasifier.
• Other Fuels: This is the annual cost of any other fuels used by the gasifier.
• Misc. Chemicals: This is the annual cost of the miscellaneous chemicals used by the
gasifier.
• Electricity: The cost of electricity consumed by the processes in the gasifier area.
• Water: This is the annual cost of the water used by the gasifier.
• Slag Disposal: This is the solid disposal cost per year for the GE entrained-flow
reactor.
5.4.3.4.1.6. Total Cost
Illustration 552: IGCC: GET RESULTS: Gasifier Area: GE: O&M Cost
Illustration 553: IGCC: GET RESULTS: Gasifier Area: GE: Total Cost
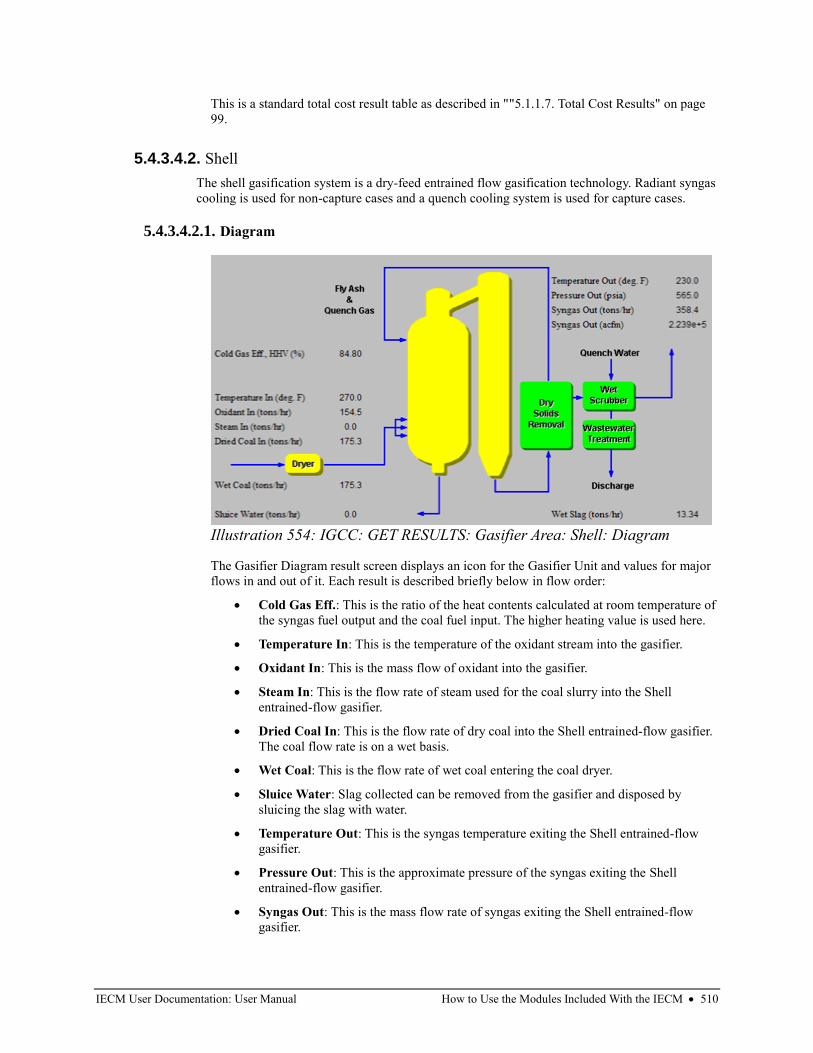
IECM User Documentation: User Manual How to Use the Modules Included With the IECM • 510
This is a standard total cost result table as described in ""5.1.1.7. Total Cost Results" on page
99.
5.4.3.4.2. Shell
The shell gasification system is a dry-feed entrained flow gasification technology. Radiant syngas
cooling is used for non-capture cases and a quench cooling system is used for capture cases.
5.4.3.4.2.1. Diagram
The Gasifier Diagram result screen displays an icon for the Gasifier Unit and values for major
flows in and out of it. Each result is described briefly below in flow order:
• Cold Gas Eff.: This is the ratio of the heat contents calculated at room temperature of
the syngas fuel output and the coal fuel input. The higher heating value is used here.
• Temperature In: This is the temperature of the oxidant stream into the gasifier.
• Oxidant In: This is the mass flow of oxidant into the gasifier.
• Steam In: This is the flow rate of steam used for the coal slurry into the Shell
entrained-flow gasifier.
• Dried Coal In: This is the flow rate of dry coal into the Shell entrained-flow gasifier.
The coal flow rate is on a wet basis.
• Wet Coal: This is the flow rate of wet coal entering the coal dryer.
• Sluice Water: Slag collected can be removed from the gasifier and disposed by
sluicing the slag with water.
• Temperature Out: This is the syngas temperature exiting the Shell entrained-flow
gasifier.
• Pressure Out: This is the approximate pressure of the syngas exiting the Shell
entrained-flow gasifier.
• Syngas Out: This is the mass flow rate of syngas exiting the Shell entrained-flow
gasifier.
Illustration 554: IGCC: GET RESULTS: Gasifier Area: Shell: Diagram
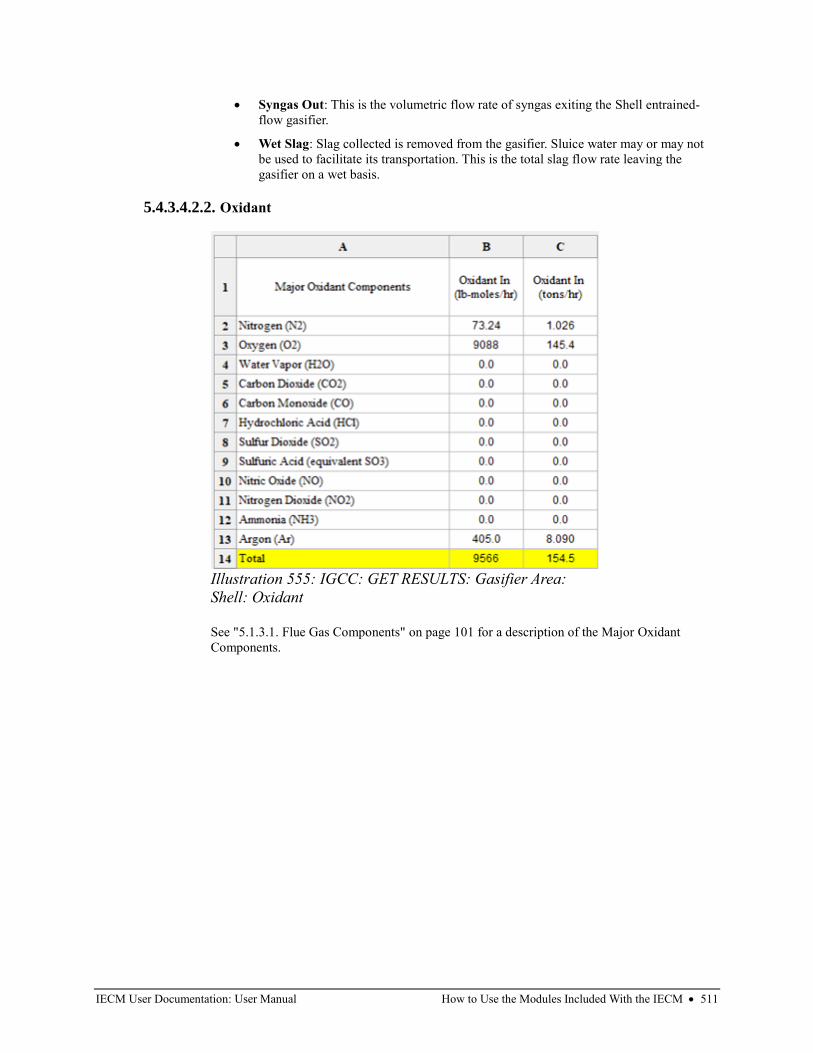
IECM User Documentation: User Manual How to Use the Modules Included With the IECM • 511
• Syngas Out: This is the volumetric flow rate of syngas exiting the Shell entrained-
flow gasifier.
• Wet Slag: Slag collected is removed from the gasifier. Sluice water may or may not
be used to facilitate its transportation. This is the total slag flow rate leaving the
gasifier on a wet basis.
5.4.3.4.2.2. Oxidant
See "5.1.3.1. Flue Gas Components" on page 101 for a description of the Major Oxidant
Components.
Illustration 555: IGCC: GET RESULTS: Gasifier Area:
Shell: Oxidant
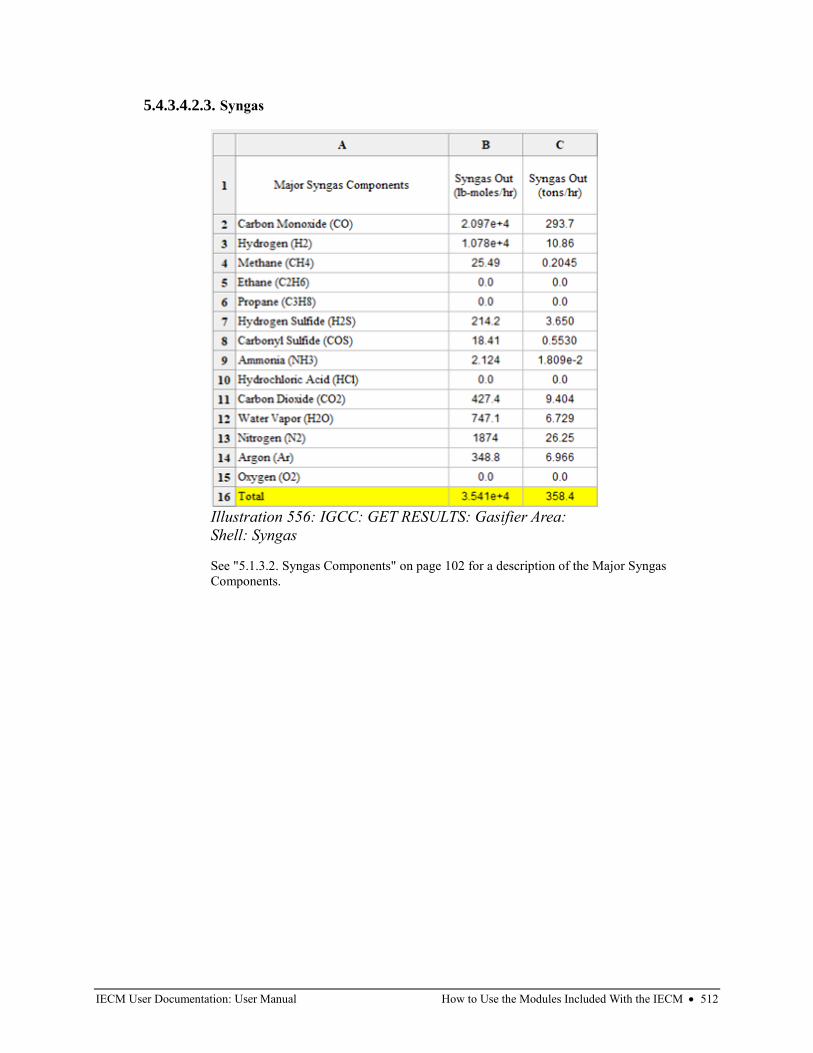
IECM User Documentation: User Manual How to Use the Modules Included With the IECM • 512
5.4.3.4.2.3. Syngas
See "5.1.3.2. Syngas Components" on page 102 for a description of the Major Syngas
Components.
Illustration 556: IGCC: GET RESULTS: Gasifier Area:
Shell: Syngas
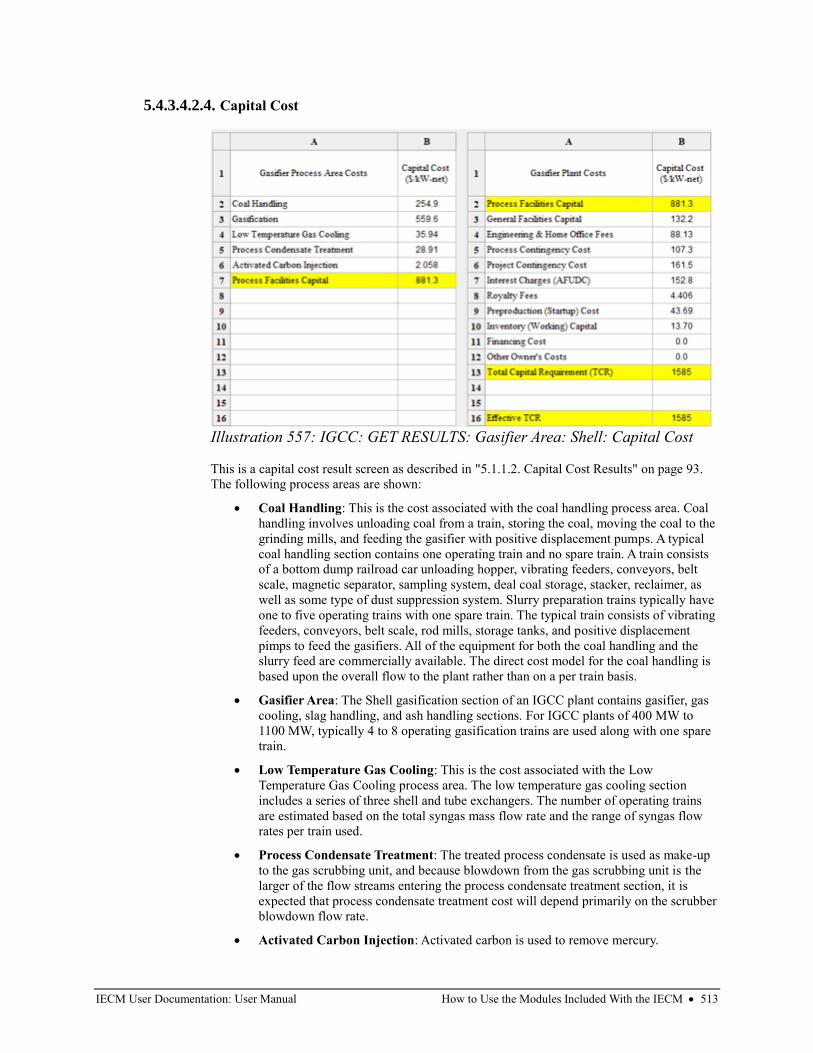
IECM User Documentation: User Manual How to Use the Modules Included With the IECM • 513
5.4.3.4.2.4. Capital Cost
This is a capital cost result screen as described in "5.1.1.2. Capital Cost Results" on page 93.
The following process areas are shown:
• Coal Handling: This is the cost associated with the coal handling process area. Coal
handling involves unloading coal from a train, storing the coal, moving the coal to the
grinding mills, and feeding the gasifier with positive displacement pumps. A typical
coal handling section contains one operating train and no spare train. A train consists
of a bottom dump railroad car unloading hopper, vibrating feeders, conveyors, belt
scale, magnetic separator, sampling system, deal coal storage, stacker, reclaimer, as
well as some type of dust suppression system. Slurry preparation trains typically have
one to five operating trains with one spare train. The typical train consists of vibrating
feeders, conveyors, belt scale, rod mills, storage tanks, and positive displacement
pimps to feed the gasifiers. All of the equipment for both the coal handling and the
slurry feed are commercially available. The direct cost model for the coal handling is
based upon the overall flow to the plant rather than on a per train basis.
• Gasifier Area: The Shell gasification section of an IGCC plant contains gasifier, gas
cooling, slag handling, and ash handling sections. For IGCC plants of 400 MW to
1100 MW, typically 4 to 8 operating gasification trains are used along with one spare
train.
• Low Temperature Gas Cooling: This is the cost associated with the Low
Temperature Gas Cooling process area. The low temperature gas cooling section
includes a series of three shell and tube exchangers. The number of operating trains
are estimated based on the total syngas mass flow rate and the range of syngas flow
rates per train used.
• Process Condensate Treatment: The treated process condensate is used as make-up
to the gas scrubbing unit, and because blowdown from the gas scrubbing unit is the
larger of the flow streams entering the process condensate treatment section, it is
expected that process condensate treatment cost will depend primarily on the scrubber
blowdown flow rate.
• Activated Carbon Injection: Activated carbon is used to remove mercury.
Illustration 557: IGCC: GET RESULTS: Gasifier Area: Shell: Capital Cost
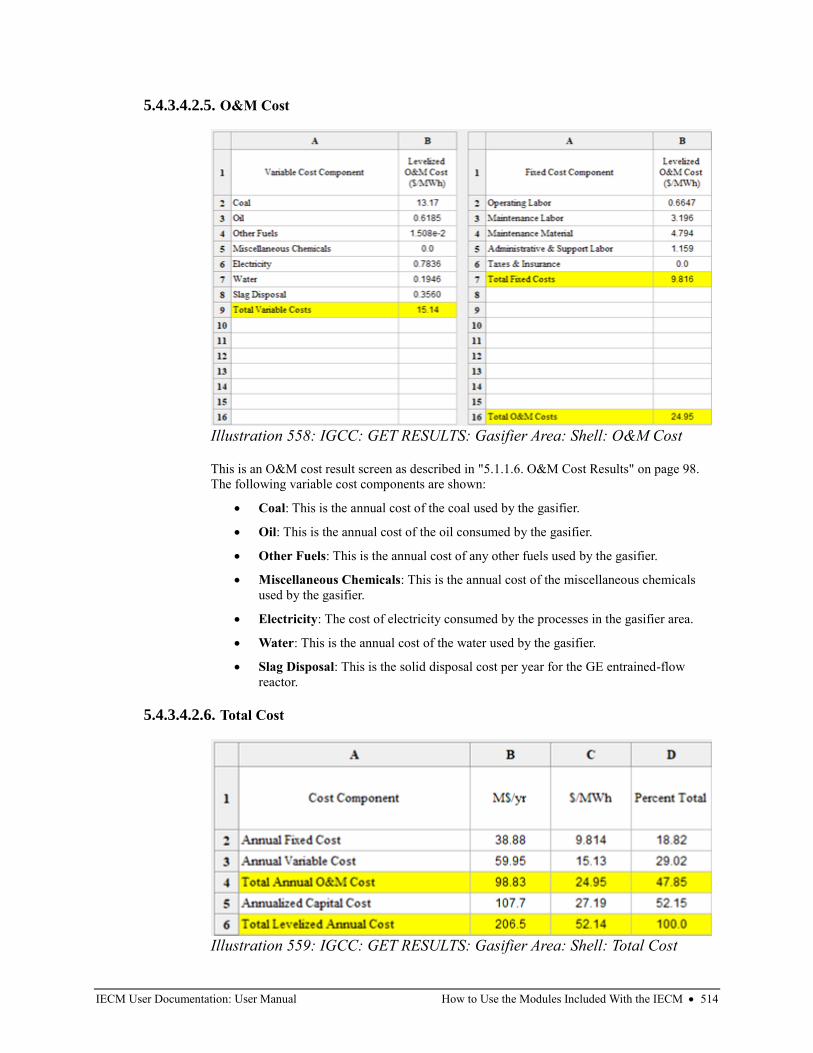
IECM User Documentation: User Manual How to Use the Modules Included With the IECM • 514
5.4.3.4.2.5. O&M Cost
This is an O&M cost result screen as described in "5.1.1.6. O&M Cost Results" on page 98.
The following variable cost components are shown:
• Coal: This is the annual cost of the coal used by the gasifier.
• Oil: This is the annual cost of the oil consumed by the gasifier.
• Other Fuels: This is the annual cost of any other fuels used by the gasifier.
• Miscellaneous Chemicals: This is the annual cost of the miscellaneous chemicals
used by the gasifier.
• Electricity: The cost of electricity consumed by the processes in the gasifier area.
• Water: This is the annual cost of the water used by the gasifier.
• Slag Disposal: This is the solid disposal cost per year for the GE entrained-flow
reactor.
5.4.3.4.2.6. Total Cost
Illustration 558: IGCC: GET RESULTS: Gasifier Area: Shell: O&M Cost
Illustration 559: IGCC: GET RESULTS: Gasifier Area: Shell: Total Cost
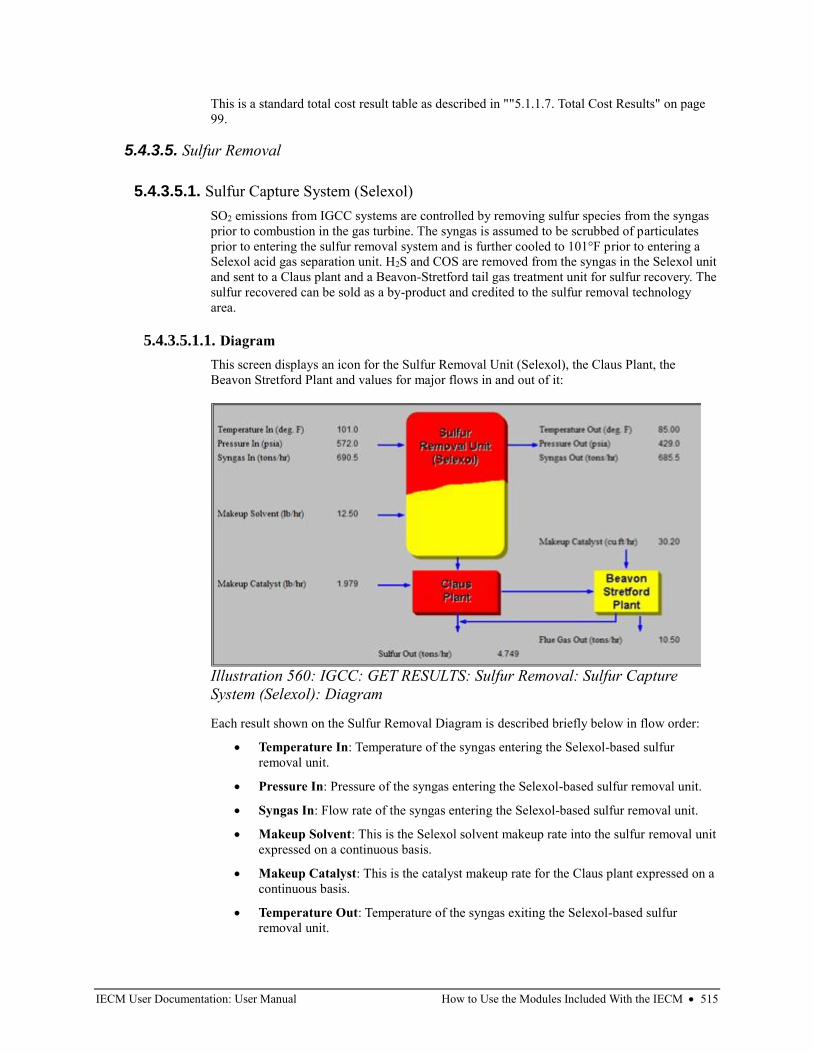
IECM User Documentation: User Manual How to Use the Modules Included With the IECM • 515
This is a standard total cost result table as described in ""5.1.1.7. Total Cost Results" on page
99.
5.4.3.5. Sulfur Removal
5.4.3.5.1. Sulfur Capture System (Selexol)
SO2 emissions from IGCC systems are controlled by removing sulfur species from the syngas
prior to combustion in the gas turbine. The syngas is assumed to be scrubbed of particulates
prior to entering the sulfur removal system and is further cooled to 101°F prior to entering a
Selexol acid gas separation unit. H2S and COS are removed from the syngas in the Selexol unit
and sent to a Claus plant and a Beavon-Stretford tail gas treatment unit for sulfur recovery. The
sulfur recovered can be sold as a by-product and credited to the sulfur removal technology
area.
5.4.3.5.1.1. Diagram
This screen displays an icon for the Sulfur Removal Unit (Selexol), the Claus Plant, the
Beavon Stretford Plant and values for major flows in and out of it:
Each result shown on the Sulfur Removal Diagram is described briefly below in flow order:
• Temperature In: Temperature of the syngas entering the Selexol-based sulfur
removal unit.
• Pressure In: Pressure of the syngas entering the Selexol-based sulfur removal unit.
• Syngas In: Flow rate of the syngas entering the Selexol-based sulfur removal unit.
• Makeup Solvent: This is the Selexol solvent makeup rate into the sulfur removal unit
expressed on a continuous basis.
• Makeup Catalyst: This is the catalyst makeup rate for the Claus plant expressed on a
continuous basis.
• Temperature Out: Temperature of the syngas exiting the Selexol-based sulfur
removal unit.
Illustration 560: IGCC: GET RESULTS: Sulfur Removal: Sulfur Capture
System (Selexol): Diagram
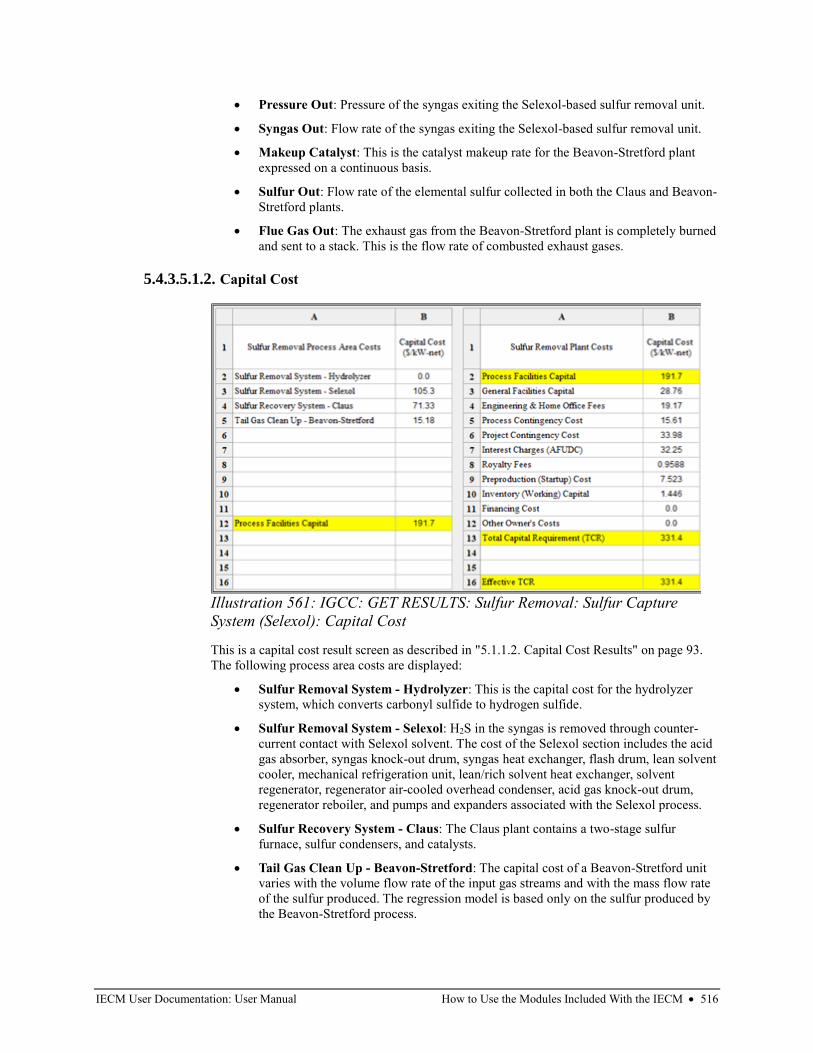
IECM User Documentation: User Manual How to Use the Modules Included With the IECM • 516
• Pressure Out: Pressure of the syngas exiting the Selexol-based sulfur removal unit.
• Syngas Out: Flow rate of the syngas exiting the Selexol-based sulfur removal unit.
• Makeup Catalyst: This is the catalyst makeup rate for the Beavon-Stretford plant
expressed on a continuous basis.
• Sulfur Out: Flow rate of the elemental sulfur collected in both the Claus and Beavon-
Stretford plants.
• Flue Gas Out: The exhaust gas from the Beavon-Stretford plant is completely burned
and sent to a stack. This is the flow rate of combusted exhaust gases.
5.4.3.5.1.2. Capital Cost
This is a capital cost result screen as described in "5.1.1.2. Capital Cost Results" on page 93.
The following process area costs are displayed:
• Sulfur Removal System - Hydrolyzer: This is the capital cost for the hydrolyzer
system, which converts carbonyl sulfide to hydrogen sulfide.
• Sulfur Removal System - Selexol: H2S in the syngas is removed through counter-
current contact with Selexol solvent. The cost of the Selexol section includes the acid
gas absorber, syngas knock-out drum, syngas heat exchanger, flash drum, lean solvent
cooler, mechanical refrigeration unit, lean/rich solvent heat exchanger, solvent
regenerator, regenerator air-cooled overhead condenser, acid gas knock-out drum,
regenerator reboiler, and pumps and expanders associated with the Selexol process.
• Sulfur Recovery System - Claus: The Claus plant contains a two-stage sulfur
furnace, sulfur condensers, and catalysts.
• Tail Gas Clean Up - Beavon-Stretford: The capital cost of a Beavon-Stretford unit
varies with the volume flow rate of the input gas streams and with the mass flow rate
of the sulfur produced. The regression model is based only on the sulfur produced by
the Beavon-Stretford process.
Illustration 561: IGCC: GET RESULTS: Sulfur Removal: Sulfur Capture
System (Selexol): Capital Cost
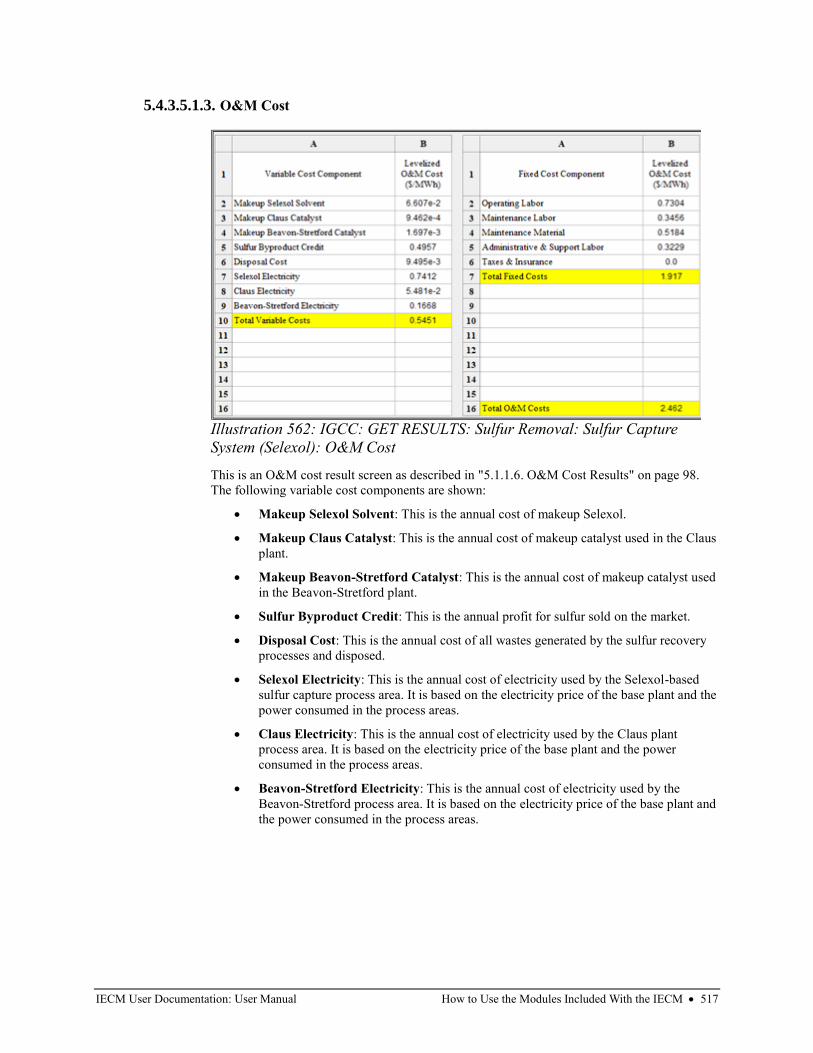
IECM User Documentation: User Manual How to Use the Modules Included With the IECM • 517
5.4.3.5.1.3. O&M Cost
This is an O&M cost result screen as described in "5.1.1.6. O&M Cost Results" on page 98.
The following variable cost components are shown:
• Makeup Selexol Solvent: This is the annual cost of makeup Selexol.
• Makeup Claus Catalyst: This is the annual cost of makeup catalyst used in the Claus
plant.
• Makeup Beavon-Stretford Catalyst: This is the annual cost of makeup catalyst used
in the Beavon-Stretford plant.
• Sulfur Byproduct Credit: This is the annual profit for sulfur sold on the market.
• Disposal Cost: This is the annual cost of all wastes generated by the sulfur recovery
processes and disposed.
• Selexol Electricity: This is the annual cost of electricity used by the Selexol-based
sulfur capture process area. It is based on the electricity price of the base plant and the
power consumed in the process areas.
• Claus Electricity: This is the annual cost of electricity used by the Claus plant
process area. It is based on the electricity price of the base plant and the power
consumed in the process areas.
• Beavon-Stretford Electricity: This is the annual cost of electricity used by the
Beavon-Stretford process area. It is based on the electricity price of the base plant and
the power consumed in the process areas.
Illustration 562: IGCC: GET RESULTS: Sulfur Removal: Sulfur Capture
System (Selexol): O&M Cost
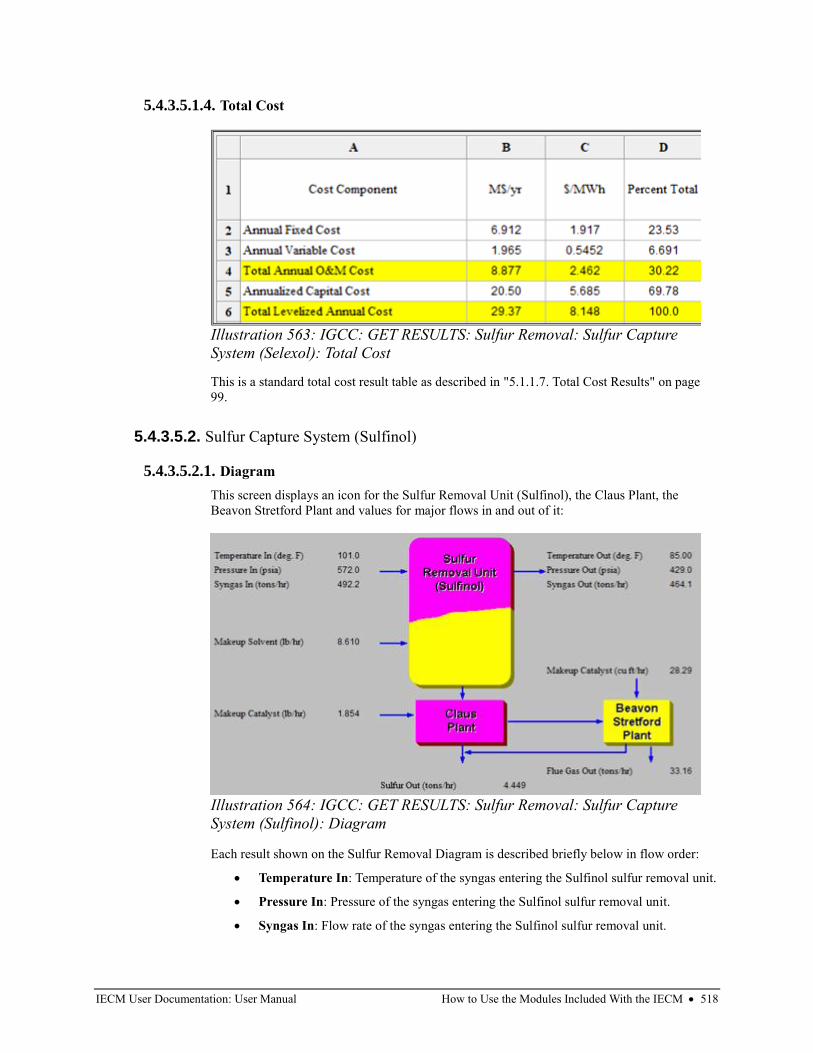
IECM User Documentation: User Manual How to Use the Modules Included With the IECM • 518
5.4.3.5.1.4. Total Cost
This is a standard total cost result table as described in "5.1.1.7. Total Cost Results" on page
99.
5.4.3.5.2. Sulfur Capture System (Sulfinol)
5.4.3.5.2.1. Diagram
This screen displays an icon for the Sulfur Removal Unit (Sulfinol), the Claus Plant, the
Beavon Stretford Plant and values for major flows in and out of it:
Each result shown on the Sulfur Removal Diagram is described briefly below in flow order:
• Temperature In: Temperature of the syngas entering the Sulfinol sulfur removal unit.
• Pressure In: Pressure of the syngas entering the Sulfinol sulfur removal unit.
• Syngas In: Flow rate of the syngas entering the Sulfinol sulfur removal unit.
Illustration 563: IGCC: GET RESULTS: Sulfur Removal: Sulfur Capture
System (Selexol): Total Cost
Illustration 564: IGCC: GET RESULTS: Sulfur Removal: Sulfur Capture
System (Sulfinol): Diagram
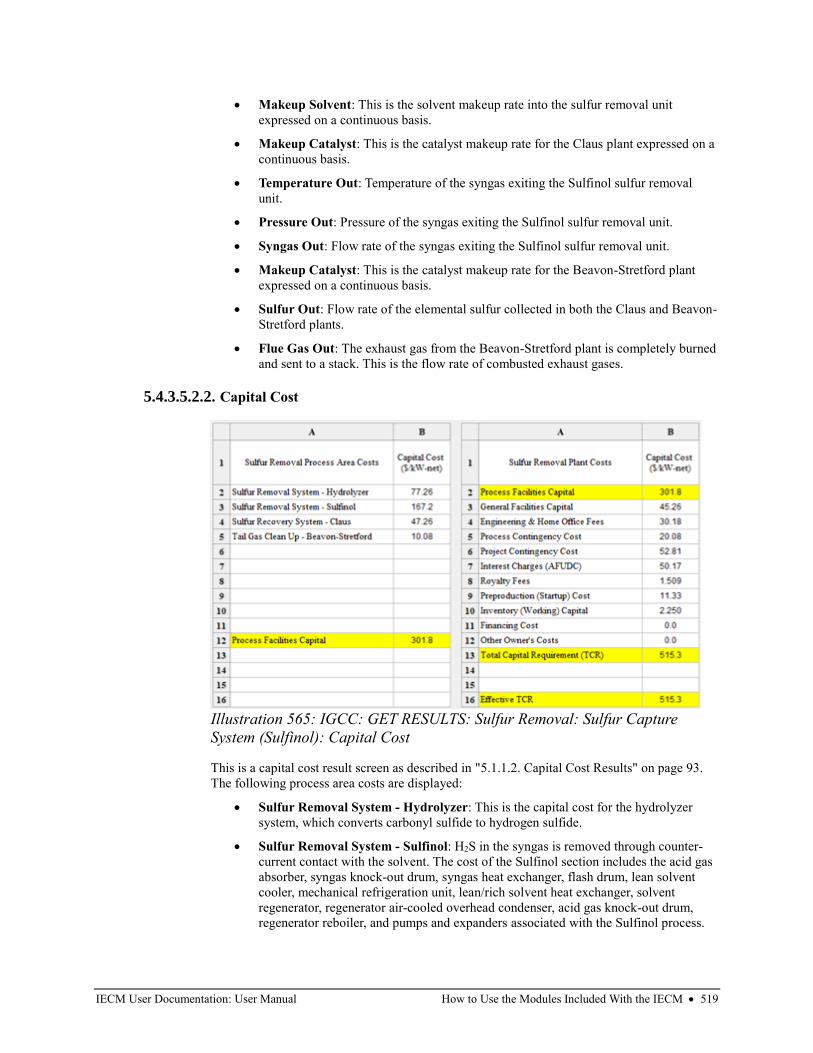
IECM User Documentation: User Manual How to Use the Modules Included With the IECM • 519
• Makeup Solvent: This is the solvent makeup rate into the sulfur removal unit
expressed on a continuous basis.
• Makeup Catalyst: This is the catalyst makeup rate for the Claus plant expressed on a
continuous basis.
• Temperature Out: Temperature of the syngas exiting the Sulfinol sulfur removal
unit.
• Pressure Out: Pressure of the syngas exiting the Sulfinol sulfur removal unit.
• Syngas Out: Flow rate of the syngas exiting the Sulfinol sulfur removal unit.
• Makeup Catalyst: This is the catalyst makeup rate for the Beavon-Stretford plant
expressed on a continuous basis.
• Sulfur Out: Flow rate of the elemental sulfur collected in both the Claus and Beavon-
Stretford plants.
• Flue Gas Out: The exhaust gas from the Beavon-Stretford plant is completely burned
and sent to a stack. This is the flow rate of combusted exhaust gases.
5.4.3.5.2.2. Capital Cost
This is a capital cost result screen as described in "5.1.1.2. Capital Cost Results" on page 93.
The following process area costs are displayed:
• Sulfur Removal System - Hydrolyzer: This is the capital cost for the hydrolyzer
system, which converts carbonyl sulfide to hydrogen sulfide.
• Sulfur Removal System - Sulfinol: H2S in the syngas is removed through counter-
current contact with the solvent. The cost of the Sulfinol section includes the acid gas
absorber, syngas knock-out drum, syngas heat exchanger, flash drum, lean solvent
cooler, mechanical refrigeration unit, lean/rich solvent heat exchanger, solvent
regenerator, regenerator air-cooled overhead condenser, acid gas knock-out drum,
regenerator reboiler, and pumps and expanders associated with the Sulfinol process.
Illustration 565: IGCC: GET RESULTS: Sulfur Removal: Sulfur Capture
System (Sulfinol): Capital Cost
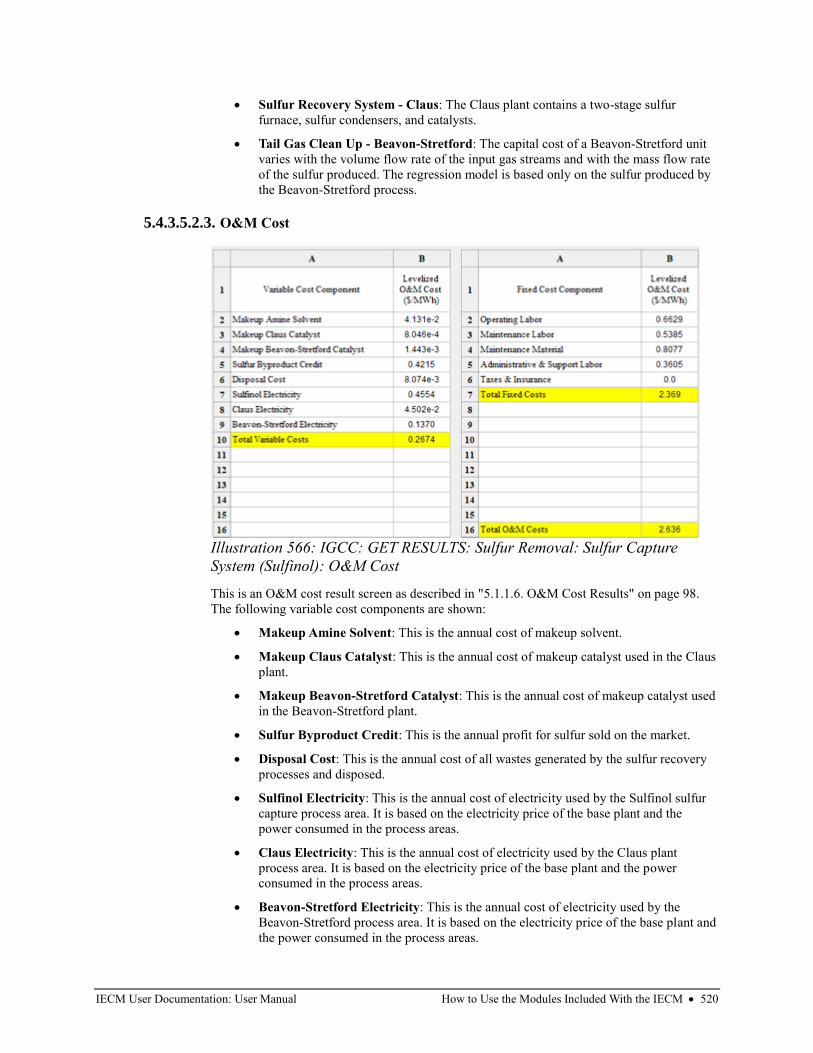
IECM User Documentation: User Manual How to Use the Modules Included With the IECM • 520
• Sulfur Recovery System - Claus: The Claus plant contains a two-stage sulfur
furnace, sulfur condensers, and catalysts.
• Tail Gas Clean Up - Beavon-Stretford: The capital cost of a Beavon-Stretford unit
varies with the volume flow rate of the input gas streams and with the mass flow rate
of the sulfur produced. The regression model is based only on the sulfur produced by
the Beavon-Stretford process.
5.4.3.5.2.3. O&M Cost
This is an O&M cost result screen as described in "5.1.1.6. O&M Cost Results" on page 98.
The following variable cost components are shown:
• Makeup Amine Solvent: This is the annual cost of makeup solvent.
• Makeup Claus Catalyst: This is the annual cost of makeup catalyst used in the Claus
plant.
• Makeup Beavon-Stretford Catalyst: This is the annual cost of makeup catalyst used
in the Beavon-Stretford plant.
• Sulfur Byproduct Credit: This is the annual profit for sulfur sold on the market.
• Disposal Cost: This is the annual cost of all wastes generated by the sulfur recovery
processes and disposed.
• Sulfinol Electricity: This is the annual cost of electricity used by the Sulfinol sulfur
capture process area. It is based on the electricity price of the base plant and the
power consumed in the process areas.
• Claus Electricity: This is the annual cost of electricity used by the Claus plant
process area. It is based on the electricity price of the base plant and the power
consumed in the process areas.
• Beavon-Stretford Electricity: This is the annual cost of electricity used by the
Beavon-Stretford process area. It is based on the electricity price of the base plant and
the power consumed in the process areas.
Illustration 566: IGCC: GET RESULTS: Sulfur Removal: Sulfur Capture
System (Sulfinol): O&M Cost
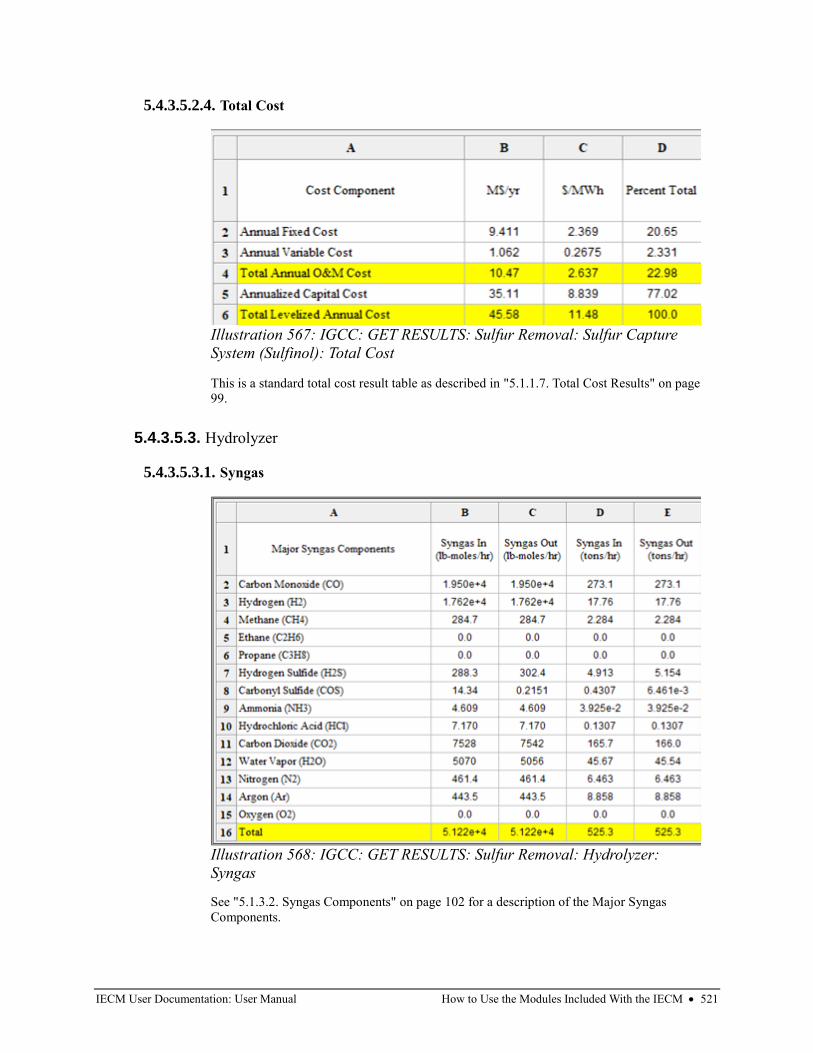
IECM User Documentation: User Manual How to Use the Modules Included With the IECM • 521
5.4.3.5.2.4. Total Cost
This is a standard total cost result table as described in "5.1.1.7. Total Cost Results" on page
99.
5.4.3.5.3. Hydrolyzer
5.4.3.5.3.1. Syngas
See "5.1.3.2. Syngas Components" on page 102 for a description of the Major Syngas
Components.
Illustration 567: IGCC: GET RESULTS: Sulfur Removal: Sulfur Capture
System (Sulfinol): Total Cost
Illustration 568: IGCC: GET RESULTS: Sulfur Removal: Hydrolyzer:
Syngas
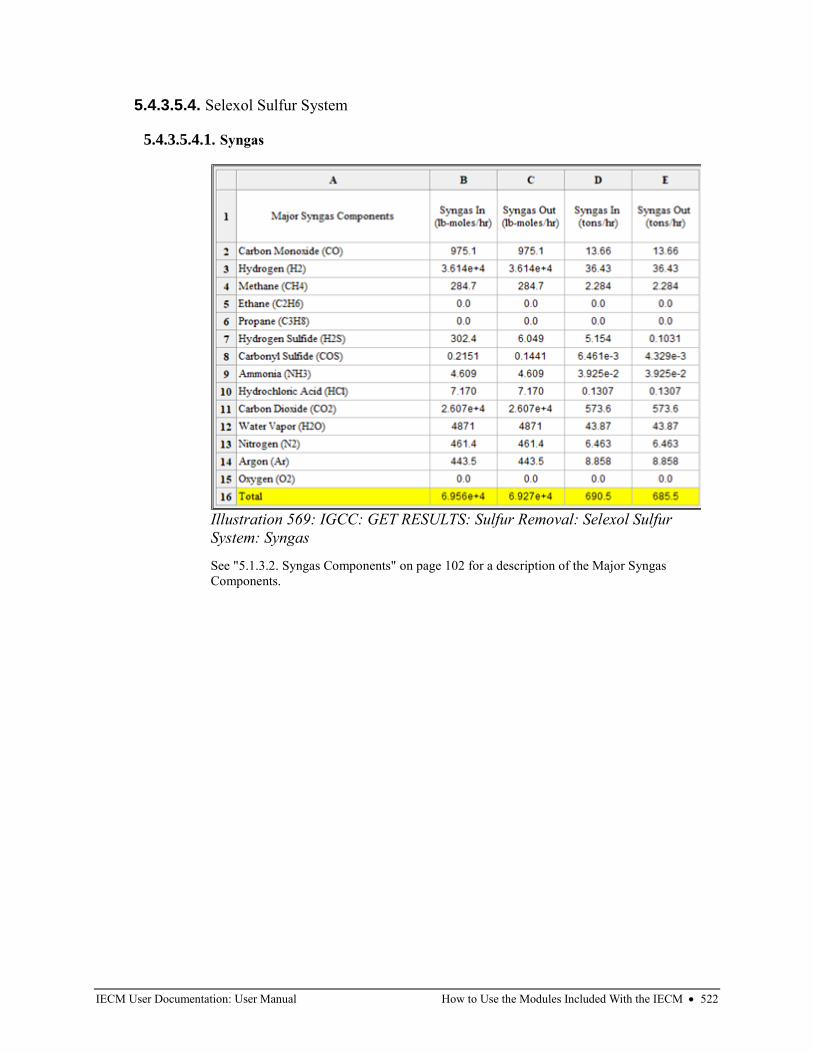
IECM User Documentation: User Manual How to Use the Modules Included With the IECM • 522
5.4.3.5.4. Selexol Sulfur System
5.4.3.5.4.1. Syngas
See "5.1.3.2. Syngas Components" on page 102 for a description of the Major Syngas
Components.
Illustration 569: IGCC: GET RESULTS: Sulfur Removal: Selexol Sulfur
System: Syngas
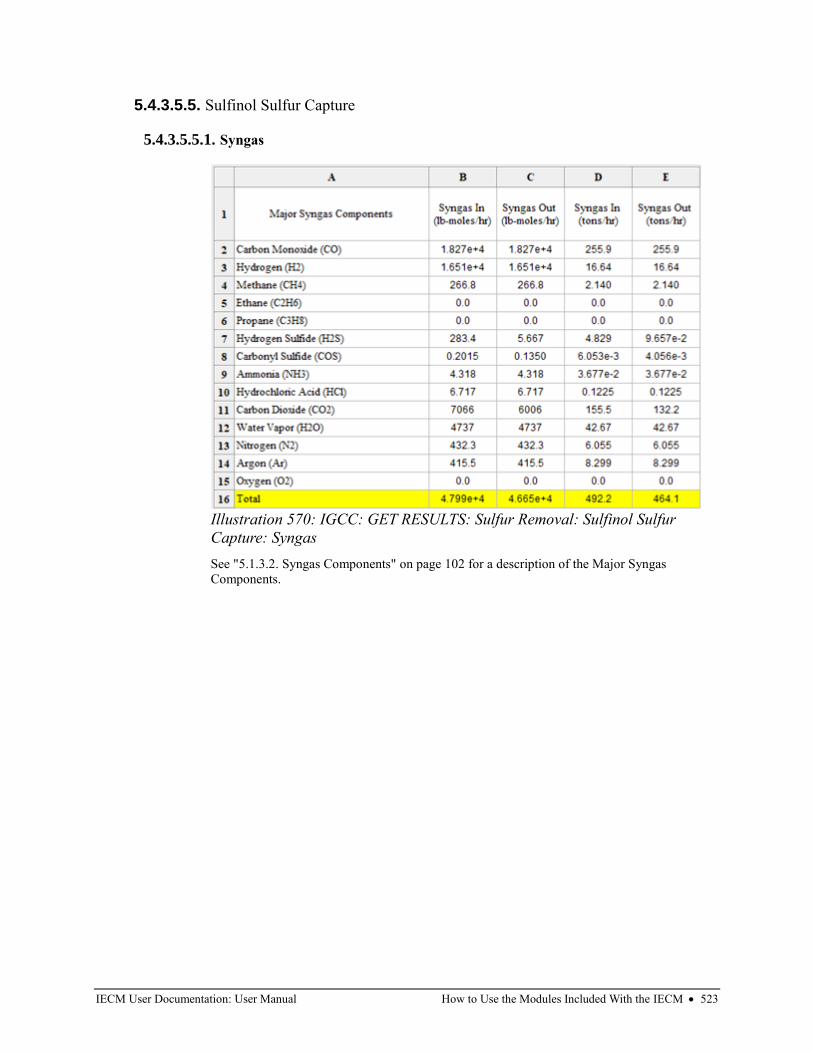
IECM User Documentation: User Manual How to Use the Modules Included With the IECM • 523
5.4.3.5.5. Sulfinol Sulfur Capture
5.4.3.5.5.1. Syngas
See "5.1.3.2. Syngas Components" on page 102 for a description of the Major Syngas
Components.
Illustration 570: IGCC: GET RESULTS: Sulfur Removal: Sulfinol Sulfur
Capture: Syngas
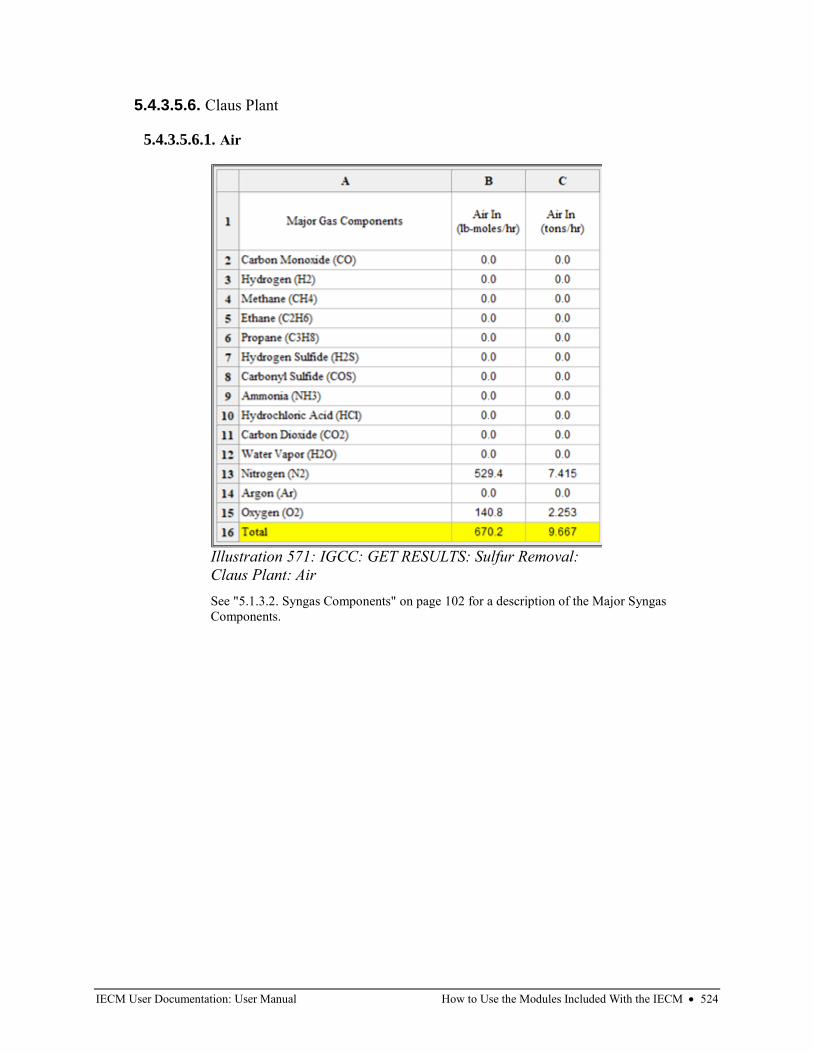
IECM User Documentation: User Manual How to Use the Modules Included With the IECM • 524
5.4.3.5.6. Claus Plant
5.4.3.5.6.1. Air
See "5.1.3.2. Syngas Components" on page 102 for a description of the Major Syngas
Components.
Illustration 571: IGCC: GET RESULTS: Sulfur Removal:
Claus Plant: Air
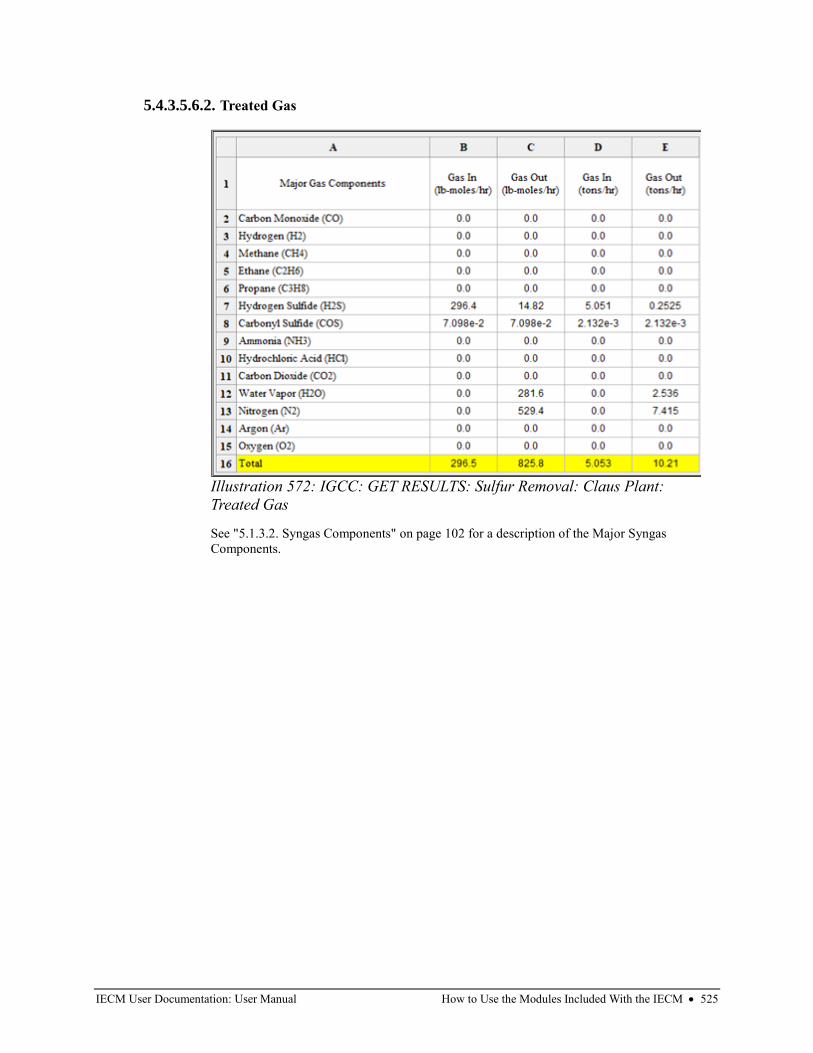
IECM User Documentation: User Manual How to Use the Modules Included With the IECM • 525
5.4.3.5.6.2. Treated Gas
See "5.1.3.2. Syngas Components" on page 102 for a description of the Major Syngas
Components.
Illustration 572: IGCC: GET RESULTS: Sulfur Removal: Claus Plant:
Treated Gas

IECM User Documentation: User Manual How to Use the Modules Included With the IECM • 526
5.4.3.5.7. Beavon-Stretford Plant
5.4.3.5.7.1. Treated Gas
See "5.1.3.2. Syngas Components" on page 102 for a description of the Major Syngas
Components.
Illustration 573: IGCC: GET RESULTS: Sulfur Removal:
Beavon-Stretford Plant: Treated Gas
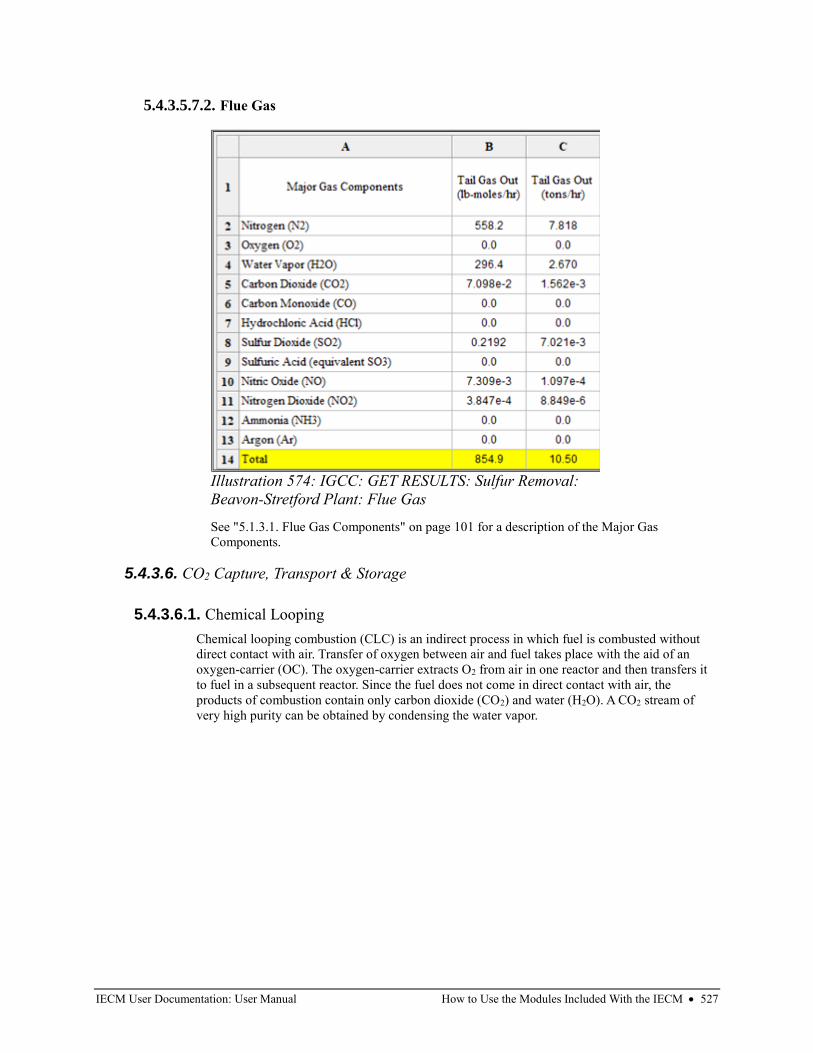
IECM User Documentation: User Manual How to Use the Modules Included With the IECM • 527
5.4.3.5.7.2. Flue Gas
See "5.1.3.1. Flue Gas Components" on page 101 for a description of the Major Gas
Components.
5.4.3.6. CO2 Capture, Transport & Storage
5.4.3.6.1. Chemical Looping
Chemical looping combustion (CLC) is an indirect process in which fuel is combusted without
direct contact with air. Transfer of oxygen between air and fuel takes place with the aid of an
oxygen-carrier (OC). The oxygen-carrier extracts O2 from air in one reactor and then transfers it
to fuel in a subsequent reactor. Since the fuel does not come in direct contact with air, the
products of combustion contain only carbon dioxide (CO2) and water (H2O). A CO2 stream of
very high purity can be obtained by condensing the water vapor.
Illustration 574: IGCC: GET RESULTS: Sulfur Removal:
Beavon-Stretford Plant: Flue Gas
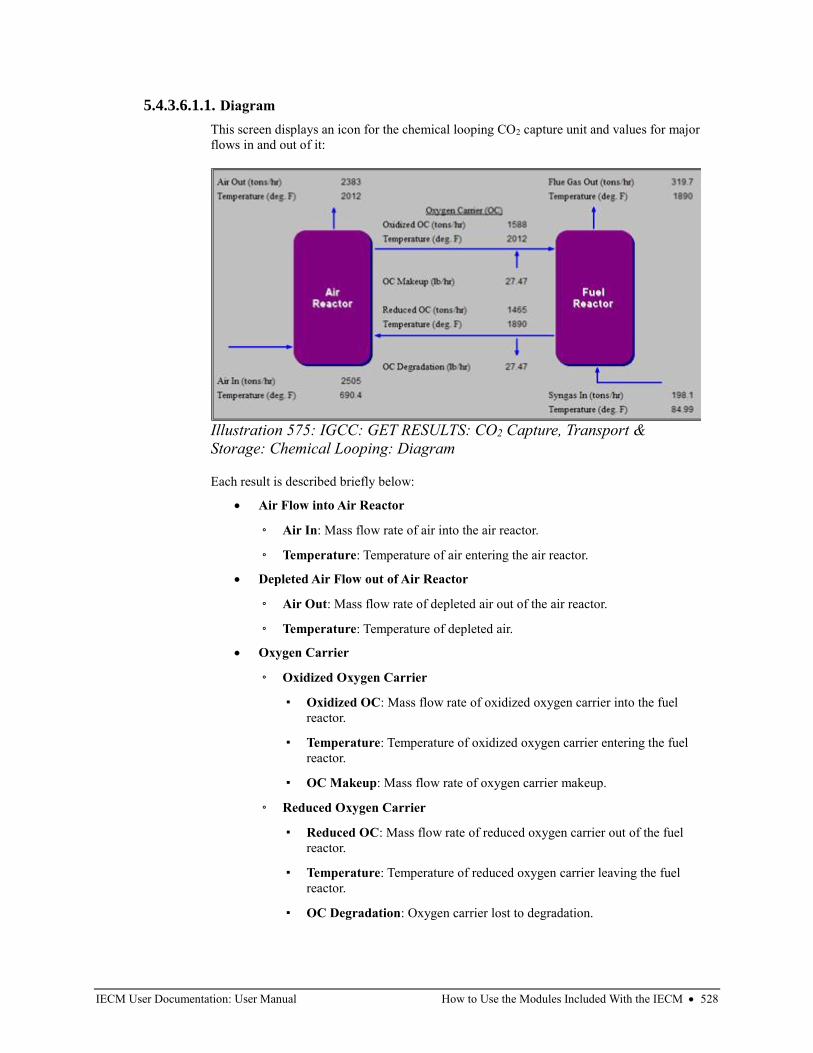
IECM User Documentation: User Manual How to Use the Modules Included With the IECM • 528
5.4.3.6.1.1. Diagram
This screen displays an icon for the chemical looping CO2 capture unit and values for major
flows in and out of it:
Each result is described briefly below:
• Air Flow into Air Reactor
◦ Air In: Mass flow rate of air into the air reactor.
◦ Temperature: Temperature of air entering the air reactor.
• Depleted Air Flow out of Air Reactor
◦ Air Out: Mass flow rate of depleted air out of the air reactor.
◦ Temperature: Temperature of depleted air.
• Oxygen Carrier
◦ Oxidized Oxygen Carrier
▪ Oxidized OC: Mass flow rate of oxidized oxygen carrier into the fuel
reactor.
▪ Temperature: Temperature of oxidized oxygen carrier entering the fuel
reactor.
▪ OC Makeup: Mass flow rate of oxygen carrier makeup.
◦ Reduced Oxygen Carrier
▪ Reduced OC: Mass flow rate of reduced oxygen carrier out of the fuel
reactor.
▪ Temperature: Temperature of reduced oxygen carrier leaving the fuel
reactor.
▪ OC Degradation: Oxygen carrier lost to degradation.
Illustration 575: IGCC: GET RESULTS: CO2 Capture, Transport &
Storage: Chemical Looping: Diagram
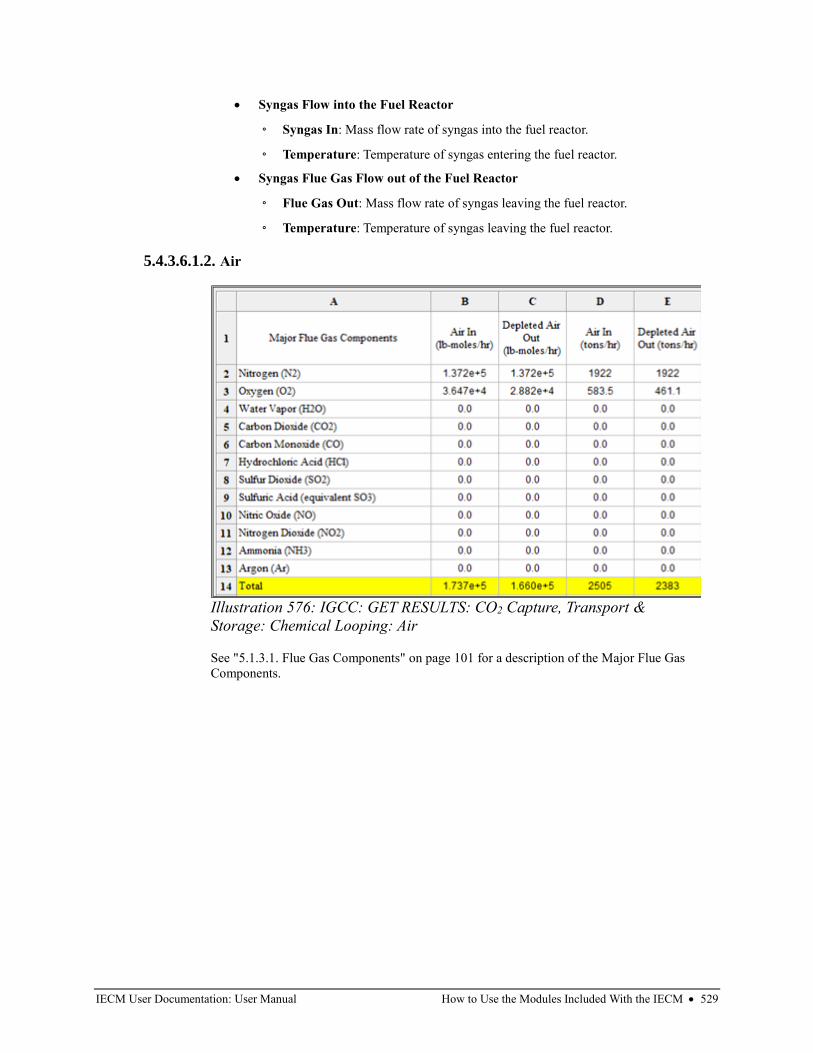
IECM User Documentation: User Manual How to Use the Modules Included With the IECM • 529
• Syngas Flow into the Fuel Reactor
◦ Syngas In: Mass flow rate of syngas into the fuel reactor.
◦ Temperature: Temperature of syngas entering the fuel reactor.
• Syngas Flue Gas Flow out of the Fuel Reactor
◦ Flue Gas Out: Mass flow rate of syngas leaving the fuel reactor.
◦ Temperature: Temperature of syngas leaving the fuel reactor.
5.4.3.6.1.2. Air
See "5.1.3.1. Flue Gas Components" on page 101 for a description of the Major Flue Gas
Components.
Illustration 576: IGCC: GET RESULTS: CO2 Capture, Transport &
Storage: Chemical Looping: Air
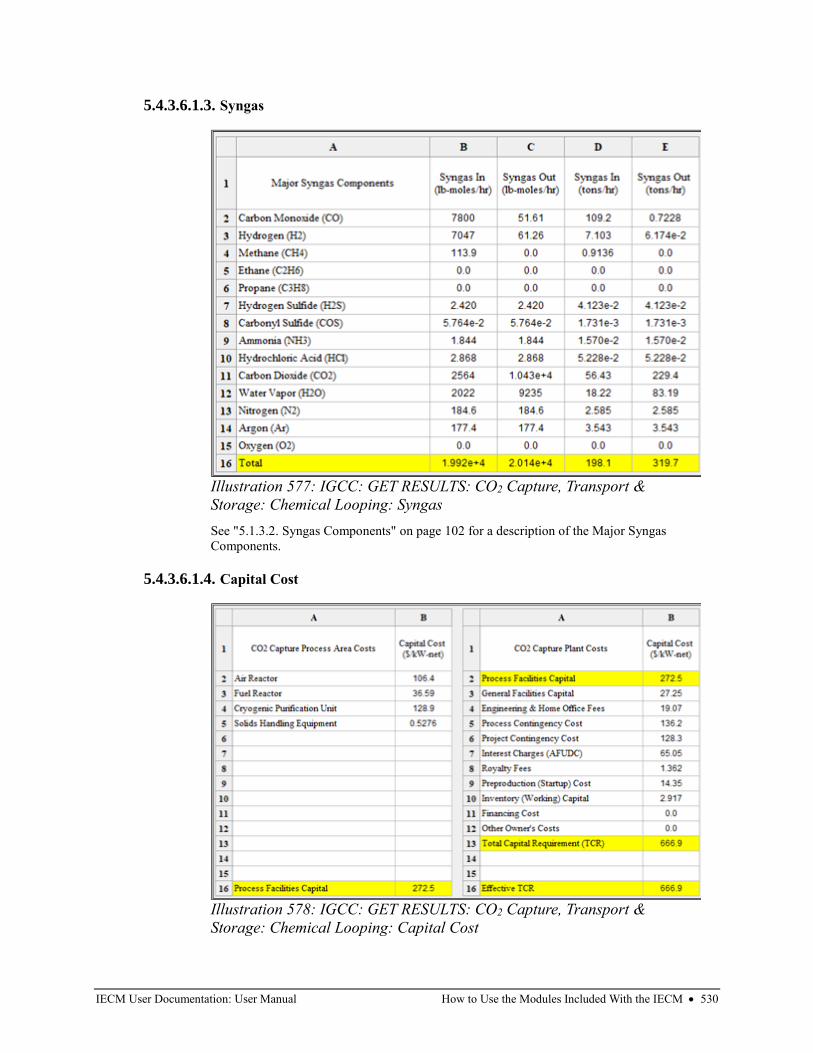
IECM User Documentation: User Manual How to Use the Modules Included With the IECM • 530
5.4.3.6.1.3. Syngas
See "5.1.3.2. Syngas Components" on page 102 for a description of the Major Syngas
Components.
5.4.3.6.1.4. Capital Cost
Illustration 577: IGCC: GET RESULTS: CO2 Capture, Transport &
Storage: Chemical Looping: Syngas
Illustration 578: IGCC: GET RESULTS: CO2 Capture, Transport &
Storage: Chemical Looping: Capital Cost
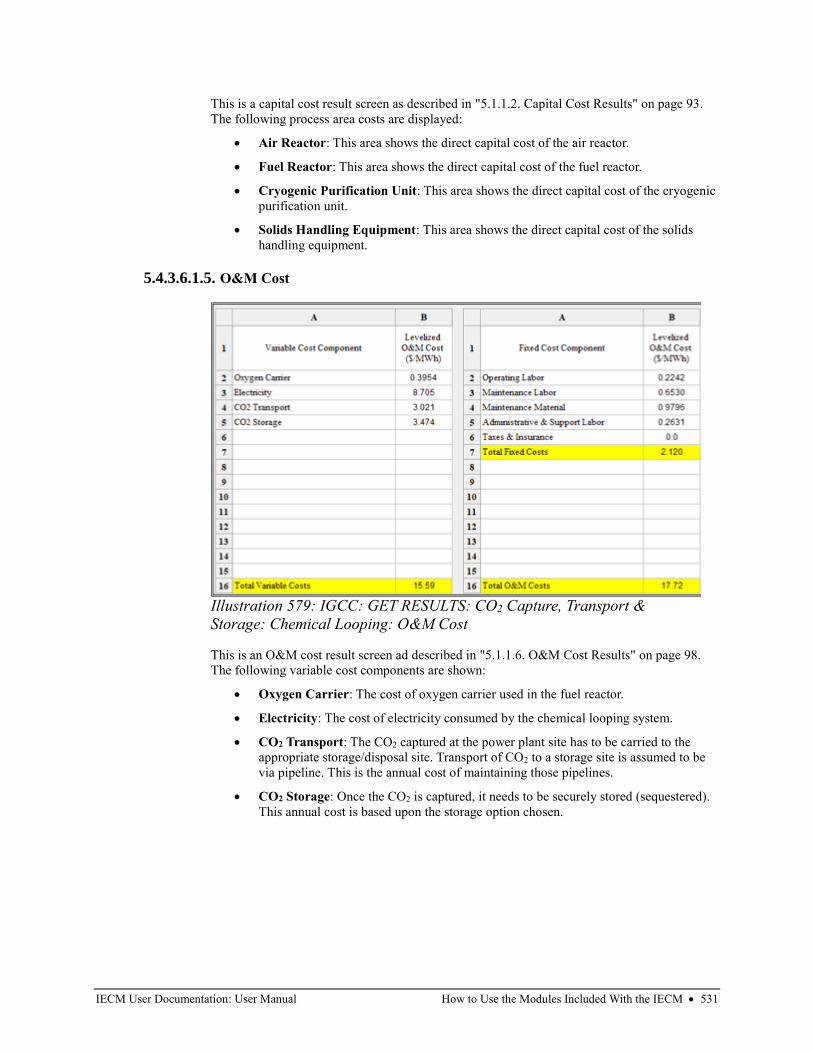
IECM User Documentation: User Manual How to Use the Modules Included With the IECM • 531
This is a capital cost result screen as described in "5.1.1.2. Capital Cost Results" on page 93.
The following process area costs are displayed:
• Air Reactor: This area shows the direct capital cost of the air reactor.
• Fuel Reactor: This area shows the direct capital cost of the fuel reactor.
• Cryogenic Purification Unit: This area shows the direct capital cost of the cryogenic
purification unit.
• Solids Handling Equipment: This area shows the direct capital cost of the solids
handling equipment.
5.4.3.6.1.5. O&M Cost
This is an O&M cost result screen ad described in "5.1.1.6. O&M Cost Results" on page 98.
The following variable cost components are shown:
• Oxygen Carrier: The cost of oxygen carrier used in the fuel reactor.
• Electricity: The cost of electricity consumed by the chemical looping system.
• CO2 Transport: The CO2 captured at the power plant site has to be carried to the
appropriate storage/disposal site. Transport of CO2 to a storage site is assumed to be
via pipeline. This is the annual cost of maintaining those pipelines.
• CO2 Storage: Once the CO2 is captured, it needs to be securely stored (sequestered).
This annual cost is based upon the storage option chosen.
Illustration 579: IGCC: GET RESULTS: CO2 Capture, Transport &
Storage: Chemical Looping: O&M Cost

IECM User Documentation: User Manual How to Use the Modules Included With the IECM • 532
5.4.3.6.1.6. Total Cost
This is a standard total cost result table as described in ""5.1.1.7. Total Cost Results" on page
99.
5.4.3.6.1.7. Summary
Illustration 580: IGCC: GET RESULTS: CO2 Capture, Transport &
Storage: Chemical Looping: Total Cost
Illustration 581: IGCC: GET RESULTS: CO2 Capture, Transport &
Storage: Chemical Looping: Summary
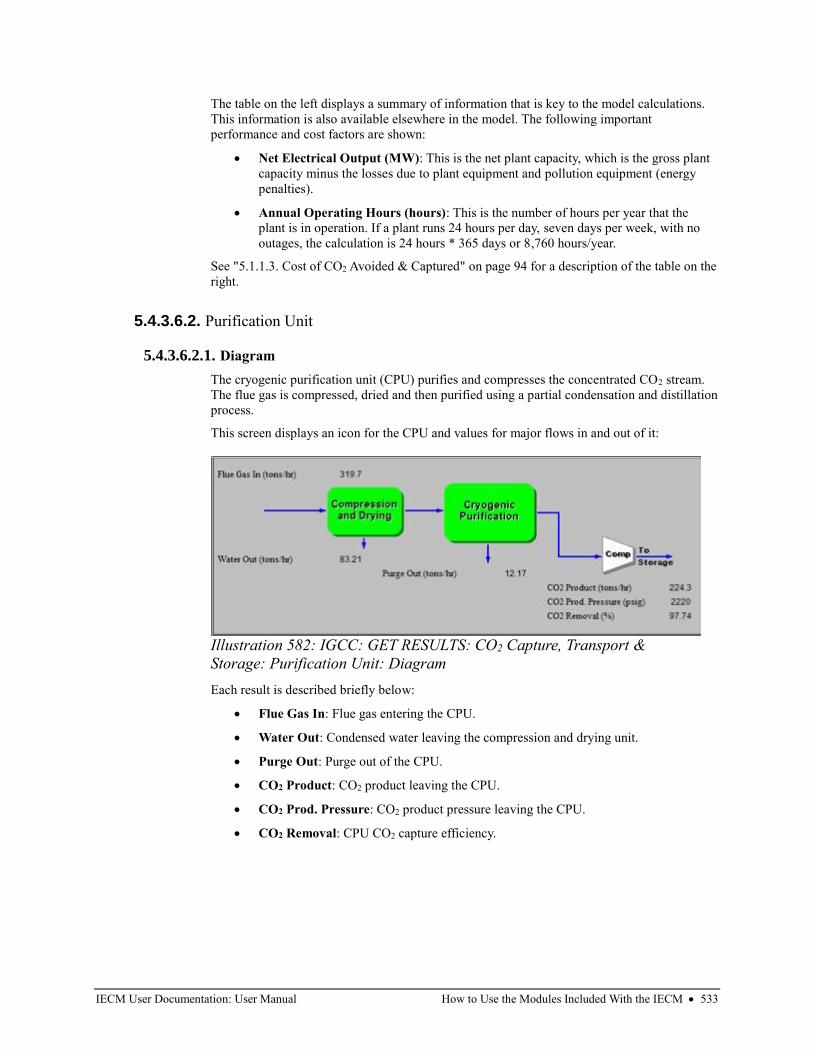
IECM User Documentation: User Manual How to Use the Modules Included With the IECM • 533
The table on the left displays a summary of information that is key to the model calculations.
This information is also available elsewhere in the model. The following important
performance and cost factors are shown:
• Net Electrical Output (MW): This is the net plant capacity, which is the gross plant
capacity minus the losses due to plant equipment and pollution equipment (energy
penalties).
• Annual Operating Hours (hours): This is the number of hours per year that the
plant is in operation. If a plant runs 24 hours per day, seven days per week, with no
outages, the calculation is 24 hours * 365 days or 8,760 hours/year.
See "5.1.1.3. Cost of CO2 Avoided & Captured" on page 94 for a description of the table on the
right.
5.4.3.6.2. Purification Unit
5.4.3.6.2.1. Diagram
The cryogenic purification unit (CPU) purifies and compresses the concentrated CO2 stream.
The flue gas is compressed, dried and then purified using a partial condensation and distillation
process.
This screen displays an icon for the CPU and values for major flows in and out of it:
Each result is described briefly below:
• Flue Gas In: Flue gas entering the CPU.
• Water Out: Condensed water leaving the compression and drying unit.
• Purge Out: Purge out of the CPU.
• CO2 Product: CO2 product leaving the CPU.
• CO2 Prod. Pressure: CO2 product pressure leaving the CPU.
• CO2 Removal: CPU CO2 capture efficiency.
Illustration 582: IGCC: GET RESULTS: CO2 Capture, Transport &
Storage: Purification Unit: Diagram
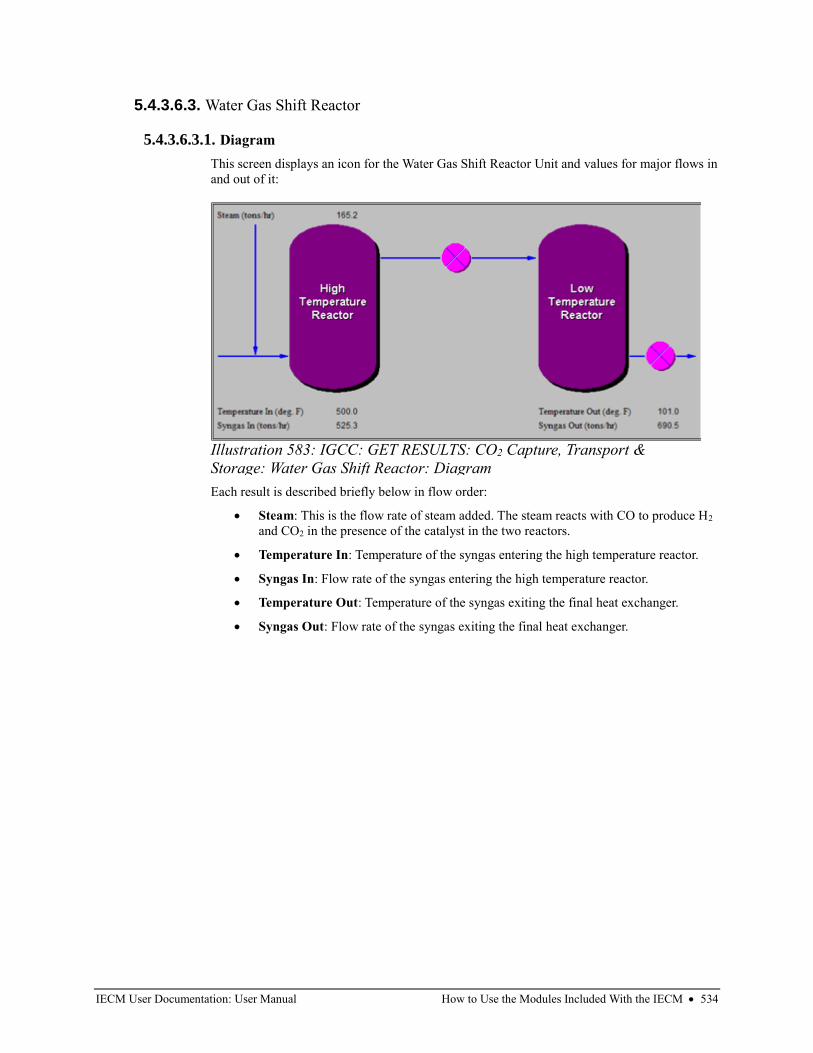
IECM User Documentation: User Manual How to Use the Modules Included With the IECM • 534
5.4.3.6.3. Water Gas Shift Reactor
5.4.3.6.3.1. Diagram
This screen displays an icon for the Water Gas Shift Reactor Unit and values for major flows in
and out of it:
Each result is described briefly below in flow order:
• Steam: This is the flow rate of steam added. The steam reacts with CO to produce H2
and CO2 in the presence of the catalyst in the two reactors.
• Temperature In: Temperature of the syngas entering the high temperature reactor.
• Syngas In: Flow rate of the syngas entering the high temperature reactor.
• Temperature Out: Temperature of the syngas exiting the final heat exchanger.
• Syngas Out: Flow rate of the syngas exiting the final heat exchanger.
Illustration 583: IGCC: GET RESULTS: CO2 Capture, Transport &
Storage: Water Gas Shift Reactor: Diagram
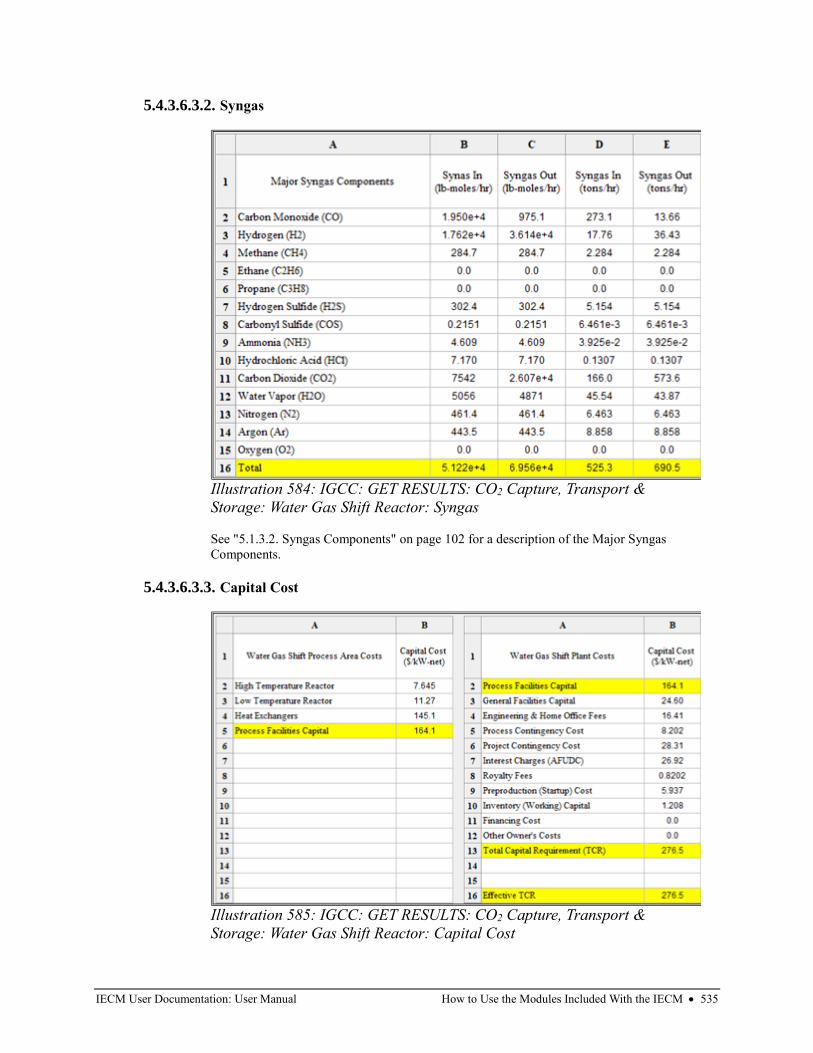
IECM User Documentation: User Manual How to Use the Modules Included With the IECM • 535
5.4.3.6.3.2. Syngas
See "5.1.3.2. Syngas Components" on page 102 for a description of the Major Syngas
Components.
5.4.3.6.3.3. Capital Cost
Illustration 584: IGCC: GET RESULTS: CO2 Capture, Transport &
Storage: Water Gas Shift Reactor: Syngas
Illustration 585: IGCC: GET RESULTS: CO2 Capture, Transport &
Storage: Water Gas Shift Reactor: Capital Cost
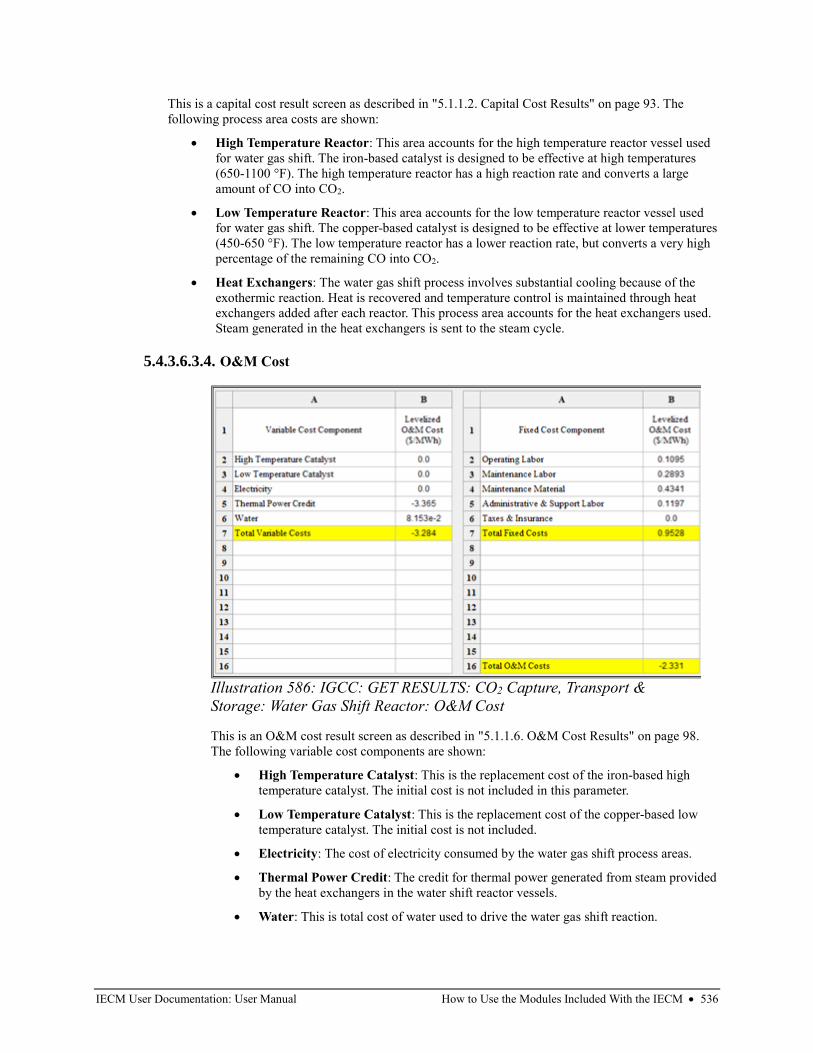
IECM User Documentation: User Manual How to Use the Modules Included With the IECM • 536
This is a capital cost result screen as described in "5.1.1.2. Capital Cost Results" on page 93. The
following process area costs are shown:
• High Temperature Reactor: This area accounts for the high temperature reactor vessel used
for water gas shift. The iron-based catalyst is designed to be effective at high temperatures
(650-1100 °F). The high temperature reactor has a high reaction rate and converts a large
amount of CO into CO2.
• Low Temperature Reactor: This area accounts for the low temperature reactor vessel used
for water gas shift. The copper-based catalyst is designed to be effective at lower temperatures
(450-650 °F). The low temperature reactor has a lower reaction rate, but converts a very high
percentage of the remaining CO into CO2.
• Heat Exchangers: The water gas shift process involves substantial cooling because of the
exothermic reaction. Heat is recovered and temperature control is maintained through heat
exchangers added after each reactor. This process area accounts for the heat exchangers used.
Steam generated in the heat exchangers is sent to the steam cycle.
5.4.3.6.3.4. O&M Cost
This is an O&M cost result screen as described in "5.1.1.6. O&M Cost Results" on page 98.
The following variable cost components are shown:
• High Temperature Catalyst: This is the replacement cost of the iron-based high
temperature catalyst. The initial cost is not included in this parameter.
• Low Temperature Catalyst: This is the replacement cost of the copper-based low
temperature catalyst. The initial cost is not included.
• Electricity: The cost of electricity consumed by the water gas shift process areas.
• Thermal Power Credit: The credit for thermal power generated from steam provided
by the heat exchangers in the water shift reactor vessels.
• Water: This is total cost of water used to drive the water gas shift reaction.
Illustration 586: IGCC: GET RESULTS: CO2 Capture, Transport &
Storage: Water Gas Shift Reactor: O&M Cost
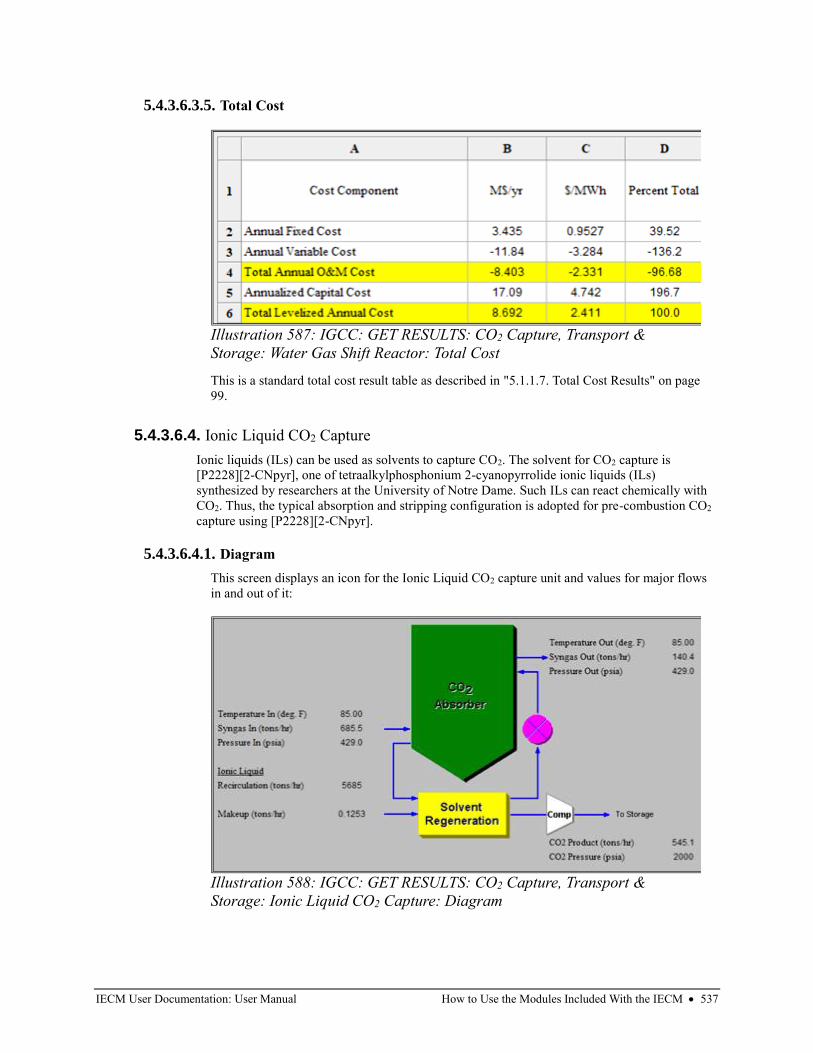
IECM User Documentation: User Manual How to Use the Modules Included With the IECM • 537
5.4.3.6.3.5. Total Cost
This is a standard total cost result table as described in "5.1.1.7. Total Cost Results" on page
99.
5.4.3.6.4. Ionic Liquid CO2 Capture
Ionic liquids (ILs) can be used as solvents to capture CO2. The solvent for CO2 capture is
[P2228][2-CNpyr], one of tetraalkylphosphonium 2-cyanopyrrolide ionic liquids (ILs)
synthesized by researchers at the University of Notre Dame. Such ILs can react chemically with
CO2. Thus, the typical absorption and stripping configuration is adopted for pre-combustion CO2
capture using [P2228][2-CNpyr].
5.4.3.6.4.1. Diagram
This screen displays an icon for the Ionic Liquid CO2 capture unit and values for major flows
in and out of it:
Illustration 587: IGCC: GET RESULTS: CO2 Capture, Transport &
Storage: Water Gas Shift Reactor: Total Cost
Illustration 588: IGCC: GET RESULTS: CO2 Capture, Transport &
Storage: Ionic Liquid CO2 Capture: Diagram
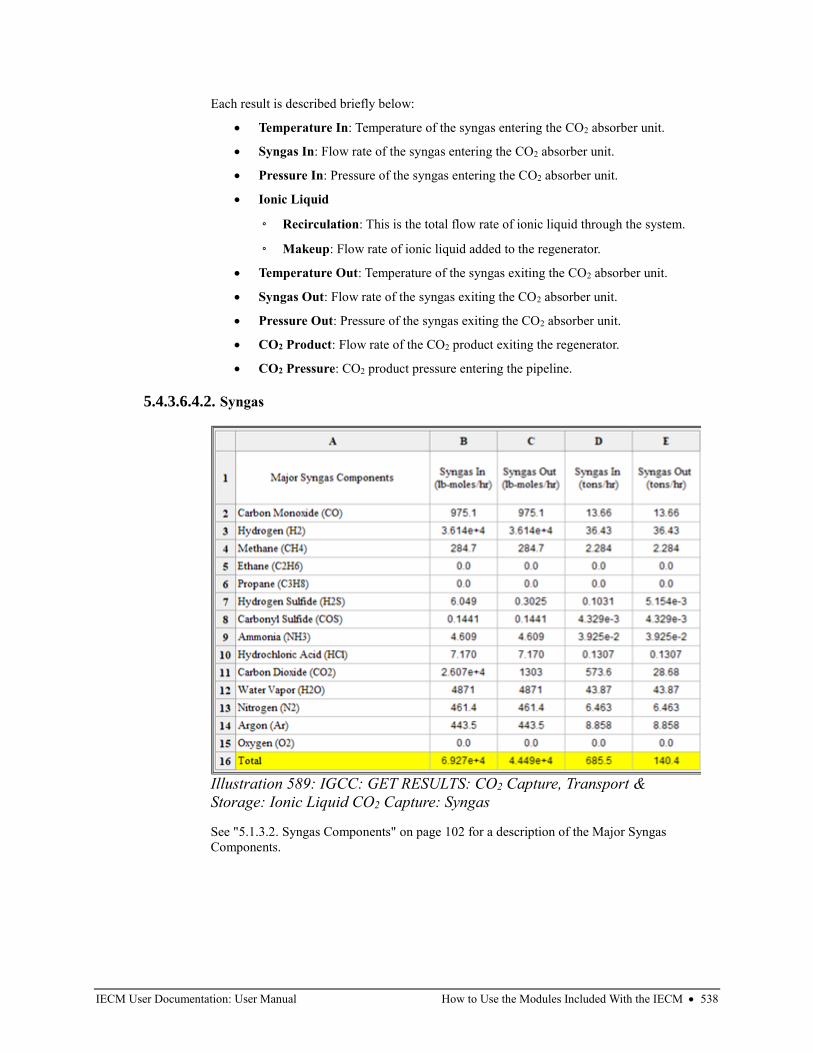
IECM User Documentation: User Manual How to Use the Modules Included With the IECM • 538
Each result is described briefly below:
• Temperature In: Temperature of the syngas entering the CO2 absorber unit.
• Syngas In: Flow rate of the syngas entering the CO2 absorber unit.
• Pressure In: Pressure of the syngas entering the CO2 absorber unit.
• Ionic Liquid
◦ Recirculation: This is the total flow rate of ionic liquid through the system.
◦ Makeup: Flow rate of ionic liquid added to the regenerator.
• Temperature Out: Temperature of the syngas exiting the CO2 absorber unit.
• Syngas Out: Flow rate of the syngas exiting the CO2 absorber unit.
• Pressure Out: Pressure of the syngas exiting the CO2 absorber unit.
• CO2 Product: Flow rate of the CO2 product exiting the regenerator.
• CO2 Pressure: CO2 product pressure entering the pipeline.
5.4.3.6.4.2. Syngas
See "5.1.3.2. Syngas Components" on page 102 for a description of the Major Syngas
Components.
Illustration 589: IGCC: GET RESULTS: CO2 Capture, Transport &
Storage: Ionic Liquid CO2 Capture: Syngas
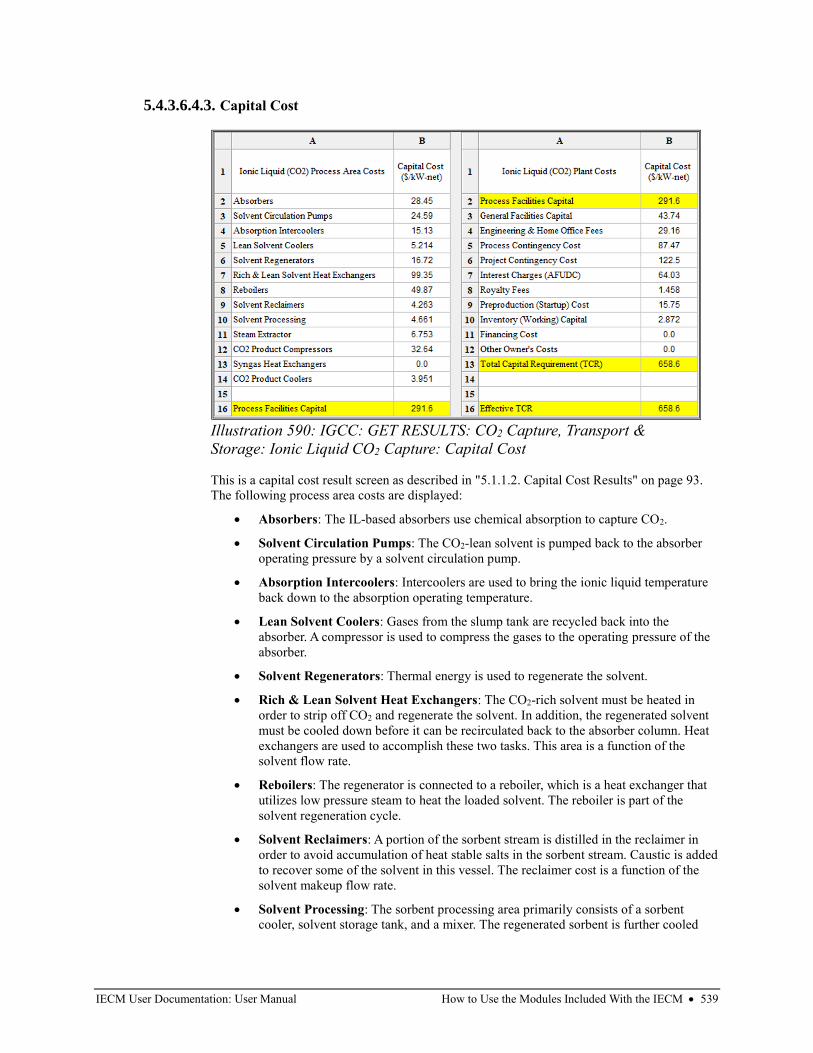
IECM User Documentation: User Manual How to Use the Modules Included With the IECM • 539
5.4.3.6.4.3. Capital Cost
This is a capital cost result screen as described in "5.1.1.2. Capital Cost Results" on page 93.
The following process area costs are displayed:
• Absorbers: The IL-based absorbers use chemical absorption to capture CO2.
• Solvent Circulation Pumps: The CO2-lean solvent is pumped back to the absorber
operating pressure by a solvent circulation pump.
• Absorption Intercoolers: Intercoolers are used to bring the ionic liquid temperature
back down to the absorption operating temperature.
• Lean Solvent Coolers: Gases from the slump tank are recycled back into the
absorber. A compressor is used to compress the gases to the operating pressure of the
absorber.
• Solvent Regenerators: Thermal energy is used to regenerate the solvent.
• Rich & Lean Solvent Heat Exchangers: The CO2-rich solvent must be heated in
order to strip off CO2 and regenerate the solvent. In addition, the regenerated solvent
must be cooled down before it can be recirculated back to the absorber column. Heat
exchangers are used to accomplish these two tasks. This area is a function of the
solvent flow rate.
• Reboilers: The regenerator is connected to a reboiler, which is a heat exchanger that
utilizes low pressure steam to heat the loaded solvent. The reboiler is part of the
solvent regeneration cycle.
• Solvent Reclaimers: A portion of the sorbent stream is distilled in the reclaimer in
order to avoid accumulation of heat stable salts in the sorbent stream. Caustic is added
to recover some of the solvent in this vessel. The reclaimer cost is a function of the
solvent makeup flow rate.
• Solvent Processing: The sorbent processing area primarily consists of a sorbent
cooler, solvent storage tank, and a mixer. The regenerated sorbent is further cooled
Illustration 590: IGCC: GET RESULTS: CO2 Capture, Transport &
Storage: Ionic Liquid CO2 Capture: Capital Cost
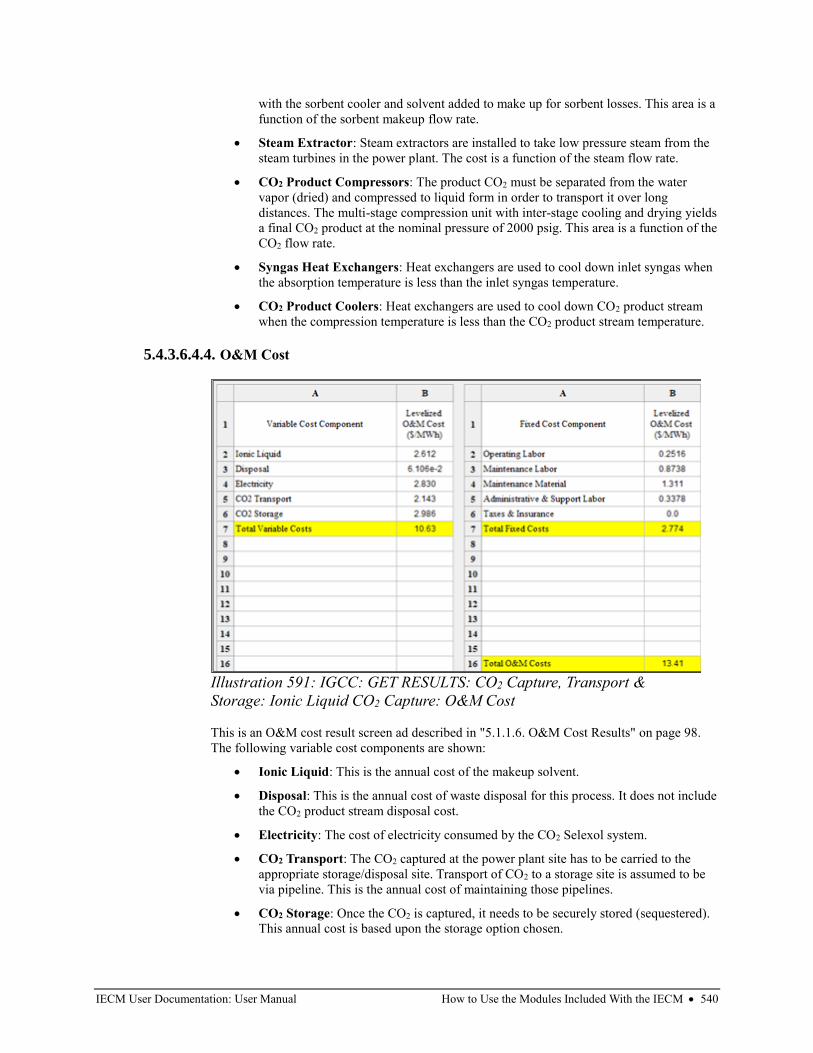
IECM User Documentation: User Manual How to Use the Modules Included With the IECM • 540
with the sorbent cooler and solvent added to make up for sorbent losses. This area is a
function of the sorbent makeup flow rate.
• Steam Extractor: Steam extractors are installed to take low pressure steam from the
steam turbines in the power plant. The cost is a function of the steam flow rate.
• CO2 Product Compressors: The product CO2 must be separated from the water
vapor (dried) and compressed to liquid form in order to transport it over long
distances. The multi-stage compression unit with inter-stage cooling and drying yields
a final CO2 product at the nominal pressure of 2000 psig. This area is a function of the
CO2 flow rate.
• Syngas Heat Exchangers: Heat exchangers are used to cool down inlet syngas when
the absorption temperature is less than the inlet syngas temperature.
• CO2 Product Coolers: Heat exchangers are used to cool down CO2 product stream
when the compression temperature is less than the CO2 product stream temperature.
5.4.3.6.4.4. O&M Cost
This is an O&M cost result screen ad described in "5.1.1.6. O&M Cost Results" on page 98.
The following variable cost components are shown:
• Ionic Liquid: This is the annual cost of the makeup solvent.
• Disposal: This is the annual cost of waste disposal for this process. It does not include
the CO2 product stream disposal cost.
• Electricity: The cost of electricity consumed by the CO2 Selexol system.
• CO2 Transport: The CO2 captured at the power plant site has to be carried to the
appropriate storage/disposal site. Transport of CO2 to a storage site is assumed to be
via pipeline. This is the annual cost of maintaining those pipelines.
• CO2 Storage: Once the CO2 is captured, it needs to be securely stored (sequestered).
This annual cost is based upon the storage option chosen.
Illustration 591: IGCC: GET RESULTS: CO2 Capture, Transport &
Storage: Ionic Liquid CO2 Capture: O&M Cost
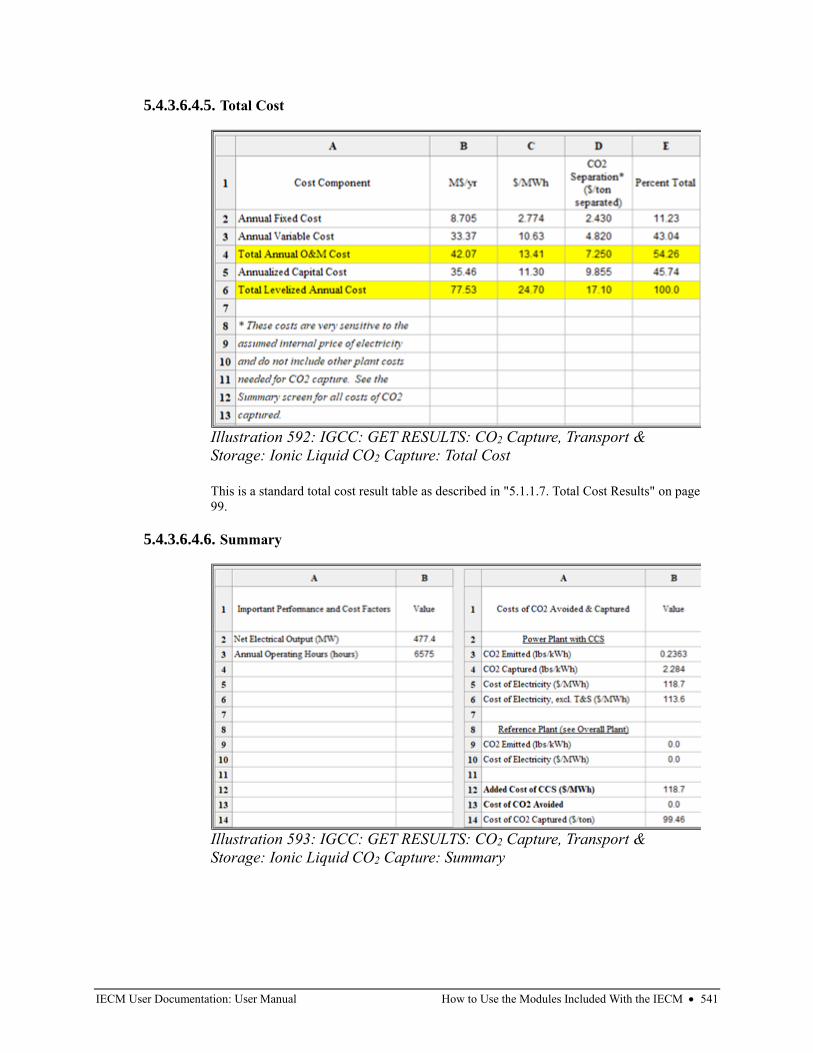
IECM User Documentation: User Manual How to Use the Modules Included With the IECM • 541
5.4.3.6.4.5. Total Cost
This is a standard total cost result table as described in "5.1.1.7. Total Cost Results" on page
99.
5.4.3.6.4.6. Summary
Illustration 592: IGCC: GET RESULTS: CO2 Capture, Transport &
Storage: Ionic Liquid CO2 Capture: Total Cost
Illustration 593: IGCC: GET RESULTS: CO2 Capture, Transport &
Storage: Ionic Liquid CO2 Capture: Summary
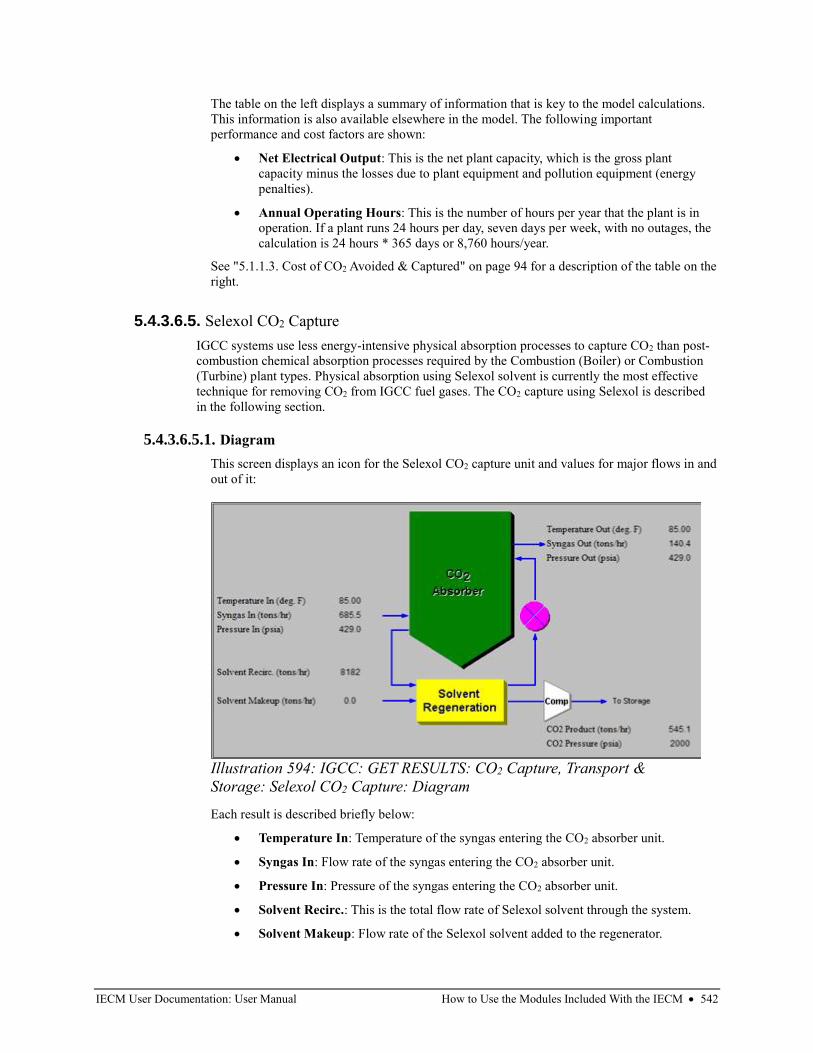
IECM User Documentation: User Manual How to Use the Modules Included With the IECM • 542
The table on the left displays a summary of information that is key to the model calculations.
This information is also available elsewhere in the model. The following important
performance and cost factors are shown:
• Net Electrical Output: This is the net plant capacity, which is the gross plant
capacity minus the losses due to plant equipment and pollution equipment (energy
penalties).
• Annual Operating Hours: This is the number of hours per year that the plant is in
operation. If a plant runs 24 hours per day, seven days per week, with no outages, the
calculation is 24 hours * 365 days or 8,760 hours/year.
See "5.1.1.3. Cost of CO2 Avoided & Captured" on page 94 for a description of the table on the
right.
5.4.3.6.5. Selexol CO2 Capture
IGCC systems use less energy-intensive physical absorption processes to capture CO2 than post-
combustion chemical absorption processes required by the Combustion (Boiler) or Combustion
(Turbine) plant types. Physical absorption using Selexol solvent is currently the most effective
technique for removing CO2 from IGCC fuel gases. The CO2 capture using Selexol is described
in the following section.
5.4.3.6.5.1. Diagram
This screen displays an icon for the Selexol CO2 capture unit and values for major flows in and
out of it:
Each result is described briefly below:
• Temperature In: Temperature of the syngas entering the CO2 absorber unit.
• Syngas In: Flow rate of the syngas entering the CO2 absorber unit.
• Pressure In: Pressure of the syngas entering the CO2 absorber unit.
• Solvent Recirc.: This is the total flow rate of Selexol solvent through the system.
• Solvent Makeup: Flow rate of the Selexol solvent added to the regenerator.
Illustration 594: IGCC: GET RESULTS: CO2 Capture, Transport &
Storage: Selexol CO2 Capture: Diagram
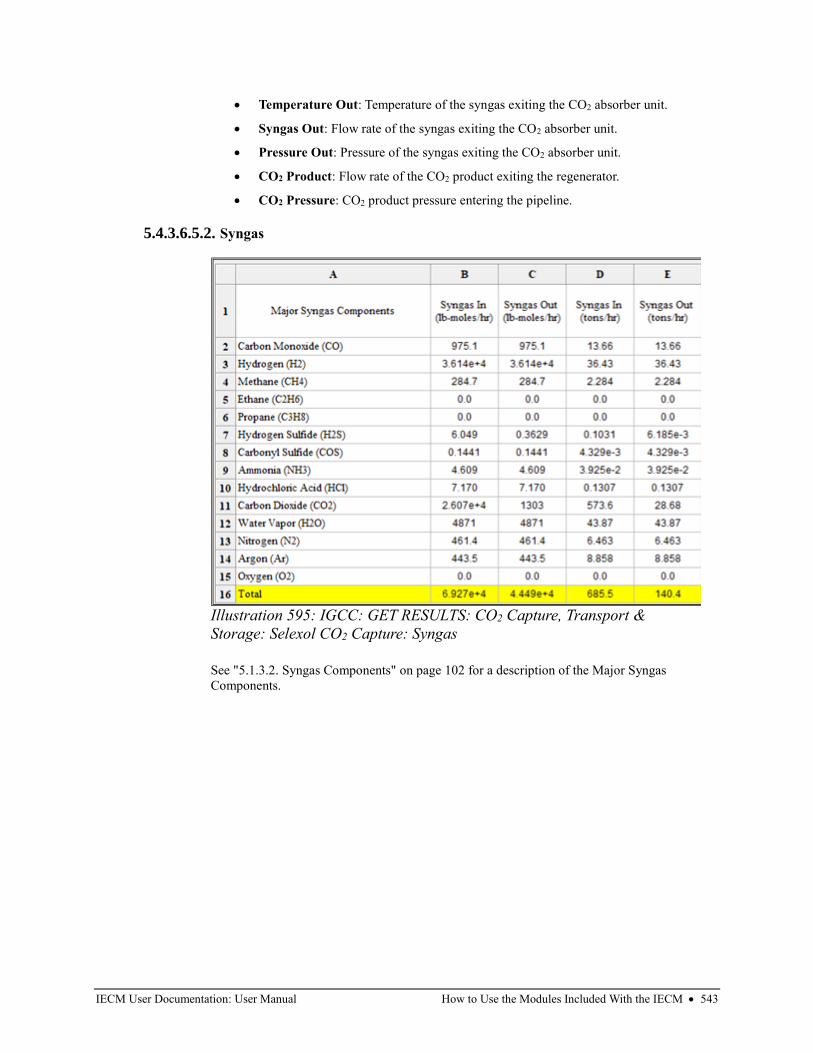
IECM User Documentation: User Manual How to Use the Modules Included With the IECM • 543
• Temperature Out: Temperature of the syngas exiting the CO2 absorber unit.
• Syngas Out: Flow rate of the syngas exiting the CO2 absorber unit.
• Pressure Out: Pressure of the syngas exiting the CO2 absorber unit.
• CO2 Product: Flow rate of the CO2 product exiting the regenerator.
• CO2 Pressure: CO2 product pressure entering the pipeline.
5.4.3.6.5.2. Syngas
See "5.1.3.2. Syngas Components" on page 102 for a description of the Major Syngas
Components.
Illustration 595: IGCC: GET RESULTS: CO2 Capture, Transport &
Storage: Selexol CO2 Capture: Syngas
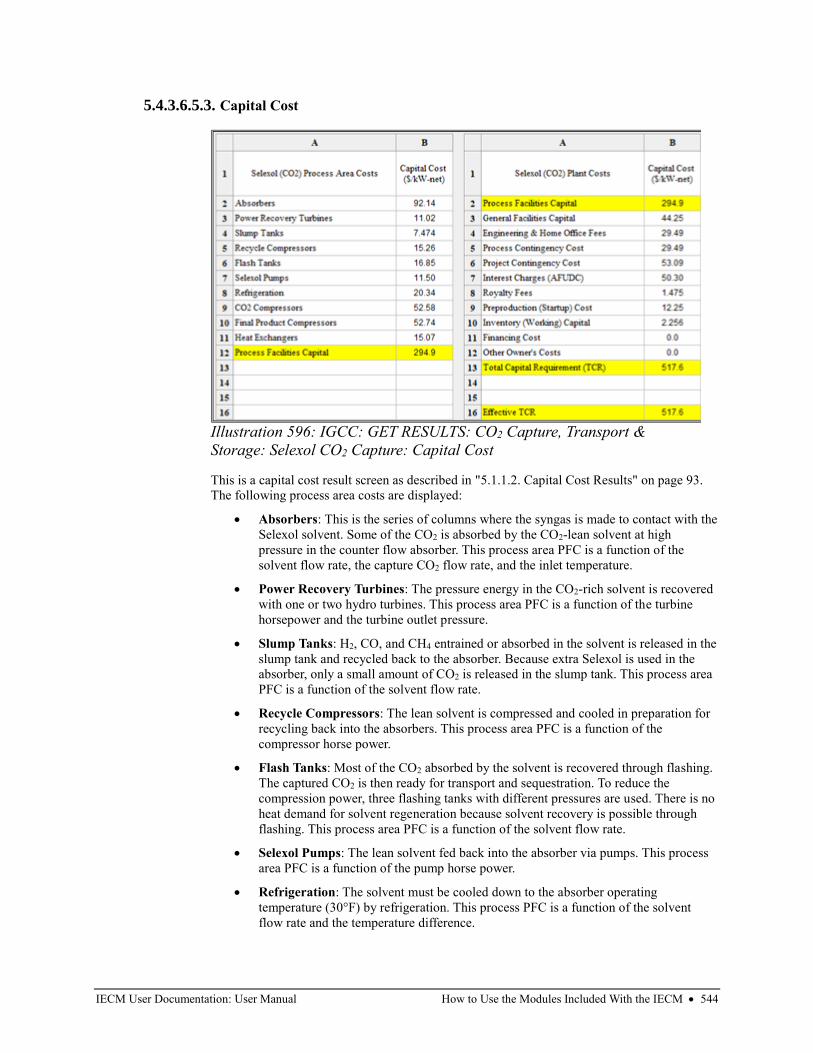
IECM User Documentation: User Manual How to Use the Modules Included With the IECM • 544
5.4.3.6.5.3. Capital Cost
This is a capital cost result screen as described in "5.1.1.2. Capital Cost Results" on page 93.
The following process area costs are displayed:
• Absorbers: This is the series of columns where the syngas is made to contact with the
Selexol solvent. Some of the CO2 is absorbed by the CO2-lean solvent at high
pressure in the counter flow absorber. This process area PFC is a function of the
solvent flow rate, the capture CO2 flow rate, and the inlet temperature.
• Power Recovery Turbines: The pressure energy in the CO2-rich solvent is recovered
with one or two hydro turbines. This process area PFC is a function of the turbine
horsepower and the turbine outlet pressure.
• Slump Tanks: H2, CO, and CH4 entrained or absorbed in the solvent is released in the
slump tank and recycled back to the absorber. Because extra Selexol is used in the
absorber, only a small amount of CO2 is released in the slump tank. This process area
PFC is a function of the solvent flow rate.
• Recycle Compressors: The lean solvent is compressed and cooled in preparation for
recycling back into the absorbers. This process area PFC is a function of the
compressor horse power.
• Flash Tanks: Most of the CO2 absorbed by the solvent is recovered through flashing.
The captured CO2 is then ready for transport and sequestration. To reduce the
compression power, three flashing tanks with different pressures are used. There is no
heat demand for solvent regeneration because solvent recovery is possible through
flashing. This process area PFC is a function of the solvent flow rate.
• Selexol Pumps: The lean solvent fed back into the absorber via pumps. This process
area PFC is a function of the pump horse power.
• Refrigeration: The solvent must be cooled down to the absorber operating
temperature (30°F) by refrigeration. This process PFC is a function of the solvent
flow rate and the temperature difference.
Illustration 596: IGCC: GET RESULTS: CO2 Capture, Transport &
Storage: Selexol CO2 Capture: Capital Cost
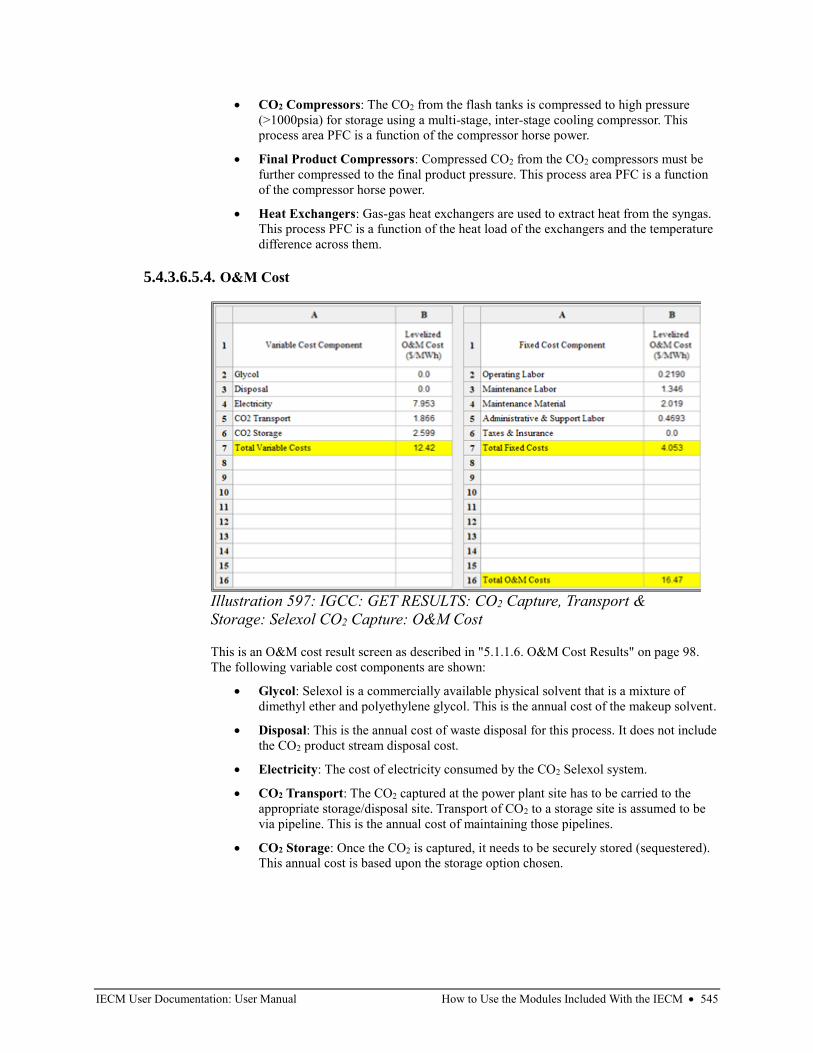
IECM User Documentation: User Manual How to Use the Modules Included With the IECM • 545
• CO2 Compressors: The CO2 from the flash tanks is compressed to high pressure
(>1000psia) for storage using a multi-stage, inter-stage cooling compressor. This
process area PFC is a function of the compressor horse power.
• Final Product Compressors: Compressed CO2 from the CO2 compressors must be
further compressed to the final product pressure. This process area PFC is a function
of the compressor horse power.
• Heat Exchangers: Gas-gas heat exchangers are used to extract heat from the syngas.
This process PFC is a function of the heat load of the exchangers and the temperature
difference across them.
5.4.3.6.5.4. O&M Cost
This is an O&M cost result screen as described in "5.1.1.6. O&M Cost Results" on page 98.
The following variable cost components are shown:
• Glycol: Selexol is a commercially available physical solvent that is a mixture of
dimethyl ether and polyethylene glycol. This is the annual cost of the makeup solvent.
• Disposal: This is the annual cost of waste disposal for this process. It does not include
the CO2 product stream disposal cost.
• Electricity: The cost of electricity consumed by the CO2 Selexol system.
• CO2 Transport: The CO2 captured at the power plant site has to be carried to the
appropriate storage/disposal site. Transport of CO2 to a storage site is assumed to be
via pipeline. This is the annual cost of maintaining those pipelines.
• CO2 Storage: Once the CO2 is captured, it needs to be securely stored (sequestered).
This annual cost is based upon the storage option chosen.
Illustration 597: IGCC: GET RESULTS: CO2 Capture, Transport &
Storage: Selexol CO2 Capture: O&M Cost
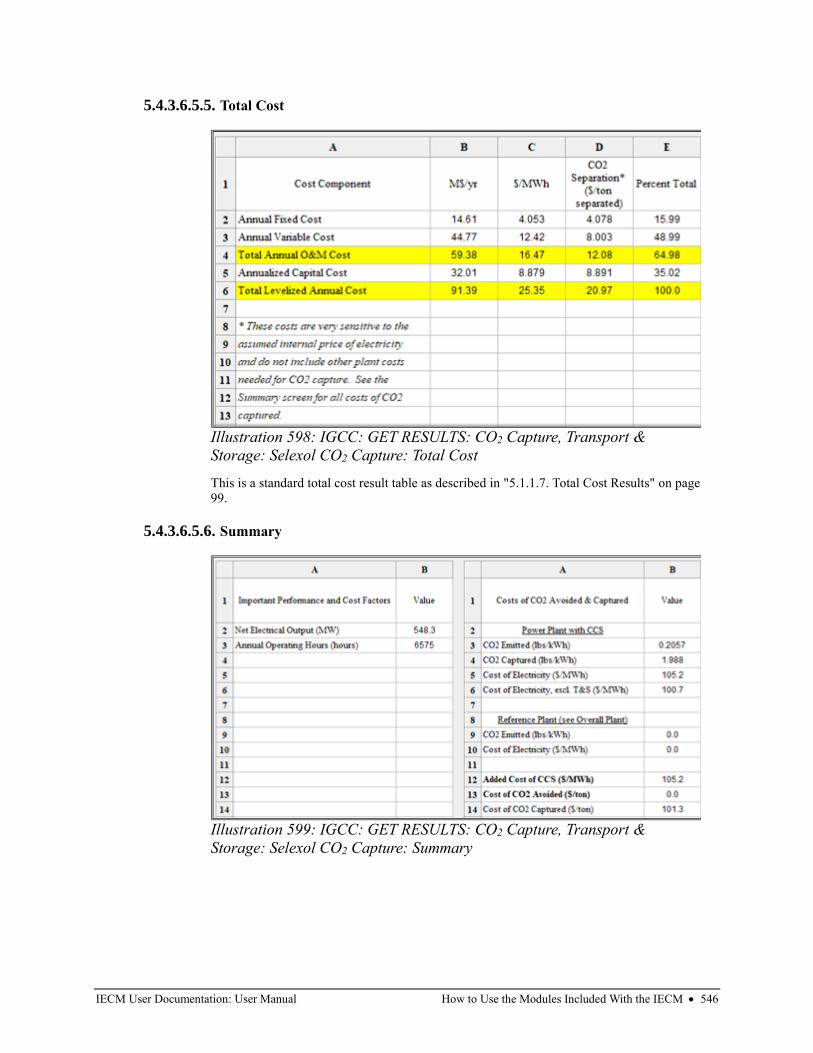
IECM User Documentation: User Manual How to Use the Modules Included With the IECM • 546
5.4.3.6.5.5. Total Cost
This is a standard total cost result table as described in "5.1.1.7. Total Cost Results" on page
99.
5.4.3.6.5.6. Summary
Illustration 598: IGCC: GET RESULTS: CO2 Capture, Transport &
Storage: Selexol CO2 Capture: Total Cost
Illustration 599: IGCC: GET RESULTS: CO2 Capture, Transport &
Storage: Selexol CO2 Capture: Summary
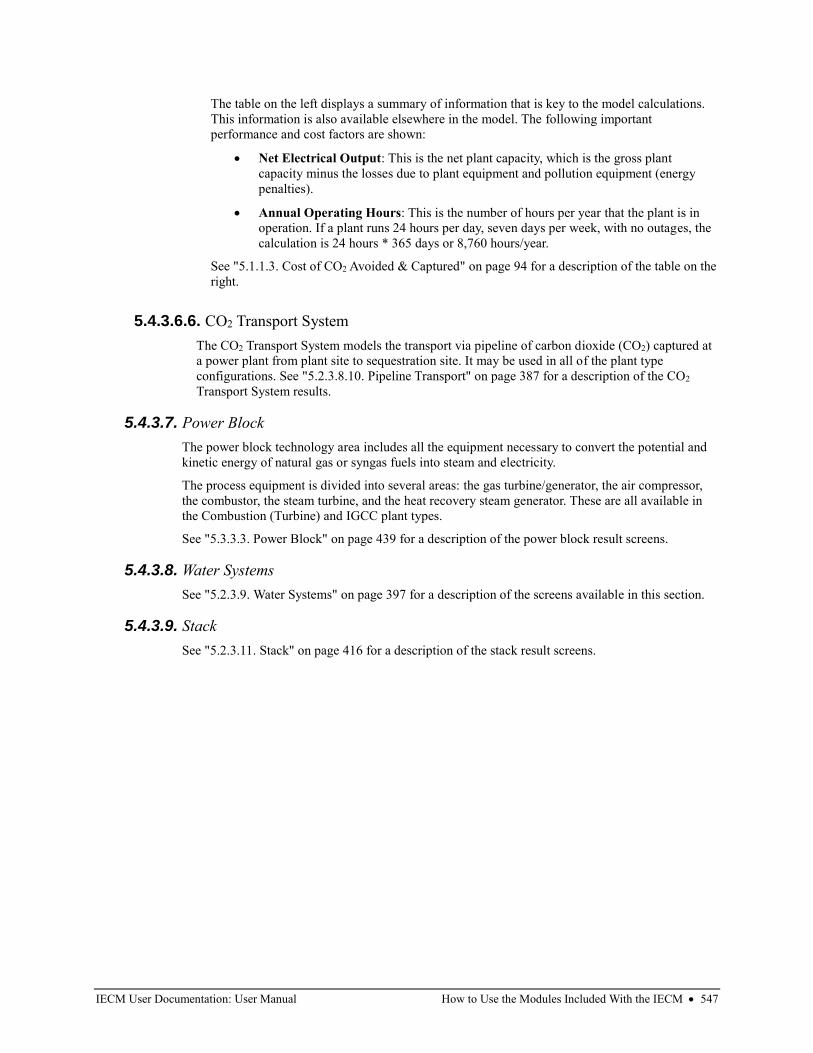
IECM User Documentation: User Manual How to Use the Modules Included With the IECM • 547
The table on the left displays a summary of information that is key to the model calculations.
This information is also available elsewhere in the model. The following important
performance and cost factors are shown:
• Net Electrical Output: This is the net plant capacity, which is the gross plant
capacity minus the losses due to plant equipment and pollution equipment (energy
penalties).
• Annual Operating Hours: This is the number of hours per year that the plant is in
operation. If a plant runs 24 hours per day, seven days per week, with no outages, the
calculation is 24 hours * 365 days or 8,760 hours/year.
See "5.1.1.3. Cost of CO2 Avoided & Captured" on page 94 for a description of the table on the
right.
5.4.3.6.6. CO2 Transport System
The CO2 Transport System models the transport via pipeline of carbon dioxide (CO2) captured at
a power plant from plant site to sequestration site. It may be used in all of the plant type
configurations. See "5.2.3.8.10. Pipeline Transport" on page 387 for a description of the CO2
Transport System results.
5.4.3.7. Power Block
The power block technology area includes all the equipment necessary to convert the potential and
kinetic energy of natural gas or syngas fuels into steam and electricity.
The process equipment is divided into several areas: the gas turbine/generator, the air compressor,
the combustor, the steam turbine, and the heat recovery steam generator. These are all available in
the Combustion (Turbine) and IGCC plant types.
See "5.3.3.3. Power Block" on page 439 for a description of the power block result screens.
5.4.3.8. Water Systems
See "5.2.3.9. Water Systems" on page 397 for a description of the screens available in this section.
5.4.3.9. Stack
See "5.2.3.11. Stack" on page 416 for a description of the stack result screens.
IECM User Documentation: User Manual A Case Study • 548
6. A Case Study
6.1. Introduction This chapter is meant to be used with the IECM Interface installed and running. The case study takes you
to the commonly used screens described in the previous chapter. It is recommended that you:
1. Follow the directions to set up a plant, enter input parameters, and look at results for the sample
plant.
2. Compare the screen shots to the screens you see.
If you have not already done so, you will need to install the IECM software as described in "3. Installing
the IECM" on page 10.
A detailed description of all available screens is found in "5. How to Use the Modules Included With the
IECM" on page 90.
6.2. Start the IECM To start the IECM Interface, click on it in the Start Menu. (For more detailed instructions, see
"4.1.1. Starting the IECM Interface" on page 19.) When the IECM launches, a Splash Screen is displayed:
Illustration 600: The IECM Splash Screen
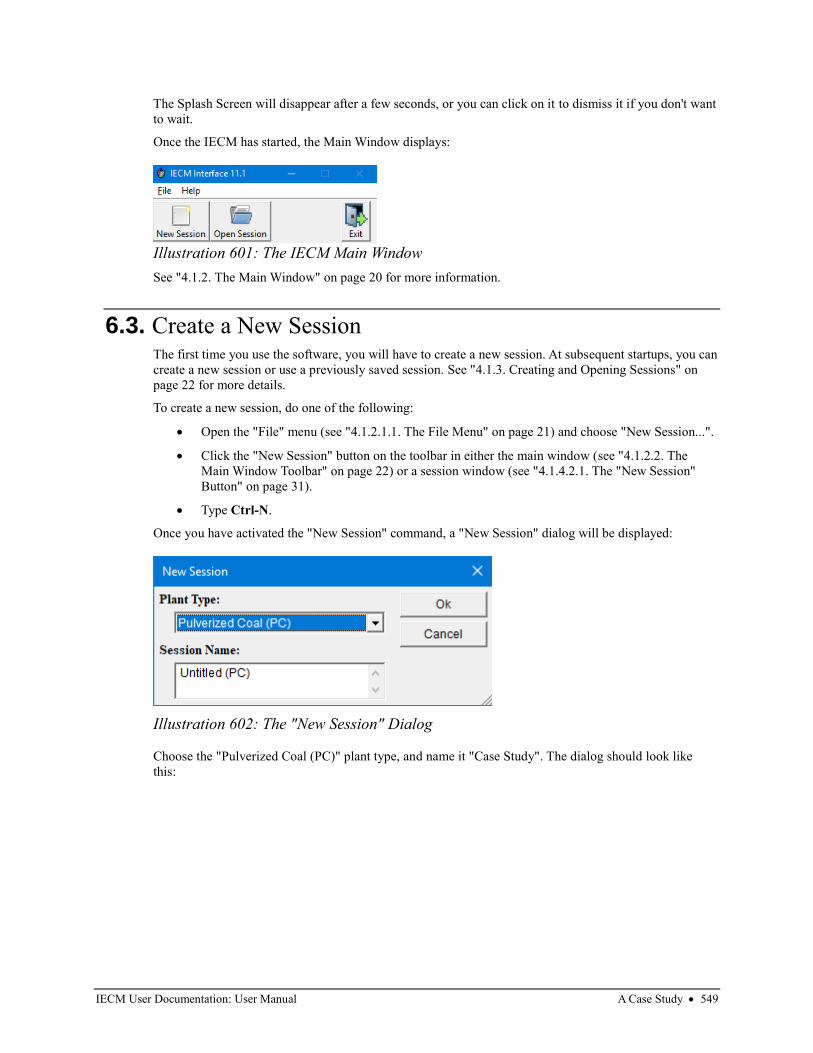
IECM User Documentation: User Manual A Case Study • 549
The Splash Screen will disappear after a few seconds, or you can click on it to dismiss it if you don't want
to wait.
Once the IECM has started, the Main Window displays:
See "4.1.2. The Main Window" on page 20 for more information.
6.3. Create a New Session The first time you use the software, you will have to create a new session. At subsequent startups, you can
create a new session or use a previously saved session. See "4.1.3. Creating and Opening Sessions" on
page 22 for more details.
To create a new session, do one of the following:
• Open the "File" menu (see "4.1.2.1.1. The File Menu" on page 21) and choose "New Session...".
• Click the "New Session" button on the toolbar in either the main window (see "4.1.2.2. The
Main Window Toolbar" on page 22) or a session window (see "4.1.4.2.1. The "New Session"
Button" on page 31).
• Type Ctrl-N.
Once you have activated the "New Session" command, a "New Session" dialog will be displayed:
Choose the "Pulverized Coal (PC)" plant type, and name it "Case Study". The dialog should look like
this:
Illustration 601: The IECM Main Window
Illustration 602: The "New Session" Dialog
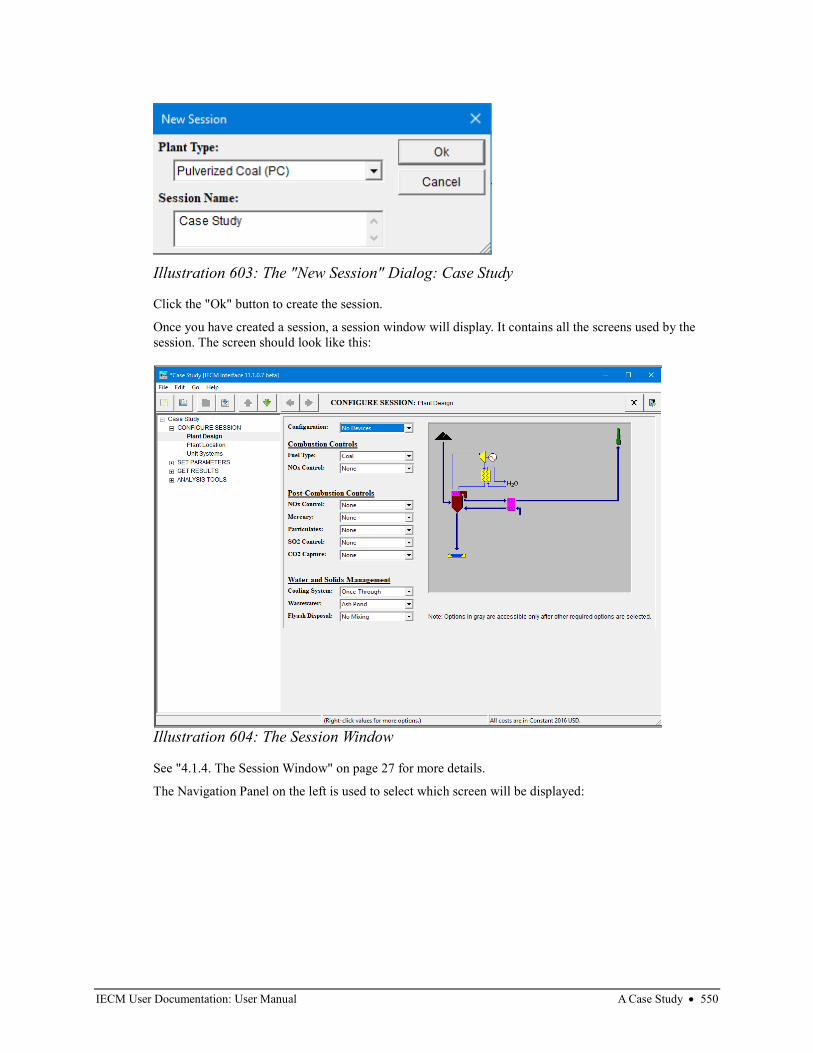
IECM User Documentation: User Manual A Case Study • 550
Click the "Ok" button to create the session.
Once you have created a session, a session window will display. It contains all the screens used by the
session. The screen should look like this:
See "4.1.4. The Session Window" on page 27 for more details.
The Navigation Panel on the left is used to select which screen will be displayed:
Illustration 603: The "New Session" Dialog: Case Study
Illustration 604: The Session Window
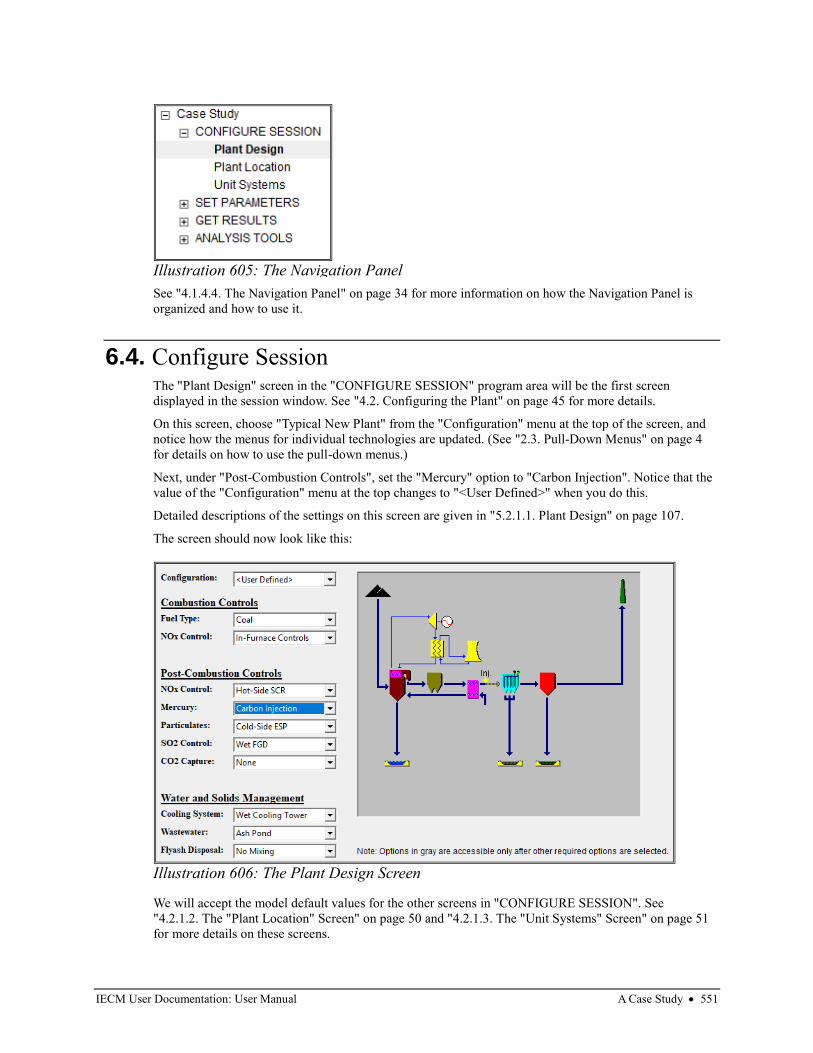
IECM User Documentation: User Manual A Case Study • 551
See "4.1.4.4. The Navigation Panel" on page 34 for more information on how the Navigation Panel is
organized and how to use it.
6.4. Configure Session The "Plant Design" screen in the "CONFIGURE SESSION" program area will be the first screen
displayed in the session window. See "4.2. Configuring the Plant" on page 45 for more details.
On this screen, choose "Typical New Plant" from the "Configuration" menu at the top of the screen, and
notice how the menus for individual technologies are updated. (See "2.3. Pull-Down Menus" on page 4
for details on how to use the pull-down menus.)
Next, under "Post-Combustion Controls", set the "Mercury" option to "Carbon Injection". Notice that the
value of the "Configuration" menu at the top changes to "<User Defined>" when you do this.
Detailed descriptions of the settings on this screen are given in "5.2.1.1. Plant Design" on page 107.
The screen should now look like this:
We will accept the model default values for the other screens in "CONFIGURE SESSION". See
"4.2.1.2. The "Plant Location" Screen" on page 50 and "4.2.1.3. The "Unit Systems" Screen" on page 51
for more details on these screens.
Illustration 605: The Navigation Panel
Illustration 606: The Plant Design Screen
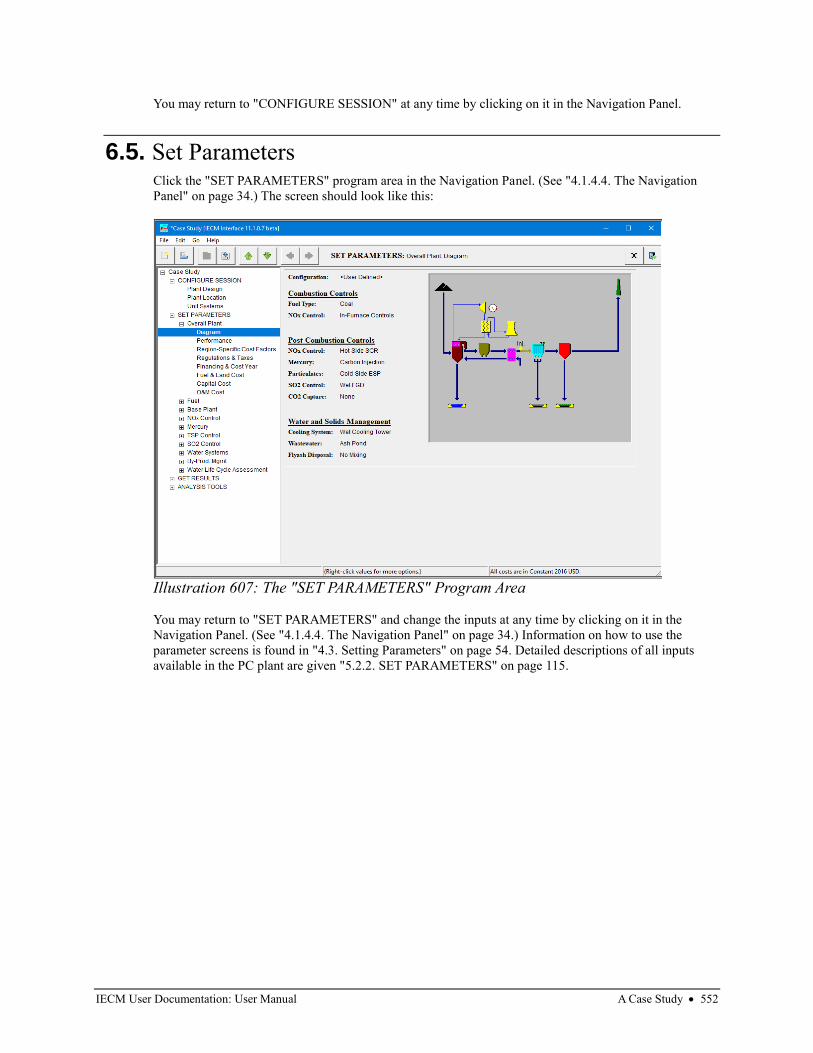
IECM User Documentation: User Manual A Case Study • 552
You may return to "CONFIGURE SESSION" at any time by clicking on it in the Navigation Panel.
6.5. Set Parameters Click the "SET PARAMETERS" program area in the Navigation Panel. (See "4.1.4.4. The Navigation
Panel" on page 34.) The screen should look like this:
You may return to "SET PARAMETERS" and change the inputs at any time by clicking on it in the
Navigation Panel. (See "4.1.4.4. The Navigation Panel" on page 34.) Information on how to use the
parameter screens is found in "4.3. Setting Parameters" on page 54. Detailed descriptions of all inputs
available in the PC plant are given "5.2.2. SET PARAMETERS" on page 115.
Illustration 607: The "SET PARAMETERS" Program Area
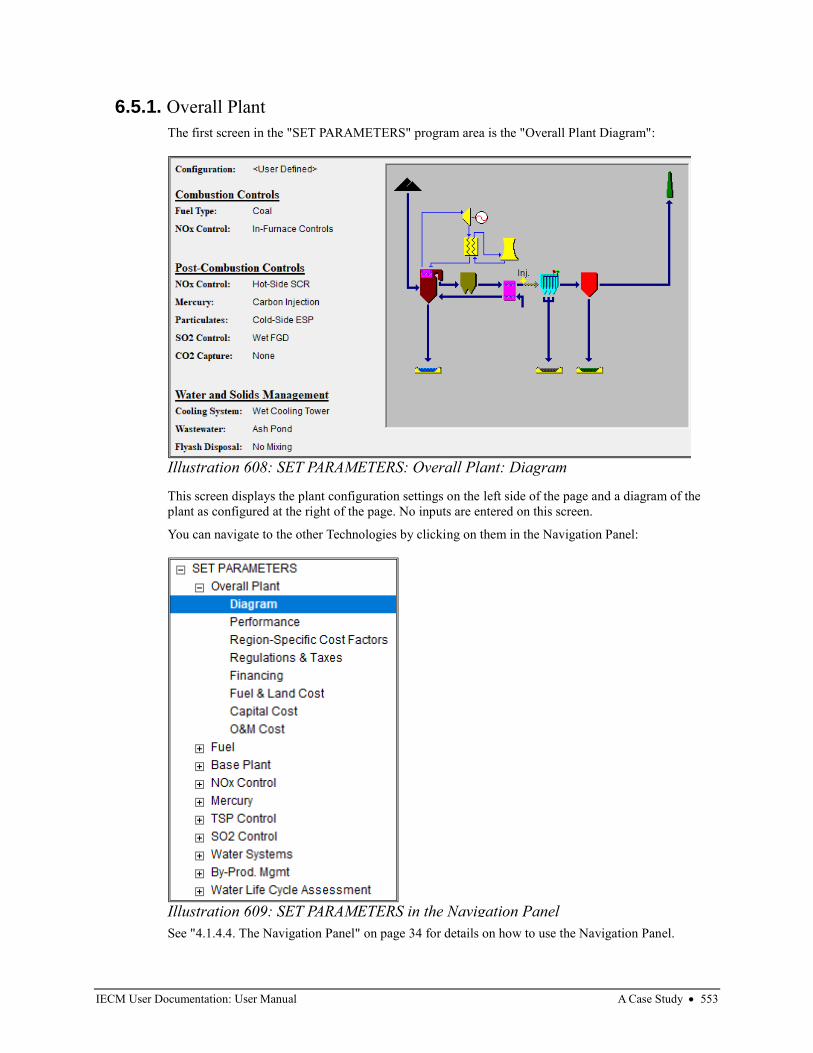
IECM User Documentation: User Manual A Case Study • 553
6.5.1. Overall Plant
The first screen in the "SET PARAMETERS" program area is the "Overall Plant Diagram":
This screen displays the plant configuration settings on the left side of the page and a diagram of the
plant as configured at the right of the page. No inputs are entered on this screen.
You can navigate to the other Technologies by clicking on them in the Navigation Panel:
See "4.1.4.4. The Navigation Panel" on page 34 for details on how to use the Navigation Panel.
Illustration 608: SET PARAMETERS: Overall Plant: Diagram
Illustration 609: SET PARAMETERS in the Navigation Panel
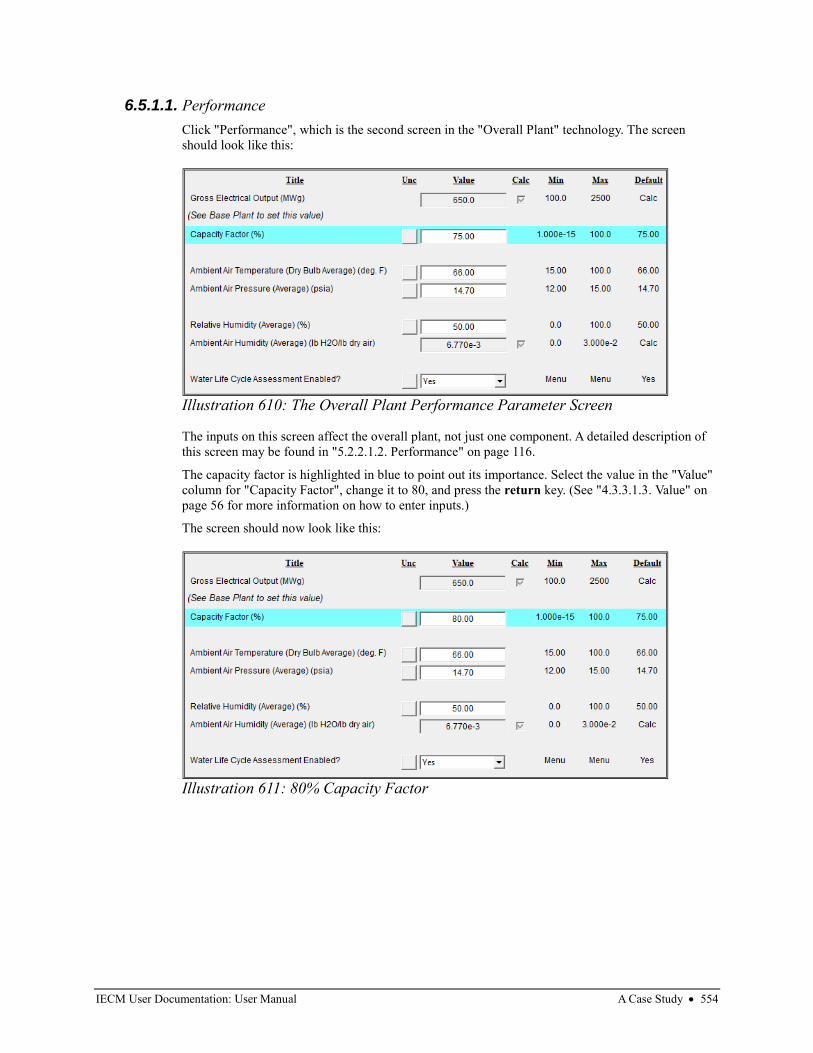
IECM User Documentation: User Manual A Case Study • 554
6.5.1.1. Performance
Click "Performance", which is the second screen in the "Overall Plant" technology. The screen
should look like this:
The inputs on this screen affect the overall plant, not just one component. A detailed description of
this screen may be found in "5.2.2.1.2. Performance" on page 116.
The capacity factor is highlighted in blue to point out its importance. Select the value in the "Value"
column for "Capacity Factor", change it to 80, and press the return key. (See "4.3.3.1.3. Value" on
page 56 for more information on how to enter inputs.)
The screen should now look like this:
Illustration 610: The Overall Plant Performance Parameter Screen
Illustration 611: 80% Capacity Factor
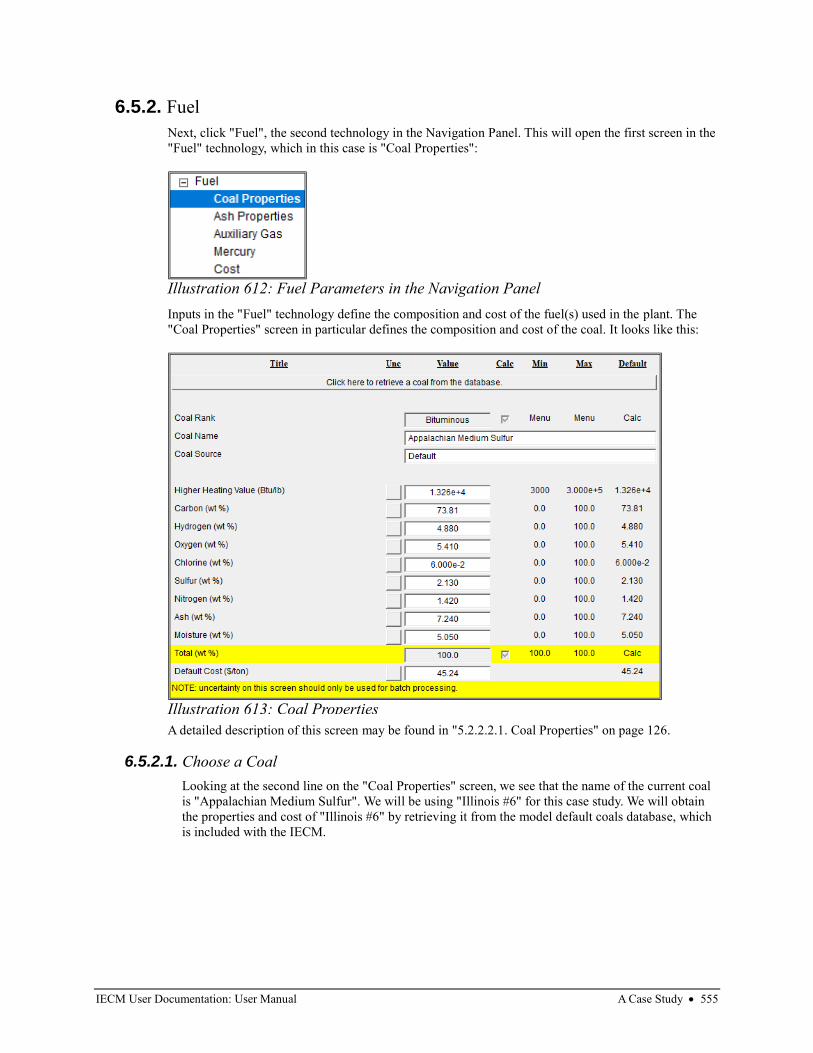
IECM User Documentation: User Manual A Case Study • 555
6.5.2. Fuel
Next, click "Fuel", the second technology in the Navigation Panel. This will open the first screen in the
"Fuel" technology, which in this case is "Coal Properties":
Inputs in the "Fuel" technology define the composition and cost of the fuel(s) used in the plant. The
"Coal Properties" screen in particular defines the composition and cost of the coal. It looks like this:
A detailed description of this screen may be found in "5.2.2.2.1. Coal Properties" on page 126.
6.5.2.1. Choose a Coal
Looking at the second line on the "Coal Properties" screen, we see that the name of the current coal
is "Appalachian Medium Sulfur". We will be using "Illinois #6" for this case study. We will obtain
the properties and cost of "Illinois #6" by retrieving it from the model default coals database, which
is included with the IECM.
Illustration 612: Fuel Parameters in the Navigation Panel
Illustration 613: Coal Properties
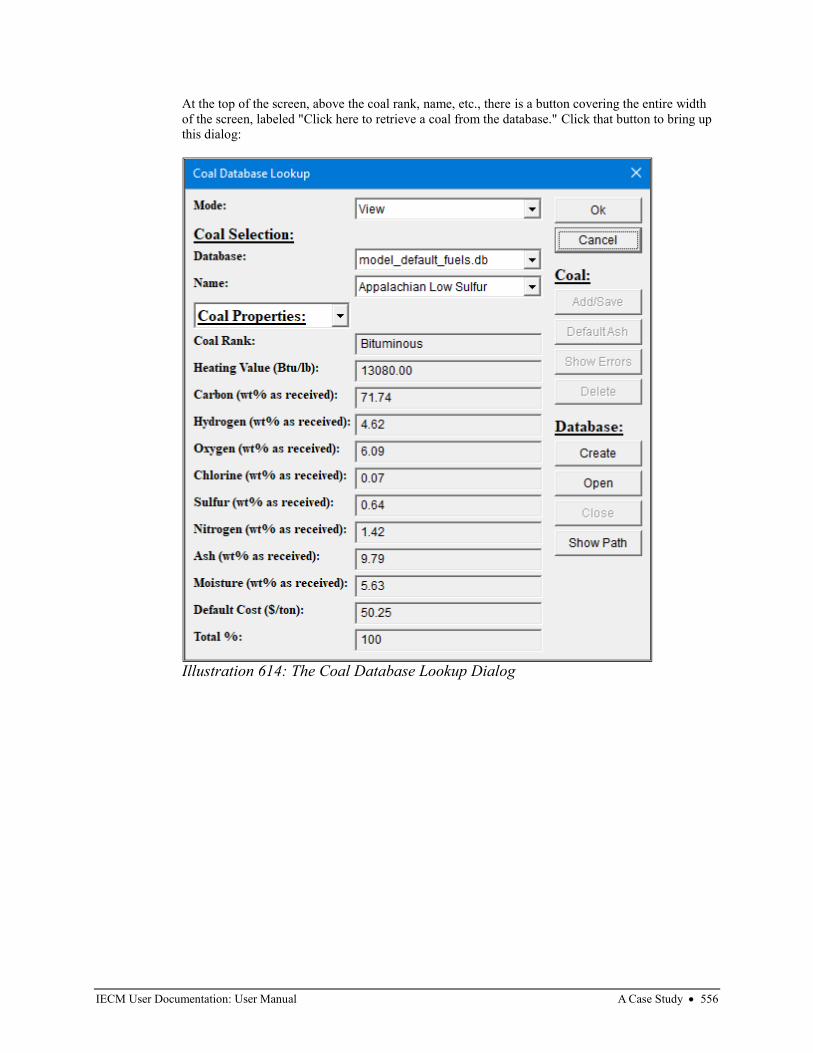
IECM User Documentation: User Manual A Case Study • 556
At the top of the screen, above the coal rank, name, etc., there is a button covering the entire width
of the screen, labeled "Click here to retrieve a coal from the database." Click that button to bring up
this dialog:
Illustration 614: The Coal Database Lookup Dialog
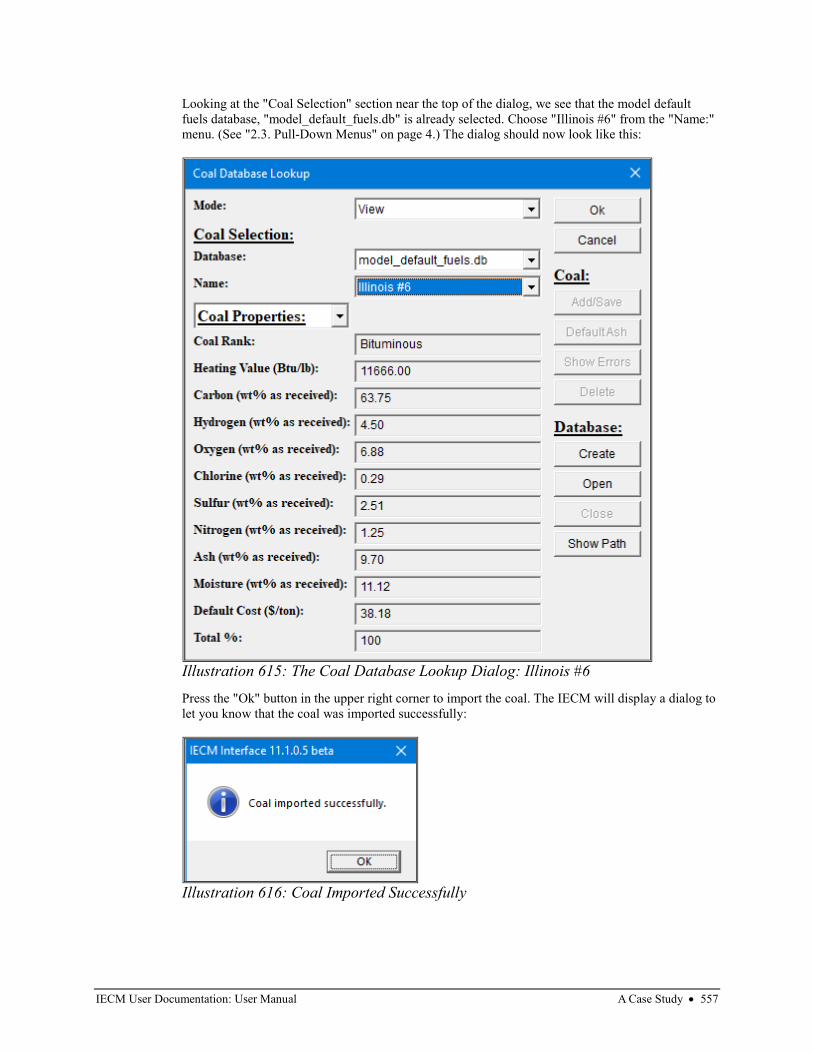
IECM User Documentation: User Manual A Case Study • 557
Looking at the "Coal Selection" section near the top of the dialog, we see that the model default
fuels database, "model_default_fuels.db" is already selected. Choose "Illinois #6" from the "Name:"
menu. (See "2.3. Pull-Down Menus" on page 4.) The dialog should now look like this:
Press the "Ok" button in the upper right corner to import the coal. The IECM will display a dialog to
let you know that the coal was imported successfully:
Illustration 615: The Coal Database Lookup Dialog: Illinois #6
Illustration 616: Coal Imported Successfully
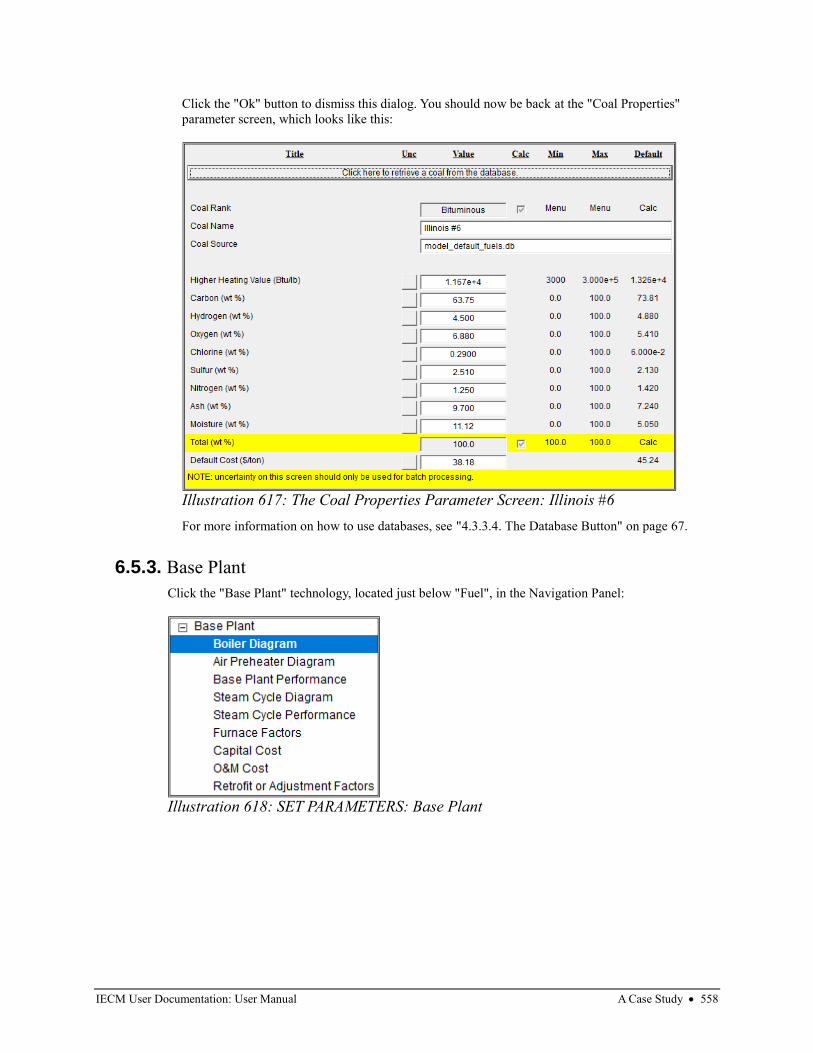
IECM User Documentation: User Manual A Case Study • 558
Click the "Ok" button to dismiss this dialog. You should now be back at the "Coal Properties"
parameter screen, which looks like this:
For more information on how to use databases, see "4.3.3.4. The Database Button" on page 67.
6.5.3. Base Plant
Click the "Base Plant" technology, located just below "Fuel", in the Navigation Panel:
Illustration 617: The Coal Properties Parameter Screen: Illinois #6
Illustration 618: SET PARAMETERS: Base Plant
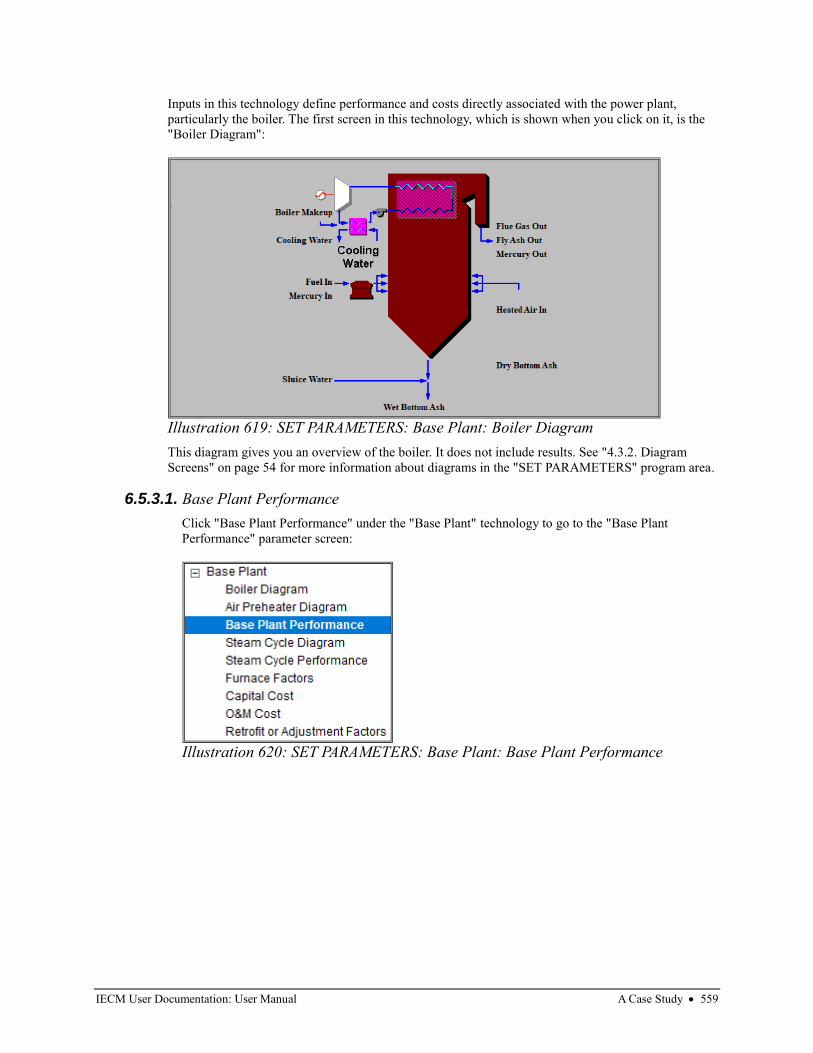
IECM User Documentation: User Manual A Case Study • 559
Inputs in this technology define performance and costs directly associated with the power plant,
particularly the boiler. The first screen in this technology, which is shown when you click on it, is the
"Boiler Diagram":
This diagram gives you an overview of the boiler. It does not include results. See "4.3.2. Diagram
Screens" on page 54 for more information about diagrams in the "SET PARAMETERS" program area.
6.5.3.1. Base Plant Performance
Click "Base Plant Performance" under the "Base Plant" technology to go to the "Base Plant
Performance" parameter screen:
Illustration 619: SET PARAMETERS: Base Plant: Boiler Diagram
Illustration 620: SET PARAMETERS: Base Plant: Base Plant Performance
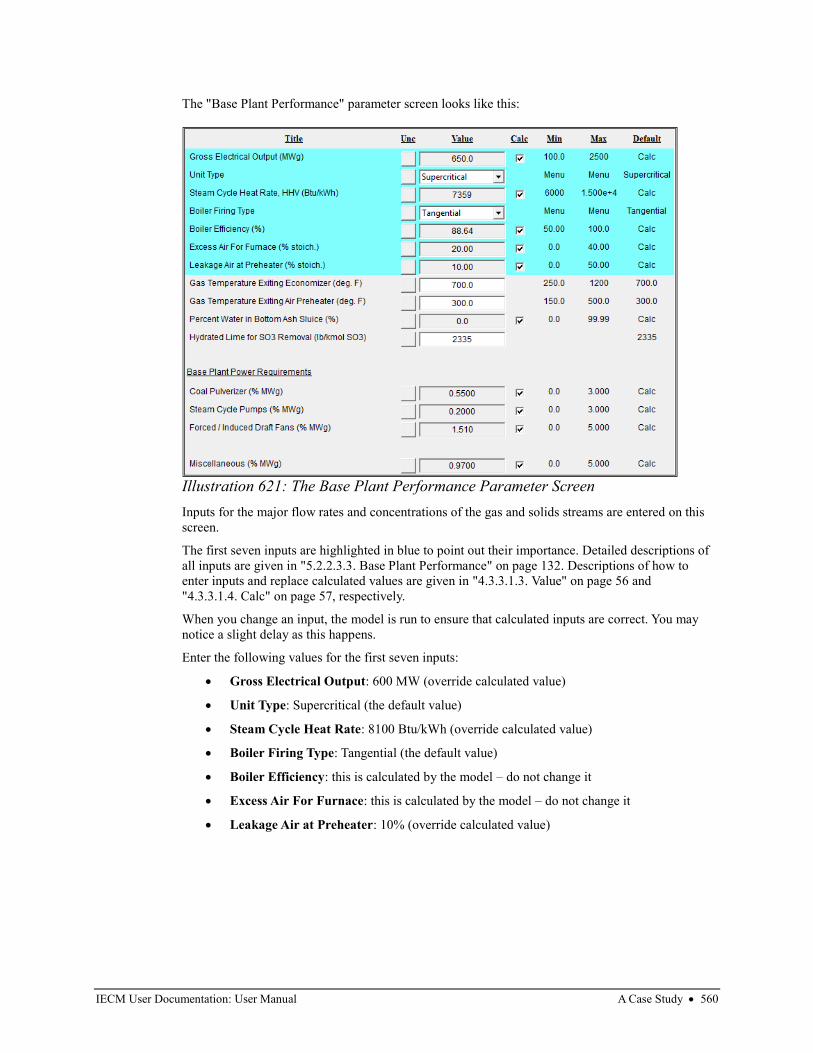
IECM User Documentation: User Manual A Case Study • 560
The "Base Plant Performance" parameter screen looks like this:
Inputs for the major flow rates and concentrations of the gas and solids streams are entered on this
screen.
The first seven inputs are highlighted in blue to point out their importance. Detailed descriptions of
all inputs are given in "5.2.2.3.3. Base Plant Performance" on page 132. Descriptions of how to
enter inputs and replace calculated values are given in "4.3.3.1.3. Value" on page 56 and
"4.3.3.1.4. Calc" on page 57, respectively.
When you change an input, the model is run to ensure that calculated inputs are correct. You may
notice a slight delay as this happens.
Enter the following values for the first seven inputs:
• Gross Electrical Output: 600 MW (override calculated value)
• Unit Type: Supercritical (the default value)
• Steam Cycle Heat Rate: 8100 Btu/kWh (override calculated value)
• Boiler Firing Type: Tangential (the default value)
• Boiler Efficiency: this is calculated by the model – do not change it
• Excess Air For Furnace: this is calculated by the model – do not change it
• Leakage Air at Preheater: 10% (override calculated value)
Illustration 621: The Base Plant Performance Parameter Screen
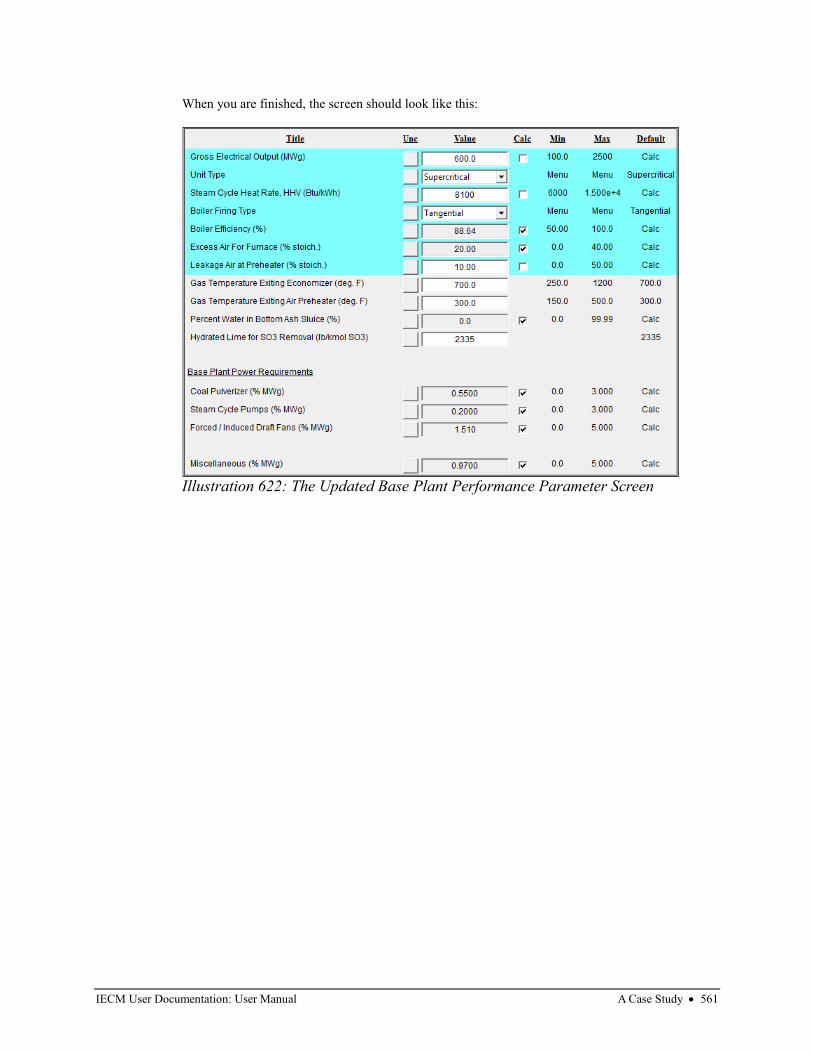
IECM User Documentation: User Manual A Case Study • 561
When you are finished, the screen should look like this:
Illustration 622: The Updated Base Plant Performance Parameter Screen
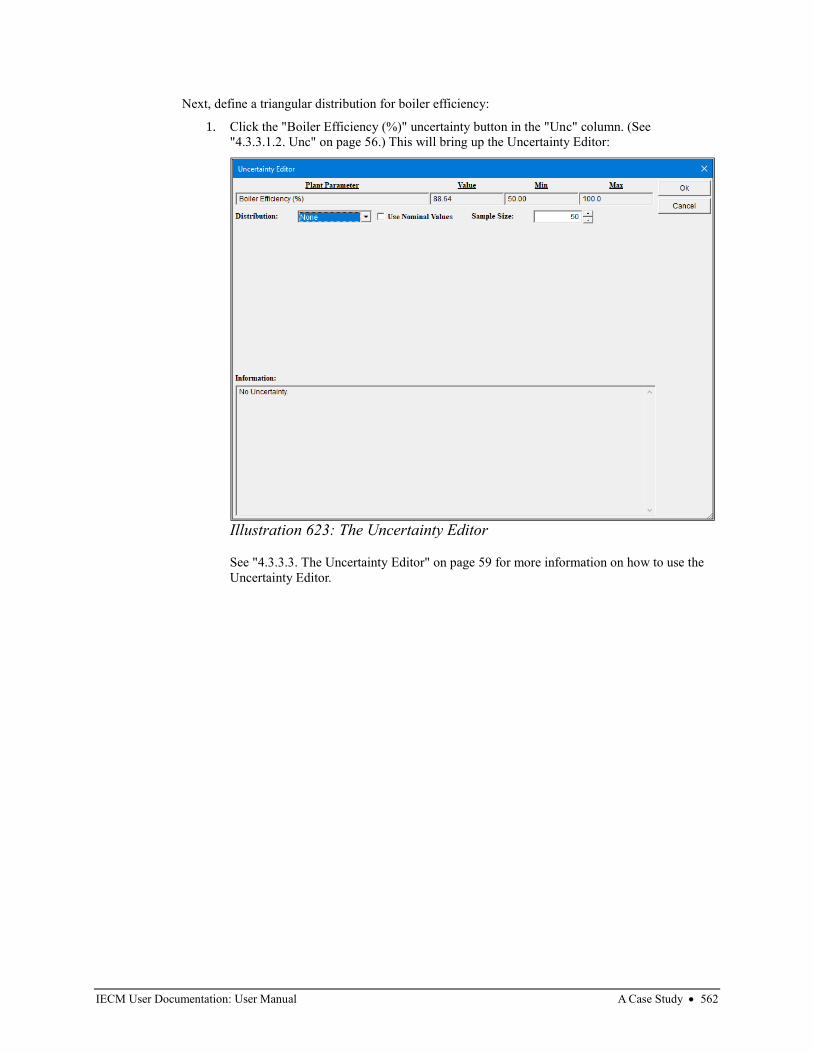
IECM User Documentation: User Manual A Case Study • 562
Next, define a triangular distribution for boiler efficiency:
1. Click the "Boiler Efficiency (%)" uncertainty button in the "Unc" column. (See
"4.3.3.1.2. Unc" on page 56.) This will bring up the Uncertainty Editor:
See "4.3.3.3. The Uncertainty Editor" on page 59 for more information on how to use the
Uncertainty Editor.
Illustration 623: The Uncertainty Editor
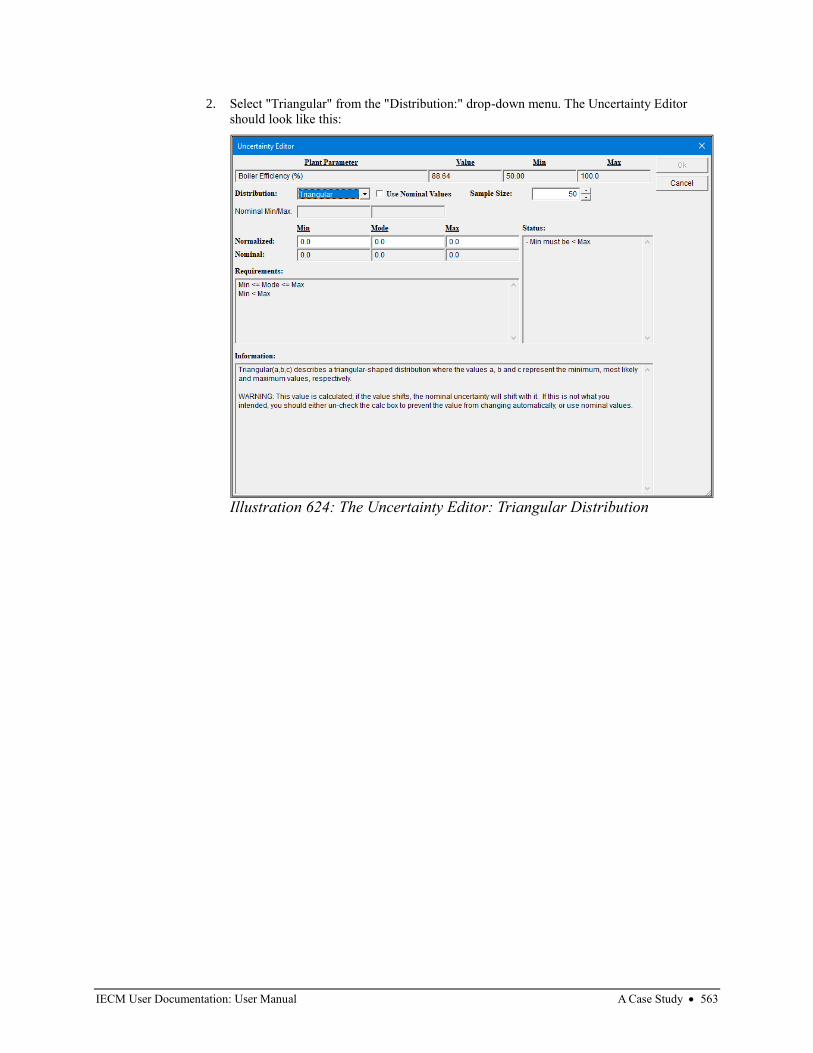
IECM User Documentation: User Manual A Case Study • 563
2. Select "Triangular" from the "Distribution:" drop-down menu. The Uncertainty Editor
should look like this:
Illustration 624: The Uncertainty Editor: Triangular Distribution
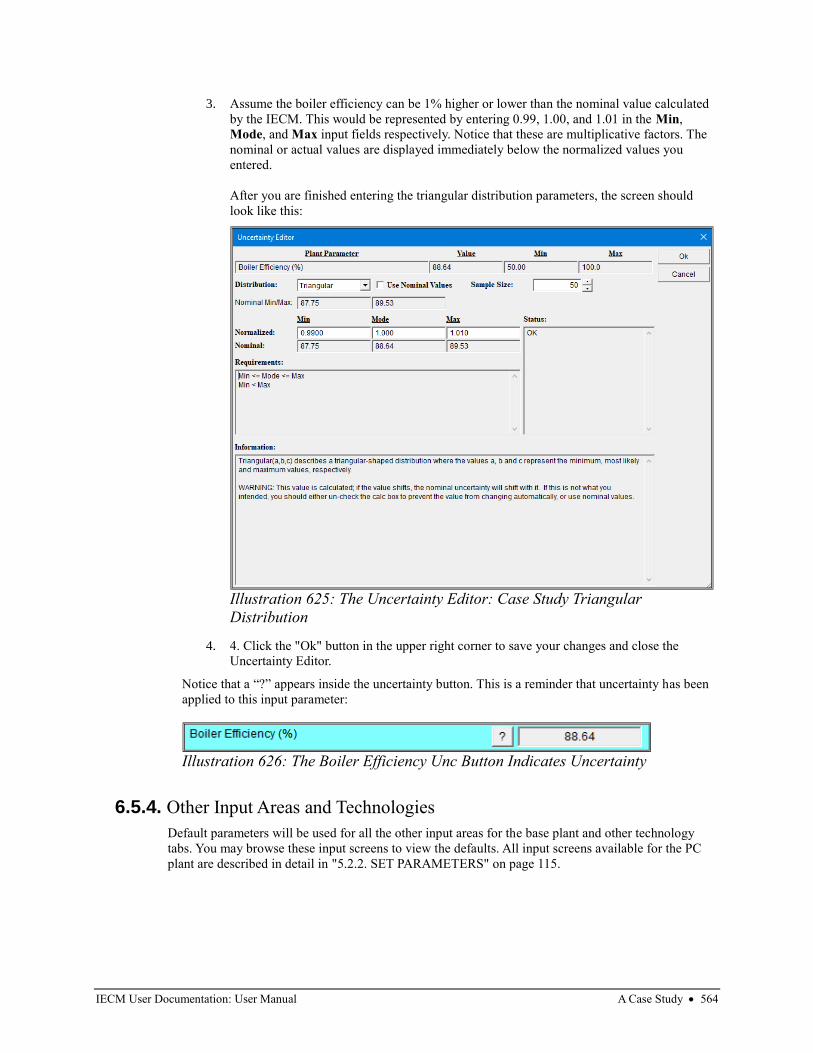
IECM User Documentation: User Manual A Case Study • 564
3. Assume the boiler efficiency can be 1% higher or lower than the nominal value calculated
by the IECM. This would be represented by entering 0.99, 1.00, and 1.01 in the Min,
Mode, and Max input fields respectively. Notice that these are multiplicative factors. The
nominal or actual values are displayed immediately below the normalized values you
entered.
After you are finished entering the triangular distribution parameters, the screen should
look like this:
4. 4. Click the "Ok" button in the upper right corner to save your changes and close the
Uncertainty Editor.
Notice that a “?” appears inside the uncertainty button. This is a reminder that uncertainty has been
applied to this input parameter:
6.5.4. Other Input Areas and Technologies
Default parameters will be used for all the other input areas for the base plant and other technology
tabs. You may browse these input screens to view the defaults. All input screens available for the PC
plant are described in detail in "5.2.2. SET PARAMETERS" on page 115.
Illustration 625: The Uncertainty Editor: Case Study Triangular
Distribution
Illustration 626: The Boiler Efficiency Unc Button Indicates Uncertainty
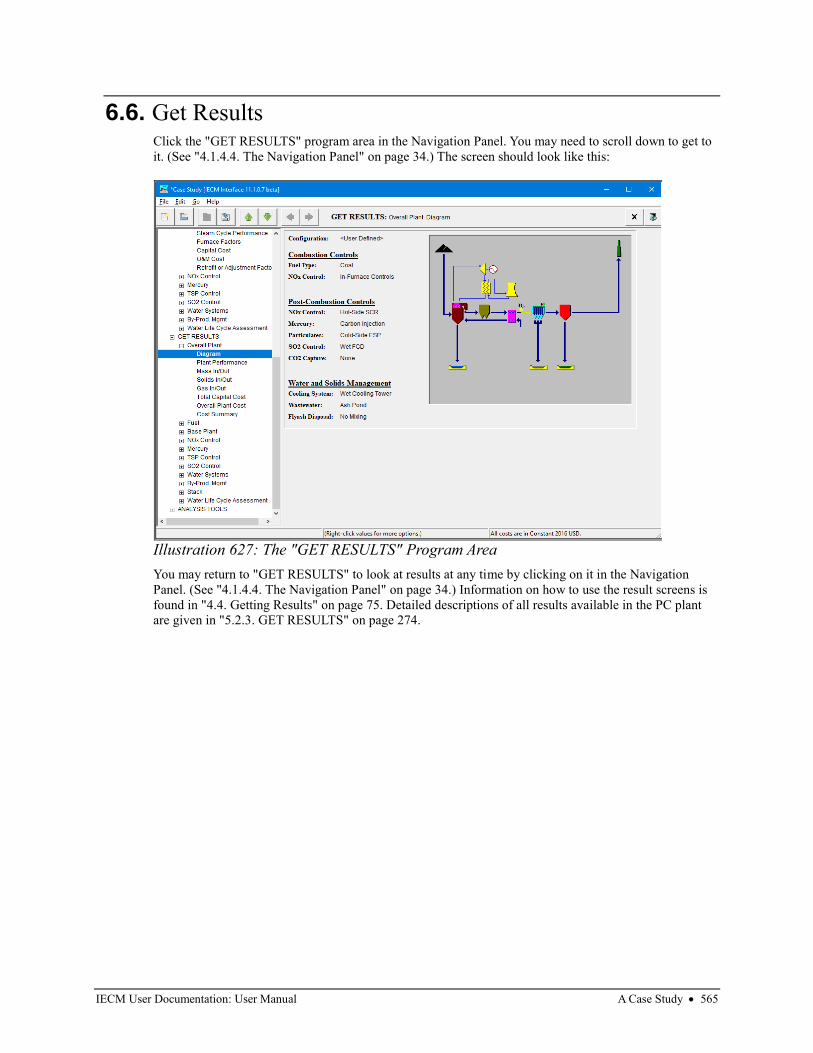
IECM User Documentation: User Manual A Case Study • 565
6.6. Get Results Click the "GET RESULTS" program area in the Navigation Panel. You may need to scroll down to get to
it. (See "4.1.4.4. The Navigation Panel" on page 34.) The screen should look like this:
You may return to "GET RESULTS" to look at results at any time by clicking on it in the Navigation
Panel. (See "4.1.4.4. The Navigation Panel" on page 34.) Information on how to use the result screens is
found in "4.4. Getting Results" on page 75. Detailed descriptions of all results available in the PC plant
are given in "5.2.3. GET RESULTS" on page 274.
Illustration 627: The "GET RESULTS" Program Area
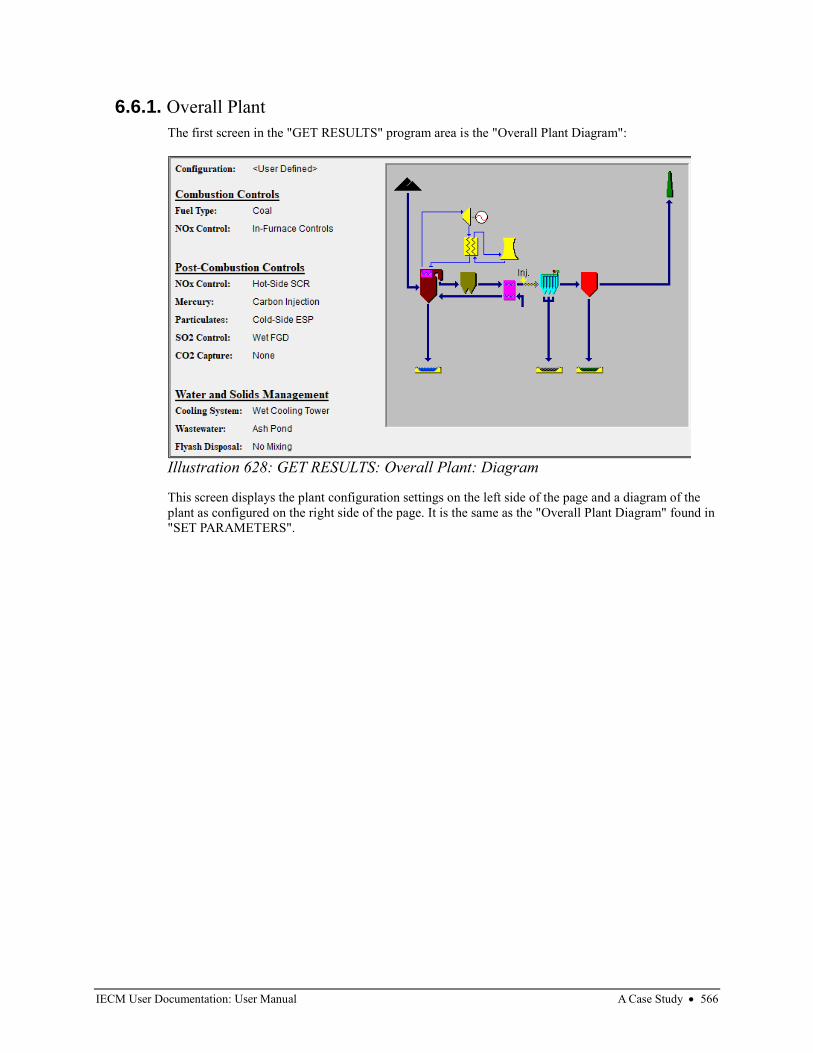
IECM User Documentation: User Manual A Case Study • 566
6.6.1. Overall Plant
The first screen in the "GET RESULTS" program area is the "Overall Plant Diagram":
This screen displays the plant configuration settings on the left side of the page and a diagram of the
plant as configured on the right side of the page. It is the same as the "Overall Plant Diagram" found in
"SET PARAMETERS".
Illustration 628: GET RESULTS: Overall Plant: Diagram
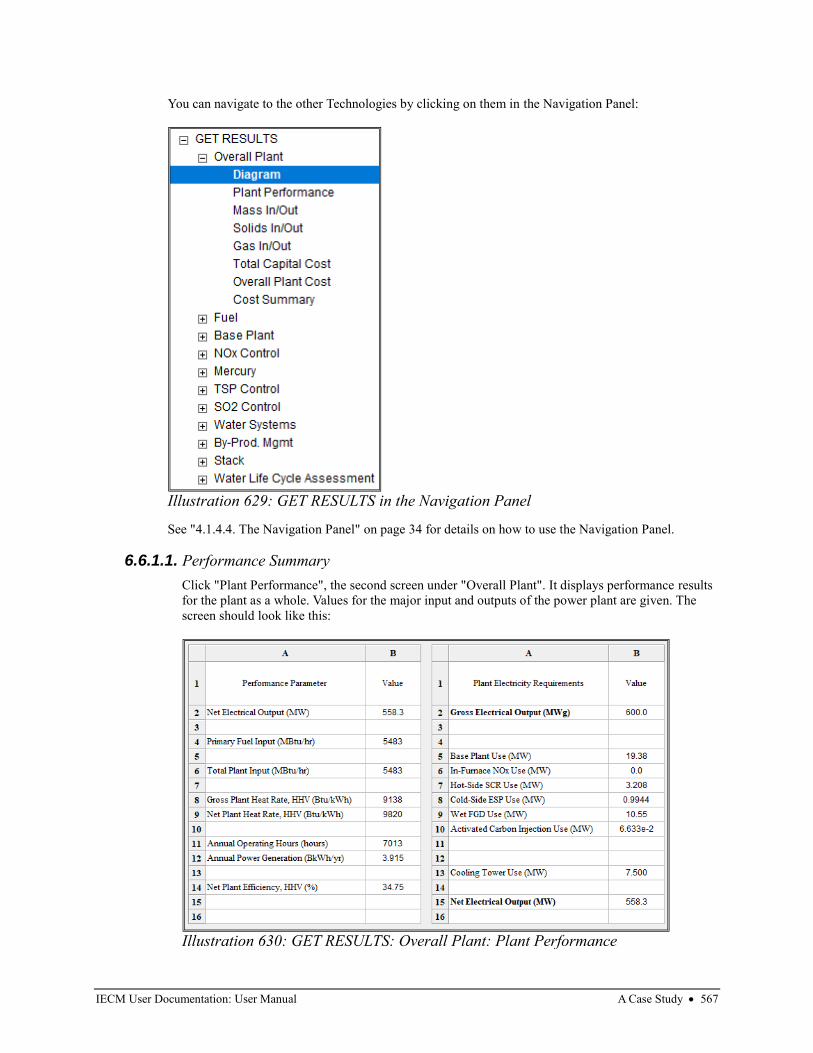
IECM User Documentation: User Manual A Case Study • 567
You can navigate to the other Technologies by clicking on them in the Navigation Panel:
See "4.1.4.4. The Navigation Panel" on page 34 for details on how to use the Navigation Panel.
6.6.1.1. Performance Summary
Click "Plant Performance", the second screen under "Overall Plant". It displays performance results
for the plant as a whole. Values for the major input and outputs of the power plant are given. The
screen should look like this:
Illustration 629: GET RESULTS in the Navigation Panel
Illustration 630: GET RESULTS: Overall Plant: Plant Performance
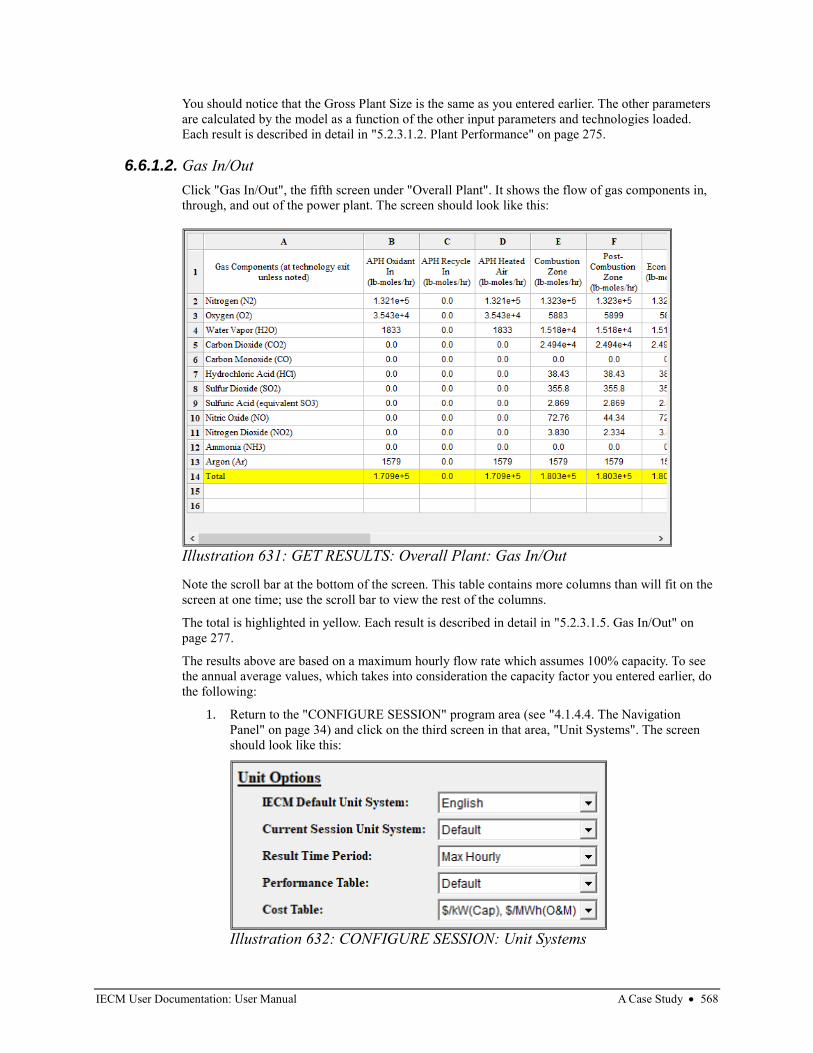
IECM User Documentation: User Manual A Case Study • 568
You should notice that the Gross Plant Size is the same as you entered earlier. The other parameters
are calculated by the model as a function of the other input parameters and technologies loaded.
Each result is described in detail in "5.2.3.1.2. Plant Performance" on page 275.
6.6.1.2. Gas In/Out
Click "Gas In/Out", the fifth screen under "Overall Plant". It shows the flow of gas components in,
through, and out of the power plant. The screen should look like this:
Note the scroll bar at the bottom of the screen. This table contains more columns than will fit on the
screen at one time; use the scroll bar to view the rest of the columns.
The total is highlighted in yellow. Each result is described in detail in "5.2.3.1.5. Gas In/Out" on
page 277.
The results above are based on a maximum hourly flow rate which assumes 100% capacity. To see
the annual average values, which takes into consideration the capacity factor you entered earlier, do
the following:
1. Return to the "CONFIGURE SESSION" program area (see "4.1.4.4. The Navigation
Panel" on page 34) and click on the third screen in that area, "Unit Systems". The screen
should look like this:
Illustration 631: GET RESULTS: Overall Plant: Gas In/Out
Illustration 632: CONFIGURE SESSION: Unit Systems
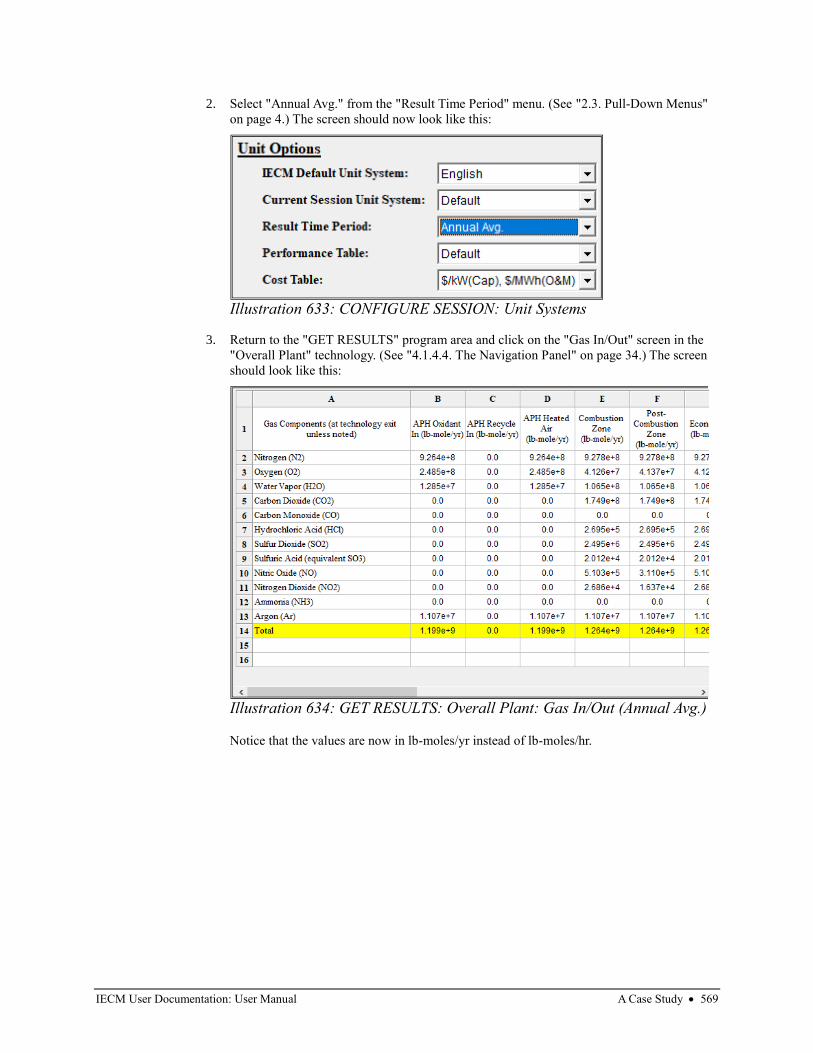
IECM User Documentation: User Manual A Case Study • 569
2. Select "Annual Avg." from the "Result Time Period" menu. (See "2.3. Pull-Down Menus"
on page 4.) The screen should now look like this:
3. Return to the "GET RESULTS" program area and click on the "Gas In/Out" screen in the
"Overall Plant" technology. (See "4.1.4.4. The Navigation Panel" on page 34.) The screen
should look like this:
Notice that the values are now in lb-moles/yr instead of lb-moles/hr.
Illustration 633: CONFIGURE SESSION: Unit Systems
Illustration 634: GET RESULTS: Overall Plant: Gas In/Out (Annual Avg.)
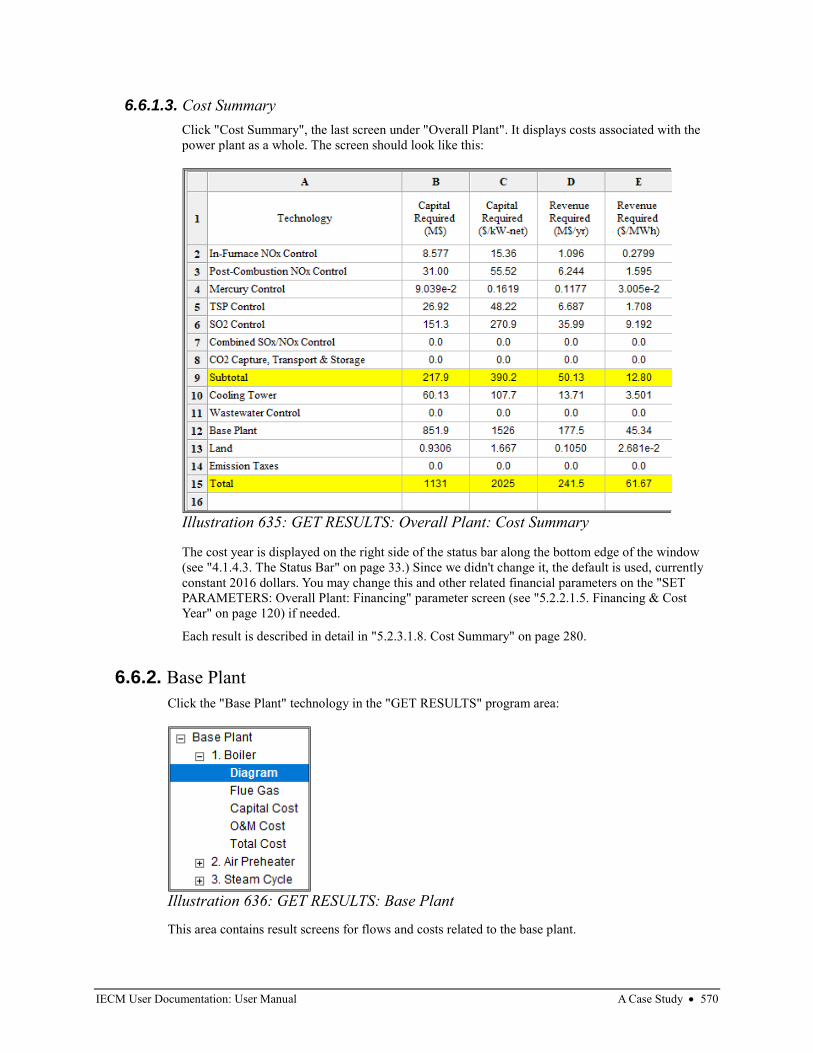
IECM User Documentation: User Manual A Case Study • 570
6.6.1.3. Cost Summary
Click "Cost Summary", the last screen under "Overall Plant". It displays costs associated with the
power plant as a whole. The screen should look like this:
The cost year is displayed on the right side of the status bar along the bottom edge of the window
(see "4.1.4.3. The Status Bar" on page 33.) Since we didn't change it, the default is used, currently
constant 2016 dollars. You may change this and other related financial parameters on the "SET
PARAMETERS: Overall Plant: Financing" parameter screen (see "5.2.2.1.5. Financing & Cost
Year" on page 120) if needed.
Each result is described in detail in "5.2.3.1.8. Cost Summary" on page 280.
6.6.2. Base Plant
Click the "Base Plant" technology in the "GET RESULTS" program area:
This area contains result screens for flows and costs related to the base plant.
Illustration 635: GET RESULTS: Overall Plant: Cost Summary
Illustration 636: GET RESULTS: Base Plant
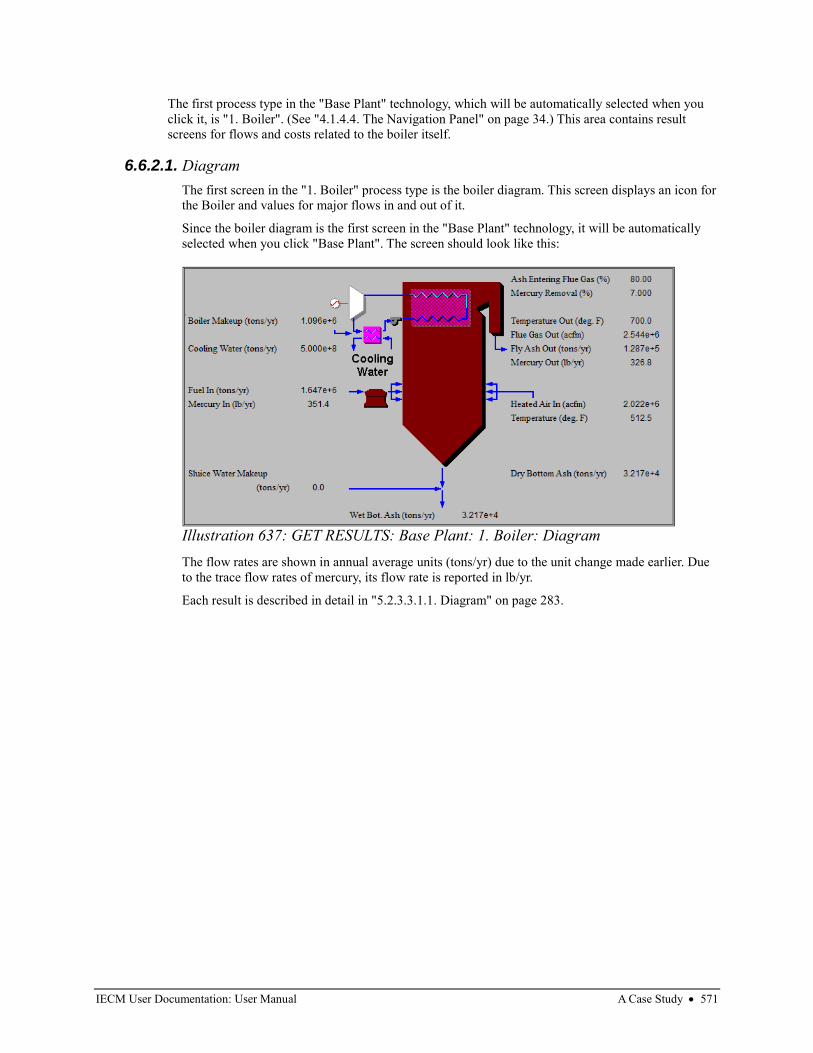
IECM User Documentation: User Manual A Case Study • 571
The first process type in the "Base Plant" technology, which will be automatically selected when you
click it, is "1. Boiler". (See "4.1.4.4. The Navigation Panel" on page 34.) This area contains result
screens for flows and costs related to the boiler itself.
6.6.2.1. Diagram
The first screen in the "1. Boiler" process type is the boiler diagram. This screen displays an icon for
the Boiler and values for major flows in and out of it.
Since the boiler diagram is the first screen in the "Base Plant" technology, it will be automatically
selected when you click "Base Plant". The screen should look like this:
The flow rates are shown in annual average units (tons/yr) due to the unit change made earlier. Due
to the trace flow rates of mercury, its flow rate is reported in lb/yr.
Each result is described in detail in "5.2.3.3.1.1. Diagram" on page 283.
Illustration 637: GET RESULTS: Base Plant: 1. Boiler: Diagram
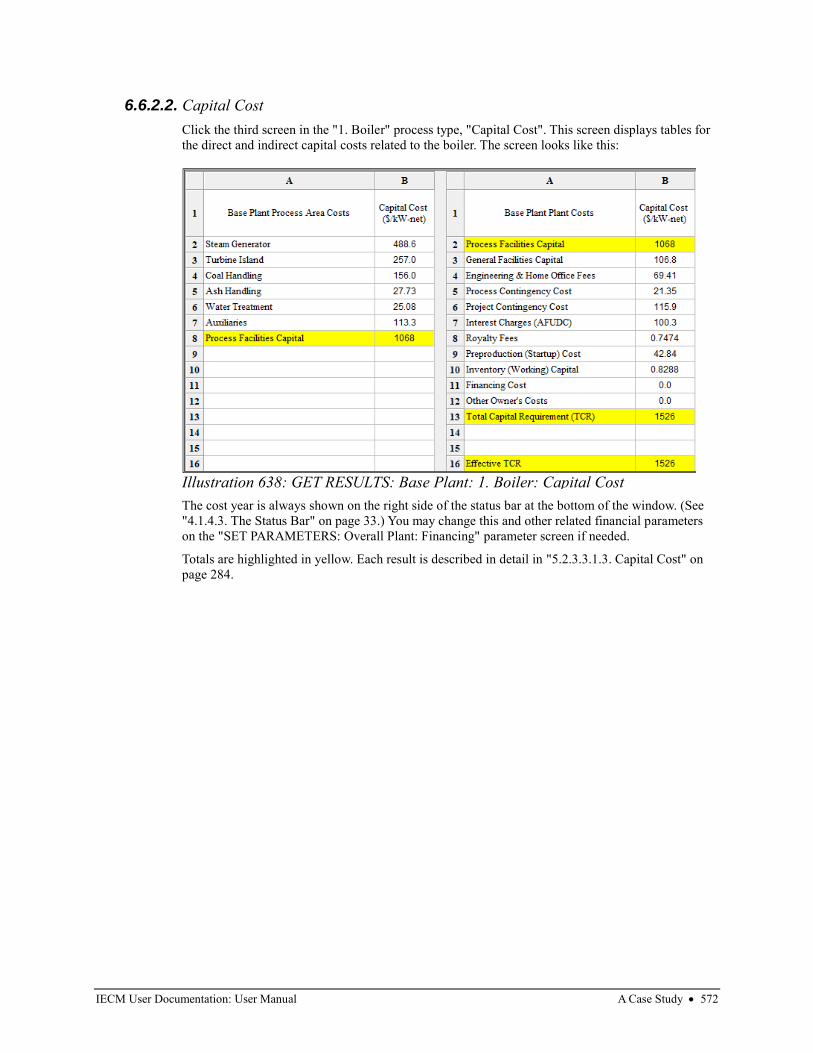
IECM User Documentation: User Manual A Case Study • 572
6.6.2.2. Capital Cost
Click the third screen in the "1. Boiler" process type, "Capital Cost". This screen displays tables for
the direct and indirect capital costs related to the boiler. The screen looks like this:
The cost year is always shown on the right side of the status bar at the bottom of the window. (See
"4.1.4.3. The Status Bar" on page 33.) You may change this and other related financial parameters
on the "SET PARAMETERS: Overall Plant: Financing" parameter screen if needed.
Totals are highlighted in yellow. Each result is described in detail in "5.2.3.3.1.3. Capital Cost" on
page 284.
Illustration 638: GET RESULTS: Base Plant: 1. Boiler: Capital Cost
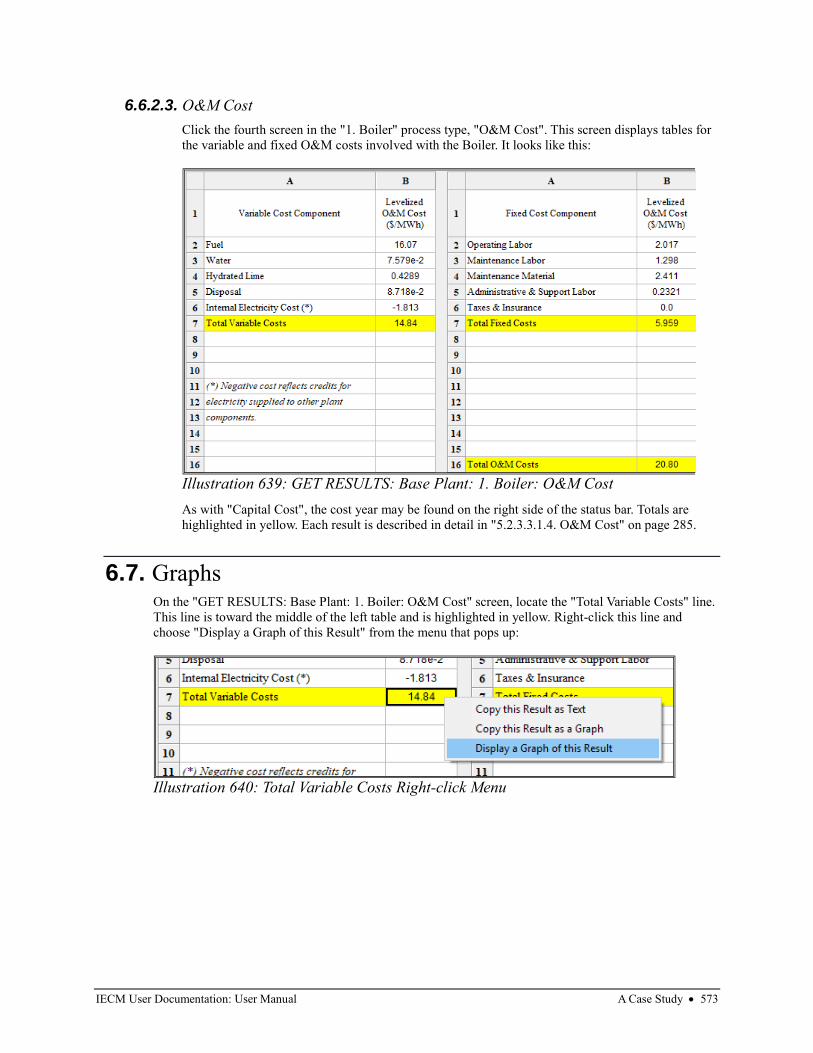
IECM User Documentation: User Manual A Case Study • 573
6.6.2.3. O&M Cost
Click the fourth screen in the "1. Boiler" process type, "O&M Cost". This screen displays tables for
the variable and fixed O&M costs involved with the Boiler. It looks like this:
As with "Capital Cost", the cost year may be found on the right side of the status bar. Totals are
highlighted in yellow. Each result is described in detail in "5.2.3.3.1.4. O&M Cost" on page 285.
6.7. Graphs On the "GET RESULTS: Base Plant: 1. Boiler: O&M Cost" screen, locate the "Total Variable Costs" line.
This line is toward the middle of the left table and is highlighted in yellow. Right-click this line and
choose "Display a Graph of this Result" from the menu that pops up:
Illustration 639: GET RESULTS: Base Plant: 1. Boiler: O&M Cost
Illustration 640: Total Variable Costs Right-click Menu
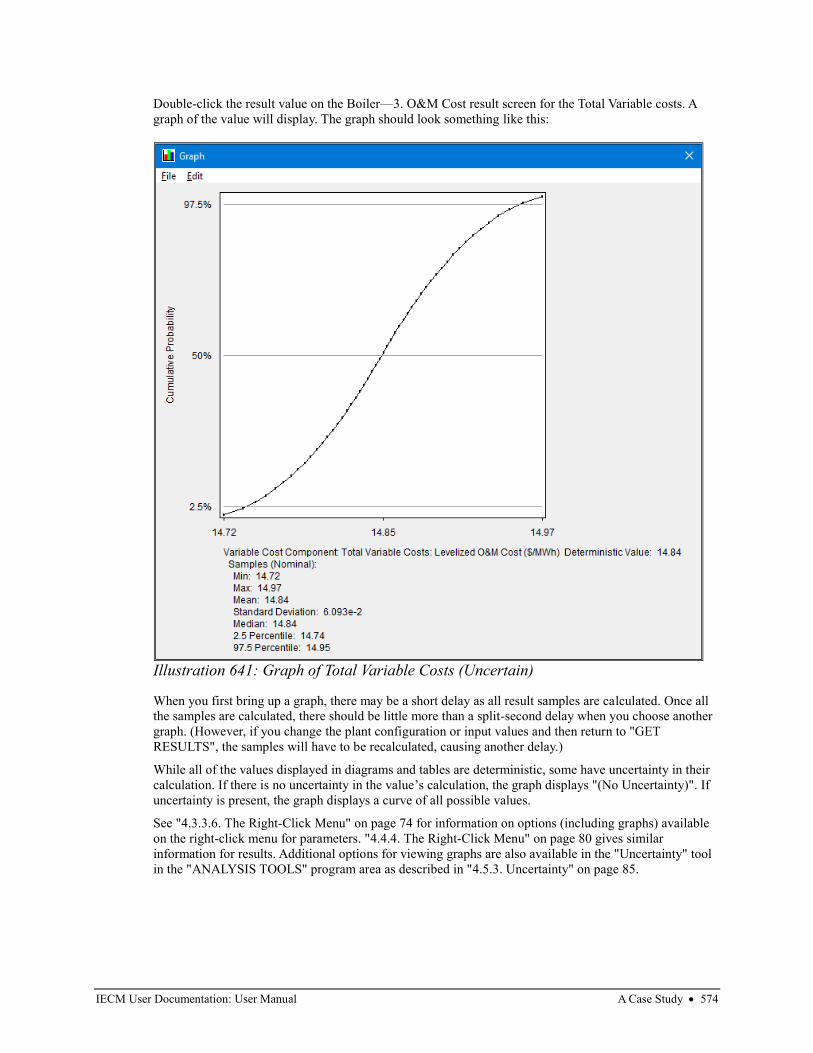
IECM User Documentation: User Manual A Case Study • 574
Double-click the result value on the Boiler—3. O&M Cost result screen for the Total Variable costs. A
graph of the value will display. The graph should look something like this:
When you first bring up a graph, there may be a short delay as all result samples are calculated. Once all
the samples are calculated, there should be little more than a split-second delay when you choose another
graph. (However, if you change the plant configuration or input values and then return to "GET
RESULTS", the samples will have to be recalculated, causing another delay.)
While all of the values displayed in diagrams and tables are deterministic, some have uncertainty in their
calculation. If there is no uncertainty in the value’s calculation, the graph displays "(No Uncertainty)". If
uncertainty is present, the graph displays a curve of all possible values.
See "4.3.3.6. The Right-Click Menu" on page 74 for information on options (including graphs) available
on the right-click menu for parameters. "4.4.4. The Right-Click Menu" on page 80 gives similar
information for results. Additional options for viewing graphs are also available in the "Uncertainty" tool
in the "ANALYSIS TOOLS" program area as described in "4.5.3. Uncertainty" on page 85.
Illustration 641: Graph of Total Variable Costs (Uncertain)
IECM User Documentation: User Manual Introduction to Uncertainty Analysis • 575
7. Introduction to Uncertainty
Analysis
7.1. Uncertainty Analysis The following section is provided as a means of introducing uncertainty analysis as a tool for model
design and operation. However, you should consult standard statistical and other texts (e.g., Morgan and
Henrion, Uncertainty, Cambridge Press, 1990) to develop a more complete understanding of the subject.
7.2. Introduction Nearly all analyses of energy and environmental control technologies involve uncertainties. The most
common approach to handling uncertainties is either to ignore them or to use simple sensitivity analysis.
In sensitivity analysis, the value of one or a few model input parameters are varied, usually from low to
high values, and the effect on a model output parameter is observed. Meanwhile, all other model
parameters are held at their nominal values. In practical problems with many input variables which may
be uncertain, the combinatorial explosion of possible sensitivity scenarios (e.g., one variable "high,"
another "low," and so on) becomes unmanageable. Furthermore, sensitivity analysis provides no insight
into the likelihood of obtaining any particular result.
A more robust approach is incorporated in the IECM to represent uncertainties in model parameters using
probability distributions. Using probabilistic simulation techniques, uncertainties in any number of model
input parameters can be propagated through the model simultaneously to determine their combined effect
on model outputs. The result of a probabilistic simulation includes both the possible range of values for
model output parameters and information about the likelihood of obtaining various results. You may have
seen probabilistic analysis referred to elsewhere as "range estimating" or "risk assessment."
The development of ranges and probability distributions for model input parameters can be based either
on statistical data analysis and/or engineering judgments. The approaches to developing probability
distributions for model parameters are similar in many ways to the approach you might take to pick a
single "best guess" number for deterministic (point-estimate) analysis, or to select a range of values to use
in sensitivity analysis.
7.3. Philosophy of Uncertainty Analysis The classical approach to probability theory requires that estimates for probability distributions be based
on empirical data. However, in many practical cases, the available data may not be available or relevant
to the problem at hand. Thus, statistical manipulation of data may be an insufficient basis for estimating
uncertainty. Engineering analysis or judgments about the data may be required.
IECM User Documentation: User Manual Introduction to Uncertainty Analysis • 576
An alternative approach is the "Bayesian" view. It differs in how probability distributions are interpreted.
The probability of an outcome is your "degree of belief" that the outcome will occur, based on all of the
relevant information you currently have about the system. Thus, the probability distribution may be based
on empirical data and/or other considerations, such as your own technically-informed judgments. The
assessment of uncertainties requires thought about all possible outcomes and their likelihood, not just the
"most likely" outcome. The advantage to thinking systematically and critically about uncertainties is the
likelihood of anticipating otherwise overlooked problems, or identifying potential payoffs that might
otherwise be overlooked.
7.4. Types of Uncertain Quantities There are a number of types of uncertainty to consider when developing a probability distribution for a
variable. Some of these are summarized briefly here.
Statistical error is associated with imperfections in measurement techniques. Statistical analysis of test
data is thus one method for developing a representation of uncertainty in a variable.
Empirical measurements also involve systematic error. The mean value of a quantity may not converge to
the "true" mean value because of biases in measurement and procedures. Such biases may arise from
imprecise calibration, faulty reading of meters, and inaccuracies in the assumptions used to infer the
actual quantity of interest from the observed readings of other quantities. Estimating the possible
magnitude of systematic error may involve an element of engineering judgment.
Variability can be represented as a probability distribution. Some quantities are variable over time. For
example, the composition of a coal (or perhaps a sorbent) may vary over time.
Uncertainty may also arise due to lack of actual experience with a process. This type of uncertainty often
cannot be treated statistically, because it requires predictions about something that has yet to be built or
tested. This type of uncertainty can be represented using technical estimates about the range and
likelihood of possible outcomes. These judgments may be based on a theoretical foundation or experience
with analogous systems.
7.5. Encoding Uncertainties as Probability Distributions As indicated in the previous sections, there are two fundamental approaches for encoding uncertainty in
terms of probability distributions. These include statistical estimation techniques and engineering
judgments. A combination of both methods may be appropriate in many practical situations. For example,
a statistical analysis of measured test data for a new emission control technology may be a starting point
for thinking about uncertainties in a hypothetical commercial scale system. You must then consider the
effect that systematic errors, variability, or uncertainties about scaling-up the process might have on
interpreting test results for commercial-scale design applications.
7.5.1. Statistical Techniques
Statistical estimation techniques involve estimating probability distributions from available data. The
fit of data to a particular probability distribution function can be evaluated using various statistical
tests. For example, the cumulative probability distribution of a set of data may be plotted on
"probability" paper. If the data plot as a straight line, then the distribution is normal. Procedures for
fitting probability distribution functions are discussed in many standard texts on probability and are not
reviewed here.
Such procedures can be utilized to obtain distribution functions for many of the power plant
parameters in the IECM when data are available for operating plants. In other cases, especially where
data are limited, expert technical judgments may be necessary to develop appropriate distribution
functions for model parameters. The emphasis of the discussion below is on the situations where
statistical analysis alone may be insufficient.
IECM User Documentation: User Manual Introduction to Uncertainty Analysis • 577
7.5.2. Judgments about Uncertainties
In making judgments about a probability distribution for a quantity, there are a number of approaches
(heuristics) that people use which psychologists have observed. Some of these can lead to biases in the
probability estimate. Some of the most common are briefly summarized.
7.5.2.1. Availability
The probability experts assign to a particular possible outcome may be linked to the ease
(availability) with which they can recall past instances of the outcome. For example, if tests have
yielded high sorbent utilization, it may be easier to imagine obtaining a high sorbent utilization in
the future than obtaining lower utilization. Thus, one tends to expect experts to be biased toward
outcomes they have recently observed or can easily imagine, as opposed to other possible outcomes
that have not been observed in tests.
7.5.2.2. Representativeness
Representativeness has also been termed the "law of small numbers." People may tend to assume
that the behavior they observe in a small set of data must be representative of the behavior of the
system, which may not be completely characterized until substantially more data are collected.
Thus, one should be cautious in inferring patterns from data with a small number of samples.
7.5.2.3. Anchoring and Adjustment
Anchoring and adjustment involves using a natural starting point as the basis for making
adjustments. For example, an expert might choose to start with a "best guess" value, which
represents perhaps an average or most likely (modal) value, and then make adjustments to the best
guess to achieve "worst" and "best" outcomes as bounds. The "worst" and "best" outcomes may be
intended to represent a 90 percent probability range for the variable. However, the adjustment from
the central "best guess" value to the extreme values is often insufficient, with the result that the
probability distribution is too tight and biased toward the central value. This phenomenon is
overconfidence, because the expert's judgment reflects less uncertainty in the variable than it should.
The "anchor" can be any value, not just a central value. For example, if an expert begins with a
"worst" case value, the entire distribution may be biased toward that value.
7.5.2.4. Motivational Bias
Judgments also may be biased for other reasons. One common concern is motivational bias. This
bias may occur for reasons such as:
• A person may want to influence a decision to go a certain way.
• The person may perceive that they will be evaluated based on the outcome and might tend
to be conservative in their estimates.
• The person may want to suppress uncertainty that they actually believe is present in order
to appear knowledgeable or authoritative.
• The expert has taken a strong stand in the past and does not want to appear to contradict
himself by producing a distribution that lends credence to alternative views.
7.6. Designing an Elicitation Protocol Studies of uncertainty judgment show that the most frequent problem encountered is overconfidence.
Knowledge of how people make judgments about probability distributions can be used to design a
procedure for eliciting these judgments. The appropriate procedure depends on the background of the
expert and the quantity for which the judgment is being elicited. For example, if you have some prior
knowledge about the shape of the distribution for the quantity, then it may be appropriate to ask you to
IECM User Documentation: User Manual Introduction to Uncertainty Analysis • 578
think about extreme values of the distribution and then to draw the distribution yourself. On the other
hand, if you have little statistical background, it may be more appropriate to ask you a series of questions.
For example, you might be asked the probability of obtaining a value less than or equal to some value x,
and then the question is repeated for a few other values of x. Your judgment can then be graphed by an
elicitor, who would review the results of the elicitation with you to see if you are comfortable with your
answers.
To overcome the typical problem of overconfidence, consider extreme high or low values before asking
about central values of the distribution. In general, experts' judgments about uncertainties tend to improve
when:
• The expert is forced to consider how things could turn out differently than expected (e.g., high
and low extremes).
• The expert is asked to list reasons for obtaining various outcomes.
While the development of expert judgments may be flawed in some respects, it does permit a more robust
analysis of uncertainties in a process when limited data are available. Furthermore, in many ways, the
assessment of probability distributions is qualitatively no different than selecting single "best guess"
values for use in a deterministic estimate. For example, a "best guess" value often represents a judgment
about the single most likely value that one expects to obtain. The "best guess" value may be selected after
considering several possible values. The types of heuristics and biases discussed above may play a similar
role in selecting the value. Thus, even when only a single "best guess" number is used in an analysis, a
seasoned engineer usually has at least a "sense" for "how good that number really is." This may be why
engineers are usually able to make judgments about uncertainties, because they implicitly make these
types of judgments routinely.
7.7. A Non-technical Example To illustrate the process of defining a subjective probability distribution, let's turn to a simple example of
eating lunch in a cafeteria. How long does it take from the time you enter the cafeteria to the time you pay
the cashier? Assume that you enter at 12:05 p.m. on a weekday and that you purchase your entire meal at
the cafeteria. The answer you give may depend on your recent experiences in the cafeteria. Think about
the shortest possible time that it could take (suppose nobody else is getting lunch) or the longest possible
time (everyone shows up at the same time). What is the probability that it will take 2 minutes or less? 45
minutes or less? Is the probability that it takes 10 minutes or less greater than 50 percent? etc. After
asking yourself a number of questions such as these, it should be possible to draw a distribution for your
judgment regarding the time require to obtain and purchase lunch at the cafeteria. Such a distribution
might take the form of a fractile distribution giving the probabilities of different waiting times to purchase
lunch. For example, your evaluation may conclude that there is only a 1 percent (1 in 100) chance it will
take one minute or less, a 60 percent chance of 1 to 10 minutes, a 25 percent likelihood of 10 to 15
minutes, and a 14 percent chance of up to 25 minutes. These probability intervals can be drawn as a
histogram and translated into a fractile distribution for a probabilistic analysis.
7.8. A Technical Example A second example focuses on a performance parameter for an advanced pollution control system. This
parameter has an important effect on system performance and cost.
The example focuses on an assessment of uncertainty in the performance of an innovative emission
control system for coal-fired power plants. In this system, a chemical sorbent circulates between a
fluidized bed reactor, where SO2 in the flue gas is removed by chemical reaction with the sorbent, and a
regenerator, in which SO2 is evolved in a reaction of the sulfated sorbent with methane. There is no
commercial experience with this system; the largest test unit has been sized to handle 100 scfm of flue
gas. Furthermore, the test units have used batch, rather than continuous, regeneration.

IECM User Documentation: User Manual Introduction to Uncertainty Analysis • 579
One of the key parameters affecting the performance and cost of this system is the regeneration
efficiency, which is defined as the fraction of the spent sorbent which is converted for reuse. In small-
scale tests in which the regeneration efficiency has been estimated, the efficiency was found to be roughly
30 to 50 percent. In a more recent test, the regeneration efficiency was not measured due to
instrumentation difficulties; however, it may have been lower than the previously obtained values.
Regeneration residence times were typically greater than 30 minutes.
A detailed modeling study of the regenerator estimated that a properly sized and designed unit, coupled
with heating of the sorbent to a sufficiently high reaction temperature, would result in a regeneration
efficiency of just over 99 percent at a 30-minute residence time.
A potential problem that may be occurring in the test units is that regenerated sorbent in the regenerator
may be reabsorbing some of the evolved SO2. However, this was not considered in the modeling study of
the regenerator.
Based on this information, it appears that it may be possible to achieve the design target of over 99
percent regeneration efficiency. Clearly, however, it is possible that the actual efficiency may be
substantially less than this target value. As a worst case, we might consider the known test results as a
lower bound. Thus, there is a small chance the regeneration efficiency may be less than 50 percent. We
expect the regeneration efficiency to tend toward the target value of 99.2 percent. Thus, to represent the
expectation that the efficiency will be near the target value, but may be substantially less, we can use a
negatively skewed distribution. In this case, we assume a triangle with a range from, say, 50 to 99.2
percent with a mode also at 99.2 percent. The triangle in this case gives us a distribution with a mean of
about 83 percent and a median of about 85 percent. This type of triangular distribution, in which a
minimum, maximum, and modal value are specified, is often a convenient way of expressing uncertainty
distributions when a little information is available.


