Embed Size (px)
Citation preview
www.elsevier.com/locate/ybbrc
Biochemical and Biophysical Research Communications 332 (2005) 1107–1114
BBRC
Imaging Erg and Jun transcription factor interaction in living cellsusing fluorescence resonance energy transfer analyses
Barbara Camuzeaux a, Corentin Spriet b, Laurent Heliot b, Jean Coll c,Martine Duterque-Coquillaud a,*
a UMR 8526CNRS/Institut Pasteur de Lille/Universite de Lille2, Institut de Biologie de Lille, BP 447, 1 rue Calmette, 59021 Lille cedex, Franceb Service d’Imagerie Cellulaire Fonctionnelle, FRC3 CNRS, Institut de Biologie de Lille, BP 447, 1 rue Calmette, 59021 Lille cedex, France
c UMR 8527CNRS/Institut Pasteur de Lille/Universite de Lille2, Institut de Biologie de Lille, BP 447, 1 rue Calmette, 59021 Lille cedex, France
Received 3 May 2005Available online 23 May 2005
Abstract
Physical interactions between transcription factors play important roles in modulating gene expression. Previous in vitro studieshave shown a transcriptional synergy between Erg protein, an Ets family member, and Jun/Fos heterodimer, members of the bZipfamily, which requires direct Erg–Jun protein interactions. Visualization of protein interactions in living cells is a new challenge inbiology. For this purpose, we generated fusion proteins of Erg, Fos, and Jun with yellow and cyan fluorescent proteins, YFP andCFP, respectively. After transient expression in HeLa cells, interactions of the resulting fusion proteins were explored by fluores-cence resonance energy transfer microscopy (FRET) in fixed and living cells. FRET between YFP–Erg and CFP–Jun was monitoredby using photobleaching FRET and fluorescence lifetime imaging microscopy. Both techniques revealed the occurrence of inter-molecular FRET between YFP–Erg and CFP–Jun. This is stressed by loss of FRET with an YFP–Erg version carrying a pointmutation in its ETS domain. These results provide evidence for the interaction of Erg and Jun proteins in living cells as a criticalprerequisite of their transcriptional synergy, but also for the essential role of the Y371 residue, conserved in most Ets proteins, in thisinteraction.� 2005 Elsevier Inc. All rights reserved.
Keywords: Transcriptional regulation; Protein interactions; Ets and AP1 families; FRET; FLIM
In eukaryotes, networks of protein interactions regu-late gene expression in response to environmental stim-uli. These interactions must be both versatile as well asselective to enable different members of the same tran-scription factor family to have differential effects on geneexpression. Jun, Fos, and Ets proteins belong to distinctfamilies of transcription factors that target specific DNAelements often found jointly in gene promoters. Previousstudies have demonstrated physical and functional inter-actions between these families [1,2]. Particularly, tran-
0006-291X/$ - see front matter � 2005 Elsevier Inc. All rights reserved.
doi:10.1016/j.bbrc.2005.05.057
* Corresponding author. Fax: +33 3 20 87 11 11.E-mail address: [email protected] (M. Duterque-Coquil-
laud).
scriptional synergy between Erg and the Jun/Fosheterodimer requires Erg–Jun physical interactionsthrough the ETS DNA-binding domain of Erg and thebZIP domain of Jun [3]. We have previously identifiedtwo conserved amino acids (residues R367 and Y371of Erg) in the ETS domain required for efficient recruit-ment of the Jun/Fos heterodimer. Whereas the R367Ksubstitution abolishes DNA binding, interaction withJun, and consequently transcription synergy, theY371V mutation abrogates interaction with Jun andsynergy without abolishing DNA binding [4].
However, complexes between Erg and Jun transcrip-tion factors have not been studied previously in their cel-lular context. The verification that these protein partners
1108 B. Camuzeaux et al. / Biochemical and Biophysical Research Communications 332 (2005) 1107–1114
interact in a meaningful way in vivo is difficult to dem-onstrate. Several methods have been developed to visu-alize protein complexes in living cells. Fluorescenceresonance energy transfer microscopy (FRET) providesa suitable methodology to confirm these protein–proteininteractions in intact cells in a non-invasive and non-destructive manner. FRET is the phenomenon by whicha donor fluorophore transfers its excited-state energy toan absorbing chromophore (Fig. 3) [5,6]. FluorophoresCFP and YFP, cyan and yellow fluorescent chromo-phore-mutated variants of green fluorescent protein(GFP), show an excellent spectral overlap and thereforeform an appropriate donor–acceptor FRET pair with adistance at which 50% of the excited donor moleculestransfer energy by FRET of 50 A [7,8].
In the present study, we construct YFP–Erg andCFP–Jun fusion proteins and use two FRET measure-ment techniques to visualize protein interactions inliving cells by microscopy: pbFRET technique (photo-bleaching FRET), based on the measurement of CFPfluorescence increase in case of interaction, after YFPphotobleaching [9], and fluorescence lifetime imagingmicroscopy (FLIM) which measures fluorescence life-time of the CFP fluorescence decrease in case of interac-tion [10]. Both techniques, optimized here to observeinteractions in nucleus, revealed FRET occurrence incells co-expressing YFP–Erg and CFP–Jun, a result con-sistent with their association in the nucleus of these liv-ing cells.
Materials and methods
Cell culture. HeLa (Human cervix epitheloid carcinoma) cells andF9 embryonic carcinoma cells were maintained in Dulbecco�s modifiedEagle�s medium supplemented with 10% fetal calf serum. F9 cells arepropagated on culture surfaces coated with 0.1% gelatine. HeLa andF9 cells do not express endogenous Erg protein; by contrast only F9cells lack endogenous AP1 activity.
Plasmid constructions. The Erg and the ErgY371V mutant expres-sion vectors have been described previously [3,4]. To construct theYFP–Erg, YFP–ErgYV, YFP–ErgRK-YV, YFP–Fos, and CFP–Junexpression vectors (Fig. 1), the DNA fragments encoding Erg, Er-gY371V, ErgR367K-Y371V, Fos, and Jun were obtained by poly-merase chain reaction using appropriate primers flanked by convenientrestriction sites, then sub-cloned into PCRII (Invitrogen), and finallycloned in-frame into pEYFP-C1 or pECFP-C1 vectors (Clontech).Full details and primer sequences are available on request. All con-structs were verified by DNA sequencing.
Transfection and luciferase assays. The day before transfection,HeLa and F9 cells were plated at 50–60% confluence in six-well plates(coated with 0.1% gelatin for F9 cells). For transfection, cells wereincubated with 1 lg of plasmid DNA and 4 ll of polyethyleneimine(Euromedex, Souffelweyersheim, France) or 4 ll Lipofectamine andPlus Reagent (Invitrogen) for HeLa and F9 cells, respectively, for 6 hin 1 ml of optiMEM and then in fresh complete medium. When nec-essary, pSG5 plasmid was used as a carrier. Cells were lysed 48 h aftertransfection and assayed for luciferase activity with a Berthold (Na-shua, NH) chemioluminometer. Experiments were repeated at leastfive times and representative results are shown here.
Western blotting. Extracts from transfected cells were prepared inRIPA buffer (20 mM Tris/HCl, pH 8, 150 mM NaCl, 1% Triton X-100, 0.1% SDS, and 0.5% desoxycholate, protease inhibitors) andquantitated for total protein (Bio-Rad protein assay). Fifty micro-grams of protein was resolved by SDS–polyacrylamide gel electro-phoresis and transferred to a Hybond-C Extra membrane (AmershamPharmacia Biotech) with a Bio-Rad dry blotter. Membrane wasblocked in PBS with 5%(w/v) dried milk for 2 h and stained with amouse antibody against all Aequorea Victoria green fluorescent pro-tein (GFP) variants (Clontech) and a secondary goat anti-mouse/per-oxidase antibody (Amersham Pharmacia Biotech). Antibodyincubations were performed for 2 h in PBS with 5%(w/v) dried milkfollowed by three 15-min washes in PBS with 0.2% Nonidet P-40. Fordetection, we used the ECL chemiluminescent peroxidase substrate kitfrom Amersham Pharmacia Biotech.
Confocal laser scanning microscopy of YFP/CFP-protein expressing
cells. HeLa cells were plated at 50–60% confluence either on coverglassfor localization and acceptor photobleaching experiments (fixed with4% paraformaldehyde for 20 min and mounted with Mounting Med-ium Immunofluore ICN) or on Lab-Tek chambered borosilicate cov-erglass for FLIM experiments. They were transfected the following daywith 1 lg of plasmid DNA. Twenty-four hours after transfection, theGFP variant fusion proteins were visualized in intact cells usingthe Leica SP2 inverted confocal microscope (DMIRE2), incorporatingthe Acousto-Optical Beam Splitter system and using 100·, NA 1.4, oilimmersion, or 63·, NA 1.2, water immersion objectives. For confocalimages, CFP was excited at 458 nm (power 13 lW) and observed from465 to 495 nm. YFP was excited at 514 nm, (power ranging from 3.5 to13 lW) and observed from 525 to 565 nm. Images were 512 pixels. Allpower measurements were done at the back pupil of the objective.
FRET measurements. For FRET by photobleaching of the accep-tor, experiments were performed on fixed cells. First, images of theCFP and the YFP channels were acquired, in appropriate cells, in thesame condition as for localization images. YFP was specificallyphotobleached, at 514 nm, power 4.5 mW. Then, images were acquiredin the same condition as before photobleaching experiments. FRETefficiency was calculated on at least 15 cells per experiment, using thefollowing adaptation of the FRET efficiency formula [11]:
Feff ¼ð1þ abÞðDpost � bckpostÞ � ðDpret � bckpreÞ
ðDpost � bckpostÞ;
where ab stands for average level of CFP photobleaching during acqui-sitions, bck stands for background, D donor channel intensity, and preand post for before and after photobleaching of the YFP. A definedregion in each cell was bleached and the non-bleached area gives aninternal reference.
For FLIM microscopy and analysis, experiments were performedon living cells. We used a two-photon pulsed excitation, given by theCoherent Mira 900-F laser 5 W (pulse frequency 76 MHz), at awavelength of 830 nm for CFP excitation. Photon detection was per-formed in appropriate cells, using the Hamamatsu MCP R3809U-52PMT. Multi-channel plate detectors are particularly adapted to FLIMimaging with their good temporal resolution [12] (measured FMHW:36 ps). The omega XF3075 band pass filter allowed specific detectionof CFP (465–500 nm). Images were acquired using a 63·, NA 1.2,water immersion objective. The main advantage of two-photon-excitedfluorescence, compared to classical laser excitation, is that it only ex-cites a small volume in the focal plane [13], allowing us to workwithout pinhole. Therefore, the detector was adapted in the non-des-canned detector port of the Leica SP2 confocal microscope, minimiz-ing fluorescence photon loss. Knowing that two-photon-excitedfluorescence is less invasive than single-photon excitation [14], thissystem was optimized for living cell imaging. The Becker & HicklTCSPC 730 card determined the time between fluorophores excitationand photon emission. This card was driven by the SPC software.Fluorescence decay curve fits, allowing lifetime determination, wereobtained using the SPCImage software. The choice between
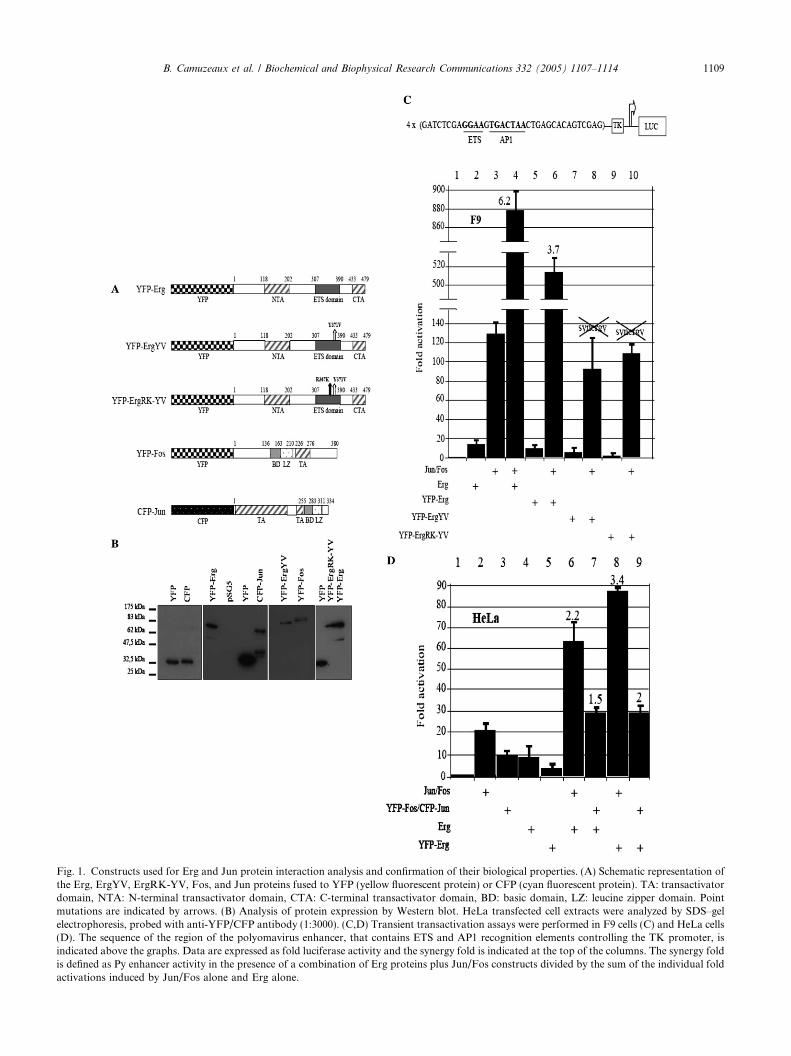
Fig. 1. Constructs used for Erg and Jun protein interaction analysis and confirmation of their biological properties. (A) Schematic representation ofthe Erg, ErgYV, ErgRK-YV, Fos, and Jun proteins fused to YFP (yellow fluorescent protein) or CFP (cyan fluorescent protein). TA: transactivatordomain, NTA: N-terminal transactivator domain, CTA: C-terminal transactivator domain, BD: basic domain, LZ: leucine zipper domain. Pointmutations are indicated by arrows. (B) Analysis of protein expression by Western blot. HeLa transfected cell extracts were analyzed by SDS–gelelectrophoresis, probed with anti-YFP/CFP antibody (1:3000). (C,D) Transient transactivation assays were performed in F9 cells (C) and HeLa cells(D). The sequence of the region of the polyomavirus enhancer, that contains ETS and AP1 recognition elements controlling the TK promoter, isindicated above the graphs. Data are expressed as fold luciferase activity and the synergy fold is indicated at the top of the columns. The synergy foldis defined as Py enhancer activity in the presence of a combination of Erg proteins plus Jun/Fos constructs divided by the sum of the individual foldactivations induced by Jun/Fos alone and Erg alone.
B. Camuzeaux et al. / Biochemical and Biophysical Research Communications 332 (2005) 1107–1114 1109
1110 B. Camuzeaux et al. / Biochemical and Biophysical Research Communications 332 (2005) 1107–1114
mono-exponential decay and bi-exponential decay fitting was doneusing the reduced v2 parameter. The weighted mean lifetime was usedto compare lifetime images. Lifetime values were extracted from threeregions of interest on a minimum of 15 cells per experiment. Statisticalanalysis was performed using the Microsoft Office�s Excel software toobtain averages and standard deviations.
Results and discussion
Biological functionality of the fluorescent fusion proteins
The major aim of this study was to analyze the Ergand Jun transcription factor interactions in living cells.We chose to use GFP chimeras of these transcription fac-tors for FRET microscopy. We have previously shownthat the Erg protein, an Ets family member, is able tobind a specific consensus DNA site and to activate tran-scription. However, Ets family members are poor trans-activators per se [15] but transcriptional activity of Ergtoward EBS/AP1 sites carrying promoter is strongly en-hanced in the presence of the Jun/Fos dimer, a memberof the AP1 family. This transcriptional synergy requiresinteractions between Erg and Jun proteins as shown byin vitro experiments [3,4]. Nevertheless, this result waitedto gain more physiological relevance by visualization in acellular context. For this purpose, we constructed a seriesof expression vectors encoding fusion proteins with YFPand CFP fluorophores tethered to the amino-terminalend of Erg, Jun or Fos proteins (Fig. 1A). Expressionvectors were transiently transfected in HeLa cells. Ineach case, Western blotting was used to demonstrate thatthe expected fusion proteins were synthesized in transfec-ted cells (Fig. 1B). Hence, we challenged the Erg and Jun/Fos synergy property with the chimeric constructs toevaluate their functionality in transactivation assays.To avoid interference with the endogenous Jun andFos proteins, we tested the synergistic properties ofYFP–Erg and its mutants with the Jun/Fos dimer inF9 cells known for their lack of endogenous AP1 activity[16]. These cells, like HeLa cells, do not express endoge-nous Erg proteins as well. The results shown in Fig. 1Cdemonstrated that YFP–Erg induced transcriptionalsynergy with Jun and Fos proteins (lanes 4 and 6) froma cotransfected Py enhancer element-luciferase reportergene. As expected, the YFP–ErgYV and YFP–ErgRK-YV point mutant proteins, chosen, respectively, for theirincapacity to interact with the Jun protein or to interactwith DNA and Jun [4], failed to synergize with the Jun/Fos dimer in transient transfection (Fig. 1C, lanes 6, 8,and 10). Second, we confirmed the synergistic propertyof YFP–Erg with Jun/Fos in HeLa cells, used hereafterfor imaging experiments (Fig. 1D, lanes 6 and 8). Albeitlower than in F9 cells due to endogenous AP1 activity,the synergistic score is similar to the score we previouslydescribed [4]. Finally, we also showed that the CFP–Junand YFP–Fos proteins were able to act in synergy with
Erg or YFP–Erg proteins in HeLa cells (Fig. 1D, lanes7 and 9). Taken together, these results showed that thefusion proteins were biologically functional and thatthe amino-terminal YFP or CFP fluorophore did not al-ter their functions.
Localization of fluorescent proteins
The fluorescent proteins allowed subnuclear localiza-tion and colocalization of Erg and Jun/Fos proteins.After transient (co)transfection of HeLa cells, intracellu-lar distribution of YFP or CFP-derived fluorescence wasimaged by confocal laser scanning microscopy. All exper-iments were performed between 24 and 48 h post-trans-fection. Fig. 2A shows that the Erg, Jun, and Fosfusion proteins were in the nucleus, compared with theYFP and CFP wild-type proteins which were observedboth in the cytoplasm and the nucleus. The Erg mutantfusion proteins were also detected in the nucleus eventhough a small amount of the YFP–ErgRK-YV doublemutant protein was also detected in the cytoplasm. Thislast observation could be explained by a recent study con-cerning the nuclear localization signal (NLS) mapping ofFli-1 protein, closely related to Erg [17]. Actually, theR337 residue of Fli-1 (corresponding to R367 in Erg)present in one of the two NLS defined for this protein isessential for nuclear localization. Thus, in the YFP–ErgRK-YV protein, the R367Kmutation combined withthe Y371V mutation may reduce the nuclear accumula-tion of the protein. Otherwise both YFP–Erg and YFP–Fos proteins were excluded from nucleolus whileCFP–Jun protein was uniformly distributed in the nu-cleus. These results obtained for YFP and CFP fusionproteins (Fig. 2A) were consistent with the localizationof the Erg protein inHeLa cells transfected byErg expres-sion vector, or the localization of Jun andFos endogenousproteins stained by indirect immunofluorescence in fixedcells (data not shown). Thus, fusion of a fluorescent pro-tein at the amino-terminus of Erg, Jun, and Fos proteinsdid not interfere with their intracellular localization.
According to our previous in vitro studies, the Ergprotein is able to interact with the Jun/Fos dimer viaJun [3,4]. With the objective to visualize colocalizationof Erg–Jun/Fos in living cells, HeLa cells were tran-siently cotransfected with the fusion expression vectors.Images of the CFP and YFP fluorescence emission wereacquired sequentially and overlaid to check colocaliza-tion. In Fig. 2B, CFP–Jun, YFP–Erg (wild-type or mu-tants), and YFP–Fos signals were encoded inpseudocolors as blue and yellow, respectively, whereasa combined detection of both fluorescent proteins isindicated by green signals. In HeLa cells coexpressingCFP–Jun with YFP–Erg or YFP–Erg mutants orYFP–Fos proteins, the merged images revealed areasof overlaps as well as regions where CFP–Jun andYFP–Erg or YFP–Fos are distinct in their localization.
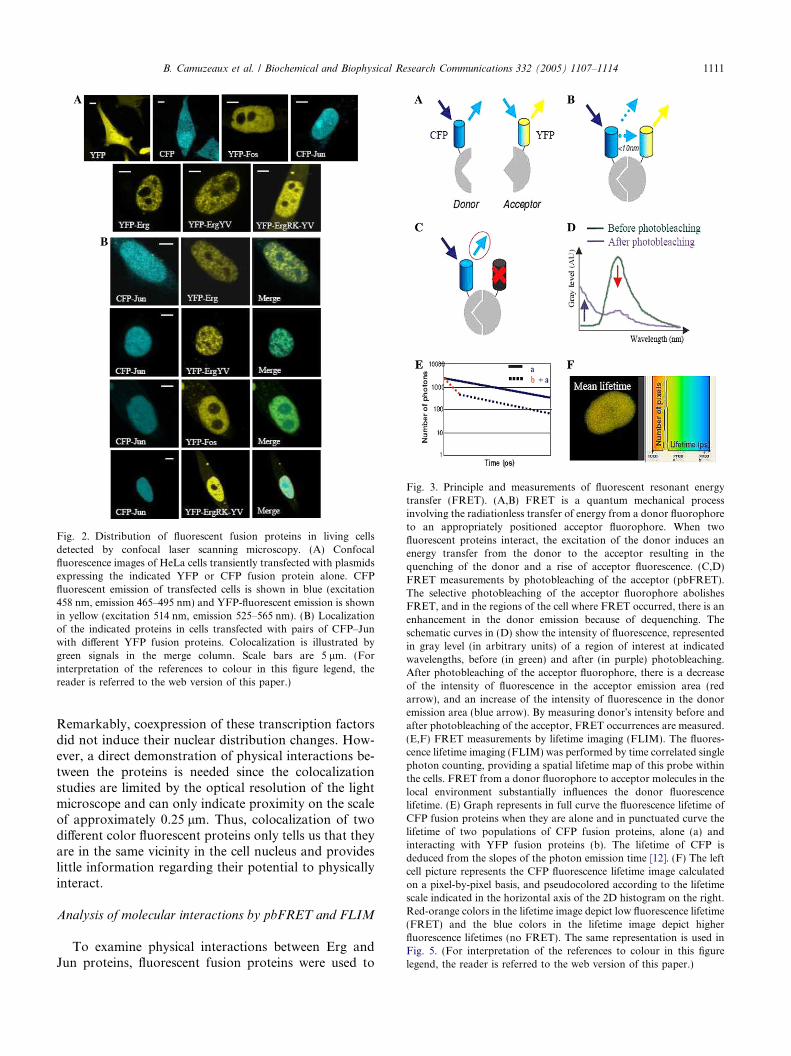
Fig. 2. Distribution of fluorescent fusion proteins in living cellsdetected by confocal laser scanning microscopy. (A) Confocalfluorescence images of HeLa cells transiently transfected with plasmidsexpressing the indicated YFP or CFP fusion protein alone. CFPfluorescent emission of transfected cells is shown in blue (excitation458 nm, emission 465–495 nm) and YFP-fluorescent emission is shownin yellow (excitation 514 nm, emission 525–565 nm). (B) Localizationof the indicated proteins in cells transfected with pairs of CFP–Junwith different YFP fusion proteins. Colocalization is illustrated bygreen signals in the merge column. Scale bars are 5 lm. (Forinterpretation of the references to colour in this figure legend, thereader is referred to the web version of this paper.)
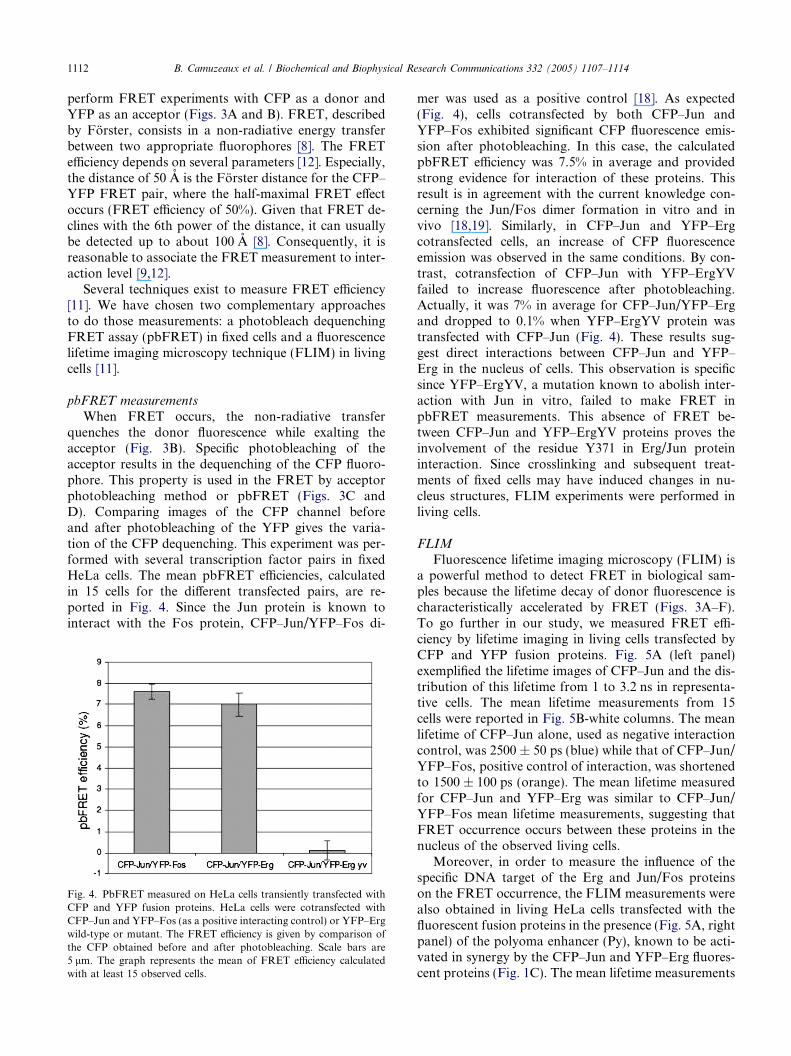
ig. 3. Principle and measurements of fluorescent resonant energyransfer (FRET). (A,B) FRET is a quantum mechanical processvolving the radiationless transfer of energy from a donor fluorophoreo an appropriately positioned acceptor fluorophore. When twouorescent proteins interact, the excitation of the donor induces annergy transfer from the donor to the acceptor resulting in theuenching of the donor and a rise of acceptor fluorescence. (C,D)RET measurements by photobleaching of the acceptor (pbFRET).he selective photobleaching of the acceptor fluorophore abolishesRET, and in the regions of the cell where FRET occurred, there is annhancement in the donor emission because of dequenching. Thechematic curves in (D) show the intensity of fluorescence, representedgray level (in arbitrary units) of a region of interest at indicated
avelengths, before (in green) and after (in purple) photobleaching.fter photobleaching of the acceptor fluorophore, there is a decreasef the intensity of fluorescence in the acceptor emission area (redrrow), and an increase of the intensity of fluorescence in the donormission area (blue arrow). By measuring donor�s intensity before andfter photobleaching of the acceptor, FRET occurrences are measured.E,F) FRET measurements by lifetime imaging (FLIM). The fluores-ence lifetime imaging (FLIM) was performed by time correlated singlehoton counting, providing a spatial lifetime map of this probe withinhe cells. FRET from a donor fluorophore to acceptor molecules in thecal environment substantially influences the donor fluorescencefetime. (E) Graph represents in full curve the fluorescence lifetime ofFP fusion proteins when they are alone and in punctuated curve thefetime of two populations of CFP fusion proteins, alone (a) andteracting with YFP fusion proteins (b). The lifetime of CFP iseduced from the slopes of the photon emission time [12]. (F) The leftell picture represents the CFP fluorescence lifetime image calculatedn a pixel-by-pixel basis, and pseudocolored according to the lifetimecale indicated in the horizontal axis of the 2D histogram on the right.ed-orange colors in the lifetime image depict low fluorescence lifetimeFRET) and the blue colors in the lifetime image depict higheruorescence lifetimes (no FRET). The same representation is used inig. 5. (For interpretation of the references to colour in this figuregend, the reader is referred to the web version of this paper.)
B. Camuzeaux et al. / Biochemical and Biophysical Research Communications 332 (2005) 1107–1114 1111
Remarkably, coexpression of these transcription factorsdid not induce their nuclear distribution changes. How-ever, a direct demonstration of physical interactions be-tween the proteins is needed since the colocalizationstudies are limited by the optical resolution of the lightmicroscope and can only indicate proximity on the scaleof approximately 0.25 lm. Thus, colocalization of twodifferent color fluorescent proteins only tells us that theyare in the same vicinity in the cell nucleus and provideslittle information regarding their potential to physicallyinteract.
Analysis of molecular interactions by pbFRET and FLIM
To examine physical interactions between Erg andJun proteins, fluorescent fusion proteins were used to
FtintfleqFTFesinwAoaea(cptloliCliindcosR(flFle
1112 B. Camuzeaux et al. / Biochemical and Biophysical Research Communications 332 (2005) 1107–1114
perform FRET experiments with CFP as a donor andYFP as an acceptor (Figs. 3A and B). FRET, describedby Forster, consists in a non-radiative energy transferbetween two appropriate fluorophores [8]. The FRETefficiency depends on several parameters [12]. Especially,the distance of 50 A is the Forster distance for the CFP–YFP FRET pair, where the half-maximal FRET effectoccurs (FRET efficiency of 50%). Given that FRET de-clines with the 6th power of the distance, it can usuallybe detected up to about 100 A [8]. Consequently, it isreasonable to associate the FRET measurement to inter-action level [9,12].
Several techniques exist to measure FRET efficiency[11]. We have chosen two complementary approachesto do those measurements: a photobleach dequenchingFRET assay (pbFRET) in fixed cells and a fluorescencelifetime imaging microscopy technique (FLIM) in livingcells [11].
pbFRET measurements
When FRET occurs, the non-radiative transferquenches the donor fluorescence while exalting theacceptor (Fig. 3B). Specific photobleaching of theacceptor results in the dequenching of the CFP fluoro-phore. This property is used in the FRET by acceptorphotobleaching method or pbFRET (Figs. 3C andD). Comparing images of the CFP channel beforeand after photobleaching of the YFP gives the varia-tion of the CFP dequenching. This experiment was per-formed with several transcription factor pairs in fixedHeLa cells. The mean pbFRET efficiencies, calculatedin 15 cells for the different transfected pairs, are re-ported in Fig. 4. Since the Jun protein is known tointeract with the Fos protein, CFP–Jun/YFP–Fos di-
Fig. 4. PbFRET measured on HeLa cells transiently transfected withCFP and YFP fusion proteins. HeLa cells were cotransfected withCFP–Jun and YFP–Fos (as a positive interacting control) or YFP–Ergwild-type or mutant. The FRET efficiency is given by comparison ofthe CFP obtained before and after photobleaching. Scale bars are5 lm. The graph represents the mean of FRET efficiency calculatedwith at least 15 observed cells.
mer was used as a positive control [18]. As expected(Fig. 4), cells cotransfected by both CFP–Jun andYFP–Fos exhibited significant CFP fluorescence emis-sion after photobleaching. In this case, the calculatedpbFRET efficiency was 7.5% in average and providedstrong evidence for interaction of these proteins. Thisresult is in agreement with the current knowledge con-cerning the Jun/Fos dimer formation in vitro and invivo [18,19]. Similarly, in CFP–Jun and YFP–Ergcotransfected cells, an increase of CFP fluorescenceemission was observed in the same conditions. By con-trast, cotransfection of CFP–Jun with YFP–ErgYVfailed to increase fluorescence after photobleaching.Actually, it was 7% in average for CFP–Jun/YFP–Ergand dropped to 0.1% when YFP–ErgYV protein wastransfected with CFP–Jun (Fig. 4). These results sug-gest direct interactions between CFP–Jun and YFP–Erg in the nucleus of cells. This observation is specificsince YFP–ErgYV, a mutation known to abolish inter-action with Jun in vitro, failed to make FRET inpbFRET measurements. This absence of FRET be-tween CFP–Jun and YFP–ErgYV proteins proves theinvolvement of the residue Y371 in Erg/Jun proteininteraction. Since crosslinking and subsequent treat-ments of fixed cells may have induced changes in nu-cleus structures, FLIM experiments were performed inliving cells.
FLIM
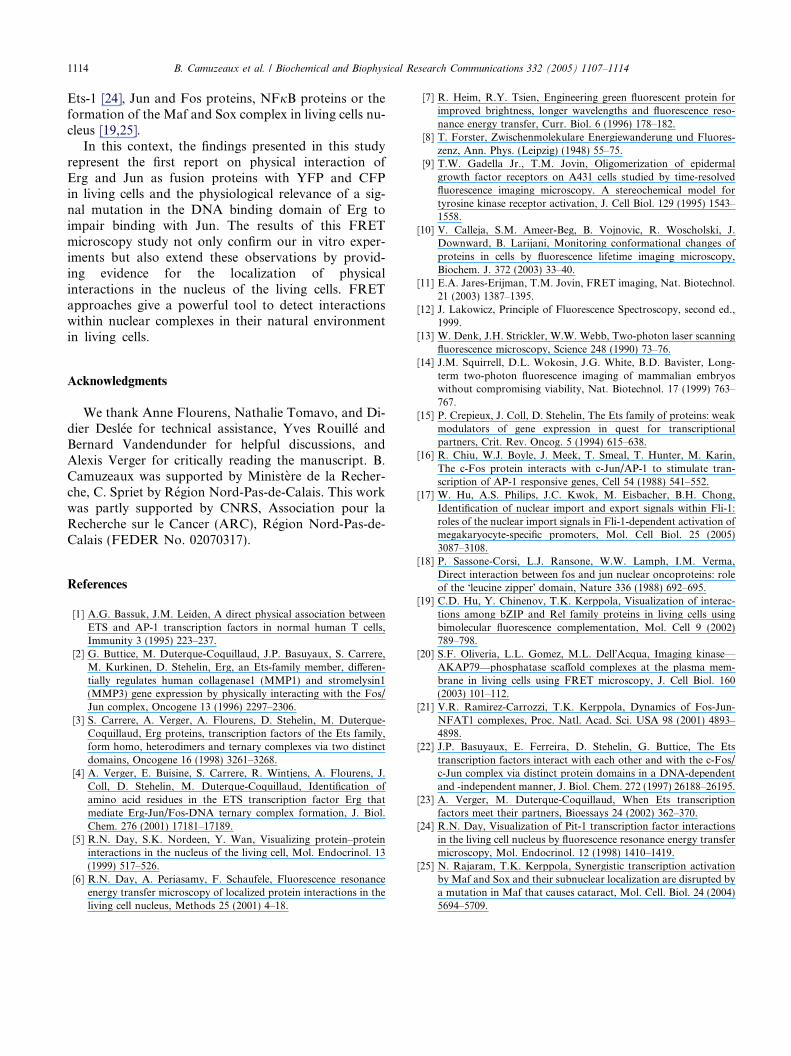
Fluorescence lifetime imaging microscopy (FLIM) isa powerful method to detect FRET in biological sam-ples because the lifetime decay of donor fluorescence ischaracteristically accelerated by FRET (Figs. 3A–F).To go further in our study, we measured FRET effi-ciency by lifetime imaging in living cells transfected byCFP and YFP fusion proteins. Fig. 5A (left panel)exemplified the lifetime images of CFP–Jun and the dis-tribution of this lifetime from 1 to 3.2 ns in representa-tive cells. The mean lifetime measurements from 15cells were reported in Fig. 5B-white columns. The meanlifetime of CFP–Jun alone, used as negative interactioncontrol, was 2500 ± 50 ps (blue) while that of CFP–Jun/YFP–Fos, positive control of interaction, was shortenedto 1500 ± 100 ps (orange). The mean lifetime measuredfor CFP–Jun and YFP–Erg was similar to CFP–Jun/YFP–Fos mean lifetime measurements, suggesting thatFRET occurrence occurs between these proteins in thenucleus of the observed living cells.
Moreover, in order to measure the influence of thespecific DNA target of the Erg and Jun/Fos proteinson the FRET occurrence, the FLIM measurements werealso obtained in living HeLa cells transfected with thefluorescent fusion proteins in the presence (Fig. 5A, rightpanel) of the polyoma enhancer (Py), known to be acti-vated in synergy by the CFP–Jun and YFP–Erg fluores-cent proteins (Fig. 1C). The mean lifetime measurements
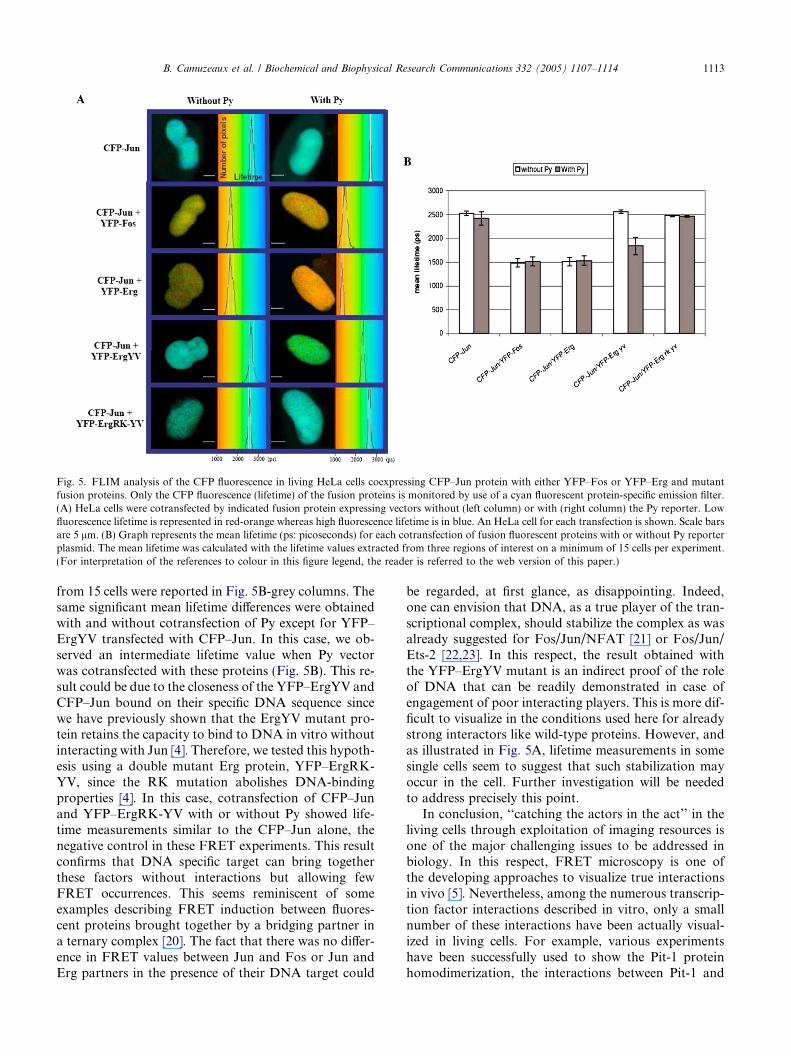
Fig. 5. FLIM analysis of the CFP fluorescence in living HeLa cells coexpressing CFP–Jun protein with either YFP–Fos or YFP–Erg and mutantfusion proteins. Only the CFP fluorescence (lifetime) of the fusion proteins is monitored by use of a cyan fluorescent protein-specific emission filter.(A) HeLa cells were cotransfected by indicated fusion protein expressing vectors without (left column) or with (right column) the Py reporter. Lowfluorescence lifetime is represented in red-orange whereas high fluorescence lifetime is in blue. An HeLa cell for each transfection is shown. Scale barsare 5 lm. (B) Graph represents the mean lifetime (ps: picoseconds) for each cotransfection of fusion fluorescent proteins with or without Py reporterplasmid. The mean lifetime was calculated with the lifetime values extracted from three regions of interest on a minimum of 15 cells per experiment.(For interpretation of the references to colour in this figure legend, the reader is referred to the web version of this paper.)
B. Camuzeaux et al. / Biochemical and Biophysical Research Communications 332 (2005) 1107–1114 1113
from 15 cells were reported in Fig. 5B-grey columns. Thesame significant mean lifetime differences were obtainedwith and without cotransfection of Py except for YFP–ErgYV transfected with CFP–Jun. In this case, we ob-served an intermediate lifetime value when Py vectorwas cotransfected with these proteins (Fig. 5B). This re-sult could be due to the closeness of the YFP–ErgYV andCFP–Jun bound on their specific DNA sequence sincewe have previously shown that the ErgYV mutant pro-tein retains the capacity to bind to DNA in vitro withoutinteracting with Jun [4]. Therefore, we tested this hypoth-esis using a double mutant Erg protein, YFP–ErgRK-YV, since the RK mutation abolishes DNA-bindingproperties [4]. In this case, cotransfection of CFP–Junand YFP–ErgRK-YV with or without Py showed life-time measurements similar to the CFP–Jun alone, thenegative control in these FRET experiments. This resultconfirms that DNA specific target can bring togetherthese factors without interactions but allowing fewFRET occurrences. This seems reminiscent of someexamples describing FRET induction between fluores-cent proteins brought together by a bridging partner ina ternary complex [20]. The fact that there was no differ-ence in FRET values between Jun and Fos or Jun andErg partners in the presence of their DNA target could
be regarded, at first glance, as disappointing. Indeed,one can envision that DNA, as a true player of the tran-scriptional complex, should stabilize the complex as wasalready suggested for Fos/Jun/NFAT [21] or Fos/Jun/Ets-2 [22,23]. In this respect, the result obtained withthe YFP–ErgYV mutant is an indirect proof of the roleof DNA that can be readily demonstrated in case ofengagement of poor interacting players. This is more dif-ficult to visualize in the conditions used here for alreadystrong interactors like wild-type proteins. However, andas illustrated in Fig. 5A, lifetime measurements in somesingle cells seem to suggest that such stabilization mayoccur in the cell. Further investigation will be neededto address precisely this point.
In conclusion, ‘‘catching the actors in the act’’ in theliving cells through exploitation of imaging resources isone of the major challenging issues to be addressed inbiology. In this respect, FRET microscopy is one ofthe developing approaches to visualize true interactionsin vivo [5]. Nevertheless, among the numerous transcrip-tion factor interactions described in vitro, only a smallnumber of these interactions have been actually visual-ized in living cells. For example, various experimentshave been successfully used to show the Pit-1 proteinhomodimerization, the interactions between Pit-1 and
1114 B. Camuzeaux et al. / Biochemical and Biophysical Research Communications 332 (2005) 1107–1114
Ets-1 [24], Jun and Fos proteins, NFjB proteins or theformation of the Maf and Sox complex in living cells nu-cleus [19,25].
In this context, the findings presented in this studyrepresent the first report on physical interaction ofErg and Jun as fusion proteins with YFP and CFPin living cells and the physiological relevance of a sig-nal mutation in the DNA binding domain of Erg toimpair binding with Jun. The results of this FRETmicroscopy study not only confirm our in vitro exper-iments but also extend these observations by provid-ing evidence for the localization of physicalinteractions in the nucleus of the living cells. FRETapproaches give a powerful tool to detect interactionswithin nuclear complexes in their natural environmentin living cells.
Acknowledgments
We thank Anne Flourens, Nathalie Tomavo, and Di-dier Deslee for technical assistance, Yves Rouille andBernard Vandendunder for helpful discussions, andAlexis Verger for critically reading the manuscript. B.Camuzeaux was supported by Ministere de la Recher-che, C. Spriet by Region Nord-Pas-de-Calais. This workwas partly supported by CNRS, Association pour laRecherche sur le Cancer (ARC), Region Nord-Pas-de-Calais (FEDER No. 02070317).
References
[1] A.G. Bassuk, J.M. Leiden, A direct physical association betweenETS and AP-1 transcription factors in normal human T cells,Immunity 3 (1995) 223–237.
[2] G. Buttice, M. Duterque-Coquillaud, J.P. Basuyaux, S. Carrere,M. Kurkinen, D. Stehelin, Erg, an Ets-family member, differen-tially regulates human collagenase1 (MMP1) and stromelysin1(MMP3) gene expression by physically interacting with the Fos/Jun complex, Oncogene 13 (1996) 2297–2306.
[3] S. Carrere, A. Verger, A. Flourens, D. Stehelin, M. Duterque-Coquillaud, Erg proteins, transcription factors of the Ets family,form homo, heterodimers and ternary complexes via two distinctdomains, Oncogene 16 (1998) 3261–3268.
[4] A. Verger, E. Buisine, S. Carrere, R. Wintjens, A. Flourens, J.Coll, D. Stehelin, M. Duterque-Coquillaud, Identification ofamino acid residues in the ETS transcription factor Erg thatmediate Erg-Jun/Fos-DNA ternary complex formation, J. Biol.Chem. 276 (2001) 17181–17189.
[5] R.N. Day, S.K. Nordeen, Y. Wan, Visualizing protein–proteininteractions in the nucleus of the living cell, Mol. Endocrinol. 13(1999) 517–526.
[6] R.N. Day, A. Periasamy, F. Schaufele, Fluorescence resonanceenergy transfer microscopy of localized protein interactions in theliving cell nucleus, Methods 25 (2001) 4–18.
[7] R. Heim, R.Y. Tsien, Engineering green fluorescent protein forimproved brightness, longer wavelengths and fluorescence reso-nance energy transfer, Curr. Biol. 6 (1996) 178–182.
[8] T. Forster, Zwischenmolekulare Energiewanderung und Fluores-zenz, Ann. Phys. (Leipzig) (1948) 55–75.
[9] T.W. Gadella Jr., T.M. Jovin, Oligomerization of epidermalgrowth factor receptors on A431 cells studied by time-resolvedfluorescence imaging microscopy. A stereochemical model fortyrosine kinase receptor activation, J. Cell Biol. 129 (1995) 1543–1558.
[10] V. Calleja, S.M. Ameer-Beg, B. Vojnovic, R. Woscholski, J.Downward, B. Larijani, Monitoring conformational changes ofproteins in cells by fluorescence lifetime imaging microscopy,Biochem. J. 372 (2003) 33–40.
[11] E.A. Jares-Erijman, T.M. Jovin, FRET imaging, Nat. Biotechnol.21 (2003) 1387–1395.
[12] J. Lakowicz, Principle of Fluorescence Spectroscopy, second ed.,1999.
[13] W. Denk, J.H. Strickler, W.W. Webb, Two-photon laser scanningfluorescence microscopy, Science 248 (1990) 73–76.
[14] J.M. Squirrell, D.L. Wokosin, J.G. White, B.D. Bavister, Long-term two-photon fluorescence imaging of mammalian embryoswithout compromising viability, Nat. Biotechnol. 17 (1999) 763–767.
[15] P. Crepieux, J. Coll, D. Stehelin, The Ets family of proteins: weakmodulators of gene expression in quest for transcriptionalpartners, Crit. Rev. Oncog. 5 (1994) 615–638.
[16] R. Chiu, W.J. Boyle, J. Meek, T. Smeal, T. Hunter, M. Karin,The c-Fos protein interacts with c-Jun/AP-1 to stimulate tran-scription of AP-1 responsive genes, Cell 54 (1988) 541–552.
[17] W. Hu, A.S. Philips, J.C. Kwok, M. Eisbacher, B.H. Chong,Identification of nuclear import and export signals within Fli-1:roles of the nuclear import signals in Fli-1-dependent activation ofmegakaryocyte-specific promoters, Mol. Cell Biol. 25 (2005)3087–3108.
[18] P. Sassone-Corsi, L.J. Ransone, W.W. Lamph, I.M. Verma,Direct interaction between fos and jun nuclear oncoproteins: roleof the �leucine zipper� domain, Nature 336 (1988) 692–695.
[19] C.D. Hu, Y. Chinenov, T.K. Kerppola, Visualization of interac-tions among bZIP and Rel family proteins in living cells usingbimolecular fluorescence complementation, Mol. Cell 9 (2002)789–798.
[20] S.F. Oliveria, L.L. Gomez, M.L. Dell�Acqua, Imaging kinase—AKAP79—phosphatase scaffold complexes at the plasma mem-brane in living cells using FRET microscopy, J. Cell Biol. 160(2003) 101–112.
[21] V.R. Ramirez-Carrozzi, T.K. Kerppola, Dynamics of Fos-Jun-NFAT1 complexes, Proc. Natl. Acad. Sci. USA 98 (2001) 4893–4898.
[22] J.P. Basuyaux, E. Ferreira, D. Stehelin, G. Buttice, The Etstranscription factors interact with each other and with the c-Fos/c-Jun complex via distinct protein domains in a DNA-dependentand -independent manner, J. Biol. Chem. 272 (1997) 26188–26195.
[23] A. Verger, M. Duterque-Coquillaud, When Ets transcriptionfactors meet their partners, Bioessays 24 (2002) 362–370.
[24] R.N. Day, Visualization of Pit-1 transcription factor interactionsin the living cell nucleus by fluorescence resonance energy transfermicroscopy, Mol. Endocrinol. 12 (1998) 1410–1419.
[25] N. Rajaram, T.K. Kerppola, Synergistic transcription activationby Maf and Sox and their subnuclear localization are disrupted bya mutation in Maf that causes cataract, Mol. Cell. Biol. 24 (2004)5694–5709.

![arXiv:1906.06669v1 [cs.LG] 16 Jun 2019](https://img.pdfslide.net/doc/110x75/63205f877cc767af2c0a38b6/arxiv190606669v1-cslg-16-jun-2019.jpg)

![arXiv:1506.05692v1 [stat.ML] 18 Jun 2015](https://img.pdfslide.net/doc/110x75/6333d1dfa6138719eb0aca91/arxiv150605692v1-statml-18-jun-2015.jpg)


![arXiv:1406.4269v1 [math.QA] 17 Jun 2014](https://img.pdfslide.net/doc/110x75/6336a9a862e2e08d4903968b/arxiv14064269v1-mathqa-17-jun-2014.jpg)

![arXiv:math/0406096v5 [math.NT] 15 Jun 2004](https://img.pdfslide.net/doc/110x75/6335b5bc62e2e08d49033272/arxivmath0406096v5-mathnt-15-jun-2004.jpg)

![arXiv:0706.3342v1 [math.HO] 22 Jun 2007](https://img.pdfslide.net/doc/110x75/6320a0cbaaa3e1b19f07965f/arxiv07063342v1-mathho-22-jun-2007.jpg)


![arXiv:1906.00416v2 [math.GR] 20 Jun 2019](https://img.pdfslide.net/doc/110x75/633796a55f466408630499ed/arxiv190600416v2-mathgr-20-jun-2019.jpg)

![arXiv:1506.01077v1 [cs.LG] 2 Jun 2015](https://img.pdfslide.net/doc/110x75/6320c4caeb38487f6b0fc3e5/arxiv150601077v1-cslg-2-jun-2015.jpg)

![arXiv:1906.00766v1 [cs.LO] 3 Jun 2019](https://img.pdfslide.net/doc/110x75/6335806bd2b728420307f1f4/arxiv190600766v1-cslo-3-jun-2019.jpg)
![arXiv:2201.04351v3 [cs.CR] 20 Jun 2022](https://img.pdfslide.net/doc/110x75/6338a5bc8414aa6520052054/arxiv220104351v3-cscr-20-jun-2022.jpg)


![arXiv:1811.04551v5 [cs.LG] 4 Jun 2019](https://img.pdfslide.net/doc/110x75/633816ca8e0e3065ef0e5572/arxiv181104551v5-cslg-4-jun-2019.jpg)