Embed Size (px)
Citation preview

Online Access: www.absronline.org/journals
*Corresponding author: Ali Bonyadi Naeini, Assistant Professor, Department of Progress Engineering, Iran University of Science and Technology (IUST), Tehran, Iran. E-Mail: [email protected]
616
Management and Administrative Sciences Review
Volume 4, Issue 3
Pages: 616-626
May 2015
e-ISSN: 2308-1368
p-ISSN: 2310-872X
Impact of Brand Equity on Purchase Intention and Development, Brand Preference and Customer Willingness to Pay Higher Prices
Ali Bonyadi Naeini1*, Parisa Roshanpanah Azali2, and Khosro Sepehr Tamaddoni3
1. Department of Progress Engineering, Iran University of Science and Technology (IUST), Tehran, ([email protected])
2. Department of Progress Engineering, Iran University of Science and Technology (IUST), Tehran, Iran ([email protected])
3. Department of Progress Engineering, Iran University of Science and Technology (IUST), Tehran, Iran ([email protected])
This study presents a conceptual model that was designed by Bill and colleagues, and at the same time evaluates the creation of brand equity (perceived quality, brand awareness / brand associations, brand loyalty) and the effects on consumer responses (purchase intent, brand extension, willingness to pay a higher price, brand preference). Data collection was conducted using simple randomized method, data was collected from the stores and customers of Sony. Sampling was conducted using convenient method, with sample size being 384. Standardized questionnaire was used, whose validity was tested using content and construct validity test, and it reliability was tested using Cronbach's alpha method. This was an applied research in terms of objective, a survey one in terms of data collected, and a correlation one in terms of relationship between variables. The results from test of hypotheses using LISREL (linear structural relations) and SPSS suggested that perceived quality had an effect of creation of brand equity, and brand equity had the highest effect on purchase intent.
Keywords: Creation of brand equity, Customer response, Perceived quality, Purchase
intention
INTRODUCTION
ne of the reasons for the importance of the concept of brand equity is it creates value for both customers and the company and
for our customers, and therefore, marketer can achieve competitive advantage using brand equity (Bharadwaj, Varadarajan and Fahy 1993). From a behavioral perspective, brand equity is essential to make the distinction that leads to competitive advantage based on non-price competition (Aaker
1991). To strengthen the dimensions of brand equity, brand equity can be created. Better understanding of the phenomenon of brand equity requires use of all areas of equity, including awareness / brand associations, perceived quality and brand loyalty (Aaker 1991).
Brand value is a key factor affecting company's value and market value, and this is due to the power of a brand to gain new customers and retain
O

Manag. Adm. Sci. Rev. e-ISSN: 2308-1368, p-ISSN: 2310-872X Volume: 4, Issue: 3, Pages: 616-626
617
existing customers. One of the issues to be considered to improve understanding of consumer-based brand equity is the interaction between dimensions of brand equity (Stahl, Heitmann, Lehmann, & Neslin, 2012). Generally, researchers believe that there is a multilateral and associative relationship between different dimensions of brand equity. Building strong brand equity through positive impact on the response of consumers to the brand has a positive influence on corporate performance. In this study, four customer responses were selected and studied: price premium, brand extension, brand preference and purchase intention (Vomberg, Homburg, & Bornemann, 2014).
THEORETICAL FRAMEWORK
Concept of Brand
In recent years, many companies have come to believe that one of their most valuable asset is their brands, products and services (Kotler 2006). Brand is usually one of the most important corporate assets because it creates value and distinction of a company (Brodie, Roderick J; 2009). Kotler and Keller (2006) argue that the brand adds dimensions to a product or service to distinguish the product or service from others (Riad and Tanwir, 2012). Strong brand makes it possible to companies to enter new markets, and companies with a strong brand are likely to be far more successful in entering new markets (Rshidi and Rahmani 2013).
One of the best known marketing concepts, which are extensively used by marketing scholars, is brand equity, with the most important reasons for such importance including strategic role of brand equity in managerial decisions and creation of competitive advantage for organizations and their customers (Atilgan, et al. 2009). Keller (2001) points out that the brand equity of the brand refers to unique effects of marketing on brand, as some analysts believe that lifetime of brand is much longer than that of products and manufacturing facilities of the company. They consider brand as a durable and permanent property of company (P. Kotler 1984).
TABLE 1 HERE
In line with Yoo et al. (2000), the structure of marginal brand equity and relationship between
the dimensions of brand equity were studied. This study is focused on consumer perceptions (e.g. awareness, brand associations and perceived quality) and also on consumer behavior (such as brand loyalty, premium price, purchase intention, brand preference and brand extensions) (Nam, Ekinci, & Whyatt, 2011).
FIGURE 1 HERE
Perceived Quality
Customers are always looking for good quality. Higher quality results in customers extending business domain, and causes company to have a proper position in the market, which helps increase and improve customer's purchase and loyalty (Myers 2003). According to Matani and Shahrokhi (1998) and Yoo et al. (2000), perceived quality and brand equity is positvely correlated (Severi and Ling 2013). Thus, the perceived quality is an essential element in consumer decision making. As a result, consumers compare quality of alternatives with respect to prices of items in the relevant category (Yee, San and Khoon 2011).
Brand Loyalty
Customers are the driving force for profitable growth and customer loyalty can lead to profit (Hayes, Bob; 2008). Robert et al (2011) point out that customer loyalty has been considered from different aspects. Brand loyalty, loyalty to products, services and other similar items are among such aspects (Rshidi and Rahmani 2013).
Awareness / Brand Association
Customer-based brand equity realizes when the customer have knowledge and familiarity with a brand some of the unique and strong signs associate that brand (Ghandehari, et al. 2012). Keller (2008) stated that improve brand recall requires establishment of a relation between the brand and needs and characteristics in the customer's mind (Rahimnia and fatemi 2011).
Customer Response
McCarthy and Hastak (2007) states that the identification of potential customers is crucial for for corporate sales and profit. This field, which is generally recognized as direct, interactive, goal-oriented and data-based marketing, has received

Manag. Adm. Sci. Rev. e-ISSN: 2308-1368, p-ISSN: 2310-872X Volume: 4, Issue: 3, Pages: 616-626
618
remarkable attention from practitioners and researchers interested in services, retail, marketing and business (Kim, Chae and Olson 2013).
VARIOUS TYPES OF CUSTOMER RESPONSE
Purchase Intention
Purchase intention refers to the probability that a customer purchases a particular brand when purchasing an item from a class of products (Crosno, Freling and Skinner 2009). Fishbin and Ajizen (1975) states that the "single best predictor of a person's behavior is the measure of his intention to do that behavior" (heidarzadeh, kambiz; alvani, seyed mahdi; ghalandai, kamal; 2010). Purchase intention is the probability of purchase of a specific product by the consumer in the future. Purchase intention refers to the extent to which a customer purchases a particular product, at the same time as refuses to shift to other products (Yoo, Donthu and Lee 2000).
Brand Extension
In 1990, 81 percent of new products used brand extension to introduce new and increase sale (Keller 1998).Launching a new product is not only time consuming but also requires a big budget to create brand awareness and promote the advantage of the new product (Tauber 1981).
Premium Prices
Customer's willing to pay premium prices reflects ability of a brand to maintain a higher price than the competitors. Thus making the customer willing to pay higher prices, despite the status of the price within a category, is important for all brands (Chattopadhyay, Shivani and Krishnan 2009). Loyal consumers are willing to pay full price for their favorite brands because they have perceived such brand to be have a higher quality, while non-loyal ones have not.
Brand Preference
Brand preference is one of the indicators of the strength of a brand in the hearts and minds of customers; brand preference shows how brands are prefered despite other options available. Measurement of brand preference is an attempt to determine the impact of marketing activities on the
hearts and minds of current customers and potential customers. Also, its construct is an indicator of financial performance of the company (Torres, Bijmolt, Tribó, & Verhoef, 2012).
LITERATURE
Domestic
In a research conducted in Shahid Beheshti University, Tehran, to study the impact of brand equity on acceptance by brand extension by consumers of engine oil of Iranol Co. by Hosseini et al. (2009), on 302 drivers who used Iranol engine oil in the late 2007 and early 2008, it was revealed that three dimensions of brand equity, including perceived quality, brand awareness and brand loyalty had a positive relationship with acceptance of brand extension (Hosseini, nekoeizade and makhzanghadimi 2011).
- A study at the University of Mashhad by Rahimnia and Fatemi studied the mediator role customer-based brand equity on the impact of successful communication with customers and brand image among 5-star hotels of Mashhad in 2011. This research was carried out by data collection. It was a descriptive method, of survey type. The data was collected through a questionnaire. Data analyzed was collected from 196 questionnaires. In this study, data analysis was performed using SPSS Smart PLC. The results showed that the variables associated with successful communication with customer had a positive significant impact on brand equity and brand image; and also, the positive impact on brand image of brand equity was confirmed. And successful relationship with the customer had also a direct effect on brand image is more than its direct effect, and the role of mediator of brand equity was confirmed.
Foreign
Yoo et al. (2000), used theory of hierarchical to provide effect of relationship model for three dimensions of equity brand, that is, brand awareness, brand association, perceived quality and brand loyalty. According to their measure, three paths existed for these three dimensions. Brand awareness and brand association has an effect on on perceived quality; and perceived
Manag. Adm. Sci. Rev. e-ISSN: 2308-1368, p-ISSN: 2310-872X Volume: 4, Issue: 3, Pages: 616-626
619
quality resulted in brand loyalty (Yoo, Donthu and Lee 2000). This model was later used by Kim and Hun, and its fit was confirmed using the structural equation model. According to Yoo et al., every three dimensions had a positive effect on marginal brand equity (Kim and Hyun 2010).
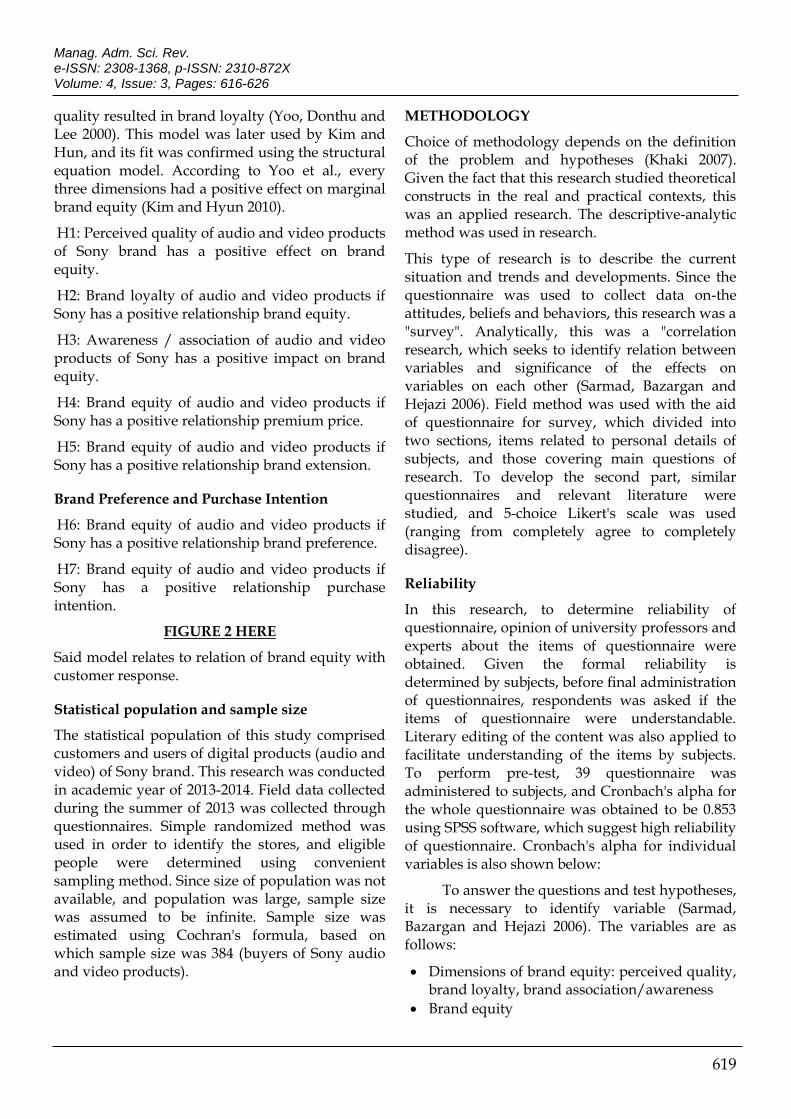
H1: Perceived quality of audio and video products of Sony brand has a positive effect on brand equity.
H2: Brand loyalty of audio and video products if Sony has a positive relationship brand equity.
H3: Awareness / association of audio and video products of Sony has a positive impact on brand equity.
H4: Brand equity of audio and video products if Sony has a positive relationship premium price.
H5: Brand equity of audio and video products if Sony has a positive relationship brand extension.
Brand Preference and Purchase Intention
H6: Brand equity of audio and video products if Sony has a positive relationship brand preference.
H7: Brand equity of audio and video products if Sony has a positive relationship purchase intention.
FIGURE 2 HERE
Said model relates to relation of brand equity with customer response.
Statistical population and sample size
The statistical population of this study comprised customers and users of digital products (audio and video) of Sony brand. This research was conducted in academic year of 2013-2014. Field data collected during the summer of 2013 was collected through questionnaires. Simple randomized method was used in order to identify the stores, and eligible people were determined using convenient sampling method. Since size of population was not available, and population was large, sample size was assumed to be infinite. Sample size was estimated using Cochran's formula, based on which sample size was 384 (buyers of Sony audio and video products).
METHODOLOGY
Choice of methodology depends on the definition of the problem and hypotheses (Khaki 2007). Given the fact that this research studied theoretical constructs in the real and practical contexts, this was an applied research. The descriptive-analytic method was used in research.
This type of research is to describe the current situation and trends and developments. Since the questionnaire was used to collect data on-the attitudes, beliefs and behaviors, this research was a "survey". Analytically, this was a "correlation research, which seeks to identify relation between variables and significance of the effects on variables on each other (Sarmad, Bazargan and Hejazi 2006). Field method was used with the aid of questionnaire for survey, which divided into two sections, items related to personal details of subjects, and those covering main questions of research. To develop the second part, similar questionnaires and relevant literature were studied, and 5-choice Likert's scale was used (ranging from completely agree to completely disagree).
Reliability
In this research, to determine reliability of questionnaire, opinion of university professors and experts about the items of questionnaire were obtained. Given the formal reliability is determined by subjects, before final administration of questionnaires, respondents was asked if the items of questionnaire were understandable. Literary editing of the content was also applied to facilitate understanding of the items by subjects. To perform pre-test, 39 questionnaire was administered to subjects, and Cronbach's alpha for the whole questionnaire was obtained to be 0.853 using SPSS software, which suggest high reliability of questionnaire. Cronbach's alpha for individual variables is also shown below:
To answer the questions and test hypotheses, it is necessary to identify variable (Sarmad, Bazargan and Hejazi 2006). The variables are as follows:
Dimensions of brand equity: perceived quality, brand loyalty, brand association/awareness
Brand equity

Manag. Adm. Sci. Rev. e-ISSN: 2308-1368, p-ISSN: 2310-872X Volume: 4, Issue: 3, Pages: 616-626
620
Customer response (premium prices, brand extension, brand preference, purchase intention)
DATA ANALYSIS
Descriptive statistics
Demographic features of sample is described here, including age, sex, and education level
Sex
Of 384 subjects, 249 (65%) were male, and 124 (32%) female.
FIGURE 3 & 4 HERE
Age
Subjects aged 25-30 accounted for the highest percentage and subjects aged 20-30 accounted for the lowest percentage of sample. Also, 16 subjects didn't complete the questionnaire.
Education
The results of descriptive analysis in terms of education are shown in the chart below:
TABLE 2 HERE
FIGURE 5 HERE
Data analysis show that the highest frequency related to high school diploma education level, which accounted for 28% (108 persons), and the lowest related to Bachelor's degree (80 persons).
Variables
Table below shows the descriptive results for variables.
Descriptive distribution of variables
TABLE 3 HERE
Inferential Statistics
KMO test
KMO test is used to study sample size adequacy. Table below shows the results from KMO test for each variable.
TABLE 4 HERE
As seen from table, all coefficients KMO test were above 0.70 and on good level, suggesting adequacy of sampling for factor analysis.
Measurement of Current Status Variables
One of the questions to be answered for this research was how well the condition of variables was. To answer this question, the status of variables (good or bad) and their dimensions was evaluated. This was performed using one-sample t-test. By doing this test, one can identify the level of each of the variables: perceived quality, brand loyalty, brand association/awareness, brand equity, premium price, brand extension, brand preference, and purchase intention.
To measure status of these dimensions, single statistical population mean test was used. Test of hypotheses for this test are as follows;
H0: µ = 3 variables have not difference with average
H1: µ ≠ 3 variables have difference with average
Given 5-choice Likert's scale was used, test value of 3 (average level) was applied. In study of dimensions, good status is one in which mean score of component is greater than 3, while bad status is one in which mean score is smaller than 3. Results from SPSS 22 software are as shown in table below.
TABLE 5 HERE
Study of mean and significance showed all variables had significance of less than 0.05, so null hypothesis was rejected for them all, suggesting their status has significant difference with mean. Given positive t statistic, the value of this variable is greater than the average value of population and their condition was so considered to be good.
Pearson's Test
Before test of the hypotheses and identifying whether or not variables have an effect on each other, it must be determined if there is relation between variables. Pearson test was used for correlation between variables. Results are shown in tables below. In case no relation exists between variables, we will stop test of the hypothesis.
REFERENCES
Aaker, D. A. (1996). Measuring brand equity across products and markets.California management review, 38(3), 103.

Manag. Adm. Sci. Rev. e-ISSN: 2308-1368, p-ISSN: 2310-872X Volume: 4, Issue: 3, Pages: 616-626
621
Atilgan, E., Akinci, S., Aksoy, S., & Kaynak, E. (2009). Customer-based brand equity for global brands: A multinational approach. Journal of Euromarketing,18(2), 115-132.
Bharadwaj, S. G., Varadarajan, P. R., & Fahy, J. (1993). Sustainable competitive advantage in service industries: a conceptual model and research propositions. The Journal of Marketing, 83-99.
Brodie, R. J. (2009). From goods to service branding An integrative perspective. Marketing Theory, 9(1), 107-111.
Buil, I., Martínez, E., & de Chernatony, L. (2013). The influence of brand equity on consumer responses. Journal of consumer marketing, 30(1), 62-74.
Chattopadhyay, T., Shivani, S., & Krishnan, M. (2009). Determinants of brand equity-A blue print for building strong brand: A study of automobile segment in India. African Journal of Marketing Management, 1(4), 109-121.
Cheng, H., Kotler, P., & Lee, N. (Eds.). (2010). Social marketing for public health: global trends and success stories. Jones & Bartlett Learning.
Crosno, J. L., Freling, T. H., & Skinner, S. J. (2009). Does brand social power mean market might? Exploring the influence of brand social power on brand evaluations. psychology & marketing, 26(2), 91-121.
Hayes, B. E. (2008). The true test of loyalty. Quality Progress, 41(6), 20.
Heidarzadeh, kambiz; alvani, seyed mahdi; ghalandai, kamal( 2010). Evaluate the effect of brand social power on decision to buy based on customer's mental readiness levels. management researches (86).
Hosseini, seyd mahmod, maryam nekoeizade, and maryam makhzanghadimi.( 2011), Analysis marketing strategies of services companies during the recession. Vision of business management 117-139.
Keller, K. L. (2003). Brand synthesis: The multidimensionality of brand knowledge. Journal of consumer research, 29(4), 595-600.
Khaki, G. (2007). Research method with emphasize to thesis. Tehran: Baztab publication.
Kim, G., Chae, B. K., & Olson, D. L. (2013). A support vector machine (SVM) approach to imbalanced datasets of customer responses: comparison with other customer response models. Service Business, 7(1), 167-182.
Kim, J. H., & Hyun, Y. J. (2011). A model to investigate the influence of marketing-mix efforts and corporate image on brand equity in the IT software sector. Industrial Marketing Management, 40(3), 424-438.
Kotler, P. (2000). Marketing management: The millennium edition (pp. 87-103). Upper Saddle River, NJ: Prentice-Hall.
Myers, C. A. (2003). Managing brand equity: a look at the impact of attributes.Journal of Product & Brand Management, 12(1), 39-51.
Nam, J., Ekinci, Y., & Whyatt, G. (2011). Brand equity, brand loyalty and consumer satisfaction. Annals of Tourism Research, 38(3), 1009-1030.
Rahimnia, fariborz, & S.H fatemi. (2011) Evaluation of the customer-based brand equity impact on successful communication with customer and brand image in Mashhad 5 star hotels. Modern marketting research 73-92.
Rshidi, hasan, & zeynolabedin Rahmani. (2013). Brnad and it's effect on brand loyalty. Ecconomic Journal 65-80.
Salehzadeh, R., Asadi, A., Khazaei Pool, J., Reza Ansari, M., & Haroni, A. (2014). The influence of perceived organizational support on dimensions of learning organization: An empirical study of SMEs in Iran. The Learning Organization, 21(3), 206-219.
Sarmad, Z, A Bazargan, & A. Hejazi. (2006). Research methods in the behavioral sciences. Tehran: Agah publication.
Manag. Adm. Sci. Rev. e-ISSN: 2308-1368, p-ISSN: 2310-872X Volume: 4, Issue: 3, Pages: 616-626
622
Severi, E., & Ling, K. C. (2013). The mediating effects of brand association, brand loyalty, brand image and perceived quality on brand equity. Asian Social Science, 9(3), p125.
Stahl, Florian, Heitmann, Mark, Lehmann, Donald R, & Neslin, Scott A. (2012). The impact of brand equity on customer acquisition, retention, and profit margin. Journal of Marketing, 76(4), 44-63 .
Tauber, E. M. (1981). Brand franchise extension: new product benefits from existing brand names. Business Horizons, 24(2), 36-41.
Torres, Anna, Bijmolt, Tammo HA, Tribó, Josep A, & Verhoef, Peter. (2012). Generating global brand equity through corporate social responsibility to key stakeholders. International Journal of Research in Marketing, 29(1), 13-24 .
Vomberg, Arnd, Homburg, Christian, & Bornemann, Torsten. (2014). Talented people and strong brands: The contribution of human capital and brand equity to firm value. Strategic Management Journal .
Yee, J., & San, N. C. (2011). Consumers' perceived quality, perceived value and perceived risk towards purchase decision on automobile. American Journal of Economics and Business Administration, 3(1), 47-57.
Yoo, B., Donthu, N., & Lee, S. (2000). An examination of selected marketing mix elements and brand equity. Journal of the academy of marketing science,28(2), 195-211.

Manag. Adm. Sci. Rev. e-ISSN: 2308-1368, p-ISSN: 2310-872X Volume: 4, Issue: 3, Pages: 616-626
623
APPENDIX
Table 1: Definitions of brand equity
The distinctive features that are created by brand and that increase the value of the company's balance sheet
De Chernatoni and McDonald
The distinct effect of brand knowledge on consumer response to marketing activity.
Keller
Preference granted by brand to the product, when it is perceived by an individual customer.
Park and Srinivasan
Part of a general preference that is not accounted for by features that are objectively measured.
Srinivasan
Financial equivalent of the general benefit of the consumer that takes a brand.
Swite et al.
The value created for company due to strong relation between its brand and customer's brand.
Davis and Mentzer
Table 2: Reliability Analysis
Variable Cronbach's alpha
Perceived quality 0.833
Brand loyalty 0.880
Brand association/awareness 0.833
Brand equity 0.840
Premium price 0.821
Brand extension 0.815
Brand preference 0.830
Purchase intention 0.846
Perceived quality 0.853
Table 3: variable Min, Max, Mean Std
Variables Size Min Max Mean Std.
Perceived quality 384 2.200 5.000 3.955 0.542
Brand loyalty 384 2.333 5.000 4.155 0.485

Manag. Adm. Sci. Rev. e-ISSN: 2308-1368, p-ISSN: 2310-872X Volume: 4, Issue: 3, Pages: 616-626
624
Brand association/awareness 384 2.000 5.000 3.680 0.592
Brand equity 384 1.750 5.000 3.622 0.648
Premium price 384 1.667 5.000 3.722 0.626
Brand extension 384 2.000 5.000 3.918 0.613
Brand preference 384 1.333 5.000 3.940 0.682
Purchase intention 384 2.000 5.000 3.964 0.598
cble : cs Te t cores
Variables KMO test scores
Perceived quality 0.793
Brand loyalty 0.757
Brand association/awareness 0.846
Brand equity 0.798
Customer response 0.882
Table 5: Test of means for variables
Variables
(µ=3) 3
Status Mean Std. T
Degree of freedom
Significance Mean
95% margin of safety
Lower bound
Higher bound
Perceived quality 3.955 0.542 34.527 383 0.000 0.955 0.901 1.009 Good
Brand loyalty 4.155 0.485 46.628 383 0.000 1.155 1.106 1.203 Good
Brand association/awareness
3.680 0.592 22.502 383 0.000 0.680 0.620 0.739 Good
Brand equity 3.622 0.648 18.833 383 0.000 0.622 0.557 0.687 Good
Premium price 3.722 0.626 22.604 383 0.000 0.722 0.659 0.785 Good
Brand extension 3.918 0.613 29.329 383 0.000 0.918 0.856 0.979 Good
Brand preference 3.940 0.682 27.001 383 0.000 0.940 0.872 1.009 Good
Purchase intention 3.964 0.598 31.578 383 0.000 0.964 0.904 1.024 Good

Manag. Adm. Sci. Rev. e-ISSN: 2308-1368, p-ISSN: 2310-872X Volume: 4, Issue: 3, Pages: 616-626
625
Figure1: Chart of conceptual model (Buil, Martínez and Chernatony 2013).
Figure 2: Conceptual model
Marginal brand equity
Purchase
Brand extension
Premium price
Brand preference
Brand awareness
Perceived quality
Brand
association
Brand loyalty
Brand preference
(Conceptual model of Isabel Bill, Martinez, and
Chernatoni, 2013)
Premium
price
Brand
preference
Purchase
intention
Brand
loyalty
Brand
equity
(Yoo et al., 2000)
Brand extension
Purchase intention
Perceived
quality
Brand awareness/association

Manag. Adm. Sci. Rev. e-ISSN: 2308-1368, p-ISSN: 2310-872X Volume: 4, Issue: 3, Pages: 616-626
626
Men[C249AT67%
Female[C124AT33%
Gender
99 79111
86
0
20
40
60
80
100
120
Under 20 20- 25 Year 25-30 Year Above 30
Education
10888 80 94
0
20
40
60
80
100
120
Diploma Associate Degree bachelor Master's Degree orhigher
Age


