Embed Size (px)
Citation preview

Impact of land use on Costa Rican tropical montane cloud forests:
Sensitivity of cumulus cloud field characteristics to lowland
deforestation
U. S. Nair,1 R. O. Lawton,2 R. M. Welch,1 and R. A. Pielke Sr.3
Received 23 July 2001; revised 24 October 2002; accepted 24 October 2002; published 3 April 2003.
[1] Recent studies have shown that there has been a reduction in dry season moisture inputfrom direct interception of cloud water and wind-blown mist at the lee edge of theMonteverde cloud forest, Costa Rica, since the mid 1970s. This reduction of moisture couldbe responsible for the population crashes of anurans observed in the region. It has beenhypothesized that this behavior is a result of increases in cloud base height, linked toincreased sea surface temperatures. In this study we present a complementary hypothesis,that deforestation upwind of the Monteverde cloud forest preserve is responsible for theobserved changes in cloud base height. An automated cumulus cloud classification schemeextracts monthly spatial maps of the frequency of occurrence of cumulus cloudiness overCosta Rica from GOES 8 visible channel satellite imagery. We find that cumulus cloudformation in the morning hours over deforested regions is suppressed compared to forestedareas. The degree of suppression appears to be related to the extent of deforestation. Thisdifference in cloud formation between forested and deforested areas is a clear signal of landuse change influencing the regional climate. Regional Atmospheric Modeling Systemnumerical modeling simulations are used to explore the differences in cloud fieldcharacteristics over the lowland pasture and forest landscapes. Statistically significantdifferences in cloud base height and cloud thickness occur between the forest and pasturesimulations. Clouds have higher base heights and are thinner over pasture landscapes thanover forested ones. On the other hand, these simulations show no statistically significantdifferences in cloud top heights, cloud cover, mean cloud water mixing ratio, or cloud liquidwater path between pasture and forest simulations. However, in the simulations there areenhanced sensible heat fluxes and reduced latent heat fluxes over pasture compared to forest.It is the drier and warmer air over pasture surfaces that results in the formation of elevatedthinner clouds. This study suggests that deforestation results in warmer, drier air upwindof the Monteverde cloud forests and that this could influence the base height of orographiccloudbanks crucial to the region during the dry season. INDEX TERMS: 0322 Atmospheric
Composition and Structure: Constituent sources and sinks; 3314 Meteorology and Atmospheric Dynamics:
Convective processes; 0315 Atmospheric Composition and Structure: Biosphere/atmosphere interactions; 1803
Hydrology: Anthropogenic effects; KEYWORDS: tropical montane cloud forests, deforestation, cumulus clouds,
cloud base height, mesoscale modeling, climatic influence of land use
Citation: Nair, U. S., R. O. Lawton, R. M. Welch, and R. A. Pielke Sr., Impact of land use on Costa Rican tropical montane cloud
forests: Sensitivity of cumulus cloud field characteristics to lowland deforestation, J. Geophys. Res., 108(D7), 4206,
doi:10.1029/2001JD001135, 2003.
1. Introduction
[2] Tropical montane cloud forests (TMCFs) dependupon predictable, frequent and prolonged immersion in
cloud [Bruinjzeel and Proctor, 1995; Pounds et al., 1999].In the Cordillera de Tilaran of Costa Rica, anuran popula-tion crashes, increases in the upper elevation of bird rangeson the Pacific slope, and longer mist-free intervals in the dryseason at the lee edge of the Monteverde TMCF have beenattributed to an increase in the base height of the orographiccloudbank due to changes in sea surface temperature[Pounds et al., 1999; Still et al., 1999]. This study proposesa complementary hypothesis: that upwind lowland defor-estation alters surface energy budgets in ways that reducethe development of tropical dry season cumulus cloud fieldsand raise cloud base heights. In this paper corroboratingevidence is offered from remote sensing of clouds in
JOURNAL OF GEOPHYSICAL RESEARCH, VOL. 108, NO. D7, 4206, doi:10.1029/2001JD001135, 2003
1Department of Atmospheric Science, National Space Science andTechnology Center, University of Alabama in Huntsville, Huntsville,Alabama, USA.
2Department of Biological Sciences, University of Alabama inHuntsville, Huntsville, Alabama, USA.
3Department of Atmospheric Science, Colorado State University, FortCollins, Colorado, USA.
Copyright 2003 by the American Geophysical Union.0148-0227/03/2001JD001135
ACL 4 - 1

northern Costa Rica and southern Nicaragua, and fromregional atmospheric simulations of idealized simple low-land tropical forest and pasture landscapes. Since TMCFsare crucial components of most tropical biodiversity ‘‘hot-spots,’’ and play important roles in local and regionalhydrological management, factors that influence TMCFdistribution and water budget are a matter of considerableinterest.[3] In the Caribbean basin, as in much of the tropics,
TMCFs occur where mountains force trade winds to risepast the point at which adiabatic cooling results in cloudformation. In such settings, upwind regional landscapecharacteristics can influence the overlying atmosphere inways that may have important consequences for cloudformation, and consequently for TMCFs.[4] It has been long recognized that through modulation
of surface energy budgets, land use can have significantinfluence on the regional climate. Land use changes areusually accompanied by variations in surface propertiessuch as albedo, temperature, roughness length, water stor-age capacity of surface soil and soil moisture distribution[Otterman, 1974; Sagan et al., 1979; Anthes, 1984; Segal etal., 1988; Shukla et al., 1990; Meher-Homji, 1991; Gashand Nobre, 1997; Pielke, 2001]. Variations in surfaceproperties also can cause changes in boundary layer airtemperature, moisture, and depth, as well as local rainfalland cloudiness [Segal et al., 1988; Bryant et al., 1990;Otterman et al., 1990; Schwartz and Karl, 1990; Meher-Homji, 1991; Bastable et al., 1993; Sud et al., 1993; Lyonset al., 1993; Gash and Nobre, 1997; Pielke, 2001].[5] Cumulus clouds are strongly influenced by the
surface, since they form from thermals induced in theboundary layer. For example, the suppression of cumuluscloudiness over water bodies has been observed since theearly days of satellite imagery [Segal et al., 1997]. Inaddition satellite imagery has shown preferential forma-tion of cumulus clouds over areas with relatively highersensible heat fluxes such as harvested wheat fields anddeforested regions [Rabin et al., 1990; Lyons et al., 1993;Cutrim et al., 1995; Rabin and Martin, 1996]. On theother hand, increased soil moisture caused by irrigationcan enhance the convective available potential energy(CAPE), thereby increasing the probability of sustainedconvection [Pielke and Zeng, 1989]. The influence ofland surface on cumulus cloud formation also is depend-ent on the stability of the overlying atmosphere. Understable atmospheric conditions, clouds may develop earlierover moist surfaces, while for weakly stable conditions,clouds form earlier over drier surfaces [Wetzel et al.,1996]. Land surface heterogeneity also can have a sig-nificant influence on the formation and development ofthe convective clouds. The majority of the modeling andtheoretical studies show that differential heating overcontrasting surfaces results in the generation of mesoscalecirculations that enhance cloudiness [Anthes, 1984;Ookouchi et al., 1984; Segal et al., 1988; Chen andAvissar, 1994; Avissar and Liu, 1996; Emori, 1998;Avissar and Schmidt, 1998]. Indeed, Avissar and Liu[1996] note that updrafts produced by surface heteroge-neity are usually stronger than those resulting fromturbulence. Over regions where convective rainfall createsa heterogeneous soil moisture distribution, Emori [1998]
found that convergence of air over drier soil initiatesconvective clouds. The rain from these convective cloudsmakes the soil wetter than the surroundings, therebymaintaining the heterogeneity of the soil moisture distri-bution. Pielke [2001] provides a detailed review on theinfluence of vegetation, soil properties, surface heteroge-neity on cumulus cloudiness and rainfall.[6] The Costa Rican lowlands are an environmentally
complex region in which the original tropical forests arebeing rapidly replaced by pastures and agricultural land-scapes. Sader and Joyce [1988] estimate that the primaryforest in Costa Rica decreased from 67% in 1940 to 17% in1983. Land use changes in the Caribbean lowlands can alterthe nature of the air masses responsible for the formation ofcumulus clouds in the lowlands as well as orographicclouds on the Caribbean slopes. In view of the large-scaledeforestation in the Caribbean lowland region east ofMonteverde and the significant influence it may exert oncloud formation, land use changes cannot be ruled out as acausative factor for the observed climate change in theMonteverde region. In this study the effects of lowlanddeforestation on cumulus cloud formation and developmentare examined using satellite data and a mesoscale numericalmodel.[7] The two main objectives of this study are to: (1) use
Geostationary Operational Environmental Satellite 8(GOES 8) and LANDSAT Multi-Spectral Scanner (MSS)imagery to examine the effect of deforestation on cloudformation, and (2) use the Regional Atmospheric ModelingSystem (RAMS), a mesoscale numerical model, to inves-tigate the effects of deforestation on cloud characteristics,especially cloud base heights.[8] Section 2 describes the data, and section 3 discusses
the methodology used in this study. The results from both theanalysis of satellite data and RAMS simulations are pre-sented in section 4, and section 5 concludes.
2. Data
[9] GOES 8 imagery has 5 spectral channels, one in thevisible (0.52–0.72 mm) and four in the infrared region(3.78–4.03 mm, 6.47–7.02 mm, 10.2–11.2 mm, 11.5–12.5mm). Spatial resolution at nadir for channel 1 is 1 km, 4 kmfor channels 2, 4, and 5, and channel 3 has nadir resolutionof 8 km. The visible channel is used for the mapping ofcumulus clouds in the present study. Daytime GOES 8imagery over the Central American region is taken at 2 hourtemporal resolution for the months of February, March andApril 1999. The GOES 8 visible channel data are calibratedand normalized by the cosine of solar zenith angle to yieldthe albedo values. Landsat Multi Spectral Scanner (MSS),used in this study to investigate deforestation and cloudinesspatterns, has four spectral bands in the range 0.5 to 0.6 mm,0.6 to 0.7 mm, 0.7 to 0.8 mm, and 0.8 to 1.1 mm with spatialresolution of 57 m nadir.[10] Radiosonde profiles from the coastal plains of Costa
Rica would be ideal for simulating the development oflowland cumulus cloud fields, but are not available, so weuse six 1200 UTC (0600 LST) soundings from San Andresisland (to the east, and upwind of Costa Rica). Thesesoundings are chosen for days characterized by relativelycalm synoptic conditions and by the observed presence of
ACL 4 - 2 NAIR ET AL.: COSTA RICAN TROPICAL MONTANE CLOUD FORESTS

fair weather cumulus clouds in Costa Rica. The convectiveavailable potential energy (CAPE), convective inhibition(CIN), and lifting condensation level (LCL) associated withthese soundings are given in Table 1. The values of CAPE,which vary between 248–1404 Jkg�1, are indicative ofweak to moderate convection [Bluestein, 1992] and are thussuitable for formation of fair weather cumulus. The low CINvalues (1–3 Jkg�1) imply an environment where convectioncan be easily initiated. Lifting condensation level values,which provide an estimate of cloud base during early hoursof cloud formation, are within the range of cloud baseheights estimated from Landsat data (see below).
3. Methodology
3.1. Analysis of Satellite Data
[11] The frequency of occurrence of cumulus cloudinessin Costa Rica for the dry season months of February, Marchand April, 1999, is derived from GOES 8 visible imageryusing structural thresholding, an automated cumulus clouddetection algorithm [Nair et al., 1999; Nair, 2002]. Thestructural thresholding approach uses the spatial structure ofthe cloud elements within a cloud field to determine theextent of cumulus cloud fields as well as to detect individualclouds within a scene. Once the cumulus cloud fields areidentified, the cloud elements within the cloud fields arelabeled as cumulus clouds. Nair [2002] compared theperformance of a variety of cumulus cloud field detectionalgorithms and determined that the structural thresholdingapproach was the most accurate, providing a classificationaccuracy of 87% for cumulus cloud fields and 89% accu-racy for identifying correctly the cumulus clouds within thefields.[12] The structural thresholding algorithm is used to
derive the cumulus cloud mask for the Caribbean regionof Costa Rica daily at 1415 UTC (0815 LST, UTC = LST +6 hrs), 1615 UTC, 1815 UTC and 2015 UTC for theecologically critical dry season months of February, Marchand April, 1999. The influence of surface characteristics oncloud formation is likely to be most significant during thedry season, due to relatively calmer synoptic situations atthis time. Further, the surface fluxes in both forested anddeforested regions are expected to be higher in the dryseason. Monthly maps of frequency of occurrence of cumu-lus clouds for 1415 UTC, 1615 UTC, 1815 UTC and 2015UTC over the Costa Rican region are derived from the dailycumulus cloud masks. Frequency of cumulus cloud occur-rence is expressed as percentage of observations in a month
for which cumulus clouds are present over a particularlocation.
3.2. Numerical Modeling Experiments
[13] The RAMS model is nonhydrostatic and is used forthe simulation of atmospheric phenomenon ranging fromcloud scale to mesoscale [Pielke et al., 1992]. RAMS usesfinite difference methods for solving the various conserva-tion equations governing the atmospheric flow. Cloudmicrophysics is represented in RAMS using bulk waterparameterization which includes cloud water, rain, pristineice, snow aggregates, graupel and hail categories. At thelower boundary, RAMS uses a multilayer soil model [Trem-back and Kessler, 1985] and a vegetation model [Avissarand Pielke, 1989] to represent the land surface processes.Various options are available for representation of radiativetransfer, turbulence and lateral boundary conditions.[14] The effect of varied surface conditions on cloud
formation was examined using a coupled design in whicheach of six sounding (S1–S6) was used for initialization ofboth forest and pasture atmospheric conditions. The impactof deforestation and conversion to pasture was examined bycomparing diurnally developing conditions between simu-lations. It was assumed that the vegetation in the forestsimulations had transfer characteristics of evergreen broad-leaf forest, with initial volumetric soil moisture set to 0.4,while pasture simulations had transfer characteristics ofshort grass, with initial volumetric soil moisture set to0.25. These forest volumetric soil moisture values areappropriate to tropical evergreen forest dry season valuesfor the region [Dietrich et al., 1982], and the pasturevolumetric soil moisture yields results consistent withempirical micrometeorological studies over Amazonianpasture [Bastable et al., 1993; Wright et al., 1992].[15] The cloud field simulations were performed over a
domain of 100 km � 100 km represented by 100 � 100horizontal grid points at uniform horizontal grid spacing of1 km. In the vertical, a stretched grid with a stretch ratio of1.08 was used, providing vertical spacing ranging from 70m near the surface to a maximum of 750 m higher up in theatmosphere. The terrain adopted in these model simulationswas flat. A periodic boundary condition was assumed at thelateral boundaries, and a rigid top boundary was adopted.Of the different radiative transfer schemes available for theRAMS, the Chen and Cotton [1983] radiative transferscheme was used to account for the effect of clouds. Theanisotropic deformation scheme was used to representhorizontal and vertical diffusion processes. Cloud formationprocesses other than those involving ice processes wereactivated. Precipitation processes were not activated in thesesimulations to save computer-processing resources since thecloud fields simulated were almost exclusively fair weathercumulus.[16] For each of the six soundings (S1–S6), the model
was integrated with forest and pasture surface conditions for12 hours starting at 1200 UTC, approximately local dawn.The simulations with atmospheric conditions represented bysoundings S1 through S6 and forest surface conditions arereferred as F1, F2, F3, F4, F5 and F6. Similarly the coupledsimulations with pasture surface conditions are referred toas P1, P2, P3, P4, P5 and P6. For each simulation the initialatmospheric conditions were set to be horizontally homo-
Table 1. The Date of Acquisition and Characteristics of the Six
1200 UTC Radiosonde Observations, From San Andres Island in
the Carribbean, Used in This Studya
Sounding Date CAPE, J/kg CIN, J/kg LCL, m
S1 3/01/1999 576 1 506S2 3/03/1999 680 3 537S3 3/11/1999 971 1 523S4 3/19/1999 248 1 605S5 3/24/1999 947 1 565S6 3/27/1999 1404 1 411
aThe sounding characteristics listed are Convective Available PotentialEnergy (CAPE), Convective Inhibition (CIN), Lifting Condensation Level(LCL) and Level of Free Convection (LFC).
NAIR ET AL.: COSTA RICAN TROPICAL MONTANE CLOUD FORESTS ACL 4 - 3

genous with the vertical structure prescribed by each atmos-pheric sounding.[17] The diurnal variations of domain averaged cloud
base height, cloud top height, cloud thickness, cloud cover,cloud water mixing ratio, liquid water path, sensible heatflux, latent heat flux, surface temperature and surfacedewpoint temperature from simulations F1–F6 are com-pared to those from corresponding simulations P1–P6.Vertical columns with integrated liquid water path greaterthan or equal to 0.2 kg m-2 were assumed to containcumulus cloud. Within each column containing cumuluscloud, cloud base height was assumed to be the height ofgrid point with non-zero liquid water content closest to thesurface. The cloud top height is chosen as the height of thetopmost grid point of a run of consecutive non-zero liquidwater content grid points, starting from the cloud base gridpoint.
4. Results
[18] The satellite analysis covers the dry season monthsof February through April 1999 in which the data has beenprocessed at 1615, 1815 and 2015 UTC (1015, 1215, and1415 LST). Deforested regions have a lower incidence ofcumulus clouds and the clouds that do form in these regionsare smaller than those in nearby forested regions. Thenumerical modeling simulations examine the diurnal devel-opment of cumulus clouds above both pastures and forests.In the simulations clouds in forested regions have lowerbase heights than those those in pastured landscapes. Sincemost tropical montane cloud forests lie downwind of low-land areas, this raises serious conservation concerns at siteslike the Monteverde cloud forests of the Cordillera deTilaran.
4.1. GOES 8 Satellite Imagery Analysis
[19] Interpretation of the GOES 8 imagery requires a briefconsideration of the geography of northern Costa Rica andsouthern Nicaragua (Figure 1b). The Cordillera de Tilaranruns as a single sinuous central ridge (the continental
divide) about 70 km from the western margin of CostaRica’s Meseta Central to the southeastern tip of the chain ofisolated volcanoes which extends into Nicaragua. TheCordillera rises abruptly from the Pacific coast, reachingpeaks of about 1800 m elevation 25 km inland. The north-east trade wind flow in the region is such that the Cordillerade Tilaran is downwind of the Nicaraguan/Costa RicanCaribbean coastal plain.[20] Deforestation and agricultural conversion in Costa
Rica has been rapid (estimated at 400–600 km2/yr in thelate 70s and early 80s) [Sader and Joyce, 1988], with theresult that less than 1,000 km2 of undisturbed forestremained on the Costa Rican portion of the coastal plainin 1993 (J. Mendez, personal communication, 1992). Therehave been no major deforestation activities since the mid-1980s in the Costa Rican coastal plains, but rather a gradualerosion of the forested regions at the boundaries [Wheel-wright, 2000] (Figures 1a and 2a). In contrast, politicalconflicts have hindered agricultural development in adjacentNicaragua, with the result that the original forest there ismuch more intact (Figures 1a, 2a, and 2b). Landsat imageryoften shows that dry season cumulus clouds do not form inthe San Carlos and Tortuguero plains, which have long beendeforested and converted to pasture and cropland [Saderand Joyce, 1988; Wheelwright, 2000] (Figure 2a). Whencumulus clouds do form in these regions, as in Figure 2b,the clouds generally are smaller and less well developedthan clouds just north of the border in the forested Nicar-aguan lowlands.[21] Figure 3 shows the percent frequencies of occurrence
of total cloud cover and cumulus cloud cover over southernNicaragua and Costa Rica retrieved at 1615, 1815 and 2015UTC for March, 1999, using the method described insection 3. Extensive cumulus cloud cover (Figure 3, rightpanels) is found along the Mosquito Coast (in NE Nicar-agua, not shown) and extending down to the border withCosta Rica. These regions are predominately forested. Notethe rather abrupt decrease in cumulus cloud cover near theNicaragua-Costa Rica border. The highest frequency ofoccurrence of cumulus cloudiness occurs at 1615 UTC
Figure 1. (a) Recent estimates of forest cover in Costa Rican region. (b) Topography of the Costa Ricanregion in meters. The labeled areas in the images are San Carlos plains (SC) and Tortuguero plains (T).
ACL 4 - 4 NAIR ET AL.: COSTA RICAN TROPICAL MONTANE CLOUD FORESTS

and then decreases throughout the day. This behavior is dueto the fact that moisture is available in the morning hours toinitiate cumulus cloud formation. Heating then dries out theboundary layer so that cumulus cloudiness decreases later inthe day. Figure 3 (left panels) shows total cloudiness. Insouthern Nicaragua total cloud cover is maximum aboutlocal noon (1815 UTC) and then decreases. Heating causesstrong convection so that larger clouds form at this time.However, the drying of the atmosphere once again leads to alower cloud cover later in the day.[22] Dry season cumulus cloudiness in northern Costa
Rica is much lower than in neighboring Nicaragua(Figure 3). Furthermore, the cumulus cloudiness is associ-ated with the presence of forests, as seen by comparingFigures 1, 2, and 3. Dry season cumulus cloudiness ismaximum in the Caribbean lowlands of Costa Rica at aboutlocal noon (1815 UTC) and then decreases rapidly. Ofparticular interest are the two extensively deforested patches(denoted as SC and T in the LANDSAT image, Figure 2) tothe east of the Monteverde cloud forests in the Cordillera deTilaran. The region T is closer to the ocean and has a higherfrequency of occurrence of cumulus clouds. As seen onthe LANDSAT imagery (Figure 2), cumulus clouds in thedeforested regions generally have smaller diameters. Thefrequency of occurrence of cumulus clouds is higher overforested regions, except over forested mountain, whereorographic clouds dominate. On the other hand, total cloudcover in Costa Rica is strongly correlated with topography,as seen by comparing Figure 3 with Figure 1b. Regions ofrapid elevation change cause uplifting which is conducive tototal cloudiness but not cumulus cloud development. The
maximum dry season total cloud cover occurs at about noon(1815 UTC).[23] Cumulus cloud fields in the dry season months of
February and April are very similar to those in March (datanot shown). On the other hand, total cloudiness is larger inboth February and April than in March, especially insouthern Nicaragua and along the Cordillera de Tilaran.In both February and April, total cloud cover is maximumat 2015 UTC in the Cordillera de Tilaran.[24] The lack of cloud cover over Lake Nicaragua is
typical of the cloud clearing that is observed over lakes,bays and wide rivers (Figure 3) [Gibson and Vonder Haar,1990; Rabin et al., 1990]. The area affected is larger thanthe actual size of the lake, especially in the downwind (leftside of the image) direction. This behavior is similar to theflow divergence field downwind of Lake Okeechobeeobserved by Pielke [1974]. Segal et al. [1997] suggestedthat drying by dynamically induced subsidence and sup-pression of the convective boundary layer over lakes con-tribute to the cloud clearing. One other interesting feature isthat both the Atlantic and Pacific oceans are nearly free ofcumulus cloud fields during all three months. Total cloudcover over the Caribbean and Pacific oceans is significantlyhigher in both February and April than in March.[25] These results for 1999 cloud cover appear represen-
tative of the region. Similar maps of cumulus and totalcloudiness, developed for February through April 2000 andfor February 2001, show that while there are variations overspecific locations, the overall pattern is consistent with theresults for 1999. In 2000 the cover by dry season cumuluscloud fields was a little higher over Nicaragua for all three
Figure 2. Deforestation and dry season cumulus cloud cover in northern Costa Rica and southernNicaragua. False color Landsat images over Costa Rica for (a) 6 February 1986 at 1521 UTC and (b) 5January 1986 at 1512 UTC. The labeled areas in the images are San Carlos plains (SC), Tortuguero plains(T), Monteverde (M), Cordillera Volcanica Central (CC), deforested lee in the Meseta Central (MC),Remnant forest (RF) south of the Costa Rica-Nicaragua border and intact lowland forest coverssoutheastern Nicaragua (N). The color composite is created by combining red, green and blue intensitiesin proportion to brightness values for band 2, 4 and 1.
NAIR ET AL.: COSTA RICAN TROPICAL MONTANE CLOUD FORESTS ACL 4 - 5

months, but total cloudiness was similar. The results forFebruary 2001 are again consistent with those for 1999 and2000. In short, the dry season of 1999 does not seem to havebeen unusual.
4.2. Numerical Modeling Experiments
[26] We use the results of RAMS simulations to comparethe diurnal patterns of cumulus clouds in these two environ-ments in order to assess the effect of deforestation oncumulus cloud formation and development. In the simula-tions shown below it is assumed that the entire region iseither pure forest or pure pasture. The issue of heteroge-
neous surfaces will be addressed in a subsequent paper. Theresults shown in Figure 4 are at 1615 UTC (1015 LST),corresponding to the time of the Landsat overpasses(Figure 2) and to the top frame of GOES images shownin Figure 3. Note that there is a strong tendency to formcloud streets in the forest simulations, as seen in the Landsatimage (Figure 2b). The majority of the simulations show atransition from organized cumulus cloud streets to unorgan-ized convection when the surface vegetation type is changedfrom forest (evergreen broadleaf) to pasture (short grass).This change in cloud field organization is caused by differ-ences in sensible heat flux. Horizontal convective roll circu-
Figure 3. Percentage frequency of occurrence of total cloudiness at 1615, 1815 and 2015 UTC areshown in panels a, c and e. Percentage frequency of occurrence of cumulus clouds at these times areshown in panels b, d and f. The labeled areas in the images are San Carlos plains (SC) and Tortugueroplains (T).
ACL 4 - 6 NAIR ET AL.: COSTA RICAN TROPICAL MONTANE CLOUD FORESTS

lations, which are responsible for the formation of cloudstreets, are caused by thermal and/or dynamic instabilities[Weckwerth et al., 1997]. Typically, one utilizes non-dimen-sional numbers that combine the thermal and dynamicinstabilities to characterize environments favorable for theformation of horizontal convective roll circulations. Onesuch non-dimensional number is the ratio u*/w*. The frictionvelocity u* and the free-convection scaling velocity w* aregiven by:
u* ¼ u0w02s þ v0w02
s
h i14
;
w* ¼ gzi
qvw0q0vs
� �13
;
where u0, v0, w0 and qv0 are turbulent fluctuations of velocity
components and virtual potential temperature, u0w0s and
v0w0s are the mean surface momentum fluxes, w0q0vs is the
mean surface buoyancy flux, g is the acceleration due togravity, zi is the depth of convective boundary layer, and qvis the mean virtual potential temperature.[27] The u*/w* ratio is larger for the forest simulations
compared to the pasture simulations (Table 2). Sykes andHenn [1989] suggested that environments with u*/w* > 0.35are favorable for the formation of convective rolls. The u*/w* ratio is greater than 0.35 for the forest simulations, whilefor pasture simulations this ratio is less than 0.35. Thesurface sensible heat flux QH, which is given by:
QH ¼ rCpw0q0v;
where r is the density of air and Cp is specific heat of air atconstant pressure, is lower for forest which allows theexistence of two-dimensional laminar flow necessary for thesustenance of cloud streets. However, when the surface ischanged to a pasture, the enhancement in sensible heat fluxmakes the flow more turbulent, impeding the organizationof clouds into streets.[28] However simulation pairs F1, P1 and F4, P4 do not
conform to the cloud organization followed by the othersimulations (Figure 4), although the u*/w* ratio suggests
that F1 and F4 simulations have environments favorable forthe formation of cloud streets while P4 should favorunorganized convection. The expected linear organizationof clouds is not present in the F1 simulation. This could bedue to the inability of the model to resolve cloud streetswith narrow spacing, since cloud street spacing is dependentupon boundary layer depth, which is relatively shallow forthe F1 simulation. The model simulations F4 and P4 show adifferent pattern in which cloud organization occurs in thepasture case but not in the forest surface type. Additionalstudy is needed to understand the reasons for this behavior.[29] In all simulations cloud base height, averaged over the
domain, shows a tendency to increase throughout the day(Figure 5). While the different soundings produce differentpatterns of cloud base height growth during the day, the cloudbase heights in pasture simulations typically are severalhundred meters higher than in the paired forest simulation.Taking the mean of the domain average of cloud base heightfor the six simulations (Figure 6a), cloud base height at 1600UTC is 776 m for the forest simulations, compared to 1473 mfor pasture simulations. These results are in reasonableagreement with cloud base heights determined from dryseason Landsat MSS imagery using the method of Berendeset al. [1992]. Cloud base heights, estimated from LandsatMSS imagery for 23 March 1985 at 1615 UTC, were lognormally distributed with a mean cloud base height of 736 m.Values ranged from a low of about 576 m near the coast to ashigh as 1099 m at the foot of the mountains.[30] The mean difference in domain-averaged cloud base
height between the six forest and pasture simulations as afunction of time is shown in Figure 6b. The dashed linesshow the 95% confidence intervals. The mean cloud base
Table 2. The u*/w* Values for Simulations F1–F6 and P1–P6 at
1615 UTC
n Simulation Fn Simulation Pn
1 0.93 0.262 0.41 0.163 0.93 0.264 0.65 0.255 0.83 0.316 0.90 0.25
Figure 4. Simulated cloud fields at 1615 UTC from simulations F1–F6 and P1–P6 are shown in panelsa–f and g–l.
NAIR ET AL.: COSTA RICAN TROPICAL MONTANE CLOUD FORESTS ACL 4 - 7

height differences (pasture - forest) differ significantly byabout 1600 UTC and then persist throughout the day.Maximum differences of about 800 m occur at about1830 UTC.[31] There are no significant differences in domain-aver-
aged cloud top height for the forest and pasture simulations(not shown). However, like cloud base height, cloud topheight increases rapidly in the morning, reaching meandomain-averaged values of about 2500 m at local noon.
Then the increase in cloud top height slows and becomesasymptotic at a mean domain-averaged value of about 3200m at 2000 UTC, late afternoon.[32] Cloud thickness, the difference between cloud top
height and cloud base height increases rapidly in both forestand pasture simulations until about 1600 UTC. At this timethe mean domain-averaged cloud thicknesses for the sixpasture simulations are about 750 m and remain at thattemporarily before decreasing slowly during the remainder
Figure 5. Comparison of diurnal variation of domain averaged cloud base height for simulations: (a)P1, F1; (b) P2, F2; (c) P3, F3; (d) P4, F4; (e) P5, F5; (f ) P6, F6. The cloud base heights from forestsimulations are shown as solid lines and those from pasture simulations as dashed lines.
ACL 4 - 8 NAIR ET AL.: COSTA RICAN TROPICAL MONTANE CLOUD FORESTS

of the day. Cloud thickness increases rapidly to meandomain-averaged values of 1500 m for the forest simula-tions at 1700 UTC, then decreases to about 1100 m at 1800UTC before decreasing slowly during the remainder of theday.[33] There is considerable variation in maximum cloud
coverage among the various simulations. Maximum cloudcoverage for the various simulations range from a low ofabout 6% to a high of about 23%, but there are no consistentpatterns. On the other hand, simulations showing highvalues of cloud cover for the forest cases similarly havehigh values for the pasture cases, and simulations showinglow values of cloud cover for the forest cases have lowvalues for the pasture cases. The mean cloud coverage forthe six forest and pasture simulations shows a maximum ofapproximately 8% in the late afternoon. The mean differ-ences in cloud cover for the forest and pasture simulationsare limited to less than 2% until 2000 UTC. Then the meancloud cover for the pasture simulations becomes about 4%larger than those for the forest simulations. This behavior isdue to the fact that the maximum in mean cloud cover forthe forest simulations occurs at about 1930 UTC and thencloud coverage decreases rapidly. The mean cloud cover forpasture simulations peaks at about 2100 UTC and thendecreases quickly.[34] The numerical modeling simulations of cloud fields
over pasture do not suggest suppression of cumulus to theextent observed over deforested regions in GOES andLandsat imagery. The timing of initiation of convection isnot significantly different for the pasture and forest simu-lations. However, note that the same soundings are used toprescribe the initial atmospheric structure in the simulations,whereas the actual boundary layer profile over forest andpasture will be different, with the boundary layer tending tobe drier over pasture. In particular, the Convective Inhib-ition (CIN) for the atmospheric profile over pasture areas isexpected to be higher than over forested regions. In order toresolve issues concerning the timing of convection over
forested and deforested areas, specific initializing profilesover these regions are needed.[35] On average, the cloud liquid water content is slightly
higher for the six pasture simulations until 1615 UTC. Afterthis time, the mean domain-averaged cloud liquid watercontent is slightly lower for the pasture cases. However themagnitude of the mean difference of cloud liquid watercontent is relatively small, and an analysis of the 95%confidence curves indicates that the small differences inmean cloud liquid water contents between the pasture andforest simulations are not statistically significant. The max-imum mean difference during the early stages of cloud fielddevelopment is about 0.16 g kg�2 Further, the differencesbetween cloud liquid water contents between 1630 UTCand 2215 UTC are less than 0.1 g kg�1.[36] The mean domain-averaged liquid water path, which
is liquid water content integrated as a function of height, forthe forest simulations is larger than for the pasture casesafter about 1600 UTC. But once again, the differences arenot statistically significant at the 95% confidence level. Atthe first glance, the low statistical significance of differencesin liquid water path between forest and pasture simulationsappears inconsistent with statistically significant differencesin cloud thickness. However, unlike cloud thickness, whichis consistently higher for forest simulations after about 1600UTC, the differences in liquid water content between theforest and pasture simulations are very variable. Thus, eventhough the mean domain averaged liquid water path for thesix forest simulations is higher compared to the pasturesimulations, the variances associated with the mean differ-ences in domain averaged values for the six simulation pairsare also high. Therefore it is the large fluctuations in liquidwater content that leads to the fact that the differences inliquid water path between forest and pasture simulations arenot statistically significant.[37] The mean domain-averaged sensible heat flux in the
pasture simulations is significantly greater than in forestsimulations (Figures 7a and 7b). The maximum mean value
Figure 6. (a) Mean domain averaged cloud thickness for six pasture and forest simulations. The meancloud thickness for forest simulations is shown using a solid line and for pasture using a dashed line. (b)The mean of difference in domain averaged cloud thickness between six pasture and forest simulations.The dash-dot lines show the 95% confidence curves, and the zero difference line is shown using thedashed line.
NAIR ET AL.: COSTA RICAN TROPICAL MONTANE CLOUD FORESTS ACL 4 - 9

of sensible heat flux for the pasture simulations is 173Wm�2 at 1730 UTC, compared to a maximum value of 91Wm�2 at 1900 UTC for the forest simulations. Note that themean sensible heat flux for the pasture simulations ispositive for the time period of 1300 to 2245 UTC, whereasit is positive for the forest simulations only between 1715and 2145 UTC. The maximum mean difference in sensibleheat flux between pasture and forest simulations is 171Wm�2 at 1700 UTC (Figure 7b).[38] The mean domain-averaged latent heat fluxes also
differ significantly between pasture and forest simulations(Figure 7c). The mean latent heat fluxes for both sets ofsimulations peaks at 1700 UTC, at 356 Wm�2 for the forestsimulations and 93 Wm�2 for the pasture simulations. Thelargest difference in mean latent heat fluxes is 263 Wm�2 at1700 UTC (Figure 7d).[39] Figure 8a shows mean domain-averaged values of
surface temperature as a function of time for the forest andpasture simulations. The pasture landscapes have signifi-cantly higher surface temperatures than forests throughout
the simulations (Figures 8a and 8b). The pattern of diurnalvariation of surface air temperature is similar for pasturesand forests, but the amplitudes are different. The pasturesachieve a maximum mean surface air temperature of 31.5�Cat 2130 UTC, while the forests achieve a maximum value of27.9�C at 2100 UTC. The mean differences in surface airtemperature increase from approximately 1.5�C at 1300UTC to a maximum of 4.1�C at 1745 UTC. After 1715UTC the difference in surface air temperature remainsrelatively constant through the remainder of the simulationperiod.[40] The mean domain-averaged surface dewpoint tem-
peratures for pasture simulations are lower than those offorest simulations throughout the day (Figures 9a and 9b).Forest mean surface dewpoint temperatures increase early inthe day, reaching a maximum value of 24.1�C at 1645 UTC,then decrease slightly but remaining relatively constant forthe remainder of the day. In contrast, the pasture surfacedewpoint temperatures are about 22�C early in the simu-lations, but then steadily decrease for most of the remainder
Figure 7. (a) Mean domain averaged sensible heat fluxes for six pasture and forest simulations. Thesensible heat fluxes for forest simulations are shown as the solid line and for pasture as the dashed line.(b) The mean of differences in domain averaged sensible heat fluxes between six pasture and forestsimulations. (c) Mean domain averaged latent heat flux for six pasture and forest simulations. The meanlatent heat flux for forest simulations is shown as the solid line and for pasture as the dashed line. (d) Themean of difference in domain averaged latent heat flux between six pasture and forest simulations. Thedash dot lines in Figures 7b and 7d show the 95% confidence curves, and the zero difference line isshown as the dashed line in Figure 7b.
ACL 4 - 10 NAIR ET AL.: COSTA RICAN TROPICAL MONTANE CLOUD FORESTS
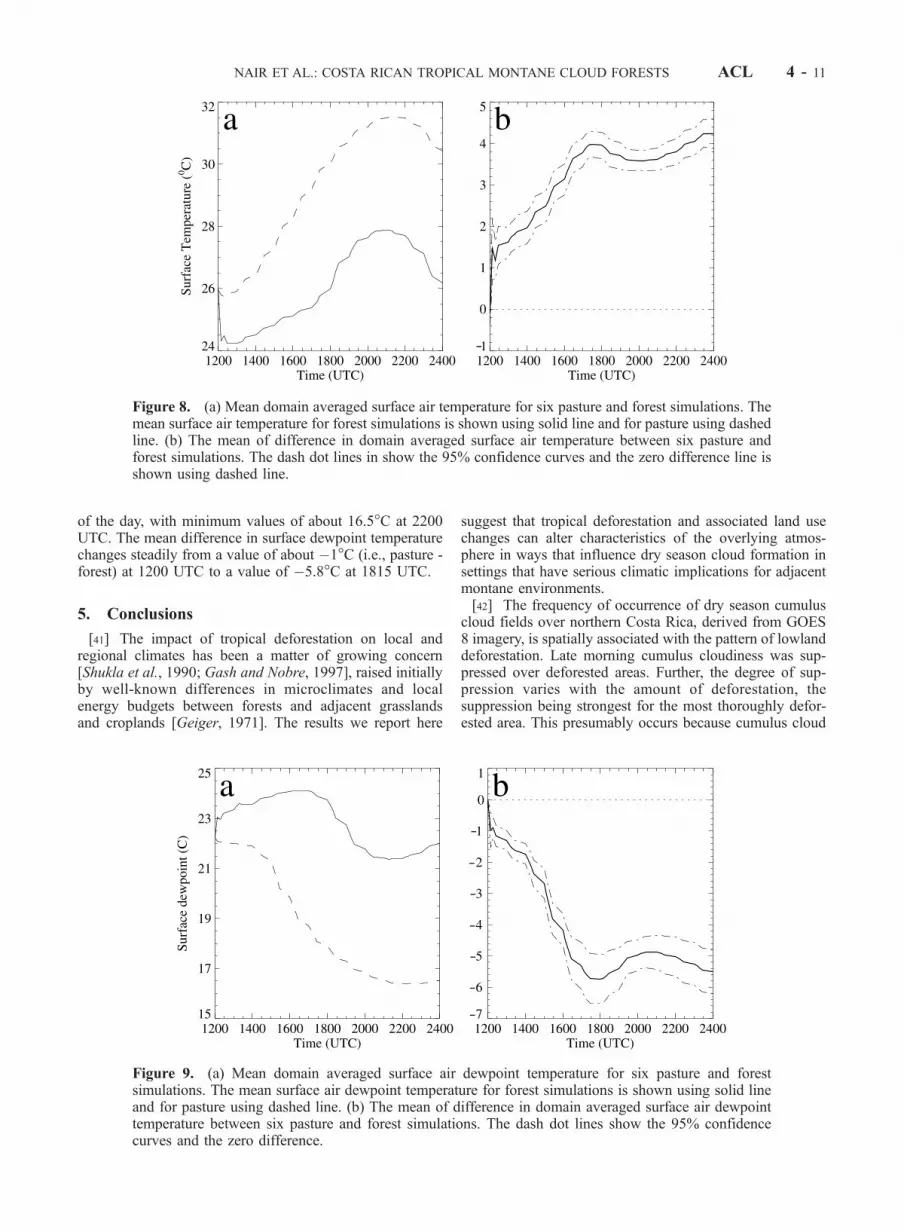
of the day, with minimum values of about 16.5�C at 2200UTC. The mean difference in surface dewpoint temperaturechanges steadily from a value of about �1�C (i.e., pasture -forest) at 1200 UTC to a value of �5.8�C at 1815 UTC.
5. Conclusions
[41] The impact of tropical deforestation on local andregional climates has been a matter of growing concern[Shukla et al., 1990; Gash and Nobre, 1997], raised initiallyby well-known differences in microclimates and localenergy budgets between forests and adjacent grasslandsand croplands [Geiger, 1971]. The results we report here
suggest that tropical deforestation and associated land usechanges can alter characteristics of the overlying atmos-phere in ways that influence dry season cloud formation insettings that have serious climatic implications for adjacentmontane environments.[42] The frequency of occurrence of dry season cumulus
cloud fields over northern Costa Rica, derived from GOES8 imagery, is spatially associated with the pattern of lowlanddeforestation. Late morning cumulus cloudiness was sup-pressed over deforested areas. Further, the degree of sup-pression varies with the amount of deforestation, thesuppression being strongest for the most thoroughly defor-ested area. This presumably occurs because cumulus cloud
Figure 8. (a) Mean domain averaged surface air temperature for six pasture and forest simulations. Themean surface air temperature for forest simulations is shown using solid line and for pasture using dashedline. (b) The mean of difference in domain averaged surface air temperature between six pasture andforest simulations. The dash dot lines in show the 95% confidence curves and the zero difference line isshown using dashed line.
Figure 9. (a) Mean domain averaged surface air dewpoint temperature for six pasture and forestsimulations. The mean surface air dewpoint temperature for forest simulations is shown using solid lineand for pasture using dashed line. (b) The mean of difference in domain averaged surface air dewpointtemperature between six pasture and forest simulations. The dash dot lines show the 95% confidencecurves and the zero difference.
NAIR ET AL.: COSTA RICAN TROPICAL MONTANE CLOUD FORESTS ACL 4 - 11

formation is strongly influenced by the surface throughmodification of the surface energy budget It should benoted that the current observations of suppression of cumu-lus clouds over deforested areas are in contradiction to priorstudies showing enhanced cumulus cloudiness over defor-ested areas [Rabin et al., 1990; Lyons et al., 1993; Cutrim etal., 1995]. However note that the atmospheric conditions inthis study are significantly different compared to thoseconsidered in these prior studies.[43] The RAMS simulations suggest that reduced cloudi-
ness over deforested areas in the dry season is due toreduced latent heat fluxes and concomitantly enhancedsensible heat fluxes in comparison to the originally forestedlandscape. Surface air temperature is consistently higher forpasture, and surface dewpoint temperature is higher forforest in paired simulations. In the RAMS simulationswarmer and drier air is found over pastures than overforests, resulting in the changes in cloud formation.[44] The RAMS simulations show that mean cloud base
height for the pasture simulations are consistently andsignificantly higher than in the paired forest simulations.As a result clouds are significantly thicker over the forestedlandscape, although differences in cloud top heightsbetween the pasture and forest simulations are not statisti-cally significant.[45] The simulation results from the present study are in
general agreement with those of a large eddy simulationstudy of the sensitivity of cumulus clouds to soil moistureover the Atmospheric Radiation Measurement (ARM) sitein Oklahoma [Golaz et al., 2002]. They also foundincreased cloud base heights and decreased cloud thicknessassociated with decreased soil moisture, while cloud topheights and liquid water contents remain relativelyunchanged [Golaz et al., 2002]. In addition they foundlower mean liquid water paths associated with decreasedsoil moisture, but we report here only statistically insignif-icantly lower values of mean liquid water path for the sixpasture simulations compared to their forest counterparts.[46] Although the simulations in this study are topo-
graphically unrealistic in that they utilize a perfectly flatlandscape, their correspondence with Landsat and GOESobservations suggests that this lack of realism does notobscure the importance or applicability of the results. Innorthern Costa Rica, as in many parts of the tropics, dryseason trade winds blow across lowlands before beingforced to rise over mountains, forming orographic clouddecks that define the character and distribution of tropicalmontane cloud forests [Clark et al., 2000].[47] In these cloud forests dry season water input is
almost entirely a matter of the direct deposition of clouddroplets and mist as the orographic clouds move through theforest. Since the air masses in lowland regions are ulti-mately responsible for the formation of orographic clouds,modification of the lowland cloudbanks crucial to cloudforests such as that at Monteverde in northern Costa Rica.After all, the primary difference between free convectivecumulus and a stratocumulus orographic bank is the liftingmechanism. Processes affecting the boundary layer willinfluence formation and development of both cloud types.The warming and drying of boundary layer air in thelowland regions could thus increase the cloud base heightsof the orographic cloudbanks.
[48] Regional climate change with associated seriousecological implications in the Monteverde cloud forest hasbeen documented recently [Still et al., 1999; Pounds et al.,1999]. Since the mid-1970s there has been a reduction in thedry season days with wind-blown mist, the major source ofdry season moisture. The reduction of dry season moisturemay have contributed to anuran population crashesobserved in this region [Pounds et al., 1999]. It has beensuggested that the reduction in dry season moisture inputdue to increased cloud base heights results from elevatedsea surface temperatures [Still et al., 1999; Pounds et al.,1999]. In this study we provide the alternative hypothesisthat deforestation alters surface energy budget in ways thatinfluence the development of Costa Rican dry seasoncumulus cloud fields and orographic cloud fields. Furtherinvestigation is needed to examine this hypothesis.[49] The elevation of cloud base height resulting from
lowland deforestation could have serious implications fortropical montane cloud forests throughout the tropics. Localhydrological changes resulting from deforestation havealready been documented [Meher-Homji, 1991], and shiftsin regional climate in tropical montane settings may haveserious local ecological impacts [Pounds et al., 1999].Systematic measurements of cloud base heights and fieldexperiments to observe the atmospheric and land surfacevariables over forested and deforested areas are required tobetter understand the regional climate changes occurring incoupled lowland and montane regions in the tropics.[50] In summary: (1) Satellite imagery shows a pattern of
suppression of cumulus cloud formation over deforestedlowland regions of northern Costa Rica. The degree ofsuppression appears to be associated with the extent ofdeforestation. Cloud suppression over deforested regions isstrongest during the month of March, the peak of the dryseason. Satellite imagery also shows that the deforestedregions show development of clouds during the later hoursof the day. (2) Paired RAMS simulations of tropical lowlandpasture and forest landscapes show enhanced sensible heatfluxes and reduced latent heat fluxes over pasture comparedto forest. This results in drier and warmer air over pasturesurfaces. (3) RAMS numerical modeling experiments showstatistically significant differences in cloud base height andcloud thickness between cloud fields forming over forestand pasture surfaces. On average the clouds have lower baseheights and are thicker over forest surfaces. Differences incloud top heights between forest and pasture simulations arenot statistically different. (4) For the same initial atmos-pheric conditions, differences in cloud cover between forestand pasture simulations are only statistically significantduring the later hours of the day. The pasture and forestsimulations do not differ significantly in cloud water mixingratio and cloud liquid water paths. (5) Modification ofboundary layer air over deforested tropical lowland regionscould lead to elevation of the base of orographic cloudbanksin downwind mountain ranges.
[51] Acknowledgments. This research was supported by NationalAeronautics and Space Administration (NASA) CERES contract NAS5-31718, NASA ASTER contract NAS1-98131, NASA grant NAG5-11941,and National Science Foundation grant ATM-0128924. The authors arethankful to Jean-Christophe Golaz, Mark Hjemfelt, and Tammy Weckwerthfor advice and helpful comments. The GOES 8 data was acquired by GOESground station at Global Hydrology and Climate Center, Huntsville,
ACL 4 - 12 NAIR ET AL.: COSTA RICAN TROPICAL MONTANE CLOUD FORESTS

Alabama. We are thankful for the helpful comments and suggestions of thereviewers.
ReferencesAnthes, R., Enhancement of convective precipitation by mesoscale varia-tions in vegetative covering in semiarid regions, J. Clim. Appl. Meteorol.,23, 541–554, 1984.
Avissar, R., and Y. Liu, Three-dimensional numerical study of shallowconvective clouds and precipitation induced by land surface forcing,J. Geophys. Res., 101, 7499–7518, 1996.
Avissar, R., and R. A. Pielke, A parameterization of heterogeneous landsurfaces for atmospheric models and its impact on regional meteorology,Mon Weather Rev., 117, 2113–2136, 1989.
Avissar, R., and T. Schmidt, An evaluation of scale at which ground-surfaceheat flux patchiness affects the convective boundary layer using large-eddy simulations, J. Atmos. Sci., 55, 2666–2689, 1998.
Bastable, H. G., W. J. Shuttleworth, R. L. G. Dallarosa, G. Fisch, and C. A.Nobre, Observations of climate, albedo and surface radiation over clearedand undisturbed Amazonian forest, Int. J. Clim., 13, 783–796, 1993.
Berendes, T., S. K. Sengupta, R. M. Welch, B. A. Wielicki, and M. Navar,Cumulus cloud base height estimation from high spatial resolution Land-sat data: A Hough transform approach, IEEE Trans. Geosci. RemoteSens., 30(3), 430–443, 1992.
Bluestein, H. B., Synoptic-Dynamic Meteorology in Midlatitudes, vol. 2,Observations and Theory of Weather Systems, 594 pp., Oxford Univ.Press, New York, 1992.
Bruinjzeel, L. A., and J. Proctor, Tropical Montane Cloud Forests, editedby L. S. Hamilton, J. O. Juvik, and F. N. Scatena, pp. 38–78, Springer-Verlag, New York, 1995.
Bryant, N. A., L. F. Johnson, A. J. Brazel, R. C. Balling, C. F. Hutchinson,and L. R. Beck, Measuring the effect of overgrazing in the SonoranDesert, Clim. Change, 17, 234–264, 1990.
Chen, C., and W. R. Cotton, A one-dimensional simulation of the strato-cumulus-capped mixed layer, Boundary Layer Meteorol., 25, 289–321,1983.
Chen, F., and R. Avissar, Impact of land-surface moisture variability onlocal shallow convective cumulus and precipitation in large-scale models,J. Appl. Meteorol., 33, 1382–1394, 1994.
Clark, K. L., R. O. Lawton, and P. R. Butler, Physical Environment, Mon-teverde: Ecology and Conservation of a Tropical Cloud Forest, edited byN. M. Nadkarni and N. T. Wheelwright, chap. 3, pp. 15–38, OxfordUniv. Press, New York, 2000.
Cutrim, E. D., W. Martin, and R. Rabin, Enhancement of cumulus cloudsover deforested lands in Amazonia, Bull. Am. Meteorol. Soc., 76, 1801–1805, 1995.
Dietrich, W. E., D. M. Windsor, and T. Dunne, The Ecology of a TropicalForest, edited by E. G. Leigh, A. S. Rand, and D. M. Windsor, pp. 21–46, Smithsonian Inst. Press, Washington, D. C., 1982.
Emori, S., Interaction of cumulus convection with soil moisture distribu-tion: An idealized simulation, J. Geophys. Res., 103, 8873–8884, 1998.
Gash, J. H. C., and C. A. Nobre, Climatic effect of Amazonian deforesta-tion: Some results from ABRACOS, Bull. Am. Meteorol. Soc., 78, 823–830, 1997.
Geiger, G., Climate Near the Ground, 611 pp., Harvard Univ. Press, Cam-bridge, Mass., 1971.
Gibson, H. M., and T. H. Vonder Haar, Cloud and convection frequenciesover the southeast United States as related to small-scale geographicfeatures, Mon. Weather Rev., 118, 2215–2227, 1990.
Golaz, J.-C., H. Jiang, and W. R. Cotton, A large-eddy simulation study ofcumulus clouds over land and sensitivity to soil moisture, Atmos. Res.,59, 373–392, 2002.
Lyons, T. J., P. Schwerdtfeger, J. M. Hacker, I. J. Foster, R. C. G. Smith,and H. Xinmei, Land-atmosphere interaction in a semiarid region: Thebunny fence experiment, Bull. Am. Meteorol. Soc., 74, 1327–1334, 1993.
Meher-Homji, V. M., Probable impact of deforestation on hydrologicalprocesses, Clim. Change, 19, 163–173, 1991.
Nair, U. S., Climatic impact of lowland deforestation on tropical montanecloud forests in Costa Rica, 122 pp., Ph.D. dissertation, Dep. of Atmos.Sci., Colo. State Univ., Fort Collins, 2002.
Nair, U. S., J. A. Rushing, R. Ramachandran, K. S. Kuo, R. M. Welch, andS. J. Graves, Detection of cumulus cloud fields in satellite imagery, inEarth Observing Systems IV, edited by W. L. Barnes, Proc. SPIE, 3750,345–355, 1999.
Ookouchi, Y., M. Segal, R. C. Kessler, and R. A. Pielke, Evaluation of soilmoisture effects on generation and modification of mesoscale circula-tions, Mon. Weather Rev., 112, 2281–2292, 1984.
Otterman, J., Baring high-albedo soils by overgrazing: A hypothesizeddesertification mechanism, Science, 86, 531–533, 1974.
Otterman, J., A. Manes, S. Rubin, P. Alpert, and D. O’C. Starr, An increaseof early rains in southern Israel following land-use change?, BoundaryLayer Meteorol., 53, 333–351, 1990.
Pielke, R. A., A three-dimensional numerical model of the sea breezes oversouth Florida, Mon. Weather Rev., 102, 115–139, 1974.
Pielke, R. A., Sr., Influence of the spatial distribution of vegetation and soilson the prediction of cumulus convective rainfall, Rev. Geophys., 39,151–178, 2001.
Pielke, R. A., and X. Zeng, Influence of severe storm development ofirrigated land, Natl. Weather Dig., 14, 16–17, 1989.
Pielke, R. A., et al., A comprehensive meteorological modeling system:RAMS, Meteorol. Atmos. Phys., 49, 69–91, 1992.
Pounds, A. J., M. P. L. Fogden, and J. H. Campbell, Biological re-sponse to climate change on tropical mountain, Nature, 389, 611–614,1999.
Rabin, R. M., and D. W. Martin, Satellite observations of shallow cumuluscoverage over the central United States: An exploration of landuse impacton cloud cover, J. Geophys. Res., 101, 7149–7155, 1996.
Rabin, R. M., S. Stadler, P. J. Wetzel, D. J. Stensrud, and M. Gregory,Observed effect of landscape variability on convective clouds, Bull.Am. Meteorol. Soc., 71, 272–280, 1990.
Sader, S. A., and A. T. Joyce, Deforestation rates and trends in Costa Rica,1940 to 1983, Biotropica, 20, 11–19, 1988.
Sagan, C., O. B. Toon, and J. B. Pollack, Anthropogenic albedo changes anthe Earth’s climate, Science, 206, 1363–1368, 1979.
Schwartz, M. D., and T. R. Karl, Spring phenology: Nature’s experiment todetect the effect of ‘‘green-up’’ on surface maximum temperatures, Mon.Weather Rev., 114, 883–890, 1990.
Segal, M., R. Avissar, M. C. McCumber, and R. A. Pielke, Evaluation ofvegetation effects on the generation and modification of mesoscale cir-culations, J. Atmos. Sci., 45, 2268–2292, 1988.
Segal, M., R. W. Arrit, J. Shen, C. Anderson, and M. Leuthold, On theclearing of cumulus clouds downwind from the lakes,Mon. Weather Rev.,125, 639–646, 1997.
Shukla, J., C. Nobre, and P. Sellers, Amazon deforestation and climatechange, Science, 247, 1322–1325, 1990.
Still, C. J., P. N. Foster, and S. H. Schneider, Simulating the effects ofclimate change on tropical montane cloud forests, Nature, 389, 608–610, 1999.
Sud, Y. C., W. C. Chao, and G. K. Walker, Dependence of rainfall onvegetation: theoretical considerations, simulation experiments, observa-tions, and inferences from simulated atmospheric soundings, J. Arid En-viron., 25, 5–18, 1993.
Sykes, R. I., and D. S. Henn, Large-eddy simulation of turbulent shearedconvection, J. Atmos. Sci., 35, 25–39, 1989.
Tremback, C. J., and R. Kessler, A surface temperature and moisture para-meterization for use in mesoscale numerical models, in Proceedings ofthe 7thAMS Conference on Numerical Weather Prediction, June 17–20.Montreal, Quebec, Canada, pp. 355–358, Am. Meteorol. Soc., Boston,Mass., 1985.
Weckwerth, T. M., J. W. Wilson, R. M. Wakimoto, and N. A. Crook,Horizontal convective rolls: Determining the environmental conditionssupporting their existence and characteristics, Mon. Weather Rev., 125,505–526, 1997.
Wetzel, P. J., S. Argentini, and A. Boone, Role of land surface in controllingdaytime cloud amount: Two case studies in GCIP-SW area, J. Geophys.Res., 101, 7359–7370, 1996.
Wheelwright, N. T., Conservation biology, in Monteverde: Ecology andConservation of a Tropical Cloud Forest, edited by N. M. Nadkarniand N. T. Wheelwright, chap. 12, pp. 419–456, Oxford Univ. Press,New York, 2000.
Wright, I. R., J. H. C. Gash, H. R. da Rocha, W. J. Shuttleworth, C. A.Nobre, G. T. M. Maitelli, C. A. G. P. Zamparoni, and P. R. A. Carvalho,Dry season micrometeorology of central Amazonian ranchland, Q. J. R.Meteorol. Soc., 118, 1083–1099, 1992.
�����������������������R. O. Lawton, Department of Biological Sciences, University of Alabama
in Huntsville, Huntsville, AL 35899, USA.U. S. Nair and R. M. Welch, Department of Atmospheric Science,
National Space Science and Technology Center, University of Alabama inHuntsville, 320 Sparkman Drive, Huntsville, AL 35806, USA. ([email protected])R. A. Pielke Sr., Department of Atmospheric Science, Colorado State
University, Fort Collins, CO 80523-1371, USA.
NAIR ET AL.: COSTA RICAN TROPICAL MONTANE CLOUD FORESTS ACL 4 - 13


