Embed Size (px)
Citation preview

1
UNDERGRADUATES
SCHOOL OF BUSINESS SCIENCES AND MANAGEMENT
B.TECH (HONOURS) DEGREE IN FINANCIAL ENGINEERING
HIT: 200
DISSERTATION: 2013
Research Topic: Impact of Liquidity risk on Banks’ Solvency in Zimbabwe,
during the period of 2009 - 2012.
DISSERTATION
BY
NAMES: SURNAMES: REG NO.
NYASHA .J. MUGOMBA H1110545P
PETER SHARARA H1110360M
EPHRAIM .T. CHIKWAWA H1110405F
SHINGIRAYI MUSHAYI H1010647N
Submitted in partial fulfilment of a Bachelor of Technology (Honours) Degree in Financial
Engineering
2
HARARE INSTITUTE OF TECHNOLOGY
RELEASE FORM
Authors: Nyasha .J. Mugomba
Peter Sharara
Ephraim .T. Chikwawa
Shingirayi Mushayi
Title of Thesis: Impact of Liquidity Risk on Banks’ Solvency in Zimbabwe, during
the period of 2009-2012.
DegreeProgram
which Thesis was
presented: Bachelor of Technology (Honors) Degree in Financial Engineering
Year Degree was granted: Part (2): 2013
Permission is hereby granted to the Harare Institute of Technology
(HIT) Library to reproduce copies of this document and to lend
such copies only for scholarly purposes or scientific research
purposes only. The authors reserve other publication rights and
neither whole nor extensive extracts from it may be printed or
reproduced without the author’s prior written permission.
Signed by: Mugomba N.J., Sharara P., Chikwawa E., and Mushayi S.
Date:…………..........
Permanent Address: Harare Institute of Technology P.O. Box BE 277 Ganges Road,
Belvedere, Harare
3
HARARE INSTITUTE OF TECHNOLOGY
APPROVAL FORM
The undersigned certify that they have read and recommend for acceptance, a
dissertation entitled “Impact of Liquidity Risk on Banks’ Solvency in Zimbabwe”,
during the period (2009-2012) submitted by Nyasha .J. Mugomba, Peter Sharara ,
Ephraim.T. Chikwawa and Shingirayi Mushayi, in Partial Fulfillment of the
Requirements of the Bachelor of Technology (Honors) Degree in Financial
Engineering with the Harare Institute of Technology.
…………………………………………………………………………….
Supervisor
………………………………………………………………………………..
Program Coordinator
…………………………………………………………………………………
Date
……………………………………………….……………………………

4
DECLARATION
We do hereby declare that this dissertation is the result of our own research, except to
the extent indicated in the Acknowledgements and References and by acknowledged
sources in the body of the research, and that it has not been submitted in part or full for
any other degree to any other University or College.
NAMES: SURNAMES: SIGNATURE: DATE:
Nyasha .J. Mugomba …..………………... .……………..
Peter Sharara …………………….. …..………….
Ephraim .T. Chikwawa. .…………………… ...……………
Shingirayi Mushayi …...………………… ………………
5
Abstract
The purpose of this paper is to examine liquidity risk in Zimbabwean banks and evaluate
the impact on bank solvency. Data are retrieved from the balance sheets, income
statements and notes of 12 commercial banks in Zimbabwe during 2009-2012. Multiple
regressions are applied to assess the impact of liquidity risk on bank solvency. The results
of multiple regressions show that liquidity risk affects bank solvency insignificantly, with
liquidity gap, capital risk and non-performing loans as the two factors exacerbating the
bank solvency. They have a positive relationship with bank solvency. The period studied
in this paper is 2009-2012, due to availability of the data and introduction of
multicurrency system in February 2009. However, the sample period does not impair the
findings since the sample includes 12 banks, which constitute the main part of the
Zimbabwean banking system. Moreover, only shareholders’ equity to total liabilities and
off-balance sheet events is used as the measure of bank solvency. Economic factors
contributing to liquidity risk are not covered in this paper. This is the first paper
addressing the liquidity risk faced by the Zimbabwean banking system. Past researchers
and practitioners have not given the proper attention to liquidity risk. This paper helps in
understanding the factors of bank specific, macroeconomic variables and their impact on
the solvency of the banking system. The authors emphasize contemporary risk managers
to mitigate liquidity risk by having sufficient cash resources. This will reduce the
liquidity gap, thereby reducing the dependence on stock market.
Keywords: Zimbabwe, Bank solvency, Banks, Risk management, Liquidity risk, Non-
performing loans, Liquidity gap,
Paper type: Research paper
6
ACKNOWLEDGEMENTS
We would like to extend our sincere gratitude to our Supervisor, Mr. J Muvingi for
giving us guidance and direction during our research. Without his invaluable
contribution, this research would not have been possible.
We are also indebted to a number of people who, through their unwavering support and
resourcefulness, ensured we were able to successfully complete this research. we wish to
acknowledge the support we got from members of staff at News day and Herald Their
support, guidance, teamwork and co-operation knew no boundaries and indeed priceless.
We also acknowledge the assertiveness and professionalism of all our peers and
supervisors within the institution which has helped us realize the yet to be tapped
potential and certainly put us on course to bring the best out of us.
We are proud to be associated with the HARARE INSTITUTE OF TECHNOLOGY
(HIT), teaching and non-teaching staff whose enthusiastic approach has seen the
continued ascent of the University into a major player in the country’s institutions of
higher education. We are humbled by the level of commitment the lecturers in the
Department of Financial Engineering displayed.
Table of Contents
DECLARATION ....................................................................................................... 4 THE ABSTRACT ..................................................................................................... 5
ACKNOWLEDGEMENTS ....................................................................................... 6 List of Tables............................................................................................................. 9
ABBREVIATIONS ................................................................................................... 9 CHAPTER 1 .......................................................................................................... 10
1.0 Introduction ....................................................................................................... 10 1.1 Background ....................................................................................................... 10
1.2 Problem statement ............................................................................................. 13 1.3 Research objectives............................................................................................ 13
1.4 Research questions............................................................................................. 13 1.5 Research Hypothesis .......................................................................................... 13
1.6 Significance of the Study ................................................................................... 14 1.7 Assumptions ...................................................................................................... 14
1.8 Scope of the Study ............................................................................................. 14 1.9 Limitation of the Study ...................................................................................... 14
7
1.10 Summary.. ....................................................................................................... 15 CHAPTER2.....................................................................................................................
2.0 LITERATURE REVIEW................................................................................... 16 2.1 Introduction ....................................................................................................... 16
2.2 Definition of key Variables ................................................................................ 16 2.2.1 Bank Solvency ................................................................................................ 16
2.2.2. Liquidity Risk ................................................................................................ 16 2.3 Measurement of Key Variables ......................................................................... 17
2.3.1 Bank Solvency ................................................................................................ 17 2.3.2 Liquidity Risk ................................................................................................. 17
2.4 Theoritical Evidence ........................................................................................ 18 2.4.1 Introduction .................................................................................................... 18
2.4.2 Bank Solvency ................................................................................................ 19 2.4.3 Liquidity Risk and Bank Solvency .................................................................. 19
2.4.4 Bank Profitability and Bank Solvency ............................................................. 19 2.4.5 Bank Size and Bank Solvency ......................................................................... 20
2.4.6 Capital Risk and Bank Solvency ..................................................................... 20 2.4.7 Credit Risk and Bank Solvency ....................................................................... 21
2.4.8 Macro- Economic Variables ............................................................................ 21 2.4.8.1 Inflation and Bank Solvency ...................................................................... 21
2.4.8.2 Growth in Real GDP (GGDP) ...................................................................... 22 2.5 Empirical Evidence ............................................................................................ 22
2.5.1 Liquidity Risk and Bank Solvency .................................................................. 22 2.5.2 Credit and Bank Solvency ............................................................................... 23
2.5.3 Capital Risk and Bank Solvency ..................................................................... 23 2.5.4 Bank Size and Bank Solvency ......................................................................... 24
2.5.5 Bank Profitability and Bank Solvency ............................................................. 24 2.5.6 Growth Domestic Product and Bank Solvency ................................................ 25
2.5.7 Inflation and Bank Solvency ........................................................................... 25 2.5.8 Summary ........................................................................................................ 26
CHAPTER3 ........................................................................................................... 27 3..0 Research Methodology ..................................................................................... 27
3.1 Introduction ....................................................................................................... 27 3.2 Research Design ................................................................................................ 27
3.3 Population ......................................................................................................... 28 3.4 Sampling ........................................................................................................... 29
3.5 Sources of Data..................................................................................................... . 30 3.5.1 Justification of Secondary Data ....................................................................... 30
3.6 Econometrics Specification ................................................................................ 31 3.6.1 Research Model................................................................................................. 31
3.6.2 Determinants of Bank Solvency Model ........................................................... 31 3.7 Defition of Key Variables ................................................................................. 31
3.7.1 Bank Solvency ................................................................................................ 31 3.7.2 Liquidity Risk ................................................................................................. 32
3.7.3 Capital Risk .................................................................................................... 33 3.7.4 Credit Risk ...................................................................................................... 33
8
3.7.5 Profitability ..................................................................................................... 33 3.7.6 Bank Size ...................................................................................................... 34
3.7.7 Growth Domestic Product ............................................................................... 34 3.7.8 Inflation .......................................................................................................... 35
3.8 Data Analysis Techniques .................................................................................. 36 3.9 Justification of Panel Regression Techniques ..................................................... 36
3.10 Statistical Techniques Used.............................................................................. 37 3.11 Statistical Package Used .................................................................................. 37
3.12 Data Interpretation ........................................................................................... 37 3.13 Summary ......................................................................................................... 38
CHAPTER4 ........................................................................................................... 39 4.0 Data Analysis and Presentation .......................................................................... 39
4.1 Introduction ....................................................................................................... 39 4.2 Secondary and Literary Data Analysis ............................................................... 39
4.3 Empirical Results and Interpretation .................................................................. 40 4.4 Durbin Watson Statistics. ................................................................................... 42
4.5 Liquidity Risk and Bank Solvency ..................................................................... 43 4.6 Credit Risk and Bank Solvency .......................................................................... 44
4.7 Capital Risk and Bank Solvency. ....................................................................... 44 4.8 Profitability and Bank Solvency ......................................................................... 44
4.9 Bank Size and Bank Sol vency. .......................................................................... 45 4.10 Liquidity Gap and Bank Solvency . .................................................................. 45
4.11 Inflation and Bank Solvency. ........................................................................... 45 4.12 Gross Domestic Product and Bank Solvency .................................................... 46
4.13 Model Based on Unstandardized Coefficiencts................................................. 46 4.14 Model Based on Standardized Coefficients ...................................................... 46
4.15 Summary ......................................................................................................... 47 CHAPTER 5 .......................................................................................................... 48
5.0 CONCLUSIONS AND RECOMMENDATIONS .............................................. 48 REFERENCES ........................................................................................................ 49
APPENDICES .............................................................................................................
9
ABBREVIATIONS
AGRIBANK - AGRICULTURAL BANK OF ZIMBABWE
CBZ - COMMERCIAL BANK OF ZIMBABWE
GDP - GROSS DOMESTIC PRODUCT
IMF - INTERNATIONAL MONETARY FUND
POSB - POST OFFICE SAVINGS BANK
STANCHART - STARNDARD CHARTETERED BANK
INF - INFLATION
LR - LIQUIDITY RISK
CR - CAPITAL RISK
NPL - NON PERFORMING LOANS
LN (TA) - LOGARITHM OF TOTAL ASSETS
Table 2.1: List of banks based on population ........................................................... 27 Table 2.2: list of banks based on sample size ........................................................... 28
Table 2.3: Summary of variables and their proxies ................................................... 34 Table 2.4: Descriptive statistics ............................................................................... 39
Table 2.5: Correlation matrix ................................................................................... 40 Table 3.1: results of multiple regression ................................................................... 41
Table 4.1ANOVA (analysis of variance)………………………………………………………………………….......42
10
CHAPTER 1
1.0 INTRODUCTION
The study examines the impact of liquidity risk on bank solvency in Zimbabwe. This
subject has become a contentious issue given by the prevailing environment in which
deposits attracted little or no interest while lending rates were pegged at exorbitant levels
of lending at 10-30% rates whereas other markets on 3% is a pipedream.
Bank solvency means that no debt exists. While liquidity risk is the current and
prospective risk to earnings or capital arising from banks inability to meet its obligations
when they come due without incurring unacceptable losses. Liquidity risk includes
inability to manage unplanned decreases or changes in funding sources. It also arises
from the failure to recognize or address changes in market conditions that affect the
ability to liquidate assets quickly and within minimum loss in value.
As regulators are increasing their focus on liquidity risk in response to the financial crisis
that occurred recently, but there are questions about whether solvency is an effective
mitigate for liquidity risks and the nature of the relationship between liquidity risk and
bank solvency. Roy Choudhury, Peter Marshall and HovikTumasyan look at the
interdependencies between liquidity risk and solvency.
1.1 BACKGROUND
Banks have had both sides of their balance sheet devastated by hyperinflation and now
have no lender of last resort to call on. They are understandably cautious in lending
deposits that are slowly filtering back into the system. Banks also lost much of their
equity capital. Barclays bank survived because it had 40 branches where the bank owned
the real estate and had strong parent. These properties plus some foreign currency
holdings represents the equity capital on which the bank current operation.
Since February 2009 there has been no lender of last resort in Zimbabwe due to the
introduction of multicurrency system causing banks to be ultra-cautious in their lending
policies.
11
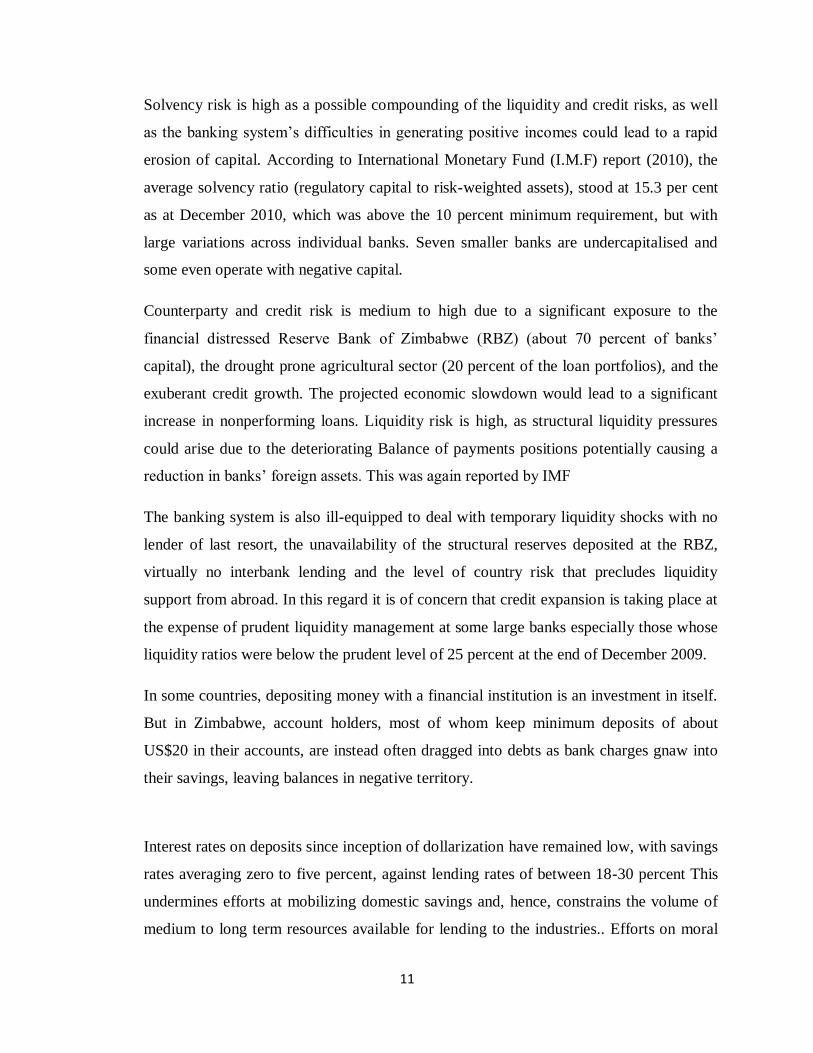
Solvency risk is high as a possible compounding of the liquidity and credit risks, as well
as the banking system’s difficulties in generating positive incomes could lead to a rapid
erosion of capital. According to International Monetary Fund (I.M.F) report (2010), the
average solvency ratio (regulatory capital to risk-weighted assets), stood at 15.3 per cent
as at December 2010, which was above the 10 percent minimum requirement, but with
large variations across individual banks. Seven smaller banks are undercapitalised and
some even operate with negative capital.
Counterparty and credit risk is medium to high due to a significant exposure to the
financial distressed Reserve Bank of Zimbabwe (RBZ) (about 70 percent of banks’
capital), the drought prone agricultural sector (20 percent of the loan portfolios), and the
exuberant credit growth. The projected economic slowdown would lead to a significant
increase in nonperforming loans. Liquidity risk is high, as structural liquidity pressures
could arise due to the deteriorating Balance of payments positions potentially causing a
reduction in banks’ foreign assets. This was again reported by IMF
The banking system is also ill-equipped to deal with temporary liquidity shocks with no
lender of last resort, the unavailability of the structural reserves deposited at the RBZ,
virtually no interbank lending and the level of country risk that precludes liquidity
support from abroad. In this regard it is of concern that credit expansion is taking place at
the expense of prudent liquidity management at some large banks especially those whose
liquidity ratios were below the prudent level of 25 percent at the end of December 2009.
In some countries, depositing money with a financial institution is an investment in itself.
But in Zimbabwe, account holders, most of whom keep minimum deposits of about
US$20 in their accounts, are instead often dragged into debts as bank charges gnaw into
their savings, leaving balances in negative territory.
Interest rates on deposits since inception of dollarization have remained low, with savings
rates averaging zero to five percent, against lending rates of between 18-30 percent This
undermines efforts at mobilizing domestic savings and, hence, constrains the volume of
medium to long term resources available for lending to the industries.. Efforts on moral
12
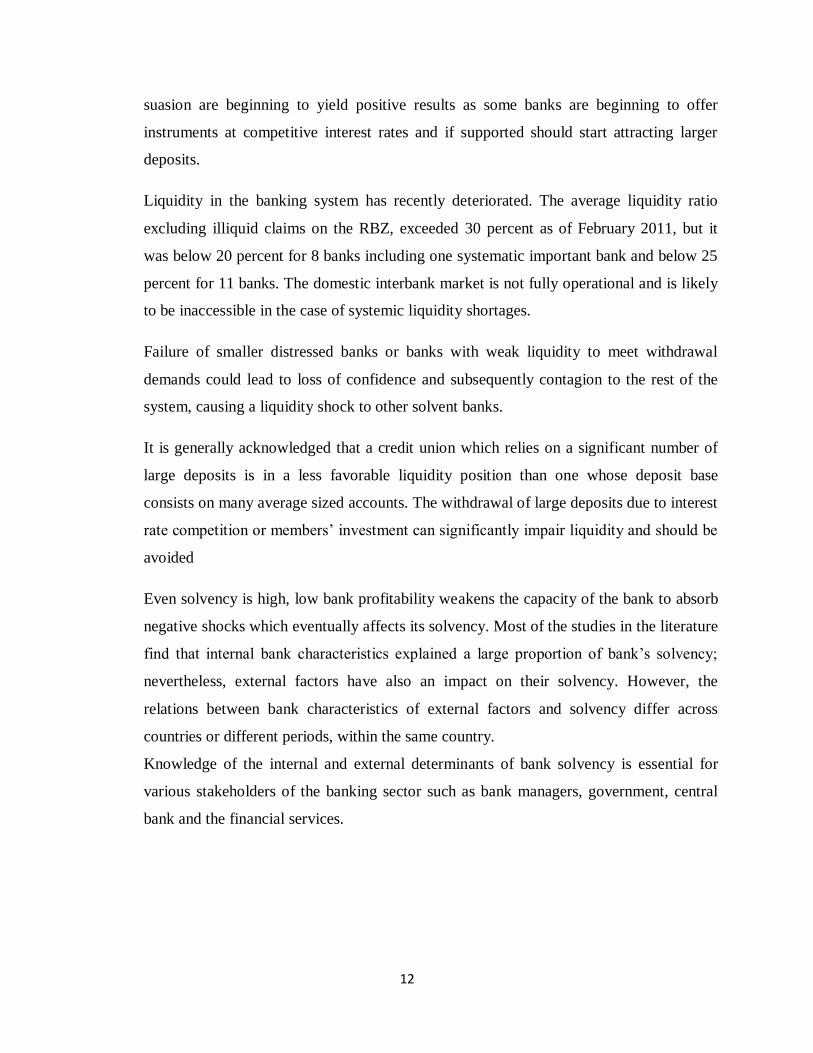
suasion are beginning to yield positive results as some banks are beginning to offer
instruments at competitive interest rates and if supported should start attracting larger
deposits.
Liquidity in the banking system has recently deteriorated. The average liquidity ratio
excluding illiquid claims on the RBZ, exceeded 30 percent as of February 2011, but it
was below 20 percent for 8 banks including one systematic important bank and below 25
percent for 11 banks. The domestic interbank market is not fully operational and is likely
to be inaccessible in the case of systemic liquidity shortages.
Failure of smaller distressed banks or banks with weak liquidity to meet withdrawal
demands could lead to loss of confidence and subsequently contagion to the rest of the
system, causing a liquidity shock to other solvent banks.
It is generally acknowledged that a credit union which relies on a significant number of
large deposits is in a less favorable liquidity position than one whose deposit base
consists on many average sized accounts. The withdrawal of large deposits due to interest
rate competition or members’ investment can significantly impair liquidity and should be
avoided
Even solvency is high, low bank profitability weakens the capacity of the bank to absorb
negative shocks which eventually affects its solvency. Most of the studies in the literature
find that internal bank characteristics explained a large proportion of bank’s solvency;
nevertheless, external factors have also an impact on their solvency. However, the
relations between bank characteristics of external factors and solvency differ across
countries or different periods, within the same country.
Knowledge of the internal and external determinants of bank solvency is essential for
various stakeholders of the banking sector such as bank managers, government, central
bank and the financial services.
13
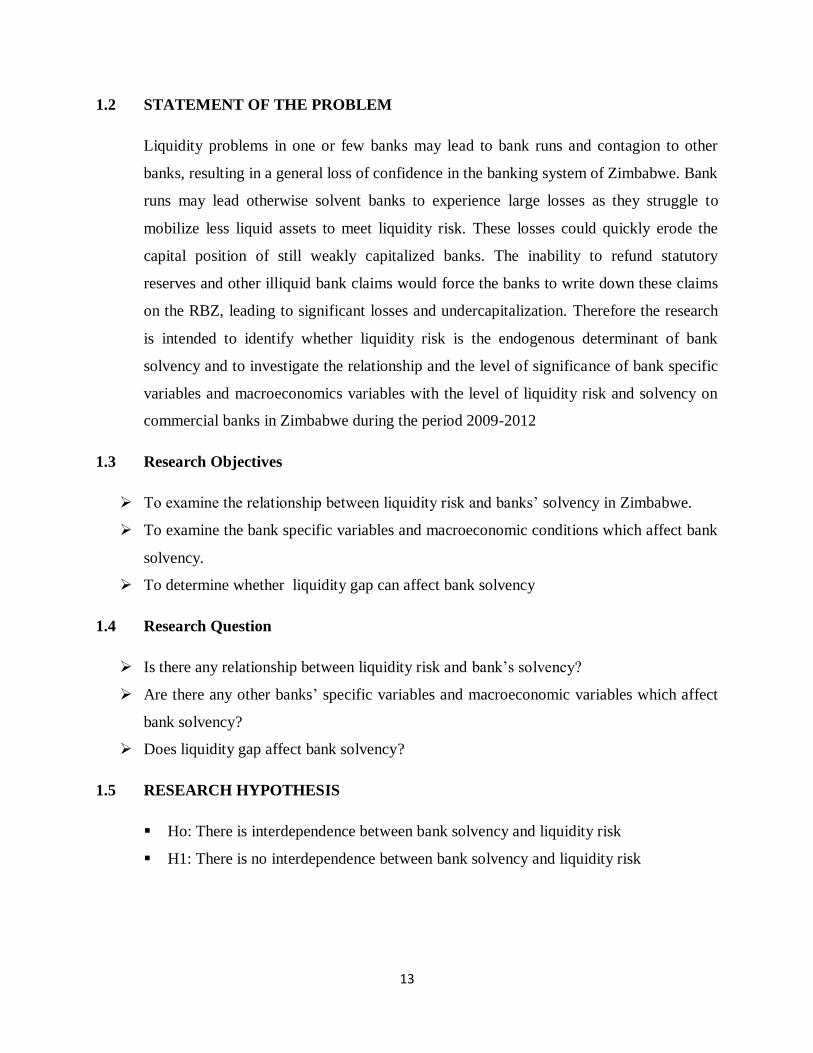
1.2 STATEMENT OF THE PROBLEM
Liquidity problems in one or few banks may lead to bank runs and contagion to other
banks, resulting in a general loss of confidence in the banking system of Zimbabwe. Bank
runs may lead otherwise solvent banks to experience large losses as they struggle to
mobilize less liquid assets to meet liquidity risk. These losses could quickly erode the
capital position of still weakly capitalized banks. The inability to refund statutory
reserves and other illiquid bank claims would force the banks to write down these claims
on the RBZ, leading to significant losses and undercapitalization. Therefore the research
is intended to identify whether liquidity risk is the endogenous determinant of bank
solvency and to investigate the relationship and the level of significance of bank specific
variables and macroeconomics variables with the level of liquidity risk and solvency on
commercial banks in Zimbabwe during the period 2009-2012
1.3 Research Objectives
To examine the relationship between liquidity risk and banks’ solvency in Zimbabwe.
To examine the bank specific variables and macroeconomic conditions which affect bank
solvency.
To determine whether liquidity gap can affect bank solvency
1.4 Research Question
Is there any relationship between liquidity risk and bank’s solvency?
Are there any other banks’ specific variables and macroeconomic variables which affect
bank solvency?
Does liquidity gap affect bank solvency?
1.5 RESEARCH HYPOTHESIS
Ho: There is interdependence between bank solvency and liquidity risk
H1: There is no interdependence between bank solvency and liquidity risk
14
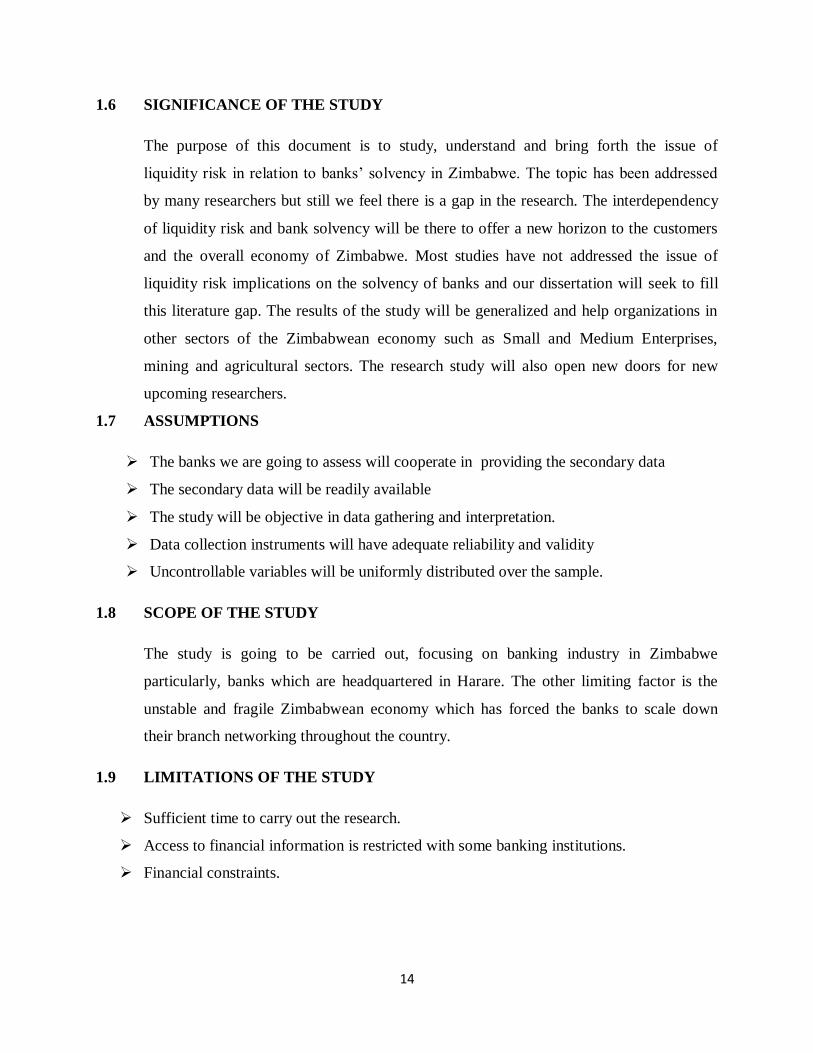
1.6 SIGNIFICANCE OF THE STUDY
The purpose of this document is to study, understand and bring forth the issue of
liquidity risk in relation to banks’ solvency in Zimbabwe. The topic has been addressed
by many researchers but still we feel there is a gap in the research. The interdependency
of liquidity risk and bank solvency will be there to offer a new horizon to the customers
and the overall economy of Zimbabwe. Most studies have not addressed the issue of
liquidity risk implications on the solvency of banks and our dissertation will seek to fill
this literature gap. The results of the study will be generalized and help organizations in
other sectors of the Zimbabwean economy such as Small and Medium Enterprises,
mining and agricultural sectors. The research study will also open new doors for new
upcoming researchers.
1.7 ASSUMPTIONS
The banks we are going to assess will cooperate in providing the secondary data
The secondary data will be readily available
The study will be objective in data gathering and interpretation.
Data collection instruments will have adequate reliability and validity
Uncontrollable variables will be uniformly distributed over the sample.
1.8 SCOPE OF THE STUDY
The study is going to be carried out, focusing on banking industry in Zimbabwe
particularly, banks which are headquartered in Harare. The other limiting factor is the
unstable and fragile Zimbabwean economy which has forced the banks to scale down
their branch networking throughout the country.
1.9 LIMITATIONS OF THE STUDY
Sufficient time to carry out the research.
Access to financial information is restricted with some banking institutions.
Financial constraints.
15
1.10 Summary.
The study is organized into five chapters as follows; Chapter one deals with study
introductions, purpose of the study, research questions, and hypotheses including
limitations of the study. Chapter two looks at the literature review relevant to the study in
line with the research objectives. Chapter three focuses on research methodology i.e.
research design; sampling techniques, sample sizes and data collection methods. The
fourth chapter is on data analysis and presentation. Finally chapter five has the
conclusions, observations and recommendations based on the research findings on which
way forward were made.
16
CHAPTER 2
2.0 REVIEW OF LITERATURE
2.1 Introduction.
This is a chapter on literature review. Basically literature review is all about making
summaries and analysis of related annual reports, journals, research reports ,textbooks
and publications on the liquidity risk management in the banking industry system to
provide the background on the theoretical and empirical reviews underpinning of a
research study
2.2 Definition of key variables
2.2.1 Bank solvency
A bank is solvent when the total value of its assets is greater than that of its liabilities. A
bank becomes risky if it is insolvent. (Mohamad Abdul Hamid).
2.2.2 Liquidity risk
A bank’s liquidity risk refers to a comparison of its liquidity needs for deposit outflows
and loan increases with the actual or potential sources of liquidity from either selling an
asset it holds or acquiring an additional liability. (Shaza Marina Azmi) Banking liquidity
risk is therefore associated both to banks’ ability to fulfill their obligation to depositors
(borrowers) to transform their deposits into legal money (to receive cash by drawing
down the credit lines), and their function of maintaining a balance between the ingoing
and outgoing cash flows deriving from the management of payments made using banking
money. Means of payment are created and cash flows managed under the direction and
control of the Central Banks, which guarantee the availability of the monetary base
needed to sustain the ordered creation of banking money. The Central Banks also play a
key role in the creation and strengthening of the infrastructures needed to settle payments
within the financial system. Liquidity risk is seen as a major risk, but it is the object of:
extreme liquidity, "security cushion" or the specialty of mobilizing capital at a "normal"
cost (Dedu, 2003)
17
2.3 Measurement of key variables
2.3.1 Bank solvency
The following are the commonly used measures for bank solvency. (Zaman et al (2001))
1) Debt equity ratio (DER) = Debt/equity capital. Bank capital can absorb financial
shock. In case asset values decrease or loans are not repaid bank capital provides
protection against those loan losses. A lower DER ratio is a good sign for a bank.
2) Debt to total asset ratio (DTA) = Debt/total asset indicates the financial strength of a
bank to pay its debtor. A high DTAR indicates that a bank involves in more risky
business.
3) Equity multiplier (EM) = Total assets/share capital. It is the amount of assets per $ of
equity capital. A higher EM indicates that the bank has borrowed more funds to convert
into asset with the share capital. The higher value of EM indicates greater risk for a bank.
4) Loan to deposit ratio (LDR) = loans/deposit measures liquidity as well as credit risk
for a bank. A high value indicates a potential source of illiquidity and insolvency.
2.3.2 Liquidity risk
Generally, liquidity risk measures can be calculated from balance sheet positions. In the
past, better practices for liquidity risk measures focused on the use of liquidity ratios.
However, Poorman and Blake (2005) indicated that it was not enough to measure
liquidity just using liquidity ratios and it was not the solution. Recently, there are many
methods provided to assess bank liquidity risk besides traditional liquidity ratios. Basel
Committee on Banking Supervision (2000) proposed maturity laddering method for
measuring liquidity risk. Saunders and Cornett (2006) indicated that banks can use
sources and uses of liquidity, peer group ratio comparisons, liquidity index, financing gap
and the financing requirement, and liquidity planning to measure their liquidity exposure.
Besides, Matz and Neu (2007) also indicated that banks can apply balance sheet liquidity
analysis, cash capital position and maturity mismatch approach to assess liquidity risk.
18
2.4 THEORETICAL EVIDENTS
2.4.1 Introduction
Few studies have examined the factors that affect bank solvency in different countries.
One strand in the literature examines the specific characteristics of banks; other studies
examine the effect of external factors such as financial industry and economic
environment. In addition previous research examines in either a particular country or a
number of countries, single countries include among others for example Tunisia [Ben
Naceur 2003] and Greece [Kosmidou and Pasiouras 2005]
The interdependencies of solvency and liquidity risk are discussed within the context of
two management function thus one the setting of risk appetite and integrated balance
sheet management and stress testing according to Roy Choudhury,Peter Marshall and
HovikTumasyan
As remarked by Good hart (2008), “liquidity and solvency are the heavenly twins of
banking, frequently indistinguishable. An illiquid bank can rapidly become insolvent, and
an insolvent bank illiquid.”
Golin (2001) shows that proportioned revenues are required so that banks can maintain
solvency in order to survive, grow and succeed in an appropriate environment. Liquidity
risk arises because inflows and outlays are not synchronized (Holmström and Tirole
(1998)). The impacts of the banks liquidity on their solvency remain unclear and further
research is required.
2.4.2 Bank solvency
Bank Solvency represents total equity to total liabilities. The measure of the extent of
leverage using liabilities instead of assets provides a more sensible measure of the bank
buffer stock that will serve as a cushion to absorb losses. Moreover if we take into
account that in the latest episodes of bank distress there were not only shocks related to
bank’s asset value, but also related to deposit base. In addition, the explicit inclusion of
off-balance-sheet positions produces a more accurate measure of bank leverage and
exposure (Breuer, 2000).
19
2.4.3 Liquidity risk and bank solvency
Liquidity risk represents liquid assets/deposits. The higher the ratio the lower the
liquidity risk and the lower the opportunity for profit. Liquid assets are used to measure
the size of available cash and near cash assets to meet the withdrawal demand. This
demand could be demand for loans withdrawals of demand deposits and opportunities for
investments in securities. Failure to provide adequate liquidity to meet the demands of
depositors or creditors can cause a shutdown of a bank within a short period. Liquidity
risk result in a decrease of the portfolio value, but could also jeopardize the investors
own credit rating thus in other words if a fund is unable to fulfill a redemption
request as agreed, the investor in turn may fail to fulfill his own credit commitments
thus according to Marshall et al (2010)
Inclusion of liquidity risk in the definition of risk appetite takes an intermediated form
through its effect on profit and loss (by identifying the highest acceptable the cost of
funding), and its impact on balance sheet structure (by defining the size and composition
of the liquidity buffer a bank can afford to hold given there are high opportunity cost and
negative carrying cost associated with the liquid assets thus according to Tumasyan et al
(2010)
2.4.4 Bank profitability and bank solvency
Bank profitability can be seen as indicator of the (in) efficiency of the banking system
(Demirguc-Kuntand Huizinga, 1999). Two indicators of bank profitability are used. The
first indicator is the return on assets (ROA) and is calculated as the net income divided by
average total assets. It shows the profits earned per $ of assets and indicates the
effectiveness of managing the fixed assets to generate revenues. The second indicator of
profitability is the return on equity (ROE), and is calculated as the net income divided by
equity. Bank profitability has improved but smaller banks have taken considerable risks.
The return on average assets (ROA) and return on equity (ROE) rose in 2010, as banks
benefited from the improved economic environment, and new financial products,
including mobile banking, generated additional revenue. Nevertheless, the profitability of
banks in Zimbabwe remained lower than that of its sub-Saharan peers (Table 1, Figures 1
20
and 2). Smaller banks have become more risk-taking, reaching for lower-end and
sometimes unbankable customers, potentially heightening the volatility to bank income
and profitability. Smaller banks are also less efficient with a higher cost structure.
2.4.5 Size of Bank and Bank solvency
Size of the bank signals specific bank risk, although the expected sign is ambiguous. To
the extent that governments are less likely to allow big banks to fail, a risk approach to
size would predict that bigger banks would require lower profits (e.g. through lower
interest rates charged to borrowers). Moreover, modern intermediation theory predicts
efficiency gains related to bank size, owing to economies of scale. This would imply
lower costs for larger banks that they may retain as higher level of solvency if they do not
operate in very competitive environments. To capture the relationship between size and
bank solvency while also accounting for such potential nonlinearities, we proxy bank size
using the logarithm of total assets and their square. Larger size may result in economies
of scale which could reduce the cost gathering information.(Calvin McDonald et al
(2009))
2.4.6 Capital risk and Bank solvency
Capital Risk (Equity) shows book value of equity divided by total assets. High ratio
means lower degree of risk. It shows how much of bank’s assets values may decline
before the position of its depositors and other creditors is jeopardized. Banks that have
high equity to assets ratio normally have less needs for external funding and consequently
is expected to be more profitable .The bank solvency can be affected by bank’s own
plans, which can be derived from the structure of its balance sheet and income statement.
One of the most factors influencing bank solvency is the capital ratio. (Berger 1995)
2.4.7 Credit risk and Bank Solvency
Credit risk represents the ratio of loans to deposits and short-term funding since this
provides a forward-looking measure of bank exposure to default and asset quality
deterioration (Valentina Flamini). The risk of default in repayment of bank interest or
principal on loans is closely related to liquidity transformation because cumulative
21
default risk tends to rise over time. The changes of the credit risk can reflect the changes
of the health of a bank loan portfolio which can affect the solvency of the enterprise
(Cooper et al., 2003). This raises a debate concerning the quality of loan. Duca and
McLaughlin (1990), among others, concluded that the variation of the banking
profitability is largely attributable to the variation of the credit risk because the increased
exposure to the credit risk is normally connected with the decrease of the firm
profitability. This starts a discussion not concerning the volume, but the quality of the
loans made. In this direction, Miller and Noulas (1997) suggest that the more the
financial institutions are exposed to high risk, the higher the accumulation of the unpaid
loans and the lower the level of bank solvency.
2.4.8 Macroeconomic variables
As for the impact of macroeconomic and financial development indicators on banks’
solvency, they find no significant impact of such variables on net interest margin, except
inflation and growth in real gross domestic product (GGDP)
2.4.8.1 Inflation and Bank Solvency
Revell (1979) introduced the notion that the effect of inflation depends on wages and
other operating costs of banks which are increasing at a faster rate than inflation. As such,
the relationship between inflation and solvency is ambiguous and depends on whether
inflation is expected or not. The inflation rate fully anticipated by the management of the
bank implies that banks can appropriately adjust the interest rates to increase their
products faster than their costs and then gain higher profits. In contrast, unanticipated
inflation could lead to an incorrect adjustment of the interest rates and therefore to the
possibility that costs may rise faster than products.
2.4.8.2 Growth in real GDP (GGDP)
It measures the total economic activity in the economy. It is expected to be positively
related to bank solvency. According to the literature of financial sector development and
economic growth, growth in GDP is positively associated with bank solvency. There is no
doubt that a well-functioning financial system is important for economic growth. Rajah
22
and Zing ales (1998); Levin (1997, 1998), among others, suggest that the efficiency of
financial intermediation affects country’s economic growth, while at the same time bank
insolvencies can result in systemic crises which have negative consequences for the
economy as a whole with losses that arise in many cases around 10-20% of GDP and
occasionally as much as 40-55% of GDP (Caprio and Klingebiel, 2003). Colin (2001), in
addition, suggests that adequate earnings are required in order for banks to maintain
solvency, to survive, and grow in a suitable environment.
2.5 EMPERICAL EVIDENCE ON THE IMPACT OF LIQUIDITY RISK ON BANK
SOLVENCY.
The only thing certain about the future is that finance and industry will continue to
change especially with the multicurrency system offering new challenges and
opportunities. With the empirical review the researcher is going to use quantitative
analysis and will be based on the basic theories and suggestions put forward by different
authors and analysts.
2.5.1 Liquidity risk and bank solvency
Kosmidou et al., (2005) found a negative and statistically significant relationship between
net interest margin and liquidity ratio only when external factors enter the equation.
Kosmidou et al., (2004) and Angbazo (1997) also found similar results. These results are
in disagreement with those of Clays and Vender Veneto (2008) who found a positive and
statistically significant relationship between net interest margin and liquidity ratio,
although it is more pronounced on the Eastern European banking markets. Thus, since the
loans are the riskiest capitals and have the highest costs, this foundation refutes the
hypothesis that the loan has resulted in wider margins and reflects the ability of the banks
to integrate risk considerations and costs in their loan pricing behavior. Bourke (1999)
found that there is a positive relationship between bank solvency and liquidity risk.
However; Demerguç-Kunt and Huizinga, (1999) found that there is a negative
relationship between bank solvency and liquidity risk.
23
2.5.2 Credit risk and bank solvency
Athanasoglou et al., (2006) also found a statistically significant negative relationship
between the credit risk variable and the bank solvency, proving that banks in South East
Europe should focus more on managing credit risk, which was a problem in the recent
past. The serious banking problems have resulted from the failure of banks to identify the
impaired assets and create reserves for their cancellation. A great help was given to these
assets in that anomalies would be provided by improving the transparency of the financial
systems, which will help banks to assess their credit risk more effectively and avoid
exposure to dangerous problems. Kosmidou et al., (2005) found a positive but
statistically non-significant relationship between the credit risk and bank solvency.
Valverde and Fernandez (2007) found that the credit risk increases significantly between
bank credit and net profit margin. This reflects that payment by bank loans is more
interesting than that by cash, which would increase the net profit margin. Other studies
have found similar results (Demirgüç-Kunt and Huizinga, 1999; Demerguç-Kunt and
Huizinga, 2001; Maudos and Gerevara, 2004). Therefore, Ho and Saunders (1981) found
a generally low but statistically non-significant relationship between the default risk and
net interest margin and thereby improving the level of bank solvency.
2.53 Capital risk and bank solvency
Capital strength is one of the main determinants of a bank solvency. Kosmidou et al.,
(2005) found a positive and highly significant relationship between the equity ratio to
total assets and net profit margin (NIM). Therefore, banks are seeking to lower the cost of
their relatively high capital ratios by requiring higher MIN. This basis is in accordance
with the interpretation that the capital serves as a signal of bank solvency.
Hence, the very high sensitivity of the margins concerning the equity capital ratios to
total assets may be explained by the existence of a depositor’s behavior in the banking
operations in transition. This can reduce the deposit cost of the well-thriven banks leading
to higher profit margins. This result is in accordance with that of other studies, namely
Demirgüç-Kunt and Huizinga, (1999); Ben Naceur, (2003); Kosmidou and
Pasiouras, (2005); Valverde and Fernandez, (2007); Brock and Suarez, (2000);
Demirgüç-Kunt, Loeven and Levine, (2004) ;and Saunders and Schumacher (2000).
24
2.5.4 Bank size and bank solvency
The results obtained by the literature for the relationship between size and solvency are
diverse. Using market data (stock prices) instead of accounting measures of solvency,
Boyd and Runkle (1993) find a significant inverse relationship between size and loan to
deposit ratio(solvency) in U.S. banks from 1971 to 1990, and a positive relationship
between financial leverage and size. They do not provide, however, any theoretical model
to rationalize this evidence. Berger, et a (1987) develop a set of scale and product mix
measures for evaluating the competitive viability of firms, and apply it to 1983 data.
Their results show that as product mix and scale increases, banks experience some
diseconomies, implying a negative relation between size and returns. Goddard et al (2004
use panel and cross-sectional regressions to estimate growth and solvency equations for a
sample of banks for five European countries over the 1990s. The growth regressions
suggest that, as banks become larger in relative terms their growth in level of solvency
tends to increase further, with little or no sign of mean reversion in growth.
2.5.5 Bank profitability and bank solvency
Bank profitability can be seen as indicator of the (in) efficiency of the banking system.
Akhavein et al, (1997) and Smirlock (1985) used two indicators of bank profitability. The
first indicator is the return on assets (ROA) and is calculated as the net income divided by
average total assets. The second indicator of profitability is the return on equity (ROE),
and is calculated as the net income divided by equity. They found a positive and
significant relationship between bank profitability and solvency. Demirgüç-Kunt and
Huizinga (2000) and Goddard et al. (2004), used linear models to estimate the impact of
bank profitability that may be important in explaining bank solvency. They found a
negative relationship between the profitability of a bank and its level of solvency.
2.5.6 Gross domestic product and bank solvency
Demirgüç-Kunt and Maksimovic (1996) provide empirical evidence that an ability to
attract equity capitals may also increase the borrowing capacity of the firms, particularly
in the stock markets of the developing countries. Funding through raising the capital can
increase and decrease the demand for financing through debt, there by reflecting that
these sources are complementary. Thus, concerning the importance of the bank relative
GDP, Demerguç-Kunt and Huizinga, (1999) found that in countries where the banking
25
assets represent a large part of the GDP, the banks are less profitable. They also found
that the ratio of bank assets to the GDP, which has a significantly negative impact on the
margin, may reflect a more intense inter-bank competition in the financial systems. This
effect is negligible in richer countries that already have a relatively developed banking
sector. However, in countries with underdeveloped financial systems, a greater financial
development, which improves the efficiency of the banking sector, potentially leads to
growth at the micro, firm and the macro level. Thus, the improved availability of funds
financing for companies can increase their borrowing capacity (Demirgüç-Kunt
Huizinga, 2001). Pasiouras and Kosmidou, (2007) found that the total bank assets to the
GDP are negatively related to profitability
2.5.7 Inflation and bank solvency
Thus, Ben Naceur and Goaid (2005) found that banks tend not to gain profits in an
inflationary environment. Therefore, most studies (i.e. Bourke, 1989; Molyneux and
Thornton. 1992) observe a positive relationship between inflation and banking solvency.
Demiurgic-Kent and Huizinga,(1999) showed that with inflation , bank costs tend to
rise , However, a greater number of transactions may lead to higher labor costs.
Bourke (1989), Molyneux and Thornton (1992), have found a positive relation between
inflation and long term interest rates with bank solvency.
In conducting their researches most authors used cross-sectional time series fixed
generalized least squares (FGLS) regression. In estimating the coefficients they used
generalized least squares. In terms of panels they used homoscedastic data. Among them
Demirgüç-Kunt, Loeven and Levine, (2004) used Hausman Test as their model.
2.5.8 Summary
The term Liquidity risk includes a wide range of proxies and their measure differ from
region to region and from country to country and there is no universally agreed measure
of liquidity risk.
26
CHAPTER 3
3.0 RESEARCH METHODOLOGY
3.1 INTRODUCTION
The previous chapter focused on literature and empirical review on the impact of
liquidity risk and bank specific variables and macroeconomic variables which affect bank
solvency. The review considered various literature sources among them books, journals,
conference papers, periodicals, research papers, magazines, newspapers and Government
circulars on bank solvency and liquidity risk.
According to Sekaran (2003), research is an organized, systematic, data-based, critical,
objective, scientific inquiry or investigation into a specific problem, undertaken with the
purpose of finding answers or solutions to it. The information provided could be the
result of a careful analysis of data gathered firsthand or of data that is already available
This chapter discusses the approach to the research project. The data collection methods
are outlined and highlighted. It describes the research design and data collection
procedures. It also includes the methods the researcher used to identify other factors
which can affect bank solvency besides liquidity risk as a major challenge facing local
banks on their daily banking operations.
There is a planned procedure that focuses to a specific scope in conducting research. This
procedure was taken in order to seek answers to some questions or objectives. As
mentioned on the section 1.3, the objectives of this research are:
To examine the relationship between liquidity risk and banks’ solvency in Zimbabwe.
To examine the bank specific variables and macroeconomic conditions which affect bank
solvency.
To determine whether liquidity gap can affect bank solvency
3.2 Research design
The research was conducted in the form of a descriptive research of commercial banks
Zimbabwe was conducted. Most research activity is carried out under conditions of strict
27
time constraints and limited budget effect. The researcher employed a quantitative
approach which is appropriate when the research purpose is to test cause-effect type of
hypotheses.
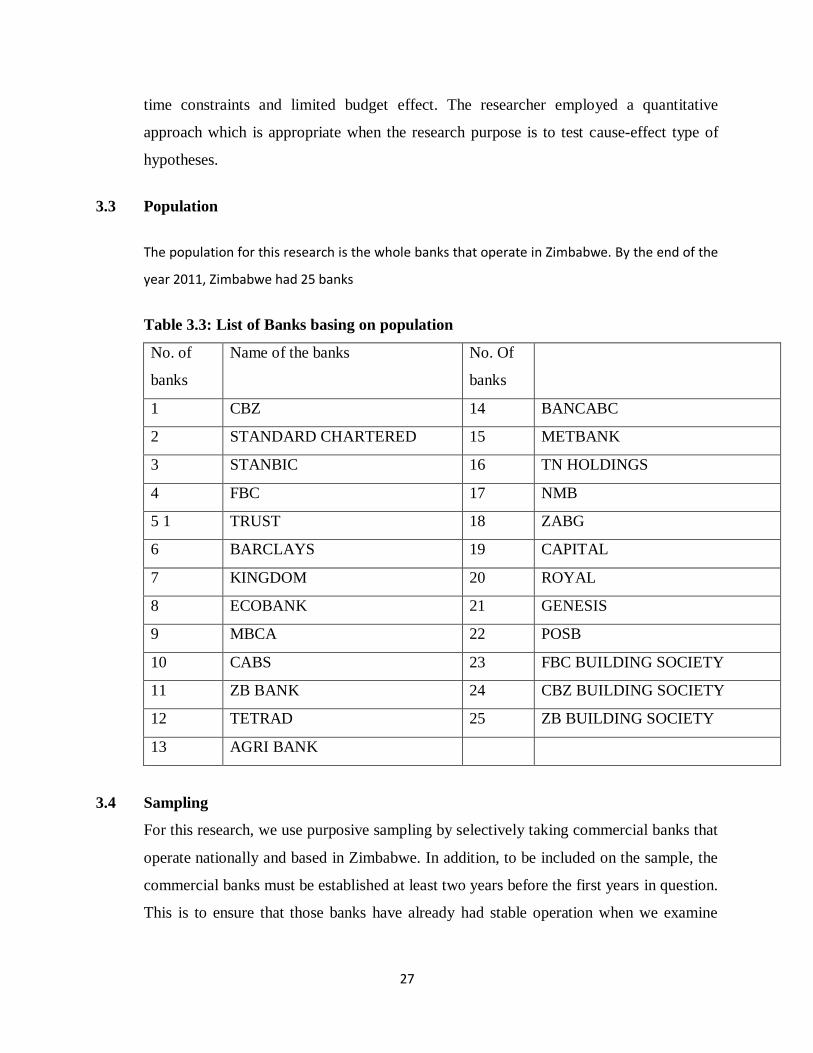
3.3 Population
The population for this research is the whole banks that operate in Zimbabwe. By the end of the
year 2011, Zimbabwe had 25 banks
Table 3.3: List of Banks basing on population
No. of
banks
Name of the banks No. Of
banks
1 CBZ 14 BANCABC
2 STANDARD CHARTERED 15 METBANK
3 STANBIC 16 TN HOLDINGS
4 FBC 17 NMB
5 1 TRUST 18 ZABG
6 BARCLAYS 19 CAPITAL
7 KINGDOM 20 ROYAL
8 ECOBANK 21 GENESIS
9 MBCA 22 POSB
10 CABS 23 FBC BUILDING SOCIETY
11 ZB BANK 24 CBZ BUILDING SOCIETY
12 TETRAD 25 ZB BUILDING SOCIETY
13 AGRI BANK
3.4 Sampling
For this research, we use purposive sampling by selectively taking commercial banks that
operate nationally and based in Zimbabwe. In addition, to be included on the sample, the
commercial banks must be established at least two years before the first years in question.
This is to ensure that those banks have already had stable operation when we examine
28
their risk positions. Hence, with above criteria, we selected 12 commercial banks to be
observed. The examination will be done in 4 years period, commencing 2009 to 2012.
3.4.1 Sample size
For any sample to be a true representative of the population, it must bear some
proportional relationship to the population from which it would have been drawn. The
researcher developed an adequate size of sample and efforts were made to balance
between the dangers of having an under or oversized sample, without over straining the
limited resources available.
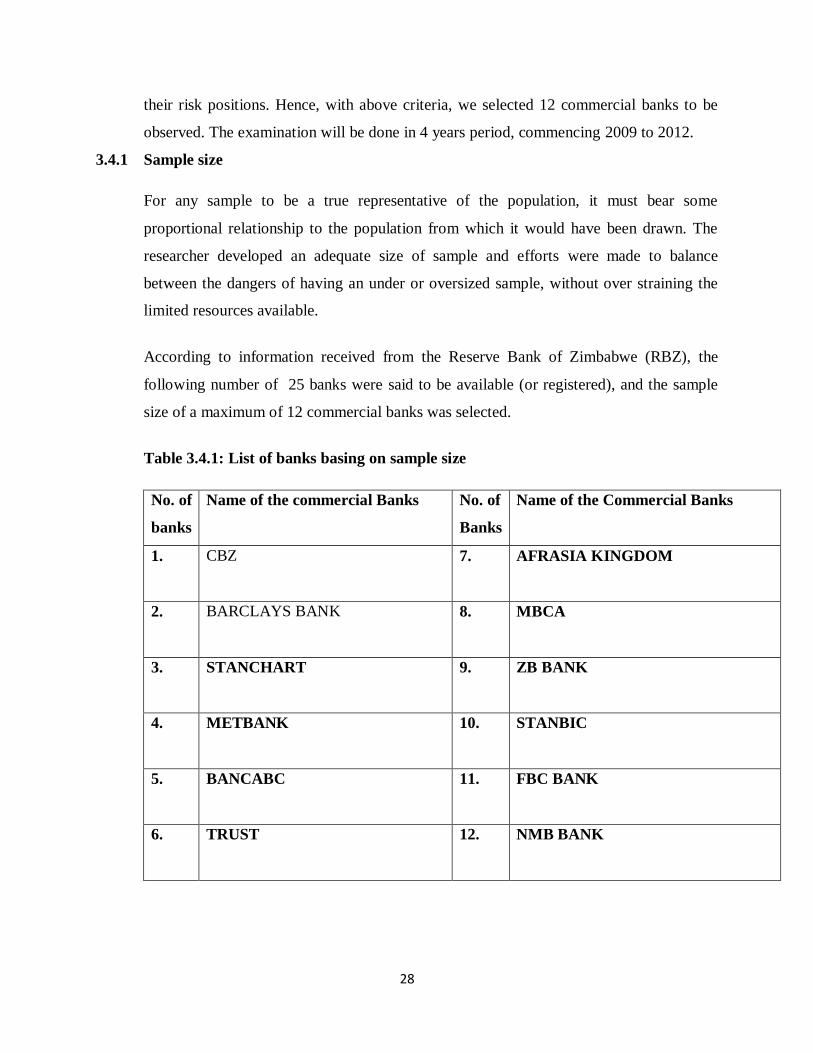
According to information received from the Reserve Bank of Zimbabwe (RBZ), the
following number of 25 banks were said to be available (or registered), and the sample
size of a maximum of 12 commercial banks was selected.
Table 3.4.1: List of banks basing on sample size
No. of
banks
Name of the commercial Banks No. of
Banks
Name of the Commercial Banks
1.
CBZ 7. AFRASIA KINGDOM
2.
BARCLAYS BANK 8. MBCA
3.
STANCHART 9. ZB BANK
4.
METBANK 10. STANBIC
5.
BANCABC 11. FBC BANK
6.
TRUST 12. NMB BANK
29
3.5 SOURCES OF DATA
According to Merril (1970) data can either be primary or secondary. He defined primary
data as raw data that is gathered through the use of interviews and questionnaires whereas
he defined secondary data as that data that can be obtained from published material. In
this research study the researcher used secondary data as type of data sources. Secondary
data
In this study, the researcher use secondary data. The main sources are from the various
publications, annual reports, press releases, and statistical bulletins the produced by
Reserve of Zimbabwe. In addition, the researcher also use online database provided in the
Harare Institute of Technology University and Reserve Bank of Zimbabwe electronic
library to search for relevant information for the research. The researcher also makes the
most of the available internet websites in searching for the relevant materials for the
study.
3.5.1 Justification for secondary data
Secondary data is very simple to obtain and is often cheaper, easier to collect and faster
to access than primary data. It is less time consuming and not strenuous. According to
Saunders (2003), secondary data is usually accessible which makes the data easier to
process during limited time. The accessibility also makes the data available to other and
easier to review. Secondary data lends itself to be generally purpose driven and authentic
for a related research study. Furthermore, it provides a way to access the work of the best
scholars all over the world. (www.kbridge.com).
However, the challenge of secondary research cannot be overlooked. It needed time to
organize and analyze the information to meet the needs of the research. Information can
be outdated and could have been researched for different purpose. Secondary data is
prone to bias as far as interpretation is concerned. Other major limitations of secondary
research are time and reliability.
30
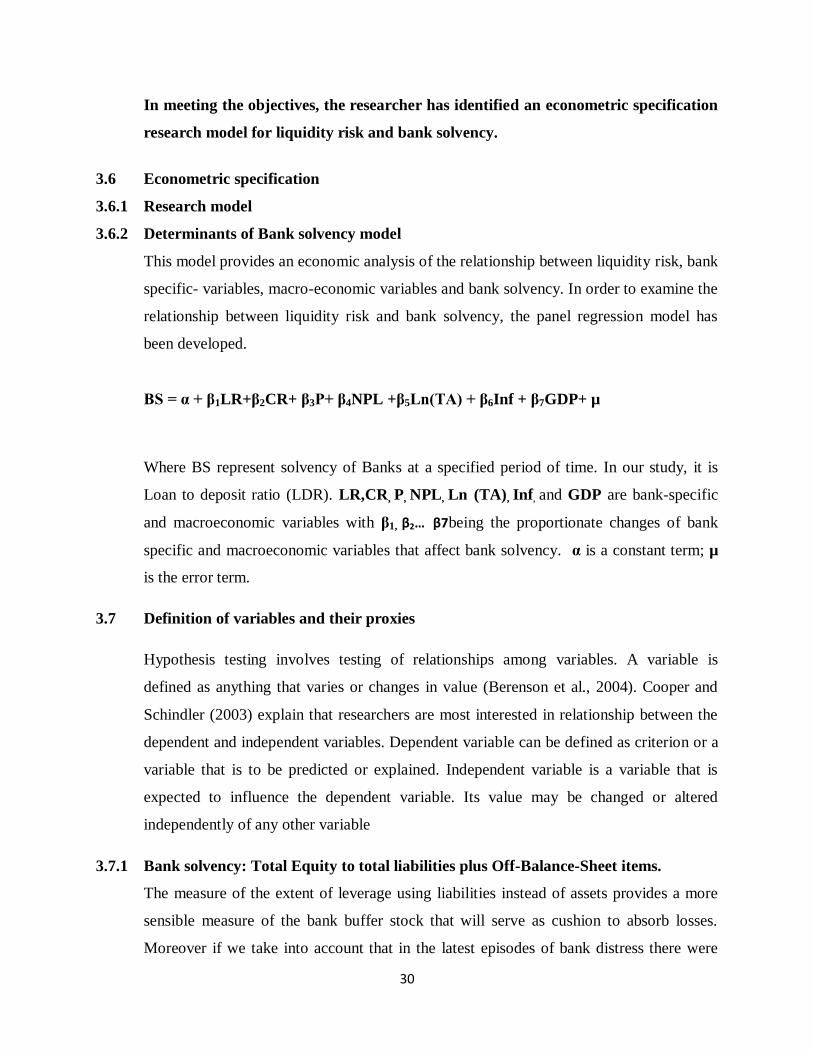
In meeting the objectives, the researcher has identified an econometric specification
research model for liquidity risk and bank solvency.
3.6 Econometric specification
3.6.1 Research model
3.6.2 Determinants of Bank solvency model
This model provides an economic analysis of the relationship between liquidity risk, bank
specific- variables, macro-economic variables and bank solvency. In order to examine the
relationship between liquidity risk and bank solvency, the panel regression model has
been developed.
BS = α + β1LR+β2CR+ β3P+ β4NPL +β5Ln(TA) + β6Inf + β7GDP+ µ
Where BS represent solvency of Banks at a specified period of time. In our study, it is
Loan to deposit ratio (LDR). LR,CR, P, NPL, Ln (TA), Inf, and GDP are bank-specific
and macroeconomic variables with β1, β2… β7being the proportionate changes of bank
specific and macroeconomic variables that affect bank solvency. α is a constant term; µ
is the error term.
3.7 Definition of variables and their proxies
Hypothesis testing involves testing of relationships among variables. A variable is
defined as anything that varies or changes in value (Berenson et al., 2004). Cooper and
Schindler (2003) explain that researchers are most interested in relationship between the
dependent and independent variables. Dependent variable can be defined as criterion or a
variable that is to be predicted or explained. Independent variable is a variable that is
expected to influence the dependent variable. Its value may be changed or altered
independently of any other variable
3.7.1 Bank solvency: Total Equity to total liabilities plus Off-Balance-Sheet items.
The measure of the extent of leverage using liabilities instead of assets provides a more
sensible measure of the bank buffer stock that will serve as cushion to absorb losses.
Moreover if we take into account that in the latest episodes of bank distress there were
31
not only shocks related to bank’s asset value, but also related to deposit base. In addition,
the explicit of inclusion of Off-Balance-Sheet positions produces a more accurate
measure of bank leverage and exposure (Breuer, 2000).
3.7.2 Liquidity risk: Ratio of liquid assets/deposits
The economics and finance literature analyze four possible reasons for firms to hold
liquid assets; the transaction motive Miller and Orr 1966, the precautionary motive
Opler, Pinkowitz, Stulz, and Williamson 1999, the tax motive Foley, Hartzell,
Titman, and Twite 2007 and finally the agency motive Jensen 1986. Analysts use
liquidity ratios to make judgments about a firm, but there are limitations to these
ratios. The liquidity of a firm's receivables and inventories can be misleading if the firm's
sales are seasonal and or the firm uses a natural business year (Gibson, Charles H. 1991
Financial Statement Analysis p.261 Cincinnati, OH: South-Western College Publishing).
Morris and Shin (2010) conceptually defines the liquidity ratio as “realizable cash on the
balance sheet to short term liabilities.” In turn, “realizable cash” is defined as liquid
assets plus other assets to which a haircut has been applied. Ration analysis is one of
the conventional way that use financial statements to evaluate the company and
create standards that have simply interpreted financial sense (George H.Pink, G.
Mark Holmes 2005). A sudden stop in an organization is generally defined as a
sudden slowdown in emerging market capital (cash)inflows, with an associated
shift from large current account deficits into smaller deficits or small surpluses.
Sudden stops are “dangerous and they may result in bankruptcies, destruction of human
capital and local credit channels” Calvo, 1998
Golin (2001) states: ''It is critical to carefully supervise the banks against liquidity
risk - Liquidity risk is the fact that it won’t have enough current assets such as money
and securities rapidly salable to meet the current commitments for example, those of
the depositors - particularly during the periods of economic stress.'' Without required
liquidity and investment to meet its commitments, a bank may go bankrupt. The ratio of
liquid assets to the customer and to short term investment (LIQ) is used in this study
as a measure of liquidity. It is a ratio that indicates which percentage of customers
and short term investments could be met if they were suddenly withdrawn.
32
3.7.3 Capital Risk: The ratio of equity capital to total assets (EQAS
This proxy is considered as one of the basic ratios for the capital strength, and is used
in this study as a measure of the capital strength (Golin, 2001). This positive impact
can be due to the fact that capital refers to the amount of own funds available to support
a bank’s business and, therefore, bank capital acts as a safety net in the case of adverse
developments. The expected positive relationship between capital and earnings could be
further strengthened due to the entry of new banks into the market. Therefore, strength
capital is related to the safety and strength of banks. In general, banks with a high capital
ratio are considered more secure in case of loss or liquidation. Therefore, the
assumption of risk agreement profitability would imply a negative relationship
between the ratio of equity capitals and bank solvency. The risk decline increases the
solvency of banks; hence reducing the investment cost.
3.7.4 Credit Risk: Non-performing loans.
The ratio of loan loss provisions to total loans (LLP/TL) is incorporated as an
independent variable in the regression analysis as a proxy of credit risk. Banks would,
therefore, improve solvency by improving screening and monitoring of credit risk and
such policies involve the forecasting of future levels of risk. The coefficient of LLP/TL is
expected to be negative because bad loans are expected to reduce solvency. In this
direction, Miller and Noulas (1997) suggest as the exposure of the financial institutions to
high risk loans increases, the accumulation of unpaid loans would increase and level of
solvency would decreases .Thakor (1987) also suggests that the level of loan loss
provisions is an indication of a bank's asset quality and signals changes in the future
performance.
3.7.5 The profitability: Return on assets or Return on equity
This variable can be represented by two alternative measures: the ratio of profits to
assets, i.e. the return on assets (ROA) and the profits to equity ratio, i.e. the return on
equity (ROE). In principle, ROA reflects the ability of a bank’s management to generate
profits from the bank’s assets, although it may be biased due to off-balance-sheet
activities. ROE indicates the return to shareholders on their equity and equals ROA times
33
the total assets-to-equity ratio. The latter is often referred to as the bank’s equity
multiplier, which measures financial leverage. Banks with lower leverage (higher equity)
will generally report higher ROA, but lower ROE. Since an analysis of ROE disregards
the greater risks associated with high leverage and financial leverage is often determined
by regulation, ROA emerges as the key ratio for the evaluation of bank solvency (IMF,
2002).
3.7.6 Size: Logarithm of total assets.
One of the most important questions underlying bank policy is which size optimizes bank
solvency. Generally, the effect of a growing size on solvency has been proved to be
positive to a certain extent. The LNTA variable is included in the regression as a proxy of
size to capture the possible cost advantages associated with size (economies of scale). In
the literature, mixed relationships are found between size and solvency, while in some
cases a U-shaped relationship is observed. LNTA is also used to control for cost
differences related to bank size and for the greater ability of larger bank to diversify. In
essence, LNTA may have a positive effect on bank solvency if there are significant
economies of scale. On the other hand, if increased diversification leads to higher risks,
the variable may exhibit negative effects.
Both of the macroeconomic variables used here are the growth of the gross domestic
product (GDP) and inflation (INF).
3.7.7 GDP: The real growth of the Gross Domestic Product.
The GDP growth (GDPGR) is among the macroeconomic indicators most commonly
used. It is a measure of all the economic activity expected to have an impact on many
factors related to the supply and demand for loans and deposits. The real GDP growth
used in this study is expected to have a positive relationship with solvency.
34
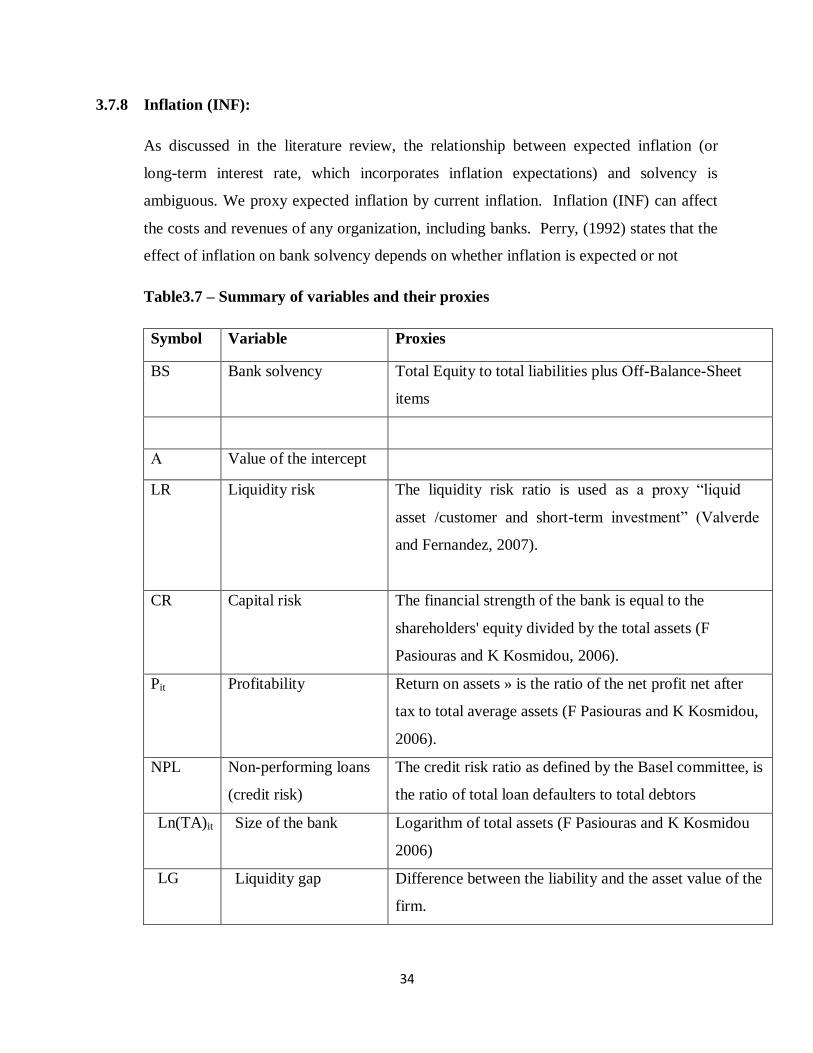
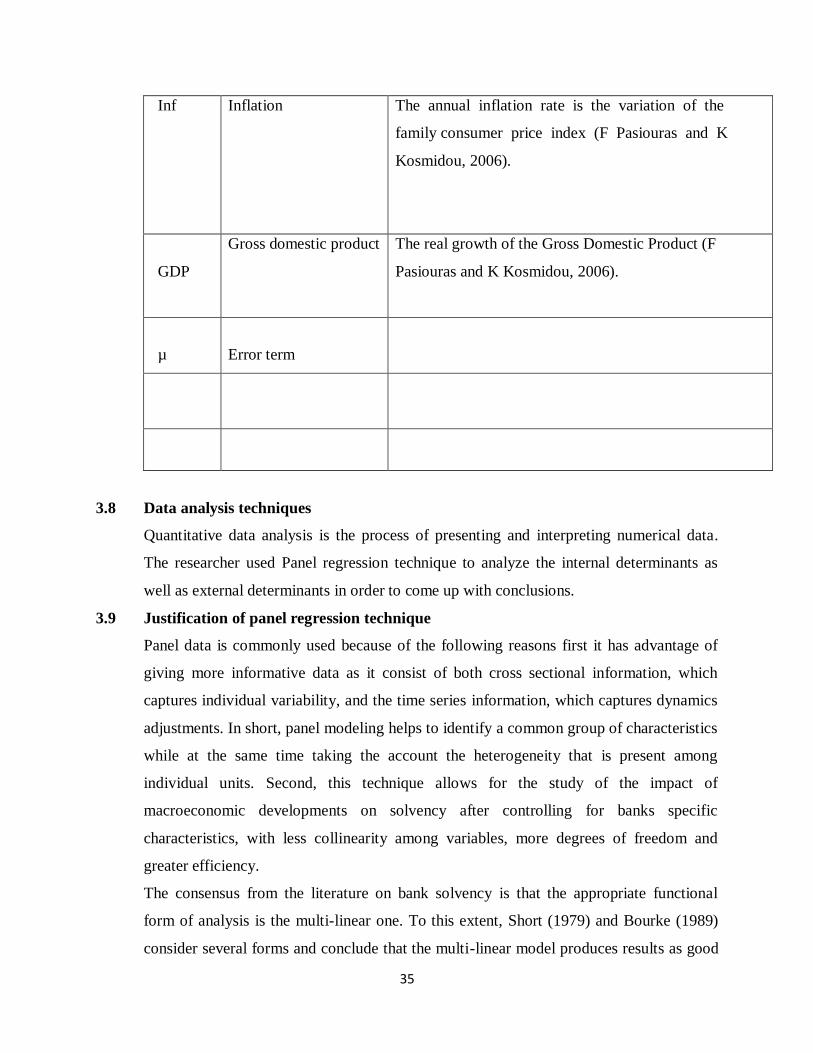
3.7.8 Inflation (INF):
As discussed in the literature review, the relationship between expected inflation (or
long-term interest rate, which incorporates inflation expectations) and solvency is
ambiguous. We proxy expected inflation by current inflation. Inflation (INF) can affect
the costs and revenues of any organization, including banks. Perry, (1992) states that the
effect of inflation on bank solvency depends on whether inflation is expected or not
Table3.7 – Summary of variables and their proxies
Symbol Variable Proxies
BS Bank solvency Total Equity to total liabilities plus Off-Balance-Sheet
items
Α Value of the intercept
LR Liquidity risk The liquidity risk ratio is used as a proxy “liquid
asset /customer and short-term investment” (Valverde
and Fernandez, 2007).
CR Capital risk The financial strength of the bank is equal to the
shareholders' equity divided by the total assets (F
Pasiouras and K Kosmidou, 2006).
Pit Profitability Return on assets » is the ratio of the net profit net after
tax to total average assets (F Pasiouras and K Kosmidou,
2006).
NPL Non-performing loans
(credit risk)
The credit risk ratio as defined by the Basel committee, is
the ratio of total loan defaulters to total debtors
Ln(TA)it Size of the bank Logarithm of total assets (F Pasiouras and K Kosmidou
2006)
LG Liquidity gap Difference between the liability and the asset value of the
firm.
35
Inf
Inflation
The annual inflation rate is the variation of the
family consumer price index (F Pasiouras and K
Kosmidou, 2006).
GDP
Gross domestic product
The real growth of the Gross Domestic Product (F
Pasiouras and K Kosmidou, 2006).
µ
Error term
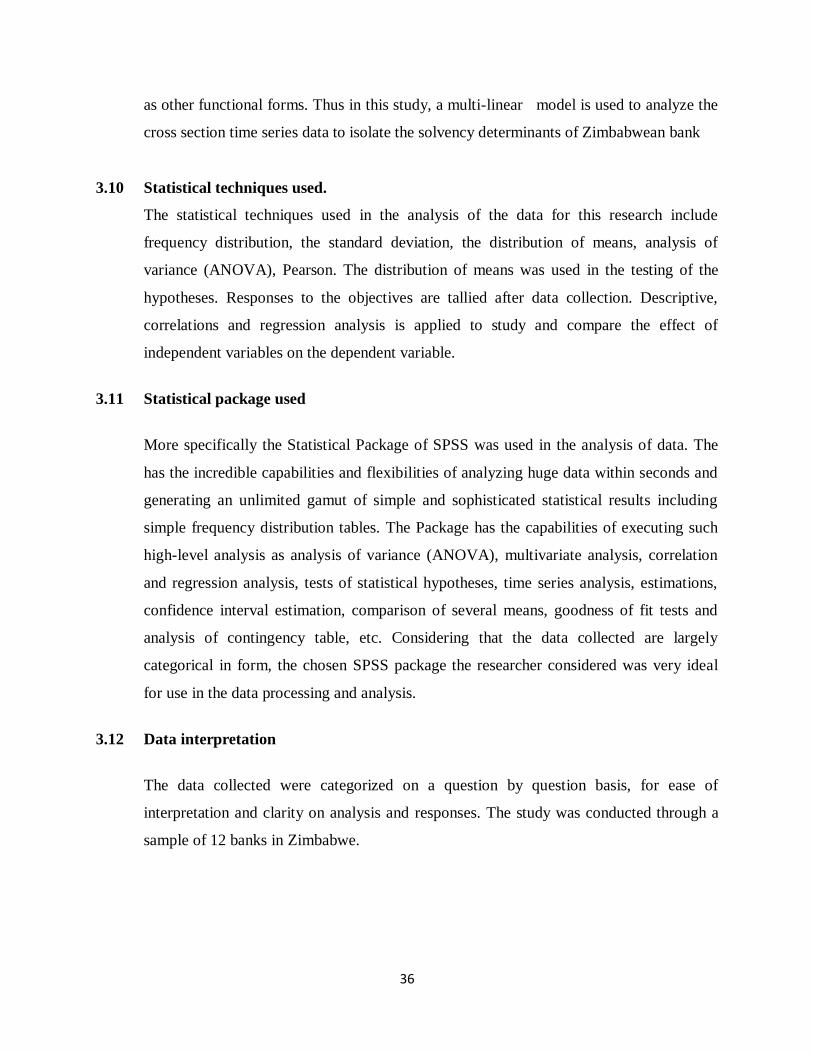
3.8 Data analysis techniques
Quantitative data analysis is the process of presenting and interpreting numerical data.
The researcher used Panel regression technique to analyze the internal determinants as
well as external determinants in order to come up with conclusions.
3.9 Justification of panel regression technique
Panel data is commonly used because of the following reasons first it has advantage of
giving more informative data as it consist of both cross sectional information, which
captures individual variability, and the time series information, which captures dynamics
adjustments. In short, panel modeling helps to identify a common group of characteristics
while at the same time taking the account the heterogeneity that is present among
individual units. Second, this technique allows for the study of the impact of
macroeconomic developments on solvency after controlling for banks specific
characteristics, with less collinearity among variables, more degrees of freedom and
greater efficiency.
The consensus from the literature on bank solvency is that the appropriate functional
form of analysis is the multi-linear one. To this extent, Short (1979) and Bourke (1989)
consider several forms and conclude that the multi-linear model produces results as good
36
as other functional forms. Thus in this study, a multi-linear model is used to analyze the
cross section time series data to isolate the solvency determinants of Zimbabwean bank
3.10 Statistical techniques used.
The statistical techniques used in the analysis of the data for this research include
frequency distribution, the standard deviation, the distribution of means, analysis of
variance (ANOVA), Pearson. The distribution of means was used in the testing of the
hypotheses. Responses to the objectives are tallied after data collection. Descriptive,
correlations and regression analysis is applied to study and compare the effect of
independent variables on the dependent variable.
3.11 Statistical package used
More specifically the Statistical Package of SPSS was used in the analysis of data. The
has the incredible capabilities and flexibilities of analyzing huge data within seconds and
generating an unlimited gamut of simple and sophisticated statistical results including
simple frequency distribution tables. The Package has the capabilities of executing such
high-level analysis as analysis of variance (ANOVA), multivariate analysis, correlation
and regression analysis, tests of statistical hypotheses, time series analysis, estimations,
confidence interval estimation, comparison of several means, goodness of fit tests and
analysis of contingency table, etc. Considering that the data collected are largely
categorical in form, the chosen SPSS package the researcher considered was very ideal
for use in the data processing and analysis.
3.12 Data interpretation
The data collected were categorized on a question by question basis, for ease of
interpretation and clarity on analysis and responses. The study was conducted through a
sample of 12 banks in Zimbabwe.
37
3.13 Summary
The study was conducted through a survey of twelve (12) banks in Zimbabwe. The
research used purposive sampling techniques to ensure a fair representation of all
commercial banks. For adequate data gathering, triangulation was used, to gather data
through secondary source.
The next chapter presents findings of the study where data collected is presented and
analyzed. This is in line with the objectives and hypothesis indicated in chapter one, to
allow for meaningful conclusions and observations.
38
CHAPTER 4
4.0 DATA ANALYSIS AND PRESENTATION
4.1 Introduction
The chapter focuses on data analysis based on information gathered during research,
mainly from the secondary data that was distributed to a sample representative of
commercial banks. The secondary data was analyzed using SPSS and accordingly it was
coded to ensure ease of classification of analysis and presentation of data.
Since the data was collected from a sample of commercial banks; and not the entire
population, it is therefore subject to sampling errors and tolerances, i.e. some differences
may not be statistically significant.
The study sought to provide answers to the following questions;
Is there any relationship between liquidity risk and bank’s solvency?
Are there any other banks specific variables and macroeconomic variables which affect
bank solvency?
Does liquidity gap affect bank solvency?
4.2 Secondary and literary data analysis
Mass literature on commercial banks in scattered form abound but published data on
categorizing and ranking of problems of liquidity challenges facing commercial banks in
Zimbabwe as well as the contribution of commercial banks to our national economic
growth and development proved rather difficult to come by. It was easier for the
researcher to access data relating to the performance of commercial banks and the impact
of liquidity risk on bank solvency in other parts of the world especially Asian, western
countries and even other African countries like Cameroon and Tunisia than those
pertaining to commercial banks in Zimbabwe. There is therefore need to come up with
credible research on the impact of liquidity risk on bank solvency in Zimbabwe and such
data research should be publicized; in order to reduce information asymmetry
39
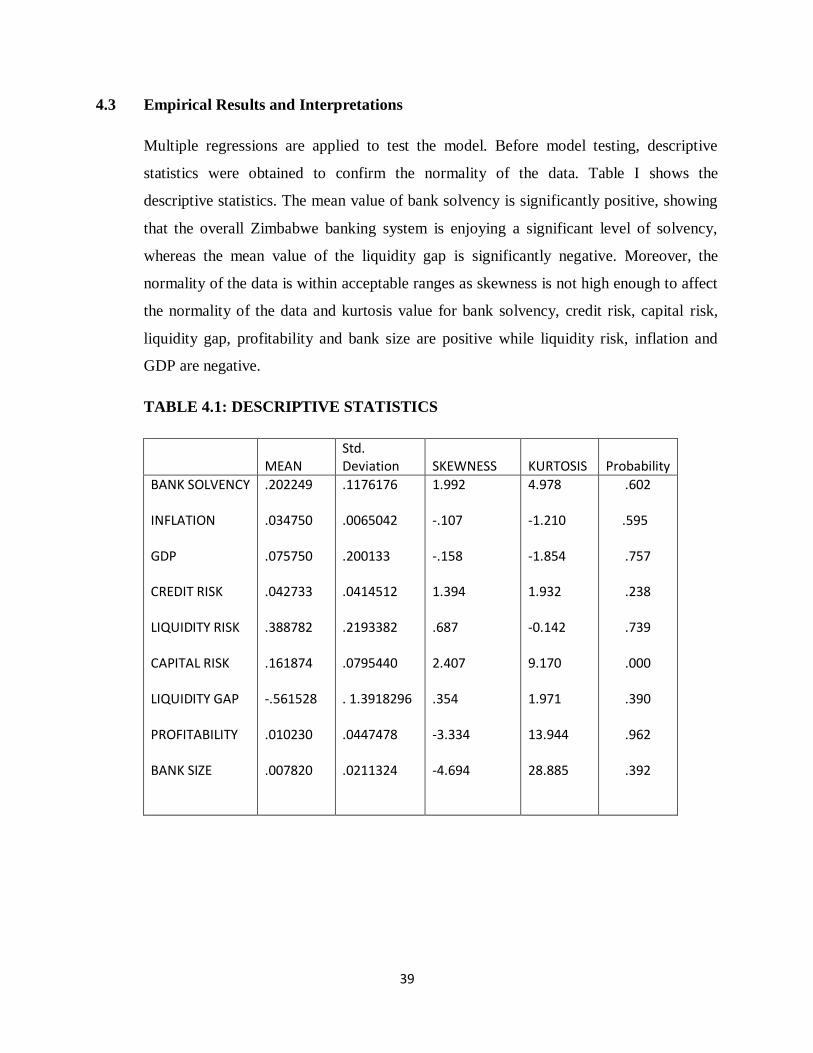
4.3 Empirical Results and Interpretations
Multiple regressions are applied to test the model. Before model testing, descriptive
statistics were obtained to confirm the normality of the data. Table I shows the
descriptive statistics. The mean value of bank solvency is significantly positive, showing
that the overall Zimbabwe banking system is enjoying a significant level of solvency,
whereas the mean value of the liquidity gap is significantly negative. Moreover, the
normality of the data is within acceptable ranges as skewness is not high enough to affect
the normality of the data and kurtosis value for bank solvency, credit risk, capital risk,
liquidity gap, profitability and bank size are positive while liquidity risk, inflation and
GDP are negative.
TABLE 4.1: DESCRIPTIVE STATISTICS
MEAN
Std. Deviation
SKEWNESS
KURTOSIS
Probability
BANK SOLVENCY INFLATION GDP CREDIT RISK LIQUIDITY RISK CAPITAL RISK LIQUIDITY GAP PROFITABILITY BANK SIZE
.202249 .034750 .075750 .042733 .388782 .161874 -.561528 .010230 .007820
.1176176 .0065042 .200133 .0414512 .2193382 .0795440 . 1.3918296 .0447478 .0211324
1.992 -.107 -.158 1.394 .687 2.407 .354 -3.334 -4.694
4.978 -1.210 -1.854 1.932 -0.142 9.170 1.971 13.944 28.885
.602
.595
.757
.238
.739
.000
.390
.962
.392
40
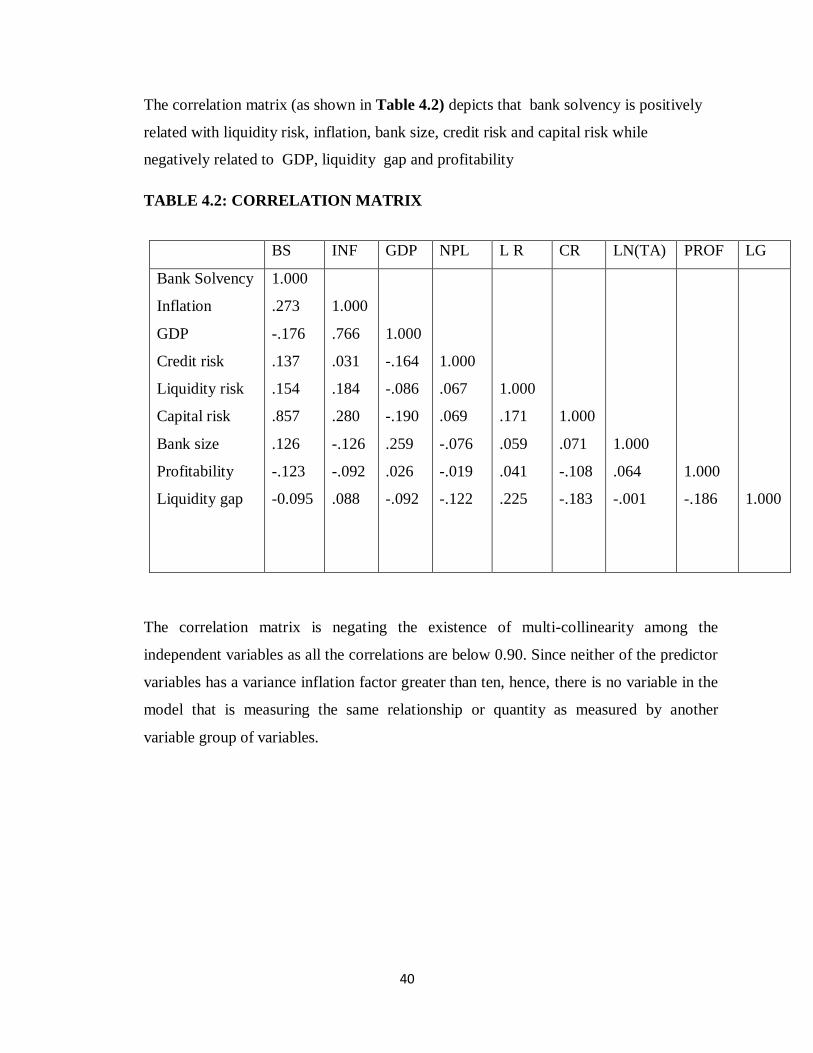
The correlation matrix (as shown in Table 4.2) depicts that bank solvency is positively
related with liquidity risk, inflation, bank size, credit risk and capital risk while
negatively related to GDP, liquidity gap and profitability
TABLE 4.2: CORRELATION MATRIX
The correlation matrix is negating the existence of multi-collinearity among the
independent variables as all the correlations are below 0.90. Since neither of the predictor
variables has a variance inflation factor greater than ten, hence, there is no variable in the
model that is measuring the same relationship or quantity as measured by another
variable group of variables.
BS INF GDP NPL L R CR LN(TA) PROF LG
Bank Solvency
Inflation
GDP
Credit risk
Liquidity risk
Capital risk
Bank size
Profitability
Liquidity gap
1.000
.273
-.176
.137
.154
.857
.126
-.123
-0.095
1.000
.766
.031
.184
.280
-.126
-.092
.088
1.000
-.164
-.086
-.190
.259
.026
-.092
1.000
.067
.069
-.076
-.019
-.122
1.000
.171
.059
.041
.225
1.000
.071
-.108
-.183
1.000
.064
-.001
1.000
-.186
1.000
41
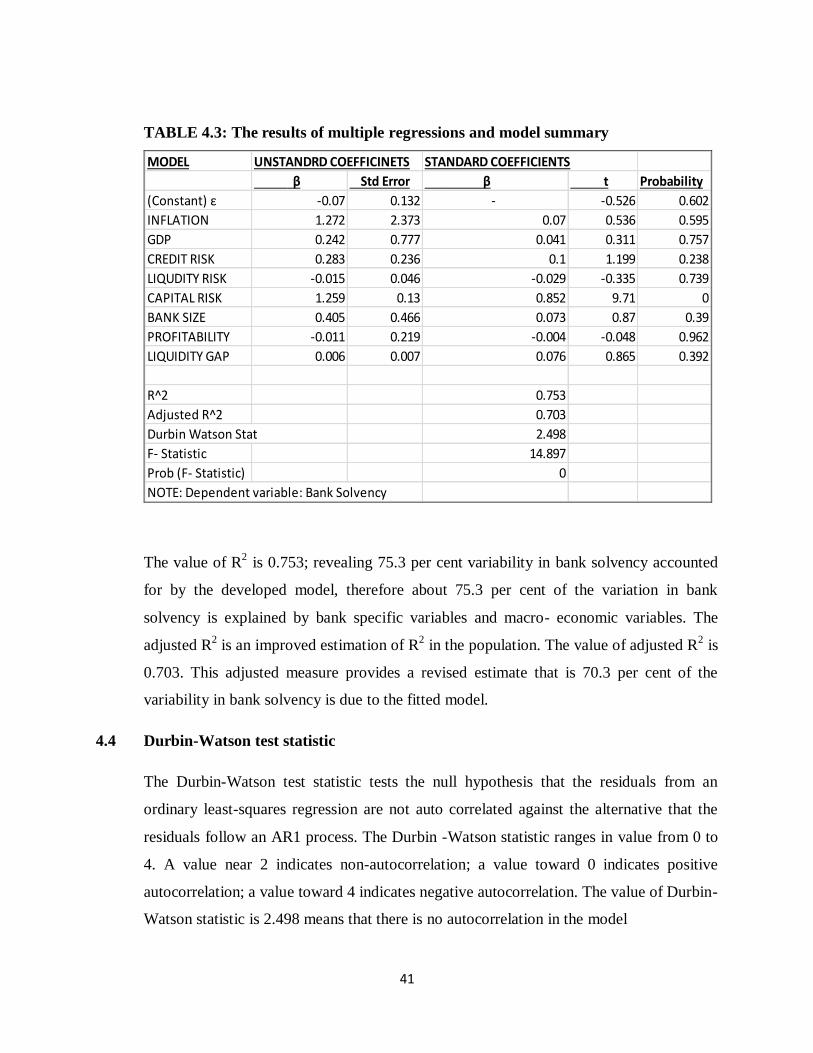
TABLE 4.3: The results of multiple regressions and model summary
MODEL UNSTANDRD COEFFICINETS STANDARD COEFFICIENTS
β Std Error β t Probability
(Constant) ε -0.07 0.132 - -0.526 0.602
INFLATION 1.272 2.373 0.07 0.536 0.595
GDP 0.242 0.777 0.041 0.311 0.757
CREDIT RISK 0.283 0.236 0.1 1.199 0.238
LIQUDITY RISK -0.015 0.046 -0.029 -0.335 0.739
CAPITAL RISK 1.259 0.13 0.852 9.71 0
BANK SIZE 0.405 0.466 0.073 0.87 0.39
PROFITABILITY -0.011 0.219 -0.004 -0.048 0.962
LIQUIDITY GAP 0.006 0.007 0.076 0.865 0.392
R^2 0.753
Adjusted R^2 0.703
Durbin Watson Stat 2.498
F- Statistic 14.897
Prob (F- Statistic) 0
NOTE: Dependent variable: Bank Solvency
The value of R2 is 0.753; revealing 75.3 per cent variability in bank solvency accounted
for by the developed model, therefore about 75.3 per cent of the variation in bank
solvency is explained by bank specific variables and macro- economic variables. The
adjusted R2 is an improved estimation of R
2 in the population. The value of adjusted R
2 is
0.703. This adjusted measure provides a revised estimate that is 70.3 per cent of the
variability in bank solvency is due to the fitted model.
4.4 Durbin-Watson test statistic
The Durbin-Watson test statistic tests the null hypothesis that the residuals from an
ordinary least-squares regression are not auto correlated against the alternative that the
residuals follow an AR1 process. The Durbin -Watson statistic ranges in value from 0 to
4. A value near 2 indicates non-autocorrelation; a value toward 0 indicates positive
autocorrelation; a value toward 4 indicates negative autocorrelation. The value of Durbin-
Watson statistic is 2.498 means that there is no autocorrelation in the model
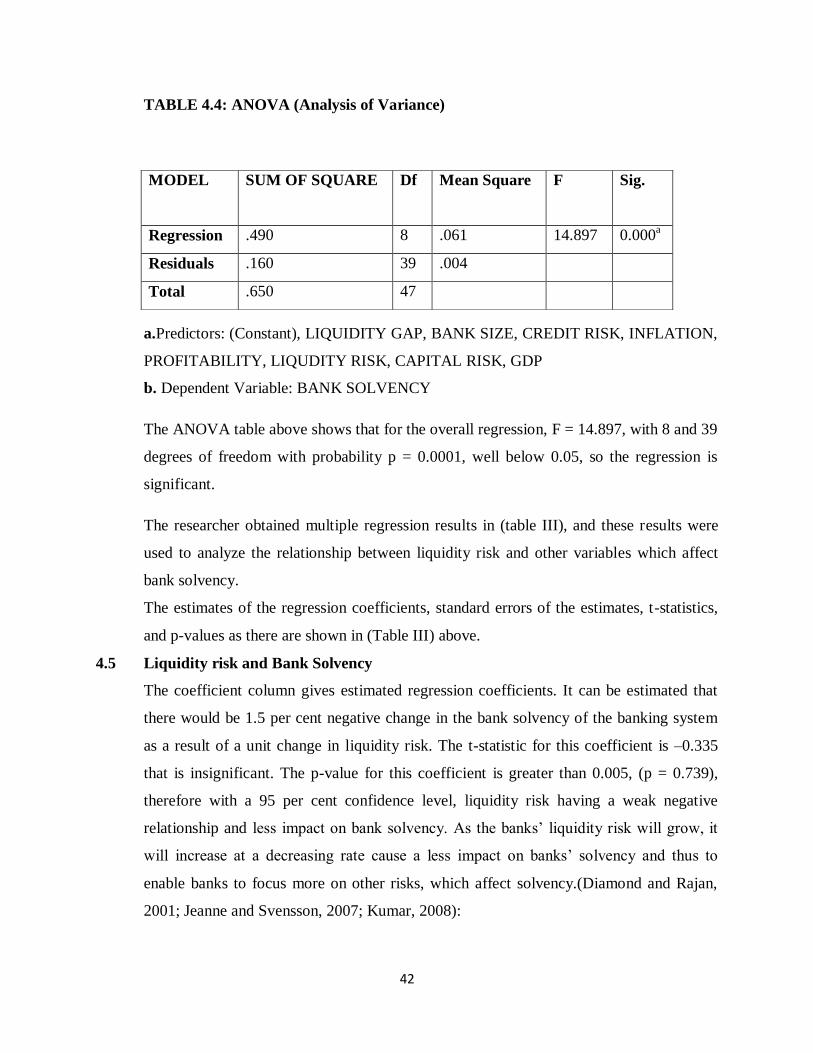
42
TABLE 4.4: ANOVA (Analysis of Variance)
a.Predictors: (Constant), LIQUIDITY GAP, BANK SIZE, CREDIT RISK, INFLATION,
PROFITABILITY, LIQUDITY RISK, CAPITAL RISK, GDP
b. Dependent Variable: BANK SOLVENCY
The ANOVA table above shows that for the overall regression, F = 14.897, with 8 and 39
degrees of freedom with probability p = 0.0001, well below 0.05, so the regression is
significant.
The researcher obtained multiple regression results in (table III), and these results were
used to analyze the relationship between liquidity risk and other variables which affect
bank solvency.
The estimates of the regression coefficients, standard errors of the estimates, t-statistics,
and p-values as there are shown in (Table III) above.
4.5 Liquidity risk and Bank Solvency
The coefficient column gives estimated regression coefficients. It can be estimated that
there would be 1.5 per cent negative change in the bank solvency of the banking system
as a result of a unit change in liquidity risk. The t-statistic for this coefficient is –0.335
that is insignificant. The p-value for this coefficient is greater than 0.005, (p = 0.739),
therefore with a 95 per cent confidence level, liquidity risk having a weak negative
relationship and less impact on bank solvency. As the banks’ liquidity risk will grow, it
will increase at a decreasing rate cause a less impact on banks’ solvency and thus to
enable banks to focus more on other risks, which affect solvency.(Diamond and Rajan,
2001; Jeanne and Svensson, 2007; Kumar, 2008):
MODEL SUM OF SQUARE Df Mean Square F Sig.
Regression .490 8 .061 14.897 0.000a
Residuals .160 39 .004
Total .650 47
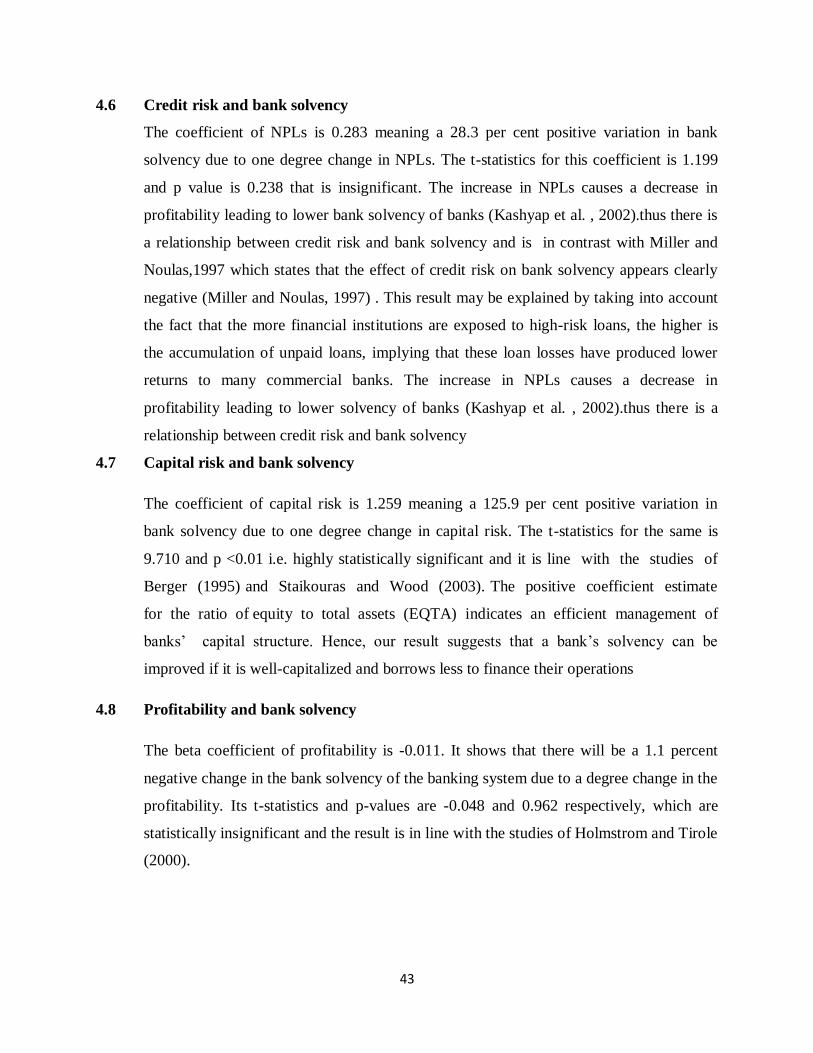
43
4.6 Credit risk and bank solvency
The coefficient of NPLs is 0.283 meaning a 28.3 per cent positive variation in bank
solvency due to one degree change in NPLs. The t-statistics for this coefficient is 1.199
and p value is 0.238 that is insignificant. The increase in NPLs causes a decrease in
profitability leading to lower bank solvency of banks (Kashyap et al. , 2002).thus there is
a relationship between credit risk and bank solvency and is in contrast with Miller and
Noulas,1997 which states that the effect of credit risk on bank solvency appears clearly
negative (Miller and Noulas, 1997) . This result may be explained by taking into account
the fact that the more financial institutions are exposed to high-risk loans, the higher is
the accumulation of unpaid loans, implying that these loan losses have produced lower
returns to many commercial banks. The increase in NPLs causes a decrease in
profitability leading to lower solvency of banks (Kashyap et al. , 2002).thus there is a
relationship between credit risk and bank solvency
4.7 Capital risk and bank solvency
The coefficient of capital risk is 1.259 meaning a 125.9 per cent positive variation in
bank solvency due to one degree change in capital risk. The t-statistics for the same is
9.710 and p <0.01 i.e. highly statistically significant and it is line with the studies of
Berger (1995) and Staikouras and Wood (2003). The positive coefficient estimate
for the ratio of equity to total assets (EQTA) indicates an efficient management of
banks’ capital structure. Hence, our result suggests that a bank’s solvency can be
improved if it is well-capitalized and borrows less to finance their operations
4.8 Profitability and bank solvency
The beta coefficient of profitability is -0.011. It shows that there will be a 1.1 percent
negative change in the bank solvency of the banking system due to a degree change in the
profitability. Its t-statistics and p-values are -0.048 and 0.962 respectively, which are
statistically insignificant and the result is in line with the studies of Holmstrom and Tirole
(2000).
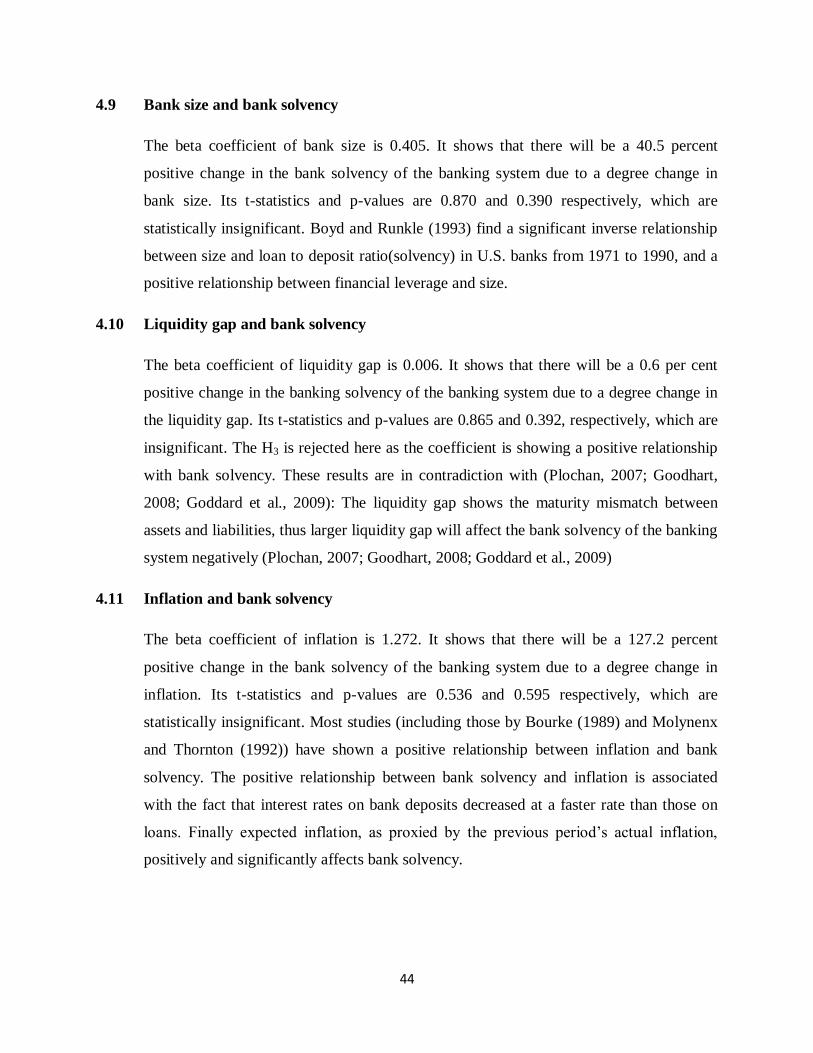
44
4.9 Bank size and bank solvency
The beta coefficient of bank size is 0.405. It shows that there will be a 40.5 percent
positive change in the bank solvency of the banking system due to a degree change in
bank size. Its t-statistics and p-values are 0.870 and 0.390 respectively, which are
statistically insignificant. Boyd and Runkle (1993) find a significant inverse relationship
between size and loan to deposit ratio(solvency) in U.S. banks from 1971 to 1990, and a
positive relationship between financial leverage and size.
4.10 Liquidity gap and bank solvency
The beta coefficient of liquidity gap is 0.006. It shows that there will be a 0.6 per cent
positive change in the banking solvency of the banking system due to a degree change in
the liquidity gap. Its t-statistics and p-values are 0.865 and 0.392, respectively, which are
insignificant. The H3 is rejected here as the coefficient is showing a positive relationship
with bank solvency. These results are in contradiction with (Plochan, 2007; Goodhart,
2008; Goddard et al., 2009): The liquidity gap shows the maturity mismatch between
assets and liabilities, thus larger liquidity gap will affect the bank solvency of the banking
system negatively (Plochan, 2007; Goodhart, 2008; Goddard et al., 2009)
4.11 Inflation and bank solvency
The beta coefficient of inflation is 1.272. It shows that there will be a 127.2 percent
positive change in the bank solvency of the banking system due to a degree change in
inflation. Its t-statistics and p-values are 0.536 and 0.595 respectively, which are
statistically insignificant. Most studies (including those by Bourke (1989) and Molynenx
and Thornton (1992)) have shown a positive relationship between inflation and bank
solvency. The positive relationship between bank solvency and inflation is associated
with the fact that interest rates on bank deposits decreased at a faster rate than those on
loans. Finally expected inflation, as proxied by the previous period’s actual inflation,
positively and significantly affects bank solvency.
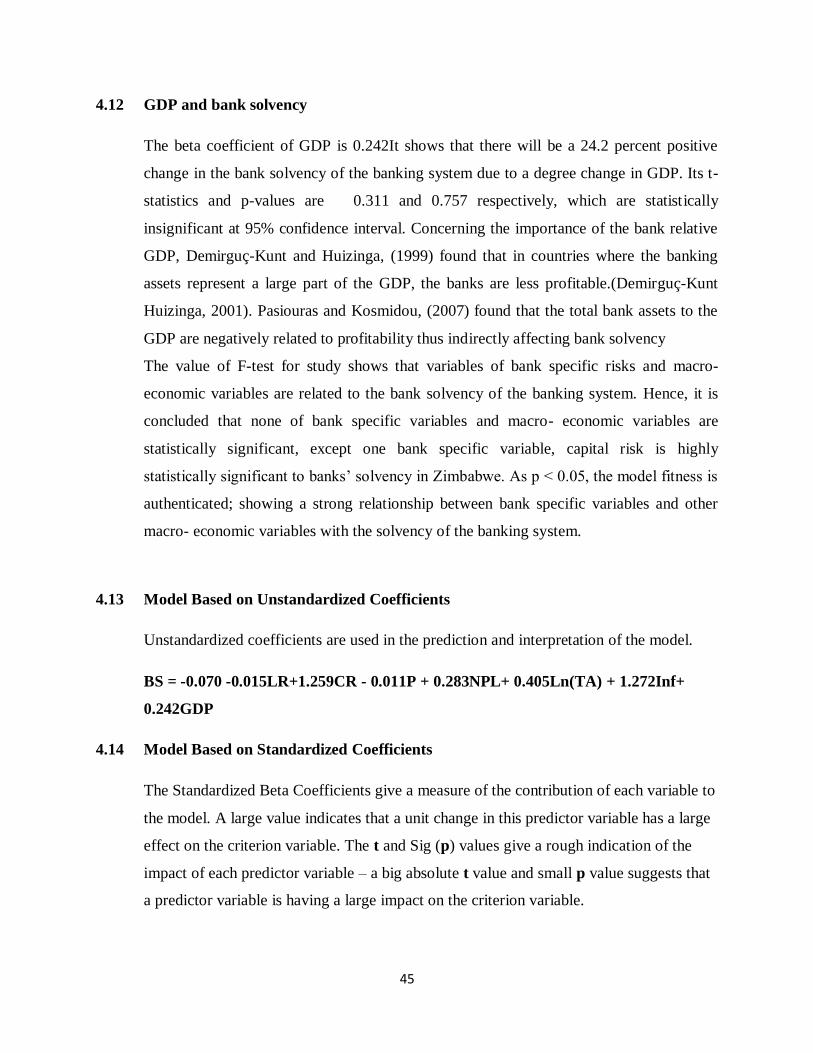
45
4.12 GDP and bank solvency
The beta coefficient of GDP is 0.242It shows that there will be a 24.2 percent positive
change in the bank solvency of the banking system due to a degree change in GDP. Its t-
statistics and p-values are 0.311 and 0.757 respectively, which are statistically
insignificant at 95% confidence interval. Concerning the importance of the bank relative
GDP, Demirguç-Kunt and Huizinga, (1999) found that in countries where the banking
assets represent a large part of the GDP, the banks are less profitable.(Demirguç-Kunt
Huizinga, 2001). Pasiouras and Kosmidou, (2007) found that the total bank assets to the
GDP are negatively related to profitability thus indirectly affecting bank solvency
The value of F-test for study shows that variables of bank specific risks and macro-
economic variables are related to the bank solvency of the banking system. Hence, it is
concluded that none of bank specific variables and macro- economic variables are
statistically significant, except one bank specific variable, capital risk is highly
statistically significant to banks’ solvency in Zimbabwe. As p < 0.05, the model fitness is
authenticated; showing a strong relationship between bank specific variables and other
macro- economic variables with the solvency of the banking system.
4.13 Model Based on Unstandardized Coefficients
Unstandardized coefficients are used in the prediction and interpretation of the model.
BS = -0.070 -0.015LR+1.259CR - 0.011P + 0.283NPL+ 0.405Ln(TA) + 1.272Inf+
0.242GDP
4.14 Model Based on Standardized Coefficients
The Standardized Beta Coefficients give a measure of the contribution of each variable to
the model. A large value indicates that a unit change in this predictor variable has a large
effect on the criterion variable. The t and Sig (p) values give a rough indication of the
impact of each predictor variable – a big absolute t value and small p value suggests that
a predictor variable is having a large impact on the criterion variable.
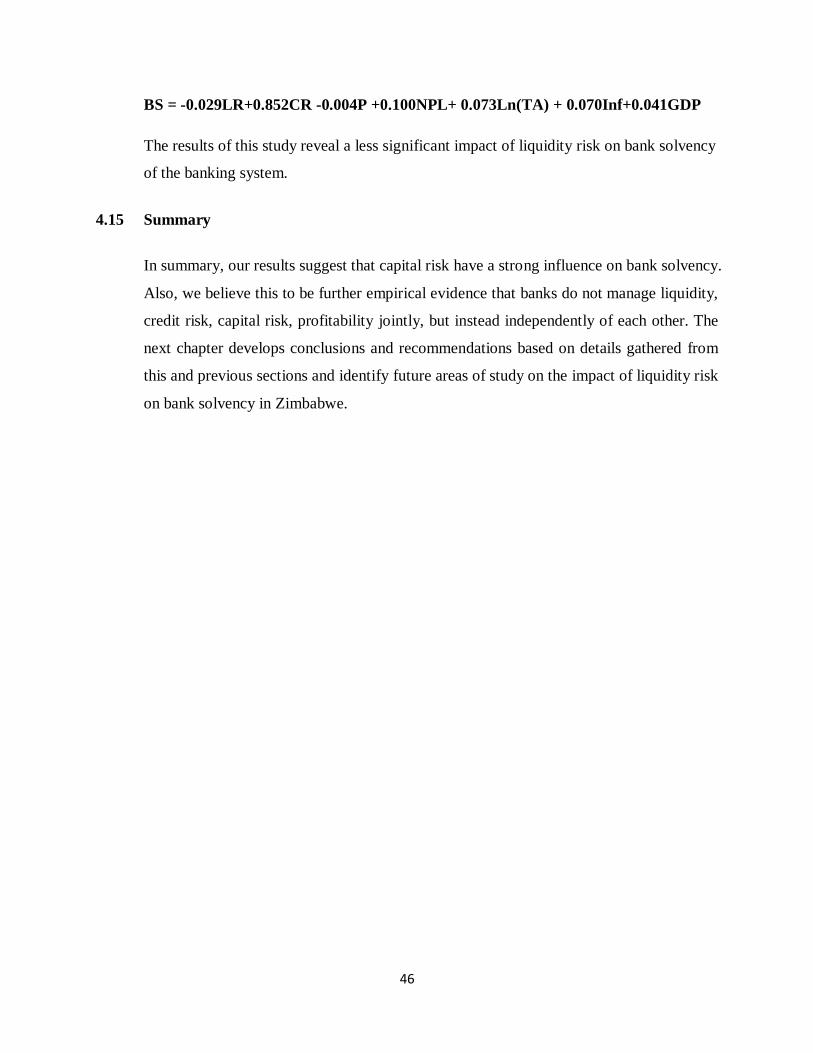
46
BS = -0.029LR+0.852CR -0.004P +0.100NPL+ 0.073Ln(TA) + 0.070Inf+0.041GDP
The results of this study reveal a less significant impact of liquidity risk on bank solvency
of the banking system.
4.15 Summary
In summary, our results suggest that capital risk have a strong influence on bank solvency.
Also, we believe this to be further empirical evidence that banks do not manage liquidity,
credit risk, capital risk, profitability jointly, but instead independently of each other. The
next chapter develops conclusions and recommendations based on details gathered from
this and previous sections and identify future areas of study on the impact of liquidity risk
on bank solvency in Zimbabwe.
47
CHAPTER 5
5.0 Conclusion and Recommendations
Liquidity problems may adversely affect a given bank’s earnings and capital. Under
extreme circumstances, it may cause the collapse of an otherwise solvent bank. A bank
having liquidity problems may experience difficulties in meeting the demands of
depositors. However, this liquidity risk may be mitigated by maintaining sufficient cash
reserves, raising deposit base, decreasing the liquidity gap and NPLs.
It is imperative for the bank’s management to be aware of its liquidity position in
different buckets. This will help them in enhancing their investment portfolio and
providing a competitive edge in the market. It is the utmost priority of a bank’s
management to pay the required attention to the liquidity problems. These problems
should be promptly addressed, and immediate remedial measures should be taken to
avoid the consequences of illiquidity.
This study paves the way for more detailed studies into controlling the liquidity risk and
to extending the proposed model to incorporate other factors other than liquidity risk.
Further, the current study has focused primarily on earning of the bank as measure of the
performance of bank. Further research may take a broader view of the performance and
can also include economic factors.
48
References
1. Auromen, L (2003) “Asymmetric information, theory and applications” paper presented
at the seminar of strategy and international business.
2. Basel (1999) Principles for the management of Liquidity risk, consultative paper issued
by the Basel Committee on banking Supervision, Basel.
3. Brown Bridge, M.and Harvey, C. (1998), Banking in Africa, James Currey, Oxford,
4. Cornett, M.M., Saunders, A. (2005), Fundamentals of Financial Institutions Management,
Irwin/McGraw-Hill, Boston, MA,
5. CEBS (2008), “Reducing liquidity risk – a new imperative”, Second Part of CEBS’s
Technical Advice to the European Commission on Liquidity Risk Management, Aleri,
Committee of European Banking Supervisors, New York, NY, p. 8.
6. Central Bank of Barbados (2008), Liquidity Risk Management Guideline, Bank
Supervision Department, Central Bank of Barbados, Bridgetown.
7. Chaplin, G., Emblow, A. and Michael, I. (2000), “Banking system liquidity:
developments and issues”, Financial Stability Review, December, pp. 93-112.
8. Clementi, D. (2001), “Financial markets: implications for financial stability”, Banca Italia
Conference on International Banking and Financial Systems Evolution and Stability,
MCB University Press, Bradford, pp. 13-19.
9. Comptroller of the Currency (2001), Liquidity: Comptroller’s Handbook, Comptroller of
the Currency: Administrator of the National Banks, Washington, DC.
10. Diamond, D.W. and Rajan, R.G. (2001), “Liquidity risk, liquidity creation, and financial
fragility: a theory of banking”, The Journal of Political Economy, Vol. 109 No. 2, pp.
287-327.
11. Diamond, D.W. and Rajan, R.G. (2005), “Liquidity shortages and banking crises”, The
Journal of Finance, Vol. 60 No. 2, pp. 615-47.

49
12. Cooper, D. R., & Schindler, P. S. (2003). Business research methods.USA:McGraw-Hill.
13. RBZ (2012) monetary policy statement www.rbz.co.zw
14. Richard, E.Chijoriga, et al (2008) Liquidity risk management system of a commercial
bank in Tanzania, www.emerald insight.com.

50


