Embed Size (px)
Citation preview
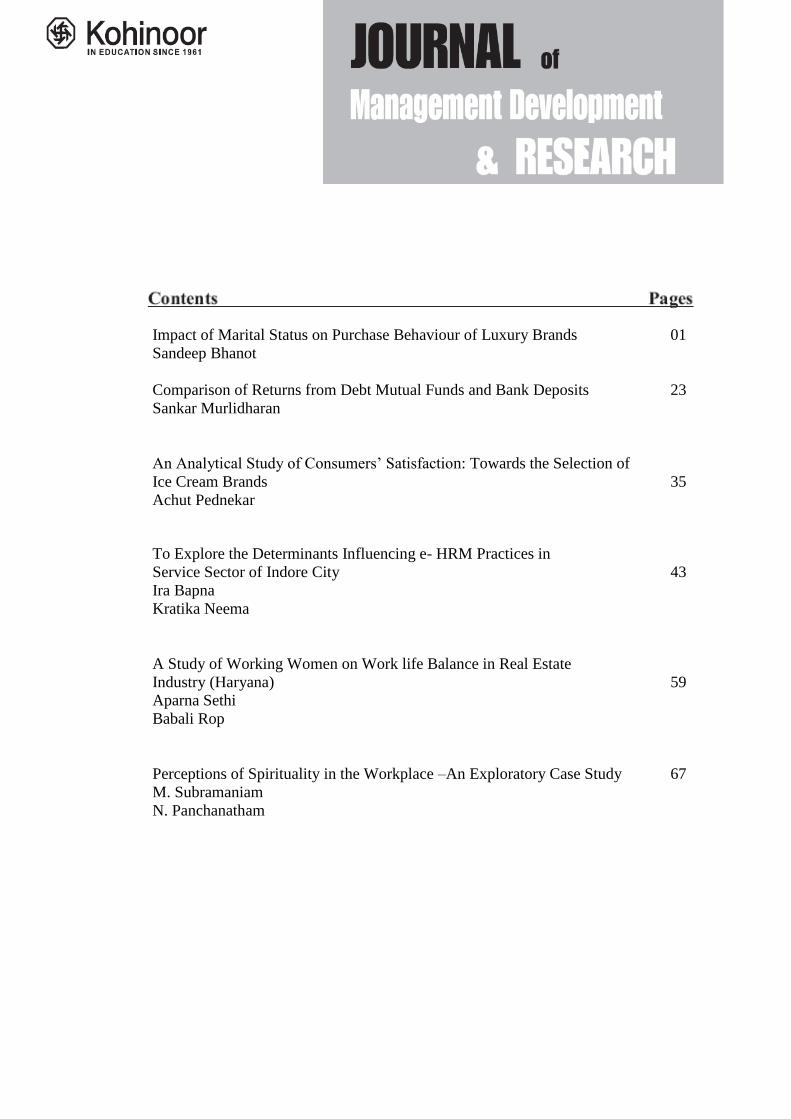
Impact of Marital Status on Purchase Behaviour of Luxury Brands 01
Sandeep Bhanot
Comparison of Returns from Debt Mutual Funds and Bank Deposits 23
Sankar Murlidharan
An Analytical Study of Consumers’ Satisfaction: Towards the Selection of
Ice Cream Brands 35
Achut Pednekar
To Explore the Determinants Influencing e- HRM Practices in
Service Sector of Indore City 43
Ira Bapna
Kratika Neema
A Study of Working Women on Work life Balance in Real Estate
Industry (Haryana) 59
Aparna Sethi
Babali Rop
Perceptions of Spirituality in the Workplace –An Exploratory Case Study 67
M. Subramaniam
N. Panchanatham
Journal of Management Development & Research, Volume: 5 No.1, June 2015
1
Impact of Marital Status on Purchase Behaviour of Luxury Brands
Prof. Sandeep Bhanot,
Associate Professor,
SIES College of Management Studies, Nerul, Navi Mumbai
___________________________________________________________________________
Abstract:
In this study, we aim to understand the influence of occupation on the frequency of buying
luxury products, influence to buy luxury products and intention to purchase the same brand
that they have previously purchased. Also we study the different luxury value dimensions like
financial value, functional value, individual value and social value and how these are
influenced by marital status of the consumer.
Keywords: Marital status, luxury, purchase behaviour, luxury brands
___________________________________________________________________________
Introduction:
Purchase behaviour: The actions a person
takes in purchasing and using products and
services, including the mental and social
processes that precede and follow these
actions can be called as purchase
behaviour. It helps us to answer questions
such as:
(i) Why people choose one product or
brand over another?
(ii) How they make these choices, and
(iii) How companies use this knowledge to
provide value to consumers
Purchase decision process: Behind the
visible act of making a purchase, lies a
decision that must be investigated. The
purchase decision process is the stages a
buyer passes through in making choices
about which products and services to buy.
There are five stages of purchase
behaviour: (i) problem recognition (ii)
information search (iii) alternative
evaluation (iv) purchase decision (v) post
purchase behaviour
Luxury brands: Luxury is no longer
restricted today to only the rich and the
selected few but is being used for mass
marketing now. The concept of luxury has
been changing dramatically across time
and culture. Earlier, luxury was connected
with things like wines, champagne,
designer clothes and sports cars. These
days, people have become richer and
luxury is a blurred genre that is no longer
the preserve of the elite. More and more
consumers have increased their financial
status as the old values of tradition and
nobility have become less important.
People are having much more disposable
Journal of Management Development & Research, Volume: 5 No.1, June 2015
2
income in comparison to earlier
generations, resulting in a tendency
towards fulfilling personal needs and
aspirations through experience. Therefore,
it could be said that luxury is more about
experience (Yeoman and McMahon-
Beattie, 2010), rather than financial value.
This is not to say that luxury is about
status, but luxury is more than financial
value. Indeed, they run hand in hand. The
need for personal gratification and
aspirations has led to greater emphasis on
having things which make life better and
easy. It means that consumers want to
improve their life. This is what Danziger
(2005) and Israel (2003) mean when they
say that luxury is not just restricted to
trophies and status symbols but also covers
things giving aesthetic experience and
indulgence. This is also due to increasing
purchasing power of women in society,
which is a good sign for luxury markets
such as wellbeing, clothes and tourism. We
see that the earlier concept of luxury of
consumption and elitism stills prevails
especially in emerging economies of
China. In the recent times, the Global
Financial Crisis has led consumers to re-
examine their priorities and as a
consequence, attitudes and behaviors
towards luxury have changed.
In management field it is accepted to
distinguish luxury products from necessary
and ordinary products within their
category by their basic characteristics.
These include things like financial value,
quality, aesthetics, exclusivity and status
giving. All of these characteristics are
relative terms. A luxury product is
characterized by a relatively high rating on
each of these dimensions compared to
other products of its category
(Trommsdorff and Heine 2008, p. 1670).
Luxury brands are those whose ratio of
functional utility to price is low while the
ratio of intangible and situational utility to
price is high.
Influence of marital status on purchase
of luxury brands: Marital status is one of
the important demographic variables
which can have an influence on purchase
behaviour of luxury brands. People of
different marital status can respond
differently to the various attributes of
luxury brands. They may want to purchase
them from different places or look for
different dimensions of luxury value. The
perception of different luxury values like
functional value, financial value,
individual value and social value can be
different for people of different marital
status.
Statement of the problem/Need for the
study: In this study, we want to
understand the influence of marital status
Journal of Management Development & Research, Volume: 5 No.1, June 2015
3
on different aspects of purchase behaviour
of luxury brands like frequency of buying
luxury products, influence to buy luxury
products and intention to purchase the
same brand that they have previously
purchased. Also we study the different
luxury value dimensions like financial
value, functional value, individual value
and social value and how these are
influenced by marital status of the
consumer. Among the various
demographic variables, we have selected
marital status because perception of
different dimensions of luxury value can
vary for consumers of different marital
status and luxury brand companies can use
different strategies to cater to the
requirements of these segments.
Literature Review:
Luxury brands: The concept of luxury is
complex and subjective and its meaning is
dependent on various personal and
interpersonal motives (Vigneron &
Johnson 2004). In order to understand the
meaning of luxury, we can first describe
the nature of luxury, luxury goods, luxury
brands and brand equity for luxury brands.
Roux & Floch (1996) say that luxury is not
just about price, but also associated with
pleasure, refinement, exclusivity and
appreciation. A luxury product is also
characterized by very limited supply and
recognition of value by other people.
Dubois, Laurent and Czellar (2001)
proposed a definition of the nature and
characteristics of the concept of luxury,
and identified six properties of luxury
products: 1) excellent quality, 2) premium
pricing, 3) exclusivity, rarity and
uniqueness, 4) aesthetics and good looks
5) ancestral heritage and 6)
superfluousness.
Kapferer (1997, p.253; as cited in
Vigneron and Johnson 2004) summarised
luxury as defining beauty, enlightening
and providing good taste. According to
him, luxury products provide sensory
pleasure and is the appendage of the ruling
or elite classes.
Luxury brands can also be described as
premium or high priced brands that
consumers purchase to satisfy their
psychological needs like materialistic,
hedonic and social needs rather than for
their economical and functional value
(Nueno and Quelch 1998). Thus, luxury
brands can be characterised as those which
are conspicuous, unique and provide high
social and emotional value and are of
excellent quality (as explained by
Vigneron and Johnson 1999).
Webster (2002) defines it simply as “non-
essential items”. Cornell (2002) says that
luxury can be characterised by a strong
element of human involvement, scarcity or
limited supply and value recognition by
others. Similarly, Kapferer (1997) says
Journal of Management Development & Research, Volume: 5 No.1, June 2015
4
that luxury exhibits beauty and aesthetics
and can be applied to functional items. He
also says that luxury has an enlightening
effect and provides sensory pleasure. Berry
(1994), similarly, characterizes luxury
goods as items that rise desire and provide
pleasure to its consumers. Also the concept
of rarity and exclusivity has not been
forgotten, being highlighted by Pantzalis
(1995). On the other hand, McKinsey
(1990 in Wiedmann, Hennings, and
Siebels 2009) sates that luxury goods are
the ones that have the higher ratio of price-
quality. Phau and Prendergast (2000) argue
that luxury goods are those which exhibit
exclusivity, brand image and identity,
brand awareness and excellent in the
minds of the consumers. Finally, Kapferer
and Bastien (2008) argue that “luxury is
qualitative and not quantitative” and is
when “hedonism takes over functionality”
as it has to be “multi-sensory and
experiential” to each consumer. Thus, both
authors claim that luxury is only a true
luxury when some part of it is handmade
and the brand has the capacity to provide
exclusive services to their consumers.
Hence, the service and/or good has to be
able to transmit to the customer extra
pleasure (Kapferer 1997) and a truly multi-
sensorial experience (Kapferer and Bastien
2008), as consumers are increasingly
seeking more personal fulfilment and
aspiration through experience (Yeoman,
McMahon-Beatie and Brown 2005 &
Yeoman and Mc-Mahon-Beattie 2006).
Luxury goods should present a high level
of perceived quality (Phau and Prendergast
2000), as a high price (McKinsey 1990)
and also a limited supply (Cornell 2002,
p.47) to ensure the exclusivity and rarity
required by customers (Pantzalis 1995;
Phau and Prendergast 2000). Finally, we
believe that luxury goods have to have
some part of it handmade and that the
brand has to be able to answer to
customer‟s wishes and needs with special
and customized offers (Kapferer and
Bastien 2008).
Luxury products help to satisfy a
consumer‟s functional needs and also fulfil
him/her psychologically (Dubois, Czellar
& Laurent, 2001). A particular good can
be desired as a luxury only if the
ownership of the goods is able to provide
pleasure (Berry, 1994). In addition,
luxuries are by definition always out of the
reach of mass consumption (Berry, 1994)
and exclusivity and rarity are therefore
features connected to the concept of luxury
(Pantzalis, 1995).
Luxury goods are premium goods with
high quality products, aesthetic design
supported by excellent service, purchased
by people from the higher income bracket
(Cheng, 2006). In the earlier days the term
„luxury‟ was applied to products that were
rare and scarce and available to a small
Journal of Management Development & Research, Volume: 5 No.1, June 2015
5
segment of the people (Sriviroj, 2007). The
luxury items were out of reach of the
ordinary people and considered rare.
Today the luxury product market has
increased manifold. The young are
spontaneously aware of the luxury brands
which reflect their desires and fantasies
and these brands provide them with social
status, comfort, good quality and self-
esteem.
Influence of marital status on purchase
of luxury brands:
Koonnaree Wongsiriwat (2007) explains
that the purpose of the study is to
investigate the factors that influenced the
brand equity of luxury handbags. The
findings of this study indicate that
demographic factors which are gender,
age, education, occupation, income,
marital status and number of children have
a great significance to brand equity of
luxury handbags and psychographic
factors like value, attitude and lifestyle
have a great significance to brand equity of
luxury handbags.
Ching-Yaw Chen et al. (2012) in their
study explain and explore the differences
in Taiwanese women‟s purchasing
decisions towards two different categories:
luxury goods and general products.
Demographic variables like age, education,
occupation, marital status and income play
a key factor in purchasing decisions. They
considered the hypothesis that women of
different demographic variables (age,
education, occupation, marital status,
income) have significant differences in
their purchase decisions (purchase
motives, sources of information, product
categories and other alternatives) for
luxury goods. After testing this hypothesis,
it was rejected and it was concluded that
these demographic variables do not have a
significant effect on purchase of luxury
brands.
Srinivasan et al. (2014) explain how
uniqueness can be expressed in terms of
three scales namely creative choice,
unpopular choice and similarity avoidance
and how these are influenced by
demographic variables like age, gender,
occupation, education, religion, monthly
income and marital status.
Sathyanarayan et al. (2015) study the role
of socio economic variables in the
polarization of luxury value of branded
products in Chennai city. The study
reveals that, statistically there is a highly
significant difference in marital status with
respect to factors of luxury brand among
the shoppers in the sample. Based on the
mean value, it is noted that, the high level
of functional, individual, social and luxury
value is perceived by the married shoppers
Journal of Management Development & Research, Volume: 5 No.1, June 2015
6
when compared to unmarried in the
sample.
Dimensionalizing Luxury:
Wiedmann, K.P., N. Hennigs & A. Siebels
(2009) developed a luxury value model
useful for studying the relationship
between value perception and luxury
consumption. Their model includes four
luxury value dimensions: financial value,
functional value, individual value and
social value. Different authors have
addressed different combinations of these
luxury value dimensions. (a) Several
authors have studied the financial value
people derive from buying products they
believe others cannot afford. Stokburger-
Sauer & Teichmann (2013) say that
despite the fact that the functional value of
luxury brands is usually not substantially
higher than other non-luxury brands,
luxury brands can reach substantial price
premiums in the market over non-luxury
ones.(b) Luxury consumption has also
been studied from the perspective of the
functional value luxury goods provide.
Simply stated, some people buy luxury
goods because they believe they offer
superior quality &perform better, that they
are more user friendly, or more unique
than their non-luxury-brand competitors
are. Luxury brands are supposed to offer
greater product quality &performance than
non-luxury brands (according to O‟Cass &
Frost, 2002; & Vigneron& Johnson, 2004).
Others have shown that perceived usability
value drives purchases of luxury goods.
Coulter, Price &Feick (2003) have focused
on the functional dimension of luxury
brands. Gardyn (2002); Chadha &
Husband(2007) and Berthon et al. (2009)
have studied about high reputation of
luxury goods which illustrate functional,
symbolic &/or experiential values in
perception of owners. Atwal & Williams
(2009) have said that luxury products no
longer provide solely on functional values,
but also, on emotional values and social
values. Ko et. al. (2010) has emphasised
on high quality value for luxury brands.
(c) Several researchers have studied the
social value of luxury consumption.
Vigneron& Johnson, 2004; Wiedmannet
al., (2009); Han,Y.J , J.C.Nunes&X.
Dreze, (2011), have studied the social
orientation of luxury brands. Such social
value has two sub-dimensions: snob value
and prestige value. People seeking snob
value derive value from buying scarce
luxury goods that others cannot access.
Prestige seeking consumers seek to
conform to aspirational groups that
consume such luxury goods to demonstrate
that they belong to this group.
(d) Individual value: Lipovetsky& Roux
(2003); Danziger, (2005);Geerts&Veg-
Sala (2011); Srinivasan, Srivastava,
&Bhanot(2013) have studied the personal
Journal of Management Development & Research, Volume: 5 No.1, June 2015
7
oriented consumption of individuals and
called it as emotional luxury. Social value
can be associated with Self-identity,
materialistic and hedonism values.
Gap analysis:
Wong & Ahuvia (1998) have studied the
impact of culture, social status, hedonic
value and country of origin but other
demographic variables have not been
considered.
Vigneron & Johnson (1999), Wiedmann et
al. (2009), Han et al. (2010) have focused
on the personal orientation and social
orientation for consumption of luxury
brands but impact of demographic
variables like marital status on purchase
of luxury brands has not been studied.
Rolf-Seringhaus (2002) have considered
the motivation of people for consuming
luxury according to psychographics and
dividing luxury consumers into three
segments i.e. „Old money‟, „Nouveau
riche‟ and „Excursionists‟, but other
demographic variables like marital status
have not been considered. Gardyn (2002),
Chadha & Husband (2007), Berthon et al.
(2009) have studied about high reputation
of luxury goods which illustrate
functional, symbolic &/or experiential
values in perception of owners. But impact
of demographic variables like marital
status on purchase of luxury brands has
not been studied.
The study by Seringhaus, F. H. Rolf
(2005) considers the impact of culture on
purchase of luxury brands but other
demographic variables like marital status
have not been considered. Also, the study
by Nelson et al. (2005) shows the purchase
behaviour of Indians towards local and
international brands but other variables
like marital status, occupation, age,
gender and education have not been
considered. Seringhaus (2005) has studied
the presence of luxury brands online but
the impact of demographic variables like
marital status on purchase of luxury
brands has not been studied.
Yeomann & Mc-Mahon-Beattie (2006)
have said that modern societies seek more
personal fulfilment and aspiration through
experience, but they have not concentrated
on aspects like limited supply and high
price. Chaudhuri & Majumdar (2006) have
found that consumers are motivated to
purchase luxury products to enhance self-
concept and materialistic value, but other
dimensions like quality and functional
value have not been studied. Chadha &
Husband (2006) have divided the Asian
economies into five stages of „Luxe
Evolution‟. They have studied the brand
awareness, price factor, gifting of luxury
brands, status value and aesthetic value of
Chinese consumers and a similar study has
been done for Indian consumers. But
impact of demographic variables like
Journal of Management Development & Research, Volume: 5 No.1, June 2015
8
marital status on purchase of luxury
brands has not been considered. The
study by Mandel et al. (2006) considers
the psychographic profile of consumers
but demographic profile has not been
considered.
Wiedmann et al. (2007) have considered
financial value, functional value, personal
value, social value and luxury value for
luxury brands but impact of demographic
and psychographic variables on purchase
of luxury brands has not been considered.
The study by Heilman et al. (2007) is an
interesting study on consumer behaviour
not undertaken by other authors but other
variables like marital status, occupation,
age and income also need to be
considered.
Fionda and Moore (2009) have
emphasised on a clear brand identity,
premium pricing, heritage and exclusivity
as a characteristic of luxury brands but
other things like quality and product
integrity have not been considered.
Berthon et al. (2009), in their article
present a philosophical analysis of
luxurybrands, focusing on their aesthetics
and degree of ephemerality. The gap in the
study is that purchase of luxury brands
with respect to demographic variables like
marital status, occupation, age, gender,
education etc. has not been considered.
Atwal & Williams (2009) have said that
luxury products no longer provide solely
on functional values, but also, on
emotional values and social values. But
impact of demographic variables like
marital status on purchase of luxury
products has not been studied.
The study by Han, Young Jee et al. (2010)
shows how purchase of luxury brands
depends on wealth but other factors like
marital status, age, occupation, culture,
personality, education and culture have
not been considered. The study by
Lasaleta et al. (2010) considers the impact
of wealth and psychographics on purchase
of luxury brands but other demographic
variables have not been considered. The
study by WWD: Women's Wear Daily,
(2010) considers the impact of culture and
wealth on purchase of luxury brands but
other demographic and psychographic
variables have not been considered. The
study by Mayne, Eric (2010) shows the
impact of culture on purchase of luxury
brands but other demographic variables
like marital status have not been
considered. Ko et al. (2010) has
emphasised on high quality value for
luxury brands, but other dimensions of
luxury value have not been considered.
Abdolvand and Reihani (2013) examined
the consumption behaviour of luxury
products among the young people and
concentrated on the two fields of brand
association and psychological antecedents.
Journal of Management Development & Research, Volume: 5 No.1, June 2015
9
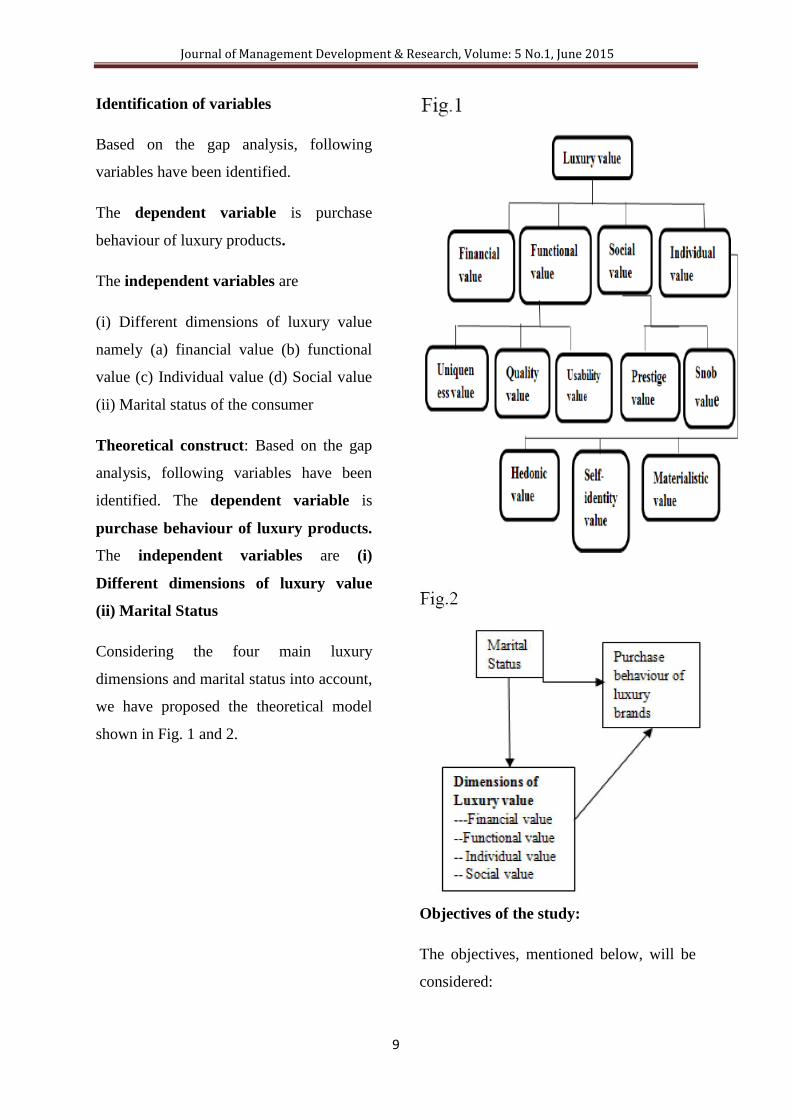
Identification of variables
Based on the gap analysis, following
variables have been identified.
The dependent variable is purchase
behaviour of luxury products.
The independent variables are
(i) Different dimensions of luxury value
namely (a) financial value (b) functional
value (c) Individual value (d) Social value
(ii) Marital status of the consumer
Theoretical construct: Based on the gap
analysis, following variables have been
identified. The dependent variable is
purchase behaviour of luxury products.
The independent variables are (i)
Different dimensions of luxury value
(ii) Marital Status
Considering the four main luxury
dimensions and marital status into account,
we have proposed the theoretical model
shown in Fig. 1 and 2.
Objectives of the study:
The objectives, mentioned below, will be
considered:
Journal of Management Development & Research, Volume: 5 No.1, June 2015
10
(i) To understand the different luxury
value perceptions among consumers: Here
we have identified four important luxury
dimensions namely financial value,
functional value, social value and
individual value based on our literature
review.
(ii) To understand whether demographic
variables like marital status influence the
purchase behaviour of luxury brands.
(iii) A conceptual model has been made to
show the influence of marital status on the
various luxury value dimensions on
purchase behaviour of luxury brands.
Formulation of hypotheses:
The hypothesis can be written as follows:
(i) First, we want to test whether there is
any relation between demographic
variables like marital status and frequency
of buying luxury brands, influence to buy
luxury brands and intention to purchase
the same brand previously purchased.
Srinivasan et al.(2014) in their study have
found that demographic variables like
gender, income, age, education, religion,
ethnicity, marital status and occupation can
influence the purchase of luxury products.
Hence the following hypothesis can be
taken:
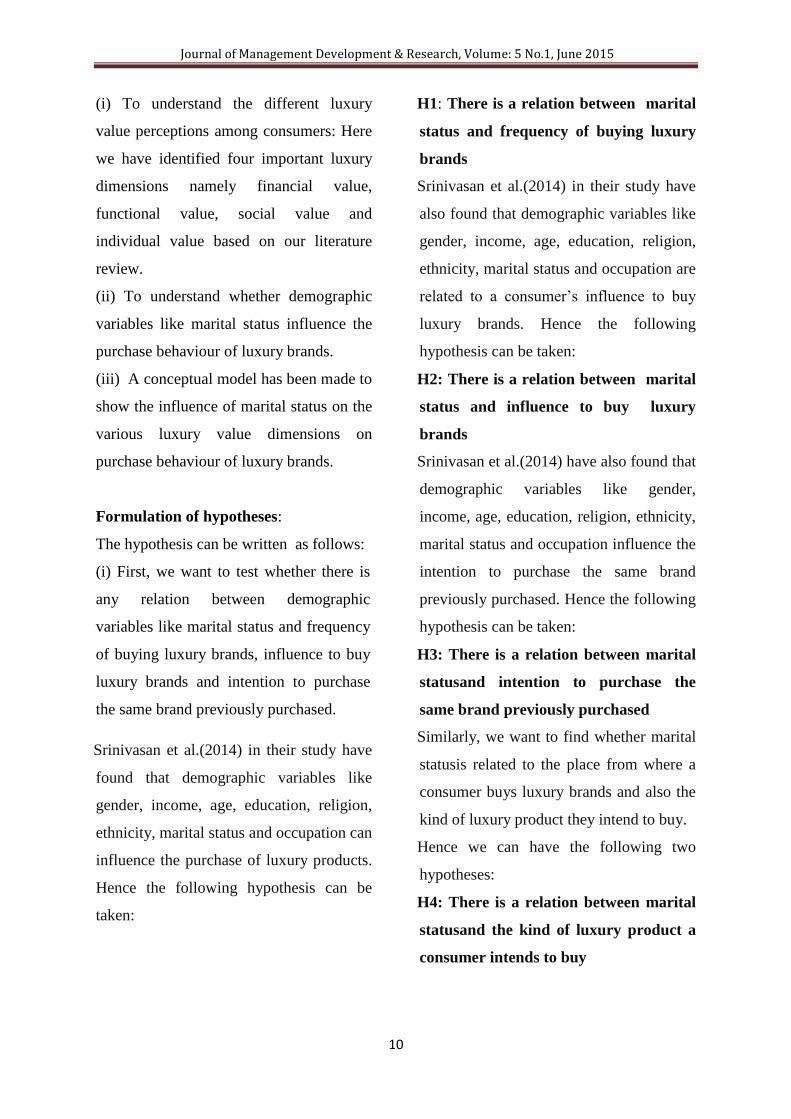
H1: There is a relation between marital
status and frequency of buying luxury
brands
Srinivasan et al.(2014) in their study have
also found that demographic variables like
gender, income, age, education, religion,
ethnicity, marital status and occupation are
related to a consumer‟s influence to buy
luxury brands. Hence the following
hypothesis can be taken:
H2: There is a relation between marital
status and influence to buy luxury
brands
Srinivasan et al.(2014) have also found that
demographic variables like gender,
income, age, education, religion, ethnicity,
marital status and occupation influence the
intention to purchase the same brand
previously purchased. Hence the following
hypothesis can be taken:
H3: There is a relation between marital
statusand intention to purchase the
same brand previously purchased
Similarly, we want to find whether marital
statusis related to the place from where a
consumer buys luxury brands and also the
kind of luxury product they intend to buy.
Hence we can have the following two
hypotheses:
H4: There is a relation between marital
statusand the kind of luxury product a
consumer intends to buy
Journal of Management Development & Research, Volume: 5 No.1, June 2015
11
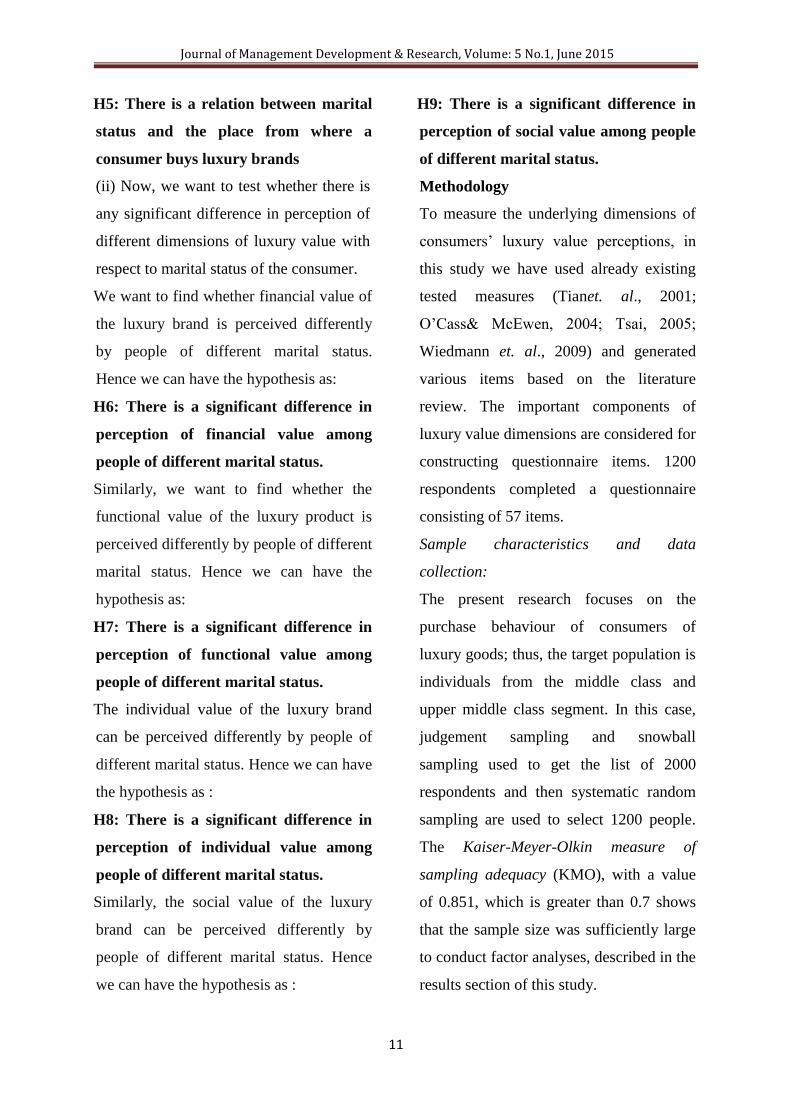
H5: There is a relation between marital
status and the place from where a
consumer buys luxury brands
(ii) Now, we want to test whether there is
any significant difference in perception of
different dimensions of luxury value with
respect to marital status of the consumer.
We want to find whether financial value of
the luxury brand is perceived differently
by people of different marital status.
Hence we can have the hypothesis as:
H6: There is a significant difference in
perception of financial value among
people of different marital status.
Similarly, we want to find whether the
functional value of the luxury product is
perceived differently by people of different
marital status. Hence we can have the
hypothesis as:
H7: There is a significant difference in
perception of functional value among
people of different marital status.
The individual value of the luxury brand
can be perceived differently by people of
different marital status. Hence we can have
the hypothesis as :
H8: There is a significant difference in
perception of individual value among
people of different marital status.
Similarly, the social value of the luxury
brand can be perceived differently by
people of different marital status. Hence
we can have the hypothesis as :
H9: There is a significant difference in
perception of social value among people
of different marital status.
Methodology
To measure the underlying dimensions of
consumers‟ luxury value perceptions, in
this study we have used already existing
tested measures (Tianet. al., 2001;
O‟Cass& McEwen, 2004; Tsai, 2005;
Wiedmann et. al., 2009) and generated
various items based on the literature
review. The important components of
luxury value dimensions are considered for
constructing questionnaire items. 1200
respondents completed a questionnaire
consisting of 57 items.
Sample characteristics and data
collection:
The present research focuses on the
purchase behaviour of consumers of
luxury goods; thus, the target population is
individuals from the middle class and
upper middle class segment. In this case,
judgement sampling and snowball
sampling used to get the list of 2000
respondents and then systematic random
sampling are used to select 1200 people.
The Kaiser-Meyer-Olkin measure of
sampling adequacy (KMO), with a value
of 0.851, which is greater than 0.7 shows
that the sample size was sufficiently large
to conduct factor analyses, described in the
results section of this study.
Journal of Management Development & Research, Volume: 5 No.1, June 2015
12
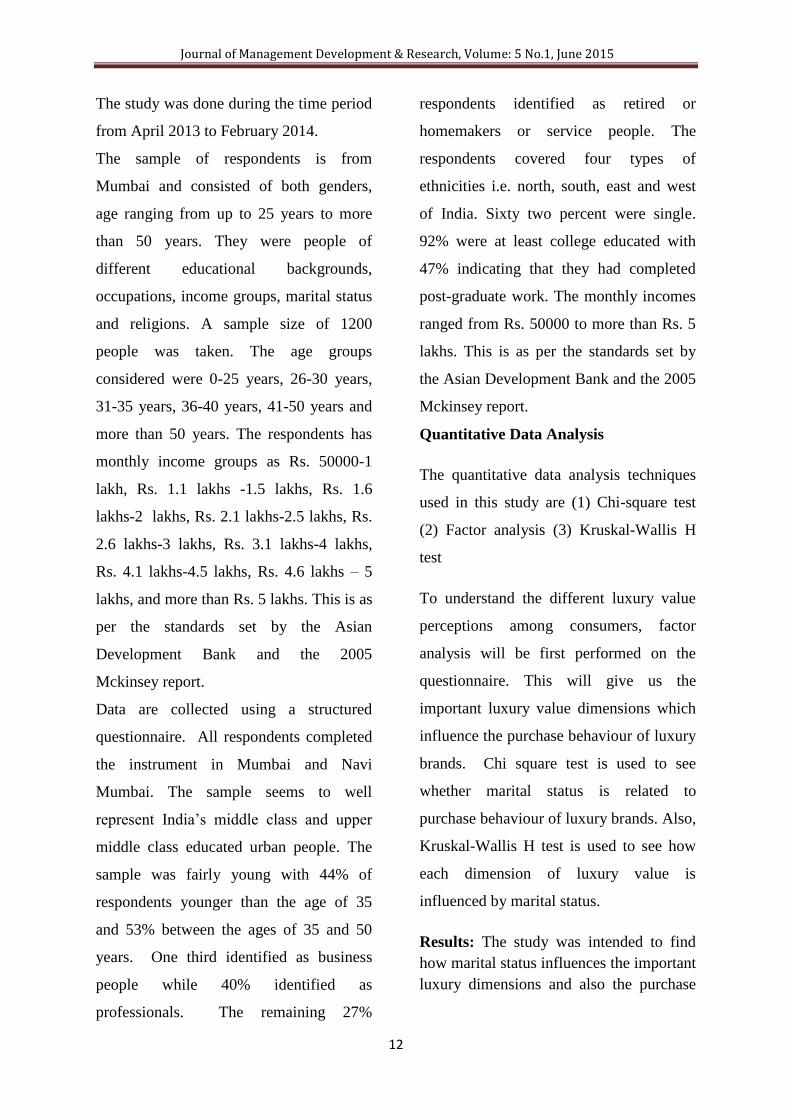
The study was done during the time period
from April 2013 to February 2014.
The sample of respondents is from
Mumbai and consisted of both genders,
age ranging from up to 25 years to more
than 50 years. They were people of
different educational backgrounds,
occupations, income groups, marital status
and religions. A sample size of 1200
people was taken. The age groups
considered were 0-25 years, 26-30 years,
31-35 years, 36-40 years, 41-50 years and
more than 50 years. The respondents has
monthly income groups as Rs. 50000-1
lakh, Rs. 1.1 lakhs -1.5 lakhs, Rs. 1.6
lakhs-2 lakhs, Rs. 2.1 lakhs-2.5 lakhs, Rs.
2.6 lakhs-3 lakhs, Rs. 3.1 lakhs-4 lakhs,
Rs. 4.1 lakhs-4.5 lakhs, Rs. 4.6 lakhs – 5
lakhs, and more than Rs. 5 lakhs. This is as
per the standards set by the Asian
Development Bank and the 2005
Mckinsey report.
Data are collected using a structured
questionnaire. All respondents completed
the instrument in Mumbai and Navi
Mumbai. The sample seems to well
represent India‟s middle class and upper
middle class educated urban people. The
sample was fairly young with 44% of
respondents younger than the age of 35
and 53% between the ages of 35 and 50
years. One third identified as business
people while 40% identified as
professionals. The remaining 27%
respondents identified as retired or
homemakers or service people. The
respondents covered four types of
ethnicities i.e. north, south, east and west
of India. Sixty two percent were single.
92% were at least college educated with
47% indicating that they had completed
post-graduate work. The monthly incomes
ranged from Rs. 50000 to more than Rs. 5
lakhs. This is as per the standards set by
the Asian Development Bank and the 2005
Mckinsey report.
Quantitative Data Analysis
The quantitative data analysis techniques
used in this study are (1) Chi-square test
(2) Factor analysis (3) Kruskal-Wallis H
test
To understand the different luxury value
perceptions among consumers, factor
analysis will be first performed on the
questionnaire. This will give us the
important luxury value dimensions which
influence the purchase behaviour of luxury
brands. Chi square test is used to see
whether marital status is related to
purchase behaviour of luxury brands. Also,
Kruskal-Wallis H test is used to see how
each dimension of luxury value is
influenced by marital status.
Results: The study was intended to find
how marital status influences the important
luxury dimensions and also the purchase
Journal of Management Development & Research, Volume: 5 No.1, June 2015
13
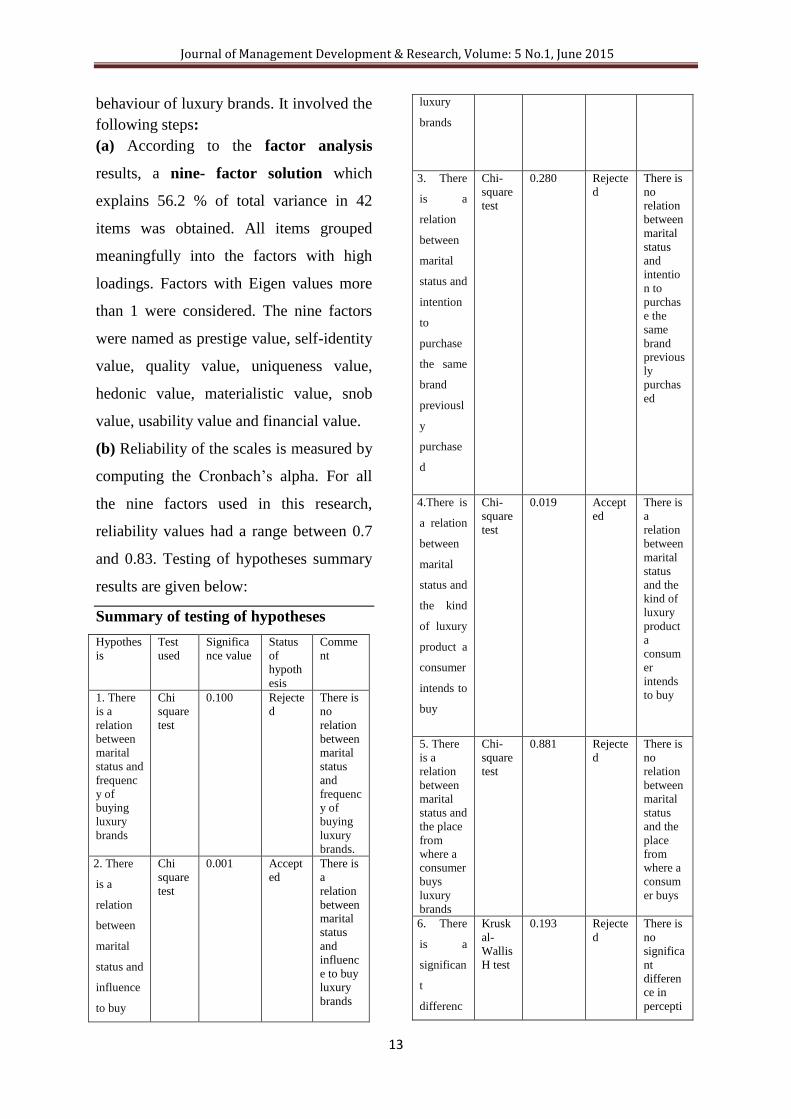
behaviour of luxury brands. It involved the
following steps:
(a) According to the factor analysis
results, a nine- factor solution which
explains 56.2 % of total variance in 42
items was obtained. All items grouped
meaningfully into the factors with high
loadings. Factors with Eigen values more
than 1 were considered. The nine factors
were named as prestige value, self-identity
value, quality value, uniqueness value,
hedonic value, materialistic value, snob
value, usability value and financial value.
(b) Reliability of the scales is measured by
computing the Cronbach‟s alpha. For all
the nine factors used in this research,
reliability values had a range between 0.7
and 0.83. Testing of hypotheses summary
results are given below:
Summary of testing of hypotheses
Hypothes
is
Test
used
Significa
nce value
Status
of
hypoth
esis
Comme
nt
1. There
is a
relation
between
marital
status and
frequenc
y of
buying
luxury
brands
Chi
square
test
0.100 Rejecte
d
There is
no
relation
between
marital
status
and
frequenc
y of
buying
luxury
brands.
2. There
is a
relation
between
marital
status and
influence
to buy
Chi
square
test
0.001 Accept
ed
There is
a
relation
between
marital
status
and
influenc
e to buy
luxury
brands
luxury
brands
3. There
is a
relation
between
marital
status and
intention
to
purchase
the same
brand
previousl
y
purchase
d
Chi-
square
test
0.280 Rejecte
d
There is
no
relation
between
marital
status
and
intentio
n to
purchas
e the
same
brand
previous
ly
purchas
ed
4.There is
a relation
between
marital
status and
the kind
of luxury
product a
consumer
intends to
buy
Chi-
square
test
0.019 Accept
ed
There is
a
relation
between
marital
status
and the
kind of
luxury
product
a
consum
er
intends
to buy
5. There
is a
relation
between
marital
status and
the place
from
where a
consumer
buys
luxury
brands
Chi-
square
test
0.881 Rejecte
d
There is
no
relation
between
marital
status
and the
place
from
where a
consum
er buys
6. There
is a
significan
t
differenc
Krusk
al-
Wallis
H test
0.193 Rejecte
d
There is
no
significa
nt
differen
ce in
percepti
Journal of Management Development & Research, Volume: 5 No.1, June 2015
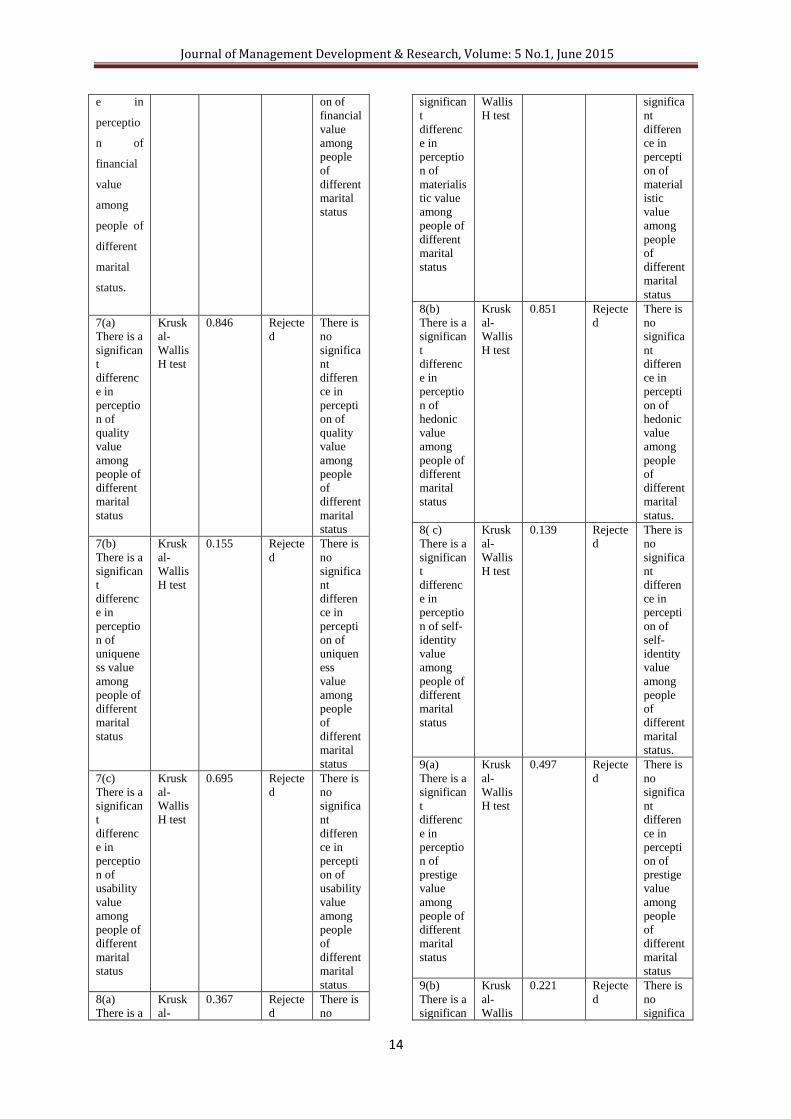
14
e in
perceptio
n of
financial
value
among
people of
different
marital
status.
on of
financial
value
among
people
of
different
marital
status
7(a)
There is a
significan
t
differenc
e in
perceptio
n of
quality
value
among
people of
different
marital
status
Krusk
al-
Wallis
H test
0.846 Rejecte
d
There is
no
significa
nt
differen
ce in
percepti
on of
quality
value
among
people
of
different
marital
status
7(b)
There is a
significan
t
differenc
e in
perceptio
n of
uniquene
ss value
among
people of
different
marital
status
Krusk
al-
Wallis
H test
0.155 Rejecte
d
There is
no
significa
nt
differen
ce in
percepti
on of
uniquen
ess
value
among
people
of
different
marital
status
7(c)
There is a
significan
t
differenc
e in
perceptio
n of
usability
value
among
people of
different
marital
status
Krusk
al-
Wallis
H test
0.695 Rejecte
d
There is
no
significa
nt
differen
ce in
percepti
on of
usability
value
among
people
of
different
marital
status
8(a)
There is a
Krusk
al-
0.367 Rejecte
d
There is
no
significan
t
differenc
e in
perceptio
n of
materialis
tic value
among
people of
different
marital
status
Wallis
H test
significa
nt
differen
ce in
percepti
on of
material
istic
value
among
people
of
different
marital
status
8(b)
There is a
significan
t
differenc
e in
perceptio
n of
hedonic
value
among
people of
different
marital
status
Krusk
al-
Wallis
H test
0.851 Rejecte
d
There is
no
significa
nt
differen
ce in
percepti
on of
hedonic
value
among
people
of
different
marital
status.
8( c)
There is a
significan
t
differenc
e in
perceptio
n of self-
identity
value
among
people of
different
marital
status
Krusk
al-
Wallis
H test
0.139 Rejecte
d
There is
no
significa
nt
differen
ce in
percepti
on of
self-
identity
value
among
people
of
different
marital
status.
9(a)
There is a
significan
t
differenc
e in
perceptio
n of
prestige
value
among
people of
different
marital
status
Krusk
al-
Wallis
H test
0.497 Rejecte
d
There is
no
significa
nt
differen
ce in
percepti
on of
prestige
value
among
people
of
different
marital
status
9(b)
There is a
significan
Krusk
al-
Wallis
0.221 Rejecte
d
There is
no
significa
Journal of Management Development & Research, Volume: 5 No.1, June 2015
15
t
differenc
e in
perceptio
n of snob
value
among
people of
different
marital
status
H test nt
differen
ce in
percepti
on of
snob
value
among
people
of
different
marital
status.
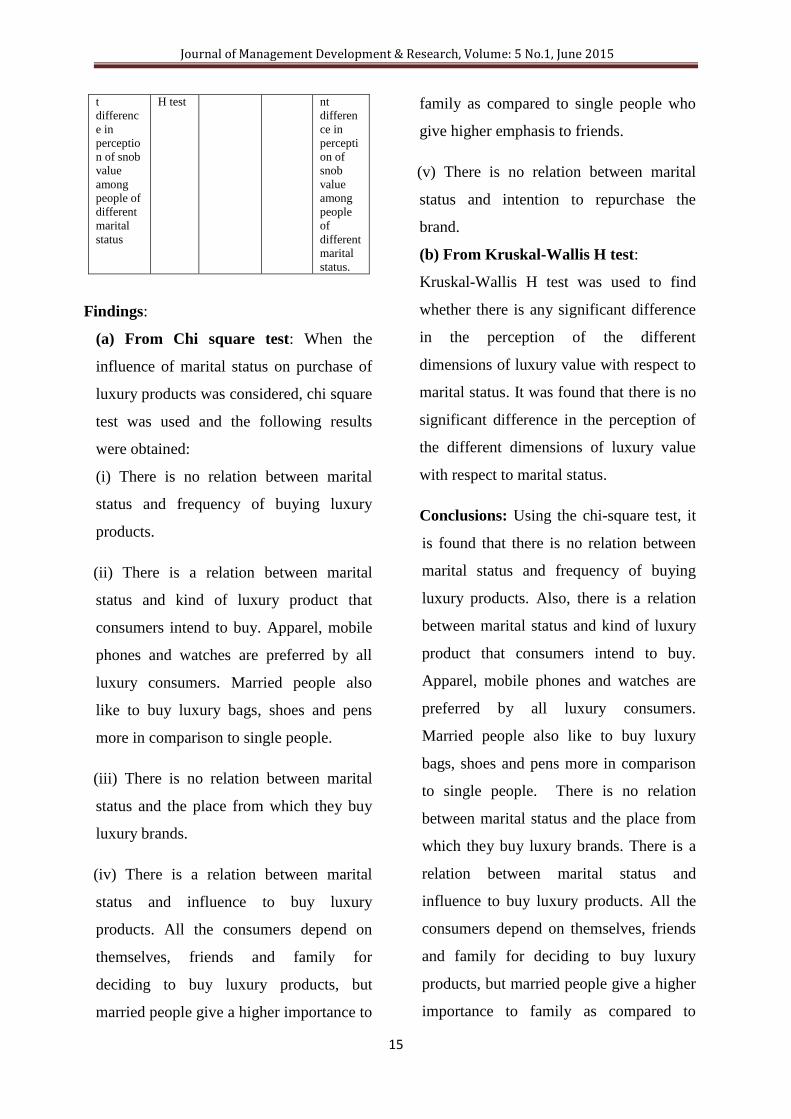
Findings:
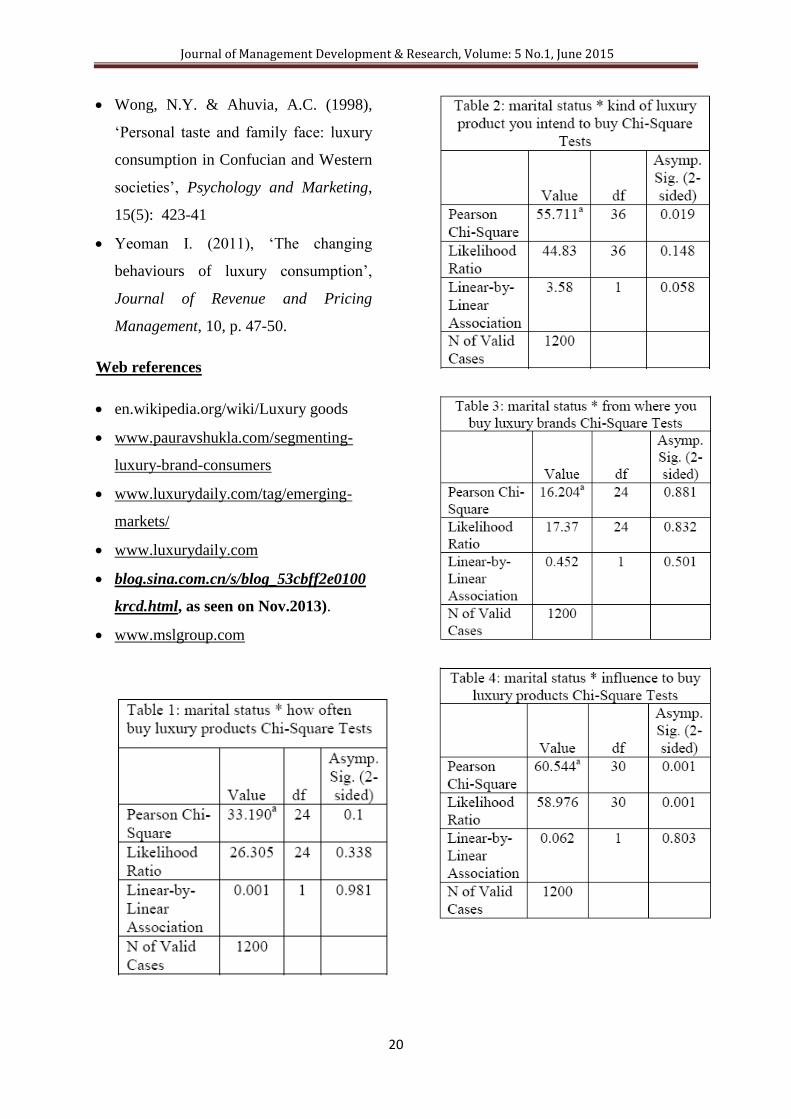
(a) From Chi square test: When the
influence of marital status on purchase of
luxury products was considered, chi square
test was used and the following results
were obtained:
(i) There is no relation between marital
status and frequency of buying luxury
products.
(ii) There is a relation between marital
status and kind of luxury product that
consumers intend to buy. Apparel, mobile
phones and watches are preferred by all
luxury consumers. Married people also
like to buy luxury bags, shoes and pens
more in comparison to single people.
(iii) There is no relation between marital
status and the place from which they buy
luxury brands.
(iv) There is a relation between marital
status and influence to buy luxury
products. All the consumers depend on
themselves, friends and family for
deciding to buy luxury products, but
married people give a higher importance to
family as compared to single people who
give higher emphasis to friends.
(v) There is no relation between marital
status and intention to repurchase the
brand.
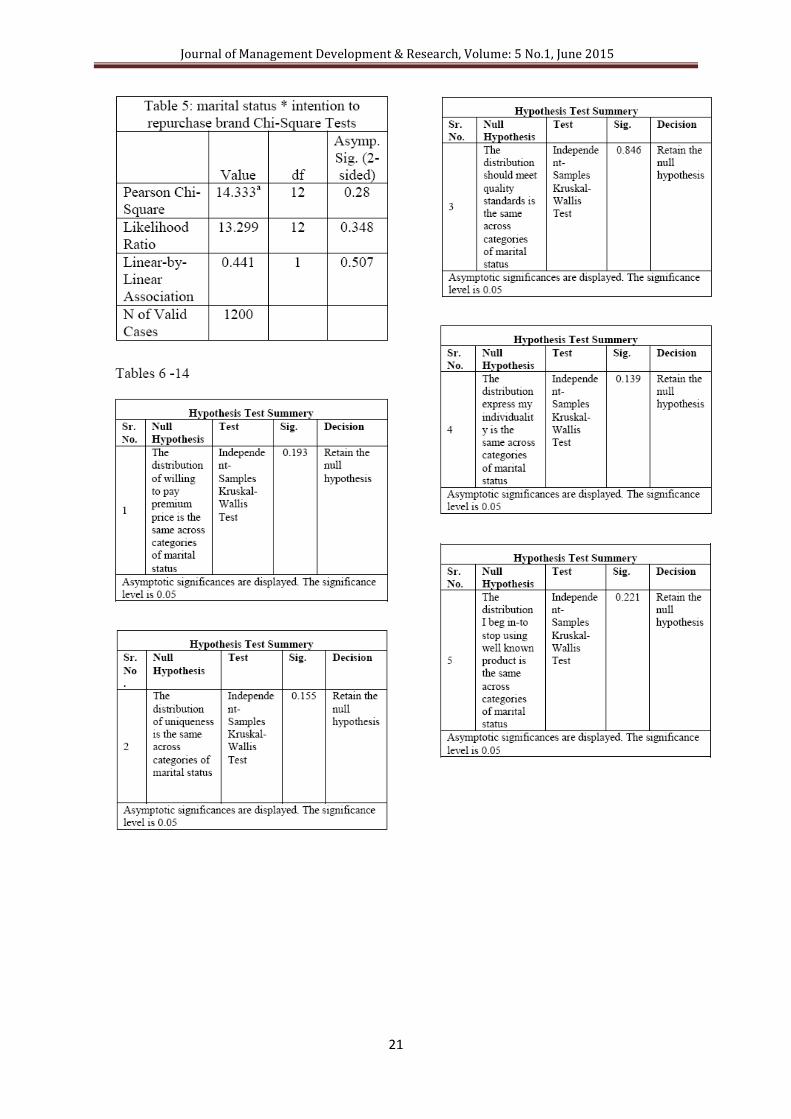
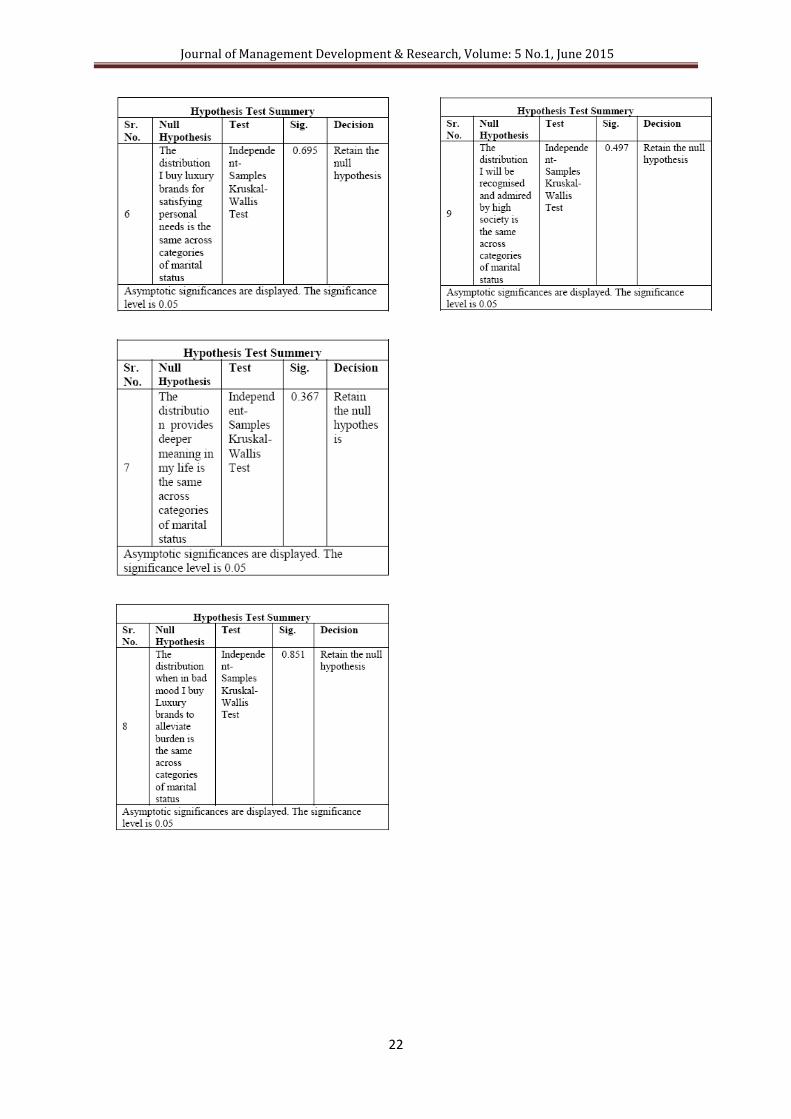
(b) From Kruskal-Wallis H test:
Kruskal-Wallis H test was used to find
whether there is any significant difference
in the perception of the different
dimensions of luxury value with respect to
marital status. It was found that there is no
significant difference in the perception of
the different dimensions of luxury value
with respect to marital status.
Conclusions: Using the chi-square test, it
is found that there is no relation between
marital status and frequency of buying
luxury products. Also, there is a relation
between marital status and kind of luxury
product that consumers intend to buy.
Apparel, mobile phones and watches are
preferred by all luxury consumers.
Married people also like to buy luxury
bags, shoes and pens more in comparison
to single people. There is no relation
between marital status and the place from
which they buy luxury brands. There is a
relation between marital status and
influence to buy luxury products. All the
consumers depend on themselves, friends
and family for deciding to buy luxury
products, but married people give a higher
importance to family as compared to
Journal of Management Development & Research, Volume: 5 No.1, June 2015
16
single people who give higher emphasis to
friends. Also, there is no relation between
marital status and intention to repurchase
the brand.
Using the Kruskal-Wallis H test, it is
found that there is no significant
difference in the perception of the
different dimensions of luxury value with
respect to marital status.
Benefits of the study: Knowledge of all
relevant aspects of consumer perceptions
of luxury can be useful for managerial
practice. According to perceived values in
luxury brands, different sets of luxury
products and different types of advertising
strategies should be applied for people of
different marital status. Strategies should
be used with focus on the more important
values for each group. Even if consumers
buy the same luxury goods, their
perceptions about luxury values can differ,
so the luxury market is heterogeneous and
the role of product characteristics plays an
important role. Thus, it is the marketer‟s
duty to consider individual differences in
evaluating luxury values and provide them
products which satisfy their requirements.
Managerial implications: The results of
this research have practical implications
for marketers working in the luxury
industry. The results suggest that a focus
on designing and managing optimal
products together with exclusivity can
create positive emotions. To effectively
react to the needs, wants and values of
purchasers is vital, especially in an
increasingly competitive global
marketplace. Positioning and segmentation
decisions have to be made on a global
level. Companies should inform
consumers about the high quality materials
and handcrafting of luxury products and
emphasize a unique, quality product.
Consumer education can transpire in the
form of advertising that stresses quality
and/or labels, packaging, and
supplementary facts that offer
comprehensive information on genuine
luxury products. Managers of luxury
goods should emphasize the positive,
functional, aesthetic and emotional
experience of owning and using a luxury
product. Knowledge and understanding of
these differences and similarities can help
in designing suitable marketing
campaigns. From a market positioning
perspective, monitoring the evaluative
criteria of consumers can help marketers to
recognize and focus on the specific luxury
dimensions, with special reference to
marital status. Luxury brand companies
can understand how people of different
marital status respond to the different
luxury value dimensions and how the
luxury products can cater to the
requirements of each group.
Journal of Management Development & Research, Volume: 5 No.1, June 2015
17
Limitations and scope for further
research: Firstly, a particular limitation of
this study was that the respondents were
all from Mumbai and Navi Mumbai and
represented only one specific demographic
group i.e. urban people of India. Thus, the
results might vary if this study was
repeated in different cities or regions of
India. In terms of further research,
therefore, researchers should consider
expanding the study focus to different
areas and different populations.
Secondly, we have considered the
influence of marital status on the different
luxury value dimensions and the purchase
behaviour of luxury products. Other
demographic variables like age,
occupation, income group, gender and
ethnicity can be considered to study their
influence on purchase behaviour of luxury
brands.
Thirdly, only the overall perceptions about
luxury value have been tested. We can
apply similar analysis for a specified
luxury product or service.
References:
Abdolvand, M.A., Reihani, N (2013),
„The effect of brand association in
psycho-social and psycho-personality
antecedents: a conceptual model of
conspicuous consumption among youth
adults‟, Research Journal of Applied
Sciences, Engineering and Technology,
6(6): 1012-1022
Achabou, M.A., & Dekhili, S. (2013),
„Luxury and sustainable development:
Is there a match?‟, Journal of Business
Research, 66(10) : 1896-1903
Atwal,G. and Khan,S. (2008), “Luxury
Marketing in India: „because I‟m worth
it‟”, Admap, World Advertising
Research Centre, pp.46-48
Chadha, R., & Husband, P. (2006), The
cult of the luxury brand: Inside Asia's
love affair with luxury. London:
Nicholas Brealey International.
Chaudhuri, H. R., & Majumdar, S.
(2006), „Of diamonds and desires:
understanding conspicuous
consumption from a contemporary
marketing perspective, Academy of
Marketing Science Review, 6 (11) :
256-267.
Ching-Yaw Chen, Chia-Hui Chao, Yu-
Je Lee and Tsai Pei-chuan (2012), „
Exploration of the differences in
Taiwanese women‟s purchasing
decisions towards luxury goods and
general products‟, African Journal of
Business Management Vol. 6(2), pp.
548-561,18
Danziger, P. (2004), „Meet the young
affluents: How the "Want-It-All, Want-
It-Now" generation is changing the
luxury market and what luxury brands
Journal of Management Development & Research, Volume: 5 No.1, June 2015
18
need to do about it.‟ Retrieved from
http://www.whypeoplebuy.com/cms/Ho
me_Page/Speeches_Presentations.php
Dubois, B. and Laurent, G. (1993), „Is
There a Euro Consumer for Luxury
Goods?‟, European Advances in
Consumer Research, 1, pp. 58-69.
Fionda, A. M., & Moore, C. M. (2008),
„The anatomy of the luxury fashion
brand‟, Journal of Brand Management,
16 (5/6) : 347-363.
Hauck, E.W. & Stanforth, N. (2007),
“Cohort perception of luxury goods and
services”, Journal of Fashion
Marketing and Management, 11 (2):
175-187.
Heine, K. (2011), "The concept of
luxury brands". Luxury Brand
Management, No.1 Technische
Universität Berlin.
Heinemann, G. (2008), Dissertation:
„Motivations for Chinese and Indian
consumers to buy luxury brands‟, AUT
University, pp. 18-22, pp. 53-54.
Kapferer, J.N. (1996), “Managing
Luxury Brands”, Journal of Brand
Management, pp. 251-260
Koonnaree Wongsiriwat (2007), „A
Study of influences of values, attitudes
and lifestyles (VALS II) on brand
equity of luxury handbags in Bangkok‟.
Nueno, J.L. & Quelch, J.A. (1998),
„The mass marketing of luxury‟,
Business Horizons, 41(6) : 61-68.
Okonkwo, U. (2007), Luxury fashion
branding: trends, tactics, techniques,
Basingstoke:
Palgrave Macmillan.
O‟Cass, A & Frost, H. (2002), „Status
Brands: Examining the Effects of Non-
Product Related Brand Associations on
Status and Conspicuous Consumption‟,
Journal of Product & Brand
Management, 11(2): 67-88.
Paurav Shukla, (2008) "Conspicuous
consumption among middle age
consumers: psychological and brand
antecedents", Journal of Product &
Brand Management, 17(1): 25 - 36
Phau, I., & Prendergast, G. (2000),
„Consuming Luxury Brands: The
Relevance of the „Rarity Principle‟,
Journal of Brand Management, 8(2):
122-138.
Quelch, J.A. (1987), "Marketing the
Premium Product," Business Horizons,
30(3): 38-45.
Rolf-Seringhaus, F. H. (2002), „Cross-
cultural exploration of global brands
and the internet’, Paper presented at the
Journal of Management Development & Research, Volume: 5 No.1, June 2015
19
18th Annual IMP Conference, Dijon,
France.
Savitha S. & Sathyanarayan K. (2015),
„Role of Socio –economic variables in
the polarisation of luxury value of
branded products: a study among the
selected shoppers in Chennai‟,
International Journal of Scientific &
Engineering Research, 6(3): 179-185
Sirgy M Joseph (1982), "Self-Concept
in Consumer Behaviour: A Critical
Review", Journal of Consumer
Research, 9, December, pp. 287-300.
Srichan Sriviroj (2007), „Purchasing
Luxury Goods: consumer behaviour of
international students in the UK‟,
Masters Dissertation in International
Business
Srinivasan, R, Srivastava, R.K.&
Bhanot, S (2013), „Study of the
influence of demographic variables on
purchase behaviour of luxury brands‟,
International Journal of Contemporary
Management Studies, 1(1): 181-195
Srinivasan, R, Srivastava, R.K.&
Bhanot, S (2014), „Identifying luxury
value dimensions for consumers and
using these dimensions for market
segmentation‟, Sydenham Management
Review, 3(2): 83-90
Srinivasan, R., Srivastava, R.K. &
Bhanot, S. (2014), „Impact of need for
uniqueness on purchase behaviour of
luxury brands‟, Excel International
Journal of Multidisciplinary
Management Studies, 4(6): 109-125
Sun, M.W., (2011), „Consumption of
luxury fashion brands: The motives of
generation Y consumers in China‟, MS
Thesis, Auckland University of
Technology
Teimourpour H. and Hanzaee, K.H.
(2011), „The impact of culture on
luxury consumption behaviour among
Iranian consumers‟, Journal of Islamic
Marketing, 2(3), 309-328.
Tian, K.T., Bearden, W. & Hunter, G.
(2001), „Consumers' need for
uniqueness: scale development and
validation‟, Journal of Consumer
Research, 28(1): 50-66.
Vigneron, F., & Johnson, L. W. (2004),
„Measuring perceptions of brand
luxury‟, Journal of Brand Management,
11(6): 484-506.
Wiedmann, K., Hennigs, N., & Siebels,
A. (2007), „Measuring consumers‟
luxury value perception: A cross
cultural framework‟, Academy of
Marketing Science Review, 7 (7): 333-
361.
Journal of Management Development & Research, Volume: 5 No.1, June 2015
20
Wong, N.Y. & Ahuvia, A.C. (1998),
„Personal taste and family face: luxury
consumption in Confucian and Western
societies‟, Psychology and Marketing,
15(5): 423-41
Yeoman I. (2011), „The changing
behaviours of luxury consumption‟,
Journal of Revenue and Pricing
Management, 10, p. 47-50.
Web references
en.wikipedia.org/wiki/Luxury goods
www.pauravshukla.com/segmenting-
luxury-brand-consumers
www.luxurydaily.com/tag/emerging-
markets/
www.luxurydaily.com
blog.sina.com.cn/s/blog_53cbff2e0100
krcd.html, as seen on Nov.2013).
www.mslgroup.com
Journal of Management Development & Research, Volume: 5 No.1, June 2015
21
Journal of Management Development & Research, Volume: 5 No.1, June 2015
22
Journal of Management Development & Research, Volume: 5 No.1, June 2015
23
Comparison of Returns from Debt Mutual Funds and Bank Deposits
Sankar Muralidaran,
Faculty of Management, Pacific University, Pacific Hills,
Pratap Nagar Extn., Airport Road, Debari, Udaipur – 313003,
Rajasthan, India.
Email: [email protected]
Abstract:
Diversification of the investment folio is the need of the hour. With volatility in all spheres of
the economy, and with rising inflation, the investor not only seeks maximum return from
his/her investments but also tries to safeguard the principal too. Traditionally preferring to
invest in Bank deposits, Post Office savings schemes and Government bonds, the retail
investor is slowly looking at other avenues. Debt Mutual funds are a relatively safe
investment avenue when compared to equity or equity mutual funds.
This paper studies whether debt funds generate higher returns in the short term periods too
and whether their performance is consistently higher than bank deposits over the years.
Keywords: Debt Mutual Funds, Bank Deposits, Returns
Introduction
Mutual Funds are fast emerging as an
alternate channel of investment in India.
Globally, they play a major role in the
economies, since they are an important
player in managing retirement funds. In
India, the Assets under Management
(AUM) of the mutual fund industry
increased from Rs. 1, 49,600 crores as at
the end of March 2005 to Rs. 10, 82,757
crores as at March 2015. While the growth
of over 7 times seems phenomenal, in
actual terms, the year on year growth has
been fluctuating due to the volatility in the
stock market. The Mutual Fund Industry‟s
net asset as a % of GDP is 7.23% in India
as against 84% for USA and 66% for
France.
Traditionally, Indians are perceived to be
thrifty which is amplified by the high
savings rate of 32% of GDP in 2013
against 17% in USA and 13% in UK. A
majority of the savings is directed towards
a purpose – child‟s education, marriage,
investment in property or for retirement.
The main outlook in all this remains
protection of and a reasonable increase in
capital. For a majority of Indians, the
corpus represented their entire life savings
and any erosion in the capital often spelt
disaster. Hence, the preferred investment
avenues are bank deposits, post office
Journal of Management Development & Research, Volume: 5 No.1, June 2015
24
savings schemes, real estate and gold.
Equity, bonds, debentures and mutual
funds are preferred by those willing to take
extra risks.
Rising income levels and widening
awareness has contributed to a change in
the investment composition in actual
terms. However, bank deposits continue to
remain the favourite investment avenue.
As per the RBI data on Financial Savings
in the Household Sector, Mutual Funds
contributed only 3.4% of the gross
financial assets in 2012-13 against 56.6%
for deposits and 17.3% for Life Insurance
products. There is a downward trend in
2013-14 with Mutual Funds accounting for
1.8% against 58.8% for Deposits and 17.0
for Insurance.
The low penetration of Mutual Funds
among households is also supported by the
monthly data released by Association of
Mutual Funds in India (AMFI).
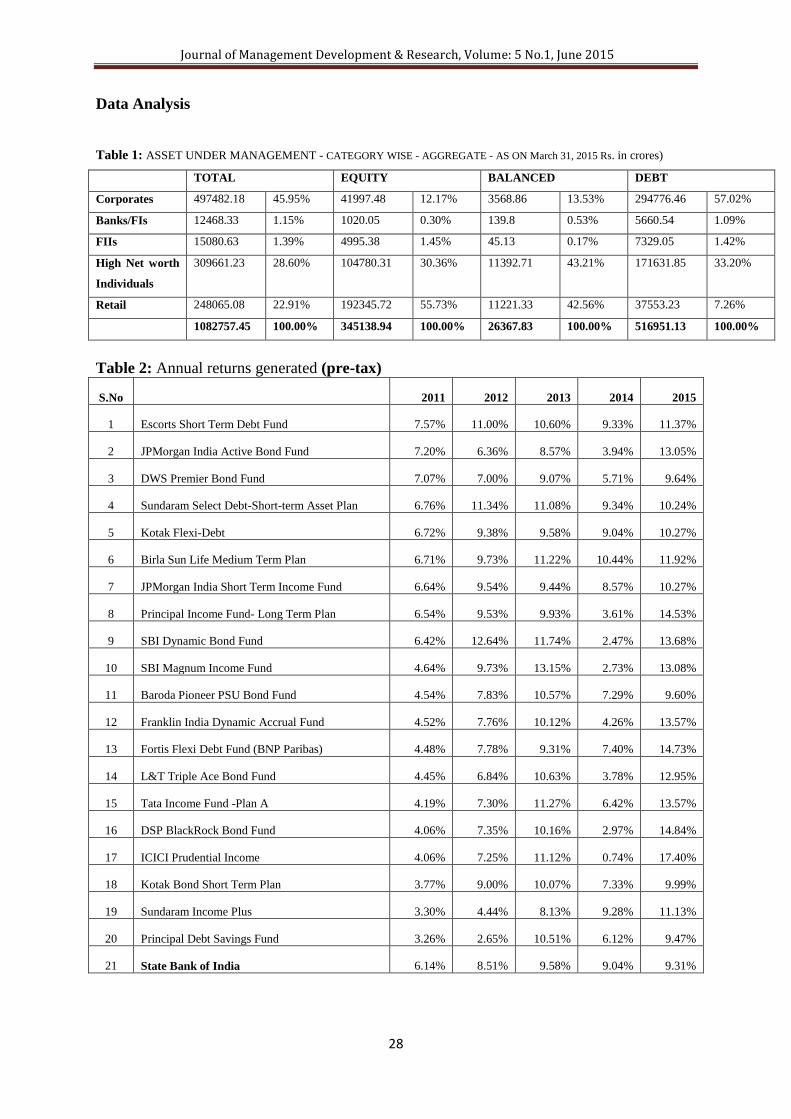
As is evident from Table 1, retail investors
account for only 22.91% of the total AUM
of the Mutual Fund Industry. This is
presumably due to the lack of awareness of
the products, unawareness of the suitability
of each category of mutual fund in line
with the individual‟s appetite and the
willingness or otherwise to take risks.
Retail investors invariably link Mutual
Fund returns to the sensex and any fall in
the sensex.like in 2008-09, will erode the
savings of the investor. It is this fear which
plays on the mind of the investor and
makes him/her seek safer avenues. While
the fear of capital erosion is not entirely
misplaced, it is necessary to differentiate
between high risk products and low risk
products. Equity funds are the most
marketed and highlighted by the fund
houses, fund advisors, rating agencies etc.
But these are high risk investments and not
suitable for every investor. An alternative
investment is Debt Mutual Funds.
Debt Funds typically invest in government
securities, Non-Convertible Debentures,
Certificate of Deposits, Commercial
Papers, Bonds and other fixed income
securities. As these funds invest in
relatively safer avenues, debt funds may
not give high returns as compared to
equity mutual funds but are still
comparable to the returns delivered by
bank deposits.
Between 31st March 2015 and 30
th April
2015, the NIFTY fell by about 3.65%. As
a result, the NAV of some of the best
performing equity funds also fell sharply.
For instance, the NAV of Franklin India
High Growth Companies Fund fell by
about 18.70% during the same period.
Comparatively, debt funds remained
steady and fell by only 0.34% (ICICI
Prudential Income Fund) in the same
period. In a volatile market and especially
when there is a downward pressure on
Journal of Management Development & Research, Volume: 5 No.1, June 2015
25
interest rates, debt funds offer better
returns.
In this scenario, it is important to analyse
the returns offered by Debt funds vis-a-vis
bank deposits, to find out if they are
beneficial to retail investors in the short
run.
Review of Literature
The survey on households conducted by
NCAER, sponsored by SEBI (July 2011),
profiled investors‟ preferences for various
market instruments like IPOs, Securities
and Mutual Funds. The survey found that
the primary destination of savings is
insurance schemes and banks. When
investing in other avenues, 43% preferred
Mutual funds. The studies by Patel, Pawar
and Datta (2012), Athma and Raj Kumar
(2012),Gupta, Chawla and Harkawat
(2011), Nandagopal, Sathish, Naveen and
Jeevanantham (2011), Raju G.V.S.S.N
(2013), Kandavel (2011), concentrated on
investor‟s awareness of mutual fund
schemes. Singh (2012), made acomparison
between investment in mutual funds and
bank and the impact of various factors on
investors‟ attitude towards mutual funds.
The study showed that most of the
respondents were still confused about
mutual funds as an investment vehicle.
Dimple and Ritu (2012), found that the
most preferred investment avenue is bank
deposit. Shares/bonds and Mutual Funds
are given equal importance when investing
in alternative avenues.
Palat in his book "Mutual Funds - an
Investor's guide"(2010), recommends
indirect investment in debt (through debt
funds) than in debt instruments directly.
While the risk factor in respect of debt
funds is low, compared to equity funds, the
tenure should also not be very long.
Annapoorna and Gupta‟s (2013), study
indicated that while debt funds have shown
a higher return for 2 year and 3 year
periods, equity funds have lagged behind.
Kar and Shil (2013), analysed the
performance and role of „Debt Funds‟ as
an investment option. They opined that
many of the debt products are unavailable
for direct retail investment to the extent
desired and hence the retail investors
should explore the option of investing in
Debt Mutual Funds. Sankaran in his book,
“Indian Mutual Funds Handbook- a guide
for industry professionals and intelligent
investors” (2007) admits that worldwide,
the debt markets are more active than
equity markets, unlike in India.
Annapoorna and Gupta (2013), have
rightly pointed out that little attempt has
been made to compare the returns from
Mutual Funds schemes and Bank deposits.
They have taken the average return (as a
mean – for the segment) given by the
Mutual Funds during the various time
periods for comparison. It was found that
Journal of Management Development & Research, Volume: 5 No.1, June 2015
26
many of the segments have outperformed
bank deposits for a 1 year period. Sankaran
in his book, has compared other
investment options with Mutual Funds at a
theoretical level, viz., Bank FDs, Company
FDs, Bonds, Debentures, Equity, Life
Insurance and Pension Fund.
While several studies have been conducted
to analyse investor behaviour in choosing
Mutual funds, or the returns generated by
equity funds, very little attempt has been
made to compare the returns generated by
debt funds vis-a-vis bank deposits and to
find out if debt funds are more beneficial
to the retail investor.
Objectives of the Study
1. To compare the average returns
generated by debt funds with the
average returns from bank deposits
2. To analyse whether the returns from
debt funds on a yearly basis are better
than bank deposits.
Hypothesis
Ho: The returns generated by bank
deposits are always higher than the returns
generated by any debt mutual fund on a
year to year basis.
H1: The returns generated by bank
deposits are not always higher than the
returns generated by debt mutual funds on
a year to year basis.
Research Methodology & Data
Collection
Research Methodology
By secondary research to evaluate the
performance of the twenty debt funds of
different fund houses and bank deposits.
Sampling Method
Twenty debt funds were randomly selected
covering the entire spectrum of returns –
high and low. For comparing the returns
from bank deposits, the prevailing interest
rates of State Bank of India were
considered. State bank of India, being the
largest public sector bank in India, is also
the representative of the banking industry.
The interest rates offered by other banks
would normally be in the same range.
Hence the interest rates of SBI have been
taken as a bench mark for comparison with
debt mutual funds.
Data Collection
The data has been collected from websites
like amfiindia.com, sbi.co.in and the
various fund houses. The NAV of the
funds were collected for the dates 1st
April
2010, 2011, 2012, 2013, 2014 and 2015.
The returns generated by the funds were
calculated for one year ending 2011, 2012,
2013, 2014 and 2015. Similarly, the
interest rates applicable for one year
deposit as on 1st
April 2010, 2011, 2012,
Journal of Management Development & Research, Volume: 5 No.1, June 2015
27
2013 and 2014 for State Bank of India
were collected.
Statistical Tools used for analysis of
data
The process of calculation was based on
the assumption that the investor would
have rolled over the fund or deposit every
year. The returns have therefore been
calculated on a year to year basis.
Return and average return
For each debt fund under analysis, the
annual returns were computed using the
NAV values, as under:
The annual rates of bank deposits were
collected from the bank‟s website and
compounded quarterly.
The returns generated (pre – tax) are
shown at Table 2.
The average returns generated are shown
at Table 3.
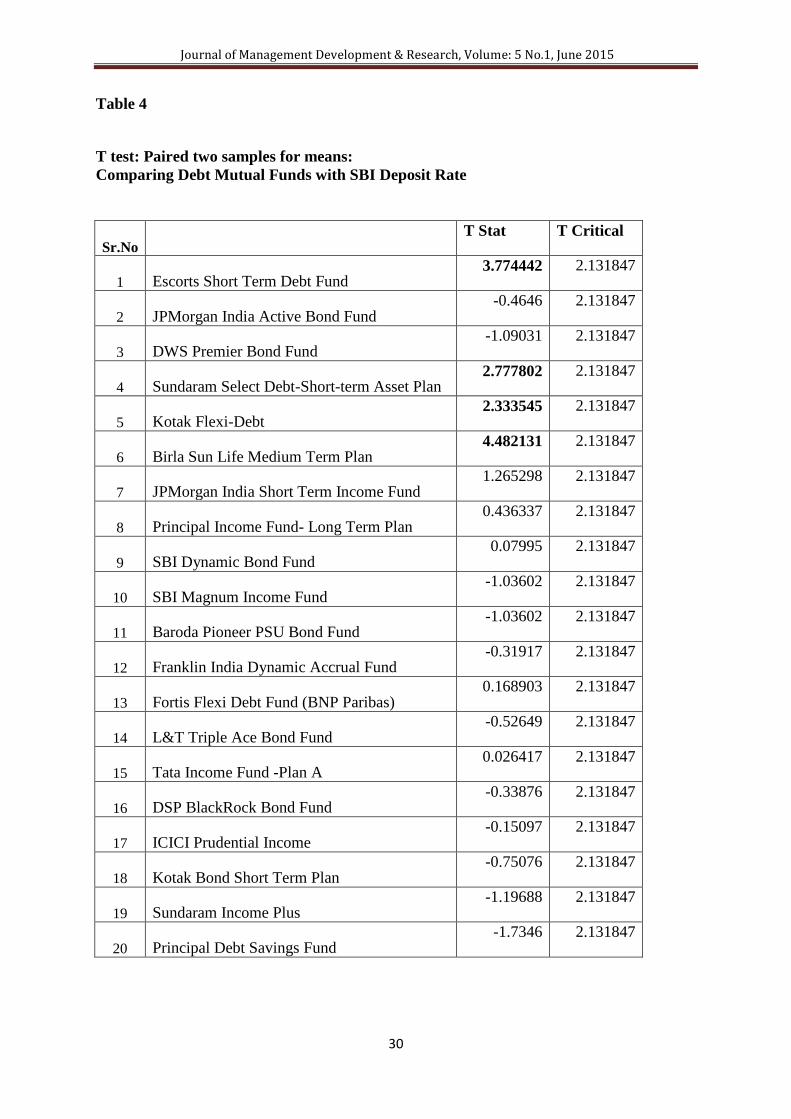
T test: Paired two sample for means
Paired sample t-test is a statistical
technique that is used to compare two
population means in the case of two
samples that are correlated.
The T critical for right tail test at 5% level
of significance and with 8 degrees of
freedom is 2.131847 and the t test results
obtained for the different funds are shown
at Table 4.
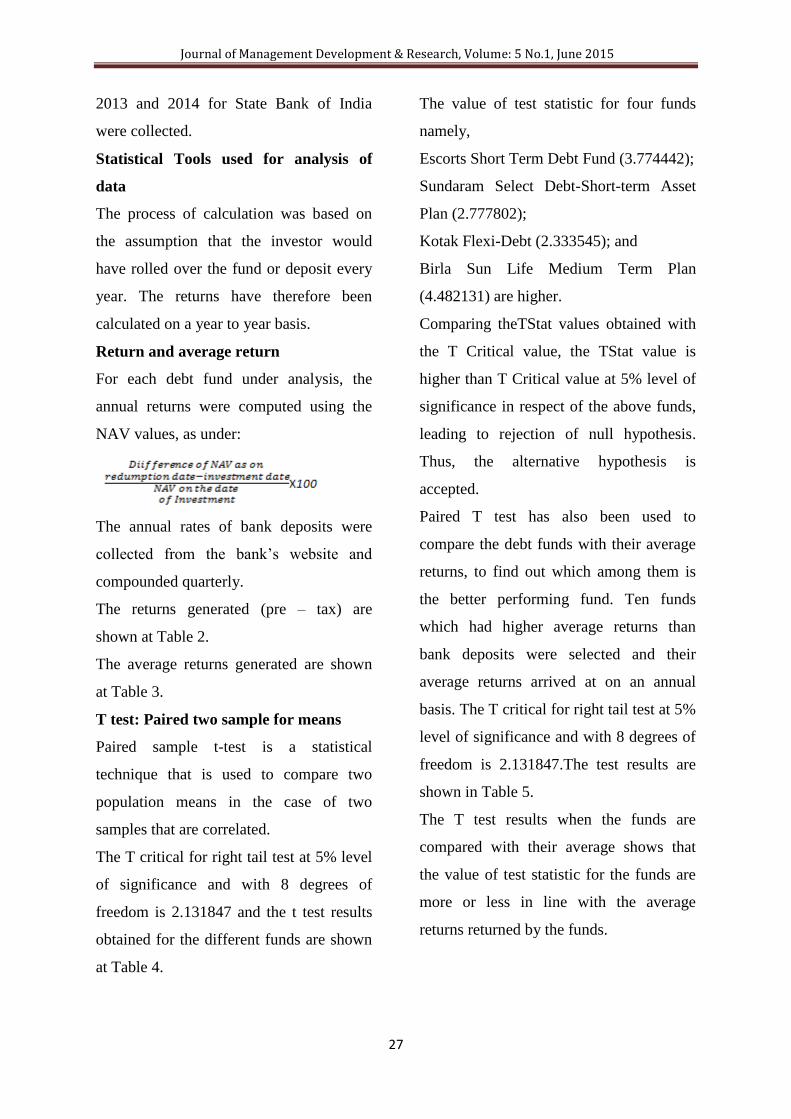
The value of test statistic for four funds
namely,
Escorts Short Term Debt Fund (3.774442);
Sundaram Select Debt-Short-term Asset
Plan (2.777802);
Kotak Flexi-Debt (2.333545); and
Birla Sun Life Medium Term Plan
(4.482131) are higher.
Comparing theTStat values obtained with
the T Critical value, the TStat value is
higher than T Critical value at 5% level of
significance in respect of the above funds,
leading to rejection of null hypothesis.
Thus, the alternative hypothesis is
accepted.
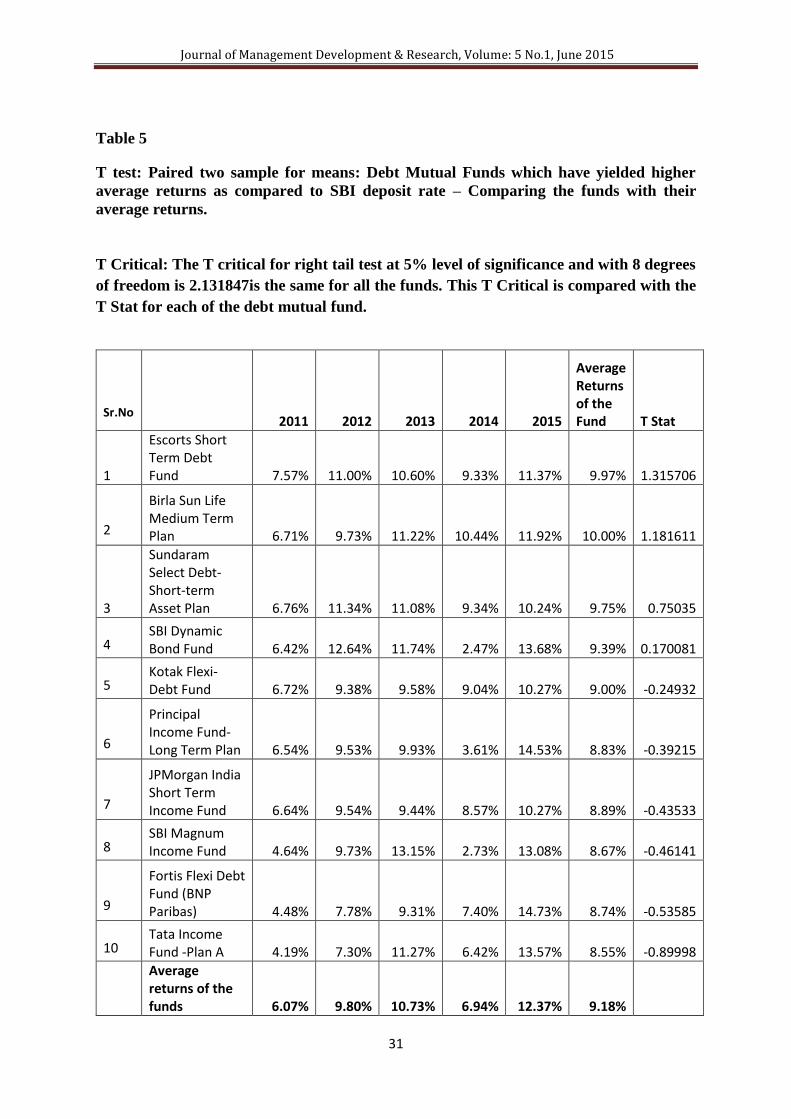
Paired T test has also been used to
compare the debt funds with their average
returns, to find out which among them is
the better performing fund. Ten funds
which had higher average returns than
bank deposits were selected and their
average returns arrived at on an annual
basis. The T critical for right tail test at 5%
level of significance and with 8 degrees of
freedom is 2.131847.The test results are
shown in Table 5.
The T test results when the funds are
compared with their average shows that
the value of test statistic for the funds are
more or less in line with the average
returns returned by the funds.
Journal of Management Development & Research, Volume: 5 No.1, June 2015
28
Data Analysis
Table 1: ASSET UNDER MANAGEMENT - CATEGORY WISE - AGGREGATE - AS ON March 31, 2015 Rs. in crores)
TOTAL EQUITY BALANCED DEBT
Corporates 497482.18 45.95% 41997.48 12.17% 3568.86 13.53% 294776.46 57.02%
Banks/FIs 12468.33 1.15% 1020.05 0.30% 139.8 0.53% 5660.54 1.09%
FIIs 15080.63 1.39% 4995.38 1.45% 45.13 0.17% 7329.05 1.42%
High Net worth
Individuals
309661.23 28.60% 104780.31 30.36% 11392.71 43.21% 171631.85 33.20%
Retail 248065.08 22.91% 192345.72 55.73% 11221.33 42.56% 37553.23 7.26%
1082757.45 100.00% 345138.94 100.00% 26367.83 100.00% 516951.13 100.00%
Table 2: Annual returns generated (pre-tax)
S.No 2011 2012 2013 2014 2015
1 Escorts Short Term Debt Fund 7.57% 11.00% 10.60% 9.33% 11.37%
2 JPMorgan India Active Bond Fund 7.20% 6.36% 8.57% 3.94% 13.05%
3 DWS Premier Bond Fund 7.07% 7.00% 9.07% 5.71% 9.64%
4 Sundaram Select Debt-Short-term Asset Plan 6.76% 11.34% 11.08% 9.34% 10.24%
5 Kotak Flexi-Debt 6.72% 9.38% 9.58% 9.04% 10.27%
6 Birla Sun Life Medium Term Plan 6.71% 9.73% 11.22% 10.44% 11.92%
7 JPMorgan India Short Term Income Fund 6.64% 9.54% 9.44% 8.57% 10.27%
8 Principal Income Fund- Long Term Plan 6.54% 9.53% 9.93% 3.61% 14.53%
9 SBI Dynamic Bond Fund 6.42% 12.64% 11.74% 2.47% 13.68%
10 SBI Magnum Income Fund 4.64% 9.73% 13.15% 2.73% 13.08%
11 Baroda Pioneer PSU Bond Fund 4.54% 7.83% 10.57% 7.29% 9.60%
12 Franklin India Dynamic Accrual Fund 4.52% 7.76% 10.12% 4.26% 13.57%
13 Fortis Flexi Debt Fund (BNP Paribas) 4.48% 7.78% 9.31% 7.40% 14.73%
14 L&T Triple Ace Bond Fund 4.45% 6.84% 10.63% 3.78% 12.95%
15 Tata Income Fund -Plan A 4.19% 7.30% 11.27% 6.42% 13.57%
16 DSP BlackRock Bond Fund 4.06% 7.35% 10.16% 2.97% 14.84%
17 ICICI Prudential Income 4.06% 7.25% 11.12% 0.74% 17.40%
18 Kotak Bond Short Term Plan 3.77% 9.00% 10.07% 7.33% 9.99%
19 Sundaram Income Plus 3.30% 4.44% 8.13% 9.28% 11.13%
20 Principal Debt Savings Fund 3.26% 2.65% 10.51% 6.12% 9.47%
21 State Bank of India 6.14% 8.51% 9.58% 9.04% 9.31%
Journal of Management Development & Research, Volume: 5 No.1, June 2015
29
Table 3
Average returns from 2010 to 2015
S.No
Average
Returns
1 Escorts Short Term Debt Fund 9.97%
2 JPMorgan India Active Bond Fund 7.82%
3 DWS Premier Bond Fund 7.70%
4 Sundaram Select Debt-Short-term Asset Plan 9.75%
5 Kotak Flexi-Debt 9.00%
6 Birla Sun Life Medium Term Plan 10.00%
7 JPMorgan India Short Term Income Fund 8.89%
8 Principal Income Fund- Long Term Plan 8.83%
9 SBI Dynamic Bond Fund 9.39%
10 SBI Magnum Income Fund 8.67%
11 Baroda Pioneer PSU Bond Fund 7.97%
12 Franklin India Dynamic Accrual Fund 8.05%
13 Fortis Flexi Debt Fund (BNP Paribas) 8.74%
14 L&T Triple Ace Bond Fund 7.73%
15 Tata Income Fund -Plan A 8.55%
16 DSP BlackRock Bond Fund 7.88%
17 ICICI Prudential Income 8.11%
18 Kotak Bond Short Term Plan 8.03%
19 Sundaram Income Plus 7.26%
20 Principal Debt Savings Fund 6.40%
21 State Bank of India 8.52%
Journal of Management Development & Research, Volume: 5 No.1, June 2015
30
Table 4
T test: Paired two samples for means:
Comparing Debt Mutual Funds with SBI Deposit Rate
Sr.No T Stat T Critical
1 Escorts Short Term Debt Fund 3.774442 2.131847
2 JPMorgan India Active Bond Fund -0.4646 2.131847
3 DWS Premier Bond Fund -1.09031 2.131847
4 Sundaram Select Debt-Short-term Asset Plan 2.777802 2.131847
5 Kotak Flexi-Debt 2.333545 2.131847
6 Birla Sun Life Medium Term Plan 4.482131 2.131847
7 JPMorgan India Short Term Income Fund 1.265298 2.131847
8 Principal Income Fund- Long Term Plan 0.436337 2.131847
9 SBI Dynamic Bond Fund 0.07995 2.131847
10 SBI Magnum Income Fund -1.03602 2.131847
11 Baroda Pioneer PSU Bond Fund -1.03602 2.131847
12 Franklin India Dynamic Accrual Fund -0.31917 2.131847
13 Fortis Flexi Debt Fund (BNP Paribas) 0.168903 2.131847
14 L&T Triple Ace Bond Fund -0.52649 2.131847
15 Tata Income Fund -Plan A 0.026417 2.131847
16 DSP BlackRock Bond Fund -0.33876 2.131847
17 ICICI Prudential Income -0.15097 2.131847
18 Kotak Bond Short Term Plan -0.75076 2.131847
19 Sundaram Income Plus -1.19688 2.131847
20 Principal Debt Savings Fund -1.7346 2.131847
Journal of Management Development & Research, Volume: 5 No.1, June 2015
31
Table 5
T test: Paired two sample for means: Debt Mutual Funds which have yielded higher
average returns as compared to SBI deposit rate – Comparing the funds with their
average returns.
T Critical: The T critical for right tail test at 5% level of significance and with 8 degrees
of freedom is 2.131847is the same for all the funds. This T Critical is compared with the
T Stat for each of the debt mutual fund.
Sr.No
2011 2012 2013 2014 2015
Average Returns of the Fund T Stat
1
Escorts Short Term Debt Fund 7.57% 11.00% 10.60% 9.33% 11.37% 9.97% 1.315706
2
Birla Sun Life Medium Term Plan 6.71% 9.73% 11.22% 10.44% 11.92% 10.00% 1.181611
3
Sundaram Select Debt-Short-term Asset Plan 6.76% 11.34% 11.08% 9.34% 10.24% 9.75% 0.75035
4
SBI Dynamic Bond Fund 6.42% 12.64% 11.74% 2.47% 13.68% 9.39% 0.170081
5
Kotak Flexi-Debt Fund 6.72% 9.38% 9.58% 9.04% 10.27% 9.00% -0.24932
6
Principal Income Fund- Long Term Plan 6.54% 9.53% 9.93% 3.61% 14.53% 8.83% -0.39215
7
JPMorgan India Short Term Income Fund 6.64% 9.54% 9.44% 8.57% 10.27% 8.89% -0.43533
8
SBI Magnum Income Fund 4.64% 9.73% 13.15% 2.73% 13.08% 8.67% -0.46141
9
Fortis Flexi Debt Fund (BNP Paribas) 4.48% 7.78% 9.31% 7.40% 14.73% 8.74% -0.53585
10
Tata Income Fund -Plan A 4.19% 7.30% 11.27% 6.42% 13.57% 8.55% -0.89998
Average returns of the funds 6.07% 9.80% 10.73% 6.94% 12.37% 9.18%
Journal of Management Development & Research, Volume: 5 No.1, June 2015
32
Findings, Observations and Conclusion
It is observed that bank deposits have
not always given higher returns than
debt funds. Debt funds like Escorts
Short Term Debt Fund; Sundaram
Select Debt-Short-term Asset Plan;
Kotak Flexi-Debt and Birla Sun Life
Medium Term Plan have been giving
consistently higher returns than Bank
deposit in all the years between
2010and 2015.In other words, the
results of the T test: Paired two sample
for means, show that the returns
generated by the above mentioned debt
funds have been consistently higher
than bank deposits on a year to year
basis. Hence, their T stat results are
higher than T critical.
Other than these funds, debt funds like
JPMorgan India Short Term Income
Fund; Principal Income Fund- Long
Term Plan; SBI Dynamic Bond Fund;
SBI Magnum Income Fund; Fortis
(BNP Paribas) Flexi Debt Fund and
Tata Income Fund -Plan A, have higher
average returns for the same period.
However, they also witnessed volatility
in their returns for some years and
hence, the T stat results are lower than
T critical. Holding on to the
investments in these funds presumably
would have given the investors better
returns than bank deposits in the long
run.
The funds which have a negative t test
score also have a lower average return
than the bank deposits. The only
exception for this is the SBI Magnum
Income Fund which though has a
negative T score has its average return
more than the SBI deposit rate. The
reason for this lies in its high variability
in its return over the five years under
review.
The results of the T test: Paired two
sample for means, for the ten funds
which have given higher average
returns than bank deposits have then
been compared amongst themselves at
Table 5. From this table, it is observed
that the T test results are more or less in
line with the average returns generated
by the funds.
Escorts Short Term Debt Fund has
ranked higher than Birla Sun Life
Medium Term Plan, because this fund
had comparatively less variations in its
returns over the years. Similar is the
case with Principal Income Fund- Long
Term Plan - JPMorgan India Short
Term Income Fund and SBI Magnum
Income Fund - Fortis Flexi Debt Fund
(BNP Paribas).
Journal of Management Development & Research, Volume: 5 No.1, June 2015
33
Conclusion
Debt funds like Escorts Short Term Debt
Fund; Sundaram Select Debt-Short-term
Asset Plan; Kotak Flexi-Debt and Birla
Sun Life Medium Term Planhave given
consistently higher returns than bank
deposit rateson a year to year basis over a
period of five years.
The average investor can therefore look at
debt funds as an additional investment
avenue and invest in the same to generate
better returns and to diversify their
portfolio.
References
Palat, Raghu (2010) Everything you
need to know about Mutual Funds,
Executive Excellence Books
Sankaran, Sundar (2007), Indian
Mutual Funds Handbook- A guide for
Industry Professionals and Intelligent
Investors, Vision Books
Patel Atul, Pawar H D and Datta
Jayshri (2012), A Study on Investors‟
Consciousness and Investment Habits
Toward Mutual Funds: - An
Exploratory Study of Mehsana District;
International Journal of Research in
Computer Application & Management,
Volume No. 2 (2012), Issue No. 6
(June) ISSN 2231-1009, pp 127-133
Athma Prashanta and Kumar Raj K
(2012), Mutual Funds in India: An
Analysis of Investors Perceptions;
International Journal of Research in
Commerce & Management, Volume
No. 3 (2012), Issue No. 7 (July) ISSN
0976-2183, pp 21-26
Gupta Sonu V, Chawla Prakash and
Harkawat Sandhya (2011), An Analysis
of Investor‟s Perception Regarding
Mutual Fund; International Journal of
Research in Commerce & Management,
Volume No: 2 (2011), Issue No. 5
(May) ISSN 0976-2183, pp 38-41
Nandagopal R., Sathish M, Naveen K.
J. and Jeevanantham V (2011),
Investors Perception Towards
Investment In Mutual Funds;
International Journal of Research in
Computer Application & Management,
Volume No: 1 (2011), Issue No. 4
(June) ISSN 2231-1009, pp 40-44
Raju Sanyasi G.V.S.S.N (2013),
Attitude of Mutual Fund Investors – An
Empirical Study; International Journal
of Research in Commerce &
Management, Volume No. 4 (2013),
Issue No. 02 (February) ISSN 0976-
2183, pp 112-116
Kandavel D (2011), Perception of the
Retail Investors Towards Investment in
Mutual Funds in Puducherry: An
Empirical Study; International Journal
of Research in Commerce &
Management, Volume No. 2 (2011),
Journal of Management Development & Research, Volume: 5 No.1, June 2015
34
Issue No. 11 (November) ISSN0976-
2183, pp 85-87
Singh Binod Kumar (2012), A study on
investors‟ attitude towards mutual funds
as an investment option; International
Journal of Research in Management
Issue2, Vol. 2 (March-2012) ISSN
2249-5908 , Page 61
Dimple and Ritu (2012), Buying
Behaviour and Perception of Retail
Investors towards Mutual Fund
Schemes; International Journal of
Research in Commerce &Management,
Volume No. 3 (2012), Issue No. 9
(September) ISSN 0976-2183, pp 147-
150
Annapoorna M.S and Gupta Pradeep K.
(2013), A Comparative Analysis Of
Returns Of Mutual Fund Schemes
Ranked 1 By CRISIL; Tactful
Management Research Journal Vol. 2 ,
Issue. 1 , Oct 2013 ISSN :2319-7943
Kar Mili and Shil Parag (2013), Debt
Funds – A Prominent Player in Indian
Mutual Fund Industry; International
Journal of Innovative Research &
Development March, 2013 Vol 2 Issue
3, ISSN: 2278 – 0211, pp 440-450
https://www.amfiindia.com/
https://www.sbi.co.in/
https://www.sbi.co.in/portal/documents/
36873/53953/1403695699641_RETAIL
_TERM_DEPOSIT_INTEREST_RAT
ES.pdf/3f68fe5f-8b81-4205-90bf-
67a825a42556
http://www.amfiindia.com/
CRISIL-Research-Assocham_mutual-
fund-paper_dec11 (PDF)
http://data.worldbank.org/indicator/NY.
GNS.ICTR.ZS
http://rbidocs.rbi.org.in/rdocs/AnnualRe
port/PDFs/RBIARE210814_FULL.pdf
http://www.amfiindia.com/research-
information/aum-data/age-wise-folio-
data
http://www.statisticssolutions.com/man
ova-analysis-paired-sample-t-test/
Journal of Management Development & Research, Volume: 5 No.1, June 2015
35
An Analytical Study of Consumers’ Satisfaction:
Towards the Selection of Ice Cream Brands
Dr. Achut P. Pednekar
Assistant Professor
Dnyanprassarak Mandal‟s College and research centre,
Assagao - Goa
Abstract
For the consumer, ice cream is a chill, soothing treat. For sellers, it's a high-stakes, high-
competition field, where innovation rules and fickle customers are always searching for the
subsequently cool twist. On the basis of flavors the market today has a number of flavors like
Chocolate; Strawberry, Pista; Mango; Vanilla; Butterscotch; Blue berry; Black current;
Oreo-cookie; Coconut; and Almond. In order to accomplish the study undertaken, 110
respondents from the Mhapsa area of Bardez taluka were selected randomly on the basis of
convenience sampling technique. Collected data was interpreted with the help of a simple
statistical technique i.e. percentage method. Likert five point scales was used to measure
attributes affecting purchasing decision. This study mainly focuses on understanding the
flavour, brand, attributes and frequency for buying ice-cream. The market is totally
dominated by chocolate, Butterscotch and Vanilla flavour, which together account for more
than 74 per cent of the market followed by strawberry and Black current. Accordingly to the
study undertaken, Amul was holding the first position, Baskin Robbins the second, Vadillal
the third and Kwality Walls the fourth.
Key words: Consumers, Brands, Ice Cream, Goa, Respondents, Mhapsa, Market
Introduction
All marketing activities start with the
consumers and ends with the consumers.
Consumer is the supreme in the market.
Consumer choose what to purchase, from
whom to purchase, why to purchase, from
where to purchase, and how to purchase.
Today the success of any firm depends
upon the satisfaction provided to the
consumers. For satisfying the consumers‟
needs, the firm should make thorough
study about the behavior of the consumers.
In order to become a successful
businessman, he must know the liking or
disliking of the consumers. To be a true
businessman, he must know the time when
it is required as well as the quality of
goods and services a consumer may prefer
Journal of Management Development & Research, Volume: 5 No.1, June 2015
36
so that he may store the goods or provide
the services accordingly. The market share
of any product is highly determined by
purchasing behavior of the consumers.
Businessman/Marketer must understand
the consumption behaviour pattern.
On the other hand, a highly
satisfied customers‟ general stays loyal
longer, buys more as the company
introduces new products and upgrades
existing products, talks favorably about the
company and its products, pays less
attention to competing brands and is less
sensitive to price, offers products or
service ideas to the company, and costs
less to serve than new customers because
transactions are routine. Gaining a
thorough, in-depth consumer
understanding helps to ensure that the right
products are marketed to the right
consumers in the right way.
In order to accomplish the study
undertaken the respondents in the Mhapsa
area were randomly selected on the
convenience sampling technique. This
study mainly focuses on understanding the
flavour, brand, attributes and frequency for
buying ice-cream.
Objectives of the Study
To examine and analyze the flavour
preferred by the respondents;
To learn and analyze the preference
towards different ice cream brands;
To study and analyze the attributes
affecting purchasing decision; and
To ascertain and analyze the respondents
consumption pattern.
Methodology of the Study
To fulfill predetermine objectives;
data from both primary as well as secondary
sources were collected. To collect the
primary data well-structured questionnaires
was prepared inclusive of close-ended and
open-ended. 110 respondents from the
Mhapsa area of Bardez taluka were selected
randomly to accomplish the study
undertaken. Convenient sampling technique
has been used to choose the sample. The
secondary data was collected by referring to
the books, journal, magazines, internet etc.
Collected data was interpreted with the help
of simple statistical technique; i.e. Percentage
method.
Analysis and Discussion
The respondents belonged to cross-
sections of the society in terms of sex, age,
education, income status and employment.
54.55 per cent of respondents are male while
45.45 per cent are female; 20.91 per cent of
the respondents belonged to the age group
between 10-20 years, 46.36 per cent of the
respondents‟ falls between the age group of
21-30 years, while 32.73 per cent of the
respondents belong to the categories of more
than 30 years of age. As far as gender-wise
classification is concern in combination with
their respective annual income; 9.28 per cent
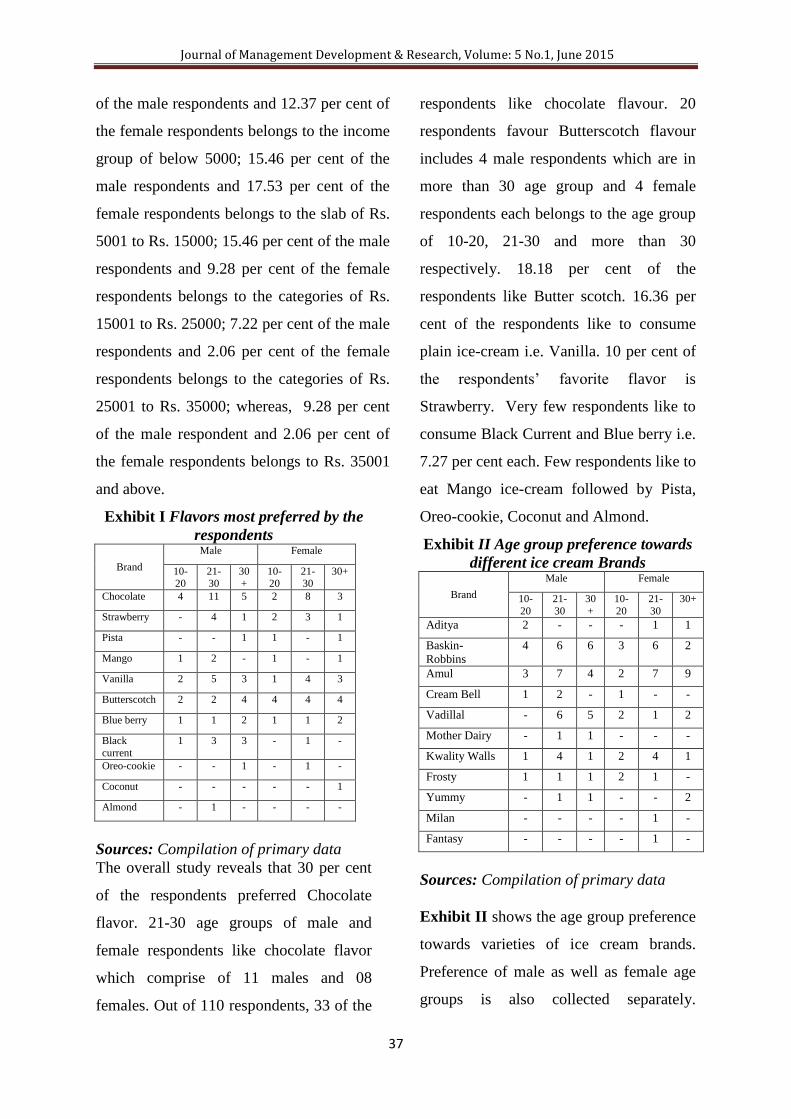
Journal of Management Development & Research, Volume: 5 No.1, June 2015
37
of the male respondents and 12.37 per cent of
the female respondents belongs to the income
group of below 5000; 15.46 per cent of the
male respondents and 17.53 per cent of the
female respondents belongs to the slab of Rs.
5001 to Rs. 15000; 15.46 per cent of the male
respondents and 9.28 per cent of the female
respondents belongs to the categories of Rs.
15001 to Rs. 25000; 7.22 per cent of the male
respondents and 2.06 per cent of the female
respondents belongs to the categories of Rs.
25001 to Rs. 35000; whereas, 9.28 per cent
of the male respondent and 2.06 per cent of
the female respondents belongs to Rs. 35001
and above.
Exhibit I Flavors most preferred by the
respondents
Brand
Male Female
10-20
21-30
30 +
10-20
21-30
30+
Chocolate 4 11 5 2 8 3
Strawberry - 4 1 2 3 1
Pista - - 1 1 - 1
Mango 1 2 - 1 - 1
Vanilla 2 5 3 1 4 3
Butterscotch 2 2 4 4 4 4
Blue berry 1 1 2 1 1 2
Black
current
1 3 3 - 1 -
Oreo-cookie - - 1 - 1 -
Coconut - - - - - 1
Almond - 1 - - - -
Sources: Compilation of primary data
The overall study reveals that 30 per cent
of the respondents preferred Chocolate
flavor. 21-30 age groups of male and
female respondents like chocolate flavor
which comprise of 11 males and 08
females. Out of 110 respondents, 33 of the
respondents like chocolate flavour. 20
respondents favour Butterscotch flavour
includes 4 male respondents which are in
more than 30 age group and 4 female
respondents each belongs to the age group
of 10-20, 21-30 and more than 30
respectively. 18.18 per cent of the
respondents like Butter scotch. 16.36 per
cent of the respondents like to consume
plain ice-cream i.e. Vanilla. 10 per cent of
the respondents‟ favorite flavor is
Strawberry. Very few respondents like to
consume Black Current and Blue berry i.e.
7.27 per cent each. Few respondents like to
eat Mango ice-cream followed by Pista,
Oreo-cookie, Coconut and Almond.
Exhibit II Age group preference towards
different ice cream Brands
Brand
Male Female
10-
20
21-
30
30
+
10-
20
21-
30
30+
Aditya 2 - - - 1 1
Baskin-
Robbins
4 6 6 3 6 2
Amul 3 7 4 2 7 9
Cream Bell 1 2 - 1 - -
Vadillal - 6 5 2 1 2
Mother Dairy - 1 1 - - -
Kwality Walls 1 4 1 2 4 1
Frosty 1 1 1 2 1 -
Yummy - 1 1 - - 2
Milan - - - - 1 -
Fantasy - - - - 1 -
Sources: Compilation of primary data
Exhibit II shows the age group preference
towards varieties of ice cream brands.
Preference of male as well as female age
groups is also collected separately.
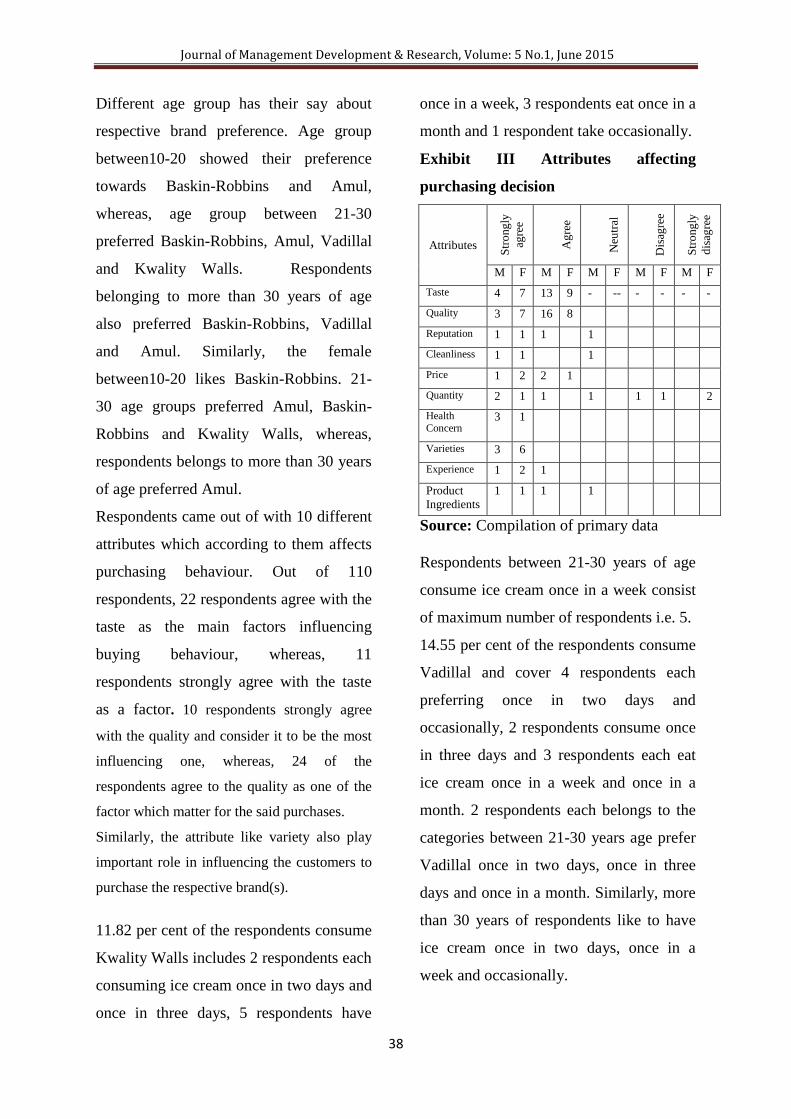
Journal of Management Development & Research, Volume: 5 No.1, June 2015
38
Different age group has their say about
respective brand preference. Age group
between10-20 showed their preference
towards Baskin-Robbins and Amul,
whereas, age group between 21-30
preferred Baskin-Robbins, Amul, Vadillal
and Kwality Walls. Respondents
belonging to more than 30 years of age
also preferred Baskin-Robbins, Vadillal
and Amul. Similarly, the female
between10-20 likes Baskin-Robbins. 21-
30 age groups preferred Amul, Baskin-
Robbins and Kwality Walls, whereas,
respondents belongs to more than 30 years
of age preferred Amul.
Respondents came out of with 10 different
attributes which according to them affects
purchasing behaviour. Out of 110
respondents, 22 respondents agree with the
taste as the main factors influencing
buying behaviour, whereas, 11
respondents strongly agree with the taste
as a factor. 10 respondents strongly agree
with the quality and consider it to be the most
influencing one, whereas, 24 of the
respondents agree to the quality as one of the
factor which matter for the said purchases.
Similarly, the attribute like variety also play
important role in influencing the customers to
purchase the respective brand(s).
11.82 per cent of the respondents consume
Kwality Walls includes 2 respondents each
consuming ice cream once in two days and
once in three days, 5 respondents have
once in a week, 3 respondents eat once in a
month and 1 respondent take occasionally.
Exhibit III Attributes affecting
purchasing decision
Attributes
Str
ong
ly
agre
e
Ag
ree
Neu
tral
Dis
agre
e
Str
ong
ly
dis
agre
e
M F M F M F M F M F
Taste 4 7 13 9 - -- - - - -
Quality 3 7 16 8
Reputation 1 1 1 1
Cleanliness 1 1 1
Price 1 2 2 1
Quantity 2 1 1 1 1 1 2
Health
Concern 3 1
Varieties 3 6
Experience 1 2 1
Product
Ingredients
1 1 1 1
Source: Compilation of primary data
Respondents between 21-30 years of age
consume ice cream once in a week consist
of maximum number of respondents i.e. 5.
14.55 per cent of the respondents consume
Vadillal and cover 4 respondents each
preferring once in two days and
occasionally, 2 respondents consume once
in three days and 3 respondents each eat
ice cream once in a week and once in a
month. 2 respondents each belongs to the
categories between 21-30 years age prefer
Vadillal once in two days, once in three
days and once in a month. Similarly, more
than 30 years of respondents like to have
ice cream once in two days, once in a
week and occasionally.
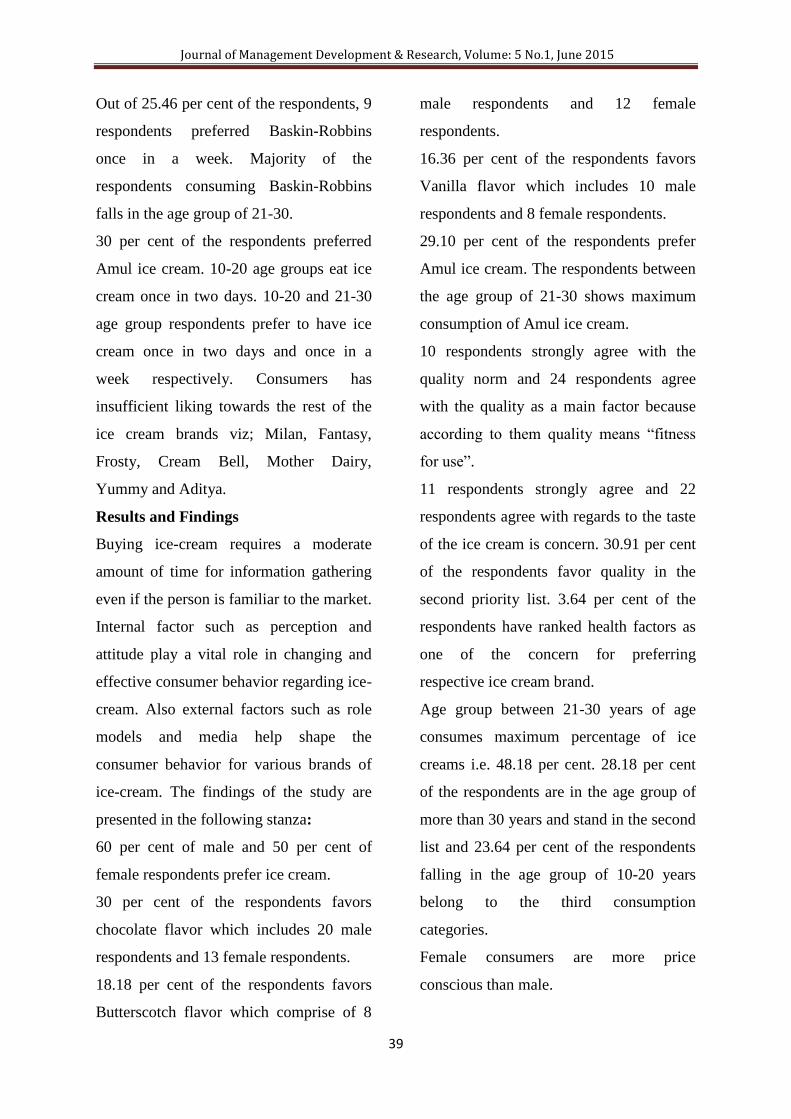
Journal of Management Development & Research, Volume: 5 No.1, June 2015
39
Out of 25.46 per cent of the respondents, 9
respondents preferred Baskin-Robbins
once in a week. Majority of the
respondents consuming Baskin-Robbins
falls in the age group of 21-30.
30 per cent of the respondents preferred
Amul ice cream. 10-20 age groups eat ice
cream once in two days. 10-20 and 21-30
age group respondents prefer to have ice
cream once in two days and once in a
week respectively. Consumers has
insufficient liking towards the rest of the
ice cream brands viz; Milan, Fantasy,
Frosty, Cream Bell, Mother Dairy,
Yummy and Aditya.
Results and Findings
Buying ice-cream requires a moderate
amount of time for information gathering
even if the person is familiar to the market.
Internal factor such as perception and
attitude play a vital role in changing and
effective consumer behavior regarding ice-
cream. Also external factors such as role
models and media help shape the
consumer behavior for various brands of
ice-cream. The findings of the study are
presented in the following stanza:
60 per cent of male and 50 per cent of
female respondents prefer ice cream.
30 per cent of the respondents favors
chocolate flavor which includes 20 male
respondents and 13 female respondents.
18.18 per cent of the respondents favors
Butterscotch flavor which comprise of 8
male respondents and 12 female
respondents.
16.36 per cent of the respondents favors
Vanilla flavor which includes 10 male
respondents and 8 female respondents.
29.10 per cent of the respondents prefer
Amul ice cream. The respondents between
the age group of 21-30 shows maximum
consumption of Amul ice cream.
10 respondents strongly agree with the
quality norm and 24 respondents agree
with the quality as a main factor because
according to them quality means “fitness
for use”.
11 respondents strongly agree and 22
respondents agree with regards to the taste
of the ice cream is concern. 30.91 per cent
of the respondents favor quality in the
second priority list. 3.64 per cent of the
respondents have ranked health factors as
one of the concern for preferring
respective ice cream brand.
Age group between 21-30 years of age
consumes maximum percentage of ice
creams i.e. 48.18 per cent. 28.18 per cent
of the respondents are in the age group of
more than 30 years and stand in the second
list and 23.64 per cent of the respondents
falling in the age group of 10-20 years
belong to the third consumption
categories.
Female consumers are more price
conscious than male.
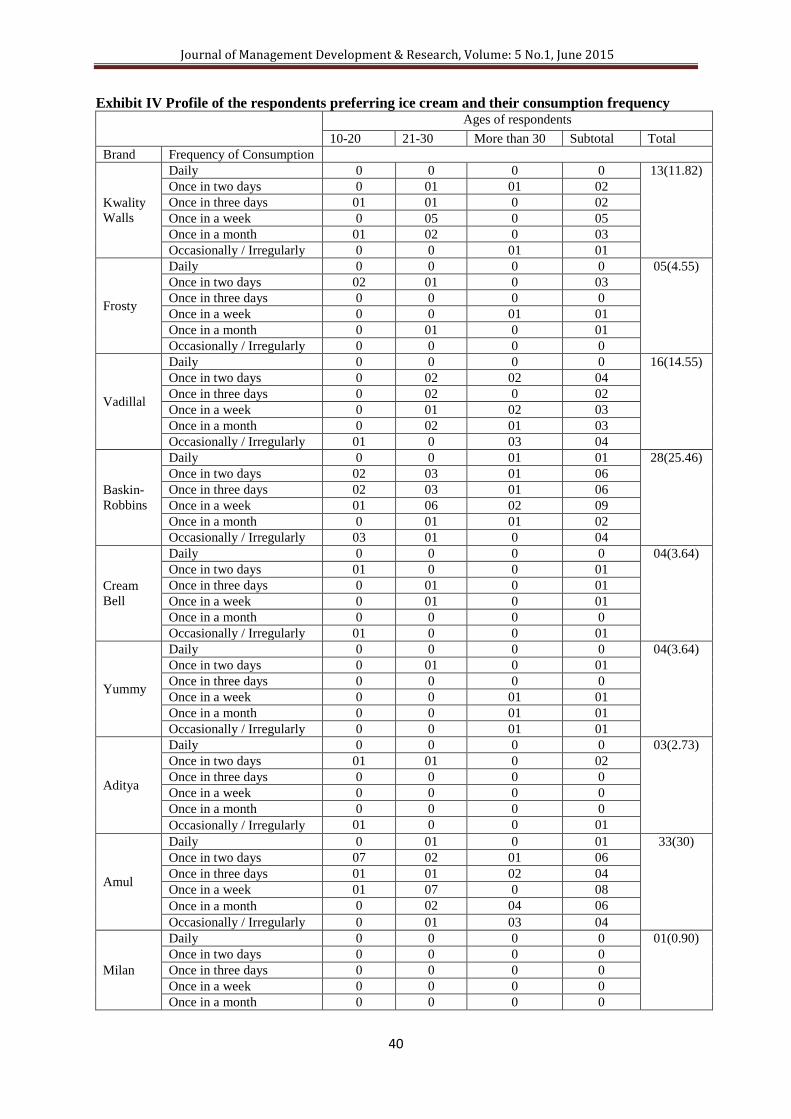
Journal of Management Development & Research, Volume: 5 No.1, June 2015
40
Exhibit IV Profile of the respondents preferring ice cream and their consumption frequency Ages of respondents
10-20 21-30 More than 30 Subtotal Total
Brand Frequency of Consumption
Kwality
Walls
Daily 0 0 0 0 13(11.82)
Once in two days 0 01 01 02
Once in three days 01 01 0 02
Once in a week 0 05 0 05
Once in a month 01 02 0 03
Occasionally / Irregularly 0 0 01 01
Frosty
Daily 0 0 0 0 05(4.55)
Once in two days 02 01 0 03
Once in three days 0 0 0 0
Once in a week 0 0 01 01
Once in a month 0 01 0 01
Occasionally / Irregularly 0 0 0 0
Vadillal
Daily 0 0 0 0 16(14.55)
Once in two days 0 02 02 04
Once in three days 0 02 0 02
Once in a week 0 01 02 03
Once in a month 0 02 01 03
Occasionally / Irregularly 01 0 03 04
Baskin-
Robbins
Daily 0 0 01 01 28(25.46)
Once in two days 02 03 01 06
Once in three days 02 03 01 06
Once in a week 01 06 02 09
Once in a month 0 01 01 02
Occasionally / Irregularly 03 01 0 04
Cream
Bell
Daily 0 0 0 0 04(3.64)
Once in two days 01 0 0 01
Once in three days 0 01 0 01
Once in a week 0 01 0 01
Once in a month 0 0 0 0
Occasionally / Irregularly 01 0 0 01
Yummy
Daily 0 0 0 0 04(3.64)
Once in two days 0 01 0 01
Once in three days 0 0 0 0
Once in a week 0 0 01 01
Once in a month 0 0 01 01
Occasionally / Irregularly 0 0 01 01
Aditya
Daily 0 0 0 0 03(2.73)
Once in two days 01 01 0 02
Once in three days 0 0 0 0
Once in a week 0 0 0 0
Once in a month 0 0 0 0
Occasionally / Irregularly 01 0 0 01
Amul
Daily 0 01 0 01 33(30)
Once in two days 07 02 01 06
Once in three days 01 01 02 04
Once in a week 01 07 0 08
Once in a month 0 02 04 06
Occasionally / Irregularly 0 01 03 04
Milan
Daily 0 0 0 0 01(0.90)
Once in two days 0 0 0 0
Once in three days 0 0 0 0
Once in a week 0 0 0 0
Once in a month 0 0 0 0
Journal of Management Development & Research, Volume: 5 No.1, June 2015
41
Occasionally / Irregularly 0 01 0 01
Fantasy
Daily 0 0 0 0
01(0.90) Once in two days 0 0 0 0
Once in three days 0 0 0 0
Once in a week 0 01 0 01
Once in a month 0 0 0 0
Occasionally / Irregularly 0 0 0 0
Mother
Dairy
Daily 0 0 0 0 02(1.81)
Once in two days 0 0 0 0
Once in three days 0 0 0 0
Once in a week 0 01 0 01
Once in a month 0 0 0 0
Occasionally / Irregularly 0 0 01 01
26(23.64) 53(48.18) 31(28.18) 110(100)
Source: Compilation of primary data
Note: Figure in the parenthesis represents percentage
References
Books
S. K. Sarangi; (second edition 2009);
Marketing Management; Asian Books
Private Ltd; New Delhi.
S. M. Jha; (reprints: 2008) Service
Marketing; Himalaya Publishing
House, Bombay.
Philip Kotler and Kevin lane Keller; (12
editions 2006); Marketing
Management; Pearson Education, Inc.
and Dorling Kindersley Publishing Inc.
S. A. Chunawalla; (2nd revised edition
2005); “Commentary on Consumer
Behaviour” Himalaya Publishing
House, Bombay.
S. A. Chunawalla; S. A. Chunawalla;
(reprint edition 2002); “Advertising,
Sales and Promotion Management”
Himalaya Publishing House, Bombay.
C.N Sontakki; (I Edition, 1992);
Marketing Management, Kalyani
Publishers Noida.
Webliography
www.scribd.com/doc/83666619/custom
ersatisfaction_with_reference_to_icecre
am_in
http://salcombediary.co.uk/customer_se
rvices/customer_satiafactions_survey/
http://digi.library.tu.ac.th/thesis/lg/0435
/06chapter_TWO.pdf
www.franchising.com/articles/new_bra
nds_amp_new_twists_bring_customer_
satisfaction_to_the_ice_cream_fran.htm
l
http://www.managementparadise.com/f
orums/marketing-management-rm-
im/128305-project-consumer-
behaviour.html
http://www.fnbnews.com/article/detnew
s.asp?articleid=33493§ionid=1
Journal of Management Development & Research, Volume: 5 No.1, June 2015
42
http://store.mintel.com/ice-cream-uk-
july-2011
http://www.docstoc.com/docs/2625028
0/kwality-walls-vs-dinshaws-ice-cream
http://www.drfoods.co.uk/108/
http://www.scribd.com/doc/34139759/
Customer-Satisfaction-of-Mother-
Dairy-New
http://www.scribd.com/doc/14123921/
Consumer-behaviour-Project-on-ice-
cream-launching-a-new-brand.
http://www.slideshare.net/rhnsml/amul-
pouch milk.
http://en.wikipedia.org/wiki/Customer_
satisfaction
http://www.usaresearchwriters.com/edit
ing/the-influence-of-dietary-benefits-in-
customer-buying-decisions-towards-
ice-cream-brands-in-the-thai-market-
by-parichat-tongserm/
Journal of Management Development & Research, Volume: 5 No.1, June 2015
43
To Explore the Determinants Influencing e- HRM Practices in
Service Sector of Indore City
Kratika Neema,
Lecturer,
School of Commerce, DAVV, Indore (MP) India,
Email: [email protected]
Dr. Ira Bapna,
Professor and Director,
Maharaja Ranjit Singh College of Professional Sciences, Indore (MP) India,
Email: [email protected]
_______________________________________________________________
Abstract:
Human resource management has a unique role in development of any sector. Different types
of technologies and methods are being used to structure the HR. Nowadays HR managers use
web- based technologies for HR practices to run them more efficiently. Service sectors use
various HRM practices to develop an effective environment for their employees or workers.
e- HRM is the transformation of traditional HRM into HRM with Information Technology.
The main objective of this paper was to explore the determinants influencing e – HRM
practices in service sector with in Indore city covering like: Banking, Telecom and Insurance.
The data was collected using a self-administered structured questionnaire at 5 point likert
scale. A sample of 1024 employees was covered including all sectors. Factor analysis was
administered to explore the determinants.
KEYWORDS: Human Resource Management, e-HRM, Virtual HRM
Introduction
Every Organization has some different
approaches & policies of working.
Organization may be from any sector, it
may be big or small but have some rules
& structure of working. Organizations are
not mere bricks, mortar or machineries.
They are the people. It is the people who
staff & manage organizations. Many
organizations are using important
management activity which is known as
Human Resource Management.
Human resource management
Human Resource Management (HRM) is
the function within an organization that
focuses on recruitment of, management
of, & providing direction for the people
who work in the organization. HRM can
also be performed by line managers.HRM
is the organizational function that deals
with issues related to people such as
compensation, hiring, performance
management, organization development ,
safety, wellness, benefits, employee
motivation, communication,
administration, & training.HRM is also a
strategic & comprehensive approach to
Journal of Management Development & Research, Volume: 5 No.1, June 2015
44
managing people & the workplace culture
& environment. Effective HRM enables
employees to contribute effectively &
productively to the overall company
direction & the accomplishment of the
organization's goals & objectives.
e- HRM (Electronic Human Resource
Management):
e- HRM is the planning, implementation
and application of information technology
for both networking and supporting at
least two individual or collective actors in
their shared performing of HR activities.
This concept highlights several crucial
aspects of e-HRM. At the outset, e-HRM
utilizes information technology in a
twofold manner: First, technology is
necessary to connect usually spatially
segregated actors and enable interactions
between them irrespective of their
working in the same room or on different
continents, i.e. technology serves as a
medium with the aim of connection and
integration. Second, technology supports
actors by partially – and sometimes even
completely – substituting for them in
executing HR activities (Strohmeier,
2007).
e- HRM could be narrowly defined as the
administrative support of the HR function
in organizations by using Internet
technology. The composite of databases,
computer applications and hardware and
software used to collect, store, manage,
deliver, present and manipulate data for
Human Resources. There was a positive
relation expected between reported ease
of use, usability, user support and output
quality of an IT system and the attitude
towards e- HRM (Voermans and
Veldhoven, 2007). Virtual HR is a
network based structure built on
partnerships and typically mediated by
information technologies to help the
organization acquire, develop, and deploy
intellectual capital (Lepak & Snell, 1998).
A Computerized Human Resource
Information System (CHRIS) consists of a
fully integrated, organization-wide
network of HR related data, information,
services, databases, tools and transactions.
Such a system can be described as e HR,
meaning the application of conventional,
web and voice technologies to improve
the HR administration, transactions and
process performance (Kettley and Reiley,
2003).
e- HRM supports HR measurement in
recruitment, people administration,
competence development, training
administration, career and succession
planning and performance management
(Jaquenoud, 2005). It alleviates the
administrative burden and produces
increased accuracy of results and quality
of HR activities. It leads to increased
information responsiveness and more
information autonomy. It also provides
savings of time and cost (Strohmeier,
2007). The application of the internet to
the Human Resource function (e-HR)
combines two elements, foremost is the
use of electronic media whilst the other is
the active participation of employees in
the process. These two elements give the
momentum to the technology that helps
organizations to lower administration
costs, improve employee communication
and satisfaction, and provide real time
access to information and reducing
processing time (Forster, 2004).
The shift from traditional HRM to e-HR
practices gives rise to several effects on
the role of HRM. e- HRM, apart from
Journal of Management Development & Research, Volume: 5 No.1, June 2015
45
substantial reductions in cost and time and
transition of administrative activities from
the HR department to the employees
themselves, can bring about an increased
emphasis on HR as a strategic business
partner whose primary challenge is to
recruit, develop and retain talented
employees for the organizations (Ensher
et al., 2002).
Literature Review:
The study of e-HRM in an e -Business
environment among 144 HR managers
from German top 1,000 firms revealed
that HR managers‟ most imperative
challenges are staff retention and internal
and external employer branding. They
concluded the importance for an e- HRM
needs to be both effective-adequately fill
vacancies – and efficient – make best use
of scarce resource (Laumer et al., 2010).
On examining the factors that, influences
the cross-national organizational adoption
of e- HRM in Europe, major general and
contextual influence factors were derived
and tested based on a large-scale survey
with a sample of 2,336 organizations in
23 European countries using logistic
regression. The study revealed that, e-
HRM is a common practice throughout
Europe since two-thirds of all
organizations have already adopted e-
HRM. They also found that, major
determinants of e- HRM adoption are
size, work organization, and configuration
of HRM (Strohmeier and Kabst, 2009).
A study conducted on attitude towards e-
HRM utilized an online questionnaire, for
99 managers and 257 employees within
Philips (Electronics) ,Netherlands and
found that differences in perceived
usability of current IT systems, as well as
the preferred HR roles strategic partner
(high preference) and employee champion
(low preference), were related to a
positive attitude towards e-HRM systems.
For managers, user support was also
found to be a predictor of a positive
attitude towards e-HRM (Voermans and
Veldhoven, 2007).
A study on the Factors Influencing
Attitude towards Using Electronic HRM
in Malaysia was administered the
questionnaire to the participants during
the seminar and explored that clarity of e-
HRM goals, user satisfaction with e-
HRM, perceived usefulness perceived
ease of use, intention to use e-HRM, user
support, social influence, and facilitating
condition have a significant impact on
attitude towards using e-HRM. However,
e-HRM trust has no influence on attitude
towards using e-HRM. This study has
identified important factors associated
with attitude of the HR professionals
towards using e-HRM (Yusliza and
Ramayah, 2011).
A Study on the e-HRM effectiveness was
conducted in a public sector organization
from multi-stakeholder perspective
presents results from a qualitative study.
Line managers and employees were
interviewed to examine the linkages
between the use of e-HRM applications
and perceived effectiveness of HRM.
Results of the analyses indicate that, the
appreciation of e-HRM applications is
associated with HRM effectiveness, and
reveals differences in the use of e-HRM
between line managers and employees
(Bondarouk and Ruel, 2009).
Journal of Management Development & Research, Volume: 5 No.1, June 2015
46
A case study was conducted on e -Human
Resource Management on banking sector
in Pakistan. The research is carried out at
the State Bank of Pakistan‟s Human
Resource Division. An open-ended
questionnaire was developed to gather
information about e -HR practices in the
organization. The research showed that as
the latest advanced technologies offer the
potential to streamline many HR
functions. The Bank is increasingly
utilizing information technology to design
and deliver their HR practices (Zafar et.al.
2010).
A study was conducted to find out the
perception level of employees regarding
e-HRM in service organizations in India.
For this purpose, 400 employees of IT and
Banking organizations are targeted.
Employees‟ responses have been
collected through a structured
questionnaire consisting of demographic
variables and statements regarding
perception. Factor analysis, ANOVA and
t-test are applied for finding out the
perception of employees. From the
analysis it can be concluded that
respondents from different organizations
have different opinion regarding all the
Factors Standardization, Career
Development, Hurdles, Globalization,
Specialization, Indifference and easily
implementation.
Respondents of different age groups have
same opinion regarding Standardization,
Career Development and Indifference
while they don‟t have same opinion
regarding Hurdles, Globalization,
Specialization and Easy Implementation.
Respondents of different experiences have
same opinion regarding Career
Development, Indifference and Easy
Implementation while they don‟t have
same opinion regarding Standardization,
Hurdles, Globalization and Specialization.
Respondents of different income have
same opinion regarding Career
Development, Hurdles, Globalization and
Indifference while they don‟t have same
opinion regarding Standardization,
indifference and Implementation (Gupta
& Saxena, 2010).
A survey was conducted in Canada
between HR managers to assess the
relationship between the degree IT
supported HR activities and HR managers
perceptions of HR„s technical and
strategic effectiveness. For the purpose of
this study across 210 firms was surveyed.
Study found a positive relationship
between the degree of IT support of HR
activities and HR manager„s perceptions
of the organization„s HR strategic
effectiveness, and with the quality of
HR„s strategic and change agent roles
(Haines and Lafleur, 2010).
Objective:
To study the prevailing factors of e-
HRM in service sectors.
RReesseeaarrcchh MMeetthhooddoollooggyy::
Sample:
In this study, a convenient judgment
sampling is used for getting convenience
sample results. It describes when the more
convenient elementary units are chosen
from a population for observation; then a
judgment sample is obtained according to
the discretion of someone who is familiar
with the relevant characteristics of the
Universe. Employees of public and
private sectors of Indore City were taken
for study to locate the determinants of e-
HRM. Sample size was find out on the
basis of population using RAO soft
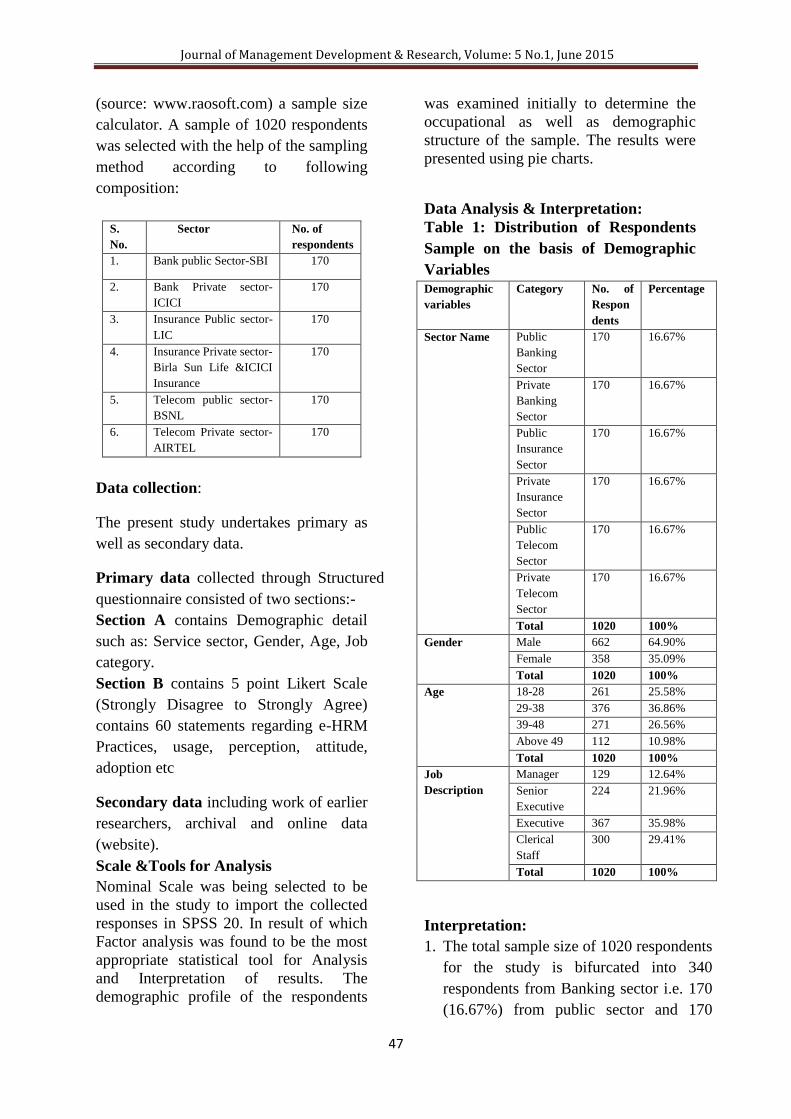
Journal of Management Development & Research, Volume: 5 No.1, June 2015
47
(source: www.raosoft.com) a sample size
calculator. A sample of 1020 respondents
was selected with the help of the sampling
method according to following
composition:
S.
No.
Sector No. of
respondents
1. Bank public Sector-SBI 170
2. Bank Private sector-
ICICI
170
3. Insurance Public sector-
LIC
170
4. Insurance Private sector-
Birla Sun Life &ICICI
Insurance
170
5. Telecom public sector-
BSNL
170
6. Telecom Private sector-
AIRTEL
170
Data collection:
The present study undertakes primary as
well as secondary data.
Primary data collected through Structured
questionnaire consisted of two sections:-
Section A contains Demographic detail
such as: Service sector, Gender, Age, Job
category.
Section B contains 5 point Likert Scale
(Strongly Disagree to Strongly Agree)
contains 60 statements regarding e-HRM
Practices, usage, perception, attitude,
adoption etc
Secondary data including work of earlier
researchers, archival and online data
(website).
Scale &Tools for Analysis
Nominal Scale was being selected to be
used in the study to import the collected
responses in SPSS 20. In result of which
Factor analysis was found to be the most
appropriate statistical tool for Analysis
and Interpretation of results. The
demographic profile of the respondents
was examined initially to determine the
occupational as well as demographic
structure of the sample. The results were
presented using pie charts.
Data Analysis & Interpretation:
Table 1: Distribution of Respondents
Sample on the basis of Demographic
Variables Demographic
variables
Category No. of
Respon
dents
Percentage
Sector Name Public
Banking
Sector
170 16.67%
Private
Banking
Sector
170 16.67%
Public
Insurance
Sector
170 16.67%
Private
Insurance
Sector
170 16.67%
Public
Telecom
Sector
170 16.67%
Private
Telecom
Sector
170 16.67%
Total 1020 100%
Gender Male 662 64.90%
Female 358 35.09%
Total 1020 100%
Age 18-28 261 25.58%
29-38 376 36.86%
39-48 271 26.56%
Above 49 112 10.98%
Total 1020 100%
Job
Description
Manager 129 12.64%
Senior
Executive
224 21.96%
Executive 367 35.98%
Clerical
Staff
300 29.41%
Total 1020 100%
Interpretation:
1. The total sample size of 1020 respondents
for the study is bifurcated into 340
respondents from Banking sector i.e. 170
(16.67%) from public sector and 170
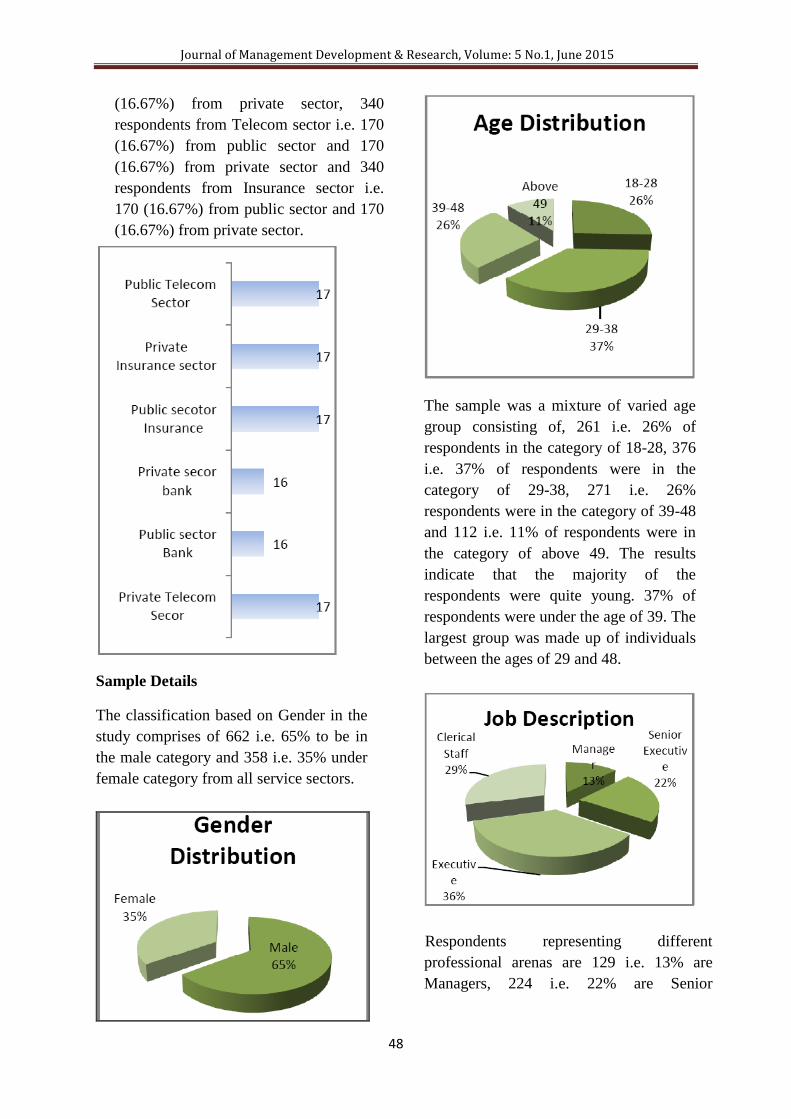
Journal of Management Development & Research, Volume: 5 No.1, June 2015
48
(16.67%) from private sector, 340
respondents from Telecom sector i.e. 170
(16.67%) from public sector and 170
(16.67%) from private sector and 340
respondents from Insurance sector i.e.
170 (16.67%) from public sector and 170
(16.67%) from private sector.
Sample Details
The classification based on Gender in the
study comprises of 662 i.e. 65% to be in
the male category and 358 i.e. 35% under
female category from all service sectors.
The sample was a mixture of varied age
group consisting of, 261 i.e. 26% of
respondents in the category of 18-28, 376
i.e. 37% of respondents were in the
category of 29-38, 271 i.e. 26%
respondents were in the category of 39-48
and 112 i.e. 11% of respondents were in
the category of above 49. The results
indicate that the majority of the
respondents were quite young. 37% of
respondents were under the age of 39. The
largest group was made up of individuals
between the ages of 29 and 48.
Respondents representing different
professional arenas are 129 i.e. 13% are
Managers, 224 i.e. 22% are Senior
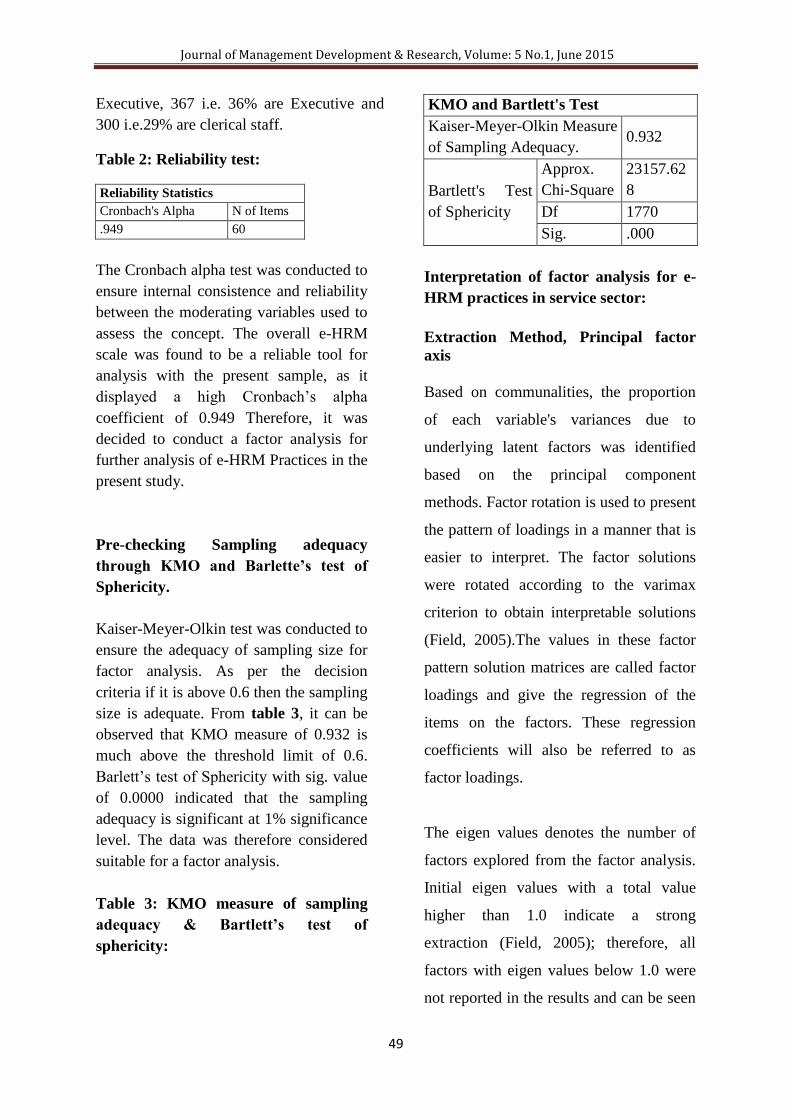
Journal of Management Development & Research, Volume: 5 No.1, June 2015
49
Executive, 367 i.e. 36% are Executive and
300 i.e.29% are clerical staff.
Table 2: Reliability test:
Reliability Statistics
Cronbach's Alpha N of Items
.949 60
The Cronbach alpha test was conducted to
ensure internal consistence and reliability
between the moderating variables used to
assess the concept. The overall e-HRM
scale was found to be a reliable tool for
analysis with the present sample, as it
displayed a high Cronbach‟s alpha
coefficient of 0.949 Therefore, it was
decided to conduct a factor analysis for
further analysis of e-HRM Practices in the
present study.
Pre-checking Sampling adequacy
through KMO and Barlette’s test of
Sphericity.
Kaiser-Meyer-Olkin test was conducted to
ensure the adequacy of sampling size for
factor analysis. As per the decision
criteria if it is above 0.6 then the sampling
size is adequate. From table 3, it can be
observed that KMO measure of 0.932 is
much above the threshold limit of 0.6.
Barlett‟s test of Sphericity with sig. value
of 0.0000 indicated that the sampling
adequacy is significant at 1% significance
level. The data was therefore considered
suitable for a factor analysis.
Table 3: KMO measure of sampling
adequacy & Bartlett’s test of
sphericity:
KMO and Bartlett's Test
Kaiser-Meyer-Olkin Measure
of Sampling Adequacy. 0.932
Bartlett's Test
of Sphericity
Approx.
Chi-Square
23157.62
8
Df 1770
Sig. .000
Interpretation of factor analysis for e-
HRM practices in service sector:
Extraction Method, Principal factor
axis
Based on communalities, the proportion
of each variable's variances due to
underlying latent factors was identified
based on the principal component
methods. Factor rotation is used to present
the pattern of loadings in a manner that is
easier to interpret. The factor solutions
were rotated according to the varimax
criterion to obtain interpretable solutions
(Field, 2005).The values in these factor
pattern solution matrices are called factor
loadings and give the regression of the
items on the factors. These regression
coefficients will also be referred to as
factor loadings.
The eigen values denotes the number of
factors explored from the factor analysis.
Initial eigen values with a total value
higher than 1.0 indicate a strong
extraction (Field, 2005); therefore, all
factors with eigen values below 1.0 were
not reported in the results and can be seen
Journal of Management Development & Research, Volume: 5 No.1, June 2015
50
as insignificant. Fourteen factors were
found to have eigen values exceeding 1.0
and are extracted from Rotated
component matrix. Table 2 depicted 14
factors explored from 60 variables, with
individual and total load of each factor,
and the percent of variance.
All these extracted factors together
account for 57.646 percent of cumulative
variance.
FACTOR 1: Opportunities and Client
Oriented (3.587).
First factor identified after factor analysis
was Opportunities & Client oriented. It
comprises of five sub factors i.e. provide
more possibilities (0.666), organizations
aim (0.665), adaptability to clients
(0.577), increase dynamic workflow and
productivity (0.487), client oriented
information system (0.417), cost
reduction program (0.416) and increase
competitiveness by improving HRM
practices (0.359).
FACTOR 2: Employees Energizer
(4.092). It includes career development
(0.611), provides high standards (0.587),
Trigger for HR (0.577), easier usage
(0.535), transparent environment (0.535),
Self initiators (0.448), clean profile of
employees (0.413), and helps in tracking
(0.387).
FACTOR 3: Proficiency (2.955). It has
as features of Time efficient (0.659), HR
specialists (0.623), Globalization (0.620),
Improves client service (0.546) and
Efficient (0.507).
FACTOR 4: Administrative
Competency (2.938). It merges condense
time on administrative task (0.705),
diminish administrative work (0.700),
reduce administrative staff (0.662),
improves administration (0.596), and
resolve issues (0.275).
FACTOR 5: User Friendly (2.557). It
has easy interface (0.675), software
friendly (0.600), simple to retrieve
(0.470), harmonize & standardize (0.426),
and manage difficulties (0.386).
FACTOR 6: HRIS (2.091). It covers
common HR infrastructure (0.605),
improve HR responsibility (0.513), act as
a push factor (0.506), and concentrate on
strategic aspects (0.467).
FACTOR 7: Quality and Value Added
(1.837). It encompasses security (0.751),
supports multi-language (0.637), and
technical (0.449).
FACTOR 8: Perception (2.088). It
consists of unwillingness (0.761),
employee‟s negative attitude (0.760), and
Talent Management (0.567).
FACTOR 9: Transparent (1.739). It
includes transparency (0.751), not
affected by demographic (0.684), and
improves HR‟s strategic orientation
(0.340).
FACTOR 10: Economic Challenge
(2.439). It composed of expenses
challenges (0.715), easily implemented
(0.701), large investments (0.518), and
performs data management (0.445).
FACTOR 11: E- Era (2.299). It mixes
online recruitment (0.657), electronic
Journal of Management Development & Research, Volume: 5 No.1, June 2015
51
payroll system (0.645), speed up
communication (0.529), and e- learning
facilities (0.468).
FACTOR 12: Enhanced System
Efficiency (1.949). It incorporates online
discussion (0.578), updated news (0.552),
reduces paper transaction (0.473), and
experiences more HRM (0.376).
FACTOR 13: Paradigm shift in
performance (1.646). It implies
improving organisation performance
(0.639), updated to involving technology
(0.532) and updating organisation
transactions (0.475).
FACTOR 14: Facilitate HRM and
faster communication (1.03). It blends
quality of HRM (0.537) and easier
communication (0.493).
Discussion:
Opportunities and Client Orientation
was the primary factor with total factor
load of 3.587, influencing the service
sectors for paradigm shift towards e-
HRM practices from the traditional one.
HR managers of the organizations stare
towards those types of HR practices
which tend to provide with additional
possibilities to the organization; satisfying
company‟s aim, and also widen self-
motivated workflow. Furthermore, it
increases the flexibility to clients and
connected with the client‟s orientation
information system. It also generates the
opportunity to craft new avenues for
organizational effectiveness. Literature
findings also support that, the result of
implementation and use of e-HRM tools
concern the new competencies required
from human resource professionals
(Hempel, 2004).
Employees Energizer was the second
factor with the highest factor load of
4.092 among all demands the service
sector to shift towards e- HRM practices
than the traditional one. Employees are
the spirit of any organization for their
existence as well as for their growth. The
HR staffs is assumed to be responsible for
the engagement of employees within the
organization, help the employees to meet
the demands placed on them, represent the
ideas and mindsets of employees in
management discussions, and offer
opportunities for growth. Thus, e- HRM
system mainly focused on Employees
growth and improvement. Presently HR
serves its employees being their
customers and the whole concept of
employee/customer relationship has been
redefined for betterment. e- HR has
transformed the culture by providing the
ownership and responsibility to the
employees for their actions, through self-
service applications (Sareen, 2014).
Proficiency being third factor with factor
load of 2.955 forces the service sectors to
move towards e- HRM practices than the
traditional one. HR professionals must
ensure that the HR jobs are executed
effectively and in time efficient manner.
e- HRM practices enhanced efficiency of
HR process by formulating HR executive
as specialists through connecting the HR
process to globalization, improve client
orientation & service and helps HR
managers to build up more efficiency in
their working. Literature also goes along
with it with new tools and technology
getting launched in the HR technology
arena, automation of HR function has
Journal of Management Development & Research, Volume: 5 No.1, June 2015
52
become more feasible, prompting mid-
sized organizations to evaluate these tools
for implementation (Sareen, 2014).
The fourth factor exposed
Administrative Competency with a
factor load of 2.938. e- HRM practices
diminish the time spent on routine
administrative task, that reduces HR staff
work, improves efficiency and resolve
issues in timely manner. From the
literature findings, e- HRM increases
productivity through decreased
requirements for HR staff, increased
speed of process due to automation as
well as cost reduction (Hawking et al.,
2004; Ruël et al., 2004; Strohmeier,
2007). Cost reduction is an operationally
efficient process of e-HRM practices,
which will craft organization on the best-
in-class processes and practices (Esen and
Erdogmus, 2011).
Fifth factor User Friendly being emerged
with a factor load of 2.557. e- HRM
practices must furnish a user friendly edge
among employees and organization by
synchronizing and regulating HR
processes. Accordingly, e- HRM software
is user friendly that simply maintains and
easily retrieves the data and also helps to
manage the difficulties. From literature
evidence, a study carried out in China for
e- HRM revealed that the e-HRM system
was advanced, complete, practical,
efficient, flexible, open and automatic as
possible. It should also be easy to operate,
maintain and expand, be fault-tolerant, be
safe and reliable and be able to handle and
coordinate different events at the same
time (Zhang and Yuan, 2007).
Developed Strategic Function was being
measured as a sixth factor with factor load
of 2.091. e- HRM practices not only exert
at the Operational level of HRM but also
developed Transformational level of
HRM i.e. it improved the strategic
orientation of HR managers.
A research finding supported that there is
a positive relationship between the role of
change agent and strategic partner for an
organization (Gardner et al., 2003). The
use of technology within HRM not only
makes HR activity more efficient, but
may also facilitate a change in emphasis
for HRM to become more strategic within
the organization (Kettley and Reilly,
2004).
Seventh factor directed towards Quality
and value added factor with a factor load
of 1.837. Human resource management
has to transform its HR policies with
contemporary varying business
environment thus, e-HRM boosted up the
technological friendly environment in
organization. A Research conducted in
Pune city to study the employee‟s attitude
towards e- HRM concluded that more
than 75% employees are highly satisfied
with secured database in e-HRM and its
various value added services provide to
traditional HRM (Patil, 2013).
Eighth factor unfolds the Perception
towards e- HRM practices with a factor
load of 2.088. e- HR implementation is
done along with new tools and technology
with some limiting factors. Execution and
adoption of new thing always face
resistance in an organization. Change has
never been easy for an organization and
especially if it involves any sort of a
negative impact. Half-hearted or
unrealistic attempts by many
organizations to bring in the change
towards the e-HR approach have only
made things difficult (Sareen, 2014).
Journal of Management Development & Research, Volume: 5 No.1, June 2015
53
Factor Nine revealed the Transparency
feature of e-HRM practices with its factor
load of 1.739. For an improved
relationship between employees and HR
managers Transparency is the imperative
feature. A study conducted for e- HRM
practices in Service and Manufacturing
companies concluded that e- HRM
practices increased transparency in
functions and a total systems approach
has facilitated better control by top
management (Verma and Gopal, 2011).
Economic challenges came into view as a
tenth factor with the factor load of 2.439.
e- HRM performs data management and
can be easily implemented in any
organisation but it faces the challenges in
terms of expenses and requires large
investments in beginning. A study in
Iranian organisation was considered the
following limitations of implementing e-
HRM such as hardware, software,
employees‟ skill and financial capabilities
(Sanayei and Mirzaei, 2008).
e- Era was known as an eleventh factor
with a factor load of 2.299 that inclined
the service sectors to move towards e-
HRM practices than traditional one. e-
HRM corresponds to the electronic era of
HRM, i.e. most of HR functions are
executed electronically. Thus, e-HRM
effectively manages all HRM activities
that included e- recruitment, e- learning
facilities, e- performance appraisal etc.
Factor Twelfth emerged as Enhanced
System Efficiency with the factor load of
1.949 that inclined the service sectors to
move towards e- HRM practices than
traditional one. Fundamentally
implementation of e- HRM is used to
transform of HRM activities from manual
conduct toward automatic by using
technologies. A study in Iranian
organisation revealed that e- HRM
applications have a significant positive
effect on the effectiveness of HRM
activities. This means that deploying e-
HRM tools impacts on the effectiveness
of HRM activities indirectly (Sanayei and
Mirzaei, 2008).
Thirteenth factor materialized as
Paradigm shift in performance with the
factor load of 1.646 that inclined the
service sectors to move towards e- HRM
practices than traditional one. E-HRM is
also seen as a facilitative tool improving
communication between stakeholders,
including human resource professionals,
line management and employees and
potential employees. An empirical
research conducted in Nigerian banks to
study the impact of IT in HRM concluded
that role and skills of HR managers was
43% before the adoption of IT
infrastructures in the whole HR
managerial process and 78% after the
adoption (Adewoye and Obasan, 2012).
Fourteenth factor Facilitate HRM and
faster communication with the factor
load of 1.03 that inclined the service
sectors to move towards e- HRM
practices than traditional one. The e-
HRM is also used as a faster means to
communicate. e- HRM utilizes the
medium of e-mail (electronic mail) for
communication purposes. Intranet and e-
forums have also been highlighted
recently as a fast, effective and easy way
of transmitting information to employees
(Panayotopoulou et al., 2007).
Conclusion:
Present scenario contemplates that, every
organisation need HRM like interface to
Journal of Management Development & Research, Volume: 5 No.1, June 2015
54
manage a proper balance between
employees or managers though sometimes
it faces obstacles due to the human or
social related problem but e-HRM
supported to easily overcome from all
these problems. The performance of the
workers could be improved and increased
by proper motivation.
Service sector is a promising fastest
growing sector with high demand in the
market. The importance of this sector in
Indian Economy also highlighted the
importance of change in approach by the
personnel and administrative departments.
Progressively more, service firms are
pursuing strategies that element a greater
customer orientation. Service firms are
utilizing their human resource practices to
stimulate and reinforce the behavior
needed for the successful implementation
of greater customer-oriented strategies.
Therefore e- HRM practices must use in
today‟s competitive scenario in each
sector.
In conclusion, the results of this study add
to our knowledge about the multi-factorial
nature of a relatively new field called e-
HRM. Technological, organizational and
human factors all appear to be equally
important and to mutually influence each
other during implementation. There are
many aspects to use e-HRM practices that
it will assist complex technical functions,
increase employees satisfaction, decrease
process and administrative costs. Afar it
can get various benefits such paperless
and liberal applications. However, e-
HRM is not subrogating traditional HRM
but it will improve HR department
activities. It plays diversified roles such as
E-recruitment, E-selection, E-
compensation, E-performance
Management and E-training.
SUGGESTIONS:
e- HRM system is more effective than the
existing manual HRM system. In this
technological era, it should provide its
services appropriately and promptly with
low cost. So to meet the changeable needs
of people, human resources should be
competitive, motivated and the
organizational environment should be
customer friendly. e- HRM system will
help more to make the manpower
competitive and motivated. An effective e
– HR strategy can leverage the value of
the service sectors HRM system and help
them to develop metrics to better gain the
competitive advantage in the market.
It should be a premeditated step by Indian
organizations to move forwards in the
digital age, by freeing themselves from
daily operational, monotonous
requirements and ascending to newer
level like relational and to highest level,
transformational, making it more in tune
with the decision making. It also amplifies
understanding of the employees,
preparing change ready workforce,
knowledge management and enhance
employees brand. Organisations should
consider the value of the HR function in
the adoption of e-HRM and make the
effort to design and implement the system
in such a way so as to promote and
maximise these benefits.
References:
Adewoye J. O. and Obasan K. (2012).
The Impact of Information Technology
(IT) on Human Resource Management
(HRM): Empirical evidence from
Journal of Management Development & Research, Volume: 5 No.1, June 2015
55
Nigeria Banking Sector. Case Study of
Selected Banks from Lagos State and
Oyo State in South- West Nigeria. A
European Journal of Business and
Management ISSN 2222-1905 (Paper)
ISSN 2222-2839 (Online), 4(6), 28-37.
Bondarouk, T. V., & Ruël, H. J. M.
(2009). Electronic Human Resource
Management: challenges in the digital
era. The International Journal of
Human Resource Management, 20(3),
505-514.
Esen, M., & Erdogmus, N. (2011). An
Investigation of the Effects of
Technology Readiness on Technology
Acceptance in e-HRM. 7th
International Strategic Management
Conference. Procedia Social and
Behavioral Sciences, 24, 487-495.
Ensher, E. A., Nielson, T. R. and
Grant-Vallone E. (2002). Tales from
the Hiring Line: Effects of the Internet
and Technology on HR Processes,
Organizational Dynamics, 31(3), 224-
244.
Field, A. (2005). Discovering Statistics
Using SPSS Mind (2), London: SAGE
Forster S. (2004) IRS Employment
Review, 11/26/2004 Issue 812, 2.
Gardner, D., Lepak, D.P. & Bartol,
K.M. (2003). Virtual HR: The impact
of information technology on the
human resource professional. Journal
of Vocational Behavior. 63(2), 159-
179.
Gupta, A. & Saxena, S. (2010).
Assessing employee‟s perception
regarding e-HRM in Service
Organisations, SMS Varanasi, VI (2).
Haines, V.Y. and Lafleur, G. (2008).
Information Technology Usage and
Human Resource Roles and
Effectiveness. Human Resource
Management, 47(3). 525-540.
Hawking, P., Stein, A., & Foster, S.
(2004). e- HR and employee self-
service: A case study of a Victorian
public sector organization. Journal of
Issues in Informing Science and
Information Technology, 1,
1019−1026.
Hempel, P.S. (2004). Preparing the HR
profession for technology and
information work. Human Resource
Management, 2(3), 163-177.
Jaquenoud, L. (2005). How to
maximize HR technology. Strategic
HR Review. 5(1), 4.
Kettley, P. and Reilly, P. (2003). e-
HR: An introduction, IES Report, 398.
Lepak, D.P. & Snell, S.A. (1998).
Virtual HR: Strategic human resource
management in the 21st Century.
Human Resource Management Review,
8(3), 215-234
Journal of Management Development & Research, Volume: 5 No.1, June 2015
56
Laumer, S., Eckhardt, A. & Weitzel, T.
(2010), „Electronic human resource
management in an e-business
environment‟, Journal of Electronic
Commerce Research, 11(4), 240-250.
Patil U. V. (2013). The Role of E-
HRM in increasing Positive Work
Attitudes among IT Employees: With
Special Reference to Pune City, Asian
Journal of Multidisciplinary Studies, 1
(3), 27-35, ISSN: 2321-8819
Panayotopoulou, L., Vakola, M. &
Galanaki, E. (2007). E-HR adoption
and the role of HRM: evidence from
Greece. Personnel Review. 36 (2), 277-
294.
Ruël, H., Bondarouk, T. & Looise, J.K.
(2004). E-HRM: Innovation or
irritation. An explorative empirical
study in five large companies in web-
based HRM. Management Revue.
15(4).364-379.
Sanayei, A. and Mirzaei, A. (2008).
Designing a model for evaluating the
effectiveness of e-HRM A case study:
Iranian organizations), International
Journal of Information Science &
Technology, 6(2), 79-98.
Sareen (2014).Integration of People,
Process and Technology: A case for e-
HRM adoption, International Journal
of Application or Innovation in
Engineering & Management (IJAIEM),
ISSN 2319 – 4847, 3(9),51-56.
Strohmeier, S. (2007). Research in e-
HRM: Review and implications.
Human Resource Management Review,
17(1), 19-37.
Strohmeier, S. and Kabst, R. (2009),
Organizational adoption of e-HRM in
Europe: An empirical exploration of
major adoption factors, Journal of
Managerial Psychology, 24(6), 482-
501.
Varma S. And Gopal R. (2011). The
Implications of Implementing
Electronic- Human Resource
Management (E-HRM) Systems In
Companies, Journal of Information
Systems and Communication .ISSN:
0976-8742, E-ISSN: 0976-8750, 2(1),
10-29.
Voermans, M. & van Veldhoven, M.
2007, „Attitude towards E-HRM: An
empirical study at Philips‟, Personnel
Review, 36(6), 887-902.
Yusoff Y. and T. Ramayah(2011).
Factors influencing attitude towards
using Electronic HRM, 2nd
international conference on business
and economic research (2nd ICBER)
proceeding, 1510-1520.
Zafar, J., Shaukat, M. and Mat, N.
(2010). An Analysis of E-Human
Resource Management Practices: A
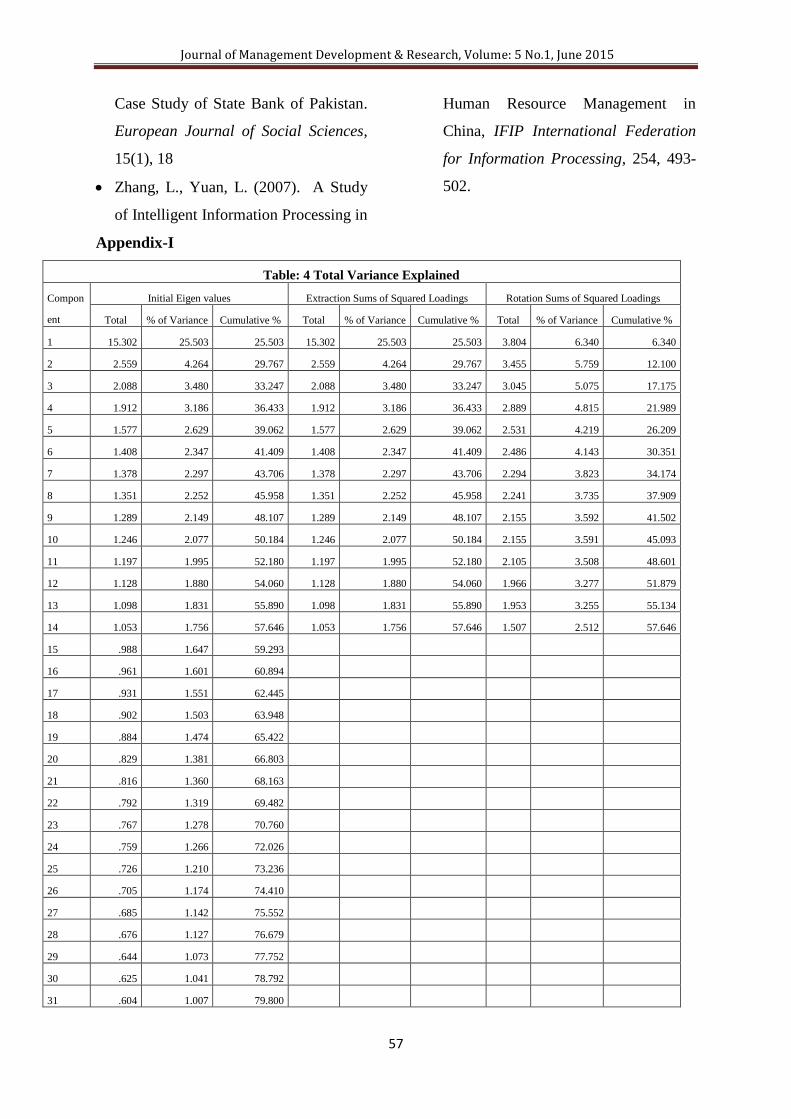
Journal of Management Development & Research, Volume: 5 No.1, June 2015
57
Case Study of State Bank of Pakistan.
European Journal of Social Sciences,
15(1), 18
Zhang, L., Yuan, L. (2007). A Study
of Intelligent Information Processing in
Human Resource Management in
China, IFIP International Federation
for Information Processing, 254, 493-
502.
Appendix-I
Table: 4 Total Variance Explained
Compon
ent
Initial Eigen values Extraction Sums of Squared Loadings Rotation Sums of Squared Loadings
Total % of Variance Cumulative % Total % of Variance Cumulative % Total % of Variance Cumulative %
1 15.302 25.503 25.503 15.302 25.503 25.503 3.804 6.340 6.340
2 2.559 4.264 29.767 2.559 4.264 29.767 3.455 5.759 12.100
3 2.088 3.480 33.247 2.088 3.480 33.247 3.045 5.075 17.175
4 1.912 3.186 36.433 1.912 3.186 36.433 2.889 4.815 21.989
5 1.577 2.629 39.062 1.577 2.629 39.062 2.531 4.219 26.209
6 1.408 2.347 41.409 1.408 2.347 41.409 2.486 4.143 30.351
7 1.378 2.297 43.706 1.378 2.297 43.706 2.294 3.823 34.174
8 1.351 2.252 45.958 1.351 2.252 45.958 2.241 3.735 37.909
9 1.289 2.149 48.107 1.289 2.149 48.107 2.155 3.592 41.502
10 1.246 2.077 50.184 1.246 2.077 50.184 2.155 3.591 45.093
11 1.197 1.995 52.180 1.197 1.995 52.180 2.105 3.508 48.601
12 1.128 1.880 54.060 1.128 1.880 54.060 1.966 3.277 51.879
13 1.098 1.831 55.890 1.098 1.831 55.890 1.953 3.255 55.134
14 1.053 1.756 57.646 1.053 1.756 57.646 1.507 2.512 57.646
15 .988 1.647 59.293
16 .961 1.601 60.894
17 .931 1.551 62.445
18 .902 1.503 63.948
19 .884 1.474 65.422
20 .829 1.381 66.803
21 .816 1.360 68.163
22 .792 1.319 69.482
23 .767 1.278 70.760
24 .759 1.266 72.026
25 .726 1.210 73.236
26 .705 1.174 74.410
27 .685 1.142 75.552
28 .676 1.127 76.679
29 .644 1.073 77.752
30 .625 1.041 78.792
31 .604 1.007 79.800
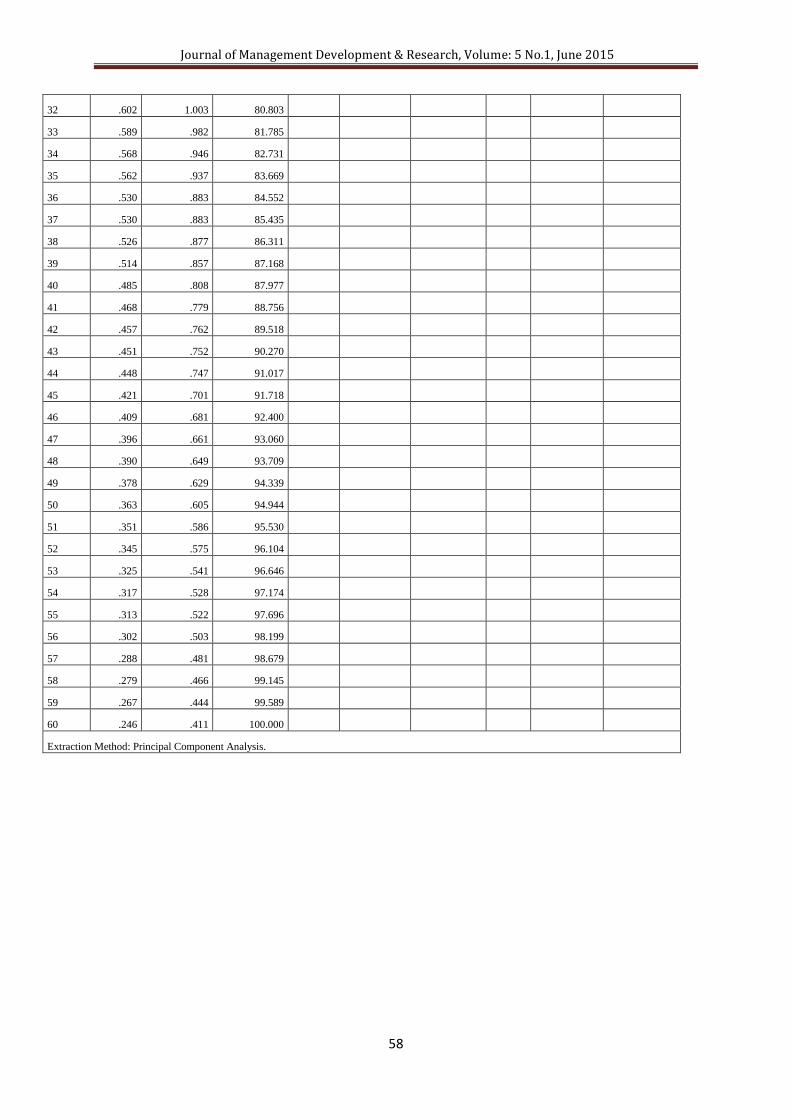
Journal of Management Development & Research, Volume: 5 No.1, June 2015
58
32 .602 1.003 80.803
33 .589 .982 81.785
34 .568 .946 82.731
35 .562 .937 83.669
36 .530 .883 84.552
37 .530 .883 85.435
38 .526 .877 86.311
39 .514 .857 87.168
40 .485 .808 87.977
41 .468 .779 88.756
42 .457 .762 89.518
43 .451 .752 90.270
44 .448 .747 91.017
45 .421 .701 91.718
46 .409 .681 92.400
47 .396 .661 93.060
48 .390 .649 93.709
49 .378 .629 94.339
50 .363 .605 94.944
51 .351 .586 95.530
52 .345 .575 96.104
53 .325 .541 96.646
54 .317 .528 97.174
55 .313 .522 97.696
56 .302 .503 98.199
57 .288 .481 98.679
58 .279 .466 99.145
59 .267 .444 99.589
60 .246 .411 100.000
Extraction Method: Principal Component Analysis.
Journal of Management Development & Research, Volume: 5 No.1, June 2015
59
A Study of Working Women On Work Life Balance In Real Estate
Industry (Haryana)
Ms. Aparna Sethi
Assistant Professor at Ansal University, Gurgaon,
Ms. Babali Rop
Student (MBA Program), at Ansal University, Gurgaon
___________________________________________________________________________
Abstract
Work – life Balance of women employees has become a significant area in organizations.
Reports have shown the increasing percentage of working women in India. As per Census
2011, the workforce participation rate for females at the national level stands at 25.51%
compared with 53.26% for males. (Ministry of Statistics & Program Implementation, 2011)
But the challenges of balancing between demands of their organization versus the
commitments of their home remain the same. Women at work need to be supported by their
employers. The purpose of present study is to find out the fundamental purpose of working of
working women in real estate industry. Respondents were also asked questions regarding
their personal and organization related issues. 120 respondents (working women across
levels) from real estate industry were approached using stratified convince sample. The data
were subjected to Cross tabulation and percentage. The result showed that most of the
women work for financial independence and justifying their talent, they did not face
discrimination regarding responsibilities and time at work place.
Keyword: Women, work force, independence, discrimination
___________________________________________________________________________
Introduction
Work – life Balance of women employees
has become a significant area in
organizations. Reports have shown the
increasing percentage of working women
in India. As per Census 2011, the
workforce participation rate for females at
the national level stands at 25.51%
compared with 53.26% for males.
(Ministry of Statistics & Program
Implementation, 2011). The increase in
working women population is been
observed across India (rural & urban).
Indian government is taking lot of
initiative and restructuring constitutional
provision to bring women on board.
Though women have become integral part
of organizations but discrimination against
them is been visible. In 2011-12, the
average salary received by women in
urban areas, it was Rs. 366.15 and Rs.
469.87 per day for females and males
respectively. There is no much change on
their duties on household front. Work- life
conflict reflects the belief that work and
family lives are interdependent (Greenhaus
& Beutell, 1985). The juggle of fulfilling
demands from family members and
meeting expectations from organization
Journal of Management Development & Research, Volume: 5 No.1, June 2015
60
still continues. Due to this economists
notes that the participation of women in
the workforce is currently 35 per cent less
than the potential. Insufficient support
from family and organizations result in
preferring conventional jobs like teaching,
banking etc. In the study of work- life
balance few studies have also mentioned
that the study should be on couple
(husband- wife) experiences as it is
dynamic process (Greenhaus at al. 1989).
But to achieve work-life balance
organizations plays major role in making
women‟s career successful. NASA
mentioned that women workers in the IT
and ITES sectors in India has risen by
almost 18 per cent in the last two years. It
is due to special facilities provided to their
female employees by an employer. Culture
in an industry, poor image of an industry
impacts while women selecting the jobs.
Due to this transformational change from
women‟s traditional role to working
women there have been implications of
family structure and child health. This has
also caused stressed to women and their
health as well. It is also been proved in
literature that women have become vital
part of an organizations.
Review of literature
The literature on Work-life balance with
diverse potential are studied and it is been
found that there has been an amplified
awareness in work family interface in the
human resource management literature,
particularly concerning the cause and
effect of conflict between these two
components (work &family). A number of
studies have dealt with this subject from
diverse outlooks. Greenhaus and Beutell
(1985) and Greenhaus et al. (1989)
scrutinize the background of argument
between family and work. Kennard (1994)
have deliberated the effects of household
tasks on the work loyalty and the
performance of working female. Goodstein
(1994) and Ingram and Simons (1995)
offered an institutional view on
organizations reactions to work-family
issues. Post this; Campbell and J.H.
Greenhaus (2002) has mentioned about the
role of family members of women in
achieving work life balance. Duel
responsibility (on professional and
domestic front) creates tension and stress
which result in leaving the job. But if
women gets support on family front by
sharing her responsibilities on family front
the chances of continuing work is very
high. Collins, K. M., & Shaw, J. D. (2003)
has given three components of work–
family balance which are time balance
(equal time devoted to work and family),
involvement balance (equal involvement
in work and family), and satisfaction
balance (equal satisfaction with work and
family). This paper has also investigated
the work –family conflict and stress.
Madikizela, K., Peninsula, C., & Africa, S.
(2005) has investigated the factors
influencing women‟s choices of career in
construction industry. The findings of this
study exhibit that the gender bias is there
within construction sector. This study has
been conducted in South Africa. This
study suggests that construction industry
requires to be broadening and overcome
specific barriers like gender bias and work
culture. Bardhan, A., & Kroll, C. A.
(2007) has mentioned that real industry
has been viewed as local industry. It has
also mentioned the growth possibilities
and the challenges of industry like talent
management. SHRM report (2009) on
“Perspectives on Women in Management
in India‟ gives evidences on impact of
Journal of Management Development & Research, Volume: 5 No.1, June 2015
61
social culture on corporate culture.
Historically India is a male dominating
culture. The social culture has an impact
on corporate culture. Women face
stereotype attitude towards them at work
place. But at the same time the report gives
evidences of positive changes happening
in Indian society towards working women
in Indian organizations. The report also
states that “Becoming a manager in a
world-class company is no longer
something that only a few women can
achieve.” In last two decades India is
experiencing changes in attitude towards
women. Anvita, Geetika and Tripti (2011)
states that the women workers do not have
a choice to work, or not to work, due to
desire need of income. The limited
opportunities available to women are
mostly low paid, low-status jobs in the
informal sector; jobs which do not have
any possibilities of betterment,
advancement of efficiency or training, to
enable them to enter better jobs at a later
stage. Hutcheson (2012) in his book Work
–Life Balance has given the importance of
achieving work- life balance in one‟s life.
It has also mentioned the success of life
and satisfaction is associated with how
person balances work and personal life. An
author has also mentioned the importance
of maintaining relationship at work and on
family front. Lakshmi, K. S., & Gopinath,
S. S. (2013) has indicated that employment
rate of females in India have increased
substantially. A woman in India has
successfully broken the barriers in
professional front. This paper has
proposed two aspects of work-life balance
which are Achievement and enjoyment. It
means that woman must have job
satisfaction (Enjoyment) and also should
be able to grow in the career
(Achievement). Singh, S. (2013) in his
paper has pointed out the impact of work-
life balance on career growth, turnover and
absenteeism, and on employee‟s stress
level. It has suggested that companies need
to come up with suitable work- life
policies to achieve fewer turnovers.
Khema Sharma (2014) mentions that it has
been observed that women struggle to
work in the structured system of organized
sector and also supports that women are
being paid less as compare to men without
any economic reason. This paper brings
out one more factor that women are been
offered typical jobs in organizations.
In the backdrop of above discussion, this
study was conducted with the fundamental
purpose of discovering the foremost causes
for the employment of women and to take
their views and opinion about their
personal and work related challenges.
Objectives of study
To study about the main reason for
working women in real estate industry.
To study about the personal issues of
working women in real estate industry.
To study about the organization issues
of working women in real estate
industry.
Research methodology
The population for this study is working
women residing in Haryana from Real
Estate industry. A sample of 120
respondents from the real estate industry
was considered and stratified convenience
sampling was used. The two prescribed
data collection methods were Primary data
Collection and the Secondary data
collection methods. Both methods set the
fundamental synthesis for the research as
the findings of the research is entirely
based on the secondary and primary data
results. In order to achieve the aims and
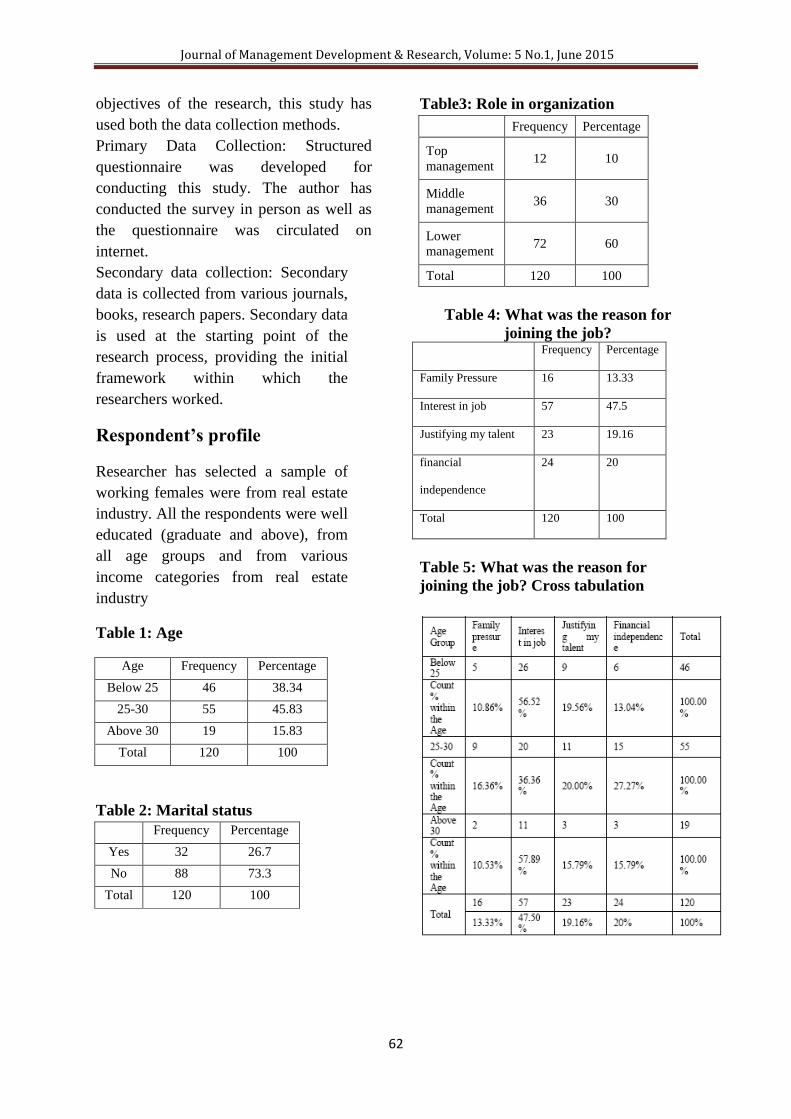
Journal of Management Development & Research, Volume: 5 No.1, June 2015
62
objectives of the research, this study has
used both the data collection methods.
Primary Data Collection: Structured
questionnaire was developed for
conducting this study. The author has
conducted the survey in person as well as
the questionnaire was circulated on
internet.
Secondary data collection: Secondary
data is collected from various journals,
books, research papers. Secondary data
is used at the starting point of the
research process, providing the initial
framework within which the
researchers worked.
Respondent’s profile
Researcher has selected a sample of
working females were from real estate
industry. All the respondents were well
educated (graduate and above), from
all age groups and from various
income categories from real estate
industry
Table 1: Age
Age Frequency Percentage
Below 25 46 38.34
25-30 55 45.83
Above 30 19 15.83
Total 120 100
Table 2: Marital status
Frequency Percentage
Yes 32 26.7
No 88 73.3
Total 120 100
Table3: Role in organization
Frequency Percentage
Top
management 12 10
Middle
management 36 30
Lower
management 72 60
Total 120 100
Table 4: What was the reason for
joining the job? Frequency Percentage
Family Pressure 16 13.33
Interest in job 57 47.5
Justifying my talent 23 19.16
financial
independence
24 20
Total 120 100
Table 5: What was the reason for
joining the job? Cross tabulation
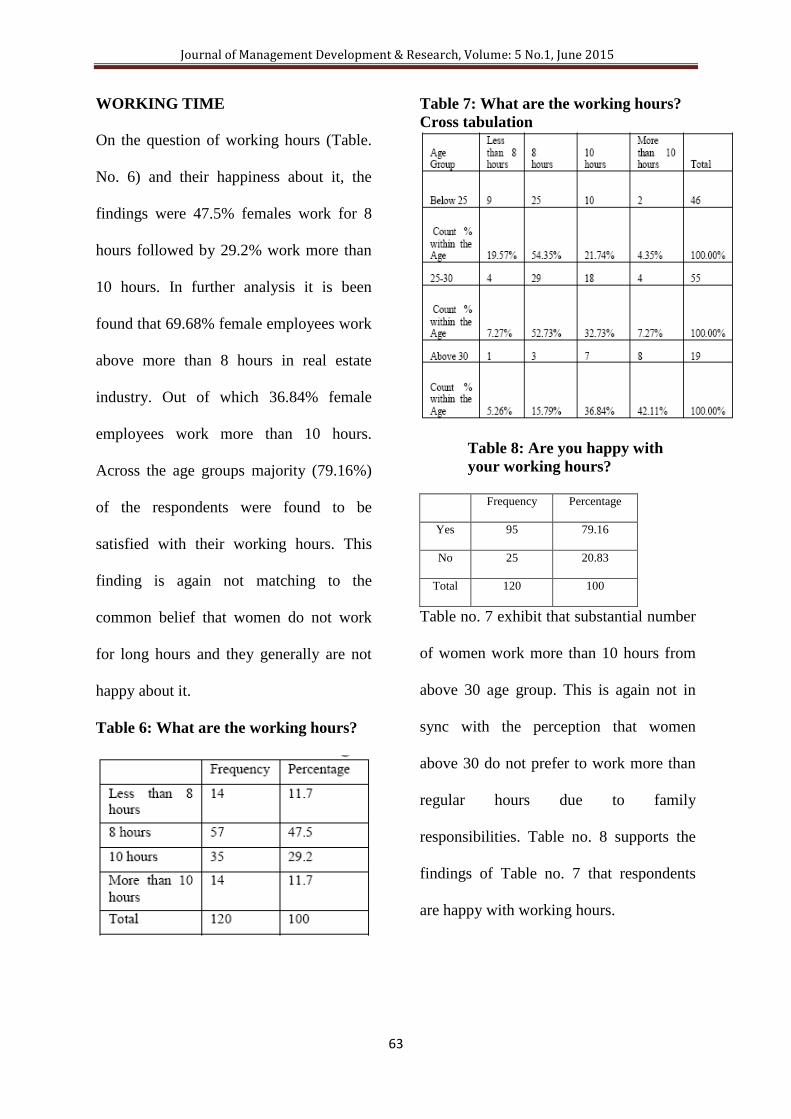
Journal of Management Development & Research, Volume: 5 No.1, June 2015
63
WORKING TIME
On the question of working hours (Table.
No. 6) and their happiness about it, the
findings were 47.5% females work for 8
hours followed by 29.2% work more than
10 hours. In further analysis it is been
found that 69.68% female employees work
above more than 8 hours in real estate
industry. Out of which 36.84% female
employees work more than 10 hours.
Across the age groups majority (79.16%)
of the respondents were found to be
satisfied with their working hours. This
finding is again not matching to the
common belief that women do not work
for long hours and they generally are not
happy about it.
Table 6: What are the working hours?
Table 7: What are the working hours?
Cross tabulation
Table 8: Are you happy with
your working hours?
Frequency Percentage
Yes 95 79.16
No 25 20.83
Total 120 100
Table no. 7 exhibit that substantial number
of women work more than 10 hours from
above 30 age group. This is again not in
sync with the perception that women
above 30 do not prefer to work more than
regular hours due to family
responsibilities. Table no. 8 supports the
findings of Table no. 7 that respondents
are happy with working hours.
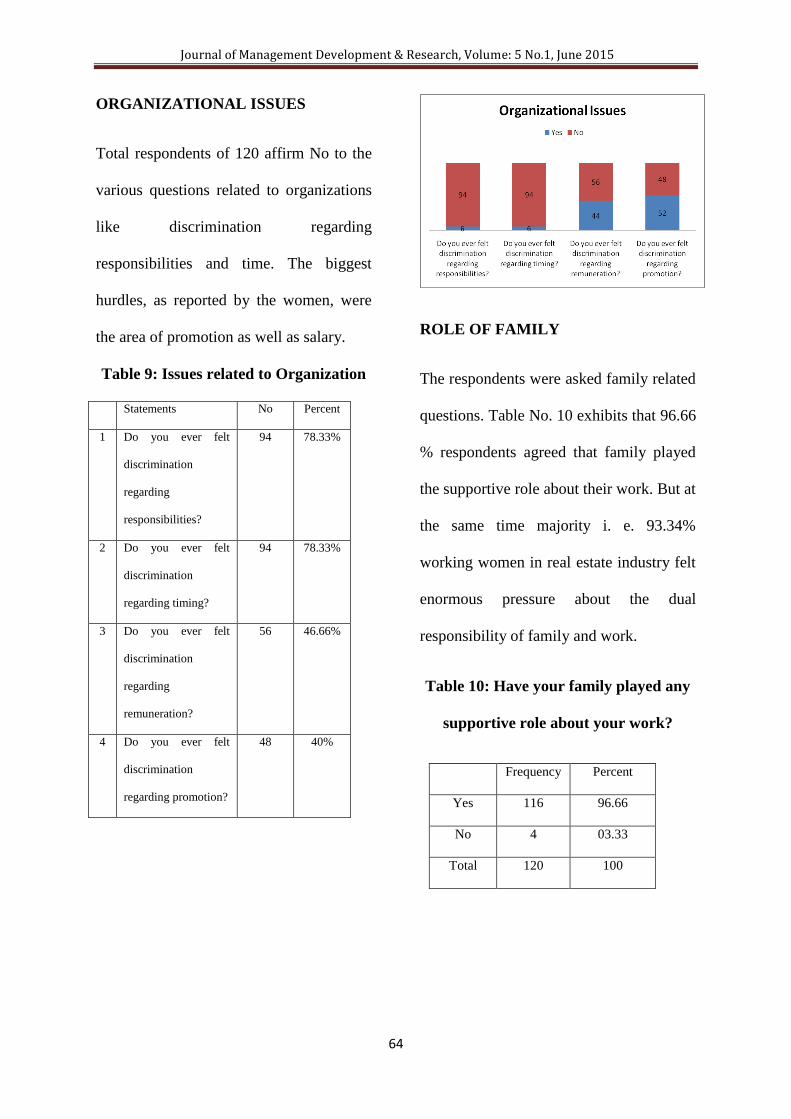
Journal of Management Development & Research, Volume: 5 No.1, June 2015
64
ORGANIZATIONAL ISSUES
Total respondents of 120 affirm No to the
various questions related to organizations
like discrimination regarding
responsibilities and time. The biggest
hurdles, as reported by the women, were
the area of promotion as well as salary.
Table 9: Issues related to Organization
Statements No Percent
1 Do you ever felt
discrimination
regarding
responsibilities?
94 78.33%
2 Do you ever felt
discrimination
regarding timing?
94 78.33%
3 Do you ever felt
discrimination
regarding
remuneration?
56 46.66%
4 Do you ever felt
discrimination
regarding promotion?
48 40%
ROLE OF FAMILY
The respondents were asked family related
questions. Table No. 10 exhibits that 96.66
% respondents agreed that family played
the supportive role about their work. But at
the same time majority i. e. 93.34%
working women in real estate industry felt
enormous pressure about the dual
responsibility of family and work.
Table 10: Have your family played any
supportive role about your work?
Frequency Percent
Yes 116 96.66
No 4 03.33
Total 120 100
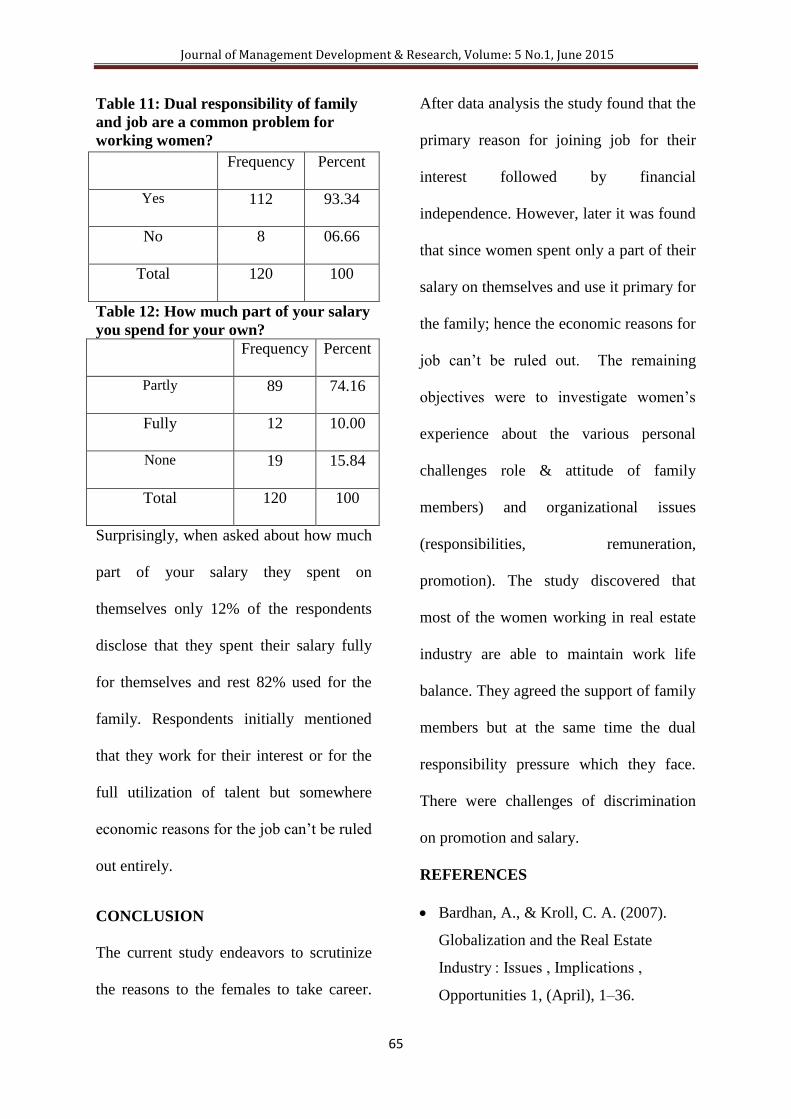
Journal of Management Development & Research, Volume: 5 No.1, June 2015
65
Table 11: Dual responsibility of family
and job are a common problem for
working women?
Table 12: How much part of your salary
you spend for your own? Frequency Percent
Partly 89 74.16
Fully 12 10.00
None 19 15.84
Total 120 100
Surprisingly, when asked about how much
part of your salary they spent on
themselves only 12% of the respondents
disclose that they spent their salary fully
for themselves and rest 82% used for the
family. Respondents initially mentioned
that they work for their interest or for the
full utilization of talent but somewhere
economic reasons for the job can‟t be ruled
out entirely.
CONCLUSION
The current study endeavors to scrutinize
the reasons to the females to take career.
After data analysis the study found that the
primary reason for joining job for their
interest followed by financial
independence. However, later it was found
that since women spent only a part of their
salary on themselves and use it primary for
the family; hence the economic reasons for
job can‟t be ruled out. The remaining
objectives were to investigate women‟s
experience about the various personal
challenges role & attitude of family
members) and organizational issues
(responsibilities, remuneration,
promotion). The study discovered that
most of the women working in real estate
industry are able to maintain work life
balance. They agreed the support of family
members but at the same time the dual
responsibility pressure which they face.
There were challenges of discrimination
on promotion and salary.
REFERENCES
Bardhan, A., & Kroll, C. A. (2007).
Globalization and the Real Estate
Industry : Issues , Implications ,
Opportunities 1, (April), 1–36.
Frequency Percent
Yes 112 93.34
No 8 06.66
Total 120 100
Journal of Management Development & Research, Volume: 5 No.1, June 2015
66
Greenhaus, J. H., Collins, K. M., &
Shaw, J. D. (2003). The relation
between work–family balance and
quality of life. Journal of Vocational
Behavior, 63(3), 510–531.
http://doi.org/10.1016/S0001-
8791(02)00042-8
Hutcheson, B. P. G. (n.d.). Work-Life
Balance.
Lakshmi, K. S., & Gopinath, S. S.
(n.d.). Abhinav WORK LIFE
BALANCE OF WOMEN
EMPLOYEES – WITH REFERENCE
TO TEACHING FACULTIES
Abhinav, II, 53–62.
Madikizela, K., Peninsula, C., & Africa,
S. (2005). Influences on Women ‟ s
Choices of Careers in Construction : A
South African study.
Management, H. R. (n.d.). Perspectives
on Women in Management in India.
Research 1. (n.d.).
Sharma, K. (2012). Role of Women in
Informal Sector in India, 4(1), 29–36.
Singh, S. (2013). WORK- LIFE
BALANCE : A LITERATURE
REVIEW, 2(3), 84–91.
Women Working in Informal Sector in
India : A saga of Lopsided Utilization
of Human Capital. (2011), 4, 534–538.
Work, D. (2010). 2006 ILO Asia-
Pacific Working Paper Series
Employment Trends for Women in India
Subregional Office for South Asia , New
Delhi Employment Trends for Women
in India.
Journal of Management Development & Research, Volume: 5 No.1, June 2015
67
Perceptions of Spirituality in the Workplace –An
Exploratory Case Study
M Subramaniam
Research Scholar, Bharathiyar University
E-Mail: [email protected]
Prof. N Panchanatham
Dept. of Business Administration,
Annamalai University,
E-mail: [email protected]
Abstract
Spirituality in the workplace is of vital significance in the organizational context as
spirituality addresses unique and positive aspects of both individual and organizational
performance. In the modern business world, workplace spirituality is considered as an
important field of interest in human resource management. However, it is observed that
research in this field has been mostly focused on western countries with limited initiatives in
the rest of the world. Considering this aspect, the purpose of the study is to explore
employees’ perceptions of spirituality as applicable to Asian context. The methodology
adopted is based on a research survey questionnaire for primary data collection and case
study qualitative research analysis to arrive at the results. The results of the study provides
answers to research questions, (a) Is there a relationship between workplace spiritualityand
employeesatisfaction at the workplace? (b) Is there an improvement in performance as a result
of integrating workplace spirituality in the organization? (c) Is there a positive impact of
spirituality in the workplace on the employees attitude? The results of the study facilitate
improved insight to managers and business leaders on the importance of spirituality in the
workplace towards boosting productivity and enhancement of performance.
Keywords: Spirituality, Workplace spirituality, Employee satisfaction, Performance
improvement
__________________________________________________________________________
Introduction
In the present global business
environment, the success of several
organizations have been attributed to
adaptation of spirituality oriented policies
and practices. Spirituality in the context
of work is increasingly gaining
importance in business and management
Journal of Management Development & Research, Volume: 5 No.1, June 2015
68
research (Doran and Natale, 2011; Kutcher
et al., 2010).Marques et al., (2007)
expressed that the new spiritual dimension
embodies employees‟ search for
simplicity, meaning, self-expression, and
interconnectedness to something higher.
Spirituality needed to be integrated into
the corporate culture and reflected in
organizational policies and practices on a
daily basis (Wong, 1998). Such an
integration results in making the
organization to have a purpose to the
employees. Unless this happens, neither
organizations nor the individuals who
work there will prosper materially as well
as spiritually. Spirituality gives individuals
the constant hope necessary to embark on
the path of transformation and to endure
the constant setbacks in its way (Mitroff
and Denton, 1999).
This case study seeks to understand from
the employees‟ perspective if spirituality
in the workplace increases the employee
satisfaction level, work performance as
well as the attitude of employees.
Eventually, the goal is to implement the
current theory with practical implications
in order to create a positive business
environment which would result in
increased organizational and individual
performance, better profits, and long term
employee satisfaction.
Literature review
Through a review of the literature, it is
learnt that spirituality in the workplace has
been emerging as a vital area of iterest. An
important trend in business in the 21st
century is employee spirituality (Milliman
et al., 2003). Spirituality (from Latin root
„spiritus‟ meaning „breath‟) is receiving
increasing attention in the context of
employee, work environment, management,
leadership, and organizational research
(Badrinarayanan & Madahvaram, 2008).
Interest in spirituality can be seen from
everywhere in the corporate environment
from the boardroom to the lunchroom, from
business conferences to business schools
(Marques, 2006). The terms „spirit at
work‟, „spirituality at work‟, and
„spirituality in the workplace‟ are used
interchangeably to capture similar notions
(Kinjerski & Skrypnek, 2008).Spirituality
is a continuing search for meaning and
purpose in life; an appreciation for the
depth of life, and it is a personal belief
system (Myers, 1990).
The core of spirituality is about people
sharing and experiencing some common
attachment, attraction, and togetherness
within their work unit and the organization
as a whole (Mitroff & Denton, 1999).
Within the framework of this
conceptualization of spirituality, Giacalone
Journal of Management Development & Research, Volume: 5 No.1, June 2015
69
& Jurkiewicz (2003) suggest that future
research be conducted on such variables
as, i) How people evaluate their work ii)
How much time they spend working iii)
The type of work they desire and accept
iv) The way they do their work v) How
they relate to work routines, coworkers,
customers, and products. These research
areas imply the necessity of incorporating
spirituality into the work place in order to
enhance worker motivation,
organizational performance, and
employee satisfaction(Krishnakumar &
Neck, 2002). Based on prior research it
appears that working in an environment
with leaders that support a higher purpose
or spiritual sense of the individual than
those who don‟t are more satisfied and
enjoy work more (Giacalone &
Jurkiewicz, 2003).
Spirituality in the workplace is a spiritual
culture recognizing that employees have
both mind and spirit, seek to find meaning
and purpose in their work, and desire to
connect with other employees and be part
of a community (Subramaniam and
Panchanatham, 2013). The most prominent
feature of spirituality is oneness with all
beings in the universe, and therefore,
Krishnan (2008) conceptualized
spirituality as oneness with all other
beings. Sengupta (2010) defines
spirituality as a psychological power that
creates positive energy and positive
attitude towards others and self. Mitroff
and Denton
(1999) found that the concept of spirituality
can provide a purpose and meaning that
inspires and employee to achievements
that go beyond the self. However, as
wisely remarked by Pava (2003), there is
no easy formula, if any, to integrate
business and spirituality. To some extent,
all human activities echo or reflect the
spiritual element, given that spirituality
has been regarded as the essence of
management (Mitroff, 1998).
Spirituality may be linked to management
behavior and employee performance
(Mohamed et al., 2004). Milliman et al.
(2003) found that organizations which
create an environment that is responsive to
their employee‟s sense of purpose and
values will have people who are more
motivated in their work. It helps to create a
unique working environment that assists
employees to foster their capacities
(Daniel, 2010). When an individual feels
connected with self, others, and the
organization, optimal performance is
achieved, thus rendering the organization a
success (Subramaniam and Panchanatham,
2013). Spirituality knowledge prompts us
to the awakening of our spiritual strengths,
which can lead to excellence in corporate
decision-making, interpersonal
relationships, and a vibrant corporate
Journal of Management Development & Research, Volume: 5 No.1, June 2015
70
culture geared toward self-sustainability
(Thaker, 2009).
Research objectives
The objectives of this study are (i) to find
out the relationship if any between
workplace spirituality and employee
satisfaction at the workplace? (ii) to
explore if there is an improvement in
performance as a result of integrating
workplace spirituality in the organization?
(iii) to examine if there a positive impact
of spirituality in the workplace on the
employees attitude. Accordingly, the
following hypothesis have been
developed:
H1: Spirituality in the work place has a
positive significant relationship with
employee satisfaction.
H2: Integrating spirituality in the
workplace results in improvement in
work performance.
H3: Spirituality in the workplace has a
positive impact on the employees‟
attitude.
Qualitative research is designed to tell the
researcher how (process) and why
(meaning) things happen as they do.
(Cooper and Schindler, 2006). The
relationshipsbetween the independent and
dependent variables viz. workplace
spirituality and employees satisfaction need
to be analyzed and interpreted. The study
seeks to determine the influence workplace
spirituality has on employee satisfaction,
performance and attitude. The relevant
research components for this proposed
study provide an explanation to the rationale
for using a qualitative study. Robson (2002)
stated, words, which are by far are the most
common form of qualitative data, are a
specialty of humans and their organizations.
This study is conducted using the qualitative
methodology and the components of the
conceptual framework use the research
questions as a guide to direct the study.
This is a qualitative research, case study, the
findings of which are expected to support
the understanding within the corporate
world that workplace spirituality increases
employee satisfaction, performance, and
attitude. This exploratory case study
specifically investigates level of
satisfaction, performance and attitude of
employees within a corporation. The impact
of spirituality in the workplace can be useful
throughout public and private organizations;
the results have implications for business,
volunteer organizations, and manufacturing
organizations by providing them the data
needed to create a spiritual workplace. In
addition, the act of conducting and
summarizing satisfaction and performance
levels may have a positive impact on the
organizational performance, productivity
and several other benefits to the otgaization.
Such action can further increase corporate
profits. The methodology and research
Journal of Management Development & Research, Volume: 5 No.1, June 2015
71
instruments used in this qualitative study
show a positive relationship between
workplace
spirituality,employeesatisfaction, work
performance, and attitude of employees.
Research methodology
The purpose of this qualitative, non-
experimental exploratory case study was to
investigate the relationship between
employee„s perceptions of how workplace
spirituality impacts employee satisfaction,
individual work performance and attitude.
The variables examined in this study were
employee satisfaction, work performance,
attitude and workplace spirituality.
employee satisfaction, work performance
and attitude are investigated as the
dependent variablesand spirituality in the
workplace is independent varaible.
Spirituality in the workplace is a key
moderating variable that affects employee
satisfaction, work performance and attitude
of employees.
The data for this case study were gathered u
sing a set of open ended questionnaires.
The questionaires statements were
intended to get the opinions,
perceptions, statements and reasons for
such responses relating to the
following research questions:
1. Is there a relationship between workplace
spirituality and employee satisfaction at
the workplace?
2. Is there an improvement in performance
as a result of integrating workplace
spirituality in the organization?
3. Is there a positive impact of spirituality
in the workplaceon the employees
attitude?
The research methodology adopted is
descriptive field study based on survey
research. This study depends mainly on the
primary data collected through the
research instrument which is a well-framed
and structured open ended questionnaire to
elicit the well-considered opinions of the
participants. The study is confined to the
participants chosen randomly from all the
advisers, senior advisers, business
associates and managerial staffs of the
local branch of a large private sector life
insurance company situated in the city of
Coimbatore in India. Survey Questionnaire
was distributed to the participants within
the organization through personal
interview or via email and responses
obtained in a rational manner. Total
number of fully completed and acceptable
responses received was 36. Strict
confidentiality of the information was
maintained at all times.
The perceptions of employees„ were the sol
e source of data for this qualitative
research study.
The survey was divided into three categories
namely, demographics, values, and
spirituality. Within each of these categories
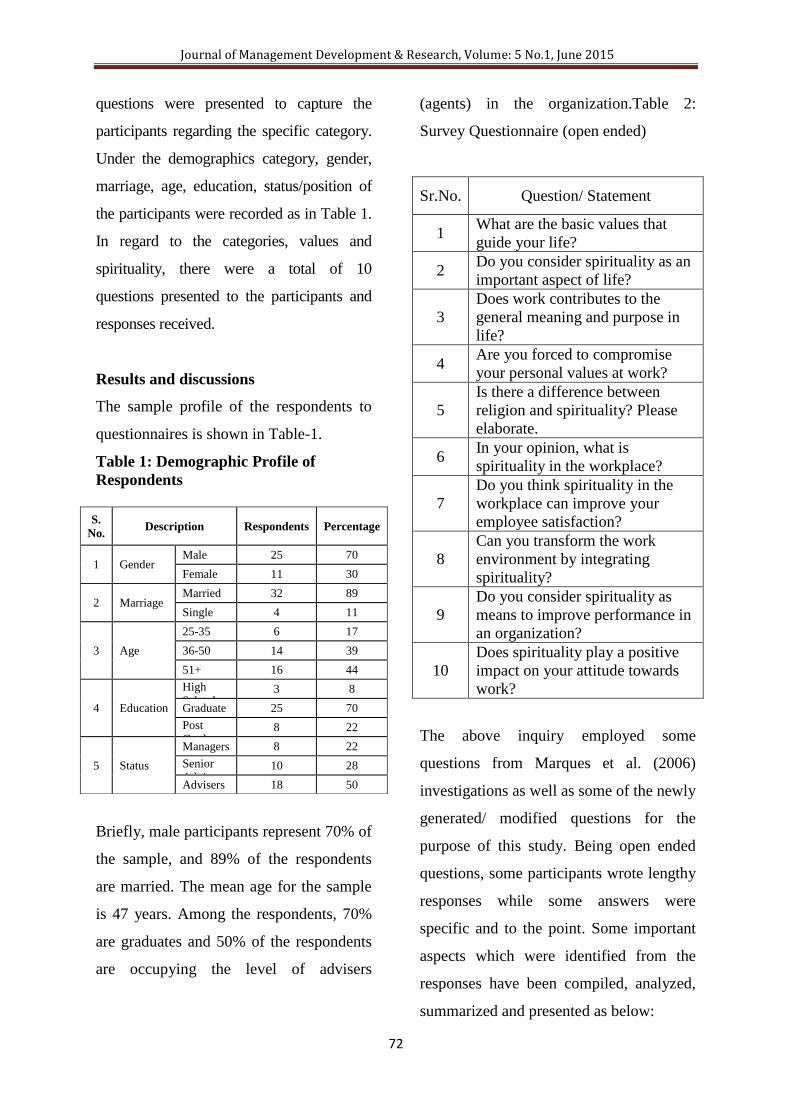
Journal of Management Development & Research, Volume: 5 No.1, June 2015
72
questions were presented to capture the
participants regarding the specific category.
Under the demographics category, gender,
marriage, age, education, status/position of
the participants were recorded as in Table 1.
In regard to the categories, values and
spirituality, there were a total of 10
questions presented to the participants and
responses received.
Results and discussions
The sample profile of the respondents to
questionnaires is shown in Table-1.
Table 1: Demographic Profile of
Respondents
Briefly, male participants represent 70% of
the sample, and 89% of the respondents
are married. The mean age for the sample
is 47 years. Among the respondents, 70%
are graduates and 50% of the respondents
are occupying the level of advisers
(agents) in the organization.Table 2:
Survey Questionnaire (open ended)
Sr.No. Question/ Statement
1 What are the basic values that
guide your life?
2 Do you consider spirituality as an
important aspect of life?
3
Does work contributes to the
general meaning and purpose in
life?
4 Are you forced to compromise
your personal values at work?
5
Is there a difference between
religion and spirituality? Please
elaborate.
6 In your opinion, what is
spirituality in the workplace?
7
Do you think spirituality in the
workplace can improve your
employee satisfaction?
8
Can you transform the work
environment by integrating
spirituality?
9
Do you consider spirituality as
means to improve performance in
an organization?
10
Does spirituality play a positive
impact on your attitude towards
work?
The above inquiry employed some
questions from Marques et al. (2006)
investigations as well as some of the newly
generated/ modified questions for the
purpose of this study. Being open ended
questions, some participants wrote lengthy
responses while some answers were
specific and to the point. Some important
aspects which were identified from the
responses have been compiled, analyzed,
summarized and presented as below:
S.
No. Description Respondents Percentage
1 Gender Male 25 70
Female 11 30
2 Marriage Married 32 89
Single 4 11
3 Age
25-35 6 17
36-50 14 39
51+ 16 44
4 Education
High
School 3 8
Graduate 25 70
Post
Graduate 8 22
5 Status
Managers 8 22
Senior
Advisers 10 28
Advisers 18 50
Journal of Management Development & Research, Volume: 5 No.1, June 2015
73
1. What are the basic values that guide
your life?
Participants responded principles, honesty,
spiritual values, family values, traditional
values, religion and hard work as some of
the basic values which guide their lives.
Some responses included, faith, belief in
God, integrity, character, education, love,
trust worthiness, dedication, positive
outlook etc. that guide their lives. Around
70% of the responses indicated spiritual
beliefs as important basic values guiding
the life. Some responses reveal that
spiritual beliefs gives sound health, ability
to instill positive thoughts, energy and get
connected with others easily.
2. Do you consider spirituality as an
important aspect of life?
More than 73% of the participants
expressed their strong belief that
spirituality is important in the workplace
as it can relieve them from depression
especially in multi-tasking environments.
It is observed from the responses that
stress reduction is considered important as
stress affects health and other aspects of
life. Mostly every one accepts that
spirituality plays an important role in
reducing the stress in day to day routine
life situations.
3. Does work contribute to the general
meaning and purpose in life?
Some of the participants responded
affirmatively revealing that their work
contribute to the general meaning and
purpose in life. However, about 16%
respondents feel that money is more
important than meaning and purpose in
life, expressing that meaningful work
depends upon the salary and benefits that
they get. Such responses reject the concept
of spirituality in the workplace. This is
probably due to the lack of knowledge and
understanding about spirituality. Proper
training should improve their awareness
and acceptance of spirituality in the
workplace.
4. Are you forced to compromise your
personal values at work?
While 20% of the respondents answered
„yes‟, around 70% expressed that they
have not been forced to compromise their
personal values at work and the remaining
responded as neutral meaning that
sometimes they had to compromise their
values depending upon the situation. As
the majority of the respondents are
matured, they keep low profile for such
challenging questions.
5. Is there a difference between religion
and spirituality? Please elaborate
There were varied responses about the
difference between religion and
spirituality. Some respondents answered
„principles we follow is from religion‟ „the
feeling and belief are from spirituality‟ etc.
Journal of Management Development & Research, Volume: 5 No.1, June 2015
74
More than 60% respondents felt
spirituality as individual‟s belief system
and relationship with God while religion is
group affiliated and follows the teachings
and practices religiously. Few respondents,
about 12%,seem to be not very clear and
have even expressed ignorance that there
is no difference between religion and
spirituality.
6. In your opinion, what is spirituality in
the workplace?
There were mixed responses. 50% of the
respondents seem to be not so clear about
spirituality in the workplace. But, some of
them find it difficult to express although
they have knowledge about spirituality in
the workplace. 25% of the participants
answered spirituality in the workplace as
„inter connectedness and they feel love,
compassion, mindfulness, praise and other
aspects constitute spirituality in the
workplace.
7. Do you think spirituality in the
workplace can improve Employee
satisfaction?
Response to this question is expected to
answer the research question about impact
of spirituality in the workplace on
Employee satisfaction. 82% of participants
stated affirmatively that there will
certainly be a positive impact. They
expressed the opinion that reward and
personal growth at work can be expected
through spirituality in the workplace which
eventually lead to employee satisfaction.
8. Can you transform the work
environment by integrating
spirituality?
Most responses, around 75%, expressed
positively and confirmed that the work
environment can be transformed by
integrating spirituality in the workplace.
Participants are of the opinion that by
integrating spirituality at the workplace
there will be a change in organizational
climate and organizational culture as well.
Eventually, both individuals and
organization are expected to benefit by
integrating spirituality in the workplace.
9. Do you consider spirituality as a
means to improve productivity in an
organization?
Among the responses to this question,
79% of the participants have expressed
that spirituality in the workplace can lead
to improvement in performance and
productivity in an organization. This
answers the research question if there will
be improvement in work performance by
integrating spirituality in the workplace.
10. Does spirituality play a positive impact
on your attitude towards work?
Attitude is everything in life and at work.
In order to get participant‟s responses
about impact of spirituality on attitude, this
question has been included.70% of the
participants responded positively
Journal of Management Development & Research, Volume: 5 No.1, June 2015
75
confirming positive impact of spirituality
on the attitude towards work. This
response is in line with question 1 about
basic values. As several respondents
considered spiritual belief as a major
consideration, they expressed that
spirituality has a positive impact on
attitude towards work.
Based on the analysis of the responses as
above, it is noticed that the participants
mostly indicate that there exists positive
relationship between spirituality in the
workplace and employee satisfaction.
Also, most participants have expressed
that integrating spirituality in the
workplace results in performance
improvement in an organization.
Participants have also responded that
spirituality in the workplace develops
positive effects on the attitude
development. Overall, some of these
findings of this enquiry of the study are in
line with similar investigations made in the
past, notably by Marques et al. (2007) and
Ashforth and Pratt (2003).
Conclusion
This study was aimed to find the
relationship, if any, between the
spirituality in the workplace and employee
satisfaction at the workplace, to examine if
there is performance improvement as a
result of integrating spirituality in the
workplace and also to explore if there is an
impact of spirituality in the workplace on
employees attitude. The results as
evidenced from the responses reveal that
spirituality in the workplace has a
significant positive influence on the
employee satisfaction and the hypothesis is
consistent with the study. Moreover, the
study also confirms, based on the
employee perception, that there is
performance improvement and attitude
development as a result of integrating
spirituality in the workplace. Confirmation
of the hypothesis implies that managers of
organizations should prepare an
appropriate atmosphere in the workplace
and increase spirituality in order to
improve employee satisfaction,
performance and also to develop the
attitude of employees. When employees
see that appropriate situations are provided
in the workplace, they work harder to
reach organizational objectives. The
results of the study provide improved
insight to managers on the importance of
spiritual workplace towards increasing
employee satisfaction, work performance
and attitude of employees.
Further, in spite of the positive results, this
study has some limitations which have to
be acknowledged. Firstly, selection of the
sample for the study involves only part
time employees working in a small city
branch of a large private sector insurance
company in India. Hence, generalizations
of the results may not be possible until the
Journal of Management Development & Research, Volume: 5 No.1, June 2015
76
sample includes several other branches of
the company in other regions as well.
Secondly, the data have been collected
from the employees of a private sector
insurance company which restricts
generalization of the results in other
companies and public sector and
government establishments. Further,
researchers are encouraged to drive the
subject of spirituality in the workplace by
conceptualizing and measuring spirituality
inthe workplace in other industries and
organizations through qualitative and
quantitative approach.
As a result of this research and its findings,
the following recommendations are
offered for the employees and the
organizations.
1. It is suggested that business leaders
and managers must try to inject
spirituality in organizational vision,
mission and policies so that the
employees can realize true meaning in
their work, experience a sense of
community and align their individual
values with organizational values,
which in turn will result in better
organizational performance.
2. It is suggested that the results of this
study may be communicated to several
other business organizations whose
employees might take up and influence
their organizations for effecting the
change which might be beneficial.
3. As seen from the participants‟
responses, there is lack of training in
spirituality. Many of the participants
had no formal training on workplace
spirituality. It is suggested that
workplace spirituality training must be
made compulsory for all employees
including the management staffs in an
organization.
4. This research work may be extended to
gather the perceptions of employees in
other organizations which would add
to the body of knowledge and
strengthen the need for spirituality in
the workplace which could be
beneficial to the individual and
organizations.
5. An in-depth study of the relationship
between the workplace spiritualitym,
work performance in different
industries and organizations would
reveal more insight and useful
findings. Further research using
quantitative study would bring out
more insight into the impact of
workplace spirituality on individual
and organizational performance
Recognizing the benefits of spirituality in
the work place, it is important that
organizations and employees embrace the
change and strive to better understand
cultural differences such as demographics,
values, religion and spirituality. The
Journal of Management Development & Research, Volume: 5 No.1, June 2015
77
perceptions from employees and the
resulting data analysis of this study
revealed several insights such as i)
spirituality in the workplace has an impact
on employee satisfaction and work
performance ii) workplace spirituality
training has been identified as a key
component towards fostering spirituality in
the workplace and thereby manifesting
into individual and organizational
performance.
References
Ashforth, B.E. and Pratt, M.G.
(2003),“Institutionalized spirituality: an
oxymoron?”, in
Giacalone, R.A. and Jurkiewicz, C.L.
(eds.), Handbook of Workplace
Spirituality and
Organizational Performance, pp. 93-
107, M.E. Sharpe, Armonk.
Badrinarayanan, V. and Madhavaram,
S. (2008), “Workplace spirituality and
the selling organization: A conceptual
framework and research propositions”,
Journal of Personal Selling and Sales
Management, 28(4), 421–434. Career
Development Quarterly, 56(4), 319–
330.
Connolly, K., & Myers, J. E. (2003),
“Wellness and mattering: The role of
holistic factorsin Employee
performance”, Journal of Employment
Counseling, 40(4), 152–160.
Cooper, D. R., & Schindler, P. S. (2006)
. Business research methods (9th ed.). B
oston.
Daniel, J. L. (2010), “The effect of
workplace spirituality on team
effectiveness”, Journal of Management
Development, 29(5), 442-456.
Doran, C. J., & Natale, S. M. (2011).
Empatheia and Caritas:The Role of
Religion in Fair Trade
Consumption. Journal of Business
Ethics, 98, 1-15.Giacalone, R.
A.&Jurkiewicz, C. L. (2003), “A value
framework for measuring impact of
workplace spirituality on organizational
performance”, Journal of Business
Ethics, 49,129-142.
Kinjerski, V. M., and Skrypnek, B. J. (2
008). “Four paths to spirit at work: Journ
eys ofpersonal meaning, fulfillment, wel
l-
being, and transcendence through work”,
The
Career Development Quarterly, 56(4), 3
19–330.
Kolodinsky, R. W., Giacalone, R. A., &
Jurkiewicz, C. L. (2008). “Workplace va
lues andoutcomes: Exploring personal, o
rganizational, and interactive workplaces
pirituality”, Journal of Business
Ethics, 81, 465–480.
Krishnakumar, S., and Neck, C. P.
Journal of Management Development & Research, Volume: 5 No.1, June 2015
78
(2002),” The „what‟ „why‟ and „how‟ of
spirituality in the workplace”, Journal
of Managerial Psychology, 17(3), 153-
64.
Krishnan, V.R. (2008), “Impact of
transformational leadership on
followers‟ duty orientation and
spirituality”, Journal of Human Values,
14(1), 11–22.
Marques, J., Dhiman, S., and King, R.
(2007), “Spirituality in the workplace:
What it is, Why it Matters, How to
Make it Work for you”, Personhood
Press, Fawnskin.
Marques, J. F. (2006). “The spiritual wo
rker: An examination of the ripple effect
that
enhances quality of life in and outside th
e work environment,”Journal of
Management Development, 25(9), 884–
895.
Miller, D. C., and Salkind, N. J. (2002).
Handbook of research design and social
measurement (6th ed.). Thousand Oaks,
CA: Sage.
Milliman, J. F., Czaplewski, A. J., & Fer
guson, J. M. (2003), “Workplace spiritu
ality and
employee work attitudes: An exploratory
empirical assessment”, Journal of
Organizational
Change, 16(4), 426–447.
Mitroff, I., & Denton, E. A. (1999). “A s
piritual audit of corporate America: A ha
rd lookat spirituality, religion, and value
s in the workplace”, San Francisco: Joss
ey-Bass.
Mohamed, A., Wisnieski, J., Askar, M.,
& Syed, I. (2004). “Towards a theory of
spirituality in the workplace”,
Competitiveness Review, 14(1/2), 102–
108.
Myers, J.E. (1990, May). Wellness
throughout the lifespan. Guideposts
Magazine, 1, 33.
Pava, M.L. (2003), “Searching for
spirituality in all the wrong places”,
Journal of Business Ethics, Vol.48,
No.4, 393-400.
Robson, C. (2002). Real world research
(2nd ed.). Malden, MA: Blackwell.
Sengupta, S.S. (2010), “Correlates of
spiritual orientation and managerial
effectiveness”, Indian Journal of
Industrial Relations, Vol. 46, No. 1, 45–
60.
Subramaniam M and Panchanatham N
(2013), “A Study of Spirituality in a
Public Sector Bank in India”,
International Journal of Advances in
Management and Economics, Jul-Aug
2013, Vol.2, No.4, 102-113.
Subramaniam M and Panchanatham N
(2013), “Spirituality in Management”,
Indian Journal of Applied Research,
Journal of Management Development & Research, Volume: 5 No.1, June 2015
79
October 2013, Vol.3, Issue 10.
Thaker, K.B. (2009), “Approaches to
implement spirituality in business”,
Journal of Human Values, Vol. 15, No.
2, pp. 185-198.
Wong, P. T. (1998), “Spirituality,
meaning, and successful aging”, In P.
T. Wong and P. S. Fry (Eds.), the
human quest for meaning: A handbook
of psychology research and clinical
applications (pp. 359–394). Mahwah,
NJ: Erlbaum.
Journal of Management Development & Research, Volume: 5 No.1, June 2015
80