Embed Size (px)
Citation preview
Impact of Mine Waste on Airborne Respirable Particulates inNortheastern Oklahoma, United States
Ami R. ZotaDepartment of Environmental Health, Harvard School of Public Health, Boston, MA
Robert WillisNational Exposure Research Laboratory, U.S. Environmental Protection Agency, ResearchTriangle Park, NC
Rebecca JimLocal Environmental Action Demanded Agency, Vinita, OK
Gary A. NorrisNational Exposure Research Laboratory, U.S. Environmental Protection Agency, ResearchTriangle Park, NC
James P. ShineDepartment of Environmental Health, Harvard School of Public Health, Boston, MA
Rachelle M. DuvallNational Exposure Research Laboratory, U.S. Environmental Protection Agency, ResearchTriangle Park, NC
Laurel A. Schaider and John D. SpenglerDepartment of Environmental Health, Harvard School of Public Health, Boston, MA
ABSTRACTAtmospheric dispersion of particles from mine waste ispotentially an important route of human exposure tometals in communities close to active and abandonedmining areas. This study assessed sources of mass andmetal concentrations in two size fractions of respirableparticles using positive matrix factorization (U.S. Environ-mental Protection Agency [EPA] PMF 3.0). Weekly inte-grated samples of particulate matter (PM) 10 �m in aero-dynamic diameter or less (PM10) and fine PM (PM2.5, orPM �2.5 �m in aerodynamic diameter) were collected at
three monitoring sites, varying distances (0.5–20 km)from mine waste piles, for 58 consecutive weeks in aformer lead (Pb) and zinc (Zn) mining region. Mean massconcentrations varied significantly across sites for coarsePM (PM10–PM2.5) but not PM2.5 particles. Concentrationsof Pb and Zn significantly decreased with increasing dis-tance from the mine waste piles in PM10–PM2.5 (P �0.0001) and PM2.5 (P � 0.0005) fractions. Source appor-tionment analyses deduced five sources contributing toPM2.5 (mobile source combustion, secondary sulfates,mine waste, crustal/soil, and a source rich in calcium [Ca])and three sources for the coarse fraction (mine waste,crustal/soil, and a Ca-rich source). In the PM2.5 fraction,mine waste contributed 1–6% of the overall mass, 40% ofPb, and 63% of Zn. Mine waste impacts were more appar-ent in the PM10–PM2.5 fraction and contributed 4–39% oftotal mass, 88% of Pb, and 97% of Zn. Percent contribu-tion of mine waste varied significantly across sites (P �0.0001) for both size fractions, with highest contributionsin the site closest to the mine waste piles. Seasonality,wind direction, and concentrations of the Ca-rich sourcewere also associated with levels of ambient aerosols fromthe mine waste source. Scanning electron microscopy re-sults indicated that the PMF-identified mine waste sourceis mainly composed of Zn-Pb agglomerates on crustalparticles in the PM10–PM2.5 fraction. In conclusion, the
IMPLICATIONSThis is the first study to use source apportionment model-ing along with scanning electron microscopy to quantify theimpact of mine waste on respirable particles in residentialareas surrounding an abandoned mining site. Fugitive dustemissions from mine waste were found predominantly inthe PM10–PM2.5 fraction. Impacts were most substantial inPicher, the source-dominated site, and decreased with in-creasing distance from the mine waste piles, suggestingthat populations living nearest to these piles may be morehighly exposed. These results will enable more accurateassessments of human exposure and health effects in com-munities adjacent to active and abandoned mining areas.
TECHNICAL PAPER ISSN:1047-3289 J. Air & Waste Manage. Assoc. 59:1347–1357DOI:10.3155/1047-3289.59.11.1347Copyright 2009 Air & Waste Management Association
Volume 59 November 2009 Journal of the Air & Waste Management Association 1347
differential impacts of mine waste on respirable particlesby size fraction and location should be considered infuture exposure evaluations.
INTRODUCTIONThe U.S. Environmental Protection Agency (EPA) esti-mates there are over 200,000 inactive and abandonedhardrock mines in the United States.1 Active and aban-doned mines have the potential to cause damage toaquatic biota; terrestrial vegetation; and wildlife, air qual-ity, and cultural resources. Seventy-two mining sites havebeen designated to the National Priority List under theEPA Superfund program. These sites pose an imminentthreat to human or ecological health and warrant federalintervention.2 Coal and hardrock mining continue glo-bally, regularly creating more abandoned mines.
In metal mining, less than 1% of processed material isrecovered as useful metal.3 Mine tailings and other metal-enriched byproducts of the mining process are oftenstored in large piles that can become sources of contam-ination to surrounding ecosystems and residential areasthrough wind-borne dispersal of particles. Suspended air-borne particles can travel off-site and infiltrate indoorswhere they can be directly inhaled, or deposit onto soil orhouse dust by settling, impaction, or washout.
Mine waste piles represent a dispersed source of metalcontamination and are particularly abundant at the TarCreek Superfund Site, a former lead (Pb) and zinc (Zn)mining area located in rural Oklahoma. Mine waste, lo-cally known as “chat,” is largely composed of chert (SiO2);dolomite (CaMg(CO3)2); and sulfide minerals includinggalena (PbS), sphalerite (ZnS), and pyrite (FeS2).4 There areapproximately 30 major chat piles in the Tar Creek area,5which contain elevated concentrations of Zn, Pb, andcadmium (Cd).6,7 Recent research suggests metal concen-trations in chat particles increase with decreasing particlesize, and ultrafine particles (�1 �m) contain Zn, Pb, andCd at concentrations up to 20 times higher than the bulkmaterial.7 Chat particles may be transported into thebroader environment through various mechanisms suchas wind erosion. Chat may also be deposited on roads,either through atmospheric settling or when used as agravel material, and then become resuspended and dis-persed with traffic. In addition, local reprocessing of chatfor asphalt and other transportation constructionprojects6–8 may lead to increased aerosol mobilization.Variable weather conditions including sporadic eventssuch as windstorms, along with human disturbances, maylead to spatial and temporal heterogeneity in airbornecontaminants.
A large body of evidence has shown that exposure toparticulate matter (PM) is harmful to human health. Par-ticle size not only determines the site and efficiency ofpulmonary deposition but also may be an indication ofparticle source and composition. Fine PM (PM2.5, or PM�2.5 �m in aerodynamic diameter) particles, largely gen-erated from combustion processes, have been associatedwith a range of adverse respiratory and cardiovascularhealth effects including mortality.9,10 Coarse particles(PM10–PM2.5), generated primarily from mechanical pro-cesses, are more commonly associated with respiratoryand cardiovascular morbidity11 (e.g., inflammatory lung
injury12). Additionally, experimental and epidemiologicevidence suggests that metal constituents in PM, suchas vanadium (V), Zn, iron (Fe), and nickel (Ni), play animportant role in inflammatory and cardiovascularhealth effects.12–15 Inhalation of metals may be partic-ularly toxic because metals such as manganese (Mn),Cd, Zn, and Ni can be transported directly to the brainvia olfactory pathways.16–18
Because there is a potential for inhalation exposure tometal-enriched PM in abandoned mining areas such asthe Tar Creek Superfund Site, it is important to quantifythe impact of mine waste piles on ambient air quality.Although previous studies have used multivariate statisti-cal receptor models to identify the contribution of activemining operations (e.g., smelting) to respirable parti-cles,19,20 few studies have used these techniques to quan-tify the impact of mine waste, a more indirect and persis-tent source of respirable particles, in residential areassurrounding abandoned mining sites. This study is part ofan ongoing effort to understand children’s exposure tomining-related metal mixtures and subsequent health ef-fects. The goal of this study was to examine the impact ofchat-related sources on ambient particle concentrations atthe Tar Creek Superfund Site. Specifically, sources ofPM2.5 and PM10–PM2.5 particles were identified, and theircontributions to mass and metal concentrations were es-timated using positive matrix factorization (PMF). Predic-tors of source contributions were identified using regres-sion analysis. Lastly, the presence of unique, local sourceswas qualitatively confirmed using scanning electron mi-croscopy techniques.
EXPERIMENTAL METHODSStudy Design
Ottawa County, OK, is a predominantly rural area withhigh humidity and abundant rainfall between themonths of May and November. The predominant winddirection is from the south with an average wind speed of11 km�hr�1.21 Three stationary air monitoring sites wereestablished in the area to capture spatial variability andrepresent potentially different human exposure scenarios.Weekly integrated samples were collected at each site for58 weeks from July 2005 to September 2006.
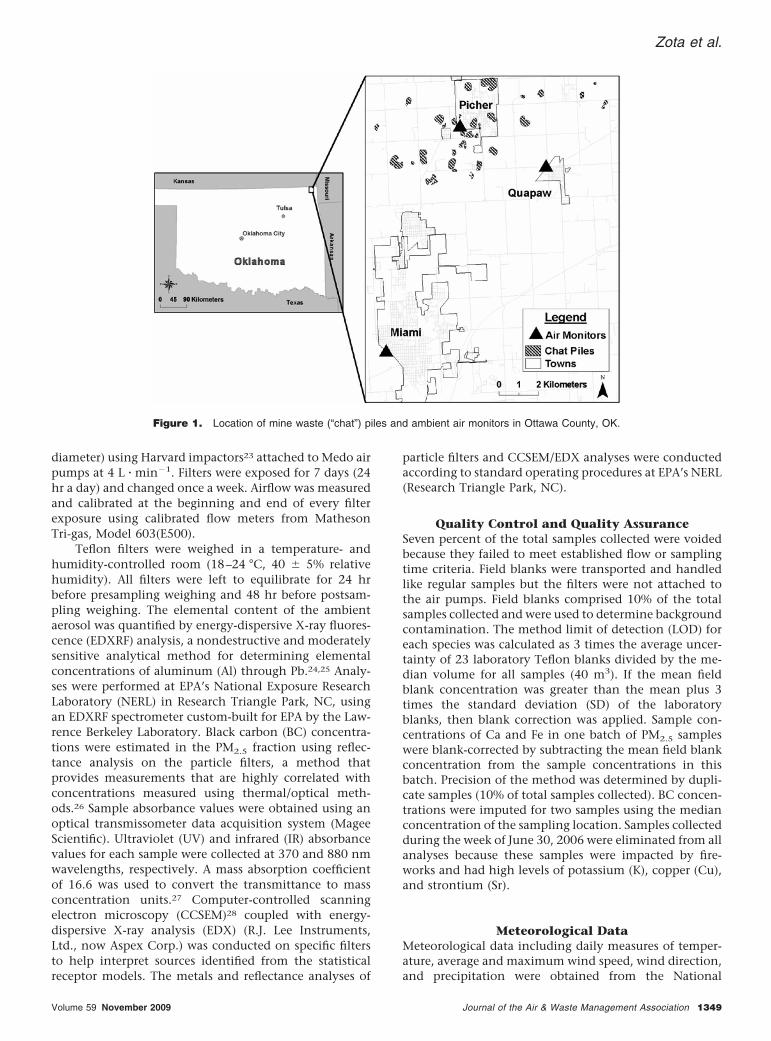
Figure 1 shows the locations of the three sites inrelation to the chat piles. Sites were chosen through con-sultation with our community partners in the area. Site 1,the source-dominated site, was located in a residentialyard in the town of Picher, surrounded by chat piles ontwo sides and within a kilometer of several other piles.Site 2 was located in the town of Quapaw, approximately5 km from the bulk of the chat piles, but close to awell-used county road and several dirt roads that arethought to be lined with chat material.22 Site 3 was lo-cated in a suburban neighborhood within Miami, thelargest town in Ottawa County, and approximately 18 kmupwind of the Picher site with no chat piles in the nearbyvicinity.
Analytical MethodsSeparate filter samples of PM2.5 particles and particlesfrom PM less than 10 �m in aerodynamic diameter (PM10)were collected on Teflon filters (2-�m pore size, 37 mm in
Zota et al.
1348 Journal of the Air & Waste Management Association Volume 59 November 2009
diameter) using Harvard impactors23 attached to Medo airpumps at 4 L � min�1. Filters were exposed for 7 days (24hr a day) and changed once a week. Airflow was measuredand calibrated at the beginning and end of every filterexposure using calibrated flow meters from MathesonTri-gas, Model 603(E500).
Teflon filters were weighed in a temperature- andhumidity-controlled room (18–24 °C, 40 � 5% relativehumidity). All filters were left to equilibrate for 24 hrbefore presampling weighing and 48 hr before postsam-pling weighing. The elemental content of the ambientaerosol was quantified by energy-dispersive X-ray fluores-cence (EDXRF) analysis, a nondestructive and moderatelysensitive analytical method for determining elementalconcentrations of aluminum (Al) through Pb.24,25 Analy-ses were performed at EPA’s National Exposure ResearchLaboratory (NERL) in Research Triangle Park, NC, usingan EDXRF spectrometer custom-built for EPA by the Law-rence Berkeley Laboratory. Black carbon (BC) concentra-tions were estimated in the PM2.5 fraction using reflec-tance analysis on the particle filters, a method thatprovides measurements that are highly correlated withconcentrations measured using thermal/optical meth-ods.26 Sample absorbance values were obtained using anoptical transmissometer data acquisition system (MageeScientific). Ultraviolet (UV) and infrared (IR) absorbancevalues for each sample were collected at 370 and 880 nmwavelengths, respectively. A mass absorption coefficientof 16.6 was used to convert the transmittance to massconcentration units.27 Computer-controlled scanningelectron microscopy (CCSEM)28 coupled with energy-dispersive X-ray analysis (EDX) (R.J. Lee Instruments,Ltd., now Aspex Corp.) was conducted on specific filtersto help interpret sources identified from the statisticalreceptor models. The metals and reflectance analyses of
particle filters and CCSEM/EDX analyses were conductedaccording to standard operating procedures at EPA’s NERL(Research Triangle Park, NC).
Quality Control and Quality AssuranceSeven percent of the total samples collected were voidedbecause they failed to meet established flow or samplingtime criteria. Field blanks were transported and handledlike regular samples but the filters were not attached tothe air pumps. Field blanks comprised 10% of the totalsamples collected and were used to determine backgroundcontamination. The method limit of detection (LOD) foreach species was calculated as 3 times the average uncer-tainty of 23 laboratory Teflon blanks divided by the me-dian volume for all samples (40 m3). If the mean fieldblank concentration was greater than the mean plus 3times the standard deviation (SD) of the laboratoryblanks, then blank correction was applied. Sample con-centrations of Ca and Fe in one batch of PM2.5 sampleswere blank-corrected by subtracting the mean field blankconcentration from the sample concentrations in thisbatch. Precision of the method was determined by dupli-cate samples (10% of total samples collected). BC concen-trations were imputed for two samples using the medianconcentration of the sampling location. Samples collectedduring the week of June 30, 2006 were eliminated from allanalyses because these samples were impacted by fire-works and had high levels of potassium (K), copper (Cu),and strontium (Sr).
Meteorological DataMeteorological data including daily measures of temper-ature, average and maximum wind speed, wind direction,and precipitation were obtained from the National
Figure 1. Location of mine waste (“chat”) piles and ambient air monitors in Ottawa County, OK.
Zota et al.
Volume 59 November 2009 Journal of the Air & Waste Management Association 1349
Oceanographic and Atmospheric Administration (Wash-ington, DC) weather station for Tulsa International Air-port, approximately 145 km south of the study area.Weekly averages for these variables were calculated andused in regression analyses. Because wind direction datawere originally provided in degrees, a dummy variablewas constructed to correspond to 90° directional incre-ments (e.g., south, west, etc.). Similarly, a dummy vari-able was constructed to correspond to the four calendarseasons.
SUMMARY STATISTICSAfter quality assurance/quality control criteria were im-plemented, a total of 156 PM10 and 155 PM2.5 sampleswere available for data analysis. Coarse concentrationswere not directly measured but were calculated as thedifference between PM10 and PM2.5 concentrations forthe 150 samples where PM10 and PM2.5 measurementswere available. To generate summary statistics and com-pare concentrations across sites, a balanced dataset wascreated that included only those samples in which corre-sponding data were available at all three sites for both sizefractions (n � 123). For data that fell below the methodLOD, estimated metal concentrations provided by EDXRFanalyses were used in calculation of summary statisticsand statistical models. Correlations were assessed usingSpearman rank correlations. Statistically significant differ-ences in metal concentrations across sites were deter-mined using the ANOVA test for differences and Scheffe’stest for multiple comparisons. Before the ANOVA analy-sis, the Levene’s test for homogeneity of variance wasimplemented. If the assumption of homogenous variancewas not upheld, the Welch’s ANOVA test, which accountsfor unequal group variances, was used instead.
Receptor Modeling: EPA PMF 3.0A receptor modeling approach using EPA PMF 3.0 wasused to quantify sources in PM2.5 and PM10–PM2.5. PMF
uses a constrained, weighted, least squares regressionvia the Multilinear Engine (ME-2) to generate sourceprofiles and source contributions. Further details on thealgorithm can be found in the PMF 3.0 user guide.29
Input data include sample concentration and uncer-tainty estimates.
Calculation of uncertainty estimates varied accordingto chemical species and size fraction. For elemental con-centrations determined by EDXRF, sample- and element-specific concentration uncertainties were provided thatequaled 1 SD of error estimates based on analytical preci-sion. Because sample-specific uncertainty estimates werenot provided for particle mass or BC concentrations, theseuncertainty estimates were defined as 10 and 20% of themeasured concentration, respectively.30 Uncertainty esti-mates for coarse fraction measurements were calculated asthe following:
coarse �ij � � �PM10�i,j�2 � �PM2.5�i,j�
2
2(1)
where uncertainty � is the jth species uncertainty esti-mated for the ith sample.
The model was run in default robust mode to mini-mize the effects of outliers and included samples from allthree sites because it was assumed that source profileswould not vary across sites. All models were normalized toPM mass concentrations. Thirty base runs were executedfor each specific model, and model goodness-of-fit wasevaluated by examining Q (robust) values. The solutionwith the lowest Q value was chosen, and 100 bootstrapsimulations were performed to estimate the stability anduncertainty of that solution, which involved each of thebootstrapped factors being mapped to exactly one of thebase-case factors. The number of factors in the final solu-tion was decided using a priori knowledge about localsources and by maximizing agreement between base runand bootstrapped results.
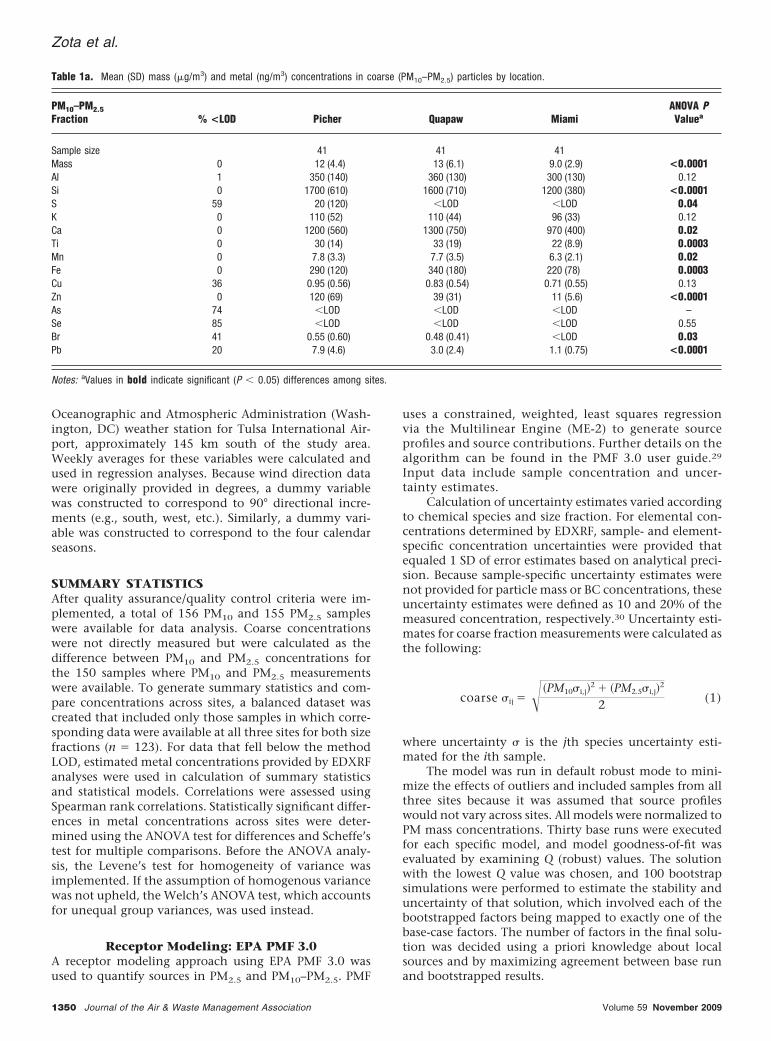
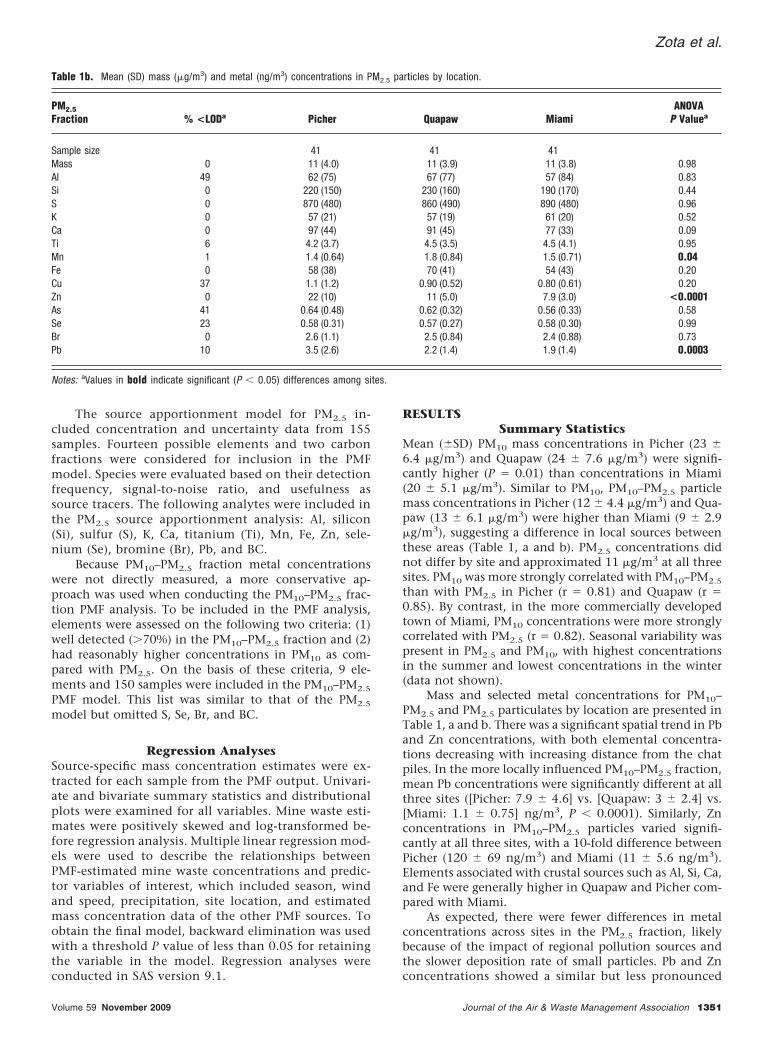
Table 1a. Mean (SD) mass (�g/m3) and metal (ng/m3) concentrations in coarse (PM10–PM2.5) particles by location.
PM10–PM2.5
Fraction % <LOD Picher Quapaw MiamiANOVA PValuea
Sample size 41 41 41Mass 0 12 (4.4) 13 (6.1) 9.0 (2.9) <0.0001Al 1 350 (140) 360 (130) 300 (130) 0.12Si 0 1700 (610) 1600 (710) 1200 (380) <0.0001S 59 20 (120) �LOD �LOD 0.04K 0 110 (52) 110 (44) 96 (33) 0.12Ca 0 1200 (560) 1300 (750) 970 (400) 0.02Ti 0 30 (14) 33 (19) 22 (8.9) 0.0003Mn 0 7.8 (3.3) 7.7 (3.5) 6.3 (2.1) 0.02Fe 0 290 (120) 340 (180) 220 (78) 0.0003Cu 36 0.95 (0.56) 0.83 (0.54) 0.71 (0.55) 0.13Zn 0 120 (69) 39 (31) 11 (5.6) <0.0001As 74 �LOD �LOD �LOD –Se 85 �LOD �LOD �LOD 0.55Br 41 0.55 (0.60) 0.48 (0.41) �LOD 0.03Pb 20 7.9 (4.6) 3.0 (2.4) 1.1 (0.75) <0.0001
Notes: aValues in bold indicate significant (P � 0.05) differences among sites.
Zota et al.
1350 Journal of the Air & Waste Management Association Volume 59 November 2009
The source apportionment model for PM2.5 in-cluded concentration and uncertainty data from 155samples. Fourteen possible elements and two carbonfractions were considered for inclusion in the PMFmodel. Species were evaluated based on their detectionfrequency, signal-to-noise ratio, and usefulness assource tracers. The following analytes were included inthe PM2.5 source apportionment analysis: Al, silicon(Si), sulfur (S), K, Ca, titanium (Ti), Mn, Fe, Zn, sele-nium (Se), bromine (Br), Pb, and BC.
Because PM10–PM2.5 fraction metal concentrationswere not directly measured, a more conservative ap-proach was used when conducting the PM10–PM2.5 frac-tion PMF analysis. To be included in the PMF analysis,elements were assessed on the following two criteria: (1)well detected (70%) in the PM10–PM2.5 fraction and (2)had reasonably higher concentrations in PM10 as com-pared with PM2.5. On the basis of these criteria, 9 ele-ments and 150 samples were included in the PM10–PM2.5
PMF model. This list was similar to that of the PM2.5
model but omitted S, Se, Br, and BC.
Regression AnalysesSource-specific mass concentration estimates were ex-tracted for each sample from the PMF output. Univari-ate and bivariate summary statistics and distributionalplots were examined for all variables. Mine waste esti-mates were positively skewed and log-transformed be-fore regression analysis. Multiple linear regression mod-els were used to describe the relationships betweenPMF-estimated mine waste concentrations and predic-tor variables of interest, which included season, windand speed, precipitation, site location, and estimatedmass concentration data of the other PMF sources. Toobtain the final model, backward elimination was usedwith a threshold P value of less than 0.05 for retainingthe variable in the model. Regression analyses wereconducted in SAS version 9.1.
RESULTSSummary Statistics
Mean (�SD) PM10 mass concentrations in Picher (23 �6.4 �g/m3) and Quapaw (24 � 7.6 �g/m3) were signifi-cantly higher (P � 0.01) than concentrations in Miami(20 � 5.1 �g/m3). Similar to PM10, PM10–PM2.5 particlemass concentrations in Picher (12 � 4.4 �g/m3) and Qua-paw (13 � 6.1 �g/m3) were higher than Miami (9 � 2.9�g/m3), suggesting a difference in local sources betweenthese areas (Table 1, a and b). PM2.5 concentrations didnot differ by site and approximated 11 �g/m3 at all threesites. PM10 was more strongly correlated with PM10–PM2.5
than with PM2.5 in Picher (r � 0.81) and Quapaw (r �0.85). By contrast, in the more commercially developedtown of Miami, PM10 concentrations were more stronglycorrelated with PM2.5 (r � 0.82). Seasonal variability waspresent in PM2.5 and PM10, with highest concentrationsin the summer and lowest concentrations in the winter(data not shown).
Mass and selected metal concentrations for PM10–PM2.5 and PM2.5 particulates by location are presented inTable 1, a and b. There was a significant spatial trend in Pband Zn concentrations, with both elemental concentra-tions decreasing with increasing distance from the chatpiles. In the more locally influenced PM10–PM2.5 fraction,mean Pb concentrations were significantly different at allthree sites ([Picher: 7.9 � 4.6] vs. [Quapaw: 3 � 2.4] vs.[Miami: 1.1 � 0.75] ng/m3, P � 0.0001). Similarly, Znconcentrations in PM10–PM2.5 particles varied signifi-cantly at all three sites, with a 10-fold difference betweenPicher (120 � 69 ng/m3) and Miami (11 � 5.6 ng/m3).Elements associated with crustal sources such as Al, Si, Ca,and Fe were generally higher in Quapaw and Picher com-pared with Miami.
As expected, there were fewer differences in metalconcentrations across sites in the PM2.5 fraction, likelybecause of the impact of regional pollution sources andthe slower deposition rate of small particles. Pb and Znconcentrations showed a similar but less pronounced
Table 1b. Mean (SD) mass (�g/m3) and metal (ng/m3) concentrations in PM2.5 particles by location.
PM2.5
Fraction % <LODa Picher Quapaw MiamiANOVA
P Valuea
Sample size 41 41 41Mass 0 11 (4.0) 11 (3.9) 11 (3.8) 0.98Al 49 62 (75) 67 (77) 57 (84) 0.83Si 0 220 (150) 230 (160) 190 (170) 0.44S 0 870 (480) 860 (490) 890 (480) 0.96K 0 57 (21) 57 (19) 61 (20) 0.52Ca 0 97 (44) 91 (45) 77 (33) 0.09Ti 6 4.2 (3.7) 4.5 (3.5) 4.5 (4.1) 0.95Mn 1 1.4 (0.64) 1.8 (0.84) 1.5 (0.71) 0.04Fe 0 58 (38) 70 (41) 54 (43) 0.20Cu 37 1.1 (1.2) 0.90 (0.52) 0.80 (0.61) 0.20Zn 0 22 (10) 11 (5.0) 7.9 (3.0) <0.0001As 41 0.64 (0.48) 0.62 (0.32) 0.56 (0.33) 0.58Se 23 0.58 (0.31) 0.57 (0.27) 0.58 (0.30) 0.99Br 0 2.6 (1.1) 2.5 (0.84) 2.4 (0.88) 0.73Pb 10 3.5 (2.6) 2.2 (1.4) 1.9 (1.4) 0.0003
Notes: aValues in bold indicate significant (P � 0.05) differences among sites.
Zota et al.
Volume 59 November 2009 Journal of the Air & Waste Management Association 1351
spatial gradient compared with the PM10–PM2.5 frac-tion. Pb concentrations at Picher (3.5 � 2.6 ng/m3)were elevated relative to Miami (1.9 � 1.4 ng/m3) by afactor of 2. A similar trend was also observed for Zn inthe PM2.5 fraction.
Characterization of SourcesWhen EPA PMF 3.0 was applied to PM2.5 data, the modelconverged, yielding a five-factor solution. There was goodagreement between the predicted and measured PM2.5
mass (R2 � 0.75). The R2 values for the elements rangedfrom 0.50 to 0.99. Over 87 bootstraps out of 100 weremapped to the original base factor.
A three-factor solution was extracted from the PM10–PM2.5 fraction data. The PMF solution for the PM10–PM2.5
data exhibited a better goodness-of-fit compared withthe solution for the PM2.5 fraction data. The correlationbetween predicted and measured PM mass yielded an R2
� 0.89, and the R2 for the elements ranged from 0.85–
0.99. All 100 bootstraps were mapped to the originalbase factor.
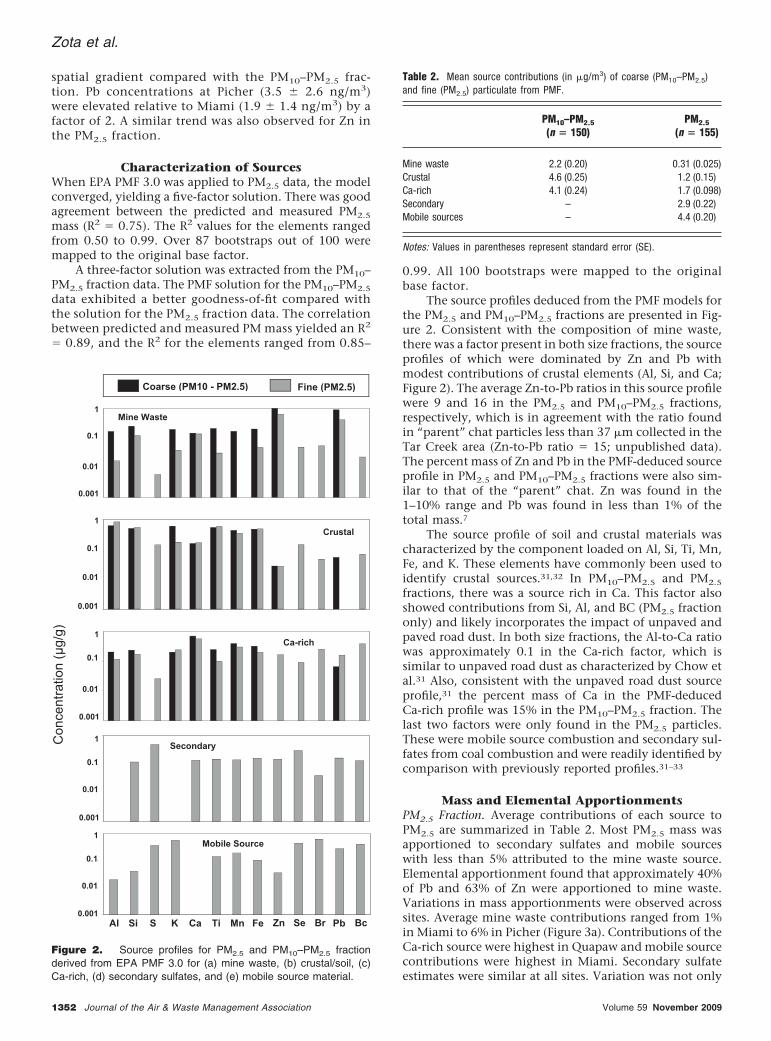
The source profiles deduced from the PMF models forthe PM2.5 and PM10–PM2.5 fractions are presented in Fig-ure 2. Consistent with the composition of mine waste,there was a factor present in both size fractions, the sourceprofiles of which were dominated by Zn and Pb withmodest contributions of crustal elements (Al, Si, and Ca;Figure 2). The average Zn-to-Pb ratios in this source profilewere 9 and 16 in the PM2.5 and PM10–PM2.5 fractions,respectively, which is in agreement with the ratio foundin “parent” chat particles less than 37 �m collected in theTar Creek area (Zn-to-Pb ratio � 15; unpublished data).The percent mass of Zn and Pb in the PMF-deduced sourceprofile in PM2.5 and PM10–PM2.5 fractions were also sim-ilar to that of the “parent” chat. Zn was found in the1–10% range and Pb was found in less than 1% of thetotal mass.7
The source profile of soil and crustal materials wascharacterized by the component loaded on Al, Si, Ti, Mn,Fe, and K. These elements have commonly been used toidentify crustal sources.31,32 In PM10–PM2.5 and PM2.5
fractions, there was a source rich in Ca. This factor alsoshowed contributions from Si, Al, and BC (PM2.5 fractiononly) and likely incorporates the impact of unpaved andpaved road dust. In both size fractions, the Al-to-Ca ratiowas approximately 0.1 in the Ca-rich factor, which issimilar to unpaved road dust as characterized by Chow etal.31 Also, consistent with the unpaved road dust sourceprofile,31 the percent mass of Ca in the PMF-deducedCa-rich profile was 15% in the PM10–PM2.5 fraction. Thelast two factors were only found in the PM2.5 particles.These were mobile source combustion and secondary sul-fates from coal combustion and were readily identified bycomparison with previously reported profiles.31–33
Mass and Elemental ApportionmentsPM2.5 Fraction. Average contributions of each source toPM2.5 are summarized in Table 2. Most PM2.5 mass wasapportioned to secondary sulfates and mobile sourceswith less than 5% attributed to the mine waste source.Elemental apportionment found that approximately 40%of Pb and 63% of Zn were apportioned to mine waste.Variations in mass apportionments were observed acrosssites. Average mine waste contributions ranged from 1%in Miami to 6% in Picher (Figure 3a). Contributions of theCa-rich source were highest in Quapaw and mobile sourcecontributions were highest in Miami. Secondary sulfateestimates were similar at all sites. Variation was not only
0.001
0.01
0.1
1
0.001
0.01
0.1
1
0.001
0.01
0.1
1
0.001
0.01
0.1
1
0.001
0.01
0.1
1
Al Si S K Ca Ti Mn Fe Zn Se Br Pb BC
Con
cent
ratio
n (µ
g/g)
Coarse (PM10 - PM2.5) Fine (PM2.5)
Mine Waste
Crustal
Ca-rich
Secondary
Mobile Source
Al Si S K Ca Ti Mn Fe Zn Se Br Pb Bc0.001
0.001
0.001
0.001
0.001
0.01
0.1
1
0.01
0.1
1
0.01
0.1
1
0.01
0.1
1
0.01
0.1
1
Figure 2. Source profiles for PM2.5 and PM10–PM2.5 fractionderived from EPA PMF 3.0 for (a) mine waste, (b) crustal/soil, (c)Ca-rich, (d) secondary sulfates, and (e) mobile source material.
Table 2. Mean source contributions (in �g/m3) of coarse (PM10–PM2.5)and fine (PM2.5) particulate from PMF.
PM10–PM2.5
(n � 150)PM2.5
(n � 155)
Mine waste 2.2 (0.20) 0.31 (0.025)Crustal 4.6 (0.25) 1.2 (0.15)Ca-rich 4.1 (0.24) 1.7 (0.098)Secondary – 2.9 (0.22)Mobile sources – 4.4 (0.20)
Notes: Values in parentheses represent standard error (SE).
Zota et al.
1352 Journal of the Air & Waste Management Association Volume 59 November 2009
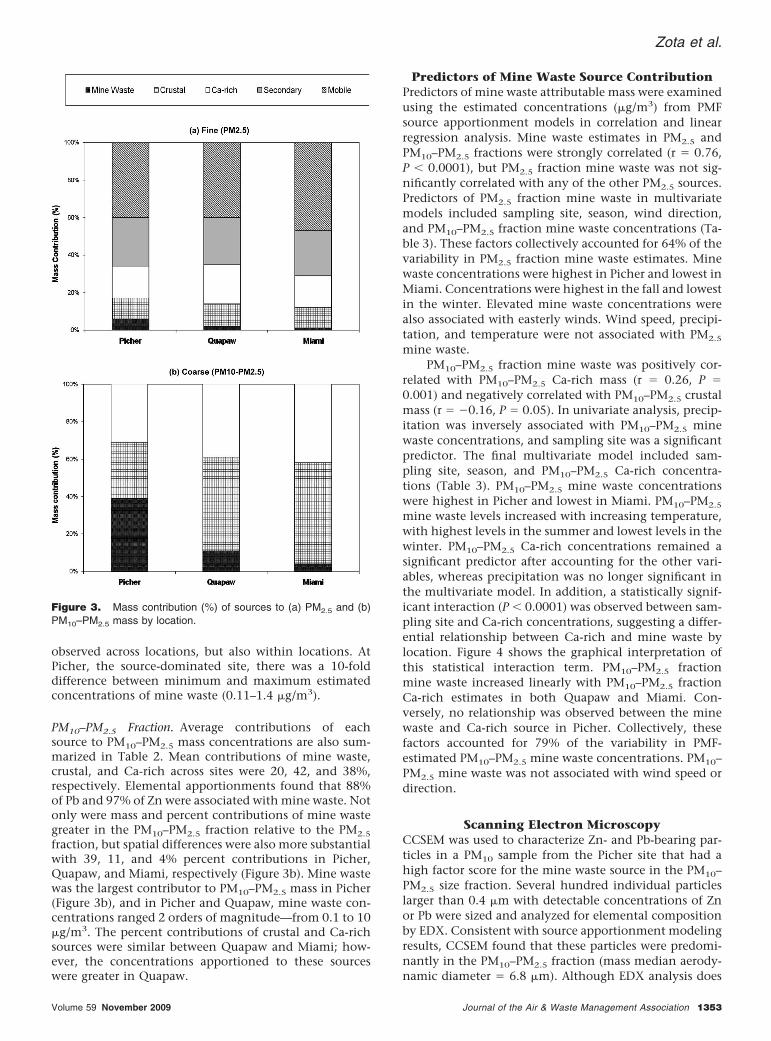
observed across locations, but also within locations. AtPicher, the source-dominated site, there was a 10-folddifference between minimum and maximum estimatedconcentrations of mine waste (0.11–1.4 �g/m3).
PM10–PM2.5 Fraction. Average contributions of eachsource to PM10–PM2.5 mass concentrations are also sum-marized in Table 2. Mean contributions of mine waste,crustal, and Ca-rich across sites were 20, 42, and 38%,respectively. Elemental apportionments found that 88%of Pb and 97% of Zn were associated with mine waste. Notonly were mass and percent contributions of mine wastegreater in the PM10–PM2.5 fraction relative to the PM2.5
fraction, but spatial differences were also more substantialwith 39, 11, and 4% percent contributions in Picher,Quapaw, and Miami, respectively (Figure 3b). Mine wastewas the largest contributor to PM10–PM2.5 mass in Picher(Figure 3b), and in Picher and Quapaw, mine waste con-centrations ranged 2 orders of magnitude—from 0.1 to 10�g/m3. The percent contributions of crustal and Ca-richsources were similar between Quapaw and Miami; how-ever, the concentrations apportioned to these sourceswere greater in Quapaw.
Predictors of Mine Waste Source ContributionPredictors of mine waste attributable mass were examinedusing the estimated concentrations (�g/m3) from PMFsource apportionment models in correlation and linearregression analysis. Mine waste estimates in PM2.5 andPM10–PM2.5 fractions were strongly correlated (r � 0.76,P � 0.0001), but PM2.5 fraction mine waste was not sig-nificantly correlated with any of the other PM2.5 sources.Predictors of PM2.5 fraction mine waste in multivariatemodels included sampling site, season, wind direction,and PM10–PM2.5 fraction mine waste concentrations (Ta-ble 3). These factors collectively accounted for 64% of thevariability in PM2.5 fraction mine waste estimates. Minewaste concentrations were highest in Picher and lowest inMiami. Concentrations were highest in the fall and lowestin the winter. Elevated mine waste concentrations werealso associated with easterly winds. Wind speed, precipi-tation, and temperature were not associated with PM2.5
mine waste.PM10–PM2.5 fraction mine waste was positively cor-
related with PM10–PM2.5 Ca-rich mass (r � 0.26, P �0.001) and negatively correlated with PM10–PM2.5 crustalmass (r � �0.16, P � 0.05). In univariate analysis, precip-itation was inversely associated with PM10–PM2.5 minewaste concentrations, and sampling site was a significantpredictor. The final multivariate model included sam-pling site, season, and PM10–PM2.5 Ca-rich concentra-tions (Table 3). PM10–PM2.5 mine waste concentrationswere highest in Picher and lowest in Miami. PM10–PM2.5
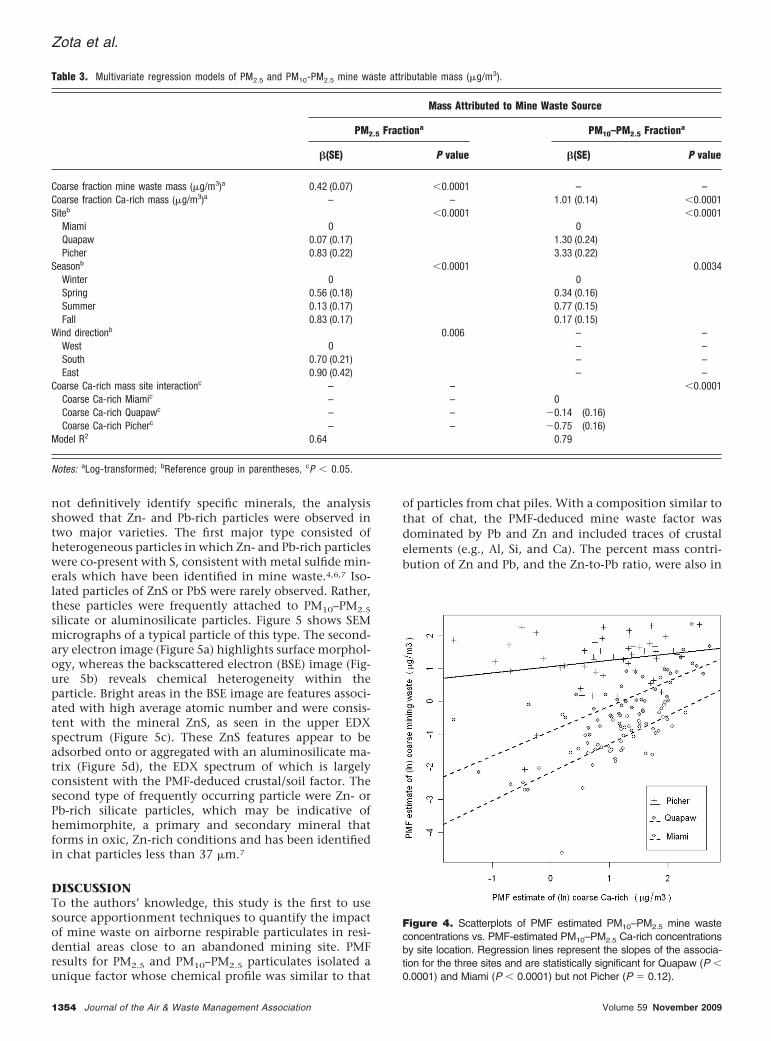
mine waste levels increased with increasing temperature,with highest levels in the summer and lowest levels in thewinter. PM10–PM2.5 Ca-rich concentrations remained asignificant predictor after accounting for the other vari-ables, whereas precipitation was no longer significant inthe multivariate model. In addition, a statistically signif-icant interaction (P � 0.0001) was observed between sam-pling site and Ca-rich concentrations, suggesting a differ-ential relationship between Ca-rich and mine waste bylocation. Figure 4 shows the graphical interpretation ofthis statistical interaction term. PM10–PM2.5 fractionmine waste increased linearly with PM10–PM2.5 fractionCa-rich estimates in both Quapaw and Miami. Con-versely, no relationship was observed between the minewaste and Ca-rich source in Picher. Collectively, thesefactors accounted for 79% of the variability in PMF-estimated PM10–PM2.5 mine waste concentrations. PM10–PM2.5 mine waste was not associated with wind speed ordirection.
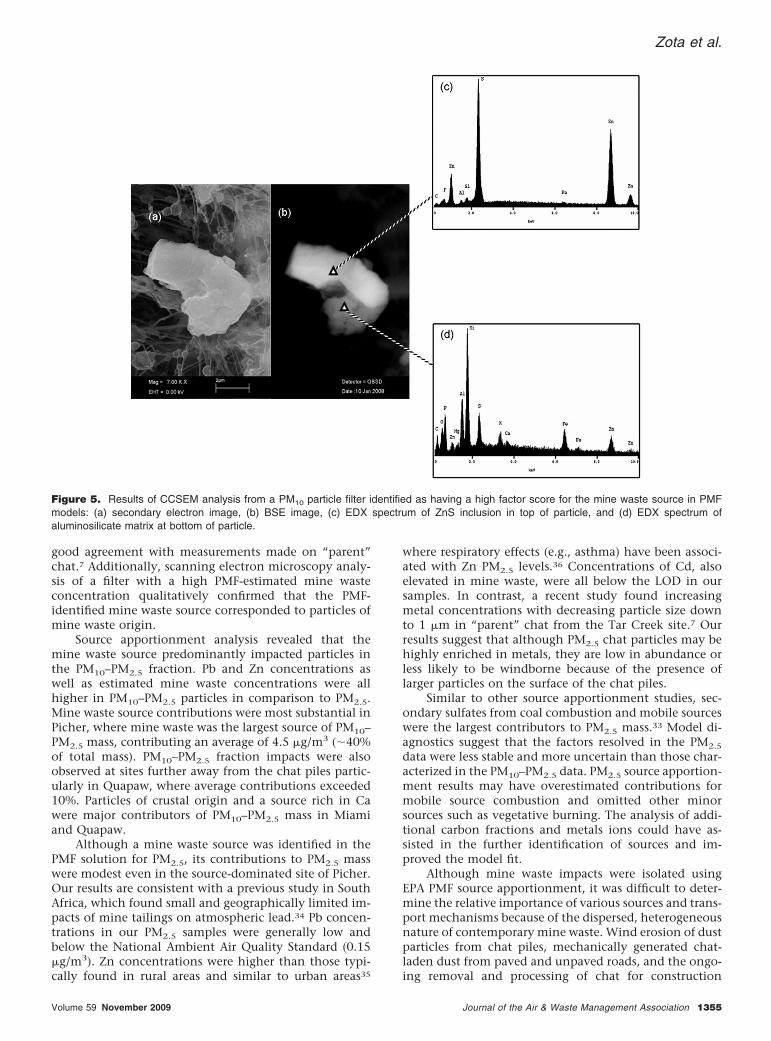
Scanning Electron MicroscopyCCSEM was used to characterize Zn- and Pb-bearing par-ticles in a PM10 sample from the Picher site that had ahigh factor score for the mine waste source in the PM10–PM2.5 size fraction. Several hundred individual particleslarger than 0.4 �m with detectable concentrations of Znor Pb were sized and analyzed for elemental compositionby EDX. Consistent with source apportionment modelingresults, CCSEM found that these particles were predomi-nantly in the PM10–PM2.5 fraction (mass median aerody-namic diameter � 6.8 �m). Although EDX analysis does
Figure 3. Mass contribution (%) of sources to (a) PM2.5 and (b)PM10–PM2.5 mass by location.
Zota et al.
Volume 59 November 2009 Journal of the Air & Waste Management Association 1353
not definitively identify specific minerals, the analysisshowed that Zn- and Pb-rich particles were observed intwo major varieties. The first major type consisted ofheterogeneous particles in which Zn- and Pb-rich particleswere co-present with S, consistent with metal sulfide min-erals which have been identified in mine waste.4,6,7 Iso-lated particles of ZnS or PbS were rarely observed. Rather,these particles were frequently attached to PM10–PM2.5
silicate or aluminosilicate particles. Figure 5 shows SEMmicrographs of a typical particle of this type. The second-ary electron image (Figure 5a) highlights surface morphol-ogy, whereas the backscattered electron (BSE) image (Fig-ure 5b) reveals chemical heterogeneity within theparticle. Bright areas in the BSE image are features associ-ated with high average atomic number and were consis-tent with the mineral ZnS, as seen in the upper EDXspectrum (Figure 5c). These ZnS features appear to beadsorbed onto or aggregated with an aluminosilicate ma-trix (Figure 5d), the EDX spectrum of which is largelyconsistent with the PMF-deduced crustal/soil factor. Thesecond type of frequently occurring particle were Zn- orPb-rich silicate particles, which may be indicative ofhemimorphite, a primary and secondary mineral thatforms in oxic, Zn-rich conditions and has been identifiedin chat particles less than 37 �m.7
DISCUSSIONTo the authors’ knowledge, this study is the first to usesource apportionment techniques to quantify the impactof mine waste on airborne respirable particulates in resi-dential areas close to an abandoned mining site. PMFresults for PM2.5 and PM10–PM2.5 particulates isolated aunique factor whose chemical profile was similar to that
of particles from chat piles. With a composition similar tothat of chat, the PMF-deduced mine waste factor wasdominated by Pb and Zn and included traces of crustalelements (e.g., Al, Si, and Ca). The percent mass contri-bution of Zn and Pb, and the Zn-to-Pb ratio, were also in
Figure 4. Scatterplots of PMF estimated PM10–PM2.5 mine wasteconcentrations vs. PMF-estimated PM10–PM2.5 Ca-rich concentrationsby site location. Regression lines represent the slopes of the associa-tion for the three sites and are statistically significant for Quapaw (P �0.0001) and Miami (P � 0.0001) but not Picher (P � 0.12).
Table 3. Multivariate regression models of PM2.5 and PM10-PM2.5 mine waste attributable mass (�g/m3).
Mass Attributed to Mine Waste Source
PM2.5 Fractiona PM10–PM2.5 Fractiona
�(SE) P value �(SE) P value
Coarse fraction mine waste mass (�g/m3)a 0.42 (0.07) �0.0001 – –Coarse fraction Ca-rich mass (�g/m3)a – – 1.01 (0.14) �0.0001Siteb �0.0001 �0.0001
Miami 0 0Quapaw 0.07 (0.17) 1.30 (0.24)Picher 0.83 (0.22) 3.33 (0.22)
Seasonb �0.0001 0.0034Winter 0 0Spring 0.56 (0.18) 0.34 (0.16)Summer 0.13 (0.17) 0.77 (0.15)Fall 0.83 (0.17) 0.17 (0.15)
Wind directionb 0.006 – –West 0 – –South 0.70 (0.21) – –East 0.90 (0.42) – –
Coarse Ca-rich mass site interactionc – – �0.0001Coarse Ca-rich Miamic – – 0Coarse Ca-rich Quapawc – – �0.14 (0.16)Coarse Ca-rich Picherc – – �0.75 (0.16)
Model R2 0.64 0.79
Notes: aLog-transformed; bReference group in parentheses, cP � 0.05.
Zota et al.
1354 Journal of the Air & Waste Management Association Volume 59 November 2009
good agreement with measurements made on “parent”chat.7 Additionally, scanning electron microscopy analy-sis of a filter with a high PMF-estimated mine wasteconcentration qualitatively confirmed that the PMF-identified mine waste source corresponded to particles ofmine waste origin.
Source apportionment analysis revealed that themine waste source predominantly impacted particles inthe PM10–PM2.5 fraction. Pb and Zn concentrations aswell as estimated mine waste concentrations were allhigher in PM10–PM2.5 particles in comparison to PM2.5.Mine waste source contributions were most substantial inPicher, where mine waste was the largest source of PM10–PM2.5 mass, contributing an average of 4.5 �g/m3 (40%of total mass). PM10–PM2.5 fraction impacts were alsoobserved at sites further away from the chat piles partic-ularly in Quapaw, where average contributions exceeded10%. Particles of crustal origin and a source rich in Cawere major contributors of PM10–PM2.5 mass in Miamiand Quapaw.
Although a mine waste source was identified in thePMF solution for PM2.5, its contributions to PM2.5 masswere modest even in the source-dominated site of Picher.Our results are consistent with a previous study in SouthAfrica, which found small and geographically limited im-pacts of mine tailings on atmospheric lead.34 Pb concen-trations in our PM2.5 samples were generally low andbelow the National Ambient Air Quality Standard (0.15�g/m3). Zn concentrations were higher than those typi-cally found in rural areas and similar to urban areas35
where respiratory effects (e.g., asthma) have been associ-ated with Zn PM2.5 levels.36 Concentrations of Cd, alsoelevated in mine waste, were all below the LOD in oursamples. In contrast, a recent study found increasingmetal concentrations with decreasing particle size downto 1 �m in “parent” chat from the Tar Creek site.7 Ourresults suggest that although PM2.5 chat particles may behighly enriched in metals, they are low in abundance orless likely to be windborne because of the presence oflarger particles on the surface of the chat piles.
Similar to other source apportionment studies, sec-ondary sulfates from coal combustion and mobile sourceswere the largest contributors to PM2.5 mass.33 Model di-agnostics suggest that the factors resolved in the PM2.5
data were less stable and more uncertain than those char-acterized in the PM10–PM2.5 data. PM2.5 source apportion-ment results may have overestimated contributions formobile source combustion and omitted other minorsources such as vegetative burning. The analysis of addi-tional carbon fractions and metals ions could have as-sisted in the further identification of sources and im-proved the model fit.
Although mine waste impacts were isolated usingEPA PMF source apportionment, it was difficult to deter-mine the relative importance of various sources and trans-port mechanisms because of the dispersed, heterogeneousnature of contemporary mine waste. Wind erosion of dustparticles from chat piles, mechanically generated chat-laden dust from paved and unpaved roads, and the ongo-ing removal and processing of chat for construction
Figure 5. Results of CCSEM analysis from a PM10 particle filter identified as having a high factor score for the mine waste source in PMFmodels: (a) secondary electron image, (b) BSE image, (c) EDX spectrum of ZnS inclusion in top of particle, and (d) EDX spectrum ofaluminosilicate matrix at bottom of particle.
Zota et al.
Volume 59 November 2009 Journal of the Air & Waste Management Association 1355
projects may all contribute to the mine waste particlesobserved in these air samples. For example, CCSEM/EDXanalyses documented two different types of particles thatappeared to be of mine waste origin.
Additionally, linear regression results, which in-cluded a statistically significant interaction term betweensampling site and Ca-rich concentrations in the PM10–PM2.5 fraction, may suggest differential transport mecha-nisms by location. Mine waste estimates increased lin-early with Ca-rich source estimates in Quapaw and Miamibut not in Picher. One possible interpretation of thisinteraction is that fugitive dust from the chat piles may bethe predominant source of airborne mine waste in Picher.Conversely, resuspension of chat, previously deposited onpaved and unpaved roads, may be a more importanttransport mechanism at the Quapaw and Miami sites,which are farther away from the chat piles. Another pos-sible explanation for this observed interaction is that theCa-rich source concentrations are a surrogate for someother unmeasured environmental factor or anthropo-genic activity that varies between Picher and the othersites and is positively associated with mine waste concen-trations. Future studies should compare the geochemicalproperties and particle size distribution profiles of wind-blown mine waste versus mechanically resuspended minewaste at relevant mining sites.
This study has several important strengths. Theunique study design and collaboration allowed us to eval-uate chronic airborne exposures to mining-related metalsin an underserved community. Although abandonedhardrock mines and associated solid mine waste are in-creasing in a global context, limited data are available onthe ambient air quality at these sites. Various methodswere used, including receptor modeling and scanningelectron microscopy, to examine mine waste impacts onambient PM. Another major strength of the study is theunique collaboration, which included university, com-munity, and government partners. Most notably, the Lo-cal Environmental Action Demanded (L.E.A.D.) agency, acommunity partner in this study, successfully conductedfield sampling from using strict quality assurance/qualitycontrol guidelines for over 1 yr. This approach should bea model for other community-based assessments of airquality.
There were also some weaknesses to this study.Although seasonal variations in mine waste concentra-tions were observed using regression analysis, weeklyintegrated samples obscured the ability to assess acuteexposures, reconstruct backward trajectories, and ana-lyze relationships with wind speed. However, thelonger sampling time allowed for increased particlemass deposition and thus improved elemental detectionlimits. Coarse fraction concentrations were calculated in-directly by subtracting PM10 and PM2.5 measurements,which may increase measurement error. However, themeasurement error in this approach did not overwhelmthe data given the strong model diagnostics for the PMFPM10–PM2.5 fraction results—including excellent replica-tion of the base factors in the bootstrapping simulations.Lastly, the scanning electron microscopy methods couldonly be used in a qualitative manner. Future air pollution
studies should expand the quantitative use of geochemi-cal techniques in source apportionment studies and com-pare source apportionment estimates for mine waste inrespirable particles to those from fugitive dust models.
CONCLUSIONSThis study estimated the contribution of mine waste, animportant local pollution source, to airborne respirableparticles using source apportionment techniques. Masscontribution of mine waste particulates was more appar-ent in the PM10–PM2.5 fraction, with average contribu-tions 3-fold greater in the PM10–PM2.5 particles comparedwith the PM2.5 fraction (20% vs. 6%). There were alsolarge differences observed in mine waste contribution bylocation. Impacts were largest at the source-dominatedsite and decreased with increasing distance from the chatpiles, suggesting that populations living nearest to thechat piles may be more highly exposed. In conclusion,this study characterized temporal and spatial variability ofmetal concentrations and potential sources in two sizefractions of respirable, ambient particles. Future studiesfrom this center will examine the impact of mining-related sources in the indoor environment and relation-ships to biological measures in children.
ACKNOWLEDGMENTSThe authors acknowledge the active involvement andcontinued cooperation of our community partners—theL.E.A.D. agency and Integris Baptist Medical Center ofMiami, OK. The authors thank the residents of OttawaCounty, who were instrumental in the collection of thisvaluable information, for welcoming us onto their landand allowing us to assemble and maintain our air sam-pling stations for over a year. The authors thank RebeccaLincoln for her assistance with sampling and manuscriptfeedback, Meredith Franklin for her programming assis-tance, and Beatriz Vinas for her laboratory assistance.This study was supported by the U.S. National Instituteof Environmental Health Sciences (NIEHS), NationalInstitutes of Health (NIH) grant P42-ES05947, SuperfundBasic Research Program, NIEHS Center grant 2 P30-ES00002, NIEHS Children’s Center grant 1P01ES012874, andEPA STAR research assistance agreement no. RD-83172501.The contents of this paper are solely the responsibility ofthe authors and do not necessarily represent the officialviews of the NIEHS, NIH, or EPA. EPA, through its Officeof Research and Development, collaborated in the re-search described here, which has been subjected to EPAreview and approved for publication.
REFERENCES1. EPA’s National Hardrock Mining Framework; U.S. Environmental Protec-
tion Agency; Office of Solid Waste and Emergency Response; Office ofEnforcement and Compliance Assurance; Office of Water: Washing-ton, DC, 1997.
2. Hardrock Mining on Federal Lands; National Research Council; NationalAcademy Press: Washington, DC, 1999.
3. Fields, S. The Earth’s open wounds: Abandoned and orphaned mines;Environ. Health Perspect. 2003, 111, A154-A161.
4. McKnight, E.T.; Fischer, R.P. Geology and Ore Deposits of the Picher Field,Oklahoma and Kansas; U.S. Government Printing Office: Washington,DC, 1970.
5. Luza, K.V. Stability Problems Associated with Abandoned UndergroundMines in the Picher Field Northeastern Oklahoma; Oklahoma GeologicalSurvey: Norman, OK, 1986.
Zota et al.
1356 Journal of the Air & Waste Management Association Volume 59 November 2009
6. Datin, D.L.; Cates, D.A. Sampling and Metal Analysis of Chat Piles in theTar Creek Superfund Site; Prepared by the Tar Creek Superfund Site,Ottawa County, OK, for the Oklahoma Department of EnvironmentalQuality: Oklahoma City, OK, 2002.
7. Schaider, L.A.; Senn, D.B.; Brabander, D.J.; McCarthy, K.D.; Shine, J.P.Characterization of Zinc, Lead, and Cadmium in Mine Waste: Impli-cations for Transport, Exposure, and Bioavailability; Environ. Sci. Tech-nol. 2007, 41, 4164-4171.
8. Five Year Review Tar Creek Superfund Site, Ottawa County, Oklahoma; U.S.Environmental Protection Agency, Region 6: Washington, DC, 2000.
9. Dockery, D.W.; Pope, C.A., III; Xu, X.; Spengler, J.D.; Ware, J.H.; Fay,M.E.; Ferris, B.G., Jr.; Speizer, F.E. An Association between Air Pollu-tion and Mortality in Six U.S. Cities; N. Engl. J. Med. 1993, 329,1753-1759.
10. Krewski, D.; Burnett, R.; Jerrett, M.; Pope, C.A.; Rainham, D.; Calle, E.;Thurston, G.; Thun, M. Mortality and Long-Term Exposure to Ambi-ent Air Pollution: Ongoing Analyses Based on the American CancerSociety Cohort; J. Toxicol. Environ. Health A 2005, 68, 1093-1109.
11. Brunekreef, B.; Forsberg, B. Epidemiological Evidence of Effects ofCoarse Airborne Particles on Health; Eur. Respir. J. 2005, 26, 309-318.
12. Schwarze, P.E.; Ovrevik, J.; Lag, M.; Refsnes, M.; Nafstad, P.; Hetland,R.B.; Dybing, E. Particulate Matter Properties and Health Effects: Con-sistency of Epidemiological and Toxicological Studies; Hum. Exp. Toxi-col. 2006, 25, 559-579.
13. Ghio, A.J. Biological Effects of Utah Valley Ambient Air Particles inHumans: a Review; J. Aerosol Med. 2004, 17, 157-164.
14. Kodavanti, U.P.; Schladweiler, M.C.; Gilmour, P.S.; Wallenborn, J.G.;Mandavilli, B.S.; Ledbetter, A.D.; Christiani, D.C.; Runge, M.S.; Karoly,E.D.; Costa, D.L.; Peddada, S.; Jaskot, R.; Richards, J.H.; Thomas, R.;Madamanchi, N.R.; Nyska, A. The Role of Particulate Matter-Associ-ated Zinc in Cardiac Injury in Rats; Environ. Health Perspect. 2008, 116,13-20.
15. Lippmann, M.; Ito, K.; Hwang, J.S.; Maciejczyk, P.; Chen, L.C. Cardio-vascular Effects of Nickel in Ambient Air; Environ. Health Perspect.2006, 114, 1662-1669.
16. Sunderman, F.W., Jr. Nasal Toxicity, Carcinogenicity, and OlfactoryUptake of Metals; Ann. Clin. Lab. Sci. 2001, 31, 3-24.
17. Tjalve, H.; Henriksson, J. Uptake of Metals in the Brain via OlfactoryPathways; Neurotoxicology 1999, 20, 181-195.
18. Thompson, K.; Molina, R.M.; Donaghey, T.; Schwob, J.E.; Brain, J.D.;Wessling-Resnick, M. Olfactory Uptake of Manganese Requires DMT1and is Enhanced by Anemia; FASEB J. 2007, 21, 223-230.
19. McDonald, J.D.; Zielinska, B.; Sagebiel, J.C.; McDaniel, M.R.; Mousset-Jones, P. Source Apportionment of Airborne Fine Particulate Matter inan Underground Mine; J. Air & Waste Manage. Assoc. 2003, 53, 386-395.
20. Williamson, B.J.; Udachin, V.; Purvis, O.W.; Spiro, B.; Cressey, G.;Jones, G.C. Characterisation of Airborne Particulate Pollution in theCu Smelter and Former Mining Town of Karabash, South Ural Moun-tains of Russia; Environ. Monitor. Assess. 2004, 98, 235-259.
21. The Climate of Ottawa County; University of Oklahoma; OklahomaClimatological Survey: Norman, OK, 2007.
22. Jim, R. Local Environmental Action Demanded, Vinita, OK, Personalcommunications, 2005.
23. Marple, V.A.; Rubow, K.L.; Turner, W.; Spengler, J.D. Low Flow-RateSharp Cut Impactors for Indoor Air Sampling—Design and Calibra-tion; JAPCA 1987, 37, 1303-1307.
24. Dzubay, T.G.; Rickel, D.G. In Electron Microscopy and X-Ray Applicationsto Environmental and Occupational Health Analysis; Russell, P.A., Hutch-ings, A.E., Eds.; Ann Arbor Science: Ann Arbor, MI, 1978.
25. Compendium Method IO-3.3: Determination of Metals in Ambient Partic-ulate Matter Using X-Ray Fluorescence (XRF) Spectroscopy; U.S. Environ-mental Protection Agency; Center for Environmental Research Infor-mation; Office of Research and Development: Cincinnati, OH, 1999.
26. Kinney, P.L.; Aggarwal, M.; Northridge, M.E.; Janssen, N.A.; Shepard,P. Airborne Concentrations of PM(2.5) and Diesel Exhaust Particles onHarlem Sidewalks: a Community-Based Pilot Study; Environ. HealthPerspect. 2000, 108, 213-218.
27. Morphy, T. Magee Scientific, Berkeley, CA, Personal communication,2008.
28. Mamane, Y.; Willis, R.; Conner, T. Evaluation of Computer-ControlledScanning Electron Microscopy Applied to an Ambient Urban AerosolSample; Aerosol Sci. Technol. 2001, 34, 97-107.
29. EPA Positive Matrix Factorization (PMF) 3.0 Fundamentals and User Guide;U.S. Environmental Protection Agency; National Exposure ResearchLaboratory; Office of Research and Development: Research TrianglePark, NC, 2008.
30. Reff, A.; Eberly, S.I.; Bhave, P.V. Receptor Modeling of Ambient Par-ticulate Matter Data Using Positive Matrix Factorization: Review ofExisting Methods; J. Air & Waste Manage. Assoc. 2007, 57, 146-154.
31. Chow, J.C.; Watson, J.G.; Kuhns, H.; Etyemezian, V.; Lowenthal, D.H.;Crow, D.; Kohl, S.D.; Engelbrecht, J.P.; Green, M.C. Source Profiles forIndustrial, Mobile, and Area Sources in the Big Bend Regional AerosolVisibility and Observational Study; Chemosphere 2004, 54, 185-208.
32. Thurston, G.D.; Spengler, J.D. A Quantitative Assessment of SourceContributions to Inhalable Particulate Matter Pollution in Metropol-itan Boston; Atmos. Environ. 1985, 19, 9-25.
33. Hopke, P.K.; Ito, K.; Mar, T.; Christensen, W.F.; Eatough, D.J.; Henry,R.C.; Kim, E.; Laden, F.; Lall, R.; Larson, T.V.; Liu, H.; Neas, L.; Pinto,J.; Stolzel, M.; Suh, H.; Paatero, P.; Thurston, G.D. PM Source Appor-tionment and Health Effects: 1. Intercomparison of Source Apportion-ment Results; J. Expo. Sci. Environ. Epidemiol. 2006, 16, 275-286.
34. Monna, F.; Poujol, M.; Losno, R.; Dominik, J.; Annegarn, H.; Coetzee,H. Origin of Atmospheric Lead in Johannesburg, South Africa; Atmos.Environ. 2006, 40, 6554-6566.
35. Toxicological Profile for Zinc; Agency for Toxic Substances and DiseaseRegistry: Atlanta, GA, 2005.
36. Hirshon, J.M.; Shardell, M.; Alles, S.; Powell, J.L.; Squibb, K.; Ondov, J.;Blaisdell, C.J. Elevated Ambient Air Zinc Increases Pediatric AsthmaMorbidity. Environ. Health Perspect. 2008, 116, 826-831.
About the AuthorsDuring this study, Dr. Ami R. Zota was a postdoctoralresearch fellow in the Department of Environmental Healthat the Harvard School of Public Health in Boston, MA, andthe Silent Spring Institute in Newton, MA. Dr. Robert Willisis a research physicist in the Environmental Characteriza-tion and Apportionment Branch of EPA NERL in ResearchTriangle Park, NC. Dr. Gary A. Norris is a research physicalscientist in the Environmental Characterization and Appor-tionment Branch of EPA NERL. Dr. James P. Shines is anassociate professor in the Department of EnvironmentalHealth at the Harvard School of Public Health. Ms. RebeccaJim heads L.E.A.D., a community-based nonprofit organi-zation in Miami, OK. Dr. Rachelle M. Duvall is a researchphysical scientist in the Environmental Characterization andApportionment Branch of EPA NERL. Dr. Laurel A. Schaideris a research associate in the Department of EnvironmentalHealth at the Harvard School of Public Health. Dr. John D.Spengler is the Akira Yamaguchi Professor of Environmen-tal Health in the Department of Environmental Health at theHarvard School of Public Health. Please address corre-spondence to: Ami R. Zota, Program on ReproductiveHealth and the Environment, Department of Obstetrics,Gynecology, and Reproductive Sciences, University of Cal-ifornia–San Francisco, 1330 Broadway Street, Suite 1100,Oakland, CA 94612; phone: �1-510-986-8928; e-mail:[email protected].
Zota et al.
Volume 59 November 2009 Journal of the Air & Waste Management Association 1357


