Embed Size (px)
Citation preview

1
Impact of redox cycles on Mn, Fe, Co and Pb in nodules S. Cornua*, J.A. Cattlea,b, A. Samouëliana, C. Laveufa, L.R.G. Guilhermea,c,d, P. Albérice
a- INRA, UR0272 Science du sol, F-45166 Olivet b- Ecotoxicology and Environmental Contaminants Section, Dept of Environment and
Climate Change, NSW. PO Box A290, Sydney South, NSW 1232, Australia c- le STUDIUM Institute for Advanced Studies, 3D avenue de la Recherche scientifique,
45071 Orléans CEDEX 2, France d- Federal University of Lavras, Soil Science Dept., CP 3037, 37200-000 Lavras (MG),
Brazil; CNPq (Brazilian Ministry of Science and Technology) Scholar e- ISTO UMR 6113 - CNRS/Université d'Orléans, 1A, rue de la Férollerie, 45071
Orléans CEDEX 2, France Corresponding author: Sophie Cornu INRA, UR1119 Géochimie des Sols et des Eaux, Europôle de l’Arbois, BP 80, F-13545 Aix en Provence cedex 4. [email protected] Acknowledgments
The authors would particularly like to thank O. Josière, B. Renaux, P. Courtemanche,
A. Besnault and C. Le Lay for technical support. This study was funded by the Conseil
Régional of Région Centre through the METALOE project and benefited from a STUDIUM
fellowship. J.Cattle is grateful to INRA, Orleans, for providing funding for this project.
insu
-004
3353
1, v
ersi
on 1
- 31
Jan
201
1Author manuscript, published in "Soil Science Society of America Journal 73, 4 (2009) 1231-1241"
DOI : 10.2136/sssaj2008.0024

2
Impact of redox cycles on Mn, Fe, Co and Pb in nodules Abstract Redox processes are responsible for iron and manganese segregation as Fe-Mn oxide coatings
or nodules. These nodules are also trace element scavengers in soils. Redox processes are of
particular importance in seasonally saturated soil containing naturally high concentrations of
trace metals. Here we report the dynamics of Fe-Mn nodules and two associated trace
elements, Co and Pb, studied under controlled redox conditions in a column experiment,
including 5 columns fed with mimicked topsoil solution. The obtained water was rich in Fe
and Mn. This water was then percolating the nodule columns. The results show that the redox
conditions reached 100 mV, which was sufficient to dissolve Mn oxides and release the
associated Co, while Pb was readsorbed onto nodule surfaces. The amounts of Mn and Co
released into the water were small compared to the quantities stored in the nodules (less than
1 ‰ of the initial stock stored in the nodules). The redox conditions were however
insufficient to allow Fe oxide dissolution. On the contrary, 70 of 90% of the Fe entering the
column was fixed onto the nodules. The number of drying cycles was too small to draw a firm
conclusion on their impact on the nodule fate and metal release. However, in terms of
environmental threat, these results showed that Pb would not be released from soil during
nodule dissolution, whereas Co, which is less toxic, would be released.
insu
-004
3353
1, v
ersi
on 1
- 31
Jan
201
1

3
Introduction
Nodules of Mn and Fe oxides are commonly found in different soil types where they
have been extensively studied (Childs and Leslie, 1977; Dawson et al., 1985; Latrille et al.,
2001; Palumbo et al., 2001; Liu et al., 2002). They are generally made of both Mn and Fe
oxide cements, both elements having a different spatial distribution within nodules (Dawson
et al., 1985; Palumbo et al., 2001; Liu et al., 2002), surrounding detrital grains of varying
nature according to the soil context (Latrille et al., 2001; Palumbo et al., 2001; Liu et al.,
2002; Cornu et al., 2005).
Iron oxides of nodules consist in goethite (Fitzpatrick, 1988) and either hematite
(Herbillon and Nahon, 1988) or ferrihydrite (Cornu et al., 2005) according to the soil type.
Hematite is mostly found in nodules formed in tropical soils while ferrihydrite is found in
those formed under temperate conditions. Manganese oxides in nodules consist mainly of
birnessite and lithiophorite (Taylor, 1968; Manceau et al., 2002; 2003; Neaman et al., 2004).
Nodules are well-known for their high content in trace elements. Cobalt, Ni, and Zn
are frequently associated with the Mn-rich parts of nodules (Childs and Leslie, 1977; Dawson
et al., 1985; Latrille et al., 2001; Liu et al., 2002; Manceau et al. 2002; Neaman et al., 2004,
2008), while Cr (Liu et al. 2002) and Pb (Latrille et al. 2001; Palumbo et al., 2001; Neaman et
al., 2004, 2008) are associated with Fe-rich parts. McKenzie (1975), Childs and Leslie (1977),
Dawson et al. (1985), Latrille et al. (2001), Palumbo et al. (2001) and Liu et al. (2002)
showed that Cu and Mn partitioning between Fe and Mn oxides in nodules is variable. In
some soils, nodules can even be the main trace element scavenger (Cornu et al., 2005).
These nodules are formed in horizons undergoing past or present seasonal
waterlogging (McKenzie, 1989 and references herein; Khan and Fenton, 1994; Zhang and
Karathanasis, 1997). In environments still undergoing seasonal waterlogging, nodules are
sensitive to variation in pH and Eh, and can be both source and sink of trace elements
insu
-004
3353
1, v
ersi
on 1
- 31
Jan
201
1

4
according to the intensity, and possibly also the duration, of the reduction phase (Jenne, 1968;
Zaidel’man and Nikiforova, 1998; Cambier and Charlatchaka, 1999). This process is of prime
importance in wetlands undergoing seasonal waterlogging periods that can last for several
months (D’Amore et al., 2004). Grybos et al. (2007) demonstrated that the fate of Fe-Mn
oxides in wetlands was entirely responsible for the fate of Co and partially for that of Pb and
Ni, while the impact of redox conditions on Cu and Cr was less clear.
Climate change has affected the duration of the annual waterlogging period, such that
it is either reduced or increased according to the latitude (IPCC, 2001). An understanding of
the dynamics and the fate of Fe and Mn in nodules, as well as their associated trace elements
is of importance in predicting their environmental impact in ecosystems such as wetlands.
Several studies report the impact of redox cycles on the fate of Fe oxides (Thompson et al.,
2006), and Fe and Mn oxides and their associated trace elements (Quantin et al., 2001; 2002;
Feder et al., 2005; Contin et al., 2007; Grybos et al., 2007). However, these oxides were
dispersed into the soil matrix and, to our knowledge, no attempt was made to understand the
sorption and release of trace elements from soil nodules that are the main trace element
scavengers in soils (Cornu et al., 2005) and have different accessibility to soil solution than
the dispersed oxides.
We aim here to investigate the effect of redox cycles on the mobility of Fe and Mn in
soil nodules and of the associated Co and Pb coming from temperate climate. For that an
original experimental design using nodule column experiments was designed in order to
mimic natural conditions of redox cycles that occur in subsurface soil horizons.
insu
-004
3353
1, v
ersi
on 1
- 31
Jan
201
1
5
Material and Methods
Site and soil
The study site, located on the Aigurande plateau in the Massif Central, is underlain by
amphibolite and gneiss. On the footslope, Planosols (FAO, 2006) – or Albaqualfs (Soil
Taxonomy, 1999) – developed on gneiss (Salvador-Blanes, 2002). The upper horizons of the
Planosols are allochthonous and derived from silty, colluvial materials of amphibolitic and
gneissic origin, while the deeper clayey B horizon (below 50 cm depth) and the alterite are
developed in gneiss. Colluvial materials differentiate into three horizons: a sandy-loam to
clay-loam organic-rich A horizon (25 to 30 cm thick) and two E horizons, one of them being
rich in Fe/Mn-nodules and gravels (Cornu et al., 2005). The nodule-rich horizon is a sink for
Fe, Mn, Co and Pb (Table 1; Cornu et al., 2005). Cornu et al. (2005) showed that Mn oxides
preferentially scavenge Co and Pb. The E horizons are waterlogged during winter and spring
due to the texture contrast with the underlying B horizon. The duration of the waterlogging
period increases down the slope. This horizon is draining most of the water of a 6-ha plot.
Soil water quality was monitored on this site by Penfrêne (2008). From the data they
provided (Penfrêne, 2008 and references herein), we estimated that the average effective
rainfall for the region ranges from 200 to 300 mm.
The nodule rich E horizon and the associated top horizon were sampled from a
midslope position equivalent to that of pit 2 in Cornu et al. (2005).
Column preparation and characterisation
Nodules were sorted from the rest of the soil and carefully cleaned. They were then
separated from the bulk soil matrix by wet sieving. For practical reasons, only the 2-5 mm
fraction was collected and oven dried at 40°C. Nodules were manually sorted with tweezers
until ~500 mL of nodules were obtained. To remove nodule clay coatings, nodules were then
insu
-004
3353
1, v
ersi
on 1
- 31
Jan
201
1

6
placed into 250-mL screw cap bottles containing ultrapure water (nodules:water 1:1 v/v). The
bottles were placed on an end-over-end shaker and rotated at 100 rpm for eight hours. Water
was changed after ~ four hours by tipping nodules onto a 1-mm sieve, followed by discarding
and rinsing excess clay suspension through the sieve with ultrapure water. Nodules were then
washed (as above) on the sieve and left covered in a tray overnight. This process was repeated
for seven days. Nodules were then sieved into 3-4 mm and 4-5 mm fractions (nodules <3mm
comprised only 1.5% of the total and were not used). Each column contained equivalent
amounts of each fraction. To keep the natural soil nodule particle-size distribution, 34.2 g of
3-4 mm nodules and 43.5 g of 4-5 mm nodules were weighed into each column (Table 2). We
thus ensured that all the columns had the same characteristics in terms of chemistry, pore
volume and surface area. A subset of nodules not used in the column experiment was kept
aside for determination of BET (Brunauer, Emmett and Teller) surface area measurement,
total elemental analysis by ICP-AES after triacid HF dissolution, and solid density with a
pycnometer (Table 1).
Quartz sand (purchased commercially) was used as a control. It was sieved to be in the
size fraction 0.4-1 mm. This size fraction was used to favour the formation of nodules around
sand particles (this sand also contained small amounts of micas and feldspars as shown by X-
ray diffraction; results not shown). Quartz sand was packed into the column on a volume basis
matching that of the nodule columns, i.e. ~98 g (Table 2). A sub-sample was kept for
characterisations as described for the nodules (Table 1).
Experimental setting
The experimental design is shown schematically in Figure 1. This consists in two main
parts: part A designed to produce a water whose quality mimicked that of a natural one and
part B that consists in the column experiment itself.
insu
-004
3353
1, v
ersi
on 1
- 31
Jan
201
1

7
The percolating water was produced by passing ultrapure water through a topsoil
monolith. A topsoil monolith of 20x13x16 cm in size was sampled from the surface A horizon
directly above the sampled nodule-rich E horizon. This monolith was removed from the
ground in a plastic box. The plastic box had four inlets in the surface, one outlet at the top of
one side (used as a drain when necessary) and two outlets at the base on the opposite side.
One of these outlets was used as the source of water to pass through the columns and the other
worked as a port for sampling the inflowing column water for separate measurements. The so-
produced inflow water was sampled and analysed for each sampling date (see below).
At the start of the experiment the surface horizon monolith had a moisture content of
37% (field moisture content). Prior to the experiment it was saturated from the base over a
period of four hours. A total of 1700 mL of ultrapure water was required to saturate the block.
Saturation continued until free water pounded on the soil surface, when the box was then
connected to the columns.
Water percolated through the topsoil monolith was then pumped (via a peristaltic
pump) through each of five columns. Columns were fashioned from standard syringes (60
mL) with Teflon® tubing as inlet and outlet and were wrapped in Al-foil to avoid photo-
oxidation. A layer of nylon mesh was placed at the base of each column to prevent fine
material blocking the column outlet. A silicon stopper was used in each column to form a
seal. A number of multi-feeder taps (5 taps from a single inlet; see Figure 1) linked all
columns to the pump to ensure an equivalent inflow rate for each treatment. All equipment
was acid-washed and blanks were performed by pumping ultrapure water through the empty
system (blank readings were all below the detection limit of the analytical procedures
described thereafter).
The experiment was conducted in a glove box under an oxygen-depleted atmosphere
(using N2), with treatments as follows:
insu
-004
3353
1, v
ersi
on 1
- 31
Jan
201
1

8
(i) nodules (in duplicate) and quartz continuously saturated for 6 months;
(ii) nodules and quartz subjected to 14-day wetting and drying cycles. Columns
undergoing drying cycles were removed from the glove box to enable exposure to oxygen.
Water sampling and analysis
Column leachates were collected daily over the first month of the experiment and
three times a week for the rest of the experiment, which lasted over six months. Electrical
conductivity (EC), pH, and redox potential (Eh) were measured immediately on sample
collection in the glove box. Redox potential was measured using an Ag/AgCl electrode and
Eh measurements were then corrected to the standard hydrogen electrode, by using a
correction factor depending on the temperature (Kölling, 1999).
Ehcorrected = Ehmeasured + (207 + 0.7 (25-T))
where T is the temperature in °C, and Ehcorrected is the corrected redox potential in mV.
Experiments were performed at room temperature (~25°C).
As only Eh corrected values are presented in the rest of the paper they are referred as Eh for
simplicity.
After collection, samples were removed from the glove box for immediate filtering (<
0.2 µm on cellulose acetate membrane). A part of the sample was then kept aside while the
rest was acidified with suprapur HNO3 for subsequent analysis by atomic absorption
spectroscopy using flame for Fe and Mn, and graphite furnace for Co and Pb.
Eh-pH diagrams
Data were reported in Eh - pH stability diagrams (Brookins, 1988; McBride, 1994) for Mn
and Fe species. For the manganese diagram, as no clear identification of the Mn oxide present
into the nodule was available (Cornu et al., 2005), the most common Mn oxides found in
insu
-004
3353
1, v
ersi
on 1
- 31
Jan
201
1

9
nodules were taken into account: birnessite (Mn54+ Mn2
3+ O13) and lithiophorite (Al2Mn34+ O9)
(Taylor, 1968; Manceau et al., 2002; 2003; Neaman et al., 2004). For iron diagrams, either
ferrihydrite (Fe2O3 0.5(H2O)) or goethite (FeOOH) with two possibilities γ or α forms were
considered as these two last minerals are observed in the nodules by Cornu et al. (2005).
Green rusts were also considered in the form (Fe(OH)3) and (Fe3(OH)8) even if not identified
as these minerals are transitory (Trolard and Bourrié, 1999; Feder et al., 2005).
Thermodynamic constants related to the different solids phases are reported in Table 3. Data
from column outflows were plotted on Eh-pH diagrams in order to estimate the potential
equilibrium or disequilibrium with minerals present in the nodules when redox conditions
reached 100 mV.
Statistic treatment
In order to determine if the discrepancies observed between the different columns were
statistically significant, ANOVA tests were performed. This test was applied to the data
obtained once the reduced conditions were reached. For each column, measurements were
then considered as different repetitions. One ANOVA analysis was performed for each of the
studied variable: pH, Eh, Fe, Mn, Co, and Pb. The results were combined in Tables 4 and 5. insu
-004
3353
1, v
ersi
on 1
- 31
Jan
201
1

10
Results and discussion
Characteristics of the water inflow along the experiment: quality and quantity
The solution percolating through the soil monolith (column inflow) had an initial pH
fluctuating from 6.6 to 6.95, increasing slightly over time to a more stable pH range of 6.85 to
6.95 (Fig. 2a; average pH value of 6.75). The pH values were of the same order of magnitude
as those recorded in the field by Pelfrêne (2008), for the same site.
Redox potential decreased from values higher than 360 mV at the beginning of the
experiment to values fluctuating between 90 and 120 mV after 30 days (Fig. 2b). Eh values
stayed in this range (moderately reducing conditions) until the end of the experiment. The lag
time needed for the re-establishment of reducing conditions in different laboratory
experiments is reported to range from 100 hours (Grybos et al., 2007) to 20 days (Quantin et
al., 2001). In the field, D’Amore et al. (2004) reported that this time ranged from a few days
to three months according to the depth and the amount of rain. Our results (30 days) are in
agreement with these data. In addition, these Eh values are of the same order of magnitude as
those recorded in the field by D’Amore et al. (2004) for wetlands, although these authors did
record more reducing conditions during the wettest years. This range of Eh was also reached
by Quantin et al. (2001) and Thompson et al. (2006) in their experiments, while the
experiments of Grybos et al. (2007) reached lower redox potentials. Their Eh values were
lower than the minimum value recorded in the field by D’Amore et al. (2004). Unfortunately,
no Eh values were recorded by Pelfrêne (2008) for this site. Quantin et al. (2001) showed that
an Eh decrease occurred only in biologically active samples and interpreted it as the result of
biological activity.
Iron concentrations were about ~0.018 mmol L-1 over the 10 first days of the
experiment, rising to ~0.18 mmol L-1 after 20 days and to 0.36 mmol L-1 after 35 days (Fig.
insu
-004
3353
1, v
ersi
on 1
- 31
Jan
201
1

11
2c). Concentrations oscillated around this value for the duration of the experiment. Thompson
et al. (2006) and Quantin et al. (2001) observed Fe oxide dissolution with comparable Eh
values. Eh-pH diagrams for Fe (Fig. 3a) show that solutions coming out of the soil monolith
are oversaturated with respect to all Fe-oxides present in the nodules.
Manganese concentrations increased rapidly at the beginning of the experiment,
reaching a value of 0.27 mmol L-1 after 20 days (Fig. 2d). Manganese concentrations in the
soil leachates (column inflow) were of the same order of magnitude as those recorded for Fe.
The inflow data (Table 4) revealed dissolution of Fe and Mn oxides at a molar Mn/Fe ratio of
0.61, whereas the surface horizon had a solid phase molar Mn/Fe ratio of 0.03 (ratio
calculated from data in Table 1). This means that Mn oxides were proportionately more
dissolved – about 20 folds – than Fe oxides, which is consistent with the higher sensitivity of
Mn oxides to redox conditions compared with Fe oxides (Jenne, 1968; Stumm and Morgan,
1981) and also with data reported by Quantin et al. (2001). After 20 days, Mn concentrations
gradually decreased to reach a value of 0.09 mmol L-1 at the end of the experiment. The Eh-
pH diagram for Mn (Fig. 4) shows that solutions coming out of the soil monolith are
undersaturated with respect to both birnessite and lithiophorite. The dissolution of these two
minerals is thus probably responsible for the Mn concentrations acquired by the percolating
waters.
Trends observed for cobalt paralleled those described for Mn (Fig. 2e). With the
exception of two high concentrations, lead concentrations decreased sharply from
0.019 µmol L-1 to about 0.005 µmol L-1 at 40 days and stabilised thereafter (Fig. 2f).
The obtained reducing conditions were sufficient to dissolve both iron and manganese
oxides from the topsoil monolith, also observed in the experiments of Quantin et al (2001)
and Thompson et al. (2006). Patrick and Jugsujinga (1992) give lower Eh values for the
insu
-004
3353
1, v
ersi
on 1
- 31
Jan
201
1

12
reduction of Fe oxides (50 mV), while their data for Mn oxides are in agreement with results
reported here.
After 80 days of the experiment the data became very noisy. The monolith structure
started to collapse and had to be replaced. This change produced sample oxidation, and
reducing conditions were not observed again before the end of the experiment (data not
shown). For this reason only data obtained for the 80 first days of the experiment are
presented here.
Impact of the redox condition on the release of Fe, Mn and associated trace elements by
nodules
As shown in Table 6, the amount of water percolated through the different columns
was reasonably similar despite the difficulties in regulating the water flow. The difference
between the continuously saturated treatment and the 14-day wetting and drying cycle
treatment was due to no solution leaching during the drying cycle. Given that the quartz and
nodule columns had such different pore volumes (Table 2), percolated volumes have been
expressed in terms of pore volumes hereafter to allow comparison.
Outflow from the columns had a significantly higher pH (around 7.1 overall; Figs. 5a
to 8a) than the inflow according to an ANOVA test at a 5% confidence level (Table 4).
The outflow Eh followed the same general trend as the inflow, decreasing sharply over
the first month and then stabilising (Figs. 5b to 8b). Once stabilised, the outflow Eh from the
quartz column before the drying cycle was not significantly different from that of the inflow,
according to an ANOVA test at a 5% confidence level (Table 4). Nodule columns had a
significantly higher Eh in the outflow (ANOVA test at a 5% confidence level, Table 4),
especially those undergoing drying cycles.
insu
-004
3353
1, v
ersi
on 1
- 31
Jan
201
1

13
Iron concentrations in both column inflow and outflow increased initially, reaching a
relatively stable level at about 35 days (Figs. 5c to 8c). Subsequent Fe concentrations in the
outflow were significantly lower than those of the inflow (ANOVA test at a 5% confidence
level, Table 4) suggesting Fe fixation within the columns. The outflow from quartz columns
contained higher Fe concentrations than that from the nodule columns (ANOVA test at a 5%
confidence level, Table 4). The nodule column undergoing wetting and drying cycles had the
smallest outflow Fe concentrations, which could be related to the higher Eh values also
recorded for this column. As inflow Fe concentrations slightly changed over time, fixation
ratios were calculated to compare the fixation of Fe between the different columns as follows:
Fefixation ratio = ([Fe]in - [Fe]out) / [Fe]in
An ANOVA test at a 5% confidence level showed that the fixation ratio of the quartz
column undergoing wetting and drying cycles was the lowest before drying and the nodule
column undergoing wetting and drying cycles fixed more Fe than the other nodule columns
(Table 5). Thus nodule columns were able to fix Fe more efficiently than quartz columns. Eh-
pH diagrams for Fe (Fig. 3) show that column outflows are oversaturated with respect to
goethite, ferrihydrite and one green rust type (Fe(OH)3). The Fe fraction retained in the
columns was thus probably precipitate as goethite, ferrihydrite and one green rust type along
the experiment. Green rust, which is a transitory phase, was probably then recrystallised into
goethite or ferrihydrite as 40% and 25% of the Fe contained in the nodules was into these
minerals respectively (Cornu et al., 2005).
Similarly to Fe, outflow Mn concentrations increased following the increase in inflow
concentrations (Figs. 5d to 8d). Once stabilised, Mn concentrations in column outflows were
significantly higher than column inflows (ANOVA test at a 5% confidence level, Table 4).
Manganese concentrations in outflows of nodule columns were also higher than those of
quartz columns, indicating a release of Mn from nodules into the water. We have expressed
insu
-004
3353
1, v
ersi
on 1
- 31
Jan
201
1

14
the Mn released from the column in terms of a release ratio to better compare the different
treatments:
Mnrelease ratio = ([Mn]out - [Mn]in) / [Mn]in
An ANOVA test at a 5% confidence level confirmed these results (Table 5). The Eh-
pH diagram for Mn shows that nearly all column outflows are undersaturated with respect to
birnessite and lithiophorite (Fig. 4). As manganese oxides contained 100% of the Mn present
in the nodules (Cornu et al., 2005), the dissolution of these minerals is responsible for the
increase in Mn concentrations in outflows from the nodule columns.
Results show that while Fe was fixed within the columns during the experiment,
reduction processes released Mn. Thus, the reducing conditions were strong enough to
dissolve Mn oxide but not sufficient to dissolved Fe oxides.
Cobalt concentrations in column outflows increased with those in the inflow and
stabilised after 35 days (Figs. 5e to 8e). Once stabilised, inflow and outflow Co
concentrations in quartz columns were not significantly different (ANOVA test at a 5%
confidence level, Table 4). Outflow Co concentrations from nodule columns were
significantly higher than inflow concentrations indicating a net release of Co from nodules.
As for Mn we calculated a Co release ratio. The results for the Co release ratio were
equivalent to those from Co concentrations (ANOVA test at a 5% confidence level, Table 5).
As for Mn, 100% of the Co found in the nodules was contained in Mn oxides (Cornu et al.,
2005). The Co/Mn ratios of the Mn and Co released from the nodule columns were close to
those of the nodules, suggesting that dissolution of Mn oxide evidenced previously is
responsible for Co losses. It also suggests that readsorption does not occur within the column
unless it is in the same proportion for the two elements as that originally present in the solid
phases, which disagrees with results of Quantin at al. (2002) who showed that Co
insu
-004
3353
1, v
ersi
on 1
- 31
Jan
201
1

15
concentrations decreased over time. This was interpreted as readsorption. Such behaviour was
not exhibited in our experiment.
As observed for the inflow, outflow Pb concentrations decreased sharply over time
and stabilised at low values with the exception of some discrepancies (Figs. 5f to 8f). If we
exclude these few very high concentrations, outflow Pb concentrations from columns
undergoing wetting and drying cycles were significantly higher than those of the inflow,
while those of the permanently saturated column were significantly lower (ANOVA test at a
5% confidence level, Table 4). While there was no obvious explanation for this behaviour, the
overall concentrations were very low. When the ANOVA was performed with the high
concentrations included no significant differences were found (ANOVA test at a 5%
confidence level; results not shown). Cornu et al. (2005) showed that Pb was present at almost
90% in Mn nodules; however, no Pb was either added to or removed from the water
suggesting that either the Mn oxides were not dissolved congruently or that the Pb was re-
adsorbed on the remaining phases in the column. Indeed, McKenzie (1989 and references
herein) stated that in general Mn oxides adsorbed more Pb than Co. The same was recorded
for Fe-oxides (Schwertmann and Taylor, 1989 and references herein).
Impact of the drying on the following reducing period
The drying cycle caused a slight increase in the outflow pH from the nodule column
(Fig. 8a) although this difference was not significant according to an ANOVA test (Table 4).
For the quartz column, the effect of the drying cycles was even smaller (Fig. 7a).
Outflow Eh values increased significantly after the drying period in the quartz column
(ANOVA test at a 5% confidence level, Table 4), becoming equivalent to outflow Eh values
recorded for nodule columns always saturated (Table 4). This increase of Eh upon drying was
insu
-004
3353
1, v
ersi
on 1
- 31
Jan
201
1

16
less clear for the nodule column, which already exhibited a higher outflow Eh before drying
than the continuously saturated nodule columns.
Iron concentrations in outflows from the quartz column dropped significantly after
drying (ANOVA test at a 5% confidence level, Table 4), however the concentrations
increased quickly again (Fig. 7c). Only a slight decrease (not significant) was observed in the
nodule column, possibly due to its low original Fe concentrations. The fixation ratios, show
that both quartz and nodule columns fixed significantly more Fe after drying (ANOVA test at
a 5% confidence level, Table 5). For these two columns, the Fe fixation ratio was closely
related to Eh values of the column outflow (Fig. 9). The drying cycle clearly increased the
efficiency of the nodules to fix Fe. Contin et al. (2007) also reported an increase in trace metal
retention upon reoxidation of oxides following consecutive redox cycles. Eh-pH diagrams for
Fe (Fig. 3b) show that after a drying period, column outflows are also oversaturated with
respect to Fe3(OH)8, which was rarely the case before the drying. Thus, more Fe oxide types
are potentially responsible for the Fe uptake from the solution by the column.
The drying cycles caused outflow Mn concentrations to drop significantly (ANOVA
test at a 5% confidence level, Table 4). For the quartz column, the concentrations became
even lower than those of the inflow, indicating Mn fixation. For the nodule column, outflow
Mn concentrations remained higher than those of the inflow, revealing Mn release. When
considered in terms of the Mn release ratio, the impact of the drying cycle was smaller in
nodule columns than in quartz columns (Table 5). The Eh-pH diagram for Mn (Fig. 4) did not
evidence a clear difference in terms of solution equilibrium with respect to birnessite and
lithiophorite before and after drying. Both type of solutions were mainly understaturated with
respect to these minerals.
The drying period provoked a net decrease in the outflow Co concentrations from the
quartz column, which were significantly lower than the inflow concentrations (ANOVA test
insu
-004
3353
1, v
ersi
on 1
- 31
Jan
201
1

17
at a 5% confidence level, Table 4). This fixation of Co within the quartz column (as was seen
for Mn) is small and not significant when expressed in terms of ratio (ANOVA test at a 5%
confidence level, Table 5). Surprisingly, outflow Co concentrations from the nodule column
increased significantly after drying, which could be better seen when expressed in terms of
release ratio (ANOVA test at a 5% confidence level, Table 5).
The drying period increased the Eh within nodule columns, inducing a larger Fe
fixation. The influence of these cycles on other elements was less clear. A slightly lower Mn
release was recorded. Cobalt release was however found to be larger; this result was not
consistent with a decrease in Mn release and Co being contained within Mn oxides. All these
trends were unable to be clearly interpreted and more wetting and drying cycles should be
performed in order to draw a firm conclusion.
Consequences of the redox cycles in terms of soil evolution and environmental impact
The total gains in Fe and respective losses in Mn and Co were calculated by mass
balance calculation on the inflow and outflow waters and reported in Table 7. They are
several orders of magnitude lower than the stocks of these elements found in the different
columns (Table 2) and are thus negligible compared with the amount of these elements
initially present in the nodules. This was confirmed by analyses of the solid phase at the end
of the experiment, which showed no difference from analyses performed on nodules and
quartz sand before the experiment (results not shown). We do not expect much of a change in
the forms of Fe and Mn present in nodules, owing to the small magnitude of the gains or
losses that occurred throughout the experiment. For this reason we did not perform any
sequential extractions after the experiment as was done in some other studies reporting much
larger releases of Fe and/or Mn (Quantin et al., 2002; Thompson et al., 2006). In these studies
insu
-004
3353
1, v
ersi
on 1
- 31
Jan
201
1

18
the focus was on the fine earth soil fraction. Our results demonstrate that in the case of
nodules the rate of release of these elements as a function of redox processes is slow.
Reducing conditions lead to a slow increase in Fe content and dissolution of Mn
oxides, which released associated Co. Lead (also contained in Mn oxides of the nodules) was
not lost, as it was probably readsorbed on the remaining phases. Despite the over-saturation of
the percolating solutions with respect to green rusts, the only Fe oxides identified in these
nodules were goethite and ferrihydrite (Cornu et al., 2005).
We can conclude that the nodules in the studied soils are still active but that their
reactivity is very low, as shown by the low amount of Fe and Mn fixed or released with an
amount of percolated water that was equivalent to 8 m. However, this study showed that
nodules were very efficient Fe scavengers as they fixed 70 to 90% of the Fe initially present
in the water (Table 5).
The water running out of the column experiment has concentrations ranging from 0.01
to 0.39 mmol L-1 for Fe, from 0 to 0.43 mmol L-1 for Mn, from 0.01 to 1.43 µmol L-1 for Co
and from 10-4 to 0.07 µmol L-1 for Pb. This water directly runs out in a small river. However,
the concentrations in Pb are very low as they never exceed the acceptable limit for drinking
water of 0.048 µmol L-1. This is also the case for Co concentrations, which are lower than the
limit concentration for waste water release into the environment. However, Fe and Mn
concentrations are generally higher, from one to several orders of magnitude, than the limit
given by the European Directive – of June, 16th 1975 – for surface waters. Thus the only
potential threat to the surrounding water will come from Fe and Mn and not from the trace
elements. However, as Mn is very sensitive to change in redox conditions, it will precipitate
easily and probably shall not reach the river. Indeed Pelfrêne (2008) gives Fe concentrations
in water for this horizon that are on the same order of magnitude as the ones obtained in this
study, while their Mn concentrations are one order of magnitude lower. At last, only Fe may
insu
-004
3353
1, v
ersi
on 1
- 31
Jan
201
1

19
represent a threat for the environment, as it is the only one exceeding in the soil water the
limit concentration given by the European Directive of June, 16th 1976.
insu
-004
3353
1, v
ersi
on 1
- 31
Jan
201
1

20
Conclusion
Simulating redox cycles in a laboratory experiment on soil nodules showed that redox
conditions similar to those found in soils could be achieved. These conditions allow reduction
of Mn oxides, while Fe oxides were still precipitated. Both the experiment and the Eh-pH
diagram results were consistent with these findings. The process was relatively slow as only a
very small fraction of the Mn and Fe contained in the nodules was either released or fixed.
This suggested that if still active, the process of formation/dissolution of nodules in soils is
slow.
These nodules are a sink for trace elements. In this study we showed that while Co
was released at the same rate as Mn, Pb also contained in Mn oxides was not released from
the column and was probably readsorbed on nodule surfaces. This suggested that the
knowledge of the trace element location as determined by sequential extraction is not
sufficient to determine the fate of a trace element in the environment. Such extractions must
be combined with other types of experiment.
Finally, redox cycles including a drying period would reduce the release of Co, given
that Mn oxide formation would occur with concurrent adsorption of Co. Due to technical
difficulties in conducting this experiment, only one complete redox cycle could be achieved.
More redox cycles of different duration should be performed in order to be able to predict the
impact of waterlogging duration on nodule fate either through agricultural practices
(irrigation/drainage) or due to climate change.
In terms of environmental threat this result also suggests that Pb would not be released
from soil during nodule dissolution, whereas Co, which is less toxic, would be released.
insu
-004
3353
1, v
ersi
on 1
- 31
Jan
201
1

21
References
Brookins, D.G. 1988. Eh-pH diagrams for geochemistry. Springer-Verlag, New York, 176 p.
Cambier, P. and Charlatchaka, R. 1999. Influence of reducing conditions on the mobility of
divalent trace metals in soils. In: H.M. Selim and I.K. Iskandar (Eds.). Fate and
transport of heavy metals in the vadose zone. Lewis Publishers, Boca Raton, p. 159-
175.
Childs, C.W. and Leslie, D.M. 1977. Interelement relationships in iron-manganese
concretions from a catenary sequence of yellow-grey earth soils in loess. Soil Science,
123(6): 369-376.
Contin, M., Mondini, C., Leita, L. and De Nobili, M. 2007. Enhanced soil toxic metal fixation
in iron (hydr)oxides by redox cycles. Geoderma, 140:164-175.
Cornu S., Deschatrettes V., Salvador-Blanes S., Clozel B., Hardy M., Branchut S., Le
Forestier L. 2005, Trace element accumulation in Mn-Fe-oxide nodules of a
planosolic horizon. Geoderma, 125:11-24.
D'Amore, D.V., Stewart, S.R. and Huddleston, J.H. 2004. Saturation, reduction and formation
of iron-manganese concretions in the Jackson-Frazier Wetland, Oregon. Soil Sci. Soc.
Am. J., 68:1012-1022.
Dawson, B.S.W., Fergusson, J.E., Campbell, A.S. and Cutler, E.J.B. 1985. Distribution of
elements in some Fe-Mn nodules and an iron-pan in some gley soils of New Zealand.
Geoderma, 35:127-143.
Détournay, J., De Miranda, L., Dérié, R. and Ghodsi, M. 1975. The region of stability of
green rust II in the electrochemical E-pH equilibrium diagram of iron in sulphate
medium. Corrosion Science, 15:295-306.
FAO, 2006. World reference base for soil resources. A framework for international
classification, correlation and communication, 128 p.
insu
-004
3353
1, v
ersi
on 1
- 31
Jan
201
1

22
Feder, F., Trolard, F., Klingelhofer, G. and Bourrié, G. 2005. In situ Mossbauer spectroscopy:
Evidence for green rust (fougerite) in a gleysol and its mineralogical transformations
with time and depth. Geochim. Cosmochim. Acta, 69:4463-4483.
Fitzpatrick, R.W. 1988. Iron compounds as indicators of pedogenic processes: example from
southern hemisphere. Chapter 13. In: J.W. Stucki, B.A. Goodman and U.
Schwertmann (Eds.). Iron in soils and clay minerals. NATO ASI Series, serie C, vol
217, p. 351-396.
Grybos, M., Davranche, M., Gruau, G. and Petitjean, P. 2007. Is trace metal release in
wetland soils controlled by organic matter mobility or Fe-oxyhydroxydes reduction? J.
Colloid and Interface Sci., 314:490-501.
Hashimoto, K. and Misawa, T. 1973. The solubility of the γFeOOH in perchloric acid at
15°C. Corrosion Science, 13:229-231.
Herbillon, A.J. and Nahon, D., 1988. Laterites and lateritization processes. Chapter 22. In:
J.W. Stucki, B.A. Goodman and U. Schwertmann (Eds.). Iron in soils and clay
minerals. NATO ASI Series, serie C, vol 217, p. 779-796.
IPCC. Climate change 2001: the scientific basis. Contribution of working group I to the third
assessment report of the intergovernmental panel on climate change. Houghton, J. T.
et al. (Eds.). Cambridge Univ. Press, Cambridge, 2001.
Jenne, E.A. 1968. Controls on Mn, Fe, Co, Ni, Cu and Zn concentrations in soils and waters:
the significant role of hydrous Mn and Fe oxides. In: R.F. Gould (Editor), Trace
inorganics in water. Adv. Chem. American Chemical Society, p. 337-387.
Khan, F.A. and Fenton, T.E. 1994. Saturated zones and soil morphology in a Mollisol catena
of Central Iowa, Soil Sci. Soc. Am. J., 58:1457-1464.
Kölling, M. 1999. Comparison of different methods for redox potential determination in
natural waters. In: J. Schüring, H.D. Schulz, W.R. Fisher, J. Bötcher and W.H.M.
insu
-004
3353
1, v
ersi
on 1
- 31
Jan
201
1

23
Duihnisveld. Redox: Fundamentals, processes and applications. Springer-Verlag,
New-York, p. 42-54
Latrille, C., Elsass, F., van Oort, F. and Denaix, L. 2001. Physical speciation of trace metals
in Fe-Mn concretions from a rendzic lithosol developed on Sinemurian limestones
(France). Geoderma, 100:127-146.
Liu, F., Colombo, C., Adamo, P., He, J.Z. and Violante, A. 2002. Trace elements in
manganese-iron nodules from a Chinese Alfisol. Soil Science Soc. Am. J., 66:661-
670.
Manceau, A., Tamura, N., Marcus, M.A., MacDowell, A.A., Celestre, R.S., Sublett, R.E.,
Sposito, G. and Padmore, H.A. 2002. Deciphering Ni sequestration in soil
ferromanganese nodules by combining X-ray fluorescence, absorption, and diffraction
at micrometer scale resolution. American Mineralogist, 87:1494-1499.
Manceau, A., Tamura, N., Celestre, R. S., MacDowell, A.A., Geoffroy, N., Sposito, G. and
Padmore, H.A. 2003. Molecular-scale speciation of Zn and Ni in soil ferromanganese nodules
from loess soils of the Mississippi Basin. Environ. Sci. Technol., 37:75-80.
McBride, M.B. 1994. Environmental chemistry of soils. Oxford University Press, Oxford, 406
p.
McKenzie, R.M., 1975. An electron microprobe study of the relationships between heavy
metals and manganese and iron in soils and ocean floor nodules. Australian Journal of
Soil Research, 13:177-188.
McKenzie, R.M. 1989. Manganese oxides and hydroxides. Chapter 9. In: J.B. Dixon and S.B.
Weed. (Eds.). Minerals in soil environments. SSSA Book Series: 1, Madison,
Wisconsin. p. 439-465.
insu
-004
3353
1, v
ersi
on 1
- 31
Jan
201
1

24
Neaman, A., Mouele, F., Trolard, F., and Bourrié, G. 2004. Improved methods for selective
dissolution of Mn oxides: applications for studying trace element associations.
Applied Geochemistry, 19:973-979.
Neaman, A., Martínez, C.E., Trolard, F. and Bourrié, G. 2008. Trace element associations
with Fe- and Mn-oxides in soil nodules: Comparison of selective dissolution with
electron probe microanalysis. Applied Geochemistry, 23:778-782.
Palumbo, B., Bellanca, A., Neri, R. and Roe, M.J. 2001. Trace metal partitioning in Fe-Mn
nodules from Sicilian soils, Italy. Chemical. Geol., 173:257-269.
Parc, S., Nahon, D., Tardy, Y. and Viellard, P. 1989. Estimated solubility products and fields
of stability for cryptomelane, nsutite, birnessite, and lithiophorite based on natural
lateritic weathering sequences. American Mineralogist, 74:466-475.
Patrick, W.H. and Jugsujinga, A. 1992. Sequential reduction and oxidation of inorganic
nitrogen, manganese and iron in flooded soil. Soil Sci. Soc. Am. J., 56:1071-1073.
Pelfrêne, A. 2008. Spéciation des métaux traces (Cd, Cu, Pb, Zn) dans les eaux d'un Planosol
non pollué (Massif Central, France). Thèse de l'Université François Rabelais de Tours.
190 p.
Ponnamperuma, F.N., Tianco, E.M. and Loy, T. 1967. Redox equilibria in flooded soils: I.
The iron hydroxide systems. Soil Science, 103:374-381.
Quantin, C., Becquer, T., Rouiller, J.H. and Berthelin, J. 2001. Oxide weathering and trace
metal release by bacterial reduction in a New Caledonia Ferralsol. Biogeochem.,
53:323-340.
Quantin, C., Becquer, T. and Berthelin, J. 2002. Mn-oxide: a major source of easily
mobilisable Co and Ni under reducing conditions in New Caledonia Ferralsols. C. R.
Geoscience, 334:273-278.
insu
-004
3353
1, v
ersi
on 1
- 31
Jan
201
1

25
Rabenhorst and Castenson, 2005. Temperature effects on iron reduction in a hydric soil. Soil
Science, 170:734-742.
Salvador-Blanes, S. 2002. Déterminisme de la distribution spatiale des éléments majeurs et
traces dans les sols en contexte métamorphique. PhD Thesis, University of Tours,
Tours. 283p.
Schwertmann, U. and Taylor, R.M. 1989. Iron oxides. Chapter 8. In: J.B. Dixon and S.B.
Weed. (Eds.). Minerals in soil environments. SSSA Book Series: 1, Madison,
Wisconsin. p. 379-438.
Soil Taxonomy. 1999. Basic system of soil classification for making and interpreting soil
surveys. United States Department of Agriculture Natural Resources Conservation
Service, 871 p.
Stumm, W. and Morgan, J.J. 1981. Aquatic Chemistry. 2 ed. Wiley, New York, 780 p.
Taylor, R.M. 1968. The association of manganese and cobalt in soils-further observations. J.
Soil Sci., 19:77-80.
Trolard, F. and Bourrié, G. 1999. L’influence des oxydes de fer de type « rouilles vertes » sur
les séquences d’oxydo-réduction dans les sols. Comptes rendus de l’académie des
Sciences, Sciences de la Terre et des planètes, 329:801-806.
Thompson, A., Chadwick, O.A., Rancourt, D.G. and Chorover, J. 2006. Iron-oxide
crystallinity increases during soil redox oscillations. Geochim. Cosmochim. Acta,
70:1710-1727.
Zaidel’man, F.R. and Nikiforova, A.S. 1998. Manganese-iron concretions in soils and their
change under the effect of gleyification on parent materials of different genesis.
Eurasian Soil Sci, 31:817-825.
Zhang, M. and Karathanasis, A.D. 1997. Characterization of iron-manganese concretions in
Kentucky Alfisols with perched water tables. Clays Clay Miner., 45:428–439.
insu
-004
3353
1, v
ersi
on 1
- 31
Jan
201
1

26
Table 1: Characteristics of the solids used in the experiment† Sample name solid
density BET
Surface Fe Mn Co Pb
g cm-3 m2 g-1 g (100g)-1 g (100g)-1 mg kg-1 mg kg-1 Surface horizon 2.43 nd 3 0.09 13 30 3-4 mm nodules 2.86 ± 0.00 66 ± 4 22 ± 1 1.45 ± 0.18 144 ± 15 59 ± 2 4-5 mm nodules 2.80 ± 0.03 60 ± 4 18 ± 1 2.02 ± 0.15 175 ± 34 48 ± 4 Quartz sand 2.56 0.57 ± 0.09 < DL <DL 0.54 19.41
† When available, arithmetic mean values ± standard deviations were provided; nd = no data; DL = detection limit
insu
-004
3353
1, v
ersi
on 1
- 31
Jan
201
1

27
Table 2: Main characteristics of the different columns
Treatment
Columns 3-4mm nodule mass
4-5mm nodule mass
Quartz mass
Solid density
Pore volume of the
column
Fe Mn Co Pb
g g g g cm-3 cm3 g/column mg/column Saturated Quartz 96.89 2.56 24 0 0 0.05 1.9
Nodules 1 34.27 43.53 2.83 34 15 1.4 12 4.1 Nodules 2 34.2 43.48 2.83 34 15 1.4 12 4.1
14-day cycles
Quartz 97.145 2.56 24 0 0 0.05 1.9
Nodule 34.24 43.51 2.83 34 15 1.4 12 4.1
insu
-004
3353
1, v
ersi
on 1
- 31
Jan
201
1

28
Table 3: Equilibrium reactions and associated solubility constants at 25°C and 1 bar, used to construct the Eh-pH diagrams for the different minerals found in the nodules Minerals Reactions log K References γgoethite γFeOOH + 3H+ + e- ↔Fe2+ + 2H20 16.65 Hashimoto et
Misawa (1973) αgoethite αFeOOH + 3H+ + e- ↔Fe2+ + 2H20 14.97 Détournay et al.
(1975) green rust Fe(OH)3 + 3H+ + e- ↔Fe2+ + 3H20 15.87 Trolard et Bourrié
(1999) green rust Fe3(OH)8 + 8H+ + 2e- ↔ 3Fe2+ + 8H20 46.41 Ponnamperuma et
al. (1967) ferrihydrite Fe2O3(0.5H2O) + 6H+ + 2e-↔ 2Fe2+ + 3.5H20 34.778 Rabenhorst et
Castenson (2005) birnessite Mn5
4+ Mn23+ O13 + 26H+ + 12e- ↔7 Mn2+ +
13H2O 249.84 to 258.6
after Parc et al. (1989)
lithiophorite Al2Mn34+ O9 + 18H+ + 6e- ↔2Al3+ + 3Mn2+ +
9H2O 140.13 after Parc et al.
(1989)
insu
-004
3353
1, v
ersi
on 1
- 31
Jan
201
1

29
Table 4: Average values for the pH and Eh values and Fe, Mn, Co and Pb concentrations according to the water type considered and Fisher’s pairwise mean comparison results (ANOVA) pH Eh Fe Mn Co Pb Inflow 6.75b 97b 0.33a 0.21c 0.242cd 0.006bc
Outflow Continuously saturated Quartz 7.05a 102b 0.18b 0.24bc 0.275cd 0.005c
Nodule 1 7.12a 128a 0.11cd 0.25b 0.592b 0.005c Nodule 2 7.07a 130a 0.11cd 0.31a 0.742a 0.005c
14-day cycles Quartz before drying 7.08a 101b 0.17bc 0.25b 0.318c 0.008ab
Quartz after drying 7.16a 133a 0.07d 0.11d 0.146d 0.006bc
Nodule before drying 7.05a 147a 0.08d 0.27ab 0.589b 0.007abc
Nodule after drying 7.26a 149a 0.05d 0.25bc 0.731ab 0.010a
a, b, c, d are indicating wether the average are significantly different or not among the different samples with a confident level of 5%
insu
-004
3353
1, v
ersi
on 1
- 31
Jan
201
1
30
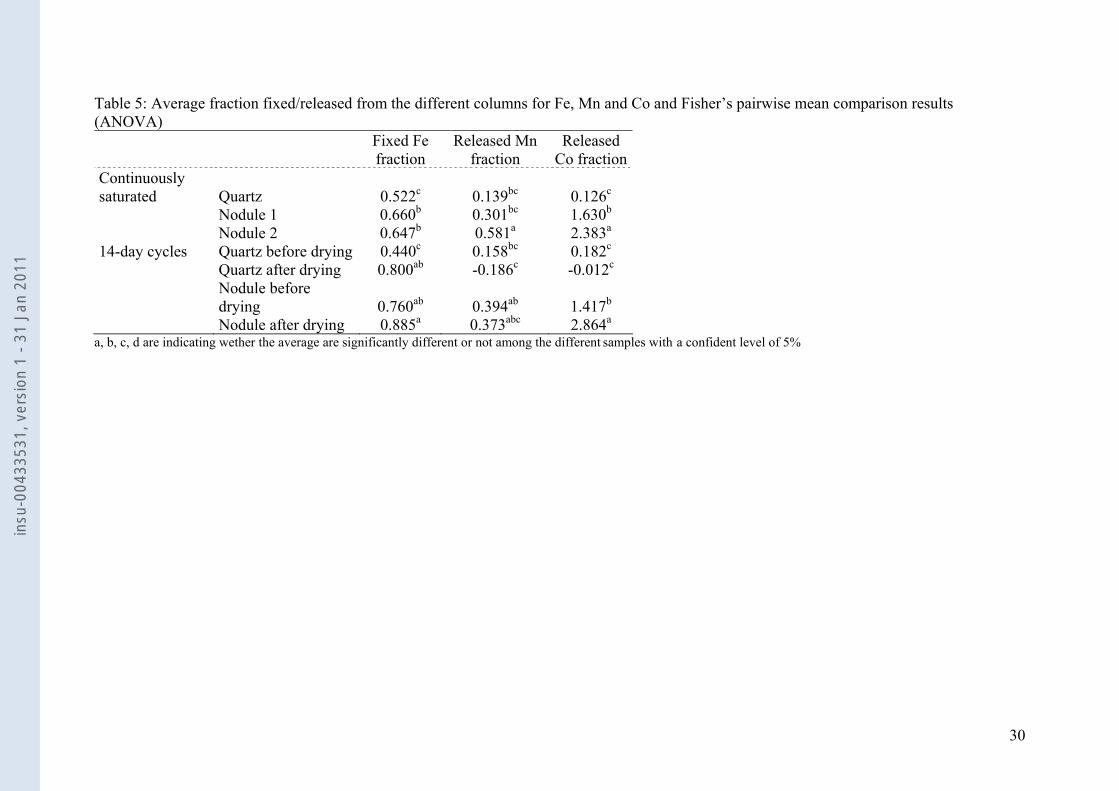
Table 5: Average fraction fixed/released from the different columns for Fe, Mn and Co and Fisher’s pairwise mean comparison results (ANOVA)
Fixed Fe fraction
Released Mn fraction
Released Co fraction
Continuously saturated Quartz 0.522c 0.139bc 0.126c Nodule 1 0.660b 0.301bc 1.630b Nodule 2 0.647b 0.581a 2.383a 14-day cycles Quartz before drying 0.440c 0.158bc 0.182c Quartz after drying 0.800ab -0.186c -0.012c
Nodule before drying 0.760ab 0.394ab 1.417b
Nodule after drying 0.885a 0.373abc 2.864a a, b, c, d are indicating wether the average are significantly different or not among the different samples with a confident level of 5%
insu
-004
3353
1, v
ersi
on 1
- 31
Jan
201
1

31
Table 6: Amount of leachate collected from the different columns Treatment Column Percolated
volume (mL) Percolated
volume (pore volumes)
Percolated volume during the cycle (mL)
Saturated Quartz 5704 238 987 Nodule 1 6183 182 1440 Nodule 2 6565 187 1411 14-day cycles Quartz 3970 165 0 Nodule 4225 124 0
insu
-004
3353
1, v
ersi
on 1
- 31
Jan
201
1

32
Table 7: Total Fe, Mn, Co and Pb gained or lost from the different columns at the end of the experiment, calculated from mass balance calculation on the inflow and outflow waters. Treatment type Column type Fe Mn Co Pb mg mg µg µg Continuously saturated Quartz 31 - 8.4 8.3 1 Nodule 1 69 -11 -102 3.7 Nodule 2 61 -28 -169 1.4 14-day cycles Quartz before drying 15 -6.7 -8.8 0.003
Quartz at the end of the experiment
25 -5.5 -8.6 0.04
Nodule before drying 27 -11 -57 0.4
Nodule at the end of the experiment
44 -15 -85 -1.9
insu
-004
3353
1, v
ersi
on 1
- 31
Jan
201
1

33
Figure caption Figure 1: Schematic diagram of the experimental design. Qz refers to the quartz columns and C to the nodule ones. Figure 2: Characteristics of the solution percolating through the topsoil monolith as a function of time: A- pH; B- Eh; C- Fe; D- Mn; E- Co; F- Pb. Dark triangles represent the outflow, while open circles are for the inflow. Figure 3: Eh-pH stability diagrams for Fe, considering 2 forms of goethite, 2 green rusts and ferrihydrite as Fe oxides, a) for a total Fe concentration in water at 10-4 mol L-1 and b) for a total Fe concentration in water at 10-5 mol L-1. Figure 4: Eh-pH stability diagram for Mn, considering total Mn concentration in water = 10-4 mol L-1 and birnessite and lithiophorite as Mn oxides. For lithiophorite, a concentration of Al in solution of 10-6 mol L-1 was considered. For birnessite a range of stability constant was encountered in the literature (Table 3). The extreme values were used to calculate the stability lines for birnessite and represented as a shaded domain on the figure. Figure 5: pH, Eh, Fe, Mn, Co and Pb concentrations as a function of the pore volume of the inflow and outflow for the quartz column undergoing permanent saturation. Dark triangles represent the outflow, while open circles are for the inflow. Figure 6: pH, Eh, Fe, Mn, Co and Pb concentrations as a function of the pore volume of the inflow and outflow for nodule columns 1 & 2 undergoing permanent saturation. Dark triangles represent the outflow, while open circles are for the inflow. Black symbols are for the first column, while grey ones state for the second column. Figure 7: pH, Eh, Fe, Mn, Co and Pb concentrations as a function of the pore volume of the inflow and outflow for the quartz column undergoing 14-day cycles. Dark triangles represent the outflow, while open circles are for the inflow. Figure 8: pH, Eh, Fe, Mn, Co and Pb concentrations as a function of the pore volume of the inflow and outflow for the nodule column undergoing 14-day cycles. Dark triangles represent the outflow, while open circles are for the inflow. Figure 9: Iron fixation ratios versus mean Eh values for the different columns.
insu
-004
3353
1, v
ersi
on 1
- 31
Jan
201
1

34
draindrain
TopsoilmonolithTopsoil
monolith
Sampling port for column
inflow
Not to scale
QzQzQzQz NN NN NNPermanently
saturated14-day cycles
Fig. 1
MilliQ® waterreservoir
Column inflow
Columnoutflow
leachate
draindrain
TopsoilmonolithTopsoil
monolithTopsoil
monolithTopsoil
monolith
Sampling port for column
inflow
Not to scale
QzQzQzQz NN NN NNPermanently
saturated14-day cycles
Fig. 1
MilliQ® waterreservoir
Column inflow
Columnoutflow
leachate
Part A Part B
insu
-004
3353
1, v
ersi
on 1
- 31
Jan
201
1

35
6.5
6.6
6.7
6.8
6.9
7.0
0
100
200
300
400
500
0
0.18
0.36
0.54
0.71
0.89
0
0.09
0.18
0.27
0.36
0.45
0
0.17
0.34
0.51
0
0.02
0.04
0.06
0 10 20 30 40 50 60 70 80 90
Time in days
Fig. 2
a
b
c
d
e
f
Fe m
mol
L-1
Mn
mm
olL-
1Eh
mV
Co
µmol
L-1
pHPb
µm
ol L
-1
insu
-004
3353
1, v
ersi
on 1
- 31
Jan
201
1

36
Fig. 3
-0.3
-0.2
-0.1
0
0.1
0.2
0.3
6.5 7 7.5 8 8.5-5
0
5
-0.3
-0.2
-0.1
0
0.1
0.2
0.3
6.5 7 7.5 8 8.5-5
0
5
FeOOHFeOOH
α FeOOH
Fe(OH)3
Fe3 (OH)8
Fe2O
30.5H2O
FeOOHFeOOH
α FeOOH
Fe(OH)3
Fe3(OH)8Fe
2O30.5H
2O
10-4 M 10-5 M
Eh (V) pE Eh (V) pE
pH pH
input
Nodule1
Quartz
Nodule 2
Quartz before drying
Nodule before drying Nodule after drying
Quartz after drying
Permanently saturated 14 days cycles
input
Nodule1Nodule1
QuartzQuartz
Nodule 2Nodule 2
Quartz before dryingQuartz before drying
Nodule before dryingNodule before drying Nodule after drying
Quartz after dryingQuartz after drying
Permanently saturated 14 days cycles
a) b)
insu
-004
3353
1, v
ersi
on 1
- 31
Jan
201
1

37
Fig. 4
-0.3
-0.2
-0.1
0
0.1
0.2
0.3
0.4
0.5
0.6
6.5 7 7.5 8 8.5-5
0
5
10
Eh (V) pE
pH
pH
Mn54+Mn2
3+013
Al2Mn34+09
input
Nodule 1Nodule 1
QuartzQuartz
Nodule 2Nodule 2
Quartz before dryingQuartz before drying
Nodule before dryingNodule before drying Nodule after drying
Quartz after dryingQuartz after drying
Permanently saturated 14 days cycles
insu
-004
3353
1, v
ersi
on 1
- 31
Jan
201
1

38
Quartz column : permanently saturated
pore volumes
Fig. 5
Eh m
VpH
0100200300400500
6.5
7.0
7.5
8.0Fe
mm
olL-
1M
n m
mol
L-1
Co
µmol
L-1
Pb µ
mol
L-1
00.180.360.540.710.89
0
0.18
0.36
0.54
00.340.681.021.361.69
0
0.02
0.05
0.07
Fe m
mol
L-1
Mn
mm
olL-
1C
o µm
ol L
-1Pb
µm
ol L
-1
00.180.360.540.710.89
0
0.18
0.36
0.54
00.340.681.021.361.69
0
0.02
0.05
0.07
0 50 100 150 200 250
a
b
c
d
e
f
insu
-004
3353
1, v
ersi
on 1
- 31
Jan
201
1

39
0100200300400500
6.5
7.0
7.5
8.0
0 50 100 150 200 250
pore volumes
Nodule columns 1 & 2 : permanently saturatedFig.6
Eh m
VpH
a
b
c
d
e
f
Fe m
mol
L-1
Mn
mm
olL-
1C
o µm
ol L
-1Pb
µm
ol L
-1
00.180.360.540.710.89
0
0.18
0.36
0.54
00.340.681.021.361.69
0
0.02
0.05
0.07
Fe m
mol
L-1
Mn
mm
olL-
1C
o µm
ol L
-1Pb
µm
ol L
-1
00.180.360.540.710.89
0
0.18
0.36
0.54
00.340.681.021.361.69
0
0.02
0.05
0.07
insu
-004
3353
1, v
ersi
on 1
- 31
Jan
201
1

40
Quartz column : 14 day-cycles
pore volumes
Fig. 7
0 50 100 150 200 250
Eh m
VpH
0100200300400500
6.5
7.0
7.5
8.0a
b
c
d
e
f
Dry
ing
Fe m
mol
L-1
Mn
mm
olL-
1C
o µm
ol L
-1Pb
µm
ol L
-1
00.180.360.540.710.89
0
0.18
0.36
0.54
00.340.681.021.361.69
0
0.02
0.05
0.07
Fe m
mol
L-1
Mn
mm
olL-
1C
o µm
ol L
-1Pb
µm
ol L
-1
00.180.360.540.710.89
0
0.18
0.36
0.54
00.340.681.021.361.69
0
0.02
0.05
0.07
insu
-004
3353
1, v
ersi
on 1
- 31
Jan
201
1

41
Nodule column: 14 day-cycles
pore volumes
Fig. 8
Eh m
VpH
0100200300400500
6.5
7.0
7.5
8.0
0 50 100 150 200 250
a
b
c
d
e
f
Dry
ing
Fe m
mol
L-1
Mn
mm
olL-
1C
o µm
ol L
-1Pb
µm
ol L
-1
00.180.360.540.710.89
0
0.18
0.36
0.54
00.340.681.021.361.69
0
0.02
0.05
0.07
insu
-004
3353
1, v
ersi
on 1
- 31
Jan
201
1

42
y = 0.008x – 0.4049R2 = 0.9039
0.3
0.4
0.5
0.6
0.7
0.8
0.9
1.0
100 110 120 130 140 150 160
Mean Eh values (mV)
Fe fi
xatio
n ra
tios
Fig. 9
insu
-004
3353
1, v
ersi
on 1
- 31
Jan
201
1


